 =========================================
 Peerless, Tiger-Soft, Peerless/ Power-Ranker Prgms.
     (C) 2016 - William Schmidt, Ph.D.
                 3/29/2018

    http://tigersoft.com/Z/NEW-2016/INSTRUCTIONS.htm
 =========================================
    INSTALLATION AND BASIC OPERATIONS
 =========================================
      1.  INSTALLATION INSTRUCTIONS
      2.  DATA DOWNLOADS
      3.  SETTING PARAMETERS
      4.  PEERLESS DJI CHART WITH AUTOMATIC BUYS and SELLS
      5.  SUPERIMPOSE DJI-BASED PEERLESS SIGNALS ON NASDAQ, etc

      6.  SELECT A TIGER DIRECTORY
      7.  SEE A TYPICAL STOCK/ETF CHART
      8.  RUBBER BAND LINES, DIAGONAL LINES, HORIZONTAL LINES, etc.
      9.  EXPERIMENT WITH DIFFERENT TIGERSOFT CHARTS
      10. TRADING INDEX ETFS

      11. QUICKSILVER RANKER
       12. POWER RANKER
       13. OPTIMIZED AND TREND-ABIDING SIGNALS
       14. BULLISH MAXCPs versus BEARISH MINCPS
       15. ADDITIONAL CHOICES FROM PEERCOMM-2016 SCREEN

       16. ADDITIONAL PEERLESS-2016 CHOICES FROM TIGER SCREEN
       17: ADDITIONAL CHOICES FROM MAIN 2016-GRAPHING SCREEN (Form 6)
       18: ADDITIONAL CHOICES FROM OLDER GRAPHING SCREEN (Form6)
       19: BUILDING YOUR OWN LIST OF STOCKS IN A SEPARATE TIGER DIRECTORY

       20: EVALUATING A STOCK TECHNICALLY

       21: TIGER BUY SIGNALS
       22: TIGER SELL SIGNALS
       23: USER SELECTED SCAN FOR A PARTICULAR SIGNAL
       24: USER SELECTED SIGNALS' SET FOR DISPLAY ON A TIGER CHART
       25: DUMMYING IN TENTATIVE DATA TO SEE IF NEW SIGNAL IS PRODUCED.

        NEXT ->>> Tiger Trading Concepts
         http://www.tigersoft.com/support/
http://tigersoft.com/Z/NEW-2016/INSTRUCTIONS.htm
=========================================
INSTALLATION AND BASIC OPERATIONS
=========================================
1. INSTALLATION INSTRUCTIONS
2. DATA DOWNLOADS
3. SETTING PARAMETERS
4. PEERLESS DJI CHART WITH AUTOMATIC BUYS and SELLS
5. SUPERIMPOSE DJI-BASED PEERLESS SIGNALS ON NASDAQ, etc
6. SELECT A TIGER DIRECTORY
7. SEE A TYPICAL STOCK/ETF CHART
8. RUBBER BAND LINES, DIAGONAL LINES, HORIZONTAL LINES, etc.
9. EXPERIMENT WITH DIFFERENT TIGERSOFT CHARTS
10. TRADING INDEX ETFS
11. QUICKSILVER RANKER
12. POWER RANKER
13. OPTIMIZED AND TREND-ABIDING SIGNALS
14. BULLISH MAXCPs versus BEARISH MINCPS
15. ADDITIONAL CHOICES FROM PEERCOMM-2016 SCREEN
16. ADDITIONAL PEERLESS-2016 CHOICES FROM TIGER SCREEN
17: ADDITIONAL CHOICES FROM MAIN 2016-GRAPHING SCREEN (Form 6)
18: ADDITIONAL CHOICES FROM OLDER GRAPHING SCREEN (Form6)
19: BUILDING YOUR OWN LIST OF STOCKS IN A SEPARATE TIGER DIRECTORY
20: EVALUATING A STOCK TECHNICALLY
21: TIGER BUY SIGNALS
22: TIGER SELL SIGNALS
23: USER SELECTED SCAN FOR A PARTICULAR SIGNAL
24: USER SELECTED SIGNALS' SET FOR DISPLAY ON A TIGER CHART
25: DUMMYING IN TENTATIVE DATA TO SEE IF NEW SIGNAL IS PRODUCED.
NEXT ->>> Tiger Trading Concepts
http://www.tigersoft.com/support/
1. INSTALLATION INSTRUCTIONS
This assumes you are in XP Mode or are using an XP.
(1) Close all other programs before running this installation.
(2)  With the Tiger Installation Disk in your Computer, you must
run a series of separate programs.

    First RUN the file 2010123.exe.

You can use START + RUN + f:\2010123.exe (where F is your CD drive.
Change the letter "F" as needed for your system.)
Alternatively, copy all the 7 files just below to your computer.
When they are all there, open and run 2010123.exe from your computer.
                            2010123.exe
                            2010123.w02
                            2010123.w03
                            2010123.w04
                            2010123.w05
                            2010123.w06
                            2010123.w07
You will see an image of a Tiger and get several prompts during
the installation.  Just click OK for each.
After the programs are all installed, you may get an error message
at the point where the data is to be installed.   This is not a problem.
The data needed will be put in place further below when using our
TigerSoft DATA page. So, you can abort the installation at this point,
because the initial programs will have been installed.

(You may also RUN STOCKS.exe, DJI-30.exe and PEER04.exe to install the
basic Stocks and Peerless data files as of 2/26/2015.)
(3) Next bring your TigerSoft/Peerless programs fully up to date.
Open and run each of the following five files.
(This installs the Tiger-Power-Ranker and installs a security code
we use to identify versions of the software.)
OPEN/RUN IN SEQUENCE THESE FROM YOUR COMPUTER:
      1. winpeer.exe   ... Older graphing program
            7/27/2006 update and security check.
      2. extra.exe ... Loads in history1.exe, history2.exe and
                 split.exe.
3. flagrank.exe ... Nightly flagging and ranking software.
4. power.exe ... Latest Analysis programs.
      5. INSTPEER.exe   2018 version of main graphing program.

      6. INSTCOMM.exe   Install 2018 Peercomm.

      7. INSTDIRL.exe   Installs ascii symbols' lists in C:\peerless.
      8. OVERRIDE.exe    Current list of company names
      to match with symbols.  (This will need frequent
      updating from the Tiger Data Page.) The most current
      list here is on the Tiger Data Page.
      8. Download DLL and VBX Files needed for TigerSoft
      and Peerless (This step is usually not needed.)
      This may require the building of C:\windows.  But
      do not do this until instructed by us.
      Run these two files.
             ZDLL1.exe -
                 to install the files into c:\peercomm\system
             ZDLL2.exe -
                 to install the files into c:\peerless\winpeer
2. DATA DOWNLOADS
      8  Using Firefox or Internet Explorer
         go to the current Tiger Data Page.
   As of 3/29/2018, it is at www.tigersoft.com/4XD78/INDEX.htm
                (This changes regularly.)

   From this Tiger Data Page, see how the data file
   downloads work.  On this page, you will find more than 90
   different .exes which send the current data to your computer.
   Pick just the ones you want for your purposes.

   It is suggested that each night, or when needed that you
   Open and Run PEER04.exe, DJI-30.exe, MAXCP.exe.
   MINCP.exe and STOCKS.exe plus any of the others you like.
   Each download places different current data in your computer.
   It will place each set of data in a directory that corresponds
   to the name of the download, with the exception of PEER04.exe
   which places the data files in c:\peerless.  Each download
   replaces the previously updated data with the new data.
   PEER04.exe - This loads the current DJI, NYSE A/D,
                OEX, SP-500, NYSE and NASDAQ data,
                as well as Hourly DJI and Weekly DJI.
   STOCKS.exe - an assortment of high caps are loaded
                into c:\stocks
DJI-30.exe - DJI and key ETFs are loaded into c:\DJI-30
   MAXCP.exe  - Current stocks making Closing Power new highs
                are loaded into c:\MAXCP
   MINCP.exe  - Current stocks making Closing Power new highs
                are loaded into c:\MAXCP
   16-a.exe   - Stocks beginning with the letter "A" are
                loaded into c:\14-a
LEVERAGE.exe - Leveraged ETFs.
REITS.exe - REIT sector data are loaded into c:\REITS
------------------------------------------------------------------

3.SETTING PARAMETERS
Now you are ready to prepare the TIGER PROGRAMS for use.
1.  Place the icon for PEERCOMM on your desk top.
     Click Start + All Programs + find Tiger Investment
     Software + with the left mouse key down drag the
     Peercomm over to your desk top.  (Alternatively,
     you can find the program c:\peercomm\PEERCOMM.exe
     using Windows Explorer and copy it to the desk top.)
     Peercomm will lead you to the other programs.
2. Now start the TigerSoft programs.
    Double-click the left mouse-key pointing to the Peercomm icon
    This is the procedure you will regularly use. In the rare
    event that the programs err out, use this procedure to restart
    them.
3. Sizing. Place a chart on the screen to see how well the image fits
    your monitor. Use these commands.

    Peercomm  + Charts2016 (upper right button +
    Daily Stocks + AA (or any stock symbol) + OK.
    How does the size of the image suit your monitor?
    Is it too small?
    Too large?
    X-Axis - left to right.
    Y-Axis - up-down.
    Set the size of the graph on your monitor for the
    Peerless/Tiger-2016 charts.

    Use Peercomm + Peerless-2016 + Run Set Ups (upper left)
    + Initial Graph Choices(2)
    + 550 (A lower number expands the screen vertically)
    + 750  (A lower number expands the screen horizontally)
            + Y + N +Y
Then use Peercomm + Peerless-2016 + Run Set Ups
+ Initial Graph Choices(1) + Y
This gives you the same type of charts we most often use for Hotline.
4. PEERLESS DJI CHART WITH AUTOMATIC BUYS and SELLS
Use Peercomm + Peerless-2016 + Peerless Daily DJI +
OK (to DATA, the current DATA. You could use DATA6566 or
DATA87, DATA04 etc. to see older data and signals.
With Peerless DJI chart on screen, ask the computer
to show the Peerless Buys and Sells using the commands
Signals(1) (upper right)+ DJI Major Buys and Sells.
See all the key internal strength indicators next.
NYSE A/D Line
P-I (21-day ma of Daily NYSE Advances-Declines
Tiger Accumulation Index (Originally called "IP21" back in 1981)
With Peerless DJI chart on screen, enter Operations + DJI Chart and ADL,PI, Accum.Index.
 To see what happens to $10,000 using Buys only at the
next day's opening after a signal. choose
Operations + What Happens to $10,000 (Buys Only) + Y.
Click X (upper right corner) three times to go back to the Main Peercomm Menu
For more information on Peerless Buys and Sells, see
Peerless Buy and Sell Signals: 1928-2016
Individual Peerless signals explained:
http://tigersoftware.com/PeerlessStudies/Signals-Res/index.htm
http://www.tigersoft.com/PeerInst-2012-2013/
http://www.tigersoft.com/PeerInst-2012-2013/
Peerless Signals and DJI Charts - version 7/4/2013
1965 1965-6 1966 1966-7 1967 1967-8 1968 1968-9 1969 1969-70 1970 1970-1 1971
1971-2 1972 1972-3 1973 1973-4 1974 1974-5 1975 1975-6 1976 1976-7 1977 1977-1978
1978 1978-79 1979 1979-80 1980 1980-1 1981 1981-2 1982 1982-1983 1983 1983-1984
1984 1984-1985 1985 1985-1986 1986 1986-1987 1987 1987-8 1988 1988-9 1989 1989-90
1990 1990-1 1991 1991-2 1992 1992-3 1993 1993-4 1994 1994-5 1995 1995-1996 1996
1996-7 1997 1997-8 1998 1998-1999 1999 1999-2000 2000 2000-1 2001 2001-2 2002
2002-3 2003 2003-4 2004 2004-5 2005 2005-6 2006 2006-7 2007 2007-8 2008 2008-9
2009 2009-10 2010 2010-11 2011 2011-12 2012 2012-2013 2013 2013-2014 2014 2014-2015
2015 2015-2016
5. SUPERIMPOSE DJI-BASED PEERLESS SIGNALS ON NASDAQ (SP-500, etc.)
Use Peercomm + Peerless-2016 + Peerless Daily DJI +
SHORT-TERM INDEXES + CURRENT NASDAQ + OK (for NASD)
+ Signals1 (Upper left) + Superimpose DJI Saved Signals.
To see what happens to $10,000 using Buys and Selling
Short at the next day's opening after a signal, choose
Operations + What Happens to $10,000 (Buys/Sell Short) + Y.
To see what happens to $10,000 using Buys only at the
next day's opening after a signal. choose
Operations + What Happens to $10,000 (Buys Only) + Y.
Click X (upper right corner) three times to go back to the Main Peercomm Menu
For more information on Peerless Buys and Sells, see
Peerless Buy and Sell Signals: 1928-2016
Individual Peerless signals explained:
http://tigersoftware.com/PeerlessStudies/Signals-Res/index.htm
http://www.tigersoft.com/PeerInst-2012-2013/
http://www.tigersoft.com/PeerInst-2012-2013/
Peerless Signals and DJI Charts - version 7/4/2013
1965 1965-6 1966 1966-7 1967 1967-8 1968 1968-9 1969 1969-70 1970 1970-1 1971
1971-2 1972 1972-3 1973 1973-4 1974 1974-5 1975 1975-6 1976 1976-7 1977 1977-1978
1978 1978-79 1979 1979-80 1980 1980-1 1981 1981-2 1982 1982-1983 1983 1983-1984
1984 1984-1985 1985 1985-1986 1986 1986-1987 1987 1987-8 1988 1988-9 1989 1989-90
1990 1990-1 1991 1991-2 1992 1992-3 1993 1993-4 1994 1994-5 1995 1995-1996 1996
1996-7 1997 1997-8 1998 1998-1999 1999 1999-2000 2000 2000-1 2001 2001-2 2002
2002-3 2003 2003-4 2004 2004-5 2005 2005-6 2006 2006-7 2007 2007-8 2008 2008-9
2009 2009-10 2010 2010-11 2011 2011-12 2012 2012-2013 2013 2013-2014 2014 2014-2015
2015 2015-2016
5. SUPERIMPOSE DJI-BASED PEERLESS SIGNALS ON NASDAQ (SP-500, etc.)
Use Peercomm + Peerless-2016 + Peerless Daily DJI +
SHORT-TERM INDEXES + CURRENT NASDAQ + OK (for NASD)
+ Signals1 (Upper left) + Superimpose DJI Saved Signals.
To see what happens to $10,000 using Buys and Selling
Short at the next day's opening after a signal, choose
Operations + What Happens to $10,000 (Buys/Sell Short) + Y.
 6. SELECT A TIGER DIRECTORY
Use Peercomm + Select Folder(upper left button) + DJI-30 + OK
This allows you to change the assumed stock directory
to any of the Tiger data directories you have
downloaded.
7. SEE A TYPICAL STOCK/ETF CHART
Peercomm + Charts2016 (upper right button +
Daily Stocks + QQQ (or any stock symbol) + OK.
6. SELECT A TIGER DIRECTORY
Use Peercomm + Select Folder(upper left button) + DJI-30 + OK
This allows you to change the assumed stock directory
to any of the Tiger data directories you have
downloaded.
7. SEE A TYPICAL STOCK/ETF CHART
Peercomm + Charts2016 (upper right button +
Daily Stocks + QQQ (or any stock symbol) + OK.
     There is a bar chart at the top with moving averages and bands,
     a blue Closing Power beneath the bar chart,
     a pink OBV Line,
     a brown Relative Strength Line and
     a blue/red Tiger Accumulation Index.


                A 2016 Super Stock - NVDA
 PINK (Magenta) CLOSING POWER DIVERGENCE SIGNALS
 These are the Closing Power divergence signals. They are warnings,
either bullish or bearish. They are significant mainly when prices then
break to the other side of the 65-dma. You can make them appear or not appear
in the first place as you do a new chart by setting them up by using
Peercomm + Charts 2017-8 + Run/Setups (upper right)+
Set Initial Screen's Signals + "Y"es or "N"o in reply to first question on
upper left: "Do you want to see automatic (magenta) CP divergence
B7/S7 signals?"
These are the Closing Power divergence signals. They are warnings,
either bullish or bearish. They are significant mainly when prices then
break to the other side of the 65-dma. You can make them appear or not appear
in the first place as you do a new chart by setting them up by using
Peercomm + Charts 2017-8 + Run/Setups (upper right)+
Set Initial Screen's Signals + "Y"es or "N"o in reply to first question on
upper left: "Do you want to see automatic (magenta) CP divergence
B7/S7 signals?"
 I've found a cluster of them for a month followed by a quick cross-over
of prices across the 65-dma is helpful. We also want to see confirming
Accumulation. But without a price cross-over, they are not significant.
The CP divergences from price show that Professionals are acting in ways
that are at variance with other market participants.
See how Boeings top in 2008 occurred after such a cluster of Closing Power
warnings.
I've found a cluster of them for a month followed by a quick cross-over
of prices across the 65-dma is helpful. We also want to see confirming
Accumulation. But without a price cross-over, they are not significant.
The CP divergences from price show that Professionals are acting in ways
that are at variance with other market participants.
See how Boeings top in 2008 occurred after such a cluster of Closing Power
warnings.
 Note. PEERLESS/TIGER CHARTS
     Generally, use Peercomm + Peerless-2016-8
     (upper button on right).  The older charting program
     can be used, but its image can only be sized by changing
     all your Image resolution settings to 600x800 and that
     may not be satisfactory for you, though we with weaker
     eyes are happy to use it.

8. RUBBER BAND LINES, DIAGONAL LINES,
HORIZONTAL LINES, etc.

     On any chart you can extend a line from a fixed point using
         Lines + Rubber Band ... Point and drag line where you want it extended.
         Experiment with the other lines.  The Vertical Line can be used
         to see the key values on a specific date.
9. EXPERIMENT WITH DIFFERENT TIGERSOFT CHARTS.
CandleStick Chart - Opening and Closing Power, Accumulation Index
PEERCOMM + Peerless-2016 + Daily Stocks + any stock symbol in
directory + OK + Operations + Candle Stick + 0 + OK.
This chart lets us magnify a chart and see our most important
indicators, Accumulation Index and Closing Power.
 6-month chart emphasizing 5-day ma and volume.
PEERCOMM + Peerless-2016 + Daily Stocks + any stock symbol in
directory + OK + Operations + Six-Month Chart.
6-month chart emphasizing 5-day ma and volume.
PEERCOMM + Peerless-2016 + Daily Stocks + any stock symbol in
directory + OK + Operations + Six-Month Chart.
 Explode a chart to magnify it.
With a stock/ETF chart on screen:
Lines + Explode + click to points to define dates' boundaries.
What it will take to break a user-drawn
Closing Power trend-line?
PEERCOMM + Peerless-2016 + Daily Stocks + any stock symbol in
directory + OK + Lines + Explode Selected Screen Area + OK
+ two clicks of mouse showing horizontal (dates) borders
+ Lines + Draw Closing Power Trend: Show Statistics +
Carefully with two clicks show where Closing Power trend is supposed
to go and see what price level is needed the next day to break this
CP trend-line.
Explode a chart to magnify it.
With a stock/ETF chart on screen:
Lines + Explode + click to points to define dates' boundaries.
What it will take to break a user-drawn
Closing Power trend-line?
PEERCOMM + Peerless-2016 + Daily Stocks + any stock symbol in
directory + OK + Lines + Explode Selected Screen Area + OK
+ two clicks of mouse showing horizontal (dates) borders
+ Lines + Draw Closing Power Trend: Show Statistics +
Carefully with two clicks show where Closing Power trend is supposed
to go and see what price level is needed the next day to break this
CP trend-line.
 Chart an extra day of tentative data.
Peercomm + Older Charting + Daily Stocks + stock/ETF + OK
+ Operations + Re-Chart Using Tentative Day's New Data.
10. TRADING INDEX ETF FUNDS
The automatic signals that Peerless Stock Market Timing gives on the DJIA
can be superimposed on any ETF. But there are times when we want more.
This is usually because Peerless is an intermediate-term system and we may want
to short-term trade. In addition, we may choose to "clinch" a reversing Peerless
signal since each Peerless signal has some chance of being premature or
wrong. We should also appreciate that each ETF has a price-path
that is somewhat independent of the DJI. So how should we proceed?
How can we distinguish the best ETFs to short or buy from those with more risk
of not working out.
First, compare the IP21 (Current Accumulation) readings for the different
ETFs. We would prefer only to short an ETF with an IP21 level close to
of below all the others. With leveraged ETFs, we want to buy mostly ETFs
with IP21 readings above +.15 and short those with readings below -.15.
(With QQQ below, the IP21 is -.052. While this is bearish, we can can
also see that IP21 is above its rising 21-day ma.)
Secondly, Watch the Closing Power trend.
We want net-Professionals to be in agreement with us. We want the Closing
Power of our choice of ETFs to not have a rising Closing Power trend
if we short it and not have a falling Closing Power trend if we buy it.
Draw trendlines to see the Closing Power trends when they are over-extended,
otherwise use the "Bearish" or "Bullish" Closing Power notation to the
right of the chart. This shows whether the Closing Power is below a falling
CP ma or above a rising CP ma. (With QQQ below, the Closing Power is clearly
downtrending and rated "Bearish", too.)
Thirdly, compare the relative strengths of the major ETFs. Compare their
annualized 5-day rate of changes and compare their ITRS (this measures the
difference in performance between some other stock or ETF and the DJI).
Try mostly to buy the best of the six ETFs: DIA, SPY, MDY, OEX, QQQ and IWM.
Each has its data in the DJI-30 download or short the weakest.
Fourth, if we are "clinching" a Peerless Sell signal, we might want to sell
short not only the ETF that is weakest in terms of 5-dma AROC and ITRS,
we might also want to be sure that its Closing Power is below its 21-day ma
and falling.
And fifth, to be safer, we may want only to be short one of these ETFs
so long as their price-5-day ma is falling. If that moving average turns up,
we may want to cover the short or not go short it. Here we compare the
chart-posted pivot-point and the close on the chart. See the chart below.
If on the next day, QQQ closes above 117.11, it will mean that its 5-day ma
will turn up and we should probably cover our short sale.
Lastly, always look for chart patterns that show where the likely support
and resistance are. In QQQ's case below, resistance is at its falling (purple)
65-dma at 117 and temporary support is at 114. We would judge that a penetration
of 117 is likely to lead to a challenge of 119.5, its previous high.
Regarding 200-day ma support:
How reliable support is the DJI's rising 200-day ma?
Google "TigerSoft" "head and shoulders".
QQQ: A Bearish Example, on 11/14/2016
Chart an extra day of tentative data.
Peercomm + Older Charting + Daily Stocks + stock/ETF + OK
+ Operations + Re-Chart Using Tentative Day's New Data.
10. TRADING INDEX ETF FUNDS
The automatic signals that Peerless Stock Market Timing gives on the DJIA
can be superimposed on any ETF. But there are times when we want more.
This is usually because Peerless is an intermediate-term system and we may want
to short-term trade. In addition, we may choose to "clinch" a reversing Peerless
signal since each Peerless signal has some chance of being premature or
wrong. We should also appreciate that each ETF has a price-path
that is somewhat independent of the DJI. So how should we proceed?
How can we distinguish the best ETFs to short or buy from those with more risk
of not working out.
First, compare the IP21 (Current Accumulation) readings for the different
ETFs. We would prefer only to short an ETF with an IP21 level close to
of below all the others. With leveraged ETFs, we want to buy mostly ETFs
with IP21 readings above +.15 and short those with readings below -.15.
(With QQQ below, the IP21 is -.052. While this is bearish, we can can
also see that IP21 is above its rising 21-day ma.)
Secondly, Watch the Closing Power trend.
We want net-Professionals to be in agreement with us. We want the Closing
Power of our choice of ETFs to not have a rising Closing Power trend
if we short it and not have a falling Closing Power trend if we buy it.
Draw trendlines to see the Closing Power trends when they are over-extended,
otherwise use the "Bearish" or "Bullish" Closing Power notation to the
right of the chart. This shows whether the Closing Power is below a falling
CP ma or above a rising CP ma. (With QQQ below, the Closing Power is clearly
downtrending and rated "Bearish", too.)
Thirdly, compare the relative strengths of the major ETFs. Compare their
annualized 5-day rate of changes and compare their ITRS (this measures the
difference in performance between some other stock or ETF and the DJI).
Try mostly to buy the best of the six ETFs: DIA, SPY, MDY, OEX, QQQ and IWM.
Each has its data in the DJI-30 download or short the weakest.
Fourth, if we are "clinching" a Peerless Sell signal, we might want to sell
short not only the ETF that is weakest in terms of 5-dma AROC and ITRS,
we might also want to be sure that its Closing Power is below its 21-day ma
and falling.
And fifth, to be safer, we may want only to be short one of these ETFs
so long as their price-5-day ma is falling. If that moving average turns up,
we may want to cover the short or not go short it. Here we compare the
chart-posted pivot-point and the close on the chart. See the chart below.
If on the next day, QQQ closes above 117.11, it will mean that its 5-day ma
will turn up and we should probably cover our short sale.
Lastly, always look for chart patterns that show where the likely support
and resistance are. In QQQ's case below, resistance is at its falling (purple)
65-dma at 117 and temporary support is at 114. We would judge that a penetration
of 117 is likely to lead to a challenge of 119.5, its previous high.
Regarding 200-day ma support:
How reliable support is the DJI's rising 200-day ma?
Google "TigerSoft" "head and shoulders".
QQQ: A Bearish Example, on 11/14/2016
 IWM: A Bullish Example, on 11/14/2016
In IWM's case, the megaphone-price pattern sets up resistance at 131-132.
Notice, too that its IP21 and ITRS are stronger than QQQ's and both its
Opening and Closing Power are stronger than QQQ's. This is the better
ETF to go long. And using the principle of abiding by the 5-day ma direction,
the risk here would seem limited.
IWM: A Bullish Example, on 11/14/2016
In IWM's case, the megaphone-price pattern sets up resistance at 131-132.
Notice, too that its IP21 and ITRS are stronger than QQQ's and both its
Opening and Closing Power are stronger than QQQ's. This is the better
ETF to go long. And using the principle of abiding by the 5-day ma direction,
the risk here would seem limited.
 11. QUICKSILVER RANKER
To find the strongest leveraged ETF, we recommend downloading LEVERAGE
from the Tiger Data Page. This consists of all the leveraged ETFs.
Then run the Tiger "QuickSilver" program using the commands:
PEERCOMM + Select Folder + (choose) LEVERAGE + Ok + Charts 2016 +
Run/Setups + Run QuickSilver + after 20 seconds...
Examine table by choosing New Display (top) + BUYs.
See in the example shown below how all the stocks
met the QuickSilver requirements for a Buy except that their
volume did not rise on an UP-day. Falling volume on a down-day
is bullish, but we would prefer to see volume rising on an up-day.
And of course, try to buy these ETFs near their rising 5-day ma,
not at their 5-day ma upper bands.
More QuickSilver Documentation
11. QUICKSILVER RANKER
To find the strongest leveraged ETF, we recommend downloading LEVERAGE
from the Tiger Data Page. This consists of all the leveraged ETFs.
Then run the Tiger "QuickSilver" program using the commands:
PEERCOMM + Select Folder + (choose) LEVERAGE + Ok + Charts 2016 +
Run/Setups + Run QuickSilver + after 20 seconds...
Examine table by choosing New Display (top) + BUYs.
See in the example shown below how all the stocks
met the QuickSilver requirements for a Buy except that their
volume did not rise on an UP-day. Falling volume on a down-day
is bullish, but we would prefer to see volume rising on an up-day.
And of course, try to buy these ETFs near their rising 5-day ma,
not at their 5-day ma upper bands.
More QuickSilver Documentation
Directory= C:\leverage date= 11/16/16
5DAROC        Symbol        Last          5-dma         Pivot         Change
....................................................................................
IP21          AI/200        OP-PWR        CP-PWR        PCT-Up   Daily Vol. notes
====================================================================================
785.8         KRU           133           131.18        122.51        -3.7
.37           58            Rising        Rising        .47           vol.fell on down-day
---------------------------------------------------------------------------------------------
442.9         FAS           34.86         34.81         33.72         -.8
.31           163           Rising        Rising        .518          vol.fell on down-day
---------------------------------------------------------------------------------------------
334.6         UYG           82.67         82.52         80.47         -1.45
.39           169           Rising        Rising        .518          vol.fell on down-day
---------------------------------------------------------------------------------------------
295.9         YCS           70.01         68.73         67.29         -.13
.43           104           Rising        Rising        .494          vol.fell on down-day
---------------------------------------------------------------------------------------------
172           TMV           22.36         22.83         22.52         -.64
.26           92            Rising        Rising        .43           vol.fell on down-day
---------------------------------------------------------------------------------------------
164.5         DDM           76.01         75.85         75.35         -.31
.25           161           Rising        Rising        .526          vol.fell on down-day
---------------------------------------------------------------------------------------------
124           TBT           38.78         39.29         38.93         -.67
.26           100           Rising        Rising        .438          vol.fell on down-day
---------------------------------------------------------------------------------------------
110.3         PST           21.92         21.85         21.66         -.07
.34           65            Rising        Rising        .442          vol.fell on down-day
---------------------------------------------------------------------------------------------
-349.6        DGAZ          7.69          8.04          8.39          -.35
.2            71            Rising        Rising        .51           vol.fell on down-day
---------------------------------------------------------------------------------------------

    To find those ETFs ranked as QuickSilver Buys, find those with

             an 5-dma AROC > 500%,
             an IP21>+.15,
             rising Opening and Closing Power,
             and rising volume on an up day.

    These make excellent short-term trades as long as their Closing Power
    is rising.   See below:


12. POWER RANKER
    To find the most bullish stocks from a 2-3 months perspective
    in the universe of 6000, we recommend running the Tiger Power Ranker.

    Select the stocks directory MAXCP and then Run ANALYSIS/RANK (lower left)
    from the 8 button Peercomm screen.  Click X at upper right to go
    back to Peercomm screen when the ranking is finished. Do not click
    return to Tiger Menu.  Then choose Peerless-2016 + Daily Stocks.
    Then pick "BULLISH" from the middle of the screen to see first stock,
    the most bullish. Click OK.

            Scrolling through a List of Stocks

    After viewing this stock, Click 2 (down) on right of keyboard to see
    the next, etc. Go up a stock in this list by clicking 8 (up).
     (The NUM-LOCK key must be turned off for this
        to work properly.)

    Or to see the most bearish stocks, Select the stocks directory MINCP
    and then run ANALYSIS/RANK (lower left) + X (upper right).
    Then pick "BEARISH" from the middle of the screen to see first stock,
    the most bullish. Click OK.

    All the other useful items in the middle of the Choices' Menu may
    be used with any directory provided you have run the Power Ranker
    for that directory.
           Bullish examples are: "New Highs", "IP21 over .25" and "HISTB12".
           Bearish examples are: "New Lows", "HISTS9", "BOTHDOWN", "IPCRUNTI"

    VERY IMPORTANT - When finished with ANALYSIS
    Power Ranker)  ALWAYS CLICK X.  Do not click
    the button in the middle.  It will take you to the older
    charting programs.

     Now let's assume you want to look at stocks based on their
     Power Ranking.
     Click X and go back to the Main Peercomm 8-Button screen.
     Click on these commands:
     Charts-2016 + Ranking Results (top center) + Tiger Power Ranker.
Click on any row + Graph to see the Charts.
The columns show the following information:
     Power = Power Ranking - high is bullish.  low is bearish
     ___________________________________________________
     AI/200 = How many days in the last 200 that Accum.Index
              was positive.  High number shows institutional
              buying on weakness.
     ____________________________________________________
     OBV%-Pr% ... below -10 shows bearish OBV divergence
              from price  Avoid these stocks.
     ____________________________________________________
     IPA%-Pr% ... below -10 shows bearish IPA divergence
              from price.  Avoid these stocks.
     ____________________________________________________
     Current IP21 ... Above +.375 is considered insider buying.
              Below -.250 is considered insider selling.
     ____________________________________________________
     Close   Closing Price
     ____________________________________________________
     Trend-50  AR bullishly above rising 50-dma
               BF bearishly below falling 50-dma
     ____________________________________________________
     CL/21-dma  above 1.00 is bullish.
     ____________________________________________________
     UP% = % of days stock has risen on day-to-day basis
     for last year.
               >50% is bullish but >60% is risky and may be over-bought.
     __________________________________________________________
     MACD Signal = Intermediate momentum trend.
     __________________________________________________________
     TGR Sig   The First letter shows whether Opening Power
               is Up or Down.
               The second letter shows whether Closing power
               is Up or Down.
               UU is most bullish but often late in a trend.
               UD is turning bearish
               DU is early bullish.
               DD is most bearish.
     ___________________________________________________________
I’d like... all the stocks in the directory listed
from highest returns to date to the lowest returns to date.
You can do it for 21, 50, 100 and 250 performance ranking:
Peercomm + Analyze/Rank for a directory + X at upper left when finished +
Charts-2016 + Ranking Results (top) + 21 or 50 or 100 0r 250 day ranking.
You also can do it for a different, odder number of days as follows:
Peercomm + Older Charting + Ranking Results + User Set Ranking (last in list)
+ your number of days to go back) + 1 (for Pct change ranking).
Then to chart one or more of them, click on a row and click Graph Stock.
(You could click 3 for IP21 to be basic of ranking.)
13. OPTIMIZED AND TREND-ABIDING SIGNALS
    The red signals that appear are those based on the
    optimized best system for the last year. The top
    line tells you what the signals are based on and
    their trading results over the last year.  Stochastic
    based Red arrows work best when the stock is
    in a trading range and not trending too much.
Place the technical signals that generally work
best given the direction of the heavy purple 65-dma.
With a Tiger chart of the screen, use Signals(1) +
==>Stocks' Signals compatible with 65-dma.
For more information see Introduction to Tiger/Peerless Buys and Sells.
Documentation for TigerSoft Automatic and Optimized Signals.
Different Types of TigerSoft/Peerless CHARTS, Signals and Indicators
Tiger S9 + S12 + Closing Power Trend-Break. Easy as 1-2-3 Short Sales
14.BULLISH MAXCPs versus BEARISH MINCPS
Contrast the very Bullish looking and very Bearish
looking Stock/ETF
We often hedge. We buys some of the BULLISH MAXCPs and
short some of the BEARISH MINCPS. We believe in this
principle so strongly that we post the best and worst of these
stocks each night on our Hotline.
Very Bullish stock - TOWN
Signals shown: Automatic Optimized Red signals based here
on (see top of chart)
Also shown are
 Very Bearish Bond Fund
Signals shown: Automatic Optimized Red signals based here
on (see top of chart)
Pink S7s warn of trouble when purple 65-dma is finally broken.
Use Signals(3) + Closing Power Divergence Signals.
Numbered technical signals shown for second half of chart.
Block off signals using Operations + Make Signals' Exclusion Zone + 2 clicks.
Then employ Signals (1) + signals technical consistent direction of
65-dma.
Very Bearish Bond Fund
Signals shown: Automatic Optimized Red signals based here
on (see top of chart)
Pink S7s warn of trouble when purple 65-dma is finally broken.
Use Signals(3) + Closing Power Divergence Signals.
Numbered technical signals shown for second half of chart.
Block off signals using Operations + Make Signals' Exclusion Zone + 2 clicks.
Then employ Signals (1) + signals technical consistent direction of
65-dma.
 15. ADDITIONAL CHOICES: FROM PEERCOMM-2016 SCREEN
Only a few of these pull-down choices should be used unless advised by us.
The others you might want to use are noted below.
File
Optimize Bands and Drop Older Data.
Running this will give somewhat better fitting bands.
Stock Data Folders
Create Data File Folder from A-Z stocks.
Running this to create your own customized Tiger Data folder.
See instructions near top of Tiger Data Page.
View
Tiger Spreadsheet of Key Values.
First Run Tiger Power Ranker/Analysis from Peercomm page.
By clicking on top row of any column you can rank the items by
this key value. For example, AI/200 (longer term Accumulation)
or IP21 (Current Accumulation)
Tiger Power Ranker.
Instructions
Tiger/Peerless Instructions.
TigerSoft Core Concepts
15. ADDITIONAL CHOICES: FROM PEERCOMM-2016 SCREEN
Only a few of these pull-down choices should be used unless advised by us.
The others you might want to use are noted below.
File
Optimize Bands and Drop Older Data.
Running this will give somewhat better fitting bands.
Stock Data Folders
Create Data File Folder from A-Z stocks.
Running this to create your own customized Tiger Data folder.
See instructions near top of Tiger Data Page.
View
Tiger Spreadsheet of Key Values.
First Run Tiger Power Ranker/Analysis from Peercomm page.
By clicking on top row of any column you can rank the items by
this key value. For example, AI/200 (longer term Accumulation)
or IP21 (Current Accumulation)
Tiger Power Ranker.
Instructions
Tiger/Peerless Instructions.
TigerSoft Core Concepts
16: ADDITIONAL CHOICES FROM MAIN 2016-GRAPHING SCREEN (Form 6)
On the right of the screen, choose what is to be graphed. (Vital.)
Peerless Daily DJI (This is source of Peerless Buys and Sells, which have
been back-tested to 1928.)
Short-Term Indexes (Hourly DJI, NASDAQ, SP-500, NYSE and OEX)(Vital.)
 Daily Stocks (This leads to key graphing of chosen stock/ETF.(Vital.)
Weekly Stocks (Data must be downloaded from Tiger Data Page. (Vital.)
Daily Stocks (This leads to key graphing of chosen stock/ETF.(Vital.)
Weekly Stocks (Data must be downloaded from Tiger Data Page. (Vital.)
 Index of your list of stocks (A Tiger Index can be created of all stocks
in directory you are currently using.
Use Indicators(1) + A/D Line (This shows group's A/D Line.
It is very handy to see the trend-changes in a directory's
combined A/D Line. This is a chart of the cumulative
daily advances-declines. At bottom of this chart
also appears a line showing how the percent of stocks
in this directory above 65-dma has changed over the last
year. (Vital.)
Index of your list of stocks (A Tiger Index can be created of all stocks
in directory you are currently using.
Use Indicators(1) + A/D Line (This shows group's A/D Line.
It is very handy to see the trend-changes in a directory's
combined A/D Line. This is a chart of the cumulative
daily advances-declines. At bottom of this chart
also appears a line showing how the percent of stocks
in this directory above 65-dma has changed over the last
year. (Vital.)
 CHOICES FROM MAIN 2016-GRAPHING SCREEN (continued)
Below are the most important pull-down choices from top. Others should be used
when one has first learned how to use the choices set out here.
Run/Setups
Run QuickSilver =5 day AROC Ranking. (Very useful.)
Compute Peerless Gains (and maximum paper losses for all stocks in directory.)
Rank Directory's Stocks for Pct. over 65-dma.
Compute BOTH UP Statistics (for all stocks in directory.)
DJI Future based on Past Seasonality. (Very useful.)
Net IDOSC (Day to day predictor of DJI when in trading ranges).
Next Day Predictor (What stock best predicts DJI day to day.)
DJI Predictor (What stock is best predicted by DJI day to day.)
Edit
Send Symbols' List to File in Peerless (using name of directory)
Tiger Selections
#1 Indicators' Results (Shows which systems work best with each stock in directory).
Bullish Stocks for next 3 months (The shows spreadsheet of key values
and easy direct graphing)
Bearish Stocks for next 3 months (The shows spreadsheet of key values
and easy direct graphing)
Tiger Groups (Spreadsheet for all flagged groups and easy graphs of those clicked on.)
Multiple Factor Screening (Scan stocks for those meeting multiple conditions)
Ranking Results
Tiger Power Ranking (Shows results from last run of Power Ranker and easy graphs)
(Very useful.)
Tiger Accumulation Index (Shows AI/200 ranking results from last run of Power Ranker
and easy direct graphing. (Very useful.)
50-Day Pct. Change Ranking and Divergences. (Very useful.)
Recent Signals
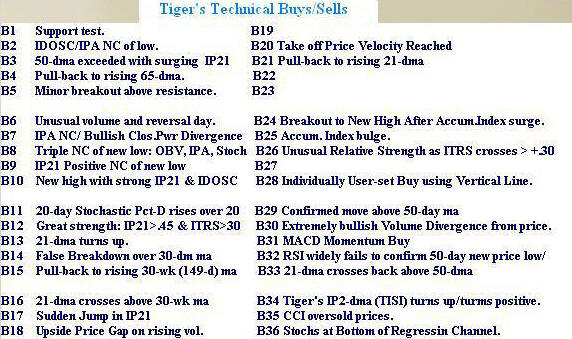
Most Recent Signal for All Stocks (Scan for favored Tiger Technical Buys/Sells.)
Tiger technical Buys and Sells explained under HELP on this form.
Key Values
Spreadsheet Display (For all stocks in directory. Click top of column to rank)
Help
Glossary Of Key Indicators, Terms and Concepts (Vital for beginner to Tiger.)
Peerless Intermediate-Term Signs (Explanation and track record) (Very useful.)
Tiger Stock Signals Explained. (Very useful.)
Weekly Signals(Very useful.)
17: ADDITIONAL CHOICES FROM MAIN 2016-GRAPHING SCREEN (Form 6)
Below is more information on the most important pull-down choices from the top.
It is recommended that you first become more familiar with the numbered Tiger
technical signals...
PEERCOMM + Charts 2016 + Daily Stocks + Stock/ETF + OK
+ Help + Tiger Signals Explained.
File
Graph New Stock - You may also click "2" key on right side of keyboard.
SAVE - stock-symbol.GIF file created in c:\peerless (Very useful.)
Build/Run User-Defined Signals Set (Very useful.)
Signals(1)
DJI Major (Peerless) Buys and Sells (Most important.)
This choice is only valid for the DJI. It is the way we show the Peerless
signals on the DJI currently ('DATA') and historically ('DATA87' or 'DATA1112')
Superimpose (Peerless) DJI Saved Signals (Very important.)
Display User Selected Tiger Signal (Very Important.)
See the details of Tiger Technical Signals by using Help + Tiger Signals
Display A User Selected Set of Tiger Signals (Very Important.)
(1) Tiger's Form6 (graph on screen) + File + Build/Run User-Defined Signals Set
(2) Tiger's Form6 (graph on screen) + Signals(1)
+ Display A User Selected Set of Tiger Signals
Stock's Signals Compatible with 65-dma. (Very Important.)
Signals(2) - experimental
Use the Stochastic Buys and Sells that cater to your trading style.
5-day is for very short-term trading. 20-day is for intermediate-term.
90-day is for still longer term. After a long advance, watch for Closing
Power penetrations of 50-day ma.
Signals(3)
Closing Power Divergence Warnings: S7 (Very useful.)
Sell S7s are to be acted only after prices move to the other side of
the 65-dma. Until then, they are warnings. The data for the new Sell S7
- CP Divergences are posted each night on the TigerSoft Data Page.
Indic(1)
Use the Stochastic Buys and Sells that cater to your trading style.
5-day is for very short-term trading. 20-day is for intermediate-term.
90-day is for still longer term. (Very useful.)
Annualized 5/21 day ROC (Useful.)
Spot trend-changes in momentum when stocks run up to support or
resistance.
CHOICES FROM MAIN 2016-GRAPHING SCREEN (continued)
Below are the most important pull-down choices from top. Others should be used
when one has first learned how to use the choices set out here.
Run/Setups
Run QuickSilver =5 day AROC Ranking. (Very useful.)
Compute Peerless Gains (and maximum paper losses for all stocks in directory.)
Rank Directory's Stocks for Pct. over 65-dma.
Compute BOTH UP Statistics (for all stocks in directory.)
DJI Future based on Past Seasonality. (Very useful.)
Net IDOSC (Day to day predictor of DJI when in trading ranges).
Next Day Predictor (What stock best predicts DJI day to day.)
DJI Predictor (What stock is best predicted by DJI day to day.)
Edit
Send Symbols' List to File in Peerless (using name of directory)
Tiger Selections
#1 Indicators' Results (Shows which systems work best with each stock in directory).
Bullish Stocks for next 3 months (The shows spreadsheet of key values
and easy direct graphing)
Bearish Stocks for next 3 months (The shows spreadsheet of key values
and easy direct graphing)
Tiger Groups (Spreadsheet for all flagged groups and easy graphs of those clicked on.)
Multiple Factor Screening (Scan stocks for those meeting multiple conditions)
Ranking Results
Tiger Power Ranking (Shows results from last run of Power Ranker and easy graphs)
(Very useful.)
Tiger Accumulation Index (Shows AI/200 ranking results from last run of Power Ranker
and easy direct graphing. (Very useful.)
50-Day Pct. Change Ranking and Divergences. (Very useful.)
Recent Signals
Most Recent Signal for All Stocks (Scan for favored Tiger Technical Buys/Sells.)
Tiger technical Buys and Sells explained under HELP on this form.
Key Values
Spreadsheet Display (For all stocks in directory. Click top of column to rank)
Help
Glossary Of Key Indicators, Terms and Concepts (Vital for beginner to Tiger.)
Peerless Intermediate-Term Signs (Explanation and track record) (Very useful.)
Tiger Stock Signals Explained. (Very useful.)
Weekly Signals(Very useful.)
17: ADDITIONAL CHOICES FROM MAIN 2016-GRAPHING SCREEN (Form 6)
Below is more information on the most important pull-down choices from the top.
It is recommended that you first become more familiar with the numbered Tiger
technical signals...
PEERCOMM + Charts 2016 + Daily Stocks + Stock/ETF + OK
+ Help + Tiger Signals Explained.
File
Graph New Stock - You may also click "2" key on right side of keyboard.
SAVE - stock-symbol.GIF file created in c:\peerless (Very useful.)
Build/Run User-Defined Signals Set (Very useful.)
Signals(1)
DJI Major (Peerless) Buys and Sells (Most important.)
This choice is only valid for the DJI. It is the way we show the Peerless
signals on the DJI currently ('DATA') and historically ('DATA87' or 'DATA1112')
Superimpose (Peerless) DJI Saved Signals (Very important.)
Display User Selected Tiger Signal (Very Important.)
See the details of Tiger Technical Signals by using Help + Tiger Signals
Display A User Selected Set of Tiger Signals (Very Important.)
(1) Tiger's Form6 (graph on screen) + File + Build/Run User-Defined Signals Set
(2) Tiger's Form6 (graph on screen) + Signals(1)
+ Display A User Selected Set of Tiger Signals
Stock's Signals Compatible with 65-dma. (Very Important.)
Signals(2) - experimental
Use the Stochastic Buys and Sells that cater to your trading style.
5-day is for very short-term trading. 20-day is for intermediate-term.
90-day is for still longer term. After a long advance, watch for Closing
Power penetrations of 50-day ma.
Signals(3)
Closing Power Divergence Warnings: S7 (Very useful.)
Sell S7s are to be acted only after prices move to the other side of
the 65-dma. Until then, they are warnings. The data for the new Sell S7
- CP Divergences are posted each night on the TigerSoft Data Page.
Indic(1)
Use the Stochastic Buys and Sells that cater to your trading style.
5-day is for very short-term trading. 20-day is for intermediate-term.
90-day is for still longer term. (Very useful.)
Annualized 5/21 day ROC (Useful.)
Spot trend-changes in momentum when stocks run up to support or
resistance.
 Graph Pct of A-Z Stocks over 65-dma (Useful.)
This can only be plotted when DATA (DJI) is charted.
Graph Pct of A-Z Stocks over 65-dma (Useful.)
This can only be plotted when DATA (DJI) is charted.
18: ADDITIONAL CHOICES FROM OLDER GRAPHING SCREEN (Form6)

          There are only a handful of operations that you may want to
              perform from the Older Charting Program.  Most of the operations
              in the older Charting Program are available in the current
              Peerless charting program.


                 RANKING FOR YOUR CHOICE OF THE NUMBER OF DAYS BACK

              It is sometimes handy to rank the stocks in a directory for how
              they have done since a recent turning point in the DJI.  For
              example, Trump's victory was a clear cut turning point for
              the market.  That occurred on November 4th, 2016, 19 days back
              from now.  See below how to get a ranking of LEVERAGED STFS
              over this time period.

              This simple RANKING of THE STOCKS IN A DIRECTORY FOR PCT. CHANGE
              OR IP21, etc. is very useful.   Use the following commands:

                    PEERCOMM + OLDER CHARTING + RANKING RESULTS +
                    USER SET RANKING: Pct/Change, AI200, IP21

                    Days Back  19 (your choice) + OK
                    Basis of Ranking  1 (Pct change)
                      (or 2 (AI200) or 3 (IP21), 4 (Days over 21-dma)
                      or 5 (Pct of Days Openings are up) 6 (Pct of Days Closings are up).
                    OK

                    This produces a spread sheet that looks like the one shown below.
                    Here we see only the top 25 items to save space.  The full listing
                    can be printed out.  It also appears  in the file named C:\peerless\RESU.txt
                    You may see any row's graph by clicking the row (the symbol) and then
                    clicking GRAPH).
C:\leverage Days back= 19
11 / 4 / 2016 - 12 / 2 / 2016
Rank Symbol Name Price Pct.Gain % over 50dma Long Term Accumulation (0-200)
--------- ----------------------------------- ---------- ------------ ----------- --------------
1 KRU ProShares Ultra KBW Regional Banking 151.74 55% 37% 62 48% 38%
2 GASL Direxion Daily Natural Gas Bull 3X 50.01 49% 17.3% 133 49% 49%
3 TNA Direxion Small Cap Bull 3x Shares 91.75 43% 15.4% 168 54% 53%
4 URTY ProShares UltraPro Russell 2000 107.35 43% 15.3% 170 52% 53%
5 UWTI VelocityShares 3x Long Crude ETN 25.72 43% 12% 121 47% 51%
6 DUST Direxion Daily Gold Miners Bear 3x Shares 50.08 40% 13.9% 90 47% 46%
7 FAS Direxion Financial Bull 3x Shares 37.17 34% 18.8% 167 56% 51%
8 ERX Direxion Energy Bull 3x Shares 38.77 32% 18% 170 48% 54%
9 TMV Direxion Daily 20 Yr Bear 3X Sh 24.07 30% 22% 103 48% 47%
10 UCO ProShares Ultra DJ Crude 11.21 29% 10.8% 130 47% 51%
11 DSLV VelocitySharesTM 3x Inverse Silver ETN 29.12 28% 13.4% 144 41% 50%
12 UWM ProShares Ultra Russell 2000 ETF 104.42 27% 10.4% 160 52% 53%
13 COPX Global X Copper Miners Etf 21.59 23% 18.3% 118 56% 50%
14 UDOW ProShares UltraPro Dow 30 86.38 23% 12.7% 151 53% 50%
15 UYG ProShares Ultra Financials 86.54 23% 13.3% 171 51% 52%
16 GLL Proshares Ultrashort Gold 87.3 22% 13.4% 121 44% 48%
17 DIG ProShares Ultra Oil & Gas ETF 42.59 21% 12.2% 159 50% 52%
18 DZZ DB Gold Double Short ETN 6.55 21% 12.4% 122 43% 46%
19 YCS ProShares UltraShort Yen 75.73 21% 14.7% 115 53% 51%
20 TBT ProShares UltraShort 20+ Year Treasury 40.83 19% 14.9% 111 47% 46%
21 UXI ProShares Ultra Industrials 48.43 18% 10.5% 149 43% 37%
22 ZSL Proshares Ultrashort Silver 35.81 18% 8.8% 124 41% 50%
23 BZQ ProShares UltraShort MSCI Brazil ETF 20.98 17% 15.5% 26 51% 46%
24 RETL Direxion Daily Retail Bull 3X 41.6 17% 2.2% 118 56% 47%
25 UYM ProShares Ultra Basic Materials 49.55 17% 11.8% 140 55% 55%
The older Tiger charting program produces a basic daily chart that
looks like the one below. It show the Tiger ITRS instead of Closing
Power. ITRS is the percent difference between the given stocks
performance and the DJIA's performance. Note that the size of the
graph on your screen here will probably be smaller. It can only be
be enlarged if you reset the basic screen resolution for you computer
to 600 X 800.
 19: BUILDING YOUR OWN LIST OF STOCKS IN A SEPARATE DIRECTORY.
This can be done but only if you first download all
the A-Z stocks.
Next you must create a simple symbols'list containing the
symbols you want to follow.
The symbols must be placed in an ascii file in C:\PEERLESS
So, you might create c:\PEERLESS\GEORGE.txt
and, let's say,it holds 4 stocks: AAPL, AMGN, NEM, OIL
The file c:\PEERLESS\GEORGE.txt would have
each symbol left justified on a separate line.
Only capital letters should be used. The symbols' file
name must not be longer than 7 characters.
Download the special program to do this from
the TigerData Page. See near the top of the
Page -
---> INSTCOMM.exe (Installation file)
Installs PEERCOMM-2016 (This sends latest PEERCOMM
c:\PEERCOMM. You should then drag c:\PEERCOMM\PEERCOMM.exe
to your desktop.
INSTCOMM.exe installs BUILDER.exe and builds a directory named c:\TIGERSUP
which contains A-Z list of all valid symbols. This directory is needed
to create your own directory of stocks from an ascii list in c:\peerless.
You must also download the 16-a ... 16uvwxyz directories to
build a customized directory using the commands
With the list built in, say, c:\peerless\GEORGE.txt and INSTCOMM run
use these commands.
Peercomm + Stock Data Folders
+ Create Data Folder from A-Z Directories + name of your ascii list
(example - GEORGE). This will also be the new folder/
( See Links and Documentation for Tiger Users )
20: EVALUATING A STOCK TECHNICALLY
When you see a Tiger chart, here are the most important aspects to focus
on. Read the materials under HELP (upper right) when a stock chart is
on the screen.
Technical Questions for each stock?
1 What is the trend of the stock based on its 65-dma?
Up? Down? Uncertain/mixed?
2 How close is the stock to the expected support of a rising
65-dma or falling 65-dma?
3 Are there obvious price patterns?
Head/Shoulders? Flat-top breakout? Wedge? Broadening top?
4 How bullish (blue) or weak (red) is the Accumulation Index?
Is the Current Accumulation Index (IP21) above/below its 21-dma (TISI)
5 Is the Blue Closing Power Line rising or falling?
It it confirming or failing to confirm?
Is the CP% above or below Pr%?
Has CP broken its recent uptrend or downtrend?
Is the stock showing the Both-Up condition? Both-Down condition?
6 Is the 5-day ma rising or falling? Will the stock surpass or
fall below its 5-dma "pivot-point"?
7 Is the Relative Strength Quotient Line rising or falling?
What is the ITRS score? Is the stock a leader or a laggard?
8 Does the chart show new CP-Divergence Buy B8s or Sell S8s?
9 What is the operative (red) Optimized signal? A Buy or Sell?
How profitable has it been?
10 How effective have the superimposed Peerless Buys/Sells been with the stock?
What does Peerless suggest about the general market's outlook?
11 When you place the Tiger Buys consistent with the 65-dma on the chart,
what is the last signal? What does it tell you about the stock?
12 When you place all the Tiger Buys/Sells on the screen what is the
last signal? What does it tell you about the stock technically?
=========================================================================
21: TIGER BUY SIGNALS
19: BUILDING YOUR OWN LIST OF STOCKS IN A SEPARATE DIRECTORY.
This can be done but only if you first download all
the A-Z stocks.
Next you must create a simple symbols'list containing the
symbols you want to follow.
The symbols must be placed in an ascii file in C:\PEERLESS
So, you might create c:\PEERLESS\GEORGE.txt
and, let's say,it holds 4 stocks: AAPL, AMGN, NEM, OIL
The file c:\PEERLESS\GEORGE.txt would have
each symbol left justified on a separate line.
Only capital letters should be used. The symbols' file
name must not be longer than 7 characters.
Download the special program to do this from
the TigerData Page. See near the top of the
Page -
---> INSTCOMM.exe (Installation file)
Installs PEERCOMM-2016 (This sends latest PEERCOMM
c:\PEERCOMM. You should then drag c:\PEERCOMM\PEERCOMM.exe
to your desktop.
INSTCOMM.exe installs BUILDER.exe and builds a directory named c:\TIGERSUP
which contains A-Z list of all valid symbols. This directory is needed
to create your own directory of stocks from an ascii list in c:\peerless.
You must also download the 16-a ... 16uvwxyz directories to
build a customized directory using the commands
With the list built in, say, c:\peerless\GEORGE.txt and INSTCOMM run
use these commands.
Peercomm + Stock Data Folders
+ Create Data Folder from A-Z Directories + name of your ascii list
(example - GEORGE). This will also be the new folder/
( See Links and Documentation for Tiger Users )
20: EVALUATING A STOCK TECHNICALLY
When you see a Tiger chart, here are the most important aspects to focus
on. Read the materials under HELP (upper right) when a stock chart is
on the screen.
Technical Questions for each stock?
1 What is the trend of the stock based on its 65-dma?
Up? Down? Uncertain/mixed?
2 How close is the stock to the expected support of a rising
65-dma or falling 65-dma?
3 Are there obvious price patterns?
Head/Shoulders? Flat-top breakout? Wedge? Broadening top?
4 How bullish (blue) or weak (red) is the Accumulation Index?
Is the Current Accumulation Index (IP21) above/below its 21-dma (TISI)
5 Is the Blue Closing Power Line rising or falling?
It it confirming or failing to confirm?
Is the CP% above or below Pr%?
Has CP broken its recent uptrend or downtrend?
Is the stock showing the Both-Up condition? Both-Down condition?
6 Is the 5-day ma rising or falling? Will the stock surpass or
fall below its 5-dma "pivot-point"?
7 Is the Relative Strength Quotient Line rising or falling?
What is the ITRS score? Is the stock a leader or a laggard?
8 Does the chart show new CP-Divergence Buy B8s or Sell S8s?
9 What is the operative (red) Optimized signal? A Buy or Sell?
How profitable has it been?
10 How effective have the superimposed Peerless Buys/Sells been with the stock?
What does Peerless suggest about the general market's outlook?
11 When you place the Tiger Buys consistent with the 65-dma on the chart,
what is the last signal? What does it tell you about the stock?
12 When you place all the Tiger Buys/Sells on the screen what is the
last signal? What does it tell you about the stock technically?
=========================================================================
21: TIGER BUY SIGNALS
 Peercomm + Charts-2016 + Daily Stocks +
any symbol that is listed on left + OK +
Help (upper right) Tiger Buys/Sells Explained
Do not confuse TigerSoft Buys/Sells with Peerless which are based on DJI
and back-tested to 1928.
Below are some of the most important signals.
CP-Divergence B7/S7
Peercomm + Charts-2016 + Daily Stocks +
any symbol that is listed on left + OK + Operations + Restore Simple Bar Chart +
Signals(3) + Closing Power Divergence Warnings (B7 and S7)
Peercomm + Charts-2016 + Daily Stocks +
any symbol that is listed on left + OK +
Help (upper right) Tiger Buys/Sells Explained
Do not confuse TigerSoft Buys/Sells with Peerless which are based on DJI
and back-tested to 1928.
Below are some of the most important signals.
CP-Divergence B7/S7
Peercomm + Charts-2016 + Daily Stocks +
any symbol that is listed on left + OK + Operations + Restore Simple Bar Chart +
Signals(3) + Closing Power Divergence Warnings (B7 and S7)
 Buy B4 at rising 65-dma
Peercomm + Charts-2016 + Daily Stocks +
any symbol that is listed on left + OK + Operations + Restore Simple Bar Chart +
Mvg.Avg. + 65-unit + Indic(2) + Accumulation Index
+ Signals(1) + Display User Selected TigerSoft Signal + B4
Buy B4 at rising 65-dma
Peercomm + Charts-2016 + Daily Stocks +
any symbol that is listed on left + OK + Operations + Restore Simple Bar Chart +
Mvg.Avg. + 65-unit + Indic(2) + Accumulation Index
+ Signals(1) + Display User Selected TigerSoft Signal + B4
 Sell S7 at falling 65-dma
Peercomm + Charts-2016 + Daily Stocks +
any symbol that is listed on left + OK + Operations + Restore Simple Bar Chart +
Mvg.Avg. + 65-unit + Indic(3) + Basis of Move
+ Signals(1) + Display User Selected TigerSoft Signal + S7
Sell S7 at falling 65-dma
Peercomm + Charts-2016 + Daily Stocks +
any symbol that is listed on left + OK + Operations + Restore Simple Bar Chart +
Mvg.Avg. + 65-unit + Indic(3) + Basis of Move
+ Signals(1) + Display User Selected TigerSoft Signal + S7
TigerSoft Technical Buy Signals
(Do not confuse with Peerless DJIA-based Buys)
B1    SUPPORT TEST
       case 1: 5 or more tests of 50-day low within 3.9% of low.
               IP21>.25  and ITRS>0"
       case 2: 3 or more tests within .26 points of 25 day low."
               close is above 15."
               ITRS greater than it was 21 days earlier."
               ITRS>-.1"
       case 3: 4 or more tests within .26 of 25-day low."
               close above 15."
               IP21>.25"
       A minor buy signal.  Not common. This suggests accumulation at a fixed price (the lows).
       Note that the price-support shows more than simply a number of successful tests at a
       fixed price level.  The ITRS (Relative Strength) must be better than -.10 and
       IP21 must normally show support, too, by being above +.25.
B2     PULLBACK TO WITHIN 1% OF A RISING 65-dma  (There should be a comparable SELL).
            CP%-PR% must not be less than -.316 - Closing Power can lag!
            OBVPCT must not be overbought (+.20).
            OBVPCT must not have shown a recent negative non-confirmation at upper band.
            The IP21, OPCT and CP%-PR% should not all be very negtive."
        Very often this is a great buy signal. It is important to use the Closing Power's
        hooks up back upward to Buy.
A recent bulge of Accumulation above .375 enhances the likelihood of success here.
        Even when there is no Buy B2 as stock falls to rising 65-dma, it will turn out to
        be a good place to buy.  Often all that is needed is waiting for the CP to
        break its minor downtrend and the stock will start rising swiftly back to new highs.
B3      50 DAY MA EXCEEDED AND IP21 SURGE
              Stock crosses above 50-day  mvg. avg. at close.
              IP21>.30"
              ITRS>.10"
        (No signals for 52 days, 10 days between signals.)
        The higher the current Accumulation (IP21), the greater the likelihood of a big
        advance.  A Buy B2-B3 combination should work well here.
        Generally, we avoid short sales in stocks with rising 65-dma.  And a B3 would
        be a good reason to cover a stock if one is short.
        Long positions are warranted if the stock shows high Accumulation, a strong Closing
        Power, has broken above evident resistance and has headroom before encountering
        likely resistance.  Where the stock shows consistently positive accumulation (AI>180)
        and has a recent IP21 bulge>.45, the stock is a strong buy unless it is late in a
        general market upswing.  But even then, we can usually exit in plenty of time,
        simply by selling if the extended Closing Power uptrend is violated.
        The ITRS (Relative Strength) needs only be better than .10.  The best signals take
        place soon after strong PEERLESS buy signals.
        These are often the next BULLISH MAXCP stocks.  See if you can identify one industry
        group that is over-represented among these high Accumulation bouncers up off the
        65-dma.  Industry-wide strength will increase your rate of success.
B4      BUY ON PULLBACK TO RISING 65-DMA  (This is the opposite of the Tiger Sell S7)
          > Stock must not be 2% over the 21-dma or 1% below it.
          > IP21 > -.15
        (No signals for 52 days, 10 days between signals)
        Often a stock has a healthy correction back to its rising 50-day mvg. avg.
        The faster the 65-dma is rising, up to a point, the more likely a stock will
        falling will rebound from it. The B4 signal will work well with high Accumulation
        Index stocks that are ranked as 'bullish' but it is not necessary for the
        IP21 to have a positive reading to get a profitable recovery from the 65-dma.
        Still, Bullish Closing Power-Divergence Buy B7s are a good combination to have
        working in combination with the B4s.
B5 MINOR BREAKOUT ABOVE HORIZONTAL RESISTANCE
        Case 1: Close above 50-day high that had been tested more than 3 times.
                A "test" requires the the difference between high and 50-day high
                to be less than 2.5% and separated by 3 days.  (Not very restrictive.)
                Additional requirements: ITRS> .1 and IP21>.20.
        Case 2:  Similar breakout above a high that had been tested at least 3 times.
               ITRS>-.10 and IP21>.45 "
        (No signals for 52 days, 5 days between signals)"""
        There Horizontal trading range breakouts are particularly significant when the stock
        is clearly uptrending amd the stock's internals are very positive and confirming>
        They are much more reliable when relative strength is superior.
        These strong B5 breakouts should cause you to set aside minor sell signals for
        several weeks. Often minor sell signals after a B5 or B10 produce limited declines.
        The breakout point becomes support and then the rally resumes.
        B5s are not reliable when internals and momentum are not quite positive.
        In fact, they probably should not be considered at all when the stock's
        65-dma is not clearly rising.
B6      UNUSUAL VOLUME AND PRICE REBERSAL BELOW 21-DMA
            Volume has more than doubled avg. daily volume and the stock must
            close near its highs.
            If the stock is below 30-wk vg. avg., stock's low must be at least
            half of distance between mvg. avg. and lower band.
        Use the B6 signal to retake positions in the strongest stocks for another run
        to new highs or to take profits in a shorted stock that has fulfilled its minimum
        objectives and whose decline is over-extended.
Look for B6s near expected levels of support.
The appearance of the B6 signal advises that a consolidation is likely in a weak stock.
B7      CLOSE NEAR LOWER BAND WITH RISING IPA MA
                   or
         (Magenta) BULLISH CP DIVERGENCE
           Case 1 - Closes more than 85% of way from 21-day mvg.avg. to lower band.
                    50 day mvg.avg.of IPA is rising.
                    50 day ma of IPA is 10% above what it was 21-days earlier.
           Case 2 - Price is much weaker than Closing Power when comparing the 65-day range of each.
                    Advisory Purple B7 to be acted only only after prices surpass its 65-dma.
        The B7 is meant to tell you that the stock has been under mounting accumulation
        or professional buying on weakness.  This we determine from the fact that the 50-day moving average
        of IPA has been rising for two or more days and that it also is quite a bit above what it was
        21 days earlier.
        At the lower band the stock is a buy unless - and this is important - there has just
        been a serious uptrend or horizontal support failure or if the stock has made a big gap down.
        In these cases the support will probably be overcome.  This is a counter-trend signal.
        Try to use it when there is upside potential.
        The B7 signal will work best with high Accumulation Index stocks that are ranked as 'bullish'."
        In this case a lagging OBV is not a serious obstacle to a rally.
        The CP-DIVERGENCE B7 usually does not bring much of a rally until suddenly the
        stock gets past its 65-dma.  Be caseful using when its 65-dma is falling.  It may
        take considerable time before it can get past its 65-dma.
B8      TRIPLE NON-CONFIRMATION OF NEW PRICE LOW
        Bullishly the OBV, IPA and Stochastic-20 fail to make a new low along with the price low.
The stock should be near the lower band.
        The B8 suggests the stock has retreated further down than its trading volume warrants.
        This is often a sign that the stock is making a false new low and should start up again.
        By itself this signal only advises of a reversal to the 21-day moving average.  However,
        if general market conditions are favorable or if the stock has high levels of accumulation
        or is in a strong up-trend or can breakout above a flat top on its next advance,
        then a very good rally can ensue and the B8 often marks its start."
B9 IP21 POSITIVE NON-CONFIRMATION AT LOWER BAND.
          > The stock's low should be at least 90% of the way to its lower band from
            its 21-day mvg.avg.
          > Close must be above its 50 day mvg.avg. ."
          > ITRS>-.15 and IP21>.0
(No signals for 52 days,10 days between signals)
         The B9 tells you the stock has probably dropped in a false or temporary way to its lower band.
         Be careful using the signal with trend-less stocks.  The stock may still gap down to the
         lower band very quickly and falls below a well-tested  support or trendline.
         A positive OBVPct and non-confirming Closing Power helps the reliabilty of the B9.
         The B9 signal will work best with high Accumulation Index stocks that are ranked as 'bullish'.
B10 FRESH NEW HIGH with STRONG ITRS & IP21"
           > The stock makes a New high closing above its previous 39-day high and IP21>.25
           > Volume must jump 50% on breakout
           > For stocks above $8, the ITRS must be above .40.
           > For stocks $6-$8, the ITRS must be above .45.
           > For stocks stocks $4-$6, the ITRS must be above .5
(No signals for 101 days, 40 days between signals)
           The B10 signal is a major buy signal.  It tells you that the trend of stock is apt
           to be up for the next three to six months.
           Use trendlines to determine exactly where the breakout point was.  This will act as
           support on the next decline or two.
           The B10 signal will work especially well with high Accumulation Index stocks that are
           ranked as 'bullish'.  The B10 commonly occurs early in a big advance.  It seldom occurs
           in a stock which will be a poorer performer.
           Quick price reversals back below the breakout point are dangerous if many other
           stocks behave similiarly.  This should not happen if the Accumulation is high
           and the Closing Power confirms the breakout unless the general market has suddenly
           become vulnerable.
B11 20-DAY STOCHASTIC PCT-D CROSSES BACK ABOVE 20.
           By itself, this is a crude signal.
           It works best with strongly uptrending stocks when Tiger Buys B10,B12,B3,B4,B8 are present or
           when you expect the uptrend to start soon because of a Tiger B7 or B9.
Short-term traders of mixed-trend stocks can use B11 signals here as a 'clincher'.
           You may want to experiment with the Stochastic-5 (K-Line) or Stochastic-15's K-Line.
           An upside penetration of the PCT-D Line by the K-Line after the K-Line has dipped below
           20 can also be used as a buy signal.
           The B11 signal is best used with 'bullish' high Accumulation Index stocks and
           when the 20-day Stochastic is one of the best trading systems to date.
B12        IP21 BULGE AND GREAT RELATIVE STRENGTH
              IP21>.45 and ITRS is above .3
(No signals for 52 days, 50 days between signals
           This an uncommon signal.  It is often associated with the beginnings of major
           stock advance.  This is even nore so if a Buy B20 (take-occ veleocity) signal
           soon follows.
           The Buy B12 is our most important stocks' buy signal.  It tells you that the
           stock has had a bulge of intense and aggressive accumulation which has
           suddenly pushed the stock up so much that it is outperforming the DJI by 30%
           over the last 50 trading days.
           It appears near the start of more than half of amy given year's top performers.
           In some years, as in 1991 and 1992, that perecentage has been closer to 80%.
           Most often the two bullish conditions used here occur at different points of time.
           So long as they both occur within about fifteen days of each other, judge a very
           'near' B12 signal to have taken place."
           The B12 signal will work best when there is consistently positive AI
           and the stock breaks out of a long base formation.
B13        CLOSING POWER TAKE-OFF
              > Closing Power Pct rises to a point above its previous 50-day high."
              > Volume must be above 760. "
              > One-day change must not be above 9%.  "
           The B13 signal shows that Professionals are rushing into the stock.  They may only
           be seeking minor 8% to 10% gain. Be care careful if the stock then reverses at
           the resistance if its falling 65-dma.
Do not chase a B13 stock that is already up 10% or more in a day or two.
           Where the 65-dma is rising, the B13 is a reliable Buy signal if one trades with
           the rising 65-dma.
B14        SUDDEN INCREASE IN IP21 (Current Accumulation)
              > IP21 jumps by more than .07 in one day.
              > Stock must have a concurrent ITRS move above +.10
              > IP21 must be above +.10
             (No signals for first 52 days.  Ten days between signals.
            B14 signifies that stock may be experiencing a take-off.
            Usually it is best to have Closing Power in uptrend or turning up.
            Be very careful with very thinly traded stocks."
            B14s may lead to an IP21 level of +.375, which strongly suggests insider buying.
B15         PULLBACK TO RISING 30 WK (149-day) Mvg. Avg.
              > Low pulls back to within 2% of the rising 30-wk mvg.avg.
              > Low must not be more than 2% below it.
              > ITRS>-.20
              > Most important, the 30-wk mvg. avg. must be rising at an annualized rate of more
                than 10%.
             The B15 signal often gives an excellent buying point for the short-term trader.
             The risk is small if one sells out immediately upon a closing below the 30-week mvg. avg.
             by a point while the upside potential is indicated by the rate of change of the
             30-week mvg. avg.  If the stock does turn back up, it could easily rise to a level
             of 20% to 30% above this rising mvg. avg. over the next few  months.
             One aspect not to not overlook, this signal lets you buy a stock that has already
             had a serious 'shakeout'.
             It is best to use the B15 signal when there has been a pattern of consistently
             positive readings from the Accumulation.  Our theory holds that this tells you the stock
             is in tight hands and can easily turn back upwards a long way.
B16 21 DAY MOVING AVERAGE CROSSES ABOVE 30-WK MA
             The B16 signal gives notice that the 30-week mvg. will most likely turning up
             soon.  Often this signal lets you buy a depressed stock that will soon rise 20%-30%
             as institutions buy it when its 30-week mvg. avg or 200-day mvg. avg. turns up.
             Look for other signs of a reversal: bulges of Accumulation and recent new
             lows widely unconfirmed by OBV, IP21 and Closing Power.
Watch volume. It must increase dramatically if stock is to make strong recovery.
B17          SUDDEN JUMP IN IP21
               > IP21 improves by +.2 in five days or .25 in seven days.
             There are NO ITRS considerations.
             (Ten days between signals.)
             All the considerations of B14s apply here.  The most important is that
             you should expect resistance on a rise back to the 65-dma and support at
             a rising 65-dma.
B18          UPSIDE PRICE GAP UP ON RISING VOLUME.
               > The gap upwards must take prices up so today's low is more than 1% above yesterday's high.
               > Today's volume must be more than 20% above yesterday's.
               > The stock should be strong at the close on the day of the gap and end up
                 being more than 75% of the way from the day's low to the day's high.
             Unless this proves to be an "exhaustion" or "climax" move, the B18 signal advises
             you that it is probable that the stock will behave well for the next few weeks,
             at least.  Often this signal leads to a rise of 20%-30% as institutions continue
             to buy the stock aggressively.
             If the stock is already up more than 50% in six months, it is possible that the
             gap represents a bearish exhaustion gap, in which case nearly everyone who has
             considered buying the stocks, now has done so, which leaves the stock quite vulnerable
             to profit-taking.  High red volume churning with little price movement following a
             a big move is a valuable clue that the advance may have peaked.
             At the time, unless the bullish news behind th stock's advance is now out,
             it is usually best for traders to believe the bullishness of the  'B17'.
B19          RELENTLESS UPSIDE MOMENTUM
             Stock has closed more than 45 straight days above 21-day mvg. avg.
             The B19 signal advises you that the stock is in an unusually relentless uptrend.
             Buyers have not had an opportunity to buy on weakness. So, it is likely that they
             will be forced to buy on price breakouts or will help support the stocks
             and turn it back upwards on the next dip near to the 21-day moving average.
Buy B5 breakouts above well-tested horizontal resistance when the B19 appears.
B20          TAKE-OFF VELOCITY REACHED.
             Stock's annualized 50-day mvg. avg. is rising at 200%.
             No other conditions are used.
             (The signal appears as early as on day-60 of your TIGER chart.)
             A major buy signal, especially when there has been steady accumulation in the months
             before the B20.  The signal suggests the stock is rising so fast that it is apt to keep
             running if only because of its new attractiveness to momentum players.  Typically the
             news on the company is breaking very quickly and quiet accumulation is impossible.
             The signal is most reliable when it occurs in conjunction with a B12 or a B10.
By itself in a low priced stock under $5, it is less meaningful."
B21          PULLBACK TO RISING 21-DAY MVG. AVG.
                 > CASE 1: Close is less than 21-day mvg. avg. with ITRS>0 and IP21>-.1
                 > CASE 2: Low is less than 21-day mvg. avg. with ITRS>+.1 and IP21>+.23.
             B21 signals start appearing on 60th day of TIGER chart.
             This signal reminds us that most rising stocks are better bought on dips
             to their 21-day, rather than our chasing them.
             Use this mainly with uptrending stocks showing steadily high accumulation showing rising
             relative strength.
             Aggressive traders should use B21 to buy calls or to write naked puts in the most
             accumulated "Bullish"-rated stocks. Conservatively, you might buy the stock and
             write (or sell) covered calls on the expected rally.
B22 This signal is not yet used.
B23 This signal is not yet used.
B24 PRICE BREAKOUT TO NEW HIGH FOLLOWING AI-IP21 BULGE
             The stock makes new 200-day high after the current AI (IP21) has bulged past .45
             (The B24s must be at least 20 days apart.)
             The B24 is a major buy signal. It commonly occurs in the early-middle stages
             of the best performing stocks. The first or second B24 is most reliable.  After
             3 B24 signals, the stock's uptrend may be over-extended and a correction becomes
             much more likely.
             Remember that Intense Bulges of Accumulation usually comes long before a stock
             reaches the ultimate highs that were foreseen by the insiders doing the intense
             accumulation.
B25 VERY INTENSE ACCUMULATION
             IP21 rises above +.5
             B25 signals must be at least 25 days apart."
             The B25 notifies you that there is a big buyer active in this stock.  By itself,
             it is not enough to buy.  Look for subsequent automatic buy signals, especially
             a B12 or B24.
             You will sometimes see this in stocks that have been lagging a bull market for
             a long time.  Do not buy into these rallies.  Watch for them to fail with S9s,
             S14s, Closing Power trend-breaks and finally failures to hold above the key
             65-dma support.
B26 UNUSUAL RELATIVE STRENGTH
             ITRS crosses above +.3.
             (B26 signals must be at least 25 days apart.)
             Here the stock is significantly outperforminh the DJI.  This means, at a minimum,
             that the stock capturing the attention of the momemtum-high performance hedfe-fund
             crowd.  If the Accumulation Index is very positive and has been some time, the stock
             is probably tightly enough held to permit a very substantial rally.
             Keep in mind the stock's typical volatility.  A wildly volatile, low-priced stock
             may have B26's which occur simply because the stock is experiencing one of its
             ordinary quick jumps.  Discount the B25 signal in these situations.
B27 This signal is not yet used.
B28 THE USER PLACE AN INDIVIDUAL BUY SIGNAL ON A CHART
             Use the vertical line command under the LINES pull-down menu with a graph
             on the screen.  Emtering a "B" places a Buy B28 on the screen and a "S"
             puts an S28 on the screen."
This might be placed, for example, where a Closing Power downtrend occurred.
B29 CONFIRMED MOVE 2% ABOVE 50-DMA or 65-DMA
               > IP21 > + .05
               > Closing Power must be above its 21-day ma.
             Use the occurrence of a B29 to buy high tech and other more volative stocks.
             It is important that the stock already is in a bullish uptrend, has a rising 50-day
             and a positive Acc.Index.
             The B29 is more powerful when there has been a very bullish divergence between
             the stock's price action and its Closing Power, Accumulation Index and Relative
             Strength.
             The start of a general market advance will also boost these stocks.  The first
             to turn up above their 50-dma or 65-dma will usually become leaders in the
             market's next leg up.
B30 EXTREME BULLISH OBV OR IPA DIVERGENCE FROM PRICE
2 cases:
                (1) OBV%-Pr% >.50
                (2) IPA%-Pr% >.5
             The B30 suggests the stock has retreated further down than its trading volume warrants.
             This is often a sign that the stock is making a false new low and should start up again.
             By itself this signal only advises of a reversal to the 21-day moving average.  However,
             if market conditions are favorable and if the stock shows high levels of accumulation
             and CP Divergence Buy B7s or is already in a strong up-trend or can breakout above
             a flat top on it next advance, a very good rally can ensue and the B30 often marks its start.
B31          MACD BUY - Two Exponential Mvg. Avgs. Cross
             Parameters=.22, .11 and 9
             By itself, the B31 is experimental.  Use it as trigger when TIGER other internal
             strength indicators are very bullish.
B32          RSI INDICATOR WIDELY FAILS TO CONFIRM A NEW 50-DAY PRICE LOW.
               > Stock must also close 80% of way to lower band from 21-day mvg. avg.
             Experimental.  Use in conjunction with other TIGER buy signals and internal strength signs.
             Do not use this signal with stocks in downtrends or ones showing heavy (red) distribution.
             This signal is most reliable when the Regression Line's Pct. Gain for the last year
             is over 25%.
B33 21-DAY MA CROSSES BACK ABOVE 50-DMA
             Crude but effective when stock's internal strength indicators are very bullish
             just before B33.
B34 TIGER 21-DMA OF ACCUM. INDEX (TISI) TURNS UP POSITIVE
             Two cases:
               > (1) TIGER TISI turns up with IP21 (current AI) above 0."
               > (2) TIGER TISI rises above 0.
             Use in conjection with the expected support of a rising 65-dma."
             Avoid when it is below a falling 65-dma
             Use where there has previously been a surge of Accumumulation after which the stock
             fell back into its base, this can show when another effort to break out of
             the base is occurring. Cover any short positions in such a stock.
             The B34 is most reliable when regression line is still rising at rate of +.20
             or more a year.
B35 CCI INDICATES OVERSOLD CONDITION
90-day CCI is used.
             Check the CCI to see if it is also failing to confirm a recent low.  This adds
             a lot to the reliability of a CCI-nased Buy. So do non-confirmations by
             OBV, IPA, Closing Power and the Accumulation Index.
B36 STOCK CLOSES AT BOTTOM OF ITS REGRESSION CHANNEL.
             Do not use if Least Squares Line is falling faster than -20% for year.
             The B36 works best in rising trend stocks suffering an intermediate-term
             decline when stock TIGER internal strength indicators have remained bullish
             just before the signal.
B37 STOCK CLOSES ABOVE ITS Regression Channel.
The Stock closes more than 3 standard deviations above its Least Squares' Line.
             This signal works best when stock TIGER internal strength indicators are very bullish
             and the stock is in already in an uptrend.  In these cases, it shows the pace of
             the advance is accelerating. But be careful.  This phase may be over in 2-3 months.
If used in a down-trending stock, the odds are that another re-test and yet
another re-test of lows will be needed unless this is one of the first beaten-
down stocks to turn up after a long bear market.
=========================================================================
22: TIGER SELL SIGNALS
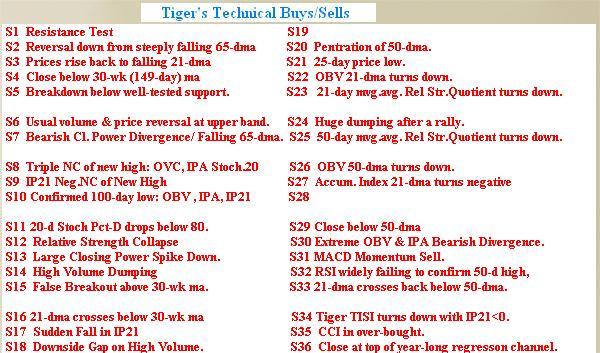 Peercomm + Charts-2016 + Daily Stocks +
any symbol that is listed on left + OK +
Help (upper right) Tiger Buys/Sells Explained
Peercomm + Charts-2016 + Daily Stocks +
any symbol that is listed on left + OK +
Help (upper right) Tiger Buys/Sells Explained
TigerSoft Technical Sell Signals
(Do not confuse with Peerless DJIA-based Sells)
S1  RESISTANCE TEST -  3 or more tests of 50-day high within 2% of high.
    IP21<.0 and ITRS<.05  The S1 is a minor sell signal.  It suggests
    short-term distribution is occurring regularly at the level of the
    recent highs.  This resistance is apt to cause a reversal.
    Having found regular resistance, theory holds that prices will probably
    dip to plumb for support.
    27 Q... stocks sampled in November 2016.  Only four instances in 27 sampled in 2016.
    QLYS 8/4/16 - Decline only to rising 65-dma
    QNST 4/21/16 - Decline to previous low.(.53/3.0)
    QQQ  8/24/16 - Decline to previous low.
    QQXT 8/24/16 - Decline to a point 2% below rising 65-dma.
S2  SELL ON REVERSAL DOWN FROM FALLING 65-Day MA
    65-day ma should be falling at an annualized rate of -1.00 or faster.
    The rate of decline of the 65-day ma should be increasing.
    Ihe stock should have just risen up to it, tagged it or fallen below it.
    The CLosing should be below the opening.
    The IP21 should be below +.10"
    In these cases, we suggest waiting for the Closing Power to break its uptrend.
    This is a very bearish signal for a stock previously showing steady red Distrobution
    and a Closing Power making new lows ahead of price.
    Short sales on this signal are often very profitable.
    Use the falling Tiger Closing Power as a sign to stay short.
    Close out this position also when stock rises back above 65-dma with IP21>+.05.
    Look at the Tiger Candle Stick chart. Big red popsicles add to the bearishness.
    Especially use S2 this with LOWACCUM and MINCP stocks AND in a bear market.
    27 Q... stocks sampled in November 2016.  Only six instances in 27 sampled in 2016.
    QID 6/16/16 - 30.15 to 33.5 (back above 65-dma) to 24 in 4 months.
    QIWI 8/19/16 - 12.31 to 12 and then rose back above 65-dma.
    QLD  10/26/16 - Quickly rose right back above 65-dma on red high volume.
    QSII 8/24/16 - Decline to a point 2% below rising 65-dma.
    QUAD 10/7/16 - 25.61 to 23.26 (Only tested earlier lows).
    QURE 9/13/16 - 7.98 to 6.77 (Tested previous lows.)
S3  PRICES RISE BACK TO FALLING 21-DMA"
    Close must be above declining 21-day mvg.avg.
    Close must not be above a declining 50-day mvg.avg.
    Close must not be more than 30% below 30-week mvg.avg.
    ITRS<0, IP21<-.03
    The 50-day mvg.avg must be falling at an annualized rate of 40%.
    No signals appear during the first 60 day.  Signals must be at least 10 days apart.
    The S3 is a device for locating short sale points with stocks in a declining trend.
    Note that the stock must not be more than 30% below the 30-week mvg.avg.
    This is to avoid going short stocks that have already sold off so far that any
    rally even to their 30-week mvg. avg. would be very costly for a short seller.
    In a rising general market, it will usually be better to short these at their
    falling 65-dma.
    27 Q... stocks sampled in November 2016.  Only eight instances in 27 sampled in 2016.
    QUADA   - 19.15 to 18.58 (earlier low).
    QBAK - 3.12 to 2.5 (earlier low).
    QID  4/22/16 - 29.86 to 32 (falling 65-dma) to 23.85 in 6 months.
    QLTI 5/10/16 - 1.58 to 1.39 (tested ealier lows)
    QNST 5/10/16 - 3.16 to 2.63  (tested ealier lows)
    QSII 6/30/16 - 11.91 to 12.91 (falling 65-dma) to 10.73 (earlier lows)
    QSIK 6/12/16 - 1.09 to 1.20 (falling 65-dma) to 0.91 (Test of earlier low).
    QURE 4/1/16 - 12.75 to 14.57 (near falling 65-dma) to 7.00 (Tested new lows.)
S4   CLOSE BELOW 30-WK Mvg. Avg by more than 2%.
     Previous closes must have been above 30-week mvg. avg. for a month.
     The S4 is a straight-forward way of recognizing when the
     intermediate-term and long-term up-trends have probably been ended.
     Where the stock has had a substantial run, it will probably fall 10-20%
     after breaking the 30-week mvg. avg.  Typically if general market conditions
     are favorable it will rally back up to tag this moving average.  The
     more over-extended a stock is that shows a S4, the more downside
     the stock probably has.
     Long positions should seldom be held when the stock falls more than
     2% below the 30-week mvg. avg.  Traders may also enter short sales on these stocks
     and use stops just 2% above the 30-week mvg. avg.
     Penetrations of the 65-dma are more serious when its annualized rate of
     change in this mvg. avg. is lower and when the Accumulation Index is
     negative and the Closing Power is lagging and CP-givergence S7s have
     appeared.
S5   BREAKDOWN BELOW 3X-TESTED SUPPORT.
     S5s should be used mainly when stock is below its 65-dma and
     when you can see that important support has given way.
     S5 breakdowns are much more significant if below a neckline in a
     a head and shoulders top.  If there is no such pattern present, the lower band
     is more likely to hold on the next test.
     Horizontal trading range breakdowns are also significant when the stock
     is already downtrending.   These S5 signal should have weak internals.
     S5s are much more reliable when relative strength is inferior (ITRS<0)
     and the IP21 shows continued red distribution.
     S5 breakdowns should cause you to set aside minor buy signals for several weeks.
     Most often minor buy signals after an S5 produce limited rallies.  The breakdown
     point becomes resistance and then the decline often resumes.
     Watch for quick reversals back up after a Sell S5.  These show a manipulated
     bear trap.  The stock will then be bullish because of short-covering.
     Example Q (6/24/2016 and 10/27/2016).
S6   UMUSUAL VOLUME & REVERSAL AT UPPER BAND.  Works best at falling 65-dma.
     Volume must have more than doubled avg. daily volume and
     closes near its lows.
     Use the S6 signal to to take profits in a stock that has run up
     and is over-extended.  The appearance of the S6 signal in this
     situation advises that a consolidation is likely.  The stock will
     often retreat to rising 21-day mvg. avg.
     If, however, the stock makes only a shallow retreat and  s
     ubsequently makes a new high with the ITRS Indicator rising back above .30,
     be prepared for another substantial run upwards in the stock.  In such cases,
     judge a re-entry buy signal to have occurred if the stock makes a new high
     and its Accumulation Index score is still greater than 180 of 200 and
     the current AI (IP21) value is greater than +.25.
S7   AT DECLINING 65-DMA
       > Close must not be more than 1.5% over the 65-dma
       > Close must not be less than 2% below the 65-dma
       > IP21 must be under +.25
     Note that a steeply falling 65-dma is more likely to deflect prices down.
     Avoid using this signal if the stock is in a sidewise trading range.
     Use the S7 signal to short a stock that has reached the expected resistance
     of the steeply declining 65-dma ma.  The risk/reward ratio is favorable
     if you guard against a big loss by covering the short sale on a closing
     5% over the 65-dma mvg. avg.

     In going short, we recommend waiting for the Closing Power's minor uptrend to
     be violated after a S7 occurs in a declining stock with weak internals.
CP-Divergence S7 CLOSING POWER BADLY LAGS PRICE
     Closing Power lags Prices.  Here we compare each's position in their
     65-day range.  As Closing Power reflects Professional Buying and
     is usually a good predictor of prices, it is bearish when CP lags
     prices.  It is best to wait to sell short these magenta S7s only
     after the stock has closed below its 65-dma.
S8  TRIPLE NON-CONFIRMATION OF NEW PRICE HIGH
    OBV, IPA and Stochastic-20 fail to make a new high along with price high."
    Stock approaches upper band above 21-dma.
    The S8 suggests the stock has advanced further up than its trading volume warrants.
    This is often a sign that the stock is making a false new high and should soon start down.
    By itself the S8 signal only advises of a decline back to the 21-day moving average,
    if that moving avg. is rising.  However, if market conditions turn bearish or if the
    stock shows negative (red) Accumulation or is already in a down-trend or can
    breakdown below a flat set of bottoms on its next decline, then a swift and
    substantial decline can quickly follow the S8.
    Please note that S8 signals have little potency in stopping the upwards march of
    the highest AI/200 blue chips.
S9  IP21 NEGATIVE NON-CONFIRMATION OF NEW HIGH - DISTRIBUTION BY INSIDERS.
        Case 1: High must tag the upper band above 21-dma with IP21 <.0
             ITRS must be less than .15 "
        Case 2: 4 or more tests of a 50 day high."
             IP21<-.15 and ITRS<.05
        Case 3: New 50 day high closing with IP21<0 and ITRS<+.1 "
        (No signals for 52 days, 10 days between signals."
        The TigerSoft Sell S9 tells you the stock has risen in a false or temporary way
        to its upper band and/or well-tested resistance.  Such a stock that has been
        uptrending for some time will probably end its advance at least for a while
        after the S9.
        But be careful with trend-less stocks to use the S9 signal very carefully
        if the stock gaps up to the upper band very quickly and rises above a well-tested
        resistance or trendline.
        We have found a negative OP21 and a falling Closing Power at the same time
        helps the reliabilty of the S9.
        The S9 signal will work best with low Accumulation Index stocks that are ranked
        as 'bearish' by the Power Ranker.
        Look for near-by Sell S14s (dumping) and then a break in the Closing Power
        uptrend.
S10 100 Day NEW PRICE LOW CONFIRMED BY OBV, IPA and IP21 INDICATORS.
        OBV and IPA must have also just made 100-day lows.  This means that PR%=0, OBV%=0 and IPA&=0."
        IP21 must be less than -.15."
        The S10 tells you that the stock is very weak, making new lows with volume indicators
        confirming the weakness.
        The stock is made even weaker if it has just ruptured a well-tested support-line,
        which you must draw by hand using a "RUBBER-BAND" LINE and the Tiger Closing
        Power has been leading prices downward.  It will help if the general market is
        also becoming weaker.
        Often soon afterwards there is a bounce in a stock that has an S10 back up to its
        21-day mvg. avg.  This represents a classic place to sell short.
        Use TigerSoft's Declining Mode signals after the S10 until there is a TigerSoft
        B3,B9,B10 or B12.  A TigerSoft B6 after an S10 tells you that the stock will probably
        cease its decline and enter a trading range phase.
S11     20-DAY PCT-D STOCHASTIC FALLS BELOW 80"
        The S11 signal signifies that the stock's advance is probably over as long as the
        stock does not breakout out from its price-trading range. By itself, this is a crude signal.
        But it is reliable if the Stochastic has failed to confirm the recent price advance or
        if there have been other major Sells (i.e. S9, S10, S12 are present) or where
        the stock is expected to start a downtrend because of its consistently negative
        Accumulation Index readings and/or a recent PEERLESS general market sell signal.
        Short-term traders can use S11 signals here as a 'clincher' following non-confirmation
        sell signals on the stock.
        You may want to experiment with the Stochastic-5's K-Line for more sensitive signals.
        A downside penetration of the PCT-D Line by the K-Line after the K-Line has risen above 80
        can also be used as a sell signal.
        Appreciate that the 20-day Stochastic S11 signal will work best with 'bearish'
        low Accumulation Index stocks, MINCP stocks (those where the Closing Power is especially
        weak) or stocks in a broad trading range.
Do not use the S11 with stocks that are in very strong uptrends.
S12 RELATIVE STRENGTH COLLAPSE - ITRS DROPS BELOW -.30
        When a stock begins to underperform the DJI by 30% or more over the last
        50-trading days, it is a dangerous situation for that stock's shareholders.
        This can oly happen when there is widespread fear about the stock's prospects.
        The S12 signal is a major sell signal.  After its appearance use the
        declining-trend-mode.
        The stock's next rally back up to its 21-day moving average is often a fine
        short-selling opportunity.  However, if the stock has just broken below well-tested support
        or a support line that you can draw, do not expect much of a bounce that will
        make short-selling easy.
        S12 stocks that show considerable (red) distribution are usually in considerable
        trouble.  Stay short them as long as their Closing Powers are in downtrends.
S13 UNUSUALLY LARGE CLOSING POWER DECLINES
        See them as unusually large red candleticks
        This shows a dramatic increase in Professionals' Selling.
        The S13 signal signifies that the stock's red candlestick is the largest in 65 days.
        But be careful if the stock's 65-dma is still rising.
        The S13 is best used to take a 'short' position when there is already
        a down-trending Closing Power and much red distribution.
S14 DUMPING - BIG INCREASE IN DOWN-DAY VOLUME
(1)Stock declines on daily volume which is 30% greater than any up volume day for
any of the previous 32 trading days.
> Here the Close must not be more than 8% below the 21-day moving average
and the Accumulation Index (IP21) must be below +.05.
(2)For the last six trading days, stock show at least four days' price declines
with volume picking up compared to the day before.
> Stock must below 50-day mvg. avg., have negative IP21 and not be
more than 8% below 50-day ma.
The S14 signal is a sign of hasty, aggressive and sometimes desperate selling.
Coupled with other TigerSoft Sells, especially earlier Sell S9s, it shows that
there are big sellers who are afraid it will no longer hold at support.
It is a significant warning sign when it occurs in a stock that has made
an extended advance over the previous twelve months.
In a stock that is in a steady downtrend or shows consistently negative (Red)
Accumulation, it usually means that a price-botttom has not been reached
When a key price support simultaneously gives way, expect much lower prices.
When it appears, check the news on the stock. Usually, there is more risk in
in a stock being dumped for no apparent reason that in the case of one being
sold because the bad news is finally coming out.
S14s are probably only of minor importance if the stock has considerable (Blue)
Accumulation evidenced and has not rallied 50% over the last year.
S15 STOCK CROSSES BACK UNDER ITS 30-WK.MVG.AVG.
Stock must have been above this moving avg. for 3 days or more.
Stock must not have gone back above its 200 day mvg. avg.
Note that no S15s appear in chart's first 220 days and twenty days
must have elapsed before a new S15 may appear.
S15 signifies that the stock is especially vulnerable. It probably has scared
a number of shorts into covering by briefly going above 30-week mvg. avg.
This reduces the cushion effect that their buying would have represented.
It may also have induced some over-eager, emotional buying. And by staying
below its 200-day moving average, the stock still appears to be in a bearish
downtrend.
If the stock's internals are weak, it can be shorted reasonably safely
with a good chance that it will fall to new lows. Cover such shorts either
when their Closing Power downtrends are broken or the stock rises back
above its 200-day ma, especially if that ma is still rising.
S16 SIGNIFICANT LOSS OF MOMENTUM - STOCK'S 21-dma CROSSES BELOW ITS 30-WEEK-ma
Note that no S16s appear in chart's first 225 days and twenty days
must have elapsed before a new S15 may appear.
The S16 signal warns you that it is probable that the 30-week mvg. will soon be
turning down, if it is not already, for a long-term sell signal. Often this signal
lets you sell or sell short a stock that is apt soon to fall 20%-30% as institutions
dump it because its 30-week mvg. avg or 200-day mvg. avg. turns down.
Look for bearish volume-indicator divergences to confirm the impending weakness.
S17 SUDDEN BIG DROP IN IP21 (CURRENT ACCUMULATION)
IP21 must decline by .2 in 5 days
This signal is helpful in taking profits in a previously strong stock.
Often an over-extended stock's first serious technical weakness is a quickening
decline in its Tiger Accumulation Index. This may precede a corresponding
weakening in Relative Strength and Closing Power.
Do not sell short on a Sell S17 if stock is above its rising 65-dma unless
the stock has risen an inordinate amount above it. Often such a stock only
falls back to that moving average's support.
The stock's technical situation is most dangerous when the S17
occurs soon after the stock has fallen below its falling 65-dma.
This shows significant distribution is under way.
S18 DOWNSIDE PRICE GAP ON RISING VOLUME
This signal requires the stock to gap down so that its high of the day is more
than 1% below yesterday's low. The volume must be more than 20% above the volume
of the day before. The stock should also close near its lows on the day of
the signal. It must close less than 25% of the way up from the day's low to
the day's high.
Support may still occur at the stock's rising 65-dma. But if the stock has
already recently broken that support, the S18 signal warns you that it is
probable that the stock will be weak for at least a few weeks. Often if
other technical indicators are weak, the S18 leads to a fall of 20%-30% more
as institutions continue to dump the stock.
A Sell S18 often occurs when a significant support level has given way.
It confirms the bearishness of the breakdown and should be used for selling
short.
If the stock falls 25% in less than a month, it will usually need several months
at least to build a base which MAY then permit a recovery.
Unless the downside gap can be explained by obvious market weakness, so that
the downside gap may prove to be a climactic 'exhaustion gap', it is usually
best for traders to sell an 'S18' stock immediately.
S19 Not used currently.
S20 PENETRATION OF USER-SPECIFIED MVG.AVG.
Use the S20 to take profits in a stock that has made a big intermediate-term advance.
When a stock has run up inordinately, over 50% in 100 days, it is apt to fall victim to profit-taking.
It then quickly decline all the way back to its 30-week mvg. avg. soon after its 65-day mvg. avg.
has been violated. This signal works best when there are Closing Power and OBV NC's and the
IP21 (AI) is nearly negative (a Tiger "S9") on the most recent high. Use 50-day ma penetrations
with over-extended speculative stocks.
S21 A USER-SET SIGNAL SHOWING A NEW LOWS HAS BEEN MADE. Usually a 25-Day Low
S22 OBV-21-DAY MA TURNS DOWN.
A signal that warns that Down-Day Volume is picking up.
Test this parameter with your stock before using it.
S23 21-DAY RELATIVE STRENGTH QUOTIENT TURNS DOWN
(Compare this signal with S25 which uses a 50-day mvg.avg turn down of the RSQ.)
You are invited to experiment here.
The S23 is useful when it tells you that a high performance stock has started
to significantly under-perform the DJI. This permits you to take profits in a booming
stock. Keep in mind that the steeper the previous advance, the more likely the stock
will fall significantly after S22 and S23 sell signals.
In general, the weaker the Accumulation Index, OBV and ITRS the more sizeable
the decline.
S24 HUGE AND HEAVY DUMPING AFTER A RALLY
Stock has the biggest volume in 175 days on a day when the stock closes down for the day.
The stock must be up at least 50% in last 100 days.
(S24 signals do not appear in the first 175 days.
Big money is taking profits unusually aggressively and the stock is not absorbing
it very well. Such a stock will usually decline next to test the 65-day mvg. avg.
and if that does not hold, it will fall to the 30-week mvg. avg.
S25 50-DAY RSQ (Relative Strength Quotient) TURNS DOWN.
The stock must be up at least 50% in last 100 days.
Users may re-define RSQ-day mvg. avg.
(S25 signals do not start appearing until the 101st day of your TIGER chart.
Use the S25 signal to take profits in a stock that has run up and is over-extended.
The appearance of the S25 signal advises that the stock has started to underperform the DJI.
This may just be normal profit-taking. Much depends on the general market's vulnerability
and how many signs of weakness appear regarding the stock. After an S25, an over-extended
stock will usually fall to its rising 50-day mvg. avg. and if the 65-dma fails to hold
the stock up, it is apt to then test its 30-wk.mvg. avg. Inspect the Accumulation Index,
Closing Power and OBV readings as well as its price pattern for signs of big money
distribution. A weakening and negative Accumulation readings plus a head and shoulders
often sets up a dangerous condtion.
S26 50-DAY OBV MVG. AVG. HAS TURNED DOWN. (Users may set a different length ma if they wish.)
(The S26 signals start on day-100 of your TIGER charts.)
The S26 warns you that down-day volume is rising. Big sellers are becoming increasingly
aggressive in their selling. In the decline that usually follows, it is uncertain if
the stock will find support in a price base or at its 30-wk.mvg.avg. Much depends on
the amount of (blue) Accumulation displayed by the stock, whether the moving averages
are rising swiftly when tested and whether the general market is weakening.
S27 SERIOUS SHIFT FROM BIG MONEY ACCUMULATION TO DISTRIBUTION
(21-day ma of Accumulation Index has turned negative. (Length of the AI mvg. avg.
may be user-adjusted.)
The stock must be up at least 50% over the last 100 days.
The S27 signals appear only after the 101st day of your TIGER chart.
The S27 signal is considered a major sell if the stock has made an extended advance
over the previous six months. The stock is likely to at least test its 30-week mvg.test.
S28 Not used.
S29 STOCK CLOSES BELOW 50-DMA
The S29 occurs either because stocks closes below 50-day mvg.avg. for first time
in trading 60 days or because Accum. Index and the AI 21-dma are negative when
50-day mvg. avg. is violated.
Apply this mostly to over-extended stocks. Often in the most vulnerable stocks,
the S29 occurs when the stock is also breaking a well-tested uptrendline and
important price-support, too. Once the 50-day and 65-day mvg.averages are broken,
expect a test of the zone between the rising 30-week mvg. avg. (149-dma) and the
rising 200-dma.
S30 EXTREME DIVERGENCE BETWEEN VOLUME AND PRICE
2 cases:
(1) OBV%-Pr% <-.50
(2) IPA%-Pr% <-.5
(OBV%, IPA% and PR% show how far each is up from its 100-day low to its
100-day high. Thus if price is making a new 100-day high, its PR% would
be 100 and if OBV is only 40% of the way up from its 100-day low to its
100-day high, the OBV% would be 40% and an S30 would be given.
The S30 suggests the stock has advanced further up than its trading volume warrants.
This is often a sign that the stock is making a false new high and should soon start
down. By itself the S30 signal only advises of a mild decline, perhaps to just the
21-day moving average, if that moving avg. is rising. However, if market conditions"
turn bearish or if the stock completes a head and shoulders pattern or has low levels
of accumulation or is already in a down-trend or can breakdown below a flat set of
bottoms on its next decline, then a swift and substantial decline can quickly follow
the S30. Weakness will be greater where the Tiger CLosing Power is also seriously
lagging the stock.
S31 MACD SELL - Two Exponential Mvg. Avgs. Cross
Parameters=.15, .075 and 9
This is considered experimental. Use the S31 trigger to sell when TIGER's
internal strength indicators are quite bearish.
S32 RSI INDICTATOR WIDELY FAILS TO COMFIRM A NEW 50-DAY PRICE HIGH
The stock must also close 80% of way to upper band from 21-day mvg. avg.
Other non-confirmations will add to the bearishness of the S32.
Momentum is important, too. Thus, a S32 is less reliable when the stock's
Least Square's Regression Line is rising at rate of 25% or more per year.
S33 21-DAY MVG. AVG. CROSSES BACK BELOW 50-DAY MA
Treat this as a valid Sell when a stock seems to be swinging broadly up and
down and when internal strength indicators are very bearish just before B33.
S34 TIGER TISI (21-dma of AI) FALLS BELOW ZERO
This works particularly Signal works well when a bearish stock has first had
its Accumulation Index fall deeply negative (below -.25) and it rises back
briefly into positive territory.
Check the stock's regression line for the last year. The S34 is most reliable
when regression line is still falling at rate of -.20 or more a year.
S35 90-d CCI Is OVER-BOUGHT
The stocks must not have a least squares best fit regression line which is rising
faster than 20% over the period shown.
Treat this as experimental. It works best when CCI is not confirming
the stock's recent strenght with a new high of its own and when its other
internal strength indicators (OBV, IPA, Closing Power) are lagging.
S36 STOCK CLOSES AT TOP OF REGRESSION CHANNEL
Stock closes between 2 and 3 standard deviations above Least Squares line
for all data.
Experimental. The signal should not be used if internal strength indicators
are very positive. This may mean that the stock will be experiencing a
vertical take-off above its existing rising resistance lines. This occurs
at near the end of a stock's bullish run.
S37 STOCK CLOSES BELOW BPTTOM OF REGRESSION CHANNEL.
23: USER SELECTED SCAN FOR A PARTICULAR SIGNAL
The present software shows any stocks having a particular signal currently or
any stocks where it occurs in the last 10 trading days.
All current occurrences of B26, for example.
(B26 = ITRS-crossing above +.30)
Peercomm + Analyze/Rank for a directory + X at upper left when
finished +
Charts-2016 + Daily Stocks + B26 ...83 + OK
.
To get the second graph showing a B26,
click 2 on
right of keyboard until new
stock appears.
Ten days of signals for S9, for example:
(S9 = IP21 NNC at upper band)
Peercomm + Analyze/Rank for a directory + X at upper left when
finished +
Charts-2016 + Daily Stocks + HistS9 ...323 + OK.
To get the second graph showing an S9,
click 2, on right of keyboard until new
stock appears.
24: USER SELECTED SIGNALS' SET FOR DISPLAY ON A TIGER CHART
You can set all graphs to show the particular signal signals that you like by using
these commands
when a graph is on the screen:
Run/Setups + Build/Run User-Defined Signals' Set +
check the signals you want + enter short unique name for this set of
signals (like BUYS, SELLS, ALL, TEST) + Save Signals Name + Apply Selections Now.
You can then always get these signals applied to any new stock using
the following commands with a chart already on the screen.
Signals(1) at top + User Defined Signals Set + BUYS (or whatever
name you have set up.)
25: DUMMYING IN TENTATIVE DATA TO SEE IF A NEW SIGNAL IS PRODUCED.
It may be helpful to see what a chart of a stock, the DJI or an ETF would look
like before the next day's opening. You might want to see if a new signal has
appeared, if Closing Power has violated a trendline or what the Stochastic, RSI
or CCI would look like with the new data.
How To See if Peerless Will Give a New Signal.
Often now the market moves significantly over-night, especially when Peerless
gives a new Buy or Sell. You can "dummy-in" tentative or provisional data
before the close and see what that yields. The key file with Peerless is
C:\peerless\DATA.txt This may be edited. If you add a new data for an additional
day of data, just remember to drop off the first day of the file.
The same thing can be achieved with the following commands:
PEERCOMM + EDIT + PEERLESS INDEXES + PEERLESS DJI + OK + EDIT + APPEND.
Fill in the blank spaces for month, day, year, theoretical DJI high,
theoretical DJI low, DJI close, NYSE advances, NYSE declines,
NYSE Up Volume, NYSE Down Volume.
How To See What A New Day's Data Would Look Like
for a Stock or ETF or Tiger Index.
PEERCOMM + OLDER CHARTS + pick a stock, etc + Operations +
Rechart Using Tentative New Day's Data +
Enter the tentative data: Opening, High, Low, Close, Volume, DJI's close
Click Proceed: Data has been entered.
To restore the older chart with real data,
Choose Operations + Restore Original Chart
Or Click X until you return to Peercomm.