TIGERSOFT/PEERLESS
HOTLINE

(C) 1985-2017 William Schmidt, Ph.D. www.tigersoft.com
All rights strictly reserved.
Tiger Software 858-273-5900 PO Box
22784 San Diego, CA 92192 Email
william_schmidt@hotmail.com
-------------------------------------------------------------------------------------------------------------
---------------------------- IMPORTANT
---------------------------------------
You are here:
www.tigersoft.com/HHH517/INDEX.htm
Earlier Hotlines
www.tigersoft.com/HHH517/OLDER.html
www.tigersoft.com/HH747/INDEX.html
www.tigersoft.com/HHLL217/INDEX.html
PREINDEX.html
www.tigersoftware.com/HL/INDEX.html
Most Recent Hotlines:
2/4/2017 - 2/15/2017
These have somehow become corrupted. Their graphs are missing.
http://www.tigersoft.com/345HLN12/ZINDEX.html
http://www.tigersoft.com/333HLLL/INDEX.html
http://www.tigersoft.com/444HL444/INDEX.html
www.tigersoft.com/119HLPAZ/INDEX.html
http://www.tigersoft.com/888HLAZ/INDEX.html
www.tigersoft.com/821-HL/INDEX.html
http://www.tigersoft.com/816-HLN/INDEX.html
http://www.tigersoft.com/77HL7778/INDEX.html
http://www.tigersoft.com/64HRL/INDEX.html
http://www.tigersoft.com/55HL55/INDEX.html
HELP
A
Guide To Profitably Using The Tiger Nightly HOTLINE
Introduction
to Tiger/Peerless Buys and Sells.
Peerless
Buy and Sell Signals: 1928-2016
Individual Peerless signals explained:
http://tigersoftware.com/PeerlessStudies/Signals-Res/index.htm
http://www.tigersoft.com/PeerInst-2012-2013/
Explanation of each Peerless signal.
http://www.tigersoft.com/PeerInst-2012-2013/
Different
Types of TigerSoft/Peerless CHARTS, Signals and Indicators
Peerless Signals and DJI
Charts - version 7/4/2013
1965
1965-6 1966
1966-7
1967
1967-8
1968
1968-9
1969
1969-70 1970
1970-1
1971
1971-2 1972
1972-3
1973 1973-4
1974
1974-5 1975
1975-6
1976 1976-7
1977
1977-1978
1978
1978-79
1979
1979-80
1980
1980-1
1981
1981-2
1982
1982-1983
1983 1983-1984
1984
1984-1985
1985
1985-1986
1986
1986-1987
1987
1987-8
1988
1988-9 1989
1989-90
1990
1990-1 1991
1991-2
1992
1992-3
1993
1993-4
1994
1994-5
1995
1995-1996 1996
1996-7
1997
1997-8 1998
1998-1999
1999
1999-2000
2000
2000-1 2001
2001-2
2002
2002-3
2003
2003-4
2004
2004-5
2005 2005-6
2006
2006-7
2007
2007-8
2008
2008-9
2009
2009-10
2010
2010-11
2011
2011-12
2012 2012-2013
2013
2013-2014
2014
2014-2015
2015
2015-2016
-----> More HELP LINKS
Documentation for
TigerSoft Automatic and Optimized Signals.
How
reliable support is the DJI's rising 200-day ma?
SPY
Charts since 1994: Advisory Closing Power S7s, Accum. Index, 65-dma, Optimized
Signals.
^^^^^^^^^^^^^^^^^^^^^^^^^^^^^^^^^^^^^^^^^^^^^^^^
1/19/2016 --->
Corrections,Deeper Declines and Bear Markets since 1945.
1/21/2016
--->
High Velocity Declines since 1929
2/12/2016 --->
Presidential Elections Years and Bullish IP21 Positive Non-Confirmations at
Lower Band.
2/12/2016 --->
OBV NNCs on
DJI's Rally to 2.7% Upper Band when DJI's 65-dma is falling.
11/6/2016 --->
Killer Short Selling Techniques:
===>
Order
Here
($42.50)
It's As Easy as 1,2,3
TigerSoft "Combination" Short-Selling...
Easy as 1-2-3 Short Sales
Earlier Q-Answers
QuickSilver
Documentation (1/11/2016)
Our Different Signals
Better
understand the difference between Peerless DJI-based signals,
the one-year optimized red Signals and
the fixed signals based
on technical developments.
Introduction to
Tiger/Peerless Buys and Sells.
Different Types of TigerSoft/Peerless CHARTS, Signals and Indicators
New
TigerPeerless
Installation and Basic Uses' Instruction
(11/25/2016)
See
the re-written materials on TigerSoft Buys and Sells.
A few more pages will be added. But users could print
this
main Installation and Uses' Page for reference.
NEW - 5/7/2017
Trading SPY WITHOUT
Peerless - Some Guidelines.
When completed this will be a
new Tiger Trading E-Book.
NEW - 5/10/2017
Examples of "Hands
above the Head" top patterns.
===> Please report any broken or
out-of-date links.
william_schmidt@hotmail.com
==============================================================================
6/9/17 A Tale of Two Cities: Friday, the
DJI was UP
nicely but the NASDAQ slumped
in another one of its cruel "Up and then Dump" two-day Reversal Days.
It appears that major funds are shifting their funds out of
high techs and
buying Bank Stocks and the DJI-30. Without a
new Peerless Sell, it is
most unlikely that the NASDAQ has just made a major top.
The DJI's advance got far fewer headlines than what happened on the
NASDAQ. The divergence between higher priced high techs and the DJI had
just
gotten too wide. With the FED about to raise rates, simple profit-taking
turned into a rout, all helped by short-selling on down-ticks.
Friday dropped
almost all of these high-flying high-techs closed far below their openings, thus
producing huge "Red Popcicles" and "Red Rolling Pins" on our Tiger charts.
Below we look at these patterns in history. For NVDA, the top performing
S&P 500 stock it was a case of just too many brokerages making their long
recommendations on Friday only AFTER its 25+% rise in a month. After
their rush to buy, who else was left I asked myself as I watched it open up 7
points, near 168.
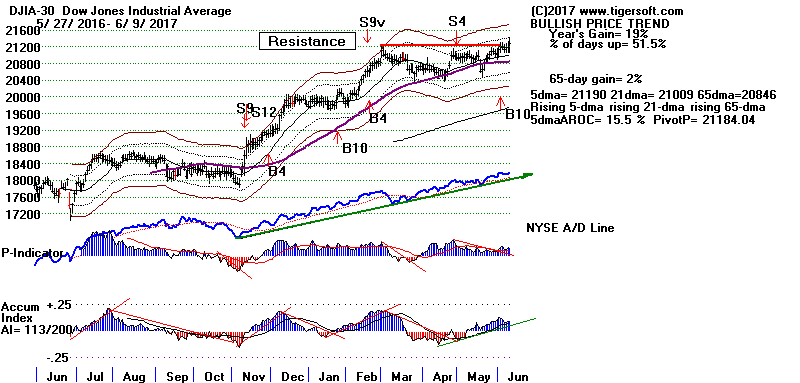
The Peerless B10 makes the DJI now looks good for now,
so long as it does not tag
the 2.3% upper band with the V-I negative. Unfortunately, the DJI's upper
band is
only 250 points away and the V-Indicator, now at -48, is not likely to turn
positive. The Bank Stocks' ETF, FAS, is rising and must like the idea of
higher interest rates
and a stronger Dollar. The highest priced DJI-13 stocks rallied above
their 65-dma and
seem to have destroyed their sprawling potential head and shoulders.
Certainly, the tech bubble of 2000 saw many "Red Popcicle" tops like
have just occurred among the highest price techs on Friday. Is there a
parallel?
Probably not for the NASDAQ, as a whole. But many individual high-flyers
have
likely seen their highs for some time. With them set sell stops a percent
or two
below their close of Friday is my counsel.
I have studied the NASDAQ since 1967. (I was weaned
on the wild OTC markets
of 1967-1968. This reminds me that we still have not yet had a low-priced
stock craze
in this bullish market.)
See the
NASDAQ charts here since 1971.
The conclusion I reach from all this history is that nearly all the major tops
of
the NASDAQ would have been called by Peerless.
Only a few NASDAQ declines
of more than 8% occurred without a Peerless signal. These could all have
been spotted
at the time by watching for bearish NASDAQ head/shoulder patterns,
hands-above-the head pattern, false flat top breakouts and rising wedges.
Of course, when the NASDAQ gets too over-extended, it is also probably a good
idea
for traders to simply take profits when its up-trend-line is violated.
Bearish "Red Popcicles, Rolling-Pins and All Engulfings"
SOXL has several times rebounded quickly from one-day down-drafts to the rising
21-day ma. A partial recovery therefore would seem likely again. But
work with a Sell
Stop 2% below Friday's close to be safe. More on this tomorrow night.
What we will
want to see is a lower opening and a high that is 3 or more points above the
opening.
This will turn our candle-stick chart blue.
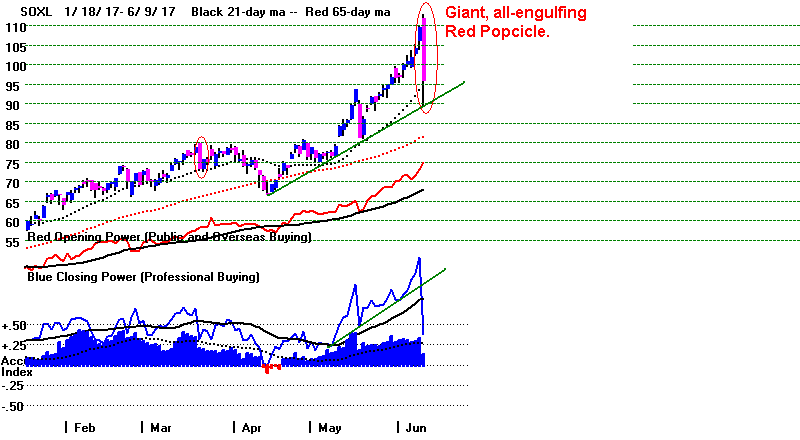
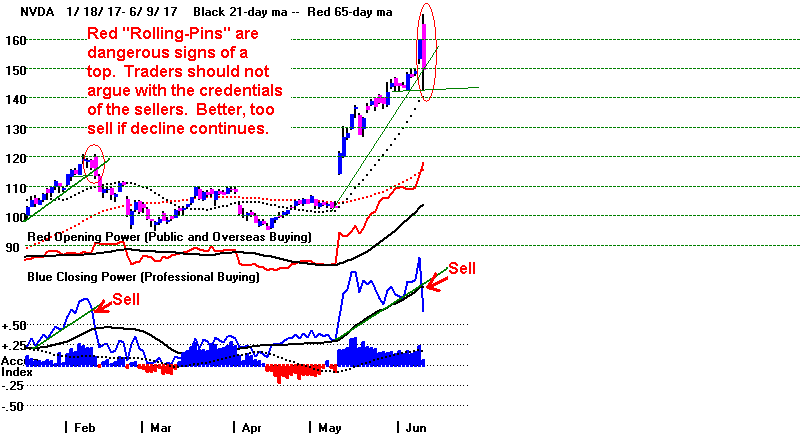
The
appearance of giant Red "Popcycles" are clearly bearish. There
is no point in attributing a big one-day sell-off to hedge funds. Only
big institutional selling could bring a stock like NVDA down so much.
Tiger's Red "Popcycles" appear when too many emotional buyers
act at the opening and then Professional and Institutional enter the fray and
rout the over-eager bulls. This often appears are very significant tops.
These "Popcycles" are a variation of the "Up and then Dump" two-day
Reversal Patterns traders must watch for in today's market of computerized
gun-slinging high-performance traders.
Know What Produces A "Red Popcicle"
Don't let a nice profit get away here when this
occurs. Sell stocks like NVDA
and and ETFS like SOXL tomorrow if they drop by more than a percent or two.
See a number of examples of "Red Popcycles" here.
www.tigersoft.com/Red-Popcicles/INDEX.htm
Traders of volatile stocks will also want to look at the longer discussion in my
E-Books, Explosive Super Stocks and Killer Short Sales. These may
be bought for $42.50 each.
http://tigersoft.com/Order_Forms/book-explo-all.htm
http://www.tigersoft.com/Order_Forms/book-short-selling.htm
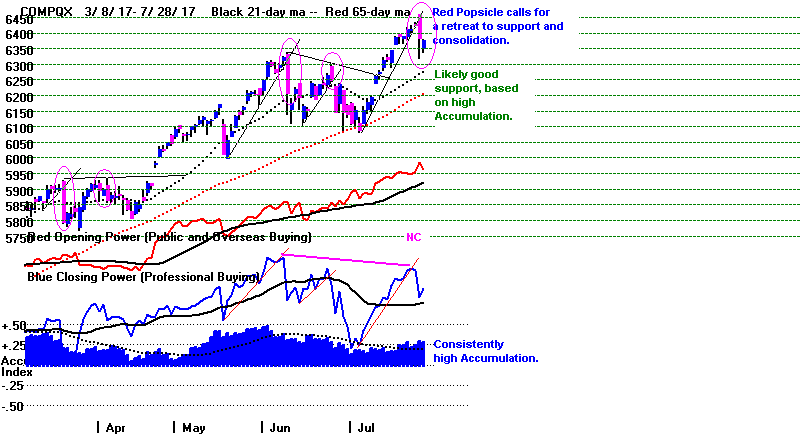
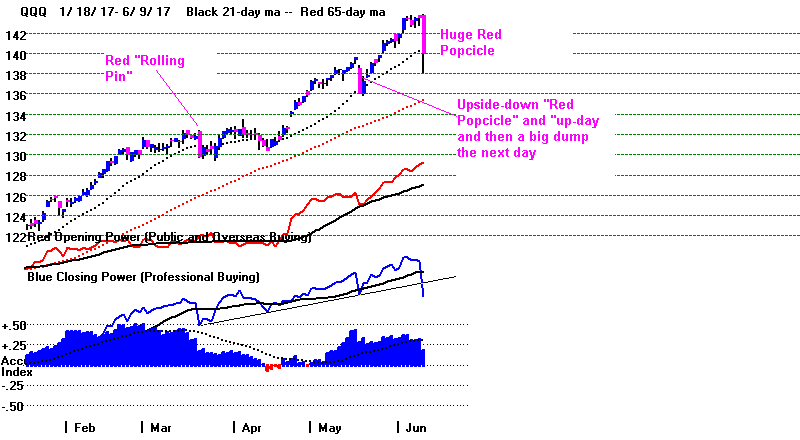
A DJI 1.3% Rally Will Likely Bring A Sell S9-V

6/9/2017 Index and ETF Charts:
PEERLESS DJI, Signals, Indicators Daily DJI Split Volume 10-Day Up/Down Vol
Hourly DJIA A/D Line for All Stocks.
S&P OEX NYSE NASDAQ COMPQX with CP
DIA SPY QQQ MDY IWM-TNA
Short Term Interest Rates DJI-Utilities DJI-Transp
CrudeOil FAS GLD BBH IBB JETS JNUG KOL NUGT OIH OIL
RSX RETL SLV SOXL TECL TMF TNA XIV YINN
To STOCKS' CHARTS
AAPL ADBE ALXN AMAT AMGN AMZN BA BIDU CAT FB GOOG GS
HD IBM JPM MASI MSFT NVDA QCOM TSLA TXN
Others REN, JJC, NIB, WEAT UUP (Dollar)
6/9/17 Bullish MAXCPs Bearish MINCPs
 RANKING OF KEY DIRECTORIES BASED PCT.OF STOCKS ABOVE 65-DMA
              6/9/17
---------------------------------------------------------------------------------------
Directory     Current       day-1         day-2         day-3         day-4         day-5
----------------------------------------------------------------------------------------
EDU            1             .875          .875          .875          .875          1
JETS           1             1             1             .777          .777          .777
BONDFUND       .964          .973          .973          .973          .973          .973
INFRA          .909          .636          .545          .545          .545          .545
REGBANKS       .888          .611          .222          .222          .333          .333
ETFS           .882          .867          .867          .867          .867          .867
NIFTY          .862          .896          .896          .862          .862          .862
HOMEBLDG       .833          .833          .777          .722          .777          .777
FINANCE        .826          .641          .456          .402          .402          .445
GAMING         .8            .8            .733          .766          .766          .766
INSURANC       .794          .588          .588          .558          .588          .705
MORNSTAR       .773          .726          .676          .68           .714          .735
UTILITY        .733          .733          .755          .755          .755          .755
SEMI           .724          .87           .801          .801          .793          .818
INDEXES        .718          .709          .718          .688          .688          .688
SOFTWARE       .718          .765          .75           .781          .765          .796
BIGBANKS       .714          .285          .285          .142          .142          .142
BEVERAGE       .7            .75           .75           .8            .9            .85
DJI-13         .692          .692          .692          .692          .692          .692
SP-100         .68           .597          .577          .587          .587          .608
N=20
------------------------------------------------------------------------------------------
MILITARY       .666          .644          .622          .666          .666          .711
ELECTRON       .664          .752          .701          .721          .721          .726
SP500          .658          .602          .587          .575          .602          .618
REIT           .652          .585          .559          .549          .554          .595
TRANSP         .65           .65           .6            .55           .55           .6
CHINA          .645          .693          .677          .661          .645          .709
RUS-1000       .637          .589          .562          .559          .584          .606
DOWJONES       .633          .566          .6            .633          .6            .6
CHEM           .625          .569          .527          .527          .527          .541
NASD-100       .615          .648          .626          .615          .648          .659
INDMATER       .581          .5            .418          .418          .459          .418
HACKERS        .555          .611          .666          .611          .666          .666
GREEN          .548          .612          .516          .612          .548          .58
FOOD           .533          .4            .333          .133          .266          .4
SOLAR          .526          .684          .578          .631          .578          .736
BIOTECH        .504          .508          .504          .483          .516          .52
N=16
------------------------------------------------------------------------------------------
GOLD           .49           .584          .566          .584          .433          .396
AUTO           .475          .425          .425          .425          .45           .475
RETAIL         .456          .403          .368          .333          .368          .385
COMPUTER       .44           .56           .52           .64           .6            .6
HOSPITAL       .428          .428          .428          .142          .142          .142
COMODITY       .38           .323          .366          .38           .338          .366
OILGAS         .259          .24           .215          .259          .227          .24
N=7
------------------------------------------------------------------------------------------
COAL           .222          .222          .222          .222          .222          .222
PIPELINE       .222          .222          .111          .222          .222          .222
N=2
====================================================================================
6/8/17
The
DJI
should make a run upwards.
Today, FAS (the leveraged Financials ETF)
moved convincingly above its 65-dma and the lagging
IWM and MDY)
moved
closer to possible upside breakouts. But we still need to see IWM and MDY
make
new highs and we need to see the biggest Bank Stocks (BAC,
GS and JPM)
rise above their 65-dma and destroy the still extant head/shoulders patterns
they show.
MAXMIN/June-8-2017/Bearish.htmpics/NVDA.GIFpics/DATA.GIF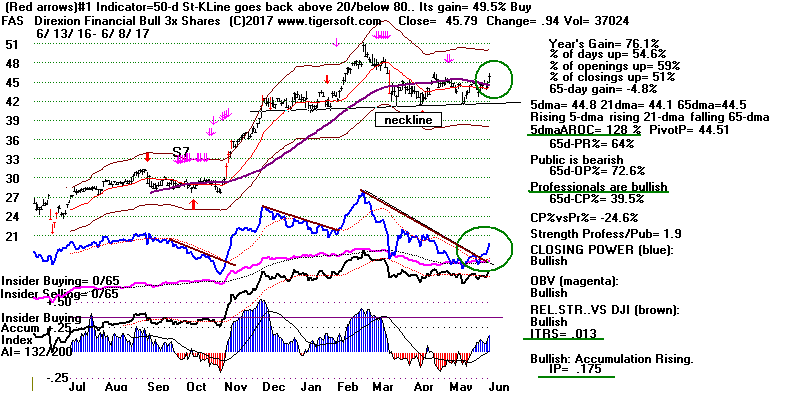
While we've been waiting for the DJI to finally move up, I've been saying for
sometime
that we should take advantage of the widening divergence between the best and
the worst
stocks as picked out by our Power Ranker with the
MAXCPs and
MINCPs
and
leveraged ETFs. This paid off again today.
SOXL
was up +5.46) and
NVDA +10.82.
Running in all-time high territory, sellers and shorts seem to have lost control
of
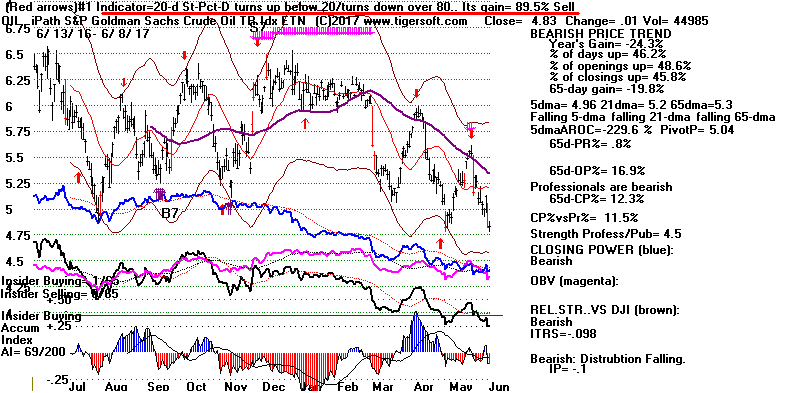
these. Similarly,
Crude OIL 's
decline has brought exceptionally swift
profits to
our bearish MINCP shorts in the group. In the case of the oil stocks, I
suggest not
covering them until we get a Stochastic Pct-D Buy. It is now positioned
to give
a new red Buy. But the current swift decline must stop first.
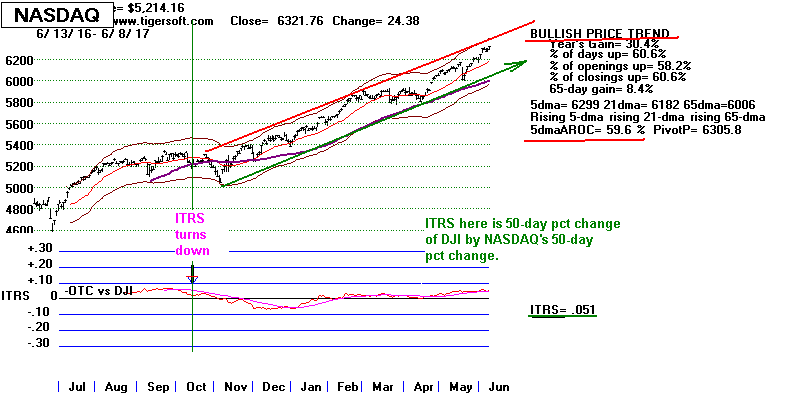
How much longer can the NASDAQ outperform the DJI?
How will we spot the next NASDAQ top?
The NASDAQ can outperform the DJI for a long, long
time if conditions are right.
Usually, the longer periods of out-performance by the NASDAQ come when Inflation
is a significant problem, such as 1967-1968 or 1976-October 1978 and June
1980-June
1981. Periods of NASDAQ out-performance also sometimes come soon after
the start of a new bull market (i.e. 1995) and also late in a bull market, as in
1999-2000.
Looking back at NASDAQ charts since 1990, I conclude that we must be on alert
for head/shoulder tops, turning-down of the 21-dma of ITRS for the NASDAQ vs the
DJI,
high volume reversal days near the upper band and of course any Peerless Sells.
None
of these bearish warnings are present. So, let's the NASDAQ longs keep
running.
6/8/2017 Index and ETF Charts:
PEERLESS DJI, Signals, Indicators Daily DJI Split Volume 10-Day Up/Down Vol
Hourly DJIA A/D Line for All Stocks.
S&P OEX NYSE NASDAQ COMPQX with CP
DIA SPY QQQ MDY IWM-TNA
Short Term Interest Rates DJI-Utilities DJI-Transp
CrudeOil FAS GLD BBH IBB JETS JNUG KOL NUGT OIH OIL
RSX RETL SLV SOXL TECL TMF TNA XIV YINN
To STOCKS' CHARTS
AAPL ADBE ALXN AMAT AMGN AMZN BA BIDU CAT FB GOOG GS
HD IBM JPM MASI MSFT NVDA QCOM TSLA TXN
Others REN, JJC, NIB, WEAT UUP (Dollar)
6/8/17 Bullish MAXCPs Bearish MINCPs
 RANKING OF KEY DIRECTORIES BASED PCT.OF STOCKS ABOVE 65-DMA
              6/8/17
---------------------------------------------------------------------------------------
Directory     Current       day-1         day-2         day-3         day-4         day-5
----------------------------------------------------------------------------------------
JETS           1             1             .777          .777          .777          .888
BONDFUND       .973          .973          .973          .973          .973          .964
NIFTY          .896          .896          .862          .862          .862          .931
EDU            .875          .875          .875          .875          1             1
SEMI           .87           .801          .801          .793          .818          .827
ETFS           .867          .867          .867          .867          .867          .867
HOMEBLDG       .833          .777          .722          .777          .777          .611
GAMING         .8            .733          .766          .766          .766          .766
SOFTWARE       .765          .75           .781          .765          .796          .734
ELECTRON       .752          .701          .726          .721          .726          .716
BEVERAGE       .75           .75           .8            .9            .85           .9
UTILITY        .733          .755          .755          .755          .755          .777
MORNSTAR       .726          .676          .68           .714          .735          .718
INDEXES        .714          .718          .688          .688          .683          .645
CHINA          .693          .677          .661          .645          .693          .709
DJI-13         .692          .692          .692          .692          .692          .692
SOLAR          .684          .578          .631          .578          .684          .736
N=17
--------------------------------------------------------------------------------------------
TRANSP         .65           .6            .55           .55           .55           .6
NASD-100       .648          .626          .615          .648          .659          .67
MILITARY       .644          .622          .666          .666          .711          .644
FINANCE        .641          .456          .402          .402          .445          .413
INFRA          .636          .545          .545          .545          .545          .545
GREEN          .612          .516          .612          .548          .58           .58
HACKERS        .611          .666          .611          .666          .666          .666
REGBANKS       .611          .222          .222          .333          .305          .305
SP500          .602          .587          .575          .602          .614          .614
N=9
--------------------------------------------------------------------------------------------
SP-100         .597          .577          .587          .587          .597          .577
RUS-1000       .589          .562          .559          .584          .599          .596
INSURANC       .588          .588          .558          .588          .705          .676
REIT           .585          .559          .549          .554          .585          .533
GOLD           .584          .566          .603          .433          .396          .32
CHEM           .569          .527          .527          .527          .541          .513
DOWJONES       .566          .6            .633          .6            .6            .566
COMPUTER       .56           .52           .64           .6            .6            .64
BIOTECH        .508          .504          .483          .516          .52           .459
N=9
--------------------------------------------------------------------------------------------
INDMATER       .5            .418          .418          .459          .418          .428
HOSPITAL       .428          .428          .142          .142          .142          .142
AUTO           .425          .425          .425          .45           .475          .45
RETAIL         .403          .368          .333          .368          .385          .403
FOOD           .4            .333          .133          .266          .4            .333
COMODITY       .323          .366          .38           .338          .366          .267
BIGBANKS       .285          .285          .142          .142          .142          .142
OILGAS         .24           .215          .259          .227          .24           .278
COAL           .222          .222          .222          .222          .222          .333
PIPELINE       .222          .111          .222          .222          .222          .333
N=11
====================================================================================
6/7/17
The Charts Tell
The Story better than Words.
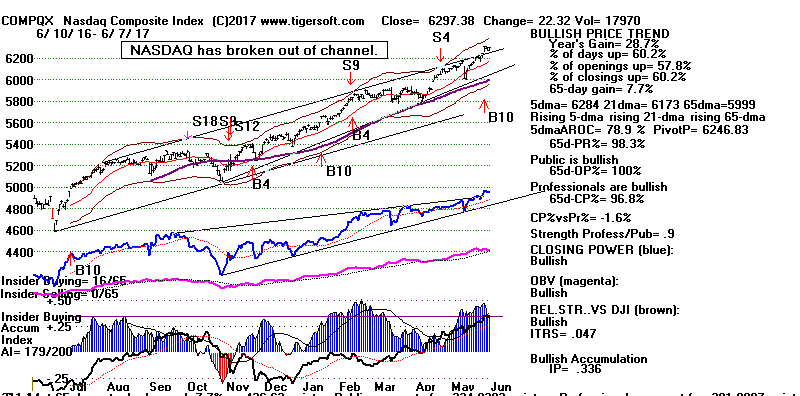
The NASDAQ has broken out of its price channel.
Its uptrend is
accelerating in all-time high, where
sell orders cannot easily
be bunched to bring a reversal
because there is no clear
resistance level present from
the chart. The
NASDAQ's strength owes to its biggest
growth stocks, like
AAPL, ADBE,
AMZN, FB,
GOOG,
MSFT
etc. Smaller priced NASDAQ stocks are mostly not
the source of this
strength, unless they are in semi-conductors.
The Russell-2000 (IWM)
is not close making a new high now.
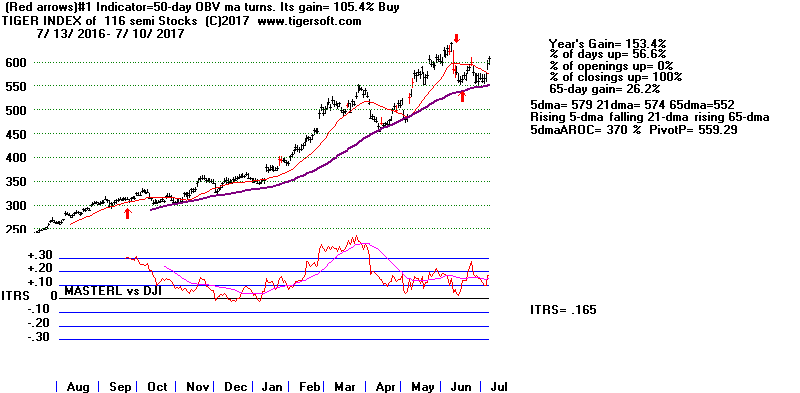
The whole camp of
semi-conductors has taken off. This
is not a small
group. See below its Tiger chart. The
A/D Line is making new
highs and shows no sign of a top.
Stay long
SOXL and NVDA.
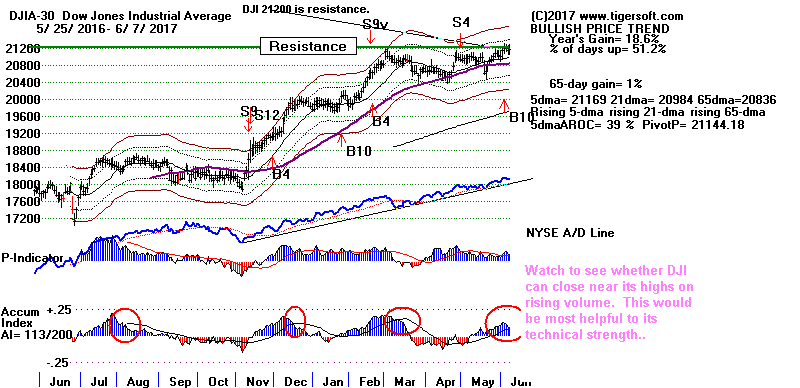
The DJIA and its older blue
chips cannot even manage a successful breakout
to new highs. But
that may change. The Big Banks are an important component.
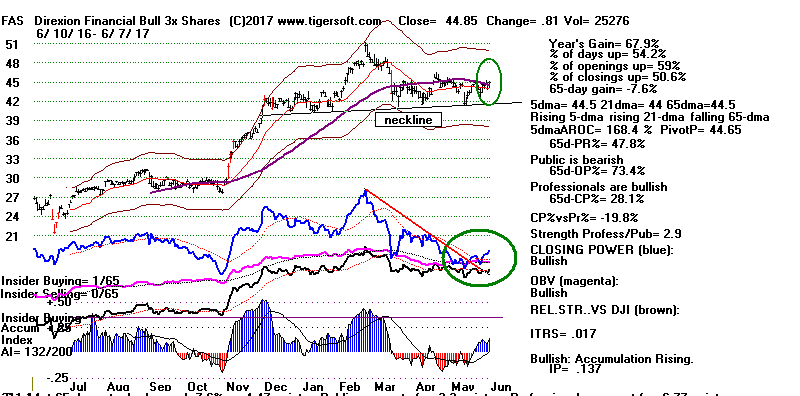
Today, FAS, the 3x
leveraged Financials broke its Closing Power
downtrend and closed
above the 65-day ma that has been
holding it back.
Perhaps, this means that the Big Banks will move up from here
and rupture their
bearish-looking head/shoulders. A rally in the DJI now would
be a big psychological
boost to the general market. Watch BAC,
GS and JPM.
Everything seems to depend on the Fed.
The FOMC meets next
Tuesday and Wednesday to decide whether they
will interest rates and
by how much.
Why does the Fed keep
talking about fighting inflation and of the
need to raise rates even
though real wages are not going up for most
Americans and inflation
is still only 2%?
Most pundits think that
they will raise rates. Surely, a rise in rates
may help the Dollar and,
therefore, Big Banks, but it will do no good for
Retailers, who are
already reeling, closing their doors and
see their stocks
struggling to avoid making more new lows.
The Fed's official
mandate is to fight inflation (there isn't much of this) and prevent
a recession that causes a
rise in Unemployment. On this basis, there seems
to be NO reason to raise
rates. But their focus is actually quite different than
what their mandate
suggests and we can benefit from it a lot.
They mostly view the
stock market as the real Economy.
Certainly in early 2009,
they all believed that the best way to
boost the Economy was to
turn the stock market back up. What a study
of the Federal Funds'
Rate changes show is that this was true also
at the bottoms of 1966,
1970, 1974, 1982, 1987,1998 and 2003.
And way before 1966, too,
let me say.
But what do you do now
when for most Americans real wages are flat
as hours worked are being
cut back? Are their backlogs? Is their
really an economic boom?
Still they focus on the
stock market and see it as over-valued.
So, they may raise rates,
despite the violation of their mandate.
Their excuse: Better to
cause a recession now than
a bigger Crash and
Depression later. I say this so that we watch
what they do about rates,
rather than their rationalizations.
One thing they have
right, their Open Market operations and the
Federal Funds rate, which
they effectively control, are the what most
good traders key off on.
My new Peerless book demonstrates the
tremendous predictive
power of the Federal Funds' changes for the
stock market. It
should be ready soon. I think you'll be amazed
at how easily the markets
swings in the past could have been predicted
this way. More on
the book next week.
Watch OIH's Closing Power downtrend.
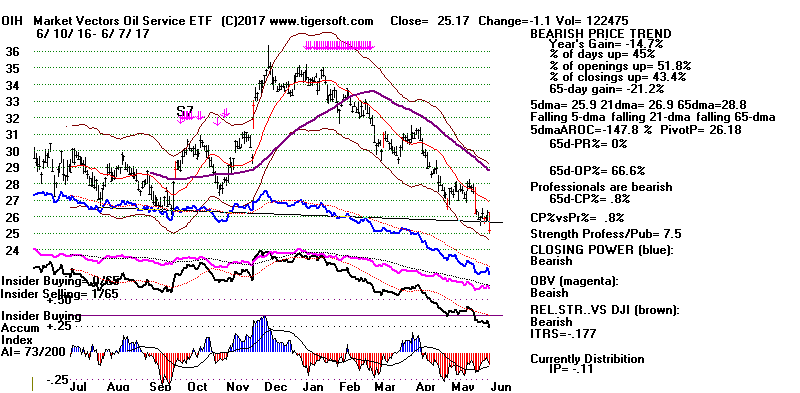
Then there's the weakest sector, the Oil and Gas Drillers.
See the
Bearish MINCP Oil and Gas stocks.
They look miserable. But here
there may be some
improvement soon. The 20-day stochastic Pct-D
for Crude Oil is reaching
oversold status. Now it needs to
turn up from below "20".
Considering how well this indicator has
worked for the last year,
when Crude Oil gives a Stochastic Buy signal,
let's cover the shorts we
have in the Oil group. Many have dropped 20%
in less than 2 months.
6/7/2017 Index and ETF Charts:
PEERLESS DJI, Signals, Indicators Daily DJI Split Volume 10-Day Up/Down Vol
Hourly DJIA A/D Line for All Stocks.
S&P OEX NYSE NASDAQ COMPQX with CP
DIA SPY QQQ MDY IWM-TNA
Short Term Interest Rates DJI-Utilities DJI-Transp
CrudeOil FAS GLD BBH IBB JETS JNUG KOL NUGT OIH OIL
RSX RETL SLV SOXL TECL TMF TNA XIV YINN
To STOCKS' CHARTS
AAPL ADBE ALXN AMAT AMGN AMZN BA BIDU CAT FB GOOG GS
HD IBM JPM MASI MSFT NVDA QCOM TSLA TXN
Others REN, JJC, NIB, WEAT UUP (Dollar)
6/7/17 Bullish MAXCPs Bearish MINCPs
 RANKING OF KEY DIRECTORIES BASED PCT.OF STOCKS ABOVE 65-DMA
               6/7/17
---------------------------------------------------------------------------------------
Directory     Current       day-1         day-2         day-3         day-4         day-5
----------------------------------------------------------------------------------------
JETS           1             .777          .777          .777          .888          .666
BONDFUND       .973          .973          .973          .973          .964          .964
NIFTY          .896          .862          .862          .862          .931          .965
EDU            .875          .875          .875          1             1             1
ETFS           .867          .867          .867          .867          .867          .852
SEMI           .801          .801          .793          .818          .827          .775
HOMEBLDG       .777          .722          .777          .777          .611          .611
UTILITY        .755          .755          .755          .755          .777          .733
BEVERAGE       .75           .8            .9            .85           .9            .8
SOFTWARE       .75           .781          .765          .796          .718          .687
GAMING         .733          .766          .766          .766          .733          .7
INDEXES        .722          .688          .688          .683          .636          .58
ELECTRON       .701          .726          .726          .726          .716          .664
DJI-13         .692          .692          .692          .692          .692          .692
CHINA          .677          .661          .645          .693          .709          .693
MORNSTAR       .676          .68           .714          .735          .718          .647
N=16
--------------------------------------------------------------------------------------------
HACKERS        .666          .611          .666          .666          .666          .666
NASD-100       .626          .615          .648          .659          .67           .626
MILITARY       .622          .666          .666          .711          .644          .666
DOWJONES       .6            .633          .6            .6            .566          .533
TRANSP         .6            .55           .55           .55           .6            .4
INSURANC       .588          .558          .588          .705          .676          .588
SP500          .585          .573          .6            .612          .612          .554
SOLAR          .578          .631          .578          .684          .736          .736
SP-100         .577          .587          .587          .597          .577          .536
GOLD           .566          .603          .452          .396          .32           .377
RUS-1000       .562          .559          .584          .599          .592          .53
REIT           .559          .549          .554          .585          .533          .471
INFRA          .545          .545          .545          .545          .545          .545
CHEM           .527          .527          .527          .541          .513          .416
COMPUTER       .52           .64           .6            .6            .6            .52
GREEN          .516          .612          .548          .58           .58           .58
BIOTECH        .504          .483          .516          .52           .463          .414
N=17
--------------------------------------------------------------------------------------------
FINANCE        .456          .402          .402          .445          .402          .326
HOSPITAL       .428          .142          .142          .142          .142          0
AUTO           .425          .425          .45           .475          .45           .375
INDMATER       .418          .418          .459          .418          .428          .397
RETAIL         .368          .333          .368          .385          .403          .333
COMODITY       .366          .38           .338          .366          .267          .295
N=6
--------------------------------------------------------------------------------------------
FOOD           .333          .133          .266          .4            .333          .333
BIGBANKS       .285          .142          .142          .142          .142          .142
COAL           .222          .222          .222          .222          .333          .222
REGBANKS       .222          .222          .333          .305          .305          .194
OILGAS         .215          .259          .227          .24           .265          .24
PIPELINE       .111          .222          .222          .222          .333          .111
N=6
====================================================================================
6/6/17
The Buy B10 still stands, but just by a little. See
the new research I
have done on B10s and flat top-breakouts further below. Much depends
on what the Fed will do this month and how the market will react to the
noise that the black crows and vultures make circling President Trump.

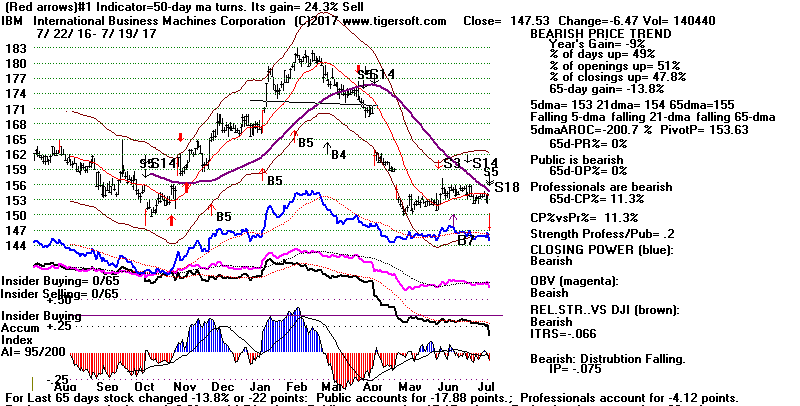 (
I have some Russian speaking subscribers. I can not help but be reminded
of this sad song about circling black ravens -
https://www.youtube.com/watch?v=lCuJJC3T8nM
- even though Trump's difficulties are far from tragic and are mostly of his own
making. Edgar
Allen Poe's famous poem, "The Raven" -
https://www.youtube.com/watch?v=WcqPQXqQXzI
reflects the potential ominousness of events in Washington, too -
https://www.youtube.com/watch?v=WcqPQXqQXzI
In the Godfather, too, a crow always portends dire events.)

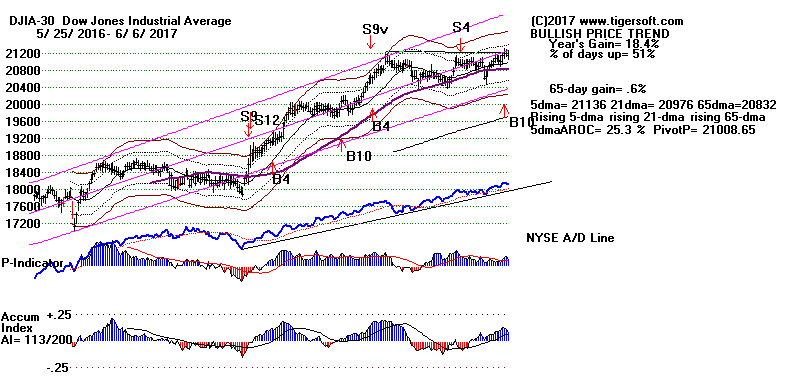

For our purposes, I would stick with the powerful uptrends of
SOXL,
TECL and QQQ.
SPY still shows rising internals. So, I would
hold long
that, too, along with NVDA.
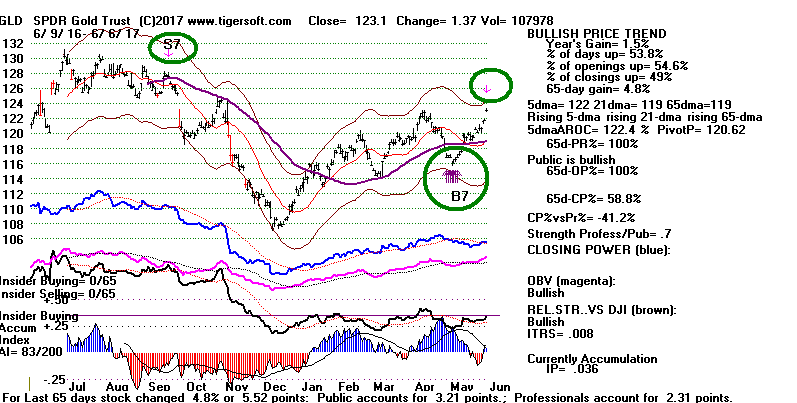
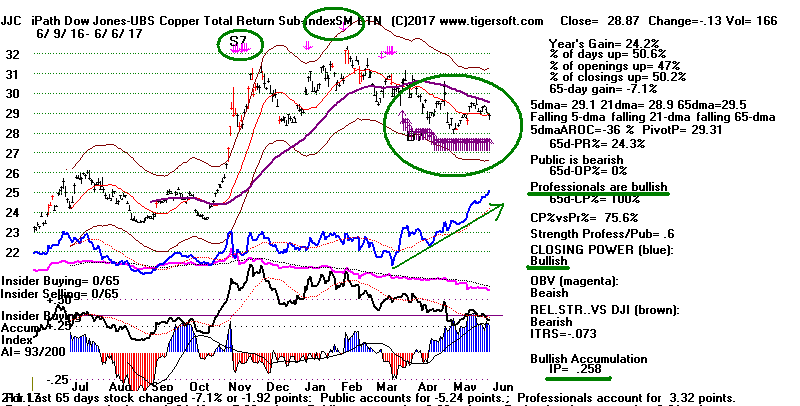
I mentioned Gold as looked like a Buy two weeks ago
because of its Buy B7 CP
bullish divergence arrows. I would say that Copper now looks like it shows
the
same type of Professional buying. Our Closing Power rules do require us to
wait until
it gets back above its 65-dma to buy it.
More Research on the
Buy B10 (Flat-topped breakout)
The DJI's hesitation and minor is not proof, in itself, that the B10 has failed.
I count 8 previous flat topped breakout new highs where, like now, there
as no Peerless Sell and the DJI hesitated not far from the old highs for 4 days
to 2 months. In 4 cases, 8/1/1929,11/24/50, 3/3/55 and 10/6/83, the DJI's
breakout did fail and the DJI retreated back very to the lower band, never more,
before rallying to new highs. On the other hand, there were 4 cases, where
the DJI went new highs after a hesitation of 4 days to 2 months. These are
the cases of 3/2/1954, 11/3/73, 2/3/86 and 3/15/86. It might be helpful
to compare their most important key values, the P-I, IP21 and V-I.
Flat topped breakouts that were ultimately
successful
without a pullback to the lower band:
Date Signal
PI IP21
V1
-----------------------------------------------------------
3/2/1954 B10
+63 +.135
0
11/3/1972 none +120
+.283 +1
2/3/1986 none
+94 +.110
-2
3/15/2006 none +291
+.093 +81
--------------------------------------------------------
Avg.
+142 +.154 +20
Flat topped breakouts that failed and brought
a pullback to the lower band:
Date Signal
PI IP21
V1
-----------------------------------------------------------
8/1/1929 none
-89 -.094
-385
11/24/1950 none +130 +.111
+118
3/3/1955 none +105
.000 +74
10/6/1983 none +50
+.073 +1
----------------------------------------------------------
Avg. +49
-.0015 +48
I would say that the biggest differences between the
breakout
successes and failures is the successes average considerably
higher P-I and IP21 readings than the failures do. The failures
actually had somewhat higher V-I readings than the successes.
Still, the 1929 cases shows that a very low V-I reading is not good
and, of course, it will bring a Sell S9V on a rally to the 2.4% upper band.
This raises the question should we consider the V-I reading of -35
so bearish right now.
Here are the cases of past B10s with V-I readings below
-14. It would seem
that I could improve the program a little by leaving out Buy B10s when the
V-I is below -14 if the IP21 is not, say, above +.15. In our case,
the IP21
stood at +.121 on the recent marginal B10 breakout. This places it in "no
man's land",
neither with the two failures or the one success here.
DJI Gain
P-I IP21 V-I
19500316 B10 207.9 +.061
+37 +.203 -22 2 week hesitation and take-off.
20050304 B10 10940.85 -.003 +251
+.093 -15 Sell S4 2 days later and 8% decline.
20120314 B10 13194.10 -.005 +129
+.069 -24 Sell S1 5 days later and decline to LB.
----------------
6/6/2017 Index and ETF Charts:
PEERLESS DJI, Signals, Indicators Daily DJI Split Volume 10-Day Up/Down Vol
Hourly DJIA A/D Line for All Stocks.
S&P OEX NYSE NASDAQ COMPQX with CP
DIA SPY QQQ MDY IWM-TNA
Short Term Interest Rates DJI-Utilities DJI-Transp
CrudeOil FAS GLD BBH IBB JETS JNUG KOL NUGT OIH OIL
RSX RETL SLV SOXL TECL TMF TNA XIV YINN
To STOCKS' CHARTS
AAPL ADBE ALXN AMAT AMGN AMZN BA BIDU CAT FB GOOG GS
HD IBM JPM MASI MSFT NVDA QCOM TSLA TXN
Others REN, JJC, NIB, WEAT UUP (Dollar)
6/6/17 Bullish MAXCPs Bearish MINCPs
 RANKING OF KEY DIRECTORIES BASED PCT.OF STOCKS ABOVE 65-DMA
               6/6/17
---------------------------------------------------------------------------------------
Directory     Current       day-1         day-2         day-3         day-4         day-5
----------------------------------------------------------------------------------------
BONDFUND       .973          .973          .973          .964          .964          .964
EDU            .875          .875          1             1             1             1
ETFS           .867          .867          .867          .867          .852          .867
NIFTY          .862          .862          .862          .931          .965          .862
BEVERAGE       .8            .9            .85           .9            .8            .8
SEMI           .79           .781          .809          .818          .772          .763
GAMING         .785          .785          .785          .75           .714          .714
JETS           .777          .777          .777          .888          .666          .555
SOFTWARE       .777          .761          .793          .714          .682          .714
UTILITY        .755          .755          .755          .777          .733          .733
ELECTRON       .726          .726          .731          .716          .675          .67
HOMEBLDG       .722          .777          .777          .611          .611          .611
DJI-13         .692          .692          .692          .692          .692          .692
INDEXES        .689          .689          .685          .637          .581          .568
MORNSTAR       .68           .714          .735          .718          .651          .642
N=15
---------------------------------------------------------------------------------------------
MILITARY       .666          .666          .711          .644          .666          .577
SOLAR          .666          .6            .733          .8            .8            .866
CHINA          .661          .645          .693          .709          .693          .709
COMPUTER       .64           .6            .6            .6            .56           .52
DOWJONES       .633          .6            .6            .566          .533          .533
NASD-100       .615          .648          .659          .67           .626          .604
GREEN          .612          .548          .58           .58           .58           .58
HACKERS        .611          .666          .666          .666          .666          .666
GOLD           .6            .44           .4            .32           .38           .42
SP-100         .587          .587          .597          .577          .536          .536
SP500          .573          .6            .612          .612          .556          .543
RUS-1000       .559          .584          .599          .592          .532          .521
INSURANC       .558          .588          .705          .676          .558          .5
TRANSP         .55           .55           .55           .6            .4            .45
INFRA          .545          .545          .545          .545          .545          .545
REIT           .537          .543          .575          .521          .451          .44
CHEM           .527          .527          .541          .513          .43           .444
N=17
---------------------------------------------------------------------------------------------
BIOTECH        .48           .507          .511          .464          .413          .413
AUTO           .425          .45           .475          .45           .375          .375
INDMATER       .406          .447          .406          .416          .395          .416
FINANCE        .402          .402          .445          .402          .326          .326
COMODITY       .38           .338          .366          .267          .295          .253
N=5
--------------------------------------------------------------------------------------------
RETAIL         .333          .368          .385          .403          .333          .333
OILGAS         .259          .227          .24           .265          .24           .253
REGBANKS       .228          .342          .314          .314          .2            .2
COAL           .222          .222          .222          .333          .222          .222
PIPELINE       .222          .222          .222          .333          .111          .222
BIGBANKS       .142          .142          .142          .142          .142          .142
FOOD           .133          .266          .4            .333          .333          .266
HOSPITAL       .125          .125          .125          .125          0             .125
N=8
====================================================================================
6/5/17
Our Buy
B10 has not brought the runaway advance that the most bullish
flat top breakouts often do. I said yesterday Volume was clearly missing.
Perhaps. the usual early June gloom explain this. More likely, traders
needs now to see what the FED will do. Will they raise short-term rates?
Or will they delay? My guess is that they will delay and that could send
the DJI up considerably. Why? Because CPI Inflation is low and the
Unemployment could certainly go still lower. It's hard to argue the
economy
is running at full capacity. Backlogs are not building up. And for
the
Fed, temporizing has worked out well, why change?
Have you noticed that nearly all the
Bearish MINCPs are energy related?
That's the result of the current down-cycle in Crude Oil. Lower oil
prices,
of course, help most consumers and also lower the rate of inflation.
Simply
following Crude Oil's Stochastic-20 Pct
swings back and forth between 20
(Buy) and 80 (Sell) would have gained a trader almost 150% for the last
year. Not shabby! So, I suspect that Oil and Oil stocks have more to
decline
before they reverse upwards. As a whole, that works out well for the
general
market, if less so for the OEX and the
DJI, which has Exxon and Chevron in
it.
The most heavily weight DJI-30 stock remains Goldman Sachs.
Wouldn't
it be something, if it turned up here because rates are not going to go up?
True, it shows a sprawling head and shoulders pattern. But it is also
sitting
on its rising 200-day ma and the right shoulders seems to be taking too long
to be completed.
There still remains much less interest in the
Russell-2000 stocks than
the big high techs. SOXL,
QQQ and TECL are the ETFs
I would still be
long. Perhaps, like in 1967 and 1968, the big high techs will be the "high
flyers"
until the Fed finally does rates. Then after a 10% DJI decline, lower
priced stocks will get full attention in the next swing back upwards.
Usually
such a stage comes late in a bull market. So, this also argues against us
being near a major top.
SPY, though moving more slowly up, continues to look
good. Its breakouts,
one right after another this past year, are usually the hallmark of a genuine
bull market. And for now, its Opening and Closing Power are both rising.
We have to be optimistic here.
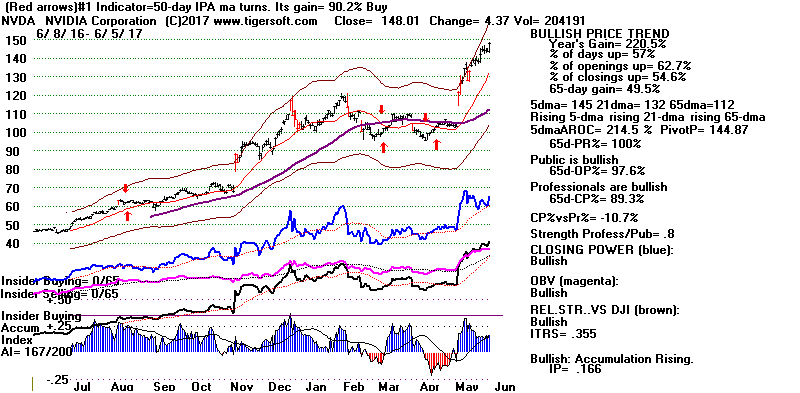
NVDA, our favorite semi-conductor made another new high even as
the DJI declined. It is in the "sweet spot" of the artificial intelligence
and semi-conductor boom.
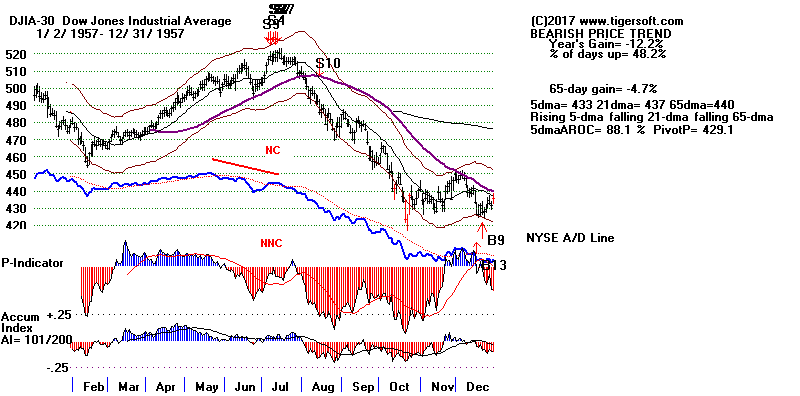
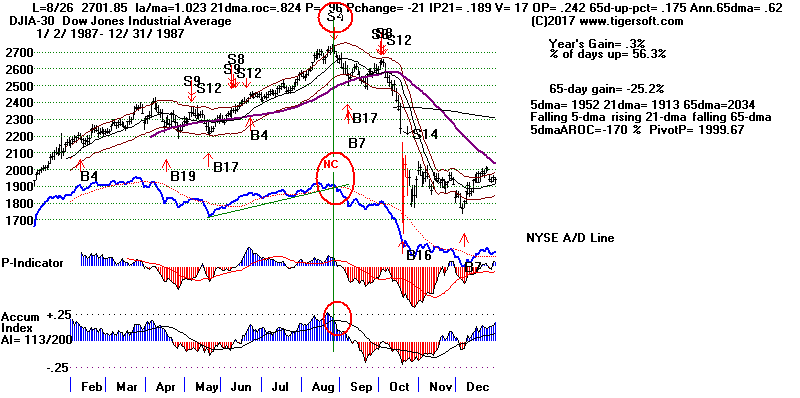
Have any of you heard of a 30-year market cycle?
1957 (20% decline) - 1987 (37% decline) - 2017?
And bull markets 1923-1927+, 1953-1957, 1983-1987, 2013-?
The 1957 top was in July and the 1987 top was in August. Both showed
Peerless Sells. What these two tops shared was a failure by the A/D
Line to confirm the final high and then a trend-break in the A/D Line.
Fortunately, for now our A/D Line is very strong and has been leading,
not lagging the DJI.
                   6/5/2017   Index and ETF Charts:


                    PEERLESS DJI, Signals, Indicators    Daily DJI Split Volume   10-Day Up/Down Vol
                    Hourly DJIA    A/D Line for All Stocks.

                   S&P    OEX    NYSE    NASDAQ   COMPQX with CP
                   DIA   SPY   QQQ    MDY   IWM-TNA

                  Short Term Interest Rates    DJI-Utilities      DJI-Transp
                  CrudeOil  FAS  GLD  BBH  IBB  JETS  JNUG  KOL  NUGT  OIH   OIL
                  RSX   RETL   SLV   SOXL   TECL   TMF   TNA   XIV  YINN

                To STOCKS' CHARTS

                   AAPL  ADBE  ALXN  AMAT  AMGN  AMZN  BA  BIDU   CAT    FB  GOOG   GS
                   HD   IBM   JPM   MASI   MSFT   NVDA  QCOM   TSLA  TXN
          Others REN, JJC,  NIB, WEAT  UUP (Dollar)


             6/5/17  Bullish MAXCPs    Bearish MINCPs


                                                                RANKING OF KEY DIRECTORIES BASED PCT.OF STOCKS ABOVE 65-DMA
              6/5/17
---------------------------------------------------------------------------------------
Directory     Current       day-1         day-2         day-3         day-4         day-5
----------------------------------------------------------------------------------------
BONDFUND       .973          .973          .964          .964          .973          .973
BEVERAGE       .9            .85           .9            .8            .8            .85
ETFS           .867          .867          .867          .852          .867          .882
NIFTY          .862          .862          .931          .965          .862          .862
EDU            .833          1             1             1             1             1
GAMING         .785          .785          .75           .714          .714          .714
SEMI           .781          .809          .818          .772          .772          .772
HOMEBLDG       .777          .777          .611          .611          .611          .666
JETS           .777          .777          .888          .666          .555          .666
SOFTWARE       .765          .796          .718          .687          .703          .718
UTILITY        .755          .755          .777          .733          .733          .733
ELECTRON       .717          .722          .711          .668          .673          .663
MORNSTAR       .714          .735          .718          .651          .647          .668
DJI-13         .692          .692          .692          .692          .692          .692
INDEXES        .689          .685          .637          .581          .568          .594
N=15
--------------------------------------------------------------------------------------------
HACKERS        .666          .666          .666          .666          .666          .666
MILITARY       .666          .711          .644          .666          .6            .622
NASD-100       .655          .666          .677          .634          .612          .623
CHINA          .645          .693          .709          .693          .709          .709
SP500          .602          .614          .614          .558          .543          .554
COMPUTER       .6            .6            .6            .56           .56           .52
DOWJONES       .6            .6            .566          .533          .533          .533
INSURANC       .588          .705          .676          .558          .5            .558
SP-100         .587          .597          .577          .536          .536          .536
RUS-1000       .584          .599          .592          .532          .519          .535
SOLAR          .578          .684          .736          .736          .789          .789
REIT           .554          .585          .533          .466          .45           .487
TRANSP         .55           .55           .6            .4            .45           .45
GREEN          .548          .58           .58           .58           .612          .645
INFRA          .545          .545          .545          .545          .545          .545
CHEM           .529          .544          .514          .426          .441          .441
BIOTECH        .511          .511          .456          .417          .413          .448
N=17
-------------------------------------------------------------------------------------------
INDMATER       .459          .418          .428          .408          .418          .428
AUTO           .45           .475          .45           .375          .375          .375
GOLD           .44           .4            .32           .38           .42           .52
FINANCE        .402          .445          .402          .326          .326          .402
RETAIL         .368          .385          .403          .333          .333          .315
REGBANKS       .342          .314          .314          .2            .171          .285
COMODITY       .338          .366          .267          .295          .253          .338
N=7
-------------------------------------------------------------------------------------------
FOOD           .266          .4            .333          .333          .266          .2
OILGAS         .227          .24           .266          .24           .259          .298
COAL           .222          .222          .333          .222          .222          .333
BIGBANKS       .142          .142          .142          .142          .142          .142
HOSPITAL       .142          .142          .142          0             .142          .285
PIPELINE       .125          .125          .25           0             .125          .25
N=6
====================================================================================
6/2/17 We finally got a
Buy B10, with the DJI close above the flat resistance
at 21200. But breakouts "should" be on higher volume, not lower
volume.
They
"should" prompt a quick move higher. We got only a marginal breakout
and there seems to be no follow-through buying overseas. Breadth did not
improve and the Peerless V-Indicator remain negative. So, more narrow
backing and filling seems likely.
As long as the VI is negative, any
1%
additional advance will give us a Sell S9-v.
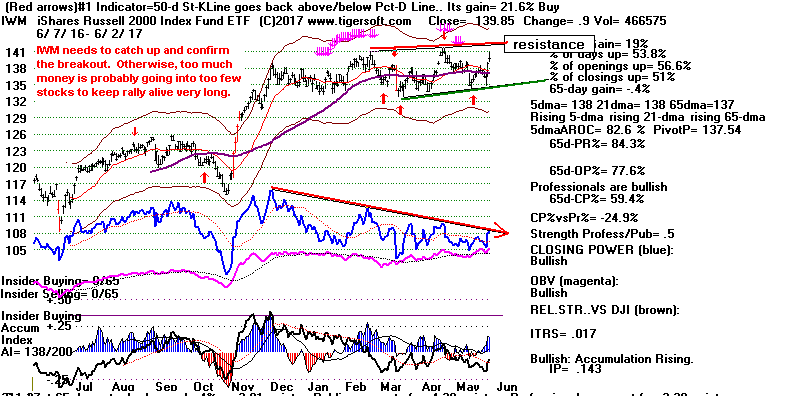
It would be constructive, and help our Volume indicators, if some of the money
that is now going into high priced NASDAQ stock and ETFs would instead
be placed in the medium and lower priced stocks that make up the
Russell- 2000 (IWM) and Midcaps (MDY).
SOXL remains the strongest
ETF and continues warranting holding.

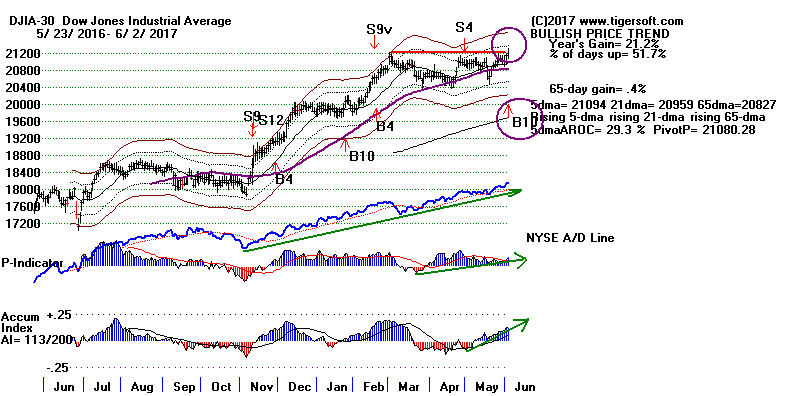
Note all the Vol. NCs below.


The NASDAQ and Big High Techs, particularly Semi-Conductors
remain the Leaders
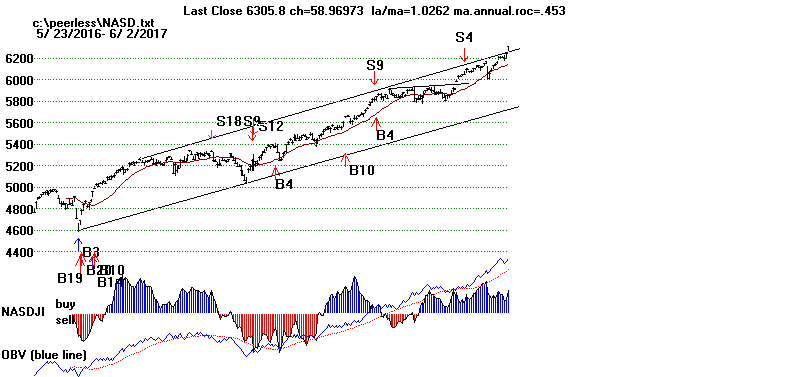
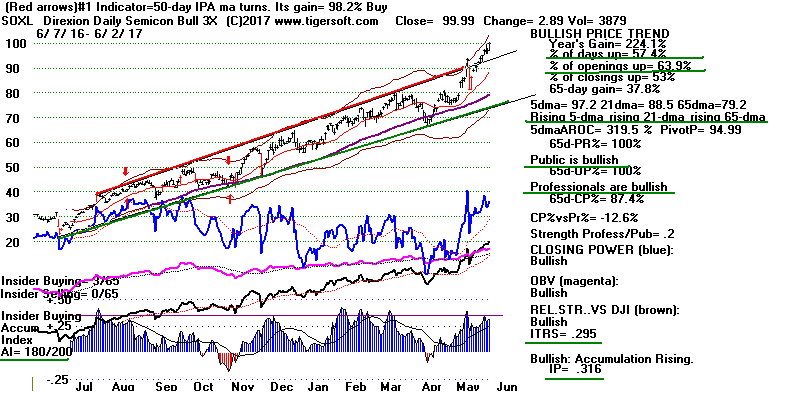
IWM needs to breakout, too.
Here are the earlier Buy B10s and flat topped breakouts to a 12-month
high from DJI consolidations of 3-5 months.
2017 4 months - Lots of volume non-confirmations but breadth is very
strong.
2016 4
months. Advance
after Trump election despite lagging internals.
1998 3
months. Failure.
V= only +28
1997-1998
4.5 months. Good advance.
(Broad pattern).
1995 3
months Strong advance.
1993 3
months DJI went sidewise for a month,
then up. Simultaneous Peerless Sell.
1988 4.2
months Failure.
V= only +11
NOW THE FED MUST DECIDE.
This Friday's Job Report showed a May increase of less than 140,000.
The market's initial response was that this was low enough to
prevent the FED from raising rates at their mid June meeting.
The last 3 months have averaged 120,000, which is well below the
150,000 which many economists estimate is needed just to cover the
gradual growth in the work force. But because the many people
who no longer look for full-time work are not counted, the official level
of Unemployment fell a new 16 year low, 4.3%. Some pundits say
market must soon obey the iron-clad laws of the normal business cycle
and now with "full employment", we will soon see the start of a bear
market.
What I have discovered is that there is still room for Unemployment to
go lower and much depends on when the FEDs start to aggressively
tighten credit. See also that the Prime Rate is far below the levels it
has
reached as market tops since 1957 were being made. The CPI
Inflation rate (2.2% ) currently remains quite modest compared to
its levels are earlier market tops. On this basis, too, there would also seem
good reason for the FED not to raise rates in June.
But with the Jobs' numbers
slipping, if they do raise rates, they may be making a bearish mistake which
will hurt the markets considerably.
(Current CPI data:
http://www.inflation.eu/inflation-rates/united-states/current-cpi-inflation-united-states.aspx
)
Business Cycles since 1945
Lowest Unemployment Rate Bull Market Peak
Prime Rate Increases
June 1, 2017 4.3%
?
Current Prime Rate = 4.0%,
starting March 16, 2017
It had been raised to 3.75%
on December 15, 2016 and
3.5% on December 17, 2015
and was previously 3.25%
starting December 16, 2008.
----------------------------------------------------------------------------------------
October 2006 4.4%
Oct 9, 2007
Prime Rate had been raised steadily from
4.0% on June 27, 2003
to 8.25% on June 29, 2006.
Showing a Fed "panic", it was lowered
to 5.0% in quick steps at end of 2007
and early 2008 to 5.0% on April 30, 2008.
----------------------------------------------------------------------------------------
April 2000
3.8% March 24, 2000
Prime Rate was raised by 1/2%
to from 8.25% on July 1, 1999.
It then rose quickly to 9.5% on
May 17, 2000.
----------------------------------------------------------------------------------------
July 17, 1998 Prime Rate
was raised from 8.25%
to 8.5% on March 27, 1997 and
was holding steady at market top.
----------------------------------------------------------------------------------------
March 1989
5.0% July 16, 1990
Prime Rate actually fell from 11.5%
(Kuwait invasion) on February 24, 1989 to
10% on
January 8, 1990.
----------------------------------------------------------------------------------------
August 25, 1987 Prime Rate was raised steadily from
7.5% on August 26, 1986
to 9.25% on October 7, 1987.
----------------------------------------------------------------------------------------
May 1979
5.6% April 27, 1981
On April 2, 1980, the Prime Rate
reached 20%. It had been rising
steadily
since November 24, 1976 when it was
6.25%. On December 19, 1980 it
reached 21.5%
----------------------------------------------------------------------------------------
October 1973 4.6%
Jan 11, 1973
Prime Rate raised steadily in 1/4%
steps from 4.5% on March 20, 1972
to 10% on September 18, 1973.
----------------------------------------------------------------------------------------
September 1968 3.4%
Nov. 29, 1968 Prime Rate raised
in 1/2% steps
to 6% on November 20, 1967 and
6.5% on April 19, 1968. It was then
raised in 1/4% steps to 7% on
January 7, 1969 and finally 8.5% on
June 9, 1969.
----------------------------------------------------------------------------------------
December 13, 1961 Prime Rate was 4.5%
and unchanged
(JFK threats to business
since 1960.
and Cuban Missile Crisis.)
----------------------------------------------------------------------------------------
June 1959
5.0% January 5, 1960
Prime Rate raised by 1/4 to 4.5%
on May 18, 1959 and 5% on
September 1, 1959.
----------------------------------------------------------------------------------------
March 1957
3.7% July 12, 1957
Prime Rate was raised steadily
(1/4% lifts) from March 17, 1954
to August 6, 1957 when it had
reached 4.5%.
----------------------------------------------------------------------------------------
May 1953
2.5% no bear market.
Prime Rate raised steadily (1/4%
lifts) from 1948 to April 27, 1953
when it had reached 3.25%.
"By February 1951, CPI inflation had reached an annualized rate of 21%.
As the Korean War intensified, the Fed faced the possibility of having to
monetize a substantial issuance of new government debt, which would have
placed even greater upward pressure on prices. But the administration
continued to urge the Fed to maintain the peg, a position the FOMC found
increasingly untenable."
https://www.federalreservehistory.org/essays/treasury_fed_accord
----------------------------------------------------------------------------------------
January 1948 3.4%
June 15, 1948 Prime
Rate boosted from
1.75% to 2.0% Aug1,'48.
Note that between June 1946 and June 1947 Consumer Price Index inflation was
17.6%, and from June 1947 to June 1948 it was 9.5%.
The Fed's priority was switching from financing war bonds to restricting
inflation
(
http://www.fedprimerate.com/wall_street_journal_prime_rate_history.htm )
------------------------------------------------
Average
4.1%
6/2/2017 Index and ETF Charts:
PEERLESS DJI, Signals, Indicators Daily DJI Split Volume 10-Day Up/Down Vol
Hourly DJIA A/D Line for All Stocks.
S&P OEX NYSE NASDAQ COMPQX with CP
DIA SPY QQQ MDY IWM-TNA
Short Term Interest Rates DJI-Utilities DJI-Transp
CrudeOil FAS GLD BBH IBB JETS JNUG KOL NUGT OIH OIL
RSX RETL SLV SOXL TECL TMF TNA XIV YINN
To STOCKS' CHARTS
AAPL ADBE
ALXN
AMAT AMGN AMZN BA BIDU CAT FB GOOG GS
HD
IBM JPM MASI MSFT NVDA QCOM TSLA
TXN
Others REN, JJC, NIB, WEAT UUP (Dollar)
6/2/17 Bullish MAXCPs Bearish MINCPs
 RANKING OF KEY DIRECTORIES BASED PCT.OF STOCKS ABOVE 65-DMA
              6/2/17
---------------------------------------------------------------------------------------
Directory     Current       day-1         day-2         day-3         day-4         day-5
----------------------------------------------------------------------------------------
EDU            1             1             1             1             1             1
BONDFUND       .973          .964          .964          .973          .973          .964
ETFS           .867          .867          .852          .867          .882          .882
NIFTY          .862          .931          .965          .862          .862          .896
BEVERAGE       .85           .9            .8            .8            .85           .8
SEMI           .818          .827          .784          .784          .784          .775
SOFTWARE       .796          .718          .687          .703          .718          .734
HOMEBLDG       .777          .611          .611          .611          .666          .777
JETS           .777          .888          .666          .555          .666          .777
GAMING         .766          .733          .7            .7            .7            .7
UTILITY        .755          .777          .733          .733          .711          .755
MORNSTAR       .735          .718          .651          .647          .663          .663
ELECTRON       .731          .721          .68           .68           .67           .659
MILITARY       .711          .644          .666          .6            .622          .6
INSURANC       .705          .676          .558          .5            .558          .558
CHINA          .693          .709          .693          .709          .709          .725
DJI-13         .692          .692          .692          .692          .692          .692
INDEXES        .685          .637          .581          .568          .594          .59
SOLAR          .684          .736          .736          .789          .789          .789
n=19
-------------------------------------------------------------------------------------------
HACKERS        .666          .666          .666          .666          .666          .722
NASD-100       .666          .677          .634          .612          .623          .677
SP500          .614          .614          .558          .543          .554          .564
COMPUTER       .6            .6            .56           .56           .52           .56
DOWJONES       .6            .566          .533          .533          .533          .533
RUS-1000       .599          .592          .532          .519          .535          .545
SP-100         .597          .577          .536          .536          .536          .525
REIT           .585          .533          .466          .45           .487          .528
GREEN          .58           .58           .58           .612          .645          .58
TRANSP         .55           .6            .4            .45           .45           .5
INFRA          .545          .545          .545          .545          .545          .545
CHEM           .541          .513          .43           .444          .444          .458
BIOTECH        .515          .456          .409          .417          .444          .472
n=13
-------------------------------------------------------------------------------------------
AUTO           .475          .45           .375          .375          .375          .4
FINANCE        .445          .402          .326          .326          .402          .423
INDMATER       .418          .428          .408          .418          .428          .428
GOLD           .415          .339          .396          .415          .509          .433
FOOD           .4            .333          .333          .266          .2            .133
RETAIL         .385          .403          .333          .333          .315          .298
COMODITY       .366          .267          .295          .253          .338          .281
REGBANKS       .305          .305          .194          .166          .277          .25
n=8
-------------------------------------------------------------------------------------------
OILGAS         .24           .265          .24           .259          .297          .265
COAL           .222          .333          .222          .222          .333          .333
PIPELINE       .222          .333          .111          .222          .333          .333
BIGBANKS       .142          .142          .142          .142          .142          .142
HOSPITAL       .142          .142          0             .142          .285          .428
n=5
------------------------------------------------------------------------------------------------------------------------------
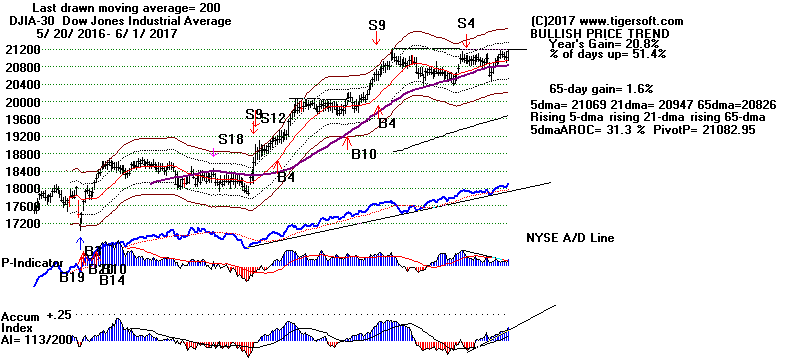
6/1/17 As has
been the pattern for some time, breadth was excellent today
but NYSE volume fell compared to Wednesday's decline. The nearly perfectly
flat
DJI resistance sets up a Peerless Buy B10 breakout tomorrow on a DJI close above
21188. But because the V-Indicator remains so negative, we will get a new
Sell S9V
if the DJI closes above the 2.3% band, now about 21476. So, the most
bullish
thing the DJI could do now is not to advance too much on the breakout while NYSE
Up Volume rises quickly, as more lower and medium priced stocks receive new
investment funds. This will probably require the FED to put a hold on their
plans
to raise rates. MDY and IWM
have been lagging the DJI.

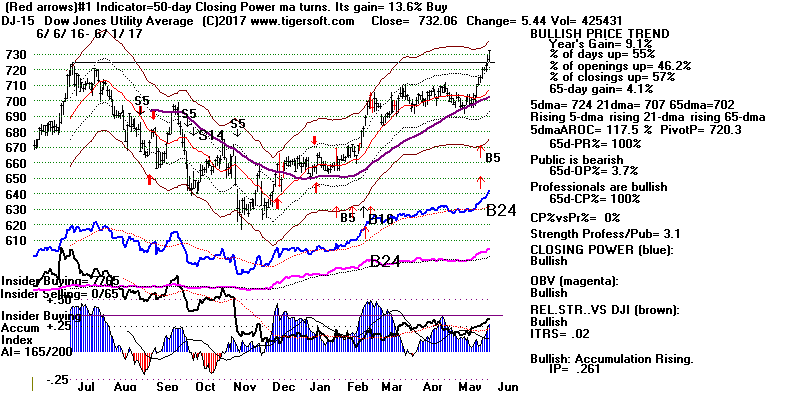
Much of the
buying surge today owed to Trump's expected decision not
to let the
US be bound by international concerns about man-made climate change due to the
use
of carbon-dioxide producing fuels Accordingly, today's decision made
coal burning
Utilities and Chemical look good today. US multi-nationals did less well,
their investors
started wondering if Trumps nationalist policies could cause an overseas
backlash
against US firms. DJ-Utilities made a year high
today.
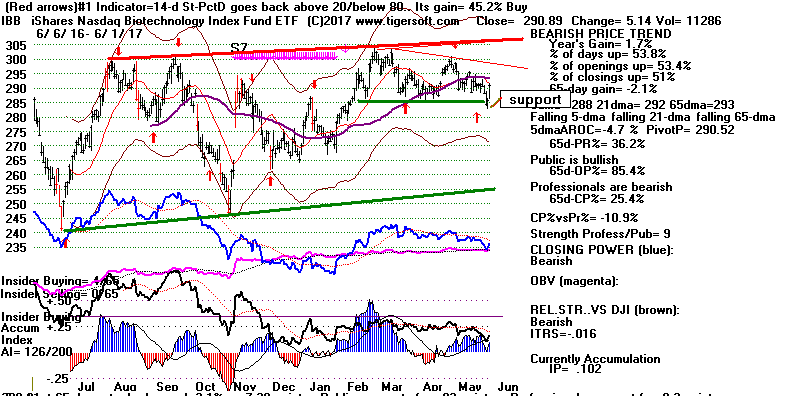
The flat top chart pattern of the DJI is clearly bullish and beckons for a
breakout.
Professional traders know this and many were buying today because they believed
a good Jobs report tomorrow would finally allow a breakout.
A third element in today's surge (There were almost 5x
more advancers than decliners.)
were hopes among Biotech stock holders that Congress will soon be in recess and
this
reduce the political "heat" about the high cost of drugs in the US.
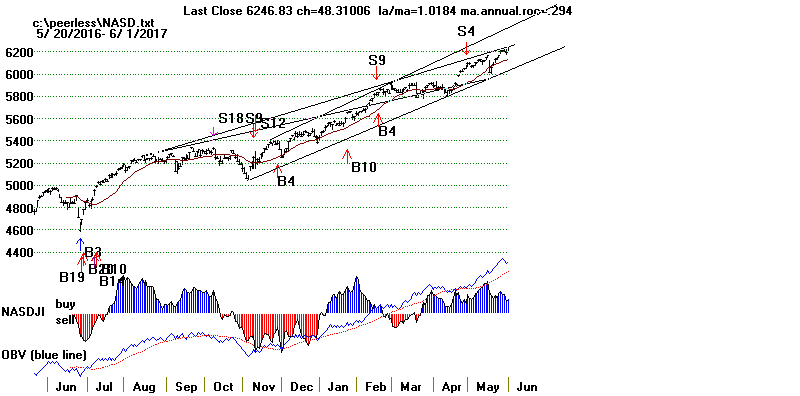
Cover DIA and
FAS if we do get a Buy B10 and buy
SPY and QQQ.. Note
that a big breakout tomorrow on excellent breadth should allow the NASDAQ
to make its own breakout above its rising resistance line and start a dramatic
vertical ascent. This will depend on the advance enveloping
MDY and IWM,
which took good strides in that direction today.
Tomorrow's Jobs Numbers?
My guess is that a Jobs number tomorrow above 200,000 will
bring the Fed
to raise short term rates modestly later this month. That will be
considered
as a sign that the Fed has confidence in the US economy. A number between
145,000 and 195,000 ought to be bullish, too, because it would give pause to
a rate hike.
But less than 140,000 would probably be taken to mean we are
facing
a weakening economy with over-priced stocks.
| |
| Year |
Jan |
Feb |
Mar |
Apr |
May |
Jun |
Jul |
Aug |
Sep |
Oct |
Nov |
Dec |
| 2007 |
240 |
89 |
190 |
80 |
143 |
75 |
-34 |
-20 |
88 |
84 |
114 |
98 |
| 2008 |
17 |
-84 |
-78 |
-210 |
-186 |
-162 |
-213 |
-267 |
-450 |
-474 |
-766 |
-694 |
| 2009 |
-793 |
-702 |
-823 |
-687 |
-349 |
-471 |
-329 |
-213 |
-220 |
-204 |
-2 |
-275 |
| 2010 |
23 |
-68 |
164 |
243 |
524 |
-137 |
-68 |
-36 |
-52 |
262 |
119 |
87 |
| 2011 |
43 |
189 |
225 |
346 |
77 |
225 |
69 |
110 |
248 |
209 |
141 |
209 |
| 2012 |
358 |
237 |
233 |
78 |
115 |
76 |
143 |
177 |
203 |
146 |
132 |
244 |
| 2013 |
211 |
286 |
130 |
197 |
226 |
162 |
122 |
261 |
190 |
212 |
258 |
47 |
| 2014 |
190 |
151 |
272 |
329 |
246 |
304 |
202 |
230 |
280 |
227 |
312 |
255 |
| 2015 |
234 |
238 |
86 |
262 |
344 |
206 |
254 |
157 |
100 |
321 |
272 |
239 |
| 2016 |
126 |
237 |
225 |
153 |
43 |
297 |
291 |
176 |
249 |
124 |
164 |
155 |
| 2017 |
216 |
232 |
50(P) |
174(P)) |
138(P) |
|
|
|
|
|
|
|
| P : preliminary |
|
|
6/1/2017 Index and ETF Charts:
PEERLESS DJI, Signals, Indicators Daily DJI Split Volume 10-Day Up/Down Vol
Hourly DJIA A/D Line for All Stocks.
S&P OEX NYSE NASDAQ COMPQX with CP
DIA SPY QQQ MDY IWM-TNA
Short Term Interest Rates DJI-Utilities DJI-Transp
CrudeOil FAS GLD BBH IBB JETS JNUG KOL NUGT OIH OIL
RSX RETL SLV SOXL TECL TMF TNA XIV YINN
To STOCKS' CHARTS
AAPL ADBE
ALXN
AMAT AMGN AMZN BA BIDU CAT FB GOOG GS
HD
IBM JPM MASI MSFT NVDA QCOM TSLA
TXN
Others REN, JJC, NIB, WEAT UUP (Dollar)
6/1/17 Bullish MAXCPs Bearish MINCPs
           RANKING OF KEY DIRECTORIES BASED PCT.OF STOCKS ABOVE 65-DMA
               6/1/17
---------------------------------------------------------------------------------------
Directory     Current       day-1         day-2         day-3         day-4         day-5
----------------------------------------------------------------------------------------
EDU            1             1             1             1             1             1
BONDFUND       .964          .964          .973          .973          .964          .964
NIFTY          .931          .965          .862          .862          .896          .896
BEVERAGE       .9            .8            .8            .85           .85           .85
JETS           .888          .666          .555          .666          .777          .555
ETFS           .867          .852          .867          .882          .882          .882
SEMI           .827          .784          .784          .784          .775          .758
UTILITY        .777          .733          .733          .711          .755          .644
SOLAR          .736          .736          .789          .789          .789          .789
GAMING         .733          .7            .7            .7            .7            .7
ELECTRON       .721          .68           .685          .67           .659          .659
MORNSTAR       .718          .651          .647          .663          .663          .642
SOFTWARE       .718          .687          .703          .718          .734          .718
CHINA          .709          .693          .709          .709          .725          .629
DJI-13         .692          .692          .692          .692          .692          .692
NASD-100       .677          .634          .612          .623          .666          .612
INSURANC       .676          .558          .5            .558          .588          .529
N=17
---------------------------------------------------------------------------------------------
HACKERS        .666          .666          .666          .666          .722          .722
MILITARY       .644          .666          .6            .622          .622          .555
INDEXES        .637          .581          .568          .594          .59           .59
SP500          .614          .558          .543          .554          .562          .535
HOMEBLDG       .611          .611          .611          .666          .777          .777
COMPUTER       .6            .56           .56           .52           .56           .48
TRANSP         .6            .4            .45           .45           .5            .4
RUS-1000       .592          .532          .519          .535          .546          .53
GREEN          .58           .58           .612          .645          .612          .58
SP-100         .577          .536          .536          .536          .525          .515
DOWJONES       .566          .533          .533          .533          .533          .566
INFRA          .545          .545          .545          .545          .545          .545
REIT           .533          .466          .45           .487          .528          .538
CHEM           .513          .43           .444          .444          .444          .444
N=14
---------------------------------------------------------------------------------------------
BIOTECH        .46           .409          .409          .448          .48           .503
AUTO           .45           .375          .375          .375          .4            .4
INDMATER       .428          .408          .418          .428          .428          .428
RETAIL         .403          .333          .333          .315          .298          .228
FINANCE        .402          .326          .326          .402          .413          .38
GOLD           .339          .396          .433          .509          .433          .471
COAL           .333          .222          .222          .333          .333          .444
FOOD           .333          .333          .266          .2            .133          .133
PIPELINE       .333          .111          .222          .333          .333          .333
REGBANKS       .305          .194          .166          .277          .25           .25
COMODITY       .267          .295          .253          .338          .267          .394
OILGAS         .265          .24           .259          .297          .259          .322
N=12
---------------------------------------------------------------------------------------------
BIGBANKS       .142          .142          .142          .142          .142          .142
HOSPITAL       .142          0             .142          .285          .428          .285
N=2
====================================================================================
5/31/17
Today the DJI stubbornly refused to sell off and break
even its 21-day ma
support despite ugly Head/Shoulder patterns in the Big
Banks, despite the
rising short interest rates and despite the latest poll purportedly showing more
than 40% favor the impeachment of Trump.
The DJI remains caught between its resistance at 21200 and
its support
at 20800. Similarly, the Peerless technicals are divided. The
NYSE A/D
Line is uptrending much more so than the DJI. This and the flat resistance
at 21200 would seem to call for a DJI breakout Buy B10. But down-day
volume keeps rising on declines (as it did today and the day before) and
our Peerless V-I remains very negative. This means that any DJI breakout
B10 will quickly be met with a Sell S9-V when the DJI closes 2.3% over the
21-day ma.
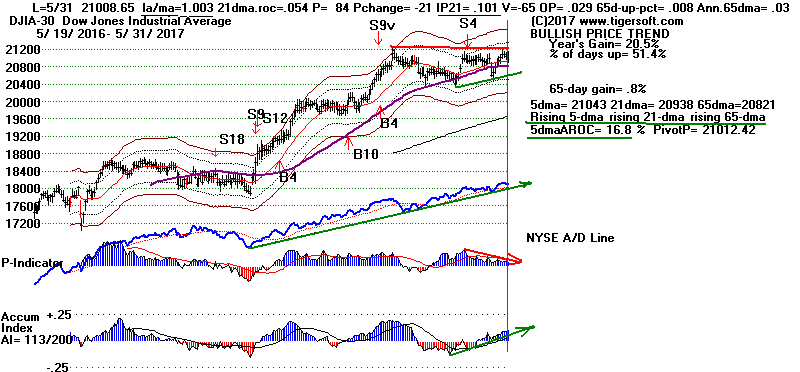


The operative Peerless
Sell
S4 still warns us still to respect June's
bearish seasonality and the bearishness seen in the Big Banks'
head/shoulders patterns.
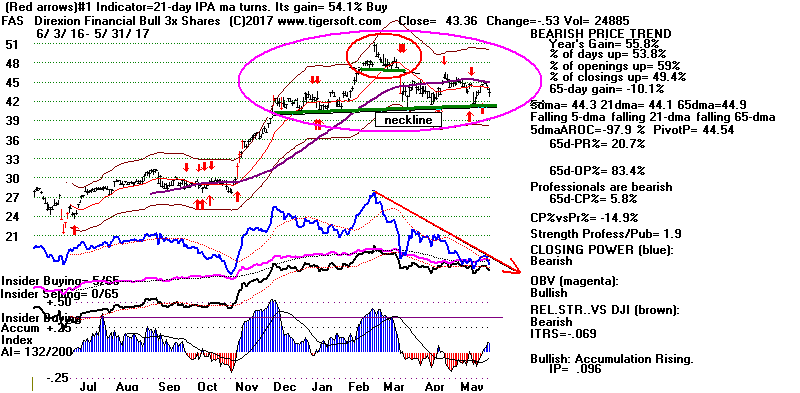
Stay hedged. Stay short DIA, RETL and some of many bearish MINCPs but
stay long SOXL and TECL.
Traders should go short FAS (representing Big Banks).
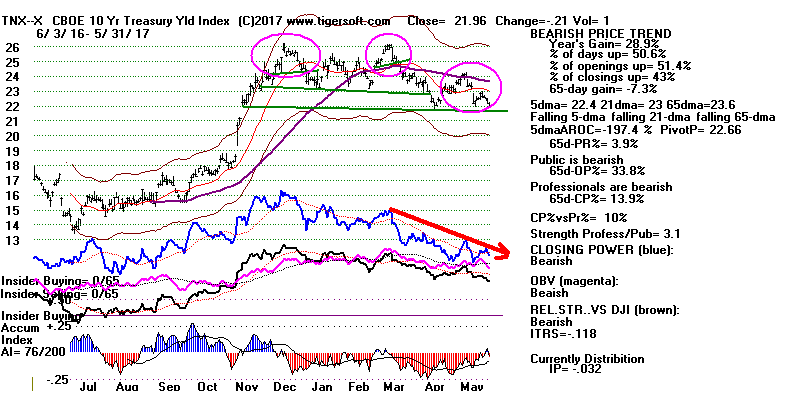
I suspect their weakness is mostly caused by the view that the Fed will soon
raise rates. See the Short-Term Rate chart below and what that is doing to
10-year Bonds.

5/31/2017 Index and ETF Charts:
PEERLESS DJI, Signals, Indicators Daily DJI Split Volume 10-Day Up/Down Vol
Hourly DJIA A/D Line for All Stocks.
S&P OEX NYSE NASDAQ COMPQX with CP
DIA SPY QQQ MDY IWM-TNA
Short Term Interest Rates DJI-Utilities DJI-Transp
CrudeOil FAS GLD BBH IBB JETS JNUG KOL NUGT OIH OIL
RSX RETL SLV SOXL TECL TMF TNA XIV YINN
To STOCKS' CHARTS
AAPL ADBE
ALXN
AMAT AMGN AMZN BA BIDU CAT FB GOOG GS
HD
IBM JPM MASI MSFT NVDA QCOM TSLA
TXN
Others REN, JJC, NIB, WEAT UUP (Dollar)
5/31/17 Bullish MAXCPs Bearish MINCPs
 RANKING OF KEY DIRECTORIES BASED PCT.OF STOCKS ABOVE 65-DMA
               5/31/17
---------------------------------------------------------------------------------------
Directory     Current       day-1         day-2         day-3         day-4         day-5
----------------------------------------------------------------------------------------
EDU            1             1             1             1             1             1
NIFTY          .965          .862          .862          .896          .896          .896
BONDFUND       .964          .973          .973          .964          .964          .955
ETFS           .852          .867          .882          .882          .882          .867
BEVERAGE       .8            .8            .85           .85           .85           .85
SEMI           .784          .784          .784          .775          .767          .732
SOLAR          .736          .789          .789          .789          .789          .736
UTILITY        .733          .733          .711          .755          .644          .622
GAMING         .7            .7            .7            .7            .7            .7
CHINA          .693          .709          .709          .725          .629          .629
DJI-13         .692          .692          .692          .692          .692          .692
SOFTWARE       .687          .703          .718          .734          .718          .687
ELECTRON       .68           .685          .675          .659          .664          .644
N=13
=============================================================================================
HACKERS        .666          .666          .666          .722          .722          .722
JETS           .666          .555          .666          .777          .555          .555
MILITARY       .666          .6            .622          .622          .555          .511
MORNSTAR       .651          .647          .663          .663          .638          .63
NASD-100       .634          .612          .623          .666          .612          .591
HOMEBLDG       .611          .611          .666          .777          .777          .722
INDEXES        .581          .568          .594          .59           .59           .556
GREEN          .58           .612          .645          .612          .58           .58
COMPUTER       .56           .56           .52           .56           .48           .48
INSURANC       .558          .5            .558          .588          .529          .47
SP500          .558          .543          .554          .562          .533          .527
INFRA          .545          .545          .545          .545          .545          .727
SP-100         .536          .536          .536          .525          .515          .463
DOWJONES       .533          .533          .533          .533          .566          .533
RUS-1000       .53           .518          .535          .546          .529          .517
N=15
==============================================================================================
==============================================================================================
REIT           .466          .45           .487          .528          .538          .512
CHEM           .43           .444          .444          .444          .444          .486
BIOTECH        .413          .409          .44           .484          .511          .515
INDMATER       .408          .418          .428          .428          .428          .459
TRANSP         .4            .45           .45           .5            .4            .4
GOLD           .396          .433          .528          .433          .452          .396
AUTO           .375          .375          .375          .4            .4            .375
FOOD           .333          .266          .2            .133          .133          .333
RETAIL         .333          .333          .315          .298          .228          .263
N=9
=============================================================================================
FINANCE        .326          .326          .402          .413          .38           .38
COMODITY       .295          .253          .338          .267          .394          .436
OILGAS         .24           .259          .297          .259          .303          .341
COAL           .222          .222          .333          .333          .444          .444
REGBANKS       .194          .166          .277          .25           .25           .222
BIGBANKS       .142          .142          .142          .142          .142          .142
PIPELINE       .111          .222          .333          .333          .333          .333
HOSPITAL       0             .142          .285          .428          .285          .285
N=8
====================================================================================
5/30/17
Sell
Short Some of the many Bearish MINCPs.
Watch the Big
Banks, they may about to fall through a "trap-door".
But hold long
SOXL and NVDA.
They rose today despite the DJI's 50-point loss.
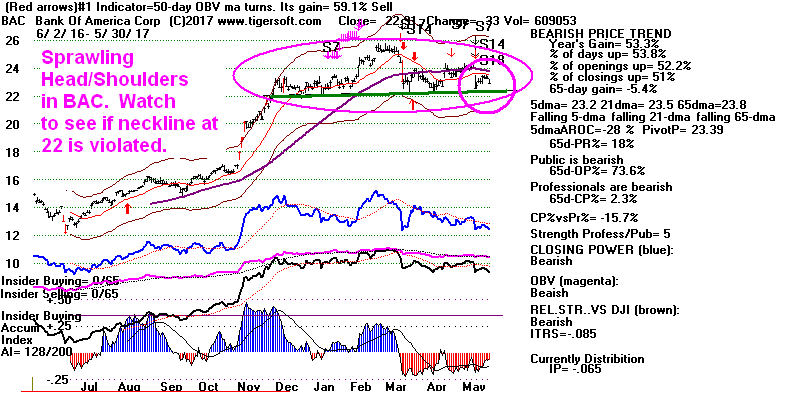
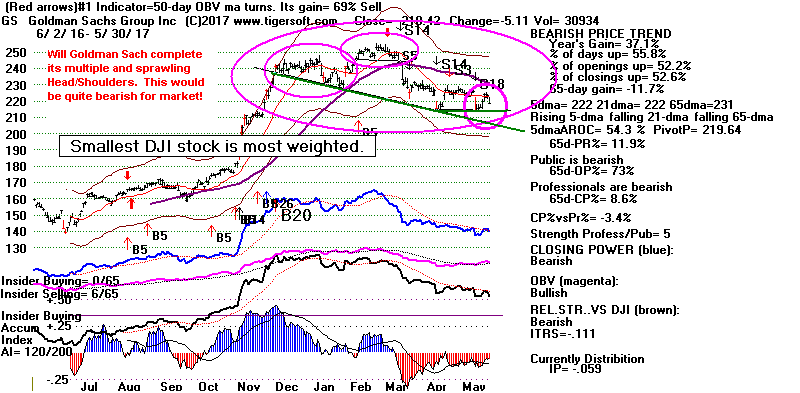
But Stick With The Most Bullish
Stocks and ETFS,
I love the way Semi-Conductors and
NVDA keeps rising. Robots,
and artificial intelligence look as inevitable now as computers did in the
1980s.
As chips get smaller and smaller, more and more programming can
be imbedded in them. And this is not static programming. It uses
artificial intelligence and the chips gets smarter. This is a powerful trend and
we want to play it as long as we safely can. We should probably hold
these
investment vehicles quite tightly, at least, until we see a major top forming
in the DJI or at least until we see a lot more weakness in the
NYSE A/D Line.
The latter is a very stubborn uptrend, despite the fact that a Fed Rate hike
looks like a good possibility next month..
By itself, the current Peerless
Sell
S4 is not very bearish. The
DJI's Accum. Index
is in a rising trend now. Probably on a 5% decline in the DJI from here is all
that
should be expected based on the "isolated" S4's history. Recall also from
last night
that a limited June decline is typically followed by a July recovery when a
Republican
is President in the year after the Election.
The Banks Look Bearish.
That is not a good sign for the general market.
Look at JPM's head/shoulders top below. Head/Shoulders patterns appeared
in JPM before each of the DJI's biggest declines since 1987:
See 1987,
1990,
1998,
2000,
2007,
2008
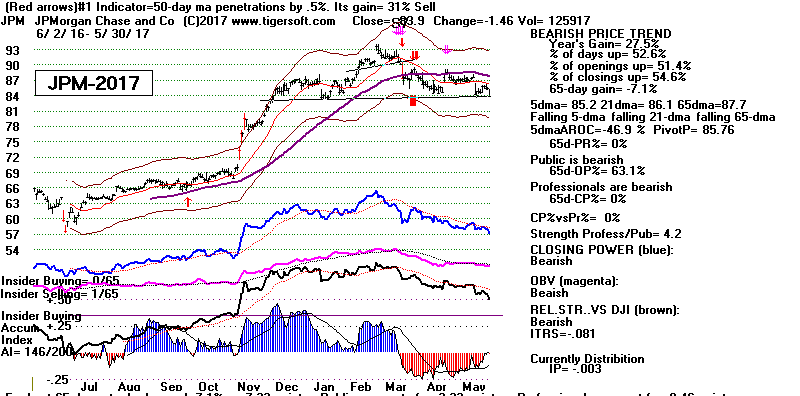
History shows that the the DJI does not go very far in one direction or the
other without the big banks like BAC and JPM going in the same direction.
We also only have to think back to 2008, when the Big Banks led the market
down into its deepest decline since the early 1930s.
I have to mention another bearish aspect of the market now. This is one
that we can exploit and profit from. See how many Retail stocks, Oil
stocks
and now big Biotechs show bearish trends and internal strength indicators.
They offer us near perfect, classic short sales using Tiger's Killer Short Sale
approaches.
http://www.tigersoft.com/--5--/
See also
http://www.tigersoft.com/Intro/The-Boggest-Decliners/Whats-down.htm
The fact is that there are an unusually small number of individual stocks among
our
Bullish MAXCPs. There are many more individual stocks among our Bearish
MINCPs.
Will this be a warning of a big decline? At the very least, it is an
invitation that we
should not ignore to play some very bearish trends on the short side
The Divide between the Strongest and
Weakest Stocks keeps widening.
Is this a metaphor of the how fast technological change is
now occurring
and how this is creating a whole new universe of corporate winners and
losers.
The same split is widening between the richest and all the rest of us, not just
in America.
What I worry about is that 1929 will repeat. By this I mean that consumers
will
be unable to keep on buying all that is produced by the companies whose
stocks we trade. Call it "over-production" or "under-consumption". by the
middle of 1929, GNP actually started to turn down. Our rate of Growth
now is not so great that this could not happen again, especially if the FED
tightens too much.
Fortunately, the stock market's technicals now look nothing like they did in
1929,
when the NYSE A/D Line was falling for 7 months before the August 2nd peak,
when the Tiger Accumulation Index had been mostly red for many months
and when millions of small investors had turned to the stock market.
5/30/2017 Index and ETF Charts:
PEERLESS DJI, Signals, Indicators Daily DJI Split Volume 10-Day Up/Down Vol
Hourly DJIA A/D Line for All Stocks.
S&P OEX NYSE NASDAQ COMPQX with CP
DIA SPY QQQ MDY IWM-TNA
Short Term Interest Rates DJI-Utilities DJI-Transp
CrudeOil FAS GLD BBH IBB JETS JNUG KOL NUGT OIH OIL
RSX RETL SLV SOXL TECL TMF TNA XIV YINN
To STOCKS' CHARTS
AAPL ADBE
ALXN
AMAT AMGN AMZN BA BIDU CAT FB GOOG GS
HD
IBM JPM MASI MSFT NVDA QCOM TSLA
TXN
Others REN, JJC, NIB, WEAT UUP (Dollar)
5/30/17 Bullish MAXCPs Bearish MINCPs incl Retailers and
TrapDoors
 RANKING OF KEY DIRECTORIES BASED PCT.OF STOCKS ABOVE 65-DMA
               5/30/17
---------------------------------------------------------------------------------------
Directory     Current       day-1         day-2         day-3         day-4         day-5
----------------------------------------------------------------------------------------
EDU            1             1             1             1             1             1
BONDFUND       .973          .973          .964          .964          .955          .946
ETFS           .867          .882          .882          .882          .867          .852
NIFTY          .862          .862          .896          .896          .896          .827
BEVERAGE       .8            .85           .85           .85           .85           .85
SOLAR          .789          .789          .789          .789          .736          .684
SEMI           .784          .784          .775          .767          .732          .732
UTILITY        .733          .711          .755          .644          .622          .577
CHINA          .709          .709          .725          .629          .629          .645
SOFTWARE       .703          .718          .734          .718          .687          .671
GAMING         .7            .7            .7            .7            .7            .733
DJI-13         .692          .692          .692          .692          .692          .692
ELECTRON       .685          .675          .664          .664          .644          .639
N=13
============================================================================================
HACKERS        .666          .666          .722          .722          .722          .666
MORNSTAR       .647          .663          .663          .638          .63           .638
GREEN          .612          .645          .612          .58           .58           .58
HOMEBLDG       .611          .666          .777          .777          .722          .833
NASD-100       .604          .615          .659          .604          .582          .593
MILITARY       .6            .622          .622          .555          .511          .488
INDEXES        .568          .594          .59           .59           .56           .573
COMPUTER       .56           .52           .56           .48           .48           .48
JETS           .555          .666          .777          .555          .555          .555
INFRA          .545          .545          .545          .545          .727          .636
SP500          .543          .554          .562          .533          .527          .52
SP-100         .536          .536          .525          .515          .463          .474
DOWJONES       .533          .533          .533          .566          .533          .533
RUS-1000       .518          .535          .546          .529          .517          .511
N=14
============================================================================================
INSURANC       .5            .558          .588          .529          .47           .411
REIT           .45           .487          .528          .538          .507          .492
TRANSP         .45           .45           .5            .4            .4            .35
CHEM           .444          .444          .444          .444          .486          .43
GOLD           .433          .528          .452          .452          .396          .603
INDMATER       .418          .428          .428          .428          .459          .418
BIOTECH        .414          .447          .483          .516          .528          .5
AUTO           .375          .375          .4            .4            .375          .375
N=8
===========================================================================================
RETAIL         .333          .315          .298          .228          .263          .28
FINANCE        .326          .402          .413          .38           .38           .315
FOOD           .266          .2            .133          .133          .333          .4
OILGAS         .259          .297          .259          .303          .329          .354
COMODITY       .242          .328          .257          .385          .414          .485
COAL           .222          .333          .333          .444          .444          .333
PIPELINE       .222          .333          .333          .333          .333          .333
REGBANKS       .166          .277          .25           .25           .222          .222
BIGBANKS       .142          .142          .142          .142          .142          .142
HOSPITAL       .142          .285          .428          .285          .285          .285
N=10
====================================================================================
5/26/17
Play
The Strongest Trends Now. The biggest high
techs are the
clear leaders. They are taking a lot of investment capital away from
weaker sections. Thus, low priced stocks, IWM (Russell-2000)
and MDY (mid-caps) are not yet participating in the bullish trends
shown by the biggest high techs. Watch
tomorrow to see if TECL
can get past its last apparent resistance, the top of its price channel.
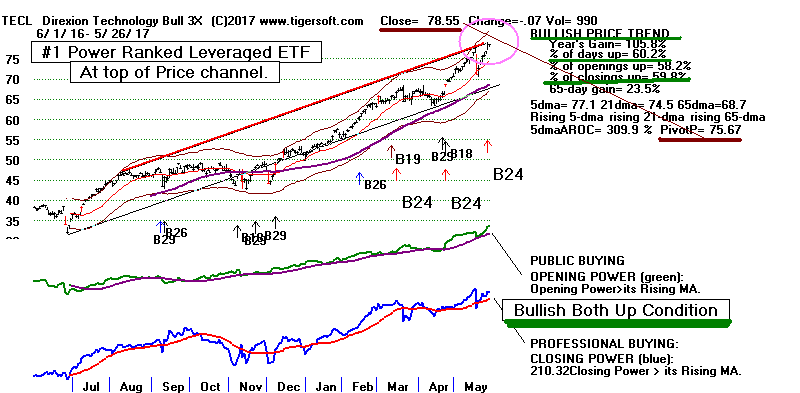
The DJI, itself, is at a high inflection point. The
bullish seasonality before
Memorial Day could not take the DJI to new highs, though it has done
that for SPY, QQQ,
TECL and SOXL. Stick with the trends for now.
I would remain long SOXL and NVDA but short
RETL and some
of the most bearish MINCPs. Using Peerless we remain short
DIA
so long as it does not produce a close above 21161.
If the DJI turns down here next week, out of respect for the active Sell
S4,
the SPY, QQQ, TECL and SOXL will probably pull back, too. But perhaps
not much. In addition, flat tops in the DJI usually bring breakouts, so at
this
point I would stay with the bullish trends of QQQ, TECL and SOXL. See
below from their ITRS readings how much stronger they are over the last
50 trading days than the DJI is. Each of these ETFs now show both rising
Opening and Closing Powers. In this "Both-Up" condition, it is usually
the Closing Power than must turn down and break its uptrend before a
significant decline can occur.
5-dma IP21
ITRS 5/26
5/30 Pivot Point
AROC
Close
---------------------------------------------------------------------------------------------
DIA
+66.2% +.135 ------
210.54 -.04 208.65
SPY +70.8% +.159 +.008
241.71 -.05 239.52
QQQ +121.3%
+.324
+.065 141.22
+.25 139.00
COMPQX +102.9%
+.441
+.047
6210.19 +4.93 6133.62
TECL +309.9%
+.262 +.166
78.55 -.07 75.67
SOXL +336.2%
+.272 +.234
94.99 +1.55 91.68
What Lies Ahead?
June Gloom,
A Patriotic Rally but then
August
Is Awful, much of the time.
Seasonality is now bearish in the first year after a Presidential Election.
Our software reports that the DJI rallies only 36% of the time over
the next two weeks in the first years after a Presidential Election since
1965.
This bearish seasonality report is also supported from the data for when
a Republican was President, as now, in the first year after the Presidential
Election. Since 1915, there have been 12 cases to study. June
produces
a decline in these years 75% of the time. But July rallies 75% of the
time.
August then turns bearish 75% of the time.
DJI DJI at end DJI
at end DJI at end
of June of July
of August
-------------------------------------------------------------------------------------------------
Harding 5/29/1921
74.80
68.50
68.40
67.10
then up a lot.
Coolidge 5/29/1925 129.90
131.00
133.80
141.20
then up a lot.
Hoover 5/29/1929
297.4
331.70 347.70
380.3 then
the
Crash!
Eisenhower 5/29/1953 272.3
268.3
275.4
261.2 then
up a lot.
Eisenhower 5/29/1957 504.9
503.3
508.5
484.4 then down 3 mo.
Nixon
5/29/1969 937.56
873.19
815.47 836.72 802.2 in 1 mo.
Nixon
5/29/1973 908.87
891.71
925.4
890.95
rally, then
crash.
Reagan 5/29/1981
991.75
976.88
952.34 881.47 down 1 more mo.
Reagan 5/29/1985
1315
1335
1347
1334
soon up a lot
Bush-Sr 5/29/1989
2480
2440
2661
2737
8% correction.
Bush-Jr 5/29/2001
10912
10502
10523
9950 3 wks=8376
Bush-Jr 5/29/2005
10467
10275
10641
10482
2 wks=10217
----------------------------------------------------------------------------------------------------------------
3 up
9 up 3-up
5 up
9 down 3 down
9-down 7 down
5/26/2017 Index and ETF Charts:
PEERLESS DJI, Signals, Indicators Daily DJI Split Volume 10-Day Up/Down Vol
Hourly DJIA A/D Line for All Stocks.
S&P OEX NYSE NASDAQ COMPQX with CP
DIA SPY QQQ MDY IWM-TNA
Short Term Interest Rates DJI-Utilities DJI-Transp
CrudeOil FAS GLD BBH IBB JETS JNUG KOL NUGT OIH OIL
RSX RETL SLV SOXL TECL TMF TNA XIV YINN
To STOCKS' CHARTS
AAPL ADBE
ALXN
AMAT AMGN AMZN BA BIDU CAT FB GOOG GS
HD
IBM JPM MASI MSFT NVDA QCOM TSLA
TXN
Others REN, JJC, NIB, WEAT UUP (Dollar)
5/26/17 Bullish MAXCPs Bearish MINCPs incl Retailers and
TrapDoors
 RANKING OF KEY DIRECTORIES BASED PCT.OF STOCKS ABOVE 65-DMA
              5/26/17
---------------------------------------------------------------------------------------
Directory     Current       day-1         day-2         day-3         day-4         day-5
----------------------------------------------------------------------------------------
EDU            1             1             1             1             1             1
BONDFUND       .973          .964          .964          .955          .946          .91
ETFS           .882          .882          .882          .867          .867          .867
NIFTY          .862          .896          .896          .896          .827          .827
BEVERAGE       .85           .85           .85           .85           .85           .85
SOLAR          .789          .789          .789          .736          .684          .684
SEMI           .784          .775          .767          .732          .732          .698
SOFTWARE       .718          .734          .718          .687          .671          .703
GAMING         .714          .714          .714          .714          .75           .678
UTILITY        .711          .755          .644          .622          .577          .488
CHINA          .709          .725          .629          .629          .645          .645
DJI-13         .692          .692          .692          .692          .692          .615
HACKERS        .687          .75           .75           .75           .687          .687
ELECTRON       .675          .664          .67           .644          .639          .587
               N=14
--------------------------------------------------------------------------------------------
HOMEBLDG       .666          .777          .777          .722          .833          .833
JETS           .666          .777          .555          .555          .555          .666
MORNSTAR       .663          .663          .638          .63           .638          .592
GREEN          .645          .612          .58           .58           .58           .58
MILITARY       .622          .622          .555          .511          .488          .488
NASD-100       .615          .659          .604          .582          .593          .582
INDEXES        .59           .59           .59           .56           .577          .525
INSURANC       .558          .588          .529          .47           .441          .382
SP500          .554          .562          .533          .527          .52           .483
INFRA          .545          .545          .545          .727          .636          .636
SP-100         .536          .525          .515          .463          .474          .422
RUS-1000       .535          .546          .529          .517          .512          .48
DOWJONES       .533          .533          .566          .533          .533          .433
COMPUTER       .52           .56           .48           .48           .48           .48
GOLD           .52           .44           .46           .4            .58           .52
               N=15
-------------------------------------------------------------------------------------------
REIT           .487          .528          .538          .507          .481          .476
TRANSP         .45           .5            .4            .4            .35           .35
BIOTECH        .448          .485          .518          .53           .497          .489
CHEM           .444          .444          .444          .486          .416          .416
INDMATER       .428          .428          .428          .459          .428          .418
FINANCE        .402          .413          .38           .38           .315          .315
AUTO           .375          .4            .4            .375          .4            .35
COMODITY       .338          .267          .394          .422          .478          .338
               N=8
-------------------------------------------------------------------------------------------
COAL           .333          .333          .444          .444          .333          .333
PIPELINE       .333          .333          .333          .333          .333          .222
RETAIL         .315          .298          .228          .263          .28           .28
OILGAS         .297          .259          .303          .329          .354          .354
HOSPITAL       .285          .428          .285          .285          .285          .285
REGBANKS       .277          .25           .25           .222          .222          .111
FOOD           .214          .142          .142          .357          .428          .214
BIGBANKS       .142          .142          .142          .142          .142          .142
               N=8
====================================================================================
5/25/17
Expect A DJI Breakout.
"Flat tops beckon for breakouts."
But Mays have not brought successful DJI flat-topped breakouts.
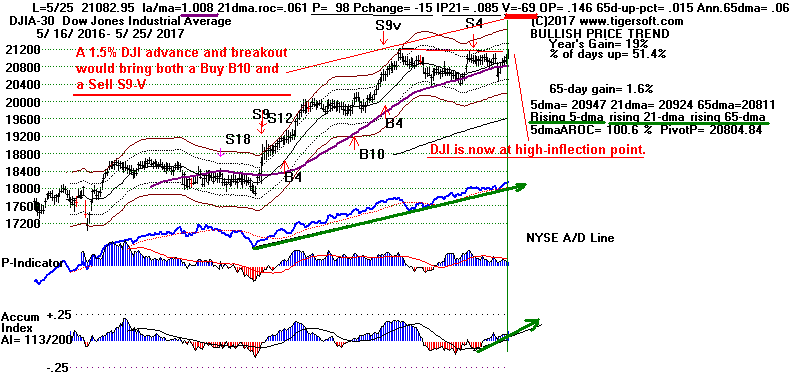
A close now above 21161 will bring a Peerless Buy B10.
But it could also bring
a Sell S9-V if the DJI reaches the 2.3% upper band. It is now at a high
inflection-
point. Tomorrow normally is a low volume trading day. But this also
allows
clever manipulators to become active.
A bigger question: Does the DJI matter so much
anymore? Look at the
NASDAQ below.
Have the Megasharks high techs taken over from blue chips?
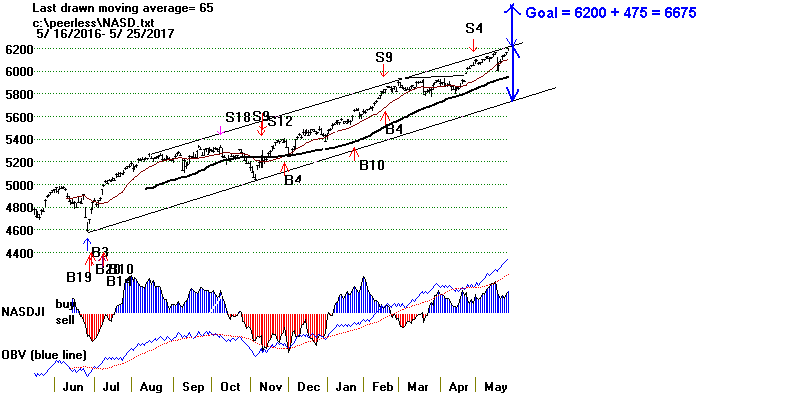
The NASDAQ is back up to the top
of its rising
channel and threatening a vertical
ascent take-off. In theory, such a
breakout could
produce a swift advance from here
that matches the height of its year-long price
channel.
It does seems ready for
another 575 point advance. All it must do is remain strong
for another
few days.
The overall breadth was only slightly positive. But that did not stop the
biggest
high techs, proving once again that this is a "megashark" high tech driven
bull market
dominated by the likes of AAPL,
ADBE, AMZN,
MSFT, FB and
GOOG, we see new
highs were made by SPY, QQQ,
SOXL and TECL. As long as their Closing
Powers are
rising, we can know that this where Professionals are still placing new money.
This is definitely not a bull market that lifts all
boats. Again the trap-door opened.
There were ten of these steep decliners today Retailers SIG (8%) and
GCO (-22%).
showed all the tell-tale signs before hand. Hedging with Bearish MINCPs
continues
to be profitable here.
Usually, if a valid breakout was about to occur,
more Professional
shorts would start to cover their positions.
Oil stocks certainly are not going to lead a charge upwards anytime soon.
Crude broke down badly from its falling 65-dma today. In their place, were
defensive Bonds and Utilities. Hardly a speculative bull market - this.
Nor did the Big Banks rally further today. Their H/S patterns may still
bearishly
play out. So all in all, I think we are still going to see a DJI breakout,
but I think
it will turn back down if the DJI tags the upper 3% band. The V-I remains
quite
negative.
The best thing about the market today was how SPY's
marginal new high was
made above a perfectly flat top. But might SPY repeat what followed a
similar
May breakout back in 1996. Compare the charts.
SPY - 2017
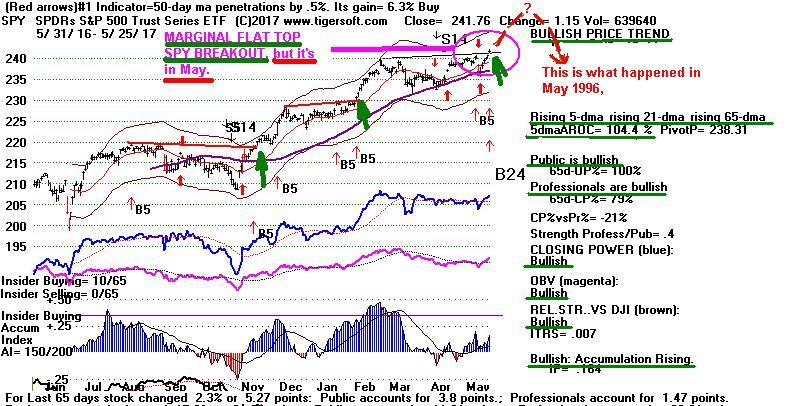
SPY'S FAILED BREAKOUT IN MAY 1996.
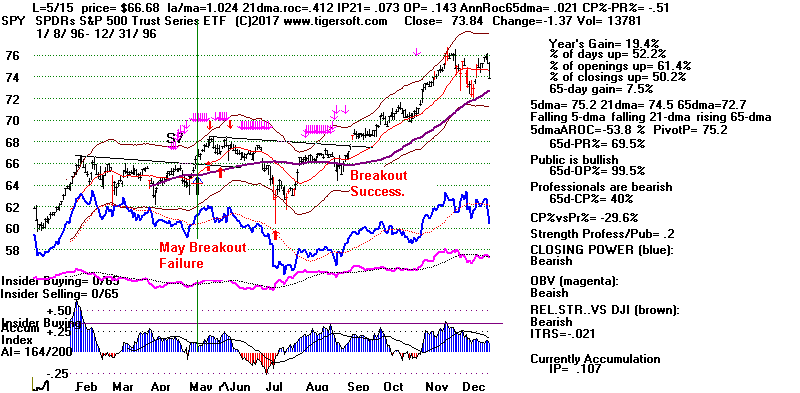 SPY - 2016
5/25/2017 Index and ETF Charts:
PEERLESS DJI, Signals, Indicators Daily DJI Split Volume 10-Day Up/Down Vol
Hourly DJIA A/D Line for All Stocks.
S&P OEX NYSE NASDAQ COMPQX with CP
DIA SPY QQQ MDY IWM-TNA
Short Term Interest Rates DJI-Utilities DJI-Transp
CrudeOil FAS GLD BBH IBB JETS JNUG KOL NUGT OIH OIL
RSX RETL SLV SOXL TECL TMF TNA XIV YINN
To STOCKS' CHARTS
AAPL ADBE
ALXN
AMAT AMGN AMZN BA BIDU CAT FB GOOG GS
HD
IBM JPM MASI MSFT NVDA QCOM TSLA
TXN
Others REN, JJC, NIB, WEAT UUP (Dollar)
5/25/17 Bullish MAXCPs
Bearish MINCPs incl Retailers and
TrapDoors
 RANKING OF KEY DIRECTORIES BASED PCT.OF STOCKS ABOVE 65-DMA
               5/25/17
---------------------------------------------------------------------------------------
Directory     Current       day-1         day-2         day-3         day-4         day-5
----------------------------------------------------------------------------------------
EDU            1             1             1             1             1             1
BONDFUND       .964          .964          .955          .946          .919          .901
NIFTY          .896          .896          .896          .827          .827          .793
ETFS           .882          .882          .867          .867          .867          .852
BEVERAGE       .85           .85           .85           .85           .85           .85
SOLAR          .789          .789          .736          .684          .684          .578
HOMEBLDG       .777          .777          .722          .833          .833          .777
JETS           .777          .555          .555          .555          .666          .666
SEMI           .775          .767          .732          .732          .698          .646
UTILITY        .755          .644          .622          .577          .511          .488
SOFTWARE       .734          .718          .687          .671          .703          .656
CHINA          .725          .629          .629          .645          .629          .564
HACKERS        .722          .722          .722          .666          .666          .666
GAMING         .7            .7            .7            .733          .666          .733
DJI-13         .692          .692          .692          .692          .615          .538
N=15
NASD-100       .666          .612          .591          .602          .591          .537
ELECTRON       .664          .67           .649          .639          .582          .561
MORNSTAR       .663          .638          .63           .638          .588          .483
MILITARY       .622          .555          .511          .488          .488          .444
GREEN          .612          .58           .58           .58           .58           .483
INDEXES        .59           .59           .56           .577          .525          .474
INSURANC       .588          .529          .47           .441          .382          .441
SP500          .562          .533          .527          .52           .481          .431
COMPUTER       .56           .48           .48           .48           .48           .48
RUS-1000       .546          .529          .517          .512          .48           .431
INFRA          .545          .545          .727          .636          .636          .545
DOWJONES       .533          .566          .533          .533          .433          .4
REIT           .528          .538          .507          .481          .466          .43
SP-100         .525          .515          .463          .474          .422          .36
N=14
===========================================================================================
TRANSP         .5            .4            .4            .35           .35           .35
BIOTECH        .48           .507          .519          .496          .48           .476
GOLD           .452          .471          .415          .566          .471          .377
CHEM           .444          .444          .486          .416          .416          .375
HOSPITAL       .428          .285          .285          .285          .285          .142
INDMATER       .428          .428          .459          .428          .397          .285
FINANCE        .413          .38           .38           .315          .315          .282
AUTO           .4            .4            .375          .4            .35           .325
N=7
COAL           .333          .444          .444          .333          .333          .111
PIPELINE       .333          .333          .333          .333          .222          .111
RETAIL         .298          .228          .263          .28           .263          .21
COMODITY       .267          .394          .422          .478          .323          .295
OILGAS         .259          .303          .329          .354          .329          .234
REGBANKS       .25           .25           .222          .222          .111          .083
BIGBANKS       .142          .142          .142          .142          .142          .142
FOOD           .142          .142          .357          .428          .214          .214
N=8
====================================================================================
5/24/17
Expect A DJI Breakout.
"Flat tops beckon for breakouts."
But Mays have not brought successful DJI flat-topped breakouts.
A close now above 21161 will bring a Peerless Buy B10.
There are 3 signs we are about to see a DJI breakout.
First. the NYSE A/D
Line made another new high ahead of the
DJI and the SP-500.
This has been one
of the hallmarks on the bull market for the last year. The second, is that
Professionals
have turned bullish on DIA and
SPY. The third is how nearly perfect the current
flat topped pattern is for the DJI and SP-500. It is as precisely formed
as any
such pattern going back to 1915.

Flat-topped patterns where prices hover just below such
a well-defined, perfectly flat
well-tested resistance are not common. They also take months to be
constructed.
These patterns make profit-taking very easy at the well-defined resistance.
But
Professional traders know that when a new high-breakout is finally made, it is
as though
a GREEN-LIGHT turns on for all the investors who have gone to the sidelines in
the market.
That is why Professionals, I believe, are buying stock now. They think
that they can
easily feed out shares to those who will be induced to buy next week or the week
afterwards
by the jump in prices following the breakout.
This is why volume
must rise sharply on any valid breakout. If not, prices will have a hard
time rising given the expected Professional selling into the breakout.
So, watch now
to see if volume picks up, even the move over 21160 takes place just before a
3-day weekend.
What will happen after the Breakout?
Will the breakout succeed in the sense that the DJI will rise steadily for six
weeks
or more and not fall back below the point of breakout?
You can see below that Seasonality is against such a breakout being successful
in the months of May, June and Julys especially when the OBV is lagging
for the DJI, as it is now. See the cases below. Since 1920, there
were only two
successful breakouts and there were six or seven failures at this time of the
year.
See also that some of the key values will need to improve considerably, or there
is apt to be trouble for this breakout.
la/ma AnnR P-I ch
IP21 V-I OBVPct
OBV lagging
May 25, 2017 1.011
.106 110 -3
+.111 -63
.145
low
negative
Successful
Breakouts (2)
la/ma AnnR P-I ch
IP21 V-I OBVPct
June 23-1987 OBV
confirmed 1.036 .997 209
-23 +.134 +21 .414
2mo advance 2439-2722
July
19-1989 OBV confirmed 1.032 .498
98 +30 +.136 +8 .241
10 wk advance 2584-2785
Failed
Flat-Topped Breakouts (7)
May-6-1929
OBV NC
1.045 .888 -14
-7 -.066 -271
.291 Quick failure.
May-1-1951
OBV confirmed 1.028 .663
57 +30 +.192 +15 .453
Quick failure
July-2-1964
OBV confirmed 1.026 .432
94 +20 +.042 +51 .548
Quick failure
July-2 1986
OBV confirmed 1.020 .246
11 +7 +.088 +3 .196
Quick failure
May-20
1993 OBV NC
1.023 .290 11 +19
+.097 +4 .025
DJI went sidewise for 8 wks.
July-20-1998
OBV NC
1.027 .636 157 +15 +.026
+11 .138
Quick failure
July-13-2007
OBV NC
1.026 .374 192
-91 +.005
-15
.090 Quick failure
5/24/2017 Key Charts:
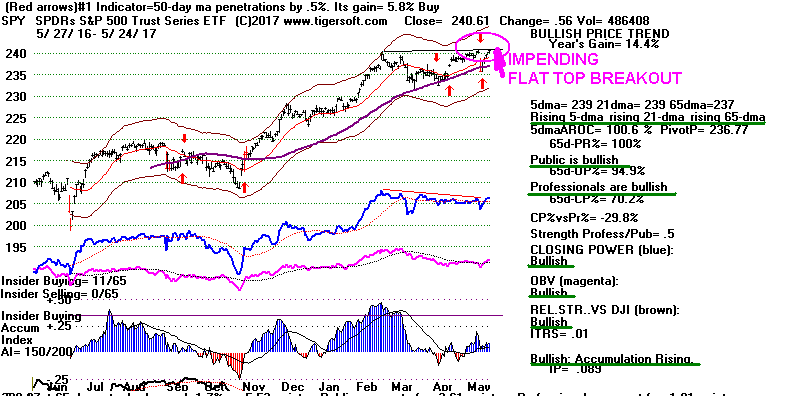
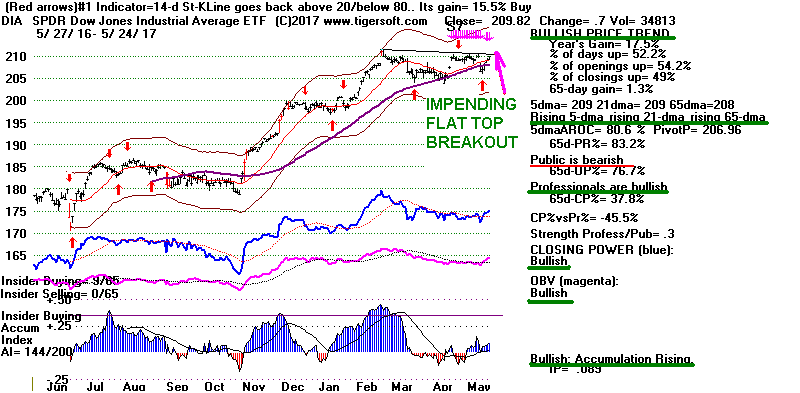

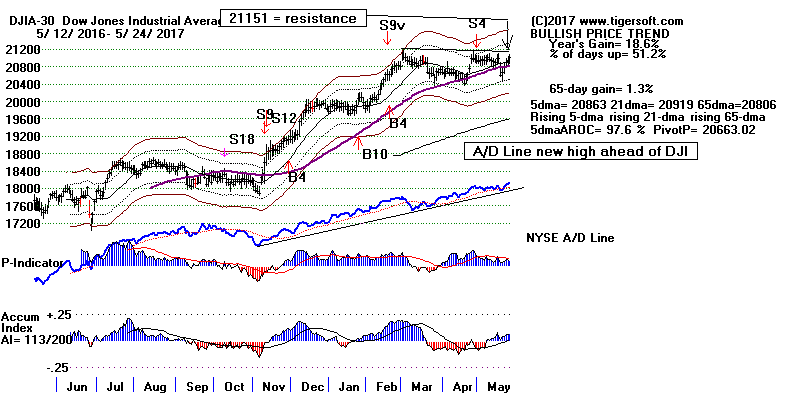
5/24/2017 Index and ETF Charts:
PEERLESS DJI, Signals, Indicators Daily DJI Split Volume 10-Day Up/Down Vol
Hourly DJIA A/D Line for All Stocks.
S&P OEX NYSE NASDAQ COMPQX with CP
DIA SPY QQQ MDY IWM-TNA
Short Term Interest Rates DJI-Utilities DJI-Transp
CrudeOil FAS GLD BBH IBB JETS JNUG KOL NUGT OIH OIL
RSX RETL SLV SOXL TECL TMF TNA XIV YINN
To STOCKS' CHARTS
AAPL ADBE
ALXN
AMAT AMGN AMZN BA BIDU CAT FB GOOG GS
HD
IBM JPM MASI MSFT NVDA QCOM TSLA
TXN
Others REN, JJC, NIB, WEAT UUP (Dollar)
5/24/17 Bullish MAXCPs
Bearish MINCPs incl Retailers and
TrapDoors
 RANKING OF KEY DIRECTORIES BASED PCT.OF STOCKS ABOVE 65-DMA
              5/24/17
---------------------------------------------------------------------------------------
Directory     Current       day-1         day-2         day-3         day-4         day-5
----------------------------------------------------------------------------------------
EDU            1             1             1             1             1             1
BONDFUND       .964          .955          .946          .919          .901          .982
NIFTY          .896          .896          .827          .827          .793          .862
ETFS           .882          .867          .867          .867          .852          .882
BEVERAGE       .85           .85           .85           .85           .85           .85
SOLAR          .789          .736          .684          .684          .578          .526
HOMEBLDG       .777          .722          .833          .833          .777          .666
SEMI           .767          .732          .732          .698          .646          .629
HACKERS        .722          .722          .666          .666          .666          .666
SOFTWARE       .718          .687          .671          .703          .656          .656
GAMING         .7            .7            .733          .666          .733          .766
DJI-13         .692          .692          .692          .615          .538          .538
ELECTRON       .67           .649          .644          .582          .561          .546
N=13
============================================================================================
UTILITY        .644          .622          .577          .511          .488          .4
MORNSTAR       .638          .63           .638          .588          .483          .495
CHINA          .629          .629          .645          .629          .564          .58
NASD-100       .612          .591          .602          .591          .537          .505
INDEXES        .596          .563          .579          .529          .483          .495
GREEN          .58           .58           .58           .58           .548          .516
DOWJONES       .566          .533          .533          .433          .4            .433
JETS           .555          .555          .555          .666          .666          .777
MILITARY       .555          .511          .488          .488          .466          .488
INFRA          .545          .727          .636          .636          .545          .454
REIT           .538          .507          .481          .466          .424          .404
SP500          .533          .527          .52           .481          .435          .41
INSURANC       .529          .47           .441          .382          .441          .352
RUS-1000       .529          .517          .512          .48           .433          .4
SP-100         .515          .463          .474          .422          .36           .36
BIOTECH        .511          .519          .488          .484          .476          .401
N=16
===========================================================================================
COMPUTER       .48           .48           .48           .48           .52           .56
GOLD           .471          .415          .584          .471          .377          .547
CHEM           .444          .486          .416          .416          .388          .416
COAL           .444          .444          .333          .333          .111          .333
INDMATER       .428          .459          .428          .397          .295          .346
AUTO           .4            .375          .4            .35           .325          .25
COMODITY       .4            .428          .485          .328          .285          .285
TRANSP         .4            .4            .35           .35           .35           .35
FINANCE        .38           .38           .315          .315          .282          .293
N=9
===========================================================================================
PIPELINE       .333          .333          .333          .222          .111          .111
OILGAS         .303          .329          .354          .329          .234          .24
HOSPITAL       .285          .285          .285          .285          .142          .142
REGBANKS       .25           .222          .222          .111          .083          .055
RETAIL         .228          .263          .28           .263          .21           .192
BIGBANKS       .142          .142          .142          .142          .142          .142
FOOD           .142          .357          .428          .214          .214          .214
N=7
====================================================================================
5/23/17
Expect A DJI Breakout.
"Flat tops beckon for breakouts."
But Mays have not brought successful DJI flat-topped breakouts.
The Closing Powers for DIA,
SPY and QQQ are rising
now, so a DJI breakout
above 21200 is still in sight on this run. But, as I said last night, the
OBV Lines
are lagging and we are still on a Sell
S4. FAS also
saw its Closing Power downtrend
break today. But the big banks will need much bigger rallies than todays'
to destroy their bearish head and shoulders. See GS,
JPM and FAS.
NYSE Up-day Volume remains not very impressive.
If there is a DJI breakout, it may not
hold up above the point of breakout very long.
I consider it a warning sign that
we keep seeing bunches of trap-door plunges each day. These stocks are
becoming
easier and easier to spot in advance. Often they show ALL the signs of
quickening
distribution. See Autozone (AZO) below. A lot of folks are reluctant
to sell short
individual stocks now. I can understand why they would not want to go
short thinly
traded stocks. But most of our
BEARISH MINCPs traded well over 10,000 shares
today.
The Signs of Quickening Distribution
1) Tiger S9s and S14s (Red big money distribution and then institutional
dumping).
2) Pink S7s showing Bearish Tiger-Closing Power divergences from Price.
3) Head and Shoulders price patterns.
4) Growing Red Distribution from Tiger's Accumulation Index.
4) An impending well-tested support is being approached or has just
been penetrated. The ratio of risk to reward is growing.
Trap-Door High Priced Stocks show Institutional Panic!
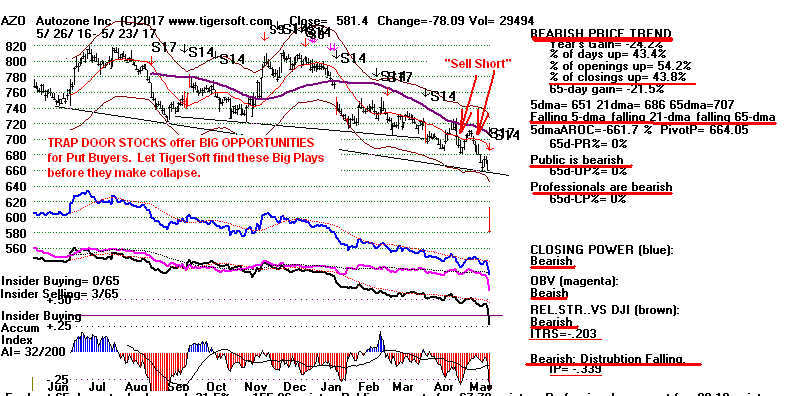
Bearish
Professionals (CP divergence) and
Heavy INSTITUTIONAL Red Distribution in AMAZON!!
Compare AMZN in 2017 with AMZN in the year 2000.
1) Closing Power is lagging - pink Tiger S7s
2) Red Sell S9s.
3) Big Down Volume - Not yet
4) Head/Shoulders top - Not yet
5) Impending major support failure - Not yet
AMZN - 2017
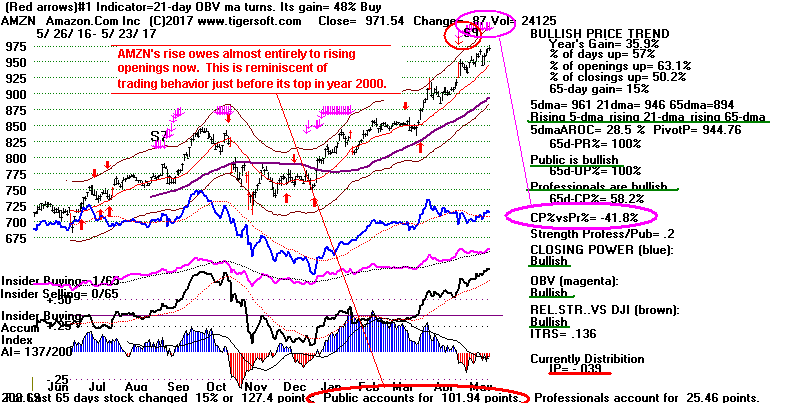

AMZN - 2000
AMZN's top in 2000 showed all the key signs of a major top.
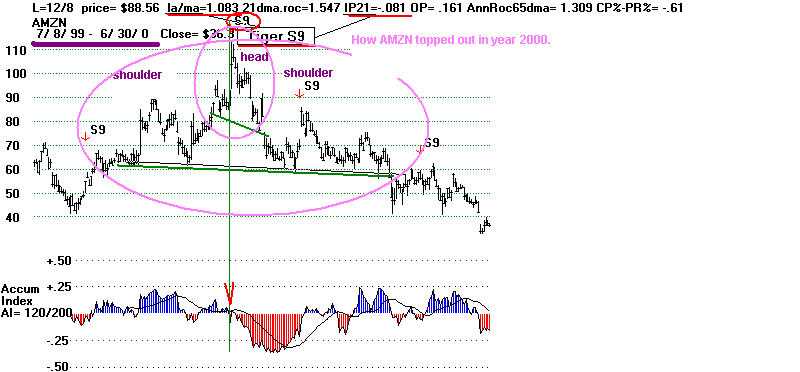


5/23/2017 Index and ETF Charts:
PEERLESS DJI, Signals, Indicators Daily DJI Split Volume 10-Day Up/Down Vol
Hourly DJIA A/D Line for All Stocks.
S&P OEX NYSE NASDAQ COMPQX with CP
DIA SPY QQQ MDY IWM-TNA
Short Term Interest Rates DJI-Utilities DJI-Transp
CrudeOil FAS GLD BBH IBB JETS JNUG KOL NUGT OIH OIL
RSX RETL SLV SOXL TECL TMF TNA XIV YINN
To STOCKS' CHARTS
AAPL ADBE
AMAT AMGN AMZN BA BIDU CAT FB GOOG GS
HD
IBM JPM MASI MSFT NVDA QCOM TSLA
pics/TXN.GIF
Others REN, JJC, NIB, WEAT UUP (Dollar)
5/23/17 Bullish MAXCPs
Bearish MINCPs incl Retailers and
TrapDoors
 RANKING OF KEY DIRECTORIES BASED PCT.OF STOCKS ABOVE 65-DMA
               5/23/17
---------------------------------------------------------------------------------------
Directory     Current       day-1         day-2         day-3         day-4         day-5
----------------------------------------------------------------------------------------
EDU            1             1             1             1             1             1
BONDFUND       .955          .946          .919          .901          .982          .937
NIFTY          .896          .827          .827          .793          .862          .931
ETFS           .867          .867          .867          .852          .882          .941
BEVERAGE       .85           .85           .85           .85           .85           .85
SOLAR          .8            .733          .733          .6            .533          .8
INFRA          .727          .636          .636          .545          .545          .545
HACKERS        .722          .666          .666          .666          .666          .722
HOMEBLDG       .722          .833          .833          .777          .722          .888
SEMI           .72           .72           .684          .63           .612          .765
GAMING         .7            .733          .666          .733          .766          .766
DJI-13         .692          .692          .615          .538          .538          .538
SOFTWARE       .682          .666          .698          .65           .666          .761
N=13
ELECTRON       .649          .644          .587          .561          .546          .711
MORNSTAR       .63           .638          .588          .483          .5            .651
CHINA          .629          .645          .629          .564          .58           .677
UTILITY        .622          .577          .511          .488          .444          .466
NASD-100       .591          .602          .591          .537          .526          .645
GREEN          .58           .58           .58           .548          .516          .612
INDEXES        .563          .579          .529          .483          .495          .6
JETS           .555          .555          .666          .666          .777          .777
DOWJONES       .533          .533          .433          .4            .433          .466
BIOTECH        .526          .493          .481          .477          .4            .538
SP500          .525          .518          .479          .433          .42           .52
RUS-1000       .517          .512          .48           .433          .408          .517
MILITARY       .511          .488          .488          .466          .488          .555
N=13
-------------------------------------------------------------------------------------------
REIT           .497          .47           .454          .41           .378          .383
CHEM           .486          .416          .416          .388          .416          .569
COMPUTER       .48           .48           .48           .52           .56           .64
INSURANC       .47           .441          .382          .441          .382          .47
SP-100         .463          .474          .422          .36           .36           .443
INDMATER       .459          .428          .397          .295          .346          .479
COAL           .444          .333          .333          .111          .333          .444
COMODITY       .428          .485          .328          .285          .285          .285
GOLD           .415          .584          .49           .377          .547          .396
TRANSP         .4            .35           .35           .35           .35           .45
FINANCE        .38           .315          .315          .282          .293          .521
AUTO           .375          .4            .35           .325          .25           .425
FOOD           .357          .428          .214          .214          .214          .285
N=13
-------------------------------------------------------------------------------------------
PIPELINE       .333          .333          .222          .111          .111          .222
OILGAS         .329          .354          .329          .234          .246          .329
HOSPITAL       .285          .285          .285          .142          .142          .285
RETAIL         .263          .28           .263          .21           .192          .315
REGBANKS       .228          .228          .114          .085          .057          .228
BIGBANKS       .142          .142          .142          .142          .142          .285
N=6
====================================================================================
5/22/17
Expect A DJI Breakout.
"Flat tops beckon for breakouts."
But Mays have not brought successful DJI flat-topped breakouts.
The Sell
S4 still stands
but the seasonality is bullish for the DJI for
the next two weeks. (The DJI has risen 60% of the time over
the next two weeks.) If it were not for
the Sell S4, it would be hard
not to predict a Buy B10 breakout over 21200.
Again we see the NYSE
A/D Line making new highs ahead of prices and signs from rising
Utilities
that the Fed may be backing away from raising interest rates.
A flat-topped breakout will bring a Peerless B10 if the DJI closes above 21200.
Such a breakout will probably be confirmed by most of the other key averages,
with the Russell-2000 (IWM) being the exception. Note the flat
topped
resistance lines in the OEX, SP-500,
NYSE that also seem to beckon for a breakout.
None of these will be confirmed by volume indicators. That may
strictly limit their
advance after the breakout. Bigger gains
should be made by the NASDAQ
and QQQ.
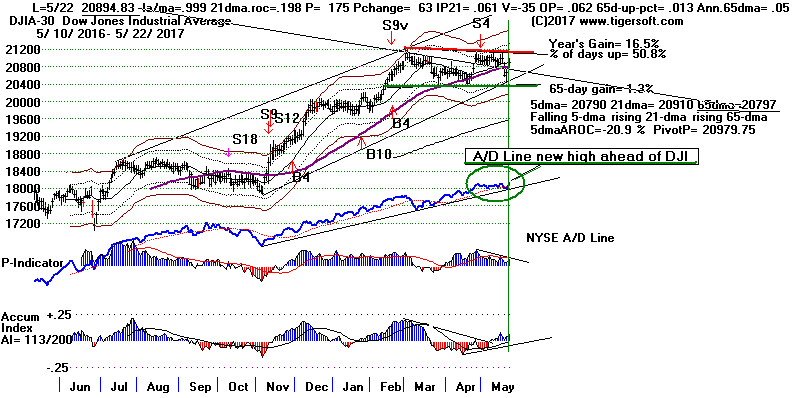
With the DJI near an all-time high, I suspect we will see a breakout.
Let's stay short DIA and
RETL and long SOXL,
NVDA, OIL and GLD
Flat-Topped Breakouts and May Failures
Flat-topped breakouts in patterns that are less than 12 weeks are by no
means necessarily bullish. Market history since 1924 shows as many
flat-topped breakout failures as breakout successes when we consider
price patterns 7-12 weeks long. There are no
successful May flat-topped
breakouts and 3 failures.
Successful Flat-Topped Breakout Patterns (13)
Nov 1924
April 1927
August 1928
October 1928
October 1936
October 1938
September 1968
June 1987
July 1989
November 1995
February 1996
August 2003
December 2004
Failed Flat-Topped Breakouts (13)
(Most of these gave Peerless Sell signals on
the failed breakouts.)
May
1929 S9/S12 not shown on failed breakout here.
May
1951
Sept 1955
July 1964
Nov 1964
April
1965
Sept 1980
Jan 1983
July 1986
April
1992
May
1993
July 1998
July 2007
5/22/2017 Index and ETF Charts:
PEERLESS DJI, Signals, Indicators Daily DJI Split Volume 10-Day Up/Down Vol
Hourly DJIA A/D Line for All Stocks.
S&P OEX NYSE NASDAQ COMPQX with CP
DIA SPY QQQ MDY IWM-TNA
Short Term Interest Rates DJI-Utilities DJI-Transp
CrudeOil FAS GLD BBH IBB JETS JNUG KOL NUGT OIH OIL
RSX RETL SLV SOXL TECL TMF TNA XIV YINN
To STOCKS' CHARTS
AAPL ADBE
AMAT AMGN AMZN BA BIDU CAT FB GOOG GS
HD
IBM JPM MASI MSFT NVDA QCOM TSLA
pics/TXN.GIF
Others REN, JJC, NIB, WEAT UUP (Dollar)
5/22/17 Bullish MAXCPs
Bearish MINCPs incl Retailers and
TrapDoors
 RANKING OF KEY DIRECTORIES BASED PCT.OF STOCKS ABOVE 65-DMA
               5/22/17
---------------------------------------------------------------------------------------
Directory     Current       day-1         day-2         day-3         day-4         day-5
----------------------------------------------------------------------------------------
EDU            1             1             1             1             1             1
BONDFUND       .946          .919          .901          .982          .937          .955
ETFS           .867          .867          .852          .882          .941          .941
BEVERAGE       .85           .85           .85           .85           .85           .85
NIFTY          .827          .827          .793          .862          .931          .896
HOMEBLDG       .823          .823          .764          .705          .823          .882
GAMING         .75           .678          .75           .785          .785          .785
SOLAR          .733          .733          .6            .533          .8            .8
SEMI           .72           .684          .63           .612          .765          .738
DJI-13         .692          .615          .538          .538          .615          .615
HACKERS        .687          .687          .687          .687          .75           .75
N=11
--------------------------------------------------------------------------------------------
SOFTWARE       .666          .698          .65           .666          .761          .746
CHINA          .645          .629          .564          .58           .629          .629
MORNSTAR       .638          .588          .483          .5            .651          .672
INFRA          .636          .636          .545          .545          .545          .636
ELECTRON       .632          .572          .551          .535          .702          .654
NASD-100       .602          .591          .537          .526          .645          .645
GOLD           .58           .48           .38           .56           .36           .3
GREEN          .58           .58           .548          .516          .612          .677
INDEXES        .579          .529          .483          .495          .605          .605
UTILITY        .577          .511          .488          .444          .511          .6
JETS           .555          .666          .666          .777          .777          .777
DOWJONES       .533          .433          .4            .433          .5            .5
SP500          .518          .479          .433          .42           .523          .55
RUS-1000       .512          .48           .433          .408          .519          .529
N=14
--------------------------------------------------------------------------------------------
BIOTECH        .493          .481          .477          .4            .538          .534
MILITARY       .488          .488          .466          .488          .555          .555
COMPUTER       .48           .48           .52           .56           .64           .64
COMODITY       .478          .323          .281          .281          .281          .267
SP-100         .474          .422          .36           .36           .453          .484
REIT           .47           .454          .41           .378          .383          .383
INDMATER       .432          .391          .288          .34           .453          .432
INSURANC       .424          .363          .424          .363          .454          .454
CHEM           .416          .416          .388          .416          .569          .541
AUTO           .4            .35           .325          .25           .4            .375
FOOD           .4            .2            .2            .2            .266          .266
OILGAS         .357          .331          .233          .246          .318          .318
TRANSP         .35           .35           .35           .35           .45           .5
N=13
--------------------------------------------------------------------------------------------
COAL           .333          .333          .111          .333          .444          .444
FINANCE        .315          .315          .282          .293          .521          .434
RETAIL         .28           .263          .21           .192          .315          .385
HOSPITAL       .25           .25           .125          .125          .25           .375
PIPELINE       .25           .125          0             0             .125          .25
REGBANKS       .228          .114          .085          .057          .228          .228
BIGBANKS       .142          .142          .142          .142          .285          .285
N=7
====================================================================================
5/19/17
The Sell
S4 still stands
but seasonality is bullish for the last
two weeks of May. Since 1965, the DJI has
risen 58% of the time in
the two weeks following May 21st. It has averaged a gain of 0.8%. So
that is favorable.
But we have not had a strong of 3 straight up-days since February. Certain
big investors, like George Soros apparently, are doing a lot of selling on
strength.
George Soros has added to his losing bets against the stock market
3 days ago -
George Soros upped his losing bet against the U.S. stock
market Friday,
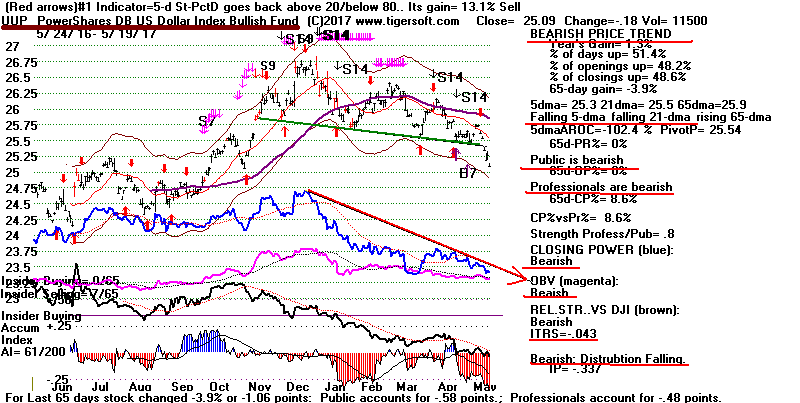
The weakness in the Dollar continues. Buying GLD
seems a reasonable
play here. The FAS and the big banks,
GS, JPM and
BAC, still look like
they are forming bearish head and shoulders patterns. So does our chart
of the 13 highest priced DOW-30 stocks.
Note that if the DJI does close above 21150, we will probably get a Buy B10.
For now stay short DIA and
RETL while being long SOXL,
OIL and
NVDA.
Breadth is Deteriorating. Only 44% of the 6000
stocks and ETFs
that we track are above their 65-dma. This means most will have
considerable
resistance overhead.
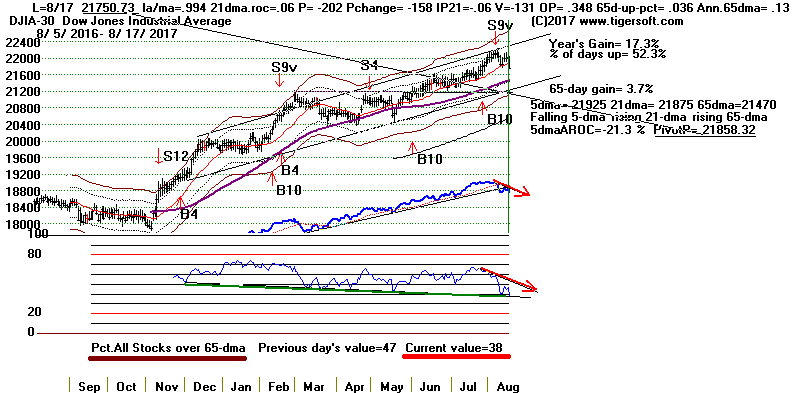
5/19/2017
Index and ETF Charts:
PEERLESS DJI, Signals, Indicators Daily DJI Split Volume 10-Day Up/Down Vol
Hourly DJIA A/D Line for All Stocks.
S&P OEX NYSE NASDAQ COMPQX with CP
DIA SPY QQQ MDY IWM-TNA
Short Term Interest Rates DJI-Utilities DJI-Transp
CrudeOil FAS GLD BBH IBB JETS JNUG KOL NUGT OIH OIL
RSX RETL SLV SOXL TECL TMF TNA XIV YINN
To STOCKS' CHARTS
AAPL ADBE
AMAT AMGN AMZN BA BIDU CAT FB GOOG GS
HD
IBM JPM MASI MSFT NVDA QCOM TSLA
pics/TXN.GIF
Others REN, JJC, NIB, WEAT UUP (Dollar)
5/19/17 Bullish MAXCPs
Bearish MINCPs incl Retailers and
TrapDoors
 RANKING OF KEY DIRECTORIES BASED PCT.OF STOCKS ABOVE 65-DMA
               5/18/17
---------------------------------------------------------------------------------------
Directory     Current       day-1         day-2         day-3         day-4         day-5
----------------------------------------------------------------------------------------
EDU            1             1             1             1             1             1
BONDFUND       .919          .901          .982          .937          .955          .928
ETFS           .867          .852          .882          .941          .941          .911
BEVERAGE       .85           .85           .85           .85           .85           .85
HOMEBLDG       .833          .777          .722          .833          .888          .722
NIFTY          .827          .793          .862          .931          .896          .896
SOFTWARE       .703          .656          .671          .765          .75           .75
SEMI           .698          .646          .629          .775          .75           .689
SOLAR          .684          .578          .526          .736          .736          .684
GAMING         .666          .733          .766          .766          .766          .766
N=10
HACKERS        .666          .666          .666          .722          .722          .666
JETS           .666          .666          .777          .777          .777          .666
INFRA          .636          .545          .545          .545          .636          .545
CHINA          .629          .564          .58           .629          .612          .548
DJI-13         .615          .538          .538          .615          .615          .615
MORNSTAR       .588          .483          .5            .651          .668          .638
ELECTRON       .587          .567          .551          .706          .659          .634
NASD-100       .582          .527          .516          .637          .637          .582
GREEN          .58           .548          .516          .612          .677          .645
INDEXES        .529          .483          .495          .605          .605          .537
UTILITY        .511          .488          .444          .511          .6            .555
N=11
GOLD           .49           .396          .566          .358          .301          .283
MILITARY       .488          .466          .488          .555          .555          .555
SP500          .481          .435          .422          .525          .55           .52
COMPUTER       .48           .52           .56           .64           .64           .56
RUS-1000       .48           .433          .408          .519          .527          .501
BIOTECH        .479          .475          .398          .536          .536          .495
REIT           .466          .424          .393          .398          .398          .414
DOWJONES       .433          .4            .433          .5            .5            .466
SP-100         .422          .36           .36           .453          .474          .443
CHEM           .416          .388          .416          .569          .541          .486
INDMATER       .397          .295          .346          .459          .438          .387
INSURANC       .382          .441          .382          .47           .47           .382
AUTO           .35           .325          .25           .4            .375          .375
TRANSP         .35           .35           .35           .45           .45           .35
N=14
COAL           .333          .111          .333          .444          .444          .444
OILGAS         .329          .234          .246          .316          .31           .284
COMODITY       .323          .281          .281          .281          .267          .253
FINANCE        .315          .282          .293          .521          .434          .358
HOSPITAL       .285          .142          .142          .285          .428          .428
RETAIL         .263          .21           .192          .315          .385          .385
PIPELINE       .222          .111          .111          .222          .333          .222
FOOD           .2            .2            .2            .266          .266          .2
BIGBANKS       .142          .142          .142          .285          .285          .285
REGBANKS       .111          .083          .055          .222          .222          .222
N=10
====================================================================================
5/18/17
The Sell
S4 still stands and is not likely to be reversed.
If you are trading
the DJIA or the SP-500, I suggest considering
the bearish head and shoulders patterns in GS,
JPM and BAC as
more important than anything else to watch. A completed FAS
head/shoulders pattern will hurt all stocks. Its neckline is only .58
below today's close.
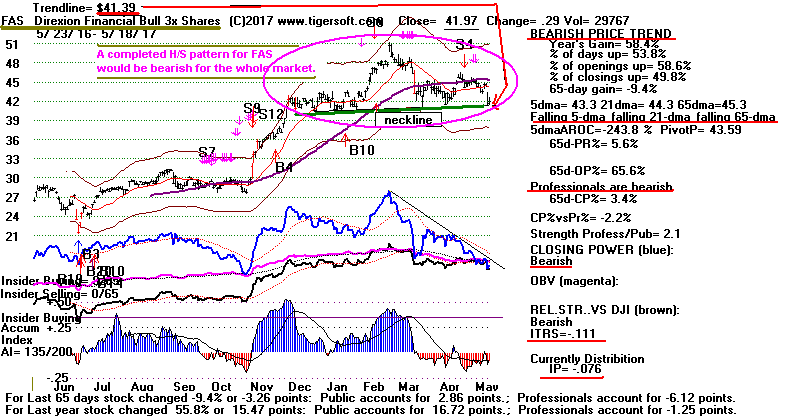
The DJI will now have a hard time rallying back up to
12100 this
coming week, despite the seasonal bullishness. But the
A/D Line uptrend
was not violated, so a little more rallying seems likely, provided FAS
does not breakdown. Such a rally should not pose much threat to our
shorts in DIA, RETL and
the many very weak Bearish MINCPs.
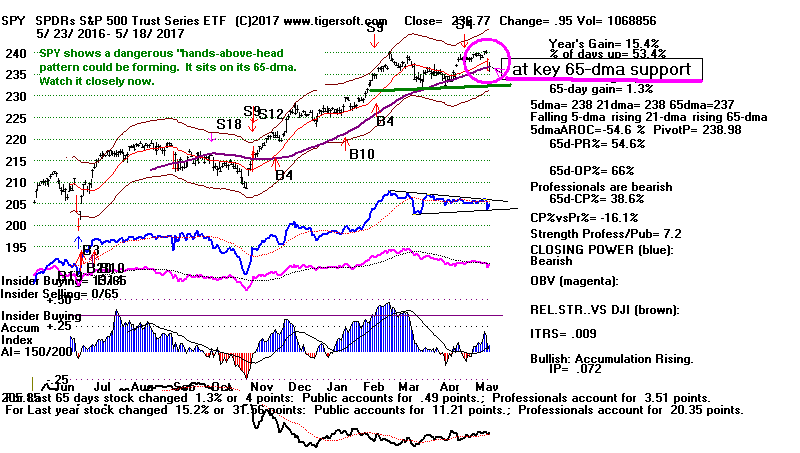
Today's was not a great rebound. The
DJI did not close at its highs
and there were only 54 more up than down on the NYSE,
so there was no reversing Buy B19. But given the news-background,
the threat of another WaterGate, we should be glad there
was a rally and it did not entirely fade away in the last hour.
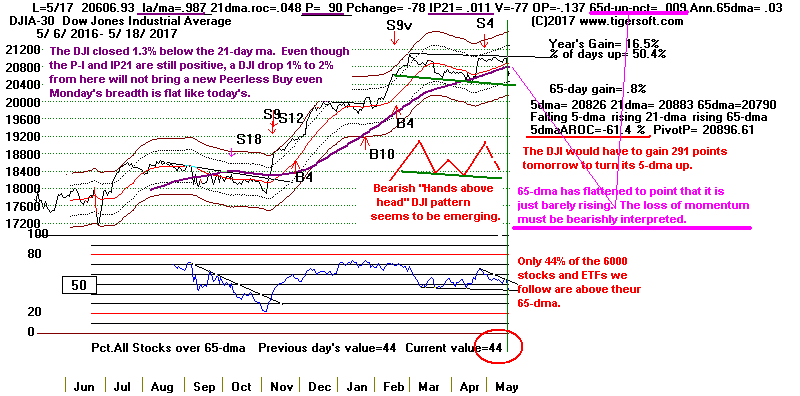
Now we are about to start the normally bullish week leading
to the three-day weekend and Memorial Day. (The DJI rises
62% of the time over the next 10 trading days), So, a little
more rallying seems likely.
Where else will performance fund managers place their
money?
Again, tech stocks and tech ETFs, like TECL and
SOXL were
the stars of the day. No big surprise. This should continue.
If you put sell stops just below Wednesday's low with SOXL
(below),
it can probably be traded profitably from here with limited risk.
Stay long NVDA, too.
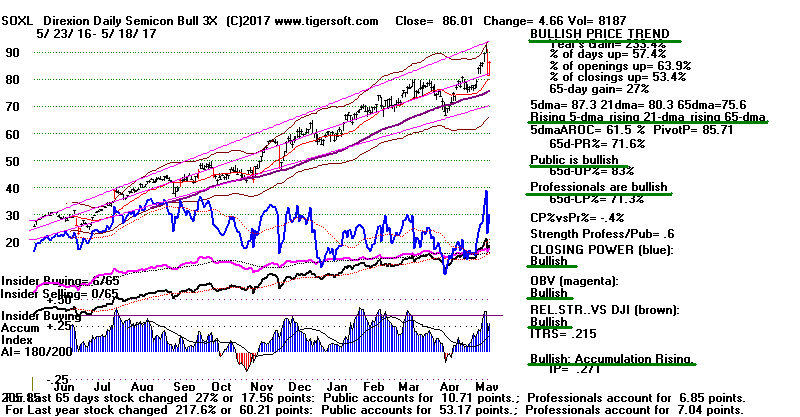
But though QQQ and TECL
rebounded nicely from their
21-dma support today and show high IP21s with rising Closing Powers,
their 5-dma are now falling.
Much Weakness Exists Now
and It Is Expanding.
The market, as a whole, looks like it will correct
more. Now more industry
groups have a plurality of their stocks below their 65-dma resistance.
Only
a minority of groups have a plurality of their stocks above their 65-dma
support.
In fact, just 44% of all 6000 stocks and ETFs are still above their 65-dma.
The underlying problem remains that Trump keeps hitting
the market
with unexpected news and comments that make him the center of attention
and distract from getting the Republican pro-business legislative agenda
through Congress.
This is a big factor in the growing number of "TRAP-DOOR" stocks.
Trump's difficulties also have scared foreigners away from the Dollar and
this has hurt the Big Banks. More and more traders are also wondering if
Congress will be able to pass a big Corporate Tax-Cut. And this makes
them worry that all the Trump stock market gains since November might
have to be given up?
5/18/2017
Index and ETF Charts:
PEERLESS DJI, Signals, Indicators Daily DJI Split Volume 10-Day Up/Down Vol
Hourly DJIA A/D Line for All Stocks.
S&P OEX NYSE NASDAQ COMPQX with CP
DIA SPY QQQ MDY IWM-TNA
Short Term Interest Rates DJI-Utilities DJI-Transp
CrudeOil FAS GLD BBH IBB JETS JNUG KOL NUGT OIH OIL
RSX RETL SLV SOXL TBF TECL TMF TNA XIV YINN
To STOCKS' CHARTS
AAPL ADBE
AMAT AMGN AMZN BA
BAC
BIDU CAT FB GOOG GS
HD
IBM JPM MASI MSFT NVDA QCOM REGN TSLA
TXN
Others REN, JJC, NIB, WEAT UUP (Dollar)
5/18/17 Bullish MAXCPs
Bearish MINCPs incl Retailers and
TrapDoors (18).
 RANKING OF KEY DIRECTORIES BASED PCT.OF STOCKS ABOVE 65-DMA
              5/18/17
      19 show more stocks above 65-dma than below it.
      But 26 show more stocks below the 65-dma.
      This is bearish sign that has not appeared in a long time.
---------------------------------------------------------------------------------------
Directory     Current       day-1         day-2         day-3         day-4         day-5
----------------------------------------------------------------------------------------
EDU            1             1             1             1             1             1
BONDFUND       .901          .982          .937          .955          .937          .776
ETFS           .852          .882          .941          .941          .911          .926
BEVERAGE       .85           .85           .85           .85           .85           .85
NIFTY          .793          .862          .931          .896          .896          .896
HOMEBLDG       .777          .722          .833          .888          .777          .888
GAMING         .733          .766          .766          .766          .766          .733
N=7
HACKERS        .666          .666          .722          .722          .666          .833
JETS           .666          .777          .777          .777          .666          .777
SOFTWARE       .656          .671          .765          .75           .75           .781
SEMI           .646          .629          .775          .75           .698          .724
SOLAR          .578          .526          .736          .736          .684          .736
ELECTRON       .567          .551          .711          .659          .639          .659
CHINA          .564          .58           .629          .612          .548          .516
GREEN          .548          .516          .612          .677          .645          .612
INFRA          .545          .545          .545          .636          .545          .636
DJI-13         .538          .538          .615          .615          .615          .538
NASD-100       .527          .516          .637          .637          .593          .626
COMPUTER       .52           .56           .64           .64           .56           .6
N=12
---------------------------------------------------------------------------------------------
UTILITY        .488          .444          .511          .6            .6            .555
INDEXES        .483          .495          .605          .605          .529          .563
MORNSTAR       .483          .5            .651          .668          .647          .668
BIOTECH        .475          .398          .536          .536          .495          .475
MILITARY       .466          .488          .555          .555          .555          .6
INSURANC       .441          .382          .47           .47           .382          .47
SP500          .435          .422          .525          .55           .529          .558
RUS-1000       .433          .408          .519          .527          .505          .53
REIT           .424          .393          .398          .398          .414          .388
DOWJONES       .4            .433          .5            .5            .466          .5
GOLD           .396          .566          .377          .301          .283          .245
CHEM           .388          .416          .569          .541          .486          .5
SP-100         .36           .36           .453          .474          .453          .453
TRANSP         .35           .35           .45           .45           .4            .4
N=14
AUTO           .325          .25           .4            .375          .375          .375
INDMATER       .295          .346          .459          .438          .387          .387
FINANCE        .282          .293          .521          .434          .358          .402
COMODITY       .281          .281          .281          .267          .253          .225
OILGAS         .234          .246          .316          .31           .284          .278
RETAIL         .21           .192          .315          .385          .385          .526
FOOD           .2            .2            .266          .266          .2            .066
BIGBANKS       .142          .142          .285          .285          .285          .285
HOSPITAL       .142          .142          .285          .428          .571          .571
COAL           .111          .333          .444          .444          .444          .444
PIPELINE       .111          .111          .222          .333          .222          .111
REGBANKS       .083          .055          .222          .222          .222          .25
N=12
====================================================================================
5/17/17 I
have belatedly posted Bullish MAXCPs and
Bearish MINCPs tomorrow, so that we have a record of them.
The Peerless Sell S4 seems to playing out correctly.
The recommended
Short sales in DIA and RETL rose nicely today. There have been dozens of
attractive short-sales posted recently in the MINCPs. Nearly all are down.
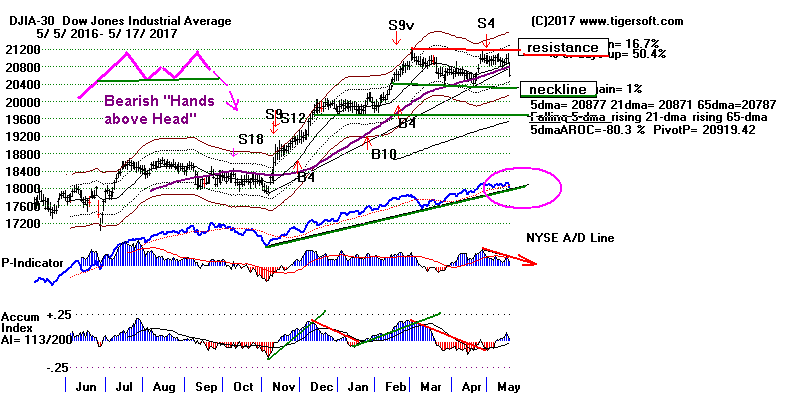
Today, the DJI broke decisively below its 65-dma. The next support is at
20400.
A close below that level would complete a very bearish "Hands-above-the Head"
speculative top. Be careful after that, though it will be tempting to buy
at the round
number 20000.
Watch tomorrow to see if the NYSE A/D Line will break its lengthy uptrend,
which is where it closed today.
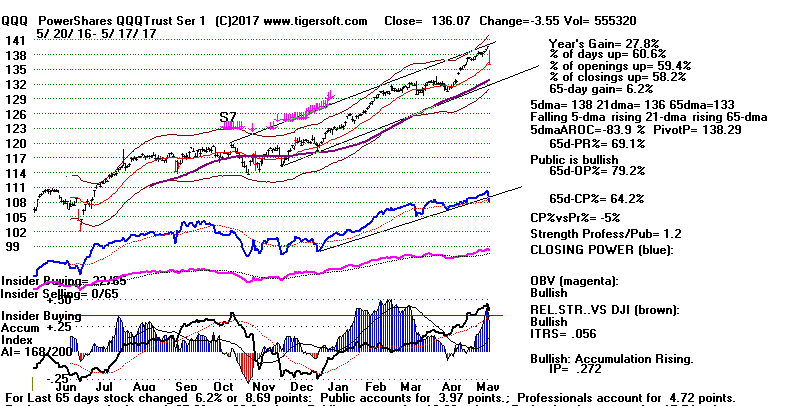
Big drops hit TECL, SOXL and
QQQ, which we were long. I have been
preaching
to traders that they take profits in leveraged ETFs that have run up a long ways
when they break their Closing Power uptrend or close below their 5-day ma pivot
points. If you did this, you no longer are in them. Otherwise, I
would sell TECL,
SOXL and QQQ if tomorrow's bounce upwards vanishes in the last hour or fails
to materialize altogether. Hold NVDA.
Today, Trump's Deputy Attorney General appointed Robert Mueller (a former FBI
Director) to be the Special Prosecutor to investigate Trump's "Russia-Gate" and
related matters. He will have wide powers. But he will try to work
mostly in secret,
as far as that is possible now. He will be thorough. This means it
may take
a year before he reaches his conclusion. Congress may or may not choose to
conduct its own investigation.
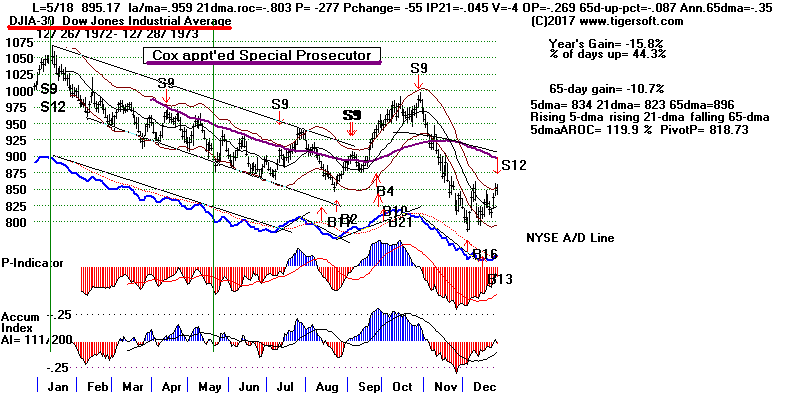
If the lessons from Watergate are any guide, secrecy will be very difficult.
The
Washington Post, New York Times and CNN are not going to sit idly by. So,
though the appointment of a Special Prosecutor might seem to be a way of
allowing
Congress to get back to its regular business, I would not bet on it.
Back in 1973, almost exactly 34 years ago, Nixon's Deputy Attorney General
appointed a Special Prosecutor, Archibald Cox to look into WaterGate.
https://en.wikipedia.org/wiki/Archibald_Cox
At the time, Nixon tried to make it seem that Cox would have his full support to
carry out the investigation wherever it led him. But in 5 months, Nixon
fired Cox.
The DJI then plunged 20% in two months.
Back then, at the beginning of 1973 Peerless had already given a series of Sell
S9s
and Sell S12s and by the time Special Prosecutor Cox was appointed, the DJI had
already fallen 13.5% from its highs. But even so, there was no 10% rally
until a
temporary August 1973 bottom was made. We are apt to be caught in similar
doldrums, I think, waiting for some resolution.
The stock market back then was caught up in a vortex made up of WaterGate
politics
plus the sharply higher oil prices coming about because of the Yom Kippur War
and the OPEC Oil Embargo. I suspect that Trump's "Russia-Gate" will
overhang
the markets now in the same way. But instead of an Oil Embargo to bring on
a recession,
we will have to cope with higher Interest Rates.
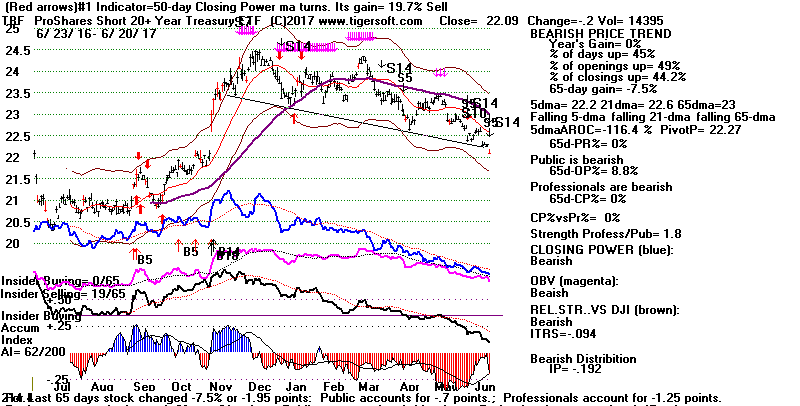
TBF, the ETF representing long-term (20) Treasuries has broken key support
and shows very heavy red-Distribution. Making matters worse for the
DJI-30,
we see that the Dollar also has broken key support.
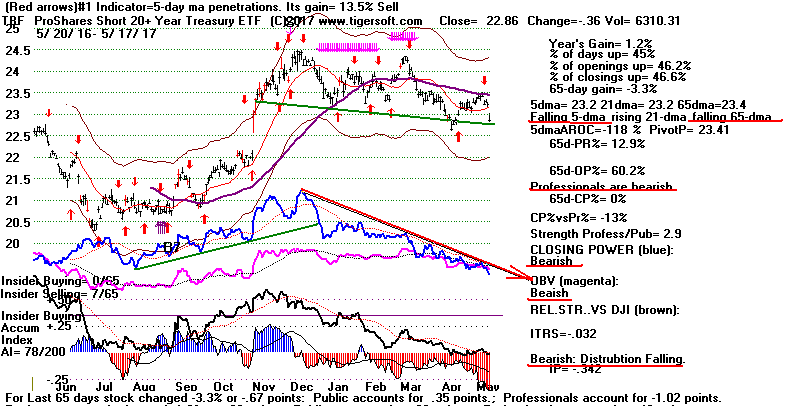
One direct result of this is that the Big Banks (JPM and JPM) have nearly
completed
sprawling head/shoulders tops. Another down-day will cause the H/S in FAS
to
completed. The same is true for the Dow Transports.
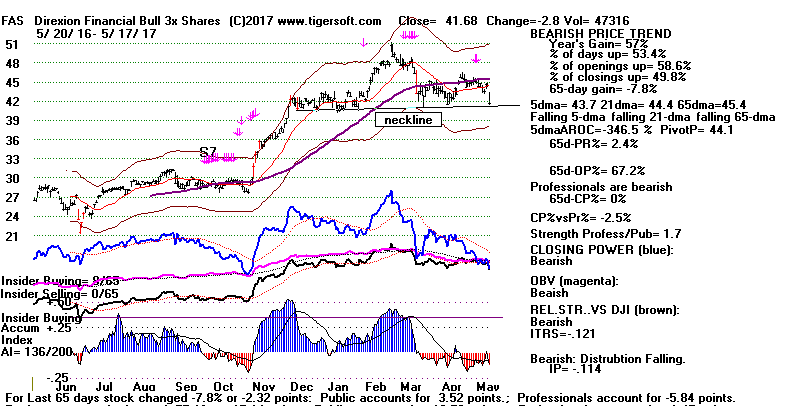
Why might Transports be about to drop? Because of the signs of a possible
recession
due to rising interest rates. And perhaps, Oil prices will keep rising.
I suggested buying
OIL a week ago because of its red Stochastic-20 Buy.
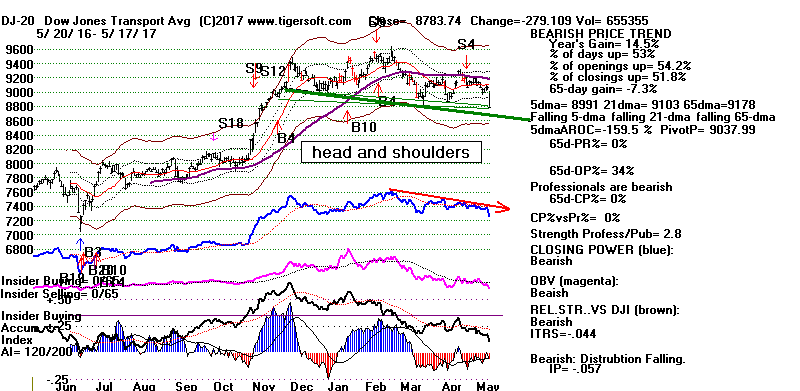
5/17/2017
Index and ETF Charts:
PEERLESS DJI, Signals, Indicators Daily DJI Split Volume 10-Day Up/Down Vol
Hourly DJIA A/D Line for All Stocks.
S&P OEX NYSE NASDAQ COMPQX with CP
DIA SPY QQQ MDY IWM-TNA
Short Term Interest Rates DJI-Utilities DJI-Transp
CrudeOil FAS GLD BBH IBB JETS JNUG KOL NUGT OIH OIL
RSX RETL SLV SOXL TECL TMF TNA XIV YINN
To STOCKS' CHARTS
AAPL ADBE
AMAT AMGN AMZN BA BIDU CAT FB GOOG GS
HD
IBM JPM MASI MSFT NVDA QCOM TSLA
pics/TXN.GIF
Others REN, JJC, NIB, WEAT UUP (Dollar)
5/17/17 Bullish MAXCPs
Bearish MINCPs incl Retailers and
TrapDoors
 RANKING OF KEY DIRECTORIES BASED PCT.OF STOCKS ABOVE 65-DMA
               5/17/17

       Note: today there were more industry groups with less than 33% of their
       stocks above the 65-dma than there were groups with more than 67% of
       their stocks above the 65-dma.
---------------------------------------------------------------------------------------
Directory     Current       day-1         day-2         day-3         day-4         day-5
----------------------------------------------------------------------------------------
EDU            1             1             1             1             1             1
BONDFUND       .982          .937          .955          .937          .776          .821
ETFS           .882          .941          .941          .911          .926          .911
NIFTY          .862          .931          .896          .896          .896          .931
BEVERAGE       .85           .85           .85           .85           .85           .85
JETS           .777          .777          .777          .666          .777          .777
GAMING         .766          .766          .766          .766          .733          .733
HOMEBLDG       .722          .833          .888          .777          .888          .888
SOFTWARE       .671          .765          .75           .75           .796          .781
N=9
HACKERS        .666          .722          .722          .666          .833          .777
SEMI           .629          .775          .75           .698          .732          .715
CHINA          .58           .629          .612          .548          .516          .516
GOLD           .566          .377          .32           .283          .245          .15
COMPUTER       .56           .64           .64           .56           .6            .64
ELECTRON       .551          .711          .664          .639          .664          .654
INFRA          .545          .545          .636          .545          .636          .636
DJI-13         .538          .615          .615          .615          .538          .538
SOLAR          .526          .736          .736          .684          .789          .736
GREEN          .516          .612          .677          .645          .645          .612
NASD-100       .516          .637          .637          .593          .626          .604
N=11
MORNSTAR       .5            .651          .668          .647          .668          .697
INDEXES        .495          .605          .605          .529          .567          .592
MILITARY       .488          .555          .555          .555          .6            .577
UTILITY        .444          .511          .6            .6            .555          .577
DOWJONES       .433          .5            .5            .466          .5            .466
SP500          .422          .525          .55           .529          .56           .579
RUS-1000       .407          .518          .526          .505          .532          .558
CHEM           .402          .555          .527          .486          .5            .527
BIOTECH        .398          .536          .536          .495          .475          .487
REIT           .393          .398          .398          .414          .398          .409
INSURANC       .382          .47           .47           .382          .47           .5
SP-100         .36           .453          .474          .453          .453          .463
TRANSP         .35           .45           .45           .4            .4            .4
INDMATER       .336          .448          .428          .387          .387          .377
N=14
COAL           .333          .444          .444          .444          .444          .444
FINANCE        .293          .521          .434          .358          .413          .478
COMODITY       .281          .281          .267          .253          .211          .211
AUTO           .25           .4            .375          .375          .375          .4
OILGAS         .246          .316          .31           .284          .272          .297
FOOD           .2            .266          .266          .2            0             .133
RETAIL         .192          .315          .385          .385          .526          .666
BIGBANKS       .142          .285          .285          .285          .285          .285
HOSPITAL       .142          .285          .428          .571          .571          .714
PIPELINE       .111          .222          .333          .222          .111          .222
REGBANKS       .055          .222          .222          .222          .25           .388
N=11
====================================================================================
5/16/2017
Once again the DJI could not breakout and once again our
TECL,
QQQ and
NVDA rose nicely. And once again, President Trump
is stealing the spotlight.
Having been unable to surpass its resistance
at 22100, the DJI will likely retest its rising 65-dma. But the
strongest
high tech ETFs, like SOXL (Semi-Conductors), don't seem to care.
Perhaps, like early in the year 2000, their investors foresee a world
that will
be run more and more by machines guided by self-instructing,
neuro-networking
software which is built into their micro-circuitry. Just about
every field
of human
endeavor will soon be impacted. In all this, it's hard not to be
reminded
of the 1999-2000 Dot-Com and Biotech Stock boom.
The
Sell
S4 still operates. Shorting DIA and
RETL or the very weakest
Retailers seems the best way now to play the Peerless Sell S4.
"Isolated S4s", those
where there is no other Peerless Sell signal, generally
do not bring
very big declines. The rising Hourly DISI-OBV
also argues against
a big decline now. And even though we are getting lots of
warnings
from the serious trouble that Big Retailers are now in, Tech Stocks
keep shooting upwards. TXN (the canary-in-the-mines semi-conductor
stock) still has not produced a tell-tale top.
See TXN's tops at all the
biggest DJI declines since
1987.
I mentioned last night that the DJI had reached a point of high
inflection.
Now the DJI seems bound to re-test 20780. But appreciate, too,
that
a DJI close now above 21150 will produce a reversing Buy B10.
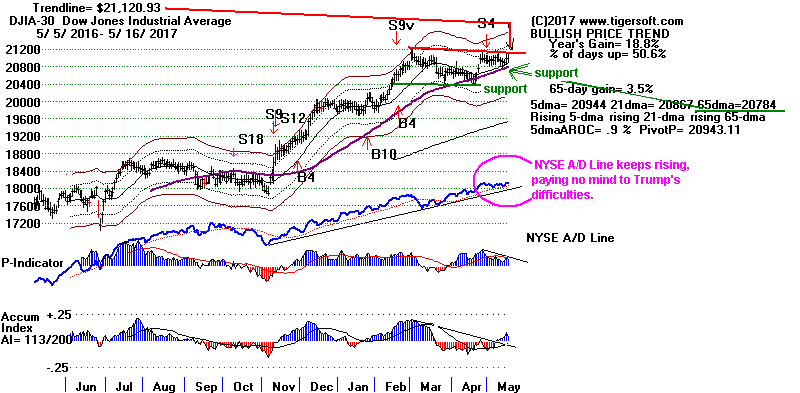
TECL and SOXL - Highest Power Ranked Leveraged ETFS
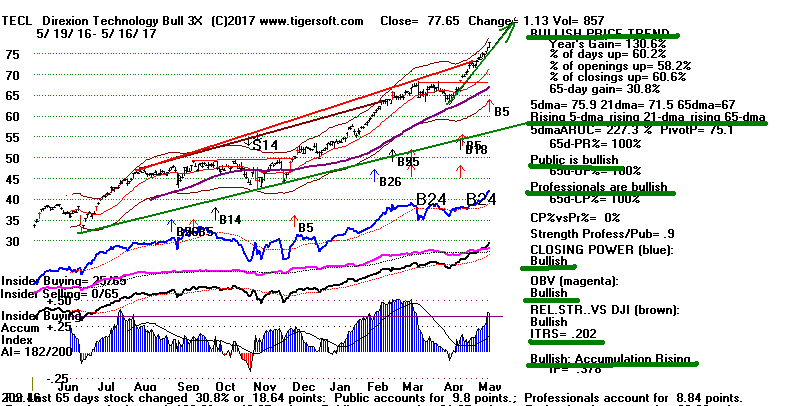
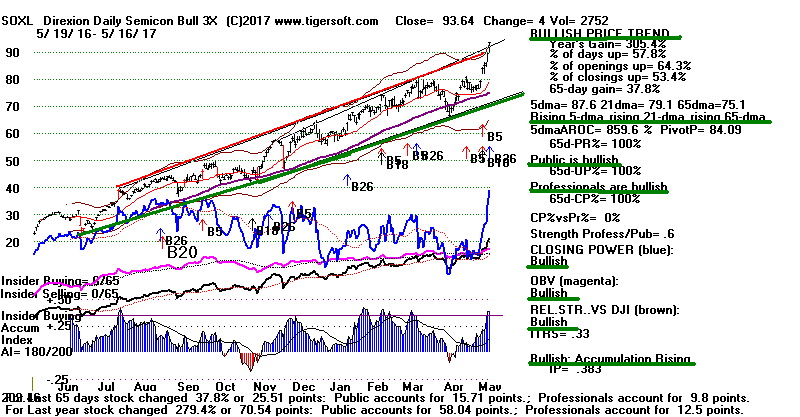
Continued Weakness in Major Retailers Now Warns
of A Weakened "Real Economy". Can The Stock Market Ignore This?
If we look at all the cases since 1987 where the DJI fell
more than 15%
from a peak, we see that JCP (JC Penney, which is used here as a
surrogate
for major retailers) broke well-tested major support 1-3 months before
SPX/SPY (SP-500) did. See
tonight's study.
Calls for Trump's impeachment are increasing, right or wrong.
This is going to cause another weak opening tomorrow.
Most
people probably figure Trump is hiding something big about Russia.
But what? Collusion in 2016 Election? Perhaps. But
this line
of thinking
smacks mostly of Democrat excuse-finding for losing the Presidential
Election.
I've yet to see any proof that Russia intervened in the US Election.
Perhaps, I missed it. Obama said he could not reveal the proof,
because of
national security considerations. Sorry, but I don't believe
Obama.
To date, I've not seen any proof of Russian involvement and I keep
looking for
it.
My guess is Trump has borrowed a lot of money from certain
Russian "oligarchs" and he does not want to release his wealth-
details because it might call into question even his solvency. We
do know
he built some of his biggest golf courses with Russian money.
But only he knows. Did he interfere with the FBI's investigation
by firing the FBI Director? Yes. Is that an impeachable
offense? Well, much will depend on what his Russian connection IS.
I trust the FBI. The story will come out. For them it is a
matter
of professional pride to see the investigation through to the end.
Today
Trump was accused
of improperly sharing classified information
about how ISIS terrorists
plan to blow up Russian civilian airliners using lap tops.
But shouldn't we applaud his efforts to save civilian Russian
lives.
Predictably,
CNN and
the NY Times do not talk about this side of the story.
Yes, there
is a very vigorous, vicious plot under way now to remove Trump.
In many ways, he is an easy target. He has an
amazing talent. No matter
what he says or tweets, he just makes his situation worse.
As the
impeachment campaign intensifies, expect the market to suffer some
big sell-offs
once the NYSE A/D Line uptrend is broken. Since the
campaign against Trump
may prevent Congress
from carrying out Trump's
economic agenda
(lower taxes, legislative de-regulation and massive
infra-structure spending), the Trump stock market rally will surely
suffer.
5/16/2017
Index and ETF Charts:
PEERLESS DJI, Signals, Indicators Daily DJI Split Volume 10-Day Up/Down Vol
Hourly DJIA A/D Line for All Stocks.
S&P OEX NYSE NASDAQ COMPQX with CP
DIA SPY QQQ MDY IWM-TNA
Short Term Interest Rates DJI-Utilities DJI-Transp
CrudeOil FAS GLD BBH IBB JETS JNUG KOL NUGT OIH OIL
RSX RETL SLV SOXL TECL TMF TNA XIV YINN
To STOCKS' CHARTS
AAPL ADBE
AMAT AMGN AMZN BA BIDU CAT FB GOOG GS
HD
IBM JPM MASI MSFT NVDA QCOM TSLA
pics/TXN.GIF
Others REN, JJC, NIB, WEAT UUP (Dollar)
5/16/17 Bullish MAXCPs
Bearish MINCPs incl Retailers and
TrapDoors(4)
 RANKING OF KEY DIRECTORIES BASED PCT.OF STOCKS ABOVE 65-DMA
               5/16/17
---------------------------------------------------------------------------------------
Directory     Current       day-1         day-2         day-3         day-4         day-5
----------------------------------------------------------------------------------------
EDU            1             1             1             1             1             1
ETFS           .941          .941          .911          .926          .911          .823
BONDFUND       .937          .955          .937          .776          .803          .875
NIFTY          .931          .896          .896          .896          .931          .931
BEVERAGE       .85           .85           .85           .85           .85           .85
HOMEBLDG       .833          .888          .777          .888          .888          .833
JETS           .777          .777          .666          .777          .777          .777
SEMI           .775          .75           .698          .732          .715          .689
GAMING         .766          .766          .766          .733          .733          .7
SOFTWARE       .765          .75           .75           .796          .781          .75
SOLAR          .736          .736          .684          .789          .736          .684
HACKERS        .722          .722          .666          .833          .777          .777
ELECTRON       .711          .664          .644          .664          .654          .644
N=13
MORNSTAR       .651          .668          .647          .668          .697          .663
NASD-100       .645          .645          .602          .634          .634          .655
COMPUTER       .64           .64           .56           .6            .64           .64
CHINA          .629          .612          .548          .516          .516          .516
DJI-13         .615          .615          .615          .538          .538          .692
GREEN          .612          .677          .645          .645          .612          .677
INDEXES        .605          .605          .529          .567          .596          .596
CHEM           .555          .527          .486          .5            .527          .527
MILITARY       .555          .555          .555          .6            .577          .577
INFRA          .545          .636          .545          .636          .636          .636
BIOTECH        .533          .529          .49           .478          .49           .474
SP500          .525          .55           .529          .56           .587          .572
FINANCE        .521          .434          .358          .413          .489          .445
RUS-1000       .518          .526          .505          .532          .564          .533
UTILITY        .511          .6            .6            .555          .6            .555
N=15
DOWJONES       .5            .5            .466          .5            .466          .6
INSURANC       .47           .47           .382          .47           .5            .441
SP-100         .453          .474          .453          .453          .484          .525
TRANSP         .45           .45           .4            .4            .4            .45
INDMATER       .448          .428          .387          .387          .377          .346
COAL           .444          .444          .444          .444          .444          .333
AUTO           .4            .375          .375          .375          .4            .4
REIT           .398          .398          .414          .398          .404          .341
GOLD           .377          .32           .301          .245          .15           .132
N=8
OILGAS         .316          .31           .284          .272          .297          .24
RETAIL         .315          .385          .385          .526          .684          .596
BIGBANKS       .285          .285          .285          .285          .285          .285
HOSPITAL       .285          .428          .571          .571          .714          .571
COMODITY       .281          .267          .253          .211          .211          .197
FOOD           .266          .266          .2            0             .133          .066
PIPELINE       .222          .333          .222          .111          .222          .111
REGBANKS       .222          .222          .222          .25           .388          .444
N=8
====================================================================================
5/15/2017 A DJI Close Tomorrow above 12151 will very likely bring
a Peerless Buy B10. This assumes that breadth remains
very positive.
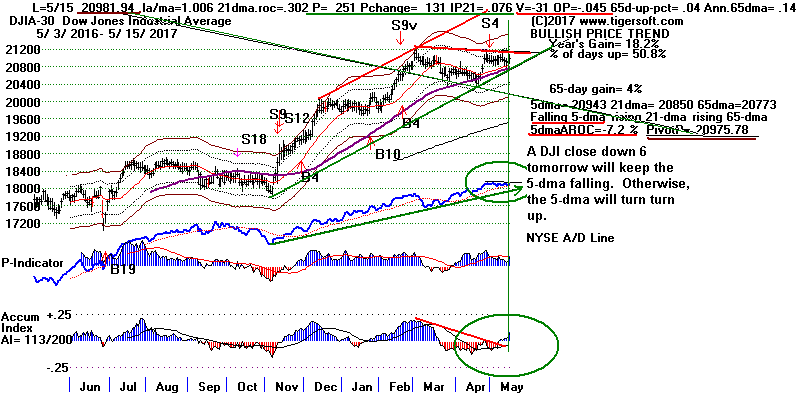
Such a breakout could add even more upward impetus to the
NASDAQ which is at the top of its price channel. I would
expect our high tech longs to continue to outpace the DJI.
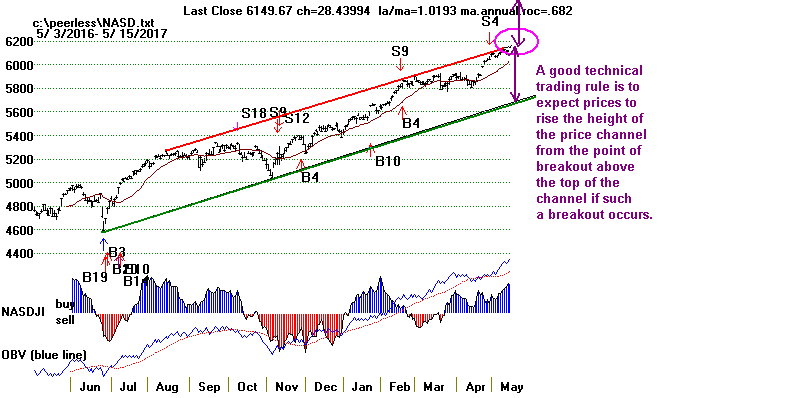
But we are at a point of "high inflection". The next couple
of days will be important. Cover
DIA if the DJI does not
fall back more than 7 points tomorrow. But note one bearish
development. The rapid decline in many Retail stocks bodes poorly
for the "real" economy.
Average consumers have little disposable
money and are not able to borrow very much. The extreme
weakness we are seeing in JCP (below) is a bearish warning. Before
every big market decline since 1987, first it turned very weak.
(Tomorrow
night I will show its charts in 1987, 1990, 1998, 2000-2001, 2007
and
2011.)
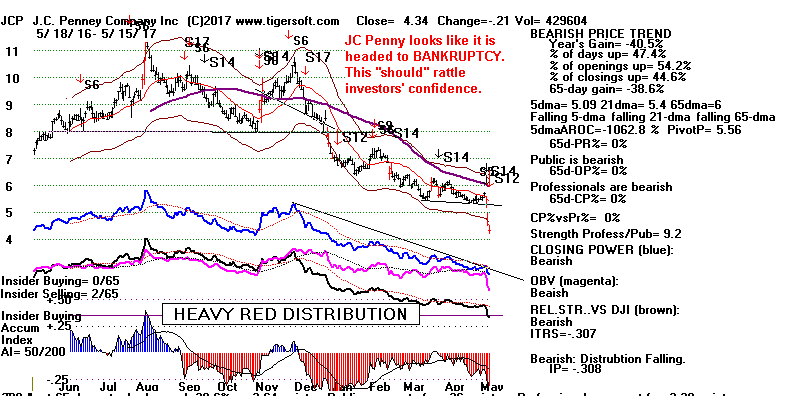
Bullish Technicals Now
The
Sell
S4 has been unable to bring a
break in the DJI. DIA and
SPY may now be about to make their own bullish flat top breakouts.
This is
growing more and more likely given the following considerations:
1) Both their Opening and Closing Powers are now rising.
2) The Hourly OBV-DISI is now steeply rising.
3) The NYSE A/D Line made a new high today ahead of the DJI.
This last condition has occurred frequently in the last two years,
always with the outcome that there would be another subsequent DJI
breakout.
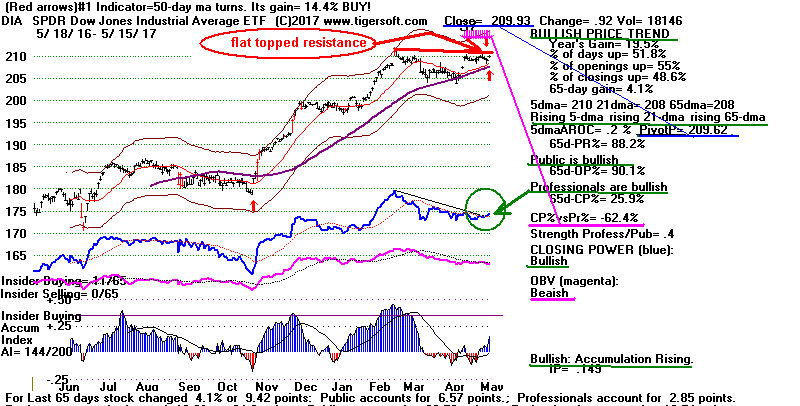
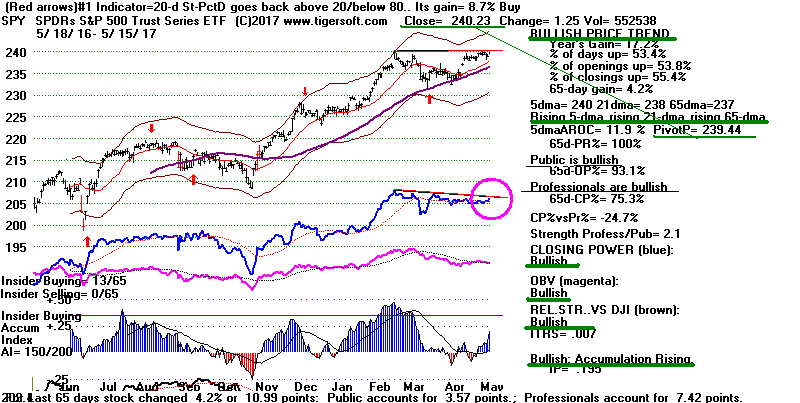
If such a flat-topped breakout in DJIA does occur, expect a quick 2%-3%
jump
in DIA. Accordingly, I will likely recommend covering
the
short in DIA if it
does not turn down at the close tomorrow. Meanwhile,
stay short RETL
and some of the bearish MINCP retailers and long
TECL, QQQ and
OIL
as well as the remarkable
NVDA.
5/15/2017 Index and ETF Charts:
PEERLESS DJI, Signals, Indicators Daily DJI Split Volume 10-Day Up/Down Vol
Hourly DJIA A/D Line for All Stocks.
S&P OEX NYSE NASDAQ COMPQX with CP
DIA SPY QQQ MDY IWM-TNA
Short Term Interest Rates DJI-Utilities DJI-Transp
CrudeOil FAS GLD BBH IBB JETS JNUG KOL NUGT OIH OIL
RSX RETL SLV SOXL TECL TMF TNA XIV YINN
To STOCKS' CHARTS
AAPL
AMAT AMGN AMZN BA BIDU CAT FB GOOG GS
HD
IBM JPM MASI MSFT NVDA QCOM TSLA
Others REN, JJC, NIB, WEAT UUP (Dollar)
5/15/17 Bullish MAXCPs
Bearish MINCPS incl TRAPDOORS (4)
 RANKING OF KEY DIRECTORIES BASED PCT.OF STOCKS ABOVE 65-DMA
              5/15/17
---------------------------------------------------------------------------------------
Directory     Current       day-1         day-2         day-3         day-4         day-5
----------------------------------------------------------------------------------------
EDU            1             1             1             1             1             1
BONDFUND       .955          .937          .776          .803          .866          .919
ETFS           .941          .911          .926          .911          .823          .823
NIFTY          .896          .896          .896          .931          .931          .862
HOMEBLDG       .882          .764          .882          .882          .823          .764
BEVERAGE       .85           .85           .85           .85           .85           .85
SOFTWARE       .8            .8            .85           .833          .8            .85
GAMING         .785          .785          .75           .75           .714          .678
SEMI           .758          .714          .75           .732          .714          .66
HACKERS        .75           .687          .875          .812          .812          .812
JETS           .75           .625          .75           .75           .75           .75
SOLAR          .736          .684          .789          .736          .684          .578
GREEN          .689          .689          .655          .655          .724          .724
MORNSTAR       .668          .647          .668          .697          .663          .676
N=13
============================================================================================
ELECTRON       .657          .636          .663          .652          .652          .636
COMPUTER       .64           .56           .6            .64           .64           .6
NASD-100       .637          .593          .626          .626          .648          .626
INFRA          .636          .545          .636          .636          .636          .636
DJI-13         .615          .615          .538          .538          .692          .615
CHINA          .612          .548          .516          .516          .516          .435
INDEXES        .605          .529          .567          .596          .596          .588
UTILITY        .6            .6            .555          .6            .555          .622
SP500          .55           .529          .56           .587          .575          .566
MILITARY       .536          .536          .585          .56           .56           .56
BIOTECH        .532          .491          .471          .487          .471          .439
RUS-1000       .526          .505          .532          .564          .535          .535
N=12
============================================================================================
CHEM           .5            .484          .484          .5            .5            .484
COAL           .5            .5            .5            .5            .375          .5
DOWJONES       .5            .466          .5            .466          .6            .566
============================================================================================
SP-100         .474          .453          .453          .484          .536          .515
INSURANC       .47           .382          .47           .5            .441          .558
TRANSP         .45           .4            .4            .4            .45           .5
FINANCE        .434          .358          .413          .489          .445          .489
INDMATER       .422          .381          .381          .371          .329          .391
RETAIL         .385          .385          .526          .684          .596          .526
REIT           .381          .397          .381          .387          .327          .408
HOSPITAL       .375          .625          .625          .75           .625          .375
AUTO           .358          .358          .358          .384          .384          .358
n=9
--------------------------------------------------------------------------------------------
GOLD           .313          .294          .235          .137          .117          .137
OILGAS         .311          .285          .272          .298          .24           .253
BIGBANKS       .285          .285          .285          .285          .285          .428
FOOD           .285          .214          0             .142          .071          .142
COMODITY       .267          .253          .211          .211          .197          .211
PIPELINE       .25           .125          0             .125          0             .125
REGBANKS       .228          .228          .257          .4            .457          .514
N=7
====================================================================================
5/12/2017
Our
Sell
S4 has brought the
DJI down very gradually to its rising
21-day ma. That should briefly act as support. A short-term
bounce
seems likely.
The Hourly DJI's DISI-OBV is now
rising. Short-term rates have stopped rising.
But seasonality will soon work against the DJI making any big gains.
Historically, the next two weeks are typically bearish: since 1965,
the DJI has risen only 36% of the time in the 10 trading days after May
14.
The DJI averages a slight decline of 0.1% in this period..
A DJI rally should benefit our long positions in QQQ
and TECL. We can use it also
to go short RETL (3x leveraged Retailers) or some of
the individual retailers
showing top patterns and heavy
distribution.
We see that Professionals have recently been bearish DIA: hence the pink
S7s.
But it it will not take much of a rise from the opening to cause DIA's
closing
Power
to break its downtrend.
The good news for our DIA short is that the DJI's 5-day ma is still
falling and
cannot easily turn up.
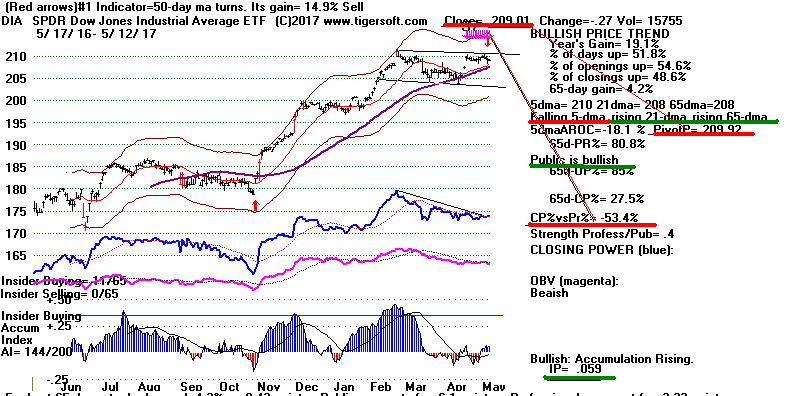
More on The Sell S4
I doubt that the DJI will be able to make significant new highs given
the
active Sell S4. Of the 36 past S4s since 1929, 11did not see any
further
DJI gains. In 11 additional cases, the DJI rallied less than 2%
and topped
within 10 days of the Sell S4. But there were 7 instances (19% of
the 36)
where the DJI did not hits its final high for between 11 and 20 days
after
the Sell S4. The additional gains here were all under 2%. In
the
remaining 7
cases, the DJI's final peak was between 21and 35 days after the Sell S4.
But even in these cases, the additional DJI rally should be small and
limited judging from the fact that in only 2 of the 36 Sell S4s did the
DJI gain as much as 3.4% or 4.3% more. These occurred in
Jan 1980 and Feb 1997. In both cases, the DJI's top occurred
32 days after the Sell S4.
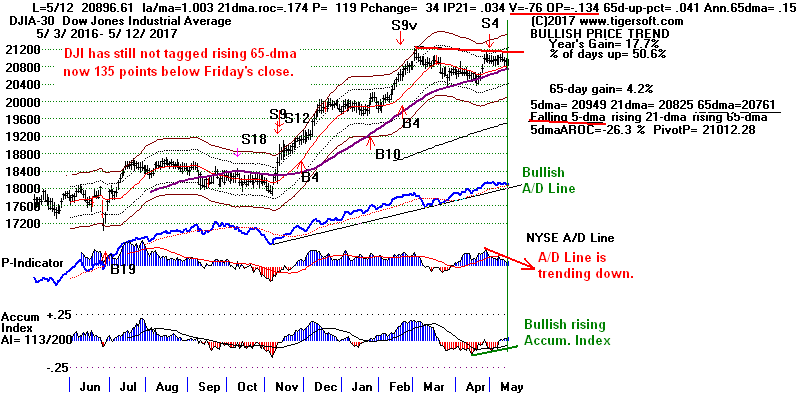
History suggests the NASDAQ could go up for another 6-8
weeks
even if the DJI does not make any more new highs. So hold TECL
and QQQ as well as NVDA.
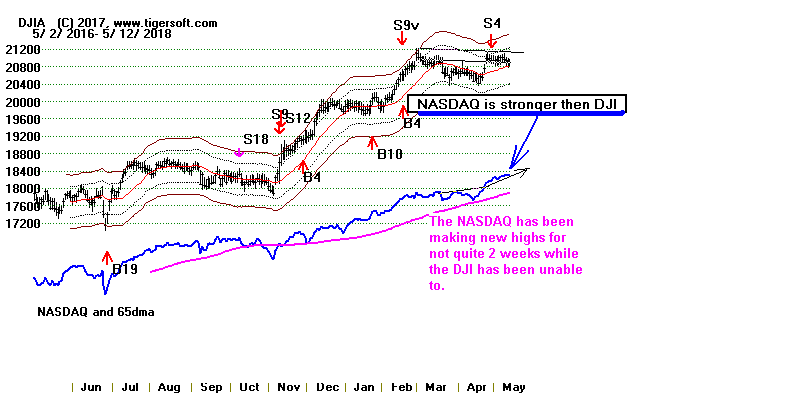
DIA falls back little by
little and QQQ rises little by little.
How much longer will they diverge? The DJI falls and the NASDAQ
rises. How were these contradictory forces resolved in the past?
I've done a new study of
when the DJI and the NASDAQ diverged
in the period since 1987.
There are many more cases where the NASDAQ
failed to make a new high when the DJI did than vice verse, our case
now.
There are only four cases where the NASDAQ keeps
making new
highs after the DJI has topped out, as has occurred now for two weeks.
My study shows that there is historical precedent for the NASDAQ
making new highs for another 6-8 weeks if the DJI does not making
any
more. But eventually the NASDAQ's rise will end, of course.
Then, a
much bigger
bigger decline is likely to be set up when the NASDAQ's price-uptrend
is finally violated. See the cases of early 2000, 2008 and 2015
just
below.
2000 NASDAQ tops out 7
weeks after DJI.
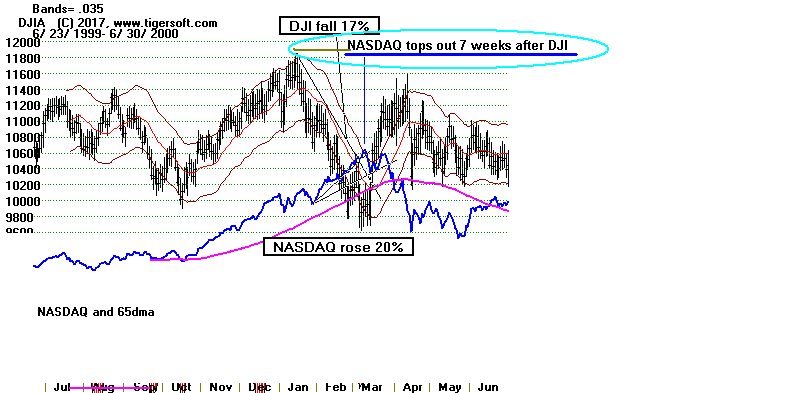 |
2008 DJI topped out 6 weeks
before NASDAQ in 2008
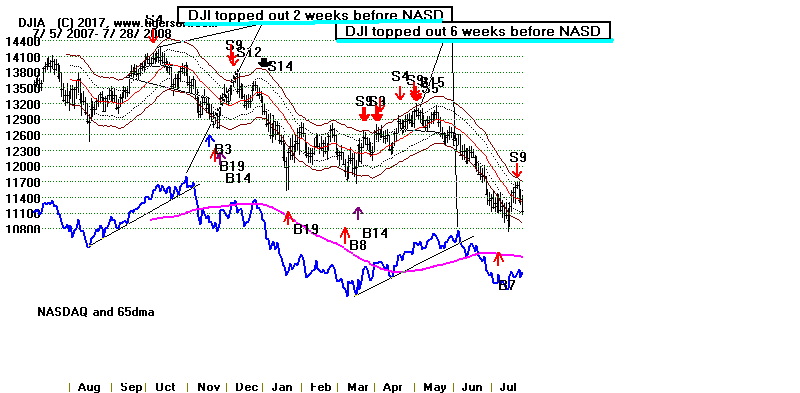 |
2015 DJI topped out 8 weeks
before NASDAQ did in 2016.
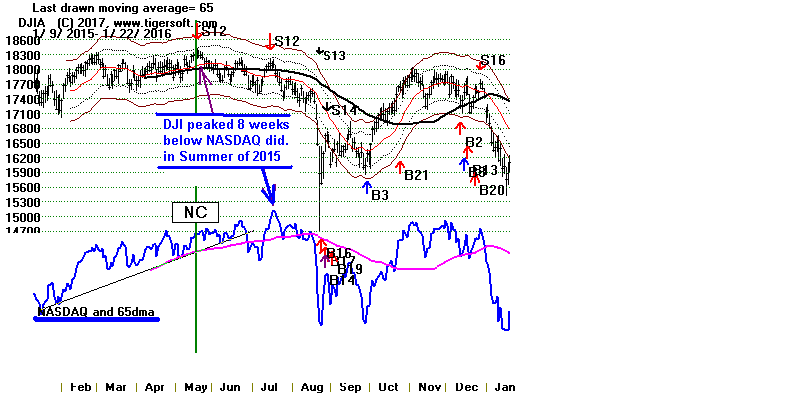
|
                       5/12/2017   Index and ETF Charts:

                                     PEERLESS DJI, Signals, Indicators    Daily DJI Split Volume   10-Day Up/Down Vol
                                     Hourly DJIA    A/D Line for All Stocks.

    S&P    OEX    NYSE    NASDAQ   COMPQX with CP

 DIA   SPY   QQQ    MDY   IWM-TNA

  Short Term Interest Rates    DJI-Utilities      DJI-Transp
                                     CrudeOil  FAS  GLD  BBH  IBB  JETS  JNUG  KOL  NUGT  OIH   OIL

 RSX   RETL   SLV   SOXL   TECL   TMF   TNA   XIV  YINN

                                                  To STOCKS' CHARTS
                                    AAPL   AMAT  AMGN  AMZN   BIDU   CAT    FB  GOOG   GS  IBM   JPM

 MASI  MSFT  NVDA  QCOM   TSLA
                  Others REN, JJC,  NIB, WEAT  UUP (Dollar)

              5/12/17  Bullish MAXCPs  Bearish MINCPS incl TRAPDOORS (4)
                           (201 vs 208 stocks/ETFs)  (167 vs 121 stocks/ETFs)
                  Most Bearish Retail Stocks

    RANKING OF KEY DIRECTORIES BASED PCT.OF STOCKS ABOVE 65-DMA
               5/12/17
---------------------------------------------------------------------------------------
Directory     Current       day-1         day-2         day-3         day-4         day-5
----------------------------------------------------------------------------------------
EDU            1             1             1             1             1             1
BONDFUND       .937          .776          .803          .866          .919          .937
ETFS           .911          .926          .911          .823          .823          .852
NIFTY          .896          .896          .931          .931          .862          .896
BEVERAGE       .85           .85           .85           .85           .85           .85
GAMING         .785          .75           .75           .714          .678          .75
HOMEBLDG       .777          .888          .888          .833          .777          .777
SOFTWARE       .746          .793          .777          .746          .809          .809
SOLAR          .733          .866          .8            .733          .6            .6
SEMI           .69           .725          .707          .69           .637          .663
N=9
===========================================================================================
HACKERS        .666          .833          .777          .777          .777          .777
JETS           .666          .777          .777          .777          .777          .777
MORNSTAR       .647          .668          .697          .663          .672          .71
GREEN          .645          .645          .612          .677          .677          .709
ELECTRON       .644          .67           .659          .654          .634          .649
DJI-13         .615          .538          .538          .692          .615          .769
UTILITY        .6            .555          .6            .555          .622          .622
NASD-100       .593          .626          .626          .648          .626          .626
HOSPITAL       .571          .571          .714          .571          .428          .571
COMPUTER       .56           .6            .64           .64           .6            .6
MILITARY       .555          .6            .577          .577          .577          .577
CHINA          .548          .516          .516          .516          .435          .483
INFRA          .545          .636          .636          .636          .636          .727
INDEXES        .529          .567          .596          .596          .588          .634
SP500          .527          .558          .585          .573          .566          .585
RUS-1000       .505          .532          .564          .535          .536          .562
N=16
===========================================================================================
BIOTECH        .491          .471          .487          .471          .439          .5
CHEM           .486          .5            .527          .513          .5            .597
DOWJONES       .466          .5            .466          .6            .566          .6
SP-100         .453          .453          .484          .536          .525          .546
COAL           .444          .444          .444          .333          .444          .333
TRANSP         .4            .4            .4            .45           .5            .6
REIT           .397          .381          .387          .327          .408          .451
RETAIL         .392          .517          .678          .589          .517          .535
INDMATER       .381          .381          .371          .329          .381          .412
AUTO           .375          .375          .4            .4            .35           .375
INSURANC       .363          .454          .484          .424          .545          .606
FINANCE        .358          .413          .489          .445          .489          .51
N=12
===========================================================================================
GOLD           .294          .235          .137          .117          .117          .098
OILGAS         .287          .274          .3            .241          .254          .228
BIGBANKS       .285          .285          .285          .285          .428          .142
COMODITY       .257          .214          .214          .2            .214          .2
REGBANKS       .228          .257          .4            .457          .514          .485
FOOD           .214          0             .142          .071          .142          .071
PIPELINE       .125          0             .125          0             .125          .125
N=7
====================================================================================
5/11/2017
For the DJI and the majority of stocks, the
Operative Peerless
signal remains a Sell
S4. A close much below 20780
followed
by a quick drop below 20400 would cause the DJI's chart to look
like a Hands
above the Head" top pattern. These are reliably bearish
and usually occur at the end of a period of excessive speculation.
The Sell S4 will probably have limited effect on the high tech
boomers among high techs unless the DJI drops back below 20000.
Certainly, for as long as the NYSE A/D Line is rising, we can find
stocks
to hold long and even buy.
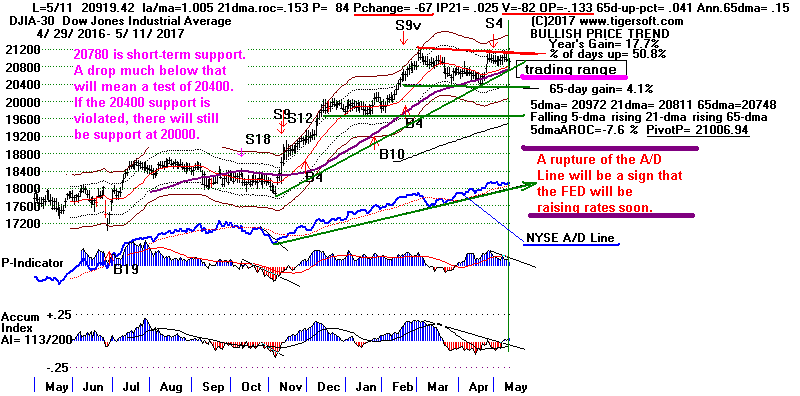
We can surmise that the main reason
many stocks look "toppy"
is the growing sense that the Trump agenda
of tax cuts and massive
infrastructure spending will be derailed
or delayed. Meanwhile,
short-term interest rates
are on the rise
and the FED is likely to
retract a good part of the trillions of liquidity it pumped into
the
markets from 2009 to 2012.
The danger, of course, is that Trump
enthusiasts may have bid up stock prices too far in advance of
what Congress can actually accomplish, especially if the Trump
Administration keeps being distracted away from the economic
concerns that matter most to Wall Street.
For the last two months, at least, a handful of big Tech ETFs,
notably TECL
and
SOXL and stocks
like AAPL,
ADBE
and AMAT
have been little
heeding the DJI's
hesitation here. This is actually normal behavior
at the end of a bull market.
The Sell S4 should not be take as meaning that we should sell
everything.
I suggested buying Crude Oil a few days ago
to take advantage of its
Stochastic Buy. Red Tiger-Optimized Stochastic Buys when a
volatile stock
is in a trading range stock should definitely be used. REGN
(below) also illustrates
this. It is a favorite for professional Options' players.
When
Tiger's Closing
Power breaks a well-tested down-trendline, expect a good rally,
especially
with the stock near price-support or when there has just been a red
Stochastic
Buy signal.
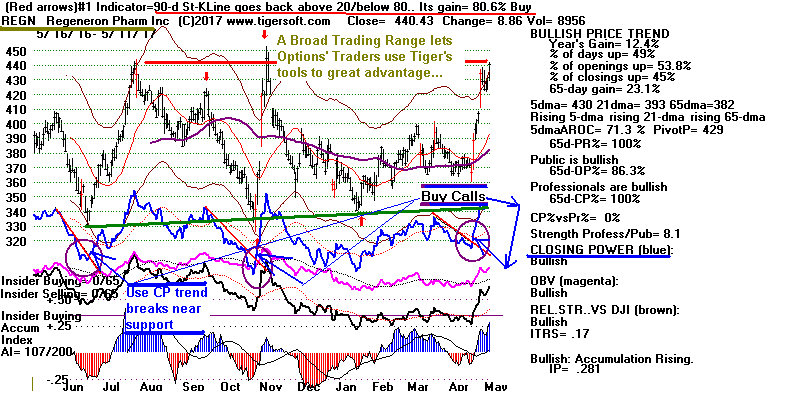
Yesterday, I argued that NVDA
looks for all the world like the
"stock of the Decade" and should be held long by traders now that it has
started what is probably another big breakout-run.
I've suggested traders stay short DIA but long the high tech ETFs
while their 5-day ma keep rising. As long as they close above
their
"pivot-points", shown below for the next day, their 5-day mvg.
averages
will be rising.
Remaining
Strong ETFs
5/11
Close
5/12 Pivot-Point IP21
-----------------------------------------------------------------------------------
TECL
74.85
-.25
73.08
+.257
QQQ
138.29 -.11
137.54
+.262
COMPQX
6129.14 +8.55
6075.34
+.259
.....
SOXL
84.94 +
.85
77.61
+.203
-----------------------------------------------------------------------------------
The Core Technical Problem.....
THE HEAD/SHOULDERS IN BIG
BANKS AND TRANSPORTS
ARE CONFOUNDING THE TRUMP BULL MARKET.
And these patterns are
bearish...Sometimes very bearish.
We see the
market's technical problem most clearly in the impending
bearish head/shoulders patterns that DJI-bank
stocks GS and JPM seem
to
have unfolding. We also see it in the
head/shoulders patterns of our
DJI-13 (high priced stocks), FAS and the
DJI-20 (Transports).
As long as these ETFS and stocks do not
rally above the apex of their
right shoulder to destroy these pattern,
there is a good chance that they
will experience the full and sudden effects
of price-gravity via their own
trap-doors. In this connection, keep in
mind that the appearance of
head and shoulders patterns seems to be the
best predictor or precursor
for trap-door declines.
TWO OTHER VERY WEAK DJI-30 STOCKS NEED TO STOP FALLING
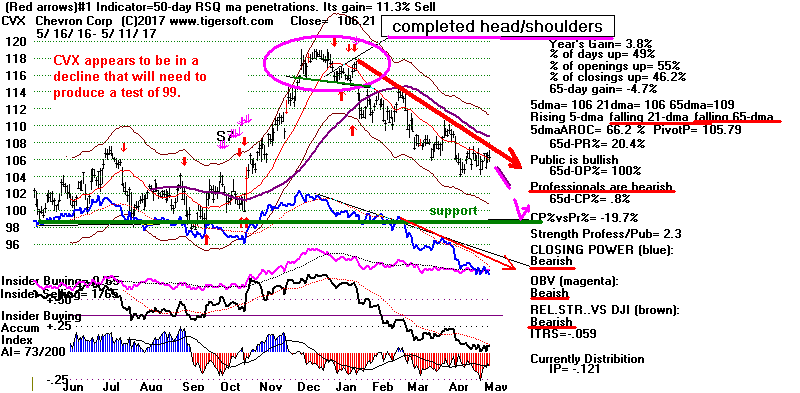 |
IBM
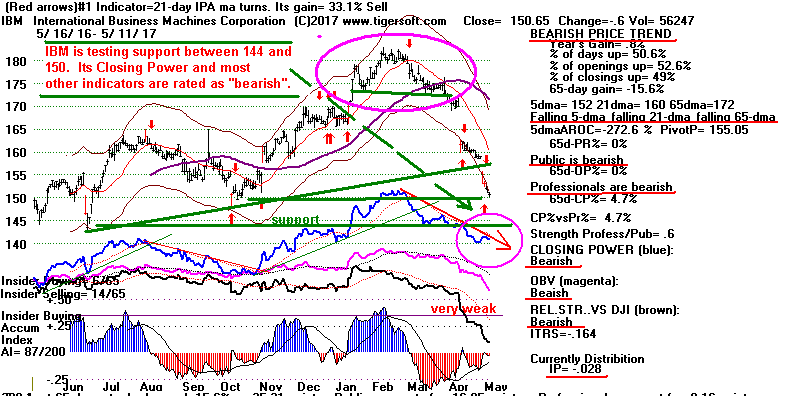 |
5/11/17
Index
and ETF Charts:
PEERLESS
DJI, Signals, Indicators Daily DJI Split Volume
10-Day Up/Down Vol
Hourly
DJIA A/D Line for All Stocks.
S&P
OEX
NYSE
NASDAQ
COMPQX
with CP
DIA
SPY
QQQ
MDY
IWM-TNA
Short
Term Interest Rates
DJI-Utilities
DJI-Transp
CrudeOil
FAS
GLD
BBH
IBB
JETS
JNUG
KOL
NUGT
OIH
OIL
RSX
RETL
SLV
SOXL
TECL
TMF
TNA XIV YINN
To STOCKS' CHARTS
AAPL
AMAT AMGN
AMZN
BIDU
CAT
FB
GOOG
GS
IBM
JPM
MASI
MSFT
NVDA
QCOM TSLA
Others REN,
JJC,
NIB,
WEAT
UUP (Dollar)
5/11/17
Bullish MAXCPs
Bearish MINCPS incl
TRAPDOORS (7)
(208 stocks/ETFs) (of 121
stocks/ETFs)
 RANKING OF KEY DIRECTORIES BASED PCT.OF STOCKS ABOVE 65-DMA
              5/11/17
---------------------------------------------------------------------------------------
Directory     Current       day-1         day-2         day-3         day-4         day-5
----------------------------------------------------------------------------------------
EDU            1             1             1             1             1             1
ETFS           .926          .911          .823          .823          .852          .808
NIFTY          .896          .931          .931          .862          .896          .896
HOMEBLDG       .888          .888          .833          .777          .777          .777
BEVERAGE       .85           .85           .85           .85           .85           .85
HACKERS        .833          .777          .777          .777          .777          .777
SOFTWARE       .796          .781          .75           .812          .812          .75
SOLAR          .789          .736          .684          .578          .578          .421
JETS           .777          .777          .777          .777          .777          .777
BONDFUND       .776          .803          .866          .919          .937          .91
GAMING         .733          .733          .7            .666          .733          .666
SEMI-COND      .732          .715          .698          .646          .672          .629
ELECTRON       .67           .659          .659          .634          .644          .613
MORNSTAR       .668          .697          .663          .672          .71           .676
N=14
=============================================================================================
GREEN          .645          .612          .677          .677          .709          .677
INFRA          .636          .636          .636          .636          .727          .909
NASD-100       .626          .626          .648          .626          .626          .637
COMPUTER       .6            .64           .64           .6            .6            .56
MILITARY       .6            .577          .577          .577          .577          .6
HOSPITAL       .571          .714          .571          .428          .571          .571
INDEXES        .567          .596          .596          .588          .634          .605
SP500          .558          .585          .573          .566          .587          .56
UTILITY        .555          .6            .555          .622          .622          .644
DJI-13         .538          .538          .692          .615          .769          .615
RUS-1000       .532          .564          .535          .536          .564          .529
RETAIL         .517          .678          .589          .517          .517          .5
CHINA          .516          .516          .516          .435          .483          .467
N=13
=============================================================================================
CHEM           .5            .527          .513          .5            .611          .486
DOWJONES       .5            .466          .6            .566          .6            .5
BIOTECH        .471          .487          .471          .439          .504          .512
INSURANC       .47           .5            .441          .558          .617          .617
SP-100         .453          .484          .536          .525          .546          .515
COAL           .444          .444          .333          .444          .333          .333
FINANCE        .413          .489          .445          .489          .521          .532
TRANSP         .4            .4            .45           .5            .6            .55
REIT           .398          .404          .347          .424          .466          .398
INDMATER       .387          .377          .336          .387          .418          .357
AUTO           .375          .4            .4            .35           .4            .325
N=11
=============================================================================================
BIGBANKS       .285          .285          .285          .428          .142          .142
OILGAS         .274          .3            .241          .254          .228          .176
REGBANKS       .25           .388          .444          .5            .472          .527
GOLD           .245          .15           .15           .132          .113          .037
COMODITY       .214          .214          .2            .214          .2            .2
PIPELINE       .111          .222          .111          .222          .222          .111
FOOD           0             .142          .071          .142          .071          0
N=7
====================================================================================
5/10/2017 For
the DJI and the majority of stocks, the Operative Peerless
signal remains a Sell
S4.
For these stocks, what happens to the DJI-30
is quite significant. So, it is important
that Sell S4 signals have historically
been quite reliable. For them, even if
there is a 2% DJI rally, considerable
risk may lie ahead because Peerless will
probably generate a Sell S9-V
on the DJI. A DJI retest of its rising
65-dma appears to be necessary now.
More likely, the DJI may need to test the
support at its lower band and the
round number 20000.
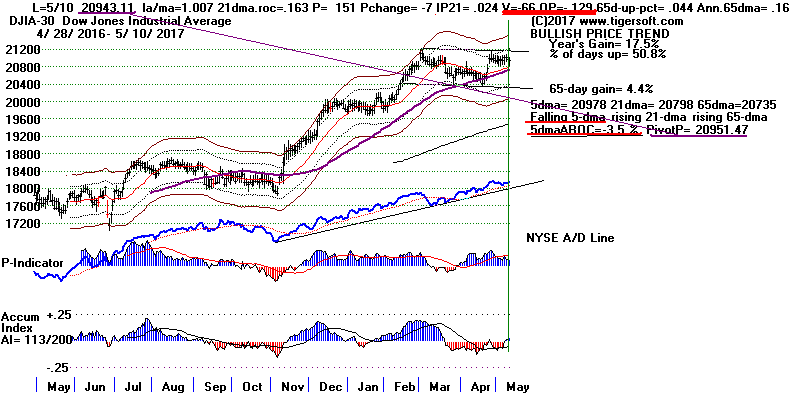
Recently,
the DJI's ups and downs have mattered less and less for the
bravest and boldest tech stocks. But let's
be safe. Traders should probably
sell TECL,
QQQ and the NASDAQ if
these close below their pivot
points.
Remaining
Strong ETFs 5/10
Close
5/11 Pivot-Point IP21
-----------------------------------------------------------------------------------
TECL
75.10
+.87
72.74
+.252
QQQ
138.4
+.08
137.04
+.215
COMPQX
6129.14 +8.55
6075.34
+.259
.....
SOXL
84.09
+5.01
76.79
+.221
THE
CASE FOR CONSIDERING NVDA
THE DECADE'S
MOST IMPORTANT TECH STOCK.
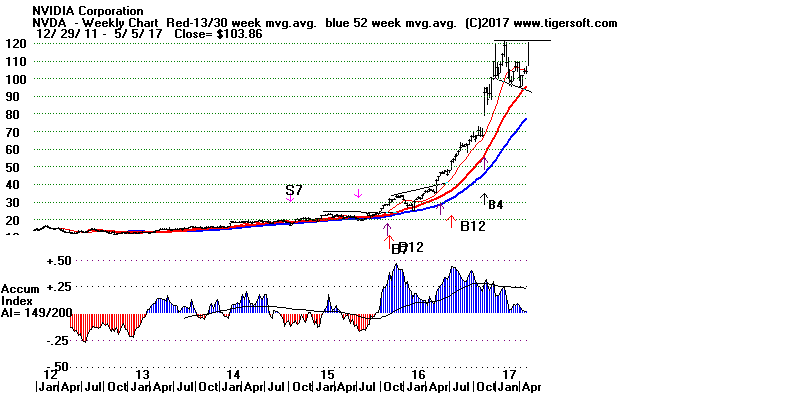
I would argue that the most important
technology stock now is not AAPL,
GOOG,
AMZN,
MSFT or FB, it is Nividia,
NVDA. If it
breaks out above 121, buy it.
NVDA's Graphics and Deep Learning software
and chips are training the
machines and neural networks that control
3-D visualizations used in games,
automobiles, visual recognition, medical
imaging, virtual reality as well as
professional data usage and storage.
Surely, these fields offer huge growth
potential for investors, especially because
they are still their infancy. For us,
it's important to appreciate that NVDA is
at the center of this revolution in graphics,
machine neural net-working and "deep
learning" programming. Want to know
more about the future in these fields?
NVDA's applications' Blog is well worth
studying. See
https://blogs.nvidia.com/
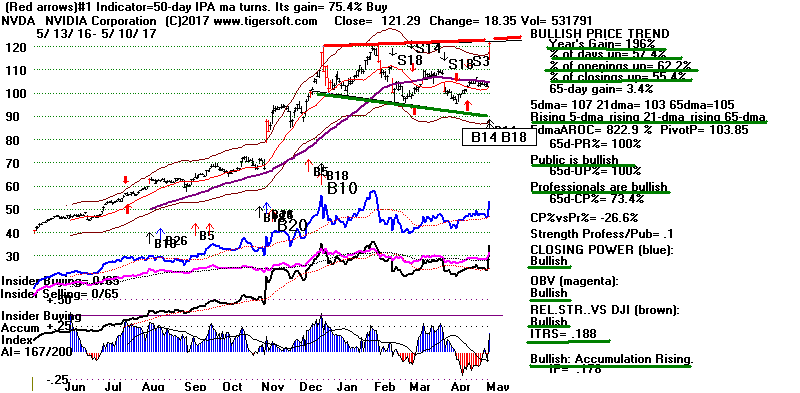
Today, NVDA reported much better earnings
and revenue that was expected.
It rose 17.8% and destroyed what looked
like a head/shoulders pattern.
Now it seems ready to breakout to new
highs. See the daily and weekly charts.
A new high here will put enormous pressure
on the shorts to cover.
It could
also set the stock loose to start another monster-advance. If this
occurs, we should be aboard it despite the
Peerless Sell S4. A breakout by
NVDA will allow etfs like
SOXL and TECL make more
big gains even as
the DJI lags or falls back to 10000. Big
NVDA gains will benefit its biggest
shareholders. Institutions own 73.4% of
its stock. They are listed by Yahoo.
See further below.
Too high priced? The head of Fidelity
Semiconductors' Select Fund said in February
that he wanted to buy more NVDA as their
earnings' growth should accelerate in 2017.
(See
https://www.fidelity.com/bin-public/060_www_fidelity_com/documents/SHDOCS/FSELX/hosts/sh_comm_pmqa.000008.RETAIL_pdf.pdf
)
| |
Top
Institutional Holders in NVDA
|
Holder |
Shares |
Date
Reported |
% Out |
Value |
|
|
5/10/17
Index
and ETF Charts:
PEERLESS
DJI, Signals, Indicators Daily DJI Split Volume
10-Day Up/Down Vol
Hourly
DJIA A/D Line for All Stocks.
S&P
OEX
NYSE
NASDAQ
COMPQX
with CP
DIA
SPY
QQQ
MDY
IWM-TNA
Short
Term Interest Rates
DJI-Utilities
DJI-Transp
A/D Line-6000 Stocks
CrudeOil
FAS
GLD
BBH
IBB
JETS
JNUG
KOL
NUGT
OIH
OIL
RSX
RETL
SLV
SOXL
TECL
TMF
TNA XIV YINN
To STOCKS' CHARTS
AAPL
AMAT AMGN
AMZN
BIDU
CAT
FB
GOOG
GS
IBM
JPM
MASI
MSFT
NVDA
QCOM TSLA
Others REN,
JJC,
NIB,
WEAT
UUP (Dollar)
5/10/17
Bullish MAXCPs
Bearish MINCPS
TRAP-DOORS
(197 stocks/ETFs) (of 100
stocks/ETFs)
 RANKING OF KEY DIRECTORIES BASED PCT.OF STOCKS ABOVE 65-DMA
               5/10/17
---------------------------------------------------------------------------------------
Directory     Current       day-1         day-2         day-3         day-4         day-5
----------------------------------------------------------------------------------------
EDU            1             1             1             1             1             1
NIFTY          .931          .931          .862          .896          .896          .862
ETFS           .911          .823          .823          .852          .808          .852
HOMEBLDG       .888          .833          .777          .777          .777          .666
BEVERAGE       .85           .85           .85           .85           .85           .75
BONDFUND       .803          .866          .919          .937          .901          .937
SOFTWARE       .781          .75           .812          .812          .75           .781
HACKERS        .777          .777          .777          .777          .777          .722
JETS           .777          .777          .777          .777          .777          .777
SOLAR          .736          .684          .578          .578          .421          .631
GAMING         .733          .7            .666          .733          .666          .8
SEMI           .715          .698          .646          .672          .629          .629
HOSPITAL       .714          .571          .428          .571          .571          .571
MORNSTAR       .697          .663          .672          .71           .676          .689
RETAIL         .678          .589          .517          .517          .5            .5
N=15
============================================================================================
ELECTRON       .659          .659          .639          .644          .613          .603
COMPUTER       .64           .64           .6            .6            .52           .48
INFRA          .636          .636          .636          .727          .909          .818
NASD-100       .626          .648          .626          .626          .637          .593
GREEN          .612          .677          .677          .709          .677          .677
UTILITY        .6            .555          .622          .622          .644          .666
INDEXES        .596          .596          .588          .634          .605          .592
SP500          .585          .573          .566          .587          .564          .541
MILITARY       .577          .577          .577          .577          .6            .577
RUS-1000       .559          .53           .531          .559          .527          .521
DJI-13         .538          .692          .615          .769          .615          .615
CHEM           .527          .513          .5            .611          .5            .541
CHINA          .516          .516          .435          .483          .467          .467
N=13
===========================================================================================
INSURANC       .5            .441          .558          .617          .617          .558
===========================================================================================
FINANCE        .489          .445          .489          .521          .543          .5
BIOTECH        .487          .471          .439          .504          .512          .512
SP-100         .484          .536          .525          .546          .525          .484
DOWJONES       .466          .6            .566          .6            .5            .566
COAL           .444          .333          .444          .333          .333          .333
REIT           .404          .347          .424          .466          .398          .445
AUTO           .4            .4            .35           .4            .35           .275
TRANSP         .4            .45           .5            .6            .55           .45
REGBANKS       .388          .444          .5            .472          .527          .5
INDMATER       .377          .336          .387          .418          .357          .367
N=10
===========================================================================================
OILGAS         .297          .24           .253          .227          .177          .221
BIGBANKS       .285          .285          .428          .142          .285          .142
PIPELINE       .222          .111          .222          .222          .111          .222
COMODITY       .214          .2            .214          .2            .2            .214
GOLD           .15           .132          .15           .113          .037          .094
FOOD           .142          .071          .142          .071          0             .142
N=6
====================================================================================
5/9/2017
The Operative Peerless signal remains a Sell
S4.
Sell S4 signals are
reliable. Even if there is a 2% rally,
Peerless will probably generate a Sell S9-V.
The DJI's Volume and Accumulation that
TigerSoft uses look quite weak.
See the many bearish warnings being given
now by the charts of the DJI
and DIA.
TECL, QQQ and the NASDAQ continue to be the
main havens
of remaining strength. It is not uncommon
for the best of the tech growth stocks
to keep rising, sometimes spectacularly,
for a month or so after the DJI tops out.
2000 is the best example of this. See the
DJI-NASDAQ chart just below.
FOR 8 WEEKS, THE DJI FELL AND NASDAQ ROSE in JAN & FEB
2000.
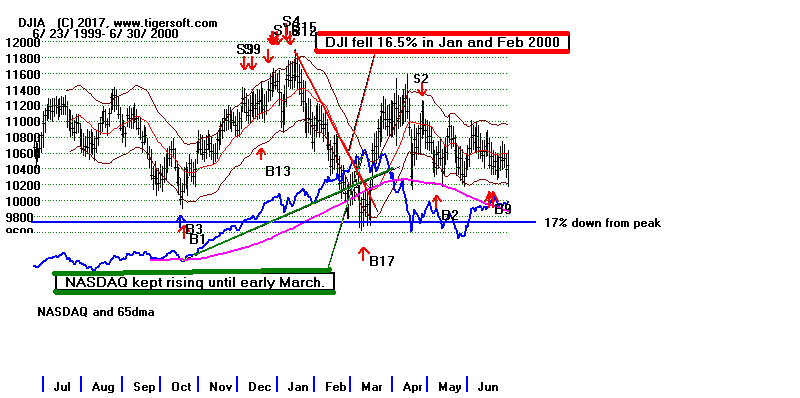
But even the best of the tech stocks can
only advance for just so long in
splendid isolation. Sell these if they
close below their 5-dma pivot-points.
Remaining Strong ETFs 5/9 Close 5/10 Pivot-Point
---------------------------------------------------------
TECL
74.23
72.3
QQQ
138.32 136.99
COMPQX
6120.59 6072.55
TOO MANY NEGATIVES FOR DJI NOW.
Already, I have note that the market must
cope with the rising probability
of higher
short-term interest rates and a much tighter monetary policy over
the next couple of years. I've also warned
that it is far from certain that
there will be a big tax cut this year. In
addition, the danger of a nuclear
war in Korea has not disappeared. Now, the
market has another negative
development to
ponder.
Pres. Trump today abruptly fired James
Comey, his FBI Director. It can not
be a coincidence that Comey told Congress
that he was intent on conducting
a thorough and independent investigation
into the Trump organization's collusion
with Russians last year. What is Trump so
desperate to hide? This eerily reminds
me of Nixon's firing of the Watergate
Special Prosecutor and his Attorney General.
This coincided with a very bad time for the
stock market. Are we in for a repeat?
See tonight's NY Times article:
https://www.nytimes.com/2017/05/09/us/politics/james-comey-fired-fbi.html?emc=edit_th_20170510&nl=todaysheadlines&nlid=58223894
Nixon Forces Firing of
Cox; Richardson, Ruckelshaus Quit
President Abolishes Prosecutor's Office; FBI Seals
Records
By Carroll Kilpatrick
Washington Post Staff Writer
Sunday, October 21, 1973;
Page A01
"In the most traumatic government upheaval of the Watergate crisis,
President Nixon yesterday discharged Special Prosecutor Archibald Cox
and accepted the resignations of Attorney General Elliot L. Richardson
and Deputy Attorney General William D. Ruckelshaus.
The President also abolished the office of the special prosecutor and
turned over to the Justice Department the entire responsibility for
further investigation and prosecution of suspects and defendants in
Watergate and related cases."
(
http://www.washingtonpost.com/wp-srv/national/longterm/watergate/articles/102173-2.htm
)
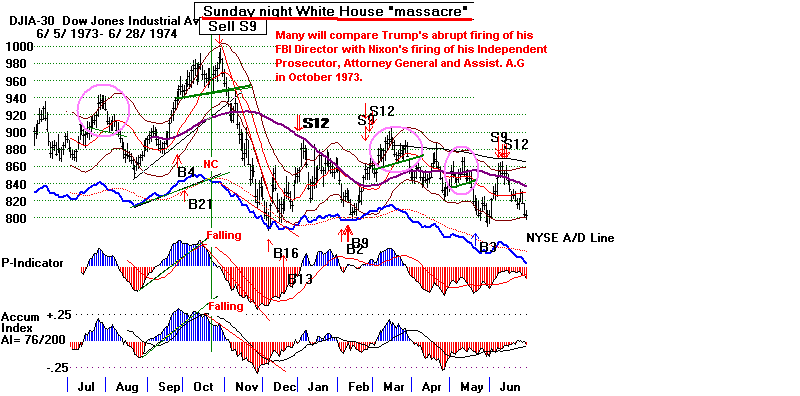
|
The
TigerSoft DJI and DIA Charts Now Are Emitting A Number of Bearish Warnings.
DJIA could be forming a rare, but
bearish "hands above the head" price pattern.
That it is unable to string together 3 straight up-days shows very
steady Big Money
distribution on strength.

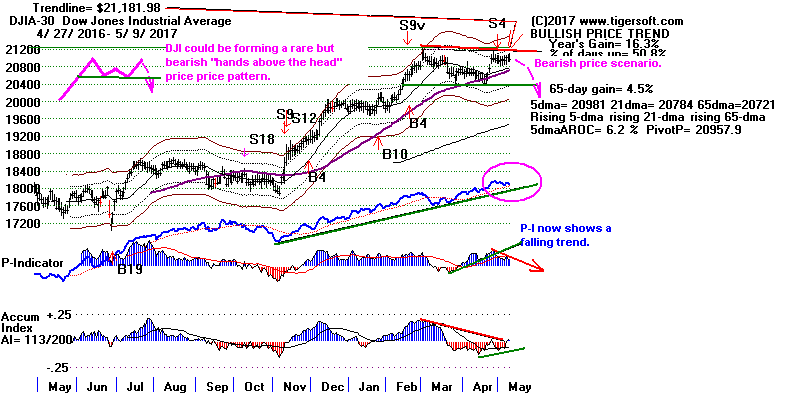
|
HOURLY DJIA shows Down-Hour again
picking up. This is short-term bearish.
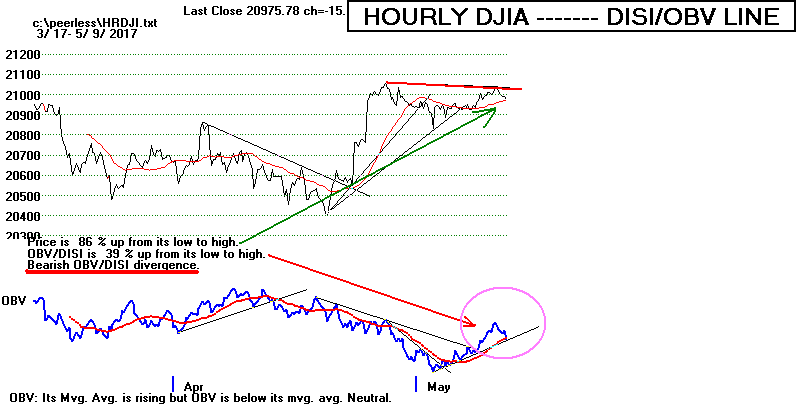 |
DIA shows significant and steady
Professional Selling to the general public.
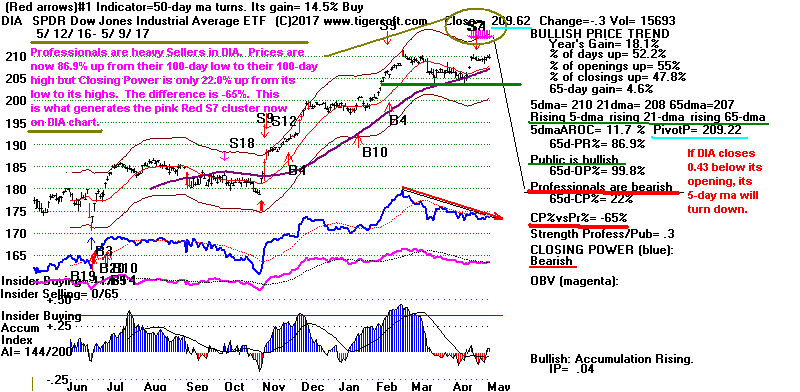 |
5/9/17
Index
and ETF Charts:
PEERLESS
DJI, Signals, Indicators Daily DJI Split Volume
10-Day Up/Down Vol
Hourly
DJIA A/D Line for All Stocks.
S&P
OEX
NYSE
NASDAQ
COMPQX
with CP
DIA
SPY
QQQ
MDY
IWM-TNA
Short
Term Interest Rates
DJI-Utilities
DJI-Transp
A/D Line-6000 Stocks
CrudeOil
FAS
GLD
BBH
IBB
JETS
JNUG
KOL
NUGT
OIH
OIL
RSX
RETL
SLV
SOXL
TECL
TMF
TNA XIV YINN
To STOCKS' CHARTS
AAPL
AMAT AMGN
AMZN
BIDU
CAT
FB
GOOG
GS
IBM
JPM
MASI
MSFT
NVDA
QCOM
TSLA
Others REN,
JJC,
NIB,
WEAT
UUP (Dollar)
5/9/17
Bullish MAXCPs
Bearish
MINCPS incl "TRAPDOORS"
(5)
5/8/2017
High Priced stocks
Breaking Badly Down: 7
 RANKING OF KEY DIRECTORIES BASED PCT.OF STOCKS ABOVE 65-DMA
               5/9/17
---------------------------------------------------------------------------------------
Directory     Current       day-1         day-2         day-3         day-4         day-5
----------------------------------------------------------------------------------------
EDU            1             1             1             1             1             1
NIFTY          .931          .862          .896          .896          .896          .965
BONDFUND       .866          .919          .937          .901          .937          .91
BEVERAGE       .85           .85           .85           .85           .75           .75
HOMEBLDG       .833          .777          .777          .777          .722          .722
ETFS           .823          .823          .852          .808          .852          .926
HACKERS        .777          .777          .777          .777          .722          .666
JETS           .777          .777          .777          .777          .777          .777
SOFTWARE       .75           .812          .812          .75           .781          .765
GAMING         .7            .666          .733          .666          .8            .766
SEMI           .698          .646          .672          .629          .637          .672
DJI-13         .692          .615          .769          .615          .615          .692
SOLAR          .684          .578          .578          .421          .631          .578
GREEN          .677          .677          .709          .677          .677          .645
N=14
=============================================================================================
MORNSTAR       .663          .672          .71           .676          .689          .739
ELECTRON       .659          .639          .649          .613          .608          .644
NASD-100       .655          .634          .634          .645          .602          .666
COMPUTER       .64           .6            .6            .52           .48           .64
INFRA          .636          .636          .727          .909          .818          .909
DOWJONES       .6            .566          .6            .5            .566          .6
INDEXES        .596          .588          .634          .605          .596          .634
RETAIL         .589          .517          .517          .5            .517          .5
MILITARY       .577          .577          .577          .6            .577          .622
SP500          .573          .566          .587          .564          .543          .581
HOSPITAL       .571          .428          .571          .571          .571          .857
UTILITY        .555          .622          .622          .644          .666          .666
SP-100         .536          .525          .546          .525          .484          .505
RUS-1000       .535          .536          .564          .532          .527          .569
CHINA          .516          .435          .483          .467          .467          .516
CHEM           .513          .5            .611          .5            .541          .583
N=16
==========================================================================================
BIOTECH        .474          .438          .501          .517          .517          .565
TRANSP         .45           .5            .6            .55           .45           .55
FINANCE        .445          .489          .521          .543          .51           .5
REGBANKS       .444          .5            .472          .527          .5            .416
INSURANC       .441          .558          .617          .617          .558          .5
AUTO           .4            .35           .4            .35           .275          .325
REIT           .347          .424          .466          .398          .445          .569
INDMATER       .336          .387          .418          .357          .367          .428
N=8
============================================================================================
COAL           .333          .444          .333          .333          .333          .333
BIGBANKS       .285          .428          .142          .285          .142          .142
OILGAS         .24           .253          .227          .177          .221          .259
COMODITY       .197          .211          .197          .197          .211          .281
GOLD           .132          .132          .132          .037          .094          .169
PIPELINE       .111          .222          .222          .111          .222          .444
FOOD           .071          .142          .071          0             .142          .214
N=7
====================================================================================
5/8/2017
The Operative Peerless signal remains a
Sell S4.
The
DJI,
however,
wants to keep us in suspense a while
longer, neither falling back or breaking
out. SPY,
IWM and
MDY also seem stuck in
their trading ranges. What
should we do?
Performance investors are not sitting still. They are jumping aboard the best
performing bigger high tech stocks. I
think we should, too.
Now more
and more of these big tech stocks, led by AAPL, are
preparing
for swift and possibly climactic vertical
ascents where they surpass the top of
their price channel.
AAPL today made such a breakout.
TECL and QQQ have
also done the same. The advances that
follow breakouts above the top of price
channels are often spectacular. Our Tiger
tools allow us to play these with
reasonable safety.
Because of the very high Power Ranking, too,
and despite the Peerless S4,
I think we
should buy TECL
and QQQ,
provided we work with steep uptrendlines
and stop-sells underneath them or use closes
below their pivot-points to sell, they
are worth going long.
We will follow them nightly here.
Consider
the current Accumulation Index Ranking for the DJI-30 stocks and the
biggest, most important ETFs. TECL is at
the top of this AI/200, Power Ranking,
IP21, is in the very bullish "BOTHUP"
condition and has outperformed DJI by
a whopping 14.5% over the last 50 trading
days.
HIGHEST POWER RANKED
in DJI-30 Download from Tiger Data base.
Symbol AI/200 Power OBV%
IPA% IP21
Up% OpenPwr ClosPwr ITRS
---------------------------------------------------------------------------------------------------------
TECL
182
584
-1% 0%
+.23 59%
Up
Up +.145
Close = 73.98 5-dma
pivot point = 72.75
SOXL
180
511 -10%
+15% +.15 56.6%
Up
Down! +.086
XIV
171 438 -33%
-3% +.06
61%
Up
?
+.22
QQQ
168
448
0
0% +.17 59.8%
Up
Up
+.049
Close = 137.84 5-dma
pivot point = 137.43
DD
165 344
-19% +17% +.02 50.6%
Up Down -.004
AAPL
163 483
-4%
0% +.15 55.4%
Up
Up +.144
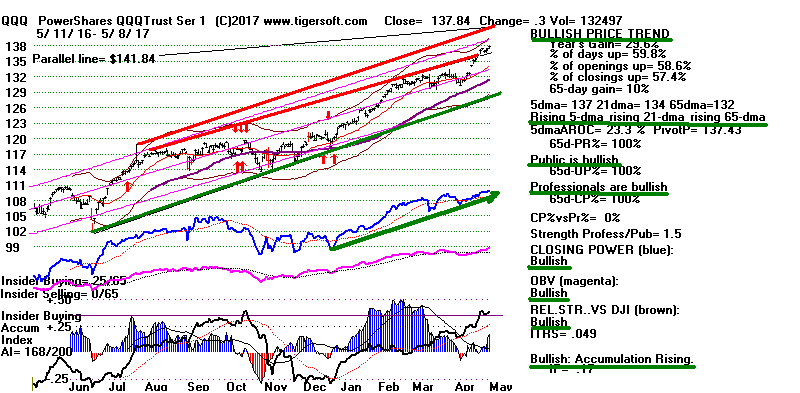 |
Another Buy recommendation is OIL
as soon as its Closing Power
downtrend is broken. See just below how
its action has just produced a red
Stochastic buy signal and these signals
have gained more than 100% over
the last year.
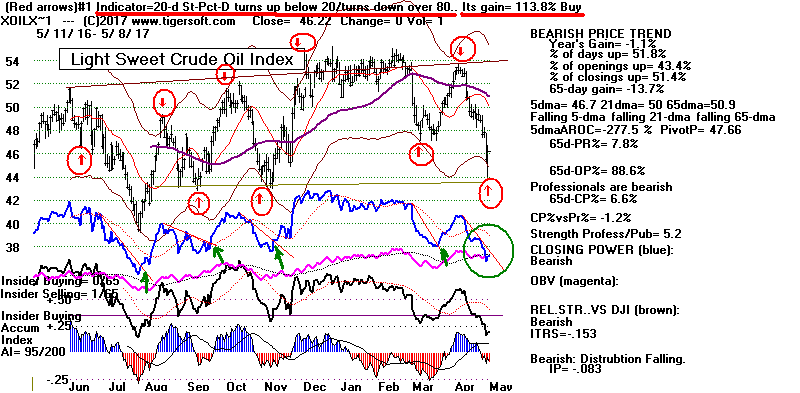
5/8/17
Index
and ETF Charts:
PEERLESS
DJI, Signals, Indicators Daily DJI Split Volume
10-Day Up/Down Vol
Hourly
DJIA A/D Line for All Stocks.
S&P
OEX
NYSE
NASDAQ
COMPQX
with CP
DIA
SPY
QQQ
MDY
IWM-TNA
Short
Term Interest Rates
DJI-Utilities
DJI-Transp
A/D Line-6000 Stocks
CrudeOil
FAS
GLD
BBH
IBB
JETS
JNUG
KOL
NUGT
OIH
OIL
RSX
RETL
SLV
SOXL
TECL
TMF
TNA XIV YINN
To STOCKS' CHARTS
AAPL
AMAT AMGN
AMZN
BIDU
CAT
FB
GOOG
GS
IBM
JPM
MASI
MSFT
NVDA
QCOM
Others REN,
JJC,
NIB,
WEAT
UUP (Dollar)
5/8/17
Bullish MAXCPs
Bearish
MINCPS
High Priced stocks Breaking Badly Down: 7
 RANKING OF KEY DIRECTORIES BASED PCT.OF STOCKS ABOVE 65-DMA
              5/8/17
---------------------------------------------------------------------------------------
Directory     Current       day-1         day-2         day-3         day-4         day-5
----------------------------------------------------------------------------------------
EDU            1             1             1             1             1             1
BONDFUND       .919          .937          .901          .937          .91           .937
NIFTY          .862          .896          .896          .896          .965          1
BEVERAGE       .85           .85           .85           .75           .75           .75
ETFS           .823          .852          .808          .852          .926          .882
SOFTWARE       .812          .812          .75           .781          .765          .765
HACKERS        .777          .777          .777          .722          .666          .722
HOMEBLDG       .777          .777          .777          .722          .722          .777
JETS           .777          .777          .777          .777          .777          .555
GREEN          .677          .709          .677          .677          .645          .612
MORNSTAR       .672          .71           .676          .689          .739          .743
N=11
GAMING         .666          .733          .666          .8            .766          .8
SEMI           .646          .672          .629          .637          .681          .698
ELECTRON       .639          .649          .618          .608          .649          .659
INFRA          .636          .727          .909          .818          .909          .909
NASD-100       .626          .626          .637          .593          .659          .67
UTILITY        .622          .622          .644          .666          .666          .644
DJI-13         .615          .769          .615          .615          .692          .769
COMPUTER       .6            .6            .52           .48           .64           .6
INDEXES        .588          .634          .605          .596          .638          .634
SOLAR          .578          .578          .421          .631          .578          .526
MILITARY       .577          .577          .6            .577          .622          .622
SP500          .568          .589          .566          .545          .585          .583
DOWJONES       .566          .6            .5            .566          .6            .666
INSURANC       .558          .617          .617          .558          .529          .647
RUS-1000       .536          .564          .532          .527          .57           .581
SP-100         .525          .546          .525          .484          .505          .505
RETAIL         .517          .517          .5            .517          .517          .464
CHEM           .507          .623          .507          .55           .594          .623
N=18
===========================================================================================
REGBANKS       .5            .472          .527          .5            .388          .444
TRANSP         .5            .6            .55           .45           .55           .45
FINANCE        .489          .521          .543          .51           .5            .532
COAL           .444          .333          .333          .333          .333          .333
BIOTECH        .442          .501          .509          .521          .565          .584
CHINA          .435          .483          .467          .467          .532          .548
BIGBANKS       .428          .142          .285          .142          .142          .142
HOSPITAL       .428          .571          .571          .571          .857          .428
REIT           .424          .466          .398          .445          .564          .616
INDMATER       .387          .418          .357          .367          .428          .469
AUTO           .35           .4            .35           .275          .325          .375
N=11
-------------------------------------------------------------------------------------------
OILGAS         .253          .227          .177          .221          .259          .259
PIPELINE       .222          .222          .111          .222          .444          .444
COMODITY       .211          .197          .197          .211          .281          .295
FOOD           .142          .071          0             .142          .214          .285
GOLD           .132          .113          .056          .094          .169          .15
N=5
====================================================================================
5/5/2017
The Operative Peerless signal remains a
Sell S4.
This has been
a reliable Sell signal. There have
only been two cases since 1945
when there was a paper loss greater
than 2%, about 400 points
here. The DJI might still make a
flat-top breakout above 21200,
but our volume indicators are quite
negative and the Accum. Index
is only +.001. So, another 1.2%
rally will likely bring a Sell S9-V
and possibly a S12 also. Our DIA
chart also offers us a clear warning:
Professionals are outright bearish.
We see this from the purple
Tiger S7s. Our Tiger Closing Power
is badly lagging prices. So, is the
Hourly DJI's
DISI-OBV.
Of
course, the DJI could just be much weaker than the other averages
because it is made up of older and
more irrelevant blue-chips, but that
is not what Peerless Stock Market
Timing teaches. Much more likely,
the NASDAQ, QQQ and TECL (tech
stocks' 3x ETF) will not be able
to rally too much longer just by
themselves. Surely, their new highs
will need to be matched, at least, by
the SP-500. As you can see below
in the SPY chart, Professionals are
still cautious here. Perhaps, they
are simply waiting for a clear SPY
breakout.
The
expected victory by the French center coalition is, I think, less important
the warning now seen in the
rising Short-Term Interest rates'
chart below.
With April's Job Report showing
210,000 new jobs and Unemployment
making new lows, the stage would seem
to be set for the FED to raise
short-term rates again. This would
make the third increase in the last
year. Rising rates are apt to be
troublesome for the market, especially if
the FED starts to sell some of the
huge $5 trillion debt portfolio that it bought up
to inflate stock and bond prices
between 2009 and 2013. Unless Congress
can reach agreement on a big tax
decrease AND an Infrastructure spending
increase, stock prices will likely
plateau and may even fall back to retest the 18000
level.
I
think taking profits in QQQ or TECL when their 5-day ma turn down
if you still have them still is
reasonable. Hold DIA short now out of respect
for the Sell S4. SPY might start a
quick spurt upwards tomorrow. Very
short-term traders may choose to play
the flat-top breakout long. But
do not hold if it closes below its
5-day ma "pivot-point". This would
mean selling it if it closes down
more than 1.02 from its Monday opening.
DJIA
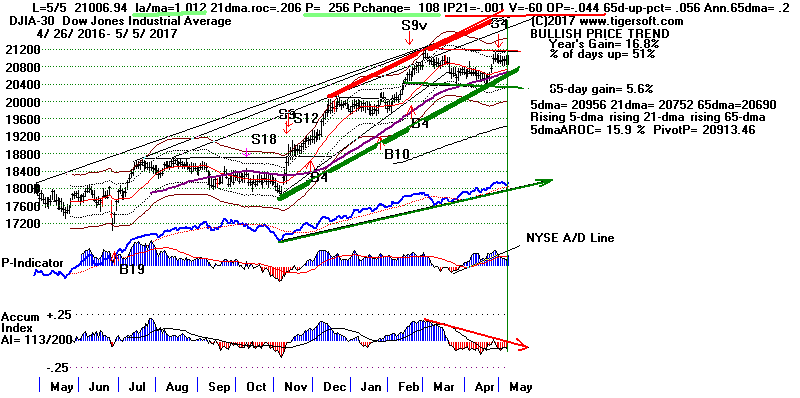
SHORT-TERM
INTEREST RATES
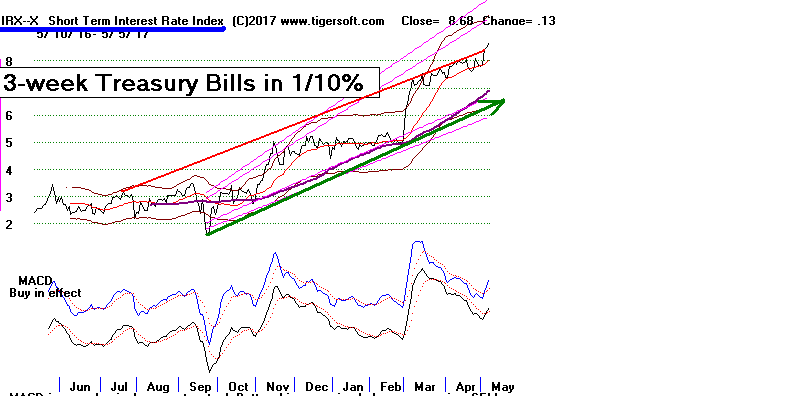
DIA
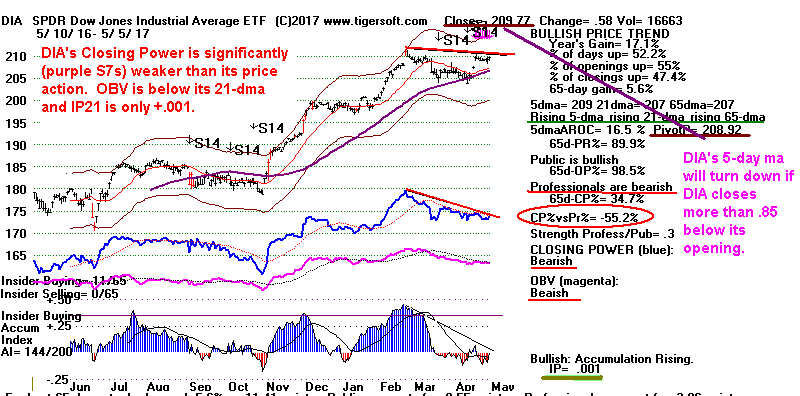
SPY
may still achieve a flat-topped breakout.
However, SPY's weak internals do
not yet show the marginal new closing high can be trusted.
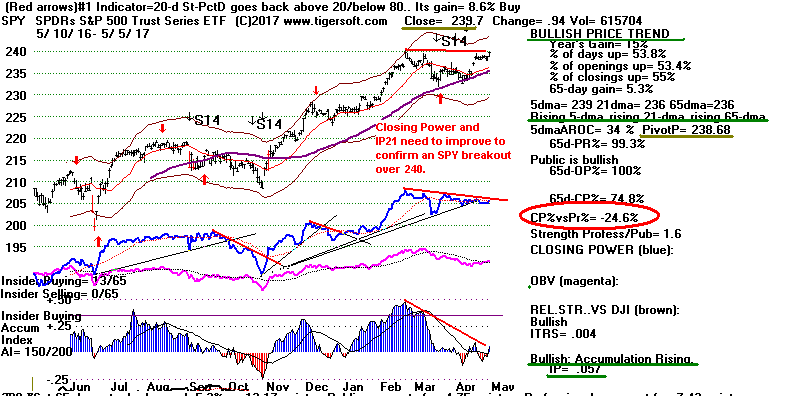
QQQ is very
close to its upper band resistance.
This should limit its upside
potential.
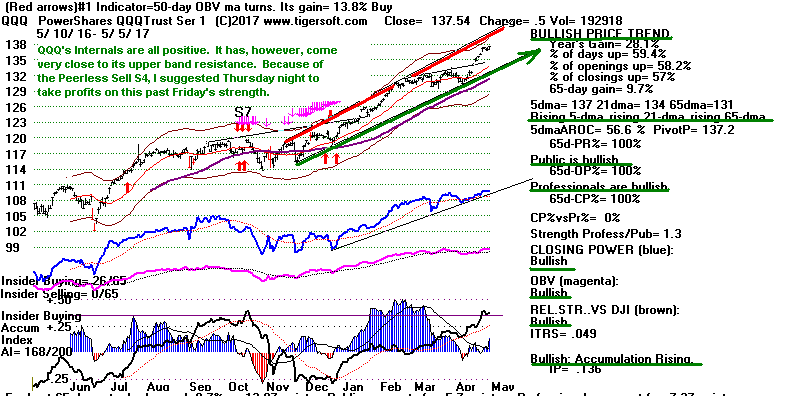
TECL
need only close 0.78 below its close to have its
5-dma turn down Monday.
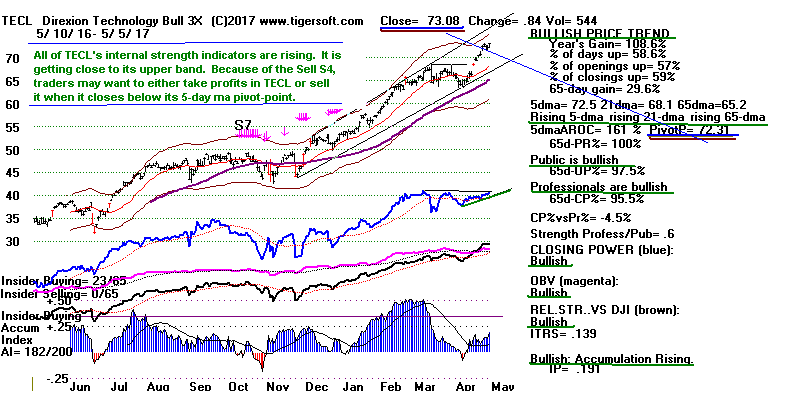
5/5/17
Index
and ETF Charts:
PEERLESS
DJI, Signals, Indicators Daily DJI Split Volume
10-Day Up/Down Vol
Hourly
DJIA A/D Line for All Stocks.
S&P
OEX
NYSE
NASDAQ
COMPQX
with CP
DIA
SPY
QQQ
MDY
IWM-TNA
Short
Term Interest Rates
DJI-Utilities
DJI-Transp
A/D Line-6000 Stocks
CrudeOil
FAS
GLD
BBH
IBB
JETS
JNUG
KOL
NUGT
OIH
OIL
RSX
RETL
SLV
SOXL
TECL
TMF
TNA XIV YINN
To STOCKS' CHARTS
AAPL
AMAT AMGN
AMZN
BIDU
CAT
FB
GOOG
GS
IBM
JPM
MASI
MSFT
NVDA
QCOM
Others REN,
JJC,
NIB,
WEAT
UUP (Dollar)
5/5/17
Bullish MAXCPs
Bearish
MINCPS
High Priced stocks Breaking Badly Down: 10
 RANKING OF KEY DIRECTORIES BASED PCT.OF STOCKS ABOVE 65-DMA
              5/5/17
---------------------------------------------------------------------------------------
Directory     Current       day-1         day-2         day-3         day-4         day-5
----------------------------------------------------------------------------------------
EDU            1             1             1             1             1             1
BONDFUND       .937          .901          .937          .91           .937          .892
NIFTY          .896          .896          .896          .965          1             1
ETFS           .852          .808          .852          .926          .882          .852
BEVERAGE       .85           .85           .75           .75           .75           .8
SOFTWARE       .812          .75           .781          .765          .765          .75
HACKERS        .777          .777          .722          .666          .722          .777
HOMEBLDG       .777          .777          .722          .722          .777          .777
JETS           .777          .777          .777          .777          .555          .555
DJI-13         .769          .615          .615          .692          .769          .769
GAMING         .733          .666          .8            .766          .8            .7
INFRA          .727          .909          .818          .909          .909          .909
MORNSTAR       .71           .676          .689          .739          .743          .747
GREEN          .709          .677          .677          .645          .612          .645
SEMI           .672          .629          .637          .681          .706          .689
N=15
---------------------------------------------------------------------------------------------
ELECTRON       .649          .618          .613          .649          .664          .675
INDEXES        .634          .605          .596          .638          .638          .617
NASD-100       .634          .645          .602          .666          .677          .709
UTILITY        .622          .644          .666          .666          .644          .711
INSURANC       .617          .617          .558          .529          .647          .676
CHEM           .605          .507          .549          .577          .591          .647
COMPUTER       .6            .52           .48           .64           .6            .64
DOWJONES       .6            .5            .566          .6            .666          .666
TRANSP         .6            .55           .45           .55           .45           .45
SP500          .589          .566          .545          .585          .585          .6
SOLAR          .578          .421          .631          .578          .526          .578
MILITARY       .577          .6            .577          .622          .622          .644
HOSPITAL       .571          .571          .571          .857          .428          .428
RUS-1000       .564          .532          .527          .57           .581          .586
SP-100         .546          .525          .484          .505          .505          .556
FINANCE        .521          .543          .51           .5            .532          .478
RETAIL         .517          .5            .517          .517          .464          .482
BIOTECH        .505          .509          .513          .569          .588          .592
N=18
-------------------------------------------------------------------------------------------
CHINA          .483          .467          .467          .532          .532          .516
REGBANKS       .472          .527          .5            .388          .444          .416
REIT           .466          .398          .445          .564          .621          .569
INDMATER       .418          .357          .367          .428          .489          .479
AUTO           .4            .35           .275          .325          .35           .375
N=5
-------------------------------------------------------------------------------------------
COAL           .333          .333          .333          .333          .333          .111
OILGAS         .227          .177          .221          .259          .259          .221
PIPELINE       .222          .111          .222          .444          .444          .333
COMODITY       .197          .197          .211          .281          .295          .281
BIGBANKS       .142          .285          .142          .142          .142          0
GOLD           .113          .037          .113          .169          .15           .188
FOOD           .071          0             .142          .214          .285          .142
N=7
====================================================================================
====================================================================================
5/4/2017
The operative Peerless signal is a
Sell S4. The DJI
stands 1.1% over
its 21-day ma but shows
Accum/Distribution and volume indicators
that are quite negative. Our
"IP21" is -.068, the
V-I is -99 and our
OBVPct for
the DJI chart below is -.141. As a result, it
would not take much of
a rally from here, about +1.2%, to
bring about a Peerless Sell S12 or Sell S15
of both. A very positive Jobs' number
tomorrow, over +250,000, could cause
such a pop upwards in the DJI.
We should sell into that strength
many of our long positions.
A number over +250,000 would eclipse
last month's weak 98,000 new jobs'
report. I think a very positive number is
expected tomorrow. Yellen said as
much. But the truth is that a very "good"
number is bound to give the Fed more
reason to raise short-term rates and
even start selling off some of the
massive $5 trillion of its inventory of debt
that it has bought in recent years to
prop the market up.
Non Agric.
New Jobs
in 1000s.
(Labor Dept) |
| Year |
Jan |
Feb |
Mar |
Apr |
May |
Jun |
Jul |
Aug |
Sep |
Oct |
Nov |
Dec |
| 2007 |
240 |
89 |
190 |
80 |
143 |
75 |
-34 |
-20 |
88 |
84 |
114 |
98 |
| 2008 |
17 |
-84 |
-78 |
-210 |
-186 |
-162 |
-213 |
-267 |
-450 |
-474 |
-766 |
-694 |
| 2009 |
-793 |
-702 |
-823 |
-687 |
-349 |
-471 |
-329 |
-213 |
-220 |
-204 |
-2 |
-275 |
| 2010 |
23 |
-68 |
164 |
243 |
524 |
-137 |
-68 |
-36 |
-52 |
262 |
119 |
87 |
| 2011 |
43 |
189 |
225 |
346 |
77 |
225 |
69 |
110 |
248 |
209 |
141 |
209 |
| 2012 |
358 |
237 |
233 |
78 |
115 |
76 |
143 |
177 |
203 |
146 |
132 |
244 |
| 2013 |
211 |
286 |
130 |
197 |
226 |
162 |
122 |
261 |
190 |
212 |
258 |
47 |
| 2014 |
190 |
151 |
272 |
329 |
246 |
304 |
202 |
230 |
280 |
227 |
312 |
255 |
| 2015 |
234 |
238 |
86 |
262 |
344 |
206 |
254 |
157 |
100 |
321 |
272 |
239 |
| 2016 |
126 |
237 |
225 |
153 |
43 |
297 |
291 |
176 |
249 |
124 |
164 |
155 |
| 2017 |
216 |
232(R) |
79(R) |
211(P) |
|
|
|
|
|
|
|
|
| P : preliminary |
https://data.bls.gov/timeseries/CES0000000001?output_view=net_1mth
|
|
Short Term Rates are already rising
steeply. This hurts the NYSE A/D Line.
With Retailing weak and many Commodities
and OIL falling, one
has to wonder will any FED tightening bring
about serious economic
weakness and endanger the long bull
market. The risks seem greater
than the rewards unless you think that
Congress will actually vote
to lower taxes and provide a big
Infrastructure stimulus plan. I doubt
if this will happen.
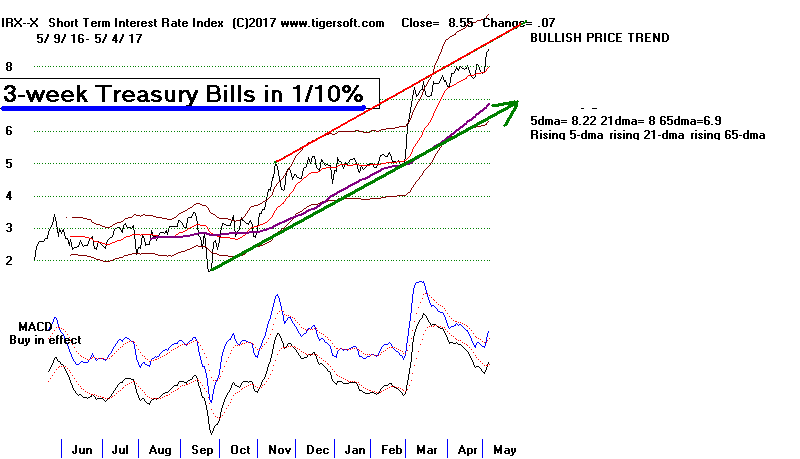
Technical Warning
Signs in Peerless chart of DJIA
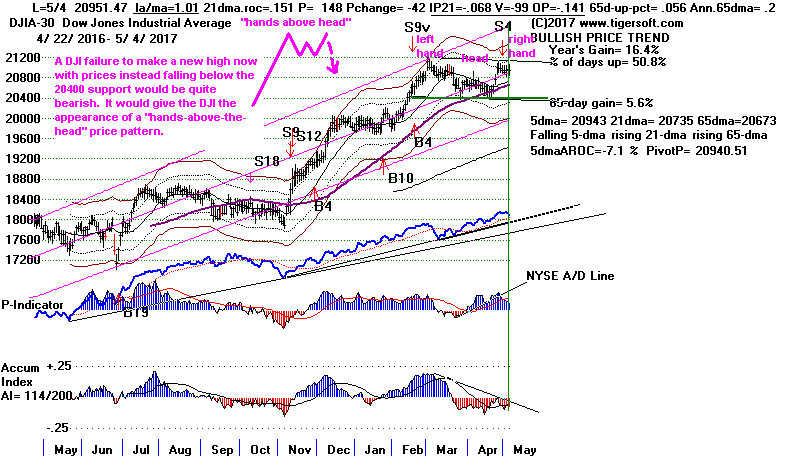
Today, by hovering just two hundred
points from an all-time high,
the DJI-30 maintained the appearance
that the stock market is
still healthy and safe after 8 years of
rallying. Keeping up
such appearances to almost the "bitter
end", after all, is the main function
of this "venerable" Blue-Chip average.
But in actuality, today there
were 828 more down than up on the NYSE
and we may now be seeing
an end to the era in which low interest
rates keep the NYSE A/D Line
bullishly rising.
This is
becoming a scary
stock market. If you doubt it, look at today's
22 "TrapDoor" stocks.
Yesterday, there were
only 16. "Trap-doors"
suddenly drop 10% or more, sometimes
simply because they break their
steep price-up-trends. Risk is
becoming too great and traders are grabbing
profits while they still can. We
should so the same, I think. Sell TECL and QQQ.
Short some
of Bearish MINCP stocks and others completing head/shoulders
patterns.
We are already short DIA.
Many
of these "trap-Door" stocks were until very recently the
best performing big-gainers. An utter
lack of bids is becoming
apparent in a good number of the
stocks completing bearish
head/shoulders patterns or are
breaking key support after
showing steady red distribution. As
traders start noticing
these big breaks to the downside, they
will become more and more
nervous about their own holdings. It
does not look like a
good time to be long so-called
high-performance "growth" stocks.
Reaching its upper band after a
long advance was
the primary way, one might have
judged MASI a sell.
HTGC's top was easier to spot.
Note the weakening
Blue Closing Power and negative
Accumulation Index
just before its big decline.
Watch to see if GKOS completes
its bearish head/shoulders
pattern and then see what happens
to it. We will be reviewing
these "TrapDoor" stocks this
weekend to see if they can
re-gain their footing. If not, it
will be a bad sign for this 8+
year old bull market, 2009-2017?
5/4/17
Index
and ETF Charts:
PEERLESS
DJI, Signals, Indicators Daily DJI Split Volume
10-Day Up/Down Vol
Hourly
DJIA A/D Line for All Stocks.
S&P
OEX
NYSE
NASDAQ
COMPQX
with CP
DIA
SPY
QQQ
MDY
IWM-TNA
Short
Term Interest Rates
DJI-Utilities
DJI-Transp
A/D Line-6000 Stocks
CrudeOil
FAS
GLD
BBH
IBB
JETS
JNUG
KOL
NUGT
OIH
OIL
RSX
RETL
SLV
SOXL
TECL
TMF
TNA XIV YINN
To STOCKS' CHARTS
AAPL
AMAT AMGN
AMZN
BIDU
CAT
FB
GOOG
GS
IBM
JPM
MASI
MSFT
NVDA
QCOM
Others REN,
JJC,
NIB,
WEAT
UUP (Dollar)
5/4/17
Bullish MAXCPs
Bearish
MINCPS
====================================================================================
5/3/2017
The operative Peerless signal is an
Sell S4. The FED
said today
that they would hold off raising rates
until they see more data. Yellen
warned, though, that last month's poor
Jobs Report, which was under +100,000,
was most likely an aberration. If so,
rates would probably then be going up.
This statement makes this Friday's
Jobs' number very significant.
Today, the DJI
did turn up from an early loss. An expected Trump victory in
Congress on repealing ObamaCare may be
the reason. So, perhaps, the DJI will
breakout above its flat top at 11200.
If it does spurt upwards, a Sell S12
or S15 seem likely given the DJI's
negative IP21, V-I and OBVPct readings.
(See
https://www.nytimes.com/2017/05/03/us/politics/gop-eyes-8-billion-addition-to-win-a-crucial-vote-to-the-latest-health-bill.html?emc=edit_th_20170504&nl=todaysheadlines&nlid=58223894&_r=0
)
Today saw 556 more down than up on
the NYSE and Down Volume was
150 million more than up volume. The
NASDAQ, QQQ and many
tech stocks
like AAPL
and FB did back-off from their upper band resistance
levels today.
I would think we will see more of that
tomorrow. Sell TECL if its Closing Power
turns down (a lower close than the
opening) tomorrow.
The DJI is stuck between a "rock and a
hard place." If it rallies, its
negative volume internals will likely
produce new red Peerless Sells.
If it
falls and breaks its neckline support, it will complete a rare, but
very bearish "hands above the head"
price pattern. Similarly,
if the Jobs' numbers are good on
Friday, the Fed will probably be
raising rates. But if the Jobs numbers
are poor on Friday, it will
show that stocks have probably
over-reached the economy unless
Congress can cuts taxes and launch an
infrastructure spending
program to make up for the weakening
economic growth.

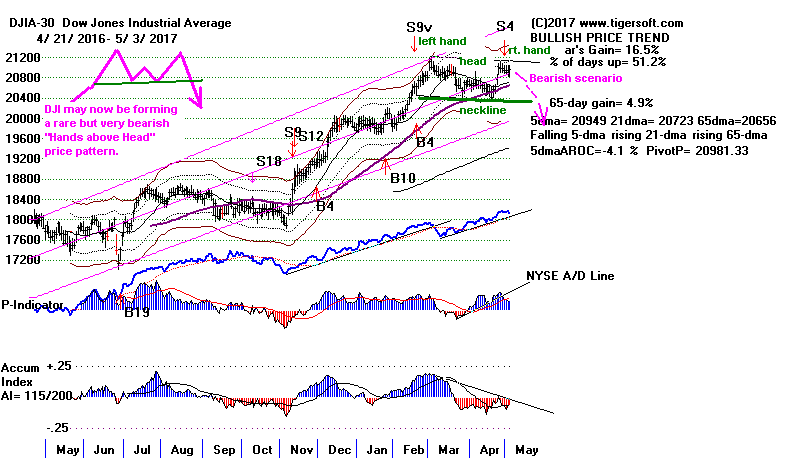

The Number of
one-day "Trap-Door" Stocks Is Increasing.
... 16 today....
Download
TRAPDOOR.exe stocks from our Data page. These are
higher priced stocks down more than 8% in one day. When
the
number of "trap-door" stocks suddenly jumps up, it is a
warning
that institutional confidence in the market is waning.
It also serves
to un-nerve investors that their pet stocks may be
next. Most often
we see typical early warnings with these stocks, such as
key support
failures, head/shoulders patterns (FLT, IPHI-11%, NBL,
OMI, PPLT, SNI,
AKAM -16%, GLT--11%) or breaks in 65-dma (BG-12%, BGFV,
MBT,
RXDX, VRSX, KTCC, and S. But sometimes, and this is the
scariest of all,
there are no clear technical warnings. See below
AZPN-9%, NANO-15%,
TOWR -11%, HSKA. We will keep a running count of these
stocks
each night. Download the stocks using TRAPDOOR.exe
tomorrow.
5/3/17
Index and ETF
Charts:
PEERLESS
DJI, Signals, Indicators Daily DJI Split Volume
10-Day Up/Down Vol
Hourly
DJIA A/D Line for All Stocks.
S&P
OEX
NYSE
NASDAQ
COMPQX
with CP
DIA
SPY
QQQ
MDY
IWM-TNA
Short
Term Interest Rates
DJI-Utilities
DJI-Transp
A/D Line-6000 Stocks
CrudeOil
FAS
GLD
BBH
IBB
JETS
JNUG
KOL
NUGT
OIH
OIL
RSX
RETL
SLV
SOXL
TECL
TMF
TNA XIV YINN
To STOCKS' CHARTS
AAPL
AMAT AMGN
AMZN
BIDU
CAT
FB
GOOG
GS
IBM
JPM
MASI
MSFT
NVDA
QCOM
Others REN,
JJC,
NIB,
WEAT
UUP (Dollar)
5/3/17
Bullish MAXCPs
Bearish
MINCPS
(of 148 (-37) stocks/ETFs) (of 196
(-34) stocks/ETFs)
 RANKING OF KEY DIRECTORIES BASED PCT.OF STOCKS ABOVE 65-DMA
   + 30 show more than 50% of their stocks are above the 65-dma.
   - 14 show more than 50% of their stocks are above the 65-dma.

               5/3/17
---------------------------------------------------------------------------------------
Directory     Current       day-1         day-2         day-3         day-4         day-5
----------------------------------------------------------------------------------------
EDU            1             1             1             1             1             1
BONDFUND       .937          .91           .937          .892          .875          .866
NIFTY          .896          .965          1             1             .965          .965
ETFS           .852          .926          .882          .852          .852          .867
INFRA          .818          .909          .909          .909          .909          .818
GAMING         .793          .758          .793          .689          .724          .827
SOFTWARE       .781          .765          .765          .75           .765          .734
JETS           .777          .777          .555          .555          .555          .555
BEVERAGE       .75           .75           .75           .8            .8            .8
HACKERS        .75           .687          .75           .812          .75           .75
HOMEBLDG       .722          .722          .777          .777          .888          .888
MORNSTAR       .689          .739          .743          .743          .777          .81
GREEN          .677          .645          .612          .645          .709          .806
N=13
--------------------------------------------------------------------------------------------
UTILITY        .666          .666          .644          .711          .666          .733
SEMI           .637          .681          .706          .689          .767          .715
SOLAR          .631          .578          .526          .578          .631          .578
HOSPITAL       .625          .875          .375          .375          .375          .375
DJI-13         .615          .692          .769          .769          .769          .769
ELECTRON       .604          .647          .663          .673          .711          .673
INDEXES        .596          .638          .638          .617          .651          .676
NASD-100       .593          .659          .67           .692          .703          .681
MILITARY       .577          .622          .622          .644          .644          .622
DOWJONES       .566          .6            .666          .666          .666          .7
INSURANC       .558          .529          .647          .676          .794          .764
CHEM           .549          .577          .591          .647          .676          .704
SP500          .543          .583          .583          .594          .619          .633
RUS-1000       .522          .566          .576          .58           .617          .639
RETAIL         .517          .517          .464          .482          .517          .535
BIOTECH        .516          .564          .588          .588          .584          .6
FINANCE        .51           .5            .532          .478          .597          .652
N=17
=============================================================================================
REGBANKS       .5            .388          .444          .416          .666          .805
=============================================================================================
SP-100         .484          .505          .505          .546          .567          .587
COMPUTER       .48           .64           .6            .64           .56           .6
CHINA          .467          .532          .532          .532          .564          .564
TRANSP         .45           .55           .45           .45           .6            .5
REIT           .447          .567          .625          .572          .64           .718
INDMATER       .367          .428          .489          .479          .469          .489
N=6
---------------------------------------------------------------------------------------------
AUTO           .275          .325          .35           .375          .45           .425
COAL           .25           .25           .25           0             .125          .125
PIPELINE       .222          .444          .444          .333          .333          .555
OILGAS         .221          .259          .259          .221          .208          .303
COMODITY       .211          .281          .295          .281          .267          .281
BIGBANKS       .142          .142          .142          0             .142          .571
FOOD           .142          .214          .285          .142          .142          .142
GOLD           .096          .173          .153          .192          .134          .211
N=8
====================================================================================
5/2/2017
The operative Peerless signal is an Sell S4. It
has not been joined by
a different Peerless Sell signal. That
would probably occur on an additional
200 point gain. Sell S4s are reliable
bearish.
Take profits in QQQ, but hold TECL long in
case it breaks out above top
of its price channel. DIA should have been
shorted on Monday because
of the S4 and DIA's falling Closing power.
S4 Short Sale Results on DJI
Avg.
Gain. Number of Cases
All
S4s since
1929
11.0%
36
All S4s since
1945
8.8%
28
S4s when no other signal present
since 1945
4.8%
14
"Type 1" S4s since
1945
7.0%
7
S4s since 1945 when P-I over
+95
7.4%
17
S4s since 1945 when
LA/MA<1.02
9.9%
9
S4s when IP21, V-I and OBVPct<
0
9.2%
2
Paper Losses on Sell
S4s since 1945
None - 10 cases
0.1% to 1.0% - 10 cases
1.1% to 2.0% - 6 cases
2.1% to 3.0% - 1 case
3.1% to 3.4% - 1 case
(See the
latest study of all Peerless S4s
here).

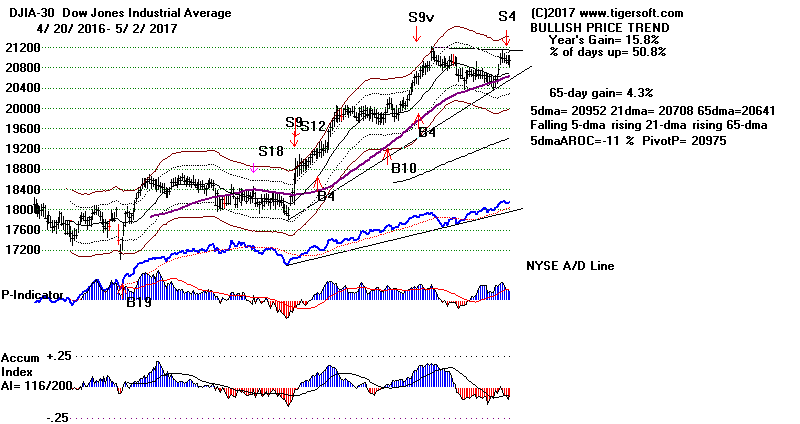

The
DJI now stands 1.1% over the 21-day with a negative IP21, OBVPct and V-I.
DIA's Closing
Power is in a clear downtrend. The Hourly DISI is significantly weaker
than DJI prices have been for the last two
months. See below. This is reliably bearish.
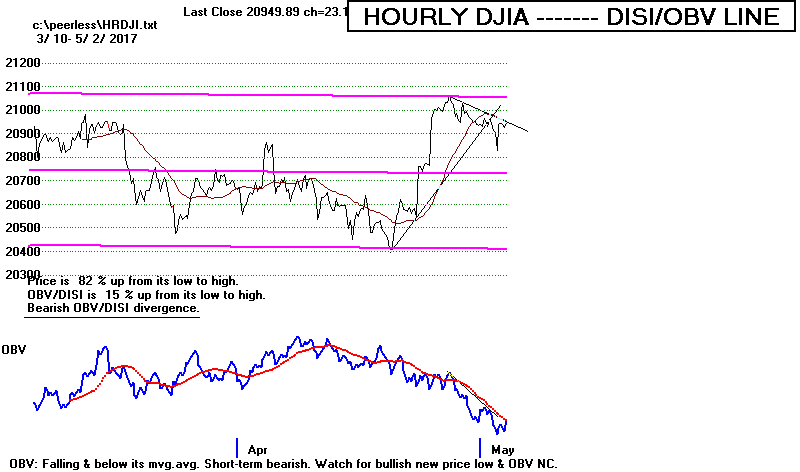
The DJI has not
managed 3-straight up-days for more than two months and only one
2-straight up-days' run since early March.
This shows the upside is limited in the
minds of big-Money and they are quickly
distributing/selling shares on a regular basis.
This can't be good after a bull market
advance that has lasted 8 years and 2 months.
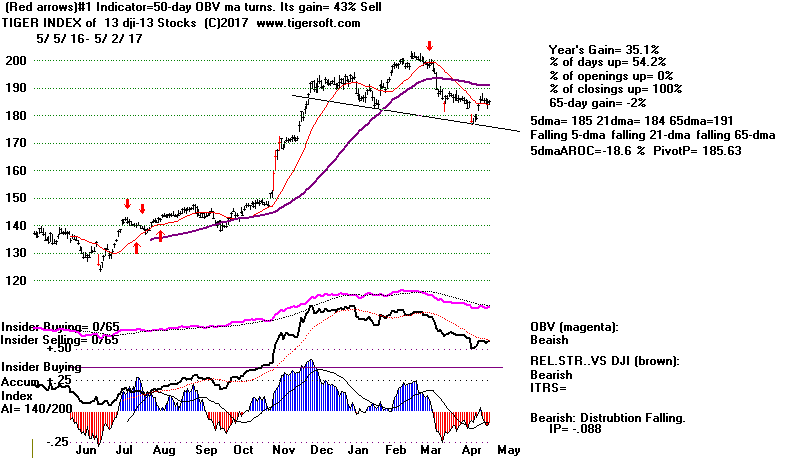
The leading 13
high-priced DJI stocks have formed a bearish head/shoulders pattern.
The DJI-30 is weighted in such a way so that
these 13 have great control on where
the full DJIA can go. This is important,
because the overall market hardly ever rises
very far without the DJI-30 participating.
And when we look back at when the DJI
did lag the general market, a top was very
near. This was definitely the case in the
second half of 1976 and in the first quarter
of 2000.
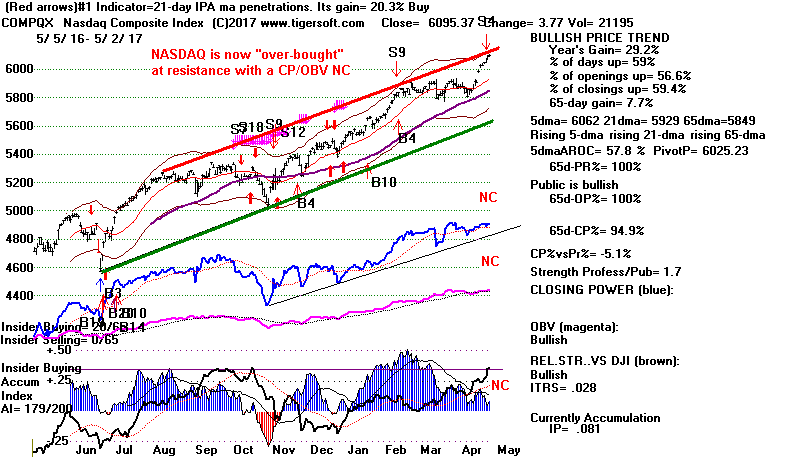
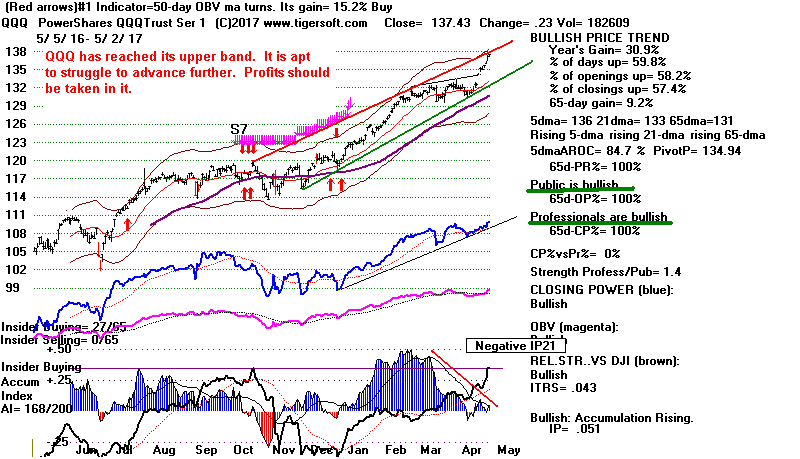
What could
be worse? Today the previously strong tech heavy QQQ,
TECL and
SOXL ETFS mostly
"spun their wheels".
They are very over-bought, having almost reached
their upper bands. Now Profit-taking in
them will probably keep them from rising.
What will now keep appearance that the US
stock market is still very strong? Will that
cause the Public to reconsider Trump's magic
for stocks and reduce the numbers
of stock-purchasers at the opening? Watch
the Opening Powers now and see if they
start turning bearish.
So what's
going on? Traders
have clearly started to think the upside is limited for now.
Short-term rates are going up. See the
Short-Term chart just below.
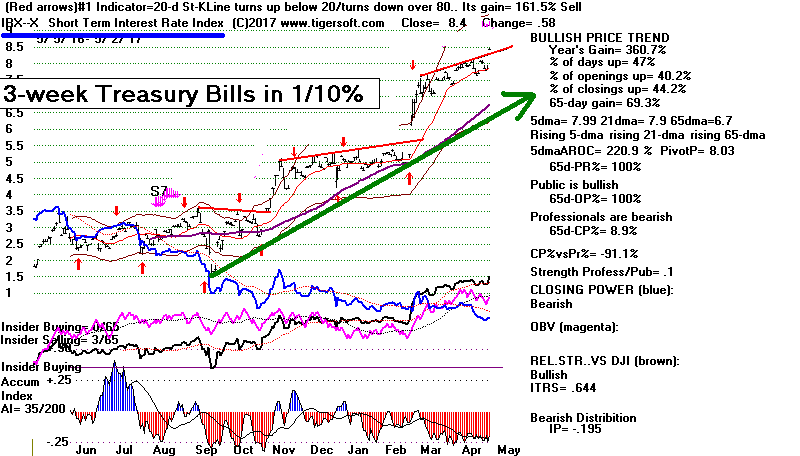
Only the FED knows for how long and how far
rates will be rising. But one thing is
clear, and it's pretty scary: the day's of
the Fed's pumping of trillions into the support
of stocks by maintaining very low interest
rates and buying huge amount of private
and government debt instruments are probably
over and are going to be reversed
someday soon. What sent the market up taken
away will surely send the market down
unless there is a massive fiscal stimulus in
the form of tax cuts AND infrastructure spending.
But when will there be such stimulus?
Trump's ability to produce a working Congressional
majority and also overcome vetoes from the
Senate now seems quite limited. Not just
his critics are starting to count his many
swift policy reversals and the increasing numbers
of empty threats and bluffs. (See
All in all,
there seems little reason for the market not to pull-back and re-think what
lies ahead. I would, however, stay long
TECL.
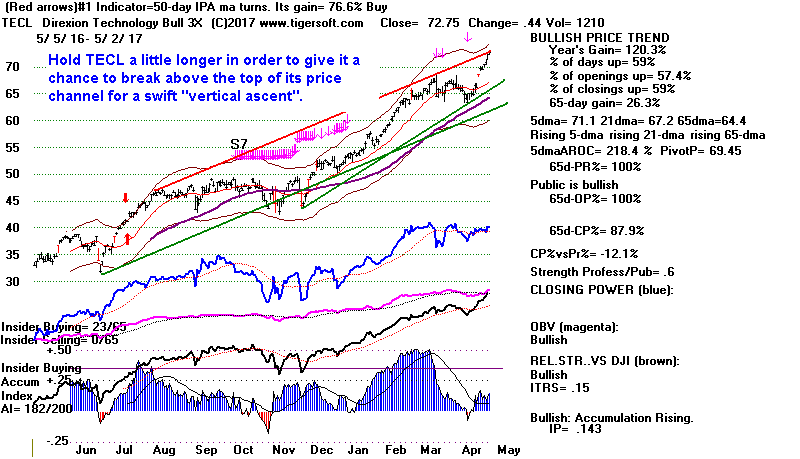
5/2/17
Index
and ETF Charts:
PEERLESS
DJI, Signals, Indicators Daily DJI Split Volume
10-Day Up/Down Vol
Hourly
DJIA A/D Line for All Stocks.
S&P
OEX
NYSE
NASDAQ
COMPQX
with CP
DIA
SPY
QQQ
MDY
IWM-TNA
Short
Term Interest Rates
DJI-Utilities
DJI-Transp
A/D Line-6000 Stocks
CrudeOil
FAS
GLD
BBH
IBB
JETS
JNUG
KOL
NUGT
OIH
OIL
RSX
RETL
SLV
SOXL
TECL
TMF
TNA XIV YINN
To STOCKS' CHARTS
AAPL
AMAT AMGN
AMZN
BIDU
CAT
FB
GOOG
GS
IBM
JPM
MASI
MSFT
NVDA
QCOM
Others REN,
JJC,
NIB,
WEAT
UUP (Dollar)
5/2/17
Bullish MAXCPs
Bearish
MINCPS
(of 181 (-8) stocks/ETFs) (of 162
(+10) stocks/ETFs)
 RANKING OF KEY DIRECTORIES BASED PCT.OF STOCKS ABOVE 65-DMA
              5/2/17
---------------------------------------------------------------------------------------
Directory     Current       day-1         day-2         day-3         day-4         day-5
----------------------------------------------------------------------------------------
EDU            100%          1             1             1             1             1
NIFTY          .965          1             1             .965          .965          .965
ETFS           .926          .882          .852          .852          .867          .897
BONDFUND       .91           .937          .892          .875          .866          .776
INFRA          .909          .909          .909          .909          .818          .909
HOSPITAL       .857          .428          .428          .428          .428          .571
JETS           .777          .555          .555          .555          .555          .666
GAMING         .766          .8            .7            .733          .833          .766
SOFTWARE       .765          .765          .75           .765          .75           .75
BEVERAGE       .75           .75           .8            .8            .8            .85
MORNSTAR       .739          .743          .743          .777          .806          .798
HOMEBLDG       .722          .777          .777          .888          .888          .777
DJI-13         .692          .769          .769          .769          .769          .769
SEMI           .681          .706          .689          .767          .724          .732
N = 14
HACKERS        .666          .722          .777          .722          .722          .722
UTILITY        .666          .644          .711          .666          .733          .8
NASD-100       .659          .67           .692          .703          .681          .703
ELECTRON       .654          .67           .68           .711          .68           .69
GREEN          .645          .612          .645          .709          .806          .774
COMPUTER       .64           .6            .64           .56           .64           .52
INDEXES        .638          .638          .617          .651          .68           .659
MILITARY       .622          .622          .644          .644          .622          .622
DOWJONES       .6            .666          .666          .666          .7            .7
SP500          .583          .583          .594          .619          .629          .64
SOLAR          .578          .526          .578          .631          .578          .526
CHEM           .577          .591          .647          .676          .704          .69
REIT           .567          .625          .572          .64           .718          .734
RUS-1000       .566          .576          .58           .617          .635          .638
BIOTECH        .565          .584          .584          .588          .604          .581
TRANSP         .55           .45           .45           .6            .5            .55
CHINA          .532          .532          .532          .564          .564          .596
INSURANC       .529          .647          .676          .794          .764          .735
RETAIL         .517          .464          .482          .517          .535          .464
SP-100         .505          .505          .546          .567          .587          .577
N = 20
=========================================================================================
FINANCE        .5            .532          .478          .597          .652          .619
PIPELINE       .444          .444          .333          .333          .333          .666
INDMATER       .428          .489          .479          .469          .479          .5
REGBANKS       .388          .444          .416          .666          .805          .666
N = 4
-------------------------------------------------------------------------------------------
COAL           .333          .333          .111          .222          .222          .222
AUTO           .325          .35           .375          .45           .45           .35
COMODITY       .285          .3            .285          .271          .285          .271
OILGAS         .259          .259          .221          .208          .291          .284
FOOD           .214          .285          .142          .142          .142          .142
GOLD           .173          .153          .192          .134          .211          .192
BIGBANKS       .142          .142          0             .142          .571          .428
N= 7

====================================================================================


