Earlier Hotlines
www.tigersoftware.com/HL/INDEX.html
Most Recent Hotlines: 2/4/2017 -
2/15/2017
These have somehow become corrupted. Their graphs are missing.
http://www.tigersoft.com/345HLN12/ZINDEX.html
http://www.tigersoft.com/333HLLL/INDEX.html
http://www.tigersoft.com/444HL444/INDEX.html
www.tigersoft.com/119HLPAZ/INDEX.html
http://www.tigersoft.com/888HLAZ/INDEX.html
www.tigersoft.com/821-HL/INDEX.html
http://www.tigersoft.com/816-HLN/INDEX.html
http://www.tigersoft.com/77HL7778/INDEX.html
http://www.tigersoft.com/64HRL/INDEX.html
http://www.tigersoft.com/55HL55/INDEX.html
HELP
A
Guide To Profitably Using The Tiger Nightly HOTLINE
Introduction
to Tiger/Peerless Buys and Sells.
Peerless
Buy and Sell Signals: 1928-2016
Individual Peerless signals explained:
http://tigersoftware.com/PeerlessStudies/Signals-Res/index.htm
http://www.tigersoft.com/PeerInst-2012-2013/
Explanation of each Peerless signal.
http://www.tigersoft.com/PeerInst-2012-2013/
Different
Types of TigerSoft/Peerless CHARTS, Signals and Indicators
Peerless Signals and DJI
Charts - version 7/4/2013
1965
1965-6 1966
1966-7
1967
1967-8
1968
1968-9
1969
1969-70 1970
1970-1
1971
1971-2 1972
1972-3
1973 1973-4
1974
1974-5 1975
1975-6
1976 1976-7
1977
1977-1978
1978
1978-79
1979
1979-80
1980
1980-1
1981
1981-2
1982
1982-1983
1983 1983-1984
1984
1984-1985
1985
1985-1986
1986
1986-1987
1987
1987-8
1988
1988-9 1989
1989-90
1990
1990-1 1991
1991-2
1992
1992-3
1993
1993-4
1994
1994-5
1995
1995-1996 1996
1996-7
1997
1997-8 1998
1998-1999
1999
1999-2000
2000
2000-1 2001
2001-2
2002
2002-3
2003
2003-4
2004
2004-5
2005 2005-6
2006
2006-7
2007
2007-8
2008
2008-9
2009
2009-10
2010
2010-11
2011
2011-12
2012 2012-2013
2013
2013-2014
2014
2014-2015
2015
2015-2016
-----> More HELP LINKS
======================================================================================================
3-3-2017 You are now at
www.tigersoft.com/HHLL217/INDEX.html
--------------------------------------------------------------------
Previous Addresses
www.tigersoft.com/HHLL217/PREINDEX.html
http://www.tigersoftware.com/HL/INDEX.html
www.tigersoft.com/HHLL217/INDEX.html
http://www.tigersoft.com/345HLN12/ZINDEX.html
http://www.tigersoft.com/333HLLL/INDEX.html
http://www.tigersoft.com/444HL444/INDEX.html
www.tigersoft.com/119HLPAZ/INDEX.html
http://www.tigersoft.com/888HLAZ/INDEX.html
www.tigersoft.com/821-HL/INDEX.html
http://www.tigersoft.com/816-HLN/INDEX.html
http://www.tigersoft.com/77HL7778/INDEX.html
http://www.tigersoft.com/64HRL/INDEX.html
http://www.tigersoft.com/55HL55/INDEX.html
-----> Suggestion <-----
A number of your email accounts are putting emails from me
using william_schmidt@hotmail into
the Junker folder. Please
"be-friend" an email from me so that you promptly get change
of address information regarding new Hotline links.
-----------------------------------------------------------------------------------------------------------------
HELP
A
Guide To Profitably Using The Tiger Nightly HOTLINE
Introduction
to Tiger/Peerless Buys and Sells.
Peerless
Buy and Sell Signals: 1928-2016
Individual Peerless signals explained:
http://tigersoftware.com/PeerlessStudies/Signals-Res/index.htm
http://www.tigersoft.com/PeerInst-2012-2013/
Explanation of each Peerless signal.
http://www.tigersoft.com/PeerInst-2012-2013/
Different
Types of TigerSoft/Peerless CHARTS, Signals and Indicators
Peerless Signals and DJI
Charts - version 7/4/2013
1965
1965-6 1966
1966-7
1967
1967-8
1968
1968-9
1969
1969-70 1970
1970-1
1971
1971-2 1972
1972-3
1973 1973-4
1974
1974-5 1975
1975-6
1976 1976-7
1977
1977-1978
1978
1978-79
1979
1979-80
1980
1980-1
1981
1981-2
1982
1982-1983
1983 1983-1984
1984
1984-1985
1985
1985-1986
1986
1986-1987
1987
1987-8
1988
1988-9 1989
1989-90
1990
1990-1 1991
1991-2
1992
1992-3
1993
1993-4
1994
1994-5
1995
1995-1996 1996
1996-7
1997
1997-8 1998
1998-1999
1999
1999-2000
2000
2000-1 2001
2001-2
2002
2002-3
2003
2003-4
2004
2004-5
2005 2005-6
2006
2006-7
2007
2007-8
2008
2008-9
2009
2009-10
2010
2010-11
2011
2011-12
2012 2012-2013
2013
2013-2014
2014
2014-2015
2015
2015-2016
Documentation for
TigerSoft Automatic and Optimized Signals.
How reliable
support is the DJI's rising 200-day ma?
SPY
Charts since 1994: Advisory Closing Power S7s, Accum. Index, 65-dma, Optimized
Signals.
Previous Hotlines -
www.tigersoft.com/55HL55/INDEX.html
^^^^^^^^^^^^^^^^^^^^^^^^^^^^^^^^^^^^^^^^^^^^^^^^
1/19/2016 --->
Corrections,Deeper Declines and Bear Markets since 1945.
1/21/2016
--->
High Velocity Declines since 1929
2/12/2016 --->
Presidential Elections Years and Bullish IP21 Positive Non-Confirmations at
Lower Band.
2/12/2016 --->
OBV NNCs on
DJI's Rally to 2.7% Upper Band when DJI's 65-dma is falling.
11/6/2016 --->
Killer Short Selling Techniques:
===>
Order
Here
($42.50)
It's As Easy as 1,2,3
TigerSoft "Combination" Short-Selling...
Easy as 1-2-3 Short Sales
Earlier Q-Answers
QuickSilver
Documentation (1/11/2016)
Our Different Signals
Better
understand the difference between Peerless DJI-based signals,
the one-year optimized red Signals and
the fixed signals based
on technical developments.
Introduction to
Tiger/Peerless Buys and Sells.
Different Types o
f TigerSoft/Peerless
CHARTS, Signals and Indicators
New
TigerPeerless
Installation and Basic Uses' Instruction
(11/25/2016)
See
the re-written materials on TigerSoft Buys and Sells.
A few more pages will be added. But users could print
this
main Installation and Uses' Page for reference.
===> Please report any broken or
out-of-date links.
william_schmidt@hotmail.com
===================================================================================
LOOK FOR EMAIL FRIDAY OR SATURDAY GIVING
NEW HOTLINE ADDRESS THAT WILL START TUESDAY AM.

===================================================================================
4/6/2017 Stick with the Buy B4. The market may be stuck
approximately where it is for a while longer, but the most
important internals I look at are improving. Any DJI test of
its lower band will almost certainly bring new Peerless Buy
signals.
Seasonality is very bullish for the next two weeks.
Since 1965, the DJI has risen 70% of these years.
Its average gain in an impressive 1.3% for the
next 10 trading days and 2.0% for the next month.
Latest Jobs Report just out shows a weakening economy. Not a good
thing if FED goes ahead with plans to raise rates to curb stock
market's supposed "over-exuberance". 180,000 was expected.
One weak number does not show a pattern, of course.
See
https://www.nytimes.com/2017/04/07/business/economy/job-creation-unemployment-trump.html
Jobs Report
just out |
| Year |
Jan |
Feb |
Mar |
Apr |
May |
Jun |
Jul |
Aug |
Sep |
Oct |
Nov |
Dec |
| 2007 |
240 |
89 |
190 |
80 |
143 |
75 |
-34 |
-20 |
88 |
84 |
114 |
98 |
| 2008 |
17 |
-84 |
-78 |
-210 |
-186 |
-162 |
-213 |
-267 |
-450 |
-474 |
-766 |
-694 |
| 2009 |
-793 |
-702 |
-823 |
-687 |
-349 |
-471 |
-329 |
-213 |
-220 |
-204 |
-2 |
-275 |
| 2010 |
23 |
-68 |
164 |
243 |
524 |
-137 |
-68 |
-36 |
-52 |
262 |
119 |
87 |
| 2011 |
43 |
189 |
225 |
346 |
77 |
225 |
69 |
110 |
248 |
209 |
141 |
209 |
| 2012 |
358 |
237 |
233 |
78 |
115 |
76 |
143 |
177 |
203 |
146 |
132 |
244 |
| 2013 |
211 |
286 |
130 |
197 |
226 |
162 |
122 |
261 |
190 |
212 |
258 |
47 |
| 2014 |
190 |
151 |
272 |
329 |
246 |
304 |
202 |
230 |
280 |
227 |
312 |
255 |
| 2015 |
234 |
238 |
86 |
262 |
344 |
206 |
254 |
157 |
100 |
321 |
272 |
239 |
| 2016 |
126 |
237 |
225 |
153 |
43 |
297 |
291 |
176 |
249 |
124 |
164 |
155 |
| 2017 |
216 |
219(P) |
98(P) |
|
|
|
|
|
|
|
|
|
P : preliminary
|
https://data.bls.gov/timeseries/CES0000000001?output_view=net_1mth
|
|
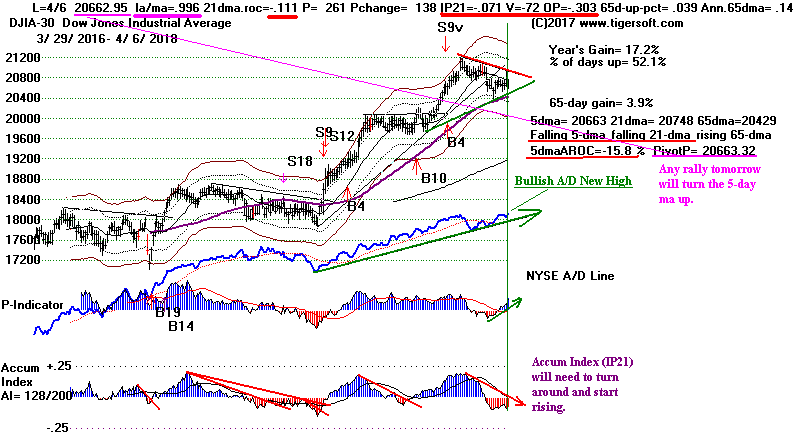
DJI - Chart with A/D Line and 10-day ma
of Up Volume and Down Volume.

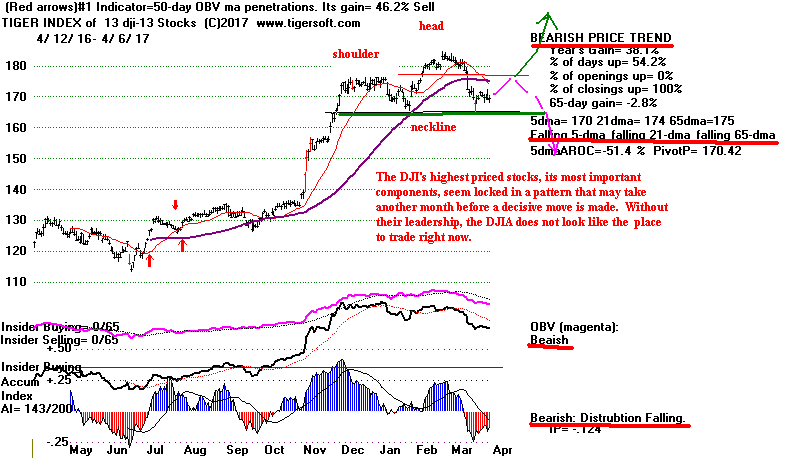
The
DJI-15
(highest priced DJI stocks' Index) does
appear to
be trapped in its emerging head/shoulders. In time, I suspect
it will breakout to the upside. But it may take a month or
two.
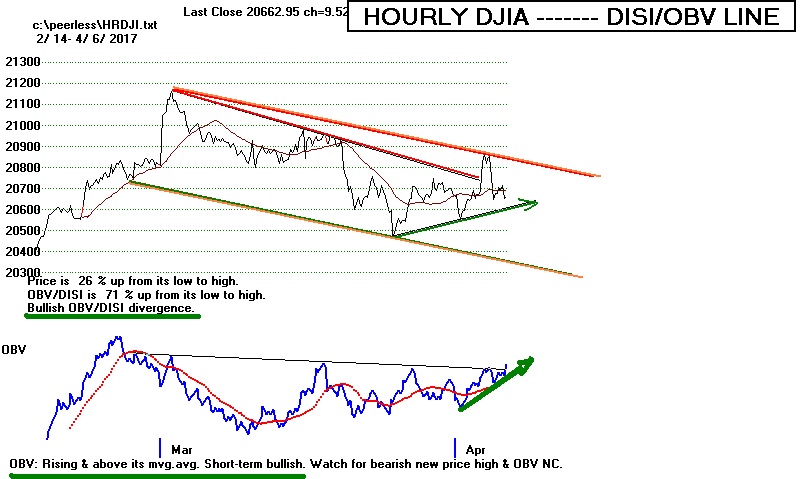
Note the bullish signs. The
A/D Line made a new high today.
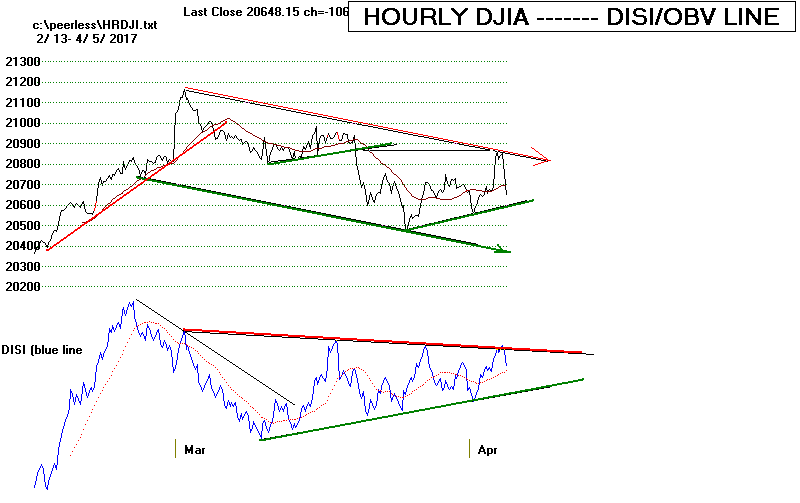
The Hourly DJI's OBV is bullishly diverging from prices. The
10-day ma of NYSE Down Volume has not turned up. The ETFs
showing head/shoulders patterns, namely
BBH,
IWM,
FAS and
MDY did not
show more weakness today.
Most of all, I think what we need now is a breakout by the
NASDAQ
or QQQ above their flat resistance-lines and a move by the DJI back
above its 21-day ma.
Let's see if these bullish elements can bring a new DJI rally.
Short-term traders should, I think come back in on the long side
when a key ETF moves above its 5-day ma pivot point its Closing
Power is rated "bullish".
Q U I C K S I L V E R V A L U E S
Key ETFs 5-dma 4-6 4-7
CP Resistance
trend Close Pivot
Trend
Point
-------------------------------------------------------------------------------------
DIA
Falling
206.45 +.19 206.34
Bearish 207 - 21-dma
SPY
Falling
235.44 +66 235.74
? 236 - 21-dma
QQQ
Falling
132.04 +.07 132.47
Bullish 133.6
MDY
Falling
310.53 +2.64 312.42
? 313.63
trendl.
IWM
Falling
135.58 +1.25 137.48 Bearish
136 - 21-dma
TECL
Falling
66.06 -.14
66.95 Bearish
68.38
                             4/6/17:    PEERLESS DJI, Signals, Indicators     DJI-13    Hourly DJIA
                                     S&P    OEX    NYSE    NASDAQ  COMPQX with Closing Power
                                     DIA   SPY   QQQ    MDY    IWM
                                     Short Term Interest Rates    DJI-Utilities      DJI-Transp      A/D Line-6000 Stocks


                                     CrudeOil  FAS  GLD  BBH  IBB  JETS  JNUG  KOL  NUGT  OIH   OIL
                                     RSX   RETL   SLV   SOXL   TECL   TMF   TNA  XIV YINN

                  To STOCKS' CHARTS
                                    AAPL   AMAT  AMZN   BIDU   CAT    FB  GOOG   GS  IBM   MSFT  NVDA JPM
                  Others    REN,  CHOC NIB, JJC,  WEAT  UUP (DollAR)
4/6/2017: Bullish MAXCPs Bearish MINCPS
 RANKING OF KEY DIRECTORIES BASED PCT.OF STOCKS ABOVE 65-DMA
               4/6/17
---------------------------------------------------------------------------------------
Directory     Current       day-1         day-2         day-3         day-4         day-5
----------------------------------------------------------------------------------------
ETFS           .897          .941          .955          .926          .911          .911
NIFTY          .896          .896          .931          .896          .931          .931
BEVERAGE       .85           .85           .85           .85           .85           .85
UTILITY        .822          .822          .844          .844          .866          .8
HOMEBLDG       .777          .722          .666          .666          .666          .722
DJI-13         .769          .769          .769          .769          .769          .769
BONDFUND       .767          .553          .616          .66           .616          .58
EDU            .75           .75           .625          .75           .875          .875
HOSPITAL       .714          .714          .714          .714          .714          .714
GAMING         .7            .7            .7            .733          .766          .766
CHINA          .693          .645          .741          .709          .709          .693
NASD-100       .677          .666          .688          .655          .709          .731
N=12
SOFTWARE       .656          .593          .656          .687          .671          .656
MORNSTAR       .642          .592          .663          .647          .714          .697
DOWJONES       .633          .633          .7            .7            .7            .733
SEMI           .629          .629          .672          .681          .724          .741
INDEXES        .613          .584          .609          .617          .63           .63
REIT           .604          .531          .546          .526          .51           .463
ELECTRON       .582          .561          .608          .623          .67           .68
GREEN          .58           .516          .516          .516          .612          .612
SP500          .579          .541          .575          .577          .604          .618
CHEM           .563          .549          .633          .619          .661          .647
SP-100         .556          .536          .587          .567          .587          .639
PIPELINE       .555          .444          .444          .444          .444          .222
RUS-1000       .552          .521          .564          .558          .6            .598
COMPUTER       .52           .48           .6            .56           .64           .6
HACKERS        .5            .5            .611          .555          .555          .555
SOLAR          .473          .473          .473          .421          .473          .473
INSURANC       .47           .47           .558          .558          .676          .588
BIOTECH        .458          .458          .549          .581          .592          .573
INFRA          .454          .181          .363          .363          .363          .363
COAL           .444          .111          .222          .222          .111          .222
JETS           .444          .444          .444          .444          .444          .444
MILITARY       .444          .422          .466          .511          .555          .577
GOLD           .415          .471          .452          .358          .32           .283
RETAIL         .41           .321          .357          .375          .482          .5
TRANSP         .4            .35           .4            .4            .45           .45
INDMATER       .397          .357          .397          .377          .408          .418
COMODITY       .38           .38           .352          .309          .366          .38
FINANCE        .326          .293          .358          .38           .423          .5
OILGAS         .291          .246          .265          .259          .24           .221
AUTO           .225          .2            .225          .225          .325          .375
BIGBANKS       .142          .142          .142          .142          .142          .428
REGBANKS       .111          .083          .111          .111          .138          .222
FOOD           .066          .2            .133          .133          .266          .266
N=6
===================================================================================
4/5/2017 Given the
operative Peerless Buy B4, the DJI
should not drop below the the lower band. But a test of that
level seems likely after today's disappointing action.
The good news is that most often, the final top in the
DJI occurs at the upper band
and only when either the P-Indicator or the Accumulation
Index is negative. So,
on this basis, too, I think we are entitled to at least
one more good advance. And I
expect the next top to coincide with Congress passing a
tax cut and a big Infrastructure
program.
The NY Times reports that Trump is "accelerating" his
trillion dollar infrastructure plan. This
is bullish. A rebound
tomorrow seems likely.
(
https://www.nytimes.com/2017/04/05/us/politics/donald-trump-infrastructure-bill.html?emc=edit_th_20170406&nl=todaysheadlines&nlid=58223894
)
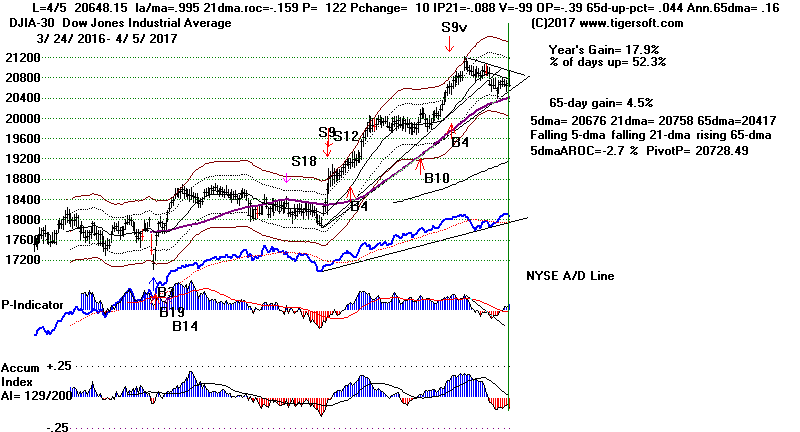
Bullishly, the A/D Line remains in an uptrend and the 10-day ma
of NYSE Down Volume remains in a downtrend, too. See below.


                              4/5/17:    PEERLESS DJI, Signals, Indicators     DJI-13    Hourly DJIA
                                     S&P    OEX    NYSE    NASDAQ  COMPQX with Closing Power
                                     DIA   SPY   QQQ    MDY    IWM
                                     Short Term Interest Rates    DJI-Utilities      DJI-Transp      A/D Line-6000 Stocks


                                     CrudeOil  FAS  GLD  BBH  IBB  JETS  JNUG  KOL  NUGT  OIH   OIL
                                     RSX   RETL   SLV   SOXL   TECL   TMF   TNA  XIV YINN

                  To STOCKS' CHARTS
                                    AAPL   AMAT  AMZN   BIDU   CAT    FB  GOOG   GS  IBM   MSFT  NVDA JPM
                  Others    REN,  CHOC NIB, JJC,  WEAT  UUP (DollAR)
4/5/2017: Bullish MAXCPs Bearish MINCPS
But short-term I admit I am worried.
There is no arguing that after
reaching the upper band at the start of March, the DJI has
since
been in a downtrend. See the
Hourly DJI chart.
Short-term traders, I think,
should now be using our QuickSilver strategy
and stay out of each major market ETF until its Closing
Powers and 5-day
moving average are rising or until Peerless gives a new
buy signal. Only
QQQ still shows its Closing Power to be uptrending. This can
be held a little longer. Give TECL another day. It may rebound
tomorrow.
Today the DJI again
could not close above the resistance of its
falling 21-day ma. As long as the IP21 and V-Indicator are
negative,
the 21-day ma is apt to be a barrier. In this situation,
I'm no longer so
sure the 65-dma will hold on the next test. Its annualized
rate of ascent
has slowed down to just 16%.
The next decline, if the NYSE A/D Line
uptrend breaks, will probably be to 20000-20200.
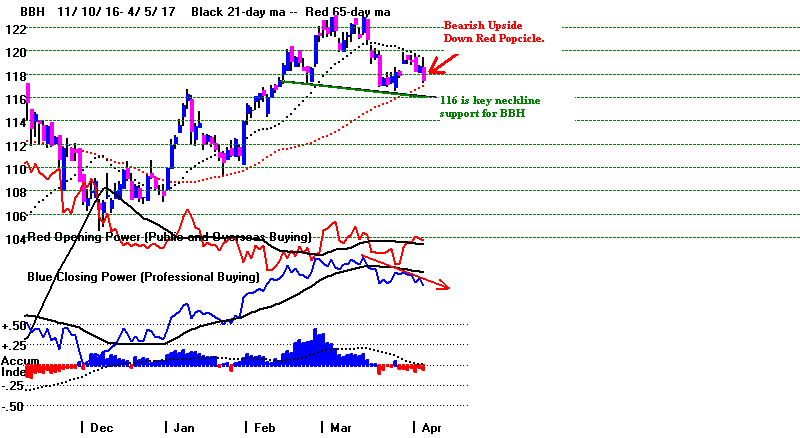
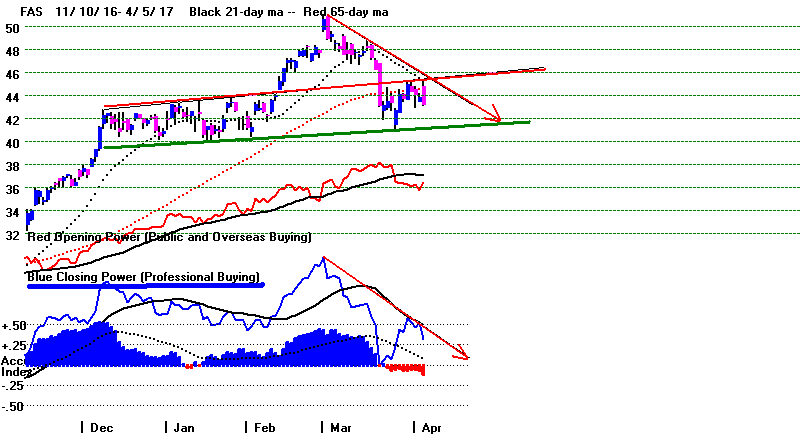
There are some other serious warning signs now. Food and
fuel prices are
falling. A number of major retail stocks show serious
weakness. Big
Banks must sense trouble ahead. The Closing Power for
FAS is
in a downtrend. Biotechs and
Mid-Caps (MDY and IWM)
now show bearish
head/shoulders patterns. And two important tech stocks,
IBM and NVDA
show bearish head/shoulders patterns.
April is usually a month that allows a good rally
above the 21-day ma.
But today's rally on good Jobs' news above that
level was quickly shot down
by the hawks at the Fed.
Think about this. The DJI
lost 200 points in just the last two hours of trading,
all because their "Minutes" showed that Yellen and the
majority were ready to
raise rates further, but not because of inflation in the
form of rising commodity, labor,
producer or consumer costs and prices, but because stocks
are too high.
I think the market is right to be scared. This is very
dangerous thinking.
In 1929, 1937 and 1987, it was worries about excessive
stock market speculation
that caused the Fed to raise rates. Real inflation was
minimal. In 1929 and 1937,
business was even contracting. The Fed seems unaware of
just how powerful they are.
But what can we do? They created the long bull market.
Now they want to take it all away.
Perhaps, so Trump will be blamed!?
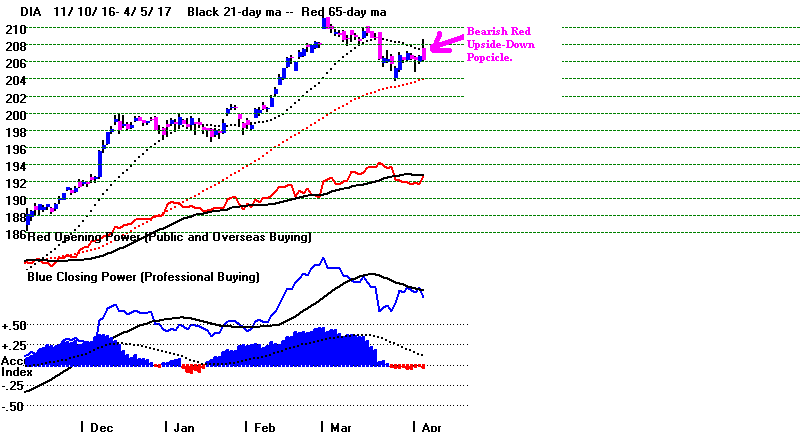
Q U I C K S I L V E R V A L U E S
Key ETFs 5-dma 4-5 4-6
CP
trend Close Pivot
Trend
Point
-------------------------------------------------------------------------------------
DIA
Falling
206.26 206.96
Bearish
SPY
Falling
234.78 236.29
?
QQQ
Falling
131.97 132.47
Bullish
MDY
Falling
307.89 312.32
Bearish
IWM
Falling
134.33 137.26
Bearish
TECL
Falling
66.20
67.26 ?
 RANKING OF KEY DIRECTORIES BASED PCT.OF STOCKS ABOVE 65-DMA
              4/5/17
---------------------------------------------------------------------------------------
Directory     Current       day-1         day-2         day-3         day-4         day-5
----------------------------------------------------------------------------------------
ETFS           .941          .955          .926          .911          .911          .941
NIFTY          .896          .931          .896          .931          .931          .931
BEVERAGE       .85           .85           .85           .85           .85           .85
UTILITY        .822          .844          .844          .866          .8            .866
DJI-13         .769          .769          .769          .769          .769          .692
EDU            .75           .625          .75           .875          .875          .75
HOMEBLDG       .722          .666          .666          .666          .722          .666
HOSPITAL       .714          .714          .714          .714          .714          .714
GAMING         .7            .7            .733          .766          .766          .733
N= 9
NASD-100       .666          .688          .655          .709          .731          .741
CHINA          .645          .741          .709          .709          .709          .677
DOWJONES       .633          .7            .7            .7            .733          .7
SEMI           .629          .672          .681          .724          .732          .706
SOFTWARE       .593          .656          .687          .671          .656          .625
MORNSTAR       .592          .663          .647          .714          .701          .655
INDEXES        .584          .609          .617          .63           .634          .596
ELECTRON       .561          .608          .628          .67           .67           .644
BONDFUND       .553          .616          .66           .616          .589          .598
CHEM           .549          .633          .619          .661          .633          .619
SP500          .541          .575          .577          .604          .618          .589
SP-100         .536          .587          .567          .587          .639          .587
REIT           .531          .546          .526          .51           .463          .437
RUS-1000       .521          .564          .558          .6            .599          .57
GREEN          .516          .516          .516          .612          .58           .548
HACKERS        .5            .611          .555          .555          .555          .5
COMPUTER       .48           .6            .56           .64           .6            .6
SOLAR          .473          .473          .421          .473          .473          .473
GOLD           .471          .433          .377          .32           .301          .339
INSURANC       .47           .558          .558          .676          .588          .588
BIOTECH        .458          .549          .577          .592          .577          .596
JETS           .444          .444          .444          .444          .444          .444
PIPELINE       .444          .444          .444          .444          .222          .222
MILITARY       .422          .466          .511          .555          .6            .555
COMODITY       .38           .352          .309          .366          .38           .394
INDMATER       .357          .397          .377          .408          .408          .377
TRANSP         .35           .4            .4            .45           .45           .35
RETAIL         .321          .357          .375          .482          .5            .517
FINANCE        .293          .358          .38           .423          .5            .38
OILGAS         .246          .265          .259          .24           .215          .234
AUTO           .2            .225          .225          .325          .375          .375
FOOD           .2            .133          .133          .266          .266          .2
INFRA          .181          .363          .363          .363          .363          .363
BIGBANKS       .142          .142          .142          .142          .428          .285
COAL           .111          .222          .222          .111          .222          .222
REGBANKS       .083          .111          .111          .138          .222          .083
N=9
