PEERLESS/TIGERSOFT HOTLINE
(C) 1985-2017 William Schmidt, Ph.D. www.tigersoft.com
All rights strictly reserved.
Tiger Software 858-273-5900 PO Box
22784 San Diego, CA 92192 Email
william_schmidt@hotmail.com
-------------------------------------------------------------------------------------------------------------
---------------------------- IMPORTANT
---------------------------------------
LOOK for an EMAIL Wednesday
Our Hotline's Address will change
Friday AM
You are here:
www.tigersoft.com/HH747/INDEX.html
Earlier Hotlines
www.tigersoft.com/HHLL217/INDEX.html
PREINDEX.html
www.tigersoftware.com/HL/INDEX.html
Most Recent Hotlines: 2/4/2017 -
2/15/2017
These have somehow become corrupted. Their graphs are missing.
http://www.tigersoft.com/345HLN12/ZINDEX.html
http://www.tigersoft.com/333HLLL/INDEX.html
http://www.tigersoft.com/444HL444/INDEX.html
www.tigersoft.com/119HLPAZ/INDEX.html
http://www.tigersoft.com/888HLAZ/INDEX.html
www.tigersoft.com/821-HL/INDEX.html
http://www.tigersoft.com/816-HLN/INDEX.html
http://www.tigersoft.com/77HL7778/INDEX.html
http://www.tigersoft.com/64HRL/INDEX.html
http://www.tigersoft.com/55HL55/INDEX.html
HELP
A
Guide To Profitably Using The Tiger Nightly HOTLINE
Introduction
to Tiger/Peerless Buys and Sells.
Peerless
Buy and Sell Signals: 1928-2016
Individual Peerless signals explained:
http://tigersoftware.com/PeerlessStudies/Signals-Res/index.htm
http://www.tigersoft.com/PeerInst-2012-2013/
Explanation of each Peerless signal.
http://www.tigersoft.com/PeerInst-2012-2013/
Different
Types of TigerSoft/Peerless CHARTS, Signals and Indicators
Peerless Signals and DJI
Charts - version 7/4/2013
1965
1965-6 1966
1966-7
1967
1967-8
1968
1968-9
1969
1969-70 1970
1970-1
1971
1971-2 1972
1972-3
1973 1973-4
1974
1974-5 1975
1975-6
1976 1976-7
1977
1977-1978
1978
1978-79
1979
1979-80
1980
1980-1
1981
1981-2
1982
1982-1983
1983 1983-1984
1984
1984-1985
1985
1985-1986
1986
1986-1987
1987
1987-8
1988
1988-9 1989
1989-90
1990
1990-1 1991
1991-2
1992
1992-3
1993
1993-4
1994
1994-5
1995
1995-1996 1996
1996-7
1997
1997-8 1998
1998-1999
1999
1999-2000
2000
2000-1 2001
2001-2
2002
2002-3
2003
2003-4
2004
2004-5
2005 2005-6
2006
2006-7
2007
2007-8
2008
2008-9
2009
2009-10
2010
2010-11
2011
2011-12
2012 2012-2013
2013
2013-2014
2014
2014-2015
2015
2015-2016
-----> More HELP LINKS
Documentation for
TigerSoft Automatic and Optimized Signals.
How reliable
support is the DJI's rising 200-day ma?
SPY
Charts since 1994: Advisory Closing Power S7s, Accum. Index, 65-dma, Optimized
Signals.
^^^^^^^^^^^^^^^^^^^^^^^^^^^^^^^^^^^^^^^^^^^^^^^^
1/19/2016 --->
Corrections,Deeper Declines and Bear Markets since 1945.
1/21/2016
--->
High Velocity Declines since 1929
2/12/2016 --->
Presidential Elections Years and Bullish IP21 Positive Non-Confirmations at
Lower Band.
2/12/2016 --->
OBV NNCs on
DJI's Rally to 2.7% Upper Band when DJI's 65-dma is falling.
11/6/2016 --->
Killer Short Selling Techniques:
===>
Order
Here
($42.50)
It's As Easy as 1,2,3
TigerSoft "Combination" Short-Selling...
Easy as 1-2-3 Short Sales
Earlier Q-Answers
QuickSilver
Documentation (1/11/2016)
Our Different Signals
Better
understand the difference between Peerless DJI-based signals,
the one-year optimized red Signals and
the fixed signals based
on technical developments.
Introduction to
Tiger/Peerless Buys and Sells.
Different Types o
f TigerSoft/Peerless
CHARTS, Signals and Indicators
New
TigerPeerless
Installation and Basic Uses' Instruction
(11/25/2016)
See
the re-written materials on TigerSoft Buys and Sells.
A few more pages will be added. But users could print
this
main Installation and Uses' Page for reference.
===> Please report any broken or
out-of-date links.
william_schmidt@hotmail.com
=================================================================================
4-19-2017 Today's DJI decline "looked" as false
as Tuesday's, but
anticipating a DIA-CP downtrend is still risky. It still may
be best to
wait for DIA's Closing Power to break
its downtrend or for Peerless to give a BUY signal.
The market remains "confused" and "confusing".
The QQQ rose today and there were only 208 more
down than up. Just like yesterday when the DJIA was dropped
artificially by the big decline in high priced GS, today it
was felled by high-high priced IBM's plunge at the opening.
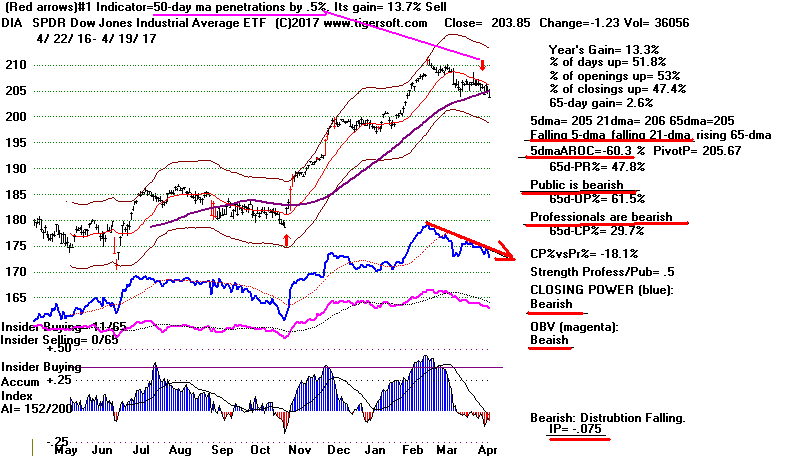
There's no getting around it, "Blue Chip"stock holders are
definitely becoming scared and the continued failure of the
DJI to sustain a rally is making matters worse. Crude Oil dropped
sharply today. That leaves us wondering how much longer
the OEX can hold up. It is disproportionately made up of big
Oil stocks. See below how very weak the OBV Line is for the OEX.
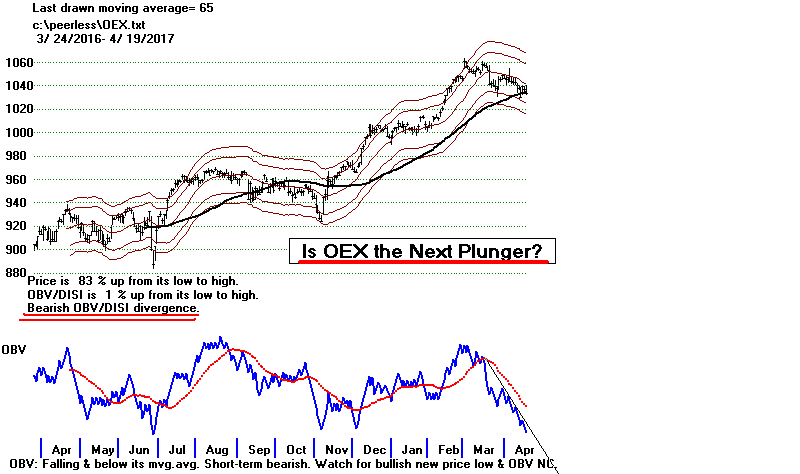
The stock markets in 2000 and 2008 showed us that a rising
QQQ (Nasdaq-100) can only hold up for a month, or so,
when the DJI keeps falling. The NYSE A/D Line can
hold longer, perhaps 6 months (as in 1977). But
eventually, if the DJI keeps falling, even the still rising
defensive stocks
and bond funds get hit. I think that we
are not yet at that point.
The DJI still should have support at
its lower band and
also at 20000, the point of breakout.
Watch The Closing Powers.
Trying to anticipate their turning up did not work today.
IBM spoiled that. What big DJI stock may get clipped tomorrow?
Traders are not going to be in a rush to buy now, especially
with Mike Pence threatening North Korea, saying the "time for
failed dialogue is over". The truth, of course, is that
isolation,
very little diplomacy and decades of waiting have created a
more much powerful and more dug-in enemy, one that could
probably survive a non-nuclear pre-emptive attack and kill thousands and
thousands of people in South Korea. There are no good options.
The markets have every right to be alarmed about what lies
ahead.
The Closing Power for DIA and
SPY keep falling
and there has not been a pair of back-to-back advances
by the DJI since March 10th. That's 26 trading days
we have gone without the DJI scoring two daily gains
in a row. Why are big holders of blue chips selling so quickly
on rallies? And why do GS and
IBM show completed
head/shoulders patterns? Might we see more completed
H/S patterns in the DJIA-30 stocks. I count 8 with completed
H/S. I have found that when we reach 11 or 12, we see
an intermediate-term correction of 10%-13.5% from the
DJI's recent peak.
Head/shoulders are both warnings of unexpected trouble
and self-fulfilling. Accordingly, we will have to become quite
worried if we see the emerging H/S Patterns in the
Transports,
MID-Caps (MDY),
IWM-Russell-2000,
BBH-IBB (Biotechs)
and FAS (Big Banks) get completed.
So far, that has not happened.
Key H/S Shoulders Patterns
4/19 neckline
AAPL 140.68
140
AXP 75.55
77 completed.
CAT 93.47
90
CVX 104.23
115 completed
DD 77.77
79 completed
GS 214.09
218 completed
HD 147.22
145
IBM 161.69
171 completed
JNJ 121.37
124 completed
JPM 84.46
85 completed Support at 83.
MMM 189.83
188.5
MRK 62.64
64 completed
NEW RESEARCH
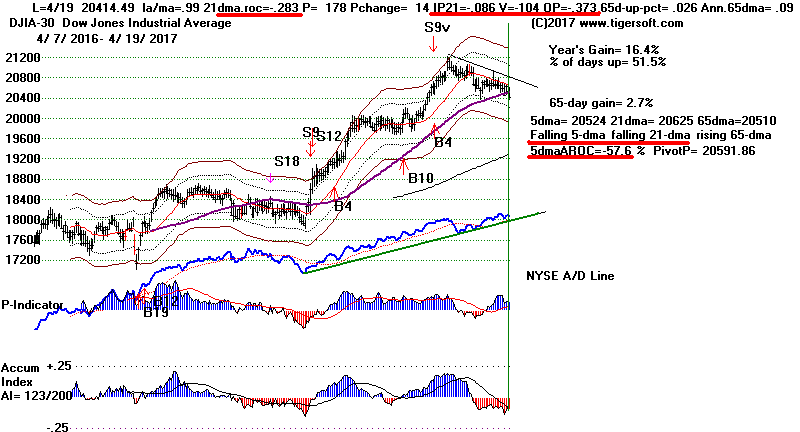
26 Trading Days without Back-to-Back DJI Advances.
What has happened in the past when the DJI would not rally
for two straight days going back 26 trading days, like now?
There have been 9 earlier cases. The first five warned
of deeper bear markets just ahead. Three of the next four would
have called bottoms. The internals of the 1995 case are
probably closest to our own case. Here the market was about
to take off to the upside. But in this case the DJI had held
above its 65-dma and showed much higher V-I and IP21
readings. Our present case also shows a positive P-I (breadth)
level. That should mean we will see Peerless Buy signals
if the DJI should tag the lower 2.5%-3.5% band. More weakness
than that coupled with the steady selling of blue chips would
have to be bearishly construed.
26-days
without
% below recent P-I
V-I IP21 Outcome
two
straight up-Days peak/long bear mkt
----------------------- ----------------------
----- ------ ------
-------------------------------
4/30/1931
.883
Long bear
market -167
-828 -.157
151.2 to 121.7 in 5 weeks.
9/29/1931
.821
Long bear market -223
-919 -.177
99.8 to 86.5 in 4 days.
12/17/1931
.833
Long bear market -242
-936 -.285
73.8 to 80.7
next day, then 71.2 in 10
12/5/1939 .982
6.6% below peak -87
-147 -.078
146.5 to 152.8 in a month,
then
DOWN
6/23/1969
.954
9% below
May peak -437 -41
-.249
870.86 to 801.96 in 5 weeks.
11/15/1978
.962
13.5% below Aug peak -454
-11
-.153
Bottom. 785.6 to 820.51 in 13
days.
3/24/1980
.936
13.5% below Feb peak -493 -14
-.182 765.44 to
759.13,
Bottom, then UP.
2/14/1984 .96
10.5% below Jan peak -369 -22
-.148
1163.84 to 1134.21 in 6days. Later
Down.
8/31/1995 .995
3% below July peak
+39
-9 -.028
Bottom.
4610 to to 5200 in 14 weeks.
Still over rising 65-dma
4/19/2017 .99
3.2% below Feb peak +178
-104 -.086
?
Just fell below rising 65-dma.

4/19/17
Index and ETF Charts: PEERLESS DJI, Signals, Indicators
Hourly DJIA A/D Line for All Stocks.
S&P OEX NYSE NASDAQ COMPQX with CP
DIA SPY QQQ MDY IWM
Short Term Interest Rates DJI-Utilities DJI-Transp A/D Line-6000 Stocks
CrudeOil FAS GLD BBH IBB JETS JNUG KOL NUGT OIH OIL
RSX RETL SLV SOXL TECL TMF TNA XIV YINN
To STOCKS' CHARTS
AAPL AMAT AMZN BIDU CAT FB GOOG GS IBM MSFT NVDA JPM
Others REN, JJC,
NIB, WEAT UUP (Dollar)
4/19 /17 Bullish MAXCPs Bearish MINCPS
 RANKING OF KEY DIRECTORIES BASED PCT.OF STOCKS ABOVE 65-DMA
 For first time in a long while, more groups have less than 1/2 their stocks
 below their 65-dma than above the 65-dma.  22 vs 24.

               4/19/17
---------------------------------------------------------------------------------------
Directory     Current       day-1         day-2         day-3         day-4         day-5
----------------------------------------------------------------------------------------
BONDFUND       .928          .919          .919          .928          .919          .857
NIFTY          .896          .896          .931          .827          .862          .896
EDU            .875          .875          .875          .75           .75           .875
BEVERAGE       .85           .85           .85           .85           .85           .8
ETFS           .794          .852          .882          .823          .882          .897
REIT           .781          .776          .734          .682          .729          .734
HOMEBLDG       .777          .833          .777          .777          .722          .833
GAMING         .766          .766          .733          .666          .7            .766
UTILITY        .755          .822          .844          .755          .866          .822
SOFTWARE       .718          .687          .64           .578          .687          .687
DJI-13         .692          .769          .769          .769          .769          .769
N=11
NASD-100       .634          .623          .602          .537          .602          .634
SEMI           .629          .62           .603          .543          .577          .637
GREEN          .612          .58           .612          .516          .612          .709
INSURANC       .588          .617          .647          .558          .647          .647
MORNSTAR       .575          .579          .609          .466          .596          .689
DOWJONES       .566          .566          .566          .533          .633          .633
ELECTRON       .561          .52           .53           .474          .505          .582
HACKERS        .555          .555          .5            .444          .555          .611
INDEXES        .55           .554          .638          .495          .634          .701
RUS-1000       .52           .522          .52           .454          .517          .566
SP500          .508          .52           .531          .466          .529          .562
N=11
===========================================================================================
CHEM           .492          .507          .492          .45           .577          .605
MILITARY       .488          .466          .488          .377          .466          .622
BIOTECH        .486          .454          .525          .482          .426          .446
CHINA          .483          .483          .58           .596          .645          .629
SOLAR          .473          .473          .526          .421          .473          .526
JETS           .444          .444          .444          .444          .444          .444
PIPELINE       .444          .333          .333          .333          .444          .555
COMPUTER       .44           .44           .44           .4            .44           .56
SP-100         .432          .443          .453          .391          .494          .515
HOSPITAL       .428          .571          .714          .714          .714          .714
GOLD           .377          .584          .603          .622          .622          .584
RETAIL         .357          .339          .339          .285          .375          .428
COMODITY       .352          .422          .507          .464          .464          .45
N=14
INDMATER       .326          .316          .316          .295          .377          .489
TRANSP         .3            .2            .25           .2            .2            .45
INFRA          .272          .272          .272          .181          .454          .545
FINANCE        .271          .282          .271          .228          .239          .282
AUTO           .225          .175          .175          .15           .2            .25
OILGAS         .183          .215          .227          .221          .278          .335
COAL           .111          .111          .111          .111          .111          .222
REGBANKS       .083          .055          .083          .055          .083          .138
BIGBANKS       0             0             0             0             0             0
FOOD           0             0             0             0             0             0
N=10
================================================================================
4-18-2017
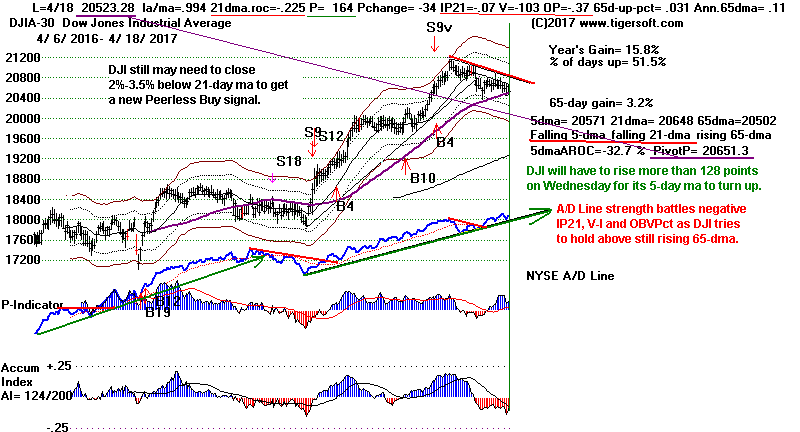
Today's decline looked quite false.
The DJI's Hourly DISI trend is
definitely pointing up. There were only 120 more up than down on
the NYSE. More than 75 of today's DJI decline owed to just
one stock, Goldman Sachs. The DJI is
sitting very invitingly on
on its still rising 65-dma. With the
Closing Powers for DIA and
SPY only needing one good day's rally, I
think our traders will want to
be buyers tomorrow at the opening, if they are not up too much.
All Trump's bluster about North Korea last week may have been just
that, "bluster". It turns out that the "armada" was actually moving away
from Korea, not
towards it, as President Trump said. Well! This should
mean peace for a
while longer. That's good. It clearly rattled the North
Koreans.
Maybe, they will re-think their nuclear and ICBM testing?
Let's hope it was all a deliberate ploy.
Otherwise, it raises new questions
about Trump's competence and ability
to communicate clearly and effectively |
with his Admirals and Generals. That would be
scary. Could we be blundered into war?
I guess no one remembers how
World War I was started by the blunders of
foolish Kings and Generals.
(This is very 'googleable'. Example -
http://wol.jw.org/en/wol/d/r1/lp-e/102009287 )
All this has left Professionals confused. But that should not last much
longer.
Our
Closing Powers, which measure Professionals' behavior, have only
turned up for QQQ despite the DJI's sitting invitingly right on top of its
rising 65-dma. Still,
a good day tomorrow for the market, one where the
DJI and SPY close considerably above their openings should set off a
very tradable rally. It would likely
turn up their Closing Powers and their
5-day mvg. averages. Their 21-day moving averages would still be
resistance.
But short-term traders should be buyers if this happens.


------------------------------
Q U I C K S I L V E R V A L U E S
------------------------------
Key ETFs
4-18 4-19
CP Resistance IP21
5-dma Close Pivot Trend
trend Point
--------------------------------------------------------------------------------------------
DIA -31.8%
205.08 -1.09
206.33
Bearish 206 - 21-dma -.051
SPY -31.4%
233.87 -0.70 235.06
? 235 - 21-dma -.012
QQQ
-28.2%
131.28 -0.20 131.45
Bullish
132 - 21-dma
+.021
MDY
-28.0%
309.17
-0.05
312.74
?
310 - 21-dma
+.077
Note head/shoulders' neckline support at 305.
IWM
-18.5%
135.32 +.03 136.9
?
136 - 21-dma
+.060
TECL -47.9%
65.02
-.07 64.89
?
65.8 - 21-dma
+.019
FAS
-107.2%
42.63 -0.63
43.55 ? 43.6
- 21-dma
-.059
Note head/shoulders' neckline support at
41.
SOXL
-246.6% 70.21 +0.83
71.87
Bearish 74.5
- 21-dma
-.007
IBB -29.7% 287.67
-2.91
288.37
Bearish 291
- 21-dma
-.078
GLD +138.3%
122.82
+.58 121.19
Bullish
120- 21-dma +.17
4/18/17
Index and ETF Charts: PEERLESS DJI, Signals, Indicators
Hourly DJIA A/D Line for All Stocks.
S&P OEX NYSE NASDAQ COMPQX with CP
DIA SPY QQQ MDY IWM
Short Term Interest Rates DJI-Utilities DJI-Transp A/D Line-6000 Stocks
CrudeOil FAS GLD BBH IBB JETS JNUG KOL NUGT OIH OIL
RSX RETL SLV SOXL TECL TMF TNA XIV YINN
To STOCKS' CHARTS
AAPL AMAT AMZN BIDU CAT FB GOOG GS IBM MSFT NVDA JPM
Others REN, JJC,
NIB, WEAT UUP (Dollar)
4/18 /17 Bullish MAXCPs Bearish MINCPS
 RANKING OF KEY DIRECTORIES BASED PCT.OF STOCKS ABOVE 65-DMA
               4/18/17
---------------------------------------------------------------------------------------
Directory     Current       day-1         day-2         day-3         day-4         day-5
----------------------------------------------------------------------------------------
BONDFUND       .919          .919          .928          .919          .857          .875
NIFTY          .896          .931          .827          .862          .896          .965
EDU            .875          .875          .75           .75           .875          .75
ETFS           .852          .882          .823          .882          .882          .897
BEVERAGE       .85           .85           .85           .85           .8            .85
HOMEBLDG       .833          .777          .777          .722          .833          .833
UTILITY        .822          .844          .755          .866          .844          .844
REIT           .776          .734          .682          .729          .734          .661
DJI-13         .769          .769          .769          .769          .769          .769
GAMING         .766          .733          .666          .7            .766          .766
SOFTWARE       .687          .64           .578          .687          .687          .671
N=11
NASD-100       .623          .602          .537          .602          .634          .698
SEMI           .62           .603          .543          .577          .637          .655
INSURANC       .617          .647          .558          .647          .647          .558
GOLD           .584          .584          .641          .622          .584          .433
GREEN          .58           .612          .516          .612          .709          .677
MORNSTAR       .579          .609          .466          .596          .684          .672
HOSPITAL       .571          .714          .714          .714          .714          .714
DOWJONES       .566          .566          .533          .633          .633          .666
HACKERS        .555          .5            .444          .555          .611          .555
INDEXES        .554          .638          .495          .634          .697          .668
RUS-1000       .522          .52           .454          .517          .562          .57
SP500          .522          .533          .468          .531          .562          .604
ELECTRON       .52           .53           .479          .505          .582          .592
CHEM           .507          .492          .45           .577          .605          .605
N=14
CHINA          .483          .58           .596          .645          .629          .677
SOLAR          .473          .526          .421          .473          .526          .526
MILITARY       .466          .488          .377          .466          .6            .511
BIOTECH        .454          .525          .478          .426          .442          .478
JETS           .444          .444          .444          .444          .444          .444
SP-100         .443          .453          .391          .494          .515          .577
COMPUTER       .44           .44           .4            .44           .56           .56
COMODITY       .422          .507          .464          .464          .45           .436
RETAIL         .339          .339          .285          .375          .428          .446
N=9
PIPELINE       .333          .333          .333          .444          .555          .555
INDMATER       .316          .316          .295          .377          .479          .459
FINANCE        .282          .271          .228          .239          .282          .304
INFRA          .272          .272          .181          .454          .545          .636
OILGAS         .215          .227          .221          .278          .329          .348
TRANSP         .2            .25           .2            .2            .45           .45
AUTO           .175          .175          .15           .2            .25           .275
COAL           .111          .111          .111          .111          .111          .222
REGBANKS       .055          .083          .055          .083          .111          .083
BIGBANKS       0             0             0             0             0             .142
FOOD           0             0             0             0             0             0
N=11
==================================================================================
4/17/2017 A
Test of The DJI's Lower Band Is Probably Still Necessary.
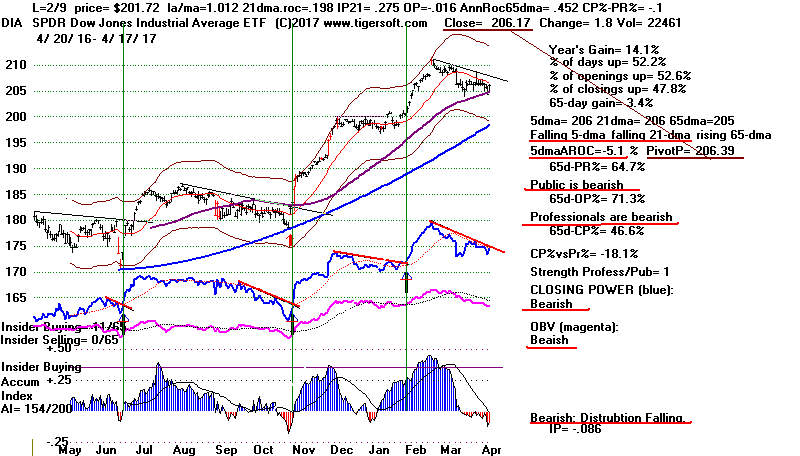
Today's the oversold-recovery failed to bring a Peerless Buy. Volume
was too low. So, we still must wait for the Closing Powers of
DIA,
SPY and QQQ
break their downtrends or Peerless to give a
Buy signal near to the lower band. If the Closing Powers break their
downtrends or we get a new Peerless Buy, Buy DIA,
SPY or QQQ.
See how well these ETFs rallied when similar Closing Power
downtrends have been broken.
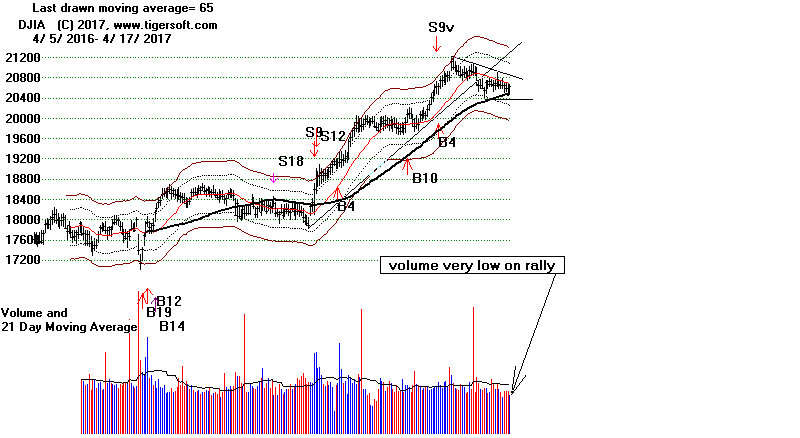
Part of the technical problem now is lack of Up Volume. Our
Bearish
MINCP stocks mostly fell. Professional shorts did not rush to cover today.
The lack of Up Volume results from the continuing weakness in other
ETFs, particularly in the SP-100 (OEX), where
the OBV has crashed and
in the other key ETFs, IWW,
MDY and FAS
are trapped in inauspicious-
looking head/shoulders patterns. The very negative Accumulation Index
is a warning that heavy selling or distribution is occurring when a rally
occurs. In fact, the DJI has not rallied two
straight days for more than
a month. This does not bode well for tomorrow.
Money is flowing mostly into the market's most
defensive realms: Bonds,
Utilities and Beverages. Foreign ETFs continue to hold up, too.


4/17/17
Index and ETF Charts: PEERLESS DJI, Signals, Indicators
Hourly DJIA A/D Line for All Stocks.
S&P OEX NYSE NASDAQ COMPQX with CP
DIA SPY QQQ MDY IWM
Short Term Interest Rates DJI-Utilities DJI-Transp A/D Line-6000 Stocks
CrudeOil FAS GLD BBH IBB JETS JNUG KOL NUGT OIH OIL
RSX RETL SLV SOXL TECL TMF TNA XIV YINN
To STOCKS' CHARTS
AAPL AMAT AMZN BIDU CAT FB GOOG GS IBM MSFT NVDA JPM
Others REN, JJC,
NIB, WEAT UUP (Dollar)
4/17 /17 Bullish MAXCPs Bearish MINCPS
 RANKING OF KEY DIRECTORIES BASED PCT.OF STOCKS ABOVE 65-DMA
               4/17/17
---------------------------------------------------------------------------------------
Directory     Current       day-1         day-2         day-3         day-4         day-5
----------------------------------------------------------------------------------------
NIFTY          .931          .827          .862          .896          .965          .965
BONDFUND       .919          .928          .919          .857          .866          .83
ETFS           .882          .823          .882          .882          .897          .882
EDU            .875          .75           .75           .875          .75           .75
BEVERAGE       .85           .85           .85           .8            .85           .85
UTILITY        .844          .755          .866          .844          .866          .866
HOMEBLDG       .777          .777          .722          .833          .833          .833
DJI-13         .769          .769          .769          .769          .769          .692
REIT           .734          .682          .729          .734          .661          .625
GAMING         .733          .666          .7            .766          .766          .766
HOSPITAL       .714          .714          .714          .714          .714          .714
N=11
INSURANC       .647          .558          .647          .647          .558          .441
SOFTWARE       .64           .578          .687          .687          .687          .656
INDEXES        .634          .495          .634          .697          .659          .613
GREEN          .612          .516          .612          .709          .677          .58
MORNSTAR       .609          .466          .596          .684          .676          .638
SEMI           .603          .543          .577          .637          .655          .655
NASD-100       .602          .537          .602          .634          .698          .645
GOLD           .584          .622          .641          .584          .433          .433
CHINA          .58           .596          .645          .629          .725          .709
DOWJONES       .566          .533          .633          .633          .633          .6
SP500          .533          .468          .531          .562          .602          .577
ELECTRON       .53           .479          .51           .582          .592          .592
SOLAR          .526          .421          .473          .526          .526          .473
BIOTECH        .525          .478          .422          .442          .478          .47
RUS-1000       .52           .454          .517          .562          .568          .546
COMODITY       .5            .457          .457          .442          .428          .357
HACKERS        .5            .444          .555          .611          .611          .555
N=17
---------------------------------------------------------------------------------------------
CHEM           .492          .45           .577          .605          .605          .577
MILITARY       .488          .377          .466          .6            .511          .488
SP-100         .453          .391          .494          .515          .567          .546
JETS           .444          .444          .444          .444          .444          .444
COMPUTER       .44           .4            .44           .56           .56           .6
RETAIL         .339          .285          .375          .428          .446          .357
N=5
---------------------------------------------------------------------------------------------
PIPELINE       .333          .333          .444          .555          .555          .555
INDMATER       .316          .295          .377          .479          .459          .448
INFRA          .272          .181          .454          .545          .636          .727
FINANCE        .271          .228          .239          .282          .304          .315
TRANSP         .25           .2            .2            .45           .45           .4
OILGAS         .227          .221          .278          .329          .335          .278
AUTO           .175          .15           .2            .25           .275          .25
COAL           .111          .111          .111          .111          .222          .222
REGBANKS       .083          .055          .083          .111          .083          .111
BIGBANKS       0             0             0             0             .142          .142
FOOD           0             0             0             0             0             0
N=11
===================================================================================
4/13/2017
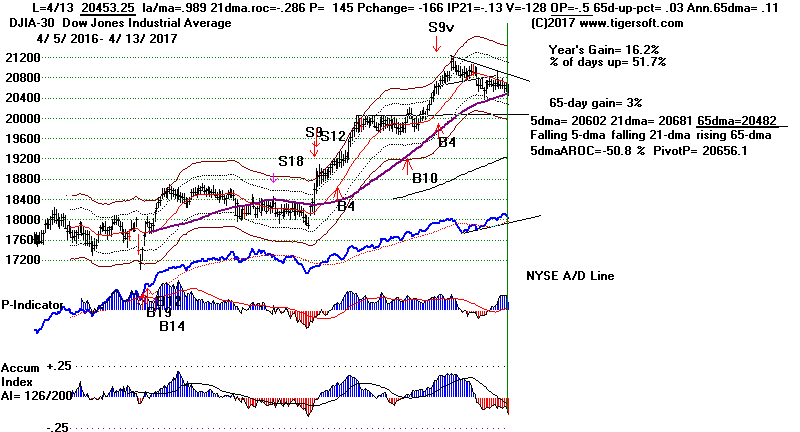
Despite today's sell-off, the NYSE A/D Line remains in
an uptrend and the P-Indicator remains positive. Fear of
war in Korea has now sent the DJI to a close
below its
still rising 65-dma. This is a high inflection point.
There
can either be a sustained decline from this point or a reversal
upwards. History does not show which is more likely when
the IP21 was well below 0 and the annualized rate of change
was rising at a modest annualized rate, below +.12, as now. Since
1929, I can find 10 occasions when selling short would have
been profitable and 9 cases where the DJI promptly turned
right around and rallied.
We have also another clue and it is more bullish.
The Tiger OBVPct has now reached
-.50. Until the 65-dma
turns down, such a low reading must
be regarded as showing the
market is "oversold".
See below.
The
key trading indicator now, I think, is the Closing Power and it is
falling for
all the major market ETFs. Gold (GLD) is major exception.
Traders should stay out of this market until Peerless gives
a new Buy signal and/or our Closing Powers turn "bullish".
I have been saying this for two weeks now.
What about the Peerless Buy B4?
It suggests a test of the lower
band may be needed, based on the 1939 case, as Poland was invaded
and WWII was started. The problem Peerless
has had on this decline
was the second Buy B4. It was not reversed
at the 3.6% upper band or
when the IP21 dropped below its 21-day
ma. The minor head/shoulders was
only a warning that the DJI would drop
to the 65-dma ma. The simplest solution
for Peerless
as a system would be for it to simply skip more days after its first
volume-based Buy B4 before allowing another one and for us now to let
the Closing Power or a new Peerless signal when to act...
Note the very low readings for "OP" or "OBVPct".
With our 65-dma still rising, this
shows an "oversold"
condition and a rally ought to occur. See the
cases below...

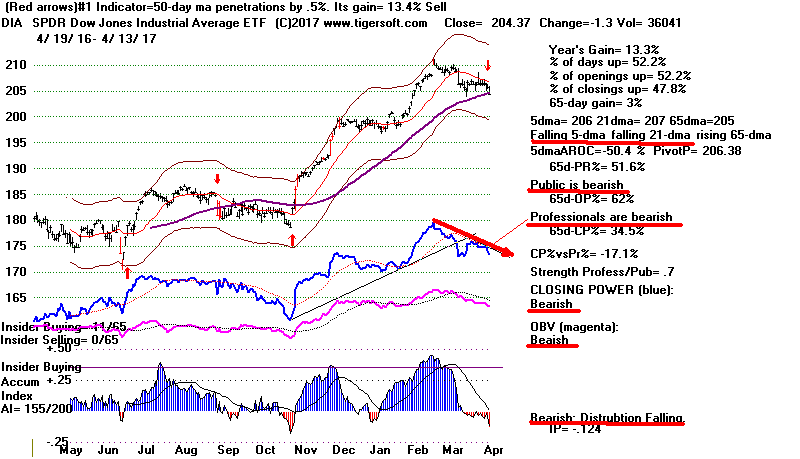
Q U I C K S I L V E R V A L U E S
Key ETFs
Ann. 4-12 4-13
CP Resistance IP21
5-dma Close Pivot Trend
trend Point
--------------------------------------------------------------------------------------------
DIA -50.4%
204.37 -1.3
206.38
Bearish 207 - 21-dma -.124
SPY -62.3%
232.51 -1.52 235.20
Bearish 235 - 21-dma -.121
QQQ
-39.8%
130.40 -.52 131.97
Bearish
132 - 21-dma
-.071
MDY
-81.8%
305.45
-3.45
310.08
Bearish
310 - 21-dma
-.007
Note head/shoulders' neckline support at 305.
IWM
-68.5%
133.72
-1.32
135.52 Bearish
136 - 21-dma
+.025
TECL
-159.9%
63.46
-.75
66.00 Bearish
66.1 - 21-dma -.077
FAS
-283.0%
41.45 -1.2
43.65 Bearish 44.1
- 21-dma
-.143
Note head/shoulders' neckline support at
41.
SOXL
-526.2% 66.77 -1.31
75.41
Bearish 75.2
- 21-dma
-.095
IBB +41.0% 290.59
+1.94
290.52
Bearish 291
- 21-dma
-.108
GLD +142.2%
122.60
+.69 119.46
Bullish
119- 21-dma
+.092
New Research: OBVPct Below -.50
It is reported that 600,000 North Koreans are being evacuated from its capital
because an attack by the US is considered imminent. These reports and
Trump's belligerent tone are starting to spook the market. We see
this most clearly in the way the DJI-30 has now fallen almost to its 65-
dma with its OBVPct now below -.50. More often than not, this shows
the market has reached an oversold condition. In a minority of cases,
the OBVPct falls below -.50 when a bear market is just starting. In these
cases, the 65-dma was already falling and the DJI was below it.
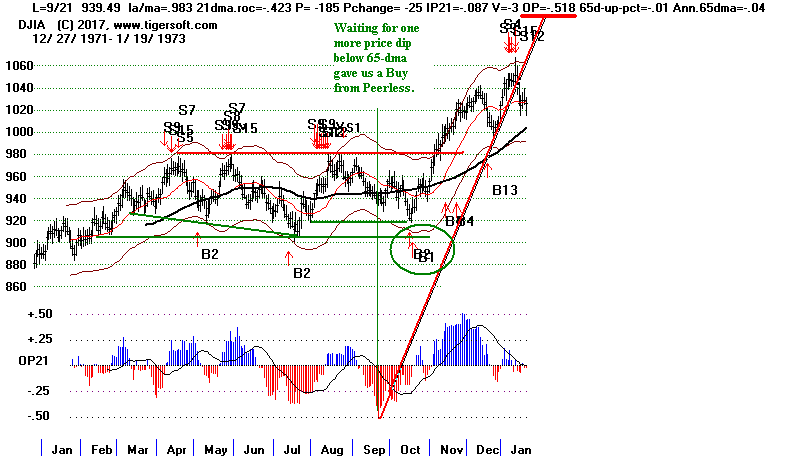
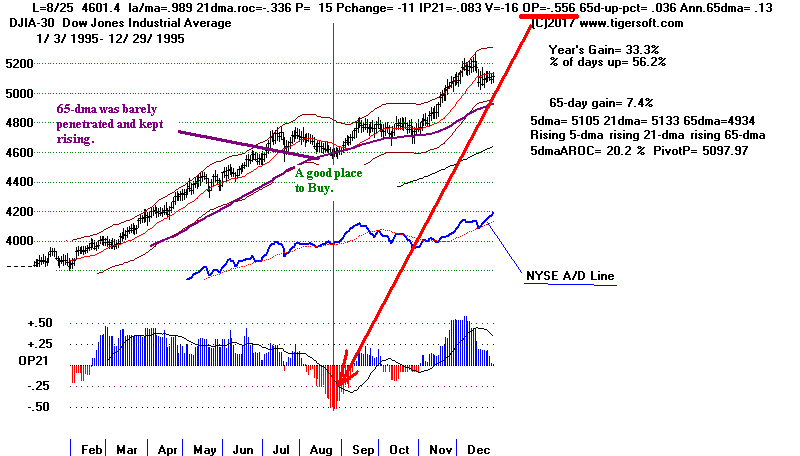
I have looked for all the cases where the OBVPct had fallen below -50, as it
has now, in a rising market and where the 65-dma was still rising. There
are only two since 1929. In both cases, the market soon turned around.
See these
two cases below. In 1972, the 65-dma was violated and the lower 2.5%
band had to be tagged before there was a reversal back upwards. But in
1995,
the OBVPCT nadir marked a superb spot to buy just as the DJI reached the
65-dma.
Two Most Similar Cases: Where
OBVPCT was below -.50 and DJI was
still above a rising 65-dma.
4/13/17
Index and ETF Charts: PEERLESS DJI, Signals, Indicators
Hourly DJIA A/D Line for All Stocks.
S&P OEX NYSE NASDAQ COMPQX with CP
DIA SPY QQQ MDY IWM
Short Term Interest Rates DJI-Utilities DJI-Transp A/D Line-6000 Stocks
CrudeOil FAS GLD BBH IBB JETS JNUG KOL NUGT OIH OIL
RSX RETL SLV SOXL TECL TMF TNA XIV YINN
To STOCKS' CHARTS
AAPL AMAT AMZN BIDU CAT FB GOOG GS IBM MSFT NVDA JPM
Others REN, JJC,
NIB, WEAT UUP (Dollar)
4/13 /17 Bullish MAXCPs Bearish MINCPS
 RANKING OF KEY DIRECTORIES BASED PCT.OF STOCKS ABOVE 65-DMA
              4/13/17
---------------------------------------------------------------------------------------
Directory     Current       day-1         day-2         day-3         day-4         day-5
----------------------------------------------------------------------------------------
BONDFUND       .928          .919          .857          .866          .83           .776
BEVERAGE       .85           .85           .8            .85           .85           .85
NIFTY          .827          .862          .896          .965          .965          .896
ETFS           .823          .882          .882          .897          .882          .897
HOMEBLDG       .777          .722          .833          .833          .833          .777
DJI-13         .769          .769          .769          .769          .692          .769
UTILITY        .755          .866          .844          .866          .866          .822
EDU            .75           .75           .875          .75           .75           .75
HOSPITAL       .714          .714          .714          .714          .714          .714
REIT           .682          .729          .734          .661          .619          .604
N = 10
GAMING         .666          .7            .766          .766          .766          .666
GOLD           .622          .622          .603          .433          .433          .396
CHINA          .596          .645          .629          .725          .709          .661
SOFTWARE       .578          .687          .687          .687          .671          .656
INSURANC       .558          .647          .647          .558          .441          .47
SEMI           .543          .577          .637          .655          .646          .629
NASD-100       .537          .602          .634          .698          .655          .677
DOWJONES       .533          .633          .633          .633          .6            .633
GREEN          .516          .612          .709          .677          .58           .612
N=9
-------------------------------------------------------------------------------------------
INDEXES        .495          .634          .697          .659          .617          .617
ELECTRON       .479          .51           .587          .592          .592          .582
BIOTECH        .478          .422          .438          .478          .478          .458
SP500          .468          .531          .562          .602          .581          .579
MORNSTAR       .466          .596          .684          .676          .638          .638
COMODITY       .457          .457          .442          .428          .342          .371
RUS-1000       .454          .517          .562          .568          .55           .551
CHEM           .45           .577          .605          .605          .591          .563
HACKERS        .444          .555          .611          .611          .611          .5
JETS           .444          .444          .444          .444          .444          .444
SOLAR          .421          .473          .526          .526          .473          .473
COMPUTER       .4            .44           .56           .56           .6            .52
SP-100         .391          .494          .515          .567          .546          .556
MILITARY       .377          .466          .6            .511          .488          .444
N=14
PIPELINE       .333          .444          .555          .555          .555          .555
INDMATER       .295          .377          .479          .459          .448          .397
RETAIL         .285          .375          .428          .446          .357          .41
FINANCE        .228          .239          .282          .304          .336          .326
OILGAS         .221          .278          .329          .335          .278          .291
TRANSP         .2            .2            .45           .45           .4            .4
INFRA          .181          .454          .545          .636          .727          .454
AUTO           .15           .2            .25           .275          .25           .225
COAL           .111          .111          .111          .222          .222          .444
REGBANKS       .055          .083          .111          .083          .111          .111
BIGBANKS       0             0             0             .142          .142          .142
FOOD           0             0             0             0             0             .071
N=12
===================================================================================
4/12/17
The main theme here for the last week or two has been to watch the
Professionals trading in DIA and SPY. Until their Closing Powers
and 5-day moving averages turn up, we just have to wait to commit to
the long side unless one is willing to ride out a DJI decline that may go
down to the lower band.
These Closing Powers and 5-day moving
averages are still falling. When we look back at the
DIA chart for the last
year, we can quickly see how the Closing Power breaking downtrends
not unlike the one now, set off excellent advances.
I have also said that the DJI's rising 65-dma is now moving up at only
a +13% annualized rate. So, this moving average now at 20473 (118 points
below today's close) may not act as strong support. Better support probably is
near
the DJI's lower 3.5% band at 20300.

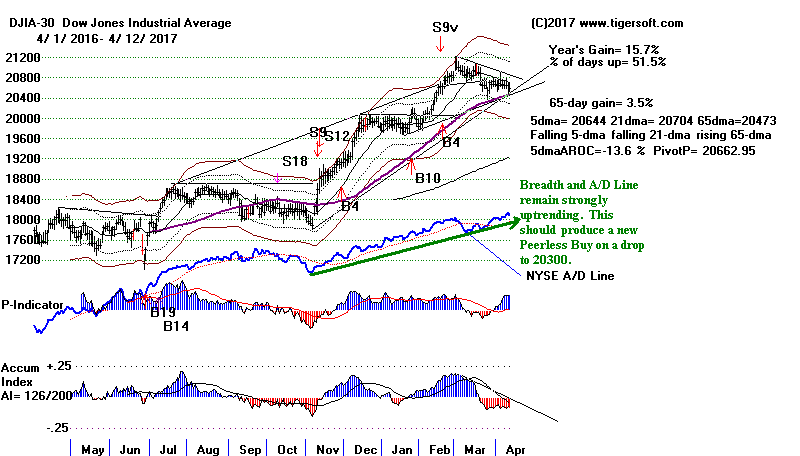
When Buy B4 signals fail, as our recent B4 has apparently here, the DJI has always
found support
between the lower band and the rising 65-dma, except in one
case. The exception was on September 1,
1939
when Germany invaded Poland
and WWII started. See the chart below.
Reading the saga of the month
before the actual invasion, one can see why traders hearing of these frightening
developments would have been selling. See Wikopedia's account:
(
https://en.wikipedia.org/wiki/Invasion_of_Poland )
Now with the US "armada" moving towards a probable showdown
with North Korea over
its nuclear armed long-ranged missiles, tensions are
growing
in the same way.
The Biggest Failed Buy B4
occurs at the start of WW II.
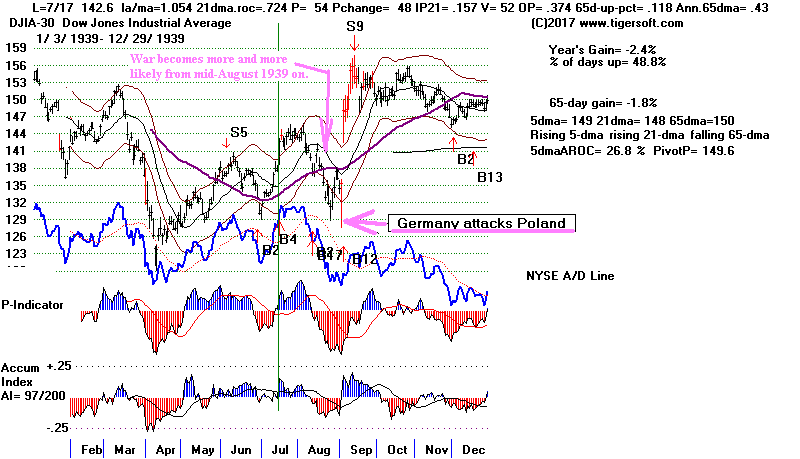
If anything, I would say Wall Street appears not too worried about the
dangers of actual fighting. The DJI, after all is still above its 65-dma
as is the NASDAQ. Nor has the number head/shoulders price patterns in
SP-500 stocks reached levels seen before other big intermediate-term sell-offs.
But the excellent breadth we have been seeing where the NYSE A/D Line keeps
making new highs of the DJI is not an absolute guard against a big selloff.
But, as I showed last night, it gives a sell-off of 7%-8% from the DJI's
recent peak only a 25% probability.
Given the developing drama between North Korea and the US, I think prudence
is warranted. Let's wait for a big Closing Power hook back up or a
new Peerless Buy signal near the lower 3% band.
Q U I C K S I L V E R V A L U E S
Key ETFs
Ann. 4-12 4-13
CP Resistance
5-dma Close Pivot Trend
trend Point
-------------------------------------------------------------------------------------
DIA -14.3%
205.67 -.66
206.45
Bearish 207 - 21-dma
SPY -15.9%
234.03-1.03 235.44
Bearish 236 - 21-dma
QQQ
-39.8%
130.92 -.53 132.04
Bearish
132 - 21-dma
MDY
+16.3%
308.9
-3.84
310.53
Bullish
311 - 21-dma
IWM
+26.2%
135.04
-1.86
135.58 Bearish
136 - 21-dma
TECL
-151.3%
64.21 -.68
66.06 Bearish
66.1 - 21-dma
FAS
-71.1%
42.65 -.9
43.91 Bearish 44.4
- 21-dma
SOXL
-410.0% 68.08 -3.79
74.42
Bearish 75.7
- 21-dma
IBB +21.3% 288.65
+.28
288.22
Bearish 292
- 21-dma
A red pivot point above, shows how much
prices will need to rally
to turn up the ETF's 5-day ma or keep it rising. Only IBB is currently
closed above its Thrusday pivot-point. Bulls should wait to buy.
Developing Head/Shoulders - Not completed,
but should be watched... DJI-20, IBB and FAS.
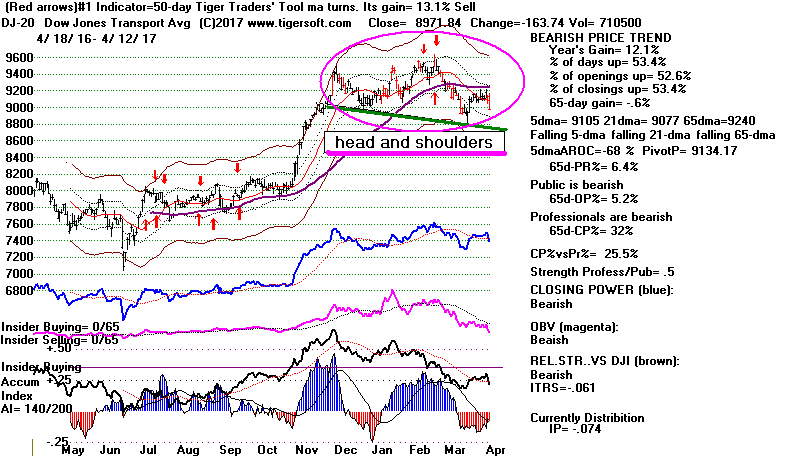
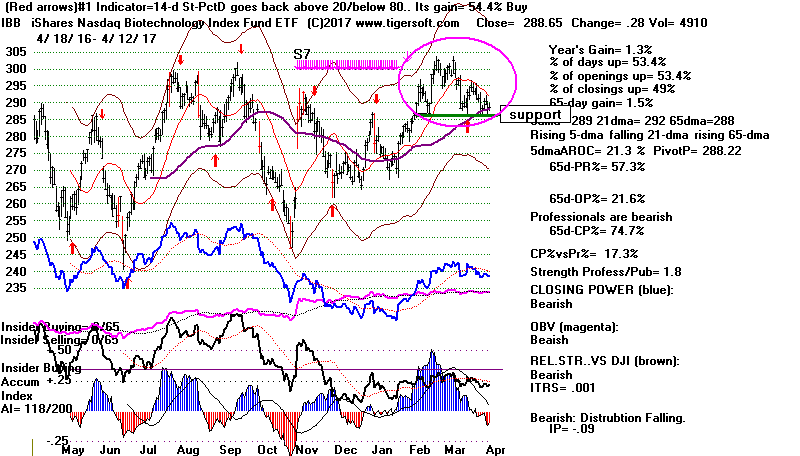
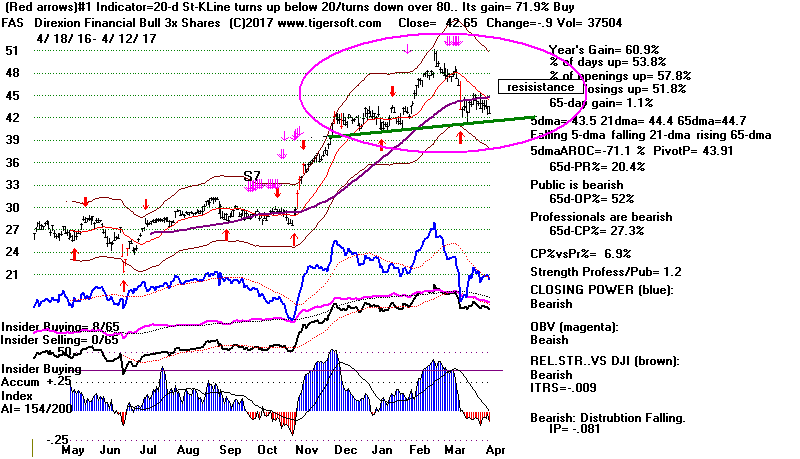
4/12/17
Index and ETF Charts: PEERLESS DJI, Signals, Indicators
Hourly DJIA A/D Line for All Stocks.
S&P OEX NYSE NASDAQ COMPQX with CP
DIA SPY QQQ MDY IWM
Short Term Interest Rates DJI-Utilities DJI-Transp A/D Line-6000 Stocks
CrudeOil FAS GLD BBH IBB JETS JNUG KOL NUGT OIH OIL
RSX RETL SLV SOXL TECL TMF TNA XIV YINN
To STOCKS' CHARTS
AAPL AMAT AMZN BIDU CAT FB GOOG GS IBM MSFT NVDA JPM
Others REN, JJC,
NIB, WEAT UUP (Dollar)
4/12/17 Bullish MAXCPs Bearish MINCPS
S&P Head/Shoulders completed:
ADI
AIG
AKAM
AXP
CVX
NTAP
S&P Potential Head/Shoulders
CSX,
MMM, MTB,
NVDA, STI
 RANKING OF KEY DIRECTORIES BASED PCT.OF STOCKS ABOVE 65-DMA
              4/12/17
---------------------------------------------------------------------------------------
Directory     Current       day-1         day-2         day-3         day-4         day-5
----------------------------------------------------------------------------------------
BONDFUND       .919          .857          .866          .83           .767          .553
ETFS           .882          .882          .897          .882          .897          .941
UTILITY        .866          .844          .866          .866          .822          .822
NIFTY          .862          .896          .965          .965          .896          .896
BEVERAGE       .85           .8            .85           .85           .85           .85
DJI-13         .769          .769          .769          .692          .769          .769
EDU            .75           .875          .75           .75           .75           .75
REIT           .729          .734          .661          .619          .604          .531
HOMEBLDG       .722          .833          .833          .833          .777          .722
HOSPITAL       .714          .714          .714          .714          .714          .714
GAMING         .7            .766          .766          .766          .7            .666
SOFTWARE       .687          .687          .687          .671          .656          .593
N= 12
INSURANC       .647          .647          .558          .441          .47           .47
CHINA          .645          .629          .725          .709          .693          .629
DOWJONES       .633          .633          .633          .6            .633          .633
INDEXES        .63           .697          .659          .617          .613          .579
GOLD           .622          .584          .452          .433          .415          .471
GREEN          .612          .709          .677          .58           .58           .516
NASD-100       .602          .634          .698          .655          .677          .666
MORNSTAR       .596          .684          .676          .638          .642          .588
CHEM           .577          .605          .605          .591          .563          .549
SEMI           .577          .637          .655          .646          .629          .629
HACKERS        .555          .611          .611          .611          .5            .555
SP500          .531          .562          .602          .581          .579          .541
RUS-1000       .517          .562          .568          .55           .552          .517
ELECTRON       .51           .587          .597          .592          .577          .556
-----------------------------------------------------------------------------------------
SP-100         .494          .515          .567          .546          .556          .536
SOLAR          .473          .526          .526          .473          .473          .473
MILITARY       .466          .6            .511          .488          .444          .422
COMODITY       .457          .442          .428          .342          .385          .385
INFRA          .454          .545          .636          .727          .454          .181
JETS           .444          .444          .444          .444          .444          .444
PIPELINE       .444          .555          .555          .555          .555          .444
COMPUTER       .44           .56           .56           .6            .52           .48
BIOTECH        .422          .438          .474          .478          .462          .45
INDMATER       .377          .479          .459          .448          .397          .357
RETAIL         .375          .428          .446          .357          .41           .321
OILGAS         .278          .329          .335          .278          .291          .246
FINANCE        .239          .282          .304          .336          .326          .282
AUTO           .2            .25           .275          .25           .225          .2
TRANSP         .2            .45           .45           .4            .4            .35
COAL           .111          .111          .222          .222          .444          .111
REGBANKS       .083          .111          .083          .111          .111          .083
BIGBANKS       0             0             .142          .142          .142          .142
FOOD           0             0             0             0             .071          .214
N= 8
=====================================================================================
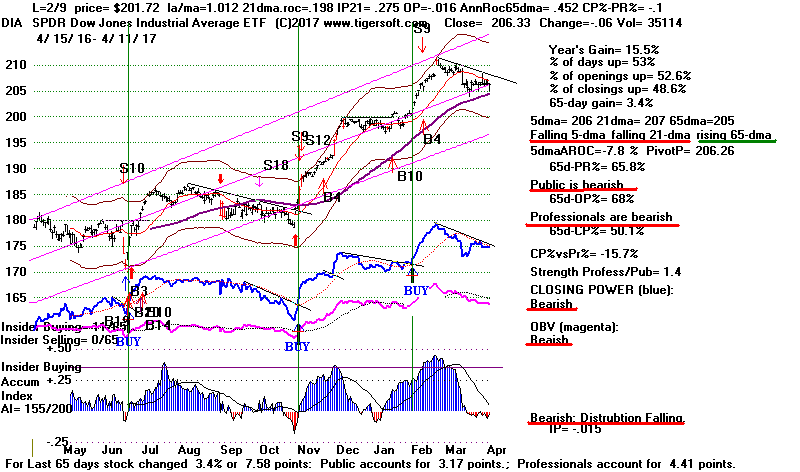
4/11/2017 Stick with the Peerless Buy. Look for a rally
soon.
The DJI is only 181 points above its rising
65-dma.
the bounce will be bullish only if it holds a good gain up from
the opening. More mid-day fades are not wanted.
Short-term traders may want to buy IWM and MDY as
well as DIA on a big move up
this week
where there
is no serious late-in-the-day retreat. With QQQ, we
will need to see it again out-performing DIA.
Index and ETF Charts: PEERLESS DJI, Signals, Indicators
Hourly DJIA A/D Line for All Stocks.
S&P OEX NYSE NASDAQ COMPQX with CP
DIA SPY QQQ MDY IWM
Short Term Interest Rates DJI-Utilities DJI-Transp A/D Line-6000 Stocks
CrudeOil FAS GLD BBH IBB JETS JNUG KOL NUGT OIH OIL
RSX RETL SLV SOXL TECL TMF TNA XIV YINN
The DJI has lagged the NYSE A/D Line by a wide margin.
In 75% of the cases in the past where such a divergence developed, it
was soon resolved by a DJI rally to the upper 3% band or higher.
Only in 2 of 8 cases did the DJI fall by as much as 7% from
its earlier peak. I like those odds.
Trump's big switch on Russia over Syria will suggest to
many that Trump wants to make peace with the Military-Intelligence
Elites in Washington. I would think Wall Street will welcome this.
See in NY Times tonight:
Trump's Shift on Russia Brings Geopolitical Whiplash
(
https://www.nytimes.com/2017/04/11/world/europe/russia-putin-trump.html?emc=edit_th_20170412&nl=todaysheadlines&nlid=58223894&_r=0
)
Today's DJI decline looked quite false.
There were 708 more
up than down on the NYSE despite the DJI's early 100-point
sell off. Not only this, but the Midcaps
(MDY) and Russell-2000 (IWM)
were up nicely and are now back above both their 21-day and
65-dma. They do still need to breakout above the apexes of
their potential right shoulder H/S peaks. We may also see bounces
tomorrow from SOXL and
IBB from the support of their rising
65-dma.
But another rally that peaks at mid-day would be disappointing.
Watch the close tomorrow. A big jump by the close up from the opening
in the case of DIA would probably mean a break in its downtrending
Closing Power. I think this will start a nice April advance up
towards the 3% upper band.
Q U I C K S I L V E R
V A L U E S
Key ETFs
Ann. 4-11 4-12
CP Resistance
5-dma Close Pivot Trend
trend Point
-------------------------------------------------------------------------------------
DIA -7.8%
206.33 -.06 206.25
Bearish 207 - 21-dma
SPY -8.9%
235.06 -.28 234.78
? 236 - 21-dma
QQQ
-40.1%
131.45 -.57 131.97
Bullish
133.6
MDY
+39.8%
312.74
+1.84 307.89
Bullish
314.81
Closed above 65-dma/21-dma
IWM
+38%
136.90
+1.08
134.33
Bullish
138.5 Closed above 65-dma/21-dma
TECL
-146.6%
64.89 -.75
66.20 Bearish
68.38
FAS
-37.8%
43.55 -.10 43.27 ?
44.6
- 21-dma
SOXL
-261.8% 71.87 -1.79
74.14
Bearish
At rising 65-dma support- 70.1
IBB
-52.4% 288.37 -1.02
287.42
Bearish
At rising 65-dma support- 288
New Study
What Does The Past Suggest We Can Expect When
NYSE Breadth Is Much Better Than The Action of
DJIA, Current Accumulation (IP21) and Volume
(V-I and OBVPct)?
There are not many cases. I can only find 8 earlier instances of this
They are all recent. Only in two cases did the DJI fall as much as 7%
from its previous high. In the other 6 cases, if the DJI did decline
anymore, it was less than 3% and in these cases DJI always soon rallied
to and tagged the 3% upper band.
LA/ 21-dma P-I P-I
IP21 VI OBCPct 65day
65-dma
MA AROC change
Up Pct AROC
----------------------------------------------------------------------------------------------
Now 4/11/2017
.997 -.132
+316 +5
-.067 -77 -.405
+.034 +.12
highest
lowest
^^^^^^^^^^^^^^^^^^^^^^^^^^^^^^^^^^^^^^^^^^^^^^^^^^^^^^^^^^^^^^^^^^^^^^^
12/20/2005
10805.55 .996 .043
+142 -30 -.12 -46
-.182 +.023 +.09
DJI goes sidewise for next month and then rallies
for 4 months to new highs and finally a successful Sell S9.
---------------------------------------------------------------------------------------------
4/10/2006
11141.33 .994 .069 +118 -91
-.072 -12 +.073 +.023
+.09
DJI rallies 5% on this test of rising 65-dma
and sets off a successful Sell S9.
--------------------------------------------------------------------------------------------
5/22/2009
8277.32 .995 .459 +300 -27
-.056 -38 -.106 +.108
+.40
DJI quickly rallies to upper band and then
falls 7 1/2%, briefly breaking 65-dma.
--------------------------------------------------------------------------------------------
8/27/2012 13124.67 .999 .044
+118 -105 -.063 -28 -.162
+.047 +.17
DJI soon rallies to upper band (for S4, S8)
and then falls 7 1/2% and below 65-dma.
--------------------------------------------------------------------------------------------
10/19/2012 13473.53 .997 .193 +116
-52 -.063 -42 +.076
+.057 +.21
DJI keeps falling after Sell S4/S8, breaks
65-dma and bottoms 7% below previous high.
--------------------------------------------------------------------------------------------
1/24/2014
15879.11 .968 -.301 +157 -172
-.072 -71 -.23
+.031 +.11
DJI keeps falling after Sell S16, breaks
65-dma and bottoms 7% below previous high.
--------------------------------------------------------------------------------------------
1/12/2015
17640.84 .997 .072 +124 60
-.100 -36 +.099 +.038
+.14
DJI falls 3% and
then rallies nearly to upper 3.5% band and goes sidewise for four
months.
--------------------------------------------------------------------------------------------
9/21/2016
18293.70 .998 -.153 +118 103
-.062 -82 -.224 +.027
+.10
DJI slowly falls 1.5% over next 7 weeks and
then rises sharply with Election of
Trump.
--------------------------------------------------------------------------------------------
To STOCKS' CHARTS
AAPL AMAT AMZN BIDU CAT FB GOOG GS IBM MSFT NVDA JPM
Others REN, JJC,
NIB, WEAT UUP (Dollar)
4/11/2017: Bullish MAXCPs Bearish MINCPS
 RANKING OF KEY DIRECTORIES BASED PCT.OF STOCKS ABOVE 65-DMA
              4/11/17
---------------------------------------------------------------------------------------
Directory     Current       day-1         day-2         day-3         day-4         day-5
----------------------------------------------------------------------------------------
NIFTY          .896          .965          .965          .896          .896          .931
("Nifty" consists of AAPL, ADBE, ADP, ALGN, AMT, AMZN, ATVI, AVGO, CHDN, CPA, CTAS, EQIX,
EXPD, FB. FISV, GOOG, HD, HSKA, JNPR, LMT, MSFT, NVR, PCL, PLVS, PNRA, REGN, TSLA, VRTX & XLNX)
NON-US ETFS    .882          .897          .882          .897          .941          .955
EDU            .875          .75           .75           .75           .75           .625
BONDFUND       .857          .866          .83           .767          .553          .589
UTILITY        .844          .866          .866          .822          .822          .822
HOMEBLDG       .833          .833          .833          .777          .722          .666
BEVERAGE       .8            .85           .85           .85           .85           .85
DJI-13         .769          .769          .692          .769          .769          .769
GAMING         .766          .766          .766          .7            .7            .7
REIT           .734          .661          .619          .604          .531          .546
HOSPITAL       .714          .714          .714          .714          .714          .714
GREEN          .709          .677          .58           .58           .516          .516
INDEXES        .697          .659          .617          .613          .584          .617
SOFTWARE       .687          .687          .671          .656          .593          .625
MORNSTAR       .684          .676          .638          .642          .592          .663
N=15
INSURANC       .647          .558          .441          .47           .47           .558
SEMI           .637          .655          .646          .629          .629          .672
NASD-100       .634          .698          .655          .677          .666          .688
DOWJONES       .633          .633          .6            .633          .633          .7
CHINA          .629          .725          .709          .693          .645          .725
HACKERS        .611          .611          .611          .5            .5            .555
CHEM           .605          .605          .591          .563          .549          .633
MILITARY       .6            .511          .488          .444          .422          .466
ELECTRON       .587          .597          .597          .577          .556          .603
GOLD           .584          .433          .452          .415          .471          .433
RUS-1000       .562          .568          .55           .552          .521          .558
SP500          .562          .602          .581          .579          .541          .568
COMPUTER       .56           .56           .6            .52           .48           .6
PIPELINE       .555          .555          .555          .555          .444          .444
INFRA          .545          .636          .727          .454          .181          .363
SOLAR          .526          .526          .473          .473          .473          .473
SP-100         .515          .567          .546          .556          .536          .587
INDMATER       .479          .459          .448          .397          .357          .397
COMODITY       .45           .422          .338          .38           .38           .352
TRANSP         .45           .45           .4            .4            .35           .4
JETS           .444          .444          .444          .444          .444          .444
BIOTECH        .438          .474          .474          .462          .462          .549
RETAIL         .428          .446          .357          .41           .321          .357
OILGAS         .329          .335          .278          .291          .246          .265
FINANCE        .282          .304          .336          .326          .293          .358
AUTO           .25           .275          .25           .225          .2            .225
COAL           .111          .222          .222          .444          .111          .222
REGBANKS       .111          .083          .111          .111          .083          .111
BIGBANKS       0             .142          .142          .142          .142          .142
FOOD           0             0             0             .066          .2            .133
N=7
===================================================================================
4/10/2017
Stick with the Peerless Buy B4.
Short-term traders should
wait a little longer
to re-commit to the upside. The Closing
Power for DIA needs to break its downtrend. See below how
this event set off 3 fine rallies in the past year. QQQ is the closest
to being a Buy using our short-term QuickSilver approach. Its
Closing Power is rising but it is below its 21-day ma and it will need
to close 0.50 higher on Tuesday to turn its 5-day ma up. It is
sitting on a still rising 21-day ma.
The market has held up well given the risks
of another Korean
War! The NYSE A/D line made another new high today far ahead of
the DJI-30. There were 1004 more up than down on the NYSE.
The 10-day ma of NYSE Up volume is above Down Volume. Tonight
there were 4 times more MAXCP stocks (where Closing Power
was making a new high) than MINCPs (where Closing Power was
making a new low). Day traders pushed 124 stocks up signifcantly
(TTH) and only 56 (TTL) down.
But something is holding back the highest priced and most
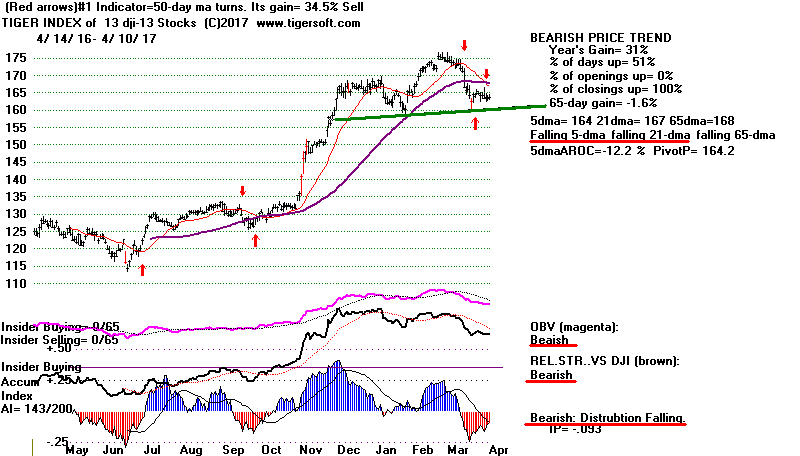
heavily weighted stocks in the Dow Jones Ind. Average. See
the chart of DJI-13 below. And something is holding back
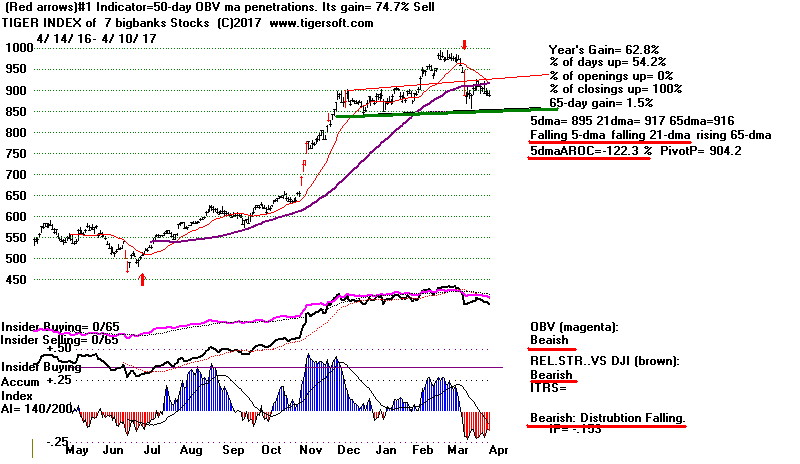
the biggest Bank stocks. See this in our Tiger Index of the Big
Banks and also note the falling Closing Power of FAS. Usually
such weakness in the biggest Banks stocks has to do with a
weakening Dollar and a sense that the the FED
may be tightening
monetary policy not far ahead.
Wall Street Professionals are worth watching now.
They are more likely to have better information about
the FED's intentions. Let's wait for DIA's Closing Power
to break its downtrends. Short-term traders may want to
play QQQ on the long side if it can close 0.50 higher.
With a Tax Cut and a Job Stimulus program still ahead,
any decline to the lower band should be a very good buying
opportunity.
The market makes an interesting study of conflicting technicals
now. On the one hand, breadth as measured by the P-I being
above +300 is clearly quite bullish. On the other hand, our
Accum. Index and OBVPct remain bearishly negative and the
DJIA is stuck below its 21-day. Check in tomorrow night
and I will show what happened in the past when there was such
a fight between our internal strength indicators.
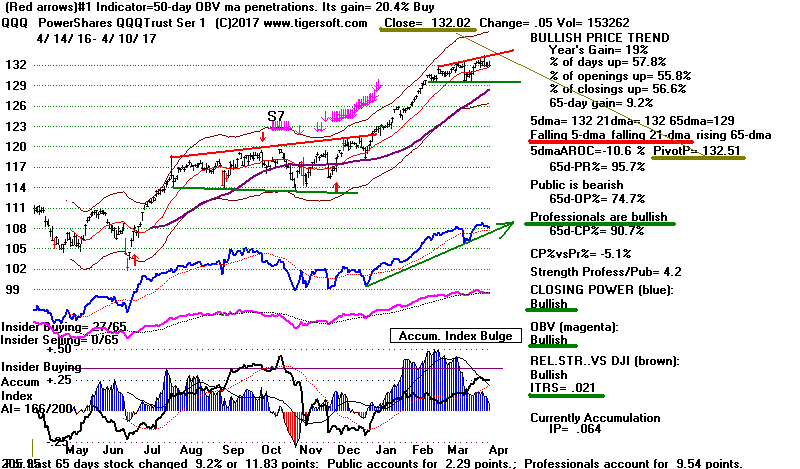
QQQ may be ready for another
attempt for a breakout above its
rising resistance line.
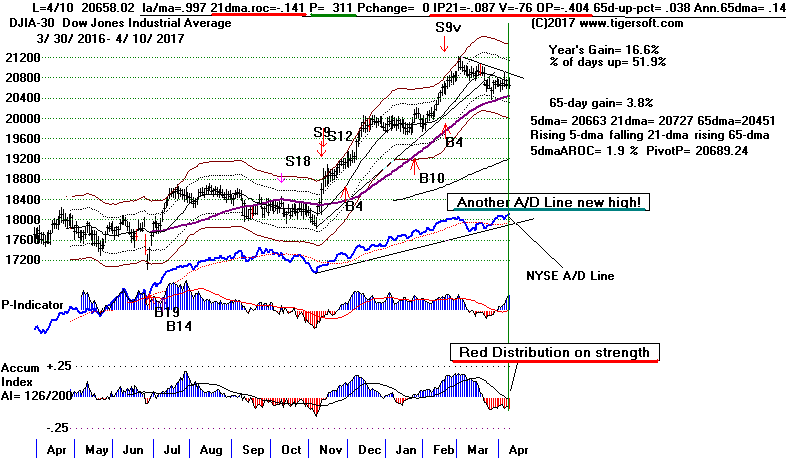
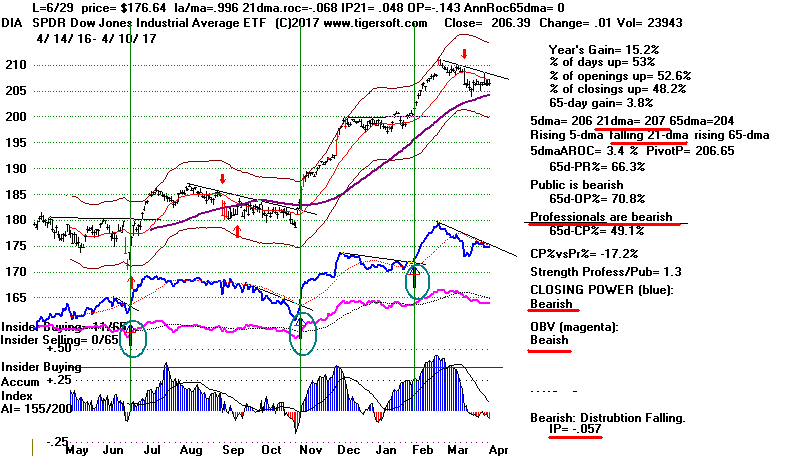
The DJIA's Peerless Key Values are fighting
among themselves. The P-I is above +300 but
the IP21 and OBVPct are negative and the DJI
stuck below its falling 21-dma. Meanwhile,
DIA's Closing Power continues its downtrend.
The DJI-30's most heavily weighted stocks, especially
Goldman Sachs and the Big Banks, look especially
"toppish" and unlikely to rise much. This is usually
not good for the market as a whole. But they also are
holding above their recent lows, too.
4/10/17: PEERLESS DJI, Signals, Indicators
Hourly DJIA A/D Line for All Stocks.
S&P OEX NYSE NASDAQ COMPQX with CP
DIA SPY QQQ MDY IWM
Short Term Interest Rates DJI-Utilities DJI-Transp A/D Line-6000 Stocks
CrudeOil FAS GLD BBH IBB JETS JNUG KOL NUGT OIH OIL
RSX RETL SLV SOXL TECL TMF TNA XIV YINN
To STOCKS' CHARTS
AAPL AMAT AMZN BIDU CAT FB GOOG GS IBM MSFT NVDA JPM
Others REN, JJC,
NIB, WEAT UUP (Dollar)
4/10/2017: Bullish MAXCPs Bearish MINCPS
 RANKING OF KEY DIRECTORIES BASED PCT.OF STOCKS ABOVE 65-DMA
              4/10/17
---------------------------------------------------------------------------------------
Directory     Current       day-1         day-2         day-3         day-4         day-5
----------------------------------------------------------------------------------------
NIFTY          .965          .965          .896          .896          .931          .896
ETFS           .897          .882          .897          .941          .955          .926
BONDFUND       .866          .83           .767          .553          .616          .642
UTILITY        .866          .866          .822          .822          .844          .844
BEVERAGE       .85           .85           .85           .85           .85           .85
HOMEBLDG       .833          .833          .777          .722          .666          .666
DJI-13         .769          .692          .769          .769          .769          .769
GAMING         .766          .766          .7            .7            .7            .766
EDU            .75           .75           .75           .75           .625          .75
CHINA          .725          .709          .693          .645          .741          .709
HOSPITAL       .714          .714          .714          .714          .714          .714
NASD-100       .698          .655          .677          .666          .688          .655
SOFTWARE       .687          .671          .656          .593          .656          .687
GREEN          .677          .58           .58           .516          .516          .516
MORNSTAR       .676          .638          .642          .592          .663          .647
N= 15
REIT           .661          .619          .604          .531          .546          .52
INDEXES        .659          .617          .613          .584          .609          .617
SEMI           .655          .646          .629          .629          .672          .672
INFRA          .636          .727          .454          .181          .363          .363
DOWJONES       .633          .6            .633          .633          .7            .666
HACKERS        .611          .611          .5            .5            .611          .555
CHEM           .605          .591          .563          .549          .633          .605
SP500          .602          .581          .579          .541          .575          .568
ELECTRON       .597          .597          .582          .556          .603          .618
RUS-1000       .568          .55           .552          .521          .564          .553
SP-100         .567          .546          .556          .536          .587          .556
COMPUTER       .56           .6            .52           .48           .6            .56
INSURANC       .558          .441          .47           .47           .558          .558
PIPELINE       .555          .555          .555          .444          .444          .444
SOLAR          .526          .473          .473          .473          .473          .421
MILITARY       .511          .488          .444          .422          .466          .511
BIOTECH        .474          .474          .458          .462          .553          .581
INDMATER       .459          .448          .397          .357          .397          .377
TRANSP         .45           .4            .4            .35           .4            .4
RETAIL         .446          .357          .41           .321          .357          .375
JETS           .444          .444          .444          .444          .444          .444
GOLD           .433          .433          .433          .471          .433          .358
COMODITY       .428          .342          .385          .385          .357          .328
OILGAS         .335          .278          .291          .246          .265          .259
FINANCE        .304          .336          .326          .293          .358          .369
AUTO           .275          .25           .225          .2            .225          .225
COAL           .222          .222          .444          .111          .222          .222
BIGBANKS       .142          .142          .142          .142          .142          .142
REGBANKS       .083          .111          .111          .083          .111          .111
FOOD           0             0             .066          .2            .133          .133
N=6
===================================================================================
4/7/2017
Stick with the Peerless Buy B4. Short-term trader should
wait a little longer
to re-commit to the upside.
The Tiger Closing Powers are not pointing up, except for QQQ and MDY,
Professionals are cautious and still selectively buying high priced tech stocks.
They are not bullish the general market. Bank stocks are depressants.
Without
clear leadership, the DJI may have to go to the lower band.
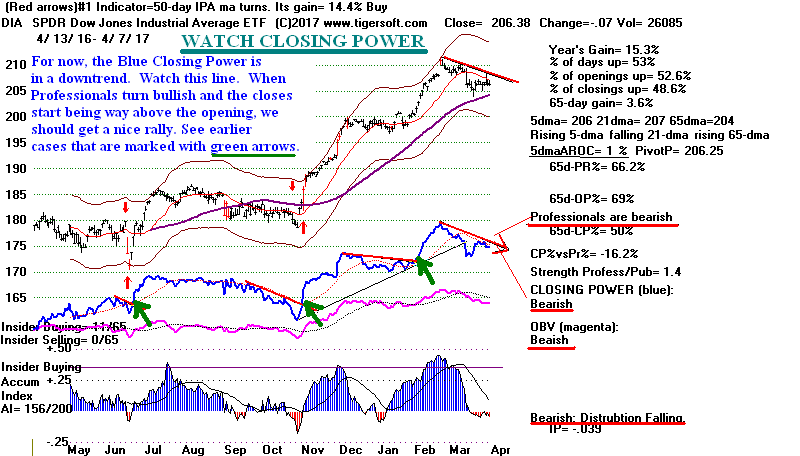
But see below
in the DIA chart how we can
very likely spot the start of the next rally
by watching
Closing Power. When it breaks its current downtrend, DIA and
the general market could start shooting up like it has done in the three
previous
instances.
Right now, among the key ETFs only DIA shows a rising 5-day ma, and just barely.
None show both a rising 5-dma and a rising Closing Power. So, traders
should
probably wait for either a Closing Power down-trend-break in DIA or a new
Peerless Buy signal to buy these ETFs.
Q U I C K S I L V E R
V A L U E S
Key ETFs
Ann. 4-7 4-10
CP Resistance
5-dma Close Pivot Trend
trend Point
-------------------------------------------------------------------------------------
DIA
+1%
206.38 -.07. 206.25
Bearish 207 - 21-dma
SPY -11.5%
235.20 -.24 235.33
? 236 - 21-dma
QQQ
-15.5%
131.97 -.07 132.30
Bullish 133.6
MDY
-37.7%
310.08 -.45 310.73
Bullish 313.63 trendl.
IWM
-72.1%
135.52 -.06 136.38 Bearish
138
TECL
-71.4%
66.00 -.06
66.75 Bearish
68.38
FAS
-85.4%
43.65 -.26
44.15 Bearish
45.
- 21-dma
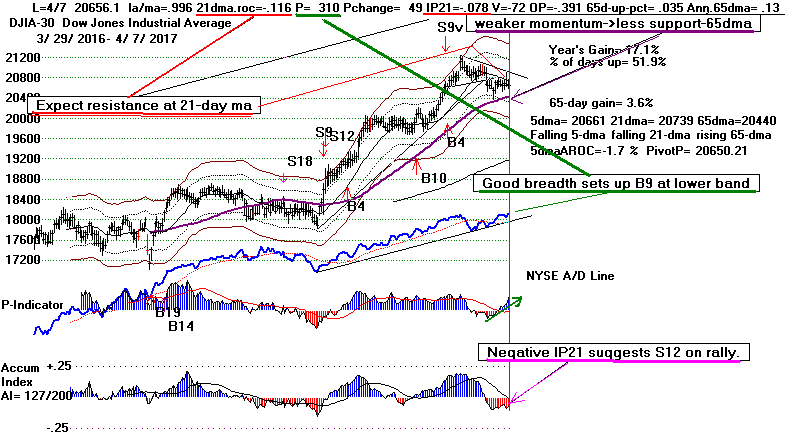
Using the Peerless Key Values To Predict The DJIA.
The DJI can't seem to overpower the resistance at its falling 21-dma,
83 points higher. We can predict that this will continue as long as
the
annualized rate of change of the 21-dma (-.116) is
below -.07 and the
Current Accum. (IP21 - -.078) is below -.07.
Seasonality is bullish but war ships
are steaming towards North Korea.
This create lots of uncertainties. A test of the lower band may be forthcoming.
If that happens, with breadth and the P-Indicator so positive, we
should get a Buy B2 or a Buy B9 there. But see how the upward
momentum of the 65-dma is weakening. That support may not be enough.
That's why we may have to see the 3.5% lower band tagged
again before mounting a rally to new highs.

                             4/9/17:    PEERLESS DJI, Signals, Indicators
                                     Hourly DJIA    A/D Line for All Stocks.
                                     S&P    OEX    NYSE    NASDAQ   COMPQX with CP
                                     DIA   SPY   QQQ    MDY    IWM
                                     Short Term Interest Rates    DJI-Utilities      DJI-Transp      A/D Line-6000 Stocks


                                     CrudeOil  FAS  GLD  BBH  IBB  JETS  JNUG  KOL  NUGT  OIH   OIL
                                     RSX   RETL   SLV   SOXL   TECL   TMF   TNA  XIV   YINN

                  To STOCKS' CHARTS
                                    AAPL   AMAT  AMZN   BIDU   CAT    FB  GOOG   GS  IBM   MSFT  NVDA JPM
                  Others REN, JJC,  NIB, WEAT  UUP (DollAR)
4/7/2017: Bullish MAXCPs Bearish MINCPS
 RANKING OF KEY DIRECTORIES BASED PCT.OF STOCKS ABOVE 65-DMA
              4/7/17
---------------------------------------------------------------------------------------
Directory     Current       day-1         day-2         day-3         day-4         day-5
----------------------------------------------------------------------------------------
NIFTY          .965          .896          .896          .931          .896          .931
ETFS           .882          .897          .941          .955          .926          .911
UTILITY        .866          .822          .822          .844          .844          .866
BEVERAGE       .85           .85           .85           .85           .85           .85
HOMEBLDG       .833          .777          .722          .666          .666          .666
BONDFUND       .83           .767          .553          .616          .66           .598
GAMING         .766          .7            .7            .7            .733          .766
EDU            .75           .75           .75           .625          .75           .875
INFRA          .727          .454          .181          .363          .363          .363
HOSPITAL       .714          .714          .714          .714          .714          .714
CHINA          .709          .693          .645          .741          .709          .709
DJI-13         .692          .769          .769          .769          .769          .769
SOFTWARE       .671          .656          .593          .656          .687          .671
N= 13
NASD-100       .655          .677          .666          .688          .655          .709
SEMI           .646          .629          .629          .672          .681          .724
MORNSTAR       .638          .642          .592          .663          .647          .714
REIT           .619          .604          .531          .546          .526          .5
INDEXES        .617          .613          .584          .609          .617          .634
HACKERS        .611          .5            .5            .611          .555          .555
COMPUTER       .6            .52           .48           .6            .56           .64
DOWJONES       .6            .633          .633          .7            .7            .7
ELECTRON       .597          .582          .561          .603          .623          .67
CHEM           .591          .563          .549          .633          .619          .647
SP500          .581          .579          .541          .575          .577          .604
GREEN          .58           .58           .516          .516          .516          .612
PIPELINE       .555          .555          .444          .444          .444          .444
RUS-1000       .55           .552          .521          .564          .558          .596
SP-100         .546          .556          .536          .587          .567          .587
MILITARY       .488          .444          .422          .466          .511          .555
BIOTECH        .474          .458          .458          .553          .581          .592
SOLAR          .473          .473          .473          .473          .421          .473
INDMATER       .448          .397          .357          .397          .377          .408
JETS           .444          .444          .444          .444          .444          .444
INSURANC       .441          .47           .47           .558          .558          .676
GOLD           .433          .415          .49           .433          .358          .32
TRANSP         .4            .4            .35           .4            .4            .45
RETAIL         .357          .41           .321          .357          .375          .482
COMODITY       .338          .38           .38           .352          .309          .366
FINANCE        .336          .326          .293          .358          .38           .413
OILGAS         .278          .291          .246          .265          .259          .24
AUTO           .25           .225          .2            .225          .225          .3
COAL           .222          .444          .111          .222          .222          .111
BIGBANKS       .142          .142          .142          .142          .142          .142
REGBANKS       .111          .111          .083          .111          .111          .138
FOOD           0             .066          .2            .133          .133          .266
N=7
===================================================================================
4/6/2017 Stick with the Buy B4. The market may be stuck
approximately where it is for a while longer, but the most
important internals I look at are improving. Any DJI test of
its lower band will almost certainly bring new Peerless Buy
signals.
Seasonality is very bullish for the next two weeks.
Since 1965, the DJI has risen 70% of these years.
Its average gain in an impressive 1.3% for the
next 10 trading days and 2.0% for the next month.
Latest Jobs Report just out shows a weakening economy. Not a good
thing if FED goes ahead with plans to raise rates to curb stock
market's supposed "over-exuberance". 180,000 was expected.
One weak number does not show a pattern, of course.
See
https://www.nytimes.com/2017/04/07/business/economy/job-creation-unemployment-trump.html
Jobs Report
just out |
| Year |
Jan |
Feb |
Mar |
Apr |
May |
Jun |
Jul |
Aug |
Sep |
Oct |
Nov |
Dec |
| 2007 |
240 |
89 |
190 |
80 |
143 |
75 |
-34 |
-20 |
88 |
84 |
114 |
98 |
| 2008 |
17 |
-84 |
-78 |
-210 |
-186 |
-162 |
-213 |
-267 |
-450 |
-474 |
-766 |
-694 |
| 2009 |
-793 |
-702 |
-823 |
-687 |
-349 |
-471 |
-329 |
-213 |
-220 |
-204 |
-2 |
-275 |
| 2010 |
23 |
-68 |
164 |
243 |
524 |
-137 |
-68 |
-36 |
-52 |
262 |
119 |
87 |
| 2011 |
43 |
189 |
225 |
346 |
77 |
225 |
69 |
110 |
248 |
209 |
141 |
209 |
| 2012 |
358 |
237 |
233 |
78 |
115 |
76 |
143 |
177 |
203 |
146 |
132 |
244 |
| 2013 |
211 |
286 |
130 |
197 |
226 |
162 |
122 |
261 |
190 |
212 |
258 |
47 |
| 2014 |
190 |
151 |
272 |
329 |
246 |
304 |
202 |
230 |
280 |
227 |
312 |
255 |
| 2015 |
234 |
238 |
86 |
262 |
344 |
206 |
254 |
157 |
100 |
321 |
272 |
239 |
| 2016 |
126 |
237 |
225 |
153 |
43 |
297 |
291 |
176 |
249 |
124 |
164 |
155 |
| 2017 |
216 |
219(P) |
98(P) |
|
|
|
|
|
|
|
|
|
P : preliminary
|
https://data.bls.gov/timeseries/CES0000000001?output_view=net_1mth
|
|
DJI - Chart with A/D Line and 10-day ma
of Up Volume and Down Volume.
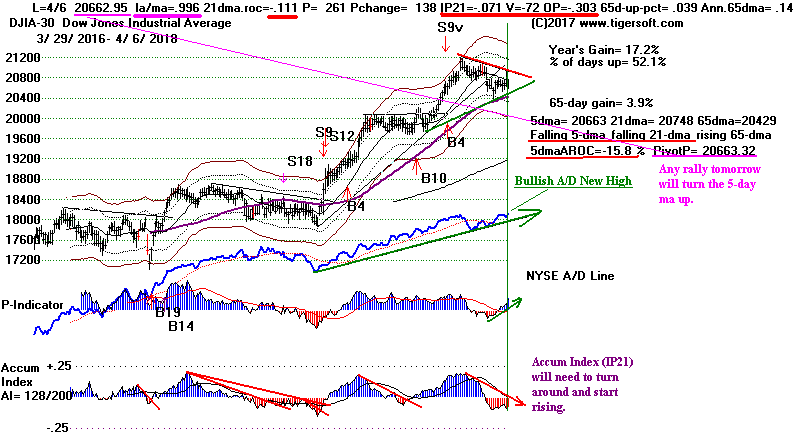

The
DJI-15
(highest priced DJI stocks' Index) does
appear to
be trapped in its emerging head/shoulders. In time, I suspect
it will breakout to the upside. But it may take a month or
two.
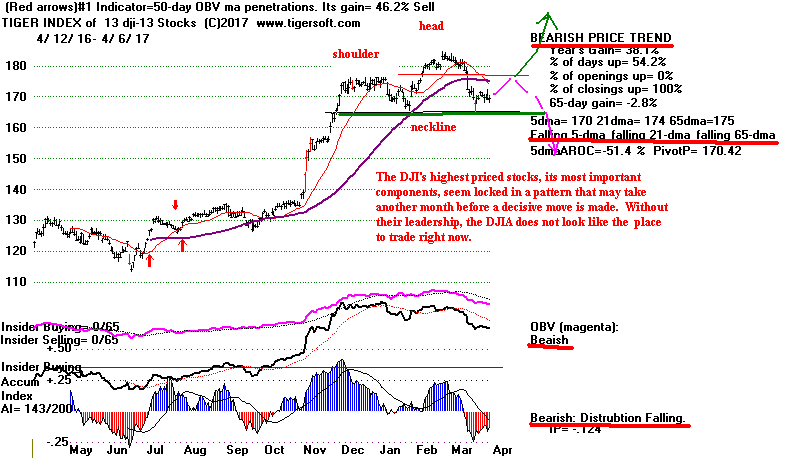
Note the bullish signs. The
A/D Line made a new high today.
The Hourly DJI's OBV is bullishly diverging from prices. The
10-day ma of NYSE Down Volume has not turned up. The ETFs
showing head/shoulders patterns, namely
BBH,
IWM,
FAS and
MDY did not
show more weakness today.
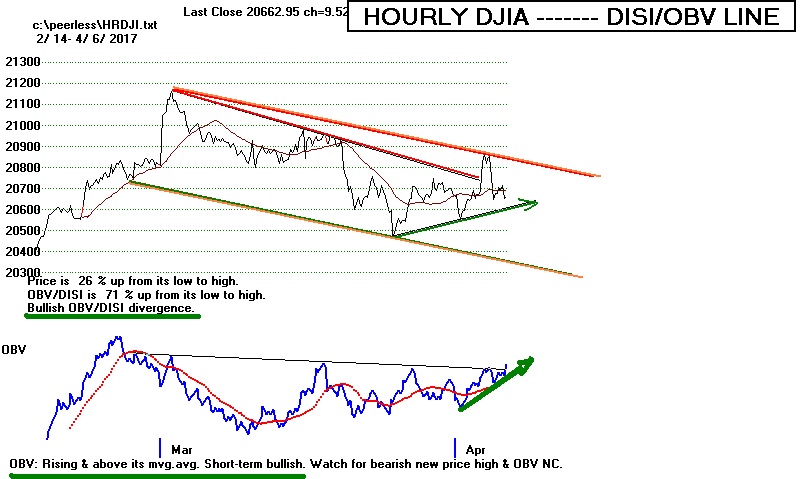
Most of all, I think what we need now is a breakout by the
NASDAQ
or QQQ above their flat resistance-lines and a move by the DJI back
above its 21-day ma.
Let's see if these bullish elements can bring a new DJI rally.
Short-term traders should, I think come back in on the long side
when a key ETF moves above its 5-day ma pivot point its Closing
Power is rated "bullish".
Q U I C K S I L V E R V A L U E S
Key ETFs 5-dma 4-6 4-7
CP Resistance
trend Close Pivot
Trend
Point
-------------------------------------------------------------------------------------
DIA
Falling
206.45 +.19 206.34
Bearish 207 - 21-dma
SPY
Falling
235.44 +66 235.74
? 236 - 21-dma
QQQ
Falling
132.04 +.07 132.47
Bullish 133.6
MDY
Falling
310.53 +2.64 312.42
? 313.63
trendl.
IWM
Falling
135.58 +1.25 137.48 Bearish
136 - 21-dma
TECL
Falling
66.06 -.14
66.95 Bearish
68.38
                             4/6/17:    PEERLESS DJI, Signals, Indicators     DJI-13    Hourly DJIA
                                     S&P    OEX    NYSE    NASDAQ  COMPQX with Closing Power
                                     DIA   SPY   QQQ    MDY    IWM
                                     Short Term Interest Rates    DJI-Utilities      DJI-Transp      A/D Line-6000 Stocks


                                     CrudeOil  FAS  GLD  BBH  IBB  JETS  JNUG  KOL  NUGT  OIH   OIL
                                     RSX   RETL   SLV   SOXL   TECL   TMF   TNA  XIV YINN

                  To STOCKS' CHARTS
                                    AAPL   AMAT  AMZN   BIDU   CAT    FB  GOOG   GS  IBM   MSFT  NVDA JPM
                  Others    REN,  CHOC NIB, JJC,  WEAT  UUP (DollAR)
4/6/2017: Bullish MAXCPs Bearish MINCPS
 RANKING OF KEY DIRECTORIES BASED PCT.OF STOCKS ABOVE 65-DMA
               4/6/17
---------------------------------------------------------------------------------------
Directory     Current       day-1         day-2         day-3         day-4         day-5
----------------------------------------------------------------------------------------
ETFS           .897          .941          .955          .926          .911          .911
NIFTY          .896          .896          .931          .896          .931          .931
BEVERAGE       .85           .85           .85           .85           .85           .85
UTILITY        .822          .822          .844          .844          .866          .8
HOMEBLDG       .777          .722          .666          .666          .666          .722
DJI-13         .769          .769          .769          .769          .769          .769
BONDFUND       .767          .553          .616          .66           .616          .58
EDU            .75           .75           .625          .75           .875          .875
HOSPITAL       .714          .714          .714          .714          .714          .714
GAMING         .7            .7            .7            .733          .766          .766
CHINA          .693          .645          .741          .709          .709          .693
NASD-100       .677          .666          .688          .655          .709          .731
N=12
SOFTWARE       .656          .593          .656          .687          .671          .656
MORNSTAR       .642          .592          .663          .647          .714          .697
DOWJONES       .633          .633          .7            .7            .7            .733
SEMI           .629          .629          .672          .681          .724          .741
INDEXES        .613          .584          .609          .617          .63           .63
REIT           .604          .531          .546          .526          .51           .463
ELECTRON       .582          .561          .608          .623          .67           .68
GREEN          .58           .516          .516          .516          .612          .612
SP500          .579          .541          .575          .577          .604          .618
CHEM           .563          .549          .633          .619          .661          .647
SP-100         .556          .536          .587          .567          .587          .639
PIPELINE       .555          .444          .444          .444          .444          .222
RUS-1000       .552          .521          .564          .558          .6            .598
COMPUTER       .52           .48           .6            .56           .64           .6
HACKERS        .5            .5            .611          .555          .555          .555
SOLAR          .473          .473          .473          .421          .473          .473
INSURANC       .47           .47           .558          .558          .676          .588
BIOTECH        .458          .458          .549          .581          .592          .573
INFRA          .454          .181          .363          .363          .363          .363
COAL           .444          .111          .222          .222          .111          .222
JETS           .444          .444          .444          .444          .444          .444
MILITARY       .444          .422          .466          .511          .555          .577
GOLD           .415          .471          .452          .358          .32           .283
RETAIL         .41           .321          .357          .375          .482          .5
TRANSP         .4            .35           .4            .4            .45           .45
INDMATER       .397          .357          .397          .377          .408          .418
COMODITY       .38           .38           .352          .309          .366          .38
FINANCE        .326          .293          .358          .38           .423          .5
OILGAS         .291          .246          .265          .259          .24           .221
AUTO           .225          .2            .225          .225          .325          .375
BIGBANKS       .142          .142          .142          .142          .142          .428
REGBANKS       .111          .083          .111          .111          .138          .222
FOOD           .066          .2            .133          .133          .266          .266
N=6
===================================================================================
4/5/2017 Given the
operative Peerless Buy B4, the DJI
should not drop below the the lower band. But a test of that
level seems likely after today's disappointing action.
The good news is that most often, the final top in the
DJI occurs at the upper band
and only when either the P-Indicator or the Accumulation
Index is negative. So,
on this basis, too, I think we are entitled to at least
one more good advance. And I
expect the next top to coincide with Congress passing a
tax cut and a big Infrastructure
program.
The NY Times reports that Trump is "accelerating" his
trillion dollar infrastructure plan. This
is bullish. A rebound
tomorrow seems likely.
(
https://www.nytimes.com/2017/04/05/us/politics/donald-trump-infrastructure-bill.html?emc=edit_th_20170406&nl=todaysheadlines&nlid=58223894
)
Bullishly, the A/D Line remains in an uptrend and the 10-day ma
of NYSE Down Volume remains in a downtrend, too. See below.
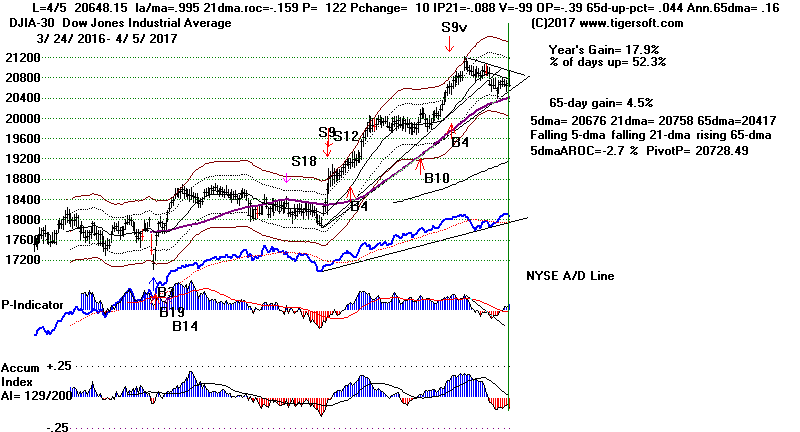


                              4/5/17:    PEERLESS DJI, Signals, Indicators     DJI-13    Hourly DJIA
                                     S&P    OEX    NYSE    NASDAQ  COMPQX with Closing Power
                                     DIA   SPY   QQQ    MDY    IWM
                                     Short Term Interest Rates    DJI-Utilities      DJI-Transp      A/D Line-6000 Stocks


                                     CrudeOil  FAS  GLD  BBH  IBB  JETS  JNUG  KOL  NUGT  OIH   OIL
                                     RSX   RETL   SLV   SOXL   TECL   TMF   TNA  XIV YINN

                  To STOCKS' CHARTS
                                    AAPL   AMAT  AMZN   BIDU   CAT    FB  GOOG   GS  IBM   MSFT  NVDA JPM
                  Others    REN,  CHOC NIB, JJC,  WEAT  UUP (DollAR)
4/5/2017: Bullish MAXCPs Bearish MINCPS
But short-term I admit I am worried.
There is no arguing that after
reaching the upper band at the start of March, the DJI has
since
been in a downtrend. See the
Hourly DJI chart.
Short-term traders, I think,
should now be using our QuickSilver strategy
and stay out of each major market ETF until its Closing
Powers and 5-day
moving average are rising or until Peerless gives a new
buy signal. Only
QQQ still shows its Closing Power to be uptrending. This can
be held a little longer. Give TECL another day. It may rebound
tomorrow.
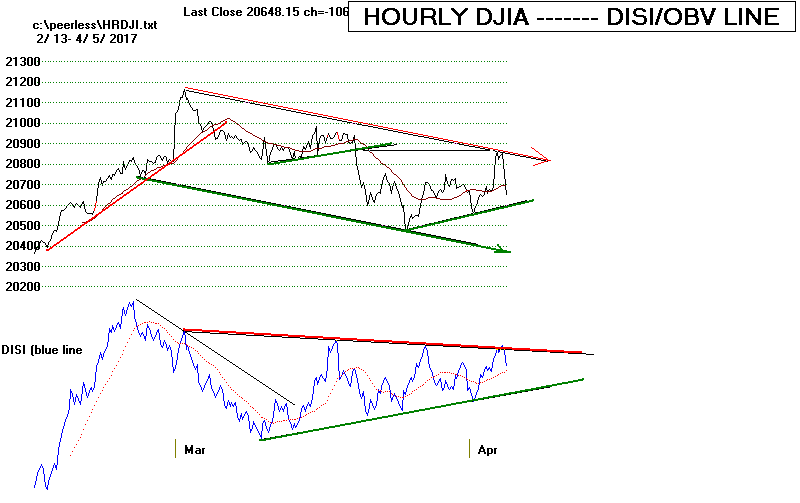
Today the DJI again
could not close above the resistance of its
falling 21-day ma. As long as the IP21 and V-Indicator are
negative,
the 21-day ma is apt to be a barrier. In this situation,
I'm no longer so
sure the 65-dma will hold on the next test. Its annualized
rate of ascent
has slowed down to just 16%.
The next decline, if the NYSE A/D Line
uptrend breaks, will probably be to 20000-20200.
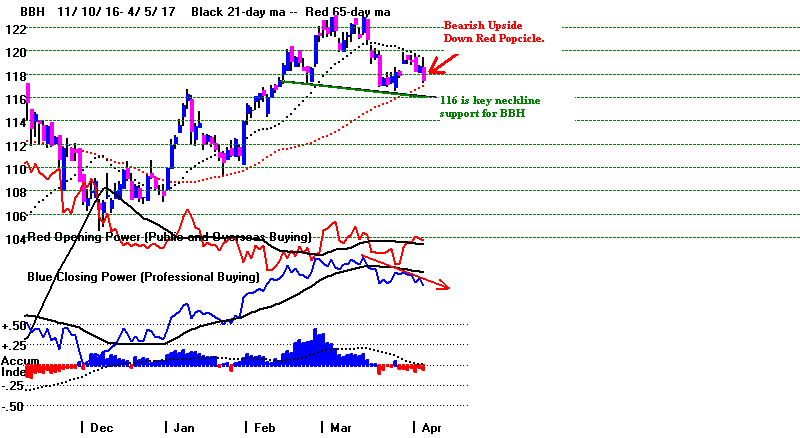
There are some other serious warning signs now. Food and
fuel prices are
falling. A number of major retail stocks show serious
weakness. Big
Banks must sense trouble ahead. The Closing Power for
FAS is
in a downtrend. Biotechs and
Mid-Caps (MDY and IWM)
now show bearish
head/shoulders patterns. And two important tech stocks,
IBM and NVDA
show bearish head/shoulders patterns.
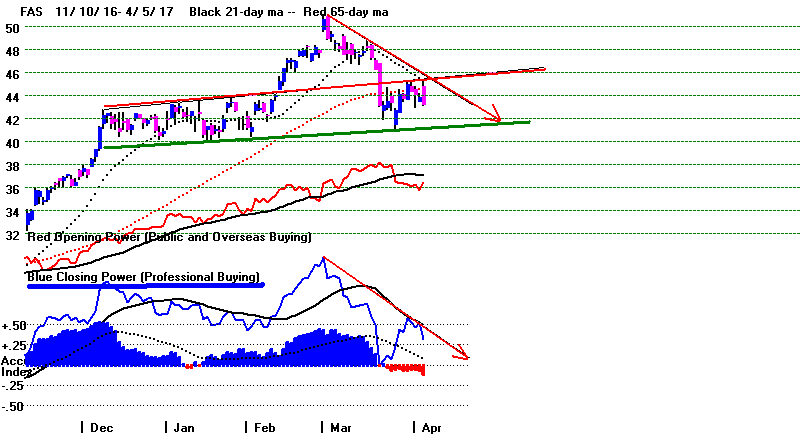
April is usually a month that allows a good rally
above the 21-day ma.
But today's rally on good Jobs' news above that
level was quickly shot down
by the hawks at the Fed.
Think about this. The DJI
lost 200 points in just the last two hours of trading,
all because their "Minutes" showed that Yellen and the
majority were ready to
raise rates further, but not because of inflation in the
form of rising commodity, labor,
producer or consumer costs and prices, but because stocks
are too high.
I think the market is right to be scared. This is very
dangerous thinking.
In 1929, 1937 and 1987, it was worries about excessive
stock market speculation
that caused the Fed to raise rates. Real inflation was
minimal. In 1929 and 1937,
business was even contracting. The Fed seems unaware of
just how powerful they are.
But what can we do? They created the long bull market.
Now they want to take it all away.
Perhaps, so Trump will be blamed!?
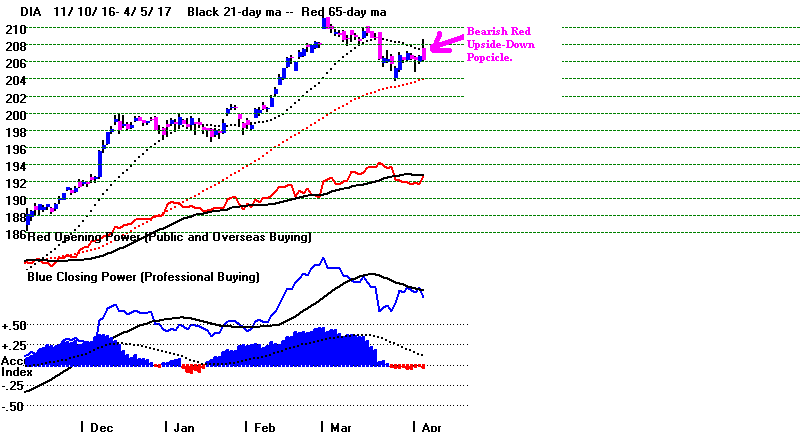
Q U I C K S I L V E R V A L U E S
Key ETFs 5-dma 4-5 4-6
CP
trend Close Pivot
Trend
Point
-------------------------------------------------------------------------------------
DIA
Falling
206.26 206.96
Bearish
SPY
Falling
234.78 236.29
?
QQQ
Falling
131.97 132.47
Bullish
MDY
Falling
307.89 312.32
Bearish
IWM
Falling
134.33 137.26
Bearish
TECL
Falling
66.20
67.26 ?
 RANKING OF KEY DIRECTORIES BASED PCT.OF STOCKS ABOVE 65-DMA
              4/5/17
---------------------------------------------------------------------------------------
Directory     Current       day-1         day-2         day-3         day-4         day-5
----------------------------------------------------------------------------------------
ETFS           .941          .955          .926          .911          .911          .941
NIFTY          .896          .931          .896          .931          .931          .931
BEVERAGE       .85           .85           .85           .85           .85           .85
UTILITY        .822          .844          .844          .866          .8            .866
DJI-13         .769          .769          .769          .769          .769          .692
EDU            .75           .625          .75           .875          .875          .75
HOMEBLDG       .722          .666          .666          .666          .722          .666
HOSPITAL       .714          .714          .714          .714          .714          .714
GAMING         .7            .7            .733          .766          .766          .733
N= 9
NASD-100       .666          .688          .655          .709          .731          .741
CHINA          .645          .741          .709          .709          .709          .677
DOWJONES       .633          .7            .7            .7            .733          .7
SEMI           .629          .672          .681          .724          .732          .706
SOFTWARE       .593          .656          .687          .671          .656          .625
MORNSTAR       .592          .663          .647          .714          .701          .655
INDEXES        .584          .609          .617          .63           .634          .596
ELECTRON       .561          .608          .628          .67           .67           .644
BONDFUND       .553          .616          .66           .616          .589          .598
CHEM           .549          .633          .619          .661          .633          .619
SP500          .541          .575          .577          .604          .618          .589
SP-100         .536          .587          .567          .587          .639          .587
REIT           .531          .546          .526          .51           .463          .437
RUS-1000       .521          .564          .558          .6            .599          .57
GREEN          .516          .516          .516          .612          .58           .548
HACKERS        .5            .611          .555          .555          .555          .5
COMPUTER       .48           .6            .56           .64           .6            .6
SOLAR          .473          .473          .421          .473          .473          .473
GOLD           .471          .433          .377          .32           .301          .339
INSURANC       .47           .558          .558          .676          .588          .588
BIOTECH        .458          .549          .577          .592          .577          .596
JETS           .444          .444          .444          .444          .444          .444
PIPELINE       .444          .444          .444          .444          .222          .222
MILITARY       .422          .466          .511          .555          .6            .555
COMODITY       .38           .352          .309          .366          .38           .394
INDMATER       .357          .397          .377          .408          .408          .377
TRANSP         .35           .4            .4            .45           .45           .35
RETAIL         .321          .357          .375          .482          .5            .517
FINANCE        .293          .358          .38           .423          .5            .38
OILGAS         .246          .265          .259          .24           .215          .234
AUTO           .2            .225          .225          .325          .375          .375
FOOD           .2            .133          .133          .266          .266          .2
INFRA          .181          .363          .363          .363          .363          .363
BIGBANKS       .142          .142          .142          .142          .428          .285
COAL           .111          .222          .222          .111          .222          .222
REGBANKS       .083          .111          .111          .138          .222          .083
N=9

