---- TIGERSOFT/PEERLESS HOTLINE ----
(C)
1985-2020 William Schmidt, Ph.D. www.tigersoft.com
william_schmidt@hotmail.com All rights strictly
reserved

It's time to
change our Hotline address again.
Look for an email
this Saturday giving the new
address starting
late Sunday night.
IMPORTANT - Always
CLICK REFRESH.
+++++++++++++++++++++++
Data used through 4/16/2020 ... 4/17/2020 6:00 AM PCT
---------------------------------------------------------------------------------
Earlier Hotlines
www.tigersoft.com/2020NIGHT/INDEX.htm
www.tigersoft.com/4ACES1/INDEX.htm
www.tigersoft.com/48HLA/INDEX.htm
www.tigersoft.com/QUICKER/INDEX.htm
www.tigersoft.com/QUICK/INDEX.htm
www.tigersoft.com/77HLZ/INDEX.htm
www.tigersoft.com/44THL/INDEX.htm
www.tigersoft.com/21PEY3/INDEX-2.htm
www.tigersoft.com/19HLK5/INDEX.htm
www.tigersoft.com/44UHL/INDEX.htm
www.tigersoft.com/NHLP/INDEX.htm
www.tigersoft.com/7LHL/INDEX.htm
www.tigersoft.com/NHL718/INDEX.htm
www.tigersoft.com/21MAY18/INDEX.htm
www.tigersoft.com/55HEP/INDEX.htm
www.tigersoft.com/44H4L/INDEX2.htm
Earlier still: Go here...
HELP
A Guide
To Profitably Using The Tiger Nightly HOTLINE
Introduction to Tiger/Peerless Buys and
Sells.
Peerless Buy and
Sell Signals: 1928-2016
Individual Peerless signals explained:
http://tigersoftware.com/PeerlessStudies/Signals-Res/index.htm
http://www.tigersoft.com/PeerInst-2012-2013/
Explanation of each Peerless signal. http://www.tigersoft.com/PeerInst-2012-2013/
Different Types of
TigerSoft/Peerless CHARTS, Signals and Indicators
-----> More HELP LINKS
Documentation for
TigerSoft Automatic and Optimized Signals.
How reliable support is the
DJI's rising 200-day ma?
SPY Charts since
1994: Advisory Closing Power S7s, Accum. Index, 65-dma, Optimized Signals.
^^^^^^^^^^^^^^^^^^^^^^^^^^^^^^^^^^^^^^^^^^^^^^^^
1/19/2016 ---> Corrections,Deeper
Declines and Bear Markets since 1945.
1/21/2016
---> High
Velocity Declines since 1929
2/12/2016 ---> Presidential
Elections Years and Bullish IP21 Positive Non-Confirmations at Lower Band.
2/12/2016 ---> OBV NNCs on DJI's Rally to
2.7% Upper Band when DJI's 65-dma is falling.
11/6/2016 --->
Killer Short Selling
Techniques: ===> Order Here ($42.50)
It's As Easy as 1,2,3
TigerSoft "Combination" Short-Selling... Easy as 1-2-3 Short Sales
Earlier Q-Answers
QuickSilver Documentation (1/11/2016)
Our Different
Signals
Better understand the difference between
Peerless DJI-based signals,
the one-year optimized red Signals and the fixed signals based
on technical developments.
Introduction to Tiger/Peerless Buys and Sells.
Different Types of
TigerSoft/Peerless CHARTS, Signals and Indicators
New TigerPeerless Installation and
Basic Uses' Instruction
See the re-written materials on TigerSoft Buys and Sells.
Study- Trading SPY
WITHOUT Peerless - Some Guidelines.
When completed this will be a new Tiger Trading E-Book.
Study- Examples of
"Hands above the Head" top patterns.
Study- 9/3/2017 TigerSoft (not
Peerless) charts of Major Tops as they occurred.
===> Please report any broken or out-of-date links. william_schmidt@hotmail.com
====================================================================
====================================================================
4/16/2020 Boeing said Thursday it "will restart production of its commercial airplanes
next week in the Seattle area, putting about 27,000 people back to work
after operations were suspended because of the COVID-19 pandemic."
Boeing has a history of gambling. Now it has the Government's money and
its doing it again.
https://archive.fortune.com/magazines/fortune/fortune_archive/1992/04/20/76312/index.htm
https://www.zerohedge.com/markets/boeing-bets-big-max-production-restart-mid-year-new-hires
https://blog.thetravelinsider.info/2019/07/did-boeing-secretly-bet-the-company-yet-again-on-an-airline-project.html

Boeing's big gamble is causing the DJI-30 to open up considerably
above
the 24000 short-term resistance. This will take it well past a 50% retracement
of what it lost earlier year. On the basis of the "segmented recovery"
theory
I have set out here, the next resistance point will likely be its 65-dma. That
is now at 25637, about 15000 points higher than its opening tomorrow
This would be too much paper loss. Cover the DIA short if it
closes Friday
above
24000 and prepare to go short DIA again above 25000 as DIA
approaches
its 65-dma.

Meanwhile, the NASDAQ and QQQ are roaring ahead on the basis
of their
high capitalization tech stocks that are actually benefitting from
the stay-at-home orders and from the biotechs that are
searching hard for a new Covid-19 vaccine and a better way to
treat those sick with the virus. The stay-at-home orders are
putting a premium on new computers, video-conferencing,
cell-phone use, semi-conductors for gaming, on-line ordering of
movies and much more. All this has benefitted AMZN, NVDA,
MSFT, NFLX and the many big Biotechs that are in QQQ.
QQQ has outperformed the DJI by 12% over the last 50 trading
days. This amount shows the possibilities and rewards in hedging.

Anyone doing his technical homework each night was
in a position|
to see how much stronger these stocks and the QQQ were
that the DIA, which was weighted down with BA, Oil stocks
and a number of financials. The financials are, of course, being
pounded by the certainty that millions of Americans will not
soon be in a position to pay their credit card debt, their car loans,
their rent and their mortgage payments.
True, the $7 Trillion Dollar bailout gives
hope that the market
will be sustained until there are enough virus-tests for everyone
so that a more normal economy can be returned to. All this money
has lifted stocks dramatically, ever since Congress was poised
to sign its bailout bill. The timing of this shows how important
the bailout bill was for the market.
Technically, this has been expresed in the "wicked good" breadth.
I did work last weekend for you on a hypothetical new Buy B12
which takes place when there are two or three days of 8:1 good
breadth days. More work will be done on it this weekend.
In the meantime, hold long NVDA (and some of the
bullish
MAXCPs). Because DIA is likely to close way above its
50% retracement level, cover the DIA short. The weakness
in the Financials is symptomatic of severe longer term, financial
probems for the US. (I say this recalling how the big bank stocks
topped out in 2007, a year before the 2008 collapse.).
I think we can say with a high degree of confidence that the huge
rise in the size of the deficits at the Treasury, the FED and all
State and Local Goverment that either there will have to be
much, much more borrowing or a very big round of new taxation
of the rich. Either way Interest Rates will rise sharply and the
stock markets must fall back again.
|
Charts 4/16/2020 (Click on Underlined link.) 2020 PEERLESS DJI, Signals, Indicators Daily DJI Volume 10-DayUp/Down Vol Stoch-20 Inverted Traders Index Graph of Pct of All Stocks above 65-dma NASDAQ S&P OEX NYSE COMPQX DJI-15 DJI-20 DJI-30 DIA QQQ MDY IWM TNA Short-Term Rates SPY http://tigersoft.com/2020CST/SPY.GIF USO-CrudeOil DBO FAS GLD BBH IBB JETS JNUG KOL NUGT OIH OIL PALL RSX RETL SDS AGQ SLV SOXL TECL TLT TMF TNA UGA (gasoline) and China: YINN CHAU Commodities: CANE CORN DBC JJC, NIB, CHOC CORN, CUT (paper) MOO, SOYB WEAT UUP (Dollar) LIT (Lithium) AAPL ADBE ALXN AMAT AMGN AMD AMZN AXP BA BABA BAC BIDU BLDP CAT CVX DE FB GOOG GS HD IBM INTU JPM M (Macy's) MSFT NEM NFLX NKE NVDA PG QCOM TSLA TXN XOM V WMT CMG , LRCX, SQ TOWN New highs and Bullish MAXCPs http://tigersoft.com/MAXMLK/4-16-20/BULLISH.htm Bearish MAXCPs - http://tigersoft.com/MINMLK/4-16-20/BEARISH.htm |
 4/16/2018   QUICKSILVER on DJI-30 STOCKS
             4 Bullish 3 Bearish
STOCKS CLOSE CHANGE PIVOT-P 5-dma AROC CL-PWR Cand. IP21 ITRS ------------------------------------------------------------------------------------- AAPL 286.69 2.26 267.99 373.9% Bullish RED .087 .082 --------------------------------------------------------------------- AXP 81.35 -2.44 94.82 -596.9% Bearish RED -.099 -.2 Bearish --------------------------------------------------------------------- BA 134.24 -11.4 151.84 -431% Bearish RED -.15 -.395 Bearish --------------------------------------------------------------------- CAT 113.22 1.69 125.03 -596.2% Bullish BLUE .115 .031 --------------------------------------------------------------------- CSCO 41.5 -.02 41.2 -28.8% Bullish RED .078 .054 --------------------------------------------------------------------- CVX 79.99 -2.5 84.31 -354.6% Bearish RED .023 -.068 --------------------------------------------------------------------- DIS 102.02 -1.35 104.5 45.8% ------- RED .095 -.112 --------------------------------------------------------------------- GS 177.04 -1.48 184.26 2.2% Bullish RED .061 -.085 --------------------------------------------------------------------- HD 199.85 1.37 201.53 125.7% Bullish BLUE .169 .033 --------------------------------------------------------------------- IBM 115.73 -2.96 121.5 -147.2% Bullish RED .005 -.041 --------------------------------------------------------------------- INTC 60.79 1.92 57.14 153.7% Bullish BLUE-.027 .112 --------------------------------------------------------------------- JNJ 149.67 2.01 141.23 223.2% Bullish BLUE .128 .17 Bullish --------------------------------------------------------------------- JPM 87.33 -3.46 102.76 -361.9% Bearish RED -.096 -.172 Bearish --------------------------------------------------------------------- KO 47.1 -.51 49 -74.9% ------- RED -.108 -.017 --------------------------------------------------------------------- MCD 179.5 1.66 183.7 55.6% Bullish BLUE .08 .019 --------------------------------------------------------------------- MMM 144.9 -.26 147.78 -138.5% Bullish RED .099 .104 --------------------------------------------------------------------- MRK 83 .93 82.49 84.2% Bullish BLUE .179 .122 Bullish --------------------------------------------------------------------- MSFT 177.04 5.16 165.14 353.9% Bullish BLUE .039 .166 --------------------------------------------------------------------- NKE 86.3 1.26 86.79 58.3% Bullish BLUE .153 .034 --------------------------------------------------------------------- PFE 35.88 -.09 35.39 180.2% Bullish RED .057 .135 --------------------------------------------------------------------- PG 121.5 .28 114.66 272.2% Bullish RED -.015 .15 --------------------------------------------------------------------- TRV 99.81 -2.36 109.74 -241.4% Bullish RED .077 -.064 --------------------------------------------------------------------- UNH 298.43 16.75 264.13 567.7% Bullish BLUE .204 .246 Bullish --------------------------------------------------------------------- UTX 86.01 -5.36 97.15 -958.4% Bullish RED .144 -.258 --------------------------------------------------------------------- V 162.42 -3.54 173.69 -364.7% ------- RED .013 -.019 --------------------------------------------------------------------- VZ 57.66 .73 57.44 -12.2% Bullish BLUE .053 .172 --------------------------------------------------------------------- WBA 43.23 -.21 43.98 15.8% Bearish RED .041 .009 --------------------------------------------------------------------- WMT 132.33 3.87 121.8 418.7% Bullish BLUE .091 .331 Bullish --------------------------------------------------------------------- XOM 39.15 -1.33 43.13 -552.6% Bearish RED -.018 -.164 |
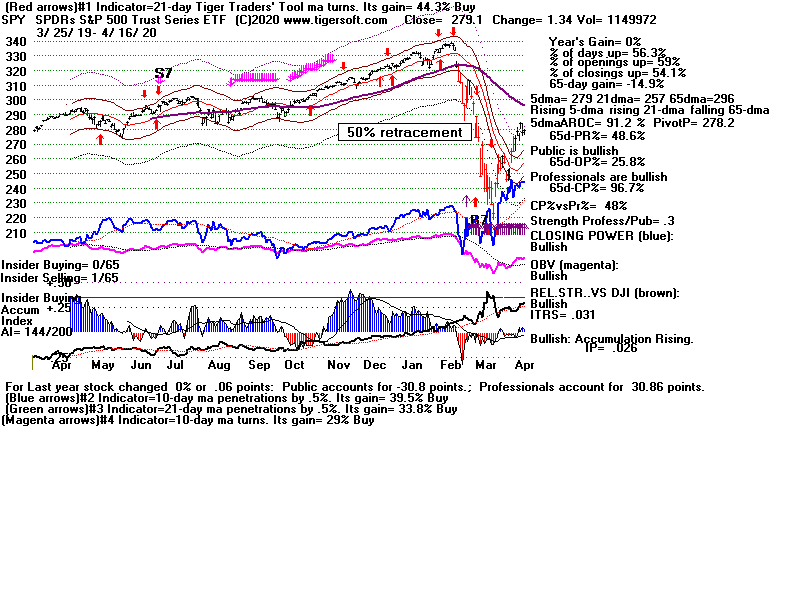
QUICKSILVER on ETFS - 04/16/20 Bearish = 4 Bullish = 2 ETF CLOSE CHANGE PIVOT-PT 5-dma AROC CL-PWR CANDLE IP21 ITRS --------------------------------------------------------------------------------------------- DIA 235.34 .26 237.14 21.4% Bullish RED .111 0 --------------------------------------------------------------------------------------------- SPY 279.1 1.34 278.2 91.2% Bullish ---- .026 .031 --------------------------------------------------------------------------------------------- QQQ 213.25 3.82 200.86 309% Bullish BLUE .128 .12 --------------------------------------------------------------------------------------------- MDY 274.4 -.24 288.97 -90% Bullish RED .069 -.084 --------------------------------------------------------------------------------------------- IWM 116.91 -.89 123.72 -48.1% Bullish RED .097 -.108 --------------------------------------------------------------------------------------------- FAS 24.32 -1.31 31.36 -612.4% Bearish RED .018 -.57 Bearish --------------------------------------------------------------------------------------------- RETL 7.23 -.02 7.71 165.6% ------- RED .072 -.518 Bearish --------------------------------------------------------------------------------------------- SOXL 125.21 8.58 108.15 408.5% Bullish BLUE .097 -.364 Bearish --------------------------------------------------------------------------------------------- TECL 146.84 4.59 133.97 466.9% Bullish RED .126 -.329 --------------------------------------------------------------------------------------------- IBB 119.08 3.39 113.97 266.6% Bullish BLUE .174 .187 Bullish --------------------------------------------------------------------------------------------- GLD 161.71 -.14 158.69 220.8% Bullish RED .044 .287 Bullish --------------------------------------------------------------------------------------------- OIH 83.21 -6.21 98.4 -750.1% Bearish RED -.125 -.442 Bearish --------------------------------------------------------------------------------------------- |
 Table 4   Count of Stocks in Key Directories
           20200416
-------------------------------
NEWHIGHS       70
NEWLOWS        102
MAXCP          123
MINCP          134
TTTNH          54
TTTNL          95
FASTUP         192
FASTDOWN       204
CPCROSSA       53
CPCROSSD       97
BIGVOLUP       5
BIGVODN        13
ACCUMVER       6
HIGHIP21       9
HIUPPCT        9
REDSELL        141
AUGSELS7       5
TRAPDOOR       333
|
RANKING OF KEY DIRECTORIES BASED PCT.OF STOCKS ABOVE 65-DMA 4/16/20 --------------------------------------------------------------------------------------- Directory Current day-1 day-2 day-3 day-4 day-5 ---------------------------------------------------------------------------------------- GOLD .562 .562 .562 .583 .354 .229 NIFTY .413 .347 .413 .239 .173 .239 HACKERS .4 .35 .45 .3 .25 .35 NASD-100 .393 .323 .404 .232 .222 .222 GAMING .363 .363 .363 .272 .227 .181 BIOTECH .347 .311 .365 .281 .269 .2 SOFTWARE .316 .266 .316 .2 .2 .216 DOWJONES .3 .3 .266 .066 .166 .233 SEMI .283 .207 .292 .15 .141 .179 INDEXES .279 .247 .274 .204 .204 .166 BEVERAGE .266 .266 .333 .2 .266 .2 GUNS .266 .266 .4 .266 .266 .2 SP-100 .255 .233 .255 .122 .144 .166 COMODITY .225 .225 .225 .2 .175 .15 ELECTRON .218 .172 .225 .132 .112 .152 FOOD .203 .203 .222 .203 .185 .148 SP500 .197 .168 .206 .105 .153 .12 FIDSTKS .191 .174 .219 .106 .134 .123 RETAIL .18 .18 .2 .12 .1 .14 RUS-1000 .17 .148 .176 .108 .134 .112 DJI-13 .153 .153 .076 0 .076 .153 TRANSP .15 0 .1 .05 .1 .1 COAL .142 .142 .142 .142 .142 .142 GREEN .142 .142 .142 .142 .142 .142 INDMATER .12 .12 .146 .106 .12 .08 CHINA .111 .092 .111 .055 .037 .037 MILITARY .111 .111 .111 .074 .037 .037 COMPUTER .105 .052 .157 .052 .052 .105 BONDFUND .09 .1 .09 .08 .09 .06 HOSPITAL .09 .09 .09 .09 .09 .045 UTILITY .076 .076 .128 .025 .128 .025 SOLAR .062 .062 .062 0 .062 .062 OILGAS .06 .06 .052 .037 .037 .037 REIT .056 .056 .106 .049 .106 .049 AUTO .05 .05 .05 .05 .025 0 CHEM .041 .041 .062 .02 .062 .02 INSURANC .038 .038 .038 0 .076 .038 FINANCE .023 .023 .023 .023 .023 .023 ETFS .017 0 0 0 0 0 BIGBANKS 0 0 0 0 0 0 COPPER 0 0 0 0 0 0 EDU 0 .2 .4 .2 0 .2 HOMEBLDG 0 0 0 0 0 0 INFRA 0 0 0 0 0 .028 JETS 0 0 0 0 0 0 REGBANKS 0 0 0 0 .038 0 |
=======================================================================
4/15/2020 The operative Peerless signal
remains last week's Sell S9. Though the
DJI has failed to close above 24000, it also keeps finding support just
above 23000. Elsewhere, the NASDAQ and QQQ are back to their
key 65-day moving averages and the SP-500 has pulled back to
to its 50% retracement levels. Will these previously overcome
resistance levels act as support and the uptrends of the NASDAQ, QQQ
and SP-500 be resumed? That is what the "segmented" steps upward
I showed last light would suggest. But a breakdown below the last level
would show serious slippage and call for a re-test of the previous
segment's lower boundaries, probably the 50% retracement level for the
NASDAQ and QQQ.

|
SP-500 This is at a pivotal point. Support is between 2650 and 2750. Resistance is at its falling 65-dma. Professionals are much more bullish than the Public or Overseas traders are.  |
|
NASDAQ (COMPQX) Support is at 8235 and resistance is at falling 65-dma. Professionals are much more bullish than the Public or Overseas traders are.  |
|
QQQ QQQ is at pivotal point, its 65-dma. Below this support is at 50% retracement level while resistance is now its February high.  |
Politics is always a key Wall Street concern
Tomorrow and Friday are politically pivotal days. Wall Street is looking forward
to the President's decision about when to re-open the country's economy
now that the number of hospital admissions and new Covid-19 cases are
rising less quickly and now that the bailout money for small businesses
is exhausted.
But any decison will be contentious. The Democrat Governors say that
the President lacks such authority. It is their call when to reopen. What
may also happen is that Speaker Pelosi could try to challenge the President
and his Wall Street backers who favor a quick re-opening. She could
use her position to sponsor a new House bill to get another emergency
check out in May for all those who choose to remain jobless because
they fear going back to work without more tests and better treatment
if they become ill with the virus. A Presidential "back-to-work order"
will
not easily be enforced. It will quickly become a political "hot potato".
So the uncertainties will not go away and a restoration of investors'
confidence is not a given.
I would stay short DIA and long NVDA and
GLD. Use the segmented
evaluation concept I suggested last night. The 50-retracement level and
the falling 65-dma will act now as support and resistance levels, respectively
for the SP-500, NASDAQ and QQQ.
Buy B12?
I have talked about the bullishness of three days of 7:1 daily breadth
(NYSE advances to declines) coming all at once in quick succession.
This predicts a quick recovery and weakens the Sell S9.
Let me suggest that a continued recovery may be in
the cards for the big
technology stocks all the while the DJIA remains in its slump much longer.
This is because the DJIA-30 (and DIA) are weighted down by Boeing, by its
big banks and by oil its stocks.
Meanwhile, we are getting a good glimpse of which are the real leaders
among tech stocks, retailers (AMZN and WMT) and biotechs. These
should continue to outperform the DJI by a margin wide enough to
profit from by hedging, as has been suggested, using our Bullish and
Bearish MINCPs.
|
Charts 4/15/2020 (Click on Underlined link.) 2020 PEERLESS DJI, Signals, Indicators Daily DJI Volume 10-DayUp/Down Vol Stoch-20 Inverted Traders Index Graph of Pct of All Stocks above 65-dma NASDAQ S&P OEX NYSE COMPQX DJI-15 DJI-20 DJI-30 DIA QQQ MDY IWM TNA Short-Term Rates SPY http://tigersoft.com/2020CST/SPY.GIF USO-CrudeOil DBO FAS GLD BBH IBB JETS JNUG KOL NUGT OIH OIL PALL RSX RETL SDS AGQ SLV SOXL TECL TLT TMF TNA UGA (gasoline) and China: YINN CHAU Commodities: CANE CORN DBC JJC, NIB, CHOC CORN, CUT (paper) MOO, SOYB WEAT UUP (Dollar) LIT (Lithium) AAPL ADBE ALXN AMAT AMGN AMD AMZN AXP BA BABA BAC BIDU BLDP CAT CVX DE FB GOOG GS HD IBM INTU JPM M (Macy's) MSFT NEM NFLX NKE NVDA PG QCOM TSLA TXN XOM V WMT CMG , LRCX, SQ TOWN New highs and Bullish MAXCPs http://tigersoft.com/MAXMLK/4-15-20/BULLISH.htm Bearish MAXCPs - http://tigersoft.com/MINMLK/4-15-20/BEARISH.htm |
 4/15/2018   QUICKSILVER on DJI-30 STOCKS
             5 Bullish 2 Bearish
STOCKS CLOSE CHANGE PIVOT-P 5-dma AROC CL-PWR Cand. IP21 ITRS ------------------------------------------------------------------------------------- AAPL 284.43 -2.62 266.07 461.7% Bullish BLUE .104 .094 --------------------------------------------------------------------- AXP 83.79 -4.6 92.08 -209.1% Bearish BLUE-.071 -.188 Bearish --------------------------------------------------------------------- BA 145.64 4.64 146.87 139.3% Bearish BLUE-.09 -.367 Bearish --------------------------------------------------------------------- CAT 111.53 -4.95 127.4 -429.4% Bullish RED .125 .032 --------------------------------------------------------------------- CSCO 41.52 -1.26 41.74 106% Bullish RED .085 .065 --------------------------------------------------------------------- CVX 82.49 -2.12 85.98 93.3% Bearish BLUE .053 -.052 --------------------------------------------------------------------- DIS 103.37 -2.66 101.07 103.1% ------- RED .087 -.096 --------------------------------------------------------------------- GS 178.52 .29 176.96 353.2% Bullish BLUE .041 -.081 --------------------------------------------------------------------- HD 198.48 -8.69 194.82 155.6% Bullish RED .229 .029 Bullish --------------------------------------------------------------------- IBM 118.69 -5.22 119.29 156% Bullish RED .08 -.016 --------------------------------------------------------------------- INTC 58.87 -1.79 58.98 40% Bullish RED -.016 .086 --------------------------------------------------------------------- JNJ 147.66 1.63 143.26 359.6% Bullish BLUE .163 .155 Bullish --------------------------------------------------------------------- JPM 90.79 -4.71 94.3 7.8% ------- ---- -.039 -.147 --------------------------------------------------------------------- KO 47.61 -1.31 47.82 115% ------- RED -.056 -.015 --------------------------------------------------------------------- MCD 177.84 -6.15 177.49 62.4% Bullish RED .107 -.001 --------------------------------------------------------------------- MMM 145.16 -4.98 148.99 19% Bullish RED .116 .099 --------------------------------------------------------------------- MRK 82.07 -.77 81.62 216.1% Bullish BLUE .184 .112 Bullish --------------------------------------------------------------------- MSFT 171.88 -1.82 165.13 251.8% Bullish BLUE .058 .158 --------------------------------------------------------------------- NKE 85.04 -2.43 85.3 51.4% ------- BLUE .146 .029 --------------------------------------------------------------------- PFE 35.97 -.47 34.6 336.8% Bullish RED .095 .131 --------------------------------------------------------------------- PG 121.22 .26 115.1 364.6% Bullish BLUE .018 .141 --------------------------------------------------------------------- TRV 102.17 -5.85 104.94 65.6% Bullish RED .166 -.063 --------------------------------------------------------------------- UNH 281.68 11.18 267.83 640% Bullish BLUE .193 .2 Bullish --------------------------------------------------------------------- UTX 86.01 -5.36 97.15 -958.4% Bullish RED .144 -.269 --------------------------------------------------------------------- V 165.96 -8.66 174.94 -76.4% ------- RED .045 -.001 --------------------------------------------------------------------- VZ 56.93 -1.21 57.8 -4.4% Bullish RED .064 .153 --------------------------------------------------------------------- WBA 43.44 -2.94 43.09 71.5% ------- RED .091 .025 --------------------------------------------------------------------- WMT 128.46 -.54 121.84 260.9% Bullish RED .123 .296 Bullish --------------------------------------------------------------------- XOM 40.48 -1.95 43.85 -89% Bearish RED .03 -.161 |
QUICKSILVER on ETFS - 04/15/20 ETF CLOSE CHANGE PIVOT-PT 5-dma AROC CL-PWR CANDLE IP21 ITRS --------------------------------------------------------------------------------------------- DIA 235.08 -4.6 234.33 180.9% Bullish BLUE .152 0 --------------------------------------------------------------------------------------------- SPY 277.76 -6.03 274.03 229.3% Bullish BLUE .049 .029 --------------------------------------------------------------------------------------------- QQQ 209.43 -2.43 200.57 321.7% Bullish BLUE .156 .114 --------------------------------------------------------------------------------------------- MDY 274.64 -11.23 279.47 156.2% Bullish RED .135 -.085 --------------------------------------------------------------------------------------------- IWM 117.8 -5.01 118.07 204.1% ------- RED .117 -.102 --------------------------------------------------------------------------------------------- FAS 25.63 -3.5 27.8 248.8% Bearish RED .047 -.559 Bearish --------------------------------------------------------------------------------------------- RETL 7.25 -1.09 6.98 750.3% Bearish RED .069 -.521 Bearish --------------------------------------------------------------------------------------------- SOXL 116.63 -10.3 115.74 503% ------- RED .118 -.367 --------------------------------------------------------------------------------------------- TECL 142.25 -9.74 133.82 662.2% ------- RED .131 -.318 --------------------------------------------------------------------------------------------- IBB 115.69 -2.96 112.94 269.9% Bullish RED .175 .171 Bullish --------------------------------------------------------------------------------------------- GLD 161.85 -.83 154.65 183.1% Bullish ---- .058 .263 Bullish --------------------------------------------------------------------------------------------- OIH 89.42 -6.98 97.6 -30.2% Bearish RED -.071 -.416 Bearish --------------------------------------------------------------------------------------------- |
  Table 3   Count of Stocks in Key Directories
            20200415
-------------------------------
NEWHIGHS       39
NEWLOWS        51
MAXCP          107
MINCP          70
TTTNH          51
TTTNL          54
FASTUP         340
FASTDOWN       57
CPCROSSA       34
CPCROSSD       57
BIGVOLUP       10
BIGVODN        12
ACCUMVER       2
HIGHIP21       13
HIUPPCT        9
REDSELL        142
AUGSELS7       7
TRAPDOOR       602
|
Table 4  RANKING OF KEY DIRECTORIES BASED PCT.OF STOCKS ABOVE 65-DMA
              4/15/20
 Gold, which often is a haven from stock market, is only category
 below that has a majority of its components above their 65-dma.
 It is bearish that Banks are generally the weakest.
---------------------------------------------------------------------------------------
Directory     Current       day-1         day-2         day-3         day-4         day-5
----------------------------------------------------------------------------------------
GOLD           .562          .562          .583          .354          .229          .208
GAMING         .363          .363          .272          .227          .181          .181
HACKERS        .35           .5            .3            .25           .35           .15
NIFTY          .347          .413          .239          .173          .239          .086
NASD-100       .323          .414          .242          .222          .222          .141
BIOTECH        .308          .362          .278          .269          .206          .155
DOWJONES       .3            .266          .066          .166          .233          .066
COAL           .285          .142          .142          .142          .142          .142
BEVERAGE       .266          .333          .2            .266          .2            .066
GUNS           .266          .4            .266          .266          .2            .133
SOFTWARE       .266          .333          .2            .2            .216          .083
COMODITY       .25           .225          .2            .175          .15           .175
INDEXES        .247          .274          .204          .204          .166          .161
SP-100         .233          .255          .122          .144          .166          .066
FOOD           .222          .222          .203          .185          .148          .166
SEMI           .214          .299          .158          .149          .186          .14
EDU            .2            .4            .2            0             .2            0
RETAIL         .18           .2            .12           .1            .14           .1
ELECTRON       .177          .23           .138          .118          .151          .118
FIDSTKS        .174          .219          .106          .134          .123          .078
SP500          .168          .208          .105          .153          .12           .069
DJI-13         .153          .076          0             .076          .153          0
RUS-1000       .149          .179          .109          .135          .113          .073
GREEN          .142          .142          .142          .142          .142          .095
INDMATER       .12           .146          .106          .12           .08           .04
SOLAR          .117          .117          .058          .117          .117          .058
MILITARY       .111          .111          .074          .037          .037          .037
BONDFUND       .1            .09           .08           .09           .06           .06
CHINA          .092          .111          .055          .037          .037          .055
HOSPITAL       .09           .09           .09           .09           .045          .045
UTILITY        .076          .128          .025          .128          .025          .025
OILGAS         .067          .052          .037          .037          .037          .029
REIT           .056          .106          .049          .106          .049          .035
COMPUTER       .052          .157          .052          .052          .105          .052
AUTO           .05           .05           .05           .025          0             .025
CHEM           .041          .062          .02           .062          .02           .02
INSURANC       .038          .038          0             .076          .038          0
FINANCE        .023          .023          .023          .023          .023          .023
BIGBANKS       0             0             0             0             0             0
COPPER         0             0             0             0             0             0
ETFS           0             0             0             0             0             0
HOMEBLDG       0             0             0             0             0             0
INFRA          0             0             0             0             .028          0
JETS           0             0             0             0             0             0
REGBANKS       0             0             0             .038          0             0
TRANSP         0             .1            .05           .1            .1            .05
|
====================================================================
4/14/2020 The operative Peerless signal
remains last week's Sell S9. The
DJI again could not get past 24000. We see a bearish rising wedge
in the DJI's price pattern, as a result. Stay short DIA but hedge with
long positions in NVDA and GLD. This morning Airlines are taking
off, but probably only for a limited flight. They and Oil stocks have
been the weakest group of stocks.

The economic effects of the Coronavirus pandemic are showing
a
wide variation from sector to sector. As a result, we can break down
the performance of stocks and ETFS by how well they have performed
in the recovery. This performance breakdown shows something of the
segented paths upward in a rebound or downwarnd in another retracement
if there is a re-test of
19000-20000.
The strongest rebounders are those making new highs, such as
Gold stocks, AMZN (+114), NFLX.
The next most powerful group are those stocks that have gotten
back above their 65-dma, show very strong Closing Power,
an inverted head and shoulders pattern and seem now ready to
challenge their highs. QQQ is here. NVDA and AMD are
semi-conductors in this category along with many of the biggest Biotechs
like ALXN, AMGN, BBH and IBB. Also WMT.
A third group are those stocks that have risen above their 50%|
retracement level and are now set to try to get past their falling
sixty five day ma. The steeper their Closing Power uptrend and
the higher their IP21 is, the better their chances of getting
above the 65-dma barrier. AAPL is a key stock to watch here.
But watch the NASDAQ and QQQ. They must notnot fall back
below their 65-dma. Another stock in this group that could move
either way from their 65-dma resistance is ADBE.
Still bearish are those stocks and indexes that have not achieved
a 50% recovery of what they lost earlier this year but are approaching
that level. Such is DIA. Most of these vehicles and stocks show
bullish Professional sponsorship and still rising Closing Powers.
The weakest among them display negative IP21. GS is here.
Near the bottom, are those stocks that are only a weak 1/3 of the
way up from their lows to their earlier yearly highs. The big banks
like BAC, JPM and WFC are examples here. FAS, IWM
The weakest groups are still way below even a 1/3 retracement.
Airlines (BA, JETS) , oils (APA, CVE, OIL, OIH) and some retailers fall into this
group. So are many retailers like DDS and M are here, too.
|
Charts 4/14/2020 (Click on Underlined link.) 2020 PEERLESS DJI, Signals, Indicators Daily DJI Volume 10-DayUp/Down Vol Stoch-20 Inverted Traders Index Graph of Pct of All Stocks above 65-dma NASDAQ S&P OEX NYSE COMPQX DJI-15 DJI-20 DJI-30 DIA QQQ MDY IWM TNA Short-Term Rates SPY http://tigersoft.com/2020CST/SPY.GIF USO-CrudeOil DBO FAS GLD BBH IBB JETS JNUG KOL NUGT OIH OIL PALL RSX RETL SDS AGQ SLV SOXL TECL TLT TMF TNA UGA (gasoline) and China: YINN CHAU Commodities: CANE CORN DBC JJC, NIB, CHOC CORN, CUT (paper) MOO, SOYB WEAT UUP (Dollar) LIT (Lithium) AAPL ADBE ALXN AMAT AMGN AMD AMZN AXP BA BABA BAC BIDU BLDP CAT CVX DE FB GOOG GS HD IBM INTU JPM M (Macy's) MSFT NEM NFLX NKE NVDA PG QCOM TSLA TXN XOM V WMT CMG , LRCX, SQ TOWN New highs and Bullish MAXCPs http://tigersoft.com/MAXMLK/4-14-20/BULLISH.htm Bearish MAXCPs - http://tigersoft.com/MINMLK/4-14-20/BEARISH.htm |
 4/14/2018   QUICKSILVER on DJI-30 STOCKS
             3 Bullish 2 Bearish
STOCKS CLOSE CHANGE PIVOT-P 5-dma AROC CL-PWR Cand. IP21 ITRS ------------------------------------------------------------------------------------- AAPL 287.05 13.8 259.43 462.3% Bullish BLUE .04 .079 --------------------------------------------------------------------- AXP 88.39 -1.94 87.58 251.8% Bearish RED -.097 -.168 Bearish --------------------------------------------------------------------- BA 141 -6.33 141.58 -263.8% Bearish RED -.143 -.406 Bearish --------------------------------------------------------------------- CAT 116.48 2.34 121.92 -162.2% Bullish ---- .091 .038 --------------------------------------------------------------------- CSCO 42.78 1.56 40.64 163.7% Bullish BLUE .068 .082 --------------------------------------------------------------------- CVX 84.61 -.3 80.92 253.3% Bearish RED -.008 -.059 --------------------------------------------------------------------- DIS 106.03 2.53 101.24 316.2% ------- BLUE .107 -.082 --------------------------------------------------------------------- GS 178.23 -.95 166.02 578.3% Bullish RED -.015 -.099 --------------------------------------------------------------------- HD 207.17 8.38 192.29 404.6% Bullish BLUE .177 .06 --------------------------------------------------------------------- IBM 123.91 2.76 114.94 384.1% Bullish BLUE .048 .013 --------------------------------------------------------------------- INTC 60.66 1.96 58.4 191.2% Bullish BLUE-.059 .1 --------------------------------------------------------------------- JNJ 146.03 6.26 137.48 223.4% Bullish BLUE .116 .132 --------------------------------------------------------------------- JPM 95.5 -2.69 90.64 317.7% ------- RED -.036 -.127 --------------------------------------------------------------------- KO 48.92 1.99 46.51 237.4% Bullish BLUE-.032 -.011 --------------------------------------------------------------------- MCD 183.99 3.87 175.59 194.4% Bullish BLUE .079 .011 --------------------------------------------------------------------- MMM 150.14 3.74 144.6 324% Bullish BLUE .119 .098 Bullish --------------------------------------------------------------------- MRK 82.84 2.3 78.56 156.7% Bullish BLUE .146 .121 Bullish --------------------------------------------------------------------- MSFT 173.7 8.19 163.49 255.6% Bullish BLUE-.011 .172 --------------------------------------------------------------------- NKE 87.47 3.01 84.16 166.9% Bullish BLUE .115 .06 --------------------------------------------------------------------- PFE 36.44 1.3 33.61 269.7% Bullish BLUE .047 .13 --------------------------------------------------------------------- PG 120.96 5.01 112.77 136.6% Bullish BLUE .025 .122 --------------------------------------------------------------------- TRV 108.02 1.6 100.78 433.9% Bullish RED .118 -.028 --------------------------------------------------------------------- UNH 270.5 6.99 248.04 428.8% Bullish BLUE .084 .144 --------------------------------------------------------------------- UTX 86.01 -5.36 97.15 -958.4% Bullish RED .144 -.289 --------------------------------------------------------------------- V 174.62 5.63 168.59 151.3% Bullish BLUE .026 .029 --------------------------------------------------------------------- VZ 58.14 1.47 56.98 126.1% Bullish BLUE .079 .129 --------------------------------------------------------------------- WBA 46.38 2.27 42.81 432.8% Bullish BLUE .121 .063 --------------------------------------------------------------------- WMT 129 3.7 121.99 118.7% Bullish BLUE .123 .278 Bullish --------------------------------------------------------------------- XOM 42.43 -.33 41.24 231.7% Bearish RED -.002 -.166 |
QUICKSILVER on ETFS - 04/14/20 ETF CLOSE CHANGE PIVOT-PT 5-dma AROC CL-PWR CANDLE IP21 ITRS --------------------------------------------------------------------------------------------- DIA 239.68 5.72 226.6 283.8% Bullish BLUE .092 ----- --------------------------------------------------------------------------------------------- SPY 283.79 8.13 265.13 348.5% Bullish BLUE .016 .033 --------------------------------------------------------------------------------------------- QQQ 211.86 8.83 196.4 385.5% Bullish BLUE .096 .118 --------------------------------------------------------------------------------------------- MDY 285.87 5.9 265.89 418.3% Bullish RED .05 -.066 --------------------------------------------------------------------------------------------- IWM 122.81 2.44 112.92 433% Bullish RED .088 -.084 --------------------------------------------------------------------------------------------- FAS 29.13 .99 24.23 1001.9% Bearish RED .022 -.536 Bearish --------------------------------------------------------------------------------------------- RETL 8.34 .87 6.15 1940.6% ------- BLUE .067 -.484 Bearish --------------------------------------------------------------------------------------------- SOXL 126.93 14.88 105.2 930.7% Bullish BLUE .075 -.328 --------------------------------------------------------------------------------------------- TECL 151.99 16.87 124.26 947.5% Bullish BLUE .055 -.282 --------------------------------------------------------------------------------------------- IBB 118.65 4.16 109.54 308.4% Bullish BLUE .147 .194 Bullish --------------------------------------------------------------------------------------------- GLD 162.68 1.27 156.04 184.1% Bullish RED .093 .241 Bullish --------------------------------------------------------------------------------------------- OIH 4.82 -.07 4.5 499.2% Bearish RED -.104 -.406 Bearish --------------------------------------------------------------------------------------------- |
 4/14/2018   QUICKSILVER on DJI-30 STOCKS
             3 Bullish 2 Bearish
STOCKS CLOSE CHANGE PIVOT-P 5-dma AROC CL-PWR Cand. IP21 ITRS ------------------------------------------------------------------------------------- AAPL 287.05 13.8 259.43 462.3% Bullish BLUE .04 .079 --------------------------------------------------------------------- AXP 88.39 -1.94 87.58 251.8% Bearish RED -.097 -.168 Bearish --------------------------------------------------------------------- BA 141 -6.33 141.58 -263.8% Bearish RED -.143 -.406 Bearish --------------------------------------------------------------------- CAT 116.48 2.34 121.92 -162.2% Bullish ---- .091 .038 --------------------------------------------------------------------- CSCO 42.78 1.56 40.64 163.7% Bullish BLUE .068 .082 --------------------------------------------------------------------- CVX 84.61 -.3 80.92 253.3% Bearish RED -.008 -.059 --------------------------------------------------------------------- DIS 106.03 2.53 101.24 316.2% ------- BLUE .107 -.082 --------------------------------------------------------------------- GS 178.23 -.95 166.02 578.3% Bullish RED -.015 -.099 --------------------------------------------------------------------- HD 207.17 8.38 192.29 404.6% Bullish BLUE .177 .06 --------------------------------------------------------------------- IBM 123.91 2.76 114.94 384.1% Bullish BLUE .048 .013 --------------------------------------------------------------------- INTC 60.66 1.96 58.4 191.2% Bullish BLUE-.059 .1 --------------------------------------------------------------------- JNJ 146.03 6.26 137.48 223.4% Bullish BLUE .116 .132 --------------------------------------------------------------------- JPM 95.5 -2.69 90.64 317.7% ------- RED -.036 -.127 --------------------------------------------------------------------- KO 48.92 1.99 46.51 237.4% Bullish BLUE-.032 -.011 --------------------------------------------------------------------- MCD 183.99 3.87 175.59 194.4% Bullish BLUE .079 .011 --------------------------------------------------------------------- MMM 150.14 3.74 144.6 324% Bullish BLUE .119 .098 Bullish --------------------------------------------------------------------- MRK 82.84 2.3 78.56 156.7% Bullish BLUE .146 .121 Bullish --------------------------------------------------------------------- MSFT 173.7 8.19 163.49 255.6% Bullish BLUE-.011 .172 --------------------------------------------------------------------- NKE 87.47 3.01 84.16 166.9% Bullish BLUE .115 .06 --------------------------------------------------------------------- PFE 36.44 1.3 33.61 269.7% Bullish BLUE .047 .13 --------------------------------------------------------------------- PG 120.96 5.01 112.77 136.6% Bullish BLUE .025 .122 --------------------------------------------------------------------- TRV 108.02 1.6 100.78 433.9% Bullish RED .118 -.028 --------------------------------------------------------------------- UNH 270.5 6.99 248.04 428.8% Bullish BLUE .084 .144 --------------------------------------------------------------------- UTX 86.01 -5.36 97.15 -958.4% Bullish RED .144 -.289 --------------------------------------------------------------------- V 174.62 5.63 168.59 151.3% Bullish BLUE .026 .029 --------------------------------------------------------------------- VZ 58.14 1.47 56.98 126.1% Bullish BLUE .079 .129 --------------------------------------------------------------------- WBA 46.38 2.27 42.81 432.8% Bullish BLUE .121 .063 --------------------------------------------------------------------- WMT 129 3.7 121.99 118.7% Bullish BLUE .123 .278 Bullish --------------------------------------------------------------------- XOM 42.43 -.33 41.24 231.7% Bearish RED -.002 -.166 |
Table 4  RANKING OF KEY DIRECTORIES BASED PCT.OF STOCKS ABOVE 65-DMA
              4/14/20
Gold is only group with majority of its stocks above 65-dma.
but HACKERS, NASDAQ-100 and NIFTY TECHS are rising quickly.
---------------------------------------------------------------------------------------
Directory     Current       day-1         day-2         day-3         day-4         day-5
----------------------------------------------------------------------------------------
GOLD           .562          .583          .354          .229          .208          .229
HACKERS        .5            .35           .25           .35           .15           .2
NASD-100       .414          .252          .232          .222          .141          .191
NIFTY          .413          .239          .173          .239          .108          .195
EDU            .4            .2            0             .2            0             0
GUNS           .4            .266          .266          .2            .133          .2
GAMING         .363          .272          .227          .181          .181          .227
BIOTECH        .359          .275          .266          .206          .164          .173
BEVERAGE       .333          .2            .266          .2            .066          .066
SOFTWARE       .333          .216          .2            .216          .083          .15
SEMI           .299          .158          .149          .186          .14           .121
INDEXES        .274          .204          .204          .166          .161          .15
DOWJONES       .266          .066          .166          .233          .066          .066
SP-100         .255          .122          .144          .166          .066          .1
ELECTRON       .23           .138          .118          .151          .118          .085
COMODITY       .225          .2            .175          .15           .175          .15
FOOD           .222          .203          .185          .148          .166          .166
FIDSTKS        .219          .106          .134          .123          .078          .095
SP500          .208          .107          .153          .12           .069          .082
RETAIL         .2            .12           .1            .14           .1            .1
RUS-1000       .179          .11           .135          .113          .075          .086
COMPUTER       .157          .052          .052          .105          .052          .052
INDMATER       .146          .106          .12           .08           .04           .026
COAL           .142          .142          .142          .142          .142          .142
GREEN          .142          .142          .142          .142          .095          .095
UTILITY        .128          .025          .128          .025          .025          .025
SOLAR          .117          .058          .117          .117          .058          .058
CHINA          .111          .055          .037          .037          .055          .092
MILITARY       .111          .074          .037          .037          .037          .037
REIT           .106          .049          .106          .049          .035          .042
TRANSP         .1            .05           .1            .1            .05           .05
BONDFUND       .09           .08           .09           .06           .06           .06
HOSPITAL       .09           .09           .09           .045          .045          .045
DJI-13         .076          0             .076          .153          0             0
CHEM           .062          .02           .062          .02           .02           .02
OILGAS         .052          .037          .037          .037          .029          .029
AUTO           .05           .05           .025          0             .025          0
INSURANC       .038          0             .076          .038          0             .038
FINANCE        .023          .023          .023          .023          .023          .023
BIGBANKS       0             0             0             0             0             0
COPPER         0             0             0             0             0             0
ETFS           0             0             0             0             0             0
HOMEBLDG       0             0             0             0             0             0
INFRA          0             0             0             .028          0             0
JETS           0             0             0             0             0             0
REGBANKS       0             0             .038          0             0             0
|
======================================================================
4/13/2020 The Dollar has formed a head/shoulders pattern,
Gold is making
new highs and Bank stocks are participating poorly in this rally
spawned by the FEDs willingness to do a new bailout worth as
much as $7 Trillion. These are signs that the FED may not have
enough money to keep the rally going and refloat the Economy.
Stay short DIA but long NVDA. Buy GLD or NUGT.
 |
 |
 |
A Rare Type of Sell S9
The most recent Peerless signal was the Sell S9 signal on Thursday.
It took place on 4/8/2020 because the DJI closed 9.4% over the 21-day
ma with all our key indicators negative. I can find only one other case
of the DJI closing so far above the 21-dma with the P-Indicator
negative. This was on 9/13/1939 soon after War was declared in
Europe after Germany attacked Poland. The result in this case was
no paper loss and the resulting decline would have given the short-
seller of the DJI only a 3.2% gain. Interestingly, back then our IP21
was an otherwise healthy +.138. Also otherwise bullish then were the
V-I (+56) and OBVPct (+.317). That the same indicators were
all negative in our case would seem to add up to a conclusion that
that there is much more vulnerability now.
See http://tigersoft.com/PeerInst-2012-2013/SellS9.htm
Moreover, the DJI is now facing heavy selling just below 24000
because that represents a 50% retracement of what has been lost.
I have warned that the FED's ammunition to support the market is
not infinite. It is limited politically because folks remember the 2008
TARP bailout of Wall Street banks rather letting them go into liquidation
and be bought out by the Government. Or having them broken up.
Or even having limitations imposed on them in return for what they got
when the Fed injected billions and billions into them. For example, there
were no salary caps, no limits on bonuses or even requirements that
they not foreclose on mortgages.
And the FED may now be limited now because traders can fend for
themselves with easy-to-use leveraged short ETFs. And if these
traders sense confidence in the FED is waning because it is spread
too thin as the FED gives away much, much more ($7 Trillion!) trying
to defend all the weakened business and finanacial sectors as well as state
and local government, I think we can easily guess that these traders
will sell and dump very aggressively once again.
So, everythng depends on how soon a return to "Normalacy" can
take place. As I suggested yesterday, the President is clearly being
pressured by Wall Street, the FED and by the Treasury.
Gold made a new high today. So did key gold stocks like NEM
(now linked to nightly). The very depressed JNUG and NUGT
turned up sharply yesterday. As speculative as they are, they look
like they must go up.
Today the NASDAQ rose on the strength AAPL, AMZN and
stocks like NVDA. If you are nervous about the Sell S9, hedge
your short sale of DIA with NVDA. But add Gold and NUGT
to your long positions. (See them among the Bullish MACPs
tonight.)
|
Charts 4/13/2020 (Click on Underlined link.) 2020 PEERLESS DJI, Signals, Indicators Daily DJI Volume 10-DayUp/Down Vol Stoch-20 Inverted Traders Index Graph of Pct of All Stocks above 65-dma NASDAQ S&P OEX NYSE COMPQX DJI-15 DJI-20 DJI-30 DIA QQQ MDY IWM TNA Short-Term Rates SPY http://tigersoft.com/2020CST/SPY.GIF USO-CrudeOil DBO FAS GLD BBH IBB JETS JNUG KOL NUGT OIH OIL PALL RSX RETL SDS AGQ SLV SOXL TECL TLT TMF TNA UGA (gasoline) and China: YINN CHAU Commodities: CANE CORN DBC JJC, NIB, CHOC CORN, CUT (paper) MOO, SOYB WEAT UUP (Dollar) LIT (Lithium) AAPL ADBE ALXN AMAT AMGN AMD AMZN AXP BA BABA BAC BIDU BLDP CAT CVX DE FB GOOG GS HD IBM INTU JPM M (Macy's) MSFT NEM NFLX NKE NVDA PG QCOM TSLA TXN XOM V WMT CMG , LRCX, SQ TOWN New highs and Bullish MAXCPs http://tigersoft.com/MAXMLK/4-13-20/BULLISH.htm Bearish MAXCPs - http://tigersoft.com/MINMLK/4-13-20/BEARISH.htm |
 4/13/2018   QUICKSILVER on DJI-30 STOCKS
             7 Bullish 1 Bearish
STOCKS CLOSE CHANGE PIVOT-P 5-dma AROC CL-PWR Candle IP21 ITRS ------------------------------------------------------------------------------------- AAPL 273.25 5.26 262.47 613.5% Bullish BLUE .072 .033 --------------------------------------------------------------------- AXP 90.33 -4.49 83.87 968.3% ------- RED -.024 -.133 --------------------------------------------------------------------- BA 147.33 -4.51 148.77 799.1% Bearish RED -.114 -.355 Bearish --------------------------------------------------------------------- CAT 114.14 -10.89 120.43 -21.7% Bullish RED .137 .032 --------------------------------------------------------------------- CSCO 41.22 .02 41.43 264.6% Bullish BLUE .107 .062 --------------------------------------------------------------------- CVX 84.91 .6 80.39 602.4% Bearish RED .073 -.049 --------------------------------------------------------------------- DIS 103.5 -1 99.58 480.7% ------- RED .166 -.06 --------------------------------------------------------------------- GS 179.18 -5.08 158.23 968.6% Bullish RED .042 -.077 --------------------------------------------------------------------- HD 198.79 -2.74 191.33 523.9% Bullish RED .21 .043 Bullish --------------------------------------------------------------------- IBM 121.15 -.35 114.82 641.8% Bullish RED .102 .075 --------------------------------------------------------------------- INTC 58.7 1.56 58.43 398% Bullish BLUE-.026 .072 --------------------------------------------------------------------- JNJ 139.77 -1.46 139.76 201.2% Bullish RED .162 .119 Bullish --------------------------------------------------------------------- JPM 98.19 -4.57 89.46 766.5% Bullish RED .062 -.088 --------------------------------------------------------------------- KO 46.93 -2.07 46.67 331.4% Bullish RED -.044 -.014 --------------------------------------------------------------------- MCD 180.12 -3.58 177.04 566% Bullish RED .09 .022 --------------------------------------------------------------------- MMM 146.4 -1.38 140.7 440.4% Bullish RED .16 .09 Bullish --------------------------------------------------------------------- MRK 80.54 -1.95 80.31 268.6% Bullish RED .176 .12 Bullish --------------------------------------------------------------------- MSFT 165.51 .37 165.27 359.2% Bullish BLUE 0 .147 --------------------------------------------------------------------- NKE 84.46 -2.33 84.63 333.5% ------- RED .108 .049 --------------------------------------------------------------------- PFE 35.14 -.25 34.57 218.3% Bullish RED .091 .137 --------------------------------------------------------------------- PG 115.95 1.29 117.81 37.8% Bullish BLUE .043 .11 --------------------------------------------------------------------- TRV 106.42 -3.32 98.98 616.2% Bullish RED .164 -.018 --------------------------------------------------------------------- UNH 263.51 -.62 248.34 676.2% Bullish BLUE .133 .127 Bullish --------------------------------------------------------------------- UTX 86.01 -5.36 97.15 -958.4% Bullish RED .144 -.252 --------------------------------------------------------------------- V 168.99 -4.7 169.44 511% Bullish RED .058 .001 --------------------------------------------------------------------- VZ 56.67 -.77 56.7 173.6% Bullish RED .124 .144 Bullish --------------------------------------------------------------------- WBA 44.11 .13 42.63 397.5% ------- BLUE .143 .038 --------------------------------------------------------------------- WMT 125.3 3.5 126.07 238.1% Bullish BLUE .144 .264 Bullish --------------------------------------------------------------------- XOM 42.76 -.37 40.47 426.9% Bearish RED .026 -.151 |
QUICKSILVER on ETFS - 04/13/20 ETF CLOSE CHANGE PIVOT-PT 5-dma AROC CL-PWR CANDLE IP21 ITRS --------------------------------------------------------------------------------------------- DIA 233.96 -3.18 226.53 514.4% Bullish RED .131 ---- --------------------------------------------------------------------------------------------- SPY 275.66 -2.54 264.86 516.2% Bullish RED .05 .03 --------------------------------------------------------------------------------------------- QQQ 203.03 2.17 196.48 502.7% Bullish BLUE .123 .101 --------------------------------------------------------------------------------------------- MDY 279.97 -9 262.83 687.9% Bullish RED .142 -.06 --------------------------------------------------------------------------------------------- IWM 120.37 -3.35 112.63 688.4% Bullish RED .136 -.077 --------------------------------------------------------------------------------------------- FAS 28.14 -3.22 23.71 1776% ------- RED .055 -.527 Bearisg --------------------------------------------------------------------------------------------- RETL 7.47 -.24 5.7 2596.6% Bearish RED .029 -.513 Bearish --------------------------------------------------------------------------------------------- SOXL 112.05 3.9 106.54 1475.4% ------- BLUE .072 -.4 Bearish --------------------------------------------------------------------------------------------- TECL 135.12 1.15 127.19 1362.9% Bullish BLUE .074 -.349 Bearish --------------------------------------------------------------------------------------------- IBB 114.49 .52 111.71 371.6% Bullish BLUE .192 .18 Bullish --------------------------------------------------------------------------------------------- GLD 161.41 2.72 156.88 281.2% Bullish BLUE .046 .276 Bullish --------------------------------------------------------------------------------------------- OIH 4.89 -.03 4.35 936.5% Bearish RED -.046 -.372 Bearish --------------------------------------------------------------------------------------------- |
 Table 3   Count of Stocks in Key Directories
             20200413
-------------------------------
NEWHIGHS       26
NEWLOWS        2
MAXCP          55
MINCP          60
TTTNH          35
TTTNL          49
FASTUP         990
FASTDOWN       31
CPCROSSA       45
CPCROSSD       134
BIGVOLUP       19
BIGVODN        14
ACCUMVER       1
HIGHIP21       8
HIUPPCT        9
VHIP21         106
LOWACCUM       134
REDSELL        132
AUGSELS7       5
TRAPDOOR       668
|
 RANKING OF KEY DIRECTORIES BASED PCT.OF STOCKS ABOVE 65-DMA
4/13/20  Gold stocks are the single group with a majority of their
stocks  over the 65-dma.
--------------------------------------------------------------------------------------- Directory Current day-1 day-2 day-3 day-4 day-5 ---------------------------------------------------------------------------------------- GOLD .583 .354 .229 .208 .229 .166 HACKERS .35 .3 .35 .15 .2 .1 BIOTECH .272 .263 .203 .164 .176 .095 GAMING .272 .227 .181 .181 .227 .09 GUNS .266 .266 .2 .133 .2 .133 NASD-100 .252 .242 .232 .141 .191 .08 NIFTY .239 .173 .239 .108 .195 .086 SOFTWARE .216 .216 .216 .083 .15 .066 INDEXES .204 .204 .166 .161 .15 .155 FOOD .203 .185 .148 .166 .166 .129 BEVERAGE .2 .266 .2 .066 .066 0 COMODITY .2 .175 .15 .175 .15 .125 EDU .2 0 .2 0 0 0 SEMI .158 .149 .186 .14 .112 .084 COAL .142 .142 .142 .142 .142 .142 GREEN .142 .142 .142 .095 .095 .095 ELECTRON .138 .118 .151 .118 .085 .059 SP-100 .122 .144 .166 .066 .1 .033 RETAIL .12 .1 .14 .1 .1 .06 RUS-1000 .11 .136 .113 .075 .084 .053 SP500 .107 .155 .12 .069 .082 .054 FIDSTKS .106 .134 .123 .078 .095 .044 INDMATER .106 .12 .08 .04 .026 .04 HOSPITAL .09 .09 .045 .045 .045 .045 BONDFUND .08 .09 .06 .06 .06 .06 MILITARY .074 .037 .037 .037 .037 .037 DOWJONES .066 .166 .233 .066 .066 .033 SOLAR .058 .117 .117 .058 .058 .058 CHINA .055 .037 .037 .055 .092 .055 COMPUTER .052 .052 .105 .052 .052 0 AUTO .05 .025 0 .025 0 0 TRANSP .05 .1 .1 .05 .05 0 REIT .049 .106 .049 .035 .042 .035 OILGAS .037 .037 .037 .029 .029 .029 UTILITY .025 .128 .025 .025 .025 .025 FINANCE .024 .024 .024 .024 .024 .024 CHEM .02 .062 .02 .02 .02 .02 BIGBANKS 0 0 0 0 0 0 COPPER 0 0 0 0 0 0 DJI-13 0 .076 .153 0 0 0 ETFS 0 0 0 0 0 0 HOMEBLDG 0 0 0 0 0 0 INFRA 0 0 .028 0 0 0 INSURANC 0 .076 .038 0 0 0 JETS 0 0 0 0 0 0 REGBANKS 0 .038 0 0 0 0 |
====================================================================
4/9/2020 Peerless gave a Sell S9 signal on Thursday and the DJI's
rally seems
to be finding, as we expected, stifff resistance at its 50% retracement
level. Traders have long used this concept in all markets. We should
watch it, too. A close above this key Fibonnaci number would signify
still higher prices and force us to cover our short sales in DIA that were
taken Thursday.

Watch our Closing Powers, too. If I am right that the FED is
urgently,
even desperately, trying to support the market, it is important that they
do not lose the confidence of NYSE traders, whose views are best reflected
in the direction of our Tiger Closing Power's trend.
. 

The reason to be very careful here with shorts in DIA should be clear.
We normally would not fight the wishes of the FED. The sheer size
of the Fed's bailout on Wall Street is totally unprecedented. Moreover,
bailout so work... for a while. Thus, it drove up stock prices last week
despite the back-drop of continuiing terrible headlines about the
deadly pandemic. How the market reacts to news is very important
Perhaps, the worst Coronavirus news is now over.
Index/Stock Current
Price 50% - level
WATCH DIA
237.14 238.99
WATCH NASDAQ 8153.58
8234.9
WATCH QQQ
200.86
201.1
WATCH SPY
278.2
278.67
AAPL 267.99
270.23
ADBE 318.7
320.93
AMAT
49.49 53.04
AMD
48.38
43.01
AMZN > 50% retracement.
AXP
94.82 102.52
CHN
19.1
19.07
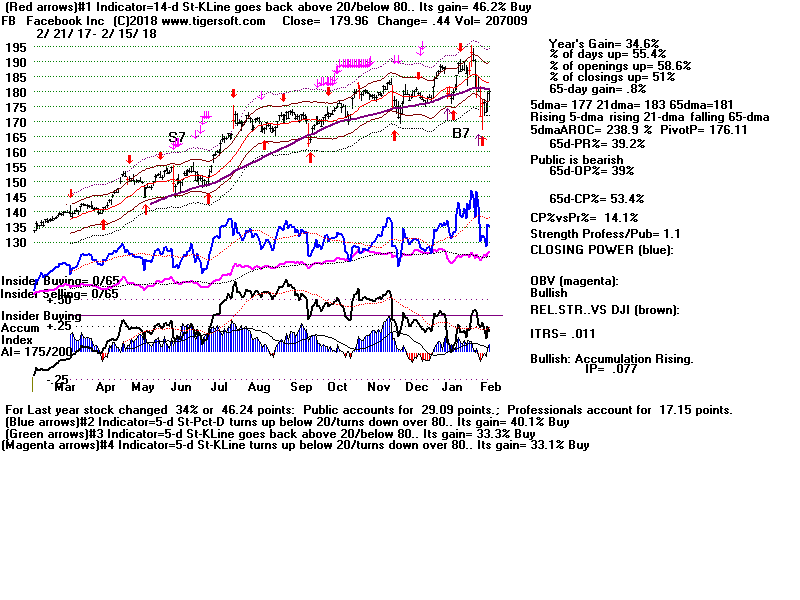
FB
175.19 186.65
GOOG - only a 33% retracement so far...
GS
184.26 190.66
HD
> 50% retracement.
IBB
> 50% retracement.
INTU
252.1
247.29
IWM - only a 33% retracement so far..
LRCX - dropped back below 50% retracement with negative IP21
QCOM 71.58
77.08
What's The Hurry?
Why would the President call for a May or even a June re-opening of closed
American businesses when there is no vacime against the virus, no sure way to
treat those are are infected with it and not enough test-kits for the whole
US population to tell officials who is now infected or has had the virus? Clearly,
Wall Street is pressuring the President. They are very scared about the
economic, financial and political consequences of the disruptions of so
many Americans being unemployed for two or more months.
Specifically, they worry that the FED is being spread too thin. It cannot
keep buying up stock of those companies on the SP-500, buying up
industrial bonds, including junk bonds, assisting financially exhausted state
and local governments as well as directly assisting the big banks. There is
a limit to the size of the their bailout, beyond which the Dollar will suffer
irreparable harm and inerest rates will start to rise very quickly. The risk of
a huge US financial panic are real if the deficits and paper losses get
too high. Even without inflation, Gold is at its yearly highs. What is the
amount that would trigger a rapid unravelling of trust in the Dollar? No one
knows. But the FED's and the Treasury's resources are limited, not infinite.
And Trump is under great and very secret pressure from Wall Street to get
the country back to work despite the obvious risks from the virus to the health
of millions of Americans. Nor can he reference the financial dangers. It would
make matters much worse.
|
Charts 4/9/2020 (Click on Underlined link.) 2020 PEERLESS DJI, Signals, Indicators Daily DJI Volume 10-DayUp/Down Vol Stoch-20 Inverted Traders Index Graph of Pct of All Stocks above 65-dma NASDAQ S&P OEX NYSE COMPQX DJI-15 DJI-20 DJI-30 DIA QQQ MDY IWM TNA Short-Term Rates SPY http://tigersoft.com/2020CST/SPY.GIF USO-CrudeOil DBO FAS GLD BBH IBB JETS JNUG KOL NUGT OIH OIL PALL RSX RETL SDS AGQ SLV SOXL TECL TLT TMF TNA UGA (gasoline) and China: YINN CHAU Commodities: CANE CORN DBC JJC, NIB, CHOC CORN, CUT (paper) MOO, SOYB WEAT UUP (Dollar) LIT (Lithium) AAPL ADBE ALXN AMAT AMGN AMD AMZN AXP BA BABA BAC BIDU BLDP CAT CVX DE FB GOOG GS HD IBM INTU JPM M (Macy's) MSFT NFLX NKE NVDA PG QCOM TSLA TXN XOM V WMT CMG , LRCX, SQ TOWN New highs and Bullish MAXCPs http://tigersoft.com/MAXMLK/4-9-20/BULLISH.htm Bearish MAXCPs - http://tigersoft.com/MINMLK/4-9-20/BEARISH.htm |
 4/9/2018   QUICKSILVER on DJI-30 STOCKS
             4 Bullish 1 Bearish
STOCKS CLOSE CHANGE PIVOT-P 5-dma AROC CL-PWR Candle IP21 ITRS ------------------------------------------------------------------------------------- AAPL 267.99 1.92 241.41 452.4% Bullish RED -.03 .001 --------------------------------------------------------------------- AXP 94.82 2.74 73.6 1097.2% ------- BLUE-.054 -.105 --------------------------------------------------------------------- BA 151.84 4.97 124.52 1042.7% Bearish RED -.117 -.354 Bearish --------------------------------------------------------------------- CAT 125.03 -2.37 114.67 344.8% Bullish RED .223 .095 Bullish --------------------------------------------------------------------- CSCO 41.2 -.54 39.06 172.7% Bullish RED .036 .05 --------------------------------------------------------------------- CVX 84.31 -1.67 75.11 513.8% ------- RED .096 -.062 --------------------------------------------------------------------- DIS 104.5 3.43 93.88 382% ------- RED .08 -.057 --------------------------------------------------------------------- GS 184.26 7.3 146.93 1075.4% Bullish BLUE .017 -.058 --------------------------------------------------------------------- HD 201.53 6.71 178.7 538.7% Bullish BLUE .171 .036 --------------------------------------------------------------------- IBM 121.5 2.21 106.34 508.5% Bullish BLUE .011 .052 --------------------------------------------------------------------- INTC 57.14 -1.84 54.13 245.3% Bullish RED -.105 .036 --------------------------------------------------------------------- JNJ 141.23 -2.03 134.17 293.7% Bullish RED .102 .113 --------------------------------------------------------------------- JPM 102.76 8.46 84.05 854.9% Bullish BLUE .037 -.06 --------------------------------------------------------------------- KO 49 1.18 43.83 551.8% Bullish BLUE-.06 .034 --------------------------------------------------------------------- MCD 183.7 6.21 160.33 651.4% Bullish BLUE .06 .031 --------------------------------------------------------------------- MMM 147.78 -1.21 133.79 349.5% Bullish RED .131 .087 --------------------------------------------------------------------- MRK 82.49 .87 76.25 357% Bullish BLUE .146 .12 Bullish --------------------------------------------------------------------- MSFT 165.14 .01 153.83 307.6% Bullish RED -.085 .157 --------------------------------------------------------------------- NKE 86.79 1.49 78.86 402.5% Bullish BLUE .075 .044 --------------------------------------------------------------------- PFE 35.39 .79 33.64 372.1% Bullish BLUE .023 .116 --------------------------------------------------------------------- PG 114.66 -.44 115.08 11.3% Bullish RED -.025 .091 --------------------------------------------------------------------- TRV 109.74 4.8 93.89 632.8% Bullish BLUE .133 -.002 --------------------------------------------------------------------- UNH 264.13 -3.7 229.49 479.9% Bullish RED .142 .108 Bulllish --------------------------------------------------------------------- UTX 86.01 -5.36 97.15 -958.4% Bullish RED .144 -.266 --------------------------------------------------------------------- V 173.69 -1.25 151.85 495.6% Bullish RED .018 .021 --------------------------------------------------------------------- VZ 57.44 -.36 54.7 194.5% Bullish BLUE .075 .139 --------------------------------------------------------------------- WBA 43.98 .89 40.72 436.6% ------- BLUE .1 .016 --------------------------------------------------------------------- WMT 121.8 -.04 119.48 129.5% Bullish BLUE .069 .226 Bullish --------------------------------------------------------------------- XOM 43.13 -.72 39.21 332.7% Bearish RED -.017 -.153 |
QUICKSILVER on ETFS - 04/09/20 ETF CLOSE CHANGE PIVOT-PT 5-dma AROC CL-PWR CANDLE IP21 ITRS --------------------------------------------------------------------------------------------- DIA 237.14 2.81 210.6 521.1% Bullish RED .057 0 --------------------------------------------------------------------------------------------- SPY 278.2 4.17 248.19 505.5% Bullish BLUE-.034 .026 --------------------------------------------------------------------------------------------- QQQ 200.86 .29 183.37 385.6% Bullish RED .027 .08 --------------------------------------------------------------------------------------------- MDY 288.97 9.5 243.09 752.6% Bullish BLUE .089 -.05 --------------------------------------------------------------------------------------------- IWM 123.72 5.65 104.62 721.8% Bullish BLUE .131 -.071 --------------------------------------------------------------------------------------------- FAS 31.36 3.56 19.17 2376.2% ------- BLUE .056 -.5 --------------------------------------------------------------------------------------------- RETL 7.71 .73 4.27 2938% Bearish BLUE-.016 -.524 --------------------------------------------------------------------------------------------- SOXL 108.15 -7.59 81.53 1082.8% Bearish RED .006 -.431 Bearish --------------------------------------------------------------------------------------------- TECL 133.97 .15 101.29 1159.3% ------- RED -.021 -.355 Bearish --------------------------------------------------------------------------------------------- IBB 113.97 1.03 106.25 286% Bullish BLUE .072 .147 --------------------------------------------------------------------------------------------- GLD 158.69 4.04 152.65 219.8% ------- BLUE-.035 .243 --------------------------------------------------------------------------------------------- OIH 4.92 .04 4.04 925.5% Bearish RED -.092 -.381 Bearish --------------------------------------------------------------------------------------------- RSX 18.78 -.11 17.77 360.3% Bullish RED .126 -.091 |
 Table 3   Count of Stocks in Key Directories
           20200409
-------------------------------
NEWHIGHS       29
NEWLOWS        19
MAXCP          203
MINCP          26
TTTNH          125
TTTNL          14
FASTUP         987
FASTDOWN       35
CPCROSSA       84
CPCROSSD       73
BIGVOLUP       29
BIGVODN        20
ACCUMVER       1
HIGHIP21       6
HIUPPCT        11
VHIP21         110
LOWACCUM       163
REDSELL        141
AUGSELS7       6
TRAPDOOR       671
|
Table 4  RANKING OF KEY DIRECTORIES BASED PCT.OF STOCKS ABOVE 65-DMA
              4/9/20
---------------------------------------------------------------------------------------
Directory     Current       day-1         day-2         day-3         day-4         day-5
----------------------------------------------------------------------------------------
GOLD           .354          .229          .208          .229          .166          .145
HACKERS        .3            .4            .15           .2            .1            .1
BEVERAGE       .266          .2            .066          .066          0             0
GUNS           .266          .2            .133          .2            .133          .133
BIOTECH        .26           .2            .161          .176          .104          .119
NASD-100       .242          .242          .151          .191          .08           .121
GAMING         .227          .181          .181          .227          .09           .181
SOFTWARE       .216          .233          .083          .15           .066          .066
INDEXES        .204          .166          .161          .15           .155          .155
FOOD           .185          .148          .166          .166          .129          .166
COMODITY       .175          .15           .175          .15           .125          .175
NIFTY          .173          .239          .108          .195          .086          .108
DOWJONES       .166          .233          .066          .066          .033          .033
SP500          .155          .122          .069          .082          .054          .056
SEMI           .149          .186          .14           .112          .084          .102
SP-100         .144          .166          .066          .1            .033          .044
COAL           .142          .142          .142          .142          .142          0
GREEN          .142          .142          .095          .095          .095          .095
RUS-1000       .136          .115          .075          .084          .053          .056
FIDSTKS        .134          .123          .078          .095          .044          .056
UTILITY        .128          .025          .025          .025          .025          .025
INDMATER       .12           .08           .04           .026          .04           .013
ELECTRON       .119          .152          .119          .086          .059          .072
SOLAR          .117          .117          .058          .058          .058          .058
REIT           .106          .049          .035          .042          .035          .035
RETAIL         .1            .14           .1            .1            .06           .06
TRANSP         .1            .1            .05           .05           0             0
BONDFUND       .09           .06           .06           .06           .06           .06
HOSPITAL       .09           .045          .045          .045          .045          .045
DJI-13         .076          .153          0             0             0             0
INSURANC       .076          .038          0             0             0             0
CHEM           .062          .02           .02           .02           .02           .02
COMPUTER       .052          .105          .052          .052          0             0
REGBANKS       .038          0             0             0             0             0
CHINA          .037          .037          .055          .092          .055          .074
MILITARY       .037          .037          .037          .037          .037          .037
OILGAS         .037          .037          .029          .029          .029          .022
AUTO           .025          0             .025          0             0             .025
FINANCE        .023          .023          .023          .023          .023          .011
BIGBANKS       0             0             0             0             0             0
COPPER         0             0             0             0             0             0
EDU            0             .2            0             0             0             0
ETFS           0             0             0             0             0             0
HOMEBLDG       0             0             0             0             0             0
INFRA          0             .028          0             0             0             0
JETS           0             0             0             0             0             0
|
=======================================================================
4/8/2020 The DJI's rally today took its
close up to 9.4% over the 21-dma.
There were multiple negative non-confirmations and Peerless gave
a new S9 and S14. It has now recoved almost 50% of what it has
lost. Many Fibonacci traders will be selling at the 50% retracement
level. A decline is likely from here. Short DIA but be careful, work
with Buy stops above 24000.
We do not know that the short-term bullish effect of the huge bailout
(potentially worth $5 billion to Wall Street) is exhausted. The DJI's 50%
recovery point, 23825, was reached way to fast for this rally simply
to be dismissed as an extreme bear market recovery. In addition,
today's breadth was magnificent. There were 2676 up and only 325 down.
Research shows that this may be a buying climax and the DJI will now
fall back 7%-10%. But if the DJI can scoot up past 24000, it will then look
like it is attempting a "V" formation, such as we saw in early 2019.
A quick succession of daily 8:1 advances/declines is
historically very bullish.
This is actually the third day since the recovery was started that the daily
breadth a positive 8:1. Some of may, therefore, choose to stick with
my recommendation recently to require negative momentum evidence that
the current uptrend is over and until then stay long some of the bullish
MAXCPs above their 65-dma. But, in any case, I would be faithful to
Peerless and short DIA now as well as some of the bearish MINCPs. .
New Sells, Negative NNCs and
50% Retracement Almost Reached.

3 or more Superb Breadth Days
in Quick Succession is Bullish, but
it does not preclude another 7% decline.
I have investigated what happens when the daily NYSE Advances/
Declines ratio jumps to more than 8 to 1 to see if this would help us
learn if this typically represents a buying climax or the start of a much bigger
move. For the purposes of testing, I called such an occurrence a
"hypothetical B12). What I found was in 6 cases
the DJI fell back
quickly to the lower band. (8/16/1971, 1/3/1974, 10/21/1987, 1/4/1988,
10/3/2008, 8/27/2015). But I
also found the the "hypothetical B12s"|
started 7 new bull markets (Jan. 1975, Jan 1987, Jan 2013, Jan 2016,
Jan 2019 plus August 1982 and March 2009). There were two
other cases that brought small gains (9/18/2007 and 3/18/2008). The
gains in all these cases summed up were much greater than the size of
losses.
Two other discoveries were made. The case of 1/3/1974
shows that a
simultaneous Sell S12 at the point of a 50% recovery in a bear market
can overcome a one-day big improvement in breadth at the start of the year.
The chart is shown below. The second, and I would
suggest, more
significant finding is that three or more hypothetical B12s
in close
succession is very bullish. This is what we see now,
too. In March
2009, three quickly hypothetical B12s occured at the very beginning
of the 2009-2020 bull market and ended the 2007-2009 bear
market. In the next case, in August 2011, the DJI had just falled
17% when these hypothetical B12s started to appear. A month later
a bottom was in place and the DJI had resumed its bull market.
We have a simultaneous S9 and S14, so the hypothetical B12s
are cancelled out by our rules, but that does not change their potential
bullishness. Watch to see if breadth worsens a lot now. If not
the DJI may be able to get past 24000.
| Jan 1974 - Simultaneous Sell and 50% retracement stop the good breadth
from the start of a new year.  |
March 2009 take-off begins with 3 separate hypothetical B12s. |
| October 2011. Multiple hypothetical B12s build a base that
re-starts the bull market. .  |
Present chart of DJI with 3 closely successive hypothetical B12s. |
Conclusion
Ttoday also brought a Sell S9 and S14 because all our key internal
strength indicators are still negative. However, since here are no cases
of Sells S9s or S14s occurring when the ratio of NYSE Advances to
Declines were ever 8:1, as today, I think we should not take these
Sells. Instead, wait for either the DJI's MACD to switch to a Sell, for
the 5-day ma to turn down (likely impossible) or the DJI again closes
at its lows for the day tomorrow.
|
Charts 4/8/2020 (Click on Underlined link.) 2020 PEERLESS DJI, Signals, Indicators Daily DJI Volume 10-DayUp/Down Vol Stoch-20 Inverted Traders Index Graph of Pct of All Stocks above 65-dma NASDAQ S&P OEX NYSE COMPQX DJI-15 DJI-20 DJI-30 DIA QQQ MDY IWM TNA Short-Term Rates SPY http://tigersoft.com/2020CST/SPY.GIF USO-CrudeOil DBO FAS GLD BBH IBB JETS JNUG KOL NUGT OIH OIL PALL RSX RETL SDS AGQ SLV SOXL TECL TLT TMF TNA UGA (gasoline) and China: YINN CHAU Commodities: CANE CORN DBC JJC, NIB, CHOC CORN, CUT (paper) MOO, SOYB WEAT UUP (Dollar) LIT (Lithium) AAPL ADBE ALXN AMAT AMGN AMD AMZN AXP BA BABA BAC BIDU BLDP CAT CVX DE FB GOOG GS HD IBM INTU JPM M (Macy's) MSFT NFLX NKE NVDA PG QCOM TSLA TXN XOM V WMT CMG , LRCX, SQ TOWN New highs and Bullish MAXCPs http://tigersoft.com/MAXMLK/4-8-20/BULLISH.htm Bearish MAXCPs - http://tigersoft.com/MINMLK/4-8-20/BEARISH.htm |
 4/8/2018   QUICKSILVER on DJI-30 STOCKS
             4 Bullish 1 Bearish
STOCKS CLOSE   CHANGE       PIVOT-P    5-dma AROC  CL-PWR  Candle IP21  ITRS
         ------------------------------------------------------------------------
AAPL   266.07  6.64          244.93        503.5%  Bullish BLUE-.047   .022
---------------------------------------------------------------------
AXP    92.08   4.5            76.66         891%   ------- BLUE-.065  -.12
---------------------------------------------------------------------
BA     146.87  5.29          123.27        604.4%  Bearish RED -.123  -.352 Bearish
---------------------------------------------------------------------
CAT    127.4  5.48           116.74        685.8%  Bullish BLUE .202   .116 Bullish
---------------------------------------------------------------------
CSCO   41.74  1.1            39.8          427.8%  Bullish BLUE .011   .058
---------------------------------------------------------------------
CVX    85.98  5.06           76.12         1142.7% Bullish BLUE .101  -.042
---------------------------------------------------------------------
DIS    101.07 -.17           96.97         316%    ------- BLUE .111  -.085
---------------------------------------------------------------------
GS     176.96  10.94         149.93        1033.1% Bullish BLUE-.028  -.086
---------------------------------------------------------------------
HD     194.82  2.53          181.31        438.9%  Bullish BLUE .154   .017
---------------------------------------------------------------------
IBM    119.29  4.35          110           641.7%  Bullish BLUE-.012   .039
---------------------------------------------------------------------
INTC   58.98  .58            54.35         640.4%  Bullish BLUE-.108   .061
---------------------------------------------------------------------
JNJ    143.26  5.78          133.15        536.5%  Bullish BLUE .074   .143
---------------------------------------------------------------------
JPM    94.3  3.66            87.51         569.9%  Bullish BLUE-.027  -.114
---------------------------------------------------------------------
KO     47.82  1.31           43.95         638.8%  ------- BLUE-.043   .023
---------------------------------------------------------------------
MCD    177.49  1.9           161.5         580.1%  Bullish BLUE .032   .028
---------------------------------------------------------------------
MMM    148.99  4.39          137.91        574.2%  Bullish BLUE .119   .084
---------------------------------------------------------------------
MRK    81.62  3.06           76.87         506.8%  Bullish BLUE .134   .131  Bullish
---------------------------------------------------------------------
MSFT   165.13  1.64          155.26        412%    Bullish RED -.09    .182
---------------------------------------------------------------------
NKE    85.3  1.14            80.14         372.8%  Bullish BLUE .088   .034
---------------------------------------------------------------------
PFE    34.6  .99             32.87         428.1%  Bullish BLUE-.022   .092
---------------------------------------------------------------------
PG     115.1  2.33           114.4         253.3%  Bullish BLUE-.032   .098
---------------------------------------------------------------------
TRV    104.94  4.16          97.19         501%    Bullish BLUE .106  -.035
---------------------------------------------------------------------
UNH    267.83  19.79         240.44        633.7%  Bullish BLUE .14   .121  Bullish
---------------------------------------------------------------------
UTX    86.01 -5.36           97.15        -958.4% Bullish RED  .144  -.256
---------------------------------------------------------------------
V      174.94  6.35          157.39        681.9% Bullish BLUE .023   .049
---------------------------------------------------------------------
VZ     57.8  .82             55.25         441.1% Bullish BLUE .076   .137
---------------------------------------------------------------------
WBA    43.09  .28            40.32         7.2%   ------- RED  .062   .001
---------------------------------------------------------------------
WMT    121.84 -.15           118.65        320.7% Bullish RED  .031   .229  Bullish
---------------------------------------------------------------------
XOM    43.85  2.61           40.4          794.6% ------- BLUE .036  -.137
|
QUICKSILVER on ETFS - 04/08/20 ETF CLOSE CHANGE PIVOT-PT 5-dma AROC CL-PWR CANDLE IP21 ITRS --------------------------------------------------------------------------------------------- DIA 234.33 7.73 213.96 573.8% Bullish BLUE .046 ----- --------------------------------------------------------------------------------------------- SPY 274.28 9.15 251.83 551.1% Bullish BLUE-.046 .023 --------------------------------------------------------------------------------------------- QQQ 200.57 4.17 186.01 483.3% Bullish BLUE .013 .09 --------------------------------------------------------------------------------------------- MDY 279.47 13.58 249.8 639.9% Bullish BLUE-.025 -.069 --------------------------------------------------------------------------------------------- IWM 118.07 5.15 107.67 523.9% Bullish BLUE .08 -.1 --------------------------------------------------------------------------------------------- FAS 27.8 3.57 20.4 2004.7% Bearish BLUE .027 -.528 --------------------------------------------------------------------------------------------- RETL 6.98 .83 4.47 2286.2% Bearish BLUE-.028 -.545 --------------------------------------------------------------------------------------------- SOXL 115.74 10.54 86.68 1977.2% ------- BLUE .032 -.417 --------------------------------------------------------------------------------------------- TECL 133.82 9.56 106.47 1528.1% Bullish BLUE-.015 -.343 --------------------------------------------------------------------------------------------- IBB 112.94 3.4 107.7 424.4% Bullish BLUE .002 .147 --------------------------------------------------------------------------------------------- GLD 154.65 -1.39 151.9 169.5% ------- RED -.1 .232 --------------------------------------------------------------------------------------------- OIH 4.88 .38 4.11 1348.7% ------- BLUE-.121 -.38 --------------------------------------------------------------------------------------------- |
 Table 3   Count of Stocks in Key Directories
           20200408
-------------------------------
NEWHIGHS       17
NEWLOWS        30
MAXCP          115
MINCP          13
TTTNH          60
TTTNL          14
FASTUP         986
FASTDOWN       61
CPCROSSA       87
CPCROSSD       15
BIGVOLUP       14
BIGVODN        7
ACCUMVER       1
HIGHIP21       6
HIUPPCT        9
VHIP21         114
LOWACCUM       146
REDSELL        141
AUGSELS7       12
TRAPDOOR       671
|
RANKING OF KEY DIRECTORIES BASED PCT.OF STOCKS ABOVE 65-DMA 4/8/20 --------------------------------------------------------------------------------------- Directory Current day-1 day-2 day-3 day-4 day-5 ---------------------------------------------------------------------------------------- HACKERS .4 .2 .2 .1 .1 .05 NASD-100 .242 .161 .202 .08 .121 .06 NIFTY .239 .108 .195 .086 .108 .086 DOWJONES .233 .066 .066 .033 .033 0 SOFTWARE .233 .1 .15 .066 .066 .05 GOLD .229 .208 .229 .166 .145 .104 BEVERAGE .2 .066 .066 0 0 0 EDU .2 0 0 0 0 0 GUNS .2 .133 .2 .133 .133 .133 BIOTECH .197 .158 .173 .104 .128 .086 SEMI .186 .14 .112 .084 .102 .074 GAMING .181 .181 .227 .09 .181 .045 INDEXES .166 .161 .15 .155 .155 .161 SP-100 .166 .066 .1 .033 .044 .011 DJI-13 .153 0 0 0 0 0 ELECTRON .151 .118 .085 .059 .072 .052 COMODITY .15 .175 .15 .125 .175 .15 FOOD .148 .166 .166 .129 .166 .129 COAL .142 .142 .142 .142 0 0 GREEN .142 .095 .095 .095 .095 .095 RETAIL .14 .1 .1 .06 .06 .02 FIDSTKS .123 .078 .095 .044 .056 .033 SP500 .122 .071 .082 .054 .056 .029 SOLAR .117 .058 .058 .058 .058 .058 RUS-1000 .115 .076 .084 .053 .056 .036 COMPUTER .105 .052 .052 0 0 0 TRANSP .1 .05 .05 0 0 0 INDMATER .08 .04 .026 .04 .013 0 BONDFUND .06 .06 .06 .06 .06 .06 REIT .049 .035 .042 .035 .035 .028 HOSPITAL .045 .045 .045 .045 .045 0 INSURANC .038 0 0 0 0 0 CHINA .037 .055 .092 .055 .074 .092 MILITARY .037 .037 .037 .037 .037 .037 OILGAS .037 .029 .029 .029 .022 .022 INFRA .028 0 0 0 0 0 UTILITY .025 .025 .025 .025 .025 .025 FINANCE .024 .024 .024 .024 .012 .012 CHEM .02 .02 .02 .02 .02 .02 AUTO 0 .025 0 0 .025 .025 BIGBANKS 0 0 0 0 0 0 COPPER 0 0 0 0 0 0 ETFS 0 0 0 0 0 0 HOMEBLDG 0 0 0 0 0 0 JETS 0 0 0 0 0 0 REGBANKS 0 0 0 0 0 0 |
====================================================================
4/7/2020 Officially, Peerless signals remain on
Sells. But I have to suggest we
buy a few of the Bullish MAXCPs, like NVDA and WTR and we
not look for another worthwhile DJI decline until the DJI's MACD
switches to a Sell or the DJI's 5-day ma turns down. Another test of 23825
seems likely when I consider the unprecedented amount of looting
Wall Street will be doing of the Federal Treasury.


Like a diversionary slight-of-hand from a cooridinated band
of magicians,
the media, especially CNN, focuses only on the daily count of the
Coronavirus cases, all the while Wall Street plucks $5 trillion dollars from
Treasury and the Federal Reserve to prop the stock market up in any way it
wants. The system of distribution is deliberately opaque and the
public accountability is even less than in 2008-2009.
To justify
the "bailout", we are told by CNN and other networks that
the decline now in the fragile, pay-check-to-pay-check US economy will be
more abrupt and dangerous than it was in the Great Depression of the 1930s.
But did you notice how the DJI, the SP-500 and the NASDAQ have been
marching up in lockstep fashion ever since the biggest Wall Street bailout
in history by a factor of 5 or 7 was launched by the President and Congress.
Very, very big money is behind this advance. You do not want to argue with
this. That is what I was trying to say last night. The DJI's rebound no
longer
looks like any of the past cases when the DJI fell more than 30%. Today it
quickly tagged its 50% retracement level of the previous decline. This it did
in less than a month of starting its rebound. It is now up more than 25%
from its lows.
This only happened six months after the October 1929 bottom. Such power
upwards was never shown in the bear market of 1937-1938 until the decline
was over. It did not occur in the 1987 crash or in the 2008 crisis. So, the
marrket (I'm not speaking of the economy) now appears much stronger than
in any of these cases. This means that another test of the lows cannot be predicted
for months.
But the reversal today argues against the DJI being able to forming a V-Bottom.
If we compare our DJI chart now with the V-Bottom cases of 1949, 2001-2002
and 2018-2019, we see a stronger NYSE A/D Line in those cases and also
very little hesitation at the 50% retracement level. Today the DJI tagged its 50%
retracement level and then fell back 860 points from opening to close. This is
what caused so many bearish "red popsicles" on the TigerSoft candle-stick
charts tonght. Also different than from early 2009, the NYSE A/D Line did
not confirm the DJI's recovery high today. We also saw a bearish break in
the key ETFS' Closing Power Uptrends. And normally bearish for the time
being, the DJI closed 5.4% over is falling 21-dma and shows a negative PI (-107),
an IP21 that is just barely positive (+.004) amd very negative VI and OBVPct
readings (-196 and -.099).
What is more, yesterday the 2006 version of Peerless produced its own
Sell S3. Our HELP routine paints this picture of the signal.
"Minor SELL S3: 70% were profitable. Sell at 21-day moving
average where DJI has been steadily declining. The DJI must not have
previously been over its rising moving average for 30 straight days.
(Automatic.) 17 cases between 1965-2004, avg. pct. DJI decline at next
automatic buy signal is 1.1% and 2.85%. "
1929-1930 Conditions that lead to an Extreme Bear
Market |
1937-1938 |
1974 Extreme Bear Market Bottom |
1987 36% Crash and very slow recovery |
2008-2009 Extreme Bear Market  |
2018-2019 - V-Bottom |
|
Charts 4/7/2020 (Click on Underlined link.) 2020 PEERLESS DJI, Signals, Indicators Daily DJI Volume 10-DayUp/Down Vol Stoch-20 Inverted Traders Index Graph of Pct of All Stocks above 65-dma NASDAQ S&P OEX NYSE COMPQX DJI-15 DJI-20 DJI-30 DIA QQQ MDY IWM TNA Short-Term Rates SPY http://tigersoft.com/2020CST/SPY.GIF USO-CrudeOil DBO FAS GLD BBH IBB JETS JNUG KOL NUGT OIH OIL PALL RSX RETL SDS AGQ SLV SOXL TECL TLT TMF TNA UGA (gasoline) and China: YINN CHAU Commodities: CANE CORN DBC JJC, NIB, CHOC CORN, CUT (paper) MOO, SOYB WEAT UUP (Dollar) LIT (Lithium) AAPL ADBE ALXN AMAT AMGN AMD AMZN AXP BA BABA BAC BIDU BLDP CAT CVX DE FB GOOG GS HD IBM INTU JPM M (Macy's) MSFT NFLX NKE NVDA PG QCOM TSLA TXN XOM V WMT CMG , LRCX, SQ TOWN New highs and Bullish MAXCPs http://tigersoft.com/MAXMLK/4-7-20/BULLISH.htm Bearish MAXCPs - http://tigersoft.com/MINMLK/4-7-20/BEARISH.htm |
 4/7/2018   QUICKSILVER on DJI-30 STOCKS
             3 Bullish 1 Bearish
STOCKS CLOSE   CHANGE       PIVOT-P    5-dma AROC  CL-PWR  Candle IP21  ITRS
         ------------------------------------------------------------------------
AAPL   259.43 -3.04          240.91        103.3% Bullish  RED -.018   .046
---------------------------------------------------------------------
AXP    87.58  3.71           77.84         123.9% -------  RED -.036  -.124
---------------------------------------------------------------------
BA     141.58 -7.19          130.7        -279.4% Bearish  RED -.098  -.347  Bearish
---------------------------------------------------------------------
CAT    121.92  1.49          111.35        253.8% Bullish  RED  .199   .104  Bullish
---------------------------------------------------------------------
CSCO   40.64 -.79            38.33         168%   Bullish  RED  .059   .062
---------------------------------------------------------------------
CVX    80.92  .53            68.56         567.6% Bullish  RED  .1    -.061
---------------------------------------------------------------------
DIS    101.24  1.66          94.92         240.7% -------  RED  .139  -.049
---------------------------------------------------------------------
GS     166.02  7.79          145.29        378.5% Bullish  RED -.015  -.097
---------------------------------------------------------------------
HD     192.29  .96           178.63        152.2% Bullish  RED  .179   .038
---------------------------------------------------------------------
IBM    114.94  .12           105.14        183.2% Bullish  RED  .032   .035
---------------------------------------------------------------------
INTC   58.4 -.03             51.88         392.1% Bullish  RED -.075   .095
---------------------------------------------------------------------
JNJ    137.48 -2.28          128.81        238%   Bullish  RED  .084   .13
---------------------------------------------------------------------
JPM    90.64  1.18           84.36         35%    Bullish  RED -.013  -.108
---------------------------------------------------------------------
KO     46.51 -.16            42.12         255.9% -------  RED -.023   .015
---------------------------------------------------------------------
MCD    175.59 -1.45          158.17        311.3% Bullish  RED  .056   .045
---------------------------------------------------------------------
MMM    144.6  3.9            133.14        296.5% Bullish  RED  .142   .029
---------------------------------------------------------------------
MRK    78.56 -1.75           73.8          105.4% Bullish  RED  .162   .118 Bullish
---------------------------------------------------------------------
MAFT   163.49 -1.78          152.11        184.3% Bullish  RED -.048   .213
---------------------------------------------------------------------
NKE    84.16 -.47            79.23         87.5%  Bullish   RED  .113  .046
---------------------------------------------------------------------
PFE    33.61 -.96            31.75         146.6% Bullish  RED -.001   .043
---------------------------------------------------------------------
PG     112.77 -5.04          109.33        122.2% Bullish  RED -.008   .103
---------------------------------------------------------------------
TRV    100.78  1.8           95.2          73.8% Bullish   RED  .121  -.04
---------------------------------------------------------------------
UNH    248.04 -.3            237.32       -27.8% Bullish   RED  .119   .079
---------------------------------------------------------------------
UTX    86.01 -5.36           97.15        -958.4% Bullish  RED  .144  -.235
---------------------------------------------------------------------
V      168.59 -.85           153.11        235.5% Bullish RED  .043   .042
---------------------------------------------------------------------
VZ     56.98  .28            52.92         297.3% Bullish RED  .095   .157  Bullish
---------------------------------------------------------------------
WBA    42.81  .18            43.03        -346%   Bullish RED  .066   .026
---------------------------------------------------------------------
WMT    121.99 -4.08          114.14        353.5% Bullish RED  .066   .259
---------------------------------------------------------------------
XOM    41.24  .77            37.53         418%   ------- RED    0   -.157
|
Table 2 QUICKSILVER on ETFS - 04/07/20 ETF CLOSE CHANGE PIVOT-PT 5-dma AROC CL-PWR CANDLE IP21 ITRS --------------------------------------------------------------------------------------------- DIA 226.6 .07 209.38 170.6% Bullish RED .062 ---- --------------------------------------------------------------------------------------------- SPY 265.13 .27 246.15 145.4% Bullish RED -.013 .025 --------------------------------------------------------------------------------------------- QQQ 196.4 -.08 182.31 159.8% Bullish RED .047 .106 --------------------------------------------------------------------------------------------- MDY 265.89 3.06 247 59.5% Bullish RED .017 -.077 --------------------------------------------------------------------------------------------- IWM 112.92 .29 106.66 -70.5% ------- RED .094 -.103 --------------------------------------------------------------------------------------------- FAS 24.23 .52 19.24 181.6% Bearish RED .003 -.537 Bearish --------------------------------------------------------------------------------------------- RETL 6.15 .45 4.67 453.4% Bearish RED -.104 -.551 Bearish --------------------------------------------------------------------------------------------- SOXL 105.2 -1.34 79.41 582.5% ------- RED .027 -.405 --------------------------------------------------------------------------------------------- TECL 124.26 -2.93 99.66 364% Bullish RED .003 -.33 --------------------------------------------------------------------------------------------- IBB 109.54 -2.17 103.79 83.8% Bullish RED .021 .149 --------------------------------------------------------------------------------------------- GLD 156.04 -.84 149.45 263.2% ------- BLUE-.123 .253 --------------------------------------------------------------------------------------------- OIH 4.5 .15 3.76 591.7% Bearish RED -.132 -.388 Bearish --------------------------------------------------------------------------------------------- |
  Table 3  Count of Stocks in Key Directories
           20200407
-------------------------------
NEWHIGHS       16
NEWLOWS        54
MAXCP          30
MINCP          55
TTTNH          30
TTTNL          29
FASTUP         213
FASTDOWN       240
CPCROSSA       13
CPCROSSD       226
BIGVOLUP       14
BIGVODN        22
ACCUMVER       2
HIGHIP21       6
HIUPPCT        8
REDSELL        133
AUGSELS7       9
TRAPDOOR       734
|
 Table 4  RANKING OF KEY DIRECTORIES BASED PCT.OF STOCKS ABOVE 65-DMA
              4/7/20
All of these groups have 79% or more of their stocks
below the 65-dma.
---------------------------------------------------------------------------------------
Directory     Current       day-1         day-2         day-3         day-4         day-5
----------------------------------------------------------------------------------------
GOLD           .208          .229          .166          .145          .104          .02
HACKERS        .2            .25           .1            .1            .05           .1
GAMING         .181          .227          .09           .181          .045          .181
COMODITY       .175          .15           .125          .175          .15           .1
FOOD           .166          .166          .129          .166          .129          .111
INDEXES        .161          .15           .155          .155          .161          .155
NASD-100       .161          .212          .09           .121          .06           .111
BIOTECH        .155          .17           .101          .128          .092          .149
COAL           .142          .142          .142          0             0             0
SEMI           .14           .112          .084          .102          .084          .093
GUNS           .133          .2            .133          .133          .133          .133
ELECTRON       .119          .086          .059          .072          .059          .066
NIFTY          .108          .195          .086          .108          .086          .13
RETAIL         .1            .1            .06           .06           .02           .08
SOFTWARE       .1            .166          .066          .066          .05           .066
GREEN          .095          .095          .095          .095          .095          .095
FIDSTKS        .078          .095          .044          .056          .033          .05
RUS-1000       .076          .086          .053          .056          .036          .052
SP500          .071          .084          .054          .056          .029          .048
BEVERAGE       .066          .066          0             0             0             0
DOWJONES       .066          .066          .033          .033          0             0
SP-100         .066          .1            .033          .044          .011          .044
BONDFUND       .06           .06           .06           .06           .06           .07
SOLAR          .058          .058          .058          .058          .058          .058
CHINA          .055          .092          .055          .074          .092          .074
COMPUTER       .052          .052          0             0             0             0
TRANSP         .05           .05           0             0             0             0
HOSPITAL       .045          .045          .045          .045          0             0
INDMATER       .04           .026          .04           .013          0             0
MILITARY       .037          .037          .037          .037          .037          .037
REIT           .035          .042          .035          .035          .028          .042
OILGAS         .029          .029          .029          .022          .022          .022
AUTO           .025          0             0             .025          .025          .025
UTILITY        .025          .025          .025          .025          .025          .025
FINANCE        .023          .023          .023          .011          .011          .011
CHEM           .02           .02           .02           .02           .02           .02
BIGBANKS       0             0             0             0             0             0
COPPER         0             0             0             0             0             0
DJI-13         0             0             0             0             0             0
EDU            0             0             0             0             0             0
ETFS           0             0             0             0             0             0
HOMEBLDG       0             0             0             0             0             0
INFRA          0             0             0             0             0             0
INSURANC       0             0             0             0             0             0
JETS           0             0             0             0             0             0
REGBANKS       0             0             0             0             0             0
|
====================================================================
4/6/2020 The Peerless
System's on-going Sells may yet be proven right,
but the speed of the recovery of the markets should not be
argued with by traders, in my view. This feels a lot like the
market did in January 2019, only the rally now is even stronger.
This is not just a DJI-30 advance. There were nearly 10 times
more NYSE advancers than decliners, 2733 versus 276. Up Volume
was 11 times down volume. (I haven't checked, but these
numbers that don't seem to fit a bear market!) Traders,
I would only
hold short oil stocks and I would buy some of the MAXCPs
that are above their 65-dma. They are the leaders of this advance.

I warned that we would likely see another test of the DJI's 33%
recovery point and that we would probably have to become bullish
if in additon to the strong Closing Powers, the major ETFs' Opening
Power downtrends were broken. This is what launched the
bull market in 2009.
Opening Power Downtrends Broken.   |
What's Going on?
Can the Fed and the Government really send the DJI back to 25,000
and the falling 200-day ma, above 27000? The amazing rally was set off by
the $5 trillion bailout coming Wall Street's way. Again we see wherepolitical
power really lies. As we saw in 2008, Wall Street insiders are amazingly
adept at turning a crisis to their advantage.
This time around they are getting 6 or 7 times more bailout money. Small wonder
we see a rally! Even before the bailout's details were released to the
Public, the market turned swiftly back up and, in fact, made a record one-
day advance. Until today, we could dismiss all this as a bear market rally.
But today the DJIA knifed right past its 33% retracement level. The 50%
retracement target is now 23825. Then comes the resistance at 24500
from the broken last May low, the 65-dma at 26000 and the 200-dma
just below 27000.
Short-term traders may want to use our 5-dma pivot points and
the MACD cross-over system shown below in playing DIA and
the strongest of the Bullish MAXCPs long.

We have no Buy signal, but we can fairly safely play the rally using
our "QuckSilver" 5-day ma. Our policy here would be to stay long
DIA so long as it does not close below its 5-day ma pivot-point. A
close below this would cause the 5-day ma to turn down on that night's
charts. This is suggested for traders. If you are trading using Peerless,
wait for this 5-dma trigger to go short DIA. In the meantime, traders
may want to buy a few of the most bullish MAXCPs today. Note
that we only want to buy and hold those MAXCPs that are above
their 65-dma and show very strong Closing Powers.
All the bearish MINCP short sales tonight are airlines stocks that
are testing their lows. I think they should be covered, as most stocks
that were testing their lows in the last two days have rebounded.
Don't Fight The FED!
I have said that never before has the DJI formed a V-bottom when it
declined 30% or more. But Fed Chairman Powell did engineer a V-Bottom
in early 2019. He seems to be trying to do the same thing here. Of course,
the DJI was then down only 20%, not 35% as we saw last month. Back then,
the recovery was achieved by re-lowering interest rates and buying $50 billion
dollars worth of bonds and mortgags from banks each month.
Perhaps, it is more useful to see how massively the
$5+ trilion 2020
bailout eclipses the 2008-9 bailout. On October 3,
2008, two weeks
after Lehman Borthers went bankrupt, Congress passed the
Troubled
Asset Relief Program. This amounted to a $700 billion
Wall Street and corporate bailout. The initial cost of a $700 billion bailout
was estimated to be about $2,295 per American. The total
cost rose
to $831 billion in 2009 following the Obama Administration's stimilus
checks
and tax rebates of $250 and $400 and an $81 billion bail out of the
American auto industry.
https://en.wikipedia.org/wiki/Emergency_Economic_Stabilization_Act_of_2008
https://en.wikipedia.org/wiki/American_Recovery_and_Reinvestment_Act_of_2009
https://www.thebalance.com/stimulus-checks-3305750
The Coronairus Congressional Bailout bill was passed and signed
into law on March 26, 2020. The market had started to rally on
March 24th even before the details of the bill were let out to most
Americans. The bill allowed $2.2 Trillion to be
allocated by the Treasury
and another $5 Trillion to Federal Reserve Relief
to "stabalize" the economy.
and the markets". This was equal to 30% of gross
domestic product. It was
totally unprecedented in size and scope. The amount the individuals and
small businesses would get was, perhaps, 20% of what Wall Street Banks and
big corporations would be getting. The crisis was being turned to their advantage
just as 2008 had, only much quicker. The amount of the bailout is potentially
eight or nine times bigger, but with far less transparency, and a lot fewer controls
and public-minded watchdogs.
Wall
Street Wins, Again: Bailouts in the Time of Coronaviru
https://en.wikipedia.org/wiki/Coronavirus_Aid,_Relief,_and_Economic_Security_Act
|
Charts 4/6/2020 (Click on Underlined link.) 2020 PEERLESS DJI, Signals, Indicators Daily DJI Volume 10-DayUp/Down Vol Stoch-20 Inverted Traders Index Graph of Pct of All Stocks above 65-dma NASDAQ S&P OEX NYSE COMPQX DJI-15 DJI-20 DJI-30 DIA QQQ MDY IWM TNA Short-Term Rates SPY http://tigersoft.com/2020CST/SPY.GIF USO-CrudeOil DBO FAS GLD BBH IBB JETS JNUG KOL NUGT OIH OIL PALL RSX RETL SDS AGQ SLV SOXL TECL TLT TMF TNA UGA (gasoline) and China: YINN CHAU Commodities: CANE CORN DBC JJC, NIB, CHOC CORN, CUT (paper) MOO, SOYB WEAT UUP (Dollar) LIT (Lithium) AAPL ADBE ALXN AMAT AMGN AMD AMZN AXP BA BABA BAC BIDU BLDP CAT CVX DE FB GOOG GS HD IBM INTU JPM M (Macy's) MSFT NFLX NKE NVDA PG QCOM TSLA TXN XOM V WMT CMG , LRCX, SQ TOWN New highs and Bullish MAXCPs http://tigersoft.com/MAXMLK/4-6-20/BULLISH.htm Bearish MAXCPs - http://tigersoft.com/MINMLK/4-6-20/BEARISH.htm |
 QUICKSILVER on DJI-30 STOCKS
 5 Bullish 1 Bearish
  Only Boeing, which rose 24 points today, is considered "bearish"
  among the DJI-30 stocks.
STOCKS CLOSE CHANGE PIVOT-P 5-dma AROC CL-PWR Candle IP21 ITRS
------------------------------------------------------------------------
AAPL 262.47 21.06 254.29 154.9% Bullish BLUE -.015 .043
---------------------------------------------------------------------------------
AXP 83.87 10.27 85.61 -396.1% ------- BLUE -.02 -.161
---------------------------------------------------------------------------------
BA 148.77 24.25 149.14 -129.1% Bearish BLUE -.055 -.321 Bearish
---------------------------------------------------------------------------------
CAT 120.43 5.76 116.04 382.1% Bullish BLUE .18 .076 Bullish
---------------------------------------------------------------------------------
CSCO 41.43 2.37 39.31 141% Bullish BLUE .088 .066
----------------------------------------------------------------------------------
CVX 80.39 5.28 72.46 579.4% Bullish BLUE .076 -.063
----------------------------------------------------------------------------------
DIS 99.58 5.7 96.6 -11.4% Bullish BLUE .12 -.071
---------------------------------------------------------------------
GS 158.23 11.3 154.59 -45.9% Bullish BLUE -.039 -.128
---------------------------------------------------------------------
HD 191.33 12.63 186.71 -129.4% Bullish BLUE .191 .043
---------------------------------------------------------------------
IBM 114.82 8.48 110.93 86.6% Bullish BLUE .013 .035
---------------------------------------------------------------------
INTC 58.43 4.3 54.12 272.3% Bullish BLUE -.059 .072
---------------------------------------------------------------------
JNJ 139.76 5.59 131.13 255.6% Bullish BLUE .099 .161 Bullish
---------------------------------------------------------------------
JPM 89.46 5.41 90.03 -229.8% Bullish BLUE -.035 -.11
---------------------------------------------------------------------
KO 46.67 2.84 44.25 190.5% Bullish BLUE -.021 .027
---------------------------------------------------------------------
MCD 177.04 16.71 165.35 273.8% Bullish BLUE .076 .056
---------------------------------------------------------------------
MMM 140.7 6.91 136.51 109% Bullish BLUE .126 .008
---------------------------------------------------------------------
MRK 80.31 4.06 76.94 220.6% Bullish BLUE .185 .152 Bullish
---------------------------------------------------------------------
MSFT 165.27 11.44 157.71 161.7% Bullish BLUE -.049 .22
---------------------------------------------------------------------
NKE 84.63 5.77 82.74 -46.1% Bullish BLUE .145 .048
---------------------------------------------------------------------
PFE 34.57 .93 32.64 290.4% Bullish BLUE .014 .086
---------------------------------------------------------------------
PG 117.81 2.73 110 124.6% Bullish BLUE .008 .16
---------------------------------------------------------------------
TRV 98.98 5.09 99.35 -184.9% Bullish BLUE .147 -.047
---------------------------------------------------------------------
UNH 248.34 18.85 249.38 -60.8% Bullish BLUE .156 .066
---------------------------------------------------------------------
UTX 86.01 -5.36 97.15 -958.4% Bullish RED .144 -.222
---------------------------------------------------------------------
V 169.44 17.59 161.12 122.6% Bullish BLUE .054 .045
---------------------------------------------------------------------
VZ 56.7 2 53.73 177.8% Bullish BLUE .102 .159 Bullish
---------------------------------------------------------------------
WBA 42.63 1.91 45.75 -294.2% Bullish BLUE .042 .038
---------------------------------------------------------------------
WMT 126.07 6.59 113.62 468.1% Bullish BLUE .111 .321 Bullish
---------------------------------------------------------------------
DOW 40.47 1.26 37.97 385.5% ------- BLUE .012 -.171
|
Table 2 QUICKSILVER on ETFS - 04/06/20 ETF CLOSE CHANGE PIVOT-PT 5-dma AROC CL-PWR CANDLE IP21 ITRS --------------------------------------------------------------------------------------------- DIA 226.53 15.93 219.23 79.7% Bullish BLUE .075 ---- --------------------------------------------------------------------------------------------- SPY 264.86 16.67 257.75 63.4% Bullish BLUE-.023 .024 --------------------------------------------------------------------------------------------- QQQ 196.48 13.11 190.4 118.8% Bullish BLUE .036 .101 --------------------------------------------------------------------------------------------- MDY 262.83 19.74 262.88 -57.7% Bullish BLUE-.034 -.082 --------------------------------------------------------------------------------------------- IWM 112.63 8.01 114.46 -109.9% Bullish BLUE .096 -.101 --------------------------------------------------------------------------------------------- FAS 23.71 4.54 23.46 -447.1% ------- BLUE .065 -.54 --------------------------------------------------------------------------------------------- RETL 5.7 1.43 5.7 -120.3% Bearish BLUE .03 -.562 Bearish --------------------------------------------------------------------------------------------- SOXL 106.54 25.01 94.74 296.4% Bullish BLUE .069 -.434 Bearish --------------------------------------------------------------------------------------------- TECL 127.19 25.9 116.24 197.6% Bullish BLUE .022 -.341 Bearish --------------------------------------------------------------------------------------------- IBB 111.71 5.46 107.74 134.3% Bullish BLUE .016 .174 --------------------------------------------------------------------------------------------- GLD 156.88 4.23 148.05 131.1% ------- BLUE-.141 .278 --------------------------------------------------------------------------------------------- OIH 4.35 .31 4.02 554.4% Bearish BLUE-.171 -.408 Bearish --------------------------------------------------------------------------------------------- |
 Table 3   Count of Stocks in Key Directories
           20200406
-------------------------------
NEWHIGHS       18
NEWLOWS        70
MAXCP          286
MINCP          41
TTTNH          99
TTTNL          25
FASTUP         170
FASTDOWN       280
CPCROSSA       93
CPCROSSD       17
BIGVOLUP       4
BIGVODN        9
ACCUMVER       4
HIGHIP21       7
HIUPPCT        9
REDSELL        128
AUGSELS7       14
TRAPDOOR       736
|
 Table 4 RANKING OF KEY DIRECTORIES BASED PCT.OF STOCKS ABOVE 65-DMA
         4/6/20
 All show more than 74% of their stocks are below the 65-dma.
---------------------------------------------------------------------------------------
Directory     Current       day-1         day-2         day-3         day-4         day-5
----------------------------------------------------------------------------------------
HACKERS        .25           .15           .1            .05           .1            .15
GOLD           .229          .166          .145          .104          .02           .145
GAMING         .227          .09           .181          .045          .181          .181
NASD-100       .212          .101          .131          .06           .111          .101
COAL           .2            .2            0             0             0             0
GUNS           .2            .133          .133          .133          .133          .133
NIFTY          .191          .085          .106          .085          .127          .127
BIOTECH        .167          .098          .125          .092          .155          .158
FOOD           .166          .129          .166          .129          .111          .203
SOFTWARE       .166          .083          .066          .05           .066          .066
COMODITY       .15           .125          .175          .15           .1            .2
INDEXES        .15           .155          .155          .161          .155          .166
SEMI           .112          .084          .102          .084          .093          .102
RETAIL         .1            .06           .06           .02           .08           .08
SP-100         .1            .033          .044          .011          .044          .044
FIDSTKS        .095          .044          .056          .033          .05           .061
GREEN          .095          .095          .095          .095          .095          .095
CHINA          .092          .055          .074          .092          .092          .092
RUS-1000       .086          .054          .056          .036          .052          .056
ELECTRON       .085          .059          .072          .059          .065          .059
SP500          .084          .056          .056          .029          .048          .05
BEVERAGE       .066          0             0             0             0             0
DOWJONES       .066          .033          .033          0             0             0
BONDFUND       .06           .06           .06           .06           .07           .07
SOLAR          .058          .058          .058          .058          .058          .058
COMPUTER       .052          0             0             0             0             .052
TRANSP         .05           0             0             0             0             0
HOSPITAL       .045          .045          .045          0             0             0
REIT           .042          .035          .035          .028          .042          .042
MILITARY       .037          .037          .037          .037          .037          .037
OILGAS         .029          .029          .022          .022          .022          .022
INDMATER       .026          .04           .013          0             0             0
UTILITY        .025          .025          .025          .025          .025          .025
FINANCE        .023          .023          .011          .011          .011          .023
CHEM           .02           .02           .02           .02           .02           .02
AUTO           0             0             .025          .025          .025          .025
BIGBANKS       0             0             0             0             0             0
COPPER         0             0             0             0             0             0
DJI-13         0             0             0             0             0             0
EDU            0             0             0             0             0             0
ETFS           0             0             0             0             0             0
HOMEBLDG       0             0             0             0             0             0
INFRA          0             0             0             0             0             0
INSURANC       0             0             0             0             0             .038
JETS           0             0             0             0             0             0
REGBANKS       0             0             0             0             0             0
|
====================================================================
4/3/2020 The DJI Futures
are up 780 as I write this. Another rally to
23500 is a possibility. This is to be expected when the market
is held up by the FED and its cohorts on Wall Street. But it
does not signify the start of a bigger advance in my opinion.
The falling 21-dma's annualized rate of decline is a still very bearish
-275%. That means lots of resistance at the falling 21-dma and just
above.
Peerless remains on a Sell. 95% of all stocks are below their
key 65-dma. Only 7 new highs were made on the NYSE and NASDAQ,
combined. There are only a few MAXCPs that are trying to lead
an advance. Recently, MAXCPs have are been unable to make more
than a nominal new. Sustained advances are non-existent.
 |
 |
History Shows the Need for Caution
and Short Sales of Bearish Mincps with
Falling Closing Powers. Buying Prematurely
Can Quickly Become very Painful as Rallies
Go Nowhere and then Fade Badly.
If we look back at 2008 and the aftermath of the 1987 Crash we see,
more than a year of backing and filling around the 21-day ma once the
normal bands are reacquired. And even in 2008-2009, when the Federal
Government and the Federal Reserve liberally bailed our banks and
automakers with trillions of dollars, another leg sharply down was needed
in early 2009. V-Bottoms just do not occur when the DJI plunges
more than 30%. .
But there's no denying that researchers are hard at work on
new ways
to treat the Coronavirus pandemic and if their successes become widely
applied, the dangers of the Virus will be lowered dramatically. In that case,
expect Governments to rapidly ease up their restrictions on younger people.
They may then be allowed to go back to work, while older people are still
resticted. So, might those who have acquired an immunity to the disease.
This scenario is somewhere out in the distance. Probably, we are months
and months away from it. But this would be one way out of our troubles
until a vacination is found. A slow recovery in the stock market might then
get under way. But a quick bounce back seems most unlikely.
I noteed last week that it will be very constructive if the
Opening Powers
of DIA, SPY and QQQ break their downtrends. Watch for that. But,
even then there appears to be an overwhelming amount of resistance.
So, I would only expect the DJI to be able to rally to 22500, the 33%
recovery line for different indexes. But for now, there appears to be
good support at 21000 for now. The weak Bearish MINCPs continue
to look more vulnerable than the strongesr Bullish MAXCPs. So,
hold the MINCPs short.
|
Charts 4/3/2020 (Click on Underlined link.) 2020 PEERLESS DJI, Signals, Indicators Daily DJI Volume 10-DayUp/Down Vol Stoch-20 Inverted Traders Index Graph of Pct of All Stocks above 65-dma NASDAQ S&P OEX NYSE COMPQX DJI-15 DJI-20 DJI-30 DIA QQQ MDY IWM TNA Short-Term Rates SPY http://tigersoft.com/2020CST/SPY.GIF USO-CrudeOil DBO FAS GLD BBH IBB JETS JNUG KOL NUGT OIH OIL PALL RSX RETL SDS AGQ SLV SOXL TECL TLT TMF TNA UGA (gasoline) and China: YINN CHAU Commodities: CANE CORN DBC JJC, NIB, CHOC CORN, CUT (paper) MOO, SOYB WEAT UUP (Dollar) LIT (Lithium) AAPL ADBE ALXN AMAT AMGN AMD AMZN AXP BA BABA BAC BIDU BLDP CAT CVX DE FB GOOG GS HD IBM INTU JPM M (Macy's) MSFT NFLX NKE NVDA PG QCOM TSLA TXN XOM V WMT CMG , LRCX, SQ TOWN New highs and Bullish MAXCPs http://tigersoft.com/MAXMLK/4-3-20/BULLISH.htm Bearish MAXCPs - http://tigersoft.com/MINMLK/4-3-20/BEARISH.htm |
 Table 1   QUICKSILVER on DJI-30 STOCKS  4/3/2020
 3 Bullish 1 Bearish
STOCKS CLOSE CHANGE PIVOT-PT 5-dma AROC CL-PWR CANDLE IP21 ITRS ----------------------------------------------------------------------------------- ----------------------------------------------------------------------------------- AAPL 241.41 -3.52 254.81 -127.3% Bullish RED -.021 .034 --------------------------------------------------------------------- AXP 73.6 -3.06 90.27 -902.5% ------- RED -.028 -.162 --------------------------------------------------------------------- BA 124.52 1.25 152.28 -1306.1% Bearish RED -.101 -.331 Bearish --------------------------------------------------------------------- CAT 114.67 -2.07 111.71 411.1% Bullish RED .196 .081 --------------------------------------------------------------------- CSCO 39.06 -.74 40.32 30.5% Bullish RED .102 .075 --------------------------------------------------------------------- CVX 75.11 -1.01 71.95 442.2% Bullish RED .063 -.058 --------------------------------------------------------------------- DIS 93.88 -3.09 99.8 -130% Bullish RED .123 -.062 --------------------------------------------------------------------- GS 146.93 -3 159.62 -371.5 % Bullish RED -.065 -.124 --------------------------------------------------------------------- HD 178.7 -2.61 196.1 -317.4% Bullish RED .186 .042 --------------------------------------------------------------------- IBM 106.34 -3.66 112.93 -77.2% Bullish RED .017 .022 --------------------------------------------------------------------- INTC 54.13 -.22 55.49 164.1% Bullish BLUE-.058 .132 --------------------------------------------------------------------- JNJ 134.17 1.02 133.01 423.9% Bullish BLUE .099 .181 Bullish --------------------------------------------------------------------- JPM 84.05 -3.46 93.5 -396.4% Bullish RED -.029 -.107 --------------------------------------------------------------------- KO 43.83 -.12 45 116.9% Bullish BLUE-.035 .036 --------------------------------------------------------------------- MCD 160.33 -1.17 168.13 -112.6% Bullish ---- .067 .029 --------------------------------------------------------------------- MMM 133.79 -4.12 137.74 20.3% Bullish RED .13 .03 --------------------------------------------------------------------- MRK 76.25 -.62 76.95 300.3% Bullish ---- .189 .139 Bullish --------------------------------------------------------------------- MSFT 153.83 -1.43 160.23 133.2% Bullish RED -.053 .2 --------------------------------------------------------------------- NKE 78.86 -1.28 85.38 -266% Bullish RED .134 .043 --------------------------------------------------------------------- PFE 33.64 .77 32.67 425.9% Bullish BLUE .028 .104 --------------------------------------------------------------------- PG 115.08 .68 115 219.6% Bullish BLUE .003 .198 --------------------------------------------------------------------- TRV 93.89 -3.3 102.59 -306.5% Bullish RED .138 -.023 --------------------------------------------------------------------- UNH 229.49 -10.95 251.28 -265.4% Bullish RED .151 .044 --------------------------------------------------------------------- UTX 86.01 -5.36 97.15 -958.4% Bullish RED .144 -.163 --------------------------------------------------------------------- V 151.85 -5.54 165.57 -303.9% Bullish RED .039 .013 --------------------------------------------------------------------- VZ 54.7 -.55 54.77 179.1% Bullish RED .102 .182 Bullish --------------------------------------------------------------------- WBA 40.72 .4 45.16 -375.7% Bullish BLUE .039 .042 --------------------------------------------------------------------- WMT 119.48 .83 115.19 433.3% Bullish BLUE .09 .309 --------------------------------------------------------------------- XOM 39.21 -1.19 37.5 296.8% ------- RED -.03 -.135 |
Table 2 QUICKSILVER on ETFS - 04/03/20 last change Pivot 5-dma aroc ClosPwr Candle IP21 ITRS --------------------------------------------------------------------------------------------- --------------------------------------------------------------------------------------------- DIA 210.6 -3.36 223.1 -132.9% Bullish RED .067 ---- --------------------------------------------------------------------------------------------- SPY 248.17 -3.66 261.65 -103.3% Bullish RED -.019 .026 --------------------------------------------------------------------------------------------- QQQ 183.37 -2.64 192.04 -51.5% Bullish RED .041 .094 --------------------------------------------------------------------------------------------- MDY 243.09 -6.71 265.76 -308.5% ------- RED -.026 -.083 --------------------------------------------------------------------------------------------- IWM 104.62 -3.05 115.04 -356.8% ------- RED .081 -.098 --------------------------------------------------------------------------------------------- FAS 19.17 -1.23 25.64 -1117.7% Bearish RED .026 -.533 Bearish --------------------------------------------------------------------------------------------- RETL 4.27 -.2 5.82 -1490% Bearish RED -.084 -.565 Bearish --------------------------------------------------------------------------------------------- SOXL 81.53 -5.15 101.28 -546.2% ------- RED .042 -.465 Bearish --------------------------------------------------------------------------------------------- TECL 101.29 -5.18 122.87 -378.9% Bullish RED .011 -.377 --------------------------------------------------------------------------------------------- IBB 106.25 -1.45 108.84 72.3% Bullish RED -.004 .167 --------------------------------------------------------------------------------------------- GLD 152.65 .75 152.92 13.3% Bearish BLUE-.146 .315 --------------------------------------------------------------------------------------------- OIH 4.04 -.07 3.91 -62.8% Bearish RED -.262 -.385 Bearish --------------------------------------------------------------------------------------------- GASL 3440 285 3685 -325.1% ------- RED -.021 .391 --------------------------------------------------------------------------------------------- |
  Table 3  Count of Stocks in Key Directories
             20200403
-------------------------------
NEWHIGHS       7
NEWLOWS        273
MAXCP          84
MINCP          75
TTTNH          65
TTTNL          48
FASTUP         100
FASTDOWN       613
CPCROSSA       12
CPCROSSD       176
BIGVOLUP       10
BIGVODN        22
ACCUMVER       2
HIGHIP21       5
HIUPPCT        7
REDSELL        116
AUGSELS7       15
TRAPDOOR       737
|
 RANKING OF KEY DIRECTORIES BASED PCT.OF STOCKS ABOVE 65-DMA
              4/3/20
All 46 are Bearish, i.e. they show more than 50% of their compnents
are below the stock's 65-dma.
---------------------------------------------------------------------------------------
Directory     Current       day-1         day-2         day-3         day-4         day-5
----------------------------------------------------------------------------------------
COAL           .2            0             0             0             0             0
GOLD           .166          .145          .104          .02           .145          .125
INDEXES        .155          .155          .161          .155          .166          .166
HACKERS        .15           .15           .05           .1            .15           .1
GUNS           .133          .133          .133          .133          .133          .066
FOOD           .129          .166          .129          .111          .203          .203
COMODITY       .125          .175          .15           .1            .2            .2
NASD-100       .101          .141          .07           .111          .09           .06
BIOTECH        .095          .122          .089          .155          .161          .101
GREEN          .095          .095          .095          .095          .095          .047
GAMING         .09           .181          .045          .181          .136          .09
NIFTY          .086          .108          .086          .13           .13           .108
SEMI           .084          .102          .084          .093          .102          .074
SOFTWARE       .083          .083          .05           .066          .066          .066
BONDFUND       .06           .06           .06           .07           .07           .06
RETAIL         .06           .06           .02           .08           .08           .02
ELECTRON       .059          .072          .059          .066          .059          .052
SOLAR          .058          .058          .058          .058          .058          .058
SP500          .056          .058          .029          .048          .048          .021
CHINA          .055          .074          .092          .092          .092          .074
RUS-1000       .054          .057          .036          .052          .054          .028
HOSPITAL       .045          .045          0             0             0             0
FIDSTKS        .044          .056          .033          .05           .061          .028
INDMATER       .04           .013          0             0             0             0
MILITARY       .037          .037          .037          .037          .037          0
REIT           .035          .035          .028          .042          .042          .014
DOWJONES       .033          .033          0             0             0             0
SP-100         .033          .044          .011          .044          .044          .011
OILGAS         .029          .022          .022          .022          .022          .022
UTILITY        .025          .025          .025          .025          .025          0
FINANCE        .023          .011          .011          .011          .023          .011
CHEM           .02           .02           .02           .02           .02           0
AUTO           0             .025          .025          .025          .025          0
BEVERAGE       0             0             0             0             0             0
BIGBANKS       0             0             0             0             0             0
COMPUTER       0             0             0             0             .052          0
COPPER         0             0             0             0             0             0
DJI-13         0             0             0             0             0             0
EDU            0             0             0             0             0             0
ETFS           0             0             0             0             0             0
HOMEBLDG       0             0             0             0             0             0
INFRA          0             0             0             0             0             0
INSURANC       0             0             0             0             .038          0
JETS           0             0             0             0             0             0
REGBANKS       0             0             0             0             0             0
TRANSP         0             0             0             0             0             0
|
====================================================================
4/2/2020 The Opening
Powers are very weak and the Closing Powers
are quite strong. NYSE Professionals are doing what they can
to hold up the market. If the virus stalls out, the rising Closing
Powers will prove to be heralding much better times. This is
what happened in 2009. But Opening Powers' declines still
show too much pressure on the market and the risks of another
big leg down, not just a consolidation around 20000 seem way too
high to be bullish. There are just no cases of "V" bottoms after the
DJI sells off more than 30%.

If you look back at the QQQ chart for 2008-2009, you can
see that Professionals (shown by blue Closing Power) did turn
bullish sooner than the Public or Foreigners (shown by Opening
Power), but the chart below also shows that it was only when
Opening Power broke its downtrend that a new bull market could start.
The Opening Powers are all in steep downtrends now.


Expect the DJI to retest 20000 again before the DJI can
get much past 22500. The operative Peerless signals are
the Sell S6s (which warn against chasing rallies) and Sell S14
(which warns of a re-test of the lows when the DJI falls
more than 20% from its highs. We see a market, however,
which the Fed and Congress desperately want to prop up,
not for political reasons only, but because this Coronavirus
could easily lead to a Depression. Tomorrow Report is
expected to see the quickest rise in national Unemployment
month to month ever. If we look back at the Unemployment
numbers for 1929-1933, 1969-1976 and 2007-2010, when a
deep bear market was starting, we do not see anything like the
sharp rise we are likely to see with tomorrow's Job Numbers.
This contagion is freezing much of the economy. Everyone eventually
will be affected adversely if the curve of the virus is not soon turned
down. Distancing and closures are the best hope of that now.
The data below show that if the virus does not get stopped
soon,
the chances for a deep, deep recession are quite high and with it
much lower stock prices over the next three to four years. We can
hope that this whole episode will be short-lived, but that's not what
history shows.
Year Unemployment
Percent June 30 DJIA
------ ------------------------
1929
3.2%
333.79
1930
8.7%
226.34
1931
15.9%
150.18
1932
23.6%
42.84
1933
24.9%
98.14
1934
21.7%
95.72
1969
3.5%
873.19
1970
6.1%
683.53
1971
6.0%
891.14
1972
5.2%
929.03
1973
4.9%
891.71
1974
7.4%
802.41
1975
8.2%
878.99
1976
7.8%
1002.78
2006
4.4%
11150
2007
5.0%
13409
2008
7.3%
11350
2009
9.9%
8447
2010
9.3%
9774
https://www.thebalance.com/unemployment-rate-by-year-3305506
.
|
Charts 4/2/2020 (Click on Underlined link.) 2020 PEERLESS DJI, Signals, Indicators Daily DJI Volume 10-DayUp/Down Vol Stoch-20 Inverted Traders Index Graph of Pct of All Stocks above 65-dma NASDAQ S&P OEX NYSE COMPQX DJI-15 DJI-20 DJI-30 DIA QQQ MDY IWM TNA Short-Term Rates SPY http://tigersoft.com/2020CST/SPY.GIF USO-CrudeOil DBO FAS GLD BBH IBB JETS JNUG KOL NUGT OIH OIL PALL RSX RETL SDS AGQ SLV SOXL TECL TLT TMF TNA UGA (gasoline) and China: YINN CHAU Commodities: CANE CORN DBC JJC, NIB, CHOC CORN, CUT (paper) MOO, SOYB WEAT UUP (Dollar) LIT (Lithium) AAPL ADBE ALXN AMAT AMGN AMD AMZN AXP BA BABA BAC BIDU BLDP CAT CVX DE FB GOOG GS HD IBM INTU JPM M (Macy's) MSFT NFLX NKE NVDA PG QCOM TSLA TXN XOM V WMT CMG , LRCX, SQ TOWN New highs and Bullish MAXCPs http://tigersoft.com/MAXMLK/4-2-20/BULLISH.htm Bearish MAXCPs - http://tigersoft.com/MINMLK/4-2-20/BEARISH.htm |
 Table 1   QUICKSILVER on DJI-30 STOCKS  4/2/2020
 5 Bullish 1 Bearish
STOCKS CLOSE CHANGE PIVOT-PT 5-dma AROC CL-PWR CANDLE IP21 ITRS ----------------------------------------------------------------------------------- ----------------------------------------------------------------------------------- AAPL 244.93 4.02 247.74 -268.9% Bullish BLUE -.035 .038 --------------------------------------------------------------------- AXP 76.66 -1.18 88.73 -954.1% Bullish RED -.012 -.15 --------------------------------------------------------------------- BA 123.27 -7.43 162 -1848.5% Bearish RED -.095 -.334 Bearish --------------------------------------------------------------------- CAT 116.74 5.39 105.44 281.1% Bullish BLUE .169 .085 Bullish --------------------------------------------------------------------- CSCO 39.8 1.47 38.82 -98.8% Bullish BLUE .092 .078 --------------------------------------------------------------------- CVX 76.12 7.56 68.78 -18.1% Bullish BLUE .096 -.059 --------------------------------------------------------------------- DIS 96.97 2.05 96.4 -425.4% Bullish BLUE .123 -.06 --------------------------------------------------------------------- GS 149.93 4.64 158.34 -506% Bullish BLUE -.07 -.126 --------------------------------------------------------------------- HD 181.31 2.68 190.55 -366.9% Bullish BLUE .165 .045 --------------------------------------------------------------------- IBM 110 4.86 108.03 -131.4% Bullish BLUE .015 .031 --------------------------------------------------------------------- INTC 54.35 2.47 52.37 -110.4% Bullish BLUE -.084 .133 --------------------------------------------------------------------- JNJ 133.15 4.34 123.16 256% Bullish BLUE .098 .165 Bullish --------------------------------------------------------------------- JPM 87.51 3.15 91.13 -580.2% Bullish BLUE -.025 -.093 --------------------------------------------------------------------- KO 43.95 1.83 42.81 -38.9% ------- BLUE -.047 .03 --------------------------------------------------------------------- MCD 161.5 3.33 164.01 -177.7% Bullish BLUE .045 .031 --------------------------------------------------------------------- MMM 137.91 4.77 133.24 63.9% Bullish BLUE .133 .041 --------------------------------------------------------------------- MRK 76.87 3.07 71.73 223.9% Bullish BLUE .178 .124 Bullish --------------------------------------------------------------------- MSFT 155.26 3.15 149.7 -27.4% Bullish BLUE -.067 .204 --------------------------------------------------------------------- NKE 80.14 .91 83.23 -250.7% Bullish BLUE .126 .034 --------------------------------------------------------------------- PFE 32.87 1.12 30.9 175.3% Bullish BLUE -.009 .085 --------------------------------------------------------------------- PG 114.4 5.07 110.17 318% Bullish BLUE -.007 .172 --------------------------------------------------------------------- TRV 97.19 1.99 99.95 -74.6% Bullish BLUE .148 -.046 --------------------------------------------------------------------- UNH 240.44 3.12 242.45 -302.4% Bullish BLUE .153 .067 --------------------------------------------------------------------- UTX 86.01 -5.36 97.15 -958.4% Bullish RED .144 -.174 --------------------------------------------------------------------- V 157.39 4.28 161.56 -354.5% Bullish BLUE .044 .024 --------------------------------------------------------------------- VZ 55.25 2.33 52.77 159.7% Bullish BLUE .114 .18 Bullish --------------------------------------------------------------------- WBA 40.32 -2.71 44 -598.1% Bullish BLUE .052 .022 --------------------------------------------------------------------- WMT 118.65 4.51 109.58 392.5% Bullish BLUE .073 .289 Bullish --------------------------------------------------------------------- DOW 40.4 2.87 36.95 209.2% ------- BLUE .006 -.132 |
Table 2 QUICKSILVER on ETFS - 04/02/20 BA weighs DJI down again today. last change Pivot 5-dma aroc ClosPwr Candle IP21 ITRS --------------------------------------------------------------------------------------------- --------------------------------------------------------------------------------------------- DIA 213.96 4.58 216.35 -254.1% Bullish BLUE .065 ---- --------------------------------------------------------------------------------------------- BA 123.27 -7.43 162 -1848.5% Bearish RED -.095 -.334 Bearish --------------------------------------------------------------------------------------------- SPY 251.83 5.68 253.42 -183% Bullish BLUE-.027 .027 --------------------------------------------------------------------------------------------- QQQ 186.01 3.7 185.3 -156.3% Bullish BLUE .002 .098 --------------------------------------------------------------------------------------------- MDY 249.8 2.8 258.94 -338.3% ------- BLUE-.026 -.074 --------------------------------------------------------------------------------------------- IWM 107.67 1.01 112.56 -404% ------- BLUE .077 -.091 --------------------------------------------------------------------------------------------- FAS 20.4 1.16 24.22 -1262.9% ------- BLUE .034 -.531 --------------------------------------------------------------------------------------------- RETL 4.47 -.2 5.85 -1843.1% Bearish RED -.091 -.568 Bearish --------------------------------------------------------------------------------------------- SOXL 86.68 7.27 91.44 -1126.4% ------- BLUE .047 -.453 Bearish --------------------------------------------------------------------------------------------- TECL 106.47 6.81 109.7 -856.2% Bullish BLUE .001 -.365 Bearish --------------------------------------------------------------------------------------------- IBB 107.7 3.91 104.71 42.8% Bullish BLUE-.009 .16 --------------------------------------------------------------------------------------------- GLD 151.9 2.45 152.25 -44.3% Bearish BLUE-.113 .302 --------------------------------------------------------------------------------------------- OIH 4.11 .35 4.09 -371.5% ------- BLUE-.264 -.394 Bearish --------------------------------------------------------------------------------------------- |
 Table 3   Count of Stocks in Key Directories
           20200402
-------------------------------
NEWHIGHS       2
NEWLOWS        119
MAXCP          238
MINCP          78
TTTNH          121
TTTNL          38
FASTUP         58
FASTDOWN       638
CPCROSSA       47
CPCROSSD       49
BIGVOLUP       13
BIGVODN        17
ACCUMVER       3
HIGHIP21       4
HIUPPCT        10
VHIP21         124
LOWACCUM       148
REDSELL        114
AUGSELS7       14
TRAPDOOR       736
|
 Table 4 RANKING OF KEY DIRECTORIES BASED PCT.OF STOCKS ABOVE 65-DMA
              4/2/20
---------------------------------------------------------------------------------------
Directory     Current       day-1         day-2         day-3         day-4         day-5
----------------------------------------------------------------------------------------
GAMING         .181          .045          .181          .136          .09           .09
COMODITY       .175          .15           .1            .2            .2            .2
FOOD           .166          .129          .111          .203          .203          .203
INDEXES        .155          .161          .155          .166          .166          .155
HACKERS        .15           .1            .1            .15           .1            .1
GOLD           .145          .104          .02           .145          .125          .187
NASD-100       .144          .082          .123          .092          .061          .092
GUNS           .133          .133          .133          .133          .066          0
BIOTECH        .119          .086          .152          .161          .107          .119
NIFTY          .106          .085          .127          .127          .106          .127
SEMI           .102          .084          .093          .102          .074          .102
GREEN          .095          .095          .095          .095          .047          .047
SOFTWARE       .083          .066          .066          .066          .066          .066
CHINA          .074          .092          .092          .092          .074          .074
ELECTRON       .072          .059          .065          .059          .052          .072
BONDFUND       .06           .06           .07           .07           .06           .06
RETAIL         .06           .02           .08           .08           .02           .02
SOLAR          .058          .058          .058          .058          .058          .117
SP500          .058          .031          .048          .048          .021          .031
RUS-1000       .057          .038          .051          .054          .028          .041
FIDSTKS        .056          .033          .05           .061          .028          .056
HOSPITAL       .045          0             0             0             0             0
SP-100         .044          .011          .044          .044          .011          .033
MILITARY       .035          .035          .035          .035          0             0
REIT           .035          .028          .042          .042          .014          .014
DOWJONES       .033          0             0             0             0             0
AUTO           .025          .025          .025          .025          0             .025
UTILITY        .025          .025          .025          .025          0             0
OILGAS         .022          .022          .022          .022          .022          .029
CHEM           .02           .02           .02           .02           0             .02
INDMATER       .013          0             0             0             0             .013
FINANCE        .011          .011          .011          .023          .011          .023
BEVERAGE       0             0             0             0             0             0
BIGBANKS       0             0             0             0             0             0
COAL           0             0             0             0             0             0
COMPUTER       0             0             0             .052          0             0
COPPER         0             0             0             0             0             0
DJI-13         0             0             0             0             0             0
EDU            0             0             0             0             0             0
ETFS           0             0             0             0             0             0
HOMEBLDG       0             0             0             0             0             0
INFRA          0             0             0             0             0             0
INSURANC       0             0             0             .038          0             0
JETS           0             0             0             0             0             0
REGBANKS       0             0             0             0             0             0
TRANSP         0             0             0             0             0             0
|
======================================================================
4/1/2020 With the DJI Futures up over
300, 21000 now seems to be
short-term support. But there is no real indication that the DJI
will be able to surpass 22500. So, I would just hold our shorts
and look for weakness in the coming month down to 20000
and then to 19000.


Seasonality is not good right after April 1st and Peerless must stand
on its Sells. April 1st has proven to be a good time for a trader to buy
in a Presidential Election year only five times since 1916. My study
shows it would have likely brought traders losses in 18 years. There
were only two years where a trader could have gained more than 10%
and six cases where there was a 10% or more decline in the DJI
soon after April 1st.
The current Peerless system remains on a Sell. But if we look
only at the period from 1965 to 2006, as the older Peerless system
does, we would see a Buy B20 signal. This occurs because the DJI
is oversold (6% below the 21-dma) and the computer program takes
note of the fact that the DJI seldom declines much in Presidential
Election years when taken as a whole.
Studying all the data back to 1916, we can see that seasonality now is
clearly bearish. Of course, the market could go up now. A drug to kill the
virus might be found. The $5 trillion dollars FED and Government
infusion into the economy may be enough if the curve of virus cases
soon turns down. True or not, the FED wants Professionals to hold
up the market and they are arranging that Wall Street can do that. But
confidence is likely to return slowly and the seasonality is just not very
good right after April 1st.
Presidential Election Years that were NOT included as basis of 2006 Peerless .
Buy on April 1st - 13
down, 1
up
Year April 1 DJI
Subsequent DJI movement and bottom
------------------------------------------------------------
1916 - 93.30
86.90 on
7/14/1916
1920 - 102.70
66.80 in December
1924 - 93.50 89.50
on 5/21/1924
1928 - 214.50 201.90
on 5/18/1920
1932 - 72.20
41.2 on 7/8/1932
1940 - 147.7 111.8
on 6/10/1940
1944 -
138.8 135.0 on
4/24/1944
1948 - 177.6
192.9 on
6/14/1948
1952 - 267.2 256.4
on 6/14/1952
1956 -
511.8 468.8 on
5/28/1956
1960 -
615.9 566.00 on
10/25/1960
2008 - 12654
7552 on 11/20/2008
2012 - 13212
12119 on 6/1/2012
2016 - 17793
17140 on 6/27/2016
Presidential Election Years that were basis of 2006 Peerless.
Buying on April 1st was risky 5 times and profitable 4 times.
1968 861
918 on 5/2/1968 LBJ won't run again.
1972 941
flat trading range, 920-970. til October
1976 994
958 on 6/7/1976
1980 786
967 on 8/15/1980 - Reagan will defeat Carter.
1984 1165
1097
on 7/23/1984
1988 1988
2110
on 4/12/1988 - basing after 1987 Crash.
1992 3249
3407
on 6/3/1988
1996 5638
5421
on 5/17/1996
2000 10980
10324 on
5/25/2000
2004 10373
9907 on 5/17/2004
|
Charts 4/1/2020 (Click on Underlined link.) 2020 PEERLESS DJI, Signals, Indicators Daily DJI Volume 10-DayUp/Down Vol Stoch-20 Inverted Traders Index Graph of Pct of All Stocks above 65-dma NASDAQ S&P OEX NYSE COMPQX DJI-15 DJI-20 DJI-30 DIA QQQ MDY IWM TNA Short-Term Rates SPY http://tigersoft.com/2020CST/SPY.GIF USO-CrudeOil DBO FAS GLD BBH IBB JETS JNUG KOL NUGT OIH OIL PALL RSX RETL SDS AGQ SLV SOXL TECL TLT TMF TNA UGA (gasoline) and China: YINN CHAU Commodities: CANE CORN DBC JJC, NIB, CHOC CORN, CUT (paper) MOO, SOYB WEAT UUP (Dollar) LIT (Lithium) AAPL ADBE ALXN AMAT AMGN AMD AMZN AXP BA BABA BAC BIDU BLDP CAT CVX DE FB GOOG GS HD IBM INTU JPM M (Macy's) MSFT NFLX NKE NVDA PG QCOM TSLA TXN XOM V WMT CMG , LRCX, SQ TOWN New highs and Bullish MAXCPs http://tigersoft.com/MAXMLK/4-1-20/BULLISH.htm Bearish MAXCPs - http://tigersoft.com/MINMLK/4-1-20/BEARISH.htm |
 Table 1   QUICKSILVER on DJI-30 STOCKS  3/31/2020
 2 Bullish 1 Bearish
STOCKS CLOSE CHANGE PIVOT-PT 5-dma AROC CL-PWR CANDLE IP21 ITRS ----------------------------------------------------------------------------------- ----------------------------------------------------------------------------------- AAPL 240.91 -13.38 258.44 -91.4% Bullish RED -.029 .044 --------------------------------------------------------------------- AXP 77.84 -7.77 93.29 -688% Bullish RED .04 -.121 --------------------------------------------------------------------- BA 130.7 -18.44 180.55 -760.4% Bearish RED -.063 -.3 Bearish --------------------------------------------------------------------- CAT 111.35 -4.69 110.5 304.5% Bullish RED .177 .046 --------------------------------------------------------------------- CSCO 38.33 -.98 40.58 83.9% Bullish BLUE .095 .068 --------------------------------------------------------------------- CVX 68.56 -3.9 76.38 -49.5% Bullish RED .098 -.112 --------------------------------------------------------------------- DIS 94.92 -1.68 105.36 -291.1% Bullish BLUE .127 -.056 --------------------------------------------------------------------- GS 145.29 -9.3 165.79 -310% Bullish RED -.075 -.126 --------------------------------------------------------------------- HD 178.63 -8.08 195.21 -82.3% Bullish BLUE .175 .049 --------------------------------------------------------------------- IBM 105.14 -5.79 112.89 -32.2% Bullish RED .011 .038 --------------------------------------------------------------------- INTC 51.88 -2.24 55.54 57.7% Bullish RED -.08 .139 --------------------------------------------------------------------- JNJ 128.81 -2.32 126.57 371.5% Bullish BLUE .102 .145 --------------------------------------------------------------------- JPM 84.36 -5.67 98.12 -396.7% Bullish RED -.022 -.101 --------------------------------------------------------------------- KO 42.12 -2.13 44.29 58.5% Bearish RED -.046 .019 --------------------------------------------------------------------- MCD 158.17 -7.18 167.35 -145.3% Bullish RED .041 .032 --------------------------------------------------------------------- MMM 133.14 -3.37 136.18 59.2% Bullish BLUE .146 .025 --------------------------------------------------------------------- MRK 73.8 -3.14 73.53 379.7% Bullish RED .188 .103 Bullish --------------------------------------------------------------------- MSFT 152.11 -5.6 156.11 168.4% Bullish RED -.068 .196 --------------------------------------------------------------------- NKE 79.23 -3.51 84.3 13.3% Bullish BLUE .136 .04 --------------------------------------------------------------------- PFE 31.75 -.89 31.75 317% Bullish RED .006 .07 --------------------------------------------------------------------- PG 109.33 -.67 107.38 386.9% Bullish BLUE-.004 .15 --------------------------------------------------------------------- TRV 95.2 -4.15 98.67 153.2% Bullish BLUE .169 -.042 --------------------------------------------------------------------- UNH 237.32 -12.06 255.39 57.4% Bullish RED .129 .072 --------------------------------------------------------------------- UTX 91.37 -2.96 104.64 -245.5% Bullish BLUE .203 -.126 --------------------------------------------------------------------- V 153.11 -8.01 168.88 -264.7% Bullish RED .044 .021 --------------------------------------------------------------------- VZ 52.92 -.81 53.54 281.4% Bullish BLUE .113 .16 Bullish --------------------------------------------------------------------- WBA 43.03 -2.72 45.67 179% Bullish RED .094 .081 --------------------------------------------------------------------- WMT 114.14 .52 109.82 212.5% Bullish BLUE .071 .27 --------------------------------------------------------------------- XOM 37.53 -.44 38.82 31.8% ------- BLUE .012 -.162 |
Table 2 QUICKSILVER on ETFS - 04/01/20 BA weighs DJI down again today. last change Pivot 5-dma aroc ClosPwr Candle IP21 ITRS --------------------------------------------------------------------------------------------- DIA 209.38 -9.85 225.07 -61.1% Bullish RED .06 0 --------------------------------------------------------------------------------------------- BA 130.7 -18.44 180.55 -760.4% Bearish RED -.063 -.3 --------------------------------------------------------------------------------------------- SPY 246.15 -11.6 261.2 -12.5% Bullish RED -.03 .026 --------------------------------------------------------------------------------------------- QQQ 182.31 -8.09 191.9 .3% Bullish RED .032 .099 --------------------------------------------------------------------------------------------- MDY 247 -15.88 267.42 -111.3% Bullish RED .01 -.066 --------------------------------------------------------------------------------------------- IWM 106.66 -7.8 116.81 -145.5% ------- RED .103 -.081 --------------------------------------------------------------------------------------------- FAS 19.24 -4.22 26.41 -636.9% ------- RED .019 -.526 --------------------------------------------------------------------------------------------- RETL 4.67 -1.03 6.58 -1118.2% Bearish RED -.062 -.547 --------------------------------------------------------------------------------------------- SOXL 79.41 -15.33 108.08 -795% Bullish RED .027 -.455 --------------------------------------------------------------------------------------------- TECL 99.66 -16.58 126.15 -289.8% Bullish RED -.008 -.369 --------------------------------------------------------------------------------------------- IBB 103.79 -3.95 106.79 84.4% Bullish RED .023 .142 --------------------------------------------------------------------------------------------- GLD 149.45 1.4 153.24 -61% Bearish BLUE-.127 .301 --------------------------------------------------------------------------------------------- OIH 3.76 -.26 4.41 -709.8% ------- RED -.273 -.411 --------------------------------------------------------------------------------------------- GASL 3440 285 3685 -325.1% ------- RED -.021 .396 --------------------------------------------------------------------------------------------- |
Table 3    Count of Stocks in Key Directories
           20200401
-------------------------------
NEWHIGHS       17
NEWLOWS        199
MAXCP          94
MINCP          35
TTTNH          63
TTTNL          43
FASTUP         93
FASTDOWN       370
CPCROSSA       14
CPCROSSD       201
BIGVOLUP       6
BIGVODN        19
ACCUMVER       3
HIGHIP21       6
HIUPPCT        9
VHIP21         129
LOWACCUM       138
REDSELL        105
AUGSELS7       17
TRAPDOOR       735
|
RANKING OF KEY DIRECTORIES BASED PCT.OF STOCKS ABOVE 65-DMA 4/1/20 --------------------------------------------------------------------------------------- Directory Current day-1 day-2 day-3 day-4 day-5 ---------------------------------------------------------------------------------------- INDEXES .161 .155 .166 .166 .155 .15 COMODITY .15 .1 .2 .2 .2 .2 GUNS .133 .133 .133 .066 0 0 FOOD .129 .111 .203 .203 .203 .203 GOLD .104 .02 .145 .125 .187 .229 HACKERS .1 .15 .15 .1 .1 .05 GREEN .095 .095 .095 .047 .047 0 CHINA .092 .092 .092 .074 .074 .092 NIFTY .085 .127 .127 .106 .127 .021 SEMI .084 .093 .102 .074 .102 .074 BIOTECH .083 .149 .158 .107 .128 .098 NASD-100 .082 .134 .103 .061 .092 .041 SOFTWARE .066 .083 .066 .066 .066 .033 BONDFUND .06 .07 .07 .06 .06 .05 ELECTRON .059 .065 .059 .052 .072 .046 SOLAR .058 .058 .058 .058 .117 .117 GAMING .045 .181 .136 .09 .09 .045 RUS-1000 .038 .053 .054 .028 .041 .025 MILITARY .035 .035 .035 0 0 0 FIDSTKS .033 .05 .061 .028 .056 .016 SP500 .031 .05 .048 .021 .031 .016 REIT .028 .042 .042 .014 .014 .007 AUTO .025 .025 .025 0 .025 0 UTILITY .025 .025 .025 0 0 0 OILGAS .022 .022 .022 .022 .029 .029 CHEM .02 .02 .02 0 .02 0 RETAIL .02 .08 .08 .02 .02 .02 FINANCE .011 .011 .023 .011 .023 .011 SP-100 .011 .044 .044 .011 .033 .011 BEVERAGE 0 0 0 0 0 0 BIGBANKS 0 0 0 0 0 0 COAL 0 0 0 0 0 0 COMPUTER 0 0 .052 0 0 0 COPPER 0 0 0 0 0 0 DJI-13 0 0 0 0 0 0 DOWJONES 0 0 0 0 0 0 EDU 0 0 0 0 0 0 ETFS 0 0 0 0 0 0 HOMEBLDG 0 0 0 0 0 0 HOSPITAL 0 0 0 0 0 .045 INDMATER 0 0 0 0 .013 .026 INFRA 0 0 0 0 0 0 INSURANC 0 0 .038 0 0 0 JETS 0 0 0 0 0 0 REGBANKS 0 0 0 0 0 0 TRANSP 0 0 0 0 0 0 |
====================================================================
3/31/2020 The 22500
resistance held. This was about a 33% recovery
and it is where the falling 21-dma crosses. Seeing that, short-term traders
took profits. The DIA's steep Closing Power uptrend was also
violated. Given the median decline for the Sell S14 is
above 10%, it looks like we may soon see another decline
which will test the support at 20000 in the DJI. We will have
watch and see how Professionals handle the DJI's much lower
opening tomorrow. At this point, the DJI is down 718. I would
think that they will wait until the round number 20,000 is reached
before they try another reversal. The US Coronavirus curve rose
arithmetically today at its fastest pace so far.
See
https://www.cdc.gov/coronavirus/2019-ncov/cases-updates/cases-in-us.html
https://www.worldometers.info/coronavirus/country/us/
https://www.nytimes.com/2020/03/31/opinion/coronavirus-cases-united-states.html
Short some of the Bearish MINCPs and hold
previously shorted
ETFs and stocks for a retest of 20000.
DJI

DIA's Closing Power

Some of the bulls are hoping April's usual
bullishness will
bring more of a rally. It is true that all the Aprils since 1955
have averaged a very solid +2.2% gain and rise in this month
about 74.5% of the time. But Aprils in the Presidential
Election years are not quite this good since 1965. In Presidential
Election years, the avage gain is +1.6% and the DJI rises 61.5%
of the time. If we go all the way back to 1916, we find that
all Presidential Election Years Aprils typically peaks at the start
of the month and does not make much of an advance until late
in the month. See our season chart of the DJI's behavior for
1916, 1920, 1924, 1928 ... 2012, 2016. I also wanted to see
how well the DJI when a Republcan was President. Clearly,
this depends a lot on the economy and the outlook for a Republican
winning the White House in the coming Election. Such considerations
clearly hurt the market in 1932, 1960 and 2008. It did not seem to
hurt the DJI in 1992, presumably because Goldman Sachs had
vouched for, groomed and campaigned for Bill Clinton, the Democrat,
for the job of President.
DJI's Performance in Presidential Election Years:
1916-2016

|
Charts 3/31/2020 (Click on Underlined link.) 2020 PEERLESS DJI, Signals, Indicators Daily DJI Volume 10-DayUp/Down Vol Stoch-20 Inverted Traders Index Graph of Pct of All Stocks above 65-dma NASDAQ S&P OEX NYSE COMPQX DJI-15 DJI-20 DJI-30 DIA QQQ MDY IWM TNA Short-Term Rates SPY http://tigersoft.com/2020CST/SPY.GIF USO-CrudeOil DBO FAS GLD BBH IBB JETS JNUG KOL NUGT OIH OIL PALL RSX RETL SDS AGQ SLV SOXL TECL TLT TMF TNA UGA (gasoline) and China: YINN CHAU Commodities: CANE CORN DBC JJC, NIB, CHOC CORN, CUT (paper) MOO, SOYB WEAT UUP (Dollar) LIT (Lithium) AAPL ADBE ALXN AMAT AMGN AMD AMZN AXP BA BABA BAC BIDU BLDP CAT CVX DE FB GOOG GS HD IBM INTU JPM M (Macy's) MSFT NFLX NKE NVDA PG QCOM TSLA TXN XOM V WMT CMG , LRCX, SQ TOWN New highs and Bullish MAXCPs http://tigersoft.com/MAXMLK/3-31-20/BULLISH.htm Bearish MAXCPs - http://tigersoft.com/MINMLK/3-31-20/BEARISH.htm |
 Table 1   QUICKSILVER on DJI-30 STOCKS  3/31/2020
 2 Bullish 1 Bearish
STOCKS CLOSE CHANGE PIVOT-PT 5-dma AROC CL-PWR CANDLE IP21 ITRS ----------------------------------------------------------------------------------- ----------------------------------------------------------------------------------- AAPL 254.29 -.52 245.52 147.8% Bullish RED -.043 .05 --------------------------------------------------------------------- AXP 85.61 -4.66 90.17 87.3% Bullish RED .029 -.097 --------------------------------------------------------------------- BA 149.14 -3.14 155 690% ------- RED -.022 -.287 Bearish --------------------------------------------------------------------- CAT 116.04 4.33 104.67 688.6% Bullish BLUE .167 .038 --------------------------------------------------------------------- CSCO 39.31 -1.01 37.67 90.6% Bullish RED .058 .054 --------------------------------------------------------------------- CVX 72.46 .51 69.27 418.6% Bullish RED .095 -.121 --------------------------------------------------------------------- DIS 96.6 -3.2 100.73 -75.9% Bullish RED .108 -.078 --------------------------------------------------------------------- GS 154.59 -5.03 155.13 31.2% Bullish RED -.075 -.128 --------------------------------------------------------------------- HD 186.71 -9.39 181.76 52.5% Bullish RED .158 .058 --------------------------------------------------------------------- IBM 110.93 -2 105.85 249.9% Bullish RED .006 .055 --------------------------------------------------------------------- INTC 54.12 -1.37 51.26 161% Bullish RED -.093 .161 --------------------------------------------------------------------- JNJ 131.13 -1.88 119.4 480.8% Bullish RED .073 .132 --------------------------------------------------------------------- JPM 90.03 -3.47 91.73 86.4% Bullish RED -.045 -.096 --------------------------------------------------------------------- KO 44.25 -.75 41.61 563% Bearish RED -.046 .03 --------------------------------------------------------------------- MCD 165.35 -2.78 162.98 103.1% Bullish RED .035 .032 --------------------------------------------------------------------- MMM 136.51 -1.23 131.54 141.1% Bullish BLUE .096 .005 --------------------------------------------------------------------- MRK 76.94 -.01 68.22 548.7% Bullish BLUE .176 .098 Bullish --------------------------------------------------------------------- MSFT 157.71 -2.52 146.92 307.7% Bullish RED -.073 .196 --------------------------------------------------------------------- NKE 82.74 -2.64 79.01 643.8% Bullish RED .112 .044 --------------------------------------------------------------------- PFE 32.64 -.03 29.75 474.9% Bullish BLUE-.008 .058 --------------------------------------------------------------------- PG 110 -5 100.92 313.5% Bullish RED -.022 .123 --------------------------------------------------------------------- TRV 99.35 -3.24 92.18 287.9% Bullish RED .174 -.042 --------------------------------------------------------------------- UNH 249.38 -1.9 234.49 614.5% Bullish BLUE .101 .088 --------------------------------------------------------------------- UTX 94.33 -4.16 96.19 391.6% Bullish RED .15 -.137 --------------------------------------------------------------------- V 161.12 -4.45 161.78 202.8% Bullish RED .031 .04 --------------------------------------------------------------------- VZ 53.73 -1.04 49.94 358.2% Bullish RED .08 .146 --------------------------------------------------------------------- WBA 45.75 .59 41.44 56.4% Bullish BLUE .082 .093 --------------------------------------------------------------------- WMT 113.62 -1.57 109.4 -63.1% Bullish RED .035 .241 Bullish --------------------------------------------------------------------- XOM 37.97 .47 37.29 340.1% Bearish RED -.024 -.194 |
Table 2 QUICKSILVER on ETFS - 03/31/20 last change Pivot 5-dma aroc ClosPwr Candle IP21 ITRS --------------------------------------------------------------------------------------------- DIA 219.23 -3.87 212.06 290.6% Bullish RED .046 ----- --------------------------------------------------------------------------------------------- SPY 257.75 -3.9 246.79 288.3% Bullish RED -.043 .029 --------------------------------------------------------------------------------------------- QQQ 190.4 -1.64 182.3 180.2% Bullish RED .003 .105 --------------------------------------------------------------------------------------------- MDY 262.88 -2.88 252.82 340.8% ------- RED -.011 -.058 --------------------------------------------------------------------------------------------- IWM 114.46 -.58 109.97 240.5% ------- RED .108 -.071 --------------------------------------------------------------------------------------------- FAS 23.46 -2.18 22.35 714% ------- RED .026 -.516 --------------------------------------------------------------------------------------------- RETL 5.7 -.12 6.01 25.1% Bearish RED -.037 -.543 --------------------------------------------------------------------------------------------- SOXL 94.74 -6.54 95.01 51.1% ------- RED .034 -.435 --------------------------------------------------------------------------------------------- TECL 116.24 -6.63 106.4 403.8% Bullish RED -.031 -.341 --------------------------------------------------------------------------------------------- IBB 107.74 -1.1 102 243.8% Bullish RED .005 .136 --------------------------------------------------------------------------------------------- GLD 148.05 -4.87 151.3 -175.3% Bearish RED -.108 .262 --------------------------------------------------------------------------------------------- OIH 4.02 .11 4.35 -402.5% Bearish RED -.29 -.43 --------------------------------------------------------------------------------------------- |
Table 3 Table 3 Count of Stocks in Key Directories
20200330
-------------------------------
NEWHIGHS 23
NEWLOWS 75
MAXCP 135
MINCP 35
TTTNH 75
TTTNL 26
FASTUP 471
FASTDOWN 108
CPCROSSA 55
CPCROSSD 51
BIGVOLUP 10
BIGVODN 13
ACCUMVER 3
HIGHIP21 6
HIUPPCT 11
REDSELL 104
AUGSELS7 8
TRAPDOOR 732
|
 Table 3 RANKING OF KEY DIRECTORIES BASED PCT.OF STOCKS ABOVE 65-DMA
              3/31/20
 All groups show at least 81% of their their are beloiw the key 65-dma
---------------------------------------------------------------------------------------
Directory     Current       day-1         day-2         day-3         day-4         day-5
----------------------------------------------------------------------------------------
GAMING         .181          .136          .09           .09           .045          .045
INDEXES        .155          .166          .166          .155          .15           .15
HACKERS        .15           .2            .1            .1            .05           0
BIOTECH        .146          .155          .104          .128          .11           .089
NASD-100       .134          .113          .072          .092          .041          .061
GUNS           .133          .133          .066          0             0             .066
NIFTY          .127          .127          .106          .127          .021          .085
FOOD           .111          .203          .203          .203          .203          .203
COMODITY       .1            .2            .2            .2            .2            .2
GREEN          .095          .095          .047          .047          0             0
SEMI           .093          .102          .074          .102          .084          .056
CHINA          .092          .092          .074          .074          .092          .074
SOFTWARE       .083          .083          .066          .066          .033          .05
RETAIL         .08           .08           .02           .02           .02           .06
BONDFUND       .07           .07           .06           .06           .05           .03
ELECTRON       .065          .059          .052          .072          .052          .039
SOLAR          .058          .058          .058          .117          .176          .058
RUS-1000       .054          .057          .03           .042          .027          .027
FIDSTKS        .05           .061          .028          .056          .016          .028
SP500          .05           .05           .021          .031          .016          .021
SP-100         .044          .044          .011          .033          .011          .022
REIT           .042          .042          .014          .014          .007          .007
CHEM           .04           .04           .02           .04           0             0
MILITARY       .035          .035          0             0             0             0
AUTO           .025          .025          0             .025          0             0
UTILITY        .025          .025          0             0             0             0
OILGAS         .022          .022          .022          .029          .037          .029
GOLD           .02           .145          .125          .187          .229          .187
FINANCE        .011          .023          .011          .023          .011          .011
BEVERAGE       0             0             0             0             0             0
BIGBANKS       0             0             0             0             0             0
COAL           0             0             0             0             0             0
COMPUTER       0             .052          0             0             0             0
COPPER         0             0             0             0             0             0
DJI-13         0             0             0             0             0             0
DOWJONES       0             0             0             0             0             0
EDU            0             0             0             0             0             0
ETFS           0             0             0             0             0             0
HOMEBLDG       0             0             0             0             0             0
HOSPITAL       0             0             0             0             .045          0
INDMATER       0             0             0             .013          .026          0
INFRA          0             0             0             0             0             0
INSURANC       0             .038          0             0             0             0
JETS           0             0             0             0             0             0
REGBANKS       0             0             0             0             0             0
TRANSP         0             0             0             0             0             0
|
===================================================================
3/30/2020 Friday's
Sell S14 was different from all the previous S14s:
the latest S14 showed a positive Accumulation Index on the day
of the signal. This can not be said of any of the other S14s.
We can easily surmise that this discrepancy owes to the
Trillion-Dollar bailouts Wall Street and Corporations will recive
to keep the economy going until the killer pandemic exhausts itself
and the economy start to recovery.
Human nature being what it is, the market always seems to
swing
back and forth between greed and fear as well as between sleepiness
and zestful excitement That is why I think the old charts tell us what to
expect. From them, I believe the primary lesson for now is that when
the DJI falls more than 25%-30%, confidence can come back only
slowly and an extended period base-building is needed. That was true
in 1929, 1930, 1931, 1932, 1937-8, 1962, 1974, 1990, 2002-3 and
2008-2009. V-bottoms are non-existent after a severe decline. 22500
seems the likely level of resistance. I expect 19000-20000 to hold
on the next test of the lows.

Watch the Closing Powers.
Watch the Closing Power uptrends now. NY
Professionals
suddenly have a lot more money to work with. Their selling
and the resulting breaks in the CP uptrends will likely tell us
when the current rally is over. So, will closing below the 5-day
moving average "pivot-points". See the abbreviated charts of
DIA, SPY and QQQ below. We zoom-in on the CP uptrends.
DIA |
SPY |
QQQ |
------------------------------------------------------------------------
Will the bailouts work?
Just the expectation of the money is boosting
the market now.
How long will it hold up the DJI? That will depend on how
long the economic restrictions last and when the virus curve falls
significantly instead of rising hyperbolically.
The Fed and Congress learned from 1987 and 2008-2009
that the the stock market can be turned up despite dire
economuc news . They discovered that a rising market will speed
up the recovery and, most importantly, prevent a long and deep
Depression like 1929-1939.
But are we in a terrible new world? One way to know a
bottom
has finally been made is to follow the charts. In particular, compare
how the DJIA recovery from the 1929 Crash stalled in early 1930
when its rally failed to get past its falling 200-day ma after a 48%
recovery. A failure like this now could still bring a new and much
deeper bear market. Watch for a new Sell S9, S12 and a head/shoulder
top. The peak of 1930 was hard to miss.
What about 2008-2009? That bear market took months
of base-building and a final deep decline (leg down) despite
the bank and auto industry bailouts. Interestingly, the DJI
rose above its key 200-dma in June just after the 10% unempoloyment
numbers had come out. But it was not until October 2009, that
the DJI fought back and recovered more than 50% of what it lost
in the 2007-2009.
Since the DJI now has recovered only about 33% of what it
lost in
February and March and since the DJI is still 4,400 points below its
200-day ma, the odds still favor a re-test of the lows and much
more base-building. Of course, the terrible 1929-1933 scenario
can still not be ruled out, but 5 trillion Dollars buys the Big Wall Street
banks lots of shares of stock. A Depression and an 86% stock
market decline should be eliminated as a possibility. The FED would
rather inflate the Dollar much, much more than let this happen.
The 2008 amd 2009 charts do have another lesson: namely, trust our Closing
Power. When the Closing Power downtrends are broken, cover
your short sales among the Bearish MINCPs. Retake those
positions when the new CP uptrends are broken.
Are We Too Bearish?
Are we too bearish? I have mentioned, that the very deadly
Spanish Flu pandemic of 1918-1919 did not prevent a bull market
that only ended in October 1919 when the FED sharply hiked
interest rates to halt the post-war inflation. World War I's high
death toll concealed the fact 675,000 Americans died due to this
Swine Flu. But this case is more of medical interest. Since only
St. Louis and San Franscico took special precautions against the
spread of this epidemic, business was not unduly impacted, Wall
Street celebrated the Allied Victory and the pandemic's impact
on stock prices was small.
What about the 2009 flu pandemic? It, too, did not hurt
the
stock market. The DJI rose from below 6600 in March to
10200 by the ned of the year, Theyear 2009 was actually the
very start of the entire 2009-2020 bull market. Its its impact,
I don't even remember even though, the CDC has estimated that
from April 12, 2009 to April 10, 2010, there were 60.8 million H1N1
U.S. cases, with 274,304 hospitalizations and 12,469 deaths.
Worldwide, as many as 150,000 to 575,000 people died from
H1N1
during the first year.
By contrast, as of today, there have been 3,000
Coronavirus deaths
in the US and 37,000 nationwide. Before the virus is defeated the
final numbers could be 10 or even 100 times higher. But for Wall
Street what counts are the economic consequences that the virus
brings. Right now, the bailouts trillions outshine the economic
costs. But if the number of cases keep expanding and there is
no subsidence in the curve, Wall Street could become worried soon
again that there will be new restrictions on trade and movement.
We will watch for charts to show signs of a change in the steep
slope of new cases here in the US. .
https://www.biospace.com/article/2009-h1n1-pandemic-versus-the-2020-coronavirus-pandemic/
|
Charts 3/30/2020 (Click on Underlined link.) 2020 PEERLESS DJI, Signals, Indicators Daily DJI Volume 10-DayUp/Down Vol Stoch-20 Inverted Traders Index Graph of Pct of All Stocks above 65-dma NASDAQ S&P OEX NYSE COMPQX DJI-15 DJI-20 DJI-30 DIA QQQ MDY IWM TNA Short-Term Rates SPY http://tigersoft.com/2020CST/SPY.GIF USO-CrudeOil DBO FAS GLD BBH IBB JETS JNUG KOL NUGT OIH OIL PALL RSX RETL SDS AGQ SLV SOXL TECL TLT TMF TNA UGA (gasoline) and China: YINN CHAU Commodities: CANE CORN DBC JJC, NIB, CHOC CORN, CUT (paper) MOO, SOYB WEAT UUP (Dollar) LIT (Lithium) AAPL ADBE ALXN AMAT AMGN AMD AMZN AXP BA BABA BAC BIDU BLDP CAT CVX DE FB GOOG GS HD IBM INTU JPM M (Macy's) MSFT NFLX NKE NVDA PG QCOM TSLA TXN XOM V WMT CMG , LRCX, SQ TOWN New highs and Bullish MAXCPs http://tigersoft.com/MAXMLK/3-30-20/BULLISH.htm Bearish MAXCPs - http://tigersoft.com/MINMLK/3-30-20/BEARISH.htm |
 Table 1   QUICKSILVER on DJI-30 STOCKS  3/30/2020
 5 Bullish 1 Bearish
STOCKS CLOSE CHANGE PIVOT-PT 5-dma AROC CL-PWR CANDLE IP21 ITRS ----------------------------------------------------------------------------------- ----------------------------------------------------------------------------------- AAPL 254.81 7.07 246.88 622.3% Bullish BLUE .019 .047 --------------------------------------------------------------------- AXP 90.27 1.54 84.05 1252.9% Bullish BLUE .094 -.07 --------------------------------------------------------------------- BA 152.28 -9.72 127.68 1596.1% ------- RED .029 -.303 Bearish --------------------------------------------------------------------- CAT 111.71 6.27 101.34 966.3% Bullish BLUE .161 -.006 --------------------------------------------------------------------- CSCO 40.32 1.5 38.6 751.6% Bullish BLUE .124 .06 --------------------------------------------------------------------- CVX 71.95 3.17 66.55 1322.3% Bullish BLUE .134 -.146 --------------------------------------------------------------------- DIS 99.8 3.4 98.12 721.7% Bullish BLUE .176 -.074 --------------------------------------------------------------------- GS 159.62 1.28 153.6 802.6% Bullish BLUE-.013 -.122 --------------------------------------------------------------------- HD 196.1 5.55 184.72 921.4% Bullish BLUE .218 .095 Bullish --------------------------------------------------------------------- IBM 112.93 4.9 105.48 861.4% Bullish BLUE .071 .057 --------------------------------------------------------------------- INTC 55.49 3.12 52.4 565.8% Bullish BLUE-.031 .168 --------------------------------------------------------------------- JNJ 133.01 9.85 119.18 912.1% Bullish BLUE .135 .136 Bullish --------------------------------------------------------------------- JPM 93.5 2.37 88.43 806.7% Bullish BLUE .017 -.08 --------------------------------------------------------------------- KO 45 2.19 39.45 904.1% Bullish BLUE .017 .03 --------------------------------------------------------------------- MCD 168.13 4.12 161.95 977.8% Bullish BLUE .093 .036 --------------------------------------------------------------------- MMM 137.74 4.5 132.72 762.4% Bullish BLUE .153 -.001 --------------------------------------------------------------------- MRK 76.95 5.22 69.05 755.9% Bullish BLUE .204 .082 Bullish --------------------------------------------------------------------- MSFT 160.23 10.53 148.34 822.5% Bullish BLUE .006 .203 --------------------------------------------------------------------- NKE 85.38 2.15 72.33 1479% Bullish BLUE .168 .064 --------------------------------------------------------------------- PFE 32.67 1.77 29.7 693.9% Bullish BLUE .029 .043 --------------------------------------------------------------------- PG 115 4.83 103.27 832.6% Bullish BLUE .055 .151 --------------------------------------------------------------------- TRV 102.59 2.64 93.74 752.3% Bullish BLUE .245 -.023 --------------------------------------------------------------------- UNH 251.28 8.83 219.8 1229.7% Bullish BLUE .144 .074 --------------------------------------------------------------------- UTX 98.49 1.34 86.76 1280.2% Bullish BLUE .208 -.12 --------------------------------------------------------------------- V 165.57 4.01 154.53 953% Bullish BLUE .119 .062 --------------------------------------------------------------------- VZ 54.77 2 49.99 434.6% Bullish BLUE .135 .156 Bullish --------------------------------------------------------------------- WBA 45.16 1.16 45.25 176.2% Bullish BLUE .137 .068 --------------------------------------------------------------------- WMT 115.19 5.61 115.03 40.8% Bullish BLUE .093 .232 Bullish --------------------------------------------------------------------- XOM 37.5 .55 35.44 840.5% Bearish BLUE .024 -.217 |
Table 2 QUICKSILVER on ETFS - 03/30/20 last change Pivot 5-dma aroc ClosPwr Candle IP21 ITRS --------------------------------------------------------------------------------------------- DIA 223.1 6.75 206.64 883.4% Bullish BLUE .106 ===== --------------------------------------------------------------------------------------------- SPY 261.65 8.23 243.15 788.2% Bullish BLUE .017 .029 --------------------------------------------------------------------------------------------- QQQ 192.04 6.74 183.66 590.5% Bullish BLUE .069 .102 --------------------------------------------------------------------------------------------- MDY 265.76 6.82 245.29 901.6% Bullish BLUE .028 -.066 --------------------------------------------------------------------------------------------- IWM 115.04 2.48 109.04 690.3% Bullish BLUE .129 -.083 --------------------------------------------------------------------------------------------- FAS 25.64 1.42 20.07 2461.8% Bullish BLUE .071 -.505 --------------------------------------------------------------------------------------------- RETL 5.82 -.03 5.67 1107.8% Bearish RED -.017 -.554 Bearish --------------------------------------------------------------------------------------------- SOXL 101.28 9.84 93.74 1712.2% ------- BLUE .106 -.421 Bearish --------------------------------------------------------------------------------------------- TECL 122.87 13.17 107 1866.1% Bullish BLUE .071 -.324 Bearish --------------------------------------------------------------------------------------------- IBB 108.84 4.13 102.62 552% Bullish BLUE .066 .128 --------------------------------------------------------------------------------------------- GLD 152.92 .67 153.4 218.8% Bearish BLUE-.108 .284 --------------------------------------------------------------------------------------------- OIH 3.91 -.18 4.36 251.1% Bearish RED -.232 -.456 Bearish --------------------------------------------------------------------------------------------- GASL 3440 285 3685 -325.1% ------- RED -.021 .352 --------------------------------------------------------------------------------------------- |
 Table 3   Count of Stocks in Key Directories
             20200330
-------------------------------
NEWHIGHS       20
NEWLOWS        100
MAXCP          292
MINCP          43
TTTNH          110
TTTNL          42
FASTUP         990
FASTDOWN       64
CPCROSSA       55
CPCROSSD       51
BIGVOLUP       10
BIGVODN        13
ACCUMVER       2
HIGHIP21       8
HIUPPCT        10
REDSELL        94
AUGSELS7       11
TRAPDOOR       734
|
Table 2 QUICKSILVER on ETFS - 03/30/20 last change Pivot 5-dma aroc ClosPwr Candle IP21 ITRS --------------------------------------------------------------------------------------------- DIA 223.1 6.75 206.64 883.4% Bullish BLUE .106 ===== --------------------------------------------------------------------------------------------- SPY 261.65 8.23 243.15 788.2% Bullish BLUE .017 .029 --------------------------------------------------------------------------------------------- QQQ 192.04 6.74 183.66 590.5% Bullish BLUE .069 .102 --------------------------------------------------------------------------------------------- MDY 265.76 6.82 245.29 901.6% Bullish BLUE .028 -.066 --------------------------------------------------------------------------------------------- IWM 115.04 2.48 109.04 690.3% Bullish BLUE .129 -.083 --------------------------------------------------------------------------------------------- FAS 25.64 1.42 20.07 2461.8% Bullish BLUE .071 -.505 --------------------------------------------------------------------------------------------- RETL 5.82 -.03 5.67 1107.8% Bearish RED -.017 -.554 Bearish --------------------------------------------------------------------------------------------- SOXL 101.28 9.84 93.74 1712.2% ------- BLUE .106 -.421 Bearish --------------------------------------------------------------------------------------------- TECL 122.87 13.17 107 1866.1% Bullish BLUE .071 -.324 Bearish --------------------------------------------------------------------------------------------- IBB 108.84 4.13 102.62 552% Bullish BLUE .066 .128 --------------------------------------------------------------------------------------------- GLD 152.92 .67 153.4 218.8% Bearish BLUE-.108 .284 --------------------------------------------------------------------------------------------- OIH 3.91 -.18 4.36 251.1% Bearish RED -.232 -.456 Bearish --------------------------------------------------------------------------------------------- GASL 3440 285 3685 -325.1% ------- RED -.021 .352 --------------------------------------------------------------------------------------------- |
======================================================================
3/27/2020 Today
brought a new Peerless S14. A re-test of 22,500 seems likely
but when that rally fails, expect another DJI decline below 20,000. Our IP21 -
Accumulation Index is positive now (unlike in the earlier S14s) and the steep
downtrends in our internal strenght indicators have all been violated.
The easiest way for the market to be moved up by those who are supporting
it would be from their buying the highest priced DJI-30 stocks.
So, also because of the positive IP21, I would defer to the FED's wishes
and the looming billions of bailout money. Conclusion: avoid shorting the
major ETFs and big blue chips until the DJI again reaches 22500.
At the same time, I would hold onto previous short positions,
especially those among our MINCPs tonight. Bear markets like ours
have never turned up straight-away with a "V" Bottom. And with such
very low values for the VI (-414) and PI (-392), I would think the DJI
will have a very hard time rising past 23000
 |
 |
 |
Peerless Sell S14s
The new S14 signal specifically tells us that a bear market rally has
failed and that another decline to the recent lows is highly likely.
There have been 8 previous instances. Except for the positive IP21,
the charts with the earlier S4s all look very much like our present case.
How important will be the Government vast sums of "magic money"
in supporting the economy and stabilize the markets? In 1987, directly
The FED's loaning money to market makers did the job, but the
base-building took more than four months. In 2008-2009, the a trillion in
bank bailouts did not prevent another leg down and 55% DJI decline.
Compare all these past S14 signals with the present case. In each
instance, the DJI's downward action after the S14 was significant. My
sense is that the psychology of the market and the dire reality of the
Pandemic will probably bring another leg down from the emerging
trading range. But that eventuality will have to wait. At this stage,
use this signal to short more Bearish MINCPs.
Peerless Gain
Paper
Selling short DJI
Loss
and covering on next Buy IP21
11/4/1929
.186
-.081 none
10/9/1931
.238
-.117 104.5->116.8
2/17/1932
.452
-.075 82.2-> 88.8
6/1/1962
.118
-.109 none
10/22/1987
.071
-.171 none
7/30/2002
.085
-.055 none
10/14/2008 .026
-.056 none
------------------------------
Median = .118
|
Charts 3/27/2020 (Click on Underlined link.) 2020 PEERLESS DJI, Signals, Indicators Daily DJI Volume 10-DayUp/Down Vol Stoch-20 Inverted Traders Index Graph of Pct of All Stocks above 65-dma NASDAQ S&P OEX NYSE COMPQX DJI-15 DJI-20 DJI-30 DIA QQQ MDY IWM TNA Short-Term Rates SPY http://tigersoft.com/2020CST/SPY.GIF USO-CrudeOil DBO FAS GLD BBH IBB JETS JNUG KOL NUGT OIH OIL PALL RSX RETL SDS AGQ SLV SOXL TECL TLT TMF TNA UGA (gasoline) and China: YINN CHAU Commodities: CANE CORN DBC JJC, NIB, CHOC CORN, CUT (paper) MOO, SOYB WEAT UUP (Dollar) LIT (Lithium) AAPL ADBE ALXN AMAT AMGN AMD AMZN AXP BA BABA BAC BIDU BLDP CAT CVX DE FB GOOG GS HD IBM INTU JPM M (Macy's) MSFT NFLX NKE NVDA PG QCOM TSLA TXN XOM V WMT CMG , LRCX, SQ TOWN New highs and Bullish MAXCPs http://tigersoft.com/MAXMLK/3-27-20/BULLISH.htm Bearish MAXCPs - http://tigersoft.com/MINMLK/3-27-20/BEARISH.htm |
Table 1 QUICKSILVER on DJI-30 STOCKS 3/27/2020 STOCKS CLOSE CHANGE PIVOT-PT 5-dma AROC CL-PWR CANDLE IP21 ITRS ----------------------------------------------------------------------------------- ----------------------------------------------------------------------------------- AAPL 247.74 -10.7 224.37 384% Bullish RED .035 ----- --------------------------------------------------------------------- AXP 88.73 -4.56 68.96 889.6% Bullish BLUE .099 -.062 --------------------------------------------------------------------- BA 162 -18.55 105.62 2522.7% Bearish RED -.031 -.254 --------------------------------------------------------------------- CAT 105.44 -5.06 91.85 493.2% Bullish BLUE .187 -.021 --------------------------------------------------------------------- CSCO 38.82 -1.76 34.6 430.4% Bullish RED .131 .063 --------------------------------------------------------------------- CVX 68.78 -7.6 54.22 720.5% Bullish RED .15 -.153 --------------------------------------------------------------------- DIS 96.4 -8.96 85.76 547.3% Bullish RED .184 -.077 --------------------------------------------------------------------- GS 158.34 -7.45 134.97 666.2% Bullish BLUE-.007 -.099 --------------------------------------------------------------------- HD 190.55 -4.66 162.39 1095.6% Bullish BLUE .208 .103 --------------------------------------------------------------------- IBM 108.03 -4.86 94.77 614.3% Bullish RED .086 .046 --------------------------------------------------------------------- INTC 52.37 -3.17 49.58 642.2% Bullish RED -.027 .143 --------------------------------------------------------------------- JNJ 123.16 -3.41 111.14 137.1% Bullish BLUE .099 .093 --------------------------------------------------------------------- JPM 91.13 -6.99 79.03 432.7% Bullish RED .006 -.079 --------------------------------------------------------------------- KO 42.81 -1.48 37.56 560.4% Bearish RED .038 .01 --------------------------------------------------------------------- MCD 164.01 -3.34 137.1 498.8% Bullish BLUE .086 .037 --------------------------------------------------------------------- MMM 133.24 -2.94 117.87 324.5% Bullish BLUE .092 -.004 --------------------------------------------------------------------- MRK 71.73 -1.8 66.4 26.5% Bullish RED .201 .038 --------------------------------------------------------------------- MSFT 149.7 -6.41 135.98 426% Bullish RED .013 .172 --------------------------------------------------------------------- NKE 83.23 -1.07 62.8 1078.2% Bullish BLUE .188 .065 --------------------------------------------------------------------- PFE 30.9 -.85 28.49 317.8% Bullish BLUE .022 .015 --------------------------------------------------------------------- PG 110.17 2.79 97.7 378.2% Bullish BLUE .092 .13 --------------------------------------------------------------------- TRV 99.95 1.28 88.36 564.4% Bullish BLUE .207 -.019 --------------------------------------------------------------------- UNH 242.45 -12.94 194.86 806.8% Bullish RED .16 .073 --------------------------------------------------------------------- UTX 97.15 -7.49 74.95 821.2% Bullish RED .229 -.106 --------------------------------------------------------------------- V 161.56 -7.32 135.74 479.6% Bullish BLUE .132 .063 --------------------------------------------------------------------- VZ 52.77 -.77 50.31 94.9% Bullish BLUE .173 .148 --------------------------------------------------------------------- WBA 44 -1.67 43.61 -272% ------- RED .171 .063 --------------------------------------------------------------------- WMT 109.95 .13 114.28 -178.7% Bullish RED .109 .209 --------------------------------------------------------------------- XOM 36.95 -1.87 31.45 598.9% Bearish RED .062 -.21 |
Table 2 QUICKSILVER on ETFS - 03/27/20 last change Pivot 5-dma aroc ClosPwr Candle IP21 ITRS --------------------------------------------------------------------------------------------- DIA 216.35 -8.72 186.13 598.2% Bullish RED .137 ----- --------------------------------------------------------------------------------------------- SPY 253.3 -7.9 222.95 509.2% Bullish BLUE .04 .027 --------------------------------------------------------------------------------------------- QQQ 185.3 -6.6 170.46 406% Bullish RED .093 .096 --------------------------------------------------------------------------------------------- MDY 258.94 -8.48 220.85 610.6% Bullish BLUE .068 -.06 --------------------------------------------------------------------------------------------- IWM 112.56 -4.25 99.9 519.4% ------- BLUE .088 -.073 --------------------------------------------------------------------------------------------- FAS 24.22 -2.19 15 1561% Bullish BLUE .038 -.496 --------------------------------------------------------------------------------------------- RETL 5.85 -.73 4.55 847.8% Bearish RED -.019 -.527 --------------------------------------------------------------------------------------------- SOXL 91.44 -16.64 69.9 1595.7% Bullish RED .11 -.422 --------------------------------------------------------------------------------------------- TECL 109.7 -16.45 83.13 1206.5% Bullish RED .08 -.338 --------------------------------------------------------------------------------------------- IBB 104.71 -2.08 97.5 328.9% Bullish BLUE .109 .115 --------------------------------------------------------------------------------------------- GLD 152.25 -.99 146.3 407.7% Bearish RED -.169 .294 --------------------------------------------------------------------------------------------- OIH 4.09 -.32 3.7 327% Bearish RED -.17 -.423 --------------------------------------------------------------------------------------------- GASL 6.34 -1.72 7 -1590.1% Bearish RED -.257 -.738 --------------------------------------------------------------------------------------------- |
Table 3    Count of Stocks in Key Directories
           20200327
-------------------------------
NEWHIGHS       15
NEWLOWS        89
MAXCP          175
MINCP          34
TTTNH          91
TTTNL          30
FASTUP         934
FASTDOWN       95
CPCROSSA       56
CPCROSSD       96
BIGVOLUP       12
BIGVODN        18
ACCUMVER       3
HIGHIP21       7
HIUPPCT        9
VHIP21         132
LOWACCUM       144
REDSELL        93
AUGSELS7       16
TRAPDOOR       735
|
Table 4 RANKING OF KEY DIRECTORIES BASED PCT.OF STOCKS ABOVE 65-DMA 3/27/20 --------------------------------------------------------------------------------------- Directory Current day-1 day-2 day-3 day-4 day-5 ---------------------------------------------------------------------------------------- FOOD .203 .203 .203 .203 .092 .111 COMODITY .2 .2 .2 .2 .075 .125 INDEXES .166 .155 .15 .15 .139 .139 HACKERS .15 .15 .05 0 0 .05 GOLD .125 .187 .229 .187 .02 0 NIFTY .106 .127 .021 .085 .042 .021 BIOTECH .098 .122 .107 .095 .08 .059 GAMING .09 .09 .045 .045 .045 .045 SOFTWARE .083 .083 .033 .05 .05 .033 NASD-100 .082 .113 .051 .061 .041 .03 CHINA .074 .074 .092 .074 .074 .092 SEMI .074 .102 .084 .065 .028 .018 GUNS .066 0 0 .066 .066 0 BONDFUND .06 .06 .05 .03 .03 .02 ELECTRON .058 .078 .058 .052 .019 .019 SOLAR .058 .117 .176 .058 0 0 GREEN .047 .047 0 0 0 0 RUS-1000 .031 .043 .027 .027 .02 .021 FIDSTKS .028 .056 .016 .028 .016 .016 SP500 .023 .033 .016 .021 .014 .014 OILGAS .022 .029 .037 .029 .022 .022 CHEM .02 .04 0 0 0 0 RETAIL .02 .02 .02 .06 .04 .04 ETFS .017 0 0 0 0 0 REIT .014 .014 .007 .007 .007 .007 FINANCE .011 .023 .011 .011 .011 .011 SP-100 .011 .033 .011 .022 .011 .011 AUTO 0 .025 0 0 0 0 BEVERAGE 0 0 0 0 0 0 BIGBANKS 0 0 0 0 0 0 COAL 0 0 0 0 0 0 COMPUTER 0 0 0 0 0 0 COPPER 0 0 0 0 0 0 DJI-13 0 0 0 0 0 0 DOWJONES 0 0 0 0 0 0 EDU 0 0 0 0 0 0 HOMEBLDG 0 0 0 0 0 0 HOSPITAL 0 0 .045 0 0 0 INDMATER 0 .013 .026 0 0 0 INFRA 0 0 0 0 0 0 INSURANC 0 0 0 0 0 0 JETS 0 0 0 0 0 0 MILITARY 0 0 0 0 0 0 REGBANKS 0 0 0 0 0 0 UTILITY 0 0 0 0 0 0 TRANSP 0 0 0 0 0 0 |
====================================================================
3/26/2020 No new
Peerless Buy. A re-test of 20,000 seems likely.
The DJI has now had a 33% recovery from its lows back up to
its February peak. The 20% three-day rally was caused by the
two+ trillion dollar bailout for Wall Street and friends . The
exact terms of the bailout have not been disclosed to the public.
Both Dems and Repubs have carefully avoided this. This weekend
the full Congress is expected to vote for the bailout just as they
did in 2008.

If we learned anything from 2008-2009, Wall Street always gets
what it wants from Congress when there is a financial crisis, no matter
how much they are over-leveraged or over-paid. As in 2008, Wall
Street and corporations like Boeing are too big to fail. Am I too harsh
when I say it is exactly in times of financial crises that the curtains are
lifted and we see where the real power in America lies. I have concluded
this truth reluctantly. I wasn't born thinking this. I was always taught this
was a Communist conspiracy theory. Now I think that it is just a fact of life,
which we should appreciate and take advantage ourselves as we trade.
It is too costly as a trader to ignore it to deny it.
I could have said all this a few days ago. But the legislation had not even reached
the House. If I had considered the political power lesson of 2008 properly here,
we might have covered all the shorts last week, not just the Airlines.
A Retest of the Lows is called for despite
the new strength in Tiger's Closing Power.
Just like in 2008-2009, Wall Street banks and brokerages are being
backed up. If anything, they are getting even more money this time.
We saw today how the "juice" and power that all this "Magic Money"
brings can reverse a weak futures market and turn it into a banner
day of widespread gains. An undeclared war has now started between
the overseas sellers who are scared by the Coronavirus pandemic and its
economic consequences, on the one side, and Wall Street's new optimists
and bulls who have a seemingly unlimited.supply of money at their
disposal to deploy on the long side as they support the market.

These are big armies. Some of the soldiers may even desert to the other
side. But the war will probably not quickly be resolved. There is likely
too much resistance overhead for the bulls to get a quick recovery back
above 23000 and the bears are not so strong as to produce another leg down
below 18000.
The technicals support the view that we are now in a trading range that
will likely move back and forth around 20000. For one thing, there are
no cases of a "V" bottom when the DJI has first fallen 30%. For another,
Peerless could not give us a Buy B12 or any other buy, even though the
ratio of NYSE Advances' sum for the last three trading days is nore than
4 times the similar sum of NYSE declines.
I studied this last point carefully tonight. I temporarily treated a
three-day
sum of NYSE Advances to decines of more than 4 to 1 as a tentative
(or hypothetical) "B12"
for testing purposes. Today's close would
have brought this "B12".
What I learned from the past was that
when the DJI was down 15% or more from its highs, the first "B12"
most often did not lead to a new bull market advance. Much more
often, there was soon a pullback and usually a test of the lows.
Below are the nine previous cases of first "B12"s:
since 1929. Seven brought
a re-test of the lows. Three of these seven saw the support fail and a new
leg down occurred.
3/16/1933 - DJI fell back 10% two week later before another
real B12 started a bull market.
8/23/1934 - DJI 's rally soon failed as did the re-test of its lows
and a new leg down occurred.
1/6/1938 - "B12" lead only to another leg down in
deep
bear market.
1/3/1958 - "B12" led only to more backing and filling.
A retest of lows followed.
5/29/1970. "B12" led only to more backing and
filling.
A retest of lows followed.
1/3/1975 - "B12" reinforced previous Peerless buy signals
and
a new bull market did begin.
Late 2008 - Two "B12s" failed to advance DJI very far and
when test of lows failed, another leg down began. This would
seem to be the closest parallel to the present

August 2011 - "B12" led only to more backing and
filling.
A retest of lows followed.
January 2019 - Real B12 did bring a strong recovery after 19%
DJI decline. This was after a 19% decline caused by Fed's raising
interest rates.
---------------------------------------------------------------------------------------------------------
Code for hypothetical "Buy B12"
For i = 3 To rn
If (adv(i - 2) + adv(i - 1) + adv(i)) / (dec(i - 2) + dec(i - 1) + dec(i)) > 4 Then pi
= i: BuyB12arrows (pi):
Next i
---------------------------------------------------------------------------------------------------------
|
Charts 3/26/2020 (Click on Underlined link.) 2020 PEERLESS DJI, Signals, Indicators Daily DJI Volume 10-DayUp/Down Vol Stoch-20 Inverted Traders Index Graph of Pct of All Stocks above 65-dma NASDAQ S&P OEX NYSE COMPQX DJI-15 DJI-20 DJI-30 DIA QQQ MDY IWM TNA Short-Term Rates SPY http://tigersoft.com/2020CST/SPY.GIF USO-CrudeOil DBO FAS GLD BBH IBB JETS JNUG KOL NUGT OIH OIL PALL RSX RETL SDS AGQ SLV SOXL TECL TLT TMF TNA UGA (gasoline) and China: YINN CHAU Commodities: CANE CORN DBC JJC, NIB, CHOC CORN, CUT (paper) MOO, SOYB WEAT UUP (Dollar) LIT (Lithium) AAPL ADBE ALXN AMAT AMGN AMD AMZN AXP BA BABA BAC BIDU BLDP CAT CVX DE FB GOOG GS HD IBM INTU JPM M (Macy's) MSFT NFLX NKE NVDA PG QCOM TSLA TXN XOM V WMT CMG , LRCX, SQ TOWN New highs and Bullish MAXCPs http://tigersoft.com/MAXMLK/3-26-20/BULLISH.htm Bearish MAXCPs - http://tigersoft.com/MINMLK/3-26-20/BEARISH.htm |
Table 1 QUICKSILVER on DJI-30 STOCKS 3/26/2020 STOCKS CLOSE CHANGE PIVOT-PT 5-dma AROC CL-PWR CANDLE IP21 ITRS ----------------------------------------------------------------------------------- ----------------------------------------------------------------------------------- AAPL 258.44 12.92 229.24 286.8% Bullish BLUE .016 .048 --------------------------------------------------------------------- AXP 93.29 3.12 74.12 1028.2% Bullish BLUE .064 -.054 --------------------------------------------------------------------- BA 180.55 25.55 95.01 3564.4% Bearish BLUE-.024 -.235 --------------------------------------------------------------------- CAT 110.5 5.83 95.5 377.2% Bullish BLUE .151 -.025 --------------------------------------------------------------------- CSCO 40.58 2.91 35.6 389.6% Bullish BLUE .096 .071 --------------------------------------------------------------------- CVX 76.38 7.11 59.39 1547.3% Bullish BLUE .157 -.121 --------------------------------------------------------------------- DIS 105.36 4.63 85.98 560.1% Bullish BLUE .172 -.053 --------------------------------------------------------------------- GS 165.79 10.66 138.41 557% Bullish BLUE-.028 -.103 --------------------------------------------------------------------- HD 195.21 13.45 152.15 1011.7% Bullish BLUE .179 .098 --------------------------------------------------------------------- IBM 112.89 7.04 95.39 625.2% Bullish BLUE .07 .053 --------------------------------------------------------------------- INTC 55.54 4.28 45.83 979.6% Bullish BLUE-.045 .156 --------------------------------------------------------------------- JNJ 126.57 7.17 119.89 -20.1% ------- BLUE .073 .086 --------------------------------------------------------------------- JPM 98.12 6.39 83.5 748.8% Bullish BLUE .006 -.071 --------------------------------------------------------------------- KO 44.29 2.68 38.3 309.4% Bearish BLUE .021 .013 --------------------------------------------------------------------- MCD 167.35 4.37 148.49 587.2% Bullish BLUE .054 .029 --------------------------------------------------------------------- MMM 136.18 4.64 124.89 -51.6% Bullish BLUE .063 -.027 --------------------------------------------------------------------- MRK 73.53 5.31 71.36 202.5% Bullish BLUE .18 .039 --------------------------------------------------------------------- MSFT 156.11 9.19 137.35 471% Bullish BLUE-.014 .185 --------------------------------------------------------------------- NKE 84.3 5.29 67.45 991.7% Bullish BLUE .144 .041 --------------------------------------------------------------------- PFE 31.75 2 29.01 225.6% Bullish BLUE-.012 .014 --------------------------------------------------------------------- PG 107.38 6.46 102.43 -167.4% Bullish BLUE .055 .083 --------------------------------------------------------------------- TRV 98.67 6.49 89.51 700.2% Bullish BLUE .163 -.056 --------------------------------------------------------------------- UNH 255.39 20.9 206.59 827.3% Bullish BLUE .142 .108 --------------------------------------------------------------------- UTX 104.64 8.45 82.53 1230.6% Bullish BLUE .22 -.088 --------------------------------------------------------------------- V 168.88 7.1 146.83 553.5% Bullish BLUE .096 .083 --------------------------------------------------------------------- VZ 53.54 3.6 51.8 -7.8% Bullish BLUE .134 .129 --------------------------------------------------------------------- WBA 45.67 4.23 46.42 -319.6% ------- BLUE .171 .058 --------------------------------------------------------------------- WMT 109.82 .42 113.97 -420.8% Bullish BLUE .091 .167 --------------------------------------------------------------------- XOM 38.82 1.53 32.74 640.5% Bearish BLUE .02 -.217 |
Table 2 QUICKSILVER on ETFS - 03/26/20 Rally in DJI owed to BA. Be careful here. last change Pivot 5-dma aroc ClosPwr Candle IP21 ITRS --------------------------------------------------------------------------------------------- DIA 225.07 13.01 191.9 595.2% Bullish BLUE .117 ------ --------------------------------------------------------------------------------------------- BA 180.55 25.55 95.01 3564.4% Bearish BLUE-.024 -.235 --------------------------------------------------------------------------------------------- SPY 262.08 15.29 228.8 456.1% Bullish BLUE .018 .022 --------------------------------------------------------------------------------------------- QQQ 191.9 9.6 170.7 402.4% Bullish BLUE .058 .094 --------------------------------------------------------------------------------------------- MDY 267.42 14.6 229.25 582.7% Bullish BLUE .028 -.07 --------------------------------------------------------------------------------------------- IWM 116.81 6.84 101.4 617.2% Bearish BLUE .059 -.077 --------------------------------------------------------------------------------------------- FAS 26.41 4.06 17.87 1648.2% Bearish BLUE .026 -.506 --------------------------------------------------------------------------------------------- RETL 6.58 .57 4.91 742.9% Bearish BLUE-.016 -.538 --------------------------------------------------------------------------------------------- SOXL 108.08 13.07 63.95 2429.8% Bullish BLUE .122 -.41 --------------------------------------------------------------------------------------------- TECL 126.15 19.75 85.19 1512.3% Bullish BLUE .067 -.308 --------------------------------------------------------------------------------------------- IBB 106.79 4.79 98.04 285.8% Bullish BLUE .06 .104 --------------------------------------------------------------------------------------------- GLD 153.24 1.94 140.11 521.2% Bearish RED -.202 .276 --------------------------------------------------------------------------------------------- OIH 4.41 .06 3.82 748.5% Bearish BLUE-.201 -.438 --------------------------------------------------------------------------------------------- |
  Table 3  Count of Stocks in Key Directories
           20200326
-------------------------------
NEWHIGHS       9
NEWLOWS        52
MAXCP          232
MINCP          24
TTTNH          117
TTTNL          17
FASTUP         990
FASTDOWN       109
CPCROSSA       282
CPCROSSD       31
BIGVOLUP       25
BIGVODN        14
ACCUMVER       5
HIGHIP21       5
HIUPPCT        11
REDSELL        104
AUGSELS7       9
TRAPDOOR       737
|
Table 4 RANKING OF KEY DIRECTORIES BASED PCT.OF STOCKS ABOVE 65-DMA 3/26/20 --------------------------------------------------------------------------------------- Directory Current day-1 day-2 day-3 day-4 day-5 ---------------------------------------------------------------------------------------- FOOD .203 .203 .203 .092 .111 .092 COMODITY .2 .2 .2 .075 .125 .125 GOLD .187 .229 .187 .02 0 0 INDEXES .155 .15 .15 .139 .139 .139 HACKERS .15 .1 0 0 .05 .05 NIFTY .127 .021 .085 .042 .021 .021 BIOTECH .119 .104 .092 .08 .068 .068 SOLAR .117 .176 .058 0 0 0 NASD-100 .113 .061 .072 .041 .03 .041 SEMI .102 .084 .065 .028 .018 .028 GAMING .09 .045 .045 .045 .045 .045 SOFTWARE .083 .05 .05 .05 .033 .033 ELECTRON .078 .058 .052 .019 .019 .026 CHINA .074 .092 .074 .074 .092 .074 BONDFUND .06 .05 .03 .03 .02 .02 FIDSTKS .056 .016 .028 .016 .016 .022 GREEN .047 0 0 0 0 0 RUS-1000 .043 .028 .027 .02 .021 .032 CHEM .04 0 0 0 0 0 SP-100 .033 .011 .022 .011 .011 .033 SP500 .033 .018 .021 .014 .014 .027 OILGAS .029 .037 .029 .022 .022 .029 AUTO .025 0 0 0 0 0 FINANCE .023 .011 .011 .011 .011 .011 RETAIL .02 .02 .06 .04 .04 .08 REIT .014 .007 .007 .007 .007 .007 INDMATER .013 .026 0 0 0 .026 BEVERAGE 0 0 0 0 0 0 BIGBANKS 0 0 0 0 0 0 COAL 0 0 0 0 0 .2 COMPUTER 0 0 0 0 0 0 COPPER 0 0 0 0 0 0 DJI-13 0 0 0 0 0 0 DOWJONES 0 0 0 0 0 .033 EDU 0 0 0 0 0 0 ETFS 0 0 0 0 0 0 GUNS 0 0 .066 .066 0 0 HOMEBLDG 0 0 0 0 0 0 HOSPITAL 0 .045 0 0 0 0 INFRA 0 0 0 0 0 0 INSURANC 0 0 0 0 0 0 JETS 0 0 0 0 0 0 MILITARY 0 0 0 0 0 0 REGBANKS 0 0 0 0 0 0 UTILITY 0 0 0 0 0 0 TRANSP 0 0 0 0 0 0 |
====================================================================
3/25/2020 No new
Peerless Buy. Breadth
was good, but the DJI lost
much of its early gain and the NASDAQ closed down. The DJI's
hypothetical high was its 33% recovery line. A little more upside
probably lies ahead. The NYSE A/D Line broke its severe
downtrendline. But many of the key NASDAQ stocks, the
potential leaders in a recovery, were turned back from the resistance
of their 65 MA. At the same time, today saw more attractive stocks
for shorting among the MINCPs than bullish MAXCPs. So more
backing and filling lies ahead. I suspect it will be marked by weak
pre-market trading and buying by NYSE Professionals who will
soon have trillions to support the market. We will probably see
this fight develop for the next few weeks as folks wait to see if the
pandemic's upward curve can be flattened. I would think that
the big banks will be the stocks to watch now. Stay short the
Bearish MINCPs short sales, but avoid all new positions long
or short new. We will be covering our shorts on weakness
now and adopt a short-term trading policy, long and short. The
failure of the Accumulation Indexes to confirm the recent new lows
suggests to me the emergency $5 trillion bailout will succeed
in proping up the DJI and the financials. No trading. Let's see
how the market reacts to the passage this weekend of the bailout
legislation. With the good news out, a top and then a re-test of the
recent lows may lie ahead next week.


Stay Healthy!
While we wait, watch this video. Going out of the house only to
get groceries can still let you bring the virus back into your house
where it could harm your family. https://youtu.be/sjDuwc9KBps
NASDAQ |
Two NASDAQ Leaders: AMZN and NVDA  |
BIG BANKS - Biggest beneficiaries of
bailout, again. |
SP-500 - Opening and Closing Powers are in
downtrends. |
|
Charts 3/25/2020 (Click on Underlined link.) 2020 PEERLESS DJI, Signals, Indicators Daily DJI Volume 10-DayUp/Down Vol Stoch-20 Inverted Traders Index Graph of Pct of All Stocks above 65-dma NASDAQ S&P OEX NYSE COMPQX DJI-15 DJI-20 DJI-30 DIA QQQ MDY IWM TNA Short-Term Rates SPY http://tigersoft.com/2020CST/SPY.GIF USO-CrudeOil DBO FAS GLD BBH IBB JETS JNUG KOL NUGT OIH OIL PALL RSX RETL SDS AGQ SLV SOXL TECL TLT TMF TNA UGA (gasoline) and China: YINN CHAU Commodities: CANE CORN DBC JJC, NIB, CHOC CORN, CUT (paper) MOO, SOYB WEAT UUP (Dollar) LIT (Lithium) AAPL ADBE ALXN AMAT AMGN AMD AMZN AXP BA BABA BAC BIDU BLDP CAT CVX DE FB GOOG GS HD IBM INTU JPM M (Macy's) MSFT NFLX NKE NVDA PG QCOM TSLA TXN XOM V WMT CMG , LRCX, SQ TOWN New highs and Bullish MAXCPs http://tigersoft.com/MAXMLK/3-25-20/BULLISH.htm Bearish MAXCPs - http://tigersoft.com/MINMLK/3-25-20/BEARISH.htm |
Table 1 QUICKSILVER on DJI-30 STOCKS 3/25/2020 0 Bullish 0 Bearish, ITRS and IP21 >+.25 and <-.25 STOCKS CLOSE CHANGE PIVOT-PT 5-dma AROC CL-PWR CANDLE IP21 ITRS ----------------------------------------------------------------------------------- ----------------------------------------------------------------------------------- AAPL 245.52 -1.36 244.78 -24.1% Bullish RED -.02 .041 --------------------------------------------------------------------- AXP 90.17 6.12 77.07 1086.1% Bullish BLUE .062 -.032 --------------------------------------------------------------------- BA 158.73 31.05 97.71 2691.7% Bearish BLUE-.047 -.253 --------------------------------------------------------------------- CAT 104.67 3.33 103.01 231.3% Bullish BLUE .102 -.021 --------------------------------------------------------------------- CSCO 37.67 -.93 37.71 74.9% Bullish RED .042 .052 --------------------------------------------------------------------- CVX 69.27 2.72 57.39 1215% Bearish BLUE .089 -.14 --------------------------------------------------------------------- DIS 100.73 2.61 94.93 657.5% ------- BLUE .126 -.034 --------------------------------------------------------------------- GS 155.13 1.53 149.49 527.2% Bullish BLUE-.085 -.101 --------------------------------------------------------------------- HD 181.76 -2.96 161.13 800.5% Bullish RED .13 .08 --------------------------------------------------------------------- IBM 105.85 .37 100.34 115.1% ------- BLUE .01 .041 --------------------------------------------------------------------- INTC 51.26 -1.14 45.94 378.1% Bullish RED -.094 .126 --------------------------------------------------------------------- JNJ 119.4 .22 127.05 -635.4% Bearish BLUE .011 .086 --------------------------------------------------------------------- JPM 91.73 3.3 85.3 466.5% Bullish BLUE-.054 -.065 --------------------------------------------------------------------- KO 41.61 2.16 41.83 -401% Bearish BLUE-.014 .008 --------------------------------------------------------------------- MCD 162.98 1.03 149.5 874.3% Bullish RED .021 .055 --------------------------------------------------------------------- MMM 131.54 -1.18 137.51 -210.8% Bearish RED .005 -.007 --------------------------------------------------------------------- MRK 68.22 -.83 70.73 -244.2% Bullish RED .123 .028 --------------------------------------------------------------------- MSFT 146.92 -1.42 142.71 231.3% Bullish RED -.057 .166 --------------------------------------------------------------------- NKE 79.01 6.68 70.34 804.3% Bullish RED .106 .04 --------------------------------------------------------------------- PFE 29.75 .05 30.42 -435.1% ------- BLUE-.035 .021 --------------------------------------------------------------------- PG 100.92 -2.35 110.83 -777.3% Bullish BLUE .006 .074 --------------------------------------------------------------------- TRV 92.18 -1.56 86.07 596.9% Bearish RED .089 -.057 --------------------------------------------------------------------- UNH 234.49 14.69 219.8 411.8% Bullish BLUE .103 .087 --------------------------------------------------------------------- UTX 96.19 9.43 83.76 1030.3% Bullish BLUE .144 -.101 --------------------------------------------------------------------- V 161.78 7.25 152.25 450.6% Bullish BLUE .028 .095 --------------------------------------------------------------------- VZ 49.94 -.05 53.62 -421.1% Bullish BLUE .087 .111 --------------------------------------------------------------------- WBA 41.44 -3.81 48.55 -1201.2% ------- RED .097 .033 --------------------------------------------------------------------- WMT 109.4 -5.63 119.45 -562.9% Bullish RED .046 .21 --------------------------------------------------------------------- XOM 37.29 1.85 34.43 651.2% Bearish BLUE -.024 -.199 |
Table 2 QUICKSILVER on ETFS - 03/25/20 Rally in DJI owed to BA. Be careful here. last change Pivot 5-dma aroc ClosPwr Candle IP21 ITRS --------------------------------------------------------------------------------------------- - DIA 212.06 5.42 201.31 321.5% Bearish BLUE .045 ----- --------------------------------------------------------------------------------------------- BA 158.73 31.05 97.71 2691.7% Bearish BLUE-.047 -.253 --------------------------------------------------------------------------------------------- SPY 246.79 3.64 240.51 144.4% Bullish BLUE-.047 .019 --------------------------------------------------------------------------------------------- QQQ 182.3 -1.36 177.66 162.1% Bullish RED .014 .091 --------------------------------------------------------------------------------------------- MDY 252.82 7.53 239.73 467.1% Bearish BLUE-.007 -.062 --------------------------------------------------------------------------------------------- IWM 109.97 .93 103.87 486.2% Bearish BLUE-.003 -.071 --------------------------------------------------------------------------------------------- FAS 22.35 2.28 20.12 836.8% Bearish BLUE-.058 -.506 --------------------------------------------------------------------------------------------- RETL 6.01 .34 5.78 894.6% Bearish BLUE-.047 -.511 --------------------------------------------------------------------------------------------- SOXL 95.01 1.27 69.93 2069.5% ------- RED .057 -.408 --------------------------------------------------------------------------------------------- TECL 106.4 -.6 97.18 422.6% Bullish RED .001 -.345 --------------------------------------------------------------------------------------------- IBB 102 -.62 101.06 184.4% ------- RED .039 .122 --------------------------------------------------------------------------------------------- GLD 151.3 -2.1 138.04 368.8% Bearish RED -.199 .304 --------------------------------------------------------------------------------------------- OIH 4.35 -.01 3.81 1257.9% Bearish RED -.226 -.397 --------------------------------------------------------------------------------------------- GASL 9.13 .5 9 76.2% Bearish BLUE-.187 -.723 --------------------------------------------------------------------------------------------- |
 Table 3   Count of Stocks in Key Directories
          20200325
-------------------------------
NEWHIGHS       8
NEWLOWS        126
MAXCP          89
MINCP          35
TTTNH          64
TTTNL          37
FASTUP         991
FASTDOWN       123
CPCROSSA       137
CPCROSSD       72
BIGVOLUP       29
BIGVODN        21
ACCUMVER       5
HIGHIP21       4
HIUPPCT        9
REDSELL        107
AUGSELS7       5
TRAPDOOR       739
|
Table 4 RANKING OF KEY DIRECTORIES BASED PCT.OF STOCKS ABOVE 65-DMA 3/25/20 When Gold is leader, market is not healthy! --------------------------------------------------------------------------------------- Directory Current day-1 day-2 day-3 day-4 day-5 ---------------------------------------------------------------------------------------- GOLD .229 .187 .02 0 0 0 FOOD .203 .203 .092 .111 .092 .092 COMODITY .2 .2 .075 .125 .125 .125 SOLAR .176 .058 0 0 0 0 INDEXES .15 .15 .139 .139 .139 .15 BIOTECH .101 .089 .077 .068 .077 .059 HACKERS .1 .05 0 .05 .05 .05 CHINA .092 .074 .074 .092 .074 .055 SEMI .084 .065 .028 .018 .028 .018 NASD-100 .061 .082 .051 .03 .041 .051 ELECTRON .058 .052 .019 .019 .026 .019 BONDFUND .05 .03 .03 .02 .02 .01 SOFTWARE .05 .066 .05 .033 .033 .033 GAMING .045 .045 .045 .045 .045 .045 HOSPITAL .045 0 0 0 0 0 OILGAS .037 .029 .022 .022 .029 .029 INDMATER .026 0 0 0 .026 .026 NIFTY .021 .085 .042 .021 .021 .021 RETAIL .02 .06 .04 .04 .08 .08 SP500 .018 .023 .014 .014 .027 .046 FIDSTKS .016 .028 .016 .016 .022 .028 FINANCE .011 .011 .011 .011 .011 .011 SP-100 .011 .022 .011 .011 .033 .044 REIT .007 .007 .007 .007 .007 .014 AUTO 0 0 0 0 0 0 BEVERAGE 0 0 0 0 0 0 BIGBANKS 0 0 0 0 0 0 CHEM 0 0 0 0 0 0 COAL 0 0 0 0 .2 .2 COMPUTER 0 0 0 0 0 0 COPPER 0 0 0 0 0 0 DJI-13 0 0 0 0 0 0 DOWJONES 0 0 0 0 .033 .066 EDU 0 0 0 0 0 0 ETFS 0 0 0 0 0 0 GREEN 0 0 0 0 0 .047 GUNS 0 .066 .066 0 0 0 HOMEBLDG 0 0 0 0 0 0 INFRA 0 0 0 0 0 0 INSURANC 0 0 0 0 0 0 JETS 0 0 0 0 0 0 MILITARY 0 0 0 0 0 0 REGBANKS 0 0 0 0 0 0 RUS-1000 0 0 0 0 0 0 UTILITY 0 0 0 0 0 .051 TRANSP 0 0 0 0 0 0 |
======================================================================
3/24/2020 No new
Peerless Buy. We may not even see a two-day rally.

Use the DJI's next decline to 19,500 to cover leveraged short
ETFs. Hold
some of the MINCPs short. We will try to buy QQQ for a quick trade
on the next test of 19000 by the DJI. I warned against chasing prices
5% above Friday's close. Now let's see if the DJI can settle down with
only a slight pull-back and try to rally again.
Surely, the $5 trillion dollars' in bailouts ought to buy more than a one-day
rally back up through 20,000. Expect the big banks to show their gratitude
and support stocks for a while. But, if the scenario of 2008-2009 repeats,
there will have to be another steep leg down after three months of
horizontal action by the DJIA. I also like the parallel between the present
and the 1937-1938 decline. Its severity was made worse because traders
then remembered all too well the terrible 1929-1933 bear market.
It is important to also note that it ended only when FDR stopped trying to
balance the Federal budget as he had sought to do in 1937. Fiscal
stimulation works!
For now our Peerless trading system refuses to give a Buy signal. The
"AROC" and "V-I" Indicators are too low. So, more tests of the
recent lows
between 19000 and 20000 must be expected. But first, if history repeats
for such severe declines of 30% or more, we ought to see a 25%-30%
recovery of what was lost in the decline from 29500 to 18000. Such rallies
have always occurred after a 30% decline from a bull market peak. Compare
our current DJI chart with those of 1929-1930, 1937-1938, 1987-1988 and
2008-2009.
Unfortunately for the bulls, after a 30% DJI decline from a
bull markett
peak, there are no "V" bottoms like the one we saw in the relatively
mild 19% sell-off in lat 2018. The technicals, just by themselves, are
scary. As I've frequently noted, this decline is the steepest DJI collapse
in its long history going all the way back to 1885. Secondly, we have not
even seen a two-day DJI rally since early February. It would look quite
bearish, if this rally was crushed like every other one-day jump up since
the pandemic started. And third, but not least, nothing prevents fund
managers from aggressively selling short on down-ticks. That is the whole
purpose of leveraged negative Index ETFs. Consider this: the NYSE was
only able to briefly stop the horrific decline of 1931 in October by taking
steps to ban short-selling pools. They did this only after President Hoover
had publicly blamed Democrats on Wall Street for the collapse of that year.
The good news is that the massiveness of today's
"bailout" is unprecedented.
That should buy some time to see if the inflection of the infection's curve
can be flattened. Perhaps in six months, or a year, a vaccine to ward it
off will be invented.
1929-1930 |
1937-1938 |
1987-1988 |
2008-2009 |
|
Charts 3/24/2020 (Click on Underlined link.) 2020 PEERLESS DJI, Signals, Indicators Daily DJI Volume 10-DayUp/Down Vol Stoch-20 Inverted Traders Index Graph of Pct of All Stocks above 65-dma NASDAQ S&P OEX NYSE COMPQX DJI-15 DJI-20 DJI-30 DIA QQQ MDY IWM TNA Short-Term Rates SPY http://tigersoft.com/2020CST/SPY.GIF USO-CrudeOil DBO FAS GLD BBH IBB JETS JNUG KOL NUGT OIH OIL PALL RSX RETL SDS AGQ SLV SOXL TECL TLT TMF TNA UGA (gasoline) and China: YINN CHAU Commodities: CANE CORN DBC JJC, NIB, CHOC CORN, CUT (paper) MOO, SOYB WEAT UUP (Dollar) LIT (Lithium) AAPL ADBE ALXN AMAT AMGN AMD AMZN AXP BA BABA BAC BIDU BLDP CAT CVX DE FB GOOG GS HD IBM INTU JPM M (Macy's) MSFT NFLX NKE NVDA PG QCOM TSLA TXN XOM V WMT CMG , LRCX, SQ TOWN New highs and Bullish MAXCPs http://tigersoft.com/MAXMLK/3-24-20/BULLISH.htm Bearish MAXCPs - http://tigersoft.com/MINMLK/3-24-20/BEARISH.htm |
Table 1 QUICKSILVER on DJI-30 STOCKS 3/24/2020 1 Bullish 1 Bearish, ITRS and IP21 >+.25 and <-.25 STOCKS CLOSE CHANGE PIVOT-PT 5-dma AROC CL-PWR CANDLE IP21 ITRS ----------------------------------------------------------------------------------- ----------------------------------------------------------------------------------- AAPL 246.88 22.51 246.67 -124.8% Bullish BLUE-.008 .079 --------------------------------------------------------------------- AXP 84.05 15.09 73.75 -166.2% ------- BLUE .043 -.057 --------------------------------------------------------------------- BA 127.68 22.06 101.89 168.8% Bearish BLUE-.076 -.33 --------------------------------------------------------------------- CAT 101.34 9.49 100.12 58.1% Bearish BLUE .071 -.023 --------------------------------------------------------------------- CSCO 38.6 4 37.12 429.3% Bullish BLUE .061 .102 --------------------------------------------------------------------- CVX 66.55 12.33 55.05 -348.8% Bearish BLUE .081 -.145 --------------------------------------------------------------------- DIS 98.12 12.36 88.8 255.6% ------- BLUE .098 -.038 --------------------------------------------------------------------- GS 153.6 18.63 140.02 -175.7% Bullish BLUE-.125 -.082 --------------------------------------------------------------------- HD 184.72 22.33 155.63 344.1% Bullish BLUE .138 .107 --------------------------------------------------------------------- IBM 105.48 10.71 103.55 -58.4% Bearish BLUE 0 .055 --------------------------------------------------------------------- INTC 52.4 2.82 47.61 242.6% Bullish RED -.111 .172 --------------------------------------------------------------------- JNJ 119.18 8.04 134.96 -691.3% Bearish BLUE .008 .105 --------------------------------------------------------------------- JPM 88.43 9.4 83.89 -313.2% Bullish BLUE-.098 -.067 --------------------------------------------------------------------- KO 39.45 1.89 44.85 -921.5% Bearish RED -.029 -.006 --------------------------------------------------------------------- MCD 161.95 24.85 137.3 497.6% Bullish BLUE .024 .064 --------------------------------------------------------------------- MMM 132.72 14.85 137.02 -66% Bearish BLUE-.032 .019 --------------------------------------------------------------------- MRK 69.05 2.65 71.63 -382.8% Bullish BLUE .113 .054 --------------------------------------------------------------------- MSFT 148.34 12.36 140.4 62.9% Bullish BLUE-.071 .203 --------------------------------------------------------------------- NKE 72.33 9.53 68.04 183.9% Bullish BLUE .106 0 --------------------------------------------------------------------- PFE 29.7 1.21 32.36 -403.4% ------- BLUE-.052 .035 --------------------------------------------------------------------- PG 103.27 5.57 117.45 -684.6% Bullish BLUE .001 .116 --------------------------------------------------------------------- TRV 93.74 5.38 81.69 -151% Bearish BLUE .052 -.025 --------------------------------------------------------------------- UNH 219.8 24.94 217.06 -564% Bullish BLUE .058 .028 --------------------------------------------------------------------- UTX 86.76 11.81 79.4 -367.6% Bearish BLUE .098 -.146 --------------------------------------------------------------------- V 154.53 18.79 148.48 -113.3% Bullish BLUE-.02 .081 --------------------------------------------------------------------- VZ 49.99 -.32 54.32 -408.5% Bullish RED .087 .131 --------------------------------------------------------------------- WBA 45.25 1.64 52.81 -451.3% ------- BLUE .125 .118 --------------------------------------------------------------------- WMT 115.03 .75 122.58 -179.4% Bullish RED .059 .271 Bullish --------------------------------------------------------------------- XOM 35.44 3.99 32.94 -203.4% Bearish BLUE -.064 -.204 Bearish |
Table 2 QUICKSILVER on ETFS - 03/23/20 last change Pivot 5-dma aroc ClosPwr Candle IP21 ITRS
---------------------------------------------------------------------------------------------
DIA 186.13 -5.77 213.47 -405.5% Bearish RED -.055 ----
---------------------------------------------------------------------------------------------
SPY 222.96 -5.84 252.8 -351.3% Bearish RED -.119 .04
---------------------------------------------------------------------------------------------
QQQ 170.46 -.24 182.14 33.1% Bullish RED -.058 .136
---------------------------------------------------------------------------------------------
MDY 220.85 -8.4 256.71 -473.2% Bearish RED -.074 -.053
---------------------------------------------------------------------------------------------
IWM 99.9 -1.5 108.37 -179.8% Bearish RED -.099 -.039
---------------------------------------------------------------------------------------------
FAS 15 -2.87 26.08 -2278.4% Bearish RED -.212 -.487 Bearish
---------------------------------------------------------------------------------------------
RETL 4.55 -.36 6.27 -1301.2% Bearish RED -.136 -.473 Bearish
---------------------------------------------------------------------------------------------
SOXL 69.9 5.95 87.71 -674.2% Bearish BLUE-.06 -.399 Bearish
---------------------------------------------------------------------------------------------
TECL 83.13 -2.06 108.77 -871.8% Bullish RED -.055 -.329 Bearish
---------------------------------------------------------------------------------------------
IBB 97.5 -.54 101.3 157.7% ------- RED -.004 .163
---------------------------------------------------------------------------------------------
GLD 146.3 6.19 143.56 165.5% Bearish BLUE-.229 .359
---------------------------------------------------------------------------------------------
OIH 3.7 -.12 3.92 -265.4% Bearish RED -.351 -.361 Bearish
---------------------------------------------------------------------------------------------
GASL .07 -.02 .12 -2884.6% Bearish -----.391 -.635 Bearish
---------------------------------------------------------------------------------------------
RSX 15.19 .39 15.77 40.4% Bearish BLUE-.064 -.055
QUICKSILVER on ETFS - 03/24/20
ETF CLOSE CHANGE PIVOT-PT 5-dma AROC CL-PWR CANDLE IP21 ITRS --------------------------------------------------------------------------------------------- DIA 206.64 20.51 199.39 -172.1% Bearish BLUE .018 0 --------------------------------------------------------------------------------------------- BA 127.68 22.06 101.89 168.8% Bearish BLUE-.076 -.33 --------------------------------------------------------------------------------------------- SPY 243.15 20.19 240 -203.6% Bearish BLUE-.071 .03 --------------------------------------------------------------------------------------------- QQQ 183.66 13.2 176.6 43.3% Bullish BLUE-.002 .124 --------------------------------------------------------------------------------------------- MDY 245.29 24.44 231.03 -242.4% Bearish BLUE-.05 -.06 --------------------------------------------------------------------------------------------- IWM 109.04 9.14 99.97 32.6% Bearish BLUE-.037 -.056 --------------------------------------------------------------------------------------------- FAS 20.07 5.07 19.26 -1528% Bearish BLUE-.097 -.507 --------------------------------------------------------------------------------------------- RETL 5.67 1.12 5.08 -564.1% Bearish BLUE-.051 -.502 --------------------------------------------------------------------------------------------- SOXL 93.74 23.84 65 422.9% Bearish BLUE .028 -.383 --------------------------------------------------------------------------------------------- TECL 107 23.87 98.44 -93.6% Bullish BLUE-.006 -.31 --------------------------------------------------------------------------------------------- IBB 102.62 5.12 98.33 66.5% Bullish BLUE .02 .135 --------------------------------------------------------------------------------------------- GLD 153.4 7.1 140.7 347.1% Bearish -----.214 .327 --------------------------------------------------------------------------------------------- OIL 153.4 7.1 140.7 347.1% Bullish -----.183 16.423 --------------------------------------------------------------------------------------------- OIH 4.36 .66 3.39 590.1% Bearish BLUE-.262 -.383 --------------------------------------------------------------------------------------------- GASL 8.63 1.63 9 -1831.5% Bearish BLUE-.221 -.707 --------------------------------------------------------------------------------------------- UGA 8.63 1.63 9 -1831.5% Bullish BLUE-.181 -.419 --------------------------------------------------------------------------------------------- UUP 25.98 -.06 26.26 -53.5% ------- -----.019 .262 --------------------------------------------------------------------------------------------- IEF 25.98 -.06 26.26 -53.5% Bullish ---- .257 -.488 --------------------------------------------------------------------------------------------- CORN 25.98 -.06 26.26 -53.5% ------- ---- .055 1.079 --------------------------------------------------------------------------------------------- WEAT 25.98 -.06 26.26 -53.5% Bearish ---- .071 3.794 --------------------------------------------------------------------------------------------- YINN 25.98 -.06 26.26 -53.5% Bullish ---- .241 .72 --------------------------------------------------------------------------------------------- RSX 16.48 1.29 13.38 238.6% Bearish BLUE-.011 -.083 |
Table 3    Count of Stocks in Key Directories
           20200324
-------------------------------
NEWHIGHS       9
NEWLOWS        202  Bearish
MAXCP          45
MINCP          56
TTTNH          29
TTTNL          66
FASTUP         380
FASTDOWN       584
CPCROSSA       32
CPCROSSD       37
BIGVOLUP       29
BIGVODN        13
ACCUMVER       6
HIGHIP21       2
HIUPPCT        9
REDSELL        110
AUGSELS7       6
TRAPDOOR       739
|
 Table 4   RANKING OF KEY DIRECTORIES BASED PCT.OF STOCKS ABOVE 65-DMA
              3/24/20
 All 46 show a majority of their stocks are below their 65-dma.
 None of the DJI-30 stocks are above their 65-dma.
--------------------------------------------------------------------------------------- Directory Current day-1 day-2 day-3 day-4 day-5 ---------------------------------------------------------------------------------------- FOOD .203 .092 .111 .092 .092 .092 COMODITY .2 .075 .125 .125 .125 .125 GOLD .187 .02 0 0 0 .062 INDEXES .145 .135 .135 .135 .145 .145 BIOTECH .086 .074 .065 .077 .065 .089 NIFTY .085 .042 .021 .021 .021 .021 NASD-100 .082 .061 .041 .041 .041 .051 CHINA .074 .074 .092 .074 .055 .074 GUNS .066 .066 0 0 0 .066 SOFTWARE .066 .066 .033 .033 .033 .033 SEMI .065 .028 .018 .028 .018 .037 RETAIL .06 .04 .04 .08 .08 .1 SOLAR .058 0 0 0 0 0 ELECTRON .052 .019 .019 .026 .019 .032 HACKERS .05 .05 .05 .05 .05 0 GAMING .045 .045 .045 .045 .045 .045 BONDFUND .03 .03 .02 .02 .01 .02 OILGAS .029 .022 .022 .029 .029 .029 FIDSTKS .028 .016 .016 .022 .028 .033 RUS-1000 .028 .021 .021 .032 .046 .056 SP500 .023 .016 .014 .027 .044 .054 SP-100 .022 .011 .011 .033 .044 .055 FINANCE .011 .011 .011 .011 .011 .011 REIT .007 .007 .007 .007 .014 .014 AUTO 0 0 0 0 0 0 BEVERAGE 0 0 0 0 0 0 BIGBANKS 0 0 0 0 0 0 CHEM 0 0 0 0 0 .04 COAL 0 0 0 .2 .2 .2 COMPUTER 0 0 0 0 0 0 COPPER 0 0 0 0 0 0 DJI-13 0 0 0 0 0 0 DOWJONES 0 0 0 .033 .033 .033 EDU 0 0 0 0 0 0 ETFS 0 0 0 0 0 0 GREEN 0 0 0 0 .047 .095 HOMEBLDG 0 0 0 0 0 0 HOSPITAL 0 0 0 0 0 0 INDMATER 0 0 0 .026 .026 .026 INFRA 0 0 0 0 0 0 INSURANC 0 0 0 0 0 .038 JETS 0 0 0 0 0 0 MILITARY 0 0 0 0 0 0 REGBANKS 0 0 0 0 0 0 UTILITY 0 0 0 0 .051 .051 TRANSP 0 0 0 0 0 0 |
====================================================================
3/23/2020 It's time for a
two-day rally!
We still have no Peerless Buy signal. But with the DJI Futures
now up +4.63% and the FED throwing $4 trillion dollars into the
Bond and Debt market, the big banks will try to support the
market. A 25%-33% recovery should be expected if history repeats.
But this is no ordinary decline or bear market.
Without a Congressional bail-out, along with the FED's supporting
Wall Street, there remains a real danger of another leg down by the DJI
after a month or two waiting to see if the Coronavirus Pandemic's curve
is turned down or a vaccine can be developed. More DJI and SP-500
tests of the lows seem very likely. So, do not chase the rally up more than
5% to cover or to buy QQQ. Expect the round number 20000 to be the
DJI's first point of resistance if there is a technical bounce tomorrow that
is not quickly suppressed like all the other bounces have been for the
last month.
DJI could reach 22500 if 20000 is penetrated.
This represents a 33% retracement.


In the past, going back to 1929, everytime the DJI has fallen
more
than 30% from a bull market peak, there has always been a 25%-33%
recovery, or technical bounce. That such a bounce may be upon us now,
we see the DJI up 5% over night. Of course, this is about what
it lost today, but look how QQQ, SOX(Semi-conductors) and BBH
(Biotechs) have fallen to flat and well-tested support. Such levels
are made-to-order locations for shorts to cover and professionals
to try to scalp a few points on the upside. Watch tomorrow's follow-through.
It remains to be seen if big sellers quickly enter from the wings and again
squech this rally, If not, a recovery by the DJI back to 20000 to test the
supply of stock there should not surprise anyone.
Since we have no new Peerless buy signal, it seems likely
that this will
only be a technical bounce. However, if Congress can agree on a
bailout plan, I would expect a bigger rally. It probably would be a
good idea to cover leveraged short ETFs tomorrow if the rally persists
longer than the first two hours. But without a Buy signal, I would only
buy QQQ for a very quick trade and hold it only so long as thr support
shown further below holds.
Technical Bounces when DJI
is down 30% or more from a bull market peak.
1929: DJI tagged the 30%-down level and then recovered 33%
of what it lost. It still had to plunge to another new low to reach
a bottom.
1937: DJI closed recovered only 25% in its first good trading
recovery in its 46% bear market.
1987: DJI recovered 33% of what it lost in the October Panic
and then had to build a base for four months before slowly
recovering.
2008: DJI recovered 33% of its 2008 loss, tried to build a base
for the next 4 months and then plunged to a new low.
 |
 |
 |
|
Charts 3/23/2020 (Click on Underlined link.) 2020 PEERLESS DJI, Signals, Indicators Daily DJI Volume 10-DayUp/Down Vol Stoch-20 Inverted Traders Index Graph of Pct of All Stocks above 65-dma NASDAQ S&P OEX NYSE COMPQX DJI-15 DJI-20 DJI-30 DIA QQQ MDY IWM TNA Short-Term Rates SPY http://tigersoft.com/2020CST/SPY.GIF USO-CrudeOil DBO FAS GLD BBH IBB JETS JNUG KOL NUGT OIH OIL PALL RSX RETL SDS AGQ SLV SOXL TECL TLT TMF TNA UGA (gasoline) and China: YINN CHAU Commodities: CANE CORN DBC JJC, NIB, CHOC CORN, CUT (paper) MOO, SOYB WEAT UUP (Dollar) LIT (Lithium) AAPL ADBE ALXN AMAT AMGN AMD AMZN AXP BA BABA BAC BIDU BLDP CAT CVX DE FB GOOG GS HD IBM INTU JPM M (Macy's) MSFT NFLX NKE NVDA PG QCOM TSLA TXN XOM V WMT CMG , LRCX, SQ TOWN New highs and Bullish MAXCPs http://tigersoft.com/MAXMLK/3-23-20/BULLISH.htm Bearish MAXCPs - http://tigersoft.com/MINMLK/3-23-23/BEARISH.htm |
Table 1 QUICKSILVER on DJI-30 STOCKS 3/23/2020 2 Bullish 3 Bearish, ITRS and IP21 >+.25 and <-.25 STOCKS CLOSE CHANGE PIVOT-PT 5-dma AROC CL-PWR CANDLE IP21 ITRS ----------------------------------------------------------------------------------- ----------------------------------------------------------------------------------- AAPL 224.37 -4.87 252.86 -366.8% Bullish RED -.041 .082 --------------------------------------------------------------------- AXP 68.96 -5.16 86.58 -1063.8% Bearish RED -.013 -.103 --------------------------------------------------------------------- BA 105.62 10.61 124.14 -1093.7% Bearish BLUE-.171 -.329 Bearish --------------------------------------------------------------------- CAT 91.85 -3.65 100.2 -79.2% Bearish RED .003 -.019 --------------------------------------------------------------------- CSCO 34.6 -1 35.5 123.9% Bullish RED -.016 .088 --------------------------------------------------------------------- CVX 54.22 -5.17 70.69 -1239.5% Bearish RED .018 -.181 --------------------------------------------------------------------- DIS 85.76 -.22 93.53 -504.6% Bearish BLUE .065 -.051 --------------------------------------------------------------------- GS 134.97 -3.44 158.67 -664.1% Bearish RED -.177 -.086 Bearish --------------------------------------------------------------------- HD 162.39 10.24 173.64 -79.6% ------- BLUE .077 .078 --------------------------------------------------------------------- IBM 94.77 -.62 106.65 -213.4% Bearish BLUE-.043 .05 --------------------------------------------------------------------- INTC 49.58 3.75 50.08 530.8% Bullish BLUE-.105 .193 --------------------------------------------------------------------- JNJ 111.14 -8.75 136.59 -619.2% Bearish RED -.057 .122 --------------------------------------------------------------------- JPM 79.03 -4.47 93.76 -536.4% Bearish RED -.126 -.068 --------------------------------------------------------------------- KO 37.56 -.74 47.18 -885.4% Bearish BLUE-.01 .036 --------------------------------------------------------------------- MCD 137.1 -11.39 147.62 -406.8% Bearish RED -.024 .015 --------------------------------------------------------------------- MMM 117.87 -7.02 134.44 -490.4% Bearish RED -.107 .008 --------------------------------------------------------------------- MRK 66.4 -4.96 74.48 -245.7% Bullish RED .083 .1 --------------------------------------------------------------------- MSFT 135.98 -1.37 146.57 19.9% Bullish RED -.094 .196 --------------------------------------------------------------------- NKE 62.8 -4.65 69.84 -291.3% ------- RED .045 -.024 --------------------------------------------------------------------- PFE 28.49 -.52 32.16 -274.1% ------- RED -.1 .09 --------------------------------------------------------------------- PG 97.7 -4.73 118.24 -484.3% Bullish RED -.06 .146 --------------------------------------------------------------------- TRV 88.36 -1.15 96.41 185.7% Bearish BLUE-.006 -.001 --------------------------------------------------------------------- UNH 194.86 -11.73 244.22 -678.1% Bearish RED -.031 .019 --------------------------------------------------------------------- UTX 74.95 -7.58 92.84 -930.2% Bearish RED .053 -.155 --------------------------------------------------------------------- V 135.74 -11.09 157.89 -537% ------- RED -.076 .06 --------------------------------------------------------------------- VZ 50.31 -1.49 54.31 -64.1% Bullish RED .087 .212 Bullish --------------------------------------------------------------------- WBA 43.61 -2.81 49.6 -151.6% ------- RED .072 .155 --------------------------------------------------------------------- WMT 114.28 .31 119.26 323% Bullish BLUE .033 .331 Bullish --------------------------------------------------------------------- XOM 31.45 -1.29 36.81 -443.4% Bearish RED -.121 -.192 Bearish |
Table 2 QUICKSILVER on ETFS - 03/23/20 last change Pivot 5-dma aroc ClosPwr Candle IP21 ITRS --------------------------------------------------------------------------------------------- DIA 186.13 -5.77 213.47 -405.5% Bearish RED -.055 ---- --------------------------------------------------------------------------------------------- SPY 222.96 -5.84 252.8 -351.3% Bearish RED -.119 .04 --------------------------------------------------------------------------------------------- QQQ 170.46 -.24 182.14 33.1% Bullish RED -.058 .136 --------------------------------------------------------------------------------------------- MDY 220.85 -8.4 256.71 -473.2% Bearish RED -.074 -.053 --------------------------------------------------------------------------------------------- IWM 99.9 -1.5 108.37 -179.8% Bearish RED -.099 -.039 --------------------------------------------------------------------------------------------- FAS 15 -2.87 26.08 -2278.4% Bearish RED -.212 -.487 Bearish --------------------------------------------------------------------------------------------- RETL 4.55 -.36 6.27 -1301.2% Bearish RED -.136 -.473 Bearish --------------------------------------------------------------------------------------------- SOXL 69.9 5.95 87.71 -674.2% Bearish BLUE-.06 -.399 Bearish --------------------------------------------------------------------------------------------- TECL 83.13 -2.06 108.77 -871.8% Bullish RED -.055 -.329 Bearish --------------------------------------------------------------------------------------------- IBB 97.5 -.54 101.3 157.7% ------- RED -.004 .163 --------------------------------------------------------------------------------------------- GLD 146.3 6.19 143.56 165.5% Bearish BLUE-.229 .359 --------------------------------------------------------------------------------------------- OIH 3.7 -.12 3.92 -265.4% Bearish RED -.351 -.361 Bearish --------------------------------------------------------------------------------------------- GASL .07 -.02 .12 -2884.6% Bearish -----.391 -.635 Bearish --------------------------------------------------------------------------------------------- RSX 15.19 .39 15.77 40.4% Bearish BLUE-.064 -.055 |
 Table 3   Count of Stocks in Key Directories
          20200323
-------------------------------
NEWHIGHS       9
NEWLOWS        1586 Bearish
MAXCP          24
MINCP          339  Bearish
TTTNH          33
TTTNL          343  Bearish
FASTUP         108
FASTDOWN       741
CPCROSSA       32
CPCROSSD       193
BIGVOLUP       11
BIGVODN        104
ACCUMVER       5
HIGHIP21       3
HIUPPCT        8
VHIP21         137
LOWACCUM       156
REDSELL        103
AUGSELS7       3
TRAPDOOR       734
|
 Table 4 RANKING OF KEY DIRECTORIES BASED PCT.OF STOCKS ABOVE 65-DMA
              3/23/20
---------------------------------------------------------------------------------------
Directory     Current       day-1         day-2         day-3         day-4         day-5
----------------------------------------------------------------------------------------
INDEXES        .135          .135          .135          .145          .145          .156
FOOD           .092          .111          .092          .092          .092          .092
COMODITY       .075          .125          .125          .125          .125          .125
CHINA          .074          .092          .074          .055          .074          .055
BIOTECH        .071          .062          .074          .065          .095          .053
GUNS           .066          0             0             0             .066          0
SOFTWARE       .066          .05           .033          .033          .033          .016
NASD-100       .061          .051          .051          .041          .051          .02
HACKERS        .05           .1            .05           .05           0             0
GAMING         .045          .045          .045          .045          .045          .045
NIFTY          .042          .021          .021          .021          .021          0
RETAIL         .04           .04           .08           .08           .1            .02
BONDFUND       .03           .02           .02           .01           .02           .04
SEMI           .028          .018          .028          .018          .028          .037
OILGAS         .022          .022          .029          .029          .029          .029
RUS-1000       .021          .023          .032          .046          .056          .024
GOLD           .02           0             0             0             .062          0
ELECTRON       .019          .019          .026          .019          .026          .026
FIDSTKS        .016          .016          .022          .028          .033          .016
SP500          .016          .016          .027          .044          .054          .023
FINANCE        .011          .011          .011          .011          .011          .011
SP-100         .011          .011          .033          .044          .055          .011
REIT           .007          .007          .007          .014          .014          .014
AUTO           0             0             0             0             0             0
BEVERAGE       0             0             0             0             0             0
BIGBANKS       0             0             0             0             0             0
CHEM           0             0             0             0             .04           0
COAL           0             0             .2            .2            .2            .2
COMPUTER       0             0             0             0             0             0
COPPER         0             0             0             0             0             0
DJI-13         0             0             0             0             0             0
DOWJONES       0             0             .033          .033          .033          0
EDU            0             0             0             0             0             0
ETFS           0             0             0             0             0             0
GREEN          0             0             0             .047          .095          0
HOMEBLDG       0             0             0             0             0             0
HOSPITAL       0             0             0             0             0             0
INDMATER       0             0             .026          .026          .026          .013
INFRA          0             0             0             0             0             0
INSURANC       0             0             0             0             .038          0
JETS           0             0             0             0             0             0
MILITARY       0             0             0             0             0             0
REGBANKS       0             0             0             0             0             0
SOLAR          0             0             0             0             0             0
UTILITY        0             0             0             .051          .051          0
TRANSP         0             0             0             0             0             0
|
=======================================================================
3/20/2020 Peerless has issued
another Sell. The S13 simply confirms what we already
should know. The downtrend is too steep to try to call a bottom. But
we should view critically super-bears, like Dr. (Doom) Roubini. See more
details below. The DJI has fallen 35% from its highs, even a rally back to
20,000 would make a good trade. More than that depends on Congress.
And Congress may need to see the DJI down 45% from its highs, before
it will itself be properly stimulated to get the stimulus checks "in the mail".
The Dumping of stocks continues at a pace
that most closely matches 1929. Avoid the
long side. Every recent rally has ended far
too quickly to trade safely on the long side.

Fear is dominant. So are the political divisions. Democrats fear
the political recriminations from their base if Congress again provides
billions in bailouts for Big Banks, Airlines and Big Business. Republicans,
like Trump, want to avoid "food riots" caused by millions of Americans
running out of money to buy food. This is definitely an Election Year
and bi-partisan cooperation is in almost as short supply as toilet paper.
Investors naturally remember 2008. Certainly the Federal Reserve does.
But the annualized rate of decline now in the DJI is more like 1929 than
2008. The DJI'S "AROC" now is a very ugly
-482%. (This is the most
recent daily percent change in the DJI's 21-dma times 250.) In 2008,
our AROC bottomed at "only" -299% but that was five months before
the DJI's final bottom. In1929, with many more bearish
divergences,
the DJI's AROC fell to -638% on Novermber 13th, after which the DJI
rose from 198.7 to 293.3 five months later. The
1929-1930 recovery was
almost a 50% recovery. Could we be close to that? Only Congress knows
the answer to that.
The DJI is now down 35% from its February peak. In
1987, the hypothetical
low after the October Crash then was down 40% from its August peak. Here
a 40% decline would take the DJI down to 17730, only a little below the low
made by the DJI futures this morning. A 47% decline, like one that would match
1929's bottom would mean we will soon be seeing the DJI at 15681. A 50%
decline would mean 14800.
How much lower will we go here? I get the sense that Big Money continues
to dump shares now like they did Bank shares in 2008 about half way down. I have
argued that the Virus'es onslaught did not give Big Money as a whole much
advance notice to sell-out. And when they first did think about selling out, the
Fed decided to put up $1.5 trillion to prevent a market collapse. Also misleading
Wall Street in February, the President denied the seriousness of the emerging
pandemic.
Just as Epidemologists like to find patient "Zero" in a pandemic, we like to
trace
back and find the first big sellers at a market's top. In 2007, it was big bankers
like Robert Rubin. See
http://www.tigersoftware.com/TigerBlogs/Nov-25-2008/index.html
and
http://www.tigersoftware.com/Insider-Trading-News-Reviews/12-30-2007/index.html
In 2020, it was four US Senators who got US dire intelligence warnings
about the pandemic and then downplayed them to the Public.
In any event, Big Money selling is continuing and the trend is still clearly down.
There is way too much volatility to try to call bottom.
We did decide to cover our Airlines shorts. The profits were large
and a bailout is coming. But, at this point, hold the other BEARISH MINCPs
short and continue to avoid the long side. There are way too many companies
hit hard. They cannot all be bailed out all at once.
|
Charts 3/20/2020 (Click on Underlined link.) 2020 PEERLESS DJI, Signals, Indicators Daily DJI Volume 10-DayUp/Down Vol Stoch-20 Inverted Traders Index Graph of Pct of All Stocks above 65-dma NASDAQ S&P OEX NYSE COMPQX DJI-15 DJI-20 DJI-30 DIA QQQ MDY IWM TNA Short-Term Rates SPY http://tigersoft.com/2020CST/SPY.GIF USO-CrudeOil DBO FAS GLD BBH IBB JETS JNUG KOL NUGT OIH OIL PALL RSX RETL SDS AGQ SLV SOXL TECL TLT TMF TNA UGA (gasoline) and China: YINN CHAU Commodities: CANE CORN DBC JJC, NIB, CHOC CORN, CUT (paper) MOO, SOYB WEAT UUP (Dollar) LIT (Lithium) AAPL ADBE ALXN AMAT AMGN AMD AMZN AXP BA BABA BAC BIDU BLDP CAT CVX DE FB GOOG GS HD IBM INTU JPM M (Macy's) MSFT NFLX NKE NVDA PG QCOM TSLA TXN XOM V WMT CMG , LRCX, SQ TOWN New highs and Bullish MAXCPs http://tigersoft.com/MAXMLK/3-20-20/BULLISH.htm Bearish MAXCPs - http://tigersoft.com/MINMLK/3-20-20/BEARISH.htm |
"Dr. Doom" lowers the Boom on the Bulls
Bears like "Dr. Doom" Roubini tell us that
the US stock markets
will need to drop 40% to 50% from their highs before Congress
is pressured sufficiently to send out the necessary $1000 checks
to turn the economy around. His main theme is that this time
Corporate Debt and PEs are much, much higher than in 2007-2008
due to massive corporate borrowing and widespread stock buybacks.
He also says the US is three weeks behind Italy in the way the
Coronavirus is hitting its people and their national economy.
So, stocks will keep sliding here until there are food riots and the divisions
between Republicans and Democrats are then put aside enough to
agree on what fiscal stimuli are needed.
https://www.youtube.com/watch?v=M-7ndSHWoes
https://www.vox.com/future-perfect/2020/3/20/21179040/coronavirus-us-italy-not-overreacting
https://www.youtube.com/watch?v=_-VxuZmEhV0
Roubini knows something of the American 1930s in saying these
things.
It's true that Congress did little until the first "food riots", those in
Minneaoplis
which took place in 1931. He seems to be aware that the stock market did not
turn up until the 15000-man, Veterans' "Bonus Army" was violently dispersed
in Washington DC in July 1932 by General Macarthur.
But he seems to be forgetting that the Obama Economic Recovery checks did
not go out until May 2009, three months after the bull market had already started.
So, $1,000 checks will likely not jump-start the economy. Nor were there
Food Riots in 2007-2008. Rather Massive Bank bailouts here and elsewhere
in late 2008 and early 2009 "did the trick" and got the market to turn up.
A half a trillion in Corporate Bailouts, I would
suggest, is what we should be looking
for now to turn the DJI up. The politics of a Presidential Election year could
delay this for months. On the other hand, I suspect Roubini does not
appreciate
the role of more proactive US Public Health policy-making. The curve of the
virus' spread in the US is still steeply up, but China and South Korea show the
curve can be smoothed out. Nor are researchers sitting still. Better treatment
options and a vaccination for the virus is likely to be found fairly soon.
So, while the trend is down, I think policy-makers are are a
lot smarter
now than in 1918-1919; there are a lot fewer Communists around to
encourage mass protests as in the 1930s; the Fed is much more committed
now than in the middle of 2008 to "helicoptering in" trillions the big
banks
and it is only a matter of time before other big bailouts are forthcoming. The
important question is just how soon Congressional policy-makers see that
bailing out Bear Stearns and the likes of Washington Mutual would ultimately
have been cheaper than not do so. Realism dictates that in the end,
"moral hazard" be seen as just a matter of class perspective.
Congressional
politicians in both parties know very well whose interests they are in Congress
to serve.
Table 1 QUICKSILVER on DJI-30 STOCKS 3/20/2020 2 Bullish 2 Bearish, ITRS and IP21 >+.25 and <-.25 STOCKS CLOSE CHANGE PIVOT-PT 5-dma AROC CL-PWR CANDLE IP21 ITRS ----------------------------------------------------------------------------------- ----------------------------------------------------------------------------------- AAPL 229.24 -15.54 242.21 -963.4% Bullish RED -.08 .088 --------------------------------------------------------------------- AXP 74.12 -2.95 85.87 -1506.4% ------- RED .017 -.077 --------------------------------------------------------------------- BA 95.01 -2.7 129.61 -3014.6% Bearish RED -.212 -.381 Bearish --------------------------------------------------------------------- CAT 95.5 -7.51 93.41 -208.5% Bearish RED .046 -.021 --------------------------------------------------------------------- CSCO 35.6 -2.11 33.71 -280.7% Bullish RED -.017 .081 --------------------------------------------------------------------- CVX 59.39 2 69.7 -1786.6% Bearish RED .067 -.163 --------------------------------------------------------------------- DIS 85.98 -8.95 95.01 -870.9% Bearish RED .034 -.076 --------------------------------------------------------------------- GS 138.41 -11.08 154.66 -1242.3% Bearish RED -.147 -.086 --------------------------------------------------------------------- HD 152.15 -8.98 164.96 -1554% Bearish RED .031 .018 --------------------------------------------------------------------- IBM 95.39 -4.95 99.08 -606.7% Bearish RED -.055 .037 --------------------------------------------------------------------- INTC 45.83 -.11 44.61 -886% Bullish RED -.151 .109 --------------------------------------------------------------------- JNJ 119.89 -7.16 127.13 -545.4% Bearish RED -.001 .159 --------------------------------------------------------------------- JPM 83.5 -1.8 88.36 -1120.9% Bullish RED -.099 -.058 --------------------------------------------------------------------- KO 38.3 -3.53 45.26 -1117.1% Bearish RED .01 .037 --------------------------------------------------------------------- MCD 148.49 -1.01 149.01 -941.4% Bullish RED .045 .053 --------------------------------------------------------------------- MMM 124.89 -12.62 130.91 -615.9% Bearish RED -.093 .024 --------------------------------------------------------------------- MRK 71.36 .63 69.92 -370.7% Bullish BLUE .124 .138 Bullish --------------------------------------------------------------------- MSFT 137.35 -5.36 135.42 -741.8% ------- RED -.106 .19 --------------------------------------------------------------------- NKE 67.45 -2.89 66.79 -579.7% Bullish RED .056 -.004 --------------------------------------------------------------------- PFE 29.01 -1.41 30.18 -586.1% ------- RED -.077 .075 --------------------------------------------------------------------- PG 102.43 -8.4 108.5 -511.3% Bullish RED -.054 .168 --------------------------------------------------------------------- TRV 89.51 3.44 85.1 -982% Bearish BLUE .052 -.012 --------------------------------------------------------------------- UNH 206.59 -13.21 225.04 -1388.8% Bearish RED -.012 .03 --------------------------------------------------------------------- UTX 82.53 -1.23 90.93 -1264% Bearish RED .089 -.13 --------------------------------------------------------------------- V 146.83 -5.42 152.01 -921.9% Bullish RED -.029 .097 --------------------------------------------------------------------- VZ 51.8 -1.82 50.99 -221.6% Bullish RED .137 .2 --------------------------------------------------------------------- WBA 46.42 -2.13 45.08 23.7% ------- RED .097 .164 Bullish --------------------------------------------------------------------- WMT 113.97 -5.48 106.76 -5.6% Bullish RED .061 .313 --------------------------------------------------------------------- XOM 32.74 -1.69 34.49 -760.8% Bearish RED -.129 -.195 Bearish |
Table 2 QUICKSILVER on ETFS - 03/20/20 last change Pivot 5-dma aroc ClosPwr Candle IP21 ITRS --------------------------------------------------------------------------------------------- DIA 191.9 -9.41 202.49 -958.5% Bearish RED -.052 0 --------------------------------------------------------------------------------------------- SPY 229.69 -10.82 239.85 -797.4% Bearish RED -.114 .04 --------------------------------------------------------------------------------------------- QQQ 170.7 -6.96 169.3 -602.4% ------- RED -.087 .118 --------------------------------------------------------------------------------------------- MDY 229.25 -10.48 243.57 -1053.8% Bearish RED -.08 -.054 --------------------------------------------------------------------------------------------- IWM 101.4 -2.47 103.62 -843.9% Bearish RED -.126 -.054 --------------------------------------------------------------------------------------------- FAS 17.87 -2.25 24.86 -4362.5% Bearish RED -.16 -.479 Bearish --------------------------------------------------------------------------------------------- RETL 4.91 -.87 6.01 -3010.3% Bearish RED -.14 -.486 Bearish --------------------------------------------------------------------------------------------- SOXL 63.95 -5.98 79.78 -3814.7% Bearish RED -.109 -.441 Bearish --------------------------------------------------------------------------------------------- TECL 85.19 -11.99 100.21 -3195.9% ------- RED -.085 -.335 Bearish --------------------------------------------------------------------------------------------- IBB 98.04 -3.02 94.39 -282.7% Bullish RED -.003 .148 --------------------------------------------------------------------------------------------- GLD 140.11 2.07 141.64 -112.1% Bearish RED -.276 .286 --------------------------------------------------------------------------------------------- OIH 3.82 .01 3.9 -821.4% Bearish ---- -.333 -.374 Bearish --------------------------------------------------------------------------------------------- GASL .09 0 .13 -3333.3% Bearish ---- -.324 -.658 Bearish --------------------------------------------------------------------------------------------- RSX 14.8 -.44 15.07 -826.8% Bearish RED -.088 -.093 |
    Count of Stocks in Key Directories
          20200320
-------------------------------
NEWHIGHS       9   Very Bearish
NEWLOWS        628 Bearish
MAXCP          18
MINCP          223 Bearish
TTTNH          24
TTTNL          238
FASTUP         108
FASTDOWN       994 Bearish
CPCROSSA       24
CPCROSSD       392 Bearish
BIGVOLUP       53
BIGVODN        134
ACCUMVER       5
HIGHIP21       3
HIUPPCT        7
REDSELL        103
AUGSELS7       3
TRAPDOOR       735
|
RANKING OF KEY DIRECTORIES BASED PCT.OF STOCKS ABOVE 65-DMA 3/20/20 --------------------------------------------------------------------------------------- Directory Current day-1 day-2 day-3 day-4 day-5 ---------------------------------------------------------------------------------------- INDEXES .135 .135 .145 .145 .151 .151 COMODITY .125 .125 .125 .125 .125 .125 FOOD .111 .092 .092 .092 .092 .092 HACKERS .1 .1 .05 0 0 0 CHINA .092 .074 .055 .074 .055 .111 BIOTECH .059 .071 .062 .095 .062 .086 NASD-100 .051 .061 .051 .051 .02 .061 SOFTWARE .05 .05 .033 .033 .016 .016 GAMING .045 .045 .045 .045 .045 .045 RETAIL .04 .08 .08 .1 .02 .04 RUS-1000 .023 .034 .046 .056 .024 .047 OILGAS .022 .029 .029 .029 .029 .029 NIFTY .021 .021 .021 .021 0 .021 BONDFUND .02 .02 .01 .02 .04 .02 ELECTRON .019 .026 .019 .026 .026 .032 SEMI .018 .028 .018 .028 .037 .046 FIDSTKS .016 .022 .028 .033 .016 .05 SP500 .016 .029 .044 .054 .023 .046 FINANCE .011 .011 .011 .011 .011 .023 SP-100 .011 .033 .044 .055 .011 .033 REIT .007 .007 .014 .014 .014 .035 AUTO 0 0 0 0 0 0 BEVERAGE 0 0 0 0 0 0 BIGBANKS 0 0 0 0 0 0 CHEM 0 0 0 .04 0 0 COAL 0 .2 .2 .2 .2 0 COMPUTER 0 0 0 0 0 0 COPPER 0 0 0 0 0 0 DJI-13 0 0 0 0 0 0 DOWJONES 0 .033 .033 .033 0 0 EDU 0 0 0 0 0 .2 ETFS 0 0 0 0 0 0 GOLD 0 0 0 .062 0 0 GREEN 0 0 .047 .095 0 0 GUNS 0 0 0 .066 0 0 HOMEBLDG 0 0 0 0 0 0 HOSPITAL 0 0 0 0 0 0 INDMATER 0 .026 .026 .026 .013 0 INFRA 0 0 0 0 0 0 INSURANC 0 0 0 .038 0 .038 JETS 0 0 0 0 0 0 MILITARY 0 0 0 0 0 0 REGBANKS 0 0 0 0 0 0 SOLAR 0 0 0 0 0 .058 UTILITY 0 0 .051 .051 0 0 TRANSP 0 0 0 0 0 0 |
====================================================================
3/19/2020 The Coronavirus news
seems grim. 13,000 Americans have tested
positive compared to less than a hundred two weeks ago.

The Governor of California demands
the state's 40 million residents stay at home
for all but essential activities. Draconian, yes. But it seems to have worked
in
China. The Governor says that that 60% of the state's residents will likely
get the Coronavirus in the next three months. The Mayor of New York
City says that his city's hospitals will run out of essential equipment to
treat Coronavirus patients in three weeks. The death toll keeps rising sharply.
Could We Really See A Rally in the Major
Markets?
Despite all this bad news, the markets rose Thursday and our
Accumulation Index readings for the major market ETFs are nearly positive
even after their steep 30% declines. As I write this, the DJI
is up 600 points.
Index/ETF Current IP21 (Accum. Index)
-----------------------------------------------
DJI-30
-.016
NASDAQ
-.025
DIA
-.001
SPY
-.081
QQQ
-.041
The DJI's Downside Objective has been reached.
See the chart below. Spring is here. This should lift
spirits. Federal Taxes are delayed. And Americans are
to get a check for $1000 or more to keep them solvent and
able to pay off their credit card debt for another few months.
Meanwhile the FED will inject $1.5 Trillion in the Big Banks!
This is exactly like 2008-2009. I would expect a 33%-50%
recovery of the 10,000 DJI points lost in the last five weeks.
But because we have no new Buy signal, I still cannot recommend
any specific long positions. But I would cover the Airlines stocks' shorts.

This morning the Airlines' stocks are up 15% overnight. An overdue technical
bounce for them is upon us. I think it's time to
cover our short sales in them..

A relief rally may be born from hopes that there is reason to be optimistic that
medical researchers have come much closer to having an effective way to
treat Coronavirus victims. But Friday rallies are notoriously unreliable in a
bear market. So, let's wait to see if the various Accumulation Indexes actually
turn positive before covering more shorts than just those in the Airlines sector.
Biotechs
are holding up well. They would seem the logical place to start
buying, given the news.

A CURE!
President Trump was right to highlight in a Press Conference today
that the old generic malaria drug hydroxychloroquine may be a
cure for Coronavirus.
A French researcher from Marseilles released wonderfully encouraging
results from a preliminary trial experiment involving 36 COVID-19 patients.
As the trial began, six of these patients were asymptomatic, 22 had upper
respiratory tract infection symptoms and eight had very dangerous lower
respiratory tract infection symptoms.
"Between early and mid-March, Raoult and his team
treated 20 of these
patients with 600 milligrams of hydroxychloroquine daily in a hospital setting.
Depending on their symptoms, an antibiotic known as azithromycin was also
added to the treatments. This antibiotic is known to be effective against
complications from bacterial lung disease. The 16 remaining patients were not
given the drug as a control.
"In the study, the scientists observed a "significant" reduction in viral
load in
the patients treated with hydroxychloroquine, and that the effect was
reinforced by azithromycin, Medscape reported.
"In fact, after six days, 70 percent of the treated patients were considered cured,
meaning that the virus was no longer detected in samples taken from them,
compared to 12.5 percent of the control group patients. Furthermore, all six
patients who were treated with both hydroxychloroquine and the antibiotic
azithromycin tested negative for the virus after six days."
https://www.msn.com/en-us/news/politics/donald-trump-says-malaria-drug-for-coronavirus-has-been-approved-by-fda/ar-BB11qhdJ
The French research needs to be replicated on a larger scale
to gain wide
acceptance. But research at the University of Minnesota suggests
the drug may even become the basis for a preventative vaccinne.
https://med.umn.edu/news-events/covid-19-clinical-trial-launches-university-minnesota
|
Charts 3/19/2020 (Click on Underlined link.) 2020 PEERLESS DJI, Signals, Indicators Daily DJI Volume 10-DayUp/Down Vol Stoch-20 Inverted Traders Index Graph of Pct of All Stocks above 65-dma NASDAQ S&P OEX NYSE COMPQX DJI-15 DJI-20 DJI-30 DIA QQQ MDY IWM TNA Short-Term Rates SPY http://tigersoft.com/2020CST/SPY.GIF USO-CrudeOil DBO FAS GLD BBH IBB JETS JNUG KOL NUGT OIH OIL PALL RSX RETL SDS AGQ SLV SOXL TECL TLT TMF TNA UGA (gasoline) and China: YINN CHAU Commodities: CANE CORN DBC JJC, NIB, CHOC CORN, CUT (paper) MOO, SOYB WEAT UUP (Dollar) LIT (Lithium) AAPL ADBE ALXN AMAT AMGN AMD AMZN AXP BA BABA BAC BIDU BLDP CAT CVX DE FB GOOG GS HD IBM INTU JPM M (Macy's) MSFT NFLX NKE NVDA PG QCOM TSLA TXN XOM V WMT CMG , LRCX, SQ TOWN New highs and Bullish MAXCPs http://tigersoft.com/MAXMLK/3-19-20/BULLISH.htm Bearish MAXCPs - http://tigersoft.com/MINMLK/3-19-20/BEARISH.htm |
Table 1 QUICKSILVER on DJI-30 STOCKS 3/19/2020 6 Bullish 3 Bearish, ITRS and IP21 >+.25 and <-.25 STOCKS CLOSE CHANGE PIVOT-PT 5-dma AROC CL-PWR CANDLE IP21 ITRS ----------------------------------------------------------------------------------- ----------------------------------------------------------------------------------- AAPL 244.78 -1.89 277.97 -68% Bullish RED -.027 .116 --------------------------------------------------------------------- AXP 77.07 3.32 99.6 -376.2% ------- BLUE .06 -.08 --------------------------------------------------------------------- BA 97.71 -4.18 170.2 -2238.4% Bearish RED -.145 -.415 Bearish --------------------------------------------------------------------- CAT 103.01 2.89 99.64 553.4% Bullish BLUE .079 -.001 --------------------------------------------------------------------- CSCO 37.71 .59 37.64 636.4% Bullish BLUE .042 .09 --------------------------------------------------------------------- CVX 57.39 2.34 83.42 -1328.4% Bearish BLUE .032 -.222 --------------------------------------------------------------------- DIS 94.93 6.13 102.52 165.4% ------- BLUE .093 -.053 --------------------------------------------------------------------- GS 149.49 9.47 177.17 -38.1% ------- BLUE-.103 -.07 --------------------------------------------------------------------- HD 161.13 5.5 205.67 -827.1% Bearish BLUE .117 .033 --------------------------------------------------------------------- IBM 100.34 -3.21 107.95 -118.7% Bearish RED .001 .043 --------------------------------------------------------------------- INTC 45.94 -1.67 54.43 41.3% Bullish RED -.117 .075 --------------------------------------------------------------------- JNJ 127.05 -7.91 134.29 62.3% Bullish RED .04 .172 --------------------------------------------------------------------- JPM 85.3 1.41 103.91 -150.1% Bullish BLUE-.069 -.077 --------------------------------------------------------------------- KO 41.83 -3.02 48.47 -572.1% ------- RED .085 .067 --------------------------------------------------------------------- MCD 149.5 12.2 177.13 -719.6% Bullish BLUE .125 .033 --------------------------------------------------------------------- MMM 137.51 .49 141.68 145% ------- BLUE-.069 .068 --------------------------------------------------------------------- MRK 70.73 -.9 76.75 -253.2% Bullish RED .113 .088 --------------------------------------------------------------------- MSFT 142.71 2.31 158.83 126.7% Bullish RED -.066 .201 --------------------------------------------------------------------- NKE 70.34 2.3 75.58 -272.3% Bullish BLUE .129 -.013 --------------------------------------------------------------------- PFE 30.42 -1.94 32.71 63.5% Bullish RED -.017 .081 --------------------------------------------------------------------- PG 110.83 -6.62 114.07 401.3% Bullish RED .017 .204 --------------------------------------------------------------------- TRV 86.07 4.38 107.45 -851.8% Bearish BLUE .07 -.068 --------------------------------------------------------------------- UNH 219.8 2.74 272.04 -930.6% ------- BLUE .034 .054 --------------------------------------------------------------------- UTX 83.76 4.36 105.4 -994.5% Bearish BLUE .087 -.158 --------------------------------------------------------------------- V 152.25 3.77 175.83 -246.4% Bullish BLUE .017 .102 --------------------------------------------------------------------- VZ 53.62 -.7 54.17 228.3% Bullish RED .14 .195 Bullish --------------------------------------------------------------------- WBA 48.55 -4.26 46.19 802.1% Bullish RED .103 .114 --------------------------------------------------------------------- WMT 119.45 -3.13 114.1 679.3% Bullish RED .114 .32 Bullish --------------------------------------------------------------------- XOM 34.43 1.49 38.12 -382.9% Bearish BLUE-.119 -.215 Bearish |
      Table 2         QUICKSILVER on ETFS - 03/19/20

          last     change    Pivot      5-dma aroc  ClosPwr    Candle  IP21  ITRS
---------------------------------------------------------------------------------------------
DIA       201.31    1.92     232.11       -254.8%   Bearish      BLUE  -.001   0
---------------------------------------------------------------------------------------------
SPY       241.4    5.67      269.32       -134.7%   -------      BLUE  -.08   .043
---------------------------------------------------------------------------------------------
QQQ       177.66    1.06     192.34        9.5%     Bullish      BLUE  -.041  .12
---------------------------------------------------------------------------------------------
MDY       239.73    8.7      282.07       -360%     Bearish      BLUE  -.053 -.062
---------------------------------------------------------------------------------------------
IWM       103.87    3.9      119.47       -489%     Bearish      BLUE  -.06  -.074
---------------------------------------------------------------------------------------------
FAS       20.12    .86       40.74        -2028%    Bearish      BLUE -.096  -.488  Bearish
---------------------------------------------------------------------------------------------
RETL      5.78    .7         8.75         -1187.3%  Bearish      BLUE -.023  -.491
---------------------------------------------------------------------------------------------
SOXL      69.93    4.93      129.92       -1728.4%  Bearish      BLUE -.043  -.456
---------------------------------------------------------------------------------------------
TECL      97.18   -1.26      156.98       -804%     -------      BLUE -.042  -.313
---------------------------------------------------------------------------------------------
IBB       101.06    2.73     103.68        179.7%   Bullish      BLUE  .057   .144
---------------------------------------------------------------------------------------------
GLD       138.04   -2.66     143.28       -340%     Bearish      RED  -.28    .228 Bearish
---------------------------------------------------------------------------------------------
OIH       3.81    .42        4.46         -241.5%   Bearish      BLUE -.348  -.421 Bearish
---------------------------------------------------------------------------------------------
GASL      .09    0           .17          -806.5%   Bearish      ---- -.29   -.696  Bearish
---------------------------------------------------------------------------------------------
RSX       15.24    1.86      17.34        -90.8%   Bearish      BLUE -.061   -.102
|
 Table 3   Count of Stocks in Key Directories
           20200319
-------------------------------
NEWHIGHS       21
NEWLOWS        1861
MAXCP          158
MINCP          100
TTTNH          62
TTTNL          126
FASTUP         186
FASTDOWN       993
CPCROSSA       135
CPCROSSD       28
BIGVOLUP       66
BIGVODN        45
ACCUMVER       4
HIGHIP21       6
HIUPPCT        7
VHIP21         143
LOWACCUM       149
REDSELL        99
AUGSELS7       5
TRAPDOOR       725
|
Table 4    RANKING OF KEY DIRECTORIES BASED PCT.OF STOCKS ABOVE 65-DMA
              3/19/20
 46 Bearish
 0  Bullish
---------------------------------------------------------------------------------------
Directory     Current       day-1         day-2         day-3         day-4         day-5
----------------------------------------------------------------------------------------
COAL           .2            .2            .2            .2            0             0
INDEXES        .139          .15           .15           .155          .155          .161
COMODITY       .125          .125          .125          .125          .125          .15
HACKERS        .1            .1            0             0             0             0
FOOD           .092          .092          .092          .092          .092          .111
RETAIL         .08           .08           .1            .02           .04           .02
CHINA          .074          .055          .074          .055          .111          .074
BIOTECH        .068          .059          .092          .062          .092          .071
NASD-100       .061          .061          .061          .02           .061          .02
SOFTWARE       .05           .05           .033          .016          .016          .016
GAMING         .045          .045          .045          .045          .045          .045
RUS-1000       .034          .047          .056          .024          .047          .023
DOWJONES       .033          .033          .033          0             0             0
SP-100         .033          .044          .055          .011          .033          .011
OILGAS         .029          .029          .029          .029          .029          .022
SP500          .029          .046          .054          .023          .046          .018
SEMI           .028          .018          .028          .037          .046          .037
ELECTRON       .026          .019          .026          .026          .032          .026
INDMATER       .026          .026          .026          .013          0             .013
FIDSTKS        .022          .028          .033          .016          .05           .028
NIFTY          .021          .021          .021          0             .021          .021
BONDFUND       .02           .01           .02           .04           .02           .02
FINANCE        .011          .011          .011          .011          .023          .011
REIT           .007          .014          .014          .014          .035          .021
AUTO           0             0             0             0             0             0
BEVERAGE       0             0             0             0             0             0
BIGBANKS       0             0             0             0             0             0
CHEM           0             0             .04           0             0             0
COMPUTER       0             0             0             0             0             0
COPPER         0             0             0             0             0             0
DJI-13         0             0             0             0             0             0
EDU            0             0             0             0             .2            0
ETFS           0             0             0             0             0             0
GOLD           0             0             .062          0             0             .083
GREEN          0             .047          .095          0             0             0
GUNS           0             0             .066          0             0             0
HOMEBLDG       0             0             0             0             0             0
HOSPITAL       0             0             0             0             0             0
INFRA          0             0             0             0             0             0
INSURANC       0             0             .038          0             .038          0
JETS           0             0             0             0             0             0
MILITARY       0             0             0             0             0             0
REGBANKS       0             0             0             0             0             0
SOLAR          0             0             0             0             .058          0
UTILITY        0             .051          .051          0             0             0
TRANSP         0             0             0             0             0             0
|
=======================================================================
3/18/2020 The operative Peerless
signals remains the recent three earlier Sell S6s.
Again an otherwise promising previous day's rally was quickly squelched
by big money selling. The DJI plunged below the round number support
at 20000 and has now fallen 33% below its peak just 31 days ago. I've
argued that the decline represents "Big Money" rushing to the exits just
like overseas investors are. The primary propulson down for all the major
market ETFs is the plunging Opening Power.
![]()


Within the DJI-30, the Boeing is the biggest culprit. It has fallen a collossal
245.56 points since the market's peak. Dividing the 245.56 by the DJI's
divisor of 1474, we see that Boeing, all by itself, accounts for 1666 points
(or 1/6th) out of the total DJI's decline of 9652 points. Boeing
has now
reached the round number of 100. Perhaps, that will be support and a
technical bounce for Boeing and the other airlines will soon take place. At
this writing Crude Oil is up 10% this morning. That will help XOM and
CVX in the DJI-30, but it just adds to the cost of jet fuel. The underlying
problem is that Boeing and the airlines are already heavily in debt and now
have very little income right now. Airlines' travel is just way down. How
how long will this continue? If the airlines' sell-off was isolated, we could
be much more optimistic. But the airlines are a leading index. Many other
sectors are now in shock, too. See last night's Hotline.

But there is hope. China's new cases have
nearly dropped to zero. Public
health policies, like those taken in South Korea, Singapore and Germany
have greatly reduced the fatality rate. US health officials are learning.
The major hope, I believe, is that a vacine will be found against the
Coronavirus. Already, researchers are discovering that there are some
treatments for those who come down with the virus that work reasonably
well. See https://www.youtube.com/watch?v=Wu2Z6bdzlkE
But this protocol is not widely used or even
accepted. Most important, a
cure does not constitute a vacine that can be used for prevention. That will
take months. In the meantime, the market must stop falling at the Openings.
As long as the openings' trends are down and so weak, expect lower prices.
Without a new Peerless Buy signal, I think we should completely avoid the
long side and stay short all Airlines, Oils, Home Builders, Big Banks,
Restaurants and Casino stocks. These are the industries whose stocks
dominate our Bearish MINCPs and show an IP21 below -.25.
|
Charts 3/18/2020 (Click on Underlined link.) 2020 PEERLESS DJI, Signals, Indicators Daily DJI Volume 10-DayUp/Down Vol Stoch-20 Inverted Traders Index Graph of Pct of All Stocks above 65-dma NASDAQ S&P OEX NYSE COMPQX DJI-15 DJI-20 DJI-30 DIA QQQ MDY IWM TNA Short-Term Rates SPY http://tigersoft.com/2020CST/SPY.GIF USO-CrudeOil DBO FAS GLD BBH IBB JETS JNUG KOL NUGT OIH OIL PALL RSX RETL SDS AGQ SLV SOXL TECL TLT TMF TNA UGA (gasoline) and China: YINN CHAU Commodities: CANE CORN DBC JJC, NIB, CHOC CORN, CUT (paper) MOO, SOYB WEAT UUP (Dollar) LIT (Lithium) AAPL ADBE ALXN AMAT AMGN AMD AMZN AXP BA BABA BAC BIDU BLDP CAT CVX DE FB GOOG GS HD IBM INTU JPM M (Macy's) MSFT NFLX NKE NVDA PG QCOM TSLA TXN XOM V WMT CMG , LRCX, SQ TOWN New highs and Bullish MAXCPs http://tigersoft.com/MAXMLK/3-18-20/BULLISH.htm Bearish MAXCPs - http://tigersoft.com/MINMLK/3-18-20/BEARISH.htm |
Table 1 QUICKSILVER on DJI-30 STOCKS 3/18/2020 6 Bullish 3 Bearish, ITRS and IP21 >+.25 and <-.25 STOCKS CLOSE CHANGE PIVOT-PT 5-dma AROC CL-PWR CANDLE IP21 ITRS ----------------------------------------------------------------------------------- ----------------------------------------------------------------------------------- AAPL 246.67 -6.19 248.23 -554.5% Bullish BLUE .01 .128 --------------------------------------------------------------------- AXP 73.75 -12.83 83.53 -1199.1% Bearish RED .014 -.1 --------------------------------------------------------------------- BA 101.89 -22.25 159.03 -2823.3% Bearish BLUE-.174 -.389 Bearish --------------------------------------------------------------------- CAT 100.12 -.08 92.26 -29.3% Bullish BLUE .056 -.02 --------------------------------------------------------------------- CSCO 37.12 1.62 33.2 9.9% Bullish BLUE .04 .082 --------------------------------------------------------------------- CVX 55.05 -15.64 76.26 -1825.9% Bearish RED -.018 -.238 Bearish --------------------------------------------------------------------- DIS 88.8 -4.73 91.81 -870.7% Bearish BLUE .07 -.085 --------------------------------------------------------------------- GS 140.02 -18.65 150.68 -979.9% Bearish RED -.133 -.096 --------------------------------------------------------------------- HD 155.63 -18.01 190.59 -1510.4% Bearish RED .052 .013 --------------------------------------------------------------------- IBM 103.55 -3.1 102.81 -674.5% Bearish BLUE .008 .077 --------------------------------------------------------------------- INTC 47.61 -2.47 45.54 -411.1% Bullish BLUE-.075 .1 --------------------------------------------------------------------- JNJ 134.96 -1.63 125.41 120.6% Bullish BLUE .085 .242 Bullish --------------------------------------------------------------------- JPM 83.89 -9.87 88.05 -642% Bullish RED -.096 -.088 --------------------------------------------------------------------- KO 44.85 -2.33 47.16 -765.8% Bullish BLUE .142 .126 Bullish --------------------------------------------------------------------- MCD 137.3 -10.32 172.04 -1527.2% Bearish RED .062 -.016 --------------------------------------------------------------------- MMM 137.02 2.58 133.58 -371.4% ------- BLUE-.085 .072 --------------------------------------------------------------------- MRK 71.63 -2.85 74.45 -508.2% Bullish BLUE .105 .087 --------------------------------------------------------------------- MSFT 140.4 -6.17 139.06 -450.9% Bullish BLUE-.049 .188 --------------------------------------------------------------------- NKE 68.04 -1.8 74.2 -1077.2% Bullish BLUE .086 -.027 --------------------------------------------------------------------- PFE 32.36 .2 30.02 30.2% Bullish BLUE .006 .138 --------------------------------------------------------------------- PG 117.45 -.79 101.84 264.3% Bullish BLUE .061 .262 Bullish --------------------------------------------------------------------- TRV 81.69 -14.72 102.18 -1534% Bearish RED .009 -.099 --------------------------------------------------------------------- UNH 217.06 -27.16 265.35 -1181.8% ------- RED .027 .05 --------------------------------------------------------------------- UTX 79.4 -13.44 102.5 -1407.8% Bearish RED .03 -.178 --------------------------------------------------------------------- V 148.48 -9.41 160.08 -747.2% Bullish BLUE .003 .09 --------------------------------------------------------------------- VZ 54.32 .01 51.2 -48% Bullish BLUE .16 .206 Bullish --------------------------------------------------------------------- WBA 52.81 3.21 41.02 739.2% Bullish BLUE .15 .191 Bullish --------------------------------------------------------------------- WMT 122.58 3.32 104.05 364.8% Bullish BLUE .138 .347 Bullish --------------------------------------------------------------------- XOM 32.94 -3.87 37.18 -1343.9% Bearish RED -.154 -.23 Bearish |
Table 2 QUICKSILVER on ETFS - 03/18/20 last change Pivot 5-dma aroc ClosPwr Candle IP21 ITRS --------------------------------------------------------------------------------------------- DIA 199.39 -14.08 212.11 -831.4% Bearish RED -.028 ----- --------------------------------------------------------------------------------------------- SPY 235.73 -17.07 248.11 -751.9% ------- RED -.095 .034 --------------------------------------------------------------------------------------------- QQQ 176.6 -5.54 177.32 -508% Bullish BLUE-.039 .124 --------------------------------------------------------------------------------------------- MDY 231.03 -25.68 258.04 -1088.5% Bearish RED -.078 -.077 --------------------------------------------------------------------------------------------- IWM 99.97 -8.4 114.55 -1132.6% Bearish RED -.094 -.09 --------------------------------------------------------------------------------------------- FAS 19.26 -6.82 31.69 -3675% Bearish RED -.13 -.491 Bearish --------------------------------------------------------------------------------------------- SOXL 65 -22.71 102.04 -3737.5% Bearish RED -.061 -.449 --------------------------------------------------------------------------------------------- TECL 98.44 -10.33 115.84 -2543.2% Bullish BLUE-.033 -.299 --------------------------------------------------------------------------------------------- IBB 98.33 -2.97 97.5 -428.7% Bullish BLUE .048 .131 --------------------------------------------------------------------------------------------- GLD 140.7 -2.86 147.79 -453% Bearish RED -.231 .26 --------------------------------------------------------------------------------------------- OIH 3.39 -.53 4 -1549.8% Bearish RED -.372 -.448 Bearish --------------------------------------------------------------------------------------------- GASL .09 -.03 .11 -1865.7% Bearish --- -.311 -.686 Bearish --------------------------------------------------------------------------------------------- RSX 13.38 -2.39 15.52 -1291.8% Bearish RED -.127 -.168 Bearish |
 Table 3   Count of Stocks in Key Directories
           20200318
-------------------------------
NEWHIGHS       30
NEWLOWS        3931
MAXCP          199
MINCP          608
TTTNH          72
TTTNL          578
FASTUP         71
FASTDOWN       993
CPCROSSA       31
CPCROSSD       223
BIGVOLUP       5
BIGVODN        263
ACCUMVER       3
HIGHIP21       9
HIUPPCT        8
VHIP21         144
LOWACCUM       153
REDSELL        93
AUGSELS7       4
TRAPDOOR       725
|
 Table 4  RANKING OF KEY DIRECTORIES BASED PCT.OF STOCKS ABOVE 65-DMA
 Bearish = 46
 Bullish = 0
              3/18/20
---------------------------------------------------------------------------------------
Directory     Current       day-1         day-2         day-3         day-4         day-5
----------------------------------------------------------------------------------------
COAL           .2            .2            .2            0             0             0
INDEXES        .15           .15           .155          .155          .161          .161
COMODITY       .125          .125          .125          .125          .15           .225
HACKERS        .1            .05           0             0             0             .05
FOOD           .092          .092          .092          .092          .111          .185
RETAIL         .08           .1            .02           .04           .02           .06
NASD-100       .061          .072          .03           .061          .02           .072
BIOTECH        .056          .089          .059          .092          .077          .134
CHINA          .055          .074          .055          .111          .074          .166
UTILITY        .051          .051          0             0             0             .051
SOFTWARE       .05           .05           .016          .016          .016          .033
GREEN          .047          .095          0             0             0             0
RUS-1000       .047          .057          .024          .047          .023          .045
SP500          .046          .056          .023          .046          .018          .044
GAMING         .045          .045          .045          .045          .045          .045
SP-100         .044          .055          .011          .033          .011          .022
DOWJONES       .034          .034          0             0             0             0
OILGAS         .029          .029          .029          .029          .022          .037
FIDSTKS        .028          .033          .016          .05           .028          .056
INDMATER       .026          .026          .013          0             .013          0
NIFTY          .021          .021          0             .021          .021          .085
ELECTRON       .019          .026          .026          .032          .026          .052
SEMI           .018          .028          .037          .046          .037          .065
REIT           .014          .014          .014          .035          .021          .028
FINANCE        .011          .011          .011          .023          .011          .011
BONDFUND       .01           .02           .04           .02           .02           .05
AUTO           0             0             0             0             0             .05
BEVERAGE       0             0             0             0             0             0
BIGBANKS       0             0             0             0             0             0
CHEM           0             .04           0             0             0             .02
COMPUTER       0             0             0             0             0             0
COPPER         0             0             0             0             0             0
DJI-13         0             0             0             0             0             0
EDU            0             0             0             .2            0             0
ETFS           0             0             0             0             0             0
GOLD           0             .062          0             0             .083          .166
GUNS           0             .066          0             0             0             0
HOMEBLDG       0             0             0             0             0             0
HOSPITAL       0             0             0             0             0             0
INFRA          0             0             0             0             0             0
INSURANC       0             .038          0             .038          0             0
JETS           0             0             0             0             0             0
MILITARY       0             0             0             0             0             0
REGBANKS       0             0             0             0             0             0
SOLAR          0             0             0             .058          0             .117
TRANSP         0             0             0             0             0             0
|
=======================================================================
3/17/2020 The operative Peerless
signals remains the recent three earlier Sell S6s.
Today's big advance in the Indexes looks like it
will be wiped out tomorrow,
just as every other advance has been since early February. "Big money"
continues to be in a great hurry to sell after all one-day advances. Or is
this overseas money? Which ever, the pattern is now well established
and it is associated with deep bear markets. The Coronavirus was completely
unexpected. There was no time for distribution at the top or a classic
head and shoulders pattern. So, Big Money selling is all along the steep decline.

Each day brings more mandatory closings. California restaurants must
all be drive-through. Nevada has closed all its casinos, movies
and restaurants. Most people do not have to be told to stay at home
except for getting essentials. Layoffs are increasing. Homebuilding
stocks are getting clobbered just like they were in 1929. Each day new rules
are adopted. Will there be curfews? Will there be ration cards? Will
there be war-time production and distribution? And will $1000 per
person be enough? We can see what may lie ahead by looking at the
very weakest MINCP stocks. All these are making Closing Power new
lows and down 70% of more for the last 21 trading days (last month).
I fear that all those that show an IP21 (Accumulation Index) below -.25
have a lot further to fall. There is
no reason to cover our short sales or
take long positions.

  MINCP stocks....  Pct. Change ... Days back= 21
  2/14/2020 - 3/17/2020
Symbol Name Price Pct.Down IP21 --------- ---------------------------------- ---------- ----- MGM Mgm Resorts International 9.55 -70% -.302 NS Nustar Energy LP 8.46 -70% -.302 PBFX PBF Logistics LP 6.3 -70% -.389 TMHC Taylor Morrison Home Corp 8.59 -70% -.258 USFD US Foods Holding Corp 12.33 -70% -.332 CAR Avis Budget Group Inc 12.15 -71% -.194 CCL Carnival Corp 12.71 -71% -.124 HTZ Hertz Global Holdings Inc 5.6 -72% -.197 LABU Daily S&P Biotech Bull 3X 16.35 -73% -.017 FANG Diamondback Energy` Inc. 20.23 -74% -.051 JACK Jack In The Box Inc 23.25 -74% -.313 SAVE Spirit Airlines` Inc 11.72 -74% -.20 BJRI BJ's Restaurants Inc 10.58 -75% -.238 MUR Murphy Oil Corp 5.55 -75% -.19 RCL Royal Caribbean Cruises 27.66 -76% -.263 RUTH Ruth's Hospitality Group` 5.42 -76% -.32 SEAS SeaWorld Entertainment` Inc 8.74 -77% -.203 CNK Cinemark Holdings Inc 6.96 -78% -.244 RHP Ryman Hospitality Properties`20.31 -78% -.401 TGI Triumph Group Inc 5.41 -78% -.051 RRR Red Rock Resorts 5.76 -79% -.246 CHEF The Chefs' Warehouse inc 7.67 -80% -.426 EAT Brinker International 8.58 -80% -.194 SGMS Scientific Games Corp 5.9 -80% -.197 PENN Penn National Gaming Inc. 7.33 -81% -.402 TRGP Targa Resources Corp 7.21 -81% -.185 RRGB Red Robin Gourmet 5.78 -84% -.458 PLAY Dave & Buster's Entertain. 6.53 -87% -.302 NAIL Direxion Daily Homebuild 3X 9.92 -90% -.068 |
|
Charts 3/17/2020 (Click on Underlined link.) 2020 PEERLESS DJI, Signals, Indicators Daily DJI Volume 10-DayUp/Down Vol Stoch-20 Inverted Traders Index Graph of Pct of All Stocks above 65-dma NASDAQ S&P OEX NYSE COMPQX DJI-15 DJI-20 DJI-30 DIA QQQ MDY IWM TNA Short-Term Rates SPY http://tigersoft.com/2020CST/SPY.GIF USO-CrudeOil DBO FAS GLD BBH IBB JETS JNUG KOL NUGT OIH OIL PALL RSX RETL SDS AGQ SLV SOXL TECL TLT TMF TNA UGA (gasoline) and China: YINN CHAU Commodities: CANE CORN DBC JJC, NIB, CHOC CORN, CUT (paper) MOO, SOYB WEAT UUP (Dollar) LIT (Lithium) AAPL ADBE ALXN AMAT AMGN AMD AMZN AXP BA BABA BAC BIDU BLDP CAT CVX DE FB GOOG GS HD IBM INTU JPM M (Macy's) MSFT NFLX NKE NVDA PG QCOM TSLA TXN XOM V WMT CMG , LRCX, SQ TOWN New highs and Bullish MAXCPs http://tigersoft.com/MAXMLK/3-17-20/BULLISH.htm Bearish MAXCPs - http://tigersoft.com/MINMLK/3-17-20/BEARISH.htm |
Table 1 QUICKSILVER on DJI-30 STOCKS 3/17/2020 2 Bullish 2 Bearish, ITRS and IP21 >+.25 and <-.25 STOCKS CLOSE CHANGE PIVOT-PT 5-dma AROC CL-PWR CANDLE IP21 ITRS ----------------------------------------------------------------------------------- ----------------------------------------------------------------------------------- AAPL 252.86 10.65 275.43 -610.9% Bullish BLUE .004 .105 --------------------------------------------------------------------- AXP 86.58 .71 95.38 -893.8% ------- RED .017 -.051 --------------------------------------------------------------------- BA 124.14 -5.47 189.08 -3039.8% Bearish RED -.28 -.373 Bearish --------------------------------------------------------------------- CAT 100.2 6.79 100.69 -319.3% Bearish BLUE .03 -.071 --------------------------------------------------------------------- CSCO 35.5 1.79 37.05 -630.2% Bullish BLUE -.003 0 --------------------------------------------------------------------- CVX 70.69 .99 83.03 -899% ------- BLUE .066 -.161 --------------------------------------------------------------------- DIS 93.53 -1.48 105.82 -884.8% Bearish RED 0 -.107 --------------------------------------------------------------------- GS 158.67 4.01 171.89 -765.4% ------- BLUE -.101 -.06 --------------------------------------------------------------------- HD 173.64 8.68 212.89 -1301.7% Bearish BLUE .014 .048 --------------------------------------------------------------------- IBM 106.65 7.57 117.97 -819.8% Bearish BLUE .017 .048 --------------------------------------------------------------------- INTC 50.08 5.47 51.66 -389.7% Bullish BLUE -.083 .088 --------------------------------------------------------------------- JNJ 136.59 9.46 131.8 -191.2% Bullish BLUE .018 .201 --------------------------------------------------------------------- JPM 93.76 5.4 95.96 -363.7% Bullish BLUE -.087 -.068 --------------------------------------------------------------------- KO 47.18 1.92 52.21 -656.5% Bullish BLUE .071 .117 --------------------------------------------------------------------- MCD 147.62 -1.39 188.25 -1473.6% Bearish RED .011 -.008 --------------------------------------------------------------------- MMM 134.44 3.53 147.24 -667.2% Bearish BLUE -.125 .008 --------------------------------------------------------------------- MRK 74.48 4.56 79.25 -493% Bullish BLUE .095 .071 --------------------------------------------------------------------- MSFT 146.57 11.15 153.63 -479.7% Bullish BLUE -.036 .178 --------------------------------------------------------------------- NKE 69.84 3.05 84 -1186.8% ------- BLUE .011 -.06 --------------------------------------------------------------------- PFE 32.16 1.98 32.17 -380.5% Bullish BLUE -.044 .081 --------------------------------------------------------------------- PG 118.24 9.74 111.59 -103.8% Bullish BLUE .032 .219 --------------------------------------------------------------------- TRV 96.41 11.31 112.6 -1098.9% Bearish BLUE .021 -.042 --------------------------------------------------------------------- UNH 244.22 19.18 277.78 -677.5% Bullish BLUE .032 .098 --------------------------------------------------------------------- UTX 92.84 1.91 107.51 -1261.6% Bearish BLUE .006 -.14 --------------------------------------------------------------------- V 157.89 5.88 172.95 -732.4% Bullish BLUE -.02 .087 --------------------------------------------------------------------- VZ 54.31 3.32 54.83 -206.4% Bullish BLUE .125 .154 Bullish --------------------------------------------------------------------- WBA 49.6 4.52 46.07 48.3% Bullish BLUE .058 .094 --------------------------------------------------------------------- WMT 119.26 12.5 114.43 -23.7% Bullish BLUE .162 .266 Bullish --------------------------------------------------------------------- XOM 36.81 2.32 43.14 -840.4% Bearish BLUE -.139 -.222 Bearish |
Table 2 QUICKSILVER on ETFS - 03/17/20 last change Pivot 5-dma aroc ClosPwr Candle IP21 ITRS --------------------------------------------------------------------------------------------- DIA 213.47 10.98 235.84 -816.4% Bearish BLUE-.044 ------ --------------------------------------------------------------------------------------------- SPY 252.8 12.95 274.36 -674.6% ------- BLUE-.081 .039 --------------------------------------------------------------------------------------------- QQQ 182.14 12.84 195.22 -585.4% Bullish BLUE-.067 .105 --------------------------------------------------------------------------------------------- MDY 256.71 13.14 288.91 -951.9% Bearish BLUE-.064 -.059 --------------------------------------------------------------------------------------------- IWM 108.37 4.75 125.88 -1089.6% Bearish BLUE-.074 -.089 --------------------------------------------------------------------------------------------- FAS 26.08 1.22 43.84 -3412.3% Bearish BLUE-.131 -.47 --------------------------------------------------------------------------------------------- RETL 6.27 .26 11.57 -4367.1% Bearish BLUE-.159 -.513 --------------------------------------------------------------------------------------------- SOXL 87.71 7.93 146.64 -3499.7% Bearish BLUE-.044 -.428 --------------------------------------------------------------------------------------------- TECL 108.77 8.56 164.15 -2804.8% ------- BLUE-.065 -.305 --------------------------------------------------------------------------------------------- IBB 101.3 6.91 106.97 -534.6% Bullish BLUE .056 .11 --------------------------------------------------------------------------------------------- GLD 143.56 1.92 153.93 -368.4% Bearish BLUE-.218 .239 --------------------------------------------------------------------------------------------- OIH 3.92 .02 4.69 -1438.2% Bearish ---- -.329 -.455 --------------------------------------------------------------------------------------------- GASL .12 -.01 .14 -2364.9% Bearish ---- -.3 -.734 --------------------------------------------------------------------------------------------- RSX 15.77 .7 17.58 -912.8% Bearish BLUE-.093 -.117 |
Table 3    Count of Stocks in Key Directories
           20200317
-------------------------------
NEWHIGHS       20
NEWLOWS        2428
MAXCP          249
MINCP          382
TTTNH          113
TTTNL          379
FASTUP         65
FASTDOWN       993
CPCROSSA       175
CPCROSSD       42
BIGVOLUP       20
BIGVODN        93
ACCUMVER       3
HIGHIP21       8
HIUPPCT        11
VHIP21         149
LOWACCUM       151
REDSELL        100
AUGSELS7       6
TRAPDOOR       564
|
 Table 3  RANKING OF KEY DIRECTORIES BASED PCT.OF STOCKS ABOVE 65-DMA
              3/17/20
 46 Bearish
 0 Bullish
---------------------------------------------------------------------------------------
Directory     Current       day-1         day-2         day-3         day-4         day-5
----------------------------------------------------------------------------------------
COAL           .2            .2            0             0             0             0
INDEXES        .15           .155          .155          .161          .161          .177
COMODITY       .125          .125          .125          .15           .225          .225
RETAIL         .1            .02           .04           .02           .06           .1
GREEN          .095          0             0             0             0             .047
FOOD           .092          .092          .092          .111          .185          .185
BIOTECH        .086          .056          .089          .077          .14           .179
CHINA          .074          .055          .111          .074          .166          .203
NASD-100       .072          .041          .072          .02           .072          .154
GUNS           .066          0             0             0             0             0
GOLD           .062          0             0             .083          .166          .291
RUS-1000       .057          .025          .047          .023          .043          .103
SP500          .056          .025          .046          .018          .042          .102
SP-100         .055          .011          .033          .011          .022          .077
UTILITY        .051          0             0             0             .051          .179
HACKERS        .05           .05           0             0             .05           .05
SOFTWARE       .05           .033          .016          .016          .033          .066
GAMING         .045          .045          .045          .045          .045          .136
CHEM           .04           0             0             0             .02           .02
INSURANC       .038          0             .038          0             0             .076
DOWJONES       .033          0             0             0             0             .033
FIDSTKS        .033          .016          .05           .028          .056          .101
OILGAS         .03           .03           .03           .022          .037          .045
SEMI           .028          .037          .046          .037          .065          .093
ELECTRON       .026          .026          .032          .026          .052          .071
INDMATER       .026          .013          0             .013          0             .026
NIFTY          .021          0             .021          .021          .085          .127
BONDFUND       .02           .04           .02           .02           .04           .31
REIT           .014          .014          .035          .021          .028          .12
FINANCE        .011          .011          .023          .011          .011          .047
AUTO           0             0             0             0             .05           .075
BEVERAGE       0             0             0             0             0             .066
BIGBANKS       0             0             0             0             0             0
COMPUTER       0             0             0             0             0             0
COPPER         0             0             0             0             0             0
DJI-13         0             0             0             0             0             0
EDU            0             0             .2            0             0             .2
ETFS           0             0             0             0             0             0
HOMEBLDG       0             0             0             0             0             0
HOSPITAL       0             0             0             0             0             .09
INFRA          0             0             0             0             0             .028
JETS           0             0             0             0             0             0
MILITARY       0             0             0             0             0             0
REGBANKS       0             0             0             0             0             0
SOLAR          0             0             .058          0             .117          .235
TRANSP         0             0             0             0             0             0
|
=======================================================================
3/16/2020 The
operative Peerless signals remains the three earlier Sell S6s.
Today's
dramatic 3000 point DJI decline reinforced the Sell S6 pattern wherein the
DJI quickly turns down after what seemed a promising one-day rally. This
shows that "Big money" continues to be in a great hurry to sell. We see the
same thing early in the big declines of 1929, 1930, 1931, 1937, 1987 and
2008.


Adding to the bearishness even with the DJI already down 32% in only
21-trading days is the fact that the DJI has never before fallen so far so fast,
going back to 1915. By comparison, it took the DJI 38 trading days to fall
32% from its highs in 1929, 43 trading days in 1937 and 39 days in 1987
and five months in 2008 from its peak. The "knife" is falling way too
fast"
to catch!
The speed of the decline is factored in by our Peerless program as "AROC",
the annualized rate of change of the 21-dma. AROC is now -4.143,
meaning if you multipled the daily one day change in the 21-day ma by
250 to annualize the daily change number, you would get -414.3% Such
a rate of decline obviously cannnot be sustained. But it can go still lower.
Its lowest level ever was -6.381 (-638.1%) at the bottom on 11/13/1929
when the DJI was down almost 48% from its 9/3/1929 peak. Another very
low AROC score, -4.806 (-486.1%) marked th bottom of 10/31/1931.
The AROC value of -141.3% now has not been matched since.
Also extremely low are the P-I and V-I values of -907 and -635. We
are in extraordinary times. The Percentage Down number of 32% looks
bleak but 1929 shows it can go lower, to 48%. With the P-I also very
low, we cannot get a Buy signal from Peerless. It seems too risky even
now to be a buyer. Perhaps, when the DJI is down 40% from its high.
Until then, I can only repeat what I have been saying: stay short the airlines
and oil stocks. Trying to call a bottom keeps being punished. That leaves
a lot of traders wanting to get out even on any rally.
Bear markets do no take all stocks down at once. When we study the
stocks in the DJI producing the decline, we see only about 6 are doing
all the damage, presently. But their weakness will force much more selling
in the stocks that have held up. With the DJI down more than 20% for
the first time in ten years, PEs are still high, especially if you factor in
negative growth for the next six months. So, hold your shorts and avoid
the long side. We have not had a 2-day rally since early February.
BA led the advance, now it is leading the decline.

Weakest DJI-30 Stocks Tell Us Weakest
Industry Groups:
Airlines, International Oils, International Banking.
BA is down 63% in last 21-trading days
XOM is down 41% in last 21-trading days
CVX is down 38% in last 21-trading days
AXP is down 37% in last 21-trading days
JPM is down 37% in last 21-trading days
GS is down 36% in last 21-trading days
|
Charts 3/16/2020 (Click on Underlined link.) 2020 PEERLESS DJI, Signals, Indicators Daily DJI Volume 10-DayUp/Down Vol Stoch-20 Inverted Traders Index Graph of Pct of All Stocks above 65-dma NASDAQ S&P OEX NYSE COMPQX DJI-15 DJI-20 DJI-30 DIA QQQ MDY IWM TNA Short-Term Rates SPY http://tigersoft.com/2020CST/SPY.GIF USO-CrudeOil DBO FAS GLD BBH IBB JETS JNUG KOL NUGT OIH OIL PALL RSX RETL SDS AGQ SLV SOXL TECL TLT TMF TNA UGA (gasoline) and China: YINN CHAU Commodities: CANE CORN DBC JJC, NIB, CHOC CORN, CUT (paper) MOO, SOYB WEAT UUP (Dollar) LIT (Lithium) AAPL ADBE ALXN AMAT AMGN AMD AMZN AXP BA BABA BAC BIDU BLDP CAT CVX DE FB GOOG GS HD IBM INTU JPM M (Macy's) MSFT NFLX NKE NVDA PG QCOM TSLA TXN XOM V WMT CMG , LRCX, SQ TOWN New highs and Bullish MAXCPs http://tigersoft.com/MAXMLK/3-16-20/BULLISH.htm Bearish MAXCPs - http://tigersoft.com/MINMLK/3-16-20/BEARISH.htm |
Table 1 QUICKSILVER on DJI-30 STOCKS 3/16/2020 1 Bullish 2 Bearish, ITRS and IP21 >+.25 and <-.25 STOCKS CLOSE CHANGE PIVOT-PT 5-dma AROC CL-PWR CANDLE IP21 ITRS ----------------------------------------------------------------------------------- ----------------------------------------------------------------------------------- AAPL 242.21 -35.76 285.34 -442.7% Bullish BLUE -.023 .105 --------------------------------------------------------------------- AXP 85.87 -13.73 103.3 -646.7% ------- BLUE .013 -.019 --------------------------------------------------------------------- BA 129.61 -40.59 231.01 -2497.7% Bearish RED -.417 -.313 Bearish --------------------------------------------------------------------- CAT 93.41 -6.23 106.49 -529.7% Bearish BLUE -.027 -.081 --------------------------------------------------------------------- CSCO 33.71 -3.93 40.08 -571.5% ------- BLUE -.013 -.005 --------------------------------------------------------------------- CVX 69.7 -13.72 84.98 -671.6% ------- RED .036 -.128 --------------------------------------------------------------------- DIS 95.01 -7.51 111.46 -452.6% Bearish BLUE .003 -.06 --------------------------------------------------------------------- GS 154.66 -22.51 184.35 -529.5% Bearish BLUE -.115 -.042 --------------------------------------------------------------------- HD 164.96 -40.71 225.7 -1088.2% Bearish RED -.06 .049 --------------------------------------------------------------------- IBM 99.08 -8.87 124.77 -819.6% Bearish BLUE -.055 .03 --------------------------------------------------------------------- INTC 44.61 -9.82 53.98 -608.3% ------- RED -.127 .032 --------------------------------------------------------------------- JNJ 127.13 -7.16 141.64 -347.6% Bullish BLUE -.044 .169 --------------------------------------------------------------------- JPM 88.36 -15.55 100.7 -263.5% ------- BLUE -.111 -.075 --------------------------------------------------------------------- KO 45.26 -3.21 53.66 -651.2% Bullish BLUE .033 .121 --------------------------------------------------------------------- MCD 149.01 -28.12 199.86 -1023.9% Bearish RED -.078 .041 --------------------------------------------------------------------- MMM 130.91 -10.77 153.3 -456.7% Bearish BLUE -.132 .026 --------------------------------------------------------------------- MRK 69.92 -6.83 82.02 -577.4% Bullish BLUE .095 .058 ---------------------------------------------------------------------------------- MSFT 135.42 -23.41 160.92 -498% ------- RED -.073 .142 --------------------------------------------------------------------- NKE 66.79 -8.79 88.3 -1066% Bearish BLUE -.004 -.048 --------------------------------------------------------------------- PFE 30.18 -2.53 34.59 -548.2% Bullish BLUE -.094 .069 --------------------------------------------------------------------- PG 108.5 -5.57 120.55 -335% Bullish BLUE .003 .178 --------------------------------------------------------------------- TRV 85.1 -22.35 119.57 -1393.4%Bearish RED -.066 -.083 --------------------------------------------------------------------- UNH 225.04 -47 280 -884.1% ------- RED -.011 .068 --------------------------------------------------------------------- UTX 90.93 -14.47 119.37 -1110.2%Bearish RED -.069 -.108 --------------------------------------------------------------------- V 152.01 -23.82 182.6 -554.1% Bullish BLUE -.021 .094 --------------------------------------------------------------------- VZ 50.99 -3.18 56.52 -444% Bullish BLUE .102 .134 --------------------------------------------------------------------- WBA 45.08 -1.11 49.16 -363.8% ------- BLUE -.017 .061 --------------------------------------------------------------------- WMT 106.76 -7.34 119.79 -456.5% Bullish BLUE .093 .196 Bullish --------------------------------------------------------------------- XOM 34.49 -3.63 43.41 -904.5% Bearish BLUE -.176 -.215 Bearish |
Table 2 QUICKSILVER on ETFS - 03/16/20 last change Pivot 5-dma aroc ClosPwr Candle IP21 ITRS --------------------------------------------------------------------------------------------- DIA 202.49 -29.62 250.47 -774.6% Bearish RED -.124 ----- --------------------------------------------------------------------------------------------- SPY 239.85 -29.47 288.42 -634.6% Bearish RED -.11 .037 --------------------------------------------------------------------------------------------- QQQ 169.3 -23.04 204.11 -630.4% ------- RED -.109 .082 --------------------------------------------------------------------------------------------- MDY 243.57 -38.5 309.33 -935.8% Bearish RED -.109 -.054 --------------------------------------------------------------------------------------------- IWM 103.62 -15.85 134.43 -1087.7% Bearish RED -.121 -.077 --------------------------------------------------------------------------------------------- FAS 24.86 -15.88 52.51 -2356.3% Bearish RED -.186 -.443 --------------------------------------------------------------------------------------------- RETL 6.01 -2.74 14.73 -3567% Bearish RED -.181 -.483 --------------------------------------------------------------------------------------------- SOXL 79.78 -50.14 176.6 -2434.6% Bearish RED -.148 -.428 --------------------------------------------------------------------------------------------- TECL 100.21 -56.77 190.4 -1898.7% ------- RED -.102 -.309 --------------------------------------------------------------------------------------------- IBB 94.39 -9.29 112.31 -735.7% Bearish RED .042 .086 --------------------------------------------------------------------------------------------- GLD 141.64 -1.64 154.48 -533.8% Bearish BLUE-.23 .282 --------------------------------------------------------------------------------------------- OIH 3.9 -.56 5.2 -1157.3% Bearish BLUE-.329 -.409 --------------------------------------------------------------------------------------------- GASL .13 -.04 .19 -3735.6% Bearish -----.252 -.688 --------------------------------------------------------------------------------------------- UGA .13 -.04 .19 -3735.6% Bullish -----.256 -.697 --------------------------------------------------------------------------------------------- UUP 25.98 -.06 26.26 -53.5% ------- -----.019 .277 --------------------------------------------------------------------------------------------- IEF 25.98 -.06 26.26 -53.5% Bullish -----.009 -.473 --------------------------------------------------------------------------------------------- CORN 25.98 -.06 26.26 -53.5% ------- ---- .054 1.104 --------------------------------------------------------------------------------------------- WEAT 25.98 -.06 26.26 -53.5% ------- ---- .074 3.801 --------------------------------------------------------------------------------------------- YINN 25.98 -.06 26.26 -53.5% Bullish -----.042 .777 --------------------------------------------------------------------------------------------- RSX 15.07 -2.27 18.85 -686% Bearish RED -.131 -.113 |
  Table 3  Count of Stocks in Key Directories
           20200316
-------------------------------
NEWHIGHS       18
NEWLOWS        4936
MAXCP          104
MINCP          488
TTTNH          71
TTTNL          343
FASTUP         46
FASTDOWN       994
CPCROSSA       93
CPCROSSD       148
BIGVOLUP       4
BIGVODN        138
ACCUMVER       5
HIGHIP21       4
HIUPPCT        12
VHIP21         151
LOWACCUM       152
REDSELL        105
AUGSELS7       6
TRAPDOOR       562
|
Table 4  RANKING OF KEY DIRECTORIES BASED PCT.OF STOCKS ABOVE 65-DMA
             3/16/20
  None were bullish...
---------------------------------------------------------------------------------------
Directory     Current       day-1         day-2         day-3         day-4         day-5
----------------------------------------------------------------------------------------
COAL           .2            0             0             0             0             0
INDEXES        .155          .155          .161          .161          .177          .172
COMODITY       .125          .125          .15           .225          .225          .225
FOOD           .092          .092          .111          .185          .185          .185
CHINA          .055          .111          .074          .166          .203          .129
BIOTECH        .053          .086          .074          .14           .185          .161
HACKERS        .05           .05           0             .05           .05           .05
GAMING         .045          .045          .045          .045          .136          .045
NASD-100       .041          .082          .03           .072          .154          .072
BONDFUND       .04           .02           .02           .04           .31           .54
SEMI           .037          .046          .037          .065          .093          .065
SOFTWARE       .033          .033          .016          .033          .066          .066
OILGAS         .03           .03           .022          .037          .045          .037
ELECTRON       .026          .032          .026          .052          .071          .045
RUS-1000       .025          .049          .023          .043          .103          .061
SP500          .025          .048          .018          .042          .102          .063
RETAIL         .02           .04           .02           .06           .1            .08
FIDSTKS        .016          .05           .028          .056          .101          .056
REIT           .014          .035          .021          .028          .12           .056
INDMATER       .013          0             .013          0             .026          .026
FINANCE        .011          .023          .011          .011          .035          .023
SP-100         .011          .033          .011          .022          .077          .033
AUTO           0             0             0             .05           .075          .025
BEVERAGE       0             0             0             0             .066          0
BIGBANKS       0             0             0             0             0             0
CHEM           0             0             0             .02           .02           .02
COMPUTER       0             0             0             0             0             0
COPPER         0             0             0             0             0             0
DJI-13         0             0             0             0             0             0
DOWJONES       0             0             0             0             .033          .033
EDU            0             .2            0             0             .2            .2
ETFS           0             0             0             0             0             0
GOLD           0             0             .083          .166          .291          .27
GREEN          0             0             0             0             .047          .047
GUNS           0             0             0             0             0             0
HOMEBLDG       0             0             0             0             0             0
HOSPITAL       0             0             0             0             .09           .045
INFRA          0             0             0             0             .028          0
INSURANC       0             .038          0             0             .076          0
JETS           0             0             0             0             0             0
MILITARY       0             0             0             0             0             0
NIFTY          0             .021          .021          .085          .127          .127
REGBANKS       0             0             0             0             0             0
SOLAR          0             .058          0             .117          .235          .176
UTILITY        0             0             0             .051          .179          .153
TRANSP         0             0             0             0             0             0
|
====================================================================
3/13/2020
The current Peerless
remains the three earlier Sell S6s seen on the
DJI chart below. They warn us to be particulalry wary of one-day DJI
bursts, even Friday's 2000 point move upward, because they they
have shown a regular pattern recently of completely failing and then
being followed immediately by an even bigger decline. This action
may be happening again this morning, as the DJI futures are down their limit,
just over 1000 points, and even though the FED has decided that they will
lower interest rates to ZERO Pct for member banks. The market here
is also ignoring the House of Representatives passage of an emergency
bailout of small businesses who have to close their businesses because of the
pandemic.
Is the DJI now "oversold" enough to allow more than a
technical bounce?
When we look at past bear markets, we see that in four significant ways
Peerless does not show the DJI to be as "oversold" as some may feel.
This means more downside action is likely.
Compare the (1) DJI's pct decline, (2) "la/ma", (3) "aroc" and (4)
"VI" of
Thursday with their levels on their first bottoms of 1929, 1937, 1940, 1987
and 2008.
1)
3/12 28% decline ... is not as much as 1929 (40%), 1937
(33%), 1987 (36%),
2008 (35%).
2) 3/12 la/ma =.79... is not
as weak as 1929 (.707) or 1987 (.698)
3) 3/12 aroc = -3.531
... is not as weak as 1929 (-4.078) or 1987 (-3.669)
4) 9/12 VI = -637 ... is not as weak as 1929
est.(-2206), 1937 (-767), 1940 (-672), 1962 (-1507)
See Table 5 below for more details.
Conclusion
Until we get a Buy signal from the new Peerless system,
avoid the
long side. Stay short airlines and oil stocks. The pandemic now is
not going to suddenly end. It will likely take months before things
can start returning to normal.

Do Not Trust The "Old Peerless"
The old Peerless (2006) did give a Buy B16 with
Friday'c slose, but my
study of deep declines by the DJI shows that we cannot yet believe
that the worse is over, especially since the DJI is down more than 20%
from its highs in record time. The old Peerless was written in 2006
and was not tested against pre-1966 data or all the data from 2006-2019.
It also forces the user to decide which mode the market is in when
that is not always clear. Table 5 below shows that there were many more
cases of extreme bear markets before 1966 as well as the 2008 case
to study and learn from than were available when the 2006 version
of Peerless was written.

Wise Public Policies Can Save Us from Disaster.
Though the pandemic's disruption of the world economy is alarming
and growing, there are grounds for hope that the worst can be delayed or
limited here in the US. Just as the President has discovered how dangerous
this epidemic is, so can we. With this knowledge, we can take steps that
may save lives.
America has now learned enough from other countries' experiences
to hold back the deadliness of the virus now. How much can public
policy-making ameliorate the suffering ahead? Of course, that depends
a lot on the testing since the virus has a gestation period of up to three weeks
and untested people can still be walking around with the disease and not know it.
The fellow next to us at a restaurant, bar or in a theatre can be highly
contagious and dangerous to us. All the assurances given by the owners
of these venues are quite misleading.
At some point, the virus could mutate and become even more deadly
in a second wave. It might even infect the same person more than once.
So, we will not soon be able to put down our guard.
But even given these dangers, history shows that preventive measures
against the virus can delay its virulence. Back in the deadly
1918-1919 Spanish Flu pandemic that killed millions so fast that mass
graves had to be used in New York City, Philadelphia and Boston,
the cities of Saint Louis and San Fransisco largely escaped the worst.
The municipal governments there understood the public health menace of
this virus and took many of the preventative steps used now, masks,
quartantines, prevention of meetings of large numbers of people and
education about the need of keeping one's hands clean and distancing.
(See https://www.history.com/news/spanish-flu-pandemic-response-cities
Go to youtube and listen to any of the chronicles of the 1918-1919
pandemic in the US)
|
Charts 3/13/2020 (Click on Underlined link.) 2020 PEERLESS DJI, Signals, Indicators Daily DJI Volume 10-DayUp/Down Vol Stoch-20 Inverted Traders Index Graph of Pct of All Stocks above 65-dma NASDAQ S&P OEX NYSE COMPQX DJI-15 DJI-20 DJI-30 DIA QQQ MDY IWM TNA Short-Term Rates SPY http://tigersoft.com/2020CST/SPY.GIF USO-CrudeOil DBO FAS GLD BBH IBB JETS JNUG KOL NUGT OIH OIL PALL RSX RETL SDS AGQ SLV SOXL TECL TLT TMF TNA UGA (gasoline) and China: YINN CHAU Commodities: CANE CORN DBC JJC, NIB, CHOC CORN, CUT (paper) MOO, SOYB WEAT UUP (Dollar) LIT (Lithium) AAPL ADBE ALXN AMAT AMGN AMD AMZN AXP BA BABA BAC BIDU BLDP CAT CVX DE FB GOOG GS HD IBM INTU JPM M (Macy's) MSFT NFLX NKE NVDA PG QCOM TSLA TXN XOM V WMT CMG , LRCX, SQ TOWN New highs and Bullish MAXCPs http://tigersoft.com/MAXMLK/3-13-20/BULLISH.htm Bearish MAXCPs - http://tigersoft.com/MINMLK/3-13-20/BEARISH.htm |
Table 1 QUICKSILVER on DJI-30 STOCKS 3/13/2020 1 Bullish 2 Bearish, ITRS and IP21 >+.25 and <-.25 STOCKS CLOSE CHANGE PIVOT-PT 5-dma AROC CL-PWR CANDLE IP21 ITRS ------------------------------------------------------------------------------------ ----------------------------------------------------------------------------------- AAPL 277.97 29.74 266.17 -202.7% Bullish BLUE .028 .132 --------------------------------------------------------------------- AXP 99.6 16.07 98.29 -442% ------- BLUE .04 -.014 --------------------------------------------------------------------- BA 170.2 11.17 227.17 -2155.3% Bearish RED -.366 -.292 Bearish --------------------------------------------------------------------- CAT 99.64 7.38 104.07 -1036.8% Bearish BLUE .015 -.139 --------------------------------------------------------------------- CSCO 37.64 4.44 37.96 -271.3% ------- BLUE .026 -.029 --------------------------------------------------------------------- CVX 83.42 7.16 80.67 -707.9% Bullish BLUE .092 -.122 --------------------------------------------------------------------- DIS 102.52 10.71 104.35 -602.9% Bearish BLUE-.029 -.105 --------------------------------------------------------------------- GS 177.17 26.49 172.81 -449.2% Bearish BLUE-.077 -.044 --------------------------------------------------------------------- HD 205.67 15.08 210.46 -534.6% ------- BLUE .015 .128 --------------------------------------------------------------------- IBM 107.95 5.14 117.81 -836.6% Bearish RED -.027 -.009 --------------------------------------------------------------------- INTC 54.43 8.89 50.85 -129.9% Bullish BLUE-.066 .095 --------------------------------------------------------------------- JNJ 134.29 8.88 136.44 -285.7% ------- BLUE-.047 .106 --------------------------------------------------------------------- JPM 103.91 15.86 93.44 -214.4% ------- BLUE-.096 -.069 --------------------------------------------------------------------- KO 48.47 1.31 51.86 -652.5% Bearish RED .025 .062 --------------------------------------------------------------------- MCD 177.13 5.09 186.86 -574.3% ------- RED -.011 .082 --------------------------------------------------------------------- MMM 141.68 8.1 144.06 -408.9% Bearish BLUE-.136 -.011 --------------------------------------------------------------------- MRK 76.75 2.3 78.96 -343.3% Bullish BLUE .102 .03 --------------------------------------------------------------------- MSFT 158.83 19.77 150.62 -89.4% Bullish BLUE-.025 .193 --------------------------------------------------------------------- NKE 75.58 1.38 84.11 -762.6% Bearish RED .033 -.068 --------------------------------------------------------------------- PFE 32.71 2.69 33.76 -348.8% ------- BLUE-.084 .021 --------------------------------------------------------------------- PG 114.07 12.23 116.06 -331.9% Bullish BLUE .023 .099 --------------------------------------------------------------------- TRV 107.45 5.27 116.2 -755.6% Bearish RED .035 -.03 --------------------------------------------------------------------- UNH 272.04 6.69 273.44 -214.2% Bullish BLUE .045 .111 --------------------------------------------------------------------- UTX 105.4 2.9 115.36 -922.6% Bearish RED -.022 -.11 --------------------------------------------------------------------- V 175.83 15.75 171.13 -244.8% Bullish BLUE .024 .122 --------------------------------------------------------------------- VZ 54.17 2.97 55.83 -245.2% Bullish BLUE .132 .068 --------------------------------------------------------------------- WBA 46.19 5.17 48.44 -459.2% Bearish BLUE-.039 -.031 --------------------------------------------------------------------- WMT 114.1 10.05 117.16 -136.6% Bullish BLUE .116 .146 Bullish --------------------------------------------------------------------- XOM 38.12 .94 41.86 -1121.8% Bearish RED -.158 -.268 Bearish |
Table 2 QUICKSILVER on ETFS - 03/13/20 last change Pivot 5-dma aroc ClosPwr Candle IP21 ITRS --------------------------------------------------------------------------------------------- DIA 232.11 20 238.72 -559% Bearish BLUE-.066 0 --------------------------------------------------------------------------------------------- SPY 271.48 23.37 274.23 -469.8% Bearish BLUE-.047 .029 --------------------------------------------------------------------------------------------- QQQ 192.34 15.02 193.57 -400.7% ------- BLUE-.058 .091 --------------------------------------------------------------------------------------------- MDY 282.07 24.03 297.31 -779.3% Bearish BLUE-.06 -.063 --------------------------------------------------------------------------------------------- IWM 119.47 4.92 130.82 -958.7% Bearish BLUE-.079 -.093 --------------------------------------------------------------------------------------------- FAS 40.74 9.05 45.01 -2347% Bearish BLUE-.05 -.384 Bearish --------------------------------------------------------------------------------------------- RETL 8.75 1.38 14.07 -3087.7% Bearish BLUE-.137 -.505 Bearish --------------------------------------------------------------------------------------------- SOXL 129.92 27.88 148.29 -2223.9% Bearish BLUE-.08 -.341 Bearish --------------------------------------------------------------------------------------------- TECL 156.98 41.14 160.01 -1467.5% ------- BLUE-.026 -.165 --------------------------------------------------------------------------------------------- IBB 103.68 6.18 110 -658.5% Bearish BLUE .047 .046 --------------------------------------------------------------------------------------------- GLD 143.28 -4.51 157.81 -462.4% Bearish RED -.268 .189 --------------------------------------------------------------------------------------------- OIH 4.46 .46 4.98 -2755.5% Bearish -----.328 -.478 --------------------------------------------------------------------------------------------- GASL .17 .06 .26 -14179.1% Bearish -----.266 -.797 Bearish --------------------------------------------------------------------------------------------- RSX 17.34 1.82 17.45 -910.9% Bearish BLUE-.124 -.12 |
Table 3    Count of Stocks in Key Directories
          20200313
-------------------------------
NEWHIGHS       10
NEWLOWS        1477
MAXCP          83
MINCP          348
TTTNH          33
TTTNL          615
FASTUP         42
FASTDOWN       994
CPCROSSA       141
CPCROSSD       42
BIGVOLUP       23
BIGVODN        21
ACCUMVER       4
HIGHIP21       6
HIUPPCT        12
VHIP21         153
LOWACCUM       159
REDSELL        106
AUGSELS7       6
TRAPDOOR       282
|
Table 4RANKING OF KEY DIRECTORIES BASED PCT.OF STOCKS ABOVE 65-DMA 3/13/20 --------------------------------------------------------------------------------------- Directory Current day-1 day-2 day-3 day-4 day-5 ---------------------------------------------------------------------------------------- EDU .2 0 0 .2 .2 .2 INDEXES .155 .161 .161 .177 .172 .236 COMODITY .125 .15 .225 .225 .225 .225 CHINA .111 .074 .166 .203 .129 .185 FOOD .092 .111 .185 .185 .185 .185 BIOTECH .083 .071 .137 .185 .167 .245 NASD-100 .082 .041 .082 .154 .072 .195 SOLAR .058 0 .117 .235 .176 .529 FIDSTKS .05 .028 .056 .101 .056 .151 HACKERS .05 .05 .05 .05 .05 .05 RUS-1000 .049 .024 .043 .103 .062 .15 SP500 .048 .021 .042 .102 .063 .157 SEMI .046 .037 .065 .093 .074 .168 GAMING .045 .045 .045 .136 .045 .227 RETAIL .04 .02 .06 .1 .08 .14 INSURANC .038 0 0 .076 0 .153 REIT .035 .021 .028 .12 .063 .241 SOFTWARE .033 .033 .033 .066 .066 .15 SP-100 .033 .011 .022 .077 .033 .133 ELECTRON .032 .026 .052 .071 .052 .137 OILGAS .03 .022 .037 .045 .037 .06 FINANCE .023 .011 .011 .035 .023 .119 NIFTY .021 .021 .085 .127 .127 .17 BONDFUND .02 .02 .04 .31 .54 .82 AUTO 0 0 .05 .075 .025 .025 BEVERAGE 0 0 0 .066 0 .133 BIGBANKS 0 0 0 0 0 0 CHEM 0 0 .02 .02 .02 .06 COAL 0 0 0 0 0 0 COMPUTER 0 0 0 0 0 .052 COPPER 0 0 0 0 0 0 DJI-13 0 0 0 0 0 .076 DOWJONES 0 0 0 .034 .034 .068 ETFS 0 0 0 0 0 0 GOLD 0 .083 .166 .291 .27 .375 GREEN 0 0 0 .047 .047 .19 GUNS 0 0 0 0 0 .066 HOMEBLDG 0 0 0 0 0 .235 HOSPITAL 0 0 0 .09 .045 .318 INDMATER 0 .013 0 .026 .026 .053 INFRA 0 0 0 .028 0 .114 JETS 0 0 0 0 0 0 MILITARY 0 0 0 0 0 0 REGBANKS 0 0 0 0 0 0 UTILITY 0 0 .051 .179 .153 .41 TRANSP 0 0 0 0 0 0 |
Table 5 1917, 1920, 1929, 1937, 1940, 1962, 1973, 1987, 1990, 1998, 2001, 2008, 2018. All these years were very bad for the market. Studying them more, we can start to see that "oversold" has many meetings. Below I show the data so that we can study and refer to it, last this week. Key Values at First Bottoms of Extreme Bear Markets: Now and 1917-2020 Date Down from la/ma aroc pi/(adv+dec) IP21 VI ObvPct
4-mo peak
==================================================================================
2020 3/12 28% .790 -3.531 -854 -.081 -637 -.244
==================================================================================
1917 12/21/16     15%      .873    -2.283                              -.451
      2/2         19%      .909    -1.263                              -.364
      DJI ultimately fell 40% from 106.80 to 65.90 on 12/19/1917
----------------------------------------------------------------------------------
1920 2/25/1920    25%      .928    -1.453                              -.280
     12/21/1920   30%      .901    -1.008                              -.394
     DJI ultimately fell 47% from 119.60 (11/3/1919) to 63.90 (8/24/1921)
----------------------------------------------------------------------------------
1929 10/29/1929   40%      .707   -4.078   -198            -.151 -2206 -.504
     11/13/1929   48%      .710   -6.381   -285            -.195 -2771 -.430
     DJI ultimately 48% fell from 381.20 (9/3/1919) to 198.7 (11/13/1929)
----------------------------------------------------------------------------------
1937 10/19/1937   33%      .867   -2.837   -251            -.018 -767  -.191
     11/24/1937   40%      .889   -1.730   -97             -.141 -160  -.065
     DJI ultimately fell from 189.3 (8/13/1937) to 98.9 (3/31/1937)
----------------------------------------------------------------------------------
1940 5/21/1940    25%      .811   -2.835   -200            -.322 -672  -.311
     DJI ultimately fell 26% from 151.3 (4/8/1940) to 111.8 (6/10/1940)
----------------------------------------------------------------------------------
1962 5/28/1962    20%      .890   -.739    -335            -.234 -1507 -.518
     6/26/1962    26%      .925   -1.556   -353            -.183 -1992 -.292
     DJI ultimately fell 26% from 723.5 (3/15/1962) to 535.7 (6/26/1962)
----------------------------------------------------------------------------------
1973 3/23/1973    12%      .962   -.607    -262            -.039 -4    -.298
     5/21/1973    18%      .954   -.978    -344            -.038 -5    -.374
     12/5/1973    26%      .917   -1.803   -473            -.224 -4    -.377
     DJI ultimately fell 45% from 1051.7 (1/11/1973) to 577.5 (12/6/1974)
----------------------------------------------------------------------------------
1987 10/19/1987   36%      .698   -3.699   -391            -.223 -69   -.267
     DJI ultimately fell 36% from 2722.42 (8/25/1987) to 1738.74 (10/  /1987)
----------------------------------------------------------------------------------
1990 8/23/1990    18%      .903   -1.923    -438           -.069  -55   -.537
     DJI ultimately fell 21% from 2999.75 (7/17/1990) to 2365.10 (10/11/1990)
----------------------------------------------------------------------------------
1998 8/31/1998    20%      .889   -1.873    -728           -.116  -208  -.262|
     DJI ultimately fell 20% from 9337.97 (7/17/1999 to 7539.07 (8/31/1998)
----------------------------------------------------------------------------------
2001 9/20/2001    26%      .851   -2.36     -558           -178   -464  -.434
     DJI ultimately fell from 11337.92 (5/21/2001) to 8376.2 (9/20/2001)
----------------------------------------------------------------------------------
2008 10/10/2008   35%      .807   -3.347    -963           -.099  -521  -.382
     11/20/2008   43%      .867   -1.314    -638           -.126  -393  -.208
     DJI ultimately fell 51% from (10/3/2008) to 6547.05 (3/9/2009)
----------------------------------------------------------------------------------
|
.
3/12/2020 We still are operating under
a series of Sell S6 signals with the
DJI having just fallen into Bear Market Territory. No new buy
signal has occurred. A rally is shaping up based on the FED's
decision to provide enormous new support. Cover some shorts
as a "public service", but hold the oil and airlines stocks short.
I would not try to call another bottom here, especially without
a new Peerless Buy. The three Sell S6s on the way down show
us that any rally can be quickly snuffed out given the heavy
Big Money selling prompted by the two-headed "black swan".
(Coronavirus pandemic and Opec's breakdown).

The DJI crashed 2350 points down today, nearly 10%. Let's put
this
in perspective and compare it with 1929 (where the internals of the
market were truly terrible), 1987 and 2008 (where there had also been
multiple S9s and the big Banks had become dangerously over-leveraged.
Of these, I think 1987 is the most interesting for our purposes, mainly due to
the widespread us of unregulated negative derivatives to hedge and
due to way the FED was able to stop the panic.
|
Charts 3/12/2020 (Click on Underlined link.) 2020 PEERLESS DJI, Signals, Indicators Daily DJI Volume 10-DayUp/Down Vol Stoch-20 Inverted Traders Index Graph of Pct of All Stocks above 65-dma NASDAQ S&P OEX NYSE COMPQX DJI-15 DJI-20 DJI-30 DIA QQQ MDY IWM TNA Short-Term Rates SPY http://tigersoft.com/2020CST/SPY.GIF USO-CrudeOil DBO FAS GLD BBH IBB JETS JNUG KOL NUGT OIH OIL PALL RSX RETL SDS AGQ SLV SOXL TECL TLT TMF TNA UGA (gasoline) and China: YINN CHAU Commodities: CANE CORN DBC JJC, NIB, CHOC CORN, CUT (paper) MOO, SOYB WEAT UUP (Dollar) LIT (Lithium) AAPL ADBE ALXN AMAT AMGN AMD AMZN AXP BA BABA BAC BIDU BLDP CAT CVX DE FB GOOG GS HD IBM INTU JPM M (Macy's) MSFT NFLX NKE NVDA PG QCOM TSLA TXN XOM V WMT CMG , LRCX, SQ TOWN New highs and Bullish MAXCPs http://tigersoft.com/MAXMLK/3-12-20/BULLISH.htm Bearish MAXCPs - http://tigersoft.com/MINMLK/3-12-20/BEARISH.htm |
Compare 2020 with 1929, 1987 and 2008.
The 508 point panic on October 19, 1987 was much worse, of
course,
in percentage terms, but if you look at the BEARISH MINCPs tonight,
you can see the dreadful damage done to Airlines, Oils and Banks Stocks.
These charts look so terrible that it's hard to imagine much more damage
in the short run unless all bids are withdrawn and the declines reach
20% in just one day, as happened on that fateful Monday in October 1987
many stocks in the SP-100.
1987 Crash

In 1987, with the DJI down 20% on a Monday, Greenspan
and the FED
told NYSE market makers to support the markets on the following Tuesday
and the FED would guarantee them against losses. This "back-stopping"
worked and the DJI built a base for the next three months and then headed
up gradually in 1988 and then much more urgently in 1989. Back then, the
main thing that triggered the decline was that the the FED had raised rates
too aggressively because of Inflation fears. (Read "fears that the Dollar was
weakening too much compared to Gold). And once the market
headed down, institutions aggressively sought to hedge with OEX puts using
computerized trading that was too crudely programmed to recognize how
ridiculously low the bids were that they were hitting. There was no foreign attack,
no contagion, no financial panic overseas, no crisis in the White House and no
assassination or heart attack. Wall Street had simply assumed that it could
easily hedge using new computerized tools and not disturb the market..
My thinking is that October 1987 was a relatively
benign setting compared
to the setting the financial markets find themselves in now. The FEDs caused
the panic and then they fixed it, somewhat like what happened in 2018.
I would argue our situation is qualitatively dfferent
now. We have a
world-wide pandemic that has gripped the World with fear. Normal
commerce has been dramatically curtailed everywhere. Low interest
rates will not much help. Holding up stock prices will not much help.
The improvement will come from Wall Street traders not so freely
hitting their own panic buttons and buying all sorts of exotic, negative
leveraged ETFs. They will be more careful now. But buying them could
not be easier and they will not hesitate to buy them aggressively again
once the FED's bounce is over. Add to that, the epic breakdown of OPEC
is real. We have all entered a very scary new world. Read about the 1918-1919
Spanish Flu pandemic.
So, now the FED enters our drama. Just like on
October 1987, they want to
support the markets. (Of course, they claim that they only want to restore
"liquidity"). The NY Fed says it will inject $1.5 TRILLION over the
next three days. That's $5,000 for each American. They have the authority
to do this based on the 1913 Federal Reserve Act. They were created
expressly to prevent financial panics. But what if the financial panic is
WORLD WIDE? Will that be enough?
That we can't answer yet, but we can look at the technicals
and reach some
conclusions. Today was a classic extreme panic. In that sense, it has some
precedents if we look back at what happened next when breadth was
nearly as lopsided as today. Look at the charts below for 1929 and 2008.
See from them also that they each needed to fall much further down than the
20% below that the NASDAQ and SP-500 have reached today.
In addition, from the table below, we get the sense that the
recovery
that is shaping up in the Futures this morning is likely to last
only a day or two. See how quickly the bounces ended when they
occurred just after very "Bad Breadth" in Earlier Big Declines
Date
Adv
Declines Outcome
------------------------------------------------------
10/29/1989 57 762
2-day rally and
another selloff.
10/19/1987 52 1973
1-day rally and a re-test of
lows
and 10 weeks of base-building
before a slow recovery.
11/2/2008 266 2941
1-day bounce and then more
weakness.
3/9/2020 70 2873
1-day bounce. Next day
brings seep decline.
3/12/2020 67 2998
?
1929 Crash

2008 - Extreme Bear Market and Financial Panic
Table 1 QUICKSILVER on DJI-30 STOCKS 3/12/2020 0 Bullish 5 Bearish, ITRS and IP21 >+.25 and <-.25 STOCKS CLOSE CHANGE PIVOT-PT 5-dma AROC CL-PWR CANDLE IP21 ITRS ------------------------------------------------------------------------------------ ------------------------------------------------------------------------------------ AAPL 248.23 -27.2 289.03 -793% Bullish RED -.014 .106 --------------------------------------------------------------------- AXP 83.53 -11.85 108.24 -1327.6% Bearish RED -.036 -.073 --------------------------------------------------------------------- BA 159.03 -30.05 262.33 -2165.5% Bearish RED -.405 -.258 Bearish --------------------------------------------------------------------- CAT 92.26 -8.43 121.41 -1339.2% Bearish RED -.04 -.12 --------------------------------------------------------------------- CSCO 33.2 -3.85 39.68 -819.4% ------- RED -.027 -.048 --------------------------------------------------------------------- CVX 76.26 -6.77 95.32 -1186% ------- BLUE .013 -.109 --------------------------------------------------------------------- DIS 91.81 -14.01 115.27 -1006.1% Bearish RED -.116 -.107 --------------------------------------------------------------------- GS 150.68 -21.21 192.85 -1306.4% Bearish RED -.157 -.09 Bearish --------------------------------------------------------------------- HD 190.59 -22.3 228.51 -993.8% Bearish RED -.044 .132 --------------------------------------------------------------------- IBM 102.81 -15.16 127.73 -1082% Bearish RED -.068 .029 --------------------------------------------------------------------- INTC 45.54 -6.12 55.77 -1060.5% Bearish RED -.145 .018 --------------------------------------------------------------------- JNJ 125.41 -6.39 142.03 -598.1% Bearish RED -.143 .118 Bearish --------------------------------------------------------------------- JPM 88.05 -7.91 108.08 -1265.3% Bearish RED -.19 -.11 Bearish --------------------------------------------------------------------- KO 47.16 -5.05 55.26 -887.9% Bearish RED -.008 .108 --------------------------------------------------------------------- MCD 172.04 -16.21 198.86 -675.8% Bullish RED -.029 .128 --------------------------------------------------------------------- MMM 133.58 -13.66 153.65 -594.6% Bearish RED -.213 .014 --------------------------------------------------------------------- MRK 74.45 -4.8 82.2 -441.2% ------- RED -.001 .072 --------------------------------------------------------------------- MSFT 139.06 -14.57 161.57 -857.8% Bearish RED -.063 .137 --------------------------------------------------------------------- NKE 74.2 -9.8 88.36 -940.6% Bearish RED .051 -.009 --------------------------------------------------------------------- PFE 30.02 -2.15 35.02 -795.3% Bearish RED -.175 .026 --------------------------------------------------------------------- PG 101.84 -9.75 121.66 -836.4% Bullish RED -.041 .073 --------------------------------------------------------------------- TRV 102.18 -10.42 124.84 -1074.5% Bearish RED -.057 .003 --------------------------------------------------------------------- UNH 265.35 -12.43 283.87 -314.9% ------- BLUE .02 .158 --------------------------------------------------------------------- UTX 102.5 -5.01 126.48 -1005.6% Bearish BLUE-.02 -.062 --------------------------------------------------------------------- V 160.08 -12.87 184.36 -748.3% ------- BLUE-.025 .107 --------------------------------------------------------------------- VZ 51.2 -3.63 56.87 -529.9% Bullish RED .028 .091 --------------------------------------------------------------------- WBA 41.02 -5.05 50.51 -798.5% Bearish RED -.077 -.049 --------------------------------------------------------------------- WMT 104.05 -10.38 117.23 -507.7% ------- RED .058 .126 --------------------------------------------------------------------- DOW 37.18 -5.96 47.69 -1429% Bearish RED -.182 -.21 Bearish |
Table 2 QUICKSILVER on ETFS - 03/12/20 last change Pivot 5-dma aroc ClosPwr Candle IP21 ITRS --------------------------------------------------------------------------------------------- DIA 212.11 -23.73 258.85 -990.7% Bearish RED -.142 0 --------------------------------------------------------------------------------------------- SPY 248.11 -26.25 297.46 -945.6% Bearish RED -.123 .027 --------------------------------------------------------------------------------------------- QQQ 177.32 -17.9 208.02 -846.2% Bearish RED -.113 .09 --------------------------------------------------------------------------------------------- MDY 258.04 -30.87 328.26 -1215.7% Bearish RED -.121 -.057 --------------------------------------------------------------------------------------------- IWM 114.55 -11.33 144.4 -1199.8% Bearish RED -.143 -.053 --------------------------------------------------------------------------------------------- FAS 31.69 -12.15 62.89 -3367.6% Bearish RED -.158 -.407 --------------------------------------------------------------------------------------------- RETL 7.37 -4.2 16.71 -3328.9% Bearish RED -.238 -.483 --------------------------------------------------------------------------------------------- SOXL 102.04 -44.6 198.61 -3099.2% Bearish RED -.143 -.372 --------------------------------------------------------------------------------------------- TECL 115.84 -48.31 206.08 -2758.6% Bearish RED -.079 -.263 --------------------------------------------------------------------------------------------- IBB 97.5 -9.47 118.03 -972.9% Bearish RED -.024 .066 --------------------------------------------------------------------------------------------- GLD 147.79 -6.14 157.55 -310.4% Bearish RED -.236 .291 --------------------------------------------------------------------------------------------- OIH 4 -.69 7.35 -3494.1% Bearish RED -.363 -.448 --------------------------------------------------------------------------------------------- GASL .11 -.03 1.31 -11491.9% Bearish -----.435 -.734 --------------------------------------------------------------------------------------------- RSX 15.52 -2.06 20.62 -1434.6% Bearish RED -.175 -.121 |
Table 3    Count of Stocks in Key Directories
           20200312
-------------------------------
NEWHIGHS       12
NEWLOWS        4374  Climactic extreme.
MAXCP          41
MINCP          759
TTTNH          44
TTTNL          527
FASTUP         38
FASTDOWN       992
CPCROSSA       70
CPCROSSD       164
BIGVOLUP       4
BIGVODN        370
ACCUMVER       4
HIGHIP21       3
HIUPPCT        10
VHIP21         155
LOWACCUM       166
REDSELL        105
AUGSELS7       4
TRAPDOOR       267
|
Table 4  RANKING OF KEY DIRECTORIES BASED PCT.OF STOCKS ABOVE 65-DMA
              3/12/20
All 46 are very bearish... --------------------------------------------------------------------------------------- Directory Current day-1 day-2 day-3 day-4 day-5 ---------------------------------------------------------------------------------------- INDEXES .161 .161 .177 .172 .236 .241 COMODITY .15 .225 .225 .225 .225 .275 FOOD .111 .185 .185 .185 .185 .222 GOLD .083 .166 .291 .27 .375 .416 CHINA .074 .166 .203 .129 .185 .333 BIOTECH .068 .134 .182 .167 .248 .311 HACKERS .05 .1 .05 .05 .05 .1 GAMING .045 .045 .136 .045 .227 .227 NASD-100 .041 .092 .164 .072 .195 .268 SEMI .037 .065 .093 .074 .168 .205 SOFTWARE .033 .05 .066 .066 .15 .266 FIDSTKS .028 .056 .101 .056 .151 .207 ELECTRON .026 .052 .071 .052 .137 .163 RUS-1000 .024 .045 .103 .062 .15 .184 OILGAS .022 .037 .045 .037 .06 .067 NIFTY .021 .085 .127 .127 .17 .255 REIT .021 .028 .12 .063 .241 .255 SP500 .021 .044 .102 .063 .157 .197 BONDFUND .02 .04 .31 .54 .82 .84 RETAIL .02 .06 .1 .08 .14 .14 INDMATER .013 0 .026 .026 .052 .052 FINANCE .011 .011 .035 .023 .119 .119 SP-100 .011 .022 .077 .033 .133 .177 AUTO 0 .05 .075 .025 .025 .05 BEVERAGE 0 0 .066 0 .133 .2 BIGBANKS 0 0 0 0 0 0 CHEM 0 .02 .02 .02 .061 .102 COAL 0 0 0 0 0 0 COMPUTER 0 0 0 0 .052 .105 COPPER 0 0 0 0 0 0 DJI-13 0 0 0 0 .076 .076 DOWJONES 0 0 .033 .033 .066 .1 EDU 0 0 .2 .2 .2 .2 ETFS 0 0 0 0 0 .035 GREEN 0 0 .047 .047 .19 .285 GUNS 0 0 0 0 .066 .2 HOMEBLDG 0 0 0 0 .235 .47 HOSPITAL 0 0 .09 .045 .318 .318 INFRA 0 0 .027 0 .111 .138 INSURANC 0 0 .076 0 .153 .153 JETS 0 0 0 0 0 0 MILITARY 0 0 0 0 0 .035 REGBANKS 0 0 0 0 0 0 SOLAR 0 .117 .235 .176 .529 .647 UTILITY 0 .051 .179 .153 .41 .41 TRANSP 0 0 0 0 0 0 |
=======================================================================
3/11/2020 The DJI is down 1200 in Futures trading
again. That puts it decisively
down more than 20% from its peak a month ago. This will unleash a myriad
of bearish hedging strategies by hard-pressed mutual funds, the sum effect of
which is likely to accelerate the decline. Bear markets typically last 18
months. Trying to ride out long positions for this duration is frustrating
and unrewarding. The lesson for us from 2008-2009 was how helpful it
was to go short Bearish Mincps and stay short until their Closing Power
downtrends were broken, then cover them and go short gain when they next
broke their CP uptrends.
The President now admits the extreme dangers posed by the Coronavirus.
This is excellent and is to be applauded. There is reason to hope that the
quarantines, travel bans, school closings and the new rush to produce more virus
test-kits will have the desired effect and in time stop the spread of the virus
here in the US. But that remains to be seen. And world-wide the virus is still
taking a wider and wider toll. At this stage, each new report seems to drop
the market down further.
It's hard not to see extremely bearish signs in the
current market's technical data.
Again today an otherwise promising rally was completely snuffed out by a big
decline on terrible breadth. Big Money wants out badly. We can see the same
action from the Peerless charts, before the terrible declines of 1929, 1930, 1931,
1987 and 2008. Sell S6s are our way now of spotting dangerous squelching.
of rallies by Big Money in full panic. I added a Sell S6 to the program to cover
today's quickly suppressed rally. The links you have been using to get updates
will have the latest Peerless software tomorrow afteroon.
Another sign of bad times ahead is that the DJI has never before severed its 20%
down-from-the-peak support in only a month's time. Add to this, it has been 11
years since the DJI was in a bear market and you get the picture: there could be
a lot more downside ahead.
Why take a chance? I thought we could buy QQQ on weakness by the DJI below
24000 today. Big mistake. The knife is falling too fast to try to catch it or
call a
bottom. We might simply wait until the DJI comes back within its normal 3.5%
bands.
And what is apt to make the market even more
dangerous is that lots of funds will
now, because the DJI is down 20%, rush to hedge their still massive portfolios
with leveraged negative puts. This alone can make the market drop like a rock.
1987 proves that. Right now there is no rule against short-selling on down ticks.
What could possibly go wrong? (This rule change was instituted in 2007 by the SEC,
the little guy's so called friend in the market,.just in time to give Wall Street the
tools
they needed to make a killing on the shoart side.)
I think we must quickly sell the QQQ position taken today, despite the loss
over-night. I would add to the short positions in the many bearish MINCPS.
Big banks also look very vulnerable. They are being heavily clobbered. They
depend on international business. Consumers are cutting back on a wide variety
of expenses. And they could be become very vulnerable to bankruptcies that
start occurring because heavily in-debt airlines and oil companies and other
enterprises experience a near-cessation of business because of fears of
the Coronavirus Pandemic.
Weekly DJI Chart
22000 may be some support.
After that, 18600?

![]()
DJIA and Peerless Signals
![]()


|
Charts 3/11/2020 (Click on
Underlined link.) 2020 PEERLESS DJI, Signals, Indicators Daily DJI Volume 10-DayUp/Down Vol Stoch-20 Inverted Traders Index Graph of Pct of All Stocks above 65-dma NASDAQ S&P OEX NYSE COMPQX DJI-15 DJI-20 DJI-30 DIA QQQ MDY IWM TNA Short-Term Rates SPY http://tigersoft.com/2020CST/SPY.GIF USO-CrudeOil DBO FAS GLD BBH IBB JETS JNUG KOL NUGT OIH OIL PALL RSX RETL SDS AGQ SLV SOXL TECL TLT TMF TNA UGA (gasoline) and China: YINN CHAU Commodities: CANE CORN DBC JJC, NIB, CHOC CORN, CUT (paper) MOO, SOYB WEAT UUP (Dollar) LIT (Lithium) AAPL ADBE ALXN AMAT AMGN AMD AMZN AXP BA BABA BAC BIDU BLDP CAT CVX DE FB GOOG GS HD IBM INTU JPM M (Macy's) MSFT NFLX NKE NVDA PG QCOM TSLA TXN XOM V WMT CMG , LRCX, SQ TOWN New highs and Bullish MAXCPs http://tigersoft.com/MAXMLK/3-11-20/BULLISH.htm Bearish MAXCPs - http://tigersoft.com/MINMLK/3-11-20/BEARISH.htm |
Table 1 QUICKSILVER on DJI-30 STOCKS 3/11/2020 1 Bullish 3 Bearish, ITRS and IP21 >+.25 and <-.25 STOCKS CLOSE CHANGE PIVOT-PT 5-dma AROC CL-PWR CANDLE IP21 ITRS ------------------------------------------------------------------------------------ ------------------------------------------------------------------------------------ AAPL 275.43 -9.91 292.92 -475.4% Bullish RED .065 .127 --------------------------------------------------------------------- AXP 95.38 -7.92 110.94 -946.9% Bearish RED .005 -.062 --------------------------------------------------------------------- BA 189.08 -41.93 260.37 -1860% Bearish RED -.338 -.251 BEARISH --------------------------------------------------------------------- CAT 100.69 -5.8 121.97 -1148.6% Bearish RED -.081 -.145 --------------------------------------------------------------------- CSCO 37.05 -3.03 39.57 -546.1% ------- RED .013 -.048 --------------------------------------------------------------------- CVX 83.03 -1.95 97.19 -848.5% ------- BLUE .003 -.133 --------------------------------------------------------------------- DIS 105.82 -5.64 113.98 -591.9% Bearish RED -.04 -.098 --------------------------------------------------------------------- GS 171.89 -12.46 198.79 -962.1% Bearish RED -.102 -.078 --------------------------------------------------------------------- HD 212.89 -12.81 234.81 -617.9% Bearish RED 0 .144 --------------------------------------------------------------------- IBM 117.97 -6.8 129.55 -640.7% Bearish RED -.003 .048 --------------------------------------------------------------------- INTC 51.66 -2.32 56.96 -635.3% Bearish RED -.068 .036 --------------------------------------------------------------------- JNJ 131.8 -9.84 142.01 -413.8% ------- RED -.072 .081 --------------------------------------------------------------------- JPM 95.96 -4.74 113.97 -1114.2% Bearish RED -.142 -.134 BEARISH --------------------------------------------------------------------- KO 52.21 -1.45 56.74 -606.8% ------- RED .056 .12 --------------------------------------------------------------------- MCD 188.25 -11.61 198.32 -473.5% Bullish RED .04 .126 --------------------------------------------------------------------- MMM 147.24 -6.06 151.41 -222.8% Bearish RED -.172 .007 --------------------------------------------------------------------- MRK 79.25 -2.77 81.58 -228.1% ------- RED .021 .042 --------------------------------------------------------------------- MSFT 153.63 -7.29 166.27 -522.3% ------- RED -.025 .143 --------------------------------------------------------------------- NKE 84 -4.3 90.58 -549.8% Bullish ---- .12 .003 --------------------------------------------------------------------- PFE 32.17 -2.42 35.46 -603.5% Bearish RED -.093 -.006 --------------------------------------------------------------------- PG 111.59 -8.96 121.63 -534% Bullish RED .017 .061 --------------------------------------------------------------------- TRV 112.6 -6.97 128.02 -763.1% ------- RED .024 -.001 --------------------------------------------------------------------- UNH 277.78 -2.22 282.96 -206.4% ------- BLUE .007 .115 --------------------------------------------------------------------- UTX 107.51 -11.86 126.44 -1257.8% Bearish RED -.076 -.108 --------------------------------------------------------------------- V 172.95 -9.65 186.96 -580.3% ------- RED 0 .09 --------------------------------------------------------------------- VZ 54.83 -1.69 57.16 -289.1% Bullish RED .071 .067 --------------------------------------------------------------------- WBA 46.07 -3.09 48.78 -266.7% Bearish RED -.044 -.043 --------------------------------------------------------------------- WMT 114.43 -5.36 115.92 -99.7% Bullish RED .156 .133 Bullish --------------------------------------------------------------------- XOM 43.14 -.27 50.11 -985.2% Bearish BLUE-.114 -.206 Bearish |
Table 2 QUICKSILVER on ETFS - 03/11/20 last change Pivot 5-dma aroc ClosPwr Candle IP21 ITRS --------------------------------------------------------------------------------------------- DIA 235.84 -14.63 261.46 -684.4% Bearish RED -.043 ------ --------------------------------------------------------------------------------------------- SPY 274.36 -14.06 302.46 -652.4% Bearish RED -.045 .026 --------------------------------------------------------------------------------------------- QQQ 195.22 -8.89 211.59 -555.3% ------- RED -.05 .09 --------------------------------------------------------------------------------------------- MDY 288.91 -20.42 333.78 -888.3% Bearish RED -.075 -.054 --------------------------------------------------------------------------------------------- IWM 125.88 -8.55 147.32 -926.5% Bearish RED -.13 -.065 --------------------------------------------------------------------------------------------- FAS 43.84 -8.67 68.42 -2752.1% Bearish RED -.058 -.361 --------------------------------------------------------------------------------------------- RETL 11.57 -3.16 17.27 -2384.7% Bearish RED -.111 -.421 --------------------------------------------------------------------------------------------- SOXL 146.64 -29.96 211.31 -2210.3% Bearish RED -.054 -.298 --------------------------------------------------------------------------------------------- TECL 164.15 -26.25 219.59 -1940.7% ------- RED -.007 -.152 --------------------------------------------------------------------------------------------- IBB 106.97 -5.34 119.56 -632.3% ------- RED .046 .056 --------------------------------------------------------------------------------------------- GLD 153.93 -.55 157.49 -7.4% Bearish RED -.198 .258 --------------------------------------------------------------------------------------------- OIH 4.69 -.51 8.26 -2925.8% Bearish RED -.317 -.471 --------------------------------------------------------------------------------------------- GASL .14 -.05 1.82 -8452% Bearish -----.43 -.809 --------------------------------------------------------------------------------------------- RSX 17.58 -1.27 21 -1108.3% Bearish RED -.107 -.122 |
Table 3    Count of Stocks in Key Directories
          20200311
-------------------------------
NEWHIGHS       12
NEWLOWS        736
MAXCP          24
MINCP          422
TTTNH          18
TTTNL          516
FASTUP         38
FASTDOWN       987
CPCROSSA       18
CPCROSSD       309
BIGVOLUP       5
BIGVODN        120
ACCUMVER       5
HIGHIP21       10
HIUPPCT        13
VHIP21         157
LOWACCUM       147
REDSELL        107
AUGSELS7       7
TRAPDOOR       143
|
 Table 4   RANKING OF KEY DIRECTORIES BASED PCT.OF STOCKS ABOVE 65-DMA
              3/11/20
 Bearish = all 46
---------------------------------------------------------------------------------------
Directory     Current       day-1         day-2         day-3         day-4         day-5
----------------------------------------------------------------------------------------
COMODITY       .225          .225          .225          .225          .275          .25
FOOD           .185          .185          .185          .185          .222          .203
CHINA          .166          .203          .129          .185          .333          .296
GOLD           .166          .291          .27           .375          .437          .354
INDEXES        .161          .177          .172          .236          .241          .29
BIOTECH        .131          .179          .164          .251          .323          .365
SOLAR          .117          .235          .176          .529          .647          .647
HACKERS        .1            .1            .05           .05           .1            .1
NASD-100       .092          .175          .082          .195          .268          .381
NIFTY          .085          .127          .127          .17           .255          .404
SEMI           .065          .093          .074          .168          .205          .299
RETAIL         .06           .1            .08           .14           .14           .28
FIDSTKS        .056          .101          .056          .151          .207          .303
ELECTRON       .052          .071          .052          .137          .163          .241
UTILITY        .051          .179          .153          .41           .41           .487
AUTO           .05           .075          .025          .025          .05           .075
SOFTWARE       .05           .083          .066          .15           .266          .35
GAMING         .045          .136          .045          .227          .227          .272
RUS-1000       .045          .105          .062          .15           .187          .247
SP500          .044          .105          .063          .157          .197          .275
BONDFUND       .04           .31           .54           .82           .84           .88
OILGAS         .037          .044          .037          .059          .059          .067
REIT           .028          .12           .063          .241          .269          .382
SP-100         .022          .077          .033          .133          .177          .244
CHEM           .02           .02           .02           .061          .122          .142
FINANCE        .012          .036          .024          .108          .108          .108
BEVERAGE       0             .066          0             .133          .2            .266
BIGBANKS       0             0             0             0             0             0
COAL           0             0             0             0             0             0
COMPUTER       0             0             0             .052          .105          .263
COPPER         0             0             0             0             0             0
DJI-13         0             0             0             .076          .076          .307
DOWJONES       0             .033          .033          .066          .1            .233
EDU            0             .2            .2            .2            .2            .2
ETFS           0             0             0             0             .035          .053
GREEN          0             .047          .047          .19           .285          .285
GUNS           0             0             0             .066          .266          .266
HOMEBLDG       0             0             0             .235          .47           .47
HOSPITAL       0             .09           .045          .318          .318          .363
INDMATER       0             .026          .026          .052          .065          .078
INFRA          0             .027          0             .111          .138          .138
INSURANC       0             .076          0             .153          .153          .153
JETS           0             0             0             0             0             0
MILITARY       0             0             0             0             .035          .071
REGBANKS       0             0             0             0             0             0
TRANSP         0             0             0             0             0             0
|
====================================================================
3/10/2020
More re-testing of Monday's lows is
likely. But the new Peerless
Buys tonight give us hope that the lows will hold and buyers when
the DJI next declines to 24000 will be rewarded. Stay short the very
weak Oil and Airlines stocks. The pandemic continues to spread
at an alarming rates and most people will sharply curtail their travel
until it runs its course or a cure is found.
Today's recovery from the 20% down-from-the-peak in the DJI
brought a new Buy B16 (very oversold) and B17 (big IP21 divergence
from DJI's close 9% below its 21-dma. In addition, the Cumulative
Inverted MKDS finally moved back above its falling 21-dma and
gave a Buy B21 for that indicator. All these are reliable signals,
but more testing of the recent lows is also indicated, first because of
how often the DJI has fallen back from any big daily gain (See S6s)
and, second, because this has been the fastest decline of 20% from
a bull market peak going back to 1915. Other especially rapid declines
down 19%-20% from their peak show an 80% probability of making
significant further declines. The exception to this rule was in late 1998
when four more tests of the 20% down-from-the-peak level were
required.
1998 Base-Building 20% Down from Peak offers
a constructive scenario for now.

There is reason for some measured optimism. The 1990 experience also
saw a slightly early Buy B16-B17 in the 20% sell-off caused the invasion
of Kuwait. See the chart just below. I also looked back at the 1916-1917
and 1919-1920 bear markets. The second did not stop 20% below the
peak, but the first one did. That slightly improves the over-all chances
for a rally to 8 in 19 cases (42%).
1990 Bottom was down 20% from Peak.

1916-1917

It's risky chasing this rally. We could get more squelched rallies
and
Sell Sell S6s. However, I suggest covering more short sales on weakness tomorrow.
I would stay short Oils and Airlines. But buy QQQ on a DJI retest of 24000.
It is much stronger than the DJI. Because of how relatively unregulated leveraged
short ETFs are, the market could still experience more dramatic weakness. To
protect against this, I would sell QQQ out if the DJI closes below 23200. Substitute
any of the Bullish MAXCPs tonight for QQQ. But buy on weakness.


| How much support can we expect from a decline of 19% to 20%
from the DJI's peak ib bull market. Let's look at all such declines since 1929. All 17 Cases: Significantly lower prices - 10 cases (58.8%) Significant Recovery: 7 cases. (41.2%) When DJI fell 19% from a peak less than ten weeks earlier: 1. Sept-Oct. 1929. DJI plunged straight away from 306 to 199. 2. Aug.-Sept 1937. DJI plunged straight away 47% down from earlier peak. 3. May 1940. DJI plunged straight away 28% down from earlier pleak.. 4. Aug-Oct 1987 DJI dropped the next day down 36% from its earlier peak. 5. July-August 1998. The built a base over the next five weeks and then rose. ===> This by itself suggests an 80% probability of lower prices. When DJI's IP21 was above -.05 10/10/1990. The closed down 19% from its peak three months on 7/17 and 4% below its 21-dma. IP21 was only -.016. OBVPct was -.267. The DJI fell only a little more, from 2407.92 to 2365.1 a day later. There is began building a bottom. 3/21/2001. The DJI closed down 20% from its peak of 14 months earlier. Its IP21 was only -.069. OBVPct was only -.08 but its VI was -257. This was the bottom and DJI rallied 21% over next two months. Current Case: DJI fell on 3/9/2020 to a point 19% below its peak of 2/12. This is the most rapid decline from a bull market peak in all the data back to 1929. IP21 =-.033 OBVPct = -585 VI =-494 All Cases 1) On 10/23/1929 the DJI reached this point. There had been many Sell signals at the peak. The IP21 (Accumulation Index) was -.154 and VI= -1103. There was NO BOUNCE and the DJI fell from 305.9 to 198.7 in just 12 more days. 2) On 9/23/1937 the DJI fell 20% below its peak six weeks before. It moved slightly below, then slightly above its 20%-down level for a week and then plunged steeply down to a point 40% down from its peak. The IP21 was -.33 and the VI was -421 as the 20%-down was tested. 3) On 5/17/1940 the DJI fell 20% from its peak, as Nazi Germany attacked Belgium and France. The IP21 was -.285 and the VI was -530. The DJI kept falling, finding a bottom 28% down from the peak 3 weeks later on 6/10. 4) On 9/9/1946, the DJI fell 20% below its bull market peak of 5/29. It see-sawed around this 20%-down level and sincally bottomed on 11/21 just 25% below the peak. Its IP21 was +-.107 and its VI was -150, readings well above the comparable levels when much bigger declines occurred. 5) On 10/22/1957, the DJI fell 19% below its peak of 3 months before. This was a bottom though it took 4 months more basing before a bull market began. The IP21 was -.183 and the VI was -.841. A Buy B16 signal marked this bottom. 6) On 5/28/1962, the DJI fell to a point 21% below its peak of six months earlier. The IP21 was -.234 and the VI was -1507. It rallied briefly and then fell a month later to a point 27% below the earlier peak A Buy B16 was given at this point. 7) On 8/22/1966, the DJI fell to a point 20% below its bull market peak of 6 months earlier. The IP21 was -.282 and the OBVPct was -,532. The newly formatted VI was only -14. The DJI fell from here, 792.03, to a bear market bottom at 744.32 on 10/7. The final bottom was marked by a Buy B8. 8) On 12/10/1969, the DJI fell to a point 20% below its 1969 peak of 7 months earlier. The IP21 was -.173 and the OBVPct was -.52. The newly formatted VI was only -4. After a weak Santa Claus rally, the fell from 783.99 (on 12/10) to 631.16 on 5/26/1970 where a Buy B16 Peerless said it was time to buy. The minor zigs and zags before this were called by Peerless signals. 9) On 11/20/1973, the DJI fell to a point 20% below its bull market peak of 10 months earlier. The IP21 was -.204 and the OBVPct was -.247. The DJI fell from 844.9 to 788.31 two weeks later. The following year it plunged to 577. 10) 10/13/1977 This was a year after its peak in 1976. IP21=-.085 OBVPct = -.341. After brief Santa Claus rally, the DJI fell from 818.17 to 742 3 months later. 11) On 9/25/1981 the DJI fell to a point 19% below its peak of five months earlier IP21=-.157 OBVPct = -.368 DJI rallied from 824.02 and 4.1% lower band to 892.69 and upper band on 12/4 before resuming a its decline to 787 in August 1982. 12) On 10/16/1987 (a Friday) the DJI closed almost 18% below its peak of 8/25. It was already 11.2% below its 21-dma. The IP21 was -.149 and the OBVPct was only -.18. The following Monday, it plunged down down almost 20% more to 1750 which was the bottom. The speed of this decline is sumilar to the cases of 1929, 1937 and 2020. 13) 10/10/1990. The closed down 19% from its peak three months on 7/17 and 4% below its 21-dma. IP21 was only -.016. OBVPct was -.267. The DJI fell only a little more, from 2407.92 to 2365.1 a day later. There is began building a bottom. 14) 8/31/1998. The DJI closed down 19% from its peak just six weeks earlier on 7/17. Its IP21 was -.116. OBVPct was -.262. This was the bottom, though it took four more tests of the support at 7500 to establish a bottom. 15) 3/21/2001. The DJI closed down 20% from its peak of 14 months earlier. Its IP21 was only -.069. OBVPct was only -.08 but its VI was -257. This was the bottom and DJI rallied 21% over next two months. 16) 6/27/2008. The DJI closed down 20% from its peak of 8 months earlier. Its IP21 was -.226. Its OBVPct was -.357 and its VI was -339. It zig-zagged in a narrow trading range for 10 weeks and then plunged down 3800 points down. 17) On 12/26/2018, the DJI fell to a point 19% below its peak of 10/3. It immediately turned up when the White House and Big Banks pressured Fed Chairman Powell to reverse course and immediately power interest rates. The IP21 was -.15 and the VI was -333 and the OBV Pct was -.157. |
|
Charts 3/10/2020 (Click on Underlined link.) 2020 PEERLESS DJI, Signals, Indicators Daily DJI Volume 10-DayUp/Down Vol Stoch-20 Inverted Traders Index Graph of Pct of All Stocks above 65-dma NASDAQ S&P OEX NYSE COMPQX DJI-15 DJI-20 DJI-30 DIA QQQ MDY IWM TNA Short-Term Rates SPY http://tigersoft.com/2020CST/SPY.GIF USO-CrudeOil DBO FAS GLD BBH IBB JETS JNUG KOL NUGT OIH OIL PALL RSX RETL SDS AGQ SLV SOXL TECL TLT TMF TNA UGA (gasoline) and China: YINN CHAU Commodities: CANE CORN DBC JJC, NIB, CHOC CORN, CUT (paper) MOO, SOYB WEAT UUP (Dollar) LIT (Lithium) AAPL ADBE ALXN AMAT AMGN AMD AMZN AXP BA BABA BAC BIDU BLDP CAT CVX DE FB GOOG GS HD IBM INTU JPM M (Macy's) MSFT NFLX NKE NVDA PG QCOM TSLA TXN XOM V WMT CMG , LRCX, SQ TOWN New highs and Bullish MAXCPs http://tigersoft.com/MAXMLK/3-10-20/BULLISH.htm Bearish MAXCPs - http://tigersoft.com/MINMLK/3-10-20/BEARISH.htm |
Table 1 QUICKSILVER on DJI-30 STOCKS 3/10/2020 1 Bullish 3 Bearish, ITRS and IP21 >+.25 and <-.25 STOCKS CLOSE CHANGE PIVOT-PT 5-dma AROC CL-PWR CANDLE IP21 ITRS ------------------------------------------------------------------------------------ ------------------------------------------------------------------------------------ AAPL 285.34 19.17 302.74 -69.1% Bullish BLUE .106 .109 --------------------------------------------------------------------- AXP 103.3 5.01 115.7 -217.6% Bearish BLUE .052 -.052 --------------------------------------------------------------------- BA 231.01 3.84 283.12 -944.2% Bearish RED -.201 -.175 Bearish --------------------------------------------------------------------- CAT 106.49 2.42 127.4 -746.4% Bearish RED -.015 -.157 --------------------------------------------------------------------- CSCO 40.08 2.12 41.39 5% Bullish BLUE .075 -.038 --------------------------------------------------------------------- CVX 84.98 4.31 98.53 -504.7% ------- RED .039 -.171 --------------------------------------------------------------------- DIS 111.46 7.11 119.18 -219.2% Bearish BLUE-.018 -.111 --------------------------------------------------------------------- GS 184.35 11.54 208.74 -488.4% ------- BLUE-.037 -.078 --------------------------------------------------------------------- HD 225.7 15.24 241.08 -49% Bullish BLUE .048 .147 --------------------------------------------------------------------- IBM 124.77 6.96 134.22 -161.8% Bearish BLUE .068 .049 --------------------------------------------------------------------- INTC 53.98 3.13 58.68 -178.8% ------- BLUE-.004 .027 --------------------------------------------------------------------- JNJ 141.64 5.2 143.48 216.2% Bullish BLUE .025 .096 --------------------------------------------------------------------- JPM 100.7 7.26 119.85 -736% Bearish BLUE-.099 -.151 Bearish --------------------------------------------------------------------- KO 53.66 1.8 58.92 -215.2% ------- BLUE .047 .1 --------------------------------------------------------------------- MCD 199.86 13 207.02 8.8% Bullish BLUE .094 .139 --------------------------------------------------------------------- MMM 153.3 9.24 153.98 269.3% Bearish BLUE-.151 -.007 --------------------------------------------------------------------- MRK 82.02 3.06 82.97 178.5% Bullish BLUE .028 .022 --------------------------------------------------------------------- MSFT 160.92 10.3 170.55 -110.3% ------- BLUE .016 .139 --------------------------------------------------------------------- NKE 88.3 4.19 93.79 -146.8% Bullish BLUE .091 .001 --------------------------------------------------------------------- PFE 34.59 .83 36.4 41.4% ------- -----.069 .003 --------------------------------------------------------------------- PG 120.55 4.49 124.5 98.8% Bullish BLUE .078 .087 --------------------------------------------------------------------- TRV 119.57 3.37 131.53 -229.3% Bullish BLUE .073 .002 --------------------------------------------------------------------- UNH 280 6.56 289.42 334.3% ------- BLUE .018 .071 --------------------------------------------------------------------- UTX 119.37 4.01 139.04 -514.2% Bearish RED -.015 -.084 --------------------------------------------------------------------- V 182.6 11.47 194.29 -84.8% Bullish BLUE .042 .09 --------------------------------------------------------------------- VZ 56.52 .69 58.12 72.3% Bullish BLUE .094 .047 --------------------------------------------------------------------- WBA 49.16 .72 48.69 313.4% ------- RED -.02 -.041 --------------------------------------------------------------------- WMT 119.79 2.63 116.77 296.6% Bullish BLUE .16 .127 Bullish --------------------------------------------------------------------- XOM 43.41 1.55 52.42 -810.5% Bearish RED -.172 -.257 Bearish |
Table 2 QUICKSILVER on ETFS - 03/10/20 last change Pivot 5-dma aroc ClosPwr Candle IP21 ITRS --------------------------------------------------------------------------------------------- DIA 250.47 11.75 270.89 -171.2% ------- BLUE .008 0 --------------------------------------------------------------------------------------------- SPY 288.42 14.19 312.86 -198.7% Bullish BLUE-.01 .018 --------------------------------------------------------------------------------------------- QQQ 204.11 10.54 218.22 -129% Bullish BLUE-.016 .079 --------------------------------------------------------------------------------------------- MDY 309.33 12.02 346.29 -385.9% Bearish BLUE .034 -.053 --------------------------------------------------------------------------------------------- IWM 134.43 3.61 152.16 -467.7% Bearish RED -.077 -.069 --------------------------------------------------------------------------------------------- FAS 52.51 7.5 77.57 -1373.3% Bearish BLUE .001 -.322 --------------------------------------------------------------------------------------------- RETL 14.73 .66 19.41 -931.2% Bearish ---- .084 -.357 --------------------------------------------------------------------------------------------- SOXL 176.6 28.31 232.13 -651.9% ------- BLUE .002 -.249 --------------------------------------------------------------------------------------------- TECL 190.4 30.39 243.28 -580.9% Bullish BLUE .028 -.095 --------------------------------------------------------------------------------------------- IBB 112.31 2.31 121.68 -167.4% Bullish RED .119 .041 --------------------------------------------------------------------------------------------- GLD 154.48 -3.33 154.16 18.9% Bearish RED -.168 .209 --------------------------------------------------------------------------------------------- OIH 5.2 .22 8.73 -2343.1% Bearish RED -.288 -.488 --------------------------------------------------------------------------------------------- GASL .19 -.07 2.04 -6166.2% Bearish RED -.41 -.857 --------------------------------------------------------------------------------------------- UGA .19 -.07 2.04 -6166.2% Bullish RED -.399 -.869 --------------------------------------------------------------------------------------------- UUP 25.98 -.06 26.26 -53.5% ------- ---- -.019 .103 --------------------------------------------------------------------------------------------- IEF 25.98 -.06 26.26 -53.5% ------- ---- -.93 -.645 --------------------------------------------------------------------------------------------- CORN 25.98 -.06 26.26 -53.5% ------- ---- .056 .898 --------------------------------------------------------------------------------------------- WEAT 25.98 -.06 26.26 -53.5% ------- ---- .061 3.52 --------------------------------------------------------------------------------------------- YINN 25.98 -.06 26.26 -53.5% Bullish ---- .171 .432 --------------------------------------------------------------------------------------------- RSX 18.85 1.4 22.01 -605.4% Bearish ---- -.06 -.119 |
 Table 3   Count of Stocks in Key Directories
          20200310
-------------------------------
NEWHIGHS       29
NEWLOWS        1392 Bearish
MAXCP          90
MINCP          262
TTTNH          22
TTTNL          387
FASTUP         37
FASTDOWN       812
CPCROSSA       123
CPCROSSD       76
BIGVOLUP       37
BIGVODN        37
ACCUMVER       8
HIGHIP21       10
HIUPPCT        16
REDSELL        104
AUGSELS7       12
TRAPDOOR       145
|
 RANKING OF KEY DIRECTORIES BASED PCT.OF STOCKS ABOVE 65-DMA
               3/10/20
All 46 are bearish
---------------------------------------------------------------------------------------
Directory     Current       day-1         day-2         day-3         day-4         day-5
----------------------------------------------------------------------------------------
BONDFUND       .31           .54           .82           .84           .89           .84
GOLD           .291          .27           .375          .437          .375          .333
SOLAR          .235          .176          .529          .647          .647          .529
COMODITY       .225          .225          .225          .275          .25           .275
CHINA          .203          .129          .185          .333          .296          .222
EDU            .2            .2            .2            .2            .2            .2
FOOD           .185          .185          .185          .222          .203          .259
UTILITY        .179          .153          .41           .41           .487          .205
INDEXES        .177          .172          .236          .241          .29           .193
BIOTECH        .176          .161          .247          .322          .373          .268
NASD-100       .175          .092          .206          .268          .381          .144
GAMING         .136          .045          .227          .227          .272          .136
NIFTY          .127          .127          .17           .255          .404          .17
REIT           .12           .063          .241          .269          .382          .198
RUS-1000       .105          .064          .15           .187          .25           .124
SP500          .105          .065          .157          .197          .275          .117
FIDSTKS        .101          .056          .151          .207          .303          .129
HACKERS        .1            .1            .05           .1            .1            .1
RETAIL         .1            .08           .14           .14           .28           .1
SEMI           .093          .074          .168          .205          .299          .177
HOSPITAL       .09           .045          .318          .318          .363          .227
SOFTWARE       .083          .083          .15           .266          .35           .216
SP-100         .077          .033          .133          .177          .244          .066
INSURANC       .076          0             .153          .153          .153          .153
AUTO           .075          .025          .025          .05           .075          .025
ELECTRON       .072          .052          .138          .164          .25           .151
BEVERAGE       .066          0             .133          .2            .266          0
GUNS           .062          .062          .125          .25           .25           .187
GREEN          .047          .047          .19           .285          .285          .19
OILGAS         .045          .037          .06           .06           .067          .075
FINANCE        .035          .023          .119          .119          .119          .107
DOWJONES       .033          .033          .066          .1            .233          .033
INFRA          .027          0             .111          .138          .138          .111
INDMATER       .026          .026          .052          .065          .078          .052
CHEM           .02           .02           .061          .122          .142          .102
BIGBANKS       0             0             0             0             0             0
COAL           0             0             0             0             0             0
COMPUTER       0             0             .052          .105          .263          0
COPPER         0             0             0             0             0             0
DJI-13         0             0             .076          .076          .307          .076
ETFS           0             0             0             .035          .053          0
HOMEBLDG       0             0             .235          .47           .47           .235
JETS           0             0             0             0             0             0
MILITARY       0             0             0             .035          .071          .071
REGBANKS       0             0             0             0             0             0
TRANSP         0             0             0             0             0             0
|
====================================================================
3/9/2020 Take some profits in your short sales. Buy very little. Without a
Peerless Buy signal
the Futures bounce this morning may soon stop. There are too many cases of the
DJI breaking significantly below the 20% down-from-the-peak level. The IP21 level
today is relatively high, but all the volume indicators are quite low and falling.
![]()

The DJI's 2000 point plunge day put its close 190 points above a
horizontal line 20% down from its peak. There was no Peerless buy signal
despite the extreme oversold condition of the market. As I write this,
the DJI is up a whopping 800. With bank stocks also in a free-fall, we
should expect the Federal Reserve to take new steps to prevent a financial
meltdown. The Trump Administration is talking now about a cut in the
payroll-tax. This should be a popular stimulus. to the economy. But I doubt
if this will be enough to undo the damage from the Coronavirus pandemic
whose spread-rate doubles every week.
In December 2018, the DJI reversed from a point 19%
down from its peak.
But this was relatively easy to accomplish. The FED had caused this decline.
They simply reversed course and lowered rates to turn the market back up.

How much support can we expect from a decline
of 19% to 20% from
the DJI's peak ib bull market. Let's look at all such declines since 1929.
1) On 10/23/1929 the DJI reached this point. There had
been many Sell
signals at the peak. The IP21 (Accumulation Index) was -.154 and
VI= -1103. There was NO BOUNCE and the DJI fell from 305.9
to 198.7 in just 12 more days.
2) On 9/23/1937 the DJI fell 20% below its peak six weeks
before.
It moved slightly below, then slightly above its 20%-down level
for a week and then plunged steeply down to a point 40% down
from its peak. The IP21 was -.33 and the VI was -421 as the
20%-down was tested.
3) On 5/17/1940 the DJI fell 20% from its peak, as Nazi
Germany
attacked Belgium and France. The IP21 was -.285 and the VI was
-530. The DJI kept falling, finding a bottom 28% down from the
peak 3 weeks later on 6/10.
4) On 9/9/1946, the DJI fell 20% below its bull market peak
of 5/29.
It see-sawed around this 20%-down level and sincally bottomed on
11/21 just 25% below the peak. Its IP21 was -.107 and its VI was
-150, readings well above the comparable levels when much bigger
declines occurred.
5) On 10/22/1957, the DJI fell 19% below its peak of 3 months
before.
This was a bottom though it took 4 months more basing before a
bull market began. The IP21 was -,183 and the VI was -.841.
A Buy B16 signal marked this bottom.
6) On 5/28/1962, the DJI fell to a point 21% below its peak
of six
months earlier. The IP21 was -.234 and the VI was -1507. It
rallied briefly and then fell a month later to a point 27% below the
earlier peak A Buy B16 was given at this point.
7) On 8/22/1966, the DJI fell to a point 20% below its bull
market
peak of 6 months earlier. The IP21 was -.282 and the OBVPct
was -,532. The newly formatted VI was only -14. The DJI fell
from here, 792.03, to a bear market bottom at 744.32 on 10/7.
The final bottom was marked by a Buy B8.
8) On 12/10/1969, the DJI fell to a point 20% below its 1969
peak of 7 months earlier. The IP21 was -.173 and the OBVPct
was -.52. The newly formatted VI was only -4. After a weak
Santa Claus rally, the fell from 783.99 (on 12/10) to 631.16 on
5/26/1970 where a Buy B16 Peerless said it was time to buy. The
minor zigs and zags before this were called by Peerless signals.
9) On 11/20/1973, the DJI fell to a point 20% below its bull market
peak of 10 months earlier. The IP21 was -.204 and the OBVPct
was -.247. The DJI fell from 844.9 to 788.31 two weeks later.
The following year it plunged to 577.
10) 10/13/1977 This was a year after its peak in 1976.
IP21=-.085 OBVPct = -.341. After brief Santa Claus rally,
the DJI fell from 818.17 to 742 3 months later.
11) On 9/25/1981 the DJI fell to a point 19% below its peak
of five months
earlier IP21=-.157 OBVPct = -.368 DJI rallied from 824.02
and 4.1% lower band to 892.69 and upper band on 12/4 before
resuming
a its decline to 787 in August 1982.
12) On 10/16/1987 (a Friday) the DJI closed almost 18% below its peak of
8/25. It was already 11.2% below its 21-dma. The IP21 was -.149
and the OBVPct was only -.18. The following Monday, it plunged down
down almost 20% more to 1750 which was the bottom. The speed of
this decline is sumilar to the cases of 1929, 1937 and 2020.
13) 10/10/1990. The closed down 19% from its peak and
4% below its
21-dma. IP21 was only -.016. OBVPct was -.267. The DJI fell only
a little more, from 2407.92 to 2365.1 a day later. There is began building
a bottom.
14) 8/31/1998. The DJI closed down 19% from its peak just six weeks earlier
on 7/17. Its IP21 was -.116. OBVPct was -.262. This was the bottom,
though it took four more tests of the support at 7500 to establish a bottom.
15) 3/21/2001. The DJI closed down 20% from its peak of 14 months earlier.
Its IP21 was only -.069. OBVPct was only -.08 but its VI was -257.
This was the bottom and DJI rallied 21% over next two months.
16) 6/27/2008. The DJI closed down 20% from its peak of 8 months earlier.
Its IP21 was -.226. Its OBVPct was -.357 and its VI was -339. It
zig-zagged in a narrow trading range for 10 weeks and then plunged
down 3800 points down.
17) On 12/26/2018, the DJI fell to a point 19% below its
peak. It
immediately turned up when the White House and Big Banks
pressured Fed Chairman Powell to reverse course and immediately
power interest rates. The IP21 was -.15 and the VI was -333
and the OBV Pct was -.157.
|
Charts 3/9/2020 (Click on Underlined link.) 2020 PEERLESS DJI, Signals, Indicators Daily DJI Volume 10-DayUp/Down Vol Stoch-20 Inverted Traders Index Graph of Pct of All Stocks above 65-dma NASDAQ S&P OEX NYSE COMPQX DJI-15 DJI-20 DJI-30 DIA QQQ MDY IWM TNA Short-Term Rates SPY http://tigersoft.com/2020CST/SPY.GIF USO-CrudeOil DBO FAS GLD BBH IBB JETS JNUG KOL NUGT OIH OIL PALL RSX RETL SDS AGQ SLV SOXL TECL TLT TMF TNA UGA (gasoline) and China: YINN CHAU Commodities: CANE CORN DBC JJC, NIB, CHOC CORN, CUT (paper) MOO, SOYB WEAT UUP (Dollar) LIT (Lithium) AAPL ADBE ALXN AMAT AMGN AMD AMZN AXP BA BABA BAC BIDU BLDP CAT CVX DE FB GOOG GS HD IBM INTU JPM M (Macy's) MSFT NFLX NKE NVDA PG QCOM TSLA TXN XOM V WMT CMG , LRCX, SQ TOWN New highs and Bullish MAXCPs http://tigersoft.com/MAXMLK/3-9-20/BULLISH.htm Bearish MAXCPs - http://tigersoft.com/MINMLK/3-9-20/BEARISH.htm |
Table 1 QUICKSILVER on DJI-30 STOCKS 3/9/2020 0 Bullish 3 Bearish, ITRS and IP21 >+.25 and <-.25 STOCKS CLOSE CHANGE PIVOT-PT 5-dma AROC CL-PWR CANDLE IP21 ITRS ------------------------------------------------------------------------------------ ------------------------------------------------------------------------------------ AAPL 266.17 -22.86 289.32 -554% Bullish BLUE .042 .099 --------------------------------------------------------------------- AXP 98.29 -9.95 108.01 -699.6% Bearish RED -.032 -.05 --------------------------------------------------------------------- BA 227.17 -35.16 280.62 -112.5% Bearish RED -.265 -.155 Bearish --------------------------------------------------------------------- CAT 104.07 -17.34 124.38 -944.6% Bearish RED -.089 -.132 --------------------------------------------------------------------- CSCO 37.96 -1.72 40.04 -397.6% ------- BLUE 0 -.043 --------------------------------------------------------------------- CVX 80.67 -14.65 94.39 -825.7% ------- RED -.007 -.167 --------------------------------------------------------------------- DIS 104.35 -10.92 116.45 -668.1% Bearish RED -.087 -.119 --------------------------------------------------------------------- GS 172.81 -20.04 203.43 -904.5% Bearish RED -.117 -.086 --------------------------------------------------------------------- HD 210.46 -18.05 227.94 -419% Bearish RED -.022 .116 --------------------------------------------------------------------- IBM 117.81 -9.92 128.9 -629.7% Bearish RED -.05 .035 --------------------------------------------------------------------- INTC 50.85 -4.92 55.97 -641.7% Bearish RED -.091 .018 --------------------------------------------------------------------- JNJ 136.44 -5.59 135.59 -127.3% Bullish BLUE-.054 .097 --------------------------------------------------------------------- JPM 93.44 -14.64 116.96 -121.6% Bearish RED -.166 -.158 Bearish --------------------------------------------------------------------- KO 51.86 -3.4 56.06 -358.8% ------- RED -.012 .11 --------------------------------------------------------------------- MCD 186.86 -12 199.51 -389.8% Bullish RED .023 .113 --------------------------------------------------------------------- MMM 144.06 -9.59 145.24 -295.8% Bearish RED -.222 -.022 --------------------------------------------------------------------- MRK 78.96 -3.24 79.13 -147.9% ------- BLUE-.043 .026 --------------------------------------------------------------------- MSFT 150.62 -10.95 164.51 -663.2% ------- BLUE-.043 .119 --------------------------------------------------------------------- NKE 84.11 -4.25 90.93 -469.5% Bullish BLUE .02 .002 --------------------------------------------------------------------- PFE 33.76 -1.26 34.3 -159% ------- BLUE-.136 .022 --------------------------------------------------------------------- PG 116.06 -5.6 118.17 -144.5% Bullish RED -.006 .089 --------------------------------------------------------------------- TRV 116.2 -8.64 125.31 -450.3% Bullish BLUE .014 .018 --------------------------------------------------------------------- UNH 273.44 -10.43 261.4 5.9% ------- BLUE-.023 .091 --------------------------------------------------------------------- UTX 115.36 -11.12 132.53 -710.3% Bearish BLUE-.057 -.066 --------------------------------------------------------------------- V 171.13 -13.23 185.73 -561.6% Bullish BLUE-.016 .075 --------------------------------------------------------------------- VZ 55.83 -1.04 55.7 -130.6% Bullish BLUE .045 .073 --------------------------------------------------------------------- WBA 48.44 -2.07 46.12 34.1% ------- BLUE-.049 -.007 --------------------------------------------------------------------- WMT 117.16 -.07 112.91 55.3% Bullish BLUE .129 .143 --------------------------------------------------------------------- XOMW 41.86 -5.83 51.3 -118.6% Bearish BLUE-.157 -.24 Bearish |
 Table 2                    QUICKSILVER on ETFS - 03/9/20
  5 Bearish
last change Pivot 5-dma aroc ClosPwr Candle IP21 ITRS --------------------------------------------------------------------------------------------- DIA 238.72 -20.13 259.3 -537.2% Bearish RED -.08 0 --------------------------------------------------------------------------------------------- SPY 276.32 -21.14 300.24 -538.2% ------- BLUE-.078 .023 --------------------------------------------------------------------------------------------- QQQ 193.57 -14.45 209.48 -537% Bullish BLUE-.093 .076 --------------------------------------------------------------------------------------------- MDY 297.31 -30.95 334.65 -665.4% Bearish RED -.053 -.045 --------------------------------------------------------------------------------------------- IWM 130.82 -13.58 147.95 -680.1% Bearish RED -.172 -.053 --------------------------------------------------------------------------------------------- FAS 45.01 -17.88 70.32 -2256.1% Bearish RED -.103 -.356 Bearish --------------------------------------------------------------------------------------------- RETL 14.07 -2.64 17.91 -1404.1% Bearish RED .054 -.332 --------------------------------------------------------------------------------------------- SOXL 148.29 -50.32 202.49 -1799.6% Bearish RED -.091 -.31 Bearish --------------------------------------------------------------------------------------------- TECL 160.01 -46.07 214.65 -1846.5% Bullish BLUE-.047 -.168 --------------------------------------------------------------------------------------------- IBB 110 -8.03 116.23 -395.9% Bullish RED .075 .053 --------------------------------------------------------------------------------------------- GLD 157.81 .26 153.89 278.7% Bearish RED -.124 .279 --------------------------------------------------------------------------------------------- OIH 4.98 -2.37 8.77 -2482.9% Bearish RED -.316 -.467 Bearish --------------------------------------------------------------------------------------------- GASL .26 -1.05 2.03 -5264.6% Bearish RED -.429 -.811 Bearish --------------------------------------------------------------------------------------------- RSX 17.45 -3.17 21.33 -1005.2% Bearish BLUE-.147 -.134 Bearish |
 Table 3   Count of Stocks in Key Directories
           20200309
-------------------------------
NEWHIGHS       68
NEWLOWS        3026
MAXCP          103
MINCP          383
TTTNH          30
TTTNL          242
FASTUP         42
FASTDOWN       990
CPCROSSA       86
CPCROSSD       233
BIGVOLUP       6
BIGVODN        173
ACCUMVER       9
HIGHIP21       6
HIUPPCT        16
VHIP21         158
LOWACCUM       153
REDSELL        107
AUGSELS7       11
TRAPDOOR       143
|
Table 4 RANKING OF KEY DIRECTORIES BASED PCT.OF STOCKS ABOVE 65-DMA
              3/9/20
 Bullish = 1
 Bearish = 45  14 categories have no stocks above 65-dma
---------------------------------------------------------------------------------------
Directory     Current       day-1         day-2         day-3         day-4         day-5
----------------------------------------------------------------------------------------
BONDFUND       .54           .82           .84           .89           .85           .7
===========================================================================================
GOLD           .27           .375          .437          .375          .333          .291
COMODITY       .225          .225          .275          .25           .275          .275
EDU            .2            .2            .2            .2            .2            .4
FOOD           .185          .185          .222          .203          .259          .24
SOLAR          .176          .529          .647          .647          .529          .588
INDEXES        .172          .236          .241          .29           .193          .188
BIOTECH        .158          .244          .319          .373          .28           .328
UTILITY        .153          .41           .41           .487          .205          .282
CHINA          .129          .185          .333          .296          .222          .222
NIFTY          .127          .17           .255          .404          .17           .361
HACKERS        .1            .1            .1            .1            .1            .05
NASD-100       .092          .216          .278          .381          .154          .278
SOFTWARE       .083          .166          .266          .35           .216          .233
RETAIL         .08           .14           .14           .28           .12           .2
SEMI           .074          .168          .205          .299          .177          .224
SP500          .065          .159          .197          .275          .121          .176
RUS-1000       .064          .151          .187          .25           .127          .17
REIT           .063          .241          .269          .382          .205          .234
GUNS           .062          .125          .25           .25           .187          .187
FIDSTKS        .056          .151          .207          .303          .14           .23
ELECTRON       .052          .137          .163          .248          .15           .183
GREEN          .047          .19           .285          .285          .19           .238
GAMING         .045          .227          .227          .272          .136          .272
HOSPITAL       .045          .318          .318          .363          .227          .409
OILGAS         .037          .06           .06           .067          .075          .075
DOWJONES       .033          .066          .1            .233          .033          .1
SP-100         .033          .133          .177          .244          .077          .133
INDMATER       .026          .052          .065          .078          .052          .039
AUTO           .025          .025          .05           .075          .025          .075
FINANCE        .023          .119          .119          .119          .107          .095
CHEM           .02           .061          .122          .142          .102          .102
BEVERAGE       0             .133          .2            .266          0             0
BIGBANKS       0             0             0             0             0             0
COAL           0             0             0             0             0             0
COMPUTER       0             .052          .105          .263          0             .157
COPPER         0             0             0             0             0             0
DJI-13         0             .076          .076          .307          .076          .153
ETFS           0             0             .035          .053          0             0
HOMEBLDG       0             .235          .47           .47           .235          .176
INFRA          0             .111          .138          .138          .111          .083
INSURANC       0             .153          .153          .153          .153          .153
JETS           0             0             0             0             0             0
MILITARY       0             0             .035          .071          .071          .035
REGBANKS       0             0             0             0             0             0
TRANSP         0             0             0             0             0             0
|
====================================================================
3/6/2020 I trust many of you have taken short positions from among our BEARISH
MINCPS. Most were airlines and oil stocks. I also had suggested buying some
strong MAXCPs on the next test of 25000. But today's huge decline nullifies
that idea as the DJI will open far below this level. Do not be in a hurry
to buy today. I expect a big surge in institutional buying of leveraged short
ETFs. Back in 1987, this produced a 20% decline on a Monday following
a weak Friday. We could see someting similar today.
The recent Sell S6s are significant bearish warnings. Historically, these signals|
often occur when big investors are scared and chose to quickly selling into the
first rally or two without even giving the market a chance to rise any more than a single
day.
See the ten earlier cases below. Seven of the ten brought on a decline of 10%
to 20%. In the extreme bear market of 2008-2009, there were four separate
S6s. So, the pair of them recently should be considered as extra
bearish.
70% of Past Sell S6s came before big Sell-offs.
Date Signal
DJI Subsequent
Paper
Decline
Lose
--------------------------------------------------------
19320428 S6 58.2 .187 59.0
-.0137 5/6
19320509 S6 57.0 .170 59.0
-.035 5/6
19320929 S6 71.5 .108
none 0
19380316 S6 122.9 .195
none 0 |
19460218 S6 201.6 .03
none 0
19480205 S6 170.9 .032
none 0
20080922 S6 11015.69
.148 11143.1 -.0115 9/26
20081021 S6 9033.66 -.003
9065.12 -.0034 10/21
20081114 S6 8497.31 .111
none 0
20090129 S6 8149.01 .191
8280.59 -.0161 2/6
As I write, this the Index Futures
are "limit down". I do not recall anything
like this. Someone said we have an "invasion of black swans".
The weekend's 30% plunge in Oil Prices this morning and the oil producing
countries' price war compounds the fears born of the swift take-off in
Coronavirus cases here and abroad. Each day, there are more and more
cancellations, state of emmergencies declared and interruptions of commerce.
We are "cursed to live in exciting times". Of course, the FED will
probably
intervene again. But dropping hundreds of millions of Dollars into banks by
Helicopter
will be highly controversial in an Election Year. I think we can also bet that the
White House will offer its own form of bailout. But getting
the Democrats in the
House to agree will not come easily. So, there would seem to be no need to rush
to buy.
My suggestion is to wait for the DJI to come back within its normal 3.5% bands
for a few days and only then act on a Buy signal at this point. The markets will
become particularly dangerous if the DJI, NASDAQ and SP-500 close more than
20% down from their peaks. See their charts below.
DJI  |
SP-500 |
NASDAQ |
|
Charts 3/6/2020 (Click on Underlined link.) 2020 PEERLESS DJI, Signals, Indicators Daily DJI Volume 10-DayUp/Down Vol Stoch-20 Inverted Traders Index Graph of Pct of All Stocks above 65-dma NASDAQ S&P OEX NYSE COMPQX DJI-15 DJI-20 DJI-30 DIA QQQ MDY IWM TNA Short-Term Rates SPY http://tigersoft.com/2020CST/SPY.GIF USO-CrudeOil DBO FAS GLD BBH IBB JETS JNUG KOL NUGT OIH OIL PALL RSX RETL SDS AGQ SLV SOXL TECL TLT TMF TNA UGA (gasoline) and China: YINN CHAU Commodities: CANE CORN DBC JJC, NIB, CHOC CORN, CUT (paper) MOO, SOYB WEAT UUP (Dollar) LIT (Lithium) AAPL ADBE ALXN AMAT AMGN AMD AMZN AXP BA BABA BAC BIDU BLDP CAT CVX DE FB GOOG GS HD IBM INTU JPM M (Macy's) MSFT NFLX NKE NVDA PG QCOM TSLA TXN XOM V WMT CMG , LRCX, SQ TOWN New highs and Bullish MAXCPs http://tigersoft.com/MAXMLK/3-6-20/BULLISH.htm Bearish MAXCPs - http://tigersoft.com/MINMLK/3-6-20/BEARISH.htm |
Table 1 QUICKSILVER on DJI-30 STOCKS 3/6/2020 0 Bullish 2 Bearish, ITRS and IP21 >+.25 and <-.25 STOCKS CLOSE CHANGE PIVOT-PT 5-dma AROC CL-PWR CANDLE IP21 ITRS ------------------------------------------------------------------------------------ ------------------------------------------------------------------------------------ AAPL 289.03 -3.89 298.81 268.8% Bullish BLUE .113 .111 --------------------------------------------------------------------- AXP 108.24 -2.7 113.87 -75.7% Bearish BLUE-.004 -.038 --------------------------------------------------------------------- BA 262.33 1.96 289.27 -230.1% Bearish BLUE-.151 -.13 Bearish --------------------------------------------------------------------- CAT 121.41 -.56 127.6 -113.1% ------- BLUE-.006 -.09 --------------------------------------------------------------------- CSCO 39.68 .11 41.17 -30.9% ------- BLUE -.013 -.082 --------------------------------------------------------------------- CVX 95.32 -1.87 96.59 103.1% ------- BLUE .1 -.115 --------------------------------------------------------------------- DIS 115.27 1.29 119.98 -101.3% Bearish BLUE-.011 -.11 --------------------------------------------------------------------- GS 192.85 -5.94 209.47 -193.9% Bearish BLUE-.11 -.065 --------------------------------------------------------------------- HD 228.51 -6.3 229.94 231.6% ------- RED .018 .135 --------------------------------------------------------------------- IBM 127.73 -1.82 134.3 -92.1% Bearish BLUE .004 .035 --------------------------------------------------------------------- INTC 55.77 -1.19 58.18 21.9% ------- BLUE -.06 .034 --------------------------------------------------------------------- JNJ 142.03 .02 140.02 271.4% ------- BLUE-.033 .063 --------------------------------------------------------------------- JPM 108.08 -5.89 121.52 -341.2% Bearish BLUE-.088 -.119 --------------------------------------------------------------------- KO 55.26 -1.48 55.92 157.4% ------- BLUE .031 .099 --------------------------------------------------------------------- MCD 198.86 .54 202.55 117.1% Bullish BLUE .04 .106 --------------------------------------------------------------------- MMM 153.65 2.24 153.02 146.4% ------- BLUE-.188 -.046 --------------------------------------------------------------------- MRK 82.2 .62 81.37 351.1% ------- BLUE-.053 -.011 --------------------------------------------------------------------- MSFT 161.57 -4.7 172.79 -13.2% ------- RED .033 .119 --------------------------------------------------------------------- NKE 88.36 -2.22 92.68 -55.8% ------- RED -.014 -.024 --------------------------------------------------------------------- PFE 35.02 -.44 34.88 229.3% ------- BLUE-.129 -.017 --------------------------------------------------------------------- PG 121.66 .03 119.56 353% Bullish BLUE .024 .067 --------------------------------------------------------------------- TRV 124.84 -3.18 127.68 198.9% ------- BLUE-.021 .009 --------------------------------------------------------------------- UNH 283.87 .91 273.11 530.7% Bearish BLUE-.05 .055 --------------------------------------------------------------------- UTX 126.48 .04 134.07 -155.1% Bearish BLUE-.042 -.063 --------------------------------------------------------------------- V 184.36 -2.6 192.33 69.1% Bullish BLUE .007 .078 --------------------------------------------------------------------- VZ 56.87 -.29 57.32 239.9% Bullish BLUE .052 .019 --------------------------------------------------------------------- WBA 50.51 1.73 48.11 500.1% Bullish BLUE-.001 -.045 --------------------------------------------------------------------- WMT 117.23 1.31 115.88 419.5% Bullish BLUE .107 .078 --------------------------------------------------------------------- XOM 47.69 -2.42 53.88 -361.8% Bearish RED -.141 -.229 Bearish |
Table 2 QUICKSILVER on ETFS - 03/6/20 last change Pivot 5-dma aroc ClosPwr Candle IP21 ITRS --------------------------------------------------------------------------------------------- DIA 258.85 -2.61 267.03 81.7% ------- BLUE-.013 0 --------------------------------------------------------------------------------------------- BA 262.33 1.96 289.27 -230.1% Bearish BLUE-.151 -.13 Bearish --------------------------------------------------------------------------------------------- SPY 297.46 -5 309.09 19.7% ------- BLUE-.029 .019 --------------------------------------------------------------------------------------------- QQQ 208.02 -3.57 216.42 52.3% Bullish BLUE-.023 .075 --------------------------------------------------------------------------------------------- MDY 328.26 -5.52 342.16 -41.9% Bearish BLUE .026 -.032 --------------------------------------------------------------------------------------------- IWM 144.4 -2.92 151.03 -64.8% Bearish BLUE-.126 -.039 Bearish --------------------------------------------------------------------------------------------- FAS 62.89 -5.53 77.17 -309.7% Bearish BLUE-.048 -.231 Bearish --------------------------------------------------------------------------------------------- RETL 16.71 -.56 19.15 -445.2% Bearish BLUE .008 -.298 --------------------------------------------------------------------------------------------- SOXL 198.61 -12.7 225.3 -148.4% Bearish BLUE-.014 -.195 --------------------------------------------------------------------------------------------- TECL 206.08 -13.51 243.24 -33.7% Bullish BLUE .029 -.044 --------------------------------------------------------------------------------------------- IBB 118.03 -1.53 119.42 175.6% Bullish BLUE .147 .053 --------------------------------------------------------------------------------------------- GLD 157.55 .06 149.2 300.4% Bearish RED -.126 .219 --------------------------------------------------------------------------------------------- OIH 7.35 -.91 9.18 -927.8% Bearish RED -.278 -.361 Bearish --------------------------------------------------------------------------------------------- GASL 1.31 -.51 2.25 -2195.9% Bearish RED -.246 -.775 Bearish --------------------------------------------------------------------------------------------- RSX 20.62 -.38 21.74 -174.5% Bearish --- -.123 -.074 |
  Table 3  Count of Stocks in Key Directories
          20200306
-------------------------------
NEWHIGHS       90   NYSE and NASDAQ
NEWLOWS        1397 NYSE and NASDAQ
MAXCP          95
MINCP          180
TTTNH          30
TTTNL          174
FASTUP         96
FASTDOWN       241
CPCROSSA       122
CPCROSSD       52
BIGVOLUP       8
BIGVODN        36
ACCUMVER       6
HIGHIP21       9
HIUPPCT        22
REDSELL        107
AUGSELS7       13
TRAPDOOR       35
|
 Table 4  RANKING OF KEY DIRECTORIES BASED PCT.OF STOCKS ABOVE 65-DMA
              3/6/20
 Bearish = 44
 Bullish = 2
---------------------------------------------------------------------------------------
Directory     Current       day-1         day-2         day-3         day-4         day-5
----------------------------------------------------------------------------------------
BONDFUND       .82           .84           .89           .85           .71           .48
SOLAR          .529          .647          .647          .529          .588          .588
-------------------------------------------------------------------------------------------
UTILITY        .41           .41           .487          .205          .282          .076
GOLD           .375          .437          .375          .333          .291          .208
HOSPITAL       .318          .318          .363          .227          .409          .363
BIOTECH        .241          .315          .369          .279          .336          .252
REIT           .241          .269          .382          .205          .241          .063
INDEXES        .236          .241          .29           .193          .188          .166
HOMEBLDG       .235          .47           .47           .235          .176          .058
GAMING         .227          .227          .272          .136          .272          .181
COMODITY       .225          .275          .25           .275          .275          .225
NASD-100       .216          .288          .391          .154          .278          .113
EDU            .2            .2            .2            .2            .4            .2
GREEN          .19           .285          .285          .19           .238          .095
CHINA          .185          .333          .296          .222          .222          .148
FOOD           .185          .222          .203          .259          .24           .203
NIFTY          .17           .255          .404          .17           .361          .191
SEMI           .168          .205          .299          .177          .224          .186
SOFTWARE       .166          .283          .35           .216          .233          .183
SP500          .159          .199          .275          .121          .178          .037
INSURANC       .153          .153          .153          .153          .153          .038
FIDSTKS        .151          .207          .303          .14           .235          .123
RUS-1000       .151          .188          .25           .127          .17           .069
RETAIL         .14           .14           .28           .12           .2            .06
ELECTRON       .137          .163          .248          .15           .183          .15
BEVERAGE       .133          .2            .266          0             0             0
SP-100         .133          .177          .244          .077          .144          .022
GUNS           .125          .25           .25           .187          .187          .062
FINANCE        .119          .119          .119          .107          .095          .071
INFRA          .111          .138          .138          .111          .083          .083
HACKERS        .1            .15           .1            .1            .05           .05
DJI-13         .076          .076          .307          .076          .153          0
DOWJONES       .066          .1            .233          .033          .1            0
CHEM           .061          .122          .142          .102          .102          .04
OILGAS         .06           .06           .067          .075          .075          .045
COMPUTER       .052          .105          .263          0             .157          0
INDMATER       .052          .065          .078          .052          .039          .026
AUTO           .025          .05           .075          .025          .075          .025
BIGBANKS       0             0             0             0             0             0
COAL           0             0             0             0             0             0
COPPER         0             0             0             0             0             0
ETFS           0             .035          .053          0             0             0
JETS           0             0             0             0             0             0
MILITARY       0             .035          .071          .071          .035          0
REGBANKS       0             0             0             0             0             0
TRANSP         0             0             0             0             0             0
|
====================================================================
3/5/2020 The DJI gave another Sell S6 today. This tells us that the bears
stand ready
to crush any promising rally. More important than Peerless in this super volatile
market are the wildly different perspectives on the market. A very positive Jobs
Report over 200,000 seems most unlikely. How the market responds to a number
like +100,000, will be telling. A negative number would be decidely bearish.
Like a ping-pong ball, the DJI is in the process of bouncing
back and
forth between its intra-day low of 25000 on this decline and its 200-
day ma resistance at 27100. Base-building is called for after the 14%
sell-off from the peak. Fears of what the Coronavirus pandemic will
do to world- and the US economies is out-weighing record low
interest rates and the seeming defeat of Wall-Street's enemy, Bernie
Sanders.
I hope you are in very few long positions and have
hedged by shorting
some of our Bearish MINCPs. A rebound from 25000 would be in keeping
with what has happened in the past to many "corrections". But can we count
on this being only a correction? A decline of more than 14% almost always
(2011 is an exception.) brings a decline to the 19%-20% boundary between
a deep correction and a "bear market". Below that level, avoid all longs
and aggressively take short sales exclusively until we get some Peerless Buys.
DJI Support is 24500-25500


RECORD LOW RATES

WATCH THE BIG BANKS

GROWING ALARM
I suspect that some are wondering if the current
Administration is up to the
task of dealing proactively with the deadly flu that is now doubling
its cases every six days. The lack of test-kits does not bode well.
But will there be a new Administration that can cope with pandemic?
If Joe Biden does win the nomination, what is his mental competence?
And will not Trump eviscerate him in the Presidential Debates?
We could hope for financial leadership. JP Morgan wants its workers to
work at home. Makes sense. But then there is Bloomberg and Warren Buffet.
The former blew a half a billion dollars on vanity advertisements and the latter
has lost 3-4 billion dollars in his airlines stocks alone. Pity Buffet did not use
TigerSoft and could not otherwise foresee the panic that the Coronavirus would
cause the travel industry.
The thing about bear markets is often how suddenly
they appear, how they
do the most damage when Big Banks lead the decline as in 2007-2008. The
TigerSoft Big Banks chart looks very weak now. And how investors hit by
losses in one very weak industry must eventually sell even their best
performing stocks to meet margin calls or pay their taxes and other expenses.
A decline by the DJI deep than 20% is often seen as the tipping point, where
a "correction" turns into a bear market. We have had not had a bear market
for 10 years. Only the advance from 1947 to 1960 was longer and conditions
are very different now.
WEAK INDUSTRIES
 |
 |
 |
 |
|
Charts 3/5/2020 (Click on Underlined link.) 2020 PEERLESS DJI, Signals, Indicators Daily DJI Volume 10-DayUp/Down Vol Stoch-20 Inverted Traders Index Graph of Pct of All Stocks above 65-dma NASDAQ S&P OEX NYSE COMPQX DJI-15 DJI-20 DJI-30 DIA QQQ MDY IWM TNA Short-Term Rates SPY http://tigersoft.com/2020CST/SPY.GIF USO-CrudeOil DBO FAS GLD BBH IBB JETS JNUG KOL NUGT OIH OIL PALL RSX RETL SDS AGQ SLV SOXL TECL TLT TMF TNA UGA (gasoline) and China: YINN CHAU Commodities: CANE CORN DBC JJC, NIB, CHOC CORN, CUT (paper) MOO, SOYB WEAT UUP (Dollar) LIT (Lithium) AAPL ADBE ALXN AMAT AMGN AMD AMZN AXP BA BABA BAC BIDU BLDP CAT CVX DE FB GOOG GS HD IBM INTU JPM M (Macy's) MSFT NFLX NKE NVDA PG QCOM TSLA TXN XOM V WMT CMG , LRCX, SQ TOWN New highs and Bullish MAXCPs http://tigersoft.com/MAXMLK/3-5-20/BULLISH.htm Bearish MAXCPs - http://tigersoft.com/MINMLK/3-5-20/BEARISH.htm |
Table 1 QUICKSILVER on DJI-30 STOCKS 3/5/2020 0 Bullish 3 Bearish, ITRS and IP21 >+.25 and <-.25 STOCKS CLOSE CHANGE PIVOT-PT 5-dma AROC CL-PWR CANDLE IP21 ITRS ------------------------------------------------------------------------------------ ------------------------------------------------------------------------------------ AAPL 292.92 -9.82 273.36 337.3% Bullish RED .075 .129 --------------------------------------------------------------------- AXP 110.94 -4.76 109.93 -83.4% Bearish RED -.048 -.037 --------------------------------------------------------------------- BA 260.37 -22.75 275.11 -483.6% Bearish RED -.181 -.125 Bearish --------------------------------------------------------------------- CAT 121.97 -5.43 124.24 -51.8% ------- RED .002 -.093 --------------------------------------------------------------------- CSCO 39.57 -1.82 39.93 -58% Bearish RED -.059 -.085 --------------------------------------------------------------------- CVX 97.19 -1.34 93.34 160.4% ------- BLUE .091 -.107 --------------------------------------------------------------------- DIS 113.98 -5.2 117.65 -171.7% Bearish RED -.094 -.143 --------------------------------------------------------------------- GS 198.79 -9.95 200.77 -167.8% Bearish RED -.104 -.051 --------------------------------------------------------------------- HD 234.81 -6.27 217.84 220.8% ------- RED .009 .142 --------------------------------------------------------------------- IBM 129.55 -4.67 130.15 -134.7% Bearish RED .037 .036 --------------------------------------------------------------------- INTC 56.96 -1.72 55.52 99.4% Bearish ---- -.078 .047 --------------------------------------------------------------------- JNJ 142.01 -1.47 134.48 104.3% ------- BLUE -.046 .053 --------------------------------------------------------------------- JPM 113.97 -5.88 116.11 -310.5% Bearish RED -.088 -.089 --------------------------------------------------------------------- KO 56.74 -2.18 53.49 162% Bearish RED .015 .113 --------------------------------------------------------------------- MCD 198.32 -8.7 194.17 -66.7% Bearish RED -.024 .087 --------------------------------------------------------------------- MMM 151.41 -2.57 149.24 41.6% Bearish BLUE-.215 -.056 Bearish --------------------------------------------------------------------- MRK 81.58 -1.39 76.56 219.8% Bearish BLUE-.053 -.028 --------------------------------------------------------------------- MSFT 166.27 -4.28 162.01 244.3% ------- BLUE-.022 .137 --------------------------------------------------------------------- NKE 90.58 -3.21 89.38 111.5% ------- RED -.051 -.013 --------------------------------------------------------------------- PFE 35.46 -.94 33.42 196.4% Bearish RED -.175 -.015 --------------------------------------------------------------------- PG 121.63 -2.87 113.23 345.1% Bullish BLUE .013 .051 --------------------------------------------------------------------- TRV 128.02 -3.51 119.81 156.7% Bullish RED -.015 .019 --------------------------------------------------------------------- UNH 282.96 -6.46 254.96 544.7% Bearish BLUE-.051 .048 --------------------------------------------------------------------- UTX 126.44 -12.6 130.59 -214.7% Bearish RED -.07 -.073 --------------------------------------------------------------------- V 186.96 -7.33 181.76 186% Bearish RED -.021 .075 --------------------------------------------------------------------- VZ 57.16 -.96 54.16 187.3% ------- BLUE .035 .002 --------------------------------------------------------------------- WBA 48.78 .09 45.76 270.3% Bearish BLUE-.085 -.084 --------------------------------------------------------------------- WMT 115.92 -.85 107.68 244.8% Bullish BLUE .095 .045 --------------------------------------------------------------------- XOM 50.11 -2.31 51.44 28% Bearish RED -.061 -.203 Bearish |
Table 2 QUICKSILVER on ETFS - 03/5/20 last change Pivot 5-dma aroc ClosPwr Candle IP21 ITRS --------------------------------------------------------------------------------------------- DIA 261.46 -9.43 254.56 75.6% Bearish RED -.033 ----- --------------------------------------------------------------------------------------------- SPY 302.46 -10.4 296.26 81.6% Bearish RED -.065 .024 --------------------------------------------------------------------------------------------- QQQ 211.59 -6.63 205.8 140.9% ------- RED -.073 .08 --------------------------------------------------------------------------------------------- MDY 333.78 -12.51 331.09 -57.2% Bearish RED .003 -.03 --------------------------------------------------------------------------------------------- IWM 147.32 -4.84 146.33 -58.3% Bearish RED -.132 -.032 --------------------------------------------------------------------------------------------- FAS 68.42 -9.15 67.36 -234.7% Bearish RED -.074 -.191 --------------------------------------------------------------------------------------------- RETL 17.27 -2.14 18.35 -390.2% Bearish RED .026 -.298 --------------------------------------------------------------------------------------------- SOXL 211.31 -20.82 205 477.7% Bearish RED -.009 -.157 --------------------------------------------------------------------------------------------- TECL 219.59 -23.69 207.6 392.7% Bearish RED -.015 .01 --------------------------------------------------------------------------------------------- IBB 119.56 -2.12 113.88 262.1% Bullish BLUE .118 .06 --------------------------------------------------------------------------------------------- GLD 157.49 3.33 148.38 114.9% Bearish BLUE-.152 .21 --------------------------------------------------------------------------------------------- OIH 8.26 -.47 8.98 -298.1% Bearish RED -.17 -.297 Bearish --------------------------------------------------------------------------------------------- GASL 1.82 -.22 2.22 -450.2% ------- RED -.166 -.719 Bearish --------------------------------------------------------------------------------------------- |
 Table 3   Count of Stocks in Key Directories
           20200305
-------------------------------
NEWHIGHS       93 WSJ NYSE + NASD NHs
NEWLOWS        562 WSJ NYSE + NASD NLs
MAXCP          62
MINCP          245
TTTNH          40
TTTNL          240
FASTUP         100
FASTDOWN       194
CPCROSSA       45
CPCROSSD       116
BIGVOLUP       5
BIGVODN        26
ACCUMVER       12
HIGHIP21       9
HIUPPCT        32
VHIP21         164
LOWACCUM       132
REDSELL        108
AUGSELS7       9
TRAPDOOR       33
|
 RANKING OF KEY DIRECTORIES BASED PCT.OF STOCKS ABOVE 65-DMA
               3/5/20
 Bullish = 2
 Bearish = 44
---------------------------------------------------------------------------------------
Directory     Current       day-1         day-2         day-3         day-4         day-5
----------------------------------------------------------------------------------------
BONDFUND       .84           .89           .85           .71           .49           .86
SOLAR          .647          .647          .529          .588          .588          .529
HOMEBLDG       .47           .47           .235          .176          .058          .117
GOLD           .437          .375          .333          .291          .208          .354
UTILITY        .41           .487          .205          .282          .102          .205
CHINA          .333          .296          .222          .222          .166          .185
HOSPITAL       .318          .363          .227          .409          .363          .454
BIOTECH        .312          .366          .276          .336          .258          .267
NASD-100       .288          .402          .164          .278          .113          .103
GREEN          .285          .285          .19           .238          .095          .19
SOFTWARE       .283          .366          .216          .233          .2            .183
COMODITY       .275          .25           .275          .275          .225          .35
REIT           .269          .382          .205          .241          .063          .141
NIFTY          .255          .404          .17           .361          .191          .148
GUNS           .25           .25           .187          .187          .062          .125
INDEXES        .241          .29           .193          .188          .166          .177
GAMING         .227          .272          .136          .272          .181          .181
FOOD           .222          .203          .259          .24           .203          .296
FIDSTKS        .207          .303          .14           .235          .123          .117
SEMI           .205          .299          .177          .224          .186          .168
BEVERAGE       .2            .266          0             0             0             .066
EDU            .2            .2            .2            .4            .2            .2
SP500          .199          .277          .121          .178          .042          .09
RUS-1000       .188          .251          .127          .17           .072          .103
SP-100         .177          .244          .077          .144          .022          .033
ELECTRON       .164          .25           .151          .184          .151          .131
INSURANC       .153          .153          .153          .153          .038          .115
HACKERS        .15           .15           .1            .05           .05           .05
RETAIL         .14           .28           .12           .2            .06           .08
INFRA          .138          .138          .111          .083          .083          .083
CHEM           .122          .142          .102          .102          .04           .04
FINANCE        .119          .119          .107          .095          .071          .059
COMPUTER       .105          .263          0             .157          0             .052
DOWJONES       .1            .233          .033          .1            0             0
DJI-13         .076          .307          .076          .153          0             0
INDMATER       .065          .078          .052          .039          .026          .039
OILGAS         .06           .067          .075          .075          .045          .06
AUTO           .05           .075          .025          .075          .025          .025
ETFS           .035          .053          0             0             0             0
MILITARY       .035          .071          .071          .035          0             .035
BIGBANKS       0             0             0             0             0             0
COAL           0             0             0             0             0             0
COPPER         0             0             0             0             0             0
JETS           0             0             0             0             0             0
REGBANKS       0             0             0             0             0             0
TRANSP         0             0             0             0             0             0
|
=======================================================================
3/4/2020 The market boomed up because it appears that social democrat
Bernie
Sanders will not be the Democrats' Presidential Candidate in 2020. Rather
corporation-friendly Joe Biden will be. But the DJI stopped abruptly at its key
200-day ma and at its 50% retracement level. Look back at past recoveries
in the DJI and see how often this happens soon after a decline of 10%-14% down
from a peak - www.tigersoft.com/correct/indexes.htm.


Did you ever expect to see 1% Interest Rates?
Observers are reaching wildly different conclusions?
I recently pictured here the base-building needed. I foresaw two tests of 27000-27500
and then another decline back to 25000. The daily moves have been enormous.
They have whipsawed the normal Peerless signals. Very unusual events have
over-taken the financial markets and now even 10-year interest rates have suddenly
dropped below 1%, a record low. The demand for money, amazingly,
by banks and businesses has fallen over a cliff. Consumers and Debtors would love
to borrow at these rates. Watch your emails to see if this impacts ordinary folks.
I'll take $100,000, please.
Is the Fed over-reacting? Do they have any choice currently? Are they under
great
pressure in this Election Year to prevent an economic slow-down? Can a collapse be
avoided given the high PEs?

Friday's Job Numbers will give us a clearer insight into how bad will be the effects on
business from the Coronavirus pandemic. We are going to cancel our March TigerSoft
meeting here. No doubt about it, the collapse of 3-month rates is
extraordinary. If this
Friday's Job numbers are good, it may be a very good sign that we have seen the lows
until there is another big move up, probably to 28000.
But right now, the broad trading range 25500-27100
seems to be the dominant feature
in the technical landscape. Hedging with the most bullish and most bearish stocks
seems
a good way to play the market for now given the violent contending forces at work on
it. Being satisfied with short-term profits also seem well-warranted and validated
by
the huge reversals day after day.
Today's Buy B5 with the DJI below its 200-day ma is
untrustworthy, much like the
Sell S6 was two days ago given the Primaries' victory for the moderate Joe Biden.
Events and swings are too much for the Peerless signals. Instead, trust the broad
trading range, 25500-27100 and hedge...
The Significance of Today's Buy B5
                                     The Buy B5 shows that the DJI has sold off rapidly, but the IP21 or OBV-Pct
                                            indicators are nearly positive with the DJI at the bottom or on a rebound soon
                                            after the bottom.  The cause for the decline is sometimes a panic caused by the
                                            President's health (heart attack in 1955) or assassination (1963). It may be
                                            caused by an expected outcome in a Presidential Election (1948). There have been
                                            only four February-March Buy B5s.  One of these B5s did very well; the others
                                            showed modest gains of +4.8%, +5.6% and 5.0%. Only one showed a paper loss
                                            as large as 1%. The DJI is now reacy to open more than 1% today.

                                            An additional rule is needed for bull market Buy B5s.  They must not occur up
                                            so much from the previous day and should not occur with the DJI below the 200-dma
                                            The resistance from the 200-day ma remains a problem.  If we see a shallow pullback
                                            now and then the next rally surpasses the 200-dma, the DJI should be able to rally
                                            back to 28000.  The closest parallel I can find would then be like from
                                            February 9th, 2018.
February-March B5s
                                                   Date       Signal          DJI       Gain       Paper Loss
                                                   ----------------------------------------------------------------------------------
                                                  19290325      B5             297.5     .048       296.5    -.003
                                                  10% correction.  DJI still above 200-dma.  Buying on immediate decline
                                                  Above rising 200-dma.
                                                   la/ma=.953  IP21=-.13  OBVPct = 0
                                                   -----------------------------------------------------------------------------------
                                                   19350312      B5              97.7     .356       96.7     -.0102    3/14
                                                   10% correction.  DJI still above 200-dma.  Buying on immediate decline.
                                                   Above rising 200-dma
                                                    la/ma=.952  IP21=-.103  OBVPct = +.058
                                                   -----------------------------------------------------------------------------------
                                                   19880328      B5            1979.77    .056       none      0
                                                   6% correction.  In long base after 1987 Crash.
                                                   la/ma=.963  IP21=+.761  OBVPct = +.002
                                                   -----------------------------------------------------------------------------------
                                                   20180209      B5           24190.90    .050       none      0
                                                   Date  Signal   DJIA  Gain   Max.Paper Loss  la/ma  IP21   AROC     P-I   V-I  OBVPct
                                                   20180209   B5 24190.90 .050      none         .941 -.545    -314   -127 -127  +.139
                                                   10% correction of steep uptrend. Above rising 200-dma.
|
Charts 3/4/2020 (Click on Underlined link.) 2020 PEERLESS DJI, Signals, Indicators Daily DJI Volume 10-DayUp/Down Vol Stoch-20 Inverted Traders Index Graph of Pct of All Stocks above 65-dma NASDAQ S&P OEX NYSE COMPQX DJI-15 DJI-20 DJI-30 DIA QQQ MDY IWM TNA Short-Term Rates SPY http://tigersoft.com/2020CST/SPY.GIF USO-CrudeOil DBO FAS GLD BBH IBB JETS JNUG KOL NUGT OIH OIL PALL RSX RETL SDS AGQ SLV SOXL TECL TLT TMF TNA UGA (gasoline) and China: YINN CHAU Commodities: CANE CORN DBC JJC, NIB, CHOC CORN, CUT (paper) MOO, SOYB WEAT UUP (Dollar) LIT (Lithium) AAPL ADBE ALXN AMAT AMGN AMD AMZN AXP BA BABA BAC BIDU BLDP CAT CVX DE FB GOOG GS HD IBM INTU JPM M (Macy's) MSFT NFLX NKE NVDA PG QCOM TSLA TXN XOM V WMT CMG , LRCX, SQ TOWN New highs and Bullish MAXCPs http://tigersoft.com/MAXMLK/3-4-20/BULLISH.htm Bearish MAXCPs - http://tigersoft.com/MINMLK/3-4-20/BEARISH.htm |
Table 1 QUICKSILVER on DJI-30 STOCKS 3/4/2020 1 Bullish 3 Bearish, ITRS and IP21 >+.25 and <-.25
Pivot 5-dma CP Trend Candle. IP21 ITRS
AROC
------------------------------------------------------------------------------
AAPL 302.74 13.42 273.52 176.7% Bullish BLUE .135 .129 Bullish
---------------------------------------------------------------------
AXP 115.7 7.69 112.81 -124.3% Bearish BLUE-.056 -.025
---------------------------------------------------------------------
BA 283.12 2.5 287.76 -390.6% Bearish RED -.09 -.103
---------------------------------------------------------------------
CAT 127.4 3.02 123.27 -33.9% ------- BLUE .035 -.074
---------------------------------------------------------------------
CSCO 41.39 1.35 40.04 -94.7% ------- BLUE-.003 -.088
---------------------------------------------------------------------
CVX 98.53 4.14 94.13 25.7% Bearish BLUE .005 -.118
---------------------------------------------------------------------
DIS 119.18 2.73 118.04 -175.5% Bearish BLUE-.063 -.137
---------------------------------------------------------------------
GS 208.74 5.31 205.69 -170% Bearish BLUE-.108 -.044 Bearish
---------------------------------------------------------------------
HD 241.08 13.14 224.73 127.7% Bullish BLUE .035 .142
---------------------------------------------------------------------
IBM 134.22 5.32 133.11 -207.5% Bearish BLUE .089 .045
---------------------------------------------------------------------
INTC 58.68 2.71 55.83 -85% Bearish BLUE-.046 .06
---------------------------------------------------------------------
JNJ 143.48 7.89 139.12 -7.2% ------- BLUE-.099 .035
---------------------------------------------------------------------
JPM 119.85 2.89 121.37 -281.7% Bearish BLUE-.091 -.08
---------------------------------------------------------------------
KO 58.92 2.86 54.93 118.7% ------- BLUE .019 .132
---------------------------------------------------------------------
MCD 207.02 7.51 201 -76.4% ------- BLUE-.029 .098
---------------------------------------------------------------------
MMM 153.98 8.74 150.16 168.1% Bearish BLUE-.243 -.058 Bearish
---------------------------------------------------------------------
MRK 82.97 3.84 78.08 191.7% Bearish BLUE-.061 -.03
---------------------------------------------------------------------
MSFT 170.55 6.04 158.18 11.5% ------- BLUE .039 .143
---------------------------------------------------------------------
NKE 93.79 2.86 88.55 98.7% ------- BLUE-.07 -.025
---------------------------------------------------------------------
PFE 36.4 2.1 34.1 245% ------- BLUE-.192 -.018
---------------------------------------------------------------------
PG 124.5 6.33 113.5 185.6% Bullish BLUE-.014 .044
---------------------------------------------------------------------
TRV 131.53 6.22 124.08 118.7% ------- BLUE-.052 .012
---------------------------------------------------------------------
UNH 289.42 28.02 253.92 505.6% Bearish RED -.027 .03
---------------------------------------------------------------------
UTX 139.04 6.51 132.18 24.7% ------- BLUE .001 -.017
---------------------------------------------------------------------
V 194.29 8.56 180.01 190.9% Bullish BLUE .003 .089
---------------------------------------------------------------------
VZ 58.12 2.42 55.06 87.7% ------- BLUE .034 .004
---------------------------------------------------------------------
WBA 48.69 2.57 46.24 109% Bearish BLUE-.099 -.109
---------------------------------------------------------------------
WMT 116.77 3.86 110.4 133.3% Bullish BLUE .073 .02
---------------------------------------------------------------------
XON 52.42 1.12 49.82 -56.9% Bearish BLUE-.134 -.197 Bearish
|
Table 2 QUICKSILVER on ETFS - 03/4/20
last change Pivot 5-dma aroc ClosPwr Candle IP21 ITRS --------------------------------------------------------------------------------------------- DIA 270.89 11.59 257.5 22% Bearish BLUE -.015 ==== --------------------------------------------------------------------------------------------- BA 283.12 2.5 287.76 -390.6% Bearish RED -.09 -.103 --------------------------------------------------------------------------------------------- SPY 312.86 12.62 297.51 22.4% ------- BLUE -.037 .023 --------------------------------------------------------------------------------------------- QQQ 218.22 8.74 205.64 41.3% Bullish BLUE -.023 .083 --------------------------------------------------------------------------------------------- MDY 346.29 11.64 337.65 -61.9% Bearish BLUE .018 -.029 --------------------------------------------------------------------------------------------- IWM 152.16 4.21 149.06 -78.1% Bearish BLUE -.106 -.034 --------------------------------------------------------------------------------------------- FAS 77.57 7.25 71.84 -338.5% Bearish BLUE -.075 -.122 --------------------------------------------------------------------------------------------- RETL 19.41 1.5 18.73 -277.5% Bearish BLUE .036 -.249 --------------------------------------------------------------------------------------------- SOXL 232.13 29.64 191.13 229.1% Bearish BLUE .045 -.088 --------------------------------------------------------------------------------------------- TECL 243.28 28.63 202.14 43.7% ------- BLUE .045 .094 --------------------------------------------------------------------------------------------- IBB 121.68 5.45 113.43 142.8% Bullish BLUE .156 .052 --------------------------------------------------------------------------------------------- GLD 154.16 .27 154 6.3% Bearish RED -.206 .154 --------------------------------------------------------------------------------------------- OIH 8.73 -.04 8.79 -322% Bearish RED -.185 -.3 --------------------------------------------------------------------------------------------- |
 Table  3   Count of Stocks in Key Directories
            20200304
-------------------------------
NEWHIGHS       88
NEWLOWS        44
MAXCP          76
MINCP          85
TTTNH          45
TTTNL          149
FASTUP         76
FASTDOWN       162
CPCROSSA       225
CPCROSSD       33
BIGVOLUP       9
BIGVODN        11
ACCUMVER       15
HIGHIP21       11
HIUPPCT        35
VHIP21         166
LOWACCUM       131
REDSELL        103
AUGSELS7       9
TRAPDOOR       33
|
Table 4  RANKING OF KEY DIRECTORIES BASED PCT.OF STOCKS ABOVE 65-DMA
              3/4/20
Bullish = 2
Bearish = 44
---------------------------------------------------------------------------------------
Directory     Current       day-1         day-2         day-3         day-4         day-5
----------------------------------------------------------------------------------------
BONDFUND       .89           .85           .71           .49           .86           .91
SOLAR          .647          .529          .588          .588          .529          .647
UTILITY        .487          .205          .282          .102          .205          .487
HOMEBLDG       .47           .235          .176          .058          .117          .47
NASD-100       .402          .175          .288          .113          .113          .329
REIT           .382          .205          .241          .063          .141          .439
GOLD           .375          .333          .291          .208          .354          .687
NIFTY          .37           .166          .333          .185          .148          .296
SOFTWARE       .366          .233          .233          .2            .183          .366
BIOTECH        .363          .273          .333          .258          .279          .333
HOSPITAL       .363          .227          .409          .363          .454          .545
DJI-13         .307          .076          .153          0             0             .23
FIDSTKS        .303          .14           .235          .123          .117          .275
SEMI           .299          .177          .224          .186          .168          .242
CHINA          .296          .222          .222          .166          .203          .24
INDEXES        .29           .193          .188          .166          .177          .247
GREEN          .285          .19           .238          .095          .19           .428
RETAIL         .28           .12           .2            .06           .12           .28
SP500          .277          .123          .178          .042          .092          .26
GAMING         .272          .136          .272          .181          .181          .363
BEVERAGE       .266          0             0             0             .066          .333
COMPUTER       .263          0             .157          0             .052          .263
RUS-1000       .251          .128          .17           .072          .106          .248
COMODITY       .25           .275          .275          .225          .35           .425
GUNS           .25           .187          .187          .062          .125          .25
ELECTRON       .248          .15           .183          .15           .137          .228
SP-100         .244          .077          .144          .022          .033          .222
DOWJONES       .233          .033          .1            0             0             .166
FOOD           .203          .259          .24           .203          .296          .37
EDU            .2            .2            .4            .2            .2            .4
INSURANC       .153          .153          .153          .038          .115          .269
HACKERS        .15           .15           .05           .05           .05           .1
CHEM           .142          .102          .102          .04           .04           .102
INFRA          .138          .111          .083          .083          .083          .111
FINANCE        .119          .107          .095          .071          .059          .095
INDMATER       .078          .052          .039          .026          .039          .092
AUTO           .075          .025          .075          .025          .025          .05
MILITARY       .071          .071          .035          0             .035          .071
OILGAS         .067          .075          .075          .045          .06           .067
ETFS           .053          0             0             0             0             0
BIGBANKS       0             0             0             0             0             0
COAL           0             0             0             0             0             0
COPPER         0             0             0             0             0             0
JETS           0             0             0             0             0             0
REGBANKS       0             0             0             0             0             0
TRANSP         0             0             0             0             0             .15
|
====================================================================
3/3/2020
The DJI, SP-500 and NASDAQ rallied in early
trading to their 50%
recovery point and then sold off badly while awaiting the results of the Democrat
Super Tuesday Primaries. As should have been expected given the still
very strong economy, most Democrats decided not to seek a socialist
alternative and voted for the moderates. This will send the DJI up a lot
tomorrow. Meanwhile, pundits are telling us that the FED acted prematurely
and is seriously "freaked out" about the consequences of the
Coronavirus on the Economy. All I know for sure, is that if the market
can again eventually make new highs, such low interest rates will be extremely
bullish. But for now, the DJI will probably rally, retrace again and then rally
again, all without making a new low or a new high.

Biden's wins today put him in the lead ahead of Sanders. This is just what
Wall Street most wants. Biden seems woefully unexciting, even slow-witted.
(Sorry, that's who I saw in the Debates. He repeatedly said "First of all"
and then
forgot his second and third points.) How will he fire up lots of new voters in
November? He won't. His handlers do not want him to. There will be no
"rocking
of corporate boats" under Biden. See how he has completely avoided taking
a
position on taxing the super-wealthy. Instead, he has taken a lot of their money for
his Presidenmtial campaign. Nor will the Military's Budget or the CIA's adventures
overseas be reduced. Russia will remain the Democrats' primary enemy. And all in
all,
Wall Street expects to enjoy a most cordial relationship with the man from Delaware,
the state where corporations go most often to obfuscate their true ownership to
avoid taxes. Once the Coronavirus is quelled, the market should do very well this
year.


But unfortunately, America is threatened by a very real pandemic. The Federal
Reserve, for one, is frightened and so are the Wall Street bears who see too much risk
in the high PE leaders. As a result, Wall Street should now advance again this
week. I would expect the DJI to rise above 27100, the 50%-retracement level,
and even reach 27500. But then we are likely to see another test of 25000.
This probably means more wide-swings of the major market ETFs. .
With Trump safe for another 4 years and the 10-year Bond now
at 1%,
one would think that the DJI will soon get back to 29000. Unfortunately,
Peerless does not agree. Today, we were given a new Sell S6. These
signals tell us that the market remains bearish. Promising rallies are being
too quickly squelched while as background, the downward momentum is still
great. At a minimum, Peerless tells us to expect more basing after the next test of
27500.

So, this remains a very volatile market. You can easily
be whipsawed with positions
in the major market indexes. My suggestion now is to hedge with short positions
from among the Bearish MINCPs and some long positions in the Bullish MAXCPs
shown tonight. Set limited goals at support and resistance with these for added
safety.

|
Charts 3/3/2020 (Click on Underlined link.) 2020 PEERLESS DJI, Signals, Indicators Daily DJI Volume 10-DayUp/Down Vol Stoch-20 Inverted Traders Index Graph of Pct of All Stocks above 65-dma NASDAQ S&P OEX NYSE COMPQX DJI-15 DJI-20 DJI-30 DIA QQQ MDY IWM TNA Short-Term Rates SPY http://tigersoft.com/2020CST/SPY.GIF USO-CrudeOil DBO FAS GLD BBH IBB JETS JNUG KOL NUGT OIH OIL PALL RSX RETL SDS AGQ SLV SOXL TECL TLT TMF TNA UGA (gasoline) and China: YINN CHAU Commodities: CANE CORN DBC JJC, NIB, CHOC CORN, CUT (paper) MOO, SOYB WEAT UUP (Dollar) LIT (Lithium) AAPL ADBE ALXN AMAT AMGN AMD AMZN AXP BA BABA BAC BIDU BLDP CAT CVX DE FB GOOG GS HD IBM INTU JPM M (Macy's) MSFT NFLX NKE NVDA PG QCOM TSLA TXN XOM V WMT CMG , LRCX, SQ TOWN New highs and Bullish MAXCPs http://tigersoft.com/MAXMLK/3-3-20/BULLISH.htm Bearish MAXCPs - http://tigersoft.com/MINMLK/3-3-20/BEARISH.htm |
Table 1 QUICKSILVER on DJI-30 STOCKS 3/3/2020 0 Bullish 6 Bearish, ITRS and IP21 >+.25 and <-.25 ------------------------------------------------------------------------------ AAPL 289.32 -9.49 292.65 21.7% Bullish RED .091 .119 --------------------------------------------------------------------- AXP 108.01 -5.86 118.5 -559.5% Bearish RED -.148 -.046 BEARISH --------------------------------------------------------------------- BA 280.62 -8.65 305.59 -402.2% Bearish RED -.133 -.067 --------------------------------------------------------------------- CAT 124.38 -3.22 128.25 -182.6% ------- RED -.061 -.07 --------------------------------------------------------------------- CSCO 40.04 -1.13 42.16 -327.6% Bearish RED -.063 -.057 --------------------------------------------------------------------- CVX 94.39 -2.2 98.04 -327.3% Bearish RED -.051 -.119 --------------------------------------------------------------------- DIS 116.45 -3.53 123.36 -483.4% Bearish RED -.085 -.119 --------------------------------------------------------------------- GS 203.43 -6.04 215.78 -337.8% Bearish RED -.176 -.033 --------------------------------------------------------------------- HD 227.94 -2 235.28 -206.1% Bearish RED -.026 .13 --------------------------------------------------------------------- IBM 128.9 -5.4 139.75 -471.6% Bearish RED .075 .043 --------------------------------------------------------------------- INTC 55.97 -2.21 59.65 -325.4% Bearish RED -.119 .063 --------------------------------------------------------------------- JNJ 135.59 -4.43 143.68 -322.7% Bearish RED -.145 .031 --------------------------------------------------------------------- JPM 116.96 -4.56 126.64 -380% Bearish RED -.174 -.068 BEARISH --------------------------------------------------------------------- KO 56.06 .14 57.6 -157.3% Bearish RED -.063 .124 --------------------------------------------------------------------- MCD 199.51 -3.04 210.1 -308.6% Bearish RED -.082 .104 --------------------------------------------------------------------- MMM 145.24 -7.78 148.96 -53.8% Bearish RED -.345 -.056 BEARISH --------------------------------------------------------------------- MRK 79.13 -2.24 79.94 -71.9% Bearish RED -.106 -.033 --------------------------------------------------------------------- MSFT 164.51 -8.28 170.17 -107.1% ------- RED .024 .15 --------------------------------------------------------------------- NKE 90.93 -1.75 92 -108.1% ------- RED -.133 -.011 --------------------------------------------------------------------- PFE 34.3 -.58 34.72 54.1% Bearish RED -.263 -.034 BEARISH --------------------------------------------------------------------- PG 118.17 -1.39 120.16 -138.6% ------- RED -.07 .037 --------------------------------------------------------------------- TRV 125.31 -2.37 128.56 -217.1% Bearish RED -.103 .008 --------------------------------------------------------------------- UNH 261.4 -11.71 263 -38% Bearish RED -.033 -.023 --------------------------------------------------------------------- UTX 132.53 -1.54 138.38 -232.9% Bearish RED -.069 -.018 --------------------------------------------------------------------- V 185.73 -6.6 187.21 -71.8% ------- RED -.05 .089 --------------------------------------------------------------------- VZ 55.7 -1.62 57.14 -126.4% Bearish RED -.042 0 --------------------------------------------------------------------- WBA 46.12 -1.99 47.67 -147.7% Bearish RED -.193 -.109 BEARISH --------------------------------------------------------------------- WMT 112.91 -2.97 113.78 -65.8% Bullish RED .006 .026 --------------------------------------------------------------------- XOM 51.3 -2.58 53.01 -276.3% Bearish RED -.186 -.181 BEARISH |
Table 2 QUICKSILVER on ETFS - 03/3/20
last change Pivot 5-dma aroc ClosPwr Candle IP21 ITRS --------------------------------------------------------------------------------------------- DIA 259.3 -7.73 269.74 -216% Bearish RED -.08 ----- --------------------------------------------------------------------------------------------- SPY 300.24 -8.85 311.5 -203.7% Bearish RED -.11 .024 --------------------------------------------------------------------------------------------- QQQ 209.48 -6.94 216.48 -139% Bearish RED -.069 .084 --------------------------------------------------------------------------------------------- MDY 334.65 -7.51 350.49 -306.5% Bearish RED -.039 -.02 --------------------------------------------------------------------------------------------- IWM 147.95 -3.08 154.5 -276% Bearish RED -.165 -.019 --------------------------------------------------------------------------------------------- FAS 70.32 -6.85 82.57 -942.7% Bearish RED -.143 -.157 --------------------------------------------------------------------------------------------- RETL 17.91 -1.24 20.46 -1014.2% Bearish RED -.05 -.257 --------------------------------------------------------------------------------------------- SOXL 202.49 -22.81 222.54 -427.4% Bearish RED .024 -.144 --------------------------------------------------------------------------------------------- TECL 214.65 -28.59 241.34 -535.8% Bearish RED .027 .025 --------------------------------------------------------------------------------------------- IBB 116.23 -3.19 118.36 -24.5% Bullish RED .11 .049 --------------------------------------------------------------------------------------------- GLD 153.89 4.69 153.97 19.4% Bearish BLUE -.19 .191 --------------------------------------------------------------------------------------------- OIH 8.77 -.41 9.31 -452.5% Bearish RED -.2 -.254 --------------------------------------------------------------------------------------------- |
 Table 3   Count of Stocks in Key Directories
           20200303
-------------------------------
NEWHIGHS       63
NEWLOWS        215
MAXCP          34
MINCP          163
TTTNH          31
TTTNL          170
FASTUP         56
FASTDOWN       360
CPCROSSA       55
CPCROSSD       226
BIGVOLUP       8
BIGVODN        100
ACCUMVER       14
HIGHIP21       10
HIUPPCT        34
VHIP21         168
LOWACCUM       147
REDSELL        103
AUGSELS7       7
TRAPDOOR       33
|
TABLE 4  RANKING OF KEY DIRECTORIES BASED PCT.OF STOCKS ABOVE 65-DMA
              3/3/20
Bullish = 2  Bearish = 44
---------------------------------------------------------------------------------------
Directory     Current       day-1         day-2         day-3         day-4         day-5
----------------------------------------------------------------------------------------
BONDFUND       .85           .71           .49           .86           .91           .9
SOLAR          .529          .588          .588          .529          .647          .705
============================================================================================
GOLD           .333          .291          .208          .354          .687          .687
COMODITY       .275          .275          .225          .35           .425          .425
BIOTECH        .27           .33           .255          .279          .351          .363
FOOD           .259          .24           .203          .296          .37           .37
HOMEBLDG       .235          .176          .058          .117          .47           .647
SOFTWARE       .233          .25           .2            .183          .366          .366
HOSPITAL       .227          .409          .363          .454          .545          .545
CHINA          .222          .222          .166          .203          .24           .24
REIT           .205          .241          .063          .141          .432          .439
UTILITY        .205          .282          .102          .205          .512          .512
EDU            .2            .4            .2            .2            .4            .2
INDEXES        .193          .188          .166          .177          .247          .247
GREEN          .19           .238          .095          .19           .428          .428
GUNS           .187          .187          .062          .125          .25           .312
SEMI           .177          .224          .186          .168          .242          .252
NASD-100       .175          .298          .123          .113          .329          .309
NIFTY          .166          .333          .185          .148          .296          .277
INSURANC       .153          .153          .038          .115          .269          .346
ELECTRON       .15           .183          .15           .137          .235          .248
HACKERS        .15           .1            .05           .05           .1            .15
FIDSTKS        .14           .235          .123          .117          .275          .28
GAMING         .136          .272          .181          .181          .363          .409
RUS-1000       .127          .17           .071          .105          .244          .264
SP500          .123          .18           .042          .092          .256          .268
RETAIL         .12           .2            .06           .12           .28           .26
INFRA          .111          .083          .083          .083          .111          .111
FINANCE        .107          .095          .071          .059          .095          .083
CHEM           .102          .102          .04           .04           .102          .142
SP-100         .077          .144          .022          .033          .222          .222
DJI-13         .076          .153          0             0             .23           .23
OILGAS         .075          .075          .045          .06           .067          .09
MILITARY       .071          .035          0             .035          .071          .107
INDMATER       .052          .039          .026          .039          .092          .131
DOWJONES       .034          .103          0             0             .172          .172
AUTO           .025          .075          .025          .025          .05           .05
BEVERAGE       0             0             0             .066          .333          .4
BIGBANKS       0             0             0             0             0             0
COAL           0             0             0             0             0             0
COMPUTER       0             .157          0             .052          .263          .263
COPPER         0             0             0             0             0             0
ETFS           0             0             0             0             0             0
JETS           0             0             0             0             0             0
REGBANKS       0             0             0             0             0             .076
TRANSP         0             0             0             0             .15           .15
|
====================================================================
3/2/2020
No buy signal from Peerless yet, but the
DJI and the tech indexes made
huge bounces up off their different support levels. We came close to a 2-day
reversal Buy B19.


The 8 highest priced DJI-30 stocks alone accounted for half of the nearly 1300
point gain as the DJI won the respect of traders by not dropping below it's yearly
lows. AAPL was the big winner.

Volatility has become very high. Before today's close there was a 1000 point
swing from +500 to -500. Add in today's record breaking change and it's clear
Emotions are running wild while the FED is doing what it can to support the
market and please market professionals, bond traders and the White House, too.
The
President believes that interest rates already should be 1/2%
lower.

But the fEars of the Coronavirus are very real.
Currently, it is estimated the number
of known new casesin the US is doubling every 5 or 6 days. Countering that is
the way interest rates are dropping, with the 10-year rate almost down to 1%.
|
Such
loose monetary policy was bound to boost stock prices almost automatically.
Another big boost is the dropping by the wayside of
two moderate Democrats
from the Primary Race for nomination as Presidential candidates and their backing
of moderate and unexciting Joe Biden. Wall Street now feels good about the chances
of
the "Establishment Democrat" Biden winning the race for the nomination as
Democrat
candidate for Presidency and then losing to President Trump in the November
Election. Of course, tomorrow's Super Tuesday vote could still offer some
surprises.
Biden is not expected to do well in California. But if Sanders loses to Biden in
Texas,
Colorado and North Carolina, I would expect the market to score another big win,
quite apart from Coronavirus news. By tomorrow night, we will see if Sanders still
has any chance against Biden. Sanders must win a commanding number of delegates
by the Primary system to avoid losing when the "Super-Delegates" vote in the
Convention.
Technical analysis of the 2-day reversal up could
treat today's action as a Buy B19.
Friday NYSE decliners led advancers by 2308 to 716 and today advancers led
decliners by 2477 to 542. That would be bullish action normally, but it is not by
itself good enough to create a reversing buy signal, especially after a 1300 point
one-day DJI gain.
Right now, we are looking for a 50% recovery of what was lost in the 14% DJI
decline by a 50% recovery. This sets up a DJI target of 27000-27500. At that
point,
a decline back to 25000 and even a retest of the recent lows would not come as
a surprise. The extraordinarily high volatility should probably get us to wait for
calmer
days to take new positions, long or short.
|
Charts 3/2/2020 (Click on Underlined link.) 2020 PEERLESS DJI, Signals, Indicators Daily DJI Volume 10-DayUp/Down Vol Stoch-20 Inverted Traders Index Graph of Pct of All Stocks above 65-dma NASDAQ S&P OEX NYSE COMPQX DJI-15 DJI-20 DJI-30 DIA QQQ MDY IWM TNA Short-Term Rates SPY http://tigersoft.com/2020CST/SPY.GIF USO-CrudeOil DBO FAS GLD BBH IBB JETS JNUG KOL NUGT OIH OIL PALL RSX RETL SDS AGQ SLV SOXL TECL TLT TMF TNA UGA (gasoline) and China: YINN CHAU Commodities: CANE CORN DBC JJC, NIB, CHOC CORN, CUT (paper) MOO, SOYB WEAT UUP (Dollar) LIT (Lithium) AAPL ADBE ALXN AMAT AMGN AMD AMZN AXP BA BABA BAC BIDU BLDP CAT CVX DE FB GOOG GS HD IBM INTU JPM M (Macy's) MSFT NFLX NKE NVDA PG QCOM TSLA TXN XOM V WMT CMG , LRCX, SQ TOWN New highs and Bullish MAXCPs http://tigersoft.com/MAXMLK/3-2-20/BULLISH.htm Bearish MAXCPs - http://tigersoft.com/MINMLK/3-2-20/BEARISH.htm |
 Table 1   QUICKSILVER on DJI-30 STOCKS  3/2/2020
 1 Bullish  5 Bearish, ITRS and IP21 >+.25 and <-.25
5 DJ-30 STOCKS GAINED 80 POINTS (25.45 + 14.16 +12.1 + 10.78 +18.15) and by themselves boosted DJI by more than 500 points All 8 of the DJI-30 stocks now over 170 were up 8.38 to 25.45 points. STOCKS CLOSE CHANGE PIVOT-PT 5-dma AROC CL-PWR CANDLE IP21 ITRS
------------------------------------------------------------------------------
AAPL 298.81 25.45 288.08 11% Bullish BLUE .102 .123
------
---------------------------------------------------------------------
AXP 113.87 3.94 120.9 -606.4% Bearish BLUE-.099 -.031
---------------------------------------------------------------------
BA 289.27 14.16 304.14 -480.2% Bearish BLUE-.111 -.058
------
---------------------------------------------------------------------
CAT 127.6 3.36 129 -179.4% ------- BLUE-.052 -.07
---------------------------------------------------------------------
CSCO 41.17 1.24 42.74 -338.7% ------- BLUE-.014 -.056
---------------------------------------------------------------------
CVX 96.59 3.25 100.71 -413.5% Bearish BLUE-.04 -.128
---------------------------------------------------------------------
DIS 119.98 2.33 128.19 -525.2% Bearish BLUE-.029 -.13
---------------------------------------------------------------------
GS 209.47 8.7 217.61 -354% Bearish BLUE-.158 -.036
------
---------------------------------------------------------------------
HD 229.94 12.1 237.38 -211.3% Bearish BLUE-.028 .114
------
---------------------------------------------------------------------
IBM 134.3 4.15 141.71 -438.8% Bearish BLUE .213 .058
---------------------------------------------------------------------
INTC 58.18 2.66 59.73 -306% Bearish BLUE-.095 .073
---------------------------------------------------------------------
JNJ 140.02 5.54 144.65 -208% ------- BLUE-.154 .033
---------------------------------------------------------------------
JPM 121.52 5.41 126.26 -427.3% Bearish BLUE-.117 -.063
---------------------------------------------------------------------
KO 55.92 2.43 57.82 -241.6% Bearish BLUE-.041 .085
---------------------------------------------------------------------
MCD 202.55 8.38 212.1 -266% Bearish BLUE-.083 .088
------
---------------------------------------------------------------------
MMM 153.02 3.78 146.85 15.7% Bearish BLUE-.329 -.042
---------------------------------------------------------------------
MRK 81.37 4.81 80.27 2.5% ------- BLUE-.097 -.028
---------------------------------------------------------------------
MSFT 172.79 10.78 168.07 57.3% Bullish BLUE .051 .175
------
---------------------------------------------------------------------
NKE 92.68 3.3 92.9 -176% ------- BLUE-.102 -.012
---------------------------------------------------------------------
PFE 34.88 1.46 33.93 30.7% Bearish BLUE-.219 -.046
---------------------------------------------------------------------
PG 119.56 6.33 121.43 -158% ------- BLUE-.065 .012
---------------------------------------------------------------------
TRV 127.68 7.87 130.79 -252.6% ------- BLUE-.109 -.01
---------------------------------------------------------------------
UNH 273.11 18.15 263.39 -89.1% ------- BLUE 0 -.002
------
---------------------------------------------------------------------
UTX 134.07 3.48 138.81 -455.5% Bearish BLUE-.049 -.04
---------------------------------------------------------------------
V 192.33 10.57 188.4 -172.5% Bullish BLUE-.053 .094
------
---------------------------------------------------------------------
VZ 57.32 3.16 57.12 -59.5% ------- BLUE-.006 -.01
---------------------------------------------------------------------
WBA 48.11 2.35 47.51 -97.4% Bearish BLUE-.173 -.1
---------------------------------------------------------------------
WMT 115.88 8.2 114.39 -19.6% Bullish BLUE .036 .013
---------------------------------------------------------------------
XOM 53.88 2.44 54.2 -234.1% Bearish BLUE-.155 -.169
|
Table 2 QUICKSILVER on ETFS - 03/2/20
last change Pivot 5-dma aroc ClosPwr Candle IP21 ITRS --------------------------------------------------------------------------------------------- DIA 267.03 12.47 270.7 -235.2% Bearish BLUE-.044 ------- --------------------------------------------------------------------------------------------- SPY 309.09 12.83 312.68 -216.3% ------- BLUE-.066 .025 --------------------------------------------------------------------------------------------- QQQ 216.42 10.62 215.37 -116.7% Bullish BLUE-.022 .091 --------------------------------------------------------------------------------------------- MDY 342.16 11.07 355.7 -379.1% ------- BLUE-.012 -.026 --------------------------------------------------------------------------------------------- IWM 151.03 4.7 156.31 -359.2% ------- BLUE-.164 -.025 --------------------------------------------------------------------------------------------- FAS 77.17 9.81 84.79 -1103.5% Bearish BLUE-.109 -.112 --------------------------------------------------------------------------------------------- RETL 19.15 .8 21.91 -1266.1% Bearish BLUE-.067 -.217 --------------------------------------------------------------------------------------------- SOXL 225.3 20.3 220.69 -409.1% ------- BLUE .038 -.085 --------------------------------------------------------------------------------------------- TECL 243.24 35.64 238.94 -448% Bullish BLUE .075 .124 --------------------------------------------------------------------------------------------- IBB 119.42 5.54 116.8 -18% Bullish BLUE .158 .045 --------------------------------------------------------------------------------------------- GLD 149.2 .82 153.3 -224.9% Bearish RED -.229 .131 --------------------------------------------------------------------------------------------- OIH 9.18 .2 9.6 -449.7% Bearish BLUE-.148 -.243 --------------------------------------------------------------------------------------------- GASL 2.25 .03 2.93 -2395.4% Bearish RED -.144 -.681 --------------------------------------------------------------------------------------------- |
Table 3 Count of Stocks in Key Directories
20200302
-------------------------------
NEWHIGHS 33
NEWLOWS 47
MAXCP 70
MINCP 49
TTTNH 27
TTTNL 92
FASTUP 52
FASTDOWN 472
CPCROSSA 453
CPCROSSD 88
BIGVOLUP 10
BIGVODN 24
ACCUMVER 17
HIGHIP21 13
HIUPPCT 35
VHIP21 170
LOWACCUM 145
REDSELL 97
AUGSELS7 7
TRAPDOOR 33
|
Table 4   RANKING OF KEY DIRECTORIES BASED PCT.OF STOCKS ABOVE 65-DMA
               3/2/20
Bullish = 2
---------------------------------------------------------------------------------------
Directory     Current       day-1         day-2         day-3         day-4         day-5
----------------------------------------------------------------------------------------
BONDFUND       .71           .49           .86           .91           .9            .9
SOLAR          .588          .588          .529          .647          .705          .764
------------------------------------------------------------------------------------------
HOSPITAL       .409          .363          .454          .545          .545          .59
EDU            .4            .2            .2            .4            .4            .6
NIFTY          .333          .185          .148          .296          .277          .537
BIOTECH        .327          .252          .276          .351          .369          .458
NASD-100       .298          .134          .123          .329          .319          .525
GOLD           .291          .208          .354          .687          .708          .708
UTILITY        .282          .102          .205          .512          .512          .743
COMODITY       .275          .225          .35           .425          .425          .425
GAMING         .272          .181          .181          .363          .409          .5
SOFTWARE       .25           .216          .183          .366          .383          .483
REIT           .241          .063          .141          .432          .446          .673
FOOD           .24           .203          .296          .37           .37           .37
GREEN          .238          .095          .19           .428          .428          .571
FIDSTKS        .235          .123          .117          .275          .28           .421
SEMI           .224          .186          .168          .242          .261          .355
CHINA          .222          .166          .203          .24           .24           .259
RETAIL         .2            .06           .12           .28           .28           .38
INDEXES        .188          .166          .177          .247          .247          .451
GUNS           .187          .062          .125          .25           .312          .625
ELECTRON       .183          .15           .137          .235          .254          .352
SP500          .18           .044          .092          .256          .273          .432
HOMEBLDG       .176          .058          .117          .47           .647          .764
RUS-1000       .17           .072          .105          .244          .265          .421
COMPUTER       .157          0             .052          .263          .263          .473
DJI-13         .153          0             0             .23           .23           .384
INSURANC       .153          .038          .115          .269          .346          .5
SP-100         .144          .022          .033          .222          .222          .366
CHEM           .102          .04           .04           .102          .142          .224
DOWJONES       .1            0             0             .166          .166          .333
HACKERS        .1            .1            .05           .1            .15           .3
FINANCE        .095          .071          .059          .095          .095          .202
INFRA          .083          .083          .083          .111          .111          .277
AUTO           .075          .025          .025          .05           .05           .2
OILGAS         .075          .045          .06           .067          .09           .142
BEVERAGE       .062          0             .125          .375          .437          .5
INDMATER       .039          .026          .039          .092          .131          .157
MILITARY       .035          0             .035          .071          .107          .214
BIGBANKS       0             0             0             0             0             0
COAL           0             0             0             0             0             0
COPPER         0             0             0             0             0             0
ETFS           0             0             0             0             0             .017
JETS           0             0             0             0             0             0
REGBANKS       0             0             0             0             .076          .153
TRANSP         0             0             0             .15           .15           .2
|
.
====================================================================
2/28/2020 Peerless
did NOT give a new Buy signal, but a recovery is possible since
the DJI is testing its 12-month lows. But without a new Buy signal, the risks
still are too high to buy.

 .
.
The TV pundits are nearly all bullish. They insist that we should appreciate that
the actual economic downside caused by the Coronavirus will be much less than
the Public Fear of it is. They argue that a FED drop in interest rates will more
than make up for the sudden decline in travel, in shopping at malls, going to casinos,
conventions, movies, restaurants and fitness centers or the supply- bottlenecks
from suppliers overseas or even here.
It is true that Fear is evident in the US even though the number of tested and confirmed
Coronavirus cases is still small compared to many overseas places. But it is not
clear to me that lower rates will have much impact on consumer demand, at this
point. Sure, it will boost Wall Street, as a knee-jerk reaction. But I think
the panic
can get much worse. Most people in America are dismissive of the pandemic's dangers
and are not particularly knowledgeable about the risks of this or any other virus in
our closely knit and much smaller world now.
What is clear is that Wall Street, most pundits and the TrumpWhite House have
an overwhelming vested interest in under-estimating the dangers. Trust the
statistics
and watch how the market actually responds to the news. The openings are much
less important that the closes. And keep in mind that with stock price earnings
ratios
still very high, with no Peerless Buy signal and most of the internal strength downtrends
"
in tact, WAIT TO BUY.
To participate in the rally, Traders may be tempted to buy into opening strength.
Trust
the Professionals, not the Public. Any chasing when there is no new Buy signal has
to
be done very carefully. A 12-month low by the DJI likely drop the DJI quickly into
bear market territory. We think we have a rush to sell. But wait until the
bear market
starts. Margin calls and hedging with leveraged shorts on down-ticks will be the
name
of this gain. The danger now for the market is thatSuper Tuesday (this week!) will
show
new electoral strength for Bernie Sanders, the Socialist. A big victory by him will
really spook Wall Street.
Usually, base-building is required after a straight away 14% correction and
turnaround.
Here are the best historical cases I can find since WW II of 10% to 14% declines by
the DJI from a 12-month high.
http://tigersoft.com/correct/INDEXES.htm
The conclusions this study offer us are:
1) None of these 10% to 14% declines went down
so fast and and so far as the present case.
So, most likely, we have not yet seen the low of this decline.
2) All the bottoms in the earlier cases saw a Peerless Buy signal. We do not show
one yet.
Again, that means that most likely we have not yet seen the low of this decline.
3) The
faster the decline, the more likely there will be more tests of the low:
Examples 1948 - 12 day decline, 2
more tests needed and then breakdown.
1955 - 12 day decline, no more test... IKE heart attack...
1978 - 11 day decline, 3 more tests needed and then full recovery
2018 - 9 day decline, 4 tests needed and then 70%
recovery.
(Each test must
be five days apart.)
2020 - 11 day decline and 14% down....
4) But assuming the size of the decline, 10%-14% is they key now to predicting
what will happen and that the bottom has been made even though there is no Peerless Buy,
then the odds of a 50%+ recovery are 13 of 15 in the next two months.
34% recover only ... 1960, 1984,
50% recovery only ... 1948, 1956(2)
68% recover only ... 1971, 1978, 1994, 2015, 2018
a full recovery ... 1955, 1956(1), 1965, 1979, 1990, 2016
Our Peerless chart has been revised to show a Sell S8 on Feb 12th based
on the many severe non-confirmations then. We get this Sell by substituting
the Cumulative Inverted MKDS for the NYSE A/D Line in the rules requiring
multiple wide non-confirmations of a new high 1.7% over the 21-dma. Now
the fact that the ADL made a confirming new high on the 12th does not deter
our Sell S8 from appearing. ESP and other purchasers of the Peerless updates
this year can download from the last place they used the 3/1/2020 version of
Peerless that makes this change. I believe that this is very close to the rules
used by the 2006 software already that also shows the Sell S8.
 |
 |
|
Charts 2/28/2020 (Click on Underlined link.) 2020 PEERLESS DJI, Signals, Indicators Daily DJI Volume 10-DayUp/Down Vol Stoch-20 Inverted Traders Index Graph of Pct of All Stocks above 65-dma NASDAQ S&P OEX NYSE COMPQX DJI-15 DJI-20 DJI-30 DIA QQQ MDY IWM TNA Short-Term Rates SPY http://tigersoft.com/2020CST/SPY.GIF USO-CrudeOil DBO FAS GLD BBH IBB JETS JNUG KOL NUGT OIH OIL PALL RSX RETL SDS AGQ SLV SOXL TECL TLT TMF TNA UGA (gasoline) and China: YINN CHAU Commodities: CANE CORN DBC JJC, NIB, CHOC CORN, CUT (paper) MOO, SOYB WEAT UUP (Dollar) LIT (Lithium) AAPL ADBE ALXN AMAT AMGN AMD AMZN AXP BA BABA BAC BIDU BLDP CAT CVX DE FB GOOG GS HD IBM INTU JPM M (Macy's) MSFT NFLX NKE NVDA PG QCOM TSLA TXN XOM V WMT CMG , LRCX, SQ TOWN New highs and Bullish MAXCPs http://tigersoft.com/MAXMLK/2-28/BULLISH.htm Bearish MAXCPs - http://tigersoft.com/MINMLK/2-28/BEARISH.htm |
 Table 1   QUICKSILVER on DJI-30 STOCKS  2/28/2020
 1 Bullish  5 Bearish, ITRS and IP21 >+.25 and <-.25
STOCKS CLOSE CHANGE PIVOT-PT 5-dma AROC CL-PWR CANDLE IP21 ITRS ------------------------------------------------------------------------------ AAPL 273.36 -.16 298.18 -677.1% Bullish BLUE .064 .077 --------------------------------------------------------------------- AXP 109.93 -2.88 128.19 -1014.5% Bearish BLUE-.204 -.01 --------------------------------------------------------------------- BA 275.11 -12.65 317.9 -893.9% Bearish RED -.155 -.058 --------------------------------------------------------------------- CAT 124.24 .97 132.17 -498.9% ------- BLUE -.091 -.045 --------------------------------------------------------------------- CSCO 39.93 -.11 44 -738.7% Bearish BLUE -.072 -.031 --------------------------------------------------------------------- CVX 93.34 -.79 104.71 -773.3% Bearish BLUE -.084 -.117 --------------------------------------------------------------------- DIS 117.65 -.39 133.01 -830.8% Bearish BLUE -.063 -.107 --------------------------------------------------------------------- GS 200.77 -4.92 224.54 -682% Bearish BLUE -.193 -.019 --------------------------------------------------------------------- HD 217.84 -6.89 239.7 -581.4% Bearish RED -.083 .111 --------------------------------------------------------------------- IBM 130.15 -2.96 146.43 -692.5% Bearish BLUE .187 .071 Bullish --------------------------------------------------------------------- INTC 55.52 -.31 61.76 -731.8% Bearish BLUE -.154 .063 --------------------------------------------------------------------- JNJ 134.48 -4.64 145.91 -534% Bearish RED -.197 .049 --------------------------------------------------------------------- JPM 116.11 -5.26 132.16 -766.8% Bearish RED -.202 -.054 Bearish --------------------------------------------------------------------- KO 53.49 -1.44 58.65 -574.1% Bearish RED -.071 .084 --------------------------------------------------------------------- MCD 194.17 -6.83 213.52 -515.4% Bearish RED -.133 .082 --------------------------------------------------------------------- MMM 149.24 -.92 152.55 -254.5% Bearish RED -.378 -.025 Bearish --------------------------------------------------------------------- MRK 76.56 -1.52 81.33 -359.5% Bearish RED -.172 -.042 --------------------------------------------------------------------- MSFT 162.01 3.83 170.89 -490% ------- BLUE -.004 .142 --------------------------------------------------------------------- NKE 89.38 .83 95.91 -578.7% ------ BLUE -.197 .005 --------------------------------------------------------------------- PFE 33.42 -.68 34.67 -332.1% Bearish --- -.253 -.045 Bearish --------------------------------------------------------------------- PG 113.23 -.27 123.3 -556.5% Bearish BLUE -.11 .003 --------------------------------------------------------------------- TRV 119.81 -4.27 134.12 -587.9% Bearish RED -.18 -.019 --------------------------------------------------------------------- UNH 254.96 1.04 277.79 -854.5% Bearish BLUE -.056 -.026 --------------------------------------------------------------------- UTX 130.59 -1.59 146.58 -739.6% Bearish BLUE -.097 -.026 --------------------------------------------------------------------- V 181.76 1.75 198.79 -702.1% Bullish BLUE -.1 .077 --------------------------------------------------------------------- VZ 54.16 -.9 57.99 -353.8% Bearish BLUE -.035 -.015 --------------------------------------------------------------------- WBA 45.76 -.48 49.03 -588.1% Bearish BLUE -.248 -.108 Bearish --------------------------------------------------------------------- WMT 107.68 -2.72 116.32 -475.2% Bearish ---- -.037 -.006 --------------------------------------------------------------------- XOM 51.44 1.62 56.36 -705.5% Bearish BLUE -.203 -.164 Bearish |
 Table 2                    QUICKSILVER on ETFS - 02/28/20
            No ETF is considered as Bullish.
last change Pivot 5-dma aroc ClosPwr Candle IP21 ITRS --------------------------------------------------------------------------------------------- DIA 254.56 -2.94 279.56 -643.3% Bearish BLUE -.1 ------ --------------------------------------------------------------------------------------------- SPY 296.26 -1.25 322.42 -589.8% Bearish BLUE -.15 .028 --------------------------------------------------------------------------------------------- QQQ 205.8 .16 221.39 -561.7% Bearish BLU -.091 .084 --------------------------------------------------------------------------------------------- MDY 331.09 -6.56 368.6 -681.4% Bearish BLUE -.061 -.009 --------------------------------------------------------------------------------------------- IWM 146.33 -2.73 162.07 -658.1% Bearish BLUE -.195 -.006 --------------------------------------------------------------------------------------------- FAS 67.36 -4.48 94.89 -2094% Bearish BLUE -.186 -.172 Bearish --------------------------------------------------------------------------------------------- RETL 18.35 -.38 24.41 -1987.5% Bearish BLUE -.091 -.182 --------------------------------------------------------------------------------------------- SOXL 205 13.87 243.01 -1689.5% Bearish BLUE -.016 -.109 --------------------------------------------------------------------------------------------- TECL 207.6 5.46 263.92 -1888.3% Bearish BLUE -.008 .005 --------------------------------------------------------------------------------------------- IBB 113.88 .45 119.84 -388.8% Bearish BLUE .061 .037 --------------------------------------------------------------------------------------------- GLD 148.38 -5.62 156.09 -204.6% Bearish RED -.196 .168 Bearish --------------------------------------------------------------------------------------------- OIH 8.98 .19 10.02 -942.7% Bearish BLUE -.176 -.21 Bearish --------------------------------------------------------------------------------------------- GASL 2.22 .21 3.51 -3199.6% Bearish BLUE -.134 -.622 Bearish --------------------------------------------------------------------------------------------- |
Table 3 March 28 Count of Stocks in Key Directories
20200228
-------------------------------
NEWHIGHS 45
NEWLOWS 388
MAXCP 37
MINCP 217
TTTNH 27
TTTNL 221
FASTUP 55
FASTDOWN 993 Oversold
CPCROSSA 180
CPCROSSD 42
BIGVOLUP 18
BIGVODN 343
ACCUMVER 23
HIGHIP21 9
HIUPPCT 28
REDSELL 97
AUGSELS7 5
TRAPDOOR 32
|
Table 4  RANKING OF KEY DIRECTORIES BASED PCT.OF STOCKS ABOVE 65-DMA
              2/28/20
  Bullish = 1  Bearish = 45
---------------------------------------------------------------------------------------
Directory     Current       day-1         day-2         day-3         day-4         day-5
----------------------------------------------------------------------------------------
SOLAR          .588          .529          .647          .705          .764          .764
============================================================================================
BONDFUND       .49           .86           .91           .9            .9            .94
HOSPITAL       .363          .454          .545          .545          .59           .681
BIOTECH        .25           .273          .348          .369          .464          .55
COMODITY       .225          .35           .425          .425          .425          .45
SOFTWARE       .216          .2            .366          .383          .483          .683
GOLD           .208          .354          .687          .708          .708          .666
FOOD           .203          .296          .37           .37           .37           .444
EDU            .2            .2            .4            .4            .6            .6
SEMI           .186          .168          .242          .261          .355          .504
NIFTY          .185          .148          .296          .277          .537          .722
GAMING         .181          .181          .363          .409          .5            .545
INDEXES        .172          .177          .247          .247          .446          .768
CHINA          .166          .203          .24           .24           .259          .407
ELECTRON       .15           .137          .235          .254          .352          .503
NASD-100       .134          .134          .34           .319          .536          .731
FIDSTKS        .123          .117          .275          .28           .421          .601
UTILITY        .102          .205          .512          .512          .743          .846
HACKERS        .1            .1            .1            .15           .3            .45
GREEN          .095          .19           .428          .428          .571          .619
INFRA          .083          .083          .111          .111          .277          .277
RUS-1000       .072          .106          .244          .265          .421          .56
FINANCE        .071          .059          .095          .095          .202          .416
REIT           .063          .141          .432          .446          .673          .751
GUNS           .062          .125          .25           .312          .625          .75
RETAIL         .06           .12           .28           .28           .38           .56
HOMEBLDG       .058          .117          .47           .647          .764          .823
OILGAS         .052          .067          .067          .089          .149          .238
SP500          .044          .094          .256          .273          .432          .598
CHEM           .04           .04           .102          .142          .224          .306
INSURANC       .038          .115          .269          .346          .5            .615
INDMATER       .026          .039          .092          .131          .157          .197
AUTO           .025          .025          .05           .05           .2            .35
SP-100         .022          .033          .222          .222          .366          .622
BEVERAGE       0             .125          .375          .437          .5            .5
BIGBANKS       0             0             0             0             0             .571
COAL           0             0             0             0             0             0
COMPUTER       0             .052          .263          .263          .473          .526
COPPER         0             0             0             0             0             0
DJI-13         0             0             .23           .23           .384          .538
DOWJONES       0             0             .172          .172          .344          .551
ETFS           0             0             0             0             .035          .285
JETS           0             0             0             0             0             .2
MILITARY       0             .035          .071          .107          .214          .464
REGBANKS       0             0             0             .076          .153          .192
TRANSP         0             0             .15           .15           .2            .4
|
=====================================================================
2/27/2020 Another failed rally today ending with the DJI
closing down almost 1200.
That will tame many of the over-eager bulls. It served also to trap them
overhead and make the next rally harder to sustain.

Short-term interest rates and ten year interest rates both fell sharply today.
This could mean the FED is considering lowering rates to try to bolster
the markets. It could also mean traders are searching desperately someplace
to park their money. My own thinking is that the Fed, through Powell's
testimony to Congress, has said they would much prefer not to cut rates
for fear that this will not only show how desperate the situation is but it mght
well show everyone how ineffective lower interest rates are in this environment.
Unfortunately, if they do wait for Congress to agree on some kind of Public
Works Program, it may be to late. So, for now, traders will likely be wary of
doing much aggressive buying even if the steep DJI downtrend shown below is
broken. When the DJI is down 20% and reaches last year's low, it may then
be much safer to start buying. But even then, understand there has been no
bear market since March 2009. One is long over-due.
I take the current Peerless signal to be a judged Sell S10. This weekend I
will do more research on officially placing a belated Sell signal on our charts
for February 12th based on the multiple wide non-confirmations there, including
the Cumulative Inverted Traders Index, shown next below.

There are very few cases of the DJI falling so fast
and so far from its high.
As you can see the DJI has now fallen 13% from its highs in just 11 trading
days. The risk of a severe economic slow-down because of the coronavirus pandemic
is just too great to sustain even the current historically high PEs. Hence, the DJI
lost 1190 today and as I write this, it is down another 350. Reaching the
20% down-from-the peak level would seem a reasonable MINIMUM
target. While it's true many indicators are "oversold", on the first-leg
down
in a severe 20% correction or deeper bear market we almost always see much
lower levels.
What to do? Too many are waiting for a
rally. There are no attractive long
equity positions that I can find. The risks are too high to hold nearly all stocks.
But I have recommended shorting MINCPs. Oil and Gas stocks dominate
that list for good reason, I think.

|
Charts 2/27/2020 (Click on Underlined link.) 2020 PEERLESS DJI, Signals, Indicators Daily DJI Volume 10-DayUp/Down Vol Stoch-20 Inverted Traders Index Graph of Pct of All Stocks above 65-dma NASDAQ S&P OEX NYSE COMPQX DJI-15 DJI-20 DJI-30 DIA QQQ MDY IWM TNA Short-Term Rates SPY http://tigersoft.com/2020CST/SPY.GIF USO-CrudeOil DBO FAS GLD BBH IBB JETS JNUG KOL NUGT OIH OIL PALL RSX RETL SDS AGQ SLV SOXL TECL TLT TMF TNA UGA (gasoline) and China: YINN CHAU Commodities: CANE CORN DBC JJC, NIB, CHOC CORN, CUT (paper) MOO, SOYB WEAT UUP (Dollar) LIT (Lithium) AAPL ADBE ALXN AMAT AMGN AMD AMZN AXP BA BABA BAC BIDU BLDP CAT CVX DE FB GOOG GS HD IBM INTU JPM M (Macy's) MSFT NFLX NKE NVDA PG QCOM TSLA TXN XOM V WMT CMG , LRCX, SQ TOWN New highs and Bullish MAXCPs http://tigersoft.com/MAXMLK/2-27/BULLISH.htm Bearish MAXCPs - http://tigersoft.com/MINMLK/2-27/BEARISH.htm |
 Table 1   QUICKSILVER on DJI-30 STOCKS  2/26/2020
 0 Bullish  14 Bearish, ITRS and IP21 >+.25 and <-.25
STOCKS CLOSE CHANGE PIVOT-PT 5-dma AROC CL-PWR CANDLE IP21 ITRS ------------------------------------------------------------------------------ ------------------------------------------------------------------------------ AAPL 273.52 -19.13 313.05 -773.3% Bearish RED -.011 .081 --------------------------------------------------------------------- AXP 112.81 -5.69 134.9 -929.9% Bearish RED -.33 -.008 Bearish --------------------------------------------------------------------- BA 287.76 -17.83 330.38 -760.8% Bearish RED -.166 -.071 Bearish --------------------------------------------------------------------- CAT 123.27 -4.98 137.21 -514.6% Bearish RED -.233 -.066 Bearish --------------------------------------------------------------------- CSCO 40.04 -2.12 46.29 -766.8% Bearish RED -.169 -.029 --------------------------------------------------------------------- CVX 94.13 -3.91 109.01 -750.6% Bearish RED -.235 -.115 Bearish --------------------------------------------------------------------- DIS 118.04 -5.32 138.97 -840.9% Bearish RED -.186 -.106 Bearish --------------------------------------------------------------------- GS 205.69 -10.09 230.62 -602.9% Bearish RED -.313 .001 --------------------------------------------------------------------- HD 224.73 -10.55 245.34 -462.6% Bearish RED -.142 .137 --------------------------------------------------------------------- IBM 133.11 -6.64 149.84 -621.1% Bearish RED .14 .079 --------------------------------------------------------------------- INTC 55.83 -3.82 64.34 -773.5% Bearish RED -.256 .053 Bearish --------------------------------------------------------------------- JNJ 139.12 -4.56 149.93 -315.7% Bearish RED -.217 .071 --------------------------------------------------------------------- JPM 121.37 -5.27 135.81 -612.1% Bearish RED -.289 -.026 Bearish --------------------------------------------------------------------- KO 54.93 -2.67 60.13 -407.4% Bearish RED -.174 .097 --------------------------------------------------------------------- MCD 201 -9.1 215.87 -330% Bearish RED -.138 .107 --------------------------------------------------------------------- MMM 150.16 1.2 156.93 -274.9% Bearish RED -.403 -.023 Bearish --------------------------------------------------------------------- MRK 78.08 -1.86 82.34 -271.3% Bearish RED -.234 -.037 Bearish --------------------------------------------------------------------- MSFT 158.18 -11.99 178.59 -752.2% Bearish RED -.064 .111 --------------------------------------------------------------------- NKE 88.55 -3.45 100.25 -722.7% Bearish RED -.338 -.007 Bearish --------------------------------------------------------------------- PFE 34.1 -.62 35.72 -250.2% Bearish RED -.344 -.023 Bearish --------------------------------------------------------------------- PG 113.5 -6.66 126.7 -529% Bearish RED -.319 -.008 Bearish --------------------------------------------------------------------- TRV 124.08 -4.48 135.16 -373.5% Bearish RED -.209 .002 --------------------------------------------------------------------- UNH 253.92 -9.08 301.43 -856.2% Bearish RED -.135 -.023 --------------------------------------------------------------------- UTX 132.18 -6.2 151.52 -610.9% Bearish RED -.202 -.026 --------------------------------------------------------------------- V 180.01 -7.2 208.81 -790.2% Bearish RED -.184 .06 --------------------------------------------------------------------- VZ 55.06 -2.08 58.2 -262.5% Bearish RED -.215 -.007 --------------------------------------------------------------------- WBA 46.24 -1.43 51.45 -568.6% Bearish RED -.387 -.114 Bearish --------------------------------------------------------------------- WMT 110.4 -3.38 118.58 -313.8% Bearish RED -.147 .005 --------------------------------------------------------------------- XOM 49.82 -3.19 59.13 -888.3% Bearish RED -.376 -.193 Bearish |
 Table 2                    QUICKSILVER on ETFS - 02/27/20
            No ETF is considered as Bullish.
ETF CLOSE CHANGE PIVOT-PT 5-dma AROC CL-PWR CANDLE IP21 ITRS --------------------------------------------------------------------------------------------- DIA 257.5 -12.24 289.74 -628.9% Bearish RED -.322 ---- Bearish --------------------------------------------------------------------------------------------- SPY 297.51 -13.99 333.48 -609.8% Bearish RED -.336 .025 Bearish --------------------------------------------------------------------------------------------- QQQ 205.64 -10.84 230.27 -651.4% Bearish RED -.219 .08 --------------------------------------------------------------------------------------------- MDY 337.65 -12.84 379.94 -630.5% Bearish RED -.289 0 Bearish --------------------------------------------------------------------------------------------- IWM 149.06 -5.44 167.1 -610.5% Bearish RED -.241 0 --------------------------------------------------------------------------------------------- FAS 71.84 -10.73 104.06 -1854.7% Bearish RED -.333 -.128 Bearish --------------------------------------------------------------------------------------------- RETL 18.73 -1.73 27.32 -1882.9% Bearish RED -.199 -.182 Bearish --------------------------------------------------------------------------------------------- SOXL 191.13 -31.41 283.45 -2347.2% Bearish RED -.137 -.155 Bearish --------------------------------------------------------------------------------------------- TECL 202.14 -39.2 301.88 -2220.8% Bearish RED -.099 -.01 --------------------------------------------------------------------------------------------- IBB 113.43 -4.93 123.08 -410.7% Bearish RED -.063 .028 --------------------------------------------------------------------------------------------- GLD 154 .03 154.7 51.6% Bearish RED -.116 .195 --------------------------------------------------------------------------------------------- OIH 8.79 -.52 10.81 -1182.8% Bearish RED -.303 -.23 Bearish --------------------------------------------------------------------------------------------- GASL 2.01 -.47 4.15 -3518.5% Bearish RED -.315 -.64 Bearish --------------------------------------------------------------------------------------------- |
Table 3    Count of Stocks in Key Directories
           20200227
-------------------------------
NEWHIGHS       48
NEWLOWS        396
MAXCP          20
MINCP          535  Bearish
TTTNH          12
TTTNL          299  Bearish
FASTUP         55
FASTDOWN       995  Bearish
CPCROSSA       31
CPCROSSD       99
BIGVOLUP       9
BIGVODN        203  Bearish
ACCUMVER       17
HIGHIP21       10
HIUPPCT        36
REDSELL        93
AUGSELS7       9
TRAPDOOR       28
|
table 4    RANKING OF KEY DIRECTORIES BASED PCT.OF STOCKS ABOVE 65-DMA
              2/27/20
 Bearish = 44
 Bullish = 2
---------------------------------------------------------------------------------------
Directory     Current       day-1         day-2         day-3         day-4         day-5
----------------------------------------------------------------------------------------
BONDFUND       .86           .91           .9            .9            .94           .96
SOLAR          .529          .647          .705          .764          .764          .882
===========================================================================================
HOSPITAL       .454          .545          .545          .59           .681          .681
GOLD           .354          .687          .708          .708          .666          .645
COMODITY       .35           .425          .425          .425          .45           .475
FOOD           .296          .37           .37           .37           .444          .481
BIOTECH        .27           .345          .366          .464          .565          .574
UTILITY        .205          .512          .512          .743          .846          .846
CHINA          .203          .24           .24           .259          .407          .425
EDU            .2            .4            .4            .6            .6            .6
SOFTWARE       .2            .383          .383          .483          .683          .7
GREEN          .19           .428          .428          .571          .619          .714
GAMING         .181          .363          .409          .5            .545          .545
INDEXES        .177          .247          .247          .446          .768          .768
SEMI           .168          .242          .261          .355          .514          .626
NIFTY          .148          .296          .277          .537          .722          .777
REIT           .141          .432          .446          .673          .751          .744
ELECTRON       .137          .235          .254          .352          .516          .581
NASD-100       .134          .35           .329          .536          .731          .793
BEVERAGE       .125          .375          .437          .5            .5            .562
GUNS           .125          .25           .312          .625          .75           .687
RETAIL         .12           .28           .28           .38           .56           .64
FIDSTKS        .117          .275          .28           .421          .589          .662
HOMEBLDG       .117          .47           .647          .764          .823          .823
INSURANC       .115          .269          .346          .5            .615          .576
RUS-1000       .106          .246          .265          .421          .559          .604
HACKERS        .1            .15           .15           .3            .45           .5
SP500          .094          .258          .273          .432          .596          .636
INFRA          .083          .111          .111          .277          .277          .277
OILGAS         .067          .067          .089          .149          .238          .246
FINANCE        .06           .096          .096          .204          .421          .506
COMPUTER       .052          .263          .263          .473          .526          .526
CHEM           .04           .102          .142          .224          .306          .346
INDMATER       .039          .092          .131          .157          .197          .223
MILITARY       .035          .071          .107          .214          .464          .464
SP-100         .033          .222          .222          .366          .622          .655
AUTO           .025          .05           .05           .2            .35           .35
BIGBANKS       0             0             0             0             .571          .857
COAL           0             0             0             0             0             0
COPPER         0             0             0             0             0             0
DJI-13         0             .23           .23           .384          .538          .538
DOWJONES       0             .172          .172          .344          .551          .517
ETFS           0             0             0             .035          .285          .428
JETS           0             0             0             0             .2            .3
REGBANKS       0             0             .076          .153          .192          .23
TRANSP         0             .15           .15           .2            .35           .45
|
====================================================================
2/26/2020 Another failed early rally. I take the current Peerless signal to be
a judged
Sell S10. This weekend I will study the DJI's nominal final new high closing and
its many extreme non-confirmations and, in particular use the concept of the
wide non-confirmation by the Cumulative MKDS to counter-balance the A/D Line
new high made on 2/12/2020 for a Sell S8.
The DJI futures are down almost 300 points now, about 2 hours before the
NYSE Opening. That a new case of
the Coronavirus has spead to California
and its origins cannot be accounted for is very worrisome. Since the incubation
period can be two-three weeks, it will be very difficult to stops the spread of the
virus once it takes hold. 3% of the people who get IT will die. The President
has
said it will not spread here. Let's hope he's right and partisanship ends.
Most folks in the market are in shock. They are not prepared for such a quick
sell-off.
I hope you have done a lot of selling. Take some shorts, if you have not already,
in our Bearish MINCPs. Airlines, oil/gas and travel stocks have to be your targets.

As of now, there are no new Peerless Buys from
either the 2020 version of Peerless or the
2006 version.


For now, we have to wait for a Peerless Buy signal or, if you
are a trader, watch the
downtrend of our Closing Power. We make the assumption that it will not be time
to buy until our Closing Power breaks its down-trend. For a traders' buy signal to
to occur, we will have to see a big advance from the openking. And even so, we
should be concerned that Friday will bring another big decline as traders anticipate
another weekend of selling.
Watch tomorrow to see if the SP-500 breaks down decisively below its 200-day
ma as the DJI already has. Usually decisive breaks in the 200-day ma support
mean substantially more weakness. See the charts of such breakdowns since 1987
at www.tigersoft.com/200dma/INDEX.htm.


QQQ has held up best. But it is vulnerable at
its rising 65-dma. A break in
that we mean a new round of tech selling.

|
Charts 2/26/2020 (Click on Underlined link.) 2020 PEERLESS DJI, Signals, Indicators Daily DJI Volume 10-DayUp/Down Vol Stoch-20 Inverted Traders Index Graph of Pct of All Stocks above 65-dma NASDAQ S&P OEX NYSE COMPQX DJI-15 DJI-20 DJI-30 DIA QQQ MDY IWM TNA Short-Term Rates SPY http://tigersoft.com/2020CST/SPY.GIF USO-CrudeOil DBO FAS GLD BBH IBB JETS JNUG KOL NUGT OIH OIL PALL RSX RETL SDS AGQ SLV SOXL TECL TLT TMF TNA UGA (gasoline) and China: YINN CHAU Commodities: CANE CORN DBC JJC, NIB, CHOC CORN, CUT (paper) MOO, SOYB WEAT UUP (Dollar) LIT (Lithium) AAPL ADBE ALXN AMAT AMGN AMD AMZN AXP BA BABA BAC BIDU BLDP CAT CVX DE FB GOOG GS HD IBM INTU JPM M (Macy's) MSFT NFLX NKE NVDA PG QCOM TSLA TXN XOM V WMT CMG , LRCX, SQ TOWN New highs and Bullish MAXCPs http://tigersoft.com/MAXMLK/2-26/BULLISH.htm Bearish MAXCPs - http://tigersoft.com/MINMLK/2-26/BEARISH.htm |
 Table 1   QUICKSILVER on DJI-30 STOCKS  2/26/2020
 1 Bullish  8 Bearish, ITRS and IP21 >+.25 and <-.25
STOCKS CLOSE CHANGE PIVOT-PT 5-dma AROC CL-PWR CANDLE IP21 ITRS ------------------------------------------------------------------------------ ------------------------------------------------------------------------------ AAPL 292.65 4.57 320.3 -501.7% Bullish BLUE .121 .121 --------------------------------------------------------------------- AXP 118.5 -2.4 136.58 -700.8% Bearish RED -.23 .01 --------------------------------------------------------------------- BA 305.59 1.45 336.28 -502.6% ------- RED -.122 -.074 --------------------------------------------------------------------- CAT 128.25 -.75 136.93 -320.2% Bearish RED -.146 -.083 --------------------------------------------------------------------- CSCO 42.16 -.58 46.85 -456.5% Bearish RED -.073 -.034 --------------------------------------------------------------------- CVX 98.04 -2.67 109.81 -593.5% Bearish RED -.155 -.132 Bearish --------------------------------------------------------------------- DIS 123.36 -4.83 140.37 -657.8% Bearish RED -.067 -.122 --------------------------------------------------------------------- GS 215.78 -1.83 232.73 -471.4% Bearish RED -.209 -.002 --------------------------------------------------------------------- HD 235.28 -2.1 247.02 -172.3% Bearish RED -.048 .153 --------------------------------------------------------------------- IBM 139.75 -1.96 151.22 -375.3% Bearish RED .209 .076 Bullish --------------------------------------------------------------------- INTC 59.65 -.08 65.45 -585.8% Bearish RED -.121 .08 --------------------------------------------------------------------- JNJ 143.68 -.97 148.37 -178.2% Bearish RED -.137 .06 --------------------------------------------------------------------- JPM 126.64 .38 137.49 -405.3% Bearish RED -.163 -.039 --------------------------------------------------------------------- KO 57.6 -.22 59.72 -183.2% Bearish RED -.142 .107 --------------------------------------------------------------------- MCD 210.1 -2 215.08 -128.9% ------- RED -.077 .114 --------------------------------------------------------------------- MMM 148.96 2.11 158.56 -335.2% Bearish RED -.428 -.073 Bearish --------------------------------------------------------------------- MRK 79.94 -.33 82.49 -126.1% Bearish RED -.188 -.064 Bearish --------------------------------------------------------------------- MSFT 170.17 2.1 184.42 -481% Bearish BLUE .058 .154 --------------------------------------------------------------------- NKE 92 -.9 102.53 -529.3% Bearish RED -.258 -.015 Bearish --------------------------------------------------------------------- PFE 34.72 .79 35.85 -214% Bearish BLUE-.331 -.056 Bearish --------------------------------------------------------------------- PG 120.16 -1.27 126.58 -211.7% ------- RED -.26 .008 Bearish --------------------------------------------------------------------- TRV 128.56 -2.23 133.98 -222.5% Bearish RED -.162 -.009 --------------------------------------------------------------------- UNH 263 -.39 302.13 -729.5% Bearish RED -.088 -.029 --------------------------------------------------------------------- UTX 138.38 -.43 149.9 -417% Bearish RED -.082 -.031 --------------------------------------------------------------------- V 187.21 -1.19 211.45 -639.2% ------- RED -.118 .068 --------------------------------------------------------------------- VZ 57.14 .02 58.09 -93.2% Bearish RED -.12 -.023 --------------------------------------------------------------------- WBA 47.67 .16 51.87 -436.6% Bearish RED -.347 -.143 Bearish --------------------------------------------------------------------- WMT 113.78 -.61 117.69 -166.8% Bearish RED -.065 -.007 --------------------------------------------------------------------- XOM 53.01 -1.19 59.86 -632.1% Bearish RED -.334 -.203 Bearish |
 Table 2                    QUICKSILVER on ETFS - 02/26/20
            No ETF is considered as Bullish.
ETF CLOSE CHANGE PIVOT-PT 5-dma AROC CL-PWR CANDLE IP21 ITRS --------------------------------------------------------------------------------------------- DIA 269.74 -.96 292.78 -426.8% Bearish RED -.202 0 --------------------------------------------------------------------------------------------- SPY 311.5 -1.18 336.95 -408.2% Bearish RED -.191 .026 --------------------------------------------------------------------------------------------- QQQ 216.48 1.11 234.78 -450% Bearish RED -.076 .092 --------------------------------------------------------------------------------------------- MDY 350.49 -5.21 384.02 -427.4% Bearish RED -.17 -.014 --------------------------------------------------------------------------------------------- IWM 154.5 -1.81 168.81 -422.4% Bearish RED -.13 -.014 --------------------------------------------------------------------------------------------- FAS 82.57 -2.22 106.95 -1203.7% Bearish RED -.212 -.056 --------------------------------------------------------------------------------------------- RETL 20.46 -1.45 27.92 -1128.8% Bearish RED -.151 -.205 Bearish --------------------------------------------------------------------------------------------- SOXL 222.54 1.85 311.41 -1867.8% Bearish RED -.028 -.089 --------------------------------------------------------------------------------------------- TECL 241.34 2.4 323.83 -1580.7% Bearish BLUE .022 .143 --------------------------------------------------------------------------------------------- IBB 118.36 1.56 123.31 -211% Bearish BLUE .045 .027 --------------------------------------------------------------------------------------------- GLD 153.97 .67 152.41 70.9% Bearish BLUE-.034 .156 --------------------------------------------------------------------------------------------- OIH 9.31 -.29 11.2 -898.9% Bearish RED -.218 -.241 Bearish --------------------------------------------------------------------------------------------- GASL 2.48 -.45 4.48 -2546.1% Bearish RED -.306 -.644 Bearish --------------------------------------------------------------------------------------------- |
Table 3    Count of Stocks in Key Directories
           20200226
-------------------------------
NEWHIGHS       46
NEWLOWS        231
MAXCP          20
MINCP          413  Bearish
TTTNH          22
TTTNL          283  Bearish
FASTUP         51
FASTDOWN       399
CPCROSSA       41
CPCROSSD       92
BIGVOLUP       5
BIGVODN        54
ACCUMVER       18
HIGHIP21       13
HIUPPCT        48
REDSELL        88
AUGSELS7       13
|
 Table 4    RANKING OF KEY DIRECTORIES BASED PCT.OF STOCKS ABOVE 65-DMA
             2/26/20
 Bullish = 5   Bearish = 41
---------------------------------------------------------------------------------------
Directory     Current       day-1         day-2         day-3         day-4         day-5
----------------------------------------------------------------------------------------
BONDFUND       .91           .9            .9            .94           .96           .93
GOLD           .687          .708          .708          .666          .645          .666
SOLAR          .647          .705          .764          .764          .882          .882
HOSPITAL       .545          .545          .59           .681          .681          .772
UTILITY        .512          .512          .743          .846          .846          .846
============================================================================================
HOMEBLDG       .47           .647          .764          .823          .823          .764
REIT           .432          .446          .673          .751          .744          .695
GREEN          .428          .428          .571          .619          .714          .714
COMODITY       .425          .425          .425          .45           .475          .475
EDU            .4            .4            .6            .6            .6            .6
SOFTWARE       .383          .4            .483          .683          .7            .716
BEVERAGE       .375          .437          .5            .5            .562          .562
FOOD           .37           .37           .37           .444          .481          .481
GAMING         .363          .409          .5            .545          .545          .59
NASD-100       .35           .34           .546          .731          .804          .824
BIOTECH        .342          .363          .461          .565          .586          .574
NIFTY          .296          .277          .537          .722          .796          .851
RETAIL         .28           .28           .38           .56           .64           .52
FIDSTKS        .275          .28           .421          .589          .668          .646
INSURANC       .269          .346          .5            .615          .576          .615
COMPUTER       .263          .263          .473          .526          .578          .526
SP500          .258          .275          .432          .596          .64           .628
GUNS           .25           .312          .625          .75           .687          .687
INDEXES        .247          .247          .446          .768          .768          .752
RUS-1000       .246          .266          .421          .559          .606          .592
SEMI           .242          .261          .355          .514          .626          .682
CHINA          .24           .24           .259          .407          .425          .481
ELECTRON       .235          .254          .352          .516          .581          .627
DJI-13         .23           .23           .384          .538          .538          .538
SP-100         .222          .222          .366          .622          .666          .655
DOWJONES       .172          .172          .344          .551          .551          .517
HACKERS        .15           .2            .3            .45           .5            .5
TRANSP         .15           .15           .2            .35           .45           .45
INFRA          .111          .111          .277          .277          .277          .305
CHEM           .102          .142          .224          .306          .346          .408
FINANCE        .095          .095          .202          .416          .5            .44
INDMATER       .092          .131          .157          .197          .223          .263
MILITARY       .071          .107          .214          .464          .464          .535
OILGAS         .067          .089          .149          .238          .246          .216
AUTO           .05           .05           .2            .35           .35           .35
BIGBANKS       0             0             0             .571          .857          .857
COAL           0             0             0             0             0             0
COPPER         0             0             0             0             0             0
ETFS           0             0             .035          .285          .428          .535
JETS           0             0             0             .2            .3            .4
REGBANKS       0             .076          .153          .192          .23           .23
|
========================================================================
2/25/2020 The DJI broke down today after a deceptive early rally of 100 points and
decisively
plunged below its 28000 support and even the 27500 breakout-point.
I believe that this should be a "Judged Sell S10". This signal was created
to "
take care of those cases where significant well-tested support is knifed through
and where we need a rule for selling so that we do not suffer a big loss because there
is no normal and no automatic Peerless Sell. In our case today, a judged S10 seems
warranted here by the many non-confirmations on February 12, by the daily big
increase in Down Volume vs Up Volume when compared to the ratio of Decline
to advance. Furthermore, it seems warranted by the crashing Closing Power. This
shows that Professionals want no part in this market, except in shorts. Their
eagerness
to sell is shown by the numerous price gaps, by the decisive breakdowns and by the
day-to-day rising volume. My advise is to avoid buying, sell QQQ if it breaks below
its support. See the chart below. Use the QQQ's test of its 65-dma to
determine
what should be done with any remaining NASDAQ stocks you hold. If it does not
rebound tomorrow, sell them.
Two weeks ago I said that an A/D Line making new
highs should probably be considered
was inconsistent with a Peerless Sell S8. This was obviously wrong.
Interestingly,
Fed Chairman Powell warned Congress about this time that lower interest rates might
not save the market from a big decline, if one were to develop. He told Congress
to use Fiscal Policy if the market started falling sharply. This is also what the
British
economist Meynard Keynes told President Roosevelt repeatedly and especially in
1938 when the DJI was down 40% from its high on the previous August.. He said
that when Consumer and Private Investment dry up from fear, only bigger Goverment
Spending can pick up the slack. Keynes warned about "liquidity traps" and
monetary
boosts being like "pushing a string". Our still rising A/D Line reflects
the a loose Fed
monetary policy. But Powell is warning that we may need a more direct fiscal boost
now.
With the big Deficit and Republicans and Democrats so widely apart, a change in Fiscal
policy will probably not be forthcoming even though the threat from a Coronavirus
pandemic will almost certainly cause a big drop in Consumer spending and will badly
disrupt
business supply chains.
I showed last night that a 3% one-day drop to the
lower band is bearish in 72%
of the cases between 1929-1965. When we look at the 2006 version of Peerless
signals on the DJI, we are getting the results for the period from 1965-2006. As of
now, there are no new Peerless Buys from either the 2020 version of Peerless or the
2006 version. The DJI has now fallen two days in a row at the steep rate of 3%
per day. With the market up so much since 2008-2009, common sense should
apply. People have big profits and they will now be grabbing them as quickly as
possible.
| DJI The DJI's penetration of at 28000 presents us with a JUDGED
Sell S10. 28000 is initial resistance if DJI rallies next.   |
NASDAQ 9300 is likely resistance. |
QQQ is at critical support. |
| The TigerSoft charts shows Solar Energy stocks have completed a
broadening top pattern. This means the semi-wild speculation in them may be coming to an end. What is left to speculate in?. Perhaps, nothing and that could be bearish.  |
|
Charts 2/25/2020 (Click on Underlined link.) 2020 PEERLESS DJI, Signals, Indicators Daily DJI Volume 10-DayUp/Down Vol Stoch-20 Inverted Traders Index Graph of Pct of All Stocks above 65-dma NASDAQ S&P OEX NYSE COMPQX DJI-15 DJI-20 DJI-30 DIA QQQ MDY IWM TNA Short-Term Rates SPY http://tigersoft.com/2020CST/SPY.GIF USO-CrudeOil DBO FAS GLD BBH IBB JETS JNUG KOL NUGT OIH OIL PALL RSX RETL SDS AGQ SLV SOXL TECL TLT TMF TNA UGA (gasoline) and China: YINN CHAU Commodities: CANE CORN DBC JJC, NIB, CHOC CORN, CUT (paper) MOO, SOYB WEAT UUP (Dollar) LIT (Lithium) AAPL ADBE ALXN AMAT AMGN AMD AMZN AXP BA BABA BAC BIDU BLDP CAT CVX DE FB GOOG GS HD IBM INTU JPM M (Macy's) MSFT NFLX NKE NVDA PG QCOM TSLA TXN XOM V WMT CMG , LRCX, SQ TOWN New highs and Bullish MAXCPs http://tigersoft.com/MAXMLK/2-25/BULLISH.htm Bearish MAXCPs - http://tigersoft.com/MINMLK/2-25/BEARISH.htm |
 Table 1   QUICKSILVER on DJI-30 STOCKS  2/25/2020
 0 Bullish  4 Bearish, ITRS and IP21 >+.25 and <-.25
STOCKS CLOSE CHANGE PIVOT-PT 5-dma AROC CL-PWR CANDLE IP21 ITRS ------------------------------------------------------------------------------ ------------------------------------------------------------------------------ AAPL 288.08 -10.1 323.62 -491.1% Bearish RED .13 .096 --------------------------------------------------------------------- AXP 120.9 -7.29 136.93 -546.7% Bearish RED -.134 .034 --------------------------------------------------------------------- BA 304.14 -13.76 338.3 -522.6% ------- RED -.104 -.099 --------------------------------------------------------------------- CAT 129 -3.17 136.86 -278.8% ------- RED -.15 -.072 --------------------------------------------------------------------- CSCO 42.74 -1.26 46.29 -418.4% Bearish RED -.04 -.003 --------------------------------------------------------------------- CVX 100.71 -4 110.74 -437.5% ------- RED -.082 -.101 --------------------------------------------------------------------- DIS 128.19 -4.82 141.3 -395.1% Bearish RED -.014 -.099 --------------------------------------------------------------------- GS 217.61 -6.93 237.33 -336.7% Bearish RED -.15 .016 --------------------------------------------------------------------- HD 237.38 -2.32 243.64 -134.5% Bullish RED .033 .152 --------------------------------------------------------------------- IBM 141.71 -4.72 150.86 -313.2% ------- RED .234 .092 --------------------------------------------------------------------- INTC 59.73 -2.03 67.11 -493.4% Bearish RED -.152 .079 --------------------------------------------------------------------- JNJ 144.65 -1.26 148.94 -151.2% ------- RED -.054 .058 --------------------------------------------------------------------- JPM 126.26 -5.9 137.49 -345.6% Bearish RED -.05 -.027 --------------------------------------------------------------------- KO 57.82 -.83 59.77 -143.6% ------- RED -.096 .104 --------------------------------------------------------------------- MCD 212.1 -1.42 215.63 -94.1% ------- RED -.013 .122 --------------------------------------------------------------------- MMM 146.85 -5.7 159.34 -382.5% Bearish RED -.45 -.097 Bearish --------------------------------------------------------------------- MRK 80.27 -1.06 82 -133.3% ------- RED -.13 -.066 --------------------------------------------------------------------- MRK 168.07 -2.82 187.28 -527.3% Bearish RED .091 .14 --------------------------------------------------------------------- NKE 92.9 -3.01 102.46 -452.2% Bearish RED -.141 -.012 --------------------------------------------------------------------- PFE 33.93 -.74 36.23 -334.2% Bearish RED -.328 -.08 Bearish --------------------------------------------------------------------- PG 121.43 -1.87 125.44 -137.2% ------- RED -.208 .006 --------------------------------------------------------------------- TRV 130.79 -3.33 134.51 -188.9% Bearish RED -.15 .004 --------------------------------------------------------------------- UNH 263.39 -14.4 305.31 -650.7% Bearish RED -.073 -.029 --------------------------------------------------------------------- UTX 138.81 -7.77 150.68 -415.7% Bearish RED -.003 -.025 --------------------------------------------------------------------- V 188.4 -10.39 213.31 -546.2% Bullish RED -.043 .067 --------------------------------------------------------------------- VZ 57.12 -.87 58.22 -68% Bearish RED -.103 -.033 --------------------------------------------------------------------- WBA 47.51 -1.52 52.07 -424.3% Bearish RED -.273 -.149 Bearish --------------------------------------------------------------------- WMT 114.39 -1.93 117.68 -222.1% Bullish RED .023 -.006 --------------------------------------------------------------------- DOW 54.2 -2.16 60.34 -480.4% Bearish RED -.323 -.182 Bearish |
 Table 2                    QUICKSILVER on ETFS - 02/25/20
   No ETF is considered as Bullish.
ETF CLOSE CHANGE PIVOT-PT 5-dma AROC CL-PWR CANDLE IP21 ITRS --------------------------------------------------------------------------------------------- DIA 270.7 -8.86 294.1 -383.9% Bearish RED -.132 ----- --------------------------------------------------------------------------------------------- BA 304.14 -13.76 338.3 -522.6% ------- RED -.104 -.099 --------------------------------------------------------------------------------------------- SPY 312.68 -9.74 338.34 -360.5% Bearish RED -.125 .027 --------------------------------------------------------------------------------------------- QQQ 215.37 -6.02 236.98 -417.9% Bearish RED -.042 .083 --------------------------------------------------------------------------------------------- MDY 355.7 -12.9 382.47 -332.8% Bearish RED -.112 -.001 --------------------------------------------------------------------------------------------- IWM 156.31 -5.76 168.4 -336.7% ------- RED -.048 -.006 --------------------------------------------------------------------------------------------- FAS 84.79 -10.1 106.51 -997.4% Bearish RED -.095 -.011 --------------------------------------------------------------------------------------------- RETL 21.91 -2.5 26.23 -779% Bearish RED -.002 -.117 --------------------------------------------------------------------------------------------- SOXL 220.69 -22.32 325.98 -1394.5% Bearish RED -.023 -.038 --------------------------------------------------------------------------------------------- TECL 238.94 -24.98 333.8 -1362.6% Bearish RED .084 .156 --------------------------------------------------------------------------------------------- IBB 116.8 -3.04 123.48 -233.6% Bearish RED .066 .01 --------------------------------------------------------------------------------------------- GLD 153.3 -2.79 151.79 78% Bearish RED -.016 .136 --------------------------------------------------------------------------------------------- OIH 9.6 -.42 11.21 -658.7% Bearish RED -.23 -.206 Bearish --------------------------------------------------------------------------------------------- UGA 2.93 -.58 4.47 -1480.5% Bullish RED -.29 -.875 Bearish --------------------------------------------------------------------------------------------- UUP 25.98 -.06 26.26 -53.5% ------- ---- -.019 .011 --------------------------------------------------------------------------------------------- |
Table 3    Count of Stocks in Key Directories
           20200225
-------------------------------
NEWHIGHS       84
NEWLOWS        205  Bearish...
MAXCP          21
MINCP          372  Bearish
TTTNH          16
TTTNL          328  Bearish
FASTUP         62
FASTDOWN       364  Bearish
CPCROSSA       22
CPCROSSD       558  Bearish
BIGVOLUP       6
BIGVODN        103
ACCUMVER       18
HIGHIP21       15
HIUPPCT        49
REDSELL        88
AUGSELS7       14
TRAPDOOR       23
|
Table 4 RANKING OF KEY DIRECTORIES BASED PCT.OF STOCKS ABOVE 65-DMA
2/25/20
Bullish = 6, including Solar, HomeBldg... and as often happens in a big decline - Bonds, Gold, Utilities
Bearish = 40
---------------------------------------------------------------------------------------
Directory Current day-1 day-2 day-3 day-4 day-5
----------------------------------------------------------------------------------------
BONDFUND .9 .9 .94 .96 .93 .94
GOLD .708 .708 .666 .645 .666 .625
SOLAR .705 .764 .764 .882 .882 .882
HOMEBLDG .647 .764 .823 .823 .764 .705
HOSPITAL .545 .59 .681 .681 .772 .727
UTILITY .512 .743 .846 .846 .846 .871
================================================================================================
REIT .446 .673 .751 .744 .695 .751
BEVERAGE .437 .5 .5 .562 .562 .562
GREEN .428 .571 .619 .714 .714 .666
COMODITY .425 .425 .45 .475 .475 .5
GAMING .409 .5 .545 .545 .59 .681
EDU .4 .6 .6 .6 .6 .6
SOFTWARE .4 .5 .683 .7 .7 .666
FOOD .37 .37 .444 .481 .481 .537
BIOTECH .36 .458 .562 .586 .586 .571
INSURANC .346 .5 .615 .576 .615 .653
NASD-100 .34 .556 .742 .804 .824 .783
GUNS .312 .625 .75 .687 .687 .812
FIDSTKS .28 .421 .589 .668 .646 .623
RETAIL .28 .38 .56 .64 .52 .5
NIFTY .277 .537 .722 .796 .851 .777
SP500 .275 .434 .596 .64 .628 .617
RUS-1000 .266 .422 .559 .606 .592 .582
COMPUTER .263 .473 .526 .578 .526 .578
SEMI .261 .355 .514 .626 .682 .579
ELECTRON .254 .352 .516 .581 .627 .562
INDEXES .252 .446 .768 .768 .752 .758
CHINA .24 .259 .407 .425 .462 .425
DJI-13 .23 .384 .538 .538 .538 .615
SP-100 .222 .366 .622 .666 .655 .644
HACKERS .2 .35 .45 .5 .5 .5
DOWJONES .172 .344 .551 .551 .517 .586
TRANSP .15 .2 .35 .45 .45 .4
CHEM .142 .224 .306 .346 .408 .408
INDMATER .131 .157 .197 .223 .276 .25
INFRA .111 .277 .277 .277 .305 .277
MILITARY .107 .214 .464 .464 .535 .535
FINANCE .095 .202 .416 .5 .44 .416
OILGAS .089 .149 .238 .246 .216 .179
REGBANKS .076 .153 .192 .23 .23 .192
AUTO .05 .2 .35 .35 .35 .3
BIGBANKS 0 0 .571 .857 .857 .714
COAL 0 0 0 0 0 0
COPPER 0 0 0 0 0 0
ETFS 0 .035 .285 .428 .535 .446
JETS 0 0 .2 .3 .3 .3
|
====================================================================
2/24/2020
Without an official Peerless sell signal from the
current version of Peerless
we have to look for a rebound to try to close some of the many gaps down.
The selling, we can hope was a typical Friday-Monday emotional wave of panic.
But I would not add to long positions and I would be
planning to reduce
long positions if we do not get a two-day reversal up. We need to see the
downward volatility end.
DJI Date should say 2/24/2020  |
NASDAQ |
QQQ |
The DJI did show multiple non-confirmations of the nominal closing high on
2/12/2020. But there was no Sell Signal from the current version of the Peerless
program. However, the 2006 version did give a Sell S8. I do not have the
source code for the 2006 version. So, I cannot reproduce it and test it.
But we did get warnings and we got out of the DJI and DIA if not the NASDAQ,
QQQ and the bullish techs stocks except on the way down. No doubt, the
decline was so fast, it caught many of you by surprise and has not given you
a chance to sell.
The temptation is usually over-powering in these circumstances to want to
"double-down" and add to positions. I would advise against that.
First,
only the NYSE A/D Line is still uptrending. All the other indicators are falling,
especially our new Cumulative Inverted Traders Index. Secondly, a majority
of all the stocks and groupings we follow now show a majority are below their 65-dma.
Thirdly, the rapidity of the decline to the lower band makes buying there
much more risky. I only had time to look at the data from 1929-1965, one
chart at a time, but what I found shows that in 25 of 35 cases where the DJI
fell by 2% or more in one day (like on this Monday) to within 1/2% of the lower
3.5% band, the decline continued substantially. Moreover, in half of the 10
other cases, where there was a good rebound, the DJI fell one or two more days
before turning up.
Fourthly, we did not get a new Peerless Buy today from either the current version
of Peerless or the older "code-lost" version from 2016.
Fifth, Bernie Sanders is looking quite threatening. He may falter, of course, and
the orthodox Democrats may block his nomination. But Wall Street is getting
more scared. And so are the pro-Wall Street pundits. If he wins big in
California
AND Texas on Super Tuesday, Wall Street will probably be clobbered again.
Sixth, and most important, the Coronovirus is becoming a "pandemic". The
President
may say it is safely under control here, but more and more evidence is pointing in a
different direction. One of my client-friends has been gratious enough to keep
me posted on this growing epidemic, day by day. Tonight he sent me the following.
Jon, this is most appreciated.
| "All of these factors combined look very, very bad. 1. Patients that test negative are released with few
symptoms then later lest positive. |
|
Charts 2/24/2020 (Click on Underlined link.) 2020 PEERLESS DJI, Signals, Indicators Daily DJI Volume 10-DayUp/Down Vol Stoch-20 Inverted Traders Index Graph of Pct of All Stocks above 65-dma NASDAQ S&P OEX NYSE COMPQX DJI-15 DJI-20 DJI-30 DIA QQQ MDY IWM TNA Short-Term Rates SPY http://tigersoft.com/2020CST/SPY.GIF USO-CrudeOil DBO FAS GLD BBH IBB JETS JNUG KOL NUGT OIH OIL PALL RSX RETL SDS AGQ SLV SOXL TECL TLT TMF TNA UGA (gasoline) and China: YINN CHAU Commodities: CANE CORN DBC JJC, NIB, CHOC CORN, CUT (paper) MOO, SOYB WEAT UUP (Dollar) LIT (Lithium) AAPL ADBE ALXN AMAT AMGN AMD AMZN AXP BA BABA BAC BIDU BLDP CAT CVX DE FB GOOG GS HD IBM INTU JPM M (Macy's) MSFT NFLX NKE NVDA PG QCOM TSLA TXN XOM V WMT CMG , LRCX, SQ TOWN New highs and Bullish MAXCPs http://tigersoft.com/MAXMLK/2-24/BULLISH.htm Bearish MAXCPs - http://tigersoft.com/MINMLK/2-24/BEARISH.htm |
 Table 1   QUICKSILVER on DJI-30 STOCKS  2/24/2020
 3 Bullish  4 Bearish, ITRS and IP21 >+.25 and <-.25
STOCKS CLOSE CHANGE PIVOT-PT 5-dma AROC CL-PWR CANDLE IP21 ITRS ------------------------------------------------------------------------------ ------------------------------------------------------------------------------ AAPL 298.18 -14.87 319 -418% Bullish BLUE .156 .11 Bullish --------------------------------------------------------------------- AXP 128.19 -6.71 135.6 -282.4% ------- RED -.099 .06 --------------------------------------------------------------------- BA 317.9 -12.48 338.88 -335.3% Bullish RED .035 -.087 --------------------------------------------------------------------- CAT 132.17 -5.04 136.58 -212.2% ------- RED -.12 -.075 --------------------------------------------------------------------- CSCO 44 -2.29 46.59 -318.7% ------- RED -.014 -.003 --------------------------------------------------------------------- CVX 104.71 -4.3 110.24 -244.1% ------- RED -.04 -.112 --------------------------------------------------------------------- DIS 133.01 -5.96 139.14 -233.4% Bearish RED .038 -.09 --------------------------------------------------------------------- GS 224.54 -6.08 233.21 -267.7% Bearish BLUE -.12 .012 --------------------------------------------------------------------- HD 239.7 -5.64 243.94 -108.8% Bullish BLUE .099 .11 --------------------------------------------------------------------- IBM 146.43 -3.41 151.1 -141.6% Bullish BLUE .235 .093 Bullish --------------------------------------------------------------------- INTC 61.76 -2.58 66.14 -417% ------- BLUE -.001 .091 --------------------------------------------------------------------- JNJ 145.91 -4.02 149.14 -141.3% Bullish RED -.035 .042 --------------------------------------------------------------------- JPM 132.16 -3.65 135.64 -193.7% ------- BLUE -.013 -.018 --------------------------------------------------------------------- KO 58.65 -1.48 59.53 -108.7% Bullish RED -.048 .09 --------------------------------------------------------------------- MCD 213.52 -2.35 216.15 -82.7% ------- BLUE .001 .095 --------------------------------------------------------------------- MMM 152.55 -4.38 158.88 -266.1% Bearish RED -.428 -.09 Bearish --------------------------------------------------------------------- MRK 81.33 -1.01 82.46 -80.1% ------- BLUE -.143 -.088 --------------------------------------------------------------------- MSFT 170.89 -7.7 187.23 -391.7% Bullish BLUE .15 .13 Bullish --------------------------------------------------------------------- NKE 95.91 -4.34 102 -373.4% ------- BLUE -.104 -.012 --------------------------------------------------------------------- PFE 34.67 -1.05 36.32 -254.7% Bearish RED -.333 -.099 Bearish --------------------------------------------------------------------- PG 123.3 -3.4 124.87 -112.7% ------- RED -.212 -.008 --------------------------------------------------------------------- TRV 134.12 -1.04 135.88 -134.4% ------- BLUE -.027 -.011 --------------------------------------------------------------------- UNH 277.79 -23.64 302.14 -347.6% ------- RED -.024 -.007 --------------------------------------------------------------------- UTX 146.58 -4.94 151.28 -227.3% ------- RED .066 .008 --------------------------------------------------------------------- V 198.79 -10.02 211.2 -272.5% Bullish BLUE .021 .09 --------------------------------------------------------------------- VZ 57.99 -.21 57.91 -44.7% ------- RED -.076 -.053 --------------------------------------------------------------------- WBA 49.03 -2.42 51.86 -367.2% Bearish RED -.278 -.161 Bearish --------------------------------------------------------------------- WMT 116.32 -2.26 119.63 -66.4% Bullish RED .044 -.024 --------------------------------------------------------------------- XOM 56.36 -2.77 59.88 -357.7% Bearish RED -.271 -.184 Bearish |
 Table 2                    QUICKSILVER on ETFS - 02/24/20
    Only TECL is still Bullish.
ETF CLOSE CHANGE PIVOT-PT 5-dma AROC CL-PWR CANDLE IP21 ITRS --------------------------------------------------------------------------------------------- DIA 279.56 -10.18 292.95 -255.8% ------- RED -.036 0 --------------------------------------------------------------------------------------------- BA 317.9 -12.48 338.88 -335.3% Bullish RED .035 -.087 --------------------------------------------------------------------------------------------- SPY 324.4 -9.08 336.73 -196.1% Bullish BLUE -.039 .034 --------------------------------------------------------------------------------------------- QQQ 221.39 -8.88 234.73 -282.8% Bullish RED .045 .085 --------------------------------------------------------------------------------------------- MDY 368.6 -11.34 380.94 -176.5% ------- BLUE .012 .003 --------------------------------------------------------------------------------------------- IWM 162.07 -5.03 167.54 -173.6% ------- BLUE -.019 -.004 --------------------------------------------------------------------------------------------- FAS 94.89 -9.17 105.45 -573.1% Bullish ---- -.012 .062 --------------------------------------------------------------------------------------------- RETL 24.41 -2.91 26.02 -238.4% ------- RED .026 -.073 --------------------------------------------------------------------------------------------- SOXL 243.01 -40.44 302.48 -1179.1% ------- BLUE .03 .091 --------------------------------------------------------------------------------------------- TECL 263.92 -37.96 323.24 -972.5% ------- BLUE .133 .267 Bullish --------------------------------------------------------------------------------------------- IBB 119.84 -3.24 122.52 -106.9% ------- RED .085 -.003 --------------------------------------------------------------------------------------------- GLD 156.09 1.39 150.91 233.6% ------- RED .115 .131 --------------------------------------------------------------------------------------------- OIH 10.02 -.79 11.03 -554.1% Bearish RED -.193 -.191 Bearish --------------------------------------------------------------------------------------------- GASL 3.51 -.64 4.16 -769.9% Bearish RED -.211 -.515 Bearish --------------------------------------------------------------------------------------------- UGA 3.51 -.64 4.16 -769.9% Bullish RED -.193 -.894 Bearish --------------------------------------------------------------------------------------------- |
 Table 3   Count of Stocks in Key Directories
           20200224
-------------------------------
NEWHIGHS       116
NEWLOWS        110
MAXCP          99
MINCP          103
TTTNH          31
TTTNL          96
FASTUP         93
FASTDOWN       156
CPCROSSA       58
CPCROSSD       8
BIGVOLUP       6
BIGVODN        29
ACCUMVER       8
HIGHIP21       21
LOWACCUM       124
REDSELL        103
AUGSELS7       17
TRAPDOOR       21
|
Table 4 RANKING OF KEY DIRECTORIES BASED PCT.OF STOCKS ABOVE 65-DMA
              2/24/20
 Bullish = 12
 Bearish = 30
---------------------------------------------------------------------------------------
Directory     Current       day-1         day-2         day-3         day-4         day-5
----------------------------------------------------------------------------------------
BONDFUND       .9            .94           .96           .93           .94           .94
HOMEBLDG       .764          .823          .823          .764          .705          .823
SOLAR          .764          .764          .882          .882          .882          .941
UTILITY        .743          .846          .846          .846          .871          .846
GOLD           .708          .666          .645          .666          .625          .541
REIT           .673          .751          .744          .695          .751          .773
GUNS           .625          .75           .687          .687          .812          .75
EDU            .6            .6            .6            .6            .6            .6
HOSPITAL       .59           .681          .681          .772          .727          .681
GREEN          .571          .619          .714          .714          .666          .714
NASD-100       .556          .752          .814          .824          .783          .835
NIFTY          .537          .722          .796          .851          .777          .888
==============================================================================================
BEVERAGE       .5            .5            .562          .562          .562          .625
GAMING         .5            .545          .545          .59           .681          .681
INSURANC       .5            .615          .576          .615          .653          .73
SOFTWARE       .5            .7            .7            .7            .666          .666
==============================================================================================
COMPUTER       .473          .526          .578          .526          .578          .631
BIOTECH        .455          .559          .583          .586          .583          .544
INDEXES        .446          .768          .768          .752          .758          .709
SP500          .434          .598          .64           .628          .615          .67
COMODITY       .425          .45           .475          .475          .5            .425
RUS-1000       .422          .56           .606          .592          .582          .621
FIDSTKS        .421          .589          .668          .646          .629          .674
DJI-13         .384          .538          .538          .538          .615          .769
RETAIL         .38           .56           .64           .52           .48           .6
FOOD           .37           .444          .481          .481          .537          .388
SP-100         .366          .622          .666          .655          .655          .7
SEMI           .355          .514          .626          .682          .579          .7
ELECTRON       .352          .516          .581          .627          .562          .64
HACKERS        .35           .5            .5            .5            .5            .5
DOWJONES       .344          .551          .551          .517          .586          .655
INFRA          .277          .277          .277          .305          .277          .388
CHINA          .259          .407          .425          .462          .425          .481
CHEM           .224          .306          .346          .408          .408          .408
MILITARY       .214          .464          .464          .535          .535          .535
FINANCE        .202          .416          .5            .44           .428          .476
AUTO           .2            .35           .35           .35           .3            .275
TRANSP         .2            .35           .45           .45           .4            .4
INDMATER       .157          .197          .223          .276          .25           .263
REGBANKS       .153          .192          .23           .23           .192          .23
OILGAS         .149          .238          .246          .216          .179          .194
ETFS           .035          .285          .428          .535          .446          .535
BIGBANKS       0             .571          .857          .857          .857          .857
COAL           0             0             0             0             0             0
COPPER         0             0             0             0             0             .125
JETS           0             .2            .3            .3            .3            .3
|
=====================================================================
2/21/2020 We are being told that the markets are down 3% because of the growing
overseas
panic due to the spread of the Coronovirus to Italy, Korea and other countries
besides China. This is seen as disruptive of all US controlled multinationals,
particularly
tech stocks like AAPL (which on Friday completed a bearish head/shoulders).
Big Bank stocks like BAC and COF have formed head/shoulders patterns, too,
which will most likely be competed unless they close up substantially from the
weak openings that lie ahead.
Interestingly, it is not true that there are a great many other H/S patterns. Nor
are
there other signs of the usual widespread Distribution that takes place at many market
topa.
But we are seeing another Monday panic on Wall Street. At this point the DJI
is down 700 and the NASDAQ is off 3% three hours before the NYSE and
NASDAQ opening. The pattern recently has been a Monday panic and a
turnaround on Tuesday. So, Tuesday could bring a sharp recovery. After all,
there was no Peerless Sell before this free-fall. A decline to the lower band
could bring a Buy B9 if NYSE breadth is not too bad and we could get a
Buy B19 if Tuesday brings a sharp turn around. We will just have to wait and
see.


I would continue to avoid buying DIA. Friday mornng I also suggested that
short-term traders sell ETFs and NASDAQ stocks that close below their
"pivot points", i.e. close below the point that will turn their 5-day ma that
afternoon at the close, or show a 10% loss. We also do not want to let a gain
turn into a loss.


I checked the type of warning signs that we saw on the last
DJI new high on February 12.
There were bearish divergences, but as a whole they do not give reliable Sells when
the A/D Line made a new 50-day high even though the DJI's nominal new high was
widely not confirmed by the Cumulative Inverted Traders' Index, the P-Indicator
and the IP21 Indicator and the V-I was below -80.
The Lesson of 1900
Perhaps, the pundits who blame the Coronovirus for
the sell-off do not want to
really scare Wall Street by suggesting a populist Democrat like Sanders or Warren
might win the Democrat nomination. History (1900) does show that a strong economy
going into January of the Presidential Election Year will not be strong enough to hold
up the DJIA up if the Democrat candidate for President turns out to be a populist
who could challenge the Wall Street Establishment. Even though he had lost in
1896, Williams Jenning Bryan was picked in 1900 again. His 1896 campaign was
centered on a critique of Wall Street Banking and his 1900 campaign added an
attack on American Imperialism and the Spanish American War.

McKinley's economy in 1900 was booming as Trump's is now. But that and McKinley's
easy victory in November did not prevent a 25% decline for the first nine months of 1900.
If you think Bernie Sanders can actually beat Donald Trump, then I think you have to be
very bearish in 2020. But don't expect the FED to allow the stock market to
collapse.
I think you should expect only intermittent, mildly bearish seasonality in the first
nine months of the Presidential Election.Year, like was true in 1900.
. Our data back to 1968, shows that in Presidential Years, the DJI has risen only
38.5%
of the time over the next two weeks but is up 69.2% of the time over the next two months.
A 1% average loss turns then into an average 2% gain, just in time to pay your Income
Taxes.
|
Charts 2/21/2020 (Click on Underlined link.) 2020 PEERLESS DJI, Signals, Indicators Daily DJI Volume 10-DayUp/Down Vol Stoch-20 Inverted Traders Index Graph of Pct of All Stocks above 65-dma NASDAQ S&P OEX NYSE COMPQX DJI-15 DJI-20 DJI-30 DIA QQQ MDY IWM TNA Short-Term Rates SPY http://tigersoft.com/2020CST/SPY.GIF USO-CrudeOil DBO FAS GLD BBH IBB JETS JNUG KOL NUGT OIH OIL PALL RSX RETL SDS AGQ SLV SOXL TECL TLT TMF TNA UGA (gasoline) and China: YINN CHAU Commodities: CANE CORN DBC JJC, NIB, CHOC CORN, CUT (paper) MOO, SOYB WEAT UUP (Dollar) LIT (Lithium) AAPL ADBE ALXN AMAT AMGN AMD AMZN AXP BA BABA BAC BIDU BLDP CAT CVX DE FB GOOG GS HD IBM INTU JPM M (Macy's) MSFT NFLX NKE NVDA PG QCOM TSLA TXN XOM V WMT CMG , LRCX, SQ TOWN New highs and Bullish MAXCPs http://tigersoft.com/MAXMLK/2-21/BULLISH.htm Bearish MAXCPs - http://tigersoft.com/MINMLK/2-21/BEARISH.htm |
 Table 1   QUICKSILVER on DJI-30 STOCKS  2/21/2020
 3 Bullish  5 Bearish, ITRS and IP21 >+.25 and <-.25
STOCKS CLOSE CHANGE PIVOT-PT 5-dma AROC CL-PWR CANDLE IP21 ITRS ------------------------------------------------------------------------------ ------------------------------------------------------------------------------ AAPL 313.05 -7.25 324.95 -183.2% Bullish RED .175 .137 Bullish --------------------------------------------------------------------- AXP 134.9 -1.68 135.87 16.2% ------- RED -.015 .084 --------------------------------------------------------------------- BA 330.38 -5.9 340.49 -183.3% Bullish RED .12 -.095 --------------------------------------------------------------------- CAT 137.21 .28 137.99 -91.2% ------- BLUE-.026 -.075 --------------------------------------------------------------------- CSCO 46.29 -.56 46.97 -110% ------- RED .093 .019 --------------------------------------------------------------------- CVX 109.01 -.8 110.08 -119.9% ------- BLUE .042 -.106 --------------------------------------------------------------------- DIS 138.97 -1.4 139.54 -68.8% Bearish RED .033 -.085 --------------------------------------------------------------------- GS 230.62 -2.11 237.08 -164% Bearish RED -.105 .004 --------------------------------------------------------------------- HD 245.34 -1.68 245.03 61% Bullish RED .146 .097 --------------------------------------------------------------------- IBM 149.84 -1.38 150.7 -147.4% Bullish RED .227 .083 Bullish --------------------------------------------------------------------- INTC 64.34 -1.11 67.27 -232.4% ------- RED .032 .102 --------------------------------------------------------------------- JNJ 149.93 1.56 150.13 -5.4% Bullish BLUE .062 .031 --------------------------------------------------------------------- JPM 135.81 -1.68 137.46 -75.4% ------- RED .014 -.031 --------------------------------------------------------------------- KO 60.13 .41 59.95 43.5% Bullish BLUE .057 .076 --------------------------------------------------------------------- MCD 215.87 .79 217.09 -35.8% ------- BLUE .023 .073 --------------------------------------------------------------------- MMM 156.93 -1.63 161.01 -88.7% ------- RED -.39 -.112 Bearish --------------------------------------------------------------------- MRK 82.34 -.15 82.65 22.5% ------- BLUE-.157 -.108 Bearish --------------------------------------------------------------------- MSFT 178.59 -5.83 185.35 -137.9% Bearish RED .148 .144 Bullish --------------------------------------------------------------------- NKE 100.25 -2.28 103.54 -151.8% ------- RED -.115 .002 --------------------------------------------------------------------- PFE 35.72 -.13 36.51 -166.4% ------- -----.257 -.104 Bearish --------------------------------------------------------------------- PG 126.7 .12 126.14 69.3% Bullish BLUE-.164 -.021 --------------------------------------------------------------------- TRV 135.16 1.18 137.76 -63.3% ------- BLUE-.093 -.038 --------------------------------------------------------------------- UNH 301.43 -.7 298.78 -12.7% Bullish BLUE .096 .05 --------------------------------------------------------------------- UTX 151.52 1.62 153.46 -50.8% ------- BLUE .103 .001 --------------------------------------------------------------------- V 208.81 -2.64 210.29 33.5% Bullish RED .013 .106 --------------------------------------------------------------------- VZ 58.2 .11 58.51 -38.6% ------- BLUE .019 -.082 --------------------------------------------------------------------- WBA 51.45 -.42 52.85 -202.1% Bearish RED -.193 -.159 Bearish --------------------------------------------------------------------- WMT 118.58 .89 117.89 48.3% Bullish BLUE .091 -.042 --------------------------------------------------------------------- XOM 59.13 -.73 60.65 -149.2% ------- RED -.176 -.187 Bearish |
QUICKSILVER on ETFS - 02/21/20 ETF CLOSE CHANGE PIVOT-PT 5-dma AROC CL-PWR CANDLE IP21 ITRS --------------------------------------------------------------------------------------------- DIA 289.74 -3.04 294.54 -86.4% ------- RED .057 ------ --------------------------------------------------------------------------------------------- SPY 333.48 -3.47 337.6 -53.1% Bullish RED .047 .027 --------------------------------------------------------------------------------------------- QQQ 230.27 -4.51 234.64 -78.7% Bullish RED .145 .093 --------------------------------------------------------------------------------------------- MDY 379.94 -4.08 382.08 -30.3% ------- RED .05 -.002 --------------------------------------------------------------------------------------------- IWM 167.1 -1.71 167.9 -43.1% ------- RED .059 -.007 --------------------------------------------------------------------------------------------- FAS 104.06 -2.89 107.04 -72.4% Bullish RED .042 .122 --------------------------------------------------------------------------------------------- RETL 27.32 -.6 25.68 265.6% ------- RED .063 -.001 --------------------------------------------------------------------------------------------- SOXL 283.45 -27.96 315.59 -543.2% Bearish RED .105 .251 --------------------------------------------------------------------------------------------- TECL 301.88 -21.95 326.52 -314.3% ------- RED .169 .415 --------------------------------------------------------------------------------------------- IBB 123.08 -.23 122.47 46% ------- RED .088 -.005 --------------------------------------------------------------------------------------------- GLD 154.7 2.29 149 210% Bullish BLUE .21 .089 --------------------------------------------------------------------------------------------- OIH 10.81 -.39 11.25 -201.1% Bearish RED -.111 -.16 --------------------------------------------------------------------------------------------- GASL 4.15 -.33 4.17 -276.9% Bearish RED -.19 -.442 --------------------------------------------------------------------------------------------- |
 Table    Count of Stocks in Key Directories
          20200221
-------------------------------
NEWHIGHS       205
NEWLOWS        44
MAXCP          86
MINCP          86
TTTNH          36
TTTNL          80
FASTUP         101
FASTDOWN       71
CPCROSSA       39
CPCROSSD       181
BIGVOLUP       9
BIGVODN        23
ACCUMVER       9
HIGHIP21       27
HIUPPCT        83
REDSELL        98
AUGSELS7       17
TRAPDOOR       21
|
 Table 4  RANKING OF KEY DIRECTORIES BASED PCT.OF STOCKS ABOVE 65-DMA
              2/21/20
 Bullish = 28   Bearish = 16
---------------------------------------------------------------------------------------
Directory     Current       day-1         day-2         day-3         day-4         day-5
----------------------------------------------------------------------------------------
BONDFUND       .94           .96           .93           .94           .94           .93
UTILITY        .846          .846          .846          .871          .846          .871
HOMEBLDG       .823          .823          .764          .705          .823          .823
INDEXES        .768          .768          .752          .758          .715          .774
SOLAR          .764          .882          .882          .882          .941          .941
NASD-100 .752 .824 .835 .783 .835 .824 REIT .751 .744 .695 .751 .773 .744 GUNS .75 .687 .687 .812 .75 .687 NIFTY .722 .796 .851 .777 .888 .888 SOFTWARE .7 .716 .7 .666 .666 .65 HOSPITAL .681 .681 .772 .727 .681 .727 EDU .666 .666 .666 .666 .666 .666 GOLD .659 .638 .659 .617 .531 .531 SP-100 .622 .666 .655 .655 .7 .711 GREEN .619 .714 .714 .666 .714 .714 INSURANC .615 .576 .615 .653 .73 .73 SP500 .598 .642 .628 .615 .672 .678 FIDSTKS .589 .668 .646 .629 .674 .679 BIGBANKS .571 .857 .857 .857 .857 .857 RETAIL .56 .64 .52 .48 .6 .58 RUS-1000 .56 .607 .592 .582 .622 .626 BIOTECH .556 .58 .583 .583 .556 .565 GAMING .545 .545 .59 .681 .681 .727 DJI-13 .538 .538 .538 .615 .769 .769 DOWJONES .533 .533 .5 .566 .633 .633 COMPUTER .526 .578 .526 .578 .631 .736 ELECTRON .516 .581 .627 .562 .64 .686 SEMI .514 .626 .682 .579 .691 .757 ============================================================================================= BEVERAGE .5 .562 .562 .562 .625 .625 HACKERS .5 .55 .5 .5 .5 .55 ============================================================================================= MILITARY .464 .464 .535 .535 .535 .571 COMODITY .45 .475 .475 .5 .425 .45 FOOD .444 .481 .481 .537 .388 .444 CHINA .418 .436 .472 .436 .49 .49 FINANCE .416 .5 .44 .428 .476 .511 AUTO .35 .35 .35 .3 .275 .275 TRANSP .35 .45 .45 .4 .4 .4 CHEM .306 .346 .408 .408 .408 .367 ETFS .298 .438 .543 .456 .543 .561 INFRA .277 .277 .305 .277 .388 .416 OILGAS .238 .246 .216 .179 .194 .201 JETS .2 .3 .3 .3 .3 .3 INDMATER .197 .223 .276 .25 .263 .276 REGBANKS .192 .23 .23 .192 .23 .384 COAL 0 0 0 0 0 0 COPPER 0 0 0 0 .125 .25 |
=========================================================================
2/20/2020 Peerless remains on a Buy B9-Buy B11. The key A/D Line
actually rose today.
There were 176 more down than up. But the DJI fell 116, wiping out Wednesday's
gain and the NASDAQ and its leaders fell back 66 to its breakout point on Wednesday.
A 10% retreat for these leaders would not be a surprise after their big advance. But
the
bullish facts remain: the NYSE A/D is still in a strong trend and there were 3x more
groups of stocks shown in Table 4 that are rising than are falling. Continue to hold
the
very strong NASDAQ stocks. If you are nervous, you can reduce your long positions
if they fall more than 10% from their highs or their 5-day ma turns down as the
"pivot-point" is closed below.


I would stick with the Peerless Buys for the stocks and ETFs recommended here,
but I would not buy DIA at 29000 on weakness tomorrow. First, because there
has been a strong tendency this year for the DJI to fall on Monday if Friday is
weak.
Second, there are more stocks in the DJI-30 that are rated as bearish than bullish
in Table 1. Third, the Cumulative Inverted MKDS is still falling.

Remember that without a classic Sell S9 (P-I NNC by
DJI at upper band, a
Sell S12 (IP21 NNC by DJI at upper band) or a Sell S10 (a completed DJI
head/shoulders pattern), the odds heavily favor more DJI new highs and not more
than an 8% decline from the recent highs. And understand, too, that there are
many cases where the NASDAQ tops out only after the last Peerless Sell on the DJI
at the end of a bull market. Green Clean Energy stocks
are in a runaway uptrend.

|
Charts 2/20/2020 (Click on Underlined link.) 2020 PEERLESS DJI, Signals, Indicators Daily DJI Volume 10-DayUp/Down Vol Stoch-20 Inverted Traders Index Graph of Pct of All Stocks above 65-dma NASDAQ S&P OEX NYSE COMPQX DJI-15 DJI-20 DJI-30 DIA QQQ MDY IWM TNA Short-Term Rates SPY http://tigersoft.com/2020CST/SPY.GIF USO-CrudeOil DBO FAS GLD BBH IBB JETS JNUG KOL NUGT OIH OIL PALL RSX RETL SDS AGQ SLV SOXL TECL TLT TMF TNA UGA (gasoline) and China: YINN CHAU Commodities: CANE CORN DBC JJC, NIB, CHOC CORN, CUT (paper) MOO, SOYB WEAT UUP (Dollar) LIT (Lithium) AAPL ADBE ALXN AMAT AMGN AMD AMZN AXP BA BABA BAC BIDU BLDP CAT CVX DE FB GOOG GS HD IBM INTU JPM M (Macy's) MSFT NFLX NKE NVDA PG QCOM TSLA TXN XOM V WMT CMG , LRCX, SQ TOWN New highs and Bullish MAXCPs http://tigersoft.com/MAXMLK/2-20/BULLISH.htm Bearish MAXCPs - http://tigersoft.com/MINMLK/2-20/BEARISH.htm |
Table 1 QUICKSILVER on DJI-30 STOCKS 2/20/2020 3 Bullish 5 Bearish, ITRS and IP21 >+.25 and <-.25 STOCKS CLOSE CHANGE PIVOT-PT 5-dma AROC CL-PWR CANDLE IP21 ITRS ------------------------------------------------------------------------------ ------------------------------------------------------------------------------ AAPL 320.3 -3.32 324.87 -106.5% Bullish RED .174 .14 Bullish --------------------------------------------------------------------- AXP 136.58 -.35 134.46 123.5% Bullish BLUE-.014 .089 --------------------------------------------------------------------- BA 336.28 -2.02 342.82 -163.5% Bullish RED .162 -.093 --------------------------------------------------------------------- CAT 136.93 .07 139.72 -96.3% ------- BLUE-.108 -.084 --------------------------------------------------------------------- CSCO 46.85 .56 47.32 -324.8% ------- BLUE .081 .026 --------------------------------------------------------------------- CVX 109.81 -.93 111.66 -100.5% ------- RED -.001 -.113 --------------------------------------------------------------------- DIS 140.37 -.93 140.9 -52.7% Bearish RED .038 -.092 --------------------------------------------------------------------- GS 232.73 -4.6 238.35 -124.9% Bearish RED -.137 -.007 --------------------------------------------------------------------- HD 247.02 3.38 242.36 111.6% Bullish BLUE .102 .11 --------------------------------------------------------------------- IBM 151.22 .36 154.31 -134.1% Bullish BLUE .189 .092 Bullish --------------------------------------------------------------------- INTC 65.45 -1.66 67.44 -149.8% Bullish RED .102 .109 --------------------------------------------------------------------- JNJ 148.37 -.57 150.09 -90.7% Bullish RED .048 .014 --------------------------------------------------------------------- JPM 137.49 0 137.88 -18.6% Bullish BLUE .003 -.025 --------------------------------------------------------------------- KO 59.72 -.05 59.61 26% Bullish ---- .052 .054 --------------------------------------------------------------------- MCD 215.08 -.55 217.42 -54.9% ------- RED -.041 .058 --------------------------------------------------------------------- MMM 158.56 -.78 159.76 -163.2% ------- RED -.408 -.118 Bearish --------------------------------------------------------------------- MRK 82.49 .49 81.97 -46.1% ------- BLUE-.197 -.115 Bearish --------------------------------------------------------------------- MSFT 184.42 -2.86 183.71 -7.8% Bullish RED .162 .172 Bullish --------------------------------------------------------------------- NKE 102.53 .07 103.37 -22.8% ------- BLUE-.128 .014 --------------------------------------------------------------------- PFE 35.85 -.38 36.93 -257.2% Bearish --- -.281 -.107 Bearish --------------------------------------------------------------------- PG 126.58 1.14 124.96 125.2% Bullish BLUE-.14 -.024 --------------------------------------------------------------------- TRV 133.98 -.53 136.88 -63.5% ------- ---- .122 -.056 --------------------------------------------------------------------- UNH 302.13 -3.18 302.2 -22.3% Bullish RED .094 .035 --------------------------------------------------------------------- UTX 149.9 -.78 153.06 -172.9% ------- RED .038 -.023 --------------------------------------------------------------------- V 211.45 -1.86 207.4 95.5% Bullish RED -.013 .118 --------------------------------------------------------------------- VZ 58.09 -.13 58.65 -12% Bearish --- -.032 -.094 --------------------------------------------------------------------- WBA 51.87 -.2 53.57 -245.4% Bearish RED -.205 -.158 Bearish --------------------------------------------------------------------- WMT 117.69 .01 117.44 78.2% Bullish BLUE .066 -.06 --------------------------------------------------------------------- XOM 59.86 -.48 60.93 -116.3% ------- RED -.194 -.182 Bearish |
QUICKSILVER on ETFS - 02/20/20 ETF CLOSE CHANGE PIVOT-PT 5-dma AROC CL-PWR CANDLE IP21 ITRS --------------------------------------------------------------------------------------------- DIA 292.78 -1.32 294.82 -49.9% ------- RED .042 ----- --------------------------------------------------------------------------------------------- SPY 336.95 -1.39 337.06 -7% Bullish RED .053 .027 --------------------------------------------------------------------------------------------- QQQ 234.78 -2.2 233.97 10.9% Bullish RED .197 .102 --------------------------------------------------------------------------------------------- MDY 384.02 1.55 382.26 39.9% ------- BLUE .051 -.003 --------------------------------------------------------------------------------------------- IWM 168.81 .41 168.55 20.8% ------- BLUE .057 -.006 --------------------------------------------------------------------------------------------- FAS 106.95 .44 105.6 119.1% Bullish BLUE .033 .141 --------------------------------------------------------------------------------------------- RETL 27.92 1.69 25.92 328.7% ------- BLUE .064 .03 --------------------------------------------------------------------------------------------- SOXL 311.41 -14.57 317.63 -87.4% ------- RED .149 .347 --------------------------------------------------------------------------------------------- TECL 323.83 -9.97 322.37 -14.6% Bullish RED .193 .489 --------------------------------------------------------------------------------------------- IBB 123.31 -.17 121.95 15.1% ------- RED .06 -.016 --------------------------------------------------------------------------------------------- GLD 152.41 .62 148.38 162.9% Bullish BLUE .249 .064 --------------------------------------------------------------------------------------------- OIH 11.2 -.01 11.26 -93.5% Bearish RED -.114 -.135 --------------------------------------------------------------------------------------------- GASL 4.48 .01 4.39 -11.5% Bearish RED -.22 -.36 --------------------------------------------------------------------------------------------- |
Count of Stocks in Key Directories
20200220
-------------------------------
NEWHIGHS 333 Bullish
NEWLOWS 29
MAXCP 141
MINCP 44
TTTNH 53
TTTNL 36
FASTUP 101
FASTDOWN 67
CPCROSSA 82
CPCROSSD 81
BIGVOLUP 4
BIGVODN 17
ACCUMVER 10
HIGHIP21 22
HIUPPCT 92
REDSELL 98
AUGSELS7 16
TRAPDOOR 19
|
RANKING OF KEY DIRECTORIES BASED PCT.OF STOCKS ABOVE 65-DMA
2/20/20
Bullish = 30
Bearish = 15
---------------------------------------------------------------------------------------
Directory Current day-1 day-2 day-3 day-4 day-5
----------------------------------------------------------------------------------------
BONDFUND .96 .93 .94 .94 .93 .94
SOLAR .882 .882 .882 .941 .941 .941
BIGBANKS .857 .857 .857 .857 .857 .857
UTILITY .846 .846 .871 .846 .871 .897
NASD-100 .824 .845 .793 .835 .835 .845
HOMEBLDG .823 .764 .705 .823 .823 .823
NIFTY .796 .851 .777 .888 .907 .907
INDEXES .768 .752 .758 .715 .779 .731
REIT .744 .695 .751 .773 .751 .695
SOFTWARE .716 .716 .666 .666 .65 .65
GREEN .714 .714 .666 .714 .714 .761
GUNS .687 .687 .812 .75 .687 .75
HOSPITAL .681 .772 .727 .681 .727 .636
FIDSTKS .668 .646 .629 .674 .679 .713
SP-100 .666 .655 .655 .7 .711 .733
GOLD .645 .666 .625 .541 .541 .458
SP500 .642 .63 .615 .672 .682 .705
RETAIL .64 .52 .48 .6 .56 .64
SEMI .626 .682 .579 .691 .757 .794
RUS-1000 .607 .593 .582 .622 .629 .638
EDU .6 .6 .6 .6 .6 .6
COMPUTER .578 .526 .578 .631 .736 .842
ELECTRON .578 .625 .559 .638 .684 .736
BIOTECH .577 .58 .58 .556 .577 .607
INSURANC .576 .615 .653 .73 .73 .73
BEVERAGE .562 .562 .562 .625 .625 .625
HACKERS .55 .55 .5 .5 .55 .5
GAMING .545 .59 .681 .681 .727 .818
DJI-13 .538 .538 .615 .769 .769 .692
DOWJONES .533 .5 .566 .633 .633 .566
---------------------------------------------------------------------------------------------
FINANCE .5 .44 .428 .476 .523 .547
---------------------------------------------------------------------------------------------
COMODITY .475 .475 .5 .425 .45 .475
FOOD .471 .471 .528 .377 .433 .433
MILITARY .464 .535 .535 .535 .571 .607
TRANSP .45 .45 .4 .4 .4 .4
ETFS .438 .543 .456 .543 .561 .701
CHINA .436 .472 .436 .49 .49 .6 AUTO .35 .35 .3 .275 .275 .3 CHEM .346 .408 .408 .408 .367 .408 JETS .3 .3 .3 .3 .3 .3 INFRA .277 .305 .277 .388 .416 .444 OILGAS .246 .216 .179 .194 .201 .194 REGBANKS .23 .23 .192 .23 .384 .23 INDMATER .223 .276 .25 .263 .276 .315 COAL 0 0 0 0 0 0 COPPER 0 0 0 .125 .25 .125 |
====================================================================
2/19/2020 On paper it looked like a slight and insignificant advance.
The DJI rose just
116 and there were only 176 more up than down on the NYSE. But Up Volume
disproprtionately tilted the NYSE market up in a way that we have not seen
for six weeks or more. Our Cumulative Inverted Traders Index could soon break its
downtrend. This could well help boost the DJI over the 28600-26800 resistance if
NYSE breadth improves and the A/D Line makes a new high, thereby avoiding
a new Sell S15. The S15 would occur, I believe, if the the DJI rises by 0.8%
and the AD-Line fails to make a new high..


The NASDAQ made another all-time high today. Speculative fervor is definitely on
the rise. Speculators want the biggest growth. With the FED seeming to
be protecting investors against any serious declines, this is an excellent environment
to speculate in the fastest growing industries.
Forget your own political preferences now... If the Democrats score victories
in the Fall, pundits say it will be because President Trump continues to deny climate
change despite most Americans now believing that the threat is very real. This
alone, apart from the merits of the issue, will continue to be hit over and over
by Democrats for month after month until the Election. This will be bullish for
the alternative energy stocks. Whatever you may think, our Power Ranker says
it's time to buy some of these stocks if you have not already.

The real story today was the follow-through strength in tech stocks, the "green"
chip
stocks and anything having to do with lithium and alternative battery stocks. TECL
(3x leveraged ETF) made another new high. Its ITRS = 57.2% showing it has
out-performed by DJI by more than 5.7% for each of the last ten weeks. Its
current IP21 is a very promising +.174 and both its Opening and Closing Power
are rising.. Continue to hold this and some of the stocks, like NVDA, which is pushing
TECL up.
2/19/2020 Solar Energy, Semi-Conductor and Green Stocks
Seven gained more than 10% today.
https://finance.yahoo.com/news/edited-transcript-spwr-earnings-conference-070209355.html
My Explosive Super stocks reported extensive research between 1990 and 2006
which showed we should buy breakouts in the strongest industries where the
AI/200 was over 147 and the IP21 was above +.37. ENPH should again be bought
according to this and BLDP is a "strong hold". Note its wondrous AI/200= 197.
Big money is tightly holding this stock.
l
Symbol Name Price One Day Pct.Gain AI/200 IP21 ITRS
----------------------------------------------------------------------------------
1 ENPH* Enphase Energy Inc 57.22 42% 156 .43 139%
Company report - Feb `19 https://finance.yahoo.com/news/edited-transcript-enph-earnings-conference-064553255.html
2 SEDG* SolarEdge Technolog. 127.82 17% 135 .155 48%
Feb 19 - SolarEdge Technologies (SEDG) came out with quarterly earnings of $1.65 per share, beating the Zacks Consensus Estimate of $1.30 per share. This compares to earnings of $0.63 per share a year ago.
https://finance.yahoo.com/news/solaredge-technologies-sedg-q4-earnings-230511768.html
3 PLUG Plug Power 5.72 17% 163 .292 79%
Plug Power Inc. (PLUG), a leading provider of hydrogen engines and fueling solutions enabling e-mobility, today announced their partnership with Colorado-based Lightning Systems, a global developer of zero-emission drivetrains. This collaboration enables both companies to offer the world’s first electric, fuel cell-powered Class 6 trucks (up to 12.5 tons) capable of supporting middle-mile delivery logistics between warehouses and distribution centers.
https://finance.yahoo.com/news/plug-power-partners-lightning-systems-120010884.html
4 BLDP Ballard Power Systems 14.14 13% 197 .30 113%
https://finance.yahoo.com/news/ballard-announces-q4-full-2019-133000540.html
5 FCEL FuelCell Energy Inc 2.79 13% 77 .152 375%
https://finance.yahoo.com/quote/FCEL/community?p=FCEL
6 SPWR* SunPower Corp 10.42 13% 92 .005 41% https://finance.yahoo.com/news/edited-transcript-spwr-earnings-conference-070209355.html


|
Charts 2/19/2020 (Click on Underlined link.) 2020 PEERLESS DJI, Signals, Indicators Daily DJI Volume 10-DayUp/Down Vol Stoch-20 Inverted Traders Index Graph of Pct of All Stocks above 65-dma NASDAQ S&P OEX NYSE COMPQX DJI-15 DJI-20 DJI-30 DIA QQQ MDY IWM TNA Short-Term Rates SPY http://tigersoft.com/2020CST/SPY.GIF USO-CrudeOil DBO FAS GLD BBH IBB JETS JNUG KOL NUGT OIH OIL PALL RSX RETL SDS AGQ SLV SOXL TECL TLT TMF TNA UGA (gasoline) and China: YINN CHAU Commodities: CANE CORN DBC JJC, NIB, CHOC CORN, CUT (paper) MOO, SOYB WEAT UUP (Dollar) LIT (Lithium) AAPL ADBE ALXN AMAT AMGN AMD AMZN AXP BA BABA BAC BIDU BLDP CAT CVX DE FB GOOG GS HD IBM INTU JPM M (Macy's) MSFT NFLX NKE NVDA PG QCOM TSLA TXN XOM V WMT CMG , LRCX, SQ TOWN New highs and Bullish MAXCPs http://tigersoft.com/MAXMLK/2-19/BULLISH.htm Bearish MAXCPs - http://tigersoft.com/MINMLK/2-19/BEARISH.htm |
Table 1 QUICKSILVER on DJI-30 STOCKS 2/19/2020 3 Bullish 5 Bearish, ITRS and IP21 >+.25 and <-.25 STOCKS CLOSE CHANGE PIVOT-PT 5-dma AROC CL-PWR CANDLE IP21 ITRS ------------------------------------------------------------------------------ ------------------------------------------------------------------------------ AAPL 323.62 4.62 327.2 62.1% Bullish BLUE .159 .158 Bullish --------------------------------------------------------------------- AXP 136.93 1.33 133.24 160% ------- BLUE-.054 .097 --------------------------------------------------------------------- BA 338.3 -.58 347.45 -89.3% Bullish BLUE .125 -.082 --------------------------------------------------------------------- CAT 136.86 .28 139.59 24.3% ------- BLUE-.121 -.09 --------------------------------------------------------------------- CSCO 46.29 -.3 49.93 -295.9% ------- RED .016 .003 --------------------------------------------------------------------- CVX 110.74 .5 112.04 -21.2% ------- BLUE-.025 -.108 --------------------------------------------------------------------- DIS 141.3 2.16 141.85 10.3% Bearish BLUE .024 -.102 --------------------------------------------------------------------- GS 237.33 4.12 238.65 18.4% Bearish BLUE-.153 .033 --------------------------------------------------------------------- HD 243.64 -.3 241.59 41.2% Bullish RED .082 .083 --------------------------------------------------------------------- IBM 150.86 -.24 155.31 -85.6% Bullish RED .208 .083 Bullish --------------------------------------------------------------------- INTC 67.11 .97 67.46 -22.3% Bullish BLUE .123 .136 Bullish --------------------------------------------------------------------- JNJ 148.94 -.2 151.09 -101.3% Bullish RED .043 .007 --------------------------------------------------------------------- JPM 137.49 1.85 138 -18.6% ------- BLUE-.032 -.027 --------------------------------------------------------------------- KO 59.77 .24 59.41 15.1% Bullish BLUE .07 .043 --------------------------------------------------------------------- MCD 215.63 -.52 217.46 -2.3% ------- RED -.053 .05 --------------------------------------------------------------------- MMM 159.34 .46 163.8 -96.5% ------- BLUE-.39 -.091 Bearish --------------------------------------------------------------------- MRK 82 -.46 83.25 -195.5% Bearish RED -.236 -.136 Bearish --------------------------------------------------------------------- MSFT 187.28 .05 184.71 76.7% Bullish RED .127 .189 --------------------------------------------------------------------- NKE 102.46 .46 103 119.2% ------- RED -.147 .009 --------------------------------------------------------------------- PFE 36.23 -.09 37.74 -250.6% Bearish ---- -.333 -.108 Bearish --------------------------------------------------------------------- PG 125.44 .57 123.45 51.3% Bullish BLUE-.148 -.054 --------------------------------------------------------------------- TRV 134.51 -1.37 135.71 -105% ------- RED -.155 -.059 --------------------------------------------------------------------- UNH 305.31 3.17 303.48 242.4% Bullish BLUE .1 .022 --------------------------------------------------------------------- UTX 150.68 -.6 155.18 -148.7% ------- RED .035 -.023 --------------------------------------------------------------------- V 213.31 2.11 207.44 225.2% Bullish BLUE .022 .112 --------------------------------------------------------------------- VZ 58.22 .31 58.23 -40.2% Bearish BLUE-.007 -.103 --------------------------------------------------------------------- WBA 52.07 .21 54.47 -86.6% Bearish BLUE-.203 -.179 Bearish --------------------------------------------------------------------- WMT 117.68 -1.95 115.85 97.2% ------- RED .102 -.069 --------------------------------------------------------------------- XOM 60.34 .46 61.27 -15.7% ------- BLUE-.206 -.178 Bearish |
Table 2 QUICKSILVER on ETFS - 02/19/20 ETF CLOSE CHANGE PIVOT-PT 5-dma AROC CL-PWR CANDLE IP21 ITRS --------------------------------------------------------------------------------------------- DIA 294.1 1.15 295.72 19.7% ------- BLUE-.013 ----- --------------------------------------------------------------------------------------------- SPY 338.34 1.61 337.42 45.7% Bullish BLUE .017 .024 --------------------------------------------------------------------------------------------- QQQ 236.98 2.25 234.27 106.2% Bullish BLUE .195 .108 --------------------------------------------------------------------------------------------- MDY 382.47 1.53 380.97 52.9% ------- BLUE .004 -.014 --------------------------------------------------------------------------------------------- IWM 168.4 .86 168.11 42.9% ------- BLUE-.016 -.014 --------------------------------------------------------------------------------------------- FAS 106.51 1.06 104.43 129.2% Bullish BLUE-.012 .148 --------------------------------------------------------------------------------------------- RETL 26.23 .21 26.21 244.6% ------- BLUE-.015 .018 --------------------------------------------------------------------------------------------- SOXL 325.98 23.5 316.93 359.7% ------- BLUE .154 .463 --------------------------------------------------------------------------------------------- TECL 333.8 10.56 324.78 293% Bullish BLUE .174 .572 --------------------------------------------------------------------------------------------- IBB 123.48 .96 122.94 33.1% ------- BLUE-.009 -.021 --------------------------------------------------------------------------------------------- GLD 151.79 .88 147.54 138.9% Bullish BLUE .281 .032 --------------------------------------------------------------------------------------------- OIH 11.21 .18 11.41 17.8% ------- BLUE-.13 -.114 --------------------------------------------------------------------------------------------- GASL 4.47 .31 4.49 197.6% Bearish BLUE-.219 -.307 --------------------------------------------------------------------------------------------- |
Table 3 Count of Stocks in Key Directories
20200219
-------------------------------
NEWHIGHS 459 Bullish
NEWLOWS 30
MAXCP 125
MINCP 75
TTTNH 38
TTTNL 56
FASTUP 101
FASTDOWN 72
CPCROSSA 64
CPCROSSD 81
BIGVOLUP 8
BIGVODN 13
ACCUMVER 10
HIGHIP21 19
HIUPPCT 88
REDSELL 95
AUGSELS7 16
TRAPDOOR 17
|
Table 4 RANKING OF KEY DIRECTORIES BASED PCT.OF STOCKS ABOVE 65-DMA
2/19/20
Bullish = 32
Bearish = 14
---------------------------------------------------------------------------------------
Directory Current day-1 day-2 day-3 day-4 day-5
----------------------------------------------------------------------------------------
BONDFUND .93 .94 .94 .93 .94 .95
SOLAR .882 .882 .941 .941 .941 .823
BIGBANKS .857 .857 .857 .857 .857 .857
NIFTY .851 .777 .888 .907 .907 .851
UTILITY .846 .871 .846 .871 .897 .897
NASD-100 .845 .804 .845 .835 .845 .814
HOSPITAL .772 .727 .681 .727 .59 .681
HOMEBLDG .764 .705 .823 .823 .823 .823
INDEXES .752 .758 .715 .779 .736 .763
SOFTWARE .716 .683 .666 .65 .65 .666
GREEN .714 .666 .714 .714 .761 .666
REIT .695 .751 .773 .751 .695 .702
GUNS .687 .812 .75 .687 .75 .687
SEMI .682 .579 .691 .757 .794 .71
GOLD .666 .625 .541 .541 .458 .583
SP-100 .655 .655 .7 .711 .733 .733
FIDSTKS .646 .629 .674 .679 .713 .691
SP500 .63 .617 .672 .682 .705 .67
ELECTRON .627 .562 .64 .686 .738 .653
INSURANC .615 .653 .73 .73 .73 .807
EDU .6 .6 .6 .6 .6 .6
RUS-1000 .593 .584 .622 .629 .638 .607
GAMING .59 .681 .681 .727 .818 .772
BIOTECH .578 .578 .554 .578 .617 .59
BEVERAGE .562 .562 .625 .625 .687 .687
HACKERS .55 .55 .5 .55 .5 .6
ETFS .543 .456 .543 .561 .701 .543
DJI-13 .538 .615 .769 .769 .692 .769
MILITARY .535 .535 .535 .571 .607 .571
COMPUTER .526 .578 .631 .736 .842 .631
RETAIL .52 .48 .6 .56 .64 .52
DOWJONES .517 .586 .655 .655 .586 .655
===========================================================================================
COMODITY .475 .5 .425 .45 .475 .425
CHINA .472 .436 .49 .49 .6 .436
FOOD .471 .528 .377 .433 .433 .415
TRANSP .45 .4 .4 .4 .4 .4
FINANCE .44 .428 .476 .523 .547 .523
CHEM .408 .408 .408 .367 .408 .367 AUTO .35 .3 .275 .275 .3 .25 INFRA .305 .277 .388 .416 .444 .388 JETS .3 .3 .3 .3 .3 .3 INDMATER .276 .25 .263 .276 .328 .302 REGBANKS .23 .192 .23 .384 .23 .269 OILGAS .216 .179 .194 .201 .194 .186 COAL 0 0 0 0 0 0 COPPER 0 0 .125 .25 .125 .125 |
=======================================================================
2/18/2020 With the operative Peerless signals being a Buy B9 - Buy B11, we
may choose to
be automatic buyers of DIA at the 28000 DJI support. But the key values for Peerless
weakened considerably. Unless breadth improves a lot on the next rally, Peerless
will|
almost cerainly give a Sell. So, the upside for the DJI is quite limted. In
this connection,
see
in Table 1 below that there are twice as many "bearish" DJI-30 stocks as
bullish.
So, I would avoid DIA. Perhaps buy VISA instead.
Please note that tonight another erroroneous Sell S15 appeared for 2/12/2020.
You can easily see that it was the result of a programming error by running
Peerless though 2/12/2020 only and then seeing no Sell S15. To do this truncate off
all the c:\peerless\DATA.txt back to but not
including 2/12. I have just fixed it. Go
to the Tiger Elite Page or the link I sent some of you last week. Open and Install
today's INSTPEER.exe and the S15 properly disappears.


As I have been saying for some time, the DJI and DIA are no longer the leaders.
Much stronger than the DJI, externally in terms of price change and internally looking
at their respective IP21s, are the NASDAQ-COMPQX, QQQ and TECL/
The strongest of tech stocks, like NVDA and BLDP (which broke out today)
joined TSLA in leading today's intra-day rally. Alternative energy Lithium led the
rally
among the commodities along with Gold, Silver and Palladium. Utilities continued
their
rebound, too. The tech and Utility recommendations should continue to do well.
Buy NVDA again.

Even if the DJI is faltering and even if we change the Peerless program that produces
S15s so that a new Advance-Decline is allowed on the day of this signal, we should
know that 1976-1977 and 2001-2002 show that the broad NYSE market and the
market's leaders will probably keep rising until the NYSE A/D uptrend is finally broken.
Remember, too, how the NASDAQ kept advancing in the year 2000 for two months
even as the DJI was plunging 17% after a Sell S9 in early January.
A decline in the DJI does not always bring broad market
weakness until the NYSE A/D Line uptrend is violated.
DJI and ADL: 1976-1977


|
Charts 2/18/2020 (Click on Underlined link.) 2020 PEERLESS DJI, Signals, Indicators Daily DJI Volume 10-DayUp/Down Vol Stoch-20 Inverted Traders Index Graph of Pct of All Stocks above 65-dma NASDAQ S&P OEX NYSE COMPQX DJI-15 DJI-20 DJI-30 DIA QQQ MDY IWM TNA Short-Term Rates SPY http://tigersoft.com/2020CST/SPY.GIF USO-CrudeOil DBO FAS GLD BBH IBB JETS JNUG KOL NUGT OIH OIL PALL RSX RETL SDS AGQ SLV SOXL TECL TLT TMF TNA UGA (gasoline) and China: YINN CHAU Commodities: CANE CORN DBC JJC, NIB, CHOC CORN, CUT (paper) MOO, SOYB WEAT UUP (Dollar) LIT (Lithium) AAPL ADBE ALXN AMAT AMGN AMD AMZN AXP BA BABA BAC BIDU BLDP CAT CVX DE FB GOOG GS HD IBM INTU JPM M (Macy's) MSFT NFLX NKE NVDA PG QCOM TSLA TXN XOM V WMT CMG , LRCX, SQ TOWN New highs and Bullish MAXCPs http://tigersoft.com/MAXMLK/2-18/BULLISH.htm Bearish MAXCPs - http://tigersoft.com/MINMLK/2-18/BEARISH.htm |
Table 1 QUICKSILVER on DJI-30 STOCKS 2/13/2020 3 Bullish 6 Bearish, ITRS and IP21 >+.25 and <-.25 STOCKS CLOSE CHANGE PIVOT-PT 5-dma AROC CL-PWR CANDLE IP21 ITRS ------------------------------------------------------------------------------ ------------------------------------------------------------------------------ AAPL 319 -5.95 319.61 -39.4% Bullish BLUE .187 .161 Bullish --------------------------------------------------------------------- AXP 135.6 -.27 132.63 125.7% ------- RED -.039 .092 --------------------------------------------------------------------- BA 338.88 -1.61 344.42 -84.2% Bullish BLUE .076 -.086 --------------------------------------------------------------------- CAT 136.58 -1.41 136.19 82.1% ------- RED -.111 -.083 --------------------------------------------------------------------- CSCO 46.59 -.38 49.13 -235.3% ------- RED -.007 .004 --------------------------------------------------------------------- CVX 110.24 .16 111.21 20.3% ------- BLUE-.092 -.115 --------------------------------------------------------------------- DIS 139.14 -.4 141.01 -122.2% Bearish BLUE-.02 -.119 --------------------------------------------------------------------- GS 233.21 -3.87 236.46 -87.3% Bearish RED -.17 .023 --------------------------------------------------------------------- HD 243.94 -1.09 241.64 68.7% Bullish RED .156 .082 --------------------------------------------------------------------- IBM 151.1 .4 153.48 -108.4% Bullish BLUE .249 .087 Bullish --------------------------------------------------------------------- INTC 66.14 -1.13 67.41 -18.6% Bullish RED .098 .123 --------------------------------------------------------------------- JNJ 149.14 -.99 151.99 -90% Bullish RED .103 .013 --------------------------------------------------------------------- JPM 135.64 -1.82 138 -76.2% ------- RED .026 -.032 --------------------------------------------------------------------- KO 59.53 -.42 59.59 -18.4% Bullish RED .052 .039 --------------------------------------------------------------------- MCD 216.15 -.94 215.73 68% ------- BLUE-.026 .055 --------------------------------------------------------------------- MMM 158.88 -2.13 162.45 -39.3% Bearish RED -.385 -.107 Bearish --------------------------------------------------------------------- MRK 82.46 -.19 85.25 -191% Bearish RED -.245 -.127 Bearish --------------------------------------------------------------------- MSFT 187.23 1.88 184.44 -39.6% Bullish BLUE .156 .192 Bullish --------------------------------------------------------------------- NKE 102 -1.54 100.02 97.1% ------- RED -.051 .031 --------------------------------------------------------------------- PFE 36.32 -.19 38.09 -199.1% Bearish RED -.324 -.105 Bearish --------------------------------------------------------------------- PG 124.87 -1.27 124.16 -52% ------- RED -.141 -.055 Bearish --------------------------------------------------------------------- TRV 135.88 -1.88 137.38 -12.4% ------- RED -.087 -.052 --------------------------------------------------------------------- UNH 302.14 3.36 290.79 254.8% Bullish BLUE .091 .024 --------------------------------------------------------------------- UTX 151.28 -2.18 155.25 -170.3% Bearish RED .038 -.011 --------------------------------------------------------------------- V 211.2 .91 203.94 125.8% Bullish BLUE .078 .112 --------------------------------------------------------------------- VZ 57.91 -.6 58.69 -197.9% Bearish RED .04 -.101 --------------------------------------------------------------------- WBA 51.86 -.99 52.99 -145.9% Bearish RED -.261 -.177 Bearish --------------------------------------------------------------------- WMT 119.63 1.74 115.4 188.2% Bullish BLUE .107 -.049 --------------------------------------------------------------------- XOM 59.88 -.77 60.53 -6.6% Bearish RED -.226 -.185 Bearish |
QUICKSILVER on ETFS - 02/18/20 ETF CLOSE CHANGE PIVOT-PT 5-dma AROC CL-PWR CANDLE IP21 ITRS --------------------------------------------------------------------------------------------- DIA 292.95 -1.59 292.94 0% ------- RED -.008 ---- --------------------------------------------------------------------------------------------- SPY 336.73 -.87 335.26 30.5% Bullish BLUE .061 .024 --------------------------------------------------------------------------------------------- QQQ 234.73 .09 232.01 59.1% Bullish BLUE .211 .102 Bullish --------------------------------------------------------------------------------------------- MDY 380.94 -1.14 378.44 71.6% ------- RED -.002 -.014 --------------------------------------------------------------------------------------------- IWM 167.54 -.36 166.96 51.7% ------- -----.048 -.015 --------------------------------------------------------------------------------------------- FAS 105.45 -1.59 103.79 132.3% Bullish RED .031 .153 --------------------------------------------------------------------------------------------- RETL 26.02 .34 24.97 328.4% ------- BLUE-.046 .001 --------------------------------------------------------------------------------------------- SOXL 302.48 -13.11 303.59 261% ------- BLUE .154 .373 Bullish --------------------------------------------------------------------------------------------- TECL 323.24 -3.28 314.91 81.1% Bullish BLUE .196 .539 Bullish --------------------------------------------------------------------------------------------- IBB 122.52 .05 122.67 -8.6% ------- BLUE-.027 -.04 --------------------------------------------------------------------------------------------- GLD 150.91 1.91 147.66 92.5% Bullish BLUE .21 .029 --------------------------------------------------------------------------------------------- OIH 11.03 -.22 11.17 26.8% ------- RED -.197 -.134 Bearish --------------------------------------------------------------------------------------------- GASL 4.16 -.01 4.3 -81.1% Bearish BLUE-.279 -.378 Bearish --------------------------------------------------------------------------------------------- |
Table 3 Count of Stocks in Key Directories
20200218
-------------------------------
NEWHIGHS 345 Bullish
NEWLOWS 34
MAXCP 137
MINCP 77
TTTNH 36
TTTNL 60
FASTUP 83
FASTDOWN 69
CPCROSSA 43
CPCROSSD 91
BIGVOLUP 2
BIGVODN 4
ACCUMVER 14
HIGHIP21 18
HIUPPCT 87
REDSELL 96
AUGSELS7 20
TRAPDOOR 17
|
RANKING OF KEY DIRECTORIES BASED PCT.OF STOCKS ABOVE 65-DMA
2/18/20
Bullish = 31
Bearish = 14
---------------------------------------------------------------------------------------
Directory Current day-1 day-2 day-3 day-4 day-5
----------------------------------------------------------------------------------------
BONDFUND .94 .94 .93 .94 .95 .96
SOLAR .882 .941 .941 .941 .823 .764
UTILITY .871 .846 .871 .897 .897 .871
BIGBANKS .857 .857 .857 .857 .857 .857
GUNS .812 .75 .687 .75 .687 .625
NASD-100 .804 .855 .845 .845 .814 .773
NIFTY .777 .888 .907 .907 .851 .796
INDEXES .752 .715 .779 .736 .763 .747
REIT .751 .773 .751 .695 .702 .709
HOSPITAL .727 .681 .727 .59 .681 .636
HOMEBLDG .705 .823 .823 .823 .823 .764
SOFTWARE .683 .683 .65 .65 .683 .666
GAMING .681 .681 .727 .818 .772 .681
GREEN .666 .714 .714 .761 .666 .619
SP-100 .655 .7 .711 .733 .733 .7
INSURANC .653 .73 .73 .73 .807 .73
FIDSTKS .629 .674 .679 .713 .691 .662
GOLD .625 .541 .541 .458 .583 .52
SP500 .617 .674 .682 .705 .67 .634
DJI-13 .615 .769 .769 .692 .769 .769
EDU .6 .6 .6 .6 .6 .6
RUS-1000 .584 .623 .629 .638 .607 .58
SEMI .579 .691 .757 .794 .71 .607
COMPUTER .578 .631 .736 .842 .631 .631
BIOTECH .575 .551 .575 .617 .605 .581
DOWJONES .566 .633 .633 .566 .633 .666
BEVERAGE .562 .625 .625 .687 .75 .625
ELECTRON .562 .64 .686 .738 .66 .575
HACKERS .55 .55 .55 .5 .6 .65
MILITARY .535 .535 .571 .607 .571 .535
FOOD .528 .377 .433 .433 .415 .43
===========================================================================================
COMODITY .5 .425 .45 .475 .425 .425
===========================================================================================
RETAIL .48 .6 .56 .64 .5 .42
ETFS .456 .543 .561 .701 .526 .368
CHINA .436 .49 .49 .6 .436 .4
FINANCE .428 .476 .523 .547 .523 .476
CHEM .408 .408 .367 .408 .367 .326
TRANSP .4 .4 .4 .4 .4 .35
AUTO .3 .275 .275 .3 .25 .225
JETS .3 .3 .3 .3 .3 .2
INFRA .277 .388 .416 .444 .388 .361
INDMATER .25 .263 .276 .328 .302 .236
REGBANKS .192 .23 .384 .23 .269 .23
OILGAS .179 .194 .201 .194 .186 .171
COAL 0 0 0 0 0 0
COPPER 0 .125 .25 .125 .125 .125
|
====================================================================
2/14/2020 Apple's warns that the supply chain for its I-Phones is being disrupted by
the Coronavirus outbreak in China. An AAPL decline will hurt the DJI this
coming week. The DJI should find support at 28000 where may want to
consider buying DIA again.
Peerless remains on its B9-B11. The P-Indicator is still too positive to
give a Sell S9 on any rally. With the IP21 (A.I.) still positive, we also can
not get a Sell S12. The V-Indicator being negative does not bring
a Sell S9-V until late May and the rest of the Summer. But we could get
a Sell S15 if the A/D Line fails to make a new 12-month high on a 150 point
rally. As I showed Thursday night, I believe all the necessary conditions would
be present for that if breadth is negative or nearly so next week and there
is a 0.55 DJI rally. A Sell S15 would most directly apply to the DJI and DIA.
If the S15 appears, we will probably recommend shorting DIA or the weakest stocks
in the DJI-30, as shown by Table 1 below.
But the QQQ, IWM and the very strong stocks shown in MAXCPs tonight,
namely HD, V, SO and NVDA should just be held. Watch to see if some of
potential breakouts among the MAXCPs, like BLDP, actually do breakout.
The NASDAQ continues to outperform the DJI by 7.3% over the last 50
trading days. Its IP21 is a still impressive +.25. The DJI's is only +.054.
In Table1 and Table 2, we sum up the IP21 and ITRS and consider a total
of +.25 as bullish and a -.25 or lower to be bearish. Of course, we also note
the price pattern, OBV and the current signals.
Presidential Election Year Seasonality is mildly bullish
looking a week out. The
DJI has rallied 76.9% of the time. But then over the next two weeks it is only
up 53.8% of the time. Thereafter, a week uptrend is indicated, the extent that
the DJI is up 84.6% over the next two months.


When we run the Power Ranker against the Leveraged ETFs, we discover
that TECL, FAS and TQQQ are the highest ranked and most bullish. The Power
Ranker factors in four factors: current IP21, AI/200, ITRS and OBV. On the
assumption, that traders and short-term performance and relative-strength based
Funds tend to focus on fewer and fewer of the still-strong stocks and ETFs late in an
advance, I would think that TECL and TQQQ should keep rising nicely now until
their 5-day moving averages' "pivot-points" are closed below even if Peerless
were
give a Sell..


|
Charts 2/14/2020 (Click on Underlined link.) 2020 PEERLESS DJI, Signals, Indicators Daily DJI Volume 10-DayUp/Down Vol Stoch-20 Inverted Traders Index Graph of Pct of All Stocks above 65-dma NASDAQ S&P OEX NYSE COMPQX DJI-15 DJI-20 DJI-30 DIA QQQ MDY IWM TNA Short-Term Rates SPY http://tigersoft.com/2020CST/SPY.GIF USO-CrudeOil DBO FAS GLD BBH IBB JETS JNUG KOL NUGT OIH OIL PALL RSX RETL SDS AGQ SLV SOXL TECL TLT TMF TNA UGA (gasoline) and China: YINN CHAU Commodities: CANE CORN DBC JJC, NIB, CHOC CORN, CUT (paper) MOO, SOYB WEAT UUP (Dollar) LIT (Lithium) AAPL ADBE ALXN AMAT AMGN AMD AMZN AXP BA BABA BAC BIDU BLDP CAT CVX DE FB GOOG GS HD IBM INTU JPM M (Macy's) MSFT NFLX NKE NVDA PG QCOM TSLA TXN XOM V WMT CMG , LRCX, SQ TOWN New highs and Bullish MAXCPs http://tigersoft.com/MAXMLK/2-14/BULLISH.htm Bearish MAXCPs - http://tigersoft.com/MINMLK/2-14/BEARISH.htm |
Table 1 QUICKSILVER on DJI-30 STOCKS 2/14/2020 4 Bullish 6 Bearish, ITRS and IP21 >+.25 and <-.25 STOCKS CLOSE CHANGE PIVOT-PT 5-dma AROC CL-PWR CANDLE IP21 ITRS ------------------------------------------------------------------------------ ------------------------------------------------------------------------------ AAPL 324.95 .08 321.55 76.2% Bullish BLUE .179 .183 --------------------------------------------------------------------- AXP 135.87 1.41 132.24 152.4% ------- BLUE-.017 .096 --------------------------------------------------------------------- BA 340.49 -2.33 344.67 54.5% Bullish RED .08 -.102 --------------------------------------------------------------------- CAT 137.99 -1.73 134.32 169.1% ------- RED -.063 -.084 --------------------------------------------------------------------- CSCO 46.97 -.35 48.87 -102.8% ------- RED .031 -.008 --------------------------------------------------------------------- CVX 110.08 -1.58 109.79 51.5% ------- RED -.12 -.119 --------------------------------------------------------------------- DIS 139.54 -1.36 142.59 -52.3% Bearish RED -.02 -.13 --------------------------------------------------------------------- GS 237.08 -1.27 237.36 -19.3% Bearish RED -.085 .048 --------------------------------------------------------------------- HD 245.03 2.67 240.61 160.6% Bullish BLUE .231 .076 Bullish --------------------------------------------------------------------- IBM 150.7 -3.61 154.43 -87.9% Bullish RED .251 .072 Bullish --------------------------------------------------------------------- INTC 67.27 -.17 66.39 93.4% Bullish RED .127 .131 Bullish --------------------------------------------------------------------- JNJ 150.13 .04 151.86 -58.1% Bullish RED .165 .025 --------------------------------------------------------------------- JPM 137.46 -.42 137.74 10.5% Bullish RED .039 -.01 --------------------------------------------------------------------- KO 59.95 .34 59.75 63.9% Bullish BLUE .09 .045 --------------------------------------------------------------------- MCD 217.09 -.33 213.21 127.4% ------- RED .017 .055 --------------------------------------------------------------------- MMM 161.01 1.25 160.15 28.8% Bearish BLUE-.355 -.094 Bearish --------------------------------------------------------------------- MRK 82.65 .68 85.66 -144.2% Bearish BLUE-.249 -.123 Bearish --------------------------------------------------------------------- MSFT 185.35 1.64 188.7 39.4% Bullish BLUE .159 .172 Bullish --------------------------------------------------------------------- NKE 103.54 .17 100.02 202.6% ------- --- -.006 .051 --------------------------------------------------------------------- PFE 36.51 -.42 37.81 -204.1% Bearish RED -.295 -.11 Bearish --------------------------------------------------------------------- PG 126.14 1.18 126.17 2.4% Bullish BLUE -.111 -.043 Bearish --------------------------------------------------------------------- TRV 137.76 .88 136.22 64.1% Bullish BLUE-.017 -.046 --------------------------------------------------------------------- UNH 298.78 -3.42 287.03 162.3% Bullish RED .114 .008 --------------------------------------------------------------------- UTX 153.46 .4 156.55 -108.4% Bearish BLUE .052 -.001 --------------------------------------------------------------------- V 210.29 2.89 205.99 183.7% Bullish BLUE .068 .087 --------------------------------------------------------------------- VZ 58.51 -.14 60.24 -120.9% Bearish RED .092 -.096 --------------------------------------------------------------------- WBA 52.85 -.72 53.42 -36.4% Bearish RED -.225 -.173 Bearish --------------------------------------------------------------------- WMT 117.89 .45 115.25 62% Bullish BLUE .081 -.076 --------------------------------------------------------------------- XOM 60.65 -.28 59.96 -67.4% Bearish RED -.256 -.176 Bearish |
QUICKSILVER on ETFS - 02/14/20 ETF CLOSE CHANGE PIVOT-PT 5-dma AROC CL-PWR CANDLE IP21 ITRS --------------------------------------------------------------------------------------------- DIA 294.54 -.28 292.95 57.1% ------- RED .026 ----- --------------------------------------------------------------------------------------------- SPY 337.6 .54 334.68 80.5% Bullish BLUE .093 .022 --------------------------------------------------------------------------------------------- QQQ 234.64 .67 231.97 117.1% Bullish BLUE .222 .096 Bullish --------------------------------------------------------------------------------------------- MDY 382.08 -.18 375.5 113.9% ------- RED .049 -.014 --------------------------------------------------------------------------------------------- IWM 167.9 -.65 165.81 90.5% ------- RED -.031 -.018 --------------------------------------------------------------------------------------------- FAS 107.04 1.44 102.68 292.3% Bullish BLUE .096 .181 Bullish --------------------------------------------------------------------------------------------- RETL 25.68 -.24 24.35 312.6% Bearish RED -.03 -.001 --------------------------------------------------------------------------------------------- SOXL 315.59 -2.04 286.4 694% ------- RED .161 .493 Bullish --------------------------------------------------------------------------------------------- TECL 326.52 4.15 318.03 323.1% Bullish BLUE .199 .561 Bullish --------------------------------------------------------------------------------------------- IBB 122.47 .52 122.73 38.4% ------- BLUE-.046 -.041 --------------------------------------------------------------------------------------------- GLD 149 .62 148.17 40.9% Bullish BLUE .181 .002 --------------------------------------------------------------------------------------------- OIH 11.25 -.01 10.97 49.2% Bearish RED -.233 -.086 Bearish --------------------------------------------------------------------------------------------- GASL 4.17 -.22 4.23 -566.1% Bearish RED -.355 -.312 Bearish --------------------------------------------------------------------------------------------- |
Table 3 Count of Stocks in Key Directories
20200214
-------------------------------
NEWHIGHS 432
NEWLOWS 35
MAXCP 140
MINCP 78
TTTNH 22
TTTNL 57
FASTUP 75
FASTDOWN 72
CPCROSSA 49
CPCROSSD 114
BIGVOLUP 1
BIGVODN 7
ACCUMVER 14
HIGHIP21 18
HIUPPCT 90
REDSELL 92
AUGSELS7 28
TRAPDOOR 14
|
RANKING OF KEY DIRECTORIES BASED PCT.OF STOCKS ABOVE 65-DMA
Bullish = 32
Bearish = 14
2/14/20
---------------------------------------------------------------------------------------
Directory Current day-1 day-2 day-3 day-4 day-5
----------------------------------------------------------------------------------------
SOLAR .941 .941 .941 .823 .764 .823
^^^^
BONDFUND .94 .93 .94 .95 .96 .94
NIFTY .888 .907 .907 .851 .796 .74
BIGBANKS .857 .857 .857 .857 .857 .857
^^^^
NASD-100 .855 .855 .855 .814 .773 .752
^^^^
UTILITY .846 .871 .897 .897 .871 .871
^^^^
HOMEBLDG .823 .823 .823 .823 .764 .764
^^^^
REIT .773 .751 .695 .702 .709 .659
DJI-13 .769 .769 .692 .769 .769 .692
GUNS .75 .687 .75 .687 .625 .562
INSURANC .73 .73 .73 .807 .73 .73
INDEXES .715 .779 .736 .763 .747 .725
GREEN .714 .714 .761 .666 .619 .571
SP-100 .7 .711 .733 .733 .7 .666
SEMI .691 .757 .794 .71 .607 .598
SOFTWARE .683 .666 .65 .683 .65 .633
GAMING .681 .727 .818 .772 .681 .727
HOSPITAL .681 .727 .59 .681 .636 .636
FIDSTKS .674 .679 .713 .691 .662 .657
SP500 .674 .684 .705 .67 .636 .632
DOWJONES .655 .655 .586 .655 .689 .62
ELECTRON .64 .686 .738 .66 .575 .581
COMPUTER .631 .736 .842 .631 .631 .526
BEVERAGE .625 .625 .687 .75 .625 .625
RUS-1000 .623 .63 .638 .607 .58 .574
EDU .6 .6 .6 .6 .6 .6
RETAIL .588 .549 .627 .49 .411 .47
HACKERS .55 .6 .5 .6 .65 .65
BIOTECH .548 .572 .614 .605 .59 .56
ETFS .543 .561 .701 .526 .403 .368
GOLD .541 .541 .458 .583 .5 .458
MILITARY .535 .571 .607 .571 .535 .464
==========================================================================================
CHINA .49 .49 .6 .436 .4 .418
FINANCE .476 .523 .547 .523 .476 .488
COMODITY .425 .45 .475 .425 .425 .425
CHEM .408 .367 .408 .367 .326 .306
TRANSP .4 .4 .4 .4 .35 .45
INFRA .388 .416 .444 .388 .361 .361 FOOD .377 .433 .433 .415 .433 .433 JETS .3 .3 .3 .3 .2 .2 AUTO .275 .275 .3 .25 .225 .25 INDMATER .263 .276 .328 .302 .223 .21 REGBANKS .23 .384 .23 .269 .23 .23 OILGAS .194 .201 .194 .186 .171 .186 COPPER .125 .25 .125 .125 .125 0 COAL 0 0 0 0 0 0 |
====================================================================
2/13/2020 I take the rising A/D Line, the very low interest rates, the strong
economy and
the low rate of Inflation (with some notable exceptions like rents) to be quite
bullish. Bonds and Utilities are the conservative investors' favorites now.
Our charts and data (especially Table 4) show that Alternative Energy stocks
are the speculative leaders along with QQQ and TECL (Table 2).
TECL,
HD and SO are recommended to buy. I think we should remain bullish when
there are many more NYSE new highs and Bullish MAXCPs than NYSE
new lows and Bearish MINCPS. The DJI's seasonality may not be great now
and the V-Indicator is clearly negative, but QQQ, TECL, SOXL and the
NASDAQ are much stronger. Their respective ITRS values are +.093,
+.507, +.441 and +.074. This shows how much more they are up over
the last 50-trading days than the DJI.

The active Peerless Signals remain the B9-B11 from January.
Typically,
they gain more than 11% at the time of the next Peerless Sell. By error,
Peerless gave a Sell S15 today for yesterday, 2/12/2012. This cannot happen.
The mistake arose from the program ascribing a failure by the A/D Line to
make a new high today to yesterday. No past Sell S15 was found to be affected
by this error. But I have posted the corrected version on our ESP Page and if you
want the correction, email me if you do not have an ESP subscription and we will "
work something out depending how out-of-date your Peerless is.
The update also
includes all the new work on the Cumulative Inverted MKDS.

We are close to a Peerless Sell
S15. Below see the necessary conditions that
will have to be met for us to get a Sell S15 in this Presidential Election Year.
1.) The 21-day AROC (its Annualized daily rate of change)
must not be above +.60
2) It must not be later than May in the year.
3) The DJI must be between in 1.65% and 2.9% upper bands.
4) Since 1980, the P-I must not be above 180.
5) The IP21 must not be above .094.
6) The OPMA must not be above +.24
7) The V-I must below 0.
8) The NYSE A/D Line must not be making a new yearly high.
Our Key Values now:
![]()
To get a new and recersing Sell S15 tomorrow the DJI will need to:
1) rally +.0036%,
2) the P-I will need to not rise from its current +125 to more than 180.
3) the IP21 must not rise by more than 0.38.
4) the OPct must not rise by more than .122
5) the V-I must not turn positive
6) the NYSE A/D Line must not jump to a new high.
So, what this all means is that the DJI may get a Sell S15 if the
DJI rallies Friday
by more than 150 points, approximately, and the Daily NYSE A/D Line does not rise
by more than +45. Any good DJI rally on Friday with negative
breadth should
bring a Sell S15. But that may not have much affect on the
leaders and QQQ,
if we consider how the markets behaved in the first few months of 2000.
Moreover, breakouts tend to produce their own momentum whether or not
they show a Buy B10. We see this in the paper losses that occurred in half
of the S15s in a Presidential Election Year. It is significant that only two of
of these S15s occurred in January and February and most also occurred
with a Sell S9 at the same time. The P-I is too positive now for a Sell S9.
Date of S15 DJI
Gain Max. Paper loss
------------------------------------------------------
19360303 S15 156.2 .042
161.9 -.0364 4/6
19360401 S15 158.9 .058
161.9 -.0188 4/6
19720406 S15 959.44 .025
968.92 -.0098 4/18
19760421 S15 1011.02 .052 none
0
19800213 S15 903.84 .14
none 0
20000107 S15 11522.56 .131 11722.9 -.0173 1/14
20080501 S15 13040.00 .127
none 0
20120501 S15 13279.32 .089
perfect 0
|
Charts 2/13/2020 (Click on Underlined link.) 2020 PEERLESS DJI, Signals, Indicators Daily DJI Volume 10-DayUp/Down Vol Stoch-20 Inverted Traders Index Graph of Pct of All Stocks above 65-dma NASDAQ S&P OEX NYSE COMPQX DJI-15 DJI-20 DJI-30 DIA QQQ MDY IWM TNA Short-Term Rates SPY http://tigersoft.com/2020CST/SPY.GIF USO-CrudeOil DBO FAS GLD BBH IBB JETS JNUG KOL NUGT OIH OIL PALL RSX RETL SDS AGQ SLV SOXL TECL TLT TMF TNA UGA (gasoline) and China: YINN CHAU Commodities: CANE CORN DBC JJC, NIB, CHOC CORN, CUT (paper) MOO, SOYB WEAT UUP (Dollar) LIT (Lithium) AAPL ADBE ALXN AMAT AMGN AMD AMZN AXP BA BABA BAC BIDU BLDP CAT CVX DE FB GOOG GS HD IBM INTU JPM M (Macy's) MSFT NFLX NKE NVDA PG QCOM TSLA TXN XOM V WMT CMG , LRCX, SQ TOWN New highs and Bullish MAXCPs http://tigersoft.com/MAXMLK/2-13/BULLISH.htm Bearish MAXCPs - http://tigersoft.com/MINMLK/2-13/BEARISH.htm |
Table 1 QUICKSILVER on DJI-30 STOCKS 2/13/2020 4 Bullish 6 Bearish, ITRS and IP21 >+.25 and <-.25 STOCKS CLOSE CHANGE PIVOT-PT 5-dma AROC CL-PWR CANDLE IP21 ITRS ------------------------------------------------------------------------------ ------------------------------------------------------------------------------ AAPL 324.87 -2.33 320.03 -5.3% Bullish BLUE .148 .17 Bullish --------------------------------------------------------------------- AXP 134.46 1.22 131.82 45.6% ------- BLUE .014 .087 --------------------------------------------------------------------- BA 342.82 -4.63 336.75 20.3% Bullish RED .061 -.095 --------------------------------------------------------------------- CAT 139.72 .13 133.37 90.7% Bearish RED -.074 -.082 --------------------------------------------------------------------- CSCO 47.32 -2.61 47.97 -140% ------- BLUE .001 -.001 --------------------------------------------------------------------- CVX 111.66 -.38 108.94 98.4% ------- BLUE-.099 -.104 --------------------------------------------------------------------- DIS 140.9 -.95 141.02 -63.5% Bearish RED -.012 -.124 --------------------------------------------------------------------- GS 238.35 -.3 238 -72.8% Bearish BLUE-.054 .035 --------------------------------------------------------------------- HD 242.36 .77 237.3 73.3% Bullish BLUE .23 .054 Bullish --------------------------------------------------------------------- IBM 154.31 -1 153.41 -79.2% Bullish RED .274 .101 Bullish --------------------------------------------------------------------- INTC 67.44 -.02 66.02 26.2% Bullish BLUE .109 .11 --------------------------------------------------------------------- JNJ 150.09 -1 151.89 -113.1% Bullish RED .165 .033 --------------------------------------------------------------------- JPM 137.88 -.12 137.17 9.8% Bullish BLUE .001 -.011 --------------------------------------------------------------------- KO 59.61 .2 59.19 52.2% Bullish BLUE .098 .049 --------------------------------------------------------------------- MCD 217.42 -.04 211.61 106.2% -------BLUE .048 .054 --------------------------------------------------------------------- MMM 159.76 -4.04 160.08 -96.7% Bearish RED -.398 -.11 Bearish --------------------------------------------------------------------- MRK 81.97 -1.28 85.08 -218.3% Bearish RED -.239 -.118 Bearish --------------------------------------------------------------------- MSFT 183.71 -1 183.89 2.2% Bullish BLUE .192 .169 Bullish --------------------------------------------------------------------- NKE 103.37 .37 99.44 154.2% ------- BLUE-.039 .045 --------------------------------------------------------------------- PFE 36.93 -.81 38.05 -175% Bearish RED -.249 -.095 Bearish --------------------------------------------------------------------- PG 124.96 1.51 126.08 -86.9% Bullish BLUE -.128 -.041 Bearish --------------------------------------------------------------------- TRV 136.88 1.17 136.01 13.9% Bullish BLUE -.023 -.048 --------------------------------------------------------------------- UNH 302.2 -1.28 289.22 166.4% Bullish BLUE .152 .021 --------------------------------------------------------------------- UTX 153.06 -2.12 156.83 -100.6% Bearish RED .038 -.004 --------------------------------------------------------------------- V 207.4 -.04 202.74 106.5% Bullish BLUE .09 .081 --------------------------------------------------------------------- VZ 58.65 .42 59.94 -66.6% Bearish BLUE .091 -.082 --------------------------------------------------------------------- WBA 53.57 -.9 53.24 7.5% Bearish RED -.183 -.156 Bearish --------------------------------------------------------------------- WMT 117.44 1.59 116.45 48.8% Bullish BLUE .086 -.075 --------------------------------------------------------------------- DOW 60.93 -.34 61.47 -77.8% Bearish RED -.263 -.169 Bearish
|
Table 2 QUICKSILVER on ETFS - 02/12/20 ETF CLOSE CHANGE PIVOT-PT 5-dma AROC CL-PWR CANDLE IP21 ITRS --------------------------------------------------------------------------------------------- DIA 294.82 -.9 291.19 18.4% Bullish BLUE .024 --- --------------------------------------------------------------------------------------------- SPY 337.06 -.36 332.2 46% Bullish BLUE .06 .022 --------------------------------------------------------------------------------------------- QQQ 233.97 -.3 229.2 81.6% Bullish BLUE .189 .093 --------------------------------------------------------------------------------------------- MDY 382.26 1.29 373.47 70.5% ------- BLUE .042 -.01 --------------------------------------------------------------------------------------------- IWM 168.55 .44 164.88 48.6% ------- BLUE-.006 -.008 --------------------------------------------------------------------------------------------- FAS 105.6 1.17 100.99 176.6% Bullish BLUE .076 .149 --------------------------------------------------------------------------------------------- RETL 25.92 -.29 24.11 120% Bearish -----.045 -.03 --------------------------------------------------------------------------------------------- SOXL 317.63 .7 273.99 386.9% ------- BLUE .155 .441 Bullish --------------------------------------------------------------------------------------------- TECL 322.37 -2.41 306.02 127.5% Bullish BLUE .178 .507 Bullish --------------------------------------------------------------------------------------------- IBB 121.95 -.99 121.53 -21.2% ------- RED -.067 -.03 --------------------------------------------------------------------------------------------- GLD 148.38 .84 147.79 33.2% Bullish BLUE .187 .017 --------------------------------------------------------------------------------------------- GASL 4.39 -.1 4.67 -629.1% Bearish RED -.315 -.295 Bearish --------------------------------------------------------------------------------------------- |
TABLE 3 Count of Stocks in Key Directories
20200213
-------------------------------
NEWHIGHS 391 Bullish
NEWLOWS 17
MAXCP 151
MINCP 50
TTTNH 33
TTTNL 26
FASTUP 60
FASTDOWN 71
CPCROSSA 105
CPCROSSD 54
BIGVOLUP 2
BIGVODN 11
ACCUMVER 11
HIGHIP21 21
HIUPPCT 89
REDSELL 87
AUGSELS7 24
TRAPDOOR 14
|
Table 4 RANKING OF KEY DIRECTORIES BASED PCT.OF STOCKS ABOVE 65-DMA
2/13/20
Bullish = 33
Bearish = 13
---------------------------------------------------------------------------------------
Directory Current day-1 day-2 day-3 day-4 day-5
----------------------------------------------------------------------------------------
SOLAR .941 .941 .823 .764 .823 .764
BONDFUND .93 .94 .95 .96 .94 .92
NIFTY .907 .907 .851 .796 .759 .814
UTILITY .871 .897 .897 .871 .871 .871
BIGBANKS .857 .857 .857 .857 .857 .857
NASD-100 .855 .865 .824 .773 .752 .824
HOMEBLDG .823 .823 .823 .764 .764 .823
INDEXES .779 .736 .763 .747 .725 .736
DJI-13 .769 .692 .769 .769 .692 .769
SEMI .757 .794 .71 .607 .607 .691
REIT .751 .695 .702 .709 .659 .702
COMPUTER .736 .842 .631 .631 .578 .684
INSURANC .73 .73 .807 .73 .73 .807
GAMING .727 .818 .772 .681 .727 .818
HOSPITAL .727 .59 .681 .636 .636 .59
GREEN .714 .761 .666 .619 .571 .666
SP-100 .711 .733 .733 .7 .666 .677
GUNS .687 .75 .687 .625 .562 .625
ELECTRON .686 .738 .66 .575 .594 .66
SP500 .684 .707 .67 .636 .628 .68
FIDSTKS .679 .713 .691 .662 .657 .691
SOFTWARE .666 .666 .683 .65 .633 .683
DOWJONES .655 .586 .655 .689 .62 .655
RUS-1000 .63 .64 .607 .58 .571 .615
BEVERAGE .625 .687 .75 .625 .625 .625
EDU .6 .6 .6 .6 .6 .6
HACKERS .6 .55 .6 .65 .65 .65
MILITARY .571 .607 .571 .535 .464 .535
BIOTECH .569 .611 .602 .59 .563 .626
ETFS .561 .701 .526 .403 .368 .508
RETAIL .549 .627 .49 .411 .45 .568
GOLD .541 .458 .583 .5 .458 .541
FINANCE .529 .552 .529 .482 .494 .564
==========================================================================================
CHINA .49 .6 .436 .4 .418 .418
COMODITY .45 .475 .425 .425 .425 .425
FOOD .433 .433 .415 .433 .433 .433
INFRA .416 .444 .388 .361 .361 .444
TRANSP .4 .4 .4 .35 .45 .4
REGBANKS .384 .23 .269 .23 .23 .269
CHEM .367 .408 .367 .326 .306 .367
JETS .3 .3 .3 .2 .2 .2
INDMATER .276 .328 .302 .223 .21 .328
AUTO .275 .3 .25 .225 .25 .25
COPPER .25 .125 .125 .125 0 .125
OILGAS .201 .194 .186 .171 .186 .231
COAL 0 0 0 0 0 0
N=13
|
====================================================================
2/12/2020 I continue to suggest waiting for a pullback to 28900-29000 to buy DIA.
Just hold the
existing position in QQQ.
The DJI gapped up to the 29500-29600 resistance. It made a nominal new. These
can set up declines when the next day is sharply down, as it is now as I write this,
about 200. Again, too much of the DJIA gain, came about because of too few big
stocks it.
UNH rose 13+ on hopes that Socialist Sanders will not be able to command enough
votes if the moderate Democrats who happily take big corporate campaign contributions
coalesce. Defensive stocks, Utilities, REITS and Bonds picked up on Fed Chairman's
Powell's statement that Congress will need to provide the next boost,
using fiscal (reduced taxes or more spending) to the market and the Economy
if there is any decline. By this, he seems to be saying that the low rates will be
continuing
even after April, so that there will not be any room for stimulative rate-cut. But
he was
also saying, that there would be no rate cuts. This is the barb in the sandwich that
the market is feeling at the opening.
 |
|
Charts 2/12/2020 (Click on Underlined link.) 2020 PEERLESS DJI, Signals, Indicators Daily DJI Volume 10-DayUp/Down Vol Stoch-20 Inverted Traders Index Graph of Pct of All Stocks above 65-dma NASDAQ S&P OEX NYSE COMPQX DJI-15 DJI-20 DJI-30 DIA QQQ MDY IWM TNA Short-Term Rates SPY http://tigersoft.com/2020CST/SPY.GIF USO-CrudeOil DBO FAS GLD BBH IBB JETS JNUG KOL NUGT OIH OIL PALL RSX RETL SDS AGQ SLV SOXL TECL TLT TMF TNA UGA (gasoline) and China: YINN CHAU Commodities: CANE CORN DBC JJC, NIB, CHOC CORN, CUT (paper) MOO, SOYB WEAT UUP (Dollar) LIT (Lithium) AAPL ADBE ALXN AMAT AMGN AMD AMZN AXP BA BABA BAC BIDU BLDP CAT CVX DE FB GOOG GS HD IBM INTU JPM M (Macy's) MSFT NFLX NKE NVDA PG QCOM TSLA TXN XOM V WMT CMG , LRCX, SQ TOWN New highs and Bullish MAXCPs http://tigersoft.com/MAXMLK/2-12/BULLISH.htm Bearish MAXCPs - http://tigersoft.com/MINMLK/2-12/BEARISH.htm |
Parallel to 1953-1957
The Buy B9 and B11 do suggest that the DJI will eventually be able to power
the DJI past the flat resistance that has been reached. More than any other
indicator,
we rely on the NYSE A/D Line and its 21-day ma, P-I. It was the strong breadth
and therefore low interest rates that gave us the B9 and B11 on weakness near the
lower band in January. Not surprisingly, our breadth indicators remain very
positive.
In fact, the A/D Line has now been steadily rising for 13-straight months. The only
previous case where the A/D Line stayed in such a steep uptrendline for so long
was between September 1953 and early 1955. It took Pres. Eisenhower's heart
attack in 1955 to bring about the first 10% correction. Rates were still under
3%
and the economy was booming. Otherwise, all declines stopped at the DJI's lower
band. But then came the Presidential Election year of 1956 and that brought two
10% corrections even before rates rose to 4%. I think 1956 shows we must
worry about seasonality. After all, our Accumulation Index is not very positive
and the V-Indicator is quite negative.
As the closest parallel, other than 1924-1929, I think it will be useful to look
at the Peerless DJI charts for 1954, 1955, 1956, and 1957. Are we in February
in 1955 or 1956?
1954 Very shallow pullbacks |
1955 Pullbacks to lower band until President's heart attack. |
1956 Two 10% declines in Broad and Flat Trading Range.
Note tops gave warnings. |
1957 Major Top and 20% decline.  |
I continue to work on the Cumulative
Inverted Traders Index program.
It should be ready this Sunday for release. More details then. Note the new
B21
when the Cum. 1/MKDS pentrates its 21-day ma after falling for 4 weeks. This
is a supplemental trading signal that is produced when the Cum. 1/MKDS is graphed.
We do now see some improvement from this indicator but a Buy B21 can only
take place at the 21-day or below.

| Table 1 QUICKSILVER on
DJI-30 STOCKS 2/11/2020 5 Bullish 5 Bearish, ITRS and IP21 >+.25 and <-.25 STOCKS CLOSE CHANGE PIVOT-PT 5-dma AROC CL-PWR CANDLE IP21 ITRS ------------------------------------------------------------------------------ AAPL 327.2 7.59 325.21 89.4% Bullish BLUE .095 .172 Bullish --------------------------------------------------------------------- AXP 133.24 .61 133.25 -13.6% ------- RED -.039 .057 --------------------------------------------------------------------- BA 347.45 3.03 341.43 263.7% Bullish BLUE .085 -.104 --------------------------------------------------------------------- CAT 139.59 3.4 137.25 79.2% Bearish BLUE-.109 -.088 --------------------------------------------------------------------- CSCO 49.93 .8 48.69 152.2% ------- BLUE-.049 .049 --------------------------------------------------------------------- CVX 112.04 .83 109.49 80% ------- RED -.09 -.096 --------------------------------------------------------------------- DIS 141.85 .84 142.7 16.9% Bearish BLUE .033 -.117 --------------------------------------------------------------------- GS 238.65 2.19 241.82 -117.9% Bearish BLUE-.092 .026 --------------------------------------------------------------------- HD 241.59 -.05 238.84 72.7% Bullish RED .193 .043 --------------------------------------------------------------------- IBM 155.31 1.83 156.76 -32.9% Bullish BLUE .253 .103 Bullish --------------------------------------------------------------------- INTC 67.46 .05 67.09 9% Bullish RED .092 .11 --------------------------------------------------------------------- JNJ 151.09 -.9 153.53 -95% Bullish RED .228 .046 Bullish --------------------------------------------------------------------- JPM 138 0 137.61 14.9% Bullish RED -.045 -.005 --------------------------------------------------------------------- KO 59.41 -.18 58.99 47.2% Bullish ---- .072 .06 --------------------------------------------------------------------- MCD 217.46 1.73 212.87 72.3% ------- BLUE .068 .066 --------------------------------------------------------------------- MMM 163.8 1.35 162.89 45.5% Bearish RED -.382 -.088 Bearish --------------------------------------------------------------------- MRK 83.25 -2 85.68 -150.9% Bearish RED -.2 -.098 Bearish --------------------------------------------------------------------- MSFT 184.71 .27 183.63 130.6% Bullish RED .134 .168 Bullish --------------------------------------------------------------------- NKE 103 2.98 100.27 122.9% ------- BLUE -.076 .049 --------------------------------------------------------------------- PFE 37.74 -.35 38.26 -56.5% Bearish RED -.18 -.073 Bearish --------------------------------------------------------------------- PG 123.45 -.71 127.14 -133.3% ------- RED -.179 -.041 --------------------------------------------------------------------- TRV 135.71 -1.67 136.5 -39.2% Bullish RED -.052 -.06 --------------------------------------------------------------------- UNH 303.48 12.69 292.46 133.1% Bullish BLUE .224 .032 Bullish --------------------------------------------------------------------- UTX 155.18 -.07 156.2 -14.4% Bearish ---- .058 -.006 --------------------------------------------------------------------- V 207.44 3.5 203.04 113.6% Bullish BLUE .086 .072 --------------------------------------------------------------------- VZ 58.23 -.46 59.44 -75.6% Bearish RED .07 -.086 --------------------------------------------------------------------- WBA 54.47 1.48 53.49 140% Bearish BLUE-.12 -.139 Bearish --------------------------------------------------------------------- WMT 115.85 .45 116.31 -41.4% Bullish BLUE .095 -.08 --------------------------------------------------------------------- XOM 61.27 .74 61.88 -119.1% Bearish RED -.262 -.153 Bearish |
QUICKSILVER on ETFS - 02/12/20 ETF CLOSE CHANGE PIVOT-PT 5-dma AROC CL-PWR CANDLE IP21 ITRS --------------------------------------------------------------------------------------------- DIA 295.72 2.78 293.74 48.8% Bullish BLUE .011 0 --------------------------------------------------------------------------------------------- SPY 337.42 2.16 333.98 68.3% Bullish BLUE .038 .021 --------------------------------------------------------------------------------------------- QQQ 234.27 2.26 230.19 131.3% Bullish BLUE .157 .09 --------------------------------------------------------------------------------------------- MDY 380.97 2.53 376.94 28.3% ------- BLUE .027 -.013 --------------------------------------------------------------------------------------------- IWM 168.11 1.15 166.93 24% ------- BLUE-.014 -.013 --------------------------------------------------------------------------------------------- FAS 104.43 .64 101.97 121.2% Bullish RED 0 .106 --------------------------------------------------------------------------------------------- RETL 26.21 1.24 25.32 76.3% Bearish BLUE-.034 -.044 --------------------------------------------------------------------------------------------- SOXL 316.93 13.34 294.79 384.1% ------- BLUE .145 .379 --------------------------------------------------------------------------------------------- TECL 324.78 9.87 314.32 294.9% Bullish BLUE .156 .463 Strongest --------------------------------------------------------------------------------------------- IBB 122.94 .27 122.47 56.5% ------- RED .013 -.025 --------------------------------------------------------------------------------------------- GLD 147.54 -.12 147.4 31.5% Bullish BLUE .165 .018 --------------------------------------------------------------------------------------------- OIH 11.41 .24 11.25 -58% Bearish -----.228 -.077 --------------------------------------------------------------------------------------------- GASL 4.49 .19 4.96 -842.6% Bearish RED -.284 -.288 Weakest --------------------------------------------------------------------------------------------- |
Table 3 Count of Stocks in Key Directories
20200212
-------------------------------
NEWHIGHS 504 Bullish
NEWLOWS 22
MAXCP 97
MINCP 52
TTTNH 25
TTTNL 39
FASTUP 72
FASTDOWN 76
CPCROSSA 101
CPCROSSD 53
BIGVOLUP 3
BIGVODN 10
ACCUMVER 8
HIGHIP21 27
LOWACCUM 98
REDSELL 87
AUGSELS7 24
TRAPDOOR 15
|
RANKING OF KEY DIRECTORIES BASED PCT.OF STOCKS ABOVE 65-DMA
2/12/20
Bullish = 33
Beairsh = 13
---------------------------------------------------------------------------------------
Directory Current day-1 day-2 day-3 day-4 day-5
----------------------------------------------------------------------------------------
SOLAR .941 .823 .764 .823 .764 .823
BONDFUND .94 .95 .96 .94 .93 .95
NIFTY .907 .851 .796 .759 .814 .777
UTILITY .897 .897 .871 .871 .871 .871
NASD-100 .865 .835 .783 .752 .814 .804
BIGBANKS .857 .857 .857 .857 .857 .857
COMPUTER .842 .631 .631 .578 .684 .631
HOMEBLDG .823 .823 .764 .764 .823 .823
GAMING .818 .772 .681 .727 .818 .772
SEMI .794 .71 .607 .607 .71 .719
GREEN .761 .666 .619 .571 .714 .666
GUNS .75 .687 .625 .562 .625 .625
ELECTRON .738 .66 .575 .594 .673 .679
INDEXES .736 .763 .747 .725 .736 .752
SP-100 .733 .733 .7 .666 .666 .655
INSURANC .73 .807 .73 .73 .807 .884
FIDSTKS .713 .691 .662 .657 .679 .674
SP500 .707 .672 .636 .628 .678 .68
ETFS .701 .526 .403 .368 .508 .438
REIT .695 .702 .709 .659 .687 .68
DJI-13 .692 .769 .769 .692 .692 .692
BEVERAGE .687 .75 .625 .625 .687 .562
SOFTWARE .666 .7 .65 .633 .683 .683
RUS-1000 .64 .608 .58 .571 .614 .629
RETAIL .627 .49 .411 .45 .568 .549
BIOTECH .608 .599 .587 .563 .632 .623
MILITARY .607 .571 .535 .464 .5 .535
CHINA .6 .436 .4 .418 .418 .4
EDU .6 .6 .6 .6 .6 .6
HOSPITAL .59 .681 .636 .636 .59 .681
DOWJONES .586 .655 .689 .62 .62 .62
FINANCE .552 .529 .482 .494 .576 .529
HACKERS .55 .65 .65 .65 .65 .7
==========================================================================================
COMODITY .475 .425 .425 .425 .425 .45
GOLD .458 .583 .5 .458 .541 .479
INFRA .444 .388 .361 .361 .444 .5
FOOD .433 .415 .433 .433 .433 .433
CHEM .408 .367 .326 .306 .387 .469
TRANSP .4 .4 .35 .45 .4 .45
INDMATER .328 .302 .223 .21 .315 .342
AUTO .3 .25 .225 .25 .25 .4
JETS .3 .3 .2 .2 .2 .4
REGBANKS .23 .269 .23 .23 .269 .538
OILGAS .194 .186 .171 .186 .223 .261
COPPER .125 .125 .125 0 .125 .25
COAL 0 0 0 0 0 .4
|
====================================================================
2/11/2020 Will the active Buy B9 and B11 power the DJI past 29500? It sure
seems
so. Flat tops "beckon for breakouts" at all time hghs and Buy B9s at this
time
of year average gains of more than 10%. Secondly, the key NYSE Adv-Decline
came very close to a new high today. Though the leading Indexes steadily fell
from their higher opening, at the close there were 1105 more NYSE Advances
than Declines. This shows the best of all economic worlds still prevails: a very
strong economy, super-low interest rates and very moderate inflation.
But the breakout and advance to 30000 may have to endure another shallow
pull-back first. The DJI's Accumulation Index is only a little above zero. So,
we could
easily get a Sell S12 if the DJI were to advance to 29500-29600. It is also not clear which
high priced DJI stocks other than HD and Visa are ready to run higher. Bullish
AAPL and MSFT (See Table 1.0) need to consolidate.
Thirdly, the Cumulative 1/MKDS remains in a downtrend. It's also hard for the DJI
to have the power to make a big advance when the Volume-I is negative. And finally,
while the DJI's history since 1968 tell us that typically in Presidential Election Years
there is only a brief bounce at this time of the year and at the end of the next four
weeks,
the DJI is right back where is is now.
So, I think we have to plan to buy DIA on another decline to
279 or 280. I do
expect QQQ to stay strong. It is tempting to buy more of it tomorrow.
But the
Tiger Seasonality chart of QQQ (shown below) in a Presidential Election Year
shows that we may see another dip around the 20th before a rally to Mid-March,
after which the QQQ will ahain settle back.
Looking at the MAXCPs tonight, we mainly see a lot of over-extended
stocks.
BLDP, for example, would seem to make a better buy near 10 than now. So,
just hold QQQ or if you prefer more leverage, than buy TECL (See Table 2 and
below). Its combined ITRS and IP21 are way above +.25.
|
Charts 2/11/2020 (Click on Underlined link.) 2020 PEERLESS DJI, Signals, Indicators Daily DJI Volume 10-DayUp/Down Vol Stoch-20 Inverted Traders Index Graph of Pct of All Stocks above 65-dma NASDAQ S&P OEX NYSE COMPQX DJI-15 DJI-20 DJI-30 DIA QQQ MDY IWM TNA Short-Term Rates SPY http://tigersoft.com/2020CST/SPY.GIF USO-CrudeOil DBO FAS GLD BBH IBB JETS JNUG KOL NUGT OIH OIL PALL RSX RETL SDS AGQ SLV SOXL TECL TLT TMF TNA UGA (gasoline) and China: YINN CHAU Commodities: CANE CORN DBC JJC, NIB, CHOC CORN, CUT (paper) MOO, SOYB WEAT UUP (Dollar) LIT (Lithium) AAPL ADBE ALXN AMAT AMGN AMD AMZN AXP BA BABA BAC BIDU BLDP CAT CVX DE FB GOOG GS HD IBM INTU JPM M (Macy's) MSFT NFLX NKE NVDA PG QCOM TSLA TXN XOM V WMT CMG , LRCX, SQ TOWN New highs and Bullish MAXCPs http://tigersoft.com/MAXMLK/2-11/BULLISH.htm Bearish MAXCPs - http://tigersoft.com/MINMLK/2-11/BEARISH.htm |
Table 1 QUICKSILVER on DJI-30 STOCKS 2/11/2020 4 Bullish 3 Bearish, ITRS and IP21 >+.25 and <-.25 STOCKS CLOSE CHANGE PIVOT-PT 5-dma AROC CL-PWR CANDLE IP21 ITRS ------------------------------------------------------------------------------ AAPL 319.61 -1.94 321.45 11.8% Bullish RED .097 .154 BULLISH --------------------------------------------------------------------- AXP 132.63 .39 133.6 29.4% ------- RED -.025 .063 --------------------------------------------------------------------- BA 344.42 -.25 329.55 396.3% Bullish RED .061 -.103 --------------------------------------------------------------------- CAT 136.19 1.87 137.44 99.1% ------- BLUE-.089 -.104 --------------------------------------------------------------------- CSCO 49.13 .26 48.45 156.2% ------- RED -.017 .047 --------------------------------------------------------------------- CVX 111.21 1.42 110.28 199.9% ------- BLUE-.069 -.097 --------------------------------------------------------------------- DIS 141.01 -1.58 141.37 -130.5% Bearish RED .01 -.108 --------------------------------------------------------------------- GS 236.46 -.9 244.3 -113.8% Bearish RED -.053 .021 --------------------------------------------------------------------- HD 241.64 1.03 238.11 139.5% Bullish BLUE .145 .044 --------------------------------------------------------------------- IBM 153.48 -.95 156.33 141.9% Bullish RED .255 .108 BULLISH --------------------------------------------------------------------- INTC 67.41 1.02 67.34 146.7% Bullish BLUE .125 .113 --------------------------------------------------------------------- JNJ 151.99 .13 153.99 12.8% Bullish RED .282 .064 BULLISH --------------------------------------------------------------------- JPM 138 .26 137.59 98.8% Bullish RED .034 .006 --------------------------------------------------------------------- KO 59.59 -.16 58.85 63.4% Bullish RED .128 .065 --------------------------------------------------------------------- MCD 215.73 2.52 214.37 26% ------- BLUE .015 .06 --------------------------------------------------------------------- MMM 162.45 2.3 162.33 162.3% Bearish BLUE-.371 -.087 BEARISH --------------------------------------------------------------------- MRK 85.25 -.41 85.83 -180.6% ------- RED -.131 -.066 --------------------------------------------------------------------- MSFT 184.44 -4.26 179.9 117.9% Bullish RED .251 .172 BULLISH --------------------------------------------------------------------- NKE 100.02 0 100.54 -67.8% ------- -----.108 .023 --------------------------------------------------------------------- PFE 38.09 .28 38.17 52.6% Bearish BLUE-.152 -.053 --------------------------------------------------------------------- PG 124.16 -2.01 126.81 -59.3% Bullish RED -.139 -.019 --------------------------------------------------------------------- TRV 137.38 1.16 136.78 177% Bullish BLUE .008 -.035 --------------------------------------------------------------------- UNH 290.79 3.76 295.73 172.1% ------- BLUE .111 -.003 --------------------------------------------------------------------- UTX 155.25 -1.3 155.63 72.3% Bearish RED .035 .004 --------------------------------------------------------------------- V 203.94 -2.05 202.81 9.3% Bullish RED .098 .067 --------------------------------------------------------------------- VZ 58.69 -1.55 59.13 33.7% Bearish RED .14 -.063 --------------------------------------------------------------------- WBA 52.99 -.43 52.98 61.2% Bearish RED -.212 -.158 BEARISH --------------------------------------------------------------------- WMT 115.4 .15 116.81 5.6% Bullish ---- .092 -.067 --------------------------------------------------------------------- XOM 60.53 .57 62.73 45.8% Bearish -----.267 -.158 BEARISH |
Table 2 QUICKSILVER on ETFS - 2/11/20 --------------------------------------------------------------------------------------------- ETF CLOSE CHANGE PIVOT-PT 5-dma AROC CL-PWR CANDLE IP21 ITRS --------------------------------------------------------------------------------------------- DIA 292.94 -.01 292.86 84% Bullish RED -.001 ---- --------------------------------------------------------------------------------------------- BA 344.42 -.25 329.55 396.3% Bullish RED .061 -.103 --------------------------------------------------------------------------------------------- SPY 335.26 .58 332.86 93.2% Bullish RED .056 .024 --------------------------------------------------------------------------------------------- QQQ 232.01 .04 228.22 98.9% Bullish RED .159 .087 --------------------------------------------------------------------------------------------- MDY 378.44 2.94 378.84 51.7% ------- BLUE .033 -.018 --------------------------------------------------------------------------------------------- IWM 166.96 1.15 167.31 66% ------- BLUE .01 -.014 --------------------------------------------------------------------------------------------- FAS 103.79 1.11 101.95 258.8% Bullish RED .058 .105 --------------------------------------------------------------------------------------------- RETL 24.97 .62 25.83 157.5% Bearish BLUE-.001 -.105 --------------------------------------------------------------------------------------------- SOXL 303.59 17.19 294.6 474.8% ------- BLUE .148 .288 Bullish --------------------------------------------------------------------------------------------- TECL 314.91 -3.12 306.38 222.5% Bullish RED .155 .415 Bullish --------------------------------------------------------------------------------------------- IBB 122.67 -.06 121.56 169.7% ------- RED -.007 -.012 --------------------------------------------------------------------------------------------- GLD 147.66 -.51 146.61 41.8% Bullish RED .116 .039 --------------------------------------------------------------------------------------------- OIH 11.17 .2 11.54 40.2% Bearish ---- -.223 -.102 Bearish --------------------------------------------------------------------------------------------- GASL 4.3 .07 5.28 -263.8% Bearish RED -.266 -.364 Bearish --------------------------------------------------------------------------------------------- |
Table 3 Count of Stocks in Key Directories
20200211
-------------------------------
NEWHIGHS 429 Bullish
NEWLOWS 22
MAXCP 89
MINCP 59
TTTNH 32
TTTNL 46
FASTUP 75
FASTDOWN 62
CPCROSSA 107
CPCROSSD 64
BIGVOLUP 3
BIGVODN 8
ACCUMVER 7
HIGHIP21 28
LOWACCUM 99
REDSELL 80
AUGSELS7 34
TRAPDOOR 14
|
Table 4 RANKING OF KEY DIRECTORIES BASED PCT.OF STOCKS ABOVE 65-DMA
2/11/20
Bullish = 32
Bearish = 14
---------------------------------------------------------------------------------------
Directory Current day-1 day-2 day-3 day-4 day-5
----------------------------------------------------------------------------------------
BONDFUND .95 .96 .94 .93 .95 .91
UTILITY .897 .871 .871 .871 .871 .871
BIGBANKS .857 .857 .857 .857 .857 .428
NIFTY .851 .796 .759 .814 .796 .759
NASD-100 .835 .793 .762 .814 .814 .773
HOMEBLDG .823 .764 .764 .823 .823 .882
SOLAR .823 .764 .823 .764 .823 .764
INSURANC .807 .73 .73 .807 .884 .73
GAMING .772 .681 .727 .818 .772 .772
DJI-13 .769 .769 .692 .692 .692 .538
INDEXES .763 .747 .725 .736 .758 .72
BEVERAGE .75 .625 .625 .687 .562 .687
SP-100 .733 .7 .666 .666 .666 .577
SEMI .71 .607 .607 .71 .719 .672
REIT .702 .709 .659 .687 .68 .659
SOFTWARE .7 .666 .633 .683 .683 .666
FIDSTKS .691 .662 .657 .679 .679 .584
GUNS .687 .625 .562 .625 .625 .437
HOSPITAL .681 .636 .636 .59 .681 .59
SP500 .672 .638 .628 .678 .682 .607
GREEN .666 .619 .571 .714 .666 .523
ELECTRON .66 .575 .594 .673 .686 .633
DOWJONES .655 .689 .62 .62 .62 .62
HACKERS .65 .7 .65 .65 .7 .65
COMPUTER .631 .631 .578 .684 .631 .526
RUS-1000 .608 .581 .571 .614 .632 .555
EDU .6 .6 .6 .6 .6 .6
BIOTECH .599 .587 .56 .632 .635 .602
GOLD .583 .5 .458 .541 .479 .5
MILITARY .571 .535 .464 .5 .535 .464
FINANCE .535 .488 .5 .583 .535 .404
ETFS .526 .403 .368 .508 .473 .298
N=+32
=============================================================================================
RETAIL .49 .411 .45 .568 .568 .45
CHINA .436 .4 .418 .418 .4 .363
COMODITY .425 .425 .425 .425 .45 .425
FOOD .415 .433 .433 .433 .433 .415
TRANSP .4 .35 .45 .4 .45 .3
INFRA .388 .361 .361 .444 .5 .416
CHEM .367 .326 .306 .387 .448 .367
INDMATER .302 .223 .21 .315 .342 .25
JETS .3 .2 .2 .2 .4 .2
REGBANKS .269 .23 .23 .269 .538 .192
AUTO .25 .225 .25 .25 .425 .25
OILGAS .187 .172 .187 .225 .263 .187
COPPER .125 .125 0 .125 .25 .125
COAL 0 0 0 0 .4 0
N=14
|
====================================================================
2/10/2020 The operative Peerless Signals are B9 and B11.
The DJI tagged the rising
21-day ma before the opening, turned up and is now set to challenge 29500.
Our Accumulation is nearly negative, so an S12 is quite possible. An extraordinary
share of the "heavy lifting" of this rally is taking place because of the big
advances
in a handful of the leading blue chips (BA +7.92), AAPL (+1.52), HD (+3.31),
V (3.25) and MSFT (4.51). We can construct a Super-DJI-8, As long as the
DJI-8 is rising, I have to expect the DJI will challenge 29500 very soon.


Stronger than the DJI and DIA are the NASDAQ, QQQ and TECH. See how
their breakouts to all-time highs were confirmed by their Closing Powers and
their Accumulation Index is very constructive. Traders will recall how TSLA
recently took off, rising from a flat topped breakout at 400 to 900 in ten weeks.
I think we have buy more QQQ. Most stocks are not participating like the
"big boys", like AMZN ( +55),
the two Googles (+59), TSLA (+23), MSFT
and NVDA(+11). Aggressive buyers are chasing TQQQ.

Cum. 1/MKDS is still falling.

I promised to write more about the lagging Cumulative Inverted Traders Index.
Below I show the code used when the Cum. 1/MKDS is graphed from the pull-down
menu under Indicators-1. In Presidential Election years the rise of the Cumulative
1/MKDS back above its 21-day ma is typically a good time to Buy. See the chart
below. Sell S19s are not allowed for the next three months because they fail more
often than they work out.

|
Sell S21 Occurrences in Presidential Election
Years: For i = 1 To rn ' rn= number of daily-sequential-records of data. num = upv(i) / adv(i) den = downv(i) / dec(i) mk = num / den mk = mk - 1 mk = mk * 1000 Next i For i = 1 To rn: ccummkds(i) = ccummkds(i - 1) + mk mkds(i) = ccummkds(i) Next i pmal=21 For i = 1 To pmal: mkdsma1(pmal) = mkdsma1(pmal) + ccummkds(i): Next i For i = (pmal + 1) To rn: mkdsma1(i) = mkdsma1(i - 1) + ccummkds(i) - ccummkds(i - pmal): Next i For i = pmal To rn: mkdsma1(i) = mkdsma1(i) / pmal: Next i For i = 67 To rn If la(i) / ma(i) > 1.035 Then 94 ' DJI must not be above 3.5% upper band. If newipxxx(i) > .072 Then 94 ' IP21 must be below +.072 If mo(i) = 2 Or mo(i) = 3 Or mo(i) = 10 Then 94 ' Skip months 2, 3 and 10. If la(i) / ma(i) > 1.018 And mkds(I) + 100 < mkdsma1(I) Then pi = i: S21arrows (pi) ' For S20, DJI must close at least at 1.8% upper band. ' Cum MKDS must close considerably below its 21-dma. 94 Next i |
|
Charts 2/10/2020 (Click on Underlined link.) 2020 PEERLESS DJI, Signals, Indicators Daily DJI Volume 10-DayUp/Down Vol Stoch-20 Inverted Traders Index Graph of Pct of All Stocks above 65-dma NASDAQ S&P OEX NYSE COMPQX DJI-15 DJI-20 DJI-30 DIA QQQ MDY IWM TNA Short-Term Rates SPY http://tigersoft.com/2020CST/SPY.GIF USO-CrudeOil DBO FAS GLD BBH IBB JETS JNUG KOL NUGT OIH OIL PALL RSX RETL SDS AGQ SLV SOXL TECL TLT TMF TNA UGA (gasoline) and China: YINN CHAU Commodities: CANE CORN DBC JJC, NIB, CHOC CORN, CUT (paper) MOO, SOYB WEAT UUP (Dollar) LIT (Lithium) AAPL ADBE ALXN AMAT AMGN AMD AMZN AXP BA BABA BAC BIDU BLDP CAT CVX DE FB GOOG GS HD IBM INTU JPM M (Macy's) MSFT NFLX NKE NVDA PG QCOM TSLA TXN XOM V WMT CMG , LRCX, SQ TOWN New highs and Bullish MAXCPs http://tigersoft.com/MAXMLK/2-10/BULLISH.htm Bearish MAXCPs - http://tigersoft.com/MINMLK/2-10/BEARISH.htm |
Table 1 QUICKSILVER on DJI-30 STOCKS 2/10/2020 STOCKS CLOSE CHANGE PIVOT-PT 5-dma AROC CL-PWR CANDLE IP21 ITRS ------------------------------------------------------------------------------ AAPL 321.55 1.52 318.85 202.1% Bullish BLUE .113 .175 Bullish --------------------------------------------------------------------- AXP 132.24 .42 131.85 46.9% ------- BLUE-.029 .063 --------------------------------------------------------------------- BA 344.67 7.92 317.94 436.6% Bullish BLUE .031 -.118 --------------------------------------------------------------------- CAT 134.32 .95 133.51 169.4% ------- BLUE-.115 -.122 --------------------------------------------------------------------- CSCO 48.87 .9 47.62 244.5% ------- BLUE-.022 .037 --------------------------------------------------------------------- CVX 109.79 .85 106.85 161.9% ------- BLUE-.14 -.109 --------------------------------------------------------------------- DIS 142.59 1.57 144.73 44.6% Bearish BLUE .026 -.101 --------------------------------------------------------------------- GS 237.36 -.64 241.94 -34.2% Bullish -----.035 .026 --------------------------------------------------------------------- HD 240.61 3.31 235 192% Bullish BLUE .133 .049 --------------------------------------------------------------------- IBM 154.43 1.02 149.11 267.8% Bullish BLUE .254 .102 Bullish --------------------------------------------------------------------- INTC 66.39 .37 65.46 149.1% Bullish BLUE .086 .086 --------------------------------------------------------------------- JNJ 151.86 -.03 151.6 55.5% Bullish BLUE .251 .066 Bullish --------------------------------------------------------------------- JPM 137.74 .57 135.29 160.4% Bullish BLUE .021 .005 --------------------------------------------------------------------- KO 59.75 .56 58.84 99.3% Bullish BLUE .09 .067 --------------------------------------------------------------------- MCD 213.21 1.6 214.62 -46.1% ------- BLUE-.056 .058 --------------------------------------------------------------------- MMM 160.15 .07 157.24 111.4% Bearish BLUE-.42 -.095 --------------------------------------------------------------------- MRK 85.66 .58 88.36 -97.2% ------- BLUE-.134 -.06 --------------------------------------------------------------------- MSFT 188.7 4.81 180.12 396.9% Bullish BLUE .175 .2 Bullish --------------------------------------------------------------------- NKE 100.02 .58 101.38 37.4% Bearish BLUE-.15 .03 --------------------------------------------------------------------- PFE 37.81 -.24 37.69 39.5% Bearish RED -.15 -.054 --------------------------------------------------------------------- PG 126.17 .09 125.66 42% Bullish RED -.095 -.009 --------------------------------------------------------------------- TRV 136.22 .21 132.58 96.6% Bullish BLUE-.053 -.045 --------------------------------------------------------------------- UNH 287.03 -2.19 280.84 227.1% ------- BLUE .103 -.021 --------------------------------------------------------------------- UTX 156.55 -.28 153 213.8% Bullish RED .064 .016 --------------------------------------------------------------------- V 205.99 3.25 203.56 127.8% Bullish BLUE .143 .087 --------------------------------------------------------------------- VZ 60.24 .3 58.29 185.7% ------- BLUE .183 -.035 --------------------------------------------------------------------- WBA 53.42 .18 52.34 234.8% Bearish BLUE-.22 -.145 Bearish --------------------------------------------------------------------- WMT 115.25 -1.2 115.27 42.3% Bullish RED .031 -.074 --------------------------------------------------------------------- XOM 59.96 -1.51 59.97 -62.7% Bearish RED -.298 -.169 Bearish |
Table 2 QUICKSILVER on ETFS - 2/10/20 --------------------------------------------------------------------------------------------- DIA 292.95 1.76 288.04 154.7% ------- BLUE -.02 ---- --------------------------------------------------------------------------------------------- SPY 334.68 2.48 329.06 159.8% Bullish BLUE .054 .024 --------------------------------------------------------------------------------------------- QQQ 231.97 2.77 227.47 210.8% Bullish BLUE .17 .093 Bullish --------------------------------------------------------------------------------------------- MDY 375.5 2.03 374.55 78.5% ------- BLUE .025 -.021 --------------------------------------------------------------------------------------------- IWM 165.81 .93 164.77 105.6% ------- BLUE .014 -.016 --------------------------------------------------------------------------------------------- FAS 102.68 1.69 98.55 370.9% Bullish BLUE .067 .107 --------------------------------------------------------------------------------------------- RETL 24.35 .24 24.19 144.2% Bearish BLUE .015 -.115 --------------------------------------------------------------------------------------------- SOXL 286.4 12.41 276.5 601.1% ------- BLUE .103 .237 Bullish --------------------------------------------------------------------------------------------- TECL 318.03 12.01 301.15 651.4% Bullish BLUE .173 .453 Bullish --------------------------------------------------------------------------------------------- IBB 122.73 1.2 118.55 288% ------- BLUE-.019 -.005 --------------------------------------------------------------------------------------------- GLD 148.17 .38 146.43 -6.4% Bullish ---- .143 .035 --------------------------------------------------------------------------------------------- OIH 10.97 -.17 11.08 44.7% Bearish RED -.216 -.101 Bearish --------------------------------------------------------------------------------------------- GASL 4.23 -.44 4.55 -292% Bearish RED -.232 -.352 Bearish |
Table 3 Count of Stocks in Key Directories
20200210
-------------------------------
NEWHIGHS 373
NEWLOWS 50
MAXCP 113
MINCP 76
TTTNH 29
TTTNL 48
FASTUP 88
FASTDOWN 61
CPCROSSA 228
CPCROSSD 54
BIGVOLUP 4
BIGVODN 9
ACCUMVER 7
HIGHIP21 23
HIUPPCT 88
REDSELL 80
AUGSELS7 31
TRAPDOOR 15
|
Table 4 RANKING OF KEY DIRECTORIES BASED PCT.OF STOCKS ABOVE 65-DMA
2/10/20
Bullish = 30
Bearish = 16
---------------------------------------------------------------------------------------
Directory Current day-1 day-2 day-3 day-4 day-5
----------------------------------------------------------------------------------------
BONDFUND .96 .94 .93 .95 .91 .91
UTILITY .871 .871 .871 .871 .871 .846
BIGBANKS .857 .857 .857 .857 .428 .285
NIFTY .796 .759 .814 .796 .777 .611
NASD-100 .793 .773 .824 .814 .773 .618
DJI-13 .769 .692 .692 .692 .538 .538
HOMEBLDG .764 .764 .823 .823 .882 .764
SOLAR .764 .823 .764 .823 .764 .705
INDEXES .747 .725 .736 .758 .72 .618
INSURANC .73 .73 .807 .884 .73 .73
REIT .709 .659 .687 .68 .666 .631
HACKERS .7 .7 .65 .7 .65 .55
SP-100 .7 .666 .666 .666 .577 .433
GAMING .681 .727 .818 .772 .772 .681
DOWJONES .666 .6 .6 .6 .6 .466
FIDSTKS .666 .661 .683 .683 .593 .48
SOFTWARE .666 .65 .683 .683 .666 .6
SP500 .638 .63 .678 .682 .607 .497
HOSPITAL .636 .636 .59 .681 .59 .545
COMPUTER .631 .578 .684 .631 .526 .473
BEVERAGE .625 .625 .687 .562 .687 .5
GUNS .625 .562 .625 .625 .437 .25
GREEN .619 .571 .714 .666 .523 .428
SEMI .607 .607 .71 .719 .672 .532
EDU .6 .6 .6 .6 .6 .6
BIOTECH .584 .557 .629 .635 .608 .513
RUS-1000 .581 .573 .614 .632 .555 .465
ELECTRON .575 .594 .673 .686 .64 .516
MILITARY .535 .464 .5 .535 .464 .357
==========================================================================================
GOLD .5 .458 .541 .479 .479 .562
==========================================================================================
FINANCE .482 .494 .576 .529 .411 .341
FOOD .433 .433 .433 .433 .415 .415
COMODITY .425 .425 .425 .45 .425 .425
RETAIL .411 .45 .568 .568 .45 .294
ETFS .403 .368 .508 .473 .298 .175
CHINA .4 .418 .418 .4 .363 .29
INFRA .361 .361 .444 .5 .416 .444
TRANSP .35 .45 .4 .45 .3 .25
CHEM .326 .306 .387 .448 .367 .244
REGBANKS .23 .23 .269 .538 .192 .153
AUTO .225 .25 .25 .425 .25 .15
INDMATER .223 .21 .315 .342 .25 .223
JETS .2 .2 .2 .4 .2 .1
OILGAS .165 .18 .218 .255 .187 .165
COPPER .125 0 .125 .25 .25 0
COAL 0 0 0 .4 0 0
|
=======================================================================
2/7/2020 The operative Peerless Signals are B9 and B11. Given the big
non-confirmations
of the DJI's minor new high on Thursday, it is likely that the next advance will be
stopped
near 29400. But first, the DJI will probably have to fall to 28900 and test its
rising
21-dma.

There are some signs that the decline will be deeper. If we are, indeed, now trapped
in
a DJI trading range, as suggested by the price gaps on the way down and the way up,
then there will not be strong support until the 65-dma is tested again. It is now at
28400-
28500. But there some good reasons, I believe, for being more optimistic.
First, I tested the proposition that the recent closing high with its many
non-confirmations
will turn out to be a major top. I plugged in the Thursday's (2-6) key values,
creating a
possible new Sell S8, like the 2006 version of Peerless now shows. What I found
was four failures for the old S8's key parameters from late January to mid-Febriary.
If you run Peerless against old data since 1965, you will see that such an "S8"
four times
failed in this period and succeeded not once. The dates of the bad potential
"S8s"
in Presidential Election Years are: 2/10/1972, 1/21/1980, 1/28/1992 and 1/24/1996.
A second reason for believing that the DJI will return to 28400, at the least, is the
fact that the 10-day ma of NYSE Up Volume still has not turned down. If you study
the DJI chart below closely, you will see what usually happens at a market top is that
a decline occurs only after the blue Up Volume stops rising AND then the red DOWN
Volume turns up shaprly or breaks out above it base. It is not enough for the blue
Up Volume line to turn down, red sellers must then step their trading.

But there remains another technical problem. When we use the 21-day
ma of the Cumulative Inverted Traders Index we continue to see disproportionately
heavy NYSE Down volume compared to the ratio of NYSE Advances to
New Lows. I have created a new graph and a new short-term Sell S21 signal
to show this when the Cumulative Inv. Traders Index (1/MKDS) is graphed.
As you can see below that Line is still far below its falling 21-dma. So,
Down Volume is already rising measured this way. What does this mean?
More ordinary NYSE stocks are lagging or falling while a lot of heavy lifting is
being done by high-priced leaders. If stocks like AAPL, BA, MSFT and UNH
in the DJI-30 do tire out, as eventually they must, then the DJI's move up is over.
I do not see warning signs in their graphs or in Table 1 yet. But I have
to note that there are very few cases when the Cumulative Inv. Traders Index
stays so far below its 21-da for so long without a significant decline soon
following. Tomorrow I will list all the Sell S21s and we will develop some rules
spotting and trading their divergences.

Stay bullish is still my conclusion. Since 1929, major market tops have all been
identified
by just five Sell signals, S9 (P-I NNC), S10 (head/shoulders neckline penetration),
S12 (IP21 NNC) and a Summer S9-V, plus a breaking of the DJI's Accumulation
Index (Sell S4) 21-day by the IP21 after a quick DJI 10% advance. Fortunately,
we do see any of these, though a big jump up now could bring a Sell S12. The
Washington, banking and corporate establishments have a powerful vested
interests in holding the market up until the November 2020 Election is over.
Ironically,
perhaps, this will cause 2020 to be artificially made uncharacteristically strong,
especially if the Socialist Sanders starts winning Primaries.
|
Charts 2/7/2020 (Click on Underlined link.) 2020 PEERLESS DJI, Signals, Indicators Daily DJI Volume 10-DayUp/Down Vol Stoch-20 Inverted Traders Index Graph of Pct of All Stocks above 65-dma NASDAQ S&P OEX NYSE COMPQX DJI-15 DJI-20 DJI-30 DIA QQQ MDY IWM TNA Short-Term Rates SPY http://tigersoft.com/2020CST/SPY.GIF USO-CrudeOil DBO FAS GLD BBH IBB JETS JNUG KOL NUGT OIH OIL PALL RSX RETL SDS AGQ SLV SOXL TECL TLT TMF TNA UGA (gasoline) and China: YINN CHAU Commodities: CANE CORN DBC JJC, NIB, CHOC CORN, CUT (paper) MOO, SOYB WEAT UUP (Dollar) LIT (Lithium) AAPL ADBE ALXN AMAT AMGN AMD AMZN AXP BA BABA BAC BIDU BLDP CAT CVX DE FB GOOG GS HD IBM INTU JPM M (Macy's) MSFT NFLX NKE NVDA PG QCOM TSLA TXN XOM V WMT CMG , LRCX, SQ TOWN New highs and Bullish MAXCPs http://tigersoft.com/MAXMLK/2-07/BULLISH.htm Bearish MAXCPs - http://tigersoft.com/MINMLK/2-07/BEARISH.htm |
Table 1QUICKSILVER on DJI-30 STOCKS 2/7/2020 STOCKS CLOSE CHANGE PIVOT-PT 5-dma AROC CL-PWR CANDLE IP21 ITRS ------------------------------------------------------------------------------ AAPL 320.03 -5.18 308.66 166.1% Bullish RED .11 .164 Bullish --------------------------------------------------------------------- AXP 131.82 -1.43 131 73.9% Bullish RED -.007 .056 --------------------------------------------------------------------- BA 336.75 -4.68 316 284.6% ------- RED .003 -.135 --------------------------------------------------------------------- CAT 133.37 -3.88 129.77 75.4% Bearish RED -.145 -.126 --------------------------------------------------------------------- CSCO 47.97 -.72 46.53 210.7% ------- RED -.09 .018 --------------------------------------------------------------------- CVX 108.94 -.55 106.28 83.3% Bearish BLUE-.155 -.117 --------------------------------------------------------------------- DIS 141.02 -1.68 141.32 95.6% Bearish RED -.029 -.095 --------------------------------------------------------------------- GS 238 -3.82 239.01 5.2% Bullish RED -.024 .031 --------------------------------------------------------------------- HD 237.3 -1.54 231.54 196.3% Bullish RED .143 .05 --------------------------------------------------------------------- IBM 153.41 -3.35 146.27 321.7% Bullish RED .244 .091 Bullish --------------------------------------------------------------------- INTC 66.02 -1.07 64.42 159.2% Bullish RED .056 .086 --------------------------------------------------------------------- JNJ 151.89 -1.64 150.17 99.6% Bullish RED .21 .07 Bullish --------------------------------------------------------------------- JPM 137.17 -.44 133.37 177.8% Bullish BLUE-.01 .006 --------------------------------------------------------------------- KO 59.19 .2 58.58 67.3% Bullish BLUE .105 .075 Bullish --------------------------------------------------------------------- MCD 211.61 -1.26 215.18 -55.1% ------- RED -.051 .066 --------------------------------------------------------------------- MMM 160.08 -2.81 156.59 44.5% Bearish RED -.402-.097 Bearish --------------------------------------------------------------------- MRK 85.08 -.6 87.34 -20.8% ------- RED -.153-.044 --------------------------------------------------------------------- MSFT 183.89 .26 174.38 384.5% Bullish BLUE .155 .179 --------------------------------------------------------------------- NKE 99.44 -.83 99.27 157.7% Bearish RED -.193 .033 --------------------------------------------------------------------- PFE 38.05 -.21 37.51 107.2% Bearish RED -.149 -.053 --------------------------------------------------------------------- PG 126.08 -1.06 125.11 58% Bullish RED -.05 .009 --------------------------------------------------------------------- TRV 136.01 -.49 133.61 163.5% Bullish RED -.055 -.03 --------------------------------------------------------------------- UNH 289.22 -3.24 274.02 296.2% ------- RED .091 -.014 --------------------------------------------------------------------- UTX 156.83 .63 149.95 216.7% Bullish BLUE .062 .026 --------------------------------------------------------------------- V 202.74 -.3 200.81 93.4% Bullish BLUE .113 .083 --------------------------------------------------------------------- VZ 59.94 .5 58.05 42.5% ------- BLUE .083 -.028 --------------------------------------------------------------------- WBA 53.24 -.25 50.95 229.3% Bearish ---- -.272-.159 Bearish --------------------------------------------------------------------- WMT 116.45 .14 114.27 84.9% Bullish BLUE .116-.058 --------------------------------------------------------------------- XOM 61.47 -.41 60.73 -52.9% Bearish BLUE -.263-.145 Bearish |
Table 2 QUICKSILVER on ETFS - 2/7/20 --------------------------------------------------------------------------------------------- DIA 291.19 -2.55 283.98 152.1% ------- RED -.036 ====== --------------------------------------------------------------------------------------------- SPY 332.2 -1.78 324.12 159.4% ------- RED .06 .023 --------------------------------------------------------------------------------------------- QQQ 229.2 -.99 222.38 224.6% Bullish ---- .153 .085 Bullish --------------------------------------------------------------------------------------------- MDY 373.47 -3.47 369.62 107.3% ------- RED 0 -.018 --------------------------------------------------------------------------------------------- IWM 164.88 -2.05 162.32 132.3% ------- RED -.03 -.017 --------------------------------------------------------------------------------------------- FAS 100.99 -.98 95.28 402.9% Bullish BLUE .053 .105 --------------------------------------------------------------------------------------------- RETL 24.11 -1.21 23.64 248.2% Bearish RED .012 -.103 --------------------------------------------------------------------------------------------- SOXL 273.99 -20.8 252.91 557.5% Bearish RED .072 .169 --------------------------------------------------------------------------------------------- TECL 306.02 -8.3 278.77 639.5% ------- RED .161 .403 Bullish --------------------------------------------------------------------------------------------- IBB 121.53 -.94 115.82 325.9% ------- RED -.052 -.009 --------------------------------------------------------------------------------------------- GLD 147.79 .39 148.36 -52.2% Bullish ---- .153 .041 --------------------------------------------------------------------------------------------- OIH 11.14 -.11 10.87 107.8% Bearish -----.169 -.109 Bearish --------------------------------------------------------------------------------------------- GASL 4.67 -.29 4.51 -10.4% Bearish RED -.163 -.345 ---------------------------------------------------------------------------- |
Table 3 Count of Stocks in Key Directories
20200207
-------------------------------
NEWHIGHS 177
NEWLOWS 30
MAXCP 42
MINCP 97
TTTNH 17
TTTNL 78
FASTUP 99
FASTDOWN 54
CPCROSSA 43
CPCROSSD 73
BIGVOLUP 4
BIGVODN 9
ACCUMVER 6
HIGHIP21 26
LOWACCUM 98
REDSELL 77
AUGSELS7 23
TRAPDOOR 16
|
Table 4RANKING OF KEY DIRECTORIES BASED PCT.OF STOCKS ABOVE 65-DMA 2/7/20 --------------------------------------------------------------------------------------- Directory Current day-1 day-2 day-3 day-4 day-5 ---------------------------------------------------------------------------------------- BONDFUND .94 .93 .95 .91 .91 .92 UTILITY .871 .871 .871 .871 .846 .871 BIGBANKS .857 .857 .857 .428 .285 .285 SOLAR .823 .764 .823 .764 .705 .647 NASD-100 .773 .835 .824 .773 .618 .577 HOMEBLDG .764 .823 .823 .882 .764 .705 NIFTY .759 .814 .796 .777 .611 .555 INSURANC .73 .807 .884 .73 .692 .423 GAMING .727 .818 .772 .772 .681 .59 INDEXES .725 .736 .758 .72 .623 .548 HACKERS .7 .7 .7 .65 .55 .55 DJI-13 .692 .692 .692 .538 .538 .538 SP-100 .666 .666 .666 .577 .433 .422 REIT .659 .687 .68 .666 .617 .581 FIDSTKS .657 .679 .679 .589 .477 .455 SOFTWARE .65 .7 .683 .666 .6 .6 HOSPITAL .636 .59 .681 .59 .545 .545 SP500 .63 .68 .682 .607 .497 .457 BEVERAGE .625 .687 .562 .687 .5 .5 SEMI .607 .71 .719 .672 .551 .485 DOWJONES .6 .6 .6 .6 .466 .433 EDU .6 .6 .6 .6 .6 .6 ELECTRON .594 .673 .686 .64 .529 .477 COMPUTER .578 .684 .631 .526 .473 .421 RUS-1000 .573 .615 .632 .555 .466 .429 GREEN .571 .714 .666 .523 .428 .428 GUNS .562 .625 .625 .437 .25 .25 BIOTECH .554 .626 .632 .608 .531 .456 FINANCE .494 .576 .529 .411 .352 .329 MILITARY .464 .5 .535 .464 .357 .357 GOLD .458 .541 .479 .479 .562 .645 RETAIL .45 .568 .568 .45 .313 .274 TRANSP .45 .4 .45 .3 .25 .25 FOOD .433 .433 .433 .415 .396 .433 COMODITY .425 .425 .45 .425 .425 .45 CHINA .418 .418 .4 .363 .29 .236 ETFS .368 .508 .473 .298 .175 .157 INFRA .361 .444 .5 .416 .444 .361 CHEM .306 .387 .448 .367 .265 .163 AUTO .25 .25 .425 .25 .15 .125 REGBANKS .23 .269 .538 .192 .153 .076 INDMATER .21 .315 .342 .25 .223 .197 JETS .2 .2 .4 .2 .1 .1 OILGAS .186 .223 .261 .194 .171 .186 COAL 0 0 .4 0 0 0 COPPER 0 .125 .25 .25 0 0 |
====================================================================
2/6/2020 The operative Peerless Signals are B9 and B11. The DJI should
find support at 29000 and more closely tag the 2.5% upper band
near 29500 before giving a Sell.
But again the DJI's advance was powered by very high priced Dow-component
Boeing. (See Table 1 below.) The thought that this is a temporary
short-covering rally inevitably comes across my mind. In any case, the 2006
version of Peerless gave a Sell S8 based on the fair assumption that the DJI
is now stuck in a trading range.


Many times the DJI reverses down just after it makes a nominal closing high or
reverses back up after a nominal new low that is unconfirmed by our key P-Indicator
and IP21 (Accumulation Index). The new high today was also not confirmed by
the NYSE A/D Line and our V-Indicator. So, the assumption about the DJI now
being stuck in a trading range seems a reasonable guess.
Tomorrow a good Jobs' Report is expected. With
the FED committed
to keeping interest rates unchanged for two more months, we could well see a
recovery from this morning's early weakness. Taking some profits on a
bounce in the DIA tomorrow would seem reasonable. But not on much
weakness. There should now be support at the DJI's rising 21-dma at 28931.
I would just continue to hold QQQ until there are more signs that it is topping
out or is starting to under-perform the DJI.
Bullish Seasonality
The seasonality is bullish for two more weeks. Since 1968 in
Presidential Election
Years, the DJI does typically achieve more gains over the next two weeks. It rises
69.2%
of the time and has averaged a gain of one half percent. So, the full upper 2.5%
band
might be expected to be reached next week.
However, the relatively heavy NYSE down volume argues against a big surge upward or a
breakout by the DJI. The V-Indicator is quite negative. Note that we cannot
get a Sell S9-V
at this time of the year, but we could quite easily get a Sell S12 since our IP21 is just
barely
positive.
Market History and Cumulative Daily
Inverted Traders Index
(Cumulative 1/MKDS)
Lets's continue also to watch the daily "MKDS" or TRIN". It has been
positive
nearly every day for 3 weeks, thus signifying unusually heavy NYSE Down Volume
relative to the NYSE ratio of declines to advances. To make an index
which tends to rise in bull markets and tends to fall in bear markets, we
have created the Inverted MKDS, 1/MKDS. Then we follow it now
as a Cumulative 1/MKDS.
When you go back over the old data, which starts in 1965, the
first thing
we see is that the natural condition for the "Cum.1/MKDS" is to rise,
almost whatever the DJI is doing. We see this pattern repeated even in
volatile years like 1966, 1967, 1968, 1978, 1979, 1980, 1987 and 1990.
We also saw it rising in September-October 2018 just as the DJI began
falling 18%. So we just cannot trust it always to go down before, or at,
an important top. 1987 below shows that very clearly.

But what about those unusual cases where it does turn down
below its
21-day ma for two weeks or more, like now? In these cases, it does tend to
give very good warnings of approaching market weakness by turning
down, perhaps like it is doing now. I would reckon its reliability in this
this to be about 75%. The best examples are from the DJI charts for
1999-2000, 2000, 2000-2001, 2001-2002 and Jan. 2008. The exceptions
are rare and came in 2013 and 2014 when the FED was engaging in quantitative easing,
as it is now.
1999-2000 |
2000-2001 |
2001-2002 |
2007-2008 |
2009-2010 |
2013-2014 |
2014-2015 |
2015-2016 |
|
Charts 2/6/2020 (Click on Underlined link.) 2020 PEERLESS DJI, Signals, Indicators Daily DJI Volume 10-DayUp/Down Vol Stoch-20 Inverted Traders Index Graph of Pct of All Stocks above 65-dma NASDAQ S&P OEX NYSE COMPQX DJI-15 DJI-20 DJI-30 DIA QQQ MDY IWM TNA Short-Term Rates SPY http://tigersoft.com/2020CST/SPY.GIF USO-CrudeOil DBO FAS GLD BBH IBB JETS JNUG KOL NUGT OIH OIL PALL RSX RETL SDS AGQ SLV SOXL TECL TLT TMF TNA UGA (gasoline) and China: YINN CHAU Commodities: CANE CORN DBC JJC, NIB, CHOC CORN, CUT (paper) MOO, SOYB WEAT UUP (Dollar) LIT (Lithium) AAPL ADBE ALXN AMAT AMGN AMD AMZN AXP BA BABA BAC BIDU BLDP CAT CVX DE FB GOOG GS HD IBM INTU JPM M (Macy's) MSFT NFLX NKE NVDA PG QCOM TSLA TXN XOM V WMT CMG , LRCX, SQ TOWN New highs and Bullish MAXCPs http://tigersoft.com/MAXMLK/2-06/BULLISH.htm Bearish MAXCPs - http://tigersoft.com/MINMLK/2-06/BEARISH.htm |
Table 1 QUICKSILVER on DJI-30 STOCKS 2-6-2020 7 Bearish 4 Bullish STOCKS CLOSE CHANGE PIVOT-PT AROC CL-PWR CANDLE IP21 ITRS ---------------------- --------------------------------------------------------- -------------------------------------------------------------------------------- AAPL 325.21 3.76 309.51 21.2% Bullish BLUE .149 .189 Bullish --------------------------------------------------------------------- AXP 133.25 -.35 129.87 1.1% Bullish RED .022 .066 --------------------------------------------------------------------- BA 341.43 11.88 318.27 282.4% ------- BLUE.01 -.134 --------------------------------------------------------------------- CAT 137.25 -.19 131.35 70.4% Bearish RED -.099 -.099 Bearish --------------------------------------------------------------------- CSCO 48.69 .24 45.97 153.7% ------- --- -.023 .032 --------------------------------------------------------------------- CVX 109.49 -.79 107.14 -88.1% Bearish RED -.196 -.13 Bearish --------------------------------------------------------------------- DIS 142.7 1.33 138.31 173.8% Bearish BLUE-.031 -.091 --------------------------------------------------------------------- GS 241.82 -2.48 237.75 -47.8% Bullish RED -.009 .044 --------------------------------------------------------------------- HD 238.84 .73 228.1 129.8% Bullish BLUE .175 .042 --------------------------------------------------------------------- IBM 156.76 .43 143.73 682.5% Bullish RED .291 .114 Bullish --------------------------------------------------------------------- INTC 67.09 -.25 63.93 47.3% Bullish RED .09 .111 Bullish --------------------------------------------------------------------- JNJ 153.53 -.46 148.87 105% Bullish RED .238 .059 --------------------------------------------------------------------- JPM 137.61 .02 132.36 63.8% Bullish RED -.003 -.001 --------------------------------------------------------------------- KO 58.99 .14 58.4 11.1% Bullish --- -.084 .059 --------------------------------------------------------------------- MCD 212.87 -1.5 213.97 -77% ------- RED .012 .049 --------------------------------------------------------------------- MMM 162.89 .56 158.66 11.9% Bearish RED -.359 -.081 Bearish --------------------------------------------------------------------- MRK 85.68 -.15 85.44 -47.3% ------- RED -.167 -.051 Bearish --------------------------------------------------------------------- MSFT 183.63 3.73 170.23 309.1% Bullish BLUE .187 .174 Bullish --------------------------------------------------------------------- NKE 100.27 -.27 96.3 104.9% Bearish RED -.177 .021 --------------------------------------------------------------------- PFE 38.26 .09 37.24 158.5% Bearish RED -.122 -.055 --------------------------------------------------------------------- PG 127.14 .33 124.62 47.4% Bullish BLUE -.024 .004 --------------------------------------------------------------------- TRV 136.5 -.28 131.62 86% Bullish RED -.051 -.043 --------------------------------------------------------------------- UNH 292.46 -3.27 272.45 204.4% Bullish RED .144 .003 --------------------------------------------------------------------- UTX 156.2 .57 150.2 72.1% Bullish RED .051 .004 --------------------------------------------------------------------- V 203.04 .23 198.97 -127.4% Bullish --- .128 .078 --------------------------------------------------------------------- VZ 59.44 .31 59.44 6.8% ------- BLUE .031 -.059 --------------------------------------------------------------------- WBA 53.49 .51 50.85 148.6% Bearish RED -.236 -.171 Bearish --------------------------------------------------------------------- WMT 116.31 -.5 114.49 -11.7% Bullish RED .098 -.079 --------------------------------------------------------------------- DOW 61.88 -.85 62.12 -234.4% Bearish RED -.312 -.161 Bearish --------------------------------------------------------------------- XOM Bearish |
Table 2 QUICKSILVER on ETFS - 2/6/20 ETF CLOSE CHANGE PIVOT-PT 5-dma AROC CL-PWR CANDLE IP21 ITRS --------------------------------------------------------------------------------------------- DIA 293.74 .88 282.42 90.5% Bullish RED .005 0 --------------------------------------------------------------------------------------------- SPY 333.98 1.12 321.73 96.3% Bullish ---- .088 .021 --------------------------------------------------------------------------------------------- QQQ 230.19 1.97 219.07 169.5% Bullish BLUE .181 .087 Bullish --------------------------------------------------------------------------------------------- MDY 376.94 -1.9 365.46 52.9% ------- RED .024 -.012 --------------------------------------------------------------------------------------------- IWM 166.93 -.38 160.53 91.6% ------- RED -.01 .002 --------------------------------------------------------------------------------------------- FAS 101.97 .02 93.08 144.5% Bullish RED .053 .122 --------------------------------------------------------------------------------------------- RETL 25.32 -.51 22.9 49.3% Bearish RED 0 -.024 --------------------------------------------------------------------------------------------- SOXL 294.79 .19 243.61 406.7% Bearish RED .126 .339 --------------------------------------------------------------------------------------------- TECL 314.32 7.94 268.44 374.3% Bullish BLUE .204 .487 Nullish --------------------------------------------------------------------------------------------- IBB 122.47 .91 113.81 296% ------- RED -.034 .008 --------------------------------------------------------------------------------------------- GLD 147.4 .79 149.33 -36.2% Bullish BLUE .086 .017 --------------------------------------------------------------------------------------------- OIH 11.25 -.29 10.9 45% Bearish RED -.198 -.093 Bearish --------------------------------------------------------------------------------------------- GASL 4.96 -.32 4.68 -62.4% Bearish RED -.184 -.293 Bearish --------------------------------------------------------------------------------------------- |
Table 3 Count of Stocks in Key Directories
20200206
-------------------------------
NEWHIGHS 308 No longer 10:1 (NH/NL)
NEWLOWS 32
MAXCP 57
MINCP 79
TTTNH 21
TTTNL 58
FASTUP 84
FASTDOWN 62
CPCROSSA 69
CPCROSSD 103
BIGVOLUP 1
BIGVODN 18
ACCUMVER 22
HIGHIP21 21
HIUPPCT 96
REDSELL 77
AUGSELS7 23
TRAPDOOR 11
|
Table 4 RANKING OF KEY DIRECTORIES BASED PCT.OF STOCKS ABOVE 65-DMA
2/6/20
Bullish = 32
Bearish = 13
---------------------------------------------------------------------------------------
Directory Current day-1 day-2 day-3 day-4 day-5
----------------------------------------------------------------------------------------
BONDFUND .93 .95 .91 .91 .92 .92
UTILITY .871 .871 .871 .846 .846 .897
BIGBANKS .857 .857 .428 .285 .285 .714
NASD-100 .835 .835 .783 .618 .587 .701
HOMEBLDG .823 .823 .882 .764 .705 .941
GAMING .818 .772 .772 .681 .59 .636
NIFTY .814 .796 .777 .611 .592 .796
INSURANC .807 .884 .73 .692 .461 .692
SOLAR .764 .823 .764 .705 .647 .705
INDEXES .736 .758 .72 .623 .559 .677
GREEN .714 .666 .523 .428 .428 .476 SEMI .71 .719 .672 .551 .485 .607 HACKERS .7 .75 .65 .55 .55 .65 SOFTWARE .7 .7 .666 .6 .6 .65 DJI-13 .692 .692 .538 .538 .538 .615 BEVERAGE .687 .562 .687 .5 .5 .562 REIT .687 .68 .666 .617 .581 .673 COMPUTER .684 .631 .526 .473 .421 .631 SP500 .68 .684 .607 .497 .462 .594 FIDSTKS .679 .679 .589 .477 .455 .578 ELECTRON .677 .69 .644 .532 .486 .625 EDU .666 .666 .666 .666 .666 .666 SP-100 .666 .666 .577 .433 .422 .555 GUNS .625 .625 .437 .25 .25 .375 BIOTECH .623 .629 .605 .531 .468 .51 DOWJONES .62 .62 .62 .482 .448 .586 RUS-1000 .615 .633 .555 .466 .432 .541 HOSPITAL .59 .681 .59 .545 .545 .59 FINANCE .576 .529 .411 .352 .329 .447 RETAIL .568 .568 .45 .313 .274 .392 GOLD .541 .479 .479 .562 .645 .625 ETFS .508 .473 .298 .175 .157 .28 ========================================================================================== MILITARY .5 .535 .464 .357 .357 .464 ========================================================================================== INFRA .444 .5 .416 .444 .361 .444 FOOD .433 .433 .415 .396 .433 .452 COMODITY .425 .45 .425 .425 .45 .45 CHINA .418 .4 .363 .29 .254 .309 CHEM .4 .46 .38 .28 .16 .26 TRANSP .4 .45 .3 .25 .25 .3 INDMATER .324 .35 .259 .233 .194 .285 REGBANKS .269 .538 .192 .153 .076 .23 AUTO .25 .425 .25 .15 .125 .2 OILGAS .223 .261 .194 .171 .186 .238 JETS .2 .4 .2 .1 .1 .1 COPPER .125 .25 .25 0 0 .125 COAL 0 .4 0 0 0 0 |
====================================================================
2/5/2020 Peerless remains on a combined
B9-B11. At this time of
year, they average a gain of 11% when the next Peerless Sell
occurs. QQQ has reached its upper band. Its Closing Power
did not confirm today's modest advance. Today's big 150-point decline
in TSLA shows that speculative sentiments still are restrained.
Half of the DJI's 400-point advance today was brought about by
the very big advances in just 3 DJI stocks, IBM (+7.22), UNH (+14.89)
and BA (11.61). This warns that the normal profit-taking will probably
limit the DJI's advance to making a nominal new closing high above 29480.
The resistance there would also come in from the upper 2.4% band.
With our IP21 (Current Accumulation) Index now only +.002, a Sell S12
would seem likely, too, if the DJI should close 1% or 292 points higher.
The negative V-Indicator works against a breakout as does the still negative
6-day ma of the Inverted Traders Index. and the still falling Cumulative
Inverted Traders Index. Traders are no doubt looking forward to the
FED continuing to support the market and the advance, but now it seems
anti-corporation Bernie Sanders lost the Iowa primary by less than 0.1%,
with 97 percent of the precincts reporting. Hold the
long positions in
DIA and QQQ. Cover the short in XOM.


|
Charts 2/5/2020 (Click on Underlined link.) 2020 PEERLESS DJI, Signals, Indicators Daily DJI Volume 10-DayUp/Down Vol Stoch-20 Inverted Traders Index Graph of Pct of All Stocks above 65-dma NASDAQ S&P OEX NYSE COMPQX DJI-15 DJI-20 DJI-30 DIA QQQ MDY IWM TNA Short-Term Rates SPY http://tigersoft.com/2020CST/SPY.GIF USO-CrudeOil DBO FAS GLD BBH IBB JETS JNUG KOL NUGT OIH OIL PALL RSX RETL SDS AGQ SLV SOXL TECL TLT TMF TNA UGA (gasoline) and China: YINN CHAU Commodities: CANE CORN DBC JJC, NIB, CHOC CORN, CUT (paper) MOO, SOYB WEAT UUP (Dollar) LIT (Lithium) AAPL ADBE ALXN AMAT AMGN AMD AMZN AXP BA BABA BAC BIDU BLDP CAT CVX DE FB GOOG GS HD IBM INTU JPM M (Macy's) MSFT NFLX NKE NVDA PG QCOM TSLA TXN XOM V WMT CMG , LRCX, SQ TOWN New highs and Bullish MAXCPs http://tigersoft.com/MAXMLK/2-05/BULLISH.htm Bearish MAXCPs - http://tigersoft.com/MINMLK/2-05/BEARISH.htm |
Table 1 QUICKSILVER on DJI-30 STOCKS 2-5-2020 STOCKS CLOSE CHANGE PIVOT-PT AROC CL-PWR CANDLE IP21 ITRS ---------------------- --------------------------------------------------------- -------------------------------------------------------------------------------- AAPL 321.45 2.6 323.87 -45.6% Bullish RED .097 .172 Bullish --------------------------------------------------------------------- AXP 133.6 1.75 133.22 73% Bullish BLUE .016 .07 --------------------------------------------------------------------- BA 329.55 11.61 323.3 117.8% ------- BLUE-.044 -.155 --------------------------------------------------------------------- CAT 137.44 3.93 135.37 62.3% ------- BLUE-.105 -.096 --------------------------------------------------------------------- CSCO 48.45 .83 47.24 149.3% ------- BLUE-.028 .026 --------------------------------------------------------------------- CVX 110.28 3.43 111.4 -4.2% Bearish BLUE-.157 -.126 Bearish also XOM Bearish --------------------------------------------------------------------- DIS 141.37 -3.36 137.81 190.1% Bearish RED -.053 -.092 --------------------------------------------------------------------- GS 244.3 2.36 244.13 86.9% Bullish RED -.024 .065 --------------------------------------------------------------------- HD 238.11 3.11 232.79 88% Bullish BLUE .149 .035 --------------------------------------------------------------------- IBM 156.33 7.22 136.77 622.9% Bullish BLUE .316 .114 Bullish --------------------------------------------------------------------- INTC 67.34 1.88 66.47 77.3% Bullish BLUE .054 .102 --------------------------------------------------------------------- JNJ 153.99 2.39 150.36 114.8% Bullish BLUE .279 .074 Bullish --------------------------------------------------------------------- JPM 137.59 2.3 135.89 125.2% Bullish BLUE-.037 .004 --------------------------------------------------------------------- KO 58.85 .01 58.86 157.7% Bullish RED .078 .057 --------------------------------------------------------------------- MCD 214.37 -.25 216.18 -1.6% Bullish RED .093 .06 --------------------------------------------------------------------- MMM 162.33 5.09 162.51 10.4% Bearish BLUE-.326 -.072 Bearish --------------------------------------------------------------------- MRK 85.83 -2.53 86.5 -81.1% ------- BLUE-.206 -.05 Bearish --------------------------------------------------------------------- MSFT 179.9 -.22 172.78 342.6% ------- RED .116 .149 Bullish --------------------------------------------------------------------- NKE 100.54 -.84 98.19 35.4% Bearish RED -.139 .036 --------------------------------------------------------------------- PFE 38.17 .48 37.07 78.8% Bearish BLUE-.146 -.043 Bearish --------------------------------------------------------------------- PG 126.81 1.15 125.95 69.8% Bullish BLUE-.049 -.001 --------------------------------------------------------------------- TRV 136.78 4.2 134.2 131.9% Bullish BLUE-.056 -.039 --------------------------------------------------------------------- UNH 295.73 14.89 280.98 230.6% Bullish BLUE .159 .015 --------------------------------------------------------------------- UTX 155.63 2.63 154 92.4% Bullish BLUE .054 .002 --------------------------------------------------------------------- V 202.81 -.75 208.21 -58% Bullish RED .127 .073 --------------------------------------------------------------------- VZ 59.13 .84 59.36 -33.9% Bearish BLUE-.026 -.063 --------------------------------------------------------------------- WBA 52.98 .64 51.95 67.7% Bearish BLUE-.202 -.181 Bearish --------------------------------------------------------------------- WMT 116.81 1.54 116.58 39.9% Bullish BLUE .098 -.08 --------------------------------------------------------------------- DOW 62.73 2.76 64.79 -110.7% Bearish BLUE-.254 -.154 Bearish |
Table 2 QUICKSILVER on ETFS - 2/5/20 ETF CLOSE CHANGE PIVOT-PT 5-dma AROC CL-PWR CANDLE IP21 ITRS --------------------------------------------------------------------------------------------- DIA 292.86 4.82 288.54 97.4% Bullish BLUE-.038 ------ --------------------------------------------------------------------------------------------- SPY 332.86 3.8 327.68 95.8% Bullish BLUE .057 .018 --------------------------------------------------------------------------------------------- QQQ 228.22 .75 222.6 143.9% Bullish RED .148 .077 Bullish --------------------------------------------------------------------------------------------- MDY 378.84 4.29 373 83.8% ------- BLUE .06 -.006 --------------------------------------------------------------------------------------------- IWM 167.31 2.54 163.93 103.6% ------- BLUE .02 .006 --------------------------------------------------------------------------------------------- FAS 101.95 3.4 99.15 285.5% Bullish BLUE .046 .136 --------------------------------------------------------------------------------------------- RETL 25.83 1.64 25.08 55.6% ------- BLUE .032 .036 --------------------------------------------------------------------------------------------- SOXL 294.6 18.1 272.98 390.2% Bearish BLUE .106 .336 --------------------------------------------------------------------------------------------- TECL 306.38 5.23 292.65 379.6% Bullish RED .145 .441 Bullish --------------------------------------------------------------------------------------------- IBB 121.56 3.01 115.54 185.9% ------- BLUE-.046 .009 --------------------------------------------------------------------------------------------- GLD 146.61 .18 148.47 -62.4% Bullish BLUE .1 .008 --------------------------------------------------------------------------------------------- OIH 11.54 .46 11.15 217.9% ------- BLUE-.162 -.065 --------------------------------------------------------------------------------------------- GASL 5.28 .73 5.02 241.5% Bearish BLUE-.125 -.216 --------------------------------------------------------------------------------------------- |
Table 3 Count of Stocks in Key Directories
20200205
-------------------------------
NEWHIGHS 328 Bullish ratio; NH/NL >
NEWLOWS 13
MAXCP 62
MINCP 28
TTTNH 21
TTTNL 24
FASTUP 72
FASTDOWN 77
CPCROSSA 129
CPCROSSD 49
BIGVOLUP 4
BIGVODN 12
ACCUMVER 20
HIGHIP21 17
HIUPPCT 88
VHIP21 172
LOWACCUM 104
REDSELL 76
AUGSELS7 27
TRAPDOOR 11
|
Table 4 RANKING OF KEY DIRECTORIES BASED PCT.OF STOCKS ABOVE 65-DMA
2/6/20
Bullish = 32
Bearish = 13
---------------------------------------------------------------------------------------
Directory Current day-1 day-2 day-3 day-4 day-5
----------------------------------------------------------------------------------------
BONDFUND .95 .91 .91 .92 .93 .92
INSURANC .884 .73 .692 .461 .692 .5
UTILITY .871 .871 .846 .846 .897 .897
BIGBANKS .857 .428 .285 .285 .714 .571
NASD-100 .835 .793 .628 .587 .701 .69
HOMEBLDG .823 .882 .764 .705 .941 .823 SOLAR .823 .764 .705 .647 .764 .764 NIFTY .796 .777 .611 .592 .796 .796 GAMING .772 .772 .681 .59 .636 .636 INDEXES .758 .72 .623 .559 .677 .698 HACKERS .75 .7 .55 .55 .65 .65 SEMI .719 .672 .551 .485 .626 .728 SOFTWARE .7 .683 .6 .6 .65 .666 DJI-13 .692 .538 .538 .538 .615 .615 ELECTRON .686 .64 .529 .483 .627 .686 SP500 .684 .609 .497 .462 .592 .579 HOSPITAL .681 .59 .545 .545 .59 .727 REIT .68 .666 .617 .581 .673 .68 FIDSTKS .679 .589 .477 .455 .573 .578 EDU .666 .666 .666 .666 .666 .666 GREEN .666 .523 .428 .428 .476 .523 SP-100 .666 .577 .433 .422 .555 .544 RUS-1000 .633 .556 .466 .432 .541 .543 COMPUTER .631 .526 .473 .421 .631 .684 BIOTECH .626 .602 .528 .468 .522 .584 GUNS .625 .437 .25 .25 .375 .437 DOWJONES .62 .62 .482 .448 .586 .586 RETAIL .568 .45 .313 .274 .392 .431 BEVERAGE .562 .687 .5 .5 .562 .562 REGBANKS .538 .192 .153 .076 .23 .153 MILITARY .535 .464 .357 .357 .464 .428 FINANCE .529 .411 .352 .329 .447 .411 ========================================================================================== INFRA .5 .416 .444 .361 .444 .416 ========================================================================================== GOLD .479 .479 .562 .645 .645 .625 ETFS .473 .298 .175 .157 .28 .315 CHEM .46 .38 .28 .16 .28 .3 COMODITY .45 .425 .425 .45 .45 .475 TRANSP .45 .3 .25 .25 .25 .3 FOOD .433 .415 .396 .433 .452 .452 AUTO .425 .25 .15 .125 .2 .25 CHINA .4 .363 .29 .254 .309 .363 COAL .4 0 0 0 0 0 JETS .4 .2 .1 .1 .1 .1 INDMATER .35 .259 .233 .194 .285 .259 OILGAS .261 .194 .171 .186 .238 .238 COPPER .25 .25 0 0 .125 .125 |
====================================================================
2/4/2020 Peerless remains on a combined
B9-B11. At this time of
year, they average a gain of 11% when thenext Peerless Sell
occurs. The market's nemisis, Bernie Sanders, did not win the
Iowa Caucus and President Trump promised in his State of the
Union that the bull market would rise a lot more if he is re-elected.
His rise in the polls to 49% and the market's strength today is making
more and more belevers of "trickle-down" economics and "de-regulaton".
If the 1920s offers us any lessons at all, it is that these forces and
low rates below 4% will cause the market to get a lot hotter and
and a lot more speculative before the end comes. The Fed is not yet
beginning to try to halt the runaway advance, as it did in 1928.
Short-term, 29000 in the DJI is a high inflection
point now.
A breakout above this will be quite bullish, while a
reversal down could easily bring a test of 28300
and the rising 65-dma. Note that our DJI's IP21 has fallen
back to .016 but a big day on the upside will mean
the A/D is bullishly breaking its recent downtrend
and surpassing the right shoulder peak in its developing
H/S pattern.
.

Bullish Technicals Today
The number of New Highs today was bullishly ten
times the number of
new lows. (See Table 3) Breadth improved today. A day-to-day
improvement now is bullish for the next day.
So is the fact that finally today NYSE Up Volume was disproportionately
high compared to the ratio of NYSE advances to decline..
Today, the number of groups and industries with the majority of their
stocks above the 65-da rose above the number having a majority
of their stocks below the 65-dma. (See table 4).
Wild Speculation is sometimes
a sign of "sloppy" trading and
brings a bearish outlook. I think
TSLA's future is very bright. So,
I would not sell it, if it was bought
when recommended near 550.

Speculation is growing. All we have to do is
to note the wild advance of
TESLA above among the bullish MAXCPs. Clearly, many Professionals are
betting the rising prices will draw in lots more speculators. This is why
the NASDAQ and QQQ jumped today to new all-time highs.
This is great. We are long a bigger psition in QQQ than DIA. MSFT
is now the leader in the DJI. QQQ has outperformed the DJI by 9% over
the last 50-trading days and shows by the way its RSQ (relative strength
vs. the DJI) is accelerating up, that it is the ETF to be long now. Watch
for a bullish QQQ Closing Power breakout tomorrow.

Meanwhile, our Bullish MAXCP stocks, as a whole, rose sharply today
and the bearish MINCPs. in toto, continue to slide. If our Bearish MINCPs
does turn up, it will probably signify a runaway, vertical ascent for the market.
But the our TigerSoft chart of all the Bearish MINCPs is still falling still.

So, Professionals are still shorting the MINCPs, thereby showing that they want
to remain hedged and not 100% long. So should we, I believe.

|
Charts 2/4/2020 (Click on Underlined link.) 2020 PEERLESS DJI, Signals, Indicators Daily DJI Volume 10-DayUp/Down Vol Stoch-20 Inverted Traders Index Graph of Pct of All Stocks above 65-dma NASDAQ S&P OEX NYSE COMPQX DJI-15 DJI-20 DJI-30 DIA QQQ MDY IWM TNA Short-Term Rates SPY http://tigersoft.com/2020CST/SPY.GIF USO-CrudeOil DBO FAS GLD BBH IBB JETS JNUG KOL NUGT OIH OIL PALL RSX RETL SDS AGQ SLV SOXL TECL TLT TMF TNA UGA (gasoline) and China: YINN CHAU Commodities: CANE CORN DBC JJC, NIB, CHOC CORN, CUT (paper) MOO, SOYB WEAT UUP (Dollar) LIT (Lithium) AAPL ADBE ALXN AMAT AMGN AMD AMZN AXP BA BABA BAC BIDU BLDP CAT CVX DE FB GOOG GS HD IBM INTU JPM M (Macy's) MSFT NFLX NKE NVDA PG QCOM TSLA TXN XOM V WMT CMG , LRCX, SQ TOWN New highs and Bullish MAXCPs http://tigersoft.com/MAXMLK/2-04/BULLISH.htm Bearish MAXCPs - http://tigersoft.com/MINMLK/2-04/BEARISH.htm |
Table 1 QUICKSILVER on DJI-30 STOCKS 2-4-2020 STOCKS CLOSE CHANGE PIVOT-PT AROC CL-PWR CANDLE IP21 ITRS ---------------------- --------------------------------------------------------- -------------------------------------------------------------------------------- AAPL 318.85 10.19 324.34 18.3% Bullish BLUE .141 .176 --------------------------------------------------------------------- AXP 131.85 .85 131.68 -22.8% Bullish RED .003 .07 --------------------------------------------------------------------- BA 317.94 1.94 322.02 21.6% ------- ---- -.058 -.178 Bearish --------------------------------------------------------------------- CAT 133.51 3.74 135.78 -120.7% ------- BLUE-.143 -.092 --------------------------------------------------------------------- CSCO 47.62 1.09 47.05 -16% ------- BLUE -.002 .021 --------------------------------------------------------------------- CVX 106.85 .57 110.37 -195.4% Bearish RED -.219 -.125 --------------------------------------------------------------------- DIS 144.73 3.41 136.06 229.8% Bearish RED .011 -.05 --------------------------------------------------------------------- GS 241.94 2.93 240.12 -13.3% Bullish RED .012 .075 --------------------------------------------------------------------- HD 235 3.46 234.02 24.6% Bullish BLUE .162 .028 --------------------------------------------------------------------- IBM 149.11 2.84 138.53 339.1% Bullish BLUE .278 .084 --------------------------------------------------------------------- INTC 65.46 1.04 66.33 -140.8% Bullish RED .037 .095 --------------------------------------------------------------------- JNJ 151.6 1.43 150.54 70.1% Bullish BLUE .275 .08 --------------------------------------------------------------------- JPM 135.29 1.92 134.23 32.1% Bullish RED -.036 .008 --------------------------------------------------------------------- KO 58.84 .26 57.01 157.8% Bullish BLUE .062 .07 --------------------------------------------------------------------- MCD 214.62 -.56 214.44 98.8% Bullish RED .136 .07 --------------------------------------------------------------------- MMM 157.24 .65 162 -258.9% Bearish RED -.349 -.098 --------------------------------------------------------------------- MRK 88.36 1.02 87.24 121.9% Bearish RED -.261 .001 --------------------------------------------------------------------- MSFT 180.12 5.74 168.04 430.7% Bullish BLUE .187 .168 Bullish --------------------------------------------------------------------- NKE 101.38 2.11 99.84 49.1% ------- RED -.098 .054 --------------------------------------------------------------------- PFE 37.69 .18 37.58 -60% Bearish RED -.141 -.018 --------------------------------------------------------------------- PG 125.66 .55 125.06 -14.8% Bullish ---- -.08 -.008 --------------------------------------------------------------------- TRV 132.58 -1.03 133.27 -67.8% Bullish RED -.071 -.056 --------------------------------------------------------------------- UNH 280.84 6.82 282.9 -90.1% ------- BLUE .144 -.016 --------------------------------------------------------------------- UTX 153 3.05 152.82 4.6% Bullish BLUE .033 .008 --------------------------------------------------------------------- V 203.56 2.75 205.17 27.6% Bullish BLUE .177 .085 --------------------------------------------------------------------- VZ 58.29 .24 59.53 -202.8% Bearish BLUE-.068 -.055 --------------------------------------------------------------------- WBA 52.34 1.39 52.28 -42.5% Bearish BLUE -.158 -.182 BEARISH --------------------------------------------------------------------- WMT 115.27 1 115.89 -57.5% Bullish ---- .076 -.068 --------------------------------------------------------------------- DOW 59.97 -.76 64.11 -369.8% Bearish RED -.314 -.154 Bearish |
Table 2 QUICKSILVER on ETFS - 2/4/20 ETF CLOSE CHANGE PIVOT-PT 5-dma AROC CL-PWR CANDLE IP21 ITRS --------------------------------------------------------------------------------------------- DIA 288.04 4.06 287.29 13.1% Bullish BLUE-.06 ---- --------------------------------------------------------------------------------------------- SPY 329.06 4.94 326.62 33.3% Bullish BLUE .061 .023 --------------------------------------------------------------------------------------------- QQQ 227.47 5.09 221.81 135.9% Bullish BLUE .201 .09 Bullish --------------------------------------------------------------------------------------------- MDY 374.55 4.93 372.62 2.2% Bullish BLUE .096 -.006 --------------------------------------------------------------------------------------------- IWM 164.77 2.45 163.93 -3.1% ------- BLUE .021 .004 --------------------------------------------------------------------------------------------- FAS 98.55 3.27 96.44 100.4% Bullish BLUE .021 .095 --------------------------------------------------------------------------------------------- RETL 24.19 .55 25.56 -321.3% ------- RED .049 -.02 --------------------------------------------------------------------------------------------- SOXL 276.5 23.59 274 -252.9% Bearish BLUE .033 .225 --------------------------------------------------------------------------------------------- TECL 301.15 22.38 284.73 324.3% Bullish BLUE .201 .415 Bullish --------------------------------------------------------------------------------------------- IBB 118.55 2.73 117.24 53% ------- BLUE-.016 .005 --------------------------------------------------------------------------------------------- GLD 146.43 -1.93 148.46 -41.4% ------- RED .052 .02 --------------------------------------------------------------------------------------------- OIH 11.08 .21 11.06 -54.4% ------- RED -.137 -.066 --------------------------------------------------------------------------------------------- GASL 4.55 .04 5.05 -851.9% Bearish RED -.165 -.285 --------------------------------------------------------------------------------------------- |
Table 3 Count of Stocks in Key Directories
20200204
-------------------------------
NEWHIGHS 258 Bullish 10:1 ratio NH/NL
NEWLOWS 24
MAXCP 69
MINCP 75
TTTNH 19
TTTNL 60
FASTUP 48
FASTDOWN 119
CPCROSSA 123
CPCROSSD 37
BIGVOLUP 4
BIGVODN 11
ACCUMVER 19
HIGHIP21 21
HIUPPCT 84
VHIP21 157
LOWACCUM 103
REDSELL 75
AUGSELS7 22
TRAPDOOR 10
|
Table 4 RANKING OF KEY DIRECTORIES BASED PCT.OF STOCKS ABOVE 65-DMA
2/4/20
Bullish = 26
Bearish = 20
---------------------------------------------------------------------------------------
Directory Current day-1 day-2 day-3 day-4 day-5
----------------------------------------------------------------------------------------
BONDFUND .91 .91 .92 .93 .92 .94
HOMEBLDG .882 .764 .705 .941 .823 .823
UTILITY .871 .846 .846 .897 .871 .846
NASD-100 .793 .639 .597 .701 .69 .731
NIFTY .777 .611 .592 .796 .796 .851
GAMING .772 .681 .59 .636 .636 .636 SOLAR .764 .705 .647 .764 .764 .823 INSURANC .73 .692 .461 .692 .5 .615 INDEXES .72 .623 .559 .677 .698 .725 HACKERS .7 .6 .55 .65 .65 .6 BEVERAGE .687 .5 .5 .562 .562 .562 SOFTWARE .683 .616 .6 .65 .666 .666 SEMI .672 .551 .485 .626 .728 .813 EDU .666 .666 .666 .666 .666 .666 REIT .666 .617 .581 .673 .673 .687 ELECTRON .64 .529 .483 .627 .686 .758 DOWJONES .62 .482 .448 .586 .586 .62 SP500 .609 .5 .462 .592 .577 .602 BIOTECH .599 .525 .465 .522 .605 .587 HOSPITAL .59 .545 .545 .59 .727 .727 FIDSTKS .589 .477 .455 .573 .578 .612 SP-100 .577 .433 .422 .555 .544 .611 RUS-1000 .556 .467 .432 .541 .541 .563 DJI-13 .538 .538 .538 .615 .615 .615 COMPUTER .526 .473 .421 .631 .684 .684 GREEN .523 .428 .428 .476 .523 .523 n=26 --------------------------------------------------------------------------------------------- GOLD .479 .562 .645 .645 .625 .562 MILITARY .464 .357 .357 .464 .428 .5 RETAIL .45 .313 .274 .392 .431 .47 GUNS .437 .25 .25 .375 .437 .5 BIGBANKS .428 .285 .285 .714 .571 .714 COMODITY .425 .425 .45 .45 .475 .5 INFRA .416 .444 .361 .444 .388 .416 FOOD .415 .396 .433 .452 .452 .509 FINANCE .411 .352 .329 .447 .423 .423 CHEM .38 .28 .16 .28 .32 .34 CHINA .363 .29 .254 .309 .363 .363 TRANSP .3 .25 .25 .25 .3 .3 ETFS .298 .175 .157 .28 .315 .35 INDMATER .259 .233 .194 .285 .272 .246 AUTO .25 .15 .125 .2 .25 .275 COPPER .25 0 0 .125 .125 .125 JETS .2 .1 .1 .1 .1 .1 OILGAS .194 .171 .186 .238 .238 .246 REGBANKS .192 .153 .076 .23 .153 .23 COAL 0 0 0 0 0 0 N = 20 |
====================================================================
2/3/2020 The operative Peerless
signals are now a combined B9 and
B11. There have been 9 B9s at this time of year, they have averaged
a gain of 11%. Big paper losses with this signal since 1945 have
been nonexistent.
The market's recovery after Friday's Buy B9 and B10 is
continuing this morning. We can see from our MAXCPs
action today just which stocks are beeing bought very aggressively
by instutions. At the same time, look at our MINCPs tonight
and see which stocks are still being heavily dumped even
though the market is rising. Battery-powered TSLA and
Ballard Power systems are very strong, as is Lithium. Hot
money naturally flows into super-stocks. when the general market
turns back upward. This is a good sign. We need speculative
confidence. It suggests the key indexes will be returning to their highs.
Meanwhile, oil and gas stocks along with coal stocks continue to be
in free-falls and should still be held as shorts.
QQQ is considerably stronger than DIA. Note the
head/
shoulders pattern in DIA's Closing Power. This warns us that
early gains in DIA may evaporate again just as they did today.
Buy more QQQ today.


Past Buy B9s have averaged a gain of about 11.1% in late January and
early February.
Since 1933, all paper losses were under 3.4%. In 5 of 9 cases, there was no paper
loss.
Date
Gain Paper Loss
19320127 B9 77.8
+ .057 71.8 -.077 2/10
19550117 B9 388.2
+.207 no paper loss
19740207 B9 828.46 + .033
803.9 -.0296 2/11
19790206 B9 822.85 +.064
807 -.0192 2/7
19830124 B9 1030.17 +.207
perfect 0
19860122 B9 1502.29 +.215
none 0
19880120 B9 1879.14 +.077
none 0
20140204 B9 15445.24+.100
none 0
20150115 B9 17320.71+ .057
17164.9 -.0089 1/30
--------------------------------------------------------------------


The
advance today certainly could have included more stocks.
57% of all stocks are still below the support of their 65-dma.
A majority of the stock groups shown in Table 4 below have most of
their stocks BELOW their 65-dma. Many Professionals are not
convinced by today's rally. The early 400 point gain melted away with
the DJI losing 2/3 of its early gain at the close. Note that there were more
MINCP stocks than MAXCP stocks on Monday.
But very often it is the Indexes and ETFs, especially DIA and QQQ,,
which act as fearless leaders. Interestingly, the recent locomotive of
the bull market, AAPL, did not rise today. Apparently MSFT and VISA
are the new sparkplugs.
I am still concerned that NYSE Down Volume again was
disproportionately
high today. The inverted MKDS was again negative and so our Cumulative
Inverted Traders Index fell today. This bearish tendency needs to end
if we are to see a significant resumption of the bull market. Tomorrow night
we will look back at past big drops in the Cumulative Inverted MKDS.

|
Charts 2/3/2020 (Click on Underlined link.) 2020 PEERLESS DJI, Signals, Indicators Daily DJI Volume 10-DayUp/Down Vol Stoch-20 Inverted Traders Index Graph of Pct of All Stocks above 65-dma NASDAQ S&P OEX NYSE COMPQX DJI-15 DJI-20 DJI-30 DIA QQQ MDY IWM TNA Short-Term Rates SPY http://tigersoft.com/2020CST/SPY.GIF USO-CrudeOil DBO FAS GLD BBH IBB JETS JNUG KOL NUGT OIH OIL PALL RSX RETL SDS AGQ SLV SOXL TECL TLT TMF TNA UGA (gasoline) and China: YINN CHAU Commodities: CANE CORN DBC JJC, NIB, CHOC CORN, CUT (paper) MOO, SOYB WEAT UUP (Dollar) LIT (Lithium) AAPL ADBE ALXN AMAT AMGN AMD AMZN AXP BA BABA BAC BIDU BLDP CAT CVX DE FB GOOG GS HD IBM INTU JPM M (Macy's) MSFT NFLX NKE NVDA PG QCOM TSLA TXN XOM V WMT CMG , LRCX, SQ TOWN New highs and Bullish MAXCPs http://tigersoft.com/MAXMLK/2-03/BULLISH.htm Bearish MAXCPs - http://tigersoft.com/MINMLK/2-03/BEARISH.htm |
Table 1Table 1 QUICKSILVER on DJI-30 STOCKS 2-3-2020 STOCKS CLOSE CHANGE PIVOT-PT AROC CL-PWR CANDLE IP21 ITRS ---------------------- --------------------------------------------------------- -------------------------------------------------------------------------------- AAPL 308.66 -.85 317.69 -4.6% Bullish BLUE .08 .142 --------------------------------------------------------------------- AXP 131 1.13 132.45 13.7% Bullish BLUE .035 .075 --------------------------------------------------------------------- BA 316 -2.27 316.56 -9.4% ------- RED -.063 -.156 --------------------------------------------------------------------- CAT 129.77 -1.58 136.74 -220.8% Bearish RED -.142 -.11 --------------------------------------------------------------------- CSCO 46.53 .56 47.77 -99.8% ------- BLUE-.052 .007 --------------------------------------------------------------------- CVX 106.28 -.86 111.12 -186.7% Bearish RED -.209 -.104 Bearish --------------------------------------------------------------------- DIS 141.32 3.01 138.37 197.4% ------- BLUE-.035 -.064 --------------------------------------------------------------------- GS 239.01 1.26 242.58 18.1% Bullish BLUE .044 .07 --------------------------------------------------------------------- HD 231.54 3.44 233.86 7.5% Bullish BLUE .186 .009 --------------------------------------------------------------------- IBM 146.27 2.54 139.55 274.3% Bullish BLUE .252 .071 Bullish --------------------------------------------------------------------- INTC 64.42 .49 67.31 -96.3% Bullish ---- .03 .087 --------------------------------------------------------------------- JNJ 150.17 1.3 149.5 47.5% Bullish BLUE .3 .097 --------------------------------------------------------------------- JPM 133.37 1.01 134.43 50.1% Bullish BLUE -.001 .005 --------------------------------------------------------------------- KO 58.58 .18 57.01 95.2% Bullish RED .1 .087 --------------------------------------------------------------------- MCD 215.18 1.21 210.39 137.2% Bullish BLUE .185 .096 Bullish --------------------------------------------------------------------- MMM 156.59 -2.07 165.58 -577.4% Bearish RED -.276 -.099 Bearish --------------------------------------------------------------------- MRK 87.34 1.9 86.25 71.8% Bearish BLUE -.238 .015 --------------------------------------------------------------------- MSFT 174.38 4.15 165.46 360.6% Bullish BLUE .125 .143 Bullish --------------------------------------------------------------------- NKE 99.27 2.97 100.41 -49% ------- BLUE-.022 .044 --------------------------------------------------------------------- PFE 37.51 .27 38.14 -348.3% Bearish -----.1 -.021 --------------------------------------------------------------------- PG 125.11 .49 126.03 -23.1% Bullish BLUE -.056 .014 --------------------------------------------------------------------- TRV 133.61 1.99 134.39 -4.5% Bullish BLUE -.018 -.03 --------------------------------------------------------------------- UNH 274.02 1.57 285.87 -179% ------- RED .149 -.017 --------------------------------------------------------------------- UTX 149.95 -.25 152.86 -35.5% Bullish RED .016 -.006 --------------------------------------------------------------------- V 200.81 1.84 202.44 -21.6% Bullish BLUE .185 .082 Bullish --------------------------------------------------------------------- VZ 58.05 -1.39 60.7 -155.5% Bearish RED -.093 -.041 --------------------------------------------------------------------- WBA 50.95 .1 52.78 -123% Bearish RED -.173 -.188 Bearish --------------------------------------------------------------------- WMT 114.27 -.22 116.6 -68.6% Bullish RED .073 -.064 --------------------------------------------------------------------- DOW 60.73 -1.39 64.65 -312.9% Bearish RED -.281 -.121 Bearish |
Table 2Table 2 QUICKSILVER on ETFS - 2/3/20 ETF CLOSE CHANGE PIVOT-PT 5-dma AROC CL-PWR CANDLE IP21 ITRS --------------------------------------------------------------------------------------------- DIA 283.98 1.56 287.29 -24.1% Bullish BLUE-.038 --- --------------------------------------------------------------------------------------------- SPY 324.12 2.39 326.89 9.5% Bullish BLUE .055 .022 --------------------------------------------------------------------------------------------- QQQ 222.38 3.31 221.45 97% Bullish BLUE .153 .077 = +0.23 Bullish --------------------------------------------------------------------------------------------- MDY 369.62 4.16 374.39 -15.2% Bullish BLUE .13 -.004 --------------------------------------------------------------------------------------------- IWM 162.32 1.79 164.87 -36.4% Bullish BLUE .054 .004 --------------------------------------------------------------------------------------------- FAS 95.28 2.2 96.62 63.1% Bullish BLUE .067 .066 --------------------------------------------------------------------------------------------- RETL 23.64 .74 25.77 -337% ------- BLUE .085 -.065 --------------------------------------------------------------------------------------------- SOXL 252.91 9.3 289.99 -327.7% Bearish BLUE-.048 .097 --------------------------------------------------------------------------------------------- TECL 278.77 10.33 282.89 193.1% Bullish BLUE .135 .3 --------------------------------------------------------------------------------------------- IBB 115.82 2.01 117.32 -11.6% ------- BLUE-.052 .004 --------------------------------------------------------------------------------------------- GLD 148.36 -.97 147.66 -21.2% Bullish RED .051 .053 --------------------------------------------------------------------------------------------- OIH 10.87 -.03 11.2 -90.3% ------- RED -.095 -.05 --------------------------------------------------------------------------------------------- GASL 4.51 -.17 5.39 -719.1% Bearish RED -.137 -.256 = -.393 Bearish --------------------------------------------------------------------------------------------- |
Table 3 Count of Stocks in Key Directories
20200203
-------------------------------
NEWHIGHS 118
NEWLOWS 55
MAXCP 65 lower than MAXCPs
MINCP 82
TTTNH 23
TTTNL 70
FASTUP 33
FASTDOWN 113
CPCROSSA 130
CPCROSSD 32
BIGVOLUP 7
BIGVODN 6
ACCUMVER 19
HIGHIP21 24
HIUPPCT 95
REDSELL 70
AUGSELS7 18
TRAPDOOR 10
|
Table 4 RANKING OF KEY DIRECTORIES BASED PCT.OF STOCKS ABOVE 65-DMA 2/3/20 Bearish =24 Bullish =19 --------------------------------------------------------------------------------------- Directory Current day-1 day-2 day-3 day-4 day-5 ---------------------------------------------------------------------------------------- BONDFUND .91 .92 .93 .92 .94 .9 UTILITY .846 .846 .897 .871 .846 .871 HOMEBLDG .764 .705 .941 .823 .823 .823 SOLAR .705 .647 .764 .764 .823 .764 INSURANC .692 .461 .692 .5 .615 .461 GAMING .681 .59 .636 .636 .636 .545 EDU .666 .666 .666 .666 .666 .666 NASD-100 .639 .608 .711 .69 .731 .68 INDEXES .629 .559 .677 .698 .725 .672 REIT .62 .586 .675 .675 .689 .662 SOFTWARE .616 .616 .65 .666 .666 .666 NIFTY .611 .592 .796 .796 .851 .777 HACKERS .6 .6 .65 .65 .6 .6 GOLD .562 .645 .645 .625 .562 .687 SEMI .551 .485 .626 .728 .822 .71 HOSPITAL .545 .545 .59 .727 .727 .727 DJI-13 .538 .538 .615 .615 .615 .692 ELECTRON .529 .483 .627 .686 .764 .692 BIOTECH .522 .462 .519 .605 .593 .545 =========================================================================================== BEVERAGE .5 .5 .562 .562 .562 .625 SP500 .5 .464 .592 .577 .605 .571 =========================================================================================== DOWJONES .482 .448 .586 .586 .62 .62 FIDSTKS .477 .455 .573 .578 .612 .544 COMPUTER .473 .421 .631 .684 .736 .631 RUS-1000 .468 .434 .542 .542 .565 .53 INFRA .444 .361 .444 .388 .416 .361 SP-100 .433 .422 .555 .544 .611 .577 GREEN .428 .428 .476 .523 .523 .523 COMODITY .425 .45 .45 .475 .5 .525 FOOD .396 .433 .452 .452 .509 .547 MILITARY .357 .357 .464 .428 .5 .428 FINANCE .352 .329 .447 .423 .423 .364 RETAIL .313 .274 .392 .431 .47 .45 CHINA .29 .254 .309 .363 .363 .363 BIGBANKS .285 .285 .714 .571 .714 .428 CHEM .28 .16 .28 .32 .34 .32 GUNS .25 .25 .375 .437 .5 .375 TRANSP .25 .25 .25 .3 .3 .35 INDMATER .233 .194 .285 .272 .259 .259 ETFS .175 .157 .28 .315 .35 .263 OILGAS .171 .186 .238 .238 .253 .223 REGBANKS .153 .076 .23 .153 .23 .192 AUTO .15 .125 .2 .25 .275 .25 JETS .1 .1 .1 .1 .1 .1 COAL 0 0 0 0 0 0 COPPER 0 0 .125 .125 .125 .125 |
====================================================================
1/31/2020 Friday's 600 DJI drop took
this "bluechip" index down to
to its 2.2% lower band (la/ma = .978) and its rising 65-dma. With the
P-Indicator a positive +16 and the IP21 a positive +.059,
Peerless produced a Buy B9 a Friday. These positive NNCs
are reliably bullish. So, buy some DIA
or QQQ.
In additon, the DJI's minor new low was not confirmed by the
NYSE A/D Line and this has caused a Buy B11. Usually Buy B9s
and B11s reflect low interest rates and a still strong economy. This
Friday's Jobs' Report for January will be important.
See http://www.tigersoft.com/PeerInst-2012-2013/-B9.htm
http://www.tigersoft.com/PeerInst-2012-2013/-b11.htm

But as often happens, such a sharp decline makes for nervousness
among investors. In our realm now, the nervousness is high among|
big investors. Whatever the causes for this nervousness - the quickly
growing coronavirus flu in China, the likelihood that the Socialist Sanders
will win the Iowa Caucus or something else, many big investors
are tahing their profits from the Trump bull market in a way that
seems just like what happened in January 1916, 1984 and 2000
in the aftermath of big gains the previous years back then.
We have the technical warning signs to prove "Big Money" is nervous.
First, there are dozens of bearish head and shoulders patterns in the
stocks we look at here each night, including the DJI. Second, the
V-Indicator stands at -146. Levels this low often appear before
big sell-offs especially when the DJI falls to its neckline in an
emerging head and shoulders. See the table below the DJI charts.
Third, our Cumulative Inverted MKDS is in a worsening down-trend.
Time and again, in sell-offs like ours now, rallies were stunted untill
the Cumilative 1/MKDS stopped falling. Typically, a big recovery
in the DJI only began in these past cases when the Cumulative 1/MKDS
broke its downtrend.

Key Values when DJI is testing Head and Shoulders Line
in Bull Markets before big declines
The IP21 (Accumulation Index) being more than +.05
does not guarantee that there will not be a signifcant
decline given the head.shoulders pattern in the DJI. But breakdowns
with a positive IP21 are uncommon. Of the 31 big sell-offs after
a DJI head/shoulder's neckline was reached at the close,
only 7 had an IP21 greater than +.05. Similarly, a positive P-Indicator
occurred in only 6 cases. See below how most (17/31) of the
big sell-offs following a DJI head/shoulders in a bull market showed both
negative P-I and IP21 readings.
Still the presence of a very negative V-Indicator can pose a problem.
It was below -90 in 15 of the 31 cases studied. The good news is that
there have been only two cases in which a very negative V-I
over-ruled a simultaneously positive P-I and IP21 (6/13/2001
and 5/4/2010).
Date LA/MA
P-I IP-21 V-I
--------------------------------------------------------
1/31/2020 .978 +16
+.059
-146
--------------------------------------------------------
9/20/1929 .973 -48
-.119 -689
8/25/1937 .979 -99
-.102 -144
10/7/1941 .980 -43
-.216 -85
8/21/1946 .994 +47 +.122 +2
6/28/1948 .983 -69
+.067 -166
626/1950 .958 -52
-.024 -244
8/20/1956 .991
-64 + .008 -239
7/29/1957 .988 -28
+.02 -181
8/18/1959 .978 -43
-.048 -302 DJI fell only 5%
1/5/1962
.983 -100 -.104 -591
10/12/1967 .983
-87 -.127 -5 (V-I numbers recalibrated)
6/17/1971 .991
-137 -.069 -2 (V-I numbers recalibrated)
9/22/1971 .986 -47
-.021 -1 (V-I numbers recalibrated)
1/12/1977 .982 +75
-.026 -1 (V-I numbers recalibrated)
3/4/1980
.978 -315 -.012 -8 (V-I
numbers recalibrated)
12/5/1980 .983
-105 +.051 -1 (V-I numbers recalibrated)
6/29/1981 .987 -44
-.085 -1 (V-I numbers recalibrated)
8/2/1990
.977 -132 +.098 -22
2/24/1994 .980 -92
-.035 -22
7/31/1998 .976 -351
-.026 -96
1/21/2000 .986 +21
-.108 -52
6/13/2001 .982 +144 +.057
-79
3/15/2005 .995 -95
-.049 -136
1/3/2008
.976 -65 -.057 -146
5/21/2008 .978 +194 +.039
-52
9/15/2008 .956
-256 -.046 -194
5/4/2010
.988 +142 +.056 -139
10/23/2012 .974
-38 -.154 -98 Only 5% decline.
1/4/2016
.980 -179 -.077 -180
2/2/2018
.985 -159 +.073 -61
10/10/2018 .969 -323 -.087
-76
Conclusion: Buy 1/2 positions in DIA and QQQ
this morning
at the opening but hold the shorts among the bearish MINCPs.
We will buy more when we see a significant improvement in
our Cumulative Inverted MKDS. The disproportionately heavy
Down Volume must end. The Iowa Caucus
results will come
in on Tuesday morning. And Wednesday, there should be a rally
in response to the President's State of the Union Address.
|
Charts 1/31/2020 (Click on Underlined link.) 2020 PEERLESS DJI, Signals, Indicators Daily DJI Volume 10-DayUp/Down Vol Stoch-20 Inverted Traders Index Graph of Pct of All Stocks above 65-dma NASDAQ S&P OEX NYSE COMPQX DJI-15 DJI-20 DJI-30 DIA QQQ MDY IWM TNA Short-Term Rates SPY http://tigersoft.com/2020CST/SPY.GIF USO-CrudeOil DBO FAS GLD BBH IBB JETS JNUG KOL NUGT OIH OIL PALL RSX RETL SDS AGQ SLV SOXL TECL TLT TMF TNA UGA (gasoline) and China: YINN CHAU Commodities: CANE CORN DBC JJC, NIB, CHOC CORN, CUT (paper) MOO, SOYB WEAT UUP (Dollar) LIT (Lithium) AAPL ADBE ALXN AMAT AMGN AMD AMZN AXP BA BABA BAC BIDU BLDP CAT CVX DE FB GOOG GS HD IBM INTU JPM M (Macy's) MSFT NFLX NKE NVDA PG QCOM TSLA TXN XOM V WMT CMG , LRCX, SQ TOWN New highs and Bullish MAXCPs http://tigersoft.com/MAXMLK/1-31/BULLISH.htm Bearish MAXCPs - http://tigersoft.com/MINMLK/1-31/BEARISH.htm |
Table 1 QUICKSILVER on DJI-30 STOCKS 1-31-2020 STOCKS CLOSE CHANGE PIVOT-PT AROC CL-PWR CANDLE IP21 ITRS ---------------------- --------------------------------------------------------- -------------------------------------------------------------------------------- AAPL 309.51 -14.36 308.95 -138.1% Bullish RED .116 .151 --------------------------------------------------------------------- AXP 129.87 -3.35 130.64 -197.6% Bullish RED .073 .078 --------------------------------------------------------------------- BA 318.27 -5.03 316.6 -74.6% ------- RED -.022 -.146 --------------------------------------------------------------------- CAT 131.35 -4.02 135.73 -330% Bearish RED -.041 -.093 --------------------------------------------------------------------- CSCO 45.97 -1.27 47.47 -302% Bearish RED -.007 .01 --------------------------------------------------------------------- CVX 107.14 -4.26 110.39 -212.1% Bearish RED -.191 -.104 Bearish XOM Bearish --------------------------------------------------------------------- DIS 138.31 .5 135.9 -64.3% Bearish BLUE -.02 -.071 --------------------------------------------------------------------- GS 237.75 -6.38 238.14 -86.4% Bullish RED .111 .074 --------------------------------------------------------------------- HD 228.1 -4.69 231.19 -83.8% Bullish RED .223 -.053 --------------------------------------------------------------------- IBM 143.73 6.96 138.62 114.2% Bullish BLUE .237 .062 --------------------------------------------------------------------- INTC 63.93 -2.54 65.69 -339.5% Bullish RED .074 .09 --------------------------------------------------------------------- JNJ 148.87 -1.49 148.75 18.4% Bullish RED .316 .096 Bullish --------------------------------------------------------------------- JPM 132.36 -3.53 132.03 -29.5% Bullish RED .045 .006 --------------------------------------------------------------------- KO 58.4 -.46 57.48 62.5% Bullish RED .121 .094 --------------------------------------------------------------------- MCD 213.97 -2.21 209.34 64.3% Bullish RED .244 .094 Bullish --------------------------------------------------------------------- MMM 158.66 -3.85 175.63 -577.4% Bearish RED -.177 -.077 Bearish --------------------------------------------------------------------- MRK 85.44 -1.06 86.1 -31.2% Bearish RED -.212 .008 --------------------------------------------------------------------- MSFT 170.23 -2.55 162.28 155.7% ------- RED .112 .125 --------------------------------------------------------------------- NKE 96.3 -1.89 100.24 -286.1% Bearish RED .057 .015 --------------------------------------------------------------------- PFE 37.24 .17 40.16 -334.6% Bearish BLUE-.08 -.007 --------------------------------------------------------------------- PG 124.62 -1.33 125.69 -20.7% ------- RED -.075 .015 --------------------------------------------------------------------- TRV 131.62 -2.58 133.73 -117.8% Bullish RED -.008 -.028 --------------------------------------------------------------------- UNH 272.45 -8.53 284.09 -356.8% ------- RED .148 -.009 --------------------------------------------------------------------- UTX 150.2 -3.8 151.03 -97.9% Bullish RED .106 0 --------------------------------------------------------------------- V 198.97 -9.24 201.69 -147.4% Bullish RED .246 .1 Bullish --------------------------------------------------------------------- VZ 59.44 .08 59.91 -70.1% Bullish BLUE -.053 -.008 --------------------------------------------------------------------- WBA 50.85 -1.1 52.23 -113.9% Bearish RED -.14 -.187 Bearish --------------------------------------------------------------------- WMT 114.49 -2.09 115.86 5.2% Bullish RED .065 -.056 --------------------------------------------------------------------- DOW 62.12 -2.67 64.74 -323.5% Bearish RED-.245 -.101 Bearish |
Table 2 QUICKSILVER on ETFS - 1/30/20 ETF CLOSE CHANGE PIVOT-PT 5-dma AROC CL-PWR CANDLE IP21 ITRS --------------------------------------------------------------------------------------------- DIA 282.42 -6.12 285.36 -128.3% Bullish RED .063 ---- --------------------------------------------------------------------------------------------- SPY 321.73 -5.95 323.5 -107.7% Bullish RED .117 .023 --------------------------------------------------------------------------------------------- QQQ 219.07 -3.53 218.1 -82% Bullish RED .178 .071 --------------------------------------------------------------------------------------------- MDY 365.46 -7.54 370.75 -139.8% ------- RED .143 -.004 --------------------------------------------------------------------------------------------- IWM 163.92 -.01 163.51 -44.7% Bullish BLUE .214 .026 --------------------------------------------------------------------------------------------- FAS 93.08 -6.07 94.07 -255.5% Bullish RED .156 .064 --------------------------------------------------------------------------------------------- RETL 22.9 -2.18 25.32 -606.7% ------- RED .037 -.139 --------------------------------------------------------------------------------------------- SOXL 243.61 -29.37 270.62 -1105.6% Bearish RED -.045 .048 --------------------------------------------------------------------------------------------- TECL 268.44 -24.21 267.98 -350.8% Bullish RED .144 .268 --------------------------------------------------------------------------------------------- IBB 113.81 -1.73 116.09 -131.6% Bearish RED -.086 .015 --------------------------------------------------------------------------------------------- GLD 149.33 .86 148.99 45.5% Bullish BLUE .054 .07 --------------------------------------------------------------------------------------------- OIH 10.9 -.25 11.07 -329.7% Bearish RED -.055 -.052 --------------------------------------------------------------------------------------------- GASL 4.68 -.34 5.24 -1083.7% Bearish RED -.128 -.29 --------------------------------------------------------------------------------------------- |
Table 3 Count of Stocks in Key Directories
20200131
-------------------------------
NEWHIGHS 110
NEWLOWS 82
MAXCP 31
MINCP 112
TTTNH 12
TTTNL 144
FASTUP 26
FASTDOWN 183
CPCROSSA 201
CPCROSSD 33
BIGVOLUP 2
BIGVODN 36
ACCUMVER 21
HIGHIP21 26
HIUPPCT 95
REDSELL 67
AUGSELS7 24
TRAPDOOR 9
|
RANKING OF KEY DIRECTORIES BASED PCT.OF STOCKS ABOVE 65-DMA 1/31/20 --------------------------------------------------------------------------------------- Directory Current day-1 day-2 day-3 day-4 day-5 ---------------------------------------------------------------------------------------- BONDFUND .92 .93 .92 .94 .9 .93 UTILITY .846 .897 .871 .846 .871 .871 HOMEBLDG .705 .941 .823 .823 .823 .823 EDU .666 .666 .666 .666 .666 .833 SOLAR .647 .764 .764 .823 .823 .882 GOLD .645 .645 .625 .562 .687 .687 SOFTWARE .616 .666 .666 .666 .666 .716 NASD-100 .608 .721 .701 .731 .68 .783 HACKERS .6 .7 .65 .6 .6 .7 NIFTY .592 .796 .796 .851 .796 .888 GAMING .59 .636 .636 .636 .545 .636 REIT .586 .675 .675 .689 .662 .689 INDEXES .556 .675 .697 .724 .686 .756 HOSPITAL .545 .59 .727 .727 .727 .772 DJI-13 .538 .615 .615 .615 .692 .692 BEVERAGE .5 .562 .562 .562 .687 .687 SEMI .485 .626 .728 .822 .719 .906 ELECTRON .48 .625 .684 .763 .697 .855 SP500 .464 .594 .577 .605 .577 .682 INSURANC .461 .692 .5 .615 .461 .576 BIOTECH .459 .516 .602 .593 .554 .602 FIDSTKS .455 .573 .578 .612 .561 .674 COMODITY .45 .45 .475 .5 .525 .5 RUS-1000 .435 .544 .542 .566 .532 .633 DOWJONES .433 .566 .566 .6 .6 .633 FOOD .433 .452 .452 .509 .547 .528 GREEN .428 .476 .523 .523 .571 .666 SP-100 .422 .555 .544 .611 .588 .666 COMPUTER .421 .631 .684 .736 .631 .736 INFRA .361 .444 .388 .416 .361 .472 MILITARY .357 .464 .428 .5 .428 .5 FINANCE .329 .447 .423 .423 .376 .458 BIGBANKS .285 .714 .571 .714 .571 .571 RETAIL .274 .392 .431 .47 .45 .529 CHINA .254 .309 .363 .363 .363 .454 GUNS .25 .375 .437 .5 .375 .5 TRANSP .25 .25 .3 .3 .35 .55 INDMATER .194 .285 .272 .259 .259 .337 OILGAS .186 .238 .238 .253 .216 .358 CHEM .16 .28 .32 .34 .32 .36 ETFS .157 .28 .315 .35 .263 .719 AUTO .125 .2 .25 .275 .25 .325 JETS .1 .1 .1 .1 .1 .4 REGBANKS .076 .23 .153 .23 .192 .384 COAL 0 0 0 0 0 0 COPPER 0 .125 .125 .125 .125 .5 |
====================================================================
1/30/2022 The Peerless Sell S20
still is operative. The signal occurs in January
when the 6-day Inverted Traders' Index is negative with the DJI closing
at least 2.2% above the upper band and is either below resistance or
fails to sustain a breakout.
DJI has good support at its neckline and 65-dma at 28216.

Normally, for a market top to be estabished, we would
expect to see bearish
negative non-confirmations (NNC) on a DJI new high by the P-Indicator,
Accumulation Index or a V-Indicator NNC. Very often there then
follows a DJI head and shoulders pattern as bearish news impacting the
market causes an accelaration in big-money Distribution. We now see
a head/shoulders top in the DJI and a NNC by the Inverted Traders
Index. If we look at all the NNC's by 1/MKDS, not just those occurring
in January, we most often see the DJI turning up from the lower band
just below the DJI's rising 65-dma. To reverse the Sell S20, I would
expect either a new Peerless Buy signal or a clear move up by the Cumulative
Inverted Traders Index above its current downtrend. See the Cum. 1/MKDS
I have created tonight. See how past NNCs by it this past year were reversed
when the heavy selling came off the market.

Today the DJI reversed a 150-point loss and closed up 120. I take
the rally to have been in part technical. The DJI turned up from the lows
of a few days ago, which now forms a neckline in a developing head/shoulders
pattern. The bounce, especially in banks stocks, was also based on the
FED's deciding to remove the major part of the "Volker regulations" that
prevent big banks from dangerously speculating in stocks. Clearly, the
FED wants the world to know that it will do all it can to prevent a serious
market decline at this time, despite the Fed Chairman's admission that
stock prices seem high.
But can the FED prevent a further decline? New Weakness
again this morning in pre-market trading shows us that the FED may be losing
control. A clear pattern has been present for the last two weeks. Repeatedly
Down Volume is disproprtionately higher than the ratio of NYSE declines
to NYSE advances. Much of the cause of this is the fear of the developing
Coronvirus pandemic and its disruption of normal international commercial
relations. But another factor are the polls showing that Bernie Sanders, a
Socialist, is rising quickly to the top of polls among Democrats as to who
they want to be the party's next Presidential nomination. If the market behaves
like last weekend when the Coronovirus was also making the biggest headlines,
especially in the Far East, then we can expect heavy emotional, week-end selling
and profit-taking Friday and Monday. After that, comes the Tuesday Democratic
Party's Iowa Caucus results. Never before have the Democrats picked an
anti-corporate, socialist candidate. William Jennings Bryan in 1896, a populist,
was not unlike Sanders. Wall Street was badly scared by Bryan's candidacy.
See https://en.wikipedia.org/wiki/Panic_of_1896
|
Charts 1/30/2020 (Click on Underlined link.) 2020 PEERLESS DJI, Signals, Indicators Daily DJI Volume 10-DayUp/Down Vol Stoch-20 Inverted Traders Index Graph of Pct of All Stocks above 65-dma NASDAQ S&P OEX NYSE COMPQX DJI-15 DJI-20 DJI-30 DIA QQQ MDY IWM TNA Short-Term Rates SPY http://tigersoft.com/2020CST/SPY.GIF USO-CrudeOil DBO FAS GLD BBH IBB JETS JNUG KOL NUGT OIH OIL PALL RSX RETL SDS AGQ SLV SOXL TECL TLT TMF TNA UGA (gasoline) and China: YINN CHAU Commodities: CANE CORN DBC JJC, NIB, CHOC CORN, CUT (paper) MOO, SOYB WEAT UUP (Dollar) LIT (Lithium) AAPL ADBE ALXN AMAT AMGN AMD AMZN AXP BA BABA BAC BIDU BLDP CAT CVX DE FB GOOG GS HD IBM INTU JPM M (Macy's) MSFT NFLX NKE NVDA PG QCOM TSLA TXN XOM V WMT CMG , LRCX, SQ TOWN New highs and Bullish MAXCPs http://tigersoft.com/MAXMLK/1-30/BULLISH.htm Bearish MAXCPs - http://tigersoft.com/MINMLK/1-30/BEARISH.htm |
Table 1 QUICKSILVER on DJI-30 STOCKS 1-30-2020 STOCKS CLOSE CHANGE PIVOT-PT AROC CL-PWR CANDLE IP21 ITRS ---------------------- --------------------------------------------------------- -------------------------------------------------------------------------------- AAPL 323.87 -.47 318.31 73% Bullish BLUE .214 .188 Bullish --------------------------------------------------------------------- AXP 133.22 1.54 135.11 69.9% Bullish BLUE .134 .072 --------------------------------------------------------------------- BA 323.3 1.28 323.05 86.3% Bullish BLUE .005 -.161 --------------------------------------------------------------------- CAT 135.37 -.41 140.38 -266.9% ------- BLUE .036 -.099 --------------------------------------------------------------------- CSCO 47.24 .19 48.85 -183.2% Bullish BLUE .074 .017 --------------------------------------------------------------------- CVX 111.4 1.03 111.85 -76.3% ------- BLUE-.123 -.107 Bearish --------------------------------------------------------------------- DIS 137.81 1.75 140.08 -158.5% Bearish BLUE-.033 -.078 --------------------------------------------------------------------- GS 244.13 4.01 241.92 -30% Bullish BLUE .17 .078 --------------------------------------------------------------------- HD 232.79 -1.23 232 -18.5% Bullish BLUE .306 -.05 --------------------------------------------------------------------- IBM 136.77 -1.76 140.56 -217.8% Bullish BLUE .151 -.013 --------------------------------------------------------------------- INTC 66.47 .14 68.47 237.8% Bullish BLUE .134 .116 Bullish --------------------------------------------------------------------- JNJ 150.36 -.18 148.32 61.4% Bullish BLUE .391 .084 Bullish --------------------------------------------------------------------- JPM 135.89 1.66 133.15 -24.2% Bullish BLUE .097 .018 --------------------------------------------------------------------- KO 58.86 1.85 57.68 89.7% Bullish BLUE .18 .087 --------------------------------------------------------------------- MCD 216.18 1.74 211.24 65.2% Bullish BLUE .295 .084 Bullish --------------------------------------------------------------------- MMM 162.51 .51 178.15 -443.2% Bearish BLUE-.099 -.085 Bearish --------------------------------------------------------------------- MRK 86.5 -.74 85.98 -118.6% Bearish RED -.173 -.012 --------------------------------------------------------------------- MSFT 172.78 4.74 165.04 183.1% Bullish RED .186 .121 Bullish --------------------------------------------------------------------- NKE 98.19 -1.65 102.03 -238.9% Bullish RED .137 .025 --------------------------------------------------------------------- PFE 37.07 -.51 39.82 -463.3% Bearish ---- -.071 -.036 --------------------------------------------------------------------- PG 125.95 .89 125.14 38.3% Bullish BLUE-.01 .014 --------------------------------------------------------------------- TRV 134.2 .93 134.78 .4% Bullish BLUE .07 -.026 --------------------------------------------------------------------- UNH 280.98 -1.92 292.81 -319.7% Bullish RED .226 .012 --------------------------------------------------------------------- UTX 154 1.18 153.19 6.5% Bullish BLUE .16 0 --------------------------------------------------------------------- V 208.21 3.04 205 41.4% Bullish BLUE .357 .127 Bullish --------------------------------------------------------------------- VZ 59.36 -.17 60.28 -95.5% Bullish BLUE -.007 -.033 --------------------------------------------------------------------- WBA 51.95 -.33 52.04 -128.5% Bearish RED -.119 -.195 Bearish --------------------------------------------------------------------- WMT 116.58 .69 114.37 33.3% Bullish BLUE .089 -.05 --------------------------------------------------------------------- DOW 64.79 .68 66.32 -151.6% Bearish BLUE-.16 -.094 |
Table 2 QUICKSILVER on ETFS - 1/30/20 ETF CLOSE CHANGE PIVOT-PT 5-dma AROC CL-PWR CANDLE IP21 ITRS --------------------------------------------------------------------------------------------- DIA 288.54 1.25 289.8 -52% Bullish BLUE .149 ----- --------------------------------------------------------------------------------------------- SPY 327.68 1.06 328.77 -61.7% Bullish BLUE .204 .02 --------------------------------------------------------------------------------------------- QQQ 222.6 .79 222.7 -44.9% Bullish BLUE .278 .066 --------------------------------------------------------------------------------------------- MDY 373 .38 375.9 -92.3% Bullish BLUE .22 -.008 --------------------------------------------------------------------------------------------- IWM 163.93 -.26 165.39 -106.6% Bullish BLUE .143 .001 --------------------------------------------------------------------------------------------- FAS 99.15 2.71 98.03 -95.6% Bullish BLUE .24 .118 Bullish --------------------------------------------------------------------------------------------- RETL 25.08 -.48 26 -381.6% ------- ---- .093 -.082 --------------------------------------------------------------------------------------------- SOXL 272.98 -1.02 306.13 -752.3% Bearish BLUE .041 .145 --------------------------------------------------------------------------------------------- TECL 292.65 7.92 288.32 -5.3% Bullish BLUE .243 .372 Bullish --------------------------------------------------------------------------------------------- IBB 115.54 -1.7 116.88 -168.6% ------- RED -.045 .006 --------------------------------------------------------------------------------------------- GLD 148.47 .01 147.98 45.6% ------- RED .02 .044 --------------------------------------------------------------------------------------------- OIH 11.15 .09 11.64 -355.7% ------- BLUE-.05 -.078 --------------------------------------------------------------------------------------------- GASL 5.02 -.03 5.83 -1167.8% ------- BLUE-.106 -.362 Bearish --------------------------------------------------------------------------------------------- |
Table 3 Count of Stocks in Key Directories
20200130
-------------------------------
NEWHIGHS 222
NEWLOWS 39
MAXCP 167
MINCP 54
TTTNH 32
TTTNL 60
FASTUP 26
FASTDOWN 183
CPCROSSA 201
CPCROSSD 33
BIGVOLUP 3
BIGVODN 8
ACCUMVER 13
HIGHIP21 44
HIUPPCT 95
REDSELL 67
AUGSELS7 18
TRAPDOOR 9
|
RANKING OF KEY DIRECTORIES BASED PCT.OF STOCKS ABOVE 65-DMA
1/30/20
Bullish = 27
Bearish = 19
---------------------------------------------------------------------------------------
Directory Current day-1 day-2 day-3 day-4 day-5
----------------------------------------------------------------------------------------
HOMEBLDG .941 .823 .823 .823 .823 .882
BONDFUND .93 .92 .94 .9 .93 .92
UTILITY .897 .871 .846 .871 .871 .923
NIFTY .796 .796 .851 .796 .907 .925
SOLAR .764 .764 .823 .823 .882 .882
NASD-100 .721 .711 .742 .68 .793 .855
BIGBANKS .714 .571 .714 .571 .571 .857
HACKERS .7 .7 .6 .6 .7 .75
INSURANC .692 .5 .615 .461 .576 .576
REIT .675 .675 .689 .662 .682 .737
INDEXES .673 .695 .721 .684 .754 .796
EDU .666 .666 .666 .666 .833 .833
SOFTWARE .666 .683 .666 .666 .7 .733
GOLD .645 .625 .562 .687 .687 .687
GAMING .636 .636 .636 .545 .636 .727
COMPUTER .631 .684 .736 .631 .736 .842
ELECTRON .627 .686 .764 .699 .856 .869
SEMI .626 .728 .822 .719 .906 .906
DJI-13 .615 .615 .615 .692 .692 .692
SP500 .594 .579 .605 .577 .684 .756
HOSPITAL .59 .727 .727 .727 .772 .772
DOWJONES .586 .586 .62 .62 .62 .724
FIDSTKS .573 .578 .612 .561 .674 .73
BEVERAGE .562 .562 .562 .687 .687 .75
SP-100 .555 .544 .611 .588 .655 .788
RUS-1000 .544 .544 .566 .532 .631 .706
BIOTECH .513 .599 .59 .554 .617 .685
===========================================================================================
GREEN .476 .523 .523 .571 .714 .714
MILITARY .464 .428 .5 .428 .5 .642
FOOD .452 .452 .509 .547 .528 .622
COMODITY .45 .475 .5 .525 .5 .625
FINANCE .447 .423 .423 .376 .458 .541
INFRA .444 .388 .416 .361 .472 .555
RETAIL .392 .431 .47 .45 .529 .607
GUNS .375 .437 .5 .375 .5 .5
CHINA .309 .363 .363 .363 .454 .6
INDMATER .285 .272 .259 .259 .337 .428
CHEM .28 .32 .34 .32 .36 .46
ETFS .28 .315 .35 .263 .719 .824
TRANSP .25 .3 .3 .35 .55 .6
OILGAS .238 .238 .253 .216 .343 .425
REGBANKS .23 .153 .23 .192 .384 .5
AUTO .2 .25 .275 .25 .325 .375
COPPER .125 .125 .125 .125 .5 .875
JETS .1 .1 .1 .1 .4 .5
COAL 0 0 0 0 0 0
|
=====================================================================
1/29/2022 Today the DJI filled in the
recent downside price gap and then tagged
the resistance of its 21-day ma. But then then twice it lost its early 200
point gain. Who is selling and why? See below how the DJI's price pattern
now looks like it is forming a bearish head/shoulders price pattern. So does
DIA's Closing Power. These are bearish developments.
And now this morning we see the DJI futures down 100 more points. It
appears that we will see a test of the rising 65-dma very soon and then 28000.
While the positive Accumulation suggests the DJI and the NASDAQ will not
quickly collapse, the NYSE DownVolume is very heavy now. The Inverted
Traders Index was again weak.There was no Buy 'b' signal with the current
Peerless. The Buy 'b' signals are safer when the DJI is near its lower 3.5%
band and when the 1/MKDS 6-day ma is not so low.
So, there should be no hurry to buy in here. Wait for a new regular Peerless
buy signal, at the very least. My suggestion has been to sell most
remaining long positions on the bounce and do some shorting of the bearish
MINCP stocks. Weakness seems likely Friday and
Monday. If Bernie
Sanders wins the Iowa Caucuses, then it is likely that we will also not see
much of a bounce on Tuesday.
DJI's Peerless Signals and
Key Indicators


DIA's H/S in Price and Closing Power Action
In the past, the appearance of so many (circled)
head/shoulders pattern in the DJI
has warned of a
coming, much bigger decline. The FED continues to inject $65 billion
a month into big
banks and has caused the 10-year Bond to drop to near 1.5%. If they
cannot
successfully support the market with this much liquidity and cheap money, we are
in for a serious
market decline, especially if Inflation (CPI) rises over 4% year-to-year
and new Jobs'
numbers start showing weakness. The big problem will prove to be,
I believe, a
Socialist gaining a major party Presidential candidacy. If Bernie Sanders
wins the Iowa
Caucuses, then it is likely that we will also not see much of a bounce on
Tuesday, the day of the
caucus.
.

|
Charts 1/29/2020 (Click on Underlined link.) 2020 PEERLESS DJI, Signals, Indicators Daily DJI Volume 10-DayUp/Down Vol Stoch-20 Inverted Traders Index Graph of Pct of All Stocks above 65-dma NASDAQ S&P OEX NYSE COMPQX DJI-15 DJI-20 DJI-30 DIA QQQ MDY IWM TNA Short-Term Rates SPY http://tigersoft.com/2020CST/SPY.GIF USO-CrudeOil DBO FAS GLD BBH IBB JETS JNUG KOL NUGT OIH OIL PALL RSX RETL SDS AGQ SLV SOXL TECL TLT TMF TNA UGA (gasoline) and China: YINN CHAU Commodities: CANE CORN DBC JJC, NIB, CHOC CORN, CUT (paper) MOO, SOYB WEAT UUP (Dollar) LIT (Lithium) AAPL ADBE ALXN AMAT AMGN AMD AMZN AXP BA BABA BAC BIDU BLDP CAT CVX DE FB GOOG GS HD IBM INTU JPM M (Macy's) MSFT NFLX NKE NVDA PG QCOM TSLA TXN XOM V WMT CMG , LRCX, SQ TOWN New highs and Bullish MAXCPs http://tigersoft.com/MAXMLK/1-29/BULLISH.htm Bearish MAXCPs - http://tigersoft.com/MINMLK/1-29/BEARISH.htm |
Table 1 QUICKSILVER on DJI-30 STOCKS 1-29-2020 STOCKS CLOSE CHANGE PIVOT-PT AROC CL-PWR CANDLE IP21 ITRS ---------------------- --------------------------------------------------------- -------------------------------------------------------------------------------- AAPL 324.34 6.65 319.23 104.9% Bullish RED .207 .202 Bullish --------------------------------------------------------------------- AXP 131.68 -.77 131.37 7.2% Bullish RED .074 .056 --------------------------------------------------------------------- BA 322.02 5.46 317.79 205.6% ------- RED -.029 -.156 Bearish --------------------------------------------------------------------- CAT 135.78 -.96 142.75 -245.3% ------- RED -.013 -.086 --------------------------------------------------------------------- CSCO 47.05 -.72 49 -207.5% ------- RED .037 .015 --------------------------------------------------------------------- CVX 110.37 -.75 113.1 -113.1% Bearish RED -.207 -.128 Bearish XOM Bearish --------------------------------------------------------------------- DIS 136.06 -2.31 142.2 -283.7% Bearish RED -.123 -.108 Bearish --------------------------------------------------------------------- GS 240.12 -2.46 245.58 -142.6% Bullish RED .112 .062 --------------------------------------------------------------------- HD 234.02 .16 233.65 24.1% Bullish RED .261 -.043 --------------------------------------------------------------------- IBM 137.69 -1.86 142.87 -219.7% Bullish RED .051 -.005 --------------------------------------------------------------------- INTC 66.33 -.98 63.32 274.8% Bullish RED .094 .115 Bullish --------------------------------------------------------------------- JNJ 150.54 1.04 148.53 77% Bullish BLUE .352 .117 Bullish --------------------------------------------------------------------- JPM 134.23 -.2 136.54 -91% Bullish RED .043 .011 --------------------------------------------------------------------- KO 57.01 0 57.83 -52.2% Bullish ---- .133 .051 --------------------------------------------------------------------- MCD 214.44 4.05 213.42 71% Bullish BLUE .266 .073 --------------------------------------------------------------------- MMM 162 -3.58 177.74 -457.9% Bearish RED -.187 -.085 Bearish --------------------------------------------------------------------- MRK 87.24 .99 88.56 -138% Bearish BLUE-.167 -.001 --------------------------------------------------------------------- MSFT 168.04 2.58 166.72 70.9% Bullish ---- .168 .102 --------------------------------------------------------------------- NKE 99.84 -.57 103.02 -227.9% Bullish RED .149 .061 --------------------------------------------------------------------- PFE 37.58 -.56 40.71 -327.9% Bearish RED -.135 -.004 --------------------------------------------------------------------- PG 125.06 -.97 124.99 -49.7% Bullish RED -.063 .005 --------------------------------------------------------------------- TRV 133.27 -1.12 134.19 -297.4% Bullish RED .033 -.038 --------------------------------------------------------------------- UNH 282.9 -2.97 299.46 -302.3% Bullish RED .179 .073 --------------------------------------------------------------------- UTX 152.82 -.04 153.8 -31.7% Bullish RED .1 -.001 --------------------------------------------------------------------- V 204.86 2.42 206.52 -74.3% Bullish BLUE .302 .107 --------------------------------------------------------------------- VZ 59.53 -1.17 60.51 -78.7% Bearish RED -.085 -.029 --------------------------------------------------------------------- WBA 52.28 -.5 53.3 -108% ------- RED -.16 -.189 Bearish --------------------------------------------------------------------- WMT 115.89 -.71 115.81 -9.1% Bullish RED .055 -.072 --------------------------------------------------------------------- DOW 64.11 -.54 66.77 -233.6% Bearish RED -.245 -.097 Bearish |
Table 2 QUICKSILVER on ETFS - 1/29/20 ETF CLOSE CHANGE PIVOT-PT 5-dma AROC CL-PWR CANDLE IP21 ITRS --------------------------------------------------------------------------------------------- QUICKSILVER on ETFS - 01/29/20 ETF CLOSE CHANGE PIVOT-PT 5-dma AROC CL-PWR CANDLE IP21 ITRS --------------------------------------------------------------------------------------------- DIA 287.29 0 291.54 -78.2% Bullish RED .065 ----- --------------------------------------------------------------------------------------------- SPY 326.58 -.31 331.72 -72.5% Bullish RED .135 .022 --------------------------------------------------------------------------------------------- QQQ 221.81 .36 224.59 -46.4% Bullish RED .215 .069 --------------------------------------------------------------------------------------------- MDY 372.62 -1.77 379.92 -85.8% Bullish RED .164 -.006 --------------------------------------------------------------------------------------------- IWM 164.19 -.68 167.45 -101.7% Bullish RED .096 .006 --------------------------------------------------------------------------------------------- FAS 96.44 -.18 101.01 -222.7% Bullish RED .169 .095 --------------------------------------------------------------------------------------------- RETL 25.56 -.21 27.06 -293.3% ------- RED .057 -.037 --------------------------------------------------------------------------------------------- SOXL 274 -15.99 316.84 -598.8% Bearish RED -.004 .179 --------------------------------------------------------------------------------------------- TECL 284.73 1.84 292.95 -73.7% Bullish RED .197 .365 --------------------------------------------------------------------------------------------- IBB 117.24 -.08 119.5 -140.2% ------- RED -.066 .035 --------------------------------------------------------------------------------------------- GLD 148.46 .8 147.12 56.5% Bullish BLUE .035 .039 --------------------------------------------------------------------------------------------- OIL 148.46 .8 147.12 56.5% Bullish BLUE .06 13.12 --------------------------------------------------------------------------------------------- OIH 11.06 -.14 11.96 -461.2% ------- RED -.119 -.067 --------------------------------------------------------------------------------------------- GASL 5.05 -.34 6.32 -1278.6% ------- RED -.186 -.319 --------------------------------------------------------------------------------------------- UGA 5.05 -.34 6.32 -1278.6% Bullish RED -.2 -.871 --------------------------------------------------------------------------------------------- UUP 25.98 -.06 26.26 -53.5% ------- --- -.019 -.054 --------------------------------------------------------------------------------------------- IEF 25.98 -.06 26.26 -53.5% Bearish --- .065 -.797 --------------------------------------------------------------------------------------------- CORN 25.98 -.06 26.26 -53.5% ------- --- .046 .764 --------------------------------------------------------------------------------------------- WEAT 25.98 -.06 26.26 -53.5% ------- --- .03 3.649 --------------------------------------------------------------------------------------------- YINN 25.98 -.06 26.26 -53.5% Bullish ---- .021 .272 --------------------------------------------------------------------------------------------- RSX 25.56 .1 25.97 -126.4% Bullish ---- .134 .011 |
Table 3 Count of Stocks in Key Directories
20200129
-------------------------------
NEWHIGHS 204
NEWLOWS 40
MAXCP 80
MINCP 82
TTTNH 25
TTTNL 70
FASTUP 29
FASTDOWN 190
CPCROSSA 42
CPCROSSD 74
BIGVOLUP 3
BIGVODN 8
ACCUMVER 21
HIGHIP21 37
HIUPPCT 94
REDSELL 66
AUGSELS7 19
TRAPDOOR 9
|
RANKING OF KEY DIRECTORIES BASED PCT.OF STOCKS ABOVE 65-DMA 1/29/20 Bullish = 27 Bearish = 18 --------------------------------------------------------------------------------------- Directory Current day-1 day-2 day-3 day-4 day-5 ---------------------------------------------------------------------------------------- BONDFUND .92 .94 .9 .93 .92 .9 UTILITY .871 .846 .871 .871 .923 .897 HOMEBLDG .823 .823 .823 .823 .882 .823 NIFTY .796 .851 .796 .907 .925 .907 SOLAR .764 .823 .823 .882 .882 .882 SEMI .728 .822 .719 .906 .906 .906 HOSPITAL .727 .727 .727 .772 .772 .818 NASD-100 .711 .752 .69 .793 .845 .845 HACKERS .7 .65 .6 .7 .75 .75 INDEXES .689 .721 .684 .754 .796 .77 ELECTRON .686 .764 .699 .856 .869 .862 COMPUTER .684 .736 .631 .736 .842 .736 SOFTWARE .683 .683 .666 .7 .733 .75 REIT .675 .689 .662 .682 .744 .655 EDU .666 .666 .666 .833 .833 .833 GAMING .636 .636 .545 .636 .727 .727 GOLD .625 .562 .687 .687 .687 .708 DJI-13 .615 .615 .692 .692 .692 .769 BIOTECH .596 .587 .551 .617 .685 .715 DOWJONES .586 .62 .62 .62 .724 .793 SP500 .579 .607 .577 .684 .756 .76 FIDSTKS .578 .612 .561 .674 .735 .775 BIGBANKS .571 .714 .571 .571 .857 .857 BEVERAGE .562 .562 .687 .687 .75 .75 RUS-1000 .544 .567 .532 .631 .705 .713 SP-100 .544 .611 .588 .655 .777 .8 GREEN .523 .523 .571 .714 .714 .714 =========================================================================================== INSURANC .5 .615 .461 .576 .576 .653 =========================================================================================== COMODITY .475 .5 .525 .5 .625 .65 FOOD .452 .509 .547 .528 .622 .641 GUNS .437 .5 .375 .5 .5 .5 RETAIL .431 .47 .45 .529 .647 .647 MILITARY .428 .5 .428 .5 .642 .642 FINANCE .423 .423 .376 .458 .541 .564 INFRA .388 .416 .361 .472 .555 .527 CHINA .363 .363 .363 .454 .6 .654 CHEM .32 .34 .32 .36 .48 .48 ETFS .315 .35 .263 .719 .824 .859 TRANSP .3 .3 .35 .55 .6 .6 INDMATER .272 .259 .259 .337 .428 .428 AUTO .25 .275 .25 .325 .375 .375 OILGAS .238 .253 .216 .343 .425 .462 REGBANKS .153 .23 .192 .384 .5 .461 COPPER .125 .125 .125 .5 1 1 JETS .1 .1 .1 .4 .5 .3 COAL 0 0 0 0 0 0 |
====================================================================
1/28/2022 Last week's false breakout with the
6-day ma of the Inverted Traders'
Index below -.05 predicts from its January Election Year history a
DJI decline down, at least to its lower band and 65-day ma, now
28000, but quite possibly a lot more given how extended is the rally
how ripe it is to severe profit-taking. I say this based on technicals.
If the Chinese flu outbreak worsens and becomes a pandemic, then
prices are apt to completely break below the DJI's rising 65-dma.
https://www.worldometers.info/coronavirus/
If Bernie Sanders wins the Iowa Primary next week by a wide margin, that, too,
will cause a much bigger decline.

The DJI did, in fact, rise back up half of what it fell on Monday. The
"Tuesday turn-around" has not quite closed Monday's price gap. The DJI
is also still 166 points below the resistance of its 21-day ma. The V-Indicator
is a weak-looking -87 and the DJI's 5-day ma is falling and cannot easily
turn up. A reversal down tomorrow will make the present rally appear to
be setting up a bearish head/shoulders pattern. So further reducing our long
positions today and using some of our Bearish MINCPs as shorts is
recommended. Additional shorts are recommended in XOM, EQT,
XIN (where shorting is allowed) and FCG on a price breakdown are recomended.
 |
 |
 |
 |
|
Charts 1/28/2020 (Click on Underlined link.) 2020 PEERLESS DJI, Signals, Indicators Daily DJI Volume 10-DayUp/Down Vol Stoch-20 Inverted Traders Index Graph of Pct of All Stocks above 65-dma NASDAQ S&P OEX NYSE COMPQX DJI-15 DJI-20 DJI-30 DIA QQQ MDY IWM TNA Short-Term Rates SPY http://tigersoft.com/2020CST/SPY.GIF USO-CrudeOil DBO FAS GLD BBH IBB JETS JNUG KOL NUGT OIH OIL PALL RSX RETL SDS AGQ SLV SOXL TECL TLT TMF TNA UGA (gasoline) and China: YINN CHAU Commodities: CANE CORN DBC JJC, NIB, CHOC CORN, CUT (paper) MOO, SOYB WEAT UUP (Dollar) LIT (Lithium) AAPL ADBE ALXN AMAT AMGN AMD AMZN AXP BA BABA BAC BIDU BLDP CAT CVX DE FB GOOG GS HD IBM INTU JPM M (Macy's) MSFT NFLX NKE NVDA PG QCOM TSLA TXN XOM V WMT CMG , LRCX, SQ TOWN New highs and Bullish MAXCPs http://tigersoft.com/MAXMLK/1-28/BULLISH.htm Bearish MAXCPs - http://tigersoft.com/MINMLK/1-28/BEARISH.htm |
Table 1 QUICKSILVER on DJI-30 STOCKS 12-27-2020 Bullish = 10 Bearish = 8 STOCKS CLOSE CHANGE PIVOT-PT AROC CL-PWR CANDLE IP21 ITRS ---------------------- --------------------------------------------------------- -------------------------------------------------------------------------------- AAPL 317.69 8.74 317.7 17.7% Bullish BLUE .196 .168 Bullish --------------------------------------------------------------------- AXP 132.45 1.81 131.49 72.8% Bullish BLUE .08 .068 --------------------------------------------------------------------- BA 316.56 -.04 309 50.5% ------- RED -.023 -.16 Bearish --------------------------------------------------------------------- CAT 136.74 1.01 142.63 -322% ------- RED .02 -.087 --------------------------------------------------------------------- CSCO 47.77 .3 49.06 -105.9% Bullish BLUE .052 -.047 --------------------------------------------------------------------- CVX 111.12 .73 112.9 -97.5% Bearish BLUE-.209 -.124 Very Bearish --------------------------------------------------------------------- DIS 138.37 2.47 144.01 -183.8% Bearish BLUE-.096 -.103 Bearish --------------------------------------------------------------------- GS 242.58 4.44 247.05 -64% Bullish BLUE .15 .073 Bullish --------------------------------------------------------------------- HD 233.86 2.67 232.9 19.6% Bullish BLUE .247 -.037 --------------------------------------------------------------------- IBM 139.55 .93 143.89 13.5% Bullish ---- .078 .004 --------------------------------------------------------------------- INTC 67.31 1.62 62.73 526.9% Bullish BLUE .114 .129 Bullish --------------------------------------------------------------------- JNJ 149.5 .75 148.25 7.7% Bullish BLUE .331 .106 Bullish --------------------------------------------------------------------- JPM 134.43 2.4 136.68 -89.2% Bullish BLUE .052 .013 --------------------------------------------------------------------- KO 57.01 -.47 57.61 -13.9% Bullish RED .154 .055 Bullish --------------------------------------------------------------------- MCD 210.39 1.05 211.44 -18.2% Bullish BLUE .272 .046 Bullish --------------------------------------------------------------------- MMM 165.58 -10.05 178.03 -388.4% Bearish RED -.112 -.062 Bearish --------------------------------------------------------------------- MRK 86.25 .15 89.65 -211.2% Bearish RED -.167 -.016 Bearish --------------------------------------------------------------------- MSFT 165.46 3.18 165.7 -31.5% Bullish BLUE .141 .09 Bullish --------------------------------------------------------------------- NKE 100.41 .17 104.49 -202.7% Bullish BLUE .184 .067 Bullish --------------------------------------------------------------------- PFE 38.14 -2.02 40.19 -273.3% Bearish RED -.087 .009 --------------------------------------------------------------------- PG 126.03 .34 126.31 -2.4% Bullish BLUE -.01 .011 --------------------------------------------------------------------- TRV 134.39 .66 141.34 -238% Bullish RED .078 -.031 --------------------------------------------------------------------- UNH 285.87 1.78 300.59 -248.1% Bullish BLUE .204 .094 Bullish --------------------------------------------------------------------- UTX 152.86 1.83 153.79 -52.5% Bullish BLUE .084 -.003 --------------------------------------------------------------------- V 202.85 1.16 207.9 -107.9% Bullish BLUE .316 .097 Bullish --------------------------------------------------------------------- VZ 60.7 .79 60.48 31.5% Bullish BLUE -.024 -.012 --------------------------------------------------------------------- WBA 52.78 .55 53.42 -102.9% ------- BLUE-.105 -.185 Bearish --------------------------------------------------------------------- WMT 116.6 .74 116.1 43.7% Bullish BLUE .084 -.069 --------------------------------------------------------------------- XOM 64.65 -.09 -220% Bearish -.246 -.094 Bearish --------------------------------------------------------------------- DOW 64.65 -.09 67.19 -220.2% Bearish RED -.246 -.094 Bearish |
Table 2 QUICKSILVER on ETFS - 1/28/20 ETF CLOSE CHANGE PIVOT-PT 5-dma AROC CL-PWR CANDLE IP21 ITRS --------------------------------------------------------------------------------------------- DIA 287.29 1.93 291.81 -78.3% Bullish BLUE .098 0 --------------------------------------------------------------------------------------------- BA 316.56 -.04 309 50.5% ------- RED -.023 -.16 --------------------------------------------------------------------------------------------- SPY 326.89 3.28 331.34 -67% Bullish BLUE .167 .024 --------------------------------------------------------------------------------------------- QQQ 221.45 3.35 223.87 -41.1% Bullish BLUE .214 .065 Bullish --------------------------------------------------------------------------------------------- MDY 374.39 3.64 379.07 -65.7% Bullish BLUE .212 .001 --------------------------------------------------------------------------------------------- IWM 164.87 1.36 167.56 -84.2% Bullish BLUE .109 .009 --------------------------------------------------------------------------------------------- FAS 96.62 2.55 100.81 -188.2% Bullish BLUE .179 .11 Bullish --------------------------------------------------------------------------------------------- RETL 25.77 .45 27.1 -299.2% ------- ---- .063 -.012 --------------------------------------------------------------------------------------------- SOXL 289.99 19.37 309.77 -208.5% Bearish BLUE .027 .238 --------------------------------------------------------------------------------------------- TECL 282.89 14.91 288.92 -51.6% Bullish BLUE .216 .349 Most Bullish --------------------------------------------------------------------------------------------- IBB 117.32 1.23 120.55 -143.2% ------- BLUE-.08 .028 --------------------------------------------------------------------------------------------- GLD 147.66 -1.33 146.79 31.2% ------- RED .001 .037 --------------------------------------------------------------------------------------------- OIH 11.2 .13 12.13 -457% ------- ---- -.106 -.064 Bearish --------------------------------------------------------------------------------------------- GASL 5.39 .15 6.55 -1377.3% ------- ---- -.177 -.297 Bearish --------------------------------------------------------------------------------------------- |
Table 3 Count of Stocks in Key Directories
20200128
-------------------------------
NEWHIGHS 180
NEWLOWS 20
MAXCP 103
MINCP 50
TTTNH 33
TTTNL 40
FASTUP 28
FASTDOWN 161
CPCROSSA 146
CPCROSSD 40
BIGVOLUP 1
BIGVODN 13
ACCUMVER 24
HIGHIP21 39
HIUPPCT 101
LOWACCUM 97
REDSELL 65
AUGSELS7 15
TRAPDOOR 8
|
Table 4 RANKING OF KEY DIRECTORIES BASED PCT.OF STOCKS ABOVE 65-DMA
1/28/20
Bullish = 29
Bearish = 14
---------------------------------------------------------------------------------------
Directory Current day-1 day-2 day-3 day-4 day-5
----------------------------------------------------------------------------------------
BONDFUND .94 .9 .93 .92 .91 .91
NIFTY .851 .796 .907 .925 .907 .907
UTILITY .846 .871 .871 .923 .897 .897
HOMEBLDG .823 .823 .823 .882 .823 .823
SOLAR .823 .823 .882 .882 .882 .882
SEMI .822 .719 .906 .906 .906 .897
ELECTRON .769 .703 .855 .868 .861 .875
NASD-100 .752 .701 .804 .845 .845 .845
COMPUTER .736 .631 .736 .842 .736 .842
HOSPITAL .727 .727 .772 .772 .818 .863
INDEXES .727 .684 .754 .796 .77 .796
BIGBANKS .714 .571 .571 .857 .857 .857
REIT .689 .662 .682 .744 .655 .751
SOFTWARE .683 .683 .7 .733 .75 .783
EDU .666 .666 .833 .833 .833 .833
HACKERS .65 .65 .7 .75 .75 .7
GAMING .636 .545 .636 .727 .727 .727
DJI-13 .615 .692 .692 .692 .769 .846
INSURANC .615 .461 .576 .576 .615 .576
FIDSTKS .612 .561 .674 .735 .775 .797
SP-100 .611 .588 .655 .777 .8 .844
SP500 .607 .579 .684 .756 .762 .787
DOWJONES .6 .6 .6 .7 .766 .8
BIOTECH .584 .548 .614 .685 .724 .727
RUS-1000 .567 .533 .631 .705 .714 .736
BEVERAGE .562 .687 .687 .75 .75 .75
GOLD .562 .687 .687 .687 .708 .708
GREEN .523 .571 .714 .714 .714 .809
FOOD .509 .547 .528 .622 .641 .66
===========================================================================================
COMODITY .5 .525 .5 .625 .65 .65
GUNS .5 .375 .5 .5 .5 .687
MILITARY .5 .428 .5 .642 .642 .678
===========================================================================================
RETAIL .47 .45 .529 .647 .647 .686
FINANCE .423 .376 .458 .541 .576 .552
INFRA .416 .361 .472 .555 .527 .583
CHINA .363 .363 .454 .6 .654 .69
ETFS .35 .263 .719 .824 .859 .807
CHEM .34 .32 .36 .48 .46 .52
TRANSP .3 .35 .55 .6 .6 .65
AUTO .275 .25 .325 .375 .375 .45
INDMATER .259 .259 .337 .428 .428 .467
OILGAS .248 .21 .338 .421 .458 .518
REGBANKS .23 .192 .384 .5 .461 .5
COPPER .125 .125 .5 1 1 1
JETS .1 .1 .4 .5 .3 .3
COAL 0 0 0 0 0 0
|
====================================================================
====================================================================
1/27/2022 DJIA Breakout
failure and Sell S20. But first we should see
an effort by
indexes and ETFs to close their downside gaps. The 400 point decline
on Monday seems to regularly bring a "Tuesday turnaround". I believe
under the present technical curcumstances (very heavy down volume,
negative Inverted Traders Index, lots of big profits to be taken
and a failed breakout by the DJI) that traders should use the overnight
advance and upside folow-through tomorrow to sell long positions in DIA
and QQQ.
Our various DJI charts show an oversold condition has developed, but we
do not yet have a Peerless Buy signal. Let's look in detail to see what they
show us about the DJI's technical position.
| There
is still flat (neckline) support for the DJI at 28400. Our IP21 stands at
+.109 and the P-I is still a positive +75. So there is still support at the lower 2.5%-3% bands 200 points lower. But the DJI knifed below 29000. So that level should be resistance now. Note the failed breakout above 29000. Now the DJI has returned and positioned itself again in a rising channel. If 28400 is broken below, mostly likely on renewed heavy selling after 28900 is again tested, the next support level will be at the rising (heavy purple) 65-dma This may give us a new Buy signal, but that will depend on the V-Indicator reading. In the past a very negative reading by the V-Indicator often signifies a deeper decline. Right now the V-I is -94. The heavy down-volume and falling 5-day ma suggests the bounce wiill be limited. The 65-dma is still rising. That will help hold up the DJI but the price channel's dominance shows the best support will be between 27000 and 27500. Remember that DJI tends frequently to be drift lower in the first quarter of a Presidential Election year. We have not quite reached "oversold" status as governed by the 20-day Stochastic and the traders' 5-day ma is still falling and cannot easily turn up tomorrow. So, the rally is apt to fail.     |
| Our Inverted Traders' Index is
now quite negative. If its 6-day ma turns up, it will bring a traders' Buy 'b'. These are most reliable when they occur with the DJI 2.5%-3.5% below its 21-dma. The DJI now is only 1.1% below its 21-dma.  |
 |
 |
 |
|
Charts 1/27/2020 (Click on Underlined link.) 2020 PEERLESS DJI, Signals, Indicators Daily DJI Volume 10-DayUp/Down Vol Stoch-20 Inverted Traders Index Graph of Pct of All Stocks above 65-dma NASDAQ S&P OEX NYSE COMPQX DJI-15 DJI-20 DJI-30 DIA QQQ MDY IWM TNA Short-Term Rates SPY http://tigersoft.com/2020CST/SPY.GIF USO-CrudeOil DBO FAS GLD BBH IBB JETS JNUG KOL NUGT OIH OIL PALL RSX RETL SDS AGQ SLV SOXL TECL TLT TMF TNA UGA (gasoline) and China: YINN CHAU Commodities: CANE CORN DBC JJC, NIB, CHOC CORN, CUT (paper) MOO, SOYB WEAT UUP (Dollar) LIT (Lithium) AAPL ADBE ALXN AMAT AMGN AMD AMZN AXP BA BABA BAC BIDU BLDP CAT CVX DE FB GOOG GS HD IBM INTU JPM M (Macy's) MSFT NFLX NKE NVDA PG QCOM TSLA TXN XOM V WMT CMG , LRCX, SQ TOWN New highs and Bullish MAXCPs http://tigersoft.com/MAXMLK/1-27/BULLISH.htm Bearish MAXCPs - http://tigersoft.com/MINMLK/1-27/BEARISH.htm |
Table 1 QUICKSILVER on DJI-30 STOCKS 1-27-2020 STOCKS CLOSE CHANGE PIVOT-PT AROC CL-PWR CANDLE IP21 ITRS ---------------------- --------------------------------------------------------- -------------------------------------------------------------------------------- AAPL 308.95 -9.36 316.57 -153.7% Bullish RED .193 .15 --------------------------------------------------------------------- AXP 130.64 -4.47 130.53 -33.3% Bullish ---- .106 .052 --------------------------------------------------------------------- BA 316.6 -6.45 313.37 -118.9% ------- BLUE-.04 -.157 --------------------------------------------------------------------- CAT 135.73 -4.65 145.85 -418.8% ------- RED .042 -.102 --------------------------------------------------------------------- CSCO 47.47 -1.38 48.8 -158.3% Bullish RED .052 -.048 --------------------------------------------------------------------- CVX 110.39 -1.46 113.31 -228.9% Bearish BLUE-.219 -.116 --------------------------------------------------------------------- DIS 135.9 -4.18 143.56 -295.1% Bearish RED -.121 -.048 --------------------------------------------------------------------- GS 238.14 -3.78 245.7 -230.1% Bullish BLUE .125 .051 --------------------------------------------------------------------- HD 231.19 -.81 232.95 -15.5% Bullish BLUE .255 -.037 --------------------------------------------------------------------- IBM 138.62 -1.94 139.17 11% Bullish BLUE .076 -.007 --------------------------------------------------------------------- INTC 65.69 -2.78 60.55 483.8% Bullish RED .097 .1 --------------------------------------------------------------------- JNJ 148.75 .43 149.27 -14.1% Bullish BLUE .34 .103 --------------------------------------------------------------------- JPM 132.03 -1.12 136.84 -226.4% Bullish BLUE .051 -.007 --------------------------------------------------------------------- KO 57.48 -.2 57.17 47% Bullish BLUE .234 .082 --------------------------------------------------------------------- MCD 209.34 -1.9 211.16 -62.3% Bullish BLUE .326 .054 --------------------------------------------------------------------- MMM 175.63 -2.52 179.39 -159.8% ------- RED .041 -.001 --------------------------------------------------------------------- MRK 86.1 .12 89.97 -273.5% Bearish BLUE-.168 -.006 --------------------------------------------------------------------- MSFT 162.28 -2.76 166.5 -145% Bullish BLUE .134 .074 --------------------------------------------------------------------- NKE 100.24 -1.79 104.58 -206.8% Bullish BLUE .209 .091 --------------------------------------------------------------------- PFE 40.16 .34 40.34 -43.4% ------- BLUE .028 .057 --------------------------------------------------------------------- PG 125.69 .55 126.09 -28.6% Bullish BLUE .002 .025 --------------------------------------------------------------------- TRV 133.73 -1.05 140.91 -252.9% Bullish RED .148 -.026 --------------------------------------------------------------------- UNH 284.09 -8.72 300.53 -241% Bullish RED .216 .084 --------------------------------------------------------------------- UTX 151.03 -2.16 154.47 -109.5% Bullish ---- .066 -.011 --------------------------------------------------------------------- V 201.69 -3.31 207.29 -73% Bullish BLUE .349 .093 --------------------------------------------------------------------- VZ 59.91 -.37 60.32 -18.2% Bullish BLUE-.039 -.019 --------------------------------------------------------------------- WBA 52.23 .19 53.87 -204.1% ------- BLUE-.111 -.196 --------------------------------------------------------------------- WMT 115.86 1.49 115.59 39% Bullish BLUE .079 -.056 --------------------------------------------------------------------- DOW 64.74 -1.58 67.58 -283.9% Bearish RED -.215 -.096 |
Table 2 QUICKSILVER on ETFS - 1/27/20 ETF CLOSE CHANGE PIVOT-PT 5-dma AROC CL-PWR CANDLE IP21 ITRS --------------------------------------------------------------------------------------------- DIA 285.36 -4.44 291.83 -135.6% Bullish BLUE .103 0 --------------------------------------------------------------------------------------------- BA 316.6 -6.45 313.37 -118.9% ------- BLUE-.04 -.157 --------------------------------------------------------------------------------------------- SPY 323.61 -5.16 331.3 -126% Bullish BLUE .169 .018 --------------------------------------------------------------------------------------------- QQQ 218.1 -4.6 223.28 -118.1% Bullish BLUE .214 .053 --------------------------------------------------------------------------------------------- MDY 370.75 -5.15 379.34 -141.1% Bullish BLUE .214 -.007 --------------------------------------------------------------------------------------------- IWM 163.51 -1.88 167.67 -166% Bullish BLUE .09 0 --------------------------------------------------------------------------------------------- FAS 94.07 -3.96 100.34 -356.5% Bullish BLUE .194 .078 --------------------------------------------------------------------------------------------- RETL 25.32 -.68 27.36 -476.3% ------- BLUE .102 -.039 --------------------------------------------------------------------------------------------- SOXL 270.62 -35.51 302.55 -528% Bearish RED -.002 .157 --------------------------------------------------------------------------------------------- TECL 267.98 -20.34 285.83 -316.5% Bullish ---- .208 .292 --------------------------------------------------------------------------------------------- IBB 116.09 -.79 120.72 -241.9% ------- BLUE-.119 .023 --------------------------------------------------------------------------------------------- GLD 148.99 1.01 146.74 81.9% Bullish RED .063 .055 --------------------------------------------------------------------------------------------- OIH 11.07 -.57 12.28 -659.2% ------- RED -.144 -.096 --------------------------------------------------------------------------------------------- GASL 5.24 -.59 7.1 -2122.6% ------ RED -.251 -.349 --------------------------------------------------------------------------------------------- |
Table 3 Count of Stocks in Key Directories
20200127
-------------------------------
NEWHIGHS 109
NEWLOWS 49
MAXCP 48
MINCP 84
TTTNH 20
TTTNL 76
FASTUP 32
FASTDOWN 242
CPCROSSA 94
CPCROSSD 60
BIGVOLUP 3
BIGVODN 14
ACCUMVER 22
HIGHIP21 40
HIUPPCT 93
REDSELL 68
AUGSELS7 19
TRAPDOOR 7
|
Table 4 RANKING OF KEY DIRECTORIES BASED PCT.OF STOCKS ABOVE 65-DMA
1/27/20
Bullish = 29
Bearish = 17
---------------------------------------------------------------------------------------
Directory Current day-1 day-2 day-3 day-4 day-5
----------------------------------------------------------------------------------------
BONDFUND .9 .93 .92 .91 .91 .891
UTILITY .875 .875 .925 .9 .9 .9
HOMEBLDG .823 .823 .882 .823 .823 .764
SOLAR .823 .882 .882 .882 .882 .882
NIFTY .796 .907 .925 .907 .907 .907
HOSPITAL .727 .772 .772 .818 .863 .909
SEMI .719 .906 .906 .906 .897 .925
NASD-100 .701 .814 .855 .845 .845 .865
ELECTRON .699 .856 .869 .862 .875 .895
DJI-13 .692 .692 .692 .769 .846 .846
BEVERAGE .687 .687 .75 .75 .75 .75
GOLD .687 .687 .687 .708 .708 .687
INDEXES .684 .754 .796 .77 .802 .834
SOFTWARE .683 .716 .733 .75 .783 .783
EDU .666 .833 .833 .833 .833 .833
REIT .662 .682 .744 .655 .744 .668
HACKERS .65 .75 .75 .75 .7 .8
COMPUTER .631 .736 .842 .736 .894 .842
DOWJONES .62 .62 .724 .793 .827 .793
SP-100 .588 .655 .777 .8 .833 .844
SP500 .579 .686 .756 .762 .789 .808
BIGBANKS .571 .571 .857 .857 .857 .857
GREEN .571 .714 .714 .714 .809 .761
FIDSTKS .561 .674 .735 .775 .803 .831
BIOTECH .547 .609 .68 .721 .733 .695
FOOD .547 .528 .622 .641 .66 .754
GAMING .545 .636 .727 .727 .727 .863
RUS-1000 .533 .633 .705 .714 .736 .777
COMODITY .525 .5 .625 .65 .65 .775
============================================================================================
INSURANC .461 .576 .576 .615 .576 .653
RETAIL .45 .529 .647 .647 .666 .725
MILITARY .428 .5 .642 .642 .678 .75
FINANCE .376 .458 .541 .576 .564 .682
GUNS .375 .5 .5 .5 .687 .75
CHINA .363 .454 .6 .654 .69 .818
INFRA .361 .472 .555 .527 .583 .638
TRANSP .35 .55 .6 .6 .65 .75
CHEM .306 .346 .469 .448 .51 .612
ETFS .263 .719 .824 .859 .807 .947
INDMATER .259 .337 .428 .428 .467 .584
AUTO .25 .325 .375 .375 .45 .5
OILGAS .216 .343 .425 .462 .529 .656
REGBANKS .192 .384 .5 .461 .5 .692
COPPER .125 .5 1 1 1 1
JETS .1 .4 .5 .3 .3 .7
COAL 0 0 0 0 0 0
|
====================================================================
1/24/2022
New S20 - Breakout Failure and Negative Non-Confirmation
by Tiger's 6-day Inverted Traders Moving Average.

Rates fell sharply on Friday, Boeing rallied
and Utilities took off, too.
But still the DJI, the NASDAQ and QQQ all fell on increasing volume.

This is not good. The Fed may be losing
control. The
DJI's breakout
above 29000 has clearly failed. What's behind this weakness and what
should we do? Well, first of all, do not let a gain turn into a loss.
That
applies especially to volatile Ballard Power Systens. Sell the rest of it.
Second, a lot of big shareholders have made oodles of money since the
2016 Presidential Election. They will want to take some big profits if
the past history of Presidential Election years after super-charged gains
for the previous year plays out.
Thirdly, and most important, the latest Iowa
Democratic Caucus Poll
that came out this weekend puts Bernie Sanders far ahead of moderate,
regular Democrat Joe Biden. I believe that this is why the market is falling
by more than 1% at today's opening. The pundits will probably say that
the decline is caused by Far East Selling because of the dangers of the new
airborn Virus spreading widely and the steps taken to prevent that in China.
Chinese travel and trade may come to a standstill. But past flu pandemics
have not brought serious declines in stocks. Usually, just the opposite.
Fourth, a Sanders' Presidency would reverse exactly those things which have
sent the market up the last four years. And whereas, Hillary Clinton and
Biden were the friends of big banks and corporations, Sanders is not their friend
and has made his populism the center of his campaign. Sanders' populism
may woo away lots of the urban blue collar voters that swung to Trump in
the Middle West in 2016. It's early, of course, but the risks are big for
the bull market. Tuesday, a week and a day from now will be the Iowa
Caucus. The market right now is very concerned. And this is just the
first big Election battle.
Fourthly, usually, a January top and a sell-off of more then 7%
to the lower band send out lots of clear warning signs: notably:
a S9 (negative P-Indicator at the upper band), a Sell S12
(negative IP21 at upper band) or a head/shoulers' top formation.
None of these were present this month.
But what was present for the last few weeks has been a rise in NYSE Down
Volume. The increase was too subtle for our V-Indicator to pick up on
until a few days ago. But I mentioned how our Inverted Traders' Index
(1/ARMS Index - 1) has regularly been negative. A week ago, I studied
the past results for a signal based on the DJI being above the 2% upper
band with the Inverted Traders' Index being negative. What I found showed
that this was not a reliable Sell signal as long as the DJI had broken out.
But a negative Inverted Traders' Index does show heavy selling by
big investors. So, I took this as a warning and suggested some selling,
especially in DIA. This weekend I went over the charts shown below
and I realized quite forcefully that the Sell S20 signal worked well
when the DJI failed to breakout or sustain a marginal breakout, such
as we we have just seen.
What To Do?
So, all this would seem to prompt us to sell
QQQ and any other
ETFS that may be held, as well as 1/2 positions in Bullish MAXCP
stocks. Become more aggressive and short some of the bearish MINCPs.
There may be a recovery on Tuesday. So, you may want to sell into
that strength instead of on Monday if the DJI is down more than 400
points in early trading and recovers back up to above -200.
New Sell S20 for When Breakout Attempt Fails
and Peerless Inverted Traders' Index is under -.05
and DJI is more than 2.2% above its 21-dma.
Jan 2020 |
Jan 1984 |
Jan 2000 |
Jan 1992 |
Jan 2012 |
Sanders Rise in Polls in Iowa Is A Threat to Wall Street.
America, of course, has never had a Socialist-Democrat run for the
Presidency. But the very
possibility is a major threat to Trump's tax cuts for the wealthy and
corporations and a clear and
present danger to Trump's de-regulation. Trump's policies and the Fed
low interest rates are
what caused the Trump bull market. A reversal of these policies would
almost certainly drop
the stock market by 20%. Of course, it is a long way to November.
The anti-socialists will
become very active if Sanders should win in Iowa and New Hampshire. The
fierce antagonisms
and the high anxieties of a Presidential Election Year will soon be front and
center. We will
start hearing about the blue collar workers who voted for Trump in 2016 and
who would vote
for Sanders in 2020 if he is the Democrat's candidates.
The stock market has been boosted by the Fed's low interest rate policies.
There is no
sign that the FED will reverse course, but its also not clear that low
interest rates are enough
to keep the stock market rally rising. Rates fell on Friday but the
market, apart from Dividend
Stocks in the Utilities, was quite weak. Down volume was quite
noticeable.
With the Iowa Democrat caucus just 8 days away, Wall Street is getting nervous that
Bernie could
win that Party's nomination for President in 2020. Sander told a crowd of
1,400 in Ames this weekend
that “We are taking on the Democratic establishment, and all across the
country, let me tell you that
the big money interests are getting very nervous. They’re looking at recent
polls in New Hampshire
and in Iowa and they’re saying ‘Oh my god, Sanders can win,’”.
"Bernie Sanders (I-Vt.) holds a
commanding lead over the Democratic field in Iowa just days before
the state is set to hold its first-in-the-nation caucuses, according to a new poll.
An Emerson College poll
released Sunday evening of registered Democrats and left-leading independents found
Sanders in the lead
with 30 percent of respondents planning to support him in the caucuses, while former Vice
President
Joe Biden (D) followed
with 21 percent.
https://thehill.com/homenews/campaign/480026-poll-sanders-leads-biden-by-9-points-ahead-of-iowa-caucuses
Chinese
Flu Virus: Historical Perpectives on Pandemics of XXth Century
1) " The 1918 influenza pandemic was the most severe pandemic in recent
history. It was caused by an H1N1 virus with genes of avian origin. Although there is not
universal consensus regarding where the virus originated, it spread worldwide during
1918-1919. In the United States, it was first identified in military personnel in
spring 1918. It is estimated that about 500 million people or one-third of the
world’s population became infected with this virus. The number of deaths was
estimated to be at least 50 million worldwide with about 675,000
occurring in the United States."
(See https://www.cdc.gov/flu/pandemic-resources/1918-pandemic-h1n1.html
)
Stock Market rose until October. US
Population was 103 million. 0.67% mortaity rate, by far the highest of the major pandemic
flus.

2) In February 1957, a new influenza A (H2N2) virus emerged in East Asia, triggering a
pandemic. It was first reported in
Singapore in February 1957, Hong Kong in April 1957, and in coastal cities in the United
States in summer 1957. The estimated number of deaths
was 1.1 million worldwide and 116,000 in the United States.
Stock Market rose until July. Stock Market rose until July
when FED started indicated
it would be raising rates. US Population was 172
million.
3) The 1968 pandemic was caused by an influenza A (H3N2) virus comprised of two genes from
an avian influenza A virus, including a new H3 hemagglutinin, but also contained the N2
neuraminidase from the 1957 H2N2 virus. It was first noted in the United States in
September 1968. The estimated number of deaths was 1 million worldwide and about 100,000 in the United States. Most excess
deaths were in people 65 years and older.
Stock Market rose until December when FED started raising rates.
US Population was 200 million.
4) The 2009 flu pandemic or swine flu was an influenza
pandemic that lasted from early 2009 to late 2010, It is estimated that 11–21% of
the global population contracted the illness, and 151,000–579,000 died. Stock Market rallied strongly in March after President Obama said
the bankers would not be prosecuted for financial collapse of 2008. US Population was 307 million.
|
Charts 1/24/2020 2020 PEERLESS DJI, Signals, Indicators Daily DJI Volume 10-DayUp/Down Vol Stoch-20 Inverted Traders Index Graph of Pct of All Stocks above 65-dma NASDAQ S&P OEX NYSE COMPQX DJI-15 DJI-20 DJI-30 DIA SPY QQQ MDY IWM TNA Short-Term Rates USO-CrudeOil DBO FAS GLD BBH IBB JETS JNUG KOL NUGT OIH OIL PALL RSX RETL SDS AGQ SLV SOXL TECL TLT TMF TNA UGA (gasoline) and China: YINN CHAU Commodities: CANE CORN DBC JJC, NIB, CHOC CORN, CUT (paper) MOO, SOYB WEAT UUP (Dollar) LIT (Lithium) AAPL ADBE ALXN AMAT AMGN AMD AMZN AXP BA BABA BAC BIDU BLDP CAT CVX DE FB GOOG GS HD IBM INTU JPM M (Macy's) MSFT NFLX NKE NVDA PG QCOM TSLA TXN XOM V WMT CMG , LRCX, SQ TOWN 1/24/2020 (Click on Underlined link.) New highs and Bullish MAXCPs http://tigersoft.com/MAXMLK/1-24/BULLISH.htm Bearish MAXCPs - http://tigersoft.com/MINMLK/1-24/BEARISH.htm |
Table 1 QUICKSILVER on DJI-30 STOCKS 12-24-2020 STOCKS CLOSE CHANGE PIVOT-PT AROC CL-PWR CANDLE IP21 ITRS ---------------------- --------------------------------------------------------- -------------------------------------------------------------------------------- AAPL 318.31 -.92 318.73 48.3% Bullish RED .198 .168 Bullish --------------------------------------------------------------------- AXP 135.11 3.74 131.52 173.9% Bullish RED .097 .072 --------------------------------------------------------------------- BA 323.05 5.26 324.15 -140.2% ------- BLUE-.046 -.165 --------------------------------------------------------------------- CAT 140.38 -2.37 147.78 -257.6% ------- RED .077 -.097 --------------------------------------------------------------------- CSCO 48.85 -.15 49.02 -20.4% Bullish RED .073 -.03 --------------------------------------------------------------------- CVX 111.85 -1.25 115.58 -220.4% Bearish RED -.232 -.12 --------------------------------------------------------------------- DIS 140.08 -2.12 144.33 -175.2% Bearish RED -.085 -.021 --------------------------------------------------------------------- GS 241.92 -3.66 249.46 -157.6% Bullish RED .113 .059 --------------------------------------------------------------------- HD 232 -1.65 231.91 68.5% Bullish RED .258 -.045 --------------------------------------------------------------------- IBM 140.56 -2.31 138.31 91.9% Bullish RED .1 -.008 --------------------------------------------------------------------- INTC 68.47 5.15 59.6 720.1% Bullish BLUE .247 .128 --------------------------------------------------------------------- JNJ 148.32 -.21 149.17 4% Bullish RED .351 .078 Bullish --------------------------------------------------------------------- JPM 133.15 -3.39 138.2 -149.5% Bullish RED .041 -.021 --------------------------------------------------------------------- KO 57.68 -.15 56.94 75.1% Bullish RED .238 .067 --------------------------------------------------------------------- MCD 211.24 -2.18 211.98 9.2% Bullish RED .332 .051 --------------------------------------------------------------------- MMM 178.15 .41 181.35 -79.7% Bullish RED .115 .002 --------------------------------------------------------------------- MRK 85.98 -2.58 90.97 -288.7% Bearish RED -.211 -.013 --------------------------------------------------------------------- MRK 165.04 -1.68 167.1 -33.9% Bullish RED .119 .084 --------------------------------------------------------------------- NKE 102.03 -.99 104.53 -64.4% Bullish RED .155 .087 --------------------------------------------------------------------- PFE 39.82 -.89 40.51 -97.6% ------- RED -.016 .033 --------------------------------------------------------------------- PG 125.14 .15 126.41 -36.9% Bullish RED .004 .003 --------------------------------------------------------------------- TRV 134.78 .59 140.73 -146.2% Bullish BLUE .195 -.036 --------------------------------------------------------------------- UNH 292.81 -6.65 298.47 -132.2% Bullish RED .225 .107 --------------------------------------------------------------------- UTX 153.19 -.61 154.4 -11.7% Bullish RED .055 -.012 --------------------------------------------------------------------- V 205 -1.52 204.7 98.6% Bullish RED .353 .096 --------------------------------------------------------------------- VZ 60.28 -.23 60.13 50.6% ------- RED -.024 -.034 --------------------------------------------------------------------- WBA 52.04 -1.26 54.41 -220.8% Bearish RED -.137 -.21 Bearish --------------------------------------------------------------------- WMT 114.37 -1.44 114.96 -66.1% ------- RED .049 -.085 --------------------------------------------------------------------- DOW 66.32 -.45 68.56 -184.4% ------- RED -.169 -.103 Bearish |
Table 2 QUICKSILVER on ETFS - 1/24/20 ETF CLOSE CHANGE PIVOT-PT 5-dma AROC CL-PWR CANDLE IP21 ITRS --------------------------------------------------------------------------------------------- DIA 289.8 -1.74 293.27 -53.5% Bullish RED .096 ----- --------------------------------------------------------------------------------------------- BA 323.05 5.26 324.15 -140.2% ------- BLUE-.046 -.165 --------------------------------------------------------------------------------------------- SPY 328.77 -2.95 331.95 -32.4% Bullish RED .195 .021 --------------------------------------------------------------------------------------------- QQQ 222.7 -1.89 223.38 9.4% Bullish RED .247 .063 --------------------------------------------------------------------------------------------- MDY 375.9 -4.02 381.45 -83.3% Bullish RED .234 -.011 --------------------------------------------------------------------------------------------- IWM 165.39 -2.06 169.07 -123% ------- RED .104 -.004 --------------------------------------------------------------------------------------------- FAS 98.03 -2.98 101.22 -95.4% Bullish RED .194 .106 --------------------------------------------------------------------------------------------- RETL 26 -1.06 27.9 -365.6% ------- RED .055 -.034 --------------------------------------------------------------------------------------------- SOXL 306.13 -10.71 303.11 143.7% Bearish RED .086 .308 --------------------------------------------------------------------------------------------- TECL 288.32 -4.63 286.24 133.8% Bullish RED .224 .388 Bullish --------------------------------------------------------------------------------------------- IBB 116.88 -2.62 121.89 -226% ------- RED -.13 .017 --------------------------------------------------------------------------------------------- GLD 147.98 .86 146.58 56.9% Bullish BLUE .077 .034 --------------------------------------------------------------------------------------------- OIH 11.64 -.32 12.67 -469% ------- RED -.093 -.077 --------------------------------------------------------------------------------------------- GASL 5.83 -.49 8.12 -1925.2% ------- RED -.235 -.298 --------------------------------------------------------------------------------------------- |
Table 3 Count of Stocks in Key Directories
20200124
-------------------------------
NEWHIGHS 177
NEWLOWS 33
MAXCP 42
MINCP 89
TTTNH 6
TTTNL 117
FASTUP 40
FASTDOWN 144
CPCROSSA 25
CPCROSSD 229
BIGVOLUP 3
BIGVODN 15
ACCUMVER 30
HIGHIP21 53
HIUPPCT 94
REDSELL 64
AUGSELS7 36
TRAPDOOR 9
|
Table 4 RANKING OF KEY DIRECTORIES BASED PCT.OF STOCKS ABOVE 65-DMA
1/24/20
Bullish = 32
Bearish = 10
---------------------------------------------------------------------------------------
Directory Current day-1 day-2 day-3 day-4 day-5
----------------------------------------------------------------------------------------
BONDFUND .93 .92 .91 .91 .891 .9
NIFTY .907 .925 .907 .907 .907 .907
SEMI .906 .906 .906 .897 .925 .915
SOLAR .882 .882 .882 .882 .882 .823
UTILITY .875 .925 .9 .9 .9 .9
ELECTRON .856 .869 .862 .875 .895 .882
HOMEBLDG .823 .882 .823 .823 .705 .705
NASD-100 .814 .865 .855 .845 .865 .876
EDU .8 .8 .8 .8 .8 .8
HOSPITAL .772 .772 .818 .863 .863 .863
INDEXES .764 .796 .77 .802 .834 .839
HACKERS .75 .8 .75 .7 .8 .85
COMPUTER .736 .842 .736 .894 .842 .894
ETFS .719 .824 .859 .807 .929 .929
SOFTWARE .716 .75 .75 .783 .75 .783
GREEN .714 .714 .714 .809 .714 .809
DJI-13 .692 .692 .769 .846 .846 .846
BEVERAGE .687 .75 .75 .75 .75 .812
GOLD .687 .687 .708 .708 .687 .77
SP500 .686 .758 .762 .789 .808 .804
REIT .682 .744 .655 .744 .675 .648
FIDSTKS .67 .731 .77 .798 .826 .804
SP-100 .655 .777 .8 .833 .844 .833
GAMING .636 .727 .727 .727 .863 .863
RUS-1000 .633 .706 .714 .736 .778 .773
DOWJONES .62 .724 .793 .827 .793 .793
BIOTECH .605 .676 .718 .732 .703 .744
INSURANC .576 .576 .615 .576 .653 .576
BIGBANKS .571 .857 .857 .857 .857 .857
TRANSP .55 .6 .6 .65 .75 .8
RETAIL .529 .647 .647 .666 .725 .705
FOOD .528 .622 .641 .66 .754 .754
==========================================================================================
COMODITY .5 .625 .65 .65 .775 .75
COPPER .5 1 1 1 1 1
GUNS .5 .5 .5 .687 .75 .75
MILITARY .5 .642 .642 .678 .75 .75
------------------------------------------------------------------------------------------
INFRA .472 .555 .527 .583 .638 .611
FINANCE .464 .547 .571 .571 .678 .702
CHINA .454 .6 .654 .69 .818 .872
JETS .4 .5 .3 .3 .7 .7
REGBANKS .384 .5 .461 .5 .692 .769
CHEM .36 .48 .46 .52 .62 .62
OILGAS .343 .425 .462 .529 .649 .686
INDMATER .337 .428 .428 .467 .584 .597
AUTO .325 .375 .375 .45 .475 .475
COAL 0 0 0 0 0 .2
|
====================================================================
1/23/2022 Peerless remains on its Buys.
Seasonality is very slightly up for the next
month. But Down Volume continues to be higher than Up Volume. The
V-I is now negative. Most likely this and Boeing's breakdown will hold
back the DJI. I think we will find more upside potential in QQQ, the
NASDAQ and Visa. The negative V-I will not bring a Sell S9V. Those
cannot ordinarily occur except between May and September.


|
Charts 1/23/2020 2020 PEERLESS DJI, Signals, Indicators Daily DJI Volume 10-DayUp/Down Vol Stoch-20 Inverted Traders Index Graph of Pct of All Stocks above 65-dma NASDAQ S&P OEX NYSE COMPQX DJI-15 DJI-20 DJI-30 DIA SPY QQQ MDY IWM TNA Short-Term Rates USO-CrudeOil DBO FAS GLD BBH IBB JETS JNUG KOL NUGT OIH OIL PALL RSX RETL SDS AGQ SLV SOXL TECL TLT TMF TNA UGA (gasoline) and China: YINN CHAU Commodities: CANE CORN DBC JJC, NIB, CHOC CORN, CUT (paper) MOO, SOYB WEAT UUP (Dollar) LIT (Lithium) AAPL ADBE ALXN AMAT AMGN AMD AMZN AXP BA BABA BAC BIDU BLDP CAT CVX DE FB GOOG GS HD IBM INTU JPM M (Macy's) MSFT NFLX NKE NVDA PG QCOM TSLA TXN XOM V WMT CMG , LRCX, SQ TOWN 1/23/2020 (Click on Underlined link.) New highs and Bullish MAXCPs http://tigersoft.com/MAXMLK/1-23/BULLISH.htm Bearish MAXCPs - http://tigersoft.com/MINMLK/1-23/BEARISH.htm |
Table 1 QUICKSILVER on DJI-30 STOCKS 11-23-2020 STOCKS CLOSE CHANGE PIVOT-PT AROC CL-PWR CANDLE IP21 ITRS ---------------------- --------------------------------------------------------- -------------------------------------------------------------------------------- AAPL 319.23 1.53 315.24 124.9% Bullish BLUE .277 .178 Bullish --------------------------------------------------------------------- AXP 131.37 -.12 130.55 59.3% Bullish BLUE .159 .032 --------------------------------------------------------------------- BA 314.89 5.89 332 -231.8% ------- BLUE-.14 -.152 Bearish --------------------------------------------------------------------- CAT 142.75 .12 147.87 -96.6% ------- BLUE .135 -.086 --------------------------------------------------------------------- CSCO 49 -.06 49.05 101.5% Bullish ---- .118 -.046 --------------------------------------------------------------------- CVX 112.31 -.59 116.89 -166.1% Bearish -----.245 -.121 --------------------------------------------------------------------- DIS 142.2 -1.81 145.12 -73.5% Bearish RED -.086 -.019 --------------------------------------------------------------------- GS 245.58 -1.47 249.72 7.5% Bullish BLUE .13 .052 --------------------------------------------------------------------- HD 231.48 -1.42 228.82 149.6% Bullish RED .189 -.055 --------------------------------------------------------------------- IBM 142.37 -1.52 137.98 206.5% Bullish RED .13 -.015 --------------------------------------------------------------------- INTC 63.32 .59 59.66 363.2% Bullish BLUE .084 .037 --------------------------------------------------------------------- JNJ 148.53 .28 148.2 51.2% Bullish BLUE .399 .067 --------------------------------------------------------------------- JPM 136.54 -.14 137.25 -6.6% Bullish BLUE .066 -.002 --------------------------------------------------------------------- KO 57.51 -.1 56.82 71% Bullish BLUE .15 .052 --------------------------------------------------------------------- MCD 213.42 1.98 210.85 86.5% Bullish BLUE .345 .053 --------------------------------------------------------------------- MMM 177.65 -.38 181.01 -59.2% Bullish BLUE .172 -.023 --------------------------------------------------------------------- MRK 88.56 -1.09 91.18 -164.3% Bearish RED -.149 .01 --------------------------------------------------------------------- MRK 166.72 1.02 166.17 106.8% Bullish BLUE .128 .093 --------------------------------------------------------------------- NKE 103.02 -1.47 103.37 11.1% Bullish RED .167 .098 --------------------------------------------------------------------- PFE 40.71 .52 40.61 4.9% Bullish BLUE .051 .049 --------------------------------------------------------------------- PG 124.09 -2.22 126.07 -74.1% Bullish RED -.031 -.013 --------------------------------------------------------------------- TRV 134.19 -7.15 138.85 -120.8% Bullish RED .146 -.043 --------------------------------------------------------------------- UNH 297.7 -2.89 300.74 21.5% Bullish RED .238 .109 Bullish --------------------------------------------------------------------- UTX 153.8 .01 153.55 59.9% Bullish BLUE .048 -.016 --------------------------------------------------------------------- V 207.17 -.73 200.95 180.5% Bullish RED .376 .108 Bullish --------------------------------------------------------------------- VZ 60.51 .03 59.67 117.6% ------- BLUE-.038 -.03 --------------------------------------------------------------------- WBA 53.3 -.12 54.42 -104.4% ------- -----.111 -.15 --------------------------------------------------------------------- WMT 115.81 -.29 115.9 22.9% ------- RED .04 -.08 --------------------------------------------------------------------- DOW 66.77 -.42 68.82 -170% Bearish BLUE-.121 -.106 |
soon Table 3 Count of Stocks in Key Directories
20200123
-------------------------------
NEWHIGHS 371 Bullish
NEWLOWS 18
MAXCP 67
MINCP 50
TTTNH 31
TTTNL 53
FASTUP 67
FASTDOWN 68
CPCROSSA 39
CPCROSSD 92
BIGVOLUP 1
BIGVODN 9
ACCUMVER 24
HIGHIP21 166
HIUPPCT 104
REDSELL 67
AUGSELS7 25
TRAPDOOR 10
|
soonTable 2 QUICKSILVER on ETFS - 1/23/20 ETF CLOSE CHANGE PIVOT-PT 5-dma AROC CL-PWR CANDLE IP21 ITRS --------------------------------------------------------------------------------------------- DIA 290.77 -1.04 292.93 7.2% Bullish ---- .087 0 -------------------------------------------------------------------------------------------- BA 314.89 5.89 332 -231.8% ------- BLUE -.14 -.152 Weak --------------------------------------------------------------------------------------------- SPY 330.52 -.82 330.92 35.2% Bullish RED .178 .02 --------------------------------------------------------------------------------------------- QQQ 224.59 .72 222.28 99.3% Bullish BLUE .282 .067 Bullish --------------------------------------------------------------------------------------------- MDY 379.92 .85 382.24 24.9% Bullish BLUE .251 -.006 --------------------------------------------------------------------------------------------- IWM 166.7 -.86 169.53 -19.9% Bullish RED .134 -.002 --------------------------------------------------------------------------------------------- FAS 101.01 .2 99.95 183.1% Bullish BLUE .183 .135 --------------------------------------------------------------------------------------------- RETL 27.06 -.04 28.01 36.4% ------- BLUE .04 .001 --------------------------------------------------------------------------------------------- SOXL 316.84 7.07 297.34 563% ------- BLUE .108 .328 strong --------------------------------------------------------------------------------------------- TECL 292.95 4.03 280.64 412.9% Bullish BLUE .293 .409 strongest --------------------------------------------------------------------------------------------- IBB 119.5 -1.05 122.35 -91.8% ------- RED -.023 .033 --------------------------------------------------------------------------------------------- GLD 147.1 .31 146.31 19.1% Bullish BLUE .078 .021 --------------------------------------------------------------------------------------------- OIH 11.87 -.26 12.8 -323.7% ------- RED -.063 -.068 --------------------------------------------------------------------------------------------- GASL 6.24 -.31 8.66 -1583.7% ------- RED -.195 -.333 Weakest --------------------------------------------------------------------------------------------- |
TABLE 4 RANKING OF KEY DIRECTORIES BASED PCT.OF STOCKS ABOVE 65-DMA
1/23/20
BULLISH = 38
BEARISH = 5
---------------------------------------------------------------------------------------
Directory Current day-1 day-2 day-3 day-4 day-5
----------------------------------------------------------------------------------------
NIFTY .925 .907 .907 .907 .907 .851
UTILITY .925 .9 .9 .9 .9 .875
BONDFUND .92 .91 .91 .891 .9 .91
SEMI .906 .906 .897 .925 .915 .887
HOMEBLDG .882 .823 .823 .705 .705 .647
SOLAR .882 .882 .882 .882 .823 .823
COPPER .875 1 1 1 1 1
ELECTRON .869 .862 .875 .895 .882 .836
NASD-100 .865 .865 .855 .865 .876 .865
BIGBANKS .857 .857 .857 .857 .857 .857
COMPUTER .842 .736 .894 .842 .894 .842
EDU .833 .833 .833 .833 .833 .833
HACKERS .8 .8 .7 .8 .85 .75
INDEXES .795 .774 .806 .838 .838 .838
ETFS .789 .859 .807 .929 .929 .894
HOSPITAL .772 .818 .863 .863 .863 .818
SP-100 .755 .8 .833 .844 .844 .822
SP500 .754 .764 .789 .808 .808 .762
BEVERAGE .75 .75 .75 .75 .812 .812
SOFTWARE .75 .766 .783 .75 .8 .733
REIT .744 .655 .744 .675 .648 .579
FIDSTKS .731 .77 .798 .826 .815 .776
GAMING .727 .727 .727 .863 .863 .863
GREEN .714 .714 .809 .714 .809 .761
RUS-1000 .703 .716 .736 .778 .776 .729
DOWJONES .7 .766 .8 .8 .766 .733
DJI-13 .692 .769 .846 .846 .846 .769
GOLD .687 .708 .708 .687 .77 .77
BIOTECH .674 .715 .73 .701 .745 .73
RETAIL .647 .647 .666 .725 .705 .647
MILITARY .642 .642 .678 .75 .75 .678
COMODITY .625 .65 .65 .775 .75 .725
FOOD .622 .641 .66 .754 .754 .698
CHINA .6 .654 .69 .818 .872 .872
TRANSP .6 .6 .65 .75 .85 .75
INSURANC .576 .615 .576 .653 .576 .461
INFRA .555 .527 .583 .638 .611 .5
FINANCE .541 .576 .564 .67 .694 .611
=============================================================================================
GUNS .5 .5 .687 .75 .75 .687
JETS .5 .3 .3 .7 .7 .6
REGBANKS .5 .461 .5 .692 .769 .538
============================================================================================
CHEM .48 .46 .52 .62 .62 .54
INDMATER .428 .428 .467 .584 .597 .545
OILGAS .425 .462 .529 .649 .679 .671
AUTO .333 .358 .435 .461 .461 .384
COAL 0 0 0 0 .2 0
|
====================================================================
1/22/2022 Peerless remains on its Buys, but high
priced Boeing and the two DJI
oil stocks XOM and CVX are pulling the Dow Jones Industrial Average
down. Selling out DIA at least partially would certainly seem to be reasonable
if we buy VISA (V) which is also in the DJI. Hedging like this using the data in
Table 1 below which shows the DJI-30 stocks with the weakest and strongest
internals (IP21 + ITRS) is a simple precaution. NYSE down volume
has been disproportionately high compared to the percentage of stocks falling.
This probably is the result of Boeing's weakness, especially now that it
has fallen below its key 320 support with a very negative IP21 and a falling
Closing Power. Without a Peerless Sell signal, I would prefer not to short
Boeing despite its downside target of 250-260.
Boeing has just broken down below its key 320 support
while Visa has just broken above its key resistance at 195-200.
As the second highest priced DJI-30 stock (AAPL is now
the highest priced) we could also simply Buy Visa and Short BA,
but this is riskier, I feel, than simply buying Visa and selling DIA.


The uptrend in the NYSE A/D Line continues. Our P-Indicator
and Accumulation Index for DIA remains positive. But short-term bearish
was today's break in DIA's Closing Power uptrend. It's hard not to conclude
simply from all this that DIA, despite its reputation as representing the safer
"blue chips", is now appreciably weaker than QQQ. So, I would continue
to hold QQQ among the ETFs. Our P-Indicator and Accumulation Index
f
or DIA remains positive. But short-term bearish was today's break in DIA's
C
losing Power uptrend. It's hard not to conclude simply from this that DIA
despite its reputation as representing the safer "blue chips" is now
appreciably
weaker than QQQ or SPY. As for individual stocks, we now own a half-sized
position in BLDP, which was originally bought new 7. It's Closing Power
uptrend has also been violated. Sell the rest of it tomorrow if it should rally
back to 10.5.


|
Charts 1/22/2020 2020 PEERLESS DJI, Signals, Indicators Daily DJI Volume 10-DayUp/Down Vol Stoch-20 Inverted Traders Index Graph of Pct of All Stocks above 65-dma NASDAQ S&P OEX NYSE COMPQX DJI-15 DJI-20 DJI-30 DIA SPY QQQ MDY IWM TNA Short-Term Rates USO-CrudeOil DBO FAS GLD BBH IBB JETS JNUG KOL NUGT OIH OIL PALL RSX RETL SDS AGQ SLV SOXL TECL TLT TMF TNA UGA (gasoline) and China: YINN CHAU Commodities: CANE CORN DBC JJC, NIB, CHOC CORN, CUT (paper) MOO, SOYB WEAT UUP (Dollar) LIT (Lithium) AAPL ADBE ALXN AMAT AMGN AMD AMZN AXP BA BABA BAC BIDU BLDP CAT CVX DE FB GOOG GS HD IBM INTU JPM M (Macy's) MSFT NFLX NKE NVDA PG QCOM TSLA TXN XOM V WMT CMG , LRCX, SQ TOWN 1/22/2020 (Click on Underlined link.) New highs and Bullish MAXCPs http://tigersoft.com/MAXMLK/1-22/BULLISH.htm Bearish MAXCPs - http://tigersoft.com/MINMLK/1-22/BEARISH.htm |
Table 1 QUICKSILVER on DJI-30 STOCKS 11-22-2020 STOCKS CLOSE CHANGE PIVOT-PT AROC CL-PWR CANDLE IP21 ITRS ---------------------- --------------------------------------------------------- --------------------------------------------------------------------- AAPL 317.7 1.13 311.34 79.7% Bullish RED .171 .171 --------------------------------------------------------------------- AXP 131.49 .96 129.82 103.3% Bullish BLUE .136 .031 --------------------------------------------------------------------- BA 309 -4.37 329.8 -357.8% ------- RED -.223 -.188 Bearish --------------------------------------------------------------------- CAT 142.63 -3.22 145.57 -138% ------- RED .188 -.083 --------------------------------------------------------------------- CSCO 49.06 .26 48.01 130.8% Bullish RED -.013 -.04 --------------------------------------------------------------------- CVX 112.9 -.41 116.13 -147% ------- RED -.141 -.127 Bearish --------------------------------------------------------------------- DIS 144.01 .45 144.32 -41.2% ------- RED -.084 .03 --------------------------------------------------------------------- GS 247.05 1.35 245.21 28.1% Bullish BLUE .066 .053 --------------------------------------------------------------------- HD 232.9 -.05 224.59 221.1% Bullish RED .26 -.053 --------------------------------------------------------------------- IBM 143.89 4.72 136.62 293.3% Bullish BLUE .169 -.008 --------------------------------------------------------------------- INTC 62.73 2.18 58.94 276.7% Bullish BLUE .171 .027 --------------------------------------------------------------------- JNJ 148.25 -1.02 147.01 58.4% Bullish BLUE .313 .075 --------------------------------------------------------------------- JPM 136.68 -.16 136.72 -77.1% Bullish RED -.056 -.002 --------------------------------------------------------------------- KO 57.61 .44 56.7 141.9% Bullish BLUE .187 .048 --------------------------------------------------------------------- MCD 211.44 .28 209.77 98% Bullish RED .229 .042 --------------------------------------------------------------------- MMM 178.03 -1.36 179.78 -92.5% Bullish RED .273 -.033 --------------------------------------------------------------------- MRK 89.65 -.32 91.54 -15.4% Bearish RED -.119 .028 --------------------------------------------------------------------- MRK 165.7 -.8 163.18 108.2% Bullish RED .088 .095 --------------------------------------------------------------------- NKE 104.49 -.09 102.79 75.7% Bullish RED .161 .103 --------------------------------------------------------------------- PFE 40.19 -.15 40.67 14.8% Bullish RED -.011 .036 --------------------------------------------------------------------- PG 126.31 .22 125.96 64.4% Bullish -----.042 .003 --------------------------------------------------------------------- TRV 141.34 .43 137.57 168.8% Bullish ---- .197 .009 --------------------------------------------------------------------- UNH 300.59 .06 296.41 208% Bullish RED .153 .119 --------------------------------------------------------------------- UTX 153.79 -.68 151.96 73.4% Bullish RED -.032 -.019 --------------------------------------------------------------------- V 207.9 .61 199.8 293.7% Bullish BLUE .416 .112 Bullish --------------------------------------------------------------------- VZ 60.48 .16 59.1 120.7% ------- ---- .046 -.054 --------------------------------------------------------------------- WBA 53.42 -.45 54.43 -110.4% ------- RED -.118 -.143 --------------------------------------------------------------------- WMT 116.1 .51 115.28 -3.5% ------- BLUE-.018 -.088 --------------------------------------------------------------------- DOW 67.19 -.39 69.09 -146.4% Bearish RED -.119 -.133 |
Table 2 QUICKSILVER on ETFS - 1/17/20 ETF CLOSE CHANGE PIVOT-PT 5-dma AROC CL-PWR CANDLE IP21 ITRS --------------------------------------------------------------------------------------------- DIA 291.81 -.02 290.35 44.4% Bullish RED .036 ----- --------------------------------------------------------------------------------------------- BA 309 -4.37 329.8 -357.8% ------- RED -.223 -.188 --------------------------------------------------------------------------------------------- SPY 331.34 .04 328.19 58.9% Bullish RED .177 .022 --------------------------------------------------------------------------------------------- QQQ 223.87 .59 220.17 85.4% Bullish RED .211 .064 --------------------------------------------------------------------------------------------- MDY 379.07 -.27 378.03 20.4% Bullish RED .215 -.009 --------------------------------------------------------------------------------------------- IWM 167.56 -.11 167.37 29.5% Bullish RED .108 .003 --------------------------------------------------------------------------------------------- FAS 100.81 .47 97.35 186% Bullish RED .103 .131 --------------------------------------------------------------------------------------------- RETL 27.1 -.26 26.86 -54.5% ------- RED .007 -.02 --------------------------------------------------------------------------------------------- SOXL 309.77 7.22 283.15 270.8% ------- BLUE .099 .315 --------------------------------------------------------------------------------------------- TECL 288.92 3.09 269.64 367% Bullish RED .239 .41 --------------------------------------------------------------------------------------------- IBB 120.55 -.17 121.73 -23% ------- RED .023 .059 --------------------------------------------------------------------------------------------- GLD 146.79 .05 146.54 48.2% Bullish BLUE .109 .008 --------------------------------------------------------------------------------------------- OIH 12.13 -.15 12.68 -327.3% ------- RED -.087 -.044 --------------------------------------------------------------------------------------------- GASL 6.55 -.55 8.72 -1427% ------- RED -.223 -.286 --------------------------------------------------------------------------------------------- |
Table 3 Count of Stocks in Key Directories
20200122
-------------------------------
NEWHIGHS 371 Bullish ratio to new lows.
NEWLOWS 18
MAXCP 67
MINCP 50
TTTNH 31
TTTNL 53
FASTUP 67
FASTDOWN 68
CPCROSSA 39
CPCROSSD 92
BIGVOLUP 1
BIGVODN 9
ACCUMVER 24
HIGHIP21 53
HIUPPCT 105
REDSELL 67
AUGSELS7 25
TRAPDOOR 10
|
Table 4 RANKING OF KEY DIRECTORIES BASED PCT.OF STOCKS ABOVE 65-DMA
1/22/20
Bullish = 38
Bearish = 7
---------------------------------------------------------------------------------------
Directory Current day-1 day-2 day-3 day-4 day-5
----------------------------------------------------------------------------------------
COPPER 1 1 1 1 1 1
BONDFUND .91 .91 .891 .9 .91 .9
NIFTY .907 .907 .907 .907 .851 .87
SEMI .906 .897 .925 .915 .878 .897
UTILITY .9 .9 .9 .9 .875 .825
SOLAR .882 .882 .882 .823 .823 .882
NASD-100 .865 .865 .886 .896 .886 .886
ELECTRON .862 .875 .895 .882 .83 .849
ETFS .859 .807 .929 .929 .894 .929
BIGBANKS .857 .857 .857 .857 .857 .857
HOMEBLDG .823 .823 .705 .705 .647 .647
HOSPITAL .818 .863 .863 .863 .818 .772
EDU .8 .8 .8 .8 .8 .8
HACKERS .8 .75 .8 .85 .75 .75
SP-100 .8 .833 .844 .844 .822 .833
INDEXES .784 .806 .838 .838 .838 .838
FIDSTKS .77 .798 .826 .815 .776 .782
DJI-13 .769 .846 .846 .846 .769 .769
DOWJONES .766 .8 .8 .766 .733 .733
SOFTWARE .766 .8 .75 .8 .733 .75
SP500 .764 .792 .808 .808 .762 .754
BEVERAGE .75 .75 .75 .812 .812 .812
COMPUTER .736 .894 .842 .894 .842 .842
GAMING .727 .727 .863 .863 .863 .863
RUS-1000 .716 .738 .778 .776 .732 .721
GREEN .714 .809 .714 .809 .761 .809
BIOTECH .713 .727 .698 .745 .739 .718
GOLD .708 .708 .687 .77 .77 .729
REIT .655 .744 .675 .648 .572 .51
CHINA .654 .69 .818 .872 .872 .872
COMODITY .65 .65 .775 .75 .725 .775
RETAIL .647 .666 .725 .705 .647 .686
MILITARY .642 .678 .75 .75 .678 .678
FOOD .641 .66 .754 .754 .716 .792
INSURANC .615 .576 .653 .576 .461 .423
TRANSP .6 .65 .75 .85 .75 .7
FINANCE .576 .564 .67 .694 .611 .623
INFRA .527 .583 .638 .611 .5 .583
--------------------------------------------------------------------------------------------
GUNS .5 .687 .75 .75 .687 .625
============================================================================================
OILGAS .462 .529 .649 .679 .664 .686
REGBANKS .461 .5 .692 .769 .653 .692
CHEM .46 .52 .62 .62 .54 .52
INDMATER .428 .467 .584 .597 .558 .571
AUTO .358 .435 .461 .461 .384 .41
JETS .3 .3 .7 .7 .6 .5
COAL 0 0 0 .2 .2 0
|
====================================================================
1/21/202 Today Boeing finally sunk below its
well-tested support at 320. It decline
accounted for about half of the DJI's sell-off. That spilled over to the general
market
and there were 600 more down than up on the NYSE. The breakdown below
Boeing's 60-point wide trading range means this one DJI component now has a downside
target about fifty points below today's close. If achieved, Boeing will thus
penalize the DJI
by about 340 points.

But a further BA decline may, in fact, be delayed. There were many positive signs
elsewhere in the market today. Interest rates fell. The 3-month notes are
still at about 1.5%.
Utilities advanced strongly and closed at their highs. Many tech stocks hardly
retreated.
Google made a new high, as did TESLA, which rose +35.7. TESLA found support
at a point where it had previously fallen 10% from its high. Our Ballard Power
Systems
fell about 10% today. It seems likely to find support at 10.5, after which it may do
as
TESLA did and rally right back up to 12. But selling 50% of it seems only prudent if
it fails to rally at the opening or later in the day if it cracks below 10.5.

Peerless remains on Buys. The A/D Line is uptrending
and our key internal strength
indicators remain very positive. Hold the longs recommended here and avoid the
short side of the market is my counsel. The schedule of trading has formed a regular
pattern: namely, that we see a weak first day of the week which is then followed by a
rally thereafter.
As has often happened in the past QQQ is still outpacing DIA late in a bull market.
With BA being vulnerable, I would prefer to buy more QQQ rather than DIA on its
current dip.


|
Charts 1/21/2020 2020 PEERLESS DJI, Signals, Indicators Daily DJI Volume 10-DayUp/Down Vol Stoch-20 Inverted Traders Index Graph of Pct of All Stocks above 65-dma NASDAQ S&P OEX NYSE COMPQX DJI-15 DJI-20 DJI-30 DIA SPY QQQ MDY IWM TNA Short-Term Rates USO-CrudeOil DBO FAS GLD BBH IBB JETS JNUG KOL NUGT OIH OIL PALL RSX RETL SDS AGQ SLV SOXL TECL TLT TMF TNA UGA (gasoline) and China: YINN CHAU Commodities: CANE CORN DBC JJC, NIB, CHOC CORN, CUT (paper) MOO, SOYB WEAT UUP (Dollar) LIT (Lithium) AAPL ADBE ALXN AMAT AMGN AMD AMZN AXP BA BABA BAC BIDU BLDP CAT CVX DE FB GOOG GS HD IBM INTU JPM M (Macy's) MSFT NFLX NKE NVDA PG QCOM TSLA TXN XOM V WMT CMG , LRCX, SQ TOWN 1/21/2020 (Click on Underlined link.) New highs and Bullish MAXCPs - http://tigersoft.com/MAXMLK/1-21/BULLISH.htm Bearish MAXCPs - http://tigersoft.com/MINMLK/1-21/BEARISH.htm |
Table 1 QUICKSILVER on DJI-30 STOCKS 11-17-2020 STOCKS CLOSE CHANGE PIVOT-PT AROC CL-PWR CANDLE IP21 ITRS ---------------------- --------------------------------------------------------- AAPL 316.57 -2.16 312.68 -6.2% Bullish RED .196 .169 --------------------------------------------------------------------- AXP 130.53 -.99 128.8 76.6% Bullish RED .182 .029 --------------------------------------------------------------------- BA 313.37 -10.78 332.35 -255.5% ------- RED -.263 -.177 --------------------------------------------------------------------- CAT 145.85 -1.93 146.68 -33% ------- RED .219 -.059 --------------------------------------------------------------------- CSCO 48.8 -.22 47.79 85.8% Bullish RED .084 -.051 --------------------------------------------------------------------- CVX 113.31 -2.27 116.3 -144% ------- RED -.151 -.117 --------------------------------------------------------------------- DIS 143.56 -.77 145.2 -11.1% ------- RED -.064 .032 --------------------------------------------------------------------- GS 245.7 -3.76 245.66 9.9% Bullish RED .069 .063 --------------------------------------------------------------------- HD 232.95 1.04 222.81 212.3% Bullish BLUE .33 -.067 --------------------------------------------------------------------- IBM 139.17 .86 135.82 93.8% Bullish BLUE .25 -.059 --------------------------------------------------------------------- INTC 60.55 .95 59.43 80.7% Bullish BLUE .154 -.011 --------------------------------------------------------------------- JNJ 149.27 .1 146.52 121.2% Bullish BLUE .321 .078 --------------------------------------------------------------------- JPM 136.84 -1.36 138.8 -13.1% Bullish RED -.064 -.004 --------------------------------------------------------------------- KO 57.17 .23 56 92% Bullish BLUE .196 .021 --------------------------------------------------------------------- MCD 211.16 -.82 207.32 111.1% Bullish RED .308 .025 --------------------------------------------------------------------- MMM 179.39 -1.96 181.37 -42.3% Bullish RED .347 -.031 --------------------------------------------------------------------- MRK 89.97 -1 89.93 25.4% ------- RED -.046 .019 --------------------------------------------------------------------- MRK 166.5 -.6 162.13 97.9% Bullish RED .189 .094 --------------------------------------------------------------------- NKE 104.58 .05 102.92 117.3% Bullish BLUE .272 .107 --------------------------------------------------------------------- PFE 40.34 -.17 40.07 115.5% Bullish -----.014 .011 --------------------------------------------------------------------- PG 126.09 -.32 124.69 48.2% Bullish -----.021 -.014 --------------------------------------------------------------------- TRV 140.91 .18 136.65 168.5% Bullish BLUE .249 .003 --------------------------------------------------------------------- UNH 300.53 2.06 288.24 249.7% Bullish BLUE .118 .138 --------------------------------------------------------------------- UTX 154.47 .07 151.54 79.2% Bullish BLUE .023 -.02 --------------------------------------------------------------------- V 207.29 2.59 196.05 300% Bullish BLUE .486 .111 --------------------------------------------------------------------- VZ 60.32 .19 59.04 98.5% ------- BLUE .032 -.059 --------------------------------------------------------------------- WBA 53.87 -.54 54.62 -17.5% ------- RED -.104 -.156 --------------------------------------------------------------------- WMT 115.59 .63 116.18 -12.5% ------- BLUE-.038 -.095 --------------------------------------------------------------------- DOW 67.58 -.98 69.2 -160.7% ------- RED -.123 -.117 |
Table 2 QUICKSILVER on ETFS - 1/17/20 ETF CLOSE CHANGE PIVOT-PT 5-dma AROC CL-PWR CANDLE IP21 ITRS --------------------------------------------------------------------------------------------- DIA 291.83 -1.44 289.22 48.3% Bullish RED .097 ---- --------------------------------------------------------------------------------------------- BA 313.37 -10.78 332.35 -255.5% ------- RED -.263 -.177 Bearish --------------------------------------------------------------------------------------------- SPY 331.3 -.65 327.45 50.9% Bullish BLUE .259 .017 --------------------------------------------------------------------------------------------- QQQ 223.28 -.1 220.08 52.6% Bullish BLUE .273 .056 --------------------------------------------------------------------------------------------- MDY 379.34 -2.11 377.52 38.4% Bullish RED .277 -.016 --------------------------------------------------------------------------------------------- IWM 167.67 -1.4 166.57 51% Bullish RED .17 -.002 --------------------------------------------------------------------------------------------- FAS 100.34 -.88 97.12 112.4% Bullish BLUE .147 .133 --------------------------------------------------------------------------------------------- RETL 27.36 -.54 27.4 72.9% ------- RED .026 -.022 --------------------------------------------------------------------------------------------- SOXL 302.55 -.56 293.74 181.9% ------- BLUE .165 .301 Bullish --------------------------------------------------------------------------------------------- TECL 285.83 -.41 268.5 220.7% Bullish BLUE .305 .416 Bullish --------------------------------------------------------------------------------------------- IBB 120.72 -1.17 121.11 64.3% ------- RED .069 .053 --------------------------------------------------------------------------------------------- GLD 146.74 .16 145.38 31.5% Bullish BLUE .1 -.017 --------------------------------------------------------------------------------------------- OIH 12.28 -.39 12.96 -253.7% ------- RED -.039 -.026 --------------------------------------------------------------------------------------------- GASL 7.1 -1.02 8.92 -860.5% ------- RED -.138 -.192 Bearish --------------------------------------------------------------------------------------------- |
Table 3 Count of Stocks in Key Directories
20200121
-------------------------------
NEWHIGHS 332 Bullish
NEWLOWS 19
MAXCP 120
MINCP 46
TTTNH 33
TTTNL 38
FASTUP 95
FASTDOWN 46
CPCROSSA 55
CPCROSSD 156
BIGVOLUP 5
BIGVODN 6
ACCUMVER 22
HIGHIP21 79
HIUPPCT 103
REDSELL 71
AUGSELS7 25
TRAPDOOR 10
|
Table 4 RANKING OF KEY DIRECTORIES BASED PCT.OF STOCKS ABOVE 65-DMA
1/21/20
Bullish = 41
Bearish = 4
---------------------------------------------------------------------------------------
Directory Current day-1 day-2 day-3 day-4 day-5
----------------------------------------------------------------------------------------
COPPER 1 1 1 1 1 1
BONDFUND .91 .89 .9 .91 .9 .88
NIFTY .907 .907 .907 .851 .888 .87
UTILITY .9 .9 .9 .875 .825 .85
SEMI .897 .925 .915 .878 .906 .897
COMPUTER .894 .842 .894 .842 .842 .842
SOLAR .882 .882 .823 .823 .882 .882
ELECTRON .875 .895 .882 .83 .856 .849
NASD-100 .865 .886 .886 .865 .876 .855
HOSPITAL .863 .863 .863 .818 .772 .818
BIGBANKS .857 .857 .857 .857 .857 .857
DJI-13 .846 .846 .846 .769 .769 .769
SP-100 .833 .844 .844 .822 .833 .833
DOWJONES .827 .793 .793 .758 .758 .793
HOMEBLDG .823 .705 .705 .647 .647 .588
GREEN .809 .714 .809 .761 .809 .809
ETFS .807 .929 .929 .894 .929 .947
INDEXES .806 .838 .838 .838 .844 .849
EDU .8 .8 .8 .8 .8 .8
SOFTWARE .8 .766 .8 .733 .75 .733
FIDSTKS .798 .826 .815 .776 .804 .776
SP500 .792 .81 .808 .762 .762 .752
BEVERAGE .75 .75 .812 .812 .687 .812
HACKERS .75 .85 .85 .75 .75 .8
REIT .744 .675 .648 .572 .51 .572
RUS-1000 .738 .78 .776 .732 .725 .712
GAMING .727 .863 .863 .863 .863 .818
BIOTECH .724 .695 .742 .739 .733 .692
GOLD .708 .687 .77 .77 .729 .666
CHINA .69 .818 .872 .872 .872 .872
GUNS .687 .75 .75 .687 .625 .625
MILITARY .678 .75 .75 .678 .678 .678
RETAIL .666 .725 .705 .647 .705 .666
FOOD .66 .754 .754 .716 .792 .792
COMODITY .65 .775 .75 .725 .775 .8
TRANSP .65 .75 .85 .75 .75 .7
INFRA .583 .638 .611 .5 .583 .583
INSURANC .576 .653 .576 .461 .423 .461
FINANCE .564 .67 .694 .611 .623 .647
OILGAS .529 .649 .679 .664 .679 .664
CHEM .52 .62 .62 .54 .54 .56
===========================================================================================
REGBANKS .5 .692 .769 .653 .692 .73
===========================================================================================
INDMATER .467 .584 .597 .558 .571 .558
AUTO .435 .461 .461 .384 .435 .435
JETS .3 .7 .7 .6 .6 .5
COAL 0 0 .2 .2 0 0
|
====================================================================
1/17/2020
The Peerless Buy signals remain intact.
The DJI's channel breakout has set
up a new target of 31500. Our internal strength indicators are too high to
quickly produce a Sell later this week even though the DJI is 2.2% over
the 21-day. The rally has been too steady to suggest a speculative top.
Most often, prices need to have a buying climax and a steeply vertical ascent
to suggest even a short-term top.
Since 1968, the DJI has shown only a 46.2%
probability of rising over the
next two days and 53.8% odds of rising over the next
10 trading days. But then
there should be a rally, so that a month from now
the DJI offers a 69.2% chance
of advancing in Presidential Election Years and brings an average gain of 1.1%.
This tends to be the peak for next three
months.
Elsewhere, the ratio of new highs to new lows is bullishly
more than 10:1 and
70% of stocks and long ETFs are above the key support of their 65-dma. So,
the breadth of the rally should give us confidence and cause us not to sell too
quickly. I would expect at most a shallow and short-lived decline even if BA
does break its key support.
DJIA has new target of 31500


The DJI-30's Biggest Problem - Boeing's Weak Internals
BA's
IP21 and ITRS are both low and the stock threatens to break below its
support at 320. Its Seasonality chart is essentially flat until April, after which
it
ordinarily rallies in a Presidential Election Year.


AAPL Is The Source of Much of the Market's Strength
AAPL has risen almost up to BA's price level.
So, long as AAPL keeps rising, the general market
should keep rallying. AAPL could soon replace BA
as the DJI-30's most heavily weighted stock. Its rise
is also a big part of the advance in the NASDAQ and QQQ.
My earlier study of AAPL showed that its most timportant tops
tend to occur only after it makes new highs with a negative IP21
and quickly forms head/shoulders tops.
See http://tigersoft.com/AAPL8612/index.html
This 2013 study of AAPL has the benefit of going back all the
way to
1982. The review I just did tonight shows several other ways that AAPL
has formed a significant top in the past. Besides a head/shoulder top,
it might make a one day new high which is widely unconfirmed by
Closing Powe. Another way, would be a quick blow-off run upwards
after a breakout above a flat top. And a third way, would be a rising
wedge price pattern. In all these cases, Tiger's Closing Power typically
fails to confirm. See these topsusing TigerSoft's candle-stick
charts. They are shown at www.tigersoft/AAPLPEAK/INDEX.htm

With no sign yet that AAPL is at a peak, the NASDAQ and QQQ
should
be expected to rise even if Boeing falls below 320.


|
Charts 1/17/2020 2020 PEERLESS DJI, Signals, Indicators Daily DJI Volume 10-DayUp/Down Vol Stoch-20 Inverted Traders Index Graph of Pct of All Stocks above 65-dma NASDAQ S&P OEX NYSE COMPQX DJI-15 DJI-20 DJI-30 DIA SPY QQQ MDY IWM TNA Short-Term Rates USO-CrudeOil DBO FAS GLD BBH IBB JETS JNUG KOL NUGT OIH OIL PALL RSX RETL SDS AGQ SLV SOXL TECL TLT TMF TNA UGA (gasoline) and China: YINN CHAU Commodities: CANE CORN DBC JJC, NIB, CHOC CORN, CUT (paper) MOO, SOYB WEAT UUP (Dollar) LIT (Lithium) AAPL ADBE ALXN AMAT AMGN AMD AMZN AXP BA BABA BAC BIDU BLDP CAT CVX DE FB GOOG GS HD IBM INTU JPM M (Macy's) MSFT NFLX NKE NVDA PG QCOM TSLA TXN XOM V WMT CMG , LRCX, SQ TOWN 1/17/2020 (Click on Underlined link.) New highs and Bullish MAXCPs - http://tigersoft.com/MAXMLK/1-17/BULLISH.htm Bearish MAXCPs - http://tigersoft.com/MINMLK/1-17/BEARISH.htm |
Table 1 QUICKSILVER on DJI-30 STOCKS 11-17-2020 STOCKS CLOSE CHANGE PIVOT-PT AROC CL-PWR CANDLE IP21 ITRS ---------------------- --------------------------------------------------------- AAPL 318.73 3.49 316.96 134.1% Bullish BLUE .195 .172 --------------------------------------------------------------------- AXP 131.52 .97 128.54 164.3% Bullish BLUE .187 .04 --------------------------------------------------------------------- BA 324.15 -7.85 330.22 -87.2% ------- RED -.263 -.162 Vulnerable --------------------------------------------------------------------- CAT 147.78 -.09 146.82 56.3% ------- BLUE .292 -.058 --------------------------------------------------------------------- CSCO 49.02 -.03 47.97 196.9% Bullish RED .142 -.041 --------------------------------------------------------------------- CVX 115.58 -1.31 116.66 -36.9% ------- RED -.149 -.119 --------------------------------------------------------------------- DIS 144.33 -.79 143.88 -10% ------- RED -.099 .031 --------------------------------------------------------------------- GS 249.46 -.26 245.21 149.6% Bullish RED .086 .074 --------------------------------------------------------------------- HD 231.91 3.09 223.34 171.1% Bullish BLUE .256 -.068 --------------------------------------------------------------------- IBM 138.31 .33 136.6 59.2% Bullish BLUE .17 -.064 --------------------------------------------------------------------- INTC 59.6 -.06 59.59 55.6% Bullish RED .145 -.032 --------------------------------------------------------------------- JNJ 149.17 .97 145.7 140.3% Bullish BLUE .314 .077 --------------------------------------------------------------------- JPM 138.2 .95 137.2 77.6% Bullish BLUE -.069 .003 --------------------------------------------------------------------- KO 56.94 .12 56.13 125.4% Bullish ---- .097 .019 --------------------------------------------------------------------- MCD 211.98 1.13 206.51 113% Bullish BLUE .305 .036 --------------------------------------------------------------------- MMM 181.35 .34 180.92 24.3% Bullish BLUE .383 -.032 --------------------------------------------------------------------- MRK 90.97 -.21 89.51 79.7% ------- RED .001 .03 --------------------------------------------------------------------- MSFT 167.1 .93 163.28 176.4% Bullish RED .212 .09 --------------------------------------------------------------------- NKE 104.53 1.16 102.16 177.2% Bullish BLUE .272 .096 --------------------------------------------------------------------- PFE 40.51 -.1 39.41 127.3% Bullish RED .016 .014 --------------------------------------------------------------------- PG 126.41 .34 124.88 97.5% Bullish RED -.09 -.004 --------------------------------------------------------------------- TRV 140.73 1.88 136.26 190.6% Bullish BLUE .229 .005 --------------------------------------------------------------------- UNH 298.47 -2.27 285.85 56.9% Bullish RED .093 .125 --------------------------------------------------------------------- UTX 154.4 .85 152.05 83.4% Bullish BLUE -.013 -.023 --------------------------------------------------------------------- V 204.7 3.75 195.33 277.2% Bullish BLUE .382 .093 --------------------------------------------------------------------- VZ 60.13 .46 59.15 96.3% ------- BLUE -.037 -.057 --------------------------------------------------------------------- WBA 54.41 -.01 54.06 17.5% ------- RED -.102 -.178 Weak --------------------------------------------------------------------- WMT 114.96 -.94 115.88 -61.2% ------- RED -.133 -.1 --------------------------------------------------------------------- DOW 68.56 -.26 69.8 -41.9% ------- RED -.066 -.129 |
Table 2 QUICKSILVER on ETFS - 1/17/20 ETF CLOSE CHANGE PIVOT-PT 5-dma AROC CL-PWR CANDLE IP21 ITRS --------------------------------------------------------------------------------------------- DIA 293.27 .34 289.02 86.7% Bullish RED .119 0 --------------------------------------------------------------------------------------------- BA 324.15 -7.85 330.22 -87.2% ------- RED -.263 -.162 Vulnerable --------------------------------------------------------------------------------------------- SPY 332.13 1.21 327.95 97.9% Bullish BLUE .271 .015 --------------------------------------------------------------------------------------------- QQQ 223.38 1.1 220.95 112.3% Bullish BLUE .259 .049 --------------------------------------------------------------------------------------------- MDY 381.45 -.79 376.43 104.9% Bullish RED .314 -.02 --------------------------------------------------------------------------------------------- IWM 169.07 -.46 165.96 125.3% Bullish RED .225 -.005 --------------------------------------------------------------------------------------------- FAS 101.22 1.27 98.12 290.4% Bullish BLUE .164 .149 --------------------------------------------------------------------------------------------- RETL 27.9 -.11 26.96 272.8% Bullish RED .076 -.025 --------------------------------------------------------------------------------------------- SOXL 303.11 5.77 291.86 384.6% ------- BLUE .158 .267 --------------------------------------------------------------------------------------------- TECL 286.24 5.6 273.66 428.6% Bullish BLUE .329 .415 --------------------------------------------------------------------------------------------- IBB 121.89 -.46 119.16 59.5% Bullish RED .106 .046 --------------------------------------------------------------------------------------------- GLD 146.58 .27 145.82 -11.3% Bullish BLUE .071 -.019 --------------------------------------------------------------------------------------------- OIH 12.67 -.13 12.93 -147.5% ------- RED .027 -.029 --------------------------------------------------------------------------------------------- GASL 8.12 -.54 8.58 -473.4% ------- RED -.038 -.132 --------------------------------------------------------------------------------------------- UGA 8.12 -.54 8.58 -473.4% Bullish RED -.139 -.797 --------------------------------------------------------------------------------------------- UUP 25.98 -.06 26.26 -53.5% ------- -----.019 -.089 --------------------------------------------------------------------------------------------- IEF 25.98 -.06 26.26 -53.5% Bearish ---- .175 -.835 --------------------------------------------------------------------------------------------- CORN 25.98 -.06 26.26 -53.5% Bullish ---- .047 .721 --------------------------------------------------------------------------------------------- WEAT 25.98 -.06 26.26 -53.5% ------- ---- .046 3.631 --------------------------------------------------------------------------------------------- YINN 25.98 -.06 26.26 -53.5% Bullish ---- .211 .441 --------------------------------------------------------------------------------------------- RSX 26.57 .36 26.44 107.2% Bullish BLUE .205 -.004 |
Table 3 Count of Stocks in Key Directories
20200117
-------------------------------
NEWHIGHS 348 Bullish Ratio NH/NL
NEWLOWS 21
MAXCP 131
MINCP 27
TTTNH 28
TTTNL 19
FASTUP 103
FASTDOWN 46
CPCROSSA 33
CPCROSSD 117
BIGVOLUP 5
BIGVODN 3
ACCUMVER 26
HIGHIP21 42
HIUPPCT 120
REDSELL 65
AUGSELS7 29
TRAPDOOR 10
|
Table 4 RANKING OF KEY DIRECTORIES BASED PCT.OF STOCKS ABOVE 65-DMA
1/17/20
Bullish = 44
Bearish = 2
---------------------------------------------------------------------------------------
Directory Current day-1 day-2 day-3 day-4 day-5
----------------------------------------------------------------------------------------
COPPER 1 1 1 1 1 .875
ETFS .929 .929 .894 .929 .947 .912
SEMI .925 .915 .878 .906 .897 .906
NIFTY .907 .907 .851 .888 .87 .814
UTILITY .9 .9 .875 .825 .85 .725
ELECTRON .895 .882 .83 .856 .856 .856
BONDFUND .891 .9 .91 .9 .881 .871
NASD-100 .886 .896 .876 .876 .855 .814
SOLAR .882 .823 .823 .882 .882 .823
GAMING .863 .863 .863 .863 .818 .772
HOSPITAL .863 .863 .818 .772 .818 .818
BIGBANKS .857 .857 .857 .857 .857 .857
HACKERS .85 .9 .75 .75 .8 .7
DJI-13 .846 .846 .769 .769 .769 .769
INDEXES .844 .838 .838 .844 .849 .827
SP-100 .844 .844 .822 .833 .833 .811
COMPUTER .842 .894 .842 .842 .842 .789
CHINA .836 .89 .89 .89 .89 .872
FIDSTKS .826 .815 .776 .804 .782 .743
SP500 .81 .81 .762 .762 .754 .716
DOWJONES .8 .766 .733 .733 .766 .733
EDU .8 .8 .8 .8 .8 .8
RUS-1000 .78 .777 .732 .725 .716 .686
COMODITY .775 .75 .725 .775 .825 .775
SOFTWARE .766 .816 .733 .75 .733 .7
FOOD .754 .754 .716 .792 .811 .811
BEVERAGE .75 .812 .812 .687 .812 .687
GUNS .75 .75 .687 .625 .625 .562
MILITARY .75 .75 .678 .678 .678 .607
TRANSP .75 .85 .75 .75 .7 .65
RETAIL .725 .705 .647 .705 .686 .627
GREEN .714 .809 .761 .809 .809 .761
HOMEBLDG .705 .705 .647 .647 .588 .647
JETS .7 .7 .6 .6 .5 .5
BIOTECH .692 .739 .736 .733 .704 .71
REGBANKS .692 .769 .653 .692 .73 .653
GOLD .687 .77 .77 .729 .666 .791
REIT .675 .648 .572 .51 .579 .468
FINANCE .67 .694 .611 .623 .658 .623
INSURANC .653 .576 .461 .423 .461 .384
OILGAS .649 .679 .664 .679 .679 .701
INFRA .638 .611 .5 .583 .583 .583
CHEM .62 .62 .54 .54 .56 .4
INDMATER .584 .597 .558 .571 .558 .48
============================================================================================
AUTO 0 0 0 0 0 0
COAL 0 .2 .2 0 0 0
|
====================================================================
1/16/2020 What I said last night applies
again tonight because there are lots of folks
who are saying the market is too high and we should be selling.
" There seems to be no
stopping the DJI. If anything, the interest rate picture
is now more bullish than it was in 1915, 1927-1928 and 1954-1955 when
the DJI rang up record gains accompanied by interest rates below 4%. The
rising NYSE A/D Line is our best single indicator in this respect and it has
hardly paused since the end of December 2018. Any retreat will be short-lived
and limited, if history is our guide. The DJI's breakout over 29000, which
started today, will set up a new trading target of 31500. Hold DIA, QQQ
and the best performing, high Power-Ranked stocks."

We are in the early stages of a vertical ascent. It is
probably not
a 'blow-off". That may not come until Trump is re-elected. Or it may come
sometime this Summer if Sanders is nominated by the Democrats. But right
now, the bulls are in charge and lots of blue-collar voters will "vote their
pocket-books", at least as they see it and vote for Trump again. So, as long
as the FED keeps its promise and stays on its present monetary path, I see
no reason the DJI can't knife past 30000 to the utter dismay of all the nay-sayers.
It seems obvious to me that we are in a market that resembles
1926-1929 or
1954-1957 or 1985-1987 in terms of Republican policies being in control,
in term of interest rates and in terms of the enduring upward momentum of
the DJI-30.
If I am right, we are in a period where readers are getting
an excellent shot at
obtaining some significant wealth by simply buying and holding the stocks that
show a clearly positive ITRS (above +.05), high IP21(above +.20), a Closing
Power that is making new highs and prices making 12-month highs. These are
leaders. Over and over, various past markets have taught me to believe in and
buy the leaders in markets like we have now. It is uncommon for a laggard to
catch-up to the leaders.
If the current DJI and OBV can be be compared favorably
to the charts below, we should still see much higher prices.

1927 |
1928 |
1954 |
1955 1985-1986  |
|
Charts 1/16/2020 2020 PEERLESS DJI, Signals, Indicators Daily DJI Volume 10-DayUp/Down Vol Stoch-20 Inverted Traders Index Graph of Pct of All Stocks above 65-dma NASDAQ S&P OEX NYSE COMPQX DJI-15 DJI-20 DJI-30 DIA SPY QQQ MDY IWM TNA Short-Term Rates USO-CrudeOil DBO FAS GLD BBH IBB JETS JNUG KOL NUGT OIH OIL PALL RSX RETL SDS AGQ SLV SOXL TECL TLT TMF TNA UGA (gasoline) and China: YINN CHAU Commodities: CANE CORN DBC JJC, NIB, CHOC CORN, CUT (paper) MOO, SOYB WEAT UUP (Dollar) LIT (Lithium) AAPL ADBE ALXN AMAT AMGN AMD AMZN AXP BA BABA BAC BIDU BLDP CAT CVX DE FB GOOG GS HD IBM INTU JPM M (Macy's) MSFT NFLX NKE NVDA PG QCOM TSLA TXN XOM V WMT CMG , LRCX, SQ TOWN 1/16/2020 (Click on Underlined link.) New highs and Bullish MAXCPs - http://tigersoft.com/MAXMLK/1-16/BULLISH.htm Bearish MAXCPs - http://tigersoft.com/MINMLK/1-16/BEARISH.htm |
Table 1 QUICKSILVER on DJI-30 STOCKS 11-16-2020 STOCKS CLOSE CHANGE PIVOT-PT AROC CL-PWR CANDLE IP21 ITRS
---------------------- ---------------------------------------------------------
AAPL 315.24 3.9 310.33 89.8% Bullish BLUE .152 .157
---------------------------------------------------------------------
AXP 130.55 .73 127.28 106.7% Bullish ---- .205 .024
---------------------------------------------------------------------
BA 332 2.2 329.92 -65.4% ------- BLUE-.173 -.121
---------------------------------------------------------------------
CAT 147.87 2.3 146.13 19.1% ------- BLUE .279 -.06
---------------------------------------------------------------------
CSCO 49.05 1.04 47.13 181.6% Bullish BLUE .217 -.034
---------------------------------------------------------------------
CVX 116.89 .76 116.44 -26.6% ------- BLUE-.13 -.105
---------------------------------------------------------------------
DIS 145.12 .8 144.62 10% ------- RED -.103 .025
---------------------------------------------------------------------
GS 249.72 4.51 242.11 145.8% Bullish BLUE .101 .069
---------------------------------------------------------------------
HD 228.82 4.23 224.22 81% Bullish BLUE .209 -.093
---------------------------------------------------------------------
IBM 137.98 1.36 136.69 45.4% Bullish BLUE .111 -.065
---------------------------------------------------------------------
INTC 59.66 .72 58.94 30.4% Bullish BLUE .111 -.031
---------------------------------------------------------------------
JNJ 148.2 1.19 145.06 96.3% Bullish BLUE .295 .071
---------------------------------------------------------------------
JPM 137.25 .53 136.07 -6.9% Bullish RED -.096 -.002
---------------------------------------------------------------------
KO 56.82 .12 55.53 132.3% Bullish ---- .107 .002
---------------------------------------------------------------------
MCD 210.85 1.08 207.27 60.1% Bullish BLUE .261 .051
---------------------------------------------------------------------
MMM 181.01 1.23 180.47 -5.3% Bullish BLUE .374 -.032
---------------------------------------------------------------------
MRK 91.18 -.36 89.53 100% ------- RED .049 .02
---------------------------------------------------------------------
MSFT 166.17 2.99 161.34 125.6% Bullish BLUE .143 .083
---------------------------------------------------------------------
NKE 103.37 .58 100.9 92.6% Bullish BLUE .229 .083
---------------------------------------------------------------------
PFE 40.61 -.06 39.49 216.6% Bullish RED -.012 .001
---------------------------------------------------------------------
PG 126.07 .11 123.97 89% Bullish RED -.073 -.008
---------------------------------------------------------------------
TRV 138.85 1.28 135.51 45% Bullish BLUE .211 -.001
---------------------------------------------------------------------
UNH 300.74 4.33 295.13 111.7% Bullish BLUE .069 .13
---------------------------------------------------------------------
UTX 153.55 1.59 151.86 -3.3% Bullish BLUE-.001 -.026
---------------------------------------------------------------------
V 200.95 1.15 193.77 196.8% Bullish ---- .323 .056
very high
---------------------------------------------------------------------
VZ 59.67 .57 58.99 69.5% ------- BLUE-.098 -.07
---------------------------------------------------------------------
WBA 54.42 -.01 54.22 -23.9% ------- -----.097 -.155
---------------------------------------------------------------------
WMT 115.9 .62 116.38 -62.8% ------- BLUE-.08 -.081
---------------------------------------------------------------------
DOW 68.82 -.27 69.14 -67.7% ------- RED -.063 -.107
|
Table 2 QUICKSILVER on ETFS - 1/16/20 ETF CLOSE CHANGE PIVOT-PT 5-dma AROC CL-PWR CANDLE IP21 ITRS --------------------------------------------------------------------------------------------- DIA 292.93 2.58 288.24 58.2% Bullish BLUE .102 ---- --------------------------------------------------------------------------------------------- BA 332 2.2 329.92 -65.4% ------- BLUE-.173 -.121 --------------------------------------------------------------------------------------------- SPY 330.85 2.66 325.71 64.2% Bullish BLUE .163 .009 --------------------------------------------------------------------------------------------- QQQ 222.28 2.11 218.43 74.9% Bullish BLUE .224 .044 --------------------------------------------------------------------------------------------- MDY 382.24 4.21 373.53 100.5% Bullish BLUE .37 -.015 --------------------------------------------------------------------------------------------- IWM 169.53 2.16 164.89 121% Bullish BLUE .303 0 --------------------------------------------------------------------------------------------- FAS 99.95 2.6 95.55 174.3% Bullish BLUE .108 .124 --------------------------------------------------------------------------------------------- RETL 28.01 1.15 26.42 236.3% Bullish BLUE .162 .025 --------------------------------------------------------------------------------------------- SOXL 297.34 14.19 280.85 185% ------- BLUE .127 .25 --------------------------------------------------------------------------------------------- TECL 280.64 11 263 294.9% Bullish BLUE .25 .38 --------------------------------------------------------------------------------------------- IBB 122.35 .62 120.45 54.3% Bullish RED .119 .05 --------------------------------------------------------------------------------------------- GLD 146.31 -.23 146.91 9.6% ------- ---- .08 -.038 --------------------------------------------------------------------------------------------- OIH 12.8 .12 13.05 -131.3% ------- BLUE .063 -.026 --------------------------------------------------------------------------------------------- GASL 8.66 -.06 8.95 -320.9% ------- RED .05 -.058 --------------------------------------------------------------------------------------------- UGA 8.66 -.06 8.95 -320.9% ------- RED -.041 -.779 --------------------------------------------------------------------------------------------- UUP 25.98 -.06 26.26 -53.5% ------- -----.019 -.088 --------------------------------------------------------------------------------------------- IEF 25.98 -.06 26.26 -53.5% Bearish ---- .217 -.833 --------------------------------------------------------------------------------------------- CORN 25.98 -.06 26.26 -53.5% Bullish ---- .035 .719 --------------------------------------------------------------------------------------------- WEAT 25.98 -.06 26.26 -53.5% ------- ---- .038 3.548 --------------------------------------------------------------------------------------------- YINN 25.98 -.06 26.26 -53.5% Bullish ---- .038 .411 --------------------------------------------------------------------------------------------- RSX 26.21 .24 26.01 69.1% Bullish BLUE .18 -.018 |
Table 3 Count of Stocks in Key Directories
20200116
-------------------------------
NEWHIGHS 692 Bullish.
NEWLOWS 17
MAXCP 160 Bullish vs mincps
MINCP 14
TTTNH 36
TTTNL 13
FASTUP 98
FASTDOWN 41
CPCROSSA 97
CPCROSSD 42
BIGVOLUP 5
BIGVODN 4
HIUPPCT 99
VHIP21 158
LOWACCUM 97
REDSELL 67
AUGSELS7 27
TRAPDOOR 11
|
RANKING OF KEY DIRECTORIES BASED PCT.OF STOCKS ABOVE 65-DMA
1/16/20
Bullish = 44
Bearish = 2
---------------------------------------------------------------------------------------
Directory Current day-1 day-2 day-3 day-4 day-5
----------------------------------------------------------------------------------------
COPPER 1 1 1 1 .875 .875
ETFS .929 .894 .929 .947 .912 .929
SEMI .915 .878 .906 .897 .906 .878
NIFTY .907 .851 .888 .87 .814 .833
BONDFUND .9 .91 .9 .881 .851 .871
HACKERS .9 .8 .75 .8 .75 .75
UTILITY .9 .875 .825 .85 .725 .675
NASD-100 .896 .886 .886 .855 .824 .845
COMPUTER .894 .842 .842 .842 .789 .789
CHINA .89 .89 .89 .89 .872 .854
ELECTRON .882 .83 .856 .856 .856 .81
GAMING .863 .863 .863 .818 .772 .818
HOSPITAL .863 .818 .772 .818 .818 .818
BIGBANKS .857 .857 .857 .857 .857 .857
TRANSP .85 .75 .75 .7 .65 .65
DJI-13 .846 .769 .769 .769 .692 .769
SP-100 .844 .822 .833 .833 .811 .844
INDEXES .833 .838 .844 .849 .822 .854
SOLAR .823 .823 .882 .882 .823 .823
SOFTWARE .816 .75 .75 .733 .716 .716
FIDSTKS .815 .776 .804 .782 .743 .793
BEVERAGE .812 .812 .687 .812 .687 .625
SP500 .81 .764 .762 .754 .724 .737
GREEN .809 .761 .809 .809 .761 .761
EDU .8 .8 .8 .8 .8 .8
DOWJONES .793 .758 .758 .793 .724 .793
RUS-1000 .777 .733 .725 .716 .693 .695
GOLD .77 .77 .729 .666 .77 .75
REGBANKS .769 .653 .692 .73 .653 .692
FOOD .759 .722 .796 .814 .814 .833
COMODITY .75 .725 .775 .825 .775 .8
GUNS .75 .687 .625 .625 .562 .687
MILITARY .75 .678 .678 .678 .607 .714
BIOTECH .736 .733 .73 .704 .718 .698
HOMEBLDG .705 .647 .647 .588 .647 .47
RETAIL .705 .647 .705 .686 .647 .607
JETS .7 .6 .6 .5 .5 .6
FINANCE .694 .611 .623 .658 .623 .705
OILGAS .679 .664 .679 .679 .716 .708
REIT .648 .572 .51 .579 .468 .393
CHEM .632 .551 .551 .571 .448 .53
INFRA .611 .5 .583 .583 .611 .638
INDMATER .597 .558 .571 .558 .493 .558
INSURANC .576 .461 .423 .461 .346 .538
===========================================================================================
AUTO .461 .384 .435 .435 .384 .435
COAL .2 .2 0 0 0 .2
|
--------------------------------------------------------------------------------------------------------
1/15/2020 There seems to
be no stopping the DJI. If anything, the interest rate picture
is now more bullish than it was in 1915, 1927-1928 and 1954-1955 when
the DJI rang up record gains accompanied by interest rates below 4%. The
rising NYSE A/D Line is our best single indicator in this respect and it has
hardly paused since the end of December 2018. Any retreat will be short-lived
and limited, if history is our guide. The DJI's breakout over 29000, which
started today, will set up a new trading target of 31500. Hold DIA, QQQ
and the best performing, high Power-Ranked stocks.

Year DJI Gain
Discount Rate (year's low)
---------------------------------------
1915 + 81.7%
3.75% July-Dec
PE 1924 +26.2%
3.5%
1925 +30.0%
3.5%
1926 -0.3%
3.5% (Florida Real
Estate Bust)
1927 + 28.8%
3.5%
PE 1928 + 48.2%
4.0%
1954 + 44.0%
1.5%
1955 + 20.8%
1.5%
PE 1956 +2.3%
3.0%
2018-2019
2.25%
(Source: https://fred.stlouisfed.org/series/M13009USM156NNBR
)
What launched today's rally? Interest rates (3-month and 10-yr bond) fell
sharply today and the US Labor Dept. reported minimal inflation.
"PPI
for final demand increased 0.1% in December; goods rose 0.3%,
services,
unchanged". This followed by two days the CPI "for all items
less food and energy rose 0.1 percent in December (SA); up 2.3
percent
over the year" . Low
inflation was great news for stocks given the steady
increase in Jobs and modest wage gains. Wall Street could hardly have
gotten better data. This sent sent the DJ-Utilities Average up past its
well-tested
flat top and gave traders additional confidence that the FED would stick to its
policy of low rates and big injections of cash into the US banking
system.
Visa in the DJI-30 surges past all obvious resistance points into all-time
high territory, as did high Power Ranked SO. Moving up again was MSFT
and our super stock, BLDP. (I only wish there were more stocks that looked
as good as BLDP does. As when playing a really big bass, you must let the
fish run itself until its tired out).
 |
 |
 |
 |
 |
|
Charts 1/15/2020 2020 PEERLESS DJI, Signals, Indicators Daily DJI Volume 10-DayUp/Down Vol Stoch-20 Inverted Traders Index Graph of Pct of All Stocks above 65-dma NASDAQ S&P OEX NYSE COMPQX DJI-15 DJI-20 DJI-30 DIA SPY QQQ MDY IWM TNA Short-Term Rates USO-CrudeOil DBO FAS GLD BBH IBB JETS JNUG KOL NUGT OIH OIL PALL RSX RETL SDS AGQ SLV SOXL TECL TLT TMF TNA UGA (gasoline) and China: YINN CHAU Commodities: CANE CORN DBC JJC, NIB, CHOC CORN, CUT (paper) MOO, SOYB WEAT UUP (Dollar) LIT (Lithium) AAPL ADBE ALXN AMAT AMGN AMD AMZN AXP BA BABA BAC BIDU BLDP CAT CVX DE FB GOOG GS HD IBM INTU JPM M (Macy's) MSFT NFLX NKE NVDA PG QCOM TSLA TXN XOM V WMT CMG , LRCX, SQ TOWN 1/15/2020 (Click on Underlined link.) New highs and Bullish MAXCPs - http://tigersoft.com/2020MAX/1-15/BULLISH.htm Bearish MAXCPs - http://tigersoft.com/2020MIN/1-15/BEARISH.htm |
Table 1 QUICKSILVER on DJI-30 STOCKS 11-15-2020 STOCKS CLOSE CHANGE PIVOT-PT AROC CL-PWR CANDLE IP21 ITRS
---------------------- -----------------------------------------------
AAPL 311.34 -1.34 309.63 131.2% Bullish RED .145 .155
highest
---------------------------------------------------------------------
AXP 129.82 1.02 127.81 167.7% Bullish BLUE .143 .027
---------------------------------------------------------------------
BA 329.8 -2.55 336.34 -23.6% ------- RED -.271 -.107
---------------------------------------------------------------------
CAT 145.57 -1.11 147.31 -71.8% ------- RED .191 -.055
---------------------------------------------------------------------
CSCO 48.01 .22 47.32 51.5% Bullish BLUE .137 -.041
---------------------------------------------------------------------
CVX 116.13 -.17 117.51 -67.1% ------- BLUE-.102 -.063
---------------------------------------------------------------------
DIS 144.32 -.88 144.83 -37.3% ------- RED -.079 .025
---------------------------------------------------------------------
GS 245.21 -.45 242.6 153.5% Bullish BLUE-.005 .066
---------------------------------------------------------------------
HD 224.59 1.78 225.19 62.6% Bullish BLUE .155 -.116
---------------------------------------------------------------------
IBM 136.62 .8 136.74 48.1% Bullish BLUE .046 -.054
---------------------------------------------------------------------
INTC 58.94 -.49 59.3 -2.5% Bullish RED .036 -.019
---------------------------------------------------------------------
JNJ 147.01 .49 145.39 70.4% Bullish BLUE .249 .058
---------------------------------------------------------------------
JPM 136.72 -2.08 137.44 -8% Bullish RED -.13 .008
---------------------------------------------------------------------
KO 56.7 .7 55.34 211.8% Bullish BLUE .064 -.01
---------------------------------------------------------------------
MCD 209.77 2.45 208.35 93.2% Bullish BLUE .266 .019
---------------------------------------------------------------------
MMM 179.78 -1.59 181.2 -23.5% Bullish RED .39 -.005
---------------------------------------------------------------------
MRK 91.54 1.61 89.38 164.4% ------- BLUE .036 .015
---------------------------------------------------------------------
MSFT 163.18 1.05 162.09 95.5% Bullish BLUE .111 .073
---------------------------------------------------------------------
NKE 102.79 -.13 101.48 60.9% Bullish RED .214 .09
---------------------------------------------------------------------
PFE 40.67 .6 38.89 204.4% Bullish BLUE-.004 -.003
---------------------------------------------------------------------
PG 125.96 1.27 123.85 139.1% Bullish BLUE-.095 -.045
---------------------------------------------------------------------
TRV 137.57 .92 137.62 35.2% Bullish BLUE .169 -.01
---------------------------------------------------------------------
UNH 296.41 8.17 294.22 8.7% Bullish BLUE .032 .113
---------------------------------------------------------------------
UTX 151.96 .42 153.65 -47.9% ------- BLUE-.051 -.026
---------------------------------------------------------------------
V 199.8 3.75 193.25 203% Bullish BLUE .297 .042
highest
---------------------------------------------------------------------
VZ 59.1 .06 58.85 -51.6% Bearish RED -.082 -.083
---------------------------------------------------------------------
WBA 54.43 -.19 54.68 -128% Bearish RED -.146 -.114
---------------------------------------------------------------------
WMT 115.28 -.9 117.36 -37.8% ------- BLUE-.156 -.082
---------------------------------------------------------------------
DOW 69.09 -.11 69.76 -10.1% ------- RED -.016 -.07
|
Table 2 QUICKSILVER on ETFS - 1/13/20 ETF CLOSE CHANGE PIVOT-PT 5-dma AROC CL-PWR CANDLE IP21 ITRS --------------------------------------------------------------------------------------------- DIA 290.35 1.13 289.56 51.1% Bullish BLUE .02 0 --------------------------------------------------------------------------------------------- BA 329.8 -2.55 336.34 -23.6% ------- RED -.271 -.107 --------------------------------------------------------------------------------------------- SPY 328.19 .74 326.65 57.3% Bullish BLUE .158 .01 --------------------------------------------------------------------------------------------- QQQ 220.17 .09 218.99 68.9% Bullish ---- .205 .045 --------------------------------------------------------------------------------------------- MDY 378.03 .51 374.68 59% Bullish BLUE .262 -.016 --------------------------------------------------------------------------------------------- IWM 167.37 .8 165.51 62.2% Bullish BLUE .223 -.004 --------------------------------------------------------------------------------------------- FAS 97.35 .23 96.57 136.4% Bullish BLUE-.011 .104 --------------------------------------------------------------------------------------------- RETL 26.86 -.54 26.74 -37.2% Bullish RED .096 .033 --------------------------------------------------------------------------------------------- SOXL 283.15 -10.59 286.71 22.8% Bearish RED .027 .274 --------------------------------------------------------------------------------------------- TECL 269.64 1.14 264.84 253.9% Bullish BLUE .178 .35 --------------------------------------------------------------------------------------------- IBB 121.73 .62 121.04 62.7% Bullish BLUE .129 .046 --------------------------------------------------------------------------------------------- GLD 146.54 1.16 146.03 -10.9% ------- BLUE .054 -.034 --------------------------------------------------------------------------------------------- OIH 12.68 -.28 13.14 -130.6% ------- RED .04 .021 --------------------------------------------------------------------------------------------- GASL 8.72 -.2 9.23 -437% ------- ---- .11 .136 --------------------------------------------------------------------------------------------- |
Table 3 Count of Stocks in Key Directories
20200115
-------------------------------
NEWHIGHS 448 Bullish Ratio: NH/NL
NEWLOWS 18
MAXCP 136
MINCP 17
TTTNH 32
TTTNL 16
FASTUP 85
FASTDOWN 58
CPCROSSA 83
CPCROSSD 36
BIGVOLUP 4
BIGVODN 8
ACCUMVER 21
HIGHIP21 72
HIUPPCT 78
REDSELL 68
AUGSELS7 32
TRAPDOOR 12
|
Table 4 RANKING OF KEY DIRECTORIES BASED PCT.OF STOCKS ABOVE 65-DMA
1/15/20
Bullish = 42
Bearish = 3
---------------------------------------------------------------------------------------
Directory Current day-1 day-2 day-3 day-4 day-5
----------------------------------------------------------------------------------------
COPPER 1 1 1 .875 .875 .875
BONDFUND .91 .9 .881 .851 .861 .881
ETFS .894 .929 .947 .912 .929 .929
CHINA .89 .89 .89 .872 .854 .818
NASD-100 .886 .896 .865 .824 .855 .845
SEMI .878 .906 .897 .906 .878 .878
UTILITY .875 .825 .85 .725 .675 .575
GAMING .863 .863 .818 .772 .818 .863
BIGBANKS .857 .857 .857 .857 1 1
COMPUTER .842 .842 .842 .789 .789 .736
INDEXES .838 .844 .849 .822 .865 .881
ELECTRON .83 .856 .856 .856 .816 .83
SOLAR .823 .882 .882 .823 .823 .705
SP-100 .822 .833 .833 .811 .855 .833
HOSPITAL .818 .772 .818 .818 .818 .727
BEVERAGE .812 .687 .812 .687 .625 .625
NIFTY .812 .875 .812 .687 .687 .75
EDU .8 .8 .8 .8 .8 .8
HACKERS .8 .8 .8 .75 .75 .75
FIDSTKS .776 .804 .782 .743 .804 .776
GOLD .77 .729 .666 .77 .75 .75
DJI-13 .769 .769 .769 .692 .769 .692
SP500 .764 .764 .754 .724 .743 .72
GREEN .761 .809 .809 .761 .761 .714
DOWJONES .758 .758 .793 .724 .793 .724
SOFTWARE .75 .766 .733 .716 .716 .716
TRANSP .75 .75 .7 .65 .7 .65
RUS-1000 .733 .727 .716 .693 .701 .69
BIOTECH .731 .728 .702 .719 .705 .705
COMODITY .725 .775 .825 .775 .825 .75
FOOD .722 .796 .814 .814 .851 .777
GUNS .687 .625 .625 .562 .687 .75
MILITARY .678 .678 .678 .607 .714 .678
OILGAS .664 .679 .679 .716 .708 .694
REGBANKS .653 .692 .73 .653 .692 .692
HOMEBLDG .647 .647 .588 .647 .47 .588
RETAIL .647 .705 .686 .647 .627 .607
FINANCE .611 .623 .658 .623 .717 .705
JETS .6 .6 .5 .5 .6 .5
REIT .572 .51 .579 .468 .4 .42
INDMATER .558 .571 .558 .493 .558 .571
CHEM .54 .54 .56 .44 .5 .52
INFRA .5 .583 .583 .611 .638 .638
--------------------------------------------------------------------------------------------
INSURANC .461 .423 .461 .346 .538 .461
AUTO .384 .435 .435 .384 .487 .512
COAL .2 0 0 0 .2 .2
|
====================================================================
1/14/2020 Peerless
remains on Buys. Simply because the DJIA seems to have stalled
another
time upon challenging its resistance at the top of its price channel,
at 29000, does not mean that it will suddenly go into reverse or that we
should deny ourselves the the opportunity to make money elsewhere in the
market.


If that is not convincing, sell short some of the Bearish MINCPs or Buy
a commodity, like Lithium.

There are too many bullish signs to be very bearish. See above how strong
the NYSE A/D Line is. The first break in the market when the A/D Line
has advanced for a whole year is invariably shallow and short-lived.
I mentioned last night that Utilities were on the verge of a bullish
flat-top breakout. This would not be so if Rates were about to rise
sharply.

Lastly see how the SP-500's Seasonality chart has risen very steadily,
if not dramatically, in Presidential Election years.

|
Charts 1/14/2020 2020 PEERLESS DJI, Signals, Indicators Daily DJI Volume 10-DayUp/Down Vol Stoch-20 Inverted Traders Index Graph of Pct of All Stocks above 65-dma NASDAQ S&P OEX NYSE COMPQX DJI-15 DJI-20 DJI-30 DIA SPY QQQ MDY IWM TNA Short-Term Rates USO-CrudeOil DBO FAS GLD BBH IBB JETS JNUG KOL NUGT OIH OIL PALL RSX RETL SDS AGQ SLV SOXL TECL TLT TMF TNA UGA (gasoline) and China: YINN CHAU Commodities: CANE CORN DBC JJC, NIB, CHOC CORN, CUT (paper) MOO, SOYB WEAT UUP (Dollar) LIT (Lithium) AAPL ADBE ALXN AMAT AMGN AMD AMZN AXP BA BABA BAC BIDU BLDP CAT CVX DE FB GOOG GS HD IBM INTU JPM M (Macy's) MSFT NFLX NKE NVDA PG QCOM TSLA TXN XOM V WMT CMG , LRCX, SQ TOWN 1/14/2020 (Click on Underlined link.) New highs and Bullish MAXCPs - http://tigersoft.com/2020MAX/1-14/BULLISH.htm Bearish MAXCPs - http://tigersoft.com/2020MIN/1-14/BEARISH.htm |
Table 1 QUICKSILVER on DJI-30 STOCKS 11-14-2020 STOCKS CLOSE CHANGE PIVOT-PT -dma AROC CL-PWR CANDLE IP21 ITRS ---------------------- ----------------------------------------------- AAPL 312.68 -4.28 303.19 232.2% Bullish RED .208 .188 Bullish --------------------------------------------------------------------- AXP 128.8 .26 125.54 213% Bullish BLUE .141 .029 --------------------------------------------------------------------- BA 332.35 2.13 331.37 -74% ------- BLUE-.268 -.092 --------------------------------------------------------------------- CAT 146.68 -.14 147.68 10.2% ------- RED .167 -.005 --------------------------------------------------------------------- CSCO 47.79 -.18 47.52 31.6% ------- RED .099 -.063 --------------------------------------------------------------------- CVX 116.3 -.36 117.7 -117.5% ------- RED -.148 -.068 --------------------------------------------------------------------- DIS 145.2 1.32 145.4 -17.3% ------- BLUE-.101 .048 --------------------------------------------------------------------- GS 245.66 .45 237.76 211.3% Bullish BLUE-.035 .082 --------------------------------------------------------------------- HD 222.81 -.53 221.79 96.4% Bullish BLUE .187 -.119 --------------------------------------------------------------------- IBM 135.82 -.78 135.31 60% Bullish RED .034 -.054 --------------------------------------------------------------------- INTC 59.43 -.16 58.97 42.3% Bullish RED .055 -.018 --------------------------------------------------------------------- JNJ 146.52 .82 144.96 53% Bullish BLUE .252 .04 --------------------------------------------------------------------- JPM 138.8 1.6 136.94 106.8% Bullish BLUE-.12 .042 --------------------------------------------------------------------- KO 56 -.13 54.35 158.7% Bullish RED .067 -.04 --------------------------------------------------------------------- MCD 207.32 .81 205.91 113.8% Bullish BLUE .264 -.015 --------------------------------------------------------------------- MMM 181.37 .45 180.63 96.3% Bullish BLUE .397 .03 --------------------------------------------------------------------- MRK 89.93 .42 88.6 40.9% ------- BLUE-.003 -.032 --------------------------------------------------------------------- MRK 162.13 -1.15 160.09 141.4% Bullish RED .149 .062 --------------------------------------------------------------------- NKE 102.92 .76 101.55 56.1% Bullish BLUE .237 .08 --------------------------------------------------------------------- PFE 40.07 .66 39.06 168.7% Bullish BLUE-.035 -.025 --------------------------------------------------------------------- PG 124.69 -.19 122.51 109.4% Bullish -----.091 -.068 --------------------------------------------------------------------- TRV 136.65 .39 136.61 54.7% Bullish BLUE .15 -.027 --------------------------------------------------------------------- UNH 288.24 2.39 295.9 -26.5% ------- BLUE-.017 .071 --------------------------------------------------------------------- UTX 151.54 -.51 153.42 -54% ------- BLUE-.049 -.014 --------------------------------------------------------------------- V 196.05 .72 191.92 191.1% Bullish RED .287 .027 --------------------------------------------------------------------- VZ 59.04 -.11 59.71 -47.2% Bearish -----.069 -.093 --------------------------------------------------------------------- WBA 54.62 .56 55.83 -419.8% Bearish BLUE-.174 -.072 --------------------------------------------------------------------- WMT 116.18 .3 116.16 -16.3% ------- BLUE-.14 -.078 --------------------------------------------------------------------- DOW 69.2 -.6 69.23 -78.3% Bearish RED -.033 -.045 |
Table 2 QUICKSILVER on ETFS - 1/13/20 ETF CLOSE CHANGE PIVOT-PT 5-dma AROC CL-PWR CANDLE IP21 ITRS --------------------------------------------------------------------------------------------- DIA 289.22 .2 287.4 60.4% Bullish BLUE-.001 0 --------------------------------------------------------------------------------------------- BA 332.35 2.13 331.37 -74% ------- BLUE-.268 -.092 --------------------------------------------------------------------------------------------- SPY 327.45 -.5 324.45 72.5% Bullish ---- .148 .01 --------------------------------------------------------------------------------------------- QQQ 220.08 -.87 217.15 104.3% Bullish RED .23 .047 --------------------------------------------------------------------------------------------- MDY 377.52 1.09 373.6 61.3% Bullish BLUE .159 -.01 --------------------------------------------------------------------------------------------- IWM 166.57 .61 165.31 53.5% Bullish BLUE .178 .002 --------------------------------------------------------------------------------------------- FAS 97.12 -1 94.72 227.6% Bullish RED -.017 .13 --------------------------------------------------------------------------------------------- RETL 27.4 .44 27.06 70.8% ------- BLUE .005 .095 --------------------------------------------------------------------------------------------- SOXL 293.74 1.88 281.84 220% Bearish BLUE-.001 .412 --------------------------------------------------------------------------------------------- TECL 268.5 -5.16 256.17 392.9% Bullish RED .23 .386 --------------------------------------------------------------------------------------------- IBB 121.11 1.95 120.22 81.7% Bullish BLUE .121 .059 --------------------------------------------------------------------------------------------- GLD 145.38 -.44 146.86 -88.3% ------- ---- .063 -.049 --------------------------------------------------------------------------------------------- OIL 145.38 -.44 146.86 -88.3% Bullish ---- .037 13.059 --------------------------------------------------------------------------------------------- OIH 12.96 .03 13.02 -190.5% ------- BLUE .03 .095 --------------------------------------------------------------------------------------------- GASL 8.92 .34 9.51 -983.2% Bearish BLUE .034 .284 --------------------------------------------------------------------------------------------- UGA 8.92 .34 9.51 -983.2% Bullish BLUE .09 -.791 --------------------------------------------------------------------------------------------- UUP 25.98 -.06 26.26 -53.5% ------- -----.019 -.091 --------------------------------------------------------------------------------------------- IEF 25.98 -.06 26.26 -53.5% Bearish ---- .329 -.837 --------------------------------------------------------------------------------------------- CORN 25.98 -.06 26.26 -53.5% Bullish ---- .047 .744 --------------------------------------------------------------------------------------------- WEAT 25.98 -.06 26.26 -53.5% ------- ---- .049 3.629 --------------------------------------------------------------------------------------------- YINN 25.98 -.06 26.26 -53.5% Bullish ---- .322 .293 --------------------------------------------------------------------------------------------- RSX 25.92 -.52 25.76 121.8% Bullish RED .152 .007 |
Count of Stocks in Key Directories
20200114
-------------------------------
NEWHIGHS 329
NEWLOWS 9
MAXCP 128
MINCP 11
TTTNH 30
TTTNL 15
FASTUP 85
FASTDOWN 58
CPCROSSA 101
CPCROSSD 53
BIGVOLUP 4
BIGVODN 7
ACCUMVER 28
HIGHIP21 69
HIUPPCT 63
VHIP21 147
LOWACCUM 109
REDSELL 71
AUGSELS7 34
TRAPDOOR 12
|
RANKING OF KEY DIRECTORIES BASED PCT.OF STOCKS ABOVE 65-DMA
1/14/20
43 Bullish and 3 Bearish
---------------------------------------------------------------------------------------
Directory Current day-1 day-2 day-3 day-4 day-5
----------------------------------------------------------------------------------------
COPPER 1 1 .875 .875 .875 .875
ETFS .929 .947 .912 .929 .929 .877
SEMI .906 .897 .906 .878 .878 .878
BONDFUND .9 .881 .851 .861 .881 .841
NASD-100 .896 .876 .835 .855 .855 .814
CHINA .89 .89 .872 .854 .836 .836
NIFTY .888 .87 .814 .833 .851 .851
SOLAR .882 .882 .823 .823 .705 .705
GAMING .863 .818 .772 .818 .863 .863
BIGBANKS .857 .857 .857 1 1 1
ELECTRON .856 .856 .856 .816 .83 .83
INDEXES .844 .849 .822 .865 .881 .87
COMPUTER .842 .842 .789 .789 .736 .736
SP-100 .833 .833 .811 .855 .833 .8
UTILITY .825 .85 .725 .675 .575 .625
GREEN .809 .809 .761 .761 .714 .809
FIDSTKS .804 .782 .743 .804 .782 .754
EDU .8 .8 .8 .8 .8 .8
HACKERS .8 .85 .75 .75 .75 .75
FOOD .796 .814 .814 .851 .796 .814
COMODITY .775 .825 .775 .825 .775 .775
HOSPITAL .772 .818 .818 .818 .727 .636
DJI-13 .769 .769 .692 .769 .692 .692
SOFTWARE .766 .75 .716 .716 .716 .7
SP500 .764 .756 .724 .743 .726 .697
DOWJONES .758 .793 .724 .793 .724 .758
TRANSP .75 .7 .65 .7 .65 .55
GOLD .729 .666 .77 .75 .75 .895
RUS-1000 .727 .717 .693 .701 .694 .671
BIOTECH .725 .699 .716 .705 .713 .687
RETAIL .705 .686 .647 .627 .627 .607
REGBANKS .692 .73 .653 .692 .692 .692
BEVERAGE .687 .812 .687 .625 .625 .625
OILGAS .679 .679 .716 .708 .694 .776
MILITARY .678 .678 .607 .714 .678 .642
HOMEBLDG .647 .588 .647 .47 .588 .411
GUNS .625 .625 .562 .687 .75 .687
FINANCE .623 .658 .623 .717 .705 .658
JETS .6 .5 .5 .6 .5 .5
INFRA .583 .583 .611 .638 .638 .583
INDMATER .571 .558 .493 .558 .584 .597
CHEM .54 .56 .44 .5 .52 .56
REIT .51 .579 .468 .4 .427 .386
===========================================================================================
AUTO .435 .435 .384 .487 .538 .564
INSURANC .423 .461 .346 .538 .461 .423
COAL 0 0 0 .2 .2 .4
|
.
=====================================================================
1/13/2020 Peerless
remains on Buys. The DJI seems stalled just below its resistance
at the top of the channel, at 29000. With the NYSE A/D Line very
strong for more than a year, history leads us not to expect much of a
pullback.

New highs jumped above 500. This can sometimes represent a
short-term over-bought condition, but I see it as a sign of ultimate
strength given the number of perma-bears that are still preaching
"doom and gloom".
Peter Schiff - https://www.youtube.com/watch?v=WD2zcyfwdJ4
Motley Fool - https://www.youtube.com/watch?v=fTREL-7eRG4
"Phil's cycles" - https://www.youtube.com/watch?v=VDd-ohNyFJI
"Marko" - https://www.youtube.com/watch?v=jvymyRS0Vug
"George" - https://www.youtube.com/watch?v=3eYyAiDhYkA
"Celente" - https://www.youtube.com/watch?v=HldgSmN2oIM
-----------------------------------------------------------------------------
I see technical strength below, not signs of a market top. It's true that
the NASDAQ peaked in March 2000 after showing exceptional technical
bullishness, but in that case the NASDAQ (COMPQX) had just doubled
in the space of eight months and TigerSoft's Closing Power began making new
12-month lows then. The NASDAQ now is up much less and our Closing Power
is making new 12-month highs, not lows now. Professionals are bullish, not bearish.

The NASDAQ (COMPQX), which is running freely in all-time high
territory, did very well today. That makes QQQ an easy way to play
the current advance.

TSLA like BLDP is a play on alternative powered vehicles.
More and more governments are jumping on this band-wagon.
The US is not eactly in the forefront here. But the broad movement
to battery powered transportation will not be stopped by that.
The Tiger Seasonality chart (not shown) for TSLA suggests a peak
in early March. The price objective we can calculate makes $700
a minimum price objective. Both TSLA and BLDP are running
very strong now. As you will see by their tomorrow's much higher
opening, there is no easy way to get aboard them. But both should
go much higher if you have patience to ride out the trading dips and
hesitations.
Weekly TSLA...

Many technology stocks rose handily today, especially those with mainly
Chinese ownership or sponsorship. With the trade bill signed, there should
be blue skies ahead for the highest Power Ranked Chinese stocks. I would
include BLDP (see the MAXCPs' report tonight) in this group. It is 51%
chinese owned.
Less speculative traders are waiting to see what the new CPI and Producer
Price figures will be. The Dow Jones Utilities is worth watching, in this regard.
A move by it above 884 should start another advance here. The lack of
significant movement up by IWM (Russell-2000) and most low-priced stocks
shows that traders are not yet ready to roll into the small caps, the so-called
"cats and dogs".
|
Charts 1/13/2020 2020 PEERLESS DJI, Signals, Indicators Daily DJI Volume 10-DayUp/Down Vol Stoch-20 Inverted Traders Index Graph of Pct of All Stocks above 65-dma NASDAQ S&P OEX NYSE COMPQX DJI-15 DJI-20 DJI-30 DIA SPY QQQ MDY IWM TNA Short-Term Rates USO-CrudeOil DBO FAS GLD BBH IBB JETS JNUG KOL NUGT OIH OIL RSX RETL SDS AGQ SLV SOXL TECL TLT TMF TNA UGA (gasoline) and China: YINN CHAU Commodities: CANE CORN DBC JJC, NIB, CHOC CORN, CUT (paper) MOO, SOYB WEAT UUP (Dollar) LIT (Lithium) AAPL ADBE ALXN AMAT AMGN AMD AMZN AXP BA BABA BAC BIDU BLDP CAT CVX DE FB GOOG GS HD IBM INTU JPM M (Macy's) MSFT NFLX NKE NVDA PG QCOM TSLA TXN XOM V WMT CMG , LRCX, SQ TOWN 1/13/2020 (Click on Underlined link.) New highs and Bullish MAXCPs - http://tigersoft.com/2020MAX/1-13/BULLISH.htm Bearish MAXCPs - http://tigersoft.com/2020MIN/1-13/BEARISH.htm |
Table 1 QUICKSILVER on DJI-30 STOCKS 11-13-2020 STOCKS CLOSE CHANGE PIVOT-PT 5-dma AROC CL-PWR CANDLE IP21 ITRS
---------------------- -----------------------------------------------
AAPL 316.96 6.63 298.39 282% Bullish BLUE .29 .239 Bullish
---------------------------------------------------------------------
AXP 128.54 1.26 123.41 178.3% Bullish BLUE .205 .025
---------------------------------------------------------------------
BA 330.22 .3 337.28 -52.7% ------- RED -.274 -.109 Bearish
---------------------------------------------------------------------
CAT 146.82 .69 146.38 -51.6% ------- BLUE .236 -.017
---------------------------------------------------------------------
CSCO 47.97 .84 47.49 17.9% ------- BLUE .16 -.055
---------------------------------------------------------------------
CVX 116.66 .22 119.06 -166.6% Bearish BLUE -.101 -.061
---------------------------------------------------------------------
DIS 143.88 -.74 145.7 -60.9% Bearish RED -.153 .047
---------------------------------------------------------------------
GS 245.21 3.1 235.49 236.2% Bullish BLUE .037 .073
---------------------------------------------------------------------
HD 223.34 -.88 218.52 76.1% Bullish RED .176 -.118
---------------------------------------------------------------------
IBM 136.6 -.09 134.19 92.3% Bullish BLUE .107 -.054
---------------------------------------------------------------------
INTC 59.59 .65 58.93 -28.7% Bullish BLUE .08 -.011
---------------------------------------------------------------------
JNJ 145.7 .64 144.98 55.2% ------- BLUE .206 .033
---------------------------------------------------------------------
JPM 137.2 1.13 135.88 -37.6% Bullish BLUE -.047 .028
---------------------------------------------------------------------
KO 56.13 .6 54.25 133.1% Bullish BLUE .075 -.023
---------------------------------------------------------------------
MCD 206.51 -.76 202.63 101.8% Bullish RED .248 -.015
high
---------------------------------------------------------------------
MMM 180.92 .45 177.9 64% Bullish ---- .394 .011
---------------------------------------------------------------------
MRK 89.51 -.02 89.2 -118.8% Bearish ---- -.035 -.025
---------------------------------------------------------------------
MSFT 163.28 1.94 157.58 132.8% Bullish BLUE .223 .066 Bullish
---------------------------------------------------------------------
NKE 102.16 1.26 101.78 16.3% Bullish BLUE .257 .069 Bullish
---------------------------------------------------------------------
PFE 39.41 -.08 38.75 67.9% ------- RED -.065 -.039
---------------------------------------------------------------------
PG 124.88 .91 121.99 86.6% Bullish BLUE -.081 -.064
---------------------------------------------------------------------
TRV 136.26 .75 135.16 -33.4% Bullish BLUE .176 -.014
---------------------------------------------------------------------
UNH 285.85 -9.28 289.79 -97.2% ------- RED -.074 .058
---------------------------------------------------------------------
UTX 152.05 .19 153.19 -53.2% ------- ---- .006 -.007
---------------------------------------------------------------------
V 195.33 1.56 188.69 160.4% Bullish BLUE .31 .026
---------------------------------------------------------------------
VZ 59.15 .16 59.6 -94.1% Bearish BLUE -.111 -.091
---------------------------------------------------------------------
WBA 54.06 -.16 59.29 -487.5% Bearish RED -.214 -.096
---------------------------------------------------------------------
WMT 115.88 -.5 116.56 -75.8% ------- RED -.178 -.082
---------------------------------------------------------------------
DOW 69.8 .66 70.29 -76.6% Bearish BLUE .025 -.033
|
Table 2 QUICKSILVER on ETFS - 1/13/20 ETF CLOSE CHANGE PIVOT-PT 5-dma AROC CL-PWR CANDLE IP21 ITRS --------------------------------------------------------------------------------------------- DIA 289.02 .78 285.74 35.5% Bullish BLUE .056 0 --------------------------------------------------------------------------------------------- BA 330.22 .3 337.28 -52.7% ------- RED -.274 -.109 Bearish --------------------------------------------------------------------------------------------- SPY 327.95 2.24 322.73 66.4% Bullish BLUE .2 .015 --------------------------------------------------------------------------------------------- QQQ 220.95 2.52 215.53 124.1% Bullish BLUE .284 .058 --------------------------------------------------------------------------------------------- MDY 376.43 2.9 372.93 33% Bullish BLUE .219 -.014 --------------------------------------------------------------------------------------------- IWM 165.96 1.07 164.8 18.5% Bullish BLUE .178 -.002 --------------------------------------------------------------------------------------------- FAS 98.12 2.57 92.77 187.2% Bullish BLUE .122 .131 --------------------------------------------------------------------------------------------- RETL 26.96 .54 27.02 -55.8% Bullish BLUE .12 .038 --------------------------------------------------------------------------------------------- SOXL 291.86 11.01 281.22 499.4% ------- BLUE .092 .381 --------------------------------------------------------------------------------------------- TECL 273.66 10.66 247.98 484.1% Bullish BLUE .323 .416 Bullish --------------------------------------------------------------------------------------------- IBB 119.16 -1.29 119.15 1.7% Bearish RED .08 .044 --------------------------------------------------------------------------------------------- GLD 145.82 -1.09 147.97 -53.4% Bearish RED .046 -.03 --------------------------------------------------------------------------------------------- OIH 12.93 -.12 13.46 -312.4% Bearish ---- .047 .08 --------------------------------------------------------------------------------------------- GASL 8.58 -.37 10.77 -891.8% Bearish RED .082 .219 --------------------------------------------------------------------------------------------- RSX 26.44 .43 25.29 202.6% Bullish BLUE .172 .02 |
Table 3 Count of Stocks in Key Directories
20200113
-------------------------------
NEWHIGHS 503 Bullish
NEWLOWS 16
MAXCP 143
MINCP 27
TTTNH 33
TTTNL 38
FASTUP 74
FASTDOWN 74
CPCROSSA 150 Bullish
CPCROSSD 43
BIGVOLUP 3
BIGVODN 9
ACCUMVER 26
HIGHIP21 57
HIUPPCT 63
REDSELL 73
AUGSELS7 33
TRAPDOOR 13
|
RANKING OF KEY DIRECTORIES BASED PCT.OF STOCKS ABOVE 65-DMA
1/13/20
Bullish = 42
Bearish = 3
---------------------------------------------------------------------------------------
Directory Current day-1 day-2 day-3 day-4 day-5
----------------------------------------------------------------------------------------
COPPER 1 .875 .875 .875 .875 .875
ETFS .947 .912 .929 .929 .894 .894
SEMI .897 .906 .878 .878 .878 .841
CHINA .89 .872 .854 .836 .836 .836
SOLAR .882 .823 .823 .705 .705 .764
BONDFUND .881 .851 .861 .881 .841 .801
NASD-100 .876 .845 .865 .855 .804 .855
NIFTY .87 .814 .833 .851 .851 .87
BIGBANKS .857 .857 1 1 1 1
ELECTRON .856 .856 .816 .83 .83 .81
HACKERS .85 .8 .75 .75 .75 .8
UTILITY .85 .725 .675 .575 .625 .65
INDEXES .844 .822 .865 .881 .87 .897
COMPUTER .842 .789 .789 .736 .736 .684
SP-100 .833 .811 .855 .833 .811 .844
COMODITY .825 .775 .825 .775 .8 .775
GAMING .818 .772 .818 .863 .863 .818
HOSPITAL .818 .818 .818 .727 .636 .681
FOOD .814 .814 .851 .796 .833 .814
BEVERAGE .812 .687 .625 .625 .562 .875
GREEN .809 .761 .761 .714 .809 .761
EDU .8 .8 .8 .8 .8 .8
DOWJONES .793 .724 .793 .724 .758 .827
FIDSTKS .782 .743 .804 .782 .759 .793
DJI-13 .769 .692 .769 .692 .692 .769
SP500 .756 .726 .743 .726 .699 .733
SOFTWARE .75 .733 .716 .716 .7 .716
REGBANKS .73 .653 .692 .692 .692 .769
RUS-1000 .717 .694 .701 .694 .675 .713
TRANSP .7 .65 .7 .65 .65 .5
BIOTECH .696 .713 .702 .713 .693 .681
RETAIL .686 .647 .627 .627 .607 .627
OILGAS .679 .716 .708 .694 .776 .805
MILITARY .678 .607 .714 .678 .642 .678
GOLD .666 .77 .75 .75 .895 .895
FINANCE .658 .623 .717 .705 .67 .729
GUNS .625 .562 .687 .75 .687 .687
HOMEBLDG .588 .647 .47 .588 .411 .47
INFRA .583 .611 .638 .638 .611 .694
REIT .579 .468 .4 .427 .393 .524
CHEM .56 .44 .5 .52 .56 .52
INDMATER .558 .493 .558 .584 .597 .584
------------------------------------------------------------------------------------------
JETS .5 .5 .6 .5 .5 .5
------------------------------------------------------------------------------------------
INSURANC .461 .346 .538 .461 .423 .576
AUTO .435 .384 .487 .538 .564 .564
COAL 0 0 .2 .2 .4 .2
|
=======================================================================
1/10/2020 Peerless
remains on Buys. The daily breadth figures are still positive,
but by less wide margins recently. The NYSE Down Volume has been
heavier, too, of late and the Inverted Traders' Index has slipped into negative
territory. But bullishly, the 10-day ma of Up-Volume (blue) is still above the
10-day
ma of NYSE Down Volume and the A/D Line's super strength suggests any
DJI retreat will be shallow. The Seasonality charts show SPY or QQQ are
apt to stay strong another two months. Get to know previously recommended
Ballard Power (BLDP). It is the highest Power Rank stock in
our universe of 6,000
stocks, much like AMGEN was at the start of its wild take-off in 1991.


I would suggest that the DJI is still poised for a breakout
above the top of its
price channel and the flat resistance at the round-number 29000. If volume
increases and our Accumulation Index rises sharply, the resulting channel
breakout would set up a target of 31500.
The big indexes' upwards momentum does seem like a constant. This shows
that we should not under-estimate the attraction of the US stock market when
the Dollar remains reasonably firm, the 10-year rates are still under 2% and the
leading general market ETFs keep making new highs. If I am right, Friday's reversal
down may not matter. It owed to the Jobs Report being under the 150,000
level that most economists espected.
Of more concern is the seasonal tendency for the DJI to make
some
kind of top in early January in years of a Presidential Election. But even
here, we have the examples of 1976 and 1996 (see the previous Hotline)
to show us that an early "PE" (Presidential Election year) decline is not
an "iron law" of history; seasonality can be wrong. So, can cycles: it may
look like we are due for one of the market's periodic declines from the top
of the DJI's price channel, but we may be pleasantly surprised. By what,
I don't know. The market may be holding that back as the surprise.
 |
 |
The Seasonality charts for the DJI since 1915 and DIA since 2000 ,
shown
above, do show that the DJI tends to be somewhat lower at the end of the
first quarter than it was at the beginning of the year. As you have seen
at www.tigersoft.com/pivodown/INDEX.htm
we do have to take seriously
any new Peerless sells in January.
And with Boeing still being bombarded by bearish reports for
its new jet,
including insiders' emails saying that they would not themselves fly in the thing,
the risk to the high priced BA stock falling significantly below 320 seems high.
That would hit the DJI hard. So would bad news on Apple, which seems
unable to "do any wrong" judging from Wall Street's steady stream of buy
orders.
The NASDAQ (COMPQX) and QQQ Show More Bullishness
ahead
in their Tiger Seasonality charts. So, instead of buying more DIA for
the breakout over 29000, perhaps, we should buy QQQ or the NASDAQ
futures. Unlike the DJI
or DIA, the NASDAQ since 1992 and QQQ since 2000
have shown a typical tendency to rise until March.
 |
 |
Is BLDP the next AMGEN?
Ballard Power Systems is not a biotech. It is a Chinese-Canadian
hyrdogen-fuel cell company. It is a play on a leading alternative energy
technology that is getting wider and wider use in an era of Climate Change.
BLDP is in full vertical ascent mode now.
https://finance.yahoo.com/quote/BLDP?p=BLDP&.tsrc=fin-srch
We ordinarily do not encourage chasing stocks like this. It breeds bad
trading habits. But this is how the really great stocks sometimes take-off.

Intense Big Money Accumulation
and very High Relative Strength
plus
Great Seasonality
BLDP, the highest Power Ranked stock now, looks great technically and also on
its Seasonality chart for the next six months. Now that it is moving, no one knows
where to buy it. It reminds me of AMGEN at the end of 1990 and early 1991 in
terms of its high Accumulation and its powerful take-off.
See http://tigersoft.com/Tiger-Blogs/9-6-2007/index.htm
 |
 |
|
Charts 1/10/2020 2020 PEERLESS DJI, Signals, Indicators Daily DJI Volume 10-DayUp/Down Vol Stoch-20 Inverted Traders Index Graph of Pct of All Stocks above 65-dma NASDAQ S&P OEX NYSE COMPQX DJI-15 DJI-20 DJI-30 DIA SPY QQQ MDY IWM TNA Short-Term Rates USO-CrudeOil DBO FAS GLD BBH IBB JETS JNUG KOL NUGT OIH OIL RSX RETL SDS AGQ SLV SOXL TECL TLT TMF TNA UGA (gasoline) and China: YINN CHAU Commodities: CANE CORN DBC JJC, NIB, CHOC CORN, CUT (paper) MOO, SOYB WEAT UUP (Dollar) LIT (Lithium) AAPL ADBE ALXN AMAT AMGN AMD AMZN AXP BA BABA BAC BIDU BLDP CAT CVX DE FB GOOG GS HD IBM INTU JPM M (Macy's) MSFT NFLX NKE NVDA PG QCOM TSLA TXN XOM V WMT CMG , LRCX, SQ TOWN 1/10/2020 (Click on Underlined link.) New highs and Bullish MAXCPs - http://tigersoft.com/2020MAX/1-10/BULLISH.htm Bearish MAXCPs - http://tigersoft.com/2020MIN/1-10/BEARISH.htm |
Table 1 QUICKSILVER on DJI-30 STOCKS 11-10-2020 STOCKS CLOSE CHANGE PIVOT-PT 5-dma AROC CL-PWR CANDLE ---------------------- ----------------------------------------------- AAPL 310.33 .7 299.8 213.8% Bullish RED .272 .211 Bullish --------------------------------------------------------------------- AXP 127.28 -.53 124.06 107.1% ------- RED .183 .02 --------------------------------------------------------------------- BA 329.92 -6.42 333.74 -42.5% ------- RED -.187 -.119 Bearish --------------------------------------------------------------------- CAT 146.13 -1.18 148.34 -78.2% Bearish RED .184 -.03 --------------------------------------------------------------------- CSCO 47.13 -.19 47.8 -52.6% ------- RED .11 -.066 --------------------------------------------------------------------- CVX 116.44 -1.07 120.6 -191.7% Bearish RED -.167 -.078 Bearish --------------------------------------------------------------------- DIS 144.62 -.21 145.65 -64.6% Bearish RED -.119 .053 --------------------------------------------------------------------- GS 242.11 -.49 233.95 222.8% Bullish RED -.008 .048 --------------------------------------------------------------------- HD 224.22 -.97 219.96 119.7% Bullish RED .18 -.106 --------------------------------------------------------------------- IBM 136.69 -.05 134.1 87.1% Bullish RED .021 -.043 --------------------------------------------------------------------- INTC 58.94 -.36 59.93 -97.6% ------- RED .095 -.018 --------------------------------------------------------------------- JNJ 145.06 -.33 144.1 26.9% ------- RED .149 .059 --------------------------------------------------------------------- JPM 136.07 -1.37 138.23 -82.6% Bullish RED -.13 .012 --------------------------------------------------------------------- KO 55.53 .19 54.67 76.8% ------- ---- .038 -.024 --------------------------------------------------------------------- MCD 207.27 -1.08 202.33 176.3% Bullish RED .245 .012 --------------------------------------------------------------------- MMM 180.47 -.73 178.62 56.3% ------- RED .44 .005 --------------------------------------------------------------------- MRK 89.53 .15 91.64 -95.5% Bearish RED -.089 -.012 --------------------------------------------------------------------- MSFT 161.34 -.75 159.03 85.3% ------- RED .215 .065 Bullish --------------------------------------------------------------------- NKE 100.9 -.58 101.83 -50.1% ------- RED .248 .066 Bullish --------------------------------------------------------------------- PFE 39.49 .6 38.88 72% ------- BLUE-.089 -.031 --------------------------------------------------------------------- PG 123.97 .12 122.75 56.6% ------- BLUE-.129 -.061 --------------------------------------------------------------------- TRV 135.51 -2.11 137.17 -55.2% Bullish RED .111 -.013 --------------------------------------------------------------------- UNH 295.13 .91 291.55 95.7% ------- RED .05 .106 --------------------------------------------------------------------- UTX 151.86 -1.79 153.68 -48.5% ------- RED .031 .005 --------------------------------------------------------------------- V 193.77 .52 189.19 109.4% Bullish BLUE .267 .027 --------------------------------------------------------------------- VZ 58.99 .14 60.27 -118% Bearish -----.145 -.084 --------------------------------------------------------------------- WBA 54.22 -.46 59.59 -421.2% Bearish RED -.188 -.101 --------------------------------------------------------------------- WMT 116.38 -.98 117.65 -64.5% ------- RED -.18 -.071 --------------------------------------------------------------------- DOW 69.14 -.62 70.87 -84.9% Bearish RED -.022 -.054 |
Table 2 QUICKSILVER on ETFS - 1/10/20 ETF CLOSE CHANGE PIVOT-PT 5-dma AROC CL-PWR CANDLE IP21 ITRS --------------------------------------------------------------------------------------------- DIA 288.24 -1.32 286.98 33.4% ------- RED .052 0 --------------------------------------------------------------------------------------------- BA 329.92 -6.42 333.74 -42.5% ------- RED -.187 -.119 --------------------------------------------------------------------------------------------- SPY 325.71 -.94 323.64 50.9% ------- RED .187 .01 --------------------------------------------------------------------------------------------- QQQ 218.43 -.56 215.56 98.3% Bullish RED .267 .05 Bullish --------------------------------------------------------------------------------------------- MDY 373.53 -1.15 373.96 -5.9% ------- RED .197 -.026 --------------------------------------------------------------------------------------------- IWM 164.89 -.62 165.35 -7.3% ------- RED .133 -.013 --------------------------------------------------------------------------------------------- FAS 95.55 -1.02 94.57 54.4% Bullish RED .051 .106 --------------------------------------------------------------------------------------------- RETL 26.42 -.32 27.26 -107.3% Bearish RED .093 -.012 --------------------------------------------------------------------------------------------- SOXL 280.85 -5.86 264 83.8% ------- RED .11 .326 Bullish --------------------------------------------------------------------------------------------- TECL 263 -1.84 248.86 313.6% Bullish RED .298 .385 Bullish --------------------------------------------------------------------------------------------- IBB 120.45 -.59 119.12 87.4% ------- RED .074 .057 --------------------------------------------------------------------------------------------- GLD 146.91 .88 147.39 35.8% ------- BLUE .1 -.017 --------------------------------------------------------------------------------------------- OIH 13.05 -.09 13.76 -171.9% ------- ---- .079 .038 --------------------------------------------------------------------------------------------- GASL 8.95 -.28 10.32 -536.6% ------- RED .057 .121 --------------------------------------------------------------------------------------------- RSX 26.01 .16 25.4 178.6% Bullish ---- .157 .015 |
Table 3 Count of Stocks in Key Directories
20200110
-------------------------------
NEWHIGHS 213 Bullish NH/NL ratio
NEWLOWS 8
MAXCP 38 Ratio of MAXCP/NHs seems low
MINCP 25
TTTNH 18
TTTNL 47 Bearish
FASTUP 73
FASTDOWN 55
CPCROSSA 45
CPCROSSD 95 Bearish short-term
BIGVOLUP 2
BIGVODN 8
ACCUMVER 27
HIGHIP21 58
HIUPPCT 57
REDSELL 77
AUGSELS7 36
TRAPDOOR 14
|
RANKING OF KEY DIRECTORIES BASED PCT.OF STOCKS ABOVE 65-DMA 1/10/20 --------------------------------------------------------------------------------------- Directory Current day-1 day-2 day-3 day-4 day-5 ---------------------------------------------------------------------------------------- ETFS .912 .929 .929 .894 .894 .894 SEMI .906 .878 .878 .878 .841 .859 COPPER .875 .875 .875 .875 .875 1 CHINA .872 .854 .836 .836 .836 .836 BIGBANKS .857 1 1 1 1 1 ELECTRON .856 .816 .83 .83 .81 .823 BONDFUND .851 .861 .881 .841 .801 .801 NASD-100 .845 .876 .865 .804 .865 .845 SOLAR .823 .823 .705 .705 .764 .764 INDEXES .822 .865 .881 .87 .892 .897 HOSPITAL .818 .818 .727 .636 .681 .681 FOOD .814 .851 .796 .833 .814 .796 NIFTY .814 .833 .851 .851 .87 .833 SP-100 .811 .855 .833 .811 .844 .833 EDU .8 .8 .8 .8 .8 .8 HACKERS .8 .8 .75 .75 .8 .65 COMPUTER .789 .789 .736 .736 .684 .684 COMODITY .775 .825 .775 .8 .775 .75 GAMING .772 .818 .863 .863 .818 .818 GOLD .77 .75 .75 .895 .895 .875 GREEN .761 .761 .714 .809 .761 .761 FIDSTKS .743 .804 .782 .759 .798 .793 SOFTWARE .733 .733 .716 .7 .716 .666 SP500 .726 .745 .726 .699 .739 .733 UTILITY .725 .675 .575 .625 .65 .625 DOWJONES .724 .793 .724 .758 .827 .862 OILGAS .716 .708 .694 .776 .805 .776 BIOTECH .708 .697 .708 .691 .685 .673 RUS-1000 .694 .702 .694 .675 .72 .728 DJI-13 .692 .769 .692 .692 .769 .769 BEVERAGE .687 .625 .625 .562 .875 .687 REGBANKS .653 .692 .692 .692 .846 .884 TRANSP .65 .7 .65 .65 .5 .6 HOMEBLDG .647 .47 .588 .411 .47 .47 RETAIL .647 .627 .627 .607 .647 .627 FINANCE .623 .717 .705 .67 .729 .764 INFRA .611 .638 .638 .611 .694 .638 MILITARY .607 .714 .678 .642 .678 .642 GUNS .562 .687 .75 .687 .687 .687 JETS .5 .6 .5 .5 .5 .5 INDMATER .493 .558 .584 .597 .61 .649 REIT .468 .4 .427 .393 .524 .537 CHEM .44 .5 .52 .56 .54 .54 AUTO .384 .487 .538 .564 .589 .717 INSURANC .346 .538 .461 .423 .576 .576 COAL 0 .2 .2 .4 .2 .2 |
====================================================================
1/9/2020 Peerless
remains on Buys. With Iran now forced to focus on how
its missile system shot-down a Jet Airliner and killed 175, Wall Street
can get back to the business of celebrating low interest rates, record
profits, an economy with near record peace-time Unemployment
and a year-to-year CPI well below 4%.
DJI is on verge of channel breakout that
could take it 2500 points higher.

See below how high the NASDAQ's Accumulation is now and
that its ITRS shows it is outperforming the DJI by +3.6%
over the last 50-trading days. It is at the top of its price
channel. Above this level, it has no obvious technical points
for sell orders to congregate. This is settiing up a "vertical
ascent" and looks very bullish.
NASDAQ

The DJI is challenging the top of its price channel, too. A close above that
level would set up a new DJI target of 31500, considering that that the
price channel the DJI is 2500 points wide and classic technical analysis
tells us to add that number to the point of channel-breakout to obtain
a new minimum price objective.
Usually the DJI pulls back in early January in a Presidential
Election
year. That this is not happening must be taken as a very bullish sign,
much like the exceptional strength it showed in October. A strong
Jobs figure tomorrow, above 200,000, would likely ignite the take-off
over 29000. Buy back the 1/2 positions sold a few
days ago
in QQQ and DIA. Buy more MSFT and BLDP. High IP21 readings
(above +.23), a positive ITRS and new price highs seems to be a good
way pick winners now.
Instead of comparing the current DJI chart with what is typical at the
start of a Presidential Election year, it now looks like we should be comparing
the chart to the very strongest starts. The problem here is that we find
very few DJI take-offs at the start of the year. The best examples I can
find are from January 1976 and January 1996. In both of these cases our
IP21 (Accum. Index) surged to new highs. Our is rising, but not close to
a 12-month high. For the IP21 now to keep rising steeply we will need
to see rising volume, day-to-day, and no willingness on the part of the
DJI to sell off at the close. We'll be watching this.
January Take-offs in Presidential Election years
are rare. The two best examples show IP21 bulges
tp 12-month highs.
| 1975-1976 |
1995-1996 |
|
Charts 1/9/2020 2020 PEERLESS DJI, Signals, Indicators Daily DJI Volume 10-DayUp/Down Vol Stoch-20 Inverted Traders Index Graph of Pct of All Stocks above 65-dma NASDAQ S&P OEX NYSE COMPQX DJI-15 DJI-20 DJI-30 DIA SPY QQQ MDY IWM TNA Short-Term Rates USO-CrudeOil DBO FAS GLD BBH IBB JETS JNUG KOL NUGT OIH OIL RSX RETL SDS AGQ SLV SOXL TECL TLT TMF TNA UGA (gasoline) and China: YINN CHAU Commodities: CANE CORN DBC JJC, NIB, CHOC CORN, CUT (paper) MOO, SOYB WEAT UUP (Dollar) LIT (Lithium) AAPL ADBE ALXN AMAT AMGN AMD AMZN AXP BA BABA BAC BIDU BLDP CAT CVX DE FB GOOG GS HD IBM INTU JPM M (Macy's) MSFT NFLX NKE NVDA PG QCOM TSLA TXN XOM V WMT CMG , LRCX, SQ TOWN 1/9/2020 (Click on Underlined link.) New highs and Bullish MAXCPs - http://tigersoft.com/2020MAX/1-9/BULLISH.htm Bearish MAXCPs - http://tigersoft.com/2020MIN/1-9/BEARISH.htm |
Table 1 QUICKSILVER on DJI-30 STOCKS 11-9-2020 STOCKS CLOSE CHANGE PIVOT-PT 5-dma AROC CL-PWR CANDLE ---------------------- ----------------------------------------------- AAPL 309.63 6.44 297.43 154.8% Bullish BLUE .289 .174 Bullish --------------------------------------------------------------------- AXP 127.81 2.27 124.6 78.6% ------- BLUE .213 .009 --------------------------------------------------------------------- BA 336.34 4.97 332.76 45.3% Bullish BLUE-.164 -.083 Bearish --------------------------------------------------------------------- CAT 147.31 -.37 148.44 -108.6% Bullish RED .223 -.017 --------------------------------------------------------------------- CSCO 47.32 -.2 47.63 -115.1% ------- RED .166 -.066 --------------------------------------------------------------------- CVX 117.51 -.19 121.01 -163.4% Bearish BLUE-.096 -.077 --------------------------------------------------------------------- DIS 144.83 -.57 146.5 -115.2% Bearish RED -.097 .04 --------------------------------------------------------------------- GS 242.6 4.84 231.58 176.5% Bullish BLUE .009 .045 --------------------------------------------------------------------- HD 225.19 3.4 218.93 125.8% Bullish BLUE .181 -.118 --------------------------------------------------------------------- IBM 136.74 1.43 134.34 49% Bullish BLUE .023 -.064 --------------------------------------------------------------------- INTC 59.3 .33 60.1 -128.9% ------- BLUE .119 -.024 --------------------------------------------------------------------- JNJ 145.39 .43 144.28 -20% ------- RED .144 .056 --------------------------------------------------------------------- JPM 137.44 .5 138.34 -132.2% Bullish RED -.077 .017 --------------------------------------------------------------------- KO 55.34 .99 54.69 32.1% ------- BLUE .048 -.036 --------------------------------------------------------------------- MCD 208.35 2.44 200.08 186.8% Bullish BLUE .287 .017 --------------------------------------------------------------------- MMM 181.2 .57 178.45 33.5% ------- RED .441 .003 --------------------------------------------------------------------- MRK 89.38 .78 91.25 -146.9% Bearish BLUE-.054 .018 --------------------------------------------------------------------- MSFT 162.09 2 158.62 46.2% ------ BLUE .245 .055 Bullish --------------------------------------------------------------------- NKE 101.48 -.07 101.92 -35.3% Bullish RED .274 .048 --------------------------------------------------------------------- PFE 38.89 -.17 38.93 -32.1% Bearish RED -.098 -.026 --------------------------------------------------------------------- PG 123.85 1.34 122.58 17.9% Bearish BLUE-.158 -.066 --------------------------------------------------------------------- TRV 137.62 1.01 137.02 4% Bullish BLUE .158 -.005 --------------------------------------------------------------------- UNH 294.22 -1.68 289.54 29.5% ------- RED .068 .122 --------------------------------------------------------------------- UTX 153.65 .23 153.35 16.6% ------- RED .021 .005 --------------------------------------------------------------------- V 193.25 1.33 189.6 56% Bullish BLUE .244 .005 --------------------------------------------------------------------- VZ 58.85 -.86 60.4 -182.7% Bearish -----.101 -.091 --------------------------------------------------------------------- WBA 54.68 -1.15 59.08 -375.6% Bearish RED -.173 -.089 --------------------------------------------------------------------- WMT 117.36 1.2 117.89 -67.3% ------- BLUE-.182 -.085 --------------------------------------------------------------------- DOW 69.76 .53 70.33 -81.1% Bearish BLUE-.007 -.053 |
Table 2 QUICKSILVER on ETFS - 1/9/20 ETF CLOSE CHANGE PIVOT-PT 5-dma AROC CL-PWR CANDLE IP21 ITRS --------------------------------------------------------------------------------------------- DIA 289.56 2.16 286.32 16.4% ------- BLUE .099 0 --------------------------------------------------------------------------------------------- BA 336.34 4.97 332.76 45.3% Bullish BLUE-.164 -.083 --------------------------------------------------------------------------------------------- SPY 326.65 2.2 322.41 27.5% ------- BLUE .202 .008 --------------------------------------------------------------------------------------------- QQQ 218.99 1.84 214.18 65.6% ------- ---- .274 .039 Bullish --------------------------------------------------------------------------------------------- MDY 374.68 1.08 373.97 -16.7% ------- RED .207 -.025 --------------------------------------------------------------------------------------------- IWM 165.51 .2 165.13 -8.2% ------- RED .15 -.011 --------------------------------------------------------------------------------------------- FAS 96.57 1.85 94.52 16.9% Bullish BLUE .073 .121 --------------------------------------------------------------------------------------------- RETL 26.74 -.32 27 -145.4% Bearish RED .096 -.056 --------------------------------------------------------------------------------------------- SOXL 286.71 4.87 276.19 -94.1% ------- RED .134 .313 --------------------------------------------------------------------------------------------- TECL 264.84 8.67 247.13 191.4% Bullish BLUE .338 .35 Bullish --------------------------------------------------------------------------------------------- IBB 121.04 .82 118.36 48.2% ------- BLUE .134 .062 --------------------------------------------------------------------------------------------- GLD 146.03 -.83 145.86 71% Bearish ---- .065 -.031 --------------------------------------------------------------------------------------------- OIL 146.03 -.83 145.86 71% Bullish ---- .06 13.192 --------------------------------------------------------------------------------------------- OIH 13.14 .12 13.51 -67.1% ------- BLUE .062 .055 --------------------------------------------------------------------------------------------- GASL 9.23 -.28 10.02 -104.9% ------- RED .078 .265 --------------------------------------------------------------------------------------------- RSX 25.85 .09 25.1 45.2% Bullish RED .181 .007 |
Table 2 Count of Stocks in Key Directories
20200109
-------------------------------
NEWHIGHS 403 Bullish
NEWLOWS 15
MAXCP 117
MINCP 26
TTTNH 25
TTTNL 33
FASTUP 66
FASTDOWN 53
CPCROSSA 70
CPCROSSD 74
BIGVOLUP 8
BIGVODN 3
ACCUMVER 23
HIGHIP21 65
HIUPPCT 48
VHIP21 140
LOWACCUM 107
REDSELL 81
AUGSELS7 30
TRAPDOOR 13
|
Table 4 RANKING OF KEY DIRECTORIES BASED PCT.OF STOCKS ABOVE 65-DMA
1/9/20
Bullish = 41
---------------------------------------------------------------------------------------
Directory Current day-1 day-2 day-3 day-4 day-5
----------------------------------------------------------------------------------------
BIGBANKS 1 1 1 1 1 1
ETFS .929 .929 .894 .894 .894 .929
SEMI .878 .878 .878 .841 .859 .878
NASD-100 .876 .876 .814 .865 .845 .896
COPPER .875 .875 .875 .875 1 1
INDEXES .865 .881 .87 .892 .897 .865
BONDFUND .861 .881 .841 .801 .801 .712
SP-100 .855 .833 .811 .844 .833 .866
CHINA .854 .836 .836 .836 .836 .836
FOOD .851 .796 .833 .814 .814 .87
NIFTY .833 .851 .851 .87 .833 .814
COMODITY .825 .775 .8 .775 .775 .825
SOLAR .823 .705 .705 .764 .764 .764
GAMING .818 .863 .863 .818 .909 .863
HOSPITAL .818 .727 .636 .681 .681 .681
ELECTRON .816 .83 .83 .81 .83 .849
FIDSTKS .804 .782 .759 .798 .793 .832
EDU .8 .8 .8 .8 .8 .8
HACKERS .8 .8 .75 .8 .65 .7
COMPUTER .789 .736 .736 .684 .684 .789
DJI-13 .769 .692 .692 .769 .769 .769
DOWJONES .766 .733 .766 .833 .866 .866
GREEN .761 .714 .809 .761 .761 .761
GOLD .75 .75 .895 .895 .875 .916
SP500 .745 .728 .699 .739 .733 .76
SOFTWARE .733 .733 .7 .716 .666 .65
FINANCE .717 .705 .67 .729 .764 .788
MILITARY .714 .678 .642 .678 .642 .571
OILGAS .708 .694 .776 .805 .776 .723
RUS-1000 .702 .695 .675 .72 .732 .754
TRANSP .7 .65 .65 .5 .6 .7
BIOTECH .694 .705 .688 .685 .682 .702
REGBANKS .692 .692 .692 .846 .923 .923
GUNS .687 .75 .687 .687 .687 .625
UTILITY .675 .575 .625 .65 .625 .625
INFRA .638 .638 .611 .694 .638 .694
RETAIL .627 .627 .607 .647 .627 .627
BEVERAGE .625 .625 .562 .875 .687 .687
JETS .6 .5 .5 .5 .5 .7
INDMATER .558 .584 .597 .61 .662 .714
INSURANC .538 .461 .423 .576 .576 .576
===========================================================================================
CHEM .5 .52 .56 .54 .58 .68
===========================================================================================
AUTO .487 .538 .564 .589 .743 .794
HOMEBLDG .47 .588 .411 .47 .47 .352
REIT .4 .427 .393 .524 .537 .42
COAL .2 .2 .4 .2 .2 .2
Bearish = 4
|
====================================================================
1/8/2020 Peerless
remains on Buys. The internals of the market look
reasonably safe. With Iran apparently satisifed with a token
counter-attack, Wall Street bulls pushed the market back towards
the DJI's 29000 resistance. A breakout above that would have
be bullishly constued and set up the round number, 30000, as
a target.

But at this stage, it's not clear that the DJI will be able to breakout
past 29000. Even so, the strongest DJI-30 stocks look like they
will continue to move higher. Consider purchasing the highest
Power Ranked SP-500 and Nasdaq-100 stocks with the most
promising technicals. I show three below.
 |
 |
 |
|
Charts 1/8/2020 2020 PEERLESS DJI, Signals, Indicators Daily DJI Volume 10-DayUp/Down Vol Stoch-20 Inverted Traders Index Graph of Pct of All Stocks above 65-dma NASDAQ S&P OEX NYSE COMPQX DJI-15 DJI-20 DJI-30 DIA SPY QQQ MDY IWM TNA Short-Term Rates USO-CrudeOil DBO FAS GLD BBH IBB JETS JNUG KOL NUGT OIH OIL RSX RETL SDS AGQ SLV SOXL TECL TLT TMF TNA UGA (gasoline) and China: YINN CHAU Commodities: CANE CORN DBC JJC, NIB, CHOC CORN, CUT (paper) MOO, SOYB WEAT UUP (Dollar) LIT (Lithium) AAPL ADBE ALXN AMAT AMGN AMD AMZN AXP BA BABA BAC BIDU BLDP CAT CVX DE FB GOOG GS HD IBM INTU JPM M (Macy's) MSFT NFLX NKE NVDA PG QCOM TSLA TXN XOM V WMT CMG , LRCX, SQ TOWN 1/8/2020 (Click on Underlined link.) New highs and Bullish MAXCPs - http://tigersoft.com/2020MAX/1-8/BULLISH.htm Bearish MAXCPs - http://tigersoft.com/2020MIN/1-8/BEARISH.htm |
Table 1 QUICKSILVER on DJI-30 STOCKS 1/8/2020 STOCKS CLOSE CHANGE PIVOT-PT 5-dma AROC CL-PWR CANDLE IP21 ITRS ---------------------------------------------------------------------------------------- AAPL 303.19 4.8 300.35 160.1% Bullish BLUE .238 .164 Bullish --------------------------------------------------------------------- AXP 125.54 2.13 125.85 42.2% ------- BLUE .146 -.004 --------------------------------------------------------------------- BA 331.37 -5.91 333.32 84.3% Bearish RED -.167 -.091 --------------------------------------------------------------------- CAT 147.68 1.3 150.53 0% Bullish BLUE .222 -.009 --------------------------------------------------------------------- CSCO 47.52 .03 48.42 -46% ------- BLUE .161 -.053 --------------------------------------------------------------------- CVX 117.7 -1.36 121.43 -116.6% ------- RED -.119 -.074 --------------------------------------------------------------------- DIS 145.4 -.3 148.2 26.3% Bearish RED -.094 .045 --------------------------------------------------------------------- GS 237.76 2.27 234.32 168% Bullish BLUE-.069 .044 --------------------------------------------------------------------- HD 221.79 3.27 219.66 77.8% Bullish BLUE .159 -.12 --------------------------------------------------------------------- IBM 135.31 1.12 135.42 47.2% ------- BLUE-.023 -.067 --------------------------------------------------------------------- INTC 58.97 .04 60.84 -73.4% ------- BLUE .072 -.022 --------------------------------------------------------------------- JNJ 144.96 -.02 145.97 -31.4% ------- BLUE .163 .063 --------------------------------------------------------------------- JPM 136.94 1.06 141.09 -88.8% Bullish BLUE-.047 .021 --------------------------------------------------------------------- KO 54.35 .1 54.99 -91.3% ------- BLUE-.04 -.055 --------------------------------------------------------------------- MCD 205.91 3.28 200.79 206.8% Bullish BLUE .249 -.008 --------------------------------------------------------------------- MMM 180.63 2.73 180 118.1% ------- BLUE .412 .022 Bullish --------------------------------------------------------------------- MRK 88.6 -.6 92.04 -129.1% Bearish RED -.036 .011 --------------------------------------------------------------------- MSFT 160.09 2.51 160.62 75.3% ------- BLUE .197 .072 --------------------------------------------------------------------- NKE 101.55 -.23 102.2 11.8% Bullish BLUE .285 .051 Bullish --------------------------------------------------------------------- PFE 39.06 .31 39.14 -15.4% ------- BLUE-.05 -.004 --------------------------------------------------------------------- PG 122.51 .52 123.41 -97.1% Bearish BLUE-.17 -.072 --------------------------------------------------------------------- TRV 136.61 1.45 137.51 -12.4% ------- BLUE .156 -.019 --------------------------------------------------------------------- UNH 295.9 6.11 292.5 32.9% ------- BLUE .058 .142 --------------------------------------------------------------------- UTX 153.42 .23 153.14 119.9% ------- BLUE-.003 .007 --------------------------------------------------------------------- V 191.92 3.23 191.12 106.2% Bullish BLUE .28 .013 --------------------------------------------------------------------- VZ 59.71 .11 61.05 -139.6% Bearish -----.037 -.077 --------------------------------------------------------------------- WBA 55.83 -3.46 59.08 -264.4% Bearish RED -.101 -.059 --------------------------------------------------------------------- WMT 116.16 -.4 118.94 -113.6% Bearish RED -.255 -.09 --------------------------------------------------------------------- DOW 69.23 -1.06 70.9 -39% Bearish RED -.029 -.066 |
Table 2 QUICKSILVER on ETFS - 1/8/20 ETF CLOSE CHANGE PIVOT-PT 5-dma AROC CL-PWR CANDLE IP21 ITRS --------------------------------------------------------------------------------------------- DIA 287.4 1.66 288.62 40.1% ------- BLUE .053 ---- --------------------------------------------------------------------------------------------- BA 331.37 -5.91 333.32 84.3% Bearish RED -.167 -.091 --------------------------------------------------------------------------------------------- SPY 324.45 1.72 324.87 40.1% ------- BLUE .148 .01 --------------------------------------------------------------------------------------------- QQQ 217.15 1.62 216.16 105.7% ------- BLUE .226 .044 Bullish --------------------------------------------------------------------------------------------- MDY 373.6 .67 375.93 -23.8% ------- BLUE .184 -.019 --------------------------------------------------------------------------------------------- IWM 165.31 .51 165.78 -10.9% ------- BLUE .143 0 --------------------------------------------------------------------------------------------- FAS 94.72 1.95 96.25 4.2% Bullish BLUE .037 .112 --------------------------------------------------------------------------------------------- RETL 27.06 .04 27.53 -226.1% ------- BLUE .105 -.016 --------------------------------------------------------------------------------------------- SOXL 281.84 .62 291.96 126.4% ------- RED .104 .364 --------------------------------------------------------------------------------------------- TECL 256.17 8.19 255.23 290.5% Bullish BLUE .26 .359 Bullish --------------------------------------------------------------------------------------------- IBB 120.22 1.07 119.89 -12.1% ------- BLUE .105 .073 --------------------------------------------------------------------------------------------- GLD 146.86 -1.11 143.95 136% Bearish RED .048 -.031 --------------------------------------------------------------------------------------------- OIH 13.02 -.44 13.32 -85.4% ------- RED .034 .04 --------------------------------------------------------------------------------------------- GASL 9.51 -1.26 9.44 -144% ------- RED .114 .237 --------------------------------------------------------------------------------------------- RSX 25.76 .47 25.62 156.3% Bullish BLUE .163 .002 |
Table 3 Count of Stocks in Key Directories
20200108
-------------------------------
NEWHIGHS 270 Bullish
NEWLOWS 7
MAXCP 148
MINCP 27
TTTNH 49
TTTNL 26
FASTUP 76
FASTDOWN 44
CPCROSSA 90
CPCROSSD 68
BIGVOLUP 6
BIGVODN 15
ACCUMVER 17
HIGHIP21 55
HIUPPCT 38
VHIP21 134
LOWACCUM 107
REDSELL 83
AUGSELS7 27
TRAPDOOR 13
|
Table 4 RANKING OF KEY DIRECTORIES BASED PCT.OF STOCKS ABOVE 65-DMA
1/8/20
Bullish = 42
Bearish = 3
---------------------------------------------------------------------------------------
Directory Current day-1 day-2 day-3 day-4 day-5
----------------------------------------------------------------------------------------
BIGBANKS 1 1 1 1 1 1
ETFS .929 .894 .894 .894 .929 .912
BONDFUND .881 .841 .801 .801 .712 .623
INDEXES .881 .87 .892 .897 .86 .881
SEMI .878 .878 .841 .859 .878 .831
NASD-100 .876 .824 .876 .845 .896 .876
COPPER .875 .875 .875 1 1 .875
GAMING .863 .863 .818 .909 .909 .818
NIFTY .851 .851 .87 .833 .814 .796
CHINA .836 .836 .836 .836 .836 .818
SP-100 .833 .811 .844 .833 .866 .844
ELECTRON .83 .83 .81 .83 .849 .797
EDU .8 .8 .8 .8 .8 .8
HACKERS .8 .8 .8 .65 .7 .7
FOOD .796 .833 .814 .814 .87 .851
FIDSTKS .782 .759 .798 .793 .832 .826
COMODITY .775 .8 .775 .775 .825 .8
GOLD .75 .895 .895 .875 .916 .854
GUNS .75 .687 .687 .687 .625 .625
COMPUTER .736 .736 .684 .684 .789 .684
DOWJONES .733 .766 .833 .866 .866 .833
SOFTWARE .733 .716 .716 .666 .65 .633
SP500 .728 .701 .739 .733 .76 .796
HOSPITAL .727 .636 .681 .681 .681 .681
GREEN .714 .809 .761 .761 .761 .761
FINANCE .705 .67 .729 .764 .788 .788
SOLAR .705 .705 .764 .764 .764 .705
BIOTECH .702 .685 .682 .682 .708 .682
RUS-1000 .695 .676 .72 .732 .751 .781
OILGAS .694 .776 .805 .776 .723 .686
DJI-13 .692 .692 .769 .769 .769 .692
REGBANKS .692 .692 .846 .923 .923 .961
MILITARY .678 .642 .678 .642 .571 .571
TRANSP .65 .65 .5 .6 .7 .7
INFRA .638 .611 .694 .638 .694 .666
RETAIL .627 .607 .647 .627 .627 .666
BEVERAGE .625 .562 .875 .687 .687 .875
HOMEBLDG .588 .411 .47 .47 .352 .294
INDMATER .584 .597 .61 .662 .727 .766
UTILITY .575 .625 .65 .625 .625 .8
AUTO .538 .564 .589 .743 .794 .743
CHEM .52 .56 .54 .58 .68 .8
=============================================================================================
JETS .5 .5 .5 .5 .7 .8
=============================================================================================
INSURANC .461 .423 .576 .576 .576 .576
REIT .427 .393 .524 .537 .427 .579
COAL .2 .4 .2 .2 .2 .2
|
====================================================================
1/7/2020 Peerless remains on Buys. The internals of the market still look
safe. The A/D Line is uptrending and the IP21-Accumulation
Index is rising, not falling. The Closing Powers have actually
moved higher this weak and 71% of all the stocks and ETFs we
get data for are above their 65-dma. Only 3 of the 46 Industry
groups listed in Table 4 show a majority of their component-stocks
are below their 65-dma. New highs greatly outnumber new lows.
Speculative confidence remains strong: the NASDAQ continues
to outperform the DJI. That is what our "NASDJI" measures below.


War Jitters Are Real and So May Be The Threat of
War
Pres. Trump is a wild card. What was Iran planning before their
General was killed? Does Trump want to rally the country around
the flag going into the Election. George Bush certainly did.
The Election's uncertainties will also confound the market. January in
a Presidential Election year has tended not to do well. At least, since 1968
the DJI has risen only 46.2% of the time and lost on average 1.2% over the
next two weeks. After 42 trading, the DJIA is still down 0.4% on
average after January 7th in PE years. The dangers of a war with Iran
will surely be with us for that long.
So, we need to keep some cash in reserve to buy QQQ and DIA
if they do pullback or for some new high Accumulation flat-top
breakouts among our Bullish MAXCPs. My thinking now is that the
round-number 28000 on the DJI will be good support unless we get
some unexpectedly bearish economic news. The Dollar is holding
firm and the yield 10-year on the 10-year Bond is a most
uncompetitive 1.82%, by historical standards. Neither God nor Crude
Oil shows impressive big-money Accumulation. Perhaps, "big
money" has been taken by surprise, but it's hard for me to recommend them
until we see higher levels of IP21-Accumulation. They are uptrending
and traders will, no doubt, buy them and place stops beneath their
uptrend-lines.
 |
 |
|
Charts 1/7/2020 2020 PEERLESS DJI, Signals, Indicators Daily DJI Volume 10-DayUp/Down Vol Stoch-20 Inverted Traders Index Graph of Pct of All Stocks above 65-dma NASDAQ S&P OEX NYSE COMPQX DJI-15 DJI-20 DJI-30 DIA SPY QQQ MDY IWM TNA Short-Term Rates USO-CrudeOil DBO FAS GLD BBH IBB JETS JNUG KOL NUGT OIH OIL RSX RETL SDS AGQ SLV SOXL TECL TLT TMF TNA UGA (gasoline) and China: YINN CHAU Commodities: CANE CORN DBC JJC, NIB, CHOC CORN, CUT (paper) MOO, SOYB WEAT UUP (Dollar) LIT (Lithium) AAPL ADBE ALXN AMAT AMGN AMD AMZN AXP BA BABA BAC BIDU BLDP CAT CVX DE FB GOOG GS HD IBM INTU JPM M (Macy's) MSFT NFLX NKE NVDA PG QCOM TSLA TXN XOM V WMT CMG , LRCX, SQ TOWN 1/7/2020 (Click on Underlined link.) New highs and Bullish MAXCPs - http://tigersoft.com/2020MAX/1-7/BULLISH.htm Bearish MAXCPs - http://tigersoft.com/2020MIN/1-7/BEARISH.htm |
Table 1 QUICKSILVER on DJI-30 STOCKS 1/7/2020 STOCKS CLOSE CHANGE PIVOT-PT 5-dma AROC CL-PWR CANDLE IP21 ITRS ---------------------------------------------------------------------------------------- AAPL 298.39 -1.41 293.65 115.8% Bullish RED .242 .159 Bullish --------------------------------------------------------------------- AXP 123.41 -.65 124.49 -35.7% ------- RED .12 -.006 --------------------------------------------------------------------- BA 337.28 3.54 325.76 164.7% ------- BLUE-.142 -.087 --------------------------------------------------------------------- CAT 146.38 -1.96 147.68 -38.4% ------- RED .211 .027 --------------------------------------------------------------------- CSCO 47.49 -.31 47.96 -10.4% ------- RED .133 -.043 --------------------------------------------------------------------- CVX 119.06 -1.54 120.51 -32.7% ------- BLUE-.071 -.054 --------------------------------------------------------------------- DIS 145.7 .05 144.63 66.2% Bearish RED -.101 .052 --------------------------------------------------------------------- GS 235.49 1.54 229.93 122.7% Bullish BLUE-.013 .05 --------------------------------------------------------------------- HD 218.52 -1.44 218.38 27.6% Bullish RED .121 -.132 --------------------------------------------------------------------- IBM 134.19 .09 134.04 51.4% ------- BLUE-.057 -.065 --------------------------------------------------------------------- INTC 58.93 -1 59.85 -57.4% ------- RED .082 .062 --------------------------------------------------------------------- JNJ 144.98 .88 145.87 -11% ------- BLUE .151 .071 --------------------------------------------------------------------- JPM 135.88 -2.35 139.4 -98.8% Bullish RED -.078 .021 --------------------------------------------------------------------- KO 54.25 -.42 55.35 -92.7% ------- RED -.014 -.073 --------------------------------------------------------------------- MCD 202.63 .3 197.61 143.3% Bullish BLUE .228 -.033 --------------------------------------------------------------------- MMM 177.9 -.72 176.42 58.2% ------- RED .431 .033 --------------------------------------------------------------------- MRK 89.2 -2.44 90.95 -100.1% Bearish RED -.002 .014 --------------------------------------------------------------------- MSFT 157.58 -1.45 157.7 -.3% ------- RED .201 .06 --------------------------------------------------------------------- NKE 101.78 -.05 101.31 48.2% Bullish BLUE .295 .046 --------------------------------------------------------------------- PFE 38.75 -.13 39.18 -20.5% ------- RED -.082 -.001 --------------------------------------------------------------------- PG 121.99 -.76 124.9 -100.3% Bearish RED -.189 -.089 --------------------------------------------------------------------- TRV 135.16 -2.01 136.95 -48.5% ------- RED .181 -.038 --------------------------------------------------------------------- UNH 289.79 -1.76 293.98 -69.5% ------- RED .003 .119 --------------------------------------------------------------------- UTX 153.19 -.49 149.76 108.9% ------- BLUE .023 .002 --------------------------------------------------------------------- V 188.69 -.5 187.9 22.7% Bullish RED .227 .005 --------------------------------------------------------------------- VZ 59.6 -.67 61.4 -132.3% Bearish RED .023 -.082 --------------------------------------------------------------------- WBA 59.29 -.3 58.96 32.1% Bearish BLUE-.149 .023 --------------------------------------------------------------------- WMT 116.56 -1.09 118.84 -119.8% Bearish RED -.213 -.088 Bearish --------------------------------------------------------------------- DOW 70.29 -.58 69.78 57.6% ------- RED .031 -.049 |
Table 2 QUICKSILVER on ETFS - 1/7/20 ETF CLOSE CHANGE PIVOT-PT 5-dma AROC CL-PWR CANDLE IP21 ITRS --------------------------------------------------------------------------------------------- DIA 285.74 -1.24 285.1 21.1% ------- RED .073 ----- --------------------------------------------------------------------------------------------- BA 337.28 3.54 325.76 164.7% ------- BLUE-.142 -.087 --------------------------------------------------------------------------------------------- SPY 322.73 -.91 321.86 25.6% ------- RED .153 .008 --------------------------------------------------------------------------------------------- QQQ 215.53 -.03 212.61 77.5% ------- RED .236 .044 Bullish --------------------------------------------------------------------------------------------- MDY 372.93 -1.03 375.38 -27.7% ------- ---- .179 -.016 --------------------------------------------------------------------------------------------- IWM 164.8 -.55 165.67 -19.3% ------- ---- .124 .003 --------------------------------------------------------------------------------------------- FAS 92.77 -1.8 94.64 -48.6% ------- RED .013 .095 --------------------------------------------------------------------------------------------- RETL 27.02 -.24 28.3 -191.8% ------- RED .133 .018 --------------------------------------------------------------------------------------------- SOXL 281.22 17.22 274.82 149.1% ------- BLUE .126 .448 --------------------------------------------------------------------------------------------- TECL 247.98 -.88 241.75 162.2% Bullish RED .267 .361 Bullish --------------------------------------------------------------------------------------------- IBB 119.15 .03 120.51 -43.1% Bearish ---- .118 .061 --------------------------------------------------------------------------------------------- GLD 147.97 .58 142.9 184.7% Bullish BLUE .126 -.021 --------------------------------------------------------------------------------------------- OIH 13.46 -.3 13.25 11.1% ------- RED .141 .09 --------------------------------------------------------------------------------------------- GASL 10.77 .45 9.8 730.8% ------- BLUE .218 .532 --------------------------------------------------------------------------------------------- |
Table 3 Count of Stocks in Key Directories
20200107
-------------------------------
NEWHIGHS 175 Bullish
NEWLOWS 5
MAXCP 90
MINCP 15
TTTNH 25
TTTNL 26
FASTUP 97
FASTDOWN 29
CPCROSSA 64
CPCROSSD 107
BIGVOLUP 7
BIGVODN 10
ACCUMVER 20
HIGHIP21 57
HIUPPCT 33
VHIP21 132
LOWACCUM 108
REDSELL 82
AUGSELS7 29
TRAPDOOR 13
|
Table 4 RANKING OF KEY DIRECTORIES BASED PCT.OF STOCKS ABOVE 65-DMA
1/7/20
Bullish = 41
Bearish = 4
---------------------------------------------------------------------------------------
Directory Current day-1 day-2 day-3 day-4 day-5
----------------------------------------------------------------------------------------
BIGBANKS 1 1 1 1 1 1
GOLD .895 .895 .875 .916 .854 .833
ETFS .894 .894 .894 .929 .912 .877
SEMI .878 .841 .859 .878 .841 .822
COPPER .875 .875 1 1 1 1
INDEXES .87 .892 .897 .86 .87 .903
GAMING .863 .818 .909 .909 .818 .863
NIFTY .851 .87 .833 .814 .796 .796
BONDFUND .841 .801 .801 .712 .613 .633
CHINA .836 .836 .836 .836 .818 .781
ELECTRON .83 .81 .83 .849 .803 .784
FOOD .83 .811 .811 .867 .849 .849
NASD-100 .824 .886 .855 .896 .876 .845
SP-100 .811 .844 .833 .866 .844 .844
GREEN .809 .761 .761 .761 .761 .761
COMODITY .8 .775 .775 .825 .8 .8
EDU .8 .8 .8 .8 .8 .8
HACKERS .8 .85 .65 .7 .7 .65
OILGAS .77 .8 .77 .718 .681 .651
FIDSTKS .759 .798 .793 .832 .826 .793
DOWJONES-30 .758 .827 .862 .862 .827 .862
COMPUTER .736 .684 .684 .789 .684 .631
SOFTWARE .716 .733 .666 .65 .633 .633
SOLAR .705 .764 .764 .764 .705 .705
SP500 .701 .741 .733 .76 .796 .758
DJI-13 .692 .769 .769 .769 .692 .692
REGBANKS .692 .846 .923 .923 .961 .923
GUNS .687 .687 .687 .625 .625 .687
BIOTECH .682 .679 .679 .708 .685 .679
RUS-1000 .676 .721 .732 .751 .781 .75
FINANCE .67 .729 .764 .788 .788 .776
TRANSP .65 .5 .6 .7 .7 .7
MILITARY .642 .678 .642 .571 .571 .607
HOSPITAL .636 .681 .681 .681 .681 .681
UTILITY .625 .65 .625 .625 .8 .725
INFRA .611 .694 .638 .694 .666 .666
RETAIL .607 .647 .627 .627 .666 .666
INDMATER .597 .61 .662 .727 .766 .727
AUTO .564 .589 .743 .794 .743 .743
BEVERAGE .562 .875 .687 .687 .875 .75
CHEM .56 .54 .58 .68 .8 .72
==========================================================================================
JETS .5 .5 .5 .7 .8 .8
==========================================================================================
INSURANC .423 .576 .576 .576 .576 .576
HOMEBLDG .411 .47 .47 .352 .294 .235
COAL .4 .2 .2 .2 .2 .2
REIT .393 .524 .537 .427 .579 .544
|
====================================================================
1/6/2020 Peerless remains on Buys. We did come close to a Sell S12.
Near
S12s early in January are particularly reliable when the DJI has had
a long advance in the previous year, there is a rising wedge pattern
and the clouds of war are gathering. As a result, I suggested selling
some of your positions in DIA and QQQ as a precaution. The seasonality
of these Presidential Election years starting in 1968 shows only a 30%
probability of rising over the next week and a 50% chance over the next month.
But Peerless is still on a Buy and there is a very good chance that it
will be a while before Iran retaliates. Morover interest rates are low
and not rising. The Dollar is down, but steady. Oil prices are not shooting
up. And Friday could well bring a very positive Jobs' Report. Let's
see if leaders like AAPL in its accelerating uptrend can breakout above
the top of its rising resistance, as BLDP (our high Accumuation - low priced
favorite) has just done. A spectacular vertical advance by AAPL would
certainly spur on the DJI to breakout past 29000.
 |
||||
 |
||||
 |
||||
 |
||||
 |
||||
|
Charts 1/6/2020 2020 PEERLESS DJI, Signals, Indicators Daily DJI Volume 10-DayUp/Down Vol Stoch-20 Inverted Traders Index Graph of Pct of All Stocks above 65-dma NASDAQ S&P OEX NYSE COMPQX DJI-15 DJI-20 DJI-30 DIA SPY QQQ MDY IWM TNA Short-Term Rates USO-CrudeOil DBO FAS GLD BBH IBB JETS JNUG KOL NUGT OIH OIL RSX RETL SDS AGQ SLV SOXL TECL TLT TMF TNA UGA (gasoline) and China: YINN CHAU Commodities: CANE CORN DBC JJC, NIB, CHOC CORN, CUT (paper) MOO, SOYB WEAT UUP (Dollar) LIT (Lithium) AAPL ADBE ALXN AMAT AMGN AMD AMZN AXP BA BABA BAC BIDU BLDP CAT CVX DE FB GOOG GS HD IBM INTU JPM M (Macy's) MSFT NFLX NKE NVDA PG QCOM TSLA TXN XOM V WMT CMG , LRCX, SQ TOWN 1/6/2020 (Click on Underlined link.) New highs and Bullish MAXCPs - http://tigersoft.com/2020MAX/1-6/BULLISH.htm Bearish MAXCPs - http://tigersoft.com/2020MIN/1-6/BEARISH.htm |
||||
Table 1 QUICKSILVER on DJI-30 STOCKS 1/6/2020 STOCKS CLOSE CHANGE PIVOT-PT 5-dma AROC CL-PWR CANDLE IP21 ITRS ---------------------------------------------------------------------------------------- AAPL 299.8 2.37 291.52 169.8% Bullish BLUE .29 .163 Bullish --------------------------------------------------------------------- AXP 124.06 -.54 124.3 -45.2% ------- BLUE .181 -.005 --------------------------------------------------------------------- BA 333.74 .98 326.4 54.6% Bearish BLUE-.182 -.09 --------------------------------------------------------------------- CAT 148.34 -.1 147.52 2% ------- BLUE .26 .026 --------------------------------------------------------------------- CSCO 47.8 .17 47.59 3.1% ------- BLUE .083 -.054 --------------------------------------------------------------------- CVX 120.6 -.41 119.85 12.4% ------- RED -.131 -.048 Bearish --------------------------------------------------------------------- DIS 145.65 -.85 143.77 -3.4% Bearish BLUE-.103 .041 --------------------------------------------------------------------- GS 233.95 2.37 229.8 71.1% ------- BLUE .058 .037 --------------------------------------------------------------------- HD 219.96 1.03 217.31 -.2% Bullish BLUE .124 -.133 --------------------------------------------------------------------- IBM 134.1 -.24 132.81 -43.5% Bearish BLUE-.092 -.072 Bearish --------------------------------------------------------------------- INTC 59.93 -.17 59.62 -12.5% ------- BLUE .131 .089 --------------------------------------------------------------------- JNJ 144.1 -.18 145.3 -56.7% ------- BLUE .144 .039 --------------------------------------------------------------------- JPM 138.23 -.11 138.63 -32.7% ------- BLUE-.007 .035 --------------------------------------------------------------------- KO 54.67 -.02 55.27 -61.7% ------- RED .048 -.069 --------------------------------------------------------------------- MCD 202.33 2.25 196.91 104.7% ------- BLUE .199 -.054 --------------------------------------------------------------------- MMM 178.62 .17 175.83 38.3% ------- BLUE .39 -.011 --------------------------------------------------------------------- MRK 91.64 .39 91.03 7.7% ------- BLUE .111 .036 --------------------------------------------------------------------- MSFT 159.03 .41 157.59 2.2% ------- BLUE .246 .089 Bullish --------------------------------------------------------------------- NKE 101.83 -.09 100.8 12.8% ------- BLUE .334 .033 Bullish --------------------------------------------------------------------- PFE 38.88 -.05 38.91 -56.3% ------- BLUE-.053 -.012 --------------------------------------------------------------------- PG 122.75 .17 124.47 -134.4% Bearish RED -.096 -.072 Bearish --------------------------------------------------------------------- TRV 137.17 .15 136.49 13.5% ------- BLUE .19 -.032 --------------------------------------------------------------------- UNH 291.55 2.01 293.85 -75.4% ------- BLUE .037 .107 --------------------------------------------------------------------- UTX 153.68 .33 149.88 112.4% ------- BLUE .019 .029 --------------------------------------------------------------------- V 189.19 -.41 187.83 -5.3% ------- BLUE .276 .034 --------------------------------------------------------------------- VZ 60.27 -.13 61.21 -103.1% Bearish BLUE .103 -.08 --------------------------------------------------------------------- WBA 59.59 .51 58.91 48.3% Bearish BLUE-.156 .022 --------------------------------------------------------------------- WMT 117.65 -.24 119.4 -81.6% Bearish BLUE-.151 -.084 Bearish --------------------------------------------------------------------- DOW 70.87 .54 69.48 69.9% ------- BLUE-.021 -.054
|
====================================================================
1/3/2020 A
decline to 28000 is probably coming, at least. Sell 50% of your
DIA and QQQ holdings and take some profits in the leading NASDAQ
stocks. The middle of the day is often a better time to sell than when
the DJI is down 100 or more at the opening.
We have no new Peerless Sell signal, but we did come very close
to a Sell S12 Thursday and Friday. See the new study tonight
showing the risks inherent in a near Sell S12 and a pivot down in
in the first week of January.
www.tigersoft.com/PIVODOWN/INDEX.htm
.
The DJI's rising wedge pattern, as we feared, has prevented a rally close enough
to the upper band to yield a proper Sell S12. I will have to spend some time
working on a revised Sell S12 that takes into account the wedge pattern and the
size of the previous year's advance. The previous
year's advance
should be considerable.
1/2/2020
la/ma= 1.023 IP21= +.042
The history of war jitters occurring at the start of a new
year clearly
shows a pattern of subsequent declines. The Peerless system, of
course, does not know or care why the market is going up or down,
it is based only on bands, momentum, internal strength indicators and
seasonality. But we should not be chained to using only technical analysis.
Just as we can factor in the bullishness of tax cuts, drops
in interest rate and
sweeping deregulation, so too, I think we have to factor in the very real dangers
of a new war, especially one in the Middle East.
Look at the Peerless charts below showing
January 1940 (when the NAZI army had just conquered Poland) or
January 1941 (when Japan's war machine conquering all of SE Asia
and the US threatened an Oil Embargo) or
Late December 1961 (when the Cubans were planning soon to set up
Soviet missiles as a deterrent against another Bay of Pigs Invasion or
January 1966 (when JCS told LBJ he needed to put 500,000 US troops in
Vietnam for the next five years).
January 2003 when George Bush II began preparing an
invasion of Iraq to avenge 9/11.
Jan 1940 |
Jan 1941 |
Dec 1961 |
Jan 1966 |
Jan 2003 |
The fact is that the coming of War that involves the
US brings market declines
in the DJIA. I can't easily imagine, at this point, just how the US and Iran
can avoid a far-reaching conflict in the volatile Middle East. Powerful US
Oil interests are too deeply embedded for it to be otherwise. Trump's
widespread unpopularity adds a dangerous internal component much like
LBJ's war in Vietnam did. And the US will inevitably be seen as a bully
and an imperialist outsider.
Even without the threat of war, we know from numerous past
Hotlines
that early January pivots-down and near Sell S12s (Low IP21 with
DJI 1.4% - 4.4% over 21-day ma) are quite dangerous. I've shown how
profit-taking in the new year following a big advance brought sells off
in early January 1916 and 1928, both before we could apply the lessons
of Peeless.
My new study today adds even more empasis to these concerns.
See www.tigersoft.com/PIVODOWN/INDEX.htm
for all the charts.
What I found was starting in 1929, early January Sell S12s (actual or "near")
brought on 18 declines below the lower band.
6 declines to the lower band.
and only 7 significant advances.
1/5/1931 1.016 -75
-.059 -443 Rose to 3.5% upper
band and then fell
to 3.5% LB.
1/5/1933 1.041 -7
-.045 -59
Rose past upper band and thenFell
quickly below LB
1/3/1935 1.032 +28
-.014 -15 Rose
to upper band and then fell to 3% LB.
PE 1/2/1936 1.015 +38 -.110
-22 Rose
a long ways after testing rising 65-dma.
1/6/1938 1.032 +74
-.104 -224 Rose for two
days more, then Fell quickly below
LB
---------
1/3/1939 1.022 -9
+.042 -89 Fell quickly below LB
PE 1/4/1940
1.022 +70 +.042 +54
Fell
quickly to 3.5% LB.
War expected
All positive - does not prevent a decline.
1/6/1941
1.017 +12 -.080
-30 Fell quickly below LB
War expected
1/2/1942
1.022 -55 +.039
-238 Fell quickly below LB
War.
1/6/1949
1.020 -6 -.016
-101 Fell
to slightly below first test of LB
----------
1/3/1958
1.019 -13 -.049
-101 Rose for next five weeks. Basing.
PE 1/5/1960
1.018 +4 -.038
-170 Fell quickly below LB
1/4/1963
1.020 +30 +.030 -104 Rose for next eight weeks.
1/4/1965
1.014 +4 -.095
-288 Rose for next eight weeks.
low
1/5/1966
1.023 +54 -.026
+8 Fell
quickly below LB War.
------------
1/2/1968 1.021 +60
+.023 +7 Fell quickly below LB
All positive
1/2/1970
1.026 -87 -.053
-2 Fell
quickly below LB
1/3/1972
1.019 +218 +.037
+2 Rose for next
eight weeks.
1/3/1973
1.021 -42 +.011
-1 Rose to 3.5% upper
band and then Fell quickly below LB
1/2/1974
1.032 -86 -.008
-2 Rose for two
days more above 3.5% UB, then fell below LB.
-------------
1/2/1981
1.029 -71 -.040
-5 Rose for two days
more above 3.5% UB, then fell to LB.
1/5/1984
1.019 +5 -.024
+0 Fell
quickly below LB
1/6/1989
1.016 +90 +.04
+8
All positive
(1/3/1990 1.027 +36
+.08
-4 Fell
quickly below LB )
too high
1/3/1997
1.017 +17 +.027
-27 Bull market starting.
1/4/2002
1.024 +269 +.040
0 Fell
quickly to 3% LB.
-------------
1/6/2003
1.031 +184 +.034
-67 Fell
quickly below LB
War expected
1/5/2009
1.033 +406 +.010
+31 Fell quickly below LB
All positive
1/4/2010
1.014 +380 -.088
-30 Fell quickly below LB
low
1/4/2011
1.016 +203 -.017
+92 DJI rose two more months.
1/3/2012
1.025 +246 -.090
+1 DJI rose ten weeks.
-------------
1/2/2014 1.020 +123
+.015 +7 Fell quickly below LB
All positive
1/4/2018
1.019 +217 -.046
+48 DJI rise another 3 weeks and then fell steeply below LB.
__________________________________________________________________________________
N = 31 18
produced declines below the lower band.
6 produced declines to the lower band.
7 produced significantly higher prices.
|
Charts 1/3/2020 2020 PEERLESS DJI, Signals, Indicators Daily DJI Volume 10-DayUp/Down Vol Stoch-20 Inverted Traders Index Graph of Pct of All Stocks above 65-dma NASDAQ S&P OEX NYSE COMPQX DJI-15 DJI-20 DJI-30 DIA SPY QQQ MDY IWM TNA Short-Term Rates USO-CrudeOil DBO FAS GLD BBH IBB JETS JNUG KOL NUGT OIH OIL RSX RETL SDS AGQ SLV SOXL TECL TLT TMF TNA UGA (gasoline) and China: YINN CHAU Commodities: CANE CORN DBC JJC, NIB, CHOC CORN, CUT (paper) MOO, SOYB WEAT UUP (Dollar) LIT (Lithium) AAPL ADBE ALXN AMAT AMGN AMD AMZN AXP BA BABA BAC BIDU BLDP CAT CVX DE FB GOOG GS HD IBM INTU JPM M (Macy's) MSFT NFLX NKE NVDA PG QCOM TSLA TXN XOM V WMT CMG , LRCX, SQ TOWN 1/3/2020 (Click on Underlined link.) New highs and Bullish MAXCPs - http://tigersoft.com/2020MAX/1-3/BULLISH.htm Bearish MAXCPs - http://tigersoft.com/2020MIN/1-3/BEARISH.htm |
Table 1 QUICKSILVER on DJI-30 STOCKS 1/3/2020 STOCKS CLOSE CHANGE PIVOT-PT 5-dma AROC CL-PWR CANDLE IP21 ITRS ---------------------------------------------------------------------------------------- AAPL 297.43 -2.92 289.8 128.3% Bullish BLUE .244 .17 --------------------------------------------------------------------- AXP 124.6 -1.25 125.19 -32.4% ------- BLUE .152 -.019 --------------------------------------------------------------------- BA 332.76 -.56 330.14 43.1% Bearish BLUE-.236 -.082 --------------------------------------------------------------------- CAT 148.44 -2.09 148.28 7.4% Bearish RED .183 .041 --------------------------------------------------------------------- CSCO 47.63 -.79 47.77 -23% ------- RED .005 -.067 --------------------------------------------------------------------- CVX 121.01 -.42 120.3 17% ------- RED -.081 -.042 --------------------------------------------------------------------- DIS 146.5 -1.7 145.75 27.5% Bearish -----.166 .037 --------------------------------------------------------------------- GS 231.58 -2.74 230.66 8% ------- ---- .01 .036 --------------------------------------------------------------------- HD 218.93 -.73 219.97 -43.1% ------- BLUE .083 -.146 --------------------------------------------------------------------- IBM 134.34 -1.08 135.27 -21.2% Bearish BLUE-.164 -.066 --------------------------------------------------------------------- INTC 60.1 -.74 60.08 23.3% Bullish BLUE .084 .086 --------------------------------------------------------------------- JNJ 144.28 -1.69 145.75 -53.2% ------- BLUE .132 .048 --------------------------------------------------------------------- JPM 138.34 -2.75 139.14 -25.1% ------- BLUE-.006 .04 --------------------------------------------------------------------- KO 54.69 -.3 55.35 -29.9% ------- BLUE .114 -.053 --------------------------------------------------------------------- MCD 200.08 -.71 198.17 76.2% ------- BLUE .18 -.065 --------------------------------------------------------------------- MMM 178.45 -1.55 177.26 52.5% ------- BLUE .35 -.004 --------------------------------------------------------------------- MRK 91.25 -.79 91.5 -4.9% ------- BLUE .127 .053 --------------------------------------------------------------------- MRK 158.62 -2 158.96 -1.6% ------- BLUE .216 .094 --------------------------------------------------------------------- NKE 101.92 -.28 101.57 59.7% ------- BLUE .331 -.003 --------------------------------------------------------------------- PFE 38.93 -.21 39.32 -57.4% Bearish BLUE-.047 0 --------------------------------------------------------------------- PG 122.58 -.83 126.09 -105.8% ------- BLUE-.045 -.066 --------------------------------------------------------------------- TRV 137.02 -.49 136.8 26.7% ------- BLUE .188 -.016 --------------------------------------------------------------------- UNH 289.54 -2.96 295.97 -103.8% ------- BLUE-.033 .091 --------------------------------------------------------------------- UTX 153.35 .21 150.28 87.6% ------- BLUE-.058 .015 --------------------------------------------------------------------- V 189.6 -1.52 189.39 11.6% Bullish BLUE .156 .041 --------------------------------------------------------------------- VZ 60.4 -.65 61.53 -72.6% Bearish ---- .145 -.075 --------------------------------------------------------------------- WBA 59.08 0 59.02 15.3% Bearish BLUE-.236 -.001 --------------------------------------------------------------------- WMT 117.89 -1.05 119.59 -68.3% Bearish RED -.18 -.083 --------------------------------------------------------------------- DOW 70.33 -.57 69.89 14.3% Bearish RED -.006 -.051 |
Table 2 QUICKSILVER on ETFS - 1/3/20 ETF CLOSE CHANGE PIVOT-PT 5-dma AROC CL-PWR CANDLE IP21 ITRS --------------------------------------------------------------------------------------------- DIA 286.32 -2.3 286.33 4.5% ------- BLUE .064 0 --------------------------------------------------------------------------------------------- BA 332.76 -.56 330.14 43.1% Bearish BLUE-.236 -.082 --------------------------------------------------------------------------------------------- SPY 322.52 -2.35 322.86 -6.5% ------- BLUE .16 .01 --------------------------------------------------------------------------------------------- QQQ 214.18 -1.98 213.61 9.1% ------- BLUE .2 .047 --------------------------------------------------------------------------------------------- MDY 373.97 -1.96 375.36 -28.2% ------- BLUE .127 -.014 --------------------------------------------------------------------------------------------- IWM 165.13 -.65 165.86 -46.7% ------- BLUE .078 .002 --------------------------------------------------------------------------------------------- FAS 94.52 -1.73 94.69 -13.7% ------- BLUE .068 .138 --------------------------------------------------------------------------------------------- RETL 27 -.53 28.71 -248.2% Bearish BLUE .067 .019 --------------------------------------------------------------------------------------------- SOXL 276.19 -15.77 278.86 -103.7% ------- RED .13 .433 --------------------------------------------------------------------------------------------- TECL 247.13 -8.1 244.33 63.2% Bullish BLUE .257 .418 --------------------------------------------------------------------------------------------- IBB 118.36 -1.53 121.56 -174.5% Bearish BLUE .071 .055 --------------------------------------------------------------------------------------------- GLD 145.86 1.91 142.33 121.8% Bullish BLUE .143 -.029 --------------------------------------------------------------------------------------------- OIH 13.51 .19 13.3 30% ------- RED .095 .078 --------------------------------------------------------------------------------------------- GASL 10.02 .58 9.33 -15.6% ------- RED .152 .484 --------------------------------------------------------------------------------------------- |
Table 3 Count of Stocks in Key Directories
20200103
-------------------------------
NEWHIGHS 119
NEWLOWS 10
MAXCP 64
MINCP 11
TTTNH 24
TTTNL 17
FASTUP 53
FASTDOWN 49
CPCROSSA 221
CPCROSSD 49
BIGVOLUP 8
BIGVODN 16
ACCUMVER 16
HIGHIP21 54
HIUPPCT 37
VHIP21 118
LOWACCUM 110
REDSELL 83
AUGSELS7 38
TRAPDOOR 15
|
RANKING OF KEY DIRECTORIES BASED PCT.OF STOCKS ABOVE 65-DMA
1/3/20
Bullish = 44
Bearish = 2
---------------------------------------------------------------------------------------
Directory Current day-1 day-2 day-3 day-4 day-5
----------------------------------------------------------------------------------------
BIGBANKS 1 1 1 1 1 1
COPPER 1 1 1 1 .875 .875
REGBANKS .923 .923 .961 .923 .923 1
GAMING .909 .909 .818 .863 .863 .818
INDEXES .897 .86 .87 .897 .844 .838
ETFS .894 .929 .912 .877 .929 .947
GOLD .875 .916 .854 .833 .812 .833
NASD-100 .865 .917 .886 .845 .865 .886
DOWJONES .862 .862 .827 .862 .862 .827
SEMI .859 .878 .841 .822 .85 .831
CHINA .836 .836 .818 .781 .763 .781
NIFTY .833 .814 .796 .796 .814 .814
SP-100 .833 .866 .844 .844 .855 .855
ELECTRON .83 .849 .803 .79 .81 .816
FOOD .814 .87 .851 .851 .851 .833
BONDFUND .801 .712 .613 .633 .633 .633
EDU .8 .8 .8 .8 .8 .8
FIDSTKS .793 .832 .826 .793 .837 .837
COMODITY .775 .825 .8 .8 .8 .775
OILGAS .77 .718 .681 .659 .637 .711
DJI-13 .769 .769 .692 .692 .692 .615
FINANCE .764 .788 .788 .776 .8 .823
SOLAR .764 .764 .705 .705 .764 .764
GREEN .761 .761 .761 .761 .809 .857
AUTO .743 .794 .743 .743 .743 .769
SP500 .735 .762 .796 .758 .777 .783
RUS-1000 .733 .753 .781 .75 .769 .773
HACKERS .7 .75 .7 .65 .65 .65
BEVERAGE .687 .687 .875 .75 .75 .812
GUNS .687 .625 .625 .687 .687 .75
COMPUTER .684 .789 .684 .631 .684 .684
SOFTWARE .683 .666 .633 .633 .666 .7
HOSPITAL .681 .681 .681 .681 .636 .636
BIOTECH .673 .702 .682 .682 .694 .7
INDMATER .662 .727 .766 .727 .74 .753
MILITARY .642 .571 .571 .607 .607 .607
INFRA .638 .694 .666 .666 .694 .722
RETAIL .627 .627 .666 .666 .725 .764
UTILITY .625 .625 .8 .725 .725 .625
TRANSP .6 .7 .7 .7 .8 .8
CHEM .58 .68 .8 .72 .74 .78
INSURANC .576 .576 .576 .576 .538 .5
REIT .537 .427 .579 .544 .551 .517
JETS .5 .7 .8 .8 .9 .9
==========================================================================================
HOMEBLDG .47 .352 .294 .294 .294 .352
COAL .2 .2 .2 .2 .2 .2
|
======================================================================
1/2/2020 War with Iraq? The market cannot be sure that this will not
follow President
Trump's ordering of the killing of a top Iranian General. So, a 500 point
further pullback seems possible. Actually, anything less than that will have to
be considered as a sign that the bulls are still very much in charge and that
the leading stocks are in "strong hands".
Stick with the Peerless Buys
and the very strong NYSE A/D Line.
Peerless has given no Sell signal. Stick with our longs. The upwards
momentum before the news leaked out in some quarters should not be
quickly dismissed.
I appreciate that traders may be tempted to lock in profits
and I admit that
it can be argued that since we have a two-day reversal-up Buy B19
signal, we should have something like a two-day reversal-down Sell
Signal if the DJI closes at its lows tomorrow. But two-day reversals down
nearly always follow a different Peerless Sell and we did not get one today.
Instead, our IP21 has jumped up above +.04.
Weakness at the close tomorrow after a down opening of 300 points
will be scary, but the DJI's uptrend is still intact, rates are low, the economy
is strong and more all-time highs probably lie ahead.

|
Charts 1/2/2020 2020 PEERLESS DJI, Signals, Indicators Daily DJI Volume 10-DayUp/Down Vol Stoch-20 Inverted Traders Index NASDAQ S&P OEX NYSE COMPQX DJI-15 DJI-20 DJI-30 DIA SPY QQQ MDY IWM TNA Short-Term Rates USO-CrudeOil DBO FAS GLD BBH IBB JETS JNUG KOL NUGT OIH OIL RSX RETL SDS AGQ SLV SOXL TECL TLT TMF TNA UGA (gasoline) and China: YINN CHAU Commodities: CANE CORN DBC JJC, NIB, CHOC CORN, CUT (paper) MOO, SOYB WEAT UUP (Dollar) LIT (Lithium) AAPL ADBE ALXN AMAT AMGN AMD AMZN AXP BA BABA BAC BIDU BLDP CAT CVX DE FB GOOG GS HD IBM INTU JPM M (Macy's) MSFT NFLX NKE NVDA PG QCOM TSLA TXN XOM V WMT CMG , LRCX, SQ TOWN 1/2/2020 (Click on Underlined link.) New highs and Bullish MAXCPs - http://tigersoft.com/2020MAX/1-2/BULLISH.htm Bearish MAXCPs - http://tigersoft.com/2020MIN/1-2/BEARISH.htm |
Table 1 QUICKSILVER on DJI-30 STOCKS 1/2/2020
Only 24 of 30 DJI-30 stocks show rising 5-dma.
STOCKS CLOSE CHANGE PIVOT-PT 5-dma AROC CL-PWR CANDLE IP21 ITRS ---------------------------------------------------------------------------------------- AAPL 300.35 6.7 289.91 277.4% Bullish BLUE .324 .173 Bullish --------------------------------------------------------------------- AXP 125.85 1.36 125.41 44.5% ------- BLUE .195 -.019 --------------------------------------------------------------------- BA 333.32 7.56 329.92 4.9% Bearish BLUE-.232 -.069 Bearish --------------------------------------------------------------------- CAT 150.53 2.85 148.22 103.2% Bearish BLUE .234 .062 Bullish --------------------------------------------------------------------- CSCO 48.42 .46 47.85 67% ------- BLUE .046 -.054 --------------------------------------------------------------------- CVX 121.43 .92 120.6 45.3% ------- BLUE-.079 -.035 --------------------------------------------------------------------- DIS 148.2 3.57 145.7 100.3% Bearish BLUE-.11 .062 --------------------------------------------------------------------- GS 234.32 4.39 231.21 95.7% ------- BLUE-.008 .044 --------------------------------------------------------------------- HD 219.66 1.28 220.82 -23% ------- BLUE .042 -.148 --------------------------------------------------------------------- IBM 135.42 1.38 134.91 16.4% Bearish BLUE-.135 -.055 Bearish --------------------------------------------------------------------- INTC 60.84 .99 59.82 119.7% ------- BLUE .067 .091 --------------------------------------------------------------------- JNJ 145.97 .1 145.83 1.4% ------- BLUE .153 .064 Bullish --------------------------------------------------------------------- JPM 141.09 1.69 139.04 126.5% ------- BLUE .022 .066 --------------------------------------------------------------------- KO 54.99 -.36 55.02 25.4% ------- RED .15 -.062 --------------------------------------------------------------------- MCD 200.79 3.18 197.06 104.4% ------- BLUE .13 -.119 --------------------------------------------------------------------- MMM 180 3.58 176.59 94% ------- BLUE .297 .009 --------------------------------------------------------------------- MRK 92.04 1.09 91.34 32.9% ------- BLUE .167 .013 --------------------------------------------------------------------- MSFT 160.62 2.92 158.67 102.5% ------- BLUE .285 .084 Bullish --------------------------------------------------------------------- NKE 102.2 .89 100.71 102.1% ------- BLUE .334 -.014 --------------------------------------------------------------------- PFE 39.14 -.04 39.38 -19.1% Bearish RED -.034 -.003 --------------------------------------------------------------------- PG 123.41 -1.49 125.22 -72.3% ------- RED .008 -.04 --------------------------------------------------------------------- TRV 137.51 .56 136.29 61.6% ------- ---- .192 -.107 --------------------------------------------------------------------- UNH 292.5 -1.48 295.65 -34.6% ------- RED -.018 .123 --------------------------------------------------------------------- UTX 153.14 3.38 150.71 119% ------- BLUE-.055 .031 --------------------------------------------------------------------- V 191.12 3.22 189.16 94.2% ------- BLUE .175 .007 --------------------------------------------------------------------- VZ 61.05 -.35 61.29 -18.7% Bearish RED .186 -.071 --------------------------------------------------------------------- WBA 59.08 .12 58.9 62% Bearish RED -.217 .006 --------------------------------------------------------------------- WMT 118.94 .1 119.52 -23.9% Bearish BLUE-.116 -.083 --------------------------------------------------------------------- DOW 70.9 1.12 70.13 63% ------- BLUE .035 -.045 |
Table 2 QUICKSILVER on ETFS - 1/2/20 ETF CLOSE CHANGE PIVOT-PT 5-dma AROC CL-PWR CANDLE IP21 ITRS
---------------------------------------------------------------------------------------------
DIA 288.62 3.52 286.06 63.2% ------- BLUE .123 -----
---------------------------------------------------------------------------------------------
BA 333.32 7.56 329.92 4.9% Bearish BLUE -.232 -.069
---------------------------------------------------------------------------------------------
SPY 324.87 3.01 322.94 56.5% ------- BLUE .208 .007
---------------------------------------------------------------------------------------------
QQQ 216.16 3.55 213.79 99.6% ------- BLUE .28 .042
high
---------------------------------------------------------------------------------------------
MDY 375.93 .55 376.09 8.9% ------- RED .144 -.016
---------------------------------------------------------------------------------------------
IWM 165.78 .11 166.68 -27.1% Bearish RED .07 0
---------------------------------------------------------------------------------------------
FAS 96.25 1.61 94.78 151.2% ------- BLUE .123 .122
---------------------------------------------------------------------------------------------
RETL 27.53 -.77 28.4 -49.5% Bearish RED .056 .075
---------------------------------------------------------------------------------------------
SOXL 291.96 17.14 282 198.3% ------- BLUE .238 .475 Bullish
---------------------------------------------------------------------------------------------
TECL 255.23 13.48 244.03 335.8% ------- BLUE .343 .397 Bullish
---------------------------------------------------------------------------------------------
IBB 119.89 -.62 122.58 -148.4% Bearish RED .111 .081
---------------------------------------------------------------------------------------------
GLD 143.95 1.05 142.38 94.2% Bullish BLUE .109 -.046
---------------------------------------------------------------------------------------------
OIH 11.91 -.37 12.55 -429.3% Bearish RED -.058 -.19
---------------------------------------------------------------------------------------------
GASL 9.44 -.36 10.05 -232.4% ------- RED .136 .454
---------------------------------------------------------------------------------------------
|
Table 3 Count of Stocks in Key Directories
20200102
-------------------------------
NEWHIGHS 440
NEWLOWS 18
MAXCP 43
MINCP 26
TTTNH 19
TTTNL 80
FASTUP 52
FASTDOWN 43
CPCROSSA 138
CPCROSSD 140
BIGVOLUP 10
BIGVODN 3
ACCUMVER 21
HIGHIP21 63
HIUPPCT 35
VHIP21 119
LOWACCUM 115
REDSELL 86
AUGSELS7 49
TRAPDOOR 15
|
RANKING OF KEY DIRECTORIES BASED PCT.OF STOCKS ABOVE 65-DMA
1/2/20
Bullish = 43
Bearish = 3
---------------------------------------------------------------------------------------
Directory Current day-1 day-2 day-3 day-4 day-5
----------------------------------------------------------------------------------------
BIGBANKS 1 1 1 1 1 1
COPPER 1 1 1 .875 .875 .875
ETFS .931 .913 .879 .931 .948 .913
REGBANKS .923 .961 .923 .923 1 1
NASD-100 .917 .896 .855 .865 .886 .886
GAMING .909 .818 .863 .863 .818 .818
GOLD .901 .843 .823 .803 .823 .803
SEMI .886 .849 .83 .858 .83 .839
FOOD .87 .851 .851 .851 .833 .796
SP-100 .866 .844 .844 .855 .855 .844
DOWJONES .862 .827 .862 .862 .827 .827
INDEXES .86 .87 .897 .844 .838 .822
ELECTRON .849 .803 .79 .81 .81 .79
CHINA .836 .818 .781 .763 .781 .763
FIDSTKS .832 .826 .793 .837 .837 .826
COMODITY .829 .804 .804 .804 .78 .731
NIFTY .814 .796 .796 .814 .814 .814
AUTO .794 .743 .743 .743 .769 .769
FINANCE .79 .79 .779 .802 .825 .825
COMPUTER .789 .684 .631 .684 .684 .684
DJI-13 .769 .692 .692 .692 .615 .615
SP500 .762 .798 .758 .777 .777 .779
RUS-1000 .753 .783 .75 .769 .769 .765
HACKERS .75 .75 .65 .65 .65 .65
INDMATER .723 .763 .723 .736 .75 .789
GREEN .72 .72 .72 .76 .8 .8
OILGAS .72 .683 .661 .639 .691 .698
BIOTECH .702 .681 .681 .696 .699 .713
JETS .7 .8 .8 .9 .9 .9
TRANSP .7 .7 .7 .8 .8 .7
INFRA .694 .666 .666 .694 .722 .694
BEVERAGE .687 .875 .75 .75 .75 .75
HOSPITAL .681 .681 .681 .636 .636 .636
CHEM .673 .795 .714 .734 .775 .795
BONDFUND .669 .58 .598 .607 .598 .598
SOFTWARE .666 .65 .633 .666 .7 .716
EDU .647 .647 .588 .647 .705 .647
RETAIL .627 .666 .666 .725 .764 .745
GUNS .625 .625 .687 .687 .75 .75
UTILITY .625 .8 .725 .725 .625 .65
SOLAR .615 .576 .576 .615 .615 .615
MILITARY .571 .571 .607 .607 .607 .607
INSURANC .567 .567 .567 .54 .513 .513
============================================================================================
REIT .427 .579 .544 .551 .517 .496
HOMEBLDG .387 .354 .354 .387 .387 .322
COAL .2 .2 .2 .2 .2 .2
|
====================================================================
12/31/2019 Peerless remains on Buys.
Until we see get a Peerless Sell, I have
suggested that we continue to hold QQQ, DIA and the leading MAXCPS.
Watch the daily breadth statistics. A rising NYSE A/D Line shows 1) that
the FED is not about to change its mind and start to tighten credit, 2) that the
economic boom is continuing and 3) that the trend is up for most NYSE
stocks. A New Year surge in technology stocks and IWM should be taken as
a very good sign, too, for the new year, showing the speculative "animal
spirits" are
coming to life among all classes of investors. The most bullish thing the DJI
could now do would be breakout above its wedge pattern's resistance line
on very high volume. It 21-dma AROC is only slightly positive. That is a
problem.

Question: What could change our Optimistic market
outlook?
Answer: a Sell S12, which would likely result from the DJI
closing 2.5%
over its 21-dma with our IP21 negative. In addition, a very weak Jobs Report
number on Friday (below 60,000) or another very big drop in the Dollar would
hurt our positive outlook.
As discussed last time, 2019 brought some very big gains in leading stocks like
AAPL and leveraged technology ETFS ( 290% in SOXL, 241% in TECL and
154% in TQQQ. Taking profits early this new year will be very tempting,
especially if their uptrendlines are broken. We know from history, notably
1915-1916, 1927-1928, 1959-1960 and 1983-1984 that broken rising
wedge patterns in early January can bring significant declines. We also
saw in our study of January S12s that a weak IP21 (Tiger's Accumuation
Index in negative territory as DJI makes a new high) brought significant
declines from the Presidential Election Year January tops in 1960, 1984
and 2000 and in non-Presidential Election year January tops, like 1966,
1973, 1981, 1990 and 2009. All these cases, except those before 1929
when we could not get Peerless Sells because the daily DJI highs' and lows'
data was not kept, did bring a Peerless Sell S12.
But what if the rising wedge pattern prevents the DJI from reaching the
2.5% upper band and so there is no Sell S12 even though the DJI closes
more than 2% over the 21-dma with the IP21 negative? We probably
should wait to see what the statistics are in that case.
But a strong opening a very weak close with negative breadth and rising
volume would certainly have to be taken as a traders' Sell signal. It would
remind us of the market's top before a sharp 10% correction in January 2018.
In the 1/30/2018 chart below, the DJI actually showed a daily high 2% above
the 21-dma with both the P-I and V-I both negative. Given the current
rising wedge pattern in the DJI and Boeing's vulnerability if it falls another 5 points
and breaks its key support, I would be inclined to sell DIA if we see another
such reversal before an upside breakout. QQQ may still hold up, even if we
get a Sell S12, so we will plan to hold that for now.
A sharp reversal down started the January 2018 Sell-off

|
Charts 12/31/2019 2020 PEERLESS DJI, Signals, Indicators Daily DJI Volume 10-DayUp/Down Vol Stoch-20 A/D Line for All Stocks Inverted Traders Index NASDAQ S&P OEX NYSE COMPQX DJI-15 DJI-20 DJI-30 DIA SPY QQQ MDY IWM TNA Short-Term Rates USO-CrudeOil DBO FAS GLD BBH IBB JETS JNUG KOL NUGT OIH OIL RSX RETL SDS AGQ SLV SOXL TECL TLT TMF TNA UGA (gasoline) and China: YINN CHAU Commodities: CANE CORN DBC JJC, NIB, CHOC CORN, CUT (paper) MOO, SOYB WEAT UUP (Dollar) LIT (Lithium) AAPL ADBE ALXN AMAT AMGN AMD AMZN AXP BA BABA BAC BIDU CAT CVX DE FB GOOG GS HD IBM INTU JPM M (Macy's) MSFT NFLX NKE NVDA PG QCOM TSLA TXN XOM V WMT CMG , LRCX, SQ TOWN 12/31/19 (Click on Underlined link.) New highs and Bullish MAXCPs - http://tigersoft.com/2020MAX/12-31/BULLISH.htm Bearish MAXCPs - http://tigersoft.com/2020MIN/12-31/BEARISH.htm |
Table 1 QUICKSILVER on DJI-30 STOCKS 12/31/2019 Only 10 of 30 DJI-30 stocks show rising 5-dma. STOCKS CLOSE CHANGE PIVOT-PT 5-dma AROC CL-PWR CANDLE IP21 ITRS ---------------------------------------------------------------------------------------- AAPL 292.99 1.47 284.27 156.1% Bullish BLUE .238 .176 Bullish --------------------------------------------------------------------- AXP 124.3 0 124.74 -7.6% Bearish BLUE .063 .001 --------------------------------------------------------------------- BA 324.36 -2.04 333 -199% Bearish RED -.336 -.12 Bearish --------------------------------------------------------------------- CAT 147.62 .1 147.48 -29.7% Bearish BLUE .125 .066 --------------------------------------------------------------------- CSCO 47.9 .31 47.78 -20.9% Bearish BLUE-.046 -.038 --------------------------------------------------------------------- CVX 120.2 .35 120.34 -5.4% ------- BLUE-.163 -.016 --------------------------------------------------------------------- DIS 144.26 .49 145.29 -14.5% Bearish BLUE-.198 .039 --------------------------------------------------------------------- GS 229.35 -.45 229.91 5.6% Bearish RED -.142 .047 --------------------------------------------------------------------- HD 218.14 .83 220.67 -24.4% Bearish BLUE-.034 -.147 --------------------------------------------------------------------- IBM 133.65 .84 134.98 -70.5% Bearish BLUE-.192 -.067 Bearish --------------------------------------------------------------------- INTC 59.69 .07 59.41 38.6% Bearish BLUE-.013 .099 --------------------------------------------------------------------- JNJ 145.62 .32 145.93 -28.1% ------- BLUE .104 .077 --------------------------------------------------------------------- JPM 138.99 .36 137.58 64.7% ------- BLUE-.074 .09 --------------------------------------------------------------------- KO 55.26 -.01 54.71 31.8% ------- BLUE .21 -.055 --------------------------------------------------------------------- MCD 197.48 .57 196.67 32.5% ------- BLUE .091 -.116 --------------------------------------------------------------------- MMM 176.25 .42 176.68 -62.7% ------- BLUE .197 .017 --------------------------------------------------------------------- MRK 90.76 -.27 91.44 -53.6% Bearish ---- .093 .008 --------------------------------------------------------------------- MSFT 157.26 -.33 157.38 -4.7% ------- BLUE .191 .081 Bullish --------------------------------------------------------------------- NKE 101.21 .41 100.14 58.1% ------- BLUE .288 -.01 --------------------------------------------------------------------- PFE 39.01 .1 39.29 -39.5% Bearish BLUE-.094 .007 --------------------------------------------------------------------- PG 124.57 .1 125.22 -13.2% ------- BLUE .058 -.003 --------------------------------------------------------------------- TRV 136.78 .29 135.83 20.2% ------- BLUE .084 -.096 --------------------------------------------------------------------- UNH 293.24 -.61 294.54 -31.4% Bearish RED -.054 .132 --------------------------------------------------------------------- UTX 149.56 -.32 149.57 -8.7% Bearish RED -.179 .03 --------------------------------------------------------------------- V 187.41 -.42 187.57 8.8% ------- BLUE .096 .003 --------------------------------------------------------------------- VZ 61.22 .01 61.28 -14.7% Bearish ---- .175 -.061 --------------------------------------------------------------------- WBA 58.91 0 58.35 28.9% Bearish BLUE-.169 .002 --------------------------------------------------------------------- WMT 118.57 -.83 119.51 -19.3% Bearish RED -.033 -.068 --------------------------------------------------------------------- DOW 69.55 .07 70.02 -52.9% Bearish BLUE-.048 -.035 |
Table 2 QUICKSILVER on ETFS - 12/31/19 ETF CLOSE CHANGE PIVOT-PT 5-dma AROC CL-PWR CANDLE IP21 ITRS --------------------------------------------------------------------------------------------- DIA 284.6 .07 285.01 -12.8% Bearish BLUE-.022 ----- --------------------------------------------------------------------------------------------- BA 324.36 -2.04 333 -199% Bearish RED -.336 -.12 --------------------------------------------------------------------------------------------- SPY 321.43 .35 321.23 3.3% ------- BLUE .115 .015 --------------------------------------------------------------------------------------------- QQQ 212.34 .13 211.92 12.5% ------- BLUE .181 .044 Bullish --------------------------------------------------------------------------------------------- MDY 376.55 1.54 375.26 17.4% ------- BLUE .105 .004 --------------------------------------------------------------------------------------------- IWM 166.1 .66 166.68 -6% Bearish BLUE .028 .025 --------------------------------------------------------------------------------------------- FAS 94.12 .43 93.4 59.6% Bearish BLUE-.038 .145 --------------------------------------------------------------------------------------------- RETL 28.38 .3 27.81 169.1% Bearish BLUE .027 .166 --------------------------------------------------------------------------------------------- SOXL 274.42 1.43 280.94 -79.8% ------- BLUE .129 .477 --------------------------------------------------------------------------------------------- TECL 240.92 .94 238.99 44.6% ------- BLUE .227 .374 Bullish --------------------------------------------------------------------------------------------- IBB 120.31 .13 123.5 -106.8% Bearish BLUE .098 .113 --------------------------------------------------------------------------------------------- GLD 143.02 .39 141.27 108.3% Bullish RED .12 -.045 --------------------------------------------------------------------------------------------- OIH 11.91 -.37 12.55 -429.3% Bearish RED -.058 -.177 --------------------------------------------------------------------------------------------- GASL 9.82 .48 9.89 -36.1% ------- BLUE .094 .562 --------------------------------------------------------------------------------------------- |
Table 3 Count of Stocks in Key Directories
20191231
-------------------------------
NEWHIGHS 167 Bullish Ratio
NEWLOWS 4
MAXCP 30
MINCP 7
TTTNH 12
TTTNL 12
FASTUP 69
FASTDOWN 49
CPCROSSA 140
CPCROSSD 24
BIGVOLUP 3
BIGVODN 10
ACCUMVER 15
HIGHIP21 41
HIUPPCT 31
VHIP21 118
LOWACCUM 97
REDSELL 88
AUGSELS7 48
TRAPDOOR 15
|
Table 4 RANKING OF KEY DIRECTORIES BASED PCT.OF STOCKS ABOVE 65-DMA
12/31/19
Bullish = 44
Beairsh = 2
---------------------------------------------------------------------------------------
Directory Current day-1 day-2 day-3 day-4 day-5
----------------------------------------------------------------------------------------
BIGBANKS 1 1 1 1 1 1
COPPER 1 1 .875 .875 .875 .875
REGBANKS .923 .923 .923 1 1 1
ETFS .913 .879 .931 .948 .913 .931
NASD-100 .896 .865 .876 .886 .876 .876
INDEXES .887 .897 .844 .838 .822 .822
BEVERAGE .875 .75 .75 .75 .75 .687
GAMING .863 .863 .863 .818 .818 .818
SEMI .858 .83 .858 .83 .839 .82
FOOD .851 .851 .851 .833 .796 .74
SP-100 .844 .844 .855 .855 .833 .833
GOLD .843 .823 .803 .823 .803 .705
DOWJONES .833 .866 .866 .833 .833 .8
FIDSTKS .821 .793 .837 .837 .821 .826
CHINA .818 .781 .763 .781 .763 .781
ELECTRON .815 .796 .815 .815 .796 .769
NIFTY .807 .807 .824 .824 .824 .824
COMODITY .804 .804 .804 .78 .731 .707
JETS .8 .8 .9 .9 .9 .9
SP500 .8 .76 .777 .777 .779 .771
FINANCE .79 .779 .802 .825 .825 .813
RUS-1000 .783 .751 .769 .769 .765 .761
CHEM .775 .714 .734 .775 .775 .795
UTILITY .775 .725 .725 .625 .65 .675
AUTO .769 .743 .743 .769 .769 .769
HACKERS .75 .7 .65 .65 .65 .65
INDMATER .75 .723 .736 .75 .776 .789
COMPUTER .736 .631 .684 .684 .684 .684
GREEN .72 .72 .76 .8 .8 .76
TRANSP .7 .7 .8 .8 .7 .75
INFRA .694 .666 .694 .722 .694 .694
DJI-13 .692 .692 .692 .615 .615 .615
RETAIL .686 .666 .725 .764 .745 .725
OILGAS .683 .661 .639 .691 .683 .683
BIOTECH .682 .676 .691 .697 .717 .705
HOSPITAL .681 .681 .636 .636 .636 .681
EDU .666 .611 .666 .722 .666 .666
SOFTWARE .666 .65 .666 .7 .716 .716
GUNS .625 .687 .687 .75 .75 .687
SOLAR .576 .576 .615 .615 .615 .615
MILITARY .571 .607 .607 .607 .607 .607
REIT .565 .544 .551 .517 .496 .475
BONDFUND .562 .598 .607 .598 .598 .526
INSURANC .54 .567 .54 .513 .513 .513
===========================================================================================
HOMEBLDG .354 .354 .387 .387 .354 .322
COAL .2 .2 .2 .2 .2 .2
|
========================================================================
12/30/2019
Peerless remains on Buys based
on seasonality and the seemingly
ever-rising NYSE A/D Line. Since 1967, the DJI has risen 70% of the
time over the next ten trading days and gained 0.8%. But this is no
ordinary third Presidential Election year rally. The 10-year Bond still
yields less than 2% and Unemployment is near record lows when we
are at peace. Hold your longs. At some point, there may be a buying
panic.
It's true that the DJI's IP21 is not very positive when we use its hypothetical
highs and lows in its calculation. It stands at only .014. With the DJI 1.8%
over the 21-day ma, there is a chance we will get a Sell S12 next week. This
would be based on the DJI closing above 29000 with the IP21 negative.
But the DJI's other variables are all positive, so there may be not even
be a Sell S12 if the DJI's IP21 drops below zero. We must wait and
see what the technical readings are apt to be next week.
Keep the Table below handy is my
suggestion.
Peerless
Seasonality: Performance of DJI by Months:
From the First if the Month to 21-trading days later:
Avg. DJI Pct Gain and Pct. of Time DJI rises:
1965-2019
(c) 2019 - www.tigersoft.com
Keep the Table below handy is my suggestion.
| All: '65,'66,'67... 2021 |
PE + 1 Yr. after Pres. Election Yr. ('65,'69,'73...) |
PE + 2 Mid-Term Election Yr. ('66,'70,'74) |
PE +3 Yr. before Pres. Election Yr. ('67,'71,'75) |
PE +4 Pres. Election Yr. ('68,'72,'76) |
|
| January | .01 (1.0%) 63% |
+.007 (+0.7%) 57.1% |
-.014 (-1.4%) 50.0% |
+.038 (3.8%) 84.6% |
+.012 (+1.2%) 61.5% |
| February | .006 (0.6%) 59.3% |
-.005 (-0.5%) 50.0% |
+.011 (+1.1%) 64.3% |
+.019 (+1.9%) 61.5% |
-.001 (-0.1%) 61.5% |
| March | .01 (1.0%) 66.7% |
+.004 (+0.4%) 50.0% |
+.007 (+0.7%) 57.1% |
+.025 (+2.5%) 92.3% |
+.006 (+0.6%) 67.2% |
| April | +.021 (+2.1%) 72.2% |
+.022 (+2.2%) 71.4% |
+.010 (+1.0%) 64.3% |
+.042 (3.8%) 92.3% |
.009 (0.9%) 61.5% |
| May | -.001 (-0.1%) 44.4% |
+.014 (+1.4%) 64.3% |
-.010 (-1.0%) 35.7% |
0 38.5% |
-.010 (-1.0%) 38.5% |
| June | -.005 (-0.5%) 44.4% |
-.014 (-1.4%) 28.6% |
-.017 (-1.7%) 21.4% |
+.009 (+0.9%) 61.5% |
+.004 (+0.4%) 69.2% |
| July | .005 (0.5%) 50.9% |
+.020 (+2.0%) 71.4% |
.004 (0.4%) 38.5% |
+.00 (+0.0%) 46.2% |
-.005 (-0.5%) 46.2% |
| August | -.004 (-0.4%) 54.7% |
-.016 (-1.6%) 35.7% |
-.008 (-0.8%) 61.5% |
-.002 (-0.2%) 53.8% |
+.011 (+1.1%) 69.2% |
| September | -.005 (-0.5%) 45.3% |
+.001 (+0.1%) 57.1% |
-.021 (-2.1%) 30.8% |
-.004 (-0.4%) 53.8% |
.003 (0.3%) 38.5% |
| October | .006 (0.6%) 60.4% |
.008 (0.8%) 71.4% |
+.042 (4.2%) 76.9% |
-.008 (-0.8%) 46.2% |
-.013 (-1.3%) 46.2% |
| November | .008 (0.8%) 64.2% |
.012 (1.2%) 78.6% |
.007 (0.7%) 69.2% |
.005 (0.5%) 53.8% |
.008 (0.8%) 53.8% |
| December | .019 (1.9%) 71.7% |
.018 (1.8%) 57.1% |
.014 (1.4%) 76.9% |
+.024 (+2.4%) 69.2% |
+.021 (+2.1%) 61.5% |
Gains in Years in the Four-Year
Cycle
Third Years
Pres.Election Year Year After
Second Year
------------
------------------- -----------
--------------
1915 81.7%
1916 -4.2%
1917 -21.7% 1918
10.5%
1919 30.5%
1920 -32.9%
1921 12.7% 1922
21.7%
1923 -3.3%
1924 26.2%
1925 30.0% 1926
0.3%
1927 28.8%
1928 48.2%
1929 -17.2% 1930 -33.8%
1931 -52.7%
1932 -23.1%
1933 +66.8% 1934
4.1%
1935 38.6%
1936 24.8%
1937 -32.8% 1938 28.0%
1939 -3.0%
1940 -12.7%
1941 -15.3% 1942
7.6%
1943 13.8%
1944 12.1%
1945 26.7% 1946
-8.1%
1947 2.2%
1948 -2.1%
1949 13.1% 1950
17.4%
1951 14.4%
1952 8.4%
1953 -3.8% 1954
44.0%
1955 20.8%
1956 2.3%
1957 -12.8% 1958 34.0%
1959 16.4%
1960 -9.3%
1961 18.7% 1962 -10.8%
1963 17.0%
1964 14.6%
1965 10.9% 1966 -18.9%
1967 15.2%
1968 4.3%
1969 -15.2% 1970 4.8%
1971 6.1%
1972 14.6%
1973 -16.6% 1974 -27.6%
1975 38.3%
1976 17.9%
1977 -17.3% 1978 -3.1%
1979 4.2%
1980 14.9%
1981 -9.2% 1982
19.6%
1983 20.3%
1984 -3.7%
1985 27.7% 1986
22.6%
1987 2.3%
1988 11.8%
1989 27.0% 1990
-4.3%
1991 20.3%
1992 4.2%
1993 13.7% 1994
2.1%
1995 33.5%
1996 26.0%
1997 22.6% 1998
16.1%
1999 25.2%
2000 -6.2%
2001 -7.1% 2002
-16.8%
2003 25.3%
2004 3.1%
2005 -0.6% 2006
16.3%
2007 6.4%
2008 -33.8%
2009 18.8% 2010 11.0%
2011 5.5%
2012 7.3%
2013 26.5% 2014
7.5%
2015 -2.2%
2016 13.4%
2017 5.2% 2018
-5.6%
---------------------------------------------------------------------
Avg. +15.6%
+5.6%
+5.7% +5.4%
22 up
4 down 17 up 9 down 14 up 12 down
17 up 9 down
(From forthcoming Peerless Stock
Market Timing: 1915-2019