---- TIGERSOFT/PEERLESS HOTLINE ----------------
(C)
1985-2019 William Schmidt, Ph.D. www.tigersoft.com
All rights
strictly reserved.
You are now at www.tigersoft.com/44THL/INDEX.htm
(Do not use the suffix ".html") |
If this site will not refresh, go to www.tigersoft.com/QUICK/INDEX.htm
IMPORTANT
AN EMAIL GIVING OUR
HOTLINE'S NEW ADDRESS
TO START THURSDAY NIGHT HAS BEEN
SENT.
If you did not get it, email
me: william_schmidt@hotmail.com
__________________________________________________
Always CLICK REFRESH
Data used through 7/16/2019
7/17/2019 4:00 AM
-----------------------------------------------------------------------------------------------------------------------
Earlier Hotlines
www.tigersoft.com/21PEY3/INDEX-2.htm
(most recent Hotlines before
current ones)
......................................................................
www.tigersoft.com/19HLK5/INDEX.htm
www.tigersoft.com/44UHL/INDEX.htm
www.tigersoft.com/NHLP/INDEX.htm
www.tigersoft.com/7LHL/INDEX.htm
www.tigersoft.com/NHL718/INDEX.htm
www.tigersoft.com/21MAY18/INDEX.htm
www.tigersoft.com/55HEP/INDEX.htm
www.tigersoft.com/44H4L/INDEX2.htm
Earlier still: Go here...
HELP
A Guide
To Profitably Using The Tiger Nightly HOTLINE
Introduction to Tiger/Peerless Buys and
Sells.
Peerless Buy and
Sell Signals: 1928-2016
Individual Peerless signals explained:
http://tigersoftware.com/PeerlessStudies/Signals-Res/index.htm
http://www.tigersoft.com/PeerInst-2012-2013/
Explanation of each Peerless signal. http://www.tigersoft.com/PeerInst-2012-2013/
Different Types of
TigerSoft/Peerless CHARTS, Signals and Indicators
-----> More HELP LINKS
Documentation for
TigerSoft Automatic and Optimized Signals.
How reliable support is the
DJI's rising 200-day ma?
SPY Charts since
1994: Advisory Closing Power S7s, Accum. Index, 65-dma, Optimized Signals.
^^^^^^^^^^^^^^^^^^^^^^^^^^^^^^^^^^^^^^^^^^^^^^^^
1/19/2016 ---> Corrections,Deeper
Declines and Bear Markets since 1945.
1/21/2016
---> High
Velocity Declines since 1929
2/12/2016 ---> Presidential
Elections Years and Bullish IP21 Positive Non-Confirmations at Lower Band.
2/12/2016 ---> OBV NNCs on DJI's Rally to
2.7% Upper Band when DJI's 65-dma is falling.
11/6/2016 --->
Killer Short Selling
Techniques: ===> Order Here ($42.50)
It's As Easy as 1,2,3
TigerSoft "Combination" Short-Selling... Easy as 1-2-3 Short Sales
Earlier Q-Answers
QuickSilver Documentation (1/11/2016)
Our Different
Signals
Better understand the difference between
Peerless DJI-based signals,
the one-year optimized red Signals and the fixed signals based
on technical developments.
Introduction to Tiger/Peerless Buys and Sells.
Different Types of
TigerSoft/Peerless CHARTS, Signals and Indicators
New TigerPeerless Installation and
Basic Uses' Instruction
See the re-written materials on TigerSoft Buys and Sells.
Study- Trading SPY
WITHOUT Peerless - Some Guidelines.
When completed this will be a new Tiger Trading E-Book.
Study- Examples of
"Hands above the Head" top patterns.
Study- 9/3/2017 TigerSoft (not
Peerless) charts of Major Tops as they occurred.
===> Please report any broken or out-of-date links. william_schmidt@hotmail.com
====================================================================
====================================================================
7/16/2019 The Peerless Buy B10 should keep us bullish and
long DIA, QQQ, FAS, MSFT, NUGT and GLD.
Buy HIG in the very strong Insurance group.

Look at Table 3 below. Notice that Insurance Stocks are
among
the
groups showing nearly 90% of their stocks above the
65-dma.
If there is a pullback, plan to buy one of the top
Power
Ranked insurance stocks, ERIE. HIG should be bought now.


|
Charts
7/16/2019 2019 PEERLESS DJI, Signals, Indicators Daily DJI Volume 10-DayUp/Down Vol Hourly DJIA A/D Line for All Stocks Inverted Traders Index NASDAQ S&P OEX NYSE COMPQX DJI-15 DJI-20 DJI-30 DIA SPY QQQ MDY IWM TNA Short-Term Rates USO-CrudeOil DBO FAS GLD BBH IBB JETS JNUG KOL NUGT OIH OIL RSX RETL SDS AGQ SLV SOXL TECL TLT TMF TNA UGA (gasoline) XIV and China: YINN CHAU Commodities: CANE CORN DBC JJC, NIB, CHOC CORN, CUT (paper) MOO, SOYB WEAT UUP (Dollar) LIT (Lithium) AAPL ADBE ALXN AMAT AMGN AMD AMZN BA BABA BAC BIDU CAT CVX DE FB GOOG GS HD IBM INTU JPM M (Macy's) MSFT NFLX NVDA PG QCOM TSLA TXN XOM WMT CMG , LRCX, SWKS, MDGL SPPI WATT SQ TOWN 7/16/19 (Click on Underlined link.) Bullish MAXCPs - http://tigersoft.com/MAXCPS/Jul-16/BULLISH.htm Bearish MAXCPs - http://tigersoft.com/MINCPs/Jul-16/BEARISH.htm |
Table 1 QUICKSILVER on ETFS - 7/16/2019 Explanation: Pivot-point is price past which the ETF's 5-dma will change direction. 5-dmaAROC is the annualized rate of change of the ETF's 5-day moving average. Closing Power is bullish when it is above its rising 21-dma and it is bearish when it is below its 5-dma. Closing Power is the cumulative change from opening to close each day. Since it does not factor in changes at the opening, it tends to reflect NYSE professionals who trade the market when the NYSE is open. "Candle" color is blue when last close was above the opening, thus showing Professional net buying, which tends to be bullish. It is red when the close is below the opening, which tends to be bearish. IP21 is the current value of the Tiger Accumulation Index. Above +.15 tends to be bullish and below -.15 tends to be bearish until reversed. ITRS is the percent rise of the ETF over 50-days less the percent rise of the DIA (DJIA) over 50 trading days. The strongest ITRS ETFs tend to keep rising and the lowest ITRS ETFs tend to keep falling. Add ITRS and IP21 to get a composite measure of intermediate-term strength. ETF CLOSE CHANGE PIVOT-PT 5-dmaAROC CL-PWR CANDLE IP21 ITRS ------------------------------------------------------------------------------------------ DIA 273.42 -.18 268.69 102.6% ------- RED .102 -------- --------------------------------------------------------------------------------------------- BA 362.75 1.14 352.3 134.8% Bullish BLUE .085 -.068 --------------------------------------------------------------------------------------------- SPY 299.71 -1.04 298.61 42.1% ------- RED .081 -.013 --------------------------------------------------------------------------------------------- QQQ 193.15 -1 192.56 64.6% ------- RED .115 -.021 --------------------------------------------------------------------------------------------- MDY 355.46 .22 354.2 12.5% Bearish BLUE .078 -.047 --------------------------------------------------------------------------------------------- IWM 155.24 -.05 155.67 -5.1% Bearish BLUE 0 -.065 --------------------------------------------------------------------------------------------- FAS 78.94 -.85 78.85 -12.6% ------- RED .047 .031 --------------------------------------------------------------------------------------------- RETL 25.26 .29 24.11 189.2% Bearish BLUE -.013 -.218 --------------------------------------------------------------------------------------------- SOXL 159.93 -5.35 151.64 365.8% Bearish RED -.079 -.205 --------------------------------------------------------------------------------------------- TECL 173.52 -4.92 171.13 179.9% ------- RED .08 .011 --------------------------------------------------------------------------------------------- IBB 105.47 -.61 108.53 -157.2% Bearish RED .029 -.055 --------------------------------------------------------------------------------------------- GLD 132.4 -1.13 133.83 24.4% ------- RED .281 .065 Bullish --------------------------------------------------------------------------------------------- OIH 14.4 -.24 15.09 -60.6% ------- RED .042 -.151 --------------------------------------------------------------------------------------------- RSX 23.75 -.18 24.12 -14.6% Bullish ---- .059 .07 Bullish |
 Table 2  Count of Stocks in Key Directories
          20190716
-------------------------------
NEWHIGHS       139
NEWLOWS        20
MAXCP          20
MINCP          40  Professionals are net Bearish
TTTNH          22
TTTNL          61
FASTUP         42
FASTDOWN       61  Swing traders are net bearish.
CPCROSSA       94
CPCROSSD       76
BIGVOLUP       6
BIGVODN        12
ACCUMVER       17
HIGHIP21       13
HIUPPCT        15
LOWACCUM       138
REDSELL        95
AUGSELS7       15
TRAPDOOR       8
|
Table 3
              RANKING OF KEY DIRECTORIES BASED PCT.OF STOCKS ABOVE 65-DMA
              7/16/19
---------------------------------------------------------------------------------------
Directory     Current       day-1         day-2         day-3         day-4         day-5
----------------------------------------------------------------------------------------
BONDFUND       .961          .961          .97           .97           .97           .961
TRANSP         .9            .75           .75           .5            .4            .4
INSURANC       .888          .888          .888          .851          .851          .851
GOLD           .882          .823          .843          .803          .843          .843
^^^^
HOMEBLDG       .882          .823          .823          .705          .705          .705
DOWJONES       .862          .931          .862          .827          .827          .793
^^^^^^^^
DJI-13         .846          .846          .846          .769          .769          .769
NASD-100       .806          .826          .816          .775          .775          .775
^^^^^^^^
JETS           .8            .8            .8            .7            .8            .7
NIFTY          .789          .789          .789          .684          .666          .631
UTILITY        .775          .75           .75           .775          .8            .8
SP500          .759          .761          .77           .716          .706          .706
FIDSTKS        .744          .755          .766          .739          .739          .722
ETFS           .736          .736          .649          .649          .649          .614
SP-100         .736          .736          .769          .714          .681          .692
INDEXES        .735          .762          .735          .702          .724          .686
INFRA          .722          .666          .722          .583          .583          .638
BIGBANKS       .714          .857          1             .857          .857          .857
MILITARY       .714          .714          .75           .678          .75           .75
HACKERS        .7            .75           .75           .7            .65           .65
RUS-1000       .678          .667          .679          .621          .612          .62
COMPUTER       .666          .666          .666          .619          .666          .666
EDU            .666          .666          .5            .5            .5            .5
SOLAR          .666          .722          .666          .611          .722          .722
COMODITY       .658          .707          .756          .731          .756          .585
FOOD           .648          .685          .74           .722          .74           .592
GUNS           .625          .625          .562          .562          .5            .5
AUTO           .615          .589          .641          .538          .512          .538
HOSPITAL       .608          .608          .521          .565          .521          .565
SOFTWARE       .606          .639          .672          .672          .639          .606
INDMATER       .6            .525          .587          .45           .5            .537
FINANCE        .579          .59           .715          .613          .59           .636
GAMING         .565          .521          .478          .478          .434          .521
SEMI           .558          .576          .576          .486          .522          .513
CHEM           .557          .519          .557          .346          .403          .5
GREEN          .545          .5            .545          .545          .59           .59
ELECTRON       .541          .541          .535          .445          .471          .458
BEVERAGE       .529          .647          .647          .647          .588          .529
RETAIL         .528          .528          .547          .433          .433          .415
REIT           .513          .533          .574          .554          .635          .614
==============================================================================================
REGBANKS       .464          .464          .642          .5            .464          .607
BIOTECH        .435          .438          .413          .438          .449          .463
OILGAS         .361          .354          .402          .381          .368          .277
CHINA          .298          .298          .14           .087          .14           .175
COAL           0             0             0             0             0             0
|
====================================================================
7/15/2019 The Peerless Buy B10 should keep us bullish and
long DIA, QQQ, FAS, MSFT, NUGT and GLD.
The FOMC will meet at the end of July. If they lower
interest rates with the key indexes making new highs,
we could well be seeing a powerful new leg up. And
even if they do not lower rates, the uptrend should keep
rising until a bad Jobs' number comes out. Inflation is low,
the Dollar is strong and wages are rising more slowly than
productivity. Bears will need something new to seize upon.
It's not clear what that will be unless Gold zooms upward
as a warning about the Dollar this autumn.

This is not yet a broad advance. Only 60% of all stocks and
ETFs
are above their 65-dma. The main general market ETFs and
their stocks are the leaders now. As long as the NYSE A/D Line is
moving to new highs, too, I would think that DIA, SPY and QQQ leadership
is fine for now. Only if the NYSE A/D Line starts lagging, could we see
a top and even then 27000 should be good support now.
It is certainly bullish now that both the Opening and Closing Power for the
SP-500 are in rising trends. Prices could soon be opening higher and then
move up even more by the close.
Let us keep an eye on the A/D Line of the stocks that make up these
all-important ETFs. Right now, their A/D Lines, which are shown below,
are each soaring to 12-month highs. This is bullish. Pullbacks most often
occur when these A/D Lines start lagging and then break their uptrends.
 |
 |
 |
|
Charts 7/15/2019 2019 PEERLESS DJI, Signals, Indicators Daily DJI Volume 10-DayUp/Down Vol Hourly DJIA A/D Line for All Stocks Inverted Traders Index NASDAQ S&P OEX NYSE COMPQX DJI-15 DJI-20 DJI-30 DIA SPY QQQ MDY IWM TNA Short-Term Rates USO-CrudeOil DBO FAS GLD BBH IBB JETS JNUG KOL NUGT OIH OIL RSX RETL SDS AGQ SLV SOXL TECL TLT TMF TNA UGA (gasoline) XIV and China: YINN CHAU Commodities: CANE CORN DBC JJC, NIB, CHOC CORN, CUT (paper) MOO, SOYB WEAT UUP (Dollar) LIT (Lithium) AAPL ADBE ALXN AMAT AMGN AMD AMZN BA BABA BAC BIDU CAT CVX DE FB GOOG GS HD IBM INTU JPM M (Macy's) MSFT NFLX NVDA PG QCOM TSLA TXN XOM WMT CMG , LRCX, SWKS, MDGL SPPI WATT SQ TOWN 7/15/19 (Click on Underlined link.) Bullish MAXCPs - http://tigersoft.com/MAXCPS/Jul-15/BULLISH.htm Bearish MAXCPs - http://tigersoft.com/MINCPs/Jul-15/BEARISH.htm |
Table 1 QUICKSILVER on ETFS - 7/15/2019 Explanation: Pivot-point is price past which the ETF's 5-dma will change direction. 5-dmaAROC is the annualized rate of change of the ETF's 5-day moving average. Closing Power is bullish when it is above its rising 21-dma and it is bearish when it is below its 5-dma. Closing Power is the cumulative change from opening to close each day. Since it does not factor in changes at the opening, it tends to reflect NYSE professionals who trade the market when the NYSE is open. "Candle" color is blue when last close was above the opening, thus showing Professional net buying, which tends to be bullish. It is red when the close is below the opening, which tends to be bearish. IP21 is the current value of the Tiger Accumulation Index. Above +.15 tends to be bullish and below -.15 tends to be bearish until reversed. ITRS is the percent rise of the ETF over 50-days less the percent rise of the DIA (DJIA) over 50 trading days. The strongest ITRS ETFs tend to keep rising and the lowest ITRS ETFs tend to keep falling. Add ITRS and IP21 to get a composite measure of intermediate-term strength. ETF CLOSE CHANGE PIVOT-PT 5-dmaAROC CL-PWR CANDLE IP21 ITRS ------------------------------------------------------------------------------------------ DIA 273.6 .21 267.86 102.7% Bullish ---- .112 ----- --------------------------------------------------------------------------------------------- BA 361.61 -3.72 353.09 147.3% ------- BLUE .089 -.079 --------------------------------------------------------------------------------------------- SPY 300.75 .1 297.19 65.8% Bullish RED .106 -.008 --------------------------------------------------------------------------------------------- QQQ 194.15 .62 190.66 115.8% Bullish BLUE .132 -.009 --------------------------------------------------------------------------------------------- MDY 355.24 -1.84 354.57 10.4% Bearish RED .04 -.042 --------------------------------------------------------------------------------------------- IWM 155.29 -.82 155.4 3.2% Bearish RED -.027 -.055 --------------------------------------------------------------------------------------------- FAS 79.79 -.63 79.14 106.7% ------- RED .078 .058 bullish --------------------------------------------------------------------------------------------- SOXL 165.28 3.76 148.52 661.8% Bearish BLUE -.062 -.169 --------------------------------------------------------------------------------------------- TECL 178.44 1.4 167.28 374% Bullish BLUE .123 .062 bullish --------------------------------------------------------------------------------------------- IBB 106.08 .56 108.84 -77.2% ------- BLUE .046 -.04 --------------------------------------------------------------------------------------------- GLD 133.53 0 131.75 84.5% Bullish BLUE .276 .073 bullish --------------------------------------------------------------------------------------------- OIH 14.64 -.34 14.58 0% Bearish RED .038 -.127 --------------------------------------------------------------------------------------------- RSX 23.93 .01 23.82 -14.6% Bullish RED .059 .081 bullish |
Table 2    Count of Stocks in Key Directories
           20190715
-------------------------------
NEWHIGHS       244
NEWLOWS        31
MAXCP          27
MINCP          30  Bearish - Professionals are still hedging.
TTTNH          7
TTTNL          55  Day Traders are net sellers at openings.
FASTUP         39
FASTDOWN       56
CPCROSSA       51
CPCROSSD       190
BIGVOLUP       5
BIGVODN        9
ACCUMVER       15
HIGHIP21       14
HIUPPCT        16
LOWACCUM       136
REDSELL        96
AUGSELS7       16
TRAPDOOR       8
|
 Table 3      RANKING OF KEY DIRECTORIES BASED PCT.OF STOCKS ABOVE 65-DMA
              7/15/19
 Bullish = 39
 Bearish = 5
---------------------------------------------------------------------------------------
Directory     Current       day-1         day-2         day-3         day-4         day-5
----------------------------------------------------------------------------------------
BONDFUND       .961          .97           .97           .97           .961          .961
DOWJONES       .931          .862          .827          .827          .793          .827
INSURANC       .888          .888          .851          .851          .851          .888
BIGBANKS       .857          1             .857          .857          .857          .857
DJI-13         .846          .846          .769          .769          .769          .769
NASD-100       .826          .816          .775          .775          .775          .755
GOLD           .823          .843          .803          .843          .843          .843
HOMEBLDG       .823          .823          .705          .705          .647          .647
JETS           .8            .8            .7            .8            .7            .8
NIFTY          .789          .789          .684          .666          .631          .649
INDEXES        .766          .739          .701          .722          .679          .673
SP500          .761          .77           .716          .706          .706          .712
FIDSTKS        .755          .766          .739          .739          .722          .739
HACKERS        .75           .75           .7            .65           .65           .5
UTILITY        .75           .75           .775          .8            .8            .825
TRANSP         .75           .75           .5            .4            .4            .65
ETFS           .736          .649          .649          .649          .614          .614
SP-100         .736          .769          .714          .681          .692          .692
SOLAR          .722          .666          .611          .722          .722          .777
MILITARY       .714          .75           .678          .75           .75           .75
COMODITY       .707          .756          .731          .756          .56           .609
FOOD           .679          .735          .716          .735          .566          .603
RUS-1000       .667          .679          .62           .613          .621          .634
COMPUTER       .666          .666          .619          .666          .666          .714
EDU            .666          .5            .5            .5            .5            .5
INFRA          .666          .722          .583          .583          .638          .583
BEVERAGE       .647          .647          .647          .588          .529          .588
SOFTWARE       .639          .672          .672          .639          .606          .573
GUNS           .625          .562          .562          .5            .5            .625
HOSPITAL       .608          .521          .565          .521          .565          .521
FINANCE        .59           .715          .613          .59           .636          .613
AUTO           .589          .641          .538          .512          .538          .615
SEMI           .576          .576          .486          .522          .513          .486
ELECTRON       .541          .535          .445          .471          .458          .439
REIT           .533          .574          .554          .635          .614          .574
RETAIL         .528          .547          .433          .433          .415          .49
INDMATER       .525          .587          .45           .5            .537          .55
GAMING         .521          .478          .478          .434          .478          .521
CHEM           .509          .547          .339          .396          .509          .509
=================================================================================================
GREEN          .5            .545          .545          .59           .59           .59
=================================================================================================
REGBANKS       .464          .642          .5            .464          .607          .571
BIOTECH        .435          .413          .438          .449          .46           .43
OILGAS         .354          .402          .381          .368          .277          .243
CHINA          .298          .14           .087          .14           .175          .122
COAL           0             0             0             0             0             0
|
====================================================================
7/12/2019 The DJI's flat-top breakout into all-time high territory has
produced
a major Buy B10. The path of least resistance is up, though on the
weekly DJI chart we see that prices have reached the last clear barrier.
Stay long DIA, QQQ, FAS, MSFT, NUGT and GLD. If you are
short a stock, I would suggest covering it. We may now be entering
an exciting "vertical ascent - take-off". It took 18 months for the
DJI to build the base it is breaking out of. We may not see another
bullish technical setup like this for a long time.


Based on the 5000+ point height of the DJI's pattern for
the last year
before last week's breakout, I would reckon we now have an upside
target above 32,000! Sounds preposterous to some, for sure.
But if the FED does lower interest rates at the next FOMC meeting,
it will be with the DJI soaring in all-time high territory. The same thing
happened in July 1927 when the Government also had already done everything
that Wall Street wanted (de-regulation, tax cuts, tariffs, suppress unions...)
The FED then cut the Discount Rate in July 1927. Over the
next two years, the DJI doubled. It should be noted that the FED lost
control of the speculative bubble that resulted and the "little guy" was
enticed back into the market by how the stock prices of familiar names he
knew kept rising and rising.
DJI - 1927 and Bullish Rate Cut in July

It is counter-intuitive to chase stocks, I realize, but if I
am right it is exactly those
stocks that are now in strong weekly uptrends and above all their resistance
levels and uptrend-lines that are likely to do the best. Performance funds must
buy them and the poor shorts in them will have no choice but to cover at higher
and higher levels. I searched through the weekly 5-year charts of all the stocks
making new 12-month highs. Here are the strongest stocks I could find. See
http://tigersoft.com/RUNWILD/INDEX.htm
|
Charts 7/12/2019 2019 PEERLESS DJI, Signals, Indicators Daily DJI Volume 10-DayUp/Down Vol Hourly DJIA A/D Line for All Stocks Inverted Traders Index NASDAQ S&P OEX NYSE COMPQX DJI-15 DJI-20 DJI-30 DIA SPY QQQ MDY IWM TNA Short-Term Rates USO-CrudeOil DBO FAS GLD BBH IBB JETS JNUG KOL NUGT OIH OIL RSX RETL SDS AGQ SLV SOXL TECL TLT TMF TNA UGA (gasoline) XIV and China: YINN CHAU Commodities: CANE CORN DBC JJC, NIB, CHOC CORN, CUT (paper) MOO, SOYB WEAT UUP (Dollar) LIT (Lithium) AAPL ADBE ALXN AMAT AMGN AMD AMZN BA BABA BAC BIDU CAT CVX DE FB GOOG GS HD IBM INTU JPM M (Macy's) MSFT NFLX NVDA PG QCOM TSLA TXN XOM WMT CMG , LRCX, SWKS, MDGL SPPI WATT SQ TOWN 7/12/19 (Click on Underlined link.) Bullish MAXCPs - http://tigersoft.com/MAXCPS/Jul-12/BULLISH.htm Bearish MAXCPs - http://tigersoft.com/MINCPs/Jul-12/BEARISH.htm |
Table 1 QUICKSILVER on ETFS - 7/12/2019 Explanation: Pivot-point is price past which the ETF's 5-dma will change direction. 5-dmaAROC is the annualized rate of change of the ETF's 5-day moving average. Closing Power is bullish when it is above its rising 21-dma and it is bearish when it is below its 5-dma. Closing Power is the cumulative change from opening to close each day. Since it does not factor in changes at the opening, it tends to reflect NYSE professionals who trade the market when the NYSE is open. "Candle" color is blue when last close was above the opening, thus showing Professional net buying, which tends to be bullish. It is red when the close is below the opening, which tends to be bearish. IP21 is the current value of the Tiger Accumulation Index. Above +.15 tends to be bullish and below -.15 tends to be bearish until reversed. ITRS is the percent rise of the ETF over 50-days less the percent rise of the DIA (DJIA) over 50 trading days. The strongest ITRS ETFs tend to keep rising and the lowest ITRS ETFs tend to keep falling. Add ITRS and IP21 to get a composite measure of intermediate-term strength. ETF CLOSE CHANGE PIVOT-PT 5-dmaAROC CL-PWR CANDLE IP21 ITRS ------------------------------------------------------------------------------------------ DIA 273.39 2.47 268.06 76.6% Bullish BLUE .087 ---- --------------------------------------------------------------------------------------------- BA 365.33 6.33 351.12 133.7% ------- BLUE .099 -.065 --------------------------------------------------------------------------------------------- SPY 300.65 1.34 296.82 36.7% Bullish BLUE .116 -.005 --------------------------------------------------------------------------------------------- QQQ 193.53 1.11 189.71 64.8% Bullish BLUE .112 -.011 --------------------------------------------------------------------------------------------- MDY 357.08 3.68 354.5 -11.4% ------- BLUE .083 -.029 --------------------------------------------------------------------------------------------- IWM 156.11 1.2 155.19 -18.3% Bearish BLUE .024 -.039 --------------------------------------------------------------------------------------------- FAS 80.42 .92 78.1 93.1% Bullish BLUE .103 .075 Bullish --------------------------------------------------------------------------------------------- SOXL 161.52 8.73 145.17 426.8% Bearish BLUE -.05 -.154 --------------------------------------------------------------------------------------------- TECL 177.04 3.9 165.66 214.9% Bullish BLUE .118 .041 Bullish --------------------------------------------------------------------------------------------- IBB 105.52 -1.46 107.74 -170.9% ------- RED .054 -.035 --------------------------------------------------------------------------------------------- GLD 133.53 .83 131.29 52.5% Bullish BLUE .27 .074 Bullish --------------------------------------------------------------------------------------------- OIH 14.98 -.02 14.64 121.7% ------- ---- .145 -.107 --------------------------------------------------------------------------------------------- GASL 19.81 .22 19.65 -194.4% ------- BLUE -.045 -.418 --------------------------------------------------------------------------------------------- RSX 23.92 -.01 24 14.6% Bullish BLUE .061 .087 Bullish |
Table 2   Count of Stocks in Key Directories
           20190712
-------------------------------
NEWHIGHS       323  Bullish >10:1 New lows
NEWLOWS        22
MAXCP          39   Low.
MINCP          11
TTTNH          16
TTTNL          39
FASTUP         34
FASTDOWN       57
CPCROSSA       168
CPCROSSD       64
BIGVOLUP       3
BIGVODN        12
ACCUMVER       10
HIGHIP21       14
HIUPPCT        15
VHIP21         116
REDSELL        95
AUGSELS7       17
TRAPDOOR       10
|
 Table 3   RANKING OF KEY DIRECTORIES BASED PCT.OF STOCKS ABOVE 65-DMA
              7/12/19
 Bullish = 39
 Bearish = 5
---------------------------------------------------------------------------------------
Directory     Current       day-1         day-2         day-3         day-4         day-5
----------------------------------------------------------------------------------------
BIGBANKS       1             .857          .857          .857          .857          .857
BONDFUND       .97           .97           .97           .961          .961          .97
INSURANC       .888          .851          .851          .851          .888          .888
DJI-13         .846          .769          .769          .769          .769          .769
GOLD           .843          .803          .843          .843          .823          .843
DOWJONES       .833          .8            .8            .766          .8            .8
HOMEBLDG       .823          .705          .705          .647          .647          .647
NASD-100       .816          .775          .775          .775          .734          .785
JETS           .8            .7            .8            .7            .8            .8
NIFTY          .789          .684          .666          .631          .614          .684
SP500          .77           .716          .706          .706          .704          .737
SP-100         .769          .714          .681          .692          .692          .703
FIDSTKS        .766          .739          .739          .722          .733          .755
COMODITY       .756          .731          .756          .56           .585          .609
HACKERS        .75           .7            .65           .65           .5            .6
MILITARY       .75           .678          .75           .75           .75           .75
UTILITY        .75           .775          .8            .8            .825          .775
TRANSP         .75           .5            .4            .4            .6            .75
FOOD           .74           .722          .74           .574          .592          .611
INDEXES        .736          .698          .725          .682          .672          .731
INFRA          .722          .583          .583          .638          .583          .666
FINANCE        .715          .613          .59           .636          .613          .761
RUS-1000       .679          .62           .612          .622          .63           .66
SOFTWARE       .672          .672          .639          .606          .573          .639
COMPUTER       .666          .619          .666          .666          .714          .761
SOLAR          .666          .611          .722          .722          .777          .777
ETFS           .649          .649          .649          .614          .614          .807
BEVERAGE       .647          .647          .588          .529          .588          .647
REGBANKS       .642          .5            .464          .607          .571          .821
AUTO           .641          .538          .512          .538          .589          .666
INDMATER       .587          .45           .5            .537          .55           .575
SEMI           .576          .486          .522          .513          .486          .54
REIT           .574          .554          .635          .614          .567          .547
GUNS           .562          .562          .5            .5            .562          .562
CHEM           .547          .339          .396          .509          .528          .566
RETAIL         .547          .433          .433          .415          .49           .452
GREEN          .545          .545          .59           .59           .59           .59
ELECTRON       .535          .445          .471          .458          .439          .503
HOSPITAL       .521          .565          .521          .565          .521          .565
==================================================================================================
EDU            .5            .5            .5            .5            .5            .5
==================================================================================================
GAMING         .478          .478          .434          .478          .521          .478
BIOTECH        .41           .438          .449          .46           .427          .46
OILGAS         .402          .381          .368          .277          .243          .263
CHINA          .14           .087          .14           .175          .105          .245
COAL           0             0             0             0             0             0
|
====================================================================
7/11/2019 Today the DJI made its flat-top breakout into all-time high
territory. This
produced a reversing and automatic Buy B10 from our Peerless sogtware.
Cover shorts in DIA and go long is the message the B10 brings. These are
reliably bullish signals. See the track record of Summer Buy B10s below.
our larger study of all Buy B10s here:
http://www.tigersoft.com/PeerInst-2012-2013/-Buy-B10.htm
Close out most short positions if their
Closing Power downtrends are
broken. Buy more MSFT. Buy FAS. Hold long DIA and QQQ as well as
NUGT and GLD.

Since 1929, there have been 15 Summer automatic Buy
B10s. The
median gain on the DJI when reversed was 8.5%, but the last 5 occurrences
brought only one gain of 8%. In 4 of the 15 cases, the Buy B10 was
very quickly reversed by a Sell signal. Fortunately, in 8 cases, there
was never any paper loss and in only 3 instances was the maximum
paper loss above 1.6% with the biggest loss being only 2.5%.
The current level of our Accumulation Index for the Peerless DJI chart is
only +.011. That may not matter, as the median gain for the Buy B10s
where the IP21 was below .039 was +9.75%. This is actually higher
than the gains for all Summer B10s.
Chasing a breakout may seem counter-intuitive, but qualified
breakout
B10s show that a good rally is most apt to occur now. Perhaps, this is
because traders expect the next FOMC to cut nterest rates by 1/4%.
The bullishness now certainly has to do with the Summer's bullish seasonality.
Since 1967, in the the third years of the four-year Presidential cycle, the DJI
has gained +2.1%, +4.2% and +6% over the next 21, 42 and 65 trading days,
respectively. It has been higher in 75% of all these periods of time.
It is bullish that the NASDAQ, QQQ, SPY and DIA have now all broken
out to new all-time highs. The sellers at the old highs appear to have been
overcome. That means prices should rise more easily now.


Summer Buy B10s: 1929-2019
Summer Buy B10s: 1929-2019 19490805 B10 179.1 .232 177.8 -.0072 8/29
la/ma=1.023 aroc = .552 P=+144(+20) IP21=.279 V=+127 OP=.294
-------------------------------------------------------------------------------
19640701 B10 838.1 .120 823.4 -.0175 8/6
la/ma=1.024 aroc = .354 P=+74(+36) IP21=.006 V=-17 OP=+.456
-------------------------------------------------------------------------------
19640909 B10 855.6 .097 none 0
la/ma=1.018 aroc = .372 P=+67(+4) IP21=.038 V=-22 OP=+.282
-------------------------------------------------------------------------------
19650817 B10 894.3 .084 887.1 -.008 8/23
la/ma=1.019 aroc = .19 P=+88(+7) IP21=.011 V=+4 OP=+.272
-------------------------------------------------------------------------------
19650916 B10 931.2 .041 926.5 -.005 9/21
la/ma=1.031 aroc = .487 P=+92(+9) IP21=.05 V=+8 OP=+.413
-------------------------------------------------------------------------------
19790815 B10 885.84 .009 none 0
la/ma=1.044 aroc =.807 P=+232(+49) IP21=.317 V=+5 OP=+.476
-------------------------------------------------------------------------------
19840802 B10 1166.07 .106 none 0
la/ma=1.046 aroc =.340 P=-33(+48) IP21=.106 V=0 OP=+.10
-------------------------------------------------------------------------------
19890714 B10 2554.82 .078 none 0
la/ma=1.025 aroc =.246 P=+56(+6) IP21=.092 V=2 OP=+.023
-------------------------------------------------------------------------------
19930819 B10 3612.12 .098 3527.23 -.025
la/ma=1.013 aroc =.189 P=+113(+6) IP21=.013 V=3 OP=+.217
-------------------------------------------------------------------------------
19960912 B10 5771.94 .188 none 0
la/ma=1.014 aroc =.261 P=+129(+60) IP21=.117 V=+8 OP=+.258
-------------------------------------------------------------------------------
20030819 B10 9428.90 .04 9275.06 -.0163 9/30
la/ma=1.022 aroc =.430 P=+147(+120) IP21=.082 V=+1 OP=+.292
-------------------------------------------------------------------------------
20070712 B10 13861.73 .006 none 0
la/ma=1.024 aroc =.500 P=+283(+189) IP21=.035 V=+25 OP=+.097
-------------------------------------------------------------------------------
20120913 B10 13539.86 .003 none 0
la/ma=1.026 aroc =.332 P=+403(+86) IP21=.06 V=+59 OP=+.136
-------------------------------------------------------------------------------
20140918 B10 17265.99 .001 none 0
la/ma=1.011 aroc =.242 P=-35(-8) IP21=.103 V=-28 OP=+.236
-------------------------------------------------------------------------------
20170727 B10 21796.55 .080 none 0
La/ma=1.013 aroc =.269 P=+275(+30) IP21=.007 V=-5 OP=+.137
===============================================================================
N=15 Median Gain = 8.4%
9 of 15 showed no paper loss. Biggest paper loss was 2.5%
20190711 B10 27088.08 open
la/ma=1.018 aroc =.466 P=+284(-1) IP21=.011 V=+22 OP=+.125
===============================================================================
|
What To Do?
I would suggest covering most short sales and buying the
highest Tiger Power ranked
stocks in some of the more volatile industry groups with an IP21 value above +.12.
Buy more MSFT.
Group
Top Power Ranked Stock
----------------------------------------------------------------
DJI-30
MSFT 138.4 V(Visa) 180.74
SP-500
MSFT
138.4 ABT 85.77
NASD-100 MSFT 138.4 XEL
61.19 SNPS 136.44 PYPL 120.65
Semi-Conductor LSCC 16.25 ENPH 19.48 SNPS
136.44
Solar
RUN 19.64
Biotech
IDXX
285.46
Another approach is to go long the major ETF with
the biggest gains while
Peerless is on a Buy signal and smallest Paper Loss. That would be FAS
now. It is 3x leveraged, so its huge +71.4% gain over the last 10 months may
not be surprising, but its biggest paper loss is only 15.8%. Buy FAS.


|
Charts 7/11/2019 2019 PEERLESS DJI, Signals, Indicators Daily DJI Volume 10-DayUp/Down Vol Hourly DJIA A/D Line for All Stocks Inverted Traders Index NASDAQ S&P OEX NYSE COMPQX DJI-15 DJI-20 DJI-30 DIA SPY QQQ MDY IWM TNA Short-Term Rates USO-CrudeOil DBO FAS GLD BBH IBB JETS JNUG KOL NUGT OIH OIL RSX RETL SDS AGQ SLV SOXL TECL TLT TMF TNA UGA (gasoline) XIV and China: YINN CHAU Commodities: CANE CORN DBC JJC, NIB, CHOC CORN, CUT (paper) MOO, SOYB WEAT UUP (Dollar) LIT (Lithium) AAPL ADBE ALXN AMAT AMGN AMD AMZN BA BABA BAC BIDU CAT CVX DE FB GOOG GS HD IBM INTU JPM M (Macy's) MSFT NFLX NVDA PG QCOM TSLA TXN XOM WMT CMG , LRCX, SWKS, MDGL SPPI WATT SQ TOWN 7/11/19 (Click on Underlined link.) Bullish MAXCPs - http://tigersoft.com/MAXCPS/Jul-11/BULLISH.htm Bearish MAXCPs - http://tigersoft.com/MINCPs/Jul-11/BEARISH.htm |
T
able 1   QUICKSILVER on ETFS - 7/11/2019
Explanation: Pivot-point is price past which the ETF's 5-dma will change direction. 5-dmaAROC is the annualized rate of change of the ETF's 5-day moving average. Closing Power is bullish when it is above its rising 21-dma and it is bearish when it is below its 5-dma. Closing Power is the cumulative change from opening to close each day. Since it does not factor in changes at the opening, it tends to reflect NYSE professionals who trade the market when the NYSE is open. "Candle" color is blue when last close was above the opening, thus showing Professional net buying, which tends to be bullish. It is red when the close is below the opening, which tends to be bearish. IP21 is the current value of the Tiger Accumulation Index. Above +.15 tends to be bullish and below -.15 tends to be bearish until reversed. ITRS is the percent rise of the ETF over 50-days less the percent rise of the DIA (DJIA) over 50 trading days. The strongest ITRS ETFs tend to keep rising and the lowest ITRS ETFs tend to keep falling. Add ITRS and IP21 to get a composite measure of intermediate-term strength. ETF CLOSE CHANGE PIVOT-PT 5-dmaAROC CL-PWR CANDLE IP21 ITRS ------------------------------------------------------------------------------------------ DIA 270.92 2.23 269.27 25.3% Bullish BLUE .038 ----- --------------------------------------------------------------------------------------------- BA 359 6.7 355.86 64.1% ------- BLUE .07 -.069 --------------------------------------------------------------------------------------------- SPY 299.31 .7 298.46 8.6% Bullish ---- .079 -.001 --------------------------------------------------------------------------------------------- QQQ 192.42 -.14 191.05 25.6% Bullish RED .054 -.004 --------------------------------------------------------------------------------------------- MDY 353.4 -.8 357.89 -58.6% Bearish RED .054 -.035 --------------------------------------------------------------------------------------------- IWM 154.91 -.76 156.68 -43.3% Bearish RED .022 -.041 --------------------------------------------------------------------------------------------- FAS 79.5 .65 78.95 59.7% Bullish BLUE .049 .053 --------------------------------------------------------------------------------------------- SOXL 152.79 1.15 148.77 54% Bearish RED -.13 -.207 --------------------------------------------------------------------------------------------- TECL 173.14 2.01 169.76 82.3% Bullish BLUE .067 .025 --------------------------------------------------------------------------------------------- IBB 106.98 -1.55 109.22 -181.1% Bullish RED .085 -.014 --------------------------------------------------------------------------------------------- GLD 132.7 -1.13 132.14 -35.1% ------- RED .247 .076 (highest) --------------------------------------------------------------------------------------------- OIH 15 -.09 14.62 177.1% Bearish RED .102 -.119 --------------------------------------------------------------------------------------------- RSX 23.93 -.19 23.85 -6.3% Bullish ---- .003 .092 |
Table 2 Count of Stocks in Key Directories
20190711
-------------------------------
NEWHIGHS 259 Bullish
NEWLOWS 32
MAXCP 23
MINCP 29
TTTNH 14
TTTNL 68
FASTUP 45
FASTDOWN 53
CPCROSSA 51
CPCROSSD 149
BIGVOLUP 3
BIGVODN 10
ACCUMVER 11
HIGHIP21 11
HIUPPCT 16
VHIP21 118
LOWACCUM 147
REDSELL 91
AUGSELS7 16
TRAPDOOR 10
|
 Table 3
          RANKING OF KEY DIRECTORIES BASED PCT.OF STOCKS ABOVE 65-DMA
              7/11/19
 Bullish = 32
 Bearish = 10
---------------------------------------------------------------------------------------
Directory     Current       day-1         day-2         day-3         day-4         day-5
----------------------------------------------------------------------------------------
BONDFUND       .97           .97           .96           .96           .97           .98
BIGBANKS       .857          .857          .857          .857          .857          .857
INSURANC       .851          .851          .851          .888          .888          .851
GOLD           .803          .843          .843          .823          .843          .901
DOWJONES       .8            .8            .766          .8            .8            .833
NASD-100       .775          .775          .775          .734          .775          .826
UTILITY        .775          .8            .8            .825          .775          .825
DJI-13         .769          .769          .769          .769          .769          .846
FIDSTKS        .739          .739          .722          .733          .75           .771
COMODITY       .731          .756          .56           .585          .609          .658
FOOD           .722          .74           .574          .592          .611          .666
SP500          .716          .706          .706          .704          .733          .759
SP-100         .714          .681          .692          .692          .703          .736
HOMEBLDG       .705          .705          .647          .647          .647          .705
INDEXES        .702          .724          .681          .675          .724          .74
HACKERS        .7            .65           .65           .5            .6            .6
JETS           .7            .8            .7            .8            .8            .8
NIFTY          .684          .666          .631          .614          .649          .684
MILITARY       .678          .75           .75           .75           .75           .714
SOFTWARE       .672          .639          .606          .573          .639          .655
ETFS           .649          .649          .614          .614          .807          .877
BEVERAGE       .647          .588          .529          .588          .647          .647
RUS-1000       .62           .612          .621          .632          .66           .664
COMPUTER       .619          .666          .666          .714          .761          .761
FINANCE        .613          .59           .636          .613          .75           .659
SOLAR          .611          .722          .722          .777          .777          .777
INFRA          .583          .583          .638          .583          .666          .638
HOSPITAL       .565          .521          .565          .521          .565          .565
GUNS           .562          .5            .5            .562          .562          .625
REIT           .554          .635          .614          .567          .547          .54
GREEN          .545          .59           .59           .59           .59           .545
AUTO           .538          .512          .538          .589          .666          .692
N=32
==============================================================================================
EDU            .5            .5            .5            .5            .5            .5
REGBANKS       .5            .464          .607          .571          .821          .678
TRANSP         .5            .4            .4            .6            .7            .75
==============================================================================================
SEMI           .486          .522          .513          .486          .531          .567
GAMING         .478          .434          .478          .521          .478          .565
INDMATER       .45           .5            .537          .55           .575          .575
ELECTRON       .445          .471          .458          .439          .496          .528
BIOTECH        .435          .449          .46           .427          .457          .476
RETAIL         .433          .433          .415          .49           .452          .433
OILGAS         .381          .368          .277          .243          .256          .263
CHEM           .339          .396          .509          .528          .584          .584
CHINA          .087          .14           .175          .105          .245          .333
COAL           0             0             0             0             0             0
N=10
|
=====================================================================
7/10/2019 Peerless remains on a combination Sell S12, S9-V, S4. But new high
breakouts
into all-time high territory were made today above flat resistance by the NASDAQ,
SP-500, SPY and QQQ. For them, this is a very bullish development.
Since the the NASDAQ and QQQ can sometimes top out two months AFTER
the DJI does, I think we should take a long
position in QQQ even as we hold
short DIA. Note how broad is the advance within the 100 QQQ stocks. This
also gives us a better way to play the bullish seasonality now beyond just holding
a long position in MSFT, the highest Power-Ranked stock in the QQQ.
See below how QQQ peaked 10 weeks after the DJI did in the year 2000. DIA
is being significantly held back by Boeing. I don't see that situation changing
soon.


Hold DIA Short. Hold long MSFT, NUGT and GLD
For now the DJI has stayed beneath 27050, where its flat resistance-line crosses.
But if the DJI closes above 27050 and shows an IP21 above, say, +.05, I think
we will have to grant such a breakout the status of a judged Buy B10 and cover
the DIA shorts at a loss. But I believe we shouId require the DJI's IP21 to shift
(IP21 is our Tiger Accumulation Index.) into clearly positive territory, say, above
+.05. Immediately below is the DJI chart currently. Just below is the DJI
chart for 1995. I show the 1995 chart to let you see how important a confirmed
DJI breakout into all-time high territory above flat resistance is. The 1995
breakout
launched the take-off that became the very bullish 1995-2000 bull market. Once
prices move into all-time high territory, they can run more freely, as there are no
more resistance-levels based on past highs where sell orders can be congregated.


Powell's Testimony Today
I listened to
most of Fed Chairman Powell's testimony in House of Representatives
today. When pressed, he finally let slip that his biggest concern is overseas
economic
weakness. (Our composite foreign ETFs' chart has already turned up with some
conviction.) He also said that a US Debt crisis is many years away because the
Dollar
is the reserve currency for much of the rest of the world. (He did not mention how strong
Gold and crypto-currencies have become). He assured us that he has all the tools he
needs to manage the next financial down-turn, which seems quite distant given how good
all his economic indicators look. (He did not address any signs that big money is
selling
a lot of stock now or that some brokerages see a bear market not far ahead). And he
assured us that while there is mounting inequality, the Fed did not create it, there are
lots of new jobs and in any case the Fed is not in the business of picking winners and
losers. He seems oblivious to the Populist critique that argues the FED always
places
a strong Dollar above low interest rates, especially on credit cards. He
emphatically
did not want to make low-interest rate loans to state governments, like Michigan,
instead of big banks. Nor did he want to predict what would happen to the economy
if the tariff war with China continues or Congress boosts the minimum pay for the first
time in ten years. Powell has become, I conclude, a much better booster for stocks
than
he was last Fall. I enjoyed listening, but I noted he seems to cough out of some
nervousness.
I suspect the cough shows that he knows a lot more than he is saying! I will listen
tomorrow and see if his cough goes away.
|
Charts 7/10/2019 2019 PEERLESS DJI, Signals, Indicators Daily DJI Volume 10-DayUp/Down Vol Hourly DJIA A/D Line for All Stocks Inverted Traders Index NASDAQ S&P OEX NYSE COMPQX DJI-15 DJI-20 DJI-30 DIA SPY QQQ MDY IWM TNA Short-Term Rates USO-CrudeOil DBO FAS GLD BBH IBB JETS JNUG KOL NUGT OIH OIL RSX RETL SDS AGQ SLV SOXL TECL TLT TMF TNA UGA (gasoline) XIV and China: YINN CHAU Commodities: CANE CORN DBC JJC, NIB, CHOC CORN, CUT (paper) MOO, SOYB WEAT UUP (Dollar) LIT (Lithium) AAPL ADBE ALXN AMAT AMGN AMD AMZN BA BABA BAC BIDU CAT CVX DE FB GOOG GS HD IBM INTU JPM M (Macy's) MSFT NFLX NVDA PG QCOM TSLA TXN XOM WMT CMG , LRCX, SWKS, MDGL SPPI WATT SQ TOWN 7/10/19 (Click on Underlined link.) Bullish MAXCPs - http://tigersoft.com/MAXCPS/Jul-10/BULLISH.htm Bearish MAXCPs - http://tigersoft.com/MINCPs/Jul-10/BEARISH.htm |
Table 1 QUICKSILVER on ETFS - 7/10/2019 Explanation: Pivot-point is price past which the ETF's 5-dma will change direction. 5-dmaAROC is the annualized rate of change of the ETF's 5-day moving average. Closing Power is bullish when it is above its rising 21-dma and it is bearish when it is below its 5-dma. Closing Power is the cumulative change from opening to close each day. Since it does not factor in changes at the opening, it tends to reflect NYSE professionals who trade the market when the NYSE is open. "Candle" color is blue when last close was above the opening, thus showing Professional net buying, which tends to be bullish. It is red when the close is below the opening, which tends to be bearish. IP21 is the current value of the Tiger Accumulation Index. Above +.15 tends to be bullish and below -.15 tends to be bearish until reversed. ITRS is the percent rise of the ETF over 50-days less the percent rise of the DIA (DJIA) over 50 trading days. The strongest ITRS ETFs tend to keep rising and the lowest ITRS ETFs tend to keep falling. Add ITRS and IP21 to get a composite measure of intermediate-term strength. ETF CLOSE CHANGE PIVOT-PT 5-dmaAROC CL-PWR CANDLE IP21 ITRS ------------------------------------------------------------------------------------------ DIA 268.69 .83 269.56 19.2% Bearish RED .015 0 --------------------------------------------------------------------------------------------- BA 352.3 -.79 354.47 -26.3% Bearish RED -.003 -.083 --------------------------------------------------------------------------------------------- SPY 298.61 1.42 298.8 36.6% ------- BLUE .029 .004 --------------------------------------------------------------------------------------------- QQQ 192.56 1.9 191.44 66.9% ------- BLUE .021 -.004 --------------------------------------------------------------------------------------------- MDY 354.2 -.37 357.57 -2.2% Bearish RED .037 -.028 --------------------------------------------------------------------------------------------- IWM 155.67 .27 156.26 16.7% Bearish RED .01 -.033 --------------------------------------------------------------------------------------------- FAS 78.85 -.29 78.56 150.2% ------- RED .013 .066 --------------------------------------------------------------------------------------------- SOXL 151.64 3.12 151.18 -64.6% Bearish RED -.157 -.188 (weakest) --------------------------------------------------------------------------------------------- TECL 171.13 3.85 170.36 122.9% ------- BLUE .042 .026 --------------------------------------------------------------------------------------------- IBB 108.53 -.31 110.93 -51.2% Bullish RED .075 -.001 --------------------------------------------------------------------------------------------- GLD 133.83 2.08 133.63 15.9% Bullish BLUE .271 .095 (strongest) --------------------------------------------------------------------------------------------- OIH 15.09 .51 14.48 223.3% ------- BLUE .086 -.135 --------------------------------------------------------------------------------------------- RSX 24.12 .3 23.96 71.2% Bullish ---- .011 .108 (highest ITRS) |
Table 2    Count of Stocks in Key Directories
           20190710
-------------------------------
NEWHIGHS       301 Bullish
NEWLOWS        21
MAXCP          37
MINCP          20
TTTNH          19
TTTNL          47
FASTUP         50
FASTDOWN       59
CPCROSSA       61
CPCROSSD       161 Bearish plurality vs CPCROSSA
BIGVOLUP       3
BIGVODN        7
ACCUMVER       12
HIUPPCT        15
VHIP21         119
LOWACCUM       145
REDSELL        88
AUGSELS7       19
TRAPDOOR       10
|
Table 3 RANKING OF KEY DIRECTORIES BASED PCT.OF STOCKS ABOVE 65-DMA
        7/10/19
 Bullish = 32
 Bearish = 13
---------------------------------------------------------------------------------------
Directory     Current       day-1         day-2         day-3         day-4         day-5
----------------------------------------------------------------------------------------
BONDFUND       .97           .96           .96           .97           .98           .99
BIGBANKS       .857          .857          .857          .857          .857          .857
INSURANC       .851          .851          .888          .888          .888          .851
GOLD           .843          .843          .823          .843          .882          .882
DOWJONES       .827          .793          .827          .827          .862          .827
JETS           .8            .7            .8            .8            .8            .8
UTILITY        .8            .8            .825          .775          .825          .75
NASD-100       .77           .76           .729          .77           .791          .75
DJI-13         .769          .769          .769          .769          .846          .769
COMODITY       .756          .56           .585          .609          .658          .634
MILITARY       .75           .75           .75           .75           .714          .714
FOOD           .74           .574          .592          .611          .666          .629
FIDSTKS        .739          .722          .733          .75           .766          .722
SOLAR          .722          .722          .777          .777          .777          .777
INDEXES        .711          .679          .673          .722          .744          .701
SP500          .706          .706          .704          .733          .755          .706
HOMEBLDG       .705          .647          .647          .647          .705          .588
SP-100         .681          .692          .692          .703          .725          .714
COMPUTER       .666          .666          .714          .761          .761          .714
NIFTY          .66           .625          .607          .642          .66           .66
HACKERS        .65           .65           .5            .6            .6            .6
ETFS           .649          .614          .614          .807          .877          .859
SOFTWARE       .639          .606          .573          .639          .655          .606
REIT           .635          .614          .567          .547          .547          .432
RUS-1000       .612          .621          .63           .661          .664          .612
FINANCE        .59           .636          .613          .75           .659          .602
GREEN          .59           .59           .59           .59           .545          .545
BEVERAGE       .588          .529          .588          .647          .647          .588
INFRA          .583          .638          .583          .666          .638          .611
SEMI           .522          .513          .486          .531          .567          .585
HOSPITAL       .521          .565          .521          .565          .565          .565
AUTO           .512          .538          .589          .666          .692          .666
================================================================================================
EDU            .5            .5            .5            .5            .5            .5
GUNS           .5            .5            .562          .562          .625          .562
INDMATER       .5            .537          .55           .575          .575          .562
================================================================================================
ELECTRON       .474          .461          .442          .5            .532          .532
REGBANKS       .464          .607          .571          .821          .678          .464
BIOTECH        .446          .46           .427          .457          .468          .457
GAMING         .434          .478          .521          .478          .565          .478
RETAIL         .433          .415          .49           .452          .433          .396
TRANSP         .4            .4            .6            .7            .75           .6
CHEM           .396          .509          .528          .584          .603          .566
OILGAS         .368          .277          .243          .256          .256          .243
CHINA          .14           .175          .105          .245          .333          .315
COAL           0             0             0             0             0             0
Bearish = 10
|
====================================================================
7/9/2019 The operative Peerless Sell signals' history we now see in
our Peerless DJI charts is quite bearish. The 11 Summer Sells
S4s show a median decline of 10.5% at the time of their
reversal. Most had a maximum paper loss of less than 1%. Independent
Summer S12s show a median decline of 11.3%. (The Summer
Sell S12 and S4 results' tables are shown further below).
Conclusion: Hold short DIA and some of the stocks mentioned last night
and some of the bearish MINCPs short. Hold long GLD, NUGT and MSFT.
Stocks and ETFs that break below or are below their 65-dma at this time
seem especially vulnerable if Powell and the Federal Reserve
do not lower rates very soon. And even if they do drop the Federal Funds
Rate down to 2%, it may be seen as a sign of weakness in the general
US economy.
Until the NYSE A/D Line and the DJI's price uptrends
are broken, more sidewise trading could continue a while
longer. Patience is needed for now.
S12 S4

For now our Sells are battling a number of bullish factors, namely:
record corporate share-buy-backs, low interest rates, the bullish
seasonality of the Summer in the third year of the four year Presidential
cycle and the strong Dollar which draws overseas money into US bonds
and blue chips.
When we consider all these bullish factors, it is actually quite
surprising that we have any Sell signals, at all. But, of course
Peerless does not read the newspapers. Each day that
27000 is not taken, it becomes a more significant barrier and
clearly "big money" is doing a lot of selling into strength above
26000. That is the meaning behind the negative Accumulation
Index readings, the Sell S12s and the Sell S4.
Will this big money distribution on strength turn into a market
decline? It will, I think, if the price uptrends for the key indexes
are broken and 27050 is not closed above. And it will if the past
record of Summer "independent S12s", those with simultaneously
high P-I readings, plays out. And they will if the past Summer
Sell S4s have anything like their usual bearish meaning in 2019.
The SP-500 and NASDAQ have been
stronger than the DJI. These two indexes
will need to break their green price uptrends if
we are going to see a DJI drop to its lower
band.


|
Charts 7/9/2019 2019 PEERLESS DJI, Signals, Indicators Daily DJI Volume 10-DayUp/Down Vol Hourly DJIA A/D Line for All Stocks Inverted Traders Index NASDAQ S&P OEX NYSE COMPQX DJI-15 DJI-20 DJI-30 DIA SPY QQQ MDY IWM TNA Short-Term Rates USO-CrudeOil DBO FAS GLD BBH IBB JETS JNUG KOL NUGT OIH OIL RSX RETL SDS AGQ SLV SOXL TECL TLT TMF TNA UGA (gasoline) XIV and China: YINN CHAU Commodities: CANE CORN DBC JJC, NIB, CHOC CORN, CUT (paper) MOO, SOYB WEAT UUP (Dollar) LIT (Lithium) AAPL ADBE ALXN AMAT AMGN AMD AMZN BA BABA BAC BIDU CAT CVX DE FB GOOG GS HD IBM INTU JPM M (Macy's) MSFT NFLX NVDA PG QCOM TSLA TXN XOM WMT CMG , LRCX, SWKS, MDGL SPPI WATT SQ TOWN 7/9/19 (Click on Underlined link.) Bullish MAXCPs - http://tigersoft.com/MAXCPS/Jul-09/BULLISH.htm Bearish MAXCPs - http://tigersoft.com/MINCPs/Jul-09/BEARISH.htm |
Table 1 QUICKSILVER on ETFS - 7/9/2019 Explanation: Pivot-point is price past which the ETF's 5-dma will change direction. 5-dmaAROC is the annualized rate of change of the ETF's 5-day moving average. Closing Power is bullish when it is above its rising 21-dma and it is bearish when it is below its 5-dma. Closing Power is the cumulative change from opening to close each day. Since it does not factor in changes at the opening, it tends to reflect NYSE professionals who trade the market when the NYSE is open. "Candle" color is blue when last close was above the opening, thus showing Professional net buying, which tends to be bullish. It is red when the close is below the opening, which tends to be bearish. IP21 is the current value of the Tiger Accumulation Index. Above +.15 tends to be bullish and below -.15 tends to be bearish until reversed. ITRS is the percent rise of the ETF over 50-days less the percent rise of the DIA (DJIA) over 50 trading days. The strongest ITRS ETFs tend to keep rising and the lowest ITRS ETFs tend to keep falling. Add ITRS and IP21 to get a composite measure of intermediate-term strength. ETF CLOSE CHANGE PIVOT-PT 5-dmaAROC CL-PWR CANDLE IP21 ITRS ------------------------------------------------------------------------------------------ DIA 267.86 -.2 267.66 16.6% Bearish BLUE -.027 ----- --------------------------------------------------------------------------------------------- BA 353.09 1.97 354.16 -47.5% Bearish BLUE -.01 -.082 --------------------------------------------------------------------------------------------- SPY 297.19 .37 296.43 25.7% Bearish BLUE -.008 .003 --------------------------------------------------------------------------------------------- QQQ 190.66 .95 190.01 36.8% ------- BLUE -.018 -.009 --------------------------------------------------------------------------------------------- MDY 354.57 .07 354.36 -10% Bearish BLUE .042 -.023 --------------------------------------------------------------------------------------------- IWM 155.4 .21 155.15 -22.5% Bearish BLUE -.022 -.028 --------------------------------------------------------------------------------------------- FAS 79.14 1.04 76.5 209.4% Bearish BLUE -.005 .09 --------------------------------------------------------------------------------------------- SOXL 148.52 3.35 153.57 -387.7% Bearish BLUE -.106 -.206 (weakest) --------------------------------------------------------------------------------------------- TECL 167.28 1.62 167 45.6% ------- BLUE .014 .006 --------------------------------------------------------------------------------------------- IBB 108.84 1.1 109.65 -40.7% Bullish BLUE .041 .004 --------------------------------------------------------------------------------------------- GLD 131.75 .46 133.41 42.7% Bullish BLUE .225 .076 (Strongest) --------------------------------------------------------------------------------------------- OIH 14.58 -.06 14.44 -116.3% Bearish ---- .001 -.167 --------------------------------------------------------------------------------------------- RSX 23.82 -.18 23.78 -12.6% ------- RED .043 .103 |
Table 2   Count of Stocks in Key Directories
          20190709
-------------------------------
NEWHIGHS       183  Bullish
NEWLOWS        15
MAXCP          45
MINCP          12
TTTNH          27
TTTNL          33
FASTUP         41
FASTDOWN       58
CPCROSSA       123
CPCROSSD       59
BIGVOLUP       2
BIGVODN        12
ACCUMVER       11
HIUPPCT        14
VHIP21         120
LOWACCUM       141
REDSELL        88
AUGSELS7       18
TRAPDOOR       10
|
 Table 3    RANKING OF KEY DIRECTORIES BASED PCT.OF STOCKS ABOVE 65-DMA
              7/9/19
 Bullish = 35
 Bearish = 7
---------------------------------------------------------------------------------------
Directory     Current       day-1         day-2         day-3         day-4         day-5
----------------------------------------------------------------------------------------
BONDFUND       .961          .961          .97           .98           .99           .951
BIGBANKS       .857          .857          .857          .857          .857          .857
INSURANC       .851          .888          .888          .888          .851          .814
GOLD           .843          .823          .843          .882          .882          .803
UTILITY        .8            .825          .775          .825          .75           .7
DOWJONES       .793          .827          .827          .862          .827          .758
DJI-13         .769          .769          .769          .846          .769          .769
NASD-100       .76           .729          .77           .791          .75           .75
MILITARY       .75           .75           .75           .714          .714          .714
FIDSTKS        .722          .733          .75           .766          .722          .744
SOLAR          .722          .777          .777          .777          .777          .777
SP500          .706          .704          .733          .755          .706          .716
JETS           .7            .8            .8            .8            .8            .8
SP-100         .692          .692          .703          .725          .714          .703
INDEXES        .677          .677          .725          .741          .704          .731
COMPUTER       .666          .714          .761          .761          .714          .714
HACKERS        .65           .5            .6            .6            .6            .5
HOMEBLDG       .647          .647          .647          .705          .588          .47
INFRA          .638          .583          .666          .638          .611          .666
FINANCE        .636          .613          .75           .659          .602          .727
NIFTY          .625          .607          .642          .66           .66           .696
RUS-1000       .621          .63           .66           .665          .613          .61
ETFS           .614          .614          .807          .877          .859          .824
REIT           .614          .567          .547          .547          .445          .351
REGBANKS       .607          .571          .821          .678          .464          .678
SOFTWARE       .606          .573          .639          .655          .622          .573
GREEN          .59           .59           .59           .545          .545          .545
FOOD           .574          .592          .611          .666          .629          .629
HOSPITAL       .565          .521          .565          .565          .565          .565
COMODITY       .56           .585          .609          .658          .634          .609
AUTO           .538          .589          .666          .692          .666          .666
INDMATER       .537          .55           .575          .575          .562          .612
BEVERAGE       .529          .588          .647          .647          .588          .529
SEMI           .513          .486          .531          .567          .585          .648
CHEM           .509          .528          .584          .603          .584          .603
Bullish = 35
==============================================================================================
EDU            .5            .5            .5            .5            .5            .5
GAMING         .5            .545          .5            .59           .5            .545
GUNS           .5            .562          .562          .625          .562          .562
==============================================================================================
ELECTRON       .458          .439          .496          .528          .535          .598
BIOTECH        .457          .427          .457          .468          .457          .476
RETAIL         .415          .49           .452          .433          .377          .358
TRANSP         .4            .6            .7            .75           .6            .7
OILGAS         .279          .244          .258          .258          .244          .293
CHINA          .175          .105          .245          .333          .315          .315
COAL           0             0             0             0             0             .142
Bearish = 7
|
One thing that needs more discussion is the technical battle now going
on between the rising NYSE A/D Line and the very positive P-Indicator
(21-dma of NYSE advances-declines) on the one hand and the
negative Accumulation Index (IP21). Tonight I show the track
record of the "independent Summer S12s.
|
Independent Summer Sell S12s:
1929-2019 (Those with very positive (breadth) P-I readings) All eventually brought gains to short sellers: +.083, +.136, +.055, +.127, +.172, +.054, +.113, +.017, +.135 5 of 9 brought a decline of more than 11%. Median gain on short sale after Sell S12 was .113 (11.3%) Paper losses: None = 5 of 9 cases but in 3 of 9 cases, the paper losses were between 3.2% and 6.4%, The huge paper loss occurred when AROC was over 1.35 (135%). Ours in 2019 was not like this. --------------------------------------------------------------------------------
#1 Signal DJI GAIN Paper Loss
19320909 S12 76.2 .083 none 0
la/ma=1.054 AROC= 1.125 PI=85(-35) IP21=-.05 V=+189 OP=.098
19320913 B7 69.9 .023 65.1 -.0686 9/19
---------------------------------------------------------------------------------
#2
19330705 S12 102.2 .136 108.7 -.0636 7/18
^^^^^^
la/ma=1.074 AROC= 1.352 PI=25(-20) IP21=-.064 V=-165 OP=.179
(very high)
19330719 S12 103.6 .144 none 0
la/ma=1.022 AROC= .907 PI=37(-65) IP21=-.146 V=-90 OP=.159
19330721 B5 88.7 .121 none 0
---------------------------------------------------------------------------------
#3
19380805 S12 144.5 .055 perfect - no paper loss
la/ma=1.029 AROC= 0.595 PI=40(+10) IP21=-.024 V=+28 OP=.029
19380812 B7 136.5 .048 perfect 0
----------------------------------------------------------------------------------
#4
19780908 S12 907.74 .127 perfect - no paper loss
la/ma=1.019 AROC= 0.216 PI=109(+6) IP21=-.062 V=+3 OP=.080
19780913 S1 899.6 .120 none 0
19781010 S9 891.63 .112 901.42 -.0109 10/11
19781113 B3 792.01 .106 785.26 -.0085 11/14
------------------------------------------------------------------------------------
#5
19810615 S12 1011.99 .172 perfect - no paper loss
la/ma=1.021 AROC= 0.469 PI=146(+0) IP21=-.001 V=+3 OP=.013
19811009 S9 873.00 .04 none 0
19811023 B9 873.99 .04 830.96 -.0492 10/26
-------------------------------------------------------------------------------------
#6
19970918 S12 7922.71 .054 8178.31 -.0322 10/7
^^^^^^
la/ma=1.013 AROC= 0.007 PI=259(-33) IP21=-.001 V=0 OP=-.103
19970929 S12 7991.43 .062 8178.31 -.0233 10/7
la/ma=1.018 AROC= 0.451 PI=335(+27) IP21=-.017 V=+19 OP=-.063
19971028 B19 7598.32 .225 7381.67 -.0285 10/30
-------------------------------------------------------------------------------------
#7
20110705 S12 S9V 12569.87 .113 12724 -.01
la/ma=1.037 AROC= 0.412 PI=239(+57) IP21=-.034 V=-48 OP=.085
20110811 B14 11143.31 .037
--------------------------------------------------------------------------------------
#8
20130910 S12 15191.06 .017 15676.9 -.0319 9/18
^^^^^^
la/ma=1.012 AROC= 0.412 PI=239(+57) IP21=-.034 V=-48 OP=.085
20130920 S17 15451.09 .033 none 0
20131007 B9 14936.24 .105 14776.5 -.0106 10/8
-------------------------------------------------------------------------------
#9
20150716 S12 18120.25 .135 none 0
la/ma=1.014 AROC= 0.144 PI=79(+18) IP21=-.193 V=-129 OP=.163
20150824 S13 15871.35 .013 16643.0 -.0486 8/28
20150825 B16 15666.44 .131 none 0
-------------------------------------------------------------------------------
#10
20190611 S12 26048.51 open 26966 (918/26048)=.029
la/ma=1.020 AROC= 0.049 PI=97(-42) IP21=-.016 V=-82 OP=.07
20190703 S4 26966.00 open
--------------------------------------------------------------------------------
|
Summer Sell S4s
Gains .409, .027, .365, .135.
.222, .105, .053, .178 , 052, .095, .056
All 11 were profitable.
6 of 11 bought gains above 10.%
Median gain was 10.5%
Paper Losses
.0738, 0, .0182, .0172,.0171, .0113, .0029, .0054, none,
none,.0022
1 of 11 brought a big paper loss. (In 1929)
6 of 11 saw a maximum paper loss of less than 1%
|
Sell 4s: 1929-2019 Date DJI Short Sale Max. Paper Loss Gain 19290814 S4 354.9 .409 381.1 -.0738 9/3 (bull market - 1929 Crash about to occur) -------------------------------------------------------------- 19310707 S4 145.9 .027 none 0 (bear market) (Sell before bear market started...) -------------------------------------------------------------- 19370803 S4 185.9 .365 189.3 -.0182 (bull market - 1937 Crash about to occur) -------------------------------------------------------------- 19380119 S4 130.1 .053 none 0 (bear market - not considered in calculations of results here.) -------------------------------------------------------------- 19401003 S4 135.1 .025 137.8 -.0199 11/17 (bull market - very timely because WWII about to start in earnest,) Not Summer S4 -------------------------------------------------------------------- 19410711 S4 127.9 .135 130.1 -.0172 7/28 (bull market - very timely because Pearl Harbor scenario coming on.) ---------------------------------------------------------------------- 19460611 S4 209.1 .22 210.6 -.0071 6/13 (bull market) (Considered a Summer S4) ---------------------------------------------------------------------- 19470711 S4 184.8 .105 186.9 -.0113 7/24 (bull market) 19471022 S4 184.4 . 103 none 0 (bull market) --------------------------------------------------------------------- 19510917 S4 275.1 .053 275.9 -.0029 10/3 (bull market) --------------------------------------------------------------------- 19550922 S4 486.0 .092 487.5 -.003 9/23 (bull market - not Summer S4) -------------------------------------------------------------------- 19570711 S4 518 .178 520.8 -.0054 7/12 (bull market) (Sell before near-bear market started...) ------------------------------------------------------------------ 19610518 S4 701.1 .014 none 0 (bull market) (Not Summer S4)) ------------------------------------------------------------------ 19660110 S4 985.41 .213 994.2 -.0089 1/18 (bull market) (Sell before bear market started...) (Not Summer S4) ----------------------------------------------------------------- 19730109 S4 1047.11 .104 1051.70 -.0043 1/11 (bull market) (Sell before bear market started...) Not Summer S4) ------------------------------------------------------------------ 19761222 S4 984.54 .051 1004.65 -.0204 12/31 (bull market) (Sell before bear market started...) Not Summer S4) ------------------------------------------------------------------ 19800116 S4 865.19 .101 903.84 -.0446 2/13 (bull market) ( Not Summer S4) ------------------------------------------------------------------- 19810326 S4 1005.76 .032 1024.05 -.0181 4/27 (bull market) (Sell before bear market started...) ( Not Summer S4) -------------------------------------------------------------------- 19831122 S4 1275.81 .031 1287.30 -.009 11/29 (bull market) Not Summer S4) -------------------------------------------------------------------- 19850208 S4 1289.97 .033 1299.36 -.0072 3/1 (bull market) ( Not Summer S4) ------------------------------------------------------------------- 19870826 S4 2701.85 .052 none 0 (bull market) (Sell before bear market started...) ------------------------------------------------------------------- 19890209 S4 2323.04 .031 2324.82 -.0007 2/17 (bull market) ( Not Summer S4) ------------------------------------------------------------------- 19940203 S4 3967.66 .074 none 0 (bull market) ( Not Summer S4) ------------------------------------------------------------------- 19970207 S4 6855.8 .036 7085.16 -.0334 3/11 (bull market) ( Not Summer S4) ------------------------------------------------------------------- 20000111 S4 11511.08 .13 11722.9 -.0184 1/14 (bull market) (Sell before bear market started...) (Not Summer S4) ------------------------------------------------------------------- 20000906 S4 11310.64 .095 none 0 (bull market) (Sell before bear market started...) ------------------------------------------------------------------- 20010517 S4 11248.58 .268 11301.7 -.0047 5/18 (bull market) (Sell before bear market started...) (Not Summer S4) ------------------------------------------------------------------- 20031015 S4 9803.05 .018 9858.46 -.0056 11/3 (bull market) (Not Summer S4) ------------------------------------------------------------------- 20050308 S4 10912.47 .064 none 0 (bull market) (Not Summer S4) -------------------------------------------------------------------- 20071005 S4 14066.01 .079 14164.5 -.007 10/9 (bull market) (Sell before bear market started...) (Not Summer S4) ------------------------------------------------------------------- 20080421 S4 12825.02 .112 13040.0 -.0167 5/1 (bear market) (Sell before bear market started...) (Not Summer S4) ------------------------------------------------------------------- 20090105 S4 8952.89 .081 none 0 (bear market) (Sell before bear market started...) (Not Summer S4) ------------------------------------------------------------------ 20090603 S4 8675.24 .041 8763.13 -.0101 6/5 (bull market) (Not Summer S4) ------------------------------------------------------------------ 20120921 S4 13579.47 .056 13610.1 -.0022 10/5 (bull market) -------------------------------------------------------------------- 20170428 S4 20940.51 -.013 21206.2 -.0126 6/2 (bull market) (Not Summer S4) |
====================================================================
7/8/2019 The operative automatic Peerless sells have been capped off with
a
very bearish Sell
S4.

What Is To Be Done?
Because of how often this signal leads to a DJI
decline of more than
9% and often a bear market, we should do some selling in stocks that
drop below the support of their 65-dma, especially if their Accumulation
Index is negative. So, we have to sell YINN, even though a deal between
Trump and China would seem to be politically wise.
Second, I have suggested shorting DIA or SPY. This is simple and
relatively safe, especially if one is ready to cover the shorts if the
DJI breaks out with any conviction over 27000. When you graph
DIA, SPY or anything else, you have the ability using TigerSoft
to superimpose the Peerless signals on the graph and then under
"Operations", see what the trading results would be selling short
at the next day's opening following a recersin Peerless signal. Below
are the displays for DIA and SPY currently. The gains are modest
and the losses are small.
Gains for DIA shorting Peerless Reversing Sells

Another approach that usually works well is to go short FAS
(which represents 3x leveraged bank stocks). Over the years,
its moves correlate closely with the DJIA. This sharply increases
the potential gain, but raises the risk of a paper loss of 10%.
The ratio of gain to paper loss is still 4:1. That would seem
to make this option attractive.

Shorting SOXL (semi-conductors) because that is the weakest
ETF in Table 1 also might be undertaken now. But notice how
high the biggest paper loss is.

The best way to reduce the paper loss and
still go short a high-potential
stock is to make a listing of the results from all the Peerless trades for each stock
in your chosen directory. This done from Operations and fourth item down
from main Tiger screen (Tiger menacing bull and bear). As a result of
looking at the Russell-1000 list, I came up with these ideas: BBBY and
RRC


|
Charts 7/8/2019 2019 PEERLESS DJI, Signals, Indicators Daily DJI Volume 10-DayUp/Down Vol Hourly DJIA A/D Line for All Stocks Inverted Traders Index NASDAQ S&P OEX NYSE COMPQX DJI-15 DJI-20 DJI-30 DIA SPY QQQ MDY IWM TNA Short-Term Rates USO-CrudeOil DBO FAS GLD BBH IBB JETS JNUG KOL NUGT OIH OIL RSX RETL SDS AGQ SLV SOXL TECL TLT TMF TNA UGA (gasoline) XIV and China: YINN CHAU Commodities: CANE CORN DBC JJC, NIB, CHOC CORN, CUT (paper) MOO, SOYB WEAT UUP (Dollar) LIT (Lithium) AAPL ADBE ALXN AMAT AMGN AMD AMZN BA BABA BAC BIDU CAT CVX DE FB GOOG GS HD IBM INTU JPM M (Macy's) MSFT NFLX NVDA PG QCOM TSLA TXN XOM WMT CMG , LRCX, SWKS, MDGL SPPI WATT SQ TOWN 7/8/19 (Click on Underlined link.) Bullish MAXCPs - http://tigersoft.com/MAXCPS/Jul-08/BULLISH.htm Bearish MAXCPs - http://tigersoft.com/MINCPs/Jul-08/BEARISH.htm |
Table 1 QUICKSILVER on ETFS - 7/8/2019 Explanation: Pivot-point is price past which the ETF's 5-dma will change direction. 5-dmaAROC is the annualized rate of change of the ETF's 5-day moving average. Closing Power is bullish when it is above its rising 21-dma and it is bearish when it is below its 5-dma. Closing Power is the cumulative change from opening to close each day. Since it does not factor in changes at the opening, it tends to reflect NYSE professionals who trade the market when the NYSE is open. "Candle" color is blue when last close was above the opening, thus showing Professional net buying, which tends to be bullish. It is red when the close is below the opening, which tends to be bearish. IP21 is the current value of the Tiger Accumulation Index. Above +.15 tends to be bullish and below -.15 tends to be bearish until reversed. ITRS is the percent rise of the ETF over 50-days less the percent rise of the DIA (DJIA) over 50 trading days. The strongest ITRS ETFs tend to keep rising and the lowest ITRS ETFs tend to keep falling. Add ITRS and IP21 to get a composite measure of intermediate-term strength. ETF CLOSE CHANGE PIVOT-PT 5-dmaAROC CL-PWR CANDLE IP21 ITRS ------------------------------------------------------------------------------------------ DIA 268.06 -1.21 266.97 41.3% Bearish BLUE -.022 ---- --------------------------------------------------------------------------------------------- BA 351.12 -4.74 356.46 -180.5% Bearish BLUE -.054 -.096 --------------------------------------------------------------------------------------------- SPY 296.82 -1.64 295.66 64.4% Bearish RED -.015 .003 --------------------------------------------------------------------------------------------- QQQ 189.71 -1.34 189.26 78.3% Bearish RED .002 -.017 --------------------------------------------------------------------------------------------- MDY 354.5 -3.39 355.28 -1.3% Bearish RED 0 -.018 --------------------------------------------------------------------------------------------- IWM 155.19 -1.49 156.1 -9.9% Bearish RED -.045 -.023 --------------------------------------------------------------------------------------------- FAS 78.1 -.85 75.89 268.3% Bearish ---- -.056 .097 --------------------------------------------------------------------------------------------- SOXL 145.17 -3.6 160.29 -102.3% Bearish BLUE -.106 -.248 (weakest) --------------------------------------------------------------------------------------------- TECL 165.66 -4.1 165.75 212.9% Bearish ---- .019 -.019 --------------------------------------------------------------------------------------------- IBB 107.74 -1.48 109.73 -62% Bullish RED .019 -.004 --------------------------------------------------------------------------------------------- GLD 131.29 -.85 130.62 -72% Bullish RED .204 .076 (strongest) --------------------------------------------------------------------------------------------- OIH 14.64 .02 14.92 -61.4% Bearish BLUE -.005 -.171 --------------------------------------------------------------------------------------------- RSX 24 .15 23.88 77.7% Bullish BLUE .025 .103 |
Table 2    Count of Stocks in Key Directories
           20190708
-------------------------------
NEWHIGHS       114  Bullish ratio to new lows.
NEWLOWS        14
MAXCP          19   But Professionals are chasing very few new highs.
MINCP          19
TTTNH          11
TTTNL          41   Day Traders are bearish.
FASTUP         47
FASTDOWN       61   Swing-traders are new bearish.
CPCROSSA       42
CPCROSSD       159
BIGVOLUP       3
BIGVODN        11
ACCUMVER       11
HIGHIP21       12
HIUPPCT        14
LOWACCUM       146
REDSELL        84
AUGSELS7       23
TRAPDOOR       11
|
 Table 3 RANKING OF KEY DIRECTORIES BASED PCT.OF STOCKS ABOVE 65-DMA
              7/8/19
 Bullish = 36
 Bearosh = 7
---------------------------------------------------------------------------------------
Directory     Current       day-1         day-2         day-3         day-4         day-5
----------------------------------------------------------------------------------------
BONDFUND       .961          .97           .98           .99           .951          .961
INSURANC       .888          .888          .888          .851          .814          .814
BIGBANKS       .857          .857          .857          .857          .857          .857
DOWJONES       .827          .827          .862          .827          .758          .724
UTILITY        .825          .775          .825          .75           .7            .7
GOLD           .823          .843          .882          .882          .823          .882
JETS           .8            .8            .8            .8            .8            .8
SOLAR          .777          .777          .777          .777          .777          .777
DJI-13         .769          .769          .846          .769          .769          .769
MILITARY       .75           .75           .714          .714          .714          .714
FIDSTKS        .733          .75           .766          .722          .739          .711
NASD-100       .729          .77           .791          .75           .75           .687
COMPUTER       .714          .761          .761          .714          .714          .619
SP500          .704          .733          .756          .706          .713          .682
SP-100         .692          .703          .725          .714          .692          .67
INDEXES        .673          .722          .744          .701          .728          .766
HOMEBLDG       .647          .647          .705          .588          .47           .588
RUS-1000       .631          .66           .664          .615          .611          .591
ETFS           .614          .807          .877          .859          .824          .649
NIFTY          .614          .649          .666          .666          .701          .596
FINANCE        .613          .75           .659          .602          .738          .647
TRANSP         .6            .7            .75           .6            .7            .7
FOOD           .592          .611          .666          .629          .629          .666
GREEN          .59           .59           .545          .545          .545          .545
AUTO           .589          .666          .692          .666          .666          .692
BEVERAGE       .588          .647          .647          .588          .529          .47
COMODITY       .585          .609          .658          .634          .609          .658
INFRA          .583          .666          .638          .611          .666          .694
SOFTWARE       .58           .645          .661          .629          .58           .548
REGBANKS       .571          .821          .678          .464          .678          .607
REIT           .567          .547          .547          .445          .351          .371
GUNS           .562          .562          .625          .562          .562          .562
INDMATER       .55           .575          .575          .562          .612          .562
CHEM           .528          .584          .603          .584          .603          .566
GAMING         .521          .478          .565          .478          .521          .391
HOSPITAL       .521          .565          .565          .565          .565          .521
Bullish = 36
=============================================================================================
EDU            .5            .5            .5            .5            .5            .5
HACKERS        .5            .6            .6            .6            .5            .45
=============================================================================================
RETAIL         .49           .452          .433          .377          .358          .358
SEMI           .486          .531          .567          .585          .648          .504
ELECTRON       .442          .5            .532          .532          .602          .5
BIOTECH        .424          .457          .468          .457          .473          .476
OILGAS         .243          .256          .256          .243          .284          .284
CHINA          .122          .245          .333          .315          .28           .157
COAL           0             0             0             0             .142          .142
Bearish = 7
|
=====================================================================
7/5/2019
The operative
automatic Peerless sells have not been reversed. In fact,
Peerless gave a new Sell S4 on July 3rd, which we did not notice until
Friday when we updated using the data from Barrons, which was slightly
different than the Wall Street Journals for the third.
(Here are the two links I am now using:
http://www.wsj.com/mdc/public/page/2_3021-tradingdiary2.html
https://www.barrons.com/market-data/market-lab?mod=md_subnav
)

The past Sell S4s are very good at calling major tops. They occur because
the Accumulation Index drops below its 21-day ma. Add to your shorts
of DIA.
We are seeing a bigger flurry or burst of Peerless Sells than in any
Summer since 1929. Bearish Big money and Bullish Professionals are
fighting for control of the market. Meanwhile, interest rates are much
higher here than in Britain or Europe. That boosts the Dollar and causes
overseas money to keep boosting US bonds and blue chips. Trump keeps
complaining about the FED. Is that because he is afraid the market is
running out of steam? It's true the current bull market is old; there
has not been a 20% or more decline since March 2009. But the 1947-1961
bull market endured much longer and the 1990-2000 bull market was almost
as long-lived as ours now.
The biggest paper loss is a little over 2% on the earliest Sell in the current
cluster of Sells. In June 1929 and June 1987 the bigger paper losses reached
4.7% and 4.0% before a reversing Buy came in. We are in a bullish seasonal
period. That helps make the case for waiting for the NYSE A/D Line
uptrend to be broken before expecting a 10% decline from the DJI's peak.
I've done back over clusters of Peerless Sells that did not quickly bring
a decline. Waiting for the NYSE A/D Line to break its downtrend was
consistently a winning way to trade the short side in these cases. Since
there is still a good chance that the DJI will breakout over 27000 and
that will send most stocks higher, I would not yet go 100% on the short side
with the positive general market ETFs. If you
study past charts, you will
see that there are more flat-top breakouts into all-time high territory than
reversals back down. See the weekly charts of DJI to get a sense of the
importance of flat-top breakouts when they do occur.
http://www.tigersoft.com/weekdji/charts.htm
At the same time, the repeated failure to breakout above the well-tested
resistance at 27000 would become quite bearish. We are at what is called
a "high inflection point".
Conclusion: Short more DIA but hold long MSFT, GLD, NUGT, YINN.
Sell S4s - IP21 drops below its 21-dma after rally.
| Date
DJI Short Sale Max.
Paper Loss Gain 19290814 S4 354.9 .409 381.1 -.0738 9/3 (bull market - 1929 Crash about to occur) 19310707 S4 145.9 .027 none 0 (bear market) (Sell before bear market started...) 19370803 S4 185.9 .365 189.3 -.0182 (bull market - 1937 Crash about to occur) 19380119 S4 130.1 .053 none 0 (bear market) 19401003 S4 135.1 .025 137.8 -.0199 11/17 (bull market - very timely because WWII about to start in earnest,) 19410711 S4 127.9 .135 130.1 -.0172 7/28 (bull market - very timely because Pearl Harbor scenario coming on.) 19460611 S4 209.1 .22 210.6 -.0071 6/13 (bull market) 19470711 S4 184.8 .105 186.9 -.0113 7/24 (bull market) 19471022 S4 184.4 . 103 none 0 (bull market) 19510917 S4 275.1 .053 275.9 -.0029 10/3 (bull market) 19550922 S4 486.0 .092 487.5 -.003 9/23 (bull market) 19570711 S4 518 .178 520.8 -.0054 7/12 (bull market) (Sell before near-bear market started...) 19610518 S4 701.1 .014 none 0 (bull market) 19660110 S4 985.41 .213 994.2 -.0089 1/18 (bull market) (Sell before bear market started...) 19730109 S4 1047.11 .104 1051.70 -.0043 1/11 (bull market) (Sell before bear market started...) 19761222 S4 984.54 .051 1004.65 -.0204 12/31 (bull market) (Sell before bear market started...) 19800116 S4 865.19 .101 903.84 -.0446 2/13 (bull market) 19810326 S4 1005.76 .032 1024.05 -.0181 4/27 (bull market) (Sell before bear market started...) 19831122 S4 1275.81 .031 1287.30 -.009 11/29 (bull market) 19850208 S4 1289.97 .033 1299.36 -.0072 3/1 (bull market) 19870826 S4 2701.85 .052 none 0 (bull market) (Sell before bear market started...) 19890209 S4 2323.04 .031 2324.82 -.0007 2/17 (bull market) 19940203 S4 3967.66 .074 none 0 (bull market) 19970207 S4 6855.8 .036 7085.16 -.0334 3/11 (bull market) 20000111 S4 11511.08 .13 11722.9 -.0184 1/14 (bull market) (Sell before bear market started...) 20000906 S4 11310.64 .095 none 0 (bull market) (Sell before bear market started...) 20010517 S4 11248.58 .268 11301.7 -.0047 5/18 (bull market) (Sell before bear market started...) 20031015 S4 9803.05 .018 9858.46 -.0056 11/3 (bull market) 20050308 S4 10912.47 .064 none 0 (bull market) 20071005 S4 14066.01 .079 14164.5 -.007 10/9 (bull market) (Sell before bear market started...) 20080421 S4 12825.02 .112 13040.0 -.0167 5/1 (bear market) (Sell before bear market started...) 20090105 S4 8952.89 .081 none 0 (bear market) (Sell before bear market started...) 20090603 S4 8675.24 .041 8763.13 -.0101 6/5 (bull market) 20120921 S4 13579.47 .056 13610.1 -.0022 10/5 (bull market) 20170428 S4 20940.51 -.013 21206.2 -.0126 6/2 (bull market) ============================================== |
ve Peerless
http://www.tigersoft.com/weekdji/charts.htm
|
Charts 7/5/2019 2019 PEERLESS DJI, Signals, Indicators Daily DJI Volume 10-DayUp/Down Vol Hourly DJIA A/D Line for All Stocks Inverted Traders Index NASDAQ S&P OEX NYSE COMPQX DJI-15 DJI-20 DJI-30 DIA SPY QQQ MDY IWM TNA Short-Term Rates USO-CrudeOil DBO FAS GLD BBH IBB JETS JNUG KOL NUGT OIH OIL RSX RETL SDS AGQ SLV SOXL TECL TLT TMF TNA UGA (gasoline) XIV and China: YINN CHAU Commodities: CANE CORN DBC JJC, NIB, CHOC CORN, CUT (paper) MOO, SOYB WEAT UUP (Dollar) LIT (Lithium) AAPL ADBE ALXN AMAT AMGN AMD AMZN BA BABA BAC BIDU CAT CVX DE FB GOOG GS HD IBM INTU JPM M (Macy's) MSFT NFLX NVDA PG QCOM TSLA TXN XOM WMT CMG , LRCX, SWKS, MDGL SPPI WATT SQ TOWN 7/5/19 (Click on Underlined link.) Bullish MAXCPs - http://tigersoft.com/MAXCPS/Jul-05/BULLISH.htm Bearish MAXCPs - http://tigersoft.com/MINCPs/Jul-05/BEARISH.htm |
Table 1 QUICKSILVER on ETFS - 7/5/2019 Explanation: Pivot-point is price past which the ETF's 5-dma will change direction. 5-dmaAROC is the annualized rate of change of the ETF's 5-day moving average. Closing Power is bullish when it is above its rising 21-dma and it is bearish when it is below its 5-dma. Closing Power is the cumulative change from opening to close each day. Since it does not factor in changes at the opening, it tends to reflect NYSE professionals who trade the market when the NYSE is open. "Candle" color is blue when last close was above the opening, thus showing Professional net buying, which tends to be bullish. It is red when the close is below the opening, which tends to be bearish. IP21 is the current value of the Tiger Accumulation Index. Above +.15 tends to be bullish and below -.15 tends to be bearish until reversed. ITRS is the percent rise of the ETF over 50-days less the percent rise of the DIA (DJIA) over 50 trading days. The strongest ITRS ETFs tend to keep rising and the lowest ITRS ETFs tend to keep falling. Add ITRS and IP21 to get a composite measure of intermediate-term strength. ETF CLOSE CHANGE PIVOT-PT 5-dmaAROC CL-PWR CANDLE IP21 ITRS ------------------------------------------------------------------------------------------ DIA 269.27 -.29 265.85 77.1% ------- BLUE -.003 ----- --------------------------------------------------------------------------------------------- BA 355.86 1.39 364.01 -113.8% Bearish BLUE -.033 -.065 --------------------------------------------------------------------------------------------- SPY 298.46 -.34 293 117.9% ------- BLUE .023 .009 --------------------------------------------------------------------------------------------- QQQ 191.05 -.39 186.74 120.5% Bullish BLUE .013 -.006 --------------------------------------------------------------------------------------------- MDY 357.89 .32 354.59 112.5% Bearish BLUE .053 -.019 --------------------------------------------------------------------------------------------- IWM 156.68 .42 155.5 98.2% Bearish BLUE -.01 -.021 --------------------------------------------------------------------------------------------- FAS 78.95 .39 73.98 491.4% Bearish ---- -.03 .115 --------------------------------------------------------------------------------------------- SOXL 148.77 -2.41 148.29 35.8% Bearish BLUE -.081 -.271 (weak) (3x) --------------------------------------------------------------------------------------------- TECL 169.76 -.6 158.58 357.1% ------- BLUE .029 .004 (3x) --------------------------------------------------------------------------------------------- IBB 109.22 -1.71 109.1 88.7% Bullish RED -.009 .021 --------------------------------------------------------------------------------------------- GLD 132.14 -1.49 133.2 -26.4% Bullish BLUE .22 .084 (strong) --------------------------------------------------------------------------------------------- OIH 14.62 .14 14.82 34.2% Bearish BLUE .01 -.192 --------------------------------------------------------------------------------------------- RSX 23.85 -.11 23.63 4.2% Bearish RED .034 .091 |
Table 2    Count of Stocks in Key Directories
          20190705
-------------------------------
NEWHIGHS       203   Bullish multiple of new lows
NEWLOWS        4
MAXCP          25    Bullish multiple of MINCPs
MINCP          6
TTTNH          9
TTTNL          19    Day Traders are net bearish.
FASTUP         34
FASTDOWN       35
CPCROSSA       131   Professionals were new buyers on Friday.
CPCROSSD       33
BIGVOLUP       3     Aggressive buying is low.
BIGVODN        7     Dumping is low.
HIGHIP21       8
HIUPPCT        17
VHIP21         116
LOWACCUM       121
REDSELL        83
AUGSELS7       18
TRAPDOOR       10
|
 Table 3   RANKING OF KEY DIRECTORIES BASED PCT.OF STOCKS ABOVE 65-DMA
               7/5/19
 Bullish = 37
 Bearish = 6
---------------------------------------------------------------------------------------
Directory     Current       day-1         day-2         day-3         day-4         day-5
----------------------------------------------------------------------------------------
BONDFUND       .97           .98           .99           .951          .961          .97
(Most bullish)
INSURANC       .888          .888          .851          .814          .814          .74
BIGBANKS       .857          .857          .857          .857          .857          .428
GOLD           .843          .882          .882          .823          .862          .862
DOWJONES       .827          .862          .827          .758          .724          .724
REGBANKS       .821          .678          .464          .678          .607          .392
ETFS           .807          .877          .859          .824          .649          .578
JETS           .8            .8            .8            .8            .8            .6
8 groups are rated most bullish
---------------------------------------------------------------------------------------------
SOLAR          .777          .777          .777          .777          .777          .777
UTILITY        .775          .825          .75           .7            .675          .675
NASD-100       .77           .791          .75           .75           .687          .593
DJI-13         .769          .846          .769          .769          .769          .769
COMPUTER       .761          .761          .714          .714          .619          .619
FIDSTKS        .75           .766          .722          .739          .717          .63
FINANCE        .75           .659          .602          .738          .659          .556
MILITARY       .75           .714          .714          .714          .714          .714
SP500          .733          .756          .706          .713          .68           .606
INDEXES        .725          .747          .698          .731          .758          .677
SP-100         .703          .725          .714          .692          .67           .626
TRANSP         .7            .75           .6            .7            .7            .35
AUTO           .666          .692          .666          .666          .692          .615
INFRA          .666          .638          .611          .666          .694          .611
RUS-1000       .66           .664          .614          .612          .592          .517
NIFTY          .649          .666          .666          .701          .578          .561
BEVERAGE       .647          .647          .588          .529          .529          .411
HOMEBLDG       .647          .705          .588          .47           .588          .411
SOFTWARE       .645          .661          .629          .58           .548          .435
FOOD           .611          .666          .629          .629          .666          .685
COMODITY       .609          .658          .634          .609          .658          .682
HACKERS        .6            .6            .6            .5            .45           .35
GREEN          .59           .545          .545          .545          .545          .545
CHEM           .584          .603          .584          .603          .584          .49
INDMATER       .575          .575          .562          .612          .562          .512
HOSPITAL       .565          .565          .565          .565          .521          .521
GUNS           .562          .625          .562          .562          .562          .5
REIT           .547          .547          .445          .351          .371          .29
SEMI           .531          .567          .585          .648          .504          .477
==============================================================================================
EDU            .5            .5            .5            .5            .5            .5
ELECTRON       .5            .532          .532          .602          .5            .435
==============================================================================================
GAMING         .478          .565          .478          .521          .391          .478
BIOTECH        .454          .468          .457          .473          .471          .41
RETAIL         .452          .433          .377          .358          .358          .339
OILGAS         .258          .258          .244          .286          .286          .237
CHINA          .245          .333          .315          .28           .157          .157
COAL           0             0             0             .142          .142          0
N=6
|
====================================================================
7/3/2019
Consider a
close above 27000 to be a new Buy B10 ...
(flat topped breakout into all-time high territory) unless June Jobs'
Report is very weak or negative, which would be dangerous, as in
June-July 2007.
Note the new study below shows how the next 10 days is usually quite
bullish
even when a Peerless signals occurs. I argue that this seasonality in the past has
outweighed even a new high with a negative IP21, a negative V-I reading or a
negative P-I. So, right now, the odds favor still higher prices. Cover the
token DIA short and go long SPY (which has a positive ITRS) if the
DJI closes above 27000.
Tonight I make the case for considering the DJI's new all-time high
on July 3rd and the 100-day new high on July 2nd to be breakout
Buy B10s. This would allow us to play the strength shown by the
DJI and SP-500 and the NYSE A/D Line in this bullish time of the
year, but it would mean applying the Buy B10 when the IP21 (current
Accumulation) remains stubbornly negative. The past B10s (shown
at http://www.tigersoft.com/PeerInst-2012-2013/-Buy-B10.htm
)
have never had a B10 with a negative IP21. To be more certain, I think
we have to wait for a close above 27000, the psychologically significant
resistance point.
Tomorrow we see the June Job's numbers. May's figure dropped sharply
from a year ago and April's this year. A strong June recovery would be
bullish, but a slippage by June's numbers into negative territory would be
reminiscent of June 2007 just before a significant market decline. See the
most recent numbers below. The number for May 2019 was only +75,000.
This was 195,000 below May 2018.
Monthly Jobs' Figures from Dept. of
Labor in 1000's
(June's update wil be released
tomorrow before the opening.)
|
|||||||||||||||||||||||||||||||||||||||||||||||||||||||||||||||||||||||||||||||||||||||||||||||||||||||||||||||||||||||||||||||||||||||||||||||||||||||||||||||||||||||||||
Tonight I make the case for a new Buy B10 that disregards a slightly
negative IP21 (current Accumulation). Such a Buy B10 occurs
when the
DJI makes a closing new high, the P-I and the V-I are positive and the IP21 is
above
-.01 in the bullish period June 26th to July 10th in bull markets. To
be a little more confident, I think we should add the requirement that the
DJI close above the round number 27,000.
The DJI made a marginal all-time closing high on July 3rd. It is close to
decisively breaking above a flat resistance area into all-time high ground.
This is potentially very bullish. Being short DIA is not recommended. But
is it safe to buy DIA or SPY which made an all-time high two days in a row?
The answer is "NO" if you judge the situation by weighting more heavily
the still negative IP21.
The answer is "YES" if you go by the rising A/D Line, the very positive
P-Indicator and the rising and positive V-Indicator. It is also "YES" if
you
weight
seasonality heavily in your decision. After July 4th, the DJI has risen
75% of the time over the next 10, 21 and 42 trading days and gained +1.6%,
+2.1% and +4.2% over the same periods, respectively.
Even more significant is how bullish the period from June 26th to July
15th is
even when Peerless has given a Sell signal. Below are the cases of early July
Sells. Look at the size of the paper losses and see how often it was better
to wait to sell until July 15th or later. There were only only 13 Peerless Sells
from July 1 to July 14 in bull markets in the 90 years since 1929. Four closely
called a top, but in 9 instances it would have been better to wait until at least
July 15th to sell.
Given the matching new all-time highs by the
DJI and the SP-500,
the positive P-I, V-I, rising A/D line and the bullish seasonality until
the 15th of July, at least, I suggest buying SPY and closing out the
token short in DIA if 27000 if closed above. I would then consider
the operative Peerless signal to be a Buy B10, a breakout into new
all-tiime high territory. I would close out shorts if their Closing Power
downtrends are broken and consider buying some of the bullish MAXCPs.
Bull Market July Sells
Date Peerless Signal
Result
------------------------------------------------------------------------------
19330705 S12
DJI rose from 102.7 to 108.7 on 7/18..
A S12 on 7/19 was more timely.
-------------------------------------------------------------------------------
19470711 S4
DJI rose from 184.8 to 186.9 on 7/24.
-------------------------------------------------------------------------------
19570708 S9
DJI rose from 518.4 to 520.8 on 7/12
-------------------------------------------------------------------------------
19570708 S9
DJI rose from 518.4 to 520.8 on 7/12
--------------------------------------------------------------------------------
19590701 S9
DJI rose from 650.2 to 678.1 on 8/3,
where a more timely S9 occurred.
--------------------------------------------------------------------------------
19680711 S7
This was peak.
--------------------------------------------------------------------------------
19820712 S12
This was peak.
--------------------------------------------------------------------------------
19900712 S9
More timely S9 on 7/19 at
about same price.
--------------------------------------------------------------------------------
19980701 S12
DJI rose from 9048.67 to 9337.97 on 7/17
There was a more timely S12 on 7/8
--------------------------------------------------------------------------------
19990706 S9
DJI rose from 11135.12 to 11193.69 on 7/9,
where a more timely S9 occurred.
--------------------------------------------------------------------------------
20070713 S9
DJI rose from 13907.25 to 14000.41 on 7/19,
where a more timely S9 occurred.
--------------------------------------------------------------------------------
20110705 S9
DJI rose from 12569.87 to 12724.41 on 7/21,
where a more timely S9V occurred.
--------------------------------------------------------------------------------
20130711 S9
DJI rose from 15460.92 to 15484.26 on 7/15,
where a more timely S5 occurred.
--------------------------------------------------------------------------------
 |
 |
 |
|
Charts 7/3/2019 2019 PEERLESS DJI, Signals, Indicators Daily DJI Volume 10-DayUp/Down Vol A/D Line for All Stocks Inverted Traders Index NASDAQ S&P OEX NYSE COMPQX DJI-15 DJI-20 DJI-30 DIA SPY QQQ MDY IWM TNA Short-Term Rates USO-CrudeOil DBO FAS GLD BBH IBB JETS JNUG KOL NUGT OIH OIL RSX RETL SDS AGQ SLV SOXL TECL TLT TMF TNA UGA (gasoline) XIV and China: YINN CHAU Commodities: CANE CORN DBC JJC, NIB, CHOC CORN, CUT (paper) MOO, SOYB WEAT UUP (Dollar) LIT (Lithium) AAPL ADBE ALXN AMAT AMGN AMD AMZN BA BABA BAC BIDU CAT CVX DE FB GOOG GS HD IBM INTU JPM M (Macy's) MSFT NFLX NVDA PG QCOM TSLA TXN XOM WMT CMG , LRCX, SWKS, MDGL SPPI WATT SQ TOWN 7/3/19 (Click on Underlined link.) Bullish MAXCPs - http://tigersoft.com/MAXCPS/Jul-03/BULLISH.htm Bearish MAXCPs - http://tigersoft.com/MINCPs/Jul-03/BEARISH.htm |
Table 1 QUICKSILVER on ETFS - 7/3/2019 ETF CLOSE CHANGE PIVOT-PT 5-dmaAROC CL-PWR CANDLE IP21 ITRS
------------------------------------------------------------------------------------------
DIA 269.56 1.9 265.15 81.5% ------- BLUE .01 ---
---------------------------------------------------------------------------------------------
BA 354.47 .31 364.02 -282.2% Bearish --- -.056 -.064
---------------------------------------------------------------------------------------------
SPY 298.8 2.37 291.5 142% Bearish BLUE .039 .009
---------------------------------------------------------------------------------------------
QQQ 191.44 1.43 186.5 150.5% ------- BLUE .025 -.006
---------------------------------------------------------------------------------------------
MDY 357.57 3.21 349.92 172.8% Bearish BLUE .046 -.015
---------------------------------------------------------------------------------------------
IWM 156.26 1.11 153.63 177% Bearish BLUE -.026 -.02
---------------------------------------------------------------------------------------------
FAS 78.56 2.06 71.55 591.4% ------- BLUE 0 .111
^^^^
---------------------------------------------------------------------------------------------
SOXL 151.18 -2.39 147.68 324.1% Bearish RED -.115 -.236
---------------------------------------------------------------------------------------------
TECL 170.36 3.36 158.05 417.7% Bearish BLUE .039 .009
---------------------------------------------------------------------------------------------
IBB 110.93 1.28 107.28 235.9% Bullish BLUE .083 .027
---------------------------------------------------------------------------------------------
GLD 133.63 .22 132.84 24.9% Bullish ---- .162 .101
^^^^^
---------------------------------------------------------------------------------------------
OIH 14.48 .04 14.52 -37.5% Bearish ---- -.031 -.231
---------------------------------------------------------------------------------------------
RSX 23.96 .18 23.83 27.3% Bearish BLUE .031 .079
^^^^^
|
Table 2    Count of Stocks in Key Directories
          20190703
-------------------------------
NEWHIGHS       440   Bulliah
NEWLOWS        16
MAXCP          22
MINCP          26    Bearish
TTTNH          15
TTTNL          31
FASTUP         49
FASTDOWN       59
CPCROSSA       138
CPCROSSD       30
BIGVOLUP       3
BIGVODN        5
ACCUMVER       10
HIGHIP21       6
HIUPPCT        17
LOWACCUM       109
REDSELL        81
AUGSELS7       20
TRAPDOOR       10
|
 Table 3      RANKING OF KEY DIRECTORIES BASED PCT.OF STOCKS ABOVE 65-DMA
              7/3/19
 Bullish = 39
 Bearish = 5
---------------------------------------------------------------------------------------
Directory     Current       day-1         day-2         day-3         day-4         day-5
----------------------------------------------------------------------------------------
BONDFUND       .98           .99           .951          .961          .97           .932
INSURANC       .888          .851          .814          .814          .777          .74
GOLD           .882          .882          .823          .862          .862          .882
ETFS           .877          .859          .824          .649          .578          .526
DOWJONES       .862          .827          .758          .724          .724          .689
BIGBANKS       .857          .857          .857          .857          .428          .285
DJI-13         .846          .769          .769          .769          .769          .769
UTILITY        .825          .75           .7            .675          .675          .7
JETS           .8            .8            .8            .8            .6            .5
NASD-100       .791          .75           .75           .687          .593          .572
SOLAR          .777          .777          .777          .777          .777          .777
FIDSTKS        .766          .722          .739          .717          .63           .619
COMPUTER       .761          .714          .714          .619          .619          .619
SP500          .756          .706          .713          .68           .608          .579
TRANSP         .75           .6            .7            .7            .35           .25
INDEXES        .741          .698          .731          .758          .688          .612
SP-100         .725          .714          .692          .67           .626          .637
MILITARY       .714          .714          .714          .714          .714          .642
HOMEBLDG       .705          .588          .47           .588          .411          .294
AUTO           .692          .666          .666          .692          .615          .538
REGBANKS       .678          .464          .678          .607          .392          .25
SOFTWARE       .672          .639          .59           .557          .442          .409
FOOD           .666          .629          .629          .666          .685          .629
NIFTY          .666          .666          .701          .578          .561          .543
RUS-1000       .664          .614          .611          .594          .521          .486
FINANCE        .659          .602          .738          .659          .568          .477
COMODITY       .658          .634          .609          .658          .682          .634
BEVERAGE       .647          .588          .529          .529          .411          .47
INFRA          .638          .611          .666          .694          .611          .583
GUNS           .625          .562          .562          .562          .5            .437
CHEM           .615          .596          .615          .596          .519          .423
HACKERS        .6            .6            .5            .45           .35           .3
INDMATER       .575          .562          .612          .562          .512          .475
SEMI           .567          .585          .648          .504          .477          .432
GAMING         .565          .478          .521          .391          .478          .434
HOSPITAL       .565          .565          .565          .521          .521          .478
REIT           .547          .445          .351          .371          .29           .25
GREEN          .545          .545          .545          .545          .545          .545
ELECTRON       .529          .529          .6            .496          .438          .406
============================================================================================
EDU            .5            .5            .5            .5            .5            .333
===========================================================================================
BIOTECH        .465          .457          .473          .471          .402          .345
RETAIL         .433          .377          .358          .358          .339          .283
CHINA          .333          .315          .28           .157          .157          .105
OILGAS         .258          .244          .286          .286          .237          .258
COAL           0             0             .142          .142          0             0
|
========================================================================
7/2/2019 The operative Peerless Sells have not been reversed.
But I have suggested
only small or token DIA short sale positions. Better, I said was to pick some
bearish MINCPs to short and then to be long GLD, NUGT, some other golds,
YINN (representing China) and MSFT (the strongest tech stock in the DJI.


The main reason we have taken only a token short
position in DIA is because
June S9s/S12s can bring losses on the first Sell S9 or S12 of more than 4%.
See the table of June S9s/S12s below. The June 1929 and June 1987 cases stand
out. They brought losses of more than 4% and then were followed by sizeable rises
in the market which could have been captured if the subsequent Buy B4 was used.
We must watch the DJI closely now for signs of an impending breakout above
the flat resistance at 27000 which would likely bring quick rises in the P-Indicator
or IP21 that could bring a Buy B4 or Buy B10. Note in the second table below
that July S9/S12s are quite reliable. None have brought losses when waiting for
a Peerless Buy signal to cover the short sales on the DJIA. But it looks like that
all three of our key indicators, P-I, IP21 and V-I may be positive. Wait and see
about that.
Meanwhile big money and Professionals are busy taking profits as the old
highs are being reached. We see this in the still negative IP21, the lagging
closing Powers and the red candle-stick charts, whose red color results from
closes below an opening.
Besides the two big losses (1929 and 1987) in June with S9s/S12s, there are several
other considerations that justify our waiting to go short DIA on the the current
Sells. We should delay, I think, because:
:
2) of how the DJI is drawn to the roof of its flat resistance
even when there are Peerless Sells lows and often will breakout above
flat resistance. (See the weekly charts of this a few nights ago).
3) of how very low interest rates make dividend stocks extra attractive.
And it is these defensive and dividend stocks that are letting the NYSE A/D Line
keep rising. Of course, if these dividend and blue chips stocks should fail to
maintain their upward momentum, which I discussed last night, then the market
would be without its leaders and would likely then fall back.
|
Past June S9-S9Vs/S12s Date Signal DJI Result when reversed. Gain Biggest Paper Loss 19290614 S9 313.7 -.047 328.6 -.0474 6/26 19290617 S12 319.3 -.029 328.6 -.0291 6/26 19290626 B4 328.6 .075 none 0 -------------------------------------------------------------------------------- 19340620 S9 98.3 .073 none 0 19340817 B20 91.1 .016 90.4 -.0076 8/20 -------------------------------------------------------------------------------- 19700617 S9 704.68 .05 716.11 -.0162 6/22 19700707 B2 669.36 .063 perfect 0 (Bear Market) -------------------------------------------------------------------------------- 19740607 S9 853.72 .271 859.67 -.0069 6/10 19740607 S12 853.72 .271 859.67 -.0069 6/10 19740611 S9 852.08 .270 none 0 19740807 S12 797.56 .220 none 0 19740823 S13 686.8 .094 none 0 19740927 B8 621.95 .053 584.56 -.0601 10/4 (Bear Market) -------------------------------------------------------------------------------- 19770621 S9 928.60 .131 929.70 -.0011 6/24 19771206 B9 806.91 -.017 793.49 -.0166 1/7 (Bear Market) -------------------------------------------------------------------------------- 19810615 S12 1011.99 .172 perfect 0 19811009 S9 873.00 .04 none 0 19811023 B9 873.99 .04 830.96 -.0492 10/26 -------------------------------------------------------------------------------- 19870608 S12 2351.64 -.04 2445.51 -.0399 6/22 19870609 S9 2352.7 -.039 2445.51 -.0394 6/22 19870610 S8 2353.61 -.039 2445.51 -.039 6/22 19870618 S8 2408.13 -.016 2445.51 -.0155 6/22 19870622 B4 2445.51 .105 2409.76 -.0146 7/1 -------------------------------------------------------------------------------- 19980701 S12 9048.67 .157 9337.97 -.0319 7/17 19980701 S9 9048.67 .157 9337.97 -.0319 7/17 19980708 S9 9174.97 .168 9337.97 -.0177 7/17 19980708 S12 9174.97 .168 9337.97 -.0177 7/17 19980904 S10 8487.31 .101 19980923 S9 8154.41 .064 none 0 19981001 B9 7632.53 .437 perfect 0 -------------------------------------------------------------------------------- 19990630 S9 10970.80 .029 11209.8 -.0217 7/16 19990706 S5 11135.12 .043 11209.8 -.0067 7/16 19990709 S9 11193.69 .105 11209.8 -.0014 7/16 19990730 B2 10655.14 .043 10645.9 -.0008 8/2 -------------------------------------------------------------------------------- 20040607 S9 10391.81 .058 10479.5 -.0084 6/23 20040726 B2 9961.92 .033 9814.66 -.0147 8/9 -------------------------------------------------------------------------------- 20090603 S9 8675.24 .041 8763.13 -.0101 6/5 20090608 S8 8764.49 .053 none 0 20090608 S5 8764.49 .053 none 0 20090610 S9 8739.02 .050 none 0 20090624 B5 8299.86 .237 perfect 0 -------------------------------------------------------------------------------- 20190611 S12 26048.51 ..... open 20190618 S9 26465.54 20190625 S12 26548.22 |
All 13 of the S9s/S12s in July would have brought gains.
|
Past July S9s/S12s Date Signal DJI Result when reversed. Gain Biggest Paper Loss 19570705 S9 516.9 .176 520.8 -.0075 7/12 19570711 S4 518 .178 520.8 -.0054 7/12 19570712 S7 520.8 .183 none 0 19570814 S10 485.9 .124 488.2 -.0047 8/16 19571217 B13 425.7 .527 perfect 0 -------------------------------------------------------------------------------- 19620705 S9 583.9 .009 615.5 -.0541 8/22 19620710 S12 586 .012 615.5 -.0503 8/22 19620716 S9 588.1 .016 615.5 -.0465 8/22 19621004 B1 582.4 .683 558.0 -.0418 10/23 -------------------------------------------------------------------------------- 19700715 S9 711.66 .006 735.56 -.0335 7/29 19700720 S12 733.91 .036 735.56 -.0022 7/29 19700723 S9 732.68 .035 735.56 -.0039 7/29 19700813 B2 707.35 .325 perfect 0 -------------------------------------------------------------------------------- 19730711 S9 908.19 .028 934.53 -.029 7/26 19730813 B17 883.20 .028 851.90 -.0354 8/22 -------------------------------------------------------------------------------- 19820712 S9 824.87 .058 833.43 -.0103 7/20 19820811 B8 777.21 .194 766.92 -.0132 8/12 -------------------------------------------------------------------------------- 19830726 S9 1243.69 .065 perfect 0 19830808 B2 1163.06 .097 perfect 0 -------------------------------------------------------------------------------- 19990709 S9 11193.69 .105 11209.8 -.0014 7/16 19990730 B2 10655.14 .043 10645.9 -.0008 8/2 -------------------------------------------------------------------------------- 20070713 S9 13907.25 .044 14000.4 -.0066 7/19 20070716 S5 13950.98 .047 14000.4 -.0035 7/19 20070723 S9 13943.42 .047 none 0 20070829 B14 13289.29 .040 13113.3 -.0132 9/17 -------------------------------------------------------------------------------- 20080723 S9 11632.38 .061 11782.3 -.0128 8/11 20080730 S9 11583.69 .058 11782.3 -.0171 8/11 20080808 S9 11734.32 .07 11782.3 -.004 8/11 20080915 B8 10917.51 .009 10609.6 -.0281 9/17 -------------------------------------------------------------------------------- 20100726 S9 10542.43 .026 10698.7 -.0148 8/9 20100809 S9 10698.75 .04 none 0 20100819 B17 10271.21 .247 9985.81 -.0277 8/26 -------------------------------------------------------------------------------- 20110705 S9 12569.87 .086 12724.4 -.0122 7/21 20110721 S9 12724.41 .098 none 0 20110815 B14 11482.9 .007 10817.6 -.0579 8/19 -------------------------------------------------------------------------------- 20130711 S9 15460.92 .032 15658.3 -.0127 8/2 20130712 S8 15464.30 .032 15658.3 -.0125 8/2 20130715 S5 15484.26 .034 15658.3 -.0112 8/2 20130822 B19 14963.74 .015 14776.1 -.0125 8/27 --------------------------------------------------------------------------------- 20150716 S12 18120.25 .135 none 0 20150824 S13 15871.35 .013 16643.0 -.0486 8/28 20150825 B16 15666.44 .131 none 0 --------------------------------------------------------------------------------- |
|
Charts 7/2/2019 2019 PEERLESS DJI, Signals, Indicators Daily DJI Volume 10-DayUp/Down Vol A/D Line for All Stocks Inverted Traders Index NASDAQ S&P OEX NYSE COMPQX DJI-15 DJI-20 DJI-30 DIA SPY QQQ MDY IWM TNA Short-Term Rates USO-CrudeOil DBO FAS GLD BBH IBB JETS JNUG KOL NUGT OIH OIL RSX RETL SDS AGQ SLV SOXL TECL TLT TMF TNA UGA (gasoline) XIV and China: YINN CHAU Commodities: CANE CORN DBC JJC, NIB, CHOC CORN, CUT (paper) MOO, SOYB WEAT UUP (Dollar) LIT (Lithium) AAPL ADBE ALXN AMAT AMGN AMD AMZN BA BABA BAC BIDU CAT CVX DE FB GOOG GS HD IBM INTU JPM M (Macy's) MSFT NFLX NVDA QCOM TSLA TXN XOM WMT CMG , LRCX, SWKS, MDGL SPPI WATT SQ TOWN 7/2/19 (Click on Underlined link.) Bullish MAXCPs - http://tigersoft.com/MAXCPS/Jul-02/BULLISH.htm Bearish MAXCPs - http://tigersoft.com/MINCPs/Jul-02/BEARISH.htm |
Table 1 QUICKSILVER on ETFS - 7/2/2019 ETF CLOSE CHANGE PIVOT-PT 5-dmaAROC CL-PWR CANDLE IP21 ITRS --------------------------------------------------------------------------------------------- DIA 267.66 .69 265.22 45.2% ------- BLUE .046 ---- --------------------------------------------------------------------------------------------- BA 354.16 -2.3 374.94 -207.2% ------- RED -.058 -.066 --------------------------------------------------------------------------------------------- SPY 296.43 .77 290.47 97% ------- BLUE .062 .011 --------------------------------------------------------------------------------------------- QQQ 190.01 .75 185.79 136.1% ------- BLUE .071 .001 --------------------------------------------------------------------------------------------- MDY 354.36 -.92 345.41 119.1% Bearish RED .057 -.01 --------------------------------------------------------------------------------------------- IWM 155.15 -.95 150.8 130.3% Bearish RED .005 -.01 --------------------------------------------------------------------------------------------- FAS 76.5 .61 69.86 387.2% ------- BLUE-.002 .107 --------------------------------------------------------------------------------------------- RETL 23.61 -.48 22.81 243.3% Bearish RED -.05 -.176 --------------------------------------------------------------------------------------------- SOXL 153.57 -6.72 141.44 834.9% Bearish RED -.018 -.198 --------------------------------------------------------------------------------------------- TECL 167 1.25 156.89 473% ------- BLUE .075 .025 --------------------------------------------------------------------------------------------- IBB 109.65 -.08 105.82 128.1% Bullish RED .1 .039 --------------------------------------------------------------------------------------------- GLD 133.41 2.79 132.97 -29.8% Bullish BLUE .175 .099 --------------------------------------------------------------------------------------------- OIH 14.44 -.48 14.59 68.4% Bearish RED -.039 -.229 --------------------------------------------------------------------------------------------- RSX 23.78 -.1 23.83 48.4% Bearish RED .03 .073 |
Table 2    Count of Stocks in Key Directories
           20190702
-------------------------------
NEWHIGHS       266  Bullish
NEWLOWS        26
MAXCP          25   low for number of new highs,
MINCP          53   Bearish compared to number of MAXCPs
TTTNH          14
TTTNL          51   Bearish
FASTUP         68
FASTDOWN       37
CPCROSSA       97
CPCROSSD       87
BIGVOLUP       3
BIGVODN        9    Bearish
ACCUMVER       11
HIGHIP21       12
HIUPPCT        14
LOWACCUM       149
REDSELL        80
AUGSELS7       23
TRAPDOOR       10
|
Table 3  RANKING OF KEY DIRECTORIES BASED PCT.OF STOCKS ABOVE 65-DMA
               7/2/19
Bullish = 38
Bearish = 8
---------------------------------------------------------------------------------------
Directory     Current       day-1         day-2         day-3         day-4         day-5
----------------------------------------------------------------------------------------
BONDFUND       .99           .951          .961          .97           .922          .941
GOLD           .882          .823          .862          .862          .882          .862
ETFS           .859          .824          .649          .578          .526          .403
BIGBANKS       .857          .857          .857          .428          .285          .285
INSURANC       .851          .814          .814          .777          .74           .777
DOWJONES       .827          .758          .724          .724          .689          .724
JETS           .8            .8            .8            .6            .5            .5
SOLAR          .777          .777          .777          .777          .777          .777
DJI-13         .769          .769          .769          .769          .769          .769
NASD-100       .75           .75           .687          .593          .572          .583
UTILITY        .75           .7            .675          .675          .7            .8
FIDSTKS        .722          .739          .717          .63           .614          .586
COMPUTER       .714          .714          .619          .619          .619          .476
MILITARY       .714          .714          .714          .714          .642          .678
SP-100         .714          .692          .67           .626          .637          .626
SP500          .706          .713          .68           .608          .577          .604
INDEXES        .702          .729          .762          .691          .616          .583
AUTO           .666          .666          .692          .615          .538          .512
NIFTY          .666          .701          .578          .561          .543          .508
COMODITY       .634          .609          .658          .682          .634          .634
FOOD           .629          .629          .666          .685          .629          .629
SOFTWARE       .629          .58           .548          .435          .403          .387
RUS-1000       .614          .611          .592          .522          .486          .517
INFRA          .611          .666          .694          .611          .555          .5
FINANCE        .602          .738          .659          .568          .477          .431
HACKERS        .6            .5            .45           .35           .3            .2
TRANSP         .6            .7            .7            .35           .25           .25
SEMI           .59           .654          .509          .481          .436          .381
BEVERAGE       .588          .529          .529          .411          .47           .47
HOMEBLDG       .588          .47           .588          .411          .294          .411
CHEM           .584          .603          .584          .509          .433          .433
HOSPITAL       .565          .565          .521          .521          .478          .434
GUNS           .562          .562          .562          .5            .437          .562
INDMATER       .562          .612          .562          .512          .475          .437
GREEN          .545          .545          .545          .545          .545          .545
ELECTRON       .532          .608          .5            .435          .403          .358
N= 36
-------------------------------------------------------------------------------------------
EDU            .5            .5            .5            .5            .333          .333
-------------------------------------------------------------------------------------------
GAMING         .478          .521          .391          .478          .434          .434
REGBANKS       .464          .678          .607          .392          .285          .214
BIOTECH        .454          .471          .473          .402          .345          .367
REIT           .445          .351          .371          .29           .25           .418
RETAIL         .377          .358          .358          .339          .283          .301
CHINA          .315          .28           .157          .157          .105          .087
OILGAS         .243          .284          .284          .236          .25           .222
COAL           0             .142          .142          0             0             0
N=8
|
====================================================================
7/1/2019
The Sell S12 still rules,
since the DJI did not breakout above 27000.
Abide by the rising A/D Line and avoid shorting more DIA until the
A/D Line uptrend is broken. But deciding what to buy is a problem,

Normally, the DJI rises in July. Since 1965, the DJI has risen 67.3% of the
time and gains on average 1.2% over the 21 trading days following July 1.
It then gains 2.3% over the next 42 trading days and 3.3% over the next 65
trading days. Taking just the third years before a Presidential Election, the
probability of the DJI being up over these periods of time rises to 75% and the
average gains are 2.1%, 4.2% and 6.0% over a month, two months and three
months, respectively.
So then, why are the big boys still net sellers, based on our Accumulation Index (IP21)
standing now at -.02 for the DJI? Perhaps, they are sellers at this time of the
year for seasonal reasons? Perhaps, they like to go on vacation and sell some
shares at this time. In any case, about 25% of the new highs now show negative
IP21s.
This is not good. The IP21 is now -.028 for the Peerless DJI and for the QQQ
-.027. The SP-500's IP21 is only +.01 and it just made a new all-time high.
And why are Professionls, judging from our Closing Power numbers as a percentage
of the stocks making new highs, not more willing to chase? I reckon less than
20% of the stocks making new highs show Closing Powers near to or at a new highs.
(By our calculations tonight, there were 46 new closing highs and 225 new highs.)
Without Professionas and the "the big boys" (as measured by the Accumulation
Index)
more aggressive, how much higher can the market go? It does seem to come down
to interest rates? Perhaps, they will be formally lowered by the FED when the Jobs'
numbers for June come ouy on Friday.
In this environment should you commit much money to the long side? I can only
conclude it's probably a lot riskier than usual chasing the dividend stocks and bond
funds that the market now favors. My suggestion: either draw the price-uptrendlines
and sell if the stocks break them or watch their 5-day ma pivot points and sell when they
close below the pivot point. Consider PG and the DJ-15 Utilities now. They
both
show potential head/shoulders developing, broken Closing Power uptrends and falling
5-day ma. So, traders should be sellers of them.
Will a new groups of stocks emerge as leaders? I'm not sure which stocks they will
be.
Perhaps,
solar energy? The SP-500 made a new high today, but only 37 of these 500
stocks made new highs. Another cautionary sign: 28.7% of the SP-500 stocks are still
below the key support of their 65-dma. This compares with the 30% number when the
SP-500 was reaching its peak at the end of September before it fell 20% last year.
We need more evidence that it's safe to buy despite the bullish seasonality.


Use the Charts below tonight.
|
Charts 7/1/2019 2019 PEERLESS DJI, Signals, Indicators Daily DJI Volume 10-DayUp/Down Vol A/D Line for All Stocks Inverted Traders Index NASDAQ S&P OEX NYSE COMPQX DJI-15 DJI-20 DJI-30 DIA SPY QQQ MDY IWM TNA Short-Term Rates USO-CrudeOil DBO FAS GLD BBH IBB JETS JNUG KOL NUGT OIH OIL RSX RETL SDS AGQ SLV SOXL TECL TLT TMF TNA UGA (gasoline) XIV and China: YINN CHAU Commodities: CANE CORN DBC JJC, NIB, CHOC CORN, CUT (paper) MOO, SOYB WEAT UUP (Dollar) LIT (Lithium) AAPL ADBE ALXN AMAT AMGN AMD AMZN BA BABA BAC BIDU CAT CVX DE FB GOOG GS HD IBM INTU JPM M (Macy's) MSFT NFLX NVDA QCOM TSLA TXN XOM WMT CMG , LRCX, SWKS, MDGL SPPI WATT SQ TOWN 7/1/19 (Click on Underlined link.) Bullish MAXCPs - http://tigersoft.com/MAXCPS/Jul-01/BULLISH.htm Bearish MAXCPs - http://tigersoft.com/MINCPs/Jul-01/BEARISH.htm |
Table 1 QUICKSILVER on ETFS - 7/1/2019 ETF CLOSE CHANGE PIVOT-PT 5-dmaAROC CL-PWR CANDLE IP21 ITRS --------------------------------------------------------------------------------------------- DIA 266.97 1.12 265.26 -3.8% ------- RED .018 0 --------------------------------------------------------------------------------------------- BA 356.46 -7.55 369.32 -237.4% ------- RED .01 -.067 --------------------------------------------------------------------------------------------- SPY 295.66 2.66 290.76 34.6% Bearish RED .01 .014 --------------------------------------------------------------------------------------------- QQQ 189.26 2.52 184.93 29.5% Bearish RED -.027 .005 --------------------------------------------------------------------------------------------- MDY 355.28 .69 346.02 105.7% ------- RED .074 -.007 --------------------------------------------------------------------------------------------- IWM 156.1 .6 151.15 131.7% Bearish RED .014 -.002 --------------------------------------------------------------------------------------------- FAS 75.89 1.91 70.89 230.6% ------- --- -.017 .093 --------------------------------------------------------------------------------------------- SOXL 160.29 12 129.29 892.9% Bearish RED -.038 -.158 --------------------------------------------------------------------------------------------- TECL 165.75 7.17 152.03 152.6% Bearish RED .002 .028 --------------------------------------------------------------------------------------------- IBB 109.73 .63 106.89 121.7% Bullish RED .07 .044 --------------------------------------------------------------------------------------------- GLD 130.62 -2.58 134.2 -124.4% ------- RED .171 .08 --------------------------------------------------------------------------------------------- OIH 14.92 .1 14.24 238.3% Bearish RED .013 -.177 --------------------------------------------------------------------------------------------- RSX 23.88 .25 23.55 16.9% Bearish RED .027 .094 |
 Table 2   Count of Stocks in Key Directories
          20190701
-------------------------------
NEWHIGHS       225 (Bullish number and nh/nl ratio is bullish._
NEWLOWS        9
MAXCP          46  Professionals are not chasing most new highs.
MINCP          8
TTTNH          38
TTTNL          17
FASTUP         97  Most new highs are not advancing rapidly.
FASTDOWN       60
CPCROSSA       278
CPCROSSD       43
BIGVOLUP       35
BIGVODN        50 Dumping going on.
ACCUMVER       10
HIGHIP21       22
HIUPPCT        12
LOWACCUM       201
REDSELL        91
AUGSELS7       19
TRAPDOOR       10
|
Table 3  RANKING OF KEY DIRECTORIES BASED PCT.OF STOCKS ABOVE 65-DMA
              7/1/19
 Bullish = 36
 Bearish = 7
---------------------------------------------------------------------------------------
Directory     Current       day-1         day-2         day-3         day-4         day-5
----------------------------------------------------------------------------------------
BONDFUND       .951          .961          .97           .922          .941          .961
BIGBANKS       .857          .857          .428          .285          .285          .428
ETFS           .824          .649          .578          .526          .403          .561
GOLD           .823          .862          .862          .882          .862          .882
INSURANC       .814          .814          .777          .74           .777          .851
JETS           .8            .8            .6            .5            .5            .5
SOLAR          .777          .777          .777          .777          .777          .777
DJI-13         .769          .769          .769          .769          .769          .846
DOWJONES       .758          .724          .724          .689          .724          .793
NASD-100       .75           .687          .593          .572          .572          .645
FIDSTKS        .739          .717          .63           .614          .586          .63
FINANCE        .738          .659          .568          .477          .443          .454
INDEXES        .733          .766          .695          .619          .586          .619
COMPUTER       .714          .619          .619          .619          .476          .523
MILITARY       .714          .714          .714          .642          .678          .714
SP500          .713          .68           .608          .577          .604          .635
NIFTY          .701          .578          .561          .543          .491          .578
UTILITY        .7            .675          .675          .7            .8            .8
TRANSP         .7            .7            .35           .25           .25           .3
SP-100         .692          .67           .626          .637          .637          .659
REGBANKS       .678          .607          .392          .285          .25           .214
AUTO           .666          .692          .615          .538          .512          .512
INFRA          .666          .694          .611          .555          .527          .555
SEMI           .648          .504          .477          .432          .387          .414
FOOD           .629          .666          .685          .629          .611          .574
INDMATER       .612          .562          .512          .475          .45           .425
RUS-1000       .61           .591          .521          .488          .518          .545
COMODITY       .609          .658          .682          .634          .609          .585
CHEM           .603          .584          .509          .433          .452          .433
ELECTRON       .602          .493          .435          .403          .365          .384
SOFTWARE       .58           .548          .435          .403          .37           .516
HOSPITAL       .565          .521          .521          .478          .434          .391
GUNS           .562          .562          .5            .437          .562          .687
GREEN          .545          .545          .545          .545          .545          .545
BEVERAGE       .529          .529          .411          .47           .47           .47
GAMING         .521          .391          .478          .434          .434          .434
N=36
============================================================================================
EDU            .5            .5            .5            .333          .333          .333
HACKERS        .5            .45           .35           .3            .2            .35
============================================================================================
HOMEBLDG       .47           .588          .411          .294          .411          .529
BIOTECH        .468          .473          .402          .345          .361          .342
RETAIL         .358          .358          .339          .283          .301          .32
REIT           .351          .371          .29           .25           .425          .5
OILGAS         .284          .284          .236          .25           .215          .201
CHINA          .28           .157          .157          .105          .087          .122
COAL           .142          .142          0             0             0             .142
N=7
=============================================================================================
|
=====================================================================|
6/28/2019
A truce in the trade war with China is one
of the things the market needs
to breakout over 27000. Another is a cut by interest rates in the FED.
With the interest on 10-year notes falling to only 2%, stocks are made
to look much more attractive, especially if they can rise 2% just on Monday.
Treat a DJI breakout over 27000 as being very bullish as long as the NYSE
A/D Line is rising.
 |
 |
 |
 |
Peerless know nothing of this news, but it does factor in the
bullishness of the
third year in a Presidential Election. And so should we. A breakout above
27000 would have be considered quite bullish given how well flat top breakouts
in the past have worked. I produced a number of historic 5-year breakout-charts
below to demonstrate this.
 |
 |
 |
 |
 |
 |
 |
Of course, this is now a much more speculative market. If interest rates were
to go back up, it would be bad news for all the defensive stocks that are
being boosted by the quick fall in interest rates. Another sign of the speculative
juices that are surging now is how Openings are becoming more important than Closes
in moving the short-term. In additon, the DJI has a broadening pattern in the weekly
chart shown below. It's really quite surprising, but the main object of all
this speculation is the group of normally safe blue-chip dividend stocks.
Imagine a bull market led by PG and MCD!
I think that the market can go considerably higher if the
breadth of the rally expands.
So, as long as the NYSE A/D Line is rising, do not sell short. This is the 1976
and 2002 scenario. Many Democrats do not trust the Trump bull market. They
can hardly believe it. And certainly, the perma-bears won't easily admit it, but the
trend is up and even the heavy selling by "big money" as the old highs have been
reached is not enough to hold the market back.
So, there's no point in being short DIA, unless it is a token position to honor the
Sell S12. Note that the V-Indicator has turned positive. It is not to late to
buy if
the market can catch more public participation. Buy some of the middle-sized
stocks that have recently jumped back above their 65-dma and have positive IP21
readings. Some examples are ALE, AMPH, ATUS, CLH, CORE, CPF, EGP,
FGEN and FRME.
|
Charts 6/28/2019 2019 PEERLESS DJI, Signals, Indicators Daily DJI Volume 10-DayUp/Down Vol Hourly DJIA A/D Line for All Stocks Inverted Traders Index NASDAQ S&P OEX NYSE COMPQX DJI-15 DJI-20 DJI-30 DIA SPY QQQ MDY IWM TNA Short-Term Rates USO-CrudeOil DBO FAS GLD BBH IBB JETS JNUG KOL NUGT OIH OIL RSX RETL SDS AGQ SLV SOXL TECL TLT TMF TNA UGA (gasoline) XIV and China: YINN CHAU Commodities: CANE CORN DBC JJC, NIB, CHOC CORN, CUT (paper) MOO, SOYB WEAT UUP (Dollar) LIT (Lithium) AAPL ADBE ALXN AMAT AMGN AMD AMZN BA BABA BAC BIDU CAT CVX DE FB GOOG GS HD IBM INTU JPM M (Macy's) MSFT NFLX NVDA QCOM TSLA TXN XOM WMT CMG , LRCX, SWKS, MDGL SPPI WATT SQ TOWN 6/28/19 (Click on Underlined link.) Bullish MAXCPs - http://tigersoft.com/MAXCPS/Jun-28/BULLISH.htm Bearish MAXCPs - http://tigersoft.com/MINCPs/Jun-28/BEARISH.htm |
Table 1 QUICKSILVER on ETFS - 6/28/2019 ETF CLOSE CHANGE PIVOT-PT 5-dmaAROC CL-PWR CANDLE IP21 ITRS --------------------------------------------------------------------------------------------- DIA 265.85 .7 267.17 -23.5% ------- RED -.036 0 --------------------------------------------------------------------------------------------- BA 364.01 -.01 373.99 -105.6% ------- BLUE .013 -.041 --------------------------------------------------------------------------------------------- SPY 293 1.5 293.64 -17.1% ------- BLUE-.05 .007 --------------------------------------------------------------------------------------------- QQQ 186.74 .24 188.16 -49% Bearish RED -.073 -.007 --------------------------------------------------------------------------------------------- MDY 354.59 4.67 347.91 55.7% Bullish BLUE .084 -.006 --------------------------------------------------------------------------------------------- IWM 155.5 1.87 152.08 50.9% ------- BLUE .017 -.009 --------------------------------------------------------------------------------------------- FAS 73.98 2.43 72.58 35.6% ------- BLUE-.046 .062 --------------------------------------------------------------------------------------------- RETL 24.06 .36 22.98 -23.7% ------- BLUE .163 -.221 --------------------------------------------------------------------------------------------- SOXL 148.29 .61 135.22 507.3% Bearish RED -.056 -.22 --------------------------------------------------------------------------------------------- TECL 158.58 .53 160.95 -47% Bearish RED -.037 -.008 --------------------------------------------------------------------------------------------- IBB 109.1 1.82 107.12 -16.3% Bullish BLUE .033 .033 --------------------------------------------------------------------------------------------- GLD 133.2 .36 133.94 45.8% Bullish BLUE .282 .102 --------------------------------------------------------------------------------------------- OIH 14.82 .3 14.23 124.9% Bearish BLUE .05 -.193 --------------------------------------------------------------------------------------------- RSX 23.63 -.2 23.8 -6.3% ------- RED .053 .079 |
Table 2    Count of Stocks in Key Directories
          20190628
-------------------------------
NEWHIGHS       225
NEWLOWS        9   (low)
MAXCP          46
MINCP          8
TTTNH          38
TTTNL          16
FASTUP         97
FASTDOWN       60
CPCROSSA       278
CPCROSSD       43
BIGVOLUP       35
BIGVODN        50
ACCUMVER       10
HIGHIP21       22
HIUPPCT        12
LOWACCUM       201
REDSELL        91
AUGSELS7       19
TRAPDOOR       10
|
 Table 3
 RANKING OF KEY DIRECTORIES BASED PCT.OF STOCKS ABOVE 65-DMA
              6/28/19
 Bullish = 35
 Bearish = 9
---------------------------------------------------------------------------------------
Directory     Current       day-1         day-2         day-3         day-4         day-5
----------------------------------------------------------------------------------------
BONDFUND       .961          .97           .922          .941          .97           .961
GOLD           .862          .862          .882          .862          .882          .803
BIGBANKS       .857          .428          .285          .285          .428          .428
INSURANC       .814          .777          .74           .777          .851          .888
JETS           .8            .6            .5            .5            .5            .5
SOLAR          .777          .777          .777          .777          .777          .777
DJI-13         .769          .769          .769          .769          .846          .769
INDEXES        .763          .693          .612          .58           .618          .677
DOWJONES       .724          .724          .689          .724          .793          .758
MILITARY       .724          .724          .655          .689          .724          .689
FIDSTKS        .717          .63           .614          .586          .641          .673
TRANSP         .7            .35           .25           .25           .3            .45
INFRA          .694          .611          .555          .527          .555          .555
AUTO           .692          .615          .538          .512          .512          .538
NASD-100       .687          .593          .572          .572          .635          .656
SP500          .68           .609          .578          .605          .64           .66
UTILITY        .675          .675          .7            .8            .8            .825
SP-100         .67           .626          .637          .637          .67           .681
FOOD           .666          .685          .629          .611          .574          .574
FINANCE        .659          .568          .477          .443          .477          .5
COMODITY       .658          .682          .634          .609          .585          .585
ETFS           .649          .578          .526          .403          .561          .526
COMPUTER       .619          .619          .619          .476          .523          .523
REGBANKS       .607          .392          .285          .25           .25           .285
RUS-1000       .592          .521          .487          .52           .548          .58
GUNS           .588          .529          .47           .588          .705          .588
HOMEBLDG       .588          .411          .294          .411          .529          .529
CHEM           .584          .509          .433          .452          .471          .452
NIFTY          .578          .561          .543          .491          .578          .578
INDMATER       .562          .512          .475          .45           .425          .487
SOFTWARE       .548          .435          .403          .37           .516          .532
GREEN          .545          .545          .545          .545          .545          .545
BEVERAGE       .529          .411          .47           .47           .47           .47
HOSPITAL       .521          .521          .478          .434          .391          .434
SEMI           .504          .477          .432          .387          .423          .441
N=35
===============================================================================================
EDU            .5            .5            .333          .333          .333          .5
===============================================================================================
ELECTRON       .496          .433          .401          .363          .388          .407
BIOTECH        .471          .402          .345          .361          .339          .41
HACKERS        .45           .35           .3            .2            .35           .4
GAMING         .391          .478          .434          .434          .434          .391
REIT           .371          .29           .25           .425          .5            .56
RETAIL         .358          .339          .283          .301          .32           .339
OILGAS         .284          .236          .25           .215          .208          .243
CHINA          .157          .157          .105          .087          .122          .122
COAL           .142          0             0             0             .142          .142
N=9
|
========================================================================
6/27/2019
The Peerless S9Vs and S12s on the DJI
stand despite today's good breadth. There
were a whopping 1298 more up than down on the NYSE and IWM (Russell 2000)
climbed back above its 65-dma, despite the DJI's small loss, which was primarily due
to high priced BA's 10.92 decline. A short-term seasonal rally should be expected.
But after that, the DJI should still fall back to the to the lower band and honor
our S9-V and S12. But it looks like this will not happen in the next week.
Remember
that the DJI tends to be up around the July 4th holiday. Moreover, if the NYSE A/D
Line makes a new high, it would be best not to short any more DIA or even IWM
(which has a weaker relative strength and lower IP21 than the DJI) until the NYSE
A/D Line breaks its uptrend. See further below how well this strategy worked in 1976
when, like now, the DJI could not get past a round number (1000) but also would
not turn down until the strong A/D Line (like now) broke its uptrend.
For bears, the good news is that 56% of all stocks are now below their 65-dma and
the Closing Powers of all the major market ETFs have been broken. Professionals
are in new selling mode. So, higher openings are apt to be blunted by big-money
selling
on strength. That should limit the advance unless there is a US-China "deal" or
the FED lowers rates by one quarter percent or more.
So, stay short DIA, some bearish MINCPs and long GLD, NUGT, BA and YINN.
  |
| 1976 - Strong
A/D Line but DJI could not get past it flat well-tested resistance. Instead, NYSE broke its uptrendline and then the DJI fell back. Twice: July and August...  |
DIA |
SPY |
QQQ |
IWM |
|
Charts 6/27/2019 2019 PEERLESS DJI, Signals, Indicators Daily DJI Volume 10-DayUp/Down Vol Hourly DJIA A/D Line for All Stocks Inverted Traders Index NASDAQ S&P OEX NYSE COMPQX DJI-15 DJI-20 DJI-30 DIA SPY QQQ MDY IWM TNA Short-Term Rates USO-CrudeOil DBO FAS GLD BBH IBB JETS JNUG KOL NUGT OIH OIL RSX RETL SDS AGQ SLV SOXL TECL TLT TMF TNA UGA (gasoline) XIV and China: YINN CHAU Commodities: CANE CORN DBC JJC, NIB, CHOC CORN, CUT (paper) MOO, SOYB WEAT UUP (Dollar) LIT (Lithium) AAPL ADBE ALXN AMAT AMGN AMD AMZN BA BABA BAC BIDU CAT CVX DE FB GOOG GS HD IBM INTU JPM M (Macy's) MSFT NFLX NVDA QCOM TSLA TXN XOM WMT CMG , LRCX, SWKS, MDGL SPPI WATT SQ TOWN 6/27/19 (Click on Underlined link.) Bullish MAXCPs - http://tigersoft.com/MAXCPS/Jun-27/BULLISH.htm Bearish MAXCPs - http://tigersoft.com/MINCPs/Jun-27/BEARISH.htm |
Table 1 QUICKSILVER on ETFS - 6/27/2019 ETF CLOSE CHANGE PIVOT-PT 5-dmaAROC CL-PWR CANDLE IP21 ITRS
---------------------------------------------------------------------------------------------
DIA 265.15 -.07 267.1 -55% ------- RED -.026 ----
---------------------------------------------------------------------------------------------
BA 364.02 -10.92 371.84 -145.6% ------- RED .01 -.049
---------------------------------------------------------------------------------------------
SPY 291.5 1.03 294 -74.4% Bearish BLUE -.057 .002
---------------------------------------------------------------------------------------------
QQQ 186.5 .71 188.57 -62.7% ------- ---- -.065 -.002
---------------------------------------------------------------------------------------------
MDY 349.92 4.51 350.71 -62.9% Bearish BLUE .012 -.024
---------------------------------------------------------------------------------------------
IWM 153.63 2.83 153.95 -54.4% ------- BLUE -.043 -.027
---------------------------------------------------------------------------------------------
FAS 71.55 1.69 73.47 -206.9% Bearish BLUE -.111 .028
---------------------------------------------------------------------------------------------
RETL 23.7 .89 24.17 -100.8% ------- BLUE .051 -.228
---------------------------------------------------------------------------------------------
SOXL 147.68 6.24 134.33 388.2% ------- BLUE -.038 -.185
---------------------------------------------------------------------------------------------
TECL 158.05 1.16 160.06 -135.4% Bearish RED -.024 .007
---------------------------------------------------------------------------------------------
IBB 107.28 1.46 109.45 -62.3% Bullish BLUE -.062 -.022
---------------------------------------------------------------------------------------------
GLD 132.84 -.13 131.98 65.1% Bullish BLUE .295 .1
^^^^^^^^^^^^^
---------------------------------------------------------------------------------------------
OIH 14.52 -.07 14.46 45.2% Bearish RED -.033 -.209
---------------------------------------------------------------------------------------------
RSX 23.83 0 23.66 2.1% Bullish ---- .052 .096
|
TABLE 2   Count of Stocks in Key Directories
          20190627
-------------------------------
NEWHIGHS       136
NEWLOWS        7
MAXCP          12
MINCP          13
TTTNH          9
TTTNL          25
FASTUP         50
FASTDOWN       101
CPCROSSA       250
CPCROSSD       36
BIGVOLUP       5
BIGVODN        12
ACCUMVER       7
HIGHIP21       11
HIUPPCT        10
LOWACCUM       151
REDSELL        99
AUGSELS7       19
TRAPDOOR       10
|
Table 3 RANKING OF KEY DIRECTORIES BASED PCT.OF STOCKS ABOVE 65-DMA
6/27/19
Bullish = 27
Bearish = 16
---------------------------------------------------------------------------------------
Directory Current day-1 day-2 day-3 day-4 day-5
----------------------------------------------------------------------------------------
BONDFUND .97 .922 .941 .97 .961 .932
GOLD .862 .882 .862 .882 .784 .784
INSURANC .777 .74 .777 .851 .888 .888
SOLAR .777 .777 .777 .777 .777 .777
DJI-13 .769 .769 .769 .846 .769 .769
DOWJONES .724 .689 .724 .793 .758 .758
MILITARY .724 .655 .689 .724 .689 .724
INDEXES .693 .612 .58 .618 .677 .655
COMODITY .682 .634 .609 .585 .585 .585
FOOD .679 .622 .603 .566 .566 .584
UTILITY .675 .7 .8 .8 .825 .85
FIDSTKS .63 .614 .586 .641 .668 .69
SP-100 .626 .637 .637 .67 .681 .67
COMPUTER .619 .619 .476 .523 .523 .571
AUTO .615 .538 .512 .512 .538 .564
INFRA .611 .555 .527 .555 .555 .555
SP500 .609 .578 .605 .64 .658 .666
JETS .6 .5 .5 .5 .5 .7
NASD-100 .593 .572 .572 .635 .645 .666
ETFS .578 .526 .403 .561 .526 .578
FINANCE .568 .477 .443 .477 .5 .522
NIFTY .561 .543 .491 .578 .578 .578
GREEN .545 .545 .545 .545 .545 .545
GUNS .529 .47 .588 .705 .588 .647
HOSPITAL .521 .478 .434 .391 .434 .478
RUS-1000 .521 .487 .519 .549 .58 .602
INDMATER .512 .475 .45 .425 .487 .5
CHEM .509 .433 .452 .471 .471 .49
------------------------------------------------------------------------------------
EDU .5 .333 .333 .333 .5 .5
------------------------------------------------------------------------------------
GAMING .478 .434 .434 .434 .347 .347
SEMI .477 .432 .387 .423 .441 .459
SOFTWARE .435 .403 .37 .516 .532 .58
ELECTRON .433 .401 .363 .388 .407 .42
BIGBANKS .428 .285 .285 .428 .428 .428
BEVERAGE .411 .47 .47 .47 .47 .47
HOMEBLDG .411 .294 .411 .529 .588 .705
BIOTECH .4 .345 .361 .339 .41 .394
REGBANKS .392 .285 .25 .25 .285 .285
HACKERS .35 .3 .2 .35 .4 .35
TRANSP .35 .25 .25 .3 .45 .5
RETAIL .339 .283 .301 .32 .339 .358
REIT .29 .25 .425 .5 .56 .722
OILGAS .236 .25 .215 .208 .243 .256
CHINA .157 .105 .087 .122 .122 .192
COAL 0 0 0 .142 .142 .142
|
========================================================================
6/26/2019 Our Peerless S9Vs and S12s typically bring a decline to the lower band,
at least. And though the NYSE A/D Line's uptrend is intact, the Closing Power
uptrends going back to January have now been broken for IWM, MDY, SPY,
OEX, QQQ and NASDAQ, but not the DJI. Apparently, NY Professionals
respect the DIA's role as the staunchest blue chip defender of the bull market.
Until the DIA's Closing Power breaks down, limit your short sales on it. The DJI
still
may be able to breakout in an isolated way above 27000. Such a move would
bring more Peerless Sells very likely. A trade deal with China could bring such a
rally.
On the other hand, Trumps public disparagement of Powell for not lowering rates
may mean rates will not be cut soon. Will that bring another sell-off if the next
Jobs' numbers do not jump back up? I would think so.

Hold present positions: Short DIA (limited position)
and some Bearish MINCPs.
Long BA, GLD, NUGT and YINN. IWM probably should have been shorted
instead of DIA because IWM shows a weaker IP21 and ITRS and lots of liquidity.
Avoid QQQ and the tech ETFs unless you are confident in your assessment of
how and when the US-China tariff conflict will be resolved.
But right now, there is not even a truce in the trade war and Professionals, who
who would be expected to be the first to know if there was about to be a trade deal,
sold the market off after hopes this morning rose that a deal was close. This sell-off
after the opening placed DIA and the other indexes significantly below their openings
today. And this was the fourth straight day we have seen such behavior this June.
To see what has happened in the past when our candle-sticks were red four
straight
days in the Summer in SPY, I put together a study-page on Summer SPY candle-sticks
that shows them year-by-year since 1993, the first year for which there is data.
This
will help in lots of candle-stick studies:
http://tigersoft.com/SPYCAND/SPYCAND.htm
For our purposes now, it shows that four straight red
candle-sticks by itself more often
shows an over-sold condition rather than special weakness, especially when SPY is
still above its 21-dma and 65-dma like now. But its short-term trend is down and
it needs, at least, to test its recent lows, I would think.
TIGER CANDLE-STICKS
Below are the Tiger candle-stock charts of the current
general market ETF's.
Study also the price-trends here, Closing Power (shorter term) and Accumulation
Index trends here. Except for DIA, they show downtrends and weakened Closing Power
and Accumulation.
DIA |
SPY |
QQQ |
IWM |
MDY |
|
Charts 6/26/2019 2019 PEERLESS DJI, Signals, Indicators Daily DJI Volume 10-DayUp/Down Vol Hourly DJIA A/D Line for All Stocks Inverted Traders Index NASDAQ S&P OEX NYSE COMPQX DJI-15 DJI-20 DJI-30 DIA SPY QQQ MDY IWM TNA Short-Term Rates USO-CrudeOil DBO FAS GLD BBH IBB JETS JNUG KOL NUGT OIH OIL RSX RETL SDS AGQ SLV SOXL TECL TLT TMF TNA UGA (gasoline) XIV and China: YINN CHAU Commodities: CANE CORN DBC JJC, NIB, CHOC CORN, CUT (paper) MOO, SOYB WEAT UUP (Dollar) LIT (Lithium) AAPL ADBE ALXN AMAT AMGN AMD AMZN BA BABA BAC BIDU CAT CVX DE FB GOOG GS HD IBM INTU JPM M (Macy's) MSFT NFLX NVDA QCOM TSLA TXN XOM WMT CMG , LRCX, SWKS, MDGL SPPI WATT SQ TOWN 6/26/19 (Click on Underlined link.) Bullish MAXCPs - http://tigersoft.com/MAXCPS/Jun-26/BULLISH.htm Bearish MAXCPs - http://tigersoft.com/MINCPs/Jun-26/BEARISH.htm |
Table 1 QUICKSILVER on ETFS - 6/26/2019 ETF CLOSE CHANGE PIVOT-PT 5-dmaAROC CL-PWR CANDLE IP21 ITRS
---------------------------------------------------------------------------------------------
DIA 265.22 -.04 268.08 -6.4% Bullish RED -.003 -----
---------------------------------------------------------------------------------------------
BA 374.94 5.62 374.88 85.8% Bullish BLUE .067 -.007
---------------------------------------------------------------------------------------------
SPY 290.47 -.29 295.86 -44.1% Bearish RED -.043 -.004
---------------------------------------------------------------------------------------------
QQQ 185.79 .86 188.85 -35.2% ------- RED -.064 -.006
---------------------------------------------------------------------------------------------
MDY 345.41 -.61 354.31 -93.7% Bearish RED -.006 -.039
---------------------------------------------------------------------------------------------
IWM 150.8 -.35 155.29 -122.6% Bearish RED -.078 -.046
---------------------------------------------------------------------------------------------
FAS 69.86 -1.03 74.54 -225.6% Bearish RED -.06 .013
---------------------------------------------------------------------------------------------
SOXL 141.44 12.15 137.16 298% Bullish BLUE-.017 -.148
---------------------------------------------------------------------------------------------
TECL 156.89 4.86 162.34 35.7% ------- BLUE-.011 .011
---------------------------------------------------------------------------------------------
IBB 105.82 -1.07 108.62 -108.7% ------- RED -.098 -.048
---------------------------------------------------------------------------------------------
GLD 132.97 -1.23 131.11 192.7% Bullish ---- .267 .088
^^^^^^^^^^^^
---------------------------------------------------------------------------------------------
OIH 14.59 .35 14.39 270.6% Bearish BLUE .015 -.19
---------------------------------------------------------------------------------------------
RSX 23.83 .28 23.82 116.4% Bullish BLUE .126 .106
^^^^^^^^^^^^
|
Table 2 Count of Stocks in Key Directories
20190626
-------------------------------
NEWHIGHS 56
NEWLOWS 28
MAXCP 8
MINCP 39
TTTNH 9
TTTNL 86
FASTUP 57
FASTDOWN 121
CPCROSSA 96
CPCROSSD 78
BIGVOLUP 5
BIGVODN 10
ACCUMVER 8
HIGHIP21 10
HIUPPCT 10
VHIP21 115
LOWACCUM 154
REDSELL 98
AUGSELS7 14
TRAPDOOR 10
|
Table 3 RANKING OF KEY DIRECTORIES BASED PCT.OF STOCKS ABOVE 65-DMA
6/26/19
Bearish = 23
Bullish = 21
---------------------------------------------------------------------------------------
Directory Current day-1 day-2 day-3 day-4 day-5
----------------------------------------------------------------------------------------
BONDFUND .922 .941 .97 .961 .932 .922
GOLD .882 .862 .882 .784 .784 .705
SOLAR .777 .777 .777 .777 .777 .777
DJI-13 .769 .769 .846 .769 .769 .615
INSURANC .74 .777 .851 .888 .888 .888
UTILITY .7 .8 .8 .825 .85 .825
DOWJONES .689 .724 .793 .758 .758 .655
MILITARY .655 .689 .724 .689 .724 .655
SP-100 .637 .637 .67 .681 .67 .626
COMODITY .634 .609 .585 .585 .585 .585
FOOD .622 .603 .566 .566 .584 .584
COMPUTER .619 .476 .523 .523 .571 .523
FIDSTKS .614 .586 .641 .668 .684 .652
INDEXES .607 .58 .618 .677 .655 .623
SP500 .578 .605 .64 .658 .666 .627
NASD-100 .572 .572 .635 .645 .666 .604
INFRA .555 .527 .555 .555 .555 .527
GREEN .545 .545 .545 .545 .545 .59
NIFTY .543 .491 .578 .578 .578 .526
AUTO .538 .512 .512 .538 .564 .512
ETFS .526 .403 .561 .526 .578 .421
--------------------------------------------------------------------------------------------
JETS .5 .5 .5 .5 .7 .7
--------------------------------------------------------------------------------------------
RUS-1000 .487 .519 .548 .581 .603 .56
HOSPITAL .478 .434 .391 .434 .478 .434
FINANCE .477 .443 .477 .5 .522 .522
INDMATER .475 .45 .425 .487 .5 .425
BEVERAGE .47 .47 .47 .47 .47 .411
GUNS .47 .588 .705 .588 .647 .588
SEMI .436 .39 .427 .445 .463 .427
GAMING .434 .434 .434 .347 .347 .391
CHEM .433 .452 .471 .471 .509 .433
ELECTRON .403 .365 .391 .41 .423 .384
SOFTWARE .403 .37 .516 .532 .58 .516
BIOTECH .342 .361 .339 .41 .391 .408
EDU .333 .333 .333 .5 .5 .5
HACKERS .3 .2 .35 .4 .35 .4
HOMEBLDG .294 .411 .529 .588 .705 .647
BIGBANKS .285 .285 .428 .428 .428 .428
REGBANKS .285 .25 .25 .285 .285 .321
RETAIL .283 .301 .32 .339 .358 .358
OILGAS .25 .215 .208 .243 .256 .194
REIT .25 .425 .5 .56 .722 .702
TRANSP .25 .25 .3 .45 .5 .4
CHINA .105 .087 .122 .122 .192 .105
COAL 0 0 .142 .142 .142 .142
|
=========================================================================
6/25/2019 The recent Sell S9v at the DJI's upper band was reinforced by a Sell S12
today..
So far, the NYSE A/D Line is still rising. Dividend stocks and bonds, blue chips
and some big insurance stocks (See Table 3) remain favored. This is a very defensive
market. Compare the DJI chart below and the charts our Nifty highs techs and the
NASDAQ, not to mention IWM or MDY, which are much weaker. This is the
type of market that the DJI-30 acts as leader. It attempts to prove by its good
behavior that all is well, even if elsehwere there are more sectors and stocks below their
65-dma supports than are above them.
Weak breadth from this point on would be a dangerous sign.
 |
 |
 |
The DJI and most of the other general market ETFs show Tiger Accumulation
readings which are negative despite being more than 2% above the 21-dma.
This shows "big money" used the last rally to do considerable selling.
While Bulls will take heart in the normal bullishmess in this the third year of the 4-year
Presidential cycle from June 26th through the July 4th holiday, Closing Power
uptrends were broken today for SPY and QQQ, adding to yesterday's similar
breakdowns for MDY and IWM. Only DIA's Closing Power is still in
and uptrend, and it - just barely.
The over-head resistance should contain any upside move until there has
been a successful re-test of the lows or the FED cuts rates dramatically.
 |
 |
 |
Powell's "Tell" Is He's Not Telling.
Why are Professionals worried? Certainly, the failure of the DJI to get above 27000
and the growing weakness in other sectors can be blamed. But I think the way
short-term rates are now below 2% while the Federal Funds rate remains at 2.4%
is scaring some, too. What's going on? Why is big money selling stocks and
rushing
to take long positions mostly in Gold and in short-term and 10-year Treasuries?
Fed Chairman Powell maddeningly refused to talk about this, or why he switched so
abruptly from hawk to dove last December or, even more basically, why his FOMC
has not already lowered rates given the low CPI numbers, the weak Jobs report for May,
the strong Dollar, productivity gains being above real wage gains and the new tariffs
acting as a fiscal drag on the economy.
Without a Fed rate cut soon, I would think the DJI will fall to the lower band again, at
the
least. My guess is that the market will have to do another attention-getting,
"cry baby"
routine in order to get a 1/4% drop in the Federal Funds rate and the Discunt Rate
in July. But such rate cuts should bring a very good rally in August. Perhaps,
President
(the populist) Trump will publicly scold Powell again. I personally would find this
very entertaining. And it may help Powell see the light, though his performance
today may have just been to make it seem that he is independent.
I would continue to hold YINN. I can't believe that the President wants to make a trade
war with China and a hot war with Iran at the very same time.
|
Charts 6/25/2019 2019 PEERLESS DJI, Signals, Indicators Daily DJI Volume 10-DayUp/Down Vol Hourly DJIA A/D Line for All Stocks Inverted Traders Index NASDAQ S&P OEX NYSE COMPQX DJI-15 DJI-20 DJI-30 DIA SPY QQQ MDY IWM TNA Short-Term Rates USO-CrudeOil DBO FAS GLD BBH IBB JETS JNUG KOL NUGT OIH OIL RSX RETL SDS AGQ SLV SOXL TECL TLT TMF TNA UGA (gasoline) XIV and China: YINN CHAU Commodities: CANE CORN DBC JJC, NIB, CHOC CORN, CUT (paper) MOO, SOYB WEAT UUP (Dollar) LIT (Lithium) AAPL ADBE ALXN AMAT AMGN AMD AMZN BA BABA BAC BIDU CAT CVX DE FB GOOG GS HD IBM INTU JPM M (Macy's) MSFT NFLX NVDA QCOM TSLA TXN XOM WMT CMG , LRCX, SWKS, MDGL SPPI WATT SQ TOWN 6/25/19 (Click on Underlined link.) Bullish MAXCPs - http://tigersoft.com/MAXCPS/Jun-25/BULLISH.htm Bearish MAXCPs - http://tigersoft.com/MINCPs/Jun-25/BEARISH.htm |
Table 1 QUICKSILVER on ETFS - 6/22/2019 ETF CLOSE CHANGE PIVOT-PT 5-dmaAROC CL-PWR CANDLE IP21 ITRS --------------------------------------------------------------------------------------------- DIA 265.26 -1.91 265.56 -1.3% Bearish RED -.035 ==== --------------------------------------------------------------------------------------------- BA 369.32 -4.67 368.56 -62.3% ------- RED .015 -.032 --------------------------------------------------------------------------------------------- SPY 290.76 -2.88 293.06 -27.9% Bearish RED -.058 -.002 --------------------------------------------------------------------------------------------- QQQ 184.93 -3.23 187.11 -39.4% ------- RED -.078 -.009 --------------------------------------------------------------------------------------------- MDY 346.02 -1.89 351.97 -69.9% Bearish RED -.007 -.038 --------------------------------------------------------------------------------------------- IWM 151.15 -.93 154.56 -92.9% Bearish RED -.074 -.046 --------------------------------------------------------------------------------------------- FAS 70.89 -1.69 73.15 -128.2% Bearish RED -.053 .015 --------------------------------------------------------------------------------------------- SOXL 129.29 -5.93 133.46 -145.2% Bearish RED -.063 -.237 weak...warning --------------------------------------------------------------------------------------------- TECL 152.03 -8.92 155.76 -61.2% ------- RED -.023 -.02 --------------------------------------------------------------------------------------------- IBB 106.89 -.23 108.17 -31% ------- RED -.115 -.042 --------------------------------------------------------------------------------------------- GLD 134.2 .26 127.89 271.5% Bullish RED .295 .097 strong...warning --------------------------------------------------------------------------------------------- OIH 14.24 .01 13.82 155.6% Bearish ---- .01 -.212 --------------------------------------------------------------------------------------------- RSX 23.55 -.25 23.28 63.7% ------- RED .067 .093 |
 Table 2   Count of Stocks in Key Directories
           20190625
-------------------------------
NEWHIGHS       80
NEWLOWS        38
MAXCP          9
MINCP          37
TTTNH          9
TTTNL          77
FASTUP         54
FASTDOWN       114
CPCROSSA       59
CPCROSSD       247
BIGVOLUP       6
BIGVODN        13
ACCUMVER       10
HIGHIP21       8
HIUPPCT        12
LOWACCUM       150
REDSELL        90
AUGSELS7       13
TRAPDOOR       9
|
Table 3   RANKING OF KEY DIRECTORIES BASED PCT.OF STOCKS ABOVE 65-DMA
              6/25/19
Bullish = 20
Bearish = 24
---------------------------------------------------------------------------------------
Directory     Current       day-1         day-2         day-3         day-4         day-5
----------------------------------------------------------------------------------------
BONDFUND       .941          .97           .961          .932          .922          .912
GOLD           .862          .882          .784          .784          .686          .647
UTILITY        .8            .8            .825          .85           .825          .7
INSURANC       .777          .851          .888          .888          .925          .814
SOLAR          .777          .777          .777          .777          .777          .777
DJI-13         .769          .846          .769          .769          .615          .615
DOWJONES       .724          .793          .758          .758          .655          .689
MILITARY       .689          .724          .689          .724          .655          .689
SP-100         .637          .67           .681          .67           .626          .626
COMODITY       .609          .585          .585          .585          .585          .609
SP500          .605          .64           .658          .666          .627          .623
FOOD           .603          .566          .566          .584          .584          .584
GUNS           .588          .705          .588          .647          .588          .588
FIDSTKS        .586          .641          .668          .684          .652          .646
INDEXES        .58           .618          .677          .655          .629          .645
NASD-100       .572          .635          .645          .666          .604          .583
GREEN          .545          .545          .545          .545          .545          .545
INFRA          .527          .555          .555          .555          .527          .527
RUS-1000       .519          .548          .58           .605          .561          .557
AUTO           .512          .512          .538          .564          .512          .512
============================================================================================
JETS           .5            .5            .5            .7            .7            .7
============================================================================================
NIFTY          .491          .578          .578          .578          .526          .456
COMPUTER       .476          .523          .523          .571          .523          .476
BEVERAGE       .47           .47           .47           .47           .411          .411
CHEM           .452          .471          .471          .509          .452          .452
INDMATER       .45           .425          .487          .5            .425          .425
FINANCE        .443          .477          .5            .522          .522          .511
GAMING         .434          .434          .347          .347          .391          .391
HOSPITAL       .434          .391          .434          .478          .434          .347
REIT           .425          .5            .56           .722          .702          .682
HOMEBLDG       .411          .529          .588          .705          .647          .764
ETFS           .403          .561          .526          .578          .421          .298
SEMI           .387          .423          .441          .459          .423          .378
SOFTWARE       .37           .516          .532          .58           .516          .5
ELECTRON       .363          .388          .407          .42           .375          .356
BIOTECH        .358          .339          .41           .391          .4            .372
EDU            .333          .333          .5            .5            .5            .5
RETAIL         .301          .32           .339          .358          .358          .377
BIGBANKS       .285          .428          .428          .428          .428          .428
REGBANKS       .25           .25           .285          .285          .321          .392
TRANSP         .25           .3            .45           .5            .45           .5
OILGAS         .215          .208          .243          .256          .187          .18
HACKERS        .2            .35           .4            .35           .4            .4
CHINA          .087          .122          .122          .192          .105          .122
COAL           0             .142          .142          .142          .142          0
|
=======================================================================
6/24/2019
Friday's Sell S9V
at the upper 3.9% band just below 27000 has stalled
the DJI's rally. The DJI's rally has failed to bring along small and medium
priced stocks most, so far. See how the Closing Powers of IWM and MDY have
broken their uptrends. Professionals are selling these. Without broader
participation
in the rally, the DJI will have a much harder time breaking out above 27000 without
just giving more Peerless Sells. The real story now, however, is not the DJI.

It is Gold's breakout above 1400, the Dollar's Head/Shoulder top and the
steep fall in 10-year and short-term rates. Something bearish usually befalls
the market when Gold rises by 20% or more over 3 months. And why is
Powell delivering an unscheduled speech tomorrow in New York? "Something
is up", to coin a phrase.
 |
 |
 |
Powell may try to weaken Gold tomorrow.
Use the 5-day ma methodology advocated
by our QUICKSILVER SYSTEM.
It appears highly likely that the FED will drop
interest rates unless the June jobs
numbers turn back up above +200,000, which right now seems unlikely. But
rather than guess about the FED, again consider buying GLD, if you have not
already. Something big is going on there. The story has not come out.
It has to
do with the FED's dropping interest rates and the Dollar being sold by
international traders. It has something to do with tensions in the middle
east. It
has something to do with the unknowns of an escalating war of tariffs. It may have
something to do with the Bank of England's refusal to send back to Venezuela its gold.
It may have something to do with Russia and other countries seeking to be paid in Gold
or in other currencies than the Dollar.


|
Charts 6/24/2019 2019 PEERLESS DJI, Signals, Indicators Daily DJI Volume 10-DayUp/Down Vol Hourly DJIA A/D Line for All Stocks Inverted Traders Index NASDAQ S&P OEX NYSE COMPQX DJI-15 DJI-20 DJI-30 DIA SPY QQQ MDY IWM TNA Short-Term Rates USO-CrudeOil DBO FAS GLD BBH IBB JETS JNUG KOL NUGT OIH OIL RSX RETL SDS AGQ SLV SOXL TECL TLT TMF TNA UGA (gasoline) XIV and China: YINN CHAU Commodities: CANE CORN DBC JJC, NIB, CHOC CORN, CUT (paper) MOO, SOYB WEAT UUP (Dollar) LIT (Lithium) AAPL ADBE ALXN AMAT AMGN AMD AMZN BA BABA BAC BIDU CAT CVX DE FB GOOG GS HD IBM INTU JPM M (Macy's) MSFT NFLX NVDA QCOM TSLA TXN XOM WMT CMG , LRCX, SWKS, MDGL SPPI WATT SQ TOWN 6/24/19 (Click on Underlined link.) Bullish MAXCPs - http://tigersoft.com/MAXCPS/Jun-24/BULLISH.htm Bearish MAXCPs - http://tigersoft.com/MINCPs/Jun-24/BEARISH.htm |
Table 1 QUICKSILVER on ETFS - 6/24/19 ETF CLOSE CHANGE PIVOT-PT 5-dmaAROC CL-PWR CANDLE IP21 ITRS
---------------------------------------------------------------------------------------------
DIA 267.17 .07 265.33 103.4% Bullish RED .068 ----
---------------------------------------------------------------------------------------------
BA 373.99 2.15 373.96 258.8% Bullish BLUE .001 -.012
---------------------------------------------------------------------------------------------
SPY 293.64 -.36 292.4 72.9% ------- RED -.021 -.003
---------------------------------------------------------------------------------------------
QQQ 188.16 -.41 186.41 118.2% ------- RED -.068 -.005
weak
---------------------------------------------------------------------------------------------
MDY 347.91 -2.8 350.93 13.5% Bearish RED .028 -.043
weak
---------------------------------------------------------------------------------------------
IWM 152.08 -1.87 154.01 -5.2% Bearish RED -.014 -.054
weak
---------------------------------------------------------------------------------------------
FAS 72.58 -.89 72.77 92.4% Bullish RED -.008 .066
---------------------------------------------------------------------------------------------
SOXL 135.22 .89 133.2 662.7% ------- --- -.069 -.186
weak
---------------------------------------------------------------------------------------------
TECL 160.95 .89 153.97 468.5% Bullish RED .006 .041
---------------------------------------------------------------------------------------------
IBB 107.12 -2.33 107.56 47.2% Bullish RED -.081 -.065
weak weak
---------------------------------------------------------------------------------------------
GLD 133.94 1.96 127.12 289.3% Bullish BLUE .362 .076
very strong
---------------------------------------------------------------------------------------------
OIH 14.23 -.23 13.8 260.8% Bearish RED -.033 -.23
very weak
---------------------------------------------------------------------------------------------
RSX 23.8 .14 23.25 192.5% Bullish BLUE .076 .093
strong
|
Table 2    Count of Stocks in Key Directories
           20190624
-------------------------------
NEWHIGHS       151
NEWLOWS        36
MAXCP          15   weak
MINCP          35
TTTNH          13
TTTNL          64
FASTUP         80
FASTDOWN       77
CPCROSSA       44
CPCROSSD       210
BIGVOLUP       6
BIGVODN        9
ACCUMVER       6
HIGHIP21       13
HIUPPCT        13
LOWACCUM       152
REDSELL        91
AUGSELS7       8
TRAPDOOR       10
|
Table 3 RANKING OF KEY DIRECTORIES BASED PCT.OF STOCKS ABOVE 65-DMA
Bullish = 25
Bearish = 18
6/24/19
---------------------------------------------------------------------------------------
Directory Current day-1 day-2 day-3 day-4 day-5
----------------------------------------------------------------------------------------
BONDFUND .97 .961 .932 .922 .922 .922
GOLD .877 .775 .775 .693 .653 .632
INSURANC .851 .888 .888 .925 .814 .814
DJI-13 .846 .769 .769 .615 .615 .538
UTILITY .8 .825 .85 .825 .7 .725
DOWJONES       .793          .758          .758          .655          .655          .62
SOLAR          .777          .777          .777          .777          .777          .666
MILITARY       .724          .689          .724          .655          .689          .482
GUNS           .705          .588          .647          .588          .588          .588
SP-100         .67           .681          .67           .626          .604          .56
FIDSTKS .641 .668 .684 .652 .641 .586 SP500 .64 .658 .666 .627 .619 .564 NASD-100 .635 .645 .666 .604 .572 .5 INDEXES .618 .677 .655 .629 .655 .5 COMODITY .585 .585 .585 .585 .609 .487 NIFTY .578 .578 .578 .526 .456 .35 FOOD .566 .566 .584 .584 .584 .49 ETFS .561 .526 .578 .421 .298 .157 INFRA .555 .555 .555 .527 .527 .388 RUS-1000 .548 .58 .603 .562 .556 .498 GREEN .545 .545 .545 .545 .545 .5 HOMEBLDG .529 .588 .705 .647 .764 .764 COMPUTER .523 .523 .571 .523 .476 .428 SOFTWARE .516 .532 .58 .516 .5 .419 AUTO .512 .538 .564 .512 .538 .512 N=25 ============================================================================================= JETS .5 .5 .7 .7 .7 .7 REIT .5 .56 .722 .702 .689 .682 ============================================================================================= FINANCE .477 .5 .522 .522 .511 .431 CHEM .471 .471 .509 .452 .471 .433 BEVERAGE .47 .47 .47 .411 .411 .411 GAMING .434 .347 .347 .391 .391 .26 BIGBANKS .428 .428 .428 .428 .428 .428 INDMATER .425 .487 .5 .425 .425 .337 SEMI .423 .441 .459 .423 .378 .288 HOSPITAL .391 .434 .478 .434 .347 .26 ELECTRON .388 .407 .42 .375 .356 .273 HACKERS .35 .4 .35 .4 .4 .3 BIOTECH .336 .41 .391 .4 .361 .306 EDU .333 .5 .5 .5 .5 .5 RETAIL .32 .339 .358 .358 .377 .358 TRANSP .3 .45 .5 .45 .5 .35 REGBANKS .25 .285 .285 .321 .392 .285 OILGAS .208 .243 .256 .187 .18 .145 COAL .142 .142 .142 .142 0 0 CHINA .122 .122 .192 .105 .122 .087 N=18 |
====================================================================
6/21/2019
Friday's Sell S9v
at the 3.9% upper band should keep the DJI busy trying
get through the resistance up to 27000. We see red Distribtion and heavy
red Down volume in our IP21 and V-I indicators on the Peerless chart.
But we also see a still rising NYSE A/D Line and rising Closing Powers.
So, we would only be short a small position in DIA, but also hold long
GLD and NUGT (Note the head/shoulders pattern in the Dollar due to the
falling interest rates), MSFT in the DJI-30 (due to its new leasing of software
instead of selling it outright) and YINN (out of the belief that there will
probably be a US-China trade deal sooner rather than later.)
Plunging Interest Rates are not always bullish.
They can show the FED has become very nervous
or that big money is quickly taking money out of
stocks and putting it into short-term Government bonds.
In either case, Gold usually rises, like it is doing now.
And a 20%-30% quick rise in Gold is very often bearish
for the market. See the H/S pattern in the Dollar. This
is also often a bearish sign for the general market.
Foreign speculators may sell their short-term US holdings
and move their money to Gold or stronger currencies.

The reasons for the remaining strength in the market are important to consider.
Number 1: Short term rates are falling very fast. See
the chart below.
These low rates make for rises in defensive, dividend stocks, utilities and bond funds.
They also cause more borrowing, where credit is good and that shouldl help
the general economy. I take this to be why NY professionals seem unwilling to
accept the proposition that the US economy is slowing down, at least not until the
monthly Jobs numbers actually turn negative, which is what happened in July and
August 2007 (and was an excellent time to be selling.)
Number 2: Having Trump in the White House and having a
Republican majority
on the Supreme Court gives corporations many economic advantages. De-regulation
was every bit as important as low taxes in keep the 1920s' and 1980s' long bull
markets alive as long as they did. Wall Street knows all this very well. I suspect
they will do whatever it takes to cause a breakout above 27000 in the DJI later
this year.
Number 3: The polls may not show it, but Trump
can win the 2020 Presidential
Election if the stock market keeps rising. People may say that they will vote for
Joe Biden, the leading Democrat, but not if the Jobs' numbers remain good and Biden
remains on the defensive and remains unable to fire up his much more youthful base.
They won't bother voting. That the polls don't show.
Right now Gold looks especially attractive. Avoid our "Nifty" Tech stocks
which are
mostly sitting below their 65-dma. The bullishness we
see in GLD is mainly the result
of short-term interest rates falling so low. True, the possibility of war with Iran
is also
a factor, as is the danger of an even bigger trade war. Gold stocks have been weak
for a long time. They have lots of overhead resistance. GLD seems relatively
safe and
has made an important 5-year price breakout. This should also breathe life into the
volatile 3x leveraged NUGT which traders love to run up and down. Use a sell stop
below its 5-day pivot-point.


|
Charts 6/21/2019 2019 PEERLESS DJI, Signals, Indicators Daily DJI Volume 10-DayUp/Down Vol Hourly DJIA A/D Line for All Stocks Inverted Traders Index NASDAQ S&P OEX NYSE COMPQX DJI-15 DJI-20 DJI-30 DIA SPY QQQ MDY IWM TNA Short-Term Rates USO-CrudeOil DBO FAS GLD BBH IBB JETS JNUG KOL NUGT OIH OIL RSX RETL SDS AGQ SLV SOXL TECL TLT TMF TNA UGA (gasoline) XIV and China: YINN CHAU Commodities: CANE CORN DBC JJC, NIB, CHOC CORN, CUT (paper) MOO, SOYB WEAT UUP (Dollar) LIT (Lithium) AAPL ADBE ALXN AMAT AMGN AMD AMZN BA BABA BAC BIDU CAT CVX DE FB GOOG GS HD IBM INTU JPM M (Macy's) MSFT NFLX NVDA QCOM TSLA TXN XOM WMT CMG , LRCX, SWKS, MDGL SPPI WATT SQ TOWN 6/21/19 (Click on Underlined link.) Bullish MAXCPs - http://tigersoft.com/MAXCPS/Jun-21/BULLISH.htm Bearish MAXCPs - http://tigersoft.com/MINCPs/Jun-21/BEARISH.htm |
Table 1 QUICKSILVER on ETFS - 6/21/19 ETF CLOSE CHANGE PIVOT-PT 5-dmaAROC CL-PWR CANDLE IP21 ITRS
---------------------------------------------------------------------------------------------
DIA 267.1 -.98 261.68 105.7% Bullish RED .11 ----
---------------------------------------------------------------------------------------------
BA 371.84 -3.04 354.9 339.1% Bullish RED .05 -.002
---------------------------------------------------------------------------------------------
SPY 294 -1.86 289.37 81.2% ------- RED .014 -.001
---------------------------------------------------------------------------------------------
QQQ 188.57 -.28 183.74 159.6% ------- ---- -.038 -.004
---------------------------------------------------------------------------------------------
MDY 350.71 -3.6 346.96 54.7% ------- RED .058 -.031
---------------------------------------------------------------------------------------------
IWM 153.95 -1.34 152.24 72.3% ------- RED .019 -.042
---------------------------------------------------------------------------------------------
FAS 73.47 -1.07 71.23 88.6% ------- RED .051 .089
---------------------------------------------------------------------------------------------
SOXL 134.33 -2.83 117.83 548.4% ------- RED -.016 -.193
---------------------------------------------------------------------------------------------
TECL 160.06 -2.28 146.36 473.8% Bullish RED .033 .031
---------------------------------------------------------------------------------------------
IBB 109.45 .83 106.1 296.1% Bullish BLUE .024 -.06
---------------------------------------------------------------------------------------------
GLD 131.98 .87 126.48 212% Bullish BLUE .3 .047
^^^^^
strong
---------------------------------------------------------------------------------------------
OIH 14.46 .07 13.5 469.6% Bearish ---- -.038 -.219
---------------------------------------------------------------------------------------------
RSX 23.66 -.16 22.9 187.4% ------- BLUE .045 .072
|
Table 2   Count of Stocks in Key Directories
          2019-06-21
-------------------------------
NEWHIGHS       145
NEWLOWS        25
MAXCP          35
MINCP          19
TTTNH          23
TTTNL          40
FASTUP         118
FASTDOWN       55
CPCROSSA       51
CPCROSSD       170
BIGVOLUP       8
BIGVODN        24
ACCUMVER       6
HIGHIP21       7
VHIP21         114
LOWACCUM       174
REDSELL        87
AUGSELS7       10
TRAPDOOR       11
|
Table 3  RANKING OF KEY DIRECTORIES BASED PCT.OF STOCKS ABOVE 65-DMA
              6/21/19
Bullish = 26
Bearish = 16
---------------------------------------------------------------------------------------
Directory     Current       day-1         day-2         day-3         day-4         day-5
----------------------------------------------------------------------------------------
BONDFUND       .961          .932          .922          .922          .941          .961
INSURANC       .888          .888          .925          .814          .814          .851
UTILITY        .825          .85           .825          .7            .725          .75
SOLAR          .823          .823          .823          .823          .705          .705
GOLD           .775          .775          .693          .653          .632          .632
DJI-13         .769          .769          .615          .615          .538          .384
DOWJONES       .758          .758          .655          .655          .62           .586
MILITARY       .689          .724          .655          .689          .482          .551
INDEXES        .677          .655          .629          .655          .505          .489
SP-100         .666          .655          .612          .591          .548          .537
FIDSTKS .664 .681 .648 .637 .583 .589 SP500 .655 .663 .624 .616 .565 .567 NASD-100 .645 .666 .604 .572 .51 .489 GUNS .588 .647 .588 .588 .588 .588 HOMEBLDG .588 .705 .647 .764 .764 .764 COMODITY .585 .585 .585 .609 .487 .512 RUS-1000 .58 .603 .561 .557 .503 .5 NIFTY .578 .578 .526 .456 .35 .333 REIT .575 .732 .712 .698 .691 .609 FOOD .566 .584 .584 .584 .49 .509 INFRA .555 .555 .527 .527 .388 .388 GREEN .545 .545 .545 .545 .5 .545 AUTO .538 .564 .512 .538 .512 .512 SOFTWARE .532 .58 .516 .5 .419 .435 ETFS .526 .578 .421 .298 .157 .263 COMPUTER .523 .571 .523 .476 .428 .38 N=26 ============================================================================================= EDU .5 .5 .5 .5 .5 .5 FINANCE .5 .522 .522 .511 .431 .465 JETS .5 .7 .7 .7 .7 .7 ============================================================================================= INDMATER .487 .5 .425 .425 .337 .337 BEVERAGE .47 .47 .411 .411 .411 .352 CHEM .461 .5 .442 .48 .461 .48 TRANSP .45 .5 .45 .5 .35 .35 SEMI .441 .459 .423 .378 .297 .306 HOSPITAL .434 .478 .434 .347 .26 .217 BIGBANKS .428 .428 .428 .428 .428 .428 BIOTECH .408 .391 .4 .361 .309 .265 ELECTRON .407 .42 .375 .356 .28 .273 HACKERS .4 .35 .4 .4 .3 .3 GAMING .347 .347 .391 .391 .26 .304 RETAIL .339 .358 .358 .377 .358 .358 REGBANKS .285 .285 .321 .392 .285 .357 OILGAS .246 .26 .197 .19 .154 .14 COAL .142 .142 .142 0 0 0 CHINA .122 .192 .105 .122 .087 .087 N=16 |
====================================================================
6/21/2019
New
S9-V at 3.9% upper band. Since the
TigerSoft indicators for
DIA are all still rising, short only a partial position in DIA at this
times. If DIA's Closing Power uptrend is violated, we will short more.
The conditions for a Buy B4 or B10 are not present at this time. That
makes a breakout like occurred in June 1929 or June 1987 much less
likely. Fortunately, we can watch the DIA's Closing Power and see what
NY Professionals make of the big decline in interest rates.
10-year rates fell almost to 2% today. This brought new
money into
bonds, dividend stocks and Gold stocks. What does it mean? A
currency war between Europe and the US to see who can lower rates
the fastest? A collapse in the world-wide economy? Is the FED already
adding liquidity in a big way? Whatever the answer, it gave a big boost to
much of the market. But now the DJI is nuzzling its 4% upper band and
its 12-month highs, yet our Accumulation Index and V-Indicator remain
negative. This produced a new Sell S9-V today. Peerless users have to
see this as bearish.
We are now officially in Summer. This is when the A/D
Line usually
guides us. And, so far, the NYSE A/D Line is rising and we see a
positive P-Indicator. Most important, this is the bullish third year in the
four-year Presidential cycle. Expect partisans to boost the market
as much as possible at this time. (Since 1915, these third years' average
DJI gain is +15%, almost 3x what it is in other years.)
As Peerless users, I think that we are bound to honor the S9-V at
the
3.9% upper band, at least a little, with some DIA shorting, provided we
consider a DJI close over 27000 reason enough to cover. Flat top
breakouts into all-time high territory should be respected.
Hold the other long positions that have been mentioned, especially NUGT,
GLD and YINN (which has jumped back to its falling 65-dma.
![]()


When we look back at all the similar situations
since 1929, we see how the
highest level in the last year can hold back the DJI and bring a reversal, as in
1957 and 2011 when the P-I was negative and the A/D Line failed to
match it's previous high as the DJI moved up to its upper band. These two
tops were made in July, by the way. But there is no A/D Line weakness now.
There has been no non-confirmation. So, the 1957 and 2011 situations are
not close parallels.
1957
A July A/D NC finally turned DJI down 19% |
2011
A July A/D NC finally turned DJI down 17% |
Another past case may apply more closely. Look below at the 1976
case where
the DJI's 1000-level's steadfast resistance at the round number (perhaps, like 27000
now) was followed by a break in the strong A/D Line uptrend in July and brought
a sell-off to the lower band. Will 27000 be like 1000? Possibly. But
first we will
need the A/D Line uptrend to be broken. With rates so low, that seems unlikely.
In additon, 1976 was not the bullish third year in the four-year cycle.
1976 |
Unfortunately for bulls, the June 1929 and June 1987 cases,
whose June parallels
I keep pointing out, both produced Buy B4 take-off signals and that seems unlikely
in 2019. This signal requires either powerfully improving breadth or
Accumulation.
Neither is present here and our DJI's IP21 is negative now. Without a positive
IP21, I also would not be quick to judge a Buy B10. Might the IP21 turn
positive.
That will take an increase in volume and more closings by the DJI at the day's high.
Today's volume did rise, but the DJI sold off in the last few minutes.
Conclusion
All this leaves us with an Sell S9-V at the upper 3.9% upper band and the
DJI right below resistance up to 27000. Another retreat back to the 21-day
ma seems likely. If China and Trump fail to reach a trade agreement and
if the June new Jobs numbers are negative, a deeper pullback will ensue.
But so long as short-term rates are as low as they are now, I doubt if there
can be much of a retreat. Too many dividend stocks and bond funds on the
NYSE will remain relatively attractive.
Traders should sell short DIA but know that our objectives
are strictly limited
and I would stay long NUGT, GLD, YINN, MSFT and some our bullish MAXCPs
and short some of our bearish MINCPS. The NASDAQ and QQQ failed to
make new highs. Their ITRS (relative strength) is negative. See Table 1.
Table 3 shows the most favored stock groups, where a majority of their
components are above the 65-dma, now are more numerous than the Bearish
groups. This shows some broadening of the market. There is a lot that is
politically
at stake A narrow DJI rally up past 27000 will pose real techincal problems.
|
Charts 6/20/2019 2019 PEERLESS DJI, Signals, Indicators Daily DJI Volume 10-DayUp/Down Vol Hourly DJIA A/D Line for All Stocks Inverted Traders Index NASDAQ S&P OEX NYSE COMPQX DJI-15 DJI-20 DJI-30 DIA SPY QQQ MDY IWM TNA Short-Term Rates USO-CrudeOil DBO FAS GLD BBH IBB JETS JNUG KOL NUGT OIH OIL RSX RETL SDS AGQ SLV SOXL TECL TLT TMF TNA UGA (gasoline) XIV and China: YINN CHAU Commodities: CANE CORN DBC JJC, NIB, CHOC CORN, CUT (paper) MOO, SOYB WEAT UUP (Dollar) LIT (Lithium) AAPL ADBE ALXN AMAT AMGN AMD AMZN BA BABA BAC BIDU CAT CVX DE FB GOOG GS HD IBM INTU JPM M (Macy's) MSFT NFLX NVDA QCOM TSLA TXN XOM WMT CMG , LRCX, SWKS, MDGL SPPI WATT SQ TOWN 6/20/19 (Click on Underlined link.) Bullish MAXCPs - http://tigersoft.com/MAXCPS/Jun-20/BULLISH.htm Bearish MAXCPs - http://tigersoft.com/MINCPs/Jun-20/BEARISH.htm |
Table 1 QUICKSILVER on ETFS - 6/20/19 ETF CLOSE CHANGE PIVOT-PT 5-dmaAROC CL-PWR CANDLE IP21 ITRS
---------------------------------------------------------------------------------------------
DIA 268.08 2.52 261.51 123.9% Bullish ---- .139 ----
---------------------------------------------------------------------------------------------
BA 374.88 6.32 347.16 362.7% Bullish BLUE .08 -.009
---------------------------------------------------------------------------------------------
SPY 295.86 2.8 289.26 108% ------- RED .044 .005
---------------------------------------------------------------------------------------------
QQQ 188.85 1.74 182.64 147% ------- RED -.033 -.001
---------------------------------------------------------------------------------------------
MDY 354.31 2.34 346.88 72.2% ------- RED .053 -.016
---------------------------------------------------------------------------------------------
IWM 155.29 .73 151.73 72.5% ------- RED .036 -.025
---------------------------------------------------------------------------------------------
FAS 74.54 1.39 72.18 202.2% ------- BLUE .094 .117
---------------------------------------------------------------------------------------------
RETL 24.17 .3 23.51 126.6% ------- RED -.066 -.207
---------------------------------------------------------------------------------------------
SOXL 137.16 3.7 120.25 258.1% ------- RED -.01 -.158
---------------------------------------------------------------------------------------------
TECL 162.34 6.58 145.58 421.9% Bullish RED .047 .065
---------------------------------------------------------------------------------------------
IBB 108.62 .45 103.13 213.6% Bullish RED .01 -.06
---------------------------------------------------------------------------------------------
GLD 131.11 3.22 126.56 177.7% Bullish BLUE .244 .04
^^^^^
---------------------------------------------------------------------------------------------
OIH 14.39 .57 13.17 290.9% Bearish BLUE-.055 -.221
---------------------------------------------------------------------------------------------
RSX 23.82 .54 22.79 208.6% ------- BLUE .002 .087
^^^^^
|
Table 1   Count of Stocks in Key Directories
          20190620
-------------------------------
NEWHIGHS       447  >10:1
NEWLOWS        35
MAXCP          45   Professionals have doubts.
MINCP          21
TTTNH          23
TTTNL          33
FASTUP         77
FASTDOWN       61
CPCROSSA       43
CPCROSSD       164
BIGVOLUP       6
BIGVODN        10
ACCUMVER       11
HIGHIP21       4
HIUPPCT        18
VHIP21         112
REDSELL        94
AUGSELS7       10
TRAPDOOR       11
|
 Table 3     RANKING OF KEY DIRECTORIES BASED PCT.OF STOCKS ABOVE 65-DMA
              6/20/19
 Bullish = 29
 Bearish = 13
---------------------------------------------------------------------------------------
Directory     Current       day-1         day-2         day-3         day-4         day-5
----------------------------------------------------------------------------------------
BONDFUND       .932          .922          .922          .941          .961          .951
INSURANC       .888          .925          .814          .814          .851          .888
UTILITY        .85           .825          .7            .725          .75           .725
SOLAR          .823          .823          .823          .705          .764          .823
GOLD           .775          .693          .653          .632          .632          .632
DJI-13         .769          .615          .615          .538          .384          .461
DOWJONES       .758          .655          .655          .62           .586          .586
REIT           .732          .712          .698          .691          .609          .623
MILITARY       .724          .655          .689          .482          .586          .655
HOMEBLDG       .705          .647          .764          .764          .764          .764
JETS .7 .7 .7 .7 .7 .8 FIDSTKS .681 .648 .637 .583 .589 .583 NASD-100 .666 .604 .572 .51 .489 .552 SP500 .663 .624 .616 .565 .567 .593 INDEXES .655 .629 .655 .505 .5 .586 SP-100 .655 .612 .591 .548 .537 .559 GUNS .647 .588 .588 .588 .588 .588 RUS-1000 .603 .561 .556 .504 .5 .524 COMODITY .585 .585 .609 .487 .512 .512 FOOD .584 .584 .584 .49 .509 .509 SOFTWARE .58 .516 .5 .419 .419 .451 ETFS .578 .421 .298 .157 .263 .385 NIFTY .578 .526 .456 .35 .333 .421 COMPUTER .571 .523 .476 .428 .38 .476 AUTO .564 .512 .538 .512 .512 .512 INFRA .555 .527 .527 .388 .388 .444 GREEN .545 .545 .545 .5 .545 .545 FINANCE .522 .522 .511 .431 .465 .465 CHEM .509 .452 .471 .452 .49 .471 N=29 ============================================================================================ EDU .5 .5 .5 .5 .5 .5 INDMATER .5 .425 .425 .337 .337 .387 TRANSP .5 .45 .5 .35 .35 .5 ============================================================================================ HOSPITAL .478 .434 .347 .26 .217 .304 BEVERAGE .47 .411 .411 .411 .411 .588 SEMI .459 .423 .378 .297 .315 .378 BIGBANKS .428 .428 .428 .428 .428 .428 ELECTRON .42 .375 .356 .28 .286 .337 BIOTECH .389 .4 .361 .309 .265 .287 RETAIL .358 .358 .377 .358 .358 .396 HACKERS .35 .4 .4 .3 .3 .4 GAMING .347 .391 .391 .26 .304 .347 REGBANKS .285 .321 .392 .285 .321 .392 OILGAS .262 .198 .191 .156 .141 .156 CHINA .192 .105 .122 .087 .087 .087 COAL .142 .142 0 0 0 0 N=13 |
====================================================================
6/20/2019
Look Out
Above. Will there be a buying panic above 27000?
Professionals are banking on something big occurring soon.
The operative Peerless signal is a Sell S12-S9-V. But the bullish seasonality
looks like it will win out.
The flat-resistance just under 27000 may stop the
present advance, as happened repeatedly in 1976,
but we should not expect that until the NYSE A/D Line
breaks its uptrend. Usually flat overhead-resistance in
the DJI leads to a breakout. Certainly, that was
the case of June 1929 and June 1987, which I believe
are the closest past parallels. (See their charts in
last night's Hotline.

As long as the A/D Line and Closing Power for DIA are rising and above
its 21-dma, I would not act on the S12-S9. See the explanations yesterday.
Instead buy some Gold stocks or ETFs and Chinese stocks. Look also for
fresh breakouts among our Bullish MAXCPs. There is a good chance the
DJI will breakout above 26700 and the make a powerful move above 27000.
Consider buying the second highest Power ranked DJI-30 stock - MSFT.
It seems ready to breakout past the top of its rising resistance line in search of
a much higher priced supply of shares.

Powell refused to lower interest rates and yet the DJI rose today. Always
watch for days when the market behaves the opposite of what might normally
be expected. I take today's rise as a sign that the market is in strong hands
and wants to achieve a flat top breakout, much like it did in June 1929 and
June 1987. The rising Closing Powers shows that the buying includes many
New York Professionals. They usually get the intermediate-term right. The
Yesterday's S9-V and S12 tell us that big money is busy selling on the rally
by the DJI back to old highs. But whatever shares they are offering now seems
to be bought by Professionals who understand the special bullishness of
the third year in the four-year cycle and how vital it is for Wall Street and
Republicans, from a political vantage point, to keep the rally moving higher.
Powell's delay in coming aboard would seem to be temporary. Half of the
voting members of the FOMC favored an immediate cut. So, lower rates
are just being postponed. I think that is the interetation that should be given
to the market's strength today, to Gold's rising today and to the emerging
head/shoulders pattern in the DJI. (Lower rates would mean a weaker DJI and
a Gold's rise.) So, I would buy NUGT and GLD.

It also appears that traders expect Trump to reach a
new trade agreement with
China fairly soon. See all the Pofessional buying in YINN.. This also should
be
bought, in my opinion.

|
Charts 6/19/2019 2019 PEERLESS DJI, Signals, Indicators Daily DJI Volume 10-DayUp/Down Vol Hourly DJIA A/D Line for All Stocks Inverted Traders Index NASDAQ S&P OEX NYSE COMPQX DJI-15 DJI-20 DJI-30 DIA SPY QQQ MDY IWM TNA Short-Term Rates USO-CrudeOil DBO FAS GLD BBH IBB JETS JNUG KOL NUGT OIH OIL RSX RETL SDS AGQ SLV SOXL TECL TLT TMF TNA UGA (gasoline) XIV and China: YINN CHAU Commodities: CANE CORN DBC JJC, NIB, CHOC CORN, CUT (paper) MOO, SOYB WEAT UUP (Dollar) LIT (Lithium) AAPL ADBE ALXN AMAT AMGN AMD AMZN BA BABA BAC BIDU CAT CVX DE FB GOOG GS HD IBM INTU JPM M (Macy's) MSFT NFLX NVDA QCOM TSLA TXN XOM WMT CMG , LRCX, SWKS, MDGL SPPI WATT SQ TOWN 6/19/19 (Click on Underlined link.) Bullish MAXCPs - http://tigersoft.com/MAXCPS/Jun-19/BULLISH.htm Bearish MAXCPs - http://tigersoft.com/MINCPs/Jun-19/BEARISH.htm |
Table 1 QUICKSILVER on ETFS - 6/19/19 ETF CLOSE CHANGE PIVOT-PT 5-dmaAROC CL-PWR CANDLE IP21 ITRS
---------------------------------------------------------------------------------------------
DIA 265.56 .23 261.56 97.5% Bullish BLUE .135 -----
---------------------------------------------------------------------------------------------
BA 368.56 -5.4 348.86 303.8% Bullish RED .06 -.025
---------------------------------------------------------------------------------------------
SPY 293.06 .66 289.58 80.6% ------- BLUE 0 .006
---------------------------------------------------------------------------------------------
QQQ 187.11 .7 183.42 129.8% Bullish BLUE-.038 .002
---------------------------------------------------------------------------------------------
MDY 351.97 1.04 349.27 70.6% ------- BLUE .072 -.017
---------------------------------------------------------------------------------------------
IWM 154.56 .55 153.07 101.3% ------- BLUE .06 -.025
---------------------------------------------------------------------------------------------
FAS 73.15 .38 71.62 109.9% ------- BLUE .081 .089
---------------------------------------------------------------------------------------------
RETL 23.87 -.02 23.57 236.5% ------- RED -.063 -.229
---------------------------------------------------------------------------------------------
SOXL 133.46 .26 130.6 209.9% ------- RED .028 -.193
---------------------------------------------------------------------------------------------
TECL 155.76 1.79 149.66 247.7% Bullish BLUE .024 .021
---------------------------------------------------------------------------------------------
IBB 108.17 .61 104.1 230.8% Bullish BLUE .065 -.064
---------------------------------------------------------------------------------------------
GLD 127.89 .77 126.6 81.4% Bullish BLUE .242 .035
^^^^^
---------------------------------------------------------------------------------------------
OIH 13.82 .02 13.6 264.2% Bearish -----.084 -.247
---------------------------------------------------------------------------------------------
RSX 23.28 .03 22.86 161.8% ------- BLUE .027 .08
^^^^^
|
 Table 2   Count of Stocks in Key Directories
          20190619
-------------------------------
NEWHIGHS       346
NEWLOWS        28
MAXCP          63
MINCP          12
TTTNH          25
TTTNL          14
FASTUP         80
FASTDOWN       51
CPCROSSA       134
CPCROSSD       83
BIGVOLUP       1
BIGVODN        9
ACCUMVER       10
HIGHIP21       2
HIUPPCT        18
LOWACCUM       139
REDSELL        89
AUGSELS7       10
TRAPDOOR       10
|
Table 3  RANKING OF KEY DIRECTORIES BASED PCT.OF STOCKS ABOVE 65-DMA
               6/19/19
 Bullish = 27
 Bearish = 17
---------------------------------------------------------------------------------------
Directory     Current       day-1         day-2         day-3         day-4         day-5
----------------------------------------------------------------------------------------
INSURANC       .925          .814          .814          .851          .888          .888
BONDFUND       .922          .922          .941          .961          .951          .951
UTILITY        .825          .7            .725          .75           .725          .675
SOLAR          .823          .823          .705          .764          .823          .823
REIT           .712          .698          .691          .609          .616          .561
JETS           .7            .7            .7            .7            .8            .7
GOLD           .693          .653          .632          .632          .632          .612
DOWJONES       .655          .655          .62           .586          .586          .586
MILITARY       .655          .689          .482          .586          .655          .517
FIDSTKS        .648          .637          .583          .589          .583          .54
HOMEBLDG       .647          .764          .764          .764          .764          .705
INDEXES        .629          .655          .505          .5            .586          .537
SP500          .624          .616          .565          .567          .589          .544
DJI-13         .615          .615          .538          .384          .461          .461
SP-100         .612          .591          .548          .537          .559          .516
NASD-100       .604          .572          .51           .489          .552          .51
GUNS           .588          .588          .588          .588          .588          .588
COMODITY       .585          .609          .487          .512          .512          .487
FOOD           .584          .584          .49           .509          .509          .49
RUS-1000       .561          .556          .503          .501          .524          .482
GREEN          .545          .545          .5            .545          .545          .545
INFRA          .527          .527          .388          .388          .444          .361
NIFTY          .526          .456          .35           .333          .421          .35
COMPUTER       .523          .476          .428          .38           .476          .476
FINANCE        .522          .511          .431          .465          .465          .443
SOFTWARE       .516          .5            .419          .419          .451          .451
AUTO           .512          .538          .512          .512          .512          .461
=============================================================================================
EDU            .5            .5            .5            .5            .5            .5
=============================================================================================
CHEM           .452          .471          .452          .49           .49           .471
TRANSP         .45           .5            .35           .35           .5            .35
HOSPITAL       .434          .347          .26           .217          .26           .26
BIGBANKS       .428          .428          .428          .428          .428          .428
INDMATER       .425          .425          .337          .337          .387          .35
SEMI           .423          .378          .297          .315          .378          .333
ETFS           .421          .298          .157          .263          .385          .438
BEVERAGE       .411          .411          .411          .411          .588          .588
HACKERS        .4            .4            .3            .3            .4            .35
BIOTECH        .397          .361          .309          .265          .284          .26
GAMING         .391          .391          .26           .304          .347          .26
ELECTRON       .375          .356          .28           .286          .337          .286
RETAIL         .358          .377          .358          .358          .377          .339
REGBANKS       .321          .392          .285          .321          .392          .321
OILGAS         .197          .19           .154          .14           .154          .14
COAL           .142          0             0             0             0             0
CHINA          .105          .122          .087          .087          .087          .087
|
========================================================================
6/19/2019
Despite the
new Sell S9-V today, wait for the A/D Line and Closing Power to
break their uptrends to go short again. Right now, they are rising. It is not safe
yet
to go short DIA. The market is waiting to see what the FED and Powell wants to
do today.
The June 1929 and 1987 take-offs occurred despite the Peerless S9-Vs and S12s.
There is a good chance this scenario will repeat again here in 2019. Trump may
soon reach a deal with China to end the trade war and Powell may soon agree to
lower interest rates now. This should send the DJI up strongly. This seems to
be
what Professionals expect even as many of the "Pauci" (what Cicero called the
super
wealthy) are selling into strength. We need to see which force wins out to be safe.
1929

1987

Today, Peerless gave a new Sell Sell, a Sell S9-V to
reinforce the
previous Sell S12. But we may see a spike to 26600 or possibly even
27000. I have warned that the bullishness of the 3rd year in the Presidential
Election Year in Junes is a powerful factor and I have shown that
powerful two month rallies followed the June S12s and S9s in 1929
and 1987. And I warned that streaks of 6 straight up-days in Junes
tend to be followed by significantly higher prices.
So, we have to be prepared for higher prices despite the S9V and Sell S12.
in this a most political year. But before deciding what to do, let's consider
the history of S9-Vs in June since 1965. After all, the DJI closed today 3.1%
over the 21-dma with both the V-Indicator and IP21 (Accumulation Index)
negative. (See the key values in the chart below.) The S9V history Table
further
below shows that a paper loss of 0.8% to 4.0% first occurred and only then
the gain on short sales in DJI was 3% to 6% in three of four instances. The
exception was in June 1987 when the Sell S9V was reversed higher 4%
higher. My conclusion is that it is the June 1987 and June 1929 cases are what
we have to be concerned about now. See their charts again a little below.
2019 A rate reduction and an agreement with China would unleash a big
advance over 27000.
See the big 2
month advances in 1929 and 1987 when new highs were made.
![]()

|
Sell S9-V since 1965 in Bull Markets (Before 1965, the up and down volume can only be poorly estimated by using the ratio of advances to declines and then apply that ratio to total NYSE volume.) S9V DJIA Gain DJIA Paper Loss -------------------------------------------------------------------------- 19870609 2352.7 -.039 2445.51 -.0394 6/22 la/ma=1.026 aroc=.1558 PI= -21 IP21= -.021 VI=-2 OPct=.031 19870610 S8 2353.61 -.039 2445.51 -.039 6/22 19870618 S8 2408.13 -.016 2445.51 -.0155 6/22 19870622 B4 2445.51 .105 2409.76 -.0146 7/1 ------------------------------------------------------------------------- 19990630 S9 10970.80 +.029 11209.8 -.0217 7/16 la/ma=1.024 aroc= .417 PI= +62 IP21=+.053 VI=-2 OPct=.180 19990706 S5 11135.12 .043 11209.8 -.0067 7/16 19990709 S9 11193.69 .105 11209.8 -.0014 7/16 19990730 B2 10655.14 .043 10645.9 -.0008 8/2 ------------------------------------------------------------------------- 20040607 S9 10391.81 +.058 10479.5 -.0084 6/23 la/ma=1.03 aroc=.177 PI=+351 IP21=+.034 VI=-22 OPct=.028 20040726 B2 9961.92 .033 9814.66 -.0147 8/9 ------------------------------------------------------------------------- 20090603 S9 8675.24 +.041 8763.13 -.0101 6/5 la/ma=1.027 aroc=.351 PI=+221 IP21=+.008 VI=-96 OPct=-.0128 20090608 S8 8764.49 .053 none 0 20090608 S5 8764.49 .053 none 0 20090610 S9 8739.02 .050 none 0 20090624 B5 8299.86 .237 perfect 0 ------------------------------------------------------------------------- 20190618 S9 26465.54 la/ma=1.031 aroc=.325 PI=+188 IP21=-.002 VI=-40 ================================================= |
|
Charts 6/18/2019 2019 PEERLESS DJI, Signals, Indicators Daily DJI Volume 10-DayUp/Down Vol Hourly DJIA A/D Line for All Stocks Inverted Traders Index NASDAQ S&P OEX NYSE COMPQX DJI-15 DJI-20 DJI-30 DIA SPY QQQ MDY IWM TNA Short-Term Rates USO-CrudeOil DBO FAS GLD BBH IBB JETS JNUG KOL NUGT OIH OIL RSX RETL SDS AGQ SLV SOXL TECL TLT TMF TNA UGA (gasoline) XIV and China: YINN CHAU Commodities: CANE CORN DBC JJC, NIB, CHOC CORN, CUT (paper) MOO, SOYB WEAT UUP (Dollar) LIT (Lithium) AAPL ADBE ALXN AMAT AMGN AMD AMZN BA BABA BAC BIDU CAT CVX DE FB GOOG GS HD IBM INTU JPM M (Macy's) MSFT NFLX NVDA QCOM TSLA TXN XOM WMT CMG , LRCX, SWKS, MDGL SPPI WATT SQ TOWN 6/18/19 (Click on Underlined link.) Bullish MAXCPs - http://tigersoft.com/MAXCPS/Jun-18/BULLISH.htm Bearish MAXCPs - http://tigersoft.com/MINCPs/Jun-18/BEARISH.htm |
Table 4 QUICKSILVER on ETFS - 6/18/19 ETF CLOSE CHANGE PIVOT-PT 5-dmaAROC CL-PWR CANDLE IP21 ITRS
---------------------------------------------------------------------------------------------
DIA 265.33 3.65 260.45 85.2% Bullish BLUE .137 ----
---------------------------------------------------------------------------------------------
BA 373.96 19.06 347.03 352.4% Bullish BLUE .127 -.05
---------------------------------------------------------------------------------------------
SPY 292.4 3.03 288.39 60.5% ------- BLUE -.045 .009
---------------------------------------------------------------------------------------------
QQQ 186.41 2.67 182.34 82.2% ------- BLUE -.079 .005
---------------------------------------------------------------------------------------------
MDY 350.93 3.97 347.05 50.6% ------- BLUE .02 -.016
---------------------------------------------------------------------------------------------
IWM 154.01 1.77 151.47 89.2% ------- BLUE .004 -.026
---------------------------------------------------------------------------------------------
FAS 72.77 1.54 71.57 23% ------- BLUE .091 .089
---------------------------------------------------------------------------------------------
RETL 23.89 .28 22.76 173.8% ------- RED -.059 -.231
---------------------------------------------------------------------------------------------
SOXL 133.2 15.37 128.17 -185.1% ------- BLUE .002 -.185
---------------------------------------------------------------------------------------------
TECL 153.97 7.61 148.39 98.8% Bullish BLUE -.014 .026
---------------------------------------------------------------------------------------------
IBB 107.56 1.46 103.33 233.9% Bullish BLUE -.004 -.069
---------------------------------------------------------------------------------------------
GLD 127.12 .64 125.83 76.9% Bullish RED .196 .038
^^^^
---------------------------------------------------------------------------------------------
OIH 13.8 .3 13.11 14.9% Bearish BLUE -.099 -.237
---------------------------------------------------------------------------------------------
RSX 23.25 .35 22.54 101% Bearish BLUE .021 .093
^^^^^
|
Table 2   Count of Stocks in Key Directories
          2019-06-18
-------------------------------
NEWHIGHS       209
NEWLOWS        8
MAXCP          39
MINCP          10
TTTNH          31
TTTNL          21
FASTUP         70
FASTDOWN       50
CPCROSSA       206
CPCROSSD       92
BIGVOLUP       3
BIGVODN        6
ACCUMVER       8
HIGHIP21       4
HIUPPCT        15
VHIP21         117
LOWACCUM       139
REDSELL        89
AUGSELS7       12
TRAPDOOR       10
|
Table 3RANKING OF KEY DIRECTORIES BASED PCT.OF STOCKS ABOVE 65-DMA 6/18/19 --------------------------------------------------------------------------------------- Directory Current day-1 day-2 day-3 day-4 day-5 ---------------------------------------------------------------------------------------- BONDFUND .922 .941 .961 .951 .951 .961 SOLAR .823 .705 .764 .823 .823 .882 INSURANC .814 .814 .851 .888 .888 .888 HOMEBLDG .764 .764 .764 .764 .705 .705 JETS .7 .7 .7 .8 .7 .6 UTILITY .7 .725 .75 .725 .675 .575 REIT .698 .691 .609 .616 .575 .493 MILITARY .689 .482 .586 .655 .517 .517 DOWJONES .655 .62 .586 .586 .586 .586 INDEXES .655 .505 .5 .586 .543 .58 GOLD .653 .632 .632 .632 .612 .551 FIDSTKS .637 .583 .589 .583 .54 .524 SP500 .616 .565 .567 .589 .546 .555 DJI-13 .615 .538 .384 .461 .461 .461 COMODITY .609 .487 .512 .512 .487 .439 SP-100 .591 .548 .537 .559 .516 .537 GUNS .588 .588 .588 .588 .588 .588 FOOD .584 .49 .509 .509 .49 .452 NASD-100 .572 .51 .489 .552 .51 .541 RUS-1000 .556 .503 .5 .525 .488 .486 GREEN .545 .5 .545 .545 .545 .545 AUTO .538 .512 .512 .512 .461 .461 INFRA .527 .388 .388 .444 .361 .388 FINANCE .511 .431 .465 .465 .443 .465 EDU .5 .5 .5 .5 .5 .5 SOFTWARE .5 .419 .419 .451 .451 .435 TRANSP .5 .35 .35 .5 .4 .4 COMPUTER .476 .428 .38 .476 .476 .476 CHEM .471 .452 .49 .49 .49 .433 NIFTY .456 .35 .333 .421 .35 .438 BIGBANKS .428 .428 .428 .428 .428 .428 INDMATER .425 .337 .337 .387 .35 .337 BEVERAGE .411 .411 .411 .588 .588 .647 HACKERS .4 .3 .3 .4 .35 .35 REGBANKS .392 .285 .321 .392 .321 .285 GAMING .391 .26 .304 .347 .26 .347 SEMI .378 .297 .315 .378 .333 .396 RETAIL .377 .358 .358 .377 .32 .301 BIOTECH .358 .309 .265 .284 .265 .257 ELECTRON .356 .28 .286 .337 .286 .318 HOSPITAL .347 .26 .217 .26 .26 .304 ETFS .298 .157 .263 .385 .421 .491 OILGAS .19 .154 .14 .154 .147 .14 CHINA .12 .086 .086 .086 .086 .086 COAL 0 0 0 0 0 0 |
====================================================================
6/17/2019 This would seem to be a perfect time for the FED to try to push the market
up to and even past 27000 with a decisive cut in interest rates. But will they?
Powell does not want to look subservient to Trump. The operative Peerless
signal remains a Sell S12. If rates are, in fact, cut this week, I would think
the DJI will quickly spike to 26600, maybe 27000, depending on what Powell
says. In that event, cover your now limited short positions in DIA. Do not go
short again until the Closing Powers and A/D Line break their uptrends. For now
traders should hold only small short positions in DIA in hopes that the FOMC
disappoints and sits tight on rates. Use protective
stops on your shorts of DIA
at 263.51.
The market is usually moved by changes in short-term interest rates,
as much
as any factor. But when the economy and the market quickly get very weak,
lowering rates does not bring a reversal back up. Similarly, when the market is
very strong, raising rates often does not quickly cause a decline in stocks.
So, Tuesday and Wednesday, we get to see how the stock market reacts to what
should be an expected and obvious change downward in the FED's short-term rates,
namely the Federal Funds' goals that determine what is the cost of borrowing by
big banks from among one another. It seems obvious to me, at least, that the FOMC
will want to ratify formally what has already happened in practice. As you can see
in our IRX--X chart, the 13-week Treasury Bills' short-term rates have recently
dropped from 2.41% on 3/21/19 to 2.14% today. This is much lower than
the 2.5% target rate that the FED has previously announced for its Federal Funds rate.
Dropping the Federal Funds rate to 2.25% would simply be ratifying the current reality.
( https://fred.stlouisfed.org/series/DFEDTARU
)
With the Dollar strong, Inflation around 2% and Productivity
outpacing real wage gains,
only slowly rising Gold prices would seem to be of concern to the FED's anti-Inflation
hawks. I suppose some on the FOMC may be waiting to see what the next Jobs'
nunbers are in two weeks, but this would otherwise seem like a perfect time for
them to formally drop the Federal Funds' rate to 2.25%. If they do this either today
or tomorrow, I would think the DJI will jump up 2%-2.5%. This would match what
happened in 3 of the 4 cases where Peerless gave a June Sell S12 in a bull market.
At that point, history suggests that the odds are one in three that the Sell S12 will
be followed by a decline to at least the lower band. In two of the three cases, 1929
and 1987, the DJI continued to rally and we then got a Buy B4 based on very good
breadth.
On the other hand, if the FED does not lower the Federal Funds' rates this week,
some might take it as a sign of confidence by the FED that the economy remains very
strong,but I suspect more traders will be disappointed and the DJI will fall back to 25000
fairly quickly.
That the A/D Line is still in an uptrend and the Closing Powers for the key ETFs
have not yet decisively broken their 21-day moving averages gives somewhat more
weight to the scenario that there will be a rate cut this week and the DJI will make
a nominal new high above 26700. So, use protective stops on your shorts of DIA
at 263.51.
Such an advance may then bring a Buy B4. But it will almost
certainly bring a new
Sell S9V. If this happens, the odds would then still seem to favor a decline to the
lower
band, but I would not take new short positions then until the rising A/D Line trend is
broken.
DJIA |
DIA |
13-Week IRX--X Rates |
| Dollar - A drop in rates could well cause the Dollar to weaken and
complete its potential H/S pattern. If that happens buy GLD.   |
|
Charts 6/17/2019 2019 PEERLESS DJI, Signals, Indicators Daily DJI Volume 10-DayUp/Down Vol Hourly DJIA A/D Line for All Stocks Inverted Traders Index NASDAQ S&P OEX NYSE COMPQX DJI-15 DJI-20 DJI-30 DIA SPY QQQ MDY IWM TNA Short-Term Rates USO-CrudeOil DBO FAS GLD BBH IBB JETS JNUG KOL NUGT OIH OIL RSX RETL SDS AGQ SLV SOXL TECL TLT TMF TNA UGA (gasoline) XIV and China: YINN CHAU Commodities: CANE CORN DBC JJC, NIB, CHOC CORN, CUT (paper) MOO, SOYB WEAT UUP (Dollar) LIT (Lithium) AAPL ADBE ALXN AMAT AMGN AMD AMZN BA BABA BAC BIDU CAT CVX DE FB GOOG GS HD IBM INTU JPM M (Macy's) MSFT NFLX NVDA QCOM TSLA TXN XOM WMT CMG , LRCX, SWKS, MDGL SPPI WATT SQ TOWN 6/17/19 (Click on Underlined link.) Bullish MAXCPs - http://tigersoft.com/MAXCPS/Jun-17/BULLISH.htm Bearish MAXCPs - http://tigersoft.com/MINCPs/Jun-17/BEARISH.htm |
| TABLE 1 QUICKSILVER on ETFS - 6/17/19 ETF CLOSE CHANGE PIVOT-PT 5-dmaAROC CL-PWR CANDLE IP21 ITRS --------------------------------------------------------------------------------------------- DIA 261.68 .17 260.88 13.2% Bullish ---- .068 0 --------------------------------------------------------------------------------------------- BA 354.9 7.74 349.33 15.7% ------- BLUE .009 -.096 --------------------------------------------------------------------------------------------- SPY 289.37 .11 288.9 6.9% ------- RED -.091 .016 --------------------------------------------------------------------------------------------- QQQ 183.74 1.1 183.4 16.1% ------- BLUE -.118 .008 --------------------------------------------------------------------------------------------- MDY 346.96 .08 347.41 -2.9% ------- RED -.019 -.007 --------------------------------------------------------------------------------------------- IWM 152.24 .51 151.3 16.1% ------- BLUE -.058 -.016 --------------------------------------------------------------------------------------------- FAS 71.23 -.95 72.44 -91.6% ------- RED .077 .085 --------------------------------------------------------------------------------------------- SOXL 117.83 -2.42 137.9 -728.1% ------- RED -.087 -.25 --------------------------------------------------------------------------------------------- TECL 146.36 .78 151.04 -148.6% Bullish BLUE -.073 0 --------------------------------------------------------------------------------------------- IBB 106.1 2.97 102.7 139.9% Bullish BLUE -.049 -.053 --------------------------------------------------------------------------------------------- GLD 126.48 -.08 125.18 45.7% Bullish RED .19 .044 --------------------------------------------------------------------------------------------- OIH 13.5 .33 13.76 -33.5% Bearish BLUE -.151 -.224 --------------------------------------------------------------------------------------------- GASL 3.7 .15 3.94 -345.2% Bearish BLUE -.292 -.497 --------------------------------------------------------------------------------------------- UGA 3.7 .15 3.94 -345.2% Bullish BLUE -.269 -.876 --------------------------------------------------------------------------------------------- UUP 26.32 .01 26.08 47.8% ------- ---- .036 .019 --------------------------------------------------------------------------------------------- IEF 26.32 .01 26.08 47.8% Bearish ---- .143 -.742 --------------------------------------------------------------------------------------------- CORN 26.32 .01 26.08 47.8% ------- ---- .011 .725 --------------------------------------------------------------------------------------------- WEAT 26.32 .01 26.08 47.8% ------- ---- .012 4.169 --------------------------------------------------------------------------------------------- YINN 26.32 .01 26.08 47.8% Bearish -----.074 .118 --------------------------------------------------------------------------------------------- RSX 22.9 .11 22.79 97% Bearish -----.076 .101 |
 Table 2   Count of Stocks in Key Directories
           20190617
-------------------------------
NEWHIGHS       155
NEWLOWS        15
MAXCP          30
MINCP          10
TTTNH          18
TTTNL          23
FASTUP         50
FASTDOWN       71
CPCROSSA       94
CPCROSSD       129
BIGVOLUP       4
BIGVODN        6
ACCUMVER       6
HIGHIP21       4
HIUPPCT        18
LOWACCUM       133
REDSELL        86
AUGSELS7       12
TRAPDOOR       10
|
Table 3 RANKING OF KEY DIRECTORIES BASED PCT.OF STOCKS ABOVE 65-DMA 6/17/19 Bullish = 18 Bearish = 24 --------------------------------------------------------------------------------------- Directory Current day-1 day-2 day-3 day-4 day-5 ---------------------------------------------------------------------------------------- BONDFUND .941 .961 .951 .951 .961 .98 INSURANC .814 .851 .888 .888 .888 .888 HOMEBLDG .764 .764 .764 .705 .705 .764 UTILITY .725 .75 .725 .675 .575 .675 SOLAR .705 .764 .823 .823 .882 .823 JETS .7 .7 .8 .7 .6 .6 REIT .693 .612 .619 .578 .517 .523 GOLD .632 .632 .632 .612 .551 .428 DOWJONES .62 .586 .586 .586 .586 .586 GUNS .588 .588 .588 .588 .588 .588 FIDSTKS .583 .589 .583 .54 .524 .562 SP500 .565 .567 .589 .546 .555 .561 SP-100 .548 .537 .559 .516 .537 .58 DJI-13 .538 .384 .461 .461 .461 .461 AUTO .512 .512 .512 .461 .461 .461 INDEXES .51 .5 .586 .543 .596 .569 NASD-100 .51 .489 .552 .51 .541 .531 RUS-1000 .503 .5 .524 .49 .488 .498 =========================================================================================== EDU .5 .5 .5 .5 .5 .5 FOOD .5 .518 .518 .5 .462 .444 GREEN .5 .545 .545 .545 .545 .545 =========================================================================================== MILITARY .482 .586 .655 .517 .517 .62 COMODITY .475 .5 .5 .475 .425 .4 CHEM .452 .49 .49 .49 .452 .415 FINANCE .431 .465 .465 .443 .465 .488 BIGBANKS .428 .428 .428 .428 .428 .428 COMPUTER .428 .38 .476 .476 .476 .38 SOFTWARE .419 .419 .451 .451 .435 .483 BEVERAGE .411 .411 .588 .588 .647 .529 INFRA .388 .388 .444 .361 .388 .305 RETAIL .358 .358 .377 .32 .301 .301 NIFTY .35 .333 .421 .35 .438 .473 TRANSP .35 .35 .5 .4 .4 .4 INDMATER .337 .337 .387 .35 .337 .3 BIOTECH .306 .265 .284 .265 .254 .268 HACKERS .3 .3 .4 .35 .35 .35 SEMI .297 .315 .378 .333 .387 .414 REGBANKS .285 .321 .392 .321 .285 .25 ELECTRON .282 .288 .339 .288 .314 .339 GAMING .26 .304 .347 .26 .347 .347 HOSPITAL .26 .217 .26 .26 .304 .26 ETFS .157 .263 .385 .421 .491 .473 OILGAS .154 .14 .154 .147 .14 .133 CHINA .086 .086 .086 .086 .086 .086 COAL 0 0 0 0 0 0 |
========================================================================
6/14/2019
The operative Peerless signal remains a Sell
S12. Stay short DIA, no stops, and
some of the bearish MINCPs. There have been 4 previous Sell S12s in bull markets.
Two were very profitable if shorted at time of the next Peerless signals and two
brought small losses. Given how extended the bull market is, I would expect the
big money distribution to win out here, especially since we have not seen a rally
even as short-term rates have dropped sharply recently. Though the NYSE A/D Line
is still rising, it may bearishly break its uptrend if the FOMC disappoints the
market
on Wednesday this week when it makes public its interest rate intentions. We will just
have to wait and see for now.
DJIA

DIA

SPY

NASDAQ

QQQ

June S12s in Bull Markets since 1929 Date Signals DJI Gain Paper loss ------------------------------------------------------------------------------ 1) 19290617 S12 319.3 -.029 328.6 -.0291 6/26 la/ma=1.04 aroc=-.031 P=-46 (+12) IP21=-.046 V=-486 OBVPct = .164 Above a slightly rising 65-dma in over-extended bull market. Fed was injecting funds into banks, market and economy. This was reversed by B4 9 days later. 19290626 B4 328.6 .075 none 0 ============================================================================= 2) 19810615 S12 1011.99 +.172 perfect 0 la/ma=1.021 aroc=+.469 P=+146 (+0) IP21=-.001 V=+3 OBVPct = .013 Prices immediately gave way. H/S formed. Bull market ended. FED was raising rates well above 10% to stop oil-driven inflation. No buy signal until October. ============================================================================= 3) 19870608 S12 2351.64 -.04 2445.51 -.0399 6/22 la/ma=1.026 aroc=+.088 P=-32 (+23) IP21=-.045 V=-4 OBVPct = -.187 Clinched 6/23 2439.73 after a B4. So S12 could have been avoided. 19870622 B4 2445.51 .105 2409.76 -.0146 7/1 Federal Funds Rate was rising at time of S12 - 6/8/1987 1987-04-29,6 1987-04-30,6.5 1987-07-02,6.625 ============================================================================= 4) 20110630 S12 12414.34 +.102 12724.41 -.026 7/21 la/ma=1.027 aroc=+.122 P=+78 (+162) IP21=-.067 V=-116 OBVPct = .012 Federal Funds Rate was flat at time of S12 - 6/30/2011. ============================================================================= Current S12 5) 20180611 S12 26048.51 ? la/ma=1.020 aroc=+.049 P=+97 (-42) IP21=-.016 V=-82 OBVPct = .07 Short-term rates are falling unusually fast. |
|
Charts 6/14/2019 2019 PEERLESS DJI, Signals, Indicators Daily DJI Volume 10-DayUp/Down Vol Hourly DJIA A/D Line for All Stocks Inverted Traders Index NASDAQ S&P OEX NYSE COMPQX DJI-15 DJI-20 DJI-30 DIA SPY QQQ MDY IWM TNA Short-Term Rates USO-CrudeOil DBO FAS GLD BBH IBB JETS JNUG KOL NUGT OIH OIL RSX RETL SDS AGQ SLV SOXL TECL TLT TMF TNA UGA (gasoline) XIV and China: YINN CHAU Commodities: CANE CORN DBC JJC, NIB, CHOC CORN, CUT (paper) MOO, SOYB WEAT UUP (Dollar) LIT (Lithium) AAPL ADBE ALXN AMAT AMGN AMD AMZN BA BABA BAC BIDU CAT CVX DE FB GOOG GS HD IBM INTU JPM M (Macy's) MSFT NFLX NVDA QCOM TSLA TXN XOM WMT CMG , LRCX, SWKS, MDGL SPPI WATT SQ TOWN 6/14/19 (Click on Underlined link.) Bullish MAXCPs - http://tigersoft.com/MAXCPS/Jun-14/BULLISH.htm Bearish MAXCPs - http://tigersoft.com/MINCPs/Jun-14/BEARISH.htm |
Table 1
QUICKSILVER on ETFS - 6/14/19 ETF CLOSE CHANGE PIVOT-PT 5-dmaAROC CL-PWR CANDLE IP21 ITRS --------------------------------------------------------------------------------------------- DIA 261.51 -.05 260.99 24.2% Bullish BLUE .072 ----- --------------------------------------------------------------------------------------------- BA 347.16 -1.7 353.8 -93.3% Bearish RED .011 -.096 --------------------------------------------------------------------------------------------- SPY 289.26 -.32 288.97 27.9% Bullish ---- -.065 .012 --------------------------------------------------------------------------------------------- QQQ 182.64 -.78 183.15 43.8% ------- BLUE -.11 -.004 --------------------------------------------------------------------------------------------- MDY 346.88 -2.39 347.16 24.8% ------- RED -.004 -.008 --------------------------------------------------------------------------------------------- IWM 151.73 -1.34 151.75 28.7% ------- RED -.068 -.02 --------------------------------------------------------------------------------------------- FAS 72.18 .56 72.55 57% Bullish BLUE .119 .101 --------------------------------------------------------------------------------------------- SOXL 120.25 -10.35 136.87 -254.3% ------- BLUE -.081 -.238 --------------------------------------------------------------------------------------------- TECL 145.58 -4.08 150.79 -29.1% Bullish RED -.051 -.023 --------------------------------------------------------------------------------------------- IBB 103.13 -.97 103.21 -33.8% ------- RED -.101 -.089 --------------------------------------------------------------------------------------------- GLD 126.56 -.04 125.33 -1.2% Bullish RED .174 .041 --------------------------------------------------------------------------------------------- OIH 13.17 -.43 13.59 -147.9% Bearish RED -.194 -.239 --------------------------------------------------------------------------------------------- RSX 22.79 -.07 22.46 104% Bearish RED -.095 .086 |
 Table 2   Count of Stocks in Key Directories
           2019-06-14
-------------------------------
NEWHIGHS       161
NEWLOWS        35
MAXCP          26
MINCP          38
TTTNH          24
TTTNL          63
FASTUP         39
FASTDOWN       68
CPCROSSA       57
CPCROSSD       145
BIGVOLUP       2
BIGVODN        8
ACCUMVER       10
HIGHIP21       2
HIUPPCT        18
LOWACCUM       121
REDSELL        86
AUGSELS7       14
TRAPDOOR       10
|
 Table 3  RANKING OF KEY DIRECTORIES BASED PCT.OF STOCKS ABOVE 65-DMA
              6/14/19
 Bullish = 17
 Bearish = 24
---------------------------------------------------------------------------------------
Directory     Current       day-1         day-2         day-3         day-4         day-5
----------------------------------------------------------------------------------------
BONDFUND       .961          .951          .951          .961          .98           .98
INSURANC       .851          .888          .888          .888          .888          .888
HOMEBLDG       .764          .764          .705          .705          .764          .764
SOLAR          .764          .823          .823          .882          .823          .823
UTILITY        .75           .725          .675          .575          .675          .725
JETS           .7            .8            .7            .6            .6            .7
GOLD           .632          .632          .612          .551          .428          .551
REIT           .612          .619          .578          .517          .53           .585
FIDSTKS        .589          .583          .54           .524          .567          .529
GUNS           .588          .588          .588          .588          .588          .529
DOWJONES       .586          .586          .586          .586          .62           .586
MILITARY       .586          .655          .517          .517          .62           .62
SP500          .567          .589          .546          .555          .563          .538
GREEN          .545          .545          .545          .545          .545          .545
SP-100         .537          .559          .516          .537          .591          .526
FOOD           .518          .518          .5            .462          .444          .481
AUTO           .512          .512          .461          .461          .461          .461
N=17
=============================================================================================
COMODITY       .5            .5            .475          .425          .4            .475
EDU            .5            .5            .5            .5            .5            .666
INDEXES        .5            .586          .543          .596          .569          .51
RUS-1000       .5            .524          .488          .49           .501          .483
=============================================================================================
CHEM           .49           .49           .49           .452          .433          .377
NASD-100       .489          .552          .51           .541          .541          .468
FINANCE        .465          .465          .443          .465          .488          .386
BIGBANKS       .428          .428          .428          .428          .428          .285
SOFTWARE       .419          .451          .451          .435          .483          .467
BEVERAGE       .411          .588          .588          .647          .529          .47
INFRA          .388          .444          .361          .388          .305          .361
DJI-13         .384          .461          .461          .461          .538          .461
COMPUTER       .38           .476          .476          .476          .428          .333
RETAIL         .358          .377          .32           .301          .301          .245
TRANSP         .35           .5            .4            .4            .4            .4
INDMATER       .337          .387          .35           .337          .3            .275
NIFTY          .333          .421          .35           .438          .491          .385
REGBANKS       .321          .392          .321          .285          .25           .25
SEMI           .315          .378          .333          .387          .414          .351
GAMING         .304          .347          .26           .347          .347          .304
HACKERS        .3            .4            .35           .35           .35           .35
ELECTRON       .286          .337          .286          .312          .337          .299
BIOTECH        .263          .284          .265          .254          .268          .26
ETFS           .263          .385          .421          .491          .473          .421
HOSPITAL       .217          .26           .26           .304          .26           .347
OILGAS         .14           .154          .147          .14           .133          .154
CHINA          .086          .086          .086          .086          .086          .068
COAL           0             0             0             0             0             0
N=24
|
====================================================================
6/13/2019
The operative Peerless signal remains a Sell S12. Stay short DIA, no
stops, and
some of the bearish MINCPs. Today's last minute jump of 100 points
in the DJI was very suspicious. So, is the low volume and the fact that there
were again more new lows than new highs on the NASDAQ. The NYSE A/D Line
bullishly scored a new high. But this was to be expected given the drop
in interest rates and the additional appeal this gives to bonds, bond funds,
utilities and defensive dividend-paying stocks like HSY and PG. Big money is
obviously
more than a little concerned and is selling into rallies. This creates a ceiling for
DJI. A pullback to the lower band would, therefore, seem likely now.
Morgan Stanley just issied a warning about how fast business is slowing down.
See
https://www.bloomberg.com/news/articles/2019-06-14/record-drop-in-morgan-stanley-business-gauge-flags-economic-woe?srnd=premium

Short-term interest rates plunged again today. We are told that this is
because traders are anticipating a rate cut next week. But it may also be
because borrowing demand is waning, not just world-wide, but in the US.
Traders should be worried that a FED rate cut
will fail to boost this market. That would be a
big problem for the market. Stay short DIA.

Wall Street and the Key Indexes
Cannot Get Too Far ahead of the Overall Economy.
The very low unemployment rate does not begin to tell the whole story.
Lots and lots of people at Walmart, Vons, Burger King and the San Diego
Credit Union tell me that they are not allowed to work full-time and typically
work just 20 hours a week so that their bosses do not have to pay them
the benefits of a full-time worker. And when you factor in how wages for years
have hardly kept up with inflation and certainly not rents, you can see that
consumer buying power for the masses is very limited, but their debts
keep growing. No wonder, bank stocks are lagging. The FED would
seem to have little choice but to lower its rates. But is that enough? The
crash of 1929 occurred in large part because it was made too easy to buy
the DJI even as the underlying economy was topping out.
We have our own problems with an exaggerated run-up in "value" stocks,
says Warren Buffet and too much debt, at every level. Any mistake that the
FED makes now could be very costly. And if Trump is wrong about the benefits
of tariffs, we will be in worse trouble.
Very low rates since 2008 have pushed the stock market way up. But there
is a limit in how much they can do, especially when Wall Street wants to
a resolution soon of Trump's trade war every bit as much as it wants even
lower rates. What if a rate cut cannot do the job? See below how the rate
cuts did not help in the Summer of 1992. People tell us that 1995 shows
how rate cuts helped launch the bull market then. But that Summer's rate
cuts were very limited and other bullish factors were more involved. Another problem
for the FED now is that if it uses up its monetary power this Summer, it will have that
much left to use to prop the market up if it falls back 10% or more in October.
See the charts below. They show the Short-Term Rates on the top and the DJI
at the bottom. A study of the inter-relationship between these short-term
rates
and the DJI is sorely needed. I hope my new books will help clarify many of the
connections between the DJI's movements and short-term rates. Until then, I will
post these charts since 1990 next week for your study and reference.
 |
 |
 |
 |
|
Charts 6/13/2019 2019 PEERLESS DJI, Signals, Indicators Daily DJI Volume 10-DayUp/Down Vol Hourly DJIA A/D Line for All Stocks Inverted Traders Index NASDAQ S&P OEX NYSE COMPQX DJI-15 DJI-20 DJI-30 DIA SPY QQQ MDY IWM TNA Short-Term Rates USO-CrudeOil DBO FAS GLD BBH IBB JETS JNUG KOL NUGT OIH OIL RSX RETL SDS AGQ SLV SOXL TECL TLT TMF TNA UGA (gasoline) XIV and China: YINN CHAU Commodities: CANE CORN DBC JJC, NIB, CHOC CORN, CUT (paper) MOO, SOYB WEAT UUP (Dollar) LIT (Lithium) AAPL ADBE ALXN AMAT AMGN AMD AMZN BA BABA BAC BIDU CAT CVX DE FB GOOG GS HD IBM INTU JPM M (Macy's) MSFT NFLX NVDA QCOM TSLA TXN XOM WMT CMG , LRCX, SWKS, MDGL SPPI WATT SQ TOWN 6/13/19 (Click on Underlined link.) Bullish MAXCPs - http://tigersoft.com/MAXCPS/Jun-13/BULLISH.htm Bearish MAXCPs - http://tigersoft.com/MINCPs/Jun-13/BEARISH.htm |
Table 1 QUICKSILVER on ETFS - 6/13/19 ETF CLOSE CHANGE PIVOT-PT 5-dmaAROC CL-PWR CANDLE IP21 ITRS --------------------------------------------------------------------------------------------- DIA 261.56 1.11 260.25 73.8% Bullish BLUE .098 ----- --------------------------------------------------------------------------------------------- BA 348.86 1.83 353.7 -25.4% Bullish BLUE .044 -.107 --------------------------------------------------------------------------------------------- SPY 289.58 1.19 287.65 83.1% Bullish BLUE-.036 .013 --------------------------------------------------------------------------------------------- QQQ 183.42 1.08 181.04 160% Bullish BLUE-.075 .004 --------------------------------------------------------------------------------------------- MDY 349.27 2.22 345.16 83.2% Bullish BLUE .055 .002 --------------------------------------------------------------------------------------------- IWM 153.07 1.6 150.86 108.3% ------- BLUE .001 -.008 --------------------------------------------------------------------------------------------- FAS 71.62 .05 71.36 45.3% ------- RED .126 .099 --------------------------------------------------------------------------------------------- RETL 23.57 .81 21.94 518.3% ------- BLUE-.039 -.199 --------------------------------------------------------------------------------------------- SOXL 130.6 2.43 126.97 286.7% ------- RED -.068 -.118 --------------------------------------------------------------------------------------------- TECL 149.66 1.27 146.45 367.1% Bullish RED -.013 .027 --------------------------------------------------------------------------------------------- IBB 104.1 .77 103.83 93.6% Bullish BLUE-.042 -.077 --------------------------------------------------------------------------------------------- GLD 126.6 .77 126.59 28.6% Bullish BLUE .182 .038 --------------------------------------------------------------------------------------------- OIH 13.6 .49 13.57 63% Bearish BLUE -.131 -.227 --------------------------------------------------------------------------------------------- RSX 22.86 .32 22.32 140.2% Bearish BLUE-.067 .083 |
 Table 2  Count of Stocks in Key Directories
          20190613
-------------------------------
NEWHIGHS       204
NEWLOWS        8
MAXCP          22
MINCP          15
TTTNH          17
TTTNL          35
FASTUP         63
FASTDOWN       46
CPCROSSA       147
CPCROSSD       32
BIGVOLUP       4
BIGVODN        6
ACCUMVER       7
HIGHIP21       1
HIUPPCT        21
LOWACCUM       127
REDSELL        90
AUGSELS7       11
TRAPDOOR       10
|
Table 3 RANKING OF KEY DIRECTORIES BASED PCT.OF STOCKS ABOVE 65-DMA
              6/13/19
 Bullish = 21
 Bearish = 21
---------------------------------------------------------------------------------------
Directory     Current       day-1         day-2         day-3         day-4         day-5
----------------------------------------------------------------------------------------
BONDFUND       .951          .951          .961          .98           .98           .922
INSURANC       .888          .888          .888          .888          .888          .888
SOLAR          .823          .823          .882          .823          .823          .823
JETS           .8            .7            .6            .6            .7            .6
HOMEBLDG       .764          .705          .705          .764          .764          .705
UTILITY        .725          .675          .575          .675          .725          .775
MILITARY       .655          .517          .517          .62           .62           .586
GOLD           .632          .612          .551          .428          .551          .571
REIT           .619          .578          .517          .53           .585          .571
SP500          .589          .546          .555          .563          .54           .508
BEVERAGE       .588          .588          .647          .529          .47           .411
GUNS           .588          .588          .588          .588          .529          .529
DOWJONES       .586          .586          .586          .62           .586          .517
INDEXES        .586          .543          .596          .569          .51           .365
FIDSTKS        .583          .54           .524          .567          .535          .502
SP-100         .559          .516          .537          .591          .537          .473
NASD-100       .552          .51           .541          .541          .479          .364
GREEN          .545          .545          .545          .545          .545          .5
RUS-1000       .524          .488          .488          .503          .486          .455
FOOD           .518          .5            .462          .444          .481          .425
AUTO           .512          .461          .461          .461          .461          .384
================================================================================================
COMODITY       .5            .475          .425          .4            .475          .4
EDU            .5            .5            .5            .5            .666          .5
TRANSP         .5            .4            .4            .4            .4            .35
================================================================================================
CHEM           .49           .49           .452          .433          .396          .32
COMPUTER       .476          .476          .476          .428          .333          .285
FINANCE        .465          .443          .465          .488          .397          .431
DJI-13         .461          .461          .461          .538          .461          .307
SOFTWARE       .451          .451          .435          .483          .467          .387
INFRA          .444          .361          .388          .305          .361          .388
BIGBANKS       .428          .428          .428          .428          .285          .428
NIFTY          .421          .35           .438          .491          .385          .35
HACKERS        .4            .35           .35           .35           .35           .2
REGBANKS       .392          .321          .285          .25           .25           .25
INDMATER       .387          .35           .337          .3            .275          .3
ETFS           .385          .421          .491          .473          .421          .263
SEMI           .378          .333          .387          .414          .36           .297
RETAIL         .377          .32           .301          .301          .245          .264
GAMING         .347          .26           .347          .347          .304          .304
ELECTRON       .337          .286          .312          .337          .305          .28
BIOTECH        .282          .265          .254          .268          .263          .241
HOSPITAL       .26           .26           .304          .26           .304          .217
OILGAS         .156          .148          .141          .134          .156          .148
CHINA          .086          .086          .086          .086          .068          .051
COAL           0             0             0             0             0             0
|
====================================================================
6/12/2019 The operative Peerless signal is a Sell S12. In
years before a Presidential
Election these June S12s have a mixed record when they occur with the
DJI within 5% of its yearly highs. Two of the three worked out eventually,
but even in these case, first the DJI rose another 2.1% to 2.4%. I also take
as a sign of the bullishness of this period of time that in all the years since
1931, there are only three cases of June S9s and S12s, in these years - 1931,
1935, 1939... 2015... 2019.
Sell S9s and S12s in Junes in Presidential Election
Years have a mixed record.
Gain/ Maximum
Paper
(Loss)
Loss
19870608 S12 2351.64
-.04 2445.51 -.0399 6/22
19990630 S9 10970.80 .029
11209.8 -.0217 7/16
20110630 S12 12414.34 .075
12724.4 -.0249 7/21
The FED is apparently very close to lowering their very short-term
"Federal Funds rates". This will likely cause a spike in the stock
market.
The FOMC meets in the middle of next week. It's true that Bonds are now
favored by the wealthy over stocks. But I would think stocks will surely benefit,
too, along with the overall economy. It seems likely the DJI will get much closer
to 26500 and the 3.5% upper band. With the A/D Line in an uptrend, I
think we should cover the DIA shorts if DJIA closes above 26280 tomorrow.


Today, overnight lending rates for big banks fell sharply. See the chart
above. The FED is not enforcing its 2.25% lower level. That means the
the FOMC will next week probably be lowering its Federal Funds rate to as low
as 2%. It is hard to imagine that this will not encourage more buying of
NYSE stocks, strictly as dividend plays. The lower rates will likely slowly
trickle down to ordinary borrowers. Since there is no indication yet that
lower rates will weaken the Dollar in a noticeable way or spur a rise in
the still low CPI rate of Inflation and boost wages gains vs. productivity
numbers, I would think that the DJI resistance at 26500 will be attacked soon.
And, it is quite possible, that a sharp rate cut will bring a powerful Summer
Rally.

|
Charts 6/12/2019 2019 PEERLESS DJI, Signals, Indicators Daily DJI Volume 10-DayUp/Down Vol Hourly DJIA A/D Line for All Stocks Inverted Traders Index NASDAQ S&P OEX NYSE COMPQX DJI-15 DJI-20 DJI-30 DIA SPY QQQ MDY IWM TNA Short-Term Rates USO-CrudeOil DBO FAS GLD BBH IBB JETS JNUG KOL NUGT OIH OIL RSX RETL SDS AGQ SLV SOXL TECL TLT TMF TNA UGA (gasoline) XIV and China: YINN CHAU Commodities: CANE CORN DBC JJC, NIB, CHOC CORN, CUT (paper) MOO, SOYB WEAT UUP (Dollar) LIT (Lithium) AAPL ADBE ALXN AMAT AMGN AMD AMZN BA BABA BAC BIDU CAT CVX DE FB GOOG GS HD IBM INTU JPM M (Macy's) MSFT NFLX NVDA QCOM TSLA TXN XOM WMT CMG , LRCX, SWKS, MDGL SPPI WATT SQ TOWN 6/1219 (Click on Underlined link.) Bullish MAXCPs - http://tigersoft.com/MAXCPS/Jun-12/BULLISH.htm Bearish MAXCPs - http://tigersoft.com/MINCPs/Jun-12/BEARISH.htm |
Table 1 QUICKSILVER on ETFS - 6/12/19 ETF CLOSE CHANGE PIVOT-PT 5-dmaAROC CL-PWR CANDLE IP21 ITRS --------------------------------------------------------------------------------------------- DIA 260.45 -.43 257.72 91.1% Bullish RED .084 ---- --------------------------------------------------------------------------------------------- BA 347.03 -2.3 350.64 -24.5% Bullish RED .03 -.106 --------------------------------------------------------------------------------------------- SPY 288.39 -.51 284.8 94.7% Bullish RED -.051 .016 --------------------------------------------------------------------------------------------- QQQ 182.34 -1.06 177.61 170% Bullish RED -.068 .009 --------------------------------------------------------------------------------------------- MDY 347.05 -.36 343.51 72.3% Bullish RED .05 -.001 --------------------------------------------------------------------------------------------- IWM 151.47 .17 149.8 42.4% Bullish BLUE -.011 -.014 --------------------------------------------------------------------------------------------- FAS 71.57 -.87 70.97 115.5% Bullish RED .122 .109 stongest --------------------------------------------------------------------------------------------- RETL 22.76 -.32 21.26 290.5% ------- RED -.054 -.242 --------------------------------------------------------------------------------------------- SOXL 128.17 -9.73 123.11 387.6% ------- RED -.054 -.125 --------------------------------------------------------------------------------------------- TECL 148.39 -2.65 138.86 484.4% Bullish RED .007 .036 --------------------------------------------------------------------------------------------- IBB 103.33 .63 102.17 7.3% Bullish BLUE -.052 -.069 --------------------------------------------------------------------------------------------- GLD 125.83 .65 125.88 14.3% Bullish BLUE .17 .043 --------------------------------------------------------------------------------------------- OIH 13.11 -.65 13.43 -73.9% Bearish RED -.198 -.254 --------------------------------------------------------------------------------------------- RSX 22.54 -.25 22.23 120.8% Bearish RED -.047 .079 |
 Table 2   Count of Stocks in Key Directories
          20190612
-------------------------------
NEWHIGHS       174
NEWLOWS        44
MAXCP          23
MINCP          47
TTTNH          13
TTTNL          46
FASTUP         45
FASTDOWN       85
CPCROSSA       87
CPCROSSD       48
BIGVOLUP       5
BIGVODN        11
ACCUMVER       7
HIGHIP21       3
HIUPPCT        21
LOWACCUM       133
REDSELL        87
AUGSELS7       10
TRAPDOOR       11
|
 Table 3  RANKING OF KEY DIRECTORIES BASED PCT.OF STOCKS ABOVE 65-DMA
              6/12/19
 Bullish = 18
 Bearish = 25
---------------------------------------------------------------------------------------
Directory     Current       day-1         day-2         day-3         day-4         day-5
----------------------------------------------------------------------------------------
BONDFUND       .951          .961          .98           .98           .912          .902
INSURANC       .888          .888          .888          .888          .888          .888
SOLAR          .823          .882          .823          .823          .823          .764
HOMEBLDG       .705          .705          .764          .764          .705          .705
JETS           .7            .6            .6            .7            .6            .6
UTILITY        .675          .575          .675          .725          .775          .75
GOLD           .612          .551          .428          .551          .571          .53
BEVERAGE       .588          .647          .529          .47           .411          .411
GUNS           .588          .588          .588          .529          .529          .529
DOWJONES       .586          .586          .62           .586          .517          .517
REIT           .578          .517          .53           .585          .571          .585
SP500          .546          .555          .563          .54           .512          .495
GREEN          .545          .545          .545          .545          .5            .454
FIDSTKS        .54           .524          .567          .535          .502          .491
INDEXES        .532          .596          .569          .51           .37           .327
MILITARY       .517          .517          .62           .62           .586          .62
SP-100         .516          .537          .591          .537          .473          .473
NASD-100       .51           .541          .541          .479          .395          .343
===============================================================================================
EDU            .5            .5            .5            .666          .5            .5
FOOD           .5            .462          .444          .481          .425          .407
===============================================================================================
CHEM           .49           .452          .433          .396          .339          .245
RUS-1000       .488          .488          .501          .487          .46           .443
COMPUTER       .476          .476          .428          .333          .285          .333
COMODITY       .475          .425          .4            .475          .4            .4
AUTO           .461          .461          .461          .461          .384          .384
DJI-13         .461          .461          .538          .461          .307          .307
SOFTWARE       .451          .435          .483          .467          .403          .37
FINANCE        .443          .465          .488          .397          .42           .454
BIGBANKS       .428          .428          .428          .285          .428          .428
ETFS           .421          .491          .473          .421          .263          .21
TRANSP         .4            .4            .4            .4            .35           .4
INFRA          .361          .388          .305          .361          .388          .333
INDMATER       .354          .341          .303          .278          .303          .265
HACKERS        .35           .35           .35           .35           .2            .3
NIFTY          .35           .438          .491          .385          .368          .298
SEMI           .333          .387          .414          .36           .315          .279
REGBANKS       .321          .285          .25           .25           .25           .285
RETAIL         .32           .301          .301          .245          .283          .226
ELECTRON       .286          .312          .337          .305          .292          .267
BIOTECH        .263          .255          .269          .263          .247          .26
GAMING         .26           .347          .347          .304          .304          .217
HOSPITAL       .26           .304          .26           .304          .217          .217
OILGAS         .148          .141          .134          .156          .148          .141
CHINA          .086          .086          .086          .068          .051          .051
COAL           0             0             0             0             0             0
|
6/11/2019 Today
our Buy B2 was replaced by a Peerless Sell S12 because our Accumulation
Index (IP21) and P-I turned negative today as the DJI closed 2% over the
21-dma.
Breadth was weak, though Up Volume was more than Down Volume. There were
only 22 more NYSE advancers than decliners and the NASDAQ showed 90 new lows
today compared to 72 new highs.
My sense is that traders want action out of Powell and the FED. Words are not
enough. Traders are again getting nervous again with the DJI above 26000.
News
that Trump is behind Biden in the Quinipiac polls also did not help the markets.
So, another test of 25000 may be needed. Sell DIA and sell some of it short.

The DJI closed 200 points below its trading peak soon after its opening.
Professionals
were heavy sellers today and overseas sellers are dominant this morning. The selling
today after the opening caused a bearish "red tulip" (or "red
popcicle") on our candle-stick
charts of the DJI, DIA, SPY and QQQ. At the very least, these red candle-sticks
usually bring hesitations. With the bull market so old, with thick resistance up to
26700
on the DJI and because there were so many bearish head/shoulders patterns recently,
we may see a bigger decline. Don't take a chance. Sell DIA and go short DIA
and
more bearish MINCPs.

"Clinching" ...
I suggested that we wait for an S9 to be clinched. But I am not so sure that we
should
do this wiith a June Sell S12 in a bull market. There have been four such cases,
1929, 1981,
1987 and 2010. "Clinching" (waiting for 30 more down than up on the NYSE
at the
close) would only have been advantageous in 1987. So, despite the bullish streak of
6 up DJI days in Junes generally and the bullishness of Summers in the third year year of
a
Presidential Election, I think we have to take the Sell S12. We have to take profits
in DIA and even sell it short now.
The Quinipiac polls put Biden ahead of Trump. Perhaps, the market is spooked by
this. But the polls could be wrong. Biden is not exactly inspriational.
The Democrats
are badly split. The Quinipiac polls do not tell us how many of the pro-Biden people
will actually come out and vote for him. So, if you sell short DIA do it in limited
amounts.
I would rather sell short more of our bearish MINCPs and take profits in most of
the bullish MAXCPs.
June S12s since 1929 Date Signals DJI Gain Paper loss ------------------------------------------------------------------------------ 19290617 S12 319.3 -.029 328.6 -.0291 6/26 Clinched 6/19 316.4 (Bull Market) 19290626 B4 328.6 .075 none 0 19700616 S12 706.26 .052 716.11 -.0139 6/22 (End of Bear Market) 19700617 S9 704.68 .05 716.11 -.0162 6/22 19700707 B2 669.36 .063 perfect 0 19740607 S12 853.72 .271 859.67 -.0069 6/10 (On-going Bear Market) 19740611 S9 852.08 .270 none 0 19740927 B8 621.95 .053 584.56 -.0601 10/4 19810615 S12 1011.99 .172 perfect 0 Clinched 6/19 1003.33 (End of Bull Market) 19811009 S9 873.00 .04 none 0 19811023 B9 873.99 .04 830.96 -.0492 10/26 19870608 S12 2351.64 -.04 2445.51 -.0399 6/22 (Bull Market) Clinched 6/23 2439.73 after a B4. So S12 could have been avoided. 19870609 S9 2352.7 -.039 2445.51 -.0394 6/22 19870610 S8 2353.61 -.039 2445.51 -.039 6/22 19870618 S8 2408.13 -.016 2445.51 -.0155 6/22 19870622 B4 2445.51 .105 2409.76 -.0146 7/1 20100616 S12 10409.46 .061 10450.6 -.0039 6/16
(Bull Market)
20100630 B8 9774.02 .079 9686.48 -.0089 7/2
Clinched on day of Sell S12.
==============================================================================
Bull Markets: Gains sell selling short were -2.9%, +17.2%, -4.0%,+6.1% or
an average decline of 4.1%
|


|
Charts 6/11/2019 2019 PEERLESS DJI, Signals, Indicators Daily DJI Volume 10-DayUp/Down Vol Hourly DJIA A/D Line for All Stocks Inverted Traders Index NASDAQ S&P OEX NYSE COMPQX DJI-15 DJI-20 DJI-30 DIA SPY QQQ MDY IWM TNA Short-Term Rates USO-CrudeOil DBO FAS GLD BBH IBB JETS JNUG KOL NUGT OIH OIL RSX RETL SDS AGQ SLV SOXL TECL TLT TMF TNA UGA (gasoline) XIV and China: YINN CHAU Commodities: CANE CORN DBC JJC, NIB, CHOC CORN, CUT (paper) MOO, SOYB WEAT UUP (Dollar) LIT (Lithium) AAPL ADBE ALXN AMAT AMGN AMD AMZN BA BABA BAC BIDU CAT CVX DE FB GOOG GS HD IBM INTU JPM M (Macy's) MSFT NFLX NVDA QCOM TSLA TXN XOM WMT CMG , LRCX, SWKS, MDGL SPPI WATT SQ TOWN 6/11/19 (Click on Underlined link.) Bullish MAXCPs - http://tigersoft.com/MAXCPS/Jun-11/BULLISH.htm Bearish MAXCPs - http://tigersoft.com/MINCPs/Jun-11/BEARISH.htm |
Table 1 QUICKSILVER on ETFS - 6/11/19 ETF CLOSE CHANGE PIVOT-PT 5-dmaAROC CL-PWR CANDLE IP21 ITRS
---------------------------------------------------------------------------------------------
DIA 260.88 -.11 255.73 140.3% Bullish RED .05 ----
---------------------------------------------------------------------------------------------
BA 349.33 -4.47 348.75 67.2% Bullish RED -.065 -.091
---------------------------------------------------------------------------------------------
SPY 288.9 -.07 282.96 146.9% Bullish RED -.08 .016
---------------------------------------------------------------------------------------------
QQQ 183.4 .25 176.21 237.7% Bullish RED -.102 .014
---------------------------------------------------------------------------------------------
MDY 347.41 .25 342.06 92.9% Bullish RED -.001 -.001
---------------------------------------------------------------------------------------------
IWM 151.3 -.45 150.19 37.9% ------- RED -.069 -.018
---------------------------------------------------------------------------------------------
FAS 72.44 -.11 69.92 335.5% Bullish RED .079 .164
^^^^^
---------------------------------------------------------------------------------------------
RETL 23.08 .69 21.48 107.1% ------- BLUE-.066 -.229
---------------------------------------------------------------------------------------------
SOXL 137.9 1.03 118.2 691.2% ------- RED -.066 -.004
---------------------------------------------------------------------------------------------
TECL 151.04 .25 134.41 788.1% Bullish RED -.041 .083
---------------------------------------------------------------------------------------------
IBB 102.7 -.51 103.18 -15% ------- RED -.117 -.088
---------------------------------------------------------------------------------------------
GLD 125.18 -.15 125.47 1.2% Bullish BLUE .194 .019
---------------------------------------------------------------------------------------------
OIH 13.76 .17 13.31 44.4% Bearish -----.173 -.208
---------------------------------------------------------------------------------------------
RSX 22.79 .33 22 166.6% Bearish -----.025 .1
^^^^^
|
 Table 2   Count of Stocks in Key Directories
           20190611
-------------------------------
NEWHIGHS       113
NEWLOWS        28
MAXCP          15
MINCP          35
TTTNH          15
TTTNL          58
FASTUP         55
FASTDOWN       108
CPCROSSA       48
CPCROSSD       147
BIGVOLUP       3
BIGVODN        10
ACCUMVER       8
HIGHIP21       1
HIUPPCT        15
LOWACCUM       136
REDSELL        87
AUGSELS7       7
TRAPDOOR       12
|
 Table 3 RANKING OF KEY DIRECTORIES BASED PCT.OF STOCKS ABOVE 65-DMA
              6/11/19
 Bullish = 18
 Bearish = 26
---------------------------------------------------------------------------------------
Directory     Current       day-1         day-2         day-3         day-4         day-5
----------------------------------------------------------------------------------------
BONDFUND       .961          .98           .98           .912          .902          .902
INSURANC       .888          .888          .888          .888          .888          .851
SOLAR          .882          .823          .823          .823          .764          .705
HOMEBLDG       .705          .764          .764          .705          .705          .647
BEVERAGE       .647          .529          .47           .411          .411          .294
JETS           .6            .6            .7            .6            .6            .5
INDEXES        .596          .569          .51           .37           .333          .311
GUNS           .588          .588          .529          .529          .529          .47
DOWJONES       .586          .62           .586          .517          .517          .482
UTILITY        .575          .675          .725          .775          .75           .675
SP500          .555          .563          .54           .512          .493          .422
GOLD           .551          .428          .551          .571          .53           .591
GREEN          .545          .545          .545          .5            .454          .409
NASD-100       .541          .541          .479          .395          .343          .281
SP-100         .537          .591          .537          .473          .473          .419
FIDSTKS        .524          .567          .535          .502          .481          .432
MILITARY       .517          .62           .62           .586          .62           .448
REIT           .517          .53           .585          .571          .591          .401
===============================================================================================
EDU            .5            .5            .666          .5            .5            .5
===============================================================================================
ETFS           .491          .473          .421          .263          .21           .228
RUS-1000       .488          .501          .486          .462          .445          .384
COMPUTER       .476          .428          .333          .285          .333          .238
FINANCE        .465          .488          .397          .42           .454          .454
FOOD           .462          .444          .481          .425          .407          .425
AUTO           .461          .461          .461          .384          .384          .333
DJI-13         .461          .538          .461          .307          .307          .307
CHEM           .452          .433          .396          .339          .264          .264
NIFTY          .438          .491          .385          .368          .298          .245
SOFTWARE       .435          .483          .467          .403          .387          .338
BIGBANKS       .428          .428          .285          .428          .428          .428
COMODITY       .425          .4            .475          .4            .4            .4
TRANSP         .4            .4            .4            .35           .4            .3
INFRA          .388          .305          .361          .388          .361          .333
SEMI           .387          .414          .36           .315          .279          .27
HACKERS        .38           .38           .38           .238          .333          .238
GAMING         .347          .347          .304          .304          .217          .26
INDMATER       .337          .3            .275          .3            .262          .25
ELECTRON       .312          .337          .305          .292          .267          .267
HOSPITAL       .304          .26           .304          .217          .217          .304
RETAIL         .301          .301          .245          .283          .226          .188
REGBANKS       .285          .25           .25           .25           .25           .285
BIOTECH        .254          .268          .263          .246          .254          .268
OILGAS         .14           .133          .154          .147          .147          .14
CHINA          .086          .086          .068          .051          .051          .051
COAL           0             0             0             0             0             0
|
====================================================================
6/10/2019
The operative Buy B2 has brought 6 straight up-days for the
DJI.
The DJI has now closed today 2.0% above its 21-day ma. Most likely,
Peerless will give a Sell S9V if the DJI closes another 0.5% higher.
However, wait for it to be clinched with 30 more down than up on the
NYSE close tomorrow or on a following day up until we see a new
Peerless Buy signal. Why?
1) Because this is the year before a Presidential Election. Expect
Republicans in Washington, in Congress, in the White House and in
the FED (despite what they say publicly) to do all that they can to push
up the general economy. (If the Democrats were in power, they would
do exactly the same. That's why the third years in the 4 year cycle bring
DJI advances averaging +15% since 1915, but the other years bring gains
of only 5.5%. For this reason, too, the gains from May to the end of July |
are much higher in the third years than in the other years. Mostly, it is
the FED that brings this stimulus. The stock market acts as a key transmission
in this. It takes 6 months or more for a rate reduction to move through
the economy.
2) Our studies show two prominent cases, June 1929 and June 1987,
when our indicators were weak and still the DJI marched significantly
higher. There were H/S patterns also in these years. But when the June
rally came, traders would have done better by waiting for the clinching. Those
who did not would have sold prematurely in June at the upper band. The
DJI did not top out until August 25th in 1987 and September 3rd in 1929.
It moved between 15% and 20% higher.
3). Our current up-day streak is quite bullish. It turns out
that 6 or more straight up days
in June is very likely a harbinger of much higher prices. There are a few minor
exceptions. But, as you can see below, an up-day streak like we are now in is
usually quite bullish. I counted 16 such cases in June since 1915. I would
rate
the 6-straight up-days in 11 or 12 cases as extremely bullish signs. Yet only one
was
followed by a decline deeper than 5%.
Year UpStreak DJI on last day
Subsequent Action
----------------------------------------------------------------------
1915 6
67.95
DJI rose to 99.20 at year's end.
1924 6
93.60
strongly up for rest of year and 1925.
1929 18/19 up 343.3
rose to 381.1 on Sept 3, 1929.
1938 6
130.4
hit 144.9 on 7/25
1954 13/14 up 333.5
hit 404.4 at end of year.
1955 10/10 up 449.8
hit 487.5 on 9/23.
1964 6
822.8
hit 891.7 at end of year.
1967 6
880.61
fell 3% and then rose to 943
1970 8
735.08
fell 4% and then began new bull
market.
1975 6
873.12
fell 8% immediately
before rallying for a year.
1987 10
2439.73
rallied steadily to 2701.85 on 8/26
1995 6
4553.68
rallied to 5182.15 on 12/14
1997 7
7782.04
rallied to 8259.31 on 8/6.
2003 6
9062.79
rallied to 10453.92 at end of year.
2005 7
10623.07
fell 4% to bottom on 10/13.
2014 6
16937.26
fell 5% to bottom on 10/16.
| DJI - The
H/S in DJI has failed. The DJI is now back above its 65-dma and the A/D Line has res-established an uptrend. The H/S patterns elsewhere are being aborted in similar fashion, but their appearance is still a warning for the general market in the not too distant future. Stick with long positions in DIA. It is the leader.  |
NASDAQ |
SPY |
QQQ |
|
Charts 6/10/2019 2019 PEERLESS DJI, Signals, Indicators Daily DJI Volume 10-DayUp/Down Vol Hourly DJIA A/D Line for All Stocks Inverted Traders Index NASDAQ S&P OEX NYSE COMPQX DJI-15 DJI-20 DJI-30 DIA SPY QQQ MDY IWM TNA Short-Term Rates USO-CrudeOil DBO FAS GLD BBH IBB JETS JNUG KOL NUGT OIH OIL RSX RETL SDS AGQ SLV SOXL TECL TLT TMF TNA UGA (gasoline) XIV and China: YINN CHAU Commodities: CANE CORN DBC JJC, NIB, CHOC CORN, CUT (paper) MOO, SOYB WEAT UUP (Dollar) LIT (Lithium) AAPL ADBE ALXN AMAT AMGN AMD AMZN BA BABA BAC BIDU CAT CVX DE FB GOOG GS HD IBM INTU JPM M (Macy's) MSFT NFLX NVDA QCOM TSLA TXN XOM WMT CMG , LRCX, SWKS, MDGL SPPI WATT SQ TOWN 6/10/19 (Click on Underlined link.) Bullish MAXCPs - http://tigersoft.com/MAXCPS/Jun-10/BULLISH.htm Bearish MAXCPs - http://tigersoft.com/MINCPs/Jun-10/BEARISH.htm |
Table 1 QUICKSILVER on ETFS - 6/10/19 ETF CLOSE CHANGE PIVOT-PT 5-dmaAROC CL-PWR CANDLE IP21 ITRS --------------------------------------------------------------------------------------------- DIA 260.99 .74 253.65 244.7% Bullish RED .088 ------ --------------------------------------------------------------------------------------------- BA 353.8 .1 344.62 214.6% Bullish RED 0 -.07 --------------------------------------------------------------------------------------------- SPY 288.97 1.32 280.53 255.2% Bullish RED -.006 .014 --------------------------------------------------------------------------------------------- QQQ 183.15 2.11 174.91 370.2% Bullish BLUE -.031 .012 --------------------------------------------------------------------------------------------- MDY 347.16 2 341.02 214% Bullish BLUE .046 -.006 --------------------------------------------------------------------------------------------- IWM 151.75 .89 150.16 180% Bullish BLUE .006 -.021 --------------------------------------------------------------------------------------------- FAS 72.55 1.19 67.71 647.5% Bullish RED .146 .167 --------------------------------------------------------------------------------------------- RETL 22.39 .45 22.61 372.4% ------- ---- -.013 -.256 --------------------------------------------------------------------------------------------- SOXL 136.87 9.9 120.6 1252.3% Bullish BLUE -.018 .026 --------------------------------------------------------------------------------------------- TECL 150.79 4.34 128.99 1256.7% Bullish BLUE .021 .103 --------------------------------------------------------------------------------------------- IBB 103.21 -.62 103.01 104.7% Bullish RED -.014 -.072 --------------------------------------------------------------------------------------------- GLD 125.33 -1.26 125.15 8.8% Bullish RED .177 .013 --------------------------------------------------------------------------------------------- OIH 13.59 .02 13.64 70.5% Bearish RED -.159 -.228 --------------------------------------------------------------------------------------------- RSX 22.46 .14 22.05 85.8% ------- ---- .006 .064 |
 Table 2   Count of Stocks in Key Directories
           2019-06-10
-------------------------------
NEWHIGHS       215
NEWLOWS        27
MAXCP          108
MINCP          26
TTTNH          49
TTTNL          37
FASTUP         115
FASTDOWN       75
CPCROSSA       66
CPCROSSD       61
BIGVOLUP       3
BIGVODN        8
ACCUMVER       12
HIGHIP21       5
HIUPPCT        16
LOWACCUM       127
REDSELL        86
AUGSELS7       7
TRAPDOOR       17
|
Table 3 RANKING OF KEY DIRECTORIES BASED PCT.OF STOCKS ABOVE 65-DMA
              6/10/19
Bullish = 19
Bearish = 25
---------------------------------------------------------------------------------------
Directory     Current       day-1         day-2         day-3         day-4         day-5
----------------------------------------------------------------------------------------
BONDFUND       .98           .98           .912          .902          .912          .912
INSURANC       .888          .888          .888          .888          .851          .814
SOLAR          .823          .823          .823          .764          .705          .647
HOMEBLDG       .764          .764          .705          .705          .705          .588
UTILITY        .675          .725          .775          .75           .675          .625
DOWJONES       .62           .586          .517          .517          .482          .31
MILITARY       .62           .62           .586          .62           .448          .379
JETS           .6            .7            .6            .6            .5            .5
SP-100         .591          .537          .473          .473          .43           .29
GUNS           .588          .529          .529          .529          .47           .47
INDEXES .569 .51 .37 .333 .306 .252 FIDSTKS .567 .535 .502 .481 .432 .297 SP500 .563 .54 .512 .493 .428 .33 GREEN .545 .545 .5 .454 .409 .272 NASD-100 .541 .479 .395 .343 .302 .187 DJI-13 .538 .461 .307 .307 .307 .153 REIT .53 .585 .571 .591 .428 .442 BEVERAGE .529 .47 .411 .411 .294 .352 RUS-1000 .502 .486 .461 .447 .391 .302 ---------------------------------------------------------------------------------------------- EDU .5 .666 .5 .5 .5 .5 ----------------------------------------------------------------------------------------------- NIFTY .491 .385 .368 .298 .263 .157 FINANCE .488 .397 .42 .454 .443 .284 SOFTWARE .483 .467 .403 .387 .354 .241 ETFS .473 .421 .263 .21 .228 .228 AUTO .461 .461 .384 .384 .333 .23 FOOD .444 .481 .425 .407 .425 .388 CHEM .433 .396 .339 .264 .283 .15 BIGBANKS .428 .285 .428 .428 .428 .142 COMPUTER .428 .333 .285 .333 .238 .142 GOLD .428 .551 .571 .53 .551 .571 SEMI .414 .36 .315 .279 .279 .189 COMODITY .4 .475 .4 .4 .4 .375 TRANSP .4 .4 .35 .4 .3 .2 HACKERS .38 .38 .238 .333 .285 .142 GAMING .347 .304 .304 .217 .26 .217 ELECTRON .337 .305 .292 .267 .267 .165 INFRA .305 .361 .388 .361 .333 .305 RETAIL .301 .245 .283 .226 .188 .132 INDMATER .3 .275 .3 .262 .237 .187 BIOTECH .265 .263 .246 .254 .265 .221 HOSPITAL .26 .304 .217 .217 .304 .217 REGBANKS .25 .25 .25 .25 .25 .071 OILGAS .133 .154 .147 .147 .14 .126 CHINA .086 .068 .051 .051 .051 .051 COAL 0 0 0 0 0 0 |
==========================================================================
6/7/2019
The operative Buy B2 has brought 5 straight up-days for the DJI.
But now the
DJI has risen to the 1.8% upper band. If it closes at 26175 or higher tomorrow,
Peerless will likely give us a Sell S9V because the DJI will then be above the 2.45%
upper band with the V-Indicator negative. But given the extra bullishness of the
Summer
Rallies in the third year of the four-year Presidential cycle, I think we should wait
in the event of a Sell S9V for this Sell to be clinched by having the number of NYSE
decliners fall below advancers by 30 or more on the close of the day of the Sell or
on a subsequent day up until Peerless gives a new Buy.
I think we have to be cautious about telling the DJI to decline right now. Recall how
the DJI kept rising in the early Summer of 1929 and 1987 despite the Peerless
Sells at the upper band and in the July 2011 case when the Sell S9V did produce
a 17% sell-off, wait until the clinching would not have mattered much.
We are now in the point of time of the four-year Presidential when we should expect
the FED, the President and Congress to do all they to boost the stock market and the
DJI so that its rise will tend to boost the US economy through the mechanism of
"trickle down". Most of the Public can be expected to vote their
pocket-books and
wallets, above all else. They care much less about Trump's character flaws than
their
pay-checks. Only a few of the Democrats running for President have fashioned a
populist economic agenda that might make in-roads among those Americans who have
been left out of the Wall Street boom and do not have full 40 hour work-weeks. And
even where they have a strong economic message based on Gilded Age size wealth
gaps. my historical studies show Democratic populists losing election after election in
good
economic times. (Consider Williams Jennings Bryan who lost three straight times:
1896, 1900 and 1904).
Expect the FED to lower rates. Powell is worth $100 million. He got this rich
being
a Washington lawyer. So, he knows how to do what his Republican clients tell him.
The Jobs numbers did show weakening in the last report. So, the case for a drop in
rates can easily be made now because of (1) how strong the Dollar is, (2) how weak labor
demands are (Productivity is out-stripping real wages very handily.) and (3) how overseas
Economies are softening. Recall the 1927 case I have mentioned when cutting rates in
the Summer then began the wild boom and bubble in stocks that did not end until
September 1929 after the US Discount Rate was lifted from 5% to 6%!
Another element now is tonight's announcement that United Technology and
Raytheon want to merge. Under most circumstances, this would probably be deemed
highly anti-competitive and tending towards monopoly. But I doubt if the Trump
Administration will block this merger. To do so would hurt an important component
in the DJI. UTX should benefit a lot. This merger will serve to boost the DJI
a lot now, just
as the buyout of General Foods (a DJI component) by Phillip Morris did in 1985.
Stay
Long DIA, Bullish MAXCPs and Short A Few MINCPs
The broader market is lagging. Only 41% of all 6000 stocks we follow are now above
their 65-dma. There were 147 new 12 month lows on the NYSE and NASDAQ. This
is not an insigificant number. And I found a lot more bearish-looking MINCP stocks
than bullish MAXCPs. One would think that the broader market will have to come
alive if a new leg up for this elderly bull market. That is asking a lot. If
the laggards
have not been able to stay in uptrends when Unemployment is officially at a 50-year
low and interest rates are under 3%, I doubt if they are suddenly turn around. But
they
may. So we should keep watching these statistics. But for now I would stay
short
some Bearish MINCPs. The odds are good that they will make more new lows.
DJI is back above resistance of 65-dma.
27000 would seem to be next resistance.
NYSE A/D Line is bullishly uptrending again.
But in Summers we can get S9Vs if DJI
reaches 2.5% band and V-I is negative.
![]()


|
Charts 6/7/2019 2019 PEERLESS DJI, Signals, Indicators Daily DJI Volume 10-DayUp/Down Vol Hourly DJIA A/D Line for All Stocks Inverted Traders Index NASDAQ S&P OEX NYSE COMPQX DJI-15 DJI-20 DJI-30 DIA SPY QQQ MDY IWM TNA Short-Term Rates USO-CrudeOil DBO FAS GLD BBH IBB JETS JNUG KOL NUGT OIH OIL RSX RETL SDS AGQ SLV SOXL TECL TLT TMF TNA UGA (gasoline) XIV and China: YINN CHAU Commodities: CANE CORN DBC JJC, NIB, CHOC CORN, CUT (paper) MOO, SOYB WEAT UUP (Dollar) LIT (Lithium) AAPL ADBE ALXN AMAT AMGN AMD AMZN BA BABA BAC BIDU CAT CVX DE FB GOOG GS HD IBM INTU JPM M (Macy's) MSFT NFLX NVDA QCOM TSLA TXN XOM WMT CMG , LRCX, SWKS, MDGL SPPI WATT SQ TOWN 6/9/19 (Click on Underlined link.) Bullish MAXCPs - http://tigersoft.com/MAXCPS/Jun-9/BULLISH.htm Bearish MAXCPs - http://tigersoft.com/MINCPs/Jun-9/BEARISH.htm |
Table 1 QUICKSILVER on ETFS - 6/6/19 ETF CLOSE CHANGE PIVOT-PT 5-dmaAROC CL-PWR CANDLE IP21 ITRS --------------------------------------------------------------------------------------------- DIA 260.25 2.53 248.5 238% Bullish BLUE .178 0 --------------------------------------------------------------------------------------------- BA 353.7 3.06 338.89 175.3% Bullish BLUE .068 -.071 --------------------------------------------------------------------------------------------- SPY 287.65 2.85 274.57 221.4% Bullish BLUE .065 .012 --------------------------------------------------------------------------------------------- QQQ 181.04 3.43 170.12 203.1% Bullish BLUE .021 .001 --------------------------------------------------------------------------------------------- MDY 345.16 1.65 332.57 222.4% Bullish BLUE .104 -.005 --------------------------------------------------------------------------------------------- IWM 150.86 1.06 146.37 168.4% Bullish BLUE .076 -.019 --------------------------------------------------------------------------------------------- FAS 71.36 .39 63.65 572.3% Bullish BLUE .236 .176 --------------------------------------------------------------------------------------------- RETL 21.94 .68 20.78 373.3% ------- BLUE .129 -.264 --------------------------------------------------------------------------------------------- SOXL 126.97 3.86 107.02 911.9% Bullish BLUE .008 -.056 --------------------------------------------------------------------------------------------- TECL 146.45 7.59 117.31 872.5% Bullish BLUE .097 .081 --------------------------------------------------------------------------------------------- IBB 103.83 1.66 101.06 188.9% Bullish BLUE .05 -.062 --------------------------------------------------------------------------------------------- GLD 126.59 .71 125.11 130.4% Bullish RED .169 .008 ------------------------------------------------------------------------------ OIH 13.57 .14 13.4 183.2% Bearish BLUE-.099 -.217 ----------------------------------------------------------------------------- RSX 22.32 .09 22.08 154.5% Bearish -----.009 .056 |
Table 2 Count of Stocks in Key Directories
20190607
-------------------------------
NEWHIGHS 327
NEWLOWS 27
MAXCP 108
MINCP 26
TTTNH 61
TTTNL 48
FASTUP 113
FASTDOWN 83
CPCROSSA 108
CPCROSSD 33
BIGVOLUP 4
BIGVODN 1
ACCUMVER 7
HIGHIP21 7
HIUPPCT 16
LOWACCUM 127
REDSELL 91
AUGSELS7 6
TRAPDOOR 20
|
Table 3 RANKING OF KEY DIRECTORIES BASED PCT.OF STOCKS ABOVE 65-DMA
6/7/19
Bullish =17
Bearish =18
---------------------------------------------------------------------------------------
Directory Current day-1 day-2 day-3 day-4 day-5
----------------------------------------------------------------------------------------
BONDFUND .98 .912 .902 .912 .912 .932
INSURANC .888 .888 .888 .851 .814 .703
SOLAR .823 .823 .764 .705 .647 .647
HOMEBLDG .764 .705 .705 .705 .647 .47
UTILITY .725 .775 .75 .675 .625 .475
JETS .7 .6 .6 .5 .5 .4
EDU .666 .5 .5 .5 .5 .5
MILITARY .62 .586 .62 .448 .379 .344
DOWJONES .586 .517 .517 .482 .31 .31
REIT .585 .571 .591 .428 .448 .394
GOLD .551 .571 .53 .551 .571 .265
GREEN .545 .5 .454 .409 .272 .272
SP500 .54 .512 .493 .428 .332 .318
SP-100 .537 .473 .473 .43 .29 .258
FIDSTKS .535 .502 .481 .432 .297 .313
GUNS .529 .529 .529 .47 .47 .411
INDEXES .51 .37 .333 .306 .258 .204
=============================================================================
RUS-1000 .486 .461 .445 .392 .305 .287
FOOD .481 .425 .407 .425 .388 .388
NASD-100 .479 .395 .343 .302 .187 .239
COMODITY .475 .4 .4 .4 .375 .35
BEVERAGE .47 .411 .411 .294 .411 .352
SOFTWARE .467 .403 .387 .354 .241 .354
AUTO .461 .384 .384 .333 .23 .23
DJI-13 .461 .307 .307 .307 .153 .23
ETFS .421 .263 .21 .228 .228 .21
TRANSP .4 .35 .4 .3 .2 .15
FINANCE .397 .42 .454 .443 .284 .238
CHEM .396 .339 .264 .283 .169 .132
NIFTY .385 .368 .298 .263 .157 .21
HACKERS .38 .238 .333 .285 .142 .285
INFRA .361 .388 .361 .333 .305 .25
SEMI .36 .315 .279 .279 .198 .216
COMPUTER .333 .285 .333 .238 .142 .19
ELECTRON .307 .294 .269 .269 .173 .173
GAMING .304 .304 .217 .26 .217 .304
HOSPITAL .304 .217 .217 .304 .217 .13
BIGBANKS .285 .428 .428 .428 .142 .142
INDMATER .275 .3 .262 .237 .187 .162
BIOTECH .26 .246 .254 .265 .221 .221
REGBANKS .25 .25 .25 .25 .071 .035
RETAIL .245 .283 .226 .188 .132 .132
OILGAS .156 .148 .148 .141 .127 .106
CHINA .068 .051 .051 .051 .051 .068
COAL 0 0 0 0 0 0
|
=======================================================================
6/6/2019
The DJI and SP-500 have now reached their 65-dma and need to keep muscling
higher to convince chartists that the head and shoulders patterns are now defunct.
The Jobs Report, to be released just before the Opening Friday, will probably
decide the day's trading. Stay long DIA and some of the bullish MAXCP breakouts
and short a few of the Bearish MINCPs.
The operative Peerless Buy Buy B2 signal has not been
reversed. The DJI
is rallying because of expected good news on the interest rate front and
hopes of another big jump in jobs' tomorrow morning. Labor costs and
inflation remain well contained. The Dollar is very strong. American bonds,
utilities and blue chips are seeing money coming into them from all around the
world. And as a bonus today, the Labor Department reported that
Productivity rose 3.4% in first-quarter 2019 while unit labor costs fall
1.6%
annually.
The speed of the rally in the DJI
makes me think that we are
seeing the first signs now of a fast-growing DJI Summer rally.
Not only will the DJI get back up to its old highs, but it will
breakout above 26800 and go substantially higher. This is the
3rd-year in the Four Year Presidential Cycle scenario.
For this most bullish scenario to play out we will need:
1) Trump to back off some of his tariff roll-outs,
2) for the FED to talk a lot more about how they need
to stimulate the economy because the rest of the world's
economies are weakening,
3) we will need to get a CPI Report with the year-to-year
numbers well below 3% and.
4) it would be nice to see some new Infrastructure spending.
In these circumstances, politics rules and everything will be done
by the Republican Establishment to make sure the economy is booming
next year. If the Democrats and Republicans agree on Public
Works expenditures, so much the better. I would not think that
the Democrats can win next year if the market is very strong. Russia-
Gate has little traction. Secondly, the southern border "crisis" resulted
as much from the two Clintons' policies toward Central America as the
Republicans, Reagan and Bush-1. The Dems can certainly score some
points about how Trump has cruelly separated refugee families, but the
truth is that Dems dare not dig too deep into why there are so many
refugees in the first place.
Of course, the Election is a long way away. A lot can happen. Let's watch
and see if Peerless gives a new Sell S9V at the old highs. If the rally stalls
out before that, at 26000, all bets will be off. Bearish chartists will
try to bring about a reversal. I don't think they will succeed for the DJI,
but they may for the NASDAQ and QQQ.

Clearly all is not quite so rosy. The DJI has now closed 0.7% above
the
21-dma and the V-I is still quite negative, at -105. A straight-up advance
of 1.5% would likely bring a Sell S9-V. And while the P-I has turned
positive at +12, that seems weak becaise so much of the strength in the
most defensive stocks. Bearishly, on the NASDAQ, there were
actually more new lows (142) than new highs (81).

|
Charts 6/6/2019 2019 PEERLESS DJI, Signals, Indicators Daily DJI Volume 10-DayUp/Down Vol Hourly DJIA A/D Line for All Stocks Inverted Traders Index NASDAQ S&P OEX NYSE COMPQX DJI-15 DJI-20 DJI-30 DIA SPY QQQ MDY IWM TNA Short-Term Rates USO-CrudeOil DBO FAS GLD BBH IBB JETS JNUG KOL NUGT OIH OIL RSX RETL SDS AGQ SLV SOXL TECL TLT TMF TNA UGA (gasoline) XIV and China: YINN CHAU Commodities: CANE CORN DBC JJC, NIB, CHOC CORN, CUT (paper) MOO, SOYB WEAT UUP (Dollar) LIT (Lithium) AAPL ADBE ALXN AMAT AMGN AMD AMZN BA BABA BAC BIDU CAT CVX DE FB GOOG GS HD IBM INTU JPM M (Macy's) MSFT NFLX NVDA QCOM TSLA TXN XOM WMT CMG , LRCX, SWKS, MDGL SPPI WATT SQ TOWN 6/6/19 (Click on Underlined link.) Bullish MAXCPs - http://tigersoft.com/MAXCPS/Jun-6/BULLISH.htm Bearish MAXCPs - http://tigersoft.com/MINCPs/Jun-6/BEARISH.htm |
Table 1 QUICKSILVER on ETFS - 6/6/19 ETF CLOSE CHANGE PIVOT-PT 5-dmaAROC CL-PWR CANDLE IP21 ITRS --------------------------------------------------------------------------------------------- DIA 257.72 1.99 248.22 116.3% Bullish BLUE .151 0 --------------------------------------------------------------------------------------------- BA 350.64 1.89 341.61 11.2% Bullish BLUE .103 -.058 --------------------------------------------------------------------------------------------- SPY 284.8 1.84 275.27 103.6% Bullish BLUE .03 .008 --------------------------------------------------------------------------------------------- QQQ 177.61 1.4 173.95 24.1% Bullish BLUE -.019 -.013 (weaker) --------------------------------------------------------------------------------------------- MDY 343.51 1.45 330.13 148.9% Bullish BLUE .068 .001 --------------------------------------------------------------------------------------------- IWM 149.8 -.39 145.86 63.1% ------- RED .04 -.018 (weaker) --------------------------------------------------------------------------------------------- FAS 70.97 1.05 63.67 412.3% Bullish BLUE .207 .168 --------------------------------------------------------------------------------------------- SOXL 123.11 4.91 106 546.5% Bullish BLUE -.031 -.114 (much weaker) --------------------------------------------------------------------------------------------- TECL 138.86 4.45 123.99 332.2% Bullish BLUE .055 .019 --------------------------------------------------------------------------------------------- IBB 102.17 -1.01 99.98 18.7% Bullish RED .035 -.079 (much weaker) --------------------------------------------------------------------------------------------- GLD 125.88 .41 123.33 168.7% Bullish ---- .18 .008 --------------------------------------------------------------------------------------------- OIH 13.43 .12 13.08 -3.7% Bearish BLUE -.14 -.221 (much weaker) --------------------------------------------------------------------------------------------- RSX 22.23 .23 21.64 121% Bearish ---- .006 .048 |
 Table 2   Count of Stocks in Key Directories
           2019-06-06
-------------------------------
NEWHIGHS       237
NEWLOWS        38
MAXCP          103
MINCP          34
TTTNH          48
TTTNL          58
FASTUP         64
FASTDOWN       116
CPCROSSA       76
CPCROSSD       56
BIGVOLUP       8
BIGVODN        14
ACCUMVER       11
HIGHIP21       6
HIUPPCT        13
LOWACCUM       134
REDSELL        92
AUGSELS7       6
TRAPDOOR       22
|
 Table 3  RANKING OF KEY DIRECTORIES BASED PCT.OF STOCKS ABOVE 65-DMA
              6/6/19
 Bullish = 13
 Bearish = 30
---------------------------------------------------------------------------------------
Directory     Current       day-1         day-2         day-3         day-4         day-5
----------------------------------------------------------------------------------------
BONDFUND       .912          .902          .912          .912          .932          .912
INSURANC       .888          .888          .851          .814          .703          .777
SOLAR          .823          .764          .705          .647          .647          .647
UTILITY        .775          .75           .675          .625          .475          .4
HOMEBLDG       .705          .705          .705          .647          .47           .529
JETS           .6            .6            .5            .5            .4            .4
MILITARY       .586          .62           .448          .379          .344          .344
GOLD           .571          .53           .551          .571          .265          .081
REIT           .571          .591          .428          .448          .401          .387
GUNS           .529          .529          .47           .47           .411          .47
DOWJONES       .517          .517          .482          .31           .31           .379
SP500          .511          .492          .427          .331          .315          .354
FIDSTKS        .502          .481          .432          .297          .308          .351
=============================================================================================
EDU            .5            .5            .5            .5            .5            .5
GREEN          .5            .454          .409          .272          .272          .227
=============================================================================================
SP-100         .468          .468          .425          .287          .255          .34
RUS-1000       .461          .445          .391          .306          .287          .317
BIGBANKS       .428          .428          .428          .142          .142          .142
FOOD           .425          .407          .425          .388          .388          .314
FINANCE        .42           .454          .443          .284          .238          .329
BEVERAGE       .411          .411          .294          .411          .352          .411
SOFTWARE       .403          .387          .354          .241          .354          .387
COMODITY       .4            .4            .4            .375          .35           .3
NASD-100       .395          .343          .302          .187          .239          .291
INFRA          .388          .361          .333          .305          .222          .222
AUTO           .384          .384          .333          .23           .23           .256
NIFTY          .368          .298          .263          .157          .21           .263
INDEXES        .365          .333          .306          .258          .204          .182
TRANSP         .35           .4            .3            .2            .15           .25
CHEM           .339          .264          .283          .169          .15           .15
SEMI           .315          .279          .279          .198          .207          .207
DJI-13         .307          .307          .307          .153          .23           .23
GAMING         .304          .217          .26           .217          .304          .26
INDMATER       .3            .262          .237          .187          .162          .15
ELECTRON       .292          .267          .267          .171          .165          .165
COMPUTER       .285          .333          .238          .142          .19           .19
RETAIL         .283          .226          .188          .132          .132          .132
ETFS           .263          .21           .228          .228          .21           .175
REGBANKS       .25           .25           .25           .071          .035          .071
BIOTECH        .243          .254          .265          .221          .221          .238
HACKERS        .238          .333          .285          .142          .285          .285
HOSPITAL       .217          .217          .304          .217          .13           .173
OILGAS         .148          .148          .141          .127          .099          .12
CHINA          .051          .051          .051          .051          .068          .068
COAL           0             0             0             0             0             0
|
=====================================================================
6/5/2019
The
operative Peerless Buy signal is a Buy B2. This typically calls for
a DJI rally back to the upper band. But a Summer Rally boosted by
the FED and more temperance from the President in trade matters vis-a-vis
Mexico are exactly what we would expect in this the third year of the four-year
Presidential cycle. At least, this is what NYSE Professionals seem to see
now as the most likely upcoming scenario.
If the DJI can get past 26000, there should not be
much resistance until it makes a nominal new high above
27000. Above that, we will see a big take-off. This
would be very bullish. Volume will have to rise for this
scenario and Professionals will have to add onto over-night
gains and not sell into them and cause a reversal.

But first the DJI will have to get move up past the red-resistance line shown
above. That may take some positive news, a cessation of the trade wars, an
interest rate reduction or another very positive Jobs report on Friday. After THAT,
I still expect the DJI to reach its 65-dma at 26000.
The DJI's job here is to be the leader of the rally. Once it gets to the
upper band, the Peerless program will have to look at the market's
internals and decide whether to give a Sell signal. That there were no
more advancers than decliners today on the NYSE should not prevent
the DJI from carrying out its mission as leader.
But just because the DJI is able to move up, does not mean the other
indexes will do so well. The SP-500 did today get above the neckline
in its much clearer head and shoulders pattern and the NASDAQ has
just reached its neckline. So, they are lagging and probably more
vulnerable.
As for individual stocks, I found more bearish MINCPs than bullish
MAXCPs. So, if your shorts are still falling, just hold onto them. But
if they turn up, especially their Closing Power, cover them and buy some
our Bullish MAXCPs.
|
Charts 6/5/2019 2019 PEERLESS DJI, Signals, Indicators Daily DJI Volume 10-DayUp/Down Vol Hourly DJIA A/D Line for All Stocks Inverted Traders Index NASDAQ S&P OEX NYSE COMPQX DJI-15 DJI-20 DJI-30 DIA SPY QQQ MDY IWM TNA Short-Term Rates USO-CrudeOil DBO FAS GLD BBH IBB JETS JNUG KOL NUGT OIH OIL RSX RETL SDS AGQ SLV SOXL TECL TLT TMF TNA UGA (gasoline) XIV and China: YINN CHAU Commodities: CANE CORN DBC JJC, NIB, CHOC CORN, CUT (paper) MOO, SOYB WEAT UUP (Dollar) LIT (Lithium) AAPL ADBE ALXN AMAT AMGN AMD AMZN BA BABA BAC BIDU CAT CVX DE FB GOOG GS HD IBM INTU JPM M (Macy's) MSFT NFLX NVDA QCOM TSLA TXN XOM WMT CMG , LRCX, SWKS, MDGL SPPI WATT SQ TOWN 6/5/19 (Click on Underlined link.) Bullish MAXCPs - http://tigersoft.com/MAXCPS/Jun-5/BULLISH.htm Bearish MAXCPs - http://tigersoft.com/MINCPs/Jun-5/BEARISH.htm |
Table 1 QUICKSILVER on ETFS - 6/5/19 ETF CLOSE CHANGE PIVOT-PT 5-dmaAROC CL-PWR CANDLE IP21 ITRS --------------------------------------------------------------------------------------------- DIA 255.73 2.08 251.87 89% Bullish BLUE .107 ----- --------------------------------------------------------------------------------------------- BA 348.75 4.13 349.87 -.7% Bullish BLUE .015 -.061 --------------------------------------------------------------------------------------------- SPY 282.96 2.43 279.03 84.5% Bullish BLUE -.003 .011 --------------------------------------------------------------------------------------------- QQQ 176.21 1.3 176.77 5.2% Bullish RED -.05 -.014 --------------------------------------------------------------------------------------------- MDY 342.06 1.04 333.51 116.8% Bullish RED .023 .009 --------------------------------------------------------------------------------------------- IWM 150.19 .03 147.93 62.6% ------- RED .004 -.003 --------------------------------------------------------------------------------------------- FAS 69.92 2.21 65.52 310.2% Bullish BLUE .149 .19 --------------------------------------------------------------------------------------------- SOXL 118.2 -2.4 110.81 445.9% ------- RED -.058 -.122 --------------------------------------------------------------------------------------------- TECL 134.41 5.42 130.42 252.5% Bullish BLUE .013 .005 --------------------------------------------------------------------------------------------- IBB 103.18 .17 101.79 70.4% Bullish RED .031 -.05 --------------------------------------------------------------------------------------------- GLD 125.47 .32 121.69 186.6% Bullish RED .217 .002 --------------------------------------------------------------------------------------------- OIH 13.31 -.33 13.44 -145% Bearish RED -.16 -.215 --------------------------------------------------------------------------------------------- RSX 22 -.05 21.7 59.5% Bearish RED -.044 .035 --------------------------------------------------------------------------------------------- |
Table 2   Count of Stocks in Key Directories
          2019-06-05
-------------------------------
NEWHIGHS       240
NEWLOWS        38
MAXCP          98
MINCP          31
TTTNH          46
TTTNL          56
FASTUP         66
FASTDOWN       92
CPCROSSA       96
CPCROSSD       134
BIGVOLUP       6
BIGVODN        10
ACCUMVER       7
HIGHIP21       4
HIUPPCT        11
LOWACCUM       145
REDSELL        87
AUGSELS7       6
TRAPDOOR       21
|
 Table 3      RANKING OF KEY DIRECTORIES BASED PCT.OF STOCKS ABOVE 65-DMA
              6/5/19
 Bullish = 12
 Bearish = 32
---------------------------------------------------------------------------------------
Directory     Current       day-1         day-2         day-3         day-4         day-5
----------------------------------------------------------------------------------------
BONDFUND       .902          .912          .912          .932          .912          .912
INSURANC       .888          .851          .814          .703          .777          .851
UTILITY        .75           .675          .625          .475          .4            .425
SOLAR          .722          .666          .611          .611          .611          .611
HOMEBLDG       .705          .705          .647          .47           .529          .588
MILITARY       .62           .448          .379          .344          .344          .344
JETS           .6            .5            .5            .4            .4            .4
REIT           .591          .428          .448          .401          .387          .408
GOLD           .53           .551          .571          .265          .081          .081
GUNS           .529          .47           .47           .411          .47           .411
DOWJONES       .517          .482          .31           .31           .379          .448
=============================================================================================
EDU            .5            .5            .5            .5            .5            .5
=============================================================================================
SP500          .496          .431          .335          .319          .364          .361
SP-100         .483          .439          .296          .263          .362          .384
FIDSTKS        .481          .432          .297          .308          .356          .362
FINANCE        .454          .443          .284          .238          .318          .34
GREEN          .454          .409          .272          .272          .227          .272
RUS-1000       .445          .391          .305          .288          .324          .322
BIGBANKS       .428          .428          .142          .142          .142          .285
BEVERAGE       .411          .294          .411          .352          .411          .411
FOOD           .407          .425          .388          .388          .314          .314
COMODITY       .4            .4            .375          .35           .3            .275
TRANSP         .4            .3            .2            .15           .25           .25
SOFTWARE       .387          .354          .241          .354          .387          .387
AUTO           .384          .333          .23           .23           .256          .256
INFRA          .361          .333          .305          .222          .222          .277
NASD-100       .343          .302          .187          .239          .312          .302
INDEXES        .338          .306          .258          .204          .182          .182
COMPUTER       .333          .238          .142          .19           .19           .19
HACKERS        .333          .285          .142          .285          .285          .285
DJI-13         .307          .307          .153          .23           .23           .23
NIFTY          .298          .263          .157          .21           .28           .263
SEMI           .279          .279          .198          .207          .207          .198
ELECTRON       .267          .267          .171          .165          .165          .159
CHEM           .264          .283          .169          .15           .169          .132
INDMATER       .262          .237          .187          .162          .15           .162
BIOTECH        .252          .265          .221          .221          .238          .243
REGBANKS       .25           .25           .071          .035          .071          .107
RETAIL         .226          .188          .132          .132          .169          .132
GAMING         .217          .26           .217          .304          .26           .26
HOSPITAL       .217          .304          .217          .13           .173          .217
ETFS           .21           .228          .228          .21           .175          .157
OILGAS         .148          .141          .127          .099          .12           .141
CHINA          .051          .051          .051          .068          .068          .068
COAL           0             0             0             0             0             0
|
====================================================================
6/4/2019
One
thing I've learned over the years is not to argue with Peerless for
very long. Another is to not fight the inclinations of the Federal Reserve.
The Federal Reserve and Republican Senators have come to the rescue
of the stock market, or so it would seem, judging by today's broad 5% jump in the
DJI. Powell indicated a reduction in rates was a possibility and, just as
important, a group of US Republican Senators went to the White House
and loudly complained about the new Mexican tariffs. They shouted that
such tariffs would be very disruptive and costly to American businesses, lose
lots of votes and do nothing to stop illegal immingration. They warned the
White House staffers that the big man's persistance here would inevitably
lead to embarrassing political failures in his dealing with Congress.
( ( https://www.cnbc.com/2019/05/16/trumps-tariffs-are-equivalent-to-one-of-the-largest-tax-increases-in-decades.html
)
The market's response to these two developments was unequivocally bullish.
While we still have to see the Buy B2 in the context of the bigger head/shoulder
patterns, we can again be bullish on the DJI. The bullish factor of this being the
year before a Presdiential Election Year now may play put more clearly.

I would say that the Buy B2 should now bring a recovery to the upper
2%-3% band on the DJI, most likely 26000, as a starter, but even a new
high if rates are, in fact, lowered. This could be the beginning of a Summer rally.
So, Buy DIA, that is the leader. It is
alone among the major market ETFs now
above its H/S neckline. NYSE Breadth was excellent. MINCPs shrank to less
than 10. Cover half of the MINCPs you shorted. Down
Volume on the
NYSE was less than 100 million, making it the lowest such number since
January 4th. The ratio of up volume to down-volume was not high enough to
give it a Peerless B14, but the news and action today were clearly unusual and
bullish enough to force me to toss out last night's notion of the DJI's H/S neckline
stopping the rally.


Today the Fed Secretary Powell told us that he is ready to lower rates if
Trump's tariff wars cause a slow-down. That would seem inevitable. As
you
probably know, even before the new Mexican tariffs, Trump's new tariffs,
despite his assurances to the contrary, equalled new taxes on Americans
amounting $72 billion. This and the world-wide economic slow-down, have
been behind the rapidly developing head and shoulders patterns, which started
suddenly the day after Trump announced that the trade talks with China had failed.
I think that we may usefully compare Trump's new economic policies (tariffs)
with Nixon's New Economic Policies in 1971/ Both produced head/shoulders
patterns. Both were unexpected. Significantly, the stock market in 1971
ultimately took its direction from what the Federal Reserve was doing and
its changes in the Discount Rate. A rate hike now would be very bullish. I
have
mentioned how mid-year rate cuts were very bullish in 1927 and June 1929.
I could also mention the rate cut of May 1985 and there are probably others
that set off big advances.
Back in 1971, President Nixon stopped transferring gold to foreign banks
when they requested it for US Dollars. Wall Street feared this would drop
the value of the Dollar...At the same time, he also put America through a 6-month
period of price and wage controls. At the time, this seemed scarily like war or
socialism. See the chart of the DJI's Head and Shoulders patterns of 1971 below.
Note how these kept forming until there finally was a 18% DJI decline when
Nixon persisted and before the FED started lowering the Discount Rate.
Nixon's N.E.P. price and wage controls lasted only six months. Trump's tariffs will
last much longer. So, it would seem to be important that the tariff wars not seem
unending and also that the FED actually lower interest rates.
| Federal Reserve Discount Rate Statistics. 1970-1973 1970-12-01 5.52 1971-01-01 5.23 Falling and Bullish 1971-02-01 4.91 Falling and Bullish 1971-03-01, 4.75 Falling and Bullish 1971-04-01, 4.75 Flat - watch out. 1971-05-01, 4.75 Flat - watch out 1971-06-01, 4.75 Flat - watch out 1971-07-01, 4.88 Rising and Bearish 1971-08-01, 5.0 Bearish 1971-09-01, 5.0 Flat - watch out 1971-10-01, 5.0 Flat - watch out 1971-11-01, 4.9 Falling and Bullish... Pres. Elect. coming up. 1971-12-01, 4.63 Falling and Bullish... Pres. Elect. coming up. 1972-01-01, 4.5 Falling and Bullish... Pres. Elect. coming up .... 1972-12-01, 4.5 Election over 1973-01-01, 4.77 Election over and rates can go back up. 1973-02-01, 5.05 Election over and rates can go back up. |

|
Charts 6/4/2019 2019 PEERLESS DJI, Signals, Indicators Daily DJI Volume 10-DayUp/Down Vol Hourly DJIA A/D Line for All Stocks Inverted Traders Index NASDAQ S&P OEX NYSE COMPQX DJI-15 DJI-20 DJI-30 DIA SPY QQQ MDY IWM TNA Short-Term Rates USO-CrudeOil DBO FAS GLD BBH IBB JETS JNUG KOL NUGT OIH OIL RSX RETL SDS AGQ SLV SOXL TECL TLT TMF TNA UGA (gasoline) XIV and China: YINN CHAU Commodities: CANE CORN DBC JJC, NIB, CHOC CORN, CUT (paper) MOO, SOYB WEAT UUP (Dollar) LIT (Lithium) AAPL ADBE ALXN AMAT AMGN AMD AMZN BA BABA BAC BIDU CAT CVX DE FB GOOG GS HD IBM INTU JPM M (Macy's) MSFT NFLX NVDA QCOM TSLA TXN XOM WMT CMG , LRCX, SWKS, MDGL SPPI WATT SQ TOWN 6/4/19 (Click on Underlined link.) Bullish MAXCPs - http://tigersoft.com/MAXCPS/Jun-4/BULLISH.htm Bearish MAXCPs - http://tigersoft.com/MINCPs/Jun-4/BEARISH.htm |
Table 1 QUICKSILVER on ETFS - 6/4/19 ETF CLOSE CHANGE PIVOT-PT 5-dmaAROC CL-PWR CANDLE IP21 ITRS
---------------------------------------------------------------------------------------------
DIA 253.65 5.15 251.27 3.6% Bullish BLUE .107 -----
---------------------------------------------------------------------------------------------
BA 344.62 5.73 348.8 -147.9% Bullish BLUE .051 -.043
---------------------------------------------------------------------------------------------
SPY 280.53 5.96 278.27 6.8% Bullish BLUE .004 .01
---------------------------------------------------------------------------------------------
QQQ 174.91 4.79 176.03 -73.8% Bullish BLUE -.042 -.015
---------------------------------------------------------------------------------------------
MDY 341.02 8.45 334.25 73.5% Bullish BLUE .022 .016
---------------------------------------------------------------------------------------------
IWM 150.16 3.79 148.34 19.3% Bullish BLUE .025 .009
---------------------------------------------------------------------------------------------
FAS 67.71 4.06 65.87 88.4% Bullish BLUE .135 .151
---------------------------------------------------------------------------------------------
SOXL 120.6 13.58 108.34 635.8% Bullish BLUE -.01 -.13
---------------------------------------------------------------------------------------------
TECL 128.99 11.68 128.06 -53.2% Bullish BLUE .031 -.039
---------------------------------------------------------------------------------------------
IBB 103.01 1.95 101.75 5.4% Bullish BLUE .06 -.043
---------------------------------------------------------------------------------------------
GLD 125.15 .04 120.87 176.5% Bullish BLUE .256 .015
^^^^^
---------------------------------------------------------------------------------------------
OIH 13.64 .24 13.7 -29.7% Bearish BLUE -.122 -.19
---------------------------------------------------------------------------------------------
RSX 22.05 -.03 21.74 152% Bearish ---- -.002 .06
^^^^^
|
Table 3    Count of Stocks in Key Directories
           20190604
-------------------------------
NEWHIGHS       129
NEWLOWS        3
MAXCP          103
MINCP          6
TTTNH          76
TTTNL          17
FASTUP         77
FASTDOWN       99
CPCROSSA       367
CPCROSSD       32
BIGVOLUP       4
BIGVODN        10
ACCUMVER       10
HIGHIP21       7
HIUPPCT        10
LOWACCUM       148
REDSELL        84
AUGSELS7       9
TRAPDOOR       22
|
 Table 3 RANKING OF KEY DIRECTORIES BASED PCT.OF STOCKS ABOVE 65-DMA
              6/4/19
 Bullish = 6
 Bearish =37
---------------------------------------------------------------------------------------
Directory     Current       day-1         day-2         day-3         day-4         day-5
----------------------------------------------------------------------------------------
BONDFUND       .912          .912          .932          .912          .912          .912
INSURANC       .851          .814          .703          .777          .851          .777
HOMEBLDG       .705          .647          .47           .529          .588          .647
SOLAR          .705          .647          .647          .647          .647          .588
UTILITY        .675          .625          .475          .4            .425          .525
GOLD           .551          .571          .265          .081          .081          .081
============================================================================================
EDU            .5            .5            .5            .5            .5            .5
JETS           .5            .5            .4            .4            .4            .5
============================================================================================
DOWJONES       .482          .31           .31           .379          .448          .482
GUNS           .47           .47           .411          .47           .411          .529
MILITARY       .448          .379          .344          .344          .344          .379
FINANCE        .443          .284          .238          .318          .34           .363
FIDSTKS        .432          .297          .308          .356          .362          .372
BIGBANKS       .428          .142          .142          .142          .285          .285
REIT           .428          .448          .401          .387          .401          .551
SP500          .427          .331          .315          .36           .358          .397
FOOD           .425          .388          .388          .314          .314          .314
SP-100         .425          .287          .255          .351          .372          .372
GREEN          .409          .272          .272          .227          .272          .318
COMODITY       .4            .375          .35           .3            .275          .275
RUS-1000       .391          .305          .287          .325          .325          .362
SOFTWARE       .354          .241          .354          .387          .387          .435
AUTO           .333          .23           .23           .256          .256          .256
INFRA          .333          .305          .222          .222          .277          .305
DJI-13         .307          .153          .23           .23           .23           .23
INDEXES        .306          .258          .204          .182          .182          .22
HOSPITAL       .304          .217          .13           .173          .217          .26
NASD-100       .302          .187          .239          .312          .302          .333
TRANSP         .3            .2            .15           .25           .25           .3
BEVERAGE       .294          .411          .352          .411          .47           .47
HACKERS        .285          .142          .285          .285          .285          .285
SEMI           .279          .198          .207          .207          .198          .171
CHEM           .269          .153          .134          .153          .134          .134
ELECTRON       .267          .171          .165          .165          .159          .165
BIOTECH        .263          .221          .221          .238          .243          .276
NIFTY          .263          .157          .21           .28           .263          .28
GAMING         .26           .217          .304          .26           .26           .26
REGBANKS       .25           .071          .035          .071          .107          .142
COMPUTER       .238          .142          .19           .19           .19           .238
INDMATER       .237          .187          .162          .15           .162          .187
ETFS           .228          .228          .21           .175          .157          .157
RETAIL         .188          .132          .132          .169          .132          .169
OILGAS         .141          .127          .099          .12           .148          .184
CHINA          .051          .051          .068          .068          .068          .086
COAL           0             0             0             0             0             0
|
====================================================================
6/3/2019
Today
brought a new Peerless Buy B2, based on the DJI closing more
than 2% below the 21-dma and there not having been a previous Sell S9
or S12. This, the exceptionally good breadth today and very low interest
rates may lift the DJI back to its head/shoulders neckline at 25280. But head/
shoulders patterns are dangerous. And typically, if there is a rally before the
DJI reaches its minimum downside objective, then the first DJI recovery to
neckline is apt to be turned back and a restest of the lows, at a minimum
is required. A rally in the DJI does not necessarily mean a jump in the NASDAQ,
QQQ or even the SP-500 and SPY. Respect the bearishness of Head and
Shoulders patterns. Hold your short MINCPs and plan to sell short DIA and
SPY on a rally above 25200.
Current DJIA

See in the DJI charts below how the first rally back to the neckline in a
completed H/S pattern fails and there is another deeper declne or a re-test
of the lower band then a Buy Signal.
1952 |
1960 |
2014 |
Late May-June Buy B2s usually are profitable. But completed
head/shoulders pattern are very dangerous and if the software was able to
spot these patterns, I would have included provision for the Buy B2s right
after they were completed to be nullified.
| Buy B2s in Late May and June: 1929-2019 Date Signal DJI Close Gain Biggest Paper Loss =================================================================== 19290527 B2 293.4 .069 0 19350531 B2 110.64 .198 0 19390628 B2 132.8 .16 -.020 6/29 19510628 B2 244.0 .127 -.006 6/29 19750529 B2 815. .061 0 19760607 B2 958.09 .052 0 19780623 B2 823.02 .103 -.013 6/26 19880519 B2 1958.72 .115 -.003 5/20 19910624 B2 2913.01 .033 -.005 8/19 19940624 B2 3636.94 .068 -.003 19980615 B2 8627.93 .049 0 19990611 B2 10490.51 .046 0 20100520 B2 10068.01 .034 -.025 6/7 20110603 B2 12151.26 .022 -.021 6/15 --------------------------------------------------------- 20190603 B2 24819.78 open.... Since 1990, none of the Buy B2s brought a gain of more than 6.9%. A 2.5% paper loss is the biggest that has ever occurred on one of these signals. A loss of any more than this would certainly show they must not be taken soon after head/shoulders patterns for all the indexes and the DJI. |

|
Charts 6/3/2019 2019 PEERLESS DJI, Signals, Indicators Daily DJI Volume 10-DayUp/Down Vol Hourly DJIA A/D Line for All Stocks Inverted Traders Index NASDAQ S&P OEX NYSE COMPQX DJI-15 DJI-20 DJI-30 DIA SPY QQQ MDY IWM TNA Short-Term Rates USO-CrudeOil DBO FAS GLD BBH IBB JETS JNUG KOL NUGT OIH OIL RSX RETL SDS AGQ SLV SOXL TECL TLT TMF TNA UGA (gasoline) XIV and China: YINN CHAU Commodities: CANE CORN DBC JJC, NIB, CHOC CORN, CUT (paper) MOO, SOYB WEAT UUP (Dollar) LIT (Lithium) AAPL ADBE ALXN AMAT AMGN AMD AMZN BA BABA BAC BIDU CAT CVX DE FB GOOG GS HD IBM INTU JPM M (Macy's) MSFT NFLX NVDA QCOM TSLA TXN XOM WMT CMG , LRCX, SWKS, MDGL SPPI WATT SQ TOWN 6/3/19 (Click on Underlined link.) Bullish MAXCPs - http://tigersoft.com/MAXCPS/Jun-3/BULLISH.htm Bearish MAXCPs - http://tigersoft.com/MINCPs/Jun-3/BEARISH.htm |
Table 1 QUICKSILVER on ETFS - 6/3/19 ETF CLOSE CHANGE PIVOT-PT 5-dmaAROC CL-PWR CANDLE IP21 ITRS
---------------------------------------------------------------------------------------------
DIA 248.5 .28 253.47 -151.1% Bullish BLUE .085 0
---------------------------------------------------------------------------------------------
BA 338.89 -2.72 354.88 -228.7% Bullish BLUE .044 -.048
---------------------------------------------------------------------------------------------
SPY 274.57 -.7 280.15 -147.1% Bullish RED -.01 .007
---------------------------------------------------------------------------------------------
QQQ 170.12 -3.83 177.49 -227.8% Bullish RED -.062 -.026
---------------------------------------------------------------------------------------------
MDY 332.57 2.44 336.12 -110.2% Bullish BLUE .023 0
---------------------------------------------------------------------------------------------
IWM 146.37 .51 149.59 -148.8% Bullish BLUE .021 -.015
---------------------------------------------------------------------------------------------
FAS 63.65 -.02 66.56 -342.6% Bullish ---- .14 .049
---------------------------------------------------------------------------------------------
SOXL 107.02 1.02 106.89 -131.9% ------- RED -.067 -.255
---------------------------------------------------------------------------------------------
TECL 117.31 -6.68 130.33 -563.5% Bullish RED .001 -.152
---------------------------------------------------------------------------------------------
IBB 101.06 1.08 102.9 -153.7% Bullish BLUE .059 -.055
---------------------------------------------------------------------------------------------
GLD 125.11 1.78 120.83 156.7% Bullish BLUE .209 .054
^^^^
---------------------------------------------------------------------------------------------
OIH 13.4 .32 13.72 -151.3% Bearish BLUE-.118 -.202
---------------------------------------------------------------------------------------------
RSX 22.08 .44 21.39 106.4% Bullish BLUE-.005 .071
|
 Table 2   Count of Stocks in Key Directories
           2019-06-03
-------------------------------
NEWHIGHS       139
NEWLOWS        49
MAXCP          74
MINCP          15
TTTNH          54
TTTNL          27
FASTUP         63
FASTDOWN       163
CPCROSSA       223
CPCROSSD       34
BIGVOLUP       5
BIGVODN        12
ACCUMVER       10
HIGHIP21       4
HIUPPCT        10
LOWACCUM       150
REDSELL        80
AUGSELS7       9
TRAPDOOR       25
|
Table 3  RANKING OF KEY DIRECTORIES BASED PCT.OF STOCKS ABOVE 65-DMA
              6/3/19
Bullish = 6
Bearish = 37
---------------------------------------------------------------------------------------
Directory     Current       day-1         day-2         day-3         day-4         day-5
----------------------------------------------------------------------------------------
BONDFUND       .912          .932          .912          .912          .912          .902
INSURANC       .814          .703          .777          .851          .777          .888
HOMEBLDG       .647          .47           .529          .588          .647          .647
UTILITY        .625          .475          .4            .425          .525          .625
SOLAR          .611          .611          .611          .611          .555          .5
GOLD           .571          .265          .081          .081          .081          .081
             big jump
=========================================================================================
EDU            .5            .5            .5            .5            .5            .5
JETS           .5            .4            .4            .4            .5            .6
=========================================================================================
GUNS           .47           .411          .47           .411          .529          .529
REIT           .448          .401          .387          .401          .557          .653
BEVERAGE       .411          .352          .411          .47           .47           .529
FOOD           .388          .388          .314          .314          .314          .222
MILITARY       .379          .344          .344          .344          .379          .413
COMODITY       .375          .35           .3            .275          .275          .2
SP500          .335          .319          .364          .361          .4            .445
DOWJONES       .31           .31           .379          .448          .482          .551
INFRA          .305          .222          .222          .277          .305          .388
RUS-1000       .305          .287          .324          .326          .363          .41
FIDSTKS        .297          .308          .356          .362          .372          .443
SP-100         .296          .263          .362          .384          .384          .483
FINANCE        .284          .238          .318          .34           .363          .409
GREEN          .272          .272          .227          .272          .318          .318
INDEXES        .258          .204          .182          .182          .225          .263
SOFTWARE       .241          .354          .387          .387          .435          .435
AUTO           .23           .23           .256          .256          .256          .256
ETFS           .228          .21           .175          .157          .157          .14
BIOTECH        .218          .221          .237          .243          .27           .278
GAMING         .217          .304          .26           .26           .26           .217
HOSPITAL       .217          .13           .173          .217          .26           .217
TRANSP         .2            .15           .25           .25           .3            .35
SEMI           .198          .207          .207          .198          .171          .189
INDMATER       .187          .162          .15           .162          .187          .187
NASD-100       .187          .239          .312          .302          .322          .354
ELECTRON       .173          .166          .166          .16           .166          .205
CHEM           .169          .15           .169          .15           .169          .169
NIFTY          .157          .21           .28           .263          .28           .315
DJI-13         .153          .23           .23           .23           .23           .307
BIGBANKS       .142          .142          .142          .285          .285          .285
COMPUTER       .142          .19           .19           .19           .238          .238
HACKERS        .142          .285          .285          .285          .285          .285
RETAIL         .132          .132          .169          .132          .169          .188
OILGAS         .127          .099          .12           .148          .184          .184
REGBANKS       .071          .035          .071          .107          .142          .214
CHINA          .051          .068          .068          .068          .086          .068
COAL           0             0             0             0             0             0
|
=====================================================================
5/31/2019
Treat the operative
Peerless signal to be a judged Sell S10. The Peerless
programs will have be revised this coming week to show that a close below
well-tested support, like we have recently seen at 25000, will automatically
produce a Selll S10. See some examples of H/S patterns and Sell S10s
here. http://www.tigersoft.com/PeerInst-2012-2013/HS-SellS10/index.html
Any recovery now back to 25200 will likely be a good place to sell short
ETFs like DIA and SPY.
The key indexes, including the DJIA, NYSE, NASDAQ, SP-500 and OEX
have all completed bearish head and shoulders patterns. This is not sinister
manipulation by anti-Trump bears. It is real and much more significant. It is
now world-wide.
 |
 |
 |
 |
 |
It has always been hard for our software to recognize every DJI head and
shoulders pattern. But that does not make them less trustworthy. Nor can
can it be argued that H/S patterns and Sell S10s can not successfully reverse
Peerless Buy signals.
What I find remarkable is that we see these same H/S patterns at important tops in
the DJIA from Wall Street's very beginning despite the great changes in the world
and in America. See below. Most reflect, I believe, a seed-change in the
thinking
among the richest one percent who own most stocks and their money managers's
view of the market.
The present case suggests that Wall Street Professionals still think that the current
market's situation can still be saved. But the heavy down-day volume I showed last
week warns that this will be very difficult. Somehow, they will need change the
minds of all the Big Sellers, including those overseas. Trump's thinking on following
his impulses will not wasily be changed. Those impulses now are seen as
"rogue"
by Bloomberg and others. Can he back-track and go for a big infrastrucure deal
with the Dems? Can he backoff on his very disruptive Tariffs on Mexico? Maybe,
but more likely not, I would judge.
Head and Shoulders DJI Patterns: 1900-1914
1893
1894
1895
1896 |
1901
1902
1903
1904 |
1909
1910
1911
1912 |
1913
1914
1915
1916 |
 |
What if the NYSE Market Professionals Start To
Aggressively Buy Leveraged Short ETFs, all at once?
It will get harder as each day passes now for the market Professionals
who ordinarily swoop in and out of leveraged ETFs with their programmed
trading to turn this market back up. The broken necklines are now resistance.
75% of all stocks and ETFs are now below their 65-dma. And looking at each
of the 200 or so Morningside sector funds shows a very wide variety now show
their own bearish H/S patterns. These should be shorted. Below is a partial
list:
Chemicals, Synthetics, Agricultural Chemicals, Specialty Chemicals,
Energy, Major Oil and Gas, Pipelines, Consumer Durables, Sporting Goods,
Auto Manufacturing, Beverages, Regional Banks, Saving & Loans, Brokerages,
Telecommunications, Internet, Wireless, CATV, Computer Hardware,
Processing, Property Management, Bankers, Farm Construction, Die Makers,
Pollution Control Equipment, General Construction and Contracting, Trucking,
and Small Tools...
|
Charts 5/31/2019 2019 PEERLESS DJI, Signals, Indicators Daily DJI Volume 10-DayUp/Down Vol Hourly DJIA A/D Line for All Stocks Inverted Traders Index NASDAQ S&P OEX NYSE COMPQX DJI-15 DJI-20 DJI-30 DIA SPY QQQ MDY IWM TNA Short-Term Rates USO-CrudeOil DBO FAS GLD BBH IBB JETS JNUG KOL NUGT OIH OIL RSX RETL SDS AGQ SLV SOXL TECL TLT TMF TNA UGA (gasoline) XIV and China: YINN CHAU Commodities: CANE CORN DBC JJC, NIB, CHOC CORN, CUT (paper) MOO, SOYB WEAT UUP (Dollar) LIT (Lithium) AAPL ADBE ALXN AMAT AMGN AMD AMZN BA BABA BAC BIDU CAT CVX DE FB GOOG GS HD IBM INTU JPM M (Macy's) MSFT NFLX NVDA QCOM TSLA TXN XOM WMT CMG , LRCX, SWKS, MDGL SPPI WATT SQ TOWN 5/31/19 (Click on Underlined link.) Bullish MAXCPs - http://tigersoft.com/MAXCPS/May-31/BULLISH.htm Bearish MAXCPs - http://tigersoft.com/MINCPs/May-31/BEARISH.htm |
Table 1 QUICKSILVER on ETFS - 5/31/19 All but GLD and RSX show 5-dma are falling... ETF CLOSE CHANGE PIVOT-PT 5-dmaAROC CL-PWR CANDLE IP21 ITRS --------------------------------------------------------------------------------------------- DIA 248.22 -3.65 256.12 -129% Bullish RED .072 0 --------------------------------------------------------------------------------------------- BA 341.61 -8.26 354.9 -127.1% Bullish RED .001 -.057 --------------------------------------------------------------------------------------------- SPY 275.27 -3.76 282.78 -122.5% Bullish RED -.001 .013 --------------------------------------------------------------------------------------------- QQQ 173.95 -2.82 178.16 -121.2% Bullish RED -.015 .003 --------------------------------------------------------------------------------------------- MDY 330.13 -3.38 339.95 -117.9% Bullish ---- .058 -.001 --------------------------------------------------------------------------------------------- IWM 145.86 -2.07 150.79 -118.3% Bullish RED .041 -.013 --------------------------------------------------------------------------------------------- FAS 63.67 -1.85 68.17 -243.2% Bullish BLUE .142 .057 --------------------------------------------------------------------------------------------- RETL 20.35 -.85 23.1 -599.4% Bearish RED -.185 -.245 --------------------------------------------------------------------------------------------- SOXL 106 -4.81 109.88 -310.3% Bullish RED -.032 -.197 --------------------------------------------------------------------------------------------- TECL 123.99 -6.43 131.84 -296.2% Bullish RED .017 -.048 --------------------------------------------------------------------------------------------- IBB 99.98 -1.81 104.2 -184.2% Bullish RED .085 -.081 --------------------------------------------------------------------------------------------- GLD 123.33 1.64 121.3 89.1% Bullish BLUE .167 .028 --------------------------------------------------------------------------------------------- OIH 13.08 -.36 13.81 -338.5% Bearish RED -.108 -.228 --------------------------------------------------------------------------------------------- RSX 21.64 -.06 21.62 55.6% ------- ---- .025 .046 |
Table 2    Count of Stocks in Key Directories
           2019-05-31
-------------------------------
NEWHIGHS       114
NEWLOWS        161
MAXCP          54
MINCP          46
TTTNH          43
TTTNL          66
FASTUP         46
FASTDOWN       140
CPCROSSA       124
CPCROSSD       35
BIGVOLUP       3
BIGVODN        13
ACCUMVER       6
HIGHIP21       3
HIUPPCT        11
LOWACCUM       153
REDSELL        82
AUGSELS7       11
TRAPDOOR       26
|
Table 3  RANKING OF KEY DIRECTORIES BASED PCT.OF STOCKS ABOVE 65-DMA
               5/31/19
Bullish = 3
Bearish = 41
---------------------------------------------------------------------------------------
Directory     Current       day-1         day-2         day-3         day-4         day-5
----------------------------------------------------------------------------------------
BONDFUND       .932          .912          .912          .912          .902          .893
INSURANC       .703          .777          .851          .777          .888          .851
SOLAR          .611          .611          .611          .555          .5            .555
===============================================================================================
EDU            .5            .5            .5            .5            .5            .5
-----------------------------------------------------------------------------------------------
UTILITY        .475          .4            .425          .525          .625          .625
HOMEBLDG       .47           .529          .588          .647          .647          .647
GUNS           .411          .47           .411          .529          .529          .529
JETS           .4            .4            .4            .5            .6            .5
REIT           .395          .382          .395          .55           .637          .61
FOOD           .388          .314          .314          .314          .222          .185
SOFTWARE       .354          .387          .387          .435          .435          .387
BEVERAGE       .352          .411          .47           .47           .529          .588
COMODITY       .35           .3            .275          .275          .2            .2
MILITARY       .344          .344          .344          .379          .413          .413
DOWJONES .333 .4 .466 .5 .566 .566 SP500 .318 .363 .361 .4 .444 .43 FIDSTKS .309 .358 .364 .375 .451 .434 GAMING .304 .26 .26 .26 .217 .217 RUS-1000 .287 .324 .325 .365 .412 .386 HACKERS .285 .285 .285 .285 .285 .333 GREEN .272 .227 .272 .318 .318 .318 GOLD .265 .081 .081 .081 .081 .081 SP-100 .26 .358 .38 .38 .478 .478 NASD-100 .239 .312 .302 .322 .364 .364 FINANCE .238 .318 .34 .363 .409 .34 AUTO .23 .256 .256 .256 .256 .256 DJI-13 .23 .23 .23 .23 .307 .307 INFRA .222 .222 .277 .305 .388 .277 BIOTECH .218 .237 .243 .27 .281 .259 ETFS .21 .175 .157 .157 .14 .14 NIFTY .21 .28 .263 .28 .315 .333 SEMI .207 .207 .198 .171 .189 .189 INDEXES .204 .182 .182 .225 .263 .252 COMPUTER .19 .19 .19 .238 .238 .19 ELECTRON .166 .166 .16 .166 .205 .179 INDMATER .151 .139 .151 .177 .177 .151 TRANSP .15 .25 .25 .3 .35 .3 BIGBANKS .142 .142 .285 .285 .285 .285 CHEM .134 .153 .134 .153 .173 .153 RETAIL .132 .169 .132 .169 .188 .207 HOSPITAL .13 .173 .217 .26 .217 .217 OILGAS .09 .111 .139 .174 .174 .16 CHINA .068 .068 .068 .086 .068 .068 REGBANKS .035 .071 .107 .142 .214 .107 COAL 0 0 0 0 0 0 |
====================================================================
5/30/2019
Treat a DJI close below 25000
as a Judged S10. Sell DIA and SPY.
Short more of our Bearish MINCPs. Head and Shoulders patterns are
very dangerous and this is a very old Bull Market.

The other general market indexes have already broken their necklines. You can
see Tiger automatic Sell S5s on most of them in this decline. Most bearish is
the way down-day volume has regularly been much higher on the down-days
than the up-days. Big money is rushing to the exits. More tariffs must be
expected without any FED intervention.

Now we see a break in the NYSE A/D Line uptrend. Turning bearish
is how we would have handled cases where the ADL is stronger than the
DJI, like in 2019. The closest parallel I can find is from 2002, where
despite low interest rates and a bullish DJI V-formation, the break in the
A/D Line on 5/21/2002 led to the DJI falling from 10106 to 7702 on 7/23.
The risk here, therefore, is that the DJI will now have fall back to 23000
or possibly even 21500.

The overall market turned very weak several weeks ago. On 5/13, a majority
of all stocks for the first time since January were below their 65-dma. and
the P-Indicator was negative. But even before that, on 5/6, the Opening Power
for DIA began falling very sharply as a result of Trump's 20% tariffs on Chinese
goods. I said then that we were going to start seeing a war between the weak
Openings and the still rising Closing Power. In effect, the overseas markets were
weakening dramatically and it would be up to NYSE Professionals to hold the
market up. But the Professionals, I warned, only had enough money to support
the key ETFs. The entire market was too much for them. The Professionals
have been helpful. But they are not fools. They know their limits and they
know when to switch to a new more powerful trend. That I think is now DOWN
based on the recently completed head and shoulders patterns.
A very high perentage of all stock is owned by the very wealthy. Overwhelmingly,
they have supported Trump's economic policies, apart from his tariffs. But there
is a point where they may abandon him and even turn on him, if his trade policies
appear too reckless. Perhaps, the best way that they now can communicate with him
their displeasure is to drive the stock market down, at least for a month or two
more, as in 2002. I say this because I see that an important wing of Wall Street,
those that depend on the Bloomberg News, not solely the Wall Street Journal,
seem to be rebelling. Today, Bloomberg's lead article declares Trump's new tariffs
on Mexico, America's third larget trading partner, a sign that he has gone
"rogue".
Many US corporations, not Mexico, will be hurt by his higher tariffs. Nor can
anyone tell how high these new tariffs will go. It will be entirely up to Trump to
decide
when Mexico is doing enough to stop the mass migrations north from brutalized and
war-torn Central America.
https://www.bloomberg.com/news/articles/2019-05-30/trump-to-impose-5-tariff-on-mexico-over-illegal-immigration?srnd=premium
  |
  |
  |
|
Charts 5/30/2019 2019 PEERLESS DJI, Signals, Indicators Daily DJI Volume 10-DayUp/Down Vol Hourly DJIA A/D Line for All Stocks Inverted Traders Index NASDAQ S&P OEX NYSE COMPQX DJI-15 DJI-20 DJI-30 DIA SPY QQQ MDY IWM TNA Short-Term Rates USO-CrudeOil DBO FAS GLD BBH IBB JETS JNUG KOL NUGT OIH OIL RSX RETL SDS AGQ SLV SOXL TECL TLT TMF TNA UGA (gasoline) XIV and China: YINN CHAU Commodities: CANE CORN DBC JJC, NIB, CHOC CORN, CUT (paper) MOO, SOYB WEAT UUP (Dollar) LIT (Lithium) AAPL ADBE ALXN AMAT AMGN AMD AMZN BA BABA BAC BIDU CAT CVX DE FB GOOG GS HD IBM INTU JPM M (Macy's) MSFT NFLX NVDA QCOM TSLA TXN XOM WMT CMG , LRCX, SWKS, MDGL SPPI WATT SQ TOWN 5/30/19 (Click on Underlined link.) Bullish MAXCPs - http://tigersoft.com/MAXCPS/May-30/BULLISH.htm Bearish MAXCPs - http://tigersoft.com/MINCPs/May-30/BEARISH.htm |
Table 1 QUICKSILVER on ETFS - 5/30/19 ETF CLOSE CHANGE PIVOT-PT 5-dmaAROC CL-PWR CANDLE IP21 ITRS --------------------------------------------------------------------------------------------- DIA 251.87 .6 254.76 -112.5% Bullish BLUE .098 ----- --------------------------------------------------------------------------------------------- BA 349.87 1.07 350.55 -41.3% Bullish RED .007 -.036 --------------------------------------------------------------------------------------------- SPY 279.03 .76 282.14 -117.1% Bullish ---- .006 .015 --------------------------------------------------------------------------------------------- QQQ 176.77 .74 178.25 -119.3% Bullish BLUE -.005 .014 --------------------------------------------------------------------------------------------- MDY 333.51 -.74 338.06 -148.6% Bullish RED .005 -.008 --------------------------------------------------------------------------------------------- IWM 147.93 -.41 149.39 -153.2% Bullish RED .019 -.018 --------------------------------------------------------------------------------------------- FAS 65.52 -.35 66.91 -296.7% Bullish RED .104 .035 --------------------------------------------------------------------------------------------- RETL 21.2 .12 23.01 -615.4% ------- RED -.253 -.241 --------------------------------------------------------------------------------------------- SOXL 110.81 2.47 112.81 -359.7% ------- BLUE -.021 -.194 --------------------------------------------------------------------------------------------- TECL 130.42 2.36 131.72 -323.8% Bullish BLUE .016 -.018 --------------------------------------------------------------------------------------------- IBB 101.79 .04 103.77 -139.7% Bullish RED .094 -.079 --------------------------------------------------------------------------------------------- GLD 121.69 .82 121.17 60% ------- BLUE -.003 .013 --------------------------------------------------------------------------------------------- OIH 13.44 -.26 14.01 -464.4% Bearish RED -.151 -.203 --------------------------------------------------------------------------------------------- RSX 21.7 -.04 21.4 0% ------- ---- -.026 .049 |
Table 2   Count of Stocks in Key Directories
          20190530
-------------------------------
NEWHIGHS       116
NEWLOWS        106
MAXCP          26
MINCP          40
TTTNH          22
TTTNL          73
FASTUP         28
FASTDOWN       167
CPCROSSA       71
CPCROSSD       61
BIGVOLUP       5
BIGVODN        9
ACCUMVER       8
HIGHIP21       2
HIUPPCT        11
LOWACCUM       137
REDSELL        80
AUGSELS7       8
TRAPDOOR       26
|
Table 3 RANKING OF KEY DIRECTORIES BASED PCT.OF STOCKS ABOVE 65-DMA
              5/30/19
 Bullish = 4
 Bearish = 41
---------------------------------------------------------------------------------------
Directory     Current       day-1         day-2         day-3         day-4         day-5
----------------------------------------------------------------------------------------
BONDFUND       .912          .912          .912          .902          .893          .902
INSURANC       .777          .851          .777          .888          .851          .925
SOLAR          .647          .647          .588          .529          .588          .647
HOMEBLDG       .529          .588          .647          .647          .647          .647
============================================================================================
EDU            .5            .5            .5            .5            .5            .5
GUNS           .47           .411          .529          .529          .529          .529
BEVERAGE       .411          .47           .47           .529          .588          .588
JETS           .4            .4            .5            .6            .5            .6
UTILITY        .4            .425          .525          .625          .625          .6
REIT           .387          .401          .557          .646          .612          .632
SOFTWARE       .387          .387          .435          .435          .387          .516
DOWJONES       .366          .433          .466          .533          .533          .566
SP500          .36           .358          .397          .441          .429          .488
FIDSTKS        .356          .362          .372          .448          .432          .481
SP-100         .351          .372          .372          .468          .468          .478
MILITARY       .344          .344          .379          .413          .413          .482
RUS-1000       .324          .325          .363          .414          .387          .452
FINANCE        .318          .34           .363          .409          .34           .443
FOOD           .314          .314          .314          .222          .185          .222
NASD-100       .312          .302          .322          .364          .364          .395
COMODITY       .3            .275          .275          .2            .2            .15
HACKERS        .285          .285          .285          .285          .333          .333
NIFTY          .28           .263          .28           .315          .333          .368
GAMING         .26           .26           .26           .217          .217          .26
AUTO           .256          .256          .256          .256          .256          .282
TRANSP         .25           .25           .3            .35           .3            .5
BIOTECH        .234          .243          .27           .281          .262          .295
DJI-13         .23           .23           .23           .307          .307          .384
GREEN          .227          .272          .318          .318          .318          .454
INFRA          .222          .277          .305          .388          .277          .416
SEMI           .207          .198          .171          .189          .189          .252
COMPUTER       .19           .19           .238          .238          .19           .285
INDEXES        .177          .182          .225          .263          .252          .295
ETFS           .175          .157          .157          .14           .14           .21
HOSPITAL       .173          .217          .26           .217          .217          .304
RETAIL         .169          .132          .169          .188          .207          .226
ELECTRON       .166          .16           .166          .205          .185          .237
BIGBANKS       .142          .285          .285          .285          .285          .285
INDMATER       .139          .151          .177          .177          .151          .177
CHEM           .137          .117          .137          .156          .156          .176
OILGAS         .12           .148          .184          .184          .17           .248
GOLD           .081          .081          .081          .081          .081          .061
REGBANKS       .071          .107          .142          .214          .107          .285
CHINA          .068          .068          .086          .068          .068          .068
COAL           0             0             0             0             0             0
|
====================================================================
5/29/2019
Today the DJI could not close
below the round number support at 25000 just
below the DJI's neckline at 25200. So, Peerless remains on its Buy signals
and that gives us hope for a Summer Rally starting now, perhaps like the one
that occurred in June1929, for example, when internals were much weaker than
now and there was also a DJI head/shoulders and the DJI had fallen to the
lower band late in May. In this case, the FED intervened to prevent a big sell-off.
They succeeded in that the DJI rose 20% over the next 13 weeks, but then
they failed dramatically because the speculative bubble could no longer be
inflated.

The influential D.J. Transportation Index needs to rally now.
But will it just be forming a big new Head/Shoulders top
as a result of a June rally?

But how much of a rally can we get if the FED sits on its hands
and there is no end to the trade war with China and now Europe? Yes, how
much of a rally can a DJI bounce here bring? We will need to see a broad
advance because so many of the other key indexes and ETFs have now
broken their necklines. Stay long DIA and SPY, but don't cover
the
Bearish MINCPs that you've shorted to be hedged while we wait to
see how all these bearish head/shoulders are resolved.
Close 5/29 Broken
Neckline and Resistance now
-----------
-----------------------------------
AAPL 277.38
182.
COMPQX 7547.31
7670. (NASDAQ)
DIA
251.37
252.50
DJIA-30 25126
25220
NYSE 12506
12866
OEX 1231.97
1240.86

Classic technical analysis (Edwards and Maggee, for example) warns that
that we should not be fooled by a low volume rally recovery of about
1/3 the recent price movement down. So, we need to watch the volume
on the recovery of these ETFs and INDEXes as well as the DJI's. One of
the warning signs recently, in fact, has been how down-day volumes
have been consistently greater than the volume on up-days.
We are told that the 10-years rates dropping below the Over-Night
rates shows a world-wide Recession is nearing. Perhaps, but American
stocks enjoy lots of advantages over foreign stocks and our blue-chips
|
and bonds act as a haven for foreign wealth provided the Dollar remains
strong. That remains true now.

But smaller US stocks are more vulnerable in any slow-down and
in any period where Big Money favors blue chips and bonds to
speculative investments. Avoid buying smaller stocks or IWM
while our Index of All Stocks shows a declining percentage of
stocks above the 65-dma and the ratio of Bearish Groups in
Table 3 is 3x the number of Bullish Groups.
|
Charts 5/29/2019 2019 PEERLESS DJI, Signals, Indicators Daily DJI Volume 10-DayUp/Down Vol Hourly DJIA A/D Line for All Stocks Inverted Traders Index NASDAQ S&P OEX NYSE COMPQX DJI-15 DJI-20 DJI-30 DIA SPY QQQ MDY IWM TNA Short-Term Rates USO-CrudeOil DBO FAS GLD BBH IBB JETS JNUG KOL NUGT OIH OIL RSX RETL SDS AGQ SLV SOXL TECL TLT TMF TNA UGA (gasoline) XIV and China: YINN CHAU Commodities: CANE CORN DBC JJC, NIB, CHOC CORN, CUT (paper) MOO, SOYB WEAT UUP (Dollar) LIT (Lithium) AAPL ADBE ALXN AMAT AMGN AMD AMZN BA BABA BAC BIDU CAT CVX DE FB GOOG GS HD IBM INTU JPM M (Macy's) MSFT NFLX NVDA QCOM TSLA TXN XOM WMT CMG , LRCX, SWKS, MDGL SPPI WATT SQ TOWN 5/29/19 (Click on Underlined link.) Bullish MAXCPs - http://tigersoft.com/MAXCPS/May-29/BULLISH.htm Bearish MAXCPs - http://tigersoft.com/MINCPs/May-29/BEARISH.htm |
Table 1 QUICKSILVER on ETFS - 5/29/19 ETF CLOSE CHANGE PIVOT-PT 5-dmaAROC CL-PWR CANDLE IP21 ITRS --------------------------------------------------------------------------------------------- DIA 251.27 -2.2 257.6 -146.4% Bullish RED .103 0 --------------------------------------------------------------------------------------------- BA 348.8 -6.08 352.78 -140.4% Bullish RED .004 -.033 --------------------------------------------------------------------------------------------- SPY 278.27 -1.88 285.63 -145.4% Bullish RED .036 .015 --------------------------------------------------------------------------------------------- QQQ 176.03 -1.46 181.02 -161.7% Bullish RED .006 .016 --------------------------------------------------------------------------------------------- MDY 334.25 -1.87 343.57 -179.6% Bullish RED .078 -.008 --------------------------------------------------------------------------------------------- IWM 148.34 -1.25 152.53 -181.2% Bullish RED .043 -.018 --------------------------------------------------------------------------------------------- FAS 65.87 -.69 69.52 -291.1% Bullish BLUE .143 .023 --------------------------------------------------------------------------------------------- RETL 21.08 -1.48 24 -920.8% Bearish RED -.091 -.254 --------------------------------------------------------------------------------------------- SOXL 108.34 1.45 118.82 -800.2% Bullish BLUE-.007 -.179 --------------------------------------------------------------------------------------------- TECL 128.06 -2.27 138.98 -486.6% Bullish BLUE .021 -.029 --------------------------------------------------------------------------------------------- IBB 101.75 -1.15 104.68 -125% Bullish RED .086 -.077 --------------------------------------------------------------------------------------------- GLD 120.87 .04 120.24 21.1% Bearish RED -.053 .012 --------------------------------------------------------------------------------------------- OIH 13.7 -.02 14.74 -548.6% Bearish BLUE-.176 -.189 --------------------------------------------------------------------------------------------- RSX 21.74 .35 21.7 41.8% ------- BLUE .016 .05 |
  Table 2  Count of Stocks in Key Directories
            20190529
-------------------------------
NEWHIGHS       70
NEWLOWS        98
MAXCP          22
MINCP          25
TTTNH          20
TTTNL          59
FASTUP         32
FASTDOWN       205
CPCROSSA       104
CPCROSSD       68
BIGVOLUP       3
BIGVODN        11
ACCUMVER       10
HIGHIP21       6
HIUPPCT        11
LOWACCUM       154
REDSELL        78
AUGSELS7       7
TRAPDOOR       25
|
Table 3 RANKING OF KEY DIRECTORIES BASED PCT.OF STOCKS ABOVE 65-DMA
5/29/19
Bullish= 4
Bearish = 40
---------------------------------------------------------------------------------------
Directory Current day-1 day-2 day-3 day-4 day-5
----------------------------------------------------------------------------------------
BONDFUND .912 .912 .902 .893 .902 .912
INSURANC .851 .777 .888 .851 .925 .925
SOLAR .647 .588 .529 .588 .647 .647
HOMEBLDG .588 .647 .647 .647 .647 .764
==========================================================================================
EDU .5 .5 .5 .5 .5 .5
==========================================================================================
BEVERAGE .47 .47 .529 .588 .588 .588
DOWJONES .433 .466 .533 .533 .566 .533
UTILITY .425 .525 .625 .625 .6 .6
GUNS .411 .529 .529 .529 .529 .47
REIT .401 .557 .646 .612 .632 .632
JETS .4 .5 .6 .5 .6 .6
SOFTWARE .387 .435 .435 .387 .516 .532
SP-100 .372 .372 .468 .468 .478 .51
FIDSTKS .362 .372 .448 .432 .481 .529
SP500 .358 .397 .441 .429 .486 .513
MILITARY .344 .379 .413 .413 .482 .551
FINANCE .34 .363 .409 .34 .443 .534
RUS-1000 .325 .363 .412 .388 .452 .474
FOOD .314 .314 .222 .185 .222 .296
NASD-100 .302 .322 .364 .364 .395 .427
BIGBANKS .285 .285 .285 .285 .285 .714
HACKERS .285 .285 .285 .333 .333 .333
INFRA .277 .305 .388 .277 .416 .444
COMODITY .275 .275 .2 .2 .15 .25
GREEN .272 .318 .318 .318 .454 .454
NIFTY .263 .28 .315 .333 .368 .438
GAMING .26 .26 .217 .217 .26 .304
AUTO .256 .256 .256 .256 .282 .333
TRANSP .25 .3 .35 .3 .5 .5
BIOTECH .241 .271 .282 .263 .295 .328
DJI-13 .23 .23 .307 .307 .384 .384
HOSPITAL .217 .26 .217 .217 .304 .304
SEMI .198 .171 .189 .189 .252 .261
COMPUTER .19 .238 .238 .19 .285 .38
INDEXES .182 .225 .263 .252 .295 .354
ELECTRON .159 .165 .203 .184 .235 .254
ETFS .157 .157 .14 .14 .21 .228
INDMATER .151 .177 .177 .151 .177 .177
OILGAS .148 .184 .184 .17 .248 .304
CHEM .134 .153 .173 .173 .192 .173
RETAIL .132 .169 .188 .207 .226 .264
REGBANKS .107 .142 .214 .107 .285 .464
GOLD .081 .081 .081 .081 .061 .061
CHINA .068 .086 .068 .068 .068 .086
COAL 0 0 0 0 0 0
|
====================================================================
5/28/2019
The key indexes have reached
"high inflection" points. These are the neckline in
their head and shoulders patterns. We watch the DJI most closely, but you
can see the head/shoulder patterns when looking at the SP-500, OEX,
NASDAQ, NYSE and QQQ. I take the DJI's neckline to be at 25200
with support existing still down to 25000. A close below 25000 will be
treated as a Sell S10, but a DJI close back above its neckline by say
100 points, above 25300, will suggest a rally. In the DJI's case another
a rally to 26000 would be likely first. If 26000 is surpassed, then the whole
pattern will look like it has been aborted.
Head/Shoulders Patterns
when completed are reliably bearish
and should be treated as giving Sell S10 or S5 signals.
We don't know what the bearish reasons are for these patterns now.
It is enough for us to see how hastily the sellers who do know are unloading their
shares..
 |
 |
 |
 |
 |
By themselves, about 20% of the head/shoulders patterns can still be
saved after a decline to their neckline, but 75%, at least, bring declines
that fall to their classic minimum target (measured by the height of the pattern
subtracted from the neckline). Perhaps, another 5% just move only small a
amounts away from the neckline for a month.
How can we tell if the neckline will be violated? Some
patterns that bring
bring break-downs are obvious in that there have been multiple Peerless
Sells and non-confirmations. Others, like ours are not so clear-cut. For
example,
the ETFs' for these indexes still show rising Closing Powers. See Table 1.
And Peerless has given no Sell here, though the turning negative of the P-Indicator
on our DJIA chart after being positive for 80+ days may be compared to the 1971
top when a classic DJI head/shoulders pattern unfolded which soon followed the
P-Indicator going negative after 100 straight positive days.
There are many scary technical signs in our situation.
First, the presence of
head/shoulders patterns in all the other indexes shows widespread vulnerability.
Secondly, the very heavy down-day volume recently compared to the up-days
indicates aggressive dumping by big institutions. They are frightened!
Thirdly,
the fact that 67% of all stocks and ETFs are now below their 65-dma undercuts
a bullish interpretation of the NYSE A/D Line's strength until recently. Fourthly,
when the A/D Line has been stronger than the DJI, like now, it has always
(1976, 1977, 2001 and 2002) been a good idea to Sell finally when the NYSE
A/D Line was penetrated. Following that approach now, it looks as though we
should be Sellers. Interest rates, set where they are now, have done about all
they can in lifting Utilities and dividend-paying stocks. It's not clear where the
new
leadership will come from.
My conclusion: if the DJI closes below 25000, Sell all long
positions in DIA
and SPY, despite the Peerless buy signals that still show on our current chart, and
treat the operative Peerless signal to be a Sell S10. Add to your short positions
from among our Bearish MINCPs.
|
Charts 5/28/2019 2019 PEERLESS DJI, Signals, Indicators Daily DJI Volume 10-DayUp/Down Vol Hourly DJIA A/D Line for All Stocks Inverted Traders Index NASDAQ S&P OEX NYSE COMPQX DJI-15 DJI-20 DJI-30 DIA SPY QQQ MDY IWM TNA Short-Term Rates USO-CrudeOil DBO FAS GLD BBH IBB JETS JNUG KOL NUGT OIH OIL RSX RETL SDS AGQ SLV SOXL TECL TLT TMF TNA UGA (gasoline) XIV and China: YINN CHAU Commodities: CANE CORN DBC JJC, NIB, CHOC CORN, CUT (paper) MOO, SOYB WEAT UUP (Dollar) LIT (Lithium) AAPL ADBE ALXN AMAT AMGN AMD AMZN BA BABA BAC BIDU CAT CVX DE FB GOOG GS HD IBM INTU JPM M (Macy's) MSFT NFLX NVDA QCOM TSLA TXN XOM WMT CMG , LRCX, SWKS, MDGL SPPI WATT SQ TOWN 5/28/19 (Click on Underlined link.) Bullish MAXCPs - http://tigersoft.com/MAXCPS/May-28/BULLISH.htm Bearish MAXCPs - http://tigersoft.com/MINCPs/May-28/BEARISH.htm |
Table 1 QUICKSILVER on ETFS - 5/28/19 ETF CLOSE CHANGE PIVOT-PT 5-dmaAROC CL-PWR CANDLE IP21 ITRS --------------------------------------------------------------------------------------------- DIA 253.47 -2.65 258.77 -62.3% Bullish RED .087 ----- --------------------------------------------------------------------------------------------- BA 354.88 -.02 358.75 29.5% Bullish RED -.012 -.045 --------------------------------------------------------------------------------------------- SPY 280.15 -2.63 286.51 -66.9% Bullish RED .022 .015 --------------------------------------------------------------------------------------------- QQQ 177.49 -.67 181.83 -68.4% Bullish RED .016 .014 --------------------------------------------------------------------------------------------- MDY 336.12 -3.83 346.49 -85.8% Bullish RED .047 -.006 --------------------------------------------------------------------------------------------- IWM 149.59 -1.2 153.82 -72.2% Bullish RED .029 -.015 --------------------------------------------------------------------------------------------- FAS 66.56 -1.61 69.84 -121.1% Bullish RED .101 .04 --------------------------------------------------------------------------------------------- SOXL 106.89 -2.99 126.75 -525.9% ------- RED -.038 -.205 --------------------------------------------------------------------------------------------- TECL 130.33 -1.51 141.18 -219.1% Bullish RED .003 -.011 --------------------------------------------------------------------------------------------- IBB 102.9 -1.3 104.35 27.9% Bullish RED .092 -.08 --------------------------------------------------------------------------------------------- GLD 120.83 -.47 120.36 7.9% Bearish --- -.023 .001 --------------------------------------------------------------------------------------------- OIH 13.72 -.09 15.27 -463% Bearish RED -.238 -.174 --------------------------------------------------------------------------------------------- RSX 21.39 -.23 21.56 41.9% Bearish RED -.026 .044 |
 Table 2   Count of Stocks in Key Directories
           2019-05-28
-------------------------------
NEWHIGHS       113
NEWLOWS        91
MAXCP          28
MINCP          49
TTTNH          31
TTTNL          76
FASTUP         34
FASTDOWN       138
CPCROSSA       38
CPCROSSD       129
BIGVOLUP       3
BIGVODN        26
ACCUMVER       13
HIGHIP21       5
HIUPPCT        14
LOWACCUM       144
REDSELL        78
AUGSELS7       8
TRAPDOOR       23
|
Table 3  RANKING OF KEY DIRECTORIES BASED PCT.OF STOCKS ABOVE 65-DMA
              5/28/19
Bullish 7
Bearish 36
---------------------------------------------------------------------------------------
Directory     Current       day-1         day-2         day-3         day-4         day-5
----------------------------------------------------------------------------------------
BONDFUND       .912          .902          .893          .902          .922          .902
INSURANC       .777          .888          .851          .925          .925          .962
HOMEBLDG       .647          .647          .647          .647          .764          .647
SOLAR          .588          .529          .588          .647          .647          .529
REIT           .557          .646          .612          .632          .632          .544
GUNS           .529          .529          .529          .529          .47           .47
UTILITY        .525          .625          .625          .6            .6            .6
------------------------------------------------------------------------------------------------
EDU            .5            .5            .5            .5            .5            .5
JETS           .5            .6            .5            .6            .6            .6
------------------------------------------------------------------------------------------------
BEVERAGE       .47           .529          .588          .588          .588          .529
DOWJONES       .466          .533          .533          .566          .5            .5
SOFTWARE       .435          .435          .387          .516          .532          .483
SP500          .397          .441          .429          .486          .509          .433
MILITARY       .379          .413          .413          .482          .551          .379
FIDSTKS        .372          .448          .432          .481          .518          .432
SP-100         .372          .468          .468          .478          .5            .414
FINANCE        .363          .409          .34           .443          .522          .397
RUS-1000       .363          .412          .387          .453          .473          .407
NASD-100       .322          .364          .364          .395          .427          .406
GREEN          .318          .318          .318          .454          .454          .409
FOOD           .314          .222          .185          .222          .296          .277
INFRA          .305          .388          .277          .416          .444          .388
TRANSP         .3            .35           .3            .5            .5            .45
BIGBANKS       .285          .285          .285          .285          .571          .285
HACKERS        .285          .285          .333          .333          .333          .333
NIFTY          .28           .315          .333          .368          .438          .35
COMODITY       .275          .2            .2            .15           .25           .225
BIOTECH        .267          .281          .262          .295          .327          .262
GAMING         .26           .217          .217          .26           .304          .304
HOSPITAL       .26           .217          .217          .304          .304          .26
AUTO           .256          .256          .256          .282          .333          .333
COMPUTER       .238          .238          .19           .285          .38           .285
DJI-13         .23           .307          .307          .384          .384          .384
INDEXES        .225          .263          .252          .295          .354          .274
OILGAS         .184          .184          .17           .248          .312          .262
INDMATER       .177          .177          .151          .177          .177          .151
SEMI           .171          .189          .189          .252          .261          .216
RETAIL         .169          .188          .207          .226          .264          .207
ELECTRON       .165          .203          .184          .235          .248          .222
ETFS           .157          .14           .14           .21           .228          .122
CHEM           .153          .173          .173          .192          .192          .192
REGBANKS       .142          .214          .107          .285          .428          .285
CHINA          .086          .068          .068          .068          .086          .068
GOLD           .081          .081          .081          .061          .061          .061
COAL           0             0             0             0             0             0
|
=====================================================================
5/24/2019
Only 36% of all stocks and ETFs are
above their 65-dma. So, it will be
up to the key ETFs, DJI and SPY, to generate an advance here. Continue
to use some bearish MINCPs as hedging short-sales. Note that Up-day volume
was again suspiciously low on Friday, even as Peerless still refuses to give a
Sell.
Look at the bull market in defensive bonds and utilities. Is this a signal?
Perhaps,
it means the FEDs will drop rates down to 2%. With the FED's help, the key
indexes (DJI, SP-500, OEX, NYSE, NASDAQ and QQQ) may be able to
avoid breaking their H/S Pattern's necklines right now. This is what happened
at the end of May 1929 when the market's internals were much weaker than now.
(Of course, the FED's intervention then only delayed the 1929 Crash by a few
months and made the diving-board that much higher. See Thursday night's Hotline
for this chart.)
Current DJI remains on Peerless Buys, but H/S Patterns Are Dangerous,
particularly 10+ Years into a bull market that has not seen a 20+% decline.


Usually, when prices come down from a right shoulder to test
the neckline, they do break the support. But with some help from
markedly lower interest rates and the bullishness of pre- and
post-Memorial Day trading, the neckline supports may hold like
they did in May 1929 or in the H/S patterns shown further below.
Our short-term traders, should buy DIA and SPY again on weakness
Monday, with the DJIA above 25300, provided they to use Sell Stops
just underneath their necklines, and reckoning the DJI's key support
to be 25000.
As you can see in the sample historical charts tonight, their 65-dma and the apex
of
the right shouders in their H/S patterns should be considered their
short-term resistance-targets. Closes just above the apex of their right shoulders
apexes are usually "release points", where spirited rallies are likely to begin.
That Peerless has not given a Sell signal is bullish. So, is the intermediate-term
seasonality for all 3rd Years and for 3rd Years with a Republican President in
the White House. See the statistics below.
|
Charts 5/24/2019 2019 PEERLESS DJI, Signals, Indicators Daily DJI Volume 10-DayUp/Down Vol Hourly DJIA A/D Line for All Stocks Inverted Traders Index NASDAQ S&P OEX NYSE COMPQX DJI-15 DJI-20 DJI-30 DIA SPY QQQ MDY IWM TNA Short-Term Rates USO-CrudeOil DBO FAS GLD BBH IBB JETS JNUG KOL NUGT OIH OIL RSX RETL SDS AGQ SLV SOXL TECL TLT TMF TNA UGA (gasoline) XIV and China: YINN CHAU Commodities: CANE CORN DBC JJC, NIB, CHOC CORN, CUT (paper) MOO, SOYB WEAT UUP (Dollar) LIT (Lithium) AAPL ADBE ALXN AMAT AMGN AMD AMZN BA BABA BAC BIDU CAT CVX DE FB GOOG GS HD IBM INTU JPM M (Macy's) MSFT NFLX NVDA QCOM TSLA TXN XOM WMT CMG , LRCX, SWKS, MDGL SPPI WATT SQ TOWN 5/24/19 (Click on Underlined link.) Bullish MAXCPs - http://tigersoft.com/MAXCPS/May-24/BULLISH.htm Bearish MAXCPs - http://tigersoft.com/MINCPs/May-24/BEARISH.htm |
Seasonality after May 27th.
in Years before A Presidential Election
(1967 - ...1971...1975...2011... -2015)
Holding Avg. Pct
Pct.of
Period Gain
Years Up
-------- ---------
----------
1 Trading Day .003
.688
3 Trading Days .010
.813
5 Trading Days .010
.563
10 Trading Days .016
.755
21 Trading Days .021
.755
42 Trading Days .042
.755
65 Trading Days .06
.813
130 Trading Days .11
.813
DJI When a Republican was in Office
in Year before Presidential Election
5/27 6/27
7/27
8/27
1923 96.70
88.70
88.40
92.50 TeaPot Dome
Scandal
1927 172.20
165.70
180.10 188.80 Lower Rates
1955 425.7
449.9
468.5
463.7
1959 636.7
639.3
669.1
663.3
1971 905.78
876.68 880.7
908.15
1975 826.11
873.12
834.09 807.2
1983 1216.14 1229.47
1230.47 1192.97
1987 2295.81 2436.86
2493.94 2675.06 (major top))
1991 2913.91 2934.93
2972.5 3026.16
6 up 7 up
6 up
3 down 2 down 3 down
Examples of What
Happens when Prices Rise above right shoulder Apex:
Example: INTU

DJI Example from 1987
DJI Example from 1996

DJI Example from 2009

DJI Example from 2013

Table 1 QUICKSILVER on ETFS - 5/24/19 ETF CLOSE CHANGE PIVOT-PT 5-dmaAROC CL-PWR CANDLE IP21 ITRS --------------------------------------------------------------------------------------------- DIA 256.12 1.36 256.67 -25.7% Bullish RED .174 0 --------------------------------------------------------------------------------------------- BA 354.9 4.35 352.79 -1.7% Bullish RED .019 -.044 --------------------------------------------------------------------------------------------- SPY 282.78 .64 283.95 -53.7% Bullish RED .091 .011 --------------------------------------------------------------------------------------------- QQQ 178.16 -.09 179.95 -134.9% Bullish RED .076 .014 --------------------------------------------------------------------------------------------- MDY 339.95 1.89 341.99 -65% Bullish BLUE .116 -.01 --------------------------------------------------------------------------------------------- IWM 150.79 1.4 151.78 -67.4% Bullish BLUE .095 -.018 --------------------------------------------------------------------------------------------- FAS 68.17 1.26 68.22 -32.8% Bullish BLUE .153 .066 --------------------------------------------------------------------------------------------- RETL 23.1 .09 24.57 -353% ------- BLUE-.004 -.2 --------------------------------------------------------------------------------------------- SOXL 109.88 -2.93 119.25 -1044.2% Bullish RED .034 -.128 --------------------------------------------------------------------------------------------- TECL 131.84 .12 136.29 -437.4% Bullish RED .07 .022 --------------------------------------------------------------------------------------------- IBB 104.2 .43 102.32 20.7% Bullish BLUE .161 -.072 --------------------------------------------------------------------------------------------- OIH 13.81 -.2 15.07 -431.4% Bearish RED -.185 -.188 --------------------------------------------------------------------------------------------- RSX 21.62 .22 21.21 112.1% Bearish RED .002 .054 Table 2 Count of Stocks in Key Directories
2019-05-24
-------------------------------
NEWHIGHS 132
NEWLOWS 45
MAXCP 40
MINCP 28
TTTNH 29
TTTNL 36
FASTUP 42
FASTDOWN 133
CPCROSSA 51
CPCROSSD 41
BIGVOLUP 3
BIGVODN 7
ACCUMVER 12
HIGHIP21 4
HIUPPCT 13
REDSELL 71
AUGSELS7 10
TRAPDOOR 24
|
 Table 3   RANKING OF KEY DIRECTORIES BASED PCT.OF STOCKS ABOVE 65-DMA
              5/24/19
 Bullish = 10
 Bearish = 34
---------------------------------------------------------------------------------------
Directory     Current       day-1         day-2         day-3         day-4         day-5
----------------------------------------------------------------------------------------
BONDFUND       .902          .893          .902          .922          .912          .902
INSURANC       .888          .851          .925          .925          .962          .925
HOMEBLDG       .647          .647          .647          .764          .647          .705
REIT           .646          .612          .632          .632          .551          .693
UTILITY        .625          .625          .6            .6            .6            .55
JETS           .6            .5            .6            .6            .6            .6
DOWJONES       .533          .533          .566          .5            .5            .466
BEVERAGE       .529          .588          .588          .588          .529          .529
GUNS           .529          .529          .529          .47           .47           .47
SOLAR          .529          .588          .647          .647          .529          .588
N=10
============================================================================================
EDU            .5            .5            .5            .5            .5            .333
============================================================================================
SP-100         .468          .468          .478          .5            .436          .436
FIDSTKS        .448          .432          .481          .518          .437          .459
SP500          .441          .429          .486          .509          .448          .474
SOFTWARE       .435          .387          .516          .532          .5            .532
MILITARY       .413          .413          .482          .551          .379          .448
RUS-1000       .412          .387          .452          .474          .419          .453
FINANCE        .409          .34           .443          .522          .42           .352
INFRA          .388          .277          .416          .444          .388          .416
NASD-100       .364          .364          .395          .427          .406          .468
TRANSP         .35           .3            .5            .5            .45           .45
GREEN .318 .318 .454 .454 .409 .454 NIFTY .315 .333 .368 .438 .368 .456 DJI-13 .307 .307 .384 .384 .384 .307 BIGBANKS .285 .285 .285 .571 .285 .285 HACKERS .285 .333 .333 .333 .333 .333 BIOTECH .278 .262 .295 .327 .273 .303 INDEXES .263 .252 .295 .354 .274 .37 AUTO .256 .256 .282 .333 .333 .256 COMPUTER .238 .19 .285 .38 .285 .285 FOOD .222 .185 .222 .296 .24 .203 GAMING .217 .217 .26 .304 .304 .347 HOSPITAL .217 .217 .304 .304 .26 .26 REGBANKS .214 .107 .285 .428 .25 .214 ELECTRON .203 .184 .235 .248 .222 .312 COMODITY .2 .2 .15 .25 .225 .2 SEMI .189 .189 .252 .261 .225 .333 RETAIL .188 .207 .226 .264 .226 .207 OILGAS .184 .17 .248 .312 .262 .262 INDMATER .177 .151 .177 .177 .151 .189 CHEM .173 .173 .192 .192 .211 .211 ETFS .14 .14 .21 .228 .14 .157 GOLD .081 .081 .061 .061 .061 .061 CHINA .068 .068 .068 .086 .068 .086 COAL 0 0 0 0 0 0 N=34 |
====================================================================
The FED may want a Summer Rally, after all.
5/23/2019
Is the Fed quietly pushing interest rates down to support the market
and bring a Summer Rally despite the menacing head and shoulders and
scary talk about Trump's tariffs. A pre- and post-Memorial Day bounce
now should not come as a surprise. I think that we should watch the key 65-day mvg.
average - resistance levels now. If they are surpassed, I would judge the
neckline-tests to be successful and buy more DIA and SPY, but not QQQ.
Among the past charts that we can look at for guidance is the DJI's in the
Summer of 1929 soon after the FED intervened to support the stock market
at its key support level.
FED's INTERVENTION IN 1929 BROUGHT A 20% SUMMER RALLY,
From Memorial Day to September 3rd.
(Fed polcies in 1929 were half-hearted and erratic. They make an interesting story.
They new the
stock market was overheating, but they were also concerned not to weaken an economy that
was
slowing down. The NY Fed had exceptional power and was more concerned about stock
market
Professionals. Making matters worse, half of all loans were going to trade stocks in
the middle of
1929 with many outside coporations getting in on this profitable business. Details
will be presented
in a new detailed Peerless manual of the years 1915-1941. See also:
https://fraser.stlouisfed.org/docs/meltzer/bogsub110130.pdf
http://library.cqpress.com/cqresearcher/document.php?id=cqresrre1929060800
)

CURRENT DJIA
Peerless Buy Signals versus Multiple Un-Completed
Head/Shoulders

SPY

The NASDAQ is now under-performing the DJI and did
slightly break
below its neckline. This is very clear-cut H/S pattern. It
will need to rise
above its right-shoulder apex for the pattern to be voided.

FED'S DOVISH INTERVENTION?
Interest rates fell considerably today. Is the FED now going to lower interest rates
to hold up and then boost the stock market this Summer.


The drop in the 10-year and short-term rates did push up Utilities again today.
More important, it also encouraged Professionals to support the key indexes at their
very important necklines. But it remains unclear if speculative moneys will return
to normal equities on the next rally. We will have to see a break in the downtrend
of our Nifty High Tech Index.
NIFTY HIGH TECHS

|
Charts 5/23/2019 2019 PEERLESS DJI, Signals, Indicators Daily DJI Volume 10-DayUp/Down Vol Hourly DJIA A/D Line for All Stocks Inverted Traders Index NASDAQ S&P OEX NYSE COMPQX DJI-15 DJI-20 DJI-30 DIA SPY QQQ MDY IWM TNA Short-Term Rates USO-CrudeOil DBO FAS GLD BBH IBB JETS JNUG KOL NUGT OIH OIL RSX RETL SDS AGQ SLV SOXL TECL TLT TMF TNA UGA (gasoline) XIV and China: YINN CHAU Commodities: CANE CORN DBC JJC, NIB, CHOC CORN, CUT (paper) MOO, SOYB WEAT UUP (Dollar) LIT (Lithium) AAPL ADBE ALXN AMAT AMGN AMD AMZN BA BABA BAC BIDU CAT CVX DE FB GOOG GS HD IBM INTU JPM M (Macy's) MSFT NFLX NVDA QCOM TSLA TXN XOM WMT CMG , LRCX, SWKS, MDGL SPPI WATT SQ TOWN 5/23/19 (Click on Underlined link.) Bullish MAXCPs - http://tigersoft.com/MAXCPS/May-23/BULLISH.htm Bearish MAXCPs - http://tigersoft.com/MINCPs/May-23/BEARISH.htm |
Table 1 QUICKSILVER on ETFS - 5/23/19 ETF CLOSE CHANGE PIVOT-PT 5-dmaAROC CL-PWR CANDLE IP21 ITRS
---------------------------------------------------------------------------------------------
DIA 254.76 -2.84 257.44 -85.3% Bullish RED .175 =====
---------------------------------------------------------------------------------------------
BA 350.55 -2.23 355.02 -46% Bullish BLUE .091 -.06
---------------------------------------------------------------------------------------------
SPY 282.14 -3.49 285.84 -97.2% Bullish RED .111 .013
---------------------------------------------------------------------------------------------
QQQ 178.25 -2.77 183.04 -183.4% Bullish RED .107 .017
---------------------------------------------------------------------------------------------
MDY 338.06 -5.51 344.41 -153.9% Bullish RED .099 -.012
---------------------------------------------------------------------------------------------
IWM 149.39 -3.14 152.84 -183.1% Bullish RED .085 -.026
---------------------------------------------------------------------------------------------
FAS 66.91 -2.61 68.62 -208.1% Bullish RED .158 .062
---------------------------------------------------------------------------------------------
RETL 23.01 -.99 24.82 -461.2% Bearish RED -.023 -.235
---------------------------------------------------------------------------------------------
SOXL 112.81 -6.01 135.49 -1210.2% Bullish BLUE .06 -.116
---------------------------------------------------------------------------------------------
TECL 131.72 -7.26 143.95 -567.3% Bullish RED .086 .031
---------------------------------------------------------------------------------------------
IBB 103.77 -.91 103.77 -32.2% Bullish ---- .202 -.074
---------------------------------------------------------------------------------------------
OIH 14.01 -.73 15.09 -521.4% Bearish RED -.198 -.169
---------------------------------------------------------------------------------------------
RSX 21.4 -.3 21.14 39.8% Bearish RED .007 .047
|
Table 2    Count of Stocks in Key Directories
           2019-05-23
-------------------------------
NEWHIGHS       119
NEWLOWS        112
MAXCP          64
MINCP          38
TTTNH          30
TTTNL          59
FASTUP         33
FASTDOWN       148
CPCROSSA       31
CPCROSSD       135
BIGVOLUP       3
BIGVODN        15
ACCUMVER       13
HIGHIP21       7
HIUPPCT        14
LOWACCUM       156
REDSELL        71
AUGSELS7       13
TRAPDOOR       25
|
Table 3   RANKING OF KEY DIRECTORIES BASED PCT.OF STOCKS ABOVE 65-DMA
              5/23/19
Bullish = 9
Bearish = 34
---------------------------------------------------------------------------------------
Directory     Current       day-1         day-2         day-3         day-4         day-5
----------------------------------------------------------------------------------------
BONDFUND       .892          .901          .921          .911          .911          .901
INSURANC       .851          .925          .925          .962          .925          .962
HOMEBLDG       .647          .647          .764          .647          .705          .764
UTILITY        .625          .6            .6            .6            .575          .575
REIT           .612          .632          .632          .551          .687          .741
BEVERAGE       .588          .588          .588          .529          .529          .588
SOLAR          .588          .647          .647          .529          .588          .764
DOWJONES       .533          .566          .5            .5            .466          .466
GUNS           .529          .529          .47           .47           .47           .47
===============================================================================================
EDU            .5            .5            .5            .5            .333          .666
JETS           .5            .6            .6            .6            .6            .6
===============================================================================================
SP-100         .468          .478          .5            .436          .436          .478
FIDSTKS        .432          .481          .518          .437          .459          .497
SP500          .429          .486          .509          .448          .474          .507
MILITARY       .413          .482          .551          .379          .448          .448
RUS-1000       .387          .452          .473          .42           .453          .492
SOFTWARE       .387          .516          .532          .5            .532          .548
NASD-100       .364          .395          .427          .406          .468          .51
FINANCE        .34           .443          .522          .42           .352          .443
HACKERS        .333          .333          .333          .333          .333          .428
NIFTY          .333          .368          .438          .368          .456          .473
GREEN          .318          .454          .454          .409          .454          .5
DJI-13         .307          .384          .384          .384          .307          .384
TRANSP         .3            .5            .5            .45           .45           .45
BIGBANKS       .285          .285          .571          .285          .285          .714
INFRA          .277          .416          .444          .388          .416          .472
BIOTECH        .259          .295          .327          .273          .3            .344
INDEXES        .258          .295          .354          .274          .376          .446
AUTO           .256          .282          .333          .333          .256          .333
GAMING         .217          .26           .304          .304          .347          .434
HOSPITAL       .217          .304          .304          .26           .26           .304
RETAIL         .207          .226          .264          .226          .207          .207
COMODITY       .2            .15           .25           .225          .2            .225
COMPUTER       .19           .285          .38           .285          .285          .333
SEMI           .19           .254          .263          .227          .336          .427
ELECTRON       .187          .238          .251          .225          .309          .412
FOOD           .185          .222          .296          .24           .203          .24
CHEM           .173          .192          .192          .211          .23           .269
OILGAS         .17           .248          .312          .262          .269          .326
INDMATER       .151          .177          .177          .151          .189          .253
ETFS           .14           .21           .228          .14           .157          .21
REGBANKS       .107          .285          .428          .25           .214          .357
GOLD           .081          .061          .061          .061          .061          .061
CHINA          .067          .067          .084          .067          .101          .135
COAL           0             0             0             0             0             .285
|
====================================================================
5/22/2019
Our Buy signals are clearly in trouble. Do some more hedging with our
Bearish MINCPs as short sales and sell off half of the long positions in
SPY and DIA. We need to see signs of a bottom before holding much
of a position in them long. "Discretion" and "Prudence" are
needed now.
I fear a breaking of the neckline will bring a big new wave of selling and
a dangerous rise in leveraged short-sale hedging.
What bullish Public policy-making, micro-circuitry and the internet melded
into for a huge 3200% rise in the DJI from August 1982 (777) to 2019 (26500)
might now be taken away if Wall Street turns against Trump's tariffs in an age of
world-wide inter-dependence.
Might we now see the start of a big correction? Normally, we would see some
major Sell signals, some weakening breadth indicators and/or red distribution
from our Accumulation Index. But, as you should know, head and shoulders tops
can also bring very big declines when they reflect Wall Street's quick pivoting
to a bearish perspective because of sudden changes, invasions, attacks and
unexpected public policies.

I've mentioned how head/shoulders warned of the coming Depression in the
aftermath of the Smoot Hawley Tariff of 1930. But there are many other examples
of DJI head/shoulders patterns bringing big declines: 1929, 1940, 1941, 1946,
1948, 1950, 1962, 1974. 1990 and 2002... So any closing below 25000 must
be treated as a judged Sell S10.
The DJI is down more than 200 presently. It usually goes up before Memorial Day
weekend. Such weakness now shows the market is in trouble. New lows
outnumbered new highs again today on the NASDAQ and only 40% of all stocks
and ETFs are still above their 65-dma. Twice as many groups are rated as
"bearish"
as bullish in Table 3.
That Head/Shoulders patterns have now formed in all the key ETFs is quite bearish,
I would judge. Once formed, they are nuch more likely to break their neckline than
not. And they are very self-fulfilling if the break takes them below the support of
their 65-dma. The height of their pattern taken down from their neckline then
becomes the MINIMUM new downside projection.
Besides, 1930, the stock market now can, perhaps, best be compared to two past
cases. With the DJI's price V-formation and then a break in the rising NYSE A/D Line,
I would compare the market now to its top in 2002, except that we did not get a Sell
signal at the recent top. This 2002 case brought a deep decline and bear market.
Watch the A/D Line closely now.
Our market now can also be compared to 1971 when the DJI fell nearly 20%
from its peak because if was un-nerved by inflation, by the escalating war in Vietnam,
by Nixon's price and wage freeze and by the Dollar no longer being backed by Gold.
Technically, the similarities between the top in 1971 and now are interesting and
scary. Note in the DJI's chart then, its clear cut head/shoulders pattern and the
way
the P-Indicator turned negative after being positive five straight months. Here we have
head and shoulders in all the main indexes and the P-Indicator has stayed positive for
more than 4 straight months.
 |
Similar H/S top in 1971 |
|
Charts 5/22/2019 2019 PEERLESS DJI, Signals, Indicators Daily DJI Volume 10-DayUp/Down Vol Hourly DJIA A/D Line for All Stocks Inverted Traders Index NASDAQ S&P OEX NYSE COMPQX DJI-15 DJI-20 DJI-30 DIA SPY QQQ MDY IWM TNA Short-Term Rates USO-CrudeOil DBO FAS GLD BBH IBB JETS JNUG KOL NUGT OIH OIL RSX RETL SDS AGQ SLV SOXL TECL TLT TMF TNA UGA (gasoline) XIV and China: YINN CHAU Commodities: CANE CORN DBC JJC, NIB, CHOC CORN, CUT (paper) MOO, SOYB WEAT UUP (Dollar) LIT (Lithium) AAPL ADBE ALXN AMAT AMGN AMD AMZN BA BABA BAC BIDU CAT CVX DE FB GOOG GS HD IBM INTU JPM M (Macy's) MSFT NFLX NVDA QCOM TSLA TXN XOM WMT CMG , LRCX, SWKS, MDGL SPPI WATT SQ TOWN 5/22/19 (Click on Underlined link.) Bullish MAXCPs - http://tigersoft.com/MAXCPS/May-22/BULLISH.htm Bearish MAXCPs - http://tigersoft.com/MINCPs/May-22/BEARISH.htm |
Table 1 QUICKSILVER on ETFS - 5/22/19 ETF CLOSE CHANGE PIVOT-PT 5-dmaAROC CL-PWR CANDLE IP21 ITRS --------------------------------------------------------------------------------------------- DIA 257.6 -1.17 259.16 13.2% Bullish RED .14 ------ --------------------------------------------------------------------------------------------- BA 352.78 -5.97 353.81 101.1% Bullish RED 0 -.067 --------------------------------------------------------------------------------------------- SPY 285.63 -.88 287.7 10% Bullish BLUE .083 .015 --------------------------------------------------------------------------------------------- QQQ 181.02 -.81 184.93 -56.7% Bullish BLUE .074 .024 --------------------------------------------------------------------------------------------- MDY 343.57 -2.92 348.68 -42.5% Bullish RED .098 -.009 --------------------------------------------------------------------------------------------- IWM 152.53 -1.29 155 -49.2% Bullish RED .111 -.019 --------------------------------------------------------------------------------------------- FAS 69.52 -.32 69.79 135.9% Bullish BLUE .158 .107 --------------------------------------------------------------------------------------------- SOXL 118.82 -7.93 144 -1213.8% Bullish RED .012 -.075 --------------------------------------------------------------------------------------------- TECL 138.98 -2.2 147.79 -151.6% Bullish BLUE .059 .092 --------------------------------------------------------------------------------------------- IBB 104.68 .33 104.44 63.2% Bullish BLUE .135 -.071 --------------------------------------------------------------------------------------------- GLD 120.24 -.12 121.51 -88.8% Bearish RED -.109 -.029 --------------------------------------------------------------------------------------------- RSX 21.7 .14 21.23 124.6% Bearish ---- -.002 .049 |
TABLE 2 Count of Stocks in Key Directories
20190522
-------------------------------
NEWHIGHS 140
NEWLOWS 58
MAXCP 80
MINCP 26
TTTNH 50
TTTNL 27
FASTUP 32
FASTDOWN 148
CPCROSSA 33
CPCROSSD 125
BIGVOLUP 2
BIGVODN 10
ACCUMVER 13
HIGHIP21 8
HIUPPCT 16
LOWACCUM 148
REDSELL 62
AUGSELS7 7
TRAPDOOR 25
|
Table 3 RANKING OF KEY DIRECTORIES BASED PCT.OF STOCKS ABOVE 65-DMA
5/22/19
Bullish = 11
Bearish = 33
---------------------------------------------------------------------------------------
Directory Current day-1 day-2 day-3 day-4 day-5
----------------------------------------------------------------------------------------
INSURANC .928 .928 .964 .928 .964 .928
BONDFUND .902 .922 .912 .912 .912 .922
HOMEBLDG .647 .764 .647 .705 .764 .705
SOLAR .647 .647 .529 .588 .764 .647
REIT .632 .632 .551 .687 .734 .687
JETS .6 .6 .6 .6 .6 .6
UTILITY .6 .6 .6 .575 .575 .55
BEVERAGE .588 .588 .529 .529 .588 .647
DOWJONES .566 .5 .5 .466 .5 .433
GUNS .529 .47 .47 .47 .47 .529
SOFTWARE .516 .532 .5 .532 .548 .532
============================================================================================
EDU .5 .5 .5 .333 .833 .666
TRANSP .5 .5 .45 .45 .45 .45
=============================================================================================SP-100 .489 .51 .445 .445 .5 .423
SP500 .486 .509 .448 .474 .509 .464
MILITARY .482 .551 .379 .448 .448 .379
FIDSTKS .481 .518 .437 .459 .502 .448
GREEN .454 .454 .409 .454 .5 .5
RUS-1000 .451 .472 .418 .454 .495 .459
FINANCE .443 .522 .42 .352 .443 .363
INFRA .416 .444 .388 .416 .472 .388
NASD-100 .395 .427 .406 .468 .51 .458
DJI-13 .384 .384 .384 .307 .461 .384
NIFTY .368 .438 .368 .456 .491 .438
HACKERS .333 .333 .333 .333 .428 .333
HOSPITAL .304 .304 .26 .26 .26 .304
INDEXES .295 .354 .274 .376 .451 .36
BIOTECH .292 .327 .273 .3 .344 .341
BIGBANKS .285 .571 .285 .285 .714 .285
COMPUTER .285 .38 .285 .285 .38 .333
REGBANKS .285 .428 .25 .214 .357 .178
AUTO .282 .333 .333 .256 .333 .333
GAMING .26 .304 .304 .347 .434 .304
SEMI .252 .261 .225 .333 .423 .477
OILGAS .248 .312 .262 .269 .333 .326
ELECTRON .235 .248 .222 .305 .407 .394
RETAIL .226 .264 .226 .207 .207 .169
FOOD .222 .296 .24 .203 .222 .203
ETFS .21 .228 .14 .157 .21 .122
CHEM .192 .192 .211 .23 .307 .23
INDMATER .177 .177 .151 .189 .265 .189
COMODITY .15 .25 .225 .2 .225 .2
CHINA .067 .084 .067 .101 .135 .135
GOLD .061 .061 .061 .061 .061 .081
COAL 0 0 0 0 .285 .285
|
====================================================================
5/21/2019
Peerless still shows its recent Buy
signals to be unreversed. The DJI and SP-500
as well as Utilities (new high today) and REITs will keep benefiting from the low
interest rate environment, the strong Dollar and how investment funds are gravitating to
what may be the last groups standing unless the market gets a new boost from the
Government, such as a new Infrastructure spending intervention or the FED unexpectedly
decides to actually lower rates to boost the Economy.
Hold long DJI and SPY and stay short some Bearish MINCPS. I suggested
selling our long position in QQQ today because of the fall-out from the decline
in semi-conductors and the trade war, generally.
----------------------- 5: 30 AM -------------------------------
A Post Script: In my opinion, the biggest danger now is not Trump or his tariffs.
Rather it is "technical", namely that the many head/shoulders patterns
will be completed and this will bring a self-fulfilling wave of selling from many
quarters. If that does happen, Wall Street, itself, can be blamed as in 2008
for creating so many leveraged hedging tools that probably be in sudden
great demand. That is why we will have to trust a DJI close below 25000 to
be a judged S10. Let's hope we can get out, if necessary, before such
an avalanche. Usually, this week is bullish and there will be more time to
consider the risks of completed head/shoulders more this weekend if needed.
-----------------------------------------------------------------------------------
causes..


The problem for the bulls now is that much of the market is no longer in an uptrend.
In fact, more stocks on the NASDAQ made new lows today than new highs despite
the nearly 200-point DJI gain. In addition, two thirds of our stock groups are rated
as "bearish" rather than "bullish" in Table 3. So, the
pressure is on the DJI and the
FED to hold the market up...
|
Charts 5/21/2019 2019 PEERLESS DJI, Signals, Indicators Daily DJI Volume 10-DayUp/Down Vol Hourly DJIA A/D Line for All Stocks Inverted Traders Index NASDAQ S&P OEX NYSE COMPQX DJI-15 DJI-20 DJI-30 DIA SPY QQQ MDY IWM TNA Short-Term Rates USO-CrudeOil DBO FAS GLD BBH IBB JETS JNUG KOL NUGT OIH OIL RSX RETL SDS AGQ SLV SOXL TECL TLT TMF TNA UGA (gasoline) XIV and China: YINN CHAU Commodities: CANE CORN DBC JJC, NIB, CHOC CORN, CUT (paper) MOO, SOYB WEAT UUP (Dollar) LIT (Lithium) AAPL ADBE ALXN AMAT AMGN AMD AMZN BA BABA BAC BIDU CAT CVX DE FB GOOG GS HD IBM INTU JPM M (Macy's) MSFT NFLX NVDA QCOM TSLA TXN XOM WMT CMG , LRCX, SWKS, MDGL SPPI WATT SQ TOWN 5/21/19 (Click on Underlined link.) Bullish MAXCPs - http://tigersoft.com/MAXCPS/May-21/BULLISH.htm Bearish MAXCPs - http://tigersoft.com/MINCPs/May-21/BEARISH.htm |
The Market Is in "Pondering"
Mode...
Patience
is needed now from traders while the stock market copes with the cross-currents
of over-seas sellers vs Professional buying and while it waits for more of the dust to
settle
from the US trade-war againt China. The market has a lot to try to make sense of at
this
juncture.
In my view, the threat of impeachment by the Democrats is not serious enough yet to
hold back the market for long, though, if "smoking guns" were found that might
change
things.
Might Consumers now be tapped out? Only if interest rates go up over 4% would
that cause a recession and a 20% market decline or more. (I base this on the 1950'a
experience). So far, Inflation is under 3% and 10-year Bonds are well under 3%.
Real Wages have actually fallen slight over the last two months and are flat for the year.
(See https://www.bls.gov/news.release/pdf/realer.pdf.
)
But might Trump's tariffs cause, or just be used to justify, a run-up in Consumer Prices?
Might the FED then raise rates exactly as the effects of tariffs start taking a lot of
money out of Consumers' pockets. And won't the trade war hurt lots of American
companies
that are deeply entangled with Chinese partners and deeply dependent on cheaper
Chinese manufactured goods? Yes - that is certainly the uncertainty that the
market's
hesistation now is coping with. The head/shoulders pattern show these risks are real.
(See the 1930 DJI chart I showed last night. The new 1930 US tariffs along with
other fiscal and monetary policy-mistakes all played important roles in bringing on the
Great Depression and bear market.
Inflation is not yet a threat yet. In fact, with the Dollar's making a
new high today, one could even argue for a rate-cut to boost
exports and help overseas borrowers who must pay back in
expensive Dollars.

.
| Chip-Makers are feeling the effects of Trump's New Tariffs and Bans on Chinese Manufactures. This will hurt QQQ. Let's avoid QQQ for now. Semi-conductors have been leaders for a long time. But now SOXL has fallen below its 65-dma. As the fastest area of profits' growth, we must watch them closely. See https://www.bloomberg.com/news/articles/2019-05-21/u-s-chipmakers-prepare-for-china-trade-fight-all-will-suffer?srnd=premium 
|


Table 1 QUICKSILVER on ETFS - 5/21/19 ETF CLOSE CHANGE PIVOT-PT 5-dmaAROC CL-PWR CANDLE IP21 ITRS
---------------------------------------------------------------------------------------------
DIA 258.77 2.1 256.92 57.5% Bullish BLUE .187 =====
---------------------------------------------------------------------------------------------
BA 358.75 5.96 345.64 224.4% Bullish BLUE .007 -.111
---------------------------------------------------------------------------------------------
SPY 286.51 2.56 285.06 54.5% Bullish BLUE .117 .021
---------------------------------------------------------------------------------------------
QQQ 181.83 1.88 183.09 35.4% Bullish BLUE .124 .033
---------------------------------------------------------------------------------------------
MDY 346.49 4.5 346.51 15.3% Bullish BLUE .153 0
---------------------------------------------------------------------------------------------
IWM 153.82 2.04 154.04 9.1% Bullish BLUE .156 -.011
---------------------------------------------------------------------------------------------
FAS 69.84 1.62 67.65 171.2% Bullish BLUE .192 .122
highest
---------------------------------------------------------------------------------------------
RETL 25.43 .86 25.34 -4% Bullish BLUE .158 -.161
---------------------------------------------------------------------------------------------
SOXL 126.75 7.5 151.7 -763.1% Bullish RED .046 -.002
---------------------------------------------------------------------------------------------
TECL 141.18 4.89 143.3 72.1% Bullish BLUE .098 .127
---------------------------------------------------------------------------------------------
IBB 104.35 2.03 103.37 92.5% Bullish BLUE .152 -.067
---------------------------------------------------------------------------------------------
GLD 120.36 -.28 122.39 -86.4% Bearish BLUE-.058 -.023
---------------------------------------------------------------------------------------------
OIH 15.27 .2 15.47 -22.9% ------- BLUE-.175 -.084
-----------------------------------------------------------------------------------------------
RSX 21.56 .35 21.17 99.2% Bearish BLUE .029 .044
|
Table 2    Count of Stocks in Key Directories
           2019-05-21
-------------------------------
NEWHIGHS       123
NEWLOWS        18
MAXCP          90
MINCP          11
TTTNH          57
TTTNL          13
FASTUP         46
FASTDOWN       111
CPCROSSA       90
CPCROSSD       22
BIGVOLUP       1
BIGVODN        9
ACCUMVER       11
HIGHIP21       6
HIUPPCT        16
LOWACCUM       145
REDSELL        60
AUGSELS7       10
TRAPDOOR       24
|
 Table 3  RANKING OF KEY DIRECTORIES BASED PCT.OF STOCKS ABOVE 65-DMA
              5/21/19
 Bearish = 28
 Bullish = 14
---------------------------------------------------------------------------------------
Directory     Current       day-1         day-2         day-3         day-4         day-5
----------------------------------------------------------------------------------------
INSURANC       .928          .964          .928          .964          .928          .892
BONDFUND       .922          .912          .912          .912          .932          .922
HOMEBLDG       .764          .647          .705          .764          .705          .705
SOLAR          .647          .529          .588          .764          .647          .529
REIT           .632          .551          .687          .734          .687          .646
JETS           .6            .6            .6            .6            .6            .6
UTILITY        .6            .6            .575          .575          .55           .575
BEVERAGE       .588          .529          .529          .588          .647          .529
BIGBANKS       .571          .285          .285          .714          .285          .285
MILITARY       .551          .379          .448          .448          .379          .379
SOFTWARE       .532          .5            .532          .548          .532          .467
FINANCE        .522          .42           .352          .443          .363          .397
FIDSTKS        .518          .437          .459          .502          .448          .432
SP500          .509          .448          .474          .509          .464          .452
============================================================================================
DOWJONES       .5            .5            .466          .5            .433          .366
EDU            .5            .5            .333          .833          .833          .666
SP-100         .5            .436          .436          .489          .414          .382
TRANSP         .5            .45           .45           .45           .45           .45
============================================================================================
RUS-1000       .472          .418          .453          .496          .461          .447
GUNS           .47           .47           .47           .47           .529          .529
GREEN          .454          .409          .454          .5            .5            .454
INFRA          .444          .388          .416          .472          .388          .361
NIFTY          .438          .368          .456          .491          .438          .385
REGBANKS       .428          .25           .214          .357          .178          .321
NASD-100       .427          .406          .468          .51           .458          .406
DJI-13         .384          .384          .307          .461          .384          .23
COMPUTER       .38           .285          .285          .38           .333          .285
INDEXES        .354          .274          .376          .451          .37           .29
AUTO           .333          .333          .256          .333          .333          .282
HACKERS        .333          .333          .333          .428          .333          .333
BIOTECH        .325          .273          .3            .344          .341          .297
OILGAS         .312          .262          .269          .333          .326          .297
GAMING         .304          .304          .347          .434          .304          .26
HOSPITAL       .304          .26           .26           .26           .304          .347
FOOD           .296          .24           .203          .222          .203          .203
RETAIL         .264          .226          .207          .207          .169          .15
SEMI           .261          .225          .333          .423          .477          .432
COMODITY       .25           .225          .2            .225          .2            .2
ELECTRON       .248          .222          .305          .407          .401          .375
ETFS           .228          .14           .157          .21           .157          .087
CHEM           .192          .211          .23           .307          .25           .25
INDMATER       .177          .151          .189          .265          .189          .177
CHINA          .084          .067          .101          .135          .135          .135
GOLD           .061          .061          .061          .061          .081          .081
COAL           0             0             0             .285          .285          .142
|
====================================================================
5/20/2019
Peerless still shows its recent Buy signals to be unreversed.
We can take some heart in the overnight rally of +140 for the DJI, at
this writing. Our long positions is DIA and SPY look safe. But keep in
mind that our Peerless judges the market from the vantage point of view
of the DJI and its blue chips. Their job is to hold up the appearance to
the general public as long as possible that all is well in the stock market.
Now ten plus years into our bull market, the risks of a 20% or more decline
are growing. The P-Indicator today turned negative. The rest of the market
may be disconnecting from the blue chips and defensive stocks.

The fact is that I have never seen so many dangerous-looking, symmetrical
head and shoulders patterns in the key indexes and ETFs, like the NASDAQ,
OEX, NYSE, SP-500 and QQQ. Any break in their neclines at the end of the
day would have to be taken as a Sell.


I must give this additional warning. It is much more common for the NASDAQ
to complete its bearish-looking pattern than not to complete it by rupturing its
neckline. See the NASDAQ's head/shoulders top formations since 1990
at www.tigersoft.com/NASDAQ-HS/
As you know, head and shoulders patterns are the market's way of adjusting
quickly to unexpected but often profoundly bearish news. Wall Street appears to
have increasing doubts about Trump's escalating tariffs' war with China. Head and
shoulders tops were how Wall Street communicated its displeasure with the
Smoot-Hawley tariffs in the Summer of1930 as the stock market pivoted down
from its 47% recovery after the Crash of 1929 and sunk in its long and deadly 1
1930-1932 bear market.

In particular, we must now watch for a break in QQQ's neckline-support on the close.
It is not good that the Semi-Conductors ETF, SOXL, has now closed below its own
neckline and TECL could with another big drop break its own neckline. The Index
of our "Nifty high-volume" tech stocks has not only broken its price-uptrend and
its
65-dma, it, too, could on one more big down-day break its own neckline support.

The overall market is becoming quite weak. There were more new lows than new
highs today. Only 44% of all stocks are above the key support of their 65-dma
and we rate three times more groups as being bearish than bullish in Table 3. The
Chinese stock market is crashing. Other overseas markets are feeling the impact
of this.

Conclusion:
I would be selling QQQ tomorrow into
strength but hold DIA and SPY.
Add a few more short sales from our bearish MINCPs tonight.
|
Charts 5/20/2019 2019 PEERLESS DJI, Signals, Indicators Daily DJI Volume 10-DayUp/Down Vol Hourly DJIA A/D Line for All Stocks Inverted Traders Index NASDAQ S&P OEX NYSE COMPQX DJI-15 DJI-20 DJI-30 DIA SPY QQQ MDY IWM TNA Short-Term Rates USO-CrudeOil DBO FAS GLD BBH IBB JETS JNUG KOL NUGT OIH OIL RSX RETL SDS AGQ SLV SOXL TECL TLT TMF TNA UGA (gasoline) XIV and China: YINN CHAU Commodities: CANE CORN DBC JJC, NIB, CHOC CORN, CUT (paper) MOO, SOYB WEAT UUP (Dollar) LIT (Lithium) AAPL ADBE ALXN AMAT AMGN AMD AMZN BA BABA BAC BIDU CAT CVX DE FB GOOG GS HD IBM INTU JPM M (Macy's) MSFT NFLX NVDA QCOM TSLA TXN XOM WMT CMG , LRCX, SWKS, MDGL SPPI WATT SQ TOWN 5/20/19 (Click on Underlined link.) Bullish MAXCPs - http://tigersoft.com/MAXCPS/May-20/BULLISH.htm Bearish MAXCPs - http://tigersoft.com/MINCPs/May-20/BEARISH.htm |
Table 1 QUICKSILVER on ETFS - 5/20/19 ETF CLOSE CHANGE PIVOT-PT 5-dmaAROC CL-PWR CANDLE IP21 ITRS --------------------------------------------------------------------------------------------- DIA 256.67 -.77 255.81 62.4% Bullish BLUE .169 ----- --------------------------------------------------------------------------------------------- BA 352.79 -2.23 343.04 222.2% Bullish RED -.038 -.173 --------------------------------------------------------------------------------------------- SPY 283.95 -1.89 283.4 54.3% Bullish RED .126 .027 --------------------------------------------------------------------------------------------- QQQ 179.95 -3.09 180.54 37.6% Bullish RED .119 .044 --------------------------------------------------------------------------------------------- MDY 341.99 -2.42 345.43 -1.4% Bullish RED .133 ----- --------------------------------------------------------------------------------------------- IWM 151.78 -1.06 153.54 4.9% Bullish RED .139 -.007 --------------------------------------------------------------------------------------------- FAS 68.22 -.4 67.5 176.1% Bullish BLUE .183 .134 --------------------------------------------------------------------------------------------- RETL 24.57 -.25 25.45 12% ------- ---- .072 -.146 --------------------------------------------------------------------------------------------- SOXL 119.25 -16.24 148.07 -659.6% Bullish RED .042 .006 --------------------------------------------------------------------------------------------- TECL 136.29 -7.66 139.13 127% Bullish RED .117 .159 --------------------------------------------------------------------------------------------- IBB 102.32 -1.45 102.44 48.5% Bullish RED .123 -.066 --------------------------------------------------------------------------------------------- GLD 120.64 -.01 122.46 -83.2% Bearish BLUE -.092 -.026 --------------------------------------------------------------------------------------------- OIH 15.07 -.02 15.34 75.3% ------- ---- -.132 -.07 --------------------------------------------------------------------------------------------- RSX 21.21 .07 21.14 130.5% Bearish ---- .02 .044 |
 Table 2
          Count of Stocks in Key Directories
          2019-05-20
-------------------------------
NEWHIGHS       76
NEWLOWS        69
MAXCP          80
MINCP          22
TTTNH          65
TTTNL          27
FASTUP         45
FASTDOWN       110
CPCROSSA       46
CPCROSSD       69
BIGVOLUP       5
BIGVODN        5
ACCUMVER       9
HIGHIP21       7
HIUPPCT        18
LOWACCUM       146
REDSELL        60
AUGSELS7       8
TRAPDOOR       25
|
Table 3   RANKING OF KEY DIRECTORIES BASED PCT.OF STOCKS ABOVE 65-DMA
          5/20/19
Bullish = 8
Bearish = 31
---------------------------------------------------------------------------------------
Directory     Current       day-1         day-2         day-3         day-4         day-5
----------------------------------------------------------------------------------------
INSURANC       .964          .928          .964          .928          .892          .821
BONDFUND       .912          .912          .912          .932          .922          .932
HOMEBLDG       .647          .705          .764          .705          .705          .647
JETS           .6            .6            .6            .6            .6            .6
UTILITY        .6            .575          .575          .55           .6            .625
REIT           .551          .687          .734          .687          .646          .591
BEVERAGE       .529          .529          .588          .647          .529          .529
SOLAR          .529          .588          .764          .647          .529          .411
N=8
==========================================================================================
DOWJONES       .5            .466          .5            .433          .4            .366
EDU            .5            .333          .833          .833          .666          .833
SOFTWARE       .5            .532          .548          .532          .467          .387
==========================================================================================
GUNS           .47           .47           .47           .529          .529          .47
TRANSP         .45           .45           .45           .45           .45           .45
SP500          .448          .474          .509          .464          .456          .397
FIDSTKS        .437          .459          .502          .448          .437          .394
SP-100         .436          .436          .489          .414          .393          .361
FINANCE        .42           .352          .443          .363          .409          .318
RUS-1000       .418          .453          .495          .462          .45           .391
GREEN          .409          .454          .5            .5            .454          .5
NASD-100       .406          .468          .51           .458          .406          .354
INFRA          .388          .416          .472          .388          .361          .333
DJI-13         .384          .307          .461          .384          .307          .23
MILITARY       .379          .448          .448          .379          .379          .379
NIFTY          .368          .456          .491          .438          .403          .35
AUTO           .333          .256          .333          .333          .282          .256
HACKERS        .333          .333          .428          .333          .333          .285
GAMING         .304          .347          .434          .304          .26           .304
BIGBANKS       .285          .285          .714          .285          .285          .428
COMPUTER       .285          .285          .38           .333          .285          .285
INDEXES        .274          .376          .451          .37           .29           .263
BIOTECH        .27           .3            .344          .341          .3            .27
OILGAS         .262          .269          .333          .326          .304          .226
HOSPITAL       .26           .26           .26           .304          .347          .26
REGBANKS       .25           .214          .357          .178          .357          .107
FOOD           .245          .207          .226          .207          .207          .207
RETAIL         .226          .207          .207          .169          .15           .132
COMODITY       .225          .2            .225          .2            .2            .2
SEMI           .225          .333          .423          .477          .432          .333
ELECTRON       .222          .305          .407          .401          .375          .312
CHEM           .211          .23           .307          .25           .269          .23
INDMATER       .151          .189          .265          .189          .177          .139
ETFS           .14           .157          .21           .157          .087          .017
CHINA          .067          .101          .135          .135          .135          .084
GOLD           .061          .061          .061          .081          .081          .142
COAL           0             0             .285          .285          .142          0
|
====================================================================
5/17/2019
The many Peerless Buy signals, the still rising NYSE A/D
Line, the rising
Closing Powers and the low interest rates all bode well for a Summer Rally.
But this is still a defensive market and a market that favors only some
very big high techs and mainly the biggest ETFs. More stocks are still below
their
65-dma than above it. Only 9 of the 46 stock groups we follow have the majority
of their stocks safely above the 65-dma. This is not a market that likes many
smaller cap stocks yet and Chinese stocks are particularly weak. We will probably
get a Sell S9v if the DJI does rally back close to 27000. But for now 25000
is support and Wall Street, the Fed, the Treasury and Trump Administration seem
ready to do what it takes to hold the market up. Perhaps, that will include a
new Public Works program soon, though CAT's decline might seem to suggest
otherwise.

We have to be patient right now. The leading ETFs, the NASDAQ, SP-500,
OEX, QQQ and TECL need to destroy their potential head and shoulders
tops. Their high level of Accumulation and rising Closing Powers make it
seem highly likely that they will do this. But more backing and filling is probably
necessary.


Friday's decline should have been expected despite the Peerless Buy signals
because the various key Indexes and ETFs hit their first resistance points on
Thursday. In the charts below, note the resistance levels that still apply.
Close Today
Resistance
DJI 25764
65-dma @ 26000
DIA 257.44
65-dma @ 260.
SP-500 2859.53 Apex of a right
shoulder in a potential head/shoulders @ 2889
SPY 290.00
Apex of a right shoulder in a potential
head/shoulders @ 289
NASDAQ 7816 Apex of a right
shoulder in a potential head/shoulders @ 7921
QQQ 183.04
Apex of a right shoulder in a potential
head/shoulders @186
TECL
Apex of a right shoulder in a potential head/shoulders @ 150.5
With Peerless Buy signals operating, I think we should consider buying those ETFs
and leading stocks that are already above their 65-dma resistance and show multiple
TigerSoft B7s. Do not confuse these CP divergence B7s with Peerless
signals.
The TigerSoft B7s show that our Closing Power is much stronger than price action
for the last 65 trading days. "CP%" (which measure how close to the
Closing Power
is to its 65-day high from its low) is 37 higher than "Price%" over the last 65
trading days.
Among the stocks we link to each night, some show multiple TigerSoft
Buy B7s, are bullishly above their 65-dma resistance (which should now be support) and
show an IP21 greater than +.15. Most of these should be bought near their 65-dma.
Otherwise, hold the long positions already taken in DIA, SPY and QQQ.
Close IP21 65-dma
Resistance
Support from right shoulder apex
NASDAQ 7816.29 .250 7788
7921
FAS
68.62 .176 65.88
70.5
QQQ 183.04
.154 181
186
TQQQ 58.84
.174 58.1
61.45
SPY
285.84 .168 285
289
TECL 143.95
.174 141
150

|
Charts 5/17/2019 2018 PEERLESS DJI, Signals, Indicators Daily DJI Volume 10-DayUp/Down Vol Hourly DJIA A/D Line for All Stocks Inverted Traders Index NASDAQ S&P OEX NYSE COMPQX DJI-15 DJI-20 DJI-30 DIA SPY QQQ MDY IWM TNA Short-Term Rates USO-CrudeOil DBO FAS GLD BBH IBB JETS JNUG KOL NUGT OIH OIL RSX RETL SDS AGQ SLV SOXL TECL TLT TMF TNA UGA (gasoline) XIV and China: YINN CHAU Commodities: CANE CORN DBC JJC, NIB, CHOC CORN, CUT (paper) MOO, SOYB WEAT UUP (Dollar) LIT (Lithium) AAPL ADBE ALXN AMAT AMGN AMD AMZN BA BABA BAC BIDU CAT CVX DE FB GOOG GS HD IBM INTU JPM M (Macy's) MSFT NFLX NVDA QCOM TSLA TXN XOM WMT CMG , LRCX, SWKS, MDGL SPPI WATT SQ TOWN 5/17/19 (Click on Underlined link.) Bullish MAXCPs - http://tigersoft.com/MAXCPS/May-17/BULLISH.htm Bearish MAXCPs - http://tigersoft.com/MINCPs/May-17/BEARISH.htm |
Table 1 QUICKSILVER on ETFS - 5/17/19 ETF CLOSE CHANGE PIVOT-PT 5-dmaAROC CL-PWR CANDLE IP21 ITRS
---------------------------------------------------------------------------------------------
DIA 257.44 -1.72 253.47 -48.2% Bullish BLUE .185 -----
---------------------------------------------------------------------------------------------
BA 355.02 1.21 337.37 5% Bullish BLUE -.029 -.17
---------------------------------------------------------------------------------------------
SPY 285.84 -1.86 280.86 -39.6% Bullish BLUE .168 .029
---------------------------------------------------------------------------------------------
QQQ 183.04 -1.89 178.58 -53.7% Bullish RED .154 .057
---------------------------------------------------------------------------------------------
MDY 344.41 -4.27 342.09 -115.7% Bullish RED .172 .002
---------------------------------------------------------------------------------------------
IWM 152.84 -2.16 151.63 -122.6% Bullish RED .17 -.003
---------------------------------------------------------------------------------------------
FAS 68.62 -1.17 65.83 -146.5% Bullish BLUE .177 .138
---------------------------------------------------------------------------------------------
SOXL 135.49 -8.51 138.18 -854.8% Bullish RED .095 .14
---------------------------------------------------------------------------------------------
TECL 143.95 -3.84 132.7 -195.5% Bullish BLUE .154 .221
(highest)
---------------------------------------------------------------------------------------------
IBB 103.77 -.67 101.32 -59.5% Bullish RED .141 -.06
---------------------------------------------------------------------------------------------
GLD 120.65 -.86 122.67 -31.9% Bearish RED -.102 -.017
---------------------------------------------------------------------------------------------
OIH 15.09 -.5 14.84 -130.3% ------- RED -.174 -.094
---------------------------------------------------------------------------------------------
RSX 21.14 -.09 20.66 49.9% Bearish --- -.033 .031
|
 Table 2   Count of Stocks in Key Directories
           20190517
-------------------------------
NEWHIGHS       103
NEWLOWS        52
MAXCP          104
MINCP          17
TTTNH          90
TTTNL          18
FASTUP         32
FASTDOWN       158
CPCROSSA       32
CPCROSSD       92
BIGVOLUP       2
BIGVODN        13
ACCUMVER       8
HIGHIP21       6
HIUPPCT        17
LOWACCUM       154
REDSELL        65
AUGSELS7       7
TRAPDOOR       25
|
Table 3 RANKING OF KEY DIRECTORIES BASED PCT.OF STOCKS ABOVE 65-DMA
5/17/19
Bullish= 9
Bearish= 37
---------------------------------------------------------------------------------------
Directory Current day-1 day-2 day-3 day-4 day-5
----------------------------------------------------------------------------------------
INSURANC .928 .964 .928 .892 .821 .928
BONDFUND .912 .912 .932 .922 .932 .961
HOMEBLDG .705 .764 .705 .705 .647 .764
REIT .682 .729 .682 .641 .601 .655
JETS .6 .6 .6 .6 .6 .6
UTILITY .575 .575 .55 .6 .625 .65
SOLAR .555 .722 .611 .5 .388 .5
SOFTWARE .532 .548 .532 .467 .419 .532
BEVERAGE .529 .588 .647 .529 .529 .588
N=9
=========================================================================
SP500 .477 .512 .467 .459 .404 .565
GUNS .47 .47 .529 .529 .47 .647
NASD-100 .468 .51 .458 .406 .354 .572
DOWJONES .466 .5 .433 .4 .366 .566
FIDSTKS .459 .502 .448 .437 .394 .594
NIFTY .456 .491 .438 .403 .368 .526
GREEN .454 .5 .5 .454 .5 .545
RUS-1000 .453 .495 .461 .451 .396 .542
TRANSP .45 .45 .45 .45 .45 .45
MILITARY .448 .448 .379 .379 .379 .551
SP-100 .445 .5 .423 .402 .38 .554
INFRA .416 .472 .388 .361 .333 .472
INDEXES .372 .448 .367 .286 .259 .567
FINANCE .352 .443 .363 .409 .329 .613
GAMING .347 .434 .304 .26 .304 .391
EDU .333 .833 .833 .666 .833 .833
HACKERS .333 .428 .333 .333 .285 .476
SEMI .333 .423 .477 .432 .333 .522
DJI-13 .307 .461 .384 .307 .23 .615
ELECTRON .305 .407 .401 .375 .312 .445
BIOTECH .297 .344 .341 .3 .273 .39
BIGBANKS .285 .714 .285 .285 .428 .857
COMPUTER .285 .38 .333 .285 .285 .476
OILGAS .269 .333 .326 .304 .226 .347
HOSPITAL .26 .26 .304 .347 .26 .391
AUTO .256 .333 .333 .282 .282 .41
INDMATER .25 .25 .25 .25 .25 .25
CHEM .23 .307 .25 .269 .25 .346
REGBANKS .214 .357 .178 .357 .107 .678
FOOD .207 .226 .207 .207 .207 .226
RETAIL .207 .207 .169 .15 .132 .377
COMODITY .2 .225 .2 .2 .2 .225
ETFS .157 .21 .157 .087 .017 .35
CHINA .101 .135 .135 .135 .101 .135
GOLD .061 .061 .081 .081 .142 .081
COAL 0 .285 .285 .142 .142 .285
|
====================================================================
5/16/2019
Peerless still shows many unreversed Buy signals. Finally we
saw a higher
opening and a higher close. Now we need to see the key indexes and ETFs, which
we most closely follow, breakout above their 65-dma and the right shoulder
apexes in their potential head and shoulders pattern. The DJI is the leader that
most traders watch. Though up, the DJI did pull back from 26000. It is still
possible that
there will be another test of the key support at 25000. I say this because Table 3
shows that only 1/3 of the stock groups we follow "safely" show a majority
of
their stocks above the 65-dma. In addition, our DJI chart shows less than 1/2 of
all the 5000 stocks we follow we are safely above their 65-dma. Most likely, this
underlying technical weakness will express itself by limiting the DJI's abiity to advance
much this summer unless a new boost is given the market by lower interest rates or
some other unexpected stimulus occurs.
Continue to hold the long positions we have in DIA, SPY, QQQ, V, MC and LLL.
We will buy TECL because it shows the highest IP21 and ITRS in (Table 1) next week.
Mondays have too often brought declines to hastily buy now. Presumably,
this is the result of unexpected weekend Presidential "tweets". Watch TECL
for
a good clue about how Professionals will treat tech stocks at this juncture. Stay short
some of
the bearish MINCP, too, but only so long as their Closing Powers remain in
downtrends.
Dow Jones is no longer providing the Hourly DJI and Volume data during weekday.
If any of you have an on-line source for this, please email me.
DJIA  |
NASDAQ |
SP-500 |
QQQ |
TECL |
|
Charts 5/16/2019 2018 PEERLESS DJI, Signals, Indicators Daily DJI Volume 10-DayUp/Down Vol Hourly DJIA A/D Line for All Stocks Inverted Traders Index NASDAQ S&P OEX NYSE COMPQX DJI-15 DJI-20 DJI-30 DIA SPY QQQ MDY IWM TNA Short-Term Rates USO-CrudeOil DBO FAS GLD BBH IBB JETS JNUG KOL NUGT OIH OIL RSX RETL SDS AGQ SLV SOXL TECL TLT TMF TNA UGA (gasoline) XIV and China: YINN CHAU Commodities: CANE CORN DBC JJC, NIB, CHOC CORN, CUT (paper) MOO, SOYB WEAT UUP (Dollar) LIT (Lithium) AAPL ADBE ALXN AMAT AMGN AMD AMZN BA BABA BAC BIDU CAT CVX DE FB GOOG GS HD IBM INTU JPM M (Macy's) MSFT NFLX NVDA QCOM TSLA TXN XOM WMT CMG , LRCX, SWKS, MDGL SPPI WATT SQ TOWN 5/16/19 (Click on Underlined link.) Bullish MAXCPs - http://tigersoft.com/MAXCPS/May-16/BULLISH.htm Bearish MAXCPs - http://tigersoft.com/MINCPs/May-16/BEARISH.htm |
Table 1 QUICKSILVER on ETFS - 5/16/19 ETF CLOSE CHANGE PIVOT-PT 5-dmaAROC CL-PWR CANDLE IP21 ITRS
---------------------------------------------------------------------------------------------
DIA 255.81 2.34 259.66 -71.8% ------- BLUE .162 =====
---------------------------------------------------------------------------------------------
BA 343.04 5.67 359.75 -201.2% Bearish BLUE-.087 -.198
---------------------------------------------------------------------------------------------
SPY 283.4 2.54 287.53 -79.1% ------- BLUE .163 .024
---------------------------------------------------------------------------------------------
QQQ 180.54 1.96 185.77 -154.8% ------- BLUE .176 .045
---------------------------------------------------------------------------------------------
MDY 345.43 3.34 352.12 -111.1% Bullish BLUE .158 -.001
---------------------------------------------------------------------------------------------
IWM 153.54 1.91 156.76 -128.1% Bullish BLUE .188 -.011
---------------------------------------------------------------------------------------------
FAS 67.5 1.67 69.4 -166.7% Bullish BLUE .184 .083
---------------------------------------------------------------------------------------------
RETL 25.45 .94 28.93 -596.2% ------- BLUE .157 -.156
---------------------------------------------------------------------------------------------
SOXL 148.07 9.89 166.34 -702% ------- BLUE .199 .148
(highest)
---------------------------------------------------------------------------------------------
TECL 139.13 6.43 151.36 -436.7% ------- BLUE .2 .136
---------------------------------------------------------------------------------------------
IBB 102.44 1.12 105.59 -152.5% Bearish BLUE .024 -.092
---------------------------------------------------------------------------------------------
GLD 122.46 -.21 120.91 51.4% ------- RED -.017 .017
---------------------------------------------------------------------------------------------
OIH 15.34 .5 15.81 -180% Bearish BLUE-.165 -.113
---------------------------------------------------------------------------------------------
RSX 21.23 .06 20.93 117.1% Bearish RED .091 .021
|
Table 2    Count of Stocks in Key Directories
          20190516
-------------------------------
NEWHIGHS       195
NEWLOWS        30
MAXCP          139
MINCP          21
TTTNH          79
TTTNL          19
FASTUP         45
FASTDOWN       126
CPCROSSA       56
CPCROSSD       68
BIGVOLUP       2
BIGVODN        10
ACCUMVER       8
HIGHIP21       8
HIUPPCT        16
LOWACCUM       144
REDSELL        62
AUGSELS7       6
TRAPDOOR       26
|
 Table 3   RANKING OF KEY DIRECTORIES BASED PCT.OF STOCKS ABOVE 65-DMA
              5/16/19
 Bullish = 14
 Bearish = 28  Most groups are still vulnerable.
---------------------------------------------------------------------------------------
Directory     Current       day-1         day-2         day-3         day-4         day-5
----------------------------------------------------------------------------------------
INSURANC       .964          .928          .892          .821          .928          .892
BONDFUND       .911          .931          .921          .931          .96           .941
EDU            .833          .833          .666          .833          .833          .666
HOMEBLDG       .764          .705          .705          .647          .764          .705
REIT           .729          .682          .641          .601          .662          .567
SOLAR          .722          .611          .5            .388          .5            .555
BIGBANKS       .714          .285          .285          .428          .857          .857
JETS           .6            .6            .6            .6            .6            .6
BEVERAGE       .588          .647          .529          .529          .588          .529
UTILITY        .575          .55           .6            .625          .65           .475
SOFTWARE .548 .532 .467 .419 .532 .548 SP500 .512 .467 .459 .404 .567 .53 ***** NASD-100 .51 .458 .406 .354 .572 .583 ******** FIDSTKS .502 .448 .437 .394 .594 .545 ============================================================================================== DOWJONES .5 .433 .4 .366 .566 .466 ******** GREEN .5 .5 .454 .5 .545 .545 SP-100 .5 .423 .402 .38 .554 .5 ============================================================================================== RUS-1000 .495 .461 .45 .397 .545 .513 NIFTY .491 .438 .403 .368 .526 .561 INFRA .472 .388 .361 .333 .444 .388 GUNS .47 .529 .529 .47 .647 .47 DJI-13 .461 .384 .307 .23 .615 .538 TRANSP .45 .45 .45 .45 .45 .5 INDEXES .448 .367 .286 .259 .567 .513 MILITARY .448 .379 .379 .379 .551 .551 FINANCE .443 .363 .409 .329 .613 .545 GAMING .434 .304 .26 .304 .391 .391 HACKERS .428 .333 .333 .285 .476 .523 SEMI .423 .477 .432 .333 .522 .54 ELECTRON .407 .401 .375 .312 .445 .452 COMPUTER .38 .333 .285 .285 .476 .38 REGBANKS .357 .178 .357 .107 .678 .642 BIOTECH .341 .341 .3 .273 .393 .379 AUTO .333 .333 .282 .282 .41 .435 OILGAS .333 .326 .304 .226 .354 .283 CHEM .307 .25 .269 .25 .365 .403 COAL .285 .285 .142 .142 .285 .142 INDMATER .265 .189 .177 .139 .202 .227 HOSPITAL .26 .304 .347 .26 .391 .391 FOOD .226 .207 .207 .207 .245 .207 COMODITY .225 .2 .2 .2 .25 .2 ETFS .21 .157 .087 .017 .315 .263 RETAIL .207 .169 .15 .132 .377 .433 CHINA .135 .135 .135 .101 .135 .152 GOLD .061 .081 .081 .142 .081 .061 N=28 |
====================================================================
5/15/2019
The Buy B3 and B17 should hold the DJI above 25000.
Today the Professionals
turned the market up after a week opening. This morning the DJI will probably
open higher. We probably need to see both a higher opening and then a higher close
to advance the market up past the potential right-shoulder apexes drawn in the charts
shown below. If the DJI can close back above 26000, I would think that 27000 will
be the next target. But there will probably get a new Peerless Sell signal.
Look at the DJI, NASDAQ, SPY, SOXL and TECL charts below. The DJI's
key support is at the round-number 25000. Its resistance is where the flat-65 dma
and the apex of a right-shoulder might be if draw a light-blue line starting at the
first LEFT shoulder peak and making it parallel the green support-line. A close
below the 25000 would bring a dangerous situation and a judged Sell S10.
Presumably it would occur because the US wants to start another ground war
in Asia, this one against Iran or else China has decided to take the offensive
in the current Trade war and Sell lots of its US bonds as a warning. There is
no sign of the second possibility, but starting a war in this the third year of a four-
year Presidential cycle would certainly be reminiscent of 1991 and 1983.

Look at the NASDAQ, SPY, SOXL and TECL charts below. I have tried
to show where theit resistance levels are using estimates of where their "right-
shoulder apexes might be. Their key support levels are not so clear-cut as
the DJI's is. Usually when the blue-chips can no longer hold up, these
other indexes and ETFs sell off badly.
NASDAQ |
 |
QQQ |
 |
STOCKS
While we wait for an adequate base to be built, I would hold long
the major market ETFs and the big credit card companies. Visa and MasterCard
are sure to make more money as consumers pay higher prices on Chinese
goods.
And let me also suggest LLL, the highest power-ranked military stock making
new highs already in this rebound. LLL has just achieved a breakout that looks
especially good on a weekly chart. One of the things that makes the military
stocks keep rising is that neither Republican or Democrat significantly challenge the
military budget. Rght now, the Democrats want the US to out-arm the
Russians while the Republicans and Trump are more concerned about China.


|
Charts 5/15/2019 2018 PEERLESS DJI, Signals, Indicators Daily DJI Volume 10-DayUp/Down Vol Hourly DJIA A/D Line for All Stocks Inverted Traders Index NASDAQ S&P OEX NYSE COMPQX DJI-15 DJI-20 DJI-30 DIA SPY QQQ MDY IWM TNA Short-Term Rates USO-CrudeOil DBO FAS GLD BBH IBB JETS JNUG KOL NUGT OIH OIL RSX RETL SDS AGQ SLV SOXL TECL TLT TMF TNA UGA (gasoline) XIV and China: YINN CHAU Commodities: CANE CORN DBC JJC, NIB, CHOC CORN, CUT (paper) MOO, SOYB WEAT UUP (Dollar) LIT (Lithium) AAPL ADBE ALXN AMAT AMGN AMD AMZN BA BABA BAC BIDU CAT CVX DE FB GOOG GS HD IBM INTU JPM M (Macy's) MSFT NFLX NVDA QCOM TSLA TXN XOM WMT CMG , LRCX, SWKS, MDGL SPPI WATT SQ TOWN 5/15/19 (Click on Underlined link.) Bullish MAXCPs - http://tigersoft.com/MAXCPS/May-15/BULLISH.htm Bearish MAXCPs - http://tigersoft.com/MINCPs/May-15/BEARISH.htm |
Table 1 QUICKSILVER on ETFS - 5/15/19 ETF CLOSE CHANGE PIVOT-PT 5-dmaAROC CL-PWR CANDLE IP21 ITRS --------------------------------------------------------------------------------------------- DIA 256.92 1.11 258.44 -53.2% Bullish BLUE .185 0 --------------------------------------------------------------------------------------------- BA 345.64 2.6 354.13 -201.7% Bearish BLUE-.062 -.191 --------------------------------------------------------------------------------------------- SPY 285.06 1.66 286.66 -43.3% Bullish BLUE .179 .027 --------------------------------------------------------------------------------------------- QQQ 183.09 2.55 184.77 -73.3% Bullish BLUE .193 .054 --------------------------------------------------------------------------------------------- MDY 346.51 1.08 351.17 -80.5% Bullish BLUE .19 .001 --------------------------------------------------------------------------------------------- IWM 154.04 .5 156.19 -87.8% Bullish BLUE .218 -.008 --------------------------------------------------------------------------------------------- FAS 67.65 .15 69.33 -127.7% Bullish BLUE .216 .088 --------------------------------------------------------------------------------------------- RETL 25.34 -.11 28.18 -666.5% Bullish BLUE .127 -.184 --------------------------------------------------------------------------------------------- SOXL 151.7 3.63 160.42 -472.9% Bullish BLUE .226 .188 --------------------------------------------------------------------------------------------- TECL 143.3 4.17 148.3 -279.5% Bullish BLUE .225 .177 --------------------------------------------------------------------------------------------- IBB 103.37 .93 105.34 -106.8% ------- BLUE .045 -.084 --------------------------------------------------------------------------------------------- GLD 122.39 -.07 121.2 60.8% ------- RED -.061 .01 --------------------------------------------------------------------------------------------- OIH 15.47 .13 15.72 -110.1% ------- BLUE-.141 -.102 --------------------------------------------------------------------------------------------- RSX 21.17 .03 20.74 2.4% ------- BLUE .153 .031 |
Table 2 Count of Stocks in Key Directories
20190515
-------------------------------
NEWHIGHS 143
NEWLOWS 25
MAXCP 112
MINCP 15
TTTNH 64
TTTNL 23
FASTUP 39
FASTDOWN 169
CPCROSSA 118
CPCROSSD 17
BIGVOLUP 4
BIGVODN 5
ACCUMVER 10
HIGHIP21 9
HIUPPCT 12
VHIP21 282
LOWACCUM 149
REDSELL 63
AUGSELS7 6
TRAPDOOR 26
|
Table 3RANKING OF KEY DIRECTORIES BASED PCT.OF STOCKS ABOVE 65-DMA 5/15/19 --------------------------------------------------------------------------------------- Directory Current day-1 day-2 day-3 day-4 day-5 ---------------------------------------------------------------------------------------- BONDFUND .932 .922 .932 .961 .951 .961 INSURANC .928 .892 .821 .928 .892 .892 EDU .833 .666 .833 .833 .666 .666 HOMEBLDG .705 .705 .647 .764 .705 .647 REIT .682 .641 .601 .662 .567 .506 BEVERAGE .647 .529 .529 .588 .529 .529 SOLAR .647 .529 .411 .529 .588 .705 JETS .6 .6 .6 .6 .6 .5 UTILITY .55 .6 .625 .65 .5 .45 SOFTWARE .532 .467 .419 .532 .548 .532 GUNS .529 .529 .47 .647 .529 .47 GREEN .478 .434 .478 .521 .565 .565 SEMI .477 .432 .333 .522 .54 .639 SP500 .464 .456 .401 .564 .535 .535 RUS-1000 .461 .45 .396 .546 .521 .512 NASD-100 .458 .406 .354 .572 .583 .635 TRANSP .45 .45 .45 .45 .5 .55 FIDSTKS .448 .437 .394 .594 .551 .551 NIFTY .438 .403 .368 .526 .561 .596 DOWJONES .433 .4 .366 .566 .5 .533 SP-100 .414 .393 .372 .542 .5 .521 ELECTRON .398 .373 .31 .443 .455 .512 INFRA .388 .361 .333 .444 .388 .472 DJI-13 .384 .307 .23 .615 .538 .538 INDEXES .367 .286 .259 .567 .529 .556 MILITARY .366 .366 .366 .533 .566 .566 FINANCE .363 .409 .329 .613 .545 .545 BIOTECH .338 .3 .273 .393 .377 .415 AUTO .333 .282 .282 .41 .435 .512 HACKERS .333 .333 .285 .476 .523 .476 OILGAS .326 .304 .226 .354 .29 .319 COMPUTER .318 .272 .272 .454 .409 .545 GAMING .304 .26 .304 .391 .391 .434 HOSPITAL .304 .347 .26 .391 .347 .391 BIGBANKS .285 .285 .428 .857 .857 .857 COAL .285 .142 .142 .285 .142 .142 CHEM .25 .269 .25 .365 .423 .403 FOOD .203 .203 .203 .24 .203 .24 COMODITY .2 .2 .2 .25 .2 .25 INDMATER .189 .177 .139 .202 .227 .253 REGBANKS .178 .357 .107 .678 .642 .571 RETAIL .169 .15 .132 .377 .452 .452 ETFS .157 .087 .017 .315 .263 .333 CHINA .135 .135 .101 .135 .152 .169 GOLD .081 .081 .142 .081 .061 .102 |
====================================================================
5/14/2019
The recent Peerless Buys make us expect a recovery from near
25000.
So, do the rising Closing Powers and rising DJI DISI-OBV. But big new
tariffs take money out of American consumers pockets. This acts against
the fiscal stimulus of lower taxes. Let's hope Powell at the Federal Reserve
knows enough not to start talking about the tariffs' inflationary effect and how
he may have to raise interest rates to fight off inflation.
The DJI has held above 25000. But is the heavy selling at the opening over? We
need to see a significantly higher opening and then a still higher close. When
that happens, I think we can expect the DJI to jump back up to 26000 and, after a
little hesitation, move up to a new high near 27000. The recent Buy B17 that
I discussed night actually also saw a Buy B3. You will see from our Peerless
history book (soon to be released) that the Buy B3 also is a reliably Bullish
signal in May and June. The B3 is based on the 20-day Stochastic K-Line reaching
a deeply "oversold" status in certain months of the year.
Few Head and Shoulders Patterns Now.
One of the important technical messages the market is giving us now is that the
SPY does NOT show a bearish head and shoulders top. Look down below and
you will see how common this price formation is just before the SP-500 is about to
decline. That makes me believe that the stock market is fairly safe, even though
most
of the leadership is very defensive (PG, HSY, utilities and reits).
I would remain hedged and be short some of our bearish MINCPs. There are more stocks
below their 65-dma than over it. Troublesome now is that many more stock groups
show a majority of their stocks below the 65-dma. This would seem to put a cap on
any rally now. In fact, I would expect a new Peerless Sell on any DJI rally to the
Upper
2.4% Band because of the V-Indicator staying in negative territory.
| May-June B3s Date Gain Max.Paper Loss ------------------------------------------------------ 19370614 B3 165.5 .123 perfect 19470519 B3 163.6 .13 none 19530609 B3 263.4 .779 2 -.0303 9/14 19740520 B3 812.42 .051 -.0209 5/29 19820607 B3 804.03 .026 -.0191 6/18 20120604 B3 12101.46 .122 none 20160627 B3 17140.24 .069 none ========================================== Mean = .122 1.3% |
The Hourly DISI shows volume is much greater on up-hours than down-hours
and shows a very bullish divergence from prices.


The main ETFs' Closing Powers are rising, but the Opening Powers are
have not turned up in a way that would suggest that over-seas' selling has
ended. Bottoms do often occur when oversold Opening Powers turn up
in conjunction with a rising Closing Power. See the importance of SPY head
and shoulders patterns in the charts below. We are fortunate now not to
see such a pattern. If one does develop, attach more weight to it than
a positive Accumulation.
|
SPY 1990 Head and shoulders here "trump" high Accumulation.  |
|||
|
SPY 1994 Head/Shoulders and Falling Closing Power warn of higher interest rates.  |
|||
SPY 2011 |
|||
|
S PY 2015-2016 Massive SPY H/S pattern in 2015 warned of Big Decline in that year  |
|||
|
Charts 5/14/2019 2018 PEERLESS DJI, Signals, Indicators Daily DJI Volume 10-DayUp/Down Vol Hourly DJIA A/D Line for All Stocks Inverted Traders Index NASDAQ S&P OEX NYSE COMPQX DJI-15 DJI-20 DJI-30 DIA SPY QQQ MDY IWM TNA Short-Term Rates USO-CrudeOil DBO FAS GLD BBH IBB JETS JNUG KOL NUGT OIH OIL RSX RETL SDS AGQ SLV SOXL TECL TLT TMF TNA UGA (gasoline) XIV and China: YINN CHAU Commodities: CANE CORN DBC JJC, NIB, CHOC CORN, CUT (paper) MOO, SOYB WEAT UUP (Dollar) LIT (Lithium) AAPL ADBE ALXN AMAT AMGN AMD AMZN BA BABA BAC BIDU CAT CVX DE FB GOOG GS HD IBM INTU JPM M (Macy's) MSFT NFLX NVDA QCOM TSLA TXN XOM WMT CMG , LRCX, SWKS, MDGL SPPI WATT SQ TOWN 5/14/19 (Click on Underlined link.) Bullish MAXCPs - http://tigersoft.com/MAXCPS/May-14/BULLISH.htm Bearish MAXCPs - http://tigersoft.com/MINCPs/May-14/BEARISH.htm |
|||
Table 1 QUICKSILVER on ETFS - 5/14/19 ETF CLOSE CHANGE PIVOT-PT 5-dmaAROC CL-PWR CANDLE IP21 ITRS
---------------------------------------------------------------------------------------------
DIA 255.81 2.34 259.66 -71.8% ------- BLUE .162 =====
---------------------------------------------------------------------------------------------
BA 343.04 5.67 359.75 -201.2% Bearish BLUE-.087 -.198
---------------------------------------------------------------------------------------------
SPY 283.4 2.54 287.53 -79.1% ------- BLUE .163 .024
---------------------------------------------------------------------------------------------
QQQ 180.54 1.96 185.77 -154.8% ------- BLUE .176 .045
---------------------------------------------------------------------------------------------
MDY 345.43 3.34 352.12 -111.1% Bullish BLUE .158 -.001
---------------------------------------------------------------------------------------------
IWM 153.54 1.91 156.76 -128.1% Bullish BLUE .188 -.011
---------------------------------------------------------------------------------------------
FAS 67.5 1.67 69.4 -166.7% Bullish BLUE .184 .083
---------------------------------------------------------------------------------------------
RETL 25.45 .94 28.93 -596.2% ------- BLUE .157 -.156
---------------------------------------------------------------------------------------------
SOXL 148.07 9.89 166.34 -702% ------- BLUE .199 .148
(highest)
---------------------------------------------------------------------------------------------
TECL 139.13 6.43 151.36 -436.7% ------- BLUE .2 .136
---------------------------------------------------------------------------------------------
IBB 102.44 1.12 105.59 -152.5% Bearish BLUE .024 -.092
---------------------------------------------------------------------------------------------
GLD 122.46 -.21 120.91 51.4% ------- RED -.017 .017
---------------------------------------------------------------------------------------------
OIH 15.34 .5 15.81 -180% Bearish BLUE-.165 -.113
---------------------------------------------------------------------------------------------
RSX 21.14 .48 21.16 -4.8% ------- BLUE .155 .041
|
|||
Table 2   Count of Stocks in Key Directories
          20190514
-------------------------------
NEWHIGHS       66
NEWLOWS        21
MAXCP          60
MINCP          15
TTTNH          41
TTTNL          37
FASTUP         34
FASTDOWN       190
CPCROSSA       94
CPCROSSD       37
BIGVOLUP       7
BIGVODN        6
ACCUMVER       10
HIGHIP21       8
HIUPPCT        11
LOWACCUM       149
REDSELL        65
AUGSELS7       10
TRAPDOOR       26
|
|||
 Table 3
 RANKING OF KEY DIRECTORIES BASED PCT.OF STOCKS ABOVE 65-DMA
              5/14/19
 Bearish = 36
 Bullish = 10
---------------------------------------------------------------------------------------
Directory     Current       day-1         day-2         day-3         day-4         day-5
----------------------------------------------------------------------------------------
BONDFUND       .922          .932          .961          .951          .961          .961
INSURANC       .892          .821          .928          .892          .892          .928
HOMEBLDG       .705          .647          .764          .705          .647          .764
EDU            .666          .833          .833          .666          .666          .666
REIT           .641          .601          .662          .567          .506          .554
JETS           .6            .6            .6            .6            .5            .6
UTILITY        .6            .625          .65           .5            .45           .625
BEVERAGE       .529          .529          .588          .529          .529          .588
GUNS           .529          .47           .647          .529          .47           .47
SOLAR          .529          .411          .529          .588          .705          .764
N= 10
============================================================================================
SOFTWARE       .467          .419          .532          .548          .548          .516
SP500          .456          .401          .564          .535          .537          .576
RUS-1000       .45           .396          .545          .523          .515          .544
TRANSP         .45           .45           .45           .5            .55           .65
FIDSTKS        .437          .394          .594          .551          .551          .567
GREEN          .434          .478          .521          .565          .565          .565
SEMI           .432          .333          .522          .54           .639          .63
FINANCE        .409          .329          .613          .545          .545          .613
NASD-100       .406          .354          .572          .583          .635          .635
NIFTY          .403          .368          .526          .561          .596          .631
DOWJONES       .4            .366          .566          .5            .533          .533
SP-100         .393          .372          .542          .5            .521          .521
ELECTRON       .373          .31           .443          .455          .512          .525
MILITARY       .366          .366          .533          .566          .566          .533
INFRA          .361          .333          .444          .388          .472          .472
REGBANKS       .357          .107          .678          .642          .571          .785
HOSPITAL       .347          .26           .391          .347          .391          .478
HACKERS        .333          .285          .476          .523          .476          .476
DJI-13         .307          .23           .615          .538          .538          .538
OILGAS         .304          .226          .354          .29           .326          .276
BIOTECH        .297          .273          .393          .377          .418          .428
INDEXES        .286          .259          .567          .529          .562          .61
BIGBANKS       .285          .428          .857          .857          .857          .857
AUTO           .282          .282          .41           .435          .512          .487
COMPUTER       .272          .272          .454          .409          .545          .59
CHEM           .269          .25           .365          .423          .423          .403
GAMING         .26           .304          .391          .391          .434          .434
FOOD           .203          .203          .24           .203          .24           .222
COMODITY       .2            .2            .25           .2            .25           .225
INDMATER       .177          .139          .202          .227          .253          .278
RETAIL         .15           .132          .377          .452          .452          .452
COAL           .142          .142          .285          .142          .142          .285
CHINA          .135          .101          .135          .152          .169          .203
ETFS           .087          .017          .315          .263          .333          .385
GOLD           .081          .142          .081          .061          .102          .122
N=36
|


====================================================================
5/13/2019
US Professionals seem to have won the battle with
the overseas' Sellers.
. A close back above the briefly broken 26420 neckline would clinch the
new Peerless Buy B17 today. So, no judged Sell S10 has occurred'; prices
should not be so quickly recovering if the S10 was valid..
The Chinese tariffifs' response did come out today. The
size of the tariff's retaliation
seems much smaller than it might have been. China's new tariffs amount to $60
billion
and Trump's tariffs will cost US tax-payers $200 billion. Wall Street seems to
like this arithmetic because much higher tariffs on US technology exports might have been
posted. And also bullish, there was no sign from 10-year bond
prices or the Dollar
that China will start selling its huge holdings of US debt instruments.
Very positively, Peerless did produce a Buy B17 today despite the 2+% DJI decline.
And now the DJI seems to be rallying upwards over-night, unlike the downward
pattern seen for the last two weeks. It seems that Professionals in the US have
won the battle with overseas' sellers.
A reversal upwards today and a big rise after the opening on big volume would
make it looks like a downside-selling selling climax has been reached. Traders should
buy more DIA, SPY or QQQ. But save a little so that in the next purchase, if there
is one, there will be an upside potential of 10% in your trade.
Seasonality since 1967
Years before Pres. Election Years
Trading Days after 5/13
DJI Pct Gain Probability of DJI Rallying
Five Days
1.0%
56.3%
Ten Days
2.6%
75.0%
Twenty-One Days 2.1%
75.0%
Forty-Two Days 4.2%
75.0%
Sixty Five Days 6.0%
81.3%
|
Historically Buy B17s reliable. The 1913 study of them shows that they rose 11.1% on average. " Buy B17s takes place when the DJI fall is sufficiently below the 21-day mvg.avg. but still shows a nearly positive or improving Accumulation Index. The average gain on the 72 Buy B17s between 1928 and 2013 was 11.1% here was only one Buy B17 that did not bring at least a gain of 2%. No losses were produced by this signal. The biggest gains generally occurred in the Mid-Term Election Year (PE +2). They averaged 14.8%. October Buy B11s were the most frequent and the most powerful, averaging 15.1%. The B17s gains from April to July were much smaller." More details: http://tigersoft.com/PeerInst-2012-2013/--Buy-B17.htm April-June Peerless B17s
Date Gain Max.Paper Loss
19380525      B17       110.6      .307       -.0244
19390629      B17       130.1      .184        none
19490606      B17       165.2      .335       -.0217
19770525      B17       903.24     .033       -.0048
19790515 B17 825.88 .082 -.0056
19870519 B17 2221.28 .059 -.0024
19990527 B17 10466.92 .048 none
20110608 B17 12048.94 .030 -.0125
20120601 B17 12118.57 .087 -.0014
===========================================================================
Median Gain = 5.9% (N=10)
Since 1980 Avg Gain = 4.5%
Median Max.Paper Loss= 0.56%
Paper Losses of close to 2.5% can occur.
More than that would show a dangerous situation.
===========================================================================
(Not closed out 20190513 25324.99 .04 (approx. to date)
|
 NASDAQ needs to get back above 65-dma.resistance just below 7800.
|
|
Charts 5/13/2019 2018 PEERLESS DJI, Signals, Indicators Daily DJI Volume 10-DayUp/Down Vol Hourly DJIA A/D Line for All Stocks Inverted Traders Index NASDAQ S&P OEX NYSE COMPQX DJI-15 DJI-20 DJI-30 DIA SPY QQQ MDY IWM TNA Short-Term Rates USO-CrudeOil DBO FAS GLD BBH IBB JETS JNUG KOL NUGT OIH OIL RSX RETL SDS AGQ SLV SOXL TECL TLT TMF TNA UGA (gasoline) XIV and China: YINN CHAU Commodities: CANE CORN DBC JJC, NIB, CHOC CORN, CUT (paper) MOO, SOYB WEAT UUP (Dollar) LIT (Lithium) AAPL ADBE ALXN AMAT AMGN AMD AMZN BA BABA BAC BIDU CAT CVX DE FB GOOG GS HD IBM INTU JPM M (Macy's) MSFT NFLX NVDA QCOM TSLA TXN XOM WMT CMG , LRCX, SWKS, MDGL SPPI WATT SQ TOWN 5/13/19 (Click on Underlined link.) Bullish MAXCPs - http://tigersoft.com/MAXCPS/May-13/BULLISH.htm Bearish MAXCPs - http://tigersoft.com/MINCPs/May-13/BEARISH.htm |
Table 1 QUICKSILVER on ETFS - 5/13/19 ETF CLOSE CHANGE PIVOT-PT 5-dmaAROC CL-PWR CANDLE IP21 ITRS --------------------------------------------------------------------------------------------- DIA 253.47 -6.45 259.52 -207.4% ------- RED .185 0 --------------------------------------------------------------------------------------------- BA 337.37 -17.3 357.23 -476.1% Bearish RED -.038 -.208 ------ --------------------------------------------------------------------------------------- SPY 280.86 -7.24 287.93 -207.2% ------- RED .195 .028 --------------------------------------------------------------------------------------------- QQQ 178.58 -6.42 186.24 -304.8% ------- RED .193 .051 --------------------------------------------------------------------------------------------- MDY 342.09 -10.35 353.21 -257.3% Bullish RED .165 .002 --------------------------------------------------------------------------------------------- IWM 151.63 -4.99 157.53 -288.1% Bullish RED .173 -.015 --------------------------------------------------------------------------------------------- FAS 65.83 -4.79 69.8 -538.2% Bullish RED .258 .058 --------------------------------------------------------------------------------------------- RETL 24.51 -3.08 28.74 -1022% Bearish RED .113 -.216 --------------------------------------------------------------------------------------------- SOXL 138.18 -22.71 170.43 -1356.1% ------- RED .212 .089 --------------------------------------------------------------------------------------------- TECL 132.7 -16.82 151.95 -979.7% ------- RED .212 .09 --------------------------------------------------------------------------------------------- IBB 101.32 -3.68 105.63 -354% Bearish RED -.012 -.093 --------------------------------------------------------------------------------------------- GLD 122.67 1.24 121.21 76.8% ------- ---- -.069 .033 --------------------------------------------------------------------------------------------- OIH 14.84 -.65 15.9 -463.8% Bearish RED -.219 -.121 --------------------------------------------------------------------------------------------- RSX 20.66 -.27 21.16 -175.5% Bearish RED .138 .037 |
Table 2 Count of Stocks in Key Directories
20190513
-------------------------------
NEWHIGHS 94 Still Bullish.
NEWLOWS 81
MAXCP 48
MINCP 31
TTTNH 21
TTTNL 86
FASTUP 40
FASTDOWN 228
CPCROSSA 23
CPCROSSD 226
BIGVOLUP 3
BIGVODN 11
ACCUMVER 12
HIGHIP21 6
HIUPPCT 11
VHIP21 310
LOWACCUM 162
REDSELL 59
AUGSELS7 8
TRAPDOOR 26
|
Table 3 RANKING OF KEY DIRECTORIES BASED PCT.OF STOCKS ABOVE 65-DMA
5/13/19
Bearish = 38
Bullish = 8
---------------------------------------------------------------------------------------
Directory Current day-1 day-2 day-3 day-4 day-5
----------------------------------------------------------------------------------------
BONDFUND .932 .961 .951 .961 .961 .97
EDU .833 .833 .666 .666 .666 .666
INSURANC .821 .928 .892 .892 .928 1
HOMEBLDG .647 .764 .705 .647 .764 .823
UTILITY .625 .65 .5 .45 .625 .7
REIT .601 .662 .567 .506 .554 .729
JETS .6 .6 .6 .5 .6 .7
BEVERAGE .529 .588 .529 .529 .588 .588
===============================================================================================
GREEN .478 .521 .565 .565 .565 .608
GUNS .47 .647 .529 .47 .47 .705
TRANSP .45 .45 .5 .55 .65 .8
BIGBANKS .428 .857 .857 .857 .857 .857
SOFTWARE .419 .532 .548 .548 .516 .645
SOLAR .411 .529 .588 .705 .764 .823
SP500 .401 .564 .535 .537 .584 .686
RUS-1000 .396 .545 .521 .516 .548 .657
FIDSTKS .394 .594 .551 .551 .567 .691
SP-100 .372 .542 .5 .521 .521 .617
NIFTY .368 .526 .561 .596 .631 .771
DOWJONES .366 .566 .5 .533 .533 .6
MILITARY .366 .533 .566 .566 .566 .666
NASD-100 .354 .572 .583 .635 .635 .75
INFRA .333 .444 .388 .472 .472 .527
SEMI .333 .522 .54 .639 .639 .693
FINANCE .329 .613 .545 .545 .613 .738
ELECTRON .31 .443 .455 .512 .525 .594
GAMING .304 .391 .391 .434 .434 .521
HACKERS .285 .476 .523 .476 .476 .666
AUTO .282 .41 .435 .512 .487 .615
COMPUTER .272 .454 .409 .545 .59 .727
BIOTECH .27 .393 .377 .418 .431 .524
INDEXES .263 .569 .532 .564 .618 .666
HOSPITAL .26 .391 .347 .391 .478 .434
CHEM .25 .365 .423 .423 .423 .519
DJI-13 .23 .615 .538 .538 .538 .692
OILGAS .225 .352 .288 .323 .274 .366
FOOD .203 .24 .203 .24 .222 .24
COMODITY .2 .25 .2 .25 .225 .25
COAL .142 .285 .142 .142 .285 .285
GOLD .142 .081 .061 .102 .122 .102
INDMATER .139 .202 .227 .253 .278 .392
RETAIL .132 .377 .452 .452 .452 .509
REGBANKS .107 .678 .642 .571 .785 .964
CHINA .101 .135 .152 .169 .203 .389
ETFS .017 .315 .263 .333 .403 .701
|


=====================================================================
5/10/2019
I'm not sure that I have ever seen such big swings in different directions first
over-night and then from the opening to the close on the NYSE. I'm pretty
sure these divergent moves will continue until China announces its response
to the Trump tariffs. Any Chinese delay in here is going to make the market
a wild affair. I imagine China will keep the US waiting. So, some of you that
like volatile trading may see how to take advantage of it.
The market wants to see how China retaliates against Trump's 25% tariffs.
At this time, the DJI is down more than 300. A retest of the lower band near
25420 is coming. Trump has asked the Chinese to retaliate quickly, presumably
to remove uncertainty from the stock market to help the biggest exporters
to adjust quickly. The NYSE A/D Line is still very strong. The Hourly DISI
shows a bullish divergence and the Accumulation Indexes for the DJI and the
other major Index and ETFs remain mostly positive.
But the DJI is up a long ways from last year's low. We have gone more
than 10 years without a DJI drop of more than 20%. Continue to hedge
with some of our Bearish MINCPs and hold only a small (partial) position
because of the Buy B2 in DIA or SPY. Avoid the tech stocks for now.
A close below 25400 would force us to issue a judged Sell S10. The size
of the overseas selling before the opening could continue for a long time.
That forces American Professionals to keep supporting the market during
the hours when the NYSE us open. That has the effect of boosting the
leading ETFs made Closing Power to new highs. Ordinarily, that
would make me quite bullish. But how long will American Professionals
play this role?
So far, most American Professionals on Wall Street, do not believe that China's
retaliation against American tariffs will matter much. I subscribe to that view
myself
But we could be wrong. Too many Trump supporters on Wall Street and elsewhere
feel that the big man can do no wrong. The rest of world is more doubtful. And
it is
the rest of the World that is now very unsettled about Trade Wars, American
Constitutional dangers and the threat of recession where they live. We will probably
need
to see some higher openings to signify that the overseas' selling is ending.
Weak Openings Are "Stress-Testing" American
Professionals
Right now Public-Overseas Selling is Very High. Will the Professionals
be able to Hold Up the Market, or will they suddenly switch to the
bearish camp. Watch the DJI's support at 24000. That is likely to
be the key point which will decide what the Professionals will do.
DIA |
SPY |
QQQ |
So far, the US Dollar is very strong and interest rates are low. But Trump can
certainly do wrong, the Constitutional crisis could certainly get much worse
and China and Russia could start dumping US bonds and demand payment in
othr currencies. We can't put our head in the sand. Treat a decline below 25400
as a judged Sell S10.
25420 Is Key Support

Thursdays' Buy B2 has been a weak signal since 2000. In this period, there have
only been three cases in May or June. Their average gain of 3.1% is only slightly
above the average maximum drawdown. That is the main reason that I suggested
waiting for the DJI to re-test its lower band before taking a limited position
in DIA and SPY. Waiting to see what China does in retaliation is the second reason
for waiting. Wanting to get some head-room before buying was the third reason for
recommending patience or even hedging with some Bearish MINCPs.
Buy B2 - Tests of Lower Band - May - June:
2000-2019
.
1 20000505
B2 10577.86
.038 10299.2
-.0263 biggest
2 20100520 B2
10068.01 .034
9816.49
-.0249
3==>20110603 B2
12151.26 .022
11897.2 -.0209
=====
=====
20190509 B2 25967.73
-----------------------------------------------------------------
Avg= +3.1% (N=24) Avg.= 2.40%
V-Formations Have Bullishly Brought Many More New Highs,
75% of the Time. But in 2002, A V-Formation Became A Bear Market.
Three of the DJI most comparable V-formations, 1941-1942, 1949-1950, 1971-1972
V-formations made new highs after only a limited hesitation or a month or two, at the old
highs. There was one that did not. That was after the DJI rally up from the
2001 attack
on the World Trade Center. In that case, the DJI we had sell signals and the NYSE
A/D
Line slid lower and lower after breaking its uptrend-line.
Might the DJI fall back and have to re-test its lows, about 18% down from the peak.
The V-formation suggests that there is a 25% chance of that. But looking back to
1950,
we see not case where the DJI enters an 18% wide trading range. The widest such
trading
trading ranges have been are about 10%, as in 1956, 1986 and 2000 and many were much
less.
So, without a Peerless Sell signal, I would think the DJI will not drop much below its
lower band, which also get support from the fact that the 200-day ma also crosses there.
But I would not be stubborn. A DJI close 100-points, or so, below its neckline
support
would force me to judge a Sell S10 in what would then appear to be a rare "hands
above
the bead" pattern. See this in the chart below.
In May 2002 Low Interest Rates, a Strong A/D Line
and a DJI V-Formation all turned into a Bear Market.
after a Judged S10 and a break in an extended A/D Line.

|
Charts 5/10/2019 2018 PEERLESS DJI, Signals, Indicators Daily DJI Volume 10-DayUp/Down Vol Hourly DJIA A/D Line for All Stocks Inverted Traders Index NASDAQ S&P OEX NYSE COMPQX DJI-15 DJI-20 DJI-30 DIA SPY QQQ MDY IWM TNA Short-Term Rates USO-CrudeOil DBO FAS GLD BBH IBB JETS JNUG KOL NUGT OIH OIL RSX RETL SDS AGQ SLV SOXL TECL TLT TMF TNA UGA (gasoline) XIV and China: YINN CHAU Commodities: CANE CORN DBC JJC, NIB, CHOC CORN, CUT (paper) MOO, SOYB WEAT UUP (Dollar) LIT (Lithium) AAPL ADBE ALXN AMAT AMGN AMD AMZN BA BABA BAC BIDU CAT CVX DE FB GOOG GS HD IBM INTU JPM M (Macy's) MSFT NFLX NVDA QCOM TSLA TXN XOM WMT CMG , LRCX, SWKS, MDGL SPPI WATT SQ TOWN 5/10/19 (Click on Underlined link.) Bullish MAXCPs - http://tigersoft.com/MAXCPS/May-10/BULLISH.htm Bearish MAXCPs - http://tigersoft.com/MINCPs/May-10/BEARISH.htm |
Table 1 QUICKSILVER on ETFS - 5/10/19 ETF CLOSE CHANGE PIVOT-PT 5-dmaAROC CL-PWR CANDLE IP21 ITRS --------------------------------------------------------------------------------------------- DIA 259.92 1.48 264.27 -96.6% ------- BLUE .235 0 --------------------------------------------------------------------------------------------- BA 354.67 .54 371.6 -299.4% ------- BLUE .069 -.196 --------------------------------------------------------------------------------------------- SPY 288.1 1.44 292.82 -102.3% Bullish BLUE .245 .031 --------------------------------------------------------------------------------------------- QQQ 185 .23 189.94 -162.9% ------- BLUE .261 .066 --------------------------- ------------------------------------------------------------------ MDY 352.44 1.27 360.3 -120.7% Bullish BLUE .224 .01 --------------------------------------------------------------------------------------------- IWM 156.62 .43 160.71 -123.5% Bullish BLUE .215 -.003 --------------------------------------------------------------------------------------------- FAS 70.62 1.29 73.42 -258.2% Bullish BLUE .295 .119 --------------------------------------------------------------------------------------------- RETL 27.59 -.59 30.39 -582.3% Bullish RED .155 -.134 --------------------------------------------------------------------------------------------- SOXL 160.89 .47 183.85 -928.1% ------- BLUE .272 .267 --------------------------------------------------------------------------------------------- TECL 149.52 1.22 162.63 -539.3% Bullish BLUE .286 .218 --------------------------------------------------------------------------------------------- IBB 105 -.34 108.83 -136.4% ------- BLUE -.019 -.071 --------------------------------------------------------------------------------------------- GLD 121.43 .23 120.81 32.2% Bullish ---- -.164 -.023 --------------------------------------------------------------------------------------------- OIH 15.49 -.23 16.31 -265.4% Bearish RED -.187 -.097 --------------------------------------------------------------------------------------------- YINN 26.15 -.01 26.18 -1.9% Bearish ---- .19 .137 --------------------------------------------------------------------------------------------- RSX 20.93 .19 21.4 -148.6% Bearish ---- .129 .023 |
TABLE 2 Count of Stocks in Key Directories
20190510
-------------------------------
NEWHIGHS 128
NEWLOWS 32
MAXCP 98
MINCP 18
TTTNH 35
TTTNL 56
FASTUP 47
FASTDOWN 175
CPCROSSA 198
CPCROSSD 111
BIGVOLUP 2
BIGVODN 13
ACCUMVER 12
HIGHIP21 10
HIUPPCT 12
LOWACCUM 153
REDSELL 60
AUGSELS7 9
TRAPDOOR 25
|
RANKING OF KEY DIRECTORIES BASED PCT.OF STOCKS ABOVE 65-DMA 5/10/19 Bullish = 26 Bearish = 19 --------------------------------------------------------------------------------------- Directory Current day-1 day-2 day-3 day-4 day-5 ---------------------------------------------------------------------------------------- BONDFUND .961 .951 .961 .961 .97 .97 INSURANC .928 .892 .892 .928 1 .928 BIGBANKS .857 .857 .857 .857 .857 .857 EDU .833 .666 .666 .666 .666 1 HOMEBLDG .764 .705 .647 .764 .823 .882 REGBANKS .678 .642 .571 .785 .964 .928 REIT .662 .567 .506 .554 .729 .729 UTILITY .65 .5 .45 .625 .7 .775 GUNS .647 .529 .47 .47 .705 .705 DJI-13 .615 .538 .538 .538 .692 .692 FINANCE .613 .545 .545 .613 .727 .738 JETS .6 .6 .5 .6 .7 .9 FIDSTKS .594 .551 .551 .567 .691 .718 BEVERAGE .588 .529 .529 .588 .588 .647 NASD-100 .572 .583 .635 .635 .75 .781 INDEXES .569 .532 .564 .618 .666 .629 DOWJONES .566 .5 .533 .533 .6 .7 SP500 .564 .535 .537 .584 .686 .733 RUS-1000 .545 .521 .515 .549 .66 .689 SP-100 .542 .5 .521 .521 .617 .659 MILITARY .533 .566 .566 .566 .7 .7 SOFTWARE .532 .548 .548 .516 .645 .645 SOLAR .529 .588 .705 .764 .823 .882 NIFTY .526 .561 .596 .631 .754 .771 SEMI .522 .54 .639 .639 .702 .756 GREEN .521 .565 .565 .565 .608 .695 ================================================================================================ HACKERS .476 .523 .476 .476 .666 .666 COMPUTER .454 .409 .545 .59 .727 .772 TRANSP .45 .5 .55 .65 .8 .8 INFRA .444 .388 .472 .472 .527 .583 ELECTRON .443 .455 .512 .525 .594 .632 AUTO .41 .435 .512 .487 .615 .666 GAMING .391 .391 .434 .434 .521 .521 HOSPITAL .391 .347 .391 .478 .434 .391 BIOTECH .39 .377 .418 .431 .521 .494 RETAIL .377 .452 .452 .452 .528 .566 CHEM .365 .423 .423 .423 .538 .519 OILGAS .352 .288 .323 .274 .366 .38 ETFS .315 .263 .333 .403 .701 .789 COAL .285 .142 .142 .285 .285 .285 COMODITY .25 .2 .25 .225 .25 .3 FOOD .24 .203 .24 .222 .24 .314 INDMATER .202 .227 .253 .278 .392 .405 CHINA .135 .152 .169 .203 .406 .627 GOLD .081 .061 .102 .122 .102 .081 |
=======================================================================
5/9/2019
Today brought a new Buy B2.
The DJI today came close enough to the lower
3.5% band for this signal. As expected Pres. Trump has imposed a 20% tariff
on a wide range of Chinese imports. This will boost Americans' credit card usage
quite royally. If you are looking for what to buy given the Buy signal, consider
the credit card companies, MA and Visa. I would expect China to retaliate very
quickly on American tech stocks, like AAPL, ADBE .... MSFT. Traders may
wait to see the selling from the Chinese reaction before buying. A further
two percent DJI decline should not come as a surprise. More than 3% would be
more than any previous May or June Buy B2 and would call for extreme caution.
In Mays and Junes, there have been 24 Buy B2s since 1929. These have averaged
+7.8% at time of next Peerless sell. But in the last thirty or so years, the gains
are much
smaller. See the table below the DJI charts. Most likely, the next rally back up to
the
recent highs, will produce a Sell, especially since Summer S9Vs are fairly common.
Buy a litttle in here, but let's wait a little longer to buy DIA or
SPY. The pattern has
been for there to be an emotionally-based Monday sell-off and a Tuesday turn-around.
Dow Jones changes tonight: D-J is now
not reporting the hourly DJI's highs and lows
and volume. In addition, they stopped providing NHs and NLs. Fortunately, these can
be
easily computed by simply adding up the individual DJI highs and lows and multiplying the
sum by the ratio of the reported DJI close to the sum of the individual DJI-30 stocks.
 |
May and June Buy B2s since 1929 Date Signal DJI Gain Max. Paper Loss
1 19290527 B2 293.4 .069 perfect 0
2 19300507 B2 263.7 .043 none 0
3===>19350531 B2 110.64 .198 none 0
(PE-1) ====
4 19360506 B2 149.7 .265 146.9 -.0187
5 19380502 B2 110.1 .071 perfect 0
6===>19390628 B2 132.8 .16 130.1 -.0203
====
7 19460506 B2 200.7 .059 none 0
8===>19510628 B2 244.0 .127 242.6 -.0057
====
9 19520501 B2 256.4 .06 perfect 0
10 19720502 B2 935.2 .032 925.12 -.0107
11==>19750529 B2 815.06 .061 none 0
12 19760607 B2 958.09 .052 perfect 0
13 19780623 B2 823.02 .103 812.28 -.013
14 19810504 B2 973.34 .04 963.44 -.0101
15 19860507 B2 1775.3 .049 1758.18 -.0096
16 19880519 B2 1958.72 .115 1952.59 -.0031
17==>19910624 B2 2913.01 .033 2898.03 -.0051
=====
18 19940624 B2 3636.94 .068 3624.96 -.0032
19 19960507 B2 5420.95 .06 none 0
20 19980615 B2 8627.93 .049 perfect 0
21==>19990611 B2 10490.51 .046 none 0
=====
22 20000505 B2 10577.86 .038 10299.2 -.0263 biggest
23 20100520 B2 10068.01 .034 9816.49 -.0249
24==>20110603 B2 12151.26 .022 11897.2 -.0209
=====
-----------------------------------------------------------------
20190509 B2 25967.73
Avg= +7.8% (N=24)
But since 1990, the avg. B2 gains only +4.9% (n=8)
and since 2000, the avg. B2 gains only +3.2% (n=3)
In the third year in Presidential Election Years since 1991, the avg. gain = 3.6%
The good news is the biggest paper loss in any of these B2s was 2.6%
but unfortunately, the last three Buy B2s each brought losses of 2.1% to 2.6%
|
  |
 |
|
Charts 5/9/2019 2018 PEERLESS DJI, Signals, Indicators Daily DJI Volume 10-DayUp/Down Vol Hourly DJIA A/D Line for All Stocks Inverted Traders Index NASDAQ S&P OEX NYSE COMPQX DJI-15 DJI-20 DJI-30 DIA SPY QQQ MDY IWM TNA Short-Term Rates USO-CrudeOil DBO FAS GLD BBH IBB JETS JNUG KOL NUGT OIH OIL RSX RETL SDS AGQ SLV SOXL TECL TLT TMF TNA UGA (gasoline) XIV and China: YINN CHAU Commodities: CANE CORN DBC JJC, NIB, CHOC CORN, CUT (paper) MOO, SOYB WEAT UUP (Dollar) LIT (Lithium) AAPL ADBE ALXN AMAT AMGN AMD AMZN BA BABA BAC BIDU CAT CVX DE FB GOOG GS HD IBM INTU JPM M (Macy's) MSFT NFLX NVDA QCOM TSLA TXN XOM WMT CMG , LRCX, SWKS, MDGL SPPI WATT SQ TOWN 5/9/19 (Click on Underlined link.) Bullish MAXCPs - http://tigersoft.com/MAXCPS/May-09/BULLISH.htm Bearish MAXCPs - http://tigersoft.com/MINCPs/May-09/BEARISH.htm |
Table 1 QUICKSILVER on ETFS - 5/9/19 ETF CLOSE CHANGE PIVOT-PT 5-dmaAROC CL-PWR CANDLE IP21 ITRS
---------------------------------------------------------------------------------------------
DIA 258.44 -1.22 264.97 -84.6% ------- BLUE .184 ------
---------------------------------------------------------------------------------------------
BA 354.13 -5.62 376.46 -294.3% Bearish RED .013 -.181
---------------------------------------------------------------------------------------------
SPY 286.66 -.87 294.03 -77.7% ------- BLUE .227 .032
---------------------------------------------------------------------------------------------
QQQ 184.77 -1 191.11 -88.7% ------- BLUE .251 .07
---------------------------------------------------------------------------------------------
MDY 351.17 -.95 361.02 -65.4% Bullish BLUE .228 .01
---------------------------------------------------------------------------------------------
IWM 156.19 -.57 160.53 -41.9% Bullish BLUE .207 -.002
---------------------------------------------------------------------------------------------
FAS 69.33 -.07 74.3 -229.5% Bullish BLUE .298 .106
^^^^^
---------------------------------------------------------------------------------------------
RETL 28.18 -.75 31.02 -321.8% Bullish BLUE .159 -.118
---------------------------------------------------------------------------------------------
SOXL 160.42 -5.92 193.35 -806% ------- BLUE .26 .274
^^^^^^
---------------------------------------------------------------------------------------------
TECL 148.3 -3.06 166.36 -424.7% ------- BLUE .276 .206
---------------------------------------------------------------------------------------------
IBB 105.34 -.25 107.91 -30% Bearish BLUE -.061 -.072
---------------------------------------------------------------------------------------------
GLD 121.2 .29 120.65 52.2% Bullish BLUE -.136 -.022
---------------------------------------------------------------------------------------------
OIH 15.72 -.09 16.34 -96.4% Bearish ---- -.202 -.088
---------------------------------------------------------------------------------------------
RSX 20.74 -.42 21.56 -138.4% Bullish RED .106 .013
|
Table 2 Count of Stocks in Key Directories
2019-05-09
-------------------------------
NEWHIGHS 85
NEWLOWS 41
MAXCP 58
MINCP 23
TTTNH 23
TTTNL 47
FASTUP 74
FASTDOWN 89
CPCROSSA 102
CPCROSSD 65
BIGVOLUP 1
BIGVODN 20
ACCUMVER 7
HIGHIP21 7
HIUPPCT 11
LOWACCUM 159
REDSELL 56
AUGSELS7 8
TRAPDOOR 24
|
Table 3 RANKING OF KEY DIRECTORIES BASED PCT.OF STOCKS ABOVE 65-DMA
5/9/19
Bullish = 24
Bearish = 17
---------------------------------------------------------------------------------------
Directory Current day-1 day-2 day-3 day-4 day-5
----------------------------------------------------------------------------------------
BONDFUND .951 .961 .961 .97 .97 .951
INSURANC .892 .892 .928 1 .928 .892
BIGBANKS .857 .857 .857 .857 .857 .857
HOMEBLDG .705 .647 .764 .823 .882 .823
EDU .666 .666 .666 .666 1 .666
REGBANKS .642 .571 .785 .964 .928 .678
JETS .6 .5 .6 .7 .8 .8
SOLAR .588 .705 .764 .823 .882 .823
NASD-100 .583 .635 .635 .75 .791 .729
^^^^^
REIT .567 .506 .554 .729 .729 .628
MILITARY .566 .566 .566 .7 .666 .533 GREEN .565 .565 .565 .608 .695 .608 NIFTY .561 .596 .631 .754 .807 .754 FIDSTKS .551 .551 .567 .691 .718 .659 SOFTWARE .548 .548 .516 .645 .661 .612 FINANCE .545 .545 .613 .727 .738 .659
SEMI .54 .639 .639 .702 .756 .747
DJI-13 .538 .538 .538 .692 .692 .615
SP500 .535 .537 .584 .686 .735 .672
^^^^^^
INDEXES .532 .564 .618 .666 .629 .623
BEVERAGE .529 .529 .588 .588 .647 .588
GUNS .529 .47 .47 .705 .705 .588
HACKERS .523 .476 .476 .666 .714 .714
RUS-1000 .521 .515 .548 .661 .688 .627
=============================================================================================
DOWJONES .5 .533 .533 .6 .7 .566
^^^^^^
SP-100 .5 .521 .521 .617 .659 .574
UTILITY .5 .45 .625 .7 .775 .725
TRANSP .5 .55 .65 .8 .8 .7
=============================================================================================
ELECTRON .455 .512 .525 .594 .632 .575
RETAIL .452 .452 .452 .528 .566 .566
AUTO .435 .512 .487 .615 .666 .615
CHEM .423 .423 .423 .538 .538 .442
COMPUTER .409 .545 .59 .727 .772 .772
GAMING .391 .434 .434 .521 .521 .565 INFRA .388 .472 .472 .527 .583 .472 BIOTECH .374 .418 .431 .521 .494 .418 HOSPITAL .347 .391 .478 .434 .347 .304 OILGAS .288 .323 .274 .366 .38 .309 ETFS .263 .333 .403 .701 .789 .736 INDMATER .227 .253 .278 .392 .405 .278 FOOD .203 .24 .222 .24 .296 .24 COMODITY .2 .25 .225 .25 .3 .225 CHINA .152 .169 .203 .406 .61 .525 COAL .142 .142 .285 .285 .285 .285 GOLD .061 .102 .122 .102 .081 .061 |
==========================================================================
5/8/2019 Read, please, what I wrote last
night. The selling from overseas is continuing
again this morning before the opening. The DJI's 65-dma is being violated
as I write this. Short-term, I would not let the absence of an official
Peerless Sell signal fool you into buying yet. The tariff war with China will
go to the next level. I do not think we should expect sovereign China to give
way to Trump's very public threats. That should bring a selling climax.
But 25% tariffs on Chinese goods and 25% Chinese tariffs on American electronics
and agricultural goods will not cause
a bear market. True, American consumers will
be taxed more by their own government. But some American industries will be helped.
Others, especially retailers will be hurt.
Our internal strength indicators are holding up quite well. The DJI is much weaker
than SPY or QQQ. So, I suspect the market's panic - which may develop this
weekend because of the new tariffs - will be short-lived. Perhaps, by Tuesday
next week we will get a good opportunity to buy, one where there is 10% head-room
back up to resistance. Very likely, Peerless will tell us when to buy with a new
signal
. Let's wait for that signal, at the very least.
  |
 |
 |
|
Charts 5/8/2019 2018 PEERLESS DJI, Signals, Indicators Daily DJI Volume 10-DayUp/Down Vol Hourly DJIA A/D Line for All Stocks Inverted Traders Index NASDAQ S&P OEX NYSE COMPQX DJI-15 DJI-20 DJI-30 DIA SPY QQQ MDY IWM TNA Short-Term Rates USO-CrudeOil DBO FAS GLD BBH IBB JETS JNUG KOL NUGT OIH OIL RSX RETL SDS AGQ SLV SOXL TECL TLT TMF TNA UGA (gasoline) XIV and China: YINN CHAU Commodities: CANE CORN DBC JJC, NIB, CHOC CORN, CUT (paper) MOO, SOYB WEAT UUP (Dollar) LIT (Lithium) AAPL ADBE ALXN AMAT AMGN AMD AMZN BA BABA BAC BIDU CAT CVX DE FB GOOG GS HD IBM INTU JPM M (Macy's) MSFT NFLX NVDA QCOM TSLA TXN XOM WMT CMG , LRCX, SWKS, MDGL SPPI WATT SQ TOWN 5/8/19 (Click on Underlined link.) Bullish MAXCPs - http://tigersoft.com/MAXCPS/May-08/BULLISH.htm Bearish MAXCPs - http://tigersoft.com/MINCPs/May-08/BEARISH.htm |
Table 1 QUICKSILVER on ETFS - 5/8/19 ETF CLOSE CHANGE PIVOT-PT 5-dmaAROC CL-PWR CANDLE IP21 ITRS --------------------------------------------------------------------------------------------- DIA 259.66 .14 262.88 -85.3% Bearish BLUE .116 ---- --------------------------------------------------------------------------------------------- BA 359.75 2.52 375.8 -229.4% Bearish BLUE -.05 -.154 --------------------------------------------------------------------------------------------- SPY 287.53 -.4 291.18 -73.4% ------- ---- .179 .033 --------------------------------------------------------------------------------------------- QQQ 185.77 -.47 188.11 -83.7% ------- BLUE .197 .073 --------------------------------------------------------------------------------------------- MDY 352.12 -1.09 355.83 -39.6% Bullish RED .16 .012 --------------------------------------------------------------------------------------------- IWM 156.76 -.77 157.52 -.9% Bullish RED .133 .001 --------------------------------------------------------------------------------------------- FAS 69.4 -.4 72.63 -212.3% ------- BLUE .238 .112 --------------------------------------------------------------------------------------------- RETL 28.93 .19 30.1 -93.5% ------- BLUE .099 -.068 --------------------------------------------------------------------------------------------- SOXL 166.34 -4.09 189.55 -464.4% ------- RED .204 .273 --------------------------------------------------------------------------------------------- TECL 151.36 -.59 161.79 -409.1% ------- BLUE .217 .225 --------------------------------------------------------------------------------------------- IBB 105.59 -.04 105.98 1.4% Bearish BLUE -.113 -.058 --------------------------------------------------------------------------------------------- GLD 120.91 -.3 119.94 21.1% Bullish RED -.142 -.034 ---------------------------------------------------------------------------------------------- OIH 15.81 -.09 16.03 -102.2% Bearish RED -.236 -.08 ---------------------------------------------------------------------------------------------- RSX 21.16 0 21.33 -35.1% Bullish ---- .117 .023 |
Table 2 Count of Stocks in Key Directories
2019-05-08
-------------------------------
NEWHIGHS 77
NEWLOWS 34
MAXCP 32
MINCP 23
TTTNH 31
TTTNL 33
FASTUP 60
FASTDOWN 80
CPCROSSA 55
CPCROSSD 130
BIGVOLUP 3
BIGVODN 11
ACCUMVER 14
HIGHIP21 5
HIUPPCT 14
VHIP21 343
LOWACCUM 150
REDSELL 63
AUGSELS7 9
TRAPDOOR 19
|
Table 3 RANKING OF KEY DIRECTORIES BASED PCT.OF STOCKS ABOVE 65-DMA
5/8/19
Bullish = 27
Bearish = 17
---------------------------------------------------------------------------------------
Directory Current day-1 day-2 day-3 day-4 day-5
----------------------------------------------------------------------------------------
BONDFUND .961 .961 .97 .97 .961 .97
INSURANC .892 .928 1 .928 .892 .892
BIGBANKS .857 .857 .857 .857 .857 .857
SOLAR .705 .764 .823 .882 .823 .823
EDU .666 .666 .666 1 .666 .666
HOMEBLDG .647 .764 .823 .882 .823 .882
SEMI .639 .639 .702 .756 .747 .711
NASD-100 .635 .635 .75 .791 .729 .729
^^^^^
NIFTY .596 .631 .754 .807 .754 .736
REGBANKS .571 .785 .964 .928 .678 .5
MILITARY .566 .566 .7 .666 .533 .566
GREEN .565 .565 .608 .695 .608 .565
INDEXES .564 .618 .666 .629 .623 .623
FIDSTKS .551 .567 .691 .718 .659 .686
TRANSP .55 .65 .8 .8 .7 .7
SOFTWARE .548 .516 .645 .661 .612 .629
COMPUTER .545 .59 .727 .772 .772 .636
FINANCE .545 .613 .727 .738 .659 .647
DJI-13 .538 .538 .692 .692 .615 .692
SP500 .537 .584 .686 .735 .676 .69
^^^^^
DOWJONES .533 .533 .6 .7 .566 .666
^^^^^
BEVERAGE .529 .588 .588 .647 .588 .647
SP-100 .521 .521 .617 .659 .574 .617
^^^^^
RUS-1000 .515 .548 .66 .689 .632 .626
AUTO .512 .487 .615 .666 .615 .589
ELECTRON .512 .525 .594 .632 .575 .563
REIT .506 .554 .729 .729 .635 .621
================================================================================================
JETS .5 .6 .7 .8 .8 .8
================================================================================================
HACKERS .476 .476 .666 .714 .714 .714
INFRA .472 .472 .527 .583 .472 .527
GUNS .47 .47 .705 .705 .588 .647
RETAIL .452 .452 .528 .566 .566 .509
UTILITY .45 .625 .7 .775 .725 .725
GAMING .434 .434 .521 .521 .565 .521
CHEM .423 .423 .538 .538 .461 .461
BIOTECH .416 .432 .523 .495 .427 .4
HOSPITAL .391 .478 .434 .347 .304 .304
ETFS .333 .403 .701 .789 .736 .771
OILGAS .323 .274 .366 .38 .316 .366
INDMATER .253 .278 .392 .405 .278 .303
COMODITY .25 .225 .25 .3 .225 .275
FOOD .245 .226 .245 .301 .245 .301
CHINA .169 .203 .406 .61 .525 .61
COAL .142 .285 .285 .285 .285 .285
GOLD .102 .122 .102 .081 .061 .102
|
======================================================================
5/7/2019 Profit-taking?
Professsionals dismiss the current decline as nothing more.
At least, that is what the strength in the Closing Powers show. But could they
be wrong this time? Surely, we need to see some signs that the selling from
over-seas is ending. Fear of a trade war brought a 10% sell-off in January
2018. Is the market safer now?
The DJI broke its recent trading pattern's low. This can be construed to be a
minor Head/Shoulders top much like last October's I'm glad we sold out our
major market ETFS (DIA, SPY and QQQ) because a retreat was expected
back from the old highs' resistance. Note today that the QQQ today failed
its recent breakouts. Now we see bearish head/shoulders tops forming in
such key stocks as NVDA, IBM, CAT and in Crude Oil. I would judge
Peerless still to be on a Buy but the minor H/S pattern, the distribution at the
old highs and today's big sell-off makes it look like 25000 on the DJI will be
reached. Watch high-priced BA in the DJI-30. This made a new low and
is now below its 65-dma.
The DJI's plunge of 1.7% today brought trading losses to those who bought
on weakness Monday. That will make Professionals and day traders extra
cautious now. Usually when there is no Sell signal, the DJI builds a base at its
rising 65-dma and recovers and goes back to, at least, its recent highs. But
today we got no Buy B11because of the size of the drop.
So, it's not safe to buy yet. I think we should wait for a new Peerless
Buy signal,
although a late recovery back above 26000 would probably set up a rally perhaps
to 26500. My sense is traders will be safest now
waiting, at a minimum, until there
is 10% upside potential back up to the recent highs that will act as ceilings.
The danger, of course, now is that if the DJI's 65-dma is broken then that will
unleash a whole new wave of selling and leveraged short selling of ETFs.
It's not hard to imagine what fears might we whipped up in the Press tomorrow.
Trump's personal loss of $2 billion in the 1980s and 1990s was the highest of
an American taxpayer. We can see why he wants to conceal his taxes. It
certainly makes me wonder about the risks he is taking with the US economy
as he threatens a trade war with China or threatens a Constitutional crisis
with Congress.
Peerless has never needed a Sell Signal based solely on a sudden, unexpected big selling
wave (DJI drop of 1.7% in a single day) right after a new DJI high was made, but times
change and this may be the "new normal" as institutions try to squeeze every
penny out
of a rally backed by good economic news now that they believe that they can quickly
sell, hedge or go short using the many new leveraged shorting vehicles now available
which are also very liquid.
 |
SPY |
QQQ |
|
Charts 5/7/2019 2018 PEERLESS DJI, Signals, Indicators Daily DJI Volume 10-DayUp/Down Vol Hourly DJIA A/D Line for All Stocks Inverted Traders Index NASDAQ S&P OEX NYSE COMPQX DJI-15 DJI-20 DJI-30 DIA SPY QQQ MDY IWM TNA Short-Term Rates USO-CrudeOil DBO FAS GLD BBH IBB JETS JNUG KOL NUGT OIH OIL RSX RETL SDS AGQ SLV SOXL TECL TLT TMF TNA UGA (gasoline) XIV and China: YINN CHAU Commodities: CANE CORN DBC JJC, NIB, CHOC CORN, CUT (paper) MOO, SOYB WEAT UUP (Dollar) LIT (Lithium) AAPL ADBE ALXN AMAT AMGN AMD AMZN BA BABA BAC BIDU CAT CVX DE FB GOOG GS HD IBM INTU JPM M (Macy's) MSFT NFLX NVDA QCOM TSLA TXN XOM WMT CMG , LRCX, SWKS, MDGL SPPI WATT SQ TOWN 5/7/19 (Click on Underlined link.) Bullish MAXCPs - http://tigersoft.com/MAXCPS/May-07/BULLISH.htm Bearish MAXCPs - http://tigersoft.com/MINCPs/May-07/BEARISH.htm |
Table 1 QUICKSILVER on ETFS - 5/7/19 ETF CLOSE CHANGE PIVOT-PT 5-dmaAROC CL-PWR CANDLE IP21 ITRS --------------------------------------------------------------------------------------------- DIA 259.52 -4.75 264.15 -118.6% Bearish RED .168 0 --------------------------------------------------------------------------------------------- BA 357.23 -14.37 376.8 -272.3% Bearish RED -.112 -.158 --------------------------------------------------------------------------------------------- SPY 287.93 -4.89 291.81 -104% ------- RED .248 .035 --------------------------------------------------------------------------------------------- QQQ 186.24 -3.7 188.93 -87.1% ------- RED .247 .079 --------------------------------------------------------------------------------------------- MDY 353.21 -7.09 354.95 -82.2% Bullish RED .233 .008 --------------------------------------------------------------------------------------------- IWM 157.53 -3.18 156.79 -23.9% Bullish RED .185 .001 --------------------------------------------------------------------------------------------- FAS 69.8 -3.62 72.48 -295% ------- RED .3 .116 --------------------------------------------------------------------------------------------- RETL 28.74 -1.65 29.49 -344.1% ------- RED .094 -.053 --------------------------------------------------------------------------------------------- SOXL 170.43 -13.42 183.44 -469.5% ------- RED .269 .279 --------------------------------------------------------------------------------------------- TECL 151.95 -10.68 164.57 -422.6% ------- RED .284 .239 --------------------------------------------------------------------------------------------- IBB 105.63 -3.2 105.56 -36.9% Bearish RED -.099 -.06 --------------------------------------------------------------------------------------------- OIH 15.9 -.41 16.14 -236.2% Bearish RED -.213 -.083 --------------------------------------------------------------------------------------------- RSX 21.16 -.24 21.31 -88.7% Bullish RED .158 .026 |
Table 2 Count of Stocks in Key Directories
2019-05-07
-------------------------------
NEWHIGHS 74
NEWLOWS 31
MAXCP 24
MINCP 14
TTTNH 25
TTTNL 45
FASTUP 60
FASTDOWN 89
CPCROSSA 25
CPCROSSD 272
BIGVOLUP 3
BIGVODN 20
ACCUMVER 24
HIGHIP21 8
HIUPPCT 13
LOWACCUM 165
REDSELL 52
AUGSELS7 10
TRAPDOOR 17
|
Table 3 RANKING OF KEY DIRECTORIES BASED PCT.OF STOCKS ABOVE 65-DMA
5/7/19
---------------------------------------------------------------------------------------
Directory Current day-1 day-2 day-3 day-4 day-5
----------------------------------------------------------------------------------------
BONDFUND .961 .97 .97 .961 .97 .932
INSURANC .928 1 .928 .892 .892 .892
BIGBANKS .857 .857 .857 .857 .857 .857
REGBANKS .785 .964 .928 .678 .5 .785
HOMEBLDG .764 .823 .882 .823 .941 .941
SOLAR .764 .823 .882 .823 .823 .823
EDU .666 .666 1 .666 .666 .666
TRANSP .65 .8 .8 .7 .7 .8
SEMI .639 .702 .756 .747 .711 .747
NASD-100 .635 .75 .791 .729 .729 .781
^^^^^
NIFTY .631 .754 .807 .754 .736 .771
UTILITY .625 .7 .775 .725 .725 .8
INDEXES .618 .666 .629 .623 .629 .639
FINANCE .613 .727 .738 .659 .647 .681
JETS .6 .7 .8 .8 .8 .8
COMPUTER .59 .727 .772 .772 .681 .727
BEVERAGE .588 .588 .647 .588 .647 .764
SP500 .584 .686 .735 .676 .698 .771
^^^^^
FIDSTKS .567 .691 .718 .659 .691 .745
MILITARY .566 .7 .666 .533 .566 .633
GREEN .565 .608 .695 .608 .565 .695
REIT .554 .729 .729 .635 .628 .648
RUS-1000 .548 .66 .688 .634 .631 .706
DJI-13 .538 .692 .692 .615 .692 .692
DOWJONES .533 .6 .7 .566 .666 .733
^^^^^
ELECTRON .522 .598 .63 .579 .56 .592
SP-100 .521 .617 .659 .574 .617 .702
SOFTWARE .516 .645 .661 .612 .629 .693
N=29
============================================================================================
AUTO .487 .615 .666 .615 .589 .717
HOSPITAL .478 .434 .347 .304 .304 .347
HACKERS .476 .666 .714 .714 .714 .714
INFRA .472 .527 .583 .472 .527 .611
GUNS .47 .705 .705 .588 .647 .588
RETAIL .452 .528 .566 .566 .509 .566
GAMING .434 .521 .521 .565 .521 .521
BIOTECH .428 .521 .494 .426 .407 .456
CHEM .423 .538 .538 .461 .5 .557
ETFS .403 .701 .789 .736 .771 .807
COAL .285 .285 .285 .285 .285 .285
INDMATER .278 .392 .405 .278 .303 .43
OILGAS .274 .366 .38 .316 .373 .5
FOOD .226 .245 .301 .245 .301 .32
COMODITY .225 .25 .3 .225 .275 .325
CHINA .203 .406 .61 .525 .61 .661
N=16
GOLD .122 .102 .081 .061 .102 .122
|
=======================================================================
5/6/2019 Peerless remains on the series of Buys shown in the
Peerless chart. The Closing
Powers are rising. The NYSE A/D Line uptrend remains pointed upwards.
But the DJI, SP-500 and NYSE have stalled below their previous highs. Only
the QQQ and SOXL, among major ETFs, have made clear new highs. But
they are pulling back and I have suggested locking in profits before too much
weakness hits them. The heavy overseas selling we saw before the opening
Monday seems to a problem again this morning. Let's wait until we get a new
Buy B11 from Peerless to retake our long positions. This seems likely to occur if
the
DJI aproaches the rising 65-dma (25951) at the close.

The breadth today was negative, but far from being the reciprocal of Friday's
numbers. So, there was no "simple Sell S6" today, as discussed last
night. Instead the
DJI and the other major market ETFs - in a most controlled and coordinated way -
staged a steady 400+ point recovery up from the opening. Did you notice that
today's DJI opening was down almost exactly 2% from Firday's close and
was exactly at the support of the rising 65-dma. This has all the markings of a
highly controlled lower opening and well-staged recovery. See below how it brought
our Closing Powers for DIA, SPY, QQQ, SOXL and IWM all to new 12-month
highs. This strength and the high levels of IP21 show the market is still in strong
Professional hands and Professionals still believe that more new prices will be made
after this pullback, possibly to 25000 on the DJI..


At the same time, we see persistent and heavy selling from overseas again this
morning. The American Professionals believe that they can keep the US markets
in an upswing, but investors elsewhere are locking in their profits in US stocks,
as we have. As long as the DJI stays above its rising 65-dma, the bullish rising
Closing
Power and Professional buying will protect the markets here from early weakness.
But I suspect a DJI drop below the 65-dma will cause the US Professionals to
withdraw their support of the US markets for a few weeks.
If you are a trader, you should probably wait for another successful test of 26000
to buy DIA, SPY and QQQ. This may produce a new Buy B11. However, a close
below 26000 will be problematic and risky, because the support there will become
resistance if the DJI then re-tests 25000.
Buy B11 - Tests of rising 65-dma - March -
July
Date Gain
Max. Paper Loss
------------ ------
------------------
19440413 + .191
-.020 4/24
19450321 + .056
-.001 3/23
19450705 + .212
-.021 7/27
PEY-1 ==> 19590608 + .046
-.006 6/9
19610726 + .031
none
19780725 + .081
none
19850315 + .464
-.004 5/1
19860516 +.058
-.001 5/19
19920327 +.038
-.016 4/8
19930423 +.162
-.005 4/26
19930702 +.139
-.010 7/6
20060417 +.046
none 0
20120726 +.054
none 0
20160520 +.047
-.021 5/20
----------------------------------------------
Median Gain = +.056 Median Loss = .006


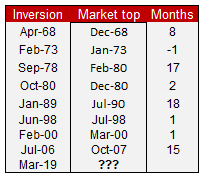


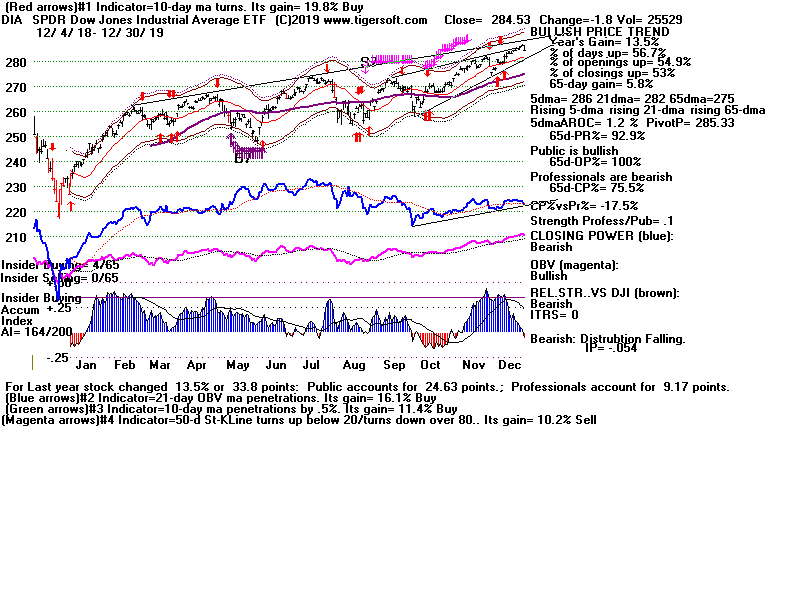
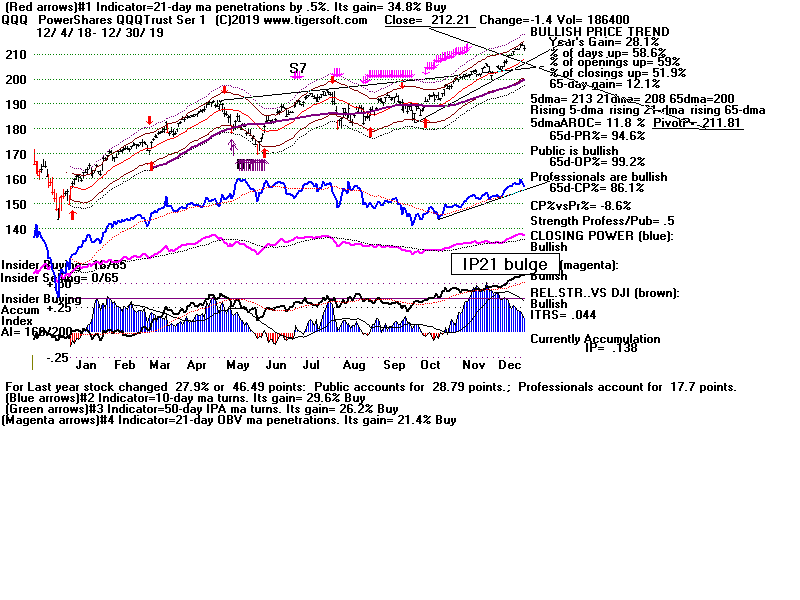
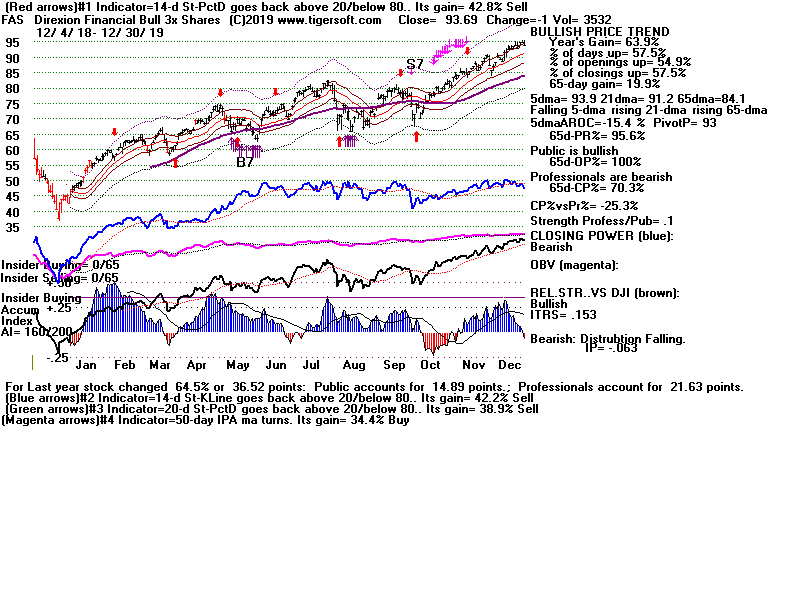
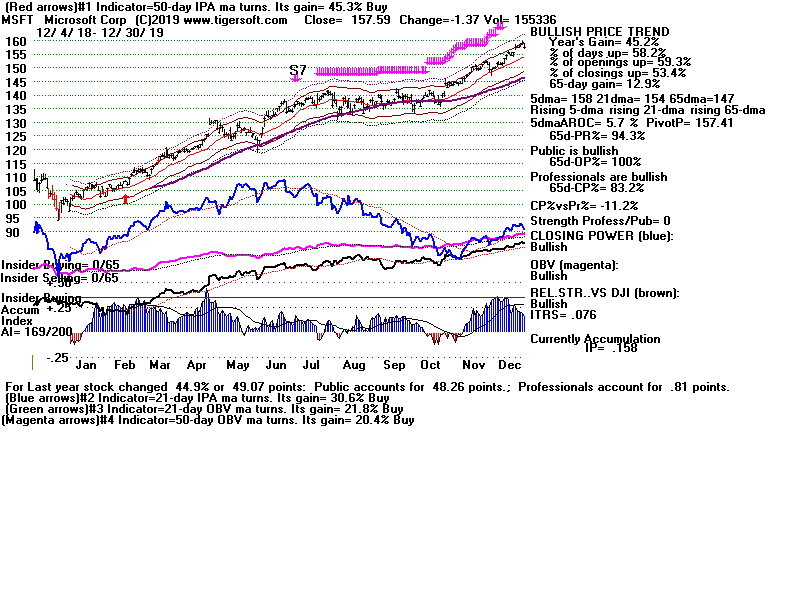
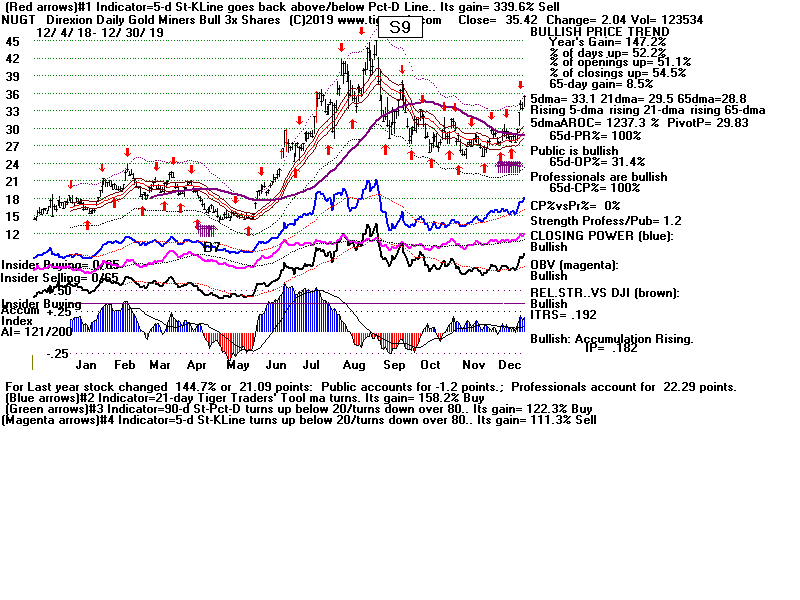
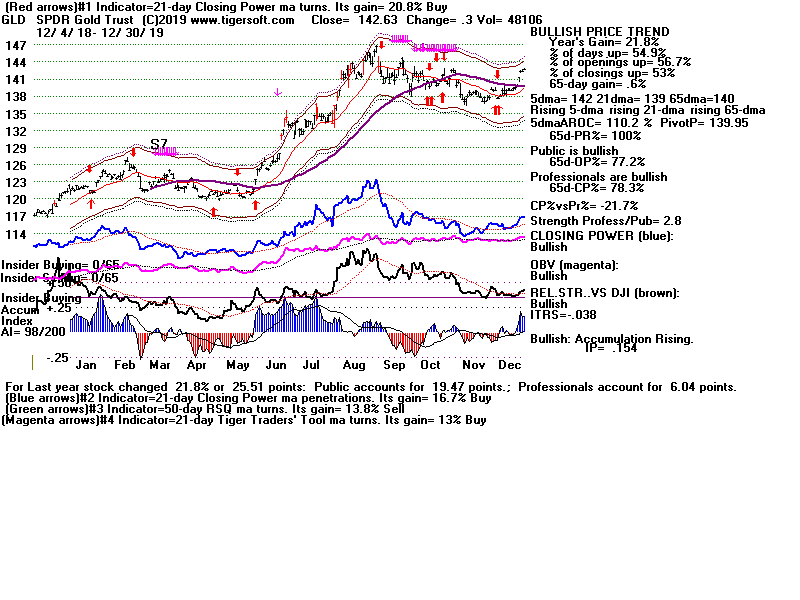
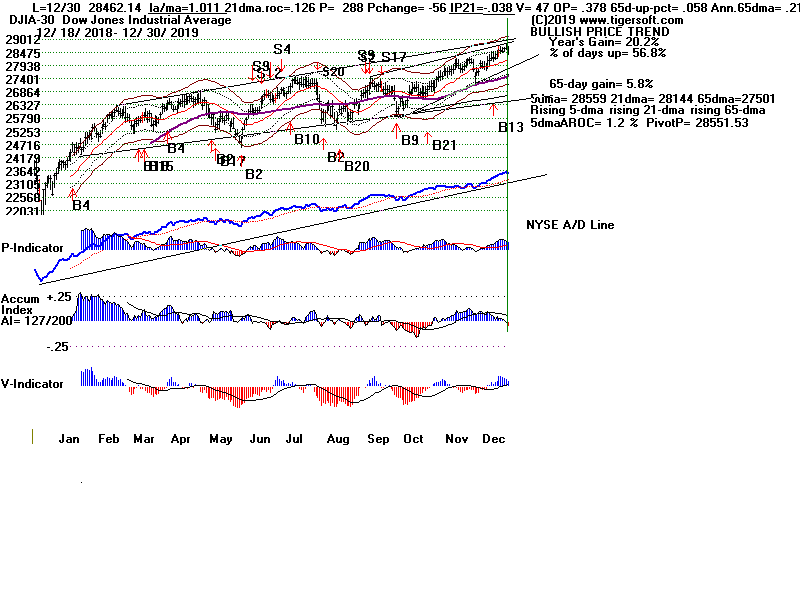
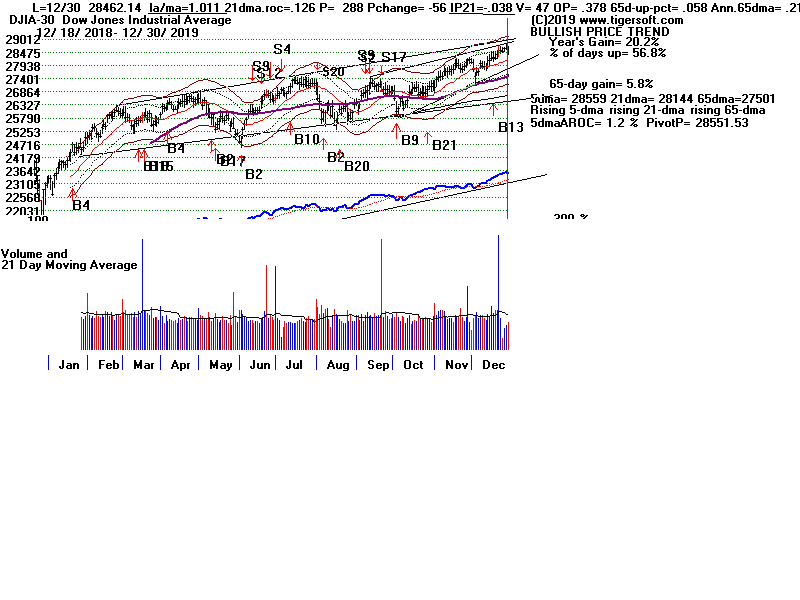
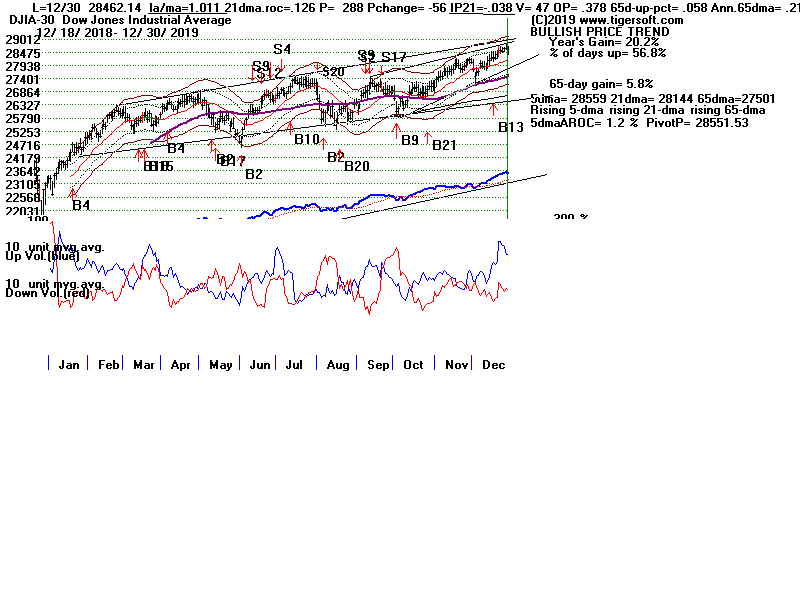
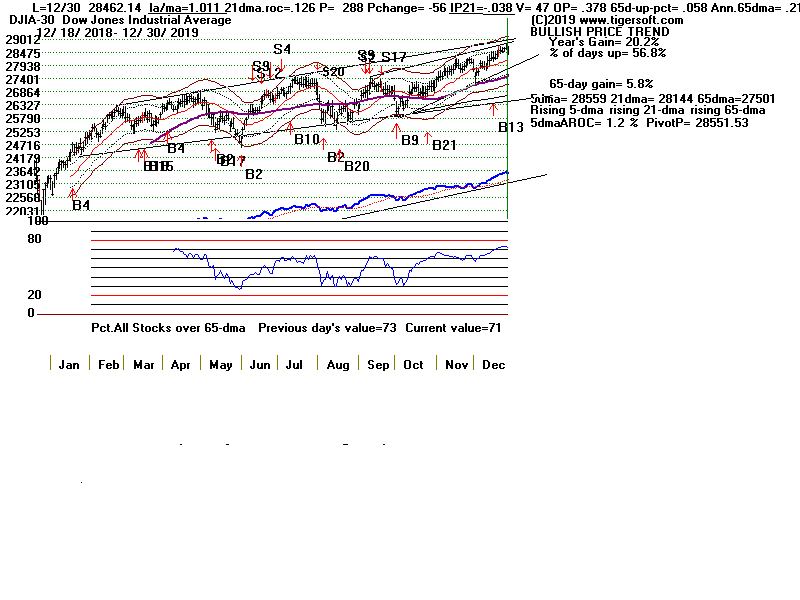
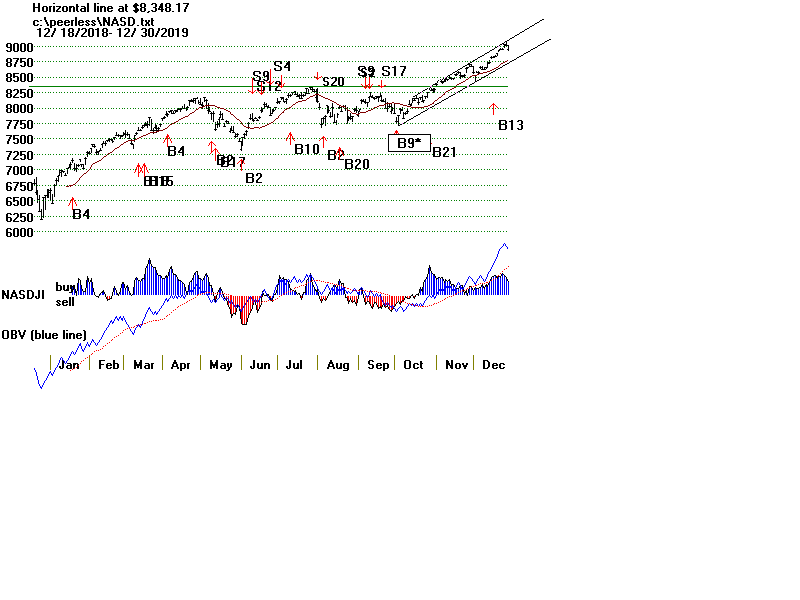
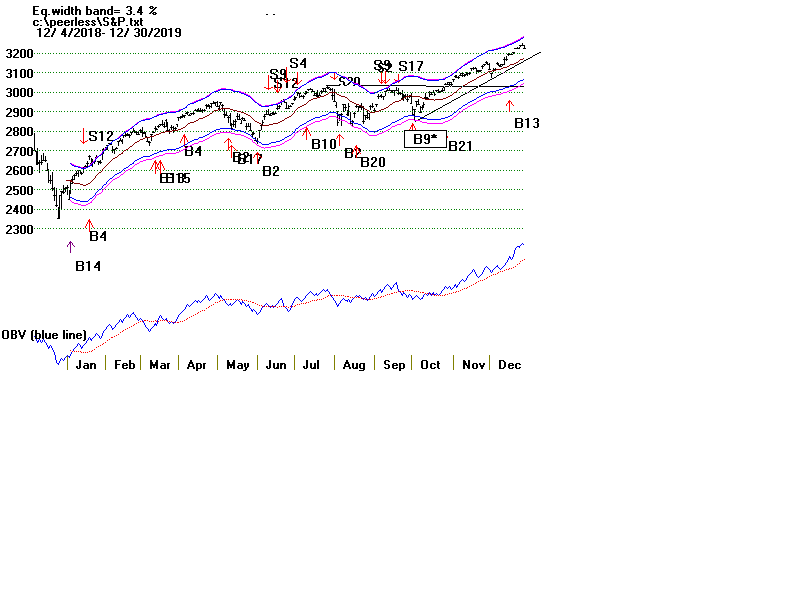
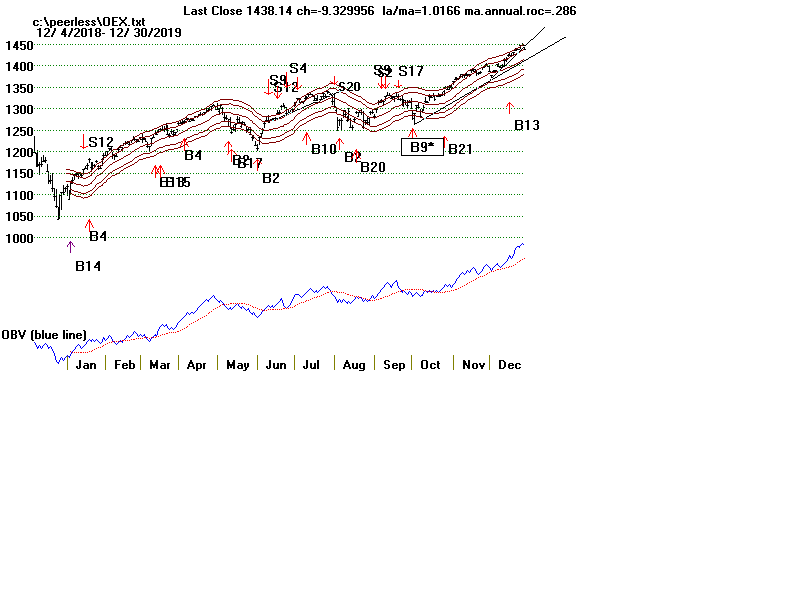
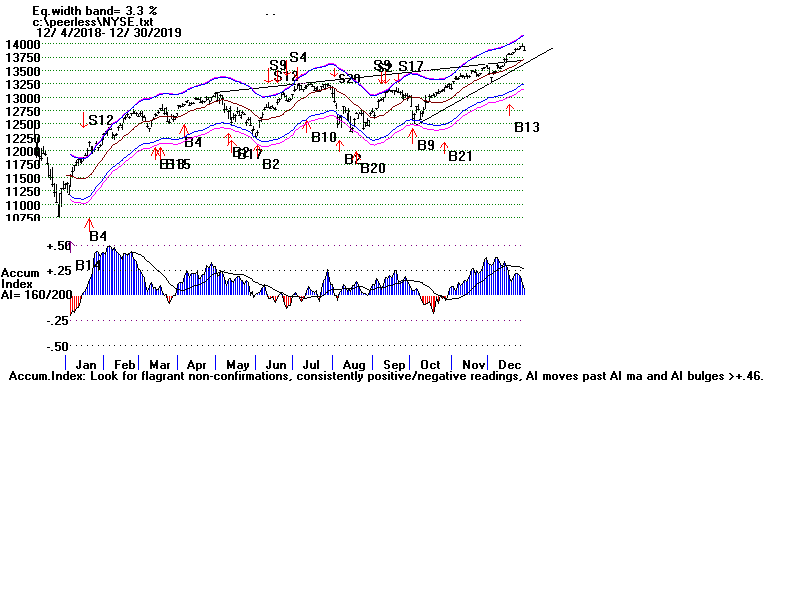
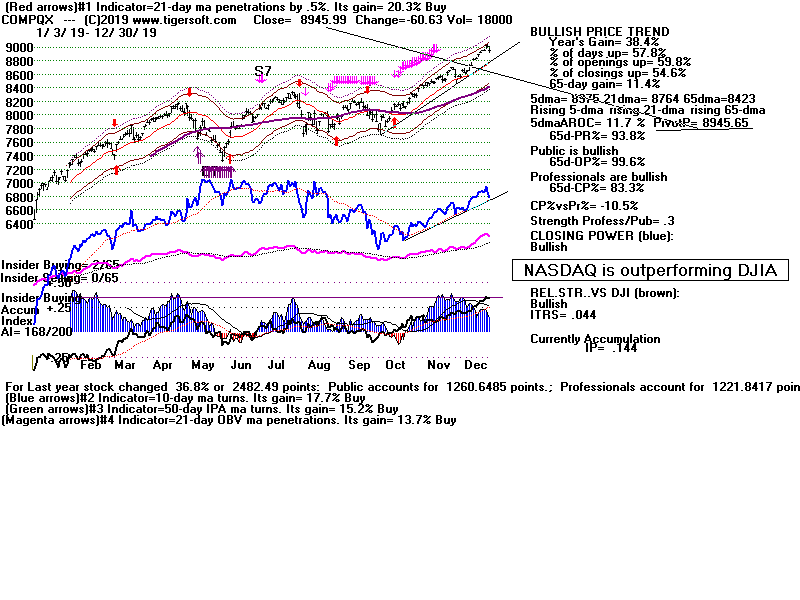
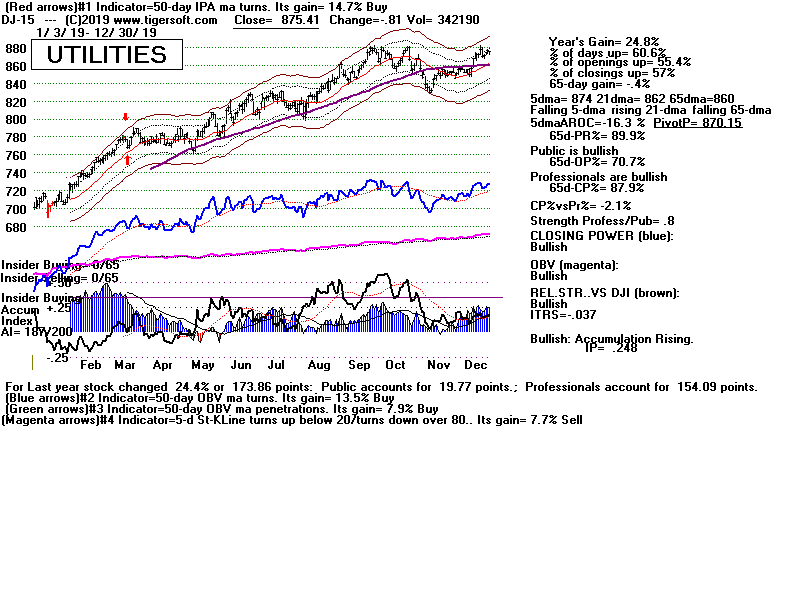
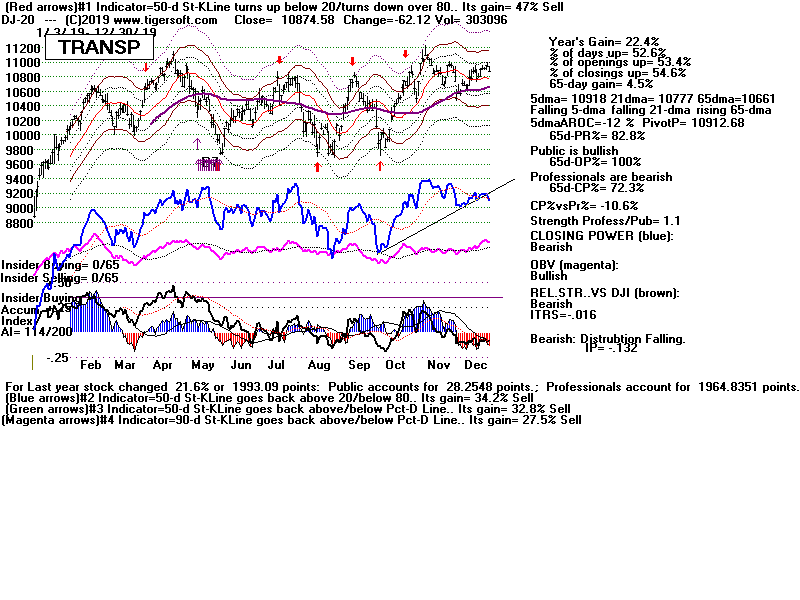
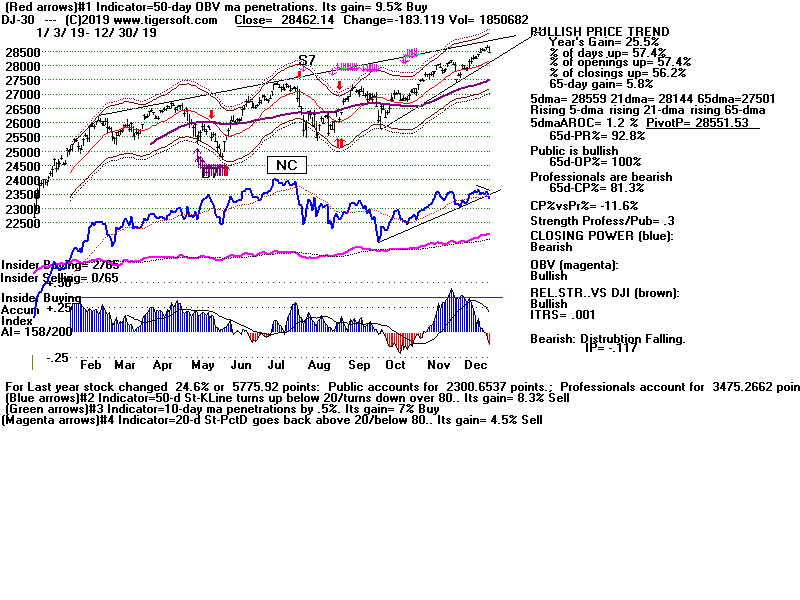
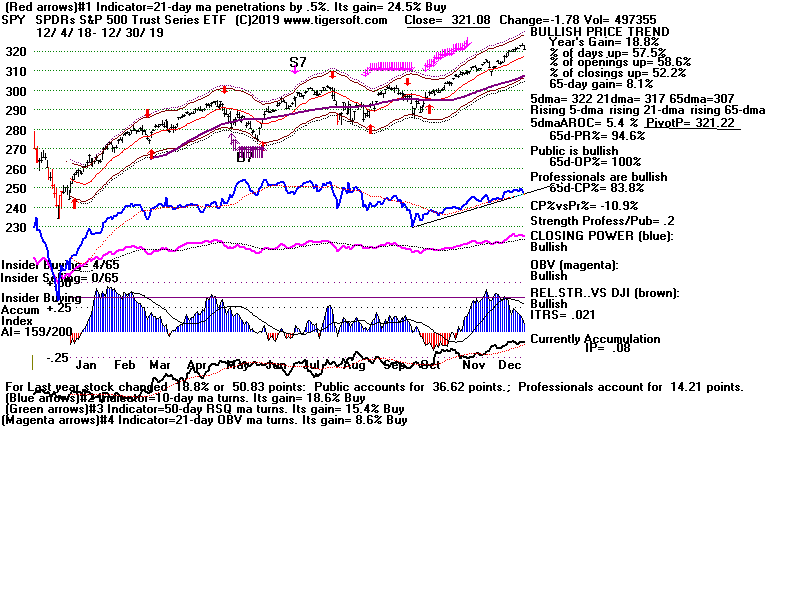
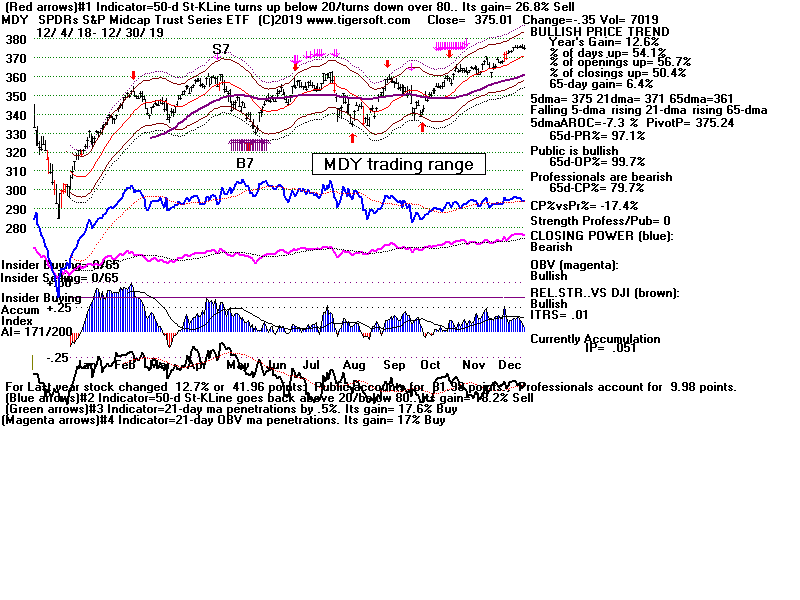
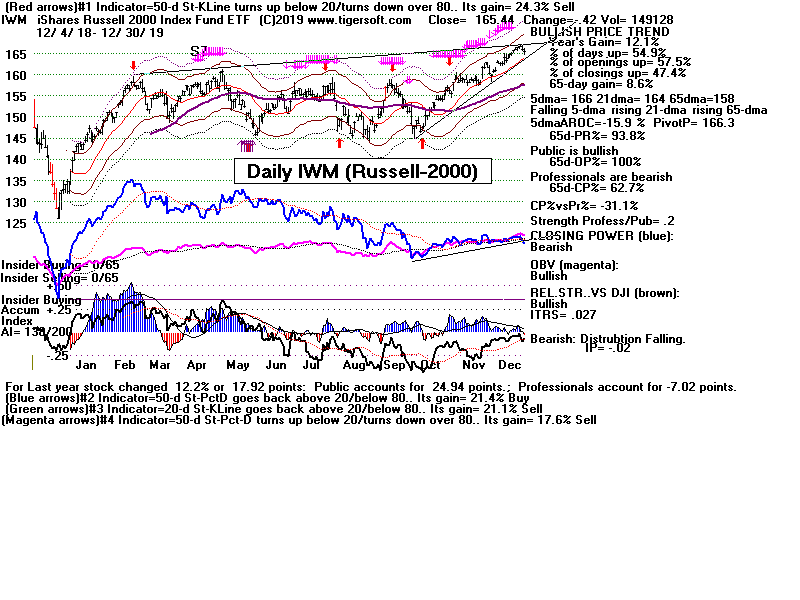
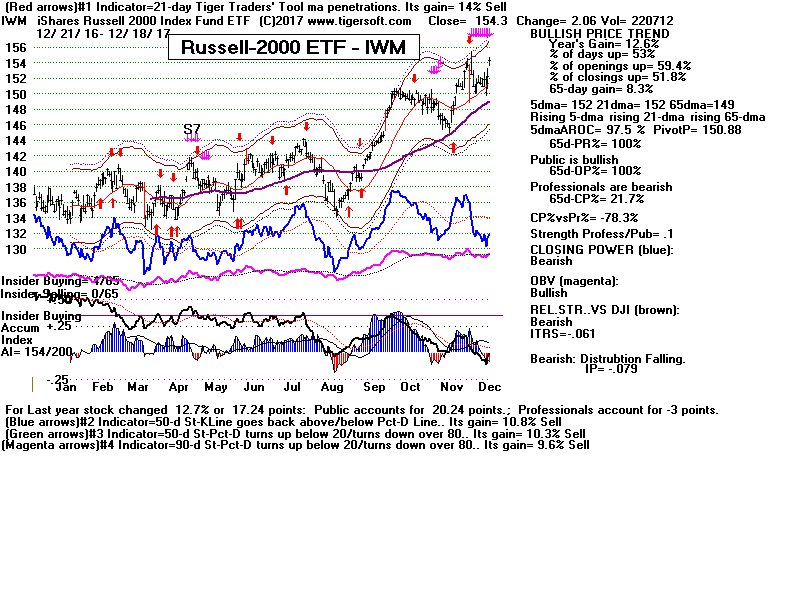
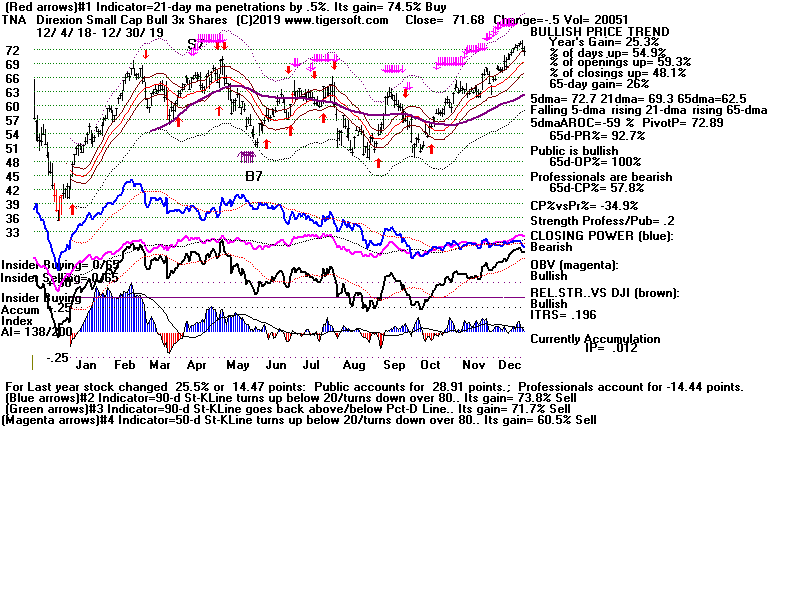
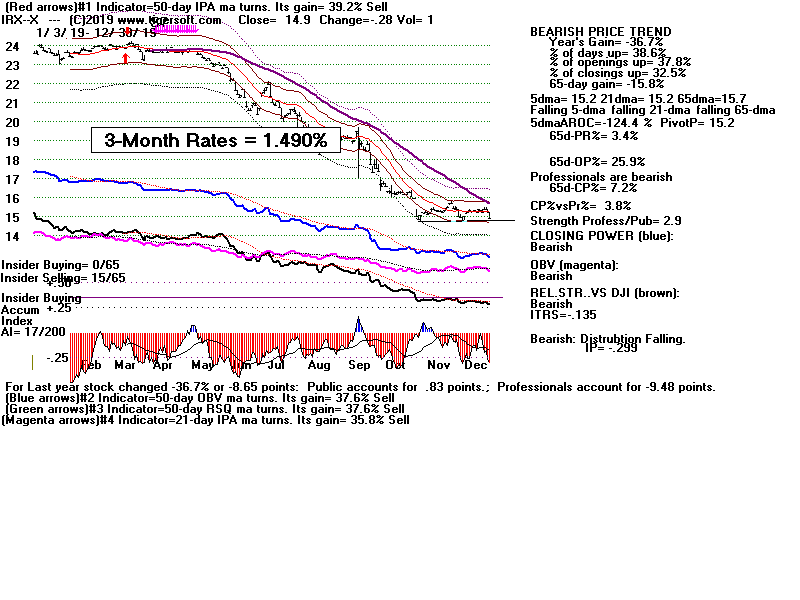
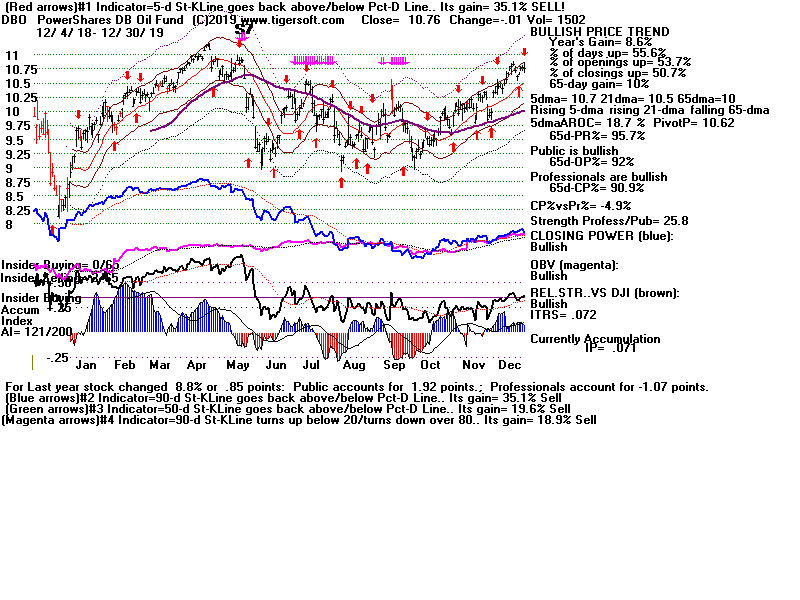
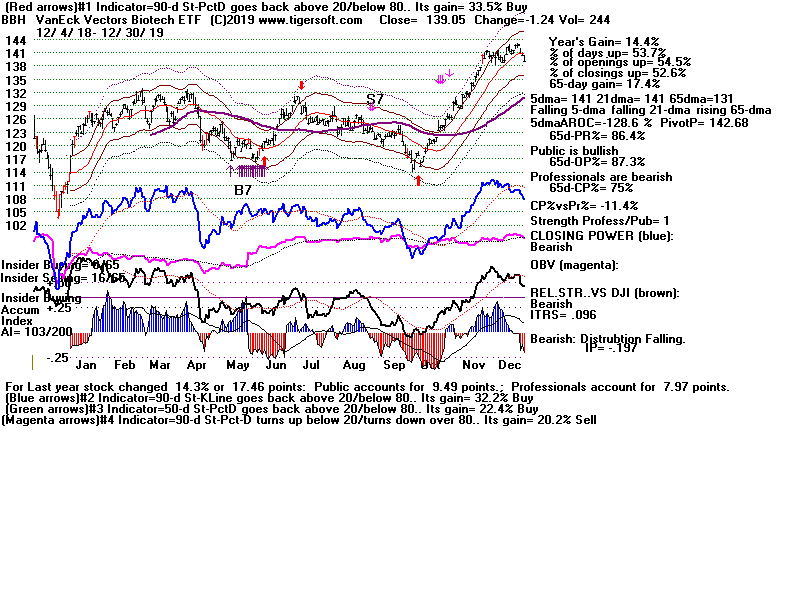
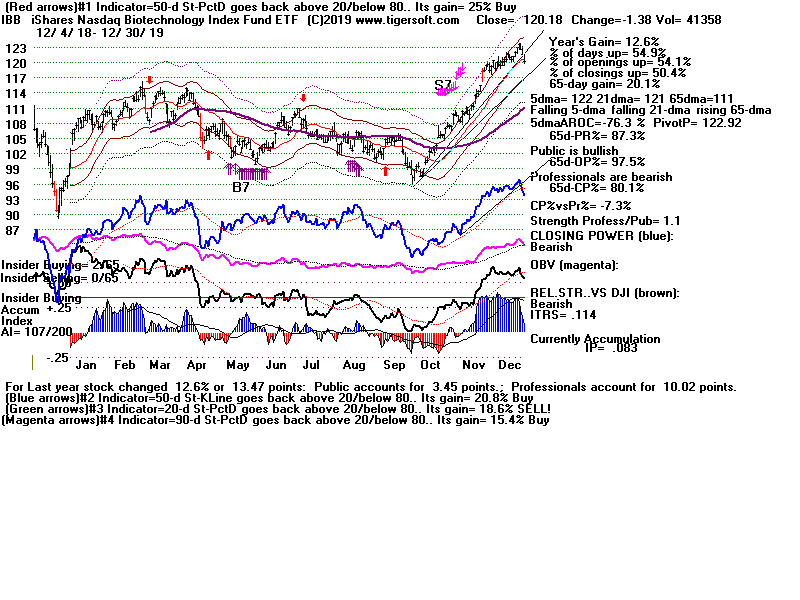
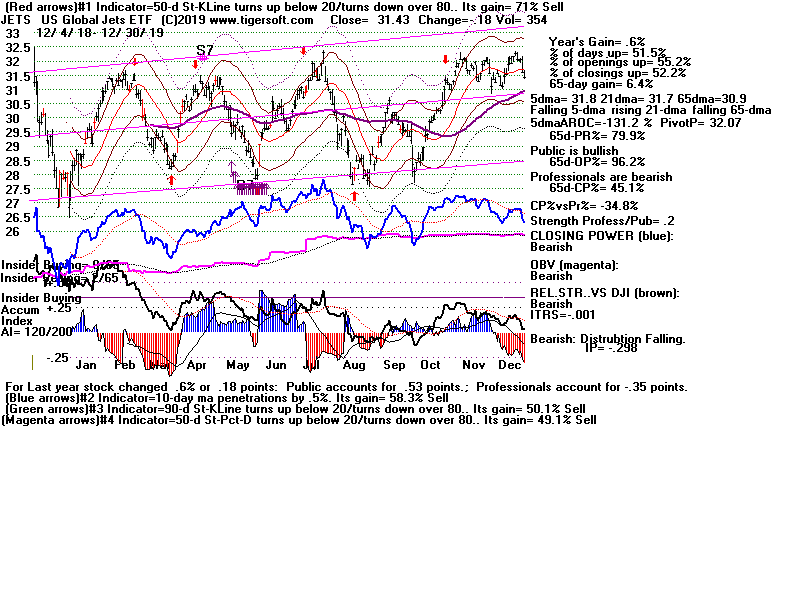
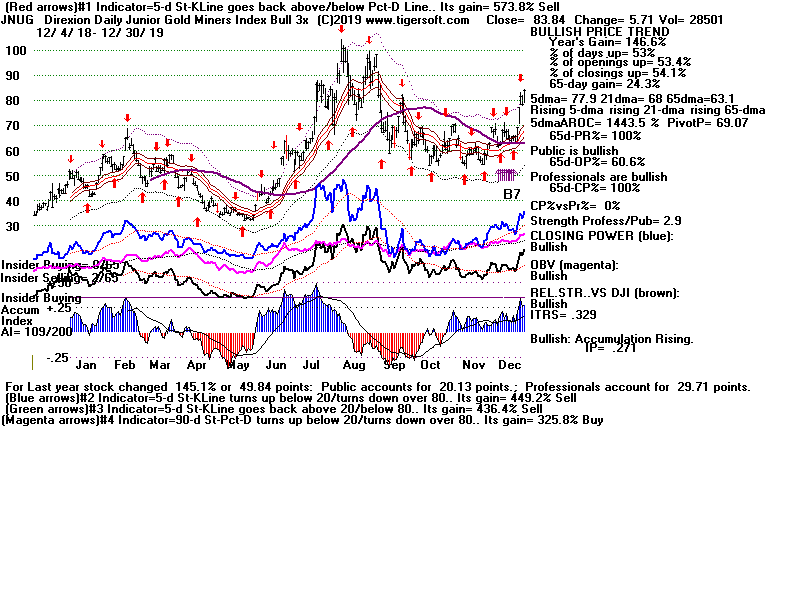
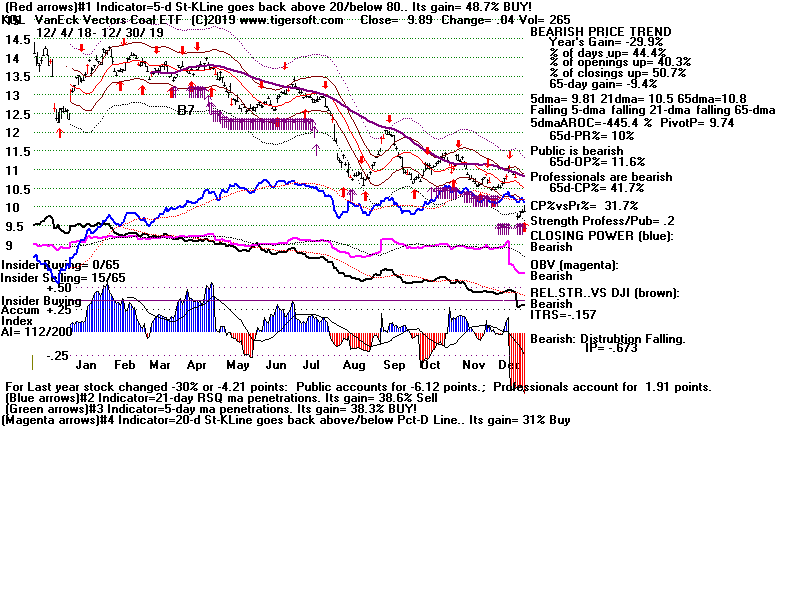
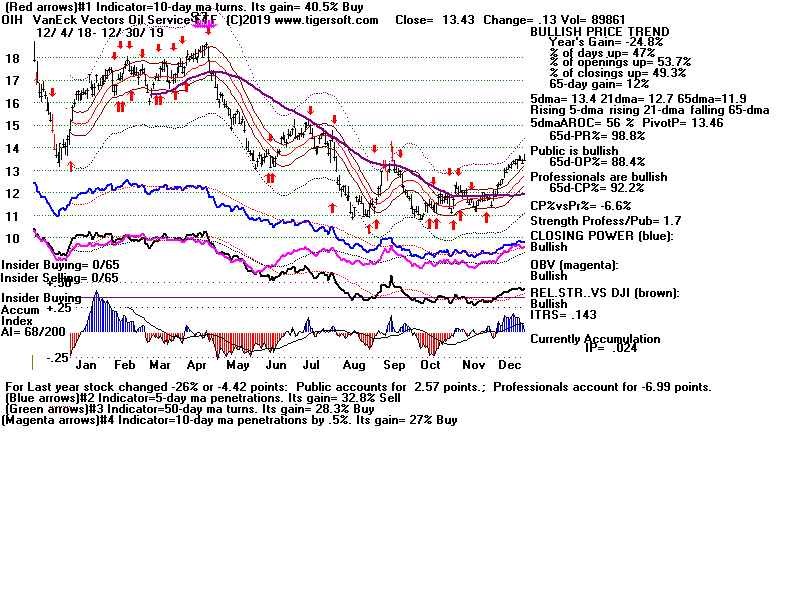
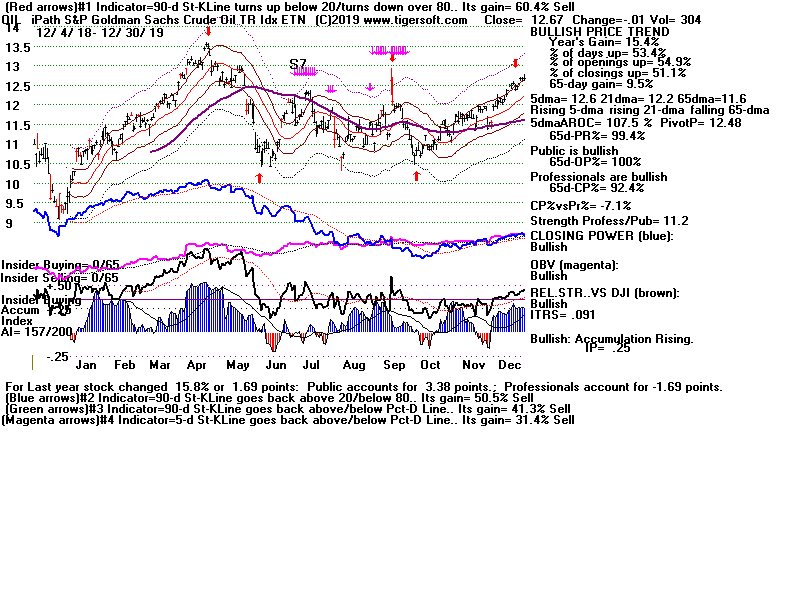
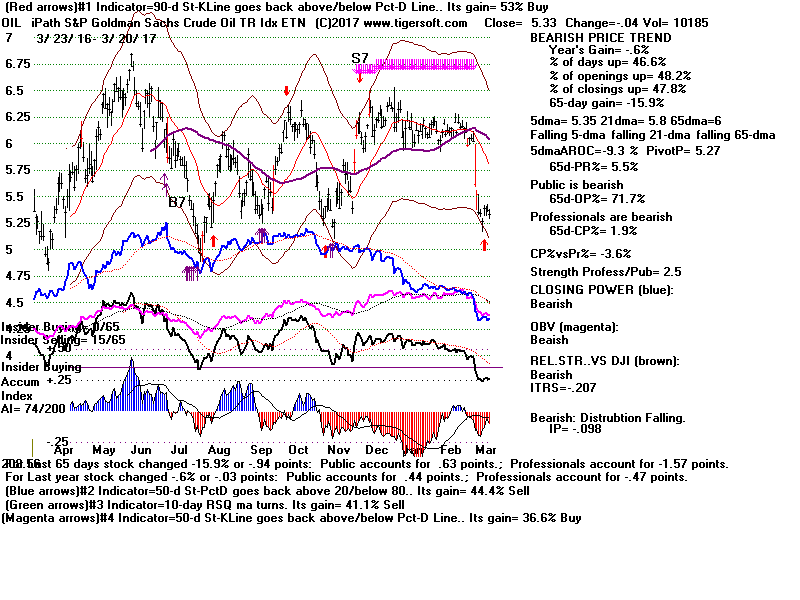
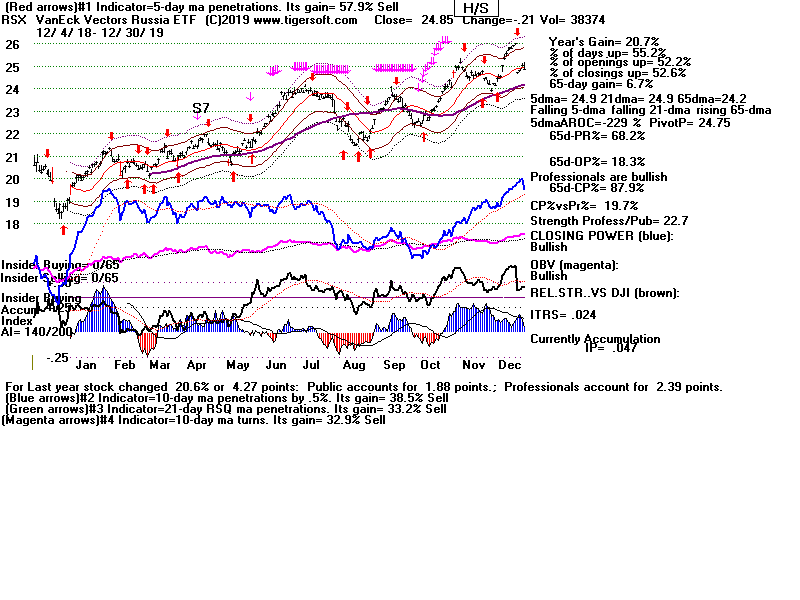
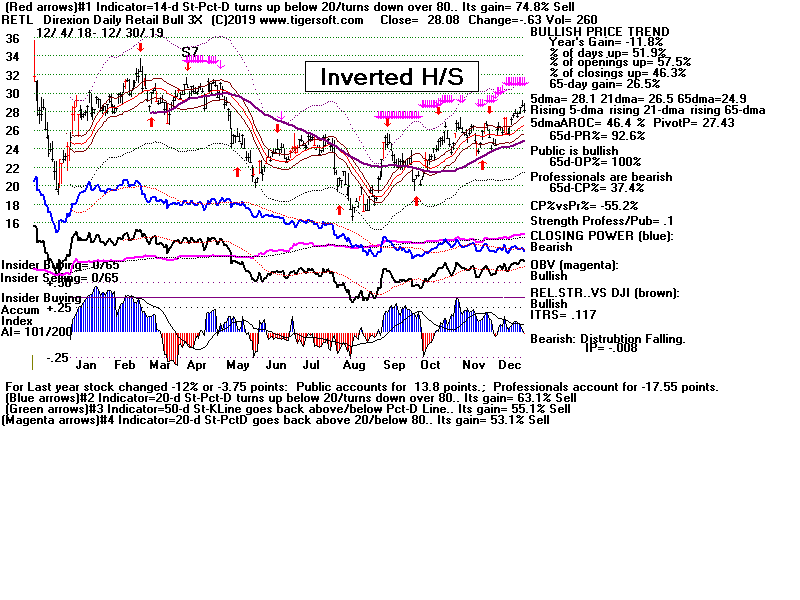
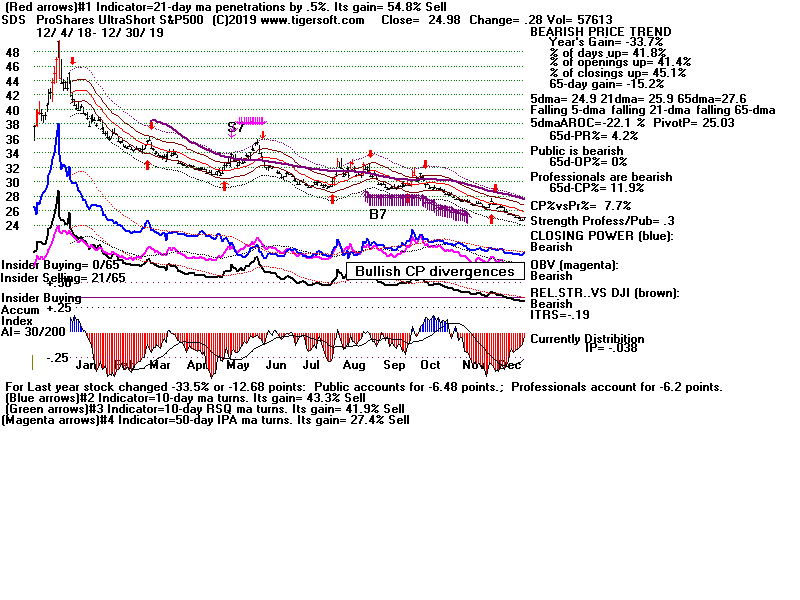
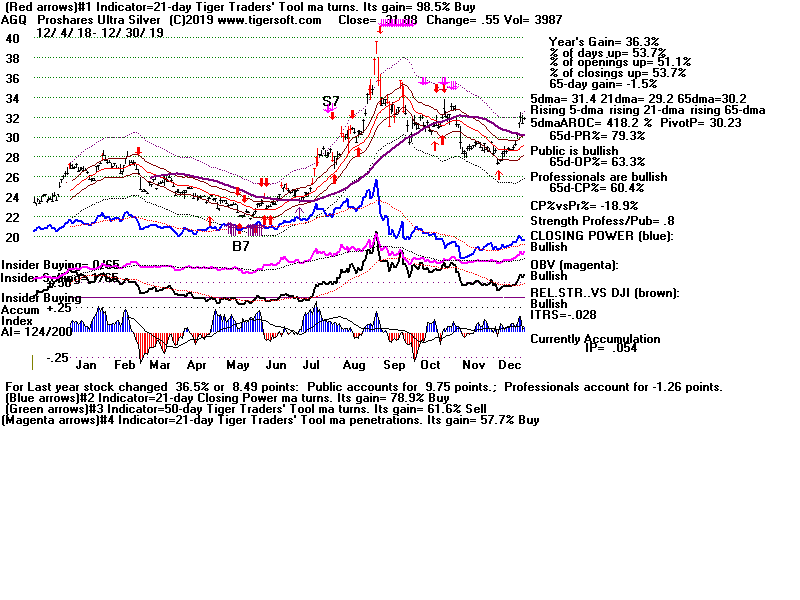
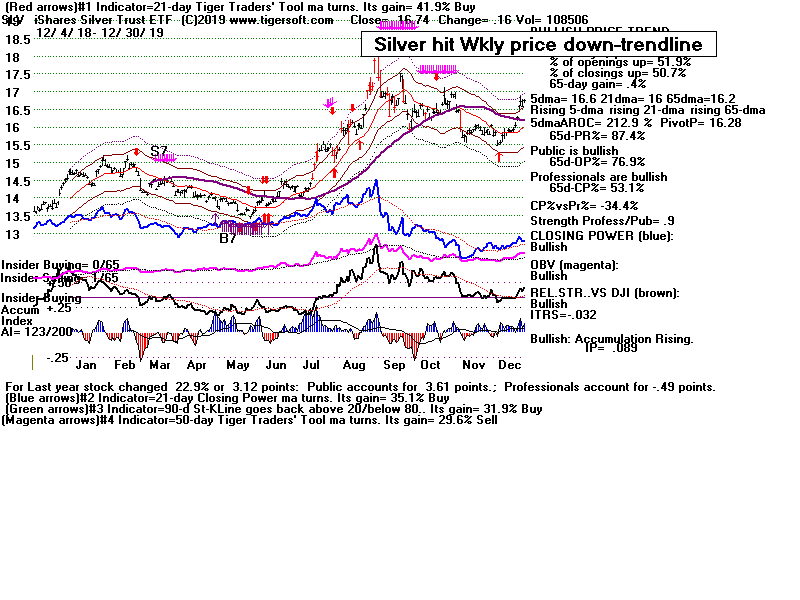
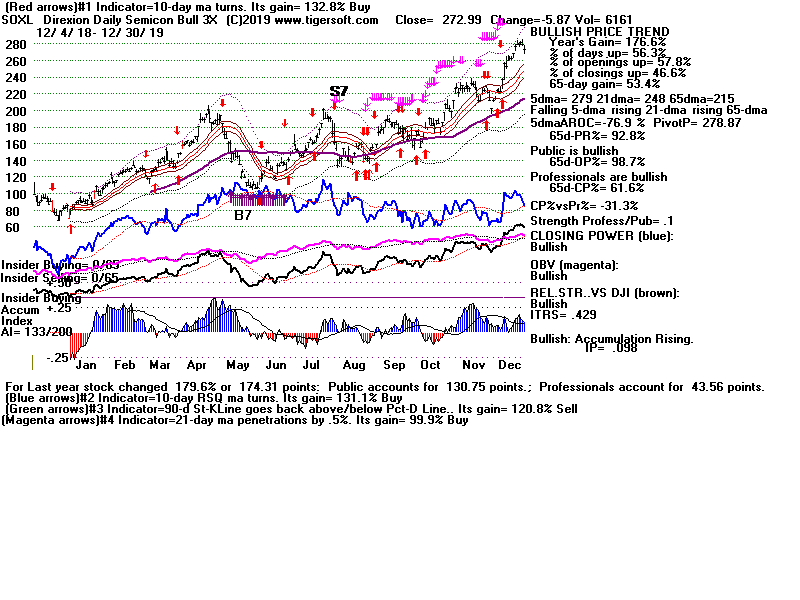
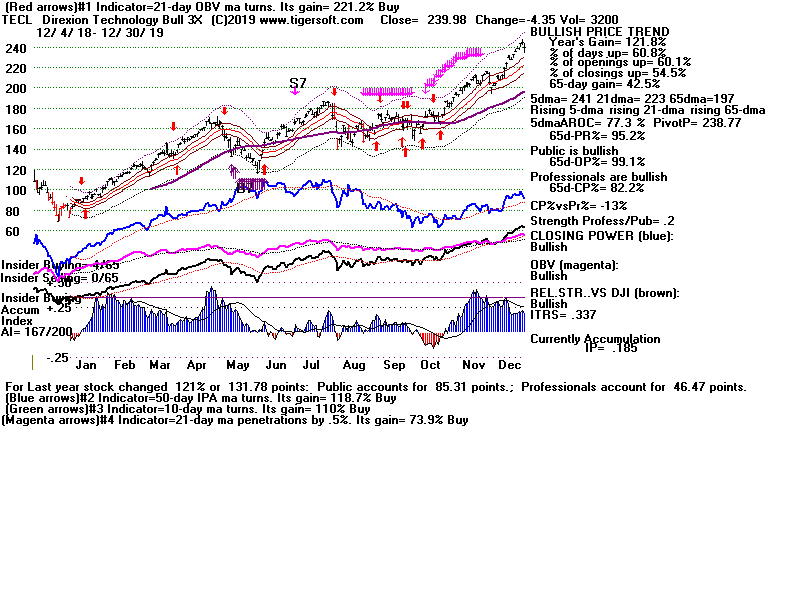
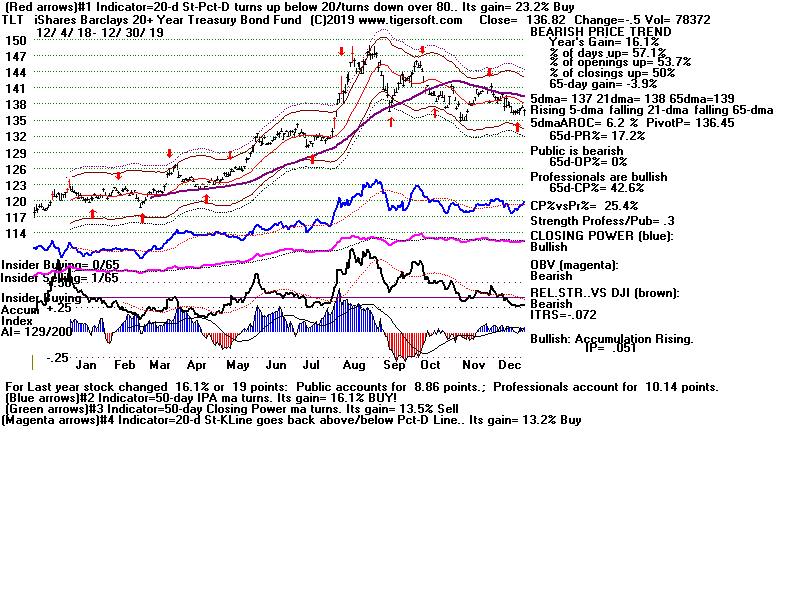
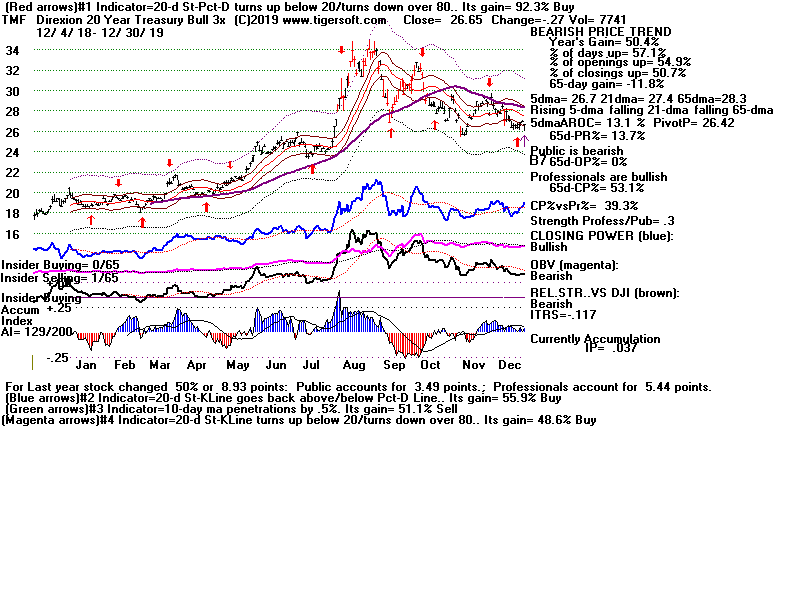
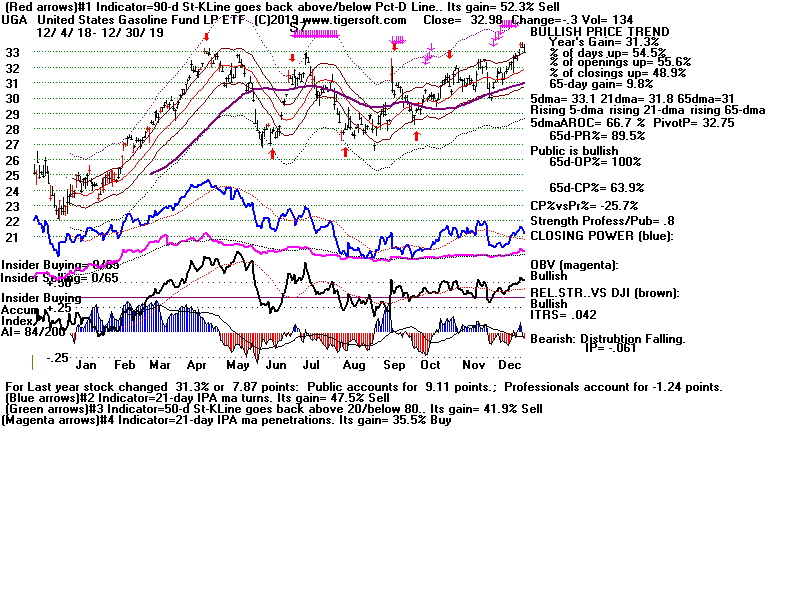
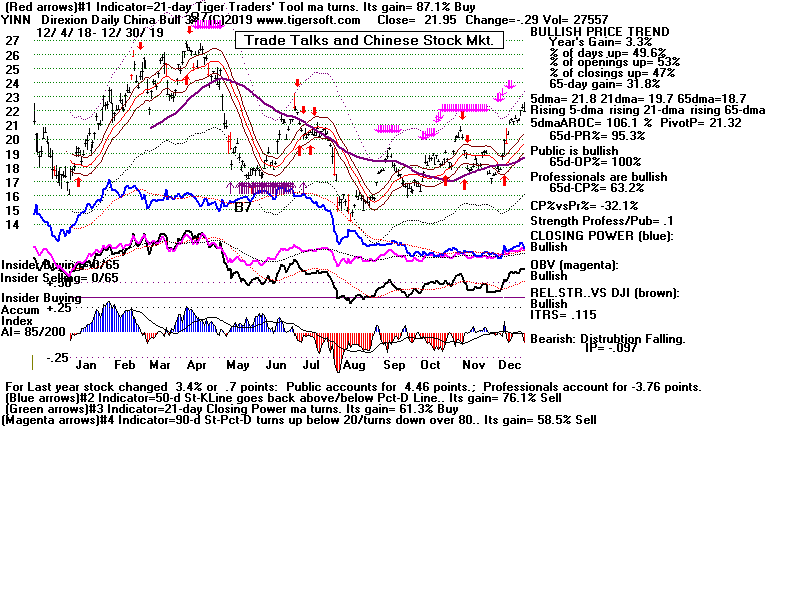
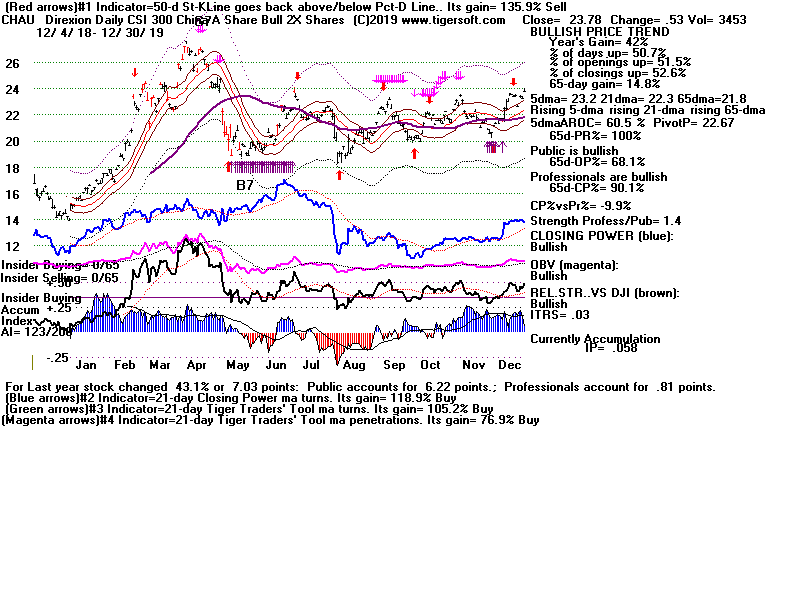
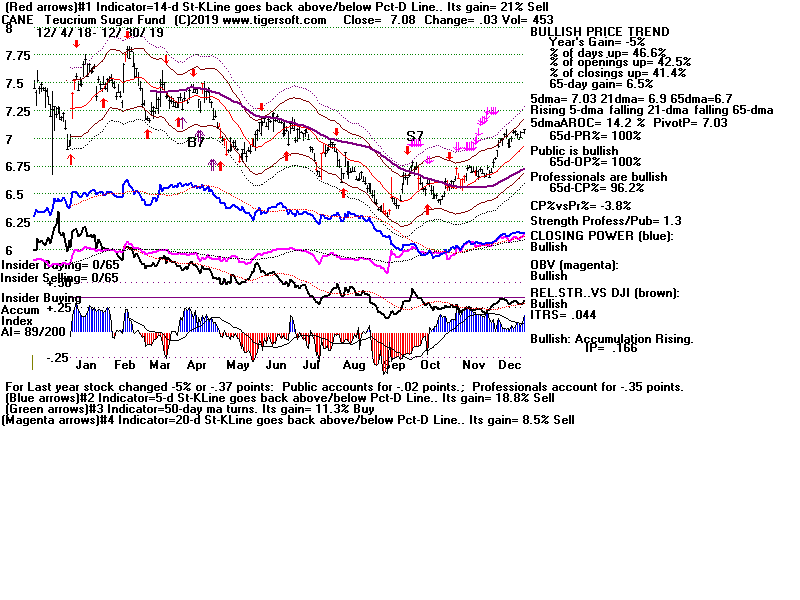
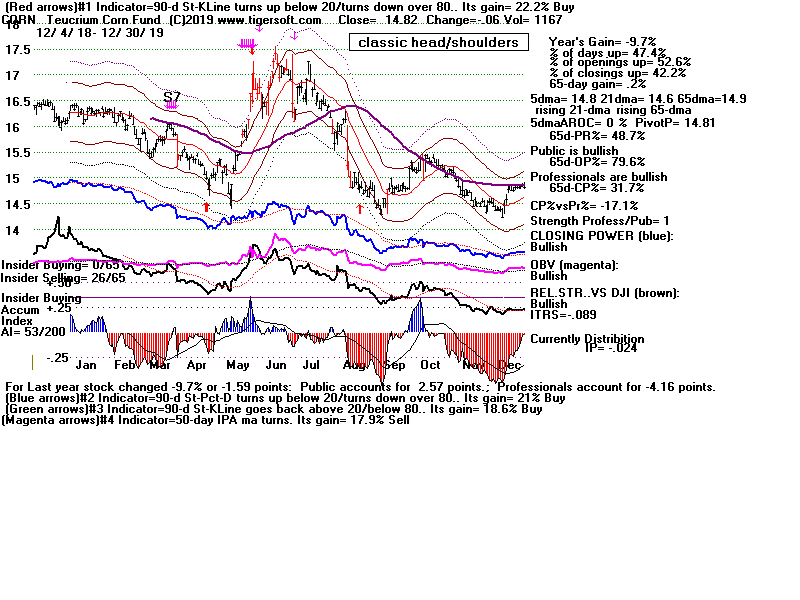
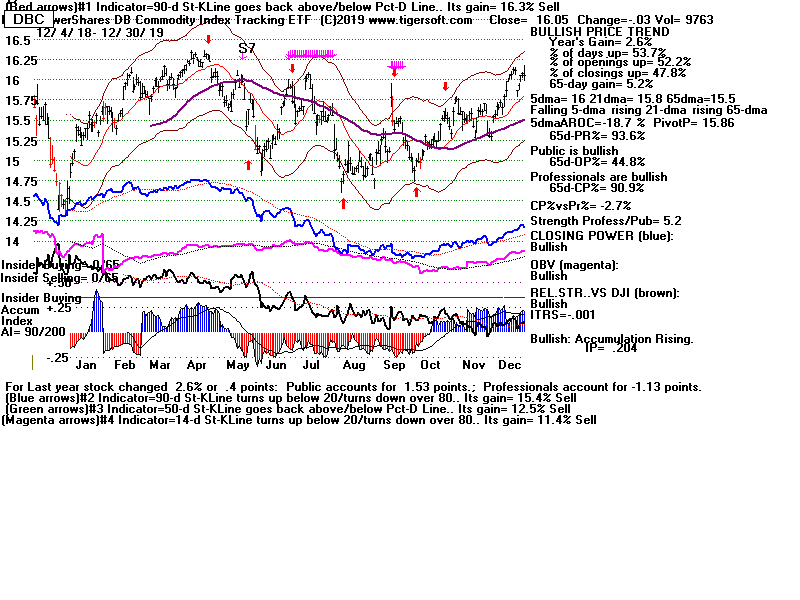
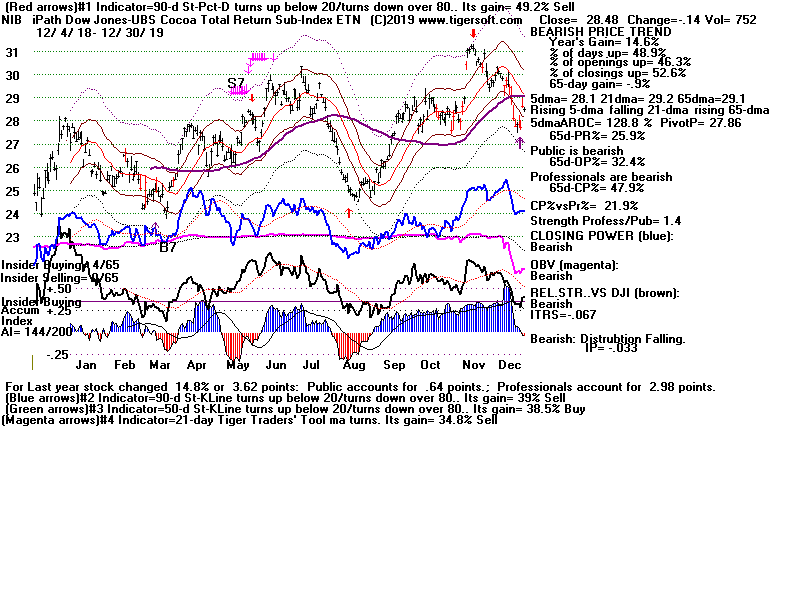
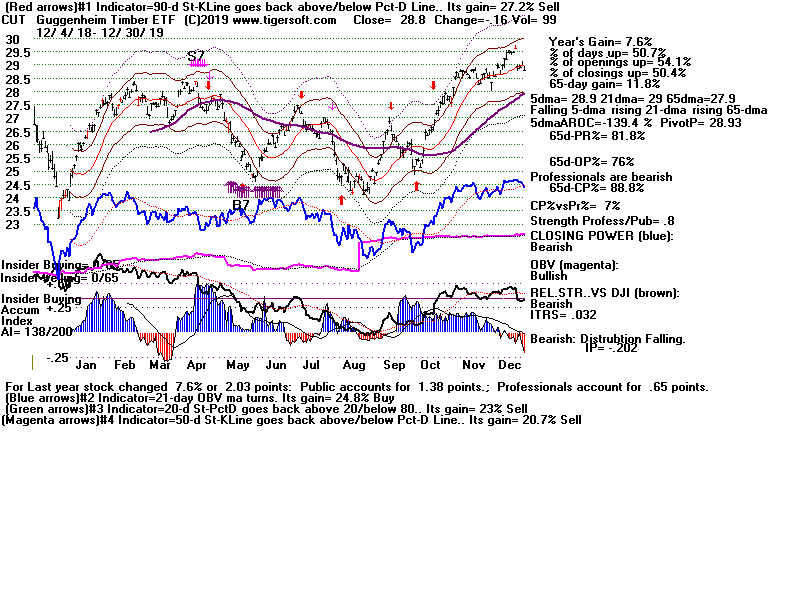
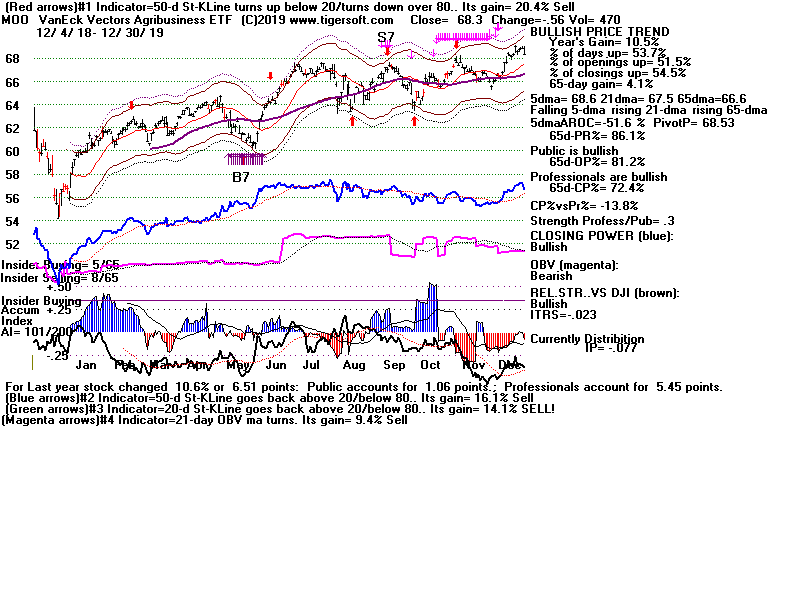
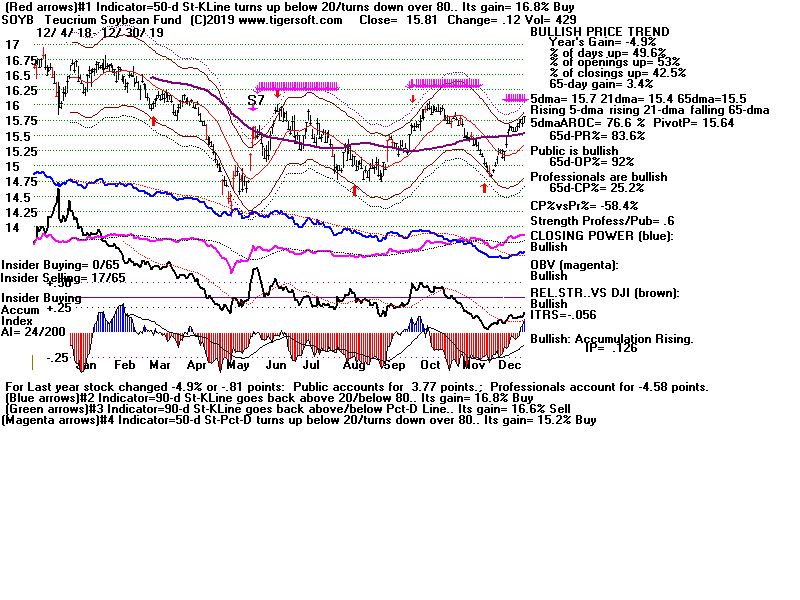
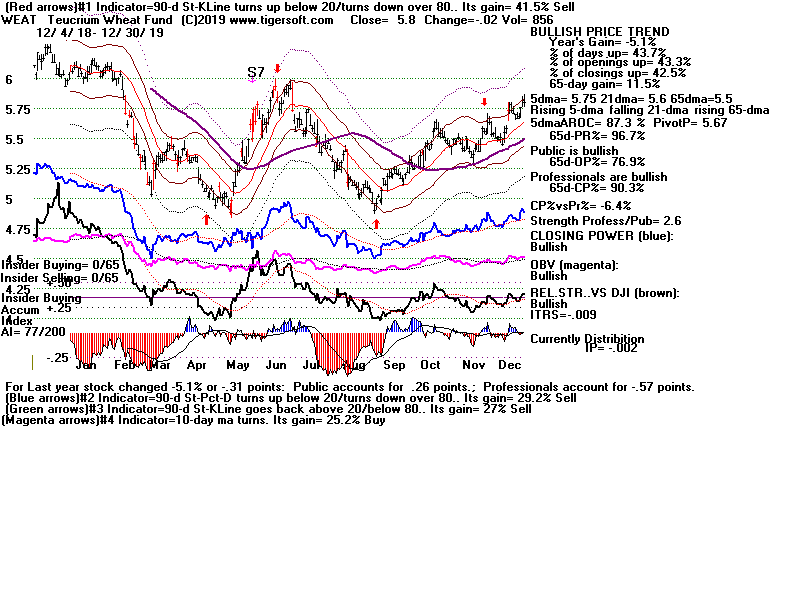
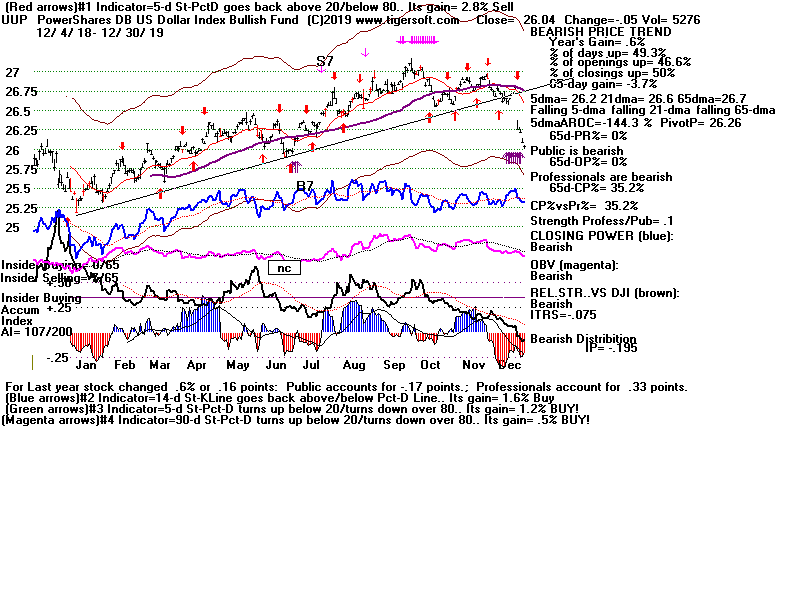
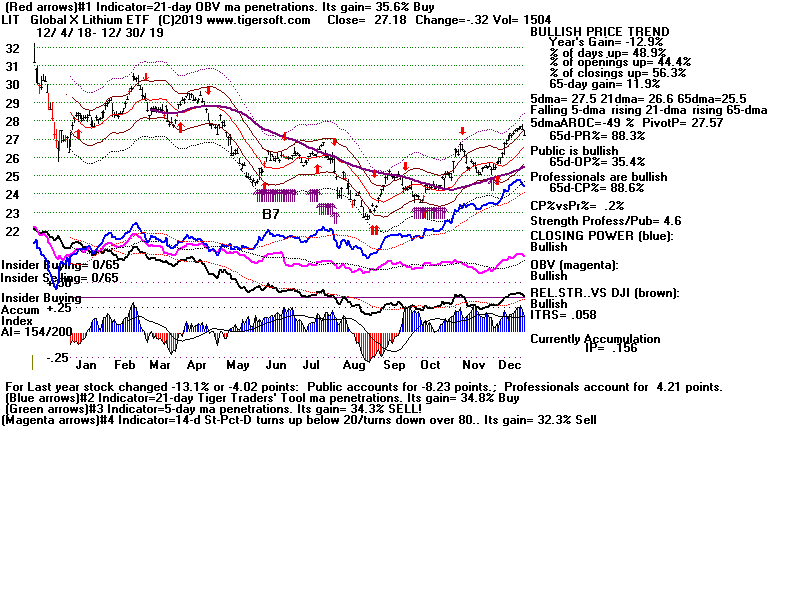
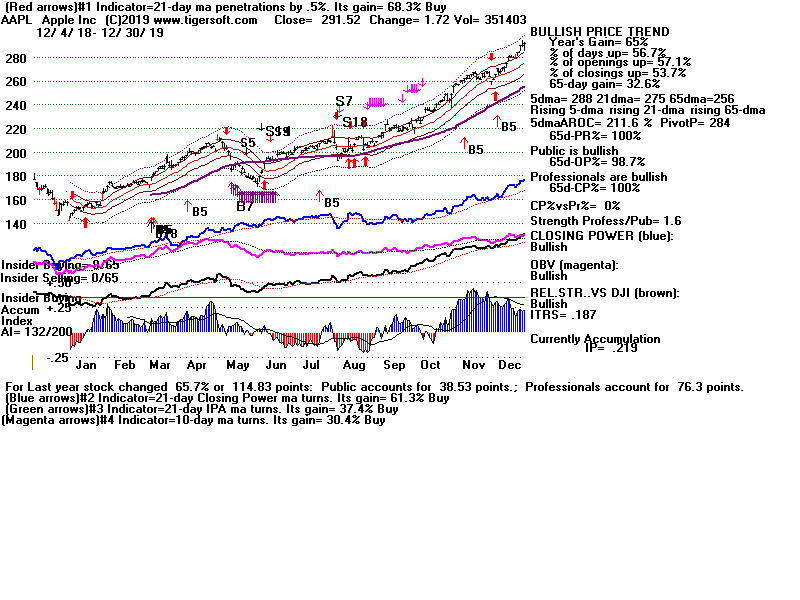
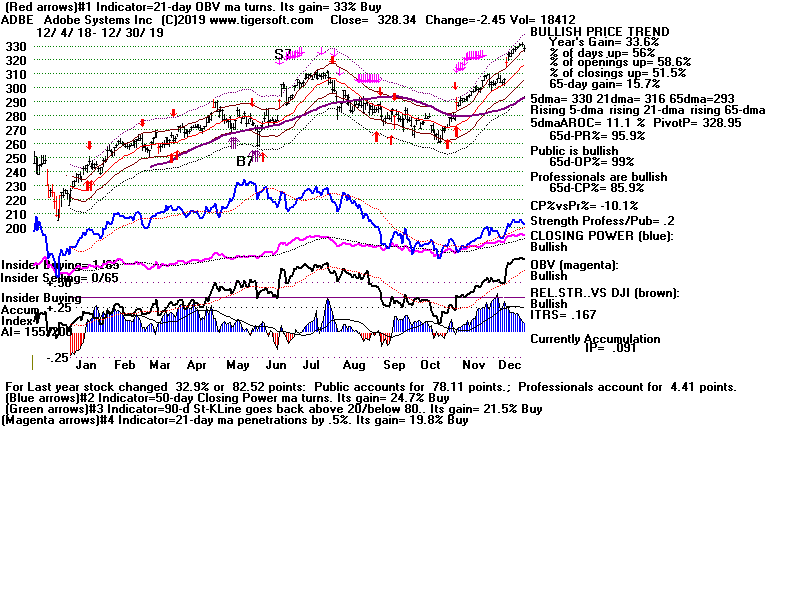
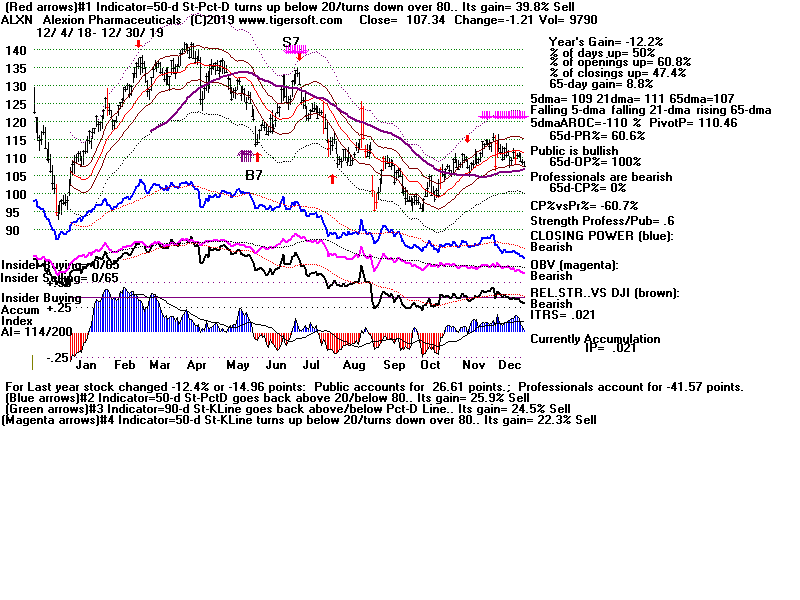
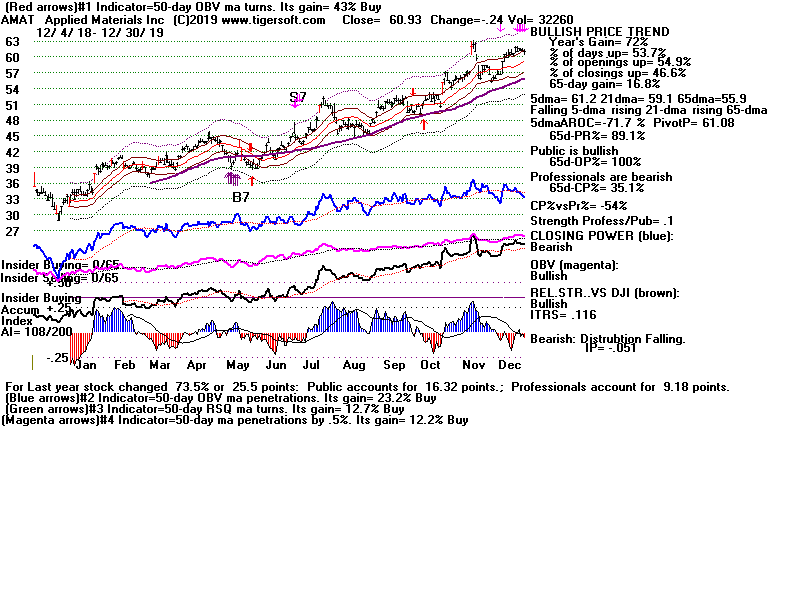
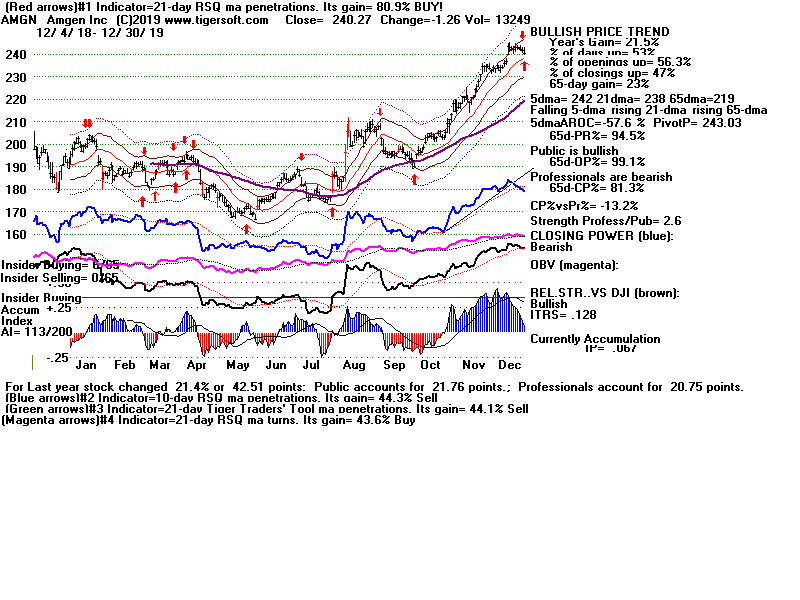
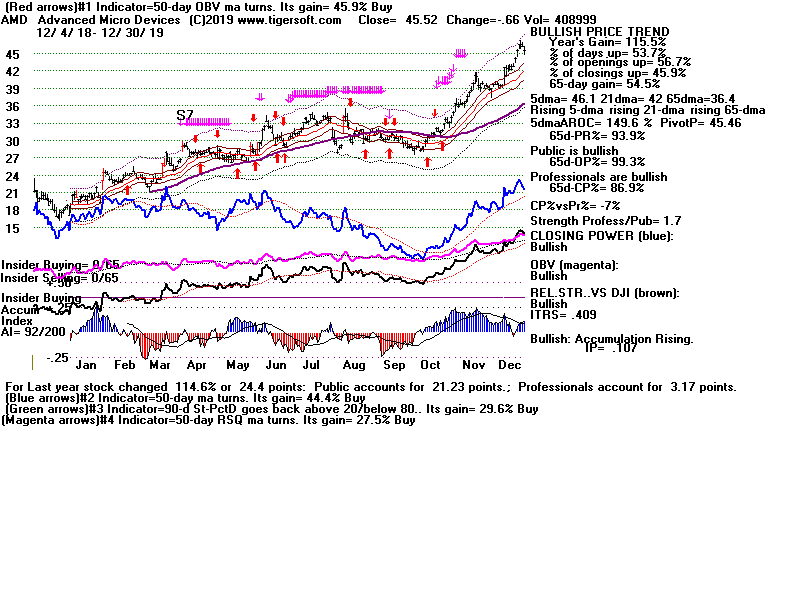
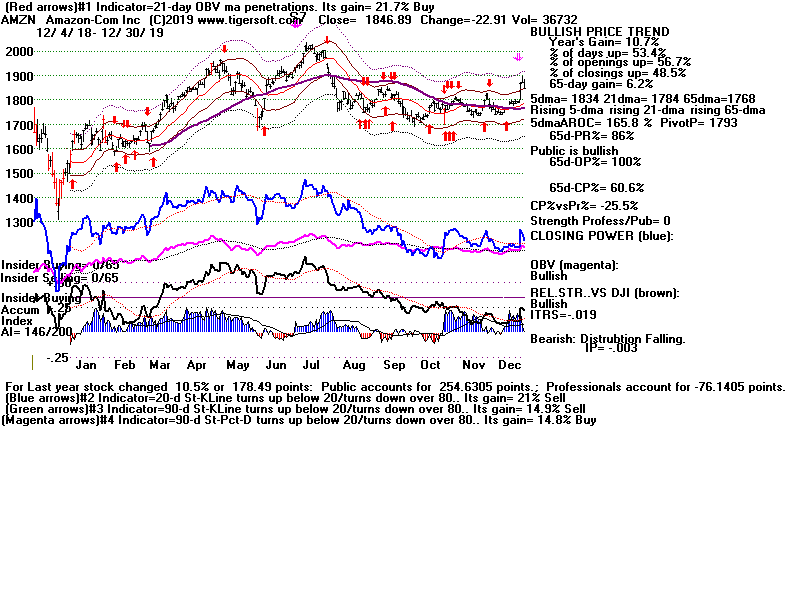
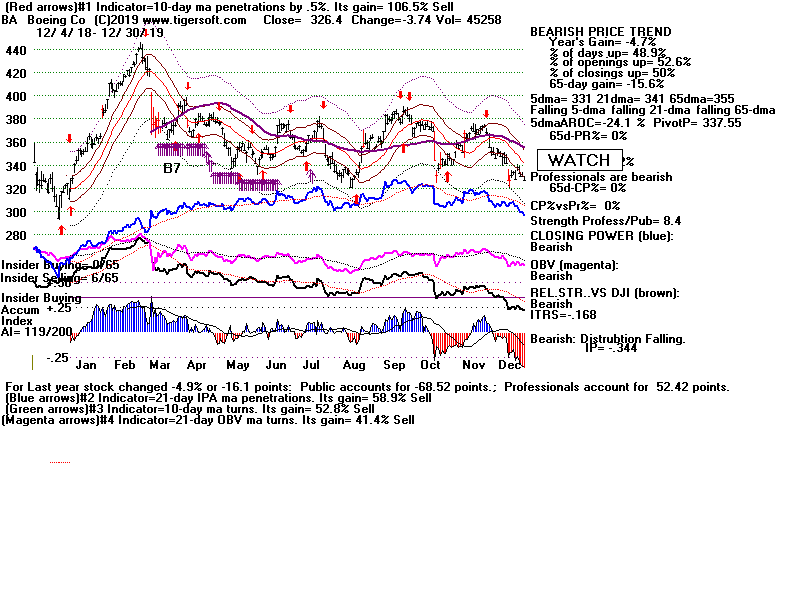
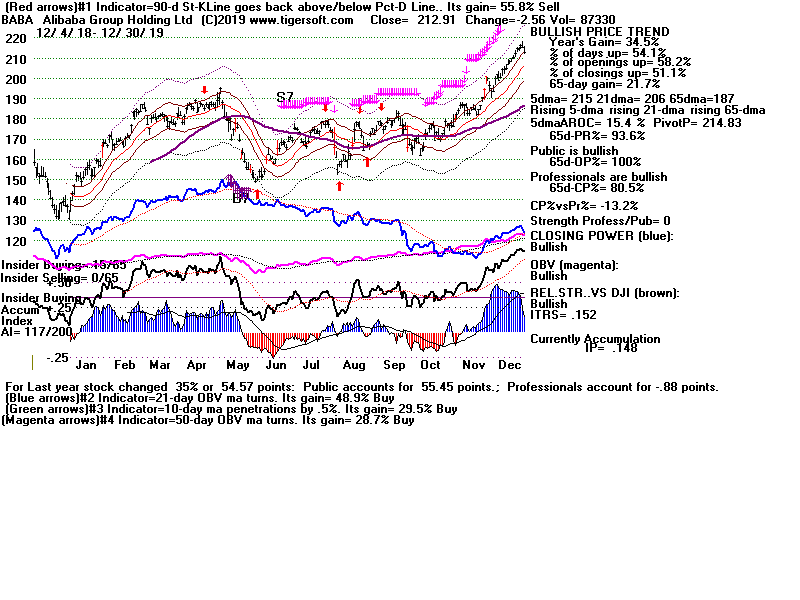
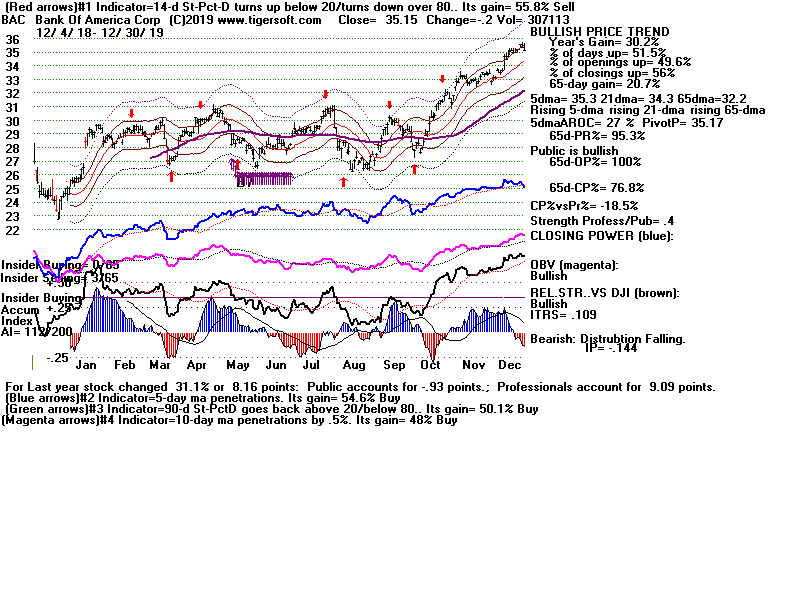
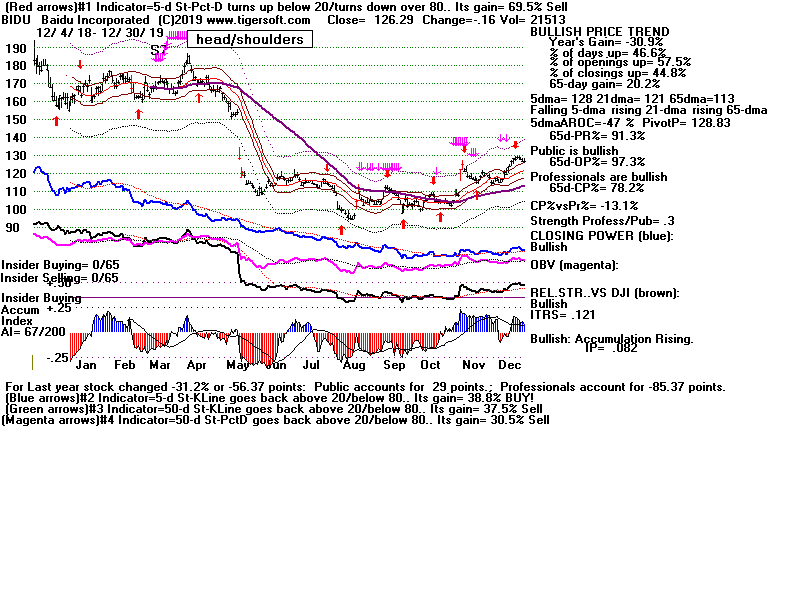
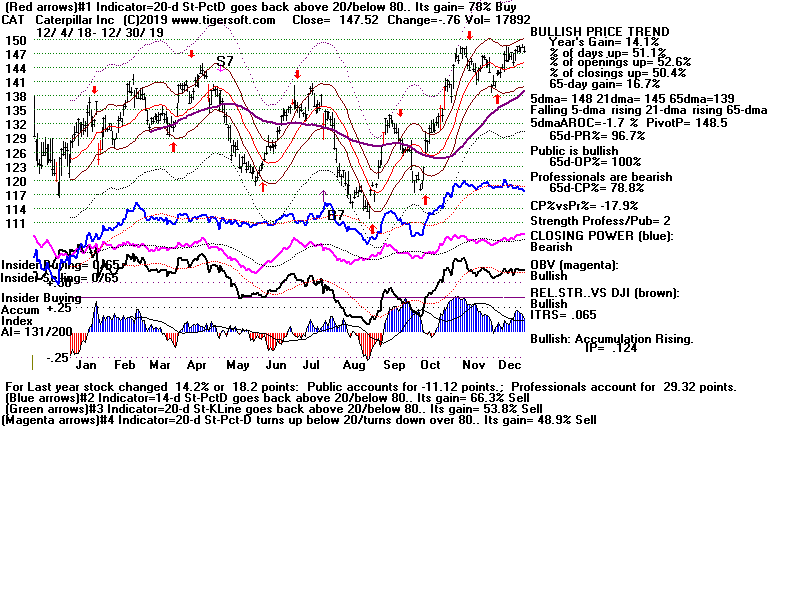
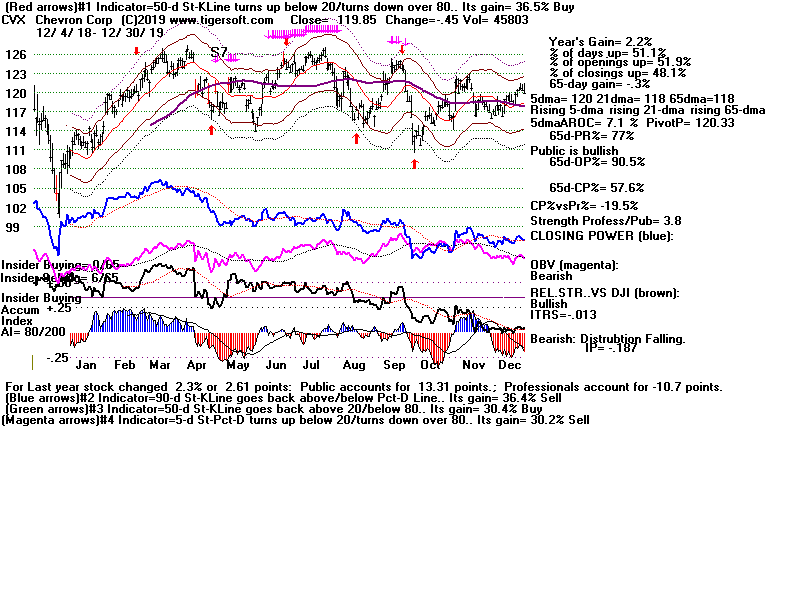
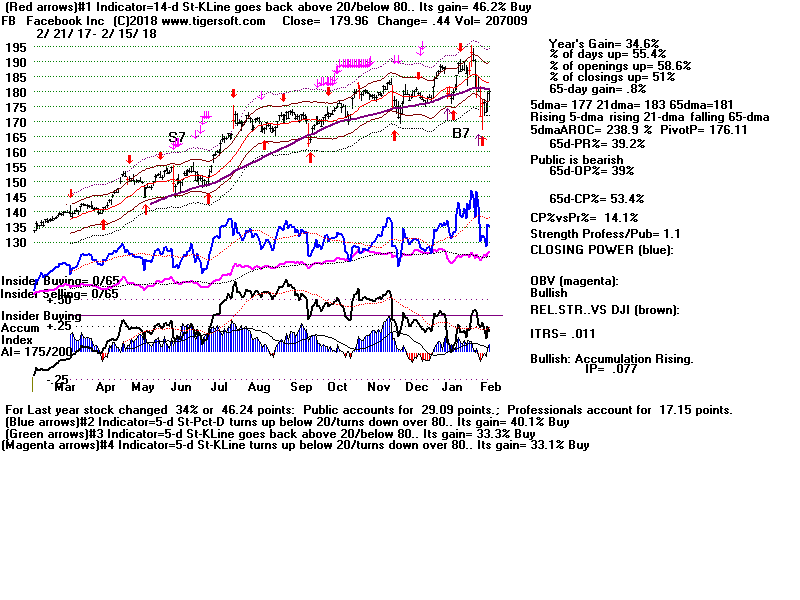
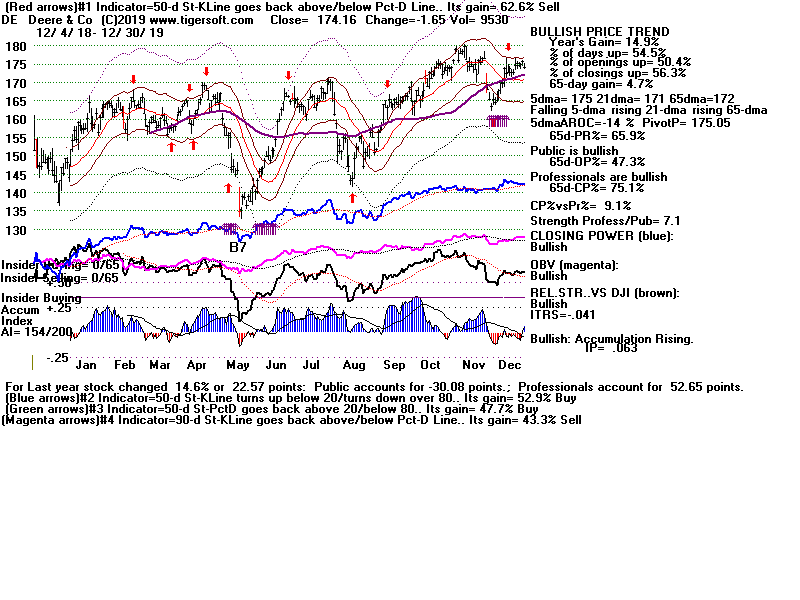
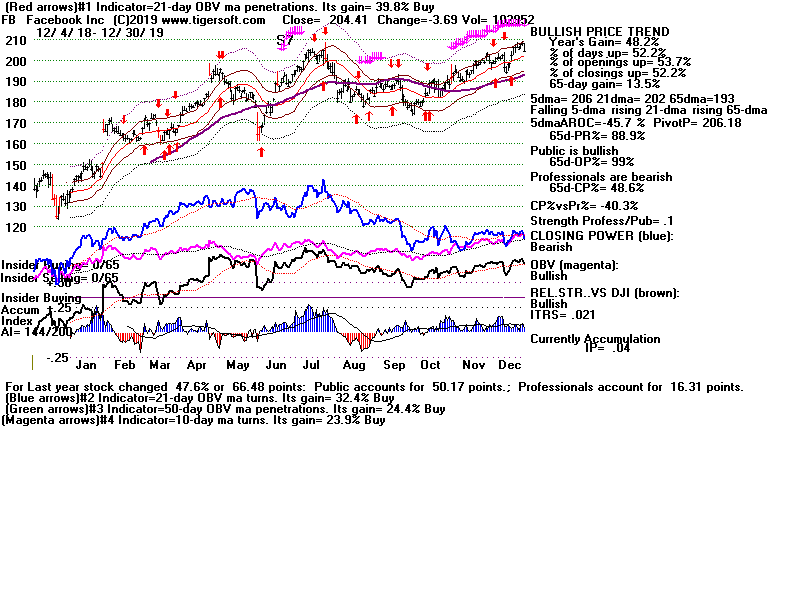
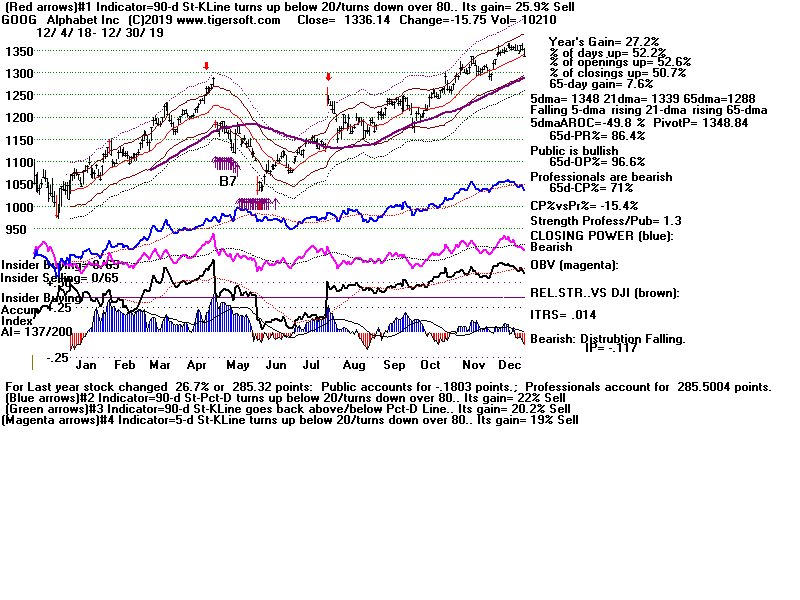
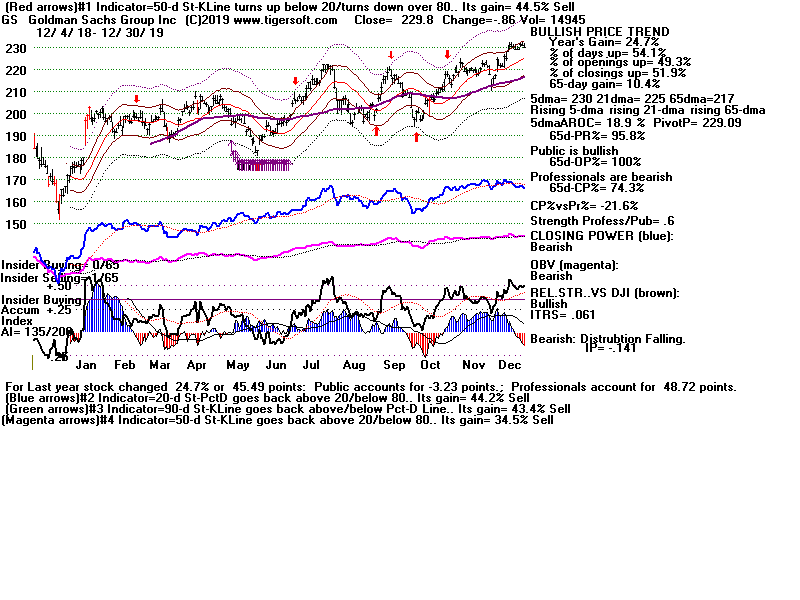
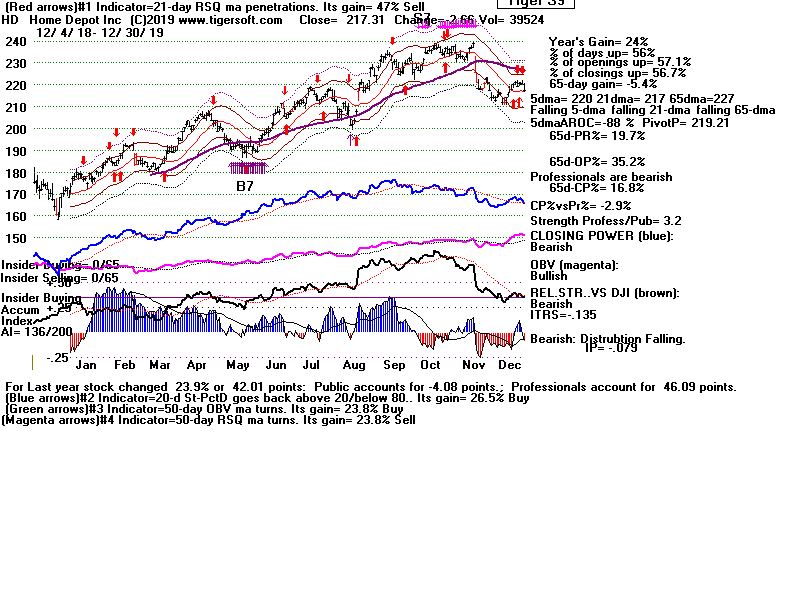
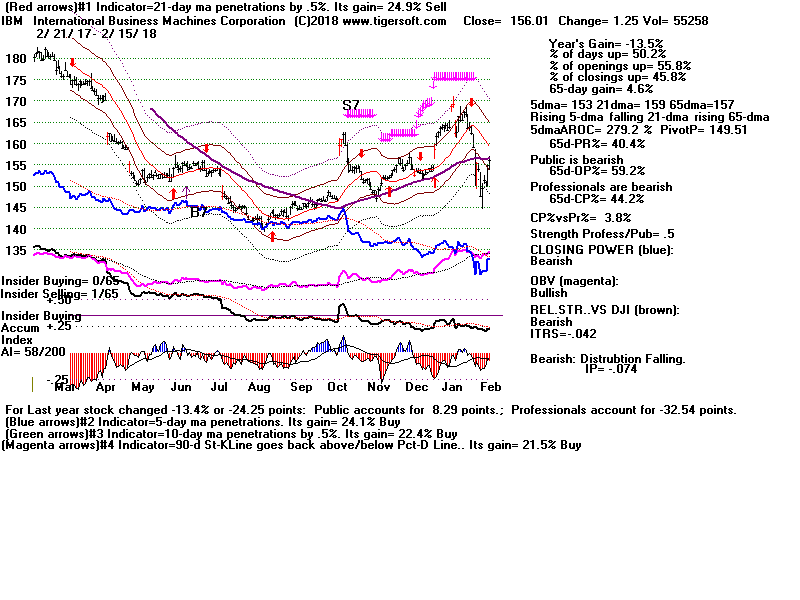
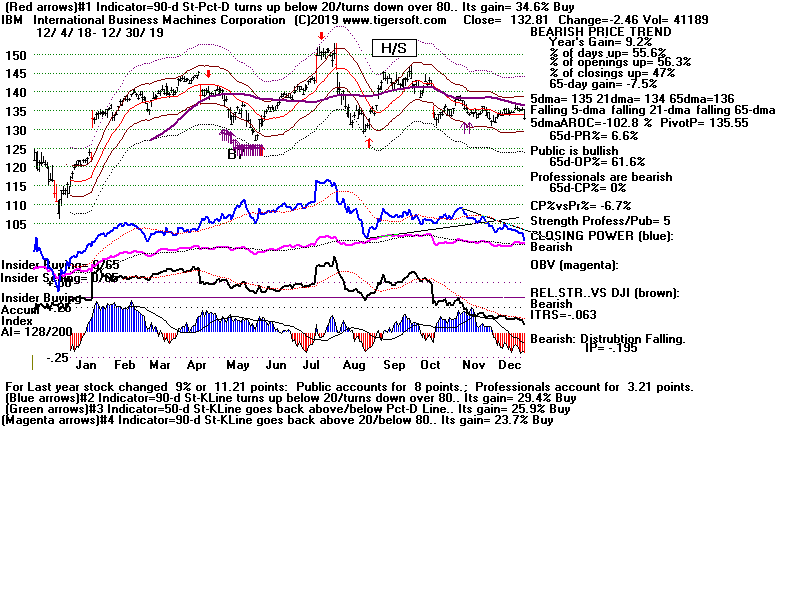
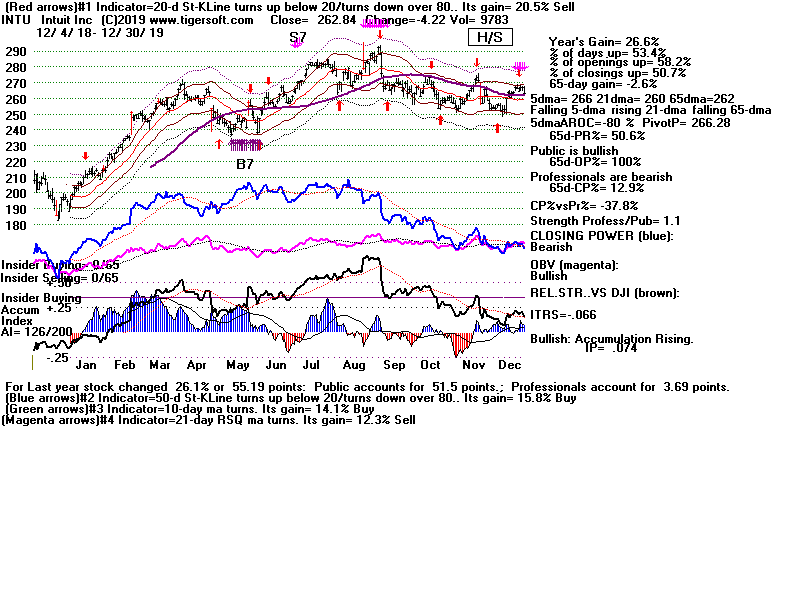
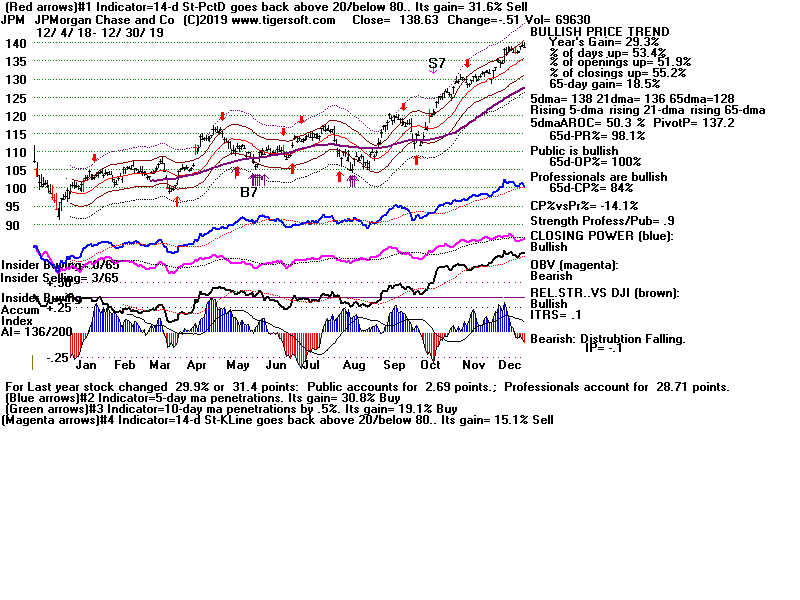
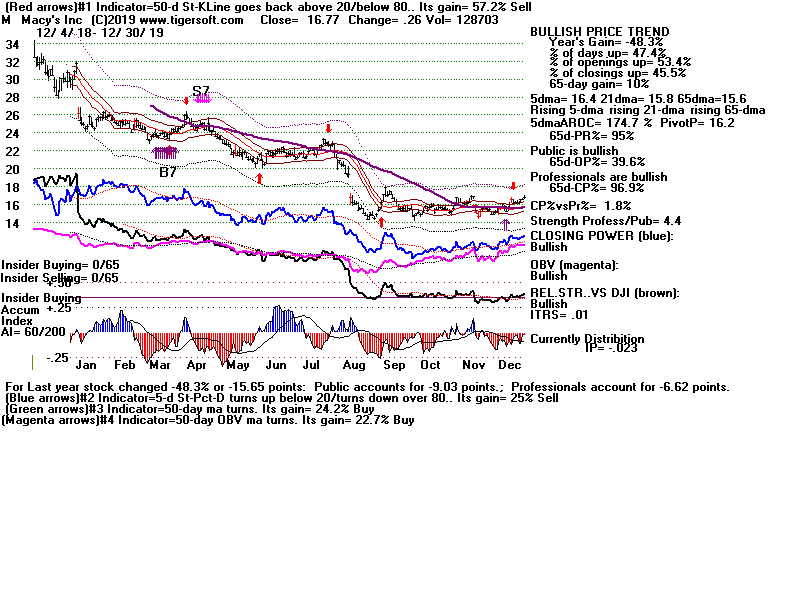
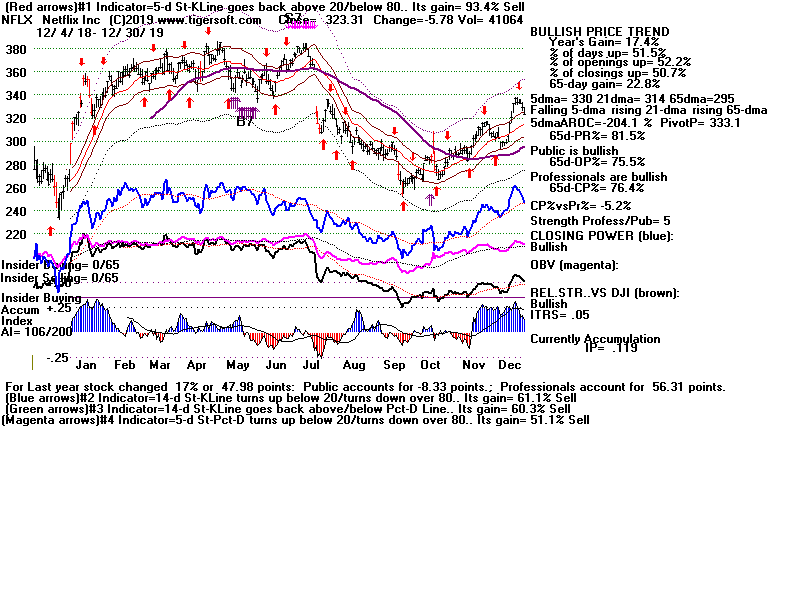
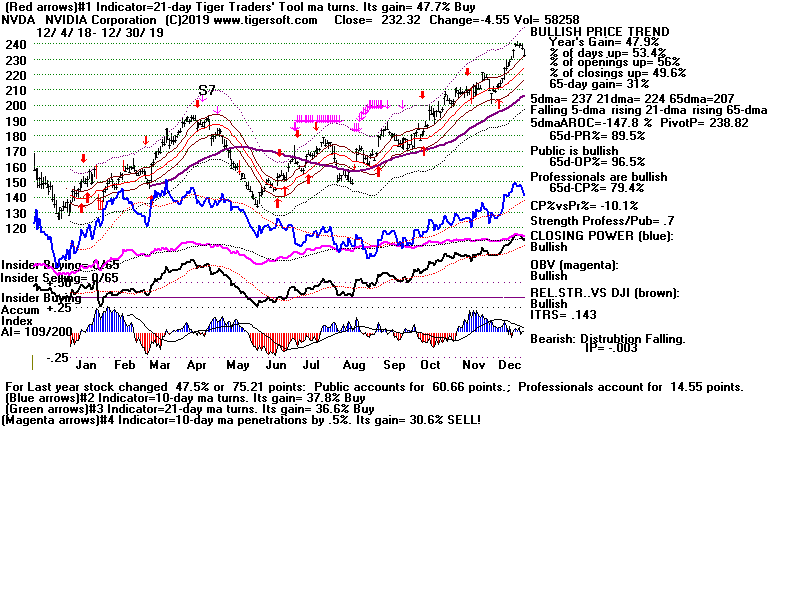
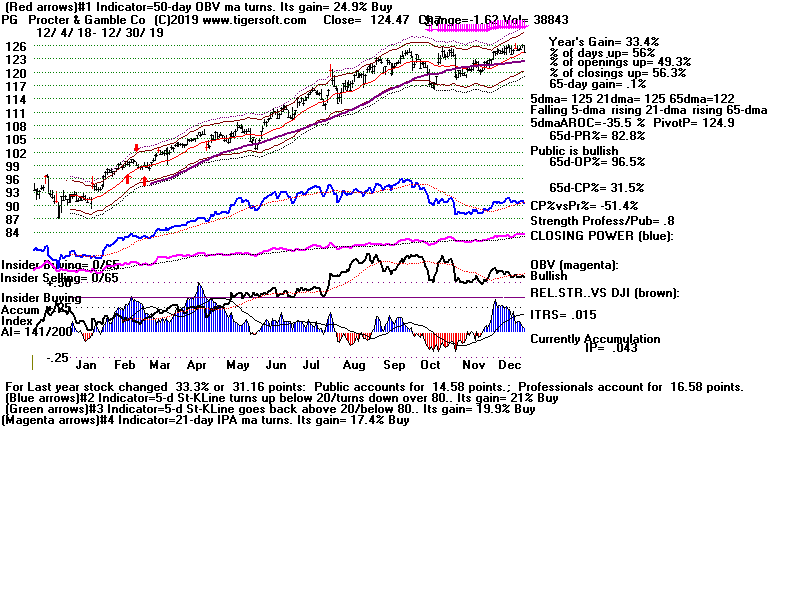
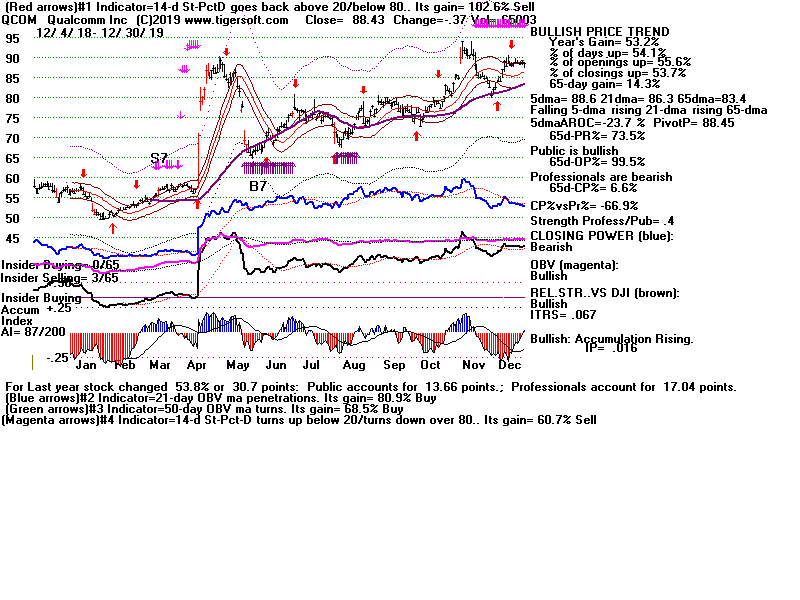
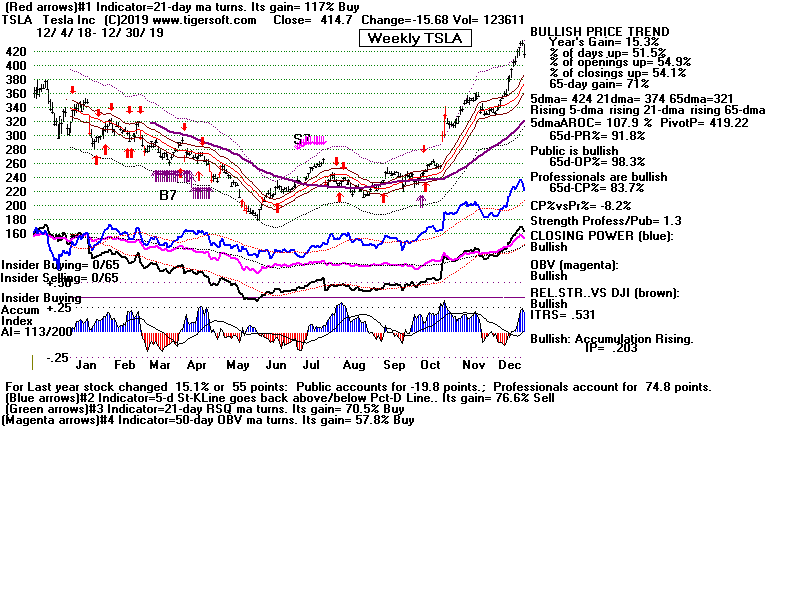
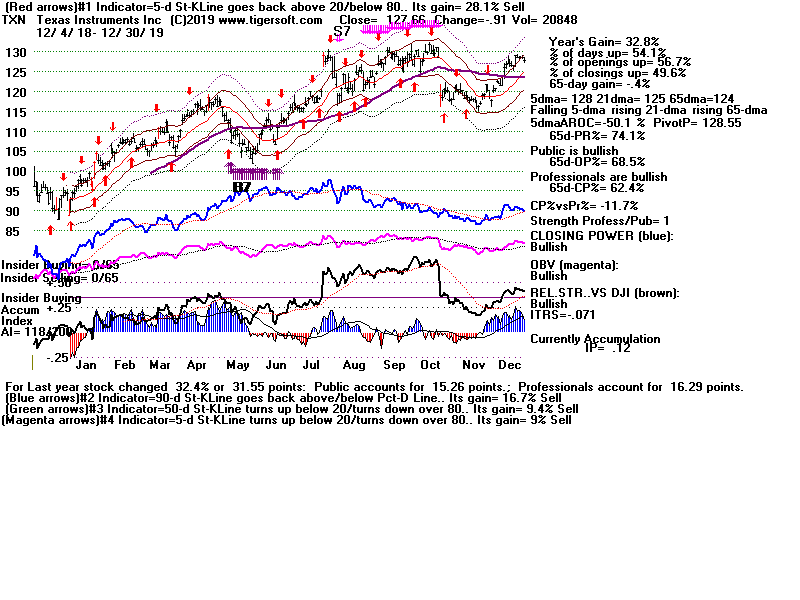
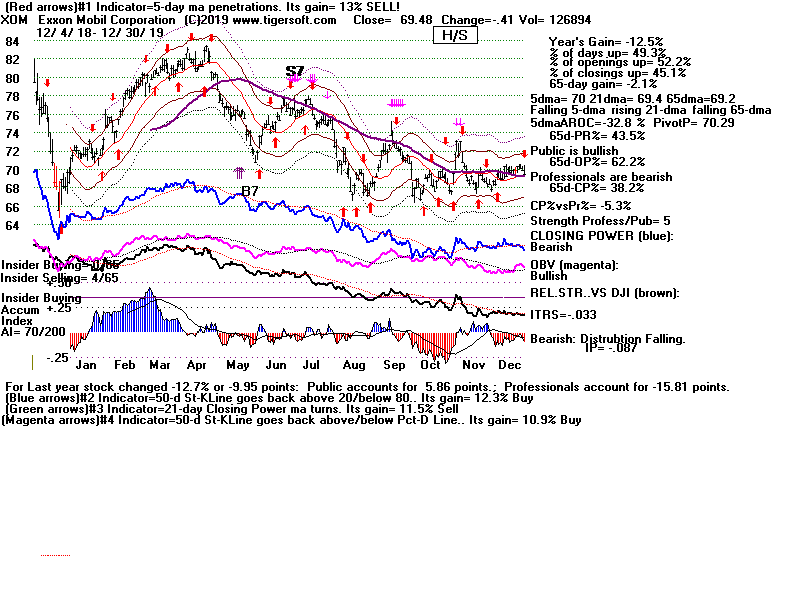
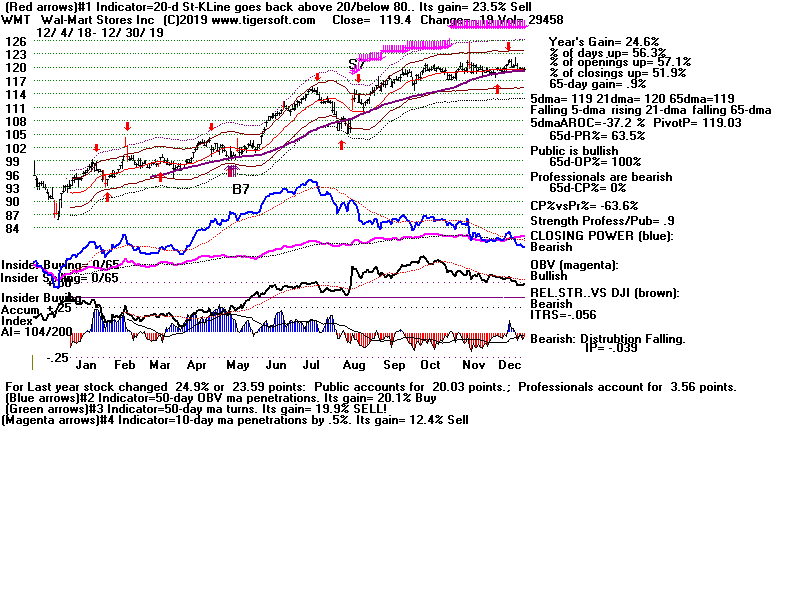
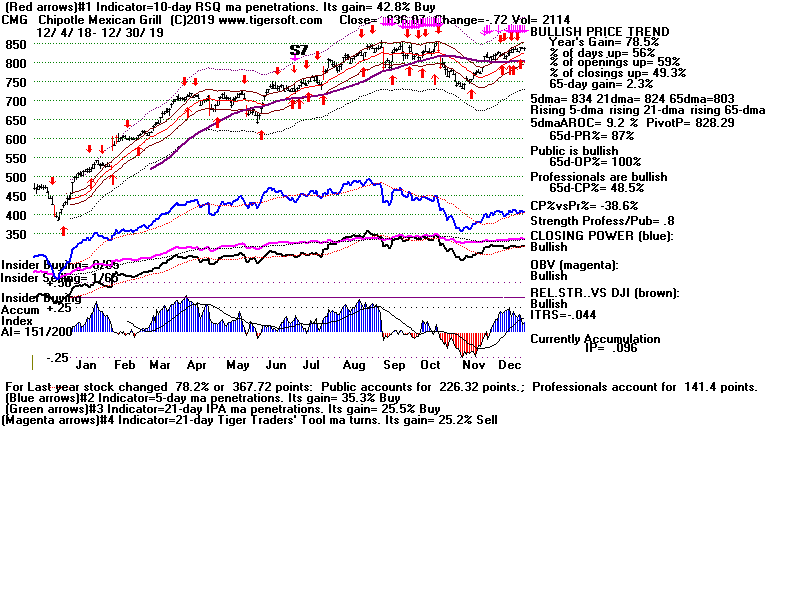
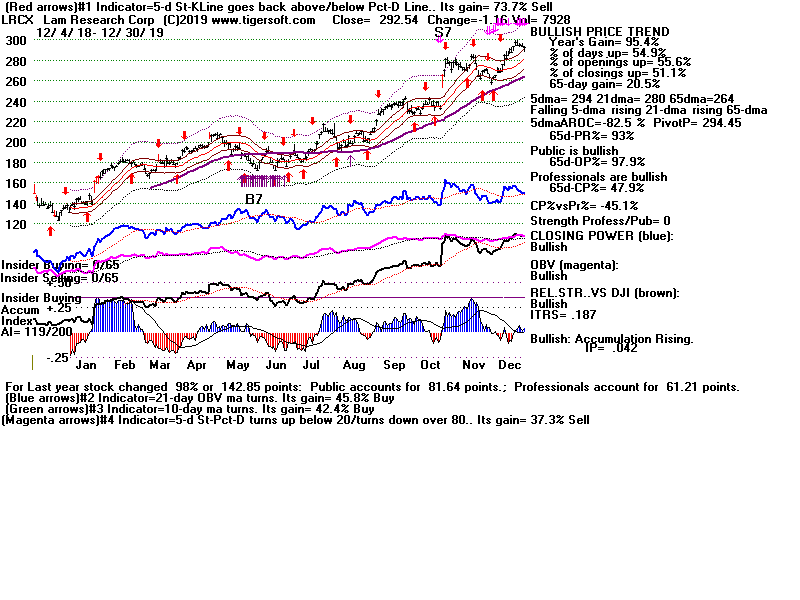
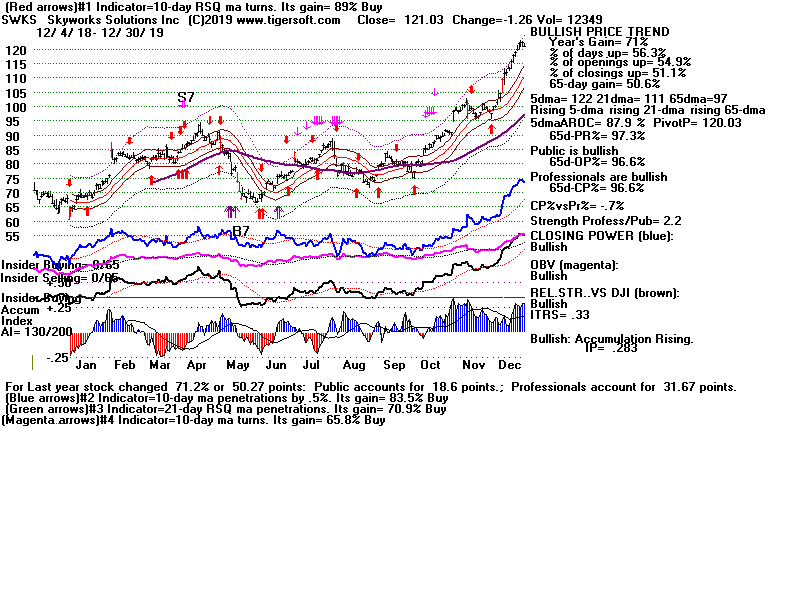
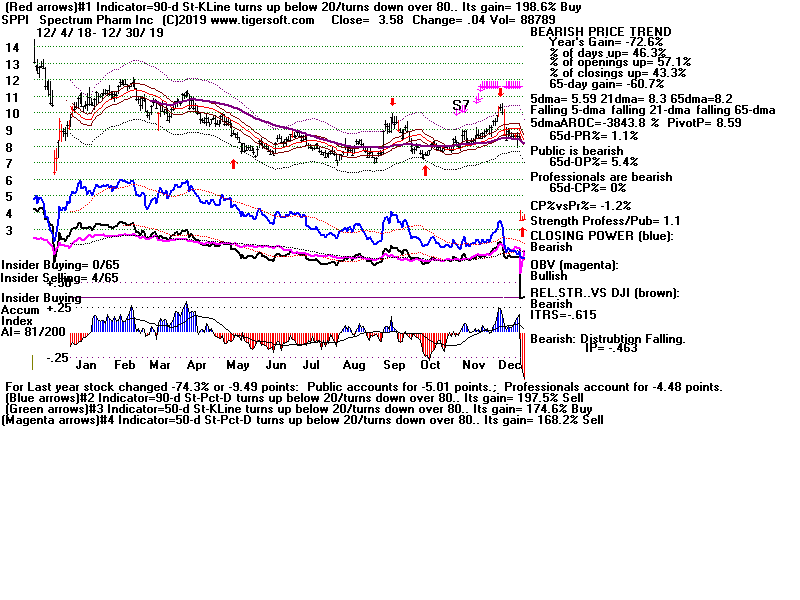
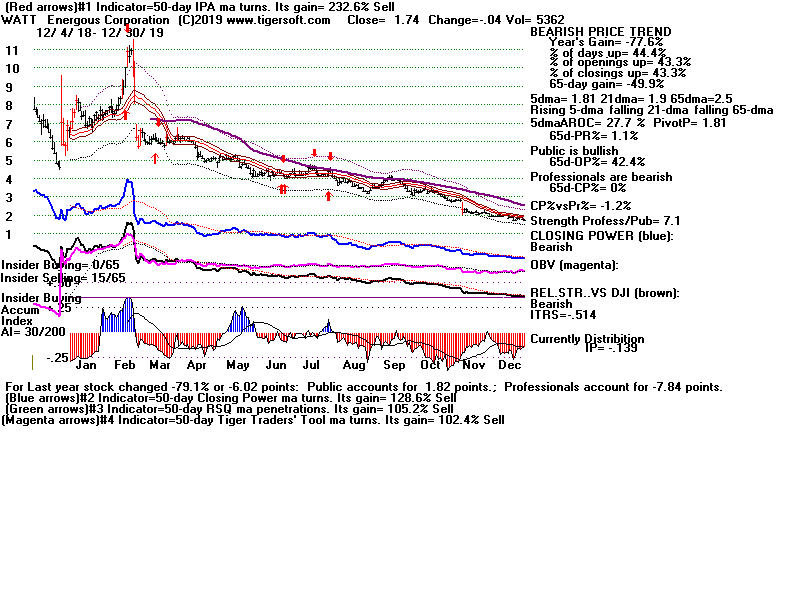
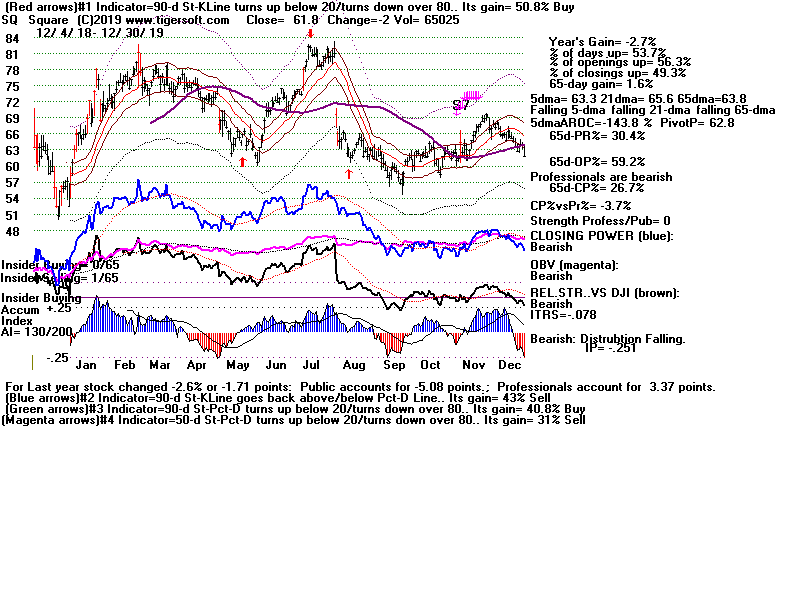
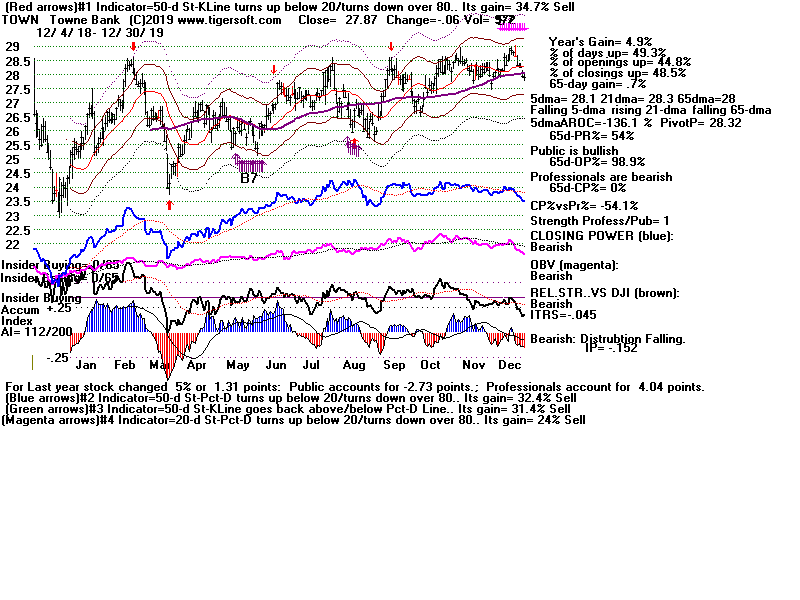
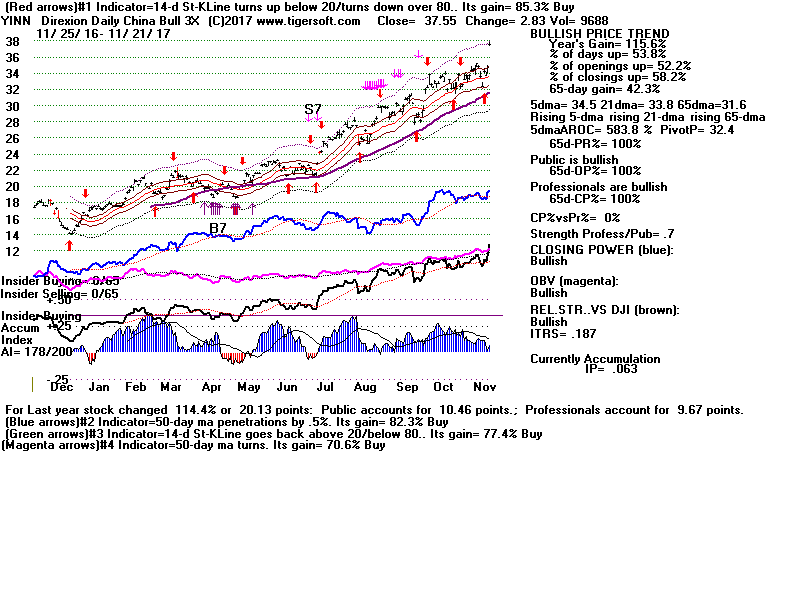