Negative
Non-Confirmations at Tops: 1928-2015
Frequency of NNCs at Major Market Tops:
PI<0
1929 1937 1939 1957
1969 1972 1980
1987 (8)
IP21<.008 1929
1960 1961 1966
1972
1980 1984 1987 (8)
VI<= 0 1929
1937 1939 1957
1960
1969 1972 1980 1981 1984 1987 (11)
OPct<0
1939 1957
PI<0
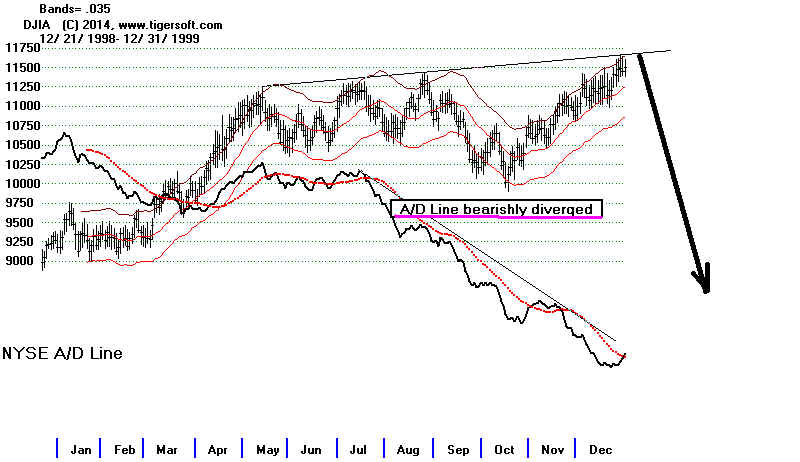
1990
2000 2007
total 11
IP21<.008
1998 2000
total 10
VI<=0
1990
1998 2000 2007
2011 total 16
OPct<0
Tops before DJI Declines of More Than
20%: 1928-2015
(C) 2014 William Schmidt, Ph.D. www.tigersoft.comLength of A/D Resulting Bear Market
Divergence
---------------------------------------------------------------------------------------------------------
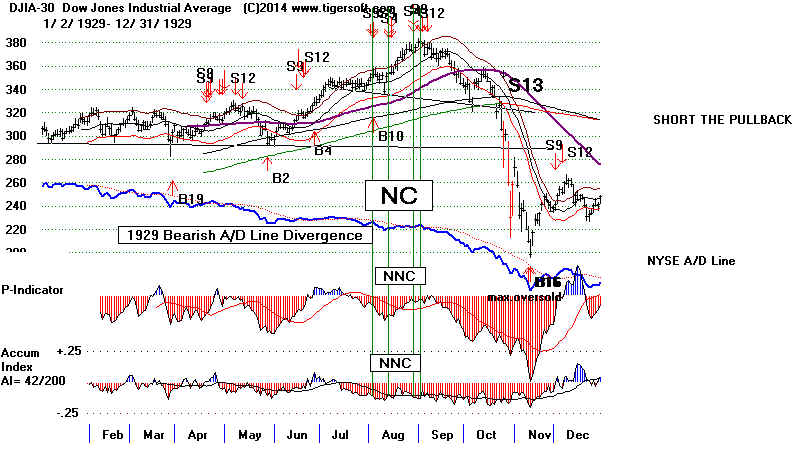
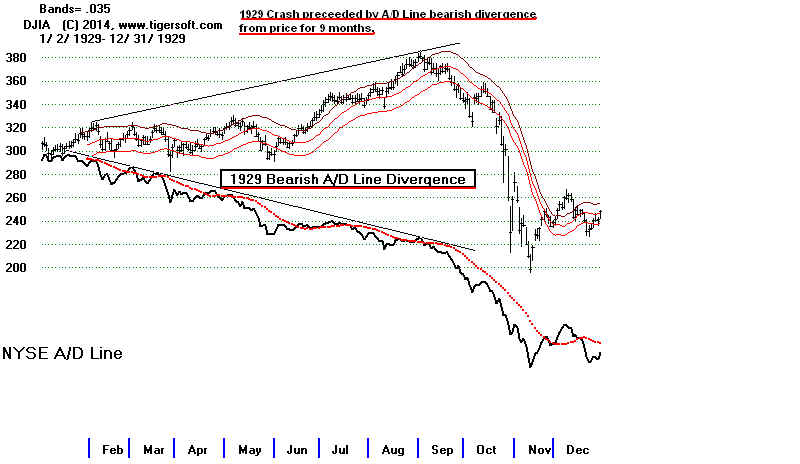
1 7
months 1929-1932
9/3/1929-7/8/1932 (35 months) 381.2 to 41.2
9/3/1929-2/27/1933
381.2 to 98.1
Sells at top: Sell S7,S12, S9
4/30/1969: la/ma 1.051, P=
-14, IP21 =-.126, V= -351 Opct= + .146, 65-day
pct ch= .281
---------------------------------------------------------------------------------------------------------
2 6
months 1937-1938 8/13/1937-
3/31/1938 (7 months) 189.3-98.9
Sells at top: Sell S4,S7,S9,S8
8/13/1937: la/ma 1.024, P= --2 , IP21 = .042, V=
-43, Opct=+.279, 65-day pct ch= .099
---------------------------------------------------------------------------------------------------------
3 8 months
1939
11/9/1939 - 4/11/1939 (
months) 158.1- 123.8
No Sell at top:
Later S16 12/30/1939 - 4/11/1939
154.4-123.8
and later still: S12, S3
12/30/1939: la/ma 1.029, P= --4 , IP21 = .046, V= 0, Opct=- .28, 65-day pct ch= .151
----------------------------------------------------------------------------------------------------------
4 8 months
1939-1942
9/12/1939-4/28/1942 (31 months) 155.9-92.9
Sell at top: Sell S9...later S16, S1
9/13/1937: la/ma 1.095, P= -43 , IP21 = .138, V=+56, Opct=+.326, 65-day pct ch= .107
---------------------------------------------------------------------------------------------------------
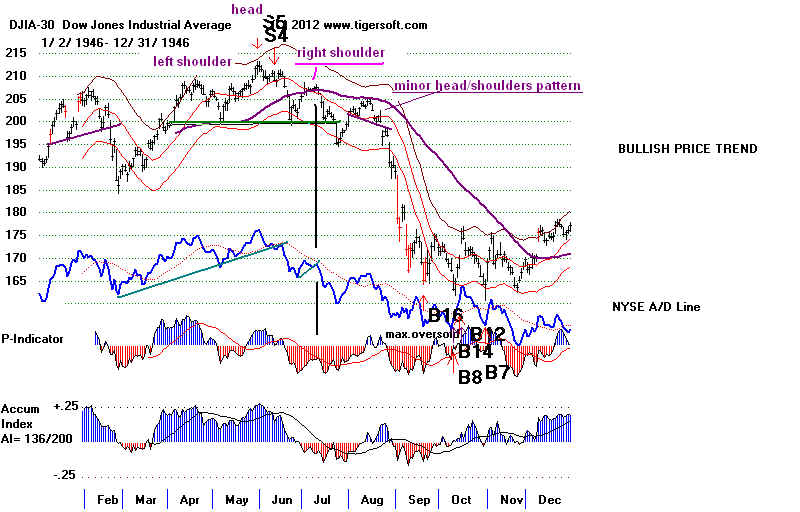
5 None
1946
5/29/1946-10/9/1946 (5 months) 212.5-163.1
H/S
Sell S5,S4
529/1946: la/ma 1.029, P= +64 , IP21 = .269, V=+43, Opct= +.375, 65-day pct ch=
.142
----------------------------------------------------------------------------------------------------------
6 16 months
1957
7/12/1957- 10/22/1957
520.8-419.8
Sell S7, S9, S4
7/12/1957: la/ma 1.022, P= --40, IP21 = .062, V=
-214,
Opct=- .248, 65-day pct ch= .078
----------------------------------------------------------------------------------------------------------------------------
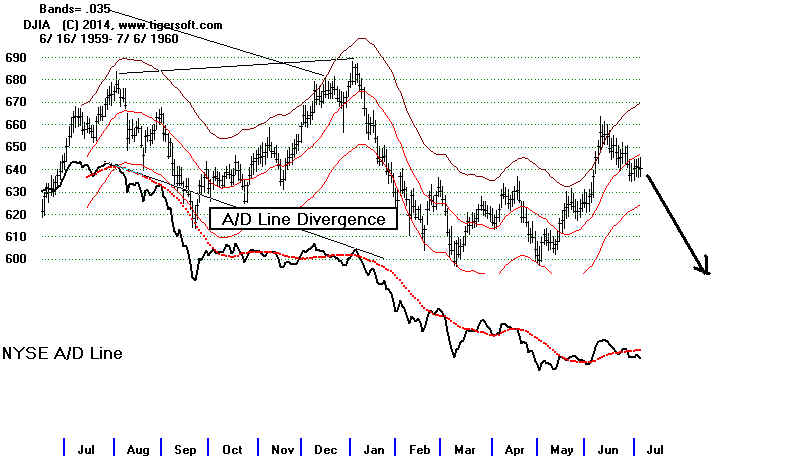
7 8
months 1960
1/5/1960 - 10/25/1960
685.5 - 566.0
Sell S12, S16, S15, S1
7/12/1957: la/ma 1.018, P= +4, IP21
=-.038, V= -170, Opct=+ .099, 65-day pct ch= .085
----------------------------------------------------------------------------------------------------------------------------
8 5 months
1961-1962
11/16/1961-5/25/1962
734.3 - 536.7
Early S9, S16 (nearly perfect)
8/3/1961: la/ma 1.025, P= +34, IP21 =- .042, V= +6, Opct= + .378,
65-day pct ch= .058
-----------------------------------------------------------------------------------------------------------------------------
9 22 days
1966
2/9/1966-10/7/1967
995.15-744.32
Sell S4, S12
1/6/1966: la/ma 1.025, P= +34, IP21 =- .042, V= +6, Opct= + .378,
65-day pct ch= .058
-----------------------------------------------------------------------------------------------------------------------------
10 none at top
1968-1970 12/3/1969-5/26/1970
985.21 - 631.16
Sell S1
4 months 1969-1970
5/14/1969-5/26/1970
968.85 - 631.16
Sell S9,
S3
4/30/1969: la/ma 1.025, P= -30, IP21 =+ .083, V= -1, Opct= +
.219, 65-day pct ch= .01
----------------------------------------------------------------------------------------------------------------------------
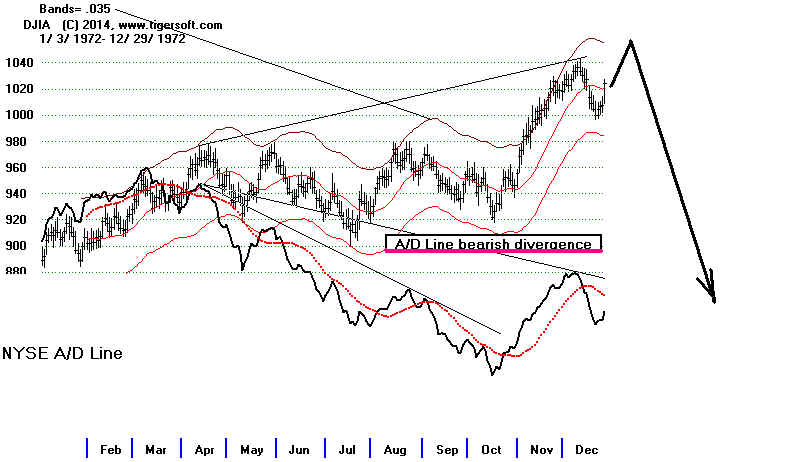
11 7
months 1972-1973
1/11/1973 - 12/6/1974
1051.7 - 577.6
Sell S1, S9, S4, S12
1/11/1973: la/ma 1.024, P= -96, IP21 =+ .002, V= -2, Opct= +
.059, 65-day pct ch= .117
----------------------------------------------------------------------------------------------------------------------------
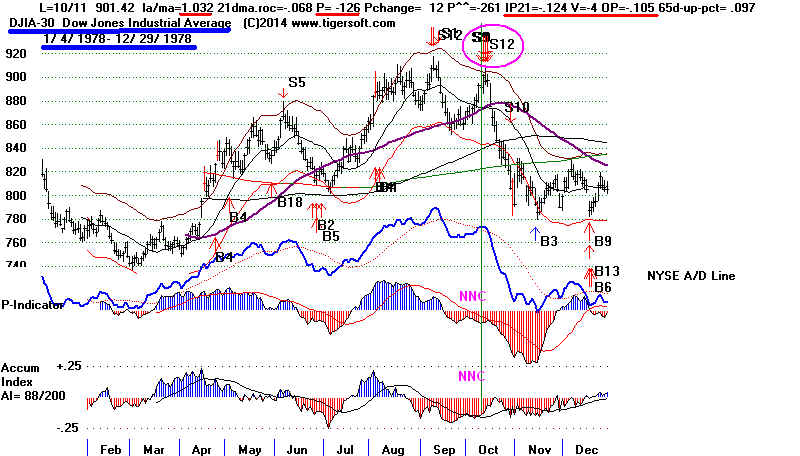
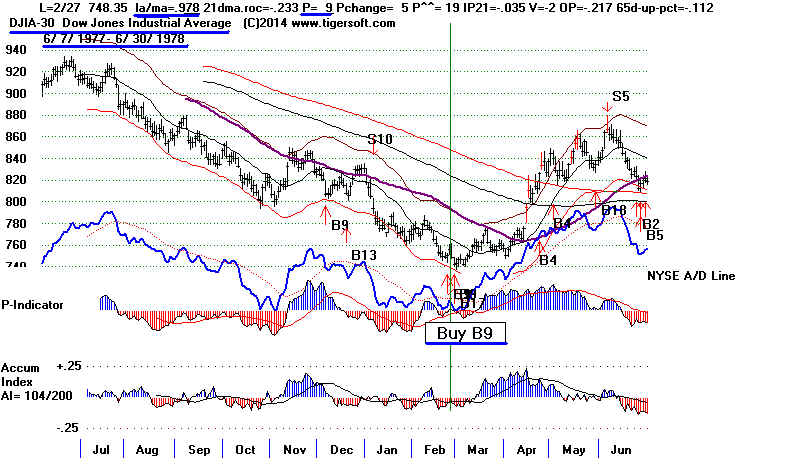
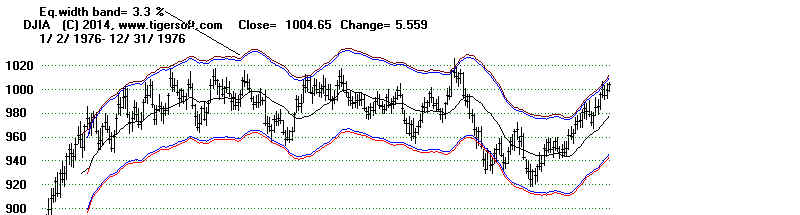
12
none
1976-1978
9/21/1976 - 2/28/1978
1014.79 -
742.12
Sell S1, S4, S16
9/21/1977: la/ma 1.033, P= +178, IP21 =+.181, V= +2, Opct= + .18,
65-day pct ch= .012
---------------------------------------------------------------------------------------------------------------------------
13
6 months 1980
2/13/1980 -
3/27/1980 903.84 -
759.98
Sell S4, S9, S15
2/13/1980: la/ma 1.028, P=
-26, IP21
=- .01, V= -1, Opct= + .212, 65-day pct ch=
.12
----------------------------------------------------------------------------------------------------------------------------
14
7 months 1981-1982
4/27/1981 - 8/11/1982
1024.05 -
777.21
Earlier S9s, Sell S4, S7, S15
4/27/1981: la/ma 1.02, P= +11, IP21 =+.026, V= 0, Opct= + .217, 65-day pct ch=
.098
---------------------------------------------------------------------------------------------------------------------------
15
7 months 1984
1/9/1984 - 7/24/1984
1286.22 - 1086.57
Sell S4, S12
1/9/1984: la/ma 1.021, P= +36, IP21
=+.007, V=-1, Opct= - .169, 65-day pct ch= .04
--------------------------------------------------------------------------------------------------------------------------
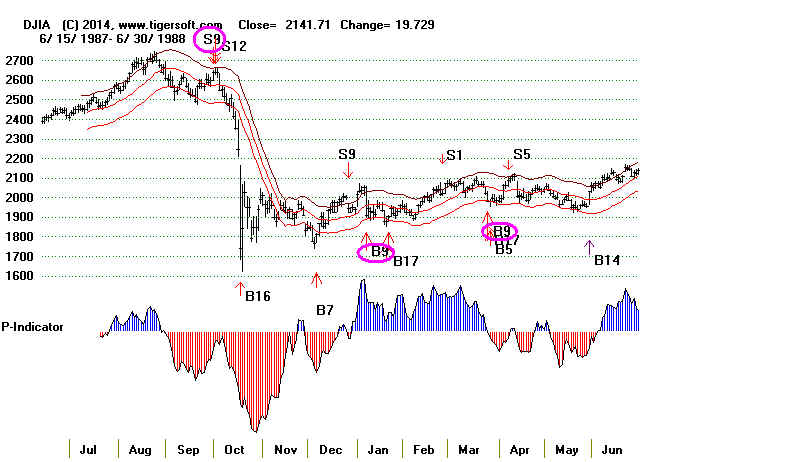
16
5 months 1987
8/25/1987-10/19/1987
2722.42 - 1738.74
Sell S4
Later S8, S9, S12 10/2/1987-10/19/1987
2640.99 - 1738.74
10/2/1987: la/ma 1.026, P= -56, IP21 =- .017, V= -7, Opct= +
.072, 65-day pct ch= .095
----------------------------------------------------------------------------------------------------------------------------
17
7 months 1990
7/17/1990-
10/11/1990 2999.75
- 2365.1
Sell S9,
S8, S5
7/17/1990: la/ma 1.032, P=
-1, IP21 =+ .024, V= -4, Opct= + .414, 65-day pct ch=
.09
---------------------------------------------------------------------------------------------------------------------------
18 4 months
1998
7/17/1998 - 8/31/1998
9337.97 - 7539.07
Sell S9, S12
7/8/1998: la/ma 1.03, P=+2, IP21 =-
.025, V=
-17, Opct= + .061, 65-day pct ch= .021
---------------------------------------------------------------------------------------------------------------------------
19 18 months
2000-2003
1/14/2000 - 3/11/2003
11722.98 - 7286.27 (10/9/02)
Sell S9, S12. S15, S4
1/7/2000: la/ma 1.021, P=-23, IP21 =- .028, V= -59, Opct= +
.356, 65-day pct ch= .088
----------------------------------------------------------------------------------------------------------------------------
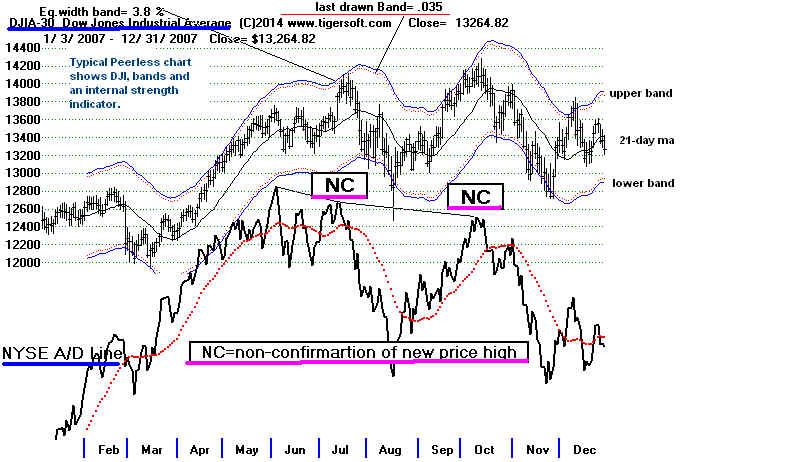
20
4 months 2007-2009
10/9/2007 - 3/9/2009
11722.98 - 6547.05
Earlier Sell S9 and S5; concurrent S2, S4
7/19/2000: la/ma 1.028, P=-51, IP21 =+ .024, V= -131, Opct= +
.054, 65-day pct ch= .096
----------------------------------------------------------------------------------------------------------------------------
21
2011
5/2/2011 - 10/3/2011
12807.36 - 10655.3
Sell S5, S8
5/2/2010: la/ma 1.028, P=+212, IP21 =+ .147, V= -17, Opct= +
.349, 65-day pct ch= .068
Later S9V
7/21/2010: la/ma 1.025, P=+269, IP21 =+. 085, V= -51, Opct= +
.005, 65-day pct ch= .042
---------------------------------------------------------------------------------------------------------------------------- |