Earlier Hotlines
Go here...
HELP
A
Guide To Profitably Using The Tiger Nightly HOTLINE
Introduction to Tiger/Peerless
Buys and Sells.
Peerless Buy and Sell Signals: 1928-2016
Individual Peerless signals explained:
http://tigersoftware.com/PeerlessStudies/Signals-Res/index.htm
http://www.tigersoft.com/PeerInst-2012-2013/
Explanation of each Peerless signal.
http://www.tigersoft.com/PeerInst-2012-2013/
Different
Types of TigerSoft/Peerless CHARTS, Signals and Indicators
----->
More HELP LINKS
Documentation
for TigerSoft Automatic and Optimized Signals.
How
reliable support is the DJI's rising 200-day ma?
SPY
Charts since 1994: Advisory Closing Power S7s, Accum. Index, 65-dma,
Optimized Signals.
^^^^^^^^^^^^^^^^^^^^^^^^^^^^^^^^^^^^^^^^^^^^^^^^
1/19/2016 --->
Corrections,Deeper Declines and Bear Markets since 1945.
1/21/2016
--->
High Velocity Declines since 1929
2/12/2016 --->
Presidential Elections Years and Bullish IP21 Positive Non-Confirmations at
Lower Band.
2/12/2016 --->
OBV NNCs
on DJI's Rally to 2.7% Upper Band when DJI's 65-dma is falling.
11/6/2016 --->
Killer Short Selling
Techniques: ===>
Order Here
($42.50)
It's As Easy as
1,2,3
TigerSoft "Combination" Short-Selling...
Easy as 1-2-3 Short Sales
Earlier Q-Answers
QuickSilver
Documentation (1/11/2016)
Our Different Signals
Better
understand the difference between Peerless DJI-based signals,
the one-year optimized red Signals
and the fixed signals based
on technical developments.
Introduction to
Tiger/Peerless Buys and Sells.
Different
Types of TigerSoft/Peerless CHARTS, Signals and Indicators
New
TigerPeerless
Installation and Basic Uses' Instruction
(11/25/2016)
See
the re-written materials on TigerSoft Buys and Sells.
A few more pages will be added. But users could
print this
main Installation and Uses' Page for reference.
Study-
Trading SPY WITHOUT Peerless - Some Guidelines.
When completed this will be
a new Tiger Trading E-Book.
Study-
Examples of "Hands above the Head" top patterns.
Study-
9/3/2017
TigerSoft (not
Peerless) charts of Major Tops as they occurred.
===> Please report any broken or out-of-date
links.
william_schmidt@hotmail.com
==============================================================================
==============================================================================
3/15/2016
Today's rally by the DJI looked false. There were 774 more down than
up on the NYSE. Traders may not want to hold positions over the
weekend because Mondays have had a tendency to open down quite
a bit and also because the expected rate hike coming next week overhangs
the market. Once that is dispensed with, the DJI and the NASDAQ
should be ready to rally into Tax Day in April. This would be
consistent
with past seasonality, at any rate.
The operative Peerless
signal remains the Buy B5.
Can we still trust this signal?
"Should we trust it so soon after a Sell
S9?" is a fair question. Below are
the
four cases of S9s occurring before a Buy B5 from 1929-2017. All of
these
worked out well.
1) 19350218 S9 107.2
19350219 S3 105.9
19350312 B5 97.7
DJI rallied way up to 132.5
1.0% paper loss.
----------------------------------------------------------------------
2) 19870406 S9 2405.54
19870414 B5 2253.98
Only 3.9% gain. 1.0% paper loss.
-----------------------------------------------------------------------
3) 19891003 S9 2754.56
19891011 S9 2773.36
19891013 B5 2569.26
9.4% gain. No paper loss.
-----------------------------------------------------------------------
4) 20090610 S9 8739.02
20090624 B5 8299.86 23.7%
gain No paper loss.
Would a sharp decline now bring a judged or actual Sell S10? I
don't think
that the recent support is flat enough for that. But a 5% paper loss
on the B5 would
be much too high. It would be inconsistent with all but one of the
previous Buy B5s. That would make me consider the B5 cancelled.
What about the Sell S18 on 2/27 @25410 with the
older Peerless?
The 2006 program, which only looked at data from 1965-2006, had in the
Help section the following. "Minor S18 - This is a warning signal
only...
The DJI tags the 1% (upper) band with the "P"-Indicator very negative
and no accompanying S9 signal. The 21-dma must be declining" The
average drop was only 0.43% at the time of the next Buy signal. This
suggests that the S18 is not a very powerful signal. When I reviewed
all the near S9s since 1945, I concluded that its "addition to the force"
of Peerless signals would have meant only small changes here and there
to the overall system.
What Might Bring A DJI Decline
Now?
If Boeing collapses, the DJI will certainly test its recent lows. If the FED
raises
short-term rates by 1/2% instead of 1/4% next week, there will certainly be
problems
for the market, too. But Trump is not going to suddenly reverse his
military build-up
to deal with North Korea. And there is still no significant Inflation.
The CPI is
rising only at a 2% rate, not the 3% or higher rate that usually brings on
interest
rates high enough to hurt the stock market. So, the FED is not likely
to surprise folks
next week.
The Republicans Might Lose in November
The series of Republican by-election losses does scare the stock market.
But, with Trump in the White House, even if Democrats got control of
both sides of Congress, he could still protect his economic agenda with
vetoes. And I don't think he will lose control of Congress. Most
incumbents will be re-elected. That's just the way the districts are
drawn.
And, more important, voters when it comes right down to deciding, usually
vote their pocket-book. As long as the market is up in November, the
Republicans will get the credit in the eyes of most voters. This is
what
Trump's "wager on the strong" is all about.
But what if the Economy turns down? That is just not what the
Jobs' numbers are showing. It is not what the low rate of inflation
shows.
And Larry Kudlow is believed to be a very effective communicator of the
supply-side, "trickle down", Coolidge-Trump agenda. Perhaps, there
will be another Crash. But first, more of the Public must join the
party.
Trading The Market Now
Short-term traders should probably pay most
attention to the Hourly
DJI and the 5-day Stochastic of the DJI-13 (its highest priced stocks.)
We are close to getting a red Buy on the DJI-13. But a break below the
Hourly DJI's support line will most likely quickly drop the DJI to 24000
and then bring a re-test of its early February lows. Watch the
OBV-DISI
Line. We will need to see the Hourly OBV break its downtrend following
such a sell-off to be able to judge that the test of 24000 is over and
a rally
will follow.
Still, the market is up a long ways over a very long time, so Profit-taking
is now
a factor once a decline starts. As a result, Professionals are now
selling into early
strength. This has caused four straight red Candle-Stick charts.
Professionals
know now that the DJI is below its 65-dma and the 65-dma will turn down
soon if the DJI were to drop below its price three months ago, 24651.74,
about
222 points below today's close. This
would be a bearish sign. Institutions sell
when this happens or quickly hedge with index option puts and leveraged
bearish ETFs. We should factor this understanding in, I would say.
So hedging by shorting some of the many
Bearish MINCPs has been
suggested. Similarly, watch the Closing Powers of your long positions.
If prices are over-extended and a stock's Closing Power breaks its uptrend,
then join in the profit-taking. For now I would still hold
AAPL, QQQ and
some of the very strong internet-computer stocks among our
Bullish MAXCPs.
 |
Table 1 QUICKSILVER on ETFS - 03/15/18
ETF      CLOSE   CHANGE     PIVOT-PT   5-dma AROC   CL-PWR    CANDLE  IP21    ITRS
---------------------------------------------------------------------------------------------
DIA       249    1.12        253.56       -2.8%     Bearish    BLUE  -.041     0
---------------------------------------------------------------------------------------------
COMPQX    7481.74   -15.07   7560.81       35.8%    Bullish    RED    .11     .064
---------------------------------------------------------------------------------------------
SPY       275   -.3          278.87        16.3%    ----       RED    .034     .019
---------------------------------------------------------------------------------------------
QQQ       171.53   -.15      173.16        48.5%    Bullish    RED    .106     .078
---------------------------------------------------------------------------------------------
MDY       350.13   -1.37     354.91        14.2%    ----       RED    .068     0
---------------------------------------------------------------------------------------------
IWM       156.92   -.79      158.92        15.8%    Bullish    RED    .097     .016
---------------------------------------------------------------------------------------------
FAS       72.45    0         76.18         39.2%    ----       RED    .131     .062
---------------------------------------------------------------------------------------------
RETL      33.55   -.63       35.33        -51.9%    Bearish    RED   -.083    -.122
---------------------------------------------------------------------------------------------
SOXL      191.24   -.56      195.2         194.3%   Bullish    RED    .14      .277
---------------------------------------------------------------------------------------------
TECL      140.9    .24       144.58        142.4%   Bullish    BLUE   .119     .207
---------------------------------------------------------------------------------------------
IBB       112.67   -1.11     114.36        2.2%     Bullish    RED    .173     .027
---------------------------------------------------------------------------------------------
GLD       124.9   -.8        125.54       -20.7%    ----       RED    .092    -.006
---------------------------------------------------------------------------------------------
OIL       6.78    .06        6.88          111.3%   ----       ----   .179     .026
---------------------------------------------------------------------------------------------
OIH       24.05   -.6       W25.04        -76.7%    Bearish    RED   -.02     -.098
---------------------------------------------------------------------------------------------
GASL      17.31   -1.3      W18.67        -112.9%   Bearish    RED   -.06     -.377
---------------------------------------------------------------------------------------------
UGA       30.82   -.02       30.43         116.8%   Bullish    RED    .24     -.022
---------------------------------------------------------------------------------------------
UUP       23.56    .09       23.55        -4.3%     Bearish    BLUE  -.118    -.019
---------------------------------------------------------------------------------------------
IEF       102.49   -.04      101.92        17.1%    Bearish    ----  -.116    -.03
---------------------------------------------------------------------------------------------
XLU      50.2   -.03         49.4          94.7%    Bullish    ----  -.059    -.042
---------------------------------------------------------------------------------------------
WEAT      6.54   -.12       W6.67         -194.3%   Bullish    RED    .245     .072
---------------------------------------------------------------------------------------------
YINN      38.48    .77       38.42         386.3%   Bearish    RED   -.015     .022
---------------------------------------------------------------------------------------------
RSX       22.76   -.18      W23.07        -53.9%    ----       RED    .101     .069
---------------------------------------------------------------------------------------------
AAPL      178.65    .21     W179.98        47.7%    Bullish    BLUE   .029     .033
---------------------------------------------------------------------------------------------
GOOG      1149.58    .09    W1160.04       102.7%   Bullish    RED    .071     .075
---------------------------------------------------------------------------------------------
MSFT      94.18    .33      W96.54        -13.1%    ----       BLUE   .118     .092
---------------------------------------------------------------------------------------------
AMZN      1582.32   -8.68    1578.89       96.3%    Bullish    RED    .155     .327
---------------------------------------------------------------------------------------------
FB        183.86   -.33     W185.23        41.4%    Bullish    BLUE   .133     .009
---------------------------------------------------------------------------------------------
NVDA     249.34    .6        245.33        165.5%   Bullish    RED    .06      .247
---------------------------------------------------------------------------------------------
BA        329.98   -.28     W354.52       -273.1%   Bearish    RED    0        .108
---------------------------------------------------------------------------------------------
GS        266.61    2.18    W270.77        5%       ----       RED    .062     .039
---------------------------------------------------------------------------------------------
HD        178.07    .66     W182.16        3.6%     Bearish    BLUE  -.111    -.057
---------------------------------------------------------------------------------------------
CAT        154.57    2.03   W158.25        31.7%    Bearish    BLUE  -.02     -.02
|
Table 2 Count of Stocks in Key Directories
20180314
3-15 3-14 3-13
-------------------------------
NEWHIGHS 84 106 127
NEWLOWS 108 63 32
MAXCP 24 40 60
MINCP 193 94 57
TTTNH 40 58 73
TTTNL 293 92 109
FASTUP 99 128 162
FASTDOWN 124 102 81
CPCROSSA 50 38 30
CPCROSSD 95 108 78 Bearish but not as much as might be expected.
BIGVOLUP 5 8 5
BIGVODN 32 14 13
|
Table 3 New Highs in Key Tiger Directories
Date = 180315
No. NHs Pct.
-------------------------------------------------------------------
MAXCP 24 12 50 %
HOSPITAL 8 1 13 %
SOLAR 21 2 10 %
HACKERS 24 2 8 %
SOFTWARE 66 3 5 %
BIG17 46 2 4 %
GAMING 28 1 4 %
FINANCE 93 3 3 %
GREEN 30 1 3 %
INSURANC 32 1 3 %
MILITARY 38 1 3 %
NASD-100 89 3 3 %
BIOTECH 383 8 2 %
CHINA 62 1 2 %
ELECTRON 178 3 2 %
FIDSTKS 192 3 2 %
SEMI 130 3 2 %
SP500 482 9 2 %
UTILITY 42 1 2 %
ETFS 67 1 1 %
INDEXES 195 2 1 %
REIT 177 1 1 %
RUS-1000 832 12 1 %
------------------------------------------------------
Remained have none.
|
| |
Table 4 RANKING OF KEY DIRECTORIES BASED PCT.OF STOCKS ABOVE 65-DMA
3/15/18
Bearish = 24
Bullish = 20
---------------------------------------------------------------------------------------
Directory Current day-1 day-2 day-3 day-4 day-5
----------------------------------------------------------------------------------------
REGBANKS .878 .787 .878 .878 .939 .727
HOSPITAL .875 .75 .75 1 .875 .875
EDU .857 .857 .857 .857 .714 .857
JETS .777 .777 .888 .777 .777 .555
NIFTY .766 .766 .866 .866 .833 .733
SOFTWARE       .681          .712          .742          .803          .787          .727
FOOD           .666          .733          .733          .733          .733          .733
HACKERS        .666          .666          .625          .666          .708          .666
GREEN          .633          .6            .6            .7            .6            .533
COMPUTER       .608          .695          .739          .739          .695          .652
NASD-100       .606          .629          .685          .73           .685          .606
ELECTRON       .584          .606          .612          .651          .617          .584
FINANCE        .58           .58           .645          .731          .709          .623
SEMI           .576          .592          .584          .661          .607          .592
BIGBANKS       .571          .571          .571          .714          .714          .571
INDEXES        .564          .584          .651          .666          .661          .569
MILITARY       .552          .578          .631          .684          .71           .684
BIOTECH        .55           .592          .629          .652          .647          .613
CHINA          .532          .532          .467          .612          .596          .483
FIDSTKS        .51           .505          .557          .598          .604          .494
N=20
===========================================================================================
BIGGEST 2017   .5            .521          .478          .565          .543          .521
Gainers
INSURANC       .5            .5            .562          .562          .625          .468
===========================================================================================
FIDELITY       .487          .512          .56           .658          .658          .463
ETFS           .477          .567          .537          .641          .611          .462
RUS-1000       .466          .477          .515          .546          .55           .45
TRANSP         .45           .45           .65           .6            .65           .4
SP500          .446          .458          .502          .541          .558          .45
GAMING         .428          .464          .464          .5            .5            .5
COAL           .4            .5            .4            .4            .4            .5
DOWJONES       .4            .366          .4            .466          .533          .366
SP-100         .395          .406          .468          .52           .552          .395
CHEM           .387          .419          .532          .58           .58           .435
DJI-13         .384          .384          .384          .538          .615          .384
SOLAR          .38           .428          .428          .476          .476          .523
INDMATER       .375          .386          .488          .522          .522          .42
COMODITY       .304          .42           .463          .507          .536          .434
BEVERAGE       .3            .4            .3            .35           .35           .3
LOWACCUM       .288          .329          .344          .363          .338          .298
AUTO           .25           .25           .275          .25           .3            .25
GOLD           .215          .333          .392          .333          .274          .235
OILGAS         .207          .271          .278          .292          .278          .185
REIT           .203          .242          .225          .231          .197          .146
INFRA          .142          .171          .257          .342          .371          .228
HOMEBLDG       .117          .117          .117          .117          .117          .117
BONDFUND       .027          .036          .027          .027          .027          .009
PIPELINE       0             0             0             0             0             0
|
| |
==============================================================================
3/14/2018
The operative Peerless
signal remains the Buy B5.
But short-term rates made another
recovery new high today, Boeing took another hit
and the talking TV heads are scaring
Republicans into thinking that they may lose their majority in the House.
As a result,
for the third day in a row, the DJI lost an early gain and fell by more than
100 points.
We see this most clearly in DIA's candle-stick chart below, where another
"red-popsicle"
appeared as a result of the market's "big fade" after an up-opening.
Boeing was a big
part of the DJI's rally since Trump was elected. Now its declining is
having an opposite
effect and making the DJI act much weaker than most of the rest of the
market.
I've suggested being long AAPL,
QQQ and some of the computer/internet
MAXCPs
while hedging with some Bearish
MINCPs. Let's continue in this mode for now.
If the Hourly DJI and DIA (below) were to break their uptrend-supports in
their triangle
patterns tomorrow, a deeper decline than to the recent lows would be
suggested.
On the other hand, if the DJI and DIA do not breakdown, it would suggest
that prices
will most likely work sidewise towards the apex of the triangle
patterns and not make
a big move either way. The biggest triangle pattern breakouts take
place about
2/3 of the way out to their apex and on a noticeable rise in volume.
The high recent turnover in the White House staff is also unsettling, but
today's
appointment of Larry Kudlow, a long-time TV stock market commentator, should
help traders feel they now have a trusted friend in the White House.
Kudlow is a
zealous supply-sider. He will help Trump explain his message that
tax-cuts especially
for the wealthy will benefit the entire country. Kudlow's appointment
represents
a double-downing of Trump's bet that the stock market will be booming at
Election time
this fall. In return, it is possible that Kudlow will get Trump to
back off his protectionist
tariffs. I would think the market will like the appointment and act
positively. Of course,
if it does not rise on this news, it will not be a good sign. DJI and SP-500
traders
should be watching BA, the uptrendline-supports, the pattern of bearish
closings below
the opening and one more thing.
The 5-day Stochastic has been trading DIA particularly well
on the chart the Index of the 13-highest priced DJI stocks.
The 14-day Stochastic has also worked well.
Our Tiger chart of the highest priced DJI-13 now shows that the automatic
Red
5-day stochastic is working exceptionally well in calling the swing of the
DJI. It is
still on a red Sell, but now oversold. Watch this chart for the time
being. It should
tell us when the DJI will turn around and rally again off support.
We have be pleased that the tech ETF trio, QQQ,
TECL and SOXL
are holding
up well near their highs and well-above their 65-dma. There is ample
precedent
for their doing significantly better than the DJI, but only as long as the
NYSE A/D
Line's uptrend is now violated.
Charts 3/14/2018
PEERLESS
DJI, Signals, Indicators Daily
DJI Volume 10-DayUp/Down Vol
V-Indicator
Hourly DJIA
A/D Line for All
Stocks
NASDAQ
S&P
OEX
NYSE COMPQX
DJI-15 DJI-20
DJI-30
DIA
SPY
QQQ MDY
IWM
TNA
CrudeOil
FAS
GLD
BBH
IBB
JETS
JNUG
KOL
NUGT
OIH
OIL
RSX
RETL
SDS
SLV
SOXL
TECL TMF
TNA
UGA
(gasoline)
XIV YINN
Commodities:
JJC, NIB,
CHOC
CORN,
WEAT
UUP
(Dollar)
AAPL ADBE
ALXN AMAT
AMGN AMD
AMZN
BA BABA
BAC
BIDU
CAT
CVX
DE
FB
GOOG
GS HD
IBM
JPM M
(Macy's)
MSFT NFLX
NVDA
QCOM
TSLA TXN
XOM WMT
ANDV (refinery),
CMG (Chipotle), LRCX,
SWKS,
MDGL
SPPI
WATT
SQ
TOWN
3/14/2018
Bullish
MAXCPs
Bearish MINCPS |
Table 1 QUICKSILVER on ETFS - 03/14/18
ETF      CLOSE   CHANGE    PIVOT-PT  5-dma AROC    CL-PWR     CANDLE  IP21     ITRS
---------------------------------------------------------------------------------------------
DIA       247.88   -2.34    W249.14       -4.6%    Bearish      RED   -.006     ----
---------------------------------------------------------------------------------------------
COMPQX    7496.81   -14.2    7427.95       66.8%   Bullish      RED    .183     .084
---------------------------------------------------------------------------------------------
SPY       275.3   -1.42      274.1         45.6%   ----         RED    .075     .03
---------------------------------------------------------------------------------------------
QQQ       171.68   -.03      169.86        80.2%   Bullish      RED    .137     .1
---------------------------------------------------------------------------------------------
MDY       351.5   -1.82      349.13        24.5%   Bullish      RED    .143     .016
---------------------------------------------------------------------------------------------
IWM       157.71   -.75      156.42        30.7%   Bullish      RED    .14     .032
---------------------------------------------------------------------------------------------
FAS       72.45   -1.58      71.87         79.9%    ----        RED    .165     .057
---------------------------------------------------------------------------------------------
RETL      34.18   -.65       33.91        -218.7%   ----        RED   -.043    -.054
---------------------------------------------------------------------------------------------
SOXL      191.8   -.08       183.75        231.1%   Bullish     RED    .168     .389
---------------------------------------------------------------------------------------------
TECL      140.66   -.42      136.86        193.3%   Bullish     RED    .143     .252
---------------------------------------------------------------- -----------------------------
IBB       113.78   -.14      112.62        87.2%    Bullish     RED    .209     .064
---------------------------------------------------------------------------------------------
GLD       125.7   -.08       125.42       -.8%      Bullish     BLUE   .129     .015
---------------------------------------------------------------------------------------------
OIL       6.72    .03        6.63         -51.8%    Bullish     ----   .201     .026
---------------------------------------------------------------------------------------------
OIH       24.65   -.05       24.43         72.9%   ----         RED    .03    -.056
---------------------------------------------------------------------------------------------
GASL      18.61   -.3        17.73         200.5%   Bullish     RED   -.018    -.269
---------------------------------------------------------------------------------------------
UGA       30.84    .67       30.11         4.9%     Bullish     BLUE   .298    -.034
---------------------------------------------------------------------------------------------
UUP       23.47    .01      W23.58         8.5%     Bearish     ----  -.134    -.025
---------------------------------------------------------------------------------------------
IEF       102.53    .2       102.14        29.4%    Bearish     BLUE  -.076    -.031
---------------------------------------------------------------------------------------------
XLU      50.23    .51        49.26         134.7%   Bullish     BLUE  -.005    -.049
---------------------------------------------------------------------------------------------
WEAT      6.66    .02       W6.8          -89.4%    Bullish     ----   .259     .108
---------------------------------------------------------------------------------------------
YINN      37.71    .48       35.58         344.4%   ----        RED    .018     .106
---------------------------------------------------------------------------------------------
RSX       22.76   -.18       23.07        -53.9%    ----        RED    .101     .071
---------------------------------------------------------------------------------------------
AAPL      178.44   -1.53     176.94        95.4%    Bullish     RED    .075     .052
---------------------------------------------------------------------------------------------
GOOG      1149.49    11.32   1126          174.8%   Bullish     BLUE   .07      .096
---------------------------------------------------------------------------------------------
MSFT      93.85   -.56      W94.43        -.5%      ----        RED    .13      .095
---------------------------------------------------------------------------------------------
AMZN      1591      2.82    1551.86        146.3%   Bullish     RED    .212     .358
---------------------------------------------------------------------------------------------
FB        184.19    2.31     182.34        13.1%    Bullish     BLUE   .047     .042
---------------------------------------------------------------------------------------------
NVDA     248.74    1.03      241.18        140.7%   Bullish     RED   .097     .283
---------------------------------------------------------------------------------------------
BA        330.26   -8.41    W348.73       -242%     Bearish     RED   -.038     .118
---------------------------------------------------------------------------------------------
GS        264.43   -4.1     W266.34       -17.1%    ----        RED    .104     .036
---------------------------------------------------------------------------------------------
HD        177.41   -.94     W177.94       -32.6%    Bearish     RED   -.076    -.066
---------------------------------------------------------------------------------------------
CAT        152.54   -1.15   W153.59        33.4%    ----        RED   -.022    -.034
|
Table 2 Count of Stocks in Key Directories
20180314
-------------------------------
NEWHIGHS 106 127
NEWLOWS 63 32
MAXCP 40 60
MINCP 94 57
TTTNH 58 73
TTTNL 92 109
FASTUP 128 162
FASTDOWN 102 81
CPCROSSA 38 30
CPCROSSD 108 78 Bearish but not as much as might be expected.
BIGVOLUP 8 5
BIGVODN 14 13
|
 Table 3
 Count of Stocks and New Highs in Key Tiger Directories
Date = 20180314
               No            NHs           Pct
-------------------------------------------------------------------
MAXCP          40            27            68 %
--------------------------------------------------
SOLAR          21            3             14 %
COMPUTER       23            3             13 %
HACKERS        24            3             13 %
SOFTWARE       66            5             8 %
FOOD           15            1             7 %
GAMING         28            2             7 %
BIOTECH        383           23            6 %
SEMI           130           6             5 %
ELECTRON       178           5             3 %
FIDSTKS        193           5             3 %
GREEN          30            1             3 %
INSURANC       32            1             3 %
MILITARY       38            1             3 %
NASD-100       89            3             3 %
NIFTY          29            1             3 %
BIG17          46            1             2 %
INDEXES        195           3             2 %
RUS-1000       832           17            2 %
SP500          482           8             2 %
UTILITY        42            1             2 %
COMODITY       69            1             1 %
ETFS           67            1             1 %
FINANCE        93            1             1 %
REIT           177           1             1 %
Others = None
|
 |
Table 4  RANKING OF KEY DIRECTORIES BASED PCT.OF STOCKS ABOVE 65-DMA
              3/14/18
 Bullish = 24
 Bearish = 21
---------------------------------------------------------------------------------------
Directory     Current       day-1         day-2         day-3         day-4         day-5
----------------------------------------------------------------------------------------
NEWHIGHS       1             .99           .99           .99           .99           .971
EDU            .857          .857          .857          .714          .857          .714
REGBANKS       .787          .878          .878          .939          .727          .787
JETS           .777          .888          .777          .777          .555          .555
NIFTY          .758          .862          .862          .827          .724          .689
HOSPITAL       .75           .75           1             .875          1             .875
FOOD           .733          .733          .733          .733          .733          .733
SOFTWARE       .712          .742          .803          .787          .727          .712
COMPUTER       .695          .739          .739          .695          .652          .695
HACKERS        .666          .625          .666          .708          .666          .666
NASD-100       .629          .685          .73           .685          .606          .584
ELECTRON       .606          .612          .651          .617          .578          .55
GREEN          .6            .6            .7            .6            .533          .5
BIOTECH        .595          .629          .652          .647          .61           .558
SEMI           .592          .584          .661          .607          .584          .561
INDEXES        .584          .651          .666          .661          .574          .558
FINANCE        .58           .645          .731          .709          .634          .634
MILITARY       .578          .631          .684          .71           .684          .657
BIGBANKS       .571          .571          .714          .714          .571          .571
ETFS           .567          .537          .641          .611          .477          .417
CHINA          .532          .467          .612          .596          .483          .467
BIG17          .521          .478          .565          .543          .521          .5
FIDELITY       .512          .56           .658          .658          .463          .463
FIDSTKS        .502          .554          .595          .601          .492          .45
N=24
============================================================================================
COAL           .5            .4            .4            .4            .5            .5
INSURANC       .5            .562          .562          .625          .531          .468
============================================================================================
RUS-1000       .477          .515          .546          .55           .456          .436
GAMING         .464          .464          .5            .5            .5            .5
SP500          .458          .502          .541          .558          .454          .437
TRANSP         .45           .65           .6            .65           .4            .4
SOLAR          .428          .428          .476          .476          .523          .428
COMODITY       .42           .463          .507          .536          .434          .55
CHEM           .419          .532          .58           .58           .451          .451
SP-100         .406          .468          .52           .552          .416          .406
BEVERAGE       .4            .3            .35           .35           .3            .3
INDMATER       .386          .488          .522          .522          .431          .465
DJI-13         .384          .384          .538          .615          .384          .461
DOWJONES       .366          .4            .466          .533          .4            .366
GOLD           .333          .392          .333          .274          .254          .235
OILGAS         .271          .278          .292          .278          .192          .207
RETAIL         .264          .358          .339          .339          .301          .339
AUTO           .25           .275          .25           .3            .25           .225
REIT           .242          .225          .231          .197          .135          .118
INFRA          .171          .257          .342          .371          .228          .285
HOMEBLDG       .117          .117          .117          .117          .117          .117
BONDFUND       .036          .027          .027          .027          .009          .009
PIPELINE       0             0             0             0             0             0
N= 21
|
==============================================================================
3/13/2017 The
DJI's close today BELOW its 65-dma seems to have set off a series of
automatic
sell programs. That coupled with news that MSFT would be sued for
gender bias,
that the Trump Admin. would not allow Chinese Broadcom to buy San
Diego-based
QCOM plus a rash of sudden Trump "You're fired"s, the swiftly gathering
crisis over the
poisonings in London and the expected loss by another Republican Congressmen
in a
key by-election in a previously Red District, - all these things - drove the
major ETFs
down sharply after a strong-looking opening. Nor is this all.
Now we must await a rate
hike the FED, though today the Labor Department reported that the official
CPI (rate
of annualized inflation) was only 2%.
The operative Peerless signals remains a
Buy B5. If it
produces a typical
gain, we should get a Sell signal on another DJI new high. Today's
action may cast
doubt on that prediction, but there is still a lot of positive
underlying Accumulation
in the NASDAQ, QQQ,
TECL and SOXL.
Also see in Table 1 further below that
their Closing Powers are rising as are their 5-day moving averages.
The news
accounted for decline today, I would say. The pullback was in keeping
with
how much tech stock prices had recently risen. As long as the
NYSE A/D Line
is in an uptrend, remain bullish and trust Peerless.
A lot depends
now on how fast the FED decides to raise interest rates.
See in the chart above how a rise to
1.75%
for the Federal Funds Rate is expected
and nearly built into the market. I
see in
the still rising NYSE A/D Line more proof
that the FED will not raise rates
aggressively. The CPI number of 2% released
by the Labor Department
today
is not scary enough, I would think, to cause the Feds to
be aggressive in
whatever
they announce next week. If I am right and they choose a more
"dovish"
announcement
then the market may still enjoy a nice advance in here.
Right now, the
Futures are
up. There should be some relief for the market when the
decision is
finally announced. My historical studies suggest that we should not fear a bear
market until
short-term
rates go over 3%. The 1950s seems like the closest historical
parallel.
There were three
or four 8%-11% DJI pullbacks in 1955 and 1956 before the final bull market
peak
in July 1957.
But note, too, that bulls will be very unhappy
if another early rally is completely
snuffed out, as happened today. These "snuffed-out" rallies take their
toll on confidence.
They also produce "red popsicles" on our candle-stick charts, falling
Closing Power
trends and declining price trend-lines. This is what the DIA and DJI
charts now show.
DIA Candle-Stick chart: the Red reversals show closings significantly
below openings.
Distribution is occurring at lower and lower levels. 
DJIA's Closing Power and TTT (Day Traders' Tool) are in falling trends.
The Tiger Chart of DJI's 13 Highest Priced
stocks
suggests we should now be using the 5-day stochastic to trade DIA.
Today's Decline
The DJI today closed 142 points below its still
rising 65-dma. Because this
key moving average is still rising, there is still a good chance that it
will whipsaw
back above it. Probably, the bearish short-term signs are too much in
evidence
to think that it will make a run to new highs this month.
What else should we have expected from the 13th of
the month? The tech decline
today confounded the promising breakout by AAPL and other tech new highs.
Big and
bearish short-term
"red" popsicles now endanger the candle-stick charts of
most
of our favorite ETFs.
These, of course, are caused by a serious
decline and lower
close following what seemed to be a very promising, higher opening.
We've seen
a number of these in the last few years. They have always been
scary-looking, but
usually the declines in the major ETFs have been over fairly quickly once
there
has been another re-test of the rising 65-dma.
.

 |
Table 1
QUICKSILVER on ETFS - 03/13/18
ETF      CLOSE   CHANGE     PIVOT-PT   5-dma AROC   CL-PWR     CANDLE  IP21   ITRS
---------------------------------------------------------------------------------------------
DIA       250.22   -1.74     248.11        27.6%    ----         RED    .046     0
---------------------------------------------------------------------------------------------
COMPQX    7511.01   -77.31   7396.65       93%      Bullish      RED   .195     .072
---------------------------------------------------------------------------------------------
SPY       276.72   -1.8      272.78        69.7%    Bullish      RED    .128     .025
---------------------------------------------------------------------------------------------
QQQ       171.71   -2.37     168.93        92.7%    Bullish      RED    .168     .087
---------------------------------------------------------------------------------------------
MDY       353.32   -1.93     349.77        60.9%    Bullish      RED   .22     .009
---------------------------------------------------------------------------------------------
IWM       158.46   -.74      156.74        98.2%    Bullish      RED   .199     .022
---------------------------------------------------------------------------------------------
FAS       74.03   -1.8       71.27         194.5%   Bullish      RED   .204     .06
---------------------------------------------------------------------------------------------
RETL      34.83   -.31      W35.71        -328.6%   ----         RED -.034    -.064
---------------------------------------------------------------------------------------------
SOXL      191.88   -9.4      182.97        273.6%   Bullish      RED   .176     .341
---------------------------------------------------------------------------------------------
TECL      141.08   -4.88     135.22        290.4%   Bullish      RED   .17     .227
---------------------------------------------------------------------------------------------
IBB       113.92   -.81      111.8         124%     Bullish      RED   .22     .048
---------------------------------------------------------------------------------------------
GLD       125.78    .24      125.72       -29.8%    Bullish      BLUE   .095     .015
---------------------------------------------------------------------------------------------
OIL       6.69   -.09       W6.79         -176.4%   Bullish      RED   .128     .021
---------------------------------------------------------------------------------------------
OIH       24.7   -.37        24.29         40.5%    Bullish      RED   .058    -.055
---------------------------------------------------------------------------------------------
GASL      18.91   -.18       17.87         133.5%   Bullish      RED   .024    -.286
---------------------------------------------------------------------------------------------
UGA       30.17   -.25      W30.81        -129.3%   Bullish      ----   .186    -.066
---------------------------------------------------------------------------------------------
UUP       23.46   -.06       23.43         2.1%     Bearish      ----  -.136    -.036
---------------------------------------------------------------------------------------------
IEF       102.33    .17      101.93        19.6%    Bearish      ----  -.103    -.038
---------------------------------------------------------------------------------------------
XLU      49.72    .11        48.9          45.7%    Bullish      RED   .006    -.064
---------------------------------------------------------------------------------------------
WEAT      6.64   -.04       W6.78         -162.8%   Bullish      RED   .285     .098
---------------------------------------------------------------------------------------------
YINN      37.23   -1.5       35.16         251%     ----         RED    .049     .093
---------------------------------------------------------------------------------------------
RSX       22.94   -.41      W23.01        -43.1%    ----         RED   .138     .074
---------------------------------------------------------------------------------------------
AAPL      179.97   -1.75     175.03        92.7%    Bullish      RED   .143     .044
---------------------------------------------------------------------------------------------
GOOG      1138.17   -26.33   1109.64       190.6%   Bullish      RED  .075     .077
---------------------------------------------------------------------------------------------
MSFT      94.41   -2.36      93.86         57.4%    Bullish      RED  .18     .093
---------------------------------------------------------------------------------------------
AMZN      1588.18   -10.21   1545          161.7%   Bullish      RED   .286     .331
---------------------------------------------------------------------------------------------
FB        181.88   -2.88    W183.71        57.3%    ----         RED   .054     .014
---------------------------------------------------------------------------------------------
NVDA     247.71   -2.05      241.84        113.7%   Bullish      RED   .053     .246
---------------------------------------------------------------------------------------------
BA        338.67   -5.52    W347.04       -147%     ----         RED  -.003     .134
---------------------------------------------------------------------------------------------
GS        268.53   -4.85     265.35        29.8%    Bullish      RED   .146     .038
---------------------------------------------------------------------------------------------
HD        178.35   -1.36    W178.58       -91.4%    Bearish      RED  -.104    -.069
---------------------------------------------------------------------------------------------
CAT        153.69   -.81     151.51       -1.9%     ----         RED   .006    -.038
|
Table 2 Count of Stocks in Key Directories
20180313
-------------------------------
NEWHIGHS 127
NEWLOWS 32
MAXCP 60
MINCP 57
TTTNH 73
TTTNL 109
FASTUP 162
FASTDOWN 81
CPCROSSA 30
CPCROSSD 78 Bearish but not as much as might be expected.
BIGVOLUP 5
BIGVODN 13
|
Table 3Count of Stocks and New Highs in Key Tiger Directories
Date = 20180313
No. NHs Pct
-------------------------------------------------------------------
MAXCP 60 40 67 % Closing Power New Highs.
(A good indicator might be the % of NHs that have CP new highs.
The higher that number, the more bullish.)
===================================================================
JETS 9 1 11 %
FIDELITY 41 4 10 %
COMPUTER 23 2 9 %
BIOTECH 383 27 7 %
GAMING 28 2 7 %
GREEN 30 2 7 %
HOMEBLDG 17 1 6 %
MILITARY 38 2 5 %
SOLAR 21 1 5 %
TRANSP 20 1 5 %
BIG17 48 2 4 %
FINANCE 93 4 4 %
NASD-100 89 3 3 %
NIFTY 29 1 3 %
SOFTWARE 66 2 3 %
SP500 482 13 3 %
CHEM 62 1 2 %
ELECTRON 178 4 2 %
INDMATER 88 2 2 %
INDEXES 195 3 2 %
RUS-1000 832 19 2 %
SEMI 130 2 2 %
UTILITY 42 1 2 %
FIDSTKS 193 2 1 %
REIT 177 1 1 %
SP-100 96 1 1 %
---------------------------------------------------
Others: None
|
Table 4 RANKING OF KEY DIRECTORIES BASED PCT.OF STOCKS ABOVE 65-DMA
3/13/18
Bullish = 27
Bearish = 19
---------------------------------------------------------------------------------------
Directory Current day-1 day-2 day-3 day-4 day-5
----------------------------------------------------------------------------------------
NEWHIGHS 1 1 1 .984 .968 .937
JETS .888 .777 .777 .555 .555 .555
REGBANKS .878 .878 .939 .727 .787 .787
NIFTY .862 .862 .827 .724 .689 .689
EDU .857 .857 .714 .857 .714 .857
HOSPITAL       .75           1             .875          1             .875          .75
SOFTWARE       .742          .803          .787          .727          .727          .666
COMPUTER       .739          .739          .695          .652          .695          .652
FOOD           .733          .733          .733          .733          .733          .733
NASD-100       .685          .73           .685          .606          .606          .606
INDEXES        .651          .666          .661          .574          .574          .574
TRANSP         .65           .6            .65           .4            .4            .35
FINANCE        .645          .731          .709          .634          .623          .58
MILITARY       .631          .684          .71           .684          .684          .631
BIOTECH        .629          .652          .647          .61           .558          .53
HACKERS        .625          .666          .708          .666          .666          .666
ELECTRON       .612          .651          .617          .578          .544          .522
GREEN          .6            .7            .6            .533          .5            .466
SEMI           .584          .661          .607          .584          .553          .515
BIGBANKS       .571          .714          .714          .571          .571          .571
INSURANC       .562          .562          .625          .531          .5            .468
FIDELITY       .56           .658          .658          .463          .463          .463
FIDSTKS        .554          .595          .601          .492          .461          .461
ETFS           .537          .641          .611          .477          .432          .447
CHEM           .532          .58           .58           .451          .451          .403
RUS-1000       .515          .546          .55           .456          .441          .454
SP500          .502          .541          .558          .454          .443          .446
N=27
--------------------------------------------------------------------------------------------
BIGGEST 2017 Gainers
               .5            .583          .562          .541          .52           .52
--------------------------------------------------------------------------------------------
INDMATER       .488          .522          .522          .431          .465          .454
SP-100         .468          .52           .552          .416          .416          .437
GAMING         .464          .5            .5            .5            .5            .428
COMODITY       .463          .507          .536          .434          .55           .666
CHINA          .46           .603          .587          .476          .46           .507
SOLAR          .428          .476          .476          .523          .428          .476
COAL           .4            .4            .4            .5            .5            .5
DOWJONES       .4            .466          .533          .4            .366          .366
GOLD           .392          .333          .274          .254          .235          .392
DJI-13         .384          .538          .615          .384          .461          .384
RETAIL         .358          .339          .339          .301          .358          .471
BEVERAGE       .3            .35           .35           .3            .3            .25
OILGAS         .278          .292          .278          .192          .207          .271
AUTO           .275          .25           .3            .25           .225          .225
INFRA          .257          .342          .371          .228          .285          .314
REIT           .225          .231          .197          .135          .118          .09
HOMEBLDG       .117          .117          .117          .117          .117          .117
BONDFUND       .027          .027          .027          .009          .009          .009
PIPELINE       0             0             0             0             0             0
N =19
|
==============================================================================
3/12/2018 The operative Peerless
signal remains the Buy B5. The median gain for
these signals is over 10% on the DJI. Today Boeing, UTX and the
DJI acted as though they were surprised that Trump said he would be
ready, if conditions were right, to talk directly to North Korea's "rocket
man".
But even though the DJI fell 157 points after a few hours of trading, it
failed
fall below its support at its rising 65-dma.
The real story is the potentially explosive power building now in tech
stocks and ETFs
as well as QQQ, now that AAPL is making a confirmed breakout into all-time
high
territory.
Elsewhere, much of the rest of the market gained, rising not just against
the DJI's decline but in spite of the FED's upcoming decision this week
on whether to raise interest rates. Thus, one had to be impressed that on
the
NYSE, where dividends are still very important, there were 305 more
gainers than losers at the close and up volume was 42% more than down
volume. As I've suggested, QQQ, TECL and SOXL remained strong.
QQQ SOXL have now risen 59.8% of the time, day-to-day, for the last year
and both Professionals and the Public are still eager buyers.
TECL is even stronger, rising 60.6% of the time. Expect much
more
out of all these. Hot DIA-ETF-money is bound to go into them.
Performance-
minded traders have surely noticed that the QQQ is now out-doing
DIA by +9.3% over just the last 50 trading days. This is the
definition of
our ITRS indicator. Of course, the leveraged SOXL is
outperforming
DIA by a whopping 40.6% over the last 50-trading days. There is
tremendous
momentum in these tech ETFs and momentum like this creates greed and
chasing, as well as short-covering.
What is also boosting QQQ is the biggest tech stock of all, AAPL,
which
made a confirmed, flat-topped breakout into all-time high territory today.
Its chart pattern looks very good. Don't be shy now. It takes a
long
time for the tech market to setup a wild, climatic advance like we may see
next. Buy AAPL.
 |
Charts 3/12/2018
PEERLESS
DJI, Signals, Indicators Daily
DJI Volume 10-DayUp/Down Vol
V-Indicator
Hourly DJIA
A/D Line for All
Stocks
NASDAQ
S&P
OEX
NYSE COMPQX
DJI-15 DJI-20
DJI-30
DIA
SPY
QQQ MDY
IWM
TNA
CrudeOil
FAS
GLD
BBH
IBB
JETS
JNUG
KOL
NUGT
OIH
OIL
RSX
RETL
SDS
SLV
SOXL
TECL TMF
TNA
UGA
(gasoline)
XIV YINN
Commodities:
JJC, NIB,
CHOC
CORN,
WEAT
UUP
(Dollar)
AAPL ADBE
ALXN AMAT
AMGN AMD
AMZN
BA BABA
BAC
BIDU
CAT
CVX
DE
FB
GOOG
GS HD
IBM
JPM M
(Macy's)
MSFT NFLX
NVDA
QCOM
TSLA TXN
XOM WMT
ANDV (refinery),
CMG (Chipotle), LRCX,
SWKS,
MDGL
SPPI
WATT
SQ
TOWN
3/12/2018
Bullish
MAXCPs
Bearish MINCPs |
Table 1 QUICKSILVER on ETFS - 03/12/18
ETF      CLOSE   CHANGE     PIVOT-PT   5-dma AROC   CL-PWR     CANDLE  IP21      ITRS
---------------------------------------------------------------------------------------------
DIA       251.96   -1.6      248.84        62.5%    Bullish      RED    .158     ----
---------------------------------------------------------------------------------------------
COMPQX    7588.32    27.51   7372.01       173.7%   Bullish      BLUE   .282     .075
---------------------------------------------------------------------------------------------
SPY       278.52   -.35      272.88        115.4%   Bullish      RED    .214     .024
---------------------------------------------------------------------------------------------
QQQ       174.08    .92      168.54        184.2%   Bullish      BLUE   .278     .094
---------------------------------------------------------------------------------------------
MDY       355.25    .34      349.04        141.3%   Bullish      ----   .338     .009
---------------------------------------------------------------------------------------------
IWM       159.2    .28       155.37        175.7%   Bullish      RED    .265     .022
---------------------------------------------------------------------------------------------
FAS       75.83   -.35       71.18         377.5%   Bullish      RED    .285     .091
---------------------------------------------------------------------------------------------
RETL      35.14   -.19      W37.16        -89.9%   ----          RED    .044    -.068
---------------------------------------------------------------------------------------------
SOXL      201.28    6.08     181.54        752.1%   Bullish      BLUE   .317     .407
---------------------------------------------------------------------------------------------
TECL      145.96    1.38     133           508.6%   Bullish      BLUE   .267     .265
---------------------------------------------------------------------------------------------
IBB       114.73    .37      111.12        172.5%   Bullish      BLUE   .299     .048
---------------------------------------------------------------------------------------------
GLD       125.54    0       W126.53        14.3%   ----          BLUE   .074     .009
---------------------------------------------------------------------------------------------
OIL       6.78   -.1        W6.93         -124.3%   Bullish      ----   .123     .031
---------------------------------------------------------------------------------------------
OIH       25.07    .03       24.5          130.4%   Bullish      BLUE   .085    -.056
---------------------------------------------------------------------------------------------
GASL      19.09    .42       18.42         2.7%     Bullish      BLUE   .086    -.264
---------------------------------------------------------------------------------------------
UGA       30.42   -.01      W30.96        -102.7%   Bullish      ----   .193    -.065
---------------------------------------------------------------------------------------------
UUP       23.52   -.03       23.45         2.1%     Bearish      ----  -.108    -.046
---------------------------------------------------------------------------------------------
IEF       102.16    .24      101.93        10.8%    Bearish      BLUE  -.167    -.05
---------------------------------------------------------------------------------------------
XLU      49.61    .21        49.27        -33.4%    Bullish      BLUE   .044    -.071
---------------------------------------------------------------------------------------------
WEAT      6.68    .01       W6.86         -154.4%   Bullish      BLUE   .216     .099
---------------------------------------------------------------------------------------------
YINN      38.73    .31       35.39         563.5%   Bullish      RED    .108     .15
---------------------------------------------------------------------------------------------
RSX       23.35   -.13       23.14        -38.7%    Bullish      ----   .224     .083
---------------------------------------------------------------------------------------------
AAPL      181.72    1.74     176.67        138.3%   Bullish      BLUE   .215     .047
---------------------------------------------------------------------------------------------
GOOG      1164.5    4.46     1095.06       329.5%   Bullish      BLUE   .184     .092
---------------------------------------------------------------------------------------------
MSFT      96.77    .23       93.32         165.9%   Bullish      BLUE   .282     .111
---------------------------------------------------------------------------------------------
AMZN      1598.39    19.5    1537.64       241.6%   Bullish      BLUE   .324     .334
---------------------------------------------------------------------------------------------
FB        184.76   -.47      179.78        119.6%   Bullish      RED    .155     .022
---------------------------------------------------------------------------------------------
NVDA     249.76    4.43      242.16        292.5%   Bullish      BLUE   .116     .249
---------------------------------------------------------------------------------------------
BA        344.19   -10.33   W348.92       -122.1%   ----         RED    .07     .146
---------------------------------------------------------------------------------------------
GS        273.38    2.61     266.93        192.5%   Bullish      BLUE   .219     .05
---------------------------------------------------------------------------------------------
HD        179.71   -2.45    W181.64       -56.3%    Bearish      RED   -.021    -.073
---------------------------------------------------------------------------------------------
CAT        154.5   -3.75     153.75        110%     Bullish      RED    .08    -.037
|
Table 2
Count of Stocks in Key Tiger Directories
Date = 180312
--------------------------------------
NEWHIGHS 297 Bullish 10:1 ratio.
NEWLOWS 28
MAXCP 184
Bullish ratio.
MINCP
33
TTTNH
148 Unusually bullish
TTTNL
53
FASTUP 244
Bullish
FASTDOWN 75
CPCROSSA 78
CPCROSSD 52 |
Table 3
Count of Stocks and New Highs in Key Tiger Directories
Date = 180312
-------------------------------------------------------------------
BIGBANKS       7             3             43 %
NIFTY          30            7             23 %
COMPUTER       23            5             22 %
NASD-100       98            18            18 %
HACKERS        24            4             17 %
FINANCE        93            15            16 %
REGBANKS       33            5             15 %
DJI-13         13            2             15 %
SOFTWARE       66            10            15 %
====================================================
MORNSTAR       238           34            14 %
SOLAR          21            3             14 %
EDU            7             1             14 %
DOWJONES       30            4             13 %
SEMI           130           17            13 %
FOOD           15            2             13 %
HOSPITAL       8             1             13 %
JETS           9             1             11 %
INDEXES        195           20            10 %
ELECTRON       178           17            10 %
BIOTECH        382           40            10 %
SP-100         96            8             8 %
RUS-1000       832           63            8 %
GAMING         28            2             7 %
SP500          482           35            7 %
HOMEBLDG       17            1             6 %
TRANSP         20            1             5 %
GREEN          30            1             3 %
MILITARY       38            1             3 %
ETFS           67            2             3 %
COMODITY       70            2             3 %
CHEM           62            1             2 %
CHINA          63            1             2 %
REIT           177           4             2 %
RETAIL         53            1             2 %
UTILITY        42            1             2 %
INDMATER       88            1             1 %
-----------------------------------------------------
Others with None: BIGMIL AUTO  OILGAS  INFRA
INSURANC  COAL  GOLD  PIPELINE BEVERAGE BONDFUND
|
Table 4 RANKING OF KEY DIRECTORIES BASED PCT.OF STOCKS ABOVE 65-DMA
3/12/18
Bullish = 31
Bearish = 14
---------------------------------------------------------------------------------------
Directory Current day-1 day-2 day-3 day-4 day-5
----------------------------------------------------------------------------------------
HOSPITAL 1 .875 1 .875 .75 .75
REGBANKS .878 .939 .727 .787 .787 .606
NIFTY .866 .833 .733 .7 .7 .733
EDU .857 .714 .857 .714 .857 .857
BIGMIL .833 1 1 1 1 1
SOFTWARE       .803          .787          .727          .727          .666          .681
JETS           .777          .777          .555          .555          .666          .444
COMPUTER       .739          .695          .652          .695          .652          .608
NASD-100       .734          .693          .653          .653          .632          .612
FOOD           .733          .733          .733          .733          .733          .733
FINANCE        .731          .709          .634          .623          .591          .548
BIGBANKS       .714          .714          .571          .571          .571          .571
GREEN          .7            .6            .533          .5            .466          .4
MILITARY       .684          .71           .684          .684          .631          .631
HACKERS        .666          .708          .666          .666          .666          .625
INDEXES        .666          .661          .574          .574          .589          .507
SEMI           .661          .607          .584          .553          .515          .453
BIOTECH        .654          .649          .612          .56           .531          .526
ELECTRON       .651          .617          .578          .544          .516          .46
ETFS           .641          .611          .477          .432          .462          .388
CHINA          .603          .587          .476          .46           .507          .444
TRANSP         .6            .65           .4            .4            .4            .3
CHEM           .58           .58           .451          .451          .403          .29
INSURANC       .562          .625          .531          .5            .468          .437
MORNSTAR       .558          .567          .462          .457          .466          .407
RUS-1000       .546          .55           .456          .441          .455          .418
SP500          .541          .558          .454          .443          .452          .427
DJI-13         .538          .615          .384          .461          .384          .461
INDMATER       .522          .522          .431          .465          .465          .34
SP-100         .52           .552          .416          .416          .437          .406
COMODITY       .514          .542          .442          .557          .671          .528
N=31
==========================================================================================
GAMING         .5            .5            .5            .5            .464          .321
==========================================================================================
SOLAR          .476          .476          .523          .428          .476          .333
DOWJONES       .466          .533          .4            .366          .366          .4
COAL           .4            .4            .5            .5            .5            .4
BEVERAGE       .35           .35           .3            .3            .25           .25
INFRA          .342          .371          .228          .285          .342          .228
RETAIL         .339          .339          .301          .358          .471          .452
GOLD           .333          .274          .254          .235          .392          .254
OILGAS         .292          .278          .192          .207          .271          .271
UTILITY        .285          .309          .285          .166          .238          .285
AUTO           .25           .3            .25           .225          .225          .225
REIT           .231          .197          .135          .118          .09           .084
HOMEBLDG       .117          .117          .117          .117          .117          .117
BONDFUND       .027          .027          .009          .009          .009          .009
PIPELINE       0             0             0             0             0             0
N=14
|
==============================================================================
==============================================================================
3/9/2018 The operative Peerless
signal remains the Buy B5. The median gain for
these is over 10%. So a new high must be expected by the DJI.
Acting
much better than DIA and
SPY are QQQ,
TECL and SOXL.
These
made confirmed flat-top breakouts into all-time high territory.
Performance
minded professionals should go on a buying binge in these.
Every 30 Years!
Several new points to make tonight: First, above every 30 years there
is a
rip-roaring Republican bull market. I skip the 1890s and the McKinley
bull market only because I have no chart for it.
The 1920s bull market lasted until the Fed raised interest rates to 6%.
They
did this despite a weakening economy because 1/2 of all loans were being
used
to play the stock market on margin as low as 10%. And Britain had
forced
their hand by raising the key rate there to 6.5%. We are nowhere near
a top like
the one in September 1929. The internal technicals of the market are
vastly better.
Back then, the DJI first had to have 3 or 4 short-term pullbacks of
10% followed by
new highs to convince most that the market would never go down. We
have
experienced only one such pullback.
The 1950s Republican bull market only peaked in July 1957 when short-
term rates rose over 3%. And before that there were 3 ten-percent
pullbacks.
The A/D Line bearishly diverged at the top because of the rise in interest
rates.
There was no big tax cut then. Instead, there was the start of a vast
Public
infrastructure program.
The 1980s Republican bull market only peaked after there had been a wave
of huge mergers and a much publicized insider trading scandal involving
Drexel Burham
and Ivan Boesky. There were four 8%-10% pullbacks in 1986 and 1987 before
the
final top in October 1987. The top took place only after the Fed
pushed up the
Discount Rate to 6% the month before the October S9/S12 peak.
Now 30 years later, we again see another big Republican bull market.
There has not
yet been a wild merger mania. There has not yet been a huge insider
trading scandal
(though Carl Icahn is pushing his luck). And the "little guy" is not
buying on margin
like in the 1920s. Instead, taxes and regulations are being reduced as
they were
in 1925 and 1926. We could have a bull market next year, too, based on
the
usual special bullishness of the year before a Presidential Election!
Weekly Charts Look Superb
Another bullish factor is how high the AI/200 scores are now on the weekly
charts of
DIA, QQQ and TECL (shown below), as well as SPY, etc. I don't yet know
if
such nearly perfect AI/200 scores on weekly charts can be said to make a big
decline very unlikely. I will work on this more this coming week.
But they certainly
look impressive. Stay tuned...
The Best Stocks as Vetted by
Fidelity and TigerSoft's Power-Ranker
Something else you should know. I looked up the top
10-holdings for
all 40+ Fidelity Sector funds. I then built a directory of
these stocks, figuring that
Fidelity has a great long-term track record and they have carefully
vetted all
these stocks. Then I ran the Tiger Power Ranker against the
190+ stocks in
the new FIDSTKs directory I created (and which can be downloaded
from
the Tiger Data page. The top 10 Power Ranked are:
New High? Symbol Price 3/9
AI/200 IP21 ITRS
------------------------------------------------------------
yes
EPAM 122.52
180 .093
.113
no
NOW 176.76
183 .038
.310
yes
CRM 127.41
175 .218
.217
no
ABBV 119.29
167 .086 .195
yes
GDDY 63.98
173 .081 .254
no
FB
185.23 166 .079
.029
yes
MSFT
96.34 165 .185
.105
no
TWOU 87.85
156 .102 .360
yes
NFLX 331.44
170 .273 .74
no
V
124.51 155 .142
.076 |
The Big Jobs' Number's Bullishness
The DJI roared past the resistance of its 65-dma. Its 441 point jump
on the
news that 313,000 new jobs were created in the 28-day month February.
Very impressive number. It is bound to help Republican re-election
odds this
November. The jobs number was way above the 200,000, or so, that
was widely expected. Bears will tell you that this means the Fed will
be
raising rates when they meet this coming week. But that just might not be
the
case. The Fed is not non-partisan. They are bankers. They
do not want
heavy-handed Democrat regulations. I'm thinking that the market is
acting as
though there will be no rate hike. That such work has already leaked
out is
quite possible. I can find no evidence that the FED has ever
disciplined
its member or staff for leaking. (The news that Trump may
succeed in getting
North Korea to not further develop missiles and nuclear weapons would also
be wonderful, if true. But this is far from definite or verifiable.)
I went back over all the cases since 2004, when
the Labor Dept. reported
a monthly Jobs figure of 300,000 or more. Such reports are bullish in
that
the DJI seems always to work its way higher until the next Peerless Sell
signal.
But I can find no big jumps in the market just after such reports came out
on the
first Friday of the month with the superb Jobs' number. But it is
bullish, though
not necessarily immediately. This is what makes me think that word may
have
gotten out that the Fed will not be very aggressive in raising rates.
Here are the cases where the monthly Jobs number
was above 300,000 and a summary of what happened.
Jobs No. Date Reported
Subsequent Action by DJI
---------------------------------------------------------------------------------------------------
1.) 332,000 4/2/2004
DJI immediately fell from 10471 to 9907 on
5/19/04.
It then stayed in a flat trading range until breaking out
to the upside in November after Bush was re-elected.
There were no Peerless Sells in this period.
2) 346,000 11/5/04
DJI rose from 10388
to 10912 on 3/8/05 and Sell S4.
3) 363,000 5/6/05
DJI rose slightly from 10345 to 10623 on 6/7/05
and then stayed in trading range until 2006.
4) 337,000 12/2/2005
DJI rose from 10345 to 11642 on 5/10/06 and S9.
5) 315,000 3/3/2006
DJI rose from 11022 to 11642 on 5/10/06 and S9.
6) 516,000 6/4/2010
DJI
rose from 9931 to 10443, the top of trading range S12 on 6/12/2010.
7) 360,000 2/3/2012
DJI rose from 12862 to 13125 on
3/12/2013.
8) 304,000 5/2/2014
DJI rose from 16513 to 16977 on
7/17/2014.
9) 353,000 12/5/2014
DJI fell from 17959
to 17069 two weeks later and then rose
to 18312 on 5/19/15.
10) 326,000 6/5/2015
DJI rose from 17842 to 18120 on 7/16/2015 and S12.
11) 351,000 11/6/2015
DJI rose from 17910 to 18120 on 7/16/2015 and S12.
12) 325,000 8/5/2016
DJI traded very flat and sidewise for 3 months until Trump's election.
-----------------------------------------------------------------------------------------------------------------------------------
13) 313,000 3/9/2018
Jumped 400+ on the news.
===============================================================================
WEEKLY CHARTS SHOW EXCEPTIONALLY HIGH AI
(Accumulation)
Charts 3/9/2018
PEERLESS
DJI, Signals, Indicators Daily
DJI Volume 10-DayUp/Down Vol
V-Indicator
Hourly DJIA
A/D Line for All
Stocks
NASDAQ
S&P
OEX
NYSE COMPQX
DJI-15 DJI-20
DJI-30
DIA
SPY
QQQ MDY
IWM
TNA
CrudeOil
FAS
GLD
BBH
IBB
JETS
JNUG
KOL
NUGT
OIH
OIL
RSX
RETL
SDS
SLV
SOXL
TECL TMF
TNA
UGA
(gasoline)
XIV YINN
Commodities:
JJC, NIB,
CHOC
CORN,
WEAT
UUP
(Dollar)
AAPL ADBE
ALXN AMAT
AMGN AMD
AMZN
BA BABA
BAC
BIDU
CAT
CVX
DE
FB
GOOG
GS HD
IBM
JPM M
(Macy's)
MSFT NFLX
NVDA
QCOM
TSLA TXN
XOM WMT
ANDV (refinery),
CMG (Chipotle), LRCX,
SWKS,
MDGL
SPPI
WATT
SQ
TOWN
3/9/2018
Bullish
MAXCPs
Bearish MINCPs |
Table 1
                 QUICKSILVER on ETFS - 03/09/18
ETF      CLOSE   CHANGE     PIVOT-PT   5-dma AROC   CL-PWR      CANDLE  IP21   ITRS
---------------------------------------------------------------------------------------------
DIA       253.56    4.42     248.84        165.5%   ----         BLUE   .077    -----
---------------------------------------------------------------------------------------------
COMPQX    7560.81    132.86  7330.7        205.9%   Bullish      BLUE   .216    .065
---------------------------------------------------------------------------------------------
SPY       278.87    4.77     272.19        179.8%   Bullish      BLUE   .12     .018
---------------------------------------------------------------------------------------------
QQQ       173.16    3.3      167.83        213.1%   Bullish      BLUE   .162    .081
---------------------------------------------------------------------------------------------
MDY       354.91    5.78     345.37        189.2%   Bullish      BLUE   .197     0
---------------------------------------------------------------------------------------------
IWM       158.92    2.5      153.71        212%     Bullish      BLUE   .169    .011
---------------------------------------------------------------------------------------------
FAS       76.18    4.31      70.38         605.2%   Bullish      BLUE   .21     .093
                                           high
---------------------------------------------------------------------------------------------
RETL      35.33    1.42      35.78         21.1%    Bullish      BLUE  -.025   -.105
---------------------------------------------------------------------------------------------
SOXL      195.2    11.45     173.69        732.9%   Bullish      BLUE   .234    .37
                                           high
---------------------------------------------------------------------------------------------
TECL      144.58    7.72     132.09        612%     Bullish      BLUE   .206    .25
                                           high
---------------------------------------------------------------------------------------------
IBB       114.36    1.74     110.86        211.8%   Bullish      BLUE   .218    .039
---------------------------------------------------------------------------------------------
GLD       125.54    .12      125.18        6%       ----         BLUE   .056    .005
---------------------------------------------------------------------------------------------
OIL       6.88    .25       W6.95          58.7%    Bullish      BLUE   .063    .035
---------------------------------------------------------------------------------------------
OIH       25.04    .61       24.43         203.4%   ----         BLUE  -.007   -.065
---------------------------------------------------------------------------------------------
GASL      18.67    .94      W19.08         148%     ----         BLUE  -.02    -.302
---------------------------------------------------------------------------------------------
UGA       30.43    .32      W31.05        -24.4%    Bullish      ----   .112   -.07
---------------------------------------------------------------------------------------------
UUP       23.55   -.03       23.51         8.5%     Bearish      ----  -.034   -.054
---------------------------------------------------------------------------------------------
IEF       101.92   -.22     W101.94       -7.4%     Bearish      ----  -.13    -.056
---------------------------------------------------------------------------------------------
XLU      49.4    .14        W49.94         46.7%    Bullish      BLUE  -.04    -.078
---------------------------------------------------------------------------------------------
WEAT      6.67   -.13       W6.89         -80.6%    Bullish      RED    .191    .099
---------------------------------------------------------------------------------------------
YINN      38.42    2.84      34.69         513.9%   ----         BLUE   .044    .117
                                           high
---------------------------------------------------------------------------------------------
RSX       23.48    .41      W23.53         49.6%    Bullish      BLUE   .113    .076
---------------------------------------------------------------------------------------------
AAPL      179.98    3.04     176.82        106.9%   Bullish      BLUE   .132    .03
---------------------------------------------------------------------------------------------
GOOG      1160.04    34.04   1090.93       368.7%   Bullish      BLUE   .123    .072
---------------------------------------------------------------------------------------------
MSFT      96.54    2.11      93.64         186.3%   Bullish      BLUE   .186    .105
---------------------------------------------------------------------------------------------
AMZN      1578.89    27.03   1523.61       256.7%   Bullish      BLUE   .236    .316
---------------------------------------------------------------------------------------------
FB        185.23    2.89     180.4         238.4%   ----         BLUE   .08     .027
---------------------------------------------------------------------------------------------
NVDA     245.33    4.15      235.65        183.5%   ----         BLUE   .04     .217
---------------------------------------------------------------------------------------------
BA        354.52    5.79     352.75        141.4%   Bullish      BLUE   .043    .175
---------------------------------------------------------------------------------------------
GS        270.77    4.43     263.12        239.6%   Bullish      BLUE   .149    .025
---------------------------------------------------------------------------------------------
HD        182.16    4.22     181.74        103%     Bearish      BLUE  -.039   -.069
---------------------------------------------------------------------------------------------
CAT        158.25    4.66    151.12        392.3%   Bullish      BLUE   .037   -.014
|
Table 2
Count of Stocks in Key Tiger Directories
Date = 180309
--------------------------------------
NEWHIGHS       408     Bullish Ratio >10:1
NEWLOWS        37
MAXCP          279     Pros are overwhelmingly bullish.
MINCP          39
TTTNH          177     Days Traders are bullish.
TTTNL          49
FASTUP         266     Swing traders are more than 3:1
FASTDOWN       73
CPCROSSA       82      Professions switched modestly to bullish side.
CPCROSSD       36
BIGVOLUP       3
BIGVODN        9       Still more stocks being dumped than bought aggressively
|
Table 3
Count of Stocks and New Highs in Key Tiger Directories
Date = 180309
               No.           NHs           Pct.
-------------------------------------------------------------------
NIFTY          30            11            37 %
SOFTWARE       66            24            36 %
COMPUTER       23            7             30 %
BIGBANKS       7             2             29 %
EDU            7             2             29 %
NASD-100       99            28            28 %
REGBANKS       33            9             27 %
HACKERS        24            6             25 %
HOSPITAL       8             2             25 %
FINANCE        93            22            24 %
MILITARY       38            7             18 %
BIGMIL         6             1             17 %
MORNSTAR       238           41            17 %
SP500          482           77            16 %
===================================================
SP-100         96            13            14 %
SEMI           130           18            14 %
RUS-1000       833           116           14 %
DOWJONES       30            4             13 %
ELECTRON       178           23            13 %
INDEXES        195           24            12 %
GAMING         28            3             11 %
JETS           9             1             11 %
BIOTECH        383           37            10 %
SOLAR          21            2             10 %
DJI-13         13            1             8 %
FOOD           15            1             7 %
HOMEBLDG       17            1             6 %
INDMATER       89            5             6 %
CHEM           62            3             5 %
TRANSP         20            1             5 %
UTILITY        43            2             5 %
BEVERAGE       20            1             5 %
RETAIL         53            2             4 %
ETFS           67            2             3 %
INFRA          35            1             3 %
INSURANC       32            1             3 %
CHINA          63            2             3 %
REIT           177           3             2 %
COMODITY       70            1             1 %
---------------------------------------------------
Others: None
GREEN  AUTO  OILGAS COAL  GOLD  PIPELINE  BONDFUND
|
 |
 RANKING OF KEY DIRECTORIES BASED PCT.OF STOCKS ABOVE 65-DMA
              3/9/18
 Bullish = 32
 Bearish = 14
---------------------------------------------------------------------------------------
Directory     Current       day-1         day-2         day-3         day-4         day-5
----------------------------------------------------------------------------------------
BIGMIL         1             1             1             1             1             1
REGBANKS       .939          .727          .787          .787          .606          .545
HOSPITAL       .875          1             .875          .75           .75           .875
NIFTY          .833          .733          .7            .7            .733          .666
SOFTWARE       .787          .727          .727          .666          .681          .681
JETS           .777          .555          .555          .666          .444          .444
FOOD           .733          .733          .733          .733          .733          .6
BIGBANKS       .714          .571          .571          .571          .571          .571
EDU            .714          .857          .714          .857          .857          .428
MILITARY       .71           .684          .684          .631          .631          .605
FINANCE        .709          .634          .623          .591          .559          .451
HACKERS        .708          .666          .666          .666          .625          .625
NASD-100       .696          .656          .656          .636          .616          .575
COMPUTER       .695          .652          .695          .652          .608          .565
INDEXES        .661          .574          .574          .589          .512          .456
BIOTECH        .65           .613          .561          .532          .524          .503
TRANSP         .65           .4            .4            .4            .3            .3
INSURANC       .625          .531          .5            .468          .437          .281
ELECTRON       .617          .578          .544          .516          .46           .477
DJI-13         .615          .384          .461          .384          .461          .307
GREEN          .612          .548          .516          .483          .387          .451
ETFS           .611          .477          .432          .462          .388          .373
SEMI           .607          .584          .553          .515          .453          .469
CHINA          .587          .476          .46           .507          .444          .412
CHEM           .58           .451          .451          .403          .274          .241
MORNSTAR       .567          .462          .457          .466          .407          .352
SP500          .558          .454          .443          .452          .433          .381
SP-100         .552          .416          .416          .437          .416          .385
RUS-1000       .551          .457          .441          .456          .423          .366
COMODITY       .542          .442          .557          .671          .542          .5
DOWJONES       .533          .4            .366          .366          .4            .333
INDMATER       .528          .438          .471          .471          .337          .359
N=32
===========================================================================================
GAMING         .5            .5            .5            .464          .321          .285
SOLAR          .476          .523          .428          .476          .333          .285
COAL           .4            .5            .5            .5            .4            .4
INFRA          .371          .228          .285          .342          .228          .257
BEVERAGE       .35           .3            .3            .25           .25           .2
RETAIL         .339          .301          .358          .471          .471          .415
UTILITY        .325          .302          .186          .255          .302          .279
AUTO           .3            .25           .225          .225          .225          .175
OILGAS         .278          .192          .207          .271          .271          .214
GOLD           .274          .254          .235          .392          .254          .294
REIT           .197          .135          .118          .09           .084          .045
HOMEBLDG       .117          .117          .117          .117          .117          .117
BONDFUND       .027          .009          .009          .009          .018          .009
PIPELINE       0             0             0             0             0             0
N=14
|
==============================================================================
==============================================================================
3/8/2018 The DJI is at a key
inflection point. Stay hedged. Volume was very low on
the most recent rally.
The DJI, the NASDAQ,
QQQ and TECL are each at key resistance
now. The
markets could swing either way. This is a "high inflection" point.
The Buy B5 does
not demand that there be a breakout now. More basing next would be
constructive.
A breakout now would likely cause of rush of short-covering. It may
prove to
be more than that, but volume remains low and more that 56% of all the 6000
stocks
we follow are BELOW their 65-dma.
DJI
24895 109 points below its key 65-dma.
NASDAQ 7428
79 points below its late January peak at 7507.
QQQ
169.86 1.04 points below its late January peak at 170.90
TECL
141.40 4.56 points below its late January peak at 141.40
What could make the market decide which way it
wants to move? Tomorrow
before the opening, the February JOBs' Report comes out. A number
above
200,000 but not above 230,000 should be bullish. It would show good
economic
growth, but not be so high as to bring higher interest rates until the CPI
is shown to
be rising significantly. A number below 150,000 would show a weakening
economy.
If the Fed were to raise interest rates with the economy in this situation,
it might cause
a recession. So, in my judgment, a number below 140,000 could be
dangerous
and the market will sense that. That means that a number between
140,000 and
200,000 should pose no problem for the market.
Since the NYSE A/D Line is up-trending now, I think there is a good
chance that the FED will not be raising rates in March. Therefore, the
DJI should
remain well above its lower 3.5% band. Keep in mind that March and
April
are usually bullish months. In the past, the next ten days produce a
DJI advance only
52.8% the time since 1965. But over the next two months, the DJI rises
62.3% of the
time and gains on average 1.2%. The Buy B5 should be given time.
If there is no breakout, expect the DJI to continue to
be weaker than the QQQ.
Stay hedged by holding short some of the
Bearish MINCPs.
But give QQQ a
little time to breakout even if it holds back here. History (March
2000 and October
2007) shows that the QQQ can top out after the DJI does.
Jobs Reports
from Labor Dept.
each month. |
| Year |
Jan |
Feb |
Mar |
Apr |
May |
Jun |
Jul |
Aug |
Sep |
Oct |
Nov |
Dec |
| 2008 |
8 |
-81 |
-55 |
-229 |
-184 |
-154 |
-213 |
-277 |
-443 |
-475 |
-759 |
-707 |
| 2009 |
-787 |
-704 |
-802 |
-704 |
-354 |
-469 |
-342 |
-196 |
-229 |
-209 |
12 |
-277 |
| 2010 |
18 |
-73 |
193 |
221 |
522 |
-140 |
-78 |
-16 |
-63 |
267 |
129 |
73 |
| 2011 |
44 |
182 |
254 |
323 |
81 |
234 |
72 |
112 |
233 |
209 |
145 |
201 |
| 2012 |
348 |
233 |
264 |
72 |
117 |
68 |
156 |
173 |
194 |
153 |
130 |
243 |
| 2013 |
207 |
265 |
156 |
179 |
240 |
158 |
111 |
260 |
201 |
210 |
221 |
93 |
| 2014 |
174 |
182 |
261 |
311 |
252 |
306 |
196 |
226 |
284 |
255 |
307 |
251 |
| 2015 |
211 |
267 |
78 |
282 |
326 |
191 |
256 |
164 |
88 |
351 |
264 |
234 |
| 2016 |
103 |
257 |
235 |
174 |
34 |
285 |
325 |
175 |
264 |
140 |
172 |
180 |
| 2017 |
259 |
200 |
73 |
175 |
155 |
239 |
190 |
221 |
14 |
271 |
216 |
160(P) |
| 2018 |
200(P) |
|
|
|
|
|
|
|
|
|
|
|
| P : preliminary |
https://data.bls.gov/timeseries/CES0000000001?output_view=net_1mth
|
|
 |
Charts 3/8/2018
PEERLESS
DJI, Signals, Indicators Daily
DJI Volume 10-DayUp/Down Vol
V-Indicator
Hourly DJIA
A/D Line for All
Stocks
NASDAQ
S&P
OEX
NYSE COMPQX
DJI-15 DJI-20
DJI-30
DIA
SPY
QQQ MDY
IWM
TNA
CrudeOil
FAS
GLD
BBH
IBB
JETS
JNUG
KOL
NUGT
OIH
OIL
RSX
RETL
SDS
SLV
SOXL
TECL TMF
TNA
UGA
(gasoline)
XIV YINN
Commodities:
JJC, NIB,
CHOC
CORN,
WEAT
UUP
(Dollar)
AAPL ADBE
ALXN AMAT
AMGN AMD
AMZN
BA BABA
BAC
BIDU
CAT
CVX
DE
FB
GOOG
GS HD
IBM
JPM M
(Macy's)
MSFT NFLX
NVDA
QCOM
TSLA TXN
XOM WMT
ANDV (refinery),
CMG (Chipotle), LRCX,
SWKS,
MDGL
SPPI
WATT
SQ
TOWN
3/8/2018
Bullish
MAXCPs
Bearish MINCPs |
Table 1
                 QUICKSILVER on ETFS - 03/08/18
ETF      CLOSE   CHANGE     PIVOT-PT  5-dma AROC    CL-PWR       CANDLE IP21    ITRS
---------------------------------------------------------------------------------------------
DIA       249.14    1.03     245.35        63.9%    ----         ----   .007     ----
---------------------------------------------------------------------------------------------
COMPQX    7427.95    31.3    7257.87       169.3%   Bullish      BLUE   .115     .06
---------------------------------------------------------------------------------------------
SPY       274.1    1.32      269.08        118.1%   Bullish      BLUE   .014     .018
---------------------------------------------------------------------------------------------
QQQ       169.86    .93      165.99        160.9%   Bullish      BLUE   .039     .072
---------------------------------------------------------------------------------------------
MDY       349.13   -.64      341.78        157.6%   Bullish      RED    .131     .002
---------------------------------------------------------------------------------------------
IWM       156.42   -.32      152.35        210.6%   Bullish      RED    .134     .014
---------------------------------------------------------------------------------------------
FAS       71.87    .6        67.65         352.6%   Bullish      BLUE   .12     .044
---------------------------------------------------------------------------------------------
RETL      33.91   -1.8       35.18        -28.1%    Bullish      RED   -.026    -.088
---------------------------------------------------------------------------------------------
SOXL      183.75    .78      169.08        661.8%   Bullish      RED    .128     .269
---------------------------------------------------------------------------------------------
TECL      136.86    1.64     128.29        462.6%   Bullish      BLUE   .09      .176
---------------------------------------------------------------------------------------------
IBB       112.62    .82      109.65        253.4%   Bullish      BLUE   .163     .046
---------------------------------------------------------------------------------------------
GLD       125.42   -.3       125.39        27.9%    Bearish      RED    .011     .03
---------------------------------------------------------------------------------------------
OIL       6.63   -.16        6.8          -116.8%   ----         RED   -.004     .049
---------------------------------------------------------------------------------------------
OIH       24.43    .14       24.05         121.8%   ----         BLUE  -.13    -.057
---------------------------------------------------------------------------------------------
GASL      17.73   -.14      W18.13         160%     Bearish      RED   -.079    -.277
---------------------------------------------------------------------------------------------
UGA       30.11   -.7       W30.58        -53.6%    Bullish      RED    .085    -.045
---------------------------------------------------------------------------------------------
UUP       23.58    .15       23.51        -6.4%     Bearish      BLUE   .057    -.035
---------------------------------------------------------------------------------------------
IEF       102.14    .21      102.07       -15.2%    Bearish      BLUE  -.173    -.035
---------------------------------------------------------------------------------------------
XLU      49.26    .36        48.94         19.3%    ----         BLUE  -.13    -.068
---------------------------------------------------------------------------------------------
WEAT      6.8    .02         6.78         -131.2%   Bullish      ----   .234     .138
---------------------------------------------------------------------------------------------
YINN      35.58    .42       34.81         140.3%   Bearish      RED   -.049     .049
---------------------------------------------------------------------------------------------
RSX       23.07    .06      W23.25        -17.2%    ----         ----   .026     .086
---------------------------------------------------------------------------------------------
AAPL      176.94    1.91     176.21        55.1%    Bullish      BLUE   .043     .004
---------------------------------------------------------------------------------------------
GOOG      1126    16.36      1078.92       259.4%   Bullish      BLUE   .008     .055
---------------------------------------------------------------------------------------------
MSFT      94.43    .57       93.05         84.6%    Bullish      BLUE   .089     .097
---------------------------------------------------------------------------------------------
AMZN      1551.86    6.86    1500.25       192.1%   Bullish      BLUE   .143     .321
---------------------------------------------------------------------------------------------
FB        182.34   -1.37     176.62        178.5%   ----         RED   -.003     .022
---------------------------------------------------------------------------------------------
NVDA     241.18   -.66       236.54        188.7%   ----         RED   -.009     .228
---------------------------------------------------------------------------------------------
BA        348.73    1.69     344.67       -13.8%    Bullish      RED    .031     .175
---------------------------------------------------------------------------------------------
GS        266.34    .99      258.12        182.4%   Bullish      RED    .061     .021
---------------------------------------------------------------------------------------------
HD        177.94   -.64      178.46       -47.2%    Bearish      RED   -.089    -.061
---------------------------------------------------------------------------------------------
CAT        153.59    2.08    146.38        111.6%   ----         BLUE  -.048    -.021
|
Table 2 Count of Stocks in Key Tiger Directories
3/8/2018
--------------------------------------
NEWHIGHS 219 Bullish Preponderance
NEWLOWS 34
MAXCP          168    Professionals are net sullish more than 3:1
MINCP          51
TTTNH          241    Day Traders are very bullish
TTTNL          73
FASTUP         298    Swing traders are bullish
FASTDOWN       59
CPCROSSA       40
CPCROSSD       117    Professionals took profits and switch to bearish today.
BIGVOLUP       3
BIGVODN        14     Dunping continues.
|
Table 3   Count of Stocks and New Highs in Key Tiger Directories
Date = 180308
               No.           NHs           Pct
--------------------------------------------------------
-------------------------------------------------------------------
HOSPITAL       8             4             50 %
EDU            7             2             29 %
HACKERS        24            6             25 %
SOFTWARE       66            13            20 %
-----------------------------------------------------
GAMING         28            4             14 %
NIFTY          30            4             13 %
COMPUTER       23            3             13 %
FOOD           15            2             13 %
NASD-100       99            11            11 %
SEMI           130           13            10 %
COAL           10            1             10 %
ELECTRON       178           14            8 %
MORNSTAR       238           17            7 %
BIOTECH        383           28            7 %
INDEXES        195           11            6 %
RUS-1000       833           46            6 %
FINANCE        93            5             5 %
SP500          482           25            5 %
SOLAR          21            1             5 %
UTILITY        43            2             5 %
COMODITY       70            3             4 %
MILITARY       38            1             3 %
INSURANC       32            1             3 %
CHEM           62            1             2 %
SP-100         96            2             2 %
INDMATER       89            2             2 %
RETAIL         53            1             2 %
ETFS           67            1             1 %
REIT           177           2             1 %
=================================================
Others: None
|
Table 4
 RANKING OF KEY DIRECTORIES BASED PCT.OF STOCKS ABOVE 65-DMA
               3/8/18
 Bearish = 23
 Bullish = 21
---------------------------------------------------------------------------------------
Directory     Current       day-1         day-2         day-3         day-4         day-5
----------------------------------------------------------------------------------------
BIGMIL         1             1             1             1             1             1
HOSPITAL       1             .875          .75           .75           .875          .625
EDU            .857          .714          .857          .857          .428          .571
FOOD           .733          .733          .733          .733          .6            .6
NIFTY          .733          .7            .7            .733          .633          .6
REGBANKS       .727          .787          .787          .606          .545          .333
SOFTWARE       .727          .727          .666          .681          .681          .636
MILITARY       .684          .684          .631          .631          .605          .605
HACKERS        .666          .666          .666          .625          .625          .583
NASD-100       .656          .656          .636          .616          .606          .505
COMPUTER       .652          .695          .652          .608          .565          .478
FINANCE        .634          .623          .591          .559          .451          .365
BIOTECH        .613          .561          .532          .524          .503          .433
SEMI           .584          .553          .515          .453          .469          .353
ELECTRON       .578          .544          .516          .46           .477          .376
INDEXES        .574          .574          .589          .512          .456          .369
BIGBANKS       .571          .571          .571          .571          .571          .428
JETS           .555          .555          .666          .444          .444          .555
GREEN          .548          .516          .483          .387          .451          .322
INSURANC       .531          .5            .468          .437          .281          .312
SOLAR          .523          .428          .476          .333          .285          .238
N=21
===========================================================================================
COAL           .5            .5            .5            .4            .4            .4
GAMING         .5            .5            .464          .321          .285          .285
===========================================================================================
ETFS           .477          .432          .462          .388          .373          .358
CHINA          .468          .453          .5            .437          .406          .328
MORNSTAR       .462          .457          .466          .407          .361          .294
RUS-1000       .457          .441          .456          .423          .37           .316
SP500          .454          .443          .452          .433          .387          .329
CHEM           .451          .451          .403          .274          .241          .193
COMODITY       .442          .557          .671          .542          .5            .542
INDMATER       .438          .471          .471          .337          .359          .348
SP-100         .416          .416          .437          .416          .385          .343
DOWJONES       .4            .366          .366          .4            .333          .333
TRANSP         .4            .4            .4            .3            .3            .3
DJI-13         .384          .461          .384          .461          .307          .307
UTILITY        .302          .186          .255          .302          .279          .186
RETAIL         .301          .358          .471          .471          .415          .377
BEVERAGE       .3            .3            .25           .25           .2            .05
GOLD           .254          .235          .392          .254          .294          .235
AUTO           .25           .225          .225          .225          .175          .2
INFRA          .228          .285          .342          .228          .257          .285
OILGAS         .192          .207          .271          .271          .221          .207
REIT           .135          .118          .09           .084          .045          .039
HOMEBLDG       .117          .117          .117          .117          .117          .117
BONDFUND       .009          .009          .009          .018          .009          .018
PIPELINE       0             0             0             0             0             0
N=23
|
==============================================================================
==============================================================================
3/7/2018 We
have to like the way the markets closed up off the lows today
after a very weak opening. Professionals were taking away stock from
weak holders at the opening. See how the P-Indicator is now quite
positive as are the AROC of the 21-dma and our Accumulation Index.
This doesn't guarantee against a bear market, but it makes it most
unlikely so long as the A/D Line uptrend is intact.
Today was a good day for the NASDAQ, QQQ and the techs TECL and SOXL.
But the DJI could not make it back into positive territory. It was
down
too much before the opening. Talk of tariffs was too much for the
multi-nationals there. Expect the DJIA to be unlikely to match the
strength
shown by QQQ and the Techs for some time.
QQQ Is The New Leader if It Breaks Out
QQQ may be able to make a stunning, flat-top
breakout into all-time high
territory. That is where the "hot money" will now flow if it does.
Note its
positive and improving internals. Of
course, its now familiar leaders in Table 4
do show bullish (blue) across-the-board strength: FB,
AMZN, GOOG and
MSFT. But there are other QQQ stocks now
making confirmed new highs,
notably ADBE and ADSK
(+17.83 today). In light of this and also how
strong much of the software sector is now, I believe QQQ should be bought
even now
for an impending breakout. But I would still be hedged with some
Bearish
MINCP shorts. We don't know what the Jobs Report will show on Friday
and the FED may raise rates this month.
At the same time, I would suggest continue staying
hedged by being long some
of the Bullish MAXCPs and
short some of Bearish MINCPs.
Traders of
DIA will have to be patient. DIA needs to restore our confidence
by getting back above its 65-dma or again successfully testing its
3.5% lower band at 24000.
Meanwhile, watch the broad market. There are
still more bearish sectors
than bullish sectors in Table 4. Only 43% of all stocks enjoy the
relative
safety of being above their 65-dma.
If interest rates are not raised in March, I look forward to seeing the
smaller
stocks, those making up IWM, pick up many more followers. The
short-term rates,
however, did make another recovery high today.
QQQ Is The Leader Now
| |
 |
Charts 3/7/2018
PEERLESS
DJI, Signals, Indicators Daily
DJI Volume 10-DayUp/Down Vol
V-Indicator
Hourly DJIA
A/D Line for All
Stocks
NASDAQ
S&P
OEX
NYSE COMPQX
DJI-15 DJI-20
DJI-30
DIA
SPY
QQQ MDY
IWM
TNA
CrudeOil
FAS
GLD
BBH
IBB
JETS
JNUG
KOL
NUGT
OIH
OIL
RSX
RETL
SDS
SLV
SOXL
TECL TMF
TNA
UGA
(gasoline)
XIV YINN
Commodities:
JJC, NIB,
CHOC
CORN,
WEAT
UUP
(Dollar)
AAPL ADBE
ALXN AMAT
AMGN AMD
AMZN
BA BABA
BAC
BIDU
CAT
CVX
DE
FB
GOOG
GS HD
IBM
JPM M
(Macy's)
MSFT NFLX
NVDA
QCOM
TSLA TXN
XOM WMT
ANDV (refinery),
CMG (Chipotle), LRCX,
SWKS,
MDGL
SPPI
WATT
SQ
TOWN
3/7/2018
Bullish
MAXCPs
Bearish MINCPs |
Table 1
QUICKSILVER on ETFS - 03/07/18 Except for DIA, the key general market ETFs now have rising 5-dma
and rising Closing Powers (SPY, QQQ, MDY, IWM as well as FAS, SOXL,
TECL and IBB
ETF      CLOSE   CHANGE     PIVOT-PT  5-dma AROC   CL-PWR      CANDLE  IP21     ITRS
---------------------------------------------------------------------------------------------
---------------------------------------------------------------------------------------------
DIA       248.11   -.73      245.98       -42.2%   Bullish      BLUE   .097     ------
---------------------------------------------------------------------------------------------
COMPQX    7396.65    24.64   7180.56       84.9%   Bullish      BLUE   .108     .06
---------------------------------------------------------------------------------------------
SPY       272.78   -.1       267.7         20.9%   Bullish      BLUE   .102     .018
---------------------------------------------------------------------------------------------
QQQ       168.93    .39      164.48        51.6%   Bullish      BLUE   .113     .07
---------------------------------------------------------------------------------------------
MDY       349.77    .73      338.26        153.3%  Bullish      BLUE   .27      .009
---------------------------------------------------------------------------------------------
IWM       156.74    1.37     149.95        209.7%  Bullish      BLUE   .212     .019
---------------------------------------------------------------------------------------------
FAS       71.27    .09       66.97         95.3%   Bullish      BLUE   .177     .039
---------------------------------------------------------------------------------------------
RETL      35.71   -1.45      34.11         71.9%   Bullish      RED    .12     -.028
---------------------------------------------------------------------------------------------
SOXL      182.97    1.43     160.77        411.3%  Bullish      BLUE   .202     .265
---------------------------------------------------------------------------------------------
TECL      135.22    2.22     124.77        155.9%  Bullish      BLUE   .152     .164
---------------------------------------------------------------------------------------------
IBB       111.8    .68       107.04        170.1%  Bullish      BLUE   .214     .045
---------------------------------------------------------------------------------------------
GLD       125.72   -.81      124.72        28.7%   Bearish      RED   -.066     .043
---------------------------------------------------------------------------------------------
OIL       6.79   -.14       &6.79          0%      Bullish      RED   -.019     .081
---------------------------------------------------------------------------------------------
OIH       24.29   -.21       23.84         112%    Bearish      BLUE  -.116    -.06
---------------------------------------------------------------------------------------------
GASL      17.87   -.55       17.15         326.9%  Bearish      RED   -.036    -.255
---------------------------------------------------------------------------------------------
UGA       30.81   -.15       30.44        -13%     Bullish      RED    .012    -.015
---------------------------------------------------------------------------------------------
UUP       23.43   -.02      W23.61        -55.2%   Bearish      RED    .011    -.036
---------------------------------------------------------------------------------------------
IEF       101.93    0       W102.45       -11.8%   Bearish      RED   -.243    -.031
---------------------------------------------------------------------------------------------
XLU      48.9   -.37        W49.07        -16.2%   ----         RED   -.099    -.068
---------------------------------------------------------------------------------------------
WEAT      6.78   -.08       W6.98          80.5%   Bullish      RED    .241     .136
---------------------------------------------------------------------------------------------
YINN      35.16   -.23       34.6          48.8%   Bullish      BLUE  -.007     .061
---------------------------------------------------------------------------------------------
RSX       23.01   -.13      W23.15        -32.3%   Bullish      ----   .088     .103
---------------------------------------------------------------------------------------------
AAPL      175.03   -1.64     175          -87.5%   Bullish      RED    .085    -.002
---------------------------------------------------------------------------------------------
GOOG      1109.64    14.58   1069.52       22.6%   Bullish      BLUE   .064     .041
---------------------------------------------------------------------------------------------
MSFT      93.86    .54       92.85         4.8%    Bullish      BLUE   .174     .096
---------------------------------------------------------------------------------------------
AMZN      1545    7.36       1493.45       107.5%  Bullish      BLUE   .205     .313
---------------------------------------------------------------------------------------------
FB        183.71    3.93     175.94        151.2%  Bullish      BLUE   .078     .033
---------------------------------------------------------------------------------------------
NVDA     241.84   -.32       232.21       -3.4%    Bullish      BLUE   .059     .233
---------------------------------------------------------------------------------------------
BA        347.04   -1.88    W349.69       -215.7%  Bullish      BLUE   .111     .174
---------------------------------------------------------------------------------------------
GS        265.35   -1.58     256.78        46.3%   Bullish      BLUE   .139     .015
---------------------------------------------------------------------------------------------
HD        178.58   -3.06    W179.64       -102.1%  Bearish      RED    .003    -.052
---------------------------------------------------------------------------------------------
CAT        151.51   -2.24    150.23       -103.2%  Bullish      BLUE   .027    -.022
|
Table 2
  Count of Stocks in Key Tiger Directories
Date = 180307
--------------------------------------
NEWHIGHS       288     Bullish Preponderance.
NEWLOWS        51
MAXCP          286     Professionals are 7x more bullish than bearish.
MINCP          41
TTTNH          241     Day Traders are quite bullish.  This is unusual.
TTTNL          55
FASTUP         288     Swing-traders are mostly bullish.
FASTDOWN       59
CPCROSSA       209     Professionals heavily switched to bullish camp.
CPCROSSD       39
BIGVOLUP       2
BIGVODN        10      Still dumping in some stocks.
|
Table 3
 Count of Stocks and New Highs in Key Tiger Directories
Date = 180307
               No.           NHs           Pct
--------------------------------------------------------
EDU            7             3             43 %
HACKERS        24            9             38 %
HOSPITAL       8             3             38 %
SOFTWARE       66            20            30 %
NIFTY          30            6             20 %
COMPUTER       23            4             17 %
REGBANKS       33            5             15 %
======================================================
NASD-100       99            13            13 %
FINANCE        93            11            12 %
SOLAR          20            2             10 %
COAL           10            1             10 %
BIOTECH        384           35            9 %
MORNSTAR       238           20            8 %
SEMI           130           11            8 %
GAMING         28            2             7 %
RUS-1000       834           61            7 %
HOMEBLDG       17            1             6 %
INDEXES        195           11            6 %
ELECTRON       178           11            6 %
SP500          483           30            6 %
RETAIL         53            3             6 %
CHEM           62            3             5 %
SP-100         96            4             4 %
INDMATER       89            4             4 %
GREEN          31            1             3 %
AUTO           40            1             3 %
DOWJONES       30            1             3 %
MILITARY       38            1             3 %
CHINA          64            1             2 %
REIT           177           3             2 %
UTILITY        43            1             2 %
=======================================================
Others         None.
|
 |
 Table 4  RANKING OF KEY DIRECTORIES BASED PCT. OF STOCKS ABOVE 65-DMA
              3/7/18
 Bearish = 22
 Bullish = 21
---------------------------------------------------------------------------------------
Directory     Current       day-1         day-2         day-3         day-4         day-5
----------------------------------------------------------------------------------------
BIGMIL         1             1             1             1             1             1
HOSPITAL       .875          .75           .75           .875          .625          .5
REGBANKS       .787          .787          .606          .545          .333          .333
FOOD           .733          .733          .733          .6            .6            .666
SOFTWARE       .727          .666          .681          .681          .651          .681
EDU            .714          .857          .857          .428          .571          .571
NIFTY          .7            .7            .733          .633          .6            .733
COMPUTER       .695          .652          .608          .565          .478          .565
MILITARY       .684          .631          .631          .605          .605          .71
HACKERS        .666          .666          .625          .625          .583          .625
NASD-100       .656          .636          .616          .606          .505          .616
FINANCE        .623          .591          .559          .451          .397          .462
INDEXES        .589          .589          .512          .456          .374          .461
BIGBANKS       .571          .571          .571          .571          .428          .571
BIOTECH        .562          .533          .526          .505          .434          .473
COMODITY       .557          .671          .542          .5            .542          .585
JETS           .555          .666          .444          .444          .555          .555
SEMI           .553          .515          .453          .469          .353          .4
ELECTRON       .544          .516          .46           .477          .376          .415
GREEN          .516          .483          .387          .451          .322          .354
N=21
============================================================================================
COAL           .5            .5            .4            .4            .4            .4
GAMING         .5            .464          .321          .285          .285          .285
INSURANC       .5            .468          .437          .281          .281          .437
============================================================================================
INDMATER       .471          .471          .337          .359          .348          .337
DJI-13         .461          .384          .461          .307          .307          .384
MORNSTAR       .457          .466          .407          .361          .306          .365
CHINA          .453          .5            .437          .406          .343          .421
CHEM           .451          .403          .274          .241          .209          .209
SOLAR          .45           .5            .35           .3            .25           .3
SP500          .445          .453          .434          .389          .341          .414
RUS-1000       .442          .456          .424          .371          .322          .389
ETFS           .432          .462          .388          .373          .373          .402
SP-100         .416          .437          .416          .385          .354          .427
TRANSP         .4            .4            .3            .3            .3            .4
DOWJONES       .366          .366          .4            .333          .333          .4
RETAIL         .358          .471          .471          .415          .377          .415
BEVERAGE       .3            .25           .25           .2            .05           .1
INFRA          .285          .342          .228          .257          .285          .285
GOLD           .235          .392          .254          .294          .235          .215
AUTO           .225          .225          .225          .175          .2            .225
OILGAS         .207          .271          .271          .221          .214          .185
UTILITY        .186          .255          .302          .279          .186          .186
REIT           .118          .09           .084          .045          .039          .039
HOMEBLDG       .117          .117          .117          .117          .117          .117
BONDFUND       .009          .009          .018          .009          .018          .009
PIPELINE       0             0             0             0             0             0
N=22
|
==============================================================================
3/6/2018 Today's DJI's rally
faltered at its 65-dma. There was too much bearish news.
Short-term interest rates reached a recovery
new high. North Korea might
reduce tensions enough to allow US military spending to stop its
quick escalation; this would hurt the DJI-30's highest flyer, BA And,
Trump
has alienated Gary Cohen, Goldman's and Wall Street's single best hope
for keeping the Trump economic master plan one that Wall Street approves of.
Without Cohen in the Cabinet, the NY Times warns that Trump will now
be
surrounded by arch protectionists. That's a lot of bearish news for just one
day.
Small wonder that the DJI is down more than 200 over-night.
https://www.nytimes.com/2018/03/06/us/politics/gary-cohn-resigns.html?emc=edit_th_180307&nl=todaysheadlines&nlid=582238940307
But breadth has been good. So, I would think the
DJI will stay within
the confines of its price triangle and the lower 3.5% band on the DJI will
again bring a reversal back upwards.
Stay hedged is my advise, long
some bullish
MAXCPs
and short some bearish
MINCPs.
Traders
will need to watch and heed the Hourly DJI's trend-breaks to make
dollars and sense of the DJI's quick fluctuations. As long as
QQQ and
the NASDAQ stay above their 65-dma, I think we
should look forward
to a DJI new high in April. But clearly, there could be big problems
if the DJI breaks its recent intra-day low.
That would likely cause all
the indexes to crumble.
Right now, the DJI needs to stay above its 3.5%
lower band, at 24000, for us
to credit the market as still being governed by the Buy B5.
Keep the faith,
I suggest. Even a second S9 in here should not bring a big sell-off.
It is
rare for the DJI not to hold up until there are more sets of major Sells,
a clear divergence by the A/D line from the DJI and/or, at least, one S12.
We should expect the DJI to be weaker than the
Nasdaq and QQQ because
of the dangers of a trade war. We are
also seeing the Russell-2000 begin
to outperform the DJI. This sell-off will be a good test of these
other indexes
and ETFs.
Charts 3/6/2018
PEERLESS
DJI, Signals, Indicators Daily
DJI Volume 10-DayUp/Down Vol
V-Indicator
Hourly DJIA
A/D Line for All
Stocks
NASDAQ
S&P
OEX
NYSE COMPQX
DJI-15 DJI-20
DJI-30
DIA
SPY
QQQ MDY
IWM
TNA
CrudeOil
FAS
GLD
BBH
IBB
JETS
JNUG
KOL
NUGT
OIH
OIL
RSX
RETL
SDS
SLV
SOXL
TECL TMF
TNA
UGA
(gasoline)
XIV YINN
Commodities:
JJC, NIB,
CHOC
CORN,
WEAT
UUP
(Dollar)
AAPL ADBE
ALXN AMAT
AMGN AMD
AMZN
BA BABA
BAC
BIDU
CAT
CVX
DE
FB
GOOG
GS HD
IBM
JPM M
(Macy's)
MSFT NFLX
NVDA
QCOM
TSLA TXN
XOM WMT
ANDV (refinery),
CMG (Chipotle), LRCX,
SWKS,
MDGL
SPPI
WATT
SQ
TOWN
3/6/2018
Bullish
MAXCPs
Bearish MINCPs |
Table 1
                 QUICKSILVER on ETFS - 03/06/18
ETF      CLOSE   CHANGE     PIVOT-PT  5-dma AROC   CL-PWR    CANDLE  IP21     ITRS
---------------------------------------------------------------------------------------------
---------------------------------------------------------------------------------------------
DIA       248.84    0       W250.2        -102.9%   Bearish    RED    .021     0
---------------------------------------------------------------------------------------------
COMPQX    7372.01    41.31  W7273.01       28.6%    Bullish    BLUE   .033     .052
---------------------------------------------------------------------------------------------
SPY       272.88    .69      271.65       -28.6%    ----       RED   -.009     .015
---------------------------------------------------------------------------------------------
QQQ       168.54    .71      167.21        7.5%     Bullish    RED    .003     .063
---------------------------------------------------------------------------------------------
MDY       349.04    3.67    W339.26        83.7%    Bullish    BLUE   .143     .004
---------------------------------------------------------------------------------------------
IWM       155.37    1.66     150.35        86%      Bullish    BLUE   .095     .006
---------------------------------------------------------------------------------------------
FAS       71.18    .8        69.95        -69.1%    ----       RED    .084     .047
---------------------------------------------------------------------------------------------
RETL      37.16    1.38      35.2          326.9%   Bullish    BLUE   .056     .012
---------------------------------------------------------------------------------------------
SOXL      181.54    7.85     168.92        231.6%   Bullish    BLUE   .108     .209
---------------------------------------------------------------------------------------------
TECL      133    .91         131.17       -51.1%    Bullish    RED    .012     .132
---------------------------------------------------------------------------------------------
IBB       111.12    .26      108.08        46.7%    Bullish    RED    .094     .035
---------------------------------------------------------------------------------------------
GLD       126.53    1.35     125           56%      Bearish    BLUE  -.083     .046
---------------------------------------------------------------------------------------------
OIL       6.93   -.02        6.79         -51%      ----       ----  -.063     .105
---------------------------------------------------------------------------------------------
OIH       24.5    .07        23.75        -10.4%    Bearish    RED   -.18    -.027
---------------------------------------------------------------------------------------------
GASL      18.42   -.66       16.7          143.3%   Bearish    RED   -.055    -.179
---------------------------------------------------------------------------------------------
UGA       30.96   -.09       30.89        -138.9%   Bullish    ----  -.043    -.012
---------------------------------------------------------------------------------------------
UUP       23.45   -.06      W23.69        -36%      Bearish    ----   .02    -.041
---------------------------------------------------------------------------------------------
IEF       101.93   -.01     W102.17        0%       Bearish    ----  -.155    -.037
---------------------------------------------------------------------------------------------
XLU      49.27   -.67        49.06        -13.2%    Bearish    RED   -.142    -.078
---------------------------------------------------------------------------------------------
WEAT      6.86   -.03        6.67          258.6%   Bullish    ----   .248     .148
---------------------------------------------------------------------------------------------
YINN      35.39    .7        34.82        -227.4%   Bearish    RED   -.069     .12
---------------------------------------------------------------------------------------------
RSX       23.14   -.39      W23.16        -107.1%   ----       RED    .013     .106
---------------------------------------------------------------------------------------------
AAPL      176.67   -.15     W178.12       -48.6%    Bullish    RED    .015     .006
---------------------------------------------------------------------------------------------
GOOG      1095.06    4.13   W1104.73      -106.3%   Bullish    RED   -.042     .021
---------------------------------------------------------------------------------------------
MSFT      93.32   -.32      W93.77        -47.1%    Bullish    RED    .068     .084
---------------------------------------------------------------------------------------------
AMZN      1537.64    14.03   1512.45       85.1%    Bullish    BLUE   .167     .299
---------------------------------------------------------------------------------------------
FB        179.78   -.62      178.32       -47%      Bearish    RED   -.016     .003
---------------------------------------------------------------------------------------------
NVDA     242.16    6.51      242          -81.8%    Bearish    BLUE   .02     .223
---------------------------------------------------------------------------------------------
BA        348.92   -3.83    W362.21       -221.5%   Bullish    RED    .06     .164
---------------------------------------------------------------------------------------------
GS        266.93    3.81     262.93       -19.1%    Bullish    BLUE   .085     .039
---------------------------------------------------------------------------------------------
HD        181.64   -.1      W182.27       -92.1%    Bearish    RED   -.047    -.037
---------------------------------------------------------------------------------------------
CAT        153.75    2.63   W154.63       -245.9%   ----       BLUE   .007     .001
|
Table 2Count of Stocks in Key Tiger Directories
Date = 180306
--------------------------------------
NEWHIGHS 245 Good ratio.
NEWLOWS 45
MAXCP          164    Good ratio
MINCP          34
TTTNH          142    Unusual - Positive
TTTNL          69
FASTUP         181    Hedge bullish ratio of 2:1
FASTDOWN       93
CPCROSSA       74
CPCROSSD       105
BIGVOLUP       6
BIGVODN        9
|
Table 3
Count of Stocks and New Highs in Key Tiger Directories
Date = 180306
               No.           NHs           Pct.
-------------------------------------------------------------------
HACKERS        24            6             25 %
SOFTWARE       66            13            20 %
SOLAR          20            4             20 %
NIFTY          29            5             17 %
=======================================================
EDU            7             1             14 %
COMPUTER       23            3             13 %
FOOD           15            2             13 %
HOSPITAL       8             1             13 %
NASD-100       99            12            12 %
FINANCE        93            9             10 %
COAL           10            1             10 %
REGBANKS       33            3             9 %
SEMI           130           12            9 %
RUS-1000       835           64            8 %
RETAIL         53            4             8 %
GAMING         28            2             7 %
ELECTRON       178           12            7 %
MORNSTAR       238           16            7 %
GREEN          31            2             6 %
BIOTECH        384           23            6 %
SP500          483           31            6 %
CHEM           62            3             5 %
INDEXES        195           9             5 %
SP-100         96            4             4 %
COMODITY       70            3             4 %
DOWJONES       30            1             3 %
MILITARY       38            1             3 %
INDMATER       89            3             3 %
CHINA          64            2             3 %
REIT           177           3             2 %
UTILITY        43            1             2 %
ETFS           67            1             1 %
==================================================
Others: None
|
 |
 Table 4
 RANKING OF KEY DIRECTORIES BASED PCT.OF STOCKS ABOVE 65-DMA
              3/6/18
 Bearish = 24
 Bullish = 19
---------------------------------------------------------------------------------------
Directory     Current       day-1         day-2         day-3         day-4         day-5
----------------------------------------------------------------------------------------
BIGMIL         1             1             1             1             1             1
EDU            .857          .857          .428          .571          .571          .571
REGBANKS       .787          .606          .545          .333          .333          .515
HOSPITAL       .75           .75           .875          .625          .75           .875
FOOD           .733          .733          .6            .6            .733          .733
NIFTY          .689          .724          .62           .586          .724          .793
COMODITY       .671          .542          .5            .542          .6            .671
HACKERS        .666          .625          .625          .583          .625          .625
JETS           .666          .444          .444          .555          .555          .666
SOFTWARE       .666          .681          .681          .651          .681          .666
COMPUTER       .652          .608          .565          .478          .565          .652
NASD-100       .636          .616          .606          .505          .626          .666
MILITARY       .631          .631          .605          .605          .71           .71
FINANCE        .591          .559          .451          .397          .473          .58
INDEXES        .589          .512          .456          .374          .482          .62
BIGBANKS       .571          .571          .571          .428          .571          .714
BIOTECH        .533          .526          .505          .434          .476          .531
ELECTRON       .516          .46           .477          .376          .415          .455
SEMI           .515          .453          .469          .353          .4            .423
n=19
============================================================================================
CHINA          .5            .437          .406          .343          .421          .468
COAL           .5            .4            .4            .4            .4            .4
SOLAR          .5            .35           .3            .25           .3            .35
============================================================================================
GREEN          .483          .387          .451          .322          .354          .419
INDMATER       .471          .337          .359          .348          .337          .46
RETAIL         .471          .471          .415          .377          .415          .433
INSURANC       .468          .437          .281          .281          .437          .5
MORNSTAR       .466          .407          .361          .306          .373          .5
GAMING         .464          .321          .285          .285          .357          .357
ETFS           .462          .388          .373          .373          .402          .567
RUS-1000       .457          .425          .372          .323          .394          .452
SP500          .453          .434          .389          .341          .42           .488
SP-100         .437          .416          .385          .354          .427          .541
CHEM           .403          .274          .241          .209          .209          .306
TRANSP         .4            .3            .3            .3            .4            .45
GOLD           .392          .254          .294          .235          .215          .254
DJI-13         .384          .461          .307          .307          .384          .615
DOWJONES       .366          .4            .333          .333          .4            .533
INFRA          .342          .228          .257          .285          .285          .342
OILGAS         .271          .271          .221          .214          .185          .307
UTILITY        .255          .302          .279          .186          .186          .232
BEVERAGE       .25           .25           .2            .05           .1            .2
AUTO           .225          .225          .175          .2            .225          .275
HOMEBLDG       .117          .117          .117          .117          .117          .176
REIT           .09           .084          .045          .039          .039          .045
BONDFUND       .009          .018          .009          .018          .009          .009
PIPELINE       0             0             0             0             0             .142
n=24
|
==============================================================================
==============================================================================
3/5/2018 Today's rally
reinforces the notion that the DJI will likely
next challenge its falling resistance line. That's only about
500 points away. Unless volume picks up a lot, I doubt if there
will be a dramatic upside breakout above the falling Hourly DJI
resistance line. And first, the DJI must move above its 65-day ma,
about
200 points above today's close.
The expected narrowing trading range market would seem to be a
perfect environment to be both long some of our
bullish MAXCPs
and short some of the bearish
MINCPs.

The DJIA could well be held back by "tough talk"
from Trump
about more tariffs, as long as Congress chooses not to over-ride him.
Also holding back the market will be the expectation that interest rates
will soon be pegged higher soon by the Fed. That this reality does
still
impinge on the market of individual stocks, if not ETFs, see above how only
39% of the 6000 stocks we follow are now above the relative safety
of their 65-dma. Only about 1/3 of all the industrial sectors we
follow
are in this condition. (See Table 4).
My longer-term expectation is that there will be a DJI
breakout to the
upside in April but it may have to follow the lead of the NASDAQ
and QQQ. Such action would confirm the judgment of those who
have
preferred to consider the operative Peerless signal to be a Buy B5.
But in the shorter-term, i.e. in this month, I would expect the DJI
simply to bounce back and forth between the upper 2% and 3.5%
lower bands. In this environment, I would prefer to be long some of
our Bullish MAXCPs and, for
hedging purposes, short some of our .
Bearish MINCPs.
Below are 4 "pin-ups" to keep in mind. One of our bullish MAXCPs rose
30% today. One of our bearish MINCPs fell 25% yesterday.
 |
Charts 3/5/2018
PEERLESS
DJI, Signals, Indicators Daily
DJI Volume 10-DayUp/Down Vol
V-Indicator
Hourly DJIA
A/D Line for All
Stocks
NASDAQ
S&P
OEX
NYSE COMPQX
DJI-15 DJI-20
DJI-30
DIA
SPY
QQQ MDY
IWM
TNA
CrudeOil
FAS
GLD
BBH
IBB
JETS
JNUG
KOL
NUGT
OIH
OIL
RSX
RETL
SDS
SLV
SOXL
TECL TMF
TNA
UGA
(gasoline)
XIV YINN
Commodities:
JJC, NIB,
CHOC
CORN,
WEAT
UUP
(Dollar)
AAPL ADBE
ALXN AMAT
AMGN AMD
AMZN
BA BABA
BAC
BIDU
CAT
CVX
DE
FB
GOOG
GS HD
IBM
JPM M
(Macy's)
MSFT NFLX
NVDA
QCOM
TSLA TXN
XOM WMT
ANDV (refinery),
CMG (Chipotle), LRCX,
SPPI
, WATT,
SQ, MDGL
3/5/2018
Bullish
MAXCPs
Bearish MINCPs |
Table 1
             QUICKSILVER on ETFS and Key Stocks - 03/05/18
ETF      CLOSE   CHANGE     PIVOT-PT  5-dma AROC   CL-PWR    CANDLE  IP21     ITRS
---------------------------------------------------------------------------------------------
DIA       248.84    3.49    W253.96       -161.3%   ----      BLUE  -.027     -----
---------------------------------------------------------------------------------------------
COMPQX    7330.7    72.83    7330.35      -62.2%    Bullish   BLUE  -.053     .047
---------------------------------------------------------------------------------------------
SPY       272.19    3.11    W274.43       -104.9%   ----      BLUE  -.075     .013
---------------------------------------------------------------------------------------------
QQQ       167.83    1.84    W168.29       -76.8%    Bullish   BLUE  -.052     .058
---------------------------------------------------------------------------------------------
MDY       345.37    3.59     343.32       -44.3%    Bullish   BLUE   .078    -.004
---------------------------------------------------------------------------------------------
IWM       153.71    1.36     152.76       -42.1%    Bullish   BLUE   .03    -.002
---------------------------------------------------------------------------------------------
FAS       70.38    2.73     W72.14        -292.6%   ----      BLUE   .011     .025
---------------------------------------------------------------------------------------------
RETL      35.78    .6        34.87        -196.9%   Bullish   BLUE  -.025    -.015
---------------------------------------------------------------------------------------------
SOXL      173.69    4.61    W173.7        -48.1%    Bullish   BLUE   .021     .183
---------------------------------------------------------------------------------------------
TECL      132.09    3.8     W134.33       -233.3%   ----      BLUE  -.051     .126
---------------------------------------------------------------------------------------------
IBB       110.86    1.21     110.1        -28.8%    Bullish   BLUE   .028     .039
---------------------------------------------------------------------------------------------
GLD       125.18   -.21      125.13       -50.7%    Bearish   RED   -.08     .039
---------------------------------------------------------------------------------------------
OIL       6.95    .15       W7            -152%     ----      BLUE  -.052     .122
---------------------------------------------------------------------------------------------
OIH       24.43    .38      W24.55        -109.4%   Bearish   BLUE  -.216    -.005
---------------------------------------------------------------------------------------------
GASL      19.08    .95       17.91         16.9%    ----      BLUE  -.071    -.098
---------------------------------------------------------------------------------------------
UGA       31.05    .47      W31.82        -176.4%   Bullish   BLUE  -.023     .013
---------------------------------------------------------------------------------------------
UUP       23.51    0        W23.62         8.5%     Bearish   ----  -.044    -.038
---------------------------------------------------------------------------------------------
IEF       101.94   -.13      101.93       -15.2%    Bearish   RED   -.133    -.039
---------------------------------------------------------------------------------------------
XLU      49.94    1          49.4         -26.4%    Bullish   BLUE  -.147    -.071
---------------------------------------------------------------------------------------------
WEAT      6.89    .11        6.51          314.3%   Bullish   ----   .203     .16
---------------------------------------------------------------------------------------------
YINN      34.69   -.12      W36.99        -1010.5%  ----      BLUE  -.098     .093
---------------------------------------------------------------------------------------------
RSX       23.53    .28      W23.64        -165.9%   ----      BLUE  -.004     .125
---------------------------------------------------------------------------------------------
AAPL      176.82    .61     W178.39       -60.6%    Bullish   BLUE  -.052     .007
---------------------------------------------------------------------------------------------
GOOG      1090.93    12.01  W1118.29      -239.4%   ----      BLUE  -.08     .013
---------------------------------------------------------------------------------------------
MSFT      93.64    .59      W94.2         -94.8%    Bullish   BLUE   .032     .085
---------------------------------------------------------------------------------------------
AMZN      1523.61    23.36   1511.98       5.5%     Bullish   BLUE   .101     .277
---------------------------------------------------------------------------------------------
FB        180.4    3.78     W181.46       -126.2%   ----      BLUE  -.043    -.001
---------------------------------------------------------------------------------------------
NVDA     235.65   -.89      W246.06       -227.1%   Bearish   BLUE  -.02     .196
---------------------------------------------------------------------------------------------
BA        352.75    8.08    W364.64       -150.3%   Bullish   BLUE   .035     .181
---------------------------------------------------------------------------------------------
GS        263.12    5       W267.93       -154.5%   ----      BLUE  -.003     .02
---------------------------------------------------------------------------------------------
HD        181.74    3.28    W184.98       -183.8%   Bearish   BLUE  -.091    -.029
---------------------------------------------------------------------------------------------
CAT        151.12    4.74   W161.26       -404.9%   Bearish   BLUE  -.032    -.004
|
 Table 2

Count of Stocks in Key Tiger Directories
Date = 180305
--------------------------------------
NEWHIGHS       175   Healthy, once again.
NEWLOWS        46
MAXCP          149   Bullish, again.
MINCP          25
TTTNH          176   Day Traders are surprisingly bullish.
TTTNL          44
FASTUP         130   Swing Traders are hedged.
FASTDOWN       154
CPCROSSA       148   Professionals turned bullish today.
CPCROSSD       30
BIGVOLUP       2
BIGVODN        5
|
Table 3
Count of Stocks and New Highs in Key Tiger Directories
Date = 180305
               No.          NHs            Pct.
-------------------------------------------------------------------
HACKERS        24            5             21 %
NIFTY          30            6             20 %
SOFTWARE       66            12            18 %
-------------------------------------------------------------------
FOOD           15            2             13 %
COAL           10            1             10 %
GAMING         28            2             7 %
BIOTECH        385           27            7 %
NASD-100       99            6             6 %
COMODITY       70            4             6 %
FINANCE        93            5             5 %
SOLAR          21            1             5 %
SP500          483           20            4 %
RUS-1000       834           33            4 %
RETAIL         53            2             4 %
GREEN          31            1             3 %
REGBANKS       33            1             3 %
MILITARY       38            1             3 %
INDMATER       89            3             3 %
CHEM           62            1             2 %
SP-100         96            2             2 %
INDEXES        195           3             2 %
ELECTRON       178           3             2 %
MORNSTAR       238           5             2 %
SEMI           130           3             2 %
REIT           176           3             2 %
OILGAS         140           1             1 %
===============================================
Others: None
|
 |
Table 4
 RANKING OF KEY DIRECTORIES BASED PCT.OF STOCKS ABOVE 65-DMA
               3/5/18
 Bearish = 30
 Bullish = 15
---------------------------------------------------------------------------------------
Directory     Current       day-1         day-2         day-3         day-4         day-5
----------------------------------------------------------------------------------------
BIGMIL         1             1             1             1             1             1
EDU            .857          .428          .571          .571          .571          .571
HOSPITAL       .75           .875          .625          .75           .875          .75
FOOD           .733          .6            .6            .733          .733          .733
NIFTY          .733          .633          .6            .733          .8            .866
SOFTWARE       .681          .681          .651          .681          .681          .696
MILITARY       .631          .605          .605          .71           .71           .789
HACKERS        .625          .625          .583          .625          .625          .625
NASD-100       .616          .606          .505          .626          .666          .707
COMPUTER       .608          .565          .478          .565          .652          .739
REGBANKS       .606          .545          .333          .333          .515          .666
BIGBANKS       .571          .571          .428          .571          .714          .714
FINANCE        .559          .451          .397          .473          .58           .666
COMODITY       .542          .5            .542          .6            .671          .714
BIOTECH        .524          .503          .433          .475          .532          .558
INDEXES        .517          .456          .374          .482          .62           .738
N=16
=============================================================================================
RETAIL         .471          .415          .377          .415          .433          .584
DJI-13         .461          .307          .307          .384          .615          .692
ELECTRON       .46           .477          .376          .415          .449          .494
SEMI           .453          .469          .353          .4            .415          .484
JETS           .444          .444          .555          .555          .666          .666
CHINA          .437          .406          .343          .421          .468          .656
INSURANC       .437          .281          .281          .437          .5            .5
SP500          .434          .389          .341          .42           .488          .561
RUS-1000       .424          .371          .322          .393          .454          .525
SP-100         .416          .385          .354          .427          .541          .635
MORNSTAR       .407          .361          .306          .373          .5            .63
COAL           .4            .4            .4            .4            .4            .4
DOWJONES       .4            .333          .333          .4            .533          .633
ETFS           .388          .373          .373          .402          .567          .776
GREEN          .387          .451          .322          .354          .419          .58
INDMATER       .337          .359          .348          .337          .46           .606
SOLAR          .333          .285          .238          .285          .333          .428
GAMING         .321          .285          .285          .357          .357          .535
TRANSP         .3            .3            .3            .4            .45           .65
UTILITY        .285          .261          .166          .166          .214          .19
CHEM           .274          .241          .209          .209          .306          .387
OILGAS         .271          .221          .214          .185          .314          .364
GOLD           .254          .294          .235          .215          .254          .352
BEVERAGE       .25           .2            .05           .1            .2            .25
INFRA          .228          .257          .285          .285          .342          .428
AUTO           .225          .175          .2            .225          .275          .375
HOMEBLDG       .117          .117          .117          .117          .176          .176
REIT           .079          .039          .034          .034          .039          .068
BONDFUND       .018          .009          .018          .009          .009          .009
PIPELINE       0             0             0             0             .142          .142
N=30
|
==============================================================================
==============================================================================
3/2/2018
If we think the operative Peerless signal is the Buy B5 of two weeks
ago, then we should expect the DJI NOT to break below the lower 3.5%
band which is at about 24140, some 400 points below Friday's close.
This is because the Peerless signals are designed not to have a bigger
loss than this. This might be called the orthodox Peerless approach.
When you look at three of the most important leveraged short ETFs below,
we do see that a near-term recovery in the market does seem likely.
Watch these three charts. But note, too, that they also still show rising 5-dma.
So, the
market's decline is probably not over.
We Need More Evidence of A Bottom.
Besides just the automatic signals, I think we also have to keep looking at
the
real-time evidence, too.
The DJI's rally to 25709.27 on 2/26 meant a close at the 2% upper band with
a very negative P-I reading (-112),
a still declining AROC
(annualized
rate of change of the 65-dma of -.322 plus an
IP21 of only +.004.
When the DJI makes such a weak rally after previously falling 10% from
its
peak on a Sell S9, we should probably also expect another re-test of the previous
lows.
The breaking of the Hourly DJI's uptrend-line when the OBV-DISI line
showed serious weakness and suggested a decline to the previous lows
We
must also add into
this bearish mix that the bull market is almost 9
years
old and
therefore ripe for a big decline. So, we cannot afford to be dogmatic
or
stubborn
about the Buy B5 still operating. And what if all the bearish
leveraged ETFs
are employed aggressively as OEX puts were in October
1987?
But even when we consider a second Sell S9 to have been rendered on
2/26
that still only makes two S9s and it usually takes 4 or more for a rally big
decline.
So, I don't think the DJI will break to new lows. The divergences
are not
big
enough for a decline of much more than 10% down from the
first peak.
It remains my opinion, too, that Wall Street and the Administration realize
that
they have too much at stake to allow a big decline to start now. So,
somehow,
they will prevent it. But we may still need a new Buy signal, I think.
We
cannot be sure the lower 3.5% band will hold. Of course, short-term traders
can watch the Hourly DJI's current price down-trend-line and seek to call
a bottom before we get a Peerless Buy.
One more item.
On the day of the near S9, the
21-day ma was falling at
an annualized rate of -.322. We don't usually pay much attention to
this.
But this key value does show unusual weakness with the DJI at the 2%
upper band. What is interesting here is that in only one of the 10 earlier
near S9 cases
with the 21-dma AROC below -.25 (when the DJI closed at
the 2% band
with a negative P-I and an IP21 below .01) was the DJI still
in a bull
market.
That was in May 1987. (You can see
the
list of 10 past
occurrences here.) In this case, the DJI did reverse at the lower 3.5% band.
19870506
2342.19 1.021 -.329
-184.7 -.08
DJI declined directly to lower 3.5% band.
Adding this signal here would have not changed results.
1987
Chart:
At lower band, there was a perfect B17.
The P-I was improving and
the 65-dma was still rising.
Will The NASDAQ Hold Up?
The DJI-30, with all its multi-nationals, will be hurt the most in a trade
war where other countries post tariffs on American products. Watch to
see if
NASDAQ can stay bullishly above its rising 65-dma. I'm not convinced
that
the NASDAQ will continue to escape the bearish consequences of Trump's
first steps towards a trade war. Software and Biotech would seem to be
the safest
sectors in a trade war. Boeing, however, may be in trouble. What
if
China
or Europe places 25% tariff on Boeing's jets?
Charts 3/2/2018
PEERLESS
DJI, Signals, Indicators Daily
DJI Volume 10-DayUp/Down Vol
V-Indicator
Hourly DJIA
A/D Line for All
Stocks
NASDAQ
S&P
OEX
NYSE COMPQX
DJI-15 DJI-20
DJI-30
DIA
SPY
QQQ MDY
IWM
TNA
CrudeOil
FAS
GLD
BBH
IBB
JETS
JNUG
KOL
NUGT
OIH
OIL
RSX
RETL
SDS
SLV
SOXL
TECL TMF
TNA
UGA
(gasoline)
XIV YINN
Commodities:
JJC, NIB,
CHOC
CORN,
WEAT
UUP
(Dollar)
AAPL ADBE
ALXN AMAT
AMGN AMD
AMZN
BA BABA
BAC
BIDU
CAT
CVX
DE
FB
GOOG
GS HD
IBM
JPM M
(Macy's)
MSFT NFLX
NVDA
QCOM
TSLA TXN
XOM WMT
ANDV (refinery),
CMG (Chipotle), LRCX,
SWKS,
SPPI WATT
SQ TOWN
3/2/2018
Bullish
MAXCPs
Bearish MINCPs |
Table 1
QUICKSILVER on ETFS and Leading Stocks - 03/02/18
Only 2 of the items below are above their
5-day ma.
Only 5 show positive IP21s.ETF CLOSE CHANGE PIVOT-PT 5-dma AROC CL-PWR CANDLE IP21 ITRS
---------------------------------------------------------------------------------------------
DIA 245.35 -.63 W256.92 -150% Bearish BLUE -.04 ---
---------------------------------------------------------------------------------------------
COMPQX 7257.87 77.31 W7421.46 -54.4% ---- BLUE -.102 .047
---------------------------------------------------------------------------------------------
SPY 269.08 1.38 W277.9 -103% Bearish BLUE -.104 .013
---------------------------------------------------------------------------------------------
QQQ 165.99 1.51 W170.4 -65% ---- BLUE -.09 .056
---------------------------------------------------------------------------------------------
MDY 341.78 3.52 W348.4 -67.3% ---- BLUE .069 -.002
---------------------------------------------------------------------------------------------
IWM 152.35 2.4 W154.99 -53.5% ---- BLUE .031 -.003
---------------------------------------------------------------------------------------------
FAS 67.65 .68 W74.49 -305.9% Bearish BLUE .01 -.021
---------------------------------------------------------------------------------------------
RETL 35.18 1.07 W37.17 -216.2% ---- BLUE -.055 -.036
---------------------------------------------------------------------------------------------
SOXL 169.08 8.31 W175.32 126% Bullish BLUE -.011 .162
---------------------------------------------------------------------------------------------
TECL 128.29 3.52 W138.22 -138.5% ---- BLUE -.077 .087
---------------------------------------------------------------------------------------------
IBB 109.65 2.61 W111.49 -47% ---- BLUE -.024 .041
---------------------------------------------------------------------------------------------
GLD 125.39 .67 W126.45 -29.9% Bearish RED -.028 .057
---------------------------------------------------------------------------------------------
OIL 6.8 .01 W7.16 -208.2% ---- BLUE -.051 .121
---------------------------------------------------------------------------------------------
OIH 24.05 .21 W24.96 -178.2% Bearish BLUE -.201 -.002
---------------------------------------------------------------------------------------------
GASL 18.13 .98 W19.02 -131.5% Bearish BLUE -.106 -.125
---------------------------------------------------------------------------------------------
UGA 30.58 .14 W32.15 -213.1% ---- BLUE -.007 .025
---------------------------------------------------------------------------------------------
UUP 23.51 -.1 23.47 2.1% Bearish ---- -.061 -.025
---------------------------------------------------------------------------------------------
IEF 102.07 -.38 W102.25 -2.9% Bearish RED -.202 -.026
---------------------------------------------------------------------------------------------
XLU 48.94 -.13 W50.2 -142.1% Bearish RED -.211 -.091
---------------------------------------------------------------------------------------------
WEAT 6.78 -.2 6.47 341.3% Bullish RED .176 .159
---------------------------------------------------------------------------------------------
YINN 34.81 .21 W42.1 -765.4% Bearish BLUE -.145 .091
---------------------------------------------------------------------------------------------
RSX 23.25 .1 W24.31 -108% ---- BLUE -.024 .112
---------------------------------------------------------------------------------------------
AAPL 176.21 1.21 W178.97 20% Bullish BLUE -.058 .009
---------------------------------------------------------------------------------------------
GOOG 1078.92 9.4 W1143.75 -215.1% Bearish BLUE -.079 .011
---------------------------------------------------------------------------------------------
MSFT 93.05 .2 W95.42 -53.7% Bullish BLUE -.007 .087
---------------------------------------------------------------------------------------------
AMZN 1500.25 6.8 W1521.95 .8% ---- BLUE .015 .27
---------------------------------------------------------------------------------------------
FB 176.62 .68 W184.93 -184.5% Bearish BLUE -.022 -.013
---------------------------------------------------------------------------------------------
NVDA 236.54 4.33 W246.58 -193.6% Bearish BLUE -.056 .205
---------------------------------------------------------------------------------------------
BA 344.67 -5.02 W363.48 -166.8% ---- BLUE -.009 .174
---------------------------------------------------------------------------------------------
GS 258.12 1.34 W271.26 -163.1% Bearish BLUE .015 .003
---------------------------------------------------------------------------------------------
HD 178.46 -1.18 W188.46 -267.7% Bearish BLUE -.129 -.024
---------------------------------------------------------------------------------------------
CAT 146.38 -3.85 W163.69 -505.9% Bearish RED -.074 -.013
|
Table 2
 Count of Stocks in Key Tiger Directories
Date = 180302
--------------------------------------
NEWHIGHS       136
NEWLOWS        99

MAXCP          110
MINCP          88

TTTNH          120
TTTNL          147

FASTUP         121
FASTDOWN       159

CPCROSSA       308
CPCROSSD       25

BIGVOLUP       4
BIGVODN        10
|
  Table 3
  Count of Stocks and New Highs in Key Tiger Directories
  Date = 180302
-------------------------------------------------------------------
HACKERS        24            6             25 %
SOFTWARE       66            10            15 %
====================================================
FOOD           15            2             13 %
HOSPITAL       8             1             13 %
SOLAR          21            2             10 %
COAL           10            1             10 %
BIOTECH        385           27            7 %
RETAIL         53            3             6 %
MILITARY       38            1             3 %
INDMATER       89            3             3 %
COMODITY       70            2             3 %
ELECTRON       178           3             2 %
SEMI           130           3             2 %
RUS-1000       835           18            2 %
NASD-100       99            2             2 %
INDEXES        195           1             1 %
MORNSTAR       238           2             1 %
OILGAS         140           1             1 %
SP500          483           7             1 %
----------------------------------------------------
Others - None
|
 Table 4
 RANKING OF KEY DIRECTORIES BASED PCT.OF STOCKS ABOVE 65-DMA
                             3/2/18
Bearish = 33
Bullish = 12
---------------------------------------------------------------------------------------
Directory     Current       day-1         day-2         day-3         day-4         day-5
----------------------------------------------------------------------------------------
BIGMIL         1             1             1             1             1             1
HOSPITAL       .875          .625          .75           .875          .75           .75
SOFTWARE       .681          .651          .681          .681          .696          .712
HACKERS        .625          .583          .625          .625          .625          .666
NIFTY          .62           .586          .724          .793          .862          .793
NASD-100       .606          .505          .626          .666          .717          .666
MILITARY       .605          .605          .71           .71           .789          .71
FOOD           .6            .6            .733          .733          .733          .8
BIGBANKS       .571          .428          .571          .714          .714          .714
COMPUTER       .565          .478          .565          .652          .739          .695
REGBANKS       .545          .333          .333          .515          .666          .636
BIOTECH        .503          .433          .475          .532          .555          .527
N = 12
==========================================================================================
COMODITY       .5            .542          .6            .671          .714          .728
==========================================================================================
ELECTRON       .477          .376          .415          .449          .494          .426
SEMI           .469          .353          .4            .415          .484          .392
INDEXES        .456          .374          .482          .62           .738          .687
FINANCE        .451          .397          .473          .58           .666          .612
GREEN          .451          .322          .354          .419          .58           .548
JETS           .444          .555          .555          .666          .777          .666
EDU            .428          .571          .571          .571          .571          .571
RETAIL         .415          .377          .415          .433          .584          .528
CHINA          .406          .343          .421          .468          .656          .64
COAL           .4            .4            .4            .4            .4            .4
SP500          .389          .341          .42           .488          .565          .532
SP-100         .385          .354          .427          .541          .635          .562
ETFS           .373          .373          .402          .567          .776          .686
RUS-1000       .372          .323          .394          .455          .525          .492
MORNSTAR       .361          .306          .373          .5            .634          .584
INDMATER       .359          .348          .337          .46           .606          .528
DOWJONES       .333          .333          .4            .533          .633          .5
DJI-13         .307          .307          .384          .615          .692          .538
TRANSP         .3            .3            .4            .45           .7            .55
GOLD           .294          .235          .215          .254          .352          .333
GAMING         .285          .285          .357          .357          .535          .392
SOLAR          .285          .238          .285          .333          .428          .333
INSURANC       .281          .281          .437          .5            .5            .5
UTILITY        .279          .186          .186          .232          .209          .186
INFRA          .257          .285          .285          .342          .428          .4
CHEM           .241          .209          .209          .306          .387          .387
OILGAS         .221          .214          .185          .314          .371          .364
BEVERAGE       .2            .05           .1            .2            .25           .25
AUTO           .175          .2            .225          .275          .375          .35
HOMEBLDG       .117          .117          .117          .176          .176          .176
REIT           .034          .028          .028          .034          .062          .062
BONDFUND       .009          .018          .009          .009          .018          .009
PIPELINE       0             0             0             .142          .142          .142
|
==============================================================================
==============================================================================
3/1/2018
We came so close to an S9/S12 at the top of this advance, I
think we should create a new category of signal, called a near S9-S12.
It should take into account the narrower trading since 1945. Below
are the results of having a Sell signal when the DJI closes at the 2%-2.4%
band with negative PI and negative or almost negative IP21.
Near S9-S12 with DJI 2%-2.4% above
21-dma
Work in Progress - Will be finished this weekend.
There can be an intervening small
rally, but a decline to at least
the 3% lower band occurs 80%+ of time.
 1            19470505       174.2         1.02         -94           -.177
 DJI declined directly to lower band.
 A signal here would have closed out a previous Buy19 with a 2.8% gain
 and produced a 6.1% gain on the hypothetical new short sale.
---------------------------------------------------------------------------------
 2            19561211       490.4         1.022        -52.2         -.065
 DJI declined directly below lower band.  Bottom was 9% from peak.
 Adding this signal here would have not changed results.
---------------------------------------------------------------------------------
 3            19601014       596.5         1.02         -77.1         -.078
 DJI declined directly to lower 3% band.  Bottom was 5% from peak.
 Adding this signal here would have not changed results.
---------------------------------------------------------------------------------
 4            19620709       580.8         1.023        -347.8        -.065
 DJI rose from 580.8 to 615.5 on 8/22 before falling to 558 on 10/23.
 Adding this signal here would have not changed results.
---------------------------------------------------------------------------------
 5            19661018       791.87        1.021        -135.2        -.103
 DJI rose from 791.87 to 820.54 on 12/22 before falling to LB, 786.35 on 12/29
 Adding this signal here would have meant prematurely selling as there was
 a better Sell S9/S12 on 10.25 at 793.09.
---------------------------------------------------------------------------------
 6            19671128       884.88        1.02         -88           -.078
 DJI rose from 884.88 to 908.92 on 1/8/68 before falling to 825.13 on 3/21/68
 Adding this signal here would have meant prematurely selling as there was
 a much better Sell S12 on 1/8 at 908.92.
---------------------------------------------------------------------------------
 7            19700604       706.53        1.023        -164.1        -.006
 DJI rose from 706.53 to 735.56 on 7/29 and then fell to LB, 669.36 on 7/7.
 Adding this signal here would have not changed results.
---------------------------------------------------------------------------------
 8            19700715       711.66        1.022        -86.5         -.016
 DJI rose from 711.66 to 735.56 and then fell to LB, 707.35 on 8/13.
 Adding this signal here would have not changed results.
---------------------------------------------------------------------------------
 9            19701109       779.5         1.02         -128.3        -.188
 DJI rose fell from 779.5 to 755.82, just below rising 65-dma and then rose sharply.
 This would have added a 2.3% gain since there was a Buy B11 signal on 11/13 @759.79
---------------------------------------------------------------------------------
 10           19710818       886.17        1.022        -131.7        -.199
 DJI rose from 886.17 to 916.47 on 9/6 and fell far below lower band to 797.97
 Adding this signal here would have not changed results.
---------------------------------------------------------------------------------
 11           19720522       965.31        1.023        -89           -.031
 DJI fell directly to lower band.
  Adding this signal here would have not changed results.
---------------------------------------------------------------------------------
 12           19720803       947.7         1.021        -81.1         -.057
 DJI fell directly to lower band.
  Adding this signal here would have not changed results.
---------------------------------------------------------------------------------
 13           19730111       1051.7        1.023        -95.6          .001
 Severe bear market followed.  Also S9-S12
  Adding this signal here would have not changed results.
---------------------------------------------------------------------------------
 14           19740509       865.77        1.02         -137.4        -.061
 Fell far below lower band. Already a bear market.
 This would have added an additional +6.2% gain.
---------------------------------------------------------------------------------
 15           19740606       845.35        1.023        -116.3        -.065
 Fell far below lower band. Already a bear market.
 Adding this signal here would have not changed results.
---------------------------------------------------------------------------------
 16           19740614       843.09        1.02         -63.4         -.047
 Fell far below lower band.  Already a bear market.
 Adding this signal here would have not changed results.
---------------------------------------------------------------------------------
 17           19750905       835.97        1.021        -64           -.038
 Fell directly to lower band.
 Adding this signal here would have not changed results.
---------------------------------------------------------------------------------
 18           19780714       839.83        1.02         -141.6        -.028
 DJI continued higher, reaching 890-900 in Sept-Oct.
 Adding this signal here would have produced a sizeable loss.
 There was a Buy B4 on 8/3 @886.87
---------------------------------------------------------------------------------
 19           19781009       893.19        1.02         -120.1        -.154
 Sharp sell-off followed immediately.
 Adding this signal here would have not changed results much. One day earlier Sell.
---------------------------------------------------------------------------------
 20           19801112       964.93        1.021        -109.6        -.169
 Small additional rally and then decline slightly below lower band.
 Adding this signal here would have not changed results much. One day earlier Sell.
---------------------------------------------------------------------------------
 21           19801231       963.99        1.02         -79.6         -.027
 Small additional rally and then decline to lower band.
 Adding this signal here would have not changed results
---------------------------------------------------------------------------------
 22           19870506       2342.19       1.021        -184.7        -.08
 DJI declined directly to lower band.
  Adding this signal here would have not changed results
---------------------------------------------------------------------------------
 23           19891003       2754.56       1.022        -66.5         -.018
 DJI declined 8% in a week.
 Adding this signal here would have not changed results
---------------------------------------------------------------------------------
 24           19901105       2502.23       1.02         -86.5          .007
 DJI rallied from 2503.23 to 2633.66 on 12/21 and then fell to 2470.3 on 1/9/91
 Adding this signal here would have produced a 3.6% loss because of B13 on 12/17/90.
---------------------------------------------------------------------------------
 25           19941019       3936.04       1.02         -113.6        -.009
 DJI declined directly 6.5%, from 3674.63 to 2502.23, LB, on 11/23
 Adding this signal here would have not changed results
---------------------------------------------------------------------------------
 26           19990407       10085.3       1.021        -116.4        -.012
 DJI rallied 10%.  This occurs in bullish seasonal period of year before Election.
 Adding this signal here would have produced a 5.6% loss after B9 on 5/24/99.
---------------------------------------------------------------------------------
 27           19991210       11224.7       1.02         -390.1         .009
 DJI rallied from 11224.7 to 11497.12 on 12/31 and then fell to 10997.93 on 1/4/2000
 Adding this signal here would have not changed results
---------------------------------------------------------------------------------
 28           19991223       11405.76      1.023        -305.6        -.053
 DJI rallied from 11405.76 to 11497.12 on 12/31 and then fell to 10997.93 on 1/4/2000
 Adding this signal here would have not changed results
---------------------------------------------------------------------------------
 29           19991231       11497.12      1.021        -129.2        -.068
 DJI fell directly to 10997.93 on 1/4/2000
 Adding this signal here would have not changed results
---------------------------------------------------------------------------------
 30           20051107       10586.23      1.022        -70.8          .01
 DJI rallied from 10586.23 to 11043.44 on 1/11/06
 before falling back only to 10667.39 on 1/20.  There was a Buy B4 on 11/21 at 10820.28
---------------------------------------------------------------------------------
 31           20060703       11228.02      1.022        -128.7        -.077
 DJI fell directly to 10739.35 on 7/14/2006
 This would have added an additional +3.8% gain.
---------------------------------------------------------------------------------
 32           20071205       13445.04      1.021        -192.9        -.082
 DJI rallied from 13445.04 on 12/10 and then began deep bear market
 Adding this signal here would have not changed results
---------------------------------------------------------------------------------
 33           20071213       13517.96      1.02         -76.2         -.051
 DJI began deep bear market
 Adding this signal here would have not changed results
---------------------------------------------------------------------------------
 34           20080722       11602.5       1.02         -352.9        -.01
 DJI rallied from 11602.5 to 11782.35 on 8/11 and then began deep bear market.
 Adding this signal here would only have meant selling one day earlier.
---------------------------------------------------------------------------------
 35           20081105       9139.27       1.02         -136.8        -.051
 DJI fell directly to 7552.29 on 11/20.
 Adding this signal here would have not changed results.
---------------------------------------------------------------------------------
 36           20111205       12097.83      1.022        -61.5         -.007
 DJI rose bullishly with only brief decline to 21-dma
 Adding this signal here would have not changed results
---------------------------------------------------------------------------------
 37           20111220       12103.58      1.021        -75.4         -.087
 DJI rose bullishly
 Adding this signal here would have not changed results
---------------------------------------------------------------------------------
 38           20180226       25709.27      1.02         -112            .004
 This would have added an additional +4.6% gain assuming closed out on Friday's close.
|
The Bull Market Is Stealing Way.
I've suggested taking profits in QQQ,
TECL and SOXL and shorting some
of our bearish MINCPs. I also said I expected the DJI
to drop to
test its recent lows between 23500 and 24500. But I did not suggest
shorting any of the major market ETFs. I was too loyal to the Buy B5
and reluctant to over-rule it after just a rally to the 2.0% upper band.
But in retrospect, we should have recognized how vulnerable the market
and the DJI were by the depth of the previous decline and the failure
of the DJI to get past its 2% upper band coupled with the negative internals
at the upper band.
Word apparently must have
gotten out from the inner sanctuary of the White
House about Trump's
intent "to do" tariffs early this week, unless one
thinks he just conjured up this idea
very suddenly on Twitter. The NY Times
seems to suggest that.
But someone knew more than a week ago. Look
at the jump in high (red) volume in US Steel's stock more than a week ago.
This was what was really causing so much distribution at the upper 2% band
and explains why the DJI could not go higher.
https://www.nytimes.com/2018/03/01/business/trump-tariffs.html?emc=edit_th_180302&nl=todaysheadlines&nlid=582238940302
.
Trump has been mostly true to his campaign promises. So, the
market should not be so surprised that he will be putting tariffs on
imported
steel and aluminum. But Wall Street likes free trade and strongly
dislikes
the uncertainties of possible trade wars. Everyone who went to high
school
in the US in the last 50 years has been taught about the 1930 Smoot Hawley
Tariff, which Hoover opposed by the way, and how it, as much as the DJI
Crash
in 1929 caused the Great Depression. So, we are all conditioned to
view Trump's
decision today as knee-jerk bearish. All this weekend, the pundits
will be
voicing this fear. So I still expect the DJI to have to test 24000.
If it can build
a little base there, we should see another rally. After all, it almost
always takes
several sets of Peerless Sells in the last 6-8 months to bring a major
decline.
A big and un-discussed problem the bulls will have now is if the
how leveraged Short ETFs on the general market are eminently
marginable and could huge investor interest if key support levels
like 24000 are violated on the DJI. See in our BIGSHORT chart
below the negative ETFs on the general market with with the the
heaviest trading volume, excluding VIX. Volume is not yet as high
as it was the first week of February. But we will be watching the
Tiger Index of these 15 bearish ETFs. So far, they seem to be mostly
used to hedge portfolios. But the danger is that they will be used
aggressively and thereby allow the bears to use all the leverage the
market has afforded bulls in this long bull market on the downside.
This could be dangerous.
Perhaps, the wags will be talking about how "the "DOG wags the DJI."
Actually, the most active are the shorts on the SP-500, SPXU, the QQQ,
SQQQ and the Russell-2000, TZA.
Next week, we will start providing more each night on the internals of these
15 bearish hedges on the general market and provide a nightly ranking
of them using QuickSilver.
See how much volume these bearish ETFs on the major market are
already attracting.
DOG 31668
DXD 67661
FAZ 49792
QID 116918
RWM 10124
SDOW 118291
SDS 145459
SH 81301
SPXU 309431 most active
SQQQ 291936 second most active
SRTY 11884
TECS 17061
TZA 191849 third most active
YANG 50696
popularity of the Leveraged Negative ETFS.
Charts 3/1/2018
PEERLESS
DJI, Signals, Indicators Daily
DJI Volume 10-DayUp/Down Vol
V-Indicator
Hourly DJIA
A/D Line for All
Stocks
NASDAQ
S&P
OEX
NYSE COMPQX
DJI-15 DJI-20
DJI-30
DIA
SPY
QQQ MDY
IWM
TNA
CrudeOil
FAS
GLD
BBH
IBB
JETS
JNUG
KOL
NUGT
OIH
OIL
RSX
RETL
SDS
SLV
SOXL
TECL TMF
TNA
UGA
(gasoline)
XIV YINN
Commodities:
JJC, NIB,
CHOC
CORN,
WEAT
UUP
(Dollar)
AAPL ADBE
ALXN AMAT
AMGN AMD
AMZN
BA BABA
BAC
BIDU
CAT
CVX
DE
FB
GOOG
GS HD
IBM
JPM M
(Macy's)
MSFT NFLX
NVDA
QCOM
TSLA TXN
XOM WMT
ANDV (refinery),
CMG (Chipotle), LRCX,
SWKS,
SPPI WATT
SQ TOWN
3/1/2018
Bullish
MAXCPs
Bearish MINCPs |
Table 1                 QUICKSILVER on ETFS - 03/01/18
W = warning: CLose below 5-dma pivot point.
ETF      CLOSE   CHANGE     PIVOT-PT      5-dma AROC   CL-PWR   CANDLE  IP21    ITRS
---------------------------------------------------------------------------------------------
DIA       245.98   -4.22    W252.91       -69.5%   Bearish      RED    -.069     ----
---------------------------------------------------------------------------------------------
COMPQX    7180.56   -92.45  W7337.39      -20.2%   Bearish      RED    -.143     .036
---------------------------------------------------------------------------------------------
SPY       267.7   -3.95     W274.71       -49.3%   Bearish      RED    -.139     .006
---------------------------------------------------------------------------------------------
QQQ       164.48   -2.73    W168.17       -9.5%    Bearish      RED    -.12      .044
---------------------------------------------------------------------------------------------
MDY       338.26   -1       W346.4        -57.7%   Bearish      RED     .036    -.011
---------------------------------------------------------------------------------------------
IWM       149.95   -.4      W153.98       -67.1%   Bearish      RED    -.033    -.014
---------------------------------------------------------------------------------------------
FAS       66.97   -2.98     W72           -133.6%  Bearish      RED    -.023    -.019
---------------------------------------------------------------------------------------------
RETL      34.11   -1.09     W36.72        -142.4%  Bearish      RED    -.119     .002
---------------------------------------------------------------------------------------------
SOXL      160.77   -8.15    W164.83        178.8%  Bearish      RED    -.047     .17
---------------------------------------------------------------------------------------------
TECL      124.77   -6.4     W131.95        16.7%   Bearish      RED    -.098     .076
---------------------------------------------------------------------------------------------
IBB       107.04   -1.04    W110.68       -62.9%   Bearish      RED    -.108     .005
---------------------------------------------------------------------------------------------
GLD       124.72   -.28     W126.14       -62.8%   Bearish      BLUE    .013     .048
---------------------------------------------------------------------------------------------
OIL       6.79    0         W7.09         -114.3%   ----        BLUE   -.042     .107
---------------------------------------------------------------------------------------------
OIH       23.84    .09      W24.92        -98%     Bearish      BLUE   -.236    -.023
---------------------------------------------------------------------------------------------
GASL      17.15    .45      W18.6         -5.6%    Bearish      BLUE   -.15     -.134
---------------------------------------------------------------------------------------------
UGA       30.44   -.45      W31.92        -156.4%  Bearish      RED    -.019     .02
---------------------------------------------------------------------------------------------
UUP       23.61   -.08       23.5          34%     Bearish      RED    -.043    -.032
---------------------------------------------------------------------------------------------
IEF       102.45    .28     W102.13        34.8%   Bearish      BLUE   -.178    -.033
---------------------------------------------------------------------------------------------
XLU      49.07    .01       W50.35         0%      Bearish      RED    -.152    -.107
---------------------------------------------------------------------------------------------
WEAT      6.98    .31        6.33          495%    Bullish      BLUE    .204     .186
---------------------------------------------------------------------------------------------
YINN      34.6   -.22       W40.6         -510.2%  Bearish      RED    -.165     .092
---------------------------------------------------------------------------------------------
RSX       23.15   -.01      W23.76        -124.4%  Bearish      RED    -.041     .057
---------------------------------------------------------------------------------------------
AAPL      175   -3.12       W175.5         70.7%   Bullish      RED    -.096     .007
---------------------------------------------------------------------------------------------
GOOG      1069.52   -35.21  W1126.79      -165.7%  Bearish      RED    -.101     .006
---------------------------------------------------------------------------------------------
MSFT      92.85   -.92      W94.06         59.7%   ----         RED    -.009     .07
---------------------------------------------------------------------------------------------
AMZN      1493.45   -19     W1500          26.9%   Bearish      RED    -.067     .268
---------------------------------------------------------------------------------------------
FB        175.94   -2.38    W183.29       -84.1%   Bearish      RED    -.067    -.022
---------------------------------------------------------------------------------------------
NVDA     232.21   -9.79     W245.93       -203.2%  Bearish      RED    -.123     .213
---------------------------------------------------------------------------------------------
BA        349.69   -12.52   W356.66       -86.4%   Bearish      RED    -.097     .191
---------------------------------------------------------------------------------------------
GS        256.78   -6.15    W266.77       -87.4%   Bearish      RED    -.018      0
---------------------------------------------------------------------------------------------
HD        179.64   -2.63    W188.35       -156.8%  Bearish      RED    -.175    -.015
---------------------------------------------------------------------------------------------
CAT        150.23   -4.4    W162.41       -269.4%  Bearish      RED    -.053     .025
|
| |
| |
| |
 Table 2
Count of Stocks in Key Tiger Directories
Date = 180301
--------------------------------------
NEWHIGHS       44
NEWLOWS        139   Bearish plurality here so near DJI's highs.
MAXCP          21
MINCP          336   Professionals overwhelmingly bearish
TTTNH          43
TTTNL          286   Day Traders are bearish.
FASTUP         87
FASTDOWN       165   Swing traders are bearish.
CPCROSSA       51
CPCROSSD       165   Professionals still switching to bearish mode.
BIGVOLUP       1
BIGVODN        22    Lot of Big Money Dumping
|
Table 3
   Count of Stocks and New Highs in Key Tiger Directories
Date = 180301
-------------------------------------------------------------------
FOOD           15            2             13 %
COAL           10            1             10 %
HACKERS        24            1             4 %
SOFTWARE       66            2             3 %
INFRA          35            1             3 %
COMODITY       70            2             3 %
CHEM           62            1             2 %
BIOTECH        385           8             2 %
CHINA          64            1             2 %
RETAIL         53            1             2 %
INDMATER       89            1             1 %
ELECTRON       178           1             1 %
OILGAS         140           1             1 %
RUS-1000       835           5             1 %
All others     None.
|
 Table 4
RANKING OF KEY DIRECTORIES BASED PCT.OF STOCKS ABOVE 65-DMA
                                 3/1/18
Bearish = 34  3x more than the bullish number here.
Bullish = 11
---------------------------------------------------------------------------------------
Directory     Current       day-1         day-2         day-3         day-4         day-5
----------------------------------------------------------------------------------------
BIGMIL         1             1             1             1             1             1
SOFTWARE       .651          .681          .681          .696          .712          .696
HOSPITAL       .625          .75           .875          .75           .75           .875
MILITARY       .605          .71           .71           .789          .736          .631
FOOD           .6            .733          .733          .733          .8            .8
NIFTY          .586          .724          .793          .862          .793          .689
HACKERS        .583          .625          .625          .625          .666          .625
EDU            .571          .571          .571          .571          .571          .428
JETS           .555          .555          .666          .777          .666          .555
COMODITY       .542          .6            .671          .714          .728          .671
NASD-100       .505          .626          .666          .717          .676          .575
N = 11
===========================================================================================
COMPUTER       .478          .565          .652          .739          .695          .478
BIOTECH        .433          .475          .532          .555          .535          .472
BIGBANKS       .428          .571          .714          .714          .714          .714
COAL           .4            .4            .4            .4            .4            .4
FINANCE        .397          .473          .58           .666          .612          .537
INDEXES        .389          .482          .62           .738          .692          .512
RETAIL         .377          .415          .433          .584          .547          .471
ELECTRON       .376          .415          .449          .494          .426          .359
ETFS           .373          .402          .567          .776          .686          .597
SP-100         .354          .427          .541          .635          .583          .416
SEMI           .353          .4            .415          .484          .392          .346
INDMATER       .348          .337          .46           .606          .528          .494
CHINA          .343          .421          .468          .656          .64           .609
SP500          .341          .42           .488          .565          .54           .434
DOWJONES       .333          .4            .533          .633          .533          .433
REGBANKS       .333          .333          .515          .666          .636          .515
RUS-1000       .323          .394          .455          .525          .499          .413
GREEN          .322          .354          .419          .58           .548          .354
DJI-13         .307          .384          .615          .692          .538          .538
MORNSTAR       .306          .373          .5            .634          .588          .441
TRANSP         .3            .4            .45           .7            .55           .4
GAMING         .285          .357          .357          .535          .428          .357
INFRA          .285          .285          .342          .428          .4            .428
INSURANC       .281          .437          .5            .5            .5            .375
SOLAR          .238          .285          .333          .428          .333          .333
GOLD           .235          .215          .254          .352          .333          .294
OILGAS         .214          .185          .314          .371          .371          .307
CHEM           .209          .209          .306          .387          .37           .306
AUTO           .2            .225          .275          .375          .35           .225
UTILITY        .186          .186          .232          .209          .186          .162
HOMEBLDG       .117          .117          .176          .176          .176          .176
BEVERAGE       .05           .1            .2            .25           .3            .3
REIT           .028          .028          .034          .062          .062          .022
BONDFUND       .018          .009          .009          .018          .009          .018
PIPELINE       0             0             .142          .142          .142          .142
Bearish = 35
|
==============================================================================
2/28/2018
All The Leveraged Negative ETFS May Be
Allowed To
Run Wild again. Hedging with some Bearish MINCPs
and not holding QQQ,
TECL or
SOXL long was suggested
last night if the Hourly DJI uptrend was broken. That
happened today and the DJI closed dangerously at its
lows of the day. What will Fed Chairman say today?
The operative Peerless signal remains the
recent
Buy B5
but
another test of the recent lows seems likely unless Fed Chairman
reverses himself tomorrow and does not insist on 4 rate hikes
being needed over the next 10 months. He testifies before the
Senate tomorrow. We will know what he's saying quickly enough
because if the DJI resumes its 670 point two-day sell off, it will break
below
its rising 65-dma, just a few points below today's close.
Given the weak technicals we see now, I would expect the DJI then to
quickly break below its 65-dma and for the DJI to have to retest
24000.
This is because there are a multitude of leveraged bearish ETFs and
Index options and Futures which are ready-made to bring another
rapid sell-off from aggressive Professionals and those who simply want to
hedge
because the bull market is now almost nine years old and it's doubtful that
the Trump Administration has any more tricks up its sleeve to boost stock
prices, especially now with interest rates rising and a big Federal deficit
likely.
Still, there is still a chance that Peerless will be proven correct here
and we will see another DJIA rally to the 2.4% upper band where
we may see a reversing Sell. But the broad market is in trouble.
The P-Indicator, Accumulation Index and V-Indicator are all quite
negative. The short-term A/D Line uptrend has been broken.
Only 34% of all stocks and ETFs are still above their 65-dma and only 13
of the 46 Industry groups we follow still have the majority of their
stocks above the 65-dma. In addition, new 52-week new lows outnumbered
new highs by a whopping 188 to 54. The plurality of MINCPs is even
greater.
I have to add that none of the bullish MAXCP looks good enough to buy.
What's worse? Now we see the Hourly DJI's OBV-DISI Line making a new
low ahead of the DJI and today the Hourly DJI has broken its well-tested
rising
uptrend. In many ways, the Hourly DJI's internal OBV weakness is
starting to look like it did in August and December 2015 when Janet Yellen
scared the market with talk of three and then four rate hikes over the
following year. Interestingly, in these cases, the DJI could also not
close
as high as the 2.4% upper band, but Peerless still gave Sell signals based
on heavy red Distribution and because these signals were not taking place
in the more bullish beginning of the year.
It cannot be good that the internals yesterday were much worse than in these
three recent cases where hawkish talk from the normally dovish Yellen
spooked the market. The main difference now is the more bullish
seasonality
that March and April regularly bring. Since 1965, the DJI rallied on
average
+1.5% over the next two weeks and declined only 36.5% of the time.
Over
the next two months, the average DJI gain was +2.2% and the DJI only fell
32.7% of the time.
The bullish seasonality should save the DJI even if the broader market
suffers is my conclusion. But a re-testing of 24000 should not come as
a surprise. We can also hope that Fed Chairman Powell has done enough
"hawkish" jaw-boning for the time being and he now will be more discreet
before the Senate tomorrow. But we can't be sure about him. The
market
does not yet trust him. He is new to the job and Wall Street may have
to
try to train him with another decline. So, I would prefer to hold few
NASDAQ
stocks (if their Closing Power uptrends are broken) and would prefer to be "
short some of the many Bearish
MINCPs. Hold DIA only if you an
intermediate-term investor and are prepared to ride out another sell-off
like we saw two weeks ago. I would avoid the tech ETFs. They
closed
at their upper-bands with negative IP21 readings.
la/ma AROC P-I P-ch
IP21 V-I DJI Declined from
------------------------------------------------------------------------------------------------------------
S12 5/19/2015 1.013
.183 +13 -90
-.008 -48 18312 to 15666 on
8/25
S12 7/16/2015 1.014
.144 +79 18
-.193 -129 18120 to 15666 on 8/25
S16 12/29/2015 1.009 -.053
-67 40 -.100
-147 17720 to 15660 on 2/11
Compare with Tuesday's key values this week
----- 2/27/2018
1.010 -.57
-202 -91
-.059 -136 25410.03
Charts 2/28/2018
PEERLESS
DJI, Signals, Indicators Daily
DJI Volume 10-DayUp/Down Vol
V-Indicator
Hourly DJIA
A/D Line for All
Stocks
NASDAQ
S&P
OEX
NYSE COMPQX
DJI-15 DJI-20
DJI-30
DIA
SPY
QQQ MDY
IWM
TNA
CrudeOil
FAS
GLD
BBH
IBB
JETS
JNUG
KOL
NUGT
OIH
OIL
RSX
RETL
SDS
SLV
SOXL
TECL TMF
TNA
UGA
(gasoline)
XIV YINN
Commodities:
JJC, NIB,
CHOC
CORN,
WEAT
UUP
(Dollar)
AAPL ADBE
ALXN AMAT
AMGN AMD
AMZN
BA BABA
BAC
BIDU
CAT
CVX
DE
FB
GOOG
GS HD
IBM
JPM M
(Macy's)
MSFT NFLX
NVDA
QCOM
TSLA TXN
XOM WMT
ANDV (refinery),
CMG (Chipotle), LRCX,
SWKS,
SPPI WATT
SQ TOWN
2/28/2018
Bullish
MAXCPs
Bearish MINCPs |
 |
Table 1
QUICKSILVER on ETFS - 02/28/18
ETF      CLOSE   CHANGE     PIVOT-PT  5-dma AROC   CL-PWR     CANDLE   IP21    ITRS
---------------------------------------------------------------------------------------------
DIA       250.2   -3.76      249.49        49.2%   Bearish      RED   -.071     ----
---------------------------------------------------------------------------------------------
COMPQX    7273.01   -57.34   7210.09       37.5%   Bearish      RED   -.138     .042
---------------------------------------------------------------------------------------------
SPY       271.65   -2.78     270.4         29.3%   Bearish      RED   -.14      .004
---------------------------------------------------------------------------------------------
QQQ       167.21   -1.08     164.8         71.4%   Bearish      RED   -.095     .054
---------------------------------------------------------------------------------------------
MDY       339.26   -4.06     342.23       -49.6%   Bearish      RED    .022    -.022
---------------------------------------------------------------------------------------------
IWM       150.35   -2.41    W152          -61.7%   Bearish      RED   -.048    -.017
---------------------------------------------------------------------------------------------
FAS       69.95   -2.19      68.88         24.5%   Bearish      RED   -.01      .031
---------------------------------------------------------------------------------------------
RETL      35.2    .33        35.13        -23.7%   Bearish      RED   -.165     .064
---------------------------------------------------------------------------------------------
SOXL      168.92   -4.78     154.78        393.5%   ----        RED   -.072     .264
---------------------------------------------------------------------------------------------
TECL      131.17   -3.16     124.33        274.6%   ----        RED   -.086     .15
---------------------------------------------------------------------------------------------
IBB       108.08   -2.02    W108.42       -45.5%   Bearish      RED   -.113     .009
---------------------------------------------------------------------------------------------
GLD       125   -.13        W126.3        -26.2%   Bearish      RED   -.052     .032
---------------------------------------------------------------------------------------------
OIL       6.79   -.21       W6.95          42.9%   Bearish      RED   -.089     .094
---------------------------------------------------------------------------------------------
OIH       23.75   -.8       W24.32        -4.1%    Bearish      RED   -.186    -.049
---------------------------------------------------------------------------------------------
GASL      16.7   -1.21      W17.17        -75.3%   Bearish      RED   -.168    -.219
---------------------------------------------------------------------------------------------
UGA       30.89   -.93      W31.43        -18.9%   ----         RED   -.151     .004
---------------------------------------------------------------------------------------------
UUP       23.69    .07       23.45         34%     Bullish      ----  -.007    -.045
---------------------------------------------------------------------------------------------
IEF       102.17    .24      101.74        28%     Bearish      BLUE  -.23     -.056
---------------------------------------------------------------------------------------------
XLU      49.06   -.34       W49.07         24.2%   Bearish      RED   -.135    -.132
---------------------------------------------------------------------------------------------
WEAT      6.67    .16        6.34          313.3%  Bullish      BLUE   .092     .112
---------------------------------------------------------------------------------------------
YINN      34.82   -2.17     W38.54        -559.6%  Bearish      RED   -.16      .059
---------------------------------------------------------------------------------------------
RSX       23.16   -.48      W23.74        -14.7%   Bearish      RED   -.068     .033
---------------------------------------------------------------------------------------------
AAPL      178.12   -.27      172.5         201.1%  Bullish      RED   -.048     .015
---------------------------------------------------------------------------------------------
GOOG      1104.73   -13.56  W1106.63      -29.5%   ----         RED   -.089     .034
---------------------------------------------------------------------------------------------
MSFT      93.77   -.43       91.73         122.1%  Bullish      RED   -.005     .088
---------------------------------------------------------------------------------------------
AMZN      1512.45    .47     1485.34       98.4%   Bearish      RED   -.033     .269
---------------------------------------------------------------------------------------------
FB        178.32   -3.14    W178.99        11.3%   Bearish      RED   -.025    -.019
---------------------------------------------------------------------------------------------
NVDA     242   -4.06        W242.15        10%     Bearish      RED   -.093     .279
---------------------------------------------------------------------------------------------
BA        362.21   -2.43     355.92        137.2%  Bullish      RED   -.052     .214
---------------------------------------------------------------------------------------------
GS        262.93   -5        261.43       -8.8%    Bearish      RED    .005     .01
---------------------------------------------------------------------------------------------
HD        182.27   -2.71    W185.47       -21.2%   Bearish      RED   -.117    -.018
---------------------------------------------------------------------------------------------
CAT        154.63   -6.63   W158.86       -18.7%   Bearish      RED    .021     .038
|
Table 2
Count of Stocks in Key Tiger Directories
 Directories
Date = 180228
--------------------------------------
NEWHIGHS       53    A small sector remains bullish.
NEWLOWS        188   More extreme weakness is a bad sign.
--------------------------------------
MAXCP          27
MINCP          431   Professional selling dominates
------------------------------------------------
TTTNH          50
TTTNL          303   Day Traders are "fading" most stocks.
---------------------------------------------------
FASTUP         95
FASTDOWN       172   Swing Traders are mostly bearish
-----------------------------------------------------------
CPCROSSA       28
CPCROSSD       439   Professional bearishness is dominant.
-----------------------------------------------------------
BIGVOLUP       3
BIGVODN        18    Big money Dumping is growing.
===========================================================
|
 Table 3 Count of Stocks and New Highs in Key Tiger Directories
                    Date = 180228
               No            NHs           Pct.
-------------------------------------------------------------------
HACKERS        24            3             13 %
COAL           10            1             10 %
SOLAR          21            1             5 %
CHEM           62            2             3 %
MILITARY       38            1             3 %
INDMATER       89            3             3 %
SOFTWARE       66            2             3 %
BIOTECH        385           12            3 %
ELECTRON       178           3             2 %
SEMI           130           2             2 %
RETAIL         53            1             2 %
SP-100         96            1             1 %
OILGAS         140           1             1 %
SP500          483           3             1 %
RUS-1000       835           7             1 %
NASD-100       99            1             1 %
---------------------------------------------------
All others     None.
|
 |
 Table 4  RANKING OF KEY DIRECTORIES BASED PCT.OF STOCKS ABOVE 65-DMA
              2/28/18
 Bearish = 33  3 of 4 sectors are now below the key 65-dma
 Bullish = 13
---------------------------------------------------------------------------------------
Directory     Current       day-1         day-2         day-3         day-4         day-5
----------------------------------------------------------------------------------------
BIGMIL         1             1             1             1             1             1
HOSPITAL       .75           .875          .75           .75           .875          .75
FOOD           .733          .733          .733          .8            .8            .8
NIFTY          .733          .8            .866          .8            .7            .666
MILITARY       .71           .71           .789          .736          .631          .657
SOFTWARE       .681          .681          .696          .712          .696          .651
NASD-100       .626          .666          .717          .676          .575          .575
HACKERS        .625          .625          .625          .666          .625          .583
COMODITY       .6            .671          .714          .728          .671          .657
BIGBANKS       .571          .714          .714          .714          .714          .714
EDU            .571          .571          .571          .571          .428          .285
COMPUTER       .565          .652          .739          .695          .521          .565
JETS           .555          .666          .777          .666          .555          .444
N= 13
============================================================================================
INDEXES        .482          .62           .738          .692          .528          .533
BIOTECH        .475          .532          .555          .535          .472          .501
FINANCE        .473          .58           .666          .612          .537          .58
INSURANC       .437          .5            .5            .5            .375          .437
SP-100         .427          .541          .635          .583          .427          .427
CHINA          .421          .468          .656          .64           .609          .578
SP500          .42           .488          .565          .54           .438          .445
ELECTRON       .415          .449          .494          .426          .359          .393
RETAIL         .415          .433          .584          .547          .471          .452
ETFS           .402          .567          .776          .686          .597          .552
COAL           .4            .4            .4            .4            .4            .4
DOWJONES       .4            .533          .633          .533          .433          .4
SEMI           .4            .415          .484          .392          .346          .376
TRANSP         .4            .45           .7            .55           .4            .3
RUS-1000       .394          .455          .525          .499          .417          .428
DJI-13         .384          .615          .692          .538          .538          .461
MORNSTAR       .373          .5            .634          .588          .453          .466
GAMING         .357          .357          .535          .428          .357          .357
GREEN          .354          .419          .58           .548          .354          .483
INDMATER       .337          .46           .606          .528          .494          .471
REGBANKS       .333          .515          .666          .636          .515          .606
INFRA          .285          .342          .428          .4            .428          .428
SOLAR          .285          .333          .428          .333          .333          .428
AUTO           .225          .275          .375          .35           .225          .225
GOLD           .215          .254          .352          .333          .294          .333
CHEM           .209          .306          .387          .37           .306          .225
UTILITY        .186          .232          .209          .186          .162          .162
OILGAS         .185          .314          .371          .371          .314          .257
HOMEBLDG       .117          .176          .176          .176          .176          .176
BEVERAGE       .1            .2            .25           .3            .3            .3
REIT           .034          .034          .062          .062          .022          .022
BONDFUND       .009          .009          .018          .009          .018          .009
PIPELINE       0             .142          .142          .142          .142          0
N = 33
|
==============================================================================
2/27/2018
Do Some Selling in Techs and Some
Shorting from among
our Bearish MINCPs.
Expect a re-test of the recent lows
if
the Hourly DJI breaks its steep uptrend-line.
The operative Peerless signal remains the
recent
Buy B5
but yesterday
we
almost (<100 points away) got a Sell S9 and today produced a dramatic
299
point reversal down after yesterday's 400 point rise. This reversal
is the
subject of tonight's historical study. See Table A. From it, we
get
a sense
that the odds are about 50% that the DJI will need now to fall
back to
the lower 3.5%.
But most of these cases occurred in deep bear
markets. So, I would stick
with the Buy B5 and consider today to be Wall
Street's warning to the new
Fed Governor that he should be very careful
what he says about future interest
rate hikes. He is supposed to speak
on Thursday to the Senate. He may face
a more difficult audience there.
Today's
sell-off began when Fed Chairman Powell told Congress that the US
economy
is strong enough to endure four rate hikes this year, rather than the
three
that the Fed
had previously planned. If the market can be hit this hard with
such
"jaw-boning", what will it do when rates are actually raised? Or is
this
just
posturing by a new Fed Chairman who wants to show he's a "tough guy"?
I'm
inclined to favor the second interpretation. That makes me think the
DJI
will move up closer again to the 2.4% upper band and we will get a normal
Sell
signal when the DJI is ready to decline again. That view
is colored by
my
political sense that the Administration and the Federal Reserve do not
want to
risk a big decline now. But do some
profit-taking now, especially in
some
of the leading tech stocks,
TECL,
SOXL
and QQQ.
See how they have
each
reached their upper bands with the IP21s clearly negative.
Technically, we do see lots of negative key values from Peerless. Monday's
advance was not
confirmed by the P-Indicator or the Accumulation Index. This
will
pose a problem, I suspect, for all but the strongest of the high-priced DJI-30
stocks.
The Utilities and Bonds were again very weak.
I have to add that it
was
weak Utilities which led the DJI down in September
1929. Surely, the
FED
knows
enough to not punch up rates too fast, now.
Expect
a re-test of the recent lows if
the Hourly DJI
breaks its steep uptrend-line.
The
Bearish MINCPs look awful.
They invite some hedging.
Two Day Reversals
It is
quite rare for the DJI to reverse like we saw today. This occurred
most
frequently in Great Depression years. But taking all 20 cases where it
occurred
and the
DJI was between the 0.7% and 3.5% upper band, 50% of them saw the
DJI
fall directly to the lower band. Only in 4 instances did the DJI
advance so
much as
to make a short sale a likely failure. In 6 or 7 cases, the DJI rose
for
a while
longer before declining.
Only in
one instance did such a reversal take place in February. That was in
1935
and the
DJI quickly declined below the lower band. The conclusion I reach from
the
study in Table A is that we do not have enough evidence that the reversal
we saw
today should reverse the current Buy B5. But traders should watch the
Hourly
DJI's uptrend-line. A break in it will tilt the scales in favor of a
re-test of the
recent
lows. Add some more Bearish MINCPs to the shorts we are using for
hedging.
The Hourly DISI-OBV is much weaker than
the DJI's Price Action. There is too much selling
of dividend stocks and ETFs on the NYSE to present
a prettier picture. This reinforces the notion that
we should be sellers on strength near the 2.4% upper
band or on a break by the hourly DJI below its
uptrend-line.
Table A
2-Day Reversal Day Down
1929-2018
Conditions:
DJI is 0.7% above the 21-dma and below its 3.5% band.
DJI down more than 1.1% on the current day
DJI was up more than 1.5% on the previous day.
------------------------------------------------------------
20 cases:
10 instances where DJI fell directly to or
below the lower band.
7-6
instances where DJI initially rose and then fell profitably at least
to lower band.
3-4 instances where shorting the DJI here
would have produced a loss.
1) 7/24/1930 DJI rose from 235.5 to 241.8 on 7/28/1930,
then fell to 217.2 on 8/12/1930
---------------------------------------------------------
2) 8/17/1931 DJI fell from 140.9
to 86.5 on 10/5/1931
---------------------------------------------------------
3) 12/15/1932 DJI fell from 61.2 to 56.6
on 12/22/1932
---------------------------------------------------------
4) 3/29/1933 DJI ran up sharply
after FDR's Bank Holiday.
-----------------------------------------------------------
5) 6/19/1934 DJI fell from 99.0 to
85.5 on 7/26/1934.
-----------------------------------------------------------
6) 2/19/1935 DJI fell from 105.9
to 96.7 on 3/14/1935
-----------------------------------------------------------
7) 1/21/1938 DJI fell from 130.7
to 118.5 on 2/3/1938.
-----------------------------------------------------------
8) 5/10/1938 DJI fell from 117.9
to 107.9 on 5/27/1938.
-----------------------------------------------------------
9) 6/13/1940 DJI ran up sharply.
-----------------------------------------------------------
10) 7/3/1941 DJI rose from 124.0 to 129.6 on 7/22 and
then fell to 106.6 on 12/22/1941.
-----------------------------------------------------------
11) 7/7/1955 DJI rose from 460.2 to 468.4 on 7/26 and
then fell to 448.8 on 8/19/1955
-----------------------------------------------------------
12) 10/29/1975 DJI rose from 838.63 to 855.24 on 10/29 and
then fell to 818.8 on 12/5/1979.
-----------------------------------------------------------
13) 11/10/1982 DJI fell from 1044.52 to 990.89
on 11/23/1982.
-----------------------------------------------------------
14) 12/17/1988 DJI rose from 1924.4 to 2031.5 on 1/5/1992 and
then fell to 1879.14 on 1/5/1993.
-------------------------------------------------------------
15) 9/15/1992 DJI fell from
3327.32 to 3136.58 on 10/9/1992.
-------------------------------------------------------------
16) 9/24/1998 DJI fell from
8001.99 to 7784.69 on 10/2/1998.
--------------------------------------------------------------
17) 5/4/1999 DJI rose from 10886.10 to 11107.19 on
5/13/1999 and
then fell to 10490.51 on 6/11/1999.
--------------------------------------------------------------
18) 10/16/2002 DJI rose from 8036.03 to 8931.68 on 11/27/2002
and
then fell 8303.78 on 12/27/2002. Big Paper Loss!
---------------------------------------------------------------
19) 11/15/2008 DJI fell from 9139.27 to
7552.29 on 11/20/2008
---------------------------------------------------------------
20) 5/1/2009 DJI rose
- but was at higher on its next decline to LB.
===============================================================================
|
                               Table 1
                    QUICKSILVER on ETFS - 02/27/18
ETF      CLOSE   CHANGE     PIVOT-PT   5-dma AROC   CL-PWR   CANDLE  IP21     ITRS
---------------------------------------------------------------------------------------------
DIA       253.96   -2.96     247.72        91.7%    ----      RED   -.067     0
---------------------------------------------------------------------------------------------
COMPQX    7330.35   -91.11   7218.23       65.9%    ----      RED   -.112     .035
---------------------------------------------------------------------------------------------
SPY       274.43   -3.47     270.05        55.5%    ----      RED   -.132    -.002
---------------------------------------------------------------------------------------------
QQQ       168.29   -2.11     164.82        90%      ----      RED   -.075     .048
---------------------------------------------------------------------------------------------
MDY       343.32   -5.08     342.68       -1.3%     ----      RED    .021    -.031
---------------------------------------------------------------------------------------------
IWM       152.76   -2.23     152.24        22.2%    ----      RED   -.028    -.025
---------------------------------------------------------------------------------------------
FAS       72.14   -2.35      69.6          114.6%   ----      RED   -.024     .038
---------------------------------------------------------------------------------------------
RETL      34.87   -2.3      W35.37        -48.7%    Bearish   RED   -.136    -.022
---------------------------------------------------------------------------------------------
SOXL      173.7   -1.62      155.94        378.3%   Bullish   RED   -.023     .285
---------------------------------------------------------------------------------------------
TECL      134.33   -3.89     124           297.2%   ----      RED   -.069     .161
---------------------------------------------------------------------------------------------
IBB       110.1   -1.39      109.08        38.7%    Bearish   RED   -.084     .001
---------------------------------------------------------------------------------------------
GLD       125.13   -1.32    W125.66       -44%      Bearish   RED   -.035     .019
---------------------------------------------------------------------------------------------
OIL       7   -.16           6.73          136.7%   ----      RED   -.038     .13
---------------------------------------------------------------------------------------------
OIH       24.55   -.41       23.77         67.5%    Bearish   RED   -.178    -.045
---------------------------------------------------------------------------------------------
GASL      17.91   -1.11      16.97        -174.4%   Bearish   RED   -.15    -.196
---------------------------------------------------------------------------------------------
UGA       31.82   -.33       31.01         136.5%   Bullish   RED   -.134     .037
---------------------------------------------------------------------------------------------
UUP       23.62    .15       23.53         38.3%    ----      BLUE  -.042    -.059
---------------------------------------------------------------------------------------------
IEF       101.93   -.32      101.6         1.5%     Bearish   RED   -.237    -.071
---------------------------------------------------------------------------------------------
XLU      49.4   -.8          48.82        -7.1%     Bearish   RED   -.138    -.139
---------------------------------------------------------------------------------------------
WEAT      6.51    .04        6.27          149.7%   Bullish   ----   .116     .078
---------------------------------------------------------------------------------------------
YINN      36.99   -5.11     W39.24        -78.2%    Bearish   RED   -.146     .082
---------------------------------------------------------------------------------------------
RSX       23.64   -.67       23.23         116.4%   ----      RED   -.065     .039
---------------------------------------------------------------------------------------------
AAPL      178.39   -.58      171.07        188%     Bullish   RED   -.033     .004
---------------------------------------------------------------------------------------------
GOOG      1118.29   -25.46   1111.34       70.8%    Bullish   RED   -.068     .044
---------------------------------------------------------------------------------------------
MSFT      94.2   -1.22       91.49         79.5%    Bullish   RED   -.003     .073
---------------------------------------------------------------------------------------------
AMZN      1511.98   -9.97    1482.92       146.2%   ----      RED   -.001     .268
---------------------------------------------------------------------------------------------
FB        181.46   -3.47     177.91        151.2%   Bearish   RED   -.022    -.013
---------------------------------------------------------------------------------------------
NVDA     246.06   -.52       241.51       -61.6%    Bearish   BLUE  -.046     .291
---------------------------------------------------------------------------------------------
BA        364.64    1.16     352.37        158.4%   Bullish   RED   -.028     .218
---------------------------------------------------------------------------------------------
GS        267.93   -3.33     263.4         57.2%    Bullish   RED    .062     .017
---------------------------------------------------------------------------------------------
HD        184.98   -3.48     183.06       -46.4%    Bearish   RED   -.094    -.02
---------------------------------------------------------------------------------------------
CAT        161.26   -2.43    155.23        179.1%   Bullish   RED    .064     .054
|
Table 2:  Count of Stocks in Key Tiger Directories
Date = 180227
--------------------------------------
NEWHIGHS       55
NEWLOWS        104   Bearish so near DJI's new highs.
MAXCP          33
MINCP          227   Professionals are bearish.
TTTNH          78
TTTNL          206   Day Traders Switched to bearish side.
FASTUP         110
FASTDOWN       115   Swing traders are confused about general market's direction.
CPCROSSA       18
CPCROSSD       481   Professionals acted very bearishly today.
BIGVOLUP       3
BIGVODN        27    Lots of Big Money Dumping again.
|
 Table 3 Count of Stocks and New Highs in Key Tiger Directories
Date = 180227
               No            NHs
-------------------------------------------------------------------
BIGMIL         6             1             17 %
HACKERS        24            4             17 %
-------------------------------------------------------------------
COAL           10            1             10 %
DJI-13         13            1             8 %
SOFTWARE       66            3             5 %
DOWJONES       30            1             3 %
NIFTY          29            1             3 %
MILITARY       38            1             3 %
RETAIL         53            1             2 %
UTILITY        43            1             2 %
FINANCE        93            1             1 %
SP-100         96            1             1 %
INDMATER       89            1             1 %
INDEXES        195           1             1 %
ELECTRON       178           1             1 %
MORNSTAR       238           2             1 %
SEMI           130           1             1 %
BIOTECH        385           5             1 %
SP500          484           6             1 %
RUS-1000       836           12            1 %
------------------------------------------------
Others have none.
|
Table 4
 RANKING OF KEY DIRECTORIES BASED PCT.OF STOCKS ABOVE 65-DMA
                 2/27/18
 Bearish = 23
 Bullish = 21
---------------------------------------------------------------------------------------
Directory     Current       day-1         day-2         day-3         day-4         day-5
----------------------------------------------------------------------------------------
BIGMIL         1             1             1             1             1             .833
HOSPITAL       .875          .75           .75           .875          .75           .75
NIFTY          .793          .862          .793          .689          .62           .655
FOOD           .733          .733          .8            .8            .8            .8
BIGBANKS       .714          .714          .714          .714          .714          .714
MILITARY       .71           .789          .736          .631          .657          .684
SOFTWARE       .681          .696          .712          .696          .636          .712
COMODITY       .671          .714          .728          .671          .657          .657
JETS           .666          .777          .666          .555          .444          .444
NASD-100       .666          .717          .676          .575          .565          .595
COMPUTER       .652          .739          .695          .521          .565          .478
HACKERS        .625          .625          .666          .625          .583          .583
INDEXES        .62           .738          .692          .528          .548          .6
DJI-13         .615          .692          .538          .538          .461          .461
FINANCE        .58           .666          .612          .537          .58           .569
EDU            .571          .571          .571          .428          .285          .142
ETFS           .567          .776          .686          .597          .567          .597
SP-100         .541          .635          .583          .427          .427          .458
DOWJONES       .533          .633          .533          .433          .4            .4
BIOTECH        .532          .555          .535          .472          .498          .488
REGBANKS       .515          .666          .636          .515          .606          .545
N = 21
---------------------------------------------------------------------------------------------
INSURANC       .5            .5            .5            .375          .468          .437
MORNSTAR       .5            .634          .588          .453          .478          .491
---------------------------------------------------------------------------------------------
SP500          .487          .564          .539          .438          .446          .456
CHINA          .468          .656          .64           .609          .578          .515
INDMATER       .46           .606          .528          .494          .471          .471
RUS-1000       .454          .525          .498          .417          .434          .449
TRANSP         .45           .7            .55           .4            .3            .35
ELECTRON       .449          .494          .426          .359          .382          .404
RETAIL         .433          .584          .547          .471          .471          .509
GREEN          .419          .58           .548          .354          .516          .387
SEMI           .415          .484          .392          .346          .361          .392
COAL           .4            .4            .4            .4            .4            .4
GAMING         .357          .535          .428          .357          .392          .428
INFRA          .342          .428          .4            .428          .428          .457
SOLAR          .333          .428          .333          .333          .428          .428
OILGAS         .314          .371          .371          .314          .25           .278
CHEM           .306          .387          .37           .306          .225          .225
AUTO           .275          .375          .35           .225          .225          .25
GOLD           .254          .352          .333          .294          .333          .392
UTILITY        .232          .209          .186          .162          .162          .162
BEVERAGE       .2            .25           .3            .3            .3            .3
HOMEBLDG       .176          .176          .176          .176          .176          .176
PIPELINE       .142          .142          .142          .142          0             .285
REIT           .033          .062          .062          .022          .022          .05
BONDFUND       .009          .018          .009          .018          .009          .009
N = 23
|
==============================================================================
2/23/2018
The operative Peerless signal remains the
recent
Buy B5.
Semi-conductors
were the stars of the day along with the high priced-DJI 13. The 978 more up
than down on the NYSE was acceptable, but not exactly the glorious equal
of the DJI's near-400 point advance.
The DJI needs to digest the day's big advance and let the broad market
catch up if we are to see the rally continue This is because the
DJI closed
at the 2% upper band with the P-Indicator still negative at -112 and
the IP21
Indicator only barely positive at +.004.
If the DJI had risen just 100 points higher at the close, today would
have brought a Sell S9. And if it were to close 100 points higher
tomorrow
and show the same breadth and up and down volume we saw today, we
will get a Sell S9. But let's not anticipate this.
When we run today's key values over past data looking for similar near
S9s in February and March, we find 4 earlier instances of such near S9s
much like today's. In two cases, Peerless was already on a Sell S9 and
the DJI had
clearly stopped at the upper band with the A/D Line lagging. These
brought quick declines of 10% and 15%.
In the second two cases, however, there was no Sell S9. Breadth
continued
to improve, the A/D Line rose and the DJI advanced for two more months.
However, at that point trouble began. The next automatic Peerless Sell
in
these cases, brought significant tops. The DJI then declined 26% in
1946
and 20% in 1982.
As an additional warning, I should add that in the 1937 case, the FED chose
to tighten rates and margin requirements, apparently fearing another 1929
bubble
because of the big DJI gains in 1935 and 1936. The result was that
stock prices
were crushed by 46% in what was called the Roosevelt Bear Market which
started at the peak on August 13, 1937 with another Sell S9.

                 Jerome Powell, the new chairman of the Federal Reserve,
                 makes his first appearance before Congress tomorrow.  He appears
                 in the morning before the House and on Thursday he will talk to
                 Senators.   We will be paying close attention to what he says
                 about the pace of coming interest rate rises. The market rallied
                 into his speech.  So, it expects him to speak about the economy's
                 strength and not to interject any surprises. But we can be sure
                 that he will be asked hypotheticals about what he will do if the
                 Bond Market, the Dollar or stock market starts falling rapidly.
                 More tomorrow night...
|
Charts 2/26/2018
PEERLESS
DJI, Signals, Indicators Daily
DJI Volume 10-DayUp/Down Vol
V-Indicator
Hourly DJIA
A/D Line for All
Stocks
NASDAQ
S&P
OEX
NYSE COMPQX
DJI-15 DJI-20
DJI-30
DIA
SPY
QQQ MDY
IWM
TNA
CrudeOil
FAS
GLD
BBH
IBB
JETS
JNUG
KOL
NUGT
OIH
OIL
RSX
RETL
SDS
SLV
SOXL
TECL TMF
TNA
UGA
(gasoline)
XIV YINN
Commodities:
JJC, NIB,
CHOC
CORN,
WEAT
UUP
(Dollar)
AAPL ADBE
ALXN AMAT
AMGN AMD
AMZN
BA BABA
BAC
BIDU
CAT
CVX
DE
FB
GOOG
GS HD
IBM
JPM M
(Macy's)
MSFT NFLX
NVDA
QCOM
TSLA TXN
XOM WMT
ANDV (refinery),
CMG (Chipotle), LRCX,
SWKS,
SPPI WATT
SQ MDGL
TOWN
2/26/2018
Bullish
MAXCPs
Bearish MINCPs |
 Table 1           QUICKSILVER on ETFS - 02/26/18

 Bullish Across-the-Board blue Quicksilver values:
   SOXL, OIL, WEAT, GOOG, MSFT, CAT
ETF      CLOSE   CHANGE     PIVOT-PT    5-dma AROC  CL-PWR   CANDLE  IP21     ITRS
---------------------------------------------------------------------------------------------
DIA       256.92    4.01     249.35        99.1%    ----      BLUE  -.012     ----
---------------------------------------------------------------------------------------------
COMPQX    7421.46    84.07   7234.31       125.5%   Bullish   BLUE  -.025     .035
---------------------------------------------------------------------------------------------
SPY       277.9    3.19      271.4         88.1%    ----      BLUE  -.069    -.005
---------------------------------------------------------------------------------------------
QQQ       170.4    2.23      165.29        164.2%   Bullish   BLUE  -.019     .048
---------------------------------------------------------------------------------------------
MDY       348.4    2         343.41        37.5%    ----      BLUE   .059    -.032
---------------------------------------------------------------------------------------------
IWM       154.99    1.01     152.08        54%      ----      BLUE   .021    -.02
---------------------------------------------------------------------------------------------
FAS       74.49    2.49      70.51         214.9%   ----      BLUE   .046     .027
---------------------------------------------------------------------------------------------
RETL      37.17    .45       35.22        -68%      ----      BLUE  -.061     .062
---------------------------------------------------------------------------------------------
SOXL      175.32    10.49    161.41        691.4%   Bullish   BLUE   .07      .281
---------------------------------------------------------------------------------------------
TECL      138.22    6.27     126.66        487.1%   Bullish   BLUE   0        .183
---------------------------------------------------------------------------------------------
IBB       111.49    .81      109.25        51.6%    ----      BLUE  -.042     .007
---------------------------------------------------------------------------------------------
GLD       126.45    .31      126.24       -59.7%    Bearish   ----  -.048     .023
---------------------------------------------------------------------------------------------
OIL       7.16    .07        6.81          261.8%   Bullish   BLUE   .023     .123
---------------------------------------------------------------------------------------------
OIH       24.96    .04       24.22         119.2%   Bearish   RED   -.144    -.058
---------------------------------------------------------------------------------------------
GASL      19.02    .42       18.54         175.6%   Bearish   BLUE  -.106    -.183
---------------------------------------------------------------------------------------------
UGA       32.15    .23       30.96         188.8%   Bullish   BLUE  -.105     .004
---------------------------------------------------------------------------------------------
UUP       23.47   -.03       23.44         38.4%    Bearish   ----  -.041    -.088
---------------------------------------------------------------------------------------------
IEF       102.25    .12      101.9         11.8%    Bearish   RED   -.233    -.08
---------------------------------------------------------------------------------------------
XLU      50.2   -.15         49.47         8.1%     Bullish   RED   -.085    -.138
---------------------------------------------------------------------------------------------
WEAT      6.47    .14        6.32          31.6%    Bullish   BLUE   .122     .067
---------------------------------------------------------------------------------------------
YINN      42.1    1.5        37.61         265.3%   ----      BLUE  -.065     .3
---------------------------------------------------------------------------------------------
RSX       24.31    .55       23.09         282.5%   ----      BLUE  -.019     .062
---------------------------------------------------------------------------------------------
AAPL      178.97    3.47     171.85        189.4%   Bullish   BLUE   .017    -.004
---------------------------------------------------------------------------------------------
GOOG      1143.75    16.96   1102.46       220.8%   Bullish   BLUE   .015     .052
---------------------------------------------------------------------------------------------
MSFT      95.42    1.36      92.72         185.1%   Bullish   BLUE   .064     .068
---------------------------------------------------------------------------------------------
AMZN      1521.95    21.95   1468.35       248%     ----      BLUE   .046     .26
---------------------------------------------------------------------------------------------
FB        184.93    1.64     176.01        211.8%   Bullish   BLUE   .035    -.002
---------------------------------------------------------------------------------------------
NVDA     246.58    .65      W249.08        56%      Bearish   RED    .001     .245
---------------------------------------------------------------------------------------------
BA        363.48    6.82     353.35        119%     Bullish   BLUE  -.013     .207
---------------------------------------------------------------------------------------------
GS        271.26    4.49     264.89        68.7%    Bullish   BLUE   .118     .006
---------------------------------------------------------------------------------------------
HD        188.46    .11      186.71        40%      Bearish   RED   -.034    -.01
---------------------------------------------------------------------------------------------
CAT        163.69    1.28    155.56        234.7%   Bullish   BLUE   .097     .095
|
Table 2Count of Stocks in Key Tiger Directories
Date = 180226
--------------------------------------
NEWHIGHS 222 Bullish, but not at the 10:1 we see in strong bull markets.
NEWLOWS 32
MAXCP          143
MINCP          78     Professionals still short many stocks despite rally.
TTTNH          138    Day Traders are still bullish.  This is a good sign.
TTTNL          90
FASTUP         135
FASTDOWN       101    Swing Traders are not covering shorts.
CPCROSSA       35     Professionals bought agressively a limited number of stocks.
CPCROSSD       77
BIGVOLUP       3
BIGVODN        9      Big money Dumping continues.
|
Table 3
Count of Stocks and New Highs in Key Tiger Directories
Date = 20180226
               No.          NHs            Pct
-------------------------------------------------------------------
BIGMIL         6             3             50 %
JETS           9             2             22 %
SOFTWARE       66            14            21 %
DOWJONES       30            6             20 %
NIFTY          30            5             17 %
HACKERS        24            4             17 %
MILITARY       38            6             16 %
NASD-100       100           15            15 %
===================================================================
BIGBANKS       7             1             14 %
SP-100         96            13            14 %
COMPUTER       23            3             13 %
SP500          485           52            11 %
SOLAR          21            2             10 %
COAL           10            1             10 %
REGBANKS       33            3             9 %
DJI-13         13            1             8 %
RUS-1000       837           65            8 %
RETAIL         53            4             8 %
GAMING         28            2             7 %
HOMEBLDG       17            1             6 %
CHEM           62            4             6 %
FINANCE        93            6             6 %
INDMATER       90            5             6 %
INDEXES        195           12            6 %
MORNSTAR       238           15            6 %
AUTO           40            2             5 %
ELECTRON       178           9             5 %
BIOTECH        385           19            5 %
CHINA          64            3             5 %
SEMI           130           5             4 %
GREEN          31            1             3 %
ETFS           67            2             3 %
INFRA          35            1             3 %
INSURANC       32            1             3 %
UTILITY        43            1             2 %
OILGAS         139           1             1 %
COMODITY       70            1             1 %
---------------------------------------------
Others         none
|
Table 4 RANKING OF KEY DIRECTORIES BASED PCT.OF STOCKS ABOVE 65-DMA
2/26/18
Bullish = 30
Bearish = 15
---------------------------------------------------------------------------------------
Directory Current day-1 day-2 day-3 day-4 day-5
----------------------------------------------------------------------------------------
BIGMIL 1 1 1 1 .833 1
NIFTY .866 .8 .7 .633 .666 .666
MILITARY .789 .736 .631 .657 .71 .736
JETS .777 .666 .555 .444 .444 .444
ETFS .776 .686 .597 .567 .611 .731
HOSPITAL .75 .75 .875 .75 .75 .75
COMPUTER .739 .695 .521 .565 .478 .521
FOOD .733 .8 .8 .8 .8 .8
INDEXES .733 .692 .528 .548 .62 .707
NASD-100 .72 .68 .58 .57 .6 .64
BIGBANKS .714 .714 .714 .714 .714 .714
COMODITY .714 .728 .671 .657 .657 .628
TRANSP .7 .55 .4 .3 .35 .5
SOFTWARE .696 .712 .696 .636 .727 .712
DJI-13 .692 .538 .538 .461 .461 .538
FINANCE .666 .612 .537 .58 .569 .655
REGBANKS .666 .636 .515 .606 .545 .666
CHINA .656 .64 .609 .578 .515 .609
SP-100 .635 .583 .427 .427 .468 .51
MORNSTAR .634 .588 .453 .478 .508 .588
DOWJONES .633 .533 .433 .4 .4 .5
HACKERS .625 .666 .625 .583 .625 .583
INDMATER .611 .533 .5 .477 .477 .533
RETAIL .584 .547 .471 .471 .528 .66
GREEN .58 .548 .354 .516 .451 .419
EDU .571 .571 .428 .285 .142 .571
SP500 .564 .54 .439 .447 .468 .519
BIOTECH .555 .535 .472 .498 .49 .535
GAMING .535 .428 .357 .392 .428 .392
RUS-1000 .525 .499 .418 .434 .455 .488
N= 30
============================================================================================
INSURANC .5 .5 .375 .468 .437 .5
============================================================================================
ELECTRON .494 .426 .359 .382 .404 .37
SEMI .484 .392 .346 .361 .392 .338
INFRA .428 .4 .428 .428 .457 .457
SOLAR .428 .333 .333 .428 .428 .285
COAL .4 .4 .4 .4 .4 .4
CHEM .387 .37 .306 .225 .241 .274
AUTO .375 .35 .225 .225 .25 .325
OILGAS .374 .374 .316 .251 .28 .302
GOLD .352 .333 .294 .333 .392 .509
BEVERAGE .25 .3 .3 .3 .3 .4
UTILITY .209 .186 .162 .162 .162 .209
HOMEBLDG .176 .176 .176 .176 .176 .176
PIPELINE .142 .142 .142 0 .285 .142
REIT .062 .062 .022 .022 .05 .05
BONDFUND .018 .009 .018 .009 .009 .027
N = 15
|
==============================================================================
2/23/2018
The operative Peerless signal remains the
recent
Buy B5
and predicts
new highs by the DJI. This will
not be easy as the 30 DJIA stocks have
dispersed in all kinds of different technical directions. In addition,
the P-Indicator
and our IP21 will also need to turn positive if the DJI does quickly to
advance to the
3.5% band. That could be a problem if the DJI gets too far ahead of
the rest of
market.
But, at this point, examination of the high-priced DJI stocks like
AAPL and BA shows
that they are poised for breakouts to new highs, and
JPM and UNH have
bullish Closing
Powers which are already at new highs. So, a nominal DJI new high may
be achieved
sooner than most people think possible.
An Hourly DJI run above 25500 will establish an upside-target
that is 1500 points higher. This is the height of the inverted
traders' index from its low point up to its neckline. 26900 would
represent then a nominal new closing high near the upper 3.5% band.
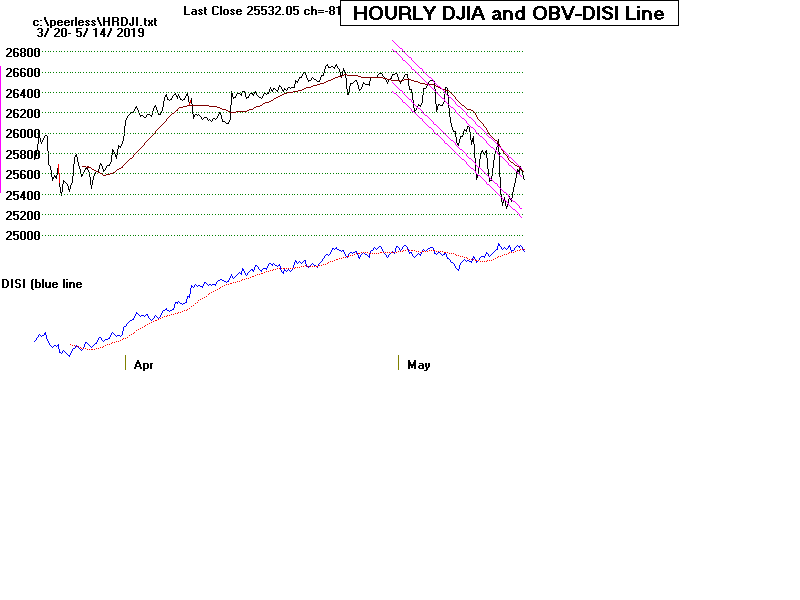
Which Stocks Will Lift The DJI To A New High?
I would not expect much help from old Blue,
IBM, the big pharmaceuticals,
JNJ and MRK, or the defensives, KO or PG. Puny and underweighted
GE looks
like a "lost soul", if stocks are so endowed. Certainly, more bad news
on GE will
dampen the speculative animal spirits, but as a stock well below 15, it has
almost
no weight in the DJI. GE is about 1/60th of its total. Don't be
surprised id
GE is replaced by AMZN or GOOG in the DJI-30.
But there are other stocks in the DJI-30 can do the job of lifting the DJI
to new highs.
More than countering this weakness
in the 7 stock just mentioned, there are the 8
high AI/200 stocks. These are mostly the higher priced DJI-30 stocks,
too:
BA (AI/200=149, 356.66), MMM (AI/200=149, 237.02),
UNH (AI/200=146, 230.16),
AAPL (AI/200=156, 175.5, CAT (AI/200=158, 162.41), V (AI/200=149, 122.93),
MSFT (AI/200=169, 94.06).
These 7 stocks constitute 36.3% of the DJI's total weight. Because of their
high A/I scores,
I think we can expect them hold well above their recent lows. Some
should soon make
new highs. And that will surely help the DJI go significantly higher.
In particular, I would
watch BA and AAPL.
It would not take much of an advance for them to make new highs.
As high priced DJI-30 stocks, such moves up will send the DJIA up a lot.
Watch JPM and UNH,
too. Both show Closing Powers which are very strong now
and making new highs. I believe that means JPM should make a new
high to match its
Closing Power new high. If JPM does so, I would expect its bullish
action to boost
GS (Goldman Sachs), the second highest priced stock in the DJI.
The other stock in the DJI now whose Closing Power is making new highs is
UNH,
which bullishly poised just above its rising 65-fma. UNH is the fourth
highest priced
DJI stocks and thus also the fourth most heavily weighted.
The other symbol to watch is SOXL
(Semi-conductors). If it can rise now, it will
destroy its potential head and shoulder pattern. This will breathe new
life into
the technology stocks, as well as QQQ and
TECL. Almost certainly, the
NASDAQ
will then jump to new highs.
The most bullish combination of relative strength, Professional buying
and Accumulation is shown by CAT (AI/200=158).
MSFT has the highest AI/200
now.
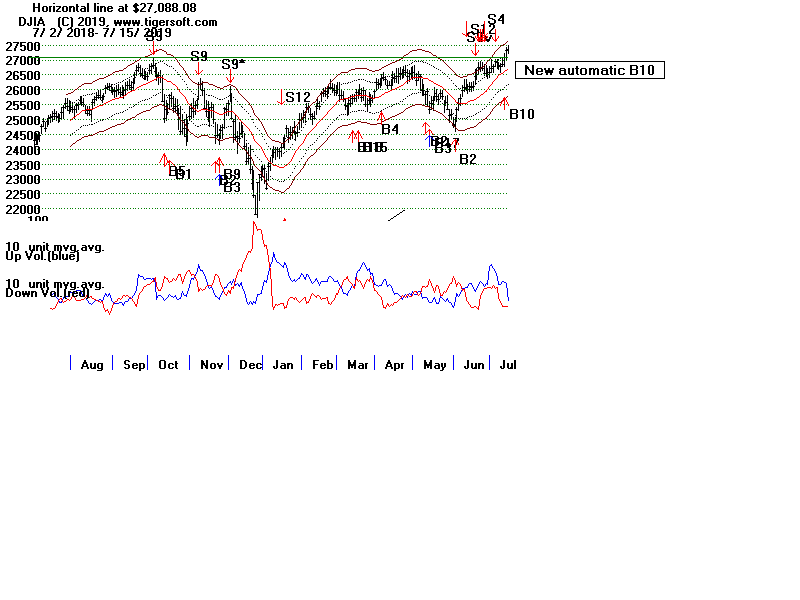
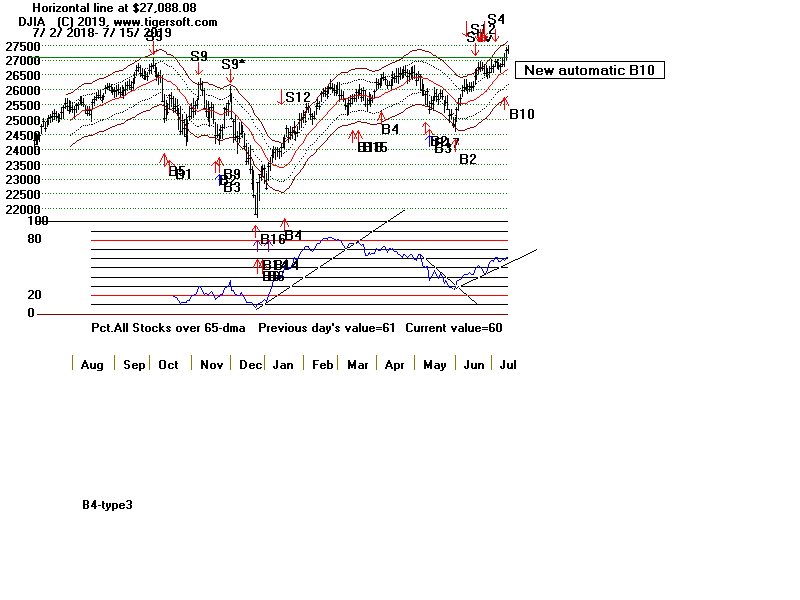
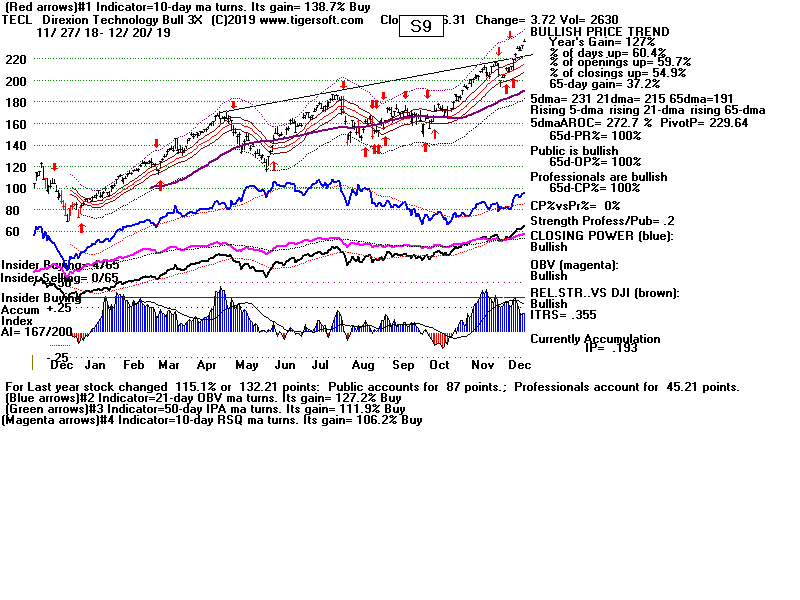
Charts 2/23/2018
PEERLESS
DJI, Signals, Indicators Daily
DJI Volume 10-DayUp/Down Vol
V-Indicator
Hourly DJIA
A/D Line for All
Stocks
NASDAQ
S&P
OEX
NYSE COMPQX
DJI-15 DJI-20
DJI-30
DIA
SPY
QQQ MDY
IWM
TNA
CrudeOil
FAS
GLD
BBH
IBB
JETS
JNUG
KOL
NUGT
OIH
OIL
RSX
RETL
SDS
SLV
SOXL
TECL TMF
TNA
UGA
(gasoline)
XIV YINN
Commodities:
JJC, NIB,
CHOC
CORN,
WEAT
UUP
(Dollar)
AAPL ADBE
ALXN AMAT
AMGN AMD
AMZN
BA BABA
BAC
BIDU
CAT
CVX
DE
FB
GOOG
GS HD
IBM
JPM M
(Macy's)
MSFT NFLX
NVDA
QCOM
TSLA TXN
XOM WMT
ANDV (refinery),
CMG (Chipotle), LRCX,
SWKS,
SPPI WATT
SQ MDGL
TOWN
2/23/2018
Bullish
MAXCPs
Bearish MINCPs |
Table 1 QUICKSILVER on ETFS - 02/23/18
 Only  RETL, IBB, GLD, GASL, WEAT, NVDA and GS show falling 5-dma.
 But only COMPQX, UGA, XLU, AAPL, GOOG, FB, GS and BA show rising Closing Powers.
 IP21 is positive only for MDY, IWM, FAS, WEAT, MSFT, AMZN, FB, GS and CAT .
 ITRS shows greatest relative strength to be: SOXL (+17.5%), TECL (+13.6%),
          OIL (10.2%), YINN (+22.5%), AMZN (+24.6%), NVDA (+22.8%), BA(+22.4)
 GASL shows weakest relative strength (-21.2%)
 UUP(-7.6%)is second weakest.
 FAS, MSFT and CAT show bullish across-the-board strength.
ETF      CLOSE   CHANGE     PIVOT-PT   5-dma AROC   CL-PWR   CANDLE  IP21    ITRS
---------------------------------------------------------------------------------------------
DIA       252.91    3.42     251.96        8.2%     ----      BLUE  -.027     ----
---------------------------------------------------------------------------------------------
COMPQX    7337.39    127.3   7239.47       56%      Bullish   BLUE  -.078     .031
---------------------------------------------------------------------------------------------
SPY       274.71    4.31     273.11        30.9%    ----      BLUE  -.095    -.004
---------------------------------------------------------------------------------------------
QQQ       168.17    3.37     164.96        74.8%    ----      BLUE  -.06      .043
---------------------------------------------------------------------------------------------
MDY       346.4    4.17      345.82        18.8%    ----      BLUE   .038    -.029
---------------------------------------------------------------------------------------------
IWM       153.98    1.98     153.34        38.7%    ----      BLUE   .003    -.018
---------------------------------------------------------------------------------------------
FAS       72    3.12         71.46         54.7%    ----      BLUE   .01      .027
---------------------------------------------------------------------------------------------
RETL      36.72    1.59      37.66        -133.9%   ----      BLUE  -.076     .009
---------------------------------------------------------------------------------------------
SOXL      164.83    10.05    153.46        307.7%   ----      BLUE  -.016     .175
---------------------------------------------------------------------------------------------
TECL      131.95    7.62     125.89        209.9%   ----      BLUE  -.05      .136
---------------------------------------------------------------------------------------------
IBB       110.68    2.26     110.36       -3.7%     ----      BLUE  -.04      .006
---------------------------------------------------------------------------------------------
GLD       126.14   -.16      127.96       -88.3%    Bearish   BLUE  -.08      .033
---------------------------------------------------------------------------------------------
OIL       7.09    .14        6.8           234.9%   ----      BLUE  -.055     .102
---------------------------------------------------------------------------------------------
OIH       24.92    .6        24.38         148.9%   Bearish   BLUE  -.176    -.047
---------------------------------------------------------------------------------------------
GASL      18.6    1.43       18.39        -19.5%    Bearish   BLUE  -.159    -.212
---------------------------------------------------------------------------------------------
UGA       31.92    .49       30.97         188.6%   Bullish   BLUE  -.167    -.01
---------------------------------------------------------------------------------------------
UUP       23.45   -.08       23.13         47.2%    ----      ----   .039    -.076
---------------------------------------------------------------------------------------------
IEF       102.13    .39      102.01        17.7%    Bearish   BLUE  -.174    -.071
---------------------------------------------------------------------------------------------
XLU      50.35    1.28       50.12         67.8%    Bullish   BLUE  -.02     -.14
---------------------------------------------------------------------------------------------
WEAT      6.33   -.01        6.43         -110%     ----      RED    .054     .046
---------------------------------------------------------------------------------------------
YINN      40.6    2.06       40.02         80.6%    Bearish   BLUE  -.095     .225
---------------------------------------------------------------------------------------------
RSX       23.76    .02       22.99         83.7%    ----      ----  -.082     .044
---------------------------------------------------------------------------------------------
AAPL      175.5    3         172.43        72.9%    Bullish   BLUE  -.041    -.019
---------------------------------------------------------------------------------------------
GOOG      1126.79    20.16   1094.8        169.3%   Bullish   BLUE  -.014     .047
---------------------------------------------------------------------------------------------
MSFT      94.06    2.33      92            76%      Bullish   BLUE   .017     .068
---------------------------------------------------------------------------------------------
AMZN      1500    14.66      1448.69       130.1%   Bearish   BLUE   .048     .247
---------------------------------------------------------------------------------------------
FB        183.29    4.3      177.36        93.5%    Bullish   BLUE   .019    -.012
---------------------------------------------------------------------------------------------
NVDA     245.93    3.78      243.84       -11.7%    Bearish   BLUE  -.026     .228
---------------------------------------------------------------------------------------------
BA        356.66    .74      355.04        2.8%     Bullish   RED   -.006     .224
---------------------------------------------------------------------------------------------
GS        266.77    5.34     267.62       -17.2%    Bullish   BLUE   .117     .031
---------------------------------------------------------------------------------------------
HD        188.35    2.88     186.97        83%      Bearish   BLUE  -.021    -.002
---------------------------------------------------------------------------------------------
CAT        162.41    3.55    156.29        77.3%   ----       BLUE   .094     .094
|
Table 2    Count of Stocks in Key Tiger Directories
                 Date = 180223
--------------------------------------
NEWHIGHS       188    Bullish plurality
NEWLOWS        36

MAXCP          102
MINCP          73     Professionals are hedging...

TTTNH          103    Day Traders are net bullish.  This is important.
TTTNL          78

FASTUP         126    Swing traders are hedging.
FASTDOWN       133

CPCROSSA       75     Disappointing plurality.
CPCROSSD       48

BIGVOLUP       3
BIGVODN        8      Still more dumping...
|
Table 3      Count of Stocks and New Highs in Key Tiger Directories
Date = 20180223
               No.          NHs            Pct
-------------------------------------------------------------------
HACKERS        24            5             21 %
SOFTWARE       66            14            21 %
BIGMIL         6             1             17 %
===================================================================
BIGBANKS       7             1             14 %
EDU            7             1             14 %
NIFTY          30            4             13 %
MILITARY       38            4             11 %
JETS           9             1             11 %
COMPUTER       23            2             9 %
NASD-100       100           8             8 %
RETAIL         53            4             8 %
HOMEBLDG       17            1             6 %
SP500          485           29            6 %
AUTO           40            2             5 %
FINANCE        93            5             5 %
SP-100         96            5             5 %
RUS-1000       837           44            5 %
CHINA          64            3             5 %
SOLAR          21            1             5 %
UTILITY        43            2             5 %
GAMING         28            1             4 %
BIOTECH        385           17            4 %
CHEM           62            2             3 %
DOWJONES       30            1             3 %
INDMATER       90            3             3 %
ELECTRON       178           6             3 %
MORNSTAR       238           8             3 %
INFRA          35            1             3 %
INDEXES        194           2             1 %
SEMI           130           1             1 %
OILGAS         140           1             1 %
=================================================
Others         None
|
Table 4 RANKING OF KEY DIRECTORIES BASED PCT.OF STOCKS ABOVE 65-DMA
              2/23/18
 Bullish = 28
 Bearish = 17
---------------------------------------------------------------------------------------
Directory     Current       day-1         day-2         day-3         day-4         day-5
----------------------------------------------------------------------------------------
BIGMIL         1             1             1             .833          1             1
FOOD           .8            .8            .8            .8            .8            .8
NIFTY          .8            .7            .633          .666          .666          .633
HOSPITAL       .75           .875          .75           .75           .75           .75
MILITARY       .736          .631          .657          .71           .763          .763
COMODITY       .728          .671          .657          .657          .628          .671
BIGBANKS       .714          .714          .714          .714          .714          .857
SOFTWARE       .712          .696          .636          .727          .712          .727
COMPUTER       .695          .521          .565          .478          .521          .565
INDEXES        .69           .53           .551          .623          .711          .747
ETFS           .686          .597          .567          .611          .731          .761
NASD-100       .68           .58           .57           .6            .64           .64
HACKERS        .666          .625          .583          .625          .583          .583
JETS           .666          .555          .444          .444          .444          .444
CHINA          .64           .609          .578          .515          .625          .625
REGBANKS       .636          .515          .606          .545          .666          .606
FINANCE        .612          .537          .58           .569          .655          .645
MORNSTAR       .588          .453          .478          .508          .592          .596
SP-100         .583          .427          .427          .468          .52           .52
EDU            .571          .428          .285          .142          .571          .571
TRANSP         .55           .4            .3            .35           .5            .5
GREEN          .548          .354          .516          .451          .419          .419
RETAIL         .547          .471          .471          .528          .66           .679
SP500          .54           .439          .447          .468          .521          .513
DJI-13         .538          .538          .461          .461          .538          .538
BIOTECH        .535          .472          .498          .49           .535          .524
DOWJONES       .533          .433          .4            .4            .5            .466
INDMATER       .533          .5            .477          .477          .533          .522
N=28
===========================================================================================
INSURANC       .5            .375          .468          .437          .5            .468
===========================================================================================
RUS-1000       .499          .418          .434          .455          .492          .491
GAMING         .428          .357          .392          .428          .392          .464
ELECTRON       .426          .359          .382          .404          .376          .393
COAL           .4            .4            .4            .4            .4            .4
INFRA          .4            .428          .428          .457          .457          .485
SEMI           .392          .346          .361          .392          .346          .369
OILGAS         .371          .314          .25           .278          .3            .328
CHEM           .37           .306          .225          .241          .274          .258
AUTO           .35           .225          .225          .25           .325          .35
GOLD           .333          .294          .333          .392          .529          .647
SOLAR          .333          .333          .428          .428          .285          .285
BEVERAGE       .3            .3            .3            .3            .4            .35
UTILITY        .186          .162          .162          .162          .209          .162
HOMEBLDG       .176          .176          .176          .176          .176          .235
PIPELINE       .142          .142          0             .285          .285          .428
REIT           .062          .022          .022          .05           .05           .039
BONDFUND       .009          .018          .009          .009          .027          0
N = 17
|
==============================================================================
==============================================================================
2/22/2018
The operative Peerless signal remains the
recent
Buy B5.
History favors the
current decline remaining limited. The DJIA,
QQQ, Big Military (especially
Boeing) and
our Nifty-30 are the leaders. Boeing which is now given a weight equal
to 9.8% of the
entire DJIA is up more than 22% than the DJI itself in the last 50 trading
days. Another
way of saying this is that the DJI without Boeing would be 500 points lower
since 50 trading
days ago or 1227 points lower since mid-May last year.
The four stocks in the DJIA over $200/share, BA, GS, MMM and UNH comprise
29.5% of the DJIA's total weight. As long as these stocks hold up, the
DJI will not sell
off much. Since Professionals know that the DJIA is usually among the
very last groups
of stocks to top out in a bull market, these are the stocks bullish
Professionals will keep
pouring new money into.
It is important to understand that Peerless predicts these leaders and the
DJIA, not the
broader market. At some point in most past bull markets, the A/D Line,
the Russell-2000
and even SPY do start lagging the DJI significantly. We could be entering
this stage soon.
A wide divergence between the DJI on its next new high and the lagging NYSE
A/D line
would show this... As Goldman analysts have recently pointed out, just
about all the bullish
governmental policy choices have already been made unless we count what will
likely be a
diminutive Public Works program this Summer, just in time to impact the Fall
Election.
If the Hourly DJI can break above its current downtrend (shown just below),
expect the
DJI to attempt another advance and challenge the neckline resistance at
25800. It will mean
that word has gotten out to those most connected with the FED, that Chairman
Powell
will coo "dovishly" in his maiden pronouncements before Congress next
Tuesday and
Wednesday. But if NYSE Up Volume
does not pick up noticeably, most likely the
market's advance will probably be narrow and may not much lift the
non-leading ETFs.
So far, bond traders have heard nothing to reduce their rush to sell
dividend-paying municipals,
REITS, Utilities and junk bonds. If you are short some of these, and I
have been saying "Sell"
on these for three months, cover if their Closing Power downtrends are
violated. It will mean
Chairman Power may be backing away from a March increase in short-term
rates. His "dovish"
comments could launch the DJI and the whole market into another bullish leg
up. That
is what happened in 1927 and set off the huge bubble in stocks in 1928 and
1929. The Fed
then lost control of the speculative boom, which stopped only when they
raised the Discount
Rate to 6% in late September 1929, despite a then weakening economy.
The FED is in a
very tricky spot now. If they raise rates, they could cause a
slow-down in the Economy
just about when voters go to the poll in November. If they do not
raise rates and actually
lower them instead, they could set off a wild stock-buying binge which they
would no longer
be able to limit, short of disastrous increases. Either way, the FED
could lose control. That
would make for a wild ride. Be prepared for it.
If Hourly DJIA can move past downtrend,
it will likely allow the leaders
to move ahead. Of all these leaders, Boeing is the most important.
DJI's Buy B5 tells us the DJI's rally will continue.


Charts 2/22/2018
PEERLESS
DJI, Signals, Indicators Daily
DJI Volume 10-DayUp/Down Vol
V-Indicator
Hourly DJIA
A/D Line for All
Stocks
NASDAQ
S&P
OEX
NYSE COMPQX
DJI-15 DJI-20
DJI-30
DIA
SPY
QQQ MDY
IWM
TNA
CrudeOil
FAS
GLD
BBH
IBB
JETS
JNUG
KOL
NUGT
OIH
OIL
RSX
RETL
SDS
SLV
SOXL
TECL TMF
TNA
UGA
(gasoline)
XIV YINN
Commodities:
JJC, NIB,
CHOC
CORN,
WEAT
UUP
(Dollar)
AAPL ADBE
ALXN AMAT
AMGN AMD
AMZN
BA BABA
BAC
BIDU
CAT
CVX
DE
FB
GOOG
GS HD
IBM
JPM M
(Macy's)
MSFT NFLX
NVDA
QCOM
TSLA TXN
XOM WMT
ANDV (refinery),
CMG (Chipotle), LRCX,
SWKS,
SPPI WATT
SQ MDGL
TOWN
2/22/2018
Bullish
MAXCPs
Bearish MINCPs |
Table 1 QUICKSILVER on ETFS - 02/22/18
   Most ETFs now are below their 5-day ma pivot points ("W")
   and many more show Bearish Closing Powers.  It will
   be interesting how these ETFs behave on Friday, as
   Mondays have recently been down-days.  Much depends on
   what Fed Chairman Power is expected to say before the
   House of Representatives.
ETF      CLOSE    CHANGE     PIVOT-PT   5-dma AROC  CL-PWR    CANDLE  IP21     ITRS
---------------------------------------------------------------------------------------------
---------------------------------------------------------------------------------------------
DIA       249.49    1.77    W252.5         3.8%     Bearish   BLUE  -.045     0
---------------------------------------------------------------------------------------------
COMPQX    7210.09   -8.14   W7256.43       46%      ----      RED   -.109     .03
---------------------------------------------------------------------------------------------
SPY       270.4    .35      W273.03        14.9%    Bearish   RED   -.125    -.006
---------------------------------------------------------------------------------------------
QQQ       164.8   -.02      W165.7         64.4%    ----      RED   -.113     .041
---------------------------------------------------------------------------------------------
MDY       342.23   -.45     W345.11        12.4%    ----      RED    .01    -.03
---------------------------------------------------------------------------------------------
IWM       152   -.24        W152.8         27.9%    ----      RED   -.039    -.02
--------------------------------------------------- ------------------------------------------
FAS       68.88   -.72      W71.23        -56.7%    Bearish   RED   -.003    -.01
---------------------------------------------------------------------------------------------
RETL      35.13   -.24      W37.69        -187.7%   ----      RED   -.104    -.033
---------------------------------------------------------------------------------------------
SOXL      154.78   -1.16    W155.22        164%     ----      RED   -.075     .133
---------------------------------------------------------------------------------------------
TECL      124.33    .33     W126.68        172.9%   ----      RED   -.111     .107
---------------------------------------------------------------------------------------------
IBB       108.42   -.66     W110.76       -59.6%    Bearish   RED   -.076    -.002
---------------------------------------------------------------------------------------------
GLD       126.3    .64      W128.38       -75.8%    Bearish   BLUE  -.074     .042
---------------------------------------------------------------------------------------------
OIL       6.95    .22        6.77          222.2%   Bullish   BLUE  -.017     .108
---------------------------------------------------------------------------------------------
OIH       24.32    .55       24.2         -4.1%     Bearish   BLUE  -.212    -.042
---------------------------------------------------------------------------------------------
GASL      17.17    .2       W18.67        -389.4%   Bearish   RED   -.226    -.227
---------------------------------------------------------------------------------------------
UGA       31.43    .42       30.75         160.6%   Bullish   BLUE  -.082    -.009
---------------------------------------------------------------------------------------------
UUP       23.45   -.08       23.13         47.2%    ----      ----   .039    -.065
---------------------------------------------------------------------------------------------
IEF       101.74    .14     W101.77        0%      Bearish    ----  -.194    -.063
---------------------------------------------------------------------------------------------
XLU      49.07    .25       W49.68         47.6%   ----       BLUE  -.077    -.146
---------------------------------------------------------------------------------------------
WEAT      6.34    .07       W6.47         -39.2%   Bullish    ----   .099     .047
---------------------------------------------------------------------------------------------
YINN      38.54   -.7       W39.97         196%    Bearish    RED   -.129     .201
---------------------------------------------------------------------------------------------
RSX       23.74    .51       23.37         144.7%   ----      BLUE  -.064     .077
---------------------------------------------------------------------------------------------
AAPL      172.5    1.43     W172.99        149.9%   ----      BLUE  -.093    -.006
---------------------------------------------------------------------------------------------
GOOG      1106.63   -4.71    1089.52       168.9%   ----      RED   -.06     .043
---------------------------------------------------------------------------------------------
MSFT      91.73    .24      W92.66         50%      ----      RED   -.045     .066
---------------------------------------------------------------------------------------------
AMZN      1485.34    2.42    1461.76       117.2%   Bearish   RED    .008     .254
---------------------------------------------------------------------------------------------
FB        178.99    1.08    W179.96       -14.9%    Bearish   BLUE  -.051    -.024
---------------------------------------------------------------------------------------------
NVDA     242.15    .64      W246.5         14.9%    Bearish   RED   -.064     .24
---------------------------------------------------------------------------------------------
BA        355.92    3.55    W356.46        157.1%   Bullish   BLUE  -.037     .221
---------------------------------------------------------------------------------------------
GS        261.43   -1.97    W267.68       -21.7%    Bullish   RED    .136     .02
---------------------------------------------------------------------------------------------
HD        185.47    2.41     185.27        21%      Bearish   BLUE  -.043    -.013
---------------------------------------------------------------------------------------------
CAT        158.86    3.63   W159.98        25.5%    ----      BLUE   .031     .08
|
Table 2
Count of Stocks in Key Tiger Directories
Date = 180222
--------------------------------------
NEWHIGHS       97
NEWLOWS        89

MAXCP          60
MINCP          132   Professionals are next bearish.

TTTNH          127   Day Traders are new bullish.
TTTNL          92

FASTUP         122
FASTDOWN       147

CPCROSSA       20
CPCROSSD       212   Professionals sold into today's strength.

BIGVOLUP       6     An improvement
BIGVODN        15    But dumping continues.
|
Table 2
Count of Stocks and New Highs in Key Tiger Directories
Date = 180222
               No.          NHs            Pct
-------------------------------------------------------------------
EDU            7             2             29 %
-------------------------------------------------------------------
COMPUTER       23            2             9 %
HACKERS        24            2             8 %
SOFTWARE       66            3             5 %
SOLAR          21            1             5 %
AUTO           40            1             3 %
NIFTY          30            1             3 %
MILITARY       38            1             3 %
ELECTRON       178           6             3 %
BIOTECH        385           13            3 %
NASD-100       100           3             3 %
SEMI           130           3             2 %
RETAIL         53            1             2 %
UTILITY        43            1             2 %
FINANCE        93            1             1 %
SP-100         96            1             1 %
INDMATER       90            1             1 %
INDEXES        194           1             1 %
OILGAS         140           1             1 %
SP500          485           4             1 %
RUS-1000       837           10            1 %
Others: None
|
Table 4
 RANKING OF KEY DIRECTORIES BASED PCT.OF STOCKS ABOVE 65-DMA
              2/22/18
Bearish = 27
Bullish = 18
---------------------------------------------------------------------------------------
Directory     Current       day-1         day-2         day-3         day-4         day-5
----------------------------------------------------------------------------------------
BIGMIL         1             1             .833          1             1             .833
HOSPITAL       .875          .75           .75           .75           .75           .75
FOOD           .8            .8            .8            .8            .8            .666
BIGBANKS       .714          .714          .714          .714          .857          .714
NIFTY          .7            .633          .666          .666          .633          .4
SOFTWARE       .696          .636          .727          .712          .727          .651
COMODITY       .671          .657          .657          .628          .671          .657
MILITARY       .631          .657          .71           .763          .763          .605
HACKERS        .625          .583          .625          .583          .583          .583
CHINA          .609          .578          .515          .625          .625          .468
ETFS           .597          .567          .611          .731          .761          .582
NASD-100       .58           .57           .6            .64           .64           .49
JETS           .555          .444          .444          .444          .444          .333
DJI-13         .538          .461          .461          .538          .538          .384
FINANCE        .537          .58           .569          .655          .645          .602
COMPUTER       .521          .565          .478          .521          .565          .347
INDEXES        .52           .551          .623          .711          .752          .613
REGBANKS       .515          .606          .545          .666          .606          .575
N=18
============================================================================================
INDMATER       .5            .477          .477          .533          .522          .522
============================================================================================
BIOTECH        .472          .498          .49           .535          .524          .496
RETAIL         .471          .471          .528          .66           .679          .641
MORNSTAR       .453          .478          .508          .592          .596          .504
SP500          .439          .447          .468          .521          .513          .461
DOWJONES       .433          .4            .4            .5            .466          .4
EDU            .428          .285          .142          .571          .571          .285
INFRA          .428          .428          .457          .457          .485          .428
SP-100         .427          .427          .468          .52           .52           .447
RUS-1000       .418          .434          .455          .492          .491          .436
COAL           .4            .4            .4            .4            .4            .5
TRANSP         .4            .3            .35           .5            .5            .4
INSURANC       .375          .468          .437          .5            .468          .437
ELECTRON       .359          .382          .404          .376          .393          .308
GAMING         .357          .392          .428          .392          .464          .392
GREEN          .354          .516          .451          .419          .419          .354
SEMI           .346          .361          .392          .346          .369          .307
SOLAR          .333          .428          .428          .285          .285          .19
OILGAS         .314          .25           .278          .3            .321          .364
CHEM           .306          .225          .241          .274          .258          .258
BEVERAGE       .3            .3            .3            .4            .35           .25
GOLD           .294          .333          .392          .529          .647          .686
AUTO           .225          .225          .25           .325          .35           .325
HOMEBLDG       .176          .176          .176          .176          .235          .235
UTILITY        .162          .162          .162          .209          .162          .186
PIPELINE       .142          0             .285          .285          .428          .428
REIT           .022          .022          .05           .05           .039          .033
BONDFUND       .018          .009          .009          .027          0             .018
Bearish N = 27
|
==============================================================================
2/21/2018
The operative Peerless signal remains the
recent
Buy B5.
History favors the
current decline remaining limited. Until there are more Sell S9s or Sell
S12s,
a DJI decline much below 24000 seems unlikely. However, it should be
added that
a decline limited to 13.5% from the highs would still be considered a
healthy correction
given the long 8-year advance. Since that would mean a decline to
23000, do some
hedging with our Bearish MINCPs
until the DJI's downtrend-line is broken.
"There's some scary stuff happening". Simple base-building now should
be viewed as quite constructive.
Is The Fed Whistling in The Graveyard?
"Being optimistic in a situation that doesn't warrant cheer
or optimism")
Today's early rally
fizzled on news that the FOMC, as presently constituted,
concluded two weeks
ago that the US economy was strong enough to withstand
a hiking of interest
rates soon. But what that would do for stocks after the long
advance since March 2009 remains to be seen. We are already seeing how
much a small rally in short-term rates is hurting dividend stocks and bonds.
It's true that history suggests the DJI's bull market can withstand rises in
short
term rates up to about 3.2%, one percent away. But what about the
world-wide
economic recovery. Other central banks are not likely to sit idly by
and let the
US alone offer higher interest rates. There could be a quick
spiraling up of
rates of foreign central banks quickly join in the tightening.
The even bigger question here is will the Feds have the ability to stop a
stock market
decline that gets out of control. Would a 15% DJI decline quickly lead
to a 20%
decline. And would that not cause lots and lots of selling all at
once, including the
widespread use of all sorts sorts of computerized hedging and bear market
strategies employing leveraged ETFS, futures and options?
With rates already low and with the Fed already holding vast amount of
public debt
and private mortgages, what ammunition does the Fed have left? And
what can
Congress still do that will provide still more fiscal stimulus? A big
infra-structure
program would help. But it is constrained by the size of the deficits
already.
I think we can assume that Wall Street and the FED knows all this.
They want
Trump's trickle-down policies to succeed. Their failure would create
very serious
economic and political problems. But can they control the twin
Frankenstein monster
that they have created, their leveraged trading vehicles and all their
powerful
computerized sell programs? Will not the system require them, when
things get
really explosive and dangerous, to save themselves first and make as much
money
as they can for themselves and their own firms. This is always the
dilemma when
industries are self-policing and government regulators are weak and
under-staffed.
As if these fears were not enough, the mid-day rally also failed because
some traders
are thinking about how much
trouble the high school students
from Florida
could cause the NRA and its
beneficiaries
in Congress, many of
whom are biggest supporters of the
Trump Administration and its economic
growth policies.
What Is The Downside Tipping Point?
That's very hard to say. Certainly a close more than 3.5% below the
21-dma
would be a bad sign. That would also turn down the 65-dma. And
that would
cause computerized sell programs to start up again. Considering all
this,
being hedged with some shorts now seems a good plan. Many of the
Bearish
MINCPs look very weak and incapable of rallying much. If 24000 fails to
hold up the DJI, 23000 and a 13.5% DJI decline from the recent high would
then be considered the next probable support.


Traders, wait for this downtrend on the Hourly DJI chart to come to an end
before adding to long positions. See the chart below.
Tax Free Municipal Bond Market looks very weak.
|
 |
Table 1 QUICKSILVER on ETFS - 02/21/18
ETF      CLOSE    CHANGE     PIVOT-PT   5-dma AROC  CL-PWR  CANDLE  IP21     ITRS
---------------------------------------------------------------------------------------------
DIA       247.72   -1.63    W249.3         23%     Bearish    RED   -.033     ----
---------------------------------------------------------------------------------------------
COMPQX    7218.23   -16.08   7143.62       142.6%   ----      RED   -.071     .037
---------------------------------------------------------------------------------------------
SPY       270.05   -1.35     269.59        74.8%   Bearish    RED   -.092     .001
---------------------------------------------------------------------------------------------
QQQ       164.82   -.47      162.68        156.7%   ----      RED   -.075     .048
---------------------------------------------------------------------------------------------
MDY       342.68   -.73      341.38        108.7%   ----      RED    .036    -.023
---------------------------------------------------------------------------------------------
IWM       152.24    .16      151.15        124%     ----      RED   -.001    -.016
---------------------------------------------------------------------------------------------
FAS       69.6   -.91        69.68         244.9%   ----      RED    .056     .018
---------------------------------------------------------------------------------------------
RETL      35.37    .15       36.5          111.5%   ----      BLUE  -.024     .013
---------------------------------------------------------------------------------------------
SOXL      155.94   -5.47     149.69        515.4%   ----      RED   -.037     .126
---------------------------------------------------------------------------------------------
TECL      124   -2.66        120.02        420.9%   ----      RED   -.078     .123
---------------------------------------------------------------------------------------------
IBB       109.08   -.17     W109.73        70.3%   Bearish    RED   -.028     .026
---------------------------------------------------------------------------------------------
GLD       125.66   -.58     W128.23       -16.5%   Bearish    RED   -.067     .038
---------------------------------------------------------------------------------------------
OIL       6.73   -.08        6.65          216.6%  Bearish    ----   .002     .094
---------------------------------------------------------------------------------------------
OIH       23.77   -.45      W24.34        -43.3%   Bearish    RED   -.197    -.051
---------------------------------------------------------------------------------------------
GASL      16.97   -1.57     W18.59        -52%     Bearish    RED   -.2      -.206
---------------------------------------------------------------------------------------------
UGA       31.01    .05       30.44         178.1%  Bullish    BLUE  -.062    -.01
---------------------------------------------------------------------------------------------
UUP       23.53    .09       23.23         25.8%   Bearish    BLUE   .031    -.058
---------------------------------------------------------------------------------------------
IEF       101.6   -.3       W101.74       -37.3%   Bearish    RED   -.162    -.064
---------------------------------------------------------------------------------------------
XLU      48.82   -.65        48.6         -33.4%   ----       RED   -.065    -.145
---------------------------------------------------------------------------------------------
WEAT      6.27   -.05       W6.39         -140.4%  Bullish    ----   .062     .028
---------------------------------------------------------------------------------------------
YINN      39.24    1.63      37.02         690.4%  Bearish    RED   -.061     .288
---------------------------------------------------------------------------------------------
RSX       23.23    .14       23.07         167.4%  Bearish    RED   -.065     .058
---------------------------------------------------------------------------------------------
AAPL      171.07   -.78      167.37        198.2%  ----       RED   -.11     -.012
---------------------------------------------------------------------------------------------
GOOG      1111.34    8.88    1069.7        273.8%  Bullish    BLUE  -.021     .056
---------------------------------------------------------------------------------------------
MSFT      91.49   -1.23      90.81         90.6%   ----       RED   -.033     .087
---------------------------------------------------------------------------------------------
AMZN      1482.92    14.57   1451.05       236.1%  Bearish    RED    .045     .256
---------------------------------------------------------------------------------------------
FB        177.91    1.9     W179.52        134.3%  Bearish    BLUE  -.016    -.034
---------------------------------------------------------------------------------------------
NVDA     241.51   -7.57      241.42        182.9%  Bearish    RED   -.041     .236
---------------------------------------------------------------------------------------------
BA        352.37   -.98      344.85        131.4%  Bullish    RED   -.064     .228
---------------------------------------------------------------------------------------------
GS        263.4   -1.49      262.58        149.2%  Bullish    RED    .199     .038
---------------------------------------------------------------------------------------------
HD        183.06   -3.65    W184.69       -17.8%   Bearish    RED    -.076    -.016
---------------------------------------------------------------------------------------------
CAT        155.23   -.33    W158.06        40.2%   Bearish    RED    -.009     .064
|
Table 2  Count of Stocks in Key Tiger Directories
Date = 180221
--------------------------------------
NEWHIGHS       101
NEWLOWS        125   This is not good.

MAXCP          88
MINCP          127   Professionals have shifted to being more bearish.

TTTNH          165   Day Traders are net bullish.
TTTNL          90

FASTUP         172   More stocks are still in very strong short-term uptrends.
FASTDOWN       97

CPCROSSA       32
CPCROSSD       214   Rapid shift to sell side by Professionals.

BIGVOLUP       3
BIGVODN        13    More dumping than aggressive buying.
|
Table 3
Count of Stocks and New Highs in Key Tiger Directories
Date = 180221
-------------- NO.          NHS            Pct --------------------
-------------------------------------------------------------------
HACKERS        24            2             8 %
SOFTWARE       66            3             5 %
SOLAR          21            1             5 %
BIOTECH        385           14            4 %
COMPUTER       23            1             4 %
REGBANKS       33            1             3 %
NIFTY          30            1             3 %
MILITARY       38            1             3 %
CHEM           62            1             2 %
FINANCE        93            2             2 %
INDEXES        194           4             2 %
ELECTRON       178           4             2 %
SEMI           130           2             2 %
SP500          485           8             2 %
RUS-1000       837           15            2 %
NASD-100       100           2             2 %
CHINA          64            1             2 %
RETAIL         53            1             2 %
SP-100         96            1             1 %
OILGAS         140           1             1 %
-------------------------------------------------
Others have none.
|
Table 4 RANKING OF KEY DIRECTORIES BASED PCT.OF STOCKS ABOVE 65-DMA
               2/21/18
Bearish = 29
Bullish = 17
---------------------------------------------------------------------------------------
Directory     Current       day-1         day-2         day-3         day-4         day-5
----------------------------------------------------------------------------------------
BIGMIL         1             .833          1             1             .833          .833
FOOD           .8            .8            .8            .8            .666          .6
HOSPITAL       .75           .75           .75           .75           .75           .625
BIGBANKS       .714          .714          .714          .857          .714          .571
COMODITY       .657          .657          .628          .671          .657          .442
MILITARY       .657          .71           .763          .763          .605          .421
SOFTWARE       .636          .727          .712          .727          .651          .5
NIFTY          .633          .666          .666          .633          .4            .333
REGBANKS       .606          .545          .666          .606          .575          .363
HACKERS        .583          .625          .583          .583          .583          .541
FINANCE        .58           .569          .655          .645          .602          .451
CHINA          .578          .515          .625          .625          .468          .296
NASD-100       .57           .6            .64           .64           .5            .36
ETFS           .567          .611          .731          .761          .582          .373
COMPUTER       .565          .478          .521          .565          .347          .347
INDEXES        .551          .623          .711          .752          .623          .381
GREEN          .516          .451          .419          .419          .354          .225
N = 17
=============================================================================================
BIOTECH        .498          .49           .535          .524          .501          .444
MORNSTAR       .478          .508          .592          .596          .508          .348
INDMATER       .477          .477          .533          .522          .533          .388
RETAIL         .471          .528          .66           .679          .641          .49
INSURANC       .468          .437          .5            .468          .437          .187
DJI-13         .461          .461          .538          .538          .384          .384
SP500          .447          .468          .521          .513          .463          .35
JETS           .444          .444          .444          .444          .333          .333
RUS-1000       .434          .455          .492          .491          .44           .338
INFRA          .428          .457          .457          .485          .428          .4
SOLAR          .428          .428          .285          .285          .19           .142
SP-100         .427          .468          .52           .52           .447          .322
COAL           .4            .4            .4            .4            .5            .4
DOWJONES       .4            .4            .5            .466          .4            .366
GAMING         .392          .428          .392          .464          .392          .321
ELECTRON       .382          .404          .376          .393          .303          .202
SEMI           .361          .392          .346          .369          .3            .192
GOLD           .333          .392          .529          .647          .686          .313
BEVERAGE       .3            .3            .4            .35           .25           .2
TRANSP         .3            .35           .5            .5            .4            .3
EDU            .285          .142          .571          .571          .285          .142
OILGAS         .25           .278          .3            .321          .364          .264
CHEM           .225          .241          .274          .258          .274          .145
AUTO           .205          .23           .307          .333          .307          .256
HOMEBLDG       .176          .176          .176          .235          .235          .235
UTILITY        .162          .162          .209          .162          .162          .139
REIT           .022          .05           .05           .039          .033          .028
BONDFUND       .009          .009          .027          0             .018          .018
PIPELINE       0             .285          .285          .428          .428          .428
N = 29
|
==============================================================================
==============================================================================
2/20/2018
The operative Peerless signal is a
B5. The intra-day rally failed today and there
were 1000 more down than up. Even though the NASDAQ actually rose
slightly,
more of a decline is likely. 24250-24500 is expected to be good
support
if the rally is going to quickly resume. Below that the next support
is at the
DJI's recent lows. Traders should note the 3x tested Hourly
Downtrend-Line
just below. As long as this is not violated, we must assume more
base-building is
needed. Only 40% of all stocks and ETFs are above their 65-dma like
the
DJI, NASDAQ and QQQ now are. So, if the DJI falters, we should expect
the
majority of stocks to fall, too. But there is no problem for so long
as the DJIA stays
above its recent intra-day lows and the DJI's 65-dma does not turn down.
Much will will depend on the DJI's highest priced components. It is a
little disturbing
now to see that only 40% of the DJIA's 30 stocks are now above the support
of their
65-dma. If the DJIA were to drop back below its falling 65-dma, I would then
expect
another round of leveraged computerized SELL problems.
The main technical problem now is that we can draw a downtrend-line from
the
January peak through last Friday's high. Short-Sellers may start
keying off this with
leveraged short vehicles, knowing that threat of rising interest rates
is unsettling
to many traders of Bonds and dividend stocks. FED Chairman Powell's
intentions
have not been made clear. Why is he in hiding? Is he
afraid that whatever he says
could cause trouble in the markets? He needs to be more visible now.
He is not
expected to make any public comments until he appears before Congress on
February 28th.
Could The Fed Stop A Decline Now?
Google "FED Chairman Powell" each morning to see if he has made clearer
where
he stands on interest rates. The markets are now waiting for some
guidance
about his intentions. In the interim, they are also watching who he
has chosen
as his closest advisors. One of those picked recently said that "One
challenge
facing the Fed and Mr. Powell would be to develop tools to reduce the
prospect of
resorting to unconventional stimulus measures, such as bond buying, when
interest rates
are pinned near zero, during future downturns. “The Fed isn’t out of
ammunition, but the
ammunition has been shown to be quite weak,” (advisor Faust) said.
“That’s
a very frightening
prospect that we’ve all got to hope we don’t face.”
Several
Fed officials have said Mr.
Powell should launch a review of the central bank’s
inflation targeting
framework to potentially
allow for periods of higher inflation to create
more space for the Fed to
cut interest rates in
future downturns.
(
https://www.wsj.com/articles/fed-chairman-powell-taps-two-advisers-1518969788
)
"It's The Economy, Stupid"
One thing that could boost the market soon would be the President's
appointing
the three missing members of the Fed's Open Market Committee. His
picks
could be "Doves" who want the markets to have a chance to give his
1920s-like
policies of tax-cuts for big investors, deregulation of Wall Street and
leasing of
more minerals' and oil/gas lands to "trickle-down" and have a big political
pay-off
this November.
On the other hand, there may be more mass shootings. In the broad
public mind,
Republicans are now closely tied to the NRA gun-lobby. Even more in
lots of
young people's minds. But since young people tend not to vote, the
Republican
Congress may shrug-off such popular calls for a ban on assault weapons and
simply pass
legislation for more back-ground checks. As 2/3 of the American people
favor
an outright ban on civilian ownership of these weapons, one would think that
the Democrats have a ready-made issue. But most of them also take lots
of money
from the NRA and know that NRA-supporters usually do vote. So thus
far, the
Dems still seem mostly focused on the 13 Russian agents that they say tilted
the
entire last election away from Hillary Clinton. I suppose they think
that this is a
winning issue. But a lot more evidence is needed to attribute such
blame to 13
Russians. They have apparently have forgotten the words, "It's the
economy, stupid"
or, perhaps, they don't want their own ties to Wall Street to make problems
for them
in this year's Primaries.


===============================================================================
2/16/2018
The operative Peerless signal is a
B5. Look for the DJI to continue to advance
back to its old highs. Where it goes from there will depend on
breadth, volume
and whether Peerless gives a new Sell. It is very difficult for a
market that gains
this much momentum to stay down. There are too many ready buyers on
weakness.
While it's true the DJI-30 leadership is heavily influenced by its
high-priced components
BA and GS, it's also true that overall breadth is good and is improving,
except for
Bonds, REITS and Utilities, which are being sold by those who expect higher
interest
rates. The interest rates trend is clearly up but rates have not reached
levels expected to be
dangerous for the market. Short-term rates would have to rise above
3.2% to start
causing serious problems.
Futures are down. Below see the (pink) inverted head/shoulders
pattern that may develop next on Hourly DJI chart. Further below
see how BA has run up so much, it is under red Distribution on
strength.
Second most heavily weighted DJI stock Goldman Sachs just got an
optimized Red Sell based on 20day stochastic.

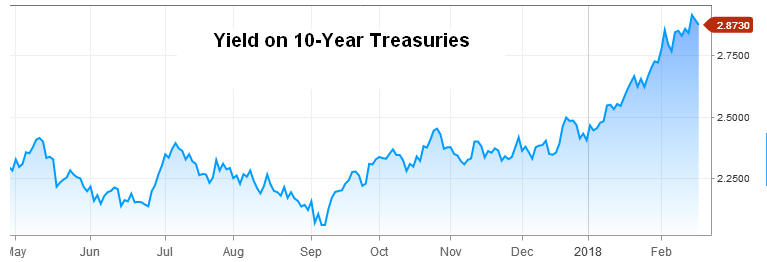
Is It The 1920s Again?
At some point, if the 1920s play out again here - and that's what the
current economic
policies bear closest resemblance to, the FED will obviously fail in its
efforts to contain
the bullish bubble even when it raises rates. This is what
happened in 1928.
At that point, there will be more flat top breakouts and an additional
30%-50% DJI gain,
as professional traders buy aggressively to make as much money as they can while the
bull market
lasts. I leave out the 1980s as a parallel, because then there was a
larger-than-life
Fed Chairman (Volcker) whose whole career was marked by a determination to
bring
much higher Inflation rates back under control.
If the 1920s do offer the
most similar past
bull market to study, then we should expect an
exponential advance
and this may occur even while A/D Line is falling and the Accumulation
Index is negative. In that type of market, only by falling can the DJI
end the grip that
Greed has over the stock prices among all the active players and of course,
we get many
sets of S9s and S12s.
One of the things that stands up about the stock market between mid-1926 and
September 1929 is how many minor intermediate term corrections there were
back then.
In our case, the recent 10% DJI decline was only the first in the last 3
years. We should
expect more such declines from new highs. Each turnaround better
conditions traders
to think that each pull-back is a buying opportunity.
There's another lesson in all the 10% pullbacks from 1926-1929.
Recovery hesitations
at the old highs occurs when the market still has more upside. It is when
the DJI dashes
up 20% or 30% from such a 10% pullback that the DJI becomes most dangerously
over-bought.
Of course, what makes this market so unique is the lack of downside
volatility for
so long. The upwards momentum is even even steeper now than in the
1920s and
the bull market is now one month short of being 9 years old. The 1920s
bull market
lasted only 8 years.
But before we make too much of the current bull market's ripe old age, we
should
know that the longest bull market without a 20% DJI decline was from
10/9/1946 to
12/13/1961 (15 plus years). The 1957 decline stopped with the DJI down
about 19.3% from its high. The second next longest bull market
when defined as
not having a 20% DJI decline was the one from 10/11/1990 to 1/14/2000. (9.25
years)
It also was punctuated with a 19.3% decline based on closing prices in 1998. Based
on the 1990s experience, we should start seriously warning in May. On the
other hand,
if the 1946-1961 were to repeat, then we can expect the DJI to go much, much
higher.
10% Corrections: 1926-1929.
DJI Peak
Size of Decline Bottom
Subsequent Action
---------
---------------
-------
-------------------
9/7/1926
12%
10/19/1926 Next flat-top breakout
on 4/11/27
10/3/1927 9%
10/24/1927 Next flat-top breakout
on 3/21/28
11/28/1928 10%
12/10/1928 DJI shot right back up
22% by 2/5/1928.
3/1/1929
8%
3/26/1929 DJI quickly
rose back up 10% by 5/6/1929.
5/6/1929
10%
5/27/1929 DJI quickly
rose back up 30% to final top on 9/3/1929.
==============================================================================
2/15/2018
The very quick recovery from
the 10% sell-off continues. In trading range recoveries,
prices move very quickly back to the old highs. That suits Peerless.
The median gain in the
DJI after past Buy
B5s was 10.5%. Such a gain
here would take the DJI to a nominal
new high at 26730 at the time of the next Peerless Sell.
Today, SPY closed decisively
above its now rising 65-dma, following the lead of the DJI, NASDAQ and QQQ.
It was a
another good breadth day. There were 1043 more up then down on the
NYSE and the A/D
Line now shows an uptrend. The same goes for all the items we have
data on. And see how the
their percentage above the 65-dma has now moved up to a more respectable 44%.
Can we keep on rising in this fashion all the
way back to 26500? The answer appears to be
"YES" based on the four earlier cases where DJI fell 10% and then very
quickly rose right
back above its 21-dma. But after that, it will depend on whether
Peerless gives a Sell signal,
This will be based on the P-I and IP21 readings.
The DJI has quickly risen back above its 65-dma
after falling 10%.
What has happened after these developments in the past.
December 1928-January 1929 - DJI rose to new highs, stopping only after
S9/S12 when FED raised rates.
September 1938 - DJI rose to new highs, stopping only after an S12 way
above 21-dma.
June-July 1956 - DJI rose back to old highs and topped out after S2 and
A/D Line uptrend-break.
December 1980-January 1981 - DJI rose to nominal new high closing and
S9/S12.
Buy B5s' History N=14 Avg.=13.2% Median Gain = 10.5% Avg Paper Loss=0.7%


 |
 |
 |
Charts 2/15/2018
PEERLESS
DJI, Signals, Indicators Daily
DJI Volume 10-DayUp/Down Vol
V-Indicator
Hourly DJIA A/D Line for All
Stocks
A/D
Line for SP-500 Stocks
NASDAQ
S&P
OEX
NYSE COMPQX
DJI-15 DJI-20
DJI-30
DIA
SPY
QQQ MDY
IWM
TNA
CrudeOil
FAS
GLD
BBH
IBB
JETS
JNUG
KOL
NUGT
OIH
OIL
RSX
RETL
SDS
SLV
SOXL
TECL
TMF
TNA UGA
(gasoline)
XIV YINN
Commodities:
JJC, NIB,
CHOC
CORN,
WEAT UUP
(Dollar)
AAPL ADBE
ALXN AMAT
AMGN AMD
AMZN BA
BABA BAC
BIDU
CAT CVX
DE
FB
GOOG
GS HD
IBM JPM M
(Macy's)
MSFT NFLX
NVDA QCOM
TSLA TXN
XOM WMT
ANDV (refinery),
CMG (Chipotle), LRCX,
SWKS,
TOWN
Also SPPI WATT
SQ
2/15/2018
Bullish
MAXCPs
Bearish MINCPs |
Table 1
COLOR-CODED QUICKSILVER on ETFS - 02/15/18
ETF      CLOSE   CHANGE     PIVOT-PT   5-dma AROC   CL-PWR    CANDLE  IP21   ITRS
---------------------------------------------------------------------------------------------
DIA       252.5    3.2       242.03        282.8%   ----      BLUE   .072     -----
---------------------------------------------------------------------------------------------
COMPQX    7256.43    112.81  6874.49       344.4%   Bullish   BLUE   .096     .032
---------------------------------------------------------------------------------------------
SPY       273.03    3.44     261.5         291.7%   Bearish   BLUE   .04    -.005
---------------------------------------------------------------------------------------------
QQQ       165.7    3.02      156.1         387.3%   Bullish   BLUE   .042     .046
---------------------------------------------------------------------------------------------
MDY       345.11    3.73     331.03        265.2%   ----      BLUE   .096    -.038
---------------------------------------------------------------------------------------------
IWM       152.8    1.65      146.77        248.6%   ----      BLUE   .105    -.036
---------------------------------------------------------------------------------------------
FAS       71.23    1.55      63            825.6%   ----      BLUE   .153     .021
---------------------------------------------------------------------------------------------
RETL      37.69    1.19      34            635.4%   Bullish   BLUE   .169     .055
---------------------------------------------------------------------------------------------
SOXL      155.22    5.53     133.44        1199.4%  Bearish   BLUE   .036     .151
---------------------------------------------------------------------------------------------
TECL      126.68    6.66     107.03        1133.5%   ----     BLUE   .026     .175
---------------------------------------------------------------------------------------------
IBB       110.76    1.03     105.67        275.6%   Bullish   BLUE   .095     .026
---------------------------------------------------------------------------------------------
GLD       128.38    .15      124.77        135%     ----      ----  -.046     .021
---------------------------------------------------------------------------------------------
OIL       6.77      .12        6.43          146%   ----      BLUE   .082     .06
---------------------------------------------------------------------------------------------
OIH       24.2   -.14        23.84         0%       Bearish   RED   -.103    -.087
---------------------------------------------------------------------------------------------
GASL      18.67    .08       16.55         522.7%   Bearish   BLUE  -.093    -.235
---------------------------------------------------------------------------------------------
UGA       30.75    .31       30.26        -38%      Bullish   BLUE   .022    -.032
---------------------------------------------------------------------------------------------
UUP       23.13   -.1       W23.62        -100.1%   Bearish   RED   -.034    -.085
---------------------------------------------------------------------------------------------
IEF       101.77    .03     W102.22       -30.8%    Bearish   ----  -.201    -.077
---------------------------------------------------------------------------------------------
XLU      49.68    1.08       48.56         218.3%   ----      BLUE  -.094    -.153
---------------------------------------------------------------------------------------------
WEAT      6.47    .08        6.27          78.2%    Bullish   ----   .159     .024
---------------------------------------------------------------------------------------------
YINN      39.97    2.95      32.73         1059.7%  Bearish   BLUE   .076     .205
---------------------------------------------------------------------------------------------
RSX       23.37    .3        21.67         414.8%   Bearish   BLUE   .035     .037
---------------------------------------------------------------------------------------------
AAPL      172.99    5.62     156.41        553.4%   ----      BLUE  -.038    -.02
---------------------------------------------------------------------------------------------
GOOG      1089.52  19.82    1037.78        422%     Bullish   BLUE   .076     .052
---------------------------------------------------------------------------------------------
MSFT      92.66    1.85      88.18         431.8%   Bullish   BLUE   .015     .104
---------------------------------------------------------------------------------------------
AMZN      1461.76  10.71    1339.6        400.7%    Bearish   RED    .096     .25
---------------------------------------------------------------------------------------------
FB        179.96    .44      176.11        238.9%   ----      RED    .078     .011
---------------------------------------------------------------------------------------------
NVDA     246.5     5.08      232.08        629.1%   Bullish   BLUE   .089     .282
---------------------------------------------------------------------------------------------
BA        356.46    11.61    332.83        395.4%   ----      BLUE  -.066     .244
---------------------------------------------------------------------------------------------
GS        267.68    5.1      249.3         420.9%   Bullish   BLUE   .268     .029
---------------------------------------------------------------------------------------------
HD        185.27    .58      184.12        110.3%   Bearish   RED    .086    -.037
---------------------------------------------------------------------------------------------
CAT        159.98    1.92    149.21        460.5%   ----      BLUE   .102     .092
|
Table 2Count of Stocks in Key Tiger Directories
Date = 180215
--------------------------------------
NEWHIGHS 158 A quick recovery into healthy territory.
NEWLOWS 34
MAXCP 136 Professionals are bullish.
MINCP 35
TTTNH 76
TTTNL 79
FASTUP 422 Many more long plays by swing traders.
FASTDOWN 78
CPCROSSA 92
CPCROSSD 83
BIGVOLUP 3
BIGVODN 6
|
Table 3
Count of Stocks and New Highs in Key Tiger Directories
               Date = 180215
               No.           NHs           Pct.
-------------------------------------------------------------------
BIGMIL         6             3             50 %
HACKERS        24            6             25 %
SOFTWARE       66            11            17 %
===================================================================
NIFTY          30            4             13 %
MILITARY       38            5             13 %
JETS           9             1             11 %
COAL           10            1             10 %
DOWJONES       30            2             7 %
SP-100         96            7             7 %
INFRA          35            2             6 %
INDEXES        194           9             5 %
BIOTECH        385           19            5 %
RUS-1000       837           42            5 %
NASD-100       100           5             5 %
TRANSP         20            1             5 %
SOLAR          21            1             5 %
BEVERAGE       20            1             5 %
FINANCE        93            4             4 %
GAMING         28            1             4 %
INDMATER       90            4             4 %
SP500          485           20            4 %
COMPUTER       23            1             4 %
RETAIL         53            2             4 %
REGBANKS       33            1             3 %
MORNSTAR       238           6             3 %
INSURANC       32            1             3 %
CHEM           62            1             2 %
ELECTRON       178           4             2 %
SEMI           130           3             2 %
CHINA          64            1             2 %
ETFS           67            1             1 %
OILGAS         140           1             1 %
REIT           178           1             1 %
COMODITY       70            1             1 %
Others                      None
|
Table 4
 RANKING OF KEY DIRECTORIES BASED PCT.OF STOCKS ABOVE 65-DMA
              2/15/18
 Bullish = 26
 Bearish = 20
---------------------------------------------------------------------------------------
Directory     Current       day-1         day-2         day-3         day-4         day-5
----------------------------------------------------------------------------------------
BIGMIL         1             .833          .833          1             .833          1
BIGBANKS       .857          .714          .571          .571          .285          .285
FOOD           .8            .666          .6            .533          .533          .6
MILITARY       .763          .605          .421          .421          .315          .368
ETFS           .761          .582          .388          .268          .223          .149
INDEXES        .752          .623          .391          .35           .288          .293
HOSPITAL       .75           .75           .625          .75           .75           .625
SOFTWARE       .727          .651          .5            .484          .409          .287
RETAIL         .679          .641          .509          .452          .528          .396
COMODITY       .671          .657          .442          .428          .414          .5
GOLD           .647          .686          .333          .313          .215          .235
FINANCE        .645          .602          .451          .43           .344          .268
NASD-100       .64           .5            .37           .37           .38           .3
NIFTY          .633          .4            .333          .333          .3            .233
CHINA          .625          .468          .312          .218          .234          .171
REGBANKS       .606          .575          .363          .333          .333          .181
MORNSTAR       .596          .508          .357          .352          .231          .168
HACKERS        .583          .583          .541          .5            .458          .333
EDU            .571          .285          .142          .142          .142          .142
COMPUTER       .565          .347          .347          .26           .217          .26
DJI-13         .538          .384          .384          .461          .153          .153
BIOTECH        .524          .501          .446          .42           .376          .376
INDMATER       .522          .533          .388          .377          .211          .2
SP-100         .52           .447          .322          .333          .25           .218
SP500          .513          .463          .354          .34           .276          .214
N= 24
============================================================================================
TRANSP         .5            .4            .4            .3            .3            .3
============================================================================================
RUS-1000       .491          .44           .345          .327          .253          .201
INFRA          .485          .428          .428          .342          .228          .171
INSURANC       .468          .437          .187          .218          .187          .093
DOWJONES       .466          .4            .366          .4            .266          .166
GAMING         .464          .392          .321          .357          .357          .357
JETS           .444          .333          .555          .333          .333          .333
PIPELINE       .428          .428          .428          .428          .142          .142
GREEN          .419          .354          .225          .258          .129          .193
COAL           .4            .5            .4            .4            .1            .4
ELECTRON       .393          .303          .202          .179          .123          .112
SEMI           .369          .3            .207          .169          .107          .092
AUTO           .35           .325          .275          .4            .325          .3
BEVERAGE       .35           .25           .2            .3            .2            .15
OILGAS         .321          .364          .278          .285          .192          .207
SOLAR          .285          .19           .142          .142          0             .047
CHEM           .258          .274          .145          .161          .096          .08
HOMEBLDG       .235          .235          .235          .176          .176          .176
UTILITY        .162          .162          .139          .162          .093          .069
REIT           .044          .039          .033          .028          .033          .028
BONDFUND       0             .018          .018          0             0             .018
N = 19
|
===============================================================================
===============================================================================
2/14/2018
The median gain in the DJI after past Buy
B5s was 10.5%. If the DJI gains as much
here, we should see it reach 26730 at the next Peerless Sell. This is
not so outlandish.
After all, the September Buy B21 brought almost exactly the 17.5% gain it
had averaged
in the past.
The DJI, NASDAQ and QQQ each closed decisively above their now rising
65-dma. today
Simultaneously, the NYSE A/D Line has broken above its steep downtrend-line.
This is a bullish
combination and makes it seem that they are setting up broad trading ranges,
bounded by the
resistance at their highs at the end of January and their lows 10% down from
that a few days
ago. If this chart interpretation is correct, expect prices to fairly
easily rise until we reach the
necklines of the quickly formed head/shoulders patterns at the recent tops.
Of course, this assumes that the round number 25,000 can quickly be
surmounted. Making
the market rally now are two Labor Department reports that just came out
yesterday. The
first pegs the CPI (Inflation Rate) at 2.1% annualized. 3.2% is the
level history suggests we
have to worry about. The second is that real wages actually declined
in January. For the last
30 years, there is ample evidence in the Fed's own FOMC deliberations that
shows they|
often sought to raises rates only when rising real wages themselves posed a
threat to corporate
profits.
That we may be on our way
back to the recent highs, the DJI moved up 1% today.
As
expected, the
leaders today in the DJI-30 were its 3 highest priced components:
BA (
343.11 +8.42),
GS (269.03 +3.35) and MMM (252.36 + 4.67). But it was
. also a broad advance
today, as there were 1145
more up than down on the NYSE.
Tomorrow we will want to see follow-trough strength that lifts the SP-500,
NYSE,
OEX and
Russell-2000 above their 65-dma, too.
 |
 |
| |
Charts 2/14/2018
PEERLESS
DJI, Signals, Indicators Daily
DJI Volume 10-DayUp/Down Vol
V-Indicator
Hourly DJIA A/D Line for All
Stocks
(new) A/D
Line for SP-500 Stocks
NASDAQ
S&P
OEX
NYSE COMPQX
DJI-15 DJI-20
DJI-30
DIA
SPY
QQQ MDY
IWM
TNA
CrudeOil
FAS
GLD
BBH
IBB
JETS
JNUG
KOL
NUGT
OIH
OIL
RSX
RETL
SDS
SLV
SOXL
TECL
TMF
TNA UGA
(gasoline)
XIV YINN
Commodities:
JJC, NIB,
CHOC
CORN,
WEAT UUP
(Dollar)
AAPL ADBE
ALXN AMAT
AMGN AMD
AMZN BA
BABA BAC
BIDU
CAT CVX
DE
FB
GOOG
GS HD
IBM JPM M
(Macy's)
MSFT NFLX
NVDA QCOM
TSLA TXN
XOM WMT
ANDV (refinery),
CMG (Chipotle), LRCX,
SWKS,
TOWN
Also SPPI WATT
SQ
2/14/2018
Bullish
MAXCPs
Bearish MINCPs
Augmented Buy B20s
See how
well Buy B20s timed entrance into long positions for top 2017
stocks. |
| |
 |
 |
 |
 |
Table 1
QUICKSILVER on ETFS - 02/14/18
ETF      CLOSE   CHANGE     PIVOT-PT     5-dmaAROC   CL-PWR      CANDLE  IP21    ITRS
---------------------------------------------------------------------------------------------
DIA       249.3    2.73      238.67        11%       Bearish      BLUE   .069     ----
---------------------------------------------------------------------------------------------
COMPQX    7143.62    130.11  6777.16       66%       Bullish      BLUE   .085     .015
---------------------------------------------------------------------------------------------
SPY       269.59    3.59     257.63        36.4%     Bearish      BLUE   .03    -.009
---------------------------------------------------------------------------------------------
QQQ       162.68    2.99     153.45        78.3%     Bearish      BLUE   .021     .025
---------------------------------------------------------------------------------------------
MDY       341.38    6.14     327.4         42.9%     ----         BLUE   .082    -.039
---------------------------------------------------------------------------------------------
IWM       151.15    2.67     145.44        44.3%     ----         BLUE   .09    -.04
---------------------------------------------------------------------------------------------
FAS       69.68    3.5       60.51         135.5%    Bullish      BLUE   .137     .025
---------------------------------------------------------------------------------------------
RETL      36.5    1.94       33.31        -20.3%     Bullish      BLUE   .149     .108
---------------------------------------------------------------------------------------------
SOXL      149.69    9.42     122.3         357.3%    Bearish      BLUE   .026     .036
---------------------------------------------------------------------------------------------
TECL      120.02    6.34     101.51        272.2%    Bearish      BLUE  -.004     .066
---------------------------------------------------------------------------------------------
IBB       109.73    2.19     104.86        15%       Bullish      BLUE   .082     .01
---------------------------------------------------------------------------------------------
GLD       128.23    2.15     124.98        137.4%    ----         BLUE  -.088     .026
---------------------------------------------------------------------------------------------
OIL       6.65    .21        6.58         -107.1%    Bearish      BLUE   .036     .032
---------------------------------------------------------------------------------------------
OIH       24.34    .36       24.2         -215.7%    Bearish      BLUE  -.119    -.07
---------------------------------------------------------------------------------------------
GASL      18.59    1.43      16.85        -176.8%    Bearish      BLUE  -.111    -.263
---------------------------------------------------------------------------------------------
UGA       30.44    .52      W30.98        -147.8%    ----         BLUE  -.001    -.056
---------------------------------------------------------------------------------------------
UUP       23.23   -.18      W23.6         -78.5%     Bearish      RED    .018    -.067
---------------------------------------------------------------------------------------------
IEF       101.74   -.62     W102.4        -27.9%     Bearish      RED   -.191    -.068
---------------------------------------------------------------------------------------------
XLU      48.6   -.55         47.56         51.6%     Bearish      RED   -.107    -.167
---------------------------------------------------------------------------------------------
WEAT      6.39   -.06        6.37         -39.1%     Bullish      ----   .144     .007
---------------------------------------------------------------------------------------------
YINN      37.02    2.99      32.74        -102.2%    Bearish      BLUE   .074     .124
---------------------------------------------------------------------------------------------
RSX       23.07    .61       21.53         211.4%    Bearish      BLUE   .002     .047
---------------------------------------------------------------------------------------------
AAPL      167.37    3.03     155.15        245.3%    ----         BLUE  -.056    -.05
---------------------------------------------------------------------------------------------
GOOG      1069.7    17.6     1001.52       101.7%    ----         BLUE   .067     .031
---------------------------------------------------------------------------------------------
MSFT      90.81    .98       85.01         67.9%     Bullish      BLUE   .009     .049
---------------------------------------------------------------------------------------------
AMZN      1451.05    36.54   1350.5        124%      Bearish      BLUE   .07     .22
---------------------------------------------------------------------------------------------
FB        179.52    6.37     171.58       -18.8%     ----         BLUE   .053    -.003
---------------------------------------------------------------------------------------------
NVDA     241.42    8.79      217.52        277%      Bullish      BLUE   .101     .193
---------------------------------------------------------------------------------------------
BA        344.85    1.69     329.66       -48.2%     Bullish      BLUE  -.047     .242
---------------------------------------------------------------------------------------------
GS        262.58    7.05     246.35        108.6%    Bullish      BLUE   .2     .026
---------------------------------------------------------------------------------------------
HD        184.69    .97      181.22       -178.5%    Bearish      BLUE   .117    -.005
---------------------------------------------------------------------------------------------
CAT        158.06    4.09    145.99        123%      ----         BLUE   .045     .089
|
Table 2
Count of Stocks in Key Tiger Directories
Date = 2018-02-14
--------------------------------------
NEWHIGHS
118
NEWLOWS
87
MAXCP
141 Professionals have turned bullish
MINCP
36
TTTNH
117 Day Traders have turned bullish
TTTNL
94
FASTUP
177 More fast-movers up for swing traders.
FASTDOWN
105
CPCROSSA
389 Ratio shows today was significant. 12:25 AM 2/15/2018
CPCROSSD
40
BIGVOLUP
3
BIGVODN
9 Small scale dumping now. |
Table 3Count of Stocks and New Highs in Key Tiger Directories
Date = 180214
No. NHs Pct
-------------------------------------------------------------------
BIGMIL 6 2 33 %
HACKERS 25 4 16 %
----------------------------------------------------
COAL 10 1 10 %
MILITARY 38 3 8 %
SOFTWARE 66 4 6 %
INFRA 35 2 6 %
RETAIL 53 3 6 %
BIOTECH 385 17 4 %
REGBANKS 33 1 3 %
NIFTY 30 1 3 %
SP-100 96 3 3 %
INSURANC 32 1 3 %
RUS-1000 837 23 3 %
CHINA 64 2 3 %
FINANCE 93 2 2 %
INDMATER 90 2 2 %
INDEXES 194 4 2 %
MORNSTAR 238 4 2 %
SP500 485 12 2 %
NASD-100 100 2 2 %
ELECTRON 178 2 1 %
REIT 178 1 1 %
COMODITY 70 1 1 %
Others none
|
Table 4
 RANKING OF KEY DIRECTORIES BASED PCT.OF STOCKS ABOVE 65-DMA
              2/14/18
 Bearish = 27
 Bullish = 17
---------------------------------------------------------------------------------------
Directory     Current       day-1         day-2         day-3         day-4         day-5
----------------------------------------------------------------------------------------
BIGMIL         .833          .833          1             .833          1             1
HOSPITAL       .75           .625          .75           .75           .625          .75
BIGBANKS       .714          .571          .571          .285          .285          .571
GOLD           .686          .333          .313          .215          .235          .274
FOOD           .666          .6            .533          .533          .6            .533
COMODITY       .657          .442          .428          .414          .5            .614
SOFTWARE       .651          .5            .484          .409          .303          .469
RETAIL         .641          .509          .452          .528          .396          .66
INDEXES        .608          .391          .35           .288          .293          .5
MILITARY       .605          .421          .421          .315          .368          .421
FINANCE        .602          .451          .43           .344          .268          .537
HACKERS        .6            .56           .52           .48           .36           .4
ETFS           .582          .388          .268          .223          .149          .388
REGBANKS       .575          .363          .333          .333          .181          .424
INDMATER       .533          .388          .377          .211          .2            .4
MORNSTAR       .508          .357          .352          .231          .176          .47
BIOTECH        .501          .446          .42           .376          .376          .48
N=17
=============================================================================================
COAL           .5            .4            .4            .1            .4            .3
NASD-100       .5            .37           .37           .38           .3            .48
============================================================================================-
CHINA          .468          .312          .218          .234          .171          .343
SP500          .463          .354          .34           .276          .222          .457
SP-100         .447          .322          .333          .25           .229          .479
RUS-1000       .44           .345          .327          .253          .209          .42
INSURANC       .437          .187          .218          .187          .093          .281
INFRA          .428          .428          .342          .228          .171          .457
PIPELINE       .428          .428          .428          .142          .142          .571
DOWJONES       .4            .366          .4            .266          .2            .466
NIFTY          .4            .333          .333          .3            .233          .4
TRANSP         .4            .4            .3            .3            .3            .5
GAMING         .392          .321          .357          .357          .357          .571
DJI-13         .384          .384          .461          .153          .153          .538
OILGAS         .364          .278          .285          .192          .207          .371
GREEN          .354          .225          .258          .129          .193          .193
COMPUTER       .347          .347          .26           .217          .26           .26
JETS           .333          .555          .333          .333          .333          .333
AUTO           .325          .275          .4            .325          .325          .375
ELECTRON       .303          .202          .179          .123          .112          .207
SEMI           .3            .207          .169          .107          .1            .184
EDU            .285          .142          .142          .142          .142          .142
CHEM           .274          .145          .161          .096          .08           .258
BEVERAGE       .25           .2            .3            .2            .15           .3
HOMEBLDG       .235          .235          .176          .176          .176          .294
SOLAR          .19           .142          .142          0             .047          .095
UTILITY        .162          .139          .162          .093          .069          .116
REIT           .039          .033          .028          .033          .028          .033
BONDFUND       .018          .018          0             0             .018          .018
N = 27
|
==============================================================================
==============================================================================
2/13/2018
The current Peerless
Buy B5 predicts more
than a 9% jump in the DJI by the
time of the next Peerless Sell signal, assuming the median rise after this
signal
plays out. True, the Closing Powers and 5-day moving averages are
still falling
for DIA, SPY,
QQQ and the NASDAQ
and true the DJI and the other key
indexes must still get past their 65-dma, but Buy B5s have always been profitable.
As usually happens, it is up to the DJI to lead the market up. But we
have to be
impressed today that there were more than 600 advancers on the NYSE as well
as
how the most Bullish MAXCPs are
doing. Note, we still do not see enough Bullish
MAXCP stocks, however, to be complacent. So stay short a few of the
Bearish
MINCPs is my counsel.
We definitely want to be buyers of some the
augmented
B20 special situations.
See their amazing success in 2017-2018.
Positive OBVPct with DJI below the Lower Band
There's another interesting statistic now that we may be able to learn from
by looking at
its history. The DJI closed 3.7% below its 21-day ma and the OBVPct
stands at a
positive +.143. See Table A below. The conclusion I reach
looking at all 12 past
cases is that
these technical characteristics usually brings
an excellent rally after
some minor weakness but only when the DJI is still in a bull market and
above a rising
200-day ma. Otherwise, a positive OBVPct
when the DJI is below its 200-day ma
can be a very bearish sign, notably in 1930 and 2008.
The CPI figures, just out, show that the 12-month rate of inflation is
holding steady
at 2.1%. This is 1% less than the level that my research shows is
dangerous.
(
https://www.bls.gov/news.release/cpi.nr0.htm )
Watch the "la/ma" number. We need to see it rise above .965 to show
that the
DJI is coming back within our normal 3.5% bands.

STOCKS: Augmented Buy B20s
(Takeoff velocity reached)
When we look at the best performing stocks of 2017, we find, as usual, that
about
75% show flat top breakouts with the Accumulation Index either bulging above
+.375
in the month or two before the breakout or during the breakout. This
we have found
to be true in all our yearly studies of super stocks going back to the
1980s.
One important additional finding should be noticed. A Tiger Buy B20
occurred early on,
in a very timely manner, for nearly all of 2017's super-stocks.
As a result, I want to start
showing the best of the Tiger Buy
B20s here several times a week. By downloading
BIG17 (that is the name I have given the 48 top performing stocks of 2017)
from our
Tiger Data Page, you can readily replicate these findings. Because of
this study's
significance, you can now also download the full list of BUYB20s for the
last two
weeks, too, and inspect them more closely.
Here are the next best 12 best performing stocks of 2017. All
but one had
nearly perfect Buy
B20s at the start of their move.
I'm quite stunned by their
success here. This is quite amazing.
You can readily replicate these results yourself.
Charts 2/13/2018
PEERLESS
DJI, Signals, Indicators Daily
DJI Volume 10-DayUp/Down Vol
V-Indicator
Hourly DJIA A/D Line for All
Stocks
(new) A/D
Line for SP-500 Stocks
NASDAQ
S&P
OEX
NYSE COMPQX
DJI-15 DJI-20
DJI-30
DIA
SPY
QQQ MDY
IWM
TNA
CrudeOil
FAS
GLD
BBH
IBB
JETS
JNUG
KOL
NUGT
OIH
OIL
RSX
RETL
SDS
SLV
SOXL
TECL
TMF
TNA UGA
(gasoline)
XIV YINN
Commodities:
JJC, NIB,
CHOC
CORN,
WEAT UUP
(Dollar)
AAPL ADBE
ALXN AMAT
AMGN AMD
AMZN BA
BABA BAC
BIDU
CAT CVX
DE
FB
GOOG
GS HD
IBM JPM M
(Macy's)
MSFT NFLX
NVDA QCOM
TSLA TXN
XOM WMT
ANDV (refinery),
CMG (Chipotle), LRCX,
SWKS,
TOWN
Also SPPI WATT
SQ
2/13/2018
Bullish
MAXCPs
Bearish MINCPs
Augmented Buy B20s
 |
Table A
Special Study
Conditions:
DJI is below the 3.5% lower band and the OBVPct is above +.12
In addition, the P-I and IP21 were negative, as now.
Date
DJIA
LA/MA
P-I
IP21 1 19290524 305.6 .961 -98.4 -.071
RISING 200 DMA. Bull market.
DJI fell from 305.6 to 293.4 on 5/27/1929. DJI then rallied to 381 on 9/3/29.
----------------------------------------------------------------------------------------------
2 19300428 276.9 .959 -74.9 -.028
DJI began a long bear market.
----------------------------------------------------------------------------------------------
3 19300609 250.8 .93 -52 -.123
DJI turned down again and fell sharply.
----------------------------------------------------------------------------------------------
4 19300814 221.1 .95 -67 -.046
DJI immediately rallied from 221.1 to 244.3 on 9/9/30.
----------------------------------------------------------------------------------------------
5 19320602 47.3 .899 -103.9 -.084
DJI based and 3 wks later rose dramatically from 42.8 to 79.9 on 9/7/32.
----------------------------------------------------------------------------------------------
6 19340502 98.8 .95 -32.3 -.038
DJI fell immediately to 91.8 on 5/14/34.
----------------------------------------------------------------------------------------------
7 19390810 137.3 .965 -19.8 -.05
DJI fell immediately to 131.3 on 8/24/1939. But then jumped to 155.9 on 9/12/1039
----------------------------------------------------------------------------------------------
8 19730814 870.71 .956 -142.1 -.035
DJI fell immediately to 851.9 on 8/22/1973. But then jumped to 987.06 on 10/26/73.
----------------------------------------------------------------------------------------------
9 19860717 1781.78 .962 -82.8 -.034
RISING 200 DMA. Bull market.
DJI fell to 1766.87 on 7/29/1986. But then jumped to 1919.71 on 9/4/86.
----------------------------------------------------------------------------------------------
10 20070803 13181.91 .965 -428.6 -.071
RISING 200 DMA. Bull market.
DJI fell to 12845.78 on 8/16/2007. But then jumped to 14164.53 on 10/9/2007.
----------------------------------------------------------------------------------------------
11 20080104 12800.18 .958 -103.9 -.077
DJI fell to 11971.19 on 1/22/2008.
----------------------------------------------------------------------------------------------
12 20080915 10917.51 .956 -256 -.046
DJI fell to 8451.19 on 10/10/2008.
|
| |
Table 1
QUICKSILVER on ETFS -
02/13/18ETF CLOSE CHANGE PIVOT-PT 5-dma AROC CL-PWR CANDLE IP21 ITRS
---------------------------------------------------------------------------------------------
DIA 246.57 .4 W248.76 -48.8% Bearish BLUE .017 -----
---------------------------------------------------------------------------------------------
COMPQX 7013.51 31.55 W7051.98 -73.5% Bearish BLUE .01 .005
---------------------------------------------------------------------------------------------
SPY 266 .66 W267.67 -59.2% Bearish BLUE -.023 -.012
---------------------------------------------------------------------------------------------
QQQ 159.69 .82 W160.21 -82.8% Bearish BLUE -.043 .014
---------------------------------------------------------------------------------------------
MDY 335.24 .99 W338.52 -55.4% Bearish BLUE .026 -.046
---------------------------------------------------------------------------------------------
IWM 148.48 .32 W149.84 -40.9% Bearish BLUE .007 -.049
---------------------------------------------------------------------------------------------
FAS 66.18 .94 W67.93 -139.4% Bearish BLUE .061 -.011
---------------------------------------------------------------------------------------------
RETL 34.56 .6 W36.64 -131.2% Bearish BLUE .042 .041
---------------------------------------------------------------------------------------------
SOXL 140.27 -.21 140.02 -354.5% Bearish BLUE -.023 -.053
---------------------------------------------------------------------------------------------
TECL 113.68 .76 W114.04 -230.5% Bearish BLUE -.069 .006
---------------------------------------------------------------------------------------------
IBB 107.54 .19 W109.41 -84.8% Bearish BLUE -.003 .006
---------------------------------------------------------------------------------------------
GLD 126.08 .71 124.79 28% Bearish BLUE -.108 .026
---------------------------------------------------------------------------------------------
OIL 6.44 0 W6.79 -458.1% Bearish BLUE -.006 .035
---------------------------------------------------------------------------------------------
OIH 23.98 -.32 W25.39 -445.9% Bearish RED -.196 -.04
---------------------------------------------------------------------------------------------
GASL 17.16 -.73 W19.21 -1020.4% Bearish RED -.232 -.271
---------------------------------------------------------------------------------------------
UGA 29.92 .17 W31.34 -343.3% Bearish BLUE -.066 -.057
---------------------------------------------------------------------------------------------
UUP 23.41 -.13 W23.6 -2.1% Bullish ---- .025 -.048
---------------------------------------------------------------------------------------------
IEF 102.36 .17 102.31 -12.2% Bearish BLUE -.164 -.047
---------------------------------------------------------------------------------------------
XLU 49.15 .22 48.1 84.9% Bearish BLUE -.096 -.147
---------------------------------------------------------------------------------------------
WEAT 6.45 -.02 6.44 141.4% Bullish ---- .145 .044
---------------------------------------------------------------------------------------------
YINN 34.03 -.01 W37.72 -1417% Bearish BLUE .008 .015
---------------------------------------------------------------------------------------------
RSX 22.46 .28 22.14 -86.1% Bearish BLUE -.098 .021
---------------------------------------------------------------------------------------------
AAPL 164.34 1.63 159.54 41.1% Bearish BLUE -.123 -.059
---------------------------------------------------------------------------------------------
GOOG 1052.1 .16 1048.58 -136.5% Bearish BLUE .015 .015
---------------------------------------------------------------------------------------------
MSFT 89.83 .7 89.61 -84.6% Bearish BLUE -.062 .052
---------------------------------------------------------------------------------------------
AMZN 1414.51 28.28 W1416.78 -102.1% Bearish BLUE .009 .187
---------------------------------------------------------------------------------------------
FB 173.15 -3.26 W180.18 -341.7% Bearish RED -.037 -.038
---------------------------------------------------------------------------------------------
NVDA 232.63 4.6 228.8 155.7% Bearish BLUE .045 .144
---------------------------------------------------------------------------------------------
BA 343.16 -.64 W348.12 33.2% ---- BLUE -.093 .224
---------------------------------------------------------------------------------------------
GS 255.53 2.37 W257.1 -62.7% Bullish BLUE .151 .017
---------------------------------------------------------------------------------------------
HD 183.72 -.34 W191.29 -196.4% Bearish BLUE .044 .006
---------------------------------------------------------------------------------------------
CAT 153.97 1.68 W154.34 -80.4% Bearish BLUE -.003 .075
|
Table 2    Count of Stocks in Key Tiger Directories
Date = 180213
--------------------------------------
NEWHIGHS       43
NEWLOWS        75   Many stocks remain vulnerable.
MAXCP          30
MINCP          114  Professionals are still net bearish
TTTNH          46
TTTNL          223  Day Traders who fade the market are still dominant.
FASTUP         123
FASTDOWN       178
CPCROSSA       103
CPCROSSD       15
BIGVOLUP       3
BIGVODN        6
|
Table 3       New Highs by Sector
Date = 180213
               No.          NHs            Pct/
-------------------------------------------------------------------
BIGMIL         6             1             17 %
HACKERS        25            4             16 %
SOFTWARE       66            3             5 %
MILITARY       38            1             3 %
INDEXES        194           3             2 %
BIOTECH        386           8             2 %
FINANCE        93            1             1 %
ELECTRON       178           1             1 %
RUS-1000       837           6             1 %
REIT           178           1             1 %
(Others show no highs)
|
Table 4
RANKING OF KEY DIRECTORIES BASED PCT.OF STOCKS ABOVE 65-DMA
              2/13/18
---------------------------------------------------------------------------------------
Directory     Current       day-1         day-2         day-3         day-4         day-5
----------------------------------------------------------------------------------------
BIGMIL         .833          1             .833          1             1             1
HOSPITAL       .625          .75           .75           .625          .75           .75
FOOD           .6            .533          .533          .6            .533          .6
BIGBANKS       .571          .571          .285          .285          .571          .571
HACKERS        .56           .52           .48           .36           .4            .36
JETS           .555          .333          .333          .333          .333          .333
RETAIL         .509          .452          .528          .396          .66           .622
N=7
===========================================================================================
SOFTWARE       .5            .484          .409          .303          .469          .484
===========================================================================================
FINANCE        .451          .43           .344          .268          .537          .526
BIOTECH        .448          .422          .378          .378          .487          .463
COMODITY       .442          .428          .414          .5            .614          .685
INFRA          .428          .342          .228          .171          .485          .428
PIPELINE       .428          .428          .142          .142          .571          .571
MILITARY       .421          .421          .315          .368          .421          .421
COAL           .4            .4            .1            .4            .3            .4
TRANSP         .4            .3            .3            .3            .5            .45
INDEXES        .391          .35           .288          .293          .505          .572
ETFS           .388          .268          .223          .149          .402          .656
INDMATER       .388          .377          .211          .2            .4            .433
DJI-13         .384          .461          .153          .153          .538          .538
NASD-100       .37           .37           .38           .3            .48           .55
DOWJONES       .366          .4            .266          .2            .466          .466
REGBANKS       .363          .333          .333          .181          .393          .363
MORNSTAR       .357          .352          .231          .176          .47           .495
SP500          .354          .34           .276          .222          .457          .482
COMPUTER       .347          .26           .217          .26           .26           .304
RUS-1000       .345          .327          .253          .209          .42           .422
GOLD           .333          .313          .215          .235          .274          .372
NIFTY          .333          .333          .3            .233          .4            .5
SP-100         .322          .333          .25           .229          .479          .541
GAMING         .321          .357          .357          .357          .571          .571
CHINA          .312          .218          .234          .171          .328          .578
OILGAS         .278          .285          .192          .207          .371          .464
AUTO           .275          .4            .325          .325          .375          .45
HOMEBLDG       .235          .176          .176          .176          .294          .176
GREEN          .225          .258          .129          .193          .193          .129
SEMI           .207          .169          .107          .1            .192          .23
ELECTRON       .202          .179          .123          .112          .213          .247
BEVERAGE       .2            .3            .2            .15           .3            .3
INSURANC       .187          .218          .187          .093          .281          .281
CHEM           .145          .161          .096          .08           .258          .274
EDU            .142          .142          .142          .142          .142          .142
SOLAR          .142          .142          0             .047          .095          .095
UTILITY        .139          .162          .093          .069          .116          .116
REIT           .033          .028          .033          .028          .033          .033
BONDFUND       .018          0             0             .018          .018          .009
N= 38
|
==============================================================================
==============================================================================
2/12/2018
The Futures show another decline is shaping up.
We need to see the DJI refuse
to zig-zag much below 24000 and then start another rally. That,
however, is not
what happened in the past when a Buy B5 took place below a flat 65-dma.
In the two cases this happened, in
1935 and
1955, the DJI had to
make another
new low before it could rally significantly. But then it did rally
nicely.
The President's Infrastructure Spending plan is far more private than
public, says
the NY Times tonight. It is quite unlike Eisenhower's interstate
highway plan,
which was a powerful stimulus in the 1950s and 1960s. Instead, we will
see more
partisan Congressional fighting, a longer delay and in the end, probably
just
a token effort to deal with the crumbing US infrastructure. This will
give the
market an excuse to sell-off a bit here. But, little more should have
been expected.
The federal budget's deficit is already very big. If I am right, and Trump's
proosals
here are not much of a surprise, then the DJI should shrug this news off.
Watch CAT, though, to see how it reacts.
(See
https://www.nytimes.com/2018/02/12/business/trump-infrastructure-proposal.html?emc=edit_th_180213&nl=todaysheadlines&nlid=58223894
)
The DJI and leading stocks took a nice step
forward in repairing the technical
damage of last week's decline. But it is still below its flat 65-dma
and still is not
within its normal bands. There appears to be lots of resistance
overhead up to
25,000 on the Dow. From Table 1, we see that almost all the 31 items
there
are below their 5-dma pivot point and show falling Closing Powers.
From Table 1,
we note that only 4 of our 46 sectors show a majority of their stocks above
the
65-dma. There are many more stocks below the resistance of their
65-dma than
above its support. There is a great deal of pressure on the strongest
and highest
priced DJI-30 stocks, BA,
GS, UNH,
CAT... They need to hold up.
But for one day, at least, breadth was good and
we do now have a Peerless Buy B5
as the operative Peerless signal. After more base-building, the
DJI should able to
stabilize the market and then make new highs again in a month or two.
All the political-
economic factors that made the market soar last year are still in effect.
Today the NY Fed
said it believed Inflation is not yet a serious threat. Bond holders
apparently did not believe
him. Bonds and REITs rallied very little. We will be eager to
see the latest CPI numbers
later this week.
Right now, 24000 should be considered support
and 25000 considered resistance.
Owning some of the few bullish MAXCPs and holding short some of the bearish
MINCPs
would seem to be prudent and offer a high chance for a profit.

 |
Charts 2/12/2018
PEERLESS
DJI, Signals, Indicators Daily
DJI Volume 10-DayUp/Down Vol
V-Indicator
Hourly DJIA A/D Line for All
Stocks
(new) A/D
Line for SP-500 Stocks
NASDAQ
S&P
OEX
NYSE COMPQX
DJI-15 DJI-20
DJI-30
DIA
SPY
QQQ MDY
IWM
TNA
CrudeOil
FAS
GLD
BBH
IBB
JETS
JNUG
KOL
NUGT
OIH
OIL
RSX
RETL
SDS
SLV
SOXL
TECL
TMF
TNA UGA
(gasoline)
XIV YINN
Commodities:
JJC, NIB,
CHOC
CORN,
WEAT UUP
(Dollar)
AAPL ADBE
ALXN AMAT
AMGN AMD
AMZN BA
BABA BAC
BIDU
CAT CVX
DE
FB
GOOG
GS HD
IBM JPM M
(Macy's)
MSFT NFLX
NVDA QCOM
TSLA TXN
XOM WMT
ANDV (refinery),
CMG (Chipotle), LRCX,
SWKS,
TOWN
Also SPPI WATT
SQ
2/12/2018
Bullish
MAXCPs
Bearish MINCPs |
 |
 |
Table 1
QUICKSILVER on ETFS - 02/12/18 Only 5 of the 31 ETFs and leading stocks below are above their 5-day pivot points:
These include NVDA and BA
Only 2 of the 31 ETFs and leading stocks have "Bullish" Closing Powers:
WEAT and GS
ETF      CLOSE   CHANGE     PIVOT-PT   5-dma AROC   CL-PWR   CANDLE    IP21   ITRS
---------------------------------------------------------------------------------------------
DIA       246.17    4.14    W248.96        59.3%   Bearish      BLUE   .017    ----
---------------------------------------------------------------------------------------------
COMPQX    6981.96  107.47   W7115.88       10.4%   Bearish      BLUE   .018    -.005
---------------------------------------------------------------------------------------------
SPY       265.34    3.84    W269.13        26.7%   Bearish      BLUE  -.016    -.018
---------------------------------------------------------------------------------------------
QQQ       158.87    2.77    W162.31        23.7%   Bearish      BLUE  -.036     .004
---------------------------------------------------------------------------------------------
MDY       334.25    3.22    W338.94       -19%     Bearish      BLUE   .013    -.056
---------------------------------------------------------------------------------------------
IWM       148.16    1.39    W149.69        8.1%    Bearish      BLUE  -.021    -.062
---------------------------------------------------------------------------------------------
FAS       65.24    2.24     W67.99         16.2%   Bearish      BLUE   .07    -.02
---------------------------------------------------------------------------------------------
RETL      33.96   -.04      W35.47         206.4%  Bearish      RED    .054    -.003
---------------------------------------------------------------------------------------------
SOXL      140.48    7.04    W150           163.5%  Bearish      BLUE  -.033    -.046
---------------------------------------------------------------------------------------------
TECL      112.92    5.89    W118.79        156.6%  Bearish      BLUE  -.077     .012
---------------------------------------------------------------------------------------------
IBB       107.35    1.68    W109.36        7.9%    Bearish      BLUE  -.009     .007
---------------------------------------------------------------------------------------------
GLD       125.37    .6      W125.38       -53.5%   Bearish      BLUE  -.091    -.001
---------------------------------------------------------------------------------------------
OIL       6.44    .01       W7.05         -478.8%  Bearish      RED    .015     .019
---------------------------------------------------------------------------------------------
OIH       24.3    .46       W26.19        -299%    Bearish      BLUE  -.167    -.021
---------------------------------------------------------------------------------------------
GASL      17.89    1.34     W20.89        -631.9%  Bearish      BLUE  -.208    -.202
---------------------------------------------------------------------------------------------
UGA       29.75   -.51      W32.04        -446.9%  Bearish      RED   -.087    -.077
---------------------------------------------------------------------------------------------
UUP       23.54   -.08       23.42         36.1%   ----         RED    .008    -.057
---------------------------------------------------------------------------------------------
IEF       102.19   -.03     W102.61       -42.4%   Bearish      ----  -.178    -.064
---------------------------------------------------------------------------------------------
XLU      48.93    .37        48.33        -13.5%   Bearish      BLUE  -.143    -.161
---------------------------------------------------------------------------------------------
WEAT      6.47    .2         6.27          221.9%  Bullish      BLUE   .077     .032
---------------------------------------------------------------------------------------------
YINN      34.04    1.31     W44.32        -1066.5% Bearish      BLUE   .004    -.022
---------------------------------------------------------------------------------------------
RSX       22.18    .51      W22.84        -20.4%   Bearish      BLUE  -.111    -.011
---------------------------------------------------------------------------------------------
AAPL      162.71    6.3     W163.03        196.7%  Bearish      BLUE  -.13    -.068
---------------------------------------------------------------------------------------------
GOOG      1051.94    14.16  W1080.6       -18.5%   Bearish      BLUE   .043     .001
---------------------------------------------------------------------------------------------
MSFT      89.13    .95      W91.33         63.9%   Bearish      BLUE  -.068     .041
---------------------------------------------------------------------------------------------
AMZN      1386.23    46.63  W1442.84      -13.6%   Bearish      BLUE   .016     .166
---------------------------------------------------------------------------------------------
FB        176.41    .3      W185.31       -135.6%  Bearish      RED   -.007    -.021
---------------------------------------------------------------------------------------------
NVDA     228.03   -4.05      225.58        320.5%  Bearish      RED    .018     .133
---------------------------------------------------------------------------------------------
BA        343.8    10.97     340.91        222%    Bearish      BLUE  -.051     .248
---------------------------------------------------------------------------------------------
GS        253.16    3.86    W258.7         80.3%   Bullish      BLUE   .156     .021
---------------------------------------------------------------------------------------------
HD        184.06   -.06     W91.04         25.5%   Bearish      RED   -.003     .01
---------------------------------------------------------------------------------------------
CAT        152.29    3.08   W156.41        40%     Bearish      BLUE  -.005     .075
|
Table 2
Count of Stocks in Key Tiger Directories
Date = 180212
--------------------------------------
NEWHIGHS       31
NEWLOWS        71

MAXCP          14
MINCP          159    Professionals are in no hurray to play this rally
                      with most stocks.

TTTNH          25
TTTNL          359    Day Traders will keep playing fades from higher openings
                      for a while longer.

FASTUP         126
FASTDOWN       146

CPCROSSA       69
CPCROSSD       28

BIGVOLUP       7
BIGVODN        9      Dumping has largely stopped.
|
Table 3Count of Stocks and New Highs in Key Tiger Directories
Date = 180212
-------------------------------------------------------------------
HACKERS 25 1 4 %
FINANCE 93 1 1 %
INDEXES 194 2 1 %
ELECTRON 178 2 1 %
BIOTECH 386 3 1 %
---------------------------------------------------
All other have none...
|
Table 4
 RANKING OF KEY DIRECTORIES BASED PCT.OF STOCKS ABOVE 65-DMA
              2/12/18
   Bearish = 41
   Bullish = 5
---------------------------------------------------------------------------------------
Directory     Current       day-1         day-2         day-3         day-4         day-5
----------------------------------------------------------------------------------------
BIGMIL         1             .833          1             1             1             1
HOSPITAL       .75           .75           .625          .75           .75           .75
BIGBANKS       .571          .285          .285          .571          .571          .285
FOOD           .533          .533          .6            .533          .6            .533
HACKERS        .52           .48           .36           .4            .36           .36
N=5
============================================================================================
SOFTWARE       .484          .409          .303          .469          .484          .439
DJI-13         .461          .153          .153          .538          .538          .23
RETAIL         .452          .528          .396          .66           .622          .452
FINANCE        .43           .344          .268          .537          .537          .408
COMODITY       .428          .414          .5            .614          .685          .671
PIPELINE       .428          .142          .142          .571          .571          .571
BIOTECH        .422          .378          .378          .487          .466          .417
MILITARY       .421          .315          .368          .421          .473          .447
COAL           .4            .1            .4            .3            .4            .4
DOWJONES       .4            .266          .2            .466          .466          .3
AUTO           .384          .307          .307          .358          .435          .333
INDMATER       .377          .211          .2            .4            .433          .388
NASD-100       .37           .38           .3            .48           .55           .44
GAMING         .357          .357          .357          .571          .571          .607
MORNSTAR       .352          .231          .176          .47           .495          .348
INDEXES        .345          .288          .293          .505          .603          .396
INFRA          .342          .228          .171          .485          .428          .342
SP500          .34           .276          .222          .457          .482          .377
JETS           .333          .333          .333          .333          .333          .333
NIFTY          .333          .3            .233          .4            .5            .4
REGBANKS       .333          .333          .181          .393          .393          .303
SP-100         .333          .25           .229          .479          .541          .364
RUS-1000       .327          .253          .209          .42           .43           .35
GOLD           .313          .215          .235          .274          .372          .431
BEVERAGE       .3            .2            .15           .3            .3            .35
TRANSP         .3            .3            .3            .5            .45           .4
OILGAS         .285          .192          .207          .371          .464          .407
ETFS           .268          .223          .149          .402          .656          .507
COMPUTER       .26           .217          .26           .26           .347          .304
GREEN          .258          .129          .193          .193          .161          .129
CHINA          .218          .234          .171          .328          .578          .515
INSURANC       .218          .187          .093          .281          .281          .281
ELECTRON       .179          .123          .112          .213          .258          .191
HOMEBLDG       .176          .176          .176          .294          .176          .117
SEMI           .169          .107          .1            .192          .238          .176
UTILITY        .162          .093          .069          .116          .093          .093
CHEM           .161          .096          .08           .258          .274          .177
EDU            .142          .142          .142          .142          .142          .142
SOLAR          .142          0             .047          .095          .095          .047
REIT           .028          .033          .028          .033          .033          .028
BONDFUND       0             0             .018          .018          .009          .018
Bearish = 41
|
==============================================================================
==============================================================================
2/9/2018
It is extremely rare for the DJI to drop more
10% from its highs after
just the first Sell S9. The
current Buy B15 is not
abated. hindered or denied
by the recent Sell S9. But the flat 65-dma and its resistance up to 25000
is apt to be a problem for the rebound which the new B5 and the Futures are
producing. Unless Up-Volume surges dramatically, possibly because
Fed Chairman Powell speaks out dovishly, more basing will probably be
needed.
The DJI needs to get back within its normal 3.5% bands and stay there for a
few weeks to show what happened last week was just a aberration. My
opinion
is that until all the VIX-related leveraged derivatives are eliminated from
the market,
most traders will be nervous and they will be quick to take rebound profits.
Others
will use these VIX-related derivatives right up to the very last day that
they
are allowed. And as we have seen, these tools are a double-edged
sword. They
can cut down share prices very quickly.
It's nice to see that the bulls still have enough fire-power to turn the market around.
The DJI
could not be forced down Friday. In the last two hours the key major
market
indexes all reversed. Instead of a Buy B19 (two-day reversal day Buy
signal),
Peerless gave us a new Buy B5. This is reliably bullish even when it
occurs
with the DJI looking quite scary. See all the cases of past B5s below
in Table A.
and all the charts of the
past B5s.
But in the two prior cases when the B5 occurred
below
a flat 65-dma, the DJI's recovery was
short-lived, could not get past
its 65-dma and needed to build a better base by making more minor lows.
Those
were the cases of 1935 and 1956.
The new Buy B5 is bullish. Watch the
NYSE A/D Line. It needs to move up,
at least a little. But, the worst of the decline may now be
over...unless, of course,
the FED under Chairman Powell is going to more aggressively raise rates or
more
aggressively dispose of its $5 trillion in Debt Instruments. Assuming,
this is not so,
I would think the market will gradually calm down over the next month.
Of course,
there might still be another rogue influence on the market. But I do
not see any big
banks about to collapse. It's true that General Electric looks very
weak. A plunge
downward by it now would certainly spook the market and that could set off
another
leg down in the DJI and SP-500 as all the computerized sell programs again
kick in.
So, it looks like the DJI will try to rally the market back up to the 65-dma
now at 24728. That level is likely to offer too much resistance and
the DJI
will most likely then need to fall back to 23730 and build a better base
from which to rally. That would also give the market time to show that
the
recent volatility is subsiding. That would give the DJI time to come
back
within its normal 3.5% bands and rally after then testing its lower 3.5%
band.
perhaps like occurred in October-November 1989.
What the DJI does, so
will the NASDAQ, SP-500 and QQQ do. They are all moving in lock-step,
again showing the dominant influence of computerized trading
New Buy B5 CAN reverse S9,
especially when the S9 was first in 10 Months.
Closest Parallels with Now
3/11/1935 - DJI was below a flat 65-dma, DJI
needed to drop to new news before rallying above 65-dma.
10/7/1956 - DJI was below a flat 65-dma, DJI
needed to drop to new news before rallying above 65-dma.
2/9/2014 - DJI was below a flat
65-dma.
1935
 |
1956
 |
           Past Peerless Buy B15s:
               1929-2018

Date          Signal     DJI       Gain       Paper Loss
#1 19281212      B5         266.8     .172       none
                     Key Values
.949	-.123	-29	-6	-.004	-535	.048	.103   .37   (type 1)
la/ma   aroc    P      p-cha    IP21    V-I     OP      65d-up 65-aroc
-----------------------------------------------------------------------------
#2 19321101      B5         60.2      .09        none        0          (type 1)
.952	-.123	-29	-6	-.004	-535	.048	.103   .37
la/ma   aroc    P      p-cha    IP21    V-I     OP      65d-up 65-aroc
-----------------------------------------------------------------------
#3 19330616      B5         89.2      .121       none        0          (type 4)
1.002    .886   85     -36       .092    194    .237    .436   1.41
la/ma   aroc    P      p-cha    IP21    V-I     OP      65d-up 65-aroc
----------------------------------------------------------------------
#4 19350311      B5         99.4    .356       96.7     -.010    3/14 (type 4)
.967    -.093   -47      -2     -.027   -103    .065    -.032  -.130
la/ma   aroc    P      p-cha    IP21    V-I     OP      65d-up 65-aroc
----------------------------------------------------------------------
#5 19481116      B5        176.2      .023       171.2    -.028    11/30 (type 4)
.961    -.538   33      -1     -.114   -88    .154    -.018    -.07
la/ma   aroc    P      p-cha    IP21    V-I     OP      65d-up 65-aroc
----------------------------------------------------------------------
#6 19551007      B5        458.2      .132       438.6    -.048    10/11  (type 4)
.969    -.425   -30    -30      .074   -343    .094    -.005    -.02
la/ma   aroc    P      p-cha    IP21    V-I     OP      65d-up 65-aroc
----------------------------------------------------------------------
#7 19631122      B5        711.5      .320       none       0             (type 1)
.953    -.557  -151    -40     -.141  -1021    .016    -.006    -.03
la/ma   aroc    P      p-cha    IP21    V-I     OP      65d-up 65-aroc
----------------------------------------------------------------------
#8 19780627      B5        817.31     .107       none       0             (type 4)
.970    -.203  -114     3     -.11     -1     .072     .08     .28
la/ma   aroc    P      p-cha    IP21    V-I     OP      65d-up 65-aroc
----------------------------------------------------------------------
#9 19860717      B5       1781.78     .032       1769.97  -.005      8/4  (type 4)
.963    -.539  -83     +29      -.034     -11     .151   -.016    -.06
la/ma   aroc    P      p-cha    IP21    V-I     OP      65d-up 65-aroc
----------------------------------------------------------------------
#10 19870414      B5       2253.98     .039       2230.54  -.010      4/27  (type 4)
.966     .028 -203     -48     .108     -17     .213    .121     .42
la/ma   aroc    P      p-cha    IP21    V-I     OP      65d-up 65-aroc
----------------------------------------------------------------------
#11 19880328      B5       1998.34     .056       none       0              (type 4)
.964    -.252 -35     -38      .08     -6     .005    .013     -.05
la/ma   aroc    P      p-cha    IP21    V-I     OP      65d-up 65-aroc
----------------------------------------------------------------------
#12 19891013      B5       2569.26     .094       perfect    0              (type 1)
.947    -.419 -73     -36      .007    -7     .143    .014     .05
la/ma   aroc    P      p-cha    IP21    V-I     OP      65d-up 65-aroc
----------------------------------------------------------------------
#13 20090623      B5       8322.91    .237       perfect    0               (type 4)
.968     .063  36     -14      .011   -115    .032    .143     .48
la/ma   aroc    P      p-cha    IP21    V-I     OP      65d-up 65-aroc
----------------------------------------------------------------------
#14 20111123      B5       11257.55    .075       none       0              (type 1)
.946    -.449  -153     -17      .001   -152    .042    .007     .02
la/ma   aroc    P      p-cha    IP21    V-I     OP      65d-up 65-aroc
----------------------------------------------------------------------
     N=14    Avg.=13.2%  Median Gain = 10.5% Avg  Paper Loss=0.7%
======================================================================
20180209      B5       24190.90                                           (type 4)
.941    -.545  -314    57       .003   -127    .139    .027     .09
lowest         lowest  highest
la/ma   aroc    P      p-cha    IP21    V-I     OP      65d-up 65-aroc
----------------------------------------------------------------------
|
What Will Boost The DJI To New Highs.
(From our San Diego Tiger User
Group Meeting on Saturday.)
Charts 2/9/2018
PEERLESS
DJI, Signals, Indicators Daily
DJI Volume 10-DayUp/Down Vol
V-Indicator
Hourly DJIA A/D Line for All
Stocks
(new) A/D
Line for SP-500 Stocks
NASDAQ
S&P
OEX
NYSE COMPQX
DJI-15 DJI-20
DJI-30
DIA
SPY
QQQ MDY
IWM
TNA
CrudeOil
FAS
GLD
BBH
IBB
JETS
JNUG
KOL
NUGT
OIH
OIL
RSX
RETL
SDS
SLV
SOXL
TECL
TMF
TNA UGA
(gasoline)
XIV YINN
Commodities:
JJC, NIB,
CHOC
CORN,
WEAT UUP
(Dollar)
AAPL ADBE
ALXN AMAT
AMGN AMD
AMZN BA
BABA BAC
BIDU
CAT CVX
DE
FB
GOOG
GS HD
IBM JPM M
(Macy's)
MSFT NFLX
NVDA QCOM
TSLA TXN
XOM WMT
ANDV (refinery),
CMG (Chipotle), LRCX,
SWKS,
TOWN
Also SPPI WATT
SQ
2/9/2018
Bullish
MAXCPs
Bearish MINCPs |
Table 1
QUICKSILVER on ETFS - 02/09/18
  Only 2 of these closed above their 5-dma pivot points: Dollar (UUP and Wheat)
  Only Wheat shows rising Closing Powers,
  but RETL, UUP, MSFT, NVDA, BA, GS and HD have closed above they 5-dma pivot-points.
ETF      CLOSE   CHANGE     PIVOT-PT     5dma AROC  CL-PWR      CANDLE  IP21   ITRS
---------------------------------------------------------------------------------------------
DIA       242.03    3.36    W243.27       -261.2%   Bearish      BLUE   .015     0
---------------------------------------------------------------------------------------------
COMPQX    6874.49    97.33  W6967.53      -260.6%   Bearish      BLUE  -.006    -.021
---------------------------------------------------------------------------------------------
SPY       261.5    3.87     W263.93       -261.5%   Bearish      BLUE  -.013    -.021
---------------------------------------------------------------------------------------------
QQQ       156.1    2.65     W158.12       -266.4%   Bearish      BLUE  -.041    -.019
---------------------------------------------------------------------------------------------
MDY       331.03    3.63    W335.52       -256.8%   Bearish      BLUE   .017    -.049
---------------------------------------------------------------------------------------------
IWM       146.77    1.33    W147.92       -236.4%   Bearish      ----  -.016    -.055
---------------------------------------------------------------------------------------------
FAS       63    2.49        W65.03        -878.7%   Bearish      ----   .086    -.018
---------------------------------------------------------------------------------------------
RETL      34    .69          32.54        -318.6%   Bearish      BLUE   .112     .087
---------------------------------------------------------------------------------------------
SOXL      133.44    11.14   W136.02       -836.1%   Bearish      BLUE  -.038    -.205
---------------------------------------------------------------------------------------------
TECL      107.03    5.52    W109.47       -779.6%   Bearish      BLUE  -.09    -.094
---------------------------------------------------------------------------------------------
IBB       105.67    .81     W107.18       -297.9%   Bearish      BLUE  -.005     .003
---------------------------------------------------------------------------------------------
GLD       124.77   -.21     W126.71       -64.5%    Bearish      BLUE  -.085     0
---------------------------------------------------------------------------------------------
OIL       6.43   -.15       W7.09         -617.8%   Bearish      RED   -.045     .018
---------------------------------------------------------------------------------------------
OIH       23.84   -.36      W25.8         -582.1%   Bearish      RED   -.145    -.023
---------------------------------------------------------------------------------------------
GASL      16.55   -.3       W20.26        -1423.3%  Bearish      RED   -.211    -.245
---------------------------------------------------------------------------------------------
UGA       30.26   -.72      W32.56        -469.8%   Bearish      RED   -.103    -.064
---------------------------------------------------------------------------------------------
UUP       23.62    .02       23.37         74.6%    Bullish      ----   .032    -.042
---------------------------------------------------------------------------------------------
IEF       102.22   -.18     W03.06        0%        Bearish      BLUE  -.164    -.054
---------------------------------------------------------------------------------------------
XLU      48.56    1         W49.06        -135.8%   Bearish      BLUE  -.181    -.154
---------------------------------------------------------------------------------------------
WEAT      6.27   -.1         6.19          15.9%    Bullish      RED    .052     .024
                                           rising
---------------------------------------------------------------------------------------------
YINN      32.73   -.01      W42.13        -1571.5%  Bearish      BLUE  -.009    -.105
---------------------------------------------------------------------------------------------
RSX       21.67    .14      W22.27        -293%     Bearish      ----  -.096    -.043
---------------------------------------------------------------------------------------------
AAPL      156.41    1.26    W156.49       -128.7%   Bearish      RED   -.166    -.112
---------------------------------------------------------------------------------------------
GOOG      1037.78    36.26  W1055.8       -349.7%   Bearish      BLUE   .057    -.025
---------------------------------------------------------------------------------------------
MSFT      88.18    3.17      88           -201.9%   Bearish      BLUE  -.063     .023
                            bullish
---------------------------------------------------------------------------------------------
AMZN      1339.6   -10.9    W1390         -321.3%   Bearish      RED    .005     .107
---------------------------------------------------------------------------------------------
FB        176.11    4.53    W181.26       -389.9%   Bearish      BLUE  -.041    -.05
---------------------------------------------------------------------------------------------
NVDA     232.08    14.56     213.7        -32.2%    Bearish      RED    .04      .086
                            bullish
---------------------------------------------------------------------------------------------
BA        332.83    3.17     328.88       -237%     Bearish      RED   -.041     .226
                            bullish
---------------------------------------------------------------------------------------------
GS        249.3    2.95      249.11       -211.2%   ----        RED    .163      .026
                            bullish
---------------------------------------------------------------------------------------------
HD        184.12    2.9      183.11       -261.8%   Bearish      BLUE   .065     .027
                            bullish
---------------------------------------------------------------------------------------------
CAT        149.21    3.22   W151.08       -270.5%   Bearish      BLUE   .007     .058
|
Table 2 Count
of Stocks in Key Tiger Directories
Date = 180209
--------------------------------------
NEWHIGHS 28
NEWLOWS 171
MAXCP 16
MINCP 381
TTTNH 36
TTTNL 806
FASTUP 73
FASTDOWN 485
CPCROSSA 60
CPCROSSD 34
BIGVOLUP 1
BIGVODN 45 |
Table 3Count of Stocks and New Highs in Key Tiger Directories
Date = Date = 2018.02.09
------------------------------------------------
No. NHs Pct.
------------------------------------------------
HACKERS 25 2 8 %
SOFTWARE 66 2 3 %
INDEXES 194 3 2 %
FINANCE 93 1 1 %
ELECTRON 177 1 1 %
BIOTECH 386 2 1 %
===================================================
All the rest have none.
Monday, we may have to switch to showing
the percent of SECTORS at new 12-month lows.
|
| |
Table 4
 RANKING OF KEY DIRECTORIES BASED PCT.OF STOCKS ABOVE 65-DMA
              2/9/18
 Bullish = 42
 Bearish = 4
---------------------------------------------------------------------------------------
Directory     Current       day-1         day-2         day-3         day-4         day-5
----------------------------------------------------------------------------------------
BIGMIL         .833          1             1             1             1             1
HOSPITAL       .75           .625          .75           .75           .75           .875
FOOD           .533          .6            .533          .6            .466          .733
RETAIL         .528          .396          .66           .622          .49           .698
N=4
==========================================================================================
HACKERS        .48           .36           .4            .36           .36           .6
COMODITY       .414          .5            .614          .685          .657          .771
SOFTWARE       .409          .303          .469          .484          .439          .712
NASD-100       .38           .3            .48           .55           .44           .69
BIOTECH        .378          .378          .487          .466          .419          .536
GAMING         .357          .357          .571          .571          .607          .714
FINANCE        .344          .268          .537          .537          .419          .774
JETS           .333          .333          .333          .333          .333          .555
REGBANKS       .333          .181          .393          .393          .333          .696
AUTO           .325          .325          .375          .45           .35           .6
MILITARY       .315          .368          .421          .473          .447          .736
NIFTY          .3            .233          .4            .5            .4            .666
TRANSP         .3            .3            .5            .45           .4            .75
INDEXES        .288          .293          .505          .603          .402          .824
BIGBANKS       .285          .285          .571          .571          .285          .857
SP500          .276          .222          .457          .482          .381          .645
DOWJONES       .266          .2            .466          .466          .333          .733
RUS-1000       .253          .209          .42           .43           .354          .608
SP-100         .25           .229          .479          .541          .375          .77
CHINA          .234          .171          .328          .578          .515          .64
MORNSTAR       .231          .176          .47           .495          .365          .752
INFRA          .228          .171          .485          .428          .371          .571
ETFS           .223          .149          .402          .656          .507          .865
COMPUTER       .217          .26           .26           .347          .304          .652
GOLD           .215          .235          .274          .372          .431          .49
INDMATER       .211          .2            .4            .433          .4            .566
BEVERAGE       .2            .15           .3            .3            .35           .6
OILGAS         .192          .207          .371          .464          .407          .514
INSURANC       .187          .093          .281          .281          .281          .562
HOMEBLDG       .176          .176          .294          .176          .117          .235
DJI-13         .153          .153          .538          .538          .307          .692
EDU            .142          .142          .142          .142          .142          .142
PIPELINE       .142          .142          .571          .571          .571          .571
GREEN          .129          .193          .193          .161          .129          .483
ELECTRON       .118          .107          .209          .254          .186          .389
SEMI           .107          .1            .192          .238          .184          .33
COAL           .1            .4            .3            .4            .4            .5
CHEM           .095          .079          .253          .269          .174          .349
UTILITY        .093          .069          .116          .093          .093          .162
REIT           .033          .028          .033          .033          .028          .067
BONDFUND       0             .018          .018          .009          .018          .018
SOLAR          0             .047          .095          .095          .047          .142
N=42
|
==============================================================================
2/8/2018
How do we explain today's 1000-point decline?
Strictly speaking, right
after the DJI, SPY and the NASDAQ broke their 65-day
moving averages,
numerous computerized Sell programs were triggered. All this was just
too much
highly leveraged selling on down-ticks for buyers to be found except when
the
DJI
had fallen
exactly 10% from its highs. We closed at the
key support.
Now the Futures are bouncing up a bit. But recent
rallies have shown an
over-whelming
tendency to fail
and all the leveraged tools to sell short on down-ticks are
sure to be employed again when the rally peters out. So be very careful.
There's another explanation for the current
sell-off. Wall
Street is a "cry-baby".
(Read about the 1907 Crash, for example, and how JM Morgan and Rockefeller
threatened President Theodore Roosevelt with a market panic and recession if
he did not cease his plans to break up the biggest Steel and Banking trusts
of the
day. Or read how President Kennedy's threats against US Steel started the
1962
bear market even before the Cuban Missile Crisis). Wall Street is simply
whining for
more of the
mother's milk of Federal Reserve subsidies. Unfortunately, the Fed seems
loathe
now to
oblige. It says it is committed to 3 rate hikes in 2018.
So, hold onto your hats (and your cash), this elevator acts like an Express
going down. It's stopped at the 10% down level today, but the
Street
level is 20% down from the highs and below that is a very dark bear market-
basement. Exaggeration? I hope so. But the
simple truth is
that this extreme
volatility now makes the market very risky to be long.
When the volatility
returns to normal we can more safely go long again.
The TigerSoft Volatility Index here simply shows the
daily percent change and plots a 10-dma. of it.
This much downside volatility usually occurs
at the start of a bear market or a much deeper
correction than we have seen so far. More on this
Sunday.
I think that it's highly significant that the VIX-related hedging
may be taken away from traders next month. These tools are suddenly
in too much demand and way too hot to safely handle. Just
by themselves, they can make a 1000 stocks plunge 10% in two hours.
Perhaps, even more. History shows that the NYSE, SEC and FED
are not willing to curb the use of leverage derivatives, because
Wall Street keeps insisting on them despite their dangers to the
whole system. So, my advise is watch out BELOW if the
10%-down support gives way.
(
https://www.google.com/search?source=hp&ei=rXx9WoOOIMeP0gKEpr34CA&q=vix+volatility+etf+to+be+abolished&oq=vix+volatility+etf+to+be+abolished&gs_l=psy-ab.3...2904.30147.0.30461.46.34.5.7.7.0.109.2610.33j1.34.0....0...1c.1.64.psy-ab..0.43.2508...0j46j0i131k1j0i46k1j0i10k1j0i22i30k1j33i22i29i30k1j33i160k1j33i21k1.0.Ew5nLxBUbGc
)
Why Should We Trust A Bounce?
What happens if the DJI fails to hold here? All this volatility is new
and extremely
dangerous. The misgivings I reported about the Buy B19 seem justified.
I would
formally withdraw
the recent Buy B19 (because of the 30:1 down-volume to
up-volume ratio on the day
before the signal.) and consider the Sell S9
not yet reversed.
True the DJI is down 10%.
But the Federal Reserve offers no reassurances
of support
if there is more weakness. That is what Wall Street wants to hear.
Without such FED guarantees of injections of new money into the market via
the
big Banks, there is way too much risk. This is a bull market going on nine years old.
People are
rightly nervous.
It will not take much more price weakness to cause
another wave of selling, some of it by computers and some of it by investors
who want to grab their profits while they
still can. Most of us have been schooled
into thinking that it was the Fed more than anything
else that
gave us the long bull
market.
Now they may be able to take it all away. As a result, Wall Street now bears the
burden on proof that
its can be
safely weaned away from Federal Reserve largesse
without tantrum and a
dangerous panic.
The evidence, so far this month, given how
many ways
there are to hedge with leveraged
short ETFs, is that Wall Street
cannot easily abide the withdrawal of
virtually free FED money.
So stay short lots of our
Bearish MINCPs. Limit your long exposure until the
market
calms down,
to the best Bullish MAXCPs that still show a "bullish" rated Closing Power.
Above all, be very
wary of overnight trading traps and remember how sell-offs on
Fridays very
often spill-over dramatically to Mondays.
Another Peerless Change
Peerless will now have be revised so that
no B19s (two day
reversals) are
allowed when the first day (the down day) has 30 times more
down-volume on NYSE than up-volume and the DJI is still not down
at least 5.5% from the 21-dma When a B19 occurs with this much
downside volume, we so not want to "chase" and deploy the B19
when there is no "headroom".
The only case where there was this much downside selling on the first
day of the B19 pair of days was in October 1997. As you can see just
below the the successful B19 there occurred at a lower level in relation
to the 21-dma, there was less an increase in volatility than now and
the DJI still had to fall to 13.5% below its peak. If we take this
case
as a model, there should be more of a decline than just to the 10%
"correction" level. Accordingly, the revised Peerless code will
allows
a very lop-sided first day down IF it occurs with the DJI closing on the
second day below the 5% lower band. (More information on this
Sunday.)
1997's B10 Worked but at a lower level
and only when volatility calmed down.
 |
 |
Charts 2/8/2018
PEERLESS
DJI, Signals, Indicators Daily
DJI Volume 10-DayUp/Down Vol
V-Indicator
Hourly DJIA A/D Line for All
Stocks
(new) A/D
Line for SP-500 Stocks
NASDAQ
S&P
OEX
NYSE COMPQX
DJI-15 DJI-20
DJI-30
DIA
SPY
QQQ MDY
IWM
TNA
CrudeOil
FAS
GLD
BBH
IBB
JETS
JNUG
KOL
NUGT
OIH
OIL
RSX
RETL
SDS
SLV
SOXL
TECL
TMF
TNA UGA
(gasoline)
XIV YINN
Commodities:
JJC, NIB,
CHOC
CORN,
WEAT UUP
(Dollar)
AAPL ADBE
ALXN AMAT
AMGN AMD
AMZN BA
BABA BAC
BIDU
CAT CVX
DE
FB
GOOG
GS HD
IBM JPM M
(Macy's)
MSFT NFLX
NVDA QCOM
TSLA TXN
XOM WMT
ANDV (refinery),
CMG (Chipotle), LRCX,
SWKS,
TOWN
Also SPPI WATT
SQ
2/8/2018
Bullish
MAXCPs
Bearish MINCPs |
Table 1
QUICKSILVER on ETFS - 02/08/18
  Only 2 of these closed above their 5-dma pivot points: Dollar (UUP and Wheat)
  Only 2 show rising Closing Powers: These are the leaders: Dollar (UUP and Wheat)
ETF      CLOSE   CHANGE     PIVOT-PT   5-dma AROC   CL-PWR     CANDLE   IP21    ITRS
---------------------------------------------------------------------------------------------
DIA       238.67   -10.09    254.93       -456.2%   Bearish      RED   -.051     -----
---------------------------------------------------------------------------------------------
COMPQX    6777.16   -274.82  7240.95      -425.5%   Bearish      RED    .037    -.027
---------------------------------------------------------------------------------------------
SPY       257.63   -10.04    275.45       -441%     Bearish      RED   -.059    -.022
---------------------------------------------------------------------------------------------
QQQ       153.45   -6.76     164.61       -446.1%   Bearish      RED   -.086    -.03
---------------------------------------------------------------------------------------------
MDY       327.4   -11.12     348.38       -409.8%   Bearish      RED   -.057    -.043
---------------------------------------------------------------------------------------------
IWM       145.44   -4.4      153.83       -376.3%   Bearish      RED   -.054    -.046
---------------------------------------------------------------------------------------------
FAS       60.51   -7.42      74.82        -1349.6%  Bearish      RED    .052    -.004
---------------------------------------------------------------------------------------------
RETL      33.31   -3.33      36.22        -841.9%   Bearish      RED    .105     .166
---------------------------------------------------------------------------------------------
SOXL      122.3   -17.72     157.03       -1625.1%  Bearish      RED   -.091    -.271
---------------------------------------------------------------------------------------------
TECL      101.51   -12.53    124.76       -1469.6%  Bearish      RED   -.147    -.131
---------------------------------------------------------------------------------------------
IBB       104.86   -4.55     112.14       -413%     Bearish      RED   -.061     .001
---------------------------------------------------------------------------------------------
GLD       124.98    .19      126.39       -122.4%   Bearish      BLUE  -.082     .005
---------------------------------------------------------------------------------------------
OIL       6.58   -.21        7.29         -589.2%   Bearish      RED   -.025     .045
---------------------------------------------------------------------------------------------
OIH       24.2   -1.19       26.83        -722.2%   Bearish      RED   -.158     .001
---------------------------------------------------------------------------------------------
GASL      16.85   -2.36      22.21        -1964.8%  Bearish      RED   -.338    -.218
---------------------------------------------------------------------------------------------
UGA       30.98   -.36       33.27        -421.9%   Bearish      RED   -.083    -.049
---------------------------------------------------------------------------------------------
UUP       23.6    0          23.27         100.6%   Bullish      BLUE   .03    -.036
                            Bullish
---------------------------------------------------------------------------------------------
IEF       102.4    .09       102.22       -9.8%     Bearish      BLUE  -.113    -.05
                            Bullish
---------------------------------------------------------------------------------------------
XLU      47.56   -.54        49.88        -272.8%   Bearish      RED   -.239    -.165
---------------------------------------------------------------------------------------------
WEAT      6.37   -.07        6.25          47.7%    Bullish      ----   .207     .04
                            Bullish
---------------------------------------------------------------------------------------------
YINN      32.74   -4.98      45.45        -1713.5%  Bearish      RED   -.046    -.081
---------------------------------------------------------------------------------------------
RSX       21.53   -.61       22.98        -441.7%   Bearish      RED   -.134    -.043
---------------------------------------------------------------------------------------------
AAPL      155.15   -4.39     160.5        -391.1%   Bearish      RED   -.196    -.121
---------------------------------------------------------------------------------------------
GOOG      1001.52   -47.06   1111.9       -760.3%   Bearish      RED    .009    -.062
---------------------------------------------------------------------------------------------
MSFT      85.01   -4.6       91.78        -508.3%   Bearish      RED   -.125     .001
---------------------------------------------------------------------------------------------
AMZN      1350.5   -66.28    1429.95      -139.7%   Bearish      RED   -.001     .117
---------------------------------------------------------------------------------------------
FB        171.58   -8.6      190.28       -578.2%   Bearish      RED   -.081    -.075
---------------------------------------------------------------------------------------------
NVDA     217.52   -11.28     233.52       -503%     ----         RED    .041     .003
---------------------------------------------------------------------------------------------
BA        329.66   -18.46    348.91       -395.6%   ----         RED   -.057     .229
---------------------------------------------------------------------------------------------
GS        246.35   -10.75    260.04       -498.8%   ----         RED    .142     .035
---------------------------------------------------------------------------------------------
HD        181.22   -10.07    193.97       -486.8%   Bearish      RED   -.004     .028
---------------------------------------------------------------------------------------------
CAT        145.99   -8.35    157.49       -519.8%   Bearish      RED   -.031     .052
|
Table 2
Count of Stocks in Key Tiger Directories
Date = 2018.02.08
--------------------------------------
NEWHIGHS
17
NEWLOWS
363
MAXCP
12
MINCP
596 Professionals are much more bearish than bullish.
TTTNH
30
TTTNL
473 Day traders quickly switched to selling on weakness.
FASTUP
75
FASTDOWN 1000+
Dumping in abundant evidence.
CPCROSSA
15
CPCROSSD
362 Professionals quickly switched to new selling.
BIGVOLUP
7
BIGVODN
63 Dumping ratio is 9:1. Urgent need felt to sell.
|
Table 3Count of Stocks and New Highs in Key Tiger Directories
Date = Date = 2018.02.08
No. NHs Pct.
------------------------------------------------
INDEXES 194 13 7 %
FINANCE 93 1 1 %
------------------------------------------------
The other have none. Monday, we have to switch to showing
the percent of SECTORS at new 12-month lows.
|
Table 4 RANKING OF KEY DIRECTORIES BASED PCT.OF STOCKS ABOVE 65-DMA
2/8/18
Bullish = 3
Bearish = 42 Almost every group has most of its stocks below the resistance
of its 65-dma.
---------------------------------------------------------------------------------------
Directory Current day-1 day-2 day-3 day-4 day-5
----------------------------------------------------------------------------------------
BIG MILITARY 100% 1 1 1 1 1
HOSPITAL .625 .75 .75 .75 .875 1
FOOD .6 .533 .6 .466 .733 .8
===========================================================================================
COMODITY .5 .614 .685 .657 .771 .828
============================================================================================
COAL .4 .3 .4 .4 .5 .6
RETAIL .396 .66 .622 .49 .698 .754
BIOTECH .378 .487 .466 .419 .541 .585
MILITARY .368 .421 .473 .447 .71 .763
HACKERS .36 .4 .36 .36 .6 .64
GAMING .357 .571 .571 .607 .714 .785
JETS .333 .333 .333 .333 .555 .777
AUTO .325 .375 .45 .35 .6 .75
SOFTWARE .303 .469 .484 .439 .696 .757
NASD-100 .3 .48 .55 .44 .69 .79
TRANSP .3 .5 .45 .4 .75 .8
INDEXES .293 .505 .603 .402 .824 .927
BIGBANKS .285 .571 .571 .285 .857 .857
FINANCE .268 .537 .537 .419 .774 .817
COMPUTER .26 .26 .347 .304 .652 .608
GOLD .235 .274 .372 .431 .47 .764
NIFTY .233 .4 .5 .4 .666 .766
SP-100 .229 .479 .541 .375 .77 .843
SP500 .222 .457 .482 .381 .645 .756
RUS-1000 .209 .42 .43 .354 .609 .721
OILGAS .207 .371 .464 .407 .514 .692
DOWJONES .2 .466 .466 .333 .733 .866
INDMATER .2 .4 .433 .4 .555 .677
GREEN .193 .193 .161 .129 .483 .548
REGBANKS .181 .393 .393 .333 .696 .787
HOMEBLDG .176 .294 .176 .117 .235 .352
MORNSTAR .176 .47 .495 .365 .756 .861
CHINA .171 .328 .578 .515 .656 .718
INFRA .171 .485 .428 .371 .571 .742
DJI-13 .153 .538 .538 .307 .692 .846
BEVERAGE .15 .3 .3 .35 .6 .8
ETFS .149 .402 .656 .507 .865 .925
EDU .142 .142 .142 .142 .142 .285
PIPELINE .142 .571 .571 .571 .571 .714
ELECTRON .112 .213 .258 .191 .382 .483
SEMI .1 .192 .238 .184 .323 .438
INSURANC .093 .281 .281 .281 .562 .625
CHEM .078 .25 .265 .171 .328 .546
UTILITY .069 .116 .093 .093 .162 .232
SOLAR .047 .095 .095 .047 .142 .238
REIT .028 .033 .033 .028 .073 .112
BONDFUND .018 .018 .009 .018 .018 .036
=============================================================================================
|
==============================================================================
==============================================================================
2/7/2018
The DJI and NASDAQ held above their 65-dma today.
But we see
in Table 1 nearly all the key ETFs and stocks we follow each night are still
below their falling 5-day moving averages and pivot points AND show
bearish Closing Power 21-day trends. The Futures have just turned weak
again. This is troublesome.
If the 65-dma for the DJI and NASDAQ again can hold the DJI up, look for
the operative
B19 to bring a rebound
led by the leading stocks listed just below.
Their job will be to hold the market up. A great deal is at stake for
Wall Street
and for the Administration. But the rise
in interest rates is ominous and the
contagion of fear in the Utilities, REITs and
Bond funds is spreading much more
widely. Stick with the short
MINCPs, for sure.
Make
no mistake about it, the broader market has been hit hard.
There are
3x more
sectors with the majority of their stocks below the resistance
of their
65-dma than
than sectors with most of their stocks holding above this
key support.
This means that we should require more proof that the market has found
reliable support. And even if there is a rally, after
a few days up, expect it to be
narrow and soon bring another test of the rising 65-dma.
It is the job now of the leading stocks below to rise up to and then get past
the resistance of the 5-day ma pivot points, as shown below. Watch
them.
Understand that any strength they show may only be a costume to maintain
the appearance that all is well with this 9 year old bull market
Market Leaders:
2/6
Warning 5-dma
Closing Candle IP21
ITRS
below 5-dma AROC Power
Stick
FB 180.18 -5.13
W193.09 -179.1%
Bullish
RED -.022
-.071
---------------------------------------------------------------------------------------------
NVDA 228.8 3.22
W240.5 -366.7%
Bullish RED
.142 -.002
---------------------------------------------------------------------------------------------
BA 348.12 7.21
W356.94 -90.3%
Bullish BLUE
.023 .253
---------------------------------------------------------------------------------------------
GS 257.1 -1.6
W272.23 -206.2%
Bullish BLUE .183
.033
---------------------------------------------------------------------------------------------
HD 191.29 .25
W199.9 -248%
Bullish BLUE .075
.054
-------------------------------------------------------------------------------------------
Bear Markets usually start only after there have been
several sets of
Peerless Sells S9s. A single S9 only sets the stage for a bigger
decline
a few months later. I've counted 22 first S9s in 8 months. Only
in
case, 7/1/1998, did the DJI fall more than 10%. So, the odds are
very good that the DJI will not drop below its recent intra-day lows
before there are more new highs and subsequent Sell S9s.
What To Do
I see no reason to cover any of the
Bearish MINCP stocks, but now
would go long a few of the Bullish
MAXCPs. These have held up
and should show more strength if a rising DJI and NASDAQ can bolster
confidence. At least, that is in the minds of the Professionals who
pushed
up their Closing Powers to new highs.

 |
 |
 |
Charts 2/7/2018
PEERLESS
DJI, Signals, Indicators Daily
DJI Volume 10-DayUp/Down Vol
V-Indicator
Hourly DJIA A/D Line for All
Stocks
(new) A/D
Line for SP-500 Stocks
NASDAQ
S&P
OEX
NYSE COMPQX
DJI-15 DJI-20
DJI-30
DIA
SPY
QQQ MDY
IWM
TNA
CrudeOil
FAS
GLD
BBH
IBB
JETS
JNUG
KOL
NUGT
OIH
OIL
RSX
RETL
SDS
SLV
SOXL
TECL
TMF
TNA UGA
(gasoline)
XIV YINN
Commodities:
JJC, NIB,
CHOC
CORN,
WEAT UUP
(Dollar)
AAPL ADBE
ALXN AMAT
AMGN AMD
AMZN BA
BABA BAC
BIDU
CAT CVX
DE
FB
GOOG
GS HD
IBM JPM M
(Macy's)
MSFT NFLX
NVDA QCOM
TSLA TXN
XOM WMT
ANDV (refinery),
CMG (Chipotle), LRCX,
SWKS,
TOWN
Also SPPI WATT
SQ
2/7/2018 Bullish MAXCPs
Bearish MINCPs |
Table 1
QUICKSILVER on ETFS - 02/07/18 Only 3 of the 31 items below closed above their 5-dma pivot points.
Only WEAT and the Dollar (UUP) are above their 5-dma
Only 7 show rising Closing Powers: These are the leaders:
FB, NVDA, BA, GS and HD
Expect the pivot-points to be resistance levels, from which prices
may fall back in order to re-test support.
ETF CLOSE CHANGE PIVOT-PT 5-dma AROC CL-PWR CANDLE IP21 ITRS
---------------------------------------------------------------------------------------------
DIA 248.76 -.2 W261.62 -249.6% ---- BLUE .062 ----
---------------------------------------------------------------------------------------------
COMPQX 7051.98 -63.9 W7385.86 -248.8% ---- RED .09 -.033
---------------------------------------------------------------------------------------------
SPY 267.67 -1.46 W281.58 -259.3% Bearish RED .023 -.028
---------------------------------------------------------------------------------------------
QQQ 160.21 -2.1 W167.96 -279.4% ---- RED .003 -.031
---------------------------------------------------------------------------------------------
MDY 338.52 -.42 W355.54 -237.7% Bearish BLUE .028 -.056
---------------------------------------------------------------------------------------------
IWM 149.84 .15 W156.85 -213.2% Bearish BLUE 0 -.064
---------------------------------------------------------------------------------------------
FAS 67.93 -.06 W79.7 -741.8% ---- BLUE .115 .071
---------------------------------------------------------------------------------------------
RETL 36.64 1.17 W39.38 -553.4% ---- BLUE .138 .243
---------------------------------------------------------------------------------------------
SOXL 140.02 -9.98 W171.34 -1074.8% Bearish RED -.051 -.239
---------------------------------------------------------------------------------------------
TECL 114.04 -4.75 W137.02 -909.3% Bearish RED -.097 -.066
---------------------------------------------------------------------------------------------
IBB 109.41 .05 W113.98 -209.7% Bullish BLUE .03 -.006
---------------------------------------------------------------------------------------------
GLD 124.79 -.59 W128.07 -112.7% Bearish RED -.057 -.036
---------------------------------------------------------------------------------------------
OIL 6.79 -.26 W7.42 -311.7% ---- RED .04 .011
---------------------------------------------------------------------------------------------
OIH 25.39 -.8 W28.02 -385.3% Bearish RED -.092 -.009
---------------------------------------------------------------------------------------------
GASL 19.21 -1.68 W25.33 -1281.5% Bearish RED -.232 -.201
---------------------------------------------------------------------------------------------
UGA 31.34 -.7 W33.73 -345% ---- RED -.019 -.082
---------------------------------------------------------------------------------------------
UUP 23.6 .18 23.13 75.1% Bullish BLUE -.006 -.078
---------------------------------------------------------------------------------------------
IEF 102.31 -.3 W102.6 -48.2% Bearish RED -.217 -.094
---------------------------------------------------------------------------------------------
XLU 48.1 -.23 W50.24 -295.7% Bearish RED -.219 -.196
---------------------------------------------------------------------------------------------
WEAT 6.44 .17 6.31 95.7% Bullish BLUE .236 -.004
---------------------------------------------------------------------------------------------
YINN 37.72 -6.6 W47.63 -1315.8% ---- RED .006 -.033
---------------------------------------------------------------------------------------------
RSX 22.14 -.7 W23.54 -293.2% Bearish RED -.026 -.072
---------------------------------------------------------------------------------------------
AAPL 159.54 -3.49 W167.78 -242% Bearish RED -.14 -.145
---------------------------------------------------------------------------------------------
GOOG 1048.58 -32.02 W1167.7 -543.1% ---- RED .081 -.049
---------------------------------------------------------------------------------------------
MSFT 89.61 -1.72 W94.26 -293.2% Bearish RED -.066 .02
---------------------------------------------------------------------------------------------
AMZN 1416.78 -26.06 1390 -120% ---- RED .071 .138
---------------------------------------------------------------------------------------------
FB 180.18 -5.13 W193.09 -179.1% Bullish RED -.022 -.071
---------------------------------------------------------------------------------------------
NVDA 228.8 3.22 W240.5 -366.7% Bullish RED .142 -.002
---------------------------------------------------------------------------------------------
BA 348.12 7.21 W356.94 -90.3% Bullish BLUE .023 .253
---------------------------------------------------------------------------------------------
GS 257.1 -1.6 W272.23 -206.2% Bullish BLUE .183 .033
---------------------------------------------------------------------------------------------
HD 191.29 .25 W199.9 -248% Bullish BLUE .075 .054
---------------------------------------------------------------------------------------------
CAT 154.34 -2.07 W162.24 -267.1% Bearish RED .031 .067
|
Table 2
Count of Stocks in Key Tiger Directories
Date = 180207
--------------------------------------
NEWHIGHS 34
NEWLOWS 150
MAXCP 65
MINCP 102
TTTNH 119 Very, very short-term buyers here.
TTTNL 70
FASTUP 86
FASTDOWN 454
CPCROSSA 125 Professionals have turned bullish
CPCROSSD 60
BIGVOLUP 4
BIGVODN 44 Big Money Dumping continues unabated.
|
Table 3Count of Stocks and New Highs in Key Tiger Directories
Date = Date = 180207
No. NHs Pct.
-------------------------------------------------------------------
HOMEBLDG 17 1 6 %
HACKERS 25 1 4 %
FINANCE 93 2 2 %
SOFTWARE 66 1 2 %
BIOTECH 386 6 2 %
RETAIL 53 1 2 %
INDEXES 194 2 1 %
ELECTRON 178 1 1 %
------------------------------------------------
The others have none.
|
Table 4
RANKING OF KEY DIRECTORIES BASED PCT.OF STOCKS ABOVE 65-DMA
2/7/18
There are 3x more sectors with the majority of their stocks below
than their 65-dma than the 11 sectors where the majority are
above their 65-dma.
Bullish = 11
Bearish = 34
---------------------------------------------------------------------------------------
Directory Current day-1 day-2 day-3 day-4 day-5
----------------------------------------------------------------------------------------
BIGMIL 1 1 1 1 1 1
HOSPITAL .75 .75 .75 .875 1 1
RETAIL .66 .622 .49 .698 .754 .792
COMODITY .614 .685 .657 .771 .828 .785
BIGBANKS .571 .571 .285 .857 .857 .857
GAMING .571 .571 .607 .714 .785 .785
PIPELINE .571 .571 .571 .571 .714 .714
DJI-13 .538 .538 .307 .692 .846 .769
FINANCE .537 .537 .419 .774 .817 .806
FOOD .533 .6 .466 .733 .8 .6
INDEXES .505 .603 .402 .824 .927 .927
N = 11
=============================================================================================
TRANSP .5 .45 .4 .75 .8 .85
=============================================================================================
BIOTECH .487 .466 .419 .541 .582 .585
INFRA .485 .428 .371 .571 .742 .771
NASD-100 .48 .55 .44 .69 .79 .83
SP-100 .479 .541 .375 .77 .843 .864
MORNSTAR .47 .495 .365 .756 .861 .869
SOFTWARE .469 .484 .439 .696 .757 .757
DOWJONES .466 .466 .333 .733 .866 .833
SP500 .457 .482 .381 .645 .75 .779
MILITARY .421 .473 .447 .71 .763 .763
RUS-1000 .42 .43 .354 .609 .719 .735
ETFS .402 .656 .507 .865 .925 .94
HACKERS .4 .36 .36 .6 .64 .6
INDMATER .4 .433 .4 .555 .677 .722
NIFTY .4 .5 .4 .666 .766 .766
REGBANKS .393 .393 .333 .696 .787 .696
AUTO .375 .45 .35 .6 .75 .775
OILGAS .375 .468 .404 .51 .695 .695
JETS .333 .333 .333 .555 .777 .666
CHINA .328 .578 .515 .656 .718 .765
BEVERAGE .3 .3 .35 .6 .75 .75
COAL .3 .4 .4 .5 .6 .7
HOMEBLDG .294 .176 .117 .235 .352 .352
INSURANC .281 .281 .281 .562 .625 .625
GOLD .274 .372 .431 .47 .764 .764
COMPUTER .26 .347 .304 .652 .608 .608
CHEM .25 .265 .171 .328 .546 .593
ELECTRON .213 .258 .191 .382 .483 .455
GREEN .193 .161 .129 .483 .548 .516
SEMI .192 .238 .184 .323 .438 .43
EDU .142 .142 .142 .142 .285 .285
UTILITY .116 .093 .093 .162 .232 .279
SOLAR .095 .095 .047 .142 .238 .238
REIT .033 .033 .028 .073 .112 .162
BONDFUND .018 .009 .018 .018 .036 .027
N = 34
|
==============================================================================
2/6/2018
Crazy Computerized Trading!
I'd blame them but that's what we are using,
too,
though I hope with some added human judgment, experience and perspective.
But there's more to this decline than program trading.
See how the Utilities are
falling and short-term rates made a new
recovery high today. Most of the major
ETFs and market leading stocks still show falling 5-day moving averages.
Now 3/4
of the 46 sectors shown in Table 4 have more stocks below than above the
broken support of their 65-dma. For all 6000 stocks and ETFs we follow
only 37% are above that key support. This means momentum is still down
and there will be considerable resistance overhead if he the market does
rally.
I suspect the market is waiting to hear from Powell. I'm not sure it
will like
what it hears then. Interestingly, the NY Times is now taking up this
theme
of the importance of tighter money. See its lead article tonight.
The Era of Easy Money Is Ending, and the World Is Bracing for Shocks
By PETER S. GOODMAN
Today Peerless did give a reversing
Buy B19.
The B19 was based on a very good day following a very bad day.
Most likely the B19 establishes a trading range
market bounded
by 24000 and 27000.
Tomorrow watch to see if the DJI can
close
above 24693, where its rising 65-dma is. A closing down
more than 220 would rupture the 65-dma and that
could easily set up
another decline to 24000. Interestingly,
the DJI tonight did drop 220 points but has recovered from
the support at its 65-dma.
Peerless DJI Chart


The NASDAQ and QQQ bullishly rose
above their 65-dma. They show rising Closing
Powers and lots of blue Accumulation (big money
buying on weakness). They can be bought if they
stay above their 65-dma. Use a Sell stop below
Monday's low.
How Much Should We Trust the New Peerless
B19?
Peerless gave a reversing Buy B19 today as the DJI swung
back up and gained
567.
Despite this a successful test of Monday's low should be the best place to
buy
the major market ETFs. Table A below shows the median gain for a B19 after an
S9
is only +2.75% on the DJI and the median paper loss is 1.95%. B19s are
much
less powerful when they seek to reverse a S9 than when they reverse other
signals
or reinforce an existing Peerless Buy signal. See the most recent study of
all B19s.
Did we we have a true reversal today? It was only enough to meet the
Buy B19's
minimal requirements, I would say. That means a successful retest of
yesterday's
closing of 24345.75 would be more constructive and likely prove a safer
place to buy.
All of today's came in the
last two hours. Programmed buys kicked in when the
DJI and NASDAQ rose back above their rising 65-dma. The
500+ point rebound
was impressive, but we need to put it in perspective.
From Friday high
to Monday's
intra-day low, the DJI plunged 2000 points.
Secondly, Up Volume
on the NYSE
was 4x down volume today. That looks good until, you look
back
and see that
the Down Volume
Monday was 30x greater than Up Volume.
Thirdly, Breadth
was not nearly so good today as it was bad Monday. Today
the ratio of NYSE
advances to declines was 2183/850 ( 2.57) pales to
Monday's
ratio of declines to
advances (2739/324 or 8.45).
So, though last last two day's numbers satisfied the minimal
Peerless requirements
for a Buy B19 two-day reversal-up, we should, I think be waiting for another
successful test of
Monday's closing before acting on the Buy B19 in any significant
way. This
conclusion is
supported not on the more modest sized average B19
gains when
it reversed a Sell S9.
Tables 1-4 below and the chart for all 6000 stocks adds to the caution.
Reversing B19s: 1929-2018
Blue shows the B19 reversed a Sell S9
Date DJI Gain Maximum Paper Loss
19290314 S9 316.3 .041 319.7 -.0107 3/15
19290327 B19 303.2 .029 299.1 -.0135 4/9
----------------------------------------------------------------------
19300417 S9 294.1 .169 perfect 0
19300506 B19 268.8 .023 none 0
-----------------------------------------------------------------------
19460110 S9 199.2 .085 206.6 -.0371 2/5
19460218 S6 201.6 .03 none 0
19460221 B19 195.6 .086 186.0 -.049 2/26
-----------------------------------------------------------------------
19560404 S5 518.7 .079 521.1 -.0046 4/6
19560409 S2 518.5 .079 none 0
19560529 B19 477.7 .091 475.3 -.005 6/8
-----------------------------------------------------------------------
19650513 S7 938.9 .075 939.6 -.0007 5/14
19650630 B19 868.04 .135 none 0
-----------------------------------------------------------------------
19870406 S9 2405.54 .051 perfect 0
19870415 B19 2282.95 .026 2230.54 -.0229 4/27
-----------------------------------------------------------------------
19940203 S4 3967.66 .074 none 0
19940405 B19 3675.41 .016 3598.71 -.0208 4/20
-----------------------------------------------------------------------
19970929 S12 7991.43 .062 8178.31 -.0233 10/7
19971028 B19 7598.32 .225 7381.67 -.0285 10/30
-----------------------------------------------------------------------
20020719 S13 8019.26 -.021 none 0
20020724 B19 8191.29 .064 none 0
-----------------------------------------------------------------------
20040220 S19 10619.03 .036 10678.1 -.0055 3/1
20040312 B19 10240.08 .031 10048.2 -.0187 3/24
-----------------------------------------------------------------------
20050308 S4 10912.47 .064 none 0
20050421 B19 10218.6 .133 10070.3 -.0145 4/28
-----------------------------------------------------------------------
20080102 S14 13043.96 .059 none 0
20080123 B19 12270.17 .023 11740.1 -.0431 3/10
-----------------------------------------------------------------------
20090106 S12 9015.1 .087 none 0
20090121 B19 8228.1 -.01 8077.56 -.0182 1/23
-----------------------------------------------------------------------
20120321 S1 13124.62 .024 13264.4 -.0106 4/2
20120411 B19 12805.39 .037 none 0
-----------------------------------------------------------------------
20130604 S19 15177.54 .027 15318.2 -.0092 6/18
20130625 B19 14760.31 .047 none 0
-----------------------------------------------------------------------
20130715 S5 15484.26 .034 15658.3 -.0112 8/2
20130822 B19 14963.74 .015 14776.1 -.0125 8/27
=======================================================================
All Cases: Avg Gain = 6.01% Median Gain = 3.4%
Avg Paper Loss = 1.54% Median Paper Loss = 1.4%
B19s after S9:
Avg Gain = 4.1% Median Gain = 2.75%
Avg Paper Loss = 2.3% Median Paper Loss = 1.9%
Charts 2/6/2018
PEERLESS
DJI, Signals, Indicators Daily
DJI Volume 10-DayUp/Down Vol
V-Indicator
Hourly DJIA A/D Line for All
Stocks
(new) A/D
Line for SP-500 Stocks
NASDAQ
S&P
OEX
NYSE COMPQX
DJI-15 DJI-20
DJI-30
DIA
SPY
QQQ MDY
IWM
TNA
CrudeOil
FAS
GLD
BBH
IBB
JETS
JNUG
KOL
NUGT
OIH
OIL
RSX
RETL
SDS
SLV
SOXL
TECL
TMF
TNA UGA
(gasoline)
XIV YINN
Commodities:
JJC, NIB,
CHOC
CORN,
WEAT UUP
(Dollar)
AAPL ADBE
ALXN AMAT
AMGN AMD
AMZN BA
BABA BAC
BIDU
CAT CVX
DE
FB
GOOG
GS HD
IBM JPM M
(Macy's)
MSFT NFLX
NVDA QCOM
TSLA TXN
XOM WMT
ANDV (refinery),
CMG (Chipotle), LRCX,
SWKS,
TOWN
Also SPPI WATT
SQ
2/6/2018
Bullish MAXCPs
Bearish MINCPs |
| |
Table 1
QUICKSILVER on ETFS -
02/06/18 Only UUP (Dollar is above its 5-dma pivot-point.
Only UUP, BA and AMZN show a rising 5-dma.
13 rising Closing Powers and 12 falling Closing Powers
ETF CLOSE CHANGE PIVOT-PT 5-dma AROC CL-PWR CANDLE IP21 ITRS
---------------------------------------------------------------------------------------------
DIA 248.96 5.69 W261.44 -227.4% ---- BLUE .115 ------
---------------------------------------------------------------------------------------------
COMPQX 7115.88 148.35 W7411.48 -196.8% Bullish BLUE .261 -.022
---------------------------------------------------------------------------------------------
SPY 269.13 5.2 W281.9 -228% Bearish BLUE .102 -.023
---------------------------------------------------------------------------------------------
QQQ 162.31 4.19 W169.4 -192.8% Bullish BLUE .122 -.016
---------------------------------------------------------------------------------------------
MDY 338.94 3.42 W355 -239.4% Bearish BLUE .09 -.056
---------------------------------------------------------------------------------------------
IWM 149.69 1.77 W156.36 -242.5% Bearish BLUE .017 -.067
---------------------------------------------------------------------------------------------
FAS 67.99 2.96 W78.8 -645.5% ---- BLUE .166 .072
---------------------------------------------------------------------------------------------
RETL 35.47 2.93 W40.72 -840.1% ---- BLUE .172 .187
---------------------------------------------------------------------------------------------
SOXL 150 13.98 W173.91 -605.3% ---- BLUE .02 -.16
---------------------------------------------------------------------------------------------
TECL 118.79 9.32 W136.84 -578.1% Bearish BLUE -.024 -.011
---------------------------------------------------------------------------------------------
IBB 109.36 2.18 W114.08 -306.5% ---- BLUE .029 -.009
---------------------------------------------------------------------------------------------
GLD 125.38 -1.33 W127.65 -55.9% Bearish RED -.023 -.036
---------------------------------------------------------------------------------------------
OIL 7.05 -.04 W7.24 -82.9% Bullish ---- .092 .073
---------------------------------------------------------------------------------------------
OIH 26.19 .39 W27.46 -278% Bearish BLUE .049 .02
---------------------------------------------------------------------------------------------
GASL 20.89 .63 W25.04 -969.8% Bearish BLUE -.146 -.127
---------------------------------------------------------------------------------------------
UGA 32.04 -.52 W33.62 -156.4% Bullish RED .051 -.048
---------------------------------------------------------------------------------------------
UUP 23.42 .05 23.25 30.1% Bearish RED -.052 -.092
---------------------------------------------------------------------------------------------
IEF 102.61 -.45 W103.3 -32.1% Bearish RED -.193 -.094
---------------------------------------------------------------------------------------------
XLU 48.33 -.73 W51.04 -214.4% Bearish RED -.143 -.192
---------------------------------------------------------------------------------------------
WEAT 6.27 .08 W6.32 -119.1% Bullish BLUE .173 -.047
---------------------------------------------------------------------------------------------
YINN 44.32 2.19 W49.79 -395.9% ---- BLUE .089 .114
---------------------------------------------------------------------------------------------
RSX 22.84 .57 W23.49 -90.9% ---- BLUE .06 -.044
---------------------------------------------------------------------------------------------
AAPL 163.03 6.54 W167.43 -120.2% Bearish BLUE -.109 -.127
---------------------------------------------------------------------------------------------
GOOG 1080.6 24.8 W1169.94 -366.4% Bullish BLUE .148 -.016
---------------------------------------------------------------------------------------------
MSFT 91.33 3.33 W95.01 -76.3% Bullish BLUE -.015 .04
---------------------------------------------------------------------------------------------
AMZN 1442.84 52.84 W1450.89 17.7% Bullish BLUE .139 .189
---------------------------------------------------------------------------------------------
FB 185.31 4.05 W186.89 -48.2% Bullish BLUE .036 -.034
---------------------------------------------------------------------------------------------
NVDA 225.58 11.88 W245.8 -364.3% Bullish BLUE .178 -.009
---------------------------------------------------------------------------------------------
BA 340.91 12.03 W354.37 46.3% Bullish BLUE .033 .227
---------------------------------------------------------------------------------------------
GS 258.7 9.59 W267.89 -194.2% Bullish BLUE .181 .036
---------------------------------------------------------------------------------------------
HD 191.04 7.93 W200.9 -274.8% Bullish BLUE .077 .052
---------------------------------------------------------------------------------------------
CAT 156.41 5.33 W162.78 -230.5% Bearish BLUE .107 .075
|
Table 2
Count of Stocks in Key Tiger Directories
Date = 180206
--------------------------------------
NEWHIGHS
20
NEWLOWS 156
Dangerously high when this close to a DJI high.
MAXCP 66
MINCP 73 Pros are still more bearish than bullish.
TTTNH 95
TTTNL 138 Pros are shorting openings, still
FASTUP 66
FASTDOWN 466 More downside trader plays.
CPCROSSA 479
CPCROSSD 31
BIGVOLUP 5
BIGVODN 58 Dumping continues.
|
Table 3 - Quite dismal!Count of Stocks and New Highs in Key Tiger Directories
Date = 180206
No. NHs Pct.
-------------------------------------------------------------------
HACKERS 25 1 4 %
MILITARY 38 1 3 %
SOFTWARE 66 1 2 %
BIOTECH 386 7 2 %
FINANCE 93 1 1 %
INDEXES 194 2 1 %
All others no highs
|
Table 4 RANKING OF KEY DIRECTORIES BASED PCT.OF STOCKS ABOVE 65-DMA
2/6/18
Bullish = 15
Bearish = 30
---------------------------------------------------------------------------------------
Directory Current day-1 day-2 day-3 day-4 day-5
----------------------------------------------------------------------------------------
BIGMIL 1 1 1 1 1 1
HOSPITAL .75 .75 .875 1 1 1
COMODITY .685 .657 .771 .828 .785 .8
ETFS .656 .507 .865 .925 .94 .94
RETAIL .622 .49 .698 .754 .792 .83
INDEXES .603 .402 .824 .927 .927 .932
FOOD .6 .466 .733 .8 .6 .6
CHINA .578 .515 .656 .718 .765 .734
BIGBANKS .571 .285 .857 .857 .857 .857
GAMING .571 .607 .714 .785 .785 .785
PIPELINE .571 .571 .571 .714 .714 .714
NASD-100 .55 .44 .69 .79 .83 .82
SP-100 .541 .375 .77 .843 .864 .885
DJI-13 .538 .307 .692 .846 .769 .923
FINANCE .537 .419 .774 .817 .806 .817
N=15
===========================================================================================
NIFTY-30 .5 .4 .666 .766 .766 .733
===========================================================================================
MORNSTAR .495 .365 .756 .861 .869 .873
SOFTWARE .484 .439 .696 .757 .757 .727
SP500 .482 .381 .645 .75 .777 .787
MILITARY .473 .447 .71 .763 .763 .815
OILGAS .468 .404 .51 .695 .695 .702
BIOTECH .466 .419 .541 .582 .582 .637
DOWJONES .466 .333 .733 .866 .833 .9
AUTO .45 .35 .6 .75 .775 .875
TRANSP .45 .4 .75 .8 .85 .85
INDMATER .433 .4 .555 .677 .722 .766
RUS-1000 .43 .354 .609 .719 .734 .747
INFRA .428 .371 .571 .742 .771 .857
COAL .4 .4 .5 .6 .7 .7
REGBANKS .393 .333 .696 .787 .696 .727
GOLD .372 .431 .47 .764 .764 .725
HACKERS .36 .36 .6 .64 .6 .6
COMPUTER .347 .304 .652 .608 .608 .652
JETS .333 .333 .555 .777 .666 .777
BEVERAGE .3 .35 .6 .75 .75 .8
INSURANC .281 .281 .562 .625 .625 .625
CHEM .265 .171 .328 .546 .593 .578
ELECTRON .258 .191 .382 .483 .455 .483
SEMI .238 .184 .323 .438 .43 .438
HOMEBLDG .176 .117 .235 .352 .352 .411
GREEN .161 .129 .483 .548 .516 .516
EDU .142 .142 .142 .285 .285 .285
SOLAR .095 .047 .142 .238 .238 .238
UTILITY .093 .093 .162 .232 .279 .255
REIT .033 .028 .073 .112 .162 .123
BONDFUND .009 .018 .018 .036 .027 .018
N=30
|
==============================================================================
2/5/2018 Peerless remains on a Sell S9.
This S9 variant in on-going bull markets typically brings a DJI significantly below the
lower band. This means there could be much more weakness. Of course, we do have an
oversold market. So a rebound could occur. But don't trust it is my advise. Each short-term rally
has been sold into and smothered by heavy, impatient selling. Early over-night strength
cannot be trusted. The speed of this decline on not very heavy volume, so far, suggests
to me the path of least resistance is still down. With the DJI's 65-dma penetrated,
it seems likely today's low at 24000 will soon be re-tested and if that does not hold,
a decline to 23000 may then be in the cards, and in short order. Below that, who knows?
Under 21,000 will be in bear market territory.
I believe the primary reason the market is falling so fast is because the FED is
indicating through the mouths of Yellen and Jamie Dimon that it will not step in
to support stock prices until it has fallen 15%-20%.
When the DJI dropped below 25000 today, it fell below the 3.5% lower
band. The more important support that I had suggested was the rising
65-dma, at approximately 24500. But the high velocity of today's
sell-off led to its clear penetration at the close and that has
prevented Peerless from getting a reversing Buy signal there. So,
for now we have to wait and hold our bearish MINCP short positions.
Trading ETFs is much trickier. I would suggest being patient here
unless you trade in the Futures market at night.
At one point today the DJI was down as much as 1600 points intra-day.
If you add to that the 660 points it fell on Friday, we can say that the
DJI had has now had a 9% correction in just two days. That is similar
to what happened in October 1989. This case proves that itis possible
for the DJI to quickly recover after a Sell S9. But see below how
the DJI's one-day plunge back then did not even reach its rising 65-dma.
(This was a decline that was also triggered by crazy computerized Sell
programs plus the failure of a big merger.)
It's my judgment that too much technical damage has been done in our case.
Look at the "sea of red" key values in Table 1, at how lopsided the number
of negative stocks were today compared to the number of positive stocks
(Table 2)
and then see in Table 4 that there are now only 7 industry groups with the
majority of their stocks still above the support of the 65-dma.
Wanted: Aggressive and Nimble Day Traders
Who Like Gambling
If you are a short-term trader, no doubt you will now be tempted to buy QQQ or the
NASDAQ futures as they have only retreated to their rising 65-dma and their
Accumulation Index readings are positive. That's fine buy only if you
place a sell stop
just below today's close. This is a risky venture without a Peerless
Buy signal.
As in October 1987, it appears that Computerized trading caused today's
1600 point sell-off. But we can't know that for sure. So more caution
and patience are needed I would say, especially since the FED is showing that
they are in rate-rising mode and not presently willing to come to the rescue
of Wall Street. They still wince at all the criticism they got for this back
in 2008 and 2009.
There was no particular news to account for today's 1600 point drop.
Irrational public selling was not the reason. The Public is still bullish.
Rather the speed of the decline almost certainly owed to crazy computerized
hedging using all the clever new leveraged short ETFs, puts and Futures now
available. These programs kicked in when support levels, round numbers
and key moving averages were penetrated. For now, they may have done their
damage. But we just can't be sure there will not be another even bigger selling
wave. Stay short and avoid the long side remains my advise.
The last two days' decline is quite reminiscent of what happened on the
Friday and Monday in October 1987 Crash. (The major difference between
then and now, however, was the the market's bottom then was down a whopping
34% in just 3 weeks. So, this parallel may not hold.)
After the Crash in 1987, on the following Tuesday, the DJI jumped up at the
Opening but could not make any additional headway and a re-test of the lows
soon followed. That was a much better place to buy. I like the idea of
buying on a successful re-testing of the lows here, too. See in the chart
below how how the DJI needed to retest its 65-dma before its was able to make
a recovery in late September 1987 back up to the upper band.
Don't Expect The Fed To Save The Market
The DJI closed today only down a little more than 8% below its recent peak.
If this as far down as the DJI will go in February, it would be a very minimal
correction. Without Fed intervention or the public assurances of such intervention,
the odds favor a deeper decline. What saved Wall Street in October 1987 after
its love affair with computerized leveraged hedging almost plunged the market
into an abyss of chaos, was Fed Chairman Greenspan's willingness to supply
unlimited funds to market makers to stabilize the market. It is not yet clear
that Fed Chairman Powell is willing to do this. Janet Yellen told us as she
left office, to paraphrase, "Yes, evaluations are excessive, but the Economy
is very strong" and she did not foresee any need for a bailout of Wall Street
in the event of a correction. Until Powell tells us otherwise, I would assume
his Fed will not intervene for now.
Charts 2/5/2018
PEERLESS
DJI, Signals, Indicators Daily
DJI Volume 10-DayUp/Down Vol
V-Indicator
Hourly DJIA A/D Line for All
Stocks
(new) A/D
Line for SP-500 Stocks
NASDAQ
S&P
OEX
NYSE COMPQX
DJI-15 DJI-20
DJI-30
DIA
SPY
QQQ MDY
IWM
TNA
CrudeOil
FAS
GLD
BBH
IBB
JETS
JNUG
KOL
NUGT
OIH
OIL
RSX
RETL
SDS
SLV
SOXL
TECL
TMF
TNA UGA
(gasoline)
XIV YINN
Commodities:
JJC, NIB,
CHOC
CORN,
WEAT UUP
(Dollar)
AAPL ADBE
ALXN AMAT
AMGN AMD
AMZN BA
BABA BAC
BIDU
CAT CVX
DE
FB
GOOG
GS HD
IBM JPM M
(Macy's)
MSFT NFLX
NVDA QCOM
TSLA TXN
XOM WMT
ANDV (refinery),
CMG (Chipotle), LRCX,
SWKS,
TOWN
Also SPPI WATT
SQ
2/5/2018
Bullish MAXCPs
Bearish MINCPs |
| |
Table 1
QUICKSILVER on ETFS - 02/05/18
We have a sea of red here. Extreme caution advised.ETF CLOSE CHANGE PIVOT-PT 5-dma AROC CL-PWR CANDLE IP21 ITRS
---------------------------------------------------------------------------------------------
DIA 243.27 -11.66 W260.62 -400.9% Bearish RED -.002 ----
---------------------------------------------------------------------------------------------
COMPQX 6967.53 -273.42 W7402.48 -338% Bearish RED .246 -.017
---------------------------------------------------------------------------------------------
SPY 263.93 -11.52 W281.76 -369.1% Bearish RED .005 -.017
---------------------------------------------------------------------------------------------
QQQ 158.12 -6.49 W168.7 -356.2% Bearish RED .026 -.015
---------------------------------------------------------------------------------------------
MDY 335.52 -12.86 W355.7 -336.9% Bearish RED -.11 -.041
---------------------------------------------------------------------------------------------
IWM 147.92 -5.91 W157.18 -344.2% Bearish RED -.067 -.053
---------------------------------------------------------------------------------------------
FAS 65.03 -9.79 W77.7 -963.9% Bearish RED .113 .037
---------------------------------------------------------------------------------------------
RETL 32.54 -3.68 W41.88 -1515.6% Bearish RED .151 .122
---------------------------------------------------------------------------------------------
SOXL 136.02 -21.01 W169.56 -1306% Bearish RED -.061 -.233
---------------------------------------------------------------------------------------------
TECL 109.47 -15.29 W133.63 -1047% Bearish RED -.122 -.071
---------------------------------------------------------------------------------------------
IBB 107.18 -4.96 W116.27 -492.2% Bearish RED -.084 .003
---------------------------------------------------------------------------------------------
GLD 126.71 .32 W126.8 -25.1% ---- RED .058 .011
---------------------------------------------------------------------------------------------
OIL 7.09 -.2 W7.17 -171.4% Bullish RED .129 .134
---------------------------------------------------------------------------------------------
OIH 25.8 -1.03 W27.7 -414.6% Bearish RED .027 .042
---------------------------------------------------------------------------------------------
GASL 20.26 -1.95 W25.48 -1555.4% Bearish RED -.229 -.095
---------------------------------------------------------------------------------------------
UGA 32.56 -.71 W33.08 -199.9% Bullish RED .099 -.006
---------------------------------------------------------------------------------------------
UUP 23.37 .1 23.28 10.8% Bearish ---- -.039 -.075
---------------------------------------------------------------------------------------------
IEF 103.06 .84 W103.27 -21.8% ---- BLUE -.139 -.06
---------------------------------------------------------------------------------------------
XLU 49.06 -.82 W50.48 -131.9% Bearish RED -.188 -.153
---------------------------------------------------------------------------------------------
WEAT 6.19 -.06 W6.42 -71.2% Bullish ---- .115 -.034
---------------------------------------------------------------------------------------------
YINN 42.13 -3.32 W48.01 -864.9% Bearish RED .054 .09
---------------------------------------------------------------------------------------------
RSX 22.27 -.71 W23.26 -227.3% Bearish RED -.004 -.027
---------------------------------------------------------------------------------------------
AAPL 156.49 -4.01 W166.97 -345.2% Bearish RED -.17 -.128
---------------------------------------------------------------------------------------------
GOOG 1055.8 -56.1 W1163.69 -517.3% ---- RED .088 -.011
---------------------------------------------------------------------------------------------
MSFT 88 -3.78 W92.74 -316.4% Bearish RED -.097 .019
---------------------------------------------------------------------------------------------
AMZN 1390 -39.95 W1437.82 -97.1% ---- RED .088 .188
---------------------------------------------------------------------------------------------
FB 181.26 -9.02 W187.12 -125.1% Bullish RED .001 -.035
---------------------------------------------------------------------------------------------
NVDA 213.7 -19.82 W242.72 -685.3% ---- RED .117 -.043
---------------------------------------------------------------------------------------------
BA 328.88 -20.03 W337.71 -171.7% ---- RED -.003 .2
---------------------------------------------------------------------------------------------
GS 249.11 -10.93 W268.94 -435.5% Bearish RED .113 .015
---------------------------------------------------------------------------------------------
HD 183.11 -10.86 W201.81 -544.4% Bearish RED .019 .027
---------------------------------------------------------------------------------------------
CAT 151.08 -6.41 W163.76 -355.4% Bearish RED .046 .066
|
Table 2
Count of Stocks in Key Tiger Directories
Date = 2018.02.05
--------------------------------------
NEWHIGHS 12
NEWLOWS 657
MAXCP 12
MINCP 833
TTTNH 39
TTTNL 911
FASTUP 74
FASTDOWN 938
CPCROSSA 19
CPCROSSD 226
BIGVOLUP 7
BIGVODN 136 |
Table 3
|
 |
Table 4 RANKING OF KEY DIRECTORIES BASED PCT.OF STOCKS ABOVE 65-DMA
2/5/18
Bullish = 7
Bearish = 39
---------------------------------------------------------------------------------------
Directory Current day-1 day-2 day-3 day-4 day-5
----------------------------------------------------------------------------------------
BIGMIL 1 1 1 1 1 1
HOSPITAL .75 .875 1 1 1 .875
COMODITY .657 .771 .828 .785 .8 .8
GAMING .607 .714 .785 .785 .785 .785
PIPELINE .571 .571 .714 .714 .714 .714
CHINA .515 .656 .718 .765 .75 .75
ETFS .507 .865 .925 .94 .94 .97
N=7
============================================================================================
RETAIL .49 .698 .754 .792 .83 .867
FOOD .466 .733 .8 .6 .6 .666
MILITARY .447 .71 .763 .763 .815 .789
NASD-100 .44 .69 .79 .83 .82 .85
SOFTWARE .439 .696 .757 .757 .727 .787
GOLD .431 .47 .764 .764 .725 .725
BIOTECH .419 .541 .582 .582 .632 .691
FINANCE .419 .774 .817 .806 .817 .827
OILGAS .404 .51 .695 .695 .702 .773
INDEXES .402 .824 .927 .927 .932 .938
COAL .4 .5 .6 .7 .7 .8
INDMATER .4 .555 .677 .722 .766 .788
NIFTY .4 .666 .766 .766 .733 .8
TRANSP .4 .75 .8 .85 .85 .8
SP500 .381 .645 .75 .777 .787 .814
SP-100 .375 .77 .843 .864 .885 .906
INFRA .371 .571 .742 .771 .857 .885
MORNSTAR .365 .756 .861 .869 .873 .894
HACKERS .36 .6 .64 .6 .6 .68
RUS-1000 .354 .609 .719 .734 .75 .776
AUTO .35 .6 .75 .775 .875 .9
BEVERAGE .35 .6 .75 .75 .8 .8
DOWJONES .333 .733 .866 .833 .9 .9
JETS .333 .555 .777 .666 .777 .666
REGBANKS .333 .696 .787 .696 .727 .757
DJI-13 .307 .692 .846 .769 .923 .923
COMPUTER .304 .652 .608 .608 .652 .739
BIGBANKS .285 .857 .857 .857 .857 1
INSURANC .281 .562 .625 .625 .625 .625
ELECTRON .191 .382 .483 .455 .488 .539
SEMI .184 .323 .438 .43 .446 .5
CHEM .171 .328 .546 .593 .578 .64
EDU .142 .142 .285 .285 .285 .285
GREEN .129 .483 .548 .516 .516 .58
HOMEBLDG .117 .235 .352 .352 .411 .47
UTILITY .093 .162 .232 .279 .255 .232
SOLAR .047 .142 .238 .238 .238 .38
REIT .028 .073 .112 .162 .123 .129
BONDFUND .018 .018 .036 .027 .018 .036
N=39
|
==============================================================================
2/2/2018
Peerless is now on
a Sell S9. In on-going bull markets, the original 2007
bull market Sell S9 variant dropped the DJI below the lower band
in 7 of 11 past cases when it
would have been applied in January and February. With the DJI
not having had a bear market's
18% or more DJI decline since March of 2009, lots of investors
are now worried that
a 8.5%-14% correction, at least, is now under way. Certainly, I
would expect Friday's very
steady deep decline to spill over to Monday and beyond.
I have added this Sell S9 variation
to the regular Peerless. It will be available to Elite Subscribers
on Monday.
Here is its track
record and its coded requirements.
I suspect the DJI will not rebound much until it reaches its
rising 65-dma, about 800 points
below Friday's close. A successful double-test of the rising
65-dma did take place in September
1987, whereon the DJI rallied to its upper band with all negative
internals. This is what generated
the October 1987 S9. The DJI then utterly collapsed after the
newly appointed Fed Chairman, Alan
Greenspan, went ahead with a rate hike to defend the Dollar.

A comparison of the DJI's recent top now with
the one in August 1987 seems appropriate.
Then like now, there had been a long bull market and a correction
was also long over-due. Then
like now, the Dollar had turned quite weak and this invited the
FED to raise interest rates. Then,
too, we had a new Federal Reserve Chairman. He got his baptism
in fire when the stock market
cried like a baby for a hand-out after falling 37% in just two
months.
1987 Support at Rising 65-dma
True, our internals are not so negative as in 1987, but certainly
the political situation now is much more
divided and dangerous for investors, I would judge. Republicans
in 2018 will need to prevent a deep
decline if they wish NOT to lose many Congressional seats in the
Fall Election. As of a week ago,
their polls seemed to be rising as the stock market's gains were
lifting 401K retirement accounts. But a
serious decline now would change this. The problem now is it's
not clear how they can go about the
fiscal pumping up of the market any more. Of course, the FED
could provide lot of new liquidity, but
Trump campaigned against this. Even quickly passing a big
Infrastructure spending bill may not do
the job if the bond market tanks as a result of Debt and
Inflation concerns. Far-sighted investors
have no choice but to be quite cautious now. So should we.
Conclusion: Stay clear of the major
market ETFs unless you are already short them.
If you have not already, Sell any stock whose Closing Power
uptrends are violated. Add more
bearish MINCPs short sales.
Weaker
Openings Now Cannot Be A Good Sign
For years the DJI has been boosted by higher openings. If that
pattern changes now, I would
fear this will be a very bad sign for the stock market.
Lower Openings Have Led The DJI Down This
Last Week,
Don't Fight This Down-Trend.
"Buy
at the Close and Sell at the Opening." (Rising Opening Power and Falling
Closing Power)
At long last, the New York
Times has finally taken note of our findings. Now that they have,
I would suggest that this Tiger short-term trading technique may
no longer work:
https://www.nytimes.com/2018/02/02/your-money/stock-market-after-hours-trading.html?emc=edit_th_180204&nl=todaysheadlines&nlid=58223894
Since SPY's inception in 1993, "all
of ...(its) price gain since 1993 has come outside regular trading hours...
If you had bought the SPY at the
last second of trading on each business day since 1993 and sold at the
market open the next day — capturing all of the net
after-hour gains — your cumulative price gain
would be 571 percent. On the other hand, if you had done the
reverse, buying the E.T.F. at the first
second of regular trading every morning at 9:30 a.m. and
selling at the 4 p.m. close, you would be down
4.4 percent since 1993. "
Charts 2/2/2018
PEERLESS
DJI, Signals, Indicators Daily
DJI Volume 10-DayUp/Down Vol
V-Indicator
Hourly DJIA A/D Line for All
Stocks
(new) A/D
Line for SP-500 Stocks
NASDAQ
S&P
OEX
NYSE COMPQX
DJI-15 DJI-20
DJI-30
DIA
SPY
QQQ MDY
IWM
TNA
CrudeOil
FAS
GLD
BBH
IBB
JETS
JNUG
KOL
NUGT
OIH
OIL
RSX
RETL
SDS
SLV
SOXL
TECL
TMF
TNA UGA
(gasoline)
XIV YINN
Commodities:
JJC, NIB,
CHOC
CORN,
WEAT UUP
(Dollar)
AAPL ADBE
ALXN AMAT
AMGN AMD
AMZN BA
BABA BAC
BIDU
CAT CVX
DE
FB
GOOG
GS HD
IBM JPM M
(Macy's)
MSFT NFLX
NVDA QCOM
TSLA TXN
XOM WMT
ANDV (refinery),
CMG (Chipotle), LRCX,
SWKS,
TOWN
Also SPPI WATT
SQ
2/2/2018
Bullish MAXCPs
Bearish MINCPs |
Table 1 QUICKSILVER on ETFS - 02/02/18
ETF CLOSE CHANGE PIVOT-PT 5-dma AROC CL-PWR CANDLE IP21 ITRS
---------------------------------------------------------------------------------------------
DIA 254.93 -6.69 W264.16 -208.9% ---- RED .109 ----
---------------------------------------------------------------------------------------------
COMPQX 7240.95 -144.91 W7466.51 -178.1% ---- RED .208 -.022
---------------------------------------------------------------------------------------------
SPY 275.45 -6.13 W284.68 -196.4% ---- RED .146 -.022
---------------------------------------------------------------------------------------------
QQQ 164.61 -3.35 W170.1 -186.5% ---- RED .159 -.019
---------------------------------------------------------------------------------------------
MDY 348.38 -7.16 W359.43 -197.5% Bearish RED .004 -.053
---------------------------------------------------------------------------------------------
IWM 153.83 -3.02 W158.7 -182.9% Bearish RED .037 -.06
---------------------------------------------------------------------------------------------
FAS 74.82 -4.88 W80.11 -432.8% ---- RED .169 .158
---------------------------------------------------------------------------------------------
RETL 36.22 -3.16 W44.85 -1038.5% Bearish RED .21 .146
---------------------------------------------------------------------------------------------
SOXL 157.03 -14.31 W180.55 -687.4% Bearish RED .025 -.133
---------------------------------------------------------------------------------------------
TECL 124.76 -12.26 W137.52 -597.2% Bearish RED .048 .04
---------------------------------------------------------------------------------------------
IBB 112.14 -1.84 W118.5 -253.9% ---- RED -.006 .002
---------------------------------------------------------------------------------------------
GLD 126.39 -1.68 W127.35 -65.8% ---- RED .098 -.047
---------------------------------------------------------------------------------------------
OIL 7.29 -.13 W7.34 -102.4% Bullish ---- .185 .126
---------------------------------------------------------------------------------------------
OIH 26.83 -1.19 W28.09 -337.5% Bearish RED .144 .029
---------------------------------------------------------------------------------------------
GASL 22.21 -3.12 W28.11 -1408% Bearish RED -.13 -.068
---------------------------------------------------------------------------------------------
UGA 33.27 -.46 W33.9 -129.1% Bullish BLUE .174 -.023
---------------------------------------------------------------------------------------------
UUP 23.27 .14 W23.32 2.2% Bearish ---- -.043 -.137
---------------------------------------------------------------------------------------------
IEF 102.22 -.38 W103.51 -75% Bearish RED -.173 -.124
---------------------------------------------------------------------------------------------
XLU 49.88 -.36 W50.39 -114.5% Bearish RED -.155 -.192
---------------------------------------------------------------------------------------------
WEAT 6.25 -.06 W6.28 55.5% Bullish ---- .096 -.074
---------------------------------------------------------------------------------------------
YINN 45.45 -2.18 W50.48 -836% ---- RED .124 .22
---------------------------------------------------------------------------------------------
RSX 22.98 -.56 W23.33 -134.4% ---- RED .181 -.036
---------------------------------------------------------------------------------------------
AAPL 160.5 -7.28 W167.96 -327% Bearish RED -.083 -.145
---------------------------------------------------------------------------------------------
GOOG 1111.9 -55.8 W1175.58 -273.1% Bullish RED .181 .003
---------------------------------------------------------------------------------------------
MSFT 91.78 -2.48 W93.92 -121.3% Bearish RED -.019 .023
---------------------------------------------------------------------------------------------
AMZN 1429.95 39.95 1417.68 98.3% ---- RED .091 .181
---------------------------------------------------------------------------------------------
FB 190.28 -2.81 185.98 7.4% Bullish RED .035 -.024
---------------------------------------------------------------------------------------------
NVDA 233.52 -6.98 W246.85 -201.2% Bullish RED .128 .002
---------------------------------------------------------------------------------------------
BA 348.91 -8.03 340.82 82.1% ---- RED .015 .23
---------------------------------------------------------------------------------------------
GS 260.04 -12.19 W272.48 -150% Bullish RED .14 .003
---------------------------------------------------------------------------------------------
HD 193.97 -5.93 W204.92 -326.7% ---- RED .121 .049
---------------------------------------------------------------------------------------------
CAT 157.49 -4.75 W162.58 -292.3% Bearish RED .077 .062
|
Table 2
Count of Stocks in Key Tiger Directories
Date = 180202
--------------------------------------
NEWHIGHS 42
NEWLOWS 256 So many new lows just a week from the DJI's
new high is not good.MAXCP 26
MINCP 405 Professionals have turned quite bearish.
TTTNH 44
TTTNL 551
FASTUP 77
FASTDOWN 515 There is a lot of institutional dumping going on.
CPCROSSA 27
CPCROSSD 187
BIGVOLUP 5
BIGVODN 50
|
Table 3
Count of Stocks and New Highs in Key Tiger Directories
Date = 180202
No. NHs Pct
-------------------------------------------------------------------
INDEXES 194 12 6 %
RUS-1000 837 52 6 %
GAMING 28 1 4 %
AUTO 40 1 3 %
SOFTWARE 66 2 3 %
NASD-100 100 3 3 %
BIOTECH 387 8 2 %
FINANCE 93 1 1 %
MORNSTAR 238 2 1 %
SP500 485 5 1 %
REIT 178 1 1 %
Others: None
|
 |
Table 4 RANKING OF KEY DIRECTORIES BASED PCT.OF STOCKS ABOVE 65-DMA
2/2/18
Bullish = 34
Bearish = 11
---------------------------------------------------------------------------------------
Directory Current day-1 day-2 day-3 day-4 day-5
----------------------------------------------------------------------------------------
BIGMIL 1 1 1 1 1 1
HOSPITAL .875 1 1 1 .875 .875
ETFS .865 .925 .94 .94 .97 .97
BIGBANKS .857 .857 .857 .857 1 1
INDEXES .835 .927 .927 .932 .938 .927
FINANCE .774 .817 .806 .817 .827 .827
COMODITY .771 .828 .785 .8 .8 .828
SP-100 .77 .843 .864 .885 .895 .906
MORNSTAR .756 .861 .869 .873 .894 .92
TRANSP .75 .8 .85 .85 .8 .85
DOWJONES .733 .866 .833 .9 .9 .9
FOOD .733 .8 .6 .6 .666 .733
GAMING .714 .785 .785 .785 .785 .821
MILITARY .71 .763 .763 .815 .789 .763
RETAIL .698 .754 .792 .83 .867 .867
REGBANKS .696 .787 .696 .727 .757 .787
SOFTWARE .696 .757 .757 .727 .772 .818
DJI-13 .692 .846 .769 .923 .923 .923
NASD-100 .69 .79 .83 .82 .85 .88
NIFTY .666 .766 .766 .733 .8 .8
CHINA .656 .718 .765 .75 .75 .796
COMPUTER .652 .608 .608 .652 .739 .739
SP500 .645 .75 .777 .787 .812 .845
RUS-1000 .609 .719 .734 .75 .774 .802
AUTO .6 .75 .775 .875 .875 .9
BEVERAGE .6 .75 .75 .8 .8 .85
HACKERS .6 .64 .6 .6 .68 .72
INFRA .571 .742 .771 .857 .885 .942
PIPELINE .571 .714 .714 .714 .714 .714
INSURANC .562 .625 .625 .625 .625 .656
INDMATER .555 .677 .722 .766 .8 .855
JETS .555 .777 .666 .777 .666 .666
BIOTECH .542 .583 .583 .633 .687 .697
OILGAS .514 .7 .7 .707 .778 .8
N= 34
============================================================================================
COAL .5 .6 .7 .7 .8 .8
============================================================================================
GREEN .483 .548 .516 .516 .58 .548
GOLD .47 .764 .764 .725 .725 .862
ELECTRON .382 .483 .455 .488 .533 .573
CHEM .328 .546 .593 .578 .64 .671
SEMI .323 .438 .43 .446 .5 .553
HOMEBLDG .235 .352 .352 .411 .47 .647
UTILITY .162 .232 .279 .255 .232 .232
EDU .142 .285 .285 .285 .428 .714
SOLAR .142 .238 .238 .238 .38 .333
REIT .073 .112 .162 .123 .129 .179
BONDFUND .018 .036 .027 .018 .036 .081
N=11
|
===============================================================================
===============================================================================
2/1/2018 The evidence from tonight's
research is compelling that we should consider a
revised Sell S9 to have occurred on Tuesday's close.
See below. There have
been 11 of these revised S9s in January and February in
rising markets since 1929.
All 11 brought declines to the lower 3% band. 7 of the
11 brought declines below
the lower 3.5% band. The Futures are already dropping
sharply. This probably
has something to do with the necklines of head/shoulders
being broken. It has to do with
Trump's political difficulties. But there is a lot more
at stake, as I discuss below.
A DJI decline back to its 65-dma and the lower 3% next
seems highly likely. There
should be very good support there.
All this week I have
suggested we should expect the DJI to retreat from its very
overbought position. In particular, I noted that the
recent rally has brought a
gain that more than matches the average gain after a
September Buy B21 and
so profits should be taken, rather than be too greedy.
The deterioration of
breadth was mentioned as a bearish factor. Monday and
Tuesday both were
days when the number of NYSE decliners was more than 4
times the number of
advancers. As a result, on January 30th, the P-I and
the V-I turned negative.
Since the DJI closed down at only the 1.3% upper band,
no Peerless S9 was given
on January 29th. But back in the days before 2008,
Peerless also used its
hypothetical high in relation to the 21-day ma. I
believe that is why a Sell S9
using the 2007 version of Peerless was given.
I do not have the source
code for the 2007 version of Peerless. But I tested the
following parameters for January and February when the
DJI was near its 12 month
highs and not in a bear market:
1) Close/21-dma must be above 1.013
2) Theoretical High/21-dma must be
above 1.026
3) P-Indicator must be negative.
4) V-Indicator must be negative.
There were 11 of the 2007-like variations on our classic
Sell S9. All brought declines to
at least the 3% lower band. Six saw paper losses, all
under 5%. But most significantly,
7 of the 11 produced a DJI decline below the lower 3.5%
band.
1) 1/30/1929 312.64
DJI rallied to 322.1
and then fell to lower 3.5% band.
2) 2/28/1929 317.4
DJI fell directly to the lower 3.5% band.
3) 2/15/1935 104.7
DJI rose to 107.2
and then fell to lower 3.5% band.
4) 2/11/1937 190.3
DJI rose to 194.4 (3/10)
and then fell below lower 3.5% band.
5) 1/3/1939 153.6
DJI fell directly below lower 3.5% band.
6) 1/9/1946 197.37
DJI rose to 206.6
and then fell below lower 3.5% band.
7) 2/1/1955 409.7
DJI rose to 419.7
and then fell below lower 3.5% band.
8) 1/3/1973 1939
DJI fell directly far below lower 3.5% band.
9) 2/13/1980 903.84
DJI fell directly far below lower 3.5% band.
10) 1/13/1999 9349.55
DJI fell directly to lower 3.0% band.
11) 1/7/2000 11522.56
DJI rose to 11722.98
and then fell far below the 3.5%
lower band.
What To
Do?
Take profits in longs. Do not let a gain turn
into a loss. Sell when the steep Closing Power
uptrends are violated. Sell some of the bearish
MINCP stocks short. Because of Boeing's
unduly large impact on the DJI, I am reluctant to
suggest shorting DIA.
January's JOBs' Numbers Are Unusually Important
The Fed's postponing a rise
in interest rates until March did not help dividend stocks.
Investors again quickly unloaded utilities' stocks,
REITs and bond funds Thursday.
The explanation is simple. Rates have been very, very
low. Now they will almost
certainly be going up. Trump's tax cuts and increased
spending on the military, domestic
security and, possibly, infrastructure has many big
investors in bonds really spooked.
But there is a much bigger
storm approaching. It has to do with the Trump's wager
on the strong and the power of "trickle-down" economics.
What if the Economy does not
get as big a boost as Republicans are expecting from
Trump's economic agenda? That
could cause a big turnover in Congressional seats. It
conceivably could even cause the
Democrats to regain control of the House of
Representatives. That has to be on Republican
investors' minds. I believe this is why the
DJI, SP-500, Mid-Caps, QQQ and NASDAQ
have all quickly formed compact little head/shoulders
price patterns.
If I am right, then
tomorrow's Jobs' numbers for January have taken on a special significance.
They wobble and fluctuate, of course, month to month.
But anything short of a really good
number, say above 210,000 for new jobs could be
politically troublesome. Ordinarily, a
low number, one that is less than 12 months ago and also
the previous month,
can sometimes be viewed as a cause for the Fed to delay
raising interest rates. But not
only has the Fed largely guaranteed a raise in
short-term rates in March, now a low number
of new monthly jobs, below, say 150,000 would mean
economic Growth is probably not
good enough to boost Republicans' political fortunes,
especially in the Midwest "rust belt".
So tomorrow's January Jobs' numbers will be important
for partisans and for the stock
market, too. The new numbers will be reported an hour
before the NYSE opens. Below are
current numbers which we will use for comparison.
| |
| Year |
Jan |
Feb |
Mar |
Apr |
May |
Jun |
Jul |
Aug |
Sep |
Oct |
Nov |
Dec |
| 2007 |
240 |
89 |
190 |
80 |
143 |
75 |
-34 |
-20 |
88 |
84 |
114 |
98 |
| 2008 |
17 |
-84 |
-78 |
-210 |
-186 |
-162 |
-213 |
-267 |
-450 |
-474 |
-766 |
-694 |
| 2009 |
-793 |
-702 |
-823 |
-687 |
-349 |
-471 |
-329 |
-213 |
-220 |
-204 |
-2 |
-275 |
| 2010 |
23 |
-68 |
164 |
243 |
524 |
-137 |
-68 |
-36 |
-52 |
262 |
119 |
87 |
| 2011 |
43 |
189 |
225 |
346 |
77 |
225 |
69 |
110 |
248 |
209 |
141 |
209 |
| 2012 |
358 |
237 |
233 |
78 |
115 |
76 |
143 |
177 |
203 |
146 |
132 |
244 |
| 2013 |
211 |
286 |
130 |
197 |
226 |
162 |
122 |
261 |
190 |
212 |
258 |
47 |
| 2014 |
190 |
151 |
272 |
329 |
246 |
304 |
202 |
230 |
280 |
227 |
312 |
255 |
| 2015 |
234 |
238 |
86 |
262 |
344 |
206 |
254 |
157 |
100 |
321 |
272 |
239 |
| 2016 |
126 |
237 |
225 |
153 |
43 |
297 |
291 |
176 |
249 |
124 |
164 |
155 |
| 2017 |
216 |
232 |
50 |
207 |
145 |
210 |
138 |
208 |
38 |
211 |
252(P) |
148(P) |
| P : preliminary |
|
|
Charts 2/1/2018
PEERLESS
DJI, Signals, Indicators Daily
DJI Volume 10-DayUp/Down Vol
V-Indicator
Hourly DJIA A/D Line for All
Stocks
(new) A/D
Line for SP-500 Stocks
NASDAQ
S&P
OEX
NYSE COMPQX
DJI-15 DJI-20
DJI-30
DIA
SPY
QQQ MDY
IWM
TNA
CrudeOil
FAS
GLD
BBH
IBB
JETS
JNUG
KOL
NUGT
OIH
OIL
RSX
RETL
SDS
SLV
SOXL
TECL
TMF
TNA UGA
(gasoline)
XIV YINN
Commodities:
JJC, NIB,
CHOC
CORN,
WEAT UUP
(Dollar)
AAPL ADBE
ALXN AMAT
AMGN AMD
AMZN BA
BABA BAC
BIDU
CAT CVX
DE
FB
GOOG
GS HD
IBM JPM M
(Macy's)
MSFT NFLX
NVDA QCOM
TSLA TXN
XOM WMT
ANDV (refinery),
CMG (Chipotle), LRCX,
SWKS,
TOWN
Also SPPI WATT
SQ
2/1/2018
Bullish MAXCPs
Bearish MINCPs |
Table 1
QUICKSILVER on ETFS -
02/01/18 Bullish: Closing Power Rising = 15 Falling = 12
Warnings:
Below Pivot-Points = 26 of 31
5-dma Falling = 20 Rising = 11
ETF CLOSE CHANGE PIVOT-PT 5-dma AROC CL-PWR CANDLE IP21 ITRS
---------------------------------------------------------------------------------------------
---------------------------------------------------------------------------------------------
DIA 261.62 .18 W265.91 -40.5% Bullish BLUE .226 ------
---------------------------------------------------------------------------------------------
COMPQX 7385.86 -25.62 W7505.77 -17% Bullish BLUE .307 -.032
---------------------------------------------------------------------------------------------
SPY 281.58 -.32 W286.58 -30.3% Bullish BLUE .273 -.029
---------------------------------------------------------------------------------------------
QQQ 167.96 -1.44 W170.93 -11.5% Bullish RED .288 -.03
---------------------------------------------------------------------------------------------
MDY 355.54 .54 W362.51 -75.1% ---- BLUE .087 -.06
---------------------------------------------------------------------------------------------
IWM 156.85 .49 W159.6 -68.9% ---- BLUE .103 -.064
---------------------------------------------------------------------------------------------
FAS 79.7 .9 W81.71 -30.7% Bullish BLUE .268 .22
---------------------------------------------------------------------------------------------
RETL 39.38 -1.34 W45.02 -509.8% ---- RED .253 .264
---------------------------------------------------------------------------------------------
SOXL 171.34 -2.57 W181.13 169.4% ---- BLUE .141 -.041
---------------------------------------------------------------------------------------------
TECL 137.02 .18 W141.15 70.5% Bullish BLUE .214 .132
---------------------------------------------------------------------------------------------
IBB 113.98 -.1 W118.04 -113.5% Bullish BLUE .095 -.022
---------------------------------------------------------------------------------------------
GLD 128.07 .42 *128.07 3.9% Bullish BLUE .125 -.079
---------------------------------------------------------------------------------------------
OIL 7.42 .18 W7.44 89.1% Bullish BLUE .224 .105
---------------------------------------------------------------------------------------------
OIH 28.02 .56 W28.72 -115.5% ---- BLUE .241 .04
---------------------------------------------------------------------------------------------
GASL 25.33 .29 W29.74 -779% Bearish BLUE -.08 .005
---------------------------------------------------------------------------------------------
UGA 33.73 .11 W34.14 3% Bullish ---- .181 -.047
---------------------------------------------------------------------------------------------
UUP 23.13 -.12 W23.26 -38.7% Bearish RED .015 -.171
---------------------------------------------------------------------------------------------
IEF 102.6 -.7 W103.77 -71.4% Bearish RED -.161 -.155
---------------------------------------------------------------------------------------------
XLU 50.24 -.8 W51.04 -75.8% Bearish RED -.144 -.221
---------------------------------------------------------------------------------------------
WEAT 6.31 -.01 6.18 183.8% Bullish ---- .147 -.108
---------------------------------------------------------------------------------------------
YINN 47.63 -2.16 W53.8 -240% Bullish RED .221 .292
---------------------------------------------------------------------------------------------
RSX 23.54 .05 W23.61 -55.3% Bullish BLUE .3 -.048
---------------------------------------------------------------------------------------------
AAPL 167.78 .35 W171.51 -98.5% Bearish BLUE -.014 -.135
---------------------------------------------------------------------------------------------
GOOG 1167.7 -2.24 W1175.84 -11.4% Bullish BLUE .303 .025
---------------------------------------------------------------------------------------------
MSFT 94.26 -.75 94.06 103.1% Bullish RED .06 .023
---------------------------------------------------------------------------------------------
AMZN 1390 -60.89 W1402.05 42.5% Bullish RED .194 .109
---------------------------------------------------------------------------------------------
FB 193.09 6.2 190 149.6% Bullish BLUE .108 -.042
---------------------------------------------------------------------------------------------
NVDA 240.5 -5.3 W243.33 85.4% Bullish BLUE .205 .017
---------------------------------------------------------------------------------------------
BA 356.94 2.57 343.22 201.1% Bullish BLUE .068 .24
---------------------------------------------------------------------------------------------
GS 272.23 4.34 268.14 59.4% Bullish BLUE .174 .023
---------------------------------------------------------------------------------------------
HD 199.9 -1 W207.23 -134% Bullish BLUE .205 .071
---------------------------------------------------------------------------------------------
CAT 162.24 -.54 W167.06 -215.9% Bearish BLUE .135 .071
|
Table 2
Count of Stocks in
Key Tiger Directories
Date = 180201
---------------------------------------------------------
NEWHIGHS 196
NEWLOWS 156
MAXCP 84
MINCP 223
TTTNH 83
TTTNL 281
FASTUP 75
FASTDOWN 237
CPCROSSA 211
CPCROSSD 71
BIGVOLUP 5
BIGVODN 21
|
Table 3
Count of Stocks and New Highs in Key Tiger Directories
2/1/2018
No NHs Pct.
-------------------------------------------------------------------
BIGMIL 6 4 67 %
BIGBANKS 7 2 29 %
DJI-13 13 3 23 %
MILITARY 38 8 21 %
GAMING 28 6 21 %
DOWJONES 30 5 17 %
FINANCE 93 14 15 %
=================================================
EDU 7 1 14 %
HOSPITAL 8 1 13 %
COMODITY 70 8 11 %
NIFTY 30 3 10 %
SP-100 96 10 10 %
INSURANC 32 3 9 %
NASD-100 100 8 8 %
SP500 485 34 7 %
RUS-1000 837 52 6 %
AUTO 40 2 5 %
INDEXES 194 10 5 %
MORNSTAR 238 11 5 %
TRANSP 20 1 5 %
BEVERAGE 20 1 5 %
BIOTECH 387 16 4 %
REGBANKS 33 1 3 %
ETFS 66 2 3 %
CHEM 64 1 2 %
SEMI 130 3 2 %
SOFTWARE 66 1 2 %
INDMATER 90 1 1 %
ELECTRON 178 2 1 %
REIT 178 1 1 %
====================================================
NONE:
GREEN HOMEBLDG HACKERS OILGAS INFRA CHINA SOLAR COMPUTER
COAL GOLD RETAIL UTILITY PIPELINE FOOD BONDFUND JETS
|
 |
Table 4
RANKING OF KEY DIRECTORIES BASED PCT.OF
STOCKS ABOVE 65-DMA
2/1/18Bullish = 38
Bearish = 8
---------------------------------------------------------------------------------------
Directory Current day-1 day-2 day-3 day-4 day-5
----------------------------------------------------------------------------------------
BIGMIL 1 1 1 1 1 1
HOSPITAL 1 1 1 .875 .875 .875
INDEXES .927 .927 .932 .938 .927 .927
ETFS .924 .939 .939 .969 .969 .969
DOWJONES .866 .833 .9 .9 .9 .9
MORNSTAR .861 .869 .873 .894 .92 .911
BIGBANKS .857 .857 .857 1 1 1
DJI-13 .846 .769 .923 .923 .923 .923
SP-100 .843 .864 .885 .895 .916 .927
COMODITY .828 .785 .8 .8 .8 .742
FINANCE .817 .806 .817 .827 .827 .849
FOOD .8 .6 .6 .666 .6 .4
TRANSP .8 .85 .85 .8 .85 .8
==========================================================================================
NASD-100 .79 .83 .82 .85 .89 .86
REGBANKS .787 .696 .727 .757 .787 .757
GAMING .785 .785 .785 .785 .821 .857
JETS .777 .666 .777 .666 .666 .666
NIFTY .766 .766 .733 .8 .8 .766
GOLD .764 .764 .725 .725 .862 .823
MILITARY .763 .763 .815 .789 .763 .789
SOFTWARE .757 .757 .727 .772 .818 .742
RETAIL .754 .792 .83 .867 .867 .867
AUTO .75 .775 .875 .875 .9 .875
BEVERAGE .75 .75 .8 .8 .85 .85
SP500 .75 .777 .787 .812 .851 .841
INFRA .742 .771 .857 .885 .942 .914
RUS-1000 .719 .734 .75 .774 .805 .801
CHINA .718 .765 .75 .75 .796 .781
PIPELINE .714 .714 .714 .714 .714 .714
OILGAS .7 .7 .707 .778 .8 .8
INDMATER .677 .722 .766 .8 .855 .855
HACKERS .64 .6 .6 .68 .72 .68
INSURANC .625 .625 .625 .625 .687 .75
COMPUTER .608 .608 .652 .739 .739 .739
COAL .6 .7 .7 .8 .8 .9
BIOTECH .583 .583 .633 .687 .695 .684
GREEN .548 .516 .516 .58 .548 .58
CHEM .546 .593 .578 .64 .671 .671
============================================================================================
ELECTRON .483 .455 .488 .533 .573 .511
SEMI .438 .43 .446 .5 .553 .469
HOMEBLDG .352 .352 .411 .47 .647 .647
EDU .285 .285 .285 .428 .714 .714
SOLAR .238 .238 .238 .38 .333 .333
UTILITY .232 .279 .255 .232 .232 .209
REIT .112 .162 .123 .129 .179 .235
BONDFUND .036 .027 .018 .036 .081 .099
N= 8
|
==============================================================================
==============================================================================
1/31/2018 I have suggested doing some
profit-taking and waiting for a pullback by the DJI
to buy again. In this way, we can again be positioned
long to be consistent with
the still active September Buy B21. That the 10-day
Down Volume has risen above the 10-day
Up Volume suggests this seems a good plan. So does the
break in the NYSE
A/D Line uptrend, which warns us that
interest rates are on the rise. It remains
to be seen if the DJI will decisively break below the
near-term support at 25800;
such is the power of an accelerating uptrend. So
patience seems warranted as
far as the DJI goes. A continued decline in
Crude Oil and oil
stocks would contribute
to a bigger DJI sell-off, so watch them now.
Should We Have Gotten an S9 on Tuesday?
An alert subscriber just
emailed me, saying that the 2006 version of Peerless would
have given a Sell S9 yesterday. There is no time
tonight to back-test it for January
and February. And I lost the source code for this
version of Peerless some time ago.
But the current version gives no such Sell S9 and I
would trust the current Peerless because
I know how many hours went into back-testing all of its
signals. See 2006 version's chart.
Still, tomorrow I will show this old S9's track record
for this time of the year. No time
tonight.

I still doubt if rising
interest rates are ready to bring a much bigger decline.
The bad breadth on the NYSE, so far, owes mostly to
weak dividend plays, bond
funds, REITs and utilities. I would suggest that an
economic slow-down is not in the
cards, judging from the still rising A/D Line for the
SP-500 stocks shown below.
The leading tech stocks (NVDA,
GOOG, MSFT and
AMZN) seem not to be
bothered by the prospects of higher interest rates.
And so the NASDAQ and
QQQ show very high levels
of underlying Accumulation. This suggests ample
support and only a limited pullback at this time.
These stocks, QQQ and the
NASDAQ are "tightly held". Because of this,
I would Buy QQQ if it makes a
run now and destroys its bearish-looking head/shoulders
pattern. This will
bring on another short-covering burst upwards.
There are a number of
very special biotech situations that look bullish.
We see
them in the
Bullish MAXCPs tonight. The star
performer is Madrigal. Its preliminary
trials for a novel way to treat fatty livers not caused
by drinking has had a high degree of
success. While trials are always limited. the stunning
results its drug is getting
would occur less than once in 10,000 randomized
samples. It used to be a $300
stock. It is still only half of that price. We will
watch to see who makes a bid for it.
It epitomizes what we always hope to find using our
Explosive Super Stock screens.
If someone came up to me and wanted one stock to buy,
this is what I would pick
for him.
http://www.madrigalpharma.com/wp-content/uploads/2018/01/Madrigal-Announces-EASL-Presentation.20180130_FINAL.pdf
Charts
1/31/2018
PEERLESS
DJI, Signals, Indicators Daily
DJI Volume 10-DayUp/Down Vol
V-Indicator
Hourly DJIA A/D Line for All
Stocks
NASDAQ
S&P
OEX
NYSE COMPQX
DJI-15 DJI-20
DJI-30
DIA
SPY
QQQ MDY
IWM
TNA
CrudeOil
FAS
GLD
BBH
IBB
JETS
JNUG
KOL
NUGT
OIH
OIL
RSX
RETL
SDS
SLV
SOXL
TECL
TMF
TNA UGA
(gasoline)
XIV YINN
Commodities:
JJC, NIB,
CHOC
CORN,
WEAT UUP
(Dollar)
AAPL ADBE
ALXN AMAT
AMGN AMD
AMZN BA
BABA BAC
BIDU
CAT CVX
DE
FB
GOOG
GS HD
IBM JPM M
(Macy's)
MSFT NFLX
NVDA QCOM
TSLA TXN
XOM WMT
ANDV (refinery),
CMG (Chipotle), LRCX,
SWKS,
TOWN
Also SPPI WATT
SQ (Square)
1/31/2018
Bullish MAXCPs
Bearish MINCPs |
Table 1 QUICKSILVER on ETFS - 01/31/18
Bullish: Closing Power Rising = 21 Falling = 5
Warnings:
5-dma Falling = 21 Rising = 11
ETF CLOSE CHANGE PIVOT-PT 5-dma AROC CL-PWR CANDLE IP21 ITRS
---------------------------------------------------------------------------------------------
---------------------------------------------------------------------------------------------
DIA 261.44 .82 W263.75 -21.5% Bullish RED .231 -----
---------------------------------------------------------------------------------------------
COMPQX 7411.48 9 7411.16 -2.4% Bullish RED .373 -.022
---------------------------------------------------------------------------------------------
SPY 281.9 .14 W283.3 -22.5% Bullish RED .325 -.023
---------------------------------------------------------------------------------------------
QQQ 169.4 .7 168.35 29.2% Bullish RED .364 -.017
---------------------------------------------------------------------------------------------
MDY 355 -.7 W360.93 -85.8% ---- RED .173 -.051
---------------------------------------------------------------------------------------------
IWM 156.36 -.82 W159.03 -82.2% ---- RED .118 -.055
---------------------------------------------------------------------------------------------
FAS 78.8 1.1 W80.19 -99.4% Bullish BLUE .228 .204
---------------------------------------------------------------------------------------------
RETL 40.72 -1.16 W43.79 -404.9% ---- RED .303 .428
---------------------------------------------------------------------------------------------
SOXL 173.91 4.35 165.44 -17.5% ---- RED .2 -.031
---------------------------------------------------------------------------------------------
TECL 136.84 3.21 135.09 31.1% Bullish BLUE .264 .117
---------------------------------------------------------------------------------------------
IBB 114.08 -2.19 W116.63 -77.7% Bullish RED .152 -.012
---------------------------------------------------------------------------------------------
GLD 127.65 .85 W127.97 -46.2% ---- BLUE .133 -.061
---------------------------------------------------------------------------------------------
OIL 7.24 .07 W7.29 -122.7% Bullish BLUE .21 .123
---------------------------------------------------------------------------------------------
OIH 27.46 -.24 W28.67 -260.3% ---- RED .24 .042
---------------------------------------------------------------------------------------------
GASL 25.04 -.44 W29.63 -1036.7% Bearish RED -.022 .049
---------------------------------------------------------------------------------------------
UGA 33.62 .54 W33.71 -66.6% Bullish BLUE .114 -.023
---------------------------------------------------------------------------------------------
UUP 23.25 -.03 W23.31 -6.4% Bullish ---- .051 -.16
---------------------------------------------------------------------------------------------
IEF 103.3 .03 W104.08 -26.5% Bearish RED -.071 -.139
---------------------------------------------------------------------------------------------
XLU 51.04 .56 51.01 80% Bearish BLUE -.117 -.205
---------------------------------------------------------------------------------------------
WEAT 6.32 -.1 6.08 201.4% Bullish ---- .161 -.087
---------------------------------------------------------------------------------------------
YINN 49.79 1.78 W50.05 -225% Bullish RED .28 .34
---------------------------------------------------------------------------------------------
RSX 23.49 .23 W23.8 -61.6% Bullish ---- .337 -.028
---------------------------------------------------------------------------------------------
AAPL 167.43 .46 W171.11 -199.3% Bearish BLUE .017 -.134
---------------------------------------------------------------------------------------------
GOOG 1169.94 6.25 W1170.37 24.4% Bullish RED .331 .02
---------------------------------------------------------------------------------------------
MSFT 95.01 2.27 92.33 171.6% Bullish BLUE .104 .029
---------------------------------------------------------------------------------------------
AMZN 1450.89 13.07 1377.95 333.8% Bullish RED .31 .163
---------------------------------------------------------------------------------------------
FB 186.89 -.23 W187.48 9.1% Bullish RED .106 -.072
---------------------------------------------------------------------------------------------
NVDA 245.8 3.08 236.35 207.5% Bullish ---- .257 .049
---------------------------------------------------------------------------------------------
BA 354.37 16.66 343.11 289.5% Bullish RED .087 .231
---------------------------------------------------------------------------------------------
GS 267.89 -1.05 W269.03 41.1% Bullish RED .135 .006
---------------------------------------------------------------------------------------------
HD 200.9 -.91 W205.37 -129.7% Bullish RED .159 .086
---------------------------------------------------------------------------------------------
CAT 162.78 -.98 W169.37 -167.2% Bearish RED .114 .081
|
Table 2
Count of Stocks in Key Tiger Directories
Date = 180131
--------------------------------------
NEWHIGHS 119
NEWLOWS 102
MAXCP 41
MINCP 267
TTTNH 54
TTTNL 403
FASTUP 74
FASTDOWN 234
CPCROSSA 37
CPCROSSD 119
BIGVOLUP 6
BIGVODN 28
|
Table 3
Count of Stocks and New Highs in Key Tiger Directories
Date = 180131
No. NHs Pct
-------------------------------------------------------------------
BIGMIL 6 4 67 %
DJI-13 13 3 23 %
JETS 9 2 22 %
NIFTY 30 6 20 %
MILITARY 38 7 18 %
GAMING 28 5 18 %
DOWJONES 30 5 17 %
=========================================================
BEVERAGE 20 2 10 %
INSURANC 32 3 9 %
NASD-100 100 9 9 %
FINANCE 93 6 6 %
SP-100 96 6 6 %
SOFTWARE 66 4 6 %
AUTO 39 2 5 %
SP500 485 23 5 %
RUS-1000 837 38 5 %
HACKERS 25 1 4 %
MORNSTAR 238 9 4 %
BIOTECH 393 17 4 %
COMPUTER 23 1 4 %
GREEN 31 1 3 %
CHINA 64 2 3 %
INDEXES 194 4 2 %
RETAIL 53 1 2 %
INDMATER 90 1 1 %
ELECTRON 178 1 1 %
SEMI 130 1 1 %
REIT 178 1 1 %
------------------ None -------------------------------------
BIGBANKS REGBANKS HOMEBLDG CHEM ETFS OILGAS INFRA
TRANSP SOLAR COAL GOLD EDU UTILITY PIPELINE
COMODITY FOOD BONDFUND HOSPITAL
|
| |
Table 4 RANKING OF KEY DIRECTORIES BASED PCT.OF STOCKS ABOVE 65-DMA
1/31/18
Bullish = 38
Bearish = 8
---------------------------------------------------------------------------------------
Directory Current day-1 day-2 day-3 day-4 day-5
----------------------------------------------------------------------------------------
BIGMIL 1 1 1 1 1 1
HOSPITAL 1 1 .875 .875 .875 .875
ETFS .939 .939 .969 .969 .969 .954
INDEXES .927 .932 .938 .927 .927 .938
MORNSTAR .869 .873 .894 .92 .911 .92
SP-100 .864 .885 .895 .916 .927 .927
BIGBANKS .857 .857 1 1 1 1
TRANSP .85 .85 .8 .85 .8 .9
DOWJONES .833 .9 .9 .9 .9 .933
NASD-100 .83 .82 .85 .89 .86 .86
FINANCE .806 .817 .827 .827 .849 .849
N=11
===========================================================================================
RETAIL .792 .83 .867 .867 .867 .867
COMODITY .785 .8 .8 .8 .742 .757
GAMING .785 .785 .785 .821 .857 .821
SP500 .777 .787 .812 .851 .841 .83
INFRA .771 .857 .885 .942 .914 .914
AUTO .769 .871 .871 .897 .871 .871
DJI-13 .769 .923 .923 .923 .923 1
NIFTY .766 .733 .8 .8 .766 .833
CHINA .765 .75 .75 .796 .781 .781
GOLD .764 .725 .725 .862 .803 .901
MILITARY .763 .815 .789 .763 .789 .763
SOFTWARE .757 .727 .772 .818 .742 .757
BEVERAGE .75 .8 .8 .85 .8 .8
RUS-1000 .734 .75 .774 .805 .802 .8
INDMATER .722 .766 .8 .855 .855 .855
PIPELINE .714 .714 .714 .714 .714 .714
COAL .7 .7 .8 .8 .9 .9
OILGAS .7 .707 .778 .8 .8 .814
REGBANKS .696 .727 .757 .787 .757 .818
JETS .666 .777 .666 .666 .666 .777
INSURANC .625 .625 .625 .687 .75 .687
COMPUTER .608 .652 .739 .739 .739 .782
FOOD .6 .6 .666 .6 .4 .466
HACKERS .6 .6 .68 .72 .72 .72
CHEM .593 .578 .64 .671 .671 .687
BIOTECH .587 .631 .689 .689 .676 .651
GREEN .516 .516 .58 .548 .58 .645
N=27
==============================================================================================
ELECTRON .455 .488 .533 .573 .505 .601
SEMI .43 .446 .5 .553 .461 .576
HOMEBLDG .352 .411 .47 .647 .647 .882
EDU .285 .285 .428 .714 .714 .714
UTILITY .279 .255 .232 .232 .209 .162
SOLAR .238 .238 .38 .333 .333 .38
REIT .162 .123 .129 .179 .235 .23
BONDFUND .027 .018 .036 .081 .081 .081
N=8
|
==============================================================================
1/30/2018 The Peerless September
Buy B21
has not been reversed. But a bigger pullback than
we have seen so far would seem healthy and likely.
Tomorrow's recovery will be
partisan-inspired. The State of The Union Message
is mostly a political cheer-leading
event. For this reason, the DJI may stall out soon
after it closes the downside gap in
today's trading. A run up to 26400 would do this.
Bulls, the animal that is, are actually color-blind
like most four-legged animals. So, it is the
movement of the cape that gets them in trouble, not
the color. We should not be fooled now by
a sudden lurch upwards. Buying on a decent pullback
will be safer unless Peerless first
generates a Sell signal. That could happen. We might
get a Sell at DJI-26600 later this
week since both the the P-Indicator and V-Indicators
are now negative. As the DJI is
currently 1.3% over the 21-dma, a 300 point rally up
from here on poor breadth and
low up-volume could bring a Sell S9.
Possibly good earnings this week for tech stocks,
AAPL, GOOG and AMAZON will lift
the NASDAQ, though profit-taking on the positive
news seems just as likely. Trump's
promise to take on the Drug Companies and their high
prices may bring about some weakness
on the NASDAQ, too.
Did you know that the City of New York is suing
fossil fuel companies for keeping to
themselves knowledge of their role in causing
man-made global warming? Seems far-fetched,
right? But oil stocks have turned weak.
I am always ruminating on historical parallels.
Trump's tax cut and de-Regulation are right
out of the 1920s, from the play-books of Harding and
Coolidge. The policies' parallels here
are quite close. Along with low interest rates and
margin requirements, these policies
produced the extraordinary bull market of the
1920s. But there are two important differences.
The first is the absence now of many, many new
consumer goods. In the 1920s cars, radios,
refrigerators, washing machines... were all
relatively new. The second difference is in the area
of consumer credit. At the start of the 1920s boom,
consumer credit was relatively new and
consumers were not as tapped out as they are now.
This means the dangers of over-production
and lack of consumer demand do over-hang the
market. Most people need credit, a lot of
it, to buy a new car. We should watch Ford's stock.
See below. If tariffs on auto imports are
not enacted, Ford is in trouble. The American
market is already shrinking because credit
is harder to get now than in the past.
On balance, the bullish parallels are still much
more weighty. The tax cuts have not yet had a
chance to work their "voo-doo" magic and there has
not yet been a take-over binge. So, let's
plan to buy on a 5%-7% dip from here.
Today was the second day in a row when the ratio of
NYSE decliners to advancers
was more than 4:1. This should reinforce our
resolve not to chase the market at this
point. So should the fact that there were
substantially more new lows than new highs
today on the NYSE and the NASDAQ.
See Table 2.
==============================================================================
1/29/2018 Let's not be too greedy in
here. That could get us in trouble. Take some
profits. There are many big "Red Popsicles" in Table
1. Table 2 shows us
that Professionals are doing a lot of dumping now.
MINCPs outnumber
MaxCPs by a wide margin and the number of new lows is
quite high
considering that the DJI is only one day away from its
high. It is even conceivable
that a new Peerless Sell signal could be devised that
tests well and fit in here.
The ratio of declining stocks to advancing stocks was
4.4 today. This shows
a big rush to sell by Professionals. What are they
afraid of?
Peerless has given no Sell
signal, but how can taking some very ripe profits hurt?
That seems only prudent, I admit. So go ahead.
But understand that we may
only be able to re-enter at a higher price.
Today the number of NYSE
decliners (2467) were 4.429 times the number of
advancers (557). Clearly there was a rush to sell
dividend shares. But it was more
than that. Interest rates rising are only one
explanation. Another is that Trump is now
in deeper political trouble than before A third is that
investors are afraid of a bad surprise from
Trump's State of The Union message Tuesday night.
Adding some bearish MINCPs
short sales to hedge with will help.
There is a good chance that the DJI will fall no further
than the 21-dma. Of course, that
is still a 3% decline. Such
a poor breadth ratio like we saw today with the DJI so far above
the 21-day ma, 3% now, is quite rare. Only once in the
five earlier cases with the DJI more
than 2% over the 21 day ma, did the DJI break below the
21-dma by as much as the 3% lower
band. So, the odds of a 6% or more decline now are,
perhaps, only 20%. This would
seem to suggest that we should ride out the current
decline. But why take a chance?
You have nice profits from the Buy B21, take them. As
of today's close, the September
B21 has gained +18.6% on the DJI. This is a percent
higher than they have averaged
in the past. Let's not be greedy.

============================================================================
==========================================================================
==========================================================================
A decline is certainly indicated. Below see all the
cases of such poor breadth when the
DJI was simply above the 21-dma. Only in 34% of the
cases, did the storm of selling
quickly pass. In 55% of the cases, such poor breadth
was followed by a decline to
at least the 2% lower band, but sometimes much
lower..
Below are all the cases of
such a poor breadth ratio since 1945. Note that "la/ma" shows
how far the DJI is above the 21-dma. "Bad" means this
case would have failed as a sell signal
because the DJI advanced significantly without even a
decline to the 21-dma. "Good" means
a sell signal here would have brought a decline to the
lower 2% band, at least. "Flat" means
a sell signal here would have stopped the rally for 3
weeks or more.
There have been 38 cases of such poor breadth since 1945
with the DJI above the 21-dma.
in 21 (55%) cases, the DJI fell at least to the lower 3%
band but in 13 (34%) instances, the DJI
quickly rallied significantly. In the remaining 4, the
DJI hesitated for a few weeks and then
rose significantly. This would seem to argue for some
profit-taking now, especially when our
profits are so big.
Sell?
Date
la/ma outcome
----------------------------------------------------------
BAD
8/20/1945 1.002 DJI rallied
GOOD 12/12/1945
1.011 DJI fell to lower 2% band
GOOD 8/14/1946 1.008 Bear market
followed.
GOOD 10/17/1947 1.01 DJI fell to lower
3.5% band.
GOOD 1/10/1948 1.006 DJI fell to 3%
lower band.
GOOD
5/6/1948 1.013 DJI fell to lower 3.5% band
GOOD 9/8/1948 1.004 DJI fell to lower
2% band
GOOD 10/24/1948 1.01 DJI fell below
lower 3.5% band.
GOOD 12/26/1948 1.001 DJI fell below
lower 3.5% band.
BAD
10/17/1949 1.009 DJI rallied.
BAD 8/25/1950 1.011 DJI rallied
BAD 1/10/1951 1.027
DJI rallied
STOP
1/5/1955 1.002 3-weeks sidewise.
GOOD 8/6/1956 1.001 DJI fell below
lower 3.5% band.
BAD
12/10/1962 1.008 DJI declined only to ma and then rose.
GOOD 9/21/1966 1.003 DJI fell below
lower 3.5% band.
BAD
2/25/1975 1.002 DJI rallied
GOOD
10/16/1978 1.001 DJI fell below lower 3.5% band.
GOOD 10/8/1979 1.002 DJI fell below
lower 3.5% band.
STOP 8/18/1980 1.009 DJI stopped
rallying and went sidewise.
BAD 10/25/1982 1.024 DJI fell
only to 21-dma and rise sharply.
BAD 12/28/1988 1.021 DJI fell
only to 21-dma and rose sharply.
BAD 3/17/1989 1.001 slight 4 day
decline and then strong rally.
GOOD
4/13/2004 1.007 DJI fell below lower 3.5% band.
GOOD 5/24/2007 1.008 After a run to
upper band, DJI fell below LB
GOOD 7/24/2007 1.003 DJI fell below
lower 3.5% band.
GOOD 12/11/2007 1.017 Bear market began.
GOOD 7/24/2008 1.001 Bear market
followed.
BAD
3/30/2009 1.042 New bull market continues.
BAD 5/13/2009 1.011 Bull market
continues
STOP 11/19/2009
1.026 DJI went flat for a month. .
BAD
10/19/2010
GOOD
7/11/2011 1.023 DJI fell below lower band.
GOOD 11/1/2011 1.008 DJI fell below
lower band. (No Peerless Sell here).
BAD
4/15/2013 1.001 DJI fell slightly and then rallied strongly.
GOOD 7/17/2014 1.002 DJI fell to lower
band.
GOOD 9/22/2014 1.004 DJI fell below
lower band.
STOP 8/19/2017 1.002 DJI went
sidewise for a month.
UNDECIDED
1/29/2018 1.030
Charts
1/29/2018
PEERLESS
DJI, Signals, Indicators Daily
DJI Volume 10-DayUp/Down Vol
V-Indicator
Hourly DJIA A/D Line for All
Stocks
NASDAQ
S&P
OEX
NYSE COMPQX
DJI-15 DJI-20
DJI-30
DIA
SPY
QQQ MDY
IWM
TNA
CrudeOil
FAS
GLD
BBH
IBB
JETS
JNUG
KOL
NUGT
OIH
OIL
RSX
RETL
SDS
SLV
SOXL
TECL
TMF
TNA UGA
(gasoline)
XIV YINN
Commodities:
JJC, NIB,
CHOC
CORN,
WEAT UUP
(Dollar)
AAPL ADBE
ALXN AMAT
AMGN AMD
AMZN BA
BABA BAC
BIDU
CAT CVX
DE
FB
GOOG
GS HD
IBM JPM M
(Macy's)
MSFT NFLX
NVDA QCOM
TSLA TXN
XOM WMT
ANDV (refinery),
CMG (Chipotle), LRCX,
SWKS,
TOWN
Also SPPI WATT
SQ (Square)
1/29/2018
Bullish MAXCPs
Bearish MINCPs |
Table 1
QUICKSILVER on ETFS - 01/29/18
ETF CLOSE CHANGE PIVOT-PT 5-dma AROC CL-PWR CANDLE IP21 ITRS
---------------------------------------------------------------------------------------------
DIA 264.16 -1.75 261.87 41.4% Bullish RED .319 ----
---------------------------------------------------------------------------------------------
COMPQX 7466.51 -39.26 7460.29 39.3% Bullish RED .378 -.019
---------------------------------------------------------------------------------------------
SPY 284.68 -1.9 283.29 35.1% Bullish RED .376 -.023
---------------------------------------------------------------------------------------------
QQQ 170.1 -.83 169.51 58.6% Bullish RED .299 -.018
---------------------------------------------------------------------------------------------
MDY 359.43 -3.08 W362.1 -27.9% Bullish RED .177 -.046
---------------------------------------------------------------------------------------------
IWM 158.7 -.9 W159.96 -23.5% Bullish RED .165 -.042
---------------------------------------------------------------------------------------------
FAS 80.11 -1.6 79.48 82.4% Bullish RED .258 .216
---------------------------------------------------------------------------------------------
RETL 44.85 -.17 W45.26 -42.5% Bullish BLUE .413 .677
---------------------------------------------------------------------------------------------
SOXL 180.55 -.58 W187.42 -76% Bullish BLUE .241 .015
---------------------------------------------------------------------------------------------
TECL 137.52 -3.63 W139.23 18.2% Bullish RED .23 .129
---------------------------------------------------------------------------------------------
IBB 118.5 .46 116.81 127.8% Bullish BLUE .233 .038
---------------------------------------------------------------------------------------------
GLD 127.35 -.72 127.28 27.4% Bullish RED .137 -.08
---------------------------------------------------------------------------------------------
OIL 7.34 -.1 7.22 178.3% Bullish ---- .203 .117
---------------------------------------------------------------------------------------------
OIH 28.09 -.63 W29.32 -220.7% ---- RED .261 .027
---------------------------------------------------------------------------------------------
GASL 28.11 -1.63 W31.28 -399.1% Bearish RED .047 .155
---------------------------------------------------------------------------------------------
UGA 33.9 -.24 33.9 67.9% Bullish RED .228 -.054
---------------------------------------------------------------------------------------------
UUP 23.32 .06 W23.51 -53.5% Bearish ---- .055 -.171
---------------------------------------------------------------------------------------------
IEF 103.51 -.26 W104.05 -11.5% Bearish ---- -.056 -.15
---------------------------------------------------------------------------------------------
XLU 50.39 -.65 W50.54 32.6% Bearish RED -.178 -.241
---------------------------------------------------------------------------------------------
WEAT 6.28 .1 5.94 239.6% ---- ---- .181 -.123
---------------------------------------------------------------------------------------------
YINN 50.48 -3.32 W51.26 156.2% Bullish RED .323 .374
---------------------------------------------------------------------------------------------
RSX 23.33 -.28 W23.58 -44.4% Bullish RED .322 -.057
---------------------------------------------------------------------------------------------
AAPL 167.96 -3.55 W177.04 -259.5% Bearish RED -.076 -.147
---------------------------------------------------------------------------------------------
GOOG 1175.58 -.26 1169.97 84.7% Bullish RED .35 .018
---------------------------------------------------------------------------------------------
MSFT 93.92 -.14 91.9 125.1% Bullish RED .041 -.01
---------------------------------------------------------------------------------------------
AMZN 1417.68 15.63 1362.54 330.9% Bullish BLUE .311 .119
---------------------------------------------------------------------------------------------
FB 185.98 -4.02 W189.35 16.2% Bullish RED .07 -.083
---------------------------------------------------------------------------------------------
NVDA 246.85 3.52 238.91 276.9% Bullish BLUE .242 .025
---------------------------------------------------------------------------------------------
BA 340.82 -2.4 335.59 41.6% Bullish RED .12 .174
---------------------------------------------------------------------------------------------
GS 272.48 4.34 260.09 206.9% Bullish BLUE .17 .021
---------------------------------------------------------------------------------------------
HD 204.92 -2.31 204.9 11.2% Bullish RED .069 .092
---------------------------------------------------------------------------------------------
CAT 162.58 -4.48 W169.43 -245.8% Bearish RED .115 .055
|
Table 2
Count of Stocks in Key Tiger Directories
Date = 180129
--------------------------------------
NEWHIGHS 225
NEWLOWS 130 This is a
lot of new lows when the DJI is only 1 day from its high.
MAXCP 96
MINCP 252 Professionals are much more bearish
than bullish.
TTTNH 71
TTTNL 360
FASTUP 119
FASTDOWN 135
CPCROSSA 47
CPCROSSD 122
BIGVOLUP 3
BIGVODN 31 There is big rush for the exits here! |
Table 3Count of Stocks and New Highs in Key Tiger Directories
Date = 180129
-------------------------------------------------------------------
BIGMIL 6 3 50 %
JETS 9 3 33 %
BIGBANKS 7 2 29 %
MILITARY 38 9 24 %
GAMING 28 6 21 %
NASD-100 100 16 16 %
TRANSP 20 3 15 %
RETAIL 53 8 15 %
======================================================
EDU 7 1 14 %
DOWJONES 30 4 13 %
NIFTY 30 4 13 %
HOSPITAL 8 1 13 %
SP-100 96 11 11 %
BIOTECH 386 44 11 %
INFRA 35 4 11 %
SP500 485 52 11 %
INDEXES 194 19 10 %
FINANCE 93 8 9 %
MORNSTAR 238 22 9 %
DJI-13 13 1 8 %
RUS-1000 837 68 8 %
COMODITY 70 5 7 %
HOMEBLDG 17 1 6 %
SOFTWARE 66 4 6 %
INSURANC 32 2 6 %
BEVERAGE 20 1 5 %
COMPUTER 23 1 4 %
REGBANKS 33 1 3 %
AUTO 39 1 3 %
OILGAS 141 4 3 %
CHINA 64 2 3 %
CHEM 64 1 2 %
ELECTRON 178 3 2 %
SEMI 130 2 2 %
INDMATER 90 1 1 %
====================================================
None: GREEN ETFS HACKERS SOLAR COAL GOLD
REIT UTILITY PIPELINE FOOD BONDFUND
|
| |
Table 4
RANKING OF KEY DIRECTORIES BASED PCT.OF STOCKS ABOVE 65-DMA
1/29/18
Bullish = 39
Bearish = 6
---------------------------------------------------------------------------------------
Directory Current day-1 day-2 day-3 day-4 day-5
----------------------------------------------------------------------------------------
BIGBANKS 1 1 1 1 1 1
BIGMIL 1 1 1 1 1 1
ETFS .969 .969 .969 .954 .954 .954
INDEXES .938 .927 .927 .932 .907 .907
DJI-13 .923 .923 .923 1 1 1
DOWJONES .9 .9 .9 .933 .933 .966
SP-100 .895 .916 .927 .927 .937 .947
MORNSTAR .894 .92 .911 .92 .928 .911
INFRA .885 .942 .914 .885 .942 .885
HOSPITAL .875 .875 .875 .875 .875 .875
AUTO .871 .897 .871 .871 .871 .923
RETAIL .867 .867 .867 .867 .867 .867
NASD-100 .85 .89 .86 .86 .89 .87
FINANCE .827 .827 .849 .849 .903 .881
SP500 .812 .851 .841 .83 .837 .835
BEVERAGE .8 .85 .8 .8 .8 .85
COAL .8 .8 .9 .9 .8 .8
COMODITY .8 .8 .742 .757 .7 .7
INDMATER .8 .855 .855 .855 .844 .855
NIFTY .8 .8 .766 .833 .866 .866
TRANSP .8 .85 .8 .9 .95 .9
MILITARY .789 .763 .789 .736 .736 .789
GAMING .785 .821 .857 .821 .821 .821
RUS-1000 .774 .805 .802 .799 .806 .799
OILGAS .773 .794 .794 .808 .815 .815
SOFTWARE .772 .818 .742 .757 .818 .787
REGBANKS .757 .787 .757 .787 .848 .909
CHINA .75 .796 .781 .781 .796 .796
COMPUTER .739 .739 .739 .782 .826 .826
GOLD .725 .862 .803 .901 .862 .862
PIPELINE .714 .714 .714 .714 .714 .714
BIOTECH .689 .696 .683 .655 .699 .681
HACKERS .68 .72 .72 .72 .68 .72
FOOD .666 .6 .4 .466 .333 .266
JETS .666 .666 .666 .777 .888 .777
CHEM .64 .671 .671 .687 .687 .687
INSURANC .625 .687 .75 .687 .718 .687
GREEN .58 .548 .58 .645 .677 .741
ELECTRON .533 .573 .505 .595 .657 .64
===========================================================================================
SEMI .5 .553 .461 .569 .6 .623
============================================================================================
HOMEBLDG .47 .647 .647 .882 .882 .882
EDU .428 .714 .714 .714 .714 .714
SOLAR .38 .333 .333 .38 .38 .428
UTILITY .232 .232 .209 .162 .139 .116
REIT .124 .175 .231 .225 .248 .163
BONDFUND .036 .081 .081 .081 .099 .081
|

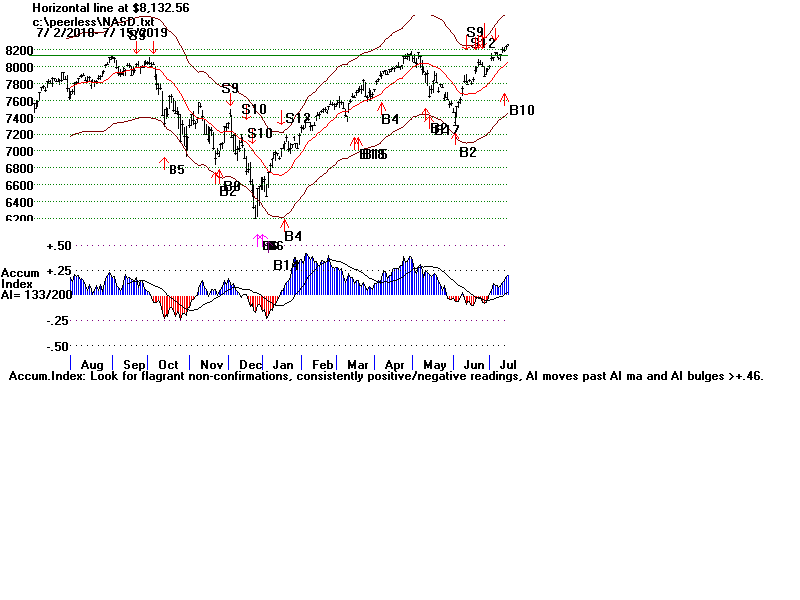
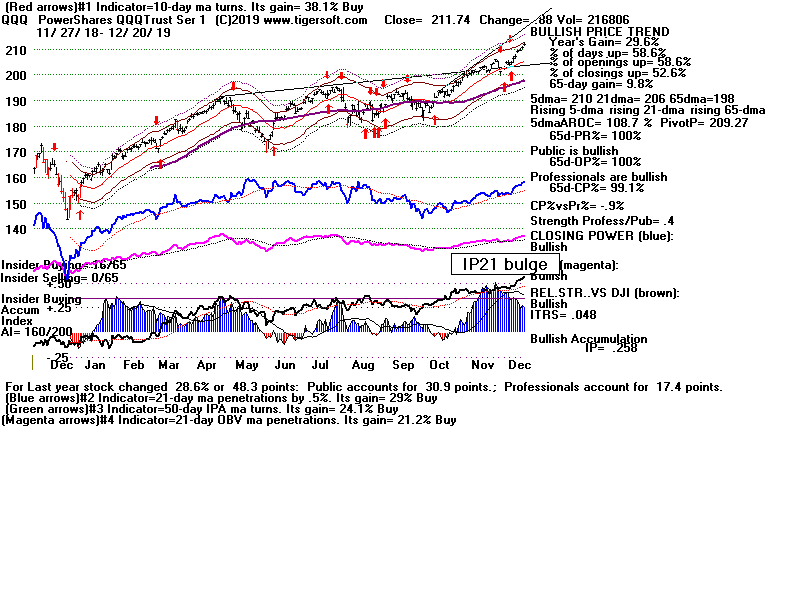
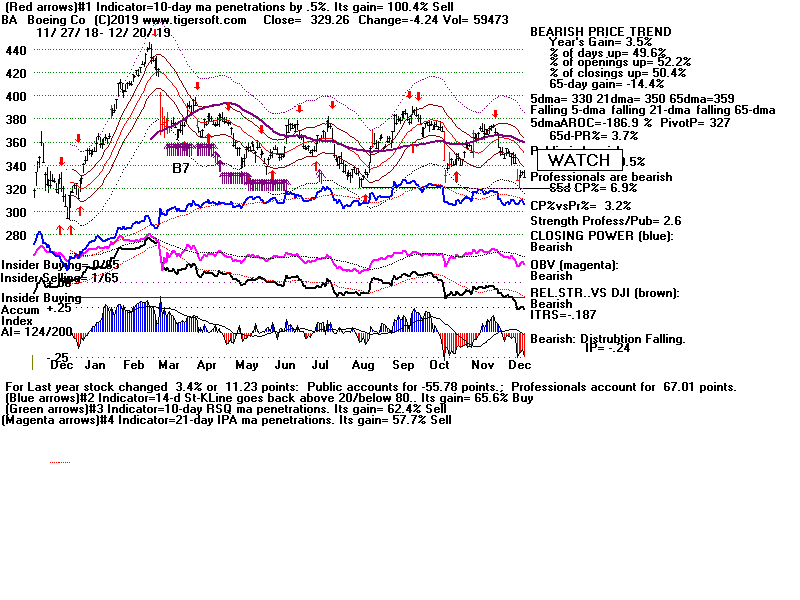
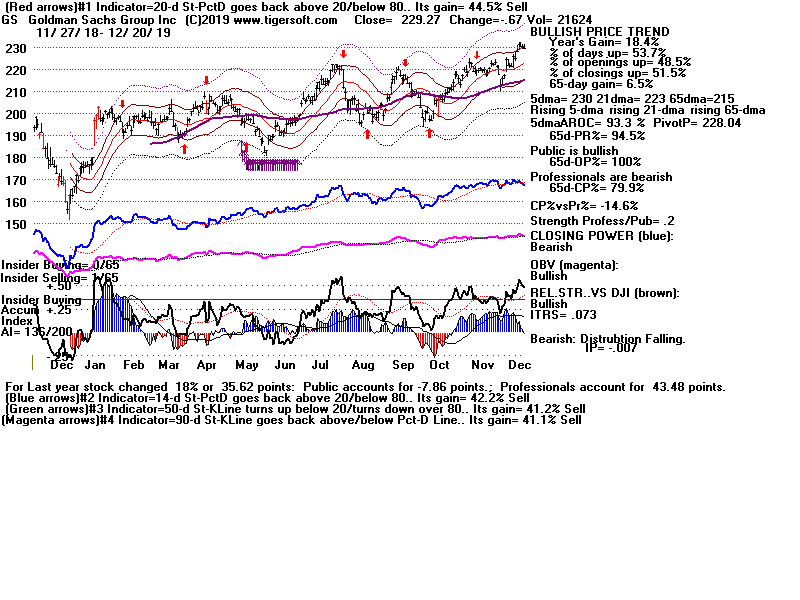

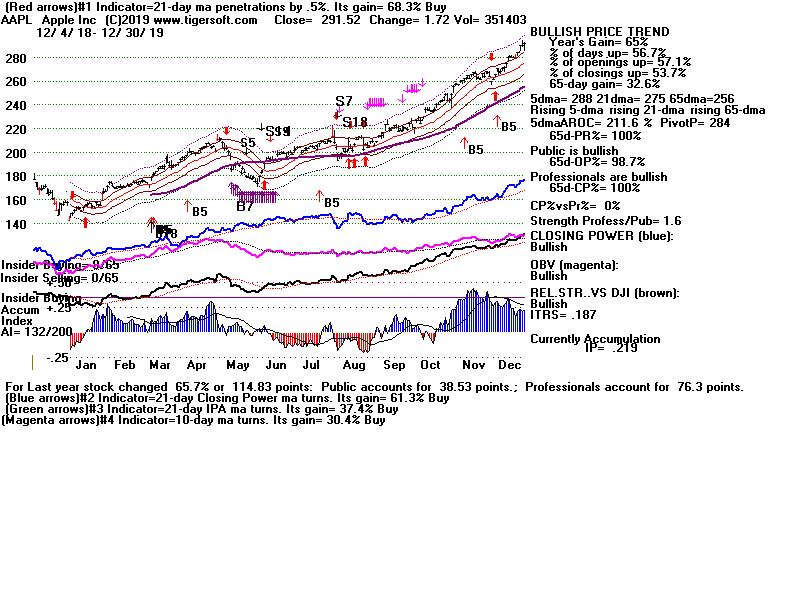
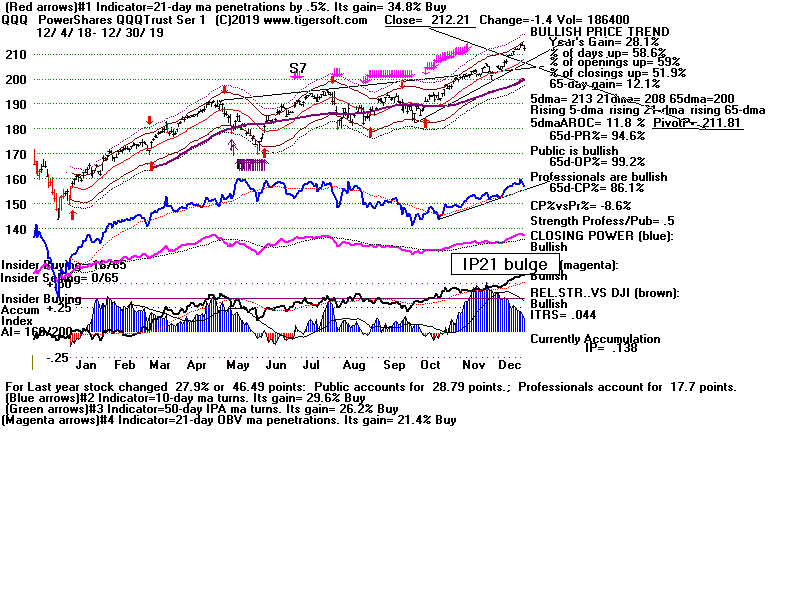
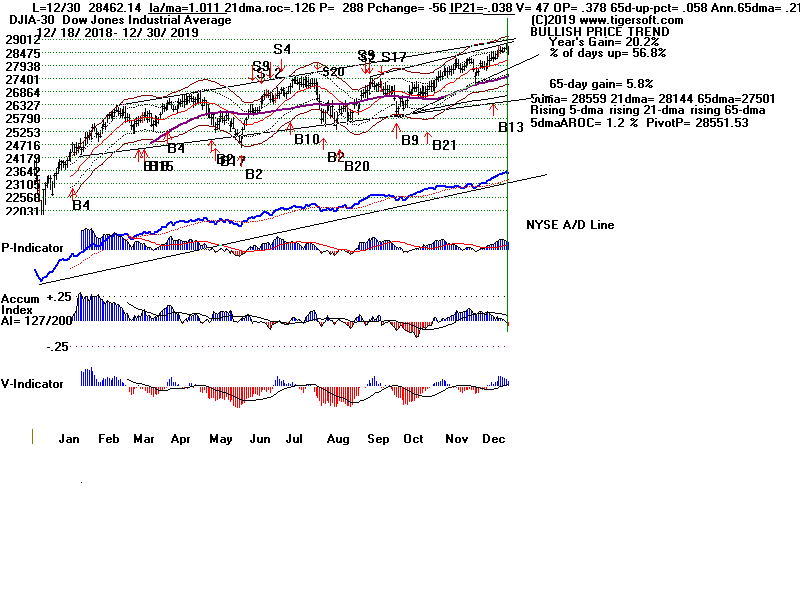
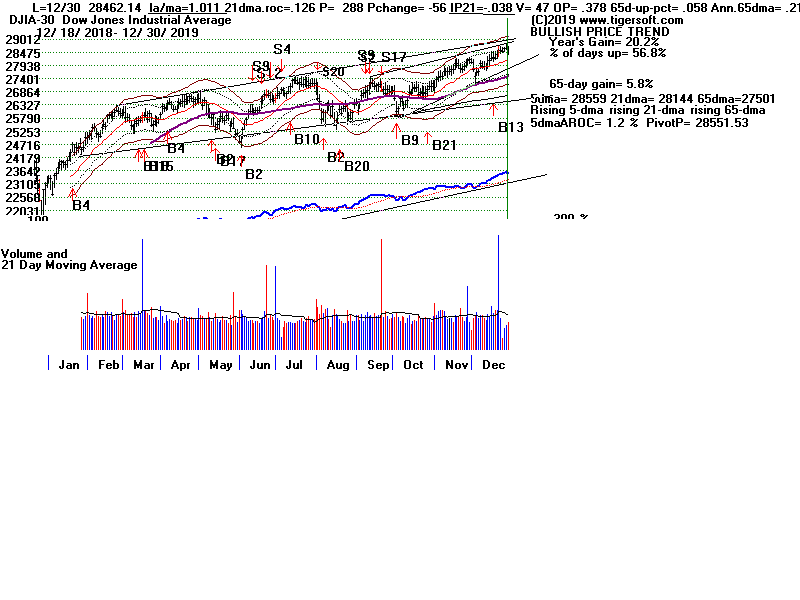
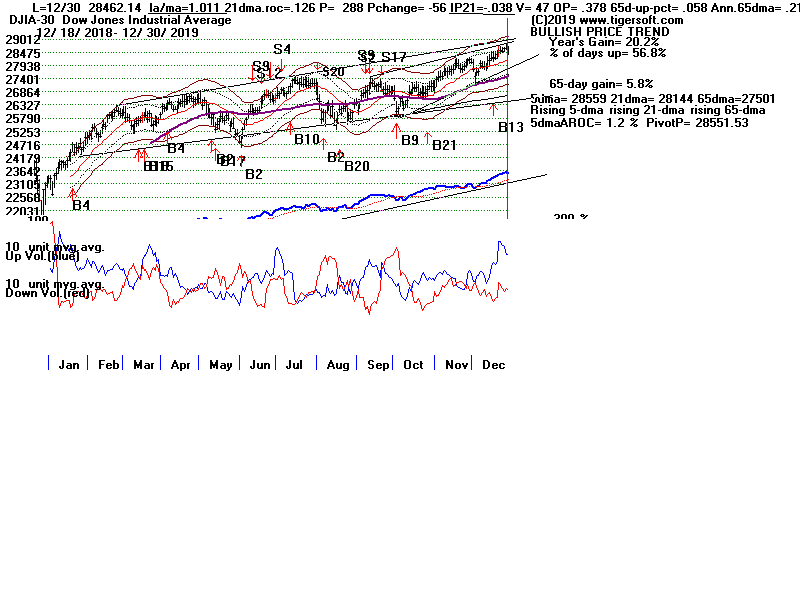
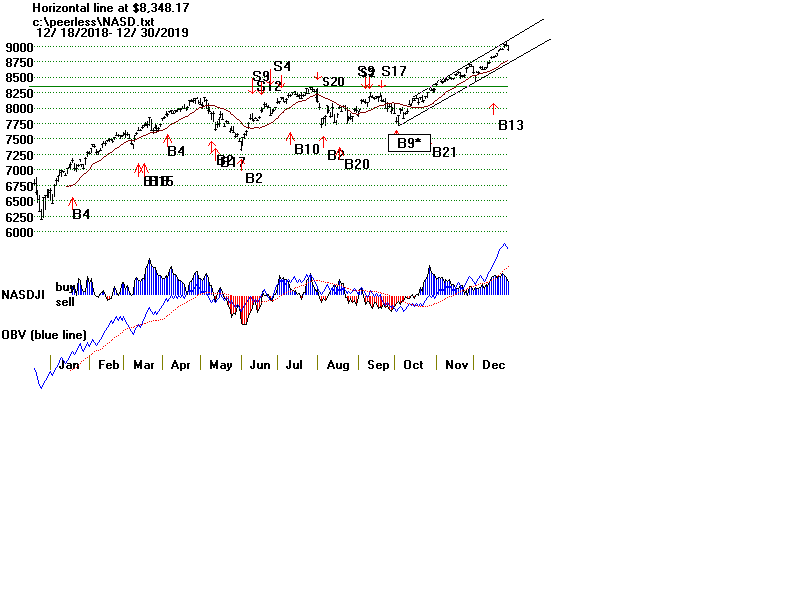
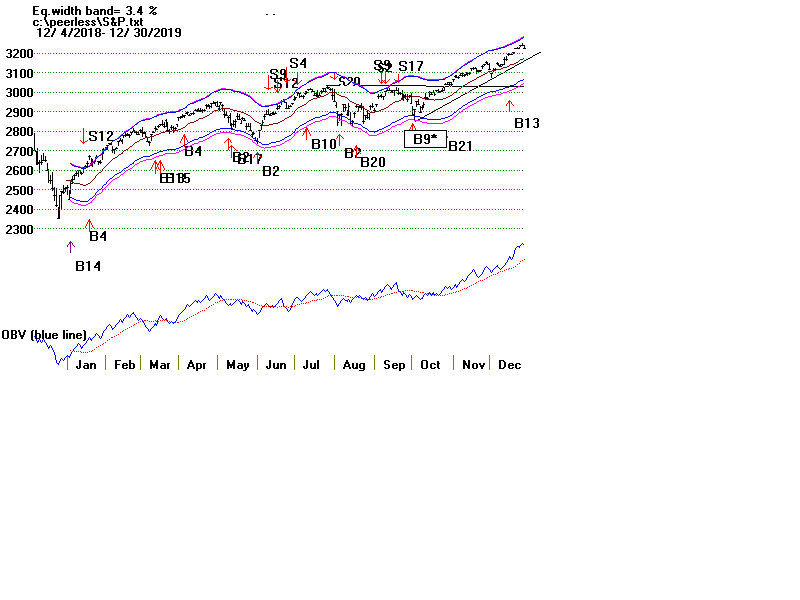
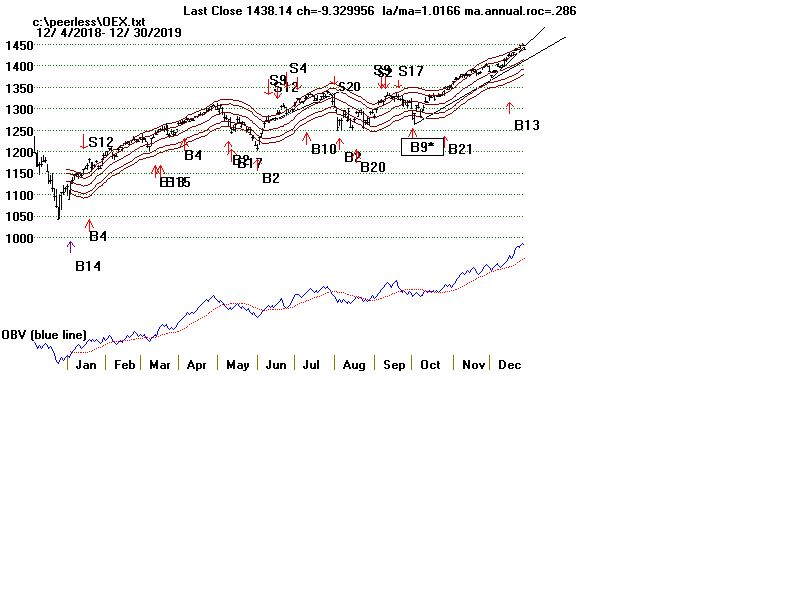
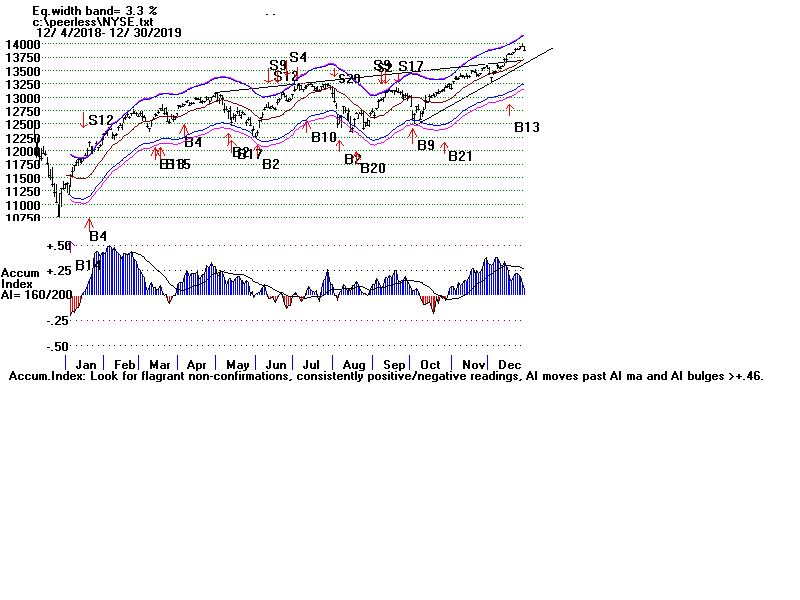
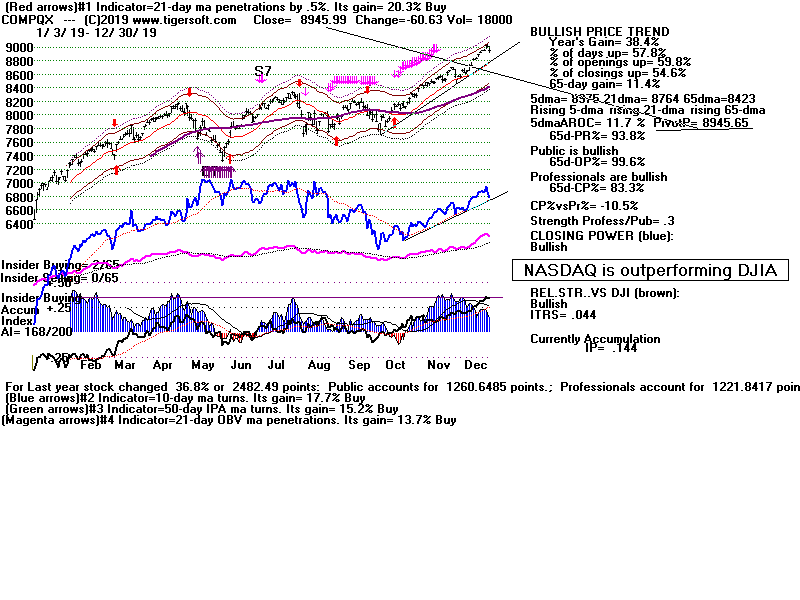
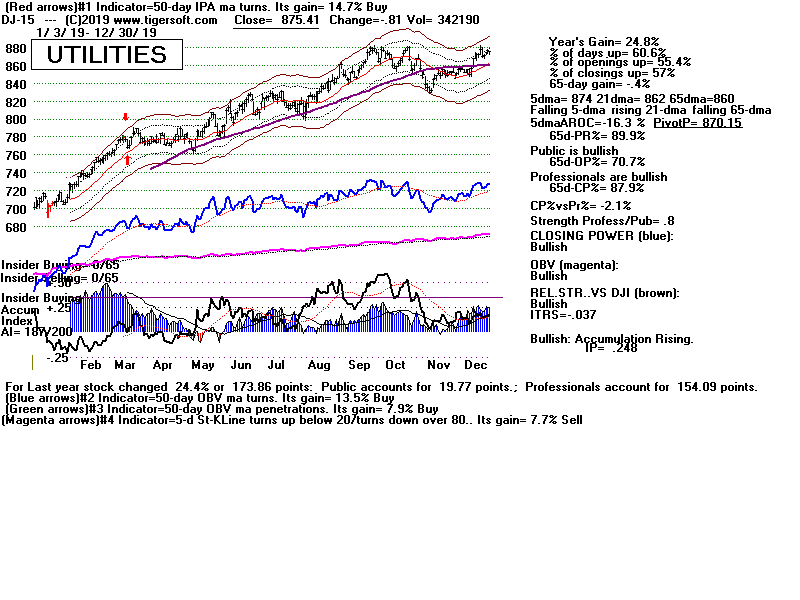
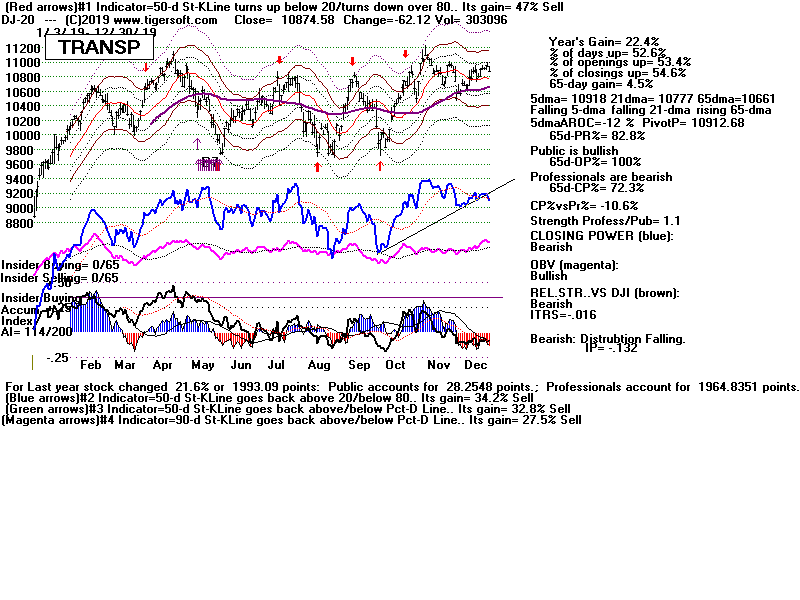
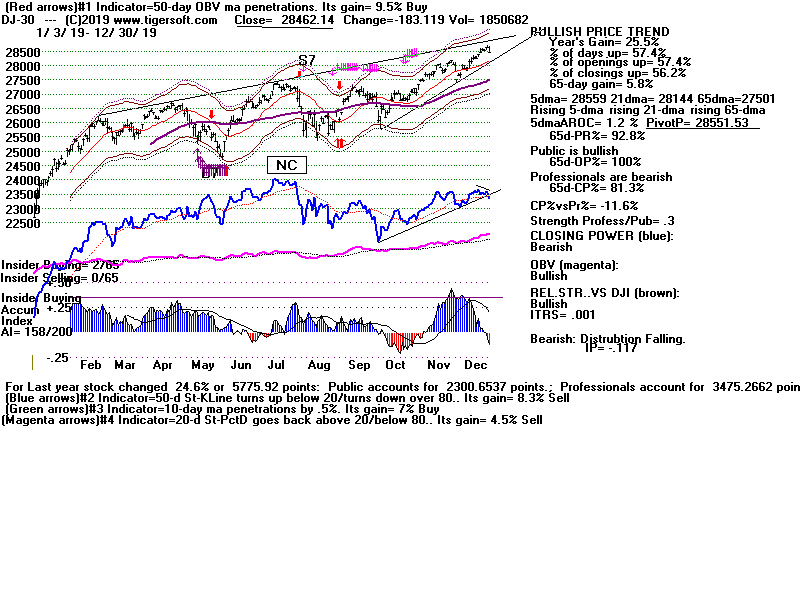
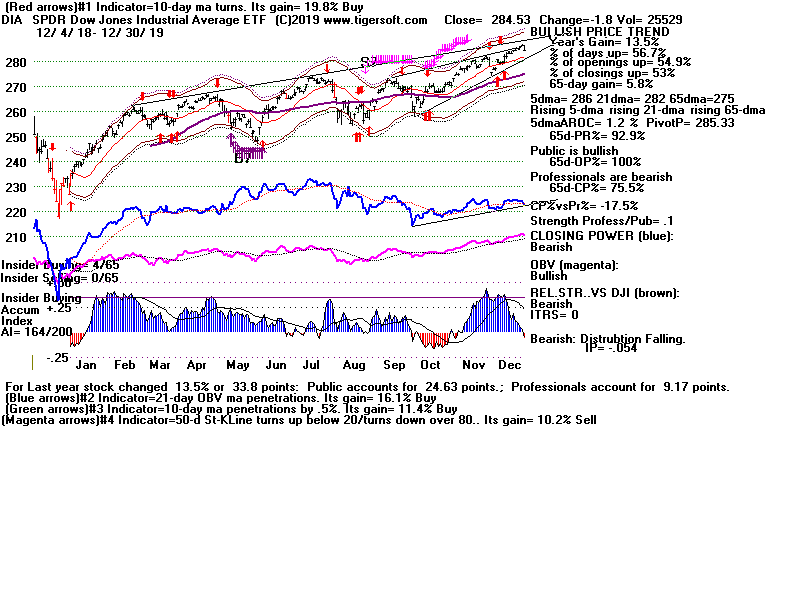
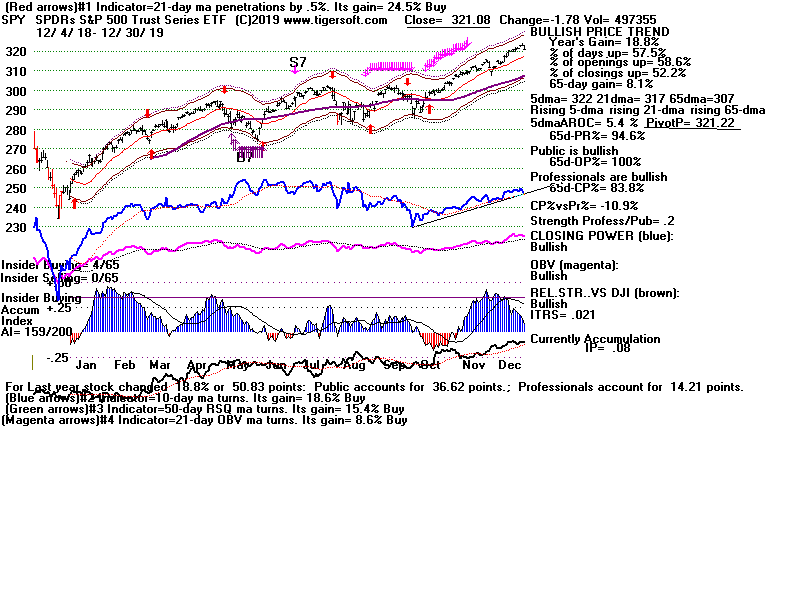
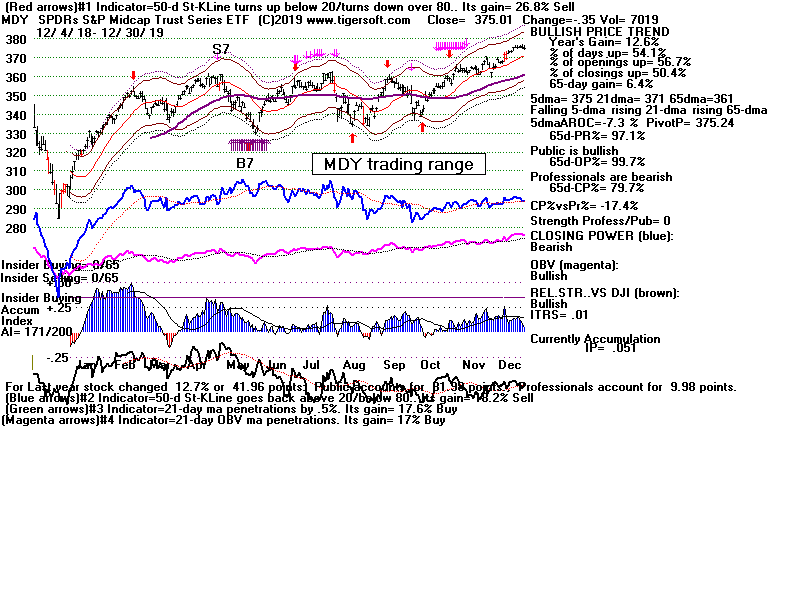
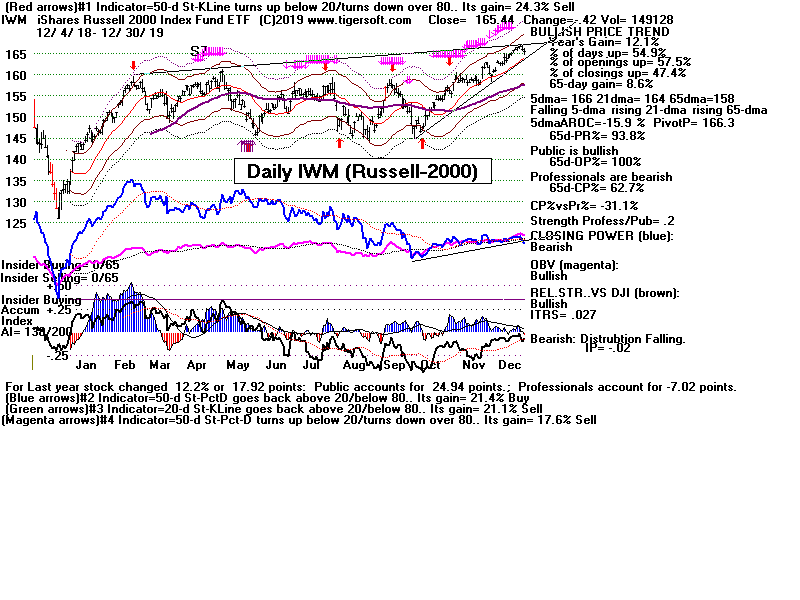
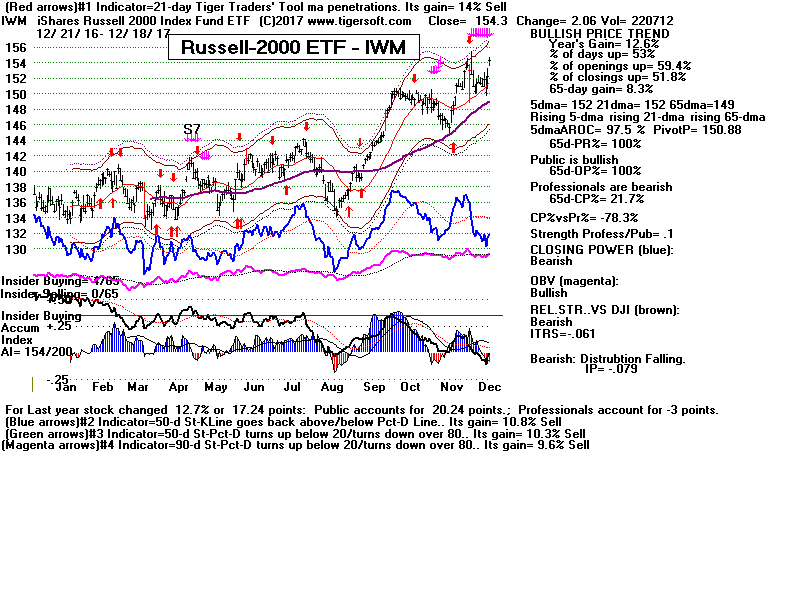
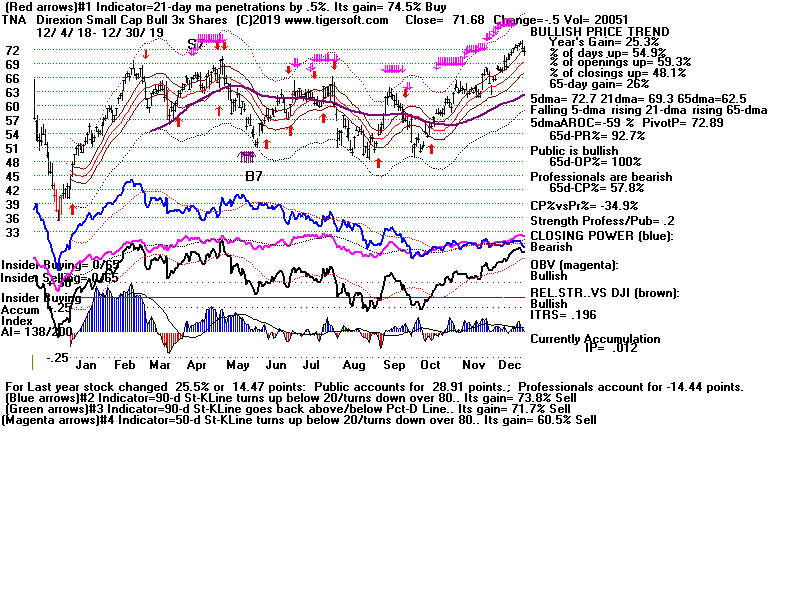
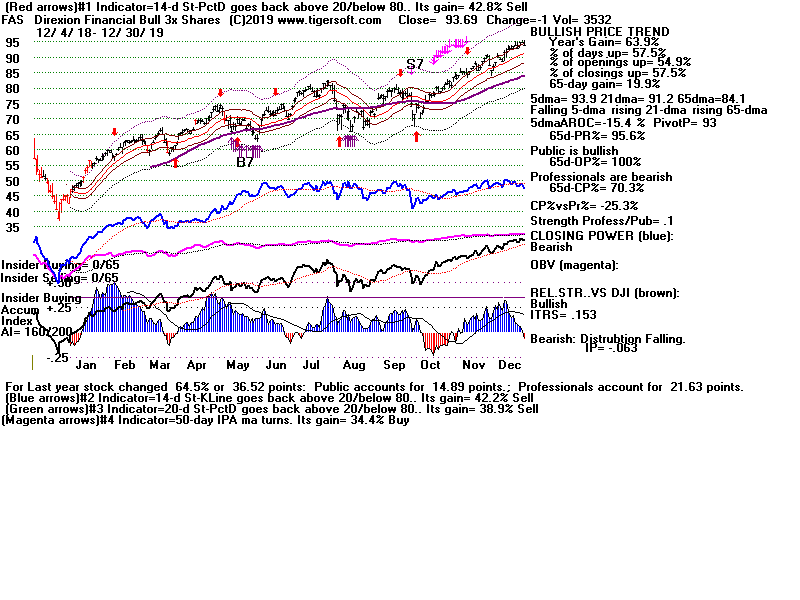
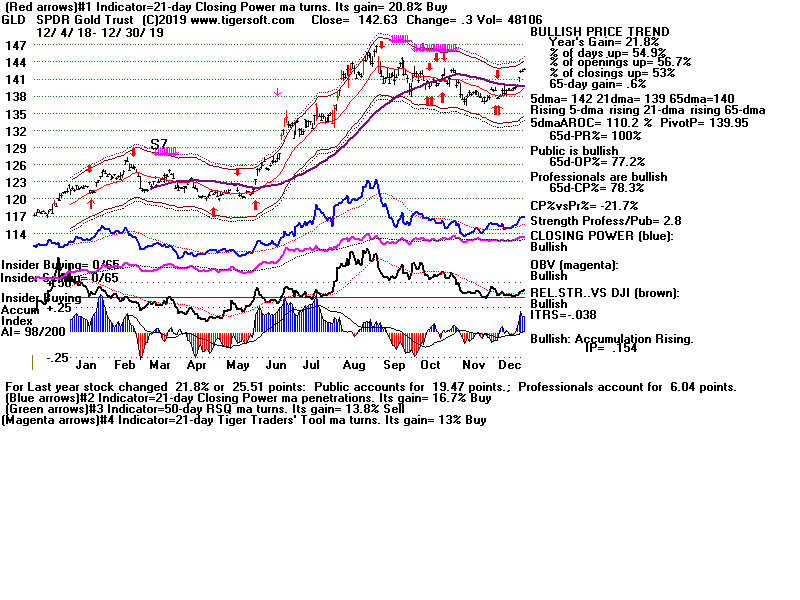
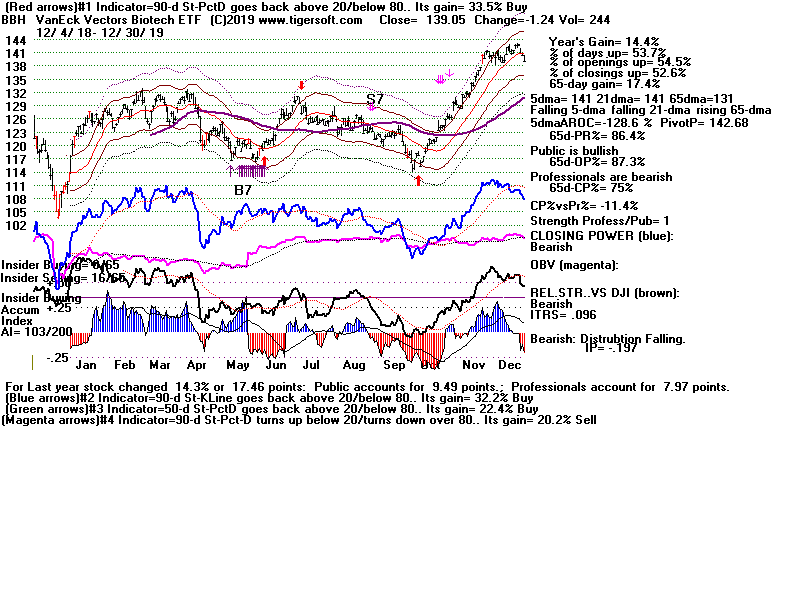
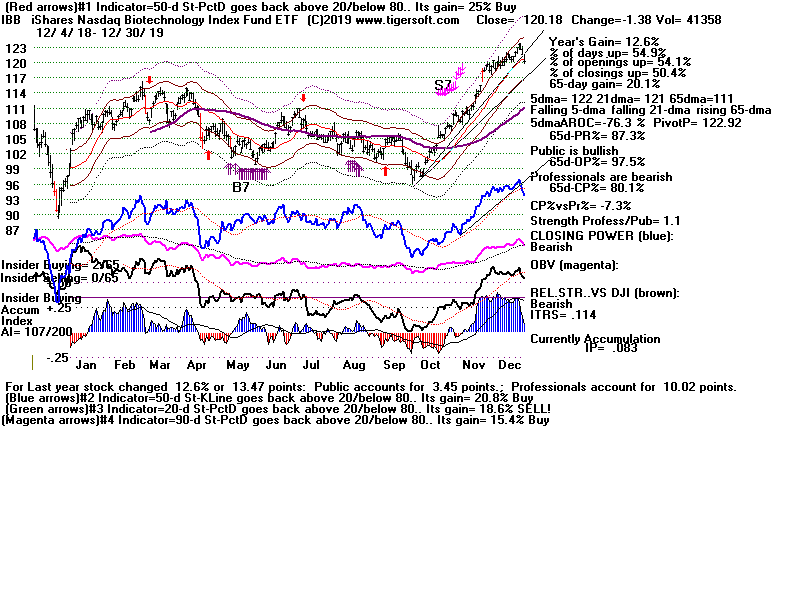
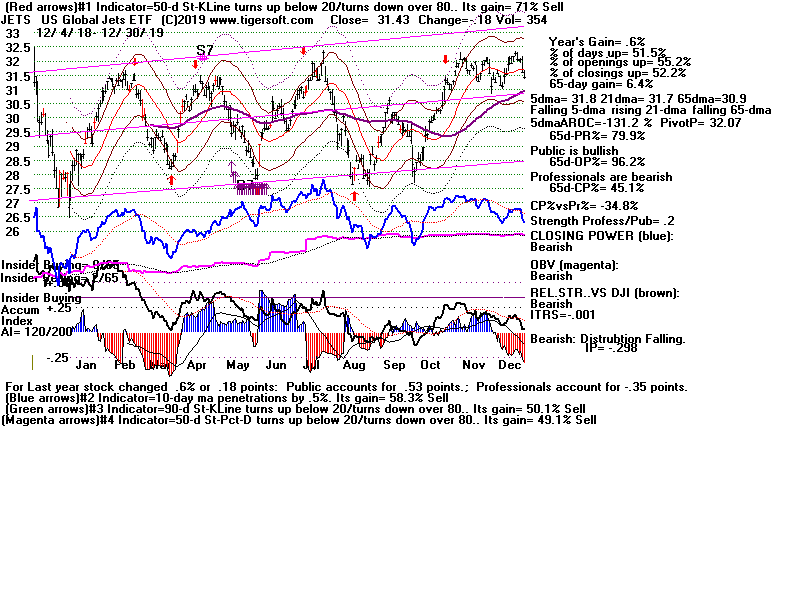
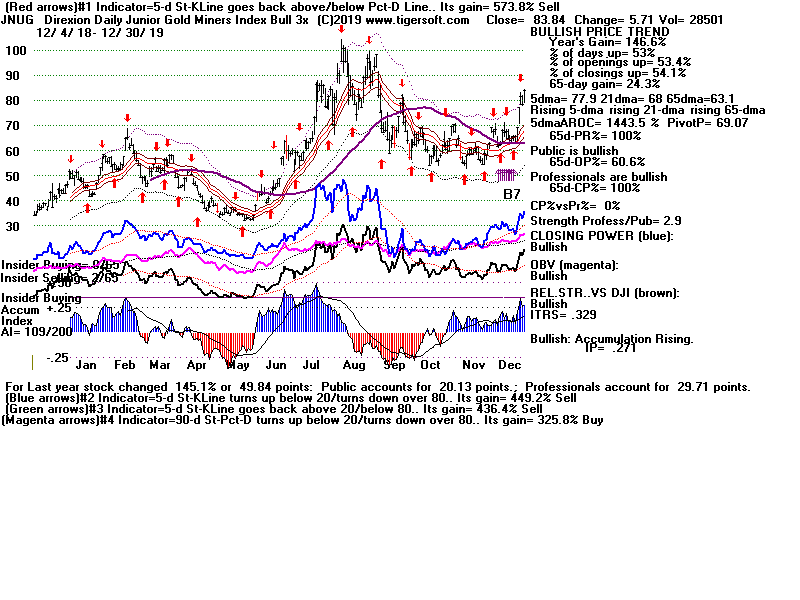
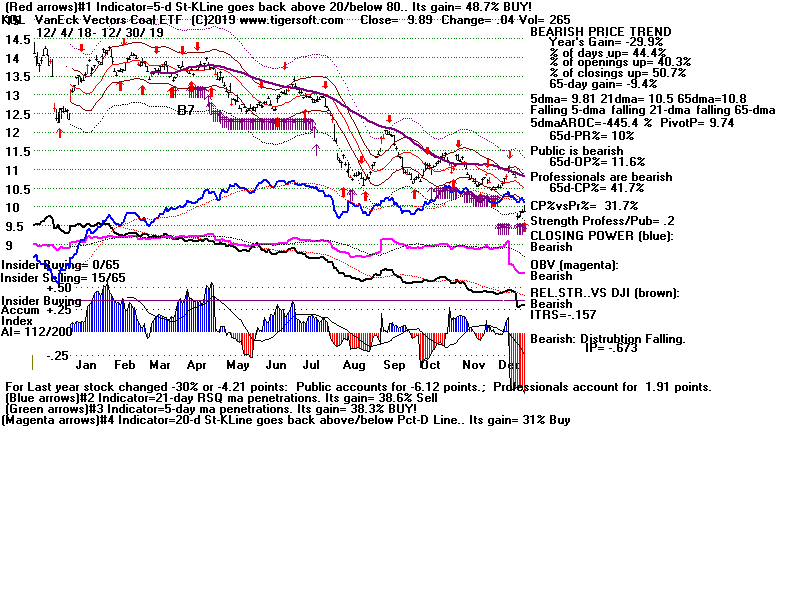
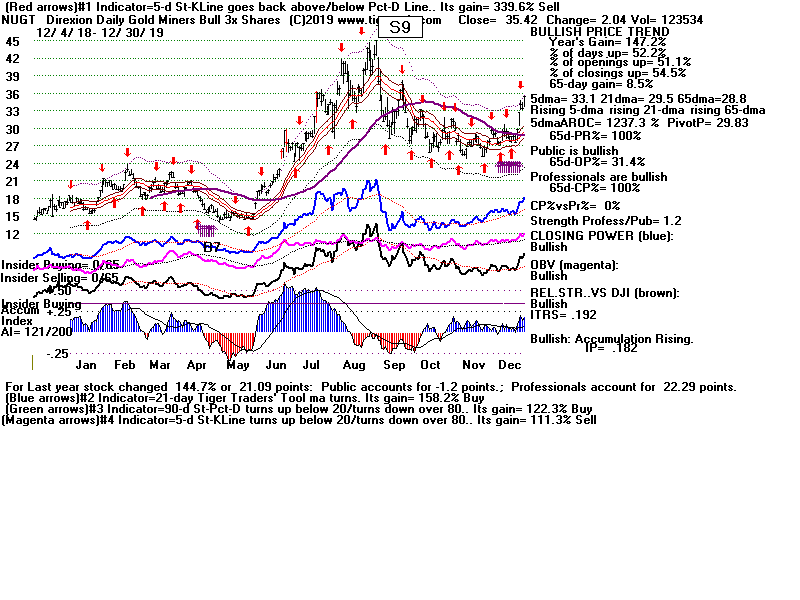
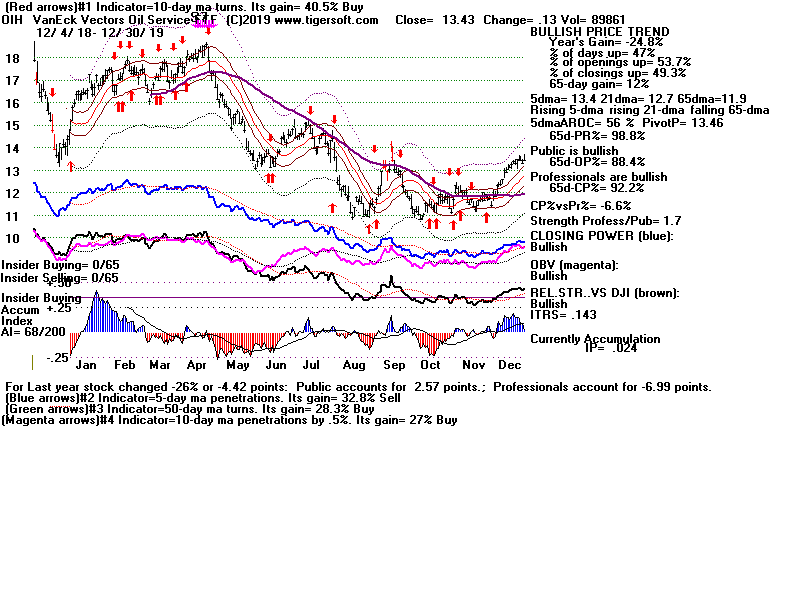
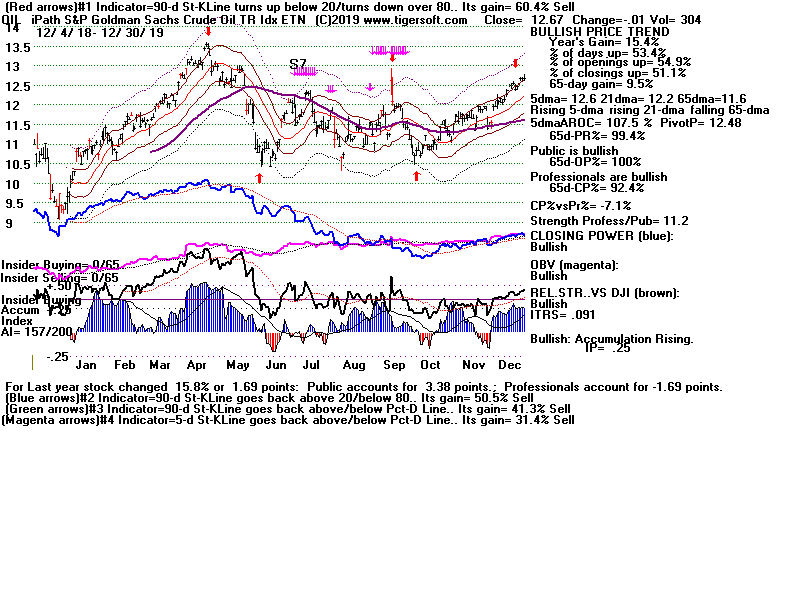
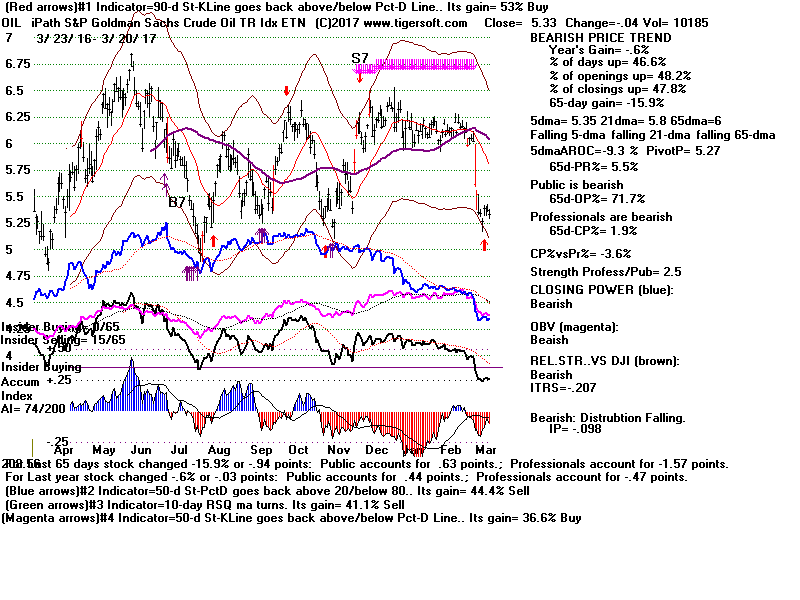
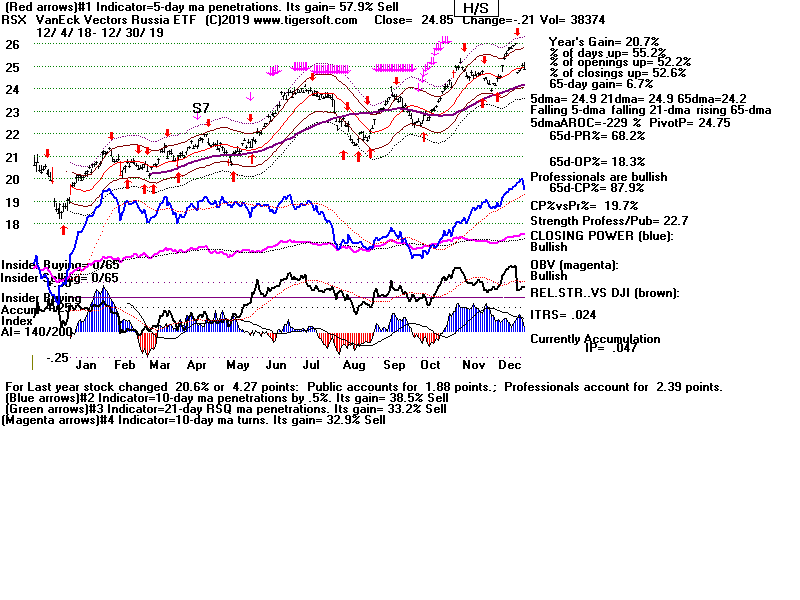
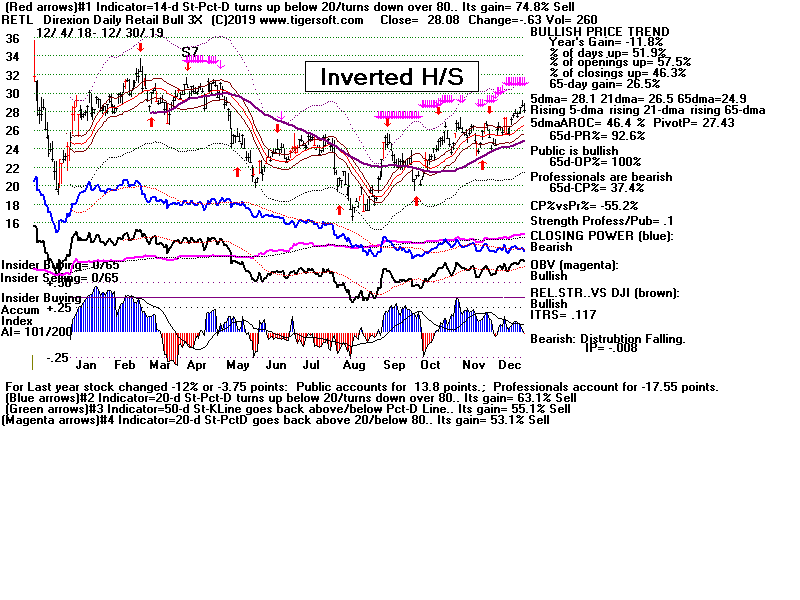
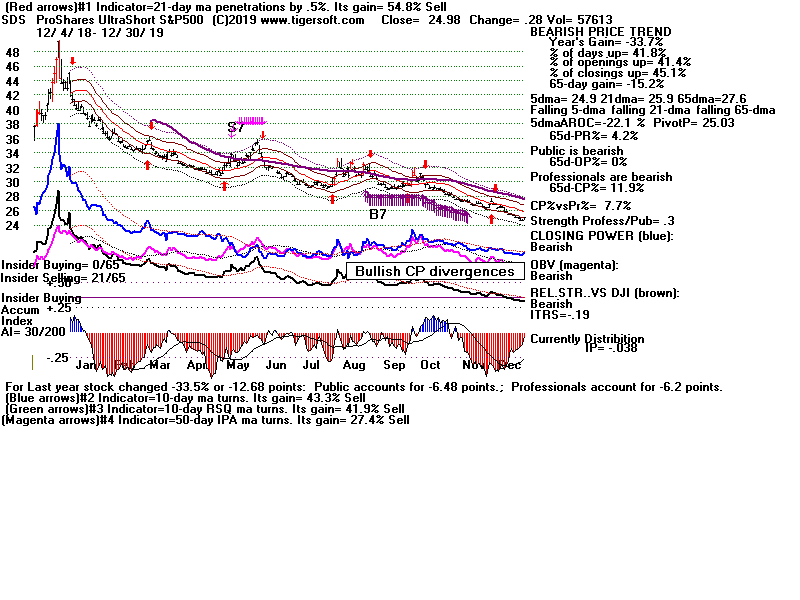
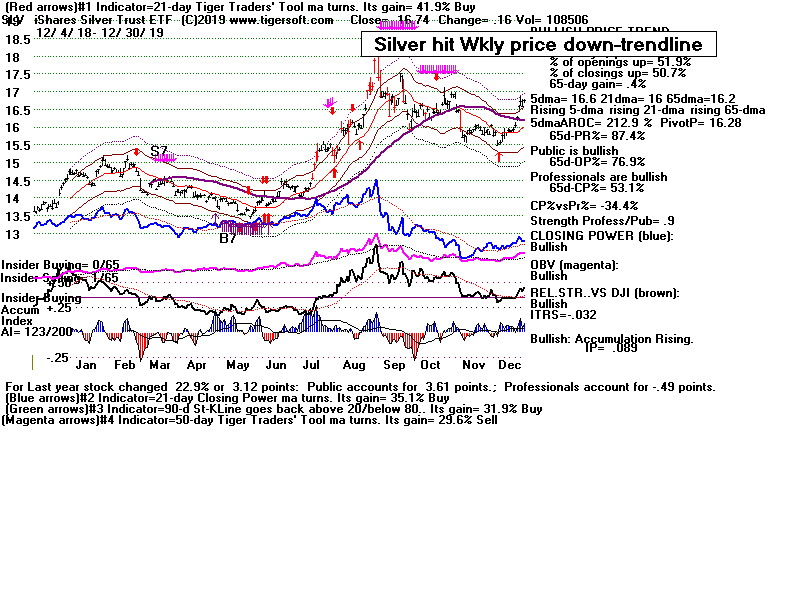
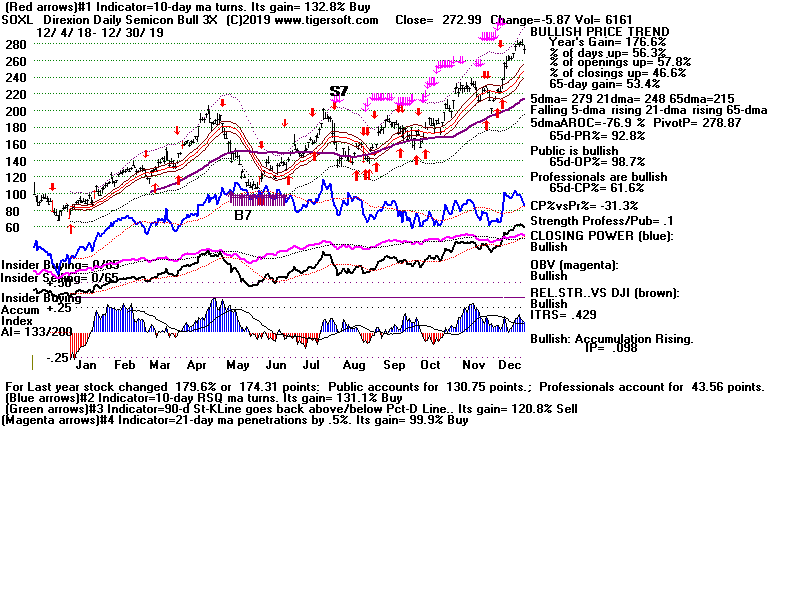
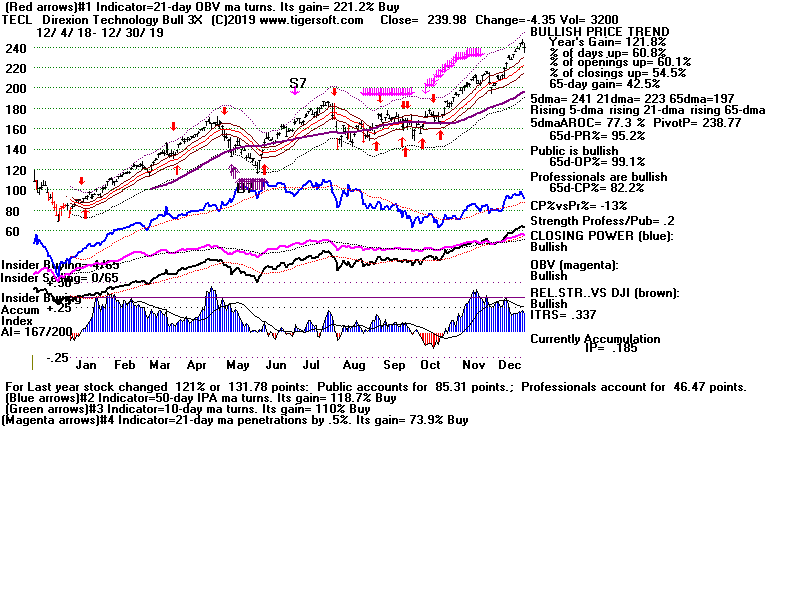
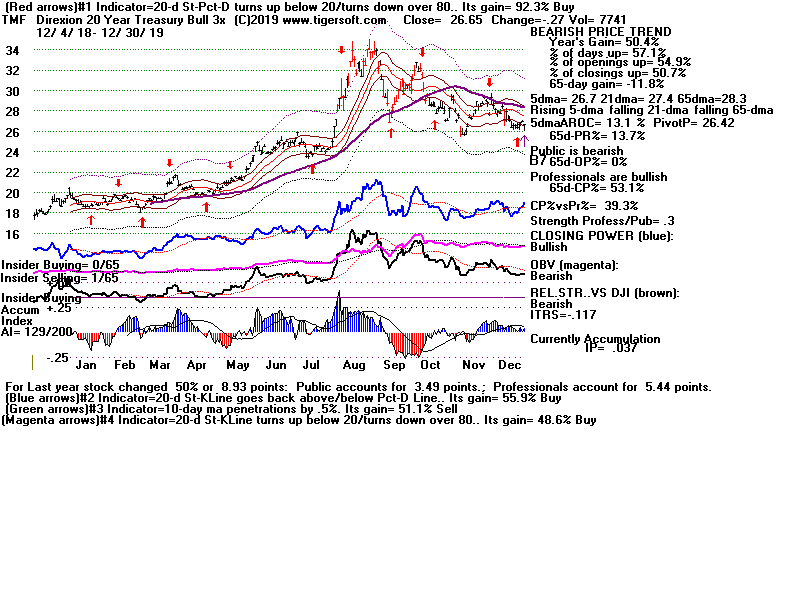
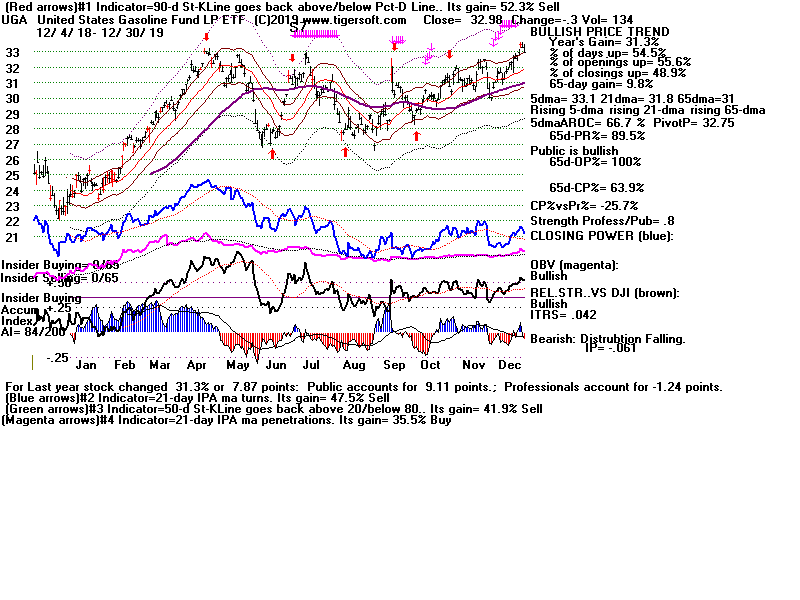
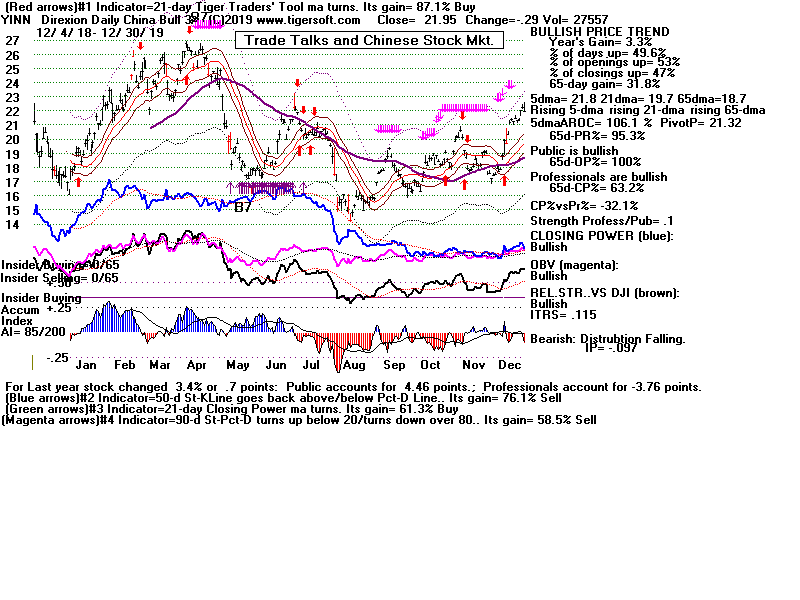
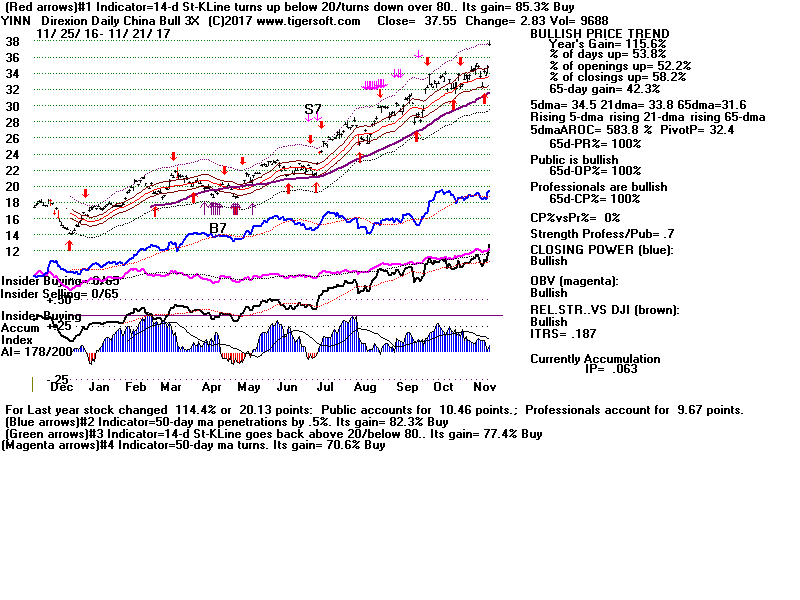
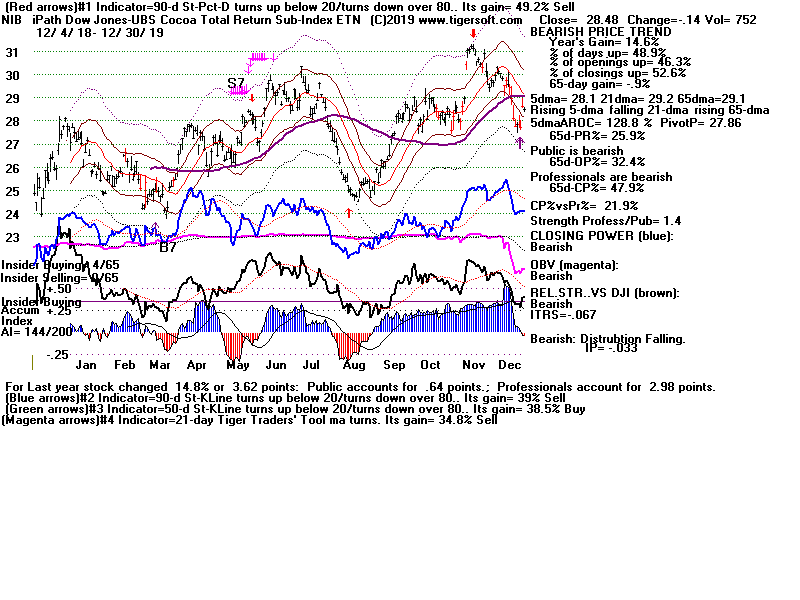
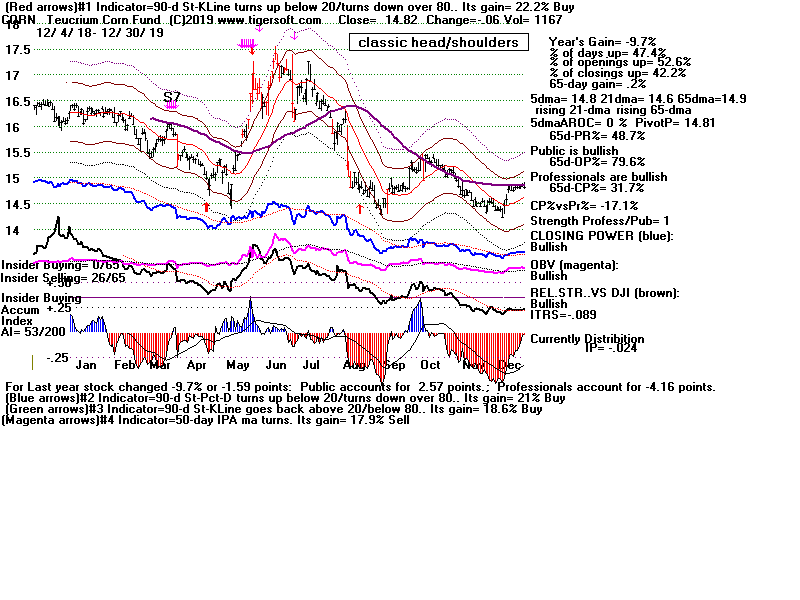
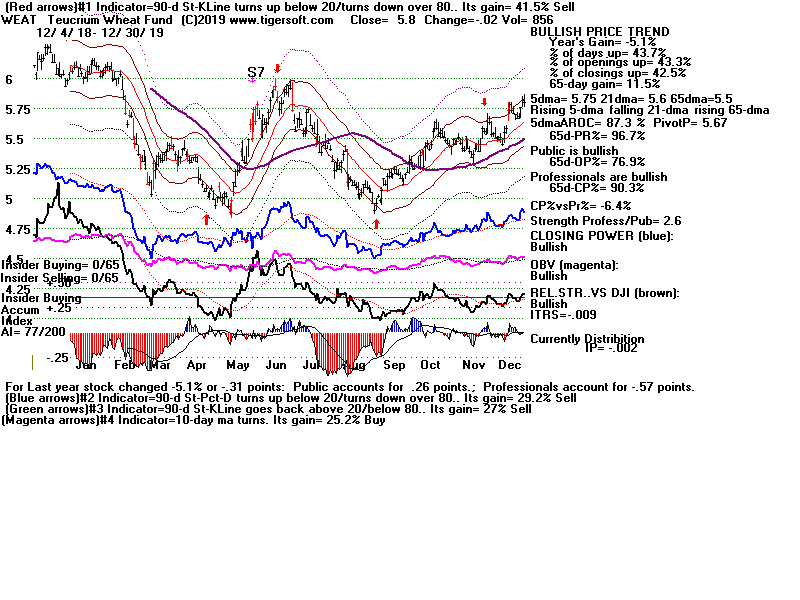
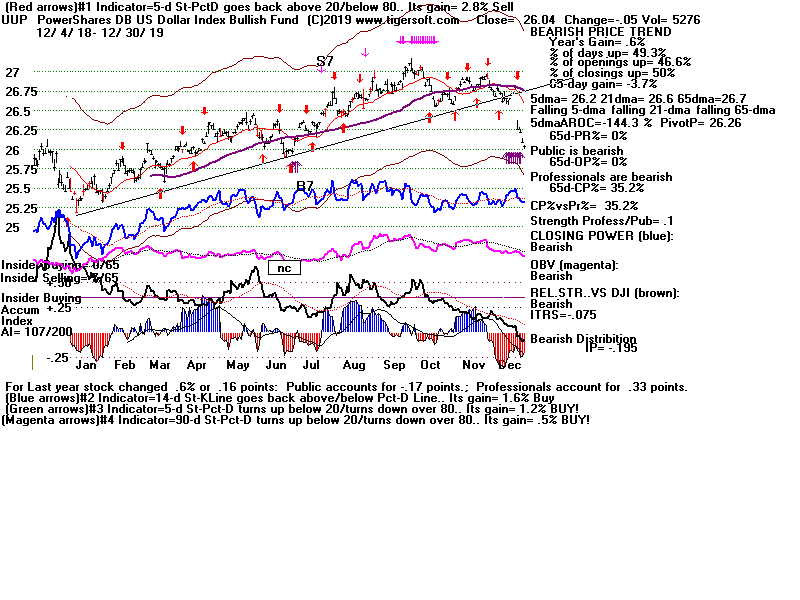
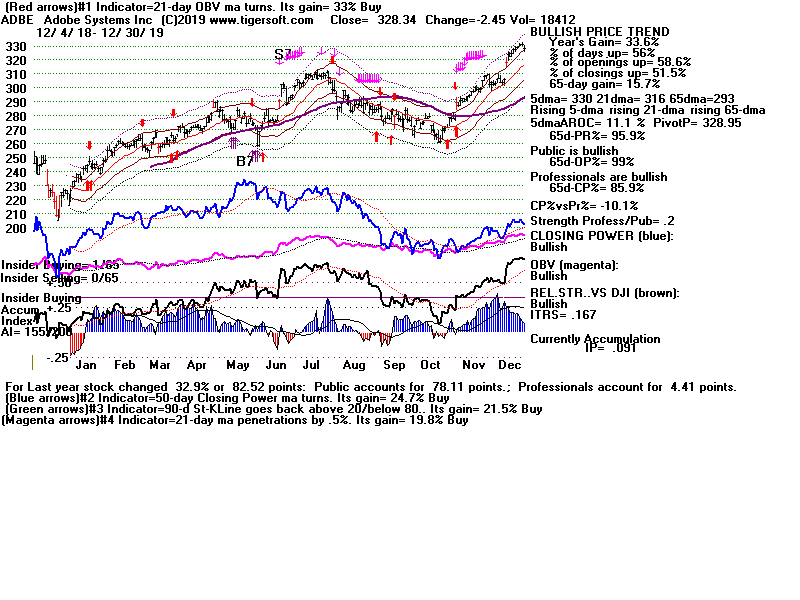
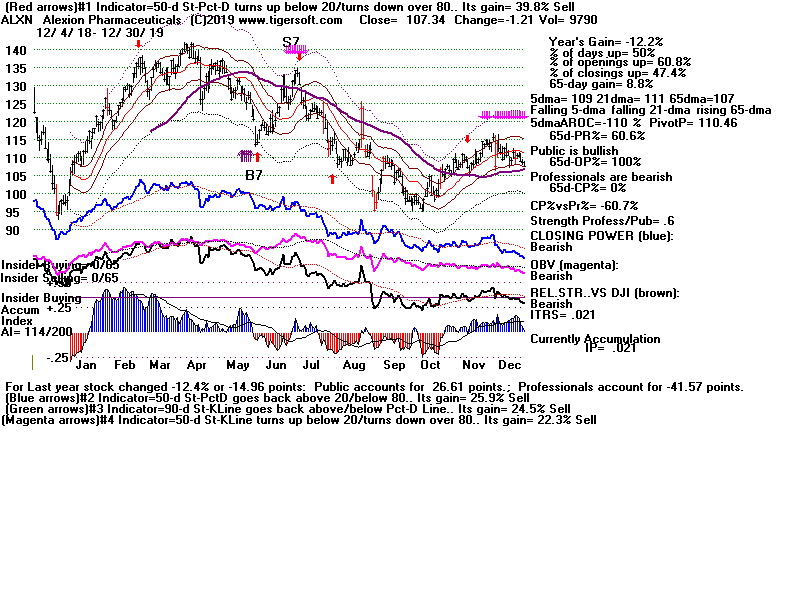
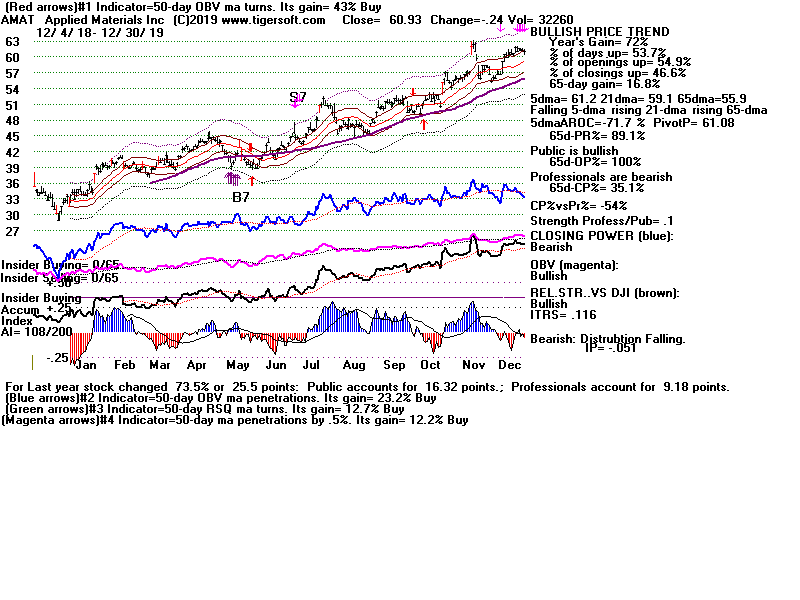
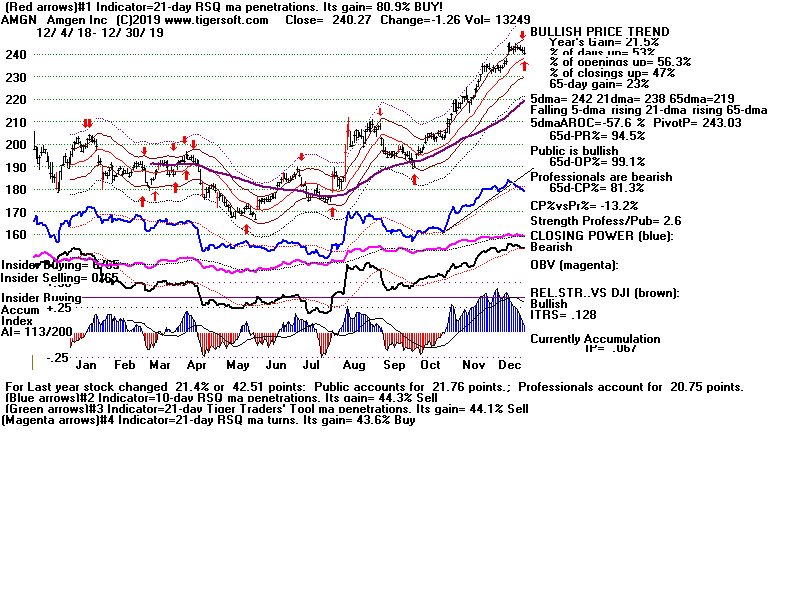
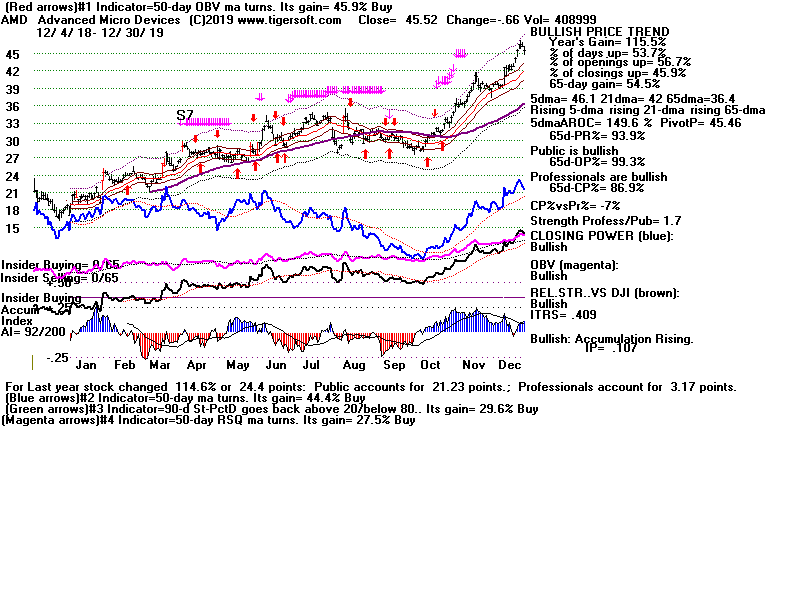
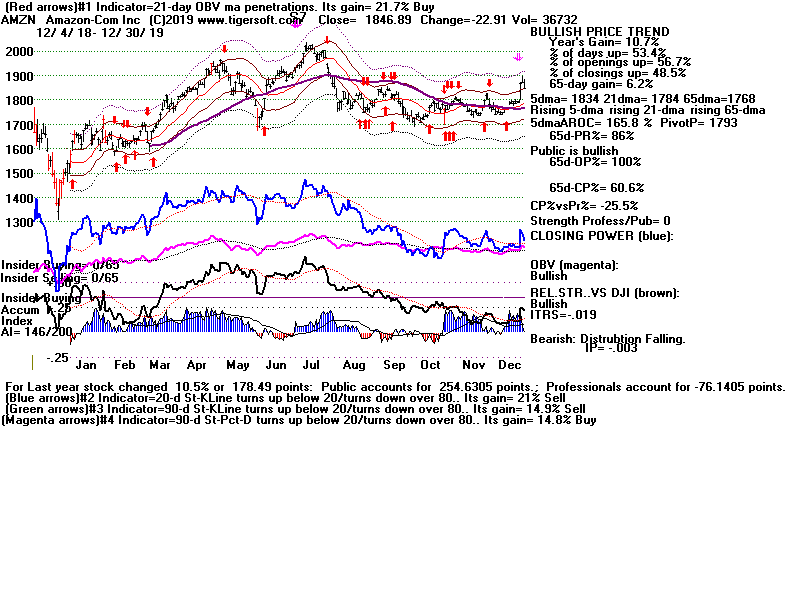
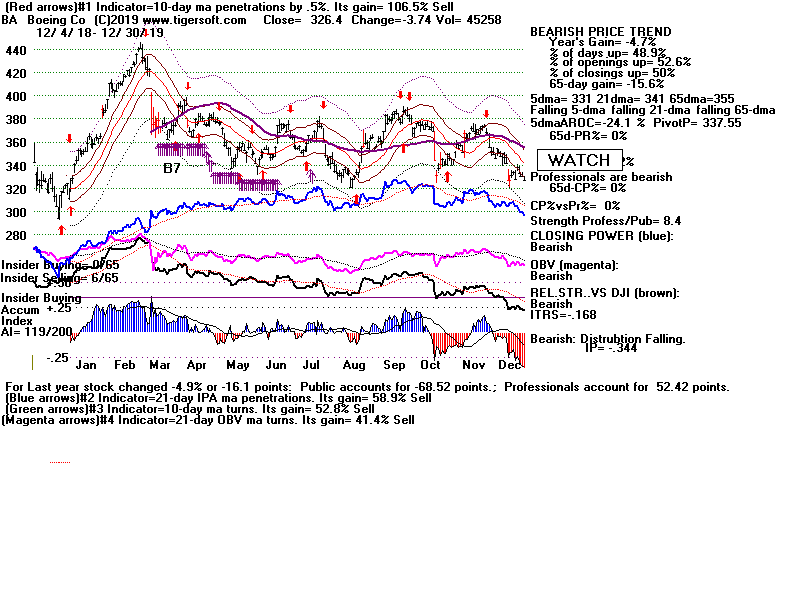
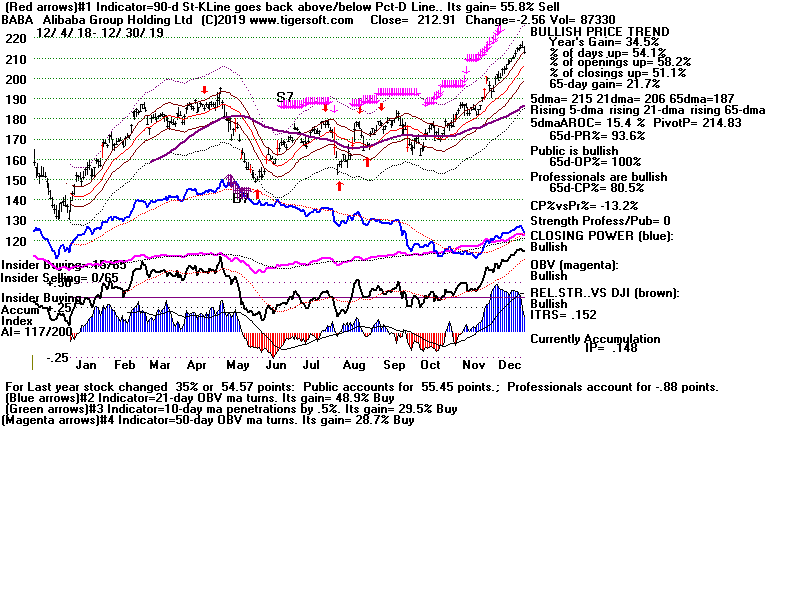
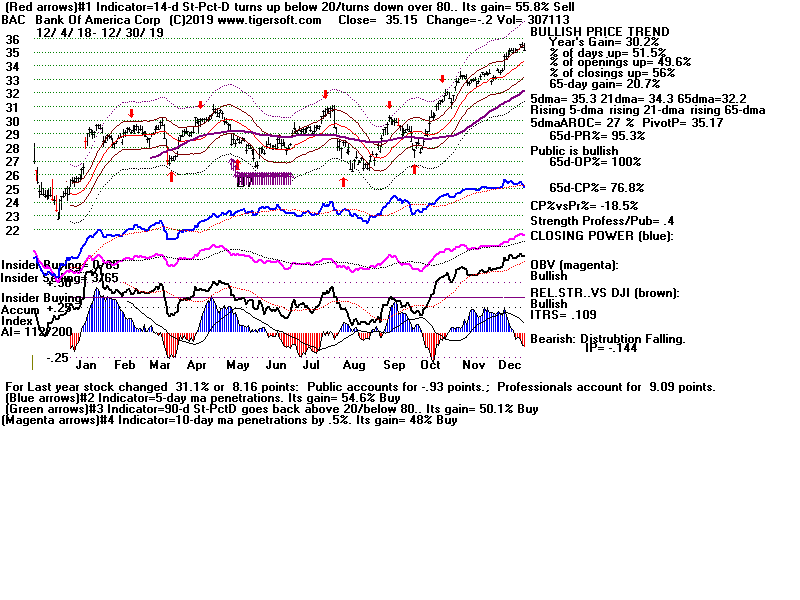
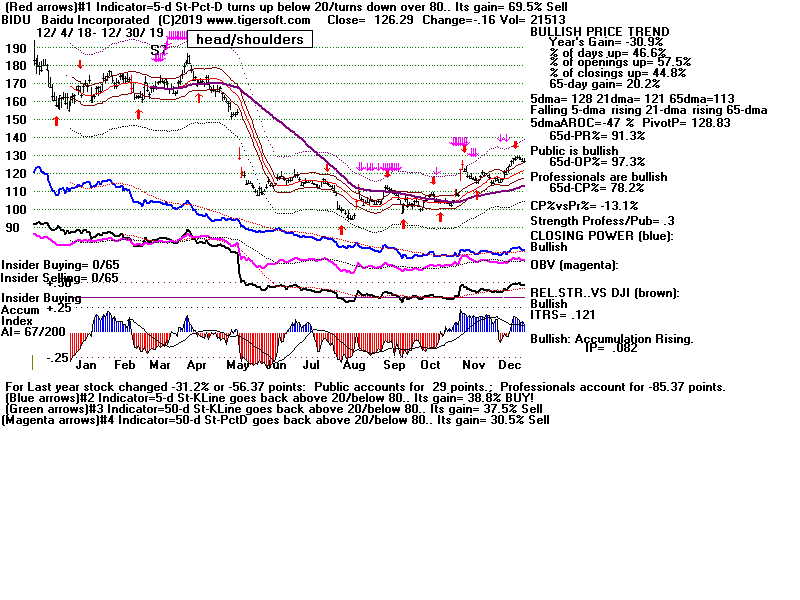
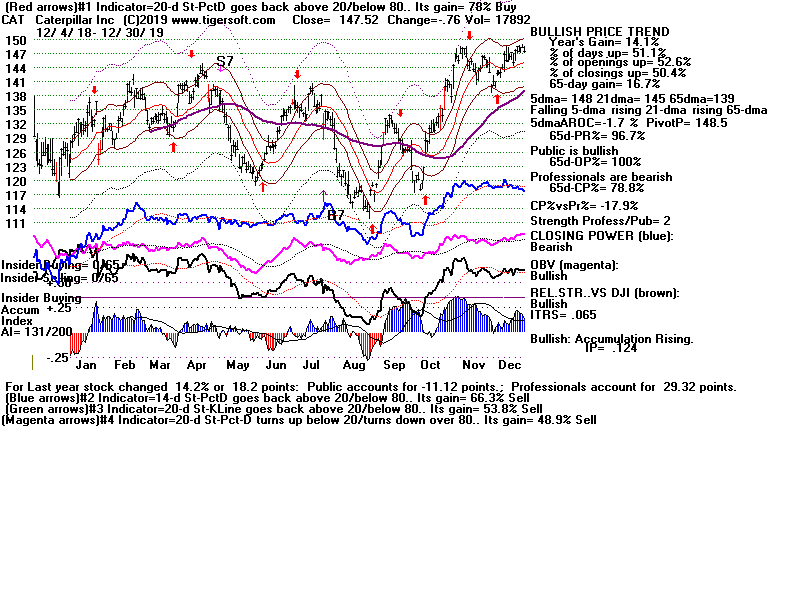
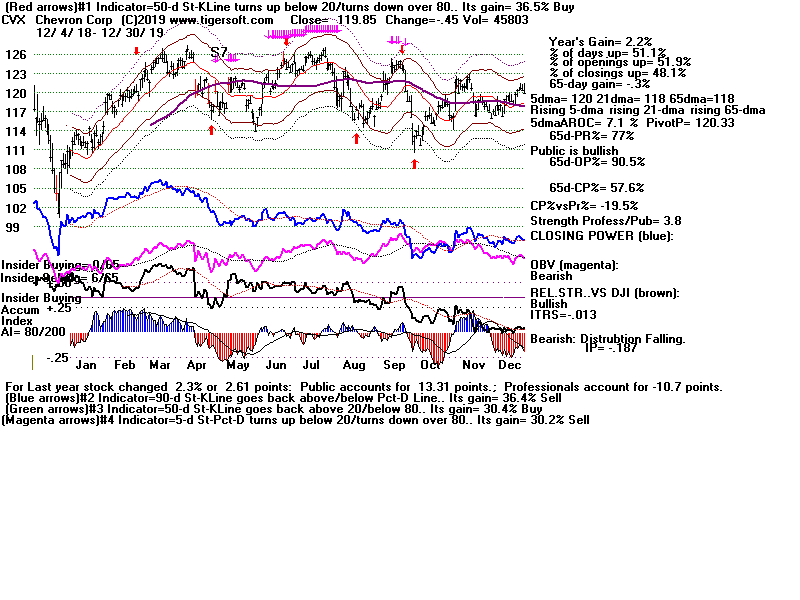
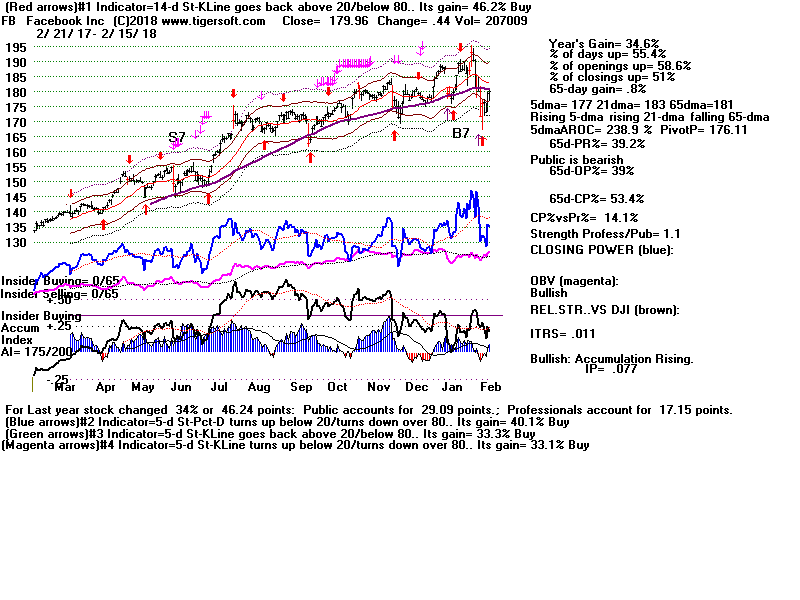
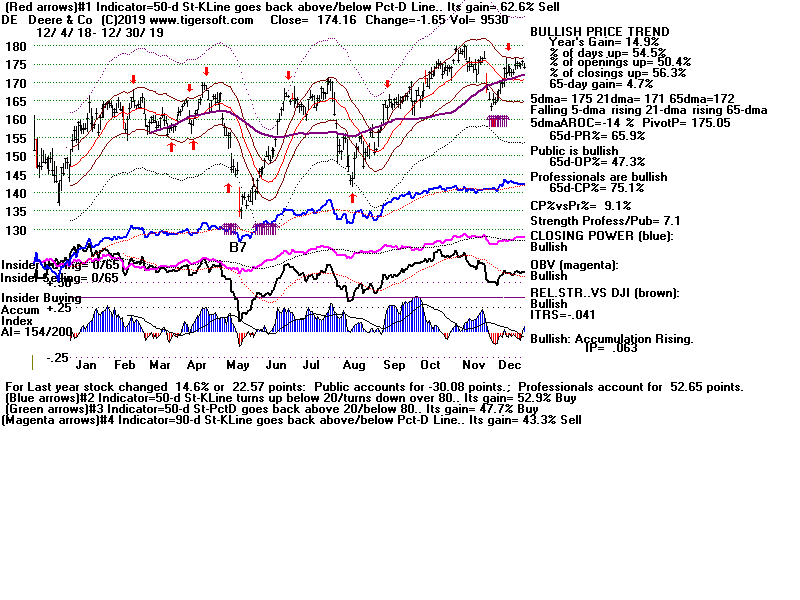
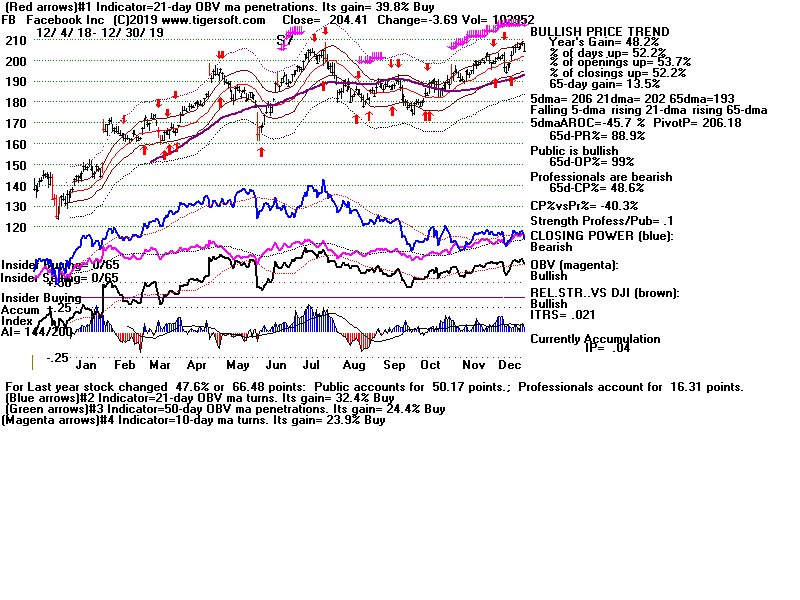
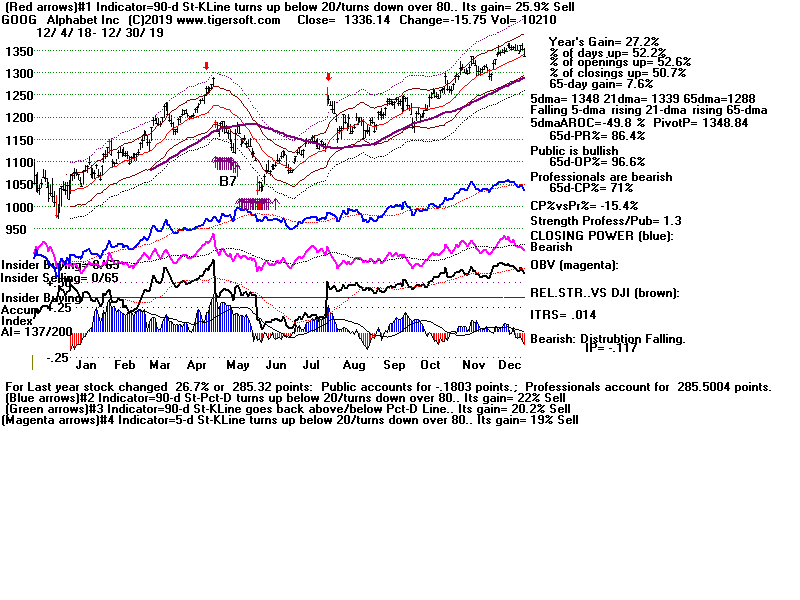
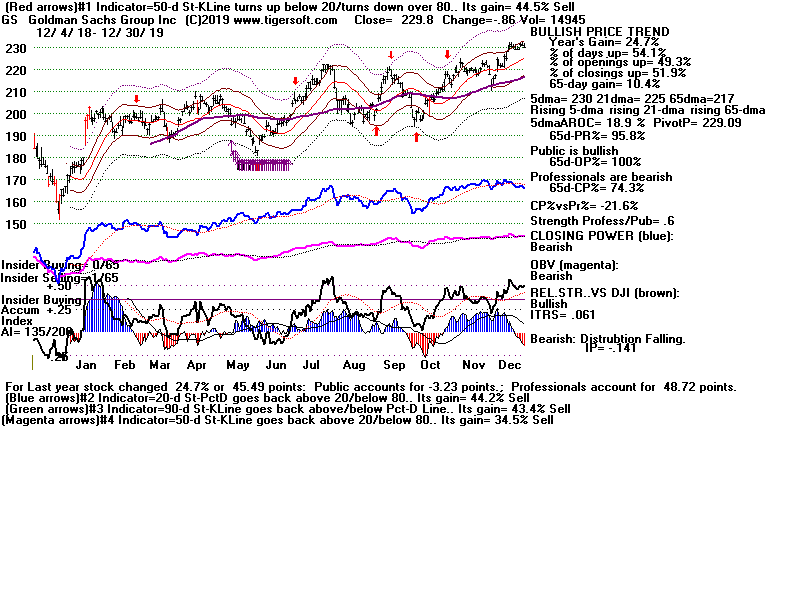
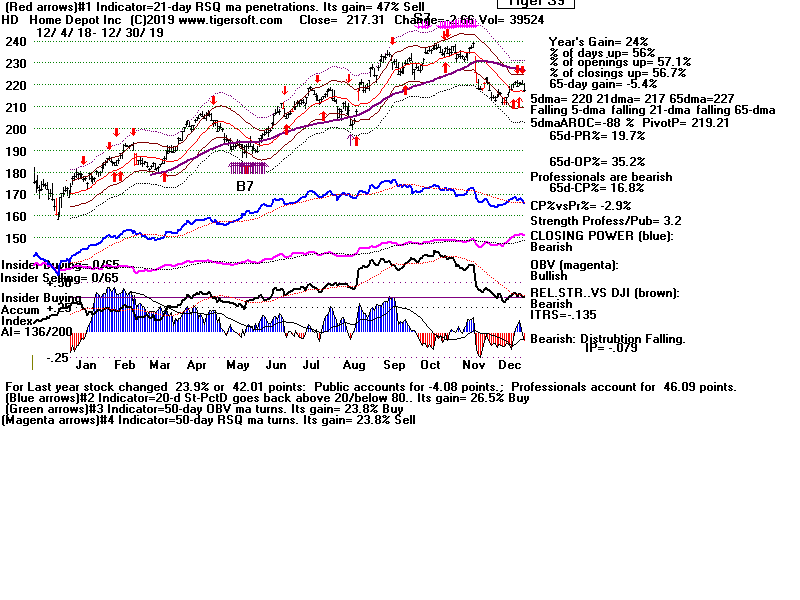
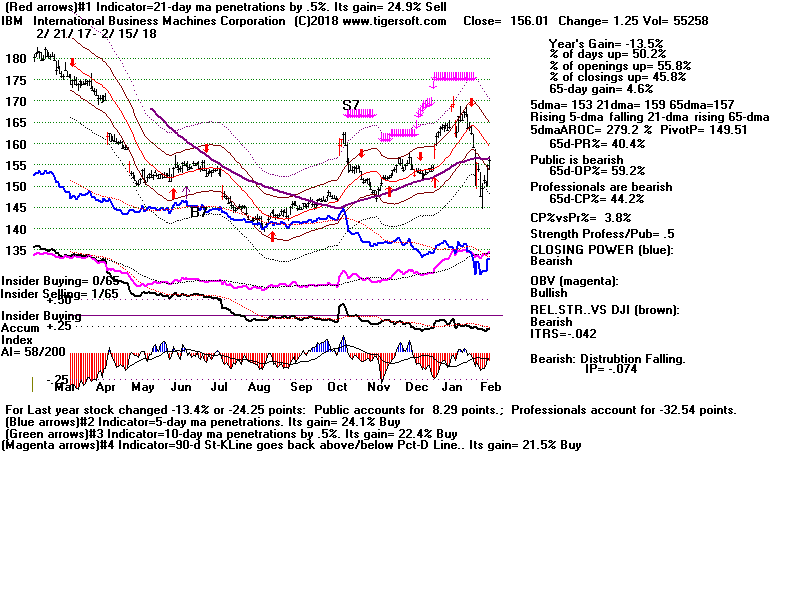
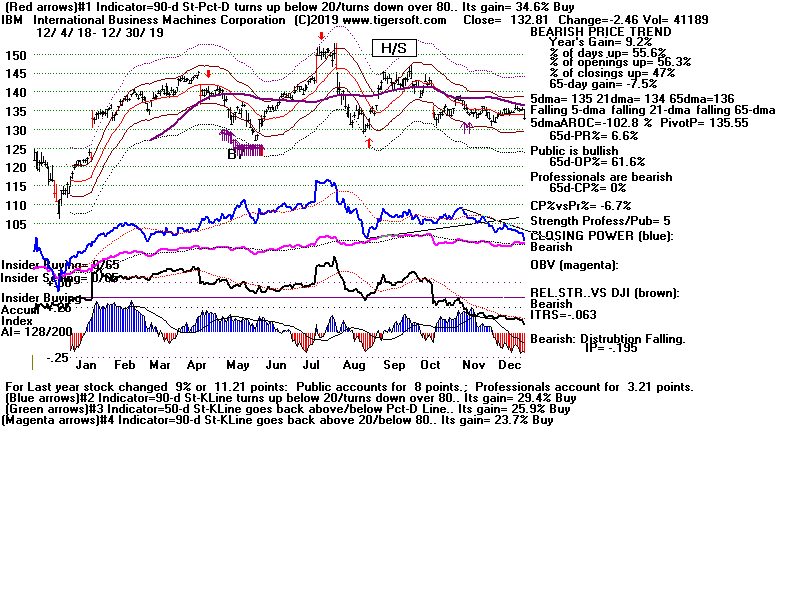
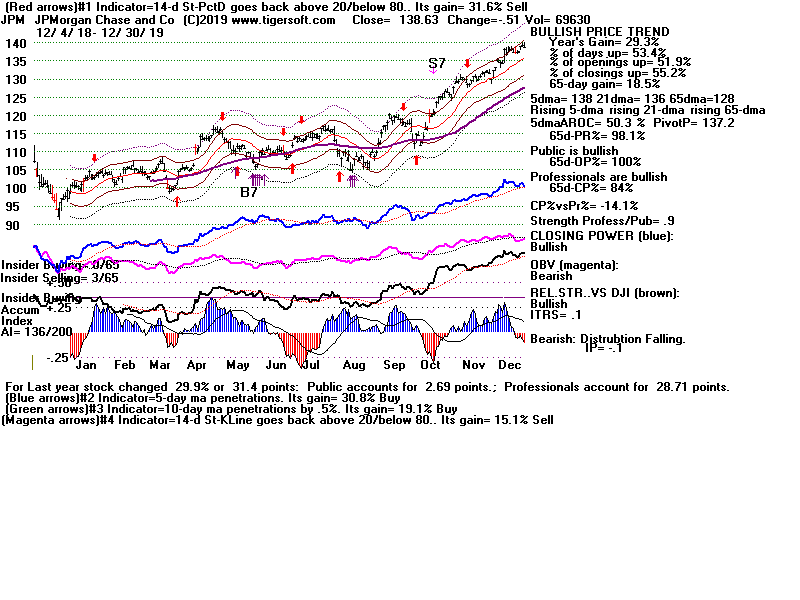
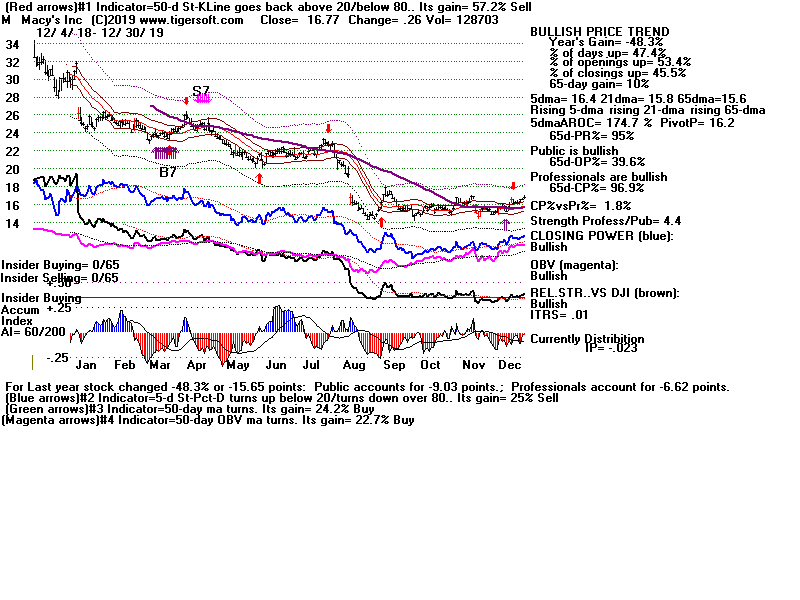
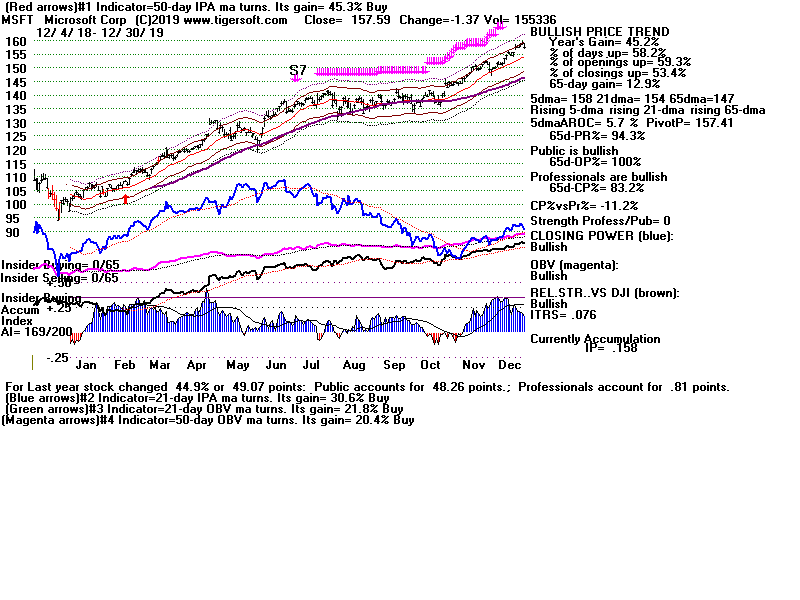
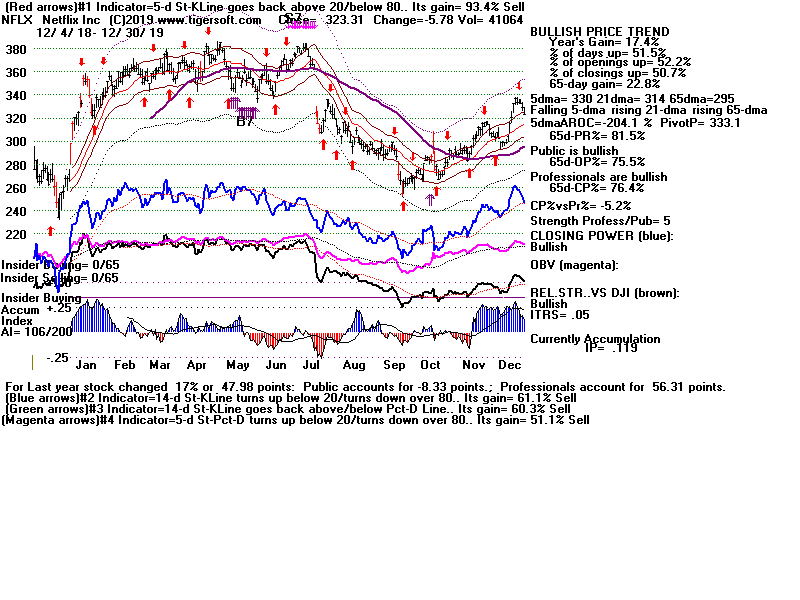
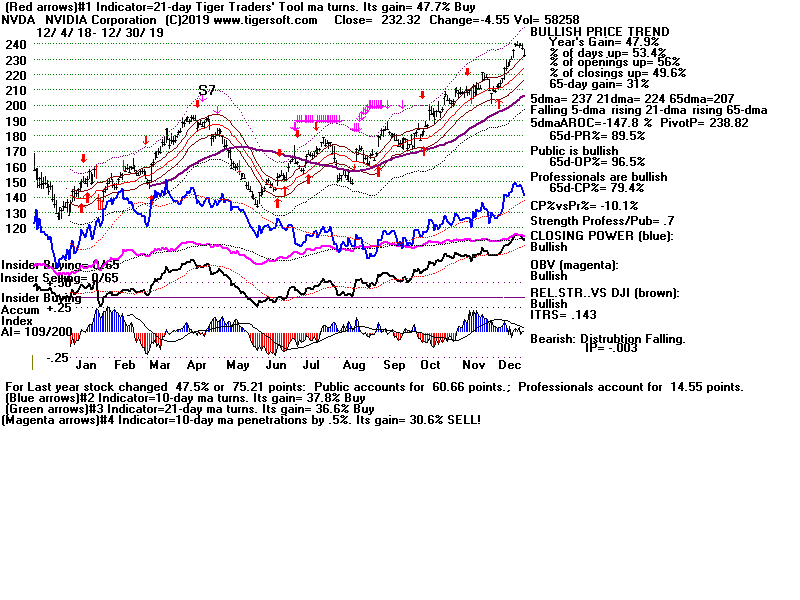
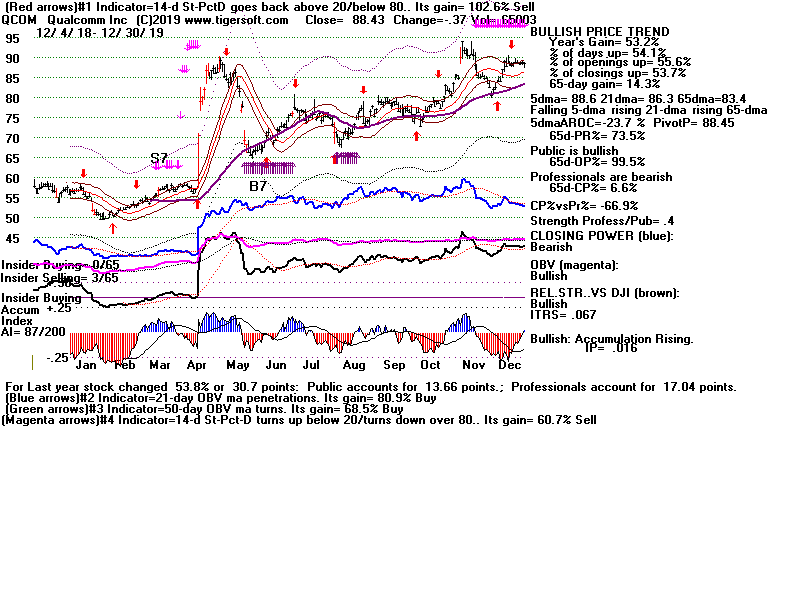
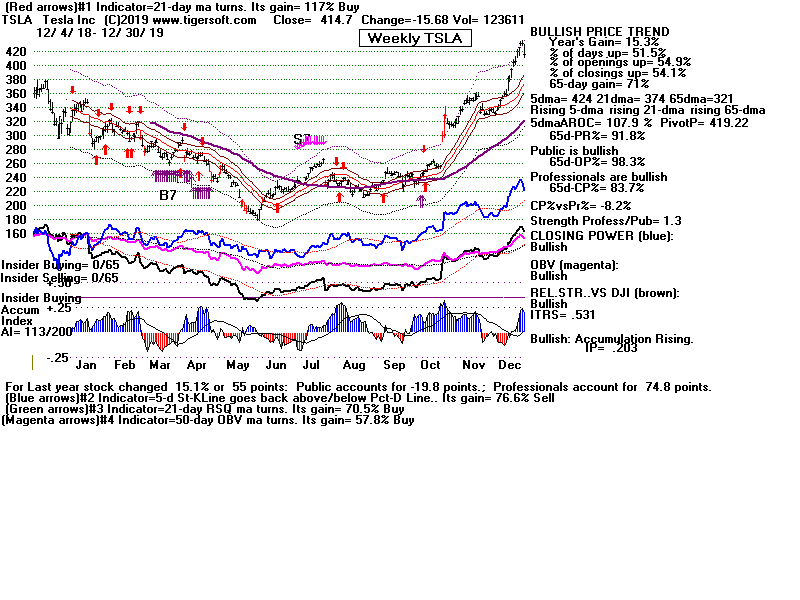
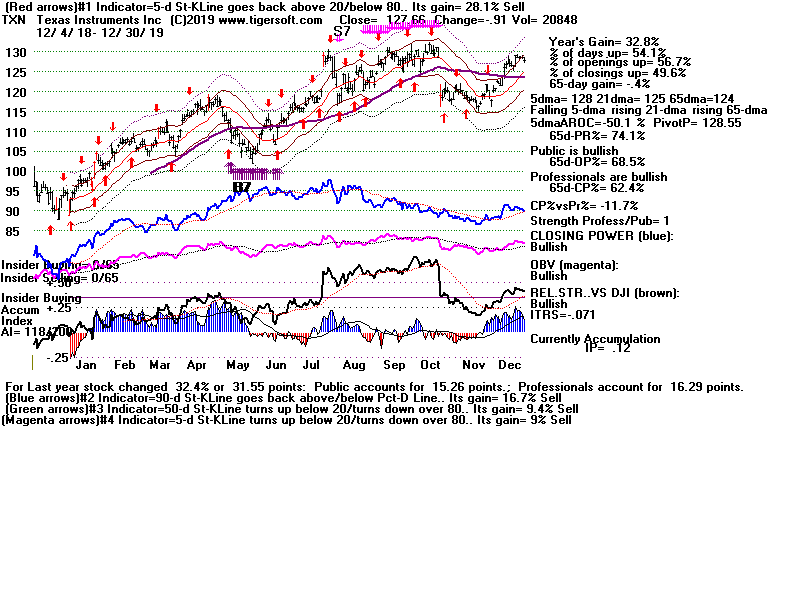
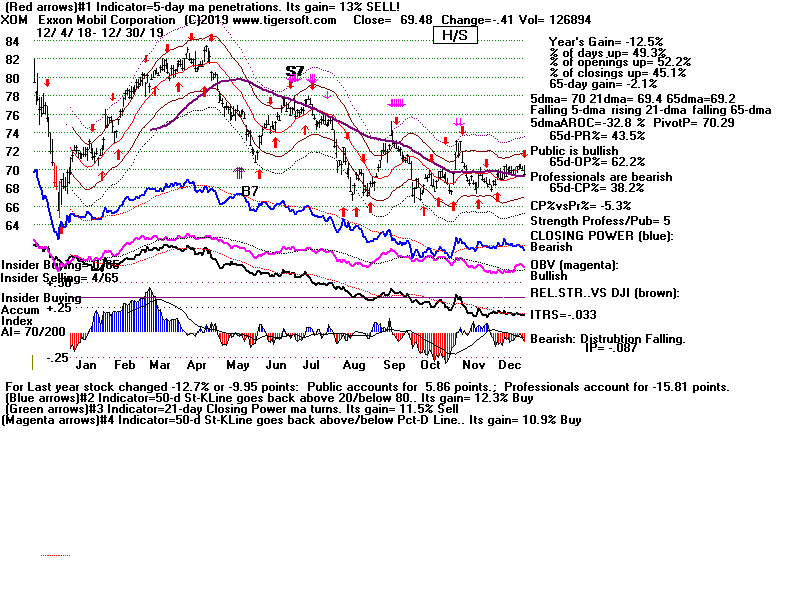
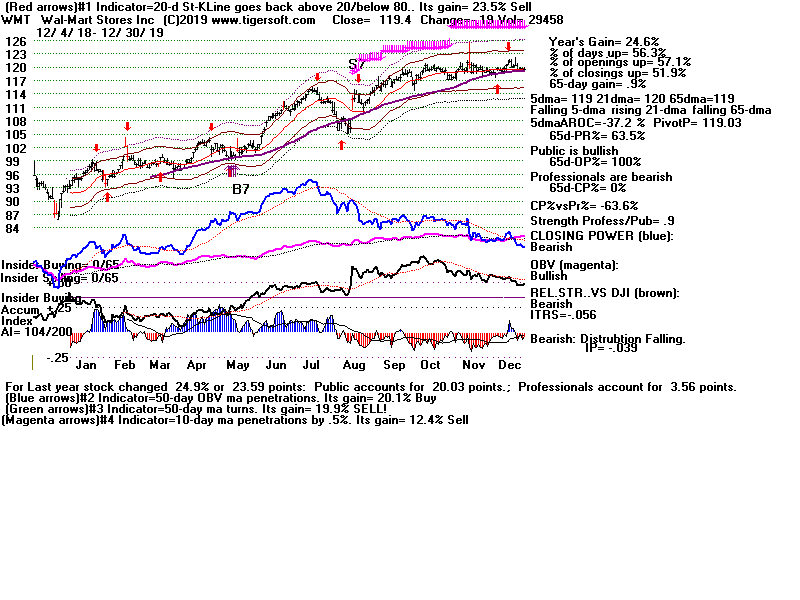
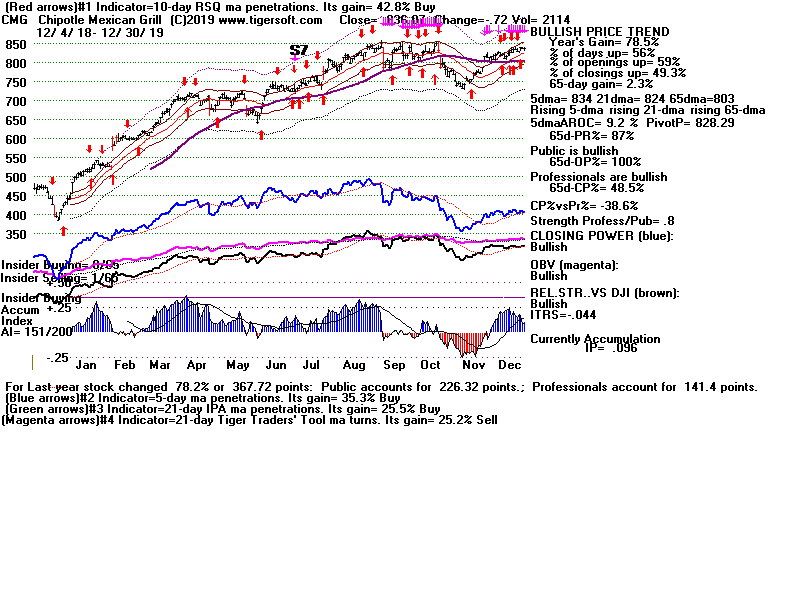
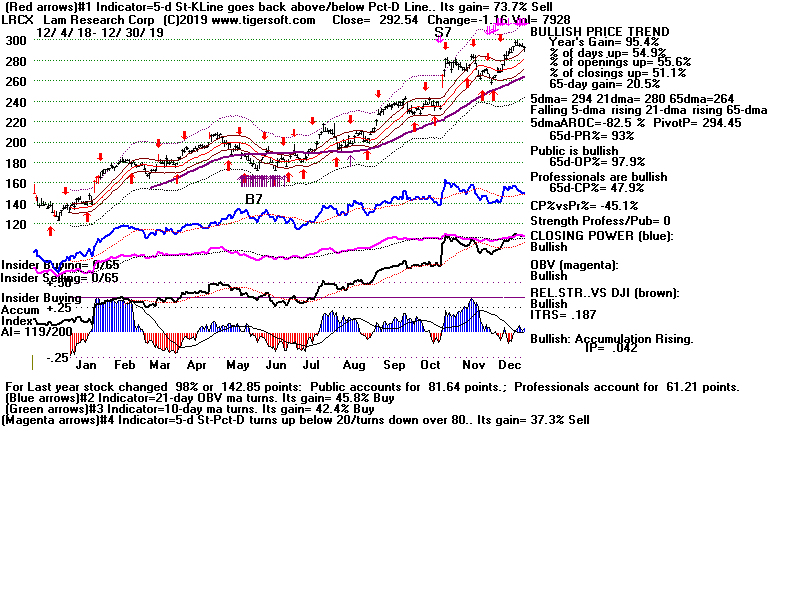
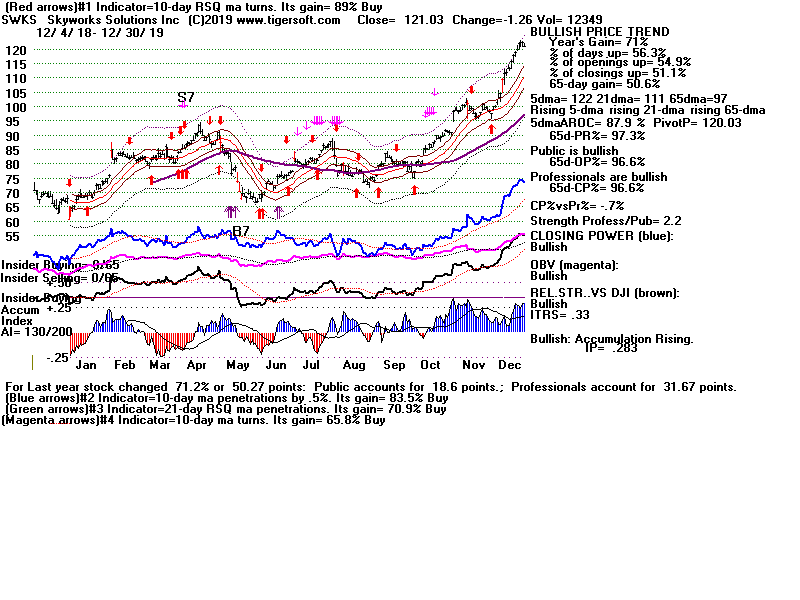
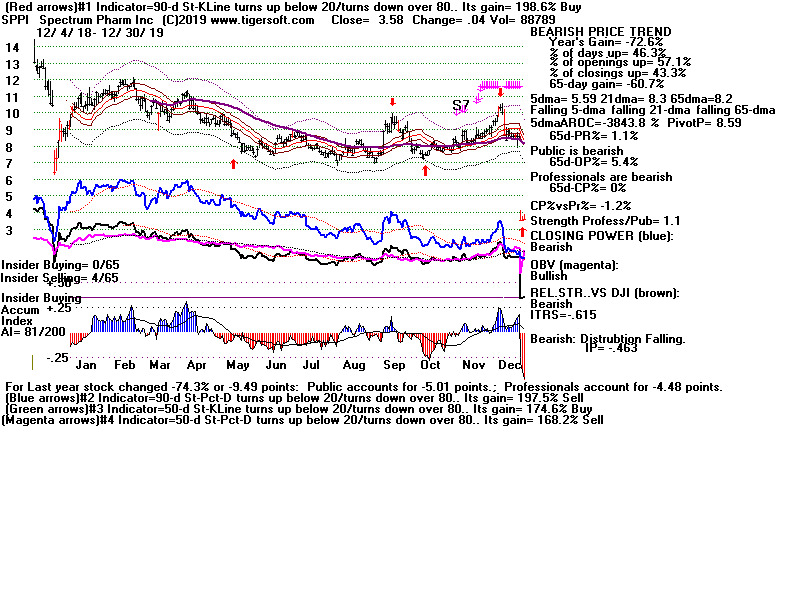
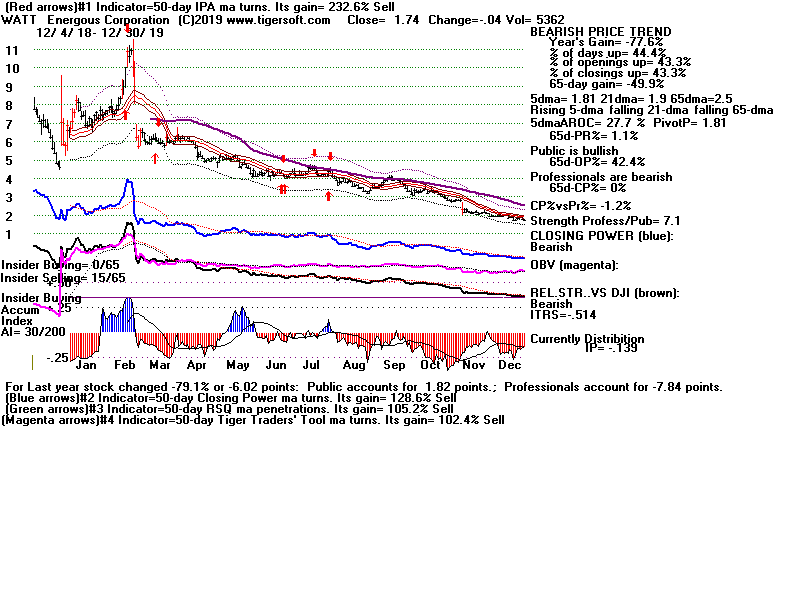
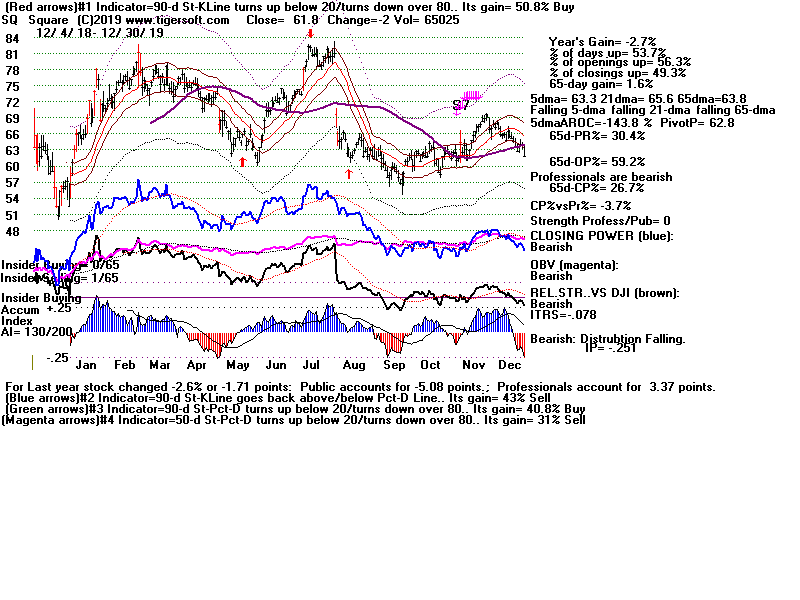
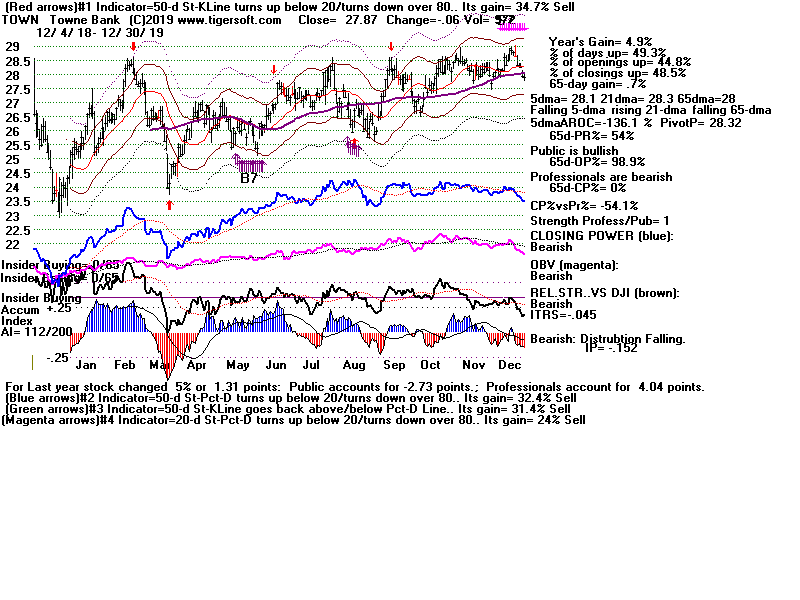
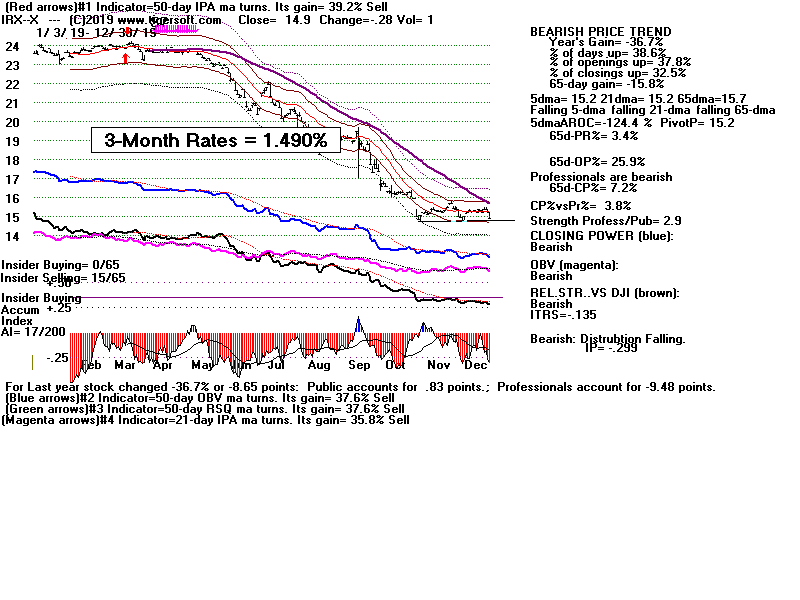
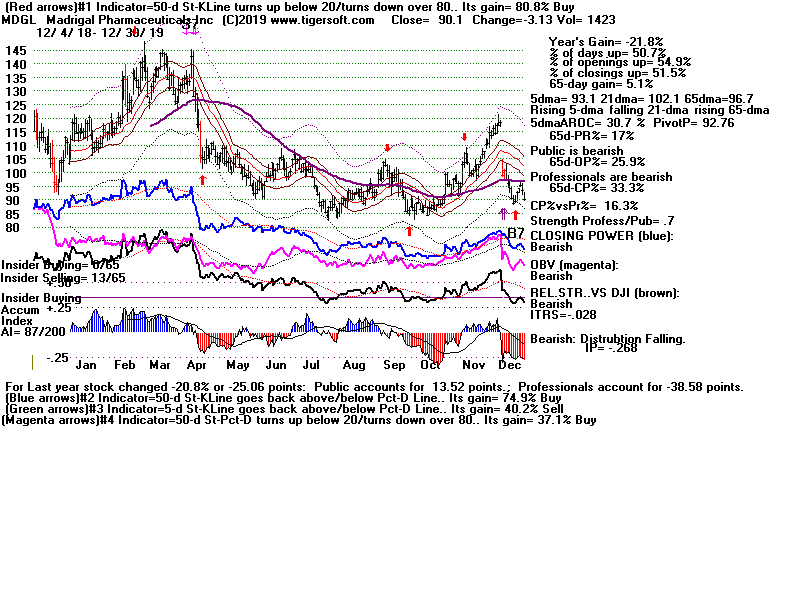
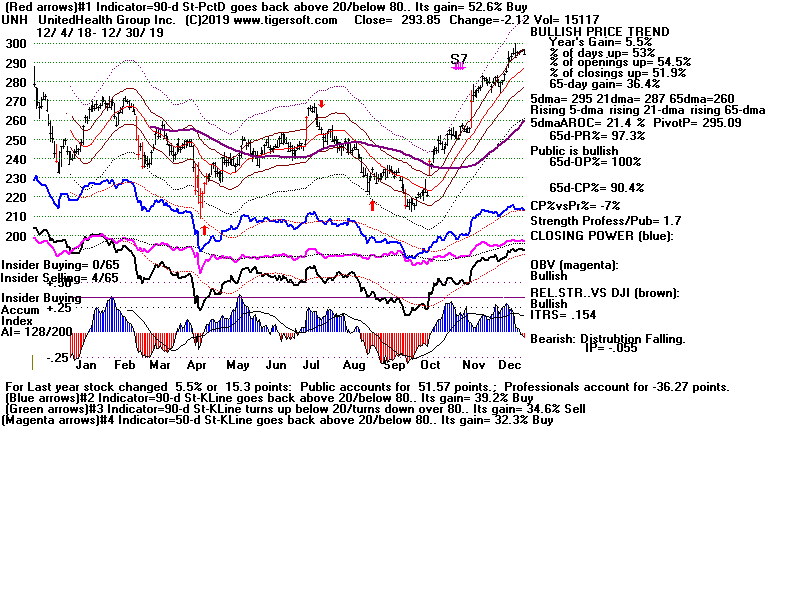
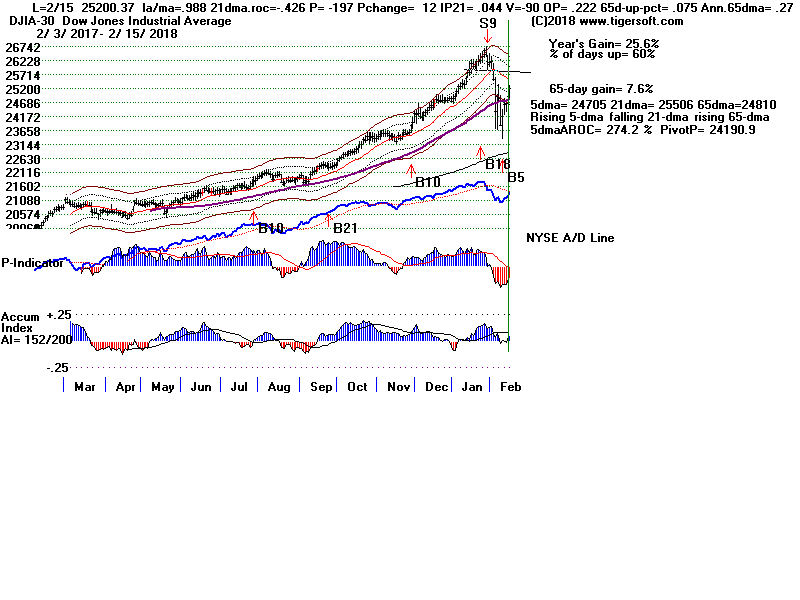
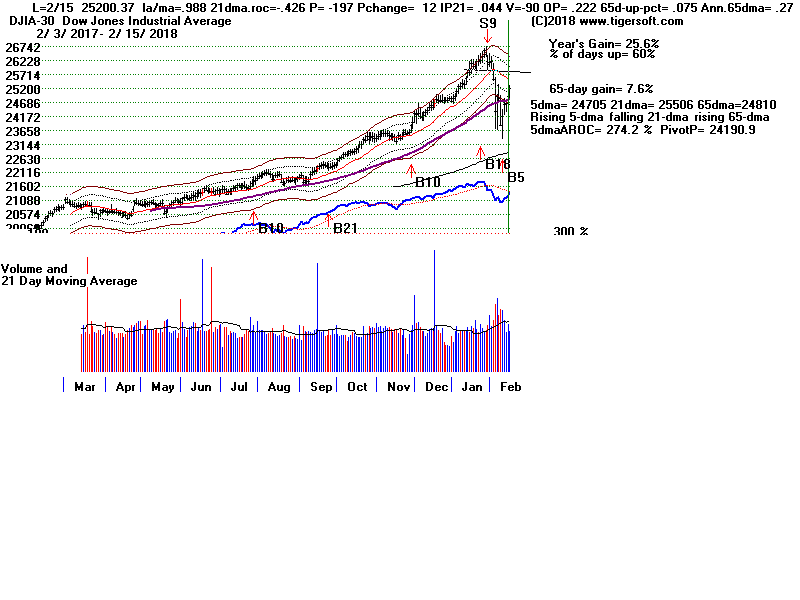
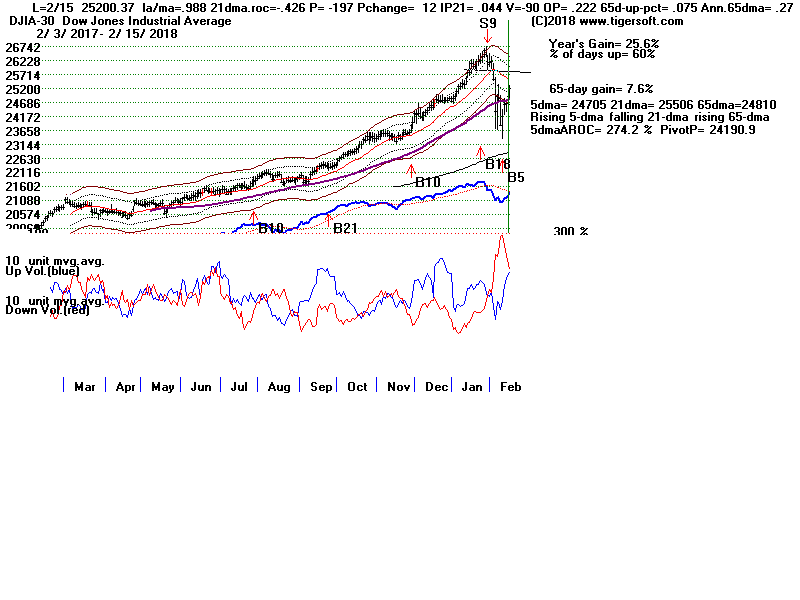
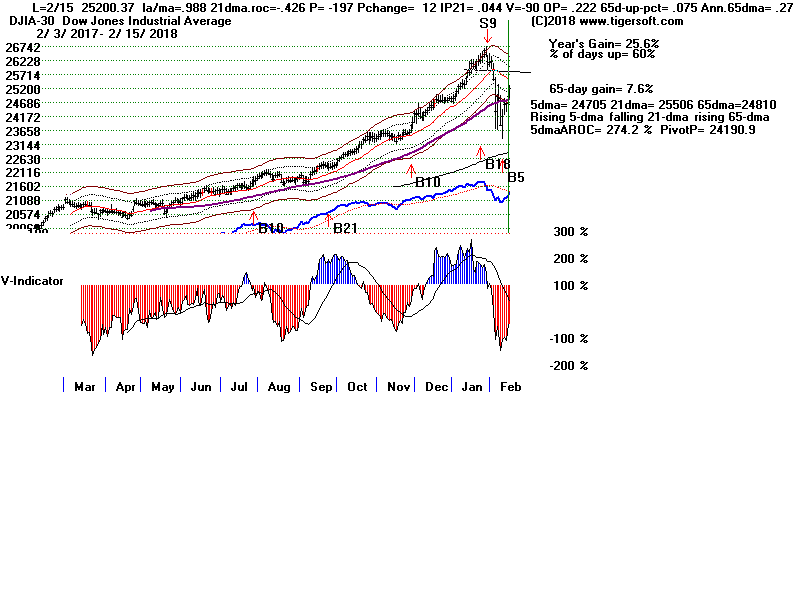
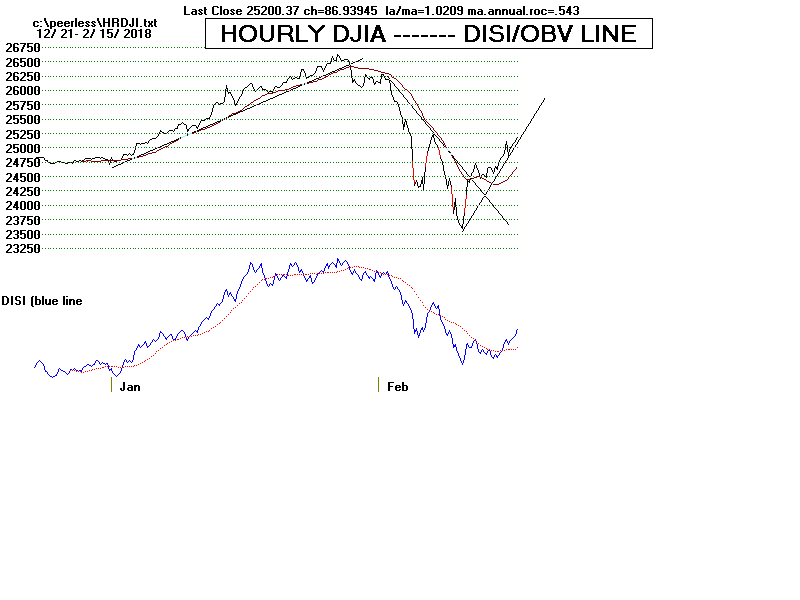
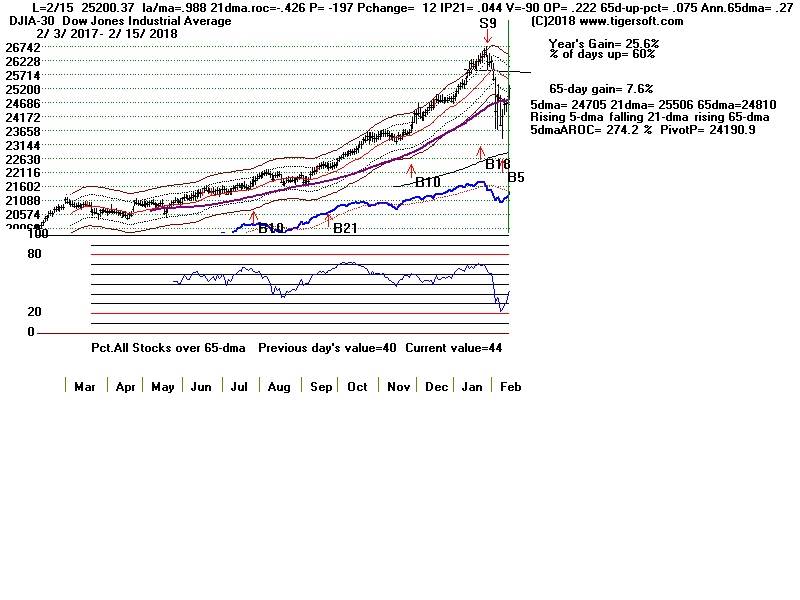
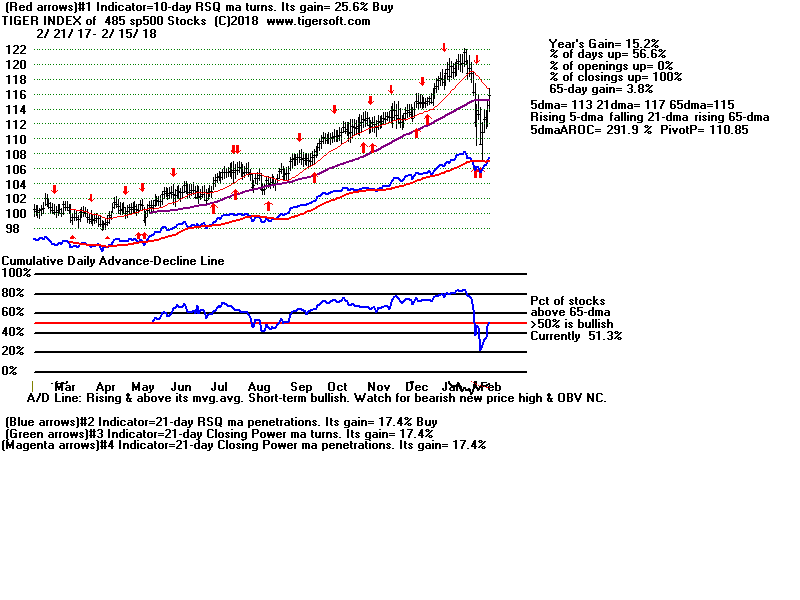
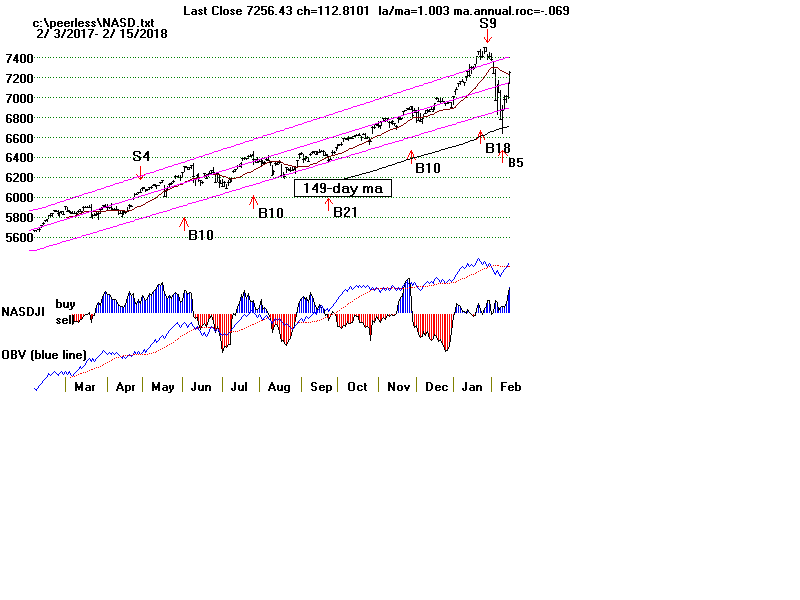
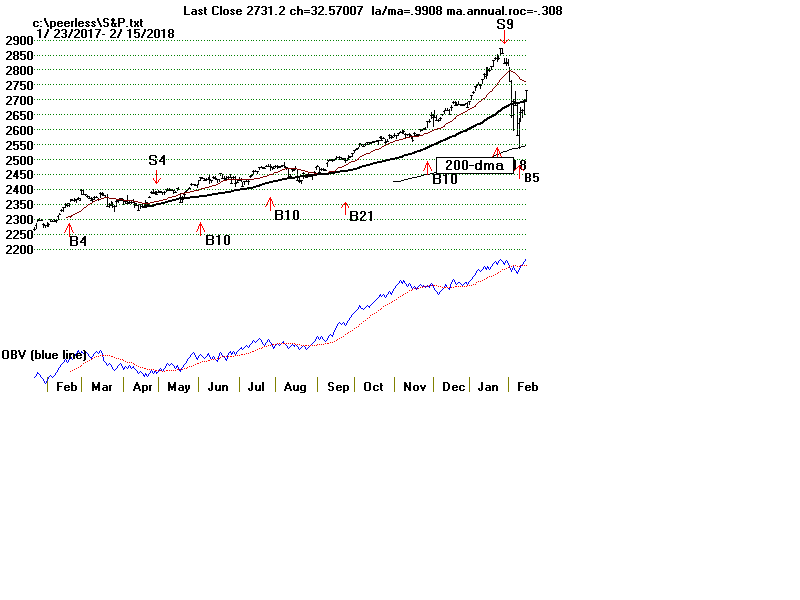
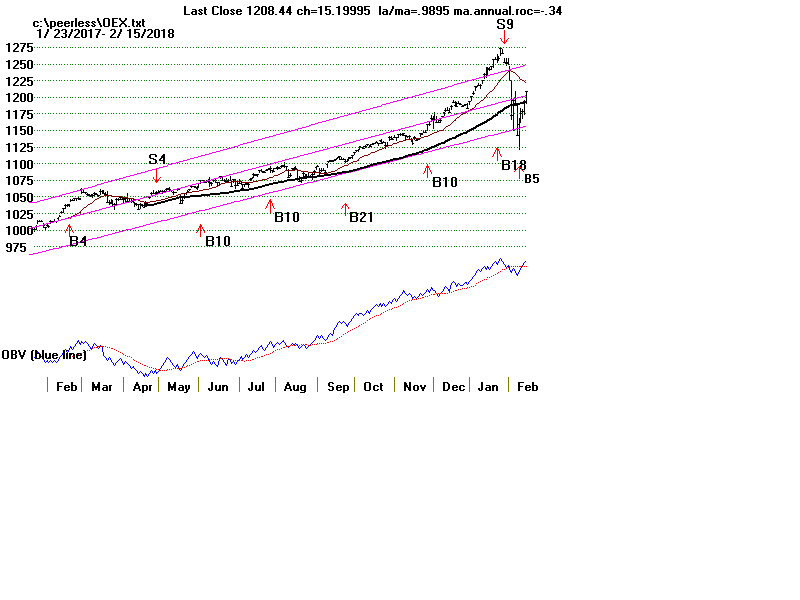
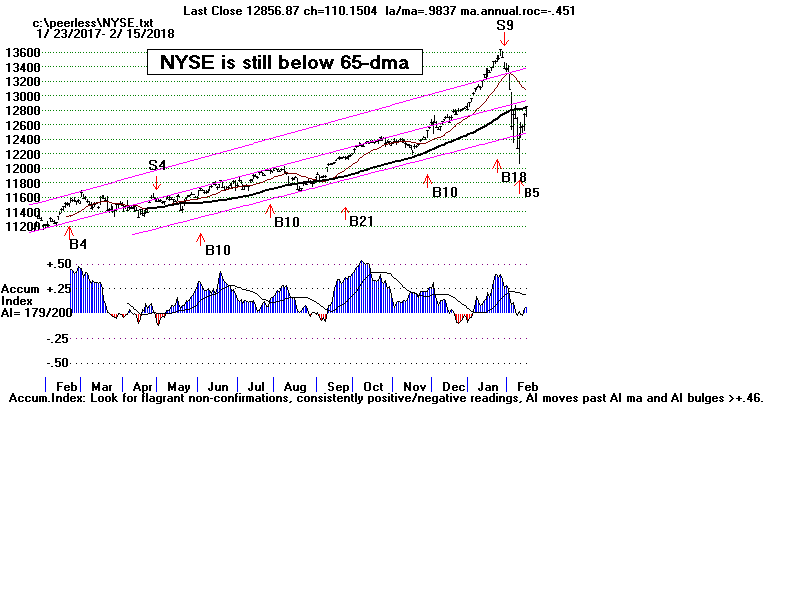
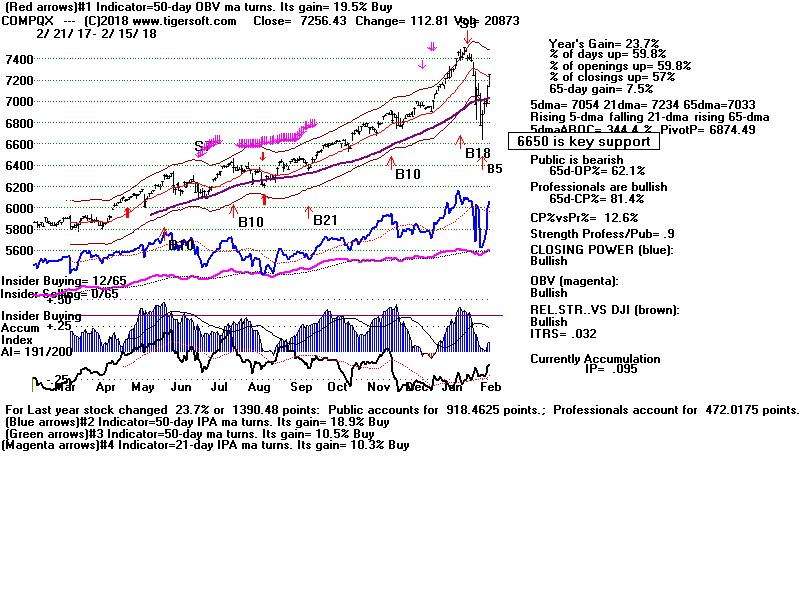
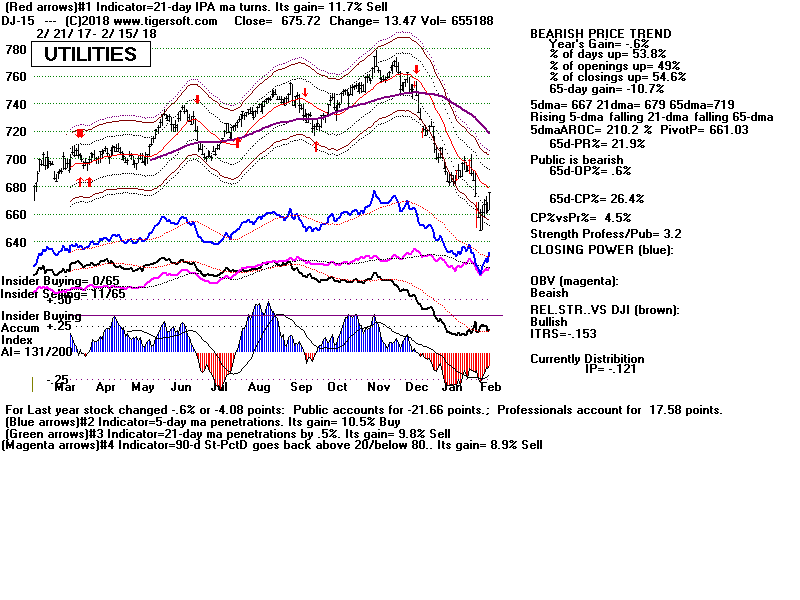
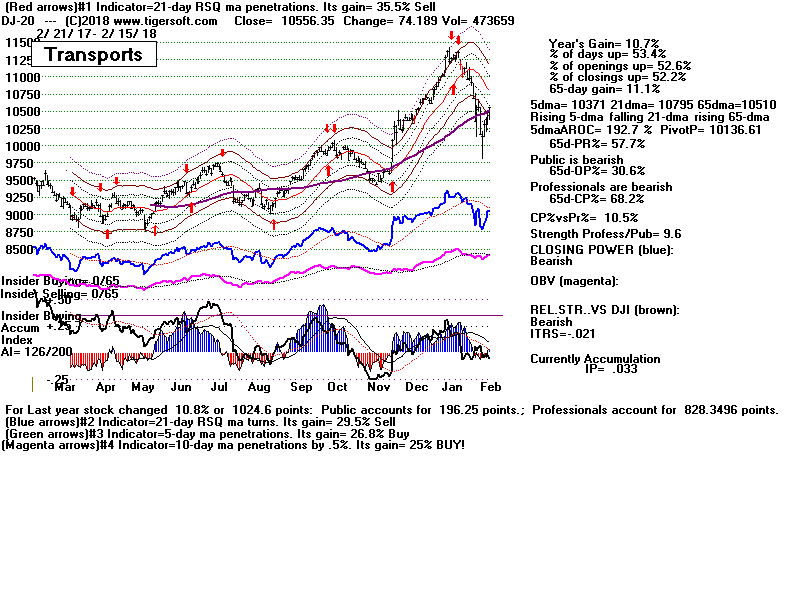
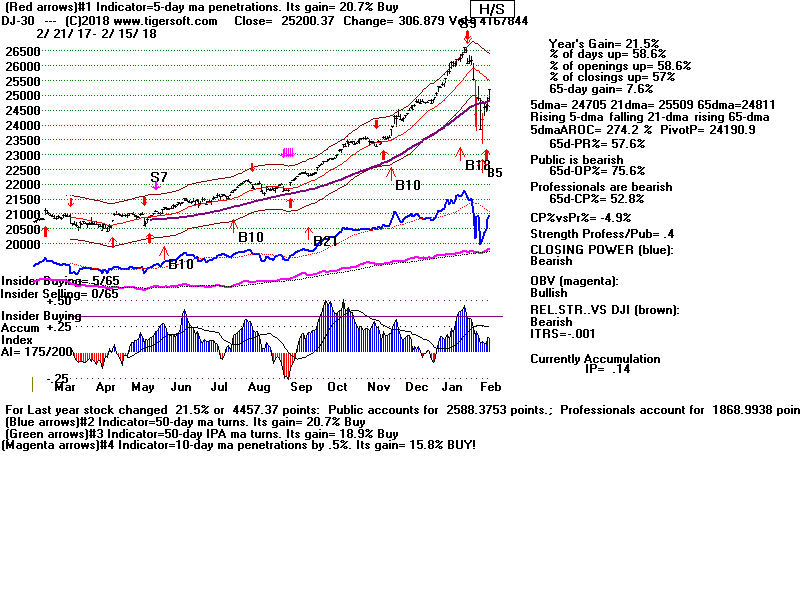
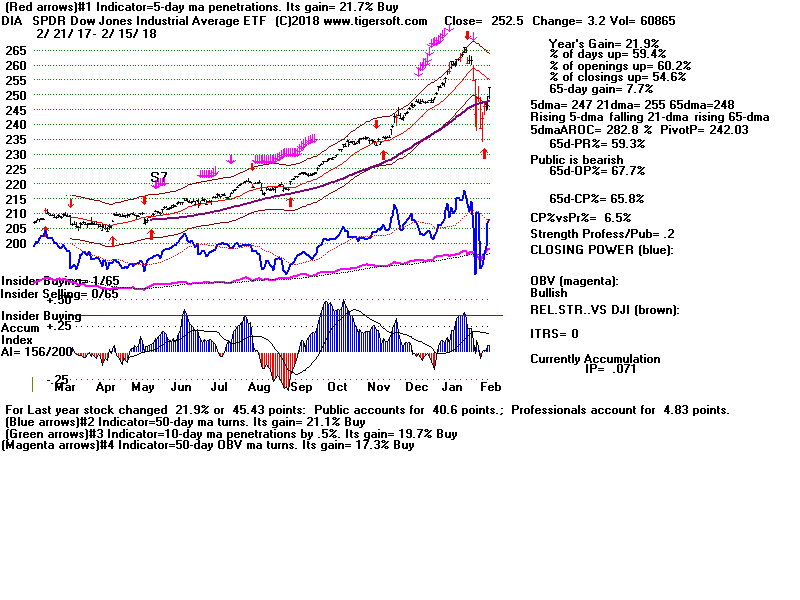
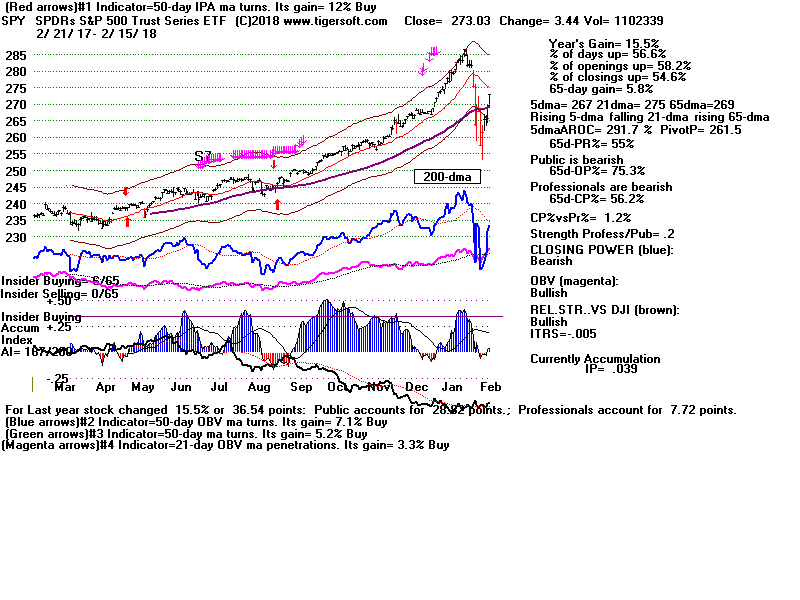
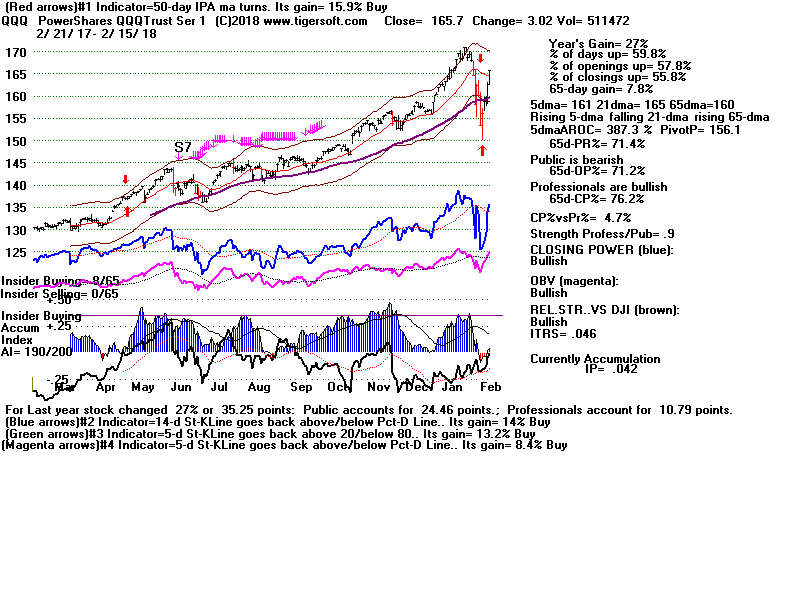
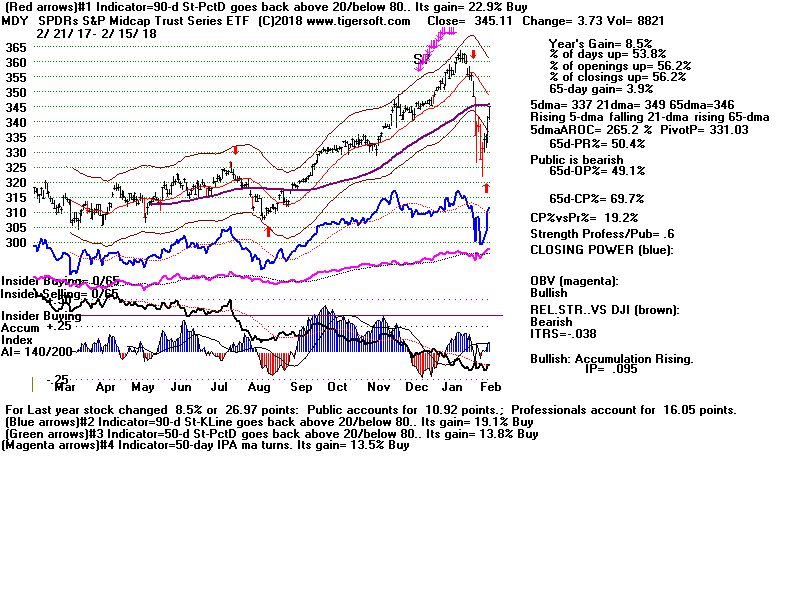
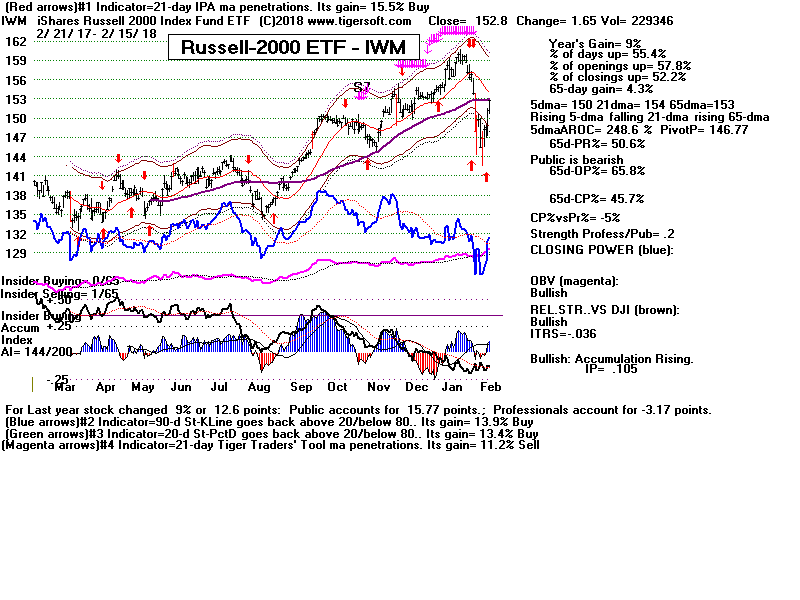
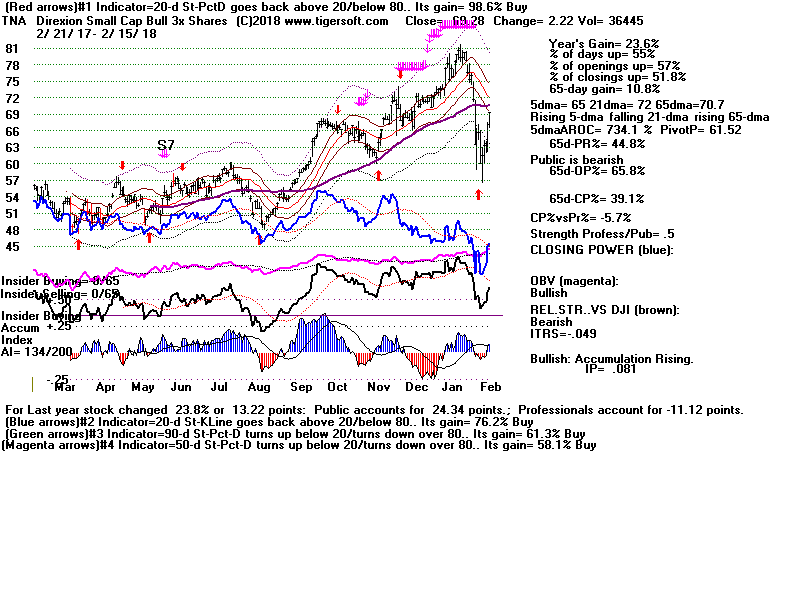
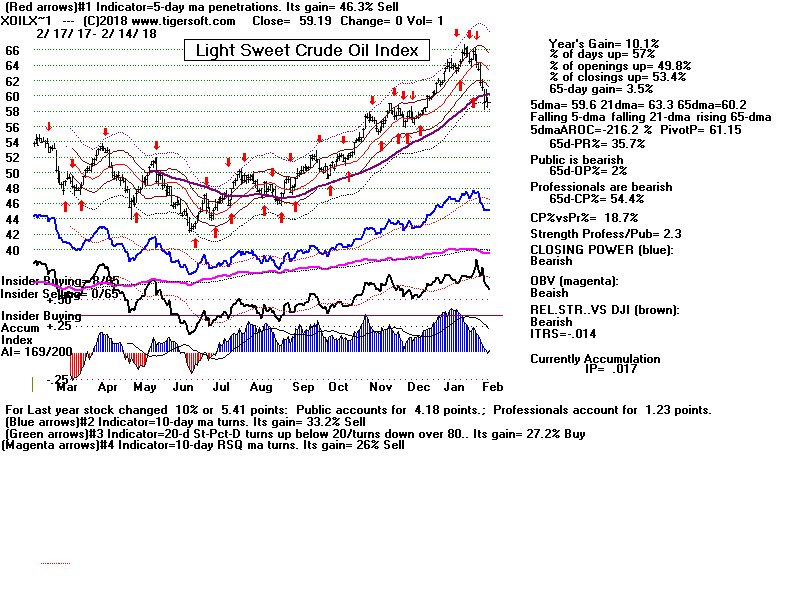
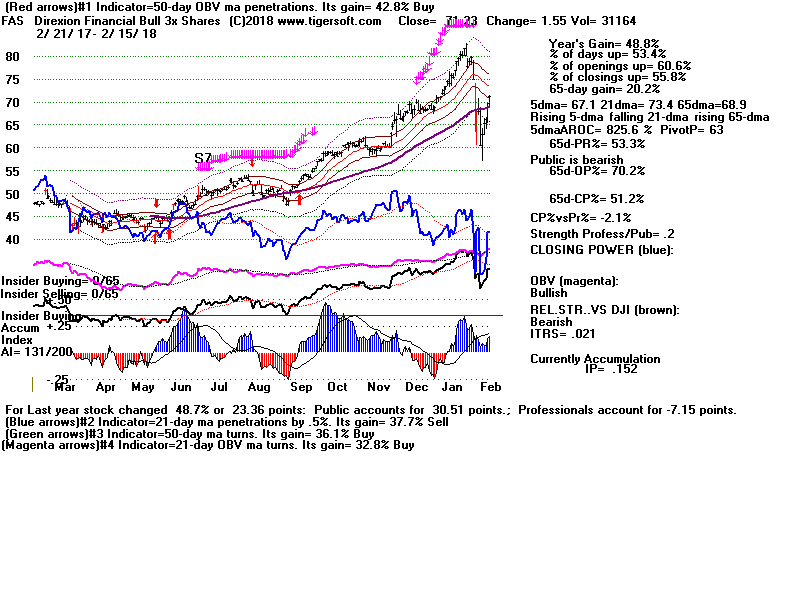
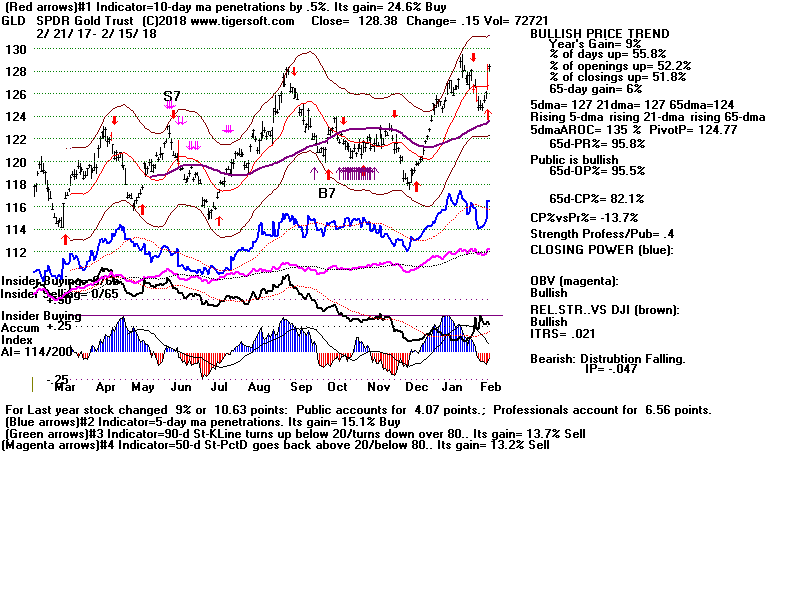
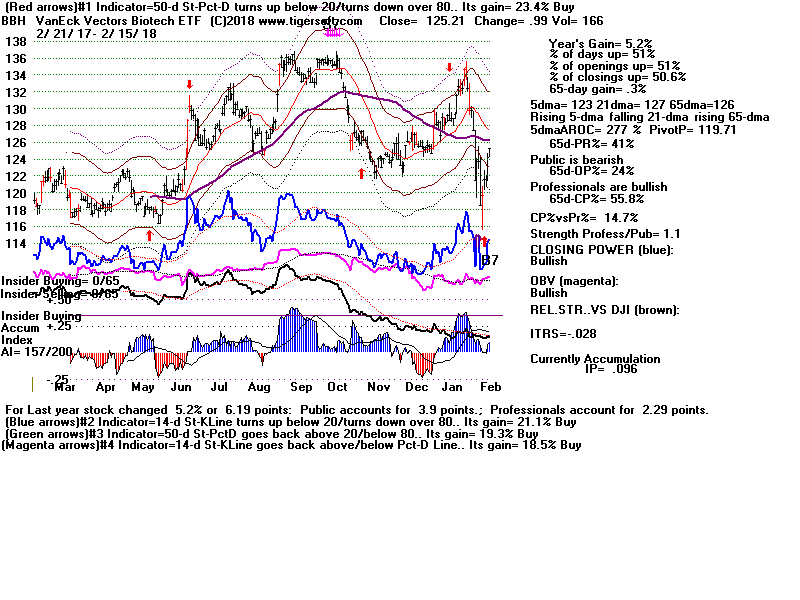
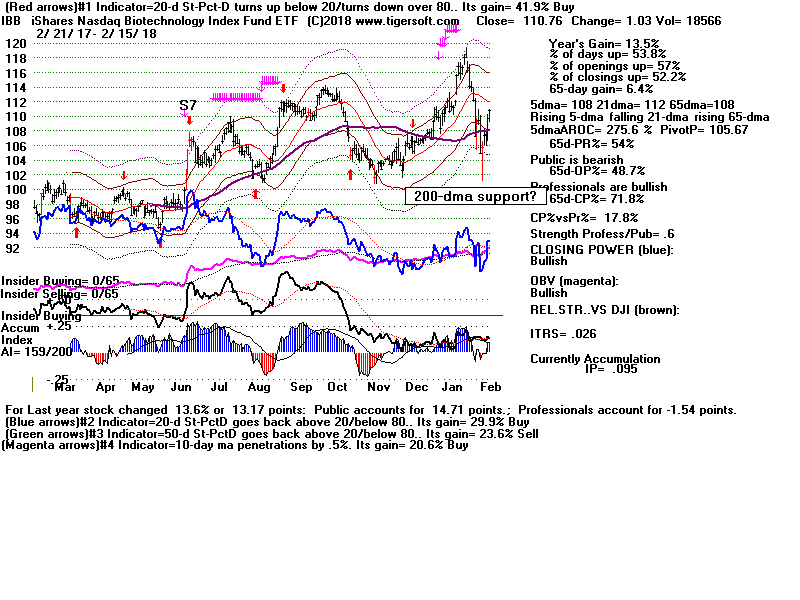
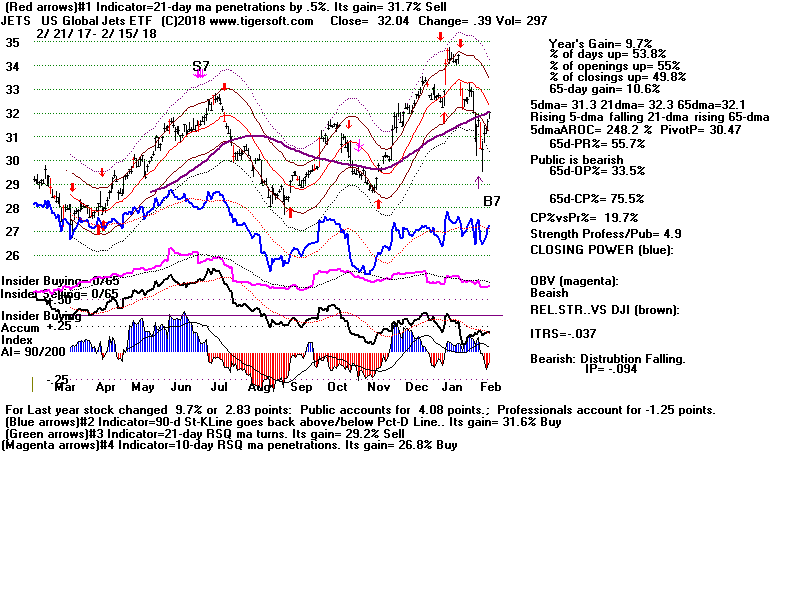
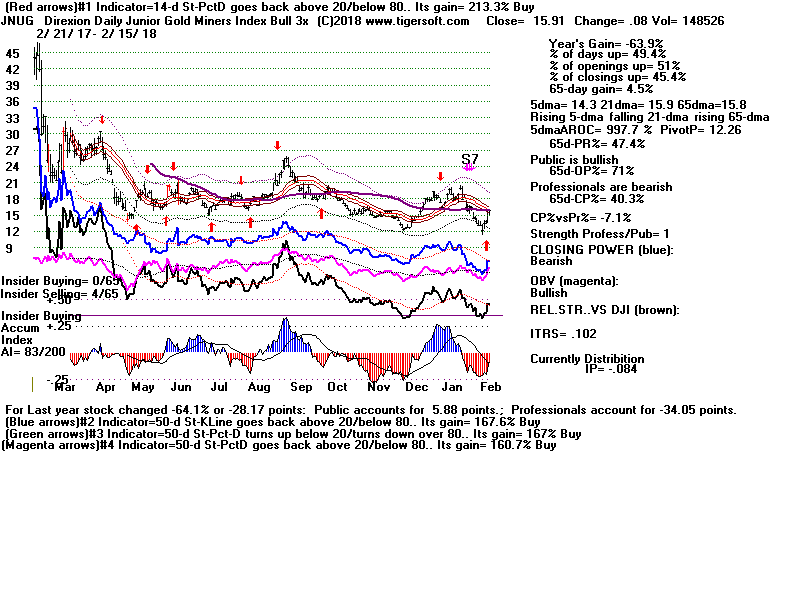
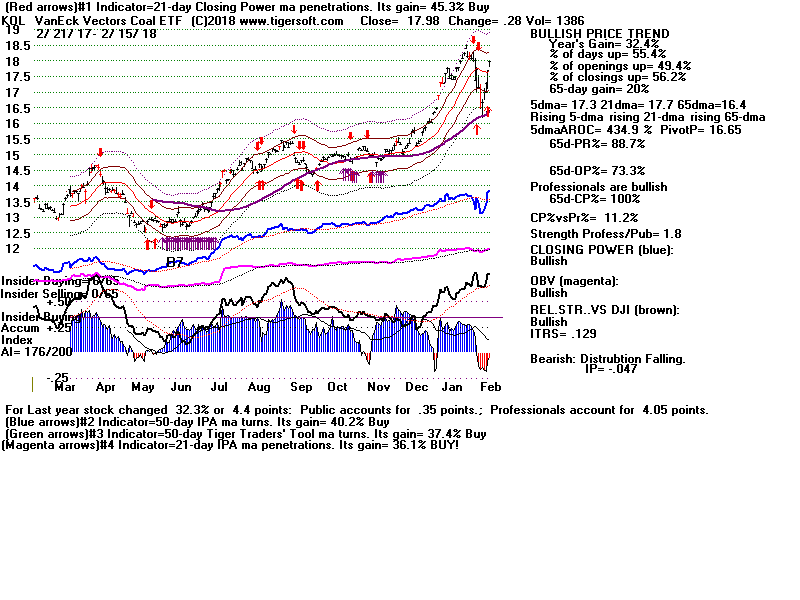
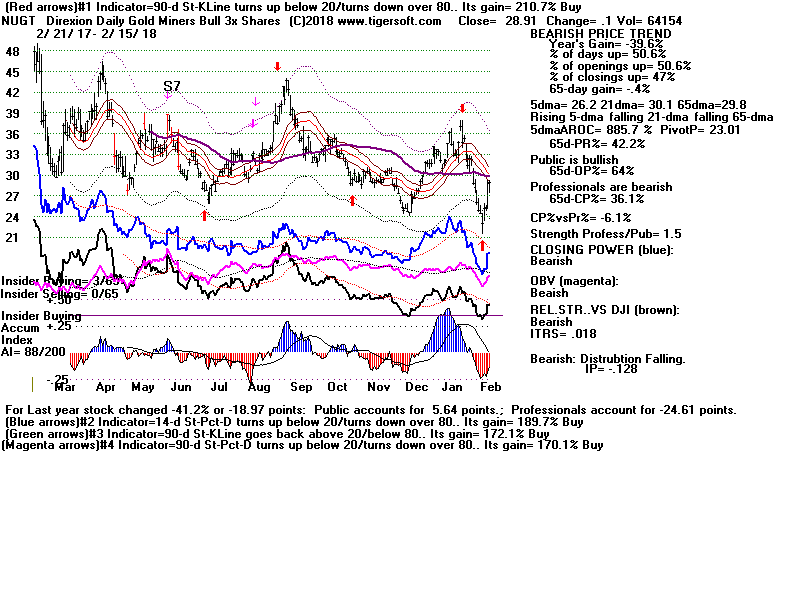
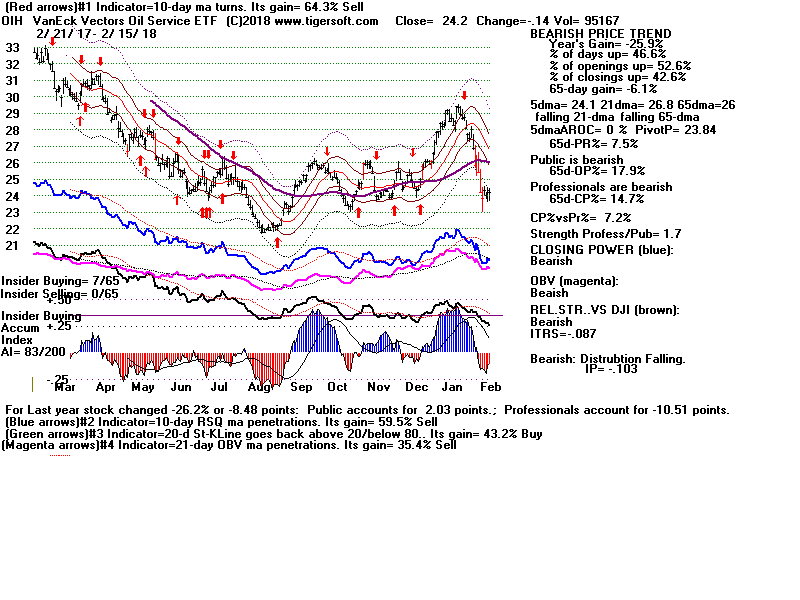
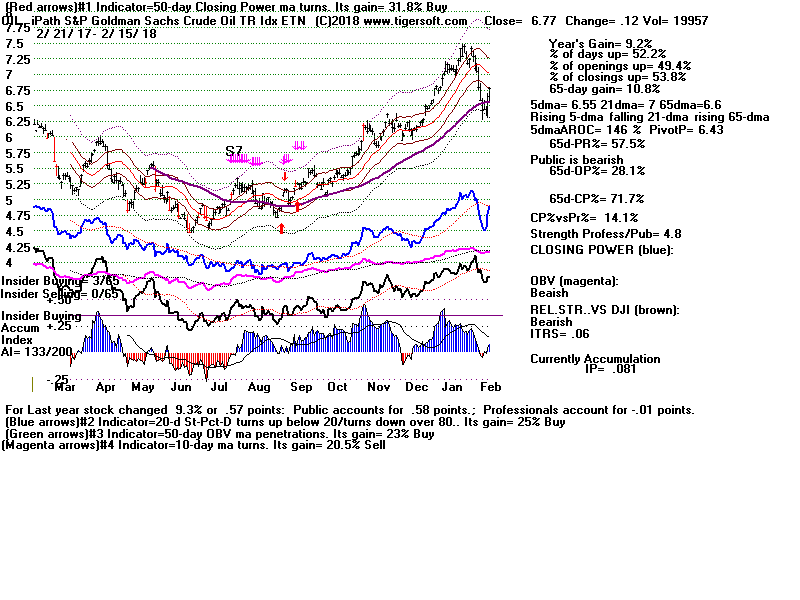
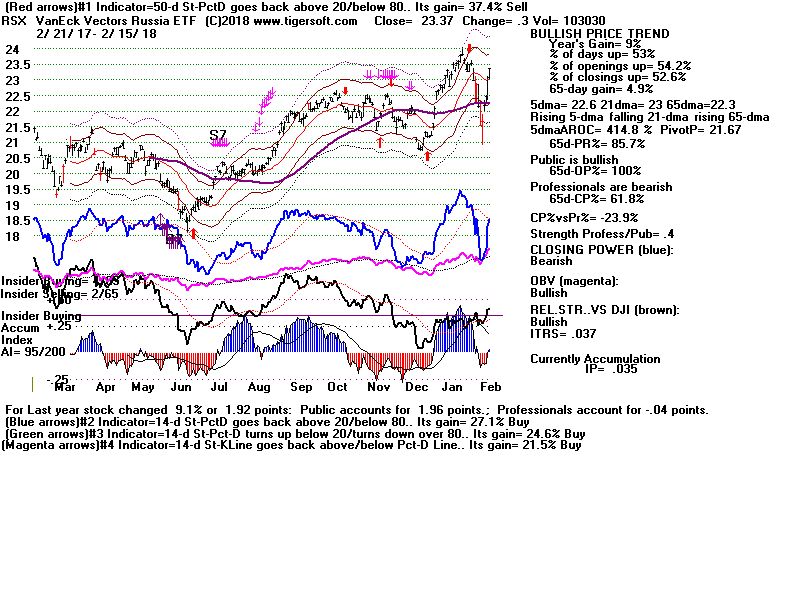
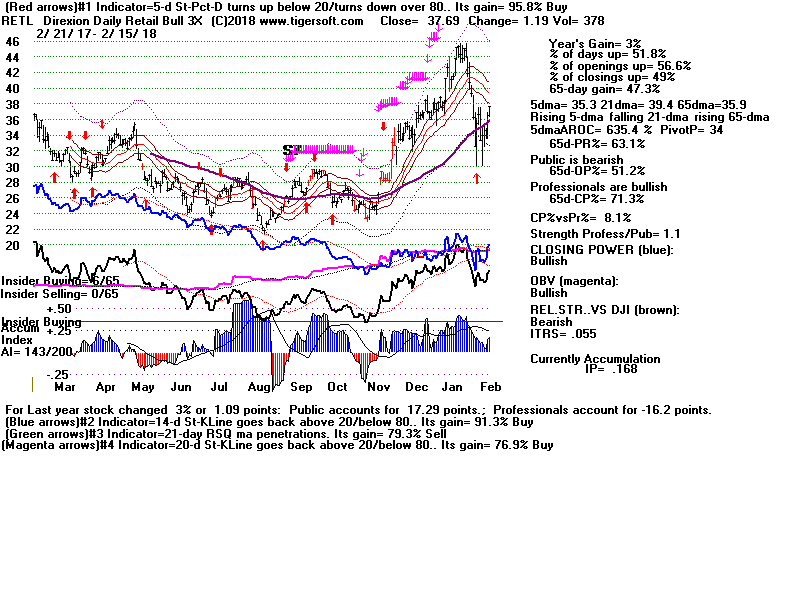
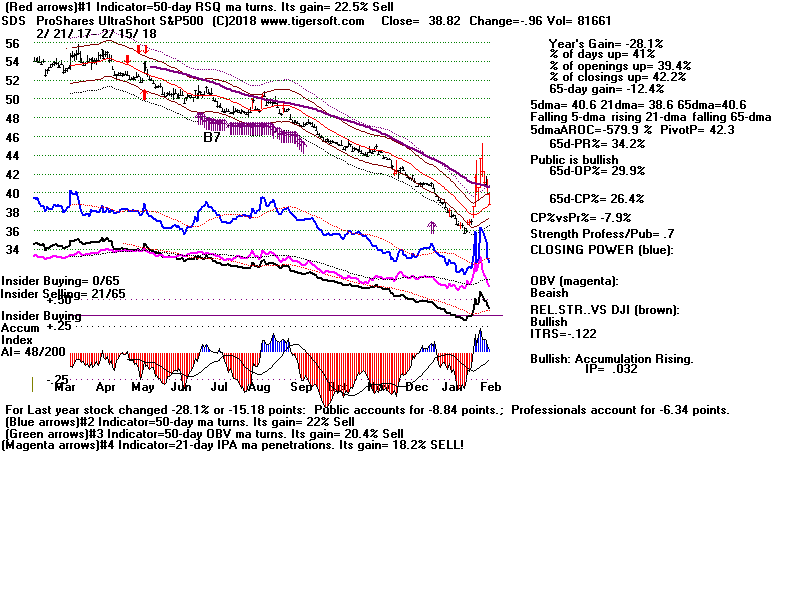
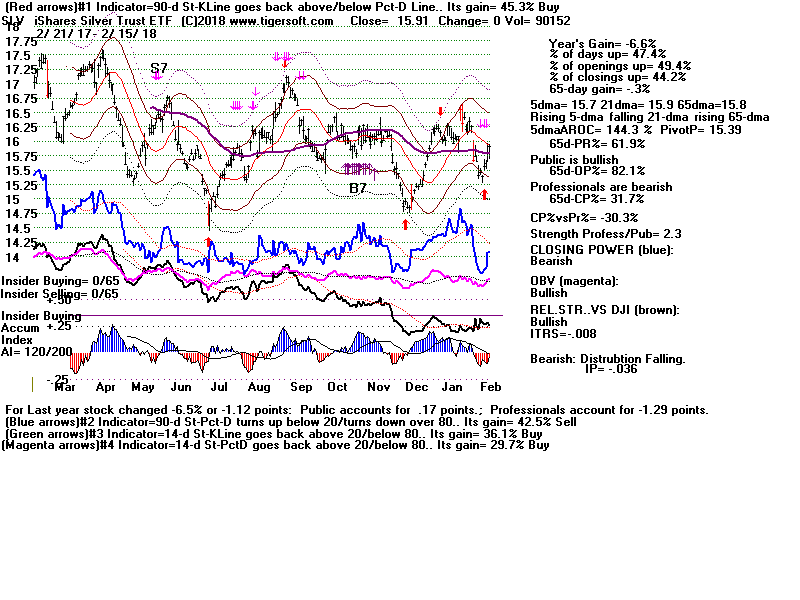
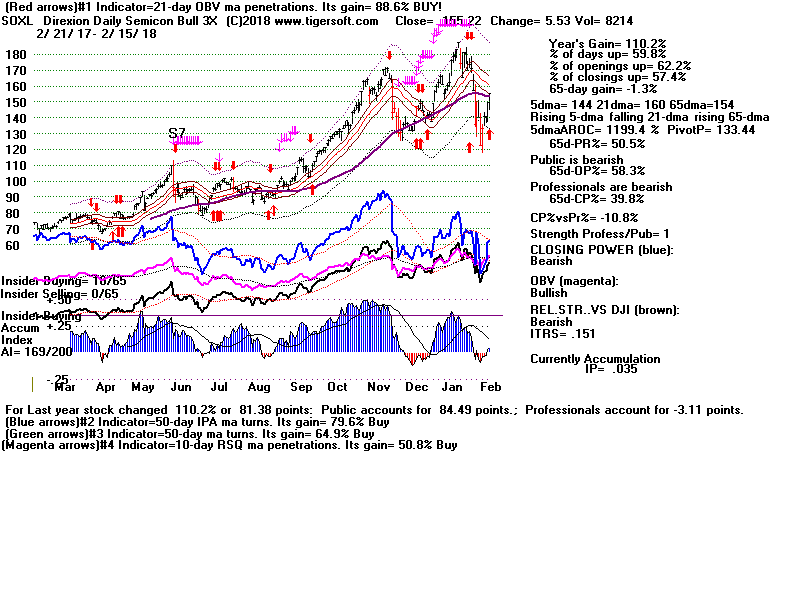
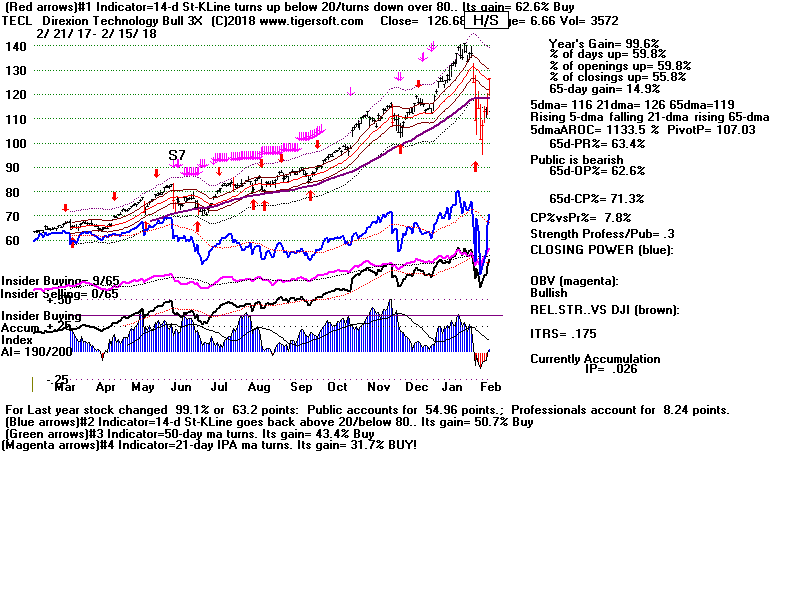
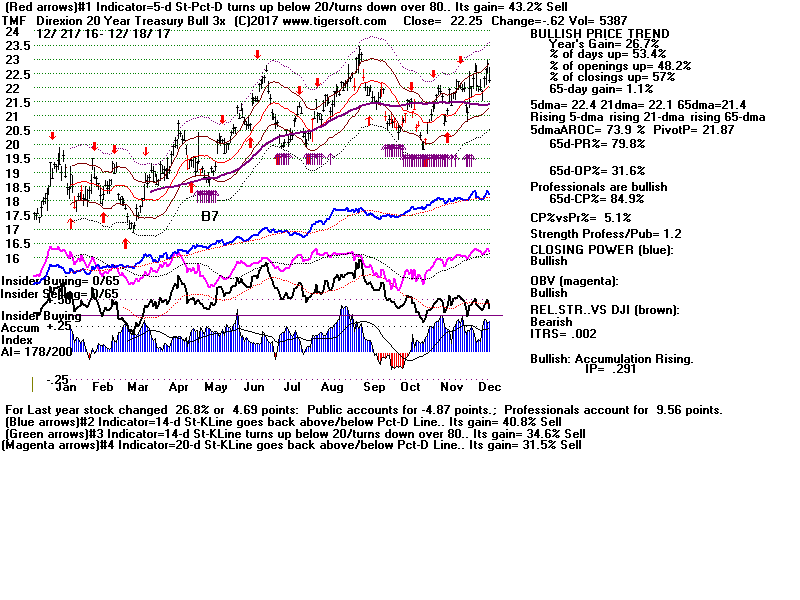
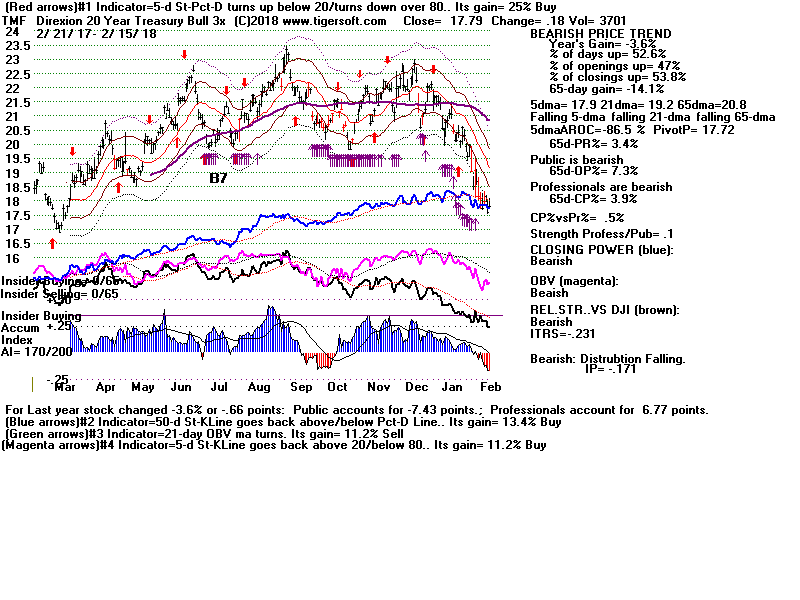
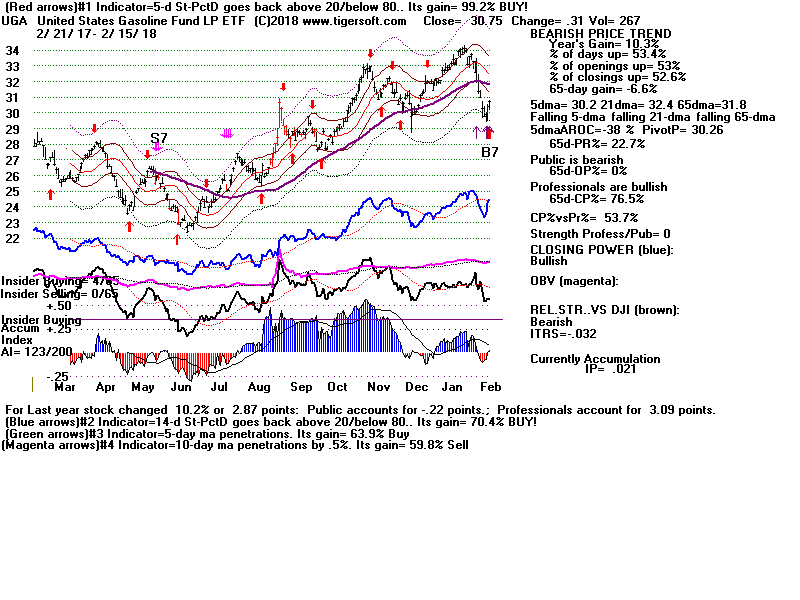
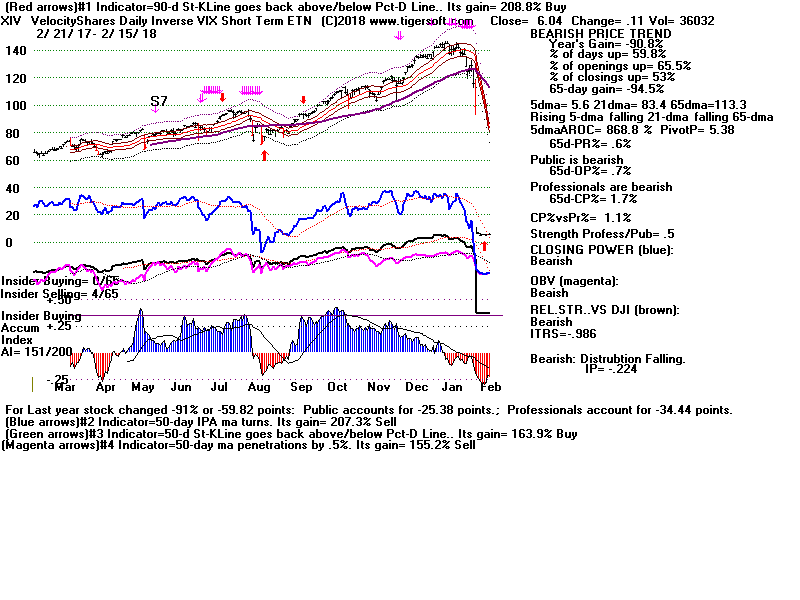
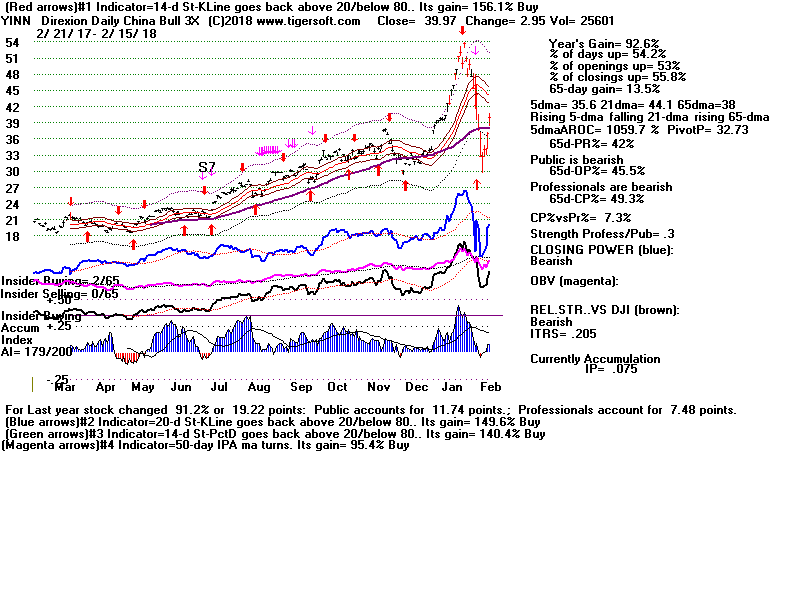
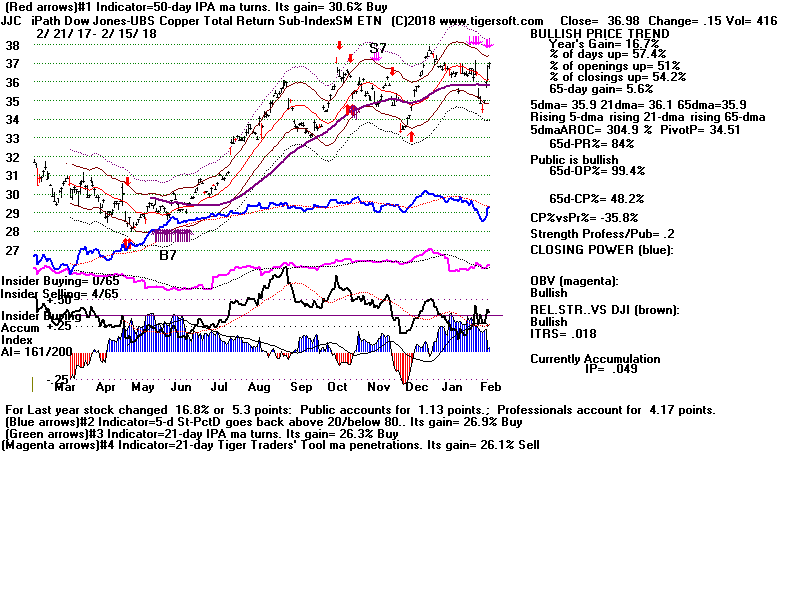
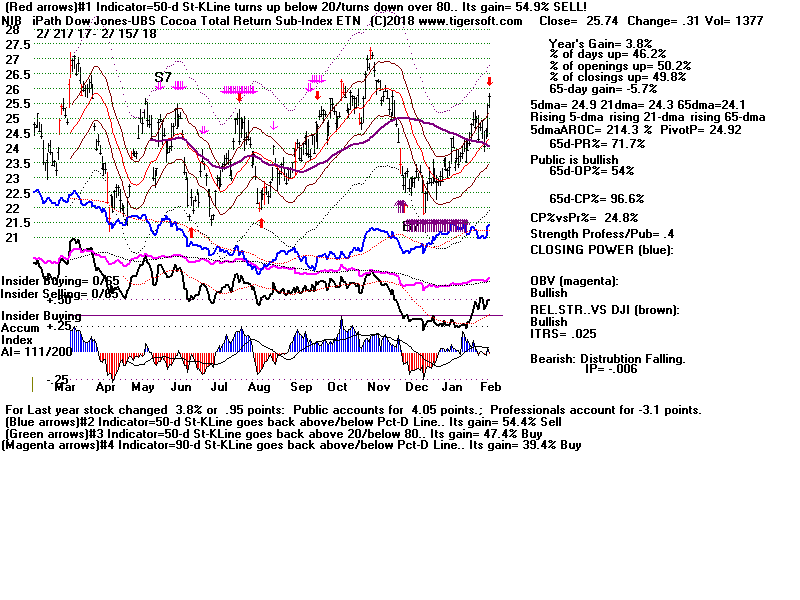
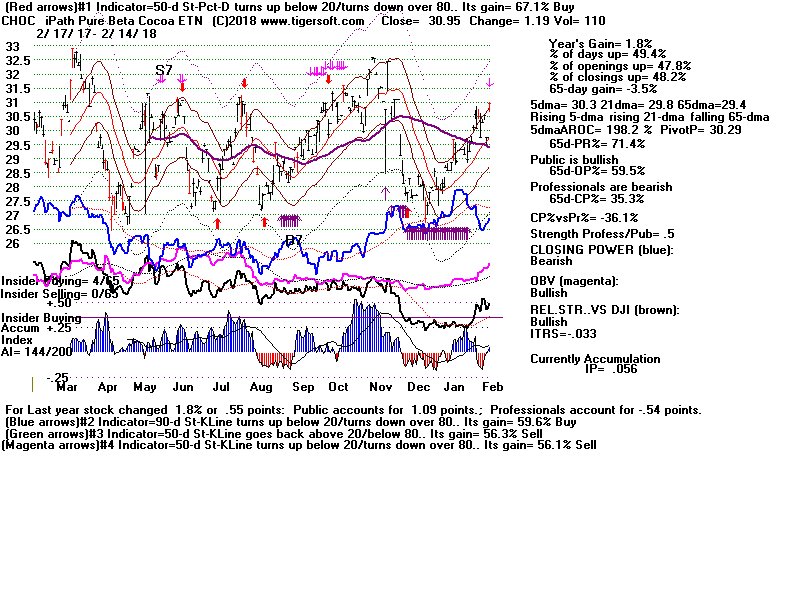
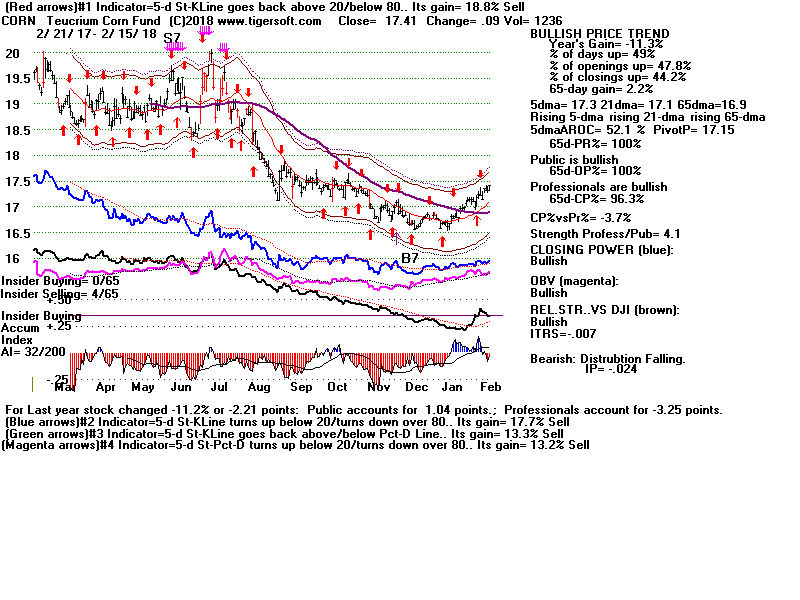
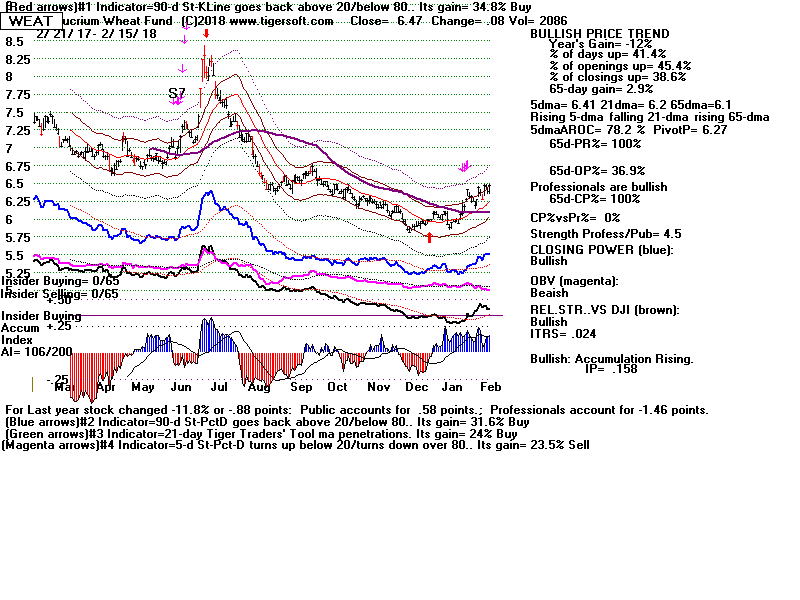
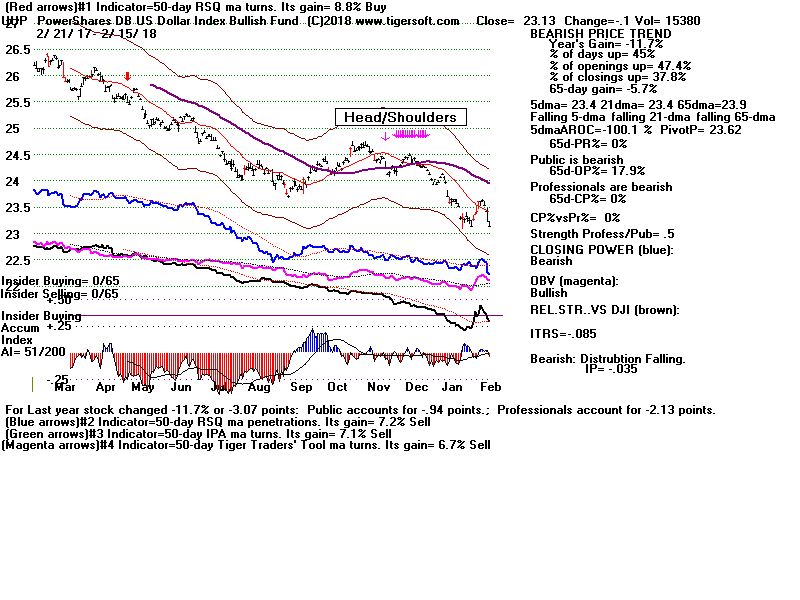
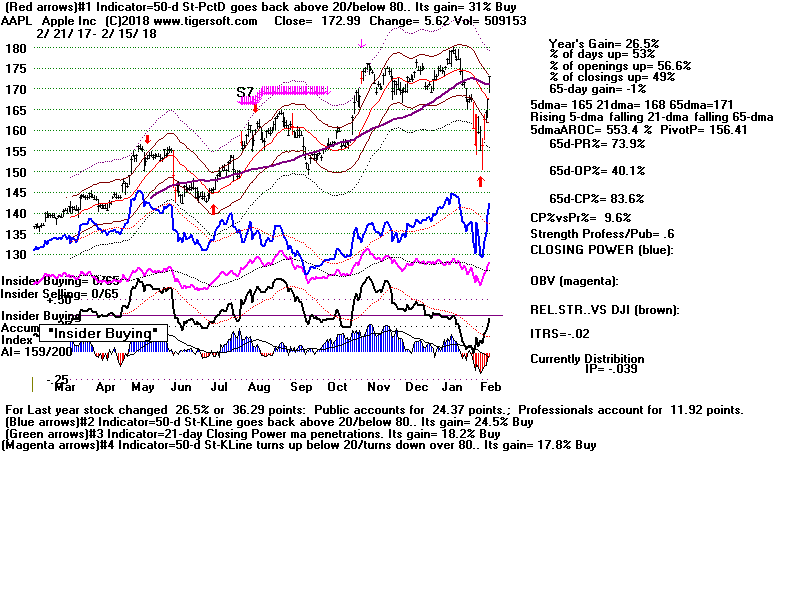
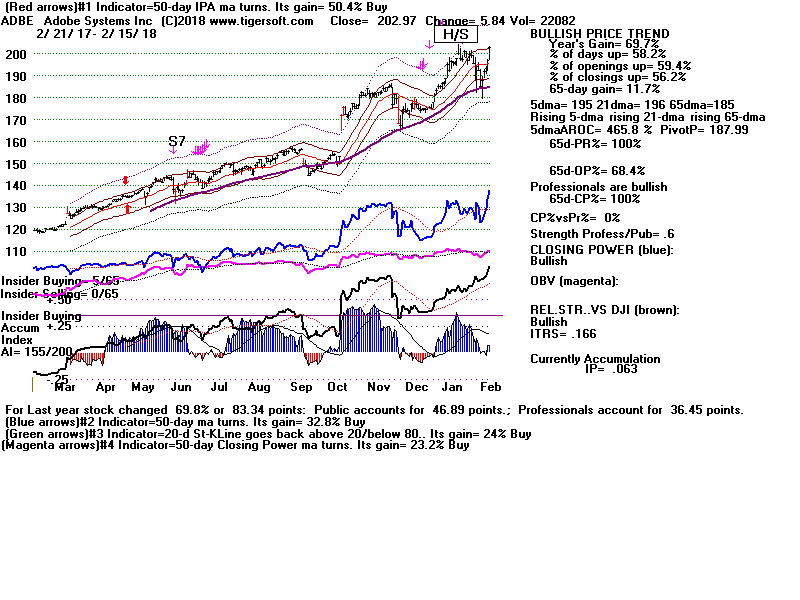
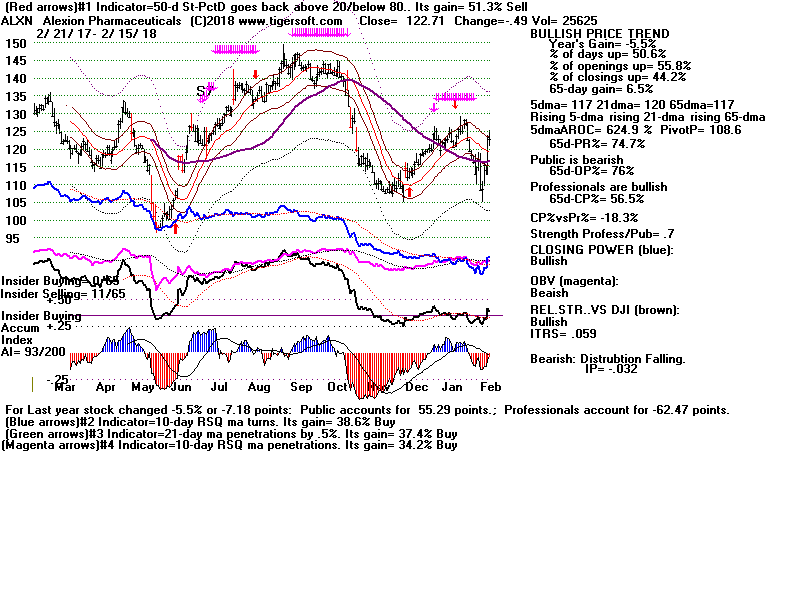
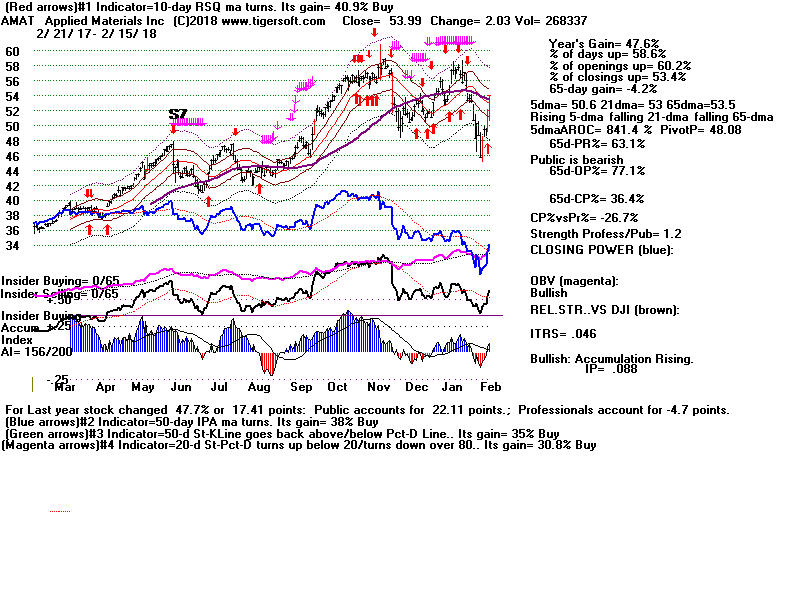
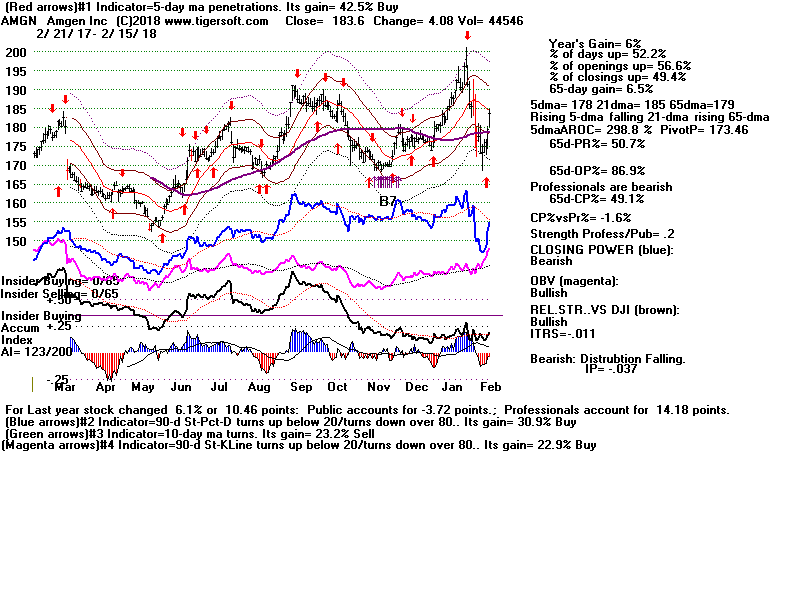
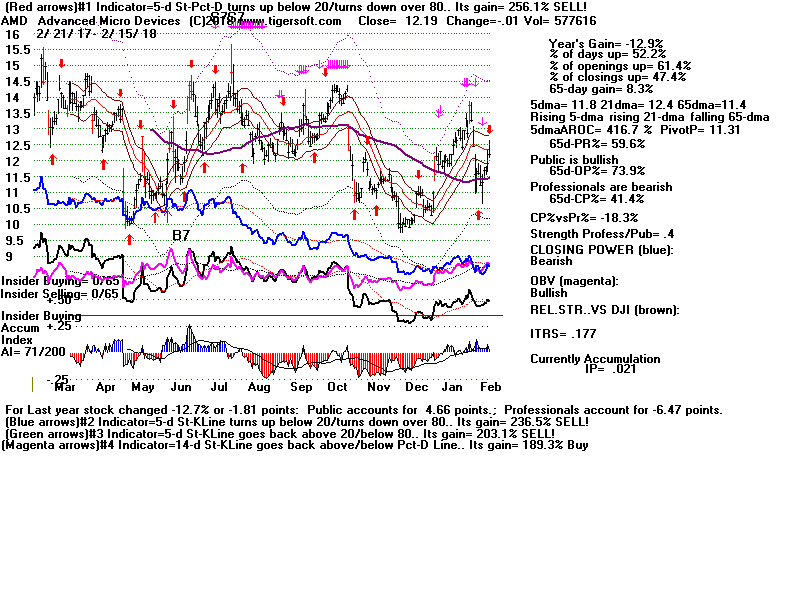
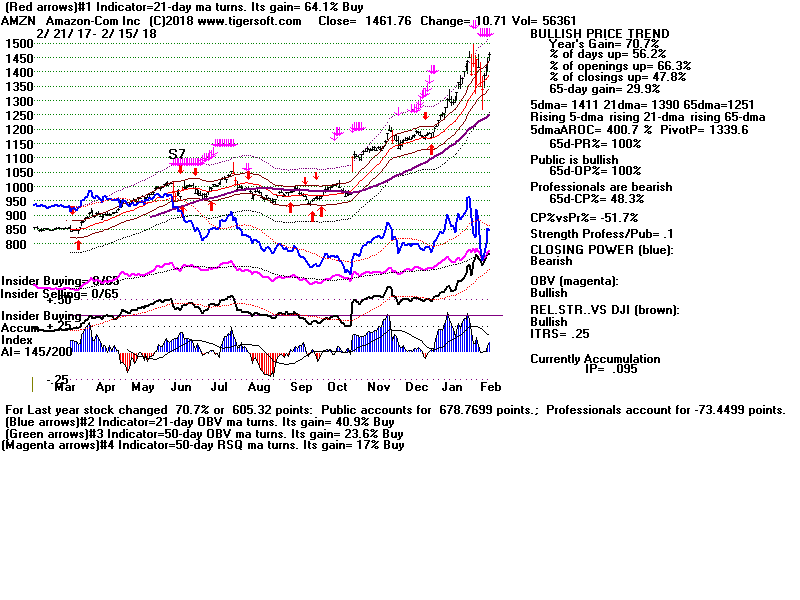
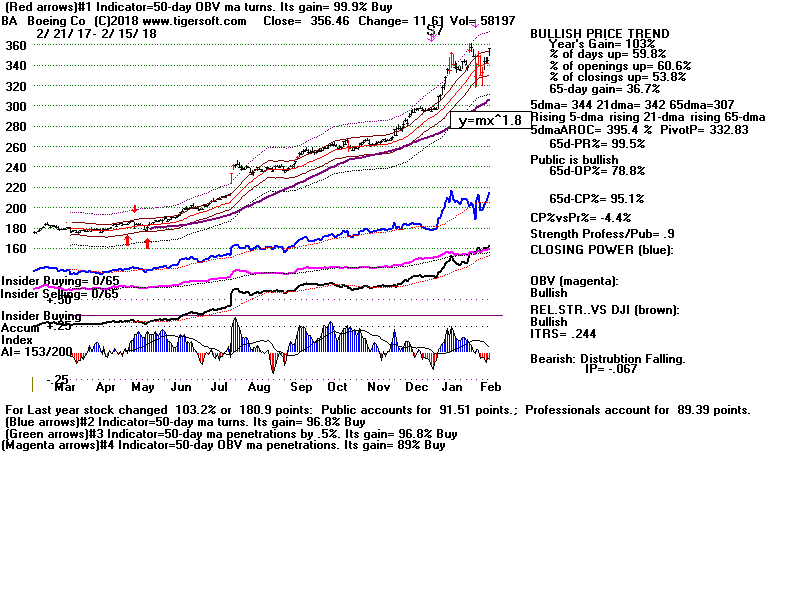
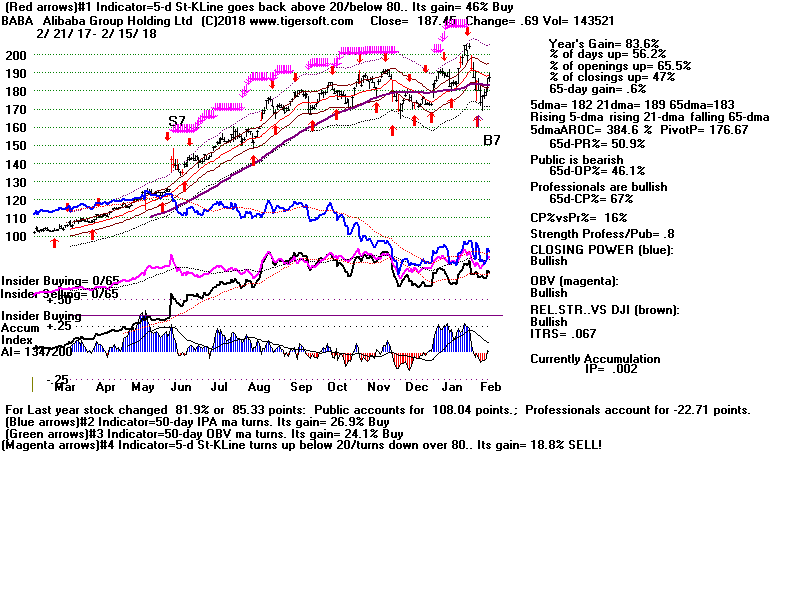
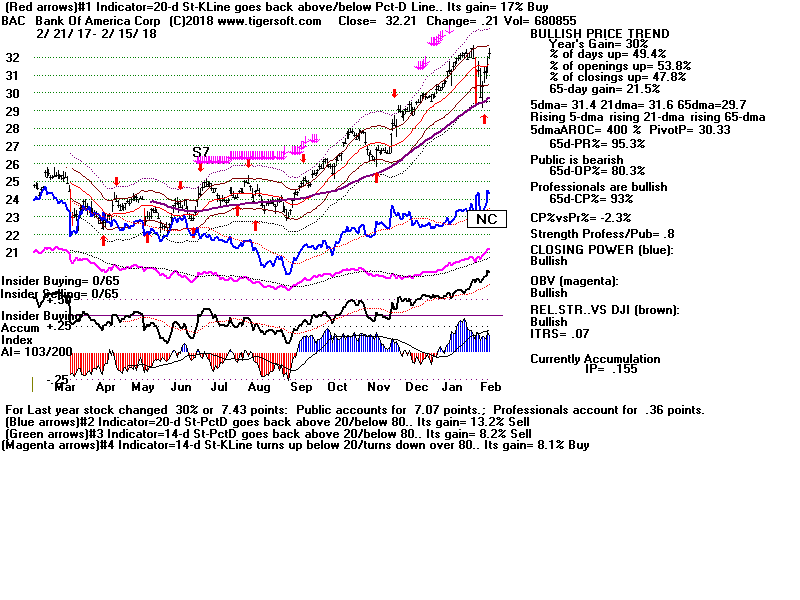
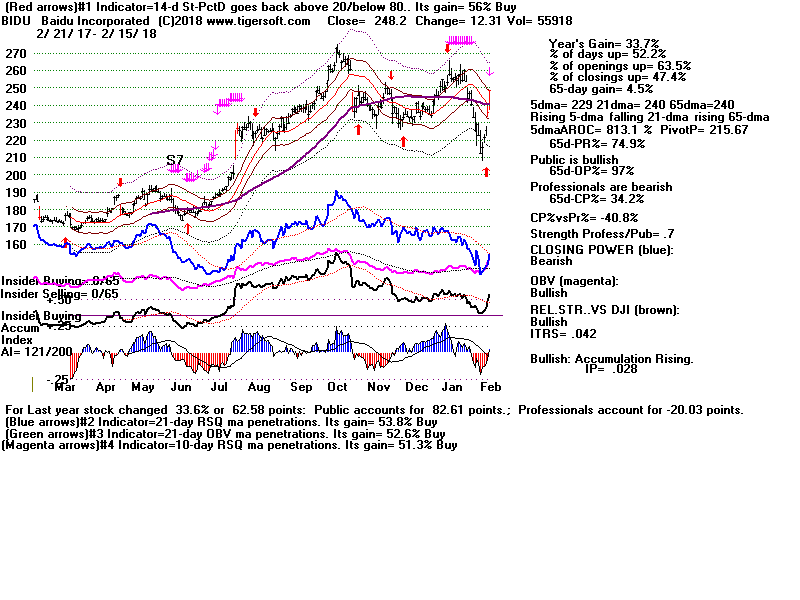
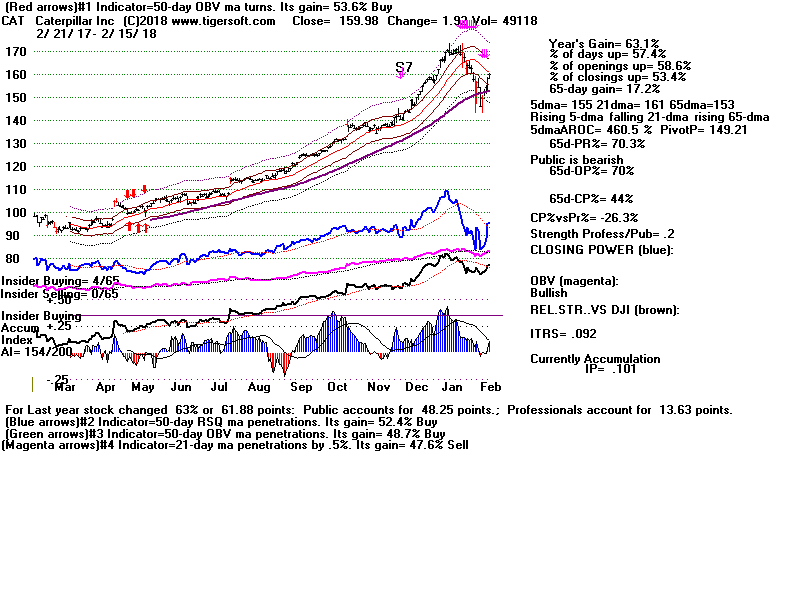
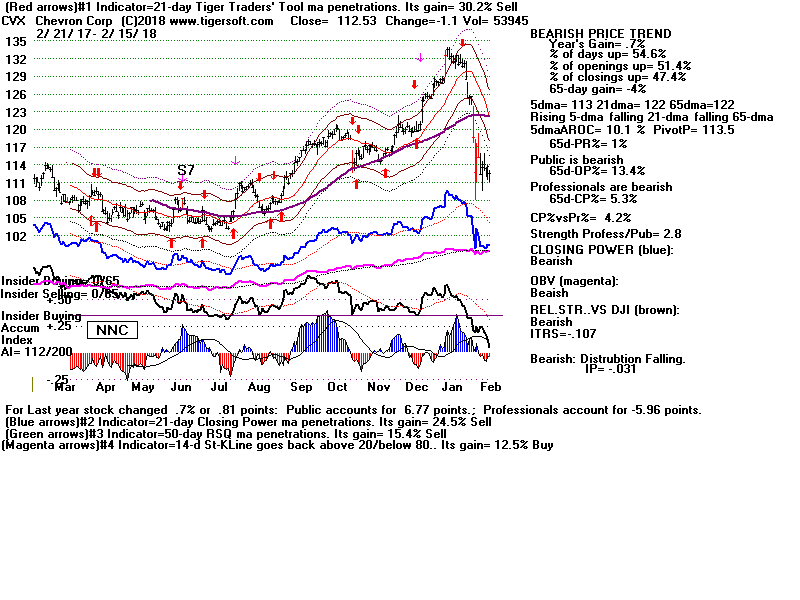
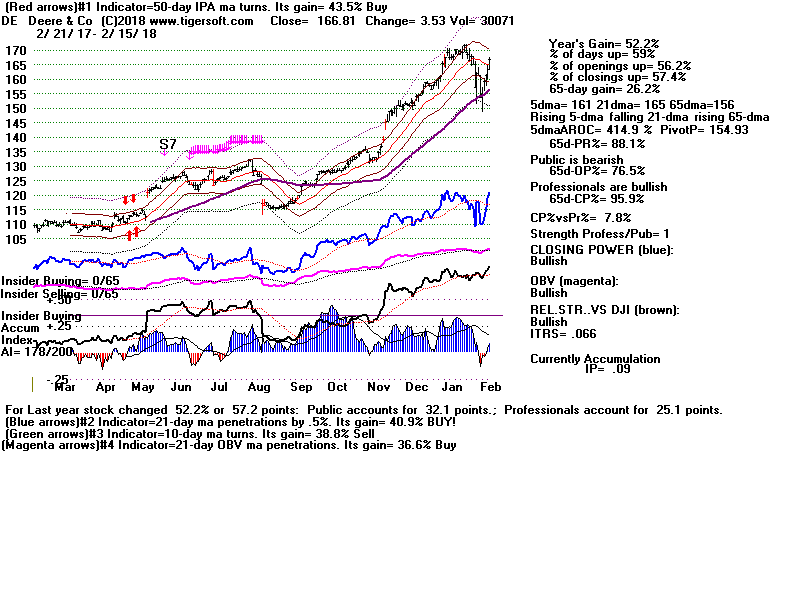
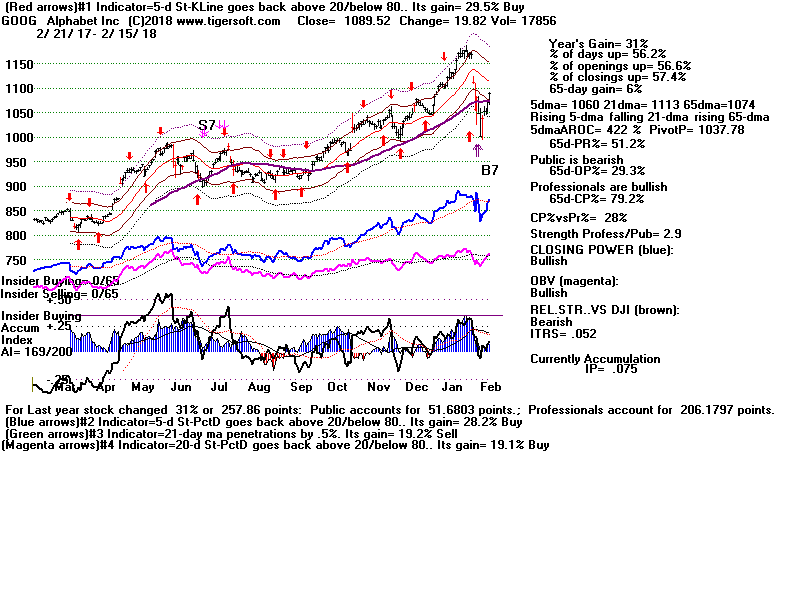
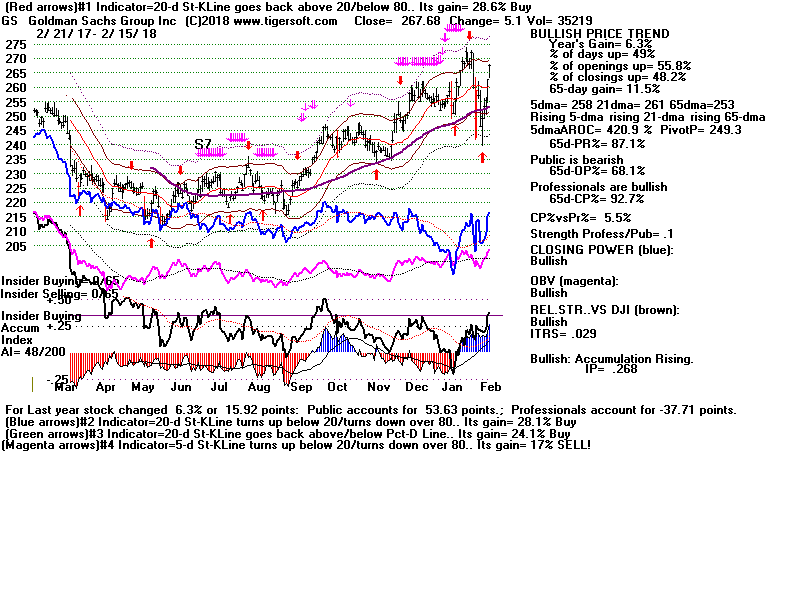
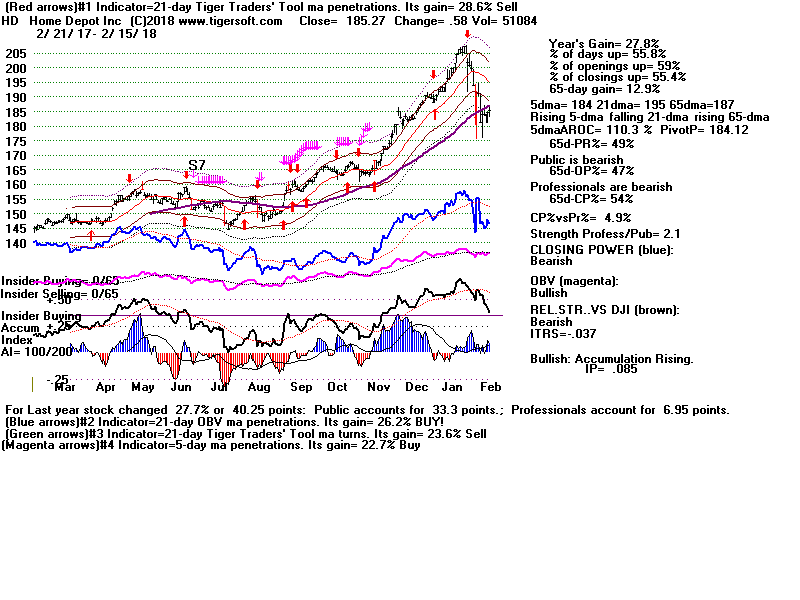
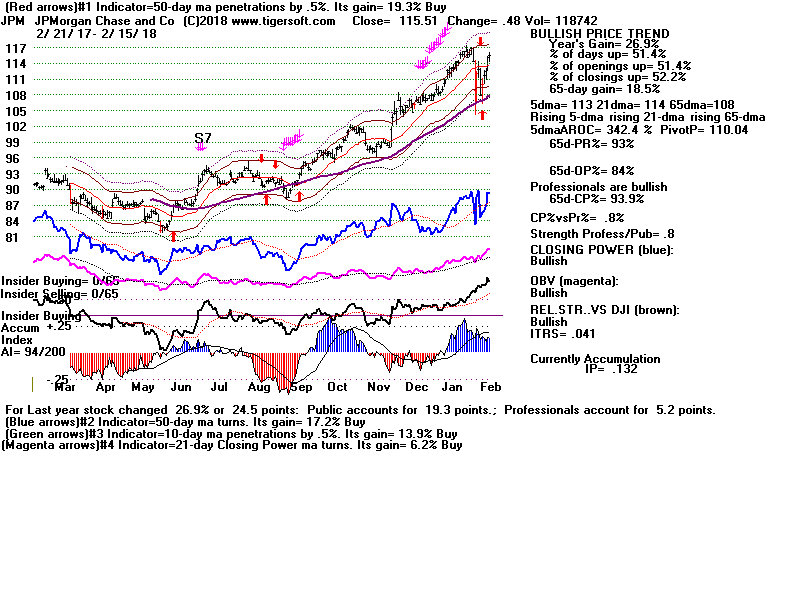
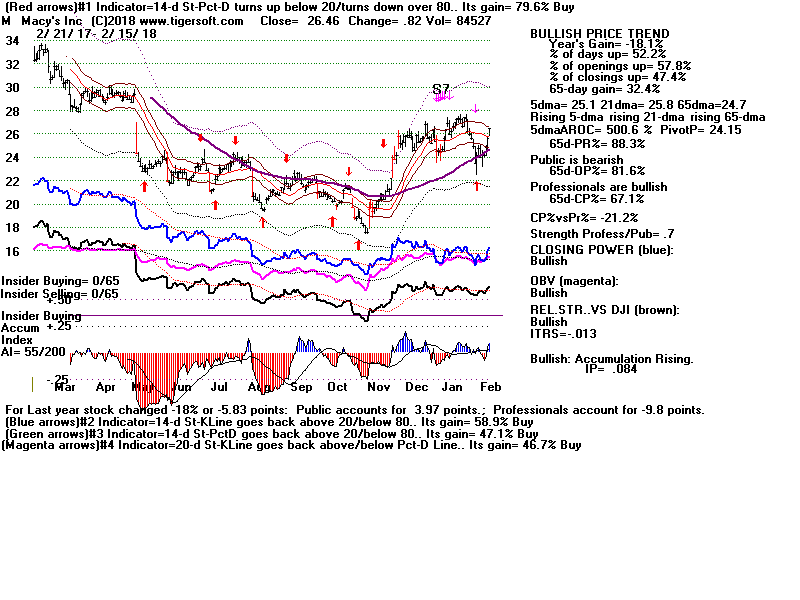
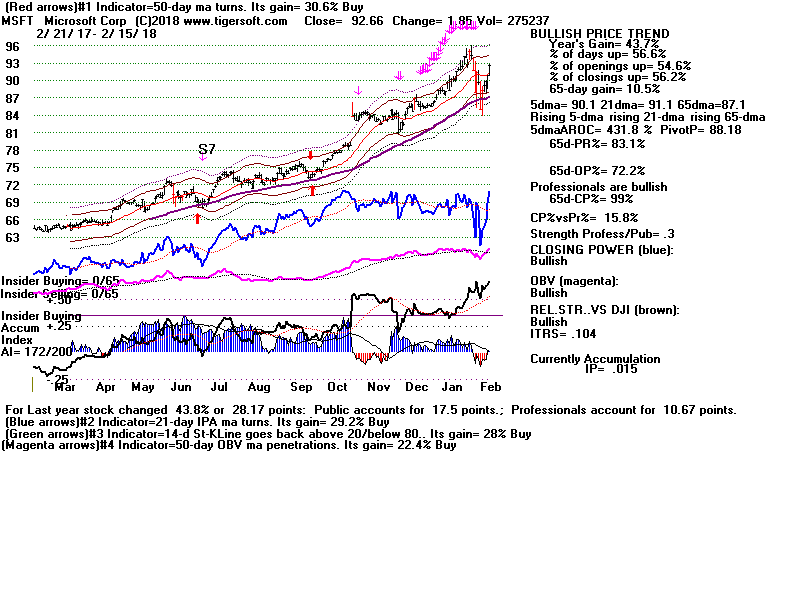
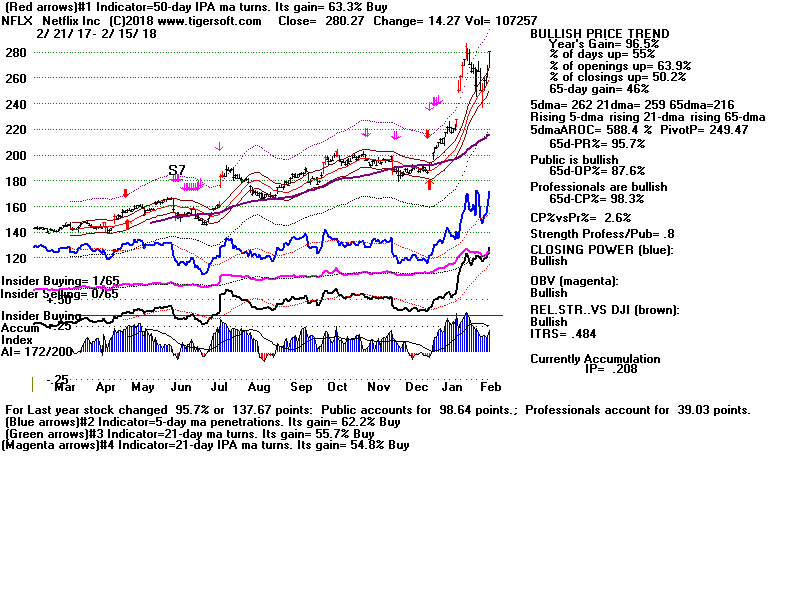
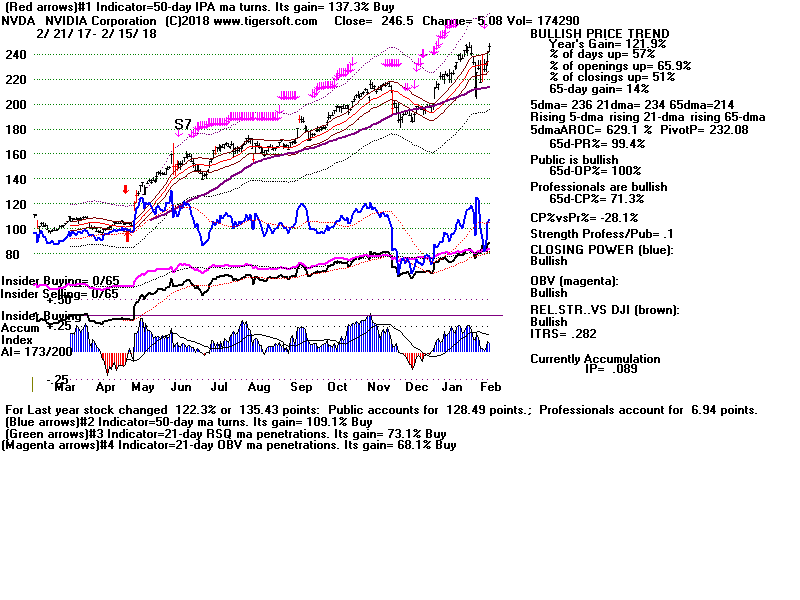
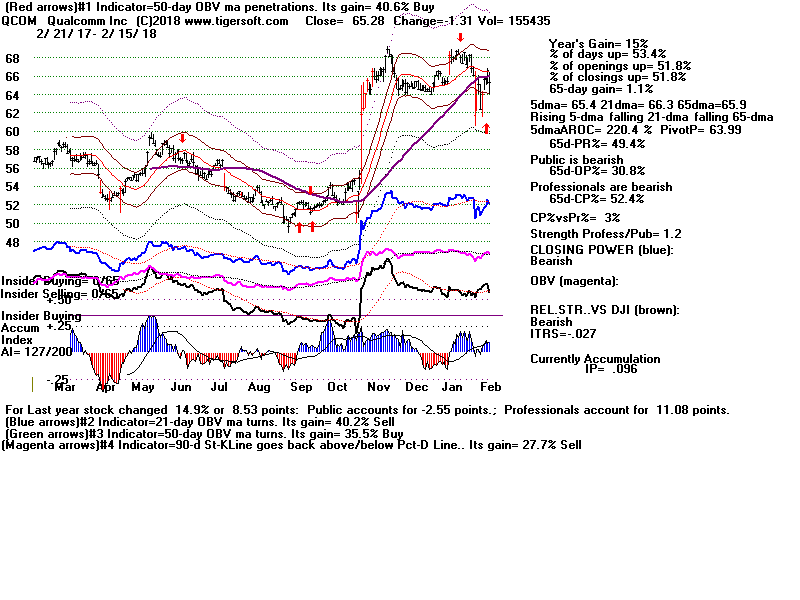
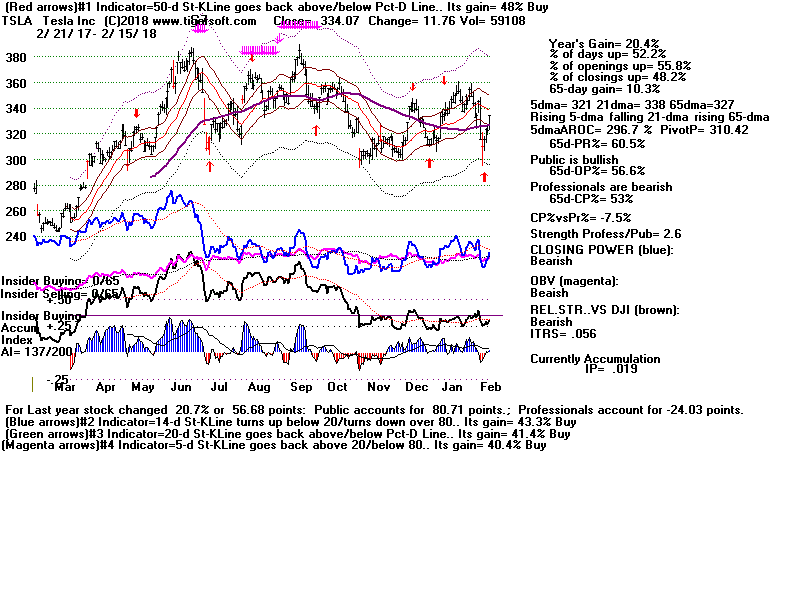
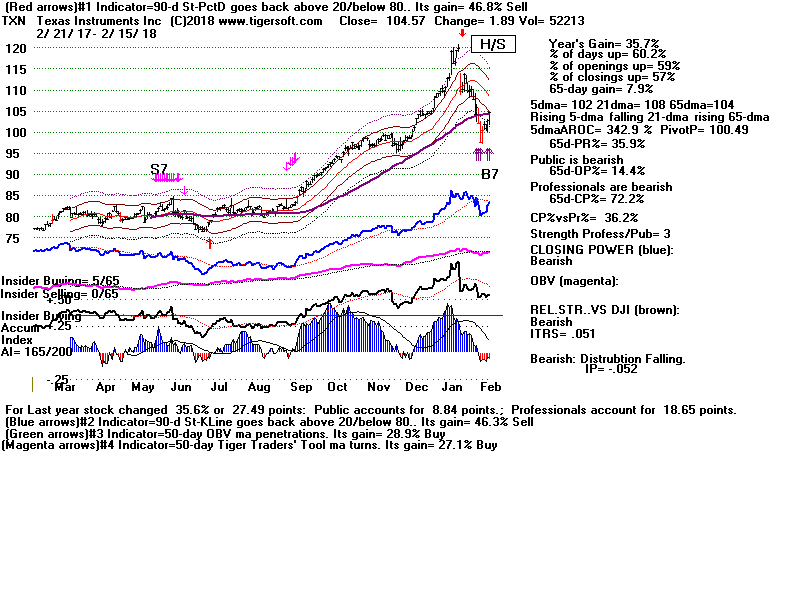
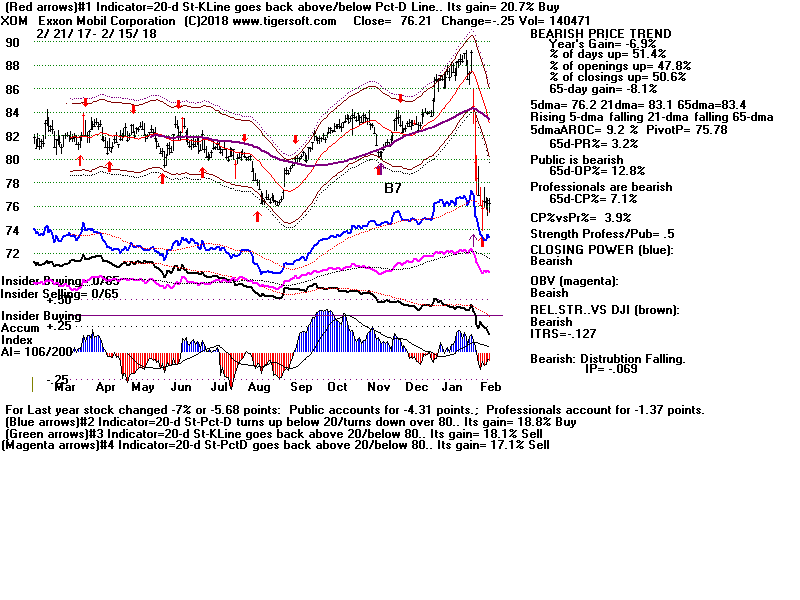
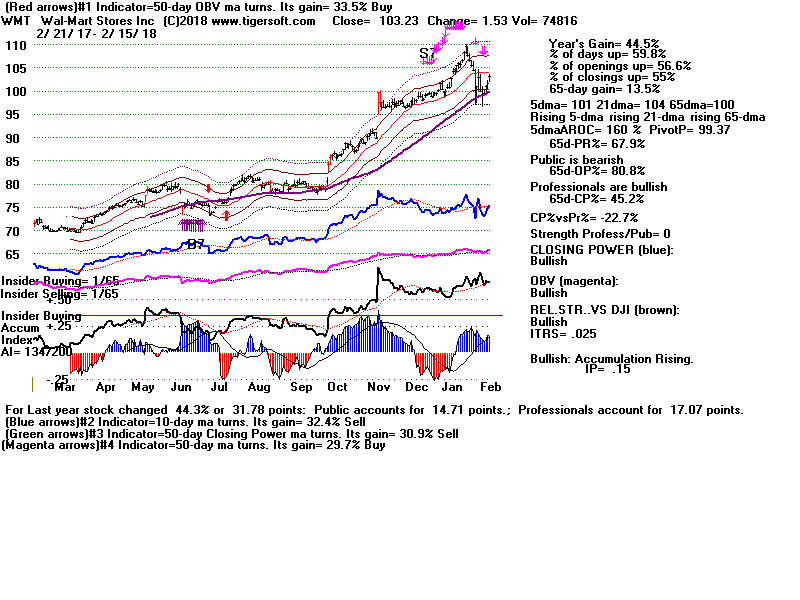
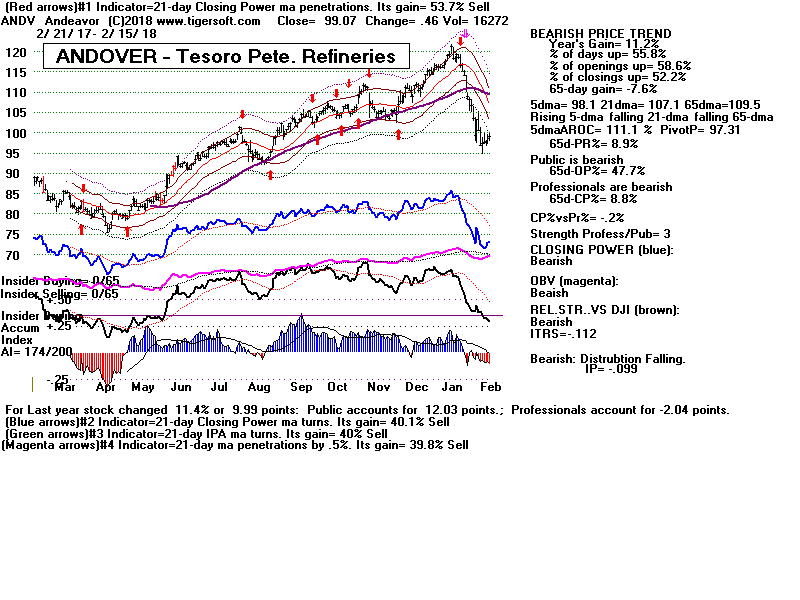
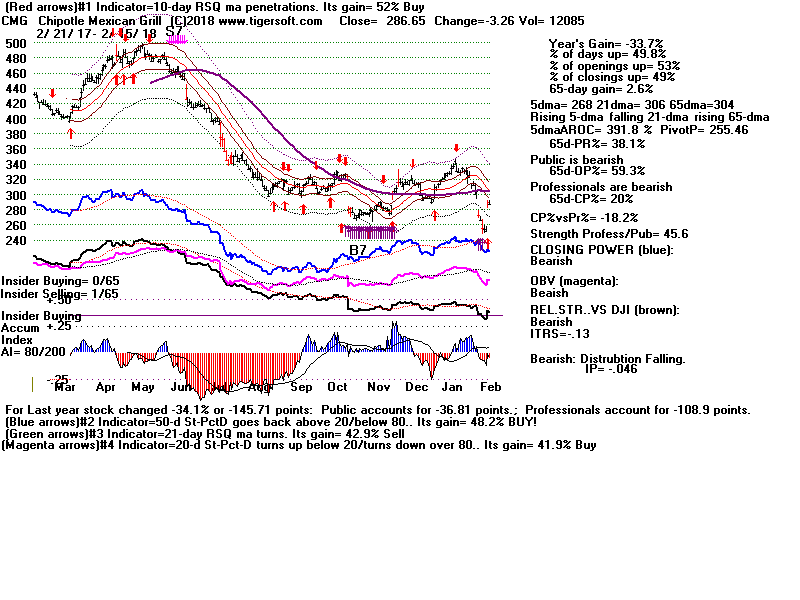
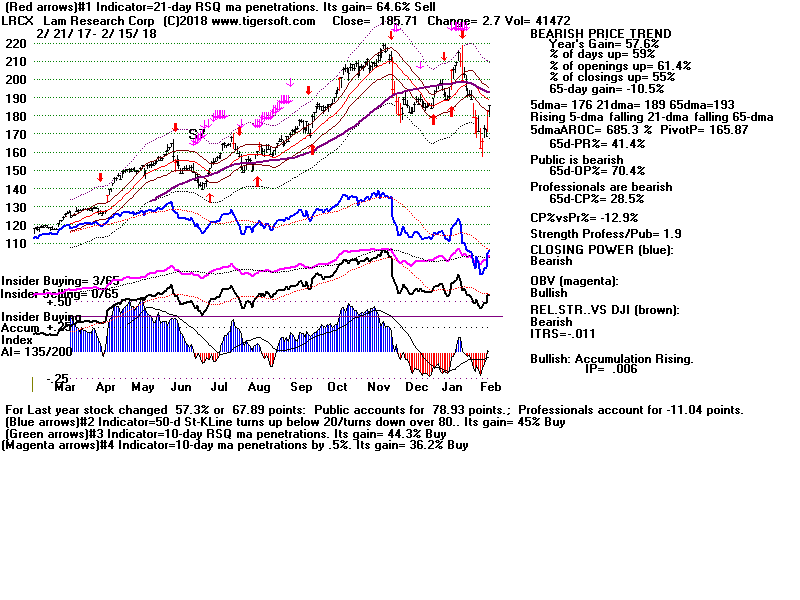
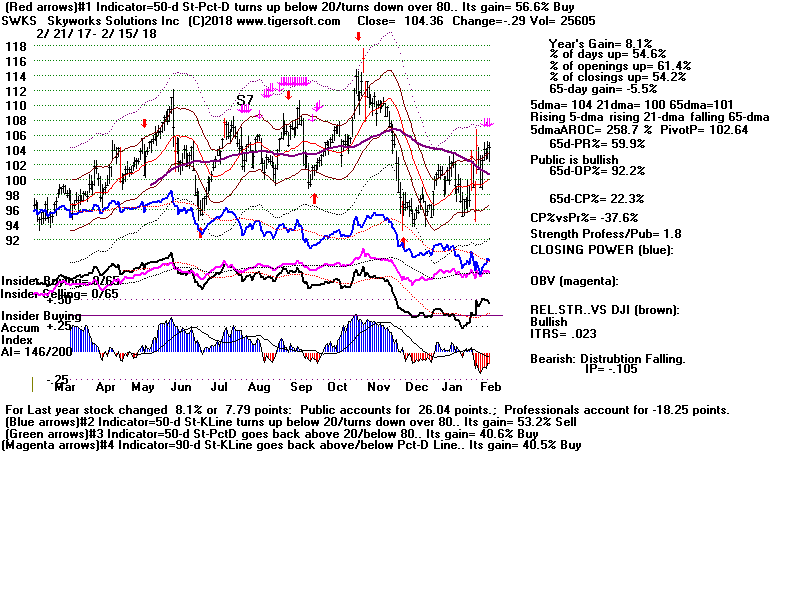
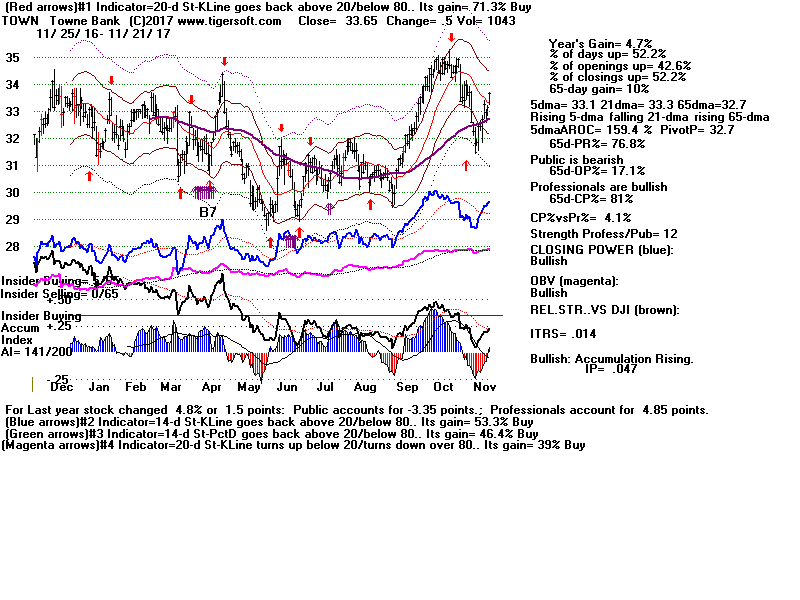
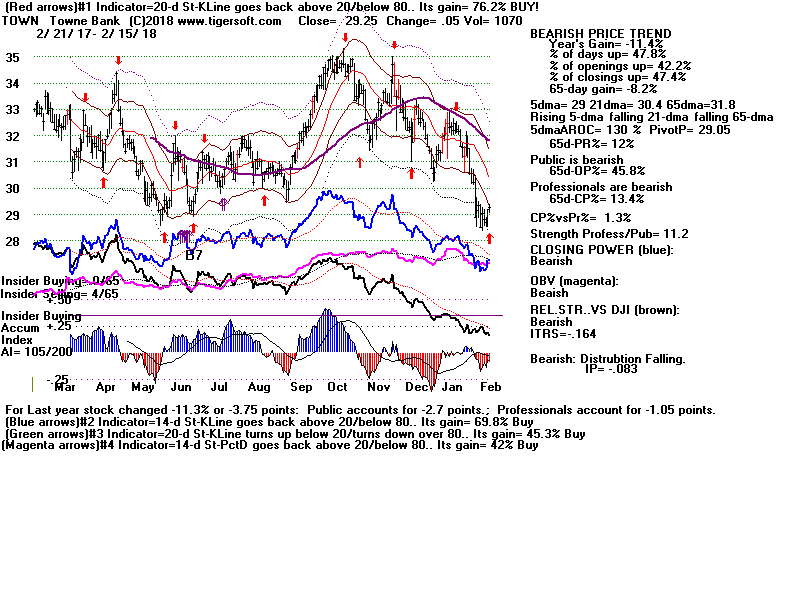
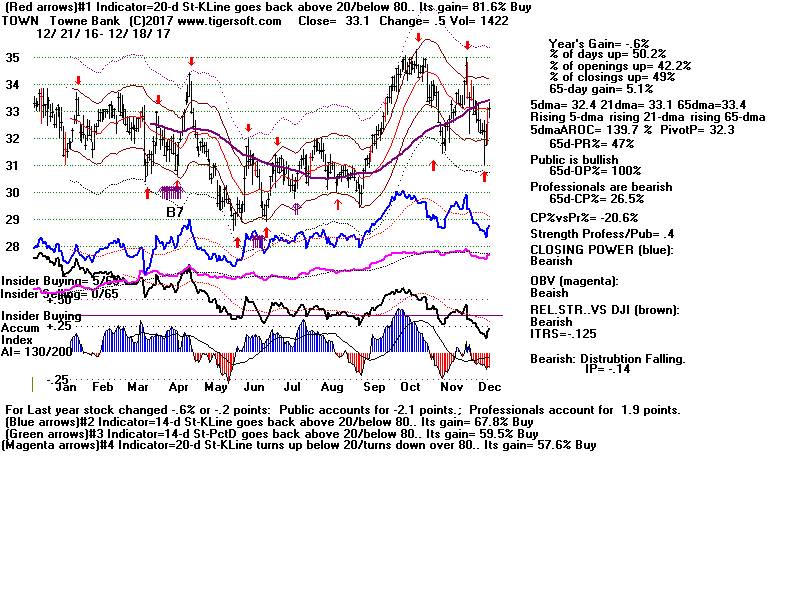
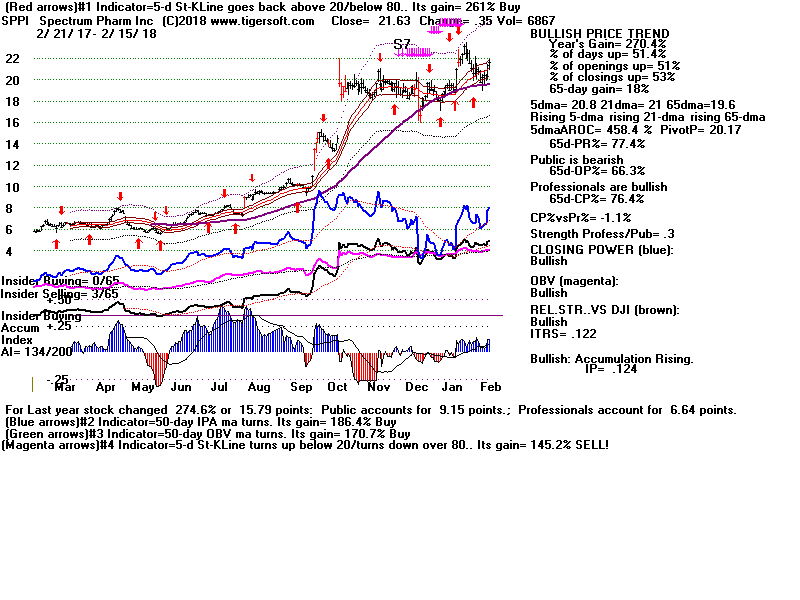
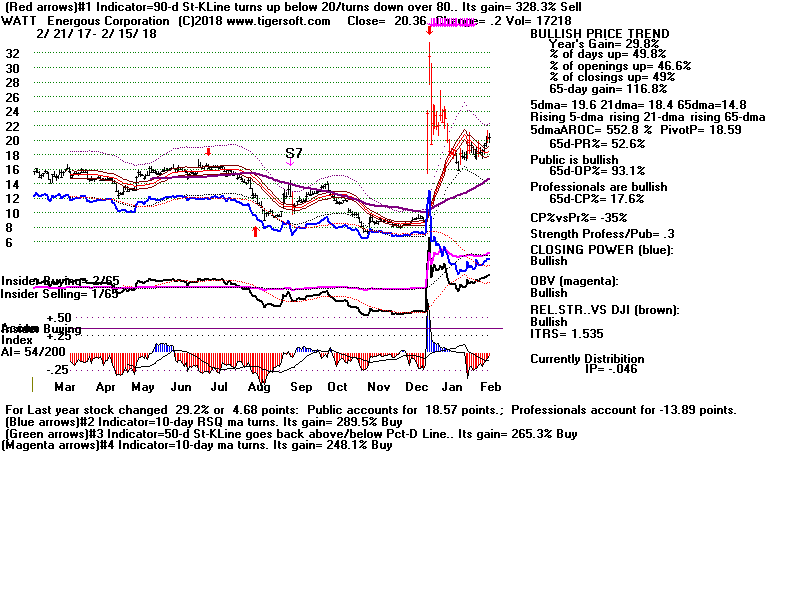
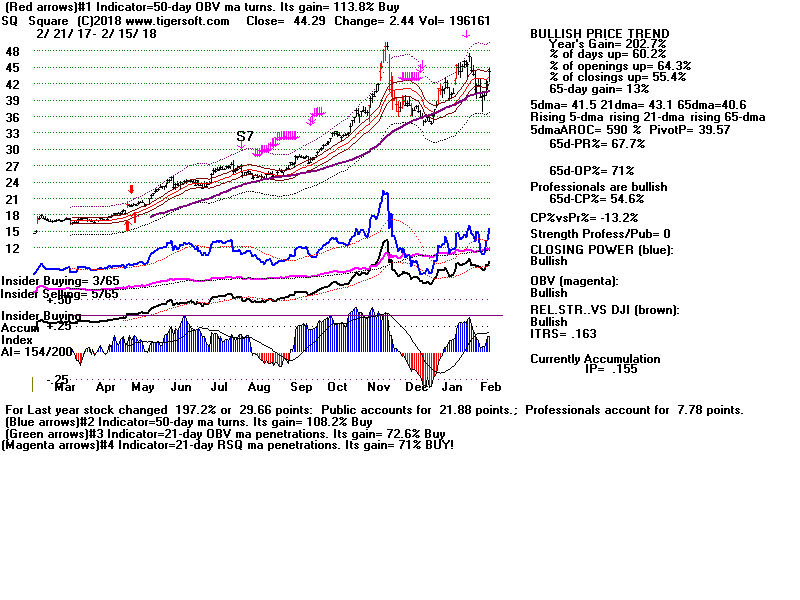
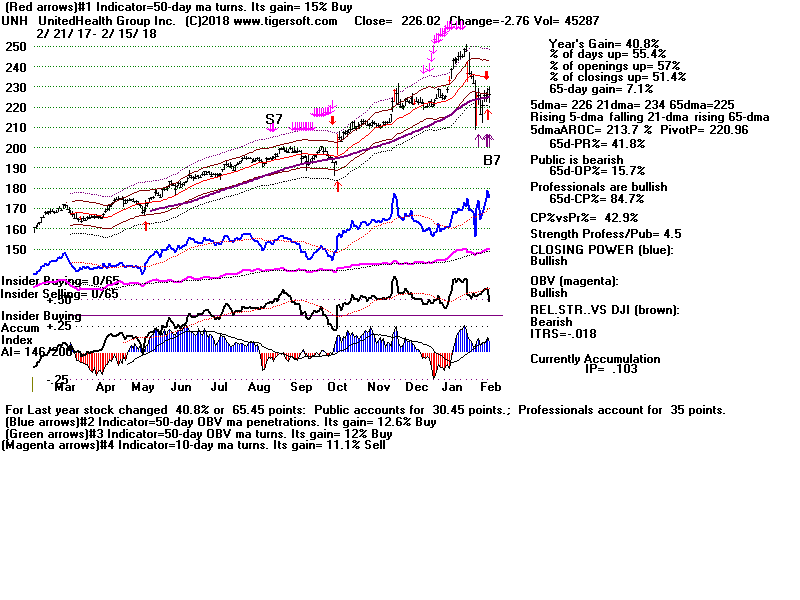
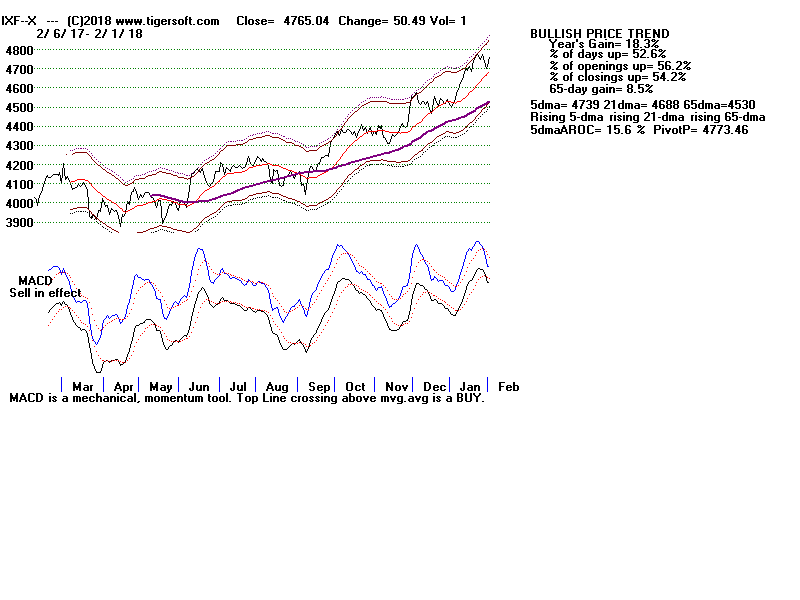
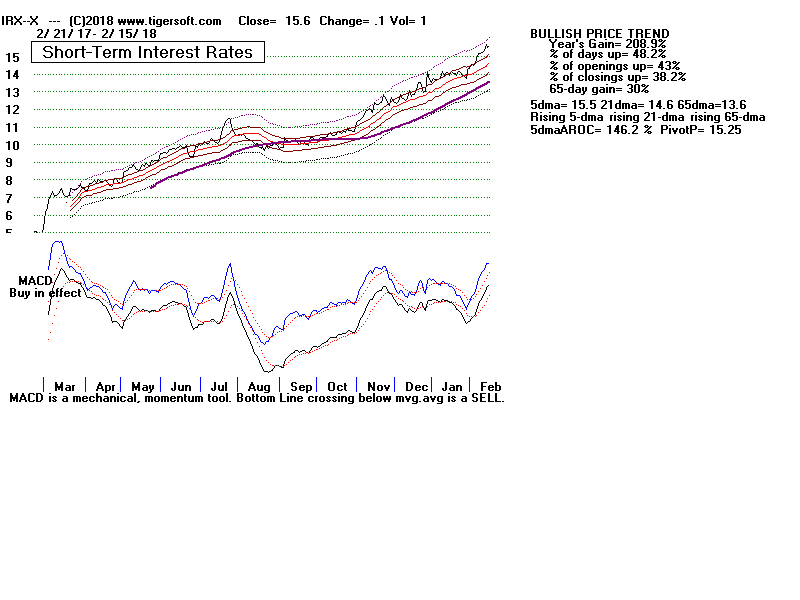