---- TIGERSOFT/PEERLESS
HOTLINE ----
(C)
1985-2020 William Schmidt, Ph.D. www.tigersoft.com
william_schmidt@hotmail.com All rights
strictly reserved
Current is May-Oct 2020 Hotlines
www.tigersoft.com/OLDINDEX.htm
Curremt Hotline ADDRESS
Go to www.tigersoft.com/1919H/INDEX.htm
and
www.tigersoft.com/191919H/INDEX.htm
************************************************
IMPORTANT
- Always CLICK REFRESH.
Server problem
here? Old images of this page may appear.
Always refresh this page and any other page that
seems incomplete or not up to date..
To refresh - Point mouse
at page and Hold down Control Key and hit F-5.
======================================================
10/12/2020
(Data used) 10/13/2020 4:50 AM. DJI futures -100.
======================================================
IMPORTANT
Earlier Hotlines:
www.tigersoft.com/777BLM/INDEX.htm
www.tigersoft.com/20HLM/INDEX.htm
www.tigersoft.com/2020NIGHT/INDEX.htm
www.tigersoft.com/4ACES1/INDEX.htm
www.tigersoft.com/48HLA/INDEX.htm
www.tigersoft.com/QUICKER/INDEX.htm
www.tigersoft.com/QUICK/INDEX.htm
www.tigersoft.com/77HLZ/INDEX.htm
www.tigersoft.com/44THL/INDEX.htm
www.tigersoft.com/21PEY3/INDEX-2.htm
www.tigersoft.com/19HLK5/INDEX.htm
www.tigersoft.com/44UHL/INDEX.htm
www.tigersoft.com/NHLP/INDEX.htm
www.tigersoft.com/7LHL/INDEX.htm
www.tigersoft.com/NHL718/INDEX.htm
www.tigersoft.com/21MAY18/INDEX.htm
www.tigersoft.com/55HEP/INDEX.htm
www.tigersoft.com/44H4L/INDEX2.htm
Earlier still: Go here...
HELP
A Guide
To Profitably Using The Tiger Nightly HOTLINE
Introduction to Tiger/Peerless Buys and
Sells.
Peerless Buy and
Sell Signals: 1928-2016
Individual Peerless signals explained:
http://tigersoftware.com/PeerlessStudies/Signals-Res/index.htm
http://www.tigersoft.com/PeerInst-2012-2013/
Explanation of each Peerless signal. http://www.tigersoft.com/PeerInst-2012-2013/
Different Types of
TigerSoft/Peerless CHARTS, Signals and Indicators
-----> More HELP LINKS
Documentation for
TigerSoft Automatic and Optimized Signals.
How reliable support is the
DJI's rising 200-day ma?
SPY Charts since
1994: Advisory Closing Power S7s, Accum. Index, 65-dma, Optimized Signals.
^^^^^^^^^^^^^^^^^^^^^^^^^^^^^^^^^^^^^^^^^^^^^^^^
1/19/2016 ---> Corrections,Deeper
Declines and Bear Markets since 1945.
1/21/2016
---> High
Velocity Declines since 1929
2/12/2016 ---> Presidential
Elections Years and Bullish IP21 Positive Non-Confirmations at Lower Band.
2/12/2016 ---> OBV NNCs on DJI's Rally to
2.7% Upper Band when DJI's 65-dma is falling.
11/6/2016 --->
Killer Short Selling
Techniques: ===> Order Here ($42.50)
It's As Easy as 1,2,3
TigerSoft "Combination" Short-Selling... Easy as 1-2-3 Short Sales
Earlier Q-Answers
QuickSilver Documentation (1/11/2016)
Our Different
Signals
Better understand the difference between
Peerless DJI-based signals,
the one-year optimized red Signals and the fixed signals based
on technical developments.
Introduction to Tiger/Peerless Buys and Sells.
Different Types of
TigerSoft/Peerless CHARTS, Signals and Indicators
New TigerPeerless Installation and
Basic Uses' Instruction
See the re-written materials on TigerSoft Buys and Sells.
Study- Trading SPY
WITHOUT Peerless - Some Guidelines.
When completed this will be a new Tiger Trading E-Book.
Study- Examples of
"Hands above the Head" top patterns.
Study- 9/3/2017 TigerSoft (not
Peerless) charts of Major Tops as they occurred.
===> Please report any broken or out-of-date links. william_schmidt@hotmail.com
====================================================================
====================================================================
10/12/2020 Take profits in TAN and
solar energy stocks. Note the red candle-sticks.

Red CandleStick days are probably our best warning of a short-term decline now
With the DJI near 29000, traders should probably expect a 5% decline in
the DJI if it closes 1% or more below its opening tomorrow. This would produce
a bearish red candle-stick. That is what started the last 8% decline. More
than
a 5% decline now seems unlikely because of QE-Infinity and because Octobers
seldom bring serious declines in a Presidential Election year.

.
The year 2020 has taught us to set aside Peerless S12s and
S9-Vs when the
FED goes all-in with what amounts to a three-year Quantitative Easing - Infinity
program. That is what the FED wants us to do. And who are we to argue.the
Fed-almighty. So, intermediate-term traders should probably abide by the
upward trend of the NYSE A/D Line. But we should understand that the upper
3.8% band brought a 7%-8% decline the last time it was reached. So, we should
be on guard. See the DJIA chart below.

At some point, the A/D Line uptrend will be broken.
Most likely Professionals
will see this coming. So, we have to watch for Closing Power trend-breaks
followed by very weak breadth numbers. Closing Power up-trends-breaks are
more dangerous near old price highs and when the Closing Power Line is below
its level on a comparable previous high. By this I am suggesting that there will
be more risk once SPY and QQQ reach the resistance of their old highs.
If the market turns down here, it will be because the Republicans
may lose control of the Senate. This seems unlikely. Democrats would have
to win Senate races in Colorado, Maine, Arizona and Iowa. Otherwise,
the partisan - Fed sponsored rally should zig-zag until the DJI closes
above 29000 and possibly until November.
SPY Candlestick chart - 355 seems to be a good target here. |
QQQ Candlestick chart |
Chinese Stocks May Avoid American Election Volatility
On a 5% DJI decline, we will probably be buying the leading Power-Ranked
Chinese stocks and ETFs. Some are shown below.


|
Charts 10/12/2020 (Click on Underlined link.) 2020 PEERLESS DJI, Signals, Indicators Daily DJI Volume 10-DayUp/Down Vol Stoch-20 Inverted Traders Index Graph of Pct of All Stocks above 65-dma Cum. Inverted Traders Index NASDAQ S&P OEX NYSE COMPQX DJI-15 DJI-20 DJI-30 DIA QQQ MDY IWM TNA Short-Term Rates DOLLAR-UUP SPY http://tigersoft.com/2121CST/SPY.GIF recent 2006 vers-Peerless signals -- http://tigersoft.com/NEWPEER/UPD6112.BMP USO-CrudeOil DBO FAS GLD BBH IBB JETS JNUG KOL NUGT OIH PALL RSX RETL SDS AGQ SLV SOXL TECL TLT TMF TNA UGA (gasoline) USO (oil) and China: YINN CHAU Commodities: CANE CORN DBC JJC, NIB, CHOC CORN, CUT (paper) MOO, SOYB WEAT UUP (Dollar) LIT (Lithium) Stocks AAPL ADBE ALXN AMAT AMGN AMD AMZN AXP BA BABA BAC BIDU BLDP CAT CRM CVX CMG DE ENPH FB GILD GOOG GS HD IBM INTU JPM LRCX M (Macy's) MSFT NEM NFLX NKE NVDA PG REGN REV SO SQ QCOM QDEL TSLA TXN XOM V VRTX WFC WMT TOWN ZM New highs and Bullish MAXCPs http://tigersoft.com/MAXCP/10-12/BULLISH.htm Bearish MAXCPs - http://tigersoft.com/MINCP/10-12/BEARISH.htm |
 Table 1
             10/12/2018   QUICKSILVER on DJI-30 STOCKS.
P21 + ITRS score >+.25 is bullish 1 Bullish (CRM)
2 Bearish (CSCO, IBM)
HIGHEST AI/200 = CRM Second Highest Tied = AAPL and MSFT STOCKS CLOSECHANGE PIVOT-PT 5-dma AROC CL-PWR CANDLE AI/200 IP21 ITRS ------------------------------------------------------------------------------------------------------- ------------------------------------------------------------------------------------------------------- AAPL 124.4 7.43 116.5 342.5% Bullish BLUE 156 .087 .08 ---------------------------------------------------------------------------------------------------------- AMGN 239.51 2.81 256.01 -331.8% Bearish BLUE 134 .037 -.112 ---------------------------------------------------------------------------------------------------------- AXP 106.61 .27 103.89 130.4% ------- RED 97 -.024 .051 ---------------------------------------------------------------------------------------------------------- BA 167.35 .02 171.2 -115.9% Bearish RED 33 -.064 -.032 ---------------------------------------------------------------------------------------------------------- CAT 162.61 3.67 153.49 294% Bullish BLUE 117 -.024 .133 ---------------------------------------------------------------------------------------------------------- CRM 267.07 1.09 251.53 301.7% Bullish RED 192 .102 .279 Bullish ---------------------------------------------------------------------------------------------------------- CSCO 40.36 .51 38.57 228.1% ------- BLUE 119 -.048 -.234 Bearish ---------------------------------------------------------------------------------------------------------- CVX 74.51 .51 72.7 123% Bearish BLUE 77 -.034 -.204 ---------------------------------------------------------------------------------------------------------- DIS 124.97 -.01 123.37 65% Bearish BLUE 100 -.052 -.023 ---------------------------------------------------------------------------------------------------------- DOW 48.58 -.78 48.58 0% Bearish RED 60 -.128 .092 ---------------------------------------------------------------------------------------------------------- GS 214.12 6.58 201.8 301.4% ------- BLUE 60 .036 -.01 ---------------------------------------------------------------------------------------------------------- HD 286.91 .99 282.1 85.2% ------- RED 154 .109 -.011 ---------------------------------------------------------------------------------------------------------- HON 175.36 .98 168.72 194.1% ------- BLUE 109 -.004 .083 ---------------------------------------------------------------------------------------------------------- IBM 127.21 -.58 122.01 207.2% Bearish RED 111 -.244 -.056 Bearish ---------------------------------------------------------------------------------------------------------- INTC 53.88 1.06 51.69 209% Bullish BLUE 91 .064 .038 ---------------------------------------------------------------------------------------------------------- JNJ 151.84 .87 148.23 121.6% ------- BLUE 114 -.054 -.049 ---------------------------------------------------------------------------------------------------------- JPM 102.44 1.24 99.04 170.1% ------- BLUE 25 .032 -.031 ---------------------------------------------------------------------------------------------------------- KO 51.09 .28 49.38 171.6% Bearish BLUE 86 -.078 -.01 ---------------------------------------------------------------------------------------------------------- MCD 226.11 1.28 226.07 .9% Bullish BLUE 136 -.014 .073 ---------------------------------------------------------------------------------------------------------- MMM 168.65 -.65 162.75 178% Bearish RED 99 -.183 .03 ---------------------------------------------------------------------------------------------------------- MRK 80.36 0 81.24 -54.8% Bearish RED 93 -.083 -.09 ---------------------------------------------------------------------------------------------------------- MSFT 221.4 5.59 210.38 261.8% Bullish BLUE 156 .121 -.011 ---------------------------------------------------------------------------------------------------------- NKE 129.46 -1.52 127.91 60% ------- RED 133 -.116 .235 ---------------------------------------------------------------------------------------------------------- PG 144.49 1.57 139.39 181% Bullish BLUE 97 .063 .011 ---------------------------------------------------------------------------------------------------------- TRV 116.54 .71 111.91 203.5% Bullish BLUE 85 -.062 -.073 ---------------------------------------------------------------------------------------------------------- UNH 329.97 2.13 318.15 184% Bullish BLUE 112 -.008 -.001 ---------------------------------------------------------------------------------------------------------- V 206.4 -.24 203.54 70.4% Bearish RED 102 -.039 -.007 ---------------------------------------------------------------------------------------------------------- VZ 59.55 .22 59.66 -9.3% ------- BLUE 118 -.065 -.055 ---------------------------------------------------------------------------------------------------------- WBA 36.93 .59 36.62 42.5% ------- BLUE 82 .022 -.184 ---------------------------------------------------------------------------------------------------------- WMT 144.25 1.47 141.8 86.6% Bullish BLUE 126 -.07 .024 |
Table 2 QUICKSILVER on ETFS - 10/12/20 Bullish = 1 SOXL TECL
Bearish = 1 OIH
ITRS + IP21>.25 is considered "Bullish"
ETF CLOSE CHANGE PIVOT-PT 5-dma AROC CL-PWR CANDLE IP21 ITRS --------------------------------------------------------------------------------------------- --------------------------------------------------------------------------------------------- DIA 288.46 2.53 277.72 123% ------- BLUE .093 ---- --------------------------------------------------------------------------------------------- SPY 352.43 5.58 334.93 185.7% Bullish BLUE .082 -.012 --------------------------------------------------------------------------------------------- QQQ 294.53 8.82 275.16 256.2% Bullish BLUE .114 .017 --------------------------------------------------------------------------------------------- MDY 366.13 2.3 352.93 159.6% Bullish BLUE .205 -.013 --------------------------------------------------------------------------------------------- IWM 163.79 1.09 156.62 210.4% ------- BLUE .143 .02 --------------------------------------------------------------------------------------------- FAS 40.55 1.34 35.8 489.3% ------- BLUE .006 .068 --------------------------------------------------------------------------------------------- RETL 276.51 1.15 243.83 342.8% Bullish RED .058 .354 --------------------------------------------------------------------------------------------- SOXL 318.39 13.25 264.26 879.4% Bullish BLUE .171 .314 Bullish --------------------------------------------------------------------------------------------- TECL 358.71 26.76 296.25 761.8% Bullish BLUE .115 .233 Bullish --------------------------------------------------------------------------------------------- IBB 143.65 1.12 137.88 145.2% ------- ---- .255 -.022 --------------------------------------------------------------------------------------------- GLD 180.56 -.52 177.3 32.2% ------- ---- .093 -.117 --------------------------------------------------------------------------------------------- OIH 102.4 -.41 98.64 112.2% Bearish BLUE-.037 -.272 Bearish --------------------------------------------------------------------------------------------- GASL 3440 285 3685 -325.1% ------- RED -.021 .022 --------------------------------------------------------------------------------------------- |
    Count of Stocks in Key Directories
          20201012
-------------------------------
NEWHIGHS       285
NEWLOWS        13
MAXCP          39
MINCP          31
TTTNH          24
TTTNL          20
FASTUP         127
FASTDOWN       21
CPCROSSA       63
CPCROSSD       62
BIGVOLUP       4
BIGVODN        6
ACCUMVER       135
HIGHIP21       17
HIUPPCT        43
VHIP21         118
LOWACCUM       174
REDSELL        78
AUGSELS7       68
TRAPDOOR       9
|
RANKING OF KEY DIRECTORIES BASED PCT.OF STOCKS ABOVE 65-DMA 10/12/20 --------------------------------------------------------------------------------------- Directory Current day-1 day-2 day-3 day-4 day-5 ---------------------------------------------------------------------------------------- HOMEBLDG .941 .941 .941 .882 .882 .882 SOLAR .909 1 .909 .909 .909 .909 NASD-100 .87 .78 .72 .68 .53 .64 BIGBANKS .857 .714 .714 .571 .142 .285 TRANSP .85 .95 .95 .8 .7 .85 DJI-13 .846 .846 .846 .769 .615 .769 NIFTY .844 .777 .733 .666 .511 .666 GREEN .809 .904 .809 .761 .714 .714 UTILITY .789 .789 .789 .657 .631 .552 SEMI .788 .798 .692 .586 .49 .509 BEVERAGE .785 .857 .785 .571 .428 .571 FINANCE .777 .666 .753 .629 .444 .493 ELECTRON .775 .782 .721 .612 .517 .523 INDEXES .774 .751 .751 .762 .7 .74 SP500 .768 .737 .722 .665 .571 .636 DOWJONES .766 .766 .766 .7 .566 .733 HOSPITAL .761 .761 .857 .761 .523 .571 CHEM .75 .75 .75 .708 .645 .666 COMPUTER .75 .75 .7 .65 .55 .5 SP-100 .747 .703 .703 .637 .505 .604 INFRA .742 .771 .742 .742 .6 .685 AUTO .736 .763 .763 .763 .657 .657 GUNS .733 .733 .666 .666 .666 .733 RUS-1000 .733 .701 .699 .646 .564 .601 FIDSTKS .731 .685 .668 .594 .497 .588 INSURANC .73 .615 .615 .5 .423 .538 REGBANKS .73 .653 .73 .615 .5 .461 ETFS .714 .75 .66 .517 .428 .553 JETS .714 .928 .857 .642 .5 .785 RETAIL .714 .693 .714 .673 .612 .673 SOFTWARE .7 .616 .55 .533 .466 .466 INDMATER .666 .666 .666 .626 .533 .586 COMODITY .634 .682 .634 .634 .414 .487 FOOD .622 .679 .641 .622 .49 .547 CHINA .62 .6 .52 .5 .52 .52 REIT .617 .531 .631 .475 .51 .553 COAL .571 .714 .714 .714 .571 .571 BIOTECH .554 .56 .549 .522 .445 .45 HACKERS .55 .45 .3 .3 .1 .15 GAMING .523 .523 .476 .523 .428 .523 COPPER .5 .625 .5 .5 .25 .25 GOLD .408 .469 .163 .142 .102 .224 MILITARY .357 .321 .392 .25 .214 .321 EDU .333 .333 .333 .333 .333 .333 BONDFUND .287 .297 .267 .207 .217 .227 OILGAS .269 .293 .277 .23 .19 .19 |
=======================================================================
10/9/2020 Very few October tops
occur in a Presidential Election year
if the market is rising then. (See Hotline of
10/8/2020 This is
probably because the market tends to let the
partisans get their way until
soon after the actual Election. At that point, things get more interesting.
Novembers bring the most reversals.
With breadth so strong and a rising number of stocks
over their 65-dma,
let's allow the Bullish MAXCPs continue to run upwards, especially the solar
power ETFs/stocks, BABA and the very high A/I 200 stocks/ETFs. The oil
stocks remain the most bearish sector. Clearly, the market expects a Biden
victory. If "second guessing" about a Democrat victory begins on
schedule,
we have another 20 days of uptrend, as least. That should alloiw our
long high Accumulation and bullish MAXCPs to make more gains.
I do note that the current Accumulation Indexes (IP21) remain weak.
"Big money" is selling into strength each day. But the Closing Powers
are still in uptrends and the NYSE A/D Line is running in all-time high territory.
The very highest Power Ranked stocks out of all 6000 stocks and ETFs
are shown below. AI/200 score, AI/100 score, IP21 and ITRS are
the composite Power Rankings' main elements. These are QCLN, TTGT,
IIPR and ARKW.
  |
 |
 |
 |
 |
 |
 |
 |
|
Charts 10/9/2020 (Click on Underlined link.) 2020 PEERLESS DJI, Signals, Indicators Daily DJI Volume 10-DayUp/Down Vol Stoch-20 Inverted Traders Index Graph of Pct of All Stocks above 65-dma Cum. Inverted Traders Index NASDAQ S&P OEX NYSE COMPQX DJI-15 DJI-20 DJI-30 DIA QQQ MDY IWM TNA Short-Term Rates DOLLAR-UUP SPY http://tigersoft.com/2121CST/SPY.GIF recent 2006 vers-Peerless signals -- http://tigersoft.com/NEWPEER/UPD6109.BMP USO-CrudeOil DBO FAS GLD BBH IBB JETS JNUG KOL NUGT OIH PALL RSX RETL SDS AGQ SLV SOXL TECL TLT TMF TNA UGA (gasoline) USO (oil) and China: YINN CHAU Commodities: CANE CORN DBC JJC, NIB, CHOC CORN, CUT (paper) MOO, SOYB WEAT UUP (Dollar) LIT (Lithium) Stocks AAPL ADBE ALXN AMAT AMGN AMD AMZN AXP BA BABA BAC BIDU BLDP CAT CRM CVX CMG DE ENPH FB GILD GOOG GS HD IBM INTU JPM LRCX M (Macy's) MSFT NEM NFLX NKE NVDA PG REGN REV SO SQ QCOM QDEL TSLA TXN XOM V VRTX WFC WMT TOWN ZM New highs and Bullish MAXCPs http://tigersoft.com/MAXCP/10-9/BULLISH.htm Bearish MAXCPs - http://tigersoft.com/MINCP/10-9/BEARISH.htm |
 Table 1
             10/9/2018   QUICKSILVER on DJI-30 STOCKS.
P21 + ITRS score >+.25 is bullish
             1  Bullish  (CRM)
             3  Bearish (CSCO,  CVX, IBM)
HIGHEST AI/200 = CRM Second Highest Tied = AAPL and MSFT STOCKS CLOSECHANGE PIVOT-PT 5-dma AROC CL-PWR CANDLE AI/200 IP21 ITRS ------------------------------------------------------------------------------------------------------- ------------------------------------------------------------------------------------------------------- AAPL 116.97 2 113.02 172.4% ------- BLUE 156 .019 .13 ---------------------------------------------------------------------------------------------------------- AMGN 236.7 -3.39 245.41 -173.9% Bearish RED 134 .026 -.124 ---------------------------------------------------------------------------------------------------------- AXP 106.34 .28 101.61 228.9% ------- BLUE 98 -.017 .037 ---------------------------------------------------------------------------------------------------------- BA 167.33 -.67 168.08 -22.6% ------- RED 33 -.045 -.053 ---------------------------------------------------------------------------------------------------------- CAT 158.94 2.28 149.94 293.6% ------- BLUE 118 -.033 .076 ---------------------------------------------------------------------------------------------------------- CRM 265.98 5.76 247.85 357% ------- BLUE 192 .091 .301 Bullish ---------------------------------------------------------------------------------------------------------- CSCO 39.85 .06 38.27 203% Bearish RED 119 -.061 -.228 Bearish ---------------------------------------------------------------------------------------------------------- CVX 74 -1.22 71.19 192.4% Bearish RED 77 -.063 -.228 Bearish ---------------------------------------------------------------------------------------------------------- DIS 124.98 1.89 122.55 99.1% Bearish BLUE 100 -.08 -.005 ---------------------------------------------------------------------------------------------------------- DOW 49.36 -.02 47.31 212.3% ------- RED 60 -.098 .097 ---------------------------------------------------------------------------------------------------------- GS 207.54 -.44 199.9 188.3% Bearish RED 59 .009 -.046 ---------------------------------------------------------------------------------------------------------- HD 285.92 1.4 279.31 117.6% ------- BLUE 154 .13 -.012 ---------------------------------------------------------------------------------------------------------- HON 174.38 .6 165.61 259% Bullish ---- 109 .019 .083 ---------------------------------------------------------------------------------------------------------- IBM 127.79 -3.7 120.57 291.1% Bearish RED 111 -.249 -.046 Bearish ---------------------------------------------------------------------------------------------------------- INTC 52.82 -.55 51.01 174% ------- RED 91 .026 .015 ---------------------------------------------------------------------------------------------------------- JNJ 150.97 2.08 146.24 160.3% ------- BLUE 115 -.035 -.058 ---------------------------------------------------------------------------------------------------------- JPM 101.2 -.58 97.89 166.7% ------- RED 24 .036 -.043 ---------------------------------------------------------------------------------------------------------- KO 50.81 .35 49.36 146.3% ------- BLUE 87 -.02 -.021 ---------------------------------------------------------------------------------------------------------- MCD 224.83 -.97 222.67 48% Bullish RED 137 -.035 .065 ---------------------------------------------------------------------------------------------------------- MMM 169.3 1.59 160.36 272.7% Bearish BLUE 100 -.139 .027 ---------------------------------------------------------------------------------------------------------- MRK 80.36 -.12 80.8 -27.4% Bearish RED 94 -.078 -.069 ---------------------------------------------------------------------------------------------------------- MSFT 215.81 5.23 206.19 230.6% Bullish BLUE 156 .09 -.028 ---------------------------------------------------------------------------------------------------------- NKE 130.98 1.27 126.64 169% Bullish BLUE 134 -.087 .267 ---------------------------------------------------------------------------------------------------------- PG 142.92 1.27 138.12 171.6% Bullish BLUE 97 .068 .001 ---------------------------------------------------------------------------------------------------------- TRV 115.83 .21 108.58 322.8% Bullish RED 86 -.081 -.087 ---------------------------------------------------------------------------------------------------------- UNH 327.84 5.43 311.98 249.3% Bullish BLUE 112 .013 -.012 ---------------------------------------------------------------------------------------------------------- V 206.64 3.66 201.46 128.1% Bearish BLUE 103 -.021 -.021 ---------------------------------------------------------------------------------------------------------- VZ 59.33 .14 59.24 7.6% ------- BLUE 119 -.082 -.051 ---------------------------------------------------------------------------------------------------------- WBA 36.34 -.73 35.77 78.3% ------- RED 81 .049 -.192 ---------------------------------------------------------------------------------------------------------- WMT 142.78 1.42 140.5 80.8% Bullish BLUE 126 -.08 .011 |
Table 2 QUICKSILVER on ETFS - 10/7/20 Bullish = 1 SOXL
Bearish = 1 OIH
ITRS + IP21>.25 is considered "Bullish"
ETF CLOSE CHANGE PIVOT-PT 5-dma AROC CL-PWR CANDLE IP21 ITRS --------------------------------------------------------------------------------------------- --------------------------------------------------------------------------------------------- DIA 285.93 1.64 281.51 162.7% ------- BLUE .089 -- --------------------------------------------------------------------------------------------- BA 167.33 -.67 171.2 -22.6% ------- RED -.045 -.053 --------------------------------------------------------------------------------------------- SPY 346.85 3.07 339.76 192.1% ------- BLUE .066 -.015 --------------------------------------------------------------------------------------------- QQQ 285.71 4.3 280.16 204.9% Bullish BLUE .084 .008 --------------------------------------------------------------------------------------------- MDY 363.83 .95 354.68 243.7% Bullish RED .192 -.022 --------------------------------------------------------------------------------------------- IWM 162.7 .84 157.07 312.3% ------- RED .121 .008 --------------------------------------------------------------------------------------------- FAS 39.21 .09 36.86 565.5% ------- RED -.013 .032 --------------------------------------------------------------------------------------------- SOXL 305.14 15.21 268.85 1116.3% Bullish BLUE .154 .238 Bullish --------------------------------------------------------------------------------------------- TECL 331.95 15.14 310.93 666.4% Bullish BLUE .076 .235 Bullish --------------------------------------------------------------------------------------------- IBB 142.53 1.15 139.57 312.1% ------- BLUE .233 -.046 --------------------------------------------------------------------------------------------- GLD 181.08 3.23 179.41 71.3% Bearish BLUE .073 -.101 --------------------------------------------------------------------------------------------- OIH 102.81 -1.64 100.13 303.2% Bearish RED -.053 -.277 Bearish --------------------------------------------------------------------------------------------- GASL 3440 285 3685 -325.1% ------- RED -.021 .027 --------------------------------------------------------------------------------------------- |
 Table 3   Count of Stocks in Key Directories
           20201009
-------------------------------
NEWHIGHS       380 Bullish >10:1
NEWLOWS        35
MAXCP          48
MINCP          31
TTTNH          35
TTTNL          14
FASTUP         215
FASTDOWN       18
CPCROSSA       30
CPCROSSD       160
BIGVOLUP       5
BIGVODN        9
ACCUMVER       132
HIGHIP21       18
HIUPPCT        39
REDSELL        80
AUGSELS7       80
TRAPDOOR       9
|
 Table 4  RANKING OF KEY DIRECTORIES BASED PCT.OF STOCKS ABOVE 65-DMA
              10/9/20
 Bullish = 40
 Bearish = 6
---------------------------------------------------------------------------------------
Directory     Current       day-1         day-2         day-3         day-4         day-5
----------------------------------------------------------------------------------------
SOLAR          1             .909          .909          .909          .909          .909
TRANSP         .95           .95           .8            .7            .8            .8
HOMEBLDG       .941          .941          .882          .882          .882          .764
JETS           .928          .857          .642          .5            .714          .714
GREEN          .904          .809          .761          .714          .714          .571
BEVERAGE       .857          .785          .571          .428          .571          .5
DJI-13         .846          .846          .769          .615          .769          .461
SEMI           .798          .692          .586          .49           .5            .423
UTILITY        .789          .789          .657          .631          .552          .552
ELECTRON       .782          .721          .612          .517          .517          .442
NASD-100       .78           .72           .68           .53           .63           .47
NIFTY          .777          .733          .666          .511          .644          .466
INFRA          .771          .742          .742          .6            .685          .6
AUTO           .769          .769          .769          .666          .692          .589
DOWJONES       .766          .766          .7            .566          .7            .5
HOSPITAL       .761          .857          .761          .571          .571          .476
INDEXES        .751          .751          .762          .7            .74           .615
CHEM           .75           .75           .708          .645          .666          .562
COMPUTER       .75           .7            .65           .55           .5            .5
ETFS           .75           .66           .517          .428          .553          .375
SP500          .735          .724          .665          .571          .632          .533
GUNS           .733          .666          .666          .666          .733          .666
BIGBANKS       .714          .714          .571          .142          .285          0
COAL           .714          .714          .714          .571          .571          .571
SP-100         .703          .703          .637          .505          .593          .461
RUS-1000       .701          .701          .646          .564          .6            .5
RETAIL         .693          .714          .673          .612          .673          .612
COMODITY       .682          .634          .634          .414          .487          .439
FIDSTKS        .68           .668          .594          .497          .588          .497
FOOD           .679          .641          .622          .49           .547          .49
INDMATER       .666          .666          .626          .533          .586          .48
FINANCE        .658          .743          .621          .439          .5            .39
REGBANKS       .653          .73           .615          .5            .461          .153
COPPER         .625          .5            .5            .25           .25           .25
SOFTWARE       .616          .566          .533          .466          .466          .4
INSURANC       .615          .615          .5            .423          .538          .384
CHINA          .6            .52           .5            .52           .52           .46
BIOTECH        .56           .549          .525          .445          .453          .32
REIT           .535          .635          .471          .514          .564          .521
GAMING         .523          .476          .523          .428          .523          .476
================================================================================================
GOLD           .469          .163          .142          .102          .224          .142
HACKERS        .45           .35           .3            .1            .15           .05
EDU            .333          .333          .333          .333          .333          .333
MILITARY       .321          .392          .25           .214          .321          .178
OILGAS         .293          .277          .222          .19           .19           .166
BONDFUND       .29           .26           .21           .21           .23           .26
|
=====================================================================
10/8/2010 Is A Big Trap Being Laid
for Democrats?
The market has a strong tendency at this time of the year
to make partisans pay a price for being too emotional. As explained
here recently, I believe the evidence now suggests that it is the Biden
supporters on Wall Street who are the ones who are most bullish now.
DIA, SPY and QQQ have reached the clearest resistance levels.
A breakout now on increased volume would be bullish. Another
minor pullback would not be particularly bearish, given the FED's
determination to support the market.
Stay long the bullish MAXCPs, especially the solar energy stocks,
as well as the highest AI/200 big techs and ETFS, CRM, BABA and
ARKW. Our short hedges, the big oils, are trying to rally based
on being over-sold, short-covering and hopes for huge bailout from
Congress. Cover 1/2 of the short positions if they close much higher
than their openngs tomorrow. This would mean a break in the Closing
Power down-trends. See the bearish MINCP charts tonight.
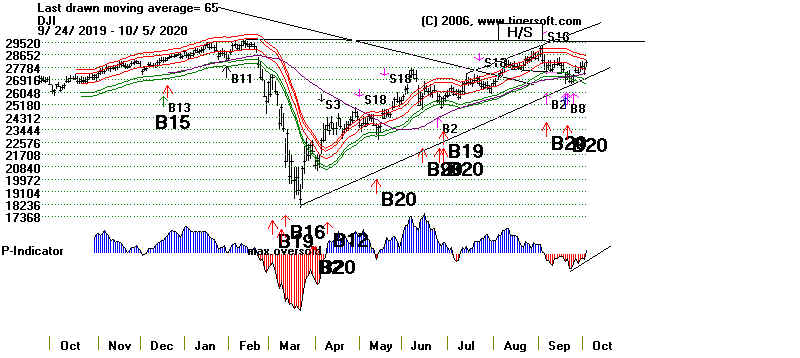
No New Peerless Sell from version-2020. Version-2006 does give
a Sell S12. What's the difference? Today, the A/D Line made a clear
new high much ahead of the DJI. In the 2020 version of Peerless such
good breadth at this time of the year in a Presidential Election Year works
against a Sell S12 occurring, even though the DJI has closed 2.8% over
the 21-day ma with our IP21 (Accum. Index) still negative.
Notice also the Closing Power uptrends and the bullish inverted head
and shoulders in the SPY and QQQ.
DJIA - version 2020  |
DIA
At
resistance. Watch for what DJI wants to do now. |
SPY |
QQQ |
Wall Street Likes to Take Advanatge
of Partisan Emotionalism
Another factor at work here is the strong tendency for the DJI to
become emotionally charged in Octobers when there is a Presidential
Election coming up. October peaks are relatively rare in these years
because political partisans tend to make rallies in this month carry
through to November or later. Since 1888, there have been 18 cases
where the DJI refused to peak on strength in October and waited
until at least November. Oppositely, there have been just 4 cases of
October peaks when the DJI had been rising. This suggests the odds
for the DJI to rally now are 18/22 or 82%. It is true
the tendency is
less pronounced since 2004, but this is a year of polorized opinions.
The market somehow knows how to take advantage of those who are
most partisan who come aboard late. This year, it's the Democrat
partisans who are most likely to be the victims of their own powerfully
anti-Trump passions!
Let me show the peaks in the fourth quarter of Presidential
Election
Years since 1886: I
have marked in blue the 18 years where a rally DJI
refused to reverse significantly in October and waited at least until
November. I have marked in fuscia the four
years where there was an
October peak. In black are those years where the DJI was
falling or flat
in October.
1888 - Sept peak and DJI fell 88 to 82 to December.
DJI fell as Republican beat Democrat.
1892 - Nov. 10 peak ending minor rally.
DJI fell as Democrat beat Republican
Exception #1
1896 - Oct -12 peak ended big rally based on anticipated Republican
victory follow a recession widely blamed on Democrat Cleveland.
1900 - Nov. 10 peak ended rally. DJI
declined from 69-64
1904 - Nov. 20 peak ended rally. DJI declined from 73 to 66.
1908 - Nov. 5 peak ended rally. DJI declined from 88 to 84.
1912 - Sept. 20. DJI fell from 94 to 85 in December.
1916 - Nov. 21 peak. DJI fell from 110 to 92.
1920 - Sept 17 peak. On going bear market. Wall
Street bombed.
1924 - Strong advance until end of year as Repub.
re-elected.
1928 - Nov. 28 peak. DJI then declined from 290 to 265.
1932 - Nov. 11 minor peak in on-going bear market.
1936 - Nov. 17 minor peak. DJI declined from 185 to 177.
1940 - Nov. 7 minor peak. DJI declined from 138 to 132.
1944 - Dec. 15 minor peak. DJI declined only from 152 to 149.
1948 - Nov. 1 Peak. Rep loss resulted in decline from 190 to 171.
1952 - bottom made on Oct 22. DJI rallied stromgly as
Rep. won.
1956 - Nov. 5 peak. DJI then fell from 495 to 465.
1960 - Oct. 24 bottom. DJI rallied beyond end of year
despite JFK
beating Nixon.
1964 - Nov. 18 minor peak. DJI fell from 891 to
860.
1968 - Dec. 2 major peak. Bear market started.
(Oct. 18 peak brought only a 2.5% decline).
1972 - Oct. 16 bottom with DJI then rallying 11 weeks.
1976 - Sept. 22 - DJI then declined from 1014 to 924.
Exception #2 1980 - Oct. 16 - DJI then fell from 959 to
918 (about 4.4%)
1984 - Nov. 16 peak. DJI fell from 1244 to 1170.
Exception #3 1988 - Oct. 20- DJI then fell from 2181 to 2039.
1992 - Oct. 9 bottom. Strong rally despite election
of Democrat.
1996 - Nov. 26 peak. DJI fell from 6528 to to
6268.
2000 - Nov. 7 peak. DJI fell from 10952 to
to 10400.
2004 - Oct. 22 bottom. Strong rally.
2008 - Oct. 27 bottom. Rally until Nov. 4. On-going bear market.
Exception #4 2012 - Oct. 5- DJI then fell from
13610 to 12592.
2016 - Very flat market until election of Trump Rally from Nov. 3 bottom..
|
Charts 10/8/2020 (Click on Underlined link.) 2020 PEERLESS DJI, Signals, Indicators Daily DJI Volume 10-DayUp/Down Vol Stoch-20 Inverted Traders Index Graph of Pct of All Stocks above 65-dma Cum. Inverted Traders Index NASDAQ S&P OEX NYSE COMPQX DJI-15 DJI-20 DJI-30 DIA QQQ MDY IWM TNA Short-Term Rates DOLLAR-UUP SPY http://tigersoft.com/2121CST/SPY.GIF recent 2006 vers-Peerless signals -- http://tigersoft.com/NEWPEER/UPD6108.BMP USO-CrudeOil DBO FAS GLD BBH IBB JETS JNUG KOL NUGT OIH PALL RSX RETL SDS AGQ SLV SOXL TECL TLT TMF TNA UGA (gasoline) USO (oil) and China: YINN CHAU Commodities: CANE CORN DBC JJC, NIB, CHOC CORN, CUT (paper) MOO, SOYB WEAT UUP (Dollar) LIT (Lithium) Stocks AAPL ADBE ALXN AMAT AMGN AMD AMZN AXP BA BABA BAC BIDU BLDP CAT CRM CVX CMG DE ENPH FB GILD GOOG GS HD IBM INTU JPM LRCX M (Macy's) MSFT NEM NFLX NKE NVDA PG REGN REV SO SQ QCOM QDEL TSLA TXN XOM V VRTX WFC WMT TOWN ZM New highs and Bullish MAXCPs http://tigersoft.com/MAXCP/10-8/BULLISH.htm Bearish MAXCPs - http://tigersoft.com/MINCP/10-8/BEARISH.htm |
 Table 1
             10/8/2018   QUICKSILVER on DJI-30 STOCKS.
P21 + ITRS score >+.25 is bullish
             1  Bullish  (CRM)
             2  Bearish (CSCO,  CVX,)
HIGHEST AI/200 = CRM Second Highest Tied = AAPL and MSFT STOCKS CLOSECHANGE PIVOT-PT 5-dma AROC CL-PWR CANDLE AI/200 IP21 ITRS ------------------------------------------------------------------------------------------------------- ------------------------------------------------------------------------------------------------------- AAPL 114.97 -.11 116.79 -79.2% ------- RED 156 -.054 .139 ---------------------------------------------------------------------------------------------------------- AMGN 240.09 -17.58 255.39 -301.9% Bearish RED 134 .01 -.106 ---------------------------------------------------------------------------------------------------------- AXP 106.06 2.68 101.33 231% Bullish BLUE 99 -.046 .026 ---------------------------------------------------------------------------------------------------------- BA 168 3.39 167.86 4.2% Bearish BLUE 33 -.049 -.059 ---------------------------------------------------------------------------------------------------------- CAT 156.66 1.89 146.71 328.8% ------- BLUE 119 -.1 .044 ----------------------------------------------------------------------------------------------- ----------- CRM 260.22 .24 253.45 134% ------- RED 192 .003 .273 Bullish ---------------------------------------------------------------------------------------------------------- CSCO 39.79 .39 38.8 127.8% Bearish ---- 119 -.081 -.219 Bearish ---------------------------------------------------------------------------------------------------------- CVX 75.22 1.44 70.42 333% Bearish BLUE 77 -.059 -.236 Bearish ---------------------------------------------------------------------------------------------------------- DIS 123.09 .18 123.31 -9% Bearish RED 100 -.157 -.006 ---------------------------------------------------------------------------------------------------------- DOW 49.38 1.08 46.11 343.2% ------- BLUE 61 -.136 .064 ---------------------------------------------------------------------------------------------------------- GS 207.98 4.38 198.55 234.6% Bearish BLUE 58 -.011 -.044 ---------------------------------------------------------------------------------------------------------- HD 284.52 1.73 277.62 123.4% Bearish BLUE 154 .092 .004 ---------------------------------------------------------------------------------------------------------- HON 173.78 2.23 163.68 301.9% Bullish BLUE 108 -.006 .053 ---------------------------------------------------------------------------------------------------------- IBM 131.49 7.42 121.09 426.4% Bullish BLUE 111 -.214 -.022 ---------------------------------------------------------------------------------------------------------- INTC 53.37 .7 52.24 109.1% Bullish BLUE 91 .022 .039 ---------------------------------------------------------------------------------------------------------- JNJ 148.89 1.01 147.32 53.3% Bearish BLUE 116 -.093 -.055 ---------------------------------------------------------------------------------------------------------- JPM 101.78 2.05 96.97 244.6% Bullish BLUE 23 -.002 -.05 ---------------------------------------------------------------------------------------------------------- KO 50.46 .9 49.18 129.9% Bearish BLUE 88 -.051 -.02 ---------------------------------------------------------------------------------------------------------- MCD 225.8 -.68 219.59 138.8% Bullish RED 138 -.036 .08 ---------------------------------------------------------------------------------------------------------- MMM 167.71 1.22 158.79 275.1% Bearish BLUE 101 -.176 .003 ---------------------------------------------------------------------------------------------------------- MRK 80.48 .44 81.64 -71.9% Bearish BLUE 95 -.088 -.057 ---------------------------------------------------------------------------------------------------------- MSFT 210.58 .75 212.46 -45% Bearish BLUE 156 .007 -.039 ---------------------------------------------------------------------------------------------------------- NKE 129.71 -.35 126.64 120.1% Bullish RED 135 -.121 .267 ---------------------------------------------------------------------------------------------------------- PG 141.65 .95 139.24 86.4% Bullish BLUE 97 .021 .033 ---------------------------------------------------------------------------------------------------------- TRV 115.62 1.82 107.81 352.7% Bullish BLUE 87 -.102 -.081 ---------------------------------------------------------------------------------------------------------- UNH 322.41 -.76 313.07 147.7% Bullish RED 112 -.054 -.019 ---------------------------------------------------------------------------------------------------------- V 202.98 .51 203.35 -9.1% Bearish RED 104 -.08 -.049 ---------------------------------------------------------------------------------------------------------- VZ 59.19 -.42 59.45 -21.9% ------- BLUE 120 -.124 -.04 ---------------------------------------------------------------------------------------------------------- WBA 37.07 .58 35.87 166% ------- BLUE 80 .058 -.17 ---------------------------------------------------------------------------------------------------------- WMT 141.36 .47 143.08 -60.8% ------- RED 126 -.133 .011 |
Table 2 QUICKSILVER on ETFS - 10/7/20 Bullish = 1 SOXL
Bearish = 1 OIH
ITRS + IP21>.25 is considered "Bullish"
ETF CLOSE CHANGE PIVOT-PT 5-dma AROC CL-PWR CANDLE IP21 ITRS --------------------------------------------------------------------------------------------- --------------------------------------------------------------------------------------------- DIA 284.29 1.37 276.8 110.1% Bearish RED .04 ----- --------------------------------------------------------------------------------------------- SPY 343.78 3.02 333.84 99.9% Bearish BLUE-.001 -.013 --------------------------------------------------------------------------------------------- QQQ 281.41 1.49 274.31 -15.1% Bearish RED .01 .013 --------------------------------------------------------------------------------------------- MDY 362.88 3.79 346.52 275.7% Bullish BLUE .162 -.017 --------------------------------------------------------------------------------------------- IWM 161.86 1.82 152.85 310.8% ------- BLUE .083 .013 --------------------------------------------------------------------------------------------- FAS 39.12 1.58 35.04 674% Bearish BLUE-.045 .008 --------------------------------------------------------------------------------------------- SOXL 289.93 9.73 244.94 396% Bullish BLUE .093 .261 Bullish --------------------------------------------------------------------------------------------- TECL 316.81 4.72 291.24 21% ------- RED -.005 .21 --------------------------------------------------------------------------------------------- IBB 141.38 .39 133.87 170.9% ------- RED .157 -.036 --------------------------------------------------------------------------------------------- GLD 177.85 .63 178.54 -23.8% Bearish RED -.023 -.11 --------------------------------------------------------------------------------------------- OIH 104.45 4.79 96.75 523.1% Bearish BLUE-.07 -.274 Bearish --------------------------------------------------------------------------------------------- |
  Table 3 -   Count of Stocks in Key Directories
               20201008
-------------------------------
NEWHIGHS       327  Bullish
NEWLOWS        24
MAXCP          38
MINCP          13
TTTNH          29
TTTNL          13
FASTUP         263  Bullish
FASTDOWN       23
CPCROSSA       61
CPCROSSD       54
BIGVOLUP       10
BIGVODN        9
ACCUMVER       132
HIGHIP21       13
HIUPPCT        34
REDSELL        84
AUGSELS7       73
TRAPDOOR       10
|
Table 4     RANKING OF KEY DIRECTORIES BASED PCT.OF STOCKS ABOVE 65-DMA
              10/8/20
  Bullish = 38
  Bearish = 7
---------------------------------------------------------------------------------------
Directory     Current       day-1         day-2         day-3         day-4         day-5
----------------------------------------------------------------------------------------
TRANSP         .95           .8            .7            .8            .8            .65
HOMEBLDG       .941          .882          .882          .882          .764          .764
SOLAR          .909          .909          .909          .909          .909          .909
HOSPITAL       .857          .761          .571          .619          .523          .428
JETS           .857          .642          .5            .714          .714          .571
DJI-13         .846          .769          .615          .769          .461          .538
GREEN          .809          .761          .714          .714          .571          .619
UTILITY        .789          .657          .631          .552          .552          .526
BEVERAGE       .785          .571          .428          .571          .5            .571
AUTO           .769          .769          .666          .692          .615          .564
DOWJONES       .766          .7            .566          .7            .5            .6
INDEXES        .755          .767          .704          .744          .63           .647
CHEM           .75           .708          .645          .666          .562          .5
FINANCE        .743          .621          .439          .5            .402          .28
INFRA          .742          .742          .6            .685          .6            .571
NIFTY          .733          .666          .511          .644          .466          .666
REGBANKS       .73           .615          .5            .461          .192          .115
SP500          .724          .668          .571          .632          .542          .523
ELECTRON       .721          .612          .517          .517          .442          .469
NASD-100       .72           .68           .53           .63           .47           .66
BIGBANKS       .714          .571          .142          .285          0             0
COAL           .714          .714          .571          .571          .571          .571
RETAIL         .714          .673          .612          .673          .612          .653
SP-100         .703          .637          .505          .593          .461          .494
COMPUTER       .7            .65           .55           .5            .5            .5
RUS-1000       .7            .647          .563          .599          .504          .464
SEMI           .692          .586          .49           .5            .423          .5
FIDSTKS        .668          .594          .497          .588          .502          .497
GUNS           .666          .666          .666          .733          .733          .6
INDMATER       .666          .626          .533          .586          .506          .506
ETFS           .66           .517          .428          .553          .375          .41
COMODITY       .634          .634          .414          .487          .463          .439
FOOD           .634          .615          .48           .538          .48           .48
REIT           .631          .475          .51           .56           .517          .333
INSURANC       .615          .5            .423          .538          .423          .307
SOFTWARE       .566          .55           .466          .466          .4            .483
BIOTECH        .549          .525          .448          .453          .322          .392
CHINA          .52           .5            .52           .52           .46           .52
-----------------------------------------------------------------------------------------------
COPPER         .5            .5            .25           .25           .375          .125
-----------------------------------------------------------------------------------------------
GAMING         .476          .523          .428          .523          .476          .523
MILITARY       .392          .25           .214          .321          .178          .178
HACKERS        .35           .35           .1            .15           .05           .25
EDU            .333          .333          .333          .333          .333          .333
OILGAS         .277          .222          .182          .19           .166          .166
BONDFUND       .267          .207          .217          .227          .267          .267
GOLD           .163          .142          .102          .224          .183          .244
|
====================================================================
10/7/2020 Hedging by being
long the bullish MAXCPs has done better
than if we were long DIA. Why change course before the
almost inevitable victory celebration by partisan Democrats,
assuming Biden wins as the polls now strongly suggest.
Breadth (the NYSE A/D Line) is about to
make
a 12-month high. See below. Breadth is our best indicator
for showing the effects of what the FED is doing
and the direction they want the market to go in.
The negative Accumulation Index warns us that
"big money" is not so happy about Biden's big lead at
the polls. Thus, they are net sellers on the current rally.
How do we decide which force is more powerful?
As long as the DIA's Closing Power is rising, we
can safely assume that Wall Street Professionals
are bullish, when taken as a whole, in the current market.
Of course, they watch the FED from close-up and
they are well aware of what big money and insiders are
doing. They are flexible, apolitical and usually right about
the market's major direction. So we should watch
them closely.


The pundits tell us this is a Biden Rally,
that Wall Street
is eager to return to a quieter kind of President. That's part
of what's happening. There are many cases when the market
celebrates the coming Election victory of its favorite. The FED's
QE-Infinity is playing a big role, too; all the infusion of capital
can find no place better to invest now than Wall Street.
The DJIA is full of "dinosaurs" one of my friends says.
There is a lot of truth to this. But it is this index that gets
most of the headlines and which has data going back to 1885
for our historical studies. On the other hand, the newer tech
stocks are in the QQQ. And it is here that we see many of the
companies that are part of the new era where folks work at home
on smaller and smaller devices, where robotics and self-teaching
chips are found along with much, much more that amounts to
a revolution in marketing and industrial engineering. So, it
is significant now that the QQQ could be forming an inverted
head/shoulders. A breakout above QQQ's red resistance line
should be construed bullishly.

But the DJI is now 2.6% over the 21-dma with the
IP21-Accumulation
and V-Indicator still negative. So, a Sell S12 seems likely if the DJI's
rally goes much higher. An October reversal may still occur if no
Relief Package is approved. Let's wait and see if we get a new Sell
first. Recent Sell S12s have not worked. The FED clearly does not
want to allow any significant decline for fear it may get out of control.
Though TigerSoft's Power Ranking system has worked well in
finding
the most bullish and bearish stocks, Peerless remain in a quandry:
the Peerless-2020 version has not given any buys for a month while
the Peerless-2006 software in bullish mode has not given only recent
Buys. Rather than choose between the different versions, our Hotline
has opted to hedge with longs in the highest AI/200 stocks and
the bullish Solar Power stocks. This has worked well. Why change
approaches.
TAN  |
To TAN and the other solar power stocks, we should consider being
long CRM, the highest AI/200 stock in the DJI, BABA (the leading
Chinese internet play) and ARKW (American internet "cloud" ETF
with an AI/200 score of 198). See these just below. (Cloud-based
software, offers users the option of not running programs on their
own machines but on a server somewhere else.)
CRM |
BABA |
ARKW |
The bearish MINCPS remain in downtrends but are not making
new
yearly lows. Still the big oil stocks (like XOM and BP should make good
stocks to be short as investors ponder how long travel will be restricted
and how Biden's policies will hurt fossil fuel companies.
XOM - Stocks dropped from the DJI-30 seldom come alive and rise sharply. |
BP |
|
Charts 10/7/2020 (Click on Underlined link.) 2020 PEERLESS DJI, Signals, Indicators Daily DJI Volume 10-DayUp/Down Vol Stoch-20 Inverted Traders Index Graph of Pct of All Stocks above 65-dma Cum. Inverted Traders Index NASDAQ S&P OEX NYSE COMPQX DJI-15 DJI-20 DJI-30 DIA QQQ MDY IWM TNA Short-Term Rates DOLLAR-UUP SPY http://tigersoft.com/2121CST/SPY.GIF recent 2006 vers-Peerless signals -- http://tigersoft.com/NEWPEER/UPD6107.BMP USO-CrudeOil DBO FAS GLD BBH IBB JETS JNUG KOL NUGT OIH PALL RSX RETL SDS AGQ SLV SOXL TECL TLT TMF TNA UGA (gasoline) USO (oil) and China: YINN CHAU Commodities: CANE CORN DBC JJC, NIB, CHOC CORN, CUT (paper) MOO, SOYB WEAT UUP (Dollar) LIT (Lithium) Stocks AAPL ADBE ALXN AMAT AMGN AMD AMZN AXP BA BABA BAC BIDU BLDP CAT CRM CVX CMG DE ENPH FB GILD GOOG GS HD IBM INTU JPM LRCX M (Macy's) MSFT NEM NFLX NKE NVDA PG REGN REV SO SQ QCOM QDEL TSLA TXN XOM V VRTX WFC WMT TOWN ZM New highs and Bullish MAXCPs http://tigersoft.com/MAXCP/10-7/BULLISH.htm Bearish MAXCPs - http://tigersoft.com/MINCP/10-7/BEARISH.htm |
 Table 1
             10/7/2018   QUICKSILVER on DJI-30 STOCKS.
P21 + ITRS score >+.25 is bullish
             1  Bullish  (CRM)
             2  Bearish (CSCO,  CVX,)
HIGHEST AI/200 = CRM Second Highest Tied = AAPL and MSFT STOCKS CLOSECHANGE PIVOT-PT 5-dma AROC CL-PWR CANDLE AI/200 IP21 ITRS
-------------------------------------------------------------------------------------------------------
-------------------------------------------------------------------------------------------------------
AAPL 115.08 1.92 115.81 -31.7% ------- BLUE 157 -.035 .162
----------------------------------------------------------------------------------------------------------
AMGN 257.67 4.98 254.16 69.4% Bullish BLUE 134 .113 -.063
----------------------------------------------------------------------------------------------------------
AXP 103.38 1.62 100.25 153.8% Bearish BLUE 100 -.074 .023
----------------------------------------------------------------------------------------------------------
BA 164.61 5.07 165.26 -19.5% Bearish BLUE 33 -.077 -.108
----------------------------------------------------------------------------------------------------------
CAT 154.77 3.24 149.15 187.1% ------- BLUE 120 -.112 .049
----------------------------------------------------------------------------------------------------------
CRM 259.98 9.84 251.32 172.6% ------- BLUE 192 .045 .3
Bullish
----------------------------------------------------------------------------------------------------------
CSCO 39.4 .83 39.39 1.3% Bearish BLUE 119 -.057 -.221
Bearish
----------------------------------------------------------------------------------------------------------
CVX 73.78 1.48 72 124.1% Bearish BLUE 77 -.103 -.244
Bearish
----------------------------------------------------------------------------------------------------------
DIS 122.91 1.98 124.08 -47.6% Bearish BLUE 100 -.173 -.014
----------------------------------------------------------------------------------------------------------
DOW 48.3 .42 47.05 131.9% ------- RED 62 -.16 .061
----------------------------------------------------------------------------------------------------------
GS 203.6 2.51 200.97 65.6% Bearish BLUE 58 -.095 -.062
----------------------------------------------------------------------------------------------------------
HD 282.79 6.32 277.71 91.2% ------- BLUE 154 .087 -.006
----------------------------------------------------------------------------------------------------------
HON 171.55 4.66 164.61 209.2% Bullish BLUE 108 -.056 .057
----------------------------------------------------------------------------------------------------------
IBM 124.07 2.1 121.67 98.8% Bullish BLUE 111 -.149 -.075
----------------------------------------------------------------------------------------------------------
INTC 52.67 1.3 51.78 86.2% Bullish BLUE 91 .014 -.002
----------------------------------------------------------------------------------------------------------
JNJ 147.88 1.62 148.88 -33.9% Bearish BLUE 117 -.086 -.065
----------------------------------------------------------------------------------------------------------
JPM 99.73 1.71 96.27 177.2% ------- BLUE 23 -.03 -.047
----------------------------------------------------------------------------------------------------------
KO 49.56 .62 49.37 19.3% Bearish BLUE 89 -.081 -.043
----------------------------------------------------------------------------------------------------------
MCD 226.48 2.39 219.49 157.2% Bullish BLUE 139 -.057 .082
----------------------------------------------------------------------------------------------------------
MMM 166.49 4.26 160.18 196.1% Bearish BLUE 102 -.192 0
----------------------------------------------------------------------------------------------------------
MRK 80.04 .41 82.95 -179.1% Bearish ---- 96 -.05 -.068
----------------------------------------------------------------------------------------------------------
MSFT 209.83 3.92 210.33 -12% ------- BLUE 156 -.002 -.033
----------------------------------------------------------------------------------------------------------
NKE 130.06 2.41 125.54 178.1% Bullish BLUE 136 -.099 .279
----------------------------------------------------------------------------------------------------------
PG 140.7 1.09 138.99 61.5% Bullish BLUE 97 .004 .028
----------------------------------------------------------------------------------------------------------
TRV 113.8 2.27 108.19 255.9% ------- BLUE 88 -.115 -.083
----------------------------------------------------------------------------------------------------------
UNH 323.17 8.72 311.77 181.6% Bullish BLUE 113 -.039 .006
----------------------------------------------------------------------------------------------------------
V 202.47 2.02 199.97 62% Bearish BLUE 105 -.073 -.043
----------------------------------------------------------------------------------------------------------
VZ 59.61 .15 59.49 10.1% Bearish BLUE 121 -.148 -.035
----------------------------------------------------------------------------------------------------------
WBA 36.49 .54 35.92 79.1% ------- BLUE 79 -.019 -.175
----------------------------------------------------------------------------------------------------------
WMT 140.89 .26 139.91 34.7% ------- RED 126 -.155 -.003
|
Table 2 QUICKSILVER on ETFS - 10/7/20 Bullish = 2 SOXL and TECL
Bearish = 1 OIH
ITRS + IP21>.25 is considered "Bullish"
ETF CLOSE CHANGE PIVOT-PT 5-dma AROC CL-PWR CANDLE IP21 ITRS --------------------------------------------------------------------------------------------- --------------------------------------------------------------------------------------------- DIA 282.92 5.2 278.14 97.4% Bearish BLUE .019 ----- --------------------------------------------------------------------------------------------- SPY 340.76 5.83 337.04 87.3% Bearish BLUE-.021 -.011 --------------------------------------------------------------------------------------------- QQQ 279.92 4.76 282.25 37.4% ------- BLUE .031 .018 --------------------------------------------------------------------------------------------- MDY 359.09 6.16 343.51 291.7% Bullish BLUE .141 -.006 --------------------------------------------------------------------------------------------- IWM 160.04 3.42 152.18 333.4% Bullish BLUE .066 .023 --------------------------------------------------------------------------------------------- FAS 37.54 1.74 34.28 521.8% Bearish BLUE-.068 .023 --------------------------------------------------------------------------------------------- SOXL 280.2 15.94 268.91 519.4% Bullish BLUE .091 .299 Bullish --------------------------------------------------------------------------------------------- TECL 312.09 15.84 315.53 103% ------- BLUE .014 .243 Bullish --------------------------------------------------------------------------------------------- IBB 140.99 3.11 136.67 204.1% Bullish BLUE .163 -.051 --------------------------------------------------------------------------------------------- GLD 177.22 -.08 178.7 2.8% Bearish BLUE-.007 -.107 --------------------------------------------------------------------------------------------- OIH 99.66 1.02 94.21 100% Bearish BLUE-.158 -.295 Bearish --------------------------------------------------------------------------------------------- |
    Count of Stocks in Key Directories
          20201007
-------------------------------
NEWHIGHS       283
NEWLOWS        41
MAXCP          55
MINCP          20
TTTNH          49
TTTNL          23
FASTUP         224
FASTDOWN       20
CPCROSSA       62
CPCROSSD       58
BIGVOLUP       8
BIGVODN        7
ACCUMVER       130
HIGHIP21       16
HIUPPCT        35
REDSELL        85
AUGSELS7       58
TRAPDOOR       12
|
Table 4  RANKING OF KEY DIRECTORIES BASED PCT.OF STOCKS ABOVE 65-DMA
              10/7/20
Bullish = 35
Bearish = 7
---------------------------------------------------------------------------------------
Directory     Current       day-1         day-2         day-3         day-4         day-5
----------------------------------------------------------------------------------------
SOLAR          .916          .916          .916          .916          .916          .833
HOMEBLDG       .882          .882          .882          .764          .764          .764
TRANSP         .8            .7            .8            .8            .65           .65
AUTO           .769          .666          .692          .615          .589          .487
DJI-13         .769          .615          .769          .461          .538          .615
GREEN          .761          .714          .714          .571          .619          .523
HOSPITAL       .761          .571          .619          .571          .428          .428
INDEXES        .755          .704          .744          .63           .659          .573
INFRA          .742          .6            .685          .6            .571          .485
COAL           .714          .571          .571          .571          .571          .571
CHEM           .708          .645          .666          .562          .52           .458
DOWJONES       .7            .566          .7            .5            .6            .633
NASD-100       .68           .53           .63           .47           .67           .56
RETAIL         .673          .612          .673          .612          .653          .612
SP500          .668          .573          .632          .542          .531          .512
GUNS           .666          .666          .733          .733          .6            .533
NIFTY          .666          .511          .644          .466          .666          .533
UTILITY        .657          .631          .552          .552          .526          .421
COMPUTER       .65           .55           .5            .5            .5            .55
RUS-1000       .647          .564          .599          .504          .472          .432
JETS           .642          .5            .714          .714          .571          .428
SP-100         .637          .505          .593          .461          .494          .516
COMODITY       .634          .414          .487          .463          .439          .56
INDMATER       .626          .533          .586          .506          .506          .453
FINANCE        .625          .45           .512          .4            .287          .25
FOOD           .615          .48           .538          .48           .48           .557
REGBANKS       .615          .5            .461          .192          .115          .115
ELECTRON       .612          .517          .517          .442          .476          .387
FIDSTKS        .594          .497          .588          .502          .508          .52
SEMI           .586          .49           .5            .423          .5            .394
BEVERAGE       .571          .428          .571          .5            .571          .428
BIGBANKS       .571          .142          .285          0             0             0
SOFTWARE       .55           .483          .466          .4            .483          .416
BIOTECH        .525          .448          .456          .322          .392          .336
GAMING         .523          .428          .523          .476          .523          .476
ETFS           .517          .428          .553          .375          .428          .321
============================================================================================
CHINA          .5            .52           .52           .46           .52           .46
COPPER         .5            .25           .25           .375          .125          .5
INSURANC       .5            .423          .538          .423          .307          .384
============================================================================================
REIT           .475          .51           .56           .517          .347          .241
HACKERS        .35           .15           .15           .05           .25           .1
EDU            .333          .333          .333          .333          .333          .333
MILITARY       .25           .214          .321          .178          .178          .214
OILGAS         .222          .182          .182          .166          .166          .134
BONDFUND       .207          .217          .227          .267          .297          .257
GOLD           .142          .102          .224          .183          .244          .224
|
========================================================================
10/6/2020 The
Peerless-2020 system remains on Sells.
Stay hedged as previously suggested. Buy BABA.
Expect more erratic moves by the market. The market is on QE-Infinity
steroids and thinks it is invincible. A DJI move above 29600 in November
would be in keeping with the tendency of the market to allow partisans a
chance to celebrate. But the technicals now show any rally must fight through
the large supply of stock overhead as well as the the erratic and contradictory
statements coming from the White House. I believe we can make money with
much less anxiety from now to November by hedging.
Though the A/D Line is strong our Accumulation Index is negative for the DJI
and quite a few important stocks that are facing stiff resistance from their
head/shoulders' right shoulder apexes. This remains a good time to avoid the
DIA, SPY, QQQ and NASDAQ indexes and their ETFs. An October
downside surprise still may still lay ahead, though it's looking more and more
that Wall Street will want to celebrate a Biden victory, given that's whom their
"big money" is backing.
|
DJIA - Peerless - 2020 signals
|
DIA |

Continue to stay hedged by being long the solar powered stocks and TAN
(their ETF), CRM (our DJIA-30 Tahiti stock) and a long new recommendation
that represents an escape from much of the craziness right now, Chinese internet
giant BABA. At the same time, stay short the bearish Oil stocks, like XOM,
CVX, BP and the ETF OIH.
BULLISH
 |
 |
BEARISH OILS TO USE HEDGING
 |
 |
STOCKS WITH HEAD and SHOULDERS PATTERNS AND RED
DISTRIBUTION.
As long as the prices below do not close above the resistance
lines shown, there is still considerable
risk in the market. A Biden victory may bring a anti-Trump
partisan celebration, but once
that is over, the realites of Biden's very different political
agenda should start to spook the
market. Trump over-night swich back to backing a new relief
stimulus may be a sign of instability
that probably derives from his illness and the steroid treatments
he is getting. If so, there may
be more wild moves ahead for the market.
 |
 |
 |
======================================================================
10/6/2020
Today the
majority of all stocks (about 6000) are now above their 65-dma
What's going on? The bearish month of September produced only a slight
decline. This is bullish. Moreover, the DJI's rise is now being fueled
by both
Opening and Closer Power rising. The A/D Line's rise continues strongly.
The P-Indicator has turned positive.
But the Accumulation Index remains negative, so a new Sell S12 could
occur if the current rally keeps going. But the strength here is building, as
though it is inviting the Democrats to celebrate a November victory or to
give Republicans one more chance to get out before taxes are raised. Either
way, the DJI's strength must be taking into account a Biden victory. That
means more new highs by the ETF TAN and the solar power stocks in
the Bullish MAXCPs. Oil stocks are still the obvious shorts, for now.

2006-Version of Peerless disregards normal bearish seasonality of September.
2020 version of Peerless gave no Buys in September because of normally
bearish seasonality. A defeat of Trump in November is now being looked
forward to by much of Wall Street. I say that based on the behavior now
of the market, itself, and because of Wall Street's big campaign contributions
to Biden. Meanwhile, the FED wants to fulfull its promise of a DJI new high
by Election time, or perhaps sooner, using QE-Infinity.


I suggested that the big banks were at a pivotal point, their 65-dma. Their
advance Monday has to be bullishly construed. Several categories of stocks
are about to breakout: casinos, guns stocks (sporting goods) an Chinese
stocks. We will look at those tomorrow night.
Stay hedged, long CRM (the highest AI/200 stock in the DJI) and the solar power
stocks. We will be watching sporting good stocks and Chinese stocks making
new highs for possible buy recommendations.


|
Charts 10/5/2020 (Click on Underlined link.) 2020 PEERLESS DJI, Signals, Indicators Daily DJI Volume 10-DayUp/Down Vol Stoch-20 Inverted Traders Index Graph of Pct of All Stocks above 65-dma Cum. Inverted Traders Index NASDAQ S&P OEX NYSE COMPQX DJI-15 DJI-20 DJI-30 DIA QQQ MDY IWM TNA Short-Term Rates DOLLAR-UUP SPY http://tigersoft.com/2121CST/SPY.GIF recent 2006 vers-Peerless signals -- http://tigersoft.com/NEWPEER/UPD6105.BMP USO-CrudeOil DBO FAS GLD BBH IBB JETS JNUG KOL NUGT OIH PALL RSX RETL SDS AGQ SLV SOXL TECL TLT TMF TNA UGA (gasoline) USO (oil) and China: YINN CHAU Commodities: CANE CORN DBC JJC, NIB, CHOC CORN, CUT (paper) MOO, SOYB WEAT UUP (Dollar) LIT (Lithium) Stocks AAPL ADBE ALXN AMAT AMGN AMD AMZN AXP BA BABA BAC BIDU BLDP CAT CRM CVX CMG DE ENPH FB GILD GOOG GS HD IBM INTU JPM LRCX M (Macy's) MSFT NEM NFLX NKE NVDA PG REGN REV SO SQ QCOM QDEL TSLA TXN XOM V VRTX WFC WMT TOWN ZM New highs and Bullish MAXCPs http://tigersoft.com/MAXCP/10-5/BULLISH.htm Bearish MAXCPs - http://tigersoft.com/MINCP/10-5/BEARISH.htm |
 Table 1
             10/5/2018   QUICKSILVER on DJI-30 STOCKS.
P21 + ITRS score >+.25 is bullish
             0  Bullish
             4  Bearish (CSCO,  CVX, IBM, TRV)
HIGHEST AI/200 = CRM Second Highest Tied = AAPL and MSFT STOCKS CLOSECHANGE PIVOT-PT 5-dma AROC CL-PWR CANDLE AI/200 IP21 ITRS
-------------------------------------------------------------------------------------------------------
-------------------------------------------------------------------------------------------------------
AAPL 116.5 3.48 114.96 67% ------- BLUE 159 -.026 .194
----------------------------------------------------------------------------------------------------------
AMGN 256.01 10.6 247.03 179.6% Bullish BLUE 134 .086 -.031
----------------------------------------------------------------------------------------------------------
AXP 103.89 2.28 98.82 253.6% Bullish BLUE 102 -.096 .026
----------------------------------------------------------------------------------------------------------
BA 171.2 3.12 166.08 154.1% Bullish BLUE 33 -.009 -.078
----------------------------------------------------------------------------------------------------------
CAT 153.49 3.55 147.68 196% ------- BLUE 122 -.075 .052
----------------------------------------------------------------------------------------------------------
CRM 251.53 3.68 246.67 97.5% Bearish BLUE 193 -.062 .271
----------------------------------------------------------------------------------------------------------
CSCO 38.57 .3 39.13 -71.9% Bearish ---- 119 -.109 -.232
Bearish
----------------------------------------------------------------------------------------------------------
CVX 72.7 1.51 73.93 -85.5% Bearish BLUE 77 -.125 -.257
Bearish
----------------------------------------------------------------------------------------------------------
DIS 123.37 .82 125.99 -105.4% Bearish ---- 100 -.158 -.015
----------------------------------------------------------------------------------------------------------
DOW 48.58 1.27 47.48 117.3% Bullish BLUE 64 -.114 .077
----------------------------------------------------------------------------------------------------------
GS 201.8 1.9 199.07 68.6% Bearish RED 59 -.1 -.062
----------------------------------------------------------------------------------------------------------
HD 282.1 2.79 272.33 177.1% Bullish BLUE 153 .123 0
----------------------------------------------------------------------------------------------------------
HON 168.72 3.11 164.64 123.9% Bearish BLUE 108 -.066 .066
----------------------------------------------------------------------------------------------------------
IBM 122.01 1.44 121.73 11.6% Bearish BLUE 111 -.201 -.094
Bearish
----------------------------------------------------------------------------------------------------------
INTC 51.69 .68 51.43 25.2% Bullish BLUE 91 -.056 -.042
----------------------------------------------------------------------------------------------------------
JNJ 148.23 1.99 147.11 38% Bearish BLUE 119 -.151 -.063
----------------------------------------------------------------------------------------------------------
JPM 99.04 1.15 96.16 149.2% ------- BLUE 24 -.042 -.056
----------------------------------------------------------------------------------------------------------
KO 49.38 .02 49.28 10.2% Bearish RED 91 -.077 -.045
----------------------------------------------------------------------------------------------------------
MCD 226.07 3.4 220.26 132% Bullish BLUE 141 -.064 .074
----------------------------------------------------------------------------------------------------------
MMM 162.75 2.39 161.66 34% Bearish BLUE 104 -.2 -.045
----------------------------------------------------------------------------------------------------------
MRK 81.24 .44 82.76 -92.7% Bearish ---- 98 -.072 -.01
----------------------------------------------------------------------------------------------------------
MSFT 210.38 4.19 209.44 22.5% Bearish BLUE 158 -.039 -.018
----------------------------------------------------------------------------------------------------------
NKE 127.91 1.27 124.32 142.6% Bullish BLUE 138 -.075 .236
----------------------------------------------------------------------------------------------------------
PG 139.39 1.27 138.01 49.9% ------- BLUE 98 -.015 .043
----------------------------------------------------------------------------------------------------------
TRV 111.91 3.33 110.22 77.9% ------- BLUE 90 -.15 -.117
Bearish
----------------------------------------------------------------------------------------------------------
UNH 318.15 6.17 303.23 241.5% Bearish BLUE 115 -.044 -.006
----------------------------------------------------------------------------------------------------------
V 203.54 2.08 200.32 80.1% Bearish BLUE 107 -.116 -.021
----------------------------------------------------------------------------------------------------------
VZ 59.66 .42 59.36 25.3% Bearish ---- 123 -.193 -.014
----------------------------------------------------------------------------------------------------------
WBA 36.62 .85 36.07 76.8% Bearish BLUE 79 -.061 -.16
----------------------------------------------------------------------------------------------------------
WMT 141.8 1.3 137.25 163% ------- BLUE 127 -.165 .017
|
Table 2 QUICKSILVER on ETFS - 10/5/20 Bullish = 2 SOXL, TECL
Bearish = 1 OIH
ITRS + IP21>.25 is considered "Bullish"
ETF CLOSE CHANGE PIVOT-PT 5-dma AROC CL-PWR CANDLE IP21 ITRS --------------------------------------------------------------------------------------------- --------------------------------------------------------------------------------------------- DIA 281.51 4.71 274.42 101.4% ------- BLUE .007 0 --------------------------------------------------------------------------------------------- SPY 339.76 5.92 332.37 83.3% ------- BLUE-.037 -.005 --------------------------------------------------------------------------------------------- QQQ 280.16 5.85 275.95 53.3% ------- BLUE .01 .033 --------------------------------------------------------------------------------------------- MDY 354.68 8.16 336.66 234.6% Bullish BLUE .137 -.012 --------------------------------------------------------------------------------------------- IWM 157.07 4.22 149.34 233.7% Bullish BLUE .08 .012 --------------------------------------------------------------------------------------------- FAS 36.86 1.82 32.87 418.9% ------- BLUE-.039 .014 --------------------------------------------------------------------------------------------- SOXL 268.85 23.91 252.85 355.9% Bullish BLUE .072 .291 Bullish --------------------------------------------------------------------------------------------- TECL 310.93 19.69 298.39 155.9% ------- BLUE .006 .259 Bullish --------------------------------------------------------------------------------------------- IBB 139.57 5.7 134.61 188.5% Bullish BLUE .166 -.04 --------------------------------------------------------------------------------------------- GLD 179.41 .87 178.19 76.2% Bearish BLUE .066 -.06 --------------------------------------------------------------------------------------------- OIH 100.13 3.38 98.46 -52.7% Bearish BLUE-.188 -.306 Bearish --------------------------------------------------------------------------------------------- |
  Table 3  Count of Stocks in Key Directories
            20201005
-------------------------------
NEWHIGHS       242
NEWLOWS        44
MAXCP          70
MINCP          5
TTTNH          48
TTTNL          8
FASTUP         143
FASTDOWN       26
CPCROSSA       60
CPCROSSD       43
BIGVOLUP       4
BIGVODN        9
ACCUMVER       127
HIGHIP21       18
HIUPPCT        34
REDSELL        76
AUGSELS7       23
TRAPDOOR       12
|
 Tablle 4  RANKING OF KEY DIRECTORIES BASED PCT.OF STOCKS ABOVE 65-DMA
              10/5/20
 Bullish = 32
 Bearish = 12
---------------------------------------------------------------------------------------
Directory     Current       day-1         day-2         day-3         day-4         day-5
----------------------------------------------------------------------------------------
HOMEBLDG       .882          .764          .764          .764          .764          .764
SOLAR          .8            .8            .733          .733          .666          .666
TRANSP         .8            .8            .65           .65           .65           .75
DJI-13         .769          .461          .538          .615          .461          .461
INDEXES        .74           .627          .655          .587          .508          .559
GUNS           .733          .733          .6            .533          .533          .533
GREEN          .714          .571          .619          .571          .476          .523
JETS           .714          .714          .571          .428          .428          .714
DOWJONES       .7            .5            .6            .633          .466          .566
AUTO           .692          .615          .589          .487          .435          .461
INFRA          .685          .6            .571          .457          .457          .514
RETAIL         .673          .612          .653          .632          .571          .632
CHEM           .666          .562          .52           .5            .5            .479
NIFTY          .644          .466          .666          .6            .533          .533
SP500          .634          .544          .531          .514          .464          .512
NASD-100       .63           .47           .67           .58           .57           .59
HOSPITAL       .619          .571          .476          .476          .333          .19
RUS-1000       .601          .506          .473          .437          .403          .455
SP-100         .593          .461          .494          .527          .461          .494
FIDSTKS        .59           .505          .511          .528          .471          .511
INDMATER       .586          .506          .506          .466          .506          .506
BEVERAGE       .571          .5            .571          .428          .428          .428
COAL           .571          .571          .571          .571          .571          .857
REIT           .56           .517          .347          .234          .241          .382
ETFS           .553          .375          .428          .321          .214          .267
UTILITY        .552          .552          .526          .421          .315          .394
FOOD           .538          .48           .48           .557          .538          .538
INSURANC       .538          .423          .307          .384          .346          .384
GAMING         .523          .476          .523          .476          .523          .619
CHINA          .52           .46           .52           .46           .36           .38
ELECTRON       .517          .442          .476          .394          .435          .408
FINANCE        .512          .402          .292          .256          .195          .317
===============================================================================================
COMPUTER       .5            .5            .5            .55           .55           .5
SEMI           .5            .423          .5            .413          .442          .423
===============================================================================================
COMODITY       .487          .463          .439          .56           .536          .536
SOFTWARE       .483          .416          .483          .416          .366          .4
REGBANKS       .461          .192          .115          .115          .076          .076
BIOTECH        .456          .325          .394          .336          .338          .328
EDU            .333          .333          .333          .333          .333          .333
MILITARY       .321          .178          .178          .214          .25           .285
BIGBANKS       .285          0             0             0             0             0
COPPER         .25           .375          .125          .5            .375          .5
BONDFUND       .227          .267          .297          .267          .247          .257
GOLD           .224          .183          .244          .244          .244          .224
HACKERS .2 .1 .25 .1 .1 .15 OILGAS .182 .158 .158 .142 .166 .158 |
=====================================================================
10/2/2020 Wall Street
seems to be growing infatuated with Biden. But there are
too many technical problems to become really bullish. Above all, the
The multiple Sells from Peerless-2020 have not been reversed. As a result,
hedging is still advised while the DJI decides which way it wants to go in
earnest. Listen for hints from Biden what industry groups he will favor most.
And watch GS and JPM. They are now at the high inflection point of their
65-dma. It is historically difficult for the DJIA to go very far in a direction
different than the one that the big banks are going in. Usually, a Democrat
replacing a Republican brings more weakness that we have seen this Autumn.
Note that all the DJI's key values are negative.
On the other hand, the NYSE A/D Line is approaching
a breakout into new high ground. The FED is defintely
pushing and shoving the market upwards.


The FED's QE-Infinity, which even as late as Friday helped reverse
the DJI from an early 500-point loss, may have the final say..
As a result, I've suggested hedging by shorting the most bearish OIL
stocks that are actively traded. These do not correlate with rhe DJIA
very well and may decline even if 29500 is reached by the DJIA. See
the bearish MINCPs for the best shorts now.
.
At the same time, I suggested holding long the solar power leaders
that we have been seeing among the the bullish MAXCPs for weeks.
This divergence is also a bet on a Biden victory, something which
Wall Street seems more and more content with.
Trump's slipping poll numbers ought, we might have expected, to weaken the
DJI. After all, it was his tax cuts and de-regulation which rocketted the DJI
up so much in 2017 and 2018. But even his coming down with Covid-19
seems not to worry Wall Street. Apparently, Biden
stands ready to be Wall Street's
friend in the White House, just as Bill Clinton and Obama were. One theory is that
Biden has already made peace with Wall Street. Proof of this is large amount
of money he has received for his 2020 campaign.
https://www.google.com/search?source=hp&ei=Xut6X-fdDoTQ-gTzhouwBQ&q=Biden+campaign+contributions+from+Wall+Street&oq=Biden+campaign+contributions+from+Wall+Street&gs_lcp=CgZwc3ktYWIQAzIFCCEQoAEyBQghEKsCMgUIIRCrAjoOCC4QsQMQxwEQowIQkwI6CwguELEDEMcBEKMCOggILhCxAxCDAToICAAQsQMQgwE6CAguEMcBEKMCOgIILjoFCC4QsQM6CwguELEDEIMBEJMCOgIIADoFCAAQsQM6CAghEBYQHRAeOgcIIRAKEKABUMMgWNh9YL2HAWgAcAB4AIABmQGIAbgdkgEEMzkuNpgBAKABAaoBB2d3cy13aXo&sclient=psy-ab&ved=0ahUKEwjnhLvPlZ3sAhUEqJ4KHXPDAlYQ4dUDCAk&uact=5
Reinforcing this, is Fed Chairman's Powell's apparent promise to keep rates
low well past 2020 in return for Biden's not challenging the legality of
QE-Infinity.
Some of you remember how well the the DJI did in 2009 with Obama taking
over the White House. He also got lots of Wall Street campaign contributions
in 2008 and, as a result, refused to prosecute a single Wall Street CEO for fraud from
his White House. The result was the long bull market that he hosted from March
2009 to the 2016 Election.
The Democrats can work well with Wall Street. Recall how the strong backing
of Goldman Sachs and Citibank got Bill Clinton elected in 1992. A bull market
began immediately afterwards and did not pause until the Fed raised interest rates
in February 1994, only to take off again quite wildly as the internet boom began.
And, lest we forget, it was the Democrat Woodrow Wilson that delivered the
Federal Reserve in December 1913 to better regulate, he said, the "money trust".
.
But I worry that Wall Street's bulls may be counting on Biden too much. Can
Biden and Nancy Pelosi really control the progressive Democrats and the social
democrats in his party? In 1912, Wall Street bulls failed to start dumping
shares
until the start of October even though Wilson's "New Freedom" agenda was
know
two months earlier. Only in Ocotber did the DJI start to fall 17% over the next
seven
months. So, sometimes, Wall Street lives in a bubble and underestimates for too long
just how unpopular they are on much of Main Street. That was true in 1912.
Will it
be true in 2020? Or do they feel their position is so secure, being disliked is not
a
problem. .

The bulls, I'm saying, may not be able to
hold up the market much longer. Supporting
that contention:
Table 1 below shows seven "bearish" DJI-30 stocks and not a single
"bullish"
one now. With the NASDAQ's relative strength "NASDJI" weakening, it will
be
up to a fairly weak DJI to hold up the market. But all its key values now are
negative.

Table 2 below shows none of the major ETFS are rated "bullish". "
Table 4 below shows more groupings of stocks that are rate bearish because the
majority of their stocks are below their 65-dma than above.
Watch JPM and GS to see if they can punch past their flat 65-dma. They still
show steady red distribution. Bank stocks are closely correlated with
what
happens to the DJIA.
 |
 |
|
Charts 10/2/2020 (Click on Underlined link.) 2020 PEERLESS DJI, Signals, Indicators Daily DJI Volume 10-DayUp/Down Vol Stoch-20 Inverted Traders Index Graph of Pct of All Stocks above 65-dma Cum. Inverted Traders Index NASDAQ S&P OEX NYSE COMPQX DJI-15 DJI-20 DJI-30 DIA QQQ MDY IWM TNA Short-Term Rates DOLLAR-UUP SPY http://tigersoft.com/2121CST/SPY.GIF recent 2006 vers-Peerless signals -- http://tigersoft.com/NEWPEER/UPD6102.BMP USO-CrudeOil DBO FAS GLD BBH IBB JETS JNUG KOL NUGT OIH PALL RSX RETL SDS AGQ SLV SOXL TECL TLT TMF TNA UGA (gasoline) USO (oil) and China: YINN CHAU Commodities: CANE CORN DBC JJC, NIB, CHOC CORN, CUT (paper) MOO, SOYB WEAT UUP (Dollar) LIT (Lithium) Stocks AAPL ADBE ALXN AMAT AMGN AMD AMZN AXP BA BABA BAC BIDU BLDP CAT CRM CVX CMG DE ENPH FB GILD GOOG GS HD IBM INTU JPM LRCX M (Macy's) MSFT NEM NFLX NKE NVDA PG REGN REV SO SQ QCOM QDEL TSLA TXN XOM V VRTX WFC WMT TOWN ZM New highs and Bullish MAXCPs http://tigersoft.com/MAXCP/10-2/BULLISH.htm Bearish MAXCPs - http://tigersoft.com/MINCP/10-2/BEARISH.htm |
 Table 1
             10/2/2018   QUICKSILVER on DJI-30 STOCKS.
IP21 + ITRS score >+.25 is bullish
             0  Bullish (CRM)
             8  Bearish (CSCO,  CVX, IBM, INTC, JNJ, MMM, TRV WBA)
HIGHEST AI/200 = CRM Second Highest Tied = AAPL and MSFT STOCKS CLOSECHANGE PIVOT-PT 5-dma AROC CL-PWR CANDLE AI/200 IP21 ITRS
-------------------------------------------------------------------------------------------------------
-------------------------------------------------------------------------------------------------------
AAPL 113.02 -3.77 112.28 32.2% ------- BLUE 160 -.111 .179
----------------------------------------------------------------------------------------------------------
AMGN 245.41 -9.98 243.82 31.8% Bearish RED 134 -.003 -.065
----------------------------------------------------------------------------------------------------------
AXP 101.61 .28 96.26 270.5% Bullish BLUE 103 -.169 .013
----------------------------------------------------------------------------------------------------------
BA 168.08 .22 156.03 367.9% ------- BLUE 33 -.083 -.085
----------------------------------------------------------------------------------------------------------
CAT 149.94 3.23 145.91 136.7% Bullish BLUE 123 -.118 .06
----------------------------------------------------------------------------------------------------------
CRM 247.85 -5.6 242.74 102.9% ------- RED 194 -.056 .277
----------------------------------------------------------------------------------------------------------
CSCO 38.27 -.53 38.45 -23.1% Bearish BLUE 119 -.15 -.231
BEARISH
----------------------------------------------------------------------------------------------------------
CVX 71.19 .77 71.83 -44.4% Bearish BLUE 77 -.204 -.256
BEARISH
----------------------------------------------------------------------------------------------------------
DIS 122.55 -.76 124 -58.2% Bearish BLUE 100 -.208 0
----------------------------------------------------------------------------------------------------------
DOW 47.31 1.2 46.04 136.1% ------- BLUE 65 -.163 .067
----------------------------------------------------------------------------------------------------------
GS 199.9 1.35 194.95 125% Bearish BLUE 60 -.14 -.053
----------------------------------------------------------------------------------------------------------
HD 279.31 1.69 268.55 196.6% Bearish BLUE 152 .049 .021
----------------------------------------------------------------------------------------------------------
HON 165.61 1.93 161.49 125.8% Bearish BLUE 108 -.126 .039
----------------------------------------------------------------------------------------------------------
IBM 120.57 -.52 118.95 67% Bearish BLUE 111 -.252 -.091
Bearish
----------------------------------------------------------------------------------------------------------
INTC 51.01 -1.23 49.94 104.3% ------- RED 91 -.13 -.193
BEARISH
----------------------------------------------------------------------------------------------------------
JNJ 146.24 -1.08 145.66 19.7% Bearish ---- 120 -.217 -.06
BEARISH
----------------------------------------------------------------------------------------------------------
JPM 97.89 .92 93.47 231.1% ------- BLUE 25 -.109 -.049
----------------------------------------------------------------------------------------------------------
KO 49.36 .18 48.72 65.2% Bearish BLUE 92 -.121 -.016
----------------------------------------------------------------------------------------------------------
MCD 222.67 3.08 218.18 102.4% Bullish BLUE 142 -.115 .089
----------------------------------------------------------------------------------------------------------
MMM 160.36 1.57 160.27 2.8% Bearish BLUE 105 -.23 -.031
BEARISH
----------------------------------------------------------------------------------------------------------
MRK 80.8 -.84 82.93 -129.2% Bearish ---- 99 -.131 -.003
----------------------------------------------------------------------------------------------------------
MSFT 206.19 -6.27 207.82 -38.9% Bearish RED 159 -.114 -.02
----------------------------------------------------------------------------------------------------------
NKE 126.64 0 124.23 96.1% Bullish BLUE 139 -.119 .25
----------------------------------------------------------------------------------------------------------
PG 138.12 -1.12 137.62 18.1% ------- BLUE 99 -.075 .057
----------------------------------------------------------------------------------------------------------
TRV 108.58 .77 108.11 21.7% Bearish BLUE 91 -.224 -.122
BEARISH
----------------------------------------------------------------------------------------------------------
UNH 311.98 -1.09 302.5 154.4% Bearish RED 116 -.101 -.008
----------------------------------------------------------------------------------------------------------
V 201.46 -1.89 197.25 105.2% Bearish BLUE 108 -.178 -.017
----------------------------------------------------------------------------------------------------------
VZ 59.24 -.21 59.39 -12.6% ------- ---- 124 -.211 .023
----------------------------------------------------------------------------------------------------------
WBA 35.77 -.1 35.43 47.6% Bearish BLUE 79 -.116 -.151
BEARISH
----------------------------------------------------------------------------------------------------------
WMT 140.5 -2.58 137.27 116.2% ------- RED 128 -.183 .029
|
Table 2 QUICKSILVER on ETFS - 09/30/20 Bullish = 0
Bearish = 1 OIH
ITRS + IP21>.25 is considered "Bullish"
ETF CLOSE CHANGE PIVOT-PT 5-dma AROC CL-PWR CANDLE IP21 ITRS --------------------------------------------------------------------------------------------- --------------------------------------------------------------------------------------------- DIA 276.8 -1.34 275.9 92.5% Bearish BLUE-.063 0 --------------------------------------------------------------------------------------------- SPY 333.84 -3.2 334.19 76.6% Bearish BLUE-.107 -.004 --------------------------------------------------------------------------------------------- QQQ 274.31 -7.94 277.2 49.6% Bearish RED -.052 .025 --------------------------------------------------------------------------------------------- MDY 346.52 3.01 338.69 233.5% ------- BLUE .05 -.018 --------------------------------------------------------------------------------------------- IWM 152.85 .67 150.02 215.3% ------- BLUE .006 -.007 --------------------------------------------------------------------------------------------- FAS 35.04 .76 34.01 482.5% ------- BLUE-.114 -.033 --------------------------------------------------------------------------------------------- SOXL 244.94 -23.97 250.76 260.6% ------- RED -.036 .137 --------------------------------------------------------------------------------------------- TECL 291.24 -24.29 301.5 97.7% Bearish RED -.085 .156 --------------------------------------------------------------------------------------------- IBB 133.87 -2.8 134.48 14.8% Bearish RED .053 -.078 --------------------------------------------------------------------------------------------- GLD 178.54 -.16 176.7 101.6% Bearish RED .048 -.03 --------------------------------------------------------------------------------------------- OIH 96.75 2.54 101.16 -31.7% Bearish BLUE-.233 -.306 Bearish --------------------------------------------------------------------------------------------- GASL 3440 285 3685 -325.1% ------- RED -.021 .075 --------------------------------------------------------------------------------------------- |
Table 3
    Count of Stocks in Key Directories
          20201002
-------------------------------
NEWHIGHS       136
NEWLOWS        81
MAXCP          45
MINCP          16
TTTNH          33
TTTNL          9
FASTUP         139
FASTDOWN       24
CPCROSSA       100
CPCROSSD       28
BIGVOLUP       4
BIGVODN        8
ACCUMVER       124
HIGHIP21       12
HIUPPCT        31
REDSELL        74
AUGSELS7       29
TRAPDOOR       14
|
Table 4   RANKING OF KEY DIRECTORIES BASED PCT.OF STOCKS ABOVE 65-DMA
              10/2/20
          Bullish = 19
          Bearish = 24
---------------------------------------------------------------------------------------
Directory     Current       day-1         day-2         day-3         day-4         day-5
----------------------------------------------------------------------------------------
SOLAR          .8            .733          .733          .666          .666          .733
TRANSP         .8            .65           .65           .65           .75           .65
HOMEBLDG       .764          .764          .764          .764          .764          .705
GUNS           .733          .6            .533          .533          .533          .466
JETS           .714          .571          .428          .428          .714          .428
INDEXES        .627          .655          .587          .508          .553          .401
AUTO           .615          .589          .487          .435          .461          .333
RETAIL         .612          .653          .632          .571          .632          .489
INFRA          .6            .571          .457          .457          .514          .457
COAL           .571          .571          .571          .571          .857          .857
GREEN .571 .619 .571 .476 .523 .428 HOSPITAL .571 .476 .476 .38 .19 .19 CHEM .562 .52 .5 .5 .479 .395 UTILITY .552 .526 .421 .315 .394 .394 SP500 .542 .532 .513 .463 .522 .402 REIT .517 .347 .234 .241 .382 .212 INDMATER .506 .506 .466 .506 .506 .48 RUS-1000 .506 .475 .437 .404 .462 .356 FIDSTKS .505 .511 .528 .471 .517 .386 =============================================================================================== BEVERAGE .5 .571 .428 .428 .428 .428 COMPUTER .5 .5 .55 .55 .5 .5 DOWJONES .5 .6 .633 .466 .6 .4 =============================================================================================== FOOD .48 .48 .557 .538 .557 .557 GAMING .476 .523 .476 .523 .619 .571 NASD-100 .47 .67 .58 .57 .6 .4 NIFTY .466 .666 .6 .533 .533 .466 COMODITY .463 .439 .56 .536 .536 .56 DJI-13 .461 .538 .615 .461 .538 .307 SP-100 .461 .494 .527 .461 .505 .373 CHINA .46 .52 .46 .36 .4 .36 ELECTRON .442 .476 .394 .435 .428 .333 INSURANC .423 .307 .384 .346 .384 .269 SEMI .423 .5 .413 .442 .432 .355 SOFTWARE .416 .5 .416 .366 .4 .3 FINANCE .402 .292 .256 .195 .317 .207 COPPER .375 .125 .5 .375 .5 .375 ETFS .375 .428 .321 .214 .303 .125 EDU .333 .333 .333 .333 .333 .166 BIOTECH .325 .394 .336 .338 .33 .29 BONDFUND .267 .297 .267 .247 .257 .207 REGBANKS .192 .115 .115 .076 .076 0 GOLD .183 .244 .244 .244 .224 .204 MILITARY .178 .178 .214 .25 .285 .25 OILGAS .157 .157 .133 .165 .157 .11 HACKERS .1 .3 .1 .1 .15 .1 BIGBANKS 0 0 0 0 0 0 |
====================================================================
10/1/2020 Most likely, we will see a
10% correction in here, after all. The
spookiness of October is on us. That would take the DJI down
to 26000. Peerless-2020 will need to give a Buy signal. Trump's
testing positing for Covid will see to making that prediction "bear"
out, I suspect. Right now we are hedged. The solar stocks and
CRM (AI/200=196) make good longs. Buy more of them on
the decline we will probably see carrying over to next week. Stay
short the many Oil stocks that make up the Bearish MINCPs. Some
of them may even make new year lows. The heavy red Distribution
and falling Closing Power at new lows is a reliably bearish combination.
DJIA - Bearish Head and Shoulders. No new Buys yet from Peerless -
2020 |
DIA - Still rising Opening Power, but negative IP21 and falling Closing
Power. |
DJIA in 1955 - 10% Correction after Ike's heart attack. |
DJI in 1963 - Steep decline to lower price channel when JFK assassinated. |
Somehow the market always seems to know.
Before the Kennedy
assassination in 1963, there was a head/shoulders pattern. Before the
Eisenhower heart attack there were multiple Sells. Now President Trump
very unexpectedly has himself come down with Covid-19. Perhaps,
this will get folks to finally always wear masks in public. Perhaps, this
will end the rampant on-going serial infections here. That would be
a positive for the market. Perhaps, there will not be another debate.
That would be no great loss. Will this affect the likely election of a
President Biden who had a big lead in the polls? Probably not.
It may get the Democrats a few more seats in Congress, if the Dems
can find the right words to take advantage of the President's bad karma.
The market was already getting used to the idea of a
Biden Presidency.
It would be a Presidency like Obama's. Relatively conservative. Certainly,
no national health care. A strong military to combat the Russian bogeymen.
No war on the banks and no quarrel with the Federal Reserve. Definitely
more taxes on the super-wealthy. But lots of new Infrastructire jobs, especially
in the area of solar energy. A faster internet for more Americans. Little
sympathy for oil stocks and lots of spending on solar and wind energy.
Bullish Solar Stocks |
 |
Bearish Oil Stocks |
 |
|
Charts 10/1/2020 (Click on
Underlined link.) 2020 PEERLESS DJI, Signals, Indicators Daily DJI Volume 10-DayUp/Down Vol Stoch-20 Inverted Traders Index Graph of Pct of All Stocks above 65-dma Cum. Inverted Traders Index NASDAQ S&P OEX NYSE COMPQX DJI-15 DJI-20 DJI-30 DIA QQQ MDY IWM TNA Short-Term Rates DOLLAR-UUP SPY http://tigersoft.com/2121CST/SPY.GIF recent 2006 vers-Peerless signals -- http://tigersoft.com/NEWPEER/UPD61012.BMP USO-CrudeOil DBO FAS GLD BBH IBB JETS JNUG KOL NUGT OIH PALL RSX RETL SDS AGQ SLV SOXL TECL TLT TMF TNA UGA (gasoline) USO (oil) and China: YINN CHAU Commodities: CANE CORN DBC JJC, NIB, CHOC CORN, CUT (paper) MOO, SOYB WEAT UUP (Dollar) LIT (Lithium) Stocks AAPL ADBE ALXN AMAT AMGN AMD AMZN AXP BA BABA BAC BIDU BLDP CAT CRM CVX CMG DE ENPH FB GILD GOOG GS HD IBM INTU JPM LRCX M (Macy's) MSFT NEM NFLX NKE NVDA PG REGN REV SO SQ QCOM QDEL TSLA TXN XOM V VRTX WFC WMT TOWN ZM New highs and Bullish MAXCPs http://tigersoft.com/MAXCP/10-1/BULLISH.htm Bearish MAXCPs - http://tigersoft.com/MINCP/10-1/BEARISH.htm |
 Table 1
             10/1/2018   QUICKSILVER on DJI-30 STOCKS.
P21 + ITRS score >+.25 is bullish
             1  Bullish (CRM)
             4  Bearish (CSCO,  CVX, TRV WBA)
HIGHEST AI/200 = CRM Second Highest Tied = AAPL and MSFT STOCKS CLOSECHANGE PIVOT-PT 5-dma AROC CL-PWR CANDLE AI/200 IP21 ITRS ------------------------------------------------------------------------------------------------------- -------------------------------------------------------------------------------------------------------- AAPL 116.79 .98 108.22 379% ------- RED 161 -.101 .17 ---------------------------------------------------------------------------------------------------------- AMGN 255.39 1.23 240.32 305.4% Bearish BLUE 135 .072 -.036 ---------------------------------------------------------------------------------------------------------- AXP 101.33 1.08 95.45 300.9% Bearish BLUE 104 -.159 .019 ---------------------------------------------------------------------------------------------------------- BA 167.86 2.6 146.05 684.1% ------- RED 33 -.094 -.097 ---------------------------------------------------------------------------------------------------------- CAT 146.71 -2.44 145.14 53.4% Bearish RED 124 -.092 .041 ---------------------------------------------------------------------------------------------------------- CRM 253.45 2.13 237.55 324.3% ------- BLUE 195 -.025 .295 +++ ---------------------------------------------------------------------------------------------------------- CSCO 38.8 -.59 37.85 122.5% Bearish RED 119 -.14 -.203 --- ---------------------------------------------------------------------------------------------------------- CVX 70.42 -1.58 71.8 -95.4% Bearish RED 77 -.238 -.257 --- ---------------------------------------------------------------------------------------------------------- DIS 123.31 -.77 122.49 33% Bearish RED 100 -.175 .006 ---------------------------------------------------------------------------------------------------------- DOW 46.11 -.94 46.41 -32.1% Bearish RED 66 -.132 .01 ---------------------------------------------------------------------------------------------------------- GS 198.55 -2.42 195.11 87.1% Bearish RED 61 -.13 -.066 ---------------------------------------------------------------------------------------------------------- HD 277.62 -.09 265.7 219.7% Bearish RED 151 .058 .017 ---------------------------------------------------------------------------------------------------------- HON 163.68 -.93 158.76 151.1% Bearish RED 108 -.086 .028 ---------------------------------------------------------------------------------------------------------- IBM 121.09 -.58 118.09 124.7% Bearish RED 111 -.185 -.089 --- ---------------------------------------------------------------------------------------------------------- INTC 52.24 .46 49.16 303.7% Bullish RED 91 -.051 -.175 ---------------------------------------------------------------------------------------------------------- JNJ 147.32 -1.56 144.67 90.3% Bearish RED 121 -.147 -.048 ---------------------------------------------------------------------------------------------------------- JPM 96.97 .7 92.66 227.4% ------- RED 26 -.104 -.048 ---------------------------------------------------------------------------------------------------------- KO 49.18 -.19 48.7 49% Bearish RED 93 -.076 -.016 ---------------------------------------------------------------------------------------------------------- MCD 219.59 .1 216.12 79.4% Bearish RED 143 -.124 .075 ---------------------------------------------------------------------------------------------------------- MMM 158.79 -1.39 160.42 -50.8% Bearish RED 106 -.179 -.03 ---------------------------------------------------------------------------------------------------------- MRK 81.64 -1.31 83.15 -91.3% Bearish RED 100 -.064 .006 ---------------------------------------------------------------------------------------------------------- MSFT 212.46 2.13 203.19 223.3% Bearish RED 160 -.056 -.027 ---------------------------------------------------------------------------------------------------------- NKE 126.64 1.1 124.75 75.6% Bearish RED 140 -.134 .25 ---------------------------------------------------------------------------------------------------------- PG 139.24 .25 136.92 84.2% ------- RED 100 -.045 .074 ---------------------------------------------------------------------------------------------------------- TRV 107.81 -.38 107.82 -.5% Bearish RED 92 -.195 -.148 --- ---------------------------------------------------------------------------------------------------------- UNH 313.07 1.3 292.66 337% Bearish BLUE 117 -.056 -.009 ---------------------------------------------------------------------------------------------------------- V 203.35 3.38 195.52 197.2% Bearish BLUE 109 -.153 -.008 ---------------------------------------------------------------------------------------------------------- VZ 59.45 -.04 59.19 21.9% Bullish ---- 125 -.138 .036 ---------------------------------------------------------------------------------------------------------- WBA 35.87 -.05 35.03 118.1% Bearish ---- 79 -.126 -.149 --- ---------------------------------------------------------------------------------------------------------- WMT 143.08 3.17 136.7 231.7% ------- BLUE 129 -.171 .048 |
Table 2 QUICKSILVER on ETFS - 10/1/20 Bullish = 0
Bearish = 1 OIH
ITRS + IP21>.25 is considered "Bullish"
ETF CLOSE CHANGE PIVOT-PT 5-dma AROC CL-PWR CANDLE IP21 ITRS --------------------------------------------------------------------------------------------- --------------------------------------------------------------------------------------------- DIA 278.14 .64 271.7 183.5% Bearish RED -.056 ---- --------------------------------------------------------------------------------------------- SPY 337.04 2.15 328.73 204.7% Bearish RED -.08 .001 --------------------------------------------------------------------------------------------- QQQ 282.25 4.41 271.56 308.1% ------- BLUE .023 .035 --------------------------------------------------------------------------------------------- MDY 343.51 4.68 330.75 259.1% ------- BLUE .037 -.018 --------------------------------------------------------------------------------------------- IWM 152.18 2.39 146.41 274.1% ------- BLUE-.011 -.003 --------------------------------------------------------------------------------------------- FAS 34.28 .41 31.82 529.4% Bearish RED -.108 -.052 --------------------------------------------------------------------------------------------- RETL 234.12 17.68 207.15 741.5% Bearish BLUE-.053 .224 --------------------------------------------------------------------------------------------- SOXL 268.91 15.72 231.83 963.6% ------- BLUE .052 .2 --------------------------------------------------------------------------------------------- TECL 315.53 9.7 285.35 856% Bearish RED -.022 .162 --------------------------------------------------------------------------------------------- IBB 136.67 1.26 133.47 223.6% ------- BLUE .115 -.068 --------------------------------------------------------------------------------------------- GLD 178.7 1.58 174.94 92.4% Bearish ---- .056 -.013 --------------------------------------------------------------------------------------------- OIH 94.21 -3.5 97.37 -266.1% Bearish RED -.281 -.295 Bearish --------------------------------------------------------------------------------------------- GASL 3440 285 3685 -325.1% ------- RED -.021 .083 --------------------------------------------------------------------------------------------- |
  Table 3   Count of Stocks in Key Directories
          20201001
-------------------------------
NEWHIGHS       171
NEWLOWS        61
MAXCP          28
MINCP          69
TTTNH          17
TTTNL          57
FASTUP         156
FASTDOWN       24
CPCROSSA       67
CPCROSSD       79
BIGVOLUP       4
BIGVODN        5
ACCUMVER       123
HIGHIP21       10
HIUPPCT        37
REDSELL        72
AUGSELS7       39
TRAPDOOR       13
|
 Table 4 RANKING OF KEY DIRECTORIES BASED PCT.OF STOCKS ABOVE 65-DMA
              10/1/20
 Bullish = 23
 Bearish = 20
---------------------------------------------------------------------------------------
Directory     Current       day-1         day-2         day-3         day-4         day-5
----------------------------------------------------------------------------------------
HOMEBLDG       .764          .764          .764          .764          .705          .705
SOLAR          .733          .733          .666          .666          .733          .666
NASD-100       .67           .58           .57           .6            .42           .29
NIFTY          .666          .6            .533          .533          .466          .333
INDEXES        .655          .587          .508          .553          .429          .265
RETAIL .653 .632 .571 .632 .489 .489 TRANSP .65 .65 .65 .75 .65 .65 GREEN .619 .571 .476 .523 .428 .38 DOWJONES .6 .633 .466 .6 .4 .4 GUNS .6 .533 .533 .533 .466 .466 AUTO .589 .487 .435 .461 .358 .333 BEVERAGE .571 .428 .428 .428 .428 .357 COAL .571 .571 .571 .857 .857 .857 INFRA .571 .457 .457 .514 .457 .457 JETS .571 .428 .428 .714 .428 .428 DJI-13 .538 .615 .461 .538 .307 .307 SP500 .531 .514 .462 .52 .41 .345 UTILITY .526 .421 .315 .394 .394 .289 GAMING .523 .476 .523 .619 .571 .571 CHEM .52 .5 .5 .479 .395 .395 CHINA .52 .46 .36 .4 .36 .38 FIDSTKS .508 .525 .468 .514 .395 .322 INDMATER .506 .466 .506 .506 .48 .453 ============================================================================================= COMPUTER .5 .55 .55 .5 .5 .45 SEMI .5 .413 .442 .432 .365 .326 SOFTWARE .5 .433 .366 .4 .3 .216 ============================================================================================= SP-100 .494 .527 .461 .505 .373 .34 FOOD .48 .557 .538 .557 .538 .538 ELECTRON .476 .394 .435 .428 .34 .285 HOSPITAL .476 .476 .38 .238 .19 .19 RUS-1000 .474 .438 .403 .461 .361 .303 COMODITY .439 .56 .536 .536 .536 .536 ETFS .428 .321 .214 .303 .125 .125 BIOTECH .393 .334 .336 .328 .288 .219 REIT .347 .234 .241 .382 .212 .113 EDU .333 .333 .333 .333 .166 .166 INSURANC .307 .384 .346 .384 .269 .153 HACKERS .3 .15 .1 .15 .1 .05 BONDFUND .297 .267 .247 .257 .217 .178 FINANCE .292 .256 .195 .317 .207 .146 GOLD .244 .244 .244 .224 .204 .224 MILITARY .178 .214 .25 .285 .25 .107 OILGAS .157 .133 .157 .157 .11 .118 COPPER .125 .5 .375 .5 .5 .625 REGBANKS .115 .115 .076 .076 0 0 BIGBANKS 0 0 0 0 0 0 |
======================================================================
9/30/2020 The Market Seems To Like
Biden. He does have a reputation as
being a "corporate Democrat" and a conservative. Is he
most like Clinton in 1992 among the Democrats who took back
the White House in the past from a Republican? That would
be bullish. But another shakeout seems likely. The DJI's Head/
Shoulders pattern still stands as a warning.
The market, or at least the major indexes are taking to Biden. In
Tuesday night's debate, Biden did not criticize or attack the
big banks, the medical insurance companies or the high prices
of big Pharma's drugs in the US. In the DJI-30, that's good news
for GS, JPM, UTX. AMGN and MRK
He assured Trump that he was "no
socialist". He would not bring
about a national health insurance program like Medicare for all.
He did not criticize the FED's bailout of big corporations and big banks.
He avoided the subject of military spending. As expected, he claimed
he wanted to reduce the country's use of carbon-based energies and
expand the use of electric cars and alternative energies. He made no
mention of nuclear power.
Solar Stocks leading now. |
 |
More and more, his lead in the polls seems insurmountable. All this
means that the 2020 Presidential Election race seems more like
Clinton's in 1992 than any other case in the past where a Democrat
won the White House from a Republican. In 1992, Clinton was
really Goldman Sach's candidate, as much as he was anyone else's.
Clinton had been carefully groomed by them. Their payoff in office
was Clinton's strong support of banking de-regulation, NAFTA and
welfare "tightening". Look below and see how the DJI behaved in the
last three months of 1992. Perhaps, this will be the best guide for 2020.
DJI 1992-1993 |
DJI -1912-1913 |
The case of Woodrow Wilson (above) might still be
examined.
JP Morgan's associates played a big role in making Wilson a national
figure ready for the White House by running a series of stories on him in
a Morgan controlled weekly magazine, Harper's (I believe). Morgan
also financially backed both Teddy Roosevelt's and Wilson's
run for the Presidency. As Morgan desired, Roosevelt's Progressive campaign
split the Republican vote and thus ensured Wilson, who was the only candidate
in favor of a new national bank, would get the most Electoral College
votes. In Wilson's case in 1912, the stock market peaked at the
end of September but kept falling the next year because of Wilson's other
"New Freedom" progressive agenda.
Peerless - 2020 |
| DIA's Opening Power remains in a strong uptrend. It has been
dominant over Closing Power. This is a relatively new phenomenon.  |
Peerless-2020 (above) still shows sells. The DJI's head/shoulders pattern has
also not been voided. On that basis, we have been short oil and
big bank stocks and long CRM and the solar energy stocks that
are booming leaders now ahead of a presumed Biden alternative
energy boom. Hedging like this has been nicely profitable. Why
change now? Biden is still ahead in the polls.
The Peerless-2006 (Below) which does not use
Presidential Election year
seasonality remains bullish. But before 2016, its September Peerless Buys
would have failed time after time. But this is no normal Presidential Election year
and typical seasonality has not worked against QE-Infinity..
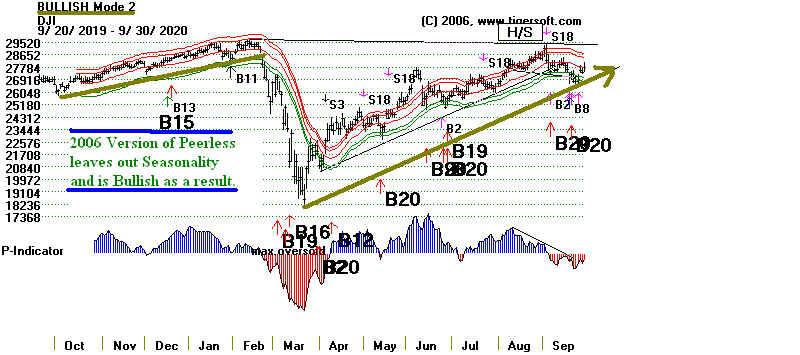
|
Charts 9/30/2020 (Click on Underlined link.) 2020 PEERLESS DJI, Signals, Indicators Daily DJI Volume 10-DayUp/Down Vol Stoch-20 Inverted Traders Index Graph of Pct of All Stocks above 65-dma Cum. Inverted Traders Index NASDAQ S&P OEX NYSE COMPQX DJI-15 DJI-20 DJI-30 DIA QQQ MDY IWM TNA Short-Term Rates DOLLAR-UUP SPY http://tigersoft.com/2121CST/SPY.GIF recent 2006 vers-Peerless signals -- http://tigersoft.com/NEWPEER/UPD6930.BMP USO-CrudeOil DBO FAS GLD BBH IBB JETS JNUG KOL NUGT OIH PALL RSX RETL SDS AGQ SLV SOXL TECL TLT TMF TNA UGA (gasoline) USO (oil) and China: YINN CHAU Commodities: CANE CORN DBC JJC, NIB, CHOC CORN, CUT (paper) MOO, SOYB WEAT UUP (Dollar) LIT (Lithium) Stocks AAPL ADBE ALXN AMAT AMGN AMD AMZN AXP BA BABA BAC BIDU BLDP CAT CRM CVX CMG DE ENPH FB GILD GOOG GS HD IBM INTU JPM LRCX M (Macy's) MSFT NEM NFLX NKE NVDA PG REGN REV SO SQ QCOM QDEL TSLA TXN XOM V VRTX WFC WMT TOWN ZM New highs and Bullish MAXCPs http://tigersoft.com/MAXCP/9-30/BULLISH.htm Bearish MAXCPs - http://tigersoft.com/MINCP/9-30/BEARISH.htm |
 Table 1
             9/30/2018   QUICKSILVER on DJI-30 STOCKS.
P21 + ITRS score >+.25 is bullish
             1  Bullish (CRM)
             4  Bearish (CSCO,  CVX, TRV WBA)
HIGHEST AI/200 = CRM Second Highest = AAPL STOCKS CLOSECHANGE PIVOT-PT 5-dma AROC CL-PWR CANDLE AI/200 IP21 ITRS ------------------------------------------------------------------------------------------------------- ------------------------------------------------------------------------------------------------------- AAPL 115.81 1.72 107.12 390.3% Bearish BLUE 162 -.073 .16 ---------------------------------------------------------------------------------------------------------- AMGN 254.16 5.86 242.59 236.7% Bearish BLUE 135 .103 -.049 ---------------------------------------------------------------------------------------------------------- AXP 100.25 2.5 95.56 242.3% ------- BLUE 104 -.174 .007 ---------------------------------------------------------------------------------------------------------- BA 165.26 1.66 151.18 449.6% ------- BLUE 33 -.076 -.109 ---------------------------------------------------------------------------------------------------------- CAT 149.15 1.74 144.38 163.2% Bullish BLUE 125 -.04 .064 ---------------------------------------------------------------------------------------------------------- CRM 251.32 3.87 235.99 316.6% Bearish BLUE 196 .04 .283 Bullish ---------------------------------------------------------------------------------------------------------- CSCO 39.39 .33 38.28 144% Bearish BLUE 119 -.088 -.196 Bearish ---------------------------------------------------------------------------------------------------------- CVX 72 .1 71.95 3.5% Bearish RED 77 -.207 -.246 Bearish ---------------------------------------------------------------------------------------------------------- DIS 124.08 -1.32 123.28 32.2% Bearish BLUE 100 -.122 .012 ---------------------------------------------------------------------------------------------------------- DOW 47.05 .48 46.74 33.2% Bullish RED 66 -.052 .059 ---------------------------------------------------------------------------------------------------------- GS 200.97 4.18 186.12 381.9% ------- BLUE 62 -.098 -.086 ---------------------------------------------------------------------------------------------------------- HD 277.71 5.6 266.55 207.4% Bearish BLUE 150 .084 .024 ---------------------------------------------------------------------------------------------------------- HON 164.61 .1 158.79 180% Bearish RED 108 -.023 .03 ---------------------------------------------------------------------------------------------------------- IBM 121.67 .73 118.83 118.6% ------- BLUE 111 -.151 -.069 ---------------------------------------------------------------------------------------------------------- INTC 51.78 .59 48.82 295.4% Bullish BLUE 91 -.02 -.181 ---------------------------------------------------------------------------------------------------------- JNJ 148.88 1.82 144.44 152.3% Bearish BLUE 122 -.138 -.04 ---------------------------------------------------------------------------------------------------------- JPM 96.27 .92 92.74 187.6% ------- BLUE 27 -.102 -.066 ---------------------------------------------------------------------------------------------------------- KO 49.37 .45 48.21 118.9% Bearish BLUE 94 -.078 .012 ---------------------------------------------------------------------------------------------------------- MCD 219.49 .81 214.97 103.8% ------- BLUE 144 -.092 .103 ---------------------------------------------------------------------------------------------------------- MMM 160.18 .37 159.51 20.9% Bearish RED 107 -.126 -.019 ---------------------------------------------------------------------------------------------------------- MRK 82.95 1.05 82.63 19.4% Bearish BLUE 101 -.053 .017 ---------------------------------------------------------------------------------------------------------- MSFT 210.33 3.07 200.59 236.8% Bearish BLUE 161 -.023 -.027 ---------------------------------------------------------------------------------------------------------- NKE 125.54 -.81 127.11 -62.6% ------- RED 141 -.112 .242 ---------------------------------------------------------------------------------------------------------- PG 138.99 1.73 136.31 97.7% Bearish BLUE 101 -.013 .077 ---------------------------------------------------------------------------------------------------------- TRV 108.19 .75 107.49 32.3% Bearish BLUE 93 -.195 -.136 Bearish ---------------------------------------------------------------------------------------------------------- UNH 311.77 7.62 292.14 328.3% Bearish BLUE 118 -.061 -.012 ---------------------------------------------------------------------------------------------------------- V 199.97 .53 195.37 116.4% Bearish RED 110 -.133 -.016 ---------------------------------------------------------------------------------------------------------- VZ 59.49 .25 58.91 49% ------- ---- 126 -.14 .031 ---------------------------------------------------------------------------------------------------------- WBA 35.92 .54 35.06 121.5% ------- BLUE 79 -.169 -.145 Bearish ---------------------------------------------------------------------------------------------------------- WMT 139.91 2.77 135.99 143.2% ------- BLUE 130 -.1 .023 |
Table 2 QUICKSILVER on ETFS - 09/30/20 Bullish = 0
Bearish = 1 OIH (oil service)
ITRS + IP21>.25 is considered "Bullish"
ETF CLOSE CHANGE PIVOT-PT 5-dma AROC CL-PWR CANDLE IP21 ITRS --------------------------------------------------------------------------------------------- --------------------------------------------------------------------------------------------- DIA 277.5 3.08 268.1 182.7% Bearish BLUE-.013 0 --------------------------------------------------------------------------------------------- SPY 334.89 2.52 323.5 186.6% Bearish BLUE-.058 -.004 --------------------------------------------------------------------------------------------- QQQ 277.84 1.89 265.39 252.5% Bearish BLUE .026 .018 --------------------------------------------------------------------------------------------- MDY 338.83 2.17 326.19 191% Bearish BLUE .026 -.028 --------------------------------------------------------------------------------------------- IWM 149.79 .45 144.07 194.8% ------- RED -.033 -.022 --------------------------------------------------------------------------------------------- FAS 33.87 1 30.82 501% Bearish BLUE-.083 -.054 --------------------------------------------------------------------------------------------- RETL 216.44 4.15 202.67 66.4% Bearish BLUE-.032 .185 --------------------------------------------------------------------------------------------- SOXL 253.19 .34 222.24 793.7% ------- BLUE .051 .138 --------------------------------------------------------------------------------------------- TECL 305.83 7.44 265.65 778.6% Bearish BLUE-.002 .15 --------------------------------------------------------------------------------------------- IBB 135.41 .8 130.69 125.1% ------- BLUE .05 -.084 --------------------------------------------------------------------------------------------- GLD 177.12 -1.07 175.44 66.2% Bearish RED .038 -.01 --------------------------------------------------------------------------------------------- OIH 97.71 -.75 99.47 -122.3% Bearish RED -.238 -.288 Bearish --------------------------------------------------------------------------------------------- GASL 3440 285 3685 -325.1% ------- RED -.021 .079 --------------------------------------------------------------------------------------------- |
Table 3 Count of Stocks in Key Directories
20200930
-------------------------------
NEWHIGHS 154
NEWLOWS 45
MAXCP 23
MINCP 73
TTTNH 20
TTTNL 49
FASTUP 117
FASTDOWN 25
CPCROSSA 43
CPCROSSD 87
BIGVOLUP 1
BIGVODN 7
ACCUMVER 123
HIGHIP21 10
HIUPPCT 34
VHIP21 110
LOWACCUM 198
REDSELL 72
AUGSELS7 36
TRAPDOOR 13
|
 Table 4  RANKING OF KEY DIRECTORIES BASED PCT.OF STOCKS ABOVE 65-DMA
              9/30/20
 Bearish = 26
 Bullish = 18
---------------------------------------------------------------------------------------
Directory     Current       day-1         day-2         day-3         day-4         day-5
----------------------------------------------------------------------------------------
HOMEBLDG       .764          .764          .764          .705          .705          .705
SOLAR          .733          .666          .666          .733          .666          .666
TRANSP         .65           .65           .75           .65           .65           .65
DOWJONES       .633          .466          .6            .4            .433          .366
RETAIL         .632          .571          .632          .489          .489          .489
DJI-13         .615          .461          .538          .307          .384          .23
NIFTY          .6            .533          .533          .466          .355          .333
INDEXES        .587          .508          .553          .429          .259          .242
NASD-100       .58           .57           .6            .42           .3            .28
COAL           .571          .571          .857          .857          .857          .857
GREEN .571 .476 .523 .428 .38 .333 FOOD .566 .547 .566 .547 .547 .547 COMODITY .56 .536 .536 .536 .536 .56 COMPUTER .55 .55 .5 .5 .45 .4 GUNS .533 .533 .533 .466 .466 .466 SP-100 .527 .461 .505 .373 .351 .34 FIDSTKS .525 .468 .514 .395 .333 .344 SP500 .514 .464 .52 .41 .355 .338 ============================================================================================ CHEM .5 .5 .479 .395 .395 .395 COPPER .5 .375 .5 .5 .625 .375 ============================================================================================ AUTO .487 .435 .461 .358 .333 .358 GAMING .476 .523 .619 .571 .571 .619 HOSPITAL .476 .38 .238 .238 .19 .19 INDMATER .466 .506 .506 .48 .453 .4 CHINA .46 .36 .4 .36 .38 .44 INFRA .457 .457 .514 .457 .457 .4 RUS-1000 .438 .404 .461 .361 .313 .306 SOFTWARE .433 .383 .4 .3 .233 .216 BEVERAGE .428 .428 .428 .428 .357 .357 JETS .428 .428 .714 .428 .428 .428 UTILITY .421 .315 .394 .394 .289 .131 SEMI .413 .442 .432 .365 .336 .298 ELECTRON .394 .435 .428 .34 .292 .265 INSURANC .384 .346 .384 .269 .153 .153 BIOTECH .339 .342 .334 .294 .23 .267 EDU .333 .333 .333 .166 .166 .333 ETFS .321 .214 .303 .125 .125 .16 BONDFUND .267 .247 .257 .217 .198 .168 FINANCE .256 .195 .317 .207 .146 .158 GOLD .244 .244 .224 .204 .224 .122 REIT .234 .241 .382 .212 .113 .106 MILITARY .214 .25 .285 .25 .142 .214 HACKERS .15 .15 .15 .1 .05 .1 OILGAS .133 .157 .149 .11 .118 .125 REGBANKS .115 .076 .076 0 0 0 BIGBANKS 0 0 0 0 0 0 |
=====================================================================
9/29/2020 The DJI could not rise above
it falling 21-dma. The head/shoulders
pattern in the DJI was not destroyed by a rally above the right
shoulder. With the Sells from Peerless-2020 unreversed and the
Closing Powers for DIA, SPY and QQQ all below their falling
21-dma, a retest of the recent lows seems likely.
 |
 |
The odds of a rally over the next two weeks are only 38.5% if
we consider this a "typical" Presidential Election Year. Of course,
this year is anything but typical. The uncertainties with the country
so divided are bound to produce extra volatility in the market.
Support on declines does seem likely to come in given the FED's
QE-Infinity. Much depends on the efficacy of the vaccines being
developed and whether Congress will pass another piece of relief
legislation. All these amount to lots of reasons for being hedged.
Wall Street knows Trump is behind in the polls. It seems to be
holding up well given that. But the pressure on the bulls will
intensify as we get closer to the Election. And Biden did not
fall apart in the "debate" tonight. Many expected Biden might
become tongue-tied, but he wasn't. And Biden did say he would
be reversing the Trump tax-cuts. Since this was a big part of what
fueled the rally in 2017, removing the tax cuts will probably deflate
stock prices. I think this accounts for the weak opening this
morning.
All in all, I would stay hedged. I've suggested being long CRM
(AI/200=196) and the leading solar energy stocks shown
among the bullish MAXCPs and being short the big oil stocks
(CVX and XOM) and the big bank stocks (C and JPM) as well
as other actively traded bearish MINCPs. See how heavy is their
red distribution and how much weaker their Closing Powers are than
their price action.
|
Charts 9/29/2020 (Click on Underlined link.) 2020 PEERLESS DJI, Signals, Indicators Daily DJI Volume 10-DayUp/Down Vol Stoch-20 Inverted Traders Index Graph of Pct of All Stocks above 65-dma Cum. Inverted Traders Index NASDAQ S&P OEX NYSE COMPQX DJI-15 DJI-20 DJI-30 DIA QQQ MDY IWM TNA Short-Term Rates DOLLAR-UUP SPY http://tigersoft.com/2121CST/SPY.GIF recent 2006 vers-Peerless signals -- http://tigersoft.com/NEWPEER/UPD6929.BMP USO-CrudeOil DBO FAS GLD BBH IBB JETS JNUG KOL NUGT OIH PALL RSX RETL SDS AGQ SLV SOXL TECL TLT TMF TNA UGA (gasoline) USO (oil) and China: YINN CHAU Commodities: CANE CORN DBC JJC, NIB, CHOC CORN, CUT (paper) MOO, SOYB WEAT UUP (Dollar) LIT (Lithium) Stocks AAPL ADBE ALXN AMAT AMGN AMD AMZN AXP BA BABA BAC BIDU BLDP CAT CRM CVX CMG DE ENPH FB GILD GOOG GS HD IBM INTU JPM LRCX M (Macy's) MSFT NEM NFLX NKE NVDA PG REGN REV SO SQ QCOM QDEL TSLA TXN XOM V VRTX WFC WMT TOWN ZM New highs and Bullish MAXCPs http://tigersoft.com/MAXCP/9-29/BULLISH.htm Bearish MAXCPs - http://tigersoft.com/MINCP/9-29/BEARISH.htm |
 Table 1
             9/29/2018   QUICKSILVER on DJI-30 STOCKS.
P21 + ITRS score >+.25 is bullish
             1  Bullish (CRM)
             4  Bearish (CSCO,  CVX, IBM, WBA)
hughest priced DJI-30 = UNH, HD, CRM, AMGN MCD, MSFT, V
HIGHEST AI/200 = CRM Second Highest Tied = AAPL and MSFT STOCKS CLOSECHANGE PIVOT-PT 5-dma AROC CL-PWR CANDLE AI/200 IP21 ITRS ------------------------------------------------------------------------------------------------------- ------------------------------------------------------------------------------------------------------- AAPL 114.09 -.87 111.81 102.8% Bearish RED 163 -.066 .131 ---------------------------------------------------------------------------------------------------------- AMGN 248.3 1.27 247.5 16.4% Bearish BLUE 135 .077 -.077 ---------------------------------------------------------------------------------------------------------- AXP 97.75 -1.07 98.48 -37.7% Bearish RED 105 -.219 .011 ---------------------------------------------------------------------------------------------------------- BA 163.6 -2.48 156.8 219% ------- RED 33 -.057 -.091 ---------------------------------------------------------------------------------------------------------- CAT 147.41 -.27 147.15 8.9% Bullish RED 126 -.071 .066 ---------------------------------------------------------------------------------------------------------- CRM 247.45 .78 247.78 -6.8% Bearish BLUE 196 .084 .24 Bullish ---------------------------------------------------------------------------------------------------------- CSCO 39.06 -.07 39.32 -33.7% Bearish ---- 119 -.079 -.197 Bearish ---------------------------------------------------------------------------------------------------------- CVX 71.9 -2.03 75.53 -248.6% Bearish RED 77 -.226 -.185 Bearish ---------------------------------------------------------------------------------------------------------- DIS 125.4 -.59 127.21 -72.6% Bearish RED 100 -.148 .036 ---------------------------------------------------------------------------------------------------------- DOW 46.57 -.91 47.8 -131.1% Bullish RED 66 -.069 .072 ---------------------------------------------------------------------------------------------------------- GS 196.79 -2.28 191.62 133.7% Bearish RED 63 -.106 -.099 ---------------------------------------------------------------------------------------------------------- HD 272.11 -.22 273.31 -22.3% Bearish RED 149 .068 .017 ---------------------------------------------------------------------------------------------------------- HON 164.51 -.13 162.68 56.7% Bearish RED 108 -.046 .044 ---------------------------------------------------------------------------------------------------------- IBM 120.94 -.79 120.51 18% ------- RED 111 -.183 -.071 Bearish ---------------------------------------------------------------------------------------------------------- INTC 51.19 -.24 49.95 124.3% ------- RED 92 -.016 -.191 ---------------------------------------------------------------------------------------------------------- JNJ 147.06 -.05 144.21 98.1% Bearish ---- 123 -.163 -.045 ---------------------------------------------------------------------------------------------------------- JPM 95.35 -.81 94.27 57.5% ------- RED 28 -.136 -.049 ---------------------------------------------------------------------------------------------------------- KO 48.92 -.36 49.66 -75.6% Bearish RED 95 -.118 .032 ---------------------------------------------------------------------------------------------------------- MCD 218.68 -1.58 216.41 52.3% ------- RED 145 -.087 .113 ---------------------------------------------------------------------------------------------------------- MMM 159.81 -1.85 162.34 -78.6% Bearish RED 107 -.135 -.006 ---------------------------------------------------------------------------------------------------------- MRK 81.9 -.86 82.94 -62.7% Bearish RED 102 -.11 .003 ---------------------------------------------------------------------------------------------------------- MSFT 207.26 -2.18 207.42 -3.9% Bearish RED 162 -.056 -.049 ---------------------------------------------------------------------------------------------------------- NKE 126.35 2.03 116.87 383.9% ------- BLUE 142 -.084 .292 ---------------------------------------------------------------------------------------------------------- PG 137.26 -.75 137.96 -25.5% Bearish RED 102 -.019 .067 ---------------------------------------------------------------------------------------------------------- TRV 107.44 -2.78 109.25 -83.4% Bearish RED 94 -.182 -.124 ---------------------------------------------------------------------------------------------------------- UNH 304.15 .92 294.26 166.5% Bearish BLUE 119 -.16 -.026 ---------------------------------------------------------------------------------------------------------- V 199.44 -.88 200.56 -28.3% Bearish RED 111 -.154 -.024 ---------------------------------------------------------------------------------------------------------- VZ 59.24 -.12 59.82 -48.9% Bullish ---- 127 -.151 .032 ---------------------------------------------------------------------------------------------------------- WBA 35.38 -.69 35.72 -47.9% ------- RED 79 -.213 -.154 Bearish ---------------------------------------------------------------------------------------------------------- WMT 137.14 -.11 138.31 -42.7% Bearish RED 130 -.054 .015 |
Table 2 QUICKSILVER on ETFS - 09/29/20 Bullish = 0
Bearish = 1 OIH
ITRS + IP21>.25 is considered "Bullish"
ETF CLOSE CHANGE PIVOT-PT 5-dma AROC CL-PWR CANDLE IP21 ITRS --------------------------------------------------------------------------------------------- --------------------------------------------------------------------------------------------- DIA 274.42 -1.48 267.58 29.7% Bearish RED -.044 ---- --------------------------------------------------------------------------------------------- SPY 332.37 -1.82 322.64 31.6% Bearish RED -.072 -.004 --------------------------------------------------------------------------------------------- QQQ 275.95 -1.25 264.16 64.2% Bearish RED .038 .006 --------------------------------------------------------------------------------------------- MDY 336.66 -2.03 326.16 44.5% Bearish RED -.005 -.016 --------------------------------------------------------------------------------------------- IWM 149.34 -.68 144.07 9.5% Bearish RED -.049 -.005 --------------------------------------------------------------------------------------------- FAS 32.87 -1.14 30.66 28.1% Bearish RED -.121 -.048 --------------------------------------------------------------------------------------------- RETL 212.29 -9.46 213.63 -425.5% Bearish RED -.056 .248 --------------------------------------------------------------------------------------------- SOXL 252.85 2.09 215.93 423.5% ------- BLUE .069 .117 --------------------------------------------------------------------------------------------- TECL 298.39 -3.11 261.83 164.6% Bearish RED -.003 .095 --------------------------------------------------------------------------------------------- IBB 134.61 .13 132.08 29% ------- RED .093 -.105 --------------------------------------------------------------------------------------------- GLD 178.19 1.49 174.79 -13.1% Bearish BLUE .052 .014 --------------------------------------------------------------------------------------------- OIH 98.46 -2.7 100.14 -412.9% Bearish RED -.249 -.216 Bearish --------------------------------------------------------------------------------------------- GASL 3440 285 3685 -325.1% ------- RED -.021 .085 --------------------------------------------------------------------------------------------- |
 Table 3   Count of Stocks in Key Directories
          20200929
-------------------------------
NEWHIGHS       130
NEWLOWS        44
MAXCP          19
MINCP          69
TTTNH          10
TTTNL          46
FASTUP         66
FASTDOWN       70
CPCROSSA       25
CPCROSSD       133
BIGVOLUP       6
BIGVODN        5
ACCUMVER       123
HIGHIP21       10
HIUPPCT        28
REDSELL        68
AUGSELS7       35
TRAPDOOR       16
|
Table 4 RANKING OF KEY DIRECTORIES BASED PCT.OF STOCKS ABOVE 65-DMA
              9/29/20
 Bullish = 14
 Bearish = 31
---------------------------------------------------------------------------------------
Directory     Current       day-1         day-2         day-3         day-4         day-5
----------------------------------------------------------------------------------------
HOMEBLDG       .764          .764          .705          .705          .705          .764
SOLAR          .666          .666          .733          .666          .666          .666
TRANSP         .65           .75           .65           .65           .65           .7
COAL           .571          .857          .857          .857          .857          .857
RETAIL         .571          .632          .489          .489          .489          .612
NASD-100       .57           .6            .42           .3            .3            .47
COMPUTER       .55           .5            .5            .45           .45           .5
FOOD           .547          .566          .547          .547          .547          .641
COMODITY       .536          .536          .536          .536          .56           .658
GUNS           .533          .533          .466          .466          .466          .466
NIFTY .533 .533 .466 .355 .355 .466 GAMING .523 .619 .571 .571 .619 .714 INDEXES .508 .553 .429 .259 .259 .536 INDMATER .506 .506 .48 .453 .4 .546 ============================================================================================ CHEM .5 .479 .395 .395 .395 .52 ============================================================================================ GREEN .476 .523 .428 .38 .333 .476 FIDSTKS .468 .514 .395 .333 .355 .497 BEVERAGE .466 .466 .466 .4 .4 .466 DOWJONES .466 .6 .4 .433 .4 .6 SP500 .464 .523 .41 .355 .345 .468 DJI-13 .461 .538 .307 .384 .307 .538 SP-100 .461 .505 .373 .351 .351 .483 INFRA .457 .514 .457 .457 .4 .485 SEMI .438 .428 .361 .333 .295 .333 AUTO .435 .461 .358 .333 .358 .487 ELECTRON .432 .425 .337 .29 .27 .351 JETS .428 .714 .428 .428 .428 .571 RUS-1000 .404 .463 .361 .313 .309 .413 SOFTWARE .383 .416 .3 .233 .233 .366 HOSPITAL .38 .238 .238 .238 .19 .238 COPPER .375 .5 .5 .625 .375 .625 CHINA .36 .4 .36 .38 .44 .5 INSURANC .346 .384 .269 .153 .153 .307 BIOTECH .342 .334 .294 .23 .267 .366 EDU .333 .333 .166 .166 .333 .333 UTILITY .315 .394 .394 .289 .131 .289 MILITARY .25 .285 .25 .142 .178 .25 BONDFUND .247 .257 .217 .198 .178 .277 GOLD .244 .224 .204 .224 .142 .448 REIT .241 .382 .212 .113 .106 .241 ETFS .214 .303 .125 .125 .196 .321 FINANCE .197 .32 .209 .148 .16 .259 OILGAS .157 .149 .102 .118 .125 .149 HACKERS .15 .2 .1 .05 .1 .15 REGBANKS .076 .076 0 0 0 0 BIGBANKS 0 0 0 0 0 0 |
======================================================================
9/28/2020 The DJI has now rallied
almost to the resistance of its falling
21-day ma. Its Closing Power has jumped up towards its
falling 21-dma. Peerless is contradicting itself with Buys from
the 2006 version that does not factor in the bearish seasonality
of Presidential Election Years in September and early October,
while the 2020 version which does factor this in is still bearish.
Given how easily QE-Infinity rallies like Mondays can be started
on low volume at the opening and then extended on cheap
money, I've warned not to be short DIA and instead be hedged.
Our longs in the Solar Power field surged upwards in expectation
of Biden pledges. The carbon-based Oil stocks rose a little,
but there is no reason yet to cover them as part of the recommended
hedging. The finance stocks did much better and JPM gave a
red TigerSoft Buy. It will probably have to rally back to its 65-dma.
But given how much red distribution it shows, I would stay short it.
Oppositely, given how much accumulation CRM shows, I would use
this as one of the longs in a hedged portfolio.
DJIA - Peerless - 2020 Signals |
DIA |
SPY |
QQQ |
The DJI's Head/Shoulders is still alive and well. It would take a
rally clearly above its right shoulder, as shown in the cases of
1945, 1987 and 2009, to abort this and tell us to expect
significantly higher prices
1945 |
1987 |
2009 |
Hedging
Long |
Long |
Short |
Short |
Short |
|
Charts 9/28/2020 (Click on Underlined link.) 2020 PEERLESS DJI, Signals, Indicators Daily DJI Volume 10-DayUp/Down Vol Stoch-20 Inverted Traders Index Graph of Pct of All Stocks above 65-dma Cum. Inverted Traders Index NASDAQ S&P OEX NYSE COMPQX DJI-15 DJI-20 DJI-30 DIA QQQ MDY IWM TNA Short-Term Rates DOLLAR-UUP SPY http://tigersoft.com/2121CST/SPY.GIF recent 2006 vers-Peerless signals -- http://tigersoft.com/NEWPEER/UPD6928.BMP USO-CrudeOil DBO FAS GLD BBH IBB JETS JNUG KOL NUGT OIH PALL RSX RETL SDS AGQ SLV SOXL TECL TLT TMF TNA UGA (gasoline) USO (oil) and China: YINN CHAU Commodities: CANE CORN DBC JJC, NIB, CHOC CORN, CUT (paper) MOO, SOYB WEAT UUP (Dollar) LIT (Lithium) Stocks AAPL ADBE ALXN AMAT AMGN AMD AMZN AXP BA BABA BAC BIDU BLDP CAT CRM CVX CMG DE ENPH FB GILD GOOG GS HD IBM INTU JPM LRCX M (Macy's) MSFT NEM NFLX NKE NVDA PG REGN REV SO SQ QCOM QDEL TSLA TXN XOM V VRTX WFC WMT TOWN ZM New highs and Bullish MAXCPs http://tigersoft.com/MAXCP/9-28/BULLISH.htm Bearish MAXCPs - http://tigersoft.com/MINCP/9-28/BEARISH.htm |
 Table 1
             9/28/2018   QUICKSILVER on DJI-30 STOCKS.
P21 + ITRS score >+.25 is bullish
             1  Bullish (CRM)
             4  Bearish (CSCO,  CVX, TRV, WBA)
hughest priced DJI-30 = UNH, HD, CRM, AMGN MCD, MSFT, V
HIGHEST AI/200 = CRM Second Highest Tied = AAPL and MSFT STOCKS CLOSECHANGE PIVOT-PT 5-dma AROC CL-PWR CANDLE AI/200 IP21 ITRS ------------------------------------------------------------------------------------------------------- ------------------------------------------------------------------------------------------------------- AAPL 114.96 2.68 110.08 222% Bearish ---- 164 -.089 .159 ---------------------------------------------------------------------------------------------------------- AMGN 247.03 3.21 243.19 78.9% Bearish RED 135 .173 -.079 ---------------------------------------------------------------------------------------------------------- AXP 98.82 2.56 98.17 33.6% Bearish RED 105 -.17 .004 ---------------------------------------------------------------------------------------------------------- BA 166.08 10.05 156.35 317.4% ------- BLUE 33 -.036 -.089 ---------------------------------------------------------------------------------------------------------- CAT 147.68 1.77 145.33 80.7% Bullish RED 127 -.085 .044 ---------------------------------------------------------------------------------------------------------- CRM 246.67 3.93 245.05 33.5% Bearish RED 196 .041 .279 Bullish ---------------------------------------------------------------------------------------------------------- CSCO 39.13 .68 39.04 11.7% Bearish ---- 119 -.064 -.197 Bearish ---------------------------------------------------------------------------------------------------------- CVX 73.93 2.1 76.3 -161.3% Bearish BLUE 77 -.184 -.186 Bearish ---------------------------------------------------------------------------------------------------------- DIS 125.99 1.99 125.41 23.3% Bearish ---- 101 -.144 .028 ---------------------------------------------------------------------------------------------------------- DOW 47.48 1.44 47.91 -45.8% Bullish BLUE 67 -.027 .053 ---------------------------------------------------------------------------------------------------------- GS 199.07 4.12 194 131.8% ------- BLUE 64 -.133 -.093 ---------------------------------------------------------------------------------------------------------- HD 272.33 3.78 272.35 -.4% Bearish BLUE 148 .064 .012 ---------------------------------------------------------------------------------------------------------- HON 164.64 3.15 161.37 101.8% Bearish BLUE 108 .11 .028 ---------------------------------------------------------------------------------------------------------- IBM 121.73 2.78 120.25 62% ------- BLUE 111 -.154 -.061 ---------------------------------------------------------------------------------------------------------- INTC 51.43 1.49 49.72 172.7% Bullish BLUE 93 .018 -.177 ---------------------------------------------------------------------------------------------------------- JNJ 147.11 1.45 145.1 69.4% Bearish BLUE 124 -.131 -.049 ---------------------------------------------------------------------------------------------------------- JPM 96.16 2.69 95.31 45.4% ------- BLUE 29 -.13 -.055 ---------------------------------------------------------------------------------------------------------- KO 49.28 .56 49.09 19.4% ------- ---- 96 -.036 .018 ---------------------------------------------------------------------------------------------------------- MCD 220.26 2.08 216.41 88.9% ------- BLUE 146 -.049 .116 ---------------------------------------------------------------------------------------------------------- MMM 161.66 1.39 161.36 9.3% Bearish RED 108 -.091 -.023 ---------------------------------------------------------------------------------------------------------- MRK 82.76 -.17 83.13 -22.3% Bearish RED 103 -.066 .002 ---------------------------------------------------------------------------------------------------------- MSFT 209.44 1.62 202.54 168.9% Bearish RED 163 -.029 -.002 ---------------------------------------------------------------------------------------------------------- NKE 124.32 .09 113.37 451.5% ------- RED 143 -.095 .257 ---------------------------------------------------------------------------------------------------------- PG 138.01 .39 136.71 47.4% Bearish RED 103 .022 .064 ---------------------------------------------------------------------------------------------------------- TRV 110.22 2.11 109.45 35.5% Bearish BLUE 95 -.175 -.109 Bearish ---------------------------------------------------------------------------------------------------------- UNH 303.23 .73 299.19 68.2% Bearish RED 120 -.145 -.045 ---------------------------------------------------------------------------------------------------------- V 200.32 3.07 197.45 72.8% Bearish RED 112 -.09 -.008 ---------------------------------------------------------------------------------------------------------- VZ 59.36 -.03 59.61 -21% Bullish RED 128 -.123 .02 ---------------------------------------------------------------------------------------------------------- WBA 36.07 .64 35.79 39.5% ------- BLUE 79 -.206 -.164 Bearish ---------------------------------------------------------------------------------------------------------- WMT 137.25 -.02 137.07 6.6% Bearish BLUE 130 -.007 .007 |
Table 2 QUICKSILVER on ETFS - 09/24/20 Bullish = 0
Bearish = 1 OIH
ITRS + IP21>.25 is considered "Bullish"
ETF CLOSE CHANGE PIVOT-PT 5-dma AROC CL-PWR CANDLE IP21 ITRS --------------------------------------------------------------------------------------------- --------------------------------------------------------------------------------------------- ---------- DIA 275.9 4.2 272.81 82.5% Bearish BLUE-.025 0 --------------------------------------------------------------------------------------------- SPY 334.19 5.46 330.3 110.6% Bearish BLUE-.032 .004 --------------------------------------------------------------------------------------------- QQQ 277.2 5.64 272.48 180.6% Bearish BLUE .057 .034 --------------------------------------------------------------------------------------------- MDY 338.69 7.94 333.71 109.4% Bearish BLUE .034 -.022 --------------------------------------------------------------------------------------------- IWM 150.02 3.61 149.06 71.8% ------- BLUE-.033 -.011 --------------------------------------------------------------------------------------------- FAS 34.01 2.19 32.69 37.6% Bearish BLUE-.079 -.02 --------------------------------------------------------------------------------------------- RETL 221.75 14.6 230.6 199.6% Bearish BLUE-.044 .278 --------------------------------------------------------------------------------------------- SOXL 250.76 18.93 233.3 567.6% ------- BLUE .121 .172 --------------------------------------------------------------------------------------------- TECL 301.5 16.15 289.15 469.8% Bearish BLUE .015 .187 --------------------------------------------------------------------------------------------- IBB 134.48 1.01 133.84 62.2% ------- RED .128 -.1 --------------------------------------------------------------------------------------------- GLD 176.7 1.76 178.65 -79.8% Bearish BLUE .02 .004 --------------------------------------------------------------------------------------------- OIL 176.7 1.76 178.65 -79.8% Bullish BLUE .03 22.003 --------------------------------------------------------------------------------------------- OIH 101.16 3.79 106.8 -288.3% Bearish BLUE-.218 -.201 --------------------------------------------------------------------------------------------- GASL 3440 285 3685 -325.1% ------- RED -.021 .079 --------------------------------------------------------------------------------------------- UGA 3440 285 3685 -325.1% ------- RED .544 173.762 --------------------------------------------------------------------------------------------- UUP 25.98 -.06 26.26 -53.5% ------- -----.019 -.056 --------------------------------------------------------------------------------------------- IEF 25.98 -.06 26.26 -53.5% Bullish ---- .214 -.82 --------------------------------------------------------------------------------------------- CORN 25.98 -.06 26.26 -53.5% ------- ---- .058 1.111 --------------------------------------------------------------------------------------------- WEAT 25.98 -.06 26.26 -53.5% Bullish ---- .053 4.05 --------------------------------------------------------------------------------------------- YINN 25.98 -.06 26.26 -53.5% ------- ---- .277 .619 --------------------------------------------------------------------------------------------- RSX 20.83 -.03 21.6 -99.2% Bearish -----.065 -.053 |
    Count of Stocks in Key Directories
          20200928
-------------------------------
NEWHIGHS       55
NEWLOWS        1
MAXCP          20
MINCP          39
TTTNH          14
TTTNL          25
FASTUP         56
FASTDOWN       72
CPCROSSA       61
CPCROSSD       47
BIGVOLUP       5
BIGVODN        6
ACCUMVER       123
HIGHIP21       11
HIUPPCT        28
VHIP21         112
LOWACCUM       166
REDSELL        69
AUGSELS7       38
TRAPDOOR       16
|
Table 4RANKING OF KEY DIRECTORIES BASED PCT.OF STOCKS ABOVE 65-DMA 9/28/20 --------------------------------------------------------------------------------------- Directory Current day-1 day-2 day-3 day-4 day-5 ---------------------------------------------------------------------------------------- COAL .857 .857 .857 .857 .857 .857 HOMEBLDG .764 .705 .705 .705 .764 .705 TRANSP .75 .65 .65 .65 .7 .75 JETS .714 .428 .428 .428 .571 .642 SOLAR .666 .733 .666 .666 .733 .733 RETAIL .632 .489 .489 .489 .612 .612 GAMING .619 .571 .571 .619 .714 .666 DOWJONES .6 .4 .433 .4 .6 .5 NASD-100 .6 .42 .3 .3 .47 .39 FOOD .566 .547 .547 .547 .698 .735 INDEXES .553 .429 .259 .259 .548 .418 DJI-13 .538 .307 .384 .307 .538 .461 COMODITY .536 .536 .536 .56 .731 .756 GUNS .533 .466 .466 .466 .466 .466 NIFTY .533 .466 .355 .355 .466 .4 GREEN .523 .428 .38 .333 .476 .476 SP500 .523 .412 .355 .345 .466 .439 FIDSTKS .514 .395 .333 .355 .497 .451 INFRA .514 .457 .457 .4 .485 .514 INDMATER .506 .48 .453 .4 .56 .573 SP-100 .505 .373 .351 .351 .483 .428 COMPUTER .5 .5 .45 .45 .5 .5 COPPER .5 .5 .625 .375 .625 .625 CHEM .479 .395 .395 .395 .541 .541 BEVERAGE .466 .466 .4 .4 .466 .466 RUS-1000 .463 .363 .313 .309 .411 .391 AUTO .461 .358 .333 .358 .487 .487 SEMI .428 .361 .333 .295 .342 .323 ELECTRON .425 .337 .29 .27 .351 .337 SOFTWARE .416 .316 .233 .233 .366 .3 CHINA .4 .36 .38 .44 .54 .54 UTILITY .394 .394 .289 .131 .289 .184 INSURANC .384 .269 .153 .153 .307 .269 REIT .382 .212 .113 .106 .241 .212 EDU .333 .166 .166 .333 .333 .333 BIOTECH .332 .295 .231 .268 .369 .34 FINANCE .317 .207 .146 .158 .256 .207 ETFS .303 .125 .125 .196 .339 .375 MILITARY .285 .25 .142 .178 .25 .25 BONDFUND .257 .217 .198 .178 .277 .267 HOSPITAL .238 .238 .238 .238 .238 .333 GOLD .224 .204 .224 .142 .51 .53 HACKERS .2 .15 .05 .1 .15 .1 OILGAS .149 .102 .11 .125 .157 .165 REGBANKS .076 0 0 0 0 .076 BIGBANKS 0 0 0 0 0 0 |
-----------------------------------------------------------------------------------------------------
9/25/2020 I'm not sure that we can
trust the rally that started on Friday. The
volume was relatively low and two thirds of all stocks are still below
the resistance of their 65-dma. The head and shoulders patterns at
this time of year are reliably bearish. So, breadth and volume will need
to improve to confirm the effort by the DJI now to get back above
its 65-dma. I would stay hedged but watch for breaks in the Closing
Power downtrends of any shorted oil stocks and bank stocks. Cover
these if the Closing Power downtrends are broken.
Stay hedged. Hold long CRM and the two solar power stocks which
were previously recommended (VSLR and RUN). They rose sharply
on Friday, presumably because Biden will give them a "plug" on Tuesday
night..
Peerless-2020 -- which does factor in the bearish seasonality of
Presidential Election years -- remains on Sells. At the same time,
Peerless-2006 version -- which does not
allow for the frequent
bearishness in September and early October in election years --
gave another buy on Friday. Which should we trust?
History now shows that the 2006 version's Buys are problematic. When
we look back at its Buy signals at this time of year in 1968, 1972, 1976...etc,
we see them all failing, except in 2016 when the DJI refused to sell off very
much line now so far. The DJI and the market then took off to the upside
wildly when the Republican Trump unexpectedly won the Presidential election.
Perhaps, we are seeing a repeat of 2016. Trump supporters are certainly
hoping for their man to outshine Biden in the first debate.
If you have followed what I have said here recently, you know that
I have been encouraging hedging rather than being long or short DIA. The
charts further below show that this has been working out well.
The Head/Shoulders has not been negated
and bearishly overhangs the market.


Complicating Considerations
It has occurred to me that we might disallow the seasonality
factor this year. After all, we have unique new factors: 1) the
QE-Infinity; 2) the possibility of a break-through anti-Covid-19 vaccine
3) that the Supreme Court will over-rule questionable
Democrat victories in some closely contested states. And, 4) what if
Congress suddenly votes for a massive new Relief program or a second
bailout for the airlines?
I have suggested hedging while we wait for a
resolution of all
these contradictions and not short DIA.
The Bullish vehicles to be put in a hedged portfolio are CRM and ADBE
because of their extremely high AI/200 scores and rising trends. Also
recommended have been the leading solar stocks.
 |
 |
 |
I have also suggested shorting XOM, CVX and some bearish big bank stocks
like JPM and C. The first two shorts are heavily dependent on what the Government
does regarding the airlines industry. The second two will probably be supported
by the Fed. So, watch their Closing Power downtrends. If they are broken,
cover them. You may also want to use OIH's turning from a Tiger Sell to
a Tiger Buy to close out the shorts in XOM and CVX.
  |
 |
 |
Friday's rebounds by QQQ and AAPL back above their 65-dma on Friday also
saw their Closing Power downtrends get broken. This is clearly bullish short-term.
Buy QQQ only if you are willing to put a protective stop just beneath its recent lows.
Expect resistance and another pullback from its falling
21-dma.
 |
 |
|
Charts 9/25/2020 (Click on Underlined link.) 2020 PEERLESS DJI, Signals, Indicators Daily DJI Volume 10-DayUp/Down Vol Stoch-20 Inverted Traders Index Graph of Pct of All Stocks above 65-dma Cum. Inverted Traders Index NASDAQ S&P OEX NYSE COMPQX DJI-15 DJI-20 DJI-30 DIA QQQ MDY IWM TNA Short-Term Rates DOLLAR-UUP SPY http://tigersoft.com/2121CST/SPY.GIF recent 2006 vers-Peerless signals -- http://tigersoft.com/NEWPEER/UPD6925.BMP USO-CrudeOil DBO FAS GLD BBH IBB JETS JNUG KOL NUGT OIH PALL RSX RETL SDS AGQ SLV SOXL TECL TLT TMF TNA UGA (gasoline) USO (oil) and China: YINN CHAU Commodities: CANE CORN DBC JJC, NIB, CHOC CORN, CUT (paper) MOO, SOYB WEAT UUP (Dollar) LIT (Lithium) Stocks AAPL ADBE ALXN AMAT AMGN AMD AMZN AXP BA BABA BAC BIDU BLDP CAT CRM CVX CMG DE ENPH FB GILD GOOG GS HD IBM INTU JPM LRCX M (Macy's) MSFT NEM NFLX NKE NVDA PG REGN REV SO SQ QCOM QDEL TSLA TXN XOM V VRTX WFC WMT TOWN ZM New highs and Bullish MAXCPs http://tigersoft.com/MAXCP/9-25/BULLISH.htm Bearish MAXCPs - http://tigersoft.com/MINCP/9-25/BEARISH.htm |
|
 Table 1
             9/25/2018   QUICKSILVER on DJI-30 STOCKS.
P21 + ITRS score >+.25 is bullish
             1  Bullish (CRM)
             4  Bearish (BA,  CVX, TRV, WBA)
hughest priced DJI-30 = UNH, HD, CRM, AMGN MCD, MSFT, V
HIGHEST AI/200 = CRM Second Highest Tied = AAPL and MSFT STOCKS CLOSECHANGE PIVOT-PT 5-dma AROC CL-PWR CANDLE AI/200 IP21 ITRS ------------------------------------------------------------------------------------------------------- ------------------------------------------------------------------------------------------------------- AAPL 112.28 4.06 106.84 250% Bearish BLUE 165 -.127 .147 ---------------------------------------------------------------------------------------------------------- AMGN 243.82 3.5 247.72 -79.8% Bearish BLUE 135 .152 -.06 ---------------------------------------------------------------------------------------------------------- AXP 96.26 .81 103.44 -365.5% ------- BLUE 105 -.116 -.016 ---------------------------------------------------------------------------------------------------------- BA 156.03 9.98 161.14 -165.6% ------- BLUE 33 -.145 -.143 Bearish ---------------------------------------------------------------------------------------------------------- CAT 145.91 .77 152.39 -220.6% Bullish BLUE 128 -.046 .037 ---------------------------------------------------------------------------------------------------------- CRM 242.74 5.19 242.78 -.8% Bearish BLUE 195 .115 .293 Bullish ---------------------------------------------------------------------------------------------------------- CSCO 38.45 .6 39.81 -175% Bearish BLUE 119 -.072 -.176 ---------------------------------------------------------------------------------------------------------- CVX 71.83 .03 78.21 -426.7% Bearish BLUE 77 -.182 -.203 Bearish ---------------------------------------------------------------------------------------------------------- DIS 124 1.51 128.63 -184.6% Bearish BLUE 102 -.167 .022 ---------------------------------------------------------------------------------------------------------- DOW 46.04 -.37 50.37 -452.5% Bullish BLUE 67 -.044 .035 ---------------------------------------------------------------------------------------------------------- GS 194.95 -.16 194.86 2.3% ------- BLUE 65 -.119 -.108 ---------------------------------------------------------------------------------------------------------- HD 268.55 2.85 275.19 -122.7% Bearish BLUE 147 .047 .025 ---------------------------------------------------------------------------------------------------------- HON 161.49 2.73 168.7 -222.4% Bearish BLUE 107 .08 .039 ---------------------------------------------------------------------------------------------------------- IBM 118.95 .86 122.76 -158.6% ------- BLUE 111 -.162 -.057 ---------------------------------------------------------------------------------------------------------- INTC 49.94 .78 49.89 5% ------- BLUE 93 -.035 -.171 ---------------------------------------------------------------------------------------------------------- JNJ 145.66 .99 149.18 -120.9% Bearish BLUE 125 -.095 -.04 ---------------------------------------------------------------------------------------------------------- JPM 93.47 .81 98.35 -257.7% ------- BLUE 30 -.104 -.081 ---------------------------------------------------------------------------------------------------------- KO 48.72 .02 50.45 -175.7% ------- BLUE 97 -.049 .04 ---------------------------------------------------------------------------------------------------------- MCD 218.18 2.06 220.27 -48.2% ------- BLUE 147 -.091 .127 ---------------------------------------------------------------------------------------------------------- MMM 160.27 -.15 169.55 -285.3% Bearish BLUE 109 -.069 -.017 ---------------------------------------------------------------------------------------------------------- MRK 82.93 -.22 85.81 -172.4% Bearish BLUE 104 -.032 .029 ---------------------------------------------------------------------------------------------------------- MSFT 207.82 4.63 200.39 183.2% Bearish BLUE 164 .005 .003 ---------------------------------------------------------------------------------------------------------- NKE 124.23 -.52 114.66 400.9% Bullish BLUE 144 -.088 .261 ---------------------------------------------------------------------------------------------------------- PG 137.62 .7 137.37 9.1% ------- BLUE 103 .01 .087 ---------------------------------------------------------------------------------------------------------- TRV 108.11 .29 111.61 -160.4% Bearish BLUE 96 -.143 -.119 Bearish ---------------------------------------------------------------------------------------------------------- UNH 302.5 9.84 308.02 -92.8% Bearish BLUE 121 -.096 -.031 ---------------------------------------------------------------------------------------------------------- V 197.25 1.73 202.61 -135.1% Bearish BLUE 113 -.061 .004 ---------------------------------------------------------------------------------------------------------- VZ 59.39 .2 60.35 -80.6% Bullish BLUE 129 -.14 .049 ---------------------------------------------------------------------------------------------------------- WBA 35.43 .4 36.93 -210% ------- BLUE 79 -.166 -.159 Bearish ---------------------------------------------------------------------------------------------------------- WMT 137.27 .57 135.29 72.4% Bearish BLUE 130 .043 .023 |
|
    Count of Stocks in Key Directories
          20200925
-------------------------------
NEWHIGHS       48
NEWLOWS        70
MAXCP          24
MINCP          23
TTTNH          14
TTTNL          31
FASTUP         39
FASTDOWN       361
CPCROSSA       143
CPCROSSD       13
BIGVOLUP       5
BIGVODN        6
ACCUMVER       123
HIGHIP21       8
HIUPPCT        27
REDSELL        70
AUGSELS7       31
TRAPDOOR       15
|
|
Table 4   RANKING OF KEY DIRECTORIES BASED PCT.OF STOCKS ABOVE 65-DMA
              9/25/20
  7 Bullish
 37 Bearish
---------------------------------------------------------------------------------------
Directory     Current       day-1         day-2         day-3         day-4         day-5
----------------------------------------------------------------------------------------
COAL           .857          .857          .857          .857          .857          .857
SOLAR          .733          .666          .666          .733          .733          .733
HOMEBLDG       .705          .705          .705          .764          .705          .764
TRANSP         .65           .65           .65           .7            .75           .9
GAMING         .571          .571          .619          .714          .666          .714
FOOD           .547          .547          .547          .698          .735          .886
COMODITY       .536          .536          .56           .731          .756          .878
===========================================================================================
COMPUTER       .5            .45           .45           .5            .5            .5
COPPER         .5            .625          .375          .625          .625          .875
===========================================================================================
RETAIL         .489          .489          .489          .612          .612          .653
INDMATER       .48           .453          .4            .56           .586          .72
BEVERAGE       .466          .4            .4            .466          .466          .533
GUNS           .466          .466          .466          .466          .466          .666
NIFTY          .466          .355          .355          .466          .4            .377
INFRA          .457          .457          .4            .485          .514          .714
INDEXES        .429          .259          .259          .548          .446          .627
GREEN          .428          .38           .333          .476          .476          .619
JETS           .428          .428          .428          .571          .642          .857
NASD-100       .42           .3            .3            .47           .39           .4
SP500          .412          .357          .345          .466          .447          .571
DOWJONES       .4            .433          .4            .6            .5            .7
CHEM           .395          .395          .395          .541          .541          .687
FIDSTKS        .395          .333          .355          .497          .457          .57
UTILITY        .394          .289          .131          .289          .21           .263
SP-100         .373          .351          .351          .483          .428          .593
RUS-1000       .363          .314          .309          .411          .396          .549
SEMI           .361          .333          .295          .342          .333          .38
CHINA          .36           .38           .44           .54           .54           .56
AUTO           .358          .333          .358          .487          .487          .717
ELECTRON       .337          .29           .27           .351          .344          .445
SOFTWARE       .316          .25           .233          .366          .3            .3
DJI-13         .307          .384          .307          .538          .461          .692
BIOTECH        .295          .231          .268          .369          .343          .462
INSURANC       .269          .153          .153          .307          .269          .538
MILITARY       .25           .142          .178          .25           .25           .428
HOSPITAL       .238          .238          .238          .285          .333          .476
BONDFUND       .217          .198          .178          .277          .277          .366
REIT           .212          .113          .106          .241          .212          .446
FINANCE        .207          .146          .158          .256          .207          .475
GOLD           .204          .224          .142          .51           .53           .755
EDU            .2            .2            .4            .4            .4            .4
HACKERS        .15           .1            .1            .15           .1            .1
ETFS           .125          .125          .196          .339          .375          .607
OILGAS         .102          .11           .118          .157          .165          .22
BIGBANKS       0             0             0             0             0             .571
REGBANKS       0             0             0             0             .076          .269
|
|
========================================================================
9/24/2020 Peerless remains on Sells and
much lower prices probably lie ahead.


Why would anyone want to be President
in 2021?
This coming January could be very ugly and cruel for the unemployed
unless Congress does something more to ease their lot. How will they
pay their landlords, their credit card companies and their grocers? Everything
would seem to depend on an effective virus very soon. I don't think that's
a safe bet. I doubt if the market has factored in all the dangers of civil
unrest this Winter. Like Covid-19 and QE-Infinity, mass desperation is
likely to be unprecedented, except possibly between 1930 and 1933.
Another "Fall fall" (big autumn decline) seems to be upon on us.
The clearly defined head and shoulders pattern in the DJI is its
most obvious characteristic. Since 1965, there have been 5 previous
falling FALLs, each also featuring a bearish head/shoulders top.
There are only two or three saving technical "graces" trying to save our
market now. One is big AAPL's steadiness at its 65-dma. The second is
the
still rising Opening Power in DIA. The third, the very high AI/200 score of
the NASDAQ (194/200) is helping hold it up for a while, but it will eventually
fail if there is another big leg down. Since that is what seems to be shaping up,
I would not try to be long the NASDAQ even fully hedged.
Tonight, early on, the DJI futures were up
+200. Now they are down -100.
This is a scary market. Big Money, insiders and professionals are net sellers
and seem to be bent on using any strength to quickly sell. This is exactly
what happened in the February-March 36% decline. It traps a lot of
the optiministic and more innocent bulls at high prices. This is a dangerous
condition. Sell short more bearish MINCP stocks.
--------------------------------------------------------------------------------
Fall Falls with H/S Tops since 1965
Look at all the big Autumn declines in the DJI that began from completed
head/shoulders patterns. Of course, the biggest of them all, not shown
here, was the one that occurred in 1929.
1967 |
1988 |
2012 |
2014
Fall Fall |
2018 |
 Table 1
             9/24/2018   QUICKSILVER on DJI-30 STOCKS.
P21 + ITRS score >+.25 is bullish
             1  Bullish (CRM)
             5  Bearish (BA, CSCO, CVX, TRV, WBA)
hughest priced DJI-30 = UNH, HD, CRM, AMGN MCD, MSFT, V
HIGHEST AI/200 = CRM Second Highest Tied = AAPL and MSFT STOCKS CLOSECHANGE PIVOT-PT 5-dma AROC CL-PWR CANDLE AI/200 IP21 ITRS ------------------------------------------------------------------------------------------------------- ------------------------------------------------------------------------------------------------------- AAPL 108.22 1.1 110.34 -97% Bearish BLUE 166 -.141 .11 ---------------------------------------------------------------------------------------------------------- AMGN 240.32 -2.27 248.08 -157.8% Bearish RED 135 .144 -.048 ---------------------------------------------------------------------------------------------------------- AXP 95.45 -.11 104.66 -460.2% ------- BLUE 105 -.133 -.017 ---------------------------------------------------------------------------------------------------------- BA 146.05 -5.13 167.53 -677.2% ------- RED 33 -.239 -.22 Bearish ---------------------------------------------------------------------------------------------------------- CAT 145.14 .76 153.87 -293.7% Bullish BLUE 129 -.044 .052 ---------------------------------------------------------------------------------------------------------- CRM 237.55 1.56 244.53 -143.5% ------- BLUE 194 .22 .266 Bullish ---------------------------------------------------------------------------------------------------------- CSCO 37.85 -.43 40.37 -320.1% Bearish RED 119 -.071 -.181 Bearish ---------------------------------------------------------------------------------------------------------- CVX 71.8 -.15 78.79 -458.9% Bearish BLUE 77 -.221 -.189 Bearish ---------------------------------------------------------------------------------------------------------- DIS 122.49 -.79 130.22 -304.5% Bearish BLUE 103 -.165 .016 ---------------------------------------------------------------------------------------------------------- DOW 46.41 -.33 50.97 -467.6% Bullish RED 68 -.027 .074 ---------------------------------------------------------------------------------------------------------- GS 195.11 8.99 194.83 7.3% Bearish BLUE 66 -.122 -.097 ---------------------------------------------------------------------------------------------------------- HD 265.7 -.85 279.96 -260.7% Bearish ---- 146 .078 .034 ---------------------------------------------------------------------------------------------------------- HON 158.76 -.03 170.34 -352.2% Bearish BLUE 106 .065 .048 ---------------------------------------------------------------------------------------------------------- IBM 118.09 -.74 124.92 -281.2% ------- ---- 111 -.207 -.037 ---------------------------------------------------------------------------------------------------------- INTC 49.16 .34 50.32 -116.6% ------- BLUE 94 -.036 -.164 ---------------------------------------------------------------------------------------------------------- JNJ 144.67 .23 147.17 -85.6% Bearish BLUE 126 -.075 -.021 ---------------------------------------------------------------------------------------------------------- JPM 92.66 -.08 98.56 -307.8% ------- BLUE 31 -.158 -.068 ---------------------------------------------------------------------------------------------------------- KO 48.7 .49 50.55 -186.5% ------- BLUE 98 -.057 .053 ---------------------------------------------------------------------------------------------------------- MCD 216.12 1.15 222.58 -148.1% ------- BLUE 147 -.091 .13 ---------------------------------------------------------------------------------------------------------- MMM 160.42 .91 172.38 -362.4% Bearish BLUE 109 -.061 .01 ---------------------------------------------------------------------------------------------------------- MRK 83.15 .52 85.64 -148.2% Bearish BLUE 105 -.024 .05 ---------------------------------------------------------------------------------------------------------- MSFT 203.19 2.6 202.91 6.9% Bearish BLUE 164 .01 -.02 ---------------------------------------------------------------------------------------------------------- NKE 124.75 -2.36 116.36 356.5% Bullish RED 145 -.131 .269 ---------------------------------------------------------------------------------------------------------- PG 136.92 .61 137.52 -21.9% ------- BLUE 103 -.045 .103 ---------------------------------------------------------------------------------------------------------- TRV 107.82 .33 112.6 -217.1% Bearish RED 97 -.222 -.092 Bearish ---------------------------------------------------------------------------------------------------------- UNH 292.66 .52 304.98 -205.5% Bearish BLUE 122 -.111 -.035 ---------------------------------------------------------------------------------------------------------- V 195.52 .15 205.27 -243.4% Bearish BLUE 114 -.052 -.002 ---------------------------------------------------------------------------------------------------------- VZ 59.19 .28 60.59 -116.9% Bearish BLUE 130 -.125 .078 ---------------------------------------------------------------------------------------------------------- WBA 35.03 -.03 37.21 -301.6% ------- RED 79 -.209 -.136 Bearish ---------------------------------------------------------------------------------------------------------- WMT 136.7 .71 136.69 .4% Bearish BLUE 129 .041 .039 |
Table 2 QUICKSILVER on ETFS - 09/24/20 Bullish = 0
Bearish = 1 OIH
ITRS + IP21>.25 is considered "Bullish"
ETF CLOSE CHANGE PIVOT-PT 5-dma AROC CL-PWR CANDLE IP21 ITRS --------------------------------------------------------------------------------------------- --------------------------------------------------------------------------------------------- DIA 268.1 .52 276.52 -209.6% Bearish BLUE-.036 ---- --------------------------------------------------------------------------------------------- SPY 323.5 .86 330.65 -187.4% Bearish BLUE-.052 .008 --------------------------------------------------------------------------------------------- QQQ 265.39 1.23 266.87 -91.9% Bearish BLUE .009 .02 --------------------------------------------------------------------------------------------- MDY 326.19 .03 339.97 -276.2% Bearish BLUE-.024 -.022 --------------------------------------------------------------------------------------------- IWM 144.07 0 153.29 -321.5% Bearish -----.114 -.017 --------------------------------------------------------------------------------------------- FAS 30.82 .16 36.18 -921.4% Bearish BLUE-.099 -.09 --------------------------------------------------------------------------------------------- SOXL 222.24 6.31 226.23 -330.7% Bearish BLUE .035 .079 --------------------------------------------------------------------------------------------- TECL 265.65 3.82 268.56 -317.4% Bearish BLUE-.034 .051 --------------------------------------------------------------------------------------------- IBB 130.69 -1.39 136.32 -184.1% Bearish RED .078 -.081 --------------------------------------------------------------------------------------------- GLD 175.44 .65 183.2 -209.1% Bearish BLUE-.002 .033 --------------------------------------------------------------------------------------------- OIH 99.47 -.67 115.44 -816.2% Bearish BLUE-.204 -.2 Bearish --------------------------------------------------------------------------------------------- GASL 3440 285 3685 -325.1% ------- RED -.021 .116 --------------------------------------------------------------------------------------------- |
    Count of Stocks in Key Directories
          20200924
-------------------------------
NEWHIGHS       22
NEWLOWS        204
MAXCP          6
MINCP          121 Bearish
TTTNH          6
TTTNL          92
FASTUP         39
FASTDOWN       423  Bearish
CPCROSSA       42
CPCROSSD       41
BIGVOLUP       3
BIGVODN        6
ACCUMVER       123
HIGHIP21       9
HIUPPCT        27
REDSELL        71
AUGSELS7       47
TRAPDOOR       15
|
Table 4  RANKING OF KEY DIRECTORIES BASED PCT.OF STOCKS ABOVE 65-DMA
              9/24/20
  Bullish = 8
  Bearish = 38
---------------------------------------------------------------------------------------
Directory     Current       day-1         day-2         day-3         day-4         day-5
----------------------------------------------------------------------------------------
COAL           .857          .857          .857          .857          .857          .857
HOMEBLDG       .705          .705          .764          .705          .764          .764
SOLAR          .666          .666          .733          .733          .733          .733
TRANSP         .65           .65           .7            .75           .95           .95
COPPER         .625          .375          .625          .625          .875          .875
GAMING         .571          .619          .714          .666          .619          .714
FOOD           .547          .547          .698          .735          .886          .886
COMODITY       .536          .56           .731          .756          .878          .878
============================================================================================
RETAIL         .489          .489          .612          .612          .632          .653
GUNS           .466          .466          .466          .466          .6            .6
INFRA          .457          .4            .485          .514          .685          .8
INDMATER       .453          .4            .56           .586          .72           .746
COMPUTER       .45           .45           .5            .5            .5            .55
DOWJONES       .433          .4            .6            .5            .7            .666
JETS           .428          .428          .571          .642          .857          .857
BEVERAGE       .4            .4            .466          .466          .533          .533
CHEM           .395          .395          .541          .541          .687          .729
DJI-13         .384          .307          .538          .461          .692          .615
CHINA          .38           .44           .54           .54           .58           .5
GREEN          .38           .333          .476          .476          .619          .666
SP500          .357          .347          .466          .447          .571          .621
NIFTY          .355          .355          .466          .4            .377          .466
SP-100         .351          .351          .483          .428          .593          .626
AUTO           .333          .358          .487          .487          .743          .717
FIDSTKS        .333          .355          .497          .457          .57           .61
SEMI           .333          .295          .342          .333          .38           .409
RUS-1000       .314          .31           .411          .396          .549          .607
NASD-100       .3            .3            .47           .39           .41           .49
ELECTRON       .29           .27           .351          .344          .445          .452
UTILITY        .289          .131          .289          .21           .263          .447
INDEXES        .264          .264          .55           .449          .629          .73
SOFTWARE       .25           .25           .366          .3            .3            .333
HOSPITAL       .238          .238          .285          .38           .476          .523
BIOTECH        .231          .268          .369          .343          .462          .444
GOLD           .224          .142          .51           .53           .775          .816
EDU            .2            .4            .4            .4            .4            .4
BONDFUND       .198          .178          .277          .277          .396          .475
INSURANC       .153          .153          .307          .269          .538          .538
FINANCE        .146          .158          .256          .207          .475          .475
MILITARY       .142          .178          .25           .25           .428          .464
ETFS           .125          .196          .339          .375          .625          .785
REIT           .114          .107          .242          .214          .435          .578
OILGAS         .11           .118          .149          .165          .22           .244
HACKERS        .1            .15           .15           .1            .1            .15
BIGBANKS       0             0             0             0             .571          .571
REGBANKS       0             0             0             .076          .269          .307
|
=======================================================================
9/23/2020 Peerless remains on multiple
Sells. Today was a much worse day than
was expected last night. This adds to the bearishness ahead, I think.

Hedge with shorted bank stocks and oil stocks shown
among recent
bearish MINCPs or tonight's.
Everything I have learned from market history in Presidential
Election years in
September can be summed up by saying that "If the market hates one thing more
than the uncertainty of a Presidential Election, it is the fear that a Republican friend
of
Wall Street in the White House will be defeated." Hence the DJI sell-offs
until November or December in 1892, 1912, 1932, 1968 and 2008. Clinton's defeat
of Bush Sr. in 1992 is the major exception. Clinton was actually groomed by Rubin
and Goldman Sachs for the job. Hence his de-regulation of banks and NAFTA.
Can this be said of Biden and the Democrats in 2020? Maybe so with Biden.
Hence Bloomberg's vigorous support. Doubtful for most Congressional Democrats.
.
Today was a very bad day for the market. The
DJI opened up 200
and closed down 500. This casues a very red, "all encompassing"
red candle-stick. There were 2757 down on the NYSE. The
A/D Line bearishly and decisively broke its 6-month uptrendline.
All the averages did the unexpected today. Instead of rallying a little
higher, they again collapsed below their 65-dma. Powell again
complained that fiscal stimulus is needed and Covid-19 infections
seem to be starting another up-cycle. It is also not helpful to hear
that the Presidential Election will likely cause a long period of
doubt and judication. This would be a very far cry from direct democracy.


The bearish considerations now heavily outweigh the bullish
ones,
unless Powell enters the equities market directly on the long side.
QE-Infinity with bonds has reached its limitations, it seems.
The good news is (1) that the Opening Power Lines are still in an
uptrend, (2) that the NASDAQ has very high long-term
Accumulation and (3), the DJI s 65-dma is still rising, but only barely.
The bad news remains (1) all the many Peerless Sells, are unreversed
(2) the ETFs' head/shoulders patterns have now been confirmed by
a second clear closing below their 65-dma,
(3) the Closing Powers are now weaker than they were in February,
4) Debt is much, much greater,
5) high tech PEs much, much higher,
6) Powell is now publicly admiting the limitations of monetary policy,
7) for the first time in a long while the number of NYSE and NASDAQ
new lows was more than 140, thus showing FED's QE-Infinity can no
longer prop up the weakest stocks,
8) less than 30% of all stocks are still above the support of their 65-dma.
and 9) the bearish seasonality continues. In Presidential Election years
since1968, the DJI falls an average of 2.3% over the next 21 trading
days after September 23rd and rises only 38.5% of the time.
DIA |
SPY |
QQQ |
|
Charts 9/23/2020 (Click on Underlined link.) 2020 PEERLESS DJI, Signals, Indicators Daily DJI Volume 10-DayUp/Down Vol Stoch-20 Inverted Traders Index Graph of Pct of All Stocks above 65-dma Cum. Inverted Traders Index NASDAQ S&P OEX NYSE COMPQX DJI-15 DJI-20 DJI-30 DIA QQQ MDY IWM TNA Short-Term Rates DOLLAR-UUP SPY http://tigersoft.com/2121CST/SPY.GIF recent 2006 vers-Peerless signals -- http://tigersoft.com/NEWPEER/UPD6923.BMP USO-CrudeOil DBO FAS GLD BBH IBB JETS JNUG KOL NUGT OIH PALL RSX RETL SDS AGQ SLV SOXL TECL TLT TMF TNA UGA (gasoline) USO (oil) and China: YINN CHAU Commodities: CANE CORN DBC JJC, NIB, CHOC CORN, CUT (paper) MOO, SOYB WEAT UUP (Dollar) LIT (Lithium) Stocks AAPL ADBE ALXN AMAT AMGN AMD AMZN AXP BA BABA BAC BIDU BLDP CAT CRM CVX CMG DE ENPH FB GILD GOOG GS HD IBM INTU JPM LRCX M (Macy's) MSFT NEM NFLX NKE NVDA PG REGN REV SO SQ QCOM QDEL TSLA TXN XOM V VRTX WFC WMT TOWN ZM New highs and Bullish MAXCPs http://tigersoft.com/MAXCP/9-23/BULLISH.htm Bearish MAXCPs - http://tigersoft.com/MINCP/9-23/BEARISH.htm |
 Table 1
             9/23/2018   QUICKSILVER on DJI-30 STOCKS.
P21 + ITRS score >+.25 is bullish
             1  Bullish (CRM)
             6  Bearish (BA, CSCO, CVX, GS, TRV, WBA)
hughest priced DJI-30 = UNH, HD, CRM, AMGN MCD, MSFT, V
HIGHEST AI/200 = CRM Second Highest Tied = AAPL and MSFT STOCKS CLOSECHANGE PIVOT-PT 5-dma AROC CL-PWR CANDLE AI/200 IP21 ITRS ------------------------------------------------------------------------------------------------------- ------------------------------------------------------------------------------------------------------- AAPL 107.12 -4.69 112.13 -227.2% Bearish RED 167 -.115 .1 ---------------------------------------------------------------------------------------------------------- AMGN 242.59 -4.91 247.76 -104.7% Bearish RED 135 .189 -.045 ---------------------------------------------------------------------------------------------------------- AXP 95.56 -2.92 105.98 -510.1% ------- ---- 105 -.147 .004 ---------------------------------------------------------------------------------------------------------- BA 151.18 -5.62 167.46 -502.9% ------- RED 33 -.23 -.164 Bearish ---------------------------------------------------------------------------------------------------------- CAT 144.38 -2.77 151.11 -224.4% Bullish RED 130 -.068 .051 ---------------------------------------------------------------------------------------------------------- CRM 235.99 -11.79 250.6 -296.8% ------- RED 194 .234 .241 ---------------------------------------------------------------------------------------------------------- CSCO 38.28 -1.04 40.42 -268.9% Bearish RED 119 -.075 -.176 Bearish ---------------------------------------------------------------------------------------------------------- CVX 71.95 -3.58 78.56 -426.6% Bearish RED 77 -.25 -.189 Bearish ---------------------------------------------------------------------------------------------------------- DIS 123.28 -3.93 132.09 -342.2% Bearish RED 103 -.186 .035 ---------------------------------------------------------------------------------------------------------- DOW 46.74 -1.06 49.7 -299.9% Bullish RED 69 -.064 .098 ---------------------------------------------------------------------------------------------------------- GS 186.12 -5.5 200.68 -373% Bearish RED 67 -.185 -.134 Bearish ---------------------------------------------------------------------------------------------------------- HD 266.55 -6.76 281.63 -272.7% Bearish RED 145 .101 .03 ---------------------------------------------------------------------------------------------------------- HON 158.79 -3.89 170 -336.4% Bearish RED 105 .024 .068 ---------------------------------------------------------------------------------------------------------- IBM 118.83 -1.68 124.22 -219.9% ------- RED 111 -.24 -.018 ---------------------------------------------------------------------------------------------------------- INTC 48.82 -1.13 50.37 -154.8% ------- RED 95 -.062 -.176 ---------------------------------------------------------------------------------------------------------- JNJ 144.44 .23 148.4 -134.9% Bearish RED 127 -.101 -.027 ---------------------------------------------------------------------------------------------------------- JPM 92.74 -1.53 99.7 -357.9% Bearish RED 32 -.167 -.059 ---------------------------------------------------------------------------------------------------------- KO 48.21 -1.45 50.79 -257.4% Bearish RED 99 -.07 .047 ---------------------------------------------------------------------------------------------------------- MCD 214.97 -1.44 224.81 -223.5% ------- RED 147 -.111 .123 ---------------------------------------------------------------------------------------------------------- MMM 159.51 -2.83 169.51 -299.4% Bearish RED 109 -.084 .002 ---------------------------------------------------------------------------------------------------------- MRK 82.63 -.31 85.57 -173.7% Bearish RED 106 -.055 .052 ---------------------------------------------------------------------------------------------------------- MSFT 200.59 -6.83 205.05 -109.5% Bearish RED 164 .026 -.041 ---------------------------------------------------------------------------------------------------------- NKE 127.11 10.24 118.59 367.3% Bullish RED 146 -.12 .31 ---------------------------------------------------------------------------------------------------------- PG 136.31 -1.65 137.7 -50.6% Bearish RED 104 -.043 .086 ---------------------------------------------------------------------------------------------------------- TRV 107.49 -1.76 113.17 -255.4% Bearish RED 98 -.23 -.097 Bearish ---------------------------------------------------------------------------------------------------------- UNH 292.14 -2.12 306.52 -237.6% Bearish RED 123 -.09 -.057 ---------------------------------------------------------------------------------------------------------- V 195.37 -5.19 205.13 -241.3% Bearish RED 115 -.025 .007 ---------------------------------------------------------------------------------------------------------- VZ 58.91 -.91 60.37 -121.4% ------- RED 131 -.136 .059 ---------------------------------------------------------------------------------------------------------- WBA 35.06 -.66 36.28 -167.6% ------- RED 80 -.23 -.13 Bearish ---------------------------------------------------------------------------------------------------------- WMT 135.99 -2.32 136.26 -9.9% Bearish RED 128 .041 .026 |
Table 2 QUICKSILVER on ETFS - 09/23/20 Bullish = 0
Bearish = 1 OIH
ITRS + IP21>.25 is considered "Bullish"
ETF CLOSE CHANGE PIVOT-PT 5-dma AROC CL-PWR CANDLE IP21 ITRS --------------------------------------------------------------------------------------------- --------------------------------------------------------------------------------------------- DIA 267.58 -5.23 279.57 -243.4% Bearish RED -.037 ----- --------------------------------------------------------------------------------------------- SPY 322.64 -7.66 335.84 -243.3% Bearish RED -.031 .008 --------------------------------------------------------------------------------------------- QQQ 264.16 -8.32 270.32 -193.3% Bearish RED .028 .011 --------------------------------------------------------------------------------------------- MDY 326.16 -7.55 344.71 -304.4% Bearish RED -.017 0 --------------------------------------------------------------------------------------------- IWM 144.07 -4.99 153.69 -354.2% Bearish RED -.088 .012 --------------------------------------------------------------------------------------------- FAS 30.66 -2.03 37.1 -1070.1% Bearish RED -.084 -.054 --------------------------------------------------------------------------------------------- SOXL 215.93 -17.37 237.29 -483.7% Bearish RED .06 .031 --------------------------------------------------------------------------------------------- TECL 261.83 -27.32 283.15 -523% Bearish RED -.023 .05 --------------------------------------------------------------------------------------------- IBB 132.08 -1.76 135.63 -151.2% Bearish RED .099 -.062 --------------------------------------------------------------------------------------------- GLD 174.79 -3.86 182.96 -252.7% Bearish RED .025 .023 --------------------------------------------------------------------------------------------- OIH 100.14 -6.66 117.32 -806.7% Bearish RED -.199 -.167 Bearish --------------------------------------------------------------------------------------------- GASL 3440 285 3685 -325.1% ------- RED -.021 .11 --------------------------------------------------------------------------------------------- |
 Table 3   Count of Stocks in Key Directories
           20200923
-------------------------------
NEWHIGHS       76
NEWLOWS        148
MAXCP          2
MINCP          357
TTTNH          4
TTTNL          263
FASTUP         45
FASTDOWN       454
CPCROSSA       12
CPCROSSD       214
BIGVOLUP       2
BIGVODN        11
ACCUMVER       121
HIGHIP21       10
HIUPPCT        23
REDSELL        70
AUGSELS7       60
TRAPDOOR       15
|
Table 4 RANKING OF KEY DIRECTORIES BASED PCT.OF STOCKS ABOVE 65-DMA 9/23/20 Bullish = 7 Bearish = 39 --------------------------------------------------------------------------------------- Directory Current day-1 day-2 day-3 day-4 day-5 ---------------------------------------------------------------------------------------- COAL .857 .857 .857 .857 .857 .857 HOMEBLDG .705 .764 .705 .764 .764 .882 SOLAR .666 .733 .733 .733 .733 .8 TRANSP .65 .7 .75 .95 .95 .95 GAMING .619 .714 .666 .619 .714 .714 COMODITY .56 .731 .756 .878 .878 .829 FOOD .547 .698 .735 .886 .886 .811 ============================================================================================== RETAIL .489 .612 .612 .632 .653 .673 GUNS .466 .466 .466 .6 .6 .6 COMPUTER .45 .5 .5 .5 .55 .65 CHINA .44 .54 .54 .58 .5 .56 JETS .428 .571 .642 .857 .857 .857 BEVERAGE .4 .466 .466 .533 .533 .6 DOWJONES .4 .6 .5 .7 .666 .733 EDU .4 .4 .4 .4 .4 .4 INDMATER .4 .56 .586 .72 .746 .72 INFRA .4 .485 .514 .685 .771 .8 CHEM .395 .541 .541 .687 .729 .687 COPPER .375 .625 .625 .875 .875 .875 AUTO .358 .487 .487 .743 .717 .692 FIDSTKS .355 .497 .457 .57 .615 .644 NIFTY .355 .466 .4 .377 .466 .533 SP-100 .351 .483 .428 .593 .626 .648 SP500 .347 .468 .447 .571 .625 .671 GREEN .333 .476 .476 .619 .666 .761 RUS-1000 .31 .413 .396 .549 .607 .653 DJI-13 .307 .538 .461 .692 .615 .769 NASD-100 .3 .47 .39 .41 .49 .55 SEMI .295 .342 .333 .38 .409 .457 ELECTRON .27 .351 .344 .445 .452 .472 INDEXES .269 .55 .449 .629 .73 .747 BIOTECH .268 .369 .343 .462 .449 .47 SOFTWARE .25 .383 .3 .3 .333 .416 HOSPITAL .238 .285 .38 .523 .571 .619 ETFS .196 .339 .375 .625 .785 .785 BONDFUND .178 .277 .277 .396 .495 .485 MILITARY .178 .25 .25 .428 .464 .464 FINANCE .158 .256 .207 .475 .475 .487 INSURANC .153 .307 .269 .538 .538 .653 HACKERS .15 .2 .1 .1 .15 .2 GOLD .142 .51 .53 .775 .816 .816 UTILITY .131 .289 .21 .263 .447 .473 OILGAS .118 .149 .157 .22 .244 .244 REIT .106 .241 .212 .432 .553 .673 BIGBANKS 0 0 0 .571 .571 .571 REGBANKS 0 0 .076 .269 .307 .307 |
========================================================================
9/22/2020 The DJI has closed slightly
above its 65-dma despite the completed
head/shoulders pattern. This predicts a retest of the right shoulder's peak
based on the five previous cases of this since 1980. None of these cases, it's true,
occurred in September in a Presidential Election year. But, the pattern
of such a recovery followed by another retreat to the 65-dma or below
is strong. See the charts below. Volume would need to pick up dramatically
for the DJI to be able to get above its recent right shoulder highs. The 2006
version gave a Buy again today, but note that the older version of Peerless
does not concern itself with the bearish seasonality now and its Buy signals
in September in Presidential Election years have all failed. So most likely we will
probably only see a minor DJI rally unless upside volume picks up dramatically.
Of course, the Election's uncertainties are increasing. Pennsylvania looms as the
key
state. Democrat partisans are getting very excited about the coming
vote count there and whether the Supreme Court will award Trump victory
there as they did Bush in the year 2000 for Florida. The drama's unfolding
cannot but affect the market and bring some wild swings as it plays out. Use
the market's technicals rather than emotions to judge the market bullishness
or bearishness. Except in Dewey's case in 1948, the market always seems to
somehow know. Its head/shoulders patterns are quick adjustments to new
realities it must factor in.
Our best bet in these times, I think, remains being hedged. Being long the
very highest AI/200 stocks like ADBE, CRM, the NASDAQ and the solar
stocks among the MAXCPs is the bullish part of the portfolio. The bearish part
should be made up of the bearish MINCPs as long as their Closing Powers are
down-trending. Oil stocks and now financials seem the best candidates for
shorting. What we want to see here is heavy distribution, IP21 below its 21-day ma,
Closing Power new lows ahead of prices, head/shoulders patterns and a recent
breaking of support. Cover them at their March lows or if their Closing Power
jumps above the falling 21-dma of Closing Power.
Current Peerless DJIA
Green arrow shows where the DJI climbs back above its 65-dma following a
breakdown below neckline in head/shoulders pattern.

DJI - 1984

DJI - 1987

DJI - 1988

DJI - 2009
Note the Buy B14 here allows
the DJI to take-off here instead of being stopped
at the right shoulder apex.

DJIA - 2016

----------------------------------------------------------------------------------------------------
NASDAQ and QQQ
With the NASDAQ and QQQ we also see the closes rising back above
their 65-day moving averages. This calls for a rally back to their recent
peaks. Another bullish sign is the breaking of the Closing Power downtrend
following
a test of the 65-dma when the IP21 has recently been very positive. This is
the case with the NASDAQ and QQQ. The color change of the candle-stocks
here adds to the short-term bullishness.


|
Charts 9/22/2020 (Click on Underlined link.) 2020 PEERLESS DJI, Signals, Indicators Daily DJI Volume 10-DayUp/Down Vol Stoch-20 Inverted Traders Index Graph of Pct of All Stocks above 65-dma Cum. Inverted Traders Index NASDAQ S&P OEX NYSE COMPQX DJI-15 DJI-20 DJI-30 DIA QQQ MDY IWM TNA Short-Term Rates DOLLAR-UUP SPY http://tigersoft.com/2121CST/SPY.GIF recent 2006 vers-Peerless signals -- http://tigersoft.com/NEWPEER/UPD6922.BMP USO-CrudeOil DBO FAS GLD BBH IBB JETS JNUG KOL NUGT OIH PALL RSX RETL SDS AGQ SLV SOXL TECL TLT TMF TNA UGA (gasoline) USO (oil) and China: YINN CHAU Commodities: CANE CORN DBC JJC, NIB, CHOC CORN, CUT (paper) MOO, SOYB WEAT UUP (Dollar) LIT (Lithium) Stocks AAPL ADBE ALXN AMAT AMGN AMD AMZN AXP BA BABA BAC BIDU BLDP CAT CRM CVX CMG DE ENPH FB GILD GOOG GS HD IBM INTU JPM LRCX M (Macy's) MSFT NEM NFLX NKE NVDA PG REGN REV SO SQ QCOM QDEL TSLA TXN XOM V VRTX WFC WMT TOWN ZM New highs and Bullish MAXCPs http://tigersoft.com/MAXCP/9-22/BULLISH.htm Bearish MAXCPs - http://tigersoft.com/MINCP/9-22/BEARISH.htm |
 Table 1
             9/22/2018   QUICKSILVER on DJI-30 STOCKS.
P21 + ITRS score >+.25 is bullish
             1  Bullish (CRM,)
             2  Bearish (CVX, WBA)
hughest priced DJI-30 = UNH, HD, CRM, AMGN MCD, MSFT, V
HIGHEST AI/200 = CRM Second Highest Tied = AAPL and MSFT STOCKS CLOSECHANGE PIVOT-PT 5-dma AROC CL-PWR CANDLE AI/200 IP21 ITRS ------------------------------------------------------------------------------------------------------- ------------------------------------------------------------------------------------------------------- AAPL 111.81 1.73 115.54 -168% Bearish RED 168 -.096 .126 ---------------------------------------------------------------------------------------------------------- AMGN 247.5 4.31 248.35 -17.2% Bearish BLUE 135 .208 -.055 ---------------------------------------------------------------------------------------------------------- AXP 98.48 .31 106.68 -395% ------- BLUE 105 -.055 .007 ---------------------------------------------------------------------------------------------------------- BA 156.8 .45 163.49 -205% ------- BLUE 33 -.093 -.152 ---------------------------------------------------------------------------------------------------------- CAT 147.15 1.82 148.6 -48.2% Bullish BLUE 131 -.021 .082 ---------------------------------------------------------------------------------------------------------- CRM 247.78 2.73 251.68 -79% ------- BLUE 194 .271 .271 Bullisj ---------------------------------------------------------------------------------------------------------- CSCO 39.32 .28 40.6 -159.8% Bearish BLUE 119 -.044 -.189 ---------------------------------------------------------------------------------------------------------- CVX 75.53 -.77 76.35 -52.8% Bearish RED 77 -.154 -.161 Bearish ---------------------------------------------------------------------------------------------------------- DIS 127.21 1.8 131.24 -155.6% Bearish BLUE 104 -.117 .049 ---------------------------------------------------------------------------------------------------------- DOW 47.8 -.11 51.07 -327% Bullish RED 70 .005 .114 ---------------------------------------------------------------------------------------------------------- GS 191.62 -2.38 198 -162.4% Bearish RED 68 -.109 -.128 ---------------------------------------------------------------------------------------------------------- HD 273.31 .96 285.58 -219.9% ------- BLUE 144 .19 .05 ---------------------------------------------------------------------------------------------------------- HON 162.68 1.31 168.3 -167.5% ------- BLUE 104 .069 .089 ---------------------------------------------------------------------------------------------------------- IBM 120.51 .26 122.44 -78.5% ------- BLUE 111 -.172 -.034 ---------------------------------------------------------------------------------------------------------- INTC 49.95 .23 50 -5% ------- ---- 96 -.023 -.192 ---------------------------------------------------------------------------------------------------------- JNJ 144.21 -.89 148.89 -158.4% Bearish RED 128 -.022 -.052 ---------------------------------------------------------------------------------------------------------- JPM 94.27 -1.04 99.28 -255% ------- RED 33 -.076 -.08 ---------------------------------------------------------------------------------------------------------- KO 49.66 .57 51.05 -137.9% ------- BLUE 100 .001 .052 ---------------------------------------------------------------------------------------------------------- MCD 216.41 0 222.37 -134.7% ------- ---- 147 -.068 .125 ---------------------------------------------------------------------------------------------------------- MMM 162.34 .98 166.57 -126% Bearish BLUE 109 -.019 .004 ---------------------------------------------------------------------------------------------------------- MRK 82.94 -.19 84.21 -74.8% Bearish RED 107 .016 .027 ---------------------------------------------------------------------------------------------------------- MSFT 207.42 4.88 208.78 -33.3% Bearish BLUE 164 .054 -.043 ---------------------------------------------------------------------------------------------------------- NKE 116.87 3.5 119.27 -103% Bullish BLUE 147 -.016 .167 ---------------------------------------------------------------------------------------------------------- PG 137.96 1.25 138.63 -24.3% ------- BLUE 105 .038 .067 ---------------------------------------------------------------------------------------------------------- TRV 109.25 -.2 112.15 -129.7% Bearish BLUE 99 -.1 -.089 ---------------------------------------------------------------------------------------------------------- UNH 294.26 -4.93 307.23 -212.5% Bearish RED 124 -.064 -.063 ---------------------------------------------------------------------------------------------------------- V 200.56 3.11 205.39 -118.9% Bearish BLUE 116 .034 .016 ---------------------------------------------------------------------------------------------------------- VZ 59.82 .21 60.6 -64.7% Bullish BLUE 132 -.064 .054 ---------------------------------------------------------------------------------------------------------- WBA 35.72 -.07 35.27 62% ------- RED 80 -.181 -.143 Bearish ---------------------------------------------------------------------------------------------------------- WMT 138.31 1.24 137.36 34.8% Bearish BLUE 127 .062 .023 |
Table 2 QUICKSILVER on ETFS - 09/22/20 Bullish = 0
Bearish = 0
ITRS + IP21>.25 is considered "Bullish"
ETF CLOSE CHANGE PIVOT-PT 5-dma AROC CL-PWR CANDLE IP21 ITRS --------------------------------------------------------------------------------------------- --------------------------------------------------------------------------------------------- DIA 272.81 1.37 281.03 -139.8% Bearish BLUE .037 ---- --------------------------------------------------------------------------------------------- SPY 330.3 3.33 338.82 -147.5% Bearish BLUE .043 .004 --------------------------------------------------------------------------------------------- QQQ 272.48 4.97 274.61 -121.1% Bearish BLUE .059 .009 --------------------------------------------------------------------------------------------- MDY 333.71 2.23 346.82 -176.2% Bearish BLUE .063 -.001 --------------------------------------------------------------------------------------------- IWM 149.06 1.14 154.82 -141.2% Bearish BLUE .007 .023 --------------------------------------------------------------------------------------------- FAS 32.69 -1.08 38.28 -657.7% Bearish RED .007 -.004 --------------------------------------------------------------------------------------------- SOXL 233.3 8.16 238.38 -266% Bearish BLUE .104 .132 --------------------------------------------------------------------------------------------- TECL 289.15 13.54 291.28 -283.2% Bearish BLUE .023 .154 --------------------------------------------------------------------------------------------- IBB 133.84 1.01 136.16 -82.3% Bearish BLUE .108 -.071 --------------------------------------------------------------------------------------------- GLD 178.65 -.87 183.97 -131.4% Bearish RED .033 .01 --------------------------------------------------------------------------------------------- OIH 106.8 -.25 118.37 -269.2% ------- RED -.055 -.106 --------------------------------------------------------------------------------------------- GASL 3440 285 3685 -325.1% ------- RED -.021 .068 --------------------------------------------------------------------------------------------- |
Table 3    Count of Stocks in Key Directories
          20200922
-------------------------------
NEWHIGHS       66
NEWLOWS        82
MAXCP          20
MINCP          124
TTTNH          9
TTTNL          123
FASTUP         69
FASTDOWN       166
CPCROSSA       55
CPCROSSD       54
BIGVOLUP       2
BIGVODN        4
HIUPPCT        23
VHIP21         114
LOWACCUM       165
REDSELL        72
AUGSELS7       39
TRAPDOOR       15
|
 Table 4
         RANKING OF KEY DIRECTORIES BASED PCT.OF STOCKS ABOVE 65-DMA
              9/22/20
 Bullish = 17
 Bearish = 28
---------------------------------------------------------------------------------------
Directory     Current       day-1         day-2         day-3         day-4         day-5
----------------------------------------------------------------------------------------
COAL           .857          .857          .857          .857          .857          .857
HOMEBLDG       .764          .705          .764          .764          .882          .764
SOLAR          .733          .733          .733          .733          .8            .8
COMODITY       .731          .756          .878          .878          .829          .804
GAMING         .714          .666          .619          .714          .714          .714
TRANSP         .7            .75           .95           .95           .95           .95
FOOD           .698          .735          .886          .886          .811          .773
COPPER         .625          .625          .875          .875          .875          .875
RETAIL         .612          .612          .632          .653          .673          .653
DOWJONES       .6            .5            .7            .666          .733          .733
JETS .571 .642 .857 .857 .857 .857 INDMATER .56 .586 .72 .746 .72 .693 INDEXES .55 .449 .629 .73 .747 .724 CHEM .541 .541 .687 .729 .687 .687 CHINA .54 .54 .58 .5 .54 .56 DJI-13 .538 .461 .692 .615 .769 .692 GOLD .51 .53 .775 .816 .816 .816 ---------------------------------------------------------------------------------------------- COMPUTER .5 .5 .5 .55 .65 .6 ---------------------------------------------------------------------------------------------- FIDSTKS .497 .457 .57 .615 .649 .683 AUTO .487 .487 .743 .717 .692 .871 INFRA .485 .514 .685 .771 .8 .657 SP-100 .483 .428 .593 .626 .659 .67 GREEN .476 .476 .619 .666 .761 .619 NASD-100 .47 .39 .41 .49 .57 .67 SP500 .468 .449 .571 .625 .673 .654 BEVERAGE .466 .466 .533 .533 .6 .666 GUNS .466 .466 .6 .6 .6 .6 NIFTY .466 .4 .377 .466 .555 .622 RUS-1000 .413 .398 .549 .607 .651 .611 EDU .4 .4 .4 .4 .4 .4 SOFTWARE .383 .316 .3 .333 .416 .466 BIOTECH .369 .343 .462 .449 .476 .425 ELECTRON .351 .344 .445 .452 .472 .479 SEMI .342 .333 .38 .409 .457 .476 ETFS .339 .375 .625 .785 .785 .803 INSURANC .307 .269 .538 .538 .653 .576 UTILITY .289 .21 .263 .447 .473 .394 HOSPITAL .285 .38 .523 .619 .619 .619 BONDFUND .277 .277 .396 .495 .485 .564 FINANCE .256 .207 .475 .475 .487 .463 MILITARY .25 .25 .428 .464 .464 .285 REIT .241 .212 .432 .553 .666 .581 HACKERS .2 .15 .1 .15 .2 .25 OILGAS .149 .157 .212 .244 .244 .188 BIGBANKS 0 0 .571 .571 .571 .428 REGBANKS 0 .076 .269 .307 .307 .307 |
====================================================================
9/21/2020 Peerless remains on Sells. The head and shoulders
patterns in key ETFs
and leading techs show variously violated necklines. Most are still at their
65-dma, courtesy of a late short-covering rally. The most significant A/D
Line uptrend that started in last March and is very well tested has now
been reached. Watch the breadth closely tomorrow. The 2006 version
of Peerless did give a Buy B8 because the P-Indicator did not confirm
the new low. But this version does not consider the bearish seasonality
that is at play now because of the Election. Powell will be speaking tomorrow.
He is telling us the economy is weaker than he can hold up using monetary
policy alone. See the comments on the charts below. We need to see more
than a short covering rally. I would still be mostly short the bearish MINCPs.


 |
 |
 |
 |
 |
 |
|
Charts 9/21/2020 (Click on Underlined link.) 2020 PEERLESS DJI, Signals, Indicators Daily DJI Volume 10-DayUp/Down Vol Stoch-20 Inverted Traders Index Graph of Pct of All Stocks above 65-dma Cum. Inverted Traders Index NASDAQ S&P OEX NYSE COMPQX DJI-15 DJI-20 DJI-30 DIA QQQ MDY IWM TNA Short-Term Rates DOLLAR-UUP SPY http://tigersoft.com/2121CST/SPY.GIF recent 2006 vers-Peerless signals -- http://tigersoft.com/NEWPEER/UPD6921.BMP USO-CrudeOil DBO FAS GLD BBH IBB JETS JNUG KOL NUGT OIH PALL RSX RETL SDS AGQ SLV SOXL TECL TLT TMF TNA UGA (gasoline) USO (oil) and China: YINN CHAU Commodities: CANE CORN DBC JJC, NIB, CHOC CORN, CUT (paper) MOO, SOYB WEAT UUP (Dollar) LIT (Lithium) Stocks AAPL ADBE ALXN AMAT AMGN AMD AMZN AXP BA BABA BAC BIDU BLDP CAT CRM CVX CMG DE ENPH FB GILD GOOG GS HD IBM INTU JPM LRCX M (Macy's) MSFT NEM NFLX NKE NVDA PG REGN REV SO SQ QCOM QDEL TSLA TXN XOM V VRTX WFC WMT TOWN ZM New highs and Bullish MAXCPs http://tigersoft.com/MAXCP/9-21/BULLISH.htm Bearish MAXCPs - http://tigersoft.com/MINCP/9-21/BEARISH.htm |
 Table 1
             9/21/2018   QUICKSILVER on DJI-30 STOCKS.
P21 + ITRS score >+.25 is bullish
             2  Bullish (CRM, HD)
             2  Bearish (INTC, WBA)
hughest priced DJI-30 = UNH, HD, CRM, AMGN MCD, MSFT, V
HIGHEST AI/200 = CRM Second Highest Tied = AAPL and MSFT STOCKS CLOSECHANGE PIVOT-PT 5-dma AROC CL-PWR CANDLE AI/200 IP21 ITRS ------------------------------------------------------------------------------------------------------- ------------------------------------------------------------------------------------------------------- AAPL 110.08 3.24 115.36 -235.6% Bearish BLUE 169 -.049 .107 ---------------------------------------------------------------------------------------------------------- AMGN 243.19 -4.53 246.75 -71.9% Bearish RED 135 .192 -.064 ---------------------------------------------------------------------------------------------------------- AXP 98.17 -5.27 107.27 -430.8% ------- RED 105 -.094 .012 ---------------------------------------------------------------------------------------------------------- BA 156.35 -4.79 165.35 -272.7% ------- RED 33 -.114 -.165 Bearish ---------------------------------------------------------------------------------------------------------- CAT 145.33 -7.06 153.51 -269.3% Bullish RED 132 -.031 .095 ---------------------------------------------------------------------------------------------------------- CRM 245.05 2.27 246.64 -32.2% ------- BLUE 194 .253 .191 Bullish ---------------------------------------------------------------------------------------------------------- CSCO 39.04 -.77 40.37 -165% Bearish RED 119 -.035 -.204 ---------------------------------------------------------------------------------------------------------- CVX 76.3 -1.91 77.29 -63.6% ------- ---- 77 -.08 -.145 ---------------------------------------------------------------------------------------------------------- DIS 125.41 -3.22 131.25 -223.4% Bearish RED 105 -.165 .01 ---------------------------------------------------------------------------------------------------------- DOW 47.91 -2.46 50.09 -216.1% Bullish RED 70 -.003 .135 ---------------------------------------------------------------------------------------------------------- GS 194 -.86 201.34 -185.4% ------- BLUE 69 -.092 -.097 ---------------------------------------------------------------------------------------------------------- HD 272.35 -2.84 280.65 -147.9% ------- BLUE 143 .211 .048 Bullish ---------------------------------------------------------------------------------------------------------- HON 161.37 -7.33 168.47 -209.9% ------- RED 103 .066 .092 ---------------------------------------------------------------------------------------------------------- IBM 120.25 -2.51 122.09 -74.6% ------- RED 111 -.154 -.025 ---------------------------------------------------------------------------------------------------------- INTC 49.72 -.17 49.41 31% ------- BLUE 97 .012 -.206 ---------------------------------------------------------------------------------------------------------- JNJ 145.1 -4.08 148.35 -109.5% Bearish RED 129 .015 -.022 ---------------------------------------------------------------------------------------------------------- JPM 95.31 -3.04 102.47 -359.2% ------- ---- 34 -.074 -.051 ---------------------------------------------------------------------------------------------------------- KO 49.09 -1.36 50.71 -159.7% ------- RED 100 0 .047 ---------------------------------------------------------------------------------------------------------- MCD 216.41 -3.86 220.56 -93.4% ------- RED 147 -.063 .13 ---------------------------------------------------------------------------------------------------------- MMM 161.36 -8.19 168.46 -209.7% ------- RED 109 -.025 .015 ---------------------------------------------------------------------------------------------------------- MRK 83.13 -2.68 84.16 -60.5% Bearish RED 107 .036 .043 ---------------------------------------------------------------------------------------------------------- MSFT 202.54 2.15 205.41 -70.2% Bearish BLUE 164 -.021 -.093 ---------------------------------------------------------------------------------------------------------- NKE 113.37 -1.29 119.28 -251.2% Bullish BLUE 148 -.034 .116 ---------------------------------------------------------------------------------------------------------- PG 136.71 -.66 138.63 -69.6% Bearish RED 105 .047 .063 ---------------------------------------------------------------------------------------------------------- TRV 109.45 -2.16 114.46 -222.1% Bearish BLUE 100 -.103 -.079 ---------------------------------------------------------------------------------------------------------- UNH 299.19 -8.83 308.57 -152.7% Bearish RED 125 -.006 -.013 ---------------------------------------------------------------------------------------------------------- V 197.45 -5.16 204.98 -183.9% Bearish RED 116 -.012 -.015 ---------------------------------------------------------------------------------------------------------- VZ 59.61 -.74 60.32 -58.7% Bullish RED 133 -.025 .053 ---------------------------------------------------------------------------------------------------------- WBA 35.79 -1.14 35.11 94% ------- RED 80 -.2 -.149 Bearish ---------------------------------------------------------------------------------------------------------- WMT 137.07 1.78 137.32 -9.2% Bearish BLUE 126 .051 .008 |
Table 2 QUICKSILVER on ETFS - 09/21/20 Bullish = 0
Bearish = 0
               ITRS + IP21>.25 is considered "Bullish"
               Highest ITRS + IP21 = TECL
ETF CLOSE CHANGE PIVOT-PT 5-dma AROC CL-PWR CANDLE IP21 ITRS --------------------------------------------------------------------------------------------- --------------------------------------------------------------------------------------------- DIA 271.44 -5.08 280.58 -162.5% Bearish RED .032 0 --------------------------------------------------------------------------------------------- SPY 326.97 -3.68 340.17 -170.6% Bearish BLUE .037 -.011 --------------------------------------------------------------------------------------------- QQQ 267.51 .64 279.06 -140% Bearish BLUE .051 -.027 --------------------------------------------------------------------------------------------- MDY 331.48 -8.49 345.75 -201% Bearish RED .045 -.014 --------------------------------------------------------------------------------------------- IWM 147.92 -5.37 153.37 -167.9% Bearish RED -.029 .006 --------------------------------------------------------------------------------------------- FAS 33.77 -2.41 37.5 -560.1% ------- RED .026 .016 --------------------------------------------------------------------------------------------- SOXL 225.14 -1.09 245.78 -182.4% Bearish BLUE .095 .039 --------------------------------------------------------------------------------------------- TECL 275.61 7.05 305.28 -355.7% Bearish BLUE .011 .033 --------------------------------------------------------------------------------------------- IBB 132.83 -3.49 136.07 -69.2% Bearish RED .071 -.087 --------------------------------------------------------------------------------------------- GLD 179.52 -3.68 183.45 -119.1% Bearish RED .064 .02 --------------------------------------------------------------------------------------------- OIH 107.05 -8.39 112.95 -225.1% ------- RED -.085 -.121 --------------------------------------------------------------------------------------------- GASL 3440 285 3685 -325.1% ------- RED -.021 .073 |
Table 3   Count of Stocks in Key Directories
          20200921
-------------------------------
NEWHIGHS       55
NEWLOWS        108
MAXCP          13
MINCP          153  Bearish 10:1
TTTNH          7
TTTNL          179  Bearish >10:1
FASTUP         74
FASTDOWN       130
CPCROSSA       33
CPCROSSD       160
BIGVOLUP       3
BIGVODN        8
ACCUMVER       119
HIGHIP21       11
HIUPPCT        25
REDSELL        72
AUGSELS7       86
TRAPDOOR       15
|
Table 4 RANKING OF KEY DIRECTORIES BASED PCT.OF STOCKS ABOVE 65-DMA
9/21/20
Bullish = 15
Bearish = 29
---------------------------------------------------------------------------------------
Directory Current day-1 day-2 day-3 day-4 day-5
----------------------------------------------------------------------------------------
COAL .857 .857 .857 .857 .857 .714
COMODITY .756 .878 .878 .829 .804 .804
TRANSP .75 .95 .95 .95 .95 .95
FOOD .735 .886 .886 .811 .773 .773
SOLAR .733 .733 .733 .8 .8 .8
HOMEBLDG       .705          .764          .764          .882          .764          .882
GAMING         .666          .619          .714          .714          .714          .619
JETS           .642          .857          .857          .857          .857          .857
COPPER         .625          .875          .875          .875          .875          .875
RETAIL         .612          .632          .653          .673          .653          .653
INDMATER .586 .72 .746 .72 .706 .693 CHEM .541 .687 .729 .687 .687 .708 CHINA .54 .58 .5 .54 .56 .54 GOLD .53 .775 .816 .816 .816 .877 INFRA .514 .685 .771 .8 .657 .714 =============================================================================================== COMPUTER .5 .5 .55 .65 .6 .6 DOWJONES .5 .7 .666 .733 .733 .7 =============================================================================================== AUTO .487 .743 .717 .692 .871 .871 GREEN .476 .619 .666 .761 .666 .523 BEVERAGE .466 .533 .533 .6 .666 .666 GUNS .466 .6 .6 .6 .6 .466 DJI-13 .461 .692 .615 .769 .692 .692 FIDSTKS .457 .57 .615 .649 .683 .661 INDEXES .449 .629 .73 .747 .719 .719 SP500 .449 .573 .625 .673 .652 .646 SP-100 .428 .593 .626 .659 .67 .659 EDU .4 .4 .4 .4 .4 .4 NIFTY .4 .377 .466 .555 .622 .533 RUS-1000 .398 .55 .607 .651 .611 .608 NASD-100 .39 .41 .49 .57 .67 .58 HOSPITAL .38 .523 .619 .666 .619 .619 ETFS .375 .625 .785 .785 .803 .767 ELECTRON .344 .445 .452 .472 .486 .425 BIOTECH .343 .462 .449 .476 .433 .417 SEMI .333 .38 .409 .457 .485 .409 SOFTWARE .316 .316 .333 .416 .466 .433 BONDFUND .277 .396 .495 .485 .594 .594 INSURANC .269 .538 .538 .653 .576 .653 MILITARY .25 .428 .464 .464 .285 .357 REIT .212 .432 .553 .666 .581 .531 UTILITY .21 .263 .447 .473 .394 .447 FINANCE .207 .475 .475 .487 .439 .487 OILGAS .157 .212 .236 .244 .188 .157 HACKERS .15 .15 .15 .2 .25 .2 REGBANKS .076 .269 .307 .307 .269 .307 BIGBANKS 0 .571 .571 .571 .428 .571 |
=======================================================================
9/18/2020 Peerless remains on Sells. The head and shoulders
patterns in key ETFs
and leading techs have now seen their necklines slightly violated. We see
more bearish "red popsicle" candle-sticks while these vehicles' Closing
Powers are still steeply falling. More weak openings will doom the Opening
Powers to their own uptrend-break. That and quickly failed rallies are what
coincided with the last big sell-off.

Adding to all the political uncertainties now, we note that since 1968, the
seasonality for Presidential Election years is particularly bearish over the next
21 trading days. In the course of the next month following September 20th,
the DJI falls an average 2.3% and rises only 38.5% of the time.
The inescapable conclusion is to sell more bearish
MINCPs short and
hold fewer longs. Short key ETFS if they decisively break
below their 65-dma on rising volume at the close.
NASDAQ

The last technical supports holding up key ETFs and stocks like AAPL, AMZN
and GOOG are their rising 65-dma. Declines below the necklines of Head and
Shoulders patterns can still be saved at a rising 65-dma. But once the 65-dma
is penetrated, the odds are above 80% that the DJI, ETF or stock will fulfill its
minimum downside objective, usually very quickly. At that point, there is then a 60%
chance of a rally back to the neckline or the 65-dma. After this, there usually
follows another sell-off to deeper lows.


The basic technicals of the stock market look
quite bearish now. They show
Professionals, Insiders and "Big Money" are all quite scared. Is that
because
of the political divide? More likely, it's because increasingly Fed Chairman
Powell seems almost desperate in promising very low rates until 1923, no matter
what?
Fed Chairman Power will tell us again this week -- in his appearance before
Congress -- how he intends to save the market and economy by keeping rates
low until 2023, apparently no matter what happens to inflation or the Dollar.
He will have to do this while simultaneously making his plan seem realistic
and not desperate. And he will try to get the deeply divided Congress to
provide supporting fiscal stimulus despite the trillions and trillions already
used up. Can he really juggle all these things? Can he really keep the
flood-waters
from not bursting the dam? A trillion dollars does go a long way, but what
will he say is the legal basis of QE-Infinity? Is this a subject he can safely
start talking about?
Even if the Peerless Sells have been premature on the rally because of the
unprecedented amount of FED monetary stimulae, basic technical analysis of
reversal patterns (namely, head/shoulders tops) and confirmed price-trend
changes is still reliable, because the TigerSoft indicators show what insiders and
professionals are doing with their own money. What prevents them now from using
this "stimulus" - zero-percent loans to hedge using leveraged short ETFs?
Maybe,
someone in Congress will ask them this.
|
Charts 9/18/2020 (Click on Underlined link.) 2020 PEERLESS DJI, Signals, Indicators Daily DJI Volume 10-DayUp/Down Vol Stoch-20 Inverted Traders Index Graph of Pct of All Stocks above 65-dma Cum. Inverted Traders Index NASDAQ S&P OEX NYSE COMPQX DJI-15 DJI-20 DJI-30 DIA QQQ MDY IWM TNA Short-Term Rates DOLLAR-UUP SPY http://tigersoft.com/2121CST/SPY.GIF recent 2006 vers-Peerless signals -- http://tigersoft.com/NEWPEER/UPD6918.BMP USO-CrudeOil DBO FAS GLD BBH IBB JETS JNUG KOL NUGT OIH PALL RSX RETL SDS AGQ SLV SOXL TECL TLT TMF TNA UGA (gasoline) USO (oil) and China: YINN CHAU Commodities: CANE CORN DBC JJC, NIB, CHOC CORN, CUT (paper) MOO, SOYB WEAT UUP (Dollar) LIT (Lithium) Stocks AAPL ADBE ALXN AMAT AMGN AMD AMZN AXP BA BABA BAC BIDU BLDP CAT CRM CVX CMG DE ENPH FB GILD GOOG GS HD IBM INTU JPM LRCX M (Macy's) MSFT NEM NFLX NKE NVDA PG REGN REV SO SQ QCOM QDEL TSLA TXN XOM V VRTX WFC WMT TOWN ZM New highs and Bullish MAXCPs http://tigersoft.com/MAXCP/9-18/BULLISH.htm Bearish MAXCPs - http://tigersoft.com/MINCP/9-18/BEARISH.htm |
 Table 1
             9/18/2018   QUICKSILVER on DJI-30 STOCKS.
P21 + ITRS score >+.25 is bullish
             1  Bullish (CRM)
             2  Bearish (INTC, WBA)
hughest priced DJI-30 = UNH, HD, CRM, AMGN MCD, MSFT, V
HIGHEST AI/200 = CRM Second Highest Tied = AAPL and MSFT STOCKS CLOSECHANGE PIVOT-PT 5-dma AROC CL-PWR CANDLE AI/200 IP21 ITRS ------------------------------------------------------------------------------------------------------- ------------------------------------------------------------------------------------------------------- AAPL 106.84 -3.5 112 -228.2% Bearish RED 170 -.067 .042 ---------------------------------------------------------------------------------------------------------- AMGN 247.72 -.36 243.21 91.4% Bearish RED 135 .189 -.091 ---------------------------------------------------------------------------------------------------------- AXP 103.44 -1.22 103.36 3.8% ------- RED 105 -.084 .067 ---------------------------------------------------------------------------------------------------------- BA 161.14 -6.39 160.23 27.6% ------- RED 33 -.084 -.145 ---------------------------------------------------------------------------------------------------------- CAT 152.39 -1.48 153.83 -47.3% Bullish RED 132 .013 .137 ---------------------------------------------------------------------------------------------------------- CRM 242.78 -1.75 243.1 -6.5% ------- RED 194 .251 .134 Bullish ---------------------------------------------------------------------------------------------------------- CSCO 39.81 -.56 39.88 -8.7% Bearish RED 119 -.006 -.222 ---------------------------------------------------------------------------------------------------------- CVX 78.21 -.58 77.69 33.4% Bearish BLUE 77 -.166 -.13 ---------------------------------------------------------------------------------------------------------- DIS 128.63 -1.59 131.75 -118.8% Bearish RED 106 -.158 .026 ---------------------------------------------------------------------------------------------------------- DOW 50.37 -.6 49.85 51.7% Bullish RED 71 .002 .202 ---------------------------------------------------------------------------------------------------------- GS 194.86 .03 200.92 -152.1% Bearish ---- 70 -.159 -.085 ---------------------------------------------------------------------------------------------------------- HD 275.19 -4.77 276.33 -20.3% ------- RED 142 .178 .035 ---------------------------------------------------------------------------------------------------------- HON 168.7 -1.64 166.45 66.7% Bullish RED 102 .078 .118 ---------------------------------------------------------------------------------------------------------- IBM 122.76 -2.16 121.46 52.8% ------- RED 111 -.208 -.014 ---------------------------------------------------------------------------------------------------------- INTC 49.89 -.43 49.28 61.2% ------- RED 97 -.076 -.221 Bearish ---------------------------------------------------------------------------------------------------------- JNJ 149.18 2.01 147.78 47.3% Bearish BLUE 129 .055 -.028 ---------------------------------------------------------------------------------------------------------- JPM 98.35 -.21 101.07 -135.7% ------- BLUE 35 -.107 .003 ---------------------------------------------------------------------------------------------------------- KO 50.45 -.1 51.06 -60% Bullish RED 100 .018 .074 ---------------------------------------------------------------------------------------------------------- MCD 220.27 -2.31 218 51.2% ------- RED 147 -.069 .12 ---------------------------------------------------------------------------------------------------------- MMM 169.55 -2.83 166.17 100.2% Bullish RED 109 .003 .045 ---------------------------------------------------------------------------------------------------------- MRK 85.81 .17 84.48 78.4% Bearish BLUE 107 .071 .044 ---------------------------------------------------------------------------------------------------------- MSFT 200.39 -2.52 204.03 -88.7% Bearish RED 165 -.042 -.14 ---------------------------------------------------------------------------------------------------------- NKE 114.66 -1.7 118 -141.2% Bullish RED 149 -.063 .107 ---------------------------------------------------------------------------------------------------------- PG 137.37 -.15 138.14 -27.9% Bearish BLUE 105 .055 .047 ---------------------------------------------------------------------------------------------------------- TRV 111.61 -.99 113.4 -79.1% Bearish RED 101 -.14 -.061 ---------------------------------------------------------------------------------------------------------- UNH 308.02 3.04 301.48 106.9% Bearish BLUE 126 -.064 -.017 ---------------------------------------------------------------------------------------------------------- V 202.61 -2.66 200.68 47.2% Bearish RED 117 .04 -.021 ---------------------------------------------------------------------------------------------------------- VZ 60.35 -.24 59.79 46.4% Bullish BLUE 134 -.019 .044 ---------------------------------------------------------------------------------------------------------- WBA 36.93 -.28 34.7 312.2% ------- RED 80 -.186 -.128 Bearish ---------------------------------------------------------------------------------------------------------- WMT 135.29 -1.4 136.7 -51.5% Bearish RED 125 -.005 -.016 |
Table 2 QUICKSILVER on ETFS - 09/18/20 Bullish = 0
Bearish = 0
               ITRS + IP21>.25 is considered "Bullish"
               Highest ITRS + IP21 = TECL
ETF CLOSE CHANGE PIVOT-PT 5-dma AROC CL-PWR CANDLE IP21 ITRS --------------------------------------------------------------------------------------------- --------------------------------------------------------------------------------------------- DIA 276.52 -3.05 280.53 -10.2% Bearish RED -.008 ---- --------------------------------------------------------------------------------------------- SPY 330.65 -5.19 338.46 -50.5% Bearish RED -.002 -.023 --------------------------------------------------------------------------------------------- QQQ 266.87 -3.45 275.16 -65.3% Bearish RED .026 -.057 --------------------------------------------------------------------------------------------- MDY 339.97 -4.74 345.33 19.2% Bearish RED .024 -.007 --------------------------------------------------------------------------------------------- IWM 153.29 -.4 153.08 135.5% Bearish RED -.003 .027 --------------------------------------------------------------------------------------------- FAS 36.18 -.92 37.96 21.4% Bearish RED .022 .124 --------------------------------------------------------------------------------------------- SOXL 226.23 -11.06 233.76 135.5% Bearish RED .033 -.001 --------------------------------------------------------------------------------------------- TECL 268.56 -14.59 296.16 -170.9% Bearish RED -.038 -.03 --------------------------------------------------------------------------------------------- IBB 136.32 .69 134.71 318.1% Bearish BLUE .102 -.105 --------------------------------------------------------------------------------------------- GLD 183.2 .24 183.89 20.5% Bearish BLUE .083 .005 --------------------------------------------------------------------------------------------- OIH 115.44 -1.88 112.24 169.5% ------- RED -.116 -.055 --------------------------------------------------------------------------------------------- GASL 3440 285 3685 -325.1% ------- RED -.021 .038 --------------------------------------------------------------------------------------------- |
Table 3    Count of Stocks in Key Directories
           20200918
-------------------------------
NEWHIGHS       153
NEWLOWS        50
MAXCP          18
MINCP          150
TTTNH          15
TTTNL          167
FASTUP         218
FASTDOWN       24
CPCROSSA       23
CPCROSSD       148
BIGVOLUP       8
BIGVODN        65
ACCUMVER       119
HIGHIP21       14
HIUPPCT        32
REDSELL        72
AUGSELS7       82
TRAPDOOR       16
|
 Table 4  RANKING OF KEY DIRECTORIES BASED PCT.OF STOCKS ABOVE 65-DMA
              9/18/20
Bullish = 30
Bearish = 15
---------------------------------------------------------------------------------------
Directory     Current       day-1         day-2         day-3         day-4         day-5
----------------------------------------------------------------------------------------
TRANSP         .95           .95           .95           .95           .95           .95
FOOD           .886          .886          .811          .773          .773          .773
COMODITY       .878          .878          .829          .804          .804          .804
COPPER         .875          .875          .875          .875          .875          .875
COAL           .857          .857          .857          .857          .714          .714
JETS           .857          .857          .857          .857          .857          .785
GOLD           .775          .816          .816          .816          .877          .775
HOMEBLDG       .764          .764          .882          .764          .882          .764
AUTO           .743          .717          .692          .871          .871          .82
SOLAR          .733          .733          .8            .8            .8            .8
INDMATER       .72           .746          .72           .706          .693          .626
DOWJONES       .7            .666          .733          .733          .7            .633
DJI-13         .692          .615          .769          .692          .692          .538
CHEM           .687          .729          .687          .687          .708          .625
INFRA          .685          .771          .8            .657          .714          .6
RETAIL         .632          .653          .673          .653          .653          .632
INDEXES        .629          .73           .747          .719          .73           .601
ETFS           .625          .785          .785          .803          .75           .66
GAMING         .619          .714          .714          .714          .619          .619
GREEN          .619          .666          .761          .666          .523          .523
GUNS           .6            .6            .6            .6            .466          .466
SP-100         .593          .626          .659          .67           .659          .582
CHINA          .588          .509          .549          .568          .549          .372
SP500          .573          .627          .673          .652          .652          .575
BIGBANKS       .571          .571          .571          .428          .571          .571
FIDSTKS        .57           .615          .649          .683          .661          .576
RUS-1000       .55           .608          .651          .611          .614          .536
INSURANC       .538          .538          .653          .576          .653          .615
BEVERAGE       .533          .533          .6            .666          .666          .666
HOSPITAL       .523          .619          .666          .666          .619          .476
=============================================================================================
COMPUTER       .5            .55           .65           .6            .6            .55
=============================================================================================
FINANCE        .475          .475          .487          .439          .487          .414
BIOTECH        .462          .449          .476          .433          .42           .292
ELECTRON       .445          .452          .472          .486          .439          .364
REIT           .432          .553          .666          .581          .531          .326
MILITARY       .428          .464          .464          .285          .357          .214
NASD-100       .41           .49           .57           .67           .61           .47
BONDFUND       .4            .5            .49           .6            .61           .68
EDU            .4            .4            .4            .4            .4            .4
SEMI           .38           .409          .457          .485          .419          .361
NIFTY          .377          .466          .555          .622          .555          .466
SOFTWARE .316 .35 .416 .466 .433 .366 REGBANKS .269 .307 .307 .269 .307 .153 UTILITY .263 .447 .473 .394 .447 .421 OILGAS .212 .236 .236 .188 .157 .11 HACKERS .15 .2 .2 .25 .2 .15 |
=========================================================================
9/17/2020 Hedge and Wait.
Peerless remains on Sells. But the DJI, QQQ, NASDAQ, TECL and
very big AAPL have not yet broken below their head/shoulders pattern's
necklines. So, bulls are still hoping that Congress will pass another
COVID-19 stimulus now that the FED has used up all its verbal
ammunition against the bears, at least for a while.
 |
 |
 |
The FED's Balancing Act
The burden is likely still on the FED, almost alone. It may help to conceive
this visually.
The first image I have of the FED is that their powers have been shown
to outweigh everything else.

Peerless Sells,
bearish head/shoulders patterns,
bearish Closing Powers,
bearish seasonality and uncertainty about the coming election,
COVID-19, distancing, masks and high unemployment,
very high PEs among the tech leaders.
The second image, a cartoon really, is Fed Chairman Powell trying to ride a
unicycle on a high wire while juggling huge problems and still holding the stock
market up.

The third image is Powell as the Dutch boy with his finger in the dike to
prevent the ocean from flooding in. But increasingly, there are so many holes
in the dike, he may not have enough fingers for all the holes and more and more,
they may be out of his reach.

Is Powell's task too great? Keynes did not think a deep recession -- where fear
is dominant among investors -- could be fixed by monetary policy alone. But
Keynes and the creators of the FED never considered the FED simply giving
-- a 1%/charge is really that, yes? -- money away in the trillions to Wall
Street
banks and corporations.
If Powell and the FED were not such forbidable forces, we would have to be
bearish. Of all the negatives now - including high Debt, investor fear, high PEs,
technical weakness in the market -- I would say the biggest are the uncertainties
about the coming Election, how a Biden Presidency would changes taxes and
regulations and whether the Democrats will also end up controlling the Senate.
The market seems too risky and too high...unless Powell and Biden have worked
out a semi-secret deal, low interest rates in exchange for only a small rise in
corporate taxes or the market now believes that the hundreds of Republican
Judges and the Supreme Courts can block most of what the Democrats might try to do.
It would be easy to predict the market if the FED were not so vigorously
supporting it. We would now be short and hold lots of short positions. But
the FED's powers are very great and almost no one in Government is
challenging them. So, what do we do? Perhaps, the simplest is best. Wait
for a new Buy Peerless signal or a decisive break in the necklines of the
head/shoulders patterns to become bearish and in the meantime hedge
using our Bullish MAXCPs as longs and our Bearish MINCPs as shorts.
 Table 1
             9/17/2018   QUICKSILVER on DJI-30 STOCKS.
P21 + ITRS score >+.25 is bullish
             1  Bullish (CRM)
             4  Bearish (CVX, GS, INTC, WBA)
hughest priced DJI-30 = UNH, HD, CRM, AMGN MCD, MSFT, V
HIGHEST AI/200 = CRM Second Highest Tied = AAPL and MSFT STOCKS CLOSECHANGE PIVOT-PT 5-dma AROC CL-PWR CANDLE AI/200 IP21 ITRS ------------------------------------------------------------------------------------------------------- ------------------------------------------------------------------------------------------------------- AAPL 110.34 -1.79 113.49 -138.5% Bearish BLUE 171 -.052 .085 ---------------------------------------------------------------------------------------------------------- AMGN 248.08 .32 240.64 151.6% Bearish BLUE 135 .154 -.086 ---------------------------------------------------------------------------------------------------------- AXP 104.66 -1.32 102.77 89.8% ------- BLUE 105 -.013 .054 ---------------------------------------------------------------------------------------------------------- BA 167.53 .07 157.69 302.1% ------- BLUE 34 -.089 -.142 ---------------------------------------------------------------------------------------------------------- CAT 153.87 2.76 149.86 132.4% Bullish BLUE 132 .06 .129 ---------------------------------------------------------------------------------------------------------- CRM 244.53 -6.07 247.8 -65.9% ------- RED 194 .264 .149 Bullish ---------------------------------------------------------------------------------------------------------- CSCO 40.37 -.05 39.57 99.6% Bearish BLUE 119 -.001 -.191 ---------------------------------------------------------------------------------------------------------- CVX 78.79 .23 78.15 41.2% Bearish BLUE 77 -.194 -.16 Bearish ---------------------------------------------------------------------------------------------------------- DIS 130.22 -1.87 133.22 -113.7% Bearish RED 107 -.159 .044 ---------------------------------------------------------------------------------------------------------- DOW 50.97 1.27 48.7 227.5% Bullish BLUE 71 .047 .191 ---------------------------------------------------------------------------------------------------------- GS 194.83 -5.85 200.01 -129.4% Bearish RED 71 -.213 -.109 Bearish ---------------------------------------------------------------------------------------------------------- HD 279.96 -1.67 272.7 129.9% ------- BLUE 141 .141 .051 ---------------------------------------------------------------------------------------------------------- HON 170.34 .34 164.27 181.2% Bullish BLUE 102 .091 .098 ---------------------------------------------------------------------------------------------------------- IBM 124.92 .7 120.56 178.5% ------- BLUE 112 -.186 -.011 ---------------------------------------------------------------------------------------------------------- INTC 50.32 -.05 48.96 137.1% ------- BLUE 98 -.116 -.214 Bearish ---------------------------------------------------------------------------------------------------------- JNJ 147.17 -1.23 146.91 8.8% Bearish RED 129 -.015 -.045 ---------------------------------------------------------------------------------------------------------- JPM 98.56 -1.14 99.83 -63.2% ------- RED 36 -.134 -.016 ---------------------------------------------------------------------------------------------------------- KO 50.55 -.24 50 54.2% Bullish BLUE 100 .014 .049 ---------------------------------------------------------------------------------------------------------- MCD 222.58 -2.23 217.24 121% ------- RED 147 -.028 .125 ---------------------------------------------------------------------------------------------------------- MMM 172.38 2.87 163.15 276.7% Bullish BLUE 109 .045 .043 ---------------------------------------------------------------------------------------------------------- MRK 85.64 .07 83.57 122.6% Bearish BLUE 106 .047 .027 ---------------------------------------------------------------------------------------------------------- MSFT 202.91 -2.14 205.37 -59.8% Bearish BLUE 166 -.077 -.119 ---------------------------------------------------------------------------------------------------------- NKE 116.36 -2.23 114.79 66.5% Bullish RED 150 .02 .105 ---------------------------------------------------------------------------------------------------------- PG 137.52 -.18 136.7 29.7% ------- BLUE 105 .01 .047 ---------------------------------------------------------------------------------------------------------- TRV 112.6 -.57 111.8 35.4% Bearish BLUE 102 -.119 -.077 ---------------------------------------------------------------------------------------------------------- UNH 304.98 -1.54 304.6 6.2% Bearish BLUE 127 -.118 -.05 ---------------------------------------------------------------------------------------------------------- V 205.27 .14 201.54 91.6% ------- BLUE 117 .07 -.02 ---------------------------------------------------------------------------------------------------------- VZ 60.59 .22 59.53 88.2% Bullish ---- 135 -.003 .022 ---------------------------------------------------------------------------------------------------------- WBA 37.21 .93 34.67 360.7% ------- BLUE 80 -.237 -.192 Bearish ---------------------------------------------------------------------------------------------------------- WMT 136.69 .43 136.81 -4.4% Bearish BLUE 125 .006 .026 |
Table 2 QUICKSILVER on ETFS - 09/17/20 Bullish = 0
Bearish = 0
               ITRS + IP21>.25 is considered "Bullish"
               Highest ITRS + IP21 = TECL
ETF CLOSE CHANGE PIVOT-PT 5-dma AROC CL-PWR CANDLE IP21 ITRS --------------------------------------------------------------------------------------------- --------------------------------------------------------------------------------------------- DIA 279.57 -1.46 277.09 67.7% Bearish BLUE-.029 ===== --------------------------------------------------------------------------------------------- SPY 335.84 -2.98 334.06 28.9% Bearish BLUE-.01 -.01 --------------------------------------------------------------------------------------------- QQQ 270.32 -4.29 270.45 -36.8% Bearish BLUE .015 -.033 --------------------------------------------------------------------------------------------- MDY 344.71 -2.11 338.65 85.3% Bearish BLUE .002 -.006 --------------------------------------------------------------------------------------------- IWM 153.69 -1.13 149.15 116.4% Bearish BLUE-.034 .01 --------------------------------------------------------------------------------------------- FAS 37.1 -1.18 36.02 148% ------- BLUE .017 .095 --------------------------------------------------------------------------------------------- SOXL 237.29 -1.09 219.86 359.5% Bearish BLUE .035 .099 --------------------------------------------------------------------------------------------- TECL 283.15 -8.13 278.5 -53% Bearish BLUE-.04 .043 --------------------------------------------------------------------------------------------- IBB 135.63 -.53 127.79 319.5% Bearish BLUE .041 -.109 --------------------------------------------------------------------------------------------- GLD 182.96 -1.01 182.45 13.6% Bearish BLUE .009 .003 --------------------------------------------------------------------------------------------- OIH 117.32 -1.05 111.56 248.3% ------- BLUE-.112 -.1 --------------------------------------------------------------------------------------------- GASL 3440 285 3685 -325.1% ------- RED -.021 .041 --------------------------------------------------------------------------------------------- |
 Table 3    Count of Stocks in Key Directories
            20200917
-------------------------------
NEWHIGHS       101
NEWLOWS        30
MAXCP          29
MINCP          29
TTTNH          15
TTTNL          33
FASTUP         155
FASTDOWN       52
CPCROSSA       113
CPCROSSD       30
BIGVOLUP       2
BIGVODN        11
ACCUMVER       118
HIGHIP21       11
HIUPPCT        31
VHIP21         116
LOWACCUM       170
REDSELL        76
AUGSELS7       69
TRAPDOOR       16
|
Table 4 RANKING OF KEY DIRECTORIES BASED PCT.OF STOCKS ABOVE 65-DMA
              9/17/20
Bullish = 32
Bearish = 14
---------------------------------------------------------------------------------------
Directory     Current       day-1         day-2         day-3         day-4         day-5
----------------------------------------------------------------------------------------
TRANSP         .95           .95           .95           .95           .95           .95
FOOD           .886          .811          .773          .773          .773          .735
COMODITY       .878          .829          .804          .804          .804          .756
COPPER         .875          .875          .875          .875          .875          .625
COAL           .857          .857          .857          .714          .714          .428
JETS           .857          .857          .857          .857          .785          .785
GOLD           .816          .816          .816          .877          .775          .775
ETFS           .785          .785          .803          .75           .66           .625
INFRA          .771          .8            .657          .714          .6            .485
HOMEBLDG       .764          .882          .764          .882          .764          .764
INDMATER       .746          .72           .706          .693          .64           .613
SOLAR          .733          .8            .8            .8            .8            .733
CHEM           .729          .687          .687          .708          .645          .687
INDEXES        .724          .747          .719          .73           .612          .629
AUTO           .717          .692          .871          .871          .82           .769
GAMING         .714          .714          .714          .619          .666          .666
DOWJONES       .666          .733          .733          .7            .633          .666
GREEN          .666          .761          .666          .523          .571          .619
RETAIL         .653          .673          .653          .653          .653          .673
SP500          .627          .675          .652          .652          .581          .564
SP-100         .626          .659          .67           .659          .582          .582
HOSPITAL       .619          .666          .666          .666          .476          .523
DJI-13         .615          .769          .692          .692          .538          .615
FIDSTKS        .615          .649          .683          .661          .581          .564
RUS-1000       .608          .653          .611          .614          .542          .529
GUNS           .6            .6            .6            .466          .466          .466
BIGBANKS       .571          .571          .428          .571          .571          .428
REIT           .553          .666          .581          .531          .333          .446
COMPUTER       .55           .65           .6            .6            .55           .55
INSURANC       .538          .653          .576          .653          .615          .615
BEVERAGE       .533          .6            .666          .666          .666          .6
CHINA          .509          .549          .568          .549          .392          .352
================================================================================================
BONDFUND       .495          .485          .594          .603          .712          .594
NASD-100       .49           .57           .67           .61           .49           .5
FINANCE        .475          .487          .439          .487          .414          .402
NIFTY          .466          .555          .622          .555          .466          .488
MILITARY       .464          .464          .285          .357          .214          .25
ELECTRON .452 .472 .486 .439 .371 .344 BIOTECH .449 .476 .433 .42 .295 .292 UTILITY .447 .473 .394 .447 .421 .368 SEMI .409 .457 .485 .419 .361 .352 EDU .4 .4 .4 .4 .4 .4 SOFTWARE .35 .433 .466 .433 .383 .366 REGBANKS .307 .307 .269 .307 .153 .192 OILGAS .236 .236 .181 .157 .125 .11 HACKERS .2 .25 .25 .2 .15 .15 |
====================================================================
9/16/2020 Peerless remains on Sells.
The DJI could not break above its
head/shoulders pattern's right shoulder apex. Its failure on
a day when the FED was obviously hoping for higher prices
is bearish.
| Peerless DJI
Head/Shoulders pattern is still extant. 26700 is very important support. See below how the neckline and 65-dma are nested. The recent NYSE A/D Line NC (non-confirmatiomn) looks similar to the one in February. NC NC  |
TigerSoft DIA - Candle-stick chart |
Very Weak Tech ETFS
Worse, the Closing Powers for the tech indexes and stocks like
AAPL dropped bearishly to new lows. Weakness tomorrow
will likely rupture the tech indexes' necklines. This will
produce TigerSoft Sell S5s. If the DJI were to break below
its neckline and its 65-dma, we would judge it a Sell S10,
much like occurred on this Febriary.
AAPL |
QQQ |
TECL |
Quick Traders should short more of the many Bearish MINCP stocks.
Shorting QQQ is not advised, but, if you have the TigerSoft
programs, you can explode your charts to see how much of
an advance from the opening the next day will break the steep
Closing Power downtrend, for the purpose of then covering a short sale.
See QQQ below.
Exploded QQQ Chart |
Powell Scares Wall Steet
Fed Chairman Powell tells us the FED is not responsible for
the big
increase in economic inequality since QE-Infinity began. But he admits
that increased poverty will hurt the recovery. His refusal to see
the FED as a culprit here is not the way a lot of pro-business observers
see it, especially Nouriel Rubini.
https://www.marketwatch.com/story/the-federal-reserves-policies-have-drastically-increased-inequality-2020-08-15
https://www.youtube.com/watch?v=PM6ZeC2khTc
Even raising the subject, Powell is courting danger. This whole subject
has always made Wall Street squirm uncomfortably. Of course,
it's the FED job to prevent a market and an economic Crash.
But the new super Gilded Age is real. Soon we will see the first
trillionaires.
And now the Fed thinks it can predict inflation out to 2023 and keep
rates low and near zero until then. Impressive at first blush. But this
also means that they have a pretty grim view of the US economy in the
years ahead, since any typical recovery would normally bring 3%-4%
inflations eventually. A Dickensian "Tale of Two Cities" is strongly
implied. That scares Wall Street, or at least it should.
And there's a bigger fear on Wall Street. Sooner or later, Powell's
one-percent rates for big banks aregoing to create a very unwelcome
public reaction, one in which average folks scratch their head and ask:
"Why can't I borrow at 1% from the FED? Wouldn't that be an
obvious way to boost the economy? Why should big banks and
big corporations get so much money? They won't even loan me
$500, except at 17% year or 24%/year?" Biden won't raise this
subject in his campaign, but his victory will inevitable raise such
questions from his more populist supporters. A great deal more
depends on this campaign than simply taxes and regulations on
business. Such fears will grow and grow as the Election gets closer.
|
Charts 9/16/2020 (Click on Underlined link.) 2020 PEERLESS DJI, Signals, Indicators Daily DJI Volume 10-DayUp/Down Vol Stoch-20 Inverted Traders Index Graph of Pct of All Stocks above 65-dma Cum. Inverted Traders Index NASDAQ S&P OEX NYSE COMPQX DJI-15 DJI-20 DJI-30 DIA QQQ MDY IWM TNA Short-Term Rates DOLLAR-UUP SPY http://tigersoft.com/2121CST/SPY.GIF recent 2006 vers-Peerless signals -- http://tigersoft.com/NEWPEER/UPD6916.BMP USO-CrudeOil DBO FAS GLD BBH IBB JETS JNUG KOL NUGT OIH PALL RSX RETL SDS AGQ SLV SOXL TECL TLT TMF TNA UGA (gasoline) USO (oil) and China: YINN CHAU Commodities: CANE CORN DBC JJC, NIB, CHOC CORN, CUT (paper) MOO, SOYB WEAT UUP (Dollar) LIT (Lithium) Stocks AAPL ADBE ALXN AMAT AMGN AMD AMZN AXP BA BABA BAC BIDU BLDP CAT CRM CVX CMG DE ENPH FB GILD GOOG GS HD IBM INTU JPM LRCX M (Macy's) MSFT NEM NFLX NKE NVDA PG REGN REV SO SQ QCOM QDEL TSLA TXN XOM V VRTX WFC WMT TOWN ZM New highs and Bullish MAXCPs http://tigersoft.com/MAXCP/9-16/BULLISH.htm Bearish MAXCPs - http://tigersoft.com/MINCP/9-16/BEARISH.htm |
 Table 1
             9/16/2018   QUICKSILVER on DJI-30 STOCKS.
P21 + ITRS score >+.25 is bullish
             1  Bullish (CRM)
             6  Bearish (BA, CSCO, CVX, GS, INTC, WBA)
hughest priced DJI-30 = UNH, HD, CRM, AMGN MCD, MSFT, V
HIGHEST AI/200 = CRM Second Highest Tied = AAPL and MSFT STOCKS CLOSECHANGE PIVOT-PT 5-dma AROC CL-PWR CANDLE AI/200 IP21 ITRS
-------------------------------------------------------------------------------------------------------
---------------------------------------------------------------------------------------------------------
AAPL 112.13 -3.41 117.32 -226.2% Bearish RED 172 -.036 .119
----------------------------------------------------------------------------------------------------------
AMGN 247.76 -.59 245.57 44.7% Bearish RED 135 .131 -.106
----------------------------------------------------------------------------------------------------------
AXP 105.98 -.7 103.78 105% ------- RED 105 -.061 .055
----------------------------------------------------------------------------------------------------------
BA 167.46 3.97 160.78 206.8% ------- BLUE 35 -.141 -.149
Bearish
----------------------------------------------------------------------------------------------------------
CAT 151.11 2.51 152.69 -52.1% Bullish BLUE 132 .025 .103
----------------------------------------------------------------------------------------------------------
CRM 250.6 -1.08 250.43 3.4% ------- RED 194 .283 .191
Bullish
----------------------------------------------------------------------------------------------------------
CSCO 40.42 -.18 40.13 36.2% Bearish RED 119 -.057 -.199
Bearish
----------------------------------------------------------------------------------------------------------
CVX 78.56 2.21 80.03 -94.3% Bearish BLUE 78 -.268 -.175
Bearish
----------------------------------------------------------------------------------------------------------
DIS 132.09 .85 133.36 -48% Bearish RED 108 -.163 .078
----------------------------------------------------------------------------------------------------------
DOW 49.7 -1.37 49.23 47.2% Bullish RED 71 .009 .107
----------------------------------------------------------------------------------------------------------
GS 200.68 2.68 202.22 -38.4% Bearish BLUE 72 -.202 -.078
Bearish
----------------------------------------------------------------------------------------------------------
HD 281.63 -3.95 277.04 82.4% Bearish RED 140 .095 .054
----------------------------------------------------------------------------------------------------------
HON 170 1.7 165.75 127.5% Bearish BLUE 102 .052 .088
----------------------------------------------------------------------------------------------------------
IBM 124.22 1.78 122.26 80.5% Bearish BLUE 113 -.209 -.028
----------------------------------------------------------------------------------------------------------
INTC 50.37 .37 49.62 75.8% Bearish RED 99 -.168 -.221
Bearish
----------------------------------------------------------------------------------------------------------
JNJ 148.4 -.49 149.7 -43.8% Bearish RED 130 .024 -.046
----------------------------------------------------------------------------------------------------------
JPM 99.7 .42 100.87 -58.1% Bearish BLUE 37 -.168 -.005
----------------------------------------------------------------------------------------------------------
KO 50.79 -.26 50.19 59.3% Bullish RED 100 .004 .039
----------------------------------------------------------------------------------------------------------
MCD 224.81 2.44 215.71 208% ------- BLUE 147 .001 .125
----------------------------------------------------------------------------------------------------------
MMM 169.51 2.94 165.7 114.8% Bearish BLUE 109 0 .01
----------------------------------------------------------------------------------------------------------
MRK 85.57 1.36 84.88 40.9% Bearish BLUE 105 .021 .002
----------------------------------------------------------------------------------------------------------
MSFT 205.05 -3.73 211.29 -150.7% Bearish RED 167 -.083 -.1
----------------------------------------------------------------------------------------------------------
NKE 118.59 -.68 114.9 157.4% Bullish BLUE 149 .097 .137
----------------------------------------------------------------------------------------------------------
PG 137.7 -.93 138.15 -16.3% Bearish RED 105 -.009 .042
----------------------------------------------------------------------------------------------------------
TRV 113.17 1.02 113.63 -20.3% Bearish BLUE 103 -.157 -.079
----------------------------------------------------------------------------------------------------------
UNH 306.52 -.71 312.02 -89.6% Bearish RED 128 -.152 -.052
----------------------------------------------------------------------------------------------------------
V 205.13 -.26 204.06 26.3% Bearish RED 117 .049 -.029
----------------------------------------------------------------------------------------------------------
VZ 60.37 -.23 60.04 27.5% Bullish RED 136 -.003 .012
----------------------------------------------------------------------------------------------------------
WBA 36.28 1.01 35.35 132.8% Bearish BLUE 80 -.299 -.226
Bearish
----------------------------------------------------------------------------------------------------------
WMT 136.26 -1.1 139.89 -131.9% Bearish RED 124 -.033 -.012
|
Table 3 QUICKSILVER on ETFS - 09/12/20 Bullish = 0
Bearish = 1 OIH
               ITRS + IP21>.25 is considered "Bullish"
               Highest ITRS + IP21 = TECL
ETF CLOSE CHANGE PIVOT-PT 5-dma AROC CL-PWR CANDLE IP21 ITRS --------------------------------------------------------------------------------------------- --------------------------------------------------------------------------------------------- DIA 281.03 .45 275.79 21.2% Bearish RED -.041 ----- --------------------------------------------------------------------------------------------- SPY 338.82 -1.35 333.89 -14.4% Bearish RED -.006 -.005 --------------------------------------------------------------------------------------------- QQQ 274.61 -4.45 272.34 -59.5% Bearish RED .036 -.015 --------------------------------------------------------------------------------------------- MDY 346.82 1.07 338.86 55.1% Bearish RED -.056 -.005 --------------------------------------------------------------------------------------------- IWM 154.82 1.45 150.15 88.7% Bearish BLUE-.072 .014 --------------------------------------------------------------------------------------------- FAS 38.28 .78 36 87.8% Bearish BLUE-.006 .15 --------------------------------------------------------------------------------------------- SOXL 238.38 -7.4 220.63 178% Bearish RED -.019 .14 --------------------------------------------------------------------------------------------- TECL 291.28 -14 286.24 -238.5% Bearish RED -.043 .114 --------------------------------------------------------------------------------------------- IBB 136.16 .09 127.17 259.5% Bearish RED .025 -.113 --------------------------------------------------------------------------------------------- GLD 183.97 .52 182.46 25.1% Bearish RED .002 .003 --------------------------------------------------------------------------------------------- OIH 118.37 5.42 111.69 54.4% Bearish BLUE-.17 -.098 Bearish --------------------------------------------------------------------------------------------- GASL 3440 285 3685 -325.1% ------- RED -.021 .028 --------------------------------------------------------------------------------------------- RSX 22.23 -.02 21.5 142.2% Bearish --- -.064 -.037 |
 Table 3   Count of Stocks in Key Directories
          20200916
-------------------------------
NEWHIGHS       178
NEWLOWS        28
MAXCP          22
MINCP          68
TTTNH          19
TTTNL          79
FASTUP         137
FASTDOWN       51
CPCROSSA       70
CPCROSSD       55
BIGVOLUP       1
BIGVODN        7
ACCUMVER       118
HIGHIP21       6
HIUPPCT        44
VHIP21         114
LOWACCUM       172
REDSELL        79
AUGSELS7       130
TRAPDOOR       14
|
RANKING OF KEY DIRECTORIES BASED PCT.OF STOCKS ABOVE 65-DMA 9/16/20 --------------------------------------------------------------------------------------- Directory Current day-1 day-2 day-3 day-4 day-5 ---------------------------------------------------------------------------------------- TRANSP .95 .95 .95 .95 .95 .9 HOMEBLDG .882 .764 .882 .764 .764 .705 COPPER .875 .875 .875 .875 .625 .875 COAL .857 .857 .714 .714 .428 .571 JETS .857 .857 .857 .785 .785 .714 COMODITY .829 .804 .804 .804 .756 .829 GOLD .816 .816 .877 .775 .775 .795 FOOD .811 .773 .773 .773 .735 .792 INFRA .8 .657 .714 .6 .485 .657 SOLAR .8 .8 .8 .8 .733 .8 ETFS .785 .803 .75 .66 .625 .785 DJI-13 .769 .692 .692 .538 .615 .692 GREEN .761 .666 .523 .571 .619 .619 INDEXES .747 .719 .73 .612 .629 .747 DOWJONES .733 .733 .7 .633 .666 .733 INDMATER .72 .706 .693 .64 .613 .68 GAMING .714 .714 .619 .666 .666 .761 AUTO .692 .871 .871 .82 .769 .897 CHEM .687 .687 .708 .645 .687 .77 SP500 .675 .654 .652 .581 .562 .644 RETAIL .673 .653 .653 .653 .673 .693 HOSPITAL .666 .666 .666 .523 .523 .476 REIT .666 .581 .531 .333 .439 .503 SP-100 .659 .67 .659 .582 .571 .637 INSURANC .653 .576 .653 .615 .615 .692 RUS-1000 .653 .613 .614 .542 .529 .604 COMPUTER .65 .6 .6 .55 .55 .65 FIDSTKS .649 .683 .661 .581 .559 .638 BEVERAGE .6 .666 .666 .666 .6 .733 GUNS .6 .6 .466 .466 .466 .466 BIGBANKS .571 .428 .571 .571 .428 .571 NASD-100 .57 .67 .61 .49 .51 .61 NIFTY .555 .622 .555 .466 .488 .555 CHINA .549 .568 .549 .392 .392 .549 FINANCE .487 .439 .487 .414 .402 .475 BONDFUND .485 .594 .603 .712 .613 .574 BIOTECH .476 .433 .42 .295 .295 .324 UTILITY .473 .394 .447 .421 .368 .473 ELECTRON .472 .486 .439 .371 .351 .405 MILITARY .464 .285 .357 .214 .25 .321 SEMI .457 .485 .419 .361 .352 .39 SOFTWARE .433 .483 .433 .383 .366 .433 EDU .4 .4 .4 .4 .4 .4 REGBANKS .307 .269 .307 .153 .192 .269 HACKERS .25 .3 .2 .15 .15 .2 OILGAS .236 .181 .149 .125 .11 .188 |
=====================================================================
9/15/2020
Stay short CVX and stay long highest AI/200 stock in DJI-30, CRM.
Short more oils like XOM and hold long the most
bullish MAXCP
solar energy stocks.

The Closing Power for DIA broke its steep downtrend and DIA is very
close to aborting its bearish head and shoulders pattern. A strong close
by it tomorrow would accomplish that. Simply going sidewise will also
probably be enough to convince bears to cover more shorts in DIA and
hold the DJIA up above its neckline and 65-dma nested support.


Once again, it looks like the FED intends to steer the "new" DJI-30 back up to a
point above 29500 so that it can make a nominal new high. I am guessing that
the "apolitical" Fed has reached an accord with Biden, who is leading Trump by
4%-5% nationally in the polls, that provides for QE-Infinity and low rates to continue
well into 2021 so long as Biden does not seek a swift undoing of Trump's tax-cuts
on corporations and the super-wealthy. Such an agreement would be consistent
with the action of the market.
In this environment, it serves no good purpose to be short the DIA or SPY,
despite the Peerless Sells or the fact that September and the first week of
October ordinarilly have a bearish seasonal record in Presidential Election years,
especially when the incumbent Republican in White House is about to lose.
The FED is now the patron saint of the Dow Jones, its
protector and its
demi-god almighty. This is not the capitalism of you father's day or your
grandfather's stories. We adapt or perish.
But consider some alternatives for the future.
Another explantion for the continued rally is that Trump will emerge victorious
either directly or by the intervention of the Supreme Court. Trump's poll numbers
will have to improve in the swing states of Pennsylvania and Florida and Arizona
for this to happen. But Biden must get out his vote.
And there are two other possibilities. The first is that Peerless will give a Buy
signal
after the 25th of September based on the NYSE A/D Line making new highs
exactly when the market should be falling because of seasonality. As you can
see the
NYSE A/D Line has again turned up. Watch the daily breadth figures. Today's
+352 was helpful. but more is needed.
The other possibility is that all the Peerless Sells on the DJI for the last two
months will ultimately prevail and be proven correct with or without a new
Peerless Sell. For this to happen, I would think the NASDAQ will have to
again turn very weak and the head/shoulders patterns will in AAPL, QQQ
and TECL shown below will have to be completed with obvious price
break-downs below their necklines. In addition, I would expect the big
banks to turn particularly weak, like Citigroup, which has already. JPM is
showing it could turn down. Note the its Closing Powers is making new
lows and it shows heavy red distribution. JPM is very important. It must hold
up.
The bank stocks measure the debt-load of the country. If the banks fail and freeze
up,
so does credit and the market as well as the country's economy. So watch C and
JPM, shown below.
NASDAQ |
APPL |
QQQ |
TECL |
JPM |
C ---------------------------------------------------------------------------------------------- CVX  |
|
Charts 9/15/2020 (Click on Underlined link.) 2020 PEERLESS DJI, Signals, Indicators Daily DJI Volume 10-DayUp/Down Vol Stoch-20 Inverted Traders Index Graph of Pct of All Stocks above 65-dma Cum. Inverted Traders Index NASDAQ S&P OEX NYSE COMPQX DJI-15 DJI-20 DJI-30 DIA QQQ MDY IWM TNA Short-Term Rates DOLLAR-UUP SPY http://tigersoft.com/2121CST/SPY.GIF recent 2006 vers-Peerless signals -- http://tigersoft.com/NEWPEER/UPD6915.BMP USO-CrudeOil DBO FAS GLD BBH IBB JETS JNUG KOL NUGT OIH PALL RSX RETL SDS AGQ SLV SOXL TECL TLT TMF TNA UGA (gasoline) USO (oil) and China: YINN CHAU Commodities: CANE CORN DBC JJC, NIB, CHOC CORN, CUT (paper) MOO, SOYB WEAT UUP (Dollar) LIT (Lithium) Stocks AAPL ADBE ALXN AMAT AMGN AMD AMZN AXP BA BABA BAC BIDU BLDP CAT CRM CVX CMG DE ENPH FB GILD GOOG GS HD IBM INTU JPM LRCX M (Macy's) MSFT NEM NFLX NKE NVDA PG REGN REV SO SQ QCOM QDEL TSLA TXN XOM V VRTX WFC WMT TOWN ZM New highs and Bullish MAXCPs http://tigersoft.com/MAXCP/9-15/BULLISH.htm Bearish MAXCPs - http://tigersoft.com/MINCP/9-15/BEARISH.htm |
 Table 1
             9/15/2018   QUICKSILVER on DJI-30 STOCKS.

             P21 + ITRS score  >+.25 is bullish
               1  Bullish (CRM)
               6  Bearish (BA, CVX, GS, IBM, INTC, WBA)
hughest priced DJI-30 = UNH, HD, CRM, AMGN MCD, MSFT, V HIGHEST AI/200 = CRM Second Highest Tied = AAPL and MSFT STOCKS CLOSECHANGE PIVOT-PT 5-dma AROC CL-PWR CANDLE AI/200 IP21 ITRS ------------------------------------------------------------------------------------------------------- --------------------------------------------------------------------------------------------------------- AAPL 115.54 .18 112.82 119.1% Bearish RED 173 -.011 .169 ---------------------------------------------------------------------------------------------------------- AMGN 248.35 1.6 241.18 147.2% Bearish RED 135 .162 -.098 ---------------------------------------------------------------------------------------------------------- AXP 106.68 -.59 103.67 144.5% ------- RED 105 -.109 .038 ---------------------------------------------------------------------------------------------------------- BA 163.49 -1.86 161.08 74.8% ------- RED 36 -.203 -.197 Bearish ---------------------------------------------------------------------------------------------------------- CAT 148.6 -4.91 148.52 2.6% Bullish RED 132 -.016 .081 ---------------------------------------------------------------------------------------------------------- CRM 251.68 5.04 241.27 211.7% ------- BLUE 194 .31 .206 Bullish ---------------------------------------------------------------------------------------------------------- CSCO 40.6 .23 40 75% Bearish ---- 119 -.04 -.192 ---------------------------------------------------------------------------------------------------------- CVX 76.35 -.94 78.97 -167% Bearish RED 79 -.294 -.205 Bearish ---------------------------------------------------------------------------------------------------------- DIS 131.24 -.01 134.2 -111.5% Bearish RED 109 -.148 .08 ---------------------------------------------------------------------------------------------------------- DOW 51.07 .98 47.93 319.4% Bullish BLUE 71 .03 .136 ---------------------------------------------------------------------------------------------------------- GS 198 -3.34 202.48 -111.2% Bearish RED 73 -.244 -.112 Bearish ---------------------------------------------------------------------------------------------------------- HD 285.58 4.93 269.26 296.5% ------- BLUE 139 .158 .078 ---------------------------------------------------------------------------------------------------------- HON 168.3 -.17 164.27 121.5% Bearish RED 102 .031 .076 ---------------------------------------------------------------------------------------------------------- IBM 122.44 .35 121.21 50.6% Bearish RED 114 -.247 -.048 Bearish ---------------------------------------------------------------------------------------------------------- INTC 50 .59 48.91 110.7% Bearish BLUE 100 -.159 -.227 Bearish ---------------------------------------------------------------------------------------------------------- JNJ 148.89 .54 147.26 55.1% Bearish RED 130 .048 -.026 ---------------------------------------------------------------------------------------------------------- JPM 99.28 -3.19 99.92 -31.7% Bearish RED 38 -.196 -.022 ---------------------------------------------------------------------------------------------------------- KO 51.05 .34 49.81 123.1% Bullish ---- 100 .018 .062 ---------------------------------------------------------------------------------------------------------- MCD 222.37 1.81 213.58 202.5% ------- BLUE 146 0 .113 ---------------------------------------------------------------------------------------------------------- MMM 166.57 -1.89 163.17 102.8% Bearish RED 109 -.015 -.013 ---------------------------------------------------------------------------------------------------------- MRK 84.21 .05 83.33 52.3% Bearish RED 104 .014 -.009 ---------------------------------------------------------------------------------------------------------- MSFT 208.78 3.37 202.66 148.7% Bearish BLUE 168 -.046 -.076 ---------------------------------------------------------------------------------------------------------- NKE 119.27 -.01 112.72 282.5% Bullish RED 148 .121 .126 ---------------------------------------------------------------------------------------------------------- PG 138.63 0 135.94 97.8% Bullish RED 106 .065 .073 ---------------------------------------------------------------------------------------------------------- TRV 112.15 -2.31 113.74 -70.1% Bearish RED 104 -.161 -.088 ---------------------------------------------------------------------------------------------------------- UNH 307.23 -1.34 307.25 -.3% Bearish RED 129 -.121 -.052 ---------------------------------------------------------------------------------------------------------- V 205.39 .41 200.12 130.3% ------- RED 117 .094 -.028 ---------------------------------------------------------------------------------------------------------- VZ 60.6 .28 59.96 53.4% Bullish BLUE 137 .038 .03 ---------------------------------------------------------------------------------------------------------- WBA 35.27 .16 36.1 -117.9% Bearish BLUE 80 -.334 -.25 Bearish ---------------------------------------------------------------------------------------------------------- WMT 137.36 .04 138.45 -39.5% Bearish RED 124 .014 .089 |
Table 2 QUICKSILVER on ETFS - 09/15/20 Bullish = 0
Bearish = 1
               ITRS + IP21>.25 is considered "Bullish"
               Highest ITRS + IP21 = TECL
  ETF      CLOSE    CHANGE     PIVOT-PT    5-dma AROC  CL-PWR     CANDLE  IP21  ITRS
---------------------------------------------------------------------------------------------
---------------------------------------------------------------------------------------------
DIA       280.58    .05      279.85        92.9%    Bearish      RED  -.026   -----
---------------------------------------------------------------------------------------------
SPY       340.17    1.71     339.79        103.6%   Bearish      RED  .051   .006
---------------------------------------------------------------------------------------------
QQQ       279.06    3.9      277.88        166.8%   Bearish      ---- .088   .013
---------------------------------------------------------------------------------------------
MDY       345.75    .42      343.05        107.1%   Bearish      RED -.025  -.011
---------------------------------------------------------------------------------------------
IWM       153.37    .29      152.13        116.3%   Bearish      RED -.034   .002
---------------------------------------------------------------------------------------------
FAS       37.5   -.46        37.63         174.1%   Bearish      RED -.014   .077
---------------------------------------------------------------------------------------------
SOXL      245.78    12.02    230.19        742.4%   Bearish      BLUE .016   .15
---------------------------------------------------------------------------------------------
TECL      305.28    9.12     305.32        447.9%   Bearish      RED  .008   .152
---------------------------------------------------------------------------------------------
IBB       136.07    1.36     129.36        355.7%   Bearish      BLUE .082  -.091
---------------------------------------------------------------------------------------------
GLD       183.45   -.44      183.05        59.1%   Bearish      RED   .048   .025
---------------------------------------------------------------------------------------------
OIH       112.95    .71      117.14       -177.7%   Bearish      ---- -.21  -.159  Bearish
---------------------------------------------------------------------------------------------
|
 Table 3   Count of Stocks in Key Directories
           20200915
-------------------------------
NEWHIGHS       85
NEWLOWS        8
MAXCP          21
MINCP          140
TTTNH          17
TTTNL          94
FASTUP         149
FASTDOWN       54
CPCROSSA       40
CPCROSSD       68
BIGVOLUP       2
BIGVODN        4
ACCUMVER       118
HIGHIP21       12
HIUPPCT        42
REDSELL        79
AUGSELS7       84
TRAPDOOR       15
|
 Table 4   RANKING OF KEY DIRECTORIES BASED PCT.OF STOCKS ABOVE 65-DMA
              9/15/20
 Bullish = 34
 Bearish = 12
---------------------------------------------------------------------------------------
Directory     Current       day-1         day-2         day-3         day-4         day-5
----------------------------------------------------------------------------------------
TRANSP         .95           .95           .95           .95           .9            .95
COPPER         .875          .875          .875          .625          .875          .75
AUTO           .871          .871          .82           .769          .871          .846
COAL           .857          .714          .714          .428          .571          .571
JETS           .857          .857          .785          .785          .714          .857
GOLD           .816          .877          .775          .775          .795          .755
COMODITY       .804          .804          .804          .756          .829          .78
ETFS           .803          .75           .66           .625          .785          .607
SOLAR          .8            .8            .8            .733          .8            .733
FOOD           .773          .773          .773          .735          .792          .754
HOMEBLDG       .764          .882          .764          .764          .705          .764
DOWJONES       .733          .7            .633          .666          .733          .666
INDEXES        .719          .73           .612          .629          .741          .685
INDMATER       .716          .689          .648          .621          .702          .635
GAMING         .714          .619          .666          .666          .761          .619
DJI-13         .692          .692          .538          .615          .692          .615
CHEM           .687          .708          .645          .687          .77           .687
FIDSTKS        .683          .661          .581          .559          .627          .593
NASD-100       .67           .61           .49           .51           .6            .49
SP-100         .67           .659          .582          .571          .637          .593
BEVERAGE       .666          .666          .666          .6            .733          .733
GREEN          .666          .523          .571          .619          .619          .571
HOSPITAL       .666          .666          .523          .571          .476          .523
INFRA          .657          .714          .6            .485          .657          .514
SP500          .654          .654          .581          .562          .635          .579
RETAIL         .653          .653          .653          .673          .693          .693
NIFTY          .622          .555          .466          .488          .555          .466
RUS-1000       .613          .615          .542          .529          .596          .543
COMPUTER       .6            .6            .55           .55           .65           .55
GUNS           .6            .466          .466          .466          .466          .533
BONDFUND       .594          .603          .712          .613          .594          .346
REIT           .581          .531          .333          .439          .503          .489
INSURANC       .576          .653          .615          .615          .653          .653
CHINA          .568          .549          .392          .392          .568          .529
===============================================================================================
ELECTRON       .486          .439          .371          .351          .405          .324
SEMI           .485          .419          .361          .352          .39           .285
SOFTWARE       .483          .45           .383          .366          .433          .35
FINANCE        .439          .487          .414          .402          .463          .439
BIOTECH        .431          .42           .294          .294          .319          .27
BIGBANKS       .428          .571          .571          .428          .571          .428
EDU            .4            .4            .4            .4            .4            .4
UTILITY        .394          .447          .421          .368          .421          .289
HACKERS        .3            .25           .15           .15           .2            .15
MILITARY       .285          .357          .214          .25           .321          .285
REGBANKS .269 .307 .153 .192 .269 .269 OILGAS .181 .149 .118 .11 .188 .165 |
=====================================================================
9/14/2020 Cover DIA short.
Short CVX and Buy highest AI/200 stock in DJI-30, CCRM.
Buy solar stocks among MAXCPs and sell short oil stocks among MINCPs.


Peerless-2020 remains on multiple Sells but the DIA's Closing Power
has bullishly broken its down-trend, there were 1857 more up than down on
the NYSE, there is a new optimized TigerSoft Buy on the Tiger chart of the
Dow Jones chart and the head/shoulders pattern there is being exploded
by a rally up from the DJI's rising 50-day ma.
The stock market is apparently very pleased by the day's FED's reassurances
that it will not raise rates or end QE-infinity in 2021 just because the Democrat
Biden wins. Rather they will use a longer term moving average of inflation.
Biden, for his part or in return, is letting it be known that he will not be in favor
of, or support, any plans to seek massive amounts of Federal revenue from the
super rich or those who have made big gains in this year's stock market rally.
Of course, a lot depends on the coming Presidential debates and the words he uses
then. He has to get his "supporters" in the polls to actually show up and
vote.
It does seem that Biden's lead at the polls in states like Pennsylvania, Arizona
and Wisconsin is growing. A Yahoo's compendium of national polls put him
5% ahead. Assuming he wins, one thing that should follow is much greater
emphasis on alternative energy, solar energy, as well as infrastructure spending
on safer water. Solar stocks should be
bought and oil stocks should be sold short.
These are exactly the stocks that our bullish and bearish stocks show.
|
Charts 9/14/2020 (Click on Underlined link.) 2020 PEERLESS DJI, Signals, Indicators Daily DJI Volume 10-DayUp/Down Vol Stoch-20 Inverted Traders Index Graph of Pct of All Stocks above 65-dma Cum. Inverted Traders Index NASDAQ S&P OEX NYSE COMPQX DJI-15 DJI-20 DJI-30 DIA QQQ MDY IWM TNA Short-Term Rates DOLLAR-UUP SPY http://tigersoft.com/2121CST/SPY.GIF recent 2006 vers-Peerless signals -- http://tigersoft.com/NEWPEER/UPD6911.BMP USO-CrudeOil DBO FAS GLD BBH IBB JETS JNUG KOL NUGT OIH PALL RSX RETL SDS AGQ SLV SOXL TECL TLT TMF TNA UGA (gasoline) USO (oil) and China: YINN CHAU Commodities: CANE CORN DBC JJC, NIB, CHOC CORN, CUT (paper) MOO, SOYB WEAT UUP (Dollar) LIT (Lithium) Stocks AAPL ADBE ALXN AMAT AMGN AMD AMZN AXP BA BABA BAC BIDU BLDP CAT CRM CVX CMG DE ENPH FB GILD GOOG GS HD IBM INTU JPM LRCX M (Macy's) MSFT NEM NFLX NKE NVDA PG REGN REV SO SQ QCOM QDEL TSLA TXN XOM V VRTX WFC WMT TOWN ZM New highs and Bullish MAXCPs http://tigersoft.com/MAXCP/9-14/BULLISH.htm Bearish MAXCPs - http://tigersoft.com/MINCP/9-14/BEARISH.htm |
Table 2 Table 1
9/14/2018 QUICKSILVER on DJI-30 STOCKS.
P21 + ITRS score >+.25 is bullish
             2  Bullish (CRM, NKE)
             7  Bearish (BA, CSCO,  CVX, GS, IBM, INTC, WBA)
hughest priced DJI-30 = UNH, HD, CRM, AMGN MCD, MSFT, V
HIGHEST AI/200 = CRM Second Highest Tied = AAPL and MSFT STOCKS CLOSECHANGE PIVOT-PT 5-dma AROC CL-PWR CANDLE AI/200 IP21 ITRS ------------------------------------------------------------------------------------------------------- --------------------------------------------------------------------------------------------------------- AAPL 115.36 3.36 120.96 -242.8% Bearish BLUE 174 .036 .182 ---------------------------------------------------------------------------------------------------------- AMGN 246.75 3.54 248.4 -33.8% Bearish BLUE 135 .205 -.13 ---------------------------------------------------------------------------------------------------------- AXP 107.27 3.91 105.67 77% ------- BLUE 106 -.084 .052 ---------------------------------------------------------------------------------------------------------- BA 165.35 5.12 171.05 -175.7% ------- BLUE 37 -.123 -.171 ---------------------------------------------------------------------------------------------------------- CAT 153.51 -.32 148.18 176.9% Bullish RED 133 .044 .116 ---------------------------------------------------------------------------------------------------------- CRM 246.64 3.54 254.7 -162.9% ------- RED 194 .295 .195 ---------------------------------------------------------------------------------------------------------- CSCO 40.37 .49 40.82 -56.1% Bearish BLUE 119 -.053 -.201 ---------------------------------------------------------------------------------------------------------- CVX 77.29 -.4 81.93 -292.4% Bearish RED 80 -.24 -.21 ---------------------------------------------------------------------------------------------------------- DIS 131.25 -.5 131.99 -27.8% Bearish RED 110 -.115 .084 ---------------------------------------------------------------------------------------------------------- DOW 50.09 .24 48.6 152.5% Bullish ---- 71 .036 .119 ---------------------------------------------------------------------------------------------------------- GS 201.34 .42 210.94 -236.1% Bearish RED 74 -.193 -.066 ---------------------------------------------------------------------------------------------------------- HD 280.65 4.32 269.66 201.3% ------- BLUE 138 .137 .044 ---------------------------------------------------------------------------------------------------------- HON 168.47 2.02 166.69 53.8% ------- BLUE 102 .072 .076 ---------------------------------------------------------------------------------------------------------- IBM 122.09 .63 122.3 -8.6% Bearish RED 115 -.2 -.066 ---------------------------------------------------------------------------------------------------------- INTC 49.41 .13 50.08 -67.9% Bearish BLUE 101 -.15 -.25 ---------------------------------------------------------------------------------------------------------- JNJ 148.35 .57 148.59 -8.1% Bearish BLUE 130 .058 -.033 ---------------------------------------------------------------------------------------------------------- JPM 102.47 1.4 103.52 -52% Bearish BLUE 39 -.139 .02 ---------------------------------------------------------------------------------------------------------- KO 50.71 -.35 51.04 -32.7% Bullish RED 100 .036 .044 ---------------------------------------------------------------------------------------------------------- MCD 220.56 2.56 211.73 205.1% ------- BLUE 145 .03 .116 ---------------------------------------------------------------------------------------------------------- MMM 168.46 2.29 165.77 81.6% ------- BLUE 110 .04 -.013 ---------------------------------------------------------------------------------------------------------- MRK 84.16 -.32 85.24 -64.1% Bearish BLUE 103 .009 -.017 ---------------------------------------------------------------------------------------------------------- MSFT 205.41 1.38 214.25 -213% Bearish BLUE 169 -.046 -.09 ---------------------------------------------------------------------------------------------------------- NKE 119.28 1.28 112.4 300.3% Bullish BLUE 148 .181 .126 ---------------------------------------------------------------------------------------------------------- PG 138.63 .49 137.96 24.4% Bullish BLUE 106 .085 .061 ---------------------------------------------------------------------------------------------------------- TRV 114.46 1.06 116.57 -92.7% Bearish BLUE 105 -.134 -.068 ---------------------------------------------------------------------------------------------------------- UNH 308.57 7.09 312 -55.8% Bearish BLUE 130 -.076 -.051 ---------------------------------------------------------------------------------------------------------- V 204.98 4.3 204.66 7.9% ------- BLUE 117 .111 -.038 ---------------------------------------------------------------------------------------------------------- VZ 60.32 .53 60.48 -13.3% Bullish BLUE 137 .055 .015 ---------------------------------------------------------------------------------------------------------- WBA 35.11 .41 36.89 -250.4% Bearish BLUE 80 -.303 -.249 ---------------------------------------------------------------------------------------------------------- WMT 137.32 .62 142.83 -198.3% Bearish BLUE 123 .038 .066
Table 3 QUICKSILVER on ETFS - 09/12/20 Bullish = 0
Bearish = 1
               ITRS + IP21>.25 is considered "Bullish"
               Highest ITRS + IP21 = TECL
ETF CLOSE CHANGE PIVOT-PT 5-dma AROC CL-PWR CANDLE IP21 ITRS --------------------------------------------------------------------------------------------- --------------------------------------------------------------------------------------------- DIA 280.53 3.44 275.42 -22.3% Bearish BLUE .014 --------- --------------------------------------------------------------------------------------------- SPY 338.46 4.4 333.21 -61% Bearish BLUE .065 -.002 --------------------------------------------------------------------------------------------- QQQ 275.16 4.71 269.95 -153.2% Bearish BLUE .072 .006 --------------------------------------------------------------------------------------------- MDY 345.33 6.68 338.45 -10.7% Bearish BLUE-.012 -.019 --------------------------------------------------------------------------------------------- IWM 153.08 3.93 149.86 9.3% Bearish BLUE-.005 -.011 --------------------------------------------------------------------------------------------- FAS 37.96 1.94 36.22 -139.3% Bearish BLUE .014 .117 --------------------------------------------------------------------------------------------- SOXL 233.76 13.9 212.61 -312.7% Bearish BLUE-.006 .164 --------------------------------------------------------------------------------------------- TECL 296.16 17.66 279.38 -447.4% Bearish BLUE .014 .16 --------------------------------------------------------------------------------------------- IBB 134.71 6.92 126.88 212% Bearish BLUE .081 -.113 --------------------------------------------------------------------------------------------- GLD 183.89 1.44 181.29 61.8% Bearish BLUE .057 .016 --------------------------------------------------------------------------------------------- OIH 112.24 .68 117 -547.3% Bearish BLUE-.176 -.152 Bearish --------------------------------------------------------------------------------------------- |
 Table 3   Count of Stocks in Key Directories
          20200914
-------------------------------
NEWHIGHS       116
NEWLOWS        37
MAXCP          18
MINCP          62
TTTNH          8
TTTNL          64
FASTUP         118
FASTDOWN       87
CPCROSSA       135
CPCROSSD       21
BIGVOLUP       1
BIGVODN        3
ACCUMVER       117
HIGHIP21       12
HIUPPCT        34
REDSELL        80
AUGSELS7       77
TRAPDOOR       15
|
 Table 4   RANKING OF KEY DIRECTORIES BASED PCT.OF STOCKS ABOVE 65-DMA
               9/14/20
 Bullish = 34
 Bearish = 12
---------------------------------------------------------------------------------------
Directory     Current       day-1         day-2         day-3         day-4         day-5
----------------------------------------------------------------------------------------
TRANSP         .95           .95           .95           .9            .95           .9
HOMEBLDG       .882          .764          .764          .705          .764          .882
GOLD           .877          .775          .775          .795          .755          .795
COPPER         .875          .875          .625          .875          .75           1
AUTO           .871          .82           .769          .871          .846          .923
JETS           .857          .785          .785          .714          .857          .785
COMODITY       .804          .804          .756          .829          .78           .853
SOLAR          .8            .8            .733          .8            .8            .8
FOOD           .773          .773          .735          .792          .754          .83
ETFS           .75           .66           .625          .785          .607          .803
INDEXES        .73           .612          .629          .741          .685          .78
COAL           .714          .714          .428          .571          .571          .571
INFRA          .714          .6            .485          .657          .514          .771
CHEM           .708          .645          .687          .77           .687          .77
DOWJONES       .7            .633          .666          .733          .666          .8
DJI-13         .692          .538          .615          .692          .615          .846
INDMATER       .689          .648          .621          .702          .635          .756
BEVERAGE       .666          .666          .6            .733          .733          .733
HOSPITAL       .666          .523          .571          .523          .476          .571
FIDSTKS        .661          .581          .559          .627          .593          .689
SP-100         .659          .582          .571          .637          .593          .736
SP500          .654          .583          .562          .635          .577          .709
INSURANC       .653          .615          .615          .653          .653          .769
RETAIL         .653          .653          .673          .693          .693          .734
GAMING         .619          .666          .666          .761          .619          .714
RUS-1000       .615          .543          .529          .596          .54           .674
NASD-100       .61           .49           .51           .6            .5            .67
BONDFUND       .603          .712          .613          .594          .366          .485
COMPUTER       .6            .55           .55           .65           .55           .65
BIGBANKS       .571          .571          .428          .571          .428          .857
NIFTY          .555          .466          .488          .555          .466          .6
CHINA          .549          .392          .392          .568          .549          .588
REIT           .531          .333          .439          .503          .482          .567
GREEN          .523          .571          .619          .619          .571          .666
===============================================================================================
FINANCE        .487          .414          .402          .463          .439          .695
GUNS           .466          .466          .466          .466          .533          .6
SOFTWARE       .45           .4            .366          .433          .333          .45
UTILITY        .447          .421          .368          .421          .289          .368
ELECTRON       .439          .371          .351          .405          .317          .472
BIOTECH        .42           .294          .294          .319          .276          .31
SEMI           .419          .361          .352          .39           .295          .409
EDU            .4            .4            .4            .4            .4            .4
MILITARY       .357          .214          .25           .321          .285          .428
REGBANKS       .307          .153          .192          .269          .23           .615
HACKERS        .25           .2            .15           .2            .15           .3
OILGAS         .149          .118          .102          .188          .157          .236
|

======================================================================
9/11/2020 Stay short DIA. Peerless-2020 remains on multiple Sells. Our Closing Power
is in a steep downtrend for DIA, QQQ, SPY and the NASDAQ. But the
Opening Powers remain in their uptrends and again today the DJI looks like
it will open up +230.


Now would be a good time for the Fed to pull a
rabbit-like jump in the market
out of its magic money hat. The DJI has formed a usually bearish
head/shoulders pattern just above its rising 65-dma and at its well-tested
price uptrend. We have 4 weeks of bearish seasonality to deal with.
When one looks back at all the Peerless charts since 1929, we find 23 cases
where the DJI formed a head and shoulders pattern and the DJI retreated back to
either its 50-day or 65-dma. Only in 3 cases did the DJI run up significantly.
Most often the DJIA hesistated at its support, then violated the neckline and
moving average support and fell to the lower band before rebounding back to
the neckline and then selling off again to new lows. The levels of the P-I,
IP21 and V-I were negative, as now, in nearly all of these cases.
I take the head/shoulders and negative IP21 in the DJI's chart, as well
as the falling Closing Powers and relatively heavy down volume to be signs
that "big money" and professionals are now net sellers. They are using
rallies
to reduce their long positions. Nor do they want to take much risk. That is
why the game of musical chairs among those playing the tech stocks seems to
have ended.
Steeply falling Closing Powers! Why are Professionals Afriad?


A fresh new vaccine might help a lot, too, now. A turnaround in Trump's poll
numbers might also still happen. But Professionals are now net sellers, judging
from the falling Closing Powers. Before buying again, it's probably best now
to be patient and wait for the Closing Powers to break their downtrends. See
the Closing Powers of DIA, the NASDAQ, SPY and QQQ below. The
continuing rise in the Opening Power, representing the bullishness of those buying
overseas and shortly after the NYSE, is holding the market up. This is exactly
what we saw in the QQQ, for example, just before the final speculative top in
it in March 2000. It looks like our situation now is similar, unless the FED has
still more magic than we have seen so far.
Careful: The Year 2000 shows that a rising Opening Power
does not mean higher prices for long when Closing Power has topped out
and is in a falling trend.

|
Charts 9/11/2020 (Click on Underlined link.) 2020 PEERLESS DJI, Signals, Indicators Daily DJI Volume 10-DayUp/Down Vol Stoch-20 Inverted Traders Index Graph of Pct of All Stocks above 65-dma Cum. Inverted Traders Index NASDAQ S&P OEX NYSE COMPQX DJI-15 DJI-20 DJI-30 DIA QQQ MDY IWM TNA Short-Term Rates DOLLAR-UUP SPY http://tigersoft.com/2121CST/SPY.GIF recent 2006 vers-Peerless signals -- http://tigersoft.com/NEWPEER/UPD6911.BMP USO-CrudeOil DBO FAS GLD BBH IBB JETS JNUG KOL NUGT OIH PALL RSX RETL SDS AGQ SLV SOXL TECL TLT TMF TNA UGA (gasoline) USO (oil) and China: YINN CHAU Commodities: CANE CORN DBC JJC, NIB, CHOC CORN, CUT (paper) MOO, SOYB WEAT UUP (Dollar) LIT (Lithium) Stocks AAPL ADBE ALXN AMAT AMGN AMD AMZN AXP BA BABA BAC BIDU BLDP CAT CRM CVX CMG DE ENPH FB GILD GOOG GS HD IBM INTU JPM LRCX M (Macy's) MSFT NEM NFLX NKE NVDA PG REGN REV SO SQ QCOM QDEL TSLA TXN XOM V VRTX WFC WMT TOWN ZM New highs and Bullish MAXCPs http://tigersoft.com/MAXCP/9-11/BULLISH.htm Bearish MAXCPs - http://tigersoft.com/MINCP/9-11/BEARISH.htm |
 Table 1
             9/10/2018   QUICKSILVER on DJI-30 STOCKS.
             IP21 + ITRS score  >+.25 is bullish
             2  Bullish (CRM, NKE)
             7  Bearish (BA, CSCO,  CVX, GS, IBM, INTC, WBA)
hughest priced DJI-30 = UNH, HD, CRM, AMGN MCD, MSFT, V HIGHEST AI/200 = CRM Second Highest Tied = AAPL and MSFT STOCKS CLOSECHANGE PIVOT-PT 5-dma AROC CL-PWR CANDLE AI/200 IP21 ITRS ------------------------------------------------------------------------------------------------------- ---------------------------------------------------------------------------------------------------------- AAPL 112 -1.49 120.88 -379.2% Bearish RED 174 .015 .153 ---------------------------------------------------------------------------------------------------------- AMGN 243.21 2.57 247.91 -96% Bearish BLUE 135 .183 -.124 ---------------------------------------------------------------------------------------------------------- AXP 103.36 .59 104.46 -52.8% ------- BLUE 106 -.129 .022 ---------------------------------------------------------------------------------------------------------- BA 160.23 2.54 168.77 -260.6% ------- BLUE 38 -.168 -.188 Bearish ---------------------------------------------------------------------------------------------------------- CAT 153.83 3.97 146.76 236.9% Bullish BLUE 133 .026 .143 ---------------------------------------------------------------------------------------------------------- CRM 243.1 -4.7 265.01 -435% ------- RED 194 .29 .19 Bullish ---------------------------------------------------------------------------------------------------------- CSCO 39.88 .31 40.95 -132.8% Bearish BLUE 119 -.136 -.211 Bearish ---------------------------------------------------------------------------------------------------------- CVX 77.69 -.46 82.28 -285.9% Bearish RED 81 -.263 -.19 Bearish ---------------------------------------------------------------------------------------------------------- DIS 131.75 -1.47 133.24 -55.9% ------- RED 111 -.103 .089 ---------------------------------------------------------------------------------------------------------- DOW 49.85 1.15 48.39 150.3% ------- BLUE 71 .046 .146 ---------------------------------------------------------------------------------------------------------- GS 200.92 .91 207.56 -162.2% Bearish BLUE 75 -.198 -.06 Bearish ---------------------------------------------------------------------------------------------------------- HD 276.33 3.63 274.63 31.2% ------- BLUE 137 .14 .037 ---------------------------------------------------------------------------------------------------------- HON 166.45 2.18 166.3 4.5% ------- BLUE 102 .083 .078 ---------------------------------------------------------------------------------------------------------- IBM 121.46 .9 124.45 -122.4% Bearish BLUE 116 -.202 -.052 Bearish ---------------------------------------------------------------------------------------------------------- INTC 49.28 .32 50.39 -111.9% Bearish ---- 102 -.183 -.239 Bearish ---------------------------------------------------------------------------------------------------------- JNJ 147.78 .87 149.55 -59.6% Bearish BLUE 130 .057 -.024 ---------------------------------------------------------------------------------------------------------- JPM 101.07 1.24 101.33 -12.9% Bearish BLUE 40 -.151 .007 ---------------------------------------------------------------------------------------------------------- KO 51.06 1.06 50.48 57.6% Bullish BLUE 100 .056 .062 ---------------------------------------------------------------------------------------------------------- MCD 218 .76 213.8 97.9% ------- BLUE 144 .047 .104 ---------------------------------------------------------------------------------------------------------- MMM 166.17 3.02 166.31 -4.2% ------- BLUE 110 .014 -.008 ---------------------------------------------------------------------------------------------------------- MRK 84.48 .91 85.49 -59.8% Bearish BLUE 103 .068 .005 ---------------------------------------------------------------------------------------------------------- MSFT 204.03 -1.34 217.3 -315.7% Bearish RED 170 -.047 -.08 ---------------------------------------------------------------------------------------------------------- NKE 118 3.21 112.85 226.8% Bullish BLUE 147 .189 .135 Bullish ---------------------------------------------------------------------------------------------------------- PG 138.14 1.44 138.26 -4.4% ------- BLUE 106 .137 .074 ---------------------------------------------------------------------------------------------------------- TRV 113.4 1.6 115.35 -85.4% Bearish BLUE 106 -.105 -.069 ---------------------------------------------------------------------------------------------------------- UNH 301.48 -3.12 316.23 -237.6% Bearish RED 131 -.055 -.064 ---------------------------------------------------------------------------------------------------------- V 200.68 -.86 208.96 -203.1% ------- RED 117 .08 -.041 ---------------------------------------------------------------------------------------------------------- VZ 59.79 .26 60.61 -68.2% ------- BLUE 137 .079 .017 ---------------------------------------------------------------------------------------------------------- WBA 34.7 .03 37.09 -331.8% Bearish RED 80 -.357 -.228 Bearish ---------------------------------------------------------------------------------------------------------- WMT 136.7 -.11 144.54 -279% Bearish RED 122 .08 .065 |
Table 2 QUICKSILVER on ETFS - 09/11/20 Bullish = 0
Bearish = 1
               ITRS + IP21>.25 is considered "Bullish"
               Highest ITRS + IP21 = TECL
ETF CLOSE CHANGE PIVOT-PT 5-dma AROC CL-PWR CANDLE IP21 ITRS --------------------------------------------------------------------------------------------- --------------------------------------------------------------------------------------------- DIA 277.09 1.3 281.77 -111.9% Bearish BLUE .007 0 --------------------------------------------------------------------------------------------- SPY 334.06 .17 342.57 -167.1% Bearish RED .044 -.001 --------------------------------------------------------------------------------------------- QQQ 270.45 -1.89 283.58 -304.8% Bearish RED .058 .003 --------------------------------------------------------------------------------------------- MDY 338.65 -.21 346.06 -132.7% Bearish RED -.043 -.026 --------------------------------------------------------------------------------------------- IWM 149.15 -1 152.8 -152.6% Bearish RED -.067 -.025 --------------------------------------------------------------------------------------------- FAS 36.02 .02 38.99 -439.8% Bearish RED -.018 .066 --------------------------------------------------------------------------------------------- SOXL 219.86 -.77 247.91 -752.8% Bearish RED -.027 .142 --------------------------------------------------------------------------------------------- TECL 278.5 -7.74 322.5 -942.9% Bearish RED -.006 .115 --------------------------------------------------------------------------------------------- IBB 127.79 .62 129.28 -82.5% Bearish RED .022 -.147 --------------------------------------------------------------------------------------------- GLD 182.45 -.01 181.64 36% Bearish RED .064 .018 --------------------------------------------------------------------------------------------- OIH 111.56 -.13 124.99 -544.6% Bearish RED -.227 -.135 Bearish --------------------------------------------------------------------------------------------- |
 Table 3   Count of Stocks in Key Directories
           20200911
-------------------------------
NEWHIGHS       68
NEWLOWS        63
MAXCP          6
MINCP          168  Bearish
TTTNH          7
TTTNL          194  Bearish
FASTUP         66
FASTDOWN       165
CPCROSSA       33
CPCROSSD       48
BIGVOLUP       4
BIGVODN        8
ACCUMVER       117
HIGHIP21       7
HIUPPCT        32
REDSELL        79
AUGSELS7       88
TRAPDOOR       14
|
Table 4 RANKING OF KEY DIRECTORIES BASED PCT.OF STOCKS ABOVE 65-DMA
Bullish = 30
Bearish = 16
9/11/20
---------------------------------------------------------------------------------------
Directory Current day-1 day-2 day-3 day-4 day-5
----------------------------------------------------------------------------------------
TRANSP .95 .95 .9 .95 .9 .9
COPPER .875 .625 .875 .75 1 1
AUTO .82 .769 .871 .846 .923 .897
COMODITY .804 .756 .829 .78 .853 .878
SOLAR .8 .733 .8 .8 .8 .866
-----
JETS .785 .785 .714 .857 .785 .714
GOLD .775 .775 .795 .755 .795 .816
FOOD .773 .735 .792 .754 .83 .886
HOMEBLDG .764 .764 .705 .764 .823 .764
COAL .714 .428 .571 .571 .571 .428
BONDFUND .712 .613 .594 .366 .504 .782
BEVERAGE .666 .6 .733 .733 .733 .733
GAMING .666 .666 .761 .619 .714 .714
ETFS .66 .625 .785 .607 .803 .732
RETAIL .653 .673 .693 .693 .734 .734
INDMATER .648 .621 .702 .635 .756 .675
CHEM .645 .687 .77 .687 .77 .729
DOWJONES .633 .666 .733 .666 .8 .8
INSURANC .615 .615 .653 .653 .769 .73
INDEXES .612 .629 .741 .685 .786 .814
INFRA .6 .485 .657 .514 .742 .657
SP500 .583 .564 .635 .577 .698 .705
SP-100 .582 .571 .637 .593 .725 .703
FIDSTKS .581 .559 .627 .593 .689 .717
BIGBANKS .571 .428 .571 .428 .857 .714
GREEN .571 .619 .619 .571 .666 .714
COMPUTER .55 .55 .65 .55 .65 .7
RUS-1000 .543 .531 .596 .54 .661 .668
DJI-13 .538 .615 .692 .615 .846 .846
HOSPITAL .523 .571 .523 .523 .571 .571
-----------------------------------------------------------------------------------------
NASD-100 .49 .51 .6 .5 .67 .74
GUNS .466 .466 .466 .533 .6 .533
NIFTY .466 .488 .555 .466 .6 .666
UTILITY .421 .368 .421 .289 .394 .394
FINANCE .414 .402 .463 .439 .658 .585
EDU .4 .4 .4 .4 .4 .6
SOFTWARE .4 .383 .433 .333 .45 .583
CHINA .392 .392 .568 .549 .588 .588
ELECTRON .371 .351 .405 .317 .472 .547
SEMI .361 .352 .39 .295 .409 .504
REIT .333 .439 .503 .482 .546 .567
BIOTECH .298 .298 .322 .28 .32 .338
MILITARY .214 .25 .321 .285 .428 .5
HACKERS .2 .2 .2 .15 .25 .4
REGBANKS .153 .192 .269 .23 .615 .423
OILGAS .118 .102 .181 .157 .236 .22
|
=======================================================================
9/9/2020 Stay short DIA. Peerless-2020 remains on multiple Sells. Our Closing Power
is in a steep downtrend for DIA, QQQ, SPY and the NASDAQ. But the
Opening Powers remain in their uptrends and again today the DJI looks like
it will open up +200. You can see that the DJI could well be forming a head/
shoulders top in preparation of breaking its uptrend-line. Such a breakdown
would be in keeping with the seasonal bearish of the market for the next
month. Since 1968, in Presidential Election Years like now, the DJI has
fallen 62% of the time over the next month and shown an average decline
of 2.1%. The bearishness of so many unreversed Sell signals has been noted
before here. The likelihood of a September-October decline if a Republican
incumbent in the White House has also been noted, along with references to
the polls in the key "battle-ground" states. Watch these polls, as they
could
shift over the next 7 weeks. And I have warned bulls that the FED's words
are being used against its goal of 29600 by Election Day. The many Bearish
MINCPs is another worrisome sign. Short some of them.

SPY seems to be caught in a narrow trading range as it waits to see whether
the Professionals or the buyers near the opening win their current struggle.

I looked back today at the old (2006 version) Peerless'es signals in the
Presidential Election years wear a Democrat won the White House back
from Republicans. The 2006 version produced six bad September Buys
in 1932, 1960, 2008 and several more in 1976 in the first few days of October.
These were B2s (buys at the lower band), B19 (two day reversal buys)
and B20 (buy near rising 50-day ma). This is a warning now not to heed
the B2 and B20 on the current 2006 chart.
The steep decline in the Closing Power of the NASDAQ is a danger-sign.
We saw this early in the February-March sell-off. It overcame the positive
Accumulation in our chart at the time. Now we also see a bearish head/shoulders
pattern in the NASDAQ. These are clear warnngs. Stay clear of the
NASDAQ. Short it if the green neckline at 10800 is clearly closed
below.

1912, 1912-1913 and 1913 Charts of DJIA.
I recently hand-entered the data for the DJI from 1886-1914. The yearly charts
for this period is not currently on the internet and has not been published to my
knowledge. The charts below show the importance of (1) well-tested uptrend support,
(2) false breakouts, (3) head and shoulders patterns, (4) high volume breakdowns
below neckline support and (5) the well-tested down-trend lines. In November 1912,
the incumbent Republican Taft was defeated because he was not backed by a
more progressive wing within his party who supported Theodore Roosevelt. The
winner, the Democrat Woodrow Wilson did not take office until March 1913. By
then the DJIA was already down substantially. Interestingly, the most powerful
man on Wall Street, JP Morgan, secretly financed both the Bull Moose candidate
and the Democrat to run against Taft because the latter would not support the
establishment of the Federal Reserve, which Morgan wanted.
1912 |
1912-1913 |
1913 |
|
Charts 9/10/2020 (Click on Underlined link.) 2020 PEERLESS DJI, Signals, Indicators Daily DJI Volume 10-DayUp/Down Vol Stoch-20 Inverted Traders Index Graph of Pct of All Stocks above 65-dma Cum. Inverted Traders Index NASDAQ S&P OEX NYSE COMPQX DJI-15 DJI-20 DJI-30 DIA QQQ MDY IWM TNA Short-Term Rates DOLLAR-UUP SPY http://tigersoft.com/2121CST/SPY.GIF recent 2006 vers-Peerless signals -- http://tigersoft.com/NEWPEER/UPD6910.BMP USO-CrudeOil DBO FAS GLD BBH IBB JETS JNUG KOL NUGT OIH PALL RSX RETL SDS AGQ SLV SOXL TECL TLT TMF TNA UGA (gasoline) USO (oil) and China: YINN CHAU Commodities: CANE CORN DBC JJC, NIB, CHOC CORN, CUT (paper) MOO, SOYB WEAT UUP (Dollar) LIT (Lithium) Stocks AAPL ADBE ALXN AMAT AMGN AMD AMZN AXP BA BABA BAC BIDU BLDP CAT CRM CVX CMG DE ENPH FB GILD GOOG GS HD IBM INTU JPM LRCX M (Macy's) MSFT NEM NFLX NKE NVDA PG REGN REV SO SQ QCOM QDEL TSLA TXN XOM V VRTX WFC WMT TOWN ZM New highs and Bullish MAXCPs http://tigersoft.com/MAXCP/9-10/BULLISH.htm Bearish MAXCPs - http://tigersoft.com/MINCP/9-10/BEARISH.htm |
 Table 1
             9/19/2018   QUICKSILVER on DJI-30 STOCKS.
P21 + ITRS score >+.25 is bullish
             2  Bullish (CRM, NKE)
             8  Bearish (BA, CSCO,  CVX, GS, IBM, INTC, TRV, WBA)
hughest priced DJI-30 = UNH, HD, CRM, AMGN MCD, MSFT, V
HIGHEST AI/200 = CRM Second Highest Tied = AAPL and MSFT STOCKS CLOSECHANGE PIVOT-PT 5-dma AROC CL-PWR CANDLE AI/200 IP21 ITRS ------------------------------------------------------------------------------------------------------- ---------------------------------------------------------------------------------------------------------- AAPL 113.49 -3.83 131.4 -742.1% Bearish RED 174 .058 .175 ---------------------------------------------------------------------------------------------------------- AMGN 240.64 -4.93 258.12 -352.1% Bearish RED 135 .208 -.049 ---------------------------------------------------------------------------------------------------------- AXP 102.77 -1.01 104.4 -78.1% Bearish RED 107 -.166 .01 ---------------------------------------------------------------------------------------------------------- BA 157.69 -3.09 174.78 -510.8% ------- RED 39 -.224 -.209 Bearish ---------------------------------------------------------------------------------------------------------- CAT 149.86 -2.83 149.27 19.8% Bullish RED 133 -.015 .115 ---------------------------------------------------------------------------------------------------------- CRM 247.8 -2.63 276.69 -560.7% Bullish RED 194 .289 .253 Bullish ---------------------------------------------------------------------------------------------------------- CSCO 39.57 -.56 42.42 -348.7% Bearish RED 119 -.11 -.221 Bearish ---------------------------------------------------------------------------------------------------------- CVX 78.15 -1.88 83.19 -310% Bearish RED 82 -.246 -.194 Bearish ---------------------------------------------------------------------------------------------------------- DIS 133.22 -.14 135.39 -81.2% ------- RED 112 -.079 .125 ---------------------------------------------------------------------------------------------------------- DOW 48.7 -.53 49.22 -53.4% ------- RED 71 .019 .125 ---------------------------------------------------------------------------------------------------------- GS 200.01 -2.21 210.04 -242.7% Bearish RED 76 -.216 -.057 Bearish ---------------------------------------------------------------------------------------------------------- HD 272.7 -4.34 287.2 -263.1% Bearish RED 136 .152 .019 ---------------------------------------------------------------------------------------------------------- HON 164.27 -1.48 172.47 -245.4% Bearish RED 102 .057 .067 ---------------------------------------------------------------------------------------------------------- IBM 120.56 -1.7 128.18 -308.1% Bearish RED 117 -.197 -.071 Bearish ---------------------------------------------------------------------------------------------------------- INTC 48.96 -.66 52.25 -327.4% Bearish RED 103 -.128 -.251 Bearish ---------------------------------------------------------------------------------------------------------- JNJ 146.91 -2.79 153.83 -231% Bearish RED 130 .074 -.025 ---------------------------------------------------------------------------------------------------------- JPM 99.83 -1.04 101.65 -89.7% Bearish RED 41 -.204 -.008 ---------------------------------------------------------------------------------------------------------- KO 50 -.19 51.19 -117.7% Bullish RED 100 .013 .05 ---------------------------------------------------------------------------------------------------------- MCD 217.24 1.53 216.23 23.6% ------- BLUE 143 .023 .108 ---------------------------------------------------------------------------------------------------------- MMM 163.15 -2.55 169.51 -191.5% Bearish RED 110 -.021 -.024 ---------------------------------------------------------------------------------------------------------- MRK 83.57 -1.31 86.93 -197.2% Bearish RED 102 .087 .011 ---------------------------------------------------------------------------------------------------------- MSFT 205.37 -5.92 231.65 -609.9% Bearish RED 171 -.012 -.06 ---------------------------------------------------------------------------------------------------------- NKE 114.79 -.11 116.8 -88.2% Bullish RED 146 .207 .101 Bullish ---------------------------------------------------------------------------------------------------------- PG 136.7 -1.45 140.51 -137.9% ------- RED 106 .15 .074 ---------------------------------------------------------------------------------------------------------- TRV 111.8 -1.83 117.48 -246.2% Bearish RED 107 -.151 -.089 Bearish ---------------------------------------------------------------------------------------------------------- UNH 304.6 -7.42 320.24 -249.4% Bearish RED 132 -.017 -.037 ---------------------------------------------------------------------------------------------------------- V 201.54 -2.52 216.48 -361.1% ------- RED 117 .065 -.026 ---------------------------------------------------------------------------------------------------------- VZ 59.53 -.51 60.53 -82.9% ------- RED 137 .034 .01 ---------------------------------------------------------------------------------------------------------- WBA 34.67 -.68 37.17 -342.3% Bearish RED 80 -.401 -.252 Bearish ---------------------------------------------------------------------------------------------------------- WMT 136.81 -3.08 147.68 -380.9% ------- RED 121 .104 .073 |
Table 3 QUICKSILVER on ETFS - 09/10/20 Bullish = 0
Bearish = 1
               ITRS + IP21>.25 is considered "Bullish"
               Highest ITRS + IP21 = TECL
ETF CLOSE CHANGE PIVOT-PT 5-dma AROC CL-PWR CANDLE IP21 ITRS --------------------------------------------------------------------------------------------- --------------------------------------------------------------------------------------------- DIA 275.79 -4.06 283.34 -273.1% Bearish RED .014 ---- --------------------------------------------------------------------------------------------- SPY 333.89 -5.9 345.39 -346.3% Bearish RED .07 .013 --------------------------------------------------------------------------------------------- QQQ 272.34 -5.54 287.41 -535% Bearish RED .095 .03 --------------------------------------------------------------------------------------------- MDY 338.86 -4.19 347.75 -285.6% Bearish RED -.046 -.025 --------------------------------------------------------------------------------------------- IWM 150.15 -1.98 153.78 -270.8% Bearish RED -.068 -.021 --------------------------------------------------------------------------------------------- FAS 36 -1.63 39.33 -753.8% Bearish RED -.043 .081 --------------------------------------------------------------------------------------------- SOXL 220.63 -9.56 254.98 -1732% Bearish RED .034 .103 --------------------------------------------------------------------------------------------- TECL 286.24 -19.08 336.19 -1837% Bearish RED .034 .16 --------------------------------------------------------------------------------------------- IBB 127.17 -2.19 129.91 -299.8% Bearish RED .058 -.139 --------------------------------------------------------------------------------------------- GLD 182.46 -.59 181.14 -4.4% Bearish RED -.025 .021 --------------------------------------------------------------------------------------------- OIH 111.69 -5.45 124.53 -488.3% Bearish RED -.229 -.153 Bearish --------------------------------------------------------------------------------------------- GASL 3440 285 3685 -325.1% ------- RED -.021 .044 --------------------------------------------------------------------------------------------- |
Table 3 Count of Stocks in Key Directories
20200910
-------------------------------
NEWHIGHS 118
NEWLOWS 53
MAXCP 11
MINCP 210 Bearish
TTTNH 10
TTTNL 196 Bearish
FASTUP 59
FASTDOWN 323
CPCROSSA 22
CPCROSSD 130
BIGVOLUP 6
BIGVODN 14
ACCUMVER 115
HIGHIP21 11
HIUPPCT 29
REDSELL 79
AUGSELS7 63
TRAPDOOR 19
|
Table 4 RANKING OF KEY DIRECTORIES BASED PCT.OF STOCKS ABOVE 65-DMA
9/10/20
Bullish = 28
Bearish = 18
---------------------------------------------------------------------------------------
Directory Current day-1 day-2 day-3 day-4 day-5
----------------------------------------------------------------------------------------
TRANSP .95 .9 .95 .9 .9 .9
JETS .785 .714 .857 .785 .714 .714
GOLD .775 .795 .755 .795 .816 .816
AUTO .769 .871 .846 .923 .897 .923
HOMEBLDG .764 .705 .764 .823 .764 .882
COMODITY .756 .829 .78 .853 .878 .902
FOOD .735 .792 .754 .83 .886 .924
SOLAR .733 .8 .8 .8 .866 1
CHEM .687 .77 .687 .77 .729 .812
RETAIL .673 .693 .693 .734 .734 .734
DOWJONES .666 .733 .666 .8 .8 .833
GAMING .666 .761 .619 .714 .714 .809
INDEXES .629 .741 .685 .786 .814 .814
COPPER .625 .875 .75 1 1 1
ETFS .625 .785 .607 .803 .732 .857
INDMATER .621 .702 .635 .756 .689 .756
GREEN .619 .619 .571 .666 .666 .857
DJI-13 .615 .692 .615 .846 .846 .923
INSURANC .615 .653 .653 .769 .73 .807
BONDFUND .613 .594 .366 .504 .792 .871
BEVERAGE .6 .733 .733 .733 .733 .733
HOSPITAL .571 .523 .523 .619 .571 .666
SP-100 .571 .637 .593 .725 .703 .769
SP500 .564 .638 .577 .698 .7 .784
FIDSTKS .559 .627 .593 .689 .711 .779
COMPUTER .55 .65 .55 .65 .7 .8
RUS-1000 .531 .597 .54 .661 .665 .74
NASD-100 .51 .6 .5 .67 .74 .86
============================================================================================
NIFTY .488 .555 .466 .6 .666 .844
INFRA .485 .657 .514 .742 .657 .8
GUNS .466 .466 .533 .6 .533 .666
REIT .439 .503 .482 .546 .56 .574
BIGBANKS .428 .571 .428 .857 .714 .714
COAL .428 .571 .571 .571 .428 .571 FINANCE .402 .463 .439 .658 .585 .609 EDU .4 .4 .4 .4 .6 .6 CHINA .392 .568 .549 .588 .588 .647 SOFTWARE .383 .45 .333 .45 .583 .716 UTILITY .368 .421 .289 .394 .394 .552 SEMI .352 .39 .295 .409 .504 .695 ELECTRON .351 .405 .317 .472 .547 .702 BIOTECH .295 .319 .276 .317 .338 .424 MILITARY .25 .321 .285 .428 .464 .571 HACKERS .2 .25 .15 .25 .4 .75 REGBANKS .192 .269 .23 .615 .423 .461 OILGAS .102 .181 .149 .236 .22 .259 |
========================================================================
9/9/2020 Stay short DIA and avoid the
high techs. Peerless-2020 remains on
multiple Sells. Using our TigerSoft Closing Power, we see that Professionals
are now net bearish. If the Openings turn weak and the DJI breaks below its
65-dma, the September sell-off may only have just begin. If today's rally
quickly gives way to another sell-off tomorrow, traders will be reminded of
what happened this February and March. And don't look for help from
the FED. Its words are now being taken as signs of how weak the economy
may really be getting.

About an hour before the close, the DJI was up more
than 600.
By the close it had fallen back nearly 200 points. This is because
Professionals are using any strength they see to get out. They
are not dumb. They can see that the tech bubble has quite possibly
been burst, that the game of musical chairs in which FED money was
pumped into fewer and fewer of the tech giants is probably over.
Understandably. those FED funds went into the "best investment game
in town" when nothing else looked nearly as good to bring quick returns.
The Professionals could be wrong. But they
don't like Trump chances now
and they don't much like Biden's coming taxes next year. So, they want out.
"Why take a chance?" Today's rally formed what looks like a
"head/shoulders"
pattern in the DJI. If a new low is made on this decline, that patterns' neckline-
support will be violated. Such a decline would give us a minimum
"point-count"
down below the 65-dma support. And if the DJI and the QQQ break below
their 65-dma support, the market would start to look like it did in February
on its way down 30% more.
The FED says it will keep rates very low for years whatever that brings in the
way of inflation. That not only sounds desperate, it sounds like 1930 when
high enemployment and a return of falling stock prices brought
on severe deflation. To be sure, the FED will not allow banks to
start failing, but unless they can find a way to create millions of new
jobs to replace those lost by the pandemic, aggregate consumer
buying power and massive debt will only get worse. The optimists see a
business turnaround if a new vaccine ends the virus, perhaps... But that's
not what the FED sees. And right now there IS too much risk.
The various ETFs' Closing Powers are all
declining in Table 2. The Dow
Jones Committee that replaced XOM, RTX and PFE with AMGN, CRM
and HON did boost the DJI gain today by 100 extra points. But that will
not be nearly enough if the DJI breaks below its 65-dma and it looks like
the Democrat Biden is going to sweep into office a Democrat majority
in the Senate and the House. Sure, you can argue that Biden is too bland to
bring out his voters and you can say that most new Congressmen and Biden
will be "corporate Democrats", but Trump keeps calling them "radical
"socialists". Trump, in my opinion, is making a big mistake.
He himself
is going to cause 2020 to be a very high turn-out election. This was something
which smart Republicans like Rowe and Gingrich knew to avoid.
DIA |
SPY |
QQQ |
|
Charts 9/09/2020 (Click on Underlined link.) 2020 PEERLESS DJI, Signals, Indicators Daily DJI Volume 10-DayUp/Down Vol Stoch-20 Inverted Traders Index Graph of Pct of All Stocks above 65-dma Cum. Inverted Traders Index NASDAQ S&P OEX NYSE COMPQX DJI-15 DJI-20 DJI-30 DIA QQQ MDY IWM TNA Short-Term Rates DOLLAR-UUP SPY http://tigersoft.com/2121CST/SPY.GIF recent 2006 vers-Peerless signals -- http://tigersoft.com/NEWPEER/UPD6909.BMP USO-CrudeOil DBO FAS GLD BBH IBB JETS JNUG KOL NUGT OIH PALL RSX RETL SDS AGQ SLV SOXL TECL TLT TMF TNA UGA (gasoline) USO (oil) and China: YINN CHAU Commodities: CANE CORN DBC JJC, NIB, CHOC CORN, CUT (paper) MOO, SOYB WEAT UUP (Dollar) LIT (Lithium) Stocks AAPL ADBE ALXN AMAT AMGN AMD AMZN AXP BA BABA BAC BIDU BLDP CAT CRM CVX CMG DE ENPH FB GILD GOOG GS HD IBM INTU JPM LRCX M (Macy's) MSFT NEM NFLX NKE NVDA PG REGN REV SO SQ QCOM QDEL TSLA TXN XOM V VRTX WFC WMT TOWN ZM New highs and Bullish MAXCPs http://tigersoft.com/MAXCP/9-09/BULLISH.htm Bearish MAXCPs - http://tigersoft.com/MINCP/9-09/BEARISH.htm |
Table 1
9/9/2018 QUICKSILVER on DJI-30 STOCKS.
P21 + ITRS score >+.25 is bullish
3 Bullish (AAPL, CRM, NKE)
7 Bearish (BA, CSCO, CVX, IBM, INTC, TRV, WBA)
hughest priced DJI-30 = UNH, HD, CRM, AMGN MCD, MSFT, V
HIGHEST AI/200 = CRM Second Highest Tied = AAPL and MSFT Recently added stocks boosted DJIA about 100 more than had there been no
change and XOM, PFE and RTX still been in DJI30.
STOCKS CLOSECHANGE PIVOT-PT 5-dma AROC CL-PWR CANDLE AI/200 IP21 ITRS
----------------------------------------------------------------------------------------------------------
AAPL 117.32 4.5 134.18 -679.6% Bearish ---- 174 .053 .204 Bullish
----------------------------------------------------------------------------------------------------------
AMGN 245.57 4.39 250.86 -106.1% Bearish BLUE 135 .194 -.033
(recently added to DJI-30)
----------------------------------------------------------------------------------------------------------
AXP 103.78 .11 102.47 62.9% Bearish RED 107 -.182 .004
----------------------------------------------------------------------------------------------------------
BA 160.78 -.3 172.1 -333.8% ------- RED 40 -.278 -.267 Bearish
----------------------------------------------------------------------------------------------------------
CAT 152.69 4.17 146.05 224.7% Bullish BLUE 134 -.043 .126
----------------------------------------------------------------------------------------------------------
CRM 250.43 9.16 281.25 -584.2% Bullish BLUE 194 .293 .272 Bullish
(recently added to DJI-30)
----------------------------------------------------------------------------------------------------------
CSCO 40.13 .13 42.03 -230.3% Bearish ---- 119 -.107 -.224 Bearish
----------------------------------------------------------------------------------------------------------
CVX 80.03 1.06 83.08 -186.2% Bearish ---- 83 -.229 -.181 Bearish
----------------------------------------------------------------------------------------------------------
DIS 133.36 -.84 133.55 -7.1% ------- RED 113 -.085 .102
----------------------------------------------------------------------------------------------------------
DOW 49.23 1.3 47.27 203% Bullish BLUE 71 .022 .108
----------------------------------------------------------------------------------------------------------
GS 202.22 -.26 205.46 -78.1% Bearish RED 77 -.23 -.048 Bearish
----------------------------------------------------------------------------------------------------------
HD 277.04 7.78 285.94 -160.5% ------- BLUE 135 .147 .032
----------------------------------------------------------------------------------------------------------
HON 165.75 1.48 167.97 -66.3% Bearish BLUE 102 .036 .064
(recently added to DJI-30)
----------------------------------------------------------------------------------------------------------
IBM 122.26 1.05 123.4 -46% Bearish BLUE 118 -.212 -.073 Bearish
----------------------------------------------------------------------------------------------------------
INTC 49.62 .71 50.79 -115.9% Bearish BLUE 104 -.142 -.242 Bearish
----------------------------------------------------------------------------------------------------------
JNJ 149.7 2.44 151.52 -60.6% Bearish BLUE 130 .082 -.017
----------------------------------------------------------------------------------------------------------
JPM 100.87 .95 100.14 36% Bearish BLUE 42 -.225 -.009
----------------------------------------------------------------------------------------------------------
KO 50.19 .38 49.12 106.3% Bullish BLUE 99 .029 .038
----------------------------------------------------------------------------------------------------------
MCD 215.71 2.13 212.69 70.7% ------- BLUE 142 .012 .086
----------------------------------------------------------------------------------------------------------
MMM 165.7 2.53 164.8 27.1% ------- BLUE 111 -.047 -.028
----------------------------------------------------------------------------------------------------------
MRK 84.88 1.55 84.43 26.4% ------- BLUE 101 .088 .022
----------------------------------------------------------------------------------------------------------
MSFT 211.29 8.63 227.27 -365.5% ------- BLUE 172 -.02 -.029
----------------------------------------------------------------------------------------------------------
NKE 114.9 2.18 114.84 2.6% Bullish BLUE 145 .198 .105 Bullish
----------------------------------------------------------------------------------------------------------
PG 138.15 2.21 138.18 -1.1% Bullish BLUE 105 .158 .081
----------------------------------------------------------------------------------------------------------
TRV 113.63 -.11 114.69 -45.9% Bearish RED 108 -.163 -.087 Bearish
----------------------------------------------------------------------------------------------------------
UNH 312.02 4.77 312.83 -12.9% Bearish BLUE 133 -.024 -.017
----------------------------------------------------------------------------------------------------------
V 204.06 3.94 213.35 -222.6% ------- RED 117 .053 -.027
----------------------------------------------------------------------------------------------------------
VZ 60.04 .08 59.16 73.2% Bullish RED 137 .046 .004
----------------------------------------------------------------------------------------------------------
WBA 35.35 -.75 36.76 -191.6% Bearish RED 81 -.406 -.258 Bearish
----------------------------------------------------------------------------------------------------------
WMT 139.89 1.44 147.59 -267% ------- RED 120 .119 .081
----------------------------------------------------------------------------------------------------------
==========================================================================================================
Recently Dropped form DJI-30
PFE 36.18 .25 36.88 -95.7% Bearish RED 96 .094 .015
----------------------------------------------------------------------------------------------------------
RTX 59.58 .33 60.68 -90.5% ------- RED 24 -.093 -.131
----------------------------------------------------------------------------------------------------------
XOM 37.95 -.23 39.43 -189.8% Bearish RED 44 -.326 -.237 Bearish
|
Table 3 QUICKSILVER on ETFS - 09/09/20 Bullish = 2
Bearish = 1
ITRS + IP21>.25 is considered "Bullish"
Highest ITRS + IP21 = TECL
ETF CLOSE CHANGE PIVOT-PT 5-dma AROC CL-PWR CANDLE IP21 ITRS --------------------------------------------------------------------------------------------- --------------------------------------------------------------------------------------------- DIA 279.85 4.43 291.21 -122.3% Bearish BLUE .003 0 --------------------------------------------------------------------------------------------- SPY 339.79 6.58 357.7 -185% Bearish BLUE .087 .022 --------------------------------------------------------------------------------------------- QQQ 277.88 7.93 302.76 -381.7% ------- BLUE .112 .051 --------------------------------------------------------------------------------------------- MDY 343.05 4.6 358.67 -158.3% Bearish BLUE -.037 -.023 --------------------------------------------------------------------------------------------- IWM 152.13 2.27 158.46 -164.5% Bearish BLUE -.058 -.016 --------------------------------------------------------------------------------------------- FAS 37.63 1.41 41.85 -304.2% Bearish BLUE -.073 .163 --------------------------------------------------------------------------------------------- SOXL 230.19 17.58 307.45 -995.1% Bearish BLUE .037 .228 Bullish --------------------------------------------------------------------------------------------- TECL 305.32 25.94 407.55 -1320.4% Bearish BLUE .041 .291 Bullish --------------------------------------------------------------------------------------------- IBB 129.36 2.48 134.97 -139.9% Bearish BLUE .036 -.133 --------------------------------------------------------------------------------------------- GLD 183.05 1.76 182.62 -54.8% Bearish BLUE -.104 .005 --------------------------------------------------------------------------------------------- OIH 117.14 .14 123.55 -327.1% Bearish RED -.254 -.109 Bearish --------------------------------------------------------------------------------------------- GASL 3440 285 3685 -325.1% ------- RED -.021 .02 --------------------------------------------------------------------------------------------- |
Sept 9 - Count of Stocks in Key Directories
20200909
-------------------------------
NEWHIGHS 89
NEWLOWS 41
MAXCP 16
MINCP 106
TTTNH 6
TTTNL 75
FASTUP 47
FASTDOWN 211
CPCROSSA 91
CPCROSSD 45
BIGVOLUP 4
BIGVODN 6
ACCUMVER 115
HIGHIP21 9
HIUPPCT 37
REDSELL 83
AUGSELS7 81
TRAPDOOR 18
|
Table 4 RANKING OF KEY DIRECTORIES BASED PCT.OF STOCKS ABOVE 65-DMA
9/9/20
Bullish = 34
Bearish = 12
---------------------------------------------------------------------------------------
Directory Current day-1 day-2 day-3 day-4 day-5
----------------------------------------------------------------------------------------
TRANSP .9 .95 .9 .9 .9 .9
COPPER .875 .75 1 1 1 1
AUTO .871 .846 .923 .897 .923 .923
COMODITY .829 .78 .853 .878 .902 .902
SOLAR .8 .8 .8 .866 1 .933
GOLD .795 .755 .795 .816 .816 .836
FOOD .792 .754 .83 .886 .924 .924
ETFS .785 .607 .803 .732 .857 .803
CHEM .77 .687 .77 .729 .812 .791
GAMING .761 .619 .714 .714 .809 .809
INDEXES .741 .685 .786 .814 .814 .764
BEVERAGE .733 .733 .733 .733 .733 .666
DOWJONES .733 .666 .8 .8 .833 .733
JETS .714 .857 .785 .714 .714 .714
HOMEBLDG .705 .764 .823 .764 .882 .764
INDMATER .702 .635 .756 .689 .756 .729
RETAIL .693 .693 .734 .734 .734 .714
DJI-13 .692 .615 .846 .846 .923 .692
INFRA .657 .514 .742 .657 .8 .742
INSURANC .653 .653 .769 .73 .807 .769
COMPUTER .65 .55 .65 .7 .8 .7
SP500 .638 .579 .698 .7 .782 .7
SP-100 .637 .593 .725 .703 .769 .67
FIDSTKS .627 .593 .689 .711 .768 .7
GREEN .619 .571 .666 .666 .857 .666
NASD-100 .6 .5 .67 .74 .85 .77
RUS-1000 .597 .542 .661 .665 .735 .658
BONDFUND .594 .366 .504 .792 .891 .801
BIGBANKS .571 .428 .857 .714 .714 .571
COAL .571 .571 .571 .428 .571 .571
CHINA .568 .549 .588 .588 .647 .686
NIFTY .555 .466 .6 .666 .844 .755
HOSPITAL .523 .523 .619 .619 .666 .571
REIT .503 .482 .546 .56 .581 .475
=================================================================================================
GUNS .466 .533 .6 .533 .666 .666
FINANCE .463 .439 .658 .585 .609 .548
SOFTWARE .45 .35 .45 .583 .716 .683
UTILITY .421 .289 .394 .394 .526 .368
ELECTRON .405 .317 .472 .547 .702 .635
EDU .4 .4 .4 .6 .6 .6
SEMI .39 .295 .409 .504 .695 .619
MILITARY .321 .285 .428 .464 .571 .5
BIOTECH .319 .276 .317 .338 .43 .4
REGBANKS .269 .23 .615 .423 .461 .384
HACKERS .25 .2 .25 .4 .75 .65
OILGAS .181 .149 .228 .22 .244 .299
|
========================================================================
9/8/2020
The DJIA's 2.25% decline today took it
down to its 2.2% lower band
and to a level 300 points above its 50-dma. A bounce up off the price-
uptrendline would not be a surprise. But that could set up a more
bearish head/shoulders pattern. The uncertainties of the Election
weigh heavily now on the market, as does the nervousness of the FED
itself.
The old 2006 version of Peerless would call this decline a Buy B2/B20
buying opportunity. That version does not take into all that we have learned
in the last 14 years about Election Years and what the 2007-2009 bear
market taught us. So, I would ignore it.
Stay short DIA. Usually the rising 65-dma acts as the best support,
not the 50-dma. Avoid high techs. The Peerless Sells remain unreversed.
The falling Closing Powers warn us that early strength is like to give way
to more heavy selling at the close.
The DIA's Opening Power is still rising. A Tuesday bounce without a
Peerless Buy signal or a DIA Closing Power break in its downtrend is not
to be trusted. Stay short DIA.
Many traders are now taking note of the double-top in the DJI and the
many false breakouts recently in the tech leaders. They also are fearful
of another sell-off like we saw in February and March. The FED's
QE-Infinity has limits. The decline now is probably based on fears of a
Trump defeat in November. The Yahoo compendium of polls does not
look good for Trump. See https://www.yahoo.com/elections
Short-term traders, draw the steep down-trend-lines in the leading stocks
or the Tiger Indexes of the six FANG stocks and the 7 DJI stocks above
$200 shownbelow. I show these further below.
Peerless DJI
The DJI has fallen to a well-tested uptrendline. 
DIA - Candle-Stick
No blue candle-stick to show a rally is coming up.
A weak rally rally could set up a head/shoulders pattern.

SPY-Candle-Stick

QQQ-Candle-Stick
The tech stocks led the
decline. They may lead a rebound
once they show that
they can hold at their 65-dma (dotted red on chart below).

Tiger Composite FANG-6

Tiger Composite DJI Stocks over $200.

|
Charts 9/08/2020 (Click on Underlined link.) 2020 PEERLESS DJI, Signals, Indicators Daily DJI Volume 10-DayUp/Down Vol Stoch-20 Inverted Traders Index Graph of Pct of All Stocks above 65-dma Cum. Inverted Traders Index NASDAQ S&P OEX NYSE COMPQX DJI-15 DJI-20 DJI-30 DIA QQQ MDY IWM TNA Short-Term Rates DOLLAR-UUP SPY http://tigersoft.com/2121CST/SPY.GIF recent 2006 vers-Peerless signals -- http://tigersoft.com/NEWPEER/UPD6908.BMP USO-CrudeOil DBO FAS GLD BBH IBB JETS JNUG KOL NUGT OIH PALL RSX RETL SDS AGQ SLV SOXL TECL TLT TMF TNA UGA (gasoline) USO (oil) and China: YINN CHAU Commodities: CANE CORN DBC JJC, NIB, CHOC CORN, CUT (paper) MOO, SOYB WEAT UUP (Dollar) LIT (Lithium) Stocks AAPL ADBE ALXN AMAT AMGN AMD AMZN AXP BA BABA BAC BIDU BLDP CAT CRM CVX CMG DE ENPH FB GILD GOOG GS HD IBM INTU JPM LRCX M (Macy's) MSFT NEM NFLX NKE NVDA PG REGN REV SO SQ QCOM QDEL TSLA TXN XOM V VRTX WFC WMT TOWN ZM New highs and Bullish MAXCPs http://tigersoft.com/MAXCP/9-08/BULLISH.htm Bearish MAXCPs - http://tigersoft.com/MINCP/9-08/BEARISH.htm |
Table 1
9/4/2018 QUICKSILVER on DJI-30 STOCKS.
P21 + ITRS score >+.25 is bullish
Note that AAPL now shows highest AI/200 stock here but CRM will
take over #1 position on 8/31 when it is added to DJIA.
3 Bullish ( CRM, NKE PG ) +241+113+136 = +490
6 Bearish (BA, CSCO, CVX INTC, JPM, WBA) -161-40-79-49-100-36 = -465
hughest priced DJI-30 = UNH, HD, CRM, AMGN MCD, MSFT, V
HIGHEST AI/200 = CRM Second Highest Tied = AAPL and MSFT STOCKS CLOSECHANGE PIVOT-PT 5-dma AROC CL-PWR CANDLE AI/200 IP21 ITRS ---------------------------------------------------------------------------------------------------------- AAPL 112.82 -8.14 129.04 -637.1% Bearish RED 174 .073 .176 ---------------------------------------------------------------------------------------------------------- AMGN 241.18 -7.22 253.32 -241.1% Bearish RED 135 .181 -.064 ---------------------------------------------------------------------------------------------------------- AXP 103.67 -2 101.59 100.3% ------- RED 107 -.153 .01 ---------------------------------------------------------------------------------------------------------- BA 161.08 -9.97 171.82 -312.7% ------- RED 41 -.222 -.153 Bearish ---------------------------------------------------------------------------------------------------------- CAT 148.52 .34 142.31 211.9% Bullish BLUE 135 .023 .113 ---------------------------------------------------------------------------------------------------------- CRM 241.27 -13.43 272.65 -581% Bullish BLUE 194 .273 .217 Bullish ---------------------------------------------------------------------------------------------------------- CSCO 40 -.82 42.22 -266.3% Bearish RED 119 -.103 -.236 Bearish ---------------------------------------------------------------------------------------------------------- CVX 78.97 -2.96 83.93 -299.2% Bearish RED 84 -.166 -.187 Bearish ---------------------------------------------------------------------------------------------------------- DIS 134.2 2.21 131.87 87.5% Bullish BLUE 114 -.104 .13 ---------------------------------------------------------------------------------------------------------- DOW 47.93 -.67 45.12 294.4% ------- BLUE 71 .065 .104 ---------------------------------------------------------------------------------------------------------- GS 202.48 -8.46 204.87 -57.5% Bearish RED 78 -.173 -.03 ---------------------------------------------------------------------------------------------------------- HD 269.26 -.4 285.04 -281.3% Bearish BLUE 134 .156 .017 ---------------------------------------------------------------------------------------------------------- HON 164.27 -2.42 165.55 -38.1% ------- RED 102 .078 .089 ---------------------------------------------------------------------------------------------------------- IBM 121.21 -1.09 123.31 -84.5% Bearish RED 119 -.161 -.066 ---------------------------------------------------------------------------------------------------------- INTC 48.91 -1.17 50.95 -200.4% Bearish RED 105 -.119 -.249 Bearish ---------------------------------------------------------------------------------------------------------- JNJ 147.26 -1.33 153.41 -203.1% Bearish RED 130 .063 -.031 ---------------------------------------------------------------------------------------------------------- JPM 99.92 -3.6 100.19 -13.3% Bearish RED 43 -.25 -.021 Bearish ---------------------------------------------------------------------------------------------------------- KO 49.81 -1.23 49.53 27.8% Bullish RED 98 -.007 .043 ---------------------------------------------------------------------------------------------------------- MCD 213.58 1.85 213.52 1.4% ------- BLUE 141 .037 .088 ---------------------------------------------------------------------------------------------------------- MMM 163.17 -2.6 163.02 4.5% ------- RED 112 -.01 -.03 ---------------------------------------------------------------------------------------------------------- MRK 83.33 -1.91 85.27 -113.5% Bearish RED 100 .094 .008 ---------------------------------------------------------------------------------------------------------- MSFT 202.66 -11.59 225.53 -512.3% Bearish RED 173 -.044 -.068 ---------------------------------------------------------------------------------------------------------- NKE 112.72 .32 111.89 36.5% Bullish BLUE 144 .214 .103 Bullish ---------------------------------------------------------------------------------------------------------- PG 135.94 -2.02 138.33 -86.2% Bullish RED 104 .173 .08 Bullish ---------------------------------------------------------------------------------------------------------- TRV 113.74 -2.83 116.04 -99.1% Bearish RED 109 -.116 -.075 ---------------------------------------------------------------------------------------------------------- UNH 307.25 -4.75 312.55 -84.2% Bearish RED 134 -.005 -.029 ---------------------------------------------------------------------------------------------------------- V 200.12 -4.54 211.99 -281.2% ------- RED 117 .054 -.043 ---------------------------------------------------------------------------------------------------------- VZ 59.96 -.52 59.27 57.5% Bullish RED 137 .118 .028 ---------------------------------------------------------------------------------------------------------- WBA 36.1 -.79 38.02 -258.2% Bearish RED 82 -.331 -.223 Bearish ---------------------------------------------------------------------------------------------------------- WMT 138.45 -4.38 138.85 -13.9% ------- RED 119 .162 .07 |
Table 3 QUICKSILVER on ETFS - 09/04/20 Bullish = 0
Bearish = 1
ITRS + IP21>.25 is considered "Bullish"
Highest ITRS + IP21 = TECL
ETF CLOSE CHANGE PIVOT-PT 5-dma AROC CL-PWR CANDLE IP21 ITRS --------------------------------------------------------------------------------------------- --------------------------------------------------------------------------------------------- DIA 275.42 -6.35 286.79 -155.2% Bearish RED .035 ---- --------------------------------------------------------------------------------------------- SPY 333.21 -9.36 352.6 -230.3% Bearish RED .114 .011 --------------------------------------------------------------------------------------------- QQQ 269.95 -13.63 299.92 -424.4% Bearish RED .104 .024 --------------------------------------------------------------------------------------------- MDY 338.45 -7.61 354.1 -184.2% Bearish RED -.063 -.018 --------------------------------------------------------------------------------------------- IWM 149.86 -2.94 157.21 -179.1% Bearish RED -.074 -.003 --------------------------------------------------------------------------------------------- FAS 36.22 -2.77 40.02 -413.1% Bearish RED -.093 .148 --------------------------------------------------------------------------------------------- SOXL 212.61 -35.3 282.14 -1002% Bearish RED .039 .163 --------------------------------------------------------------------------------------------- TECL 279.38 -43.12 397.38 -1299% Bearish RED .04 .203 --------------------------------------------------------------------------------------------- IBB 126.88 -2.4 133.02 -328.9% Bearish RED .016 -.161 --------------------------------------------------------------------------------------------- GLD 181.29 -.35 185.05 -96.7% Bearish BLUE-.154 -.011 --------------------------------------------------------------------------------------------- OIH 117 -7.99 125.19 -333.6% Bearish RED -.178 -.099 Bearish --------------------------------------------------------------------------------------------- GASL 3440 285 3685 -325.1% ------- RED -.021 .013 --------------------------------------------------------------------------------------------- |
Table 3 Count of Stocks in Key Directories
20200908
-------------------------------
NEWHIGHS 69
NEWLOWS 69
MAXCP 6
MINCP 113 Bearish
TTTNH 5
TTTNL 123 Bearish
FASTUP 55
FASTDOWN 211
CPCROSSA 49
CPCROSSD 99
BIGVOLUP 4
BIGVODN 3
ACCUMVER 111
HIGHIP21 11
HIUPPCT 35
REDSELL 82
AUGSELS7 58
TRAPDOOR 20
|
Table 4 RANKING OF KEY DIRECTORIES BASED PCT.OF STOCKS ABOVE 65-DMA
9/8/20
Bullish = 30
Bearish = 15
---------------------------------------------------------------------------------------
Directory Current day-1 day-2 day-3 day-4 day-5
----------------------------------------------------------------------------------------
TRANSP .95 .9 .9 .9 .9 .9
JETS .857 .785 .714 .714 .714 .785
AUTO .842 .921 .894 .921 .921 .868
SOLAR .8 .8 .866 1 .933 .933
COMODITY .78 .853 .878 .902 .902 .902
HOMEBLDG .764 .823 .764 .882 .823 .705
GOLD .755 .795 .816 .816 .836 .877
FOOD .754 .83 .886 .924 .924 .924
COPPER .75 1 1 1 1 .875
BEVERAGE .733 .733 .733 .733 .666 .666
RETAIL .693 .734 .734 .734 .714 .714
CHEM .687 .77 .729 .812 .75 .666
INDEXES .685 .786 .814 .814 .769 .786
DOWJONES .666 .8 .8 .833 .733 .733
INSURANC .653 .769 .73 .807 .769 .769
INDMATER .635 .756 .689 .756 .729 .702
GAMING .619 .714 .714 .809 .809 .761
DJI-13 .615 .846 .846 .923 .692 .692
ETFS .607 .803 .732 .857 .803 .75
FIDSTKS .593 .689 .711 .768 .7 .7
SP-100 .593 .725 .703 .769 .67 .703
SP500 .579 .7 .7 .782 .702 .713
COAL .571 .571 .428 .571 .571 .428
GREEN .571 .666 .666 .857 .666 .571
COMPUTER .55 .65 .7 .8 .7 .7
CHINA .549 .588 .588 .647 .686 .666
RUS-1000 .542 .662 .665 .735 .66 .672
GUNS .533 .6 .533 .666 .666 .6
HOSPITAL .523 .619 .619 .714 .571 .523
INFRA .514 .742 .657 .8 .771 .628
============================================================================================
NASD-100 .5 .67 .74 .85 .77 .8
============================================================================================
REIT .482 .546 .56 .581 .482 .475
NIFTY .466 .6 .666 .844 .755 .711
FINANCE .439 .658 .585 .609 .548 .548
BIGBANKS .428 .857 .714 .714 .571 .571
EDU .4 .4 .6 .6 .6 .6
BONDFUND .366 .504 .792 .891 .841 .732 SOFTWARE .35 .466 .583 .716 .683 .65 ELECTRON .317 .472 .547 .702 .635 .587 SEMI .295 .409 .504 .695 .619 .571 UTILITY .289 .394 .394 .526 .368 .394 MILITARY .285 .428 .464 .571 .5 .428 BIOTECH .276 .316 .337 .428 .404 .447 REGBANKS .23 .615 .423 .461 .384 .423 HACKERS .2 .3 .4 .75 .65 .6 OILGAS .149 .228 .212 .244 .299 .283 |
=====================================================================
9/4/2020
Stay short DIA and avoid high
techs. The Peerless Sells remain
intact. Now we see two bearish red candle-sticks on the DIA chart.
Professionals are dumping and selling into early strength.
DJI and DIA

The FED is getting desperate, telling us that they will keep rates
near zero far beond 2020 by dismissing inflationary changes and instead
using a multi-year moving average of CPI. This shows that they are extremely
concerned that their liquidity ammunition may be reaching its limits.
SPY - two straight "red popsicles"

QQQ

As noted, we have multiple Peerless Sells without an
intervening Buy
signal. We have many bearish candle-stick "red popcicles". The NYSE
A/D Line uptrend that started at the March bottom has now been broken.
Closing Power uptrend-breaks have now occurred. The DJI's IP21 has
bearishly dropped below its 21-day ma. And now we are in one of the
most reliably bearish seasonal periods. The DJI rises only 37.5% of
the time in Presidential Election years in the month following September 7th
and always since 1892 when a Democrat replaces a Republican in the
White House the market falls in Autumn.
So, I've suggested selling QQQ and the high techs.
Professionals are
dumping them. They want to lock in their profits before capital gains'
taxes go up under Democrats. Might Trump still win, you say? They key
states' polls are Florida, Pennysylvania, Wisconsin and Michigan. He is
behind by 4% in the polls I see on Yahoo. And he is also behind in
Arizona. The oldersters in Florida and Arizona do not think he is doing
anough to protect them from the coronavirus. Every time he refuses to
wear his mask in public, I have to agree with them. You decide..
Table 1
9/3/2018 QUICKSILVER on DJI-30 STOCKS.
P21 + ITRS score >+.25 is bullish
Note that AAPL now shows highest AI/200 stock here but CRM will
take over #1 position on 8/31 when it is added to DJIA.
4 Bullish (AAPL, CRM, PG, WMT)
4 Bearish (BA CVX INTC, WBA)
HIGHEST AI/200 = CRM (194) Second Highest Tied = AAPL and MSFT (174)
STOCKS CLOSECHANGE PIVOT-PT 5-dma AROC CL-PWR CANDLE AI/200 IP21 ITRS ---------------------------------------------------------------------------------------------------------- AAPL 120.96 .08 124.81 -150.3% Bearish BLUE 174 .102 .232 Bullish ---------------------------------------------------------------------------------------------------------- AMGN 248.4 .49 253.12 -93.4% Bearish RED 135 .215 -.038 ---------------------------------------------------------------------------------------------------------- AXP 105.67 1.21 102.54 151.8% ------- RED 107 -.067 -.015 ---------------------------------------------------------------------------------------------------------- BA 171.05 2.28 175.8 -137.6% Bearish RED 42 -.196 -.116 Bearish ---------------------------------------------------------------------------------------------------------- CAT 148.18 1.42 143.63 156.2% Bullish RED 135 .046 .094 ---------------------------------------------------------------------------------------------------------- CRM 254.7 -10.31 271.1 -300% Bullish RED 194 .32 .258 Bullish ---------------------------------------------------------------------------------------------------------- CSCO 40.82 -.13 42.2 -164.4% Bearish RED 119 -.043 -.192 ---------------------------------------------------------------------------------------------------------- CVX 81.93 -.35 85.63 -221.2% Bearish RED 85 -.131 -.176 Bearish ---------------------------------------------------------------------------------------------------------- DIS 131.99 -1.25 135.54 -132.5% ------- RED 115 -.13 .091 ---------------------------------------------------------------------------------------------------------- DOW 48.6 .21 46.05 270.1% ------- RED 71 .098 .121 ---------------------------------------------------------------------------------------------------------- GS 210.94 3.38 207.71 78% Bearish ---- 79 -.083 -.076 ---------------------------------------------------------------------------------------------------------- HD 269.66 -4.97 286.29 -293% Bearish RED 133 .115 .004 ---------------------------------------------------------------------------------------------------------- HON 166.69 .39 168.38 -50.3% ------- RED 102 .122 .076 ---------------------------------------------------------------------------------------------------------- IBM 122.3 -2.15 125.07 -110.9% Bearish RED 120 -.091 -.067 ---------------------------------------------------------------------------------------------------------- INTC 50.08 -.31 50.43 -34.3% Bearish RED 106 -.086 -.239 Bearish ---------------------------------------------------------------------------------------------------------- JNJ 148.59 -.96 153.64 -165.7% ------- RED 130 .154 -.031 ---------------------------------------------------------------------------------------------------------- JPM 103.52 2.19 102.77 37% Bearish RED 44 -.166 -.038 ---------------------------------------------------------------------------------------------------------- KO 51.04 .56 49.83 120.9% Bullish BLUE 99 .036 .041 ---------------------------------------------------------------------------------------------------------- MCD 211.73 -2.07 214.91 -74.2% ------- RED 140 .061 .064 ---------------------------------------------------------------------------------------------------------- MMM 165.77 -.54 165.66 3.3% ------- RED 113 .045 -.023 ---------------------------------------------------------------------------------------------------------- MRK 85.24 -.25 85.65 -24% ------- RED 100 .18 .019 ---------------------------------------------------------------------------------------------------------- MSFT 214.25 -3.05 228.91 -324.1% Bearish RED 174 .009 -.025 ---------------------------------------------------------------------------------------------------------- NKE 112.4 -.45 112.29 4.8% Bullish RED 143 .244 .014 Bullish ---------------------------------------------------------------------------------------------------------- PG 137.96 -.3 138.77 -29.2% Bullish RED 104 .235 .076 Bullish ---------------------------------------------------------------------------------------------------------- TRV 116.57 1.22 115.89 29.3% Bearish RED 110 -.018 -.077 ---------------------------------------------------------------------------------------------------------- UNH 312 -4.23 314.37 -37.6% Bearish RED 135 .013 -.041 ---------------------------------------------------------------------------------------------------------- V 204.66 -4.3 215.71 -259% ------- RED 117 .085 -.039 ---------------------------------------------------------------------------------------------------------- VZ 60.48 -.13 59.26 102.1% Bullish ---- 137 .195 .02 ---------------------------------------------------------------------------------------------------------- WBA 36.89 -.2 38.76 -248.9% Bearish RED 83 -.257 -.217 Bearish ---------------------------------------------------------------------------------------------------------- WMT 142.83 -1.71 140.3 88% ------- RED 118 .206 .099 Bullish |
Table 3 QUICKSILVER on ETFS - 09/04/20 Bullish = 4 - but each shows Falling Clos.Pwr and a bearish Candle-Stick chart
Bearish = 0
ITRS + IP21>.25 is considered "Bullish"
Highest ITRS + IP21 = TECL
ETF CLOSE CHANGE PIVOT-PT 5-dma AROC CL-PWR CANDLE IP21 ITRS --------------------------------------------------------------------------------------------- --------------------------------------------------------------------------------------------- DIA 281.77 -1.57 284.28 -86% Bearish RED .122 0 --------------------------------------------------------------------------------------------- SPY 342.57 -2.82 349.31 -114.1% Bearish RED .236 .02 Bullish --------------------------------------------------------------------------------------------- QQQ 283.58 -3.83 294.88 -151.4% Bearish RED .199 .058 Bullish --------------------------------------------------------------------------------------------- MDY 346.06 -1.69 351.4 -129.3% Bearish RED .028 -.011 --------------------------------------------------------------------------------------------- IWM 152.8 -.98 155.43 -138.1% Bearish RED .009 -.007 --------------------------------------------------------------------------------------------- FAS 38.99 -.34 39.52 -241.7% Bearish RED -.016 .114 --------------------------------------------------------------------------------------------- SOXL 247.91 -7.07 267.1 -361.4% Bearish RED .098 .29 Bullish --------------------------------------------------------------------------------------------- TECL 322.5 -13.69 374.91 -646% Bearish RED .108 .323 Bullish --------------------------------------------------------------------------------------------- IBB 129.28 -.63 135.6 -141.4% Bearish RED .059 -.157 --------------------------------------------------------------------------------------------- GLD 181.64 .5 184.83 -74.9% Bearish BLUE-.177 .001 --------------------------------------------------------------------------------------------- OIH 124.99 .46 125.32 -157.8% Bearish RED -.094 -.076 --------------------------------------------------------------------------------------------- GASL 3440 285 3685 -325.1% ------- RED -.021 .019 --------------------------------------------------------------------------------------------- |
Table 3 Count of Stocks in Key Directories
20200904
-------------------------------
NEWHIGHS 22
NEWLOWS 4
MAXCP 10
MINCP 104
TTTNH 4
TTTNL 222
FASTUP 50
FASTDOWN 156
CPCROSSA 39
CPCROSSD 111
BIGVOLUP 7
BIGVODN 6
ACCUMVER 109
HIGHIP21 13
HIUPPCT 47
REDSELL 84
AUGSELS7 78
TRAPDOOR 20
|
Table 4 RANKING OF KEY DIRECTORIES BASED PCT.OF STOCKS ABOVE 65-DMA
9/4/20
Bullish = 37
Bearish = 9
---------------------------------------------------------------------------------------
Directory Current day-1 day-2 day-3 day-4 day-5
----------------------------------------------------------------------------------------
COPPER 1 1 1 1 .875 1
AUTO .923 .897 .923 .923 .871 .923
TRANSP .9 .9 .9 .9 .9 .9
BIGBANKS .857 .714 .714 .571 .571 .857
COMODITY .853 .878 .902 .902 .902 .902
DJI-13 .846 .846 .923 .692 .769 .846
FOOD .83 .886 .924 .924 .924 .924
HOMEBLDG .823 .764 .882 .823 .705 .764
ETFS .803 .732 .857 .803 .767 .857
DOWJONES .8 .8 .833 .733 .766 .8
SOLAR .8 .866 1 .933 .933 1
GOLD .795 .816 .816 .836 .877 .877
INDEXES .786 .814 .814 .769 .786 .797
JETS .785 .714 .714 .714 .785 .785
CHEM .77 .729 .812 .75 .687 .77
INSURANC .769 .73 .807 .769 .807 .846
INDMATER .756 .689 .756 .729 .716 .797
INFRA .742 .657 .8 .771 .657 .771
RETAIL .734 .734 .734 .714 .714 .775
BEVERAGE .733 .733 .733 .666 .666 .733
SP-100 .725 .703 .769 .67 .703 .758
GAMING .714 .714 .809 .809 .761 .809
SP500 .7 .702 .782 .702 .713 .769
FIDSTKS .689 .711 .768 .7 .706 .762
NASD-100 .67 .74 .85 .77 .8 .81
GREEN .666 .666 .857 .666 .571 .619
RUS-1000 .662 .667 .735 .66 .676 .733
FINANCE .658 .585 .609 .548 .56 .719
COMPUTER .65 .7 .8 .7 .7 .75
HOSPITAL .619 .619 .714 .619 .571 .619
REGBANKS .615 .423 .461 .384 .423 .461
GUNS .6 .533 .666 .666 .6 .6
NIFTY .6 .666 .844 .755 .711 .777
CHINA .588 .588 .647 .686 .666 .725
COAL .571 .428 .571 .571 .428 .571
REIT .546 .56 .581 .482 .496 .553
BONDFUND .504 .792 .891 .841 .742 .623
===============================================================================================
ELECTRON .472 .547 .702 .635 .587 .662
SOFTWARE .466 .6 .716 .683 .65 .65
MILITARY .428 .464 .571 .5 .464 .571
SEMI .409 .504 .695 .619 .571 .666
EDU .4 .6 .6 .6 .6 .4
UTILITY .394 .394 .526 .368 .368 .421
BIOTECH .308 .335 .426 .405 .445 .429
HACKERS .3 .45 .75 .65 .6 .65
OILGAS .228 .212 .236 .299 .291 .385
|
=======================================================================
9/3/2020
The steep uptrend in QQQ has been been violated. Selling is now prudent.
Peerless remains on multiple Sells. Sell short DIA. The danger now
is that investors will start seeing similarities between the February sell-off
and what follows now in the bearish month of September.
Today's rush to the exits in leading technology stocks shows how important
the momentum-players are. They accepted any nearby bid to get out at a
profit. One view is that these stocks are now much stronger because
these "weaker" performance-chasers have sold their shares. Another view,
one
that I hold, is that a deerer correction is not over. Peerless remains on a
Sell. Declines with so many Sells have been postponed but never been
forestalled. The FED will do what it can to hold the market up until
the Election. But a September sell-off seems too likely to prevent.
And if Trump's poll numbers do not get better, a steeper sell-off seems
unavoidable no matter what the FED does.

The sell-off in leading tech stocks today like ADBE, BABA, FB, GOOG, INTU,
MSFT, NVDA and QCOM saw closes far below the openings today. All the
steep uptrend-lines were violated. It is these breaks which brought the sellers out.
This also caused their Closing Power uptrends to be broken and it caused each to
show what I term to be a "Red Popsicle" in our candle-stick charts. If we
study these
"red popsicle" charts for individual stocks or for ETFs after a sizeable
advance,
we see over and over again that they bring very tradeable sell-offs and sometimes
bear markets. Studying the QQQ and SPY "red popsicles" at significant tops
since 1998, we see that there can be a brief rebound in prices before prices
then give way much more meaningfully. But significant declines nearly always follow
these patterns. See the study I did tonight of these QQQ and SPY "red
popsicles"
here as well as these patterns in leading stocks like AAPL last night..
http://www.tigersoft.com/CANDLEQ/CANDLES.htm
Lots More Bearish "Red Popsicles"
 |
 |
 |
The DJI may still rise up to our target of 29600 and
make a nominal new
closing high, but I think it's best to get out now of any tech stocks and ETFs.
The "trend is our friend". The trend is no longer up. Why take a
chance
given how high the PEs are and the political dangers ahead for the market.
There seems little upside potential. Keep in mind the typical seasonal bearishness
for a month after September 7th. (See last night's hotline). Give ample
chance for partisan investors to sell as they worry that President Trump will
lose his re-election bid. A Biden victory inescapably means higher taxes. The
prospects of higher corporate taxes and capital gains' taxes in 2021 should
induce a lot of profit-taking in 2020.
Our Peerless Sell signals are still in place. They were not added to today.
But it is bearish that the rising NYSE A/D Line is just barely intact and the
DJI's Accumulation Index (IP21) has dropped below its own 21-dma. See
also how the Closing Power uptrends for DIA and SPY have been violated.
Professionals and Day-Traders will be net sellers on strength.
|
Charts 9/03/2020 (Click on Underlined link.) 2020 PEERLESS DJI, Signals, Indicators Daily DJI Volume 10-DayUp/Down Vol Stoch-20 Inverted Traders Index Graph of Pct of All Stocks above 65-dma Cum. Inverted Traders Index NASDAQ S&P OEX NYSE COMPQX DJI-15 DJI-20 DJI-30 DIA QQQ MDY IWM TNA Short-Term Rates DOLLAR-UUP SPY http://tigersoft.com/2121CST/SPY.GIF recent 2006 vers-Peerless signals -- http://tigersoft.com/NEWPEER/UPD6903.BMP USO-CrudeOil DBO FAS GLD BBH IBB JETS JNUG KOL NUGT OIH PALL RSX RETL SDS AGQ SLV SOXL TECL TLT TMF TNA UGA (gasoline) USO (oil) and China: YINN CHAU Commodities: CANE CORN DBC JJC, NIB, CHOC CORN, CUT (paper) MOO, SOYB WEAT UUP (Dollar) LIT (Lithium) Stocks AAPL ADBE ALXN AMAT AMGN AMD AMZN AXP BA BABA BAC BIDU BLDP CAT CRM CVX CMG DE ENPH FB GILD GOOG GS HD IBM INTU JPM LRCX M (Macy's) MSFT NEM NFLX NKE NVDA PG REGN REV SO SQ QCOM QDEL TSLA TXN XOM V VRTX WFC WMT TOWN ZM New highs and Bullish MAXCPs http://tigersoft.com/MAXCP/9-03/BULLISH.htm Bearish MAXCPs - http://tigersoft.com/MINCP/9-03/BEARISH.htm |
Table 1
9/3/2018 QUICKSILVER on DJI-30 STOCKS.
P21 + ITRS score >+.25 is bullish
Note that AAPL now shows highest AI/200 stock here but CRM will
take over #1 position on 8/31 when it is added to DJIA.
6 Bullish (AAPL, CRM, DOW, PG, WMT, VZ)
4 Bearish (BA CVX INTC, WBA)
HIGHEST AI/200 = CRM Second Highest Tied = AAPL and MSFT
STOCKS CLOSECHANGE PIVOT-PT 5-dma AROC CL-PWR CANDLE AI/200 IP21 ITRS ---------------------------------------------------------------------------------------------------------- AAPL 120.88 -10.52 125.01 -160.2% Bearish RED 174 .097 .23 Bullish ---------------------------------------------------------------------------------------------------------- AMGN 247.91 -10.21 252.81 -96.6% Bearish RED 135 .237 -.047 ---------------------------------------------------------------------------------------------------------- AXP 104.46 .06 101.53 142.9% Bullish RED 107 -.023 -.019 ---------------------------------------------------------------------------------------------------------- BA 168.77 -6.01 174.2 -156.3% ------- RED 43 -.232 -.158 Bearish ---------------------------------------------------------------------------------------------------------- CAT 146.76 -2.51 143.37 117% Bullish RED 135 .053 .09 ---------------------------------------------------------------------------------------------------------- CRM 265.01 -11.68 276.32 -205.2% Bullish RED 194 .339 .315 Bullish ---------------------------------------------------------------------------------------------------------- CSCO 40.95 -1.47 42.29 -158.6% ------- RED 119 -.007 -.198 ---------------------------------------------------------------------------------------------------------- CVX 82.28 -.91 84.91 -156.3% Bearish RED 86 -.098 -.174 Bearish ---------------------------------------------------------------------------------------------------------- DIS 133.24 -2.15 133.73 -18.3% ------- RED 115 -.02 .076 ---------------------------------------------------------------------------------------------------------- DOW 48.39 -.83 46.16 238.4% Bullish RED 71 .15 .146 Bullish ---------------------------------------------------------------------------------------------------------- GS 207.56 -2.48 210.15 -62.4% Bearish RED 80 -.131 -.065 ---------------------------------------------------------------------------------------------------------- HD 274.63 -12.57 288.63 -244.2% Bearish RED 132 .144 .003 ---------------------------------------------------------------------------------------------------------- HON 166.3 -6.17 165.99 9.2% ------- RED 102 .156 .089 ---------------------------------------------------------------------------------------------------------- IBM 124.45 -3.73 124.65 -8% Bearish RED 121 -.023 -.044 ---------------------------------------------------------------------------------------------------------- INTC 50.39 -1.86 49.4 97.5% Bearish RED 107 -.058 -.26 Bearish ---------------------------------------------------------------------------------------------------------- JNJ 149.55 -4.28 152.98 -112% Bullish RED 130 .162 -.043 ---------------------------------------------------------------------------------------------------------- JPM 101.33 -.32 102.35 -50.3% ------- RED 45 -.187 -.042 ---------------------------------------------------------------------------------------------------------- KO 50.48 -.71 48.23 226.9% Bullish RED 98 .051 .018 ---------------------------------------------------------------------------------------------------------- MCD 213.8 -2.43 212.19 37.6% ------- RED 139 .157 .047 ---------------------------------------------------------------------------------------------------------- MMM 166.31 -3.2 164.08 67.4% Bullish RED 113 .088 -.02 ---------------------------------------------------------------------------------------------------------- MRK 85.49 -1.44 85.82 -19.3% Bullish RED 99 .176 .014 ---------------------------------------------------------------------------------------------------------- MSFT 217.3 -14.35 226.58 -203.5% ------- RED 174 .025 -.014 ---------------------------------------------------------------------------------------------------------- NKE 112.85 -3.95 110.84 88.7% ------- RED 142 .226 .015 ---------------------------------------------------------------------------------------------------------- PG 138.26 -2.25 138.21 1.8% Bullish RED 103 .228 .075 Bullish ---------------------------------------------------------------------------------------------------------- TRV 115.35 -2.13 117.18 -78.7% Bearish RED 111 -.047 -.091 ---------------------------------------------------------------------------------------------------------- UNH 316.23 -4.01 311.67 72.5% Bearish RED 135 .03 -.019 ---------------------------------------------------------------------------------------------------------- V 208.96 -7.52 211.03 -48.4% ------- RED 117 .142 -.021 ---------------------------------------------------------------------------------------------------------- VZ 60.61 .08 59.43 99.1% Bullish RED 137 .262 .011 Bullish ---------------------------------------------------------------------------------------------------------- WBA 37.09 -.08 39.34 -296% Bearish RED 84 -.26 -.212 Bearish ---------------------------------------------------------------------------------------------------------- WMT 144.54 -3.14 136.63 278.1% Bullish RED 117 .198 .089 Bullish |
Table 3 QUICKSILVER on ETFS - 09/03/20 Bullish = 4
Bearish = 0
ITRS + IP21>.25 is considered "Bullish"
Highest ITRS + IP21 = TECL
ETF CLOSE CHANGE PIVOT-PT 5-dma AROC CL-PWR CANDLE IP21 ITRS --------------------------------------------------------------------------------------------- --------------------------------------------------------------------------------------------- DIA 283.34 -7.87 286.7 -29.6% ------- RED .152 ----- --------------------------------------------------------------------------------------------- SPY 345.39 -12.31 350.58 -41.8% ------- RED .268 .023 Bullish --------------------------------------------------------------------------------------------- QQQ 287.41 -15.35 292.53 -61.4% ------- RED .194 .067 Bullish --------------------------------------------------------------------------------------------- MDY 347.75 -10.92 355.2 -77.3% Bearish RED .018 -.009 --------------------------------------------------------------------------------------------- IWM 153.78 -4.68 157.12 -64.4% Bearish RED .007 -.001 --------------------------------------------------------------------------------------------- FAS 39.33 -2.52 40.94 -91.4% Bearish RED -.003 .184 --------------------------------------------------------------------------------------------- SOXL 254.98 -52.47 267.85 27% Bearish RED .096 .346 Bullish --------------------------------------------------------------------------------------------- TECL 336.19 -71.36 371.27 -341.7% Bearish RED .108 .422 Bullish --------------------------------------------------------------------------------------------- IBB 129.91 -5.06 133.05 -103.1% Bearish RED .022 -.16 --------------------------------------------------------------------------------------------- GLD 181.14 -1.48 184.39 -2.7% Bearish RED -.166 -.021 --------------------------------------------------------------------------------------------- OIH 124.53 .98 128.95 -43.7% Bearish BLUE-.119 -.058 --------------------------------------------------------------------------------------------- |
Table 3 Count of Stocks in Key Directories
20200903
-------------------------------
NEWHIGHS 86
NEWLOWS 66
MAXCP 6
MINCP 82
TTTNH 4
TTTNL 136
FASTUP 53
FASTDOWN 87
CPCROSSA 18
CPCROSSD 434
BIGVOLUP 5
BIGVODN 10
ACCUMVER 108
HIGHIP21 14
HIUPPCT 48
REDSELL 83
AUGSELS7 71
TRAPDOOR 21
|
Tabl e 4 RANKING OF KEY DIRECTORIES BASED PCT.OF STOCKS ABOVE 65-DMA
9/3/20
Bullish = 39
Bearish = 7
---------------------------------------------------------------------------------------
Directory Current day-1 day-2 day-3 day-4 day-5
----------------------------------------------------------------------------------------
COPPER 1 1 1 .875 1 .875
TRANSP .9 .9 .9 .9 .9 .9
AUTO .897 .923 .923 .871 .923 .923
FOOD .886 .924 .924 .924 .924 .905
COMODITY .878 .902 .902 .902 .902 .878
SOLAR .866 1 .933 .933 1 1
DJI-13 .846 .923 .692 .769 .923 .923
GOLD .816 .816 .836 .877 .877 .816
INDEXES .814 .814 .769 .786 .797 .769
DOWJONES .8 .833 .733 .766 .833 .833
BONDFUND .792 .891 .841 .742 .653 .475
HOMEBLDG .764 .882 .823 .705 .764 .764
NASD-100 .74 .85 .77 .8 .81 .78
RETAIL .734 .734 .714 .714 .775 .714
BEVERAGE .733 .733 .666 .666 .733 .666
ETFS .732 .857 .803 .767 .857 .803
INSURANC .73 .807 .769 .807 .884 .807
CHEM .729 .812 .75 .687 .77 .75
BIGBANKS .714 .714 .571 .571 .857 .714
GAMING .714 .809 .809 .761 .809 .809
JETS .714 .714 .714 .785 .785 .785
FIDSTKS .711 .768 .7 .706 .768 .734
SP-100 .703 .769 .67 .703 .758 .725
SP500 .703 .781 .699 .71 .771 .735
COMPUTER .7 .8 .7 .7 .75 .75
INDMATER .689 .756 .729 .716 .797 .716
RUS-1000 .667 .736 .66 .676 .736 .705
GREEN .666 .857 .666 .571 .666 .619
NIFTY .666 .844 .755 .711 .777 .777
INFRA .657 .8 .771 .657 .771 .657
HOSPITAL .619 .714 .619 .619 .619 .571
EDU .6 .6 .6 .6 .4 .4
SOFTWARE .6 .733 .683 .65 .65 .616
CHINA .588 .647 .686 .666 .725 .705
FINANCE .585 .609 .548 .56 .719 .658
REIT .56 .581 .482 .496 .553 .546
ELECTRON .547 .702 .635 .587 .668 .608
GUNS .533 .666 .666 .6 .6 .6
SEMI .504 .695 .619 .571 .676 .609
=============================================================================================
MILITARY .464 .571 .5 .464 .571 .5
HACKERS .45 .8 .65 .6 .65 .5
COAL .428 .571 .571 .428 .571 .285
REGBANKS .423 .461 .384 .423 .461 .538
UTILITY .394 .526 .368 .368 .421 .394
BIOTECH .329 .424 .403 .445 .426 .405
OILGAS .212 .236 .291 .291 .385 .33
|
=========================================================================
9/2/2020
QQQ and the
NASDAQ have been running strongly in all-time high ground.
Today, it looks like they will fall back. But I would not try to call a top on
them. See below how their levels of Accumulation are still very high and
rising.
In addition, we still have an uptrend for the Advances-Declines' Line for all
QQQ stocks as well as for the the DJI-30 stocks and for the NYSE stocks.
But the DJIA is now only 451 points from (29551.42 -29100.50) making
a closing all-time high. That's the target the FED has, I think, set up for the DJI
using its QE-Infinity. The week before Labor Day (next Monday) is usually
bullish. And marginal, nominal new closing highs and lows occur
commonly at important tops and bottoms. So, expect 29550-29600
to be keen resistance. It's simply being reached may prompt selling
elsewhere. The last three weeks of Septembers are usually bearish.
Going back to 1968, we find that the DJI in Presidential Election Years
rises only 38.5% of the time in the month following September 7th. It
falls 1.7% on average.


Of course, the DJIA might go higher still and make a serious run in
all-time high territory as the NASDAQ, SP-500, QQQ and OEX have.
But Peerless stubbornly refuses to give us a Buy signal. And the difference
between today's close and a nominal new high at 29600 is not even 2%.


So, it's time to take some trading profits in some of the recent "boomers"
Today we saw bearish "red popsicles" on our TigerSoft candle-stick
charts for some of the biggest gainers of the year. Professionals, we
must assume are taking trading profits in AAPL, NVDA and TSLA.
They certainly may go higher; they have so much upward momentum
behind their advances. But why be greedy? There will be more
opportunities.
Red Popsicle |
Red Popsicle |
Red Popsicle |
|
Charts 9/02/2020 (Click on Underlined link.) 2020 PEERLESS DJI, Signals, Indicators Daily DJI Volume 10-DayUp/Down Vol Stoch-20 Inverted Traders Index Graph of Pct of All Stocks above 65-dma Cum. Inverted Traders Index NASDAQ S&P OEX NYSE COMPQX DJI-15 DJI-20 DJI-30 DIA QQQ MDY IWM TNA Short-Term Rates DOLLAR-UUP SPY http://tigersoft.com/2121CST/SPY.GIF recent 2006 vers-Peerless signals -- http://tigersoft.com/NEWPEER/UPD6902.BMP USO-CrudeOil DBO FAS GLD BBH IBB JETS JNUG KOL NUGT OIH PALL RSX RETL SDS AGQ SLV SOXL TECL TLT TMF TNA UGA (gasoline) USO (oil) and China: YINN CHAU Commodities: CANE CORN DBC JJC, NIB, CHOC CORN, CUT (paper) MOO, SOYB WEAT UUP (Dollar) LIT (Lithium) Stocks AAPL ADBE ALXN AMAT AMGN AMD AMZN AXP BA BABA BAC BIDU BLDP CAT CRM CVX CMG DE ENPH FB GILD GOOG GS HD IBM INTU JPM LRCX M (Macy's) MSFT NEM NFLX NKE NVDA PG REGN REV SO SQ QCOM QDEL TSLA TXN XOM V VRTX WFC WMT TOWN ZM New highs and Bullish MAXCPs http://tigersoft.com/MAXCP/9-02/BULLISH.htm Bearish MAXCPs - http://tigersoft.com/MINCP/9-02/BEARISH.htm |
Table 1
9/2/2018 QUICKSILVER on DJI-30 STOCKS.
P21 + ITRS score >+.25 is bullish
Note that AAPL now shows highest AI/200 stock here but CRM will
take over #1 position on 8/31 when it is added to DJIA.
7 Bullish (AAPL, CRM, HON, NKE, PG, WMT, VZ)
Bearish 3 (BA INTC, WBA)
HIGHEST AI/200 = CRM Second Highest Tied = AAPL and MSFT
STOCKS CLOSECHANGE PIVOT-PT 5-dma AROC CL-PWR CANDLE AI/200 IP21 ITRS ---------------------------------------------------------------------------------------------------------- AAPL 131.4 -2.78 126.52 190.8% ------- RED 174 .177 .32 Bullish ---------------------------------------------------------------------------------------------------------- AMGN 258.12 7.26 250.18 157.5% Bullish BLUE 135 .263 -.019 ---------------------------------------------------------------------------------------------------------- AXP 104.4 1.93 98.4 296.1% ------- BLUE 108 .073 -.064 ---------------------------------------------------------------------------------------------------------- BA 174.78 2.68 171.9 83.2% ------- BLUE 44 -.117 -.183 Bearish ---------------------------------------------------------------------------------------------------------- CAT 149.27 3.22 141.83 259.3% Bullish BLUE 135 .113 .069 ---------------------------------------------------------------------------------------------------------- CRM 276.69 -4.56 272.32 79.5% Bullish RED 194 .348 .35 Bullish ---------------------------------------------------------------------------------------------------------- CSCO 42.42 .39 42.25 20.1% ------- BLUE 119 .029 -.181 ---------------------------------------------------------------------------------------------------------- CVX 83.19 .11 84.78 -94.1% Bearish BLUE 87 -.058 -.204 ---------------------------------------------------------------------------------------------------------- DIS 135.39 1.84 132.18 120.3% Bullish BLUE 115 .058 .048 ---------------------------------------------------------------------------------------------------------- DOW 49.22 1.95 46.34 311.8% Bullish BLUE 71 .183 .077 ---------------------------------------------------------------------------------------------------------- GS 210.04 4.58 207.22 68.1% ------- BLUE 81 -.069 -.088 ---------------------------------------------------------------------------------------------------------- HD 287.2 1.26 291.93 -82.2% Bullish BLUE 132 .205 .034 ---------------------------------------------------------------------------------------------------------- HON 172.47 4.5 165.31 214.8% Bullish BLUE 102 .234 .077 Bullish ---------------------------------------------------------------------------------------------------------- IBM 128.18 4.78 124.17 161.5% ------- BLUE 122 .022 -.04 ---------------------------------------------------------------------------------------------------------- INTC 52.25 1.46 49.55 268.8% ------- BLUE 108 -.027 -.242 Bearish ---------------------------------------------------------------------------------------------------------- JNJ 153.83 2.31 152.3 50.1% Bullish BLUE 130 .205 -.037 ---------------------------------------------------------------------------------------------------------- JPM 101.65 1.51 99.09 126.8% Bullish BLUE 46 -.138 -.076 ---------------------------------------------------------------------------------------------------------- KO 51.19 2.07 48.16 309.3% Bullish BLUE 97 .136 .008 ---------------------------------------------------------------------------------------------------------- MCD 216.23 3.54 213.76 57.9% ------- BLUE 138 .183 .045 ---------------------------------------------------------------------------------------------------------- MMM 169.51 4.71 163.9 170.7% Bullish BLUE 113 .173 -.04 ---------------------------------------------------------------------------------------------------------- MRK 86.93 2.5 85.54 81.4% Bullish BLUE 98 .223 .014 ---------------------------------------------------------------------------------------------------------- MSFT 231.65 4.38 221.15 232.4% Bullish BLUE 174 .08 .034 ---------------------------------------------------------------------------------------------------------- NKE 116.8 1.96 111.53 234.7% Bullish BLUE 141 .321 .032 Bullish ---------------------------------------------------------------------------------------------------------- PG 140.51 2.33 138.39 76.6% Bullish BLUE 102 .234 .08 Bullish ---------------------------------------------------------------------------------------------------------- TRV 117.48 2.79 113.54 170.6% ------- BLUE 111 -.008 -.103 ---------------------------------------------------------------------------------------------------------- UNH 320.24 7.41 308.82 183% ------- BLUE 135 .113 -.038 ---------------------------------------------------------------------------------------------------------- V 216.48 3.13 210.26 146.4% Bullish BLUE 117 .192 -.02 ---------------------------------------------------------------------------------------------------------- VZ 60.53 1.37 59.46 90.2% Bullish BLUE 137 .267 -.012 Bullish ---------------------------------------------------------------------------------------------------------- WBA 37.17 .41 38.67 -195.8% Bearish BLUE 85 -.25 -.245 Bearish ---------------------------------------------------------------------------------------------------------- WMT 147.68 .09 130.7 611.6% Bullish RED 116 .222 .106 Bullish |
Table 3 QUICKSILVER on ETFS - 09/02/20 Bullish = 5
Bearish = 0
ITRS + IP21>.25 is considered "Bullish"
Highest ITRS + IP21 = TECL
ETF CLOSE CHANGE PIVOT-PT 5-dma AROC CL-PWR CANDLE IP21 ITRS --------------------------------------------------------------------------------------------- --------------------------------------------------------------------------------------------- DIA 291.21 4.42 285.04 136.4% Bullish BLUE .256 ==== Bullish --------------------------------------------------------------------------------------------- SPY 357.7 5.1 348.33 144.8% Bullish BLUE .402 .033 Bullish --------------------------------------------------------------------------------------------- QQQ 302.76 2.84 291.05 183.6% Bullish RED .307 .103 Bullish --------------------------------------------------------------------------------------------- MDY 358.67 4.57 353.23 96.4% ------- BLUE .113 -.014 --------------------------------------------------------------------------------------------- IWM 158.46 1.25 155.8 97.3% ------- BLUE .114 -.006 --------------------------------------------------------------------------------------------- FAS 41.85 1.83 40.07 424.6% ------- BLUE .086 .122 --------------------------------------------------------------------------------------------- SOXL 307.45 25.31 253.49 818.4% Bullish BLUE .215 .527 Bullish --------------------------------------------------------------------------------------------- TECL 407.55 10.17 362.34 618% Bullish RED .256 .619 Bullish --------------------------------------------------------------------------------------------- IBB 134.97 1.95 132.67 80.6% Bearish BLUE .08 -.14 --------------------------------------------------------------------------------------------- GLD 182.62 -2.43 181.24 -20.1% Bearish RED -.176 -.017 --------------------------------------------------------------------------------------------- OIH 123.55 -1.64 125.63 -43.3% Bearish RED -.076 -.157 --------------------------------------------------------------------------------------------- GASL 3440 285 3685 -325.1% ------- RED -.021 0 --------------------------------------------------------------------------------------------- |
Table 3 Count of Stocks in Key Directories
20200902
-------------------------------
NEWHIGHS 426
NEWLOWS 61
MAXCP 109
MINCP 29
TTTNH 27
TTTNL 66
FASTUP 93
FASTDOWN 76
CPCROSSA 215
CPCROSSD 35
BIGVOLUP 4
BIGVODN 11
ACCUMVER 105
HIGHIP21 43
HIUPPCT 55
REDSELL 82
AUGSELS7 74
TRAPDOOR 19
|
Table 4 RANKING OF KEY DIRECTORIES BASED PCT.OF STOCKS ABOVE 65-DMA
9/2/20
Bullish = 43
Bearish = 3
---------------------------------------------------------------------------------------
Directory Current day-1 day-2 day-3 day-4 day-5
----------------------------------------------------------------------------------------
COPPER 1 1 .875 1 .875 1
SOLAR 1 .933 .933 1 1 1
FOOD .924 .924 .924 .924 .905 .924
AUTO .923 .923 .871 .923 .923 .897
DJI-13 .923 .692 .769 .923 .923 .846
COMODITY .902 .902 .902 .902 .878 .902
TRANSP .9 .9 .9 .9 .9 .8
BONDFUND .891 .841 .742 .653 .475 .702
HOMEBLDG .882 .823 .705 .764 .764 .764
NASD-100 .858 .787 .808 .818 .787 .767
ETFS .857 .803 .767 .857 .821 .857
GREEN .857 .666 .571 .666 .619 .619
NIFTY .844 .755 .711 .777 .777 .777
DOWJONES .833 .733 .766 .833 .833 .8
GOLD .816 .836 .877 .877 .816 .857
INDEXES .814 .769 .786 .797 .775 .769
CHEM .812 .75 .687 .77 .75 .729
GAMING .809 .809 .761 .809 .809 .761
INSURANC .807 .769 .807 .884 .807 .73
COMPUTER .8 .7 .7 .75 .75 .7
HACKERS .8 .7 .6 .65 .5 .65
INFRA .8 .771 .657 .771 .657 .657
SP500 .781 .701 .71 .771 .737 .668
SP-100 .769 .67 .703 .758 .725 .67
FIDSTKS .768 .7 .706 .768 .734 .683
INDMATER .756 .729 .716 .797 .716 .743
RUS-1000 .736 .661 .676 .736 .707 .646
RETAIL .734 .714 .714 .775 .714 .632
BEVERAGE .733 .666 .666 .733 .666 .666
SOFTWARE .733 .7 .65 .65 .616 .7
BIGBANKS .714 .571 .571 .857 .714 .714
HOSPITAL .714 .619 .619 .666 .571 .476
JETS .714 .714 .785 .785 .785 .642
ELECTRON .702 .635 .587 .668 .614 .641
SEMI .695 .619 .571 .676 .628 .695
GUNS .666 .666 .6 .6 .6 .666
CHINA .647 .686 .666 .725 .745 .764
FINANCE .604 .543 .555 .716 .654 .555
EDU .6 .6 .6 .4 .4 .4
REIT .581 .482 .496 .553 .546 .453
COAL .571 .571 .428 .571 .285 .428
MILITARY .571 .5 .464 .571 .5 .464
UTILITY .526 .368 .368 .421 .394 .368
============================================================================
REGBANKS .461 .384 .423 .461 .538 .423
BIOTECH .418 .4 .442 .426 .41 .437
OILGAS .244 .291 .283 .385 .33 .33
|
=======================================================================
9/1/2020 Peerless Remains Bearish on DJI
but
TigerSoft Is Very Bullish on QQQ and NASDAQ.
When
in doubt, Bet on the FED! (Part 4)
The DJI is not the story now. Let's give it a chance to rally to 29600.
The real story is the growing speculative fervor on the NASDAQ
and for technology growth stocks in this new age of working at home..

The NASDAQ rally is getting wilder and wilder.
Computer, internet and
software stocks that take advantage of working and living at home during
the Covid epidemic are rising exponentially. ZM, AAPL, CRM and ADBE
are prime examples. But our bullish MAXCPs show many more, like NVDA.
It's true that the first speculative internet bubble popped just after the NASDAQ
peaked in March 2000. But note that was a full two months after the DJI made
its final top in the 1987-2000 bull market. Right now the DJI seems headed
back to 29600, courtesy of the FED and with the boost given by the addition to
the DJIA of CRM, AMGN and HON in place of sleepy PFE, downtrending
XOM and RTX. Might we not see a NASDAQ peak for at least two months
after the DJI makes a new high?
Buy-out ZM?
I would not argue that ZM's huge advance today seems crazy.
But it may be bought out. Follow the news on it.

TSLA's steep uptrend remains intact.

I am more impressed by the breakout by BABA
and Chinese ETFs. If China's
consumers and investors turn bullish, we ought to see a lot more upside potential.


So, evaluate the techs using TigerSoft.
Respect the nearly perfect AI/200 level
of Accumulation on the NASDAQ. It is likely to go considerbably higher, based
on the still high level of its current Accumulation, IP21.

It is not very often we see extremely high AI/200
scores (consistently
positive readings) and strong uptrends in DJI-30 stocks. That is what we
see now in AAPL, CRM and also MSFT. The high AI/200 Accumulation
shows that institutional buyers are holding these stocks very tightly. That
allows them to run a long way when they breakout in all-time high territory.


Table 1
9/1/2018 QUICKSILVER on DJI-30 STOCKS.
P21 + ITRS score >+.25 is bullish
Note that AAPL now shows highest AI/200 stock here but CRM will
take over #1 position on 8/31 when it is added to DJIA.
7 Bullish (AAPL, CRM, HD, HON, NKE, PG, WMT)
Bearish 3 (BA INTC, WBA)
HIGHEST AI/200 = CRM Second Highest Tied = AAPL and MSFT
STOCKS CLOSECHANGE PIVOT-PT 5-dma AROC CL-PWR CANDLE AI/200 IP21 ITRS ---------------------------------------------------------------------------------------------------------- AAPL 134.18 5.14 124.82 371.3% Bullish BLUE 174 .192 .394 Bullish ---------------------------------------------------------------------------------------------------------- AMGN 250.86 -2.46 248.22 52.5% ------- BLUE 136 .239 -.031 ---------------------------------------------------------------------------------------------------------- AXP 102.47 .88 99.05 169.9% ------- BLUE 107 .046 -.071 ---------------------------------------------------------------------------------------------------------- BA 172.1 .28 174.73 -75.7% ------- BLUE 44 -.141 -.189 Bearish ---------------------------------------------------------------------------------------------------------- CAT 146.05 3.74 141.15 172% Bullish BLUE 135 .049 .059 ---------------------------------------------------------------------------------------------------------- CRM 281.25 8.61 216.05 1245.8% Bullish BLUE 194 .361 .366 Bullish ---------------------------------------------------------------------------------------------------------- CSCO 42.03 -.19 41.96 8.3% ------- ---- 118 .044 -.171 ---------------------------------------------------------------------------------------------------------- CVX 83.08 -.85 86.13 -179.3% Bearish BLUE 88 -.001 -.195 ---------------------------------------------------------------------------------------------------------- DIS 133.55 1.68 129.79 141.8% Bullish BLUE 114 .049 .05 ---------------------------------------------------------------------------------------------------------- DOW 47.27 2.15 45.59 183.2% ------- BLUE 71 .131 .031 ---------------------------------------------------------------------------------------------------------- GS 205.46 .59 206 -13% ------- BLUE 82 -.081 -.092 ---------------------------------------------------------------------------------------------------------- HD 285.94 .9 286.13 -3.3% Bullish BLUE 132 .209 .046 Bullish ---------------------------------------------------------------------------------------------------------- HON 167.97 2.42 164.53 103.6% Bullish BLUE 97 .21 .057 Bullish ---------------------------------------------------------------------------------------------------------- IBM 123.4 .09 124.64 -49.9% Bearish BLUE 122 -.003 -.082 ---------------------------------------------------------------------------------------------------------- INTC 50.79 -.16 49.43 136.1% Bearish RED 109 -.023 -.256 Bearish ---------------------------------------------------------------------------------------------------------- JNJ 151.52 -1.89 152.06 -17.7% ------- RED 129 .198 -.045 ---------------------------------------------------------------------------------------------------------- JPM 100.14 -.05 100.5 -17.8% Bearish BLUE 47 -.167 -.067 ---------------------------------------------------------------------------------------------------------- KO 49.12 -.41 47.91 124.1% Bullish RED 96 .078 -.028 ---------------------------------------------------------------------------------------------------------- MCD 212.69 -.83 212.65 .9% Bullish BLUE 137 .199 .033 ---------------------------------------------------------------------------------------------------------- MMM 164.8 1.78 163.1 51.8% ------- BLUE 113 .154 -.05 ---------------------------------------------------------------------------------------------------------- MRK 84.43 -.84 85.68 -73% ------- RED 97 .158 -.002 ---------------------------------------------------------------------------------------------------------- MSFT 227.27 1.74 216.47 241.4% Bullish BLUE 174 .074 .031 ---------------------------------------------------------------------------------------------------------- NKE 114.84 2.95 111.51 149.2% Bullish BLUE 140 .292 .052 Bullish ---------------------------------------------------------------------------------------------------------- PFE 36.88 -.91 38.41 -201.3% Bearish RED 91 .15 .012 ---------------------------------------------------------------------------------------------------------- PG 138.18 -.15 139.06 -31.8% Bullish BLUE 102 .26 .072 Bullish ---------------------------------------------------------------------------------------------------------- TRV 114.69 -1.35 115.62 -40.2% Bearish RED 112 -.057 -.115 ---------------------------------------------------------------------------------------------------------- UNH 312.83 .28 312.22 9.8% ------- BLUE 135 .073 -.033 ---------------------------------------------------------------------------------------------------------- V 213.35 1.36 208.1 124.2% Bullish BLUE 117 .19 -.007 ---------------------------------------------------------------------------------------------------------- VZ 59.16 -.11 59.42 -21.9% Bullish ---- 137 .234 -.039 ---------------------------------------------------------------------------------------------------------- WBA 36.76 -1.26 39.5 -352.6% Bearish RED 86 -.234 -.252 Bearish ---------------------------------------------------------------------------------------------------------- WMT 147.59 8.74 130.63 626.2% Bullish BLUE 115 .272 .111 Bullish ---------------------------------------------------------------------------------------------------------- |
Table 3 QUICKSILVER on ETFS - 09/01/20 Bullish = 5
Bearish = 0
ITRS + IP21>.25 is considered "Bullish"
Highest ITRS + IP21 = TECL
ETF CLOSE CHANGE PIVOT-PT 5-dma AROC CL-PWR CANDLE IP21 ITRS --------------------------------------------------------------------------------------------- --------------------------------------------------------------------------------------------- DIA 286.79 2.51 283.43 73.3% ------- BLUE .26 ------ Bullish --------------------------------------------------------------------------------------------- SPY 352.6 3.29 347.57 121.8% Bullish BLUE .413 .033 Bullish --------------------------------------------------------------------------------------------- QQQ 299.92 5.04 291.96 241.4% Bullish BLUE .295 .114 Bullish --------------------------------------------------------------------------------------------- MDY 354.1 2.7 351.86 13.9% ------- BLUE .112 -.015 --------------------------------------------------------------------------------------------- IWM 157.21 1.78 155.42 26% ------- BLUE .132 .002 --------------------------------------------------------------------------------------------- FAS 40.02 .5 38.47 158% ------- BLUE .037 .092 --------------------------------------------------------------------------------------------- SOXL 282.14 15.04 263.77 405.7% Bullish BLUE .216 .417 Bullish --------------------------------------------------------------------------------------------- TECL 397.38 22.47 361.39 785.7% Bullish BLUE .261 .625 Most Bullish --------------------------------------------------------------------------------------------- IBB 133.02 -2.58 132.82 -1.1% Bearish RED .041 -.139 --------------------------------------------------------------------------------------------- GLD 185.05 .22 183.36 104.6% Bearish RED -.116 .019 --------------------------------------------------------------------------------------------- GASL 3440 285 3685 -325.1% ------- RED -.021 .012 --------------------------------------------------------------------------------------------- |
Table 3 Count of Stocks in Key Directories
20200901
-------------------------------
NEWHIGHS 320
NEWLOWS 59
MAXCP 118
MINCP 59
TTTNH 35
TTTNL 85
FASTUP 106
FASTDOWN 82
CPCROSSA 220
CPCROSSD 42
BIGVOLUP 5
BIGVODN 8
ACCUMVER 104
HIGHIP21 40
HIUPPCT 50
REDSELL 83
AUGSELS7 71
TRAPDOOR 18
|
Table 4 RANKING OF KEY DIRECTORIES BASED PCT.OF STOCKS ABOVE 65-DMA
9/1/20
Bullish = 39
Bearish = 5
---------------------------------------------------------------------------------------
Directory Current day-1 day-2 day-3 day-4 day-5
----------------------------------------------------------------------------------------
COPPER 1 .875 1 .875 1 1
SOLAR .933 .933 1 1 1 1
FOOD .924 .924 .924 .905 .924 .924
AUTO .923 .871 .923 .923 .897 .897
COMODITY .902 .902 .902 .878 .902 .902
TRANSP .9 .9 .9 .9 .8 .9
BONDFUND .841 .742 .653 .475 .712 .861
GOLD .836 .877 .877 .816 .857 .816
HOMEBLDG .823 .705 .764 .764 .764 .823
GAMING .809 .761 .809 .809 .761 .761
ETFS .803 .767 .857 .821 .857 .839
NASD-100 .787 .818 .828 .787 .767 .747
INFRA .771 .657 .771 .657 .685 .685
INDEXES .769 .786 .797 .775 .769 .792
INSURANC .769 .807 .884 .807 .73 .807
NIFTY .755 .711 .777 .777 .777 .777
CHEM .75 .687 .77 .75 .729 .77
INDMATER .729 .716 .797 .716 .729 .729
JETS .714 .785 .785 .785 .642 .785
RETAIL .714 .714 .775 .714 .632 .632
SP500 .701 .712 .771 .737 .672 .72
COMPUTER .7 .7 .75 .75 .7 .7
FIDSTKS .7 .706 .768 .734 .683 .706
HACKERS .7 .65 .65 .5 .65 .5
SOFTWARE .7 .666 .65 .616 .7 .65
CHINA .686 .666 .725 .745 .764 .784
SP-100 .67 .703 .758 .725 .67 .714
BEVERAGE .666 .666 .733 .666 .666 .733
DOWJONES .666 .7 .766 .766 .733 .766
GREEN .666 .571 .666 .619 .619 .666
GUNS .666 .6 .6 .6 .666 .6
RUS-1000 .661 .678 .736 .707 .647 .699
ELECTRON .635 .587 .668 .614 .648 .648
HOSPITAL .619 .619 .666 .619 .523 .571
SEMI .619 .571 .676 .628 .704 .676
DJI-13 .615 .692 .846 .846 .769 .846
EDU .6 .6 .4 .4 .4 .4
BIGBANKS .571 .571 .857 .714 .714 .714
COAL .571 .428 .571 .285 .428 .428
FINANCE .548 .56 .719 .658 .56 .682
=============================================================================================
MILITARY .5 .464 .571 .5 .464 .535
=============================================================================================
REIT .482 .496 .553 .546 .46 .51
BIOTECH .395 .439 .424 .41 .442 .458
REGBANKS .384 .423 .461 .538 .461 .576
UTILITY .368 .368 .421 .394 .368 .447
OILGAS .291 .283 .377 .33 .322 .417
|
--------------------------------------------------------------------------------------------------------------
8/31/2020 Peerless Remains Bearish on DJI
but
TigerSoft Is Very Bullish on QQQ and NASDAQ.
When
in doubt, Bet on the FED! (Part 4)
  |
  |
History does not tell
us if the market will decline in September if Trump is going down
to defeat. It
does tell that the market will likely be very strong in November
and next year if a
Republican keeps the White House. So, watch the polls for the key
states: Pennyslvania,
Florida, Michigan and Wisconsin.
Peerless does tell us
now that the DJI is still having trouble advancing back to its old highs
On the one hand the
NYSE A/D Line and IP21 are still rising, but on the other hand, we sell
multiple Peerless Sells
and the DJI is now more than 3% over the 21-day. I have said
that we should bet on
the FED. They clearly want the DJI to get to its old highs. And so
does the DJI committee
that decides the composition of the DJI-30. So, we are in a kind
of "limbo
land", which the dictionary defines as
"an
imaginary place for lost, forgotten, or unwanted persons or things."
The uncertainty
about the DJI does not mean we must sit on the sidelines. TigerSoft
gives other options.
TigerSoft looks at the signs of insider and professional buying and
selling at the extremes to
find the best buys and sells in individual stocks and ETFs.
So, hedging with the Bullish
and Bearish MAXCPs is a good choice now. So is
buying the most bullish stock
in the DJI-30 (Table 1) or among the major ETFs (Table 2)
and selling the most bearish
short. A third for investors is to buy the highest AI/200
stock among the
"nifty" tech stocks (now CRM) and hold it so long as the QQQ stays
in its uptrend. Here we
are taking into account the tendency of the best tech stocks
to top out after the DJI
does. A fourth approach is to buy the very highest A/200 stocks
on dips below their 21-day ma
or on flat top breakouts and hold them for as long
as they do not complete head
and shoulders tops. These stocks come from the ACCUMHOR
group among the stock groups
on the TigerSoft Download Page. ADBE and CRM can be
seen among our stocks posted
each night. Here are the others. Note that they must have
an AI/200 score of 194 of
higher.
 |
 |
 |
 |
|
Charts 8/27/2020 (Click on Underlined link.) 2020 PEERLESS DJI, Signals, Indicators Daily DJI Volume 10-DayUp/Down Vol Stoch-20 Inverted Traders Index Graph of Pct of All Stocks above 65-dma Cum. Inverted Traders Index NASDAQ S&P OEX NYSE COMPQX DJI-15 DJI-20 DJI-30 DIA QQQ MDY IWM TNA Short-Term Rates DOLLAR-UUP SPY http://tigersoft.com/2121CST/SPY.GIF recent 2006 vers-Peerless signals -- http://tigersoft.com/NEWPEER/UPD6831.BMP USO-CrudeOil DBO FAS GLD BBH IBB JETS JNUG KOL NUGT OIH PALL RSX RETL SDS AGQ SLV SOXL TECL TLT TMF TNA UGA (gasoline) USO (oil) and China: YINN CHAU Commodities: CANE CORN DBC JJC, NIB, CHOC CORN, CUT (paper) MOO, SOYB WEAT UUP (Dollar) LIT (Lithium) Stocks AAPL ADBE ALXN AMAT AMGN AMD AMZN AXP BA BABA BAC BIDU BLDP CAT CRM CVX CMG DE ENPH FB GILD GOOG GS HD IBM INTU JPM LRCX M (Macy's) MSFT NEM NFLX NKE NVDA PG REGN REV SO SQ QCOM QDEL TSLA TXN XOM V VRTX WFC WMT TOWN ZM New highs and Bullish MAXCPs http://tigersoft.com/MAXCP/8-31/BULLISH.htm Bearish MAXCPs - http://tigersoft.com/MINCP/8-31/BEARISH.htm |
|
Table 1
8/30/2018 QUICKSILVER on DJI-30 STOCKS.
3 DJIA stocks have changed
P21 + ITRS score >+.25 is bullish
Note that AAPL now shows highest AI/200 stock here but CRM will
take over #1 position on 8/31 when it is added to DJIA.
5 Bullish (AAPL, CRM, NKE, PG, WMT) Bearish 3 (BA INTC, WBA)
HIGHEST AI/200 = CRM Second Highest Tied = AAPL and MSFT
STOCKS CLOSE CHANGE PIVOT-P 5-dma AROC CL-PWR Candl AI/200 IP21 ITRS --------------------------------------------------------------------------------------- --------------------------------------------------------------------------------------- AAPL 129.04 4.23 NH 124.82 126.8% Bullish BLUE 174 .124 .377 Bullish --------------------------------------------------------------------------------------- AMGN 253.32 0.20 (264) ------- 136 .237 -.037 --------------------------------------------------------------------------------------- AXP 101.59 -.95 99.05 112.8% ------- RED 106 .019 -.092 --------------------------------------------------------------------------------------- BA 171.82 -3.98 174.73 -184.3% Bullish RED 44 -.088 -.18 Bearish --------------------------------------------------------------------------------------- CAT 142.31 -1.32 141.15 22.1% ------- RED 135 -.011 .018 --------------------------------------------------------------------------------------- CRM 272.64 1.54 Bullish Blue 194 .338 .360 Bullish ---------------------------------------------------------------------------------------- CSCO 42.22 .02 41.96 4.7% ------- BLUE 117 .015 -.167 --------------------------------------------------------------------------------------- CVX 83.93 -1.7 86.13 -190.7% Bearish RED 89 .029 -.172 --------------------------------------------------------------------------------------- DIS 131.87 -3.67 129.79 44.6% Bullish RED 113 .028 .055 --------------------------------------------------------------------------------------- GS 204.87 -2.84 206 -59.5% ------- RED 83 -.066 -.082 --------------------------------------------------------------------------------------- HD 285.04 -1.25 286.13 -29.7% Bullish RED 132 .167 .057 --------------------------------------------------------------------------------------- HON 165.55 -2.83 Bullish RED 97 .162 .040 --------------------------------------------------------------------------------------- IBM 123.31 -1.76 124.64 -94.9% Bearish RED 123 .024 -.092 --------------------------------------------------------------------------------------- INTC 50.95 .52 49.43 182.5% Bearish ---- 110 -.031 -.244 Bearish --------------------------------------------------------------------------------------- JNJ 153.41 -.23 152.06 41.3% Bullish BLUE 128 .236 -.032 --------------------------------------------------------------------------------------- JPM 100.19 -2.58 100.5 6.4% Bearish RED 48 -.203 -.074 Bearish --------------------------------------------------------------------------------------- KO 49.53 -.3 47.91 161.1% Bullish RED 95 .022 -.022 --------------------------------------------------------------------------------------- MCD 213.52 -1.39 212.65 21.1% Bullish ---- 136 .167 .046 --------------------------------------------------------------------------------------- MMM 163.02 -2.64 163.1 -15.5% ------- RED 113 .121 -.068 --------------------------------------------------------------------------------------- MRK 85.27 -.38 85.68 -8.8% Bullish RED 96 .154 -.004 --------------------------------------------------------------------------------------- MSFT 225.53 -3.38 216.47 267.4% Bullish RED 174 .115 .057 --------------------------------------------------------------------------------------- NKE 111.89 -.4 111.51 2.7% Bullish RED 139 .236 .07 Bullish --------------------------------------------------------------------------------------- PG 138.33 -.44 Bullish 101 .221 .065 Bullish --------------------------------------------------------------------------------------- TRV 116.04 +.15 Bearish 112 -.058 -.103 --------------------------------------------------------------------------------------- UNH 312.55 -1.82 135 .089 -.025 --------------------------------------------------------------------------------------- V 211.99 -3.72 Bullish 117 .113 .005 --------------------------------------------------------------------------------------- VZ 59.27 .01 Bullish 137 .116 -.043 --------------------------------------------------------------------------------------- WBA 38.02 -.74 Bearish 87 -.150 -.237 Bearish --------------------------------------------------------------------------------------- WMT 138.85 -1.45 Bullish 114 .220 .060 Bullish --------------------------------------------------------------------------------------- |
|
Table 3 Count of Stocks in Key Directories
20200831
-------------------------------
NEWHIGHS 229
NEWLOWS 38
MAXCP 41
MINCP 57
TTTNH 18
TTTNL 67
FASTUP 103
FASTDOWN 55
CPCROSSA 50
CPCROSSD 92
BIGVOLUP 3
BIGVODN 9
ACCUMVER 104
HIGHIP21 25
HIUPPCT 35
REDSELL 83
AUGSELS7 79
TRAPDOOR 18
|
|
Table 4 RANKING OF KEY DIRECTORIES BASED PCT.OF STOCKS ABOVE 65-DMA
8/31/20
Bullish = 39
Bearish = 7
---------------------------------------------------------------------------------------
Directory Current day-1 day-2 day-3 day-4 day-5
----------------------------------------------------------------------------------------
SOLAR .933 1 1 1 1 1
FOOD .924 .924 .905 .924 .924 .905
COMODITY .902 .902 .878 .902 .902 .902
TRANSP .9 .9 .9 .8 .9 .9
GOLD .877 .877 .816 .857 .816 .816
COPPER .875 1 .875 1 1 1
AUTO .871 .923 .923 .897 .897 .871
NASD-100 .818 .838 .797 .767 .747 .727
INSURANC .807 .884 .807 .73 .807 .769
INDEXES .786 .797 .775 .769 .797 .797
JETS .785 .785 .785 .642 .785 .857
DJI-13 .769 .846 .846 .846 .846 .846
ETFS .767 .857 .821 .857 .839 .839
DOWJONES .766 .833 .833 .8 .833 .8
GAMING .761 .809 .809 .761 .761 .809
BONDFUND .742 .653 .475 .712 .881 .95
INDMATER .716 .797 .716 .729 .729 .729
RETAIL .714 .775 .714 .632 .653 .612
SP500 .712 .773 .737 .672 .72 .718
NIFTY .711 .777 .777 .777 .777 .777
FIDSTKS .706 .768 .734 .683 .706 .694
HOMEBLDG .705 .764 .764 .764 .823 .823
SP-100 .703 .758 .725 .67 .714 .725
COMPUTER .7 .75 .75 .7 .7 .65
CHEM .687 .77 .75 .729 .77 .75
RUS-1000 .678 .737 .707 .647 .696 .693
BEVERAGE .666 .733 .666 .666 .733 .733
CHINA .666 .725 .745 .764 .784 .784
SOFTWARE .666 .666 .616 .7 .65 .65
INFRA .657 .771 .657 .685 .685 .8
HACKERS .65 .7 .5 .65 .5 .55
HOSPITAL .619 .666 .619 .571 .571 .476
EDU .6 .4 .4 .4 .4 .4
GUNS .6 .6 .6 .666 .6 .6
ELECTRON .587 .668 .614 .648 .648 .628
BIGBANKS .571 .857 .714 .714 .714 .714
GREEN .571 .666 .619 .619 .619 .666
SEMI .571 .676 .628 .704 .676 .647
FINANCE .56 .719 .658 .56 .67 .597
================================================================================================
REIT .496 .553 .546 .46 .51 .496
MILITARY .464 .571 .5 .464 .535 .571
BIOTECH .434 .421 .408 .442 .458 .429
COAL .428 .571 .285 .428 .428 .428
REGBANKS .423 .461 .538 .461 .538 .538
UTILITY .368 .421 .394 .368 .447 .5
OILGAS .283 .377 .33 .322 .417 .401
|
Table 3 QUICKSILVER on ETFS - 08/31/20 Bullish = 4
Bearish = 0
ITRS + IP21>.25 is considered "Bullish"
Highest ITRS + IP21 = TECL
ETF CLOSE CHANGE PIVOT-PT 5-dma AROC CL-PWR CANDLE IP21 ITRS --------------------------------------------------------------------------------------------- DIA 284.28 -2.42 282.62 19.4% Bullish RED .235 ---- --------------------------------------------------------------------------------------------- SPY 349.31 -1.27 344.12 92.2% Bullish RED .372 .033 Bullish --------------------------------------------------------------------------------------------- QQQ 294.88 2.35 285.86 194.6% Bullish BLUE .265 .109 Bullish --------------------------------------------------------------------------------------------- MDY 351.4 -3.8 353.12 -33.8% ------- RED .086 -.017 --------------------------------------------------------------------------------------------- IWM 155.43 -1.69 156.4 -25.6% ------- RED .14 .004 --------------------------------------------------------------------------------------------- FAS 39.52 -1.42 38.77 159% ------- RED .007 .088 --------------------------------------------------------------------------------------------- SOXL 267.1 -.75 260.83 277.4% Bullish RED .223 .377 Bullish --------------------------------------------------------------------------------------------- TECL 374.91 3.64 340.48 555.6% Bullish RED .247 .622 Most Bullish --------------------------------------------------------------------------------------------- IBB 135.6 2.55 133.05 171.7% ------- BLUE .128 -.115 --------------------------------------------------------------------------------------------- GLD 184.83 .44 181.22 105.1% Bearish ---- -.078 .028 --------------------------------------------------------------------------------------------- OIH 125.32 -3.63 128.82 -183% Bearish RED -.008 -.123 --------------------------------------------------------------------------------------------- GASL 3440 285 3685 -325.1% ------- RED -.021 .015 --------------------------------------------------------------------------------------------- |
=======================================================================
8/28/2020 Peerless Remains Bearish on DJI
but
TigerSoft Is Very Bullish on QQQ and NASDAQ.
When
in doubt, Bet on the FED! (Part 3)
It seems to early to tell who will win the 2020 Presidential
Election.
The polls number show Trump is improving. Much will depend on
four states that Clinton lost in 2016: Pennsylvania, Michigan, Wisconsin
and Florida. Biden will have to win some combination of these to win.
Can he?
The Peerless Automatic Sells remain un-reversed. But
our DJI chart also
shows a long-rising NYSE A/D Line (It rose by more than 1000 on Friday.),
a very positive and still rising Accumulation Index (IP21) and a rise by our
Cumulative Inverted Traders Index above its recent downtrend.

It's seems very clear that the FED is not going to quit its "liquefaction" of
of the key ETFs and INDEXes any time soon. It wants to see the DJI make
a new 12-month high just as the OEX, QQQ, SP-500 and NASDAQ have done.
Note that the DJI should also be getting a big boost next week by the expulsion of three
of its poorer performers starting Tuesday and by their replacement with CRM (and its
excellent AI/200 score of 194) along with AMGN and HON.


Big techs are the leaders, of course. Even the Dow Jones folks realize the
old
"dinosaurs" have limited investment appeal. For a moment, pretend we know
nothing
of the surrounding news now and we are looking at the NASDAQ or QQQ afresh.
Assume that have only our Tiger's technical tools. As such, we would have to bet
that the NASDAQ and the QQQ will be reaching much higher prices over the next
year. The AI/200 score for the NASDAQ is a superb 193 out of a possible 200.
We know from our Tahiti analysis of very high AI/200 DJI stocks between 1970
and 2000 that they averaged yearly gains of +37% following the first Quarter in
which these results were seen. Would you believe that the NASDAQ will be
+37% higher a year from now?
How could results like this be achieved if the Democrat Biden comes into
office and raises corporate and high-income taxes? Perhaps, Trump will win despite
his lower poll numbers now. Consider this. First, Biden is afraid to campaign
much
because of his past mental gaffes aplenty. Second, Biden is clearly avoiding
Michigan
and Ohio, just as Hillory Clinton did in 2016. Why? Let me suggest the main
reason
is their votes for NAFTA. This is important. Ohio may be out of reach still
for
Biden. But Michigan has 16 electoral votes. He needs those but he's unwilling to
campaign for them. Second, the street violence in Wisconsin favors the
"law
and order" Trump campaign. Wisconsin has 10 electoral votes. Third, Biden
is
originally from Pennsylvania. Let's assume Biden wins there. Pennyslvania has
18 electoral votes. But he must win all three rust-belt states or Pennsylvania +
Florida.
In 2016 Trump won with 77 more electoral votes than Clinton (304 to 227).
Biden needs to win 39 more electoral votes than Trump. If he does not win Florida,
Biden needs to win all three of these "Rust Belt" states to win the
Presidency. With
Trump rising in the polls now and Biden avoiding public appearances, the odds look
about even that Trump will remain in power, especially if the final determination
about who wins goes to the Supreme Court as it did in 2000. I suspect Trump will
contest the results even if he is a loser by 30 points. It may all come down to the
mail-in vote count. All in all, I don't think the stock market is as crazy as it may
seem.
But a lot can happen in the next nine weeks. The main thing I point out is
how important these three states are and Trump's margin of victory though small,
would probably have been bigger if the Libertarian Gary Johnson had not taken
about 3% from Trump in each state.
Another path for victory for Biden would be to win Florida's big count of 29|
Electoral votes and some combination of 10 other Electoral votes. The Florida
polls should be watched. Trump is weakened here because the older population
are more in fear of the Covid-19 epidemic and Republican talk of reductions in
Social Security of Medicare. Currently, Biden has a 5% lead in the latest Florida
polls. So, Biden still may win even if he loses the Midwestern states that Clinton
also
lost. In that case, he would just 10 more votes from some other place. Might
Arizona with 11 votes, provide that margin? Clinton lost Arizona by 4.1% to Trump.
Adding in the 3.9% that voted for the Libertarian and I would not expect Trump
to lose Arizona in 2020. But if he does, then I can see him also losing
Pennsylvania (20 electoral votes) and and thereby the Election. You can see why
Florida is so important. Interestingly, we do see two solar stocks (TAN and RUN)
among our MAXCPs now. Perhaps, they are bets on a Biden victory.
2016 Election Results:
Closest Big States that Trump Won.
Trump plurality over Clinton Libertarian Gary Johnson
Pennyslvania
68,239
1.2%
1.9%
Michigan
21,612
0.3%
3.6%
Wisconsin
27,257
3.6%
Florida
119,770
2.1%
2.2%

|
Charts 8/28/2020 (Click on Underlined link.) 2020 PEERLESS DJI, Signals, Indicators Daily DJI Volume 10-DayUp/Down Vol Stoch-20 Inverted Traders Index Graph of Pct of All Stocks above 65-dma Cum. Inverted Traders Index NASDAQ S&P OEX NYSE COMPQX DJI-15 DJI-20 DJI-30 DIA QQQ MDY IWM TNA Short-Term Rates DOLLAR-UUP SPY http://tigersoft.com/2121CST/SPY.GIF recent 2006 vers-Peerless signals -- http://tigersoft.com/NEWPEER/UPD6828.BMP USO-CrudeOil DBO FAS GLD BBH IBB JETS JNUG KOL NUGT OIH PALL RSX RETL SDS AGQ SLV SOXL TECL TLT TMF TNA UGA (gasoline) USO (oil) and China: YINN CHAU Commodities: CANE CORN DBC JJC, NIB, CHOC CORN, CUT (paper) MOO, SOYB WEAT UUP (Dollar) LIT (Lithium) Stocks AAPL ADBE ALXN AMAT AMGN AMD AMZN AXP BA BABA BAC BIDU BLDP CAT CVX CMG DE ENPH FB GILD GOOG GS HD IBM INTU JPM LRCX M (Macy's) MSFT NEM NFLX NKE NVDA PG REGN REV SO SQ QCOM QDEL TSLA TXN XOM V VRTX WFC WMT TOWN ZM New highs and Bullish MAXCPs http://tigersoft.com/MAXCP/8-28/BULLISH.htm Bearish MAXCPs - http://tigersoft.com/MINCP/8-28/BEARISH.htm |
Table 1
8/27/2018 QUICKSILVER on DJI-30 STOCKS.
P21 + ITRS score >+.25 is bullish
Note that AAPL now shows highest AI/200 stock here but CRM will
take over #1 position on 8/31 when it is added to DJIA.
5 Bullish (AAPL, MCD, MSFT, NKE, PG) Bearish 2 (BA INTC)
STOCKS CLOSE CHANGE PIVOT-P 5-dma AROC CL-PWR Candl AI/200 IP21 ITRS --------------------------------------------------------------------------------------- --------------------------------------------------------------------------------------- AAPL 499.23 -.81 503.43 17.5% Bullish RED 174 .192 .323 Bullish --------------------------------------------------------------------- AXP 102.54 1.01 99.33 323.1% Bullish BLUE 105 .062 -.093 --------------------------------------------------------------------- BA 175.8 1.6 178.27 239.4% Bullish BLUE 44 -.087 -.182 Bearish --------------------------------------------------------------------- CAT 143.63 .26 141.68 184% Bullish RED 136 .043 .029 --------------------------------------------------------------------- CSCO 42.2 -.09 42.18 -5.9% ------- BLUE 117 .036 -.176 --------------------------------------------------------------------- CVX 85.63 .72 87.2 32.1% Bullish BLUE 89 .167 -.165 --------------------------------------------------------------------- DIS 135.54 1.81 130.69 309.7% Bullish BLUE 113 .094 .048 --------------------------------------------------------------------- GS 207.71 -2.44 207.34 127.8% ------- RED 84 -.067 -.078 --------------------------------------------------------------------- HD 286.29 -2.34 286.75 53.2% Bullish RED 132 .185 .052 --------------------------------------------------------------------- IBM 125.07 .42 125.68 76.7% ------- BLUE 123 .139 -.089 --------------------------------------------------------------------- INTC 50.43 1.03 49.14 116.5% Bearish BLUE 111 -.026 -.257 Bearish --------------------------------------------------------------------- JNJ 153.64 .66 152.15 28.9% Bullish BLUE 127 .23 -.025 --------------------------------------------------------------------- JPM 102.77 .42 100.06 272.9% Bullish RED 49 -.135 -.058 --------------------------------------------------------------------- KO 49.83 1.6 47.97 266.1% Bullish BLUE 94 .059 -.036 --------------------------------------------------------------------- MCD 214.91 2.72 212.62 78.6% Bullish BLUE 135 .226 .038 --------------------------------------------------------------------- MMM 165.66 1.58 163.53 121% ------- BLUE 113 .157 -.056 --------------------------------------------------------------------- MRK 85.65 -.17 85.42 39.2% Bullish RED 95 .173 .027 --------------------------------------------------------------------- MSFT 228.91 2.33 213.69 364.1% Bullish BLUE 174 .199 .069 --------------------------------------------------------------------- NKE 112.29 1.45 111.83 114.3% Bullish BLUE 138 .273 .044 --------------------------------------------------------------------- PFE 37.91 .05 38.84 -126.3% Bearish BLUE 89 .175 .044 --------------------------------------------------------------------- PG 138.77 .56 138.51 48.1% Bullish BLUE 101 .272 .067 --------------------------------------------------------------------- TRV 115.89 -1.29 114.9 177.1% Bearish RED 113 -.062 -.098 --------------------------------------------------------------------- UNH 314.37 2.7 308.84 3.7% ------- BLUE 135 .213 -.018 |
Table 2 QUICKSILVER on ETFS - 08/28/20 Bullish = 5
Bearish = 0
ITRS + IP21>.25 is considered "Bullish"
Highest ITRS + IP21 = TECL
ETF CLOSE CHANGE PIVOT-PT 5-dma AROC CL-PWR CANDLE IP21 ITRS --------------------------------------------------------------------------------------------- DIA 286.7 1.66 283.18 131.1% Bullish BLUE .34 ----- Bullish --------------------------------------------------------------------------------------------- SPY 350.58 2.25 342.92 161.1% Bullish BLUE .483 .028 Bullish --------------------------------------------------------------------------------------------- QQQ 292.53 1.48 283.63 185.8% Bullish BLUE .322 .101 Bullish --------------------------------------------------------------------------------------------- MDY 355.2 1.97 353.79 94.7% Bullish BLUE .167 -.012 --------------------------------------------------------------------------------------------- IWM 157.12 1.32 156.23 80.6% ------- BLUE .207 .012 --------------------------------------------------------------------------------------------- FAS 40.94 .87 38.27 593.9% Bullish BLUE .093 .09 --------------------------------------------------------------------------------------------- SOXL 267.85 14.36 252.69 430% Bullish BLUE .234 .353 Bullish --------------------------------------------------------------------------------------------- TECL 371.27 8.93 335.55 654.8% Bullish BLUE .336 .57 Bullish --------------------------------------------------------------------------------------------- IBB 133.05 .38 131.05 17% Bearish BLUE .066 -.1 --------------------------------------------------------------------------------------------- GLD 184.39 3.15 181 64.9% Bearish BLUE-.05 .04 --------------------------------------------------------------------------------------------- OIH 128.95 3.32 129.99 231.3% Bearish BLUE .03 -.115 --------------------------------------------------------------------------------------------- GASL 3440 285 3685 -325.1% ------- RED -.021 .017 --------------------------------------------------------------------------------------------- |
Table 3 Count of Stocks in Key Directories
20200828
-------------------------------
NEWHIGHS 211
NEWLOWS 56 growing
MAXCP 56
MINCP 27
TTTNH 17
TTTNL 30
FASTUP 133
FASTDOWN 57
CPCROSSA 114
CPCROSSD 30
BIGVOLUP 5
BIGVODN 6
ACCUMVER 94
HIGHIP21 34
HIUPPCT 44
REDSELL 76
AUGSELS7 62
TRAPDOOR 19
|
Table 4RANKING OF KEY DIRECTORIES BASED PCT.OF STOCKS ABOVE 65-DMA 8/28/20 --------------------------------------------------------------------------------------- Directory Current day-1 day-2 day-3 day-4 day-5 ---------------------------------------------------------------------------------------- COPPER 1 .875 1 1 1 1 SOLAR 1 1 1 1 1 1 FOOD .924 .905 .924 .924 .905 .905 AUTO .923 .923 .897 .897 .871 .897 COMODITY .902 .878 .902 .902 .902 .902 TRANSP .9 .9 .8 .9 .9 .65 INSURANC .884 .807 .73 .807 .769 .576 GOLD .877 .816 .857 .816 .816 .836 BIGBANKS .857 .714 .714 .714 .714 .285 ETFS .857 .821 .857 .839 .839 .803 NASD-100 .838 .808 .777 .747 .727 .686 GAMING .809 .809 .761 .761 .809 .761 INDMATER .797 .716 .729 .729 .729 .716 INDEXES .797 .775 .769 .797 .797 .752 JETS .785 .785 .642 .785 .857 .214 NIFTY .777 .777 .777 .777 .777 .733 RETAIL .775 .714 .632 .653 .612 .53 SP500 .773 .739 .672 .72 .722 .617 INFRA .771 .657 .685 .685 .8 .6 CHEM .77 .75 .729 .77 .77 .708 DJI-13 .769 .769 .692 .769 .769 .538 FIDSTKS .768 .734 .683 .706 .7 .598 DOWJONES .766 .766 .733 .766 .766 .6 HOMEBLDG .764 .764 .764 .823 .823 .823 SP-100 .758 .725 .67 .714 .725 .604 COMPUTER .75 .75 .7 .7 .65 .6 RUS-1000 .737 .708 .647 .696 .696 .6 BEVERAGE .733 .666 .666 .733 .733 .6 CHINA .72 .74 .76 .78 .78 .76 FINANCE .716 .654 .555 .666 .617 .419 HACKERS .7 .55 .65 .5 .55 .55 SEMI .676 .628 .704 .676 .647 .609 ELECTRON .668 .614 .648 .648 .635 .628 GREEN .666 .619 .619 .619 .666 .666 HOSPITAL .666 .619 .571 .619 .476 .619 SOFTWARE .666 .633 .7 .65 .666 .666 BONDFUND .653 .475 .712 .881 .95 .96 GUNS .6 .6 .666 .6 .6 .533 COAL .571 .285 .428 .428 .428 .428 MILITARY .571 .5 .464 .535 .571 .535 REIT .553 .546 .46 .51 .503 .425 REGBANKS .461 .538 .461 .538 .538 .346 UTILITY .421 .394 .368 .447 .5 .421 BIOTECH .416 .405 .439 .458 .434 .481 EDU .4 .4 .4 .4 .4 .6 OILGAS .377 .33 .322 .417 .401 .322 |
==========================================================================
8/27/2020
Peerless
Remains Bearish on DJI
but
TigerSoft Is Very Bullish on QQQ and NASDAQ.
When
in doubt, Bet on the FED! (Part 2)
Peerless remains on Sells for the DJI, but TigerSoft considers the charts of SPY,
QQQ and the NASDAQ to be very bullish. I've suggested several ways to
resolve this conflict. We can hedge by being long some of the Bullish MAXCPs
and short some of the Bearish MINCPs. A variation on this would be to
be long the highest AI/200 stocks in the DJI-30 (AAPL, CRM and MSFT) and
short those that are considered "Bearish" (BA and INTC) in Table 2. A
third
approach might be to be long QQQ or the NASDAQ for so long as their
IP21-Accumulation Indexes are rising and short DIA until Peerless gives a
Buy signal on the DJI-30.
Peerless is Over-Bought and Still on Sells in its DJIA chart,
but it seems determined to reach its old highs and
its IP21 is rising.

TigerSoft is Bullish on SPY, QQQ and NASDAQ


Typically the uncertainties of a Presidential Election and
even the Covid-19
epidemic's length are factored in pretty well by the market. But not always
as is shown by how the market reacted violently down in November 1948 and
and up in 2016, when respectively, Dewey enexpectedly lost and Trump
unexpectedly won.
The odds are 2:1 against Trump, at this stage. As for what this means for the
market,
we will probably be correct if we bet that a Trump loss will hurt the market. In all
of the five cases where an incumbent Republican lost the White House, the
Dow Jones decline between the start of September and some point soon after the
Election. Below are all five cases since 1892.
1892 DJ fell from 91.23 on 8/27 to
86.19 on 9/15 and 86.06 on 12/1.
1912 DJ fell from 91 at end of Aug. to 86 in early Dec. 1912.
1932 DJ fell from 73.2 at end of August to 56.4 at end of Nov.
1976 DJI fell from 986 on 9/1 to 930.77 on Nov. 9th.
1992 DJI fell from 3266 to 3193 on Nov. 17th.
The FED and the Dow Jones Co.
are boosters of the DJIA. I would not fight them.
Powell and the Fderal Reserve do not want the
market to decline. I have
been saying this since the end of March. QE-Infinity is unprecedented in
its size and its illegality. But Powell did not do this lightly and he is not
backing
off now. He wants the DJI to make a new high to match the SP-500, OEX
and NASDAQ's. So, this weekend, he took the unusual step of saying that
interest rates will stay low even if inflation rises above 2%..
And not to be outbid in pushing the DJI higher, the Dow Jones Committee
dropped three under-performers in the DJI-30 and added power-house CRM,
growth stock AMGN and HON.
My view is that as long as Peerless does not give a new S9 or its IP21 breaks
below its 21-day ma, the DJI will probably keep rising and reach 29600.
|
Charts 8/27/2020 (Click on Underlined link.) 2020 PEERLESS DJI, Signals, Indicators Daily DJI Volume 10-DayUp/Down Vol Stoch-20 Inverted Traders Index Graph of Pct of All Stocks above 65-dma Cum. Inverted Traders Index NASDAQ S&P OEX NYSE COMPQX DJI-15 DJI-20 DJI-30 DIA QQQ MDY IWM TNA Short-Term Rates DOLLAR-UUP SPY http://tigersoft.com/2121CST/SPY.GIF recent 2006 vers-Peerless signals -- http://tigersoft.com/NEWPEER/UPD6827.BMP USO-CrudeOil DBO FAS GLD BBH IBB JETS JNUG KOL NUGT OIH PALL RSX RETL SDS AGQ SLV SOXL TECL TLT TMF TNA UGA (gasoline) USO (oil) and China: YINN CHAU Commodities: CANE CORN DBC JJC, NIB, CHOC CORN, CUT (paper) MOO, SOYB WEAT UUP (Dollar) LIT (Lithium) Stocks AAPL ADBE ALXN AMAT AMGN AMD AMZN AXP BA BABA BAC BIDU BLDP CAT CVX CMG DE ENPH FB GILD GOOG GS HD IBM INTU JPM LRCX M (Macy's) MSFT NEM NFLX NKE NVDA PG REGN REV SO SQ QCOM QDEL TSLA TXN XOM V VRTX WFC WMT TOWN ZM New highs and Bullish MAXCPs http://tigersoft.com/MAXCP/8-27/BULLISH.htm Bearish MAXCPs - http://tigersoft.com/MINCP/8-27/BEARISH.htm |
Table 1
8/26/2018 QUICKSILVER on DJI-30 STOCKS.
P21 + ITRS score >+.25 is bullish
Note that AAPL now shows highest AI/200 stock here but CRM will
take over #1 position on 8/31 when it is added to DJIA.
6 Bullish (AAPL, HD, MCD, MSFT, NKE, PG) Bearish 2 (BA INTC)
STOCKS CLOSE CHANGE PIVOT-P 5-dma AROC CL-PWR Candl AI/200 IP21 ITRS --------------------------------------------------------------------------------------- --------------------------------------------------------------------------------------- AAPL 500.04 -6.05 497.48 271.6% Bullish RED 174 .256 .334 Bullish --------------------------------------------------------------------- AXP 101.53 3.13 96.15 245.6% Bullish BLUE 104 .069 -.112 --------------------------------------------------------------------- BA 174.2 2.3 167.5 134% ------- RED 44 -.112 -.184 Bearish --------------------------------------------------------------------- CAT 143.37 1.54 138.43 210.2% Bullish BLUE 136 .04 .029 --------------------------------------------------------------------- CSCO 42.29 .04 42.25 -2.4% ------- RED 117 .056 -.173 --------------------------------------------------------------------- CVX 84.91 .13 85.08 5.8% ------- RED 89 .098 -.161 --------------------------------------------------------------------- DIS 133.73 1.55 127.44 216.4% Bullish BLUE 112 .107 .048 --------------------------------------------------------------------- GS 210.15 2.93 202.43 202.5% Bullish BLUE 85 .024 -.069 --------------------------------------------------------------------- HD 288.63 -3.3 283.23 139.1% Bullish RED 132 .218 .062 Bullish --------------------------------------------------------------------- IBM 124.65 .48 123.16 60.4% ------- ---- 123 .119 -.085 --------------------------------------------------------------------- INTC 49.4 -.15 49.28 23.3% Bearish RED 112 -.057 -.272 Bearish --------------------------------------------------------------------- JNJ 152.98 .68 152.76 51.3% Bullish BLUE 126 .185 -.026 --------------------------------------------------------------------- JPM 102.35 3.26 97.32 251.9% ------- BLUE 50 -.142 -.06 --------------------------------------------------------------------- KO 48.23 .07 47.28 92.2% Bullish ---- 93 -.008 -.053 --------------------------------------------------------------------- MCD 212.19 -1.57 211.57 54.5% Bullish RED 134 .235 .023 Bullish --------------------------------------------------------------------- MMM 164.08 .18 161.71 34% ------- RED 113 .09 -.058 --------------------------------------------------------------------- MRK 85.82 .28 84.98 46.3% Bullish BLUE 94 .181 .036 --------------------------------------------------------------------- MSFT 226.58 5.43 213.02 278.1% Bullish BLUE 174 .221 .078 Bullish --------------------------------------------------------------------- NKE 110.84 -.69 109.75 128% Bullish RED 137 .267 .029 Bullish --------------------------------------------------------------------- PFE 37.86 -.19 38.88 -111.5% Bearish RED 88 .169 .039 --------------------------------------------------------------------- PG 138.21 -.18 137.44 49.3% Bullish RED 100 .271 .083 Bullish --------------------------------------------------------------------- TRV 117.18 3.64 111.83 204.5% Bullish BLUE 113 -.018 -.068 --------------------------------------------------------------------- UNH 311.67 2.85 314.14 -26.6% ------- BLUE 135 .214 -.024 |
Table 3 QUICKSILVER on ETFS - 08/27/20 Bullish = 5
Bearish = 0
ITRS + IP21>.25 is considered "Bullish" ETF CLOSE CHANGE PIVOT-PT 5-dma AROC CL-PWR CANDLE IP21 ITRS --------------------------------------------------------------------------------------------- DIA 285.04 1.61 279.29 127.5% Bullish BLUE .359 ----- Bullish --------------------------------------------------------------------------------------------- SPY 348.33 .76 339.48 146.7% Bullish RED .484 .029 Bullish --------------------------------------------------------------------------------------------- QQQ 291.05 -.91 281.87 195.3% Bullish RED .343 .106 Bullish --------------------------------------------------------------------------------------------- MDY 353.23 1.37 348.53 55.1% Bullish BLUE .18 -.013 --------------------------------------------------------------------------------------------- IWM 155.8 .38 154.61 1.3% ------- RED .218 .01 --------------------------------------------------------------------------------------------- FAS 40.07 1.6 36.38 456.2% Bullish BLUE .098 .067 --------------------------------------------------------------------------------------------- SOXL 253.49 -10.28 245.89 255.2% Bullish RED .263 .277 Bullish --------------------------------------------------------------------------------------------- TECL 362.34 .95 326.07 708.6% Bullish RED .376 .562 Bullish --------------------------------------------------------------------------------------------- IBB 132.67 -.15 132.6 -26.8% Bearish RED .039 -.09 --------------------------------------------------------------------------------------------- GLD 181.24 -2.12 182.03 -62% Bearish RED -.027 .026 --------------------------------------------------------------------------------------------- OIH 125.63 .99 123.1 -92.6% Bearish BLUE .002 -.128 --------------------------------------------------------------------------------------------- |
Table 3 Count of Stocks in Key Directories
20200827
-------------------------------
NEWHIGHS 243
NEWLOWS 33
MAXCP 30
MINCP 62 Bearish
TTTNH 9
TTTNL 74 Bearish
FASTUP 66
FASTDOWN 95 Bearish
CPCROSSA 133
CPCROSSD 64
BIGVOLUP 3
BIGVODN 6
ACCUMVER 92
HIGHIP21 37
AUGSELS7 56
TRAPDOOR 19
|
Table 4 RANKING OF KEY DIRECTORIES BASED PCT.OF STOCKS ABOVE 65-DMA 8/27/20 --------------------------------------------------------------------------------------- Directory Current day-1 day-2 day-3 day-4 day-5 ---------------------------------------------------------------------------------------- SOLAR 1 1 1 1 1 1 AUTO .923 .897 .897 .871 .897 .923 FOOD .905 .924 .924 .905 .905 .905 TRANSP .9 .8 .9 .9 .65 .65 COMODITY .878 .902 .902 .902 .902 .902 COPPER .875 1 1 1 1 1 ETFS .821 .857 .839 .839 .803 .857 GOLD .816 .857 .816 .816 .836 .897 GAMING .809 .761 .761 .809 .761 .761 NASD-100 .808 .787 .757 .727 .686 .696 INSURANC .807 .73 .807 .769 .576 .653 JETS .785 .642 .785 .857 .214 .357 NIFTY .777 .777 .777 .777 .733 .755 INDEXES .775 .769 .797 .797 .758 .769 DJI-13 .769 .692 .769 .769 .538 .538 DOWJONES .766 .733 .766 .766 .6 .6 HOMEBLDG .764 .764 .823 .823 .823 .823 CHEM .75 .729 .77 .77 .708 .75 COMPUTER .75 .7 .7 .65 .6 .6 CHINA .74 .76 .78 .78 .76 .78 SP500 .739 .674 .72 .722 .619 .636 FIDSTKS .734 .683 .706 .7 .598 .621 SP-100 .725 .67 .714 .725 .604 .615 INDMATER .716 .729 .729 .729 .716 .756 BIGBANKS .714 .714 .714 .714 .285 .285 RETAIL .714 .632 .653 .612 .53 .551 RUS-1000 .708 .649 .696 .696 .603 .621 BEVERAGE .666 .666 .733 .733 .6 .666 INFRA .657 .685 .685 .8 .6 .742 FINANCE .654 .555 .666 .617 .432 .432 SOFTWARE .633 .716 .65 .666 .666 .7 SEMI .628 .704 .676 .647 .609 .619 GREEN .619 .619 .619 .666 .666 .666 HOSPITAL .619 .571 .619 .523 .619 .666 ELECTRON .614 .648 .648 .635 .628 .621 GUNS .6 .666 .6 .6 .533 .6 HACKERS .55 .7 .5 .55 .55 .55 REIT .546 .46 .51 .503 .425 .468 REGBANKS .538 .461 .538 .538 .346 .423 ------------------------------------------------------------------------------------------------ EDU .5 .5 .5 .5 .666 .666 MILITARY .5 .464 .535 .571 .535 .535 BONDFUND .475 .712 .881 .95 .96 .99 BIOTECH .4 .437 .455 .434 .489 .51 UTILITY .394 .368 .447 .5 .421 .447 OILGAS .33 .322 .417 .401 .322 .377 COAL .285 .428 .428 .428 .428 .428 |
=========================================================================
8/26/2020
Peerless Remains Bearish on DJI
but TigerSoft Is Very Bullish on QQQ and NASDAQ.
When in doubt, Bet on the FED!
Weakness from the DJI seems likely immediately ahead. Just watching the
daily breadth is our warning now for the DJI. Negative daily breadth is beoming a
a pattern. NYSE breadth was negative on five of the last six days. This is
a problem technically. It means too much money is going into too few
stocks. An inordinate amount of money does seem to be going into high priced
tech
ETFs and tech stocks. This is stretching the tech bubble thinner and thinner.
At the same time, if it continues much longer our P-Indicator will turn negative
and this could cause a regular Sell S9, based on a negative 21-day ma
of advances minus declines.


How Much Higher Can The Leading Tech Stocks Go?
Fund managers see the super tech stocks as being
largely immune to the Covid-19
problems the rest of the economy must cope with. But they are also simply
rushing into the more speculative and strongest stocks for the sake of
performance and because they figure the FED will "backstop" them. What
choice
does the FED have and what choice do fund managers have? They latter know
it's all a game of "Musical Chairs", but each time they sell, they end up buying
at even higher prices.
The Dow Jones Committee, by inserting little known
CRM in place of Exxon, can be
seen as giving an unoffical stamp of approval to the new tech world and,
even, to the
bubble. That's why so many of the super tech stocks went wild today.
Sure, Investors'
Daily gives us perfunctory warnings that theNASDAQ is very over-bought and it must
soon deflate badly. But that is not what the FED wants. It would just
be too
dangerous for the FED to back off of QE-Infintity before the Election. It is
certainly
not what the President wants. And it is not even what the mainstream
Democrats want.
They tend to get lots of campaign contributions from Wall Street high tech
promoters
and from Silicon Valley. And if they are like Nancy Pelosi, they have
millions invested
in AAPL stock.
The NASDAQ and QQQ Are Showing All The Signs of More Gains Ahead


History
We can learn a lot about bubbles from history. Excessive confidence and Short
squeezes usually play featured parts. But big reversals are most often
brought about by changes of heart by the FED, especially in when it comes to
the role of short-term rates and tight money. (I wish I could show you here all the
cases in the past where this was true. I will have to produce a study of this.)
But look back at how short-term Federal Funds' rates rose in the year 2000.
They had to rise and hit 5% before DJI started falling in January and 5.34%
in March before the NASDAQ reached its peak. We are a very long way
from those rates!
DJI
NASDAQ
10/1/1999 4.75 10273
2737
11/1/1999 4.86 10649
2968
12/1/1999
5.0 10998
3354
1/1/2000 5.0
11497 high-11723 (1/14) 4069
2/1/2000
5.24 11041
4051
3/1/2000
5.34 10138
4784 high - 5049 (3/10)
4/1/2000 5.5
10980
4573
5/1/2000
5.71 10812
3958
6/1/2000
6.00 10652
3583
Just as the NASDAQ has ignored the DJI's weakness this year, so, too,
in the year 2000, it did, too.
But how much longer can the super tech stocks now appearing among our Bullish
MAXCPs and in our Super-7 keep rising with the DJI not even making a new high?
The experience of the year 2000 does warn us that even our own fantastic tech bubble
will eventually be burst and breakdown badly, probably once the NASDAQ's key
uptrend lines are broken. But that needs not happen for a while. Big money
and institutional buying seems ready to buy all dips on the NASDAQ. Tiger's very
high AI/200 scores in the NASDAQ, AAPL, MSFT and CRM are reliably bullish.
So are their flat-top breakouts, very high current Accumulation, Closing Power new
highs, the "Both Up" condition (both Opening and Closing Power rising),
confirming
OBV new highs and superior relative strength. These are the central themes of
Tiger's
Super Stocks.
Table 1
8/25/2018 QUICKSILVER on DJI-30 STOCKS.
P21 + ITRS score >+.25 is bullish
Note that AAPL now shows highest AI/200 stock here but CRM will
take over #1 position on 8/31 when it is added to DJIA.
7 Bullish (AAPL, HD, MCD, MSFT, NKE, PFE, PG) Bearish (INTC JPM)
STOCKS CLOSE CHANGE PIVOT-P 5-dma AROC CL-PWR Candl AI/200 IP21 ITRS --------------------------------------------------------------------------------------- --------------------------------------------------------------------------------------- AAPL 506.09 6.79 473.1 443.9% Bullish BLUE 174 .29 .363 Bullish --------------------------------------------------------------------- AXP 98.4 -.65 96.72 77.3% Bullish BLUE 103 .07 -.143 --------------------------------------------------------------------- BA 171.9 -2.83 169.58 76.5% ------- RED 44 -.095 -.205 --------------------------------------------------------------------- CAT 141.83 .68 137.48 136.7% ------- BLUE 136 .048 .016 --------------------------------------------------------------------- CSCO 42.25 .29 42.31 45.1% ------- BLUE 117 .057 -.165 --------------------------------------------------------------------- CVX 84.78 -1.35 84.81 -93.7% Bullish RED 89 .127 -.173 --------------------------------------------------------------------- DIS 132.18 2.39 128.12 171.2% Bullish BLUE 111 .121 .042 --------------------------------------------------------------------- GS 207.22 1.22 201.85 102.9% ------- BLUE 85 .034 -.086 --------------------------------------------------------------------- HD 291.93 5.8 280.68 159.7% Bullish BLUE 132 .21 .094 Bullish --------------------------------------------------------------------- IBM 124.17 -.47 123.15 13.3% ------- RED 123 .123 -.082 --------------------------------------------------------------------- INTC 49.55 .12 49.17 124.3% Bearish BLUE 113 -.109 -.254 Bearish --------------------------------------------------------------------- JNJ 152.3 .24 151.42 62.9% Bullish BLUE 125 .144 -.02 --------------------------------------------------------------------- JPM 99.09 -1.41 97.37 27.3% Bearish RED 51 -.168 -.103 Bearish --------------------------------------------------------------------- KO 48.16 .25 47.35 83% Bullish BLUE 93 .009 -.045 --------------------------------------------------------------------- MCD 213.76 1.11 209.88 100.6% Bullish BLUE 133 .25 .049 Bullish --------------------------------------------------------------------- MMM 163.9 .8 162.97 -2.1% ------- BLUE 113 .097 -.048 --------------------------------------------------------------------- MRK 85.54 -.14 85.03 29.9% Bullish BLUE 93 .174 .037 --------------------------------------------------------------------- MSFT 221.15 4.68 214.58 268.2% Bullish BLUE 174 .231 .068 Bullish --------------------------------------------------------------------- NKE 111.53 .02 108.01 142.9% Bullish RED 136 .291 .052 Bullish --------------------------------------------------------------------- PFE 38.05 -.36 38.72 -27.2% ------- RED 87 .206 .065 Bullish --------------------------------------------------------------------- PG 138.39 -.67 136.85 95.3% Bullish RED 99 .316 .097 Bullish --------------------------------------------------------------------- TRV 113.54 -2.08 112.53 15% ------- RED 113 -.011 -.097 --------------------------------------------------------------------- UNH 308.82 -3.4 313.33 -105.2% ------- RED 135 .216 -.02 |
Table 2 QUICKSILVER on ETFS - 08/26/20 Bullish = 6
Bearish = 0
ITRS + IP21>.25 is considered "Bullish"
ETF CLOSE CHANGE PIVOT-PT 5-dma AROC CL-PWR CANDLE IP21 ITRS --------------------------------------------------------------------------------------------- DIA 283.43 .81 277.87 107.1% Bullish BLUE .388 ----- Bullish --------------------------------------------------------------------------------------------- SPY 347.57 3.45 338.28 151.9% Bullish BLUE .515 .036 Bullish --------------------------------------------------------------------------------------------- QQQ 291.96 6.1 279.93 281.7% Bullish BLUE .375 .128 Bullish --------------------------------------------------------------------------------------------- MDY 351.86 -1.26 349.36 2% ------- RED .22 -.017 --------------------------------------------------------------------------------------------- IWM 155.42 -.98 155.76 -31.4% ------- RED .263 .002 Bullish --------------------------------------------------------------------------------------------- FAS 38.47 -.3 36.63 228.8% Bullish RED .113 .001 --------------------------------------------------------------------------------------------- SOXL 263.77 2.94 240.59 335.8% Bullish BLUE .326 .386 Bullish --------------------------------------------------------------------------------------------- TECL 361.39 20.91 314.77 910.1% Bullish BLUE .399 .569 Bullish --------------------------------------------------------------------------------------------- IBB 132.82 -.23 133.38 -36.2% Bearish RED .004 -.071 --------------------------------------------------------------------------------------------- GLD 183.36 2.14 183.5 30.8% Bearish BLUE .017 .056 --------------------------------------------------------------------------------------------- OIH 124.64 -4.18 127.98 -336.6% Bearish RED .005 -.164 --------------------------------------------------------------------------------------------- |
Table 3 Count of Stocks in Key Directories
20200826
-------------------------------
NEWHIGHS 273 Bullish >10:1 vs NLs
NEWLOWS 21
MAXCP 89
MINCP 62
TTTNH 14
TTTNL 56
FASTUP 61
FASTDOWN 98
CPCROSSA 94
CPCROSSD 52
BIGVOLUP 6
BIGVODN 4
ACCUMVER 88
REDSELL 74
AUGSELS7 45
TRAPDOOR 17
|
Table 4 RANKING OF KEY DIRECTORIES BASED PCT.OF STOCKS ABOVE 65-DMA
Bullish = 38
Bearish = 8
8/26/20
---------------------------------------------------------------------------------------
Directory Current day-1 day-2 day-3 day-4 day-5
----------------------------------------------------------------------------------------
COPPER 1 1 1 1 1 1
SOLAR 1 1 1 1 1 1
FOOD .924 .924 .905 .905 .905 .924
COMODITY .902 .902 .902 .902 .902 .902
AUTO .897 .897 .871 .897 .923 .923
ETFS .857 .839 .839 .803 .857 .875
GOLD .857 .816 .816 .836 .897 .877
TRANSP .8 .9 .9 .65 .65 .7
NASD-100 .787 .767 .737 .686 .696 .727
NIFTY .777 .777 .777 .733 .755 .777
INDEXES .769 .797 .797 .758 .769 .808
HOMEBLDG .764 .823 .823 .823 .823 .823
GAMING .761 .761 .809 .761 .761 .761
CHINA .76 .78 .78 .76 .78 .78
DOWJONES .733 .766 .766 .6 .6 .666
INSURANC .73 .807 .769 .576 .653 .692
CHEM .729 .77 .77 .708 .75 .77
INDMATER .729 .729 .729 .716 .756 .783
SOFTWARE .716 .666 .666 .666 .7 .716
BIGBANKS .714 .714 .714 .285 .428 .571
BONDFUND .712 .881 .95 .96 .99 .97
SEMI .704 .676 .647 .609 .628 .704
COMPUTER .7 .7 .65 .6 .6 .7
HACKERS .7 .55 .55 .55 .55 .6
DJI-13 .692 .769 .769 .538 .538 .615
INFRA .685 .685 .8 .6 .742 .771
FIDSTKS .683 .706 .7 .598 .627 .677
SP500 .674 .722 .722 .619 .64 .705
SP-100 .67 .714 .725 .604 .626 .703
BEVERAGE .666 .733 .733 .6 .666 .8
GUNS .666 .6 .6 .533 .666 .666
RUS-1000 .649 .697 .696 .603 .625 .685
ELECTRON .648 .648 .635 .628 .621 .702
JETS .642 .785 .857 .214 .428 .428
RETAIL .632 .653 .612 .53 .551 .632
GREEN .619 .619 .666 .666 .666 .809
HOSPITAL .571 .619 .523 .666 .666 .666
FINANCE .56 .67 .621 .439 .451 .536
-----------------------------------------------------------------------------
MILITARY .464 .535 .571 .535 .571 .607
REGBANKS .461 .538 .538 .346 .423 .5
REIT .46 .51 .503 .425 .468 .446
BIOTECH .431 .452 .431 .489 .515 .531
COAL .428 .428 .428 .428 .428 .571
EDU .4 .4 .4 .6 .6 .6
UTILITY .368 .447 .5 .421 .447 .473
OILGAS .322 .417 .401 .322 .385 .48
|
========================================================================
8/25/2020
Expect some
more downside volatility from the DJI this week. But
its rising Closing Power and very positive IP21 should bolster it. Meanwhile,
techs remain stronger. They are the leaders. See below: how the Dow Jones
people are upgrading the DJI-30. Watch the NYSE A/D Line. It is not far above
its uptrend and short-term rates are starting to rise again. But I doubt if the
FED will do anything to upset the bulls.

The Dow Jones Avg. Committee Is Doing Its
"Bit"
When AAPL splits 4:1 on August 31st, there
will suddenly be a need for
a lot less AAPL shares in the funds that seek to match the DJIA. Such funds
and their derivatives are very popular. Will these funds suddenly sell 75% of their
AAPL shares all at once? (Remember that AAPL at $125 will have only 1/4 of
its weigth in the DJ Index when it was $500.) So, their selling could cause a lot of
profit-taking in hyperbolic AAPL. Extra downside volatility now with the
DJI 3%
over the 21-day ma is to be expected, based on the Peerless Sell S9-V. But the
DJI's IP21 (current Accumulation Index) is so high, it's unlikely it will retreat
by much.

The Dow Jones people are trying to avoid a falling AAPL, too. They are doing
this by giving all of us a few days' notice of some big changes they are making
in the index. By far the most important is that they are adding CRM (Salesforce)
with its very high AI/200 score and excellent relative (ITRS= +.116 ) as a
replacement
for dinosaur fossile fuel stock Exxon .
The addition of CRM comes as a suprise. A lot of investors do not know much
about the company. The Dow Jones folks are also dropping sleepy PFE and
military-bound RTX with AMGN and HON. But its the choice of CRM that is most
interesting. A rise by CRM of 100 points would single-handedly boost the DJI up
nearly
700 points. CRM is now the highest AI/200 stock in the DJI. With an AI/200
score
above 193, its gain over the next 2 years could be nearly 100%.

Can Trump Win?
The BBC I just read makes that case for Trump having a 33% chance now,
based on battle-ground state leads by Biden and the wagering by bettors
on the Election's outcome.
A Trump win over Biden would help the stock market. We can easily see this
by how much it jumped in Novermber 2016 when Trump beat Hillary Clinton
in the all-important Electoral Collage. We can see it also in how differently the
market has behaved in the past when a Republican wins re-election from when
he does not.
Incumbent Republican Winning Re-Election:
In 4 of 5 cases here, the DJI fell until a bottom in October or November
before rallying strongly in the new year. Low interest rates helped in
1901 and 1925.
1. McKinley in 1900.
DJI peaked in mid August 1900 at 59 and fell to 53.
in September.
DJI then rose from 53 to 74 in April
1901.
2. Coolidge in 1924. Fed was pumping money into banks.
DJI peaked in mid August 1924 at 105.6 and fell to
100.2 in October.
DJI then rose from 100.2 to 124.3 in in
early 1925.
3. Eisenhower in 1956
DJI peaked in early August 1956 at 521 and fell to
466 in late November.
DJI then rose back to 500 at end of year, re-tested Nov. low and
rallied to 518 July peak and Sell S9 which
started a 20% decline.
Rising interest rates befell market in early and mid 1957.
4. Reagan in 1984
DJI peaked in August 1984 at 1250 and fell to 1170
in early November.
DJI then rose back to 1300 in February and
much higher in late 1985.
5. Bush Jr. in 2004.
DJI peaked on September 7, 2004 at 10342 and fell to
9750 in late October.
DJI then rose back to 10900 in late
February.
Incumbent Republican Losing Re-Election:
In the first 3 cases below, the DJI fell all year and more the year after the
Election.
in 1976, there was a brief December rally. In 1992, Clinton was preffered y Wall
Street to Bush and the Septmber decline based on uncertainty quickly gave way|
to a new Wall Street confidence in the White House.
1. Harris in 1892
DJI peaked in mid August 1892 at 93 and fell to 86.
in September.
DJI rebounded to 91 in October.
It then fell to 86 in December and then
dropped sharply to 62 in July 1893.
2. Taft in 1912
DJI peaked in late September 1912 at 94 and
fell to 85 in December
and then 78 in mid March 1913 .
3. Hoover in 1932
DJI peaked in early September 1932 at 79 and
fell to 51 in February 1933.
4. Ford in 1976
DJI peaked in late September 1976 at 1014 and fell
to 920 in November 1976
After a brief December rally back to 980, the DJI fell steadily the next year to 720..
5. Bush Sr. in 1992
DJI peaked in mid September 1976 at 3376 and fell to
3150 in early October
1976. Clinton
was Wall Street's man in the White House and 1993 was
a bullish year.
|
Charts 8/25/2020 (Click on Underlined link.) 2020 PEERLESS DJI, Signals, Indicators Daily DJI Volume 10-DayUp/Down Vol Stoch-20 Inverted Traders Index Graph of Pct of All Stocks above 65-dma Cum. Inverted Traders Index NASDAQ S&P OEX NYSE COMPQX DJI-15 DJI-20 DJI-30 DIA QQQ MDY IWM TNA Short-Term Rates DOLLAR-UUP SPY http://tigersoft.com/2121CST/SPY.GIF recent 2006 vers-Peerless signals -- http://tigersoft.com/NEWPEER/UPD6825.BMP USO-CrudeOil DBO FAS GLD BBH IBB JETS JNUG KOL NUGT OIH PALL RSX RETL SDS AGQ SLV SOXL TECL TLT TMF TNA UGA (gasoline) USO (oil) and China: YINN CHAU Commodities: CANE CORN DBC JJC, NIB, CHOC CORN, CUT (paper) MOO, SOYB WEAT UUP (Dollar) LIT (Lithium) Stocks AAPL ADBE ALXN AMAT AMGN AMD AMZN AXP BA BABA BAC BIDU BLDP CAT CVX CMG DE ENPH FB GILD GOOG GS HD IBM INTU JPM LRCX M (Macy's) MSFT NEM NFLX NKE NVDA PG REGN REV SO SQ QCOM QDEL TSLA TXN XOM V VRTX WFC WMT TOWN ZM New highs and Bullish MAXCPs http://tigersoft.com/MAXCP/8-25/BULLISH.htm Bearish MAXCPs - http://tigersoft.com/MINCP/8-25/BEARISH.htm |
Table 1
8/25/2018 QUICKSILVER on DJI-30 STOCKS.
P21 + ITRS score >+.25 is bullish
Note that AAPL now shows highest AI/200 stock here.
4 Bullish (AAPL, NKE, PFE, PG) 3 Bearish (INTC)
503 112 39 139 +793 49 = -49
NET = +455
STOCKS CLOSE CHANGE PIVOT-P 5-dma AROC CL-PWR Candl AI/200 IP21 ITRS
---------------------------------------------------------------------------------------
---------------------------------------------------------------------------------------
AAPL 499.3 -4.13 462.83 386.1% Bullish BLUE 174 .249 .362 Bullish
---------------------------------------------------------------------
AXP 99.05 -.28 96.89 122.5% Bullish RED 102 .036 -.141
---------------------------------------------------------------------
BA 174.73 -3.54 169.27 131.6% ------- RED 44 -.08 -.179 Bearish
---------------------------------------------------------------------
CAT 141.15 -.53 138.02 100.1% ------- RED 136 -.002 .048
---------------------------------------------------------------------
CSCO 41.96 -.22 41.87 -2.4% ------- RED 116 -.01 -.169
---------------------------------------------------------------------
CVX 86.13 -1.07 86.39 -87% ------- RED 89 .134 -.15
---------------------------------------------------------------------
DIS 129.79 -.9 127.77 33.8% Bullish RED 110 .108 .015
---------------------------------------------------------------------
GS 206 -1.34 203.02 115.4% Bearish RED 85 -.033 -.095
---------------------------------------------------------------------
HD 286.13 -.62 282.86 19.9% Bullish RED 131 .139 .092
---------------------------------------------------------------------
IBM 124.64 -1.04 123.84 -11.3% ------- RED 123 .11 -.069
---------------------------------------------------------------------
INTC 49.43 .29 48.33 79.7% Bearish BLUE 114 -.188 -.271 Bearish
---------------------------------------------------------------------
JNJ 152.06 -.09 150.39 65.1% Bullish RED 124 .061 -.017
---------------------------------------------------------------------
JPM 100.5 .44 98.55 110.9% ------- RED 52 -.126 -.101
---------------------------------------------------------------------
KO 47.91 -.06 47.37 -53.5% Bullish RED 92 -.073 -.059
---------------------------------------------------------------------
MCD 212.65 .03 209.51 55.3% Bullish RED 132 .147 .028
---------------------------------------------------------------------
MMM 163.1 -.43 163.97 -39.2% ------- RED 113 .046 -.06
---------------------------------------------------------------------
MRK 85.68 .26 85.03 65.9% Bullish RED 92 .148 .064
---------------------------------------------------------------------
MSFT 216.47 2.78 209.7 117.2% Bullish BLUE 173 .172 .052
On verge of flat-top breakout.
---------------------------------------------------------------------
NKE 111.51 -.32 108.39 208.3% Bullish RED 135 .281 .046 Bullish - Running
---------------------------------------------------------------------
PFE 38.41 -.43 38.26 6.5% ------- RED 86 .236 .057 Bullish - To be dropped.
---------------------------------------------------------------------
PG 139.06 .55 135.77 93.1% Bullish BLUE 98 .362 .098 Bullish
---------------------------------------------------------------------
TRV 115.62 .72 113.2 30.4% ------- RED 113 -.019 -.087
---------------------------------------------------------------------
UNH 312.22 3.38 315.4 -73.2% ------- ---- 135 .212 -.003
============================================================================================
8/31/2020 - To be dropped: XOM (weak), PFE and RTX
To be added CRM (very high AI/200 and NH today), AMGN and HON.
|
Table 3 QUICKSILVER on ETFS - 08/25/20 Bullish = 6
Bearish = 0
ITRS + IP21>.25 is considered "Bullish"
ETF CLOSE CHANGE PIVOT-PT 5-dma AROC CL-PWR CANDLE IP21 ITRS --------------------------------------------------------------------------------------------- DIA 282.62 -.56 277.43 79.2% Bullish RED .326 ---- Bullish --------------------------------------------------------------------------------------------- SPY 344.12 1.2 337.23 80.8% Bullish BLUE .431 .027 Bullish --------------------------------------------------------------------------------------------- QQQ 285.86 2.23 276.1 140.9% Bullish BLUE .289 .103 Bullish --------------------------------------------------------------------------------------------- MDY 353.12 -.67 351.72 -1% Bullish RED .194 -.012 --------------------------------------------------------------------------------------------- IWM 156.4 .17 156.4 .3% ------- RED .256 .015 Bullish --------------------------------------------------------------------------------------------- FAS 38.77 .5 36.76 203.7% Bullish RED .106 .043 --------------------------------------------------------------------------------------------- SOXL 260.83 8.14 247.02 180.1% Bullish BLUE .252 .427 Bullish --------------------------------------------------------------------------------------------- TECL 340.48 4.93 302.44 568.1% Bullish BLUE .347 .56 Bullish --------------------------------------------------------------------------------------------- IBB 133.05 2 133.78 -81.5% Bearish BLUE-.026 -.074 --------------------------------------------------------------------------------------------- GLD 181.22 .22 182.24 -189.8% Bearish BLUE .023 .022 --------------------------------------------------------------------------------------------- OIH 128.82 -1.17 133.3 -194% Bearish RED -.009 -.137 --------------------------------------------------------------------------------------------- |
Table 3 Count of Stocks in Key Directories
20200825
-------------------------------
NEWHIGHS 195
NEWLOWS 30
MAXCP 50
MINCP 37
TTTNH 9
TTTNL 48
FASTUP 53
FASTDOWN 80
CPCROSSA 65
CPCROSSD 58
BIGVOLUP 4
BIGVODN 5
ACCUMVER 86
HIGHIP21 39
HIUPPCT 35
REDSELL 78
AUGSELS7 71
TRAPDOOR 17
|
Table 4 RANKING OF KEY DIRECTORIES BASED PCT.OF STOCKS ABOVE 65-DMA
8/25/20
Bullish = 41
Bearish = 4
---------------------------------------------------------------------------------------
Directory Current day-1 day-2 day-3 day-4 day-5
----------------------------------------------------------------------------------------
COPPER 1 1 1 1 1 1
SOLAR 1 1 1 1 1 .933
FOOD .924 .905 .905 .905 .924 .924
COMODITY .902 .902 .902 .902 .902 .902
TRANSP .9 .9 .65 .65 .8 .7
AUTO .897 .871 .897 .923 .923 .923
BONDFUND .881 .95 .96 .99 .97 .99
ETFS .839 .839 .803 .857 .892 .946
HOMEBLDG .823 .823 .823 .823 .823 .823
GOLD .816 .816 .836 .897 .897 .959
INSURANC .807 .769 .576 .653 .692 .846
INDEXES .797 .797 .758 .769 .808 .814
JETS .785 .857 .214 .428 .571 .428
CHINA .784 .784 .764 .784 .784 .843
NIFTY .777 .777 .733 .755 .777 .777
CHEM .77 .77 .708 .75 .791 .791
DJI-13 .769 .769 .538 .538 .615 .692
NASD-100 .767 .747 .696 .696 .727 .777
DOWJONES .766 .766 .6 .6 .666 .7
GAMING .761 .809 .761 .761 .761 .809
BEVERAGE .733 .733 .6 .666 .8 .8
INDMATER .729 .729 .716 .756 .783 .797
SP500 .722 .724 .619 .64 .712 .731
BIGBANKS .714 .714 .285 .428 .571 .571
SP-100 .714 .725 .604 .626 .703 .714
FIDSTKS .706 .7 .598 .627 .683 .717
COMPUTER .7 .65 .6 .6 .7 .75
RUS-1000 .697 .697 .603 .625 .692 .712
INFRA .685 .8 .6 .742 .771 .771
SEMI .676 .647 .609 .628 .714 .714
FINANCE .67 .621 .439 .451 .56 .524
SOFTWARE .666 .683 .666 .7 .716 .716
RETAIL .653 .612 .53 .551 .653 .693
ELECTRON .648 .635 .628 .621 .709 .702
GREEN .619 .666 .666 .666 .809 .857
HOSPITAL .619 .523 .666 .714 .666 .666
GUNS .6 .6 .533 .666 .666 .666
HACKERS .55 .6 .55 .55 .6 .65
REGBANKS .538 .538 .346 .423 .5 .5
MILITARY .535 .571 .535 .571 .607 .642
REIT .51 .503 .425 .468 .453 .546
=============================================================================================
BIOTECH .447 .429 .486 .515 .539 .552
UTILITY .447 .5 .421 .447 .473 .5
COAL .428 .428 .428 .428 .571 .714
OILGAS .417 .401 .322 .385 .48 .48
EDU .4 .4 .6 .6 .6 .6
|
======================================================================
8/24/2020
Trump and the DJIA
Are Going To Make The Next Ten Weeks Very Exciting.
Despite the Peerless Sells, I have been saying the DJI seems to have its sights
set on 29550. Today was proof of that. Stick with the A/D Line trend and
the Closing Power uptrends with the Bullish MAXCPs. Hedging with some
Bearish MINCPs is advised if you think Peerless will ultimately prevail in
this most unusual year.


The SP-500 made an all-time high today, joining the NASDAQ and the OEX.
The DJI needs only rise another 1250 points, or 4.4%, and it will be making
all-time highs, too. As you can see in the DJI chart above, it has completed
a bullish "alligator head" pattern breakout. And today was a very bullish
day
technically. Breadth completely turned around from last Friday. The tech
advance
even spread to the beaten down banks, BA and poor REV. These are stocks the
shorts love. Their rallies today show that professional shorts are very nervous.
Notice
how much higher advancing volume was relative to decliining volume. The new highs
are expanding. And it's happening in China, too Chinese funds like CHIIQ, TDF
and CHN made new highs today, as did BABA.


A Trump Victory? Maybe.
Let me suggest the following. The market would not be going up like this if it
believed that Biden would easily beat Trump. It's going up because the FED belives
that Trump, who they surely favor, has a fighting chance to win. So, they're
doing all they can to boost the market now before the Election. Too cynical.
Powell
is a Washington corporate lawyer. He's about as apolitical as Nancy Pelosi is.
If you watch CNN, you would think that the American voter cares about what
Trump's sister or neice thinks of him persomally. Most voters care about their
jobs and their pocket-books. A rising stock market does translate into more jobs
eventually. Biden and crew need to talk a lot more about how they are going to
fix the economy. Remember, they have to compete with Trump who can just point
to how the stock market is making new highs. CNN loves to tell you that Biden is
ahead of Trump by 8%to 10% nationally. But Biden's lead is shrinking. And, in
any
case, we don't have national elections by poll. We have the Electoral College
system,
Trump could lose by 10 million votes nationally and still win the Electoral College.
|
Charts 8/24/2020 (Click on Underlined link.) 2020 PEERLESS DJI, Signals, Indicators Daily DJI Volume 10-DayUp/Down Vol Stoch-20 Inverted Traders Index Graph of Pct of All Stocks above 65-dma Cum. Inverted Traders Index NASDAQ S&P OEX NYSE COMPQX DJI-15 DJI-20 DJI-30 DIA QQQ MDY IWM TNA Short-Term Rates DOLLAR-UUP SPY http://tigersoft.com/2121CST/SPY.GIF recent 2006 vers-Peerless signals -- http://tigersoft.com/NEWPEER/UPD6824.BMP USO-CrudeOil DBO FAS GLD BBH IBB JETS JNUG KOL NUGT OIH PALL RSX RETL SDS AGQ SLV SOXL TECL TLT TMF TNA UGA (gasoline) USO (oil) and China: YINN CHAU Commodities: CANE CORN DBC JJC, NIB, CHOC CORN, CUT (paper) MOO, SOYB WEAT UUP (Dollar) LIT (Lithium) Stocks AAPL ADBE ALXN AMAT AMGN AMD AMZN AXP BA BABA BAC BIDU BLDP CAT CVX CMG DE ENPH FB GILD GOOG GS HD IBM INTU JPM LRCX M (Macy's) MSFT NEM NFLX NKE NVDA PG REGN REV SO SQ QCOM QDEL TSLA TXN XOM V VRTX WFC WMT TOWN ZM New highs and Bullish MAXCPs http://tigersoft.com/MAXCP/8-24/BULLISH.htm Bearish MAXCPs - http://tigersoft.com/MINCP/8-24/BEARISH.htm |
Table 1
8/24/2018 QUICKSILVER on DJI-30 STOCKS.
P21 + ITRS score >+.25 is bullish
Note that AAPL now shows highest AI/200 stock here.
4 Bullish (AAPL, NKE, PFE, PG) 3 Bearish (INTC)
503 112 39 139 +793 49 = -49
NET = +455
STOCKS CLOSE CHANGE PIVOT-P 5-dma AROC CL-PWR Candl AI/200 IP21 ITRS
---------------------------------------------------------------------------------------
---------------------------------------------------------------------------------------
AAPL 503.43 5.95 462.25 477.9% Bullish RED 174 .245 .383 Bullish
---------------------------------------------------------------------
AXP 99.33 3.18 96.67 91.9% Bullish BLUE 101 .086 -.126
---------------------------------------------------------------------
BA 178.27 10.77 170.23 184.4% Bullish BLUE 44 -.084 -.162
---------------------------------------------------------------------
CAT 141.68 3.25 138.37 107.1% ------- BLUE 137 .058 .047
---------------------------------------------------------------------
CSCO 42.18 -.07 41.98 10.7% ------- BLUE 117 .028 -.167
---------------------------------------------------------------------
CVX 87.2 2.12 87.63 -205.3% Bullish BLUE 89 .197 -.159
---------------------------------------------------------------------
DIS 130.69 3.25 128.92 51.4% Bullish BLUE 109 .107 .029
---------------------------------------------------------------------
GS 207.34 4.91 201.31 105.5% ------- BLUE 86 .024 -.075
---------------------------------------------------------------------
HD 286.75 3.52 285 -26.2% Bullish BLUE 131 .14 .08
---------------------------------------------------------------------
IBM 125.68 2.52 124.92 50% ------- BLUE 123 .186 -.072
---------------------------------------------------------------------
INTC 49.14 -.14 48.65 21.5% Bearish RED 115 -.273 -.275 Bearish
---------------------------------------------------------------------
JNJ 152.15 -.61 150.09 104.8% Bullish RED 123 .038 -.033
---------------------------------------------------------------------
JPM 100.06 2.74 98.32 17.8% ------- BLUE 53 -.111 -.101
---------------------------------------------------------------------
KO 47.97 .69 48.42 -25.1% Bullish BLUE 92 -.027 -.051
---------------------------------------------------------------------
MCD 212.62 1.05 210.32 94.1% Bullish BLUE 131 .186 .021
---------------------------------------------------------------------
MMM 163.53 1.82 164.38 -36.1% ------- BLUE 113 .114 -.047
---------------------------------------------------------------------
MRK 85.42 .44 84.56 38.9% Bullish BLUE 91 .211 .017
---------------------------------------------------------------------
MSFT 213.69 .67 211.49 80.5% Bullish RED 172 .179 .035
---------------------------------------------------------------------
NKE 111.83 2.08 106.97 286.3% Bullish BLUE 134 .273 .057 Bullish
---------------------------------------------------------------------
PFE 38.84 -.04 38.36 63.6% ------- RED 85 .22 .048 Bullish
---------------------------------------------------------------------
PG 138.51 1.07 136.51 110.3% Bullish BLUE 97 .347 .095 Bullish
---------------------------------------------------------------------
TRV 114.9 3.07 114.93 -44.4% ------- BLUE 113 -.032 -.089
---------------------------------------------------------------------
UNH 308.84 -5.3 316.81 -184.6% ------- RED 135 .164 -.02
|
Table 3 QUICKSILVER on ETFS - 08/24/20 Bullish = 5
Bearish = 0
ITRS + IP21>.25 is considered "Bullish"
ETF CLOSE CHANGE PIVOT-PT 5-dma AROC CL-PWR CANDLE IP21 ITRS --------------------------------------------------------------------------------------------- DIA 283.18 3.89 278.2 76% Bullish BLUE .363 ---- Bullish --------------------------------------------------------------------------------------------- SPY 342.92 3.44 338.64 74% Bullish BLUE .433 .024 Bullish --------------------------------------------------------------------------------------------- QQQ 283.63 1.76 277.97 149.3% Bullish RED .285 .099 Bullish --------------------------------------------------------------------------------------------- MDY 353.79 5.26 353.19 -37.9% ------- BLUE .227 -.001 --------------------------------------------------------------------------------------------- IWM 156.23 1.62 156.39 -53.5% ------- BLUE .266 .027 Bullish --------------------------------------------------------------------------------------------- FAS 38.27 1.89 37.26 63.6% ------- BLUE .128 .057 --------------------------------------------------------------------------------------------- SOXL 252.69 6.8 251.91 -69.5% ------- RED .265 .435 Bullish --------------------------------------------------------------------------------------------- TECL 335.55 9.48 304.5 559.3% Bullish RED .347 .574 Bullish --------------------------------------------------------------------------------------------- IBB 131.05 -1.55 135.22 -184.1% Bearish RED -.027 -.08 --------------------------------------------------------------------------------------------- GLD 181 -1.03 188.18 -149.1% Bearish RED .003 .01 --------------------------------------------------------------------------------------------- OIH 129.99 6.89 133.85 -297.2% ------- BLUE .052 -.132 --------------------------------------------------------------------------------------------- |
TABLE 3 Count of Stocks in Key Directories
20200824
-------------------------------
NEWHIGHS 240
NEWLOWS 55
MAXCP 47
MINCP 56
TTTNH 16
TTTNL 42
FASTUP 36
FASTDOWN 124
CPCROSSA 275
CPCROSSD 41
BIGVOLUP 1
BIGVODN 5
ACCUMVER 85
HIGHIP21 43
HIUPPCT 27
REDSELL 74
AUGSELS7 62
TRAPDOOR 18
|
RANKING OF KEY DIRECTORIES BASED PCT.OF STOCKS ABOVE 65-DMA 8/24/20 --------------------------------------------------------------------------------------- Directory Current day-1 day-2 day-3 day-4 day-5 ---------------------------------------------------------------------------------------- COPPER 1 1 1 1 1 1 SOLAR 1 1 1 1 1 1 BONDFUND .95 .96 .99 .97 .99 .98 FOOD .905 .905 .905 .924 .924 .924 COMODITY .902 .902 .902 .902 .902 .902 TRANSP .9 .65 .65 .8 .8 .8 AUTO .871 .897 .923 .923 .923 .948 JETS .857 .214 .428 .571 .571 .642 ETFS .839 .803 .857 .892 .946 .875 HOMEBLDG .823 .823 .823 .823 .823 .823 GOLD .816 .836 .897 .897 .959 .959 GAMING .809 .761 .761 .761 .809 .809 INFRA .8 .6 .742 .771 .8 .828 INDEXES .797 .758 .769 .808 .814 .831 CHINA .784 .764 .784 .784 .843 .823 NIFTY .777 .733 .755 .777 .8 .755 CHEM .77 .708 .75 .791 .791 .812 DJI-13 .769 .538 .538 .615 .692 .769 INSURANC .769 .576 .653 .692 .846 .807 DOWJONES .766 .6 .6 .666 .7 .766 NASD-100 .747 .707 .707 .727 .787 .777 BEVERAGE .733 .6 .666 .8 .8 .733 INDMATER .729 .716 .756 .783 .797 .81 SP-100 .725 .604 .626 .703 .714 .758 SP500 .724 .621 .64 .712 .739 .777 BIGBANKS .714 .285 .428 .571 .571 .714 FIDSTKS .7 .598 .627 .683 .723 .745 RUS-1000 .697 .604 .625 .692 .717 .764 SOFTWARE .683 .683 .7 .716 .716 .716 GREEN .666 .666 .666 .809 .857 .809 COMPUTER .65 .6 .6 .7 .75 .75 SEMI .647 .609 .628 .714 .733 .79 ELECTRON .635 .628 .621 .709 .716 .777 FINANCE .621 .439 .451 .56 .548 .719 RETAIL .612 .53 .551 .653 .693 .836 GUNS .6 .533 .666 .666 .666 .666 HACKERS .6 .6 .55 .6 .65 .65 MILITARY .592 .555 .592 .629 .666 .703 REGBANKS .538 .346 .423 .5 .538 .692 HOSPITAL .523 .666 .714 .714 .666 .666 REIT .503 .425 .468 .453 .546 .617 UTILITY .5 .421 .447 .473 .5 .552 COAL .428 .428 .428 .571 .714 .714 BIOTECH .424 .484 .513 .539 .562 .581 OILGAS .401 .322 .385 .48 .48 .551 EDU .4 .6 .6 .6 .6 .8 |
========================================================================
8/21/2020
Tech Takeover
AAPL single-handedly accounted for 185 of the 190 DJI point gain on Friday.
The bulls and performance-minded traders that are jumping aboard AAPL
are paying no mind to high PEs, Covid-19 or even the fact that on Fridat there
were 955 more down than up on the NYSE. Some, no doubt, are hoping that
a super-strong market this week will turn the tide for Trump and give him
four more years. For the market not to go up this coming week when he is
speaking at the Republican Convention would be downright rude and impolite
considering all he has done to boost the market since 2017

The DJI is still the most commonly watched index of the stock market. But traders
know that the real action now is in a handful of super high performance
technology stocks, especially AMZN, AAPL, NVDA and TSLA. Watch their
trendlines. Until they break these trendlines, the recovery is very much still
alive.
How long can this super high performance tech bubble last? The answer: a lot
longer than the bearish shorts and nay-sayers can tolerate if they fight the up-trends
and try to go short at a top.
DJI now shows a bullish "alligator head" price pattern.
Breakouts to new highs above these patterns are exciting
and reliably bullish.

Even non-partisan buyers should trust the FED now. Never before have they
pumped so much liquidity into the market. As a result, the probablity is high that
DJI will make a new high above 29500 to finally match the new all-times highs
made by the other indexes. True, we have lots of Peerless Sells. But this is
no
ordinary year. Certainly, as long as the NYSE A/D Line keeps risiing, I think
have to let the market run out of respect for QE-Infinity.
What History Shows
History strongly suggests that a bull markets can rise a lot longer than most traders
expect. The examples below show what happens when the FED is in charge,
like now.
At the start of 1929, the DJI-30's leader RCA reached 480 and then split
10:1. Like AAPL now, the pre-split RCA drove the DJI up steeply. With RCA
having
finally split, the FED began talking about the market being overly speculative. The
DJI
fell fell back to the lower band twice in the first half of 1929, but the FED could not
agree to raise rates and a summer rally sent the DJI up 25% above its February and
May lows. Only when the Bank of England raised their Key Lending Rate from 4%
to 6 1/2 % in September 1929, did the equity bubble burst in New York. Meanwhile,
for seven months the NYS A/D Line had lagged and the Accumulation Index was
negative.

In 1972, the Republican Richard Nixon was running for re-election. The FED
kept rates low during the campaign, but started raising them early in 1973. That's
when the market fell apart. Before then, in 1972, the A/D Line had been falling for
months and still the DJI held up.

In 1999-2000, the internet boom drove the NASDAQ higher and higher
despite a lagging DJI and a falling NYSE A/D Line in 1999. Only in January 2000
did Fed Chairman Greenspan finally start raising rates. That quickly drove the
DJI down 17%, but not the NASDAQ, which rose another 30% from the
end of January to its March peak.


What about how a big DJI recovery ends when the FED sponsors the rally? The
best example of this is from the year 1932. The FED pumped in lots of liquidity in
the
Summer of 1932. It caused the DJI to nearly double, rising from 42 to 79
in seven weeks. But then the FED became nervous and stopped buying so
much debt from the banks. A head/shoulders quickly developed and the
DJI fell back from 79 to 50 in March the next year, just before Frankin Roosevelt,
the Democrat took over.

These four cases tell me that it is the FED that is now in control As long as they
do not change their minds, 29500 on the DJI seems the target,
The second central point here is that the DJI is not really the story. As long as
the FED "backstops" the market, traders will naturally gravitate to the
riskier
tech stocks. At some point, professional traders will get word as insiders
always do
that the FED is no longer on their side. At that point, there will then be some
very mean profit-taking. So watch the techs' uptrendllines.
We can also watch for signs of this change by watching short-term rates. More on this
tomorrow night. They are still falling. And we can watch to see if
Gold goes up too much and the Dollar breaks down badly. These events would
probably force the FED to reverse course, too. But this also has not
happened.
Lastly, watch the Republican Convention. To the extent that the President can find
the right words and retain his indomitable spirit, he could still win.
|
Charts 8/21/2020 (Click on Underlined link.) 2020 PEERLESS DJI, Signals, Indicators Daily DJI Volume 10-DayUp/Down Vol Stoch-20 Inverted Traders Index Graph of Pct of All Stocks above 65-dma Cum. Inverted Traders Index NASDAQ S&P OEX NYSE COMPQX DJI-15 DJI-20 DJI-30 DIA QQQ MDY IWM TNA Short-Term Rates DOLLAR-UUP SPY http://tigersoft.com/2121CST/SPY.GIF recent 2006 vers-Peerless signals -- http://tigersoft.com/NEWPEER/UPD6821.BMP USO-CrudeOil DBO FAS GLD BBH IBB JETS JNUG KOL NUGT OIH PALL RSX RETL SDS AGQ SLV SOXL TECL TLT TMF TNA UGA (gasoline) USO (oil) and China: YINN CHAU Commodities: CANE CORN DBC JJC, NIB, CHOC CORN, CUT (paper) MOO, SOYB WEAT UUP (Dollar) LIT (Lithium) Stocks AAPL ADBE ALXN AMAT AMGN AMD AMZN AXP BA BABA BAC BIDU BLDP CAT CVX CMG DE ENPH FB GILD GOOG GS HD IBM INTU JPM LRCX M (Macy's) MSFT NEM NFLX NKE NVDA PG REGN REV SO SQ QCOM QDEL TSLA TXN XOM V VRTX WFC WMT TOWN ZM New highs and Bullish MAXCPs http://tigersoft.com/MAXCP/8-21/BULLISH.htm Bearish MAXCPs - http://tigersoft.com/MINCP/8-21/BEARISH.htm |
Table 1
8/21/2018 QUICKSILVER on DJI-30 STOCKS.
P21 + ITRS score >+.25 is bullish
Note that AAPL now shows highest AI/200 stock here.
4 Bullish (AAPL, NKE, PFE, PG) 3 Bearish (BA, JPM, INTC)
498 106 38 137 +769 168 97 49 = -314
NET = +455
STOCKS CLOSE CHANGE PIVOT-P 5-dma AROC CL-PWR Candl AI/200 IP21 ITRS
---------------------------------------------------------------------------------------
---------------------------------------------------------------------------------------
AAPL 497.48 24.38 458.43 408.5% Bullish BLUE 174 .315 .373 Bullish
---------------------------------------------------------------------
AXP 96.15 -.57 97.55 -218.1% ------- RED 100 .033 -.133
---------------------------------------------------------------------
BA 167.5 -2.08 172.01 -307.9% Bearish RED 44 -.185 -.123 Bearish
---------------------------------------------------------------------
CAT 138.43 .95 138.72 -55.2% ------- BLUE 137 .019 .031
---------------------------------------------------------------------
CSCO 42.25 -.06 42.09 -29.7% ------- BLUE 117 .013 -.141
---------------------------------------------------------------------
CVX 85.08 .27 90.77 -299.5% Bearish BLUE 89 .124 -.156
---------------------------------------------------------------------
DIS 127.44 -.68 129.37 -119.8% Bullish RED 108 .099 .023
---------------------------------------------------------------------
GS 202.43 .58 203.07 -136.2% ------- BLUE 86 -.086 -.065
---------------------------------------------------------------------
HD 283.23 2.55 288.24 47.3% ------- BLUE 131 .089 .075
---------------------------------------------------------------------
IBM 123.16 .01 124.44 -84.9% ------- BLUE 123 .114 -.065
---------------------------------------------------------------------
INTC 49.28 .11 48.93 40% Bearish BLUE 116 -.27 -.283 Bearish
---------------------------------------------------------------------
JNJ 152.76 1.34 148.99 150.8% Bullish BLUE 122 -.002 -.024
---------------------------------------------------------------------
JPM 97.32 -.05 99.71 -256.4% Bearish BLUE 54 -.192 -.107 Bearish
---------------------------------------------------------------------
KO 47.28 -.07 48.21 -122% Bearish RED 92 -.051 -.07
---------------------------------------------------------------------
MCD 211.57 1.69 208.67 108.6% Bullish BLUE 130 .206 .02
---------------------------------------------------------------------
MMM 161.71 -1.26 164.71 -133.5% ------- BLUE 113 .072 -.047
---------------------------------------------------------------------
MRK 84.98 -.05 84.76 88.7% Bullish RED 90 .162 -.01
---------------------------------------------------------------------
MSFT 213.02 -1.56 210.28 97.6% Bullish RED 171 .208 .035
---------------------------------------------------------------------
NKE 109.75 1.74 105.66 155% Bullish BLUE 133 .215 .045 Bullish
---------------------------------------------------------------------
PFE 38.88 .16 38.35 106.9% ------- ---- 84 .194 .059 Bullish
---------------------------------------------------------------------
PG 137.44 .59 135.5 86.1% Bullish BLUE 96 .293 .074 Bullish
---------------------------------------------------------------------
TRV 111.83 -.7 115.91 -294.3% Bearish RED 113 -.115 -.097
---------------------------------------------------------------------
UNH 314.14 .81 320.51 -150.3% ------- BLUE 135 .178 -.001
|
Table 2 QUICKSILVER on ETFS - 08/21/20 Bullish = 5
Bearish = 0
ITRS + IP21>.25 is considered "Bullish"
ETF CLOSE CHANGE PIVOT-PT 5-dma AROC CL-PWR CANDLE IP21 ITRS --------------------------------------------------------------------------------------------- DIA 279.29 1.42 278.95 -9.2% ------- BLUE .292 ---- Bullish --------------------------------------------------------------------------------------------- SPY 339.48 1.2 337.91 39.1% Bullish BLUE .394 .021 Bullish --------------------------------------------------------------------------------------------- QQQ 281.87 1.94 275.32 175.7% Bullish BLUE .318 .096 Bullish --------------------------------------------------------------------------------------------- MDY 348.53 -.83 356.46 -98.4% ------- BLUE .153 -.001 --------------------------------------------------------------------------------------------- IWM 154.61 -1.15 157.9 -79.1% ------- RED .203 .037 --------------------------------------------------------------------------------------------- FAS 36.38 -.25 37.8 -250.4% ------- RED .064 .089 --------------------------------------------------------------------------------------------- SOXL 245.89 5.3 256.14 -18.3% ------- BLUE .248 .451 Bullish --------------------------------------------------------------------------------------------- TECL 326.07 11.3 300.9 519.4% Bullish BLUE .362 .579 Bullish --------------------------------------------------------------------------------------------- IBB 132.6 -.78 135.99 -28.3% Bearish RED -.011 -.067 --------------------------------------------------------------------------------------------- GLD 182.03 -1.47 186.5 -13.8% Bearish RED .024 .013 --------------------------------------------------------------------------------------------- OIH 123.1 -4.88 137.79 -610.1% Bearish RED .011 -.136 --------------------------------------------------------------------------------------------- |
Table 3 Count of Stocks in Key Directories
20200821
-------------------------------
NEWHIGHS 146
NEWLOWS 68
MAXCP 78
MINCP 65
TTTNH 30
TTTNL 39
FASTUP 57
FASTDOWN 151
CPCROSSA 73
CPCROSSD 50
BIGVOLUP 3
BIGVODN 8
ACCUMVER 82
HIGHIP21 38
HIUPPCT 22
REDSELL 77
AUGSELS7 56
TRAPDOOR 18
|
Table 4 RANKING OF KEY DIRECTORIES BASED PCT.OF STOCKS ABOVE 65-DMA
8/21/20
Bullish = 36
Bearish = 9
---------------------------------------------------------------------------------------
Directory Current day-1 day-2 day-3 day-4 day-5
----------------------------------------------------------------------------------------
COPPER 1 1 1 1 1 1
SOLAR 1 1 1 1 1 1
BONDFUND .96 .99 .97 .99 .98 .98
FOOD .905 .905 .924 .924 .924 .867
COMODITY .902 .902 .902 .902 .902 .902
AUTO .897 .923 .923 .923 .948 .948
GOLD .836 .897 .897 .959 .959 .857
HOMEBLDG .823 .823 .823 .823 .823 .823
ETFS .803 .857 .892 .946 .875 .928
CHINA .764 .784 .784 .843 .823 .784
GAMING .761 .761 .761 .809 .809 .809
INDEXES .758 .769 .808 .814 .837 .831
NIFTY .733 .755 .777 .8 .755 .777
INDMATER .716 .756 .783 .797 .81 .797
CHEM .708 .75 .791 .791 .812 .833
NASD-100 .707 .717 .737 .787 .777 .767
SOFTWARE .683 .716 .716 .716 .716 .683
GREEN .666 .666 .809 .857 .809 .809
HOSPITAL .666 .714 .714 .714 .666 .619
TRANSP .65 .65 .8 .8 .85 .9
ELECTRON .628 .621 .709 .716 .777 .75
SP500 .621 .642 .712 .739 .783 .789
SEMI .609 .628 .714 .733 .79 .752
RUS-1000 .604 .626 .692 .717 .773 .775
SP-100 .604 .626 .703 .714 .78 .813
BEVERAGE .6 .666 .8 .8 .733 .666
COMPUTER .6 .6 .7 .75 .75 .75
DOWJONES .6 .6 .666 .7 .833 .9
EDU .6 .6 .6 .6 .8 .8
HACKERS .6 .6 .6 .65 .65 .6
INFRA .6 .742 .771 .8 .857 .885
FIDSTKS .598 .627 .683 .723 .762 .796
INSURANC .576 .653 .692 .846 .884 .923
MILITARY .555 .592 .629 .666 .703 .814
DJI-13 .538 .538 .615 .692 .846 .923
GUNS .533 .666 .666 .666 .666 .666
RETAIL .53 .551 .653 .693 .836 .836
------------------------------------------------------------------
BIOTECH .479 .51 .536 .562 .586 .518
FINANCE .439 .451 .56 .548 .743 .792
COAL .428 .428 .571 .714 .714 .714
REIT .425 .468 .453 .546 .624 .588
UTILITY .421 .447 .473 .5 .552 .552
REGBANKS .346 .423 .5 .538 .73 .846
OILGAS .322 .385 .48 .48 .551 .566
BIGBANKS .285 .428 .571 .571 .857 .857
JETS .214 .428 .571 .571 .714 .928
|
========================================================================
8/20/2020 Peerless gave another Sell signal. Today's Sell S2 is the seventh
without an
intervening buy signal. In the past, just five such Sells have always been quite
bearish. Notice today that breadth was not good. There were 611 more down
than up on the NYSE. Down volume was again disproprtionately high and
so the V-I has fallen to -65. Another DJI rally will almost certainly bring
yet another Sell-9Vs. There appears to be lots of sellers whenever the DJI
tries to rally. Should we go short DIA?
I've suggested waiting until AAPL trades split 4:1 at the end of the month, so that
this one bullish stock will not have so much influence. I've also regularly noted my
respect for the power of the FED's QE-Infinity. The FED have made a point of
intervening aggressively whenever the DJ starts to fall back. This makes me believe
that they are quite determined not to let the DJI fall back, at least until not
after the
Election. But, the FED could change its collective mind. Watch for a
rise in
short-term interest rates. There is none right now.
But the Peerless internals are weaking, So, the Peerless Sells may be right about
shorting DIA now. Using DIA shorts to hedge other
longs is fine. But, probably,
DIA will only fall to the lower band before buyers come in again. Most often,
it takes
a head/shoulders top, an A/D Line that has lagged for months and/or a negative IP21
NNC
to bring about a more severe decline. Watch to see if the QQQ and SPY follow the
DJI down or instead bullishly breakout.
Peerless DJIA Chart:
So many uninterrupted Peerless Sells is bearish.
A Biden win would also be bearish.
The A/D Line is weakening.
NYSE Down volume is rising.


We hear a lot about how artificial the rally is. But the truth is that bull markets
after bear markets have a habit of confounding all the bears who look at the high
unemployment and thereby erroneously dismiss the new bull market as craziness.
1908 is an interesting case, in point. There were bank failures and high
unemployment
until the middle of 1908, even as the DJI roared up +46.6% for the year. 1908
rose because conservatives were back in control and because the high unemployment
also had the effect of taming demands by labor and boosting profits. We exactly
see the same forces at work in 1921 after the FED loosened credit. And the same
thing in 1975. I remember how the new bull market of 1982-1983 confounded the
cartoonist for the Albuquerque Journal, who depicted the new bull market as
a bull eating a "loco" weed. And of course, 2009's advance in mid-Summer
paid no attention to the 10+% unemployment.

Right now, it looks very much like the NASDAQ can hold the SP-500 up
even if the DJI-30 might not be able to do this by itself. That was the lesson on
2000
when the NASDAQ and the QQQ topped out two months after the DJI did in
January and rose an additional +25% even after Peerless gave its A/D NNC -
based Sell S9 as Greenspan began to raise rates.
It is not an accident and it is not "manipulation" that makes the NASDAQ or QQQ
outperform the the DJI now by +9.7% and 11.%, respectively over the last 50
trading days. Moreover, if the QQQ can breakout decisively, it could well rise
by more than 20% while the DJI simply goes sidewise.

I have heard the DJI-30 referred to as a
"dinosaur". I wouldn't go this far.
But it will pay for us to track the QQQ, our NIFTY-50 and the SUPER-7,
or whatever we want to call the elite tech stocks. Tiger lets us play the
stocks and their ETFs' trends and buy their bullish flat top-breakouts.
See today's Bullish MAXCPs.
It's becoming clear that the big technology company are shaping our world
in ways few of us can fully imagine. The stay-at-home orders are just making this
clearer. Everyone on the planet needs a smart phone, it seems. Publishing has
changed. Adobe and Google are responsible for altering the way one does
research. School libraries are not nearly as important. Robots are taking
over
the workplace and much more; NVDA is the future. Schools and work-places
will never be the same. Distance learning is the new reality. Entertainment?.
Virtual reality will replace movie theaters. On-line shopping? Amazon.
And so much more, all the while the population ages. We get glimpses of this
future by watching the leading technology stocks, like AAPL, ADBE, AMZN, FB,
GOOG, NVDA and TSLA.

|
Charts 8/20/2020 (Click on Underlined link.) 2020 PEERLESS DJI, Signals, Indicators Daily DJI Volume 10-DayUp/Down Vol Stoch-20 Inverted Traders Index Graph of Pct of All Stocks above 65-dma Cum. Inverted Traders Index NASDAQ S&P OEX NYSE COMPQX DJI-15 DJI-20 DJI-30 DIA QQQ MDY IWM TNA Short-Term Rates DOLLAR-UUP SPY http://tigersoft.com/2121CST/SPY.GIF recent 2006 vers-Peerless signals -- http://tigersoft.com/NEWPEER/UPD06820.BMP USO-CrudeOil DBO FAS GLD BBH IBB JETS JNUG KOL NUGT OIH PALL RSX RETL SDS AGQ SLV SOXL TECL TLT TMF TNA UGA (gasoline) USO (oil) and China: YINN CHAU Commodities: CANE CORN DBC JJC, NIB, CHOC CORN, CUT (paper) MOO, SOYB WEAT UUP (Dollar) LIT (Lithium) Stocks AAPL ADBE ALXN AMAT AMGN AMD AMZN AXP BA BABA BAC BIDU BLDP CAT CVX CMG DE ENPH FB GILD GOOG GS HD IBM INTU JPM LRCX M (Macy's) MSFT NEM NFLX NKE NVDA PG REGN REV SO SQ QCOM QDEL TSLA TXN XOM V VRTX WFC WMT TOWN ZM New highs and Bullish MAXCPs http://tigersoft.com/MAXCP/8-20/BULLISH.htm Bearish MAXCPs - http://tigersoft.com/MINCP/8-20/BEARISH.htm |
Table 1
8/20/2018 QUICKSILVER on DJI-30 STOCKS.
P21 + ITRS score >+.25 is bullish
Note that AAPL now shows highest AI/200 stock here.
3 Bullish (AAPL, PG) 3 Bearish (BA, JPM, INTC) STOCKS CLOSE CHANGE PIVOT-P 5-dma AROC CL-PWR Candl AI/200 IP21 ITRS --------------------------------------------------------------------------------------- --------------------------------------------------------------------------------------- AAPL 473.1 10.27 459.63 141.8% Bullish BLUE 174 .216 .313 Bullish --------------------------------------------------------------------- AXP 96.72 -.17 100.41 -188% ------- BLUE 99 .063 -.116 --------------------------------------------------------------------- BA 169.58 .31 178.08 -149% Bearish BLUE 44 -.191 -.194 Bearish --------------------------------------------------------------------- CAT 137.48 -.54 139.96 -114.6% ------- BLUE 137 -.003 .011 --------------------------------------------------------------------- CSCO 42.31 .44 42.5 -48.5% ------- BLUE 116 .006 -.135 --------------------------------------------------------------------- CVX 84.81 -1.58 90.35 -281.5% Bearish RED 89 .093 -.158 --------------------------------------------------------------------- DIS 128.12 .35 130.53 -109.6% Bullish BLUE 107 .111 .021 --------------------------------------------------------------------- GS 201.85 -1.17 207.97 -159.7% Bearish BLUE 87 -.135 -.082 --------------------------------------------------------------------- HD 280.68 -2.18 280.55 -17.3% Bearish BLUE 131 .006 .076 --------------------------------------------------------------------- IBM 123.15 -.69 125.27 -75.4% Bearish ---- 123 .046 -.079 --------------------------------------------------------------------- INTC 49.17 .84 48.89 62.7% Bearish RED 117 -.321 -.258 Bearish --------------------------------------------------------------------- JNJ 151.42 1.03 148.24 114.7% ------- BLUE 122 -.064 -.003 --------------------------------------------------------------------- JPM 97.37 -1.18 102.41 -249.3% Bearish ---- 55 -.15 -.109 Bearish --------------------------------------------------------------------- KO 47.35 -.02 48.45 -106.9% Bearish BLUE 92 -.065 -.054 --------------------------------------------------------------------- MCD 209.88 .37 207.03 81.3% Bullish BLUE 129 .177 .045 --------------------------------------------------------------------- MMM 162.97 -1 166.1 -87.6% ------- RED 113 .092 -.033 --------------------------------------------------------------------- MRK 85.03 0 83.48 88.4% Bullish BLUE 89 .108 .012 --------------------------------------------------------------------- MSFT 214.58 4.88 208.9 140.1% Bullish BLUE 170 .157 .063 --------------------------------------------------------------------- NKE 108.01 -.38 106.43 69.8% Bullish BLUE 132 .149 .03 --------------------------------------------------------------------- PFE 38.72 .46 38.06 71.9% Bearish BLUE 83 .094 .051 --------------------------------------------------------------------- PG 136.85 1.08 135.1 39.4% Bullish BLUE 95 .26 .12 Bullish --------------------------------------------------------------------- TRV 112.53 -.67 118.6 -289.6% Bearish BLUE 113 -.132 -.097 --------------------------------------------------------------------- UNH 313.33 -2.07 323.7 -128.1% ------- RED 135 .13 -.003 |
Table 3 QUICKSILVER on ETFS - 08/20/20 Bullish = 4
Bearish = 0
ITRS + IP21>.25 is considered "Bullish"
ETF CLOSE CHANGE PIVOT-PT 5-dma AROC CL-PWR CANDLE IP21 ITRS --------------------------------------------------------------------------------------------- DIA 277.87 .44 279.8 -27.8% ------- BLUE .225 ------ --------------------------------------------------------------------------------------------- SPY 338.28 1.05 336.84 21.5% Bullish BLUE .315 .033 Bullish --------------------------------------------------------------------------------------------- QQQ 279.93 3.83 272.16 135.6% Bullish BLUE .233 .11 Bullish --------------------------------------------------------------------------------------------- MDY 349.36 -2.36 355.48 -97.6% ------- BLUE .134 .003 --------------------------------------------------------------------------------------------- IWM 155.76 -.64 157.09 -45.5% Bullish BLUE .198 .038 --------------------------------------------------------------------------------------------- FAS 36.63 -.13 38.25 -201.9% ------- BLUE .072 -.083 --------------------------------------------------------------------------------------------- SOXL 240.59 -6.43 246.8 -141.7% ------- BLUE .179 .207 Bullish --------------------------------------------------------------------------------------------- TECL 314.77 12.33 294.55 327.5% Bullish BLUE .261 .319 Bullish --------------------------------------------------------------------------------------------- IBB 133.38 -.4 133.36 -23.1% Bearish BLUE-.062 -.027 --------------------------------------------------------------------------------------------- GLD 183.5 1.26 182.54 4.6% Bearish BLUE .017 .094 --------------------------------------------------------------------------------------------- OIH 127.98 -5.32 139.51 -381.1% ------- RED .106 -.162 --------------------------------------------------------------------------------------------- GASL 3440 285 3685 -325.1% ------- RED -.021 .086 --------------------------------------------------------------------------------------------- |
Table 3 Count of Stocks in Key Directories
20200820
-------------------------------
NEWHIGHS 132
NEWLOWS 47 growing
MAXCP 56
MINCP 42
TTTNH 21
TTTNL 20
FASTUP 58
FASTDOWN 89
CPCROSSA 145
CPCROSSD 38
BIGVOLUP 3
BIGVODN 6
ACCUMVER 82
HIGHIP21 27
HIUPPCT 18
REDSELL 80
AUGSELS7 67
TRAPDOOR 19
|
Table 4 RANKING OF KEY DIRECTORIES BASED PCT.OF STOCKS ABOVE 65-DMA
8/20/20
Bullish = 38
Bearish = 8 (growing)
---------------------------------------------------------------------------------------
Directory Current day-1 day-2 day-3 day-4 day-5
----------------------------------------------------------------------------------------
COPPER 1 1 1 1 1 1
SOLAR 1 1 1 1 1 .933
BONDFUND .99 .97 .99 .98 .98 .98
AUTO .923 .923 .923 .948 .948 .948
FOOD .905 .924 .924 .924 .867 .867
COMODITY .902 .902 .902 .902 .902 .902
GOLD .897 .897 .959 .959 .857 .877
ETFS .857 .892 .946 .875 .946 .964
HOMEBLDG .823 .823 .823 .823 .823 .823
CHINA .784 .784 .843 .823 .784 .862
INDEXES .769 .808 .814 .837 .825 .837
GAMING .761 .761 .809 .809 .809 .809
INDMATER .756 .783 .797 .81 .797 .783
NIFTY .755 .777 .8 .755 .777 .822
CHEM .75 .791 .791 .812 .833 .833
INFRA .742 .771 .8 .857 .885 .885
NASD-100 .717 .747 .797 .777 .767 .767
SOFTWARE .716 .733 .716 .716 .7 .716
HOSPITAL .714 .714 .714 .714 .619 .619
BEVERAGE .666 .8 .8 .733 .666 .666
GREEN .666 .809 .857 .809 .809 .904
GUNS .666 .666 .666 .666 .666 .666
INSURANC .653 .692 .846 .884 .923 .961
TRANSP .65 .8 .8 .85 .9 .85
SP500 .642 .714 .739 .783 .796 .794
SEMI .628 .714 .733 .79 .761 .8
FIDSTKS .627 .683 .723 .762 .802 .785
RUS-1000 .626 .693 .717 .773 .782 .775
SP-100 .626 .703 .714 .78 .824 .813
ELECTRON .621 .709 .716 .777 .756 .81
COMPUTER .6 .7 .75 .75 .75 .75
DOWJONES .6 .666 .7 .833 .9 .833
EDU .6 .6 .6 .8 .8 .8
HACKERS .6 .65 .65 .65 .65 .65
MILITARY .592 .629 .666 .703 .814 .777
RETAIL .551 .653 .693 .836 .836 .795
DJI-13 .538 .615 .692 .846 .923 .846
BIOTECH .506 .535 .561 .587 .527 .537
===============================================================================================
REIT .468 .453 .546 .624 .595 .631
FINANCE .451 .56 .548 .743 .804 .756
UTILITY .447 .473 .5 .552 .578 .684
BIGBANKS .428 .571 .571 .857 .857 .857
COAL .428 .571 .714 .714 .714 .428
JETS .428 .571 .571 .714 .928 .857
REGBANKS .423 .5 .538 .73 .884 .807
OILGAS .385 .48 .48 .551 .566 .551
|
========================================================================
8/19/2020 The markets sold off in the last hour of trading after the just released
FED FOMC
minutes revealed a certain amount of dissension about what it might or
might do if Congress does not enact a stimulus. The way the Dollar rose today
and Gold and Silver fell, it seems that some market Professionals are interpreting
this to mean QE-Infinitity's days are numbered. I don't see it this way. I see
the inaction by Congress leaving the FED little choice but to try to hold the
market, and thereby, the economy up until folks can safely go back to work
If I am right, the Dollar should turn back down soon and Gold and Silver go
back up. If I am wrong, then the FED's powers are limited by their lack of
internal agreement and that is a new consideration to start factoring in.
Dollar and Gold |
Silver |
Peerless DJIA, Signals and Indicators |
DIA - Candlestick trends, Closing Power and IP21 |
Today's technicals were troublesome. A week ago, it seemed that QQQ might
breakout above all rising resistance lines like NVDA, TSLA and AAPL have done.
A week ago, it seemed that SPY could make a breakout run into all-time high
territory. And a week ago, it seemed like the rising NYSE A/D Line would
let the DJIA get past 28000 and target its old high near 29500. But this week
the DJI has fallen each day, breadth has deteriorated and daily NYSE down-volume
has been disproportionately high. So, perhaps, we are seeing the limits of what
the FED can do. That would mean that the set of five (now six) separate Peerless
Sells without an intervening Buy signal and the now probable defeat of a Republican
President this November will both work our their historic bearishness. Watch
the NYSE A/D Line over the next week. It should tell us if the QQ-Infinity is in
trouble.
The failure of SPY to breakout and the probability now that it must
retreat poses
a technical threat, as chartists start pointing to its potential "double-top".
As long
as SPY's uptrend is not broken, there can be no serious decline. The high level
of Accumulation offers bulls reasonable hope here. SPY's IP21 is now a very high
+.323.
SPY |
NVDA |
QQQ |
If we trust Peerless and history, we have to be sellers, not buyers. I have
suggested waiting for the A/D Line uptrend to be violated before shorting
DIA. Because of the very heavy weighting of AAPL in the DJIA and the
way AAPL has usually risen until its split goes into effect, I have said we
should probably wait until September before considering a DIA short.
That would also allow the market to get a bounce from the Republican
National Convention next week.
But today NVDA's earnings, revenue and guidance beat its already expectations
and, despite this, it fell for the second day in a row. Prudence dictates taking
profits
in it if you are a trader. I was hoping for a stock split announcement, but none
was forthcoming.
Among our Bearish MINCPs is Boeing again. Having just broken below its
65-dma with a negative Accumulation Index and very weak Closing Power, it
would seem like a good short sale, except that it may get a boost from next
week's Republican convention. Some of the Brazilian stocks shown recently
among the Bearish MINCPs may be safer short sales.
|
Charts 8/19/2020 (Click on Underlined link.) 2020 PEERLESS DJI, Signals, Indicators Daily DJI Volume 10-DayUp/Down Vol Stoch-20 Inverted Traders Index Graph of Pct of All Stocks above 65-dma Cum. Inverted Traders Index NASDAQ S&P OEX NYSE COMPQX DJI-15 DJI-20 DJI-30 DIA QQQ MDY IWM TNA Short-Term Rates DOLLAR-UUP SPY http://tigersoft.com/2121CST/SPY.GIF recent 2006 vers-Peerless signals -- http://tigersoft.com/NEWPEER/UPD06819.BMP USO-CrudeOil DBO FAS GLD BBH IBB JETS JNUG KOL NUGT OIH PALL RSX RETL SDS AGQ SLV SOXL TECL TLT TMF TNA UGA (gasoline) USO (oil) and China: YINN CHAU Commodities: CANE CORN DBC JJC, NIB, CHOC CORN, CUT (paper) MOO, SOYB WEAT UUP (Dollar) LIT (Lithium) Stocks AAPL ADBE ALXN AMAT AMGN AMD AMZN AXP BA BABA BAC BIDU BLDP CAT CVX CMG DE ENPH FB GILD GOOG GS HD IBM INTU JPM LRCX M (Macy's) MSFT NEM NFLX NKE NVDA PG REGN REV SO SQ QCOM QDEL TSLA TXN XOM V VRTX WFC WMT TOWN ZM New highs and Bullish MAXCPs http://tigersoft.com/MAXCP/8-19/BULLISH.htm Bearish MAXCPs - http://tigersoft.com/MINCP/8-19/BEARISH.htm |
Table 1
8/19/2018 QUICKSILVER on DJI-30 STOCKS.
P21 + ITRS score >+.25 is bullish
Note that AAPL now shows highest AI/200 stock here.
3 Bullish (AAPL, MSFT PG) 3 Bearish (BA, GS, INTC) STOCKS CLOSE CHANGE PIVOT-P 5-dma AROC CL-PWR Candl AI/200 IP21 ITRS --------------------------------------------------------------------------------------- --------------------------------------------------------------------------------------- AAPL 462.83 .58 460.04 117.7% Bullish RED 174 .186 .331 Bullish --------------------------------------------------------------------- AXP 96.89 .22 100.42 -241.1% ------- BLUE 98 .067 -.138 --------------------------------------------------------------------- BA 169.27 -.96 174.73 -177.2% Bearish RED 44 -.199 -.234 Bearish --------------------------------------------------------------------- CAT 138.02 -.35 140.67 -162.4% ------- RED 138 -.012 .014 --------------------------------------------------------------------- CSCO 41.87 -.11 42.72 -716.5% ------- RED 115 -.005 -.143 --------------------------------------------------------------------- CVX 86.39 -1.24 89.82 -240.9% Bullish RED 89 .179 -.164 --------------------------------------------------------------------- DIS 127.77 -1.15 130.96 -154.2% Bullish RED 106 .114 .017 --------------------------------------------------------------------- GS 203.02 1.71 208.39 -220.5% Bearish BLUE 88 -.194 -.084 Bearish --------------------------------------------------------------------- HD 282.86 -2.14 281.66 22.6% ------- RED 130 .038 .087 --------------------------------------------------------------------- IBM 123.84 -1.08 125.03 -114.2% ------- RED 123 .113 -.076 --------------------------------------------------------------------- INTC 48.33 -.32 48.56 -88% Bearish RED 118 -.295 -.248 Bearish --------------------------------------------------------------------- JNJ 150.39 .3 148 24.5% ------- BLUE 122 -.063 .016 --------------------------------------------------------------------- JPM 98.55 .23 102.37 -217% Bearish RED 56 -.152 -.123 --------------------------------------------------------------------- KO 47.37 -1.05 48.38 -109.6% ------- RED 92 .037 -.048 --------------------------------------------------------------------- MCD 209.51 -.81 206.49 84% Bullish RED 128 .204 .035 --------------------------------------------------------------------- MMM 163.97 -.41 165.86 -8.8% ------- RED 113 .1 -.031 --------------------------------------------------------------------- MRK 85.03 .47 83.54 140.2% Bullish BLUE 88 .081 .019 --------------------------------------------------------------------- MSFT 209.7 -1.79 208.7 12.2% ------- RED 169 .169 .09 Bullish --------------------------------------------------------------------- NKE 108.39 1.42 106.52 149.3% Bullish BLUE 131 .181 .041 --------------------------------------------------------------------- PFE 38.26 -.1 38.17 -9.1% Bearish RED 82 .161 .042 --------------------------------------------------------------------- PG 135.77 -.74 135.78 11.4% Bullish BLUE 94 .263 .132 Bullish --------------------------------------------------------------------- TRV 113.2 -1.73 119.27 -240.8% Bearish RED 113 -.084 -.112 --------------------------------------------------------------------- UNH 315.4 -1.41 321.52 -107% Bullish RED 135 .171 .005 |
Table 3 QUICKSILVER on ETFS - 08/19/20 Bullish = 4
Bearish = 0
ITRS + IP21>.25 is considered "Bullish"
ETF CLOSE CHANGE PIVOT-PT 5-dma AROC CL-PWR CANDLE IP21 ITRS --------------------------------------------------------------------------------------------- DIA 277.43 -.77 279.42 -46.7% ------- RED .229 0 --------------------------------------------------------------------------------------------- SPY 337.23 -1.41 336.83 -3.1% ------- RED .324 .036 Bullish --------------------------------------------------------------------------------------------- QQQ 276.1 -1.87 272.48 77.4% ------- RED .218 .12 Bullish --------------------------------------------------------------------------------------------- MDY 351.72 -1.47 356.28 -73.1% ------- RED .172 -.003 --------------------------------------------------------------------------------------------- IWM 156.4 .01 157.19 -35.6% ------- RED .203 .026 --------------------------------------------------------------------------------------------- FAS 36.76 -.5 38.15 -264.2% ------- RED .09 -.144 --------------------------------------------------------------------------------------------- SOXL 247.02 -4.89 247.67 -179.4% ------- RED .173 .264 Bullish --------------------------------------------------------------------------------------------- TECL 302.44 -2.06 295.15 122% ------- RED .256 .347 Bullish --------------------------------------------------------------------------------------------- IBB 133.78 -1.44 134 -1.1% Bearish RED -.095 -.008 --------------------------------------------------------------------------------------------- GLD 182.24 -5.94 183.33 85.4% Bearish RED .024 .115 --------------------------------------------------------------------------------------------- OIH 133.3 -.55 138.39 -311.3% ------- RED .155 -.183 --------------------------------------------------------------------------------------------- |
Table 3 Count of Stocks in Key Directories
20200819
-------------------------------
NEWHIGHS 206
NEWLOWS 55 rising
MAXCP 30
MINCP 74
TTTNH 25
TTTNL 64
FASTUP 77
FASTDOWN 85
CPCROSSA 50
CPCROSSD 62
BIGVOLUP 4
BIGVODN 16
ACCUMVER 80
HIGHIP21 22
HIUPPCT 16
REDSELL 80
AUGSELS7 95
TRAPDOOR 20
|
Table 4 RANKING OF KEY DIRECTORIES BASED PCT.OF STOCKS ABOVE 65-DMA
8/19/20
Bullish = 42
Bearish = 3
---------------------------------------------------------------------------------------
Directory Current day-1 day-2 day-3 day-4 day-5
----------------------------------------------------------------------------------------
COPPER 1 1 1 1 1 1
SOLAR 1 1 1 1 .933 .933
BONDFUND .97 .99 .98 .98 .98 .99
FOOD .924 .924 .924 .867 .867 .792
AUTO .923 .923 .948 .948 .948 .974
COMODITY .902 .902 .902 .902 .902 .853
GOLD .897 .959 .959 .857 .877 .795
ETFS .892 .946 .875 .946 .964 .946
HOMEBLDG .823 .823 .823 .823 .823 .882
GREEN .809 .857 .809 .809 .904 .904
INDMATER .808 .814 .837 .825 .837 .831
INDEXES .808 .814 .837 .825 .837 .831
BEVERAGE .8 .8 .733 .666 .733 .666
TRANSP .8 .8 .85 .9 .85 .85
CHEM .791 .791 .812 .833 .833 .833
CHINA .784 .843 .823 .784 .843 .862
NIFTY .777 .8 .755 .777 .822 .822
INFRA .771 .8 .857 .885 .885 .942
GAMING .761 .809 .809 .809 .809 .809
NASD-100 .747 .808 .787 .767 .777 .787
SOFTWARE .733 .733 .716 .7 .733 .65
HOSPITAL .714 .714 .714 .666 .619 .666
SEMI .714 .733 .79 .761 .8 .78
SP500 .714 .741 .783 .796 .802 .834
ELECTRON .709 .716 .777 .756 .81 .804
SP-100 .703 .714 .78 .824 .813 .857
COMPUTER .7 .75 .75 .75 .75 .8
RUS-1000 .693 .718 .773 .782 .783 .814
INSURANC .692 .846 .884 .923 .961 .961
FIDSTKS .683 .723 .762 .802 .79 .807
DOWJONES .666 .7 .833 .9 .833 .933
GUNS .666 .666 .666 .666 .666 .666
RETAIL .653 .693 .836 .836 .816 .836
HACKERS .65 .7 .65 .65 .65 .6
MILITARY .629 .666 .703 .814 .777 .777
DJI-13 .615 .692 .846 .923 .846 .923
EDU .6 .6 .8 .8 .8 .8
BIGBANKS .571 .571 .857 .857 .857 .857
COAL .571 .714 .714 .714 .571 .571
JETS .571 .571 .714 .928 .857 .857
FINANCE .56 .548 .743 .804 .768 .829
BIOTECH .53 .558 .584 .527 .55 .516
----------------------------------------------------------------------------------------------
REGBANKS .5 .538 .73 .884 .807 .923
----------------------------------------------------------------------------------------------
OILGAS .48 .48 .551 .566 .543 .606
UTILITY .473 .5 .552 .578 .736 .763
REIT .453 .546 .624 .595 .645 .73
|
======================================================================
8/18/2020 Still no SP-500 breakout to spur more of a rally. But the key ETFs
are also
not falling in accordance with what usually happens after multiple Peerless Sells.
So, long as the NYSE A/D Line and the key ETFs' Closing Powers remain in
uptrends, respect the power of the FED's QE-Infinity and how earnestly the
corporation Democrats are wooing Wall Street against Trump's forces. The
Dollar weakened today. That should boost GLD and SLV. The NASDAQ
made a new all-time high today. Tech stocks are favored. See the ones
shown among the MAXCPs tonight. (Every now and then history closely repeats.
Compare KIRK's bullish chart in 2009 with its chart now.)


The dominant trends remain our friends. Stick we them. If you are nervous, short
some of the Beaish MINCPs that break below the well-tested support lines
appearing on their charts tonight. I would not short DIA despite the Peerless Sells.
At some point, the Dollar's decline will force higher interest rates upon the FED.
Until that happens, Gold and Silver should continue to rise.

|
Charts 8/18/2020 (Click on Underlined link.) 2020 PEERLESS DJI, Signals, Indicators Daily DJI Volume 10-DayUp/Down Vol Stoch-20 Inverted Traders Index Graph of Pct of All Stocks above 65-dma Cum. Inverted Traders Index NASDAQ S&P OEX NYSE COMPQX DJI-15 DJI-20 DJI-30 DIA QQQ MDY IWM TNA Short-Term Rates DOLLAR-UUP SPY http://tigersoft.com/2121CST/SPY.GIF recent 2006 vers-Peerless signals -- http://tigersoft.com/NEWPEER/UPD06818.BMP USO-CrudeOil DBO FAS GLD BBH IBB JETS JNUG KOL NUGT OIH PALL RSX RETL SDS AGQ SLV SOXL TECL TLT TMF TNA UGA (gasoline) USO (oil) and China: YINN CHAU Commodities: CANE CORN DBC JJC, NIB, CHOC CORN, CUT (paper) MOO, SOYB WEAT UUP (Dollar) LIT (Lithium) Stocks AAPL ADBE ALXN AMAT AMGN AMD AMZN AXP BA BABA BAC BIDU BLDP CAT CVX CMG DE ENPH FB GILD GOOG GS HD IBM INTU JPM LRCX M (Macy's) MSFT NEM NFLX NKE NVDA PG REGN REV SO SQ QCOM QDEL TSLA TXN XOM V VRTX WFC WMT TOWN ZM New highs and Bullish MAXCPs http://tigersoft.com/MAXCP/8-18/BULLISH.htm Bearish MAXCPs - http://tigersoft.com/MINCP/8-18/BEARISH.htm |
Table 1
8/18/2018 QUICKSILVER on DJI-30 STOCKS.
P21 + ITRS score >+.25 is bullish
Note that AAPL now shows highest AI/200 stock here.
3 Bullish (AAPL, MSFT PG) 3 Bearish (BA, GS, INTC) STOCKS CLOSE CHANGE PIVOT-P 5-dma AROC CL-PWR Candl AI/200 IP21 ITRS --------------------------------------------------------------------------------------- --------------------------------------------------------------------------------------- AAPL 462.25 3.82 452.04 272.9% Bullish BLUE 174 .201 .379 Bullish --------------------------------------------------------------------- AXP 96.67 -.88 101.68 -327.3% ------- RED 97 .075 -.157 --------------------------------------------------------------------- BA 170.23 -1.78 175.44 -281.1% Bearish RED 44 -.182 -.268 Bearish --------------------------------------------------------------------- CAT 138.37 -.35 142.57 -147.6% ------- RED 139 .008 -.002 --------------------------------------------------------------------- CSCO 41.98 -.11 48.1 -585.1% ------- RED 115 .016 -.135 --------------------------------------------------------------------- CVX 87.63 -3.14 90.72 -110.2% ------- RED 88 .281 -.158 --------------------------------------------------------------------- DIS 128.92 -.45 131.79 -60.1% Bullish RED 105 .125 .006 --------------------------------------------------------------------- GS 201.31 -1.76 212.13 -233.8% Bearish RED 89 -.176 -.095 Bearish --------------------------------------------------------------------- HD 285 -3.24 281.58 179.1% Bullish RED 130 .098 .103 --------------------------------------------------------------------- IBM 124.92 .48 126.7 -72.8% Bearish RED 123 -.025 -.087 --------------------------------------------------------------------- INTC 48.65 -.28 49.19 47.2% Bearish RED 119 -.288 -.243 Bearish --------------------------------------------------------------------- JNJ 150.09 1.1 149.66 105.1% ------- BLUE 122 -.1 .016 --------------------------------------------------------------------- JPM 98.32 -1.39 102.94 -268.9% Bearish RED 57 -.087 -.14 --------------------------------------------------------------------- KO 48.42 .21 48.43 50.7% Bullish BLUE 91 .037 -.036 --------------------------------------------------------------------- MCD 210.32 1.65 206.02 128.7% Bullish BLUE 127 .197 .031 --------------------------------------------------------------------- MMM 164.38 -.33 164.26 30.3% ------- ---- 113 .108 -.022 --------------------------------------------------------------------- MRK 84.56 -.2 82.68 219.7% Bullish RED 88 .045 .013 --------------------------------------------------------------------- MSFT 211.49 1.21 209.19 194.9% Bullish BLUE 168 .152 .116 Bullish --------------------------------------------------------------------- NKE 106.97 1.31 105.22 87.4% Bullish BLUE 130 .225 .019 --------------------------------------------------------------------- PFE 38.36 .01 38.33 74.7% Bearish RED 81 .155 .041 --------------------------------------------------------------------- PG 136.51 1.01 135.46 121.5% Bullish BLUE 93 .251 .14 Bullish --------------------------------------------------------------------- TRV 114.93 -.98 118.86 -210.5% Bearish RED 113 -.053 -.109 --------------------------------------------------------------------- UNH 316.81 -3.7 322.27 19.6% Bullish RED 135 .205 .017 |
Table 2 QUICKSILVER on ETFS - 08/18/20 Bullish = 6
Bearish = 0
ITRS + IP21>.25 is considered "Bullish"
ETF CLOSE CHANGE PIVOT-PT 5-dma AROC CL-PWR CANDLE IP21 ITRS --------------------------------------------------------------------------------------------- DIA 278.2 -.75 280.04 18.1% Bullish RED .244 ---- --------------------------------------------------------------------------------------------- SPY 338.64 .73 337.44 86.8% Bullish BLUE .345 .041 Bearish --------------------------------------------------------------------------------------------- QQQ 277.97 2.65 271.86 235.4% Bullish BLUE .204 .144 Bearish --------------------------------------------------------------------------------------------- MDY 353.19 -3.27 356.92 -20.4% Bullish RED .216 -.013 --------------------------------------------------------------------------------------------- IWM 156.39 -1.51 157.52 -15.6% Bullish RED .216 .015 --------------------------------------------------------------------------------------------- FAS 37.26 -.54 38.77 -171% ------- RED .107 -.166 --------------------------------------------------------------------------------------------- RETL 256.45 -6.63 240.12 465% ------- RED .236 .456 Bearish --------------------------------------------------------------------------------------------- SOXL 251.91 -4.23 256.05 389.1% ------- RED .155 .299 Bearish --------------------------------------------------------------------------------------------- TECL 304.5 3.6 295.17 494.1% Bullish BLUE .228 .382 Bearish --------------------------------------------------------------------------------------------- IBB 135.22 -.77 133.81 124.8% Bearish RED -.112 .009 --------------------------------------------------------------------------------------------- GLD 188.18 1.68 179.1 226% Bullish RED .083 .171 Bearish --------------------------------------------------------------------------------------------- OIH 133.85 -3.94 141.91 -250.2% ------- RED .25 -.236 --------------------------------------------------------------------------------------------- |
Table 3 Count of Stocks in Key Directories
20200818
-------------------------------
NEWHIGHS 237
NEWLOWS 33
MAXCP 31
MINCP 50
TTTNH 11
TTTNL 45
FASTUP 97
FASTDOWN 83
CPCROSSA 43
CPCROSSD 83
BIGVOLUP 6
BIGVODN 7
ACCUMVER 74
HIGHIP21 30
HIUPPCT 19
REDSELL 72
AUGSELS7 88
TRAPDOOR 17
|
Table 4 RANKING OF KEY DIRECTORIES BASED PCT.OF STOCKS ABOVE 65-DMA
8/18/20
Bullish = 44
Bearish = 1
---------------------------------------------------------------------------------------
Directory Current day-1 day-2 day-3 day-4 day-5
----------------------------------------------------------------------------------------
COPPER 1 1 1 1 1 1
SOLAR 1 1 1 .933 .933 .933
BONDFUND .99 .98 .98 .98 .99 1
GOLD .959 .959 .857 .877 .795 .816
ETFS .946 .875 .946 .964 .946 .928
FOOD .924 .924 .867 .867 .792 .792
AUTO .923 .948 .948 .948 .974 .948
COMODITY .902 .902 .902 .902 .853 .829
GREEN .857 .809 .809 .904 .904 .904
INSURANC .846 .884 .923 .961 .961 1
CHINA .843 .823 .784 .843 .882 .803
HOMEBLDG .823 .823 .823 .823 .882 .882
INDEXES .814 .837 .825 .837 .831 .825
GAMING .809 .809 .809 .809 .809 .809
NASD-100 .808 .797 .777 .777 .787 .757
BEVERAGE .8 .733 .666 .733 .666 .533
INFRA .8 .857 .885 .885 .942 .942
NIFTY .8 .755 .777 .822 .822 .777
TRANSP .8 .85 .9 .85 .9 .9
INDMATER .797 .81 .797 .783 .797 .824
CHEM .791 .812 .833 .833 .854 .854
COMPUTER .75 .75 .75 .75 .8 .8
SP500 .741 .785 .796 .802 .834 .808
SEMI .733 .79 .761 .8 .78 .733
SOFTWARE .733 .733 .7 .733 .683 .666
FIDSTKS .723 .762 .802 .79 .813 .802
RUS-1000 .718 .775 .782 .783 .819 .808
ELECTRON .716 .777 .756 .81 .804 .79
COAL .714 .714 .714 .571 .571 .571
HOSPITAL .714 .714 .666 .666 .666 .571
SP-100 .714 .78 .824 .813 .857 .835
DOWJONES .7 .833 .9 .833 .933 .9
HACKERS .7 .7 .65 .65 .6 .7
RETAIL .693 .836 .836 .816 .857 .857
DJI-13 .692 .846 .923 .846 .923 .846
GUNS .666 .666 .666 .666 .666 .666
MILITARY .666 .703 .814 .777 .814 .814
EDU .6 .8 .8 .8 .8 .8
BIGBANKS .571 .857 .857 .857 .857 .857
JETS .571 .714 .928 .857 .928 .928
BIOTECH .553 .582 .524 .55 .53 .509
REIT .55 .628 .6 .65 .742 .742
FINANCE .543 .74 .802 .765 .839 .876
REGBANKS .538 .73 .884 .807 .923 .923
==============================================================================================
UTILITY .5 .552 .578 .736 .763 .71
==============================================================================================
OILGAS .48 .551 .566 .543 .622 .551
|
========================================================================
8/17/2020 Trump says the Democrats are radical Socialists. That's not
exactly apparent
from anything I've heard yet from Democratic Convention. Except for the 30
blue chips, the other index and ETFs seem to like what they are hearing, or perhaps,
not hearish. Despite the multiple Peerless Sells based mostly in disproportionately
high Down Volume, the SPY and SP-500 is very close to breaking out into all-
time high territory, as are NASDAQ and QQQ. So... as long as the NYSE A/D Line
is rising, I would not short DIA and expect a challenge by it of its high near 29500.
This, of course, is going to mean more FED QE-Infinity and rising Silver and Gold
prices. Buy them back and stay short the Dollar. Nividia may be pointing the
way
for what QQQ will do. NVDA will announce earnings on Wednesday. I'm not
clever enough to know if this will bring a climactic run-upwards. But that seems
likely
along with a bullish stock split, like TESLA. Speaking or which, a Democrat victory
in November should be a boost to solar power and battern-powered cars and buses.


|
Charts 8/17/2020 (Click on Underlined link.) 2020 PEERLESS DJI, Signals, Indicators Daily DJI Volume 10-DayUp/Down Vol Stoch-20 Inverted Traders Index Graph of Pct of All Stocks above 65-dma Cum. Inverted Traders Index NASDAQ S&P OEX NYSE COMPQX DJI-15 DJI-20 DJI-30 DIA QQQ MDY IWM TNA Short-Term Rates DOLLAR-UUP SPY http://tigersoft.com/2121CST/SPY.GIF recent 2006 vers-Peerless signals -- http://tigersoft.com/NEWPEER/UPD06817.BMP USO-CrudeOil DBO FAS GLD BBH IBB JETS JNUG KOL NUGT OIH PALL RSX RETL SDS AGQ SLV SOXL TECL TLT TMF TNA UGA (gasoline) USO (oil) and China: YINN CHAU Commodities: CANE CORN DBC JJC, NIB, CHOC CORN, CUT (paper) MOO, SOYB WEAT UUP (Dollar) LIT (Lithium) Stocks AAPL ADBE ALXN AMAT AMGN AMD AMZN AXP BA BABA BAC BIDU BLDP CAT CVX CMG DE ENPH FB GILD GOOG GS HD IBM INTU JPM LRCX M (Macy's) MSFT NEM NFLX NKE NVDA PG REGN REV SO SQ QCOM QDEL TSLA TXN XOM V VRTX WFC WMT TOWN ZM New highs and Bullish MAXCPs http://tigersoft.com/MAXCP/8-17/BULLISH.htm Bearish MAXCPs - http://tigersoft.com/MINCP/8-17/BEARISH.htm |
Table 1
8/17/2018 QUICKSILVER on DJI-30 STOCKS.
P21 + ITRS score >+.25 is bullish
Note that AAPL now shows highest AI/200 stock here.
4 Bullish (AAPL, HD, MSFT PG) 2 Bearish (BA, INTC) STOCKS CLOSE CHANGE PIVOT-P 5-dma AROC CL-PWR Candl AI/200 IP21 ITRS --------------------------------------------------------------------------------------- --------------------------------------------------------------------------------------- AAPL 458.43 -1.2 437.5 83.2% Bullish RED 174 .208 .356 Bullsih --------------------------------------------------------------------- AXP 97.55 -2.86 103.26 -200.5% ------- RED 96 .087 -.138 --------------------------------------------------------------------- BA 172.01 -6.07 180.13 -208.4% Bearish RED 44 -.164 -.19 Bearish --------------------------------------------------------------------- CAT 138.72 -1.24 142.53 -116.6% ------- RED 139 -.003 -.001 --------------------------------------------------------------------- CSCO 42.09 -.41 47.19 -617.8% ------- RED 115 .055 -.147 --------------------------------------------------------------------- CVX 90.77 .42 89.62 57.7% ------- BLUE 87 .251 -.127 --------------------------------------------------------------------- DIS 129.37 -1.16 130.49 22.2% Bullish RED 104 .132 .009 --------------------------------------------------------------------- GS 203.07 -4.9 211.06 -150.4% Bearish RED 90 -.136 -.095 --------------------------------------------------------------------- HD 288.24 7.69 274.92 242.4% Bullish BLUE 130 .177 .104 Bullish --------------------------------------------------------------------- IBM 124.44 -.83 126.75 -105.8% Bearish RED 124 -.006 -.085 --------------------------------------------------------------------- INTC 48.93 .04 48.19 -29.7% Bearish RED 120 -.255 -.267 Bearish --------------------------------------------------------------------- JNJ 148.99 .75 146.97 32.4% ------- BLUE 122 -.123 -.016 --------------------------------------------------------------------- JPM 99.71 -2.7 103.82 -45.4% ------- RED 58 -.097 -.131 --------------------------------------------------------------------- KO 48.21 -.24 47.93 50.8% Bearish RED 91 -.011 -.045 --------------------------------------------------------------------- MCD 208.67 1.64 205 110.6% Bullish BLUE 126 .158 .031 --------------------------------------------------------------------- MMM 164.71 -1.39 163.38 99.6% ------- BLUE 113 .084 -.043 --------------------------------------------------------------------- MRK 84.76 1.28 80.91 233.9% Bullish BLUE 88 .023 .003 --------------------------------------------------------------------- MSFT 210.28 1.38 203.38 48.9% ------- BLUE 167 .178 .096 Bullish --------------------------------------------------------------------- NKE 105.66 -.77 105.12 11.8% Bullish RED 129 .174 .001 --------------------------------------------------------------------- PFE 38.35 .29 37.79 -5.2% Bearish BLUE 80 .103 .038 --------------------------------------------------------------------- PG 135.5 .4 133.23 52% Bullish BLUE 92 .253 .118 Bullish --------------------------------------------------------------------- TRV 115.91 -2.69 119.92 -134.7% Bearish RED 113 -.051 -.095 --------------------------------------------------------------------- UNH 320.51 -3.19 315.55 22% Bullish RED 135 .208 ----- |
Table 3 QUICKSILVER on ETFS - 08/14/20 Bullish = 5
Bearish = 0
ITRS + IP21>.25 is considered "Bullish"
ETF CLOSE CHANGE PIVOT-PT 5-dma AROC CL-PWR CANDLE IP21 ITRS --------------------------------------------------------------------------------------------- DIA 278.95 -.85 277.19 14.5% Bullish RED .262 ----- Bullish --------------------------------------------------------------------------------------------- SPY 337.91 1.07 332.8 34.8% Bullish ---- .35 .031 Bullish --------------------------------------------------------------------------------------------- QQQ 275.32 3.16 265.19 92.6% ------- BLUE .221 .121 Bullish --------------------------------------------------------------------------------------------- MDY 356.46 .98 354.64 18.3% Bullish BLUE .234 -.004 --------------------------------------------------------------------------------------------- IWM 157.9 .81 156.88 3.5% Bullish BLUE .224 .024 --------------------------------------------------------------------------------------------- FAS 37.8 -.45 38.57 -46.9% ------- RED .131 -.135 --------------------------------------------------------------------------------------------- SOXL 256.14 9.34 232.62 317.7% ------- BLUE .212 .293 Bullish --------------------------------------------------------------------------------------------- TECL 300.9 6.35 275.62 156% ------- BLUE .25 .369 Bullish --------------------------------------------------------------------------------------------- IBB 135.99 2.63 131.88 41.9% Bearish BLUE-.065 .008 --------------------------------------------------------------------------------------------- GLD 186.5 3.96 179.94 -99.7% Bullish BLUE .086 .153 ---------------------------------------------------------------------------------------------- OIH 137.79 -1.72 140.84 -86.7% ------- RED .222 -.135 --------------------------------------------------------------------------------------------- GASL 3440 285 3685 -325.1% ------- RED -.021 .086 --------------------------------------------------------------------------------------------- |
Table 3 Count of Stocks in Key Directories
20200817
-------------------------------
NEWHIGHS 227
NEWLOWS 25
MAXCP 41
MINCP 26
TTTNH 22
TTTNL 20
FASTUP 75
FASTDOWN 94
CPCROSSA 86
CPCROSSD 52
BIGVOLUP 6
BIGVODN 5
ACCUMVER 73
HIGHIP21 29
HIUPPCT 19
REDSELL 71
AUGSELS7 76
TRAPDOOR 17
|
Table 4 RANKING OF KEY DIRECTORIES BASED PCT.OF STOCKS ABOVE 65-DMA
8/17/20
All 46 Bullish
---------------------------------------------------------------------------------------
Directory Current day-1 day-2 day-3 day-4 day-5
----------------------------------------------------------------------------------------
COPPER 1 1 1 1 1 1
SOLAR 1 1 .933 .933 .933 .933
BONDFUND .98 .98 .98 .99 1 1
GOLD .959 .857 .877 .795 .816 .959
AUTO .948 .948 .948 .974 .948 .948
FOOD .924 .867 .867 .792 .792 .83
COMODITY .902 .902 .902 .853 .829 .853
INSURANC .884 .923 .961 .961 1 1
ETFS .875 .946 .964 .946 .946 .875
BIGBANKS .857 .857 .857 .857 .857 .857
INFRA .857 .885 .885 .942 .914 .828
TRANSP .85 .9 .85 .9 .9 .9
DJI-13 .846 .923 .846 .923 .846 .846
INDEXES .837 .825 .837 .831 .825 .82
RETAIL .836 .836 .816 .857 .857 .836
DOWJONES .833 .9 .833 .933 .9 .9
CHINA .823 .784 .843 .882 .803 .823
HOMEBLDG .823 .823 .823 .882 .882 .941
CHEM .812 .833 .833 .854 .854 .875
INDMATER .81 .797 .783 .797 .824 .851
GAMING .809 .809 .809 .809 .809 .857
GREEN .809 .809 .904 .904 .904 .857
EDU .8 .8 .8 .8 .8 .8
NASD-100 .797 .787 .787 .787 .767 .757
SEMI .79 .761 .8 .78 .742 .761
SP500 .785 .798 .802 .834 .81 .827
SP-100 .78 .824 .813 .857 .835 .857
ELECTRON .777 .756 .81 .804 .797 .817
RUS-1000 .775 .783 .783 .819 .807 .811
FIDSTKS .762 .802 .79 .813 .796 .802
NIFTY .755 .777 .822 .822 .777 .777
COMPUTER .75 .75 .75 .8 .8 .85
FINANCE .74 .802 .765 .839 .864 .839
BEVERAGE .733 .666 .733 .666 .533 .533
SOFTWARE .733 .716 .733 .683 .666 .75
REGBANKS .73 .884 .807 .923 .923 .846
COAL .714 .714 .571 .571 .571 .571
HOSPITAL .714 .666 .666 .714 .619 .809
JETS .714 .928 .857 .928 .928 .928
MILITARY .703 .814 .777 .814 .814 .74
HACKERS .7 .7 .65 .6 .7 .8
GUNS .666 .666 .666 .666 .666 .666
REIT .628 .6 .65 .742 .75 .75
BIOTECH .577 .522 .548 .53 .522 .566
UTILITY .552 .578 .736 .763 .71 .815
OILGAS .551 .566 .543 .622 .551 .582
|
========================================================================
8/14/2020 Peerless produced another Sell on Friday, a Sell S9-V. The
V-Indicator is less than
zero with the DJI more than 3.4% over the 21-day ma. This tells us NYSE daily
Down volume is unusually high given that the DJI is over-bought at the upper band.
The
declining Inverted Cumulative Traders' Index gives the same message. My sense of
is that traders are buying higher priced stocks and ETFs and selling the lower priced
ones that are not performing well.
Let's see if the QQQ and SPY can make a new all-time high this week when
Wall Street discovers that the Democrats only want to be a shade or two
to the left on the President and the Republicans.
SPY is very close to making headline stealing, new highs.

28400 is current resistance for DJIA

Traders are clearly pushing up internet and tech stocks that are handling the
stay-at-home Covid problems better than most others. Let's see if QQQ can
breakout above its current resistance just overhead. NVDA is my preferred
play here.

As long as the NYSE A/D Line is rising, I have suggested not shorting DIA despite
the Peerless Sells. The FED seems to want the DJI to get back to 29500 by the
time of the November Elections. We see that in how a number of DJI-30 stocks
are behaving. The leader is high priced AAPL. I have said history suggests it
will rise
until the end of the month when its 4:1 split goes into effect. It shows a flag
formation.
Classical technical analysis theory now sets up a move to $540 if the "flag flies at
half mast". For the DJI to rally up to 30000, wee will also need to see
breakout runs by Home Depot ($227 - already running), MSFT ($209 - now 10
points below its recent highs' resistance.), NKE ($107 - on verge of a breakout),
PG ($135 - running), WMT (132.6 - 2 points below its resistance and a where a
breakout run can start from and UNH ($323.7 - on the threshold for a breakout.)
See these charts below.
DJI-30 Stocks at or near their highs.
 |
 |
 |
 |
 |
Democrat Populism?
I thought this week would produce a decline owing to populist
rhetoric coming
out of the Democratic Convention. But with speeches limited to 5 minutes, how
much can they say? Besides that California's "Corporate" Democrats,
Feinstein and
Pelosi are each worth close to $100 million. Who's going to challenge Nancy Pelosi?
Will she really let her huge profits in AAPL be taken away from her? Don't
bet on it. Most likely, Wall Street will be pleasantly surprised by what the
Democrats
say are their plans for 2021 should they win. Infrastructure spending?
Yes...National
health care along lines of Medicare? No....UNH is at a marginal new high.
Would it
be so strong if Medicare for all was really being considered by Biden? I don't
think so.
|
Charts 8/14/2020 (Click on Underlined link.) 2020 PEERLESS DJI, Signals, Indicators Daily DJI Volume 10-DayUp/Down Vol Stoch-20 Inverted Traders Index Graph of Pct of All Stocks above 65-dma Cum. Inverted Traders Index NASDAQ S&P OEX NYSE COMPQX DJI-15 DJI-20 DJI-30 DIA QQQ MDY IWM TNA Short-Term Rates DOLLAR-UUP SPY http://tigersoft.com/2121CST/SPY.GIF recent 2006 vers-Peerless signals -- http://tigersoft.com/NEWPEER/UPD06814.BMP USO-CrudeOil DBO FAS GLD BBH IBB JETS JNUG KOL NUGT OIH PALL RSX RETL SDS AGQ SLV SOXL TECL TLT TMF TNA UGA (gasoline) USO (oil) and China: YINN CHAU Commodities: CANE CORN DBC JJC, NIB, CHOC CORN, CUT (paper) MOO, SOYB WEAT UUP (Dollar) LIT (Lithium) Stocks AAPL ADBE ALXN AMAT AMGN AMD AMZN AXP BA BABA BAC BIDU BLDP CAT CVX CMG DE ENPH FB GILD GOOG GS HD IBM INTU JPM LRCX M (Macy's) MSFT NEM NFLX NKE NVDA PG REGN REV SO SQ QCOM QDEL TSLA TXN XOM V VRTX WFC WMT TOWN ZM New highs and Bullish MAXCPs http://tigersoft.com/MAXCP/8-14/BULLISH.htm Bearish MAXCPs - http://tigersoft.com/MINCP/8-14/BEARISH.htm |
Table 1
8/14/2020 QUICKSILVER on DJI-30 STOCKS.
P21 + ITRS score >+.25 is bullish
Note that AAPL now shows highest AI/200 stock here.
2 Bullish (AAPL, PG) 2 Bearish (BA, INTC) STOCKS CLOSE CHANGE PIVOT-P 5-dma AROC CL-PWR Candl AI/200 IP21 ITRS --------------------------------------------------------------------------------------- --------------------------------------------------------------------------------------- AAPL 459.63 -.41 450.91 169% Bullish BLUE 174 .216 .363 Bullish --------------------------------------------------------------------- AXP 100.41 -.01 101.62 61.7% Bullish BLUE 95 .114 -.12 --------------------------------------------------------------------- BA 178.08 3.35 179.41 229% Bearish BLUE 44 -.171 -.096 Bearish --------------------------------------------------------------------- CAT 139.96 -.71 142.02 179.3% Bullish BLUE 140 -.009 .023 --------------------------------------------------------------------- CSCO 42.5 -.22 47.73 -528.6% ------- BLUE 114 .119 -.156 --------------------------------------------------------------------- CVX 90.35 .53 89.73 198.7% Bullish BLUE 86 .227 -.124 --------------------------------------------------------------------- DIS 130.53 -.43 128.79 23% Bullish BLUE 103 .14 -.007 --------------------------------------------------------------------- GS 207.97 -.42 209.38 -7.1% Bearish BLUE 91 -.139 -.094 --------------------------------------------------------------------- HD 280.55 -1.11 274.73 160.9% Bullish RED 129 .164 .064 --------------------------------------------------------------------- IBM 125.27 .24 127.11 12.3% Bearish BLUE 125 .049 -.091 --------------------------------------------------------------------- INTC 48.89 .33 49.22 88.4% Bearish BLUE 121 -.245 -.286 Bearish --------------------------------------------------------------------- JNJ 148.24 .24 148.03 -12.1% ------- BLUE 122 -.13 -.052 --------------------------------------------------------------------- JPM 102.41 .04 100.64 148.8% ------- BLUE 59 -.107 -.1 --------------------------------------------------------------------- KO 48.45 .07 47.72 67.6% ------- BLUE 91 .052 -.051 --------------------------------------------------------------------- MCD 207.03 .54 204.12 59.2% Bullish BLUE 125 .16 .009 --------------------------------------------------------------------- MMM 166.1 .24 161.44 238.9% ------- BLUE 113 .062 -.041 --------------------------------------------------------------------- MRK 83.48 -.06 80.91 150.3% Bullish BLUE 88 .018 -.039 --------------------------------------------------------------------- MSFT 208.9 .2 208.25 -85.9% Bullish BLUE 166 .162 .079 --------------------------------------------------------------------- NKE 106.43 -.09 105.41 218% Bullish BLUE 128 .136 -.012 --------------------------------------------------------------------- PFE 38.06 -.11 38.39 -51% Bearish BLUE 79 .109 -.006 --------------------------------------------------------------------- PG 135.1 -.68 134.1 57.7% Bullish RED 91 .238 .102 Bullish --------------------------------------------------------------------- TRV 118.6 -.67 119.12 52.1% Bullish BLUE 113 -.061 -.057 --------------------------------------------------------------------- UNH 323.7 2.18 319.1 104.5% Bullish BLUE 135 .182 .023 |
Table 3 QUICKSILVER on ETFS - 08/14/20 Bullish = 5 ( -1)
Bearish = 0
ITRS + IP21>.25 is considered "Bullish"
ETF CLOSE CHANGE PIVOT-PT 5-dma AROC CL-PWR CANDLE IP21 ITRS --------------------------------------------------------------------------------------------- DIA 279.8 .38 278.14 93.2% Bullish BLUE .256 ---- Bullish --------------------------------------------------------------------------------------------- SPY 336.84 .01 335.57 33.8% Bullish BLUE .351 .019 Bullish --------------------------------------------------------------------------------------------- QQQ 272.16 -.32 270.31 12.8% Bullish RED .215 .095 Bullish --------------------------------------------------------------------------------------------- MDY 355.48 -.8 355.16 31.1% Bullish BLUE .246 -.01 --------------------------------------------------------------------------------------------- IWM 157.09 -.1 157.79 29.3% Bullish BLUE .203 .024 --------------------------------------------------------------------------------------------- FAS 38.25 .1 38.16 22.2% Bullish BLUE .166 -.062 --------------------------------------------------------------------------------------------- SOXL 246.8 -.87 240.59 130.6% Bullish RED .215 .302 Bullish --------------------------------------------------------------------------------------------- TECL 294.55 -.6 291.84 -4% Bullish RED .26 .41 Bullish --------------------------------------------------------------------------------------------- IBB 133.36 -.64 134.87 -107% Bearish RED -.061 -.048 --------------------------------------------------------------------------------------------- GLD 182.54 -.79 190.15 -223.9% ------- RED .08 .069 --------------------------------------------------------------------------------------------- OIH 139.51 1.12 140.22 188% ------- BLUE .196 -.042 --------------------------------------------------------------------------------------------- |
Count of Stocks in Key Directories
20200814
-------------------------------
NEWHIGHS 99
NEWLOWS 21
MAXCP 24
MINCP 25
TTTNH 15
TTTNL 10
FASTUP 77
FASTDOWN 79
CPCROSSA 88
CPCROSSD 34
BIGVOLUP 6
BIGVODN 8
ACCUMVER 71
HIGHIP21 23
HIUPPCT 16
REDSELL 65
AUGSELS7 80
TRAPDOOR 17
|
Table 4 RANKING OF KEY DIRECTORIES BASED PCT.OF STOCKS ABOVE 65-DMA
8/14/20
All 46 are Bullish.
---------------------------------------------------------------------------------------
Directory Current day-1 day-2 day-3 day-4 day-5
----------------------------------------------------------------------------------------
COPPER 1 1 1 1 1 1
SOLAR 1 .933 .933 .933 .933 .933
BONDFUND .98 .98 .99 1 1 1
AUTO .948 .948 .974 .948 .948 .923
ETFS .946 .964 .946 .946 .875 .875
JETS .928 .857 .928 .928 .928 .642
DJI-13 .923 .846 .923 .846 .846 .846
INSURANC .923 .961 .961 1 1 .961
COMODITY .902 .902 .853 .829 .853 .829
DOWJONES .9 .833 .933 .9 .9 .833
TRANSP .9 .85 .9 .9 .9 .85
INFRA .885 .885 .942 .914 .828 .771
REGBANKS .884 .807 .923 .923 .846 .807
FOOD .867 .867 .792 .792 .83 .792
BIGBANKS .857 .857 .857 .857 .857 .857
GOLD .857 .877 .795 .816 .959 .959
RETAIL .836 .816 .857 .857 .836 .734
CHEM .833 .833 .854 .854 .875 .833
INDEXES .825 .837 .831 .825 .82 .825
SP-100 .824 .813 .857 .835 .857 .802
HOMEBLDG .823 .823 .882 .882 .941 .823
MILITARY .814 .777 .814 .814 .74 .74
GAMING .809 .809 .809 .809 .857 .857
GREEN .809 .904 .904 .904 .857 .857
FINANCE .804 .768 .841 .865 .841 .817
FIDSTKS .802 .79 .813 .796 .802 .785
EDU .8 .8 .8 .8 .8 .8
SP500 .798 .804 .834 .81 .829 .794
NASD-100 .787 .797 .797 .767 .767 .737
INDMATER .786 .773 .786 .813 .826 .786
CHINA .784 .843 .882 .803 .823 .745
RUS-1000 .783 .785 .819 .807 .812 .773
NIFTY .777 .822 .822 .777 .8 .777
SEMI .759 .798 .778 .74 .769 .807
ELECTRON .756 .81 .804 .797 .824 .837
COMPUTER .75 .75 .8 .8 .85 .8
SOFTWARE .716 .75 .683 .666 .75 .783
COAL .714 .571 .571 .571 .571 .428
HACKERS .7 .7 .6 .7 .8 .8
BEVERAGE .666 .733 .666 .533 .533 .533
GUNS .666 .666 .666 .666 .666 .666
HOSPITAL .666 .666 .714 .666 .809 .809
REIT .595 .645 .737 .744 .744 .659
UTILITY .578 .736 .763 .71 .815 .789
OILGAS .566 .543 .622 .551 .582 .48
BIOTECH .516 .545 .527 .522 .571 .558
|
========================================================================
8/13/2020 Peerless still shows six Sells without an intervening Buy signal.
This is reliably
bearish. The DJI is 3.5% over the 21-day ma with the V-Indicator again
negative. This sets the stage for another Sell S9-V. The S9-V does not appear
today
only because it has not been a week since the last S9-V. All the key indexes
and major market ETFs are still close to resistance. There is no point in
buying until there is a pullback even though their Opening and Closing Powers
are both rising. A retreat in the face of next week's Democratic convention
should come as no surprise. The rising A/D Line shows the effects of low interest
rates and QE-Infinity. But without fiscal stimulus, the market will probably
have to retreat and regroup for another upside attack. It's important now to
be patient. The FED is still in control. Rates remain very low and the Dollar
is holding up extraordinarily well considering the trillions being magically printed.


I looked back at how the DJI does from mid August to the end of the year
when a Democrat will win the White House away from a Republican. In
each of the seven cases since 1892, the DJI always is lower at the end of the year.
But on a percentage base, not by much, except for the case of 2008.
Democrat Wins back White House:
1888-2008
Year DJI in mid August Subseq. High.
DJI at end of year.
------ ------------------ --------------
-------------------
1992 91.42
same
97.61
1912 92
94
87
1932 63
80
61
1960 626
638
616
1976 990
1014
986
1992 3321
3227
3300
2008 11642
11715
8776


|
Charts 8/13/2020 (Click on Underlined link.) 2020 PEERLESS DJI, Signals, Indicators Daily DJI Volume 10-DayUp/Down Vol Stoch-20 Inverted Traders Index Graph of Pct of All Stocks above 65-dma Cum. Inverted Traders Index NASDAQ S&P OEX NYSE COMPQX DJI-15 DJI-20 DJI-30 DIA QQQ MDY IWM TNA Short-Term Rates DOLLAR-UUP SPY http://tigersoft.com/2121CST/SPY.GIF recent 2006 vers-Peerless signals -- http://tigersoft.com/NEWPEER/UPD06813.BMP USO-CrudeOil DBO FAS GLD BBH IBB JETS JNUG KOL NUGT OIH PALL RSX RETL SDS AGQ SLV SOXL TECL TLT TMF TNA UGA (gasoline) USO (oil) and China: YINN CHAU Commodities: CANE CORN DBC JJC, NIB, CHOC CORN, CUT (paper) MOO, SOYB WEAT UUP (Dollar) LIT (Lithium) Stocks AAPL ADBE ALXN AMAT AMGN AMD AMZN AXP BA BABA BAC BIDU BLDP CAT CVX CMG DE ENPH FB GILD GOOG GS HD IBM INTU JPM LRCX M (Macy's) MSFT NEM NFLX NKE NVDA PG REGN REV SO SQ QCOM QDEL TSLA TXN XOM V VRTX WFC WMT TOWN ZM New highs and Bullish MAXCPs http://tigersoft.com/MAXCP/8-13/BULLISH.htm Bearish MAXCPs - http://tigersoft.com/MINCP/8-13/BEARISH.htm |
Table 1
8/13/2018 QUICKSILVER on DJI-30 STOCKS.
P21 + ITRS score >+.25 is bullish
Note that AAPL now shows highest AI/200 stock here.
2 Bullish (AAPL, PG) 3 Bearish (BA, GS, INTC) STOCKS CLOSE CHANGE PIVOT-P 5-dma AROC CL-PWR Candl AI/200 IP21 ITRS --------------------------------------------------------------------------------------- --------------------------------------------------------------------------------------- AAPL 460.04 8 444.45 49.4% Bullish BLUE 174 .171 .353 Bullish --------------------------------------------------------------------- AXP 100.42 -1.26 99.16 224.3% Bullish BLUE 94 .096 -.109 --------------------------------------------------------------------- BA 174.73 -.71 170.02 72.1% Bearish BLUE 44 -.229 -.053 Bearish --------------------------------------------------------------------- CAT 140.67 -1.9 134.92 225.4% Bullish RED 141 -.037 .045 --------------------------------------------------------------------- CSCO 42.72 -5.38 47.43 -530% ------- RED 113 .175 -.152 --------------------------------------------------------------------- CVX 89.82 -.9 86.8 132.2% Bullish ---- 85 .204 -.137 --------------------------------------------------------------------- DIS 130.96 -.83 129.93 5.4% Bullish BLUE 102 .154 .01 --------------------------------------------------------------------- GS 208.39 -3.74 208.27 99% ------- RED 92 -.191 -.072 Bearish --------------------------------------------------------------------- HD 281.66 .08 271.64 223.9% Bullish BLUE 128 .162 .06 --------------------------------------------------------------------- IBM 125.03 -1.67 124.96 -43.1% ------- RED 125 .055 -.093 --------------------------------------------------------------------- INTC 48.56 -.63 48.03 -1% Bearish RED 122 -.236 -.278 Bearish --------------------------------------------------------------------- JNJ 148 -1.66 148.6 15.2% Bearish RED 122 -.043 -.066 --------------------------------------------------------------------- JPM 102.37 -.57 99.38 254.5% Bullish BLUE 59 -.102 -.08 --------------------------------------------------------------------- KO 48.38 -.05 47.8 94% Bullish BLUE 90 .024 -.052 --------------------------------------------------------------------- MCD 206.49 .47 204.6 80.9% Bullish BLUE 124 .122 .007 --------------------------------------------------------------------- MMM 165.86 1.6 158.33 306.8% ------- BLUE 113 .063 -.033 --------------------------------------------------------------------- MRK 83.54 .86 81.02 153.1% ------- BLUE 87 .048 -.044 --------------------------------------------------------------------- MSFT 208.7 -.49 212.48 -182.2% Bullish RED 165 .15 .064 --------------------------------------------------------------------- NKE 106.52 1.3 101.86 292.9% Bullish BLUE 127 .104 -.039 --------------------------------------------------------------------- PFE 38.17 -.16 38.45 -13.1% Bearish BLUE 78 .138 -.006 --------------------------------------------------------------------- PG 135.78 .32 133.55 114.7% Bullish BLUE 90 .243 .084 Bullish --------------------------------------------------------------------- TRV 119.27 .41 117.36 234.7% Bullish BLUE 113 -.058 -.02 --------------------------------------------------------------------- UNH 321.52 -.75 317.03 117.4% Bullish BLUE 135 .149 -.009 |
Table 2 QUICKSILVER on ETFS - 08/13/20 Bullish = 6 ( -2)
Bearish = 0
ITRS + IP21>.25 is considered "Bullish"
ETF CLOSE CHANGE PIVOT-PT 5-dma AROC CL-PWR CANDLE IP21 ITRS --------------------------------------------------------------------------------------------- DIA 279.42 -.62 274.62 99.7% Bullish BLUE .227 ---- --------------------------------------------------------------------------------------------- SPY 336.83 -.61 334.57 37.3% Bullish BLUE .361 .017 Bullish --------------------------------------------------------------------------------------------- QQQ 272.48 .62 271.47 -39.9% Bullish RED .248 .089 Bullish --------------------------------------------------------------------------------------------- MDY 356.28 -.64 353.27 101.9% Bullish BLUE .262 -.007 Bullish --------------------------------------------------------------------------------------------- IWM 157.19 -.33 156.17 110.6% Bullish BLUE .214 .024 --------------------------------------------------------------------------------------------- FAS 38.15 -.62 38.08 191.8% Bullish RED .162 -.044 --------------------------------------------------------------------------------------------- RETL 241.5 1.38 234.37 438.2% Bullish BLUE .209 .515 Bullish --------------------------------------------------------------------------------------------- SOXL 247.67 -8.38 240.44 -25.2% Bullish RED .255 .344 Bullish --------------------------------------------------------------------------------------------- TECL 295.15 -.02 294.78 -221.9% Bullish RED .263 .377 Bullish --------------------------------------------------------------------------------------------- IBB 134 .19 136.23 -102.4% Bearish BLUE-.029 -.052 --------------------------------------------------------------------------------------------- GLD 183.33 4.23 190.81 -282.7% ------- BLUE .06 .087 --------------------------------------------------------------------------------------------- OIH 138.39 -3.52 134.28 166.8% ------- RED .183 .007 --------------------------------------------------------------------------------------------- |
Table 3 Count of Stocks in Key Directories
20200813
-------------------------------
NEWHIGHS 161
NEWLOWS 21 low
MAXCP 30
MINCP 30
TTTNH 11
TTTNL 20
FASTUP 108
FASTDOWN 73
CPCROSSA 69
CPCROSSD 56
BIGVOLUP 7
BIGVODN 5
ACCUMVER 65
HIGHIP21 25
HIUPPCT 20
REDSELL 66
AUGSELS7 90
TRAPDOOR 15
|
RANKING OF KEY DIRECTORIES BASED PCT.OF STOCKS ABOVE 65-DMA 8/13/20 --------------------------------------------------------------------------------------- Directory Current day-1 day-2 day-3 day-4 day-5 ---------------------------------------------------------------------------------------- COPPER 1 1 1 1 1 1 BONDFUND .98 .99 1 1 1 1 ETFS .964 .946 .946 .875 .875 .946 INSURANC .961 .961 1 1 .961 .884 AUTO .948 .974 .948 .948 .923 .923 SOLAR .933 .933 .933 .933 .933 1 GREEN .904 .904 .904 .857 .857 .761 COMODITY .902 .853 .829 .853 .829 .853 INFRA .885 .942 .914 .828 .771 .8 GOLD .877 .795 .816 .959 .959 .959 FOOD .867 .792 .792 .83 .792 .811 BIGBANKS .857 .857 .857 .857 .857 .857 JETS .857 .928 .928 .928 .642 .785 TRANSP .85 .9 .9 .9 .85 .8 DJI-13 .846 .923 .846 .846 .846 .846 CHINA .843 .882 .803 .823 .745 .862 INDEXES .837 .831 .825 .82 .825 .82 CHEM .833 .854 .854 .875 .833 .812 DOWJONES .833 .933 .9 .9 .833 .833 HOMEBLDG .823 .882 .882 .941 .823 .823 NIFTY .822 .822 .777 .8 .777 .866 RETAIL .816 .857 .857 .836 .734 .653 SP-100 .813 .857 .835 .857 .802 .747 ELECTRON .81 .804 .797 .824 .831 .81 GAMING .809 .809 .809 .857 .857 .904 REGBANKS .807 .923 .923 .846 .846 .538 SP500 .804 .836 .81 .829 .794 .75 EDU .8 .8 .8 .8 .8 .8 SEMI .798 .778 .74 .769 .798 .817 NASD-100 .797 .808 .777 .767 .737 .767 FIDSTKS .79 .813 .796 .802 .779 .751 RUS-1000 .785 .821 .807 .812 .775 .726 MILITARY .777 .814 .814 .74 .74 .74 INDMATER .773 .786 .813 .826 .786 .773 FINANCE .768 .841 .865 .841 .817 .585 COMPUTER .75 .8 .8 .85 .8 .8 SOFTWARE .75 .7 .666 .75 .783 .833 UTILITY .736 .763 .71 .815 .789 .763 BEVERAGE .733 .666 .533 .533 .533 .466 HACKERS .7 .65 .7 .8 .8 .9 GUNS .666 .666 .666 .666 .666 .666 HOSPITAL .666 .714 .666 .857 .857 .809 REIT .65 .742 .75 .75 .664 .607 COAL .571 .571 .571 .571 .428 .428 OILGAS .543 .622 .551 .582 .488 .511 BIOTECH .541 .526 .52 .57 .568 .526 |
-----------------------------------------------------------------------------------------------------------
8/12/2020 Peerless still shows multiple Sells. In the past when six
appeared, as now,
without any intervening Buys, the DJI has always gone down significantly
when its basic price-uptrend-line was broken.

The best thing I can say about the DJI now is that it is probably destined to
match 29500 again while the FED is controling the throttle of magic money-making.
There's no denying the bullish effect of this. We can easily find bullish technicals
in Table 2-4. In particular, the number of new lows is very low; 80% of all stocks
are above the support of their 65-dma and the NYSE A/D Line rose by another +760
today.


American political conventions are all about
arousing the political bases to
vote. Next week is the Democrat's turn. Expect populist, anti-Elite,
anti-Wall
Street rhetoric. Since the DJI is now 4% over the 21-day ma and over-bought,
we will likely see a decline in equities now.
The multiple Peerless Sells without an intervening Buy signal suggest a deeper
than average decline. But I would discard this prediction while the NYSE A/D Line
is in a strong uptrend, as long as interest rates do not go up sharply and the Dollar
does not go down sharply.
If the market were about to be about to start a big decline because of a change
in FED policy, I would expect inside-traders to know about it and I would not
expect the volatile SOXL (semi-conductors) and TECL (technology) to be in
powerful relative strength uptrends. See these immediately below.


If there is a decline, it may give us a chance to rebuy SLV
near 22 and GLD
near 170. Purchases at these levels should let us then to sell SLV at 25
and GLD at 200 on their next rallies, something I think we have to expect because
of QE-Infinity and the nearly $30 trillion dollar Federal deficit now.


|
Charts 8/12/2020 (Click on Underlined link.) 2020 PEERLESS DJI, Signals, Indicators Daily DJI Volume 10-DayUp/Down Vol Stoch-20 Inverted Traders Index Graph of Pct of All Stocks above 65-dma Cum. Inverted Traders Index NASDAQ S&P OEX NYSE COMPQX DJI-15 DJI-20 DJI-30 DIA QQQ MDY IWM TNA Short-Term Rates DOLLAR-UUP SPY http://tigersoft.com/2121CST/SPY.GIF recent 2006 vers-Peerless signals -- http://tigersoft.com/NEWPEER/UPD06812.BMP USO-CrudeOil DBO FAS GLD BBH IBB JETS JNUG KOL NUGT OIH PALL RSX RETL SDS AGQ SLV SOXL TECL TLT TMF TNA UGA (gasoline) USO (oil) and China: YINN CHAU Commodities: CANE CORN DBC JJC, NIB, CHOC CORN, CUT (paper) MOO, SOYB WEAT UUP (Dollar) LIT (Lithium) Stocks AAPL ADBE ALXN AMAT AMGN AMD AMZN AXP BA BABA BAC BIDU BLDP CAT CVX CMG DE ENPH FB GILD GOOG GS HD IBM INTU JPM LRCX M (Macy's) MSFT NEM NFLX NKE NVDA PG REGN REV SO SQ QCOM QDEL TSLA TXN XOM V VRTX WFC WMT TOWN ZM New highs and Bullish MAXCPs http://tigersoft.com/MAXCP/8-12/BULLISH.htm Bearish MAXCPs - http://tigersoft.com/MINCP/8-12/BEARISH.htm |
Table 1
8/12/2018 QUICKSILVER on DJI-30 STOCKS.
P21 + ITRS score >+.25 is bullish
Note that AAPL now shows highest AI/200 stock here.
2 Bullish (AAPL, CSCO) 21 Bearish (GS, INTC) STOCKS CLOSE CHANGE PIVOT-P 5-dma AROC CL-PWR Candl AI/200 IP21 ITRS --------------------------------------------------------------------------------------- --------------------------------------------------------------------------------------- AAPL 452.04 14.54 455.61 132.3% Bullish BLUE 174 .167 .312 Bullish --------------------------------------------------------------------- AXP 101.68 -1.58 95.92 317.5% Bullish RED 93 .129 -.06 --------------------------------------------------------------------- BA 175.44 -4.69 172.2 33.1% Bearish RED 44 -.171 .058 --------------------------------------------------------------------- CAT 142.57 .04 134.39 275.8% Bullish RED 142 -.033 .07 --------------------------------------------------------------------- CSCO 48.1 .91 47.77 81.1% ------- BLUE 112 .353 -.06 Bullish --------------------------------------------------------------------- CVX 90.72 1.1 87.47 199.6% Bullish RED 84 .231 -.128 --------------------------------------------------------------------- DIS 131.79 1.3 130.82 161.4% Bullish BLUE 101 .16 .024 --------------------------------------------------------------------- GS 212.13 1.07 204.25 183.4% ------- RED 93 -.242 -.047 Bearish --------------------------------------------------------------------- HD 281.58 6.66 269.37 259.5% Bullish BLUE 127 .133 .028 --------------------------------------------------------------------- IBM 126.7 -.05 126.12 49.6% ------- RED 125 .073 -.081 --------------------------------------------------------------------- INTC 49.19 1 48.57 27.8% Bearish BLUE 123 -.213 -.294 Bearish --------------------------------------------------------------------- JNJ 149.66 2.69 147.55 42.6% Bearish BLUE 122 -.087 -.077 --------------------------------------------------------------------- JPM 102.94 -.88 97.24 287.5% ------- RED 59 -.105 -.046 --------------------------------------------------------------------- KO 48.43 .5 47.48 127% Bullish BLUE 89 -.019 -.053 --------------------------------------------------------------------- MCD 206.02 1.02 203.18 166.3% Bullish RED 123 .108 .012 --------------------------------------------------------------------- MMM 164.26 .88 156 280.4% ------- RED 112 .018 -.044 --------------------------------------------------------------------- MRK 82.68 1.77 81.05 64.1% ------- BLUE 86 .012 -.063 --------------------------------------------------------------------- MSFT 209.19 5.81 216.35 -89% Bullish BLUE 164 .165 .045 --------------------------------------------------------------------- NKE 105.22 .1 100.45 208.3% Bullish RED 126 .104 -.042 --------------------------------------------------------------------- PFE 38.33 .54 38.27 -15.7% Bearish BLUE 77 .113 -.026 --------------------------------------------------------------------- PG 135.46 2.23 132.71 75.7% Bullish BLUE 89 .158 .061 --------------------------------------------------------------------- TRV 118.86 -1.06 113.74 161.5% ------- RED 113 -.099 -.015 --------------------------------------------------------------------- UNH 322.27 6.72 314.06 155.2% Bullish BLUE 135 .103 -.034 |
Table 3 QUICKSILVER on ETFS - 08/11/20 Bullish = 8 (DIA dropped from "bullish")
Bearish = 0
ITRS + IP21>.25 is considered "Bullish"
ETF CLOSE CHANGE PIVOT-PT 5-dma AROC CL-PWR CANDLE IP21 ITRS --------------------------------------------------------------------------------------------- DIA 280.04 2.85 273.9 146.1% Bullish BLUE .214 ---- --------------------------------------------------------------------------------------------- SPY 337.44 4.64 334.33 79.8% Bullish BLUE .379 .009 Bullish --------------------------------------------------------------------------------------------- QQQ 271.86 6.67 274.64 15% Bullish BLUE .279 .068 Bullish --------------------------------------------------------------------------------------------- MDY 356.92 2.28 349.07 95.5% Bullish RED .312 0 Bullish --------------------------------------------------------------------------------------------- IWM 157.52 .64 153.73 119.8% Bullish RED .259 .028 Bullish --------------------------------------------------------------------------------------------- FAS 38.77 .2 36.69 303.2% Bullish RED .228 .045 Bullish --------------------------------------------------------------------------------------------- SOXL 256.05 23.43 248.9 128.7% Bullish BLUE .274 .494 Bullish --------------------------------------------------------------------------------------------- TECL 295.17 19.55 308.16 1.2% Bullish BLUE .281 .386 Bullish --------------------------------------------------------------------------------------------- IBB 133.81 1.93 136.76 -128.1% Bearish BLUE .009 -.091 --------------------------------------------------------------------------------------------- GLD 179.1 -.84 193.89 -323.7% ------- RED .069 .015 --------------------------------------------------------------------------------------------- OIH 141.91 1.07 133.78 174.9% ------- RED .217 .043 Bullish --------------------------------------------------------------------------------------------- |
Table 3 Count of Stocks in Key Directories
20200812
-------------------------------
NEWHIGHS 199
NEWLOWS 26
MAXCP 36
MINCP 31
TTTNH 23
TTTNL 32
FASTUP 133
FASTDOWN 101
CPCROSSA 86
CPCROSSD 59
BIGVOLUP 5
BIGVODN 9
ACCUMVER 61
HIGHIP21 34
HIUPPCT 19
REDSELL 63
AUGSELS7 80
TRAPDOOR 16
|
RANKING OF KEY DIRECTORIES BASED PCT.OF STOCKS ABOVE 65-DMA 8/12/20 --------------------------------------------------------------------------------------- Directory Current day-1 day-2 day-3 day-4 day-5 ---------------------------------------------------------------------------------------- COPPER 1 1 1 1 1 1 BONDFUND .99 1 1 1 1 1 AUTO .974 .948 .948 .923 .923 .923 INSURANC .961 1 1 .961 .923 .923 ETFS .946 .946 .875 .875 .946 .928 INFRA .942 .914 .828 .771 .8 .8 DOWJONES .933 .9 .9 .833 .833 .8 SOLAR .933 .933 .933 .933 1 1 JETS .928 .928 .928 .642 .785 .571 DJI-13 .923 .846 .846 .846 .846 .846 REGBANKS .923 .923 .846 .846 .576 .576 GREEN .904 .904 .857 .857 .761 .809 TRANSP .9 .9 .9 .85 .8 .75 CHINA .882 .803 .823 .745 .862 .843 HOMEBLDG .882 .882 .941 .823 .823 .823 BIGBANKS .857 .857 .857 .857 .857 .857 RETAIL .857 .857 .836 .734 .653 .693 SP-100 .857 .835 .857 .802 .747 .736 CHEM .854 .854 .875 .833 .812 .875 COMODITY .853 .829 .853 .829 .853 .853 FINANCE .841 .865 .841 .817 .621 .634 SP500 .836 .813 .829 .794 .756 .752 INDEXES .831 .825 .82 .825 .82 .831 NIFTY .822 .777 .8 .777 .866 .844 RUS-1000 .821 .808 .812 .775 .732 .736 MILITARY .814 .814 .74 .74 .74 .703 FIDSTKS .813 .796 .802 .779 .757 .74 GAMING .809 .809 .857 .857 .904 .857 NASD-100 .808 .787 .777 .737 .767 .767 ELECTRON .804 .797 .824 .831 .817 .837 COMPUTER .8 .8 .85 .8 .8 .8 EDU .8 .8 .8 .8 .8 .8 GOLD .795 .816 .959 .959 .959 .979 FOOD .792 .792 .83 .792 .811 .792 INDMATER .786 .813 .826 .786 .773 .8 SEMI .778 .74 .769 .798 .817 .817 UTILITY .763 .71 .815 .789 .789 .631 REIT .737 .744 .744 .659 .602 .581 HOSPITAL .714 .666 .857 .904 .809 .857 SOFTWARE .7 .683 .75 .783 .833 .816 BEVERAGE .666 .533 .533 .533 .466 .466 GUNS .666 .666 .666 .666 .666 .733 HACKERS .65 .75 .8 .8 .9 .9 OILGAS .622 .551 .582 .488 .511 .559 COAL .571 .571 .571 .428 .428 .571 BIOTECH .519 .516 .569 .569 .54 .584 |
=========================================================================
8/11/2020 The multiple Peerless SELLs warn us not to chase the rally that
is shaping up
at the opening this morning. But our analytical tables 2-4 below are all bullish.
Today's drop, let's assume, resulted from the selling of those who are bearish
about the Biden-Harris Democrat ticket. I doubt if their selling is finished.
Today's rally, let's say on the other hand, is ocassioned by all those on
Wall Street who are either pleased with this ticket for its own sake or because
they think having a non-white woman as the VP candidate will make it easier for
Trump to pull a victory off. The August Democrat convention may scare away
some of the bulls by its populist rhetoric. Let's not jump on any bandwagons
prematurely. These swings in a Presidential Election year are to be expected,
I suppose.
We have to look at the trends and internal strength indicators of our key charts.
Most show uptrends but nearby overhead resistance.
Having sold out our long positions in ETFs, QQQ, GLD and SLV, we need now
to see some calming down of the volatility before retaking most positions.
There is one exception. I think.Nividia (NVDA) should now be bought again.
See its chart just below.
 |
 |
 |
 |
 |
 |

|
Charts 8/11/2020 (Click on Underlined link.) 2020 PEERLESS DJI, Signals, Indicators Daily DJI Volume 10-DayUp/Down Vol Stoch-20 Inverted Traders Index Graph of Pct of All Stocks above 65-dma Cum. Inverted Traders Index NASDAQ S&P OEX NYSE COMPQX DJI-15 DJI-20 DJI-30 DIA QQQ MDY IWM TNA Short-Term Rates DOLLAR-UUP SPY http://tigersoft.com/2121CST/SPY.GIF recent 2006 vers-Peerless signals -- http://tigersoft.com/NEWPEER/UPD06811.BMP USO-CrudeOil DBO FAS GLD BBH IBB JETS JNUG KOL NUGT OIH PALL RSX RETL SDS AGQ SLV SOXL TECL TLT TMF TNA UGA (gasoline) USO (oil) and China: YINN CHAU Commodities: CANE CORN DBC JJC, NIB, CHOC CORN, CUT (paper) MOO, SOYB WEAT UUP (Dollar) LIT (Lithium) Stocks AAPL ADBE ALXN AMAT AMGN AMD AMZN AXP BA BABA BAC BIDU BLDP CAT CVX CMG DE ENPH FB GILD GOOG GS HD IBM INTU JPM LRCX M (Macy's) MSFT NEM NFLX NKE NVDA PG REGN REV SO SQ QCOM QDEL TSLA TXN XOM V VRTX WFC WMT TOWN ZM New highs and Bullish MAXCPs http://tigersoft.com/MAXCP/8-11/BULLISH.htm Bearish MAXCPs - http://tigersoft.com/MINCP/8-11/BEARISH.htm |
Table 1
8/11/2018 QUICKSILVER on DJI-30 STOCKS.
P21 + ITRS score >+.25 is bullish
Note that AAPL now shows highest AI/200 stock here.
2 Bullish (AAPL, CSCO) 1 Bearish (INTC) STOCKS CLOSE CHANGE PIVOT-P 5-dma AROC CL-PWR Candl AI/200 IP21 ITRS --------------------------------------------------------------------------------------- --------------------------------------------------------------------------------------- AAPL 437.5 -13.41 440.25 -13% Bullish RED 174 .173 .273 Bullish --------------------------------------------------------------------- AXP 103.26 1.64 95.39 518.8% Bullish RED 92 .188 -.019 --------------------------------------------------------------------- BA 180.13 .72 174.28 437.3% Bearish RED 44 -.104 .104 --------------------------------------------------------------------- CAT 142.53 .51 134.97 406.1% Bullish RED 143 .06 .097 --------------------------------------------------------------------- CSCO 47.19 -.54 47.33 -50.4% ------- RED 111 .325 -.067 Bullish --------------------------------------------------------------------- CVX 89.62 -.11 87.2 178.8% Bullish RED 83 .26 -.12 --------------------------------------------------------------------- DIS 130.49 1.7 127.61 520.1% Bullish ---- 100 .194 .013 --------------------------------------------------------------------- GS 211.06 1.68 204.52 229.1% ------- RED 94 -.166 -.03 --------------------------------------------------------------------- HD 274.92 .19 267.48 130.5% Bullish RED 126 .168 .026 --------------------------------------------------------------------- IBM 126.75 -.36 125.45 36.1% ------- RED 125 .113 -.071 --------------------------------------------------------------------- INTC 48.19 -1.03 48.92 -96.4% Bearish RED 124 -.226 -.307 Bearish --------------------------------------------------------------------- JNJ 146.97 -1.06 148.4 -8.4% Bearish RED 122 -.07 -.087 --------------------------------------------------------------------- JPM 103.82 3.18 97.21 421.9% Bullish ---- 59 -.078 -.033 --------------------------------------------------------------------- KO 47.93 .21 47.22 130.9% ------- RED 89 .024 -.066 --------------------------------------------------------------------- MCD 205 .88 199.26 139.5% Bullish ---- 122 .177 .008 --------------------------------------------------------------------- MMM 163.38 1.94 155.35 388.9% ------- RED 111 .067 -.036 --------------------------------------------------------------------- MRK 80.91 0 81.64 -46.8% Bearish RED 85 .003 -.069 --------------------------------------------------------------------- MSFT 203.38 -4.87 212.94 -233% Bearish RED 164 .182 .027 --------------------------------------------------------------------- NKE 105.12 -.29 100.94 384.9% Bullish RED 125 .103 -.03 --------------------------------------------------------------------- PFE 37.79 -.6 38.45 -78.1% Bearish RED 76 .113 -.02 --------------------------------------------------------------------- PG 133.23 -.87 133.44 -21% Bullish RED 88 .154 .05 --------------------------------------------------------------------- TRV 119.92 .8 115.08 294.8% Bullish RED 113 -.006 .013 --------------------------------------------------------------------- UNH 315.55 -3.55 312.47 176.3% Bullish RED 135 .125 -.054 |
Table 3 QUICKSILVER on ETFS - 08/11/20 Bullish = 9 (GLD dropped from "bullish")
Bearish = 0
ITRS + IP21>.25 is considered "Bullish"
ETF CLOSE CHANGE PIVOT-PT 5-dma AROC CL-PWR CANDLE IP21 ITRS --------------------------------------------------------------------------------------------- DIA 277.19 -.95 272 160.6% Bullish RED .288 0 Bullish --------------------------------------------------------------------------------------------- SPY 332.8 -2.77 332.11 41.1% Bullish RED .395 .003 Bullish --------------------------------------------------------------------------------------------- QQQ 265.19 -5.12 271.05 -95.6% ------- RED .316 .047 Bullish --------------------------------------------------------------------------------------------- MDY 354.64 -.52 350.19 132.2% Bullish RED .384 .003 Bullish --------------------------------------------------------------------------------------------- IWM 156.88 -.91 153.79 197.1% Bullish RED .317 .033 Bullish --------------------------------------------------------------------------------------------- FAS 38.57 .41 36.49 468.8% Bullish RED .304 .068 Bullish --------------------------------------------------------------------------------------------- SOXL 232.62 -7.97 249.81 -359.3% Bullish RED .29 .443 Bullish --------------------------------------------------------------------------------------------- TECL 275.62 -16.22 295.1 -287.8% ------- RED .304 .328 Bullish --------------------------------------------------------------------------------------------- IBB 131.88 -2.99 137.28 -212.4% Bearish RED .063 -.102 --------------------------------------------------------------------------------------------- GLD 179.94 -10.21 191.35 -252.4% ------- RED .167 .014 --------------------------------------------------------------------------------------------- OIH 140.84 .62 137.11 319.2% ------- RED .267 .091 Bullish --------------------------------------------------------------------------------------------- GASL 3440 285 3685 -325.1% ------- RED -.021 .027 --------------------------------------------------------------------------------------------- |
Count of Stocks in Key Directories
20200811
-------------------------------
NEWHIGHS 262 Bullish >10:1 NH/NL
NEWLOWS 13
MAXCP 25
MINCP 30
TTTNH 19
TTTNL 52
FASTUP 256
FASTDOWN 72
CPCROSSA 31
CPCROSSD 77
BIGVOLUP 7
BIGVODN 13
ACCUMVER 58
HIGHIP21 66
HIUPPCT 18
REDSELL 62
AUGSELS7 47
TRAPDOOR 16
|
RANKING OF KEY DIRECTORIES BASED PCT.OF STOCKS ABOVE 65-DMA
8/11/20
Bullish = 46 (max. possible)
---------------------------------------------------------------------------------------
Directory Current day-1 day-2 day-3 day-4 day-5
----------------------------------------------------------------------------------------
BONDFUND 1 1 1 1 1 1
COPPER 1 1 1 1 1 1
INSURANC 1 1 .961 .923 .923 .846
AUTO .948 .948 .923 .923 .948 .923
ETFS .946 .875 .875 .946 .928 .91
SOLAR .933 .933 .933 1 1 1
JETS .928 .928 .642 .785 .571 .285
REGBANKS .923 .846 .846 .576 .576 .346
INFRA .914 .828 .771 .8 .8 .771
GREEN .904 .857 .857 .761 .809 .809
DOWJONES .9 .9 .833 .833 .8 .666
TRANSP .9 .9 .85 .8 .75 .6
HOMEBLDG .882 .941 .823 .823 .823 .823
FINANCE .865 .841 .817 .621 .646 .5
BIGBANKS .857 .857 .857 .857 .857 .571
RETAIL .857 .836 .734 .653 .693 .673
CHEM .854 .875 .833 .812 .875 .833
DJI-13 .846 .846 .846 .846 .846 .692
SP-100 .835 .857 .802 .747 .747 .659
COMODITY .829 .853 .829 .853 .853 .853
INDEXES .825 .82 .825 .82 .831 .792
GOLD .816 .959 .959 .959 .979 .979
MILITARY .814 .74 .74 .74 .703 .592
INDMATER .813 .826 .786 .773 .8 .786
SP500 .813 .831 .794 .756 .76 .72
GAMING .809 .857 .857 .904 .857 .857
RUS-1000 .808 .814 .775 .732 .739 .697
CHINA .803 .823 .745 .862 .843 .784
COMPUTER .8 .85 .8 .8 .8 .8
EDU .8 .8 .8 .8 .8 .8
ELECTRON .797 .824 .831 .817 .837 .871
FIDSTKS .796 .802 .779 .757 .751 .672
FOOD .792 .83 .792 .811 .792 .811
NASD-100 .787 .787 .747 .767 .767 .757
NIFTY .777 .8 .777 .866 .866 .844
HACKERS .75 .85 .8 .9 .9 .9
REIT .744 .744 .659 .602 .581 .581
SEMI .74 .769 .798 .817 .817 .855
UTILITY .71 .815 .789 .789 .657 .763
SOFTWARE .683 .766 .783 .833 .816 .85
GUNS .666 .666 .666 .666 .733 .6
HOSPITAL .666 .857 .904 .857 .857 .809
COAL .571 .571 .428 .428 .571 .571
OILGAS .551 .582 .488 .511 .566 .488
BEVERAGE .533 .533 .533 .466 .466 .533
BIOTECH .511 .566 .566 .54 .59 .563
|
========================================================================
8/10/2020 We have what appears to be a remarkably strong market at the moment.
Table 2 below shows each of the key ETFs we track there, with the exception of IBB, is
rated as "bullish". Table 3 shows the ratio of DJI and NASDAQ new highs
to their new lows is almost 20:1. There is very little to short because there
is so little downside. Table 4 says that each of the 46 groups we follow
each night now has a majority of their stocks above their 65-dma. Again, this means
the downside is limited.
I don't know if this signifies that Trump is expected to win the Presidential Election or
Biden is making lots of secret deals with his Wall Street backers. But surely it
shows
that any retreat by the DJI and the other key ETFs back to their rising 65-dma should
be bought and very likely the FED will not reverse course from its QE-Infinityprogram
until the DJI scores its own new high above 29500. Even Gold has weakened. The
FED
may have reached a secret accomodation with the central banks of Europe and Japan
that will protect the Dollar until after the Election.
At this writing the DJIA is up over 250. It does seem
to have 29500 as
its objective now that it has closed above 27500 for a new recovery high.
It has risen 7 days in a row and it now 3.6% over its 21-day ma. Two months
ago it shot up to its 10% upper band briefly. So, I would not short it even
though we now see six different Peerless Sells without a Buy signal. Abide
by the rising NYSE A/D Line and the DJI's uptrend. The market is "fair" in
the
sense that before it tops out we should see some warning non-confirmations like
those appeared this February. See our DJI chart below. Note the uptrendlines
below in our TigerSoft candle-stick charts.
 |
 |
Gold appears to have broken its
uptrend. We should take the nice profits in it along
with Silver, which usually follows the yellow metal.
 |
 |
SPY seems bound to breakout clearly into all-time high territory. Its uptrends
are still intact. We do not want to fight
that trend. At some point, its Closing
Power uptrend will be violated and it will fall back. But do not try to anticipate
that.
The NASDAQ and QQQ have become significantly weaker than the
DJI
and DIA. Let's sell QQQ and await developments.
 |
|
|
Charts 8/10/2020 (Click on Underlined link.) 2020 PEERLESS DJI, Signals, Indicators Daily DJI Volume 10-DayUp/Down Vol Stoch-20 Inverted Traders Index Graph of Pct of All Stocks above 65-dma Cum. Inverted Traders Index NASDAQ S&P OEX NYSE COMPQX DJI-15 DJI-20 DJI-30 DIA QQQ MDY IWM TNA Short-Term Rates DOLLAR-UUP SPY http://tigersoft.com/2121CST/SPY.GIF recent 2006 vers-Peerless signals -- http://tigersoft.com/NEWPEER/UPD06810.BMP USO-CrudeOil DBO FAS GLD BBH IBB JETS JNUG KOL NUGT OIH PALL RSX RETL SDS AGQ SLV SOXL TECL TLT TMF TNA UGA (gasoline) USO (oil) and China: YINN CHAU Commodities: CANE CORN DBC JJC, NIB, CHOC CORN, CUT (paper) MOO, SOYB WEAT UUP (Dollar) LIT (Lithium) Stocks AAPL ADBE ALXN AMAT AMGN AMD AMZN AXP BA BABA BAC BIDU BLDP CAT CVX CMG DE ENPH FB GILD GOOG GS HD IBM INTU JPM LRCX M (Macy's) MSFT NEM NFLX NKE NVDA PG REGN SO SQ QCOM QDEL TSLA TXN XOM V VRTX WFC WMT TOWN ZM New highs and Bullish MAXCPs http://tigersoft.com/MAXCP/8-10/BULLISH.htm Bearish MAXCPs - http://tigersoft.com/MINCP/8-10/BEARISH.htm |
Table 1
8/10/2018 QUICKSILVER on DJI-30 STOCKS.
P21 + ITRS score >+.25 is bullish
Note that AAPL now shows highest AI/200 stock here.
2 Bullish (AAPL, CSCO) 1 Bearish (INTC) STOCKS CLOSE CHANGE PIVOT-P 5-dma AROC CL-PWR Candl AI/200 IP21 ITRS --------------------------------------------------------------------------------------- --------------------------------------------------------------------------------------- AAPL 450.91 6.46 438.66 171.1% Bullish BLUE 174 .168 .324 Bullish --------------------------------------------------------------------- AXP 101.62 2.46 93.19 423.3% Bullish BLUE 91 .205 -.025 --------------------------------------------------------------------- BA 179.41 9.39 165.07 507.8% Bearish BLUE 44 -.074 .136 --------------------------------------------------------------------- CAT 142.02 7.1 131.52 383.5% Bullish BLUE 143 .119 .088 --------------------------------------------------------------------- CSCO 47.73 .3 47.67 60% ------- BLUE 110 .334 -.096 Bullish --------------------------------------------------------------------- CVX 89.73 2.93 86.49 284.2% Bullish BLUE 82 .284 -.115 --------------------------------------------------------------------- DIS 128.79 -1.14 117.29 500% Bullish RED 99 .178 .004 --------------------------------------------------------------------- GS 209.38 1.11 201.64 245.3% ------- RED 94 -.142 -.028 --------------------------------------------------------------------- HD 274.73 3.09 267.87 159.2% Bullish BLUE 125 .143 .012 --------------------------------------------------------------------- IBM 127.11 2.15 125.84 111.7% Bullish BLUE 125 .135 -.076 --------------------------------------------------------------------- INTC 49.22 1.19 49.13 94.7% Bearish BLUE 125 -.214 -.312 Bearish --------------------------------------------------------------------- JNJ 148.03 -.57 147.22 23% Bearish RED 122 -.031 -.099 --------------------------------------------------------------------- JPM 100.64 1.26 95.55 233.8% Bullish BLUE 59 -.015 -.06 --------------------------------------------------------------------- KO 47.72 -.08 46.69 150.7% ------- RED 89 .041 -.072 --------------------------------------------------------------------- MCD 204.12 -.48 199.36 242.8% Bullish RED 121 .151 .002 --------------------------------------------------------------------- MMM 161.44 3.11 151.21 357.5% ------- BLUE 110 .1 -.062 --------------------------------------------------------------------- MRK 80.91 -.11 81.67 -99.9% Bearish RED 84 .012 -.091 --------------------------------------------------------------------- MSFT 208.25 -4.23 213.29 -193.4% Bearish RED 163 .181 .043 --------------------------------------------------------------------- NKE 105.41 3.55 97.33 354.8% Bullish BLUE 125 .103 -.025 --------------------------------------------------------------------- PFE 38.39 -.06 38.39 5.2% Bearish RED 75 .14 -.089 --------------------------------------------------------------------- PG 134.1 .55 133.79 105.7% Bullish BLUE 87 .152 .063 --------------------------------------------------------------------- TRV 119.12 1.76 113.1 205.7% Bullish BLUE 113 .03 .02 --------------------------------------------------------------------- UNH 319.1 2.07 304.5 249.6% Bullish BLUE 135 .178 -.047 |
Table 3 QUICKSILVER on ETFS - 08/10/20 Bullish = 10
Bearish = 0
ITRS + IP21>.25 is considered "Bullish"
ETF CLOSE CHANGE PIVOT-PT 5-dma AROC CL-PWR CANDLE IP21 ITRS --------------------------------------------------------------------------------------------- DIA 278.14 3.52 268.41 210.6% Bullish BLUE .274 ---- Bullish --------------------------------------------------------------------------------------------- SPY 335.57 1 330.06 102.1% Bullish BLUE .363 .009 Bullish --------------------------------------------------------------------------------------------- QQQ 270.31 -1.16 270.38 17.1% Bullish RED .287 .065 Bullish --------------------------------------------------------------------------------------------- MDY 355.16 1.89 345.37 165.5% Bullish BLUE .322 .011 Bullish --------------------------------------------------------------------------------------------- IWM 157.79 1.62 150.79 262.7% Bullish BLUE .29 .042 Bullish --------------------------------------------------------------------------------------------- FAS 38.16 .08 35.11 411.8% Bullish RED .281 .088 Bullish --------------------------------------------------------------------------------------------- SOXL 240.59 .15 250.3 12.2% Bullish RED .255 .467 Bullish --------------------------------------------------------------------------------------------- TECL 291.84 -2.94 292.69 29.7% Bullish RED .292 .406 Bullish --------------------------------------------------------------------------------------------- IBB 134.87 -1.36 137.68 -134.7% Bearish RED .052 -.093 --------------------------------------------------------------------------------------------- GLD 190.15 -.66 189.59 118.5% Bullish RED .262 .076 Bullish --------------------------------------------------------------------------------------------- OIH 140.22 5.94 132.19 447.3% Bullish BLUE .266 .087 Bullish --------------------------------------------------------------------------------------------- |
Table 3 Count of Stocks in Key Directories
20200810
-------------------------------
NEWHIGHS 262 Bullish >10:1 NH/NL
NEWLOWS 13
MAXCP 76
MINCP 24
TTTNH 29
TTTNL 39
FASTUP 299
FASTDOWN 55
CPCROSSA 71
CPCROSSD 74
BIGVOLUP 7
BIGVODN 4
ACCUMVER 49
HIGHIP21 58
HIUPPCT 19
REDSELL 63
AUGSELS7 50
TRAPDOOR 10
|
Table 4 RANKING OF KEY DIRECTORIES BASED PCT.OF STOCKS ABOVE 65-DMA
8/10/20
Bullish = 46
Bearish = 0
---------------------------------------------------------------------------------------
Directory Current day-1 day-2 day-3 day-4 day-5
----------------------------------------------------------------------------------------
BONDFUND 1 1 1 1 1 1
COPPER 1 1 1 1 1 1
INSURANC 1 .961 .923 .923 .846 .923
GOLD .959 .959 .959 .979 .979 .959
AUTO .948 .923 .923 .948 .948 .871
HOMEBLDG .941 .823 .823 .823 .823 .823
SOLAR .933 .933 1 1 1 1
JETS .928 .642 .785 .571 .285 .142
DOWJONES .9 .833 .833 .8 .7 .666
TRANSP .9 .85 .8 .75 .6 .55
CHEM .875 .833 .812 .875 .854 .812
ETFS .875 .875 .946 .928 .91 .892
BIGBANKS .857 .857 .857 .857 .714 .714
GAMING .857 .857 .904 .857 .857 .809
GREEN .857 .857 .761 .809 .809 .809
HOSPITAL .857 .904 .857 .904 .809 .809
SP-100 .857 .802 .747 .747 .703 .692
COMODITY .853 .829 .853 .853 .853 .878
COMPUTER .85 .8 .8 .8 .8 .8
HACKERS .85 .85 .9 .9 .9 .8
DJI-13 .846 .846 .846 .846 .692 .692
REGBANKS .846 .846 .576 .576 .346 .384
FINANCE .841 .817 .621 .646 .536 .597
RETAIL .836 .734 .653 .693 .673 .591
SP500 .831 .796 .756 .76 .733 .714
FOOD .83 .792 .811 .792 .811 .849
INFRA .828 .771 .8 .8 .771 .742
INDMATER .826 .786 .773 .8 .786 .72
CHINA .823 .745 .862 .843 .803 .784
ELECTRON .823 .829 .816 .836 .87 .87
INDEXES .82 .825 .82 .831 .792 .786
UTILITY .815 .789 .789 .657 .763 .71
RUS-1000 .814 .776 .732 .739 .705 .693
FIDSTKS .802 .779 .757 .751 .694 .683
EDU .8 .8 .8 .8 .8 .6
NIFTY .8 .777 .866 .866 .844 .866
NASD-100 .787 .757 .777 .767 .757 .767
SEMI .766 .796 .815 .815 .854 .854
SOFTWARE .766 .8 .833 .816 .85 .816
REIT .744 .659 .602 .581 .588 .546
MILITARY .74 .74 .74 .703 .592 .592
GUNS .666 .666 .666 .733 .6 .6
OILGAS .582 .488 .511 .566 .496 .448
COAL .571 .428 .428 .571 .571 .571
BIOTECH .561 .563 .537 .59 .579 .582
BEVERAGE .533 .533 .466 .466 .533 .533
|
=======================================================================
8/7/2020 Peerless gave us a new Sell S9-v this past week. We have
now had six Sells
without a Peerless Buy signal. See the table below this paragraph. This has
happened only five times in the past. Each time the market went substantially lower.
But the Federal Reserve keeps propping the market up with QE-Infinity and Donald
Trump feels he can spend trillions without Congressional approval. The Constitution
apparently does not matter any more. We live in times radically different from
those we grew up in. So, perhaps, the rally in the DJI will continue until 29500
and the Election is over. Perhaps... Apart from selling IBB now because of its
weak performance, I have to suggest simply abiding by the uptrends shown in
the charts below.
|
Five Straight Peerless Sells has always been followed by a bear market Peerless Users, this comes from c:\peerless\NEW.txt 19290802 S9 353.1 .402 381.2 -.0795 9/3 19290813 S9 354 .408 381.2 -.0768 9/3 19290814 S4 354.9 .409 381.1 -.0738 9/3 19290828 S12 372.1 .436 381.2 -.0244 9/3 19290903 S9 381.2 .45 none 0 19290905 S12 369.8 .433 none 0 1929 Crash - DJI fell below 200 in two months. ------------------------------------------------------------------------- 19320216 S9 85.8 .449 88.8 -.0349 3/8 19320217 S14 82.2 .425 88.8 -.0802 3/8 19320226 S9 82.1 .424 88.8 -.0816 3/8 19320226 S12 82.2 .424 88.8 -.0802 3/8 19320301 S9 81.9 .422 88.8 -.0842 3/8 19320308 S9 88.8 .467 none 0 1932 Crash - DJI fell to 42 in four months. ------------------------------------------------------------------------- 19370810 S7 186.9 .368 189.3 -.0128 8/13 19370813 S9 189.3 .376 none 0 19370816 S8 189.3 .376 none 0 19370910 S13 157.9 .252 162.9 .03 19370910 S13 157.9 .252 162.9 .03 19370917 S13 162.2 .272 164.8 -.016 9/16 1937 Crash ----------------------------------------------------------------------------- 19380106 S9 128.9 .044 134.4 -.0426 1/11 19380106 S12 128.9 .044 134.4 -.0426 1/11 19380114 S12 131.8 .065 none 0 19380119 S9 130.1 .053 none 0 19380119 S4 130.1 .053 none 0 19380121 S9 130.7 .057 none 0 1938 - Another leg down in 1937-1938 Crash. ----------------------------------------------------------------------------- 19980701 S12 9048.67 .157 9337.97 -.0319 7/17 19980701 S9 9048.67 .157 9337.97 -.0319 7/17 19980708 S9 9174.97 .168 9337.97 -.0177 7/17 19980708 S12 9174.97 .168 9337.97 -.0177 7/17 19980804 S10 8487.31 .101 8693.28 -.0243 8/19 19980923 S9 8154.41 .064 none 0 1998 - 20% DJI decline followed in one month. ----------------------------------------------------------------------------- 20200714 S5 26642.59 20200714 S9 26642.59 20200715 S9 26870.10 20200715 S5 26870.10 20200716 S12 26734.71 20200720 S8 26680.87 20200806 S9 27386.98 |
 |
 |
 |
 |
 |
 |
 |
|
Charts 8/7/2020 (Click on Underlined link.) 2020 PEERLESS DJI, Signals, Indicators Daily DJI Volume 10-DayUp/Down Vol Stoch-20 Inverted Traders Index Graph of Pct of All Stocks above 65-dma Cum. Inverted Traders Index NASDAQ S&P OEX NYSE COMPQX DJI-15 DJI-20 DJI-30 DIA QQQ MDY IWM TNA Short-Term Rates DOLLAR-UUP SPY http://tigersoft.com/2121CST/SPY.GIF recent 2006 vers-Peerless signals -- http://tigersoft.com/NEWPEER/UPD06807.BMP USO-CrudeOil DBO FAS GLD BBH IBB JETS JNUG KOL NUGT OIH PALL RSX RETL SDS AGQ SLV SOXL TECL TLT TMF TNA UGA (gasoline) USO (oil) and China: YINN CHAU Commodities: CANE CORN DBC JJC, NIB, CHOC CORN, CUT (paper) MOO, SOYB WEAT UUP (Dollar) LIT (Lithium) Stocks AAPL ADBE ALXN AMAT AMGN AMD AMZN AXP BA BABA BAC BIDU BLDP CAT CVX CMG DE ENPH FB GILD GOOG GS HD IBM INTU JPM LRCX M (Macy's) MSFT NEM NFLX NKE NVDA PG REGN SO SQ QCOM QDEL TSLA TXN XOM V VRTX WFC WMT TOWN ZM New highs and Bullish MAXCPs http://tigersoft.com/MAXCP/8-7/BULLISH.htm Bearish MAXCPs - http://tigersoft.com/MINCP/8-7/BEARISH.htm |
Table 1
8/7/2018 QUICKSILVER on DJI-30 STOCKS.
P21 + ITRS score >+.25 is bullish
Note that AAPL now shows highest AI/200 stock here.
4 Bullish (AAPL, CSCO, DIS, MSFT) 1 Bearish (INTC) STOCKS CLOSE CHANGE PIVOT-P 5-dma AROC CL-PWR Candl AI/200 IP21 ITRS --------------------------------------------------------------------------------------- --------------------------------------------------------------------------------------- AAPL 444.45 -11.16 435.75 221% Bullish RED 174 .17 .317 Bullish --------------------------------------------------------------------- AXP 99.16 3.24 93.54 309.7% Bullish BLUE 90 .234 -.068 --------------------------------------------------------------------- BA 170.02 -2.18 162.27 361.3% Bearish RED 44 -.072 .055 --------------------------------------------------------------------- CAT 134.92 .53 131.78 76.6% Bullish BLUE 143 .08 .038 --------------------------------------------------------------------- CSCO 47.43 -.34 47.16 34.8% ------- ---- 109 .329 -.04 Bullish --------------------------------------------------------------------- CVX 86.8 -.67 84.81 166.3% Bullish BLUE 81 .273 -.124 --------------------------------------------------------------------- DIS 129.93 -.89 116.35 533.2% Bullish RED 98 .249 .033 Bullish --------------------------------------------------------------------- GS 208.27 4.02 199.39 255.8% Bullish BLUE 94 -.092 -.045 --------------------------------------------------------------------- HD 271.64 2.27 266.18 115% Bullish BLUE 124 .149 .028 --------------------------------------------------------------------- IBM 124.96 -1.16 124.31 80.8% Bullish BLUE 125 .137 -.076 --------------------------------------------------------------------- INTC 48.03 -.54 48.3 30.9% Bearish RED 126 -.228 -.301 Bearish --------------------------------------------------------------------- JNJ 148.6 1.05 147.35 96.4% Bearish BLUE 122 -.004 -.069 --------------------------------------------------------------------- JPM 99.38 2.14 96.1 141.9% Bullish BLUE 59 .063 -.085 --------------------------------------------------------------------- KO 47.8 .32 46.3 59.6% Bullish BLUE 89 .107 -.065 --------------------------------------------------------------------- MCD 204.6 1.42 194.4 260.5% Bullish BLUE 120 .165 .004 --------------------------------------------------------------------- MMM 158.33 2.33 150.41 257.4% ------- BLUE 109 .087 -.07 --------------------------------------------------------------------- MRK 81.02 -.03 82.54 47.9% Bearish BLUE 83 -.009 -.055 --------------------------------------------------------------------- MSFT 212.48 -3.87 216.54 175.5% ------- RED 162 .22 .092 Bullish --------------------------------------------------------------------- NKE 101.86 1.41 98.33 214.8% Bullish BLUE 124 .104 -.045 --------------------------------------------------------------------- PFE 38.45 .18 38.35 -3.9% Bearish BLUE 74 .157 -.073 --------------------------------------------------------------------- PG 133.55 .84 131.29 91.7% Bullish BLUE 86 .151 .071 --------------------------------------------------------------------- TRV 117.36 3.62 114.4 128.8% Bullish BLUE 112 .03 .011 --------------------------------------------------------------------- UNH 317.03 2.97 303.61 231.7% Bullish BLUE 135 .166 -.037 |
Table 3 QUICKSILVER on ETFS - 08/07/20 Bullish = 9
Bearish = 0
ITRS + IP21>.25 is considered "Bullish"
ETF CLOSE CHANGE PIVOT-PT 5-dma AROC CL-PWR CANDLE IP21 ITRS --------------------------------------------------------------------------------------------- DIA 274.62 .72 266.72 190.8% Bullish BLUE .28 --- --------------------------------------------------------------------------------------------- SPY 334.57 .24 328.79 121.8% Bullish BLUE .369 .025 Bullish --------------------------------------------------------------------------------------------- QQQ 271.47 -3.17 269.38 105.1% Bullish RED .307 .101 Bullish --------------------------------------------------------------------------------------------- MDY 353.27 4.2 343.63 197.5% Bullish BLUE .375 .013 Bullish --------------------------------------------------------------------------------------------- IWM 156.17 2.44 149.76 291.6% Bullish BLUE .332 .038 Bullish --------------------------------------------------------------------------------------------- FAS 38.08 1.39 35.17 435.7% Bullish BLUE .368 .075 Bullish --------------------------------------------------------------------------------------------- SOXL 240.44 -8.46 239.99 286.5% Bullish RED .242 .599 Bullish --------------------------------------------------------------------------------------------- TECL 294.78 -13.38 290.08 409.2% Bullish RED .316 .489 Bullish --------------------------------------------------------------------------------------------- IBB 136.23 -.53 138.57 67.9% Bearish ---- .037 -.05 --------------------------------------------------------------------------------------------- GLD 190.81 -3.08 185.64 142.2% Bullish RED .302 .1 Bullish --------------------------------------------------------------------------------------------- OIH 134.28 .5 128.31 356.2% ------- BLUE .277 .021 Bullish --------------------------------------------------------------------------------------------- GASL 3440 285 3685 -325.1% ------- RED -.021 .034 --------------------------------------------------------------------------------------------- |
Table 3 Count of Stocks in Key Directories
20200807
-------------------------------
NEWHIGHS 251 Bullish 10:1 NH/NL
NEWLOWS 18
MAXCP 76
MINCP 11
TTTNH 32
TTTNL 34
FASTUP 240
FASTDOWN 36
CPCROSSA 139
CPCROSSD 69
BIGVOLUP 8
BIGVODN 7
ACCUMVER 43
HIGHIP21 73
HIUPPCT 22
REDSELL 64
AUGSELS7 49
TRAPDOOR 11
|
RANKING OF KEY DIRECTORIES BASED PCT.OF STOCKS ABOVE 65-DMA 8/7/20 --------------------------------------------------------------------------------------- Directory Current day-1 day-2 day-3 day-4 day-5 ---------------------------------------------------------------------------------------- BONDFUND 1 1 1 1 1 .99 COPPER 1 1 1 1 1 1 INSURANC .961 .923 .923 .846 .923 .807 GOLD .959 .959 .979 .979 .959 .959 SOLAR .933 1 1 1 1 .933 AUTO .923 .923 .948 .948 .897 .846 HOSPITAL .904 .857 .904 .857 .809 .809 ETFS .875 .946 .928 .91 .892 .839 DOWJONES .862 .862 .827 .724 .689 .655 BIGBANKS .857 .857 .857 .714 .714 .714 GAMING .857 .904 .857 .857 .809 .809 GREEN .857 .761 .809 .809 .809 .761 HACKERS .85 .95 .9 .9 .8 .8 TRANSP .85 .8 .75 .6 .6 .55 DJI-13 .846 .846 .846 .692 .692 .538 REGBANKS .846 .576 .576 .346 .384 .346 CHEM .833 .812 .875 .854 .833 .687 ELECTRON .831 .817 .837 .871 .871 .837 COMODITY .829 .853 .853 .853 .878 .853 INDEXES .825 .82 .831 .792 .786 .758 HOMEBLDG .823 .823 .823 .823 .823 .882 FINANCE .817 .621 .646 .536 .609 .585 SP-100 .802 .747 .747 .703 .692 .67 COMPUTER .8 .8 .8 .8 .8 .8 EDU .8 .8 .8 .8 .6 .6 SOFTWARE .8 .85 .816 .85 .816 .783 SEMI .798 .817 .817 .855 .855 .836 SP500 .796 .758 .76 .733 .716 .714 FOOD .792 .811 .792 .811 .849 .83 UTILITY .789 .789 .657 .763 .71 .763 INDMATER .786 .773 .8 .786 .746 .68 FIDSTKS .779 .757 .751 .694 .683 .672 NIFTY .777 .866 .866 .844 .866 .844 RUS-1000 .776 .733 .739 .705 .697 .674 INFRA .771 .8 .8 .771 .771 .742 NASD-100 .757 .787 .777 .757 .767 .747 CHINA .745 .862 .843 .803 .784 .784 RETAIL .734 .653 .693 .673 .591 .612 MILITARY .714 .714 .678 .571 .571 .464 GUNS .666 .666 .733 .6 .6 .533 REIT .659 .602 .581 .588 .546 .581 JETS .642 .785 .571 .285 .214 .142 BIOTECH .558 .535 .587 .579 .592 .493 BEVERAGE .533 .466 .466 .533 .533 .666 OILGAS .488 .511 .566 .496 .448 .393 COAL .428 .428 .571 .571 .571 .428 |
=====================================================================
8/6/2020 The DJI closed at its upper band. Because the V-Indicator
was negative, a new
Sell S9-V appeared. In addition, we note that there were 37 more down than up
today on the NYSE and that Down Volume was 95 million more than up volume.
The DJI, however, rose +175. One hundred points of this Dow Jones Index gain
owed to thh 15+ point jump by high priced AAPL on its way to a split at the end
of the month. But one day is not a pattern. We will need to see more breadth
weakness to become bearish on the long positions that have been recommended
here in tech stocks, GLD, SLV and IBB.
Before the DJI can drop by much, I suspect the
NYSE A/D Line will have to top out, thereby showing us that
the FED is backing away from its Easy Money and QE-Infinity
programs.

Ordinarily, we would judge the DJI ought to pull back to its lower band or, at least,
its price-uptrend, but the FED does not want that and AAPL's inclusion in the FED
guards against that now until its pre-split season of all of August is over.


Gold and Silver shot up again today while the Dollar again weakened. Do not expect
any of the big media to tell the world that the FED is destroying the Dollar. Doing
so
would upset their sponsors, their owners and those in the Government that feed them
the stories they write about. It has always been this way. I have been reading
a paper from
Harvard which talks about how the Wall Street Journal and the New York Times
in 1907 covered up the real story of the day, namely why the DJIA was collapsing.
It involved NY bankers and brokers who used bank funds to try to rig a short squeeze
on a copper stock, only to have it fail miserably and bring about a nation-wide banking
panic when the copper stock they were trying to drive up fell from 60 to 10 in two
days.
Two weeks later they were lavishing wild prasie on JP Morgan for saving the country
from what really was a NY bankers' panic.
(See https://histecon.fas.harvard.edu/crisis-next/1907/docs/Kavoussi-Panic_of_1907.pdf )
|
Charts 8/6/2020 (Click on Underlined link.) 2020 PEERLESS DJI, Signals, Indicators Daily DJI Volume 10-DayUp/Down Vol Stoch-20 Inverted Traders Index Graph of Pct of All Stocks above 65-dma Cum. Inverted Traders Index NASDAQ S&P OEX NYSE COMPQX DJI-15 DJI-20 DJI-30 DIA QQQ MDY IWM TNA Short-Term Rates DOLLAR-UUP SPY http://tigersoft.com/2121CST/SPY.GIF recent 2006 vers-Peerless signals -- http://tigersoft.com/NEWPEER/UPD06806.BMP USO-CrudeOil DBO FAS GLD BBH IBB JETS JNUG KOL NUGT OIH PALL RSX RETL SDS AGQ SLV SOXL TECL TLT TMF TNA UGA (gasoline) USO (oil) and China: YINN CHAU Commodities: CANE CORN DBC JJC, NIB, CHOC CORN, CUT (paper) MOO, SOYB WEAT UUP (Dollar) LIT (Lithium) Stocks AAPL ADBE ALXN AMAT AMGN AMD AMZN AXP BA BABA BAC BIDU BLDP CAT CVX CMG DE ENPH FB GILD GOOG GS HD IBM INTU JPM LRCX M (Macy's) MSFT NEM NFLX NKE NVDA PG REGN SO SQ QCOM QDEL TSLA TXN XOM V VRTX WFC WMT TOWN ZM New highs and Bullish MAXCPs http://tigersoft.com/MAXCP/8-6/BULLISH.htm Bearish MAXCPs - http://tigersoft.com/MINCP/8-6/BEARISH.htm |
Table 1
8/6/2018 QUICKSILVER on DJI-30 STOCKS.
P21 + ITRS score >+.25 is bullish
Note that AAPL now shows highest AI/200 stock here.
4 Bullish (AAPL, CSCO, DIS, MSFT) 1 Bearish (INTC) STOCKS CLOSE CHANGE PIVOT-P 5-dma AROC CL-PWR Candl AI/200 IP21 ITRS --------------------------------------------------------------------------------------- --------------------------------------------------------------------------------------- AAPL 455.61 15.36 425.04 833.7% Bullish BLUE 174 .214 .361 Bullish --------------------------------------------------------------------- AXP 95.92 .53 93.32 67.5% Bullish BLUE 89 .153 -.123 --------------------------------------------------------------------- BA 172.2 -2.08 158 311.9% Bearish RED 44 -.107 .081 --------------------------------------------------------------------- CAT 134.39 -.58 132.88 -87.6% Bullish RED 143 .025 .027 --------------------------------------------------------------------- CSCO 47.77 .44 47.1 141.1% ------- BLUE 108 .3 -.032 Bullish --------------------------------------------------------------------- CVX 87.47 .27 83.94 70% Bullish BLUE 80 .203 -.139 --------------------------------------------------------------------- DIS 130.82 3.21 116.94 638.2% Bullish BLUE 97 .271 .006 Bullish --------------------------------------------------------------------- GS 204.25 -.27 197.96 117.6% ------- RED 94 -.145 -.097 --------------------------------------------------------------------- HD 269.37 1.89 265.49 57.4% Bullish BLUE 123 .151 .018 --------------------------------------------------------------------- IBM 126.12 .67 122.94 129.5% Bullish BLUE 125 .076 -.066 --------------------------------------------------------------------- INTC 48.57 -.35 47.73 59.9% Bearish RED 126 -.209 -.307 Bearish --------------------------------------------------------------------- JNJ 147.55 -.85 145.76 24.1% Bearish RED 122 -.031 -.053 --------------------------------------------------------------------- JPM 97.24 .03 96.64 11.4% Bullish RED 58 -.022 -.112 --------------------------------------------------------------------- KO 47.48 .26 47.24 -22.3% ------- BLUE 88 .054 -.055 --------------------------------------------------------------------- MCD 203.18 3.92 194.28 197.7% Bullish BLUE 119 .144 .011 --------------------------------------------------------------------- MMM 156 .65 150.47 127.7% ------- RED 108 .024 -.084 --------------------------------------------------------------------- MRK 81.05 -.59 80.24 127.1% Bearish RED 83 -.068 -.026 --------------------------------------------------------------------- MSFT 216.35 3.41 205.01 296% Bullish BLUE 161 .238 .119 Bullish --------------------------------------------------------------------- NKE 100.45 -.49 97.61 184.8% Bullish RED 124 .027 -.065 --------------------------------------------------------------------- PFE 38.27 -.18 38.48 -61.1% Bearish RED 73 .146 -.048 --------------------------------------------------------------------- PG 132.71 -.73 131.12 48.8% Bullish RED 85 .106 .094 --------------------------------------------------------------------- TRV 113.74 -1.34 114.42 -95.6% ------- RED 111 -.061 -.006 --------------------------------------------------------------------- UNH 314.06 1.59 302.78 144.4% Bullish BLUE 135 .136 -.037 |
Table 3 QUICKSILVER on ETFS - 08/06/20 Bullish = 8 now includes SPY, IWM and MDY!
Bearish = 0
ITRS + IP21>.25 is considered "Bullish"
ETF CLOSE CHANGE PIVOT-PT 5-dma AROC CL-PWR CANDLE IP21 ITRS --------------------------------------------------------------------------------------------- DIA 273.9 1.9 264.35 198.9% Bullish BLUE .224 ----- --------------------------------------------------------------------------------------------- SPY 334.33 2.22 326.52 157.9% Bullish BLUE .339 .031 Bullish --------------------------------------------------------------------------------------------- QQQ 274.64 3.59 265.79 252.5% Bullish BLUE .355 .122 Bullish --------------------------------------------------------------------------------------------- MDY 349.07 -1.12 339.62 103.3% Bullish RED .325 -.007 Bullish --------------------------------------------------------------------------------------------- IWM 153.73 -.06 147.36 165.6% Bullish RED .263 .003 Bullish --------------------------------------------------------------------------------------------- FAS 36.69 .2 34.97 229.1% Bullish BLUE .296 .018 Bullish --------------------------------------------------------------------------------------------- SOXL 248.9 -.91 226.51 386.4% Bullish BLUE .28 .553 Bullish --------------------------------------------------------------------------------------------- TECL 308.16 13.06 270.93 1014.5% Bullish BLUE .354 .556 Bullish --------------------------------------------------------------------------------------------- IBB 136.76 -.52 134.37 -9.5% Bearish RED .042 -.035 --------------------------------------------------------------------------------------------- GLD 193.89 2.54 185.43 270.6% Bullish BLUE .322 .132 Bullish --------------------------------------------------------------------------------------------- OIH 133.78 -3.33 124.93 259.8% ------- RED .187 .028 --------------------------------------------------------------------------------------------- GASL 3440 285 3685 -325.1% ------- RED -.021 .042 --------------------------------------------------------------------------------------------- |
Table 3 Count of Stocks in Key Directories
20200806
-------------------------------
NEWHIGHS 326 Bullish
NEWLOWS 14
MAXCP 93
MINCP 32
TTTNH 21
TTTNL 31
FASTUP 193
FASTDOWN 45
CPCROSSA 63
CPCROSSD 94
BIGVOLUP 5
BIGVODN 13
ACCUMVER 42
HIGHIP21 51
HIUPPCT 21
REDSELL 70
AUGSELS7 60
TRAPDOOR 8
|
RANKING OF KEY DIRECTORIES BASED PCT.OF STOCKS ABOVE 65-DMA
8/6/20
Bullish = 44
Bearish = 2
---------------------------------------------------------------------------------------
Directory Current day-1 day-2 day-3 day-4 day-5
----------------------------------------------------------------------------------------
BONDFUND 1 1 1 1 .99 1
COPPER 1 1 1 1 1 1
SOLAR 1 1 1 1 .933 .933
GOLD .959 .979 .979 .959 .959 .959
HACKERS .95 .95 .9 .8 .8 .75
ETFS .946 .928 .91 .892 .839 .91
AUTO .923 .948 .948 .897 .846 .897
INSURANC .923 .923 .846 .923 .807 .846
GAMING .904 .857 .857 .809 .809 .809
NIFTY .866 .866 .844 .866 .844 .866
CHINA .862 .843 .803 .784 .784 .745
BIGBANKS .857 .857 .714 .714 .714 .857
HOSPITAL .857 .904 .857 .857 .809 .857
COMODITY .853 .853 .853 .878 .853 .853
SOFTWARE .85 .833 .85 .816 .8 .8
DJI-13 .846 .846 .692 .692 .538 .692
DOWJONES .833 .8 .7 .666 .633 .733
HOMEBLDG .823 .823 .823 .823 .882 .882
INDEXES .82 .831 .792 .786 .758 .808
ELECTRON .817 .837 .871 .871 .837 .837
SEMI .817 .817 .855 .855 .836 .817
CHEM .812 .875 .854 .833 .708 .77
FOOD .811 .792 .811 .849 .83 .811
COMPUTER .8 .8 .8 .8 .8 .75
EDU .8 .8 .8 .6 .6 .6
INFRA .8 .8 .771 .771 .742 .771
TRANSP .8 .75 .6 .6 .55 .6
UTILITY .789 .657 .763 .71 .736 .815
NASD-100 .787 .787 .767 .767 .747 .777
JETS .785 .571 .285 .214 .142 .214
INDMATER .773 .8 .786 .746 .693 .733
GREEN .761 .809 .809 .809 .761 .809
SP500 .758 .762 .733 .716 .718 .737
FIDSTKS .757 .751 .694 .683 .677 .694
SP-100 .747 .747 .703 .692 .67 .714
MILITARY .74 .703 .592 .592 .481 .555
RUS-1000 .733 .74 .705 .697 .675 .693
GUNS .666 .733 .6 .6 .533 .6
RETAIL .653 .693 .673 .591 .612 .632
FINANCE .621 .646 .536 .609 .585 .695
REIT .602 .581 .588 .546 .588 .602
REGBANKS .576 .576 .346 .384 .346 .384
BIOTECH .53 .584 .577 .592 .511 .566
OILGAS .511 .566 .496 .448 .401 .401
==========================================================================================
BEVERAGE .466 .466 .533 .533 .666 .666
COAL .428 .571 .571 .571 .428 .428
|
=========================================================================
8/5/2020 The DJI has now reached its 2.5% upper band. A minor retreat seems
to be shaping up. Since we have no new Sells I think we have to assume
that the last decline to just below the 21-day ma has fulfilled the bearishness
of the Peerless Sells. The NYSE A/D Line uptrend is very strong. We have
a record nine ETFs showing an IP21 + ITRS level of greater
than +.25 and so are rated "bullish". Both the Opening and Closing Powers
are rising for DIA. The DJI seems to be under the FED's control as far as its
limited downside goes. I suspect the DJI will probably need to make a nominal new
high closing above 29551 before enough profit-taking develops to drop it
back to its lower band.


Wall Street seems at this stage not to be much upset if Biden replaces
Trump. But
Biden's choice for Vice President could scare Wall Street and conservative,
pro-corporate Democrats. I doubt if the July Jobs Report will surprise anyone.
In fact, it will just give the FED more reason for continuing their QE-Infinity.
Without a normal Democrat convention this year, there will be less populist
speech-making. Wall Street should like that.

Stay long the tech stocks and QQQ as well as GLD, SLV and laggard IBB.
Shorts should be covered when their Closing Power downtrends are broken,
as shown in REV a few nights ago.
Another shallow retreat from the DJI resistance near 27500
should not shock or
scare us. The DJIA has risen four straight days and does not feature a
a very positive IP21, showing that the "big money" selling into strength is not
done with. The A/D Line's
strength and the OEX new high today show the
momentum is clearly upwards.

The Dollar keeps falling while Gold and Silver are making new highs.
This strength
pressures
the Dollar and represents storm clouds that the FED must now be aware of.
A
crack in the Dollar to a new 12-month low will cause the FED to take a step back
from
their QE-Infinity. At the very least, I would expect them to check with the other
central
banks around the world.

|
Charts 8/5/2020 (Click on Underlined link.) 2020 PEERLESS DJI, Signals, Indicators Daily DJI Volume 10-DayUp/Down Vol Stoch-20 Inverted Traders Index Graph of Pct of All Stocks above 65-dma Cum. Inverted Traders Index NASDAQ S&P OEX NYSE COMPQX DJI-15 DJI-20 DJI-30 DIA QQQ MDY IWM TNA Short-Term Rates DOLLAR-UUP SPY http://tigersoft.com/2121CST/SPY.GIF recent 2006 vers-Peerless signals -- http://tigersoft.com/NEWPEER/UPD06805.BMP USO-CrudeOil DBO FAS GLD BBH IBB JETS JNUG KOL NUGT OIH PALL RSX RETL SDS AGQ SLV SOXL TECL TLT TMF TNA UGA (gasoline) USO (oil) and China: YINN CHAU Commodities: CANE CORN DBC JJC, NIB, CHOC CORN, CUT (paper) MOO, SOYB WEAT UUP (Dollar) LIT (Lithium) Stocks AAPL ADBE ALXN AMAT AMGN AMD AMZN AXP BA BABA BAC BIDU BLDP CAT CVX CMG DE ENPH FB GILD GOOG GS HD IBM INTU JPM LRCX M (Macy's) MSFT NEM NFLX NKE NVDA PG REGN SO SQ QCOM QDEL TSLA TXN XOM V VRTX WFC WMT TOWN ZM New highs and Bullish MAXCPs http://tigersoft.com/MAXCP/8-5/BULLISH.htm Bearish MAXCPs - http://tigersoft.com/MINCP/8-5/BEARISH.htm |
Table 1
8/5/2018 QUICKSILVER on DJI-30 STOCKS.
P21 + ITRS score >+.25 is bullish
Note that AAPL now shows highest AI/200 stock here.
2 Bullish (AAPL, MSFT) 1 Bearish (INTC) STOCKS CLOSE CHANGE PIVOT-P 5-dma AROC CL-PWR Candl AI/200 IP21 ITRS --------------------------------------------------------------------------------------- --------------------------------------------------------------------------------------- AAPL 440.25 1.59 384.76 727.7% Bullish BLUE 174 .203 .303 Bullish --------------------------------------------------------------------- AXP 95.39 2.2 94.65 -68.9% Bullish BLUE 88 .191 -.076 --------------------------------------------------------------------- BA 174.28 9.21 161.95 254.2% Bearish BLUE 44 -.064 .117 --------------------------------------------------------------------- CAT 134.97 3.45 136.73 -206.4% Bullish BLUE 143 .034 .063 --------------------------------------------------------------------- CSCO 47.33 -.34 46.44 65.9% ------- RED 107 .278 -.031 --------------------------------------------------------------------- CVX 87.2 .71 86.27 -166.2% Bullish RED 79 .165 -.152 --------------------------------------------------------------------- DIS 127.61 10.32 115.66 515.6% Bullish BLUE 96 .251 -.032 --------------------------------------------------------------------- GS 204.52 2.88 199.53 48.4% ------- BLUE 94 -.109 -.044 --------------------------------------------------------------------- HD 267.48 -.39 266.31 53% Bullish RED 122 .159 .016 --------------------------------------------------------------------- IBM 125.45 -.39 122.9 5.2% Bullish RED 125 .056 -.057 --------------------------------------------------------------------- INTC 48.92 -.21 47.99 88.1% Bearish RED 126 -.208 -.302 Bearish --------------------------------------------------------------------- JNJ 148.4 1.18 146.84 63.4% Bearish RED 122 .02 -.06 --------------------------------------------------------------------- JPM 97.21 1.66 97.02 -127.3% Bullish BLUE 58 .027 -.072 --------------------------------------------------------------------- KO 47.22 .53 47.69 -84.8% ------- BLUE 88 .053 -.062 --------------------------------------------------------------------- MCD 199.26 -.1 195.41 77.8% Bullish RED 118 .099 -.009 --------------------------------------------------------------------- MMM 155.35 4.14 152.12 -29.6% ------- BLUE 107 -.003 -.065 --------------------------------------------------------------------- MRK 81.64 -.03 78.99 142.1% ------- RED 83 -.067 -.03 --------------------------------------------------------------------- MSFT 212.94 -.35 203.9 212.9% Bearish RED 160 .231 .086 Bullish --------------------------------------------------------------------- NKE 100.94 3.61 96.82 203.8% Bullish BLUE 124 .08 -.042 --------------------------------------------------------------------- PFE 38.45 .06 38.74 -104.8% Bearish ---- 72 .149 -.061 --------------------------------------------------------------------- PG 133.44 -.35 131.42 195.5% Bullish RED 84 .126 .104 --------------------------------------------------------------------- TRV 115.08 1.98 115.93 -77% ------- BLUE 111 -.001 .026 --------------------------------------------------------------------- UNH 312.47 7.97 305.23 95.1% Bullish BLUE 135 .126 -.027 |
Table 2 QUICKSILVER on ETFS - 08/05/20 Bullish = 9 now includes SPY, IWM, OIH and MDY!
Bearish = 0
ITRS + IP21>.25 is considered "Bullish" ETF CLOSE CHANGE PIVOT-PT 5-dma AROC CL-PWR CANDLE IP21 ITRS --------------------------------------------------------------------------------------------- DIA 272 3.59 263.28 122.3% Bullish BLUE .223 ----- -------------------------------------------------------------------------------------------- SPY 332.11 2.05 323.96 106.9% Bullish BLUE .343 .024 Bullish --------------------------------------------------------------------------------------------- QQQ 271.05 .67 261.13 212.6% Bullish BLUE .361 .097 Bullish --------------------------------------------------------------------------------------------- MDY 350.19 4.82 341.96 86.3% Bullish BLUE .349 .008 Bullish --------------------------------------------------------------------------------------------- IWM 153.79 3 148.76 148.8% Bullish BLUE .292 .021 Bullish --------------------------------------------------------------------------------------------- FAS 36.49 1.38 35.07 29.7% Bullish BLUE .316 .088 Bullish --------------------------------------------------------------------------------------------- SOXL 249.81 -.49 230.4 690% Bullish BLUE .291 .612 Bullish --------------------------------------------------------------------------------------------- TECL 295.1 2.41 251.34 882.9% Bullish BLUE .362 .494 Bullish --------------------------------------------------------------------------------------------- IBB 137.28 -.4 137.02 24.1% Bearish RED .065 -.037 --------------------------------------------------------------------------------------------- GLD 191.35 1.76 183.76 167.3% Bullish RED .289 .102 Bullish --------------------------------------------------------------------------------------------- OIH 137.11 4.92 127.03 234.3% ------- BLUE .196 .078 Bullish --------------------------------------------------------------------------------------------- GASL 3440 285 3685 -325.1% ------- RED -.021 .026 --------------------------------------------------------------------------------------------- |
Table 3 Count of Stocks in Key Directories
20200805
-------------------------------
NEWHIGHS 417 Bullish >10:1 NH/NLs
NEWLOWS 15
MAXCP 114
MINCP 23
TTTNH 28
TTTNL 25
FASTUP 193
FASTDOWN 51
CPCROSSA 78
CPCROSSD 75
BIGVOLUP 6
BIGVODN 11
ACCUMVER 39
HIGHIP21 52
HIUPPCT 20
VHIP21 75
LOWACCUM 165
REDSELL 76
AUGSELS7 53
TRAPDOOR 6
|
Table 4 RANKING OF KEY DIRECTORIES BASED PCT.OF STOCKS ABOVE 65-DMA
Bullish = 44
Bearish = 2
8/5/20
---------------------------------------------------------------------------------------
Directory Current day-1 day-2 day-3 day-4 day-5
----------------------------------------------------------------------------------------
BONDFUND 1 1 1 .99 1 1
COPPER 1 1 1 1 1 1
SOLAR 1 1 1 .933 .933 .933
GOLD .979 .979 .959 .959 .959 .959
HACKERS .95 .95 .8 .8 .75 .75
AUTO .948 .948 .897 .846 .897 .974
ETFS .928 .91 .892 .839 .91 .964
INSURANC .923 .846 .923 .807 .846 .846
HOSPITAL .904 .857 .857 .857 .857 .809
CHEM .875 .854 .833 .708 .77 .895
NIFTY .866 .844 .866 .844 .866 .888
BIGBANKS .857 .714 .714 .714 .857 .857
GAMING .857 .857 .809 .809 .809 .857
COMODITY .853 .853 .878 .853 .853 .853
DJI-13 .846 .692 .692 .538 .692 .846
CHINA .843 .803 .784 .784 .745 .803
ELECTRON .837 .871 .871 .837 .837 .81
SOFTWARE .833 .866 .816 .8 .8 .8
INDEXES .831 .792 .786 .758 .808 .825
DOWJONES .827 .724 .689 .655 .758 .862
HOMEBLDG .823 .823 .823 .882 .882 .882
SEMI .817 .855 .855 .836 .817 .788
GREEN .809 .809 .809 .761 .809 .857
COMPUTER .8 .8 .8 .8 .75 .75
EDU .8 .8 .6 .6 .6 .6
INDMATER .8 .786 .746 .693 .733 .8
INFRA .8 .771 .771 .742 .771 .828
FOOD .792 .811 .849 .83 .811 .811
NASD-100 .787 .777 .777 .747 .777 .777
SP500 .762 .735 .716 .718 .733 .789
FIDSTKS .751 .694 .683 .677 .694 .751
TRANSP .75 .6 .6 .55 .6 .65
SP-100 .747 .703 .692 .67 .714 .835
RUS-1000 .74 .707 .697 .675 .693 .761
GUNS .733 .6 .6 .533 .6 .6
MILITARY .703 .592 .592 .481 .555 .629
RETAIL .693 .673 .591 .612 .632 .714
UTILITY .657 .763 .71 .736 .815 .815
FINANCE .646 .536 .609 .585 .67 .768
REIT .581 .588 .546 .588 .609 .652
BIOTECH .579 .574 .59 .511 .574 .548
REGBANKS .576 .346 .384 .346 .384 .73
COAL .571 .571 .571 .428 .428 .714
JETS .571 .285 .214 .142 .214 .357
========================================================================================
OILGAS .566 .496 .448 .401 .401 .527
BEVERAGE .466 .533 .533 .666 .6 .666
|
======================================================================
8/4/2020 I would continue to downplay the Peerless Sells and give
deference to
to the rising NYSE A/D Line and the much stronger tech sector. Not
only have QQQ and NASDAQ surpassed flat reistance levels recently,
they are now running clearly in all-time high territory where the path of
least resistance is upwards.


Bullishly, we now see in Table 2 that MDY and SPY have a "bullish" score
well above +.25 when adding up their IP21 and ITRS values.

And, another bullish clue we notice: some of the obvious shorts like BA
and WFC now have positive IP21s. This means that big money is covering
their shorts in these stocks. The FED will not allow breakdowns here. And
even the DJI-30's IP21 has turned slightly positive.
We could still get a Sell S9-V if the DJI rallies one percent
higher and the
V-I stays negative, but even
then I would prefer to trust the rising NYSE
A/D Line trend. As mentioned here before, AAPL is in an emotional upthrust
created by world-wide sales of its I-Phone and the typically positive trading
in the weeks before it splits. AAPL alone has more weight than nine of
the lowest priced DJI-30 stocks.
All this may bring even the leaden DJIA back to its yearly
highs. At that
point, will the FED continue its QE-Infinity? If Covid-19 does not relent
and the Congress cannot even agree on relief payments soon to the
millions whose jobs have been ended by governmental edict, what choice does
the FED have? A breakdown by the DJIA and an end to QE-Infinity would
bring on a very bad market and a much worse economy. Meanwhile,
of course, a weak Dollar will help our GLD and SLV longs. If history repeats
SLV will rally by another 100% from here and reach $50!
The International Limits That Might Stop QE-Infinity
A break in the A/D Line uptrend will probably tell
us when the FED has decided
to back away from its QE-Infinity. Another way the QE could be threatened
would be if the Bank of England and German Central Bank decide to try to
discourage their countrymen's investments in the over-heated and bloated
American stock market. This would be quite bearish and it has happened
before, sometimes with very little warning. In December 1899, the British raised
their key lending rate after defeats at the hands of the Boers in South Africa.
That resulted in a 20% DJI decline in what had been a very strong US market.
After the San Francisco Earthquake in 1906, they raised rates from 3 3/4%
to 6% in less than two months to protect the Pound after British Insurance
companies had to pay millions to American earthquake and fire victims. That
also lead to a quick 20% decline and set the stage for the still deeper 1907
Panic. And last, and worst, the Governor of the Bank of England and the
Labour Chancellor of the Exchequer raised the key lending rate from 4% to 6% just
two months before the 1929 October Crash. So, there are international limits
to what the FED can get away with in this situation. At 29000, at its old highs,
I would think the DJI will be at maximum risk and, of course,
it will not have a
super-high priced AAPL to lift it.
|
Charts 8/4/2020 (Click on Underlined link.) 2020 PEERLESS DJI, Signals, Indicators Daily DJI Volume 10-DayUp/Down Vol Stoch-20 Inverted Traders Index Graph of Pct of All Stocks above 65-dma Cum. Inverted Traders Index NASDAQ S&P OEX NYSE COMPQX DJI-15 DJI-20 DJI-30 DIA QQQ MDY IWM TNA Short-Term Rates DOLLAR-UUP SPY http://tigersoft.com/2121CST/SPY.GIF recent 2006 vers-Peerless signals -- http://tigersoft.com/NEWPEER/UPD06804.BMP USO-CrudeOil DBO FAS GLD BBH IBB JETS JNUG KOL NUGT OIH PALL RSX RETL SDS AGQ SLV SOXL TECL TLT TMF TNA UGA (gasoline) USO (oil) and China: YINN CHAU Commodities: CANE CORN DBC JJC, NIB, CHOC CORN, CUT (paper) MOO, SOYB WEAT UUP (Dollar) LIT (Lithium) Stocks AAPL ADBE ALXN AMAT AMGN AMD AMZN AXP BA BABA BAC BIDU BLDP CAT CVX CMG DE ENPH FB GILD GOOG GS HD IBM INTU JPM LRCX M (Macy's) MSFT NEM NFLX NKE NVDA PG REGN SO SQ QCOM QDEL TSLA TXN XOM V VRTX WFC WMT TOWN ZM New highs and Bullish MAXCPs http://tigersoft.com/MAXCP/8-4/BULLISH.htm Bearish MAXCPs - http://tigersoft.com/MINCP/8-4/BEARISH.htm |
Table 1
8/4/2018 QUICKSILVER on DJI-30 STOCKS.
P21 + ITRS score >+.25 is bullish
Note that AAPL now shows highest AI/200 stock here.
2 Bullish (AAPL, MSFT) 1 Bearish (INTC) STOCKS CLOSE CHANGE PIVOT-P 5-dma AROC CL-PWR Candl AI/200 IP21 ITRS --------------------------------------------------------------------------------------- --------------------------------------------------------------------------------------- AAPL 438.66 2.91 380.16 821.2% Bullish BLUE 173 .151 .279 Bullish --------------------------------------------------------------------- AXP 93.19 -.35 96.69 -65.1% Bullish RED 87 .11 -.053 --------------------------------------------------------------------- BA 165.07 2.8 166.01 -176.1% Bearish BLUE 44 -.165 .104 --------------------------------------------------------------------- CAT 131.52 -.26 140.53 -239.4% Bullish BLUE 142 -.003 .073 --------------------------------------------------------------------- CSCO 47.67 .51 46.71 148.7% ------- BLUE 106 .241 -.034 --------------------------------------------------------------------- CVX 86.49 1.68 90.07 -150.9% Bullish BLUE 78 .147 -.138 --------------------------------------------------------------------- DIS 117.29 .94 115.61 47.8% Bullish BLUE 95 .236 -.102 --------------------------------------------------------------------- GS 201.64 2.25 202.58 .5% ------- BLUE 94 -.161 .025 --------------------------------------------------------------------- HD 267.87 1.69 264.66 48.8% Bullish BLUE 121 .106 .011 --------------------------------------------------------------------- IBM 125.84 1.53 125.32 55.2% Bullish BLUE 124 .031 -.033 --------------------------------------------------------------------- INTC 49.13 .83 48.07 -11.4% Bearish BLUE 126 -.208 -.307 Bearish --------------------------------------------------------------------- JNJ 147.22 -.13 146.54 13.3% Bearish BLUE 121 .037 -.076 --------------------------------------------------------------------- JPM 95.55 -.55 99.68 -90.9% ------- RED 57 -.023 -.028 --------------------------------------------------------------------- KO 46.69 .39 48.02 -156.9% ------- BLUE 87 .035 -.059 --------------------------------------------------------------------- MCD 199.36 4.96 196.21 79.9% Bullish BLUE 117 .077 -.015 --------------------------------------------------------------------- MMM 151.21 .8 156.25 -134.7% ------- BLUE 107 -.073 -.064 --------------------------------------------------------------------- MRK 81.67 -.87 79.35 123.5% Bearish RED 83 -.087 -.027 --------------------------------------------------------------------- MSFT 213.29 -3.25 204.06 273.1% ------- RED 159 .197 .066 Bullish --------------------------------------------------------------------- NKE 97.33 -1 96.97 54.5% Bearish RED 124 -.026 -.058 --------------------------------------------------------------------- PFE 38.39 .04 39.26 -81.2% Bearish BLUE 71 .109 -.072 --------------------------------------------------------------------- PG 133.79 2.5 128.31 227.3% Bullish BLUE 83 .154 .092 --------------------------------------------------------------------- TRV 113.1 -1.3 116.85 -83.7% ------- RED 111 -.024 .034 --------------------------------------------------------------------- UNH 304.5 .89 306.68 75.3% Bullish BLUE 135 .057 -.046 |
Table 2 QUICKSILVER on ETFS - 08/04/20 Bullish = 8 now includes SPY, OIH and MDY!
Bearish =
ITRS + IP21>.25 is considered "Bullish"
ETF CLOSE CHANGE PIVOT-PT 5-dma AROC CL-PWR CANDLE IP21 ITRS --------------------------------------------------------------------------------------------- DIA 268.41 1.69 265.5 84.6% Bullish BLUE .162 ----- --------------------------------------------------------------------------------------------- SPY 330.06 1.27 325.12 136.7% Bullish BLUE .266 .021 Bullish --------------------------------------------------------------------------------------------- QQQ 270.38 1 259.77 258.4% Bullish BLUE .306 .081 Bullish --------------------------------------------------------------------------------------------- MDY 345.37 1.74 344.27 125.9% Bullish BLUE .262 .022 Bullish --------------------------------------------------------------------------------------------- IWM 150.79 1.03 149.35 157.1% Bullish BLUE .224 .022 --------------------------------------------------------------------------------------------- FAS 35.11 -.06 36.28 116.6% Bullish BLUE .25 .166 Bullish --------------------------------------------------------------------------------------------- SOXL 250.3 10.31 217.66 1025% Bullish BLUE .24 .659 Bullish --------------------------------------------------------------------------------------------- TECL 292.69 2.61 247.34 1065.3% Bullish BLUE .317 .472 Bullish --------------------------------------------------------------------------------------------- IBB 137.68 -.89 136.62 -17.5% Bearish RED .069 -.064 --------------------------------------------------------------------------------------------- GLD 189.59 3.95 185.13 158.1% Bullish BLUE .376 .066 Bullish --------------------------------------------------------------------------------------------- OIH 132.19 3.88 131.08 152.4% ------- BLUE .153 .09 Bullish --------------------------------------------------------------------------------------------- GASL 3440 285 3685 -325.1% ------- RED -.021 .017 --------------------------------------------------------------------------------------------- |
Table 3 Count of Stocks in Key Directories
20200804
-------------------------------
NEWHIGHS 306 >10:1 NL's
NEWLOWS 30
MAXCP 105
MINCP 24
TTTNH 25
TTTNL 25
FASTUP 195
FASTDOWN 51
CPCROSSA 120
CPCROSSD 40
BIGVOLUP 8
BIGVODN 10
ACCUMVER 33
HIGHIP21 47
HIUPPCT 18
REDSELL 97
AUGSELS7 66
TRAPDOOR 6
|
RANKING OF KEY DIRECTORIES BASED PCT.OF STOCKS ABOVE 65-DMA 8/4/20 --------------------------------------------------------------------------------------- Directory Current day-1 day-2 day-3 day-4 day-5 ---------------------------------------------------------------------------------------- BONDFUND 1 1 .99 1 1 .99 COPPER 1 1 1 1 1 1 SOLAR 1 1 .933 .933 .933 .933 GOLD .979 .959 .959 .959 .959 .959 HACKERS .95 .85 .8 .75 .75 .7 AUTO .948 .897 .846 .897 .974 .948 ETFS .91 .892 .839 .91 .964 .946 ELECTRON .871 .871 .837 .837 .817 .77 SOFTWARE .866 .833 .8 .8 .8 .666 GAMING .857 .809 .809 .809 .857 .714 HOSPITAL .857 .857 .857 .904 .809 .809 SEMI .855 .855 .836 .817 .798 .75 CHEM .854 .833 .708 .77 .895 .854 COMODITY .853 .878 .853 .853 .853 .853 INSURANC .846 .923 .807 .846 .846 .807 NIFTY .844 .866 .844 .866 .888 .777 HOMEBLDG .823 .823 .882 .882 .882 .823 FOOD .811 .849 .83 .811 .811 .83 GREEN .809 .809 .761 .809 .857 .904 CHINA .803 .784 .784 .745 .803 .725 COMPUTER .8 .8 .8 .75 .75 .8 EDU .8 .6 .6 .6 .6 .8 INDEXES .792 .786 .758 .808 .825 .82 INDMATER .786 .746 .693 .733 .8 .773 NASD-100 .777 .787 .757 .777 .777 .757 INFRA .771 .771 .742 .771 .828 .685 UTILITY .769 .717 .743 .82 .82 .769 SP500 .735 .718 .718 .733 .792 .743 BIGBANKS .714 .714 .714 .857 .857 .857 RUS-1000 .707 .699 .675 .693 .762 .694 SP-100 .703 .692 .67 .714 .835 .78 DOWJONES .7 .666 .633 .733 .833 .8 FIDSTKS .694 .683 .677 .694 .751 .723 DJI-13 .692 .692 .538 .692 .846 .846 RETAIL .673 .591 .612 .632 .714 .612 GUNS .6 .6 .533 .6 .6 .533 TRANSP .6 .6 .55 .6 .65 .75 MILITARY .592 .592 .481 .555 .629 .592 REIT .588 .546 .588 .609 .652 .602 COAL .571 .571 .428 .428 .714 .428 BIOTECH .569 .587 .509 .574 .556 .579 FINANCE .536 .609 .585 .67 .768 .597 BEVERAGE .533 .533 .666 .6 .666 .666 OILGAS .496 .448 .401 .401 .527 .44 REGBANKS .346 .384 .346 .384 .73 .423 JETS .285 .214 .142 .214 .357 .428 |
========================================================================
8/3/2020 The operative Peerless signals are sells. But QQQ is much stronger
than
DIA. Hedging now with a long position in QQQ and a short position in
DIA should be considered, but the FED is probably too powerful to be taken on. We
will need to see weakness in the A/D Line and AAPL before going short DIA.


The DJI is now 1% over the 21-day ma and faces resistance just overhead.
Its IP21 is slightly positive and its V-I is negative. Another 1% DJI gain
would likely produce both a new Sell S9-v and a Sell S12. In addition, our
Cumulative Inverted MKDS Indicator has bearishly broken its uptrend.
Watch AAPL tomorrow. AAPL alone is weighted more than the nine lowest
priced DJI-30 stocks. So, if AAPL stalls out here and falls back, the DJI could
be hit particularly hard.. See below how high-priced AAPL has reached its last red
resistance line (shown in its chart just below).

I would buy NVDA. Note its breakout above flat resistance,
its steadily positive Accumulation and the fact that both its Opening Power
Closing Power are rising. QQQ has also nudged to a new all-time high.
A more decisive breakout has been made by NVDA (Nividia).


GLD should be held long despite its TigerSoft red Sell.
All those who
are nervous about how the trillions of dollars in new Federal Debt will
impact the Dollar are trying to figure out how to take a position in GLD.
Rumors that Trump would not voluntarily leave the office if defeated
also is working to bring in additional buyers of GLD.

|
Charts 8/3/2020 (Click on Underlined link.) 2020 PEERLESS DJI, Signals, Indicators Daily DJI Volume 10-DayUp/Down Vol Stoch-20 Inverted Traders Index Graph of Pct of All Stocks above 65-dma Cum. Inverted Traders Index NASDAQ S&P OEX NYSE COMPQX DJI-15 DJI-20 DJI-30 DIA QQQ MDY IWM TNA Short-Term Rates DOLLAR-UUP SPY http://tigersoft.com/2121CST/SPY.GIF recent 2006 vers-Peerless signals -- http://tigersoft.com/NEWPEER/UPD06803.BMP USO-CrudeOil DBO FAS GLD BBH IBB JETS JNUG KOL NUGT OIH PALL RSX RETL SDS AGQ SLV SOXL TECL TLT TMF TNA UGA (gasoline) USO (oil) and China: YINN CHAU Commodities: CANE CORN DBC JJC, NIB, CHOC CORN, CUT (paper) MOO, SOYB WEAT UUP (Dollar) LIT (Lithium) Stocks AAPL ADBE ALXN AMAT AMGN AMD AMZN AXP BA BABA BAC BIDU BLDP CAT CVX CMG DE ENPH FB GILD GOOG GS HD IBM INTU JPM LRCX M (Macy's) MSFT NEM NFLX NKE NVDA PG REGN SO SQ QCOM QDEL TSLA TXN XOM V VRTX WFC WMT TOWN ZM New highs and Bullish MAXCPs http://tigersoft.com/MAXCP/8-3/BULLISH.htm Bearish MAXCPs - http://tigersoft.com/MINCP/8-3/BEARISH.htm |
Table 1
7/31/2018 QUICKSILVER on DJI-30 STOCKS.
P21 + ITRS score >+.25 is bullish
Note that AAPL now shows highest AI/200 stock here.
2 Bullish (AAPL, MSFT) 1 Bearish (INTC) STOCKS CLOSE CHANGE PIVOT-P 5-dma AROC CL-PWR Candl AI/200 IP21 ITRS --------------------------------------------------------------------------------------- --------------------------------------------------------------------------------------- AAPL 435.75 10.71 373.01 727.4% Bullish BLUE 172 .163 .287 Bullish --------------------------------------------------------------------- AXP 93.54 .22 94.42 -118.5% Bullish BLUE 86 .093 -.047 --------------------------------------------------------------------- BA 162.27 4.27 170.84 -240% Bearish BLUE 44 -.117 .079 --------------------------------------------------------------------- CAT 131.78 -1.1 138.03 -294.7% Bullish RED 142 .002 .067 --------------------------------------------------------------------- CSCO 47.16 .06 46.28 -3.2% ------- ---- 105 .238 -.032 --------------------------------------------------------------------- CVX 84.81 .87 89.11 -353.6% Bullish BLUE 77 .094 -.167 --------------------------------------------------------------------- DIS 116.35 -.59 116.18 1.7% Bullish ---- 94 .273 -.101 --------------------------------------------------------------------- GS 199.39 1.43 201.62 -90.3% ------- BLUE 94 -.143 .019 --------------------------------------------------------------------- HD 266.18 .69 265.28 -23.3% Bullish RED 120 .075 .016 --------------------------------------------------------------------- IBM 124.31 1.37 124.47 -76.4% ------- BLUE 123 -.015 -.045 --------------------------------------------------------------------- INTC 48.3 .57 49.24 -130.9% Bearish ---- 126 -.223 -.309 Bearish --------------------------------------------------------------------- JNJ 147.35 1.59 146.83 5.8% ------- BLUE 120 .012 -.084 --------------------------------------------------------------------- JPM 96.1 -.54 97.32 -41% Bullish RED 57 .007 -.023 --------------------------------------------------------------------- KO 46.3 -.94 48.18 -227.5% ------- RED 86 .057 -.064 --------------------------------------------------------------------- MCD 194.4 .12 196.24 -174.1% Bullish BLUE 116 .07 -.038 --------------------------------------------------------------------- MMM 150.41 -.06 155.33 -412.6% ------- RED 107 -.114 -.057 --------------------------------------------------------------------- MRK 82.54 2.3 79.69 227.2% Bearish BLUE 83 -.07 -.01 --------------------------------------------------------------------- MSFT 216.54 11.53 202.02 311.4% Bullish BLUE 158 .208 .092 Bullish --------------------------------------------------------------------- NKE 98.33 .72 96.27 57.7% Bullish BLUE 124 .004 -.045 --------------------------------------------------------------------- PFE 38.35 -.13 39.02 104.9% Bearish RED 70 .087 -.059 --------------------------------------------------------------------- PG 131.29 .17 127.88 192.6% Bullish BLUE 82 .103 .088 --------------------------------------------------------------------- TRV 114.4 -.02 115.03 -96.3% ------- ---- 111 -.028 .065 --------------------------------------------------------------------- UNH 303.61 .83 299.93 82.8% Bullish ---- 135 .084 -.03 |
Table 2 QUICKSILVER on ETFS - 08/03/20 Bullish = FAS QQQ, SOXL, TECL, GLD. (5)
Bearish =
ITRS + IP21>.25 is considered "Bullish"
ETF CLOSE CHANGE PIVOT-PT 5-dma AROC CL-PWR CANDLE IP21 ITRS --------------------------------------------------------------------------------------------- DIA 266.72 2.37 263.93 14.6% Bullish BLUE .17 ---- --------------------------------------------------------------------------------------------- BA 162.27 4.27 170.84 -240% Bearish BLUE -.117 .079 --------------------------------------------------------------------------------------------- SPY 328.79 2.27 321.17 86% Bullish BLUE .25 .026 --------------------------------------------------------------------------------------------- QQQ 269.38 3.59 256.81 177.6% Bullish BLUE .303 .088 --------------------------------------------------------------------------------------------- MDY 343.63 4.01 336.78 50.8% Bullish BLUE .204 .022 --------------------------------------------------------------------------------------------- IWM 149.76 2.4 146.13 73.1% Bullish BLUE .165 .027 --------------------------------------------------------------------------------------------- FAS 35.17 .2 34.29 131.5% Bullish RED .209 .185 --------------------------------------------------------------------------------------------- RETL 203.36 12.09 182.26 497.3% Bullish BLUE .248 .701 --------------------------------------------------------------------------------------------- SOXL 239.99 13.48 204.42 518.1% Bullish BLUE .234 .619 --------------------------------------------------------------------------------------------- TECL 290.08 19.15 237.42 889.2% Bullish BLUE .288 .479 --------------------------------------------------------------------------------------------- IBB 138.57 4.2 138.16 -53.9% Bearish BLUE .037 -.043 --------------------------------------------------------------------------------------------- GLD 185.64 .21 183.75 92.6% Bullish BLUE .348 .056 --------------------------------------------------------------------------------------------- OIH 128.31 3.38 128.29 -189.3% ------- BLUE .145 .03 --------------------------------------------------------------------------------------------- GASL 3440 285 3685 -325.1% ------- RED -.021 .025 --------------------------------------------------------------------------------------------- |
August 3 Count of Stocks in Key Directories
20200803
-------------------------------
NEWHIGHS 357
NEWLOWS 42
MAXCP 88
MINCP 32
TTTNH 29
TTTNL 51
FASTUP 129
FASTDOWN 59
CPCROSSA 121
CPCROSSD 76
BIGVOLUP 8
BIGVODN 6
ACCUMVER 29
HIGHIP21 43
HIUPPCT 17
REDSELL 107
AUGSELS7 80
TRAPDOOR 6
|
RANKING OF KEY DIRECTORIES BASED PCT.OF STOCKS ABOVE 65-DMA 8/3/20 --------------------------------------------------------------------------------------- Directory Current day-1 day-2 day-3 day-4 day-5 ---------------------------------------------------------------------------------------- BONDFUND 1 .99 1 1 .99 .99 COPPER 1 1 1 1 1 1 SOLAR 1 .933 .933 .933 .933 .933 GOLD .959 .959 .959 .959 .959 .959 INSURANC .923 .807 .846 .846 .807 .807 AUTO .897 .846 .897 .974 .948 .948 ETFS .892 .839 .91 .964 .946 .964 COMODITY .878 .853 .853 .853 .853 .853 ELECTRON .871 .837 .837 .817 .777 .81 NIFTY .866 .844 .866 .888 .8 .844 HOSPITAL .857 .857 .904 .857 .809 .761 SEMI .855 .836 .817 .798 .759 .798 HACKERS .85 .85 .75 .75 .7 .85 FOOD .849 .83 .811 .811 .83 .849 CHEM .833 .708 .77 .895 .854 .916 SOFTWARE .833 .816 .8 .8 .666 .75 HOMEBLDG .823 .882 .882 .882 .823 .823 GAMING .809 .809 .809 .857 .761 .809 GREEN .809 .761 .809 .857 .904 .952 COMPUTER .8 .8 .75 .75 .8 .8 NASD-100 .787 .767 .787 .777 .767 .808 INDEXES .786 .758 .808 .825 .82 .808 CHINA .784 .784 .745 .803 .725 .764 INFRA .771 .742 .771 .828 .714 .857 INDMATER .746 .693 .733 .8 .8 .853 SP500 .718 .72 .733 .792 .75 .76 BIGBANKS .714 .714 .857 .857 .857 .857 UTILITY .71 .736 .815 .815 .763 .657 RUS-1000 .699 .676 .693 .762 .701 .718 DJI-13 .692 .538 .692 .846 .846 .846 SP-100 .692 .67 .714 .835 .78 .802 FIDSTKS .683 .677 .694 .751 .728 .723 DOWJONES .666 .633 .733 .833 .8 .833 EDU .666 .666 .666 .666 .833 .833 FINANCE .609 .585 .67 .768 .597 .621 GUNS .6 .533 .6 .6 .533 .533 TRANSP .6 .55 .6 .65 .75 .65 MILITARY .592 .481 .555 .629 .592 .555 BIOTECH .582 .506 .571 .556 .582 .634 RETAIL .58 .6 .62 .7 .6 .58 COAL .571 .428 .428 .714 .428 .428 REIT .546 .588 .609 .652 .609 .51 BEVERAGE .533 .666 .6 .666 .666 .666 OILGAS .448 .401 .401 .527 .448 .472 REGBANKS .384 .346 .384 .73 .423 .423 JETS .214 .142 .214 .357 .428 .357 |
=====================================================================
7/31/2020 Seldom do I argue with the operative Peerless signals. But Friday, I
chose, too. The NASDAQ and QQQ were too strong. Many of the
leading tech stocks are doing very well because of Covid-19 and the
stay-at-home demands of the time. AAPL, the world's most heavily
capitalized stock, just announced plans for a 7:1 split. If history repeats, AAPL
will do well until then end of August when its split actually takes effect.
And if AAPL keeps rising, so will the DJI because of the way the DJIA
is weighted by price only. (See the cases below where AAPL has split
in the past.) After that, it is not clear which of the DJIA's high priced stocks
will take over AAPL's bullish role in the DJI.

The FED seems serious about boosting the market through the Election.
Until Friday, we have the NYSE A/D Line rise almost daily, no matter
how bearish the news seems to be. But Friday was different, there 476
more down than up, despite the DJI late hour advance and gain of 115.
Friday's breadth. If negative breadth repeats and the DJI rises to its 2.45%
upper band, there is a good chance we will see not just another Sell S12
and another Sell S9-V, but also a Sell S9 based on a negative P-I reading
at the upper band. If we do get a Sell S9-P, it would also mean that the
rising A/D Line uptrend will be broken. In that case, we will again go short
DIA.

For now, the NASDAQ and QQQ are acting much
better than the DJI.
A good way to play this is by being long some of our Bullish MAXCPs
and short some of our Bearish MINCPs that have broken below the
support of their 65-dma.

Another way I have suggested is to be long QQQ and short DIA. That
seems risky now because of the way the pre-split AAPL tends to rally.
This would inordinately lift the DJI. I would also hold long GLD and be
short UUP (Dollar). IBB has a tendency to rally late in a bull market.
I would hold it long, too.
AAPL Splits
AAPL's stock split 7-for-1 on June
9, 2014 and split 2-for-1 on February 28, 2005,
June 21, 2000, and June 16, 1987. On July 30, AAPL also announced a four for one
split which will begin trading on split adjusted basis on
August 31, 2020.
AAPL 2014 Split - 7:1 Rally until Split, then 2 week decline. |
AAPL 2005 Rally until split, then 10 week and 20%
decline |
AAPL 2000 - late in bull market - 20% decline after
split. |
AAPL 1987 - late in bull market. Traded flat for
month after split. But DJI rallied. |
|
Charts 7/31/2020 (Click on Underlined link.) 2020 PEERLESS DJI, Signals, Indicators Daily DJI Volume 10-DayUp/Down Vol Stoch-20 Inverted Traders Index Graph of Pct of All Stocks above 65-dma Cum. Inverted Traders Index NASDAQ S&P OEX NYSE COMPQX DJI-15 DJI-20 DJI-30 DIA QQQ MDY IWM TNA Short-Term Rates DOLLAR-UUP SPY http://tigersoft.com/2121CST/SPY.GIF recent 2006 vers-Peerless signals -- http://tigersoft.com/NEWPEER/UPD06731.BMP USO-CrudeOil DBO FAS GLD BBH IBB JETS JNUG KOL NUGT OIH PALL RSX RETL SDS AGQ SLV SOXL TECL TLT TMF TNA UGA (gasoline) USO (oil) and China: YINN CHAU Commodities: CANE CORN DBC JJC, NIB, CHOC CORN, CUT (paper) MOO, SOYB WEAT UUP (Dollar) LIT (Lithium) Stocks AAPL ADBE ALXN AMAT AMGN AMD AMZN AXP BA BABA BAC BIDU BLDP CAT CVX CMG DE ENPH FB GILD GOOG GS HD IBM INTU JPM LRCX M (Macy's) MSFT NEM NFLX NKE NVDA PG REGN SO SQ QCOM QDEL TSLA TXN XOM V VRTX WFC WMT TOWN ZM New highs and Bullish MAXCPs http://tigersoft.com/MAXCP/7-31/BULLISH.htm Bearish MAXCPs - http://tigersoft.com/MINCP/7-31/BEARISH.htm |
Table 1
7/31/2018 QUICKSILVER on DJI-30 STOCKS.
P21 + ITRS score >+.25 is bullish
Note that AAPL now shows highest AI/200 stock here.
1 Bullish (AAPL) 3 Bearish (INTC, RTX, XOM) STOCKS CLOSE CHANGE PIVOT-P 5-dma AROC CL-PWR Candl AI/200 IP21 ITRS --------------------------------------------------------------------------------------- --------------------------------------------------------------------------------------- AAPL 425.04 40.28 379.24 722.9% Bullish BLUE 171 .189 .256 Bullish --------------------------------------------------------------------- AXP 93.32 -1.33 95.79 -105.4% Bullish RED 85 .052 -.047 --------------------------------------------------------------------- BA 158 -3.95 170.21 -467.5% Bearish RED 44 -.204 .109 --------------------------------------------------------------------- CAT 132.88 -3.85 139.89 -169.6% Bullish BLUE 141 -.012 .073 --------------------------------------------------------------------- CSCO 47.1 .66 47.19 75.1% Bullish BLUE 104 .188 -.039 --------------------------------------------------------------------- CVX 83.94 -2.33 91.04 -346.5% ------- BLUE 76 .035 -.173 --------------------------------------------------------------------- DIS 116.94 1.28 116.31 -28.8% Bullish BLUE 93 .226 -.101 --------------------------------------------------------------------- GS 197.96 -1.57 203.02 -87% ------- RED 94 -.192 .015 --------------------------------------------------------------------- HD 265.49 -.82 267.42 3.4% Bullish BLUE 119 .059 .039 --------------------------------------------------------------------- IBM 122.94 .04 126.21 -114.1% ------- BLUE 123 -.067 -.063 --------------------------------------------------------------------- INTC 47.73 -.26 49.57 -291.3% Bearish RED 126 -.251 -.319 Bearish --------------------------------------------------------------------- JNJ 145.76 -1.08 147.18 -80.2% Bearish RED 119 -.009 -.089 --------------------------------------------------------------------- JPM 96.64 -.38 96.9 -83.8% ------- BLUE 56 -.006 -.018 --------------------------------------------------------------------- KO 47.24 -.45 48.48 -129.7% ------- RED 86 .06 -.046 --------------------------------------------------------------------- MCD 194.28 -1.13 201.25 -112.4% Bullish BLUE 115 .052 -.02 --------------------------------------------------------------------- MMM 150.47 -1.65 163.24 -297.7% ------- RED 107 -.135 -.07 --------------------------------------------------------------------- MRK 80.24 1.25 78.93 199.2% Bearish RED 83 -.051 -.032 --------------------------------------------------------------------- MSFT 205.01 1.11 203.85 91.4% Bearish BLUE 157 .142 .028 --------------------------------------------------------------------- NKE 97.61 .79 97.21 -42.2% Bearish BLUE 123 -.005 -.026 --------------------------------------------------------------------- PFE 38.48 -.26 37.54 106.6% Bearish RED 69 .112 -.053 --------------------------------------------------------------------- PG 131.12 -.3 126.32 201.6% Bullish BLUE 81 .067 .082 --------------------------------------------------------------------- TRV 114.42 -1.51 116.63 -165.6% Bearish RED 111 -.067 .122 --------------------------------------------------------------------- UNH 302.78 -2.45 298.6 32.9% Bullish RED 134 .04 -.024 XOM and RTX left out temporarily. Both are bearish. |
Table 2 QUICKSILVER on ETFS - 07/31/20 Bullish = FAS QQQ, SOXL, TECL, GLD. (5)
Bearish =
ITRS + IP21>.25 is considered "Bullish"
ETF CLOSE CHANGE PIVOT-PT 5-dma AROC CL-PWR CANDLE IP21 ITRS --------------------------------------------------------------------------------------------- DIA 264.35 1.07 265.95 -6.4% Bullish BLUE .107 ---- --------------------------------------------------------------------------------------------- SPY 326.52 2.56 323.22 87.3% Bullish BLUE .209 .024 --------------------------------------------------------------------------------------------- QQQ 265.79 4.66 260.12 197.7% Bullish RED .269 .073 Bullish --------------------------------------------------------------------------------------------- MDY 339.62 -2.34 340.17 35.3% Bullish RED .138 .028 --------------------------------------------------------------------------------------------- IWM 147.36 -1.4 147.6 43.4% ------- RED .095 .024 --------------------------------------------------------------------------------------------- FAS 34.97 -.1 34.25 110.6% Bullish RED .145 .172 Bullish --------------------------------------------------------------------------------------------- SOXL 226.51 -3.89 217.27 656.2% Bullish RED .174 .411 Bullish --------------------------------------------------------------------------------------------- TECL 270.93 19.59 245.53 737.9% Bullish BLUE .237 .333 Bullish --------------------------------------------------------------------------------------------- IBB 134.37 -2.65 140.05 -74.1% Bearish RED -.003 -.072 --------------------------------------------------------------------------------------------- GLD 185.43 1.67 182.23 184.2% Bullish BLUE .337 .05 Bullish --------------------------------------------------------------------------------------------- OIH 124.93 -2.1 133.19 -274.7% ------- RED .101 .009 --------------------------------------------------------------------------------------------- GASL 3440 285 3685 -325.1% ------- RED -.021 .037 --------------------------------------------------------------------------------------------- |
Table 3 Count of Stocks in Key Directories
20200731
-------------------------------
NEWHIGHS 240
NEWLOWS 46
MAXCP 61
MINCP 48
TTTNH 18
TTTNL 82
FASTUP 125
FASTDOWN 79
CPCROSSA 17
CPCROSSD 161
BIGVOLUP 4
BIGVODN 16
ACCUMVER 24
HIGHIP21 34
HIUPPCT 16
REDSELL 119
AUGSELS7 90
TRAPDOOR 7
|
Table 4 RANKING OF KEY DIRECTORIES BASED PCT.OF STOCKS ABOVE 65-DMA
7/31/20
Bullish = 4
Bearish = 5
---------------------------------------------------------------------------------------
Directory Current day-1 day-2 day-3 day-4 day-5
----------------------------------------------------------------------------------------
COPPER 1 1 1 1 1 1
BONDFUND .99 1 1 .99 .99 .99
GOLD .959 .959 .959 .959 .959 .959
SOLAR .933 .933 .933 .933 .933 .933
HOMEBLDG .882 .882 .882 .823 .823 .882
HOSPITAL .857 .904 .857 .857 .761 .761
HACKERS .85 .8 .75 .7 .85 .75
AUTO .846 .897 .974 .948 .948 .974
COMODITY .846 .846 .846 .846 .846 .82
NIFTY .844 .866 .888 .8 .844 .777
ETFS .839 .91 .964 .946 .982 .964
ELECTRON .836 .836 .816 .775 .809 .741
SEMI .836 .817 .798 .759 .798 .74
FOOD .83 .811 .811 .83 .849 .849
SOFTWARE .816 .816 .8 .666 .766 .683
GAMING .809 .809 .857 .761 .809 .761
INSURANC .807 .846 .846 .807 .807 .807
COMPUTER .8 .75 .75 .8 .8 .65
CHINA .784 .745 .803 .725 .764 .705
NASD-100 .767 .797 .787 .767 .808 .747
GREEN .761 .809 .857 .904 .952 .952
INDEXES .758 .808 .825 .82 .808 .82
UTILITY .743 .82 .82 .769 .692 .743
INFRA .742 .771 .828 .714 .857 .828
SP500 .72 .735 .792 .75 .764 .775
BIGBANKS .714 .857 .857 .857 .857 .857
CHEM .708 .77 .895 .854 .895 .895
INDMATER .693 .733 .8 .8 .84 .813
FIDSTKS .677 .694 .751 .728 .734 .74
RUS-1000 .677 .695 .763 .702 .721 .734
SP-100 .67 .714 .835 .78 .813 .802
BEVERAGE .666 .6 .666 .666 .666 .666
DOWJONES .633 .733 .833 .8 .866 .8
EDU .6 .6 .6 .8 .8 1
RETAIL .6 .62 .7 .6 .58 .58
FINANCE .59 .674 .771 .602 .626 .722
REIT .588 .609 .652 .609 .51 .531
TRANSP .55 .6 .65 .75 .65 .7
DJI-13 .538 .692 .846 .846 .923 .846
GUNS .533 .6 .6 .533 .466 .466
BIOTECH .501 .569 .553 .582 .647 .597
===========================================================================================
MILITARY .481 .555 .629 .592 .555 .555
COAL .428 .428 .714 .428 .428 .714
OILGAS .401 .401 .527 .448 .48 .527
REGBANKS .346 .384 .73 .423 .423 .576
JETS .142 .214 .357 .428 .428 .428
|
========================================================================
7/30/2020 Despite the bearish news and the Peerless Sells, the DJI is finding
support
at its rising 21-dma. I think we should
cover the short in DIA.

More interesting are the divergences between the Bullish MAXCPs and
the Bearish MINCPs. Hedging by being long some of the first and short
some of the second seems a reasonable course of action. Being short the
Dollar and long GLD is still recommended. I've also said we should be
long either IBB or some of the explosive superstock biotechs.

Watch the NASDAQ and the A/D Line
Now the NASDAQ is again getting an upwards play, though it is still caught
in its trading range. The NASDAQ today ended up one percent after having
been down the same before the market opened. Big earnings by the NASDAQ
leaders, which actually are benefitting from the "stay-at-home" orders, plus
the announcement today that AAPL would split 4:1 have turned the techs
upwards.short-term.
We can easily see how the divergence between the DJI and the QQQ shift up
and down by watching the QQQ's Relative Strength Quotient and its ITRS Indicator.
Right now, the QQQ's relative strength is rising. This means we can probably
profitably buy QQQ and hedge by being short DIA. But only for a brief period.


Meanwhile the DJI is languishing and suffering from multiple
Peerless Sells. Note that
AAPL's split will significantly reduce its role in the computation of the DJI-30.
Also acting to hurt the DJI is the continuing weakness in price for UTX, BA
and INTC. Once gain, it looks like we have to distinguish between the
DJIA and the NYSE A/D Line, the NASDAQ and QQQ. We've talked about
this before. This is not a new phenomenon. The thing to appreciate is that
this tends
to occur near the end of Bull Markets. And the best way to call the tops in the
NASDAQ are:
#1, Watch for a completed head/shoulders or hands-above-the head
NASDAQ/QQQ top. (Notably April 2000).
#2, Watch for a break in the NYSE A/D Line uptrend.
(We see this in the 1977 chart and the 2002 chart)
#3, Watch for a break in a much over-extended NASDAQ/QQQ
uptrendline. (Examples 2000 and 2007.)
For now, the A/D Line is strong and uptrending. The necklines for the NASDAQ
and QQQ remain intact.
Watch REV and BA.

.
BA broke its 65-dma and may start a sell-off to 125
|
Charts 7/30/2020 (Click on Underlined link.) 2020 PEERLESS DJI, Signals, Indicators Daily DJI Volume 10-DayUp/Down Vol Stoch-20 Inverted Traders Index Graph of Pct of All Stocks above 65-dma Cum. Inverted Traders Index NASDAQ S&P OEX NYSE COMPQX DJI-15 DJI-20 DJI-30 DIA QQQ MDY IWM TNA Short-Term Rates DOLLAR-UUP SPY http://tigersoft.com/2121CST/SPY.GIF recent 2006 vers-Peerless signals -- http://tigersoft.com/NEWPEER/UPD06730.BMP USO-CrudeOil DBO FAS GLD BBH IBB JETS JNUG KOL NUGT OIH PALL RSX RETL SDS AGQ SLV SOXL TECL TLT TMF TNA UGA (gasoline) USO (oil) and China: YINN CHAU Commodities: CANE CORN DBC JJC, NIB, CHOC CORN, CUT (paper) MOO, SOYB WEAT UUP (Dollar) LIT (Lithium) Stocks AAPL ADBE ALXN AMAT AMGN AMD AMZN AXP BA BABA BAC BIDU BLDP CAT CVX CMG DE ENPH FB GILD GOOG GS HD IBM INTU JPM LRCX M (Macy's) MSFT NEM NFLX NKE NVDA PG REGN SO SQ QCOM QDEL TSLA TXN XOM V VRTX WFC WMT TOWN ZM New highs and Bullish MAXCPs http://tigersoft.com/MAXCP/7-30/BULLISH.htm Bearish MAXCPs - http://tigersoft.com/MINCP/7-30/BEARISH.htm |
Table 1
7/30/2018 QUICKSILVER on DJI-30 STOCKS.
P21 + ITRS score >+.25 is bullish
Note that AAPL now shows highest AI/200 stock here.
0 Bullish ) 3 Bearish (INTC, UTX, XOM) STOCKS CLOSE CHANGE PIVOT-P 5-dma AROC CL-PWR Candl AI/200 IP21 ITRS --------------------------------------------------------------------------------------- --------------------------------------------------------------------------------------- AAPL 384.76 4.6 370.46 178.5% ------- BLUE 170 .034 .142 --------------------------------------------------------------------- AXP 94.65 -2.04 95.33 -105.4% Bullish BLUE 84 .025 -.002 --------------------------------------------------------------------- BA 161.95 -4.06 173.76 -422.9% Bearish RED 45 -.239 .155 --------------------------------------------------------------------- CAT 136.73 -3.8 137.58 4.7% Bullish RED 142 -.063 .133 --------------------------------------------------------------------- CSCO 46.44 -.27 46.4 -103.6% Bearish BLUE 103 .101 -.046 --------------------------------------------------------------------- CVX 86.27 -3.8 90.13 -262.5% ------- RED 75 -.103 -.124 --------------------------------------------------------------------- DIS 115.66 .05 117.61 -105.3% Bullish BLUE 92 .155 -.076 --------------------------------------------------------------------- GS 199.53 -3.05 201.47 -86.2% ------- ---- 94 -.189 .035 --------------------------------------------------------------------- HD 266.31 1.65 265.31 47.1% Bullish BLUE 118 .015 .032 --------------------------------------------------------------------- IBM 122.9 -2.42 125.79 -176% ------- RED 123 -.153 -.065 --------------------------------------------------------------------- INTC 47.99 -.08 50.59 -1203.1% Bearish BLUE 126 -.287 -.291 Bearish --------------------------------------------------------------------- JNJ 146.84 .3 148.12 -93.8% Bearish RED 119 -.036 -.102 --------------------------------------------------------------------- JPM 97.02 -2.66 98.28 -99.8% ------- RED 56 -.066 .007 --------------------------------------------------------------------- KO 47.69 -.33 48.49 -61.1% ------- ---- 85 .031 -.016 --------------------------------------------------------------------- MCD 195.41 -.8 198.72 -54% Bullish BLUE 114 .005 .001 --------------------------------------------------------------------- MMM 152.12 -4.13 159.84 -225.8% ------- RED 107 -.172 -.062 --------------------------------------------------------------------- MRK 78.99 -.36 77.1 59.1% Bearish BLUE 83 -.036 -.068 --------------------------------------------------------------------- MSFT 203.9 -.16 201.3 33.5% Bearish BLUE 156 .09 .023 --------------------------------------------------------------------- NKE 96.82 -.15 98.43 -75.9% Bearish BLUE 123 -.083 -.029 --------------------------------------------------------------------- PFE 38.74 -.52 37.66 43% Bearish BLUE 68 .003 -.059 --------------------------------------------------------------------- PG 131.42 3.11 125.96 207.2% Bullish BLUE 80 .031 .082 --------------------------------------------------------------------- TRV 115.93 -.92 118.28 -114.5% Bearish BLUE 111 -.101 .156 --------------------------------------------------------------------- UNH 305.23 -1.45 300.79 37.4% Bullish BLUE 133 -.006 -.031 --------------------------------------------------------------------- UTX Bearish --------------------------------------------------------------------- V 194.06 -4.52 195.15 -85.5% ------- RED 112 .05 -.062 --------------------------------------------------------------------- VZ 57.3 -.15 56.85 127.4% ------- BLUE 123 .018 -.033 --------------------------------------------------------------------- WBA 40.64 -.52 40.51 37% Bearish BLUE 81 -.024 -.065 --------------------------------------------------------------------- WMT 130.12 -.57 131.24 -57.9% ------- BLUE 97 .074 -.046 --------------------------------------------------------------------- XOM 41.87 -2.16 43.43 -209.1% Bearish RED 43 -.199 -.134 Bearish --------------------------------------------------------------------- DOW 41.73 -1.79 42.61 -126.4% Bullish RED 68 .128 .084 |
Table 2 QUICKSILVER on ETFS - 07/30/20 Bullish = FAS QQQ, SOXL, TECL, GLD. (5)
Bearish =
ITRS + IP21>.25 is considered "Bullish"
ETF CLOSE CHANGE PIVOT-PT 5-dma AROC CL-PWR CANDLE IP21 ITRS --------------------------------------------------------------------------------------------- DIA 263.28 -2.22 264.69 -64.3% ------- BLUE .017 0 --------------------------------------------------------------------------------------------- SPY 323.96 -1.16 320.88 15.5% Bullish BLUE .156 .023 --------------------------------------------------------------------------------------------- QQQ 261.13 1.36 255.56 60.5% Bullish BLUE .239 .064 Bullish --------------------------------------------------------------------------------------------- MDY 341.96 -2.31 337.22 32.7% Bullish BLUE .076 .048 --------------------------------------------------------------------------------------------- IWM 148.76 -.59 146.08 17% ------- BLUE .037 .057 --------------------------------------------------------------------------------------------- FAS 35.07 -1.21 34.2 30.2% Bullish BLUE .119 .242 Bullish --------------------------------------------------------------------------------------------- SOXL 230.4 12.74 198.47 525.7% Bullish BLUE .112 .597 Bullish --------------------------------------------------------------------------------------------- TECL 251.34 4 235.02 154.2% Bullish BLUE .163 .304 Bullish --------------------------------------------------------------------------------------------- IBB 137.02 .4 136.41 -88.7% Bearish BLUE .047 -.043 --------------------------------------------------------------------------------------------- GLD 183.76 -1.37 178.7 181.4% Bullish BLUE .329 .032 Bullish --------------------------------------------------------------------------------------------- OIH 127.03 -4.05 132.09 -193.4% ------- RED .057 .088 --------------------------------------------------------------------------------------------- GASL 3440 285 3685 -325.1% ------- RED -.021 .026 --------------------------------------------------------------------------------------------- |
Table 3 Count of Stocks in Key Directories
20200730
-------------------------------
NEWHIGHS 215
NEWLOWS 34
MAXCP 77
MINCP 25
TTTNH 26
TTTNL 33
FASTUP 111
FASTDOWN 81
CPCROSSA 87
CPCROSSD 72
BIGVOLUP 7
BIGVODN 14
ACCUMVER 21
HIGHIP21 25
HIUPPCT 17
REDSELL 130
AUGSELS7 110
TRAPDOOR 9
|
RANKING OF KEY DIRECTORIES BASED PCT.OF STOCKS ABOVE 65-DMA 7/30/20 --------------------------------------------------------------------------------------- Directory Current day-1 day-2 day-3 day-4 day-5 ---------------------------------------------------------------------------------------- BONDFUND 1 1 .99 .99 .99 .99 COPPER 1 1 1 1 1 1 GOLD .959 .959 .959 .959 .959 .959 SOLAR .937 .937 .937 .937 .937 1 ETFS .91 .964 .946 .982 .964 .964 HOSPITAL .904 .857 .857 .809 .761 .809 AUTO .897 .974 .948 .948 .974 .974 HOMEBLDG .882 .882 .823 .823 .882 .882 NIFTY .866 .888 .8 .844 .8 .866 BIGBANKS .857 .857 .857 .857 .857 .857 COMODITY .846 .846 .846 .846 .82 .82 INSURANC .846 .846 .807 .807 .807 .884 ELECTRON .837 .817 .777 .81 .743 .804 UTILITY .82 .82 .769 .692 .743 .794 SEMI .817 .798 .759 .798 .74 .778 SOFTWARE .816 .816 .666 .766 .7 .75 FOOD .811 .811 .83 .849 .849 .849 GAMING .809 .857 .761 .809 .761 .761 GREEN .809 .857 .904 .952 .952 .952 INDEXES .808 .825 .82 .808 .82 .842 HACKERS .8 .8 .7 .85 .8 .8 NASD-100 .797 .797 .777 .808 .747 .818 INFRA .771 .828 .714 .857 .828 .828 CHEM .77 .895 .854 .895 .895 .895 COMPUTER .75 .75 .8 .8 .65 .8 CHINA .745 .803 .725 .764 .725 .725 SP500 .735 .794 .75 .764 .779 .821 DOWJONES .733 .833 .8 .866 .8 .833 INDMATER .733 .8 .8 .84 .813 .8 SP-100 .714 .835 .78 .813 .802 .824 FIDSTKS .694 .751 .728 .734 .74 .779 RUS-1000 .694 .763 .701 .72 .741 .785 DJI-13 .692 .846 .846 .923 .846 .923 FINANCE .674 .771 .602 .626 .734 .795 RETAIL .62 .7 .6 .58 .6 .72 REIT .609 .652 .609 .51 .524 .602 BEVERAGE .6 .666 .666 .666 .666 .666 EDU .6 .6 .8 .8 1 1 GUNS .6 .6 .533 .466 .466 .466 TRANSP .6 .65 .75 .65 .7 .85 BIOTECH .565 .552 .58 .648 .617 .658 MILITARY .555 .629 .592 .555 .555 .629 COAL .428 .714 .428 .428 .714 .285 OILGAS .398 .523 .445 .476 .531 .554 REGBANKS .384 .73 .423 .423 .576 .73 JETS .214 .357 .428 .428 .428 .571 |
======================================================================
7/29/2020 The Peerless Sells tell us to expect a DJI test of 25000.
The head-winds
against the market are howling. First is the failure of Congress to provide a
relief package for the millions who are again unemployed because of the
mandatory closings; second is the bi-partisan attacks on AMZN, AAPL, FB
GOOG and, third, is the still heavy net selling of blue chips by Big
Money (negative IP21 on DJIA chart below). Unless there is a political
breakthrough on the Relief package, our scenario wherein the DJI declines
back to 25000 seems realistic, desite the new high today made by the A/D Line.

The FED told us today that they will keep boosting the stock market, no matter
what, for the rest of this year. That was expected. QE Infinity and the
continuing
wild protests in Portland make Gold very attractive. And if Gold goes up, so
should Silver. How can they not? $6 trillion in new Federal debt added in the
last 4 years strains trust in the Dollar, as does all additional private and corporate
debt. Gold stocks pay no dividends. With 10-year bonds paying only 1/2%,
Gold is very appealing world-wide. That is a threat to the Dollar's standing.
Frankly, unless there is a super vaccine, I can't see why anyone would want to be
President next year.

And apart from the economy and the stock market, the Fear of getting
the virus
if one goes out is gathering steam again, though there are still many young folks
who do not wear masks and sit close to one another at lunch, outside a bar or
at the beach here in San Diego. Ask yourself...would you fly or take a train or
a car trip with non-family members to Yosemite or Yellowstone? Even a vaccine
will not be a solution if most people do not want to take it soon after it becomes
available.
So, wait to buy just now. And watch the neckline-supports of the QQQ, NASDAQ
and IBB. If all three break down, look to buy them back at their rising 65-dma.
Short REV. We will watch it here each night. It will tell us just how
far the FED
is prepared to go.
COMP729

REV looks terrible technically.

|
Charts 7/29/2020 (Click on Underlined link.) 2020 PEERLESS DJI, Signals, Indicators Daily DJI Volume 10-DayUp/Down Vol Stoch-20 Inverted Traders Index Graph of Pct of All Stocks above 65-dma Cum. Inverted Traders Index NASDAQ S&P OEX NYSE COMPQX DJI-15 DJI-20 DJI-30 DIA QQQ MDY IWM TNA Short-Term Rates DOLLAR-UUP SPY http://tigersoft.com/2121CST/SPY.GIF recent 2006 vers-Peerless signals -- http://tigersoft.com/NEWPEER/UPD06729.BMP USO-CrudeOil DBO FAS GLD BBH IBB JETS JNUG KOL NUGT OIH PALL RSX RETL SDS AGQ SLV SOXL TECL TLT TMF TNA UGA (gasoline) USO (oil) and China: YINN CHAU Commodities: CANE CORN DBC JJC, NIB, CHOC CORN, CUT (paper) MOO, SOYB WEAT UUP (Dollar) LIT (Lithium) Stocks AAPL ADBE ALXN AMAT AMGN AMD AMZN AXP BA BABA BAC BIDU BLDP CAT CVX CMG DE ENPH FB GILD GOOG GS HD IBM INTU JPM LRCX M (Macy's) MSFT NEM NFLX NKE NVDA PG REGN SO SQ QCOM QDEL TSLA TXN XOM V VRTX WFC WMT TOWN ZM New highs and Bullish MAXCPs http://tigersoft.com/MAXCP/7-29/BULLISH.htm Bearish MAXCPs - http://tigersoft.com/MINCP/7-29/BEARISH.htm |
Table 1
7/29/2018 QUICKSILVER on DJI-30 STOCKS.
P21 + ITRS score >+.25 is bullish
Note that AAPL now shows highest AI/200 stock here.
1 Bullish (DOW) 2 Bearish (INTC, UTX) STOCKS CLOSE CHANGE PIVOT-P 5-dma AROC CL-PWR Candl AI/200 IP21 ITRS --------------------------------------------------------------------------------------- --------------------------------------------------------------------------------------- AAPL 380.16 7.15 371.38 -118.5% Bearish BLUE 170 .021 .127 --------------------------------------------------------------------- AXP 96.69 2.27 96.67 7.8% Bullish BLUE 83 .015 .014 --------------------------------------------------------------------- BA 166.01 -4.83 176.45 -395.5% Bearish RED 46 -.239 .146 --------------------------------------------------------------------- CAT 140.53 2.5 136.6 128.8% Bullish BLUE 142 -.008 .142 --------------------------------------------------------------------- CSCO 46.71 .43 47.41 -20.3% Bearish BLUE 102 .071 -.043 --------------------------------------------------------------------- CVX 90.07 .96 91.01 -53.6% Bullish BLUE 75 -.037 -.106 --------------------------------------------------------------------- DIS 115.61 -.57 118.12 -145.6% Bullish RED 91 .153 -.09 --------------------------------------------------------------------- GS 202.58 .96 203.02 -84.2% ------- BLUE 94 -.192 .034 --------------------------------------------------------------------- HD 264.66 -.62 263.81 -9.6% Bullish RED 117 .033 -.001 --------------------------------------------------------------------- IBM 125.32 .85 127.33 -132.4% ------- BLUE 123 -.135 -.049 --------------------------------------------------------------------- INTC 48.07 -1.17 60.4 -1198.1%Bearish RED 126 -.257 -.277 Bearish --------------------------------------------------------------------- JNJ 146.54 -.29 149.61 -117% ------- BLUE 119 .008 -.106 --------------------------------------------------------------------- JPM 99.68 2.36 98.98 50.5% ------- BLUE 56 -.051 .022 --------------------------------------------------------------------- KO 48.02 -.16 48.28 -47.5% ------- RED 84 .074 -.012 --------------------------------------------------------------------- MCD 196.21 -.03 197.55 -60.7% Bullish ---- 113 .014 .012 --------------------------------------------------------------------- MMM 156.25 .92 159.29 -77.2% Bullish RED 107 -.117 -.033 --------------------------------------------------------------------- MRK 79.35 -.34 78.06 36.3% Bearish RED 83 -.031 -.084 --------------------------------------------------------------------- MSFT 204.06 2.04 202.54 -188.2% ------- BLUE 155 .098 .024 --------------------------------------------------------------------- NKE 96.97 .7 98.3 -99.2% ------- BLUE 123 -.029 -.014 --------------------------------------------------------------------- PFE 39.26 .24 38.41 91.5% Bearish ---- 67 -.001 -.048 --------------------------------------------------------------------- PG 128.31 .43 126.16 85.8% Bullish BLUE 79 .03 .025 --------------------------------------------------------------------- TRV 116.85 1.82 118.61 -228.1% Bearish BLUE 111 -.089 .147 --------------------------------------------------------------------- UNH 306.68 6.75 302.97 -.5% Bullish BLUE 133 .002 -.034 --------------------------------------------------------------------- UTX 86.01 -5.36 97.15 -958.4% Bullish RED 114 .144 -.52 Bearish --------------------------------------------------------------------- V 198.58 1.84 197.43 -7.1% Bullish BLUE 111 .098 -.042 --------------------------------------------------------------------- VZ 57.45 -.03 55.85 150.3% ------- BLUE 122 .058 -.049 --------------------------------------------------------------------- WBA 41.16 .48 40.34 58.2% Bearish BLUE 81 -.024 -.072 --------------------------------------------------------------------- WMT 130.69 -1.07 131.64 -74.8% ------- RED 96 .078 -.056 --------------------------------------------------------------------- XOM 44.03 .48 43.7 48.1% ------- BLUE 43 -.095 -.108 --------------------------------------------------------------------- DOW 43.52 .9 42.82 -94.7% Bullish BLUE 67 .188 .105 Bullish |
Table 2 QUICKSILVER on ETFS - 07/29/20 Bullish = FAS QQQ, SOXL, TECL, GLD. (5)
Bearish =
ITRS + IP21>.25 is considered "Bullish"
ETF CLOSE CHANGE PIVOT-PT 5-dma AROC CL-PWR CANDLE IP21 ITRS --------------------------------------------------------------------------------------------- DIA 265.5 1.57 266.69 -84.1% Bullish BLUE .008 ----- --------------------------------------------------------------------------------------------- SPY 325.12 3.95 322.96 -26.9% Bullish BLUE .147 .023 --------------------------------------------------------------------------------------------- QQQ 259.77 2.96 258.01 -99.6% Bullish BLUE .24 .063 Bullish --------------------------------------------------------------------------------------------- MDY 344.27 7.49 339.74 73.1% Bullish BLUE .072 .047 --------------------------------------------------------------------------------------------- IWM 149.35 3.22 148.26 42.1% ------- BLUE .046 .046 --------------------------------------------------------------------------------------------- FAS 36.28 1.99 34.86 181% Bullish BLUE .122 .22 Bullish --------------------------------------------------------------------------------------------- SOXL 217.66 13.24 208.4 -22% Bullish BLUE .111 .492 Bullish --------------------------------------------------------------------------------------------- TECL 247.34 9.92 243.88 -350.8% Bullish BLUE .151 .273 Bullish --------------------------------------------------------------------------------------------- IBB 136.62 -1.54 139.47 -196.8% Bearish RED .068 -.058 --------------------------------------------------------------------------------------------- GLD 185.13 1.38 177.18 264.6% Bullish BLUE .319 .058 Bullish --------------------------------------------------------------------------------------------- OIH 131.08 2.79 132.11 115.5% ------- BLUE .091 .071 --------------------------------------------------------------------------------------------- GASL 3440 285 3685 -325.1% ------- RED -.021 .034 --------------------------------------------------------------------------------------------- UUP 25.98 -.06 26.26 -53.5% ------- -----.019 -.101 --------------------------------------------------------------------------------------------- |
Table 3 Count of Stocks in Key Directories
20200729
-------------------------------
NEWHIGHS 243
NEWLOWS 30
MAXCP 54
MINCP 40
TTTNH 30
TTTNL 31
FASTUP 116
FASTDOWN 89
CPCROSSA 132
CPCROSSD 49
BIGVOLUP 7
BIGVODN 14
ACCUMVER 21
HIGHIP21 20
HIUPPCT 17
REDSELL 125
AUGSELS7 123
TRAPDOOR 9
|
RANKING OF KEY DIRECTORIES BASED PCT.OF STOCKS ABOVE 65-DMA 7/29/20 --------------------------------------------------------------------------------------- Directory Current day-1 day-2 day-3 day-4 day-5 ---------------------------------------------------------------------------------------- BONDFUND 1 .99 .99 .99 .99 .99 COPPER 1 1 1 1 1 1 AUTO .974 .948 .948 .974 .974 .948 ETFS .964 .946 .982 .964 .964 1 GOLD .959 .959 .959 .959 .959 .959 SOLAR .937 .937 .937 .937 1 1 CHEM .895 .854 .895 .895 .895 .895 NIFTY .888 .8 .844 .8 .866 .866 HOMEBLDG .882 .823 .823 .882 .882 .882 BIGBANKS .857 .857 .857 .857 .857 .857 GAMING .857 .761 .809 .761 .761 .761 GREEN .857 .904 .952 .952 .952 .904 HOSPITAL .857 .857 .809 .809 .809 .809 COMODITY .846 .846 .846 .82 .82 .82 DJI-13 .846 .846 .923 .846 .923 .923 INSURANC .846 .807 .807 .807 .884 .884 SP-100 .835 .78 .813 .802 .824 .824 DOWJONES .833 .8 .866 .8 .833 .866 INFRA .828 .714 .857 .828 .828 .828 INDEXES .825 .82 .808 .82 .842 .837 UTILITY .82 .769 .692 .743 .769 .743 ELECTRON .817 .777 .81 .743 .81 .797 SOFTWARE .816 .683 .766 .7 .75 .783 FOOD .811 .83 .849 .849 .849 .83 CHINA .803 .725 .764 .725 .725 .764 HACKERS .8 .75 .85 .8 .8 .8 INDMATER .8 .8 .84 .813 .8 .826 SEMI .798 .759 .798 .74 .788 .788 NASD-100 .797 .787 .818 .747 .818 .858 SP500 .794 .752 .764 .779 .821 .804 FINANCE .768 .597 .621 .731 .792 .707 RUS-1000 .763 .702 .72 .741 .788 .764 FIDSTKS .751 .728 .734 .74 .79 .779 COMPUTER .75 .8 .8 .65 .8 .8 REGBANKS .73 .423 .423 .576 .73 .461 COAL .714 .428 .428 .714 .285 .285 RETAIL .7 .6 .58 .6 .72 .7 BEVERAGE .666 .666 .666 .666 .666 .666 REIT .652 .609 .51 .524 .609 .617 TRANSP .65 .75 .65 .7 .85 .8 MILITARY .629 .592 .555 .555 .666 .629 EDU .6 .8 .8 1 1 1 GUNS .6 .533 .466 .466 .466 .466 BIOTECH .547 .576 .644 .615 .663 .692 OILGAS .523 .445 .476 .531 .554 .609 JETS .357 .428 .428 .428 .571 .571 |
========================================================================
7/28/2020 The Peerless Sells still tell us to expect a DJI test of 25000.
But the FED
will be telling the world more about its plans to support the market. Their
words will be geared to lifting up prices. I would think if the markets rally
briefly, as is also suggested by the big jumps in the DJI's IP21 and V-Indicator,
the best gains will come to smaller NASDAQ stocks, GLD and SLV. The
biggest tech stocks' CEOs will be subjected to Congressional hearings about
their monopolistic tendencies. The bearish MINCPs look vulnerable. But the
number of new lows is so small, it will be hard to find winners there.
REV (Revlon) stands out for its weakness, internally and externally.

Watch the NASDAQ to see if it can make a new high and AAPL and ADBE
to see if they break below their neckline support or abort t their H/S Patterns.
In this way, we may be able to spot the next big move of the market.
At present,. the DJI is stuck between 25000 and 27000, but the key NYSE A/D
Line, reflecting the actions of the FED is in a rising trend.
I have no idea what Nancy Pelosi and the House Dems will do about the size of
AAPL, GOOG, AMZN and MSFT or what they will do with Senate's relief bill
with all its non-relief riders. It best to watch the technicals and stick with
simple
trendlines and support and resistance levels.
DJI - Peerless Signals are bearish.
Rising A/D Line and improving IP21 and V-I are bullish.

The FED's QE-Infinity must weaken the Dollar
and boost Gold and Silver.

NASDAQ is caught in a tight, flat trading range.
AAPL bulls will want to see its potential H/S Pattern destroyed.
IBB and biotech bulls will want to see the H/S pattern below aborted.
 |
 |
 |
|
Charts 7/28/2020 (Click on Underlined link.) 2020 PEERLESS DJI, Signals, Indicators Daily DJI Volume 10-DayUp/Down Vol Stoch-20 Inverted Traders Index Graph of Pct of All Stocks above 65-dma Cum. Inverted Traders Index NASDAQ S&P OEX NYSE COMPQX DJI-15 DJI-20 DJI-30 DIA QQQ MDY IWM TNA Short-Term Rates DOLLAR-UUP SPY http://tigersoft.com/2121CST/SPY.GIF recent 2006 vers-Peerless signals -- http://tigersoft.com/NEWPEER/UPD06728.BMP USO-CrudeOil DBO FAS GLD BBH IBB JETS JNUG KOL NUGT OIH PALL RSX RETL SDS AGQ SLV SOXL TECL TLT TMF TNA UGA (gasoline) USO (oil) and China: YINN CHAU Commodities: CANE CORN DBC JJC, NIB, CHOC CORN, CUT (paper) MOO, SOYB WEAT UUP (Dollar) LIT (Lithium) Stocks AAPL ADBE ALXN AMAT AMGN AMD AMZN AXP BA BABA BAC BIDU BLDP CAT CVX CMG DE ENPH FB GILD GOOG GS HD IBM INTU JPM LRCX M (Macy's) MSFT NEM NFLX NKE NVDA PG REGN SO SQ QCOM QDEL TSLA TXN XOM V VRTX WFC WMT TOWN ZM New highs and Bullish MAXCPs http://tigersoft.com/MAXCP/7-28/BULLISH.htm Bearish MAXCPs - http://tigersoft.com/MINCP/7-28/BEARISH.htm |
Table 1
7/28/2018 QUICKSILVER on DJI-30 STOCKS.
P21 + ITRS score >+.25 is bullish
Note that AAPL now shows highest AI/200 stock here.
1 Bullish (DOW) 2 Bearish (INTC, UTX) STOCKS CLOSE CHANGE PIVOT-P 5-dma AROC CL-PWR Candl AI/200 IP21 ITRS --------------------------------------------------------------------------------------- --------------------------------------------------------------------------------------- AAPL 373.01 -6.23 389.09 -197.4% Bearish RED 170 .042 .098 --------------------------------------------------------------------- AXP 94.42 -1.37 96.54 -99.3% Bullish RED 82 -.006 .034 --------------------------------------------------------------------- BA 170.84 .63 179.79 -221.6% ------- BLUE 47 -.121 .31 --------------------------------------------------------------------- CAT 138.03 -1.86 136.98 78.6% Bullish RED 142 -.014 .165 --------------------------------------------------------------------- CSCO 46.28 -.91 46.9 -78.8% ------- RED 101 .072 -.069 --------------------------------------------------------------------- CVX 89.11 -1.93 91.04 -125.4% Bullish RED 75 -.072 -.115 --------------------------------------------------------------------- DIS 116.18 -.13 119.03 -103.4% Bullish BLUE 90 .211 -.049 --------------------------------------------------------------------- GS 201.62 -1.4 206 -253.5% ------- RED 94 -.164 .059 --------------------------------------------------------------------- HD 265.28 -2.14 265.17 54% Bullish RED 116 .109 -.006 --------------------------------------------------------------------- IBM 124.47 -1.74 128.67 -62.7% ------- RED 123 -.103 -.05 --------------------------------------------------------------------- INTC 49.24 -.33 61.05 -1015% Bearish RED 126 -.179 -.269 Bearish --------------------------------------------------------------------- JNJ 146.83 -.35 150.01 -97.7% ------- RED 118 .029 -.138 --------------------------------------------------------------------- JPM 97.32 .42 98.69 -106.1% ------- BLUE 56 -.091 .019 --------------------------------------------------------------------- KO 48.18 -.3 48.48 101.7% Bullish RED 83 .115 0 --------------------------------------------------------------------- MCD 196.24 -5.01 198.62 82.4% Bullish RED 112 .087 .015 --------------------------------------------------------------------- MMM 155.33 -7.91 158.71 -77.3% Bullish RED 107 -.106 .006 --------------------------------------------------------------------- MRK 79.69 .76 78.78 51.1% ------- BLUE 83 -.03 -.115 --------------------------------------------------------------------- MSFT 202.02 -1.83 211.75 -163.6% ------- RED 154 .116 -.011 --------------------------------------------------------------------- NKE 96.27 -.94 98.91 -106.4% Bullish RED 123 .04 -.007 --------------------------------------------------------------------- PFE 39.02 1.48 38.56 308.4% Bearish BLUE 67 -.004 -.081 --------------------------------------------------------------------- PG 127.88 1.56 126.14 111.6% Bullish BLUE 78 .057 .002 --------------------------------------------------------------------- TRV 115.03 -1.6 122.24 -226% Bearish RED 111 -.091 .16 --------------------------------------------------------------------- UNH 299.93 1.33 306.71 -85.5% Bullish BLUE 132 -.011 -.083 --------------------------------------------------------------------- UTX 86.01 -5.36 97.15 -958.4% Bullish RED 114 .144 -.555 Bearish --------------------------------------------------------------------- V 196.74 -.17 198.86 6.6% ------- RED 110 .094 -.042 --------------------------------------------------------------------- VZ 57.48 .61 55.75 145.8% ------- BLUE 121 .105 -.063 --------------------------------------------------------------------- WBA 40.68 .84 40.69 33.5% Bearish BLUE 81 -.034 -.055 --------------------------------------------------------------------- WMT 131.76 .55 132.66 -21.6% Bullish BLUE 95 .086 -.068 --------------------------------------------------------------------- XOM 43.55 -.52 43.61 -125.3% ------- RED 43 -.102 -.077 --------------------------------------------------------------------- DOW 42.62 -1.38 44.34 -48.4% Bullish RED 66 .202 .156 Bullish |
Table 2 QUICKSILVER on ETFS - 07/28/20 Bullish = FAS QQQ, SOXL, TECL, GLD. (5)
Bearish =
ITRS + IP21>.25 is considered "Bullish"
RETL has been taken out. AMZN has too much weight in it.
ETF CLOSE CHANGE PIVOT-PT 5-dma AROC CL-PWR CANDLE IP21 ITRS --------------------------------------------------------------------------------------------- DIA 263.93 -2.02 269.98 -82.5% Bullish RED .04 --- --------------------------------------------------------------------------------------------- SPY 321.17 -2.05 326.86 -59.3% Bullish RED .171 .008 --------------------------------------------------------------------------------------------- QQQ 256.81 -3.31 264.93 -138% Bullish RED .266 .036 Bullish --------------------------------------------------------------------------------------------- MDY 336.78 -3.39 339.32 -1.9% Bullish RED .08 .055 --------------------------------------------------------------------------------------------- IWM 146.13 -1.47 148.11 -64.4% Bearish RED .052 .054 --------------------------------------------------------------------------------------------- FAS 34.29 .04 35.03 -36.2% Bullish BLUE .127 .301 Bullish --------------------------------------------------------------------------------------------- SOXL 204.42 -12.85 218.58 -273.2% Bullish RED .125 .569 Bullish --------------------------------------------------------------------------------------------- TECL 237.42 -8.11 264.55 -417.5% ------- RED .179 .282 Bullish --------------------------------------------------------------------------------------------- IBB 138.16 -1.89 142.1 -153.5% Bearish RED .089 -.069 --------------------------------------------------------------------------------------------- GLD 183.75 1.52 175.63 303.1% Bullish BLUE .308 .007 Bullish --------------------------------------------------------------------------------------------- OIH 128.29 -4.9 128.06 -100.6% Bullish RED .074 .153 --------------------------------------------------------------------------------------------- GASL 3440 285 3685 -325.1% ------- RED -.021 -.001 --------------------------------------------------------------------------------------------- |
Table 3 Count of Stocks in Key Directories
20200728
-------------------------------
NEWHIGHS 147
NEWLOWS 28
MAXCP 27
MINCP 47
TTTNH 16
TTTNL 11
FASTUP 93
FASTDOWN 114
CPCROSSA 78
CPCROSSD 128
BIGVOLUP 6
BIGVODN 13
ACCUMVER 18
HIGHIP21 21
HIUPPCT 15
REDSELL 125
AUGSELS7 118
TRAPDOOR 9
|
Table 4 RANKING OF KEY DIRECTORIES BASED PCT.OF STOCKS ABOVE 65-DMA
7/28/20
---------------------------------------------------------------------------------------
Directory Current day-1 day-2 day-3 day-4 day-5
----------------------------------------------------------------------------------------
COPPER 1 1 1 1 1 1
BONDFUND .99 .99 .99 .99 .99 .98
GOLD .959 .959 .959 .959 .959 .959
AUTO .948 .948 .974 .974 .948 1
ETFS .946 .982 .964 .964 1 1
SOLAR .937 .937 .937 1 1 1
GREEN .904 .952 .952 .952 .904 .904
BIGBANKS .857 .857 .857 .857 .857 .857
HOSPITAL .857 .809 .809 .857 .809 .761
CHEM .854 .895 .895 .895 .937 .937
COMODITY .846 .846 .82 .82 .82 .794
DJI-13 .846 .923 .846 .923 .923 .923
FOOD .83 .849 .849 .849 .83 .811
HOMEBLDG .823 .823 .882 .882 .882 .882
INDEXES .82 .808 .82 .842 .848 .853
INSURANC .807 .807 .807 .884 .884 .846
COMPUTER .8 .8 .65 .8 .8 .9
DOWJONES .8 .866 .8 .833 .866 .866
EDU .8 .8 1 1 1 1
INDMATER .8 .84 .813 .8 .853 .853
NIFTY .8 .844 .8 .866 .866 .844
NASD-100 .787 .828 .757 .818 .858 .848
SP-100 .78 .813 .802 .824 .824 .824
ELECTRON .777 .81 .743 .81 .804 .831
UTILITY .769 .692 .743 .769 .769 .641
GAMING .761 .809 .761 .761 .761 .904
SEMI .759 .798 .74 .788 .788 .826
SP500 .752 .766 .779 .821 .813 .8
HACKERS .75 .9 .8 .8 .8 .85
TRANSP .75 .65 .7 .85 .85 .85
FIDSTKS .728 .734 .74 .79 .785 .813
CHINA .725 .764 .725 .725 .784 .823
INFRA .714 .857 .828 .828 .828 .857
RUS-1000 .701 .72 .74 .787 .77 .766
SOFTWARE .683 .783 .7 .75 .783 .8
BEVERAGE .666 .666 .666 .666 .666 .666
REIT .609 .51 .524 .609 .617 .553
FINANCE .602 .626 .734 .795 .734 .795
RETAIL .6 .58 .6 .72 .7 .72
MILITARY .592 .555 .555 .666 .666 .666
BIOTECH .569 .643 .614 .664 .706 .719
GUNS .533 .466 .466 .466 .466 .466
OILGAS .441 .472 .527 .55 .612 .627
COAL .428 .428 .714 .285 .285 .285
JETS .428 .428 .428 .571 .642 .714
REGBANKS .423 .423 .576 .73 .5 .73
|
=======================================================================
7/27/2020 Monday's rally in the stock market was not as broad as most up-days have
been
recently. There were only 585 more up than down on the NYSE today. This
is 500 less than on the market's good days from April to June. Still, the DJI and
the rest
of the markets are holding up well considering the resurgence of covid-19 cases,
the widespread demonstrations and the falling Dollar. Today's big jump in Gold
and Silver could introduce some profit-taking. But, the opening apprears to
be weak for the DJI, too, tomorrow. This demonstrates that "Big Money" is
still a net
seller after a rally. A DJI decline to 25000 and the lower band is still called for
by the current Peerless Sell signals.

I expect Gold and Silver to keep rising. The best indicator here is the Dollar's
downtrend. There is a good chance the FED will just keep letting the Dollar fall.
They are very much afraid that a DJI breaking of 25000 could start another leg down.
They view their job to be stabilizing the market this year. Since Congress refuses
to "get its act together" and pass a new people's bailout for all those who are
now again unemployed and pressed for how to pay for food, rent and credit cards
debt, the FED sees QE-Infinity as more indispensble than ever.

Besides the Dollar-Gold chart (UUP/GLD), we should
be watching AAPL, BBH and
IBB to see if they can now surpass their potential right shoulder peaks in potentially
bearish head/shoulders patterns and we should see which way QQQ moves out of its
flat trading range.
50 Straight Days of Demonstrations in Portland
Time permitting, I am trying to put together a study of how the DJI behaves when there
are big protests in the street that do not involve unions or strikes. The best
examples
are the race riots of 1919 and the urban riots of the 1960s. In 1919, it took months
and months of race riots all across America to stop the bull market that began in February
of that year when the Seattle General Strike was silenced. Finally, in the Summer of
1919,
letter bombs were sent high officials by foreign born anarchists. This provoked the
Wilson Administration to crush the IWW Labor Party. They had opposed entry in
World War I and to arrest a thousand IWW members and anarchists. In this case,
Wall Street became frightened and a deep bear market soon began as the FED
sought to raise rates, fight inflation and protect the Dollar and the Government's Gold
Reserve. There were so many elements back then that do not apply now, so I
hestitate
to offer1919 as a parallel, except as regards the dangers of an escalation of violence
over time. In other cases, my reading of the history of dozens and dozens of Labor
strikes
leads to the two conclusions. First, they may start peacefully, but they mostly turn
violent.
And second, when the protestors are violently broken up by the local police, the State
Militia or the National Guard or Army, Wall Street always celebrates the silencing of
the protestors. That is what started the major bull market in 1920 and in 1932, for
example.
Table 1
7/27/2018 QUICKSILVER on DJI-30 STOCKS.
P21 + ITRS score >+.25 is bullish
Note that AAPL now shows highest AI/200 stock here.
1 Bullish (DOW) 2 Bearish (INTC, UTX) STOCKS CLOSE CHANGE PIVOT-P 5-dma AROC CL-PWR Candl AI/200 IP21 ITRS --------------------------------------------------------------------------------------- --------------------------------------------------------------------------------------- AAPL 379.24 8.78 388 -185.5% Bearish BLUE 169 .013 .102 --------------------------------------------------------------------- AXP 95.79 .46 96.33 93.4% ------- BLUE 82 -.021 .02 --------------------------------------------------------------------- BA 170.21 -3.55 178.63 -119.2% Bearish RED 48 -.129 .266 --------------------------------------------------------------------- CAT 139.89 2.31 135.87 192.9% Bullish BLUE 142 -.006 .194 --------------------------------------------------------------------- CSCO 47.19 .79 47.02 23.4% Bullish BLUE 100 .204 -.047 --------------------------------------------------------------------- CVX 91.04 .91 91.39 321.4% ------- BLUE 75 -.102 -.112 --------------------------------------------------------------------- DIS 116.31 -1.3 118.62 -62.6% Bullish RED 89 .172 -.025 --------------------------------------------------------------------- GS 203.02 1.55 212.02 -210.1% ------- BLUE 94 -.23 .04 --------------------------------------------------------------------- HD 267.42 2.11 262.42 137.6% Bullish BLUE 115 .076 .017 --------------------------------------------------------------------- IBM 126.21 .42 126.06 -6.3% ------- BLUE 123 -.096 -.044 --------------------------------------------------------------------- INTC 49.57 -1.02 60.7 -985.1% ------- RED 126 -.14 -.284 Bearish --------------------------------------------------------------------- JNJ 147.18 -.94 149.74 -81% ------- RED 117 .022 -.126 --------------------------------------------------------------------- JPM 96.9 -1.38 99.41 -20.3% Bearish RED 56 -.15 -.016 --------------------------------------------------------------------- KO 48.48 -.01 47.2 247.3% Bullish BLUE 82 .094 -.014 --------------------------------------------------------------------- MCD 201.25 2.53 192.98 246% Bullish BLUE 111 .109 .024 --------------------------------------------------------------------- MMM 163.24 3.4 157.8 216.9% Bullish BLUE 107 -.112 .077 --------------------------------------------------------------------- MRK 78.93 1.83 78.89 -30.6% Bearish BLUE 83 -.087 -.137 --------------------------------------------------------------------- MSFT 203.85 2.55 208.75 -187% ------- BLUE 154 .109 .006 --------------------------------------------------------------------- NKE 97.21 -1.22 98.36 79.6% ------- BLUE 122 -.117 0 --------------------------------------------------------------------- PFE 37.54 -.12 36.69 138.4% Bearish BLUE 67 -.027 -.133 --------------------------------------------------------------------- PG 126.32 .36 125.07 43% Bullish BLUE 77 -.072 -.013 --------------------------------------------------------------------- TRV 116.63 -1.65 120.42 -89.4% Bearish RED 111 -.109 .169 --------------------------------------------------------------------- UNH 298.6 -2.19 305.11 -80% Bullish BLUE 132 -.08 -.096 --------------------------------------------------------------------- UTX 86.01 -5.36 97.15 -958.4% Bullish RED 114 .144 -.564 Bearish --------------------------------------------------------------------- V 196.91 1.76 196.48 -39.5% ------- BLUE 109 .065 -.035 --------------------------------------------------------------------- VZ 56.87 .02 55.84 89.2% ------- RED 121 .037 -.088 --------------------------------------------------------------------- WBA 39.84 -.67 40.41 -76.6% Bearish RED 81 -.063 -.098 --------------------------------------------------------------------- WMT 131.21 -.03 132.33 -9.9% Bullish BLUE 94 .045 -.06 --------------------------------------------------------------------- XOM 44.07 .64 44.65 180.1% ------- BLUE 43 -.126 -.081 --------------------------------------------------------------------- DOW 44 1.39 43.04 197.6% Bullish BLUE 66 .285 .19 Bullish |
Table 2 QUICKSILVER on ETFS - 07/27/20 Bullish = FAS QQQ, SOXL, TECL, GLD. OIH (6)
Bearish =
ITRS + IP21>.25 is considered "Bullish"
RETL has been taken out. AMZN has too much weight in it.
ETF CLOSE CHANGE PIVOT-PT 5-dma AROC CL-PWR CANDLE IP21 ITRS --------------------------------------------------------------------------------------------- DIA 265.95 1.26 268.34 -16.3% ------- BLUE .001 ----- --------------------------------------------------------------------------------------------- SPY 323.22 2.34 325.01 -17% Bullish BLUE .127 .011 --------------------------------------------------------------------------------------------- QQQ 260.12 4.56 264 -127.2% Bullish BLUE .237 .049 Bullish --------------------------------------------------------------------------------------------- MDY 340.17 2.95 336.91 111.7% Bullish BLUE .056 .067 --------------------------------------------------------------------------------------------- IWM 147.6 1.52 148.03 55.7% ------- BLUE .011 .075 --------------------------------------------------------------------------------------------- FAS 34.25 .05 34.54 106% ------- RED .004 .279 Bullish --------------------------------------------------------------------------------------------- SOXL 217.27 18.8 215.99 -79.8% Bullish BLUE .119 .553 Bullish --------------------------------------------------------------------------------------------- TECL 245.53 10.51 258.25 -396.1% ------- BLUE .158 .337 Bullish --------------------------------------------------------------------------------------------- IBB 140.05 3.64 142.46 -203.5% Bearish BLUE .071 -.038 --------------------------------------------------------------------------------------------- GLD 182.23 3.53 173 322.4% Bullish BLUE .307 -.005 Bullish --------------------------------------------------------------------------------------------- OIH 133.19 1.1 130.93 467.9% Bullish BLUE .068 .196 Bullish --------------------------------------------------------------------------------------------- GASL 3440 285 3685 -325.1% ------- RED -.021 -.01 --------------------------------------------------------------------------------------------- |
Table 3 Count of Stocks in Key Directories
20200727
-------------------------------
NEWHIGHS 194
NEWLOWS 36
MAXCP 49
MINCP 49
TTTNH 17
TTTNL 34
FASTUP 145
FASTDOWN 63
CPCROSSA 136
CPCROSSD 106
BIGVOLUP 6
BIGVODN 7
ACCUMVER 15
HIGHIP21 20
HIUPPCT 13
REDSELL 130
AUGSELS7 234
TRAPDOOR 10
|
RANKING OF KEY DIRECTORIES BASED PCT.OF STOCKS ABOVE 65-DMA 7/27/20 --------------------------------------------------------------------------------------- Directory Current day-1 day-2 day-3 day-4 day-5 ---------------------------------------------------------------------------------------- COPPER 1 1 1 1 1 1 BONDFUND .99 .99 .99 .99 .98 .99 ETFS .982 .964 .964 1 1 1 GOLD .959 .959 .959 .959 .959 .938 GREEN .952 .952 .952 .904 .904 .904 AUTO .948 .974 .974 .948 1 .974 SOLAR .937 .937 1 1 1 .937 DJI-13 .923 .846 .923 .923 .923 .846 HACKERS .9 .85 .8 .8 .85 .85 CHEM .895 .895 .895 .937 .937 .895 DOWJONES .866 .8 .833 .866 .866 .833 BIGBANKS .857 .857 .857 .857 .857 .714 INFRA .857 .828 .828 .828 .857 .742 FOOD .849 .849 .849 .83 .811 .811 COMODITY .846 .82 .82 .82 .794 .82 NIFTY .844 .8 .866 .866 .866 .888 INDMATER .84 .813 .8 .853 .853 .733 NASD-100 .828 .767 .828 .858 .858 .868 HOMEBLDG .823 .882 .882 .882 .882 .882 SP-100 .813 .802 .824 .824 .824 .769 ELECTRON .81 .743 .81 .804 .831 .797 GAMING .809 .761 .761 .761 .904 .761 HOSPITAL .809 .809 .857 .857 .761 .714 INDEXES .808 .82 .842 .848 .853 .792 INSURANC .807 .807 .884 .884 .846 .807 COMPUTER .8 .65 .8 .8 .9 .8 EDU .8 1 1 1 1 .8 SEMI .798 .74 .788 .788 .836 .826 SOFTWARE .783 .716 .75 .783 .8 .8 SP500 .766 .781 .821 .813 .804 .743 CHINA .764 .725 .725 .784 .823 .784 FIDSTKS .734 .74 .79 .785 .813 .762 RUS-1000 .72 .741 .787 .77 .77 .691 UTILITY .692 .743 .769 .769 .641 .615 BEVERAGE .666 .666 .666 .666 .666 .666 TRANSP .65 .7 .85 .85 .85 .85 BIOTECH .637 .611 .661 .706 .729 .74 FINANCE .626 .734 .795 .734 .795 .542 RETAIL .58 .6 .72 .7 .74 .64 MILITARY .555 .555 .666 .666 .666 .592 REIT .51 .524 .609 .617 .56 .503 OILGAS .472 .527 .55 .612 .635 .395 GUNS .466 .466 .466 .466 .466 .4 COAL .428 .714 .285 .285 .285 .285 JETS .428 .428 .571 .642 .714 .642 REGBANKS .423 .576 .73 .5 .73 .153 |
====================================================================
7/24/2020 The DJI seems stuck below 27000. On the one hand, we have
the Peerless Sell
signals, the negative Accumulation Index on the DJI, the negative V-Indicator
and the falling Closing Power for DIA. On the other hand, we see a rising
NYSE A/D Line and strength still in the more speculative tech sector, as shown
by QQQ and the NASDAQ. I've suggested "big money" is selling into strength
the blue chips, but they are not yet net sellers of tech stocks. The DJI's 25000-
27500 broad range seems solid as long as the FED keeps providing support,
especially for weak stocks. See in Table 3 how the number of new lows is unable
to expand by much even on declines.


I suspect the FED will not withdraw its support for
bonds and the market until
after the Election is over. But the FED is not without limits in its
powers. A
falling Dollar could become a big problem. The skyrocketing national debt
is directly responsible for Gold and Silver's rise now. Gold shows lots of big
money Accumulation even at current prices and Silver's history suggests it
can quickly jump to 45 if it gets past 20. Gold and Silver should keep rising
until the FED reverses course or international fears about the economic effects of the
Covid pandemic subside.


With the FED supporting the market, speculative low priced stocks that breakout
look safer. Look at the Bullish MAXCPs each night for ideas about low-priced
stock breakouts from bases, where we also see major Tiger Buys, high Accumulation
and red high volume on the breakout. I will keep scanning all stocks under $10 for
new ideas and will post them among the Bullish MAXCPs each night. They don't
appear every night. But when they do appear, the gains are often extraordinary.
Below is what NVAX looked like at the start of its 1250% rally.

|
Charts 7/24/2020 (Click on Underlined link.) 2020 PEERLESS DJI, Signals, Indicators Daily DJI Volume 10-DayUp/Down Vol Stoch-20 Inverted Traders Index Graph of Pct of All Stocks above 65-dma Cum. Inverted Traders Index NASDAQ S&P OEX NYSE COMPQX DJI-15 DJI-20 DJI-30 DIA QQQ MDY IWM TNA Short-Term Rates DOLLAR-UUP SPY http://tigersoft.com/2121CST/SPY.GIF recent 2006 vers-Peerless signals -- http://tigersoft.com/NEWPEER/UPD06724.BMP USO-CrudeOil DBO FAS GLD BBH IBB JETS JNUG KOL NUGT OIH PALL RSX RETL SDS AGQ SLV SOXL TECL TLT TMF TNA UGA (gasoline) USO (oil) and China: YINN CHAU Commodities: CANE CORN DBC JJC, NIB, CHOC CORN, CUT (paper) MOO, SOYB WEAT UUP (Dollar) LIT (Lithium) Stocks AAPL ADBE ALXN AMAT AMGN AMD AMZN AXP BA BABA BAC BIDU BLDP CAT CVX CMG DE ENPH FB GILD GOOG GS HD IBM INTU JPM LRCX M (Macy's) MSFT NEM NFLX NKE NVDA PG REGN SO SQ QCOM QDEL TSLA TXN XOM V VRTX WFC WMT TOWN ZM New highs and Bullish MAXCPs http://tigersoft.com/MAXCP/7-24/BULLISH.htm Bearish MAXCPs - http://tigersoft.com/MINCP/7-24/BEARISH.htm |
Table 1
7/24/2018 QUICKSILVER on DJI-30 STOCKS.
P21 + ITRS score >+.25 is bullish
Note that AAPL now shows highest AI/200 stock here.
1 Bullish (DOW) 2 Bearish (MRK, UTX) STOCKS CLOSE CHANGE PIVOT-P 5-dma AROC CL-PWR Candl AI/200 IP21 ITRS --------------------------------------------------------------------------------------- --------------------------------------------------------------------------------------- AAPL 370.46 -.92 393.43 -192.6% Bearish BLUE 168 .023 .067 --------------------------------------------------------------------- AXP 95.33 -1.34 94 7.8% Bullish BLUE 82 -.003 .085 --------------------------------------------------------------------- BA 173.76 -2.69 174.42 -53.7% ------- RED 49 -.085 .293 --------------------------------------------------------------------- CAT 137.58 .98 134.63 25% Bullish BLUE 143 .01 .18 --------------------------------------------------------------------- CSCO 46.4 -1.01 46.97 -37.2% Bullish RED 99 .208 -.031 --------------------------------------------------------------------- CVX 90.13 -.88 85.27 164.8% Bullish RED 75 -.111 -.121 --------------------------------------------------------------------- DIS 117.61 -.51 117.79 -43.9% Bullish BLUE 88 .24 .006 --------------------------------------------------------------------- GS 201.47 -1.55 211.71 -238% Bearish RED 94 -.21 .036 --------------------------------------------------------------------- HD 265.31 1.5 260.17 93.9% Bullish BLUE 114 .088 .016 --------------------------------------------------------------------- IBM 125.79 -1.54 126.37 26.8% Bullish RED 123 -.074 -.05 --------------------------------------------------------------------- INTC 50.59 -9.81 61.15 -775.6% ------- RED 127 .013 -.261 --------------------------------------------------------------------- JNJ 148.12 -1.49 149.6 -41.1% Bearish RED 116 .069 -.13 --------------------------------------------------------------------- JPM 98.28 -.7 97.3 6.1% ------- RED 56 -.098 .033 --------------------------------------------------------------------- KO 48.49 .21 46.12 176.2% Bullish BLUE 82 .092 -.033 --------------------------------------------------------------------- MCD 198.72 1.17 191.61 186.2% Bullish BLUE 110 .103 .013 --------------------------------------------------------------------- MMM 159.84 .55 156.37 .3% Bullish RED 107 -.14 .037 --------------------------------------------------------------------- MRK 77.1 -.96 79.41 -175.3% Bearish RED 83 -.119 -.147 Bearish --------------------------------------------------------------------- MSFT 201.3 -1.24 211.6 -38.1% ------- BLUE 154 .107 -.017 --------------------------------------------------------------------- NKE 98.43 .13 95.65 110.3% ------- BLUE 122 -.041 .007 --------------------------------------------------------------------- PFE 37.66 -.75 36.5 189.1% Bearish RED 67 -.005 -.12 --------------------------------------------------------------------- PG 125.96 -.2 125.24 13.1% Bullish RED 77 -.057 -.031 --------------------------------------------------------------------- TRV 118.28 -.33 118.77 -36.7% ------- RED 111 -.065 .179 --------------------------------------------------------------------- UNH 300.79 -2.18 303.46 -94.1% Bullish RED 132 -.021 -.055 --------------------------------------------------------------------- UTX 86.01 -5.36 97.15 -958.4% Bullish RED 114 .144 -.578 Bearish --------------------------------------------------------------------- V 195.15 -2.28 198.47 1.5% ------- RED 108 .101 -.035 --------------------------------------------------------------------- VZ 56.85 1 55.87 49.2% Bullish BLUE 121 .083 -.1 --------------------------------------------------------------------- WBA 40.51 .17 40.46 -111.9% Bearish BLUE 81 -.017 -.081 --------------------------------------------------------------------- WMT 131.24 -.4 131.47 -18.9% Bullish BLUE 93 .069 -.076 --------------------------------------------------------------------- XOM 43.43 -.27 42.5 -10.3% Bearish RED 43 -.126 -.101 --------------------------------------------------------------------- DOW 42.61 -.21 42.3 -122.6% Bullish RED 66 .314 .18 Bullish |
Table 2 QUICKSILVER on ETFS - 07/24/20 Bullish = QQQ, SOXL, TECL, GLD. OIH (5)
Bearish =
ITRS + IP21>.25 is considered "Bullish"
RETL has been taken out. AMZN has too much weight in it.
ETF CLOSE CHANGE PIVOT-PT 5-dma AROC CL-PWR CANDLE IP21 ITRS --------------------------------------------------------------------------------------------- DIA 264.69 -2 266.82 -38.3% Bullish RED .028 ---- --------------------------------------------------------------------------------------------- SPY 320.88 -2.08 324.32 -13% Bullish ---- .149 .003 --------------------------------------------------------------------------------------------- QQQ 255.56 -2.45 266.78 -73.5% Bullish BLUE .241 .028 Bullish --------------------------------------------------------------------------------------------- MDY 337.22 -2.52 332.64 39.1% Bullish RED .073 .057 --------------------------------------------------------------------------------------------- IWM 146.08 -2.18 145.96 -17.3% Bearish RED .05 .053 --------------------------------------------------------------------------------------------- FAS 34.2 -.66 33.52 99.1% Bullish RED .058 .35 --------------------------------------------------------------------------------------------- SOXL 198.47 -9.93 220.66 -218.9% ------- BLUE .123 .517 Bullish --------------------------------------------------------------------------------------------- TECL 235.02 -8.86 265.61 -232% ------- BLUE .173 .318 Bullish --------------------------------------------------------------------------------------------- IBB 136.41 -3.06 145.8 -264.4% Bearish RED .068 -.084 --------------------------------------------------------------------------------- ----------- GLD 178.7 1.52 170.94 247.4% Bullish RED .339 -.031 Bullish --------------------------------------------------------------------------------------------- OIH 132.09 -.02 121.13 424.2% ------- BLUE .075 .192 Bullish --------------------------------------------------------------------------------------------- GASL 3440 285 3685 -325.1% ------- RED -.021 -.024 --------------------------------------------------------------------------------------------- |
Table 3 Count of Stocks in Key Directories
20200724
-------------------------------
NEWHIGHS 86
NEWLOWS 32
MAXCP 16
MINCP 49
TTTNH 6
TTTNL 40
FASTUP 123
FASTDOWN 63
CPCROSSA 54
CPCROSSD 173
BIGVOLUP 5
BIGVODN 15
ACCUMVER 9
HIGHIP21 24
LOWACCUM 168
REDSELL 128
AUGSELS7 197
TRAPDOOR 12
|
RANKING OF KEY DIRECTORIES BASED PCT.OF STOCKS ABOVE 65-DMA
7/24/20
---------------------------------------------------------------------------------------
Directory Current day-1 day-2 day-3 day-4 day-5
----------------------------------------------------------------------------------------
COPPER 1 1 1 1 1 1
EDU 1 1 1 1 .833 .833
BONDFUND .99 .99 .99 .98 .99 .99
AUTO .974 .974 .948 1 .974 .974
ETFS .964 .964 1 1 1 1
GOLD .959 .959 .959 .959 .938 .959
GREEN .952 .952 .904 .904 .904 .952
SOLAR .937 1 1 1 .937 .937
CHEM .895 .895 .937 .937 .916 .958
HOMEBLDG .882 .882 .882 .882 .882 .882
BIGBANKS .857 .857 .857 .857 .714 .714
HACKERS .85 .85 .8 .85 .85 .75
FOOD .849 .849 .83 .811 .811 .849
DJI-13 .846 .923 .923 .923 .846 .846
INFRA .828 .828 .828 .857 .742 .828
COMODITY .82 .82 .82 .794 .82 .82
INDEXES .82 .842 .848 .853 .792 .814
INDMATER .813 .8 .853 .853 .746 .813
HOSPITAL .809 .857 .857 .809 .714 .761
INSURANC .807 .884 .884 .846 .769 .807
SP-100 .802 .824 .824 .824 .769 .802
DOWJONES .8 .833 .866 .866 .833 .833
NIFTY .8 .866 .866 .866 .888 .8
SP500 .781 .823 .813 .804 .747 .802
NASD-100 .767 .838 .868 .858 .868 .878
GAMING .761 .761 .761 .904 .761 .857
ELECTRON .748 .816 .809 .836 .802 .768
UTILITY .743 .769 .769 .641 .615 .666
RUS-1000 .741 .788 .77 .77 .696 .756
FIDSTKS .74 .79 .785 .813 .762 .813
SEMI .74 .788 .788 .836 .826 .759
FINANCE .734 .795 .734 .795 .542 .626
CHINA .725 .725 .784 .823 .784 .784
COAL .714 .285 .285 .285 .285 .285
SOFTWARE .711 .762 .796 .813 .813 .745
TRANSP .7 .85 .85 .85 .85 .85
BEVERAGE .666 .666 .666 .666 .666 .666
COMPUTER .65 .8 .8 .9 .8 .8
BIOTECH .606 .658 .703 .729 .745 .758
RETAIL .6 .72 .7 .74 .64 .72
REGBANKS .576 .73 .5 .73 .153 .384
MILITARY .555 .666 .666 .666 .592 .629
OILGAS .527 .55 .612 .635 .41 .441
REIT .524 .609 .617 .56 .51 .602
================================================================================================
GUNS .466 .466 .466 .466 .4 .466
JETS .428 .571 .642 .714 .642 .714
|
=======================================================================
7/23/2020 The Peerless Sells remain if effect. The DJI continues to
face stiff resistance
at 27000. Given the deep red distribution and heavy down-day volume, the DJI
may have to probe again for support at 25000. The rising NYSE A/D Line uptrend
bodes well that the 25000 support will once again hold.

The NASDAQ is also problematic short-term. We can see in the QQQ and
NASDAQ charts below how all declines since April have stopped at their
21-day ma. We are probably just seeing another one of the techs' episodic bouts of
profit-taking and phases of relative weakness vis-a-vis the DJI. The positive
Accumulation, rising 65-dma and V-formations are positives that will work to
prop up the NASDAQ and QQQ. AAPL, on the other hand, is now showing
red distribution. Traders therefore cannot take a chance with AAPL now that it
has broken its uptrend. They should sell.


The Gold Standard Come-Back
If you have a lot of money right now, you have to be concerned about
the Dollar being hit hard eventually by all the borrowing that the Government
is doing to prevent an economic collapse. One solution is to keep buying
strong stocks and ETFs. Historically, they do well even when Inflation returns.
Another solution is to buy Gold Stocks and encourage the Government to
go back on the Gold Standard to prevent runaway inflation.
We should not ignore the meaning behind Gold's Breakout and its
long-term significance. The trillions and trillions of Dollars worth of additional
Debt since the pandemic started make the Federal Reserve's job of holding
up the market and the economy much harder. Eventually, the rest of the world
may not trust the Dollar and prefer to have debts denominated in Gold, Silver,
Oil or some other currency. Only much higher interest rates and a fully
functioning US economy will avoid this eventual outcome. Right now, we are
seeing Dollar slow-walk into a bigger decline.
Interestingly, the President's latest candidate for the Federal Reserve, Judy Shelton,
https://en.wikipedia.org/wiki/Judy_Shelton
is a supporter of the Gold Standard. Going back on the Gold Standard now would
take us back a pre-1933 world. It would certainly strictly limit monetary
policy.
Excessive borrowing, printing money and certainly handing out trillions in "magic
money"
would not be possible. Are we really ready for this? And it reminds me of the
world
of hurt that Britain suffered in 1924 when Churchill as Chancellor of the Exchequer
re-established the Gold Standard for the UK. There was to be no roaring 1920s
for England, just years of high unemplyment even before the Great Depression.
This was the subject of my dissertation at Columbia.
Churchill subsequently considered returning to the Gold Standard to be the worst
decision in public life, even worse than his deadly WW I Dardanelles beach-landing
against the entrenched Turkish army on cliffs high above his British troops below.
Of course, one person on the FOMC cannot make such momentous decisions.
Most likely, Trump just wants to get electoral support from conservative "Gold
Bugs".
But a continued big rise of Gold now should be seen as a threat to the FED and
therefore to the stock market.
|
Charts 7/23/2020 (Click on Underlined link.) 2020 PEERLESS DJI, Signals, Indicators Daily DJI Volume 10-DayUp/Down Vol Stoch-20 Inverted Traders Index Graph of Pct of All Stocks above 65-dma Cum. Inverted Traders Index NASDAQ S&P OEX NYSE COMPQX DJI-15 DJI-20 DJI-30 DIA QQQ MDY IWM TNA Short-Term Rates DOLLAR-UUP SPY http://tigersoft.com/2121CST/SPY.GIF recent 2006 vers-Peerless signals -- http://tigersoft.com/NEWPEER/UPD06723.BMP USO-CrudeOil DBO FAS GLD BBH IBB JETS JNUG KOL NUGT OIH PALL RSX RETL SDS AGQ SLV SOXL TECL TLT TMF TNA UGA (gasoline) USO (oil) and China: YINN CHAU Commodities: CANE CORN DBC JJC, NIB, CHOC CORN, CUT (paper) MOO, SOYB WEAT UUP (Dollar) LIT (Lithium) Stocks AAPL ADBE ALXN AMAT AMGN AMD AMZN AXP BA BABA BAC BIDU BLDP CAT CVX CMG DE ENPH FB GILD GOOG GS HD IBM INTU JPM LRCX M (Macy's) MSFT NEM NFLX NKE NVDA PG REGN SO SQ QCOM QDEL TSLA TXN XOM V VRTX WFC WMT TOWN ZM New highs and Bullish MAXCPs http://tigersoft.com/MAXCP/7-23/BULLISH.htm Bearish MAXCPs - http://tigersoft.com/MINCP/7-23/BEARISH.htm |
Table 1
7/23/2018 QUICKSILVER on DJI-30 STOCKS.
P21 + ITRS score >+.25 is bullish
Note that AAPL now shows highest AI/200 stock here.
1 Bullish (DOW) 2 Bearish (UTX, XOM) STOCKS CLOSE CHANGE PIVOT-P 5-dma AROC CL-PWR Candl AI/200 IP21 ITRS --------------------------------------------------------------------------------------- --------------------------------------------------------------------------------------- AAPL 371.38 -17.71 385.31 -189.4% Bearish RED 168 -.081 .072 --------------------------------------------------------------------- AXP 96.67 .13 95.18 18.3% ------- BLUE 82 -.049 .043 --------------------------------------------------------------------- BA 176.45 -3.34 175.66 -63.4% Bearish RED 50 -.105 .289 --------------------------------------------------------------------- CAT 136.6 -.38 136.9 -71.7% Bullish RED 143 -.035 .181 --------------------------------------------------------------------- CSCO 47.41 .51 46.75 174.6% Bullish BLUE 99 .212 -.023 --------------------------------------------------------------------- CVX 91.01 -.03 87.19 149.5% ------- BLUE 75 -.102 -.121 --------------------------------------------------------------------- DIS 118.12 -.91 118.65 -55.2% Bullish RED 87 .182 .01 --------------------------------------------------------------------- GS 203.02 -2.98 211.41 -275.9% Bearish RED 94 -.201 .025 --------------------------------------------------------------------- HD 263.81 -1.36 260.38 109.7% Bullish RED 113 .074 .013 --------------------------------------------------------------------- IBM 127.33 -1.34 125.11 131.7% ------- RED 124 -.082 -.061 --------------------------------------------------------------------- INTC 60.4 -.65 60 104.3% Bullish RED 127 .085 -.086 --------------------------------------------------------------------- JNJ 149.61 -.4 149.35 12% ------- RED 116 .061 -.103 --------------------------------------------------------------------- JPM 98.98 .29 98.16 -52.2% ------- BLUE 56 -.114 .017 --------------------------------------------------------------------- KO 48.28 -.2 46.82 226.8% ------- RED 82 .052 -.043 --------------------------------------------------------------------- MCD 197.55 -1.07 191.48 171.7% Bullish RED 109 .091 -.001 --------------------------------------------------------------------- MMM 159.29 .58 159.83 -38.1% ------- BLUE 107 -.178 .005 --------------------------------------------------------------------- MRK 78.06 -.72 79.87 -84.5% Bearish RED 83 -.134 -.109 --------------------------------------------------------------------- MSFT 202.54 -9.21 202.88 -33.2% Bearish RED 154 .055 -.01 --------------------------------------------------------------------- NKE 98.3 -.61 96.28 53.4% ------- RED 122 -.032 -.006 --------------------------------------------------------------------- PFE 38.41 -.15 36.25 382.6% Bearish RED 67 -.016 -.092 --------------------------------------------------------------------- PG 126.16 .02 125.63 55.8% Bullish RED 77 -.075 -.019 --------------------------------------------------------------------- TRV 118.61 -3.63 119.16 -78.6% ------- RED 111 -.048 .142 --------------------------------------------------------------------- UNH 302.97 -3.74 306.53 -68.3% Bullish RED 132 -.026 -.067 --------------------------------------------------------------------- UTX 86.01 -5.36 97.15 -958.4% Bullish RED 114 .144 -.561 Bearish --------------------------------------------------------------------- V 197.43 -1.43 195.09 100% ------- RED 107 .069 -.02 --------------------------------------------------------------------- VZ 55.85 .1 56.3 6.3% Bullish ---- 121 .072 -.113 --------------------------------------------------------------------- WBA 40.34 -.35 41.42 -123.6% Bearish RED 82 -.029 -.125 --------------------------------------------------------------------- WMT 131.64 -1.02 131.74 -21.2% Bullish RED 92 .071 -.057 --------------------------------------------------------------------- XOM 43.7 .09 43.52 -66.3% Bearish BLUE 43 -.144 -.13 Bearish --------------------------------------------------------------------- DOW 42.82 -1.52 43.67 -116.3% Bullish RED 66 .247 .147 Bullish |
Table 2 QUICKSILVER on ETFS - 07/23/20 Bullish = QQQ, SOXL, TECL, GLD (4)
Bearish =
ITRS + IP21>.25 is considered "Bullish"
RETL has been taken out. AMZN has too much weight in it.
ETF CLOSE CHANGE PIVOT-PT 5-dma AROC CL-PWR CANDLE IP21 ITRS --------------------------------------------------------------------------------------------- DIA 266.69 -3.29 266.74 -14.6% ------- RED .007 ----- --------------------------------------------------------------------------------------------- SPY 322.96 -3.9 321.72 33.5% Bullish RED .094 .006 --------------------------------------------------------------------------------------------- QQQ 258.01 -6.92 259.42 -21.1% ------- RED .181 .041 --------------------------------------------------------------------------------------------- MDY 339.74 .42 334.59 96.2% Bullish BLUE .063 .042 --------------------------------------------------------------------------------------------- IWM 148.26 .15 146.59 71.4% Bearish BLUE .049 .048 --------------------------------------------------------------------------------------------- FAS 34.86 -.17 33.52 199.9% ------- RED .012 .274 Bullish --------------------------------------------------------------------------------------------- SOXL 208.4 -10.18 207.85 101.4% Bearish RED .084 .523 Bullish --------------------------------------------------------------------------------------------- TECL 243.88 -20.67 246.89 -2.3% Bearish RED .109 .311 Bullish --------------------------------------------------------------------------------------------- IBB 139.47 -2.63 143.96 -69.2% Bearish RED .045 -.056 --------------------------------------------------------------------------------------------- GLD 177.18 1.55 170.12 246.1% Bullish BLUE .324 -.013 Bullish --------------------------------------------------------------------------------------------- OIH 132.11 4.05 121.34 346% ------- BLUE .026 .096 --------------------------------------------------------------------------------------------- GASL 3440 285 3685 -325.1% ------- RED -.021 -.007 --------------------------------------------------------------------------------------------- |
Table 3 Count of Stocks in Key Directories
20200723
-------------------------------
NEWHIGHS 266
NEWLOWS 29 rising somewhat
MAXCP 29
MINCP 26
TTTNH 15
TTTNL 36
FASTUP 144
FASTDOWN 34
CPCROSSA 47
CPCROSSD 158
BIGVOLUP 8
BIGVODN 15
ACCUMVER 6
HIGHIP21 17
HIUPPCT 16
REDSELL 130
AUGSELS7 172
TRAPDOOR 11
|
RANKING OF KEY DIRECTORIES BASED PCT.OF STOCKS ABOVE 65-DMA
7/23/20
Bullish = 44
Bearish = 2
---------------------------------------------------------------------------------------
Directory Current day-1 day-2 day-3 day-4 day-5
----------------------------------------------------------------------------------------
COPPER 1 1 1 1 1 1
EDU 1 1 1 .833 .833 .833
SOLAR 1 1 1 .937 .937 1
BONDFUND .99 .99 .98 .99 .99 .99
AUTO .974 .948 1 .974 .974 1
ETFS .964 1 1 1 1 1
GOLD .959 .959 .959 .938 .959 .938
GREEN .952 .904 .904 .904 .952 .952
DJI-13 .923 .923 .923 .846 .846 .846
CHEM .895 .937 .937 .916 .958 .958
INSURANC .884 .884 .846 .769 .807 .884
HOMEBLDG .882 .882 .882 .882 .882 .941
NIFTY .866 .866 .866 .888 .8 .8
BIGBANKS .857 .857 .857 .714 .714 .857
HOSPITAL .857 .857 .809 .761 .761 .761
HACKERS .85 .85 .85 .85 .75 .55
TRANSP .85 .85 .85 .85 .85 .9
FOOD .849 .83 .811 .811 .849 .849
INDEXES .842 .848 .853 .792 .814 .842
NASD-100 .838 .878 .868 .868 .878 .868
DOWJONES .833 .866 .866 .833 .833 .766
INFRA .828 .828 .857 .742 .828 .857
SP-100 .824 .824 .824 .769 .813 .78
SP500 .823 .814 .804 .747 .806 .804
COMODITY .82 .82 .794 .82 .82 .82
ELECTRON .81 .804 .831 .797 .77 .777
COMPUTER .8 .8 .9 .8 .8 .7
INDMATER .8 .853 .853 .746 .813 .853
SEMI .8 .8 .85 .84 .78 .81
FINANCE .795 .734 .795 .542 .638 .759
FIDSTKS .79 .785 .813 .762 .813 .813
RUS-1000 .788 .772 .77 .696 .762 .774
UTILITY .769 .769 .641 .615 .666 .589
SOFTWARE .766 .8 .8 .8 .733 .716
GAMING .761 .761 .904 .761 .857 .904
REGBANKS .73 .5 .73 .153 .423 .615
CHINA .725 .784 .823 .784 .784 .784
RETAIL .72 .7 .74 .64 .72 .74
BEVERAGE .666 .666 .666 .666 .666 .6
MILITARY .666 .666 .666 .592 .629 .74
BIOTECH .653 .7 .727 .745 .766 .7
REIT .609 .617 .56 .51 .624 .617
JETS .571 .642 .714 .642 .714 .857
OILGAS .55 .612 .635 .41 .449 .511
================================================================================================
GUNS .466 .466 .466 .4 .466 .533
COAL .285 .285 .285 .285 .285 .285
|
======================================================================
7/22/2020 The Peerless Sells remain and the DJI is still struggling to eat
up its overhead
resistance from 27000-27300. A move to 27500 would have to be taken to
be the start of a breakout run to 29000 and more likely 30000, given the
2500 point boxes the DJI has been making on its recovery. The rising A/D Line
may be the key here. The red distribution from our Accumulation Index
and the heavy down-day volume may be only holding it back, but by themselves
are not enough to bring a reversal back down. We'll see.

The real story today is Silver's knifing back above
$20/ounce.

Back in New Mexico in 1972 when I taught silver-smithing to alcholics in a half-way
house in Santa Fe as part of the Vista Program, silver was about $3.00/ounce.
When I bought it in 1974 it was $4.00-$4.50/ounce. I saw it rise from under
$20 to $48 at the start of 1980 when the Hunt Brothers tried to corner it
with huge purchases. Then the Commodities Exachange banned such large purchases
and forced the Hunt Brothers to sell out their huge positions that they had margined.
This caused the stock market to panic in March 1980, whereupon an excellent
buying opportunity developed as the market looked forward to the election of
Ronald Reagan as President.
It took a generation to pass after the 1980 collapse of silver (and gold) for
precious metals to complete the necessary basing for another run. I bought
a lot of silver and gold to make jewelry again in 2002 as the stock market
went into the doldrums. I remember that silver was about $6.50 and gold about
$700. But the stock market turned up and I just held my hoard of precious
metals. Then in 2010, Silver broke out, first above $10, then $15 and then $20.
It was easy technically to recommend at $21 and I remembered how thin the
float of silver is and, sure enough, Silver steadily rose and finally hit $48. We
went
down-town that day and cashed in all our unused silver and gold.

Now silver has again shot up past $20. Its supply at these prices inelastic.
Only
so much is mined and it takes months before enough silver is brought in by jewelers
and others to provide an adequate supply. Meanwhile, there is a whole industry
made up of precious metals' promoters. They're back in full force again.
So, it would be surprising if Silver and Gold don't keep rising.
If Silver would again jump to $40 or $50, history shows it would not be a good
thing for the DJIA or the market. In 1980, silver's rise was immediately followed
by a 20% decline in the DJI. In 2011, the top was 10 weeks away, but the DJI then
fell
17%. There are only these two cases, it's true. But the Dollar was weak again
today.
The Fed's QE Infinity is undermining the Dollar's otherwise secure position as the world's
dominant reserve currency. If it should start falling, the FED would have no choice
but
to raise rates and stop Quantitative Easing. The effects on the economy and the
market
could be very bad.
|
Charts 7/22/2020 (Click on Underlined link.) 2020 PEERLESS DJI, Signals, Indicators Daily DJI Volume 10-DayUp/Down Vol Stoch-20 Inverted Traders Index Graph of Pct of All Stocks above 65-dma Cum. Inverted Traders Index NASDAQ S&P OEX NYSE COMPQX DJI-15 DJI-20 DJI-30 DIA QQQ MDY IWM TNA Short-Term Rates DOLLAR-UUP SPY http://tigersoft.com/2121CST/SPY.GIF recent 2006 vers-Peerless signals -- http://tigersoft.com/NEWPEER/UPD06722.BMP USO-CrudeOil DBO FAS GLD BBH IBB JETS JNUG KOL NUGT OIH PALL RSX RETL SDS AGQ SLV SOXL TECL TLT TMF TNA UGA (gasoline) USO (oil) and China: YINN CHAU Commodities: CANE CORN DBC JJC, NIB, CHOC CORN, CUT (paper) MOO, SOYB WEAT UUP (Dollar) LIT (Lithium) Stocks AAPL ADBE ALXN AMAT AMGN AMD AMZN AXP BA BABA BAC BIDU BLDP CAT CVX CMG DE ENPH FB GILD GOOG GS HD IBM INTU JPM LRCX M (Macy's) MSFT NEM NFLX NKE NVDA PG REGN SO SQ QCOM QDEL TSLA TXN XOM V VRTX WFC WMT TOWN ZM New highs and Bullish MAXCPs http://tigersoft.com/MAXCP/7-22/BULLISH.htm Bearish MAXCPs - http://tigersoft.com/MINCP/7-22/BEARISH.htm |
Table 1
7/22/2018 QUICKSILVER on DJI-30 STOCKS.
P21 + ITRS score >+.25 is bullish
Note that AAPL now shows highest AI/200 stock here.
1 Bullish (DOW) 4 Bearish (CVX, MRK, UTX, XOM) STOCKS CLOSE CHANGE PIVOT-P 5-dma AROC CL-PWR Candl AI/200 IP21 ITRS --------------------------------------------------------------------------------------- --------------------------------------------------------------------------------------- AAPL 389.09 1.09 386.09 -23.3% ------- BLUE 169 -.046 .122 --------------------------------------------------------------------- AXP 96.54 .21 96.32 -42.8% ------- BLUE 82 -.086 .018 --------------------------------------------------------------------- BA 179.79 1.16 178.7 -227.6% Bearish BLUE 51 -.063 .282 --------------------------------------------------------------------- CAT 136.98 1.11 138.56 -50.4% Bullish BLUE 144 -.052 .148 --------------------------------------------------------------------- CSCO 46.9 -.12 45.78 53.7% Bullish ---- 99 .156 -.03 --------------------------------------------------------------------- CVX 91.04 -.35 88.36 121.9% ------- BLUE 75 -.148 -.138 Bearish --------------------------------------------------------------------- DIS 119.03 .41 119.43 -78.5% Bullish BLUE 86 .175 -.009 --------------------------------------------------------------------- GS 206 -6.02 214.67 -255.5% ------- RED 94 -.192 .012 --------------------------------------------------------------------- HD 265.17 2.75 258.08 141.9% Bullish BLUE 112 .047 .008 --------------------------------------------------------------------- IBM 128.67 2.61 124.01 227% ------- BLUE 125 -.099 -.063 --------------------------------------------------------------------- INTC 61.05 .35 59.14 168.3% Bullish RED 127 .078 -.098 --------------------------------------------------------------------- JNJ 150.01 .27 149.25 58.6% ------- BLUE 116 .058 -.107 --------------------------------------------------------------------- JPM 98.69 -.72 100.01 -52.6% ------- RED 57 -.155 -.016 --------------------------------------------------------------------- KO 48.48 1.28 46.15 223.5% ------- BLUE 82 .023 -.048 --------------------------------------------------------------------- MCD 198.62 5.64 190.92 178.6% Bullish BLUE 108 .055 -.015 --------------------------------------------------------------------- MMM 158.71 .91 160.5 -19.5% ------- BLUE 107 -.192 -.024 --------------------------------------------------------------------- MRK 78.78 -.11 79.4 -41.6% Bearish RED 83 -.158 -.102 Bearish --------------------------------------------------------------------- MSFT 211.75 3 203.92 89.6% ------- BLUE 154 .118 .021 --------------------------------------------------------------------- NKE 98.91 .55 97.26 19% ------- BLUE 122 .011 -.025 --------------------------------------------------------------------- PFE 38.56 1.87 35.6 392.8% Bearish BLUE 67 -.01 -.101 --------------------------------------------------------------------- PG 126.14 1.07 124.76 65.6% Bullish BLUE 77 -.097 -.019 --------------------------------------------------------------------- TRV 122.24 1.82 120.5 129.6% ------- BLUE 111 -.054 .167 --------------------------------------------------------------------- UNH 306.71 1.6 307.15 43.2% Bullish BLUE 132 .032 -.051 --------------------------------------------------------------------- UTX 86.01 -5.36 97.15 -958.4% Bullish RED 114 .144 -.554 Bearish --------------------------------------------------------------------- V 198.86 2.38 193.5 58.9% ------- BLUE 106 .087 -.03 --------------------------------------------------------------------- VZ 55.75 -.09 55.78 61.9% Bullish RED 121 -.001 -.125 --------------------------------------------------------------------- WBA 40.69 .28 41.35 1.2% Bearish BLUE 83 -.046 -.137 --------------------------------------------------------------------- WMT 132.66 .33 132.2 25% Bullish BLUE 91 .06 -.04 --------------------------------------------------------------------- XOM 43.61 -1.04 44.28 -116.1% Bearish RED 43 -.192 -.16 Bearish --------------------------------------------------------------------- DOW 44.34 1.3 43.83 116.8% ------- BLUE 66 .195 .195 Bullish |
Table 2 QUICKSILVER on ETFS - 07/221/20 Bullish = QQQ, RETL, SOXL, TECL, GLD (5)
Bearish =
ITRS + IP21>.25 is considered "Bullish" ETF CLOSE CHANGE PIVOT-PT 5-dma AROC CL-PWR CANDLE IP21 ITRS --------------------------------------------------------------------------------------------- DIA 269.98 1.64 267.47 20% ------- BLUE .004 ----- --------------------------------------------------------------------------------------------- SPY 326.86 1.85 320.79 77.6% Bullish BLUE .088 .004 --------------------------------------------------------------------------------------------- QQQ 264.93 .93 259.12 76.9% Bullish BLUE .209 .055 Bullish --------------------------------------------------------------------------------------------- MDY 339.32 2.41 333.29 70.4% ------- BLUE .023 .004 --------------------------------------------------------------------------------------------- IWM 148.11 .08 146.16 36.8% Bearish BLUE .03 .012 --------------------------------------------------------------------------------------------- FAS 35.03 .49 33.5 155.3% ------- BLUE-.026 .163 --------------------------------------------------------------------------------------------- RETL 186.68 9.17 174.02 465.3% Bullish BLUE .147 .636 Bullish --------------------------------------------------------------------------------------------- SOXL 218.58 2.59 204.07 284.1% Bearish BLUE .079 .464 Bullish --------------------------------------------------------------------------------------------- TECL 264.55 6.3 244 218.2% ------- BLUE .121 .338 Bullish --------------------------------------------------------------------------------------------- IBB 142.1 -.36 141.45 -18.1% Bearish RED .042 -.052 --------------------------------------------------------------------------------------------- GLD 175.63 2.63 168.73 155% Bullish BLUE .378 -.011 Bullish --------------------------------------------------------------------------------------------- OIH 128.06 -2.87 123.46 130.7% Bearish RED -.03 .071 --------------------------------------------------------------------------------------------- GASL 3440 285 3685 -325.1% ------- RED -.021 0 --------------------------------------------------------------------------------------------- |
Table 3 Count of Stocks in Key Directories
20200722
-------------------------------
NEWHIGHS 238 Bullish 10X NLs.
NEWLOWS 20
MAXCP 47
MINCP 16
TTTNH 14
TTTNL 23
FASTUP 171
FASTDOWN 39
CPCROSSA 71
CPCROSSD 81
BIGVOLUP 16
BIGVODN 11
ACCUMVER 3
VHIP21 68
LOWACCUM 174
REDSELL 130
AUGSELS7 198
TRAPDOOR 11
|
RANKING OF KEY DIRECTORIES BASED PCT.OF STOCKS ABOVE 65-DMA 7/22/20 --------------------------------------------------------------------------------------- Directory Current day-1 day-2 day-3 day-4 day-5 ---------------------------------------------------------------------------------------- COPPER 1 1 1 1 1 1 EDU 1 1 .833 .833 .833 .833 ETFS 1 1 1 1 1 1 SOLAR 1 1 .937 .937 1 1 BONDFUND .99 .98 .99 .99 .99 .99 GOLD .959 .959 .938 .959 .959 .959 AUTO .948 1 .974 .974 1 1 CHEM .937 .937 .916 .958 .958 .958 DJI-13 .923 .923 .846 .846 .846 .846 GREEN .904 .904 .904 .952 .952 .904 INSURANC .884 .846 .769 .807 .884 .846 HOMEBLDG .882 .882 .882 .882 .941 .941 NASD-100 .878 .878 .878 .878 .868 .868 DOWJONES .866 .866 .833 .833 .766 .766 NIFTY .866 .866 .888 .8 .8 .8 BIGBANKS .857 .857 .714 .714 .857 .857 HOSPITAL .857 .809 .761 .809 .761 .714 INDMATER .853 .853 .746 .813 .853 .853 HACKERS .85 .9 .85 .75 .55 .6 TRANSP .85 .85 .85 .85 .9 .95 INDEXES .848 .853 .792 .814 .842 .837 FOOD .83 .811 .811 .849 .849 .792 INFRA .828 .857 .742 .828 .857 .914 SP-100 .824 .824 .769 .813 .78 .791 COMODITY .82 .794 .82 .82 .82 .794 SP500 .814 .806 .747 .806 .804 .81 ELECTRON .809 .836 .802 .775 .782 .789 COMPUTER .8 .9 .8 .8 .7 .75 SEMI .8 .85 .84 .78 .81 .81 SOFTWARE .796 .813 .813 .745 .728 .762 FIDSTKS .785 .813 .762 .813 .813 .807 CHINA .784 .823 .784 .784 .784 .843 RUS-1000 .772 .772 .696 .762 .779 .781 UTILITY .769 .641 .615 .666 .589 .564 GAMING .761 .904 .761 .857 .904 .904 FINANCE .734 .795 .542 .638 .759 .807 RETAIL .7 .74 .64 .72 .74 .74 BIOTECH .695 .724 .742 .766 .711 .708 BEVERAGE .666 .666 .666 .666 .6 .6 MILITARY .666 .666 .592 .629 .74 .74 JETS .642 .714 .642 .714 .857 .928 REIT .617 .56 .51 .624 .631 .744 OILGAS .612 .635 .41 .449 .527 .589 REGBANKS .5 .73 .153 .423 .615 .692 GUNS .466 .466 .4 .466 .533 .6 COAL .285 .285 .285 .285 .285 .285 |
======================================================================
7/21/2020 The Peerless Sell signals argue that the DJI will not be able to breakout
out
above its box pattern bounded by 25000 and 27500. Most likely the DJI
will need again to fall back to 25000 or even drop lower. If it does breakout
above 27500 on rising volume and excellent breadth, that will shift the odds to
favoring a DJI rally to 29000. Accordingly, a close above 27500 should get us to
close out our DIA short. (In that event, consider the news to come out on the
anti-Covid
to be welcome and be thankful.)

Do not trust early-in-the-day bounces by the DJI. Today's illustrates that.
Opening Power is rising for DIA, but its Closing Power is much weaker
It was this pattern which we saw at the DJI's top in 2000 and 2007-8.

I suspect, the FED may now become less agressive in applying its "QE-Infinity";
the reason for more FED hesitation is that the Dollar is starting to break down below
its key support while at the same time, Gold is breaking out and becoming more
attractive than the Dollar. The domestic unrest in the US may be playing a small
role
in this. But mostly, the Dollar's decline is due to the economic weakness here and
the FED's rampant debasement of the Dollar. See next chart. So, hold short UUP
(the Dollar) and hold long GLD (Gold).

The NASDAQ's ITRS (50-day relative strength) versus the DJI has fallen back
from 15% to 6.4% in the last two weeks. But as long as the NASDAQ, QQQ and IBB
stay in uptrends, they should continue to hold up.

|
Charts 7/21/2020 (Click on Underlined link.) 2020 PEERLESS DJI, Signals, Indicators Daily DJI Volume 10-DayUp/Down Vol Stoch-20 Inverted Traders Index Graph of Pct of All Stocks above 65-dma Cum. Inverted Traders Index NASDAQ S&P OEX NYSE COMPQX DJI-15 DJI-20 DJI-30 DIA QQQ MDY IWM TNA Short-Term Rates DOLLAR-UUP SPY http://tigersoft.com/2121CST/SPY.GIF recent 2006 vers-Peerless signals -- http://tigersoft.com/NEWPEER/UPD06721.BMP USO-CrudeOil DBO FAS GLD BBH IBB JETS JNUG KOL NUGT OIH PALL RSX RETL SDS AGQ SLV SOXL TECL TLT TMF TNA UGA (gasoline) USO (oil) and China: YINN CHAU Commodities: CANE CORN DBC JJC, NIB, CHOC CORN, CUT (paper) MOO, SOYB WEAT UUP (Dollar) LIT (Lithium) Stocks AAPL ADBE ALXN AMAT AMGN AMD AMZN AXP BA BABA BAC BIDU BLDP CAT CVX CMG DE ENPH FB GILD GOOG GS HD IBM INTU JPM LRCX M (Macy's) MSFT NEM NFLX NKE NVDA PG REGN SO SQ QCOM QDEL TSLA TXN XOM V VRTX WFC WMT TOWN ZM New highs and Bullish MAXCPs http://tigersoft.com/MAXCP/7-21/BULLISH.htm Bearish MAXCPs - http://tigersoft.com/MINCP/7-21/BEARISH.htm |
Table 1
7/21/2018 QUICKSILVER on DJI-30 STOCKS.
P21 + ITRS score >+.25 is bullish
Note that AAPL (AI/200=173) now shows highest AI/200 stock here.
1 Bullish +43
3 Bearish -91-86-85
STOCKS CLOSE CHANGE PIVOT-P 5-dma AROC CL-PWR Candl AI/200 IP21 ITRS --------------------------------------------------------------------------------------- --------------------------------------------------------------------------------------- AAPL 388 -5.43 390.9 -3% ------- RED 170 -.004 .15 --------------------------------------------------------------------- AXP 96.33 2.33 97.36 78% Bearish BLUE 82 -.084 -.025 --------------------------------------------------------------------- BA 178.63 4.21 187.94 -37.1% Bearish BLUE 52 -.013 .237 --------------------------------------------------------------------- CAT 135.87 1.24 138.36 -36.8% ------- BLUE 145 -.051 .11 --------------------------------------------------------------------- CSCO 47.02 .05 46.4 81.8% ------- RED 99 .146 -.008 --------------------------------------------------------------------- CVX 91.39 6.12 88.89 173.5% ------- BLUE 75 -.171 -.144 Bearish --------------------------------------------------------------------- DIS 118.62 .83 120.9 -1.7% Bullish BLUE 85 .194 -.015 --------------------------------------------------------------------- GS 212.02 .31 216.9 -46.6% ------- RED 94 -.145 .042 --------------------------------------------------------------------- HD 262.42 2.25 257.8 89.4% Bullish BLUE 111 .047 .018 --------------------------------------------------------------------- IBM 126.06 -.31 123 220.5% ------- RED 126 -.161 -.077 --------------------------------------------------------------------- INTC 60.7 -.45 59.03 144.2% Bullish RED 127 .115 -.084 --------------------------------------------------------------------- JNJ 149.74 .14 148.26 61.1% Bearish BLUE 115 .055 -.094 --------------------------------------------------------------------- JPM 99.41 2.11 99.73 60.8% ------- BLUE 58 -.175 -.029 --------------------------------------------------------------------- KO 47.2 1.08 46.4 143.7% ------- RED 82 -.06 -.078 --------------------------------------------------------------------- MCD 192.98 1.37 191.77 59.1% ------- BLUE 107 .058 -.037 --------------------------------------------------------------------- MMM 157.8 1.43 159.33 -23.3% Bearish BLUE 108 -.187 -.039 --------------------------------------------------------------------- MRK 78.89 -.52 79.44 40.4% Bearish RED 83 -.175 -.069 --------------------------------------------------------------------- MSFT 208.75 -2.85 208.04 9.7% ------- RED 154 .114 .029 --------------------------------------------------------------------- NKE 98.36 2.71 98.54 82.6% Bullish BLUE 121 .03 -.014 --------------------------------------------------------------------- PFE 36.69 .19 35.72 203.6% Bearish RED 67 -.113 -.116 --------------------------------------------------------------------- PG 125.07 -.17 124.5 -.8% Bullish RED 77 -.152 -.023 --------------------------------------------------------------------- TRV 120.42 1.65 119.14 78.4% ------- BLUE 111 -.052 .136 --------------------------------------------------------------------- UNH 305.11 1.65 304.07 -55.7% Bullish BLUE 131 .035 -.038 --------------------------------------------------------------------- UTX 86.01 -5.36 97.15 -958.4% Bullish RED 114 .144 -.542 Bearish --------------------------------------------------------------------- V 196.48 -1.99 196.55 80.6% Bearish RED 105 .069 -.04 --------------------------------------------------------------------- VZ 55.84 -.03 55.06 35.9% ------- ---- 122 -.044 -.122 --------------------------------------------------------------------- WBA 40.41 -.05 40.68 36.8% Bearish RED 84 -.072 -.132 --------------------------------------------------------------------- WMT 132.33 .86 132 12.1% Bullish BLUE 90 .066 -.025 --------------------------------------------------------------------- XOM 44.65 2.15 44.63 66.2% Bearish BLUE 43 -.135 -.135 Bearish --------------------------------------------------------------------- DOW 43.04 .74 43.33 69.6% Bearish BLUE 66 .167 .152 Bullish |
Table 2 QUICKSILVER on ETFS - 07/21/20 Bullish = QQQ, RETL, SOXL, TECL, GLD (5)
Bearish =
ITRS + IP21>.25 is considered "Bullish" ETF CLOSE CHANGE PIVOT-PT 5-dma AROC CL-PWR CANDLE IP21 ITRS --------------------------------------------------------------------------------------------- DIA 268.34 1.52 268.91 32.7% ------- RED .016 ---- --------------------------------------------------------------------------------------------- SPY 325.01 .69 321.85 94.7% Bullish RED .096 .01 --------------------------------------------------------------------------------------------- QQQ 264 -2.78 260.9 69.5% Bullish RED .222 .073 Bullish --------------------------------------------------------------------------------------------- MDY 336.91 4.27 334.61 181.5% ------- BLUE .025 0 --------------------------------------------------------------------------------------------- IWM 148.03 2.07 147.03 213% ------- BLUE .06 .017 --------------------------------------------------------------------------------------------- FAS 34.54 1.02 33.98 340.2% ------- BLUE-.025 .103 --------------------------------------------------------------------------------------------- RETL 177.51 11.22 170.72 677% Bullish BLUE .163 .558 Bullish --------------------------------------------------------------------------------------------- SOXL 215.99 -4.67 206.59 174.4% Bearish RED .114 .453 Bullish --------------------------------------------------------------------------------------------- TECL 258.25 -7.36 253.48 192.1% Bullish RED .153 .345 Bullish --------------------------------------------------------------------------------------------- IBB 142.46 -3.34 142.62 77% Bearish RED .089 .008 --------------------------------------------------------------------------------------------- GLD 173 2.06 170.34 82.6% Bullish BLUE .317 -.023 Bullish --------------------------------------------------------------------------------------------- OIH 130.93 9.8 124.81 462% Bearish BLUE-.009 .087 --------------------------------------------------------------------------------------------- GASL 3440 285 3685 -325.1% ------- RED -.021 .012 --------------------------------------------------------------------------------------------- |
Table 3 Count of Stocks in Key Directories
20200721
-------------------------------
NEWHIGHS 334 NYSE and NASDAQ
NEWLOWS 16 NYSE and NASDAQ
MAXCP 28
MINCP 45
TTTNH 7
TTTNL 31
FASTUP 229
FASTDOWN 11
CPCROSSA 87
CPCROSSD 116
BIGVOLUP 6
BIGVODN 11
ACCUMVER 2
HIGHIP21 14
HIUPPCT 22
REDSELL 128
AUGSELS7 184
TRAPDOOR 10
|
RANKING OF KEY DIRECTORIES BASED PCT.OF STOCKS ABOVE 65-DMA
7/21/20
Bullish = 44
Bearish = 2
---------------------------------------------------------------------------------------
Directory Current day-1 day-2 day-3 day-4 day-5
----------------------------------------------------------------------------------------
AUTO 1 .974 .974 1 1 .948
COPPER 1 1 1 1 1 1
EDU 1 .833 .833 .833 .833 .5
ETFS 1 1 1 1 1 1
SOLAR 1 .937 .937 1 1 .937
BONDFUND .98 .99 .99 .99 .99 .99
GOLD .959 .938 .959 .959 .959 .959
CHEM .937 .916 .958 .958 .958 .791
DJI-13 .923 .846 .846 .846 .846 .769
GAMING .904 .761 .857 .904 .904 .714
GREEN .904 .904 .952 .952 .857 .857
COMPUTER .9 .8 .8 .7 .75 .6
HACKERS .9 .9 .75 .55 .6 .65
HOMEBLDG .882 .882 .882 .941 .941 .941
NASD-100 .878 .888 .888 .868 .868 .828
DOWJONES .866 .833 .833 .766 .766 .666
NIFTY .866 .888 .8 .8 .8 .844
BIGBANKS .857 .714 .714 .857 .857 .857
INFRA .857 .742 .828 .857 .914 .8
INDMATER .853 .746 .813 .853 .853 .76
INDEXES .853 .792 .814 .842 .842 .814
SEMI .85 .84 .78 .81 .81 .79
TRANSP .85 .85 .85 .9 .95 .85
INSURANC .846 .769 .807 .884 .846 .769
ELECTRON .831 .797 .77 .777 .783 .75
SP-100 .824 .769 .813 .78 .791 .725
CHINA .823 .784 .784 .784 .823 .823
FIDSTKS .813 .762 .813 .813 .807 .694
SOFTWARE .813 .813 .745 .728 .762 .677
FOOD .811 .811 .849 .849 .811 .754
HOSPITAL .809 .761 .809 .809 .714 .571
SP500 .806 .749 .806 .804 .808 .709
FINANCE .795 .542 .638 .759 .795 .542
COMODITY .794 .82 .82 .82 .82 .769
RUS-1000 .772 .697 .762 .779 .784 .674
RETAIL .74 .64 .72 .74 .76 .62
REGBANKS .73 .153 .423 .615 .692 .307
BIOTECH .719 .74 .763 .711 .716 .629
JETS .714 .642 .714 .857 .928 .714
BEVERAGE .666 .666 .666 .6 .6 .533
MILITARY .666 .592 .629 .74 .74 .555
UTILITY .641 .615 .666 .589 .564 .564
OILGAS .635 .41 .449 .527 .589 .457
REIT .56 .51 .624 .631 .737 .553
=============================================================================================
GUNS .466 .4 .466 .533 .6 .4
COAL .285 .285 .285 .285 .285 .285
|
====================================================================
7/20/2020
Hopes of another economic
stimulis package, a vaccine and the continuation
of QE-Infinity are boosting the general market today. Peerless looks at all
the red Distribution, the waning positive breadth and the heavy red Volume
and warns us that the bulls could be disappointed when this move up is over.

Note the charts below. Because of Peerless we are short DIA.


SPY looks like it will close its gap above.

QQQ is running in all-time high territory, but not quite so strongly as before.

Given our Peerless signals, I would prefer to own AAPL and IBB
in place of QQQ. In addition, hold GLD and hold short the Dollar UUP.


|
Charts 7/20/2020 (Click on Underlined link.) 2020 PEERLESS DJI, Signals, Indicators Daily DJI Volume 10-DayUp/Down Vol Stoch-20 Inverted Traders Index Graph of Pct of All Stocks above 65-dma Cum. Inverted Traders Index NASDAQ S&P OEX NYSE COMPQX DJI-15 DJI-20 DJI-30 DIA QQQ MDY IWM TNA Short-Term Rates DOLLAR-UUP SPY http://tigersoft.com/2121CST/SPY.GIF recent 2006 vers-Peerless signals -- http://tigersoft.com/NEWPEER/UPD06717.BMP USO-CrudeOil DBO FAS GLD BBH IBB JETS JNUG KOL NUGT OIH PALL RSX RETL SDS AGQ SLV SOXL TECL TLT TMF TNA UGA (gasoline) USO (oil) and China: YINN CHAU Commodities: CANE CORN DBC JJC, NIB, CHOC CORN, CUT (paper) MOO, SOYB WEAT UUP (Dollar) LIT (Lithium) Stocks AAPL ADBE ALXN AMAT AMGN AMD AMZN AXP BA BABA BAC BIDU BLDP CAT CVX CMG DE ENPH FB GILD GOOG GS HD IBM INTU JPM LRCX M (Macy's) MSFT NEM NFLX NKE NVDA PG REGN SO SQ QCOM QDEL TSLA TXN XOM V VRTX WFC WMT TOWN ZM New highs and Bullish MAXCPs http://tigersoft.com/MAXCP/7-20/BULLISH.htm Bearish MAXCPs - http://tigersoft.com/MINCP/7-20/BEARISH.htm |
Table 1
7/20/2018 QUICKSILVER on DJI-30 STOCKS.
IP21 + ITRS score >+.25 is bullish
Note that AAPL (AI/200=173) now shows highest AI/200 stock here.
STOCKS CLOSE CHANGE PIVOT-P 5-dma AROC CL-PWR Candl AI/200 IP21 ITRS --------------------------------------------------------------------------------------- --------------------------------------------------------------------------------------- AAPL 393.43 8.12 388.23 149% Bullish BLUE 171 .007 .178 --------------------------------------------------------------------- AXP 94 -1.18 94.84 23% Bearish RED 82 -.115 -.033 --------------------------------------------------------------------- BA 174.42 -1.24 179.96 -34.2% Bearish RED 53 -.042 .239 --------------------------------------------------------------------- CAT 134.63 -2.27 136.88 149% ------- RED 146 -.069 .138 --------------------------------------------------------------------- CSCO 46.97 .22 46.26 112.5% ------- BLUE 99 .099 .019 --------------------------------------------------------------------- CVX 85.27 -1.92 88.35 -7.4% Bearish RED 75 -.339 -.196 Bearish --------------------------------------------------------------------- DIS 117.79 -.86 118.66 66.1% Bullish RED 84 .109 -.001 --------------------------------------------------------------------- GS 211.71 .3 214.01 66.4% ------- BLUE 94 -.186 .044 --------------------------------------------------------------------- HD 260.17 -.21 257.79 205.5% ------- BLUE 111 -.093 .017 --------------------------------------------------------------------- IBM 126.37 1.26 120.6 292.9% ------- BLUE 127 -.109 -.074 --------------------------------------------------------------------- INTC 61.15 1.15 58.98 217.3% Bullish BLUE 127 .074 -.083 --------------------------------------------------------------------- JNJ 149.6 .25 147.92 148.3% Bearish RED 114 .035 -.103 --------------------------------------------------------------------- JPM 97.3 -.86 98.21 -17.7% ------- RED 59 -.219 -.05 Bearish --------------------------------------------------------------------- KO 46.12 -.7 45.87 94.4% Bearish RED 83 -.109 -.083 --------------------------------------------------------------------- MCD 191.61 .13 190.72 176.1% ------- BLUE 106 -.023 -.059 --------------------------------------------------------------------- MMM 156.37 -3.46 158.54 49.5% Bearish RED 108 -.203 -.044 --------------------------------------------------------------------- MRK 79.41 -.46 78.25 130.6% Bearish RED 83 -.03 -.066 --------------------------------------------------------------------- MSFT 211.6 8.72 208.35 109.9% Bullish BLUE 154 .109 .036 --------------------------------------------------------------------- NKE 95.65 -.63 96.76 -41.7% ------- BLUE 120 -.058 -.037 --------------------------------------------------------------------- PFE 36.5 .25 35.23 181.2% Bearish RED 67 -.097 -.129 --------------------------------------------------------------------- PG 125.24 -.39 125.09 47.7% ------- RED 77 -.222 0 --------------------------------------------------------------------- TRV 118.77 -.39 118.55 191.4% Bearish RED 111 -.039 .123 --------------------------------------------------------------------- UNH 303.46 -3.07 308.52 61.4% Bullish RED 130 -.037 -.052 --------------------------------------------------------------------- UTX 86.01 -5.36 97.15 -958.4% Bullish RED 114 .144 -.558 Bearish --------------------------------------------------------------------- V 198.47 3.38 193.33 244.2% ------- BLUE 104 .046 -.031 --------------------------------------------------------------------- VZ 55.87 -.43 55.44 128.1% Bearish RED 123 -.077 -.112 --------------------------------------------------------------------- WBA 40.46 -.96 40.11 108.3% Bearish RED 85 .011 -.122 --------------------------------------------------------------------- WMT 131.47 -.27 132.01 74.1% Bullish RED 89 .116 -.038 --------------------------------------------------------------------- XOM 42.5 -1.02 44.07 -18.3% Bearish RED 43 -.269 -.156 Bearish --------------------------------------------------------------------- DOW 42.3 -1.37 42.44 123.5% Bearish RED 66 .096 .171 Bullish |
Table 2 QUICKSILVER on ETFS - 07/16/20 Bullish = QQQ, RETL, SOXL, TECL, GLD (5)
Bearish =
ITRS + IP21>.25 is considered "Bullish"
ETF CLOSE CHANGE PIVOT-PT 5-dma AROC CL-PWR CANDLE IP21 ITRS --------------------------------------------------------------------------------------------- DIA 266.82 .08 266.59 108.6% ------- BLUE-.013 0 --------------------------------------------------------------------------------------------- SPY 324.32 2.6 318.92 148.3% ------- BLUE .064 .011 --------------------------------------------------------------------------------------------- QQQ 266.78 7.36 260.37 158.7% Bullish BLUE .243 .086 Bullish --------------------------------------------------------------------------------------------- MDY 332.64 -1.95 324.86 197.2% ------- RED -.004 .01 --------------------------------------------------------------------------------------------- IWM 145.96 -.63 141.83 223.3% Bearish RED .022 .029 --------------------------------------------------------------------------------------------- FAS 33.52 0 32.27 323.4% ------- BLUE-.063 .116 --------------------------------------------------------------------------------------------- RETL 166.29 -2.68 154.9 599.1% Bullish RED .113 .638 Bullish --------------------------------------------------------------------------------------------- SOXL 220.66 12.81 208.68 548.1% ------- BLUE .076 .61 Bullish --------------------------------------------------------------------------------------------- TECL 265.61 18.72 248.58 494.7% Bullish BLUE .155 .434 Bullish --------------------------------------------------------------------------------------------- IBB 145.8 1.84 140.26 299.4% Bullish BLUE .171 .03 --------------------------------------------------------------------------------------------- GLD 170.94 .82 170.19 45.4% Bullish BLUE .342 -.058 Bullish --------------------------------------------------------------------------------------------- OIH 121.13 -.21 119.65 306.4% Bearish RED -.15 .079 --------------------------------------------------------------------------------------------- GASL 3440 285 3685 -325.1% ------- RED -.021 -.004 --------------------------------------------------------------------------------------------- |
Table 3 Count of Stocks in Key Directories
20200720
-------------------------------
NEWHIGHS 305
NEWLOWS 14
MAXCP 61
MINCP 91
TTTNH 14
TTTNL 57
FASTUP 216
FASTDOWN 18
CPCROSSA 90
CPCROSSD 145
BIGVOLUP 11
BIGVODN 10
ACCUMVER 2
HIGHIP21 11
HIUPPCT 27
REDSELL 135
AUGSELS7 235
TRAPDOOR 10
|
Table 4 RANKING OF KEY DIRECTORIES BASED PCT.OF STOCKS ABOVE 65-DMA
7/20/20
Bullish = 42
Bearish = 4
---------------------------------------------------------------------------------------
Directory Current day-1 day-2 day-3 day-4 day-5
----------------------------------------------------------------------------------------
COPPER 1 1 1 1 1 1
ETFS 1 1 1 1 1 1
BONDFUND .99 .99 .99 .99 .99 .99
AUTO .974 .974 1 1 .974 .897
GOLD .938 .959 .959 .959 .959 .918
SOLAR .937 .937 1 1 1 .937
CHEM .916 .958 .958 .958 .812 .77
GREEN .904 .952 .952 .857 .857 .761
HACKERS .9 .8 .55 .6 .65 .65
NASD-100 .888 .898 .878 .868 .828 .787
NIFTY .888 .8 .8 .8 .844 .8
HOMEBLDG .882 .882 .941 .941 .941 .882
TRANSP .85 .85 .9 .95 .85 .85
DJI-13 .846 .846 .846 .846 .769 .615
SEMI .84 .78 .81 .81 .8 .76
DOWJONES .833 .833 .766 .766 .666 .6
EDU .833 .833 .833 .833 .5 .5
COMODITY .82 .82 .82 .82 .769 .769
SOFTWARE .816 .75 .716 .75 .666 .683
FOOD .811 .849 .849 .811 .754 .754
COMPUTER .8 .8 .7 .75 .6 .6
ELECTRON .797 .77 .777 .783 .763 .729
INDEXES .792 .814 .842 .842 .825 .758
CHINA .784 .784 .784 .823 .823 .843
INSURANC .769 .807 .884 .846 .769 .653
SP-100 .769 .813 .78 .791 .747 .659
FIDSTKS .762 .813 .813 .807 .717 .649
GAMING .761 .857 .904 .904 .761 .714
HOSPITAL .761 .809 .809 .761 .571 .523
SP500 .749 .808 .804 .808 .717 .667
INDMATER .746 .813 .853 .853 .76 .72
INFRA .742 .828 .857 .914 .8 .742
BIOTECH .734 .761 .708 .716 .645 .598
BIGBANKS .714 .714 .857 .857 .857 .857
RUS-1000 .697 .763 .779 .784 .68 .631
BEVERAGE .666 .666 .6 .6 .533 .533
JETS .642 .714 .857 .928 .714 .642
RETAIL .64 .72 .74 .76 .64 .6
UTILITY .615 .666 .589 .564 .564 .512
MILITARY .592 .629 .74 .74 .555 .592
FINANCE .542 .638 .759 .795 .554 .602
REIT .51 .624 .631 .737 .56 .524
=========================================================================================
OILGAS .41 .449 .527 .589 .472 .372
GUNS .4 .466 .533 .6 .4 .4
COAL .285 .285 .285 .285 .285 .285
REGBANKS .153 .423 .615 .692 .307 .307
|
=====================================================================
7/17/2020 The Peerless Sells S5 (A/D Line NC), S9-V (V-Indicator
negative with
the DJI at the upper band and S12 (IP21 NNC) remain operative.
Our DJI Accumulation Index and the
V-Indicator are not just negative, they
are very negative. In the three earlier cases of these multiple Sells since 1965
(when reliable up and down data becomes available) the DJI always fell to
the lower band, at least. But twice it fell 10% or more.

So, the FED has its work cut out to save the market now, especially since
big money and professionals may now prefer to use the FED's' money to
short the DJIA!. If true, this does does not bode well. The DJI is still
the leader. It is what most people pay attention to in the news. If it breaks
down, the NASDAQ may not be able to hold up. But for now the NASDAQ
shows off much higher Accumulation, an impressive V-formation along with its
still rising Closing Power. But the NASDAQ's ITRS weakened a lot last week.
Its ITRS has fallen from +.14 to +.06 in that time. So, it may simply go sidewise
now until it breaks its uptrend at its 21-dma is violated..

I would prefer to buy the Biotech ETFs, IBB or BBH the highest ranked BIOTECHs,
which are now shown among tonight's Bullish MAXCPs. As we can below, in the
years 2000 and 2008, biotechs held up longest against major Peerless Sells that
brought deep declines to the DJI and eventually QQQ.
BBH made a new high despite Peerless Sells.
This is reminiscent of 2000 and 2008

BBH 1999-2000 TOP

2008 BBH TOP

GLD looks likes it may breakout from a short-term consolidation
pattern. That cannot
be bullish with the DOLLAR now very close to breaking below key support.
Hedge your longs with some our Bearish MINCPs or sell short DIA because of
the PEERLESS Sells. As we get closer to having an effective vaccine, I would
expect most of the top Power Rankers Biotechs to remain the leaders. Currently they
are HZNP, QDEL, NTRA, NBIX, REGN, VRTX and AMED. I also suggest monitoring
our BIOTECH download each night for fresh new nighs on red high volume. See
below.
Both should be bought now, but abide by their uptrends..


|
Charts 7/17/2020 (Click on Underlined link.) 2020 PEERLESS DJI, Signals, Indicators Daily DJI Volume 10-DayUp/Down Vol Stoch-20 Inverted Traders Index Graph of Pct of All Stocks above 65-dma Cum. Inverted Traders Index NASDAQ S&P OEX NYSE COMPQX DJI-15 DJI-20 DJI-30 DIA QQQ MDY IWM TNA Short-Term Rates DOLLAR-UUP SPY http://tigersoft.com/2121CST/SPY.GIF recent 2006 vers-Peerless signals -- http://tigersoft.com/NEWPEER/UPD06717.BMP USO-CrudeOil DBO FAS GLD BBH IBB JETS JNUG KOL NUGT OIH PALL RSX RETL SDS AGQ SLV SOXL TECL TLT TMF TNA UGA (gasoline) USO (oil) and China: YINN CHAU Commodities: CANE CORN DBC JJC, NIB, CHOC CORN, CUT (paper) MOO, SOYB WEAT UUP (Dollar) LIT (Lithium) Stocks AAPL ADBE ALXN AMAT AMGN AMD AMZN AXP BA BABA BAC BIDU BLDP CAT CVX CMG DE ENPH FB GILD GOOG GS HD IBM INTU JPM LRCX M (Macy's) MSFT NEM NFLX NKE NVDA PG REGN SO SQ QCOM QDEL TSLA TXN XOM V VRTX WFC WMT TOWN ZM New highs and Bullish MAXCPs http://tigersoft.com/MAXCP/7-17/BULLISH.htm Bearish MAXCPs - http://tigersoft.com/MINCP/7-17/BEARISH.htm |
Table 1
7/17/2018 QUICKSILVER on DJI-30 STOCKS.
Considering just those stocks whose IP21 + ITRS score is >+.25 or <-.25
2 Bullish ( BA DOW
175 44 = +219
= +219 8 Bearish ( CVX UTX XOM = - 177
-87 -86 -44
----------------------------------------
Vitality Score = +42
Note that AAPL (AI/200=173) now shows highest AI/200 stock here. STOCKS CLOSE CHANGE PIVOT-P 5-dma AROC CL-PWR Candl AI/200 IP21 ITRS --------------------------------------------------------------------------------------- --------------------------------------------------------------------------------------- AAPL 385.31 -.78 381.91 21.1% Bearish RED 171 -.014 .156 --------------------------------------------------------------------- AXP 95.18 -1.14 93.56 102.6% Bearish RED 82 -.103 .007 --------------------------------------------------------------------- BA 175.66 -3.04 175.65 -77.2% Bearish RED 54 -.047 .315 Bullish --------------------------------------------------------------------- CAT 136.9 -1.66 130.57 330.5% ------- RED 147 -.051 .145 --------------------------------------------------------------------- CSCO 46.75 .97 45.93 9.7% Bearish BLUE 99 .092 .01 --------------------------------------------------------------------- CVX 87.19 -1.17 85.4 112.3% Bearish RED 75 -.286 -.158 Bearish --------------------------------------------------------------------- DIS 118.65 -.78 116.22 -29% Bullish RED 83 .133 .05 --------------------------------------------------------------------- GS 211.41 -3.26 208.88 138% ------- RED 94 -.198 .069 --------------------------------------------------------------------- HD 260.38 2.3 249.62 201.6% ------- BLUE 112 -.107 .037 --------------------------------------------------------------------- IBM 125.11 1.1 119.2 279.3% ------- BLUE 128 -.112 -.11 --------------------------------------------------------------------- INTC 60 .86 58.58 39.8% Bullish BLUE 127 .058 -.112 --------------------------------------------------------------------- JNJ 149.35 .1 145.21 238.1% Bearish RED 113 .038 -.118 --------------------------------------------------------------------- JPM 98.16 -1.85 97.65 96.1% Bearish RED 60 -.202 -.039 --------------------------------------------------------------------- KO 46.82 .67 45.25 182.5% ------- BLUE 83 -.067 -.08 --------------------------------------------------------------------- MCD 191.48 .56 184.92 174.9% ------- BLUE 106 -.018 -.044 --------------------------------------------------------------------- MMM 159.83 -.67 154.8 222% Bearish RED 108 -.155 -.033 --------------------------------------------------------------------- MRK 79.87 .47 77.35 200.7% Bearish BLUE 83 .02 -.09 --------------------------------------------------------------------- MSFT 202.88 -1.04 207.07 -259.1% Bearish RED 154 .095 -.015 --------------------------------------------------------------------- NKE 96.28 -.98 96.46 -87.8% Bearish RED 120 -.061 -.038 --------------------------------------------------------------------- PFE 36.25 .65 35.21 344.6% Bearish BLUE 67 -.056 -.185 --------------------------------------------------------------------- PG 125.63 .87 124.05 69.9% Bullish BLUE 77 -.196 -.015 --------------------------------------------------------------------- TRV 119.16 -1.34 114.24 226.9% Bearish RED 111 -.003 .151 --------------------------------------------------------------------- UNH 306.53 -.62 299.71 253.2% Bullish RED 130 .025 -.065 --------------------------------------------------------------------- UTX 86.01 -5.36 97.15 -958.4% Bullish RED 114 .144 -.567 Bearish --------------------------------------------------------------------- V 195.09 1.59 189.02 65.8% Bearish BLUE 103 .043 -.035 --------------------------------------------------------------------- VZ 56.3 .52 54.45 164.4% Bearish BLUE 124 -.048 -.114 --------------------------------------------------------------------- WBA 41.42 .07 39.58 161% ------- RED 85 .027 -.121 --------------------------------------------------------------------- WMT 131.74 -.46 129.52 40.4% Bullish RED 88 .116 -.058 --------------------------------------------------------------------- XOM 43.52 -.76 42.66 99.6% Bearish RED 43 -.207 -.137 Bearish --------------------------------------------------------------------- DOW 43.67 -.16 41.24 343.8% ------- RED 66 .14 .24 Bullish |
Table 2 QUICKSILVER on ETFS - 07/16/20 Bullish = QQQ, RETL, SOXL, TECL, GLD (5)
Bearish =
ITRS + IP21>.25 is considered "Bullish" ETF CLOSE CHANGE PIVOT-PT 5-dma AROC CL-PWR CANDLE IP21 ITRS
---------------------------------------------------------------------------------------------
DIA 267.47 -1.44 260.82 194.5% Bearish BLUE-.025 0
---------------------------------------------------------------------------------------------
BA 178.7 -9.24 178.44 151.4% Bearish RED -.047 .305
---------------------------------------------------------------------------------------------
SPY 320.79 -1.06 317.59 100.9% Bearish BLUE .028 .001
---------------------------------------------------------------------------------------------
QQQ 259.12 -1.78 263.97 -58.6% Bullish BLUE .2 .07
---------------------------------------------------------------------------------------------
MDY 333.29 -1.32 323.01 228.8% Bearish BLUE-.045 .019
---------------------------------------------------------------------------------------------
IWM 146.16 -.87 141.31 250.1% Bearish BLUE-.015 .034
---------------------------------------------------------------------------------------------
FAS 33.5 -.48 31.95 519.5% Bearish BLUE-.092 .14
---------------------------------------------------------------------------------------------
RETL 174.02 3.3 157.26 734.3% Bullish BLUE .088 .758
---------------------------------------------------------------------------------------------
SOXL 204.07 -2.52 208.59 -160.3% Bearish BLUE .034 .58
---------------------------------------------------------------------------------------------
TECL 244 -9.48 256.74 -260.3% Bearish RED .104 .402
---------------------------------------------------------------------------------------------
IBB 141.45 -1.17 139.21 31.4% Bearish RED .12 -.006
---------------------------------------------------------------------------------------------
GLD 168.73 -1.61 169.19 -26.5% Bullish RED .34 -.072
---------------------------------------------------------------------------------------------
OIL 168.73 -1.61 169.19 -26.5% ------- RED .31 23.951
---------------------------------------------------------------------------------------------
OIH 123.46 -1.35 116.36 439% Bearish BLUE-.118 .09
---------------------------------------------------------------------------------------------
GASL 3440 285 3685 -325.1% ------- RED -.021 -.007
---------------------------------------------------------------------------------------------
UGA 3440 285 3685 -325.1% ------- RED -.285 193.45
---------------------------------------------------------------------------------------------
UUP 25.98 -.06 26.26 -53.5% ------- -----.019 -.142
---------------------------------------------------------------------------------------------
IEF 25.98 -.06 26.26 -53.5% Bullish -----.108 -.906
---------------------------------------------------------------------------------------------
CORN 25.98 -.06 26.26 -53.5% ------- ---- .047 1.031
---------------------------------------------------------------------------------------------
WEAT 25.98 -.06 26.26 -53.5% ------- ---- .056 3.819
---------------------------------------------------------------------------------------------
YINN 25.98 -.06 26.26 -53.5% ------- ---- .238 .763
---------------------------------------------------------------------------------------------
RSX 21.23 -.13 21.43 -44.7% Bearish -----.084 -.011
QUICKSILVER on ETFS - 07/17/20
ETF CLOSE CHANGE PIVOT-PT 5-dma AROC CL-PWR CANDLE IP21 ITRS --------------------------------------------------------------------------------------------- DIA 266.74 -.73 261.04 111.7% Bearish RED -.012 0 --------------------------------------------------------------------------------------------- BA 175.66 -3.04 175.65 -77.2% Bearish RED -.047 .315 --------------------------------------------------------------------------------------------- SPY 321.72 .93 314.84 64.8% ------- RED .068 .006 --------------------------------------------------------------------------------------------- QQQ 259.42 .3 258.54 -87.3% Bullish RED .233 .058 --------------------------------------------------------------------------------------------- MDY 334.59 1.3 319.65 177% ------- BLUE .001 .026 --------------------------------------------------------------------------------------------- IWM 146.59 .43 139.52 184.4% Bearish ---- .027 .04 --------------------------------------------------------------------------------------------- FAS 33.52 .02 31.39 240.7% Bearish RED -.057 .195 --------------------------------------------------------------------------------------------- RETL 168.97 -5.05 146.75 364.3% Bullish RED .092 .683 --------------------------------------------------------------------------------------------- SOXL 207.85 3.78 198.18 -18% Bearish ---- .047 .548 --------------------------------------------------------------------------------------------- TECL 246.89 2.89 241.19 -198% Bearish RED .141 .385 --------------------------------------------------------------------------------------------- IBB 143.96 2.51 137.35 169.4% ------- BLUE .163 .007 --------------------------------------------------------------------------------------------- GLD 170.12 1.39 169.4 27.4% Bullish BLUE .338 -.056 --------------------------------------------------------------------------------------------- OIL 170.12 1.39 169.4 27.4% ------- BLUE .286 24.077 --------------------------------------------------------------------------------------------- OIH 121.34 -2.12 113.74 208.2% Bearish RED -.113 .118 --------------------------------------------------------------------------------------------- GASL 3440 285 3685 -325.1% ------- RED -.021 -.013 --------------------------------------------------------------------------------------------- UGA 3440 285 3685 -325.1% ------- RED .081 193.885 --------------------------------------------------------------------------------------------- UUP 25.98 -.06 26.26 -53.5% ------- -----.019 -.148 --------------------------------------------------------------------------------------------- IEF 25.98 -.06 26.26 -53.5% Bullish -----.188 -.911 --------------------------------------------------------------------------------------------- CORN 25.98 -.06 26.26 -53.5% ------- ---- .058 1.028 --------------------------------------------------------------------------------------------- WEAT 25.98 -.06 26.26 -53.5% Bearish ---- .025 3.813 --------------------------------------------------------------------------------------------- YINN 25.98 -.06 26.26 -53.5% ------- ---- .272 .674 --------------------------------------------------------------------------------------------- RSX 21.23 0 21.01 -47.1% Bearish -----.058 .001 |
Table 3 Count of Stocks in Key Directories
20200717
-------------------------------
NEWHIGHS 204
NEWLOWS 17
MAXCP 39
MINCP 37
TTTNH 11
TTTNL 30
FASTUP 165
FASTDOWN 31
CPCROSSA 69
CPCROSSD 117
BIGVOLUP 10
BIGVODN 7
ACCUMVER 2
HIGHIP21 8
HIUPPCT 25
REDSELL 133
AUGSELS7 330
TRAPDOOR 12
|
Table 4 RANKING OF KEY DIRECTORIES BASED PCT.OF STOCKS ABOVE 65-DMA
7/17/20
Bullish =44
Bearish = 4
---------------------------------------------------------------------------------------
Directory Current day-1 day-2 day-3 day-4 day-5
----------------------------------------------------------------------------------------
COPPER 1 1 1 1 1 1
ETFS 1 1 1 1 1 1
BONDFUND .99 .99 .99 .99 .99 .99
AUTO .974 1 1 .974 .897 .871
GOLD .959 .959 .959 .959 .918 .959
CHEM .958 .958 .958 .812 .812 .812
GREEN .952 .952 .857 .857 .761 .809
SOLAR .937 1 1 1 .937 .937
NASD-100 .898 .888 .878 .828 .797 .818
HOMEBLDG .882 .941 .941 .941 .882 .882
GAMING .857 .904 .904 .761 .714 .714
TRANSP .85 .9 .95 .85 .85 .8
FOOD .849 .849 .811 .754 .754 .849
DJI-13 .846 .846 .846 .769 .615 .538
DOWJONES .833 .766 .766 .666 .6 .566
INFRA .828 .857 .914 .8 .742 .742
COMODITY .82 .82 .82 .769 .769 .846
INDEXES .814 .842 .842 .825 .747 .752
FIDSTKS .813 .813 .807 .717 .661 .661
INDMATER .813 .853 .853 .76 .72 .693
SP-100 .813 .78 .791 .747 .681 .615
HOSPITAL .809 .809 .761 .619 .523 .523
SP500 .808 .806 .808 .717 .671 .677
INSURANC .807 .884 .846 .769 .653 .653
COMPUTER .8 .7 .75 .6 .6 .55
EDU .8 .8 .8 .4 .4 .4
HACKERS .8 .6 .6 .65 .65 .75
NIFTY .8 .8 .8 .844 .8 .822
CHINA .784 .784 .823 .823 .843 .843
ELECTRON .77 .777 .783 .763 .729 .756
SEMI .769 .798 .798 .788 .75 .798
RUS-1000 .763 .78 .784 .68 .636 .643
BIOTECH .755 .706 .713 .645 .611 .669
SOFTWARE .75 .733 .75 .666 .7 .75
RETAIL .72 .74 .76 .64 .6 .58
BIGBANKS .714 .857 .857 .857 .857 .857
JETS .714 .857 .928 .714 .642 .714
BEVERAGE .666 .6 .6 .533 .533 .6
UTILITY .666 .589 .564 .564 .487 .512
FINANCE .638 .759 .795 .554 .602 .554
MILITARY .629 .74 .74 .555 .555 .518
REIT .624 .631 .737 .56 .539 .56
=========================================================================================
GUNS .466 .533 .6 .4 .4 .4
OILGAS .446 .523 .584 .469 .376 .407
REGBANKS .423 .615 .692 .307 .307 .269
COAL .285 .285 .285 .285 .285 .285
|
=======================================================================
7/16/2020 Today brought a Sell S12 to add to yesterday's S9V and
S5. Our Accumulation
Index is an unusually low -.168 with the DJI at the upper band. Looking back
at all the historical data since 1965 when the V-Indicator for S9Vs starts where the
IP21 was also negative at the upper band, we see only three previous cases. In two
of the three, the DJI fell sharply, 10% and 19%. In the third case there followed
only a shallow decline to the rising 65-dma and then a new bull market began.
S12+S9-V-Date la/ma
Outcome
===================================================
7/15/2020 1.035
aroc= +.508 P= +132 (+54) IP21= -.168 V= -134
OBVPCT = +.021
highest highest
lowest
lowest
===================================================
#1
7/20/1970 1.05 720.22... Sidewise for 2 weeks, then declined
to 707.35, rising 65-dma and 3% lower band.
No significant paper loss.
aroc= +.362 P=-46 (+10) IP21= -.045 V= -2 OBVPCT = +.154
Start of new bull market.
-------------------------------------------------------------------------
#2
7/10/1998
1.021 9103 to 7529. DJI paper loss = 2.4%
19% decline in DJIA
aroc= +.179 P=+32 (+36) IP21= -.013 V= -14 OBVPCT = +.144
-------------------------------------------------------------------------
#3
7/17/2007 1.028 13972 to 12861. No significant paper
loss.
10% decline in DJIA
aroc= +.291 P=-27 (-115) IP21= -.093 V= -121 OBVPCT = +.-71
--------------------------------------------------------------------------
Another thing to notice is that in our current case, the "AROC", the annualized
21-dma
is somewhat higher than in any of these earlier S9v-S12 cases and the P-Indicator now
is much higher. These items reflect, no doubt, the influence and deterimination of
the
FED's QE-Infinity. With the upper band of the DJI having now been reached, there is
a larger amount of over-head stock than normal that must be eaten up if the advance is
to continue. The DJI may go a little higher, but I would think that it will have to
fall
back again to its lower band. While the openings are steadily higher, our Closing
Power
for DIA is much more subdued. So, be careful of big up-openings that are then
"faded"
by the professionals and "big money".
DJI's S9v and S12 versus Fed' Rising NYSE A/D Line

The NASDAQ is up 1% at this writing. It clearly wants to separate itself from the
"blue chips". But its ITRS could not breakout above +.16, so I would guess
that it
will not be able to repeat its stellar, independently bullish performances of 1999 and
2000.
But it will do better than the DJI. The V-formations' uptrendlines are still intact.
My
suggestion is to hold AAPL long and abide by the V-formation price uptrendlines and
also the NYSE A/D Line uptrend. As long as these are not broken, performance funds
will hold these V-bottomed tech stocks. The main reason - they know that Fed
Chairman
Powell is guarding their rear. QE-Infinity, after all, is Powell's most important
personal
mission. It is what history will remember him by. It is the main hope of
those whom he
is politically affiliated with, the Republicans in the 2020 Election. If he has any
hope of
being reappointed, when his term ends, he must continue with QE-Infinity and hope that
he is vindicated by a miraculous economic turnarouns and so is reappointed by Trump
and Biden, too.
See by how much the NASDAQ's ITRS has fallen off.
Performance funds are getting nervous.


As long as the Dollar does not break below its support, Powell can continue with
QE-Infinity. The Democrats are not opposing him, have you noticed? But
if the
Dollar breaks down badly, Powell will have to back away from QE-Infinity and he will
suddenly have a lot more political opposition. .

|
Charts 7/16/2020 (Click on Underlined link.) 2020 PEERLESS DJI, Signals, Indicators Daily DJI Volume 10-DayUp/Down Vol Stoch-20 Inverted Traders Index Graph of Pct of All Stocks above 65-dma Cum. Inverted Traders Index NASDAQ S&P OEX NYSE COMPQX DJI-15 DJI-20 DJI-30 DIA QQQ MDY IWM TNA Short-Term Rates SPY http://tigersoft.com/2121CST/SPY.GIF recent 2006 vers-Peerless signals -- http://tigersoft.com/NEWPEER/UPD06716.BMP USO-CrudeOil DBO FAS GLD BBH IBB JETS JNUG KOL NUGT OIH PALL RSX RETL SDS AGQ SLV SOXL TECL TLT TMF TNA UGA (gasoline) USO (oil) and China: YINN CHAU Commodities: CANE CORN DBC JJC, NIB, CHOC CORN, CUT (paper) MOO, SOYB WEAT UUP (Dollar) LIT (Lithium) Stocks AAPL ADBE ALXN AMAT AMGN AMD AMZN AXP BA BABA BAC BIDU BLDP CAT CVX CMG DE ENPH FB GILD GOOG GS HD IBM INTU JPM LRCX M (Macy's) MSFT NEM NFLX NKE NVDA PG REGN SO SQ QCOM QDEL TSLA TXN XOM V VRTX WFC WMT TOWN ZM New highs and Bullish MAXCPs http://tigersoft.com/MAXCP/7-16/BULLISH.htm Bearish MAXCPs - http://tigersoft.com/MINCP/7-16/BEARISH.htm |
Table 1
7/16/2018 QUICKSILVER on DJI-30 STOCKS.
Considering just those stocks whose IP21 + ITRS score is >+.25 or <-.25
2 Bullish ( BA DOW
179 44 = +243
= +188 8 Bearish ( CVX IBM PFE PG UTX XOM
-86 -124 -36 -125 -86 -44
tot. = - 481
----------------------------------------
Vitality Score = -293
Note that AAPL (AI/200=173) now shows highest AI/200 stock here. STOCKS CLOSE CHANGE PIVOT-P 5-dma AROC CL-PWR Candl AI/200 IP21 ITRS --------------------------------------------------------------------------------------- --------------------------------------------------------------------------------------- AAPL 386.09 -4.81 383.68 43.6% ------- RED 172 -.036 .177 --------------------------------------------------------------------- AXP 96.32 -1.04 93.23 306.1% Bearish RED 82 -.118 -.01 --------------------------------------------------------------------- BA 178.7 -9.24 178.44 151.4% Bearish RED 55 -.047 .305 Bullish --------------------------------------------------------------------- CAT 138.56 .2 128.01 486.3% ------- BLUE 148 -.059 .152 --------------------------------------------------------------------- CSCO 45.78 -.62 46.66 -99.2% Bearish BLUE 99 .045 -.016 --------------------------------------------------------------------- CVX 88.36 -.53 85.23 326.3% Bearish RED 75 -.295 -.169 Bearish --------------------------------------------------------------------- DIS 119.43 -1.47 119.34 110.7% Bullish BLUE 82 .107 .062 --------------------------------------------------------------------- GS 214.67 -2.23 205.56 427.9% ------- BLUE 94 -.179 .084 --------------------------------------------------------------------- HD 258.08 .28 250.11 200.3% ------- BLUE 113 -.168 .024 --------------------------------------------------------------------- IBM 124.01 1.01 118.35 347.7% ------- BLUE 129 -.149 -.108 Bearish --------------------------------------------------------------------- INTC 59.14 .11 59.53 61.1% ------- BLUE 127 .037 -.113 --------------------------------------------------------------------- JNJ 149.25 .99 142.37 232.7% Bearish BLUE 112 .038 -.122 --------------------------------------------------------------------- JPM 100.01 .28 96.27 451.7% Bearish BLUE 61 -.197 -.033 --------------------------------------------------------------------- KO 46.15 -.25 45.15 247.2% Bearish RED 84 -.117 -.104 --------------------------------------------------------------------- MCD 190.92 -.85 184.88 175.9% ------- RED 106 -.064 -.055 --------------------------------------------------------------------- MMM 160.5 1.17 152.85 291.2% Bearish BLUE 108 -.147 -.031 --------------------------------------------------------------------- MRK 79.4 -.04 76.73 174.4% Bearish RED 82 -.009 -.102 --------------------------------------------------------------------- MSFT 203.92 -4.12 213.67 -247.3% ------- RED 154 .082 .008 --------------------------------------------------------------------- NKE 97.26 -1.28 97.99 13.9% Bearish RED 120 -.045 -.005 --------------------------------------------------------------------- PFE 35.6 -.12 33.83 308.4% Bearish ---- 67 -.076 -.196 Bearish --------------------------------------------------------------------- PG 124.76 .26 123.89 91.9% Bullish RED 78 -.219 -.045 Bearish --------------------------------------------------------------------- TRV 120.5 1.36 113.84 454.1% ------- BLUE 111 -.013 .124 --------------------------------------------------------------------- UNH 307.15 3.08 291.23 267.4% Bullish BLUE 129 .055 -.072 --------------------------------------------------------------------- UTX 86.01 -5.36 97.15 -958.4% Bullish RED 114 .144 -.561 Bearish --------------------------------------------------------------------- V 193.5 -3.05 192.55 33.5% Bearish RED 102 0 -.036 --------------------------------------------------------------------- VZ 55.78 .72 54.49 168.3% Bearish BLUE 125 -.072 -.133 --------------------------------------------------------------------- WBA 41.35 .67 40.12 293.2% ------- BLUE 85 .032 -.136 --------------------------------------------------------------------- WMT 132.2 .2 130.68 170.6% Bullish BLUE 87 .127 -.06 --------------------------------------------------------------------- XOM 44.28 -.35 42.65 339% Bearish ---- 43 -.215 -.132 Bearish --------------------------------------------------------------------- DOW 43.83 .5 40.76 529.7% ------- BLUE 66 .105 .193 Bullish |
Table 2 QUICKSILVER on ETFS - 07/15/20 Bullish = QQQ, RETL, SOXL, TECL, GLD (5)
Bearish =
ITRS + IP21>.25 is considered "Bullish" ETF CLOSE CHANGE PIVOT-PT 5-dma AROC CL-PWR CANDLE IP21 ITRS
---------------------------------------------------------------------------------------------
DIA 268.91 2.32 257.24 156.7% Bearish RED -.003 ----
---------------------------------------------------------------------------------------------
SPY 321.85 2.93 314.38 89.6% Bearish RED .036 .002
---------------------------------------------------------------------------------------------
QQQ 260.9 .53 262.18 17.4% Bullish RED .187 .08 Bullish
---------------------------------------------------------------------------------------------
MDY 334.61 9.75 318.46 176% Bearish BLUE-.058 .022
---------------------------------------------------------------------------------------------
IWM 147.03 5.2 139.07 180.8% Bearish BLUE-.018 .037
---------------------------------------------------------------------------------------------
FAS 33.98 1.71 30.18 350.7% Bearish -----.094 .157
---------------------------------------------------------------------------------------------
RETL 170.72 15.82 151.09 356.9% Bearish BLUE .024 .77 Bullish
---------------------------------------------------------------------------------------------
SOXL 206.59 -2.09 210.69 96.2% Bearish RED .02 .676 Bullish
---------------------------------------------------------------------------------------------
TECL 253.48 4.9 257.09 -8% Bearish RED .111 .525 Bullish
---------------------------------------------------------------------------------------------
IBB 142.62 2.36 140.57 64.8% ------- ---- .128 .012
---------------------------------------------------------------------------------------------
GLD 170.34 .15 169.63 7.4% Bullish BLUE .401 -.07 Bullish
---------------------------------------------------------------------------------------------
OIH 124.81 5.16 113.14 179.1% Bearish BLUE-.162 .068
---------------------------------------------------------------------------------------------
GASL 3440 285 3685 -325.1% ------- RED -.021 -.019
---------------------------------------------------------------------------------------------
QUICKSILVER on ETFS - 07/16/20
ETF CLOSE CHANGE PIVOT-PT 5-dma AROC CL-PWR CANDLE IP21 ITRS --------------------------------------------------------------------------------------------- DIA 267.47 -1.44 260.82 194.5% Bearish BLUE-.025 0 --------------------------------------------------------------------------------------------- BA 178.7 -9.24 178.44 151.4% Bearish RED -.047 .305 --------------------------------------------------------------------------------------------- SPY 320.79 -1.06 317.59 100.9% Bearish BLUE .028 .001 --------------------------------------------------------------------------------------------- QQQ 259.12 -1.78 263.97 -58.6% Bullish BLUE .2 .07 --------------------------------------------------------------------------------------------- MDY 333.29 -1.32 323.01 228.8% Bearish BLUE-.045 .019 --------------------------------------------------------------------------------------------- IWM 146.16 -.87 141.31 250.1% Bearish BLUE-.015 .034 --------------------------------------------------------------------------------------------- FAS 33.5 -.48 31.95 519.5% Bearish BLUE-.092 .14 --------------------------------------------------------------------------------------------- RETL 174.02 3.3 157.26 734.3% Bullish BLUE .088 .758 --------------------------------------------------------------------------------------------- SOXL 204.07 -2.52 208.59 -160.3% Bearish BLUE .034 .58 --------------------------------------------------------------------------------------------- TECL 244 -9.48 256.74 -260.3% Bearish RED .104 .402 --------------------------------------------------------------------------------------------- IBB 141.45 -1.17 139.21 31.4% Bearish RED .12 -.006 --------------------------------------------------------------------------------------------- GLD 168.73 -1.61 169.19 -26.5% Bullish RED .34 -.072 --------------------------------------------------------------------------------------------- OIL 168.73 -1.61 169.19 -26.5% ------- RED .31 23.951 --------------------------------------------------------------------------------------------- OIH 123.46 -1.35 116.36 439% Bearish BLUE-.118 .09 --------------------------------------------------------------------------------------------- GASL 3440 285 3685 -325.1% ------- RED -.021 -.007 --------------------------------------------------------------------------------------------- UGA 3440 285 3685 -325.1% ------- RED -.285 193.45 --------------------------------------------------------------------------------------------- UUP 25.98 -.06 26.26 -53.5% ------- -----.019 -.142 --------------------------------------------------------------------------------------------- IEF 25.98 -.06 26.26 -53.5% Bullish -----.108 -.906 --------------------------------------------------------------------------------------------- CORN 25.98 -.06 26.26 -53.5% ------- ---- .047 1.031 --------------------------------------------------------------------------------------------- WEAT 25.98 -.06 26.26 -53.5% ------- ---- .056 3.819 --------------------------------------------------------------------------------------------- YINN 25.98 -.06 26.26 -53.5% ------- ---- .238 .763 --------------------------------------------------------------------------------------------- RSX 21.23 -.13 21.43 -44.7% Bearish -----.084 -.011 |
Table 3 Count of Stocks in Key Directories
20200716
-------------------------------
NEWHIGHS 138
NEWLOWS 18
MAXCP 30
MINCP 30
TTTNH 10
TTTNL 32
FASTUP 266
FASTDOWN 54
CPCROSSA 43
CPCROSSD 61
BIGVOLUP 11
BIGVODN 8
ACCUMVER 1
HIGHIP21 7
HIUPPCT 16
REDSELL 130
AUGSELS7 284
TRAPDOOR 12
|
TABLE 4 RANKING OF KEY DIRECTORIES BASED PCT.OF STOCKS ABOVE 65-DMA
7/16/20
Bullish = 45
Bearish = 1
---------------------------------------------------------------------------------------
Directory Current day-1 day-2 day-3 day-4 day-5
----------------------------------------------------------------------------------------
AUTO 1 1 .974 .897 .871 .82
COPPER 1 1 1 1 1 .875
ETFS 1 1 1 1 1 1
SOLAR 1 1 1 .937 .937 .937
BONDFUND .99 .99 .99 .99 .99 .99
GOLD .959 .959 .959 .918 .959 .959
CHEM .958 .958 .812 .812 .812 .645
GREEN .952 .857 .857 .761 .809 .714
HOMEBLDG .941 .941 .941 .882 .882 .882
GAMING .904 .904 .761 .714 .714 .666
TRANSP .9 .95 .85 .85 .8 .55
NASD-100 .888 .888 .838 .797 .828 .767
INSURANC .884 .846 .769 .653 .653 .346
BIGBANKS .857 .857 .857 .857 .857 .428
INFRA .857 .914 .8 .742 .742 .571
JETS .857 .928 .714 .642 .714 .5
INDMATER .853 .853 .76 .72 .706 .533
FOOD .849 .811 .754 .754 .849 .849
DJI-13 .846 .846 .769 .615 .692 .538
INDEXES .842 .842 .825 .747 .758 .702
COMODITY .82 .82 .769 .769 .846 .846
FIDSTKS .813 .807 .717 .661 .677 .564
HOSPITAL .809 .761 .619 .571 .523 .38
SP500 .806 .81 .717 .671 .684 .576
EDU .8 .8 .4 .4 .4 .4
NIFTY .8 .8 .844 .8 .822 .822
SEMI .798 .798 .788 .75 .798 .807
CHINA .784 .823 .823 .843 .843 .823
RUS-1000 .78 .785 .68 .636 .65 .537
SP-100 .78 .791 .747 .681 .637 .494
ELECTRON .777 .783 .763 .729 .763 .763
DOWJONES .766 .766 .666 .6 .633 .5
FINANCE .756 .792 .548 .597 .56 .451
MILITARY .74 .74 .555 .555 .518 .481
RETAIL .74 .76 .64 .6 .58 .58
SOFTWARE .733 .766 .666 .7 .75 .733
BIOTECH .7 .711 .643 .611 .685 .669
COMPUTER .7 .75 .6 .6 .55 .55
REIT .631 .737 .56 .539 .581 .439
REGBANKS .615 .692 .307 .307 .269 .076
BEVERAGE .6 .6 .533 .533 .6 .533
HACKERS .6 .65 .65 .65 .75 .8
UTILITY .589 .564 .564 .487 .512 .384
GUNS .533 .6 .4 .4 .4 .4
OILGAS .523 .584 .469 .376 .407 .338
=======================================================================================
COAL .285 .285 .285 .285 .285 .285
|
====================================================================
7/15/2020
Heavy selling stopped the DJI's rally at
the 3.5% upper band. While the
P-Indicator is positive, the V-Indicator and IP21 (Accumulation Index)
are quite negative. This has brought about a Peerless Sell S9V. It is a
summer time Sell. It is reliable as you can see from the July occurrences
since 1965. In all the cases below, the P-I was positive but the V-I
was negative. There were nine such cases since 1965, when the
reliable Up and Down Volume Data starts. In all cases the DJI fell
to at least the lower band. In 3 of the 9 cases the DJI fell more than 10%.
The few cases where there were paper losses were always small.
The conclusion from this is that we should be sellers of the QQQ.
The weakness this morning confirms that most of the best techs are
not immune to a sell-off. The V-bottomed techs should probably be sold, too
I would continue to hold long GLD and IBB. I would continue to hold
AAPL, our Tiger "Tahiti stock".
S9-V-Date la/ma
Outcome
7/24/1970 1.035 720.22
to 707.35. No significant paper loss.
7/16/1982 1.025 828.67
to 780.35 No significant paper loss.
7/18/1990 1.024 2982
to 2365. No significant paper loss.
Iraq invasion.
7/10/1998 1.021 9103
to 7529. No significant paper loss.
7/9/1999 1.034 11194 to 10655. No significant paper
loss.
7/13/2007 1.026 13907
to 12861. No significant paper loss.
7/26/2010 1.04 10524 up to 10680 down to 9986.
7/5/2011 1.037 12570 up to 12724 down to 10720
 |
 |
 |
 |
|
Charts 7/15/2020 (Click on Underlined link.) 2020 PEERLESS DJI, Signals, Indicators Daily DJI Volume 10-DayUp/Down Vol Stoch-20 Inverted Traders Index Graph of Pct of All Stocks above 65-dma Cum. Inverted Traders Index NASDAQ S&P OEX NYSE COMPQX DJI-15 DJI-20 DJI-30 DIA QQQ MDY IWM TNA Short-Term Rates SPY http://tigersoft.com/2121CST/SPY.GIF recent 2006 vers-Peerless signals -- http://tigersoft.com/NEWPEER/UPD71520.BMP USO-CrudeOil DBO FAS GLD BBH IBB JETS JNUG KOL NUGT OIH PALL RSX RETL SDS AGQ SLV SOXL TECL TLT TMF TNA UGA (gasoline) USO (oil) and China: YINN CHAU Commodities: CANE CORN DBC JJC, NIB, CHOC CORN, CUT (paper) MOO, SOYB WEAT UUP (Dollar) LIT (Lithium) Stocks AAPL ADBE ALXN AMAT AMGN AMD AMZN AXP BA BABA BAC BIDU BLDP CAT CVX CMG DE ENPH FB GILD GOOG GS HD IBM INTU JPM LRCX M (Macy's) MSFT NEM NFLX NKE NVDA PG REGN SO SQ QCOM QDEL TSLA TXN XOM V VRTX WFC WMT TOWN ZM New highs and Bullish MAXCPs http://tigersoft.com/MAXCP/7-15/BULLISH.htm Bearish MAXCPs - http://tigersoft.com/MINCP/7-15/BEARISH.htm |
Table 1
7/15/2018 QUICKSILVER on DJI-30 STOCKS.
Considering just those stocks whose IP21 + ITRS score is >+.25 or <-.25
1 Bullish ( BA
188
= +188 8 Bearish ( CVX IBM JPM PFE PG UTX VZ XOM
-89 -123 -100 -36 -125 -86 -55 -45
tot. = - 659
----------------------------------------
Vitality Score = -471
Note that AAPL (AI/200=173) now shows highest AI/200 stock here. STOCKS CLOSE CHANGE PIVOT-P 5-dma AROC CL-PWR Candl AI/200 IP21 ITRS --------------------------------------------------------------------------------------- --------------------------------------------------------------------------------------- AAPL 390.9 2.67 382.73 124.2% ------- RED 173 .01 .201 --------------------------------------------------------------------- AXP 97.36 2.52 90.57 239.7% Bearish BLUE 82 -.111 -.006 --------------------------------------------------------------------- BA 187.94 7.98 173.28 221.4% Bearish BLUE 56 -.049 .297 Bullish --------------------------------------------------------------------- CAT 138.36 1.48 125.73 393.9% ------- RED 149 -.012 .152 --------------------------------------------------------------------- CSCO 46.4 .14 46.7 63.8% Bearish RED 99 -.004 -.011 --------------------------------------------------------------------- CVX 88.89 .54 82.74 148.3% Bearish RED 75 -.273 -.161 Bearish --------------------------------------------------------------------- DIS 120.9 2.24 116.81 180.4% ------- RED 81 .081 .039 --------------------------------------------------------------------- GS 216.9 2.89 196.83 356.4% ------- RED 94 -.136 .1 --------------------------------------------------------------------- HD 257.8 .01 247.96 172% ------- RED 114 -.123 .029 --------------------------------------------------------------------- IBM 123 2.4 115.71 223.6% ------- BLUE 130 -.176 -.122 Bearish --------------------------------------------------------------------- INTC 59.03 .05 58.42 35.7% ------- ---- 127 .015 -.115 --------------------------------------------------------------------- JNJ 148.26 .34 142.49 173% Bearish RED 112 -.007 -.133 --------------------------------------------------------------------- JPM 99.73 1.52 91.28 337.2% Bearish RED 62 -.204 -.05 Bearish --------------------------------------------------------------------- KO 46.4 .53 43.91 147.6% Bearish BLUE 85 -.11 -.105 --------------------------------------------------------------------- MCD 191.77 1.05 184.33 159% ------- RED 106 -.054 -.078 --------------------------------------------------------------------- MMM 159.33 .79 151.45 153.8% Bearish RED 109 -.177 -.059 --------------------------------------------------------------------- MRK 79.44 1.19 76.69 98.2% ------- BLUE 82 .051 -.099 --------------------------------------------------------------------- MSFT 208.04 -.31 214.32 -113.4% ------- RED 154 .084 .031 --------------------------------------------------------------------- NKE 98.54 1.78 96.99 -15.4% Bearish BLUE 120 -.04 .017 --------------------------------------------------------------------- PFE 35.72 .49 33.46 287.2% Bearish RED 67 -.085 -.183 Bearish --------------------------------------------------------------------- PG 124.5 -.59 122.48 65.1% ------- RED 79 -.205 -.057 Bearish --------------------------------------------------------------------- TRV 119.14 .59 110.04 261.5% ------- RED 111 -.019 .097 --------------------------------------------------------------------- UNH 304.07 -4.45 291.16 95.9% Bullish BLUE 128 .058 -.075 --------------------------------------------------------------------- UTX 86.01 -5.36 97.15 -958.4% Bullish RED 114 .144 -.573 Bearish --------------------------------------------------------------------- V 196.55 3.22 192.21 38.5% Bearish BLUE 102 -.03 -.017 --------------------------------------------------------------------- VZ 55.06 -.38 53.94 -29.2% Bearish RED 126 -.096 -.154 Bearish --------------------------------------------------------------------- WBA 40.68 .57 39.01 -200.1% Bearish BLUE 85 .022 -.174 --------------------------------------------------------------------- WMT 132 -.01 127.75 293.3% Bullish RED 86 .13 -.066 --------------------------------------------------------------------- XOM 44.63 .56 41.36 174.2% Bearish RED 43 -.222 -.138 Bearish --------------------------------------------------------------------- DOW 43.33 .89 39.44 364.8% ------- RED 66 .061 .178 |
Table 2 QUICKSILVER on ETFS - 07/15/20 Bullish = QQQ, RETL, SOXL, TECL, GLD (5)
Bearish =
ITRS + IP21>.25 is considered "Bullish" ETF CLOSE CHANGE PIVOT-PT 5-dma AROC CL-PWR CANDLE IP21 ITRS --------------------------------------------------------------------------------------------- DIA 268.91 2.32 257.24 156.7% Bearish RED -.003 ---- --------------------------------------------------------------------------------------------- SPY 321.85 2.93 314.38 89.6% Bearish RED .036 .002 --------------------------------------------------------------------------------------------- QQQ 260.9 .53 262.18 17.4% Bullish RED .187 .08 Bullish --------------------------------------------------------------------------------------------- MDY 334.61 9.75 318.46 176% Bearish BLUE-.058 .022 --------------------------------------------------------------------------------------------- IWM 147.03 5.2 139.07 180.8% Bearish BLUE-.018 .037 --------------------------------------------------------------------------------------------- FAS 33.98 1.71 30.18 350.7% Bearish -----.094 .157 --------------------------------------------------------------------------------------------- RETL 170.72 15.82 151.09 356.9% Bearish BLUE .024 .77 Bullish --------------------------------------------------------------------------------------------- SOXL 206.59 -2.09 210.69 96.2% Bearish RED .02 .676 Bullish --------------------------------------------------------------------------------------------- TECL 253.48 4.9 257.09 -8% Bearish RED .111 .525 Bullish --------------------------------------------------------------------------------------------- IBB 142.62 2.36 140.57 64.8% ------- ---- .128 .012 --------------------------------------------------------------------------------------------- GLD 170.34 .15 169.63 7.4% Bullish BLUE .401 -.07 Bullish --------------------------------------------------------------------------------------------- OIH 124.81 5.16 113.14 179.1% Bearish BLUE-.162 .068 --------------------------------------------------------------------------------------------- GASL 3440 285 3685 -325.1% ------- RED -.021 -.019 --------------------------------------------------------------------------------------------- |
Table 3 Count of Stocks in Key Directories
20200715
-------------------------------
NEWHIGHS 205
NEWLOWS 12
MAXCP 22
MINCP 19
TTTNH 10
TTTNL 35
FASTUP 170
FASTDOWN 60
CPCROSSA 59
CPCROSSD 81
BIGVOLUP 5
BIGVODN 7
ACCUMVER 6
HIGHIP21 8
HIUPPCT 18
REDSELL 122
AUGSELS7 369
TRAPDOOR 12
|
Table 4 RANKING OF KEY DIRECTORIES BASED PCT.OF STOCKS ABOVE 65-DMA
7/15/20
Bullish = 44
Bearish = 2
---------------------------------------------------------------------------------------
Directory Current day-1 day-2 day-3 day-4 day-5
----------------------------------------------------------------------------------------
AUTO 1 .974 .897 .871 .846 .897
COPPER 1 1 1 1 .875 1
ETFS 1 1 1 1 1 1
BONDFUND .99 .99 .99 .99 .99 .99
GOLD .959 .959 .918 .959 .959 .959
CHEM .958 .812 .812 .812 .645 .791 TRANSP .95 .85 .85 .8 .55 .8 HOMEBLDG .941 .941 .882 .882 .882 .882 JETS .928 .714 .642 .714 .571 .857 INFRA .914 .8 .742 .742 .628 .742 GAMING .904 .761 .714 .714 .666 .714 NASD-100 .888 .848 .808 .828 .767 .818 BIGBANKS .857 .857 .857 .857 .571 .571 GREEN .857 .857 .761 .809 .714 .714 INDMATER .853 .76 .72 .706 .56 .68 DJI-13 .846 .769 .615 .692 .538 .692 INSURANC .846 .769 .653 .653 .346 .5 INDEXES .842 .825 .747 .758 .702 .786 CHINA .823 .823 .843 .843 .823 .901 COMODITY .82 .769 .769 .846 .846 .82 FOOD .811 .754 .754 .849 .849 .811 SP500 .81 .72 .671 .684 .583 .673 FIDSTKS .807 .717 .661 .677 .57 .672 EDU .8 .4 .4 .4 .4 .6 NIFTY .8 .844 .8 .822 .822 .822 SEMI .798 .788 .75 .798 .826 .788 FINANCE .795 .554 .602 .566 .457 .542 SP-100 .791 .747 .681 .637 .505 .648 RUS-1000 .785 .682 .636 .65 .545 .645 ELECTRON .783 .763 .729 .763 .777 .763 DOWJONES .766 .666 .6 .633 .5 .566 SOFTWARE .766 .683 .7 .75 .733 .766 HOSPITAL .761 .619 .571 .571 .428 .523 RETAIL .76 .64 .6 .58 .58 .68 COMPUTER .75 .6 .6 .55 .55 .7 MILITARY .74 .555 .555 .518 .481 .629 REIT .737 .56 .539 .581 .453 .624 BIOTECH .706 .64 .608 .685 .679 .706 REGBANKS .692 .307 .307 .269 .115 .23 HACKERS .65 .7 .65 .75 .8 .75 BEVERAGE .6 .533 .533 .6 .533 .666 GUNS .6 .4 .4 .4 .4 .466 OILGAS .584 .469 .376 .407 .33 .453 UTILITY .564 .564 .487 .512 .384 .435 ================================================================================================ COAL .285 .285 .285 .285 .285 .285 SOLAR .045 .045 .045 .045 .068 .045 |
====================================================================
7/14/2020 The DJI futures are up 505 right now. Is it the FED or do we have a
vaccine?
Peerless gave a Sell S9V and a Sell S5 today. The S9V is a summer time
negative non-confirmation by the V-Indicator with the DJI near the upper 3%
band. As you can see the P-Indicator also failed to confirm today's new high
by a small market. This accounts for the Sell S5 at the upper band. That our
Accumulation Index is -.131 shows us that big money is selling into the rally.
We should, too, perhaps about 2%-3% above today's close. The most important
stock is AAPL . It should be held because of the very high positive IP21
consistency.
As long as it does not break its uptrend, it will act to be a big booster for the
DJIA-30, SP-500 and QQQ.
DJI 7/14/2020 Key
Values
close/21-dma = 1.028 (An advance to 1.035
would not
be unusual. But "over-bought"
21-dma aroc = +.477 (Usually we see an AROC
above
+.65 for a breakout.)
P-I = 78 but fell 37 today.
(not impressive for size of DJI gain)
IP21 = -.131 (distinctly bearish when
DJI closes more
than 2.35% over the 21-dma.
VI= -148 (serious dumping has been
occurring).
OPMA = +.031 (NYSE volume is low. Gains will
probably have
to be made in futures market before NYSE opens.)
 |
 |
I am a reluctant to Sell in here, not because S9Vs and S5s do
not work well
in the Summer, but because of the FED. Its job, as it sees it, is to build market
bubbles when it wants the market to turn the whole economy back up, or simply
to support the market until the economy does turn up. That's what it did in 2009,
2003, 1987 and also what it did in August 1982, in late 1970 and January 1967.
Lowering rates and pumping liquidity in have that effect. They build market bubbles
that make people thing Wall Street is crazy. But this what monetarists believe in
and they run the FED and most graduate Economics schools.
As long as the Dollar does not weaken much and as long as traders keep buying
stocks and not real goods, inflation will stay comfortably low. Inflation would stop
QE-Infinity much faster than any populist criticism of what the Fed is doing to pump
up the market. The FED is as insulated as it is powerful. And there is no real
choice.
The alternative (very heavy taxes on the wealthy to pay for millions of new public jobs,
guaranteed incomes and public health case) is the socialist alternative. Despite
what
Trump tells you, such an alternative is as little supported by Biden and 90% of his
fellow Democrats as they are by Republicans. So, realistically, the FED is the answer
until there is a truly effective vaccine.
Once again, to this I must therefore add: "Watch the NYSE A/D Line". This
is our
best indicator for telling us what the FED is planning.
The other element here is the special upside volatility
brought on by QE-Infinity.
The last big rally saw the DJI rally all the way to the upper 10% band. That's way
above the 3.5% band I am suggesting Sell at using based-tested Peerless norms.
We could be seeing another such advance in here right now. Let me suggest that
if you do not want to sell on a 3% more strength in the QQQ, then wait for the number
of declines on the NYSE to rise above the number of advancing stocks at the close
by 24 or more. We call this "clinching" a Sell S9. What this may
accomplish is to
give the market now every chance to create a new Buy signal first, before the clinching
of the Sells goes into effect.
 |
 |
 |
|
Charts 7/14/2020 (Click on Underlined link.) 2020 PEERLESS DJI, Signals, Indicators Daily DJI Volume 10-DayUp/Down Vol Stoch-20 Inverted Traders Index Graph of Pct of All Stocks above 65-dma Cum. Inverted Traders Index NASDAQ S&P OEX NYSE COMPQX DJI-15 DJI-20 DJI-30 DIA QQQ MDY IWM TNA Short-Term Rates SPY http://tigersoft.com/2121CST/SPY.GIF recent 2006 vers-Peerless signals -- http://tigersoft.com/NEWPEER/VERS06SL.BMP USO-CrudeOil DBO FAS GLD BBH IBB JETS JNUG KOL NUGT OIH PALL RSX RETL SDS AGQ SLV SOXL TECL TLT TMF TNA UGA (gasoline) USO (oil) and China: YINN CHAU Commodities: CANE CORN DBC JJC, NIB, CHOC CORN, CUT (paper) MOO, SOYB WEAT UUP (Dollar) LIT (Lithium) Stocks AAPL ADBE ALXN AMAT AMGN AMD AMZN AXP BA BABA BAC BIDU BLDP CAT CVX CMG DE ENPH FB GILD GOOG GS HD IBM INTU JPM LRCX M (Macy's) MSFT NEM NFLX NKE NVDA PG REGN SO SQ QCOM QDEL TSLA TXN XOM V VRTX WFC WMT TOWN ZM New highs and Bullish MAXCPs http://tigersoft.com/MAXCP/7-14/BULLISH.htm Bearish MAXCPs - http://tigersoft.com/MINCP/7-14/BEARISH.htm |
Table 1
7/14/2018 QUICKSILVER on DJI-30 STOCKS.
Considering just those stocks whose IP21 + ITRS score is >+.25 or <-.25
1 Bullish ( AAPL
388
= +388 5 Bearish ( CVX IBM PFE UTX XOM
-88 -121 -35 86 -44
tot. = - 374
----------------------------------------
Vitality Score = +14
Note that AAPL (AI/200=173) now shows highest AI/200 stock here. STOCKS CLOSE CHANGE PIVOT-P 5-dma AROC CL-PWR Candl AI/200 IP21 ITRS --------------------------------------------------------------------------------------- --------------------------------------------------------------------------------------- AAPL 388.23 6.32 381.37 204.2% Bullish BLUE 173 .042 .22 Bullish --------------------------------------------------------------------- AXP 94.84 1.28 92.9 98.8% Bearish BLUE 82 -.083 -.05 --------------------------------------------------------------------- BA 179.96 4.31 180.08 30.5% Bearish BLUE 57 -.022 .226 --------------------------------------------------------------------- CAT 136.88 6.31 128.13 378.3% Bullish BLUE 150 .044 .111 --------------------------------------------------------------------- CSCO 46.26 .33 45.81 68.3% Bearish BLUE 100 .022 .007 --------------------------------------------------------------------- CVX 88.35 2.95 86.35 119.7% Bearish BLUE 75 -.212 -.136 Bearish --------------------------------------------------------------------- DIS 118.66 2.44 116.66 215.8% Bullish BLUE 80 .115 .001 --------------------------------------------------------------------- GS 214.01 5.13 202.25 361.6% ------- BLUE 94 -.012 .085 --------------------------------------------------------------------- HD 257.79 8.17 249.17 209.8% Bullish BLUE 115 -.056 .056 --------------------------------------------------------------------- IBM 120.6 1.4 117.71 128.3% Bearish BLUE 131 -.141 -.134 Bearish --------------------------------------------------------------------- INTC 58.98 .4 58.61 57.1% ------- BLUE 127 .041 -.097 --------------------------------------------------------------------- JNJ 147.92 2.71 143.27 177% Bullish BLUE 113 .06 -.126 --------------------------------------------------------------------- JPM 98.21 .56 93.3 312.8% Bearish ---- 63 -.156 -.07 --------------------------------------------------------------------- KO 45.87 .62 45.07 73.5% Bearish BLUE 86 -.034 -.118 --------------------------------------------------------------------- MCD 190.72 5.8 185.85 132.3% ------- BLUE 106 .001 -.079 --------------------------------------------------------------------- MMM 158.54 3.74 154.58 121% Bearish BLUE 110 -.068 -.057 --------------------------------------------------------------------- MRK 78.25 .9 77.92 -30.3% Bearish BLUE 81 .003 -.116 --------------------------------------------------------------------- MSFT 208.35 1.28 212.83 2.4% ------- BLUE 154 .107 .07 --------------------------------------------------------------------- NKE 96.76 .3 98.84 -15.9% Bearish BLUE 120 -.003 .008 --------------------------------------------------------------------- PFE 35.23 .02 33.75 176.2% Bearish RED 67 -.069 -.188 Bearish --------------------------------------------------------------------- PG 125.09 1.04 122.89 116.6% Bullish BLUE 80 -.127 -.053 --------------------------------------------------------------------- TRV 118.55 4.31 113.18 269.2% Bullish BLUE 111 .036 .111 --------------------------------------------------------------------- UNH 308.52 8.81 298.36 200.9% Bullish BLUE 127 .128 -.039 --------------------------------------------------------------------- UTX 86.01 -5.36 97.15 -958.4% Bullish RED 114 .144 -.564 Bearish --------------------------------------------------------------------- V 193.33 4.31 195.07 -22.6% Bearish BLUE 102 -.012 -.022 --------------------------------------------------------------------- VZ 55.44 .99 55.38 36.6% Bearish BLUE 127 -.044 -.148 --------------------------------------------------------------------- WBA 40.11 .53 42.29 -259.6% Bearish BLUE 85 .023 -.161 --------------------------------------------------------------------- WMT 132.01 2.49 124.44 197.9% Bullish BLUE 85 .156 -.05 --------------------------------------------------------------------- XOM 44.07 1.41 43.14 97.4% Bearish BLUE 44 -.183 -.102 Bearish --------------------------------------------------------------------- DOW 42.44 1.2 40.35 92.1% Bearish BLUE 66 .098 .127 |
Table 2 QUICKSILVER on ETFS - 07/14/20 Bullish = QQQ, RETL, SOXL, TECL, GLD (5)
Bearish =
ITRS + IP21>.25 is considered "Bullish" ETF CLOSE CHANGE PIVOT-PT 5-dma AROC CL-PWR CANDLE IP21 ITRS --------------------------------------------------------------------------------------------- DIA 266.59 5.55 260.72 145.3% ------- BLUE .055 ------ --------------------------------------------------------------------------------------------- SPY 318.92 4.08 316.18 81.5% ------- BLUE .074 .004 --------------------------------------------------------------------------------------------- QQQ 260.37 1.83 259.99 72.2% Bullish BLUE .214 .1 Bullish --------------------------------------------------------------------------------------------- MDY 324.86 5.21 323.28 58.2% Bearish BLUE-.014 -.001 --------------------------------------------------------------------------------------------- IWM 141.83 2.31 141.94 33.4% Bearish BLUE .015 .01 --------------------------------------------------------------------------------------------- FAS 32.27 .88 31.77 201.5% Bearish BLUE-.066 .09 --------------------------------------------------------------------------------------------- RETL 154.9 8.15 159.73 27.3% Bearish BLUE .023 .641 Bullish --------------------------------------------------------------------------------------------- SOXL 208.68 10.5 202.63 347.4% ------- BLUE .069 .755 Bullish --------------------------------------------------------------------------------------------- TECL 248.58 7.39 253.88 112.6% ------- BLUE .139 .566 Bullish --------------------------------------------------------------------------------------------- IBB 140.26 2.91 140.81 7.2% ------- BLUE .14 .037 --------------------------------------------------------------------------------------------- GLD 170.19 .79 170.09 33.9% Bullish BLUE .402 -.058 Bullish --------------------------------------------------------------------------------------------- OIH 119.65 5.91 120.63 -11.1% Bearish BLUE-.141 .062 --------------------------------------------------------------------------------------------- GASL 3440 285 3685 -325.1% ------- RED -.021 -.01 --------------------------------------------------------------------------------------------- |
Table 3 Count of Stocks in Key Directories
20200714
-------------------------------
NEWHIGHS 78
NEWLOWS 44
MAXCP 22
MINCP 48
TTTNH 14
TTTNL 52
FASTUP 80
FASTDOWN 87
CPCROSSA 303
CPCROSSD 16
BIGVOLUP 7
BIGVODN 7
ACCUMVER 3
HIGHIP21 11
HIUPPCT 12
REDSELL 108
AUGSELS7 229
TRAPDOOR 12
|
Table 4 RANKING OF KEY DIRECTORIES BASED PCT.OF STOCKS ABOVE 65-DMA
7/14/20
Bullish = 41
Bearish = 4
---------------------------------------------------------------------------------------
Directory Current day-1 day-2 day-3 day-4 day-5
----------------------------------------------------------------------------------------
COPPER 1 1 1 .875 1 1
ETFS 1 1 1 1 1 1
SOLAR 1 .937 .937 .937 .937 .937
BONDFUND .99 .99 .99 .99 .99 .99
AUTO .974 .897 .871 .846 .897 .948
GOLD .959 .918 .959 .959 .959 .959
HOMEBLDG .941 .882 .882 .882 .882 .941
BIGBANKS .857 .857 .857 .571 .571 .571
GREEN .857 .761 .809 .714 .761 .761
TRANSP .85 .85 .8 .55 .8 .85
NASD-100 .848 .818 .838 .767 .818 .808
NIFTY .844 .8 .822 .822 .822 .822
INDEXES .825 .747 .758 .702 .786 .758
CHINA .823 .843 .843 .823 .901 .862
CHEM .812 .812 .812 .645 .812 .791
INFRA .8 .742 .742 .628 .742 .828
SEMI .8 .76 .81 .84 .8 .8
COMODITY .769 .769 .846 .846 .82 .82
DJI-13 .769 .615 .692 .538 .692 .692
INSURANC .769 .653 .653 .346 .5 .423
ELECTRON .763 .729 .763 .777 .763 .763
GAMING .761 .714 .714 .666 .714 .666
INDMATER .76 .72 .706 .56 .693 .8
FOOD .754 .754 .849 .849 .811 .811
SP-100 .747 .681 .637 .505 .648 .681
SP500 .72 .673 .684 .583 .684 .694
FIDSTKS .717 .661 .677 .57 .689 .677
JETS .714 .642 .714 .571 .857 .928
HACKERS .7 .7 .75 .8 .8 .7
RUS-1000 .682 .638 .65 .545 .657 .671
SOFTWARE .677 .711 .762 .745 .779 .762
DOWJONES .666 .6 .633 .5 .566 .6
RETAIL .64 .6 .58 .58 .7 .68
BIOTECH .635 .606 .682 .679 .719 .706
HOSPITAL .619 .571 .571 .476 .523 .523
COMPUTER .6 .6 .55 .55 .7 .6
UTILITY .564 .487 .512 .384 .435 .435
REIT .56 .539 .581 .453 .638 .652
MILITARY .555 .555 .518 .481 .629 .666
FINANCE .554 .602 .566 .457 .542 .542
BEVERAGE .533 .533 .6 .533 .666 .6
===============================================================================================
EDU .5 .5 .5 .5 .666 .833
===============================================================================================
OILGAS .469 .376 .407 .33 .484 .476
GUNS .4 .4 .4 .4 .466 .466
REGBANKS .307 .307 .269 .115 .269 .23
COAL .285 .285 .285 .285 .285 .285
|
====================================================================
7/13/2020 The Peerless Buy signals remain in effect. That we are
slipping
back into an extremely defensive posture against the pandemic is
disheartening and economically very harmful. The FED will have
to do more for Wall Street, I would expect. Another emergency
aid package for the jobless seems unavoidable. These actions should hold the
DJI above 25000. If they do not, things could unravel very quickly.
But because it is a Presidential Election Year, the odds favor more
stimulus.

Today, the DJI tagged its 3.5% upper band with a very negative V-I and
IP21. But no Sell was given because the DJI closed only 1.1% above
the 21-day ma. I looked back to 2000 to discover what a double-negative
non-confirmation using the day's intra-day high brought. In 13 cases, a decline at
least
to the lower band soon followed, but in 5 instances using such a short sale would
not have worked out. What this suggests to me, at least, is that despite the
FED, there are a lot of big sellers above 26500. As noted before, the
upside for the DIA is strictly limited. The DJI may try to rally a little to
recover some of what it lost today. But another test of 25000 is probably
necessary.
Traders naturally ask how does the market now compare with
the extreme
bear market of 2008. The FED did not intrude until the DJI broke down
in October. 2008 But the final rally before the sell-off took the DJI sidewise
and slightly up until the middle of September. As the market neared the Presidential
Election, a nervousness about a Democrat in the White House hit the market,
just as is likely now in 2020. To the extent such fears move the market, that
still gives us two more months to try to rally higher.
 |
 |
The NASDAQ's decline from its intra-day
highs was even greater.today
than the DJI's. A lot of what I call bearish "red popsicles" have appeared
in the leading V-bottomed high techs, as well as QQQ, shown below. These
are reliable near-term sells on very short-term strength. I would sell QQQ
on a 2% recovery from today's close.

|
Charts 7/13/2020 (Click on Underlined link.) 2020 PEERLESS DJI, Signals, Indicators Daily DJI Volume 10-DayUp/Down Vol Stoch-20 Inverted Traders Index Graph of Pct of All Stocks above 65-dma Cum. Inverted Traders Index NASDAQ S&P OEX NYSE COMPQX DJI-15 DJI-20 DJI-30 DIA QQQ MDY IWM TNA Short-Term Rates SPY http://tigersoft.com/2121CST/SPY.GIF recent 2006 vers-Peerless signals -- http://tigersoft.com/2121CST/VERS06ZY.BMP USO-CrudeOil DBO FAS GLD BBH IBB JETS JNUG KOL NUGT OIH PALL RSX RETL SDS AGQ SLV SOXL TECL TLT TMF TNA UGA (gasoline) USO (oil) and China: YINN CHAU Commodities: CANE CORN DBC JJC, NIB, CHOC CORN, CUT (paper) MOO, SOYB WEAT UUP (Dollar) LIT (Lithium) Stocks AAPL ADBE ALXN AMAT AMGN AMD AMZN AXP BA BABA BAC BIDU BLDP CAT CVX CMG DE ENPH FB GILD GOOG GS HD IBM INTU JPM LRCX M (Macy's) MSFT NEM NFLX NKE NVDA PG REGN SO SQ QCOM QDEL TSLA TXN XOM V VRTX WFC WMT TOWN ZM New highs and Bullish MAXCPs http://tigersoft.com/MAXCP/7-13/BULLISH.htm Bearish MAXCPs - http://tigersoft.com/MINCP/7-13/BEARISH.htm |
Table 1
7/13/2018 QUICKSILVER on DJI-30 STOCKS.
Considering just those stocks whose IP21 + ITRS score is >+.25 or <-.25
0 Bullish (
= ---- 10 Bearish ( CVX IBM UTX XOM
-85 -119 -86 -43
tot. = - 344
----------------------------------------
Vitality Score = -438
Note that AAPL (AI/200=173) now shows highest AI/200 stock here. STOCKS CLOSE CHANGE PIVOT-P 5-dma AROC CL-PWR Candl AI/200 IP21 ITRS --------------------------------------------------------------------------------------- --------------------------------------------------------------------------------------- AAPL 381.91 -1.77 372.69 106.4% Bearish RED 173 -.027 .227 --------------------------------------------------------------------- AXP 93.56 .33 93.01 -161.9% Bearish RED 82 -.086 -.048 --------------------------------------------------------------------- BA 175.65 -2.79 178.88 -341.1% Bearish RED 58 .015 .172 --------------------------------------------------------------------- CAT 130.57 2.56 127.2 44.6% Bearish BLUE 150 -.019 .049 --------------------------------------------------------------------- CSCO 45.93 -.73 45.63 -53% Bearish RED 100 .005 .01 --------------------------------------------------------------------- CVX 85.4 .17 86.31 -184.6% Bearish RED 76 -.23 -.145 Bearish --------------------------------------------------------------------- DIS 116.22 -3.12 113.63 77% ------- RED 79 .095 .001 --------------------------------------------------------------------- GS 208.88 3.32 199.36 37.6% ------- ---- 94 -.048 .066 --------------------------------------------------------------------- HD 249.62 -.49 247.35 1.4% Bearish RED 116 -.096 .062 --------------------------------------------------------------------- IBM 119.2 .85 117.58 -42% Bearish RED 132 -.152 -.124 Bearish --------------------------------------------------------------------- INTC 58.58 -.95 58.31 -81.5% Bearish RED 127 -.003 -.097 --------------------------------------------------------------------- JNJ 145.21 2.84 142.85 78.1% Bearish BLUE 113 .031 -.105 --------------------------------------------------------------------- JPM 97.65 1.38 92.32 141.5% Bearish RED 64 -.14 -.054 --------------------------------------------------------------------- KO 45.25 .1 45.21 2.2% Bearish RED 87 -.08 -.087 --------------------------------------------------------------------- MCD 184.92 .04 185.82 -96.3% Bearish RED 105 -.043 -.087 --------------------------------------------------------------------- MMM 154.8 1.95 154.82 -106.9% Bearish BLUE 111 -.108 -.054 --------------------------------------------------------------------- MRK 77.35 .62 78.72 -143.1% Bearish BLUE 80 -.038 -.098 --------------------------------------------------------------------- MSFT 207.07 -6.6 208.25 -85.6% ------- RED 154 .047 .082 --------------------------------------------------------------------- NKE 96.46 -1.53 97.07 -177.8% Bearish RED 120 -.011 .033 --------------------------------------------------------------------- PFE 35.21 1.38 34.03 103.2% Bearish BLUE 68 -.064 -.155 --------------------------------------------------------------------- PG 124.05 .16 122.22 98.7% Bullish ---- 81 -.18 -.021 --------------------------------------------------------------------- TRV 114.24 .4 112.48 -14.6% Bearish RED 110 -.013 .055 --------------------------------------------------------------------- UNH 299.71 8.48 296.65 -52.4% Bullish BLUE 126 .063 -.049 --------------------------------------------------------------------- UTX 86.01 -5.36 97.15 -958.4% Bullish RED 114 .144 -.514 --------------------------------------------------------------------- V 189.02 -3.53 194.2 -224.8% Bearish RED 102 -.038 -.016 --------------------------------------------------------------------- VZ 54.45 -.04 55.04 -72.1% Bearish RED 128 -.054 -.125 --------------------------------------------------------------------- WBA 39.58 -.54 42.22 -432.8% Bearish RED 85 -.017 -.159 --------------------------------------------------------------------- WMT 129.52 -1.16 126.95 422.7% Bullish RED 84 .095 -.008 --------------------------------------------------------------------- XOM 42.66 .01 43.24 -201.4% Bearish RED 44 -.223 -.155 Bearish --------------------------------------------------------------------- DOW 41.24 .48 41.69 -147.8% Bearish BLUE 66 .084 .051 |
Table 2 QUICKSILVER on ETFS - 07/13/20 Bullish = RETL, SOXL, TECL, GLD (4)
Bearish =
ITRS + IP21>.25 is considered "Bullish" ETF CLOSE CHANGE PIVOT-PT 5-dma AROC CL-PWR CANDLE IP21 ITRS --------------------------------------------------------------------------------------------- DIA 261.04 .22 259.04 -37.7% Bearish RED .005 0 --------------------------------------------------------------------------------------------- SPY 314.84 -2.75 313.78 -35% Bearish RED .041 .011 --------------------------------------------------------------------------------------------- QQQ 258.54 -5.43 256.61 2.9% ------- RED .134 .108 --------------------------------------------------------------------------------------------- MDY 319.65 -3.36 321.12 -119.2% Bearish RED -.042 -.007 --------------------------------------------------------------------------------------------- IWM 139.52 -1.79 140.89 -138.3% Bearish RED -.003 -.003 --------------------------------------------------------------------------------------------- FAS 31.39 -.56 31.01 -221.9% Bearish RED -.057 -.004 --------------------------------------------------------------------------------------------- RETL 146.75 -10.51 154.06 -397.4% Bearish RED .007 .444 Bullish --------------------------------------------------------------------------------------------- SOXL 198.18 -10.41 194.58 -95% Bearish RED .021 .439 Bullish --------------------------------------------------------------------------------------------- TECL 241.19 -15.55 242.94 -182.8% Bearish RED .076 .426 Bullish --------------------------------------------------------------------------------------------- IBB 137.35 -1.86 140.06 -74.6% Bearish RED .079 .034 --------------------------------------------------------------------------------------------- GLD 169.4 .21 169.04 42% Bullish RED .33 -.007 Bullish --------------------------------------------------------------------------------------------- OIH 113.74 -2.62 119.91 -450.4% Bearish RED -.203 -.037 --------------------------------------------------------------------------------------------- GASL 3440 285 3685 -325.1% ------- RED -.021 .04 --------------------------------------------------------------------------------------------- |
Table 3 Count of Stocks in Key Directories
20200713
-------------------------------
NEWHIGHS 229
NEWLOWS 30
MAXCP 11
MINCP 133
TTTNH 7
TTTNL 122
FASTUP 58
FASTDOWN 157
CPCROSSA 25
CPCROSSD 258
BIGVOLUP 9
BIGVODN 12
ACCUMVER 3
HIGHIP21 5
HIUPPCT 12
REDSELL 113
AUGSELS7 285
TRAPDOOR 27
|
Table 4 RANKING OF KEY DIRECTORIES BASED PCT.OF STOCKS ABOVE 65-DMA
7/13/20
Bullish = 40
Bearish = 5
---------------------------------------------------------------------------------------
Directory Current day-1 day-2 day-3 day-4 day-5
----------------------------------------------------------------------------------------
COPPER 1 1 .875 1 1 1
ETFS 1 1 1 1 1 1
BONDFUND .99 .99 .99 .99 .99 .98
SOLAR .937 .937 .937 .937 .937 .937
GOLD .918 .959 .959 .959 .959 .938
AUTO .897 .871 .846 .897 .948 1
HOMEBLDG .882 .882 .882 .882 .941 .941
BIGBANKS .857 .857 .571 .571 .571 .571
TRANSP .85 .8 .55 .8 .85 .95
CHINA .843 .843 .823 .901 .862 .882
NASD-100 .818 .848 .777 .818 .808 .878
CHEM .812 .812 .645 .812 .791 .854
NIFTY .8 .822 .822 .822 .822 .844
COMODITY .769 .846 .846 .82 .82 .794
GREEN .761 .809 .714 .761 .761 .857
SEMI .76 .81 .84 .8 .8 .84
FOOD .754 .849 .849 .811 .811 .792
INDEXES .747 .758 .702 .786 .764 .82
INFRA .742 .742 .628 .742 .828 .885
ELECTRON .734 .768 .782 .768 .768 .816
INDMATER .72 .706 .56 .693 .8 .84
SOFTWARE .716 .766 .733 .766 .75 .866
GAMING .714 .714 .666 .714 .666 .857
HACKERS .7 .8 .8 .8 .7 .75
SP-100 .681 .637 .505 .648 .681 .758
SP500 .673 .686 .583 .684 .698 .789
FIDSTKS .661 .677 .57 .689 .677 .774
INSURANC .653 .653 .346 .5 .423 .846
JETS .642 .714 .571 .857 .928 1
RUS-1000 .638 .651 .545 .657 .674 .769
DJI-13 .615 .692 .538 .692 .692 .692
FINANCE .602 .566 .457 .542 .542 .71
BIOTECH .601 .679 .677 .719 .721 .732
COMPUTER .6 .55 .55 .7 .6 .7
DOWJONES .6 .633 .5 .566 .6 .633
RETAIL .6 .58 .58 .7 .68 .74
HOSPITAL .571 .571 .476 .571 .523 .571
MILITARY .555 .518 .481 .629 .666 .777
REIT .539 .581 .453 .638 .652 .808
BEVERAGE .533 .6 .533 .666 .6 .666 |
============================================================================================
EDU .5 .5 .5 .666 .833 1
===========================================================================================
UTILITY .487 .512 .384 .435 .435 .512
GUNS .4 .4 .4 .466 .466 .6
OILGAS .376 .407 .33 .484 .476 .538
REGBANKS .307 .269 .115 .269 .269 .5
COAL .285 .285 .285 .285 .285 .285
|
====================================================================
7/10/2020 What will the FED do for its next encore announcement to bolster
the
market? Buying Index ETFs must not be ruled out before this is all over..
Peerless remains on Buys and the V-bottomed QQQ, NASDAQ, AAPL
other bullish MAXCP high techs should be used instead of DIA as your
investment instruments. The DJI keep under-performing QQQ, whose ITRS
has almost reached a level that is reminscent of its historic take-off
in 1999-2000. Meanwhile the DJIA' IP21 and V-I are very negative,
making any rally back up to 27000, the level at which new Peerless Sells
will become likely.


There are lots of bears, still. No problem... You've all heard how the market loves
to climb "a wall of worry". It's important also not to be spooked too much
about
FED manipulation in the short-term. Prices are mostly uptrending. That
more speculative NASDAQ high techs are doing do well should be bullishly
construed, at least for them.
As for manipulation, that is the wrong
question. Which way? That's the better
question.
Sure, we could point out the low volume, the big jump on a Friday when many
ltraders are absent and the many leaps upward before most openings when narkets
are most thin. We might even gripe about the suspiciously steady rises after
an early sell. This could well be construed as a sign of computerized
'wash-trading",
where the same few big traders swap the big ETFs' shares back and forth at higher
and higher prices. Yes, we could complain that all this is manipulation, all done
with the insider knowledge that the Fed will make another bullish announcement
about its QE-Infinity programs.
But why complain? The truth is, we can make money trading the present trend
until Peerless tells us to get out. Ever since people started trading stocks, the
"little guy" far away from New York's inner circles of high finance has always
complained. Yes, knowledge IS power and it is also profits. But illegal or
immoral, manipulation is the way the game is played. At least, we are not
at the mercy of Wall Street, we can make sense of it using technical analysis.
And we can profit from its trends. Right now the trend is up and Peerless is
on a Buy. Boil things down to this is my advise.
And when you think about it, what choice does the Fed have? If the
DJIA-30 blue chips break down below 25000, what will happen to the
market and then the economy. The decline in both will likely get much
uglier, as trend-players run for cover. The rally is important. Without the
money that the affluent are making in this rally and the 401Ks that are
holding up well, how could the economy possibly hold up? Until there is a
vaccine and ample testing to show the risks of being in crowds, at work or in
classrooms are acceptable, it will be very hard to get the "real" economic
recovery on a firm footing.
What will the FED then do when the economy is advancing strongly? Well,
that's a question for another day....
|
Charts 7/10/2020 (Click on Underlined link.) 2020 PEERLESS DJI, Signals, Indicators Daily DJI Volume 10-DayUp/Down Vol Stoch-20 Inverted Traders Index Graph of Pct of All Stocks above 65-dma Cum. Inverted Traders Index NASDAQ S&P OEX NYSE COMPQX DJI-15 DJI-20 DJI-30 DIA QQQ MDY IWM TNA Short-Term Rates SPY http://tigersoft.com/2121CST/SPY.GIF recent 2006 vers-Peerless signals -- http://tigersoft.com/2121CST/VERS06ZY.BMP USO-CrudeOil DBO FAS GLD BBH IBB JETS JNUG KOL NUGT OIH PALL RSX RETL SDS AGQ SLV SOXL TECL TLT TMF TNA UGA (gasoline) USO (oil) and China: YINN CHAU Commodities: CANE CORN DBC JJC, NIB, CHOC CORN, CUT (paper) MOO, SOYB WEAT UUP (Dollar) LIT (Lithium) Stocks AAPL ADBE ALXN AMAT AMGN AMD AMZN AXP BA BABA BAC BIDU BLDP CAT CVX CMG DE ENPH FB GILD GOOG GS HD IBM INTU JPM LRCX M (Macy's) MSFT NEM NFLX NKE NVDA PG REGN SO SQ QCOM QDEL TSLA TXN XOM V VRTX WFC WMT TOWN ZM New highs and Bullish MAXCPs http://tigersoft.com/MAXCP/7-10/BULLISH.htm Bearish MAXCPs - http://tigersoft.com/MINCP/7-10/BEARISH.htm |
Table 1
7/10/2018 QUICKSILVER on DJI-30 STOCKS.
Considering just those stocks whose IP21 + ITRS score is >+.25 or <-.25
1 Bullish (
= ----
10 Bearish ( CVX IBM JPM MMM MRK PFE UTX XOM
-85 -118 -96 -153 -155 -34 -86 -43
tot. = - 770
----------------------------------------
Vitality Score = -438
Note that AAPL now shows highest AI/200 stock here. STOCKS CLOSE CHANGE PIVOT-P 5-dma AROC CL-PWR Candl AI/200 IP21 ITRS --------------------------------------------------------------------------------------- --------------------------------------------------------------------------------------- AAPL 383.68 .95 373.85 261% ------- BLUE 174 -.034 .275 --------------------------------------------------------------------- AXP 93.23 2.66 96.58 -58.8% Bearish BLUE 82 -.124 -.088 --------------------------------------------------------------------- BA 178.44 5.16 187.91 -65.8% Bearish BLUE 58 -.019 .225 --------------------------------------------------------------------- CAT 128.01 2.28 129.43 11.4% Bearish BLUE 151 -.104 .008 --------------------------------------------------------------------- CSCO 46.66 -.04 46.42 111.9% Bearish RED 100 -.04 .018 --------------------------------------------------------------------- CVX 85.23 2.49 88.57 -178.1% Bearish BLUE 77 -.279 -.158 Bearish --------------------------------------------------------------------- DIS 119.34 2.53 114.43 312% ------- BLUE 78 .06 .005 --------------------------------------------------------------------- GS 205.56 8.73 207.36 203.3% ------- BLUE 95 -.093 .023 --------------------------------------------------------------------- HD 250.11 2.15 249.55 32.4% Bearish BLUE 117 -.115 .069 --------------------------------------------------------------------- IBM 118.35 2.64 120.19 -57.1% Bearish BLUE 133 -.221 -.139 Bearish --------------------------------------------------------------------- INTC 59.53 1.11 59.54 34% ------- BLUE 128 -.021 -.095 --------------------------------------------------------------------- JNJ 142.37 -.12 142.98 49.1% Bearish RED 113 -.055 -.111 --------------------------------------------------------------------- JPM 96.27 4.99 95 194.3% Bearish BLUE 65 -.189 -.075 Bearish --------------------------------------------------------------------- KO 45.15 1.24 45.23 30.1% Bearish BLUE 88 -.136 -.1 --------------------------------------------------------------------- MCD 184.88 .55 188.5 36.6% Bearish BLUE 105 -.053 -.074 --------------------------------------------------------------------- MMM 152.85 1.4 158.1 -135% Bearish BLUE 112 -.171 -.08 Bearish --------------------------------------------------------------------- MRK 76.73 .04 79.58 -130.8% Bearish ---- 80 -.09 -.108 --------------------------------------------------------------------- MSFT 213.67 -.65 210.7 176% Bullish BLUE 154 .02 .146 --------------------------------------------------------------------- NKE 97.99 1 99.95 -22.4% ------- BLUE 120 -.043 .054 --------------------------------------------------------------------- PFE 33.83 .37 34.51 -99.8% Bearish BLUE 68 -.158 -.171 Bearish --------------------------------------------------------------------- PG 123.89 1.41 121.63 123.3% ------- BLUE 82 -.209 0 --------------------------------------------------------------------- TRV 113.84 3.8 114.57 61.3% Bearish BLUE 110 -.095 .016 --------------------------------------------------------------------- UNH 291.23 .07 302.81 -118.2% Bearish RED 125 -.026 -.046 --------------------------------------------------------------------- UTX 86.01 -5.36 97.15 -958.4% Bullish RED 114 .144 -.499 Bearish --------------------------------------------------------------------- V 192.55 .34 197.76 -80% Bearish BLUE 102 -.058 .001 --------------------------------------------------------------------- VZ 54.49 .55 55.24 -27.3% Bearish BLUE 129 -.114 -.121 --------------------------------------------------------------------- WBA 40.12 1.11 43.16 -222.9% Bearish BLUE 86 -.023 -.174 --------------------------------------------------------------------- WMT 130.68 2.93 118.89 464.6% Bullish BLUE 84 .111 -.001 --------------------------------------------------------------------- XOM 42.65 1.29 44.39 -165.3% Bearish BLUE 44 -.281 -.16 Bearish --------------------------------------------------------------------- DOW 40.76 1.32 42.45 -101% Bearish BLUE 66 .009 .029 |
Table 2 QUICKSILVER on ETFS - 07/10/20 Bullish = QQQ RETL, SOXL, TECL, GLD (5)
Bearish = OIH(1)
ITRS + IP21>.25 is considered "Bullish" ETF CLOSE CHANGE PIVOT-PT 5-dma AROC CL-PWR CANDLE IP21 ITRS --------------------------------------------------------------------------------------------- DIA 260.82 3.58 263 46.2% Bearish BLUE-.08 0 --------------------------------------------------------------------------------------------- SPY 317.59 3.21 317.05 85.2% Bearish BLUE-.015 .025 --------------------------------------------------------------------------------------------- QQQ 263.97 1.79 258.39 228.4% Bullish BLUE .107 .147 Bullish --------------------------------------------------------------------------------------------- MDY 323.01 4.55 327.34 -14.1% Bearish BLUE-.049 -.014 --------------------------------------------------------------------------------------------- IWM 141.31 2.24 143.43 -38.5% Bearish BLUE-.051 -.015 --------------------------------------------------------------------------------------------- FAS 31.95 1.77 32.79 62% Bearish BLUE-.123 -.044 --------------------------------------------------------------------------------------------- RETL 157.26 6.17 159.17 193.8% Bearish BLUE-.038 .393 Bullish --------------------------------------------------------------------------------------------- SOXL 208.59 -2.1 202.05 540.1% ------- RED -.028 .366 Bullish --------------------------------------------------------------------------------------------- TECL 256.74 -.35 250.41 381.4% ------- BLUE .024 .514 Bullish --------------------------------------------------------------------------------------------- IBB 139.21 -1.36 139.44 23.9% Bearish RED .074 .048 --------------------------------------------------------------------------------------------- GLD 169.19 -.44 167.98 65.5% Bullish RED .328 -.012 Bullish --------------------------------------------------------------------------------------------- OIH 116.36 3.22 124.45 -159.2% Bearish BLUE-.219 -.037 Bearish --------------------------------------------------------------------------------------------- GASL 3440 285 3685 -325.1% ------- RED -.021 .055 --------------------------------------------------------------------------------------------- |
Table 3 Count of Stocks in Key Directories
20200710
-------------------------------
NEWHIGHS 196
NEWLOWS 24
MAXCP 41
MINCP 27
TTTNH 10
TTTNL 24
FASTUP 113
FASTDOWN 80
CPCROSSA 58
CPCROSSD 51
BIGVOLUP 6
BIGVODN 4
ACCUMVER 3
HIGHIP21 3
HIUPPCT 19
REDSELL 113
AUGSELS7 282
TRAPDOOR 30
|
RANKING OF KEY DIRECTORIES BASED PCT.OF STOCKS ABOVE 65-DMA
7/10/20
Bullish = 41
Bearish = 4
---------------------------------------------------------------------------------------
Directory Current day-1 day-2 day-3 day-4 day-5
----------------------------------------------------------------------------------------
COPPER 1 .875 1 1 1 1
ETFS 1 1 1 1 1 1
BONDFUND .99 .99 .99 .99 .98 .98
GOLD .959 .959 .959 .959 .938 .918
SOLAR .937 .937 .937 .937 .937 .937
HOMEBLDG .882 .882 .882 .941 .941 .941
AUTO .871 .846 .897 .948 1 1
BIGBANKS .857 .571 .571 .571 .714 .571
FOOD .849 .849 .811 .811 .792 .811
NASD-100 .848 .787 .828 .808 .898 .838
COMODITY .846 .846 .82 .82 .794 .82
CHINA .843 .823 .901 .862 .882 .764
NIFTY .822 .822 .822 .822 .844 .844
CHEM .816 .653 .816 .795 .857 .857
SEMI .81 .84 .8 .8 .84 .82
GREEN .809 .714 .761 .761 .904 .809
HACKERS .8 .85 .8 .7 .8 .7
TRANSP .8 .55 .8 .85 .95 .9
ELECTRON .763 .777 .763 .763 .81 .797
SOFTWARE .762 .745 .779 .762 .881 .813
INDEXES .758 .702 .786 .764 .82 .792
INFRA .742 .628 .742 .828 .885 .885
GAMING .714 .666 .714 .666 .904 .809
JETS .714 .571 .857 .928 1 .928
INDMATER .706 .56 .693 .8 .84 .813
DJI-13 .692 .538 .692 .692 .692 .615
SP500 .686 .585 .684 .698 .804 .751
FIDSTKS .677 .57 .689 .677 .796 .745
BIOTECH .674 .674 .716 .721 .742 .734
INSURANC .653 .346 .5 .423 .846 .692
RUS-1000 .651 .546 .657 .674 .783 .734
SP-100 .637 .505 .648 .681 .791 .67
DOWJONES .633 .5 .566 .6 .666 .533
BEVERAGE .6 .533 .666 .6 .733 .6
REIT .581 .453 .638 .652 .815 .815
RETAIL .58 .58 .7 .68 .74 .7
HOSPITAL .571 .476 .571 .571 .571 .476
FINANCE .566 .457 .542 .542 .734 .686
COMPUTER .55 .55 .7 .6 .8 .7
MILITARY .518 .481 .629 .666 .814 .814
UTILITY .512 .384 .435 .435 .538 .538
======================================================================================================
EDU .5 .5 .666 .833 1 1
======================================================================================================
OILGAS .407 .33 .484 .476 .546 .53
GUNS .4 .4 .466 .466 .666 .6
COAL .285 .285 .285 .285 .285 .285
REGBANKS .269 .115 .269 .269 .5 .5
|
========================================================================
7/9/2020
Can the Fed really plug all the holes in the Stock Market?

This is one of those times when it is not accurate to speak of one "Wall
Street".
Around 1900, there was such a gap between the Morgan Democrats and the
Rockerfeller Republicans. In 1930-1931, the WASP Wall Street bankers did
war against the the Jewish NY bankers. Hoover also blamed the latter for forming
short-selling pools in 1931 and 1932..
Now we see a quickly widening divergence between the weak DJI blue chips
and the the most heavily capitalized big growth stocks that comprise the NASDAQ
and QQQ. This divergence was also very wide in 1967-1968 and also in the
first half of 1977. A deep bear market did not begin until interest rates were
raised
very aggressively in early 1969 and the NASDAQ held up for six months while the
DJI was falling in 1977..
We measure this divergence with our "ITRS" Indicator. See at the bottom
what
happened in the two occasions since 1992 when the ITRS indicator rose above
+.16 for the NASDAQ and QQQ. In the first instance, October 1998, the QQQ
rose nearly 20%. In the second case, 1999, the QQQ rose nearly 100%.
Given all these cases when the NASDAQ took over the
leadership of the "market",
let's give the QQQ ample chance to go into vertical ascent. Let's not yet sell it.

The operative Peerless signals are a series of buys following
each test of 25000.
Despite this, I have suggested we not buy DIA, first, because QQQ was so
much stronger and, second, because of the weak internals of the DJIA, particularly
the IP21 and V-Indicator. Those indicators have only gotten worse, as has the
DIA's Closing Power and the Vitality Index for the DJI-30 stocks. So far, the
NYSE A/D Line has been in an uptrend. But it could give way tomorrow if there was
a broad decline tomorrow. This would not be an unexpected development given
past Seasonality and the uncertainty about what a Biden Presidency might mean.

The single exception about the DJI's internal strength
indicators being weak is the rising Cumulative Inverted MKDS.
Volume on the NYSE continues to be higher in the advancing stocks.
This lends hope to the view that the current decline will not lead to
a big break in the market.

But what is most scary about the blue chips is how extremely vulnerable the
big banks look. Now they are not alone. See General Motors and Exxon
below. Again short some of the bearish MINCPs as a hedge while holding
the V-Bottom high techs, QQQ, NASDAQ, IBB and GLD.
 |
 |
 |
 |
 |
 |
 |
|
Charts 7/9/2020 (Click on Underlined link.) 2020 PEERLESS DJI, Signals, Indicators Daily DJI Volume 10-DayUp/Down Vol Stoch-20 Inverted Traders Index Graph of Pct of All Stocks above 65-dma Cum. Inverted Traders Index NASDAQ S&P OEX NYSE COMPQX DJI-15 DJI-20 DJI-30 DIA QQQ MDY IWM TNA Short-Term Rates SPY http://tigersoft.com/2121CST/SPY.GIF recent 2006 vers-Peerless signals -- http://tigersoft.com/2121CST/VERS06UU.BMP USO-CrudeOil DBO FAS GLD BBH IBB JETS JNUG KOL NUGT OIH PALL RSX RETL SDS AGQ SLV SOXL TECL TLT TMF TNA UGA (gasoline) USO (oil) and China: YINN CHAU Commodities: CANE CORN DBC JJC, NIB, CHOC CORN, CUT (paper) MOO, SOYB WEAT UUP (Dollar) LIT (Lithium) Stocks AAPL ADBE ALXN AMAT AMGN AMD AMZN AXP BA BABA BAC BIDU BLDP CAT CVX CMG DE ENPH FB GILD GOOG GS HD IBM INTU JPM LRCX M (Macy's) MSFT NEM NFLX NKE NVDA PG REGN SO SQ QCOM QDEL TSLA TXN XOM V VRTX WFC WMT TOWN ZM New highs and Bullish MAXCPs http://tigersoft.com/MAXCP/7-9/BULLISH.htm Bearish MAXCPs - http://tigersoft.com/MINCP/7-9/BEARISH.htm |
Table 1
7/9/2018 QUICKSILVER on DJI-30 STOCKS.
Considering just those stocks whose IP21 + ITRS score is >+.25 or <-.25
1 Bullish ( AAPL
383 = +383
10 Bearish ( CVX IBM KO JPM MMM MRK PFE UTX VZ WBA XOM
-83 -116 -44 -91 -155 -78 -34 -86 -54 -39 -41
tot. = - 821
----------------------------------------
Vitality Score = -438
Note that AAPL now shows highest AI/200 stock here. STOCKS CLOSE CHANGE PIVOT-P 5-dma AROC CL-PWR Candl AI/200 IP21 ITRS --------------------------------------------------------------------------------------- --------------------------------------------------------------------------------------- AAPL 382.73 1.36 364.11 250.8% ------- RED 175 -.029 .307 Bullish --------------------------------------------------------------------- AXP 90.57 -2.33 94.33 -184.8% Bearish RED 82 -.204 -.04 --------------------------------------------------------------------- BA 173.28 -6.8 180.81 -193.8% Bearish RED 59 -.061 .253 --------------------------------------------------------------------- CAT 125.73 -2.4 127.72 -12.9% Bearish RED 152 -.143 .022 --------------------------------------------------------------------- CSCO 46.7 .89 45.63 69.7% Bearish BLUE 101 -.051 .032 --------------------------------------------------------------------- CVX 82.74 -3.61 88.31 -279.1% Bearish RED 78 -.359 -.147 Bearish --------------------------------------------------------------------- DIS 116.81 .15 112.18 166.7% Bearish BLUE 77 .001 .033 --------------------------------------------------------------------- GS 196.83 -5.42 197.4 -18.4% Bearish RED 96 -.181 -.014 --------------------------------------------------------------------- HD 247.96 -1.21 248.5 -3.8% Bearish RED 118 -.177 .072 --------------------------------------------------------------------- IBM 115.71 -2 119.7 -119.2% Bearish RED 134 -.291 -.151 Bearish --------------------------------------------------------------------- INTC 58.42 -.19 59.13 -33.1% Bearish BLUE 129 -.031 -.073 --------------------------------------------------------------------- JNJ 142.49 -.78 140.97 74.2% Bearish RED 114 -.081 -.126 --------------------------------------------------------------------- JPM 91.28 -2.02 92.66 -106.1% Bearish RED 66 -.281 -.109 Bearish --------------------------------------------------------------------- KO 43.91 -1.16 44.88 -101% Bearish RED 89 -.21 -.128 Bearish --------------------------------------------------------------------- MCD 184.33 -1.52 183.52 -8.9% Bearish RED 105 -.116 -.076 --------------------------------------------------------------------- MMM 151.45 -3.13 157.04 -127.6% Bearish RED 113 -.236 -.106 Bearish --------------------------------------------------------------------- MRK 76.69 -1.23 78.78 -90.9% Bearish RED 80 -.086 -.122 --------------------------------------------------------------------- MSFT 214.32 1.49 206.26 230.6% Bullish RED 154 .027 .195 --------------------------------------------------------------------- NKE 96.99 -1.85 98.43 -20.8% Bearish RED 120 -.08 .025 --------------------------------------------------------------------- PFE 33.46 -.29 34.51 -41% Bearish RED 69 -.2 -.184 Bearish --------------------------------------------------------------------- PG 122.48 -.41 120.88 102.9% Bearish RED 83 -.215 -.019 --------------------------------------------------------------------- TRV 110.04 -3.14 112.46 -108.8% Bearish RED 110 -.195 -.012 --------------------------------------------------------------------- UNH 291.16 -7.2 298.26 -110% Bearish RED 125 -.041 -.057 --------------------------------------------------------------------- UTX 86.01 -5.36 97.15 -958.4% Bullish RED 114 .144 -.508 Bearish --------------------------------------------------------------------- V 192.21 -2.86 195.67 -40.2% Bearish RED 102 -.096 .055 --------------------------------------------------------------------- VZ 53.94 -1.44 54.79 -66.3% Bearish RED 130 -.135 -.134 Bearish --------------------------------------------------------------------- WBA 39.01 -3.28 41.98 -222.1% Bearish RED 87 -.124 -.193 Bearish --------------------------------------------------------------------- WMT 127.75 3.31 119.21 330.8% ------- BLUE 84 .025 -.069 --------------------------------------------------------------------- XOM 41.36 -1.78 44.08 -268.8% Bearish RED 44 -.367 -.147 Bearish --------------------------------------------------------------------- DOW 39.44 -.91 41.59 -158.3% Bearish RED 66 -.042 .033 |
Table 2 QUICKSILVER on ETFS - 07/08/20 Bullish = RETL, SOXL, TECL, GLD (4)
Bearish = (0)
ITRS + IP21>.25 is considered "Bullish" ETF CLOSE CHANGE PIVOT-PT 5-dma AROC CL-PWR CANDLE IP21 ITRS --------------------------------------------------------------------------------------------- DIA 260.72 1.68 257.31 55% Bearish BLUE-.142 ----- --------------------------------------------------------------------------------------------- SPY 316.18 2.4 310.52 125.2% Bearish BLUE-.084 .021 --------------------------------------------------------------------------------------------- QQQ 259.99 3.38 250.49 244.8% Bullish BLUE .06 .126 --------------------------------------------------------------------------------------------- MDY 323.28 2.16 322.38 -18.7% Bearish BLUE-.123 .02 --------------------------------------------------------------------------------------------- IWM 141.94 1.05 141.82 -43.6% Bearish BLUE-.126 .035 --------------------------------------------------------------------------------------------- FAS 31.77 .76 31.51 75.9% Bearish BLUE-.205 .056 --------------------------------------------------------------------------------------------- RETL 159.73 5.67 146.87 469.7% Bearish BLUE-.145 .595 Bullish --------------------------------------------------------------------------------------------- SOXL 202.63 8.05 180.34 378.6% Bearish BLUE-.056 .478 Bullish --------------------------------------------------------------------------------------------- TECL 253.88 10.94 233.57 438.2% ------- BLUE-.005 .594 Bullish --------------------------------------------------------------------------------------------- IBB 140.81 .75 137.37 148.8% ------- RED .028 .024 --------------------------------------------------------------------------------------------- GLD 170.09 1.05 166.62 81.1% Bullish RED .397 -.028 Bullish --------------------------------------------------------------------------------------------- OIH 120.63 .72 118.44 -51.7% Bearish RED -.226 .178 --------------------------------------------------------------------------------------------- GASL 3440 285 3685 -325.1% ------- RED -.021 .033 --------------------------------------------------------------------------------------------- QUICKSILVER on ETFS - 07/09/20 ETF CLOSE CHANGE PIVOT-PT 5-dma AROC CL-PWR CANDLE IP21 ITRS --------------------------------------------------------------------------------------------- DIA 257.24 -3.48 258.42 -1.3% Bearish RED -.15 0 --------------------------------------------------------------------------------------------- BA 173.28 -6.8 180.81 -193.8% Bearish RED -.061 .253 --------------------------------------------------------------------------------------------- SPY 314.38 -1.8 312.23 61.5% Bearish RED -.068 .033 --------------------------------------------------------------------------------------------- QQQ 262.18 2.19 252.19 228.7% Bullish BLUE .073 .173 --------------------------------------------------------------------------------------------- MDY 318.46 -4.82 323.92 -60.6% Bearish RED -.123 .005 --------------------------------------------------------------------------------------------- IWM 139.07 -2.87 142.4 -96.8% Bearish RED -.133 .01 --------------------------------------------------------------------------------------------- FAS 30.18 -1.59 31.56 -209.6% Bearish RED -.218 -.012 --------------------------------------------------------------------------------------------- RETL 151.09 -8.64 151.25 136.8% Bearish RED -.138 .462 --------------------------------------------------------------------------------------------- SOXL 210.69 8.06 187.05 784.9% Bearish BLUE-.054 .579 --------------------------------------------------------------------------------------------- TECL 257.09 3.21 237.79 482.5% ------- RED .004 .701 --------------------------------------------------------------------------------------------- IBB 140.57 -.24 138.54 114.9% ------- RED .072 .059 --------------------------------------------------------------------------------------------- GLD 169.63 -.46 166.98 89.5% Bullish RED .389 -.012 --------------------------------------------------------------------------------------------- OIL 169.63 -.46 166.98 89.5% ------- RED .401 25.232 --------------------------------------------------------------------------------------------- OIH 113.14 -7.49 120.17 -219.5% Bearish RED -.293 .061 --------------------------------------------------------------------------------------------- GASL 3440 285 3685 -325.1% ------- RED -.021 .046 --------------------------------------------------------------------------------------------- UGA 3440 285 3685 -325.1% ------- RED -.311 203.573 --------------------------------------------------------------------------------------------- UUP 25.98 -.06 26.26 -53.5% ------- -----.019 -.088 --------------------------------------------------------------------------------------------- IEF 25.98 -.06 26.26 -53.5% Bullish ---- .165 -.853 --------------------------------------------------------------------------------------------- CORN 25.98 -.06 26.26 -53.5% ------- ---- .046 1.096 --------------------------------------------------------------------------------------------- WEAT 25.98 -.06 26.26 -53.5% ------- ---- .076 3.92 --------------------------------------------------------------------------------------------- YINN 25.98 -.06 26.26 -53.5% ------- ---- .065 1.148 --------------------------------------------------------------------------------------------- RSX 21.42 -.04 21.22 117.9% Bearish RED -.091 .082 |
Count of Stocks in Key Directories
20200709
-------------------------------
NEWHIGHS 251
NEWLOWS 51 (+23)
MAXCP 36
MINCP 442
TTTNH 13
TTTNL 304
FASTUP 143
FASTDOWN 183
CPCROSSA 10
CPCROSSD 139
BIGVOLUP 7
BIGVODN 10
ACCUMVER 3
HIGHIP21 7
HIUPPCT 21
REDSELL 104
AUGSELS7 380
TRAPDOOR 32
|
RANKING OF KEY DIRECTORIES BASED PCT.OF STOCKS ABOVE 65-DMA 7/9/20 Bullish = 32 Bearish = 12 --------------------------------------------------------------------------------------- Directory Current day-1 day-2 day-3 day-4 day-5 ---------------------------------------------------------------------------------------- ETFS 1 1 1 1 1 1 BONDFUND .99 .99 .99 .98 .98 .98 GOLD .959 .959 .959 .938 .938 .959 SOLAR .937 .937 .937 .937 .937 1 HOMEBLDG .882 .882 .941 .941 .941 .941 COPPER .875 1 1 1 1 1 HACKERS .85 .85 .7 .8 .7 .65 FOOD .849 .811 .811 .792 .811 .811 AUTO .846 .897 .948 1 1 .974 COMODITY .846 .82 .82 .794 .82 .82 SEMI .84 .8 .8 .84 .83 .82 CHINA .823 .901 .862 .882 .784 .705 NIFTY .822 .822 .822 .844 .844 .866 NASD-100 .787 .838 .818 .898 .838 .828 ELECTRON .777 .763 .763 .81 .804 .783 SOFTWARE .745 .779 .762 .881 .813 .813 GREEN .714 .761 .761 .904 .809 .761 INDEXES .702 .786 .764 .82 .814 .82 BIOTECH .669 .713 .719 .742 .742 .727 GAMING .666 .714 .666 .904 .809 .809 CHEM .653 .816 .795 .857 .857 .836 INFRA .628 .742 .828 .885 .885 .828 SP500 .585 .686 .698 .804 .76 .736 RETAIL .58 .7 .68 .74 .72 .74 BIGBANKS .571 .571 .571 .714 .571 .571 JETS .571 .857 .928 1 1 .857 FIDSTKS .57 .689 .677 .796 .757 .745 INDMATER .56 .693 .8 .84 .813 .773 COMPUTER .55 .7 .6 .8 .7 .75 TRANSP .55 .8 .85 .95 .9 .9 RUS-1000 .546 .658 .674 .783 .741 .727 DJI-13 .538 .692 .692 .692 .692 .692 BEVERAGE .533 .666 .6 .733 .666 .6 SP-100 .505 .648 .681 .791 .692 .67 ============================================================================================== DOWJONES .5 .566 .6 .666 .566 .566 EDU .5 .666 .833 1 1 1 ============================================================================================== MILITARY .481 .629 .666 .814 .814 .777 HOSPITAL .476 .571 .571 .619 .476 .523 FINANCE .457 .542 .542 .734 .686 .686 REIT .453 .638 .652 .815 .815 .822 GUNS .4 .466 .466 .666 .6 .533 UTILITY .384 .435 .435 .538 .538 .538 INSURANC .346 .5 .423 .846 .692 .73 OILGAS .33 .484 .476 .546 .53 .53 COAL .285 .285 .285 .285 .285 .285 REGBANKS .115 .269 .269 .5 .5 .5 |
========================================================================
7/8/2020 Peerless remains on a Buy, but our most important
internals for the DJI are now
negative and worsening. Only AAPL and BA are holding the DJI up. Eleven of
the 30 DJI stocks now show "bearish" readings in which the sum of the IP21 and
ITRS
are below -.25. Of particular
concern are the big banks (BAC, JPM and WFC). They
show heavy red distribution and very weak Closing Powers. Clearly stimulus money
is being used to short them. So, it remains an open question if the FED can simply
buy more bonds and thereby hold them up. At the same time, the
"V"-bottomed
tech leaders are being bought by aggressive performance funds and speculators
who sense the FED has no choice but to keep trying to boost the market using
its QE-Infinity techniques. The contradictions in this desperate approach are
obvious
but, at this same, seem unavoidable. So, my view is that we may see a spectacular
vertical ascent in the QQQ and the NASDAQ. I mentioned a few nights ago that
an ITRS reading above +.15 in the QQQ and NASDAQ would be the likely sign that the
take-off is beginning. On the otherhand, I fear that a completed DJI head/shoulders
with a DJI breakdown below 25000 would mean that the FED has lost its ability to
hold the market up. Of
course, it then might try negative interest rates. But this
would be a dangerous situation for all stocks. Back in 1977, the NASDAQ also
separated from the DJI. Only when the DJI fell below the significant round number
900, more than 10% below its earlier peak, did the NASDAQ sell-off. And back in
the year 2000, the NASDAQ advanced for three months with the DJI actually falling
17%. It took a NASDAQ top formation and a break in its long, over-extended
uptrendline to turn it down then, after which the tech bubble then was broken. For now hold
long the V-bottomed techs, QQQ, NASDAQ, IBB and GLD. Avoid the short side.
 |
 |
 |
 |
 |
 |
|
Charts 7/8/2020 (Click on Underlined link.) 2020 PEERLESS DJI, Signals, Indicators Daily DJI Volume 10-DayUp/Down Vol Stoch-20 Inverted Traders Index Graph of Pct of All Stocks above 65-dma Cum. Inverted Traders Index NASDAQ S&P OEX NYSE COMPQX DJI-15 DJI-20 DJI-30 DIA QQQ MDY IWM TNA Short-Term Rates SPY http://tigersoft.com/2121CST/SPY.GIF recent 2006 vers-Peerless signals -- http://tigersoft.com/2121CST/VERS06NN.BMP USO-CrudeOil DBO FAS GLD BBH IBB JETS JNUG KOL NUGT OIH PALL RSX RETL SDS AGQ SLV SOXL TECL TLT TMF TNA UGA (gasoline) USO (oil) and China: YINN CHAU Commodities: CANE CORN DBC JJC, NIB, CHOC CORN, CUT (paper) MOO, SOYB WEAT UUP (Dollar) LIT (Lithium) Stocks AAPL ADBE ALXN AMAT AMGN AMD AMZN AXP BA BABA BAC BIDU BLDP CAT CVX CMG DE ENPH FB GILD GOOG GS HD IBM INTU JPM LRCX M (Macy's) MSFT NEM NFLX NKE NVDA PG REGN SO SQ QCOM QDEL TSLA TXN XOM V VRTX WFC WMT TOWN ZM New highs and Bullish MAXCPs http://tigersoft.com/MAXCP/7-8/BULLISH.htm Bearish MAXCPs - http://tigersoft.com/MINCP/7-8/BEARISH.htm |
Table 1
7/7/2018 QUICKSILVER on DJI-30 STOCKS.
Considering just those stocks whose IP21 + ITRS score is >+.25 or <-.25
1 Bullish ( AAPL BA
381 180 = +561
12 Bearish ( CVX IBM KO JNJ JPM MMM MRK PFE PG UTX WBA XOM
-86 -118 -45 -143 -95 -155 -78 -34 -123 -86 -42 -72
tot. = - 1077
----------------------------------------
Vitality Score = -516
Note that AAPL now shows highest AI/200 stock here. STOCKS CLOSE CHANGE PIVOT-P 5-dma AROC CL-PWR Candl AI/200 IP21 ITRS --------------------------------------------------------------------------------------- --------------------------------------------------------------------------------------- AAPL 381.37 8.68 364.11 225.2% Bullish BLUE 176 -.004 .266 Bullish --------------------------------------------------------------------- AXP 92.9 -.11 94.05 -121.5% Bearish BLUE 82 -.178 .012 --------------------------------------------------------------------- BA 180.08 1.2 180.32 -88.3% Bearish BLUE 60 -.061 .319 Bullish --------------------------------------------------------------------- CAT 128.13 .93 126.06 64% Bearish RED 153 -.124 .032 --------------------------------------------------------------------- CSCO 45.81 .18 46.06 -90.1% Bearish BLUE 102 -.035 -.017 --------------------------------------------------------------------- CVX 86.35 .04 87.62 -163.6% Bearish ---- 79 -.303 -.118 Bearish --------------------------------------------------------------------- DIS 116.66 3.03 113.01 228% Bearish BLUE 76 -.031 .02 --------------------------------------------------------------------- GS 202.25 2.89 197.57 115.8% ------- BLUE 97 -.153 .022 --------------------------------------------------------------------- HD 249.17 1.82 248.15 -26.9% Bearish BLUE 119 -.157 .064 --------------------------------------------------------------------- IBM 117.71 .13 118.54 -128.2% Bearish RED 135 -.279 -.146 Bearish --------------------------------------------------------------------- INTC 58.61 .3 58.81 -103.2% Bearish BLUE 130 -.076 -.095 --------------------------------------------------------------------- JNJ 143.27 .42 140.38 93.2% Bearish BLUE 115 -.123 -.152 Bearish --------------------------------------------------------------------- JPM 93.3 .98 93.26 -40.7% Bearish BLUE 67 -.243 -.094 Bearish --------------------------------------------------------------------- KO 45.07 -.14 44.82 43.4% Bearish RED 90 -.184 -.117 Bearish --------------------------------------------------------------------- MCD 185.85 .03 184.66 37.2% Bearish BLUE 105 -.138 -.081 --------------------------------------------------------------------- MMM 154.58 -.24 155.43 -45.1% Bearish RED 114 -.184 -.074 Bearish --------------------------------------------------------------------- MRK 77.92 -.8 78.12 37.6% ------- RED 80 -.102 -.153 Bearish --------------------------------------------------------------------- MSFT 212.83 4.58 204.7 225.5% Bullish BLUE 154 .04 .142 --------------------------------------------------------------------- NKE 98.84 1.77 97.4 40.2% Bearish BLUE 120 -.083 .026 --------------------------------------------------------------------- PFE 33.75 -.28 33.74 154.9% Bearish RED 70 -.222 -.201 Bearish --------------------------------------------------------------------- PG 122.89 .67 119.98 137.4% ------- BLUE 84 -.229 -.034 Bearish --------------------------------------------------------------------- TRV 113.18 .7 112.5 -38.4% Bearish BLUE 110 -.171 .02 --------------------------------------------------------------------- UNH 298.36 1.71 297.73 57.2% Bearish BLUE 125 -.039 -.065 --------------------------------------------------------------------- UTX 86.01 -5.36 97.15 -958.4% Bullish RED 114 .144 -.521 Bearish --------------------------------------------------------------------- V 195.07 .87 193.78 48.7% Bearish ---- 102 -.107 .055 --------------------------------------------------------------------- VZ 55.38 .34 54.67 22.7% Bearish BLUE 131 -.096 -.122 --------------------------------------------------------------------- WBA 42.29 .07 40.88 -11.9% Bearish RED 88 -.142 -.129 Bearish --------------------------------------------------------------------- WMT 124.44 -2.51 119.69 192.7% ------- RED 84 -.022 -.11 --------------------------------------------------------------------- XOM 43.14 -.1 43.71 -179.4% Bearish BLUE 44 -.299 -.099 Bearish --------------------------------------------------------------------- DOW 40.35 -1.34 40.75 -49.5% Bearish RED 67 -.018 .091 |
Table 2 QUICKSILVER on ETFS - 07/08/20 Bullish = RETL, SOXL, TECL, GLD (4)
Bearish = (0)
ITRS + IP21>.25 is considered "Bullish" ETF CLOSE CHANGE PIVOT-PT 5-dma AROC CL-PWR CANDLE IP21 ITRS --------------------------------------------------------------------------------------------- DIA 260.72 1.68 257.31 55% Bearish BLUE-.142 ----- --------------------------------------------------------------------------------------------- SPY 316.18 2.4 310.52 125.2% Bearish BLUE-.084 .021 --------------------------------------------------------------------------------------------- QQQ 259.99 3.38 250.49 244.8% Bullish BLUE .06 .126 --------------------------------------------------------------------------------------------- MDY 323.28 2.16 322.38 -18.7% Bearish BLUE-.123 .02 --------------------------------------------------------------------------------------------- IWM 141.94 1.05 141.82 -43.6% Bearish BLUE-.126 .035 --------------------------------------------------------------------------------------------- FAS 31.77 .76 31.51 75.9% Bearish BLUE-.205 .056 --------------------------------------------------------------------------------------------- RETL 159.73 5.67 146.87 469.7% Bearish BLUE-.145 .595 Bullish --------------------------------------------------------------------------------------------- SOXL 202.63 8.05 180.34 378.6% Bearish BLUE-.056 .478 Bullish --------------------------------------------------------------------------------------------- TECL 253.88 10.94 233.57 438.2% ------- BLUE-.005 .594 Bullish --------------------------------------------------------------------------------------------- IBB 140.81 .75 137.37 148.8% ------- RED .028 .024 --------------------------------------------------------------------------------------------- GLD 170.09 1.05 166.62 81.1% Bullish RED .397 -.028 Bullish --------------------------------------------------------------------------------------------- OIH 120.63 .72 118.44 -51.7% Bearish RED -.226 .178 --------------------------------------------------------------------------------------------- GASL 3440 285 3685 -325.1% ------- RED -.021 .033 --------------------------------------------------------------------------------------------- |
Table 3 Count of Stocks in Key Directories
20200708
-------------------------------
NEWHIGHS 212
NEWLOWS 35
MAXCP 54
MINCP 166 Bearish
TTTNH 29
TTTNL 104
FASTUP 155
FASTDOWN 145
CPCROSSA 54
CPCROSSD 41
BIGVOLUP 7
BIGVODN 7
ACCUMVER 3
HIGHIP21 8
HIUPPCT 21
REDSELL 98
AUGSELS7 533
TRAPDOOR 32
|
RANKING OF KEY DIRECTORIES BASED PCT.OF STOCKS ABOVE 65-DMA
7/8/20
Bullish = 40
Bearish = 5
---------------------------------------------------------------------------------------
Directory Current day-1 day-2 day-3 day-4 day-5
----------------------------------------------------------------------------------------
COPPER 1 1 1 1 1 1
ETFS 1 1 1 1 1 .982
BONDFUND .99 .99 .98 .98 .98 .98
GOLD .959 .959 .938 .938 .959 .959
SOLAR .937 .937 .937 .937 1 .875
CHINA .901 .862 .882 .784 .705 .705
AUTO .897 .948 1 1 .974 1
HOMEBLDG .882 .941 .941 .941 .941 .941
JETS .857 .928 1 1 .857 .857
HACKERS .85 .75 .8 .7 .7 .7
NASD-100 .838 .828 .909 .838 .828 .818
NIFTY .822 .822 .844 .844 .866 .911
COMODITY .82 .82 .794 .82 .82 .769
CHEM .816 .795 .857 .857 .836 .877
FOOD .811 .811 .792 .811 .811 .735
TRANSP .8 .85 .95 .9 .9 1
SEMI .788 .788 .826 .817 .817 .846
INDEXES .786 .764 .82 .814 .82 .808
SOFTWARE .783 .766 .866 .8 .8 .75
ELECTRON .763 .763 .81 .804 .79 .831
GREEN .761 .761 .904 .809 .809 .857
INFRA .742 .828 .885 .885 .857 .885
GAMING .714 .666 .904 .809 .809 .809
BIOTECH .708 .716 .74 .742 .742 .729
COMPUTER .7 .6 .8 .7 .75 .8
RETAIL .7 .68 .74 .72 .74 .76
INDMATER .693 .8 .84 .813 .786 .813
DJI-13 .692 .692 .692 .692 .692 .692
FIDSTKS .689 .677 .796 .757 .745 .774
SP500 .686 .701 .804 .76 .741 .751
BEVERAGE .666 .6 .733 .666 .666 .6
RUS-1000 .658 .675 .783 .741 .733 .758
SP-100 .648 .681 .791 .692 .67 .725
REIT .638 .652 .815 .815 .822 .801
MILITARY .629 .666 .814 .814 .777 .777
EDU .6 .8 1 1 1 .8
BIGBANKS .571 .571 .714 .571 .571 .714
HOSPITAL .571 .571 .619 .523 .523 .523
DOWJONES .566 .6 .666 .566 .566 .6
FINANCE .542 .542 .734 .686 .686 .855
==============================================================================================
INSURANC .5 .423 .846 .692 .73 .807
==============================================================================================
OILGAS .484 .476 .546 .53 .53 .638
GUNS .466 .466 .666 .6 .533 .533
UTILITY .435 .435 .538 .538 .538 .358
COAL .285 .285 .285 .285 .285 .285
REGBANKS .269 .269 .5 .5 .5 .73
|
=====================================================================
7/7/2020 The DJI continues to significantly under-perform the NASDAQ and QQQ.
Despite its Peerless Buy signals, the DJI's P-Indicator, Accumulation Index
and V-I are negative and bearishly worsening. The Vitality Index for the DJI-30
stocks is below -700 and the Closing Power for DIA is still falling rapidly. The
FED will have a hard enough time holding the DJI above its 25000 support.
It will be even more difficult for it to push it above 27000, especially given the
obvious weakness in the big bank stocks, which were hit hard in today's decline.


All this means that I think we should avoid being long DIA in favor of QQQ and
its highest Power-Ranked stocks and Gold (GLD) and its highest Power-Ranked
stocks. See below that the QQQ has completed a bullish V-bottom, shows all
positive internal strength indicators and has out-performed the DJI by 11.3%
(ITRS) over the last 50 trading days.


|
Charts 7/7/2020 (Click on Underlined link.) 2020 PEERLESS DJI, Signals, Indicators Daily DJI Volume 10-DayUp/Down Vol Stoch-20 Inverted Traders Index Graph of Pct of All Stocks above 65-dma Cum. Inverted Traders Index NASDAQ S&P OEX NYSE COMPQX DJI-15 DJI-20 DJI-30 DIA QQQ MDY IWM TNA Short-Term Rates SPY http://tigersoft.com/2121CST/SPY.GIF recent 2006 vers-Peerless signals -- http://tigersoft.com/2121CST/VERS0677.BMP USO-CrudeOil DBO FAS GLD BBH IBB JETS JNUG KOL NUGT OIH PALL RSX RETL SDS AGQ SLV SOXL TECL TLT TMF TNA UGA (gasoline) USO (oil) and China: YINN CHAU Commodities: CANE CORN DBC JJC, NIB, CHOC CORN, CUT (paper) MOO, SOYB WEAT UUP (Dollar) LIT (Lithium) Stocks AAPL ADBE ALXN AMAT AMGN AMD AMZN AXP BA BABA BAC BIDU BLDP CAT CVX CMG DE ENPH FB GILD GOOG GS HD IBM INTU JPM LRCX M (Macy's) MSFT NEM NFLX NKE NVDA PG REGN SO SQ QCOM QDEL TSLA TXN XOM V VRTX WFC WMT TOWN ZM New highs and Bullish MAXCPs http://tigersoft.com/MAXCP/7-7/BULLISH.htm Bearish MAXCPs - http://tigersoft.com/MINCP/7-7/BEARISH.htm |
Table 1
7/7/2018 QUICKSILVER on DJI-30 STOCKS.
Considering just those stocks whose IP21 + ITRS score is >+.25 or <-.25
1 Bullish ( BA
178 = +178
9 Bearish ( CVX IBM KO JNJ JPM PFE PG UTX XOM
-86 -118 -45 -143 -95 -34 -122 -86 -43 = -772
----------------------------------------
Vitality Score = -594
Note that AAPL now shows highest AI/200 stock here. STOCKS CLOSE CHANGE PIVOT-P 5-dma AROC CL-PWR Candl AI/200 IP21 ITRS --------------------------------------------------------------------------------------- --------------------------------------------------------------------------------------- AAPL 372.69 -1.16 364.8 149.2% Bullish RED 177 -.008 .228 --------------------------------------------------------------------- AXP 93.01 -3.57 95.2 -79.5% Bearish RED 82 -.166 .029 --------------------------------------------------------------------- BA 178.88 -9.03 183.3 -421.1% Bearish RED 61 -.043 .298 Bullish --------------------------------------------------------------------- CAT 127.2 -2.23 126.5 76.8% Bearish RED 154 -.124 .026 --------------------------------------------------------------------- CSCO 45.63 -.79 46.64 -56.3% Bearish RED 102 -.008 -.016 --------------------------------------------------------------------- CVX 86.31 -2.26 89.23 -77% Bearish RED 80 -.233 -.097 Bearish --------------------------------------------------------------------- DIS 113.63 -.8 111.51 93.8% Bearish BLUE 76 -.024 .034 --------------------------------------------------------------------- GS 199.36 -8 197.62 148.2% Bearish RED 98 -.159 .037 --------------------------------------------------------------------- HD 247.35 -2.2 250.51 24.7% Bearish ---- 120 -.129 .077 --------------------------------------------------------------------- IBM 117.58 -2.61 120.77 -90.6% Bearish RED 136 -.241 -.146 Bearish --------------------------------------------------------------------- INTC 58.31 -1.23 59.83 3.4% Bearish RED 131 -.085 -.105 --------------------------------------------------------------------- JNJ 142.85 -.13 140.63 135.3% Bearish BLUE 115 -.151 -.167 Bearish --------------------------------------------------------------------- JPM 92.32 -2.68 94.06 -36.3% Bearish RED 68 -.26 -.071 Bearisg --------------------------------------------------------------------- KO 45.21 -.02 44.68 94.9% Bearish BLUE 91 -.18 -.094 Bearish --------------------------------------------------------------------- MCD 185.82 -2.68 184.47 81.7% Bearish RED 105 -.075 -.079 --------------------------------------------------------------------- MMM 154.82 -3.28 155.99 -24% Bearish RED 115 -.187 -.036 --------------------------------------------------------------------- MRK 78.72 -.86 77.33 166.7% Bearish RED 81 -.057 -.122 --------------------------------------------------------------------- MSFT 208.25 -2.45 203.51 239.6% Bullish RED 154 .047 .104 --------------------------------------------------------------------- NKE 97.07 -2.88 98.05 61.3% Bearish RED 120 -.077 .009 --------------------------------------------------------------------- PFE 34.03 -.48 32.7 206.7% Bearish ---- 71 -.163 -.179 Bearish --------------------------------------------------------------------- PG 122.22 .59 119.57 190.1% ------- BLUE 85 -.206 -.06 Bearish --------------------------------------------------------------------- TRV 112.48 -2.09 114.05 -18.5% Bearish RED 110 -.112 .026 --------------------------------------------------------------------- UNH 296.65 -6.16 294.95 116.1% Bearish RED 125 -.077 -.071 --------------------------------------------------------------------- UTX 86.01 -5.36 97.15 -958.4% Bullish RED 114 .144 -.53 Bearish --------------------------------------------------------------------- V 194.2 -3.56 193.17 72.5% Bearish RED 102 -.106 .071 --------------------------------------------------------------------- VZ 55.04 -.2 55.13 31.9% Bearish BLUE 132 -.098 -.139 --------------------------------------------------------------------- WBA 42.22 -.94 42.39 -11.9% Bearish RED 89 -.076 -.124 --------------------------------------------------------------------- WMT 126.95 8.06 119.78 330.6% Bullish BLUE 85 .111 -.108 --------------------------------------------------------------------- XOM 43.24 -1.15 44.72 -122.1% Bearish RED 44 -.253 -.1 Bearish --------------------------------------------------------------------- DOW 41.69 -.76 40.76 85.9% Bearish ---- 68 .044 .17 |
Table 2 QUICKSILVER on ETFS - 07/07/20 Bullish = RETL, SOXL, TECL, GLD (4)
Bearish = (0)
ITRS + IP21>.25 is considered "Bullish" ETF CLOSE CHANGE PIVOT-PT 5-dma AROC CL-PWR CANDLE IP21 ITRS --------------------------------------------------------------------------------------------- DIA 259.04 -3.96 257.87 60.5% Bearish RED -.117 ---- --------------------------------------------------------------------------------------------- SPY 313.78 -3.27 308.36 150.1% Bearish RED -.075 .02 --------------------------------------------------------------------------------------------- QQQ 256.61 -1.78 247.6 275.1% Bullish RED .062 .111 --------------------------------------------------------------------------------------------- MDY 321.12 -6.22 324.49 9.6% Bearish RED -.105 .049 --------------------------------------------------------------------------------------------- IWM 140.89 -2.54 143.18 -8.8% Bearish RED -.119 .062 --------------------------------------------------------------------------------------------- FAS 31.01 -1.78 31.29 168.7% Bearish RED -.195 .135 --------------------------------------------------------------------------------------------- RETL 154.06 -5.11 145.51 359.2% Bearish RED -.087 .798 Bullish --------------------------------------------------------------------------------------------- SOXL 194.58 -7.47 188.21 548.1% Bearish RED -.08 .467 Bullish --------------------------------------------------------------------------------------------- TECL 242.94 -7.47 232.89 477.6% Bearish RED .023 .561 Bullish --------------------------------------------------------------------------------------------- IBB 140.06 .62 136.69 195.9% Bullish BLUE .048 .021 --------------------------------------------------------------------------------------------- GLD 169.04 1.06 167.37 72.1% Bullish BLUE .463 -.05 Bullish --------------------------------------------------------------------------------------------- OIH 119.91 -4.54 121.88 37.3% Bearish RED -.098 .152 --------------------------------------------------------------------------------------------- GASL 3440 285 3685 -325.1% ------- RED -.021 .024 --------------------------------------------------------------------------------------------- |
Table 3 Count of Stocks in Key Directories
20200707
-------------------------------
NEWHIGHS 183
NEWLOWS 24
MAXCP 28
MINCP 321
TTTNH 12
TTTNL 156
FASTUP 127
FASTDOWN 88
CPCROSSA 44
CPCROSSD 85
BIGVOLUP 7
BIGVODN 6
ACCUMVER 3
HIGHIP21 11
HIUPPCT 18
REDSELL 93
AUGSELS7 585
TRAPDOOR 32
|
Table 4 RANKING OF KEY DIRECTORIES BASED PCT.OF STOCKS ABOVE 65-DMA
7/7/20
Bullish = 40
Bearish = 6
---------------------------------------------------------------------------------------
Directory Current day-1 day-2 day-3 day-4 day-5
----------------------------------------------------------------------------------------
COPPER 1 1 1 1 1 1
ETFS 1 1 1 1 .982 1
BONDFUND .99 .98 .98 .98 .98 .98
GOLD .959 .938 .938 .959 .959 .959
AUTO .948 1 1 .974 1 1
HOMEBLDG .941 .941 .941 .941 .941 .941
SOLAR .937 .937 .937 1 .937 .937
JETS .928 1 1 .857 .857 .857
CHINA .862 .882 .784 .705 .705 .627
TRANSP .85 .95 .9 .9 1 1
EDU .833 1 1 1 .833 .833
INFRA .828 .885 .885 .857 .885 .857
NASD-100 .828 .919 .848 .828 .818 .787
========
NIFTY .822 .844 .844 .866 .911 .866
COMODITY .82 .794 .82 .82 .769 .717
FOOD .811 .792 .811 .811 .735 .698
INDMATER .8 .84 .813 .786 .813 .8
SEMI .8 .84 .83 .83 .87 .84
CHEM .795 .857 .857 .836 .877 .877
INDEXES .764 .82 .814 .82 .808 .792
ELECTRON .763 .81 .804 .79 .837 .804
SOFTWARE .762 .881 .813 .813 .762 .762
GREEN .761 .904 .809 .809 .857 .809
HACKERS .75 .85 .7 .7 .7 .6
BIOTECH .711 .737 .74 .742 .745 .695
SP500 .701 .806 .76 .741 .757 .69
DJI-13 .692 .692 .692 .692 .769 .615
SP-100 .681 .791 .692 .67 .736 .615
RETAIL .68 .74 .72 .74 .76 .72
FIDSTKS .677 .796 .757 .745 .785 .706
RUS-1000 .675 .784 .741 .733 .762 .701
GAMING .666 .904 .809 .809 .809 .809
MILITARY .666 .814 .814 .777 .777 .777
REIT .652 .815 .815 .822 .801 .773
BEVERAGE .6 .733 .666 .666 .6 .6
COMPUTER .6 .8 .7 .75 .8 .75
DOWJONES .6 .666 .566 .566 .666 .533
BIGBANKS .571 .714 .571 .571 .714 .571
HOSPITAL .571 .619 .523 .571 .523 .428
FINANCE .542 .734 .686 .686 .855 .771
============================================================================================
OILGAS .476 .546 .53 .53 .661 .576
GUNS .466 .666 .6 .533 .533 .6
UTILITY .435 .538 .538 .538 .358 .358
INSURANC .423 .846 .692 .73 .807 .73
COAL .285 .285 .285 .285 .285 .285
REGBANKS .269 .5 .5 .5 .73 .538
|
====================================================================
7/6/2020 Typical seasonality in a Presidential Election years calls for a
decline soon
after the July 4th weekend. But we have no new Peerless Sell. Moreover,
our times now are far from ordinary. The FED is mightily trying to hold up the
market in the face of the Covid-19 pandemic's dire effects on the economy.
We've seen its power since the end of March when it started inflating bonds
and thus stocks with trillions of its magic money.

But it has a problem. The trickle-down down from the stock market to main street
has been pinched off by stock speculators. And what is worse? The speculators,
like ourselves, quite naturally put their money into the companies that are most
immune to the effects of the virus, namely technology and work-at-home stocks.
This has left behind, among others, the big banks, the very stocks that the FED
targetted back in 2008-2009. The result is that bank stocks like JPM, BAC and
WFC are not only unable to get off the floor, they are being beaten down by
Closing -Power (professional selling) and red distribution (big money selling).

Capitalism gives private investors the right to choose their investments. So, what
can the FED do now but lay out more money for bonds and let the private investors
do what they want with that money?
The result is the NASDAQ is starting to run away to the upside, much like it
started to do from December 1998 until its top in April 2000. Note that
we can measure fairly precisely the point where the NASDAQ breaks away from
the blue chips using our TigerSoft ITRS indicator. This is simply the percent change
for fifty days by the NASDAQ (or whatever we are looking at) minus the percent
change in the DJI. Right now the NASDAQ's ITRS is +.107. It has been a
little
higher recently. But if it rises above +.15, I would suggest it is going into its
own
"vertical ascent phase" just like it did in the period December 1998 to April
2000.
When I look back at the ITRS charts for the NASDAQ from 1992 to the present,
I find that this period of hyperbolic NASDAQ speculation in 1999 and 2000 is the
only time our ITRS rose above +.15.
Since the FED is unlikely to let the big banks start new legs downward, I think that
there is a very good chance that they will continue pumping trillions of dollars into
markets. This, I am suggesting, is bound to produce a hyperbolic NASDAQ.
The dynamics of greed and bubbles are too imbedded to change.
Accordingly, I would not sell the V-bottom techs, QQQ or the NASDAQ despite
their nice advance.
  |
 |
 |
|
Charts 7/2/2020 (Click on Underlined link.) 2020 PEERLESS DJI, Signals, Indicators Daily DJI Volume 10-DayUp/Down Vol Stoch-20 Inverted Traders Index Graph of Pct of All Stocks above 65-dma Cum. Inverted Traders Index NASDAQ S&P OEX NYSE COMPQX DJI-15 DJI-20 DJI-30 DIA QQQ MDY IWM TNA Short-Term Rates SPY http://tigersoft.com/2121CST/SPY.GIF recent 2006 vers-Peerless signals -- http://tigersoft.com/2121CST/VERS06MM.BMP USO-CrudeOil DBO FAS GLD BBH IBB JETS JNUG KOL NUGT OIH PALL RSX RETL SDS AGQ SLV SOXL TECL TLT TMF TNA UGA (gasoline) USO (oil) and China: YINN CHAU Commodities: CANE CORN DBC JJC, NIB, CHOC CORN, CUT (paper) MOO, SOYB WEAT UUP (Dollar) LIT (Lithium) Stocks AAPL ADBE ALXN AMAT AMGN AMD AMZN AXP BA BABA BAC BIDU BLDP CAT CVX CMG DE ENPH FB GILD GOOG GS HD IBM INTU JPM LRCX M (Macy's) MSFT NEM NFLX NKE NVDA PG REGN SO SQ QCOM QDEL TSLA TXN XOM V VRTX WFC WMT TOWN ZM New highs and Bullish MAXCPs http://tigersoft.com/MAXCP/7-6/BULLISH.htm Bearish MAXCPs - http://tigersoft.com/MINCP/7-6/BEARISH.htm |
Table 1
7/6/2018 QUICKSILVER on DJI-30 STOCKS.
Considering just those stocks whose IP21 + ITRS score is >+.25 or <-.25
1 Bullish ( AAPL
+364 = +364
9 Bearish ( CVX IBM KO JNJ JPM PFE PG UTX XOM
-89 -120 -45 -143 -95 -35 -122 -86 -44 = -779
----------------------------------------
Vitality Score = -415
Note that AAPL now shows highest AI/200 stock here. STOCKS CLOSE CHANGE PIVOT-P 5-dma AROC CL-PWR Candl AI/200 IP21 ITRS --------------------------------------------------------------------------------------- --------------------------------------------------------------------------------------- AAPL 373.85 9.74 361.78 279.5% Bullish BLUE 178 .062 .24 Bullish --------------------------------------------------------------------- AXP 96.58 2.25 94.52 167.5% Bearish BLUE 82 -.174 .052 --------------------------------------------------------------------- BA 187.91 7.1 194.49 492.3% Bearish BLUE 62 -.034 .245 --------------------------------------------------------------------- CAT 129.43 1.71 125.25 280.3% Bearish RED 155 -.133 .027 --------------------------------------------------------------------- CSCO 46.42 .79 46.15 11.9% Bearish BLUE 102 .026 -.003 --------------------------------------------------------------------- CVX 88.57 .26 87.67 120.1% Bearish RED 81 -.189 -.098 Bearish --------------------------------------------------------------------- DIS 114.43 2.25 111.52 239.1% Bearish BLUE 77 -.056 .014 --------------------------------------------------------------------- GS 207.36 9.96 193.47 465.8% Bearish BLUE 99 -.177 .066 --------------------------------------------------------------------- HD 249.55 1.05 246.12 173% Bearish RED 121 -.064 .115 --------------------------------------------------------------------- IBM 120.19 .49 119.75 125.8% Bearish RED 137 -.248 -.128 Bearish --------------------------------------------------------------------- INTC 59.54 .41 58.27 173.7% Bearish BLUE 132 -.051 -.11 --------------------------------------------------------------------- JNJ 142.98 2.01 139.04 185% Bearish BLUE 115 -.184 -.199 Bearish --------------------------------------------------------------------- JPM 95 2.34 93 129.4% Bearish BLUE 69 -.254 -.056 Bearish --------------------------------------------------------------------- KO 45.23 .35 44.36 186.7% Bearish BLUE 92 -.171 -.115 Bearish --------------------------------------------------------------------- MCD 188.5 4.98 182.8 239.3% Bearish BLUE 105 -.088 -.083 --------------------------------------------------------------------- MMM 158.1 1.06 155.57 179.6% Bearish RED 116 -.123 -.023 --------------------------------------------------------------------- MRK 79.58 .8 76.12 284.7% ------- BLUE 82 -.036 -.135 --------------------------------------------------------------------- MSFT 210.7 4.44 198.44 356% Bullish BLUE 154 .133 .11 --------------------------------------------------------------------- NKE 99.95 1.52 95.87 324.8% Bearish BLUE 121 -.07 .025 --------------------------------------------------------------------- PFE 34.51 0 32.64 372.8% Bearish RED 72 -.172 -.178 Bearish --------------------------------------------------------------------- PG 121.63 .75 117.66 269.7% Bearish RED 86 -.182 -.1 Bearish --------------------------------------------------------------------- TRV 114.57 2.11 112.9 158.6% Bearish RED 111 -.051 .022 --------------------------------------------------------------------- UNH 302.81 4.55 289.76 271.4% Bearish RED 125 -.005 -.058 --------------------------------------------------------------------- UTX 86.01 -5.36 97.15 -958.4% Bullish RED 114 .144 -.56 Bearish --------------------------------------------------------------------- V 197.76 2.09 191.38 220.3% Bearish RED 102 -.025 .07 --------------------------------------------------------------------- VZ 55.24 .45 54.69 190.9% Bearish ---- 133 -.08 -.16 --------------------------------------------------------------------- WBA 43.16 1.18 42.32 238.3% Bearish BLUE 90 -.067 -.127 --------------------------------------------------------------------- WMT 118.89 -.32 119.06 23.9% Bearish RED 85 -.016 -.194 --------------------------------------------------------------------- XOM 44.39 .31 44.32 87.3% Bearish RED 44 -.175 -.097 Bearish --------------------------------------------------------------------- DOW 42.45 .86 40.98 324.9% Bearish RED 67 -.019 .185 |
Table 2 QUICKSILVER on ETFS - 07/06/20 Bullish = RETL, SOXL, TECL, GLD (4)
Bearish = (0)
ITRS + IP21>.25 is considered "Bullish" ETF CLOSE CHANGE PIVOT-PT 5-dma AROC CL-PWR CANDLE IP21 ITRS --------------------------------------------------------------------------------------------- DIA 263 4.58 255.91 246.5% Bearish BLUE-.102 ----- --------------------------------------------------------------------------------------------- BA 187.91 7.1 194.49 492.3% Bearish BLUE-.034 .245 --------------------------------------------------------------------------------------------- SPY 317.05 4.82 304.46 276.8% Bearish BLUE-.04 .017 --------------------------------------------------------------------------------------------- QQQ 258.39 6.2 242.84 368.3% Bullish BLUE .136 .109 --------------------------------------------------------------------------------------------- MDY 327.34 3.42 320.5 225.4% Bearish RED -.115 .057 --------------------------------------------------------------------------------------------- IWM 143.43 1.03 141.14 239.6% Bearish RED -.13 .073 --------------------------------------------------------------------------------------------- FAS 32.79 1.23 29.95 614.7% Bearish RED -.193 .218 --------------------------------------------------------------------------------------------- RETL 159.17 7.92 143.34 1024.8% Bearish BLUE-.111 .99 Bullish --------------------------------------------------------------------------------------------- SOXL 202.05 15 174.15 937.8% Bearish BLUE-.085 .6 Bullish --------------------------------------------------------------------------------------------- TECL 250.41 12.62 220.49 790.7% Bullish BLUE .089 .685 Bullish --------------------------------------------------------------------------------------------- IBB 139.44 .9 134.68 156.8% ------- RED .043 .013 --------------------------------------------------------------------------------------------- GLD 167.98 1 166.63 43.2% Bullish BLUE .408 -.09 Bullish --------------------------------------------------------------------------------------------- OIH 124.45 4.28 119.01 317.8% Bearish BLUE .006 .147 --------------------------------------------------------------------------------------------- GASL 3440 285 3685 -325.1% ------- RED -.021 -.006 --------------------------------------------------------------------------------------------- |
Table 3 Count of Stocks in Key Directories
20200706
-------------------------------
NEWHIGHS 316 Bullish
NEWLOWS 22
MAXCP 27
MINCP 198
TTTNH 19
TTTNL 125
FASTUP 219
FASTDOWN 42
CPCROSSA 40
CPCROSSD 93
BIGVOLUP 8
BIGVODN 8
ACCUMVER 4
HIGHIP21 10
HIUPPCT 22
VHIP21 57
LOWACCUM 140
REDSELL 94
AUGSELS7 678
TRAPDOOR 32
|
Table 3 RANKING OF KEY DIRECTORIES BASED PCT.OF STOCKS ABOVE 65-DMA
7/6/20
---------------------------------------------------------------------------------------
Directory Current day-1 day-2 day-3 day-4 day-5
----------------------------------------------------------------------------------------
AUTO 1 1 .974 1 1 .923
COPPER 1 1 1 1 1 1
EDU 1 1 1 .833 .833 .833
ETFS 1 1 1 .982 1 1
JETS 1 1 .857 .857 .857 .857
BONDFUND .98 .98 .98 .98 .99 .99
TRANSP .95 .9 .9 1 1 .95
HOMEBLDG .941 .941 .941 .941 .941 .882
GOLD .938 .938 .959 .959 .959 .918
SOLAR .937 .937 1 .937 .937 .875
NASD-100 .919 .858 .838 .818 .797 .727
--------------------
GAMING .904 .809 .809 .809 .809 .666
GREEN .904 .809 .809 .857 .809 .714
INFRA .885 .885 .857 .885 .857 .8
SOFTWARE .883 .816 .8 .75 .75 .716
CHINA .882 .784 .705 .705 .627 .666
CHEM .857 .857 .836 .877 .877 .714
HACKERS .85 .75 .7 .7 .6 .55
INSURANC .846 .692 .73 .807 .73 .538
NIFTY .844 .844 .866 .911 .866 .866
INDMATER .84 .813 .786 .813 .8 .666
SEMI .826 .817 .817 .855 .826 .769
INDEXES .825 .819 .825 .814 .814 .759
REIT .815 .815 .822 .801 .773 .673
MILITARY .814 .814 .777 .777 .74 .629
ELECTRON .81 .804 .79 .837 .81 .729
SP500 .806 .762 .741 .757 .696 .597
COMPUTER .8 .7 .75 .8 .75 .7
FIDSTKS .796 .757 .745 .785 .717 .615
COMODITY .794 .82 .82 .769 .717 .692
FOOD .792 .811 .811 .735 .698 .641
SP-100 .791 .692 .67 .736 .637 .549
RUS-1000 .784 .743 .733 .762 .707 .592
RETAIL .74 .72 .74 .76 .72 .56
FINANCE .734 .686 .686 .855 .783 .578
BEVERAGE .733 .666 .666 .6 .6 .6
BIOTECH .732 .737 .74 .745 .713 .711
BIGBANKS .714 .571 .571 .714 .571 .571
DJI-13 .692 .692 .692 .769 .692 .615
DOWJONES .666 .566 .566 .666 .566 .466
GUNS .666 .6 .533 .533 .533 .466
HOSPITAL .619 .523 .571 .571 .428 .333
OILGAS .546 .53 .53 .661 .584 .561
UTILITY .538 .538 .538 .358 .358 .23
------------------------------------------------------------------------------------------------------
REGBANKS .5 .5 .5 .73 .538 .384
COAL .285 .285 .285 .285 .285 .428
======================================================================================================
|
========================================================================
7/2/2020 Wall Street must like Biden. We know it loves the FED.
The FED is seen as the
all-powerful guarantor against a falling market, much to the grim displeasure of the
shorts. Big money is still not convinced of the DJI stocks' bullishness. So,
I would avoid
DIA. The Tiger Accumulation for the DJIA is very negative, as is the
V-Indicator.
Also negative is our DJI-30 Vitality Index.
But the DJI is still 2.6% away from a new Peerless Sell and our QQQ and NASDAQ
are much stronger and have outperformed the DJI by more than 10% over the last
50-trading days. Thire V-bottom breakouts with very high Accumulation and strong
Closing Powers are very much still in favor by performance funds and those that want
to invest in the areas of the economy least affected by the pandemic.
I suggested covering the weak bank stocks last week. They are in their base
and
I do not believe the FED will allow them to start new legs down. With the NASDAQ
about to make a breakout into all-time high territory where the path of least resistance
is up,
I would buy more QQQ and switch out of remaining short sale positions to the bullish
MAXCPs.


|
Charts 7/2/2020 (Click on Underlined link.) 2020 PEERLESS DJI, Signals, Indicators Daily DJI Volume 10-DayUp/Down Vol Stoch-20 Inverted Traders Index Graph of Pct of All Stocks above 65-dma Cum. Inverted Traders Index NASDAQ S&P OEX NYSE COMPQX DJI-15 DJI-20 DJI-30 DIA QQQ MDY IWM TNA Short-Term Rates SPY http://tigersoft.com/2121CST/SPY.GIF recent 2006 vers-Peerless signals -- http://tigersoft.com/2121CST/VERS06LL.BMP USO-CrudeOil DBO FAS GLD BBH IBB JETS JNUG KOL NUGT OIH PALL RSX RETL SDS AGQ SLV SOXL TECL TLT TMF TNA UGA (gasoline) USO (oil) and China: YINN CHAU Commodities: CANE CORN DBC JJC, NIB, CHOC CORN, CUT (paper) MOO, SOYB WEAT UUP (Dollar) LIT (Lithium) Stocks AAPL ADBE ALXN AMAT AMGN AMD AMZN AXP BA BABA BAC BIDU BLDP CAT CVX CMG DE ENPH FB GILD GOOG GS HD IBM INTU JPM LRCX M (Macy's) MSFT NEM NFLX NKE NVDA PG REGN SO SQ QCOM QDEL TSLA TXN XOM V VRTX WFC WMT TOWN ZM New highs and Bullish MAXCPs http://tigersoft.com/MAXCP/7-2/BULLISH.htm Bearish MAXCPs - http://tigersoft.com/MINCP/7-2/BEARISH.htm |
Table 1
7/2/2018 QUICKSILVER on DJI-30 STOCKS.
Considering just those stocks whose IP21 + ITRS score is >+.25 or <-.25
1 Bullish ( AAPL
+364 = +364
7 Bearish ( IBM KO JNJ JPM PFE PG UTX
-120 -45 -141 -93 -35 -121 -86 = -653
----------------------------------------
Vitality Score = -289
Note that AAPL now shows highest AI/200 stock here. STOCKS CLOSE CHANGE PIVOT-P 5-dma AROC CL-PWR Candl AI/200 IP21 ITRS --------------------------------------------------------------------------------------- --------------------------------------------------------------------------------------- AAPL 364.11 0 353.63 -10.1% Bullish RED 178 .04 .218 Bullish --------------------------------------------------------------------- AXP 94.33 .28 93.42 -185.2% Bearish RED 82 -.136 .042 --------------------------------------------------------------------- BA 180.81 .49 170.01 164.2% Bearish RED 63 -.044 .239 --------------------------------------------------------------------- CAT 127.72 1.66 122.39 120.4% Bearish RED 156 -.097 .054 --------------------------------------------------------------------- CSCO 45.63 -.43 46.31 44.5% Bearish RED 101 0 -.008 --------------------------------------------------------------------- CVX 88.31 .69 86.46 -51.1% Bearish RED 82 -.166 -.055 --------------------------------------------------------------------- DIS 112.18 -.83 109.1 36.8% Bearish RED 78 -.073 .01 --------------------------------------------------------------------- GS 197.4 -.17 189.19 -246.2% Bearish RED 100 -.174 .021 --------------------------------------------------------------------- HD 248.5 .35 241.01 63.4% Bearish RED 122 -.084 .116 --------------------------------------------------------------------- IBM 119.7 1.16 117.19 28.1% Bearish ---- 138 -.203 -.097 Bearish --------------------------------------------------------------------- INTC 59.13 .32 57.5 52.9% Bearish RED 133 -.062 -.117 --------------------------------------------------------------------- JNJ 140.97 .59 137.81 46.6% Bearish RED 115 -.196 -.179 Bearish --------------------------------------------------------------------- JPM 92.66 -.6 92.59 -281.4% Bearish RED 70 -.23 -.064 Bearish --------------------------------------------------------------------- KO 44.88 .06 43.57 -5.6% Bearish RED 93 -.199 -.118 Bearish --------------------------------------------------------------------- MCD 183.52 -1.14 179.74 20.8% Bearish RED 105 -.112 -.117 --------------------------------------------------------------------- MMM 157.04 1.61 152.52 76.5% Bearish RED 117 -.066 -.007 --------------------------------------------------------------------- MRK 78.78 .66 75.19 144.1% Bearish BLUE 82 -.04 -.116 --------------------------------------------------------------------- MSFT 206.26 1.56 196.33 147.5% Bullish BLUE 154 .079 .088 --------------------------------------------------------------------- NKE 98.43 1.03 93.67 -152.7% Bearish RED 122 -.12 .008 --------------------------------------------------------------------- PFE 34.51 .77 32.04 335% Bearish ---- 73 -.15 -.149 Bearish --------------------------------------------------------------------- PG 120.88 .9 115.23 126.6% Bearish RED 87 -.21 -.088 Bearish --------------------------------------------------------------------- TRV 112.46 -.04 111 -95.6% Bearish RED 112 -.009 .004 --------------------------------------------------------------------- UNH 298.26 .53 286.88 34.8% Bearish RED 125 -.039 -.024 --------------------------------------------------------------------- UTX 86.01 -5.36 97.15 -958.4% Bullish RED 114 .144 -.541 Bearish --------------------------------------------------------------------- V 195.67 1.89 189.27 43.9% Bearish RED 102 -.062 .074 --------------------------------------------------------------------- VZ 54.79 .12 53.16 46.9% Bearish RED 134 -.059 -.156 --------------------------------------------------------------------- WBA 41.98 1.1 41.17 -7.2% Bearish BLUE 91 -.031 -.131 --------------------------------------------------------------------- WMT 119.21 -.48 118.32 -21% Bearish RED 85 -.041 -.195 --------------------------------------------------------------------- XOM 44.08 .37 43.62 -123% Bearish RED 44 -.141 -.054 --------------------------------------------------------------------- DOW 41.59 .84 39.8 199% Bearish RED 67 -.006 .205 |
Table 2 QUICKSILVER on ETFS - 07/02/20 Bullish = RETL, SOXL, TECL, GLD, OIH(5)
Bearish = (0)
ITRS + IP21>.25 is considered "Bullish" ETF CLOSE CHANGE PIVOT-PT 5-dma AROC CL-PWR CANDLE IP21 ITRS --------------------------------------------------------------------------------------------- DIA 258.42 1.11 250.38 19.2% Bearish RED -.115 ----- --------------------------------------------------------------------------------------------- SPY 312.23 1.71 300.05 79.7% Bearish RED -.044 .018 --------------------------------------------------------------------------------------------- QQQ 252.19 1.7 240.22 125.5% Bullish RED .094 .095 --------------------------------------------------------------------------------------------- MDY 323.92 1.54 312.88 71.7% Bearish RED -.079 .077 --------------------------------------------------------------------------------------------- IWM 142.4 .58 136.67 69.3% Bearish RED -.108 .094 --------------------------------------------------------------------------------------------- FAS 31.56 .05 29.02 -113.6% Bearish RED -.128 .172 --------------------------------------------------------------------------------------------- RETL 151.25 4.38 129.79 578.1% Bearish ---- -.105 .949 --------------------------------------------------------------------------------------------- SOXL 187.05 6.71 168.36 223.8% Bearish RED -.082 .45 --------------------------------------------------------------------------------------------- TECL 237.79 4.22 214.38 229.2% ------- RED .069 .577 --------------------------------------------------------------------------------------------- IBB 138.54 1.17 135.16 22.7% ------- RED .04 .02 --------------------------------------------------------------------------------------------- GLD 166.98 .36 166.54 35.4% Bullish BLUE .39 -.068 --------------------------------------------------------------------------------------------- OIH 120.17 1.73 116.87 -106% Bearish RED .058 .24 --------------------------------------------------------------------------------------------- GASL 3440 285 3685 -325.1% ------- RED -.021 .013 --------------------------------------------------------------------------------------------- |
Table 3 Count of Stocks in Key Directories
20200702
-------------------------------
NEWHIGHS 267 Bullish >10:1 NH/NL
NEWLOWS 14
MAXCP 25
MINCP 154
TTTNH 9
TTTNL 65
FASTUP 80
FASTDOWN 78
CPCROSSA 32
CPCROSSD 123
BIGVOLUP 4
BIGVODN 9
ACCUMVER 4
HIGHIP21 6
HIUPPCT 17
REDSELL 82
AUGSELS7 545
TRAPDOOR 31
|
Table 4 RANKING OF KEY DIRECTORIES BASED PCT.OF STOCKS ABOVE 65-DMA
7/2/20
Bullish = 44
Bearish = 1
---------------------------------------------------------------------------------------
Directory Current day-1 day-2 day-3 day-4 day-5
----------------------------------------------------------------------------------------
AUTO 1 .974 1 1 .948 .948
COPPER 1 1 1 1 1 1
EDU 1 1 .833 .833 .833 .833
ETFS 1 1 .982 1 1 1
JETS 1 .857 .857 .857 .857 .857
BONDFUND .98 .98 .98 .99 .99 .98
HOMEBLDG .941 .941 .941 .941 .882 .941
GOLD .938 .959 .959 .959 .918 .938
SOLAR .937 1 .937 .937 .875 .875
TRANSP .9 .9 1 1 .9 .95
INFRA .885 .857 .885 .857 .828 .857
NASD-100 .858 .848 .828 .797 .727 .797
CHEM .857 .836 .877 .877 .755 .795
NIFTY .844 .866 .911 .866 .866 .866
SEMI .831 .831 .871 .841 .782 .831
COMODITY .82 .82 .769 .717 .692 .769
INDEXES .819 .825 .814 .814 .77 .808
REIT .815 .822 .801 .773 .673 .773
MILITARY .814 .777 .777 .74 .629 .666
INDMATER .813 .786 .813 .8 .693 .773
SOFTWARE .813 .813 .762 .762 .728 .796
FOOD .811 .811 .735 .698 .641 .698
GAMING .809 .809 .809 .809 .666 .857
GREEN .809 .809 .857 .809 .761 .857
ELECTRON .804 .79 .837 .81 .729 .783
CHINA .784 .705 .705 .627 .666 .725
SP500 .762 .743 .757 .696 .602 .722
FIDSTKS .757 .745 .785 .717 .615 .762
HACKERS .75 .75 .7 .6 .55 .65
RUS-1000 .743 .734 .762 .707 .599 .725
BIOTECH .732 .735 .74 .712 .725 .78
RETAIL .72 .74 .76 .72 .56 .74
COMPUTER .7 .75 .8 .75 .7 .7
DJI-13 .692 .692 .769 .692 .615 .769
INSURANC .692 .73 .807 .73 .538 .73
SP-100 .692 .67 .736 .637 .549 .714
FINANCE .686 .686 .855 .783 .59 .795
BEVERAGE .666 .666 .6 .6 .6 .666
GUNS .6 .533 .533 .533 .466 .533
BIGBANKS .571 .571 .714 .571 .571 .857
DOWJONES .566 .566 .666 .566 .466 .666
UTILITY .538 .538 .358 .358 .23 .307
OILGAS .527 .527 .658 .581 .558 .666
HOSPITAL .523 .571 .571 .428 .333 .428
==========================================================================================
REGBANKS .5 .5 .73 .538 .384 .576
==========================================================================================
COAL .285 .285 .285 .285 .428 .428
|
------------------------------------------------------------------------------------------------------
7/1/2020 The week before July 4th ordinarily brings a market advance.
That seems to
be what is happening in here. But volume is low and the risk is higher next week
as the Presidential Election Year seasonality turns bearish. Because the IP21,
V-I and OBVPct are quite negative for the DJIA as viewed by Peerless, it's
difficult to see how the DJI will rise much above 27000 unless the FED can
talk it up past that barrier. The best way now to trade a narrow trading range
in the DJI is probably to look for ETFs and stocks that are running freely in new
high territory and are not bounded by resistance.


Since we have Peerless buy signals, we want to be long
something. I have been
suggesting the strongest V-Bottom tech stocks. Many of these are software stocks.
They actually benefit from stay-at-home orders. So, the safest approach now would
seem to be long AAPL, QQQ, IBB, GLD. At the same time, the key bank stocks,
BAC, JPM and WFC all show head/shoulders patterns, are below their 65-dma
support and have very weak Closing Powers and negative Accumulation. But the
problem with holding them shorting is that I can't see how the FED will let them
start a new leg down. So, with them near their lows, it's probably best to cover
these
shorts.
Traders seem confident for the time being that the FED will
continue to bolster
the market. As long as the bullish MAXCP V-bottom - tech stocks, like those shown
among the bullish MAXCPs tonight, continue to make breakouts and do not violate
their rising up-trends, the market should hold up a while longer, despite the bearish
news on the Covid-19 front for most sectors.
Very often Wall Street does manage to work itself into a
state of high anxiety in
the months before the Democratic Convention. But I would not think that
Biden will actually be much of a problem. He has long been a friend of Wall Street,
and big banks. So, don't be fooled by stories to the contrary. As long as we do not
get a new Peerless Sell and the DJI stays above 25000, relax and enjoy this week's
rally in tech stocks.
|
Charts 7/1/2020 (Click on Underlined link.) 2020 PEERLESS DJI, Signals, Indicators Daily DJI Volume 10-DayUp/Down Vol Stoch-20 Inverted Traders Index Graph of Pct of All Stocks above 65-dma Cum. Inverted Traders Index NASDAQ S&P OEX NYSE COMPQX DJI-15 DJI-20 DJI-30 DIA QQQ MDY IWM TNA Short-Term Rates SPY http://tigersoft.com/2121CST/SPY.GIF recent 2006 vers-Peerless signals -- http://tigersoft.com/2121CST/VERS06JJ.BMP USO-CrudeOil DBO FAS GLD BBH IBB JETS JNUG KOL NUGT OIH PALL RSX RETL SDS AGQ SLV SOXL TECL TLT TMF TNA UGA (gasoline) USO (oil) and China: YINN CHAU Commodities: CANE CORN DBC JJC, NIB, CHOC CORN, CUT (paper) MOO, SOYB WEAT UUP (Dollar) LIT (Lithium) Stocks AAPL ADBE ALXN AMAT AMGN AMD AMZN AXP BA BABA BAC BIDU BLDP CAT CVX CMG DE ENPH FB GILD GOOG GS HD IBM INTU JPM LRCX M (Macy's) MSFT NEM NFLX NKE NVDA PG REGN SO SQ QCOM QDEL TSLA TXN XOM V VRTX WFC WMT TOWN ZM New highs and Bullish MAXCPs http://tigersoft.com/MAXCP/7-1/BULLISH.htm Bearish MAXCPs - http://tigersoft.com/MINCP/7-1/BEARISH.htm |
Table 1
7/1/2018 QUICKSILVER on DJI-30 STOCKS.
Considering just those stocks whose IP21 + ITRS score is >+.25 or <-.25
1 Bullish ( AAPL
+364 = +364
3 Bearish ( IBM KO JNJ PG UTX
-118 -45 -140 -120 -86 = -509
----------------------------------------
Vitality Score = -143
Note that AAPL now shows highest AI/200 stock here. STOCKS CLOSE CHANGE PIVOT-P 5-dma AROC CL-PWR Candl AI/200 IP21 ITRS --------------------------------------------------------------------------------------- --------------------------------------------------------------------------------------- AAPL 364.11 -.69 364.84 56.1% Bullish RED 178 .086 .239 Bullish --------------------------------------------------------------------- AXP 94.05 -1.15 97.85 -75% Bearish RED 82 -.063 .036 --------------------------------------------------------------------- BA 180.32 -2.98 174.88 100.9% ------- RED 64 .025 .205 --------------------------------------------------------------------- CAT 126.06 -.44 124.71 161.1% Bearish RED 157 -.039 .03 --------------------------------------------------------------------- CSCO 46.06 -.58 45.22 143% Bearish RED 101 .03 .018 --------------------------------------------------------------------- CVX 87.62 -1.61 89.21 -1.1% Bearish RED 82 -.119 -.044 --------------------------------------------------------------------- DIS 113.01 1.5 111.36 42.3% Bearish BLUE 79 -.007 .012 --------------------------------------------------------------------- GS 197.57 -.05 207.1 -11.4% Bearish RED 101 -.115 .019 --------------------------------------------------------------------- HD 248.15 -2.36 245.38 41.1% Bearish RED 123 -.082 .119 --------------------------------------------------------------------- IBM 118.54 -2.23 119.03 89.4% Bearish RED 139 -.164 -.102 Bearish --------------------------------------------------------------------- INTC 58.81 -1.02 58.51 -23.9% Bearish RED 134 -.051 -.074 --------------------------------------------------------------------- JNJ 140.38 -.25 139.67 20.1% Bearish RED 115 -.165 -.18 Bearish --------------------------------------------------------------------- JPM 93.26 -.8 97.96 -74.1% Bearish RED 71 -.169 -.07 --------------------------------------------------------------------- KO 44.82 .14 44.93 19.1% Bearish RED 94 -.145 -.13 Bearish --------------------------------------------------------------------- MCD 184.66 .19 182.76 10.1% Bearish RED 105 -.048 -.078 --------------------------------------------------------------------- MMM 155.43 -.56 154.67 104.1% Bearish RED 118 -.006 -.02 --------------------------------------------------------------------- MRK 78.12 .79 76.57 147.6% Bearish BLUE 82 -.005 -.123 --------------------------------------------------------------------- MSFT 204.7 1.19 200.34 172.1% Bullish BLUE 154 .104 .102 --------------------------------------------------------------------- NKE 97.4 -.65 101.4 -137% Bearish RED 123 -.078 .026 --------------------------------------------------------------------- PFE 33.74 1.04 32.32 239.4% Bearish RED 74 -.139 -.17 Bearish --------------------------------------------------------------------- PG 119.98 .41 117.89 151.7% ------- BLUE 88 -.187 -.115 Bearish --------------------------------------------------------------------- TRV 112.5 -1.55 114.62 -15.9% ------- RED 112 .033 -.012 --------------------------------------------------------------------- UNH 297.73 2.78 296.22 146.7% Bearish BLUE 125 -.038 -.032 --------------------------------------------------------------------- UTX 86.01 -5.36 97.15 -958.4% Bullish RED 114 .144 -.558 Bearish --------------------------------------------------------------------- V 193.78 .61 193.98 61.8% Bearish RED 102 -.042 .089 --------------------------------------------------------------------- VZ 54.67 -.46 54.28 68.2% Bearish RED 135 .004 -.156 --------------------------------------------------------------------- WBA 40.88 -1.51 42.04 -34.7% Bearish RED 92 -.078 -.157 --------------------------------------------------------------------- WMT 119.69 -.09 119.71 -25.5% Bearish BLUE 85 -.01 -.191 --------------------------------------------------------------------- XOM 43.71 -1.01 45.17 -88.8% Bearish RED 44 -.081 -.051 --------------------------------------------------------------------- DOW 40.75 -.01 39.98 287.5% Bearish ---- 67 -.033 .202 |
Table 2 QUICKSILVER on ETFS - 07/01/20 Bullish = RETL, SOXL, TECL, GLD, OIH(5)
Bearish = (0)
ITRS + IP21>.25 is considered "Bullish" ETF CLOSE CHANGE PIVOT-PT 5-dma AROC CL-PWR CANDLE IP21 ITRS --------------------------------------------------------------------------------------------- DIA 257.31 -.56 257.44 52.5% Bearish RED -.061 ---- --------------------------------------------------------------------------------------------- SPY 310.52 2.16 307.35 105.5% Bearish BLUE-.008 .02 --------------------------------------------------------------------------------------------- QQQ 250.49 2.89 246.03 138.9% Bullish BLUE .126 .105 --------------------------------------------------------------------------------------------- MDY 322.38 -2.11 319.33 113.7% Bearish RED -.017 .07 --------------------------------------------------------------------------------------------- IWM 141.82 -1.36 140.45 123.6% Bearish RED -.081 .087 --------------------------------------------------------------------------------------------- FAS 31.51 .22 32.26 194.6% Bearish -----.049 .218 --------------------------------------------------------------------------------------------- RETL 146.87 1.36 135.05 510.5% Bearish BLUE .019 .889 Bullish --------------------------------------------------------------------------------------------- SOXL 180.34 -7.87 179.08 157.1% Bearish RED -.03 .628 Bullish --------------------------------------------------------------------------------------------- TECL 233.57 .68 227.44 325.1% ------- BLUE .105 .721 Bullish --------------------------------------------------------------------------------------------- IBB 137.37 .68 137.92 35.6% ------- ---- .021 .004 --------------------------------------------------------------------------------------------- GLD 166.62 -.75 165.8 21.6% Bullish RED .332 -.067 Bullish --------------------------------------------------------------------------------------------- OIH 118.44 -3.44 122.71 15% Bearish RED .118 .251 Bullish --------------------------------------------------------------------------------------------- |
Table 3 Count of Stocks in Key Directories
20200701
-------------------------------
NEWHIGHS 159
NEWLOWS 16
MAXCP 47
MINCP 42
TTTNH 16
TTTNL 26
FASTUP 102
FASTDOWN 66
CPCROSSA 70
CPCROSSD 183
BIGVOLUP 4
BIGVODN 10
ACCUMVER 4
HIGHIP21 5
HIUPPCT 14
VHIP21 57
AUGSELS7 364
TRAPDOOR 31
|
Tabke 4 RANKING OF KEY DIRECTORIES BASED PCT.OF STOCKS ABOVE 65-DMA
7/1/20
Bullish - 45
Bearish - 1
---------------------------------------------------------------------------------------
Directory Current day-1 day-2 day-3 day-4 day-5
----------------------------------------------------------------------------------------
COPPER 1 1 1 1 1 1
EDU 1 .833 .833 .833 .833 .833
ETFS 1 .982 1 1 1 1
SOLAR 1 .937 .937 .875 .875 .875
BONDFUND .98 .98 .99 .99 .99 .99
AUTO .974 1 1 .948 .948 .948
GOLD .959 .959 .959 .918 .938 .918
HOMEBLDG .941 .941 .941 .882 .941 .882
TRANSP .9 1 1 .9 .95 .95
NIFTY .866 .911 .866 .866 .866 .866
INFRA .857 .885 .857 .828 .857 .857
JETS .857 .857 .857 .857 .857 .857
NASD-100 .848 .838 .808 .727 .797 .767
CHEM .836 .877 .877 .755 .795 .795
SEMI .831 .871 .841 .782 .841 .811
INDEXES .825 .814 .814 .77 .808 .814
REIT .822 .801 .773 .673 .78 .666
COMODITY .82 .769 .717 .692 .769 .743
SOFTWARE .813 .762 .762 .728 .796 .762
FOOD .811 .735 .698 .641 .698 .698
GAMING .809 .809 .809 .666 .857 .857
GREEN .809 .857 .809 .761 .857 .809
ELECTRON .789 .836 .809 .727 .789 .748
INDMATER .786 .813 .8 .693 .773 .733
MILITARY .777 .777 .74 .629 .666 .518
COMPUTER .75 .8 .75 .7 .7 .65
HACKERS .75 .75 .6 .55 .65 .6
SP500 .746 .763 .702 .606 .731 .693
FIDSTKS .745 .785 .717 .615 .768 .728
RETAIL .74 .76 .72 .56 .72 .7
RUS-1000 .733 .763 .708 .599 .729 .683
BIOTECH .732 .74 .712 .727 .787 .756
INSURANC .73 .807 .73 .538 .73 .653
CHINA .705 .705 .627 .666 .725 .705
DJI-13 .692 .769 .692 .615 .769 .692
FINANCE .69 .857 .785 .595 .809 .714
SP-100 .677 .744 .644 .555 .722 .655
BEVERAGE .666 .6 .6 .6 .666 .533
BIGBANKS .571 .714 .571 .571 .857 .714
HOSPITAL .571 .571 .428 .333 .428 .523
DOWJONES .566 .666 .566 .466 .666 .6
UTILITY .538 .358 .358 .23 .358 .358
GUNS .533 .533 .533 .466 .533 .466
OILGAS .53 .661 .584 .561 .669 .607
REGBANKS .5 .73 .538 .384 .576 .461
===============================================================================================
COAL .285 .285 .285 .428 .428 .285
|
====================================================================
6/30/2020 Who would be a buyer in here with Covid-19 cases rising sharply,
businesses
being forced to close and Trump seemingly "on the ropes?" Answer: Someone
investing someone else's money. Namely, the Federal Reserve which thinks it
can print an infinite amount of money without consequences and numerous
technically minded momentum and trend-following hedge-funds. In the 1960's
they were called called "go-go" funds. My warning here is that if the
uptrends
in the leading tech stocks and the DJI's support at 25000 are both broken,
the "gig may be up", as Groucho Marx famously said in October 1929.
That is
the lesson from the charts of 1930 and 1932 shown Thursday night. This is the
same Groucho who complained: "I almost made a killing on Wall Street. I
went
to kill my broker but he had already committed suicide".
All our internal strength indicators are either negative
or in downtrend. DIA's Closing Power is falling and
its Opening Power is sitting dangerously on its uptrend.

It is unclear to me how the DJI can get back up to its upper
band for a Peerless
Sell unless the Fed continues to very publicly buy 1/2 billion or more in bonds of
the biggest blue chips each day. In the lighter trading just before the Fourth of
July
holiday this may work out, as prices do normally rise until the Fourth.. But if we
look at the period from May 30th to July 15th since 1968 in Presidential Election
Years, we see that the DJI rose only 30.8% of the time and averaged a decline of
1.1%.
So, despite the Peerless Buys, I would suggest staying hedged with some of the
bearish MINCPs while avoiding the DJI or DIA and holding long only GLD, AAPL
(the current Tiger "Tahiti stock" in the DJI-30) plus the tech ETFs, QQQ and
IBB.
The traders in the leading tech stocks are very
savvy. They are shrewdly speculating
that they can play the uptrends in AAPL, ADBE, MSFT and a few other V-bottom
stocks for the time being. They probably are right that they will learn ahead of the
crowd when the FED decides to back away from QE-Infinity. But at that point, I think
we can bet that they will then quickly dump these stocks, especially if they believe
that the DJI is about to begin another major decline. So, watch the leading
techs below.
If their price up-trends are broken, watch-out below! Either it will signify, first,
that the
FED is downsizing their "QE-Infinity", or, second, that the economic news is
going from
bad to much worse or, third, the political news as Wall Street sees it is becoming
almost dangerous because of Trump's weakness at the polls. Of the these three
developments, I would worry only about the first two. There is nothing that I know
of in Biden's background that could be accurately construed to make him anythng
but a friend of Wall Street in the tradition of the two Clintons and Obama. History
shows, despite this, that political anxieties on Wall Street should be highest just before
the August 17-20th Democrat Convention.
See - https://www.americanbanker.com/articles/bidens-wall-street-pals-think-they-have-his-ear-despite-snubs
https://time.com/5841292/biden-campaign-wall-street-fundraiser/
https://www.opensecrets.org/news/2020/03/biden-boosted-by-wall-street/
Very Strong Software Stocks with "V"
formations.
This group have a habit of topping out after the DJI,
sometimes months afterwards, as in the year 2000.
 |
 |
 |
|
|
Charts 6/30/2020 (Click on Underlined link.) 2020 PEERLESS DJI, Signals, Indicators Daily DJI Volume 10-DayUp/Down Vol Stoch-20 Inverted Traders Index Graph of Pct of All Stocks above 65-dma Cum. Inverted Traders Index NASDAQ S&P OEX NYSE COMPQX DJI-15 DJI-20 DJI-30 DIA QQQ MDY IWM TNA Short-Term Rates SPY http://tigersoft.com/2121CST/SPY.GIF recent 2006 vers-Peerless signals -- http://tigersoft.com/2121CST/VERS06FF.BMP USO-CrudeOil DBO FAS GLD BBH IBB JETS JNUG KOL NUGT OIH PALL RSX RETL SDS AGQ SLV SOXL TECL TLT TMF TNA UGA (gasoline) USO (oil) and China: YINN CHAU Commodities: CANE CORN DBC JJC, NIB, CHOC CORN, CUT (paper) MOO, SOYB WEAT UUP (Dollar) LIT (Lithium) Stocks AAPL ADBE ALXN AMAT AMGN AMD AMZN AXP BA BABA BAC BIDU BLDP CAT CVX CMG DE ENPH FB GILD GOOG GS HD IBM INTU JPM LRCX M (Macy's) MSFT NEM NFLX NKE NVDA PG REGN SO SQ QCOM QDEL TSLA TXN XOM V VRTX WFC WMT TOWN ZM New highs and Bullish MAXCPs http://tigersoft.com/MAXCP/6-30/BULLISH.htm Bearish MAXCPs - http://tigersoft.com/MINCP/6-30/BEARISH.htm |
Table 1
6/29/2018 QUICKSILVER on DJI-30 STOCKS.
Considering just those stocks whose IP21 + ITRS score is >+.25 or <-.25
1 Bullish ( AAPL
+365 = +365
3 Bearish ( JNJ PG UTX
-141 -120 -86 = -347
----------------------------------------
Vitality Score = +18
Note that AAPL now shows highest AI/200 stock here. STOCKS CLOSE CHANGE PIVOT-P 5-dma AROC CL-PWR Candl AI/200 IP21 ITRS --------------------------------------------------------------------------------------- --------------------------------------------------------------------------------------- AAPL 364.8 3.02 360.06 -23.9% Bullish BLUE 178 .144 .228 Bullish --------------------------------------------------------------------- AXP 95.2 .68 95.48 -219.5% Bearish BLUE 82 -.052 .043 --------------------------------------------------------------------- BA 183.3 -11.19 176.69 -126.7% ------- RED 64 .053 .187 --------------------------------------------------------------------- CAT 126.5 1.25 122.06 10.1% Bearish BLUE 158 .013 .014 --------------------------------------------------------------------- CSCO 46.64 .49 44.75 128.3% Bearish BLUE 101 .093 .007 --------------------------------------------------------------------- CVX 89.23 1.56 87.64 -124.9% Bearish BLUE 82 -.069 -.022 --------------------------------------------------------------------- DIS 111.51 -.01 112.07 -226.5% Bearish RED 80 .012 .001 --------------------------------------------------------------------- GS 197.62 4.15 198.02 -180.3% Bearish BLUE 102 -.106 .006 --------------------------------------------------------------------- HD 250.51 4.39 246.13 4.1% Bearish BLUE 124 -.016 .126 --------------------------------------------------------------------- IBM 120.77 1.02 116.42 57.5% Bearish BLUE 139 -.104 -.087 --------------------------------------------------------------------- INTC 59.83 1.56 59.09 -7.7% Bearish BLUE 135 .007 -.079 --------------------------------------------------------------------- JNJ 140.63 1.59 139.82 -79.7% Bearish BLUE 115 -.113 -.163 Bearish --------------------------------------------------------------------- JPM 94.06 1.06 94.66 -203.2% Bearish BLUE 72 -.146 -.064 --------------------------------------------------------------------- KO 44.68 .32 44.65 -107.6% Bearish BLUE 95 -.12 -.129 --------------------------------------------------------------------- MCD 184.47 1.67 184.29 -58.7% Bearish BLUE 105 -.032 -.074 --------------------------------------------------------------------- MMM 155.99 .42 152.22 -59.8% Bearish BLUE 119 .018 -.004 --------------------------------------------------------------------- MRK 77.33 1.21 75.87 13.8% Bearish BLUE 83 .037 -.159 --------------------------------------------------------------------- MSFT 203.51 5.07 197.84 40.2% Bullish BLUE 154 .132 .073 --------------------------------------------------------------------- NKE 98.05 2.18 100.08 -196.3% Bearish BLUE 124 -.004 .026 --------------------------------------------------------------------- PFE 32.7 .06 32.19 -10.8% Bearish BLUE 75 .009 -.183 --------------------------------------------------------------------- PG 119.57 1.91 116.42 78.6% ------- BLUE 89 -.169 -.098 Bearish --------------------------------------------------------------------- TRV 114.05 1.15 112.86 -94.3% Bullish BLUE 112 .074 .031 --------------------------------------------------------------------- UNH 294.95 5.19 289.18 -45.4% Bearish BLUE 125 -.022 -.044 --------------------------------------------------------------------- UTX 86.01 -5.36 97.15 -958.4% Bullish RED 114 .144 -.53 Bearish --------------------------------------------------------------------- V 193.17 1.79 191.41 -124.5% Bearish BLUE 102 -.031 .087 --------------------------------------------------------------------- VZ 55.13 .44 53.93 17.5% Bearish BLUE 135 .072 -.141 --------------------------------------------------------------------- WBA 42.39 .07 41.17 -50.1% Bearish BLUE 93 -.024 -.1 --------------------------------------------------------------------- WMT 119.78 .72 120.3 -53.9% Bearish BLUE 85 -.008 -.167 --------------------------------------------------------------------- XOM 44.72 .4 44.5 -220.7% Bearish BLUE 45 -.028 -.004 --------------------------------------------------------------------- DOW 40.76 -.22 38.45 -73.5% Bearish BLUE 67 -.007 .203 |
Table 2 QUICKSILVER on ETFS - 06/30/20 Bullish = RETL, SOXL, TECL, OIH(4)
Bearish = (0)
ITRS + IP21>.25 is considered "Bullish" ETF CLOSE CHANGE PIVOT-PT 5-dma AROC CL-PWR CANDLE IP21 ITRS --------------------------------------------------------------------------------------------- DIA 257.87 1.96 254.63 -70.9% Bearish BLUE-.009 ---- --------------------------------------------------------------------------------------------- SPY 308.36 3.9 304.09 -60.4% Bearish BLUE .022 .005 --------------------------------------------------------------------------------------------- QQQ 247.6 4.76 243.71 -25.4% Bullish BLUE .143 .074 --------------------------------------------------------------------------------------------- MDY 324.49 3.99 315.14 -28.1% Bearish BLUE .026 .075 --------------------------------------------------------------------------------------------- IWM 143.18 2.04 138.36 6.4% Bearish BLUE-.044 .097 --------------------------------------------------------------------------------------------- FAS 31.29 1.34 30.32 -413.4% Bearish BLUE-.047 .12 --------------------------------------------------------------------------------------------- RETL 145.51 2.17 132.85 -128.2% Bearish BLUE .11 .748 Bullish --------------------------------------------------------------------------------------------- SOXL 188.21 14.06 174.78 23.8% ------- BLUE .065 .476 Bullish --------------------------------------------------------------------------------------------- TECL 232.89 12.4 219.08 -51.9% Bullish BLUE .144 .514 Bullish --------------------------------------------------------------------------------------------- IBB 136.69 2.01 136.4 -71.8% ------- BLUE .029 -.007 --------------------------------------------------------------------------------------------- GLD 167.37 .74 165.9 26.8% Bullish BLUE .29 -.042 --------------------------------------------------------------------------------------------- OIH 121.88 2.87 118.08 -299.6% Bearish BLUE .179 .292 Bullish --------------------------------------------------------------------------------------------- GASL 3440 285 3685 -325.1% ------- RED -.021 .024 --------------------------------------------------------------------------------------------- |
Table 3 Count of Stocks in Key Directories
20200630
-------------------------------
NEWHIGHS 160
NEWLOWS 22
MAXCP 30
MINCP 17
TTTNH 6
TTTNL 37
FASTUP 67
FASTDOWN 144
CPCROSSA 185
CPCROSSD 25
BIGVOLUP 5
BIGVODN 9
ACCUMVER 8
HIGHIP21 6
HIUPPCT 16
VHIP21 58
AUGSELS7 280
TRAPDOOR 30
|
RANKING OF KEY DIRECTORIES BASED PCT.OF STOCKS ABOVE 65-DMA 6/30/20 --------------------------------------------------------------------------------------- Directory Current day-1 day-2 day-3 day-4 day-5 ---------------------------------------------------------------------------------------- AUTO 1 1 .948 .948 .948 1 COPPER 1 1 1 1 1 1 TRANSP 1 1 .9 .95 .95 1 ETFS .982 1 1 1 1 1 BONDFUND .98 .99 .99 .99 .99 .98 GOLD .959 .959 .918 .938 .938 .938 HOMEBLDG .941 .941 .882 .941 .882 .941 SOLAR .937 .937 .875 .875 .937 .937 NIFTY .911 .866 .866 .866 .866 .911 INFRA .885 .857 .828 .857 .857 .885 CHEM .877 .877 .755 .795 .795 .877 FINANCE .857 .785 .595 .809 .726 .88 GREEN .857 .809 .761 .857 .809 .857 JETS .857 .857 .857 .857 .857 1 SEMI .855 .826 .769 .826 .826 .884 NASD-100 .838 .818 .737 .797 .767 .919 ELECTRON .837 .81 .729 .79 .77 .851 INDEXES .814 .814 .77 .808 .819 .852 INDMATER .813 .8 .693 .773 .733 .853 GAMING .809 .809 .666 .857 .857 .904 INSURANC .807 .73 .538 .73 .653 .769 REIT .801 .773 .673 .78 .687 .829 COMPUTER .8 .75 .7 .7 .65 .75 EDU .8 .8 .8 .8 .8 .8 FIDSTKS .785 .717 .615 .768 .734 .841 MILITARY .777 .74 .629 .666 .555 .814 COMODITY .769 .717 .692 .769 .743 .743 DJI-13 .769 .692 .615 .769 .692 .769 SOFTWARE .766 .766 .716 .783 .75 .833 RUS-1000 .763 .708 .599 .729 .696 .823 RETAIL .76 .72 .56 .72 .7 .78 SP500 .76 .698 .602 .726 .696 .831 HACKERS .75 .65 .55 .65 .6 .8 SP-100 .736 .637 .549 .714 .659 .78 BIOTECH .732 .706 .725 .787 .78 .824 FOOD .73 .692 .634 .692 .692 .711 REGBANKS .73 .538 .384 .576 .461 .615 BIGBANKS .714 .571 .571 .857 .857 .857 CHINA .705 .627 .666 .725 .705 .784 DOWJONES .666 .566 .466 .666 .633 .733 OILGAS .661 .584 .561 .669 .623 .776 BEVERAGE .6 .6 .6 .666 .533 .866 HOSPITAL .571 .428 .333 .428 .523 .571 GUNS .533 .533 .466 .533 .533 .666 UTILITY .358 .358 .23 .358 .384 .41 COAL .285 .285 .428 .428 .285 .428 |
=======================================================================
6/29/2020 The Fed announced that has bought $428 million worth of the corporate
bonds of
UnitedHealth, AT&T, Coca-Cola, Nike, PayPal, Campbell's Soup, Boeing
Exxon and Mobil. This sent the DJI nicely up from its 25000 support.
Today's recovery also brought a two-day reversal Buy B19 from Peerless. So,
now it looks again like the DJIA may advance to the 27000 resistance. But
25000 now takes on added significance as key support.


Presently, it seems like tje marlet will achieve its advance in a series of up-openings
since
our Closing Powers for DIA and the other major market ETFs are in steep
downtrends.
We can see that the Fed can hold the DJI up above 25,000 with timely announcements.
But will it be able to run the DJI up to the upper band and 27000? Down volume
has recently been quite high. No surprise here: the sharp upswing in Covid-19 cases
and the downswing in President's Approval rating might well have been expected
to break the market down badly, but for the continuing bullish presence of the FED.
At least, the market is now "over-sold" and the Volume is disproportionately in
rising stocks. But what can the FED do now to cause more buying? That is not
clear, at this stage. Perhaps, the usually bullish seasonality around the Fourth of
July
will help bring a continuation of the rally.
For now, the many head/shoulders patterns tells us that the Fed will have to do a
lot more buying of bonds and possibly stocks, too. The key big banks' bearish
head/shoulders patterns (BAC, GS, JPM and QFC) do not usually appear
like are now when the overall market is going to go much higher. So stay short some
of the bearish MINCPs while being long AAPL, QQQ, IBB and GLD.


|
Table 1
6/29/2018 QUICKSILVER on DJI-30 STOCKS.
Considering just those stocks whose IP21 + ITRS score is >+.25 or <-.25
2 Bullish ( AAPL BA
+362 +94 = +456
4 Bearish ( JNJ UTX KO PG
-139 -86 -44 -118 = -387
----------------------------------------
Vitality Score = +69
Note that AAPL now shows highest AI/200 stock here. STOCKS CLOSE CHANGE PIVOT-P 5-dma AROC CL-PWR Candl AI/200 IP21 ITRS --------------------------------------------------------------------------------------- --------------------------------------------------------------------------------------- AAPL 361.78 8.15 366.53 40.3% Bullish BLUE 178 .141 .224 Bullish --------------------------------------------------------------------- AXP 94.52 1.1 99.42 -253.3% Bearish BLUE 82 -.064 .026 --------------------------------------------------------------------- BA 194.49 24.48 187.88 166.2% Bullish BLUE 64 .078 .207 Bullish --------------------------------------------------------------------- CAT 125.25 2.86 126.25 -21.7% Bearish BLUE 158 .008 .021 --------------------------------------------------------------------- CSCO 46.15 -.16 45.47 109.1% Bearish RED 100 .052 .031 --------------------------------------------------------------------- CVX 87.67 1.21 91.44 -219.6% Bearish BLUE 82 -.078 -.05 --------------------------------------------------------------------- DIS 111.52 2.42 116.59 -194.7% Bearish BLUE 80 .007 -.01 --------------------------------------------------------------------- GS 193.47 4.28 204.78 -248.1% Bearish BLUE 103 -.122 -.001 --------------------------------------------------------------------- HD 246.12 5.11 250.31 -61.7% Bearish BLUE 125 -.054 .12 --------------------------------------------------------------------- IBM 119.75 2.56 119.41 -55.6% Bearish BLUE 140 -.126 -.059 --------------------------------------------------------------------- INTC 58.27 .77 59.92 -154.2% Bearish BLUE 135 -.05 -.09 --------------------------------------------------------------------- JNJ 139.04 1.23 142.86 -154.6% Bearish BLUE 115 -.149 -.141 Bearish --------------------------------------------------------------------- JPM 93 .41 97.93 -195.4% Bearish RED 73 -.159 -.079 --------------------------------------------------------------------- KO 44.36 .79 45.64 -153.7% Bearish BLUE 96 -.15 -.133 Bearish --------------------------------------------------------------------- MCD 182.8 3.06 186.62 -126.5% Bearish BLUE 105 -.037 -.073 --------------------------------------------------------------------- MMM 155.57 3.05 157.84 -36.2% Bearish BLUE 118 -.02 .007 --------------------------------------------------------------------- MRK 76.12 .93 77.12 -41.3% Bearish BLUE 83 .006 -.144 --------------------------------------------------------------------- MSFT 198.44 2.11 201.91 -53.4% Bullish BLUE 154 .124 .055 --------------------------------------------------------------------- NKE 95.87 2.2 101.92 -183.3% Bearish BLUE 125 -.029 .011 --------------------------------------------------------------------- PFE 32.64 .6 32.77 -72.3% Bearish BLUE 75 .027 -.171 --------------------------------------------------------------------- PG 117.66 2.43 117.73 -3.8% Bearish BLUE 90 -.177 -.112 Bearish --------------------------------------------------------------------- TRV 112.9 1.9 116.19 -145.8% ------- BLUE 112 .088 .019 --------------------------------------------------------------------- UNH 289.76 2.88 297.6 -49.7% Bearish BLUE 125 -.011 -.058 --------------------------------------------------------------------- UTX 86.01 -5.36 97.15 -958.4% Bullish RED 114 .144 -.496 Bearish --------------------------------------------------------------------- V 191.38 2.11 197.97 -92.5% Bearish BLUE 103 -.075 .073 --------------------------------------------------------------------- VZ 54.69 1.53 54.94 -89.2% Bearish BLUE 135 -.008 -.12 --------------------------------------------------------------------- WBA 42.32 1.15 42.81 -109.3% Bearish BLUE 94 -.016 -.105 --------------------------------------------------------------------- WMT 119.06 .74 121.07 -109% Bearish BLUE 85 -.008 -.154 --------------------------------------------------------------------- XOM 44.32 .7 46.7 -231.9% Bearish BLUE 46 -.029 -.03 --------------------------------------------------------------------- DOW 40.98 1.18 41.35 -94.4% Bearish BLUE 67 -.034 .171 |
Table 2 QUICKSILVER on ETFS - 06/29/20 Bullish = RETL, SOXL, TECL, GLD, OIH(5)
Bearish = (0)
ITRS + IP21>.25 is considered "Bullish" ETF CLOSE CHANGE PIVOT-PT 5-dma AROC CL-PWR CANDLE IP21 ITRS --------------------------------------------------------------------------------------------- DIA 255.91 5.53 261.5 -85.8% Bearish BLUE -.009 ---- --------------------------------------------------------------------------------------------- SPY 304.46 4.41 312.05 -100.4% Bearish BLUE .019 .007 --------------------------------------------------------------------------------------------- QQQ 242.84 2.62 248.84 -79.6% ------- BLUE .131 .072 --------------------------------------------------------------------------------------------- MDY 320.5 7.62 326.28 -82.4% Bearish BLUE .014 .073 --------------------------------------------------------------------------------------------- IWM 141.14 4.47 143 -44.9% Bearish BLUE-.069 .101 --------------------------------------------------------------------------------------------- FAS 29.95 .93 33.86 -564.5% Bearish BLUE-.051 .022 --------------------------------------------------------------------------------------------- RETL 143.34 13.55 149.05 -180.2% Bearish BLUE .095 .71 Bullish --------------------------------------------------------------------------------------------- SOXL 174.15 5.79 187.37 -326.4% Bearish BLUE .036 .3 Bullish --------------------------------------------------------------------------------------------- TECL 220.49 6.11 235.21 -215.5% ------- BLUE .138 .386 Bullish --------------------------------------------------------------------------------------------- IBB 134.68 -.48 138.65 -125.7% Bearish RED .008 .025 --------------------------------------------------------------------------------------------- GLD 166.63 .09 166.48 46.4% Bullish BLUE .312 -.005 Bullish --------------------------------------------------------------------------------------------- OIH 119.01 2.14 129.14 -404.4% Bearish BLUE .149 .266 Bullish --------------------------------------------------------------------------------------------- |
Table 3 Count of Stocks in Key Directories
20200629
-------------------------------
NEWHIGHS 132
NEWLOWS 23
MAXCP 16
MINCP 37
TTTNH 5
TTTNL 68
FASTUP 62
FASTDOWN 138
CPCROSSA 136
CPCROSSD 21
BIGVOLUP 5
BIGVODN 6
ACCUMVER 10
HIGHIP21 9
AUGSELS7 357
TRAPDOOR 32
|
Table 4 RANKING OF KEY DIRECTORIES BASED PCT.OF STOCKS ABOVE 65-DMA
6/29/20
Bullish = 43
Bearish = 3
---------------------------------------------------------------------------------------
Directory Current day-1 day-2 day-3 day-4 day-5
----------------------------------------------------------------------------------------
AUTO 1 .948 .948 .948 1 1
COPPER 1 1 1 1 1 1
ETFS 1 1 1 1 1 1
TRANSP 1 .9 .95 .95 1 .95
BONDFUND .99 .99 .99 .99 .99 .99
GOLD .959 .918 .938 .938 .938 .938
HOMEBLDG .941 .882 .941 .882 .941 .941
SOLAR .937 .875 .875 .937 .937 .875
CHEM .877 .755 .795 .795 .857 .877
NIFTY .866 .866 .866 .866 .911 .977
INFRA .857 .828 .857 .857 .885 .942
JETS .857 .857 .857 .857 1 1
SEMI .826 .769 .826 .826 .884 .875
NASD-100 .818 .747 .808 .767 .919 .929
INDEXES .814 .77 .808 .819 .852 .874
ELECTRON .81 .729 .79 .77 .851 .858
GAMING .809 .666 .857 .857 .904 .904
GREEN .809 .761 .857 .809 .857 .857
EDU .8 .8 .8 .8 .8 .8
INDMATER .8 .693 .773 .733 .84 .88
FINANCE .785 .595 .809 .726 .88 .928
REIT .773 .673 .78 .687 .829 .872
SOFTWARE .766 .733 .783 .75 .85 .883
COMPUTER .75 .7 .7 .65 .8 .85
MILITARY .74 .629 .666 .555 .814 .851
INSURANC .73 .538 .73 .653 .769 .846
RETAIL .72 .56 .72 .7 .78 .82
COMODITY .717 .692 .769 .743 .743 .743
FIDSTKS .717 .615 .768 .734 .841 .858
RUS-1000 .707 .601 .729 .695 .834 .845
BIOTECH .701 .722 .785 .78 .829 .821
SP500 .698 .604 .726 .696 .844 .852
DJI-13 .692 .615 .769 .692 .769 .846
FOOD .692 .634 .692 .692 .711 .711
HACKERS .65 .6 .65 .6 .85 .85
SP-100 .637 .549 .714 .659 .78 .802
CHINA .627 .666 .725 .705 .784 .803
BEVERAGE .6 .6 .666 .533 .866 .866
OILGAS .584 .561 .669 .623 .776 .753
BIGBANKS .571 .571 .857 .857 .857 .857
DOWJONES .566 .466 .666 .633 .733 .766
REGBANKS .538 .384 .576 .461 .615 .692
GUNS .533 .466 .533 .533 .666 .733
================================================================================================
HOSPITAL .428 .333 .428 .523 .571 .619
UTILITY .358 .23 .358 .384 .461 .487
COAL .285 .428 .428 .285 .428 .428
|
====================================================================
6/26/2020 Friday's trading was ugly. The FED would not say any banks
failed its
solvency test, but it asked GS to stop paying dividends. This did not go
well with bank stocks, which look like they have now completed all their
individual H/S patterns. There is still some hope elsewhere. The DJI fell
back to its 24700-25000 neckline support and right now seems again to
rebounding, as would be in keeping with the weak Buy B2. Bearishly, there were
1898 more down than up on the NYSE. This establishes a down-trendline for
NYSE A/D Line.
If 24700 is closed below, look for a retreat to 23000.
The NYSE A/D Line's uptrend has been broken. This probably
means the FED has lost control of the market. Certainly,
the existence of so many head/shoulders patterns has been
a warnng.

If we look back at the turns-downward in April 1930
and September 1932
following bear market rallies, we see how the bear markets continued when,. first,
the NYSE A/D Line broke its steep uptrend, as has now happened here, and, second,
after the DJI broke below a head/shoulders' neckline, which has not
happened here
and would take a close below 24750. So, the DJI's neckline takes on special
importance now.
In both of the 1930 and 1932 cases, the DJI's breakdown below the neckline
support was the best warning the Public and outhsiders got at the time that the
FED would soon be ending its aggressive buying of massive amounts of
Treasuries to inject funds into the market. Without this FED support, the
markets soon collapsed badly.
April 1930 Top

September 1932 Top

As long as the DJI does not close above 24750, I
think we can assume that the
FED is still doing its best to support the market. But the news for traders is not
good. The Covid-19 rebound is very substantial and the economic recovery will
be delayed. Trump's decline is also a factor, too, if it hurts other Republicans
running for Congress.
I have suggested not buying DIA and instead holding long
AAPL, QQQ, IBB and GLD.
Another down day for them may break their price uptrends. We will have to wait and
see. Volatility is so high in current market that I have suggested we accept breaks
in simple uptrends to get Sells. Meanwhile, hedging with short sales in the weak
MINCPs showing Head/shoulders patterns is working out well.

|
Charts 6/26/2020 (Click on Underlined link.) 2020 PEERLESS DJI, Signals, Indicators Daily DJI Volume 10-DayUp/Down Vol Stoch-20 Inverted Traders Index Graph of Pct of All Stocks above 65-dma Cum. Inverted Traders Index NASDAQ S&P OEX NYSE COMPQX DJI-15 DJI-20 DJI-30 DIA QQQ MDY IWM TNA Short-Term Rates SPY http://tigersoft.com/2121CST/SPY.GIF recent 2006 vers-Peerless signals -- http://tigersoft.com/2121CST/VERSYY06.BMP USO-CrudeOil DBO FAS GLD BBH IBB JETS JNUG KOL NUGT OIH PALL RSX RETL SDS AGQ SLV SOXL TECL TLT TMF TNA UGA (gasoline) USO (oil) and China: YINN CHAU Commodities: CANE CORN DBC JJC, NIB, CHOC CORN, CUT (paper) MOO, SOYB WEAT UUP (Dollar) LIT (Lithium) Stocks AAPL ADBE ALXN AMAT AMGN AMD AMZN AXP BA BABA BAC BIDU BLDP CAT CVX CMG DE ENPH FB GILD GOOG GS HD IBM INTU JPM LRCX M (Macy's) MSFT NEM NFLX NKE NVDA PG REGN SO SQ QCOM QDEL TSLA TXN XOM V VRTX WFC WMT TOWN New highs and Bullish MAXCPs http://tigersoft.com/MAXCP/6-26/BULLISH.htm Bearish MAXCPs - http://tigersoft.com/MINCP/6-26/BEARISH.htm |
Table 1
6/26/2018 QUICKSILVER on DJI-30 STOCKS.
Considering just those stocks whose IP21 + ITRS score is >+.25 or <-.25
1 Bullish ( AAPl
+365 = +365
5 Bearish ( JNJ UTX KO PG DOW
-138 -86 -45 -115 -40 = -424
----------------------------------------
Vitality Score = -59
Note that AAPL now shows highest AI/200 stock here. STOCKS CLOSE CHANGE PIVOT-P 5-dma AROC CL-PWR Candl AI/200 IP21 ITRS --------------------------------------------------------------------------------------- --------------------------------------------------------------------------------------- AAPL 353.63 -11.21 358.87 54.3% Bullish RED 177 .083 .17 Bullish --------------------------------------------------------------------- AXP 93.42 -4.43 99.44 -381.2% Bearish RED 82 -.107 .084 --------------------------------------------------------------------- BA 170.01 -4.87 188.52 -464.8% ------- RED 64 .014 .203 --------------------------------------------------------------------- CAT 122.39 -2.32 125.79 -202.4% Bearish RED 158 .026 .017 --------------------------------------------------------------------- CSCO 46.31 1.09 45.16 109.6% Bearish BLUE 99 .125 .052 --------------------------------------------------------------------- CVX 86.46 -2.75 91.59 -231.4% Bearish RED 82 -.006 .017 --------------------------------------------------------------------- DIS 109.1 -2.26 115.92 -230.1% Bearish RED 80 .018 .005 --------------------------------------------------------------------- GS 189.19 -17.91 203.42 -306.4% Bearish RED 104 -.185 .005 --------------------------------------------------------------------- HD 241.01 -4.37 249.16 -113.9% Bearish RED 126 -.056 .142 --------------------------------------------------------------------- IBM 117.19 -1.84 121.07 -220.6% Bearish RED 140 -.099 -.051 --------------------------------------------------------------------- INTC 57.5 -1.01 60.09 -178.3% Bearish RED 136 -.063 -.118 --------------------------------------------------------------------- JNJ 137.81 -1.86 143.39 -212.1% Bearish RED 115 -.119 -.143 Bearish --------------------------------------------------------------------- JPM 92.59 -5.37 96.75 -269% Bearish RED 74 -.174 -.004 --------------------------------------------------------------------- KO 43.57 -1.36 45.74 -269.8% Bearish RED 97 -.159 -.139 Bearish --------------------------------------------------------------------- MCD 179.74 -3.02 187.46 -183.8% Bearish RED 105 -.105 -.063 --------------------------------------------------------------------- MMM 152.52 -2.15 156.69 -180.5% Bearish RED 118 .067 -.011 --------------------------------------------------------------------- MRK 75.19 -1.38 76.75 -176.3% Bearish RED 82 .042 -.158 --------------------------------------------------------------------- MSFT 196.33 -4.01 200.57 29.6% Bullish RED 154 .114 .045 --------------------------------------------------------------------- NKE 93.67 -7.73 99.51 -105.8% Bearish RED 126 -.053 .021 --------------------------------------------------------------------- PFE 32.04 -.28 33.11 -210.6% Bearish RED 75 .025 -.171 --------------------------------------------------------------------- PG 115.23 -2.66 117.75 -156.7% Bearish RED 91 -.187 -.116 Bearish --------------------------------------------------------------------- TRV 111 -3.62 116.23 -241.1% Bullish RED 112 .062 .048 --------------------------------------------------------------------- UNH 286.88 -9.34 292.67 -74.3% Bearish RED 125 -.01 -.103 --------------------------------------------------------------------- UTX 86.01 -5.36 97.15 -958.4% Bullish RED 114 .144 -.505 Bearish --------------------------------------------------------------------- V 189.27 -4.71 194.96 -75.5% Bearish RED 103 -.109 .101 --------------------------------------------------------------------- VZ 53.16 -1.12 55.66 -272.8% Bearish RED 136 .016 -.142 --------------------------------------------------------------------- WBA 41.17 -.87 43.24 -346.8% Bearish RED 95 .03 -.112 --------------------------------------------------------------------- WMT 118.32 -1.39 121.68 -63.5% ------- RED 85 .016 -.17 --------------------------------------------------------------------- XOM 43.62 -1.55 46.42 -257.9% Bearish RED 47 -.013 .05 --------------------------------------------------------------------- DOW 39.8 -.18 41.74 -227.6% Bearish BLUE 67 -.057 .194 Bearish |
Table 2 QUICKSILVER on ETFS - 06/26/20 Bullish = RETL, SOXL, TECL, OIH(4)
Bearish = (0)
ITRS + IP21>.25 is considered "Bullish" ETF CLOSE CHANGE PIVOT-PT 5-dma AROC CL-PWR CANDLE IP21 ITRS --------------------------------------------------------------------------------------------- DIA 250.38 -7.06 260.32 -162.8% Bearish RED -.013 ------ --------------------------------------------------------------------------------------------- SPY 300.05 -7.3 310.62 -139.2% Bearish RED .028 .011 --------------------------------------------------------------------------------------------- QQQ 240.22 -5.81 246.74 -81.7% ------- RED .143 .063 --------------------------------------------------------------------------------------------- MDY 312.88 -6.45 325.77 -186.9% Bearish RED .006 .076 --------------------------------------------------------------------------------------------- IWM 136.67 -3.78 142.4 -153.1% Bearish RED -.057 .105 --------------------------------------------------------------------------------------------- FAS 29.02 -3.24 33.54 -655.3% Bearish RED -.065 .129 --------------------------------------------------------------------------------------------- RETL 129.79 -5.26 148.35 -313.3% Bearish RED .121 .731 Bullish --------------------------------------------------------------------------------------------- SOXL 168.36 -10.72 185.84 -348% Bearish RED .055 .281 Bullish --------------------------------------------------------------------------------------------- TECL 214.38 -13.06 230.2 -79% ------- RED .129 .396 Bullish --------------------------------------------------------------------------------------------- IBB 135.16 -2.76 138.13 -97.6% Bearish RED .064 .071 --------------------------------------------------------------------------------------------- GLD 166.54 .74 165.09 75.8% Bullish BLUE .253 -.034 --------------------------------------------------------------------------------------------- OIH 116.87 -5.84 128.97 -463.8% Bearish RED .155 .341 Bullish --------------------------------------------------------------------------------------------- GASL 3440 285 3685 -325.1% ------- RED -.021 .049 --------------------------------------------------------------------------------------------- |
Table 3 Count of Stocks in Key Directories
20200626
-------------------------------
NEWHIGHS 104
NEWLOWS 42
MAXCP 16
MINCP 223 Bearish
TTTNH 8
TTTNL 258 Bearish
FASTUP 81
FASTDOWN 185
CPCROSSA 45
CPCROSSD 82
BIGVOLUP 26
BIGVODN 113
ACCUMVER 8
HIGHIP21 6
HIUPPCT 14
VHIP21 53
AUGSELS7 357
TRAPDOOR 30
|
Table 4 RANKING OF KEY DIRECTORIES BASED PCT.OF STOCKS ABOVE 65-DMA
6/26/20
Bullish = 40
Bearish = 6
---------------------------------------------------------------------------------------
Directory Current day-1 day-2 day-3 day-4 day-5
----------------------------------------------------------------------------------------
COPPER 1 1 1 1 1 1
ETFS 1 1 1 1 1 1
BONDFUND .99 .99 .99 .99 .99 .99
AUTO .948 .948 .948 1 1 .974
GOLD .918 .938 .938 .938 .959 .857
TRANSP .9 .95 .95 1 .95 1
HOMEBLDG .882 .941 .882 .941 .941 .941
SOLAR .875 .875 .937 .937 .875 1
NIFTY .866 .866 .866 .911 .977 .977
JETS .857 .857 .857 1 1 1
INFRA .828 .857 .857 .885 .942 .914
EDU .8 .8 .8 .8 1 .8
SEMI .771 .828 .828 .885 .876 .895
INDEXES .77 .808 .819 .852 .874 .841
GREEN .761 .857 .809 .857 .857 .857
CHEM .755 .795 .795 .857 .897 .918
NASD-100 .747 .818 .777 .919 .929 .959
SOFTWARE .733 .8 .75 .85 .883 .866
ELECTRON .729 .79 .77 .851 .851 .871
BIOTECH .717 .782 .777 .829 .832 .837
COMPUTER .7 .7 .65 .8 .85 .85
INDMATER .693 .773 .733 .84 .88 .893
COMODITY .692 .769 .743 .743 .743 .794
REIT .673 .78 .687 .829 .865 .872
CHINA .666 .725 .705 .784 .803 .823
GAMING .666 .857 .857 .904 .904 .952
FOOD .634 .692 .692 .711 .711 .73
MILITARY .629 .666 .555 .814 .851 .851
DJI-13 .615 .769 .692 .769 .846 .923
FIDSTKS .615 .768 .734 .841 .864 .892
SP500 .604 .728 .696 .844 .858 .871
BEVERAGE .6 .666 .533 .866 .933 .933
HACKERS .6 .7 .6 .85 .85 .8
RUS-1000 .6 .73 .694 .833 .855 .855
FINANCE .595 .809 .726 .88 .928 .88
BIGBANKS .571 .857 .857 .857 .857 .857
RETAIL .56 .72 .7 .78 .82 .76
OILGAS .557 .664 .618 .77 .763 .793
SP-100 .549 .714 .659 .78 .813 .846
INSURANC .538 .73 .653 .769 .846 .807
==============================================================================================
DOWJONES .466 .666 .633 .733 .8 .866
GUNS .466 .533 .533 .666 .733 .733
COAL .428 .428 .285 .428 .428 .571
REGBANKS .384 .576 .461 .615 .692 .653
HOSPITAL .333 .428 .523 .571 .619 .619
UTILITY .23 .358 .384 .461 .538 .461
|
=======================================================================
6/25/2020 The DJI rebounded up from the zone of support near 25000 mainly
because
of new European stimulus but also because US Federal regulators have decided
that the Big US banks have learned their lesson from 2008 and can be trusted
to invest in stocks and leveraged ETFs despite the dreadful outcome of non-regulation
in the 1930s and 2007-2009. Will de-regulation boost the market as it did under
Clinton? Perhaps.
As a group, the big financials like BAC, C, GS, JPM and WFC have moved up
from the neckline of their individual head and shoulders patterns. Now today we
will see if they passed their "stress tests" for financial solvency. I
don't see how they
can fail given how much each big bank has received for its toxic loans and bonds
from a most generous and obliging Federal Reserve. But we'll see
soon. A lot of folks will be watching this news.

The Buy B20 and B2 do offer hope of a rally back to 27000. But I have suggested
not buying DIA and instead holding long AAPL, QQQ, IBB, GLD and
V-formation MAXCPs. As a hedge, stay short some of Bearish MINCPs below
their 65-dma that show head/shoulders patterns, negative IP21 and very weak
Closing Power.
With the breadth not so bullish and with both the IP21 and
V-Indicators still
negative, I would expect a July 4th DJI rally to 27000 to produce a Sell S9-V
and a Sell S12. The declining trendlines, weak Closing Power, negative Accumulation
should contain the DJI's advance. But I also doubt if the FED will allow a decline
much below 25000 for fear that it would feed on itself at that point..
New Presidential Election Year Research:
With Trump falling further behind in the Polls, we should
consider the cases
more closely where a Democrat beat a Republican to regain the White House.
How much the Democrat wins by is important to the
market as is how close
Wall Street banks, brokerages and hedge funds can get to the Democrat.
Different Types of Democrat Victories
against Republican Incumbents.
In only three of the six Presidential Elections since 1888 where a Democrat beat
a Republican to regain the White House did the Democrat get more than a majority of
the popular vote. These were the Elections of 1932 when DJI fell 23.1% for year,
of 1976 when the DJI rose +17.9%
and 2008 when the DJI fell 33.8%. The average
DJI decline was 13% in the Presidential Election years for these cases.
The prospects of a big Biden victory will probably
un-nerve the market
more and more this year unless Wall Street gets behind him.
In three other cases, the Democrat victor did
not get a majority of the popular vote:
In 1892, Cleveland beat Harrison 46% vs 43% and the DJI
fell 6.6%. As a "Gold
Democrat" Cleveland had considerable support from JP Morgan and other NY
bankers.
In 1912, the two Republicans (Roosevelt and Taft) actually got 50.6% of the vote even
though Wilson won in the Electoral College overwhelmingly. Here the DJI actually
rose +7.6% for the year.
And in 1992 the two Republicans got 56.3% (Bush and Perot) of the vote despite
Clinton winning the Electoral College by more tthan 2:1. The DJI rose +4.2% for the
year. As in 1912, the Democrat
Clinton who won in 1992 was groomed for the
Presidency by powerful Wall Street bankers. In
these three cases, the DJI
rose on average +1.7%. The DJI may also perform considerably better if Biden
gets big financial backing, probably unpublicized, from Wall Street. That Obama
got bigger campaign contributions in 2008 than McCain did not help the extreme bear
market of 2008.
|
Charts 6/25/2020 (Click on Underlined link.) 2020 PEERLESS DJI, Signals, Indicators Daily DJI Volume 10-DayUp/Down Vol Stoch-20 Inverted Traders Index Graph of Pct of All Stocks above 65-dma Cum. Inverted Traders Index NASDAQ S&P OEX NYSE COMPQX DJI-15 DJI-20 DJI-30 DIA QQQ MDY IWM TNA Short-Term Rates SPY http://tigersoft.com/2121CST/SPY.GIF recent 2006 vers-Peerless signals -- http://tigersoft.com/2121CST/VERSYYYY.BMP USO-CrudeOil DBO FAS GLD BBH IBB JETS JNUG KOL NUGT OIH PALL RSX RETL SDS AGQ SLV SOXL TECL TLT TMF TNA UGA (gasoline) USO (oil) and China: YINN CHAU Commodities: CANE CORN DBC JJC, NIB, CHOC CORN, CUT (paper) MOO, SOYB WEAT UUP (Dollar) LIT (Lithium) Stocks AAPL ADBE ALXN AMAT AMGN AMD AMZN AXP BA BABA BAC BIDU BLDP CAT CVX CMG DE ENPH FB GILD GOOG GS HD IBM INTU JPM LRCX M (Macy's) MSFT NEM NFLX NKE NVDA PG REGN SO SQ QCOM QDEL TSLA TXN XOM V VRTX WFC WMT TOWN New highs and Bullish MAXCPs http://tigersoft.com/MAXCP/6-25/BULLISH.htm Bearish MAXCPs - http://tigersoft.com/MINCP/6-25/BEARISH.htm |
Table 1
6/24/2018 QUICKSILVER on DJI-30 STOCKS.
Considering just those stocks whose IP21 + ITRS score is >+.25 or <-.25
1 Bullish ( AAPl
+365 = +365
4 Bearish ( UTX KO
-86 -45 = -131
----------------------------------------
Vitality Score = +234
Note that AAPL now shows highest AI/200 stock here. STOCKS CLOSE CHANGE PIVOT-P 5-dma AROC CL-PWR Candl AI/200 IP21 ITRS --------------------------------------------------------------------------------------- --------------------------------------------------------------------------------------- AAPL 364.84 4.78 349.72 183.4% Bullish BLUE 177 .127 .188 Bullish --------------------------------------------------------------------- AXP 97.85 2.37 100.94 -216.6% Bearish BLUE 82 -.143 .073 --------------------------------------------------------------------- BA 174.88 -1.81 187.02 -466.8% Bullish BLUE 64 .001 .106 --------------------------------------------------------------------- CAT 124.71 2.65 127.46 -114.4% Bearish BLUE 158 .005 .023 --------------------------------------------------------------------- CSCO 45.22 .47 45.32 -67.3% Bearish BLUE 98 .011 -.006 --------------------------------------------------------------------- CVX 89.21 1.57 90.63 -150.6% Bearish BLUE 82 -.001 -.014 --------------------------------------------------------------------- DIS 111.36 -.71 114.35 -303.6% Bearish BLUE 80 -.012 -.018 --------------------------------------------------------------------- GS 207.1 9.08 201.63 80.6% ------- BLUE 105 -.148 .065 --------------------------------------------------------------------- HD 245.38 -.75 246.65 -77.1% ------- BLUE 127 -.063 .141 --------------------------------------------------------------------- IBM 119.03 2.61 122.47 -212.5% Bearish BLUE 141 -.108 -.092 --------------------------------------------------------------------- INTC 58.51 -.58 59.62 -131.4% Bearish RED 137 -.059 -.101 --------------------------------------------------------------------- JNJ 139.67 -.15 143.83 -131.1% Bearish RED 115 -.093 -.149 --------------------------------------------------------------------- JPM 97.96 3.3 97.81 -50.4% Bearish BLUE 75 -.163 -.016 --------------------------------------------------------------------- KO 44.93 .28 46.02 -224.9% Bearish BLUE 98 -.119 -.151 Bearish --------------------------------------------------------------------- MCD 182.76 -1.53 186.56 -180.1% Bearish RED 105 -.071 -.067 --------------------------------------------------------------------- MMM 154.67 2.45 158.15 -144.8% Bearish BLUE 117 .072 -.03 --------------------------------------------------------------------- MRK 76.57 .7 77.9 22.8% Bearish BLUE 81 .055 -.162 --------------------------------------------------------------------- MSFT 200.34 2.5 195.15 101.3% Bullish BLUE 154 .124 .07 --------------------------------------------------------------------- NKE 101.4 1.32 95.78 148.8% Bearish BLUE 127 .056 .097 --------------------------------------------------------------------- PFE 32.32 .13 33.42 -139.6% Bearish BLUE 74 .018 -.197 --------------------------------------------------------------------- PG 117.89 1.47 118.92 -58.9% ------- BLUE 92 -.103 -.123 --------------------------------------------------------------------- TRV 114.62 1.76 116.56 -61.9% Bullish BLUE 112 .097 .027 --------------------------------------------------------------------- UNH 296.22 7.04 291.24 81% Bearish BLUE 125 -.01 -.043 --------------------------------------------------------------------- UTX 86.01 -5.36 97.15 -958.4% Bullish RED 114 .144 -.536 Bearish --------------------------------------------------------------------- V 193.98 2.57 192.2 1.8% Bearish BLUE 104 -.074 .074 --------------------------------------------------------------------- VZ 54.28 .35 56.16 -235.1% Bearish BLUE 136 .089 -.142 --------------------------------------------------------------------- WBA 42.04 .87 44.13 7% Bearish BLUE 95 .003 -.127 --------------------------------------------------------------------- WMT 119.71 -.59 119.85 71.6% ------- ---- 84 .037 -.163 --------------------------------------------------------------------- XOM 45.17 .67 45.98 -189.8% Bearish BLUE 48 .003 .021 --------------------------------------------------------------------- DOW 39.98 1.53 41.65 -195.3% Bearish BLUE 67 -.13 .145 |
Table 2 QUICKSILVER on ETFS - 06/24/20 Bullish = QQQ, RETL, SOXL, TECL, OIH(5)
Bearish = (0)
ITRS + IP21>.25 is considered "Bullish" ETF CLOSE CHANGE PIVOT-PT 5-dma AROC CL-PWR CANDLE IP21 ITRS --------------------------------------------------------------------------------------------- DIA 254.63 -6.87 261.45 -137.9% Bearish RED .003 ---- --------------------------------------------------------------------------------------------- SPY 304.09 -7.96 311.78 -121.7% Bearish RED .056 .009 --------------------------------------------------------------------------------------------- QQQ 243.71 -5.13 244.28 1.8% ------- RED .188 .088 Bullish --------------------------------------------------------------------------------------------- MDY 315.14 -11.14 327.38 -201.1% Bearish RED .014 .04 --------------------------------------------------------------------------------------------- IWM 138.36 -4.64 141.72 -120.1% Bearish RED -.035 .064 --------------------------------------------------------------------------------------------- FAS 30.32 -3.54 34.49 -640.2% Bearish RED -.027 -.022 --------------------------------------------------------------------------------------------- RETL 132.85 -16.2 143.54 -408% Bearish RED .137 .531 Bullish --------------------------------------------------------------------------------------------- SOXL 174.78 -12.59 184.72 -292% Bearish RED .079 .315 Bullish --------------------------------------------------------------------------------------------- TECL 219.08 -16.13 222.74 -10.4% ------- RED .141 .379 Bullish --------------------------------------------------------------------------------------------- IBB 136.4 -2.25 133.49 131.4% Bullish RED .106 .087 --------------------------------------------------------------------------------------------- GLD 165.9 -.58 162.24 101.8% Bullish RED .232 -.043 --------------------------------------------------------------------------------------------- OIH 118.08 -11.06 131.42 -491.2% Bearish RED .161 .163 Bullish --------------------------------------------------------------------------------------------- QUICKSILVER on ETFS - 06/25/20 ETF CLOSE CHANGE PIVOT-PT 5-dma AROC CL-PWR CANDLE IP21 ITRS --------------------------------------------------------------------------------------------- DIA 257.44 2.81 258.8 -77.3% Bearish BLUE-.01 0 --------------------------------------------------------------------------------------------- BA 174.88 -1.81 187.02 -466.8% Bullish BLUE .001 .106 --------------------------------------------------------------------------------------------- SPY 307.35 3.26 308.64 -71.6% Bearish BLUE .045 .011 --------------------------------------------------------------------------------------------- QQQ 246.03 2.32 244.24 35.6% Bullish BLUE .166 .08 --------------------------------------------------------------------------------------------- MDY 319.33 4.19 324.93 -124.3% Bearish BLUE .004 .068 --------------------------------------------------------------------------------------------- IWM 140.45 2.09 140.99 -44.9% Bearish BLUE-.038 .097 --------------------------------------------------------------------------------------------- FAS 32.26 1.94 33.3 -336.8% Bearish BLUE-.022 .164 --------------------------------------------------------------------------------------------- RETL 135.05 2.2 138.61 -297.9% Bearish BLUE .102 .768 --------------------------------------------------------------------------------------------- SOXL 179.08 4.3 181 -154.3% Bearish BLUE .044 .44 --------------------------------------------------------------------------------------------- TECL 227.44 8.36 217.95 104.4% Bullish BLUE .126 .504 --------------------------------------------------------------------------------------------- IBB 137.92 1.52 137.85 161.8% Bullish BLUE .064 .097 --------------------------------------------------------------------------------------------- GLD 165.8 -.1 164.03 108% Bullish RED .211 -.071 --------------------------------------------------------------------------------------------- OIL 165.8 -.1 164.03 108% ------- RED .265 28.833 --------------------------------------------------------------------------------------------- OIH 122.71 4.63 128.51 -342.3% Bearish BLUE .161 .277 --------------------------------------------------------------------------------------------- GASL 3440 285 3685 -325.1% ------- RED -.021 .018 --------------------------------------------------------------------------------------------- UGA 3440 285 3685 -325.1% ------- RED -.012 233.078 --------------------------------------------------------------------------------------------- UUP 25.98 -.06 26.26 -53.5% ------- -----.019 -.117 --------------------------------------------------------------------------------------------- IEF 25.98 -.06 26.26 -53.5% Bullish ---- .082 -.881 --------------------------------------------------------------------------------------------- CORN 25.98 -.06 26.26 -53.5% Bullish ---- .04 1.066 --------------------------------------------------------------------------------------------- WEAT 25.98 -.06 26.26 -53.5% ------- ---- .029 3.844 --------------------------------------------------------------------------------------------- YINN 25.98 -.06 26.26 -53.5% ------- ---- .084 1.043 --------------------------------------------------------------------------------------------- RSX 21.63 .41 20.85 200.8% ------- BLUE 0 .123 |
Table 3 Count of Stocks in Key Directories
20200625
-------------------------------
NEWHIGHS 98
NEWLOWS 31
MAXCP 35
MINCP 43
TTTNH 16
TTTNL 67
FASTUP 96
FASTDOWN 137
CPCROSSA 150
CPCROSSD 12
BIGVOLUP 7
BIGVODN 10
ACCUMVER 7
HIGHIP21 10
HIUPPCT 17
REDSELL 66
AUGSELS7 364
TRAPDOOR 30
|
Table 3 RANKING OF KEY DIRECTORIES BASED PCT.OF STOCKS ABOVE 65-DMA
Bullish = 43
Bearish = 3
6/25/20 --------------------------------------------------------------------------------------- Directory Current day-1 day-2 day-3 day-4 day-5 ---------------------------------------------------------------------------------------- COPPER 1 1 1 1 1 1 ETFS 1 1 1 1 1 1 BONDFUND .99 .99 .99 .99 .99 .99 TRANSP .95 .95 1 .95 1 1 AUTO .948 .948 1 1 .974 .974 HOMEBLDG .941 .882 .941 .941 .941 1 GOLD .938 .938 .938 .959 .857 .795 SOLAR .875 .937 .937 .875 1 .937 NIFTY .866 .866 .911 .977 .977 .955 BIGBANKS .857 .857 .857 .857 .857 .857 GAMING .857 .857 .904 .904 .952 .952 GREEN .857 .809 .857 .857 .857 .857 INFRA .857 .857 .885 .942 .942 .942 JETS .857 .857 1 1 1 1 SEMI .828 .828 .885 .876 .895 .904 NASD-100 .818 .787 .929 .929 .959 .939 FINANCE .809 .726 .88 .928 .88 .904 INDEXES .808 .819 .852 .874 .846 .863 EDU .8 .8 .8 1 .8 .8 SOFTWARE .8 .766 .85 .883 .866 .883 CHEM .795 .795 .857 .897 .918 .897 ELECTRON .79 .77 .851 .851 .871 .878 REIT .78 .687 .829 .865 .879 .929 BIOTECH .777 .774 .827 .832 .85 .827 INDMATER .773 .733 .84 .88 .893 .88 COMODITY .769 .743 .743 .743 .794 .769 DJI-13 .769 .692 .769 .846 .923 .923 FIDSTKS .768 .734 .841 .864 .892 .898 INSURANC .73 .653 .769 .846 .807 .884 RUS-1000 .73 .695 .833 .855 .856 .896 SP500 .728 .698 .844 .858 .871 .915 CHINA .725 .705 .784 .803 .823 .882 RETAIL .72 .7 .78 .82 .76 .8 SP-100 .714 .659 .78 .813 .846 .868 COMPUTER .7 .65 .8 .85 .85 .9 HACKERS .7 .65 .85 .85 .8 .8 FOOD .692 .692 .711 .711 .73 .711 BEVERAGE .666 .533 .866 .933 .933 .933 DOWJONES .666 .633 .733 .8 .866 .833 MILITARY .666 .555 .814 .851 .851 .888 OILGAS .664 .618 .77 .763 .801 .839 REGBANKS .576 .461 .615 .692 .692 .73 GUNS .533 .533 .666 .733 .733 .8 =========================================================================================== COAL .428 .285 .428 .428 .571 .714 HOSPITAL .428 .523 .571 .619 .619 .619 UTILITY .358 .384 .461 .538 .461 .743 |
=====================================================================
6/24/2020 Critics suggest the FED has built a very bubble in the market.
What if
Wall Street Professionals are tempted now to use their bailout money to
burst the bubble? Our technical indicators show that is what is
starting to happen.
The DJI is now down 8% from its recent price peak. When we first got
the Buy B20 two or so weeks ago, I suggested we wait for more of a retreat
to buy the DIA because the closest parallels I could find suggested a 10%
decline. A rally to close the gap coming down has been accomplished.
But apart from the V-Bottom NASDAQ techs, the market has become
quite weak. The news about the Covid-19's deadly new wave and President
Trump's decline in the polls should have been anticipated but now it
seems not. Today's Buy B2 is not a strong Buy signal. A re-testing of
the DJI's support near at 24750 is in the offing now.
DJI support is at 24750 and 23000
A/D Line has broken its uptrend.
Is the FED backing away from its pledge to use
QE-Infinity to support the market or is
the job too big even for the FED?

DIA's Closing Power, Day Traders' Tool and IP21
have turned quite weak. These show that NY Professionals
and big money have turned bearish despite the FED's
promises. The weak A/D Line shows the FED may be
losing control or, at least, backing away from its pattern
of heavy buying.

Most of QQQ's Internal Strength Indicators are still rising
and
it has outperformed DIA by 8% over the last 50-trading days.

The breadth as well as the Closing Power,
Accumulation Index and
Day Traders' Tool have turned sharply down since the recent peak.
At the same time, the number of bearish head and shoulders patterns
has multiplied. These patterns are not just in the financials. If they were,
I could try to dismiss them by saying the FED will never let the big banks
come anywhere near close to being the leaders on a new leg down. The
results of the "Stress tests" on them due later this weak should mark a
bottom I had been thinking.
All the Big Banks now show Head/Shoulders Patterns.

The big problem now is there many, many head/shoulders tops in all sorts of stocks,
like GM shown below or seen in our MINCPS all this week. This makes me and
others wonder now if the FED can really bail all of them out if there is another serious
pandemic wave. This also makes me wonder if NY Professionals might even use
their baleout money to aggressively short these weak stocks, thereby nullifying
or, at least, working against exactly what the FED is trying to do to support the market.
The FED seems to be imposing no conditions on the recipients of
their money.

We are probably OK holding the
strongest of the V-Bottom Techs, GLD
and IBB, but hedging with some of the bearish MINCPs still seems in order.
Lots of folks are trying to find the right Covid-19
vaccine play. NVAX seems to
be the leader. Its CEO is speaking tomorrow. See if you can hear
what he has to say. If NVAX can rally half as fast as it fell four years ago from
a high of 300, a vaccine may be out by the end of the year. So watch NVAX.

|
Charts 6/24/2020 (Click on Underlined link.) 2020 PEERLESS DJI, Signals, Indicators Daily DJI Volume 10-DayUp/Down Vol Stoch-20 Inverted Traders Index Graph of Pct of All Stocks above 65-dma Cum. Inverted Traders Index NASDAQ S&P OEX NYSE COMPQX DJI-15 DJI-20 DJI-30 DIA QQQ MDY IWM TNA Short-Term Rates SPY http://tigersoft.com/2121CST/SPY.GIF recent 2006 vers-Peerless signals -- http://tigersoft.com/2121CST/VERSAABB.BMP USO-CrudeOil DBO FAS GLD BBH IBB JETS JNUG KOL NUGT OIH PALL RSX RETL SDS AGQ SLV SOXL TECL TLT TMF TNA UGA (gasoline) USO (oil) and China: YINN CHAU Commodities: CANE CORN DBC JJC, NIB, CHOC CORN, CUT (paper) MOO, SOYB WEAT UUP (Dollar) LIT (Lithium) Stocks AAPL ADBE ALXN AMAT AMGN AMD AMZN AXP BA BABA BAC BIDU BLDP CAT CVX CMG DE ENPH FB GILD GOOG GS HD IBM INTU JPM LRCX M (Macy's) MSFT NEM NFLX NKE NVDA PG REGN SO SQ QCOM QDEL TSLA TXN XOM V VRTX WFC WMT TOWN New highs and Bullish MAXCPs http://tigersoft.com/MAXCP/6-24/BULLISH.htm Bearish MAXCPs - http://tigersoft.com/MINCP/6-24/BEARISH.htm |
Table 1
6/24/2018 QUICKSILVER on DJI-30 STOCKS.
Considering just those stocks whose IP21 + ITRS score is >+.25 or <-.25
1 Bullish ( AAPl
+352 = +352
4 Bearish ( UTX KO
-86 -45 = -131
----------------------------------------
Vitality Score = +221
Note that AAPL now shows highest AI/200 stock here. STOCKS CLOSE CHANGE PIVOT-P 5-dma AROC CL-PWR Candl AI/200 IP21 ITRS --------------------------------------------------------------------------------------- --------------------------------------------------------------------------------------- AAPL 360.06 -6.47 351.73 119.1% Bullish RED 176 .114 .192 --------------------------------------------------------------------- AXP 95.48 -3.94 102.16 -419% Bearish RED 82 -.105 .018 --------------------------------------------------------------------- BA 176.69 -11.19 192.29 -417.9% Bearish RED 64 .01 .191 --------------------------------------------------------------------- CAT 122.06 -4.19 127.59 -242.8% Bearish RED 158 .024 -.014 --------------------------------------------------------------------- CSCO 44.75 -.72 45.83 -155.7% Bearish RED 97 .023 -.016 --------------------------------------------------------------------- CVX 87.64 -3.8 91.94 -213.3% Bearish RED 82 -.013 -.027 --------------------------------------------------------------------- DIS 112.07 -4.52 118.37 -239.3% Bearish RED 80 -.068 -.005 --------------------------------------------------------------------- GS 198.02 -6.76 203.84 -200.3% Bearish RED 105 -.089 .049 --------------------------------------------------------------------- HD 246.13 -4.18 249.21 -94.7% Bearish RED 128 -.032 .126 --------------------------------------------------------------------- IBM 116.42 -2.99 124.16 -316.2% Bearish RED 142 -.118 -.123 --------------------------------------------------------------------- INTC 59.09 -.83 60.08 -116.6% Bearish RED 137 -.033 -.088 --------------------------------------------------------------------- JNJ 139.82 -3.04 143.41 -146.3% Bearish RED 115 -.077 -.105 --------------------------------------------------------------------- JPM 94.66 -3.27 98.94 -245.5% Bearish RED 76 -.174 -.071 --------------------------------------------------------------------- KO 44.65 -.99 46.99 -208.9% Bearish RED 99 -.139 -.15 Bearish --------------------------------------------------------------------- MCD 184.29 -2.33 189.49 -172.7% Bearish RED 105 -.061 -.061 --------------------------------------------------------------------- MMM 152.22 -5.62 159.21 -221.2% Bearish RED 116 .124 -.049 --------------------------------------------------------------------- MRK 75.87 -1.25 76.22 -27.3% Bearish RED 80 .084 -.147 --------------------------------------------------------------------- MSFT 197.84 -4.07 196.32 91.1% Bullish RED 154 .14 .077 --------------------------------------------------------------------- NKE 100.08 -1.84 98.45 44% Bearish RED 127 .051 .082 --------------------------------------------------------------------- PFE 32.19 -.58 33.24 -206.2% Bearish RED 73 .009 -.179 --------------------------------------------------------------------- PG 116.42 -1.31 119.28 -63.8% Bullish RED 93 -.081 -.1 --------------------------------------------------------------------- TRV 112.86 -3.33 116.05 -84.5% Bullish RED 111 .094 -.018 --------------------------------------------------------------------- UNH 289.18 -8.42 291.48 -58.3% Bearish RED 125 .025 .007 --------------------------------------------------------------------- UTX 86.01 -5.36 97.15 -958.4% Bullish RED 114 .144 -.503 Bearish --------------------------------------------------------------------- V 191.41 -6.56 193.91 -55.3% Bearish RED 105 -.102 .034 --------------------------------------------------------------------- VZ 53.93 -1.01 56.89 -242.6% ------- RED 136 .089 -.135 --------------------------------------------------------------------- WBA 41.17 -1.64 41.98 -114.3% Bearish RED 95 -.032 -.175 --------------------------------------------------------------------- WMT 120.3 -.77 117.99 53% ------- RED 83 .009 -.13 --------------------------------------------------------------------- XOM 44.5 -2.2 46.92 -228.9% Bearish RED 48 -.03 -.014 --------------------------------------------------------------------- DOW 38.45 -2.9 41.58 -327.7% Bearish RED 67 -.182 .025 |
Table 2 QUICKSILVER on ETFS - 06/24/20 Bullish = QQQ, RETL, SOXL, TECL, OIH(5)
Bearish = (0)
ITRS + IP21>.25 is considered "Bullish" ETF CLOSE CHANGE PIVOT-PT 5-dma AROC CL-PWR CANDLE IP21 ITRS --------------------------------------------------------------------------------------------- DIA 254.63 -6.87 261.45 -137.9% Bearish RED .003 ---- --------------------------------------------------------------------------------------------- SPY 304.09 -7.96 311.78 -121.7% Bearish RED .056 .009 --------------------------------------------------------------------------------------------- QQQ 243.71 -5.13 244.28 1.8% ------- RED .188 .088 Bullish --------------------------------------------------------------------------------------------- MDY 315.14 -11.14 327.38 -201.1% Bearish RED .014 .04 --------------------------------------------------------------------------------------------- IWM 138.36 -4.64 141.72 -120.1% Bearish RED -.035 .064 --------------------------------------------------------------------------------------------- FAS 30.32 -3.54 34.49 -640.2% Bearish RED -.027 -.022 --------------------------------------------------------------------------------------------- RETL 132.85 -16.2 143.54 -408% Bearish RED .137 .531 Bullish --------------------------------------------------------------------------------------------- SOXL 174.78 -12.59 184.72 -292% Bearish RED .079 .315 Bullish --------------------------------------------------------------------------------------------- TECL 219.08 -16.13 222.74 -10.4% ------- RED .141 .379 Bullish --------------------------------------------------------------------------------------------- IBB 136.4 -2.25 133.49 131.4% Bullish RED .106 .087 --------------------------------------------------------------------------------------------- GLD 165.9 -.58 162.24 101.8% Bullish RED .232 -.043 --------------------------------------------------------------------------------------------- OIH 118.08 -11.06 131.42 -491.2% Bearish RED .161 .163 Bullish --------------------------------------------------------------------------------------------- |
Table 3 Count of Stocks in Key Directories
20200624
-------------------------------
NEWHIGHS 69
NEWLOWS 28
MAXCP 18
MINCP 316
TTTNH 10
TTTNL 288
FASTUP 82
FASTDOWN 157
CPCROSSA 10
CPCROSSD 101
BIGVOLUP 5
BIGVODN 14
ACCUMVER 5
HIGHIP21 6
HIUPPCT 18
VHIP21 50
AUGSELS7 439 Very high
TRAPDOOR 30
|
Table 4 RANKING OF KEY DIRECTORIES BASED PCT.OF STOCKS ABOVE 65-DMA
6/24/20
Bullish = 43
Bearish = 3
---------------------------------------------------------------------------------------
Directory Current day-1 day-2 day-3 day-4 day-5
----------------------------------------------------------------------------------------
COPPER 1 1 1 1 1 1
ETFS 1 1 1 1 1 1
BONDFUND .99 .99 .99 .99 .99 .99
TRANSP .95 1 .95 1 1 1
AUTO .948 1 1 .974 .974 .974
GOLD .938 .938 .959 .857 .816 .877
SOLAR .937 .937 .875 1 .937 .937
HOMEBLDG .882 .941 .941 .941 1 1
NIFTY .866 .911 .977 .977 .977 .955
BIGBANKS .857 .857 .857 .857 .857 .857
GAMING .857 .904 .904 .952 .952 .952
INFRA .857 .885 .942 .942 .942 .971
JETS .857 1 1 1 1 1
SEMI .828 .885 .876 .895 .904 .933
INDEXES .819 .852 .874 .846 .863 .874
GREEN .809 .857 .857 .857 .857 .857
EDU .8 .8 1 .8 .8 .8
CHEM .795 .857 .897 .918 .897 .938
NASD-100 .787 .939 .939 .959 .939 .929
ELECTRON .77 .851 .851 .871 .878 .898
BIOTECH .769 .824 .829 .85 .837 .824
SOFTWARE .766 .866 .883 .866 .883 .916
COMODITY .743 .743 .743 .794 .769 .769
FIDSTKS .734 .841 .864 .892 .903 .909
INDMATER .733 .84 .88 .893 .88 .92
FINANCE .726 .88 .928 .88 .916 .94
CHINA .705 .784 .803 .823 .882 .882
RETAIL .7 .78 .82 .76 .8 .84
FOOD .698 .716 .716 .735 .716 .698
SP500 .698 .846 .858 .871 .92 .917
RUS-1000 .695 .834 .855 .856 .899 .9
DJI-13 .692 .769 .846 .923 .923 .923
REIT .687 .829 .865 .879 .929 .936
SP-100 .659 .78 .813 .846 .868 .868
INSURANC .653 .769 .846 .807 .884 .846
COMPUTER .65 .8 .85 .85 .9 .9
HACKERS .65 .9 .85 .8 .8 .85
DOWJONES .633 .733 .8 .866 .833 .833
OILGAS .618 .77 .763 .801 .847 .847
MILITARY .555 .814 .851 .851 .888 .888
BEVERAGE .533 .866 .933 .933 .933 .933
GUNS .533 .666 .733 .733 .8 .866
HOSPITAL .523 .571 .619 .619 .619 .619
==============================================================================================
REGBANKS .461 .615 .692 .692 .73 .73
UTILITY .384 .461 .538 .461 .717 .717
COAL .285 .428 .428 .571 .714 .857
|
------------------------------------------------------------------------------------------------------
6/23/2020 The operative Peerless signal is still a Buy B20. But the
last two trading days'
breadth pluralities in favor of advances have been quite modest compared to
what we were seeing:when the FED was most aggressively in the market.
Monday this week was only +203 (adv-dec) and Tuesday was only +448.
The Buy B20 itself is not a powerful Buy signal, but the risks of a big decline
seem low. The P-Indicator stands at +438. Any decline of 2.5% should bring
a Buy B9.

That the DJI may open down more than 200 shows us that the Virus is coming
back and this will slow the re-opening of the economy and also work against
President Trump's re-election. Bearishly, the Closing Power for DIA is falling at
a rate that looks menacing. So are the large number of head/shoulders
among financials and our Bearish MINCPs.
The "V" formation tech stocks like AAPL, AMZN and ADBE have had good runs.
Some profit-taking in them should not be surprising. That Gold is breaking out and
may be starting another run and the Dollar is simultaneously downtrending warns us
that the FED may have to start paying a price for its "QE-Infinity". But
so far,
very, very few in the Mainstreet Media or Congress are questioning the FED's
endless bailouts of Wall Street much less wondering out-loud how big the bubble
will be before it breaks. (I heard Naomi Princ two year ago say the Fed owned 26%
of ALL US mortgages. If true, what is that percentage now?)
( https://www.youtube.com/watch?v=tUPzZFsH9NM&t=1398s
)
My suggested long holds are AAPL, QQQ, IBB, GLD and some of the bullish
MAXCPs showing "V" formation, new 12-month highs. But also hold short some
of the bearish MINCPs that display head/shoulders patterns, negative Accumulation
and break below their 65-dma.
The DJI is considerably weaker than the NASDAQ or QQQ. I can foresee an options
trader who writes out-of-the-money July puts and calls making money on both sides
of their trade. I expect the FED to continue to support the market aggressively,
but
Trump is clearly losing ground to Biden and the history of the DJIA in Presidential
Election years since 1885 is seldom good in the second half when a Republican President
is going to be replaced by a Democrat.
|
Charts 6/23/2020 (Click on Underlined link.) 2020 PEERLESS DJI, Signals, Indicators Daily DJI Volume 10-DayUp/Down Vol Stoch-20 Inverted Traders Index Graph of Pct of All Stocks above 65-dma Cum. Inverted Traders Index NASDAQ S&P OEX NYSE COMPQX DJI-15 DJI-20 DJI-30 Vitality INDEX for DJIA DIA QQQ MDY IWM TNA Short-Term Rates SPY http://tigersoft.com/2121CST/SPY.GIF recent 2006 vers-Peerless signals -- http://tigersoft.com/2121CST/VERS06.BMP USO-CrudeOil DBO FAS GLD BBH IBB JETS JNUG KOL NUGT OIH PALL RSX RETL SDS AGQ SLV SOXL TECL TLT TMF TNA UGA (gasoline) USO (oil) and China: YINN CHAU Commodities: CANE CORN DBC JJC, NIB, CHOC CORN, CUT (paper) MOO, SOYB WEAT UUP (Dollar) LIT (Lithium) Stocks AAPL ADBE ALXN AMAT AMGN AMD AMZN AXP BA BABA BAC BIDU BLDP CAT CVX CMG DE ENPH FB GILD GOOG GS HD IBM INTU JPM LRCX M (Macy's) MSFT NEM NFLX NKE NVDA PG REGN SO SQ QCOM QDEL TSLA TXN XOM V VRTX WFC WMT TOWN New highs and Bullish MAXCPs http://tigersoft.com/MAXCP/6-23/BULLISH.htm Bearish MAXCPs - http://tigersoft.com/MINCP/6-23/BEARISH.htm |
Table 1
6/22/2018 QUICKSILVER on DJI-30 STOCKS.
Considering just those stocks whose IP21 + ITRS score is >+.25 or <-.25
1 Bullish ( AAPl
+367 = +367
2 Bearish ( UTX KO
-86 -46 = -134
----------------------------------------
Vitality Score = +233
Note that AAPL now shows highest AI/200 stock here. STOCKS CLOSE CHANGE PIVOT-P 5-dma AROC CL-PWR Candl AI/200 IP21 ITRS --------------------------------------------------------------------------------------- --------------------------------------------------------------------------------------- AAPL 366.53 7.66 351.59 204.8% Bullish BLUE 175 .122 .224 Bullish --------------------------------------------------------------------- AXP 99.42 -.02 103.96 -302.7% Bearish RED 82 -.072 -.017 --------------------------------------------------------------------- BA 187.88 -.64 192.54 -258.1% Bullish RED 64 .055 .158 --------------------------------------------------------------------- CAT 126.25 .46 128.23 -151% Bearish RED 157 .068 -.012 --------------------------------------------------------------------- CSCO 45.47 .31 46.17 -110.3% Bearish RED 96 .006 -.015 --------------------------------------------------------------------- CVX 91.44 -.15 91.54 -140.8% Bearish RED 82 .015 -.041 --------------------------------------------------------------------- DIS 116.59 .67 117.65 -79.1% Bearish RED 81 -.073 .009 --------------------------------------------------------------------- GS 204.78 1.36 206.19 -117.4% Bearish RED 105 .005 .025 --------------------------------------------------------------------- HD 250.31 1.15 250.85 7.2% ------- RED 129 -.066 .141 --------------------------------------------------------------------- IBM 119.41 -1.66 124.15 -232.6% Bearish RED 142 -.089 -.132 --------------------------------------------------------------------- INTC 59.92 -.17 60.49 -39.9% Bearish RED 137 -.053 -.097 --------------------------------------------------------------------- JNJ 142.86 -.53 144.02 -55.6% Bearish RED 115 -.092 -.096 --------------------------------------------------------------------- JPM 97.93 1.18 99.48 -208.6% Bearish RED 76 -.113 -.12 --------------------------------------------------------------------- KO 45.64 -.1 46.58 -121.7% Bearish RED 100 -.145 -.145 Bearish --------------------------------------------------------------------- MCD 186.62 -.84 190.79 -97.9% Bearish RED 106 -.117 -.082 --------------------------------------------------------------------- MMM 157.84 1.15 159.22 -57.7% ------- RED 115 .182 -.04 --------------------------------------------------------------------- MRK 77.12 .37 76.29 9.8% Bearish RED 79 .051 -.16 --------------------------------------------------------------------- MSFT 201.91 1.34 194.24 212.8% Bullish RED 154 .13 .102 --------------------------------------------------------------------- NKE 101.92 2.41 99.21 146.3% Bearish BLUE 127 .06 .089 --------------------------------------------------------------------- PFE 32.77 -.34 33.56 -94.5% Bearish RED 72 .004 -.185 --------------------------------------------------------------------- PG 117.73 -.02 117.93 -16.9% ------- RED 94 -.092 -.102 --------------------------------------------------------------------- TRV 116.19 -.04 114.82 1.7% Bullish RED 110 .082 -.026 --------------------------------------------------------------------- UNH 297.6 4.93 292.6 78.7% Bearish BLUE 124 .041 .012 --------------------------------------------------------------------- UTX 86.01 -5.36 97.15 -958.4% Bullish RED 114 .144 -.558 Bearish --------------------------------------------------------------------- V 197.97 3.01 193.56 131.5% Bearish BLUE 106 -.1 .054 --------------------------------------------------------------------- VZ 54.94 -.72 56.65 -175.4% ------- RED 136 .055 -.148 --------------------------------------------------------------------- WBA 42.81 -.43 42.15 77.2% ------- RED 95 .046 -.147 --------------------------------------------------------------------- WMT 121.07 -.61 119.03 59.3% ------- RED 82 -.021 -.151 --------------------------------------------------------------------- XOM 46.7 .28 46.63 -160.2% Bearish RED 49 .007 -.026 --------------------------------------------------------------------- DOW 41.35 -.39 41.17 -108% Bearish RED 67 -.085 .056 |
Table 2 QUICKSILVER on ETFS - 06/23/20 Bullish = QQQ, RETL, SOXL, TECL, OIH(5)
Bearish = (0)
ITRS + IP21>.25 is considered "Bullish" ETF CLOSE CHANGE PIVOT-PT 5-dma AROC CL-PWR CANDLE IP21 ITRS --------------------------------------------------------------------------------------------- DIA 261.5 1.18 261.82 -44.4% Bearish RED 0 ----- --------------------------------------------------------------------------------------------- SPY 312.05 1.43 311.66 -14.6% Bearish RED .091 .014 --------------------------------------------------------------------------------------------- QQQ 248.84 2.1 243.62 122.6% Bullish BLUE .187 .108 Bullish --------------------------------------------------------------------------------------------- MDY 326.28 .51 328.27 -101.3% Bearish RED .012 .048 --------------------------------------------------------------------------------------------- IWM 143 .6 141.77 -48.5% Bearish RED -.007 .07 --------------------------------------------------------------------------------------------- FAS 33.86 .32 34.67 -280.9% Bearish RED .015 .086 --------------------------------------------------------------------------------------------- RETL 149.05 .7 144.67 69.2% Bearish RED .141 .878 Bullish --------------------------------------------------------------------------------------------- SOXL 187.37 1.53 185.58 185% Bearish RED .046 .554 Bullish --------------------------------------------------------------------------------------------- TECL 235.21 5.01 219.55 344.3% Bullish RED .138 .623 Bullish --------------------------------------------------------------------------------------------- IBB 138.65 .52 132.82 234.2% ------- RED .081 .093 --------------------------------------------------------------------------------------------- GLD 166.48 1.39 162.56 129.6% Bullish BLUE .2 -.086 --------------------------------------------------------------------------------------------- OIH 129.14 .17 130.83 -298.5% ------- RED .224 .203 Bullish --------------------------------------------------------------------------------------------- GASL 3440 285 3685 -325.1% ------- RED -.021 -.004 --------------------------------------------------------------------------------------------- |
Table 3 Count of Stocks in Key Directories
20200623
-------------------------------
NEWHIGHS 263 Bullsih >10:1 NYSE & NASDAQ NH/NL
NEWLOWS 12
MAXCP 21
MINCP 150
TTTNH 12
TTTNL 153
FASTUP 117
FASTDOWN 123
CPCROSSA 37
CPCROSSD 82
BIGVOLUP 10
BIGVODN 11
ACCUMVER 5
HIGHIP21 11
HIUPPCT 19
VHIP21 50
AUGSELS7 417
TRAPDOOR 30
|
Table 4 RANKING OF KEY DIRECTORIES BASED PCT.OF STOCKS ABOVE 65-DMA
6/23/20
Bullish = 44
Bearish = 2
---------------------------------------------------------------------------------------
Directory Current day-1 day-2 day-3 day-4 day-5
----------------------------------------------------------------------------------------
AUTO 1 1 .974 .974 .974 1
COPPER 1 1 1 1 1 1
ETFS 1 1 1 1 1 1
JETS 1 1 1 1 1 1
TRANSP 1 .95 1 1 1 1
BONDFUND .99 .99 .99 .99 .99 .98
HOMEBLDG .941 .941 .941 1 1 1
NASD-100 .939 .949 .969 .939 .929 .939
GOLD .938 .959 .857 .816 .877 .877
SOLAR .937 .875 1 .937 .937 1
NIFTY .911 .977 .977 .977 .955 .977
GAMING .904 .904 .952 .952 .952 1
HACKERS .9 .9 .8 .8 .85 .85
INFRA .885 .942 .942 .942 .971 .971
SEMI .885 .876 .895 .904 .933 .961
FINANCE .88 .928 .88 .916 .928 .976
BEVERAGE .866 .933 .933 .933 .933 .933
SOFTWARE .866 .9 .866 .883 .916 .933
BIGBANKS .857 .857 .857 .857 .857 1
CHEM .857 .897 .918 .897 .938 .938
GREEN .857 .857 .857 .857 .857 .904
INDEXES .852 .874 .846 .863 .874 .879
ELECTRON .851 .851 .871 .878 .898 .939
SP500 .846 .861 .871 .92 .922 .941
FIDSTKS .841 .864 .892 .903 .909 .926
INDMATER .84 .88 .893 .88 .92 .933
RUS-1000 .834 .856 .856 .899 .903 .929
REIT .829 .865 .879 .929 .929 .957
BIOTECH .819 .827 .848 .837 .832 .858
MILITARY .814 .851 .851 .888 .888 .962
COMPUTER .8 .85 .85 .9 .9 1
EDU .8 1 .8 .8 .8 1
CHINA .784 .803 .823 .882 .882 .862
RETAIL .78 .82 .76 .8 .84 .86
SP-100 .78 .813 .846 .868 .868 .89
OILGAS .77 .763 .801 .847 .839 .9
DJI-13 .769 .846 .923 .923 .923 .923
INSURANC .769 .846 .807 .884 .846 .923
COMODITY .743 .743 .794 .769 .769 .769
DOWJONES .733 .8 .866 .833 .833 .833
FOOD .716 .716 .735 .716 .698 .716
GUNS .666 .733 .733 .8 .8 1
REGBANKS .615 .692 .692 .73 .73 .846
HOSPITAL .571 .619 .619 .619 .619 .904
============================================================================================
UTILITY .461 .538 .461 .717 .717 .743
COAL .428 .428 .571 .714 .857 1
|
====================================================================
6/22/2020 The DJI is now sitting on its 21-day ma. A rally to 27000
seems in order.
The operative Peerless signal remains a B20. Again today the Futures
are up. The ratio of new highs to new lows is still a bullish 10:1. More
speculative NASDAQ and QQQ stocks are more in demand while
defensive utilities and blue chips lag. With more than 80% of all stocks
above their 65-dma, look for higher prices even in there is selling
toward the close. Enjoy the bullish action in the stocks and indexes
that have already formed a "V" formation. We see this in our bullish
MAXCPs.

Among the Bearish MINCPs are a number of financials with continuation
head/shoulders patterns. Even if these breakdown, I would only look for
them to fall into their base formations and dawdle there a while. I looked
back at JP Morgan and found head/shoulders patterns in it in March 1985
and September 1991 that did not bring a general market decline, though
more often its H/S pattern is a bad sign (Sept. 1987, July 1990, April 2000
and May 2011).
I trust the FED to do what it says it will. And the FED is not going to let big
banks lead the market into a new downward leg like in the second half of
2008. After all, this is an Election Year and they do not want another 52%
DJI bear market with all its bankruptcies and political repercussions. With
unlimited funds available to them, and the Democrats having no better alternative|
to support the market, surely the FED can hold up the market another month or two.
But after that, I would expect the prospects of a Democrat victory will un-nerve
traders, just as I showed last night happened in the second half of 1892, 1932,
1960, 1976, 1992 and 2008. Unless we can trust that Biden, Pelosi, Schumer
et al. will reach a secret deal with Wall Street moguls like Woodrow Wilson
did in 1912 and probably much earlier, I would not expect a strong market
as the Election draws near from September on.
Can Trump still win? Only if the stock market recovers some more
and if a vaccine is found and people can safely go back to work soon.
His path to an electoral college victory requires him to win some of
same mid-Western heavily industrialized states that he won in 2016.
I would think that this will require protective tariffs against China.
Let's see what the new tariff deal the White House looks like.
|
Charts 6/22/2020 (Click on Underlined link.) 2020 PEERLESS DJI, Signals, Indicators Daily DJI Volume 10-DayUp/Down Vol Stoch-20 Inverted Traders Index Graph of Pct of All Stocks above 65-dma Cum. Inverted Traders Index NASDAQ S&P OEX NYSE COMPQX DJI-15 DJI-20 DJI-30 Vitality INDEX for DJIA DIA QQQ MDY IWM TNA Short-Term Rates SPY http://tigersoft.com/2121CST/SPY.GIF recent 2006 vers-Peerless signals -- http://tigersoft.com/2121CST/VERSABCD.BMP USO-CrudeOil DBO FAS GLD BBH IBB JETS JNUG KOL NUGT OIH PALL RSX RETL SDS AGQ SLV SOXL TECL TLT TMF TNA UGA (gasoline) USO (oil) and China: YINN CHAU Commodities: CANE CORN DBC JJC, NIB, CHOC CORN, CUT (paper) MOO, SOYB WEAT UUP (Dollar) LIT (Lithium) Stocks AAPL ADBE ALXN AMAT AMGN AMD AMZN AXP BA BABA BAC BIDU BLDP CAT CVX CMG DE ENPH FB GILD GOOG GS HD IBM INTU JPM LRCX M (Macy's) MSFT NEM NFLX NKE NVDA PG REGN SO SQ QCOM QDEL TSLA TXN XOM V VRTX WFC WMT TOWN New highs and Bullish MAXCPs http://tigersoft.com/MAXCP/6-22/BULLISH.htm Bearish MAXCPs - http://tigersoft.com/MINCP/6-22/BEARISH.htm |
Table 1
6/22/2018 QUICKSILVER on DJI-30 STOCKS.
Considering just those stocks whose IP21 + ITRS score is >+.25 or <-.25
1 Bullish ( AAPl MSFT
+359 +201 = +560
4 Bearish ( UTX KO
-86 -46 = -134
----------------------------------------
Vitality Score = +426
Note that AAPL now shows highest AI/200 stock here. STOCKS CLOSE CHANGE PIVOT-P 5-dma AROC CL-PWR Candl AI/200 IP21 ITRS --------------------------------------------------------------------------------------- --------------------------------------------------------------------------------------- AAPL 358.87 9.15 352.08 227.1% Bullish BLUE 174 .164 .241 Bullish --------------------------------------------------------------------- AXP 99.44 -1.5 105.62 -218.2% Bearish BLUE 82 -.038 -.049 --------------------------------------------------------------------- BA 188.52 1.5 197.77 -63% Bullish BLUE 64 .037 .144 --------------------------------------------------------------------- CAT 125.79 -1.67 130.11 85.6% Bearish RED 156 .072 -.092 --------------------------------------------------------------------- CSCO 45.16 -.16 46.48 -20.7% Bearish BLUE 95 .061 -.002 --------------------------------------------------------------------- CVX 91.59 .96 94.03 19.6% Bearish BLUE 81 .027 -.011 --------------------------------------------------------------------- DIS 115.92 1.57 118.44 -49.5% Bearish BLUE 82 -.057 .012 --------------------------------------------------------------------- GS 203.42 1.79 209.59 -70.3% ------- BLUE 105 .031 .006 --------------------------------------------------------------------- HD 249.16 2.51 249.95 157.5% ------- BLUE 130 -.018 .139 --------------------------------------------------------------------- IBM 121.07 -1.4 125.15 -23.5% Bearish RED 142 -.044 -.101 --------------------------------------------------------------------- INTC 60.09 .47 60.4 -.8% Bearish BLUE 137 .007 -.046 --------------------------------------------------------------------- JNJ 143.39 -.44 144.46 74.6% Bearish RED 115 -.093 -.082 --------------------------------------------------------------------- JPM 96.75 -1.06 102.06 -225.2% Bearish RED 76 -.089 -.156 --------------------------------------------------------------------- KO 45.74 -.28 46.77 -60.2% Bearish RED 101 -.111 -.164 Bearish --------------------------------------------------------------------- MCD 187.46 .9 190.32 -53.6% ------- BLUE 107 -.085 -.077 --------------------------------------------------------------------- MMM 156.69 -1.46 159.67 -32.7% ------- RED 114 .2 -.037 --------------------------------------------------------------------- MRK 76.75 -1.15 76.97 178.9% Bearish RED 78 .083 -.167 --------------------------------------------------------------------- MSFT 200.57 5.42 193.57 300.3% Bullish BLUE 154 .158 .117 Bullish --------------------------------------------------------------------- NKE 99.51 3.73 99.04 85.1% Bearish BLUE 127 .025 .049 --------------------------------------------------------------------- PFE 33.11 -.31 33.4 -37.4% Bearish RED 71 .066 -.162 --------------------------------------------------------------------- PG 117.75 -1.17 118.13 44.8% Bullish RED 95 -.066 -.071 --------------------------------------------------------------------- TRV 116.23 -.33 116.15 59.6% Bullish BLUE 110 .14 -.039 --------------------------------------------------------------------- UNH 292.67 1.43 293 109.8% Bearish BLUE 123 .045 .01 --------------------------------------------------------------------- UTX 86.01 -5.36 97.15 -958.4% Bullish RED 114 .144 -.538 Bearish --------------------------------------------------------------------- V 194.96 2.76 192.88 83% Bearish BLUE 107 -.085 .025 --------------------------------------------------------------------- VZ 55.66 -.5 56.92 -43.3% ------- RED 136 .128 -.129 --------------------------------------------------------------------- WBA 43.24 -.89 42.15 206.5% ------- RED 94 .073 -.115 --------------------------------------------------------------------- WMT 121.68 1.83 119.65 151.4% ------- BLUE 82 -.001 -.099 --------------------------------------------------------------------- XOM 46.42 .44 48.2 -76.6% Bearish BLUE 49 .046 -.021 --------------------------------------------------------------------- DOW 41.74 .09 42.25 -28.8% Bearish BLUE 67 -.034 .044 |
Table 2 QUICKSILVER on ETFS - 06/22/20 Bullish = QQQ, RETL, SOXL, TECL, OIH(5)
Bearish = (0)
ITRS + IP21>.25 is considered "Bullish" ETF CLOSE CHANGE PIVOT-PT 5-dma AROC CL-PWR CANDLE IP21 ITRS --------------------------------------------------------------------------------------------- DIA 260.32 1.52 263.82 37.8% Bearish BLUE .03 ---- --------------------------------------------------------------------------------------------- SPY 310.62 1.98 312.96 57.5% Bearish BLUE .138 .019 --------------------------------------------------------------------------------------------- QQQ 246.74 2.5 242.85 164.6% Bullish BLUE .229 .131 Bullish --------------------------------------------------------------------------------------------- MDY 325.77 .84 332.92 -8.2% Bearish BLUE .062 .03 --------------------------------------------------------------------------------------------- IWM 142.4 1.41 144.38 49.7% Bearish BLUE .033 .053 --------------------------------------------------------------------------------------------- FAS 33.54 .24 35.79 -81.2% Bearish BLUE .063 -.028 --------------------------------------------------------------------------------------------- RETL 148.35 9.74 147.05 440.7% Bearish BLUE .164 .826 Bullish --------------------------------------------------------------------------------------------- SOXL 185.84 4.84 180.58 397.1% ------- BLUE .103 .621 Bullish --------------------------------------------------------------------------------------------- TECL 230.2 12.25 219.92 559.6% Bullish BLUE .195 .621 Bullish --------------------------------------------------------------------------------------------- IBB 138.13 .28 132.33 286% Bullish BLUE .132 .114 --------------------------------------------------------------------------------------------- GLD 165.09 1.06 162.25 84.8% Bullish ---- .164 -.057 --------------------------------------------------------------------------------------------- OIH 128.97 .46 136.98 -214% Bearish BLUE .231 .213 Bullish --------------------------------------------------------------------------------------------- GASL 3440 285 3685 -325.1% ------- RED -.021 .016 --------------------------------------------------------------------------------------------- |
Table 3 Count of Stocks in Key Directories
20200622
-------------------------------
NEWHIGHS 214
NEWLOWS 21
MAXCP 41
MINCP 73
TTTNH 17
TTTNL 113
FASTUP 134
FASTDOWN 84
CPCROSSA 119
CPCROSSD 35
BIGVOLUP 8
BIGVODN 7
ACCUMVER 7
HIGHIP21 9
HIUPPCT 15
REDSELL 51
AUGSELS7 317
TRAPDOOR 30
|
Table 4 RANKING OF KEY DIRECTORIES BASED PCT.OF STOCKS ABOVE 65-DMA
6/22/20
All but 2 of the 46 groups have more than 60% of their stocks above the 65-dma.
---------------------------------------------------------------------------------------
Directory Current day-1 day-2 day-3 day-4 day-5
----------------------------------------------------------------------------------------
AUTO 1 .974 .974 .974 1 1
COPPER 1 1 1 1 1 1
EDU 1 .8 .8 .8 1 .8
ETFS 1 1 1 1 1 1
JETS 1 1 1 1 1 1
BONDFUND .99 .99 .99 .99 .98 .99
NIFTY .977 .977 .977 .955 .977 .977
GOLD .959 .857 .816 .877 .877 .959
TRANSP .95 1 1 1 1 1
NASD-100 .949 .979 .949 .929 .939 .919
INFRA .942 .942 .942 .971 .971 .971
HOMEBLDG .941 .941 1 1 1 1
BEVERAGE .933 .933 .933 .933 .933 .933
FINANCE .928 .88 .916 .928 .976 .976
GAMING .904 .952 .952 .952 1 1
HACKERS .9 .85 .8 .85 .85 .85
SOFTWARE .9 .883 .883 .916 .933 .933
CHEM .897 .918 .897 .938 .938 .897
INDMATER .88 .893 .88 .92 .933 .906
SEMI .876 .895 .904 .933 .961 .952
SOLAR .875 1 .937 .937 1 1
INDEXES .868 .846 .863 .874 .879 .874
REIT .865 .879 .929 .929 .957 .95
FIDSTKS .864 .892 .903 .909 .926 .892
SP500 .861 .873 .92 .922 .945 .905
BIGBANKS .857 .857 .857 .857 1 1
GREEN .857 .857 .857 .857 .904 .904
RUS-1000 .856 .858 .899 .903 .931 .903
ELECTRON .851 .871 .878 .898 .952 .925
MILITARY .851 .851 .888 .888 .962 .925
COMPUTER .85 .85 .9 .9 1 .95
DJI-13 .846 .923 .923 .923 .923 .846
INSURANC .846 .807 .884 .846 .923 .923
BIOTECH .821 .845 .835 .832 .863 .827
RETAIL .82 .76 .8 .84 .86 .78
SP-100 .813 .846 .868 .868 .901 .846
CHINA .803 .823 .882 .882 .862 .823
DOWJONES .8 .866 .833 .833 .833 .8
OILGAS .763 .801 .847 .839 .908 .885
COMODITY .743 .794 .769 .769 .769 .743
GUNS .733 .733 .8 .8 1 1
FOOD .716 .735 .716 .698 .716 .698
REGBANKS .692 .692 .73 .73 .846 .73
HOSPITAL .619 .619 .619 .619 .904 .714
UTILITY .538 .461 .717 .717 .769 .743
---------------------------------------------------------------------------------------------
COAL .428 .571 .714 .857 1 .857
|
------------------------------------------------------------------------------------------------------
6/19/2020 The operative B20, rising A/D Line, lack of very many new lows
and the
fact that such a high percentage of groupings have a big majority of their
stocks above their 65-dma should bolster the market even as President
Trump suffers in the polls. A decline to the lower 2% band should just give
us another Buy B9.

Note that the Closing Power for DIA and SPY is falling. This means that we cannot
trust strength at the opening and if the opening is weak there may not be much
of a bounce.

AAPL is such a big part of the DJI-30, we will have to watch if its Closing
Power can stay in an uptrend. The breakout by IBB and biotechs will help
QQQ, but such a breakout can also occur late in a bull market, as can a Gold
breakout, which GLD is threatening now. QQQ
looks like much the better
buy now than DIA.

The good breadth and the FED should hold up the market for now.
But it seems doubtful that the DJI will make it back to 28000. Consider
what happens in a Presidential Election year when a Dmocrat is going to win
in the November the Elections and a Republican must leave the White
House. The charts of these seven cases since 1885 are shown further
below. The conclusion I reach is that not once did the Dow Jones Avg.
make a 12-month high in November or December. In 1892 the peak
was in April. Only in 1912 and 1976 was the top as late as October.
Usually it was much earlier. In 1932 it was in February, in 1960 it was"
January and in 1992 and 2008 it was in May. In other words,
only twice in the seven cases where a Democrat ousted a Republican,
did the Dow Jones make a new yearly high after June in a
Presidential Election Year.
1892 - Cleveland beats Harrison

1912 - Wilson beats Taft

1932 - FDR beats Hoover

1960 - JFK beats Nixon

1976 - Carter beats Ford

1992 - Clinton beats Bush I

2008 - Obama beats McCain

====================================================================
6/18/2020 The operative Peerless signal remains the Buy B20 from a week
ago. It is
not a very powerful Buy signal but the NYSE A/D Line is still uptrending.
The futures are up +200, thereby completely ignoring the President's decliing
poll numbers and worries about another COVID-19 spike. The NY Times tells
us tonight that there will be many more bankruptices this year. Actually, this is
more reason for the FED to rev up "QE-Infinity".

However, a big DJIA advance seems unlikely. Look at all the menacing little
head/shouders patterns still developing in all the Big Banks and many of the
regional banks, too. (See them among the Bearish MINCPs tonight.
There also many mini-head/shoulders patterns in the Morningside
Sector funds we follow. Quite a lot! See them at
www.tigersoft.com/JUNE-HS/INDEX.htm
Big money wants out even as the FED seeks to support
the market. For now
these forces will probably cancel each other out. Technically, head/shoulders
patterns' price breakdowns must also take out the 65-dma and even when they
do, the relevant warning for shorts here is that "They must have a rally to
reverse".
Otherwise, even price breakdowns below their necklines frequently seem just to
dribble a little lower into the base and prices fall asleep for a while. I imagine
that
selling out of the money one-month calls and puts for DIA and the DJIA now will be
profitable.
On the positive side, the stay-at-home regimen has brought a boom to many
internet and computer stocks. Where they have made new highs, as in the case
of AAPL, ADBE and NVDA, we see leadership that is not likely to falter.
Performance funds must invest in these stocks. Biotechs may breakout soon.
At least, that is what IBB shows. While the DJI is stuck in a narrow range near
26000, we probably do better buying the leading tech stocks and, at the same
time, holding short some of our Bearish MINCPs. As you can see in our ITRS
Indicator, the QQQ is still outperforming the DJI by 9% for the last 50
trading days. Buy it. All its indicators are now bullish.

|
Charts 6/18/2020 (Click on Underlined link.) 2020 PEERLESS DJI, Signals, Indicators Daily DJI Volume 10-DayUp/Down Vol Stoch-20 Inverted Traders Index Graph of Pct of All Stocks above 65-dma Cum. Inverted Traders Index NASDAQ S&P OEX NYSE COMPQX DJI-15 DJI-20 DJI-30 Vitality INDEX for DJIA DIA QQQ MDY IWM TNA Short-Term Rates SPY http://tigersoft.com/2121CST/SPY.GIF recent 2006 vers-Peerless signals -- http://tigersoft.com/2121CST/2006Z618.BMP USO-CrudeOil DBO FAS GLD BBH IBB JETS JNUG KOL NUGT OIH PALL RSX RETL SDS AGQ SLV SOXL TECL TLT TMF TNA UGA (gasoline) USO (oil) and China: YINN CHAU Commodities: CANE CORN DBC JJC, NIB, CHOC CORN, CUT (paper) MOO, SOYB WEAT UUP (Dollar) LIT (Lithium) Stocks AAPL ADBE ALXN AMAT AMGN AMD AMZN AXP BA BABA BAC BIDU BLDP CAT CVX CMG DE ENPH FB GILD GOOG GS HD IBM INTU JPM LRCX M (Macy's) MSFT NEM NFLX NKE NVDA PG REGN SO SQ QCOM QDEL TSLA TXN XOM V VRTX WFC WMT TOWN New highs and Bullish MAXCPs http://tigersoft.com/MAXCP/6-18/BULLISH.htm Bearish MAXCPs - http://tigersoft.com/MINCP/6-18/BEARISH.htm |
Table 1
6/18/2018 QUICKSILVER on DJI-30 STOCKS.
Considering just those stocks whose IP21 + ITRS score is >+.25 or <-.25
1 Bullish ( AAPL
352 = 352
4 Bearish ( UTX WMT
-86 -118 = -204
----------------------------------------
Vitality Score = -148
Note that AAPL now shows highest AI/200 stock here. STOCKS CLOSE CHANGE PIVOT-P 5-dma AROC CL-PWR Candl AI/200 IP21 ITRS --------------------------------------------------------------------------------------- --------------------------------------------------------------------------------------- AAPL 351.73 .14 338.8 229.9% Bullish BLUE 174 .162 .202 Bullish --------------------------------------------------------------------- AXP 102.16 -1.8 101.68 173.2% Bearish ---- 82 -.023 .013 --------------------------------------------------------------------- BA 192.29 -.25 189.51 592.3% Bullish BLUE 65 .02 .204 --------------------------------------------------------------------- CAT 127.59 -.64 123.15 241% ------- BLUE 154 .069 -.107 --------------------------------------------------------------------- CSCO 45.83 -.34 45.07 238.2% Bearish ---- 93 .074 -.026 --------------------------------------------------------------------- CVX 91.94 .4 92.39 140.1% Bearish BLUE 81 .091 -.018 --------------------------------------------------------------------- DIS 118.37 .72 115.49 246.4% Bearish BLUE 84 .02 .015 --------------------------------------------------------------------- GS 203.84 -2.35 201.78 238.5% ------- RED 105 .071 .074 --------------------------------------------------------------------- HD 249.21 -1.64 242.45 198.9% ------- RED 131 .099 .142 --------------------------------------------------------------------- IBM 124.16 .01 121.91 251.7% Bearish BLUE 143 .004 -.074 --------------------------------------------------------------------- INTC 60.08 -.41 59.33 31.7% Bearish RED 136 .046 -.125 --------------------------------------------------------------------- JNJ 143.41 -.61 142.15 89.1% Bearish BLUE 115 -.115 -.111 --------------------------------------------------------------------- JPM 98.94 -.54 99.87 86.5% Bearish BLUE 78 -.053 -.062 --------------------------------------------------------------------- KO 46.99 .41 45.6 157.1% ------- BLUE 103 -.03 -.143 --------------------------------------------------------------------- MCD 189.49 -1.3 189.17 52.3% ------- RED 109 .031 -.075 --------------------------------------------------------------------- MMM 159.21 -.01 154.87 217.8% ------- BLUE 112 .191 -.053 --------------------------------------------------------------------- MRK 76.22 -.07 76.3 -74.2% Bearish BLUE 78 -.006 -.184 --------------------------------------------------------------------- MSFT 196.32 2.08 187.74 264.3% Bullish BLUE 154 .161 .047 --------------------------------------------------------------------- NKE 98.45 -.76 96.43 168.1% ------- RED 127 .077 .016 --------------------------------------------------------------------- PFE 33.24 -.32 33.75 -9% Bearish RED 69 .049 -.165 --------------------------------------------------------------------- PG 119.28 1.35 115.62 129.1% Bullish BLUE 97 .044 -.096 --------------------------------------------------------------------- TRV 116.05 1.23 113.33 241.4% Bullish BLUE 110 .164 -.002 --------------------------------------------------------------------- UNH 291.48 -1.12 285.15 134.5% Bearish BLUE 121 .044 .021 --------------------------------------------------------------------- UTX 86.01 -5.36 97.15 -958.4% Bullish RED 114 .144 -.595 Bearish --------------------------------------------------------------------- V 193.91 .35 192.26 131.1% Bearish BLUE 109 -.091 -.004 --------------------------------------------------------------------- VZ 56.89 .24 56.53 38.9% ------- BLUE 136 .153 -.155 --------------------------------------------------------------------- WBA 41.98 -.17 41.4 147.9% ------- BLUE 92 -.043 -.173 --------------------------------------------------------------------- WMT 117.99 -1.04 117.74 -88.3% Bearish RED 83 -.093 -.187 Bearish --------------------------------------------------------------------- XOM 46.92 .29 47.17 78.6% Bearish BLUE 50 .105 -.016 --------------------------------------------------------------------- DOW 41.58 .41 41.23 281.7% ------- BLUE 67 -.038 .132 |
Table 2 QUICKSILVER on ETFS - 06/18/20 Bullish = FAS, RETL, SOXL, TECL, OIH(6)
Bearish = (0)
ITRS + IP21>.25 is considered "Bullish" ETF CLOSE CHANGE PIVOT-PT 5-dma AROC CL-PWR CANDLE IP21 ITRS --------------------------------------------------------------------------------------------- DIA 261.45 -.37 256.74 182.2% Bearish BLUE .036 ----- --------------------------------------------------------------------------------------------- SPY 311.78 .12 304.21 181.7% Bearish BLUE .136 .022 --------------------------------------------------------------------------------------------- QQQ 244.28 .66 235.88 214.6% Bullish BLUE .205 .09 --------------------------------------------------------------------------------------------- MDY 327.38 -.89 321.15 193.1% Bearish BLUE .075 .077 --------------------------------------------------------------------------------------------- IWM 141.72 -.05 138.27 238.8% Bearish BLUE .057 .101 --------------------------------------------------------------------------------------------- FAS 34.49 -.18 33 608.8% Bearish BLUE .074 .27 Bullish --------------------------------------------------------------------------------------------- RETL 143.54 -1.13 131 640.6% Bearish BLUE .156 1.18 Bullish --------------------------------------------------------------------------------------------- SOXL 184.72 -.86 164.28 784.6% ------- BLUE .092 .602 Bullish --------------------------------------------------------------------------------------------- TECL 222.74 3.19 200.04 709.1% Bullish BLUE .168 .639 Bullish --------------------------------------------------------------------------------------------- IBB 133.49 .67 128.08 233.4% Bearish BLUE .074 .065 --------------------------------------------------------------------------------------------- GLD 162.24 -.32 162.62 -4.6% Bullish ---- .122 -.114 --------------------------------------------------------------------------------------------- OIH 131.42 .59 133.92 181.8% ------- BLUE .28 .306 Bullish --------------------------------------------------------------------------------------------- GASL 3440 285 3685 -325.1% ------- RED -.021 -.041 --------------------------------------------------------------------------------------------- |
Table 3 Count of Stocks in Key Directories
20200618
-------------------------------
NEWHIGHS 147 Bullish
NEWLOWS 9 (It's hard to see a bear market starting with so few NLs.)
MAXCP 40
MINCP 32
TTTNH 19
TTTNL 20
FASTUP 243
FASTDOWN 26
CPCROSSA 151
CPCROSSD 18
BIGVOLUP 10
BIGVODN 21
ACCUMVER 6
HIGHIP21 12
HIUPPCT 14
VHIP21 46
AUGSELS7 246
TRAPDOOR 32
|
Table 4 RANKING OF KEY DIRECTORIES BASED PCT.OF STOCKS ABOVE 65-DMA
6/18/20
All 46 groups have at least 60% of their stocks above their 65-dma.
---------------------------------------------------------------------------------------
Directory Current day-1 day-2 day-3 day-4 day-5
----------------------------------------------------------------------------------------
COPPER 1 1 1 1 1 1
ETFS 1 1 1 1 1 1
HOMEBLDG 1 1 1 1 1 .941
JETS 1 1 1 1 1 .928
TRANSP 1 1 1 1 1 1
BONDFUND .99 .99 .98 .99 .99 .99
NIFTY .977 .955 .977 .977 .977 .933
AUTO .974 .974 1 1 1 1
NASD-100 .959 .949 .949 .919 .919 .898
-----
GAMING .952 .952 1 1 1 .952
INFRA .942 .971 .971 .971 .942 .971
SOLAR .937 .937 1 1 1 .937
BEVERAGE .933 .933 .933 .933 .933 .733
REIT .929 .929 .957 .943 .943 .879
DJI-13 .923 .923 .923 .846 .846 .846
SP500 .922 .924 .945 .905 .894 .85
-----
FINANCE .916 .928 .976 .976 .976 .845
SEMI .904 .933 .961 .952 .952 .923
FIDSTKS .903 .909 .926 .892 .892 .836
COMPUTER .9 .9 1 .95 .9 .75
RUS-1000 .9 .904 .931 .902 .882 .837
SOFTWARE .9 .933 .933 .933 .9 .816
CHEM .897 .938 .938 .897 .897 .897
MILITARY .888 .888 .962 .925 .925 .888
INSURANC .884 .846 .923 .923 .846 .769
CHINA .882 .882 .862 .823 .784 .745
INDMATER .88 .92 .933 .906 .92 .893
ELECTRON .878 .898 .952 .925 .925 .891
SP-100 .868 .868 .901 .835 .835 .758
INDEXES .858 .869 .875 .869 .869 .875
BIGBANKS .857 .857 1 1 1 .857
GREEN .857 .857 .904 .904 .904 .857
HACKERS .85 .9 .85 .85 .85 .85
OILGAS .847 .839 .908 .885 .893 .839
DOWJONES .833 .833 .833 .8 .8 .766
-----
BIOTECH .825 .825 .859 .838 .791 .757
GOLD .816 .877 .877 .959 .918 .918
EDU .8 .8 1 .8 1 1
GUNS .8 .8 1 1 1 .933
RETAIL .8 .84 .86 .8 .82 .8
COMODITY .769 .769 .769 .743 .794 .769
REGBANKS .73 .73 .846 .73 .73 .653
UTILITY .717 .717 .769 .743 .717 .692
FOOD .716 .698 .716 .698 .735 .716
COAL .714 .857 1 .857 1 1
HOSPITAL .619 .619 .904 .761 .619 .666
|
========================================================================
6/17/2020 It looks like 25000 will be re-tested. Another reversal at
that point would be
constructive and seem to be a good place to buy DIA.
The current operative B20 is based on a series of excellent days of breadth, exactly
what we would expect to see if the Federal Reserve is boosting the market
with heavy purchases of bonds, like now, and what we did see in 2009, 2010
and 2011. We see in these years charts swiftly rising A/D Lines like now. And
we also see the new augmented Buy B4s. These occur after a series of 5:1 breadth
days
and the DJI falls below its 21-day ma. Please see the explanation here. I count 11
or 12 such 5:1 good breadth days since the Fed first announced that they would be
buying billions and billions worth of corporate bonds in late March, right at the stock
market's bottom. Fighting a determined FED usually does not pay. But watch out
when the FED changes its mind. At that point, expect to see a break in A/D Line
uptrend and possibly the completion of a head/shoulders pattern.
http://tigersoft.com/Five2One/INDEX.htm
Below see the rising A/D Line. That is
certainly bullish. But note
also the head/shoulders pattern that the DJI started to
form until Tuesday's big advance. A quick decline over the
next few trading days might allow it to be reestablished.
And watch what happens to the big banks. GS, JPM and WFC.
show potential H/S patterns. Usually the DJIA and these three
stock work in tandem. And note in Table 1 below that our DJI-30
Vitality Index did turn negative today.

Past augmented Buy B4s all have all had the power to
turn up DJI dips to the
lower band until eventually much higher prices have been achieved. They overpower
other Sells, even when they come in bunches. That would seem
to make any decline
to the lower band now a good place to buy DIA. With the P-Indicator so high,
such a dip will also most likely give us a reinforcing Buy B9 if the DJI should fall
to
the lower 2% band.
Of course, it is possible that he Fed may not be equal to the
task it has assigned
itself of holding up the market if the COVID-19 worsens. Powell did tell
Congress today that for the FED to do its job successfully, it needs their help
in sustaining unemployed workers incomes. Otherwise, he hinted, wealth inequality
might widen dangerously. His job was to help Wall Street; theirs is to help Main
Street. Since Senator McConnell's opposition to any more fiscal bailout seems quite
fixed and unchanging, there is risk to the market that the current protests will morph
into class inequality protests. Other pundits worry about the President's
difficulties.
What's new here? Biden is a life-long friend of big corporations and the market has
long ago gotten used to bad news for the President. At this point, it might prefer
a President who is seldom seen and speaks publicly even less.
So, I would hold long APPL and some other bullish MAXCPs as
long as they can
stay in new high territory. I've also suggested hedging with some Bearish MINCP
shorts.
Today I posted more than ten bearish MIMCPs that also show bearish head/shoulders
patterns and the 1-2 TigerSoft combination Sell "S9-S14".
I adnit that it is troublesome to see bearish head/shoulders patterns in JPM, WFC and GS.
Weak banks stocks could be a real danger sign. Certainly, they were in mid-2008.
Watch them today.
Table 1
6/17/2018 QUICKSILVER on DJI-30 STOCKS.
Considering just those stocks whose IP21 + ITRS score is >+.25 or <-.25
1 Bullish ( AAPL
352 = 352
4 Bearish ( JNJ MRK UTX WBA WMT
-144 76 -86 -42 -119 = -467
----------------------------------------
Vitality Score = -115
Note that AAPL now shows highest AI/200 stock here. STOCKS CLOSE CHANGE PIVOT-P 5-dma AROC CL-PWR Candl AI/200 IP21 ITRS --------------------------------------------------------------------------------------- --------------------------------------------------------------------------------------- AAPL 351.59 -.49 335.9 -18.1% Bullish RED 173 .118 .184 Bullish --------------------------------------------------------------------- AXP 103.96 -1.66 98.6 -106.6% Bearish RED 82 -.038 .084 --------------------------------------------------------------------- BA 192.54 -5.23 170 -285.6% ------- RED 65 -.003 .138 --------------------------------------------------------------------- CAT 128.23 -1.88 121.55 -166.8% Bearish RED 153 .035 -.091 --------------------------------------------------------------------- CSCO 46.17 -.31 43.67 -137.1% Bearish RED 92 .038 -.041 --------------------------------------------------------------------- CVX 91.54 -2.49 89.37 -325% Bearish RED 81 .05 -.017 --------------------------------------------------------------------- DIS 117.65 -.79 112.64 -193.3% Bearish RED 84 -.029 .026 --------------------------------------------------------------------- GS 206.19 -3.4 194.13 -178.7% ------- RED 105 .057 .147 --------------------------------------------------------------------- HD 250.85 .9 239.47 -73.3% ------- RED 131 .02 .155 --------------------------------------------------------------------- IBM 124.15 -1 118.01 -231.9% Bearish RED 142 -.042 -.075 --------------------------------------------------------------------- INTC 60.49 .09 59.7 -278.5% Bearish RED 135 .009 -.121 --------------------------------------------------------------------- JNJ 144.02 -.44 140.87 -131.9% Bearish RED 115 -.146 -.125 Bearish --------------------------------------------------------------------- JPM 99.48 -2.58 97.21 -324.8% Bearish RED 79 -.078 -.044 --------------------------------------------------------------------- KO 46.58 -.19 45.54 -219% Bearish RED 104 -.07 -.158 --------------------------------------------------------------------- MCD 190.79 .47 187.51 -131.5% ------- RED 109 .022 -.078 --------------------------------------------------------------------- MMM 159.22 -.45 152.38 -148.4% ------- RED 111 .15 -.024 --------------------------------------------------------------------- MRK 76.29 -.68 77.35 -354.5% Bearish RED 79 -.067 -.206 Bearish --------------------------------------------------------------------- MSFT 194.24 .67 186.27 -68.2% Bullish RED 154 .099 .02 --------------------------------------------------------------------- NKE 99.21 .17 95.17 -148.3% ------- BLUE 127 .059 .016 --------------------------------------------------------------------- PFE 33.56 .16 33.3 -347.6% Bearish ---- 68 .048 -.185 --------------------------------------------------------------------- PG 117.93 -.2 116.26 -55.5% ------- RED 97 -.024 -.155 --------------------------------------------------------------------- TRV 114.82 -1.33 110.55 -267.4% Bullish RED 110 .125 .004 --------------------------------------------------------------------- UNH 292.6 -.4 283.73 -226.1% Bearish RED 120 -.018 .022 --------------------------------------------------------------------- UTX 86.01 -5.36 97.15 -958.4% Bullish RED 114 .144 -.597 Bearish --------------------------------------------------------------------- V 193.56 .68 188.88 -179% Bearish BLUE 110 -.153 -.013 --------------------------------------------------------------------- VZ 56.65 -.27 56.45 -123.2% ------- RED 136 .087 -.157 --------------------------------------------------------------------- WBA 42.15 0 40.75 -253.5% Bearish RED 92 -.086 -.167 Bearish --------------------------------------------------------------------- WMT 119.03 -.62 120.09 -89.2% Bearish RED 83 -.185 -.212 Bearish --------------------------------------------------------------------- XOM 46.63 -1.57 46.18 -419.9% Bearish RED 50 .043 -.004 --------------------------------------------------------------------- DOW 41.17 -1.08 39.26 -289.2% Bearish RED 67 -.09 .192 |
Table 2 QUICKSILVER on ETFS - 06/17/20 Bullish = FAS, RETL, SOXL, TECL, OIH(6)
Bearish = (0)
ITRS + IP21>.25 is considered "Bullish" ETF CLOSE CHANGE PIVOT-PT 5-dma AROC CL-PWR CANDLE IP21 ITRS --------------------------------------------------------------------------------------------- DIA 261.82 -2 252.03 -166% Bearish RED -.014 ---- --------------------------------------------------------------------------------------------- SPY 311.66 -1.3 300.61 -118.9% Bearish RED .07 .021 --------------------------------------------------------------------------------------------- QQQ 243.62 .77 234.02 -54.3% Bullish RED .145 .084 --------------------------------------------------------------------------------------------- MDY 328.27 -4.65 314.84 -166% Bearish RED .036 .093 --------------------------------------------------------------------------------------------- IWM 141.77 -2.61 135.03 -156.4% Bearish RED .02 .103 --------------------------------------------------------------------------------------------- FAS 34.67 -1.12 30.4 -597.1% Bearish RED .03 .306 Bullish --------------------------------------------------------------------------------------------- RETL 144.67 -2.38 126 -256.6% Bearish RED .148 1.382 Bullish --------------------------------------------------------------------------------------------- SOXL 185.58 5 157.74 -269.3% Bearish BLUE .029 .586 Bullish --------------------------------------------------------------------------------------------- TECL 219.55 -.37 193.28 -337.9% Bullish RED .098 .57 Bullish --------------------------------------------------------------------------------------------- IBB 132.82 .49 127.41 -19.9% Bearish RED .029 .033 --------------------------------------------------------------------------------------------- GLD 162.56 .31 162.39 -31.1% Bullish BLUE .13 -.12 --------------------------------------------------------------------------------------------- OIH 130.83 -6.15 126.6 -626.5% ------- RED .242 .348 Bullish --------------------------------------------------------------------------------------------- GASL 3440 285 3685 -325.1% ------- RED -.021 -.043 --------------------------------------------------------------------------------------------- |
Table 3 Count of Stocks in Key Directories
20200617
-------------------------------
NEWHIGHS 211 (bullish)
NEWLOWS 10
MAXCP 26
MINCP 115
TTTNH 7
TTTNL 125
FASTUP 57
FASTDOWN 243
CPCROSSA 32
CPCROSSD 172
BIGVOLUP 8
BIGVODN 12
ACCUMVER 4
HIGHIP21 9
HIUPPCT 8
REDSELL 52
AUGSELS7 349
TRAPDOOR 32
|
Table 4 RANKING OF KEY DIRECTORIES BASED PCT.OF STOCKS ABOVE 65-DMA
6/17/20
All groups show at least 60% of their stocks above the 65-dma
---------------------------------------------------------------------------------------
Directory Current day-1 day-2 day-3 day-4 day-5
----------------------------------------------------------------------------------------
COPPER 1 1 1 1 1 1
ETFS 1 1 1 1 1 1
HOMEBLDG 1 1 1 1 .941 1
JETS 1 1 1 1 .928 1
TRANSP 1 1 1 1 1 1
BONDFUND .99 .98 .99 .99 1 .99
AUTO .974 1 1 1 1 1
INFRA .971 .971 .971 .942 .942 .971
NIFTY .955 .977 .977 .977 .955 1
GAMING .952 1 1 1 .952 1
NASD-100 .949 .959 .929 .919 .898 .969
CHEM .938 .938 .897 .897 .897 .979
SOLAR .937 1 1 1 .937 1
BEVERAGE .933 .933 .933 .933 .733 .933
SEMI .933 .961 .952 .952 .914 .971
SOFTWARE .933 .95 .933 .9 .833 .966
REIT .929 .957 .943 .943 .872 .964
FINANCE .928 .976 .976 .976 .845 1
SP500 .924 .947 .905 .894 .856 .968
DJI-13 .923 .923 .846 .846 .846 .923
INDMATER .92 .933 .906 .92 .893 .96
FIDSTKS .909 .926 .892 .892 .836 .966
RUS-1000 .904 .932 .902 .882 .838 .957
COMPUTER .9 1 .95 .9 .75 1
HACKERS .9 .9 .85 .85 .85 .95
ELECTRON .898 .952 .925 .925 .891 .959
MILITARY .888 .962 .925 .925 .888 1
CHINA .882 .862 .823 .784 .745 .823
GOLD .877 .877 .959 .918 .938 .959
INDEXES .869 .875 .869 .869 .875 .869
SP-100 .868 .901 .835 .835 .769 .967
BIGBANKS .857 1 1 1 .857 1
COAL .857 1 .857 1 1 1
GREEN .857 .904 .904 .904 .857 .904
INSURANC .846 .923 .923 .846 .769 .923
RETAIL .84 .86 .8 .82 .8 .9
OILGAS .839 .908 .885 .893 .832 .931
DOWJONES .833 .833 .8 .8 .766 .933
BIOTECH .82 .856 .835 .791 .768 .893
EDU .8 1 .8 1 1 1
GUNS .8 1 1 1 .933 1
COMODITY .769 .769 .743 .794 .769 .82
REGBANKS .73 .846 .73 .73 .653 .884
UTILITY .717 .769 .743 .717 .692 .948
FOOD .698 .716 .698 .735 .716 .754
HOSPITAL .619 .904 .761 .619 .619 .857
|
====================================================================
6/16/2020 Don't Sell the Fed Short. They are very clever and they have
trillions to
work with. AAPL seems a natural play here.
The Buy B20 tells us to expect a rally back to 27000. If there is
good news about Covid-19 or the development of new and much better
treatment options, the NASDAQ shoulde be making new highs again,
as will Apple, the current Tiger Tahiti stock. The bullish MAXCPs
showing high A/I 200 scores, high IP21 and Closing Power new highs
and a price breakout are the most favored now. But we will be watching
low priced stocks, too. The Fed's guaranteeing against bankruptcy
could be a big boost to low priced stocks.
Note below the new price-at-the-close uptrend
and the very strong NYSE A/D Line The A/D Line
is rising powerfully. This indicator is a Fed-watcher tool,
along with augmented B4s and classic Buy B20s.

The FED seems in charge again. The gap in the DJI just below 27000
was closed today. So, it may be harder for the DJI and the other indexes
to keep rising, but the trends are up. See the Closing's trend just below,
the powerfully rising NYSE A/D Line and the fact that both the Opening
and Closing Powers are rising.
Buying billions in private bonds may not be a legal FED undertaking, but
realistically, it is also something that the Democrats in Congress
are not willing to challenge. Biden, Pelosi and Schumer are loudly silent.
Apparently, they have no better solutions and they may need Powell to do
the same thing next year, if their Party retakes power.
The Feds are now operating under the convenient fiction that they are
merely pumping money into a FED-Treasury agency to do their buying
of corporate binds. They call this "SPV", a special pur[ose vehicle.
It is also known as SMCCF. See
https://www.federalreserve.gov/newsevents/pressreleases/monetary20200615a.htm
So, as long as the Treasury Secretary approves, there is no legal problem they
claim.
And in any case, the arrangement they say is temporary and for the COVID-19 emergency
only. The beauty of their cleverness is its flexibility. If what they are
doing now fails
to hold up the market, then they could soon be buying stock indexes and futures.
Why not individual stocks, you might well ask? That IS its logical extension,
especially
when "over-sight" is unwelcome to those in power. I can envision a
situation, too, where
the FED will be buying individual corporate bonds that no one else will be buying.
They
could end up owning 125% of the whole bond issue, where shorts are also counted.
This is a crazy socialism.


|
Charts 6/16/2020 (Click on Underlined link.) 2020 PEERLESS DJI, Signals, Indicators Daily DJI Volume 10-DayUp/Down Vol Stoch-20 Inverted Traders Index Graph of Pct of All Stocks above 65-dma Cum. Inverted Traders Index NASDAQ S&P OEX NYSE COMPQX DJI-15 DJI-20 DJI-30 Vitality INDEX for DJIA DIA QQQ MDY IWM TNA Short-Term Rates SPY http://tigersoft.com/2121CST/SPY.GIF recent 2006 vers-Peerless signals -- http://tigersoft.com/2121CST/2006VIVV.BMP USO-CrudeOil DBO FAS GLD BBH IBB JETS JNUG KOL NUGT OIH PALL RSX RETL SDS AGQ SLV SOXL TECL TLT TMF TNA UGA (gasoline) USO (oil) and China: YINN CHAU Commodities: CANE CORN DBC JJC, NIB, CHOC CORN, CUT (paper) MOO, SOYB WEAT UUP (Dollar) LIT (Lithium) Stocks AAPL ADBE ALXN AMAT AMGN AMD AMZN AXP BA BABA BAC BIDU BLDP CAT CVX CMG DE ENPH FB GILD GOOG GS HD IBM INTU JPM LRCX M (Macy's) MSFT NEM NFLX NKE NVDA PG REGN SO SQ QCOM QDEL TSLA TXN XOM V VRTX WFC WMT TOWN New highs and Bullish MAXCPs http://tigersoft.com/MAXCP/6-16/BULLISH.htm Bearish MAXCPs - http://tigersoft.com/MINCP/6-16/BEARISH.htm |
Table 1
6/16/2018 QUICKSILVER on DJI-30 STOCKS.
Considering just those stocks whose IP21 + ITRS score is >+.25 or <-.25
3 Bullish ( AAPL BA GS
352 198 210 = 760
4 Bearish ( JNJ MRK UTX WMT
-144 77 -96 -120 = -437
----------------------------------------
Vitality Score = +323
Note that AAPL now shows highest AI/200 stock here. STOCKS CLOSE CHANGE PIVOT-P 5-dma AROC CL-PWR Candl AI/200 IP21 ITRS --------------------------------------------------------------------------------------- --------------------------------------------------------------------------------------- AAPL 352.08 9.09 352.84 118% Bullish BLUE 172 .176 .206 Bullish --------------------------------------------------------------------- AXP 105.62 1.67 106.16 -232.3% Bearish RED 82 .024 .182 --------------------------------------------------------------------- BA 197.77 6.83 203.41 -488.6% Bullish RED 66 .052 .336 Bullish --------------------------------------------------------------------- CAT 130.11 6.5 132.44 -160.6% Bullish RED 152 .102 -.118 --------------------------------------------------------------------- CSCO 46.48 1.13 47.42 -171% Bearish RED 91 .086 -.063 --------------------------------------------------------------------- CVX 94.03 2.8 97.58 -397.2% Bearish RED 81 .082 -.001 --------------------------------------------------------------------- DIS 118.44 1.36 122.18 -230.4% Bearish RED 85 -.025 .009 --------------------------------------------------------------------- GS 209.59 3.28 213.52 -205.8% ------- RED 105 .111 .174 Bullish --------------------------------------------------------------------- HD 249.95 8.59 254.45 -137.9% ------- BLUE 131 .016 .146 --------------------------------------------------------------------- IBM 125.15 3.5 129.87 -269.5% Bearish BLUE 142 -.013 -.076 --------------------------------------------------------------------- INTC 60.4 .3 63.87 -215.7% Bearish RED 134 .031 -.137 --------------------------------------------------------------------- JNJ 144.46 3.21 147.8 -52.2% Bearish BLUE 115 -.175 -.176 Bearish --------------------------------------------------------------------- JPM 102.06 .81 106.06 -411.7% Bearish RED 80 -.018 -.038 --------------------------------------------------------------------- KO 46.77 .47 48.62 -237.2% Bearish RED 105 -.03 -.186 --------------------------------------------------------------------- MCD 190.32 .83 195.8 -239.2% ------- RED 109 .053 -.066 --------------------------------------------------------------------- MMM 159.67 1.94 163.9 -220.9% ------- RED 110 .217 -.059 --------------------------------------------------------------------- MRK 76.97 2.95 81.77 -337.6% Bearish BLUE 80 -.075 -.243 Bearish --------------------------------------------------------------------- MSFT 193.57 4.63 196.84 99.3% Bullish BLUE 154 .111 .006 --------------------------------------------------------------------- NKE 99.04 1.2 102.12 -181.6% ------- RED 127 .088 .003 --------------------------------------------------------------------- PFE 33.4 .04 35.92 -407.2% Bearish RED 67 .046 -.26 --------------------------------------------------------------------- PG 118.13 1.44 119.23 -9% ------- RED 98 .014 -.226 --------------------------------------------------------------------- TRV 116.15 1.3 120.98 -396.1% Bullish RED 110 .159 -.016 --------------------------------------------------------------------- UNH 293 6.72 305.75 -275.7% Bearish RED 120 -.039 .024 --------------------------------------------------------------------- UTX 86.01 -5.36 97.15 -958.4% Bullish RED 114 .144 -.693 Bearish --------------------------------------------------------------------- V 192.88 1.12 200.48 -159.4% Bearish RED 111 -.1 .017 --------------------------------------------------------------------- VZ 56.92 .77 58.05 -82.4% ------- ---- 136 .109 -.212 --------------------------------------------------------------------- WBA 42.15 .66 44.28 -367% ------- RED 92 -.008 -.218 --------------------------------------------------------------------- WMT 119.65 1.57 121.16 -71% Bearish RED 83 -.154 -.251 Bearish --------------------------------------------------------------------- XOM 48.2 1.06 50.65 -543.6% Bearish RED 50 .118 -.023 --------------------------------------------------------------------- DOW 42.25 .27 43.58 -256.6% ------- RED 67 -.07 .258 |
Table 2 QUICKSILVER on ETFS - 06/16/20 Bullish = FAS, RETL, SOXL, TECL, OIH(6)
Bearish = (0)
ITRS + IP21>.25 is considered "Bullish" ETF CLOSE CHANGE PIVOT-PT 5-dma AROC CL-PWR CANDLE IP21 ITRS --------------------------------------------------------------------------------------------- DIA 263.82 5.47 270.46 -182.3% Bearish RED .022 ----- --------------------------------------------------------------------------------------------- SPY 312.96 5.91 319 -126.2% Bearish RED .095 .008 --------------------------------------------------------------------------------------------- QQQ 242.85 4.1 246.22 -9.4% Bullish RED .168 .072 --------------------------------------------------------------------------------------------- MDY 332.92 6.61 339.12 -225.1% Bearish RED .101 .117 --------------------------------------------------------------------------------------------- IWM 144.38 3.39 146.18 -206.8% Bearish RED .074 .127 --------------------------------------------------------------------------------------------- FAS 35.79 1.69 38.78 -901.9% Bearish RED .085 .614 Bullish --------------------------------------------------------------------------------------------- RETL 147.05 11.21 151.77 -569% Bearish RED .177 2.191 Bullish --------------------------------------------------------------------------------------------- SOXL 180.58 9.09 194.94 -356.7% ------- RED .071 .962 Bullish --------------------------------------------------------------------------------------------- TECL 219.92 14.03 233.78 -50.2% Bullish RED .124 .918 Bullish --------------------------------------------------------------------------------------------- IBB 132.33 1.83 133.34 -22.2% Bearish ---- .014 -.007 --------------------------------------------------------------------------------------------- GLD 162.25 -.08 163.57 30.5% ------- BLUE .063 -.19 --------------------------------------------------------------------------------------------- OIH 136.98 2.34 147.87 -828.9% ------- RED .297 .443 Bullish --------------------------------------------------------------------------------------------- GASL 3440 285 3685 -325.1% ------- RED -.021 -.139 --------------------------------------------------------------------------------------------- |
Table 3 Count of Stocks in Key Directories
20200616
-------------------------------
NEWHIGHS 78
NEWLOWS 3
MAXCP 19
MINCP 29
TTTNH 9
TTTNL 65
FASTUP 61
FASTDOWN 348
CPCROSSA 44
CPCROSSD 170
BIGVOLUP 8
BIGVODN 7
ACCUMVER 11
HIGHIP21 10
HIUPPCT 7
REDSELL 54
AUGSELS7 239
TRAPDOOR 33
|
RANKING OF KEY DIRECTORIES BASED PCT.OF STOCKS ABOVE 65-DMA 6/16/20 --------------------------------------------------------------------------------------- Directory Current day-1 day-2 day-3 day-4 day-5 ---------------------------------------------------------------------------------------- AUTO 1 1 1 1 1 1 BIGBANKS 1 1 1 .857 1 1 COAL 1 .857 1 1 1 1 COMPUTER 1 .95 .9 .75 1 1 COPPER 1 1 1 1 1 1 EDU 1 .8 1 1 1 1 ETFS 1 1 1 1 1 1 GAMING 1 1 1 .952 1 1 GUNS 1 1 1 .933 1 1 HOMEBLDG 1 1 1 .941 1 1 JETS 1 1 1 .928 1 1 SOLAR 1 1 1 .937 1 1 TRANSP 1 1 1 1 1 1 BONDFUND .98 .99 .99 1 .99 .98 NIFTY .977 .977 .977 .955 1 1 FINANCE .976 .976 .976 .845 1 1 INFRA .971 .971 .942 .942 .971 .971 MILITARY .962 .925 .925 .888 1 1 SEMI .961 .952 .952 .914 .971 .98 NASD-100 .959 .939 .929 .898 .969 .969 REIT .957 .943 .943 .872 .964 .985 ELECTRON .952 .925 .925 .891 .959 .972 SOFTWARE .95 .95 .9 .833 .966 .966 SP500 .947 .907 .894 .856 .968 .974 CHEM .938 .897 .897 .897 .979 1 BEVERAGE .933 .933 .933 .733 .933 1 INDMATER .933 .906 .92 .893 .96 1 RUS-1000 .932 .903 .882 .838 .955 .971 FIDSTKS .926 .892 .892 .836 .966 .966 DJI-13 .923 .846 .846 .846 .923 .923 INSURANC .923 .923 .846 .769 .923 .923 OILGAS .908 .885 .893 .832 .931 .938 GREEN .904 .904 .904 .857 .904 .904 HOSPITAL .904 .761 .619 .619 .857 .904 SP-100 .901 .835 .835 .769 .967 .967 HACKERS .9 .9 .85 .85 .95 .95 GOLD .877 .959 .918 .938 .959 .959 INDEXES .875 .869 .869 .875 .869 .869 CHINA .862 .823 .784 .745 .823 .843 RETAIL .86 .8 .82 .8 .9 .92 BIOTECH .852 .834 .789 .768 .897 .907 REGBANKS .846 .73 .73 .653 .884 1 DOWJONES .833 .8 .8 .766 .933 .933 COMODITY .769 .743 .794 .769 .82 .82 UTILITY .769 .743 .717 .692 .948 .948 FOOD .716 .698 .735 .716 .754 .754 |
======================================================================
6/15/2020 The 1000 point reversal today clearly was a result of the Fed
statement
that they will, in fact, soon start buying billions and billions of dollars worth
of corporate bonds, in effect, guaranteeing that many of the biggest corporations
won't fall to bankruptcy. I was impressed that it took only a 10% decline
in the DJI to get the FED to make this statement. Clearly, they want to show
that they are serious about keeping the stock market rally alive. 25000
on the DJI is support now. Look for the DJI rally back to, perhaps, 26800,
and close the price gap just above.
The average gain on Buy B20s is only +4.4% since 2000, bit paper losses are all small.
.
Buy more bullish MAXCPs and cover some of the shorted Bearish MINCPs
if their Closing Powers break their downtrends. AAPL is the highest AI/200
stock in the DJI-30.
With the DJI up 500 at this moment, it's difficult to suggest buying DIA unless
it retreats again to 25000. Note that today the 2006 version of Peerless matched
the current version of Peerless'es Buy B20.
Buy B20s since 2000 Date Signal DJIA Gain ---- Paper Loss ------- 20070831 B20 13357.74 .034 13113.3 -.018 9/17 20130701 B20 14974.96 .032 none 20131017 B20 15371.65 .074 none 0 20140213 B20 16027.59 .060 none 0 20140818 B20 16838.74 .085 none 0 20151223 B20 17602.61 .007 none 0 20160629 B20 17694.68 .036 none 0 20180404 B20 24505.22 .022 23932.76 -.023 4/6 20190819 B20 26135.79 .027 25479.42 -.024 ---------------------------------------------------------------------------- N=9 AVG. +.044 -.007 20200611 B20 25128.17
 |
 |
 |
|
Charts 6/15/2020 (Click on Underlined link.) 2020 PEERLESS DJI, Signals, Indicators Daily DJI Volume 10-DayUp/Down Vol Stoch-20 Inverted Traders Index Graph of Pct of All Stocks above 65-dma Cum. Inverted Traders Index NASDAQ S&P OEX NYSE COMPQX DJI-15 DJI-20 DJI-30 DIA QQQ MDY IWM TNA Short-Term Rates SPY http://tigersoft.com/2121CST/SPY.GIF recent 2006 vers-Peerless signals -- http://www.tigersoft.com/2121CST/2006XYZ.BMP USO-CrudeOil DBO FAS GLD BBH IBB JETS JNUG KOL NUGT OIH PALL RSX RETL SDS AGQ SLV SOXL TECL TLT TMF TNA UGA (gasoline) USO (oil) and China: YINN CHAU Commodities: CANE CORN DBC JJC, NIB, CHOC CORN, CUT (paper) MOO, SOYB WEAT UUP (Dollar) LIT (Lithium) Stocks AAPL ADBE ALXN AMAT AMGN AMD AMZN AXP BA BABA BAC BIDU BLDP CAT CVX CMG DE ENPH FB GILD GOOG GS HD IBM INTU JPM LRCX M (Macy's) MSFT NEM NFLX NKE NVDA PG REGN SO SQ QCOM QDEL TSLA TXN XOM V VRTX WFC WMT TOWN New highs and Bullish MAXCPs http://tigersoft.com/MAXCP/6-15/BULLISH.htm Bearish MAXCPs - http://tigersoft.com/MINCP/6-15/BEARISH.htm |
Table 1
6/15/2018 QUICKSILVER on DJI-30 STOCKS.
Considering just those stocks whose IP21 + ITRS score is >+.25 or <-.25
2 Bullish ( AAPL BA GS
343 191 206 = 750
1 Bearish ( JNJ KO MRK UTX WMT
-141 46 -74 -86 -118 = -465
----------------------------------------
Vitality Score = +285
Note that AAPL now shows highest AI/200 stock here. STOCKS CLOSE CHANGE PIVOT-P 5-dma AROC CL-PWR Candl AI/200 IP21 ITRS --------------------------------------------------------------------------------------- --------------------------------------------------------------------------------------- AAPL 342.99 4.19 343.99 139.7% Bullish BLUE 171 .19 .193 Bullish --------------------------------------------------------------------- AXP 103.95 2.27 110.46 -458% Bearish BLUE 81 .026 .149 --------------------------------------------------------------------- BA 190.94 1.43 216.74 -979.1% Bullish BLUE 66 .079 .341 Bullish --------------------------------------------------------------------- CAT 123.61 .46 134.19 -543.5% Bullish BLUE 151 .157 -.149 --------------------------------------------------------------------- CSCO 45.35 .28 48.05 -299.1% ------- BLUE 90 .157 -.068 --------------------------------------------------------------------- CVX 91.23 -1.16 101.53 -620.2% Bearish BLUE 80 .034 -.009 --------------------------------------------------------------------- DIS 117.08 1.59 123.89 -424% Bullish BLUE 86 .049 0 --------------------------------------------------------------------- GS 206.31 4.53 218.1 -345.8% Bullish BLUE 105 .1 .169 Bullish --------------------------------------------------------------------- HD 241.36 -1.09 256.76 -308.2% Bullish BLUE 131 .022 .124 --------------------------------------------------------------------- IBM 121.65 -.26 131.87 -553% Bearish BLUE 142 .019 -.102 --------------------------------------------------------------------- INTC 60.1 .77 63.04 -288.3% Bullish BLUE 133 .079 -.102 --------------------------------------------------------------------- JNJ 141.25 -.9 145.96 -190.7% Bearish BLUE 115 -.122 -.147 Bearish --------------------------------------------------------------------- JPM 101.25 1.38 110.54 -578.6% Bearish BLUE 81 -.032 -.05 --------------------------------------------------------------------- KO 46.3 .7 49 -371.9% ------- BLUE 106 -.088 -.154 Bearish --------------------------------------------------------------------- MCD 189.49 .32 199.52 -337.6% Bullish BLUE 109 .089 -.034 --------------------------------------------------------------------- MMM 157.73 2.86 166.7 -283.9% ------- BLUE 109 .308 -.064 --------------------------------------------------------------------- MRK 74.02 -2.28 82.26 -554.2% Bearish RED 81 -.128 -.245 Bearish --------------------------------------------------------------------- MSFT 188.94 1.2 189.8 15.3% Bullish BLUE 154 .123 .009 --------------------------------------------------------------------- NKE 97.84 1.41 102.63 -322.1% ------- BLUE 127 .144 .013 --------------------------------------------------------------------- PFE 33.36 -.39 36.21 -459.4% Bearish BLUE 66 .038 -.193 --------------------------------------------------------------------- PG 116.69 1.07 118.34 -100.3% ------- BLUE 97 .063 -.187 --------------------------------------------------------------------- TRV 114.85 1.52 125.42 -549.5% Bullish BLUE 109 .222 -.026 --------------------------------------------------------------------- UNH 286.28 1.13 309.21 -388.4% Bearish BLUE 120 -.159 -.017 --------------------------------------------------------------------- UTX 86.01 -5.36 97.15 -958.4% Bullish RED 114 .144 -.648 Bearish --------------------------------------------------------------------- V 191.76 -.5 199.08 -199.9% Bearish BLUE 112 -.017 .011 --------------------------------------------------------------------- VZ 56.15 -.38 57.86 -169% Bullish BLUE 136 .122 -.191 --------------------------------------------------------------------- WBA 41.49 .09 45.28 -632.1% ------- BLUE 92 .095 -.178 --------------------------------------------------------------------- WMT 118.08 .34 121.35 -131.3% Bearish RED 83 -.116 -.212 Bearish --------------------------------------------------------------------- XOM 47.14 -.03 53.52 -753.2% ------- BLUE 49 .098 -.041 --------------------------------------------------------------------- DOW 41.98 .75 44.41 -457.1% Bullish BLUE 67 -.036 .29 |
Table 2 QUICKSILVER on ETFS - 06/15/20 Bullish = QQQ, FAS, RETL, SOXL, TECL, OIH(6)
Bearish = (0)
ITRS + IP21>.25 is considered "Bullish" ETF CLOSE CHANGE PIVOT-PT 5-dma AROC CL-PWR CANDLE IP21 ITRS --------------------------------------------------------------------------------------------- DIA 258.35 1.61 273.38 -337.3% ------- BLUE .042 ----- --------------------------------------------------------------------------------------------- SPY 307.05 2.84 320.79 -257.5% ------- BLUE .121 .012 --------------------------------------------------------------------------------------------- QQQ 238.75 2.87 243.3 -58.3% Bullish BLUE .203 .076 Bullish --------------------------------------------------------------------------------------------- MDY 326.31 5.16 347.77 -430.5% ------- BLUE .131 .099 --------------------------------------------------------------------------------------------- IWM 140.99 2.72 150.26 -418.5% Bearish BLUE .101 .102 --------------------------------------------------------------------------------------------- FAS 34.1 1.1 42.23 -1353.8% Bearish BLUE .118 .464 Bullish --------------------------------------------------------------------------------------------- RETL 135.84 4.84 163.16 -1320.8% ------- BLUE .207 1.831 Bullish --------------------------------------------------------------------------------------------- SOXL 171.49 7.21 193.16 -590.8% ------- BLUE .119 .771 Bullish --------------------------------------------------------------------------------------------- TECL 205.89 5.85 222.04 -313.1% Bullish BLUE .15 .726 Bullish --------------------------------------------------------------------------------------------- IBB 130.5 2.42 132.91 -99.3% Bearish BLUE .035 .004 --------------------------------------------------------------------------------------------- GLD 162.33 -.29 161.26 80.6% ------- BLUE .049 -.139 --------------------------------------------------------------------------------------------- OIH 134.64 .72 160.3 -1311.5% ------- BLUE .33 .43 Bullish --------------------------------------------------------------------------------------------- GASL 3440 285 3685 -325.1% ------- RED -.021 -.094 --------------------------------------------------------------------------------------------- |
Table 3 Count of Stocks in Key Directories
20200615
-------------------------------
NEWHIGHS 42
NEWLOWS 3
MAXCP 43
MINCP 8
TTTNH 19
TTTNL 6
FASTUP 66
FASTDOWN 809
CPCROSSA 814
CPCROSSD 19
BIGVOLUP 5
BIGVODN 12
ACCUMVER 8
HIGHIP21 11
HIUPPCT 7
REDSELL 53
AUGSELS7 134
TRAPDOOR 34
|
Table 4 RANKING OF KEY DIRECTORIES BASED PCT.OF STOCKS ABOVE 65-DMA
6/15/20
All groups above 69%
---------------------------------------------------------------------------------------
Directory Current day-1 day-2 day-3 day-4 day-5
----------------------------------------------------------------------------------------
AUTO 1 1 1 1 1 1
BIGBANKS 1 1 .857 1 1 1
COPPER 1 1 1 1 1 1
ETFS 1 1 1 1 1 1
GAMING 1 1 .952 1 1 1
GUNS 1 1 .933 1 1 1
HOMEBLDG 1 1 .941 1 1 1
JETS 1 1 .928 1 1 1
SOLAR 1 1 .937 1 1 1
TRANSP 1 1 1 1 1 1
BONDFUND .99 .99 1 .99 .98 .98
NIFTY .977 .977 .955 1 1 1
FINANCE .976 .976 .845 1 1 1
INFRA .971 .942 .942 .971 .971 .971
GOLD .959 .918 .938 .959 .938 .918
SEMI .952 .952 .914 .971 .98 .98
COMPUTER .95 .9 .75 1 1 1
SOFTWARE .95 .916 .833 .966 .966 .966
REIT .943 .943 .872 .964 .978 .992
NASD-100 .939 .939 .909 .969 .969 .969
BEVERAGE .933 .933 .733 .933 1 1
ELECTRON .925 .925 .891 .959 .972 .979
MILITARY .925 .925 .888 1 1 1
INSURANC .923 .846 .769 .923 .923 .961
SP500 .907 .896 .856 .968 .974 .978
INDMATER .906 .92 .893 .96 1 1
GREEN .904 .904 .857 .904 .904 .904
RUS-1000 .903 .884 .838 .955 .969 .977
HACKERS .9 .9 .85 .95 .95 .95
CHEM .897 .897 .897 .979 1 1
FIDSTKS .892 .892 .836 .966 .966 .971
OILGAS .885 .893 .832 .931 .938 .954
INDEXES .869 .869 .875 .869 .864 .869
COAL .857 1 1 1 1 1
DJI-13 .846 .846 .846 .923 .923 .923
SP-100 .835 .835 .769 .967 .967 .967
BIOTECH .828 .786 .765 .897 .913 .894
CHINA .823 .784 .745 .823 .843 .823
DOWJONES .8 .8 .766 .933 .933 .933
EDU .8 1 1 1 1 1
RETAIL .8 .82 .8 .9 .92 .92
HOSPITAL .761 .619 .619 .857 .904 1
COMODITY .743 .794 .769 .82 .82 .846
UTILITY .743 .717 .692 .948 .948 .974
REGBANKS .73 .73 .653 .884 1 1
FOOD .698 .735 .716 .754 .754 .773
|
=======================================================================
6/12/2020 If 25000 is closed below, we will probably see a drop by
the DJI to 23000.
The Buy B20 will likely be reinforced at that point with a new buy signal.
Stay hedged with short sales from our Bearish MINCPs.
Yes, the wild openings and volatility are back. My warning about the
Thursday's Buy B20 because of the disastrously negative breadth on the same
day as the signal caused me to find the charts for 1955 and 2011, shown Friday
morning. These are the two cases that show such terrible breadth and still have
a rising 65-dma, In both cases there was an immediate 3% DJI bounce and then a
6% decline. Time is being compressed now. The opening on Friday achieved
the first part of that prediction. A few minutes ago, the DJI was down before
the opening about 4%. So my prediction has almost been fulfulled.
If 25000 is closed below, I suppose a decline to 23000 would not be so terrible.
It would mean a retest of the earlier support on the steep "QE-Infinity" rally
up
from 19000. But at 23000, we would have to watch for a possible new
head/shoulders forming. If its neckline is broken, that would signal a big decline
back to 19000.

For the DJI, NASDAQ, QQQ and SPY, the new norm is the wild premarket
trading as well as intra-day hyper-volatility. Since late March when the FED
began "QE-Infinity", the accuracy and value of the Peerless signals has been
strained.
My suggestion: while this hyper-volatility lasts, use simple trendlines.
First, use the A/D Line. This will best reflect what the FED is up to.
Enlarged A/D Line on Peerless DJI chart

Secondly, use closing price trendlines. (Not Closing Power). They will let you
take a position at the close. At least, that will allow you to know what price
you will be getting.
Thirdly, watch the Opening Power's trendline. Since this is where the most
action (power) is coming from, this tactic would seem to make sense.
Fourthly, look at our Closing Power. NY Professionals are usually privy first to
what the FED is planning, the when, the what and the how much.
See the trendlines, Opening and Closing Powers for the DIA, SPY, NASDAQ
and QQQ below.
 |
 |
 |
 |
|
Charts 6/12/2020 (Click on Underlined link.) 2020 PEERLESS DJI, Signals, Indicators Daily DJI Volume 10-DayUp/Down Vol Stoch-20 Inverted Traders Index Graph of Pct of All Stocks above 65-dma Cum. Inverted Traders Index NASDAQ S&P OEX NYSE COMPQX DJI-15 DJI-20 DJI-30 DIA QQQ MDY IWM TNA Short-Term Rates SPY http://tigersoft.com/2121CST/SPY.GIF recent 2006 vers-Peerless signals -- http://www.tigersoft.com/2121CST/2006XXX.BMP USO-CrudeOil DBO FAS GLD BBH IBB JETS JNUG KOL NUGT OIH PALL RSX RETL SDS AGQ SLV SOXL TECL TLT TMF TNA UGA (gasoline) USO (oil) and China: YINN CHAU Commodities: CANE CORN DBC JJC, NIB, CHOC CORN, CUT (paper) MOO, SOYB WEAT UUP (Dollar) LIT (Lithium) Stocks AAPL ADBE ALXN AMAT AMGN AMD AMZN AXP BA BABA BAC BIDU BLDP CAT CVX CMG DE ENPH FB GILD GOOG GS HD IBM INTU JPM LRCX M (Macy's) MSFT NEM NFLX NKE NVDA PG REGN SO SQ QCOM QDEL TSLA TXN XOM V VRTX WFC WMT TOWN New highs and Bullish MAXCPs http://tigersoft.com/MAXCP/6-12/BULLISH.htm Bearish MAXCPs - http://tigersoft.com/MINCP/6-12/BEARISH.htm |
Table 1
6/9/2018 QUICKSILVER on DJI-30 STOCKS.
Considering just those stocks whose IP21 + ITRS score is >+.25 or <-.25
2 Bullish ( AAPL BA GS MMM DOW
336 190 202 155 41 = 924
1 Bearish ( KO UTX WMT
-46 -86 -118 = -250
----------------------------------------
Vitality Score = +674
Note that AAPL now shows highest AI/200 stock here. STOCKS CLOSE CHANGE PIVOT-P 5-dma AROC CL-PWR Candl AI/200 IP21 ITRS --------------------------------------------------------------------------------------- --------------------------------------------------------------------------------------- AAPL 338.8 2.9 333.46 107.5% Bullish RED 170 .215 .18 Bullish --------------------------------------------------------------------- AXP 101.68 3.08 113.67 -373.6% ------- RED 80 .061 .08 --------------------------------------------------------------------- BA 189.51 19.51 230.5 -387.9% ------- BLUE 65 .063 .224 Bullish --------------------------------------------------------------------- CAT 123.15 1.6 137.72 -452.7% ------- RED 150 .181 -.12 --------------------------------------------------------------------- CSCO 45.07 1.4 48.13 -293.5% ------- ---- 89 .113 -.05 --------------------------------------------------------------------- CVX 92.39 3.02 103.24 -427.4% Bearish RED 79 .035 .121 --------------------------------------------------------------------- DIS 115.49 2.85 127.28 -381.9% ------- BLUE 86 .081 -.009 --------------------------------------------------------------------- GS 201.78 7.65 220.81 -379.1% ------- BLUE 104 .11 .163 Bullish --------------------------------------------------------------------- HD 242.45 2.98 256.77 -246.6% Bullish RED 131 .033 .131 --------------------------------------------------------------------- IBM 121.91 3.9 135.75 -391.9% Bearish BLUE 141 .035 -.067 --------------------------------------------------------------------- INTC 59.33 -.37 63.67 -398.1% ------- RED 132 .084 -.083 --------------------------------------------------------------------- JNJ 142.15 1.28 146.77 -176.7% Bearish RED 115 -.096 -.123 --------------------------------------------------------------------- JPM 99.87 2.66 113.45 -527.4% Bearish RED 82 -.018 -.042 --------------------------------------------------------------------- KO 45.6 .06 49.85 -360.4% Bearish RED 107 -.113 -.144 Bearish --------------------------------------------------------------------- MCD 189.17 1.66 202.65 -203.3% ------- RED 109 .099 -.03 --------------------------------------------------------------------- MMM 154.87 2.49 166.87 -383.6% ------- RED 108 .336 -.063 Bullish --------------------------------------------------------------------- MRK 76.3 -1.05 82.9 -366.5% Bearish RED 82 -.048 -.192 --------------------------------------------------------------------- MSFT 187.74 1.47 188.36 14.2% Bullish RED 154 .153 .008 --------------------------------------------------------------------- NKE 96.43 1.26 104.29 -309.7% ------- RED 126 .14 -.009 --------------------------------------------------------------------- PFE 33.75 .45 36.59 -314.6% Bearish RED 65 .057 -.163 --------------------------------------------------------------------- PG 115.62 -.64 119.05 -114.6% Bearish RED 96 .062 -.169 --------------------------------------------------------------------- TRV 113.33 2.78 128 -452.6% Bullish RED 108 .23 -.036 --------------------------------------------------------------------- UNH 285.15 1.42 309.48 -439.1% Bearish RED 120 -.153 -.025 --------------------------------------------------------------------- UTX 86.01 -5.36 97.15 -958.4% Bullish RED 114 .144 -.667 Bearish --------------------------------------------------------------------- V 192.26 3.38 199.6 -186% Bearish RED 113 .005 .03 --------------------------------------------------------------------- VZ 56.53 .08 58.09 -105% Bullish RED 135 .148 -.158 --------------------------------------------------------------------- WBA 41.4 .65 47.02 -443.5% ------- RED 91 .148 -.264 --------------------------------------------------------------------- WMT 117.74 -2.35 121.24 -157.7% Bearish RED 83 -.128 -.195 --------------------------------------------------------------------- XOM 47.17 .99 54.74 -572.3% Bearish RED 48 .107 .031 --------------------------------------------------------------------- DOW 41.23 1.97 45.9 -315.5% ------- RED 67 -.018 .299 |
Table 2 QUICKSILVER on ETFS - 06/12/20 Bullish = QQQ, FAS, RETL, SOXL, TECL, OIH(6)
Bearish = (0)
ITRS + IP21>.25 is considered "Bullish" ETF CLOSE CHANGE PIVOT-PT 5-dma AROC CL-PWR CANDLE IP21 ITRS --------------------------------------------------------------------------------------------- DIA 256.74 4.71 276.28 -275.4% ------- RED .054 0 --------------------------------------------------------------------------------------------- SPY 304.21 3.6 323.2 -239% ------- RED .129 .01 --------------------------------------------------------------------------------------------- QQQ 235.88 1.86 241.55 -79.1% ------- RED .216 .08 BULLISH --------------------------------------------------------------------------------------------- MDY 321.15 6.31 355.21 -400.5% Bearish RED .119 .074 --------------------------------------------------------------------------------------------- IWM 138.27 3.24 153.09 -405.2% Bearish RED .112 .07 --------------------------------------------------------------------------------------------- FAS 33 2.6 44.32 -1182.5% Bearish RED .146 .489 BULLISH --------------------------------------------------------------------------------------------- RETL 131 5 175.32 -1099.9% Bearish RED .199 1.579 BULLISH --------------------------------------------------------------------------------------------- SOXL 164.28 6.54 192.83 -796.9% ------- RED .147 .843 BULLISH --------------------------------------------------------------------------------------------- TECL 200.04 6.76 219.27 -356.1% ------- RED .169 .781 BULLISH --------------------------------------------------------------------------------------------- IBB 128.08 .67 133.1 -124.2% Bearish RED .014 .008 --------------------------------------------------------------------------------------------- GLD 162.62 .23 159.72 143.2% ------- RED .064 -.138 --------------------------------------------------------------------------------------------- OIH 133.92 7.32 173.58 -669.7% ------- RED .318 .555 BULLISH --------------------------------------------------------------------------------------------- GASL 3440 285 3685 -325.1% ------- RED -.021 -.113 --------------------------------------------------------------------------------------------- |
Table 3 Count of Stocks in Key Directories
20200613
-------------------------------
NEWHIGHS 36
NEWLOWS 15
MAXCP 7
MINCP 143
TTTNH 2
TTTNL 163
FASTUP 76
FASTDOWN 655
CPCROSSA 38
CPCROSSD 48
BIGVOLUP 5
BIGVODN 22
ACCUMVER 13
HIGHIP21 14
HIUPPCT 6
VHIP21 39
AUGSELS7 173
TRAPDOOR 36
|
RANKING OF KEY DIRECTORIES BASED PCT.OF STOCKS ABOVE 65-DMA
6/12/20
All 46 show at least 60% above their 65-dma
---------------------------------------------------------------------------------------
Directory Current day-1 day-2 day-3 day-4 day-5
----------------------------------------------------------------------------------------
AUTO 1 1 1 1 1 1
BIGBANKS 1 .857 1 1 1 1
COAL 1 1 1 1 1 1
COPPER 1 1 1 1 1 1
EDU 1 1 1 1 1 1
ETFS 1 1 1 1 1 1
GAMING 1 .952 1 1 1 .952
GUNS 1 .933 1 1 1 1
HOMEBLDG 1 .941 1 1 1 1
JETS 1 .928 1 1 1 1
SOLAR 1 .937 1 1 1 1
TRANSP 1 1 1 1 1 1
BONDFUND .99 1 .99 .98 .98 .98
NIFTY .978 .956 1 1 1 1
FINANCE .976 .845 1 1 1 1
SEMI .952 .914 .971 .98 .98 .98
REIT .943 .872 .964 .978 .992 .964
INFRA .942 .942 .971 .971 .971 .971
NASD-100 .939 .919 .979 .969 .969 .979
BEVERAGE .933 .733 .933 1 1 1
ELECTRON .926 .892 .959 .973 .979 .979
MILITARY .925 .888 1 1 1 1
INDMATER .92 .893 .96 1 1 .986
GOLD .918 .938 .959 .938 .897 .897
SOFTWARE .916 .85 .966 .966 .966 .95
GREEN .904 .857 .904 .904 .904 .857
COMPUTER .9 .75 1 1 1 1
HACKERS .9 .9 .95 .95 .95 .9
CHEM .897 .897 .979 1 1 .979
SP500 .896 .858 .968 .974 .978 .97
OILGAS .893 .832 .931 .938 .954 .923
FIDSTKS .892 .836 .966 .966 .971 .966
RUS-1000 .884 .84 .955 .969 .977 .96
INDEXES .869 .875 .869 .864 .869 .864
DJI-13 .846 .846 .923 .923 .923 .923
INSURANC .846 .769 .923 .923 .961 .923
SP-100 .835 .769 .967 .967 .967 .978
RETAIL .82 .8 .9 .92 .92 .92
DOWJONES .8 .766 .933 .933 .933 .933
COMODITY .794 .769 .82 .82 .846 .82
BIOTECH .784 .76 .897 .913 .897 .865
CHINA .784 .745 .823 .843 .823 .784
FOOD .735 .716 .754 .754 .773 .735
REGBANKS .73 .653 .884 1 1 1
UTILITY .717 .692 .948 .948 .974 .948
HOSPITAL .619 .619 .857 .904 1 .809
|
====================================================================
6/11/2020 The one-day "crash" has pulled the DJI back far enough to get a
regular Buy B20.
These occur when there have been at least 4 days in the past 8 which show a
2.5 ratio of NYSE Advances to Decline and the DJI is not more than 1.2%
over the 21-dma.
The crazy markets have returned. The DJI plunged almost 7% today. Only
one out of every 32 NYSE stocks were up. Down volume was 80 times
NYSE up volume. Can a simple uptrend-break justify such murder and mayhem
in the market? Is this the start of another big swing downward? If so, I would
think this mornings' overnight (>500 point) recovery will soon be wiped out
tomorrow, as frequenly happened in the February-March sell-off. In this
case, it may be safest to simply draw trendlines and be hedged by being long
the highest Accumulation Bullish MAXCPs and short the lowest Accumulation
Bearish MINCPs.

But most readers here care a lot about the general market and
DIA, in particular.
For them, we must note first that today's extreme of 31:1 NYSE declines over advances
does have a few precedents. But they nearly all occur when the DJI is way below a
falling 65-dma. In these bear market cases, a 31:1 declines over advances ratio
shows utter and complete capitulation, as when they occurred at the bottoms of the
1987 and 2011 sell-offs. More often, in falling markets these bad breadth numbers
show that there is much worse to come, as on
9/7/1937, 5/13/1940 and twice
already this year - 3/9/2020 and 3/12/2020. Terrible breadth days, like ours today,
almost never occur in bull markets. The single exception is when
President Eisenhower
had a heart attack and the breadth was as bad as it was today. But in that case the
DJI
first moved back up from 456 to 466, before then settling back and finding a bottom
a month later at 439. Accordingly, by this example, we should expect a 2.5% rally
and then a 6% decline from there.

Today's B20 shows a similar case back in 2011. See just below. This case
also supports
the notion of a rally and then a deeper pullback. See in this case how the B20
occurred
on th first pullback after a big jump upwards to the DJI's 7% band. In this case,
too,
the DJI first rose but then had to fall back before resuming its upward swing.

So, a bounce and then a deeper pullback seems to be the most likely course for the market
over the next few weeks. One thing that could change this and bring a more bullish
outcome
would be if the FED were to make clear that they will continue to buy billions and
billions
of corporate bonds or if Congress were to agree to pass more Stimulus legislation.
That
Covid-19 will not disappear quickly should be obvious and is already built into the
market,
I would suggest. Similarly, an increase in corporate taxes if the Democrats win the
Presidency should not be in doubt. The market is still ruled by the optimists who
believe
that next year will be much better than this year, for everyone.
|
Charts 6/11/2020 (Click on Underlined link.) 2020 PEERLESS DJI, Signals, Indicators Daily DJI Volume 10-DayUp/Down Vol Stoch-20 Inverted Traders Index Graph of Pct of All Stocks above 65-dma Cum. Inverted Traders Index NASDAQ S&P OEX NYSE COMPQX DJI-15 DJI-20 DJI-30 DIA QQQ MDY IWM TNA Short-Term Rates SPY http://tigersoft.com/2121CST/SPY.GIF recent 2006 vers-Peerless signals -- www.tigersoft.com/2121CST/xver2006.bmp USO-CrudeOil DBO FAS GLD BBH IBB JETS JNUG KOL NUGT OIH PALL RSX RETL SDS AGQ SLV SOXL TECL TLT TMF TNA UGA (gasoline) USO (oil) and China: YINN CHAU Commodities: CANE CORN DBC JJC, NIB, CHOC CORN, CUT (paper) MOO, SOYB WEAT UUP (Dollar) LIT (Lithium) Stocks AAPL ADBE ALXN AMAT AMGN AMD AMZN AXP BA BABA BAC BIDU BLDP CAT CVX CMG DE ENPH FB GILD GOOG GS HD IBM INTU JPM LRCX M (Macy's) MSFT NEM NFLX NKE NVDA PG REGN SO SQ QCOM QDEL TSLA TXN XOM V VRTX WFC WMT TOWN New highs and Bullish MAXCPs http://tigersoft.com/MAXCP/6-11/BULLISH.htm Bearish MAXCPs - http://tigersoft.com/MINCP/6-11/BEARISH.htm |
Table 1
6/11/2018 QUICKSILVER on DJI-30 STOCKS.
Considering just those stocks whose IP21 + ITRS score is >+.25 or <-.25
2 Bullish ( AAPL MMM
336 152 = 488
1 Bearish ( UTX
-86 = -86
----------------------------------------
Vitality Score = +402
Note that AAPL now shows highest AI/200 stock here. STOCKS CLOSE CHANGE PIVOT-P 5-dma AROC CL-PWR Candl AI/200 IP21 ITRS --------------------------------------------------------------------------------------- --------------------------------------------------------------------------------------- AAPL 335.9 -16.94 331.5 201.6% Bullish RED 169 .215 .171 Bullish --------------------------------------------------------------------- AXP 98.6 -7.56 109.73 -363.2% Bearish RED 79 -.007 .002 --------------------------------------------------------------------- BA 170 -33.41 205.43 -343.6% ------- RED 65 -.007 -.01 --------------------------------------------------------------------- CAT 121.55 -10.89 135.12 -277.1% ------- RED 149 .189 -.102 --------------------------------------------------------------------- CSCO 43.67 -3.75 47.83 -334.7% Bearish RED 88 .077 -.039 --------------------------------------------------------------------- CVX 89.37 -8.21 100.81 -345.9% Bearish RED 78 .023 .084 --------------------------------------------------------------------- DIS 112.64 -9.54 124.82 -444.2% ------- RED 86 .062 .016 --------------------------------------------------------------------- GS 194.13 -19.39 217.92 -476.7% ------- RED 104 .052 .106 --------------------------------------------------------------------- HD 239.47 -14.98 254.9 -186.3% Bullish RED 131 -.004 .133 --------------------------------------------------------------------- IBM 118.01 -11.86 132.06 -413.1% Bearish RED 140 -.023 -.086 --------------------------------------------------------------------- INTC 59.7 -4.17 64.34 -257.2% Bullish RED 131 .082 -.047 --------------------------------------------------------------------- JNJ 140.87 -6.93 147.3 -199.4% Bearish RED 115 -.112 -.075 --------------------------------------------------------------------- JPM 97.21 -8.85 111.23 -421.3% Bearish RED 83 -.072 -.07 --------------------------------------------------------------------- KO 45.54 -3.08 49.09 -243.4% Bearish RED 107 -.124 -.12 --------------------------------------------------------------------- MCD 187.51 -8.29 197.16 -144.9% Bullish RED 109 .07 -.016 --------------------------------------------------------------------- MMM 152.38 -11.52 167.41 -307.3% ------- RED 107 .296 -.033 Bullish --------------------------------------------------------------------- MRK 77.35 -4.42 82.26 -255.6% Bearish RED 82 -.017 -.144 --------------------------------------------------------------------- MSFT 186.27 -10.57 187.2 88.6% Bullish RED 154 .156 .031 --------------------------------------------------------------------- NKE 95.17 -6.95 102.71 -297.7% ------- RED 125 .121 .001 --------------------------------------------------------------------- PFE 33.3 -2.62 35.99 -374.9% Bearish RED 64 .043 -.129 --------------------------------------------------------------------- PG 116.26 -2.97 118.33 8.9% Bearish RED 95 .056 -.093 --------------------------------------------------------------------- TRV 110.55 -10.43 124.36 -302% Bullish RED 107 .194 -.037 --------------------------------------------------------------------- UNH 283.73 -22.02 311.85 -233.8% Bearish RED 120 -.174 -.012 --------------------------------------------------------------------- UTX 86.01 -5.36 97.15 -958.4% Bullish RED 114 .144 -.59 Bearish --------------------------------------------------------------------- V 188.88 -11.6 199.61 -119.9% Bearish RED 113 -.032 .023 --------------------------------------------------------------------- VZ 56.45 -1.6 57.74 -66.6% Bullish RED 134 .104 -.099 --------------------------------------------------------------------- WBA 40.75 -3.53 45.35 -381.4% Bearish RED 90 .094 -.259 --------------------------------------------------------------------- WMT 120.09 -1.07 121.56 -83.1% Bearish RED 83 -.124 -.093 --------------------------------------------------------------------- XOM 46.18 -4.47 53.08 -279.6% Bearish RED 47 .069 .067 --------------------------------------------------------------------- DOW 39.26 -4.32 43.97 -391% ------- RED 67 -.049 .193 |
Table 2 QUICKSILVER on ETFS - 06/11/20 Bullish = QQQ, RETL, SOXL, TECL, OIH(5)
Bearish = (0)
ITRS + IP21>.25 is considered "Bullish" ETF CLOSE CHANGE PIVOT-PT 5-dma AROC CL-PWR CANDLE IP21 ITRS --------------------------------------------------------------------------------------------- DIA 252.03 -18.43 271.54 -208.5% ------- RED .008 ----- --------------------------------------------------------------------------------------------- SPY 300.61 -18.39 319.34 -168.6% ------- RED .103 .017 --------------------------------------------------------------------------------------------- QQQ 234.02 -12.2 239.69 -20.9% Bullish RED .197 .079 Bullish --------------------------------------------------------------------------------------------- MDY 314.84 -24.28 348.47 -331.8% Bearish RED .081 .048 --------------------------------------------------------------------------------------------- IWM 135.03 -11.15 150.18 -321.1% Bearish RED .086 .03 --------------------------------------------------------------------------------------------- FAS 30.4 -8.38 42.37 -951.7% Bearish RED .076 .146 --------------------------------------------------------------------------------------------- RETL 126 -25.77 165.39 -852.1% Bearish RED .189 1.061 Bullish --------------------------------------------------------------------------------------------- SOXL 157.74 -37.2 194.01 -604.2% ------- RED .119 .515 Bullish --------------------------------------------------------------------------------------------- TECL 193.28 -40.5 215.48 -154% Bullish RED .151 .513 Bullish --------------------------------------------------------------------------------------------- IBB 127.41 -5.93 131.35 -152.2% Bearish RED -.012 .033 --------------------------------------------------------------------------------------------- GLD 162.39 -1.18 158.01 34.5% ------- RED .129 -.053 --------------------------------------------------------------------------------------------- OIH 126.6 -21.27 154.35 -327.1% ------- RED .287 .425 Bullish --------------------------------------------------------------------------------------------- GASL 3440 285 3685 -325.1% ------- RED -.021 -.036 --------------------------------------------------------------------------------------------- |
Table 2 Count of Stocks in Key Directories
20200611
-------------------------------
NEWHIGHS 33
NEWLOWS 15
MAXCP 8
MINCP 125
TTTNH 7
TTTNL 84
FASTUP 78
FASTDOWN 320
CPCROSSA 24
CPCROSSD 372
BIGVOLUP 7
BIGVODN 19
ACCUMVER 13
HIGHIP21 13
HIUPPCT 5
REDSELL 55
AUGSELS7 252
TRAPDOOR 37
|
Table 4 RANKING OF KEY DIRECTORIES BASED PCT.OF STOCKS ABOVE 65-DMA
6/11/20
All groups show at least 60% of their stockas are above their 65-dma
---------------------------------------------------------------------------------------
Directory Current day-1 day-2 day-3 day-4 day-5
----------------------------------------------------------------------------------------
AUTO 1 1 1 1 1 1
BONDFUND 1 .99 .98 .98 .98 .97
COAL 1 1 1 1 1 .857
COPPER 1 1 1 1 1 1
EDU 1 1 1 1 1 1
ETFS 1 1 1 1 1 .982
TRANSP 1 1 1 1 1 1
NIFTY .956 1 1 1 1 1
GAMING .952 1 1 1 .952 .952
INFRA .942 .971 .971 .971 .971 .971
HOMEBLDG .941 1 1 1 1 .941
GOLD .938 .959 .938 .897 .897 .918
SOLAR .937 1 1 1 1 1
GUNS .933 1 1 1 1 .933
JETS .928 1 1 1 1 .928
NASD-100 .919 .989 .979 .969 .979 .969
SEMI .914 .971 .98 .98 .98 .98
HACKERS .9 1 .95 .95 .9 .95
CHEM .897 .979 1 1 .979 .979
INDMATER .893 .96 1 1 .986 .946
ELECTRON .892 .959 .973 .979 .979 .959
MILITARY .888 1 1 1 1 1
INDEXES .875 .869 .864 .869 .869 .864
REIT .872 .964 .978 .992 .957 .907
SP500 .858 .97 .974 .978 .968 .964
BIGBANKS .857 1 1 1 1 1
GREEN .857 .904 .904 .904 .857 .857
SOFTWARE .85 .983 .966 .966 .95 .95
DJI-13 .846 .923 .923 .923 .923 .923
FINANCE .845 1 1 1 1 1
RUS-1000 .84 .957 .969 .977 .958 .942
FIDSTKS .836 .966 .966 .971 .966 .96
OILGAS .832 .931 .938 .954 .923 .839
RETAIL .8 .9 .92 .92 .92 .94
COMODITY .769 .82 .82 .846 .82 .794
INSURANC .769 .923 .923 .961 .923 .884
SP-100 .769 .967 .967 .967 .978 .978
DOWJONES .766 .933 .933 .933 .933 .966
BIOTECH .757 .892 .913 .897 .871 .857
COMPUTER .75 1 1 1 1 .95
CHINA .745 .823 .843 .823 .784 .725
BEVERAGE .733 .933 1 1 1 1
FOOD .716 .754 .754 .773 .735 .735
UTILITY .692 .948 .948 .974 .948 .897
REGBANKS .653 .884 1 1 1 .884
HOSPITAL .619 .857 .904 1 .761 .809
|
====================================================================
6/10/2020 What Powell giveth, he can take away. QE will be continuing, but
Powell said
not a word about buying corporate bonds. I think that's what traders needed to
hear to remain in their frenzied, speculative buying mood. A second wave of Covid-19
seems to be developing. This is bad news. And now Biden is trying to sound
like a populist and talking about taxing Wealth. Definitely, not what the "trickle-
down" folks want to hear. Frankly, it's surprising that the the DJI futures are
only down 500.
We have to face facts. Unless there is a dramatic reversal from the lower
DJI opening (<-500). it looks like the steep NYSE A/D Line uptrend will be violated
and that is what I have suggested we use to sell the DJI. Such a break would mean
that the 10% upper band has held and another decline to the lower band would
be likely. It would also mean reinstating the last Peerless Sell signal in place of
the
augmented Buy B4.
The A/D Line gives us our best window into the FED's intetntions.
A break in the ADL uptrend would be a warning that they are
backing off of their buying of vast amounts of corporate bonds,
though still buying billions of Treasuries.
DJIA's uptrendline using intra-day lows crosses at 26486.
The ADL Uptrend is in more imminent danger of breaking.


As long as the high Accumulation - Bullish MAXCPs stay above
their
February highs, I would hold them. There were nice breakouts today by MSFT
and BLDP. AAPL is the highest AI/200 stock in the DJ-30, i.e. our "Tahiti
stock". That name was given by us to show that the stock could be held
with enough confidence that one could sail happily to Tahiti owning it.
That's definitely what we need now. Amazon's openings were so far above
its closes recently, I hope that gave pause for some of you and you did not buy
it when it was recommended here two nights ago.
I would continue the hedge the Dollar (short) which keeps falling and hold Gold (long).
Gold is now rising again.
Tonight the MINCPs have a lot more offerings for
shorting. They would seem to be
prudent now to hedge the Bullish MAXCPs' longs. Did you notice that the
short-covering
rally in Boeing, WFC and many of the big financials seems ended? With the
shorts wrung out of these MINCP stocks, they ought to start falling again.
When the DJIA goes wild like this, reaching the 10% upper band twice
after falling to a point 36% below its close just two months earlier, there
seems little point in trying to be clever. All we have to do to make money is
to trade the short-term swings. The moves over-night make this much more
difficult. But we can trade at the closes. The suggestion here is to
use the Closing Price only charts for the trendlines. (Note this is not
our Closing Power indicator, it is simply the closings for each day.).
Below are the Closing Price only charts for the DJI, the NASDAQ, the SP-500
and QQQ. I have drawn the current trendlines and the computer has calculated
where they now cross. This is the key price level to watch. Use the breaking
of
these trendlines to reverse positions to go from long to short and short to long if
you are trading DIA.
DJIA Closing Price Chart |
NASDAQ Closing Price Chart |
SP-500 Closing Price Chart |
QQQ Closing Price Chart |
|
Charts 6/10/2020 (Click on Underlined link.) 2020 PEERLESS DJI, Signals, Indicators Daily DJI Volume 10-DayUp/Down Vol Stoch-20 Inverted Traders Index Graph of Pct of All Stocks above 65-dma Cum. Inverted Traders Index NASDAQ S&P OEX NYSE COMPQX DJI-15 DJI-20 DJI-30 DIA QQQ MDY IWM TNA Short-Term Rates SPY http://tigersoft.com/2121CST/SPY.GIF recent 2006 vers-Peerless signals -- not available tonight. I can't get it to load. USO-CrudeOil DBO FAS GLD BBH IBB JETS JNUG KOL NUGT OIH PALL RSX RETL SDS AGQ SLV SOXL TECL TLT TMF TNA UGA (gasoline) USO (oil) and China: YINN CHAU Commodities: CANE CORN DBC JJC, NIB, CHOC CORN, CUT (paper) MOO, SOYB WEAT UUP (Dollar) LIT (Lithium) Stocks AAPL ADBE ALXN AMAT AMGN AMD AMZN AXP BA BABA BAC BIDU BLDP CAT CVX CMG DE ENPH FB GILD GOOG GS HD IBM INTU JPM LRCX M (Macy's) MSFT NEM NFLX NKE NVDA PG REGN SO SQ QCOM QDEL TSLA TXN XOM V VRTX WFC WMT TOWN New highs and Bullish MAXCPs http://tigersoft.com/MAXCP/6-10/BULLISH.htm Bearish MAXCPs - http://tigersoft.com/MINCP/6-10/BEARISH.htm |
Table 1
6/9/2018 QUICKSILVER on DJI-30 STOCKS.
Considering just those stocks whose IP21 + ITRS score is >+.25 or <-.25
6 Bullish ( AAPL MMM DOW
353 164 44 = 561
1 Bearish ( UTX WMT
-86 -121 = -207
----------------------------------------
Vitality Score = +354
Note that AAPL now shows highest AI/200 stock here. STOCKS CLOSE CHANGE PIVOT-P 5-dma AROC CL-PWR Candl AI/200 IP21 ITRS --------------------------------------------------------------------------------------- --------------------------------------------------------------------------------------- AAPL 352.84 8.85 322.32 418.4% Bullish BLUE 168 .236 .172 Bullish --------------------------------------------------------------------- AXP 106.16 -4.3 106.54 34.8% Bearish RED 79 .004 -.036 --------------------------------------------------------------------- BA 203.41 -13.33 184.3 748.7% Bullish RED 66 .046 .123 --------------------------------------------------------------------- CAT 132.44 -1.75 128.96 201.7% Bullish RED 148 .218 -.027 --------------------------------------------------------------------- CSCO 47.42 -.63 46.86 50.5% Bullish RED 87 .1 -.036 --------------------------------------------------------------------- CVX 97.58 -3.95 96.28 20% Bearish RED 77 .05 .144 --------------------------------------------------------------------- DIS 122.18 -1.71 123.69 0% Bullish RED 86 .079 .012 --------------------------------------------------------------------- GS 213.52 -4.58 214.82 68.1% Bullish RED 103 .077 .125 --------------------------------------------------------------------- HD 254.45 -2.31 248.95 68% Bullish RED 132 .007 .085 --------------------------------------------------------------------- IBM 129.87 -2 128.89 31.2% Bearish RED 140 .044 -.062 --------------------------------------------------------------------- INTC 63.87 .83 62.97 153.5% Bullish BLUE 130 .106 -.061 --------------------------------------------------------------------- JNJ 147.8 1.84 146.73 -28.9% Bearish BLUE 116 -.083 -.101 --------------------------------------------------------------------- JPM 106.06 -4.48 106.44 82% Bearish RED 84 -.072 -.078 --------------------------------------------------------------------- KO 48.62 -.38 47.92 73.8% ------- RED 107 -.1 -.132 --------------------------------------------------------------------- MCD 195.8 -3.72 193.24 63.7% Bullish RED 109 .076 -.048 --------------------------------------------------------------------- MMM 163.9 -2.8 162.55 81.5% Bullish RED 106 .324 -.022 Bullish --------------------------------------------------------------------- MRK 81.77 -.49 81.55 -17.6% Bullish RED 83 .007 -.15 --------------------------------------------------------------------- MSFT 196.84 7.04 182.92 307.4% Bullish BLUE 154 .19 .016 --------------------------------------------------------------------- NKE 102.12 -.51 101.28 -96.6% Bullish RED 124 .155 -.016 --------------------------------------------------------------------- PFE 35.92 -.29 36.01 -33.2% ------- RED 63 .119 -.113 --------------------------------------------------------------------- PG 119.23 .89 116.05 29.6% Bullish BLUE 94 .083 -.175 --------------------------------------------------------------------- TRV 120.98 -4.44 118 266.7% Bullish RED 106 .234 -.033 --------------------------------------------------------------------- UNH 305.75 -3.46 298.08 6.5% ------- RED 120 -.171 .004 --------------------------------------------------------------------- UTX 86.01 -5.36 97.15 -958.4% Bullish RED 114 .144 -.653 Bearish --------------------------------------------------------------------- V 200.48 1.4 193.64 91.3% ------- BLUE 114 -.012 -.001 --------------------------------------------------------------------- VZ 58.05 .19 57.22 106% Bullish BLUE 133 .131 -.152 --------------------------------------------------------------------- WBA 44.28 -1 44.2 74.3% ------- RED 89 .106 -.232 --------------------------------------------------------------------- WMT 121.16 -.19 122.11 -94.7% ------- RED 83 -.124 -.16 Bearish --------------------------------------------------------------------- XOM 50.65 -2.87 49.1 135.7% Bearish RED 46 .094 .138 --------------------------------------------------------------------- DOW 43.58 -.83 42.71 223% Bullish RED 67 -.032 .309 Bullish |
Table 2 QUICKSILVER on ETFS - 06/10/20 Bullish = QQQ, FAS, RETL, SOXL, TECL, OIH(6)
Bearish = (0)
ITRS + IP21>.25 is considered "Bullish" ETF CLOSE CHANGE PIVOT-PT 5-dma AROC CL-PWR CANDLE IP21 ITRS --------------------------------------------------------------------------------------------- DIA 270.46 -2.92 263.33 135.2% Bullish RED .076 ---- --------------------------------------------------------------------------------------------- SPY 319 -1.79 311.36 107.4% Bullish RED .161 .007 --------------------------------------------------------------------------------------------- QQQ 246.22 2.92 235.03 199.2% Bullish BLUE .242 .07 Bullish --------------------------------------------------------------------------------------------- MDY 339.12 -8.65 337.78 20.8% Bearish RED .082 .064 --------------------------------------------------------------------------------------------- IWM 146.18 -4.08 144.59 46.4% Bearish RED .126 .058 --------------------------------------------------------------------------------------------- FAS 38.78 -3.45 38.24 158.8% Bearish RED .131 .3 Bullish --------------------------------------------------------------------------------------------- RETL 151.77 -11.39 153.58 -41.9% Bearish RED .209 1.395 Bullish --------------------------------------------------------------------------------------------- SOXL 194.94 1.78 180.84 500% Bullish RED .138 .712 Bullish --------------------------------------------------------------------------------------------- TECL 233.78 11.74 200 675% Bullish BLUE .204 .69 Bullish --------------------------------------------------------------------------------------------- IBB 133.34 .43 131.44 26.1% Bearish RED -.044 .013 --------------------------------------------------------------------------------------------- GLD 163.57 2.31 161.28 124.1% Bullish BLUE .137 -.143 --------------------------------------------------------------------------------------------- OIH 147.87 -12.43 136.71 610.8% ------- RED .325 .679 Nullish --------------------------------------------------------------------------------------------- GASL 3440 285 3685 -325.1% ------- RED -.021 -.099 --------------------------------------------------------------------------------------------- |
Table 4 Count of Stocks in Key Directories
20200610
-------------------------------
NEWHIGHS 217
NEWLOWS 45
MAXCP 52
MINCP 58
TTTNH 16
TTTNL 83
FASTUP 144
FASTDOWN 37
CPCROSSA 41
CPCROSSD 490
BIGVOLUP 10
BIGVODN 19
ACCUMVER 11
HIGHIP21 12
HIUPPCT 6
REDSELL 58
AUGSELS7 204
TRAPDOOR 21
|
RANKING OF KEY DIRECTORIES BASED PCT.OF STOCKS ABOVE 65-DMA 6/10/20 All above 75% --------------------------------------------------------------------------------------- Directory Current day-1 day-2 day-3 day-4 day-5 ---------------------------------------------------------------------------------------- AUTO 1 1 1 1 1 1 BIGBANKS 1 1 1 1 1 1 COAL 1 1 1 1 .857 .714 COMPUTER 1 1 1 1 .95 .9 COPPER 1 1 1 1 1 1 EDU 1 1 1 1 1 1 ETFS 1 1 1 1 .982 .982 FINANCE 1 1 1 1 1 .988 GAMING 1 1 1 .952 .952 .952 GUNS 1 1 1 1 .933 .933 HACKERS 1 1 .95 .9 .95 .95 HOMEBLDG 1 1 1 1 .941 .941 JETS 1 1 1 1 .928 .857 MILITARY 1 1 1 1 .962 .962 NIFTY 1 1 1 1 1 .978 SOLAR 1 1 1 1 1 1 TRANSP 1 1 1 1 1 1 BONDFUND .99 .98 .98 .98 .97 .97 NASD-100 .989 .989 .979 .979 .969 .949 SOFTWARE .983 .983 .966 .95 .95 .933 CHEM .979 1 1 .979 .979 .979 INFRA .971 .971 .971 .971 .971 .971 REIT .971 .985 .992 .964 .907 .9 SEMI .971 .98 .98 .98 .98 .971 SP500 .97 .976 .978 .968 .964 .964 SP-100 .967 .967 .967 .978 .978 .967 FIDSTKS .966 .966 .971 .966 .96 .954 INDMATER .96 1 1 .986 .946 .92 ELECTRON .959 .972 .979 .979 .959 .959 GOLD .959 .938 .897 .897 .918 .877 RUS-1000 .957 .971 .977 .958 .94 .933 UTILITY .948 .948 .974 .948 .897 .948 BEVERAGE .933 1 1 1 1 .933 DOWJONES .933 .933 .933 .933 .966 .933 OILGAS .931 .938 .954 .923 .832 .809 DJI-13 .923 .923 .923 .923 .923 .923 INSURANC .923 .923 .961 .923 .884 .884 GREEN .904 .904 .904 .857 .857 .857 RETAIL .9 .92 .92 .92 .94 .9 BIOTECH .889 .907 .897 .871 .855 .847 REGBANKS .884 1 1 1 .846 .846 INDEXES .869 .864 .869 .869 .864 .858 HOSPITAL .857 .904 1 .761 .809 .809 CHINA .823 .843 .823 .784 .705 .745 COMODITY .82 .82 .846 .82 .794 .769 FOOD .754 .754 .773 .735 .735 .698 |
====================================================================
6/9/2020 The NASDAQ, AAPL and AMZN scored impressive breakouts today
even as the DJI pulled back from its 10% upper band. These tech new
high breakouts would not have occurred if traders were really afriad of
what Fed Chairman Powell might be saying Wednesday or Thursday
about "QE-Infinity". One day of weakness in the NYSE A/D Line certainly
does not break its swift uptrend. So, most likely Powell and the FOMC
will not back off from their QE-Infinity program of buying corporate bonds..
My suggestion remains, buy MAXCP new highs like AAPL and AMZN,
that are confirmed by similar or stronger Closing Power strength and an IP21
above +.20. Avoid the short side.
DJIA


NASDAQ

AAPL

AMZN

Our Cable company tells me that they will be down early this morning, so
this will be a shorter than usual Hotline.
===================================================

One unrelated thing I want to share with you for your thoughts, if you have
some you could send along. I have produced the daily Dow Jones charts now
for the period 1885-1914. I have never seen these before. It is amazing to
me how well simple trendlines governed the price swings back then. How is
this possible? Did traders do this by hand? They had no computers, of course.
Or was there some other force at work guiding the market so exactly. And after
1897 when volume first is reported, we see red volume picking up exactly when
there are trend-breaks. It reminds me of the Nazca Lines in the Peruvian Desert
that can only be seen by airplane. Spooky stuff.
Below are the Dow Jones charts for 1885, 1886, 1887, 1888, 1889 without
monthly demarcations for the sake of brevity. Look at how precise the
well-tested support and resistance lines are and the price channels. How was
this possible without computers?
 |
 |
 |
 |
 |
|
Charts 6/9/2020 (Click on Underlined link.) 2020 PEERLESS DJI, Signals, Indicators Daily DJI Volume 10-DayUp/Down Vol Stoch-20 Inverted Traders Index Graph of Pct of All Stocks above 65-dma Cum. Inverted Traders Index NASDAQ S&P OEX NYSE COMPQX DJI-15 DJI-20 DJI-30 DIA QQQ MDY IWM TNA Short-Term Rates SPY http://tigersoft.com/2121CST/SPY.GIF recent 2006 vers-Peerless signals -- http://tigersoft.com/B2006.BMP USO-CrudeOil DBO FAS GLD BBH IBB JETS JNUG KOL NUGT OIH PALL RSX RETL SDS AGQ SLV SOXL TECL TLT TMF TNA UGA (gasoline) USO (oil) and China: YINN CHAU Commodities: CANE CORN DBC JJC, NIB, CHOC CORN, CUT (paper) MOO, SOYB WEAT UUP (Dollar) LIT (Lithium) Stocks AAPL ADBE ALXN AMAT AMGN AMD AMZN AXP BA BABA BAC BIDU BLDP CAT CVX CMG DE ENPH FB GILD GOOG GS HD IBM INTU JPM LRCX M (Macy's) MSFT NEM NFLX NKE NVDA PG REGN SO SQ QCOM QDEL TSLA TXN XOM V VRTX WFC WMT TOWN New highs and Bullish MAXCPs http://tigersoft.com/MAXCP/6-9/BULLISH.htm Bearish MAXCPs - http://tigersoft.com/MINCP/6-9/BEARISH.htm |
Table 1
6/9/2018 QUICKSILVER on DJI-30 STOCKS.
Considering just those stocks whose IP21 + ITRS score is >+.25 or <-.25
6 Bullish ( AAPL CVX MMM TRV XOM DOW
344 102 167 125 54 44 = 836
1 Bearish ( UTX
-86 = -86
----------------------------------------
Vitality Score = +750
Note that AAPL now shows highest AI/200 stock here. STOCKS CLOSE CHANGE PIVOT-P 5-dma AROC CL-PWR Candl AI/200 IP21 ITRS --------------------------------------------------------------------------------------- --------------------------------------------------------------------------------------- AAPL 343.99 10.53 325.12 315.6% Bullish BLUE 167 .235 .125 --------------------------------------------------------------------- AXP 110.46 -3.21 105.4 532.8% Bullish BLUE 78 0 -.019 --------------------------------------------------------------------- BA 216.74 -13.76 173.16 1675% Bullish RED 66 .065 .074 --------------------------------------------------------------------- CAT 134.19 -3.53 127.09 416.7% Bullish RED 147 .195 .009 --------------------------------------------------------------------- CSCO 48.05 -.08 46.94 122.5% Bullish ---- 86 .123 -.026 --------------------------------------------------------------------- CVX 101.53 -1.71 97.18 347.4% ------- BLUE 76 .076 .213 --------------------------------------------------------------------- DIS 123.89 -3.39 122.18 208.4% Bullish RED 86 .091 .022 --------------------------------------------------------------------- GS 218.1 -2.71 210.57 326.7% Bullish BLUE 103 .111 .114 --------------------------------------------------------------------- HD 256.76 -.01 251 80.1% Bullish BLUE 132 .049 .084 --------------------------------------------------------------------- IBM 131.87 -3.88 129.05 225.2% Bullish RED 139 .103 -.043 --------------------------------------------------------------------- INTC 63.04 -.63 61.93 73% Bullish ---- 129 .074 -.06 --------------------------------------------------------------------- JNJ 145.96 -.81 148.65 -77.6% Bearish RED 116 -.065 -.078 --------------------------------------------------------------------- JPM 110.54 -2.91 104.27 543.2% ------- RED 85 -.046 -.051 --------------------------------------------------------------------- KO 49 -.85 47.9 217.2% ------- RED 107 -.093 -.119 --------------------------------------------------------------------- MCD 199.52 -3.13 193.29 306.2% Bullish RED 108 .118 -.047 --------------------------------------------------------------------- MMM 166.7 -.17 161.21 277.7% Bullish BLUE 105 .32 -.012 --------------------------------------------------------------------- MRK 82.26 -.64 82.06 86.7% Bullish RED 83 .05 -.117 --------------------------------------------------------------------- MSFT 189.8 1.44 185.36 131.6% Bullish BLUE 154 .188 .004 --------------------------------------------------------------------- NKE 102.63 -1.66 104.11 92.1% Bullish RED 123 .189 -.031 --------------------------------------------------------------------- PFE 36.21 -.38 36.16 6.9% Bullish RED 62 .197 -.092 --------------------------------------------------------------------- PG 118.34 -.71 118.53 11.9% ------- RED 93 .059 -.189 --------------------------------------------------------------------- TRV 125.42 -2.58 114.47 605% Bullish BLUE 105 .317 -.009 --------------------------------------------------------------------- UNH 309.21 -.27 305.35 47.4% Bullish RED 120 -.148 .012 --------------------------------------------------------------------- UTX 86.01 -5.36 97.15 -958.4% Bullish RED 114 .144 -.704 --------------------------------------------------------------------- V 199.08 -.52 196.87 69% ------- RED 115 .006 -.031 --------------------------------------------------------------------- VZ 57.86 -.23 56.83 127.5% Bullish BLUE 132 .101 -.167 --------------------------------------------------------------------- WBA 45.28 -1.74 43.61 193.3% Bullish RED 88 .147 -.235 --------------------------------------------------------------------- WMT 121.35 .11 123.47 -105.7% Bearish RED 83 -.079 -.156 --------------------------------------------------------------------- XOM 53.52 -1.22 49.24 612.5% Bullish BLUE 45 .14 .185 --------------------------------------------------------------------- DOW 44.41 -1.49 41.63 443.4% Bullish RED 67 .009 .291 |
Table 2 QUICKSILVER on ETFS - 06/09/20 Bullish = QQQ. IWM, FAS, RETL, SOXL, TECL, OIH(7)
Bearish = (0)
ITRS + IP21>.25 is considered "Bullish" ETF CLOSE CHANGE PIVOT-PT 5-dma AROC CL-PWR CANDLE IP21 ITRS --------------------------------------------------------------------------------------------- DIA 273.38 -2.9 263.17 291.4% Bullish BLUE .133 0 --------------------------------------------------------------------------------------------- SPY 320.79 -2.41 312.18 201.9% Bullish BLUE .202 .002 --------------------------------------------------------------------------------------------- QQQ 243.3 1.75 236.69 161.3% Bullish BLUE .268 .049 --------------------------------------------------------------------------------------------- MDY 347.77 -7.44 337.68 280.8% Bullish RED .138 .079 --------------------------------------------------------------------------------------------- IWM 150.26 -2.83 144.8 302.1% Bearish RED .195 .071 --------------------------------------------------------------------------------------------- FAS 42.23 -2.09 37.48 1010.5% ------- BLUE .182 .48 --------------------------------------------------------------------------------------------- RETL 163.16 -12.16 153.13 704.3% ------- RED .275 1.525 --------------------------------------------------------------------------------------------- SOXL 193.16 .33 176.2 859.9% Bullish BLUE .156 .849 --------------------------------------------------------------------------------------------- TECL 222.04 2.77 205.11 517.6% Bullish BLUE .219 .76 --------------------------------------------------------------------------------------------- IBB 132.91 -.19 132.65 -57.3% Bearish BLUE .033 .006 --------------------------------------------------------------------------------------------- GLD 161.26 1.54 159.6 -41.8% Bearish BLUE .069 -.204 --------------------------------------------------------------------------------------------- OIH 160.3 -13.28 129.44 1203.6% ------- RED .367 .696 --------------------------------------------------------------------------------------------- GASL 3440 285 3685 -325.1% ------- RED -.021 -.15 --------------------------------------------------------------------------------------------- |
Table 3 Count of Stocks in Key Directories
20200609
-------------------------------
NEWHIGHS 124
NEWLOWS 8
MAXCP 88
MINCP 25
TTTNH 24
TTTNL 32
FASTUP 586
FASTDOWN 25
CPCROSSA 50
CPCROSSD 135
BIGVOLUP 11
BIGVODN 21
ACCUMVER 12
HIGHIP21 20
HIUPPCT 5
REDSELL 55
AUGSELS7 132
TRAPDOOR 18
|
RANKING OF KEY DIRECTORIES BASED PCT.OF STOCKS ABOVE 65-DMA
6/9/20
All 46 directories show more than 75% of their stocks are above their 65-dma support.
Highly unusual.
---------------------------------------------------------------------------------------
Directory Current day-1 day-2 day-3 day-4 day-5
----------------------------------------------------------------------------------------
AUTO 1 1 1 1 1 .974
BEVERAGE 1 1 1 1 .866 .933
BIGBANKS 1 1 1 1 1 .857
CHEM 1 1 .979 .979 .979 .979
COAL 1 1 1 .857 .714 .571
COMPUTER 1 1 1 .95 .9 .85
COPPER 1 1 1 1 1 1
EDU 1 1 1 1 1 1
ETFS 1 1 1 .982 .982 .964
FINANCE 1 1 1 1 .988 .869
GAMING 1 1 .952 .952 .952 .904
GUNS 1 1 1 .933 .933 .933
HACKERS 1 1 .9 .95 .95 .95
HOMEBLDG 1 1 1 .941 .941 .941
INDMATER 1 1 .986 .946 .92 .906
JETS 1 1 1 .928 .857 .714
MILITARY 1 1 1 .962 .962 .888
NIFTY 1 1 1 1 .978 .978
REGBANKS 1 1 1 .846 .846 .692
SOLAR 1 1 1 1 1 .937
TRANSP 1 1 1 1 1 .9
NASD-100 .989 .989 .989 .969 .949 .939
SOFTWARE .983 .983 .95 .95 .933 .95
BONDFUND .98 .98 .98 .97 .98 .98
SEMI .98 .98 .98 .98 .971 .952
REIT .978 .992 .957 .9 .879 .751
SP500 .976 .981 .968 .964 .964 .926
ELECTRON .973 .979 .979 .959 .959 .926
INFRA .971 .971 .971 .971 .971 .942
RUS-1000 .971 .979 .958 .94 .932 .889
SP-100 .967 .967 .978 .978 .967 .934
FIDSTKS .966 .971 .966 .96 .954 .926
UTILITY .948 .974 .948 .897 .948 .871
GOLD .938 .897 .897 .918 .877 .938
OILGAS .938 .954 .923 .832 .809 .77
DOWJONES .933 .933 .933 .966 .933 .933
DJI-13 .923 .923 .923 .923 .923 .923
INSURANC .923 .961 .923 .884 .846 .807
RETAIL .92 .92 .92 .94 .88 .78
BIOTECH .907 .894 .873 .857 .855 .847
GREEN .904 .904 .857 .857 .857 .857
HOSPITAL .904 1 .761 .809 .809 .809
INDEXES .864 .869 .869 .864 .858 .853
CHINA .843 .823 .784 .705 .725 .647
COMODITY .82 .846 .82 .794 .769 .743
FOOD .754 .773 .735 .735 .679 .641
|
=====================================================================
6/8/2020 What will $8 Trillion buy in the stock market? We're seeing
the effect now.
Almost anything and everything is soaring. 95% of
all stocks, ETFs and
Bond funds are now above the support of their 65-dma. The 21-day AROC
is far above the 100% annualized level that shows there is way too much upward
momentum to fight. Our DJI-30 Vitality Index is now almost +900. The
Cumulative Inverted Traders Index is making a 2-month high, thus showing
almost all volume is in rising stocks. New lows on the NYSE and NASDAQ
total just 8. The Opening and Closing Powers for the key major market ETFs
are both bullishly rising. No industry group shows less than 75% of its stocks
are above their individual 65-dma.
But the DJI is now 10.1% over the 21-day ma
and has not yet made its own
new yearly high. History suggests that the
DJI still might turn down if it does not
make a new high and, as I tried to show yesterday, the DJI has on a few occasions
mostly in the early 1930s, turned back down from a point 9% to 12% over
its 21-day ma. It has never turned
back down significantly lf reached the 13%
level above the 65-dma.
First DJIA Closes 9.2% over the 21-dma.
(From Sunday night.)
Date last/ma Outcome
-------------------------------------------------------------
12/6/1929 1.103 Top. 12% decline.
2/24/1931 1.103 Top Deep bear mkt follows.
6/25/1931 1.112 Top. Deep bear mkt follows.
11/9/1931 1.11 Top
8/8/1932
1.34 DJI goes still higher, 67.7 to 77.3
11/11/1932 1.091 Top. 17% DJI decline follows.
3/16/1933 1.122 Brief top. 10% decline follows.
----------------------------------------------------
11/20/1933 1.213 DJI still
rises, 72.3 to 108.3
6/29/1938 1.149 DJI rallies from 135.9 to 144.9 before 10% decline.
9/12/1939 1.113 7% decline to lower band as WWII
starts in Europe.
8/23/1982 1.097 start of 1982-1987 bull market
3/26/2009 1.106 5% pull-back then new bull market roars ahead.
4/9/2020 1.107 23719.57...DJI went sidewise and then up strongly.
6/5/2010 1.092 DJI closed above 27000. Still more than a thousand
below its 2020 high.
Why would the FED back off now? If the Dollar were caving in, it might.
But the Dollar has only modestly retreated. If interest rates were zooming back
up, it might. But that is not true. If Inflation was coming back too strong,
apart
from in equities, it might. But that is not true. Nor do we see a
head/shoulders
top in the DJI or a break in the A/D Line, as we see in the 1929-1930 and 1932
charts when the FED did back away from its big liquidity injection (open market
buying of gov't securities) programs and there followed, in the first case, a terrible
bear market and, in the second case a decline from 79 to 50 by the DJIA.
There is no organized opposition to the FED's
illegally buying private bonds
(and therefore indirectly equities). Why would they not press onward? After
all, this is an Election year. They do not want a repeat of 2008. So, onward
and upward until shown otherwise. The Fed's FOMC does
meet on Wednesday.
Out of caution, the FED may pull back, until Powell says whatever he will.
But the FED is in control. Powell is a Washington lawyer. Why would he
voluntarily relinquish power? When does anyone ever do that anywhere,
especially in D.C.


|
Charts 6/8/2020 (Click on Underlined link.) 2020 PEERLESS DJI, Signals, Indicators Daily DJI Volume 10-DayUp/Down Vol Stoch-20 Inverted Traders Index Graph of Pct of All Stocks above 65-dma Cum. Inverted Traders Index NASDAQ S&P OEX NYSE COMPQX DJI-15 DJI-20 DJI-30 DIA QQQ MDY IWM TNA Short-Term Rates SPY http://tigersoft.com/2121CST/SPY.GIF recent 2006 vers-Peerless signals -- http://tigersoft.com/2006.BMP USO-CrudeOil DBO FAS GLD BBH IBB JETS JNUG KOL NUGT OIH PALL RSX RETL SDS AGQ SLV SOXL TECL TLT TMF TNA UGA (gasoline) USO (oil) and China: YINN CHAU Commodities: CANE CORN DBC JJC, NIB, CHOC CORN, CUT (paper) MOO, SOYB WEAT UUP (Dollar) LIT (Lithium) Stocks AAPL ADBE ALXN AMAT AMGN AMD AMZN AXP BA BABA BAC BIDU BLDP CAT CVX CMG DE ENPH FB GILD GOOG GS HD IBM INTU JPM LRCX M (Macy's) MSFT NEM NFLX NKE NVDA PG REGN SO SQ QCOM QDEL TSLA TXN XOM V VRTX WFC WMT TOWN New highs and Bullish MAXCPs http://tigersoft.com/MAXCP/6-8/BULLISH.htm Bearish MAXCPs - http://tigersoft.com/MINCP/6-8/BEARISH.htm |
Table 1
6/8/2018 QUICKSILVER on DJI-30 STOCKS.
Considering just those stocks whose IP21 + ITRS score is >+.25 or <-.25
5 Bullish ( AAPL CAT MMM TRV XOM DOW
333 138 167 128 85 46 = 897
1 Bearish ( UTX
-86 = -86
----------------------------------------
Vitality Score = +811
Note that AAPL now shows highest AI/200 stock here. STOCKS CLOSE CHANGE PIVOT-P 5-dma AROC CL-PWR Candl AI/200 IP21 ITRS --------------------------------------------------------------------------------------- --------------------------------------------------------------------------------------- AAPL 333.46 1.96 323.34 178.7% Bullish BLUE 166 .242 .063 Bullish --------------------------------------------------------------------- AXP 113.67 3.94 99.07 817.4% Bullish BLUE 77 .018 -.009 --------------------------------------------------------------------- BA 230.5 25.07 153.31 2279.6% Bullish BLUE 66 .106 .049 --------------------------------------------------------------------- CAT 137.72 2.6 123.32 678% Bullish BLUE 146 .243 .019 Bullish --------------------------------------------------------------------- CSCO 48.13 .3 46.89 194.8% Bullish BLUE 85 .146 -.041 --------------------------------------------------------------------- CVX 103.24 2.43 94.69 542.3% ------- BLUE 75 .109 .124 --------------------------------------------------------------------- DIS 127.28 2.46 118.75 349.8% Bullish BLUE 86 .165 -.019 --------------------------------------------------------------------- GS 220.81 2.89 204.14 498.4% Bullish BLUE 103 .125 .104 --------------------------------------------------------------------- HD 256.77 1.87 252.71 188.9% Bullish BLUE 132 .057 .088 --------------------------------------------------------------------- IBM 135.75 3.69 126 423.6% Bullish BLUE 138 .162 -.025 --------------------------------------------------------------------- INTC 63.67 -.67 62.12 144.5% Bullish RED 128 .141 -.081 --------------------------------------------------------------------- JNJ 146.77 -.53 148.25 -14.2% ------- BLUE 117 -.011 -.068 --------------------------------------------------------------------- JPM 113.45 2.22 98.93 714.7% ------- ---- 86 -.066 -.071 --------------------------------------------------------------------- KO 49.85 .76 46.9 299.4% ------- BLUE 107 -.052 -.102 --------------------------------------------------------------------- MCD 202.65 5.49 187.59 397.4% Bullish BLUE 108 .134 -.017 --------------------------------------------------------------------- MMM 166.87 -.54 157.64 350.9% Bullish RED 104 .323 -.002 Bullish --------------------------------------------------------------------- MRK 82.9 .64 80.84 205.5% Bullish BLUE 83 .076 -.1 --------------------------------------------------------------------- MSFT 188.36 1.16 184.91 149.7% Bullish BLUE 154 .195 -.021 --------------------------------------------------------------------- NKE 104.29 1.58 100.74 233.6% Bullish BLUE 123 .239 .01 --------------------------------------------------------------------- PFE 36.59 .6 36.16 157.1% Bullish BLUE 61 .23 -.075 --------------------------------------------------------------------- PG 119.05 .72 118.06 76.5% Bullish BLUE 92 .129 -.119 --------------------------------------------------------------------- TRV 128 3.64 111 816.8% Bullish BLUE 104 .347 .07 --------------------------------------------------------------------- UNH 309.48 -2.37 306.31 58.1% Bullish BLUE 120 -.151 -.016 --------------------------------------------------------------------- UTX 86.01 -5.36 97.15 -958.4% Bullish RED 114 .144 -.668 Bearish --------------------------------------------------------------------- V 199.6 -.01 196.36 133.8% Bullish BLUE 115 .037 -.046 --------------------------------------------------------------------- VZ 58.09 .35 56.4 203.4% Bullish BLUE 132 .119 -.143 --------------------------------------------------------------------- WBA 47.02 1.67 43.55 422.7% Bullish BLUE 87 .194 -.198 --------------------------------------------------------------------- WMT 121.24 -.32 123.94 -110.6% Bearish BLUE 83 -.051 -.124 --------------------------------------------------------------------- XOM 54.74 1.66 47.31 863.2% Bullish BLUE 45 .158 .183 Bullish --------------------------------------------------------------------- DOW 45.9 1.93 40.6 878.2% Bullish BLUE 66 .039 .319 |
Table 2 QUICKSILVER on ETFS - 06/08/20 Bullish = (All but IBB, GLD and GASL)
Bearish = (0)
ITRS + IP21>.25 is considered "Bullish" ETF CLOSE CHANGE PIVOT-PT 5-dma AROC CL-PWR CANDLE IP21 ITRS --------------------------------------------------------------------------------------------- DIA 276.28 4.74 257.85 400.6% Bullish BLUE .174 ----- --------------------------------------------------------------------------------------------- SPY 323.2 3.86 308.08 283.3% Bullish BLUE .239 .01 --------------------------------------------------------------------------------------------- QQQ 241.55 1.86 235.63 158.5% Bullish BLUE .28 .031 --------------------------------------------------------------------------------------------- MDY 355.21 6.74 328.59 439.9% Bullish BLUE .192 .101 --------------------------------------------------------------------------------------------- IWM 153.09 2.91 141.39 445.8% Bullish BLUE .234 .083 --------------------------------------------------------------------------------------------- FAS 44.32 1.95 34.28 1465.3% ------- RED .199 .451 --------------------------------------------------------------------------------------------- RETL 175.32 9.93 140.95 1451.1% ------- RED .343 1.437 --------------------------------------------------------------------------------------------- SOXL 192.83 -1.18 162 1173.9% Bullish RED .181 .557 --------------------------------------------------------------------------------------------- TECL 219.27 3.79 200.5 599.2% Bullish BLUE .264 .511 --------------------------------------------------------------------------------------------- IBB 133.1 1.75 134.43 -38% ------- BLUE .065 .019 --------------------------------------------------------------------------------------------- GLD 159.72 1.71 162.6 -122.3% Bearish BLUE .044 -.185 --------------------------------------------------------------------------------------------- OIH 173.58 19.23 125.65 2023.8% Bullish BLUE .399 .74 --------------------------------------------------------------------------------------------- GASL 3440 285 3685 -325.1% ------- RED -.021 -.114 --------------------------------------------------------------------------------------------- |
Count of Stocks in Key Directories
20200608
-------------------------------
NEWHIGHS 184
NEWLOWS 8
MAXCP 126
MINCP 22
TTTNH 37
TTTNL 25
FASTUP 420
FASTDOWN 30
CPCROSSA 131
CPCROSSD 79
BIGVOLUP 39
BIGVODN 7
ACCUMVER 11
HIGHIP21 34
HIUPPCT 7
REDSELL 52
AUGSELS7 113
TRAPDOOR 18
|
Table 3 RANKING OF KEY DIRECTORIES BASED PCT.OF STOCKS ABOVE 65-DMA
6/8/20
Extraordinary - All above 75%
---------------------------------------------------------------------------------------
Directory Current day-1 day-2 day-3 day-4 day-5
----------------------------------------------------------------------------------------
AUTO 1 1 1 1 .974 .948
BEVERAGE 1 1 1 .866 .933 .933
BIGBANKS 1 1 1 1 .857 .857
CHEM 1 .979 .979 .979 .979 .979
COAL 1 1 .857 .714 .571 .714
COMPUTER 1 1 .95 .9 .85 .85
COPPER 1 1 1 1 1 1
EDU 1 1 1 1 1 1
ETFS 1 1 .982 .982 .964 .946
FINANCE 1 1 1 .988 .809 .821
GAMING 1 .952 .952 .952 .904 .904
GUNS 1 1 .933 .933 .933 .933
HACKERS 1 .95 .95 .95 .95 .95
HOMEBLDG 1 1 .941 .941 .941 .941
HOSPITAL 1 .761 .809 .809 .809 .809
INDMATER 1 .986 .946 .92 .906 .906
JETS 1 1 .928 .857 .714 .642
MILITARY 1 1 .962 .962 .888 .888
NIFTY 1 1 1 .978 .978 .978
REGBANKS 1 1 .846 .846 .653 .692
SOLAR 1 1 1 1 .937 .937
TRANSP 1 1 1 1 .9 .85
REIT .992 .957 .9 .879 .73 .666
NASD-100 .989 1 .979 .949 .939 .939
SOFTWARE .983 .966 .95 .933 .95 .95
SP500 .981 .97 .964 .964 .915 .905
BONDFUND .98 .98 .97 .98 .98 .98
SEMI .98 .98 .98 .971 .952 .942
ELECTRON .979 .979 .959 .959 .926 .926
RUS-1000 .979 .96 .94 .932 .877 .873
UTILITY .974 .948 .897 .948 .82 .82
FIDSTKS .971 .966 .96 .954 .92 .926
INFRA .971 .971 .971 .971 .914 .942
SP-100 .967 .978 .978 .967 .912 .901
INSURANC .961 .923 .884 .846 .807 .73
OILGAS .954 .923 .832 .809 .763 .717
DOWJONES .933 .933 .966 .933 .933 .933
DJI-13 .923 .923 .923 .923 .923 .923
RETAIL .92 .92 .94 .88 .78 .78
GREEN .904 .857 .857 .857 .857 .809
GOLD .897 .897 .918 .877 .938 .938
BIOTECH .889 .866 .855 .853 .85 .842
INDEXES .869 .869 .864 .858 .847 .847
COMODITY .846 .82 .794 .769 .717 .717
CHINA .823 .784 .705 .725 .647 .607
FOOD .773 .735 .735 .679 .622 .622
-------------------------------------------------------------------------------------------
|
====================================================================
6/5/2020 Consider the operative Peerless signal to be the augmented Buy B4 (5:1
adv/dec
and QE Trillions). It should suppress Sell S5s and probably other Sell Signals.
New Peerless software will be released soon to reflect this.
The DJI closed 9.2% above the 21-dma. Since late 1933 this condition has
led to higher prices in 5 of 6 cases when it first occurred. As discussed before,
QE-Trillions has no precedent for its, but the augmented B4s allow us to track
FED QE bailouts. Ultimately, they were always bullish when they occurred,
i.e. 2009, 2010 and 2011. Friday brought us yet another 5:1 adv/dec day on the
NYSE. The FED's QE Trillions may continue a lot longer. So, Buying MAXCP
stocks making new highs with a confirming Closing Power and a positive IP21 above
+.22 has been my suggestion here. Buy Blackrock (BLK). QE-Infinity was
designed
by them for the Fed and Treasury. See MAXCPs today.
The DJI is targetting its February highs.
A close more than 12.5% above the 21-dma has a very
bullish track record. NYSE volume is much more heavily
now in rising stocks. Both Opening and Closing Powers are
rising. This is classically bullish. As long As NYSE A/D Line
uptrend persists, the FED's QE will continue. The Dollar is
weakening, but so is Gold. So, right now the FED is under
little pressure to shift gears.


The FED has the market stampeding in the direction they want. My guess is that
they will not back off their QE-Trillions anytime soon. Too much rides on it
being successful. If they study their history, they will see in 1932 (as I showed
Thursday)
that there could be another very serious 40% decline. As long as the NYSE A/D Line
is rising, we want to be long this market. Almost no stocks look like they should be
shorted based on price weakness and bearish internals. More than 90% of all stocks
and ETFs are above their 65-dma.
The protestors don't spook Wall Street. They believe they will ensure the FED
"keeps its foot on the gas" when they meet mid-week. And they show that
lots of workers and consumers are ready for Spring and leaving their homes despite
Covid-19 virus risks. Both will be good for Wall Street and, if trickle-down works,
the economy and the borad populace.
The DJI has closed 9.2% over the 21-dma. Below are first occurrences since
1929. Starting in late 1933, all but one was actually a good time to buy the DJIA.
The data below show that a DJI close more than 12.3% above the 21-dma has
always been a good time to buy.
First DJIA Closes 9.2% over the 21-dma.
Date last/ma Outcome
-------------------------------------------------------------
12/6/1929 1.103 Top. 12% decline.
2/24/1931 1.103 Top Deep bear mkt follows.
6/25/1931 1.112 Top. Deep bear mkt follows.
11/9/1931 1.11 Top
8/8/1932
1.34 DJI goes still higher, 67.7 to 77.3
11/11/1932 1.091 Top. 17% DJI decline follows.
3/16/1933 1.122 Brief top. 10% decline follows.
----------------------------------------------------
11/20/1933 1.213 DJI still
rises, 72.3 to 108.3
6/29/1938 1.149 DJI rallies from 135.9 to 144.9 before 10% decline.
9/12/1939 1.113 7% decline to lower band as WWII
starts in Europe.
8/23/1982 1.097 start of 1982-1987 bull market
3/26/2009 1.106 5% pull-back then new bull market roars ahead.
4/9/2020 1.107 23719.57...DJI went sidewise and then up strongly.
6/5/2010 1.092 DJI closed above 27000. Still more than a thousand
below its 2020 high.
DJIA
DIA, NASDAQ and SPY: Both UP
(Closing Powers and Opening Powers


|
Charts 6/5/2020 (Click on Underlined link.) 2020 PEERLESS DJI, Signals, Indicators Daily DJI Volume 10-DayUp/Down Vol Stoch-20 Inverted Traders Index Graph of Pct of All Stocks above 65-dma Cum. Inverted Traders Index NASDAQ S&P OEX NYSE COMPQX DJI-15 DJI-20 DJI-30 DIA QQQ MDY IWM TNA Short-Term Rates SPY http://tigersoft.com/2121CST/SPY.GIF recent 2006 vers-Peerless signals -- http://tigersoft.com/A2006.jpg.jpg USO-CrudeOil DBO FAS GLD BBH IBB JETS JNUG KOL NUGT OIH PALL RSX RETL SDS AGQ SLV SOXL TECL TLT TMF TNA UGA (gasoline) USO (oil) and China: YINN CHAU Commodities: CANE CORN DBC JJC, NIB, CHOC CORN, CUT (paper) MOO, SOYB WEAT UUP (Dollar) LIT (Lithium) Stocks AAPL ADBE ALXN AMAT AMGN AMD AMZN AXP BA BABA BAC BIDU BLDP CAT CVX CMG DE ENPH FB GILD GOOG GS HD IBM INTU JPM LRCX M (Macy's) MSFT NEM NFLX NKE NVDA PG REGN SO SQ QCOM QDEL TSLA TXN XOM V VRTX WFC WMT TOWN New highs and Bullish MAXCPs http://tigersoft.com/MAXCP/6-5/BULLISH.htm Bearish MAXCPs - http://tigersoft.com/MINCP/6-5/BEARISH.htm |
Table 1
6/4/2018 QUICKSILVER on DJI-30 STOCKS.
Considering just those stocks whose IP21 + ITRS score is >+.25 or <-.25
3 Bullish ( AAPL GS MMM TRV
332 218 167 124 = 841
3 Bearish ( UTX VZ WMT
-86 -48 -122 = -256
----------------------------------------
Vitality Score = +585
Note that AAPL now shows highest AI/200 stock here. STOCKS CLOSE CHANGE PIVOT-P 5-dma AROC CL-PWR Candl AI/200 IP21 ITRS --------------------------------------------------------------------------------------- --------------------------------------------------------------------------------------- AAPL 331.5 9.18 321.85 210.5% Bullish BLUE 165 .21 .07 Bullish --------------------------------------------------------------------- AXP 109.73 3.19 96.75 728.9% Bullish RED 76 -.013 -.064 --------------------------------------------------------------------- BA 205.43 21.13 151.39 1843.4% Bullish BLUE 65 .079 .045 --------------------------------------------------------------------- CAT 135.12 6.16 120.5 604.4% Bullish RED 145 .204 .01 --------------------------------------------------------------------- CSCO 47.83 .97 46.3 1.1% Bullish BLUE 84 .095 -.011 --------------------------------------------------------------------- CVX 100.81 4.53 92.79 481.9% ------- BLUE 74 .053 .175 --------------------------------------------------------------------- DIS 124.82 1.13 118.77 313% Bullish RED 86 .182 -.041 --------------------------------------------------------------------- GS 217.92 3.1 199.93 522.2% Bullish RED 103 .13 .124 Bullish --------------------------------------------------------------------- HD 254.9 5.95 247.29 128.6% Bullish BLUE 132 .032 .122 --------------------------------------------------------------------- IBM 132.06 3.17 124.89 282.5% ------- RED 137 .079 -.033 --------------------------------------------------------------------- INTC 64.34 1.37 61.86 113% Bullish BLUE 127 .113 -.025 --------------------------------------------------------------------- JNJ 147.3 .57 147.19 -49% Bearish RED 118 -.04 -.047 --------------------------------------------------------------------- JPM 111.23 4.79 98.6 688.4% ------- RED 87 -.095 -.068 --------------------------------------------------------------------- KO 49.09 1.17 46.99 254.9% ------- BLUE 107 -.108 -.101 --------------------------------------------------------------------- MCD 197.16 3.92 187.41 285.9% ------- RED 108 .111 -.071 --------------------------------------------------------------------- MMM 167.41 4.86 155.58 345.7% Bullish BLUE 103 .319 -.008 Bullish --------------------------------------------------------------------- MRK 82.26 .71 79.56 95.1% Bullish BLUE 83 .001 -.075 --------------------------------------------------------------------- MSFT 187.2 4.28 182.83 107.4% Bullish BLUE 154 .154 -.006 --------------------------------------------------------------------- NKE 102.71 1.43 99.54 204.8% Bullish RED 123 .175 .019 --------------------------------------------------------------------- PFE 35.99 -.02 35.46 -302.2% ------- RED 60 .128 -.071 --------------------------------------------------------------------- PG 118.33 2.28 117.25 102.8% ------- BLUE 91 .049 -.108 --------------------------------------------------------------------- TRV 124.36 6.36 109.15 776.4% Bullish BLUE 103 .289 .069 Bullish --------------------------------------------------------------------- UNH 311.85 13.77 305.93 115.1% ------- BLUE 121 -.153 .049 --------------------------------------------------------------------- UTX 86.01 -5.36 97.15 -958.4% Bullish RED 114 .144 -.721 Bearish --------------------------------------------------------------------- V 199.61 5.97 194.35 111.9% Bullish BLUE 115 -.012 -.047 --------------------------------------------------------------------- VZ 57.74 .52 55.78 31.7% ------- ---- 132 .082 -.124 --------------------------------------------------------------------- WBA 45.35 1.15 43.3 276.9% ------- BLUE 86 .135 -.186 --------------------------------------------------------------------- WMT 121.56 -.55 123.96 -101.2% Bearish RED 83 -.131 -.169 Bearish --------------------------------------------------------------------- XOM 53.08 3.98 46.28 801.4% Bullish BLUE 44 .111 .143 --------------------------------------------------------------------- DOW 43.97 1.26 38.61 664.1% Bullish RED 65 -.032 .167 |
Table 2 QUICKSILVER on ETFS - 06/04/20 Bullish = QQQ IWM FAS RETL OIH SOXL TECL OIH(7)
Bearish = (0)
ITRS + IP21>.25 is considered "Bullish" ETF CLOSE CHANGE PIVOT-PT 5-dma AROC CL-PWR CANDLE IP21 ITRS --------------------------------------------------------------------------------------------- DIA 271.54 8.21 255.27 333.3% Bullish BLUE .105 ----- --------------------------------------------------------------------------------------------- SPY 319.34 7.98 305.56 243.6% Bullish BLUE .183 .013 --------------------------------------------------------------------------------------------- QQQ 239.69 4.66 234.06 134.7% Bullish BLUE .254 .034 Bullish --------------------------------------------------------------------------------------------- MDY 348.47 10.69 325.68 407.9% Bullish RED .132 .098 --------------------------------------------------------------------------------------------- IWM 150.18 5.59 140.23 397.2% Bullish RED .205 .085 Bullish --------------------------------------------------------------------------------------------- FAS 42.37 4.13 33.43 1435.6% ------- RED .167 .615 Bullish --------------------------------------------------------------------------------------------- RETL 165.39 11.81 132.07 1251% Bullish RED .285 1.471 Bullish --------------------------------------------------------------------------------------------- SOXL 194.01 13.17 152.2 1208.6% Bullish BLUE .164 .762 Bullish --------------------------------------------------------------------------------------------- TECL 215.48 15.48 194.92 523.3% Bullish BLUE .205 .745 Bullish --------------------------------------------------------------------------------------------- IBB 131.35 -.09 134.11 -127% Bearish RED .02 .007 --------------------------------------------------------------------------------------------- GLD 158.01 -3.27 163.66 -139.6% Bearish RED .045 -.236 --------------------------------------------------------------------------------------------- OIH 154.35 17.64 119.68 1411.8% Bullish BLUE .33 .494 Bullish --------------------------------------------------------------------------------------------- GASL 3440 285 3685 -325.1% ------- RED -.021 -.167 --------------------------------------------------------------------------------------------- |
Count of Stocks in Key Directories
20200605
-------------------------------
NEWHIGHS 183 - Bullish NH/NL >10:1 ratio (actially almost 23:1 today)
NEWLOWS 8 - too low for shorting anything based on weakness.
MAXCP 107
MINCP 28
TTTNH 43
TTTNL 20
FASTUP 869
FASTDOWN 27
CPCROSSA 86
CPCROSSD 138
BIGVOLUP 22
BIGVODN 7
ACCUMVER 13
HIGHIP21 22
HIUPPCT 7
VHIP21 30
LOWACCUM 191
TRAPDOOR 18
|
Table 4 RANKING OF KEY DIRECTORIES BASED PCT.OF STOCKS ABOVE 65-DMA
6/5/20
All directories show more than 73% of their stocks are above the 65-dma. A record high.
---------------------------------------------------------------------------------------
Directory Current day-1 day-2 day-3 day-4 day-5
----------------------------------------------------------------------------------------
AUTO 1 1 1 .974 .948 .948
BEVERAGE 1 1 .866 .933 .933 .933
BIGBANKS 1 1 1 .857 .857 .857
COAL 1 .857 .714 .571 .571 .714
COMPUTER 1 .95 .9 .85 .85 .85
COPPER 1 1 1 1 1 1
EDU 1 1 1 1 1 1
ETFS 1 .982 .982 .964 .946 .91
FINANCE 1 1 .988 .809 .785 .773
GUNS 1 .933 .933 .933 .933 .8
HOMEBLDG 1 .941 .941 .941 .941 .882
JETS 1 .928 .857 .714 .571 .428
MILITARY 1 .962 .962 .888 .814 .74
NASD-100 1 .989 .959 .939 .939 .959
NIFTY 1 1 .978 .978 .956 .956
REGBANKS 1 .846 .846 .653 .692 .73
SOLAR 1 1 1 .937 .937 .812
TRANSP 1 1 1 .9 .85 .8
INDMATER .986 .946 .92 .906 .906 .84
BONDFUND .98 .97 .98 .98 .98 .97
SEMI .98 .98 .971 .952 .942 .923
CHEM .979 .979 .979 .979 .959 .938
ELECTRON .979 .959 .959 .926 .912 .892
SP-100 .978 .978 .967 .912 .89 .901
INFRA .971 .971 .971 .914 .914 .914
SP500 .97 .966 .964 .915 .898 .869
FIDSTKS .966 .96 .954 .92 .909 .909
SOFTWARE .966 .966 .933 .95 .933 .883
RUS-1000 .96 .942 .932 .877 .859 .82
REIT .957 .9 .879 .73 .617 .482
GAMING .952 .952 .952 .904 .904 .904
HACKERS .95 1 .95 .95 .95 .95
UTILITY .948 .897 .948 .82 .794 .769
DOWJONES .933 .966 .933 .933 .9 .9
DJI-13 .923 .923 .923 .923 .846 .846
INSURANC .923 .884 .846 .807 .73 .692
OILGAS .923 .832 .809 .763 .694 .694
RETAIL .92 .94 .88 .78 .78 .7
GOLD .897 .918 .877 .938 .938 .918
INDEXES .869 .864 .858 .847 .836 .82
BIOTECH .863 .85 .853 .85 .842 .834
GREEN .857 .857 .857 .857 .809 .809
COMODITY .82 .794 .769 .717 .717 .692
CHINA .784 .705 .725 .647 .607 .47
HOSPITAL .761 .809 .809 .809 .761 .714
FOOD .735 .735 .679 .622 .622 .584
|
====================================================================
6/4/2020 Possible Scenarios Now: 1930 (X), 1932(?), 2009(?) and 2019 (?).
Avoid Short Sales. Buy stocks making new highs with confirming high
IP21 and Closing Powers. Let's see if the QQQ and the NASDAQ can
make new highs. Nearly 90% of stocks are above their 65-dma. The
only question is whether the FED will back off its QE-Trillions if the
DJI and SP-500 reach their old highs. Meanwhile, the NYSE A/D Line
trend is our friend and guide. The FED giveaway is way beyond anything
it has ever tried. Still, there is no public on Congressional
reaction to the inequality it produces. So why should it stop?
Today's pullback by the DJI from its
200-day ma was quite limited and now
that blue chip average is powering up past that boundary, the one that
turned back the DJI in the 1930 recovery scenario which rose in large
part because of the Fed's lowing of interest rates. Now history-minded Peerless
users must look back at what the lessons of 1932, 2009 and 2019 are
as the FED added massive liquidity, though much less than now. The lesson
seems to be that the FED is in control and it will probably not back off
the gas pedal until the old highs are reached and surpassed, if at all.


1932 Scenario

Actually, the DJI recovered
"only" 80% of what it had lost in the 1932
Summer recovery when large injections of Fed liquidity again was the dominant
factor in bringing it to pass. The DJI nearly doubled. At its top, we see a
head/shoulders top and a break in the A/D Line uptrend. In August 1932, the
FED
grew timid. It had by then bought up nearly a billion in Bonds and there
was no precedent for this. Perhaps, it still appreciated that its own legal
foundation was shaky since the Constitution had originally forbidden
Congress to charter a privately owned bank as a national bank. So, it backed
off with the result that the DJI fell back from 80 to 50 over the next six months.


Watch Boeing - It Is Recovery Leader now.

|
Charts 6/4/2020 (Click on Underlined link.) 2020 PEERLESS DJI, Signals, Indicators Daily DJI Volume 10-DayUp/Down Vol Stoch-20 Inverted Traders Index Graph of Pct of All Stocks above 65-dma Cum. Inverted Traders Index NASDAQ S&P OEX NYSE COMPQX DJI-15 DJI-20 DJI-30 DIA QQQ MDY IWM TNA Short-Term Rates SPY http://tigersoft.com/2121CST/SPY.GIF recent 2006 vers-Peerless signals -- www.tigersoft.com/NEWPEER/2006vers.jpg USO-CrudeOil DBO FAS GLD BBH IBB JETS JNUG KOL NUGT OIH PALL RSX RETL SDS AGQ SLV SOXL TECL TLT TMF TNA UGA (gasoline) USO (oil) and China: YINN CHAU Commodities: CANE CORN DBC JJC, NIB, CHOC CORN, CUT (paper) MOO, SOYB WEAT UUP (Dollar) LIT (Lithium) Stocks AAPL ADBE ALXN AMAT AMGN AMD AMZN AXP BA BABA BAC BIDU BLDP CAT CVX CMG DE ENPH FB GILD GOOG GS HD IBM INTU JPM LRCX M (Macy's) MSFT NEM NFLX NKE NVDA PG REGN SO SQ QCOM QDEL TSLA TXN XOM V VRTX WFC WMT TOWN New highs and Bullish MAXCPs http://tigersoft.com/MAXCP/6-4/BULLISH.htm Bearish MAXCPs - http://tigersoft.com/MINCP/6-4/BEARISH.htm |
Table 1
6/4/2018 QUICKSILVER on DJI-30 STOCKS.
Considering just those stocks whose IP21 + ITRS score is >+.25 or <-.25
3 Bullish ( BA GS NKE
184 215 101 = 500
3 Bearish ( UTX VZ WMT
-106 -48 -122 = -276
----------------------------------------
Vitality Score = +244
Note that AAPL now shows highest AI/200 stock here. STOCKS CLOSE CHANGE PIVOT-P 5-dma AROC CL-PWR Candl AI/200 IP21 ITRS --------------------------------------------------------------------------------------- --------------------------------------------------------------------------------------- AAPL 322.32 -2.8 317.94 63.3% Bullish RED 164 .151 .031 --------------------------------------------------------------------- AXP 106.54 1.14 95.07 428.8% Bullish BLUE 76 -.001 -.007 --------------------------------------------------------------------- BA 184.3 11.14 145.85 1114.4% Bullish BLUE 64 .087 .169 Bullish --------------------------------------------------------------------- CAT 128.96 1.87 120.13 335.9% Bullish BLUE 144 .21 -.002 --------------------------------------------------------------------- CSCO 46.86 -.08 47.82 134.9% Bullish BLUE 83 .073 -.06 --------------------------------------------------------------------- CVX 96.28 -.9 91.7 289.5% ------- RED 73 -.005 .172 --------------------------------------------------------------------- DIS 123.69 1.51 117.3 292.2% Bullish BLUE 86 .15 -.014 --------------------------------------------------------------------- GS 214.82 4.25 196.49 335.9% Bullish BLUE 103 .179 .124 Bullish --------------------------------------------------------------------- HD 248.95 -2.05 248.48 76.5% Bullish BLUE 132 -.02 .073 --------------------------------------------------------------------- IBM 128.89 -.16 124.9 173.2% ------- BLUE 136 .125 -.052 --------------------------------------------------------------------- INTC 62.97 1.04 62.93 102.2% Bullish BLUE 126 .079 -.073 --------------------------------------------------------------------- JNJ 146.73 -1.92 148.75 -8.1% Bearish RED 119 -.048 -.043 --------------------------------------------------------------------- JPM 106.44 2.17 97.31 329.7% ------- BLUE 88 -.091 -.071 --------------------------------------------------------------------- KO 47.92 .02 46.68 88.1% ------- ---- 107 -.15 -.06 --------------------------------------------------------------------- MCD 193.24 -.05 186.32 119.5% ------- BLUE 107 .098 -.081 --------------------------------------------------------------------- MMM 162.55 1.34 156.44 181.9% Bullish BLUE 102 .286 -.05 --------------------------------------------------------------------- MRK 81.55 -.51 80.72 156% Bullish BLUE 83 -.038 -.093 --------------------------------------------------------------------- MSFT 182.92 -2.44 183.25 41.4% ------- RED 154 .095 -.041 --------------------------------------------------------------------- NKE 101.28 -2.83 98.58 140.6% Bullish RED 122 .239 .126 Bullish --------------------------------------------------------------------- PFE 36.01 -.15 38.19 -294.6% ------- BLUE 59 .13 -.062 --------------------------------------------------------------------- PG 116.05 -2.48 115.92 -.4% ------- RED 90 -.022 -.151 --------------------------------------------------------------------- TRV 118 3.53 106.98 473.9% Bullish BLUE 102 .223 -.016 --------------------------------------------------------------------- UNH 298.08 -7.27 304.85 -96.5% ------- RED 122 -.223 .082 --------------------------------------------------------------------- UTX 86.01 -5.36 97.15 -958.4% Bullish RED 114 .144 -.715 Bearish --------------------------------------------------------------------- V 193.64 -3.23 195.24 -15.9% ------- RED 116 -.069 -.021 --------------------------------------------------------------------- VZ 57.22 .39 57.38 132.9% ------- BLUE 132 .041 -.13 --------------------------------------------------------------------- WBA 44.2 .59 42.94 275.3% ------- BLUE 85 .123 -.298 --------------------------------------------------------------------- WMT 122.11 -1.36 124.06 -63.8% Bearish RED 83 -.169 -.213 Bearish --------------------------------------------------------------------- XOM 49.1 -.14 45.47 435% ------- BLUE 44 .02 .111 --------------------------------------------------------------------- DOW 42.71 1.08 38.6 504.7% Bullish BLUE 65 -.01 .226 |
Table 2 QUICKSILVER on ETFS - 06/04/20 Bullish = MDY IWM FAS RETL OIH SOXL TECL (7)
Bearish = (0)
ETF CLOSE CHANGE PIVOT-PT 5-dma AROC CL-PWR CANDLE IP21 ITRS --------------------------------------------------------------------------------------------- DIA 263.33 .16 254.29 174.7% Bullish BLUE .094 0 --------------------------------------------------------------------------------------------- SPY 311.36 -.82 304.32 136.8% Bullish BLUE .154 .006 --------------------------------------------------------------------------------------------- QQQ 235.03 -1.66 233.36 107.7% Bullish RED .201 .005 --------------------------------------------------------------------------------------------- MDY 337.78 .1 321.53 220.4% Bullish BLUE .151 .103 Bullish --------------------------------------------------------------------------------------------- IWM 144.59 -.21 138.9 173.4% ------- BLUE .228 .052 Bullish --------------------------------------------------------------------------------------------- FAS 38.24 .76 32.28 773% ------- BLUE .171 .631 Bullish --------------------------------------------------------------------------------------------- RETL 153.58 .45 129.88 918.6% ------- BLUE .316 1.434 Bullish --------------------------------------------------------------------------------------------- SOXL 180.84 4.64 154.11 1193.6% Bullish BLUE .141 .655 Bullish --------------------------------------------------------------------------------------------- TECL 200 -5.11 194.65 306.7% Bullish RED .154 .595 Bullish --------------------------------------------------------------------------------------------- IBB 131.44 -1.21 134.74 -33.3% Bearish RED .018 .007 --------------------------------------------------------------------------------------------- GLD 161.28 1.68 162.53 -13.6% Bearish BLUE .035 -.223 --------------------------------------------------------------------------------------------- OIH 136.71 7.27 118.76 597.9% ------- BLUE .259 .293 Bullish --------------------------------------------------------------------------------------------- GASL 3440 285 3685 -325.1% ------- RED -.021 -.161 --------------------------------------------------------------------------------------------- |
Table 3 Count of Stocks in Key Directories
20200604
-------------------------------
NEWHIGHS 113
NEWLOWS 16
MAXCP 71
MINCP 13
TTTNH 37
TTTNL 17
FASTUP 476
FASTDOWN 36
CPCROSSA 98
CPCROSSD 69
BIGVOLUP 15
BIGVODN 11
ACCUMVER 13
HIGHIP21 13
HIUPPCT 7
AUGSELS7 99
TRAPDOOR 18
|
Table 4 RANKING OF KEY DIRECTORIES BASED PCT.OF STOCKS ABOVE 65-DMA
6/4/20
Bullish = 46 Bearish = ZERO!
---------------------------------------------------------------------------------------
Directory Current day-1 day-2 day-3 day-4 day-5
----------------------------------------------------------------------------------------
AUTO 1 1 .974 .948 .948 .948
BEVERAGE 1 .866 .933 .933 .866 .866
BIGBANKS 1 1 .857 .857 .857 .857
COPPER 1 1 1 1 1 1
EDU 1 1 1 1 1 1
FINANCE 1 .988 .809 .785 .75 .797
HACKERS 1 1 .95 .95 .95 .95
NIFTY 1 .978 .978 .956 .956 .956
SOLAR 1 1 .937 .937 .812 .812
TRANSP 1 1 .9 .85 .8 .8
NASD-100 .989 .969 .949 .939 .949 .939
ETFS .982 .982 .964 .946 .875 .857
SEMI .98 .971 .952 .942 .914 .904
CHEM .979 .979 .979 .959 .938 .959
SP-100 .978 .967 .912 .89 .879 .89
INFRA .971 .971 .914 .914 .914 .914
BONDFUND .97 .98 .98 .98 .97 .91
DOWJONES .966 .933 .933 .9 .866 .9
SOFTWARE .966 .95 .95 .933 .866 .9
SP500 .966 .966 .915 .898 .863 .884
MILITARY .962 .962 .888 .814 .74 .777
FIDSTKS .96 .954 .92 .909 .892 .898
ELECTRON .959 .959 .926 .912 .879 .872
GAMING .952 .952 .904 .904 .904 .904
COMPUTER .95 .9 .85 .85 .8 .85
INDMATER .946 .92 .906 .906 .826 .853
RUS-1000 .942 .933 .877 .859 .808 .836
HOMEBLDG .941 .941 .941 .941 .882 .882
RETAIL .94 .88 .78 .78 .66 .76
GUNS .933 .933 .933 .933 .8 .8
JETS .928 .857 .714 .571 .428 .428
DJI-13 .923 .923 .923 .846 .846 .846
GOLD .918 .877 .938 .938 .897 .918
REIT .9 .879 .73 .617 .432 .595
UTILITY .897 .948 .82 .794 .769 .666
INSURANC .884 .846 .807 .73 .692 .769
INDEXES .864 .858 .847 .836 .82 .82
COAL .857 .714 .571 .571 .714 .714
GREEN .857 .857 .857 .809 .809 .809
BIOTECH .848 .845 .851 .843 .838 .83
REGBANKS .846 .846 .653 .692 .73 .807
OILGAS .832 .809 .763 .694 .694 .709
HOSPITAL .809 .809 .809 .761 .714 .761
COMODITY .794 .769 .717 .717 .666 .589
FOOD .735 .679 .622 .622 .566 .509
CHINA .705 .725 .647 .607 .45 .372
------------------------------------------------------------------------------------------
none
|
====================================================================
6/3/2020 Will the Fed start backing off their "QE-Infinity"?
That would seem to
be the biggest risk now. They did this in 1930 and 1932, with the
result that the spirited market recoveries stalled out. They did not
do this in 2009 and 2019, with the result that the market kept rising.
All we would have had to do in these markets was watch the NYSE
A/D Line. It is the best tool we have for watching the Fed's intentions
and guarding against another sell-off.
The NASDAQ and QQQ have made it back to their highs of February.
This invites us and others to sell them. The DJI has now rallied to its flat
200-day ma. This could become a point of reversal if the Fed backs away now
from its QE-Infinity or the President starts a new international Trade wars or
we see severe Deflation or (most likely) the Fed turns neutral on injecting
addition stimulus funds by means of buying government and corporate bonds.
The Dollar weakened again today. That is the major limit to the Fed's power to
create unlimited "magic money".
Technically, for there to be a real reversal, we will likely see a break in the still
sharply rising NYSE A/D Line and/or a new head/shoulders pattern. Two weeks ago
a potential H/S pattern was aborted as we got 5:1 Buy B4s. The destruction
of a H/S pattern and renewed A/D Line strength is reminiscent of the
2009 and 2019 scenarios shown below.


But the DJI has reached its key 200-day ma. And this is exactly where
the 1929-1930 rallied stalled out, thus beginning the long and deep
1930s bear market and Depression. A curtailment of the Fed's QE-Infinity
program now would be dangerous for the market. We must watch for the
signs of top like in 1930 or 1932, namely A/D Line trend-breaks, Sell S9s and
completed H/S patterns.
Four Scenarios: 1930, 1932, 2009 and 2019
Most bearish scenario - 1930
1930 March 6, Communist led
demonstration on behalf of unemployed in Washinton D.C.
1930 Mar 24, The U.S. Senate passed
a bill increasing tariffs.
1930 Jun 17, Pres. Hoover signed
the Smoot-Hawley Tariff Bill, placing the highest tariff on imports to the U.S. An
international trade war began.
1930 July 4 - "No Government
can lead our contry to a recovery". Pres. Hoover.
1930 Aug 7, In Marion, Indiana, a
mob broke into a jail and beat to death 2 young black men and hung them from a tree in the
courthouse square.
1930 August - Fed stopped lowering
discount rates despite Deflation. Monetarists
like Freedman and Bernanke blame this for the Depression.
FED's
Discount Rate Cuts
1929
. November 1, 1929 Fed lowers
rate from 6% to 5%.
November 15, 1929 Fed lowers rate from 5% to 4 1/2%.
December - no change
1930
January - no change
February 1, 1930 Fed lowers rate to 4.11%
March 1, 1930 Fed lowers rate to 3.71%
April 1, 1930 Fed lowers rate to 3.50%
May 1, 1930 Fed lowers rate to 3.02%
June 1, 1930 Fed lowers rate to 2.82%
July 1, 1930 Fed lowers rate to 2.50%
The NY Fed's request for more "easing"
of FED monetary policy was rejected by the other
Fed Governors and by the "liquidationist" Secretary of the Treasury,
Andrew Mellon. A lasting recovery could only start, he said,
when weak-minded, weak-willed and under-capitalized
speculative ventures fell by the way-side and labor was properly disciplined and
even cheaper.

---------------------------------------------------------------------------------------------
Bullish Scenario - Nearly 100% DJI Rise Off 1932 Bottom.
- 1932 – June 17, Bonus Army. March by 20,000 World War I veterans and their families seeking advance payment of bonuses from the Hoover administration; several killed.1932
- 1932 – March 4 - US Senate's Pecora Investigation begins inquiry into Wall Street bankers role in Crash and Depression.
- 1932 – June - - Big Bank failures in Chicago.
- 1932 – June 17, Bonus Army. March by 20,000 World War I
veterans and their families seeking advance payment of bonuses from the Hoover
administration.
1932 – July 28 - Hoover orders General Macarthur to clear "Communist infiltrated" Bonus Army. Several killed in resulting fires and mayhem. - 1932 – August - Federal Reserve stops its record program that buys government securities.
- 1932 – December, Hunger March. Communist-led
march of unemployed workers from across the country.

------------------------------------------------------------------------------------------------------------------------------------
Bullish Scenario - DJI Begins New Bull Market in 2009
after Massive Injection of Billions of Almost Zero Cost Loans to Banks.
Our 5:1 Buy B5s track this stimulus. The A/D Line Does not top out
until early 2010 when a Head Shoulders Top appears after huge British
Petroleum spillage in Gulf of Mexico.

------------------------------------------------------------------------------------------------------------------------------------
Bullish Scenario - 2019 - "V" Bottom after a 20% DJI decline as
FED reverses its rise in interest rates and assures Wall Street it will
be "accomodative" as long as is needed. Market rose throughout
most of 2019. Trading the A/D Lines would have worked well.
See how Fed's QE led to only brief appearance of H/S. Rising A/D
Line destroyed this and showed Fed still intended high prices.

|
Charts 6/3/2020 (Click on Underlined link.) 2020 PEERLESS DJI, Signals, Indicators Daily DJI Volume 10-DayUp/Down Vol Stoch-20 Inverted Traders Index Graph of Pct of All Stocks above 65-dma Cum. Inverted Traders Index NASDAQ S&P OEX NYSE COMPQX DJI-15 DJI-20 DJI-30 DIA QQQ MDY IWM TNA Short-Term Rates SPY http://tigersoft.com/2121CST/SPY.GIF recent 2006 vers-Peerless signals -- www.tigersoft.com/NEWPEER/2006vers.jpg USO-CrudeOil DBO FAS GLD BBH IBB JETS JNUG KOL NUGT OIH PALL RSX RETL SDS AGQ SLV SOXL TECL TLT TMF TNA UGA (gasoline) USO (oil) and China: YINN CHAU Commodities: CANE CORN DBC JJC, NIB, CHOC CORN, CUT (paper) MOO, SOYB WEAT UUP (Dollar) LIT (Lithium) Stocks AAPL ADBE ALXN AMAT AMGN AMD AMZN AXP BA BABA BAC BIDU BLDP CAT CVX CMG DE ENPH FB GILD GOOG GS HD IBM INTU JPM LRCX M (Macy's) MSFT NEM NFLX NKE NVDA PG REGN SO SQ QCOM QDEL TSLA TXN XOM V VRTX WFC WMT TOWN New highs and Bullish MAXCPs http://tigersoft.com/MAXCP/6-3/BULLISH.htm Bearish MAXCPs - http://tigersoft.com/MINCP/6-3/BEARISH.htm |
Table 1
6/3/2018 QUICKSILVER on DJI-30 STOCKS.
Considering just those stocks whose IP21 + ITRS score is >+.25 or <-.25
3 Bullish ( BA CVX NKE
173 97 104 = +374
6 Bearish ( JPM KO UTX VZ WBA WMT
-104 -48 -86 -57 -44 -123 = -462
----------------------------------------
Vitality Score = -88
Note that AAPL now shows highest AI/200 stock here. STOCKS CLOSE CHANGE PIVOT-P 5-dma AROC CL-PWR Candl AI/200 IP21 ITRS --------------------------------------------------------------------------------------- --------------------------------------------------------------------------------------- AAPL 325.12 1.78 318.25 109.6% Bullish BLUE 163 .156 .035 --------------------------------------------------------------------- AXP 105.4 6.33 98.06 212.7% ------- BLUE 77 -.048 .115 --------------------------------------------------------------------- BA 173.16 19.85 149.82 788.1% Bullish BLUE 63 .024 .226 (Bullish) --------------------------------------------------------------------- CAT 127.09 3.77 120.74 192.3% Bullish BLUE 143 .14 -.03 --------------------------------------------------------------------- CSCO 46.94 .05 45.6 105.3% Bullish RED 82 .054 -.057 --------------------------------------------------------------------- CVX 97.18 2.49 90.87 176.7% ------- BLUE 74 -.07 .378 Bullish --------------------------------------------------------------------- DIS 122.18 3.43 116.75 27.4% Bullish BLUE 86 .081 .011 --------------------------------------------------------------------- GS 210.57 6.43 201.22 22.5% Bullish BLUE 103 .092 .146 --------------------------------------------------------------------- HD 251 -1.71 245.14 73.3% Bullish RED 133 -.015 .132 --------------------------------------------------------------------- IBM 129.05 3.05 124.53 140.2% ------- BLUE 135 .05 -.052 --------------------------------------------------------------------- INTC 61.93 -.19 61.7 -130.5% Bullish RED 125 .047 -.165 --------------------------------------------------------------------- JNJ 148.65 .4 146.97 127.7% Bearish BLUE 120 -.048 -.076 --------------------------------------------------------------------- JPM 104.27 5.34 99.86 146.1% ------- BLUE 89 -.171 -.095 Bearish --------------------------------------------------------------------- KO 47.9 1 47.09 124.8% ------- BLUE 107 -.174 -.139 Bearish --------------------------------------------------------------------- MCD 193.29 5.7 188.73 148.5% ------- BLUE 107 .043 -.004 --------------------------------------------------------------------- MMM 161.21 3.57 156.82 97.5% Bullish BLUE 101 .237 -.046 --------------------------------------------------------------------- MRK 82.06 1.22 79.04 283.5% Bullish BLUE 84 -.035 -.178 --------------------------------------------------------------------- MSFT 185.36 .45 181.4 97.1% ------- BLUE 154 .091 -.051 --------------------------------------------------------------------- NKE 104.11 3.37 98.46 213.2% Bullish BLUE 121 .272 .244 Bullish --------------------------------------------------------------------- PFE 36.16 0 38.18 -168.6% ------- RED 58 .121 -.145 --------------------------------------------------------------------- PG 118.53 .47 116.06 199.6% ------- BLUE 90 .001 -.201 --------------------------------------------------------------------- TRV 114.47 3.47 107.59 353.2% Bullish BLUE 101 .142 -.118 --------------------------------------------------------------------- UNH 305.35 -.96 303.97 25.9% ------- RED 123 -.207 .153 --------------------------------------------------------------------- UTX 86.01 -5.36 97.15 -958.4% Bullish RED 114 .144 -.855 Bearish --------------------------------------------------------------------- V 196.87 .51 194.26 104.1% ------- RED 117 -.1 .036 --------------------------------------------------------------------- VZ 56.83 .43 55.72 150.7% ------- BLUE 132 .015 -.284 Bearish --------------------------------------------------------------------- WBA 43.61 .06 41.83 74.6% Bearish RED 84 .054 -.414 Bearish --------------------------------------------------------------------- WMT 123.47 -.47 123.69 40% Bearish RED 83 -.124 -.333 Bearish --------------------------------------------------------------------- XOM 49.24 1.93 45.04 325.6% ------- BLUE 44 -.068 .152 --------------------------------------------------------------------- DOW 41.63 1.03 38.71 230.5% Bullish BLUE 65 -.08 .152 |
Table 2 QUICKSILVER on ETFS - 06/03/20 Bullish = FAS RETL OIH SOXL TECL
Bearish = GASL
ETF CLOSE CHANGE PIVOT-PT 5-dma AROC CL-PWR CANDLE IP21 ITRS --------------------------------------------------------------------------------------------- DIA 263.17 5.32 254.35 144.8% Bullish BLUE .05 0 --------------------------------------------------------------------------------------------- SPY 312.29 4.21 302.97 143.7% Bullish BLUE .146 -.013 --------------------------------------------------------------------------------------------- QQQ 236.69 1.06 229.99 137.5% Bullish BLUE .195 -.025 --------------------------------------------------------------------------------------------- MDY 337.68 9.09 323.35 146.3% Bullish BLUE .098 .115 --------------------------------------------------------------------------------------------- IWM 144.8 3.41 139.7 60.8% ------- BLUE .192 .036 --------------------------------------------------------------------------------------------- FAS 37.48 3.2 32.97 570.1% ------- BLUE .084 1.085 --------------------------------------------------------------------------------------------- RETL 153.13 12.18 128.43 556.7% ------- BLUE .266 1.952 --------------------------------------------------------------------------------------------- SOXL 176.2 14.2 143.23 748.9% Bullish BLUE .096 1.107 --------------------------------------------------------------------------------------------- TECL 205.11 4.61 187.94 406.5% Bullish BLUE .146 1.053 --------------------------------------------------------------------------------------------- IBB 132.65 -1.78 132.33 24.3% Bearish RED .049 -.053 --------------------------------------------------------------------------------------------- GLD 159.6 -3 161.72 -48.7% Bearish RED .056 -.323 --------------------------------------------------------------------------------------------- OIH 129.44 3.79 121.99 315.5% ------- BLUE .161 .335 --------------------------------------------------------------------------------------------- GASL 3440 285 3685 -325.1% ------- RED -.021 -.301 Bearish --------------------------------------------------------------------------------------------- |
Table 3 Count of Stocks in Key Directories
20200603
-------------------------------
NEWHIGHS 193 Bullish >10:1 NH/NL
NEWLOWS 10
MAXCP 106
MINCP 17
TTTNH 33
TTTNL 11
FASTUP 236
FASTDOWN 56
CPCROSSA 104
CPCROSSD 65
BIGVOLUP 17
BIGVODN 9
ACCUMVER 11
HIGHIP21 16
HIUPPCT 9
REDSELL 79
AUGSELS7 131
TRAPDOOR 18
|
Table 4 100% Bullish! RANKING OF KEY DIRECTORIES BASED PCT.OF STOCKS ABOVE 65-DMA
6/3/20
---------------------------------------------------------------------------------------
Directory Current day-1 day-2 day-3 day-4 day-5
----------------------------------------------------------------------------------------
AUTO 1 .974 .948 .948 .948 .948
BIGBANKS 1 .857 .857 .857 .857 .857
EDU 1 1 1 1 1 1
HACKERS 1 1 .95 .95 .95 .9
SOLAR 1 .937 .937 .812 .812 .812
TRANSP 1 .9 .85 .8 .8 .85
FINANCE .988 .809 .785 .75 .797 .869
ETFS .982 .964 .946 .875 .821 .821
BONDFUND .98 .98 .98 .97 .871 .772
CHEM .979 .979 .959 .938 .959 .959
NIFTY .978 .978 .956 .956 .956 .956
INFRA .971 .914 .914 .914 .914 .914
SEMI .971 .952 .942 .914 .904 .933
NASD-100 .969 .959 .949 .949 .939 .919
SP-100 .967 .912 .89 .879 .879 .846
SP500 .966 .917 .898 .863 .871 .85
MILITARY .962 .888 .814 .74 .777 .777
ELECTRON .959 .926 .912 .879 .872 .892
FIDSTKS .954 .92 .909 .892 .892 .87
GAMING .952 .904 .904 .904 .904 .952
SOFTWARE .95 .966 .933 .866 .9 .9
UTILITY .948 .82 .794 .769 .641 .487
HOMEBLDG .941 .941 .941 .882 .882 .882
DOWJONES .933 .933 .9 .866 .9 .766
GUNS .933 .933 .933 .8 .8 .866
RUS-1000 .933 .878 .859 .808 .823 .829
DJI-13 .923 .923 .846 .846 .846 .846
INDMATER .92 .906 .906 .826 .84 .853
COMPUTER .9 .85 .85 .8 .85 .9
RETAIL .88 .78 .78 .66 .76 .82
REIT .879 .73 .617 .432 .539 .624
GOLD .877 .938 .938 .897 .877 .918
BEVERAGE .866 .933 .933 .866 .866 .8
INDEXES .858 .847 .836 .82 .815 .788
GREEN .857 .857 .809 .809 .809 .809
JETS .857 .714 .571 .428 .428 .5
INSURANC .846 .807 .73 .692 .769 .769
REGBANKS .846 .653 .692 .73 .807 .923
BIOTECH .845 .845 .842 .837 .829 .839
HOSPITAL .809 .809 .761 .714 .714 .809
OILGAS .809 .763 .694 .694 .702 .702
COMODITY .769 .717 .717 .666 .589 .538
CHINA .725 .647 .607 .45 .372 .372
COPPER .725 .647 .607 .45 .372 .372
COAL .714 .571 .571 .714 .714 .714
FOOD .679 .622 .622 .566 .509 .49
|
=====================================================================
6/2/2020 Clearly, the extraordinary breadth and the 5:1 Buy B4s are more powerful
that the DJI's weak IP21 and negative VI that Peerless ordinarily uses.
Why do we see a "V" formation in the NASDAQ? Is Peerless not
working?
Is it just a short-covering panic? Or is the Fed is working with an infinite anount
of
money and those getting all this magic money think the opportunities are
greater in stocks than in Main Street, especially with it rioting? Is that the
explanation? Or is there a huge pent-up demand for goods and services
overseas and in the US? Or is a vaccine very close? Take your pick.
The fact IS that the indexes and the DJI are very strong in face of news
that would hold most markets back. And the DJI is weaker than most of the
ETFs we see in Table 3. There is just too much technical strength to deny.
Most most likley, the rising A/D Line is our best friend in determining
the trend. If the DJI closes above its 200-day ma, just a little above 26000,
close out the short sale in DIA based on the Peerless Sells and go long the
Bullish MAXCP stocks making new highs. This is "stampede time" until
the steep A/D Line shown below breaks its uptrend. Hold
long the NASDAQ
and hold short only the Dollar.


|
Charts 6/2/2020 (Click on Underlined link.) 2020 PEERLESS DJI, Signals, Indicators Daily DJI Volume 10-DayUp/Down Vol Stoch-20 Inverted Traders Index Graph of Pct of All Stocks above 65-dma Cum. Inverted Traders Index NASDAQ S&P OEX NYSE COMPQX DJI-15 DJI-20 DJI-30 DIA QQQ MDY IWM TNA Short-Term Rates SPY http://tigersoft.com/2121CST/SPY.GIF recent 2006 vers-Peerless signals -- www.tigersoft.com/NEWPEER/2006vers.jpg USO-CrudeOil DBO FAS GLD BBH IBB JETS JNUG KOL NUGT OIH PALL RSX RETL SDS AGQ SLV SOXL TECL TLT TMF TNA UGA (gasoline) USO (oil) and China: YINN CHAU Commodities: CANE CORN DBC JJC, NIB, CHOC CORN, CUT (paper) MOO, SOYB WEAT UUP (Dollar) LIT (Lithium) Stocks AAPL ADBE ALXN AMAT AMGN AMD AMZN AXP BA BABA BAC BIDU BLDP CAT CVX CMG DE ENPH FB GILD GOOG GS HD IBM INTU JPM LRCX M (Macy's) MSFT NEM NFLX NKE NVDA PG REGN SO SQ QCOM QDEL TSLA TXN XOM V VRTX WFC WMT TOWN New highs and Bullish MAXCPs http://tigersoft.com/MAXCP/6-2/BULLISH.htm Bearish MAXCPs - http://tigersoft.com/MINCP/6-2/BEARISH.htm |
Table 1
5/28/2018 QUICKSILVER on DJI-30 STOCKS.
Considering just those stocks whose IP21 + ITRS score is >+.25 or <-.25
1 Bullish ( HD NKE WBA
253 101 44 = +398
7 Bearish ( JPM KO MRK UTX VZ WMT
-99 -47 -81 -86 -56 -124 = -493
----------------------------------------
Vitality Score = -95
Note that AAPL now shows highest AI/200 stock here. STOCKS CLOSE CHANGE PIVOT-P 5-dma AROC CL-PWR Candl AI/200 IP21 ITRS --------------------------------------------------------------------------------------- --------------------------------------------------------------------------------------- AAPL 323.34 1.49 318.11 103.7% Bullish BLUE 162 .179 .067 --------------------------------------------------------------------- AXP 99.07 2.32 101.23 244.6% ------- BLUE 78 -.086 -.007 --------------------------------------------------------------------- BA 153.31 1.92 149.52 289.4% ------- RED 62 -.023 .27 --------------------------------------------------------------------- CAT 123.32 2.82 122.42 245.8% ------- BLUE 142 .084 -.052 --------------------------------------------------------------------- CSCO 46.89 .59 45.96 222.3% Bullish BLUE 81 .074 -.027 --------------------------------------------------------------------- CVX 94.69 1.9 93.9 75.1% Bearish BLUE 75 -.038 .251 --------------------------------------------------------------------- DIS 118.75 -.02 121.53 -92.4% Bullish RED 86 .083 .037 --------------------------------------------------------------------- GS 204.14 4.21 209.66 201.3% Bullish BLUE 103 .104 .131 --------------------------------------------------------------------- HD 252.71 5.42 247.36 207.8% Bullish BLUE 134 .031 .317 Bullish --------------------------------------------------------------------- IBM 126 1.11 125.54 170.5% ------- BLUE 134 .059 -.023 --------------------------------------------------------------------- INTC 62.12 .26 63.56 -17.6% ------- BLUE 124 .097 .012 --------------------------------------------------------------------- JNJ 148.25 1.06 144.89 126% Bearish BLUE 121 -.067 -.107 --------------------------------------------------------------------- JPM 98.93 .33 101.37 157.7% ------- RED 90 -.195 -.159 Bearish --------------------------------------------------------------------- KO 46.9 -.09 46.73 86.7% Bearish RED 107 -.18 -.119 Bearish --------------------------------------------------------------------- MCD 187.59 .18 187.72 73.5% ------- RED 106 .035 -.08 --------------------------------------------------------------------- MMM 157.64 2.06 158.15 178.4% Bearish BLUE 100 .233 -.081 --------------------------------------------------------------------- MRK 80.84 1.28 77.55 227.1% ------- BLUE 84 -.084 -.211 Bearish --------------------------------------------------------------------- MSFT 184.91 2.08 181.81 91.7% Bullish BLUE 154 .111 .003 --------------------------------------------------------------------- NKE 100.74 1.2 99.87 208.9% Bullish BLUE 120 .283 .15 Bullish --------------------------------------------------------------------- PFE 36.16 .7 37.41 -178.1% ------- BLUE 57 .089 -.097 --------------------------------------------------------------------- PG 118.06 .81 113.89 262.1% ------- BLUE 89 -.007 -.191 --------------------------------------------------------------------- TRV 111 1.85 106.82 357.7% Bullish BLUE 100 .154 -.104 --------------------------------------------------------------------- UNH 306.31 .38 303.77 188.6% ------- BLUE 124 -.167 .139 --------------------------------------------------------------------- UTX 86.01 -5.36 97.15 -958.4% Bullish RED 114 .144 -.784 Bearish --------------------------------------------------------------------- V 196.36 2.01 192.82 80.9% Bullish BLUE 118 -.066 -.006 --------------------------------------------------------------------- VZ 56.4 .62 55.14 188.6% ------- BLUE 131 -.02 -.255 Bearish --------------------------------------------------------------------- WBA 43.55 .25 42.97 163% ------- BLUE 83 .097 -.405 Bullish --------------------------------------------------------------------- WMT 123.94 -.02 122.48 3.2% Bearish BLUE 83 -.117 -.256 Bearish --------------------------------------------------------------------- XOM 47.31 1.03 46.24 152.9% Bearish BLUE 45 -.051 .101 --------------------------------------------------------------------- DOW 40.6 1.99 39.82 232.6% Bullish BLUE 65 -.001 .136 |
Table 2 QUICKSILVER on ETFS - 06/02/20 Bullish = SPY FAS IWM RETL OIH SOXL TECL Highest = RETL
Bearish =
ETF CLOSE CHANGE PIVOT-PT 5-dma AROC CL-PWR CANDLE IP21 ITRS --------------------------------------------------------------------------------------------- DIA 257.85 2.58 255.77 149.6% ------- BLUE .051 0 --------------------------------------------------------------------------------------------- SPY 308.08 2.52 303.53 148.5% Bullish BLUE .163 .003 --------------------------------------------------------------------------------------------- QQQ 235.63 1.57 230.29 142.4% Bullish BLUE .219 .037 Bullish --------------------------------------------------------------------------------------------- MDY 328.59 2.91 328.16 135% Bullish BLUE .105 .09 --------------------------------------------------------------------------------------------- IWM 141.39 1.16 143.09 93.1% Bearish BLUE .221 .051 Bullish --------------------------------------------------------------------------------------------- FAS 34.28 .85 33.68 492.6% ------- ---- .067 .575 Bullish --------------------------------------------------------------------------------------------- RETL 140.95 8.88 138.22 603% ------- BLUE .215 1.527 Bullish --------------------------------------------------------------------------------------------- SOXL 162 9.8 153.29 499.8% Bullish BLUE .112 1.19 Bullish --------------------------------------------------------------------------------------------- TECL 200.5 5.58 189.38 362.3% Bullish BLUE .162 1.01 Bullish --------------------------------------------------------------------------------------------- IBB 134.43 .32 132 136.3% Bullish BLUE .109 .028 --------------------------------------------------------------------------------------------- GLD 162.6 -1.06 161.18 52.8% ------- RED .07 -.183 --------------------------------------------------------------------------------------------- OIH 125.65 5.97 121.77 332.1% ------- BLUE .144 .301 Bullish --------------------------------------------------------------------------------------------- |
Table 3 Count of Stocks in Key Directories
20200602
-------------------------------
NEWHIGHS 160 Bullish >10: NH/NL Bullish
NEWLOWS 12
MAXCP 89
MINCP 17
TTTNH 28
TTTNL 19
FASTUP 187
FASTDOWN 58
CPCROSSA 92
CPCROSSD 62
BIGVOLUP 6
BIGVODN 7
ACCUMVER 9
HIGHIP21 17
HIUPPCT 9
VHIP21 32
AUGSELS7 125
TRAPDOOR 18
|
Table 3 RANKING OF KEY DIRECTORIES BASED PCT.OF STOCKS ABOVE 65-DMA
6/2/20
100% of Directories are bullish
---------------------------------------------------------------------------------------
Directory Current day-1 day-2 day-3 day-4 day-5
----------------------------------------------------------------------------------------
COPPER 1 1 1 1 1 1
EDU 1 1 1 1 1 1
HACKERS 1 1 .95 .95 .9 .9
BONDFUND .98 .98 .97 .871 .742 .564
CHEM .979 .959 .938 .959 .938 .918
NIFTY .978 .956 .956 .956 .956 .956
AUTO .974 .948 .948 .948 .948 .923
SOFTWARE .966 .95 .866 .9 .9 .866
ETFS .964 .946 .875 .821 .821 .803
NASD-100 .959 .959 .959 .939 .919 .898
SEMI .952 .942 .914 .904 .933 .914
HOMEBLDG .941 .941 .882 .882 .882 .823
GOLD .938 .938 .897 .877 .918 .897
SOLAR .937 .937 .812 .812 .812 .812
BEVERAGE .933 .933 .866 .866 .8 .6
DOWJONES .933 .9 .866 .9 .766 .766
GUNS .933 .933 .8 .8 .866 .8
ELECTRON .926 .912 .879 .872 .892 .879
DJI-13 .923 .846 .846 .846 .846 .846
FIDSTKS .92 .909 .892 .892 .87 .824
SP500 .917 .901 .863 .871 .842 .785
INFRA .914 .914 .914 .914 .914 .8
SP-100 .912 .89 .879 .879 .824 .791
INDMATER .906 .906 .826 .84 .853 .8
GAMING .904 .904 .904 .904 .952 .952
TRANSP .9 .85 .8 .8 .85 .8
MILITARY .888 .814 .74 .777 .777 .629
RUS-1000 .878 .86 .808 .823 .82 .756
BIGBANKS .857 .857 .857 .857 .857 .857
GREEN .857 .809 .809 .809 .809 .809
COMPUTER .85 .85 .8 .85 .9 .85
INDEXES .847 .836 .82 .815 .782 .788
BIOTECH .842 .837 .837 .829 .84 .848
UTILITY .82 .794 .769 .641 .461 .461
FINANCE .819 .795 .759 .807 .879 .686
HOSPITAL .809 .761 .714 .714 .761 .761
INSURANC .807 .73 .692 .769 .769 .653
RETAIL .78 .78 .66 .76 .82 .64
OILGAS .763 .694 .694 .702 .687 .671
REIT .73 .617 .432 .539 .581 .446
COMODITY .717 .717 .666 .589 .512 .641
JETS .714 .571 .428 .428 .5 .428
REGBANKS .653 .692 .73 .807 .923 .692
CHINA .647 .607 .45 .372 .372 .411
FOOD .622 .622 .566 .509 .471 .603
COAL .571 .571 .714 .714 .714 .714
|
6/1/2020 Watchfulness and Patience seems best now. Hedging
by being long the NASDAQ and short the DJI as well as
buying Gold and shorting the Dollar is recommended for traders.
Sell S5. 26000 is likely resistance. Lower band will likely offer
us a better place to buy. The DJI is over-bought and there
are many negative internal strength readings. See
DJI chart
below.
DJI overbought and still below 200-day ma    |
While Peerless is on a Sell, we should see the signs of technical strength.
1) The breadth (rising A/D Line,
2) New high/new low ratio (now >10:1 - Table 3)),
3) Percent of all stocks over 65-dma (>80) (See Table 4),
4) The steeply rising NASDAQ and IWM
AND 5) the fact that the 200-day ma turned up and has been breached by SP-500
and OEX are undeniably bullish. Short sales have not be recommended.
In fact, Shorts are being run-in (Look atBA and the strength in FAS (Financials)
internals now. Table 2 shows no key general market ETFs are now showing
six items with Bullish internals and no with bearish internals.

The rising strength is most attributable to the FED, but the hope for a Covid-19
vaccine and an economic turn-around are strong. Nor will Wall Street be
intimidated by protests turned violence, at least not yet. But there is one problem.
The biggest threat to the market is a weakening Dollar, which is just beginning to
show. As the Dollar goes down, it may tends to put pressure on the Fed to
raise interest rates. A seriously weak Dollar will tend to cause less foreign
investments in the US, bonds and stocks. Clearly, we are not at that point yet.
But Gold is on the rise again. Hedge
here: Buy Gold and Short the Dollar.

Besides hedging as suggested, let me offer that the best way to trade now would
be buying any Bullish MAXCPs that retreat to their rising 21-day ma.
This is tricky. Sometimes, it is best to just wait and watch developments.
But hedging should risk little and keep us attentive.
|
Charts 6/1/2020 (Click on Underlined link.) 2020 PEERLESS DJI, Signals, Indicators Daily DJI Volume 10-DayUp/Down Vol Stoch-20 Inverted Traders Index Graph of Pct of All Stocks above 65-dma Cum. Inverted Traders Index NASDAQ S&P OEX NYSE COMPQX DJI-15 DJI-20 DJI-30 DIA QQQ MDY IWM TNA Short-Term Rates SPY http://tigersoft.com/2121CST/SPY.GIF recent 2006 vers-Peerless signals -- www.tigersoft.com/NEWPEER/2006vers.jpg USO-CrudeOil DBO FAS GLD BBH IBB JETS JNUG KOL NUGT OIH PALL RSX RETL SDS AGQ SLV SOXL TECL TLT TMF TNA UGA (gasoline) USO (oil) and China: YINN CHAU Commodities: CANE CORN DBC JJC, NIB, CHOC CORN, CUT (paper) MOO, SOYB WEAT UUP (Dollar) LIT (Lithium) Stocks AAPL ADBE ALXN AMAT AMGN AMD AMZN AXP BA BABA BAC BIDU BLDP CAT CVX CMG DE ENPH FB GILD GOOG GS HD IBM INTU JPM LRCX M (Macy's) MSFT NEM NFLX NKE NVDA PG REGN SO SQ QCOM QDEL TSLA TXN XOM V VRTX WFC WMT TOWN New highs and Bullish MAXCPs http://tigersoft.com/MAXCP/6-1/BULLISH.htm Bearish MAXCPs - http://tigersoft.com/MINCP/6-1/BEARISH.htm |
Table 1
5/28/2018 QUICKSILVER on DJI-30 STOCKS.
Considering just those stocks whose IP21 + ITRS score is >+.25 or <-.25
1 Bullish (CVX HD NKE
93 247 100 = +439
7 Bearish ( JPM KO MRK PG UTX VZ WBA WMT
-96 -47 -80 -117 -106 -56 -43 -124 = -679
----------------------------------------
Vitality Score = -212
Note that AAPL now shows highest AI/200 stock here. STOCKS CLOSE CHANGE PIVOT-P 5-dma AROC CL-PWR Candl AI/200 IP21 ITRS --------------------------------------------------------------------------------------- --------------------------------------------------------------------------------------- AAPL 321.85 3.91 316.73 46.5% Bullish BLUE 161 .099 .047 --------------------------------------------------------------------- AXP 96.75 1.68 94.32 388.1% ------- BLUE 79 -.07 -.013 --------------------------------------------------------------------- BA 151.39 5.54 144.73 476.3% ------- BLUE 62 -.064 .281 --------------------------------------------------------------------- CAT 120.5 .37 117.41 338.4% Bearish BLUE 142 .025 -.098 --------------------------------------------------------------------- CSCO 46.3 -1.52 44.84 152.8% Bullish RED 80 .011 -.04 --------------------------------------------------------------------- CVX 92.79 1.09 93.3 136.4% Bearish BLUE 76 -.056 .349 Bullish --------------------------------------------------------------------- DIS 118.77 1.47 120.95 31.5% Bullish BLUE 86 .08 -.017 --------------------------------------------------------------------- GS 199.93 3.44 196.06 508.5% Bullish BLUE 103 .076 .069 --------------------------------------------------------------------- HD 247.29 -1.19 242.48 110.4% Bullish RED 133 0 .267 Bullish --------------------------------------------------------------------- IBM 124.89 -.01 121.76 264.2% ------- BLUE 134 -.001 -.023 --------------------------------------------------------------------- INTC 61.86 -1.07 62.34 -32% Bearish RED 123 .014 .078 --------------------------------------------------------------------- JNJ 147.19 -1.56 144.56 96.6% Bearish RED 122 -.104 -.11 --------------------------------------------------------------------- JPM 98.6 1.29 95.82 471.8% ------- BLUE 91 -.17 -.112 Bearish --------------------------------------------------------------------- KO 46.99 .31 46.09 211.6% Bearish BLUE 107 -.191 -.145 Bearish --------------------------------------------------------------------- MCD 187.41 1.09 184.84 80.5% ------- BLUE 106 -.006 -.014 --------------------------------------------------------------------- MMM 155.58 -.86 152.08 296.8% Bearish RED 99 .223 -.137 --------------------------------------------------------------------- MRK 79.56 -1.16 77.26 204% ------- RED 84 -.145 -.143 Bearish --------------------------------------------------------------------- MSFT 182.83 -.42 181.57 -18.6% Bullish BLUE 154 .028 .013 --------------------------------------------------------------------- NKE 99.54 .96 96.62 297.1% Bullish BLUE 119 .23 .147 Bullish --------------------------------------------------------------------- PFE 35.46 -2.73 37.49 -270.2% ------- ---- 56 .011 -.102 --------------------------------------------------------------------- PG 117.25 1.33 112.03 203.8% ------- BLUE 89 -.065 -.21 Bearish --------------------------------------------------------------------- TRV 109.15 2.17 103.36 431.1% ------- BLUE 99 .072 0 --------------------------------------------------------------------- UNH 305.93 1.08 294.89 267% ------- BLUE 124 -.178 .124 --------------------------------------------------------------------- UTX 86.01 -5.36 97.15 -958.4% Bullish RED 114 .144 -.709 Bearish --------------------------------------------------------------------- V 194.35 -.89 193.22 90.3% Bullish RED 119 -.097 .008 --------------------------------------------------------------------- VZ 55.78 -1.6 54.3 151.8% ------- RED 131 -.084 -.228 --------------------------------------------------------------------- WBA 43.3 .36 42.16 441.5% ------- BLUE 82 .06 -.376 --------------------------------------------------------------------- WMT 123.96 -.1 123.86 -15% Bearish BLUE 83 -.112 -.23 Bearish --------------------------------------------------------------------- XOM 46.28 .81 45.91 184.8% Bearish BLUE 45 -.142 .076 --------------------------------------------------------------------- DOW 38.61 .01 38.79 324.2% ------- ---- 65 -.059 .105 |
Table 2 QUICKSILVER on ETFS - 06/01/20 Bullish = FAS IWM RETL OIH SOXL TECL
Bearish =
ETF CLOSE CHANGE PIVOT-PT 5-dma AROC CL-PWR CANDLE IP21 ITRS --------------------------------------------------------------------------------------------- DIA 255.27 .98 250.25 206.2% ------- BLUE-.012 ---- --------------------------------------------------------------------------------------------- SPY 305.56 1.24 299.08 168.1% ------- BLUE .076 .002 --------------------------------------------------------------------------------------------- QQQ 234.06 .7 229.04 95.5% Bullish BLUE .146 .049 --------------------------------------------------------------------------------------------- MDY 325.68 4.15 319.85 259.8% ------- BLUE .072 .09 --------------------------------------------------------------------------------------------- IWM 140.23 1.33 138.78 192% Bearish BLUE .191 .082 Bullish --------------------------------------------------------------------------------------------- FAS 33.43 1.15 31.06 890.4% ------- BLUE .044 .393 Bullish --------------------------------------------------------------------------------------------- RETL 132.07 2.19 125.18 660.2% ------- BLUE .101 1.017 Bullish --------------------------------------------------------------------------------------------- SOXL 152.2 -1.91 147.01 324.6% ------- BLUE .007 .908 Bullish --------------------------------------------------------------------------------------------- TECL 194.92 .27 186.68 218.4% Bullish BLUE .082 .738 Bullish --------------------------------------------------------------------------------------------- IBB 134.11 -.63 130.81 29% Bullish RED .068 .059 --------------------------------------------------------------------------------------------- GLD 163.66 1.13 160.89 13.9% ------- BLUE .107 -.082 --------------------------------------------------------------------------------------------- OIH 119.68 .92 117.68 347.8% Bearish BLUE .098 .303 Bullish --------------------------------------------------------------------------------------------- GASL 3440 285 3685 -325.1% ------- RED -.021 -.155 --------------------------------------------------------------------------------------------- |
Table 3 Count of Stocks in Key Directories
20200601
-------------------------------
NEWHIGHS 163 >10:1 Bullish
NEWLOWS 14
MAXCP 76
MINCP 11
TTTNH 38
TTTNL 12
FASTUP 301
FASTDOWN 47
CPCROSSA 147
CPCROSSD 42
BIGVOLUP 10
BIGVODN 6
ACCUMVER 7
HIGHIP21 9
HIUPPCT 8
VHIP21 29
LOWACCUM 157
REDSELL 85
AUGSELS7 127
TRAPDOOR 19
|
RANKING OF KEY DIRECTORIES BASED PCT.OF STOCKS ABOVE 65-DMA 6/1/20 --------------------------------------------------------------------------------------- Directory Current day-1 day-2 day-3 day-4 day-5 ---------------------------------------------------------------------------------------- COPPER 1 1 1 1 1 1 EDU 1 1 1 1 1 1 HACKERS 1 1 .95 .9 .9 .9 BONDFUND .98 .97 .871 .742 .524 .425 CHEM .959 .938 .959 .938 .918 .897 NASD-100 .959 .969 .949 .919 .888 .848 NIFTY .956 .956 .956 .956 .934 .934 SOFTWARE .95 .883 .9 .9 .85 .866 AUTO .948 .948 .948 .948 .897 .82 ETFS .946 .875 .821 .821 .785 .607 SEMI .942 .914 .904 .933 .914 .876 HOMEBLDG .941 .882 .882 .882 .823 .823 GOLD .938 .897 .877 .918 .897 .897 SOLAR .937 .812 .812 .812 .812 .75 BEVERAGE .933 .866 .866 .8 .533 .533 GUNS .933 .8 .8 .866 .8 .533 INFRA .914 .914 .914 .914 .8 .657 ELECTRON .912 .879 .872 .892 .865 .798 FIDSTKS .909 .892 .892 .87 .79 .694 INDMATER .906 .826 .84 .853 .786 .72 GAMING .904 .904 .904 .952 .952 .857 SP500 .901 .865 .871 .842 .766 .627 DOWJONES .9 .866 .9 .766 .766 .633 SP-100 .89 .879 .879 .824 .758 .648 RUS-1000 .86 .809 .823 .82 .743 .604 BIGBANKS .857 .857 .857 .857 .857 .285 COMPUTER .85 .8 .85 .9 .85 .75 TRANSP .85 .8 .8 .85 .8 .55 DJI-13 .846 .846 .846 .846 .846 .692 BIOTECH .834 .832 .829 .842 .845 .826 INDEXES .831 .82 .815 .782 .788 .695 MILITARY .814 .74 .777 .777 .555 .481 GREEN .809 .809 .809 .809 .761 .761 UTILITY .794 .769 .641 .461 .41 .23 FINANCE .785 .75 .797 .869 .619 .273 RETAIL .78 .66 .76 .82 .58 .56 HOSPITAL .761 .714 .714 .761 .761 .714 INSURANC .73 .692 .769 .769 .653 .307 COMODITY .717 .666 .589 .512 .564 .487 OILGAS .694 .694 .702 .687 .671 .641 REGBANKS .692 .73 .807 .923 .653 .269 FOOD .622 .566 .509 .471 .509 .433 REIT .617 .432 .539 .581 .425 .248 CHINA .607 .45 .372 .372 .372 .274 COAL .571 .714 .714 .714 .714 .571 JETS .571 .428 .428 .5 .428 .071 |
====================================================================
5/29/2020 Sell S5. 26000 is resistance. Lower band will likely
offer
us a good place to buy. A decline to 23500 seems the
most
likely next DJI move.
First, the DJI is now 4.6% above its 21-day ma. By any
measure, this
is a technically over-bought condition. All of our internal strength indicators
are negative, except for the P-I and the daily change of the P-I was
a bearish -113. In addition, our Cumulative Inverted Traders Index is
negative and below its falling 21-day ma. This is the condition it was in
at the start of the February crash. Big money wants out. And they want
out of the DJI-30 stocks, at least this is what the negative Vitality Index
shows us.
Multiple Negative Non-Confirmations


Secondly, I would not look for a big decline The Federal Reserve has
a trillion dollars or more to buy private corporate bonds and seems
to be testing the waters to buy equity ETFs. It has no authority
to buy private corporate bonds, so why not buy stock ETFs, if it gets
away with buying corporate bonds. At this stage, both Congressional
Democrats and Republicans are silent and submissive to the Fed's
whims. "QE-Infinity" does have precedent, at least as far as Peerless
goes. We spot the track of the Fed's Quantitative Easing (buying massive
amounts of toxic debt from Wall Street) by observing the appearance
of a string of 5:1 adv/decline days. Wall Street insiders know the market
is very safe to buy into when the FED is on a Q.E. bender. So, they tell
their computerized trading programs buy everything in sight. Hence the
5:1 and even 8:1 up days. See the charts of 2009, 2010 and 2011. Our new
Buy B5s show how bullish the market becomes when the FED acts this
way. See the discussion and charts at http://tigersoft.com/Five2One/INDEX.htm
Third, historically violent demonstrations and race riots are largely ignored by
Wall Street until they take place in the biggest US cities, especially Chicago,
New York and also Washington DC. See how in 1919, chart just below,
the DJI rose mostly until August. 1919 also shows how difficult it will be
to end the urban social upheavals once they have started. Unlike in 1919,
the protests now are taking place in many places all at once. But, at least
there have not been letter-bombs sent to public officials. That ended the
1919 bull market and started the Red Scare of that year. There are not
many Communists "left on the left" to blame one hundred and twenty one
years later. I noticed that President Trump wants to blame the "Anti-Fascist
League" for the violence of this weekend. He must believe that they are
preparing a long, hot Summer of protests. They probably love the publicity
and will sell more of their fighting-back handbooks.
https://www.amazon.com/Antifa-Anti-Fascist-Handbook
Bloody 1919

1919 Race Riots - Click on image box to see this image

|
Charts 5/29/2020 (Click on Underlined link.) 2020 PEERLESS DJI, Signals, Indicators Daily DJI Volume 10-DayUp/Down Vol Stoch-20 Inverted Traders Index Graph of Pct of All Stocks above 65-dma Cum. Inverted Traders Index NASDAQ S&P OEX NYSE COMPQX DJI-15 DJI-20 DJI-30 DIA QQQ MDY IWM TNA Short-Term Rates SPY http://tigersoft.com/2121CST/SPY.GIF recent 2006 vers-Peerless signals -- www.tigersoft.com/NEWPEER/2006vers.jpg USO-CrudeOil DBO FAS GLD BBH IBB JETS JNUG KOL NUGT OIH PALL RSX RETL SDS AGQ SLV SOXL TECL TLT TMF TNA UGA (gasoline) USO (oil) and China: YINN CHAU Commodities: CANE CORN DBC JJC, NIB, CHOC CORN, CUT (paper) MOO, SOYB WEAT UUP (Dollar) LIT (Lithium) Stocks AAPL ADBE ALXN AMAT AMGN AMD AMZN AXP BA BABA BAC BIDU BLDP CAT CVX CMG DE ENPH FB GILD GOOG GS HD IBM INTU JPM LRCX M (Macy's) MSFT NEM NFLX NKE NVDA PG REGN SO SQ QCOM QDEL TSLA TXN XOM V VRTX WFC WMT TOWN New highs and Bullish MAXCPs http://tigersoft.com/MAXCP/5-29/BULLISH.htm Bearish MAXCPs - http://tigersoft.com/MINCP/5-29/BEARISH.htm |
Table 1
5/28/2018 QUICKSILVER on DJI-30 STOCKS.
Explanation: If the DJI stock shows an IP21 + ITRS greater than +.25 then,
it is Bullish". If its ITRS and IP21 are less than -.25 it is considered
Bearish. The Vitality Index here takes the closings of the Bullish DJI
stocks and subtracts the closings of the Bearish DJI stocks. The idea is that
the highest priced stocks move the DJI the most, so if the sum of the bullish
ones is positive, the DJI should go up and vice verse. In fact, divergences
do develop. But they show reversals of direction for DJI may be close at hand.
Considering just those stocks whose IP21 + ITRS score is >+.25 or <-.25
1 Bullish (CVX HD NKE
92 248 99 = +439
7 Bearish ( JPM KO MRK PG UTX VZ WBA WMT
-97 -47 -81 -116 -114 -57 -43 -124 = -679
----------------------------------------
Vitality Score = -240
Note that AAPL now shows highest AI/200 stock here. STOCKS CLOSE CHANGE PIVOT-P 5-dma AROC CL-PWR Candl AI/200 IP21 ITRS --------------------------------------------------------------------------------------- --------------------------------------------------------------------------------------- AAPL 317.94 -.31 318.89 17.2% Bullish RED 160 .118 .014 --------------------------------------------------------------------- AXP 95.07 -2.99 89.33 277.1% ------- RED 80 -.123 .014 --------------------------------------------------------------------- BA 145.85 -3.97 137.53 237.6% Bearish BLUE 62 -.061 .156 --------------------------------------------------------------------- CAT 120.13 -.61 112.47 258.5% Bearish BLUE 141 -.003 -.075 --------------------------------------------------------------------- CSCO 47.82 2.22 44.9 351.9% Bullish BLUE 79 .012 .013 --------------------------------------------------------------------- CVX 91.7 .83 90.28 -18.5% Bearish BLUE 77 -.095 .39 Bullish --------------------------------------------------------------------- DIS 117.3 .55 118.02 -22.3% ------- BLUE 86 .061 .046 --------------------------------------------------------------------- GS 196.49 -4.73 179.93 423.7% ------- RED 103 .032 .128 --------------------------------------------------------------------- HD 248.48 3.34 241.88 156% Bullish BLUE 133 .016 .321 Bullish --------------------------------------------------------------------- IBM 124.9 .37 118.39 237.1% Bearish BLUE 135 -.046 -.069 --------------------------------------------------------------------- INTC 62.93 1.23 62.26 76.2% Bearish BLUE 122 -.012 .046 --------------------------------------------------------------------- JNJ 148.75 1.78 144.37 70.1% Bearish BLUE 123 -.022 -.173 --------------------------------------------------------------------- JPM 97.31 -2.55 89.47 374.5% Bearish RED 92 -.17 -.115 Bearish --------------------------------------------------------------------- KO 46.68 -.41 45.03 164.1% Bearish ---- 107 -.236 -.235 Bearish --------------------------------------------------------------------- MCD 186.32 -2.41 184.41 33.3% Bearish RED 106 .045 .082 --------------------------------------------------------------------- MMM 156.44 -.38 146.44 350% Bearish BLUE 98 .194 -.134 --------------------------------------------------------------------- MRK 80.72 1.68 76.37 269.5% ------- BLUE 84 -.167 -.148 Bearish --------------------------------------------------------------------- MSFT 183.25 1.85 183.51 -4.9% Bullish BLUE 154 .034 .03 --------------------------------------------------------------------- NKE 98.58 .12 93.75 223.6% Bullish BLUE 118 .194 .174 Bullish --------------------------------------------------------------------- PFE 38.19 .01 37.5 123.8% ------- RED 55 .003 -.095 --------------------------------------------------------------------- PG 115.92 -.14 112.6 189.9% Bearish RED 89 -.045 -.288 Bearish --------------------------------------------------------------------- TRV 106.98 -.61 100.1 377.6% ------- BLUE 98 -.004 .034 --------------------------------------------------------------------- UNH 304.85 .88 289.94 303.1% ------- BLUE 124 -.16 .129 --------------------------------------------------------------------- UTX 86.01 -5.36 97.15 -958.4% Bullish RED 114 .144 -.716 Bearish --------------------------------------------------------------------- V 195.24 .98 190.86 120.1% Bullish BLUE 120 -.114 .04 --------------------------------------------------------------------- VZ 57.38 1.66 54.1 312% ------- BLUE 131 -.053 -.219 Bearish --------------------------------------------------------------------- WBA 42.94 1.11 39.6 386.6% Bearish BLUE 81 -.008 -.462 Bearish --------------------------------------------------------------------- WMT 124.06 .37 124.33 -37.5% Bearish RED 83 -.167 -.263 Bearish --------------------------------------------------------------------- XOM 45.47 .43 44.6 100.5% Bearish BLUE 45 -.186 .105 --------------------------------------------------------------------- DOW 38.6 -.11 36.12 367.2% ------- BLUE 65 -.058 .185 |
Table 2 QUICKSILVER on ETFS - 05/29/20
Here were use the same criteria used with the Vitality Index to establish
which ETFs are Bullish or Bearish.
Bullish = FAS IWM RETL OIH SOXL TECL
Bearish =
ETF CLOSE CHANGE PIVOT-PT 5-dma AROC CL-PWR CANDLE IP21 ITRS --------------------------------------------------------------------------------------------- --------------------------------------------------------------------------------------------- DIA 254.29 -.06 244.88 185.4% ------- BLUE-.039 ----- --------------------------------------------------------------------------------------------- SPY 304.32 1.35 295.44 157.8% ------- BLUE .045 -.007 --------------------------------------------------------------------------------------------- QQQ 233.36 3.37 229.66 97.8% Bullish BLUE .131 .046 --------------------------------------------------------------------------------------------- MDY 321.53 -1.82 309.03 192.2% Bearish BLUE .005 .116 --------------------------------------------------------------------------------------------- IWM 138.9 -.8 134.89 168.7% Bearish BLUE .136 .114 --------------------------------------------------------------------------------------------- FAS 32.28 -.69 27.81 760.7% ------- BLUE .022 .401 --------------------------------------------------------------------------------------------- RETL 129.88 1.45 115.25 655.3% Bearish BLUE .035 1.281 --------------------------------------------------------------------------------------------- SOXL 154.11 10.88 142.59 466.5% Bearish BLUE-.057 1.096 --------------------------------------------------------------------------------------------- TECL 194.65 6.71 186.66 254.9% Bullish BLUE .058 .702 --------------------------------------------------------------------------------------------- IBB 134.74 2.41 133.34 85.9% Bearish BLUE .048 .095 --------------------------------------------------------------------------------------------- GLD 162.53 .81 163.21 8.6% ------- RED .048 -.12 --------------------------------------------------------------------------------------------- OIH 118.76 -3.23 111.45 174% Bearish RED .084 .476 --------------------------------------------------------------------------------------------- |
Table 3 Count of Stocks in Key Directories
A ratio of new highs to new lows is considered Bearish.
Closing Power tends to show what NY Professionals expect.
Closing Power new highs are bullish and Closing Power new lows are bearish.
Consider is the percentage of CP NHs/ total NH (new highs) = 68/108
or CPNH - NH = -40
and how many more CP NLs there are than NLs (52-31 = 28) -28
Total score here = -68
20200529
-------------------------------
NEWHIGHS 108 (NYSE and NASDAQ)
NEWLOWS 31 (NYSE and NASDAQ)
MAXCP 68 (CP NHs)
MINCP 52 (CP NLs)
TTTNH 31
TTTNL 84
FASTUP 210
FASTDOWN 47
CPCROSSA 79
CPCROSSD 65
BIGVOLUP 10
BIGVODN 54
ACCUMVER 11
HIGHIP21 10
HIUPPCT 5
VHIP21 32
LOWACCUM 174
REDSELL 93
AUGSELS7 154
TRAPDOOR 19
|
Table 4 RANKING OF KEY DIRECTORIES BASED PCT.OF STOCKS ABOVE 65-DMA
5/29/20
Bullish = 43
Bearish = 3
---------------------------------------------------------------------------------------
Directory Current day-1 day-2 day-3 day-4 day-5
----------------------------------------------------------------------------------------
COPPER 1 1 1 1 1 1
EDU 1 1 1 1 1 1
ELECTRON 1 1 1 1 1 1
HACKERS 1 1 .9 .9 .9 .85
BONDFUND .97 .871 .742 .524 .425 .326
NASD-100 .969 .959 .929 .888 .838 .838
NIFTY .956 .956 .956 .934 .913 .934
AUTO .948 .948 .948 .897 .82 .794
CHEM .938 .959 .938 .918 .836 .857
INFRA .914 .914 .914 .8 .628 .657
SEMI .914 .904 .933 .914 .847 .904
GAMING .904 .904 .952 .952 .857 .952
GOLD .897 .877 .918 .897 .897 .897
FIDSTKS .892 .892 .87 .79 .677 .638
SOFTWARE .883 .916 .9 .85 .866 .833
HOMEBLDG .882 .882 .882 .823 .823 .823
SP-100 .879 .879 .824 .758 .615 .637
ETFS .875 .821 .821 .785 .571 .607
BEVERAGE .866 .866 .8 .533 .533 .533
DOWJONES .866 .9 .766 .766 .6 .633
SP500 .865 .873 .842 .766 .606 .595
BIGBANKS .857 .857 .857 .857 .285 .285
DJI-13 .846 .846 .846 .846 .615 .692
BIOTECH .829 .824 .842 .845 .832 .824
INDMATER .826 .84 .853 .786 .666 .76
INDEXES .82 .815 .782 .788 .684 .711
SOLAR .812 .812 .812 .812 .75 .875
GREEN .809 .809 .809 .761 .714 .714
RUS-1000 .809 .825 .82 .743 .586 .592
COMPUTER .8 .85 .9 .85 .75 .7
GUNS .8 .8 .866 .8 .533 .533
TRANSP .8 .8 .85 .8 .45 .5
UTILITY .769 .641 .461 .41 .205 .153
FINANCE .75 .797 .869 .619 .273 .309
MILITARY .74 .777 .777 .555 .481 .444
REGBANKS .73 .807 .923 .653 .269 .346
COAL .714 .714 .714 .714 .571 .571
HOSPITAL .714 .714 .761 .761 .714 .619
INSURANC .692 .769 .769 .653 .307 .269
OILGAS .692 .7 .684 .669 .615 .615
COMODITY .666 .589 .512 .564 .487 .512
RETAIL .66 .76 .82 .58 .56 .56
FOOD .566 .509 .471 .509 .433 .452
================================================================================================
CHINA .45 .372 .372 .372 .254 .509
REIT .432 .539 .581 .425 .226 .198
JETS .428 .428 .5 .428 0 0
|
====================================================================
5/28/2020 New Sell S5. 26000 is resistance. Watch Dollar and
Gold Closely.
Lower band will likely offer us a good place to buy.
The DJI's hypothetical high tagged 25000 which is just under its
200-day ma barrier. Our Peerless chart produced a new Sell S5.
This sell signal occurs because the DJI is overbought (4.8% over
the 21-dma certainly qualifies it as this.) and the P-Indication (21-dma
of advances minus declines) did not confirm. As I have shown, Sell S5s
typically produce a 5% decline. In addition, we see today that the DJI
closed 4.8% over the 21-day ma with the IP21 (-.077) and VI (61)
in negative territory.
Reaching the 4.8% upper band with a negative IP21 occurred on
17 separate occasions since 1929. My research tonight shows that
the DJI promptly fell to the lower band in 12 of these cases. But in most
of these cases, the P-I breadth indicator was negative, which cannot be
said to be true now. There have only been four cases since 1929 where
the P-I was also negative. In three of these cases, the DJI fell to the lower
band. I conclude, the odds favor now a DJI decline to the lower band again
before it can get past the 200-day ma resistance just above 26000.
IP21 NNCs when DJI is >4.5% over 21-dma
and P-I Is Positive
Date la/ma
P-I IP21
Result
-------------------------------------------------------------------------
9/9/1932 1.054 +85 -.05 DJI fell
from 76.2 to 65.1
1/11/1933 1.056 +2 -.083 DJI fell from
63.8 to 50.2
4/11/1933 1.050 +26 -.082 DJI rose strongly from 62
4/29/2020 1.063 +386 -.063 DJI fell from 24634 to 23248
-------------------------------------------------------------------------
In addition, our Vitality Index is now quite negative and the Cumulative
Inverted Traders Index is falling and below its 21-dma, just as it was
at the February top. These, too, are warnings.
But "QE Infinity" and superb breadth have been the market's
salvation here. The FED dares not lose control of this market.
If confidence in it and the Dollar breakdown, interest rates might
have to rise. The Dollar did break its support slightly today
and Gold looks like it wants to try making another run.
If there is another decline, it should be shallow. Look below
how more than 80% of all stocks, ETFs and Indexes are above
the support of their 65-dma. The history of augmented 5:1
(adv/declines) Buy B4s teaches us from its occurrences in 2009,
2010 and 2011 to believe that there will be more recovery highs. So,
while the odds favor another pull-back, we should probably look
upon it as a buying opportunity until the NYSE A/D Line uptrend
is broken.
Note below the new Sell S5, the PI-NC, the falling and negative IP21,
the falling cumul. Inverted Traders Index and the falling and
negative Vitality Index. The momentum is up, as shown
by the fact that 80% of all stocks are now above
their 65-dma. This should strictly contain any decline. If
not, the FED and the market will be in big trouble.


|
Charts 5/28/2020 (Click on Underlined link.) 2020 PEERLESS DJI, Signals, Indicators Daily DJI Volume 10-DayUp/Down Vol Stoch-20 Inverted Traders Index Graph of Pct of All Stocks above 65-dma Cum. Inverted Traders Index NASDAQ S&P OEX NYSE COMPQX DJI-15 DJI-20 DJI-30 DIA QQQ MDY IWM TNA Short-Term Rates SPY http://tigersoft.com/2121CST/SPY.GIF recent 2006 vers-Peerless signals -- www.tigersoft.com/NEWPEER/2006vers.jpg USO-CrudeOil DBO FAS GLD BBH IBB JETS JNUG KOL NUGT OIH PALL RSX RETL SDS AGQ SLV SOXL TECL TLT TMF TNA UGA (gasoline) USO (oil) and China: YINN CHAU Commodities: CANE CORN DBC JJC, NIB, CHOC CORN, CUT (paper) MOO, SOYB WEAT UUP (Dollar) LIT (Lithium) Stocks AAPL ADBE ALXN AMAT AMGN AMD AMZN AXP BA BABA BAC BIDU BLDP CAT CVX CMG DE ENPH FB GILD GOOG GS HD IBM INTU JPM LRCX M (Macy's) MSFT NEM NFLX NKE NVDA PG REGN SO SQ QCOM QDEL TSLA TXN XOM V VRTX WFC WMT TOWN New highs and Bullish MAXCPs http://tigersoft.com/MAXCP/5-28/BULLISH.htm Bearish MAXCPs - http://tigersoft.com/MINCP/5-28/BEARISH.htm |
Table 1
5/28/2018 QUICKSILVER on DJI-30 STOCKS.
Considering just those stocks whose IP21 + ITRS score is >+.25 or <-.25
1 Bullish (NKE
98
7 Bearish ( JPM KO MRK UTX VZ WBA WMT
-100 -47 -79 -114 -56 -42 -124
----------------------------------------
Vitality Score = -435
Note that AAPL now shows highest AI/200 stock here. STOCKS CLOSE CHANGE PIVOT-P 5-dma AROC CL-PWR Candl AI/200 IP21 ITRS --------------------------------------------------------------------------------------- --------------------------------------------------------------------------------------- AAPL 318.25 .14 316.85 -15.4% Bullish BLUE 159 .153 .067 --------------------------------------------------------------------- AXP 98.06 -3.17 89.83 393.7% ------- RED 81 -.022 -.059 --------------------------------------------------------------------- BA 149.82 .3 139 585.9% Bearish RED 62 -.074 .015 --------------------------------------------------------------------- CAT 120.74 -1.68 114.06 216.9% Bearish RED 141 -.003 .013 --------------------------------------------------------------------- CSCO 45.6 -.36 44.64 17.7% ------- RED 78 -.06 .093 --------------------------------------------------------------------- CVX 90.87 -3.03 92.04 -115.1% Bearish RED 78 -.128 .094 --------------------------------------------------------------------- DIS 116.75 -4.78 117.83 -132.5% Bullish RED 86 .066 .057 --------------------------------------------------------------------- GS 201.22 -8.44 180.1 522.1% ------- RED 103 .022 .077 --------------------------------------------------------------------- HD 245.14 -2.22 240.88 143.5% Bullish RED 132 -.01 .22 --------------------------------------------------------------------- IBM 124.53 -1.01 119.12 129.9% Bearish RED 136 -.1 -.024 --------------------------------------------------------------------- INTC 61.7 -1.86 61.98 -111.7% ------- RED 122 .024 .041 --------------------------------------------------------------------- JNJ 146.97 2.08 146.71 -24.4% Bearish BLUE 124 -.068 -.116 --------------------------------------------------------------------- JPM 99.86 -1.51 90.17 455.5% ------- RED 93 -.161 -.126 Bearish --------------------------------------------------------------------- KO 47.09 .36 45.17 131.1% Bearish RED 107 -.284 -.193 Bearish --------------------------------------------------------------------- MCD 188.73 1.01 185.08 125% ------- RED 106 .068 .087 --------------------------------------------------------------------- MMM 156.82 -1.33 145.81 237.3% Bearish RED 97 .1 -.025 --------------------------------------------------------------------- MRK 79.04 1.49 76.55 139.7% ------- BLUE 85 -.204 -.13 Bearish --------------------------------------------------------------------- MSFT 181.4 -.41 183.43 -116.3% Bullish BLUE 154 .069 .046 --------------------------------------------------------------------- NKE 98.46 -1.41 94.26 288.5% Bullish RED 117 .109 .218 Bullish --------------------------------------------------------------------- PFE 38.18 .77 37.26 73.4% ------- BLUE 54 -.038 -.004 --------------------------------------------------------------------- PG 116.06 2.17 111.62 123.4% ------- BLUE 89 -.038 -.21 --------------------------------------------------------------------- TRV 107.59 .77 99.17 596.5% ------- RED 98 .021 -.076 --------------------------------------------------------------------- UNH 303.97 .2 286.91 273% ------- RED 125 -.192 .053 --------------------------------------------------------------------- UTX 86.01 -5.36 97.15 -958.4% Bullish RED 114 .144 -.632 Bearish --------------------------------------------------------------------- V 194.26 1.44 190.62 10.4% Bullish BLUE 121 -.065 .039 --------------------------------------------------------------------- VZ 55.72 .58 53.97 134.3% Bearish BLUE 131 -.133 -.166 Bearish --------------------------------------------------------------------- WBA 41.83 -1.14 39.75 206.5% Bearish RED 81 -.04 -.348 Bearish --------------------------------------------------------------------- WMT 123.69 1.21 124.99 -70.8% Bearish BLUE 83 -.213 -.154 Bearish --------------------------------------------------------------------- XOM 45.04 -1.2 44.56 -36.4% Bearish RED 45 -.173 .032 --------------------------------------------------------------------- DOW 38.71 -1.11 35.82 338.7% Bullish RED 65 -.075 .264 |
Table 2 QUICKSILVER on ETFS - 05/28/20 Bullish = RETL OIH SOXL TECL
Bearish =
ETF CLOSE CHANGE PIVOT-PT 5-dma AROC CL-PWR CANDLE IP21 ITRS --------------------------------------------------------------------------------------------- --------------------------------------------------------------------------------------------- DIA 254.35 -1.42 245.02 173.6% ------- RED -.054 0 --------------------------------------------------------------------------------------------- SPY 302.97 -.56 294.88 101.4% ------- RED .014 .007 --------------------------------------------------------------------------------------------- QQQ 229.99 -.3 228.87 -30.5% Bullish BLUE .111 .071 --------------------------------------------------------------------------------------------- MDY 323.35 -4.81 309.31 247% ------- RED .006 .068 --------------------------------------------------------------------------------------------- IWM 139.7 -3.39 134.24 208% Bearish RED .124 .098 --------------------------------------------------------------------------------------------- FAS 32.97 -.71 27.62 833.3% ------- RED .022 .073 --------------------------------------------------------------------------------------------- RETL 128.43 -9.79 113.61 893.2% Bearish RED .045 .857 Bullish --------------------------------------------------------------------------------------------- SOXL 143.23 -10.06 140.55 -311.2% Bearish RED -.051 .441 Bullish --------------------------------------------------------------------------------------------- TECL 187.94 -1.44 185.11 -114.9% Bullish BLUE .067 .536 Bullish --------------------------------------------------------------------------------------------- IBB 132.33 .33 132.47 -59.6% ------- BLUE-.023 .115 --------------------------------------------------------------------------------------------- GLD 161.72 .54 162.25 -90.2% ------- RED .122 -.065 --------------------------------------------------------------------------------------------- OIH 121.99 .22 114.67 292.7% ------- RED .1 .364 Bullish --------------------------------------------------------------------------------------------- YINN 25.98 -.06 26.26 -53.5% Bullish -----.1 .907 --------------------------------------------------------------------------------------------- RSX 20.74 .1 20.37 34.2% Bearish ---- .018 .124 |
Table 3 Count of Stocks in Key Directories
20200528
-------------------------------
NEWHIGHS 121 Bullish (10:1)
NEWLOWS 12
MAXCP 30
MINCP 72
TTTNH 19
TTTNL 99
FASTUP 303
FASTDOWN 47
CPCROSSA 53
CPCROSSD 509
BIGVOLUP 8
BIGVODN 13
ACCUMVER 7
HIGHIP21 7
HIUPPCT 3
VHIP21 33
AUGSELS7 154
TRAPDOOR 17
|
RANKING OF KEY DIRECTORIES BASED PCT.OF STOCKS ABOVE 65-DMA
5/28/20
Bullish = 44
Bearish = 2
---------------------------------------------------------------------------------------
Directory Current day-1 day-2 day-3 day-4 day-5
----------------------------------------------------------------------------------------
COPPER 1 1 1 1 1 1
EDU 1 1 1 1 1 1
HACKERS 1 .95 .9 .9 .85 .9
CHEM .959 .938 .918 .836 .836 .857
NASD-100 .959 .939 .898 .838 .808 .868
NIFTY .956 .956 .934 .913 .913 .891
AUTO .95 .95 .9 .825 .8 .8
SOFTWARE .916 .916 .85 .866 .783 .85
INFRA .914 .914 .8 .628 .628 .6
GAMING .904 .952 .952 .857 .904 .904
SEMI .904 .933 .914 .847 .857 .914
DOWJONES .9 .766 .766 .6 .633 .666
FIDSTKS .892 .87 .79 .677 .615 .655
HOMEBLDG .882 .882 .823 .823 .823 .823
SP-100 .879 .824 .758 .615 .604 .648
GOLD .877 .918 .897 .897 .897 .918
SP500 .873 .844 .766 .606 .572 .604
ELECTRON .872 .892 .865 .771 .765 .812
BONDFUND .871 .742 .524 .425 .297 .306
BEVERAGE .866 .8 .533 .533 .466 .533
BIGBANKS .857 .857 .857 .285 .285 .285
COMPUTER .85 .9 .85 .75 .7 .8
DJI-13 .846 .846 .846 .615 .692 .769
INDMATER .84 .853 .786 .666 .733 .72
RUS-1000 .825 .822 .744 .587 .566 .588
BIOTECH .821 .837 .845 .832 .81 .808
ETFS .821 .821 .785 .571 .589 .66
INDEXES .815 .782 .788 .684 .695 .722
SOLAR .812 .812 .812 .75 .812 .875
GREEN .809 .809 .761 .714 .714 .714
REGBANKS .807 .923 .653 .269 .307 .346
GUNS .8 .866 .8 .533 .466 .533
TRANSP .8 .85 .8 .45 .5 .5
FINANCE .797 .869 .619 .273 .285 .273
MILITARY .777 .777 .555 .481 .407 .296
INSURANC .769 .769 .653 .307 .269 .192
RETAIL .76 .82 .58 .56 .54 .54
COAL .714 .714 .714 .571 .571 .571
HOSPITAL .714 .761 .761 .714 .619 .619
OILGAS .702 .687 .671 .618 .587 .625
UTILITY .641 .461 .41 .205 .153 .179
COMODITY .589 .512 .564 .487 .512 .512
REIT .539 .581 .425 .226 .17 .156
FOOD .509 .471 .509 .433 .452 .452
-----------------------------------------------------------------------------------------------
JETS .428 .5 .428 0 0 0
CHINA .372 .372 .372 .254 .45 .529
|
=======================================================================
5/27/2020 Breadth is king and the FED wants still higher prices. But
the
QQQ and NASDAQ have stopped participating. We have to
wait before making new commitment and would sell QQQ and
the NASDAQ. Today, the DJI rose in large part
because of big
bounces in beaten down Financials, Oils and Boeing. Is this a
bottom-of-the-barrell" final bounce. The poor Vitality readings
would argue that. But, high priced UNH could make a bullish
flat-topped breakout and AAPL might run 30 points if it can
score a new high. So, 26000 and the 200-day ma remain the DJI's
target now.
Our 2006 Peerless program tells us to just stick with the
rising A/D
Line trend if we are trading the DJI. But with the 200-day ma not very
far overhead, buying DIA at this stage offers us little upside potential.
I also take the negative IP21 with the DJI nearly 6% over the 21-day ma
as a sign of dangerous sign of steady big money distribution as the DJI
approaches 26000.


|
Look at all the excellent breadth days since March when the FED announced they would spend a trillion + dollars on US corporate bonds. From c:\peerless\DATA.txt Green: NYSE Advances and Declines 3,23,20,19592.16,17939.76,18591.93,676,2760,395.245,1170.901 3,24,20,20892.91,19295.85,20704.91,2791,244,1593.829,95.450 3,25,20,22261.96,20309.10,21200.55,2422,587,1437.103,369.530 3,26,20,22826.51,21217.71,22552.17,2649,369,1381.290,237.237 3,27,20,22427.69,21246.31,21636.78,655,2355,204.957,1144.290 3,30,20,22497.10,21337.49,22327.48,1801,1198,682.747,554.661 3,31,20,22698.93,21688.94,21917.16,1326,1660,737.976,1001.994 4,1,20,21637.26,20670.87,20943.51,209,2801,96.695,1202.130 4,2,20,21710.91,20502.87,21413.44,1759,1198,839.673,484.633 4,3,20,21614.86,20733.17,21052.53,632,2340,492.286,933.460 4,6,20,22857.61,21676.88,22679.99,2733,276,1311.881,116.055 4,7,20,23892.32,22548.65,22653.86,2175,816,1029.939,439.262 4,8,20,23698.02,22647.58,23433.57,2675,325,1126.401,83.058 4,9,20,24268.81,23309.54,23719.37,2584,422,1177.791,317.772 4,13,20,23859.88,22999.50,23390.77,750,2214,318.685,829.428 4,14,20,24343.22,23449.66,23949.76,2229,745,739.754,405.765 4,15,20,23889.42,23035.82,23504.35,480,2493,114.054,1002.876 4,16,20,23909.62,23026.44,23537.68,1104,1864,336.938,773.072 4,17,20,24542.81,23687.33,24242.49,2537,400,1216.641,171.272 4,20,20,24248.38,23482.12,23650.44,670,2294,238.946,841.261 4,21,20,23549.50,22751.83,23018.88,588,2365,182.552,839.919 4,22,20,23802.89,23169.26,23475.82,2084,881,715.142,289.057 4,23,20,24024.54,23325.11,23515.26,1817,1135,700.165,351.755 4,24,20,23989.04,23316.93,23775.27,1835,1107,624.215,418.319 4,27,20,24391.23,23673.55,24133.78,2329,644,804.570,159.384 4,28,20,24704.26,23900.67,24101.55,2139,822,794.923,232.056 4,29,20,24989.68,24241.39,24633.86,2628,365,1029.822,188.243 4,30,20,24734.96,23989.07,24345.72,794,2161,382.591,1133.898 5,1,20,24251.65,23513.06,23723.69,436,2534,80.074,840.352 5,4,20,23896.69,23226.15,23749.76,1369,1569,425.050,526.421 5,5,20,24369.24,23729.89,23883.09,1644,1306,429.978,484.902 5,6,20,24207.96,23565.11,23664.64,900,2030,170.816,713.597 5,7,20,24237.42,23644.07,23875.89,2145,771,683.444,249.080 5,8,20,24478.41,23994.95,24331.32,2479,488,816.506,90.519 5,11,20,24479.71,23922.43,24221.99,1007,1913,259.763,741.530 5,12,20,24524.21,23739.41,23764.78,679,2262,176.013,754.335 5,13,20,23868.41,23004.71,23247.97,326,2648,109.336,1007.278 5,14,20,23737.12,22673.17,23625.34,1614,1353,731.743,318.841 5,15,20,23959.26,23212.94,23685.42,1658,1268,752.070,605.195 5,18,20,24876.53,24156.99,24597.37,2647,331,1089.984,107.634 5,19,20,24811.73,24138.20,24206.86,1141,1801,235.267,636.217 5,20,20,24851.72,24291.10,24575.90,2361,587,719.512,189.504 5,21,20,24852.24,24260.03,24474.12,1542,1395,446.132,508.419 5,22,20,24647.58,24211.66,24465.16,1648,1275,322.081,383.566 5,26,20,25410.15,24743.51,24995.11,2493,466,938.626,196.790 5,27,20,25699.48,24903.46,25548.27,2421,550,938.218,194.160 |
The superb breadth gave a Buy B20 on the 2006 version of Peerless
and an augmented Buy B4 on the new Peerless-DJI chart.|
2006-Version of Peerless

But the truth is this rally's engines are sputtering. The Relative
Strength uptrends for QQQ and the NASDAQ (COMPQX) have
been broken. After a big advance, this is a dangerous development.
See the QQQ-RSQ charts for 2000, 2008 and 2009 just below.
They tell me that the QQQ and NASDAQ should be sold now.


QQQ top in 2000 |
QQQ top in 2007 |
QQQ top in 2008 |
|
Charts 5/27/2020 (Click on Underlined link.) 2020 PEERLESS DJI, Signals, Indicators Daily DJI Volume 10-DayUp/Down Vol Stoch-20 Inverted Traders Index Graph of Pct of All Stocks above 65-dma Cum. Inverted Traders Index NASDAQ S&P OEX NYSE COMPQX DJI-15 DJI-20 DJI-30 DIA QQQ MDY IWM TNA Short-Term Rates SPY http://tigersoft.com/2121CST/SPY.GIF recent 2006 vers-Peerless signals -- www.tigersoft.com/NEWPEER/2006vers.jpg USO-CrudeOil DBO FAS GLD BBH IBB JETS JNUG KOL NUGT OIH PALL RSX RETL SDS AGQ SLV SOXL TECL TLT TMF TNA UGA (gasoline) USO (oil) and China: YINN CHAU Commodities: CANE CORN DBC JJC, NIB, CHOC CORN, CUT (paper) MOO, SOYB WEAT UUP (Dollar) LIT (Lithium) Stocks AAPL ADBE ALXN AMAT AMGN AMD AMZN AXP BA BABA BAC BIDU BLDP CAT CVX CMG DE ENPH FB GILD GOOG GS HD IBM INTU JPM LRCX M (Macy's) MSFT NEM NFLX NKE NVDA PG REGN SO SQ QCOM QDEL TSLA TXN XOM V VRTX WFC WMT TOWN New highs and Bullish MAXCPs http://tigersoft.com/MAXCP/5-27/BULLISH.htm Bearish MAXCPs - http://tigersoft.com/MINCP/5-27/BEARISH.htm |
Table 1
5/27/2018 QUICKSILVER on DJI-30 STOCKS.
Considering just those stocks whose IP21 + ITRS score is >+.25 or <-.25
2 Bullish (NKE DOW
100 40 = 140
8 Bearish ( JPM KO MRK PG UTX VZ WBA WMT
-101 -47 -78 -114 -86 -55 -43 -142
--------------------------------------------
Vitality Score = -506
Note that AAPL now shows highest AI/200 stock here. STOCKS CLOSE CHANGE PIVOT-P 5-dma AROC CL-PWR Candl AI/200 IP21 ITRS --------------------------------------------------------------------------------------- --------------------------------------------------------------------------------------- AAPL 318.11 1.38 319.23 78.4% Bullish BLUE 158 .135 .05 --------------------------------------------------------------------- AXP 101.23 6.91 90.73 773.6% Bullish BLUE 82 .069 -.084 --------------------------------------------------------------------- BA 149.52 4.79 133.32 696.3% ------- RED 62 -.046 -.11 --------------------------------------------------------------------- CAT 122.42 5.01 115.69 452.2% ------- BLUE 142 .025 .047 --------------------------------------------------------------------- CSCO 45.96 1.12 45.44 151.5% ------- BLUE 78 -.064 .1 --------------------------------------------------------------------- CVX 93.9 .6 93 233.5% Bearish RED 79 -.084 .084 --------------------------------------------------------------------- DIS 121.53 .58 119.92 302.8% Bullish RED 86 .065 .016 --------------------------------------------------------------------- GS 209.66 13.6 181.44 869.3% Bullish BLUE 103 .081 .092 --------------------------------------------------------------------- HD 247.36 4.88 238.19 192.7% Bullish BLUE 133 -.008 .236 --------------------------------------------------------------------- IBM 125.54 3.78 121.38 218.4% ------- BLUE 137 -.086 .004 --------------------------------------------------------------------- INTC 63.56 1.22 63.1 263.7% Bullish BLUE 121 .027 .162 --------------------------------------------------------------------- JNJ 144.89 .33 147.68 -141% Bearish BLUE 124 -.091 -.123 --------------------------------------------------------------------- JPM 101.37 5.55 91.33 697.1% ------- RED 94 -.161 -.116 Bearish --------------------------------------------------------------------- KO 46.73 .64 45.89 241.5% Bearish RED 107 -.312 -.231 Bearish --------------------------------------------------------------------- MCD 187.72 2.88 184.1 221.9% ------- RED 106 .027 -.003 --------------------------------------------------------------------- MMM 158.15 6.07 149.68 329% Bearish BLUE 96 .065 -.055 --------------------------------------------------------------------- MRK 77.55 .29 76.89 0% ------- BLUE 86 -.178 -.154 Bearish --------------------------------------------------------------------- MSFT 181.81 .24 185.66 -49.6% ------- BLUE 153 .052 .079 --------------------------------------------------------------------- NKE 99.87 3.25 92.95 445.5% Bullish BLUE 116 .123 .232 Bullish --------------------------------------------------------------------- PFE 37.41 -.08 37.63 -36% ------- ---- 54 -.08 -.024 --------------------------------------------------------------------- PG 113.89 1.86 113.28 64.5% Bearish BLUE 89 -.051 -.213 Bearish --------------------------------------------------------------------- TRV 106.82 3.46 95.54 689.3% ------- RED 97 .025 -.008 --------------------------------------------------------------------- UNH 303.77 8.88 287.99 254% ------- BLUE 125 -.179 .087 --------------------------------------------------------------------- UTX 86.01 -5.36 97.15 -958.4% Bullish RED 114 .144 -.704 Bearish --------------------------------------------------------------------- V 192.82 -.4 193.86 90.3% Bullish RED 122 -.073 .005 --------------------------------------------------------------------- VZ 55.14 .84 54.26 70.1% Bearish BLUE 131 -.19 -.182 Bearish --------------------------------------------------------------------- WBA 42.97 .81 40.14 397.2% Bearish BLUE 81 -.014 -.31 Bearish --------------------------------------------------------------------- WMT 122.48 -1.38 125.45 -99% Bearish RED 83 -.224 -.116 Bearish --------------------------------------------------------------------- XOM 46.24 .33 45.37 256.3% Bearish RED 45 -.12 .078 --------------------------------------------------------------------- DOW 39.82 1.03 36.18 572.4% Bullish RED 65 -.028 .547 Bullish |
Table 2 QUICKSILVER on ETFS - 05/26/20 Bullish = RETL OIH SOXL TECL
Bearish =
ETF CLOSE CHANGE PIVOT-PT 5-dma AROC CL-PWR CANDLE IP21 ITRS --------------------------------------------------------------------------------------------- --------------------------------------------------------------------------------------------- DIA 255.77 5.52 245.73 275.8% ------- BLUE-.048 ---- --------------------------------------------------------------------------------------------- SPY 303.53 4.45 296.93 195.5% ------- BLUE-.002 .002 --------------------------------------------------------------------------------------------- QQQ 230.29 1.25 231.39 74.8% Bullish BLUE .09 .097 --------------------------------------------------------------------------------------------- MDY 328.16 8.31 307.8 434.6% ------- BLUE .023 .084 --------------------------------------------------------------------------------------------- IWM 143.09 4.31 134 484.8% ------- BLUE .137 .118 --------------------------------------------------------------------------------------------- FAS 33.68 2.62 28.03 1295.2% ------- RED .007 .092 --------------------------------------------------------------------------------------------- RETL 138.22 13.04 107.02 1418.6% ------- BLUE .049 1.037 Bullish --------------------------------------------------------------------------------------------- SOXL 153.29 6.28 152.39 572% ------- BLUE-.08 .658 Bullish --------------------------------------------------------------------------------------------- TECL 189.38 2.7 192.26 231.4% ------- BLUE .054 .627 Bullish --------------------------------------------------------------------------------------------- IBB 132 1.19 133.91 29.8% ------- BLUE-.019 .135 --------------------------------------------------------------------------------------------- GLD 161.18 .29 164.65 -94.4% Bullish BLUE .155 -.125 --------------------------------------------------------------------------------------------- OIH 121.77 4.09 115.19 600.4% ------- BLUE .151 .298 Bullish --------------------------------------------------------------------------------------------- GASL 3440 285 3685 -325.1% ------- RED -.021 -.15 --------------------------------------------------------------------------------------------- |
Table 3 Count of Stocks in Key Directories
20200527
-------------------------------
NEWHIGHS 70
NEWLOWS 19
MAXCP 56
MINCP 25
TTTNH 22
TTTNL 66
FASTUP 652
FASTDOWN 29
CPCROSSA 119
CPCROSSD 83
BIGVOLUP 12
BIGVODN 9
ACCUMVER 9
HIGHIP21 11
HIUPPCT 4
REDSELL 100
AUGSELS7 117
TRAPDOOR 19
|
Table 4 RANKING OF KEY DIRECTORIES BASED PCT.OF STOCKS ABOVE 65-DMA
5/27/20
Bullish = 42
Bearish = 3
---------------------------------------------------------------------------------------
Directory Current day-1 day-2 day-3 day-4 day-5
----------------------------------------------------------------------------------------
COPPER 1 1 1 1 1 .875
EDU 1 1 1 1 1 1
NIFTY .956 .934 .913 .913 .891 .913
GAMING .952 .952 .857 .904 .904 .809
AUTO .95 .9 .825 .8 .8 .65
HACKERS .95 .95 .9 .85 .9 .8
NASD-100 .939 .909 .848 .808 .848 .818
CHEM .938 .918 .836 .836 .816 .714
SEMI .933 .914 .847 .857 .895 .79
REGBANKS .923 .653 .269 .307 .346 .192
GOLD .918 .897 .897 .897 .897 .918
SOFTWARE .916 .866 .866 .783 .85 .7
INFRA .914 .8 .628 .628 .6 .342
COMPUTER .9 .85 .75 .7 .8 .75
ELECTRON .892 .865 .771 .765 .791 .724
HOMEBLDG .882 .823 .823 .823 .823 .764
FIDSTKS .87 .79 .677 .615 .644 .61
FINANCE .869 .619 .273 .285 .273 .214
GUNS .866 .8 .533 .466 .533 .466
BIGBANKS .857 .857 .285 .285 .285 .142
INDMATER .853 .786 .666 .733 .706 .626
TRANSP .85 .8 .45 .5 .5 .45
DJI-13 .846 .846 .615 .692 .769 .538
SP500 .844 .768 .606 .572 .583 .538
BIOTECH .834 .84 .832 .81 .805 .762
SP-100 .824 .758 .615 .604 .615 .56
RUS-1000 .822 .745 .587 .566 .568 .519
ETFS .821 .785 .571 .589 .66 .571
RETAIL .82 .58 .56 .54 .52 .5
SOLAR .812 .812 .75 .812 .812 .812
GREEN .809 .761 .714 .714 .714 .714
BEVERAGE .8 .533 .533 .466 .533 .533
INDEXES .788 .788 .684 .695 .717 .641
MILITARY .777 .555 .481 .407 .296 .37
INSURANC .769 .653 .307 .269 .153 .115
DOWJONES .766 .766 .6 .633 .666 .566
HOSPITAL .761 .761 .714 .619 .571 .571
BONDFUND .742 .524 .425 .297 .287 .247
COAL .714 .714 .571 .571 .571 .571
OILGAS .687 .671 .618 .587 .618 .534
REIT .581 .425 .226 .17 .141 .127
COMODITY .512 .564 .487 .512 .512 .41
===============================================================================================
JETS .5 .428 0 0 0 0
===============================================================================================
FOOD .471 .509 .433 .452 .452 .377
UTILITY .461 .41 .205 .153 .179 .179
CHINA .372 .372 .254 .45 .529 .529
|
=======================================================================
5/26/2020
I
would treat the current Peerless signal to be a new augmented
Buy B4, based on the series of now 10+ days where daily NYSE advances
were more than 5x the decliners in the last three months. The augmented
Buy B4 (explained below) tests well and it reflects the current reality, namely
that the Fed can set prices on Wall Street as much as it chooses, in times
like these. The A/D Line uptrend will have to be watched. "The Fed
maketh and taketh". But for now, I would expect the DJI to reach its
200-day ma. So, I would continue to hold long the NASDAQ, QQQ and
IBB. So...It is best to avoid the short-side. Watch to see if some of the
low-priced MAXCPs get renewed "animal spirits".
Both Gold and the
Dollar declined today in favor of Crude Oil.
The DJI's big jump to 25000 today was not matched by the
NASDAQ, QQQ or
IBB. The gain today grew out of rises in the previously beaten down
sectors (especially oil, airlines and financials). Shorts are being run in and
even with the trillions provided to Wall Street by the Fed, traders decided
to take profits in the last two hours in stocks like AAPL and MSFT.
I suspect that this will not prevent the DJI from heading up another 1000
points to its 200-day ma. If it does this, it will match what the it did
in its 1929-1930 recovery. See that immediately below. And if the 1930
top were to exactly repeat now in 2020, we would then see the next serious reversal
back down not only at the falling 200-day ma, but when Peerless gives a
a Sell S9, the uptrend of the A/D Line is broken and then a day or two later,
the IP21 and OBVPct break their 21-day ma.
1929-1930 Scenario Tells Us
to be wary after DJI reaches 200-day ma, especially if
NYSE breadth weakens and we get a classic Sell S9.

Another 5:1 Adv/Dec Day Today!

Today brought the 10th 5:1 Adv/declines Buy B4 day since the
Fed
reported their plans to buy trillions in corporate bonds. See above. I believe that
we should treat the a sixth occurrence within the last forty trading days
as very bullish. The augmented B4 I have created tonight marks such
a cluster of six 5:1 B4s when the DJI is below its 21-day ma. As you can
see further below, this signal would have given us an excellent time to buy
in the past (notably 2009, 2010 and 2011). We can have more confidence
in this augmented Buy B4, I think, because we also know the cause, namely
the FED's telling favored NY traders, bankers and brokers of their continuing
intentions to add vast amounts of liquidity into Wall Street.
Sometimes.. There Is a Conspiracy.
Someone should write a book or "spill the beans" on them. The FED is
seldom
accused of "insider trading". Never have they been prosecuted for
it. They
have too many friends in high places...
https://theintercept.com/2017/04/07/a-federal-reserve-bank-ignored-insider-trading-investigation-when-reappointing-its-president/
https://www.frbatlanta.org/research/publications/economic-review/1997/q4/vol82no4_insider-trading-debate.aspx
(Suppressed)
https://www.wsj.com/articles/questions-about-leak-at-federal-reserve-escalate-to-insider-trading-probe-1443650303
https://www.reuters.com/article/us-usa-fed-probe/u-s-launches-insider-trading-probe-into-federal-reserve-leak-wsj-idUSKCN0RU2WW20150930
https://www.wanttoknow.info/financialbankingcoverup?gclid=EAIaIQobChMI6a792v3T6QIVEdvACh0u1QnCEAAYASAAEgIMlvD_BwE
Computerized buy programs are just the tool used by Wall Street insiders
to take advantage of this inside information. The real problem is the Fed's
lack of transparency and their control over vast sums of money with very
weak oversight. This won't change, so we must use these augmented B4s
to track the FED in times like these. At some point, the FED will back off.
We should see that when the NYSE A/D Line weakens.
Augmented Buy B4s - Six 5:1 Adv/dec Clusters in 40 trading days.
2020 - Fed' Trillion Dollar Recovery

2009 - Take Off

2010 - Basing before bull market resumes.

2011 - Basing before bull market resumes.

|
Charts 5/26/2020 (Click on Underlined link.) 2020 PEERLESS DJI, Signals, Indicators Daily DJI Volume 10-DayUp/Down Vol Stoch-20 Inverted Traders Index Graph of Pct of All Stocks above 65-dma Cum. Inverted Traders Index NASDAQ S&P OEX NYSE COMPQX DJI-15 DJI-20 DJI-30 DIA QQQ MDY IWM TNA Short-Term Rates SPY http://tigersoft.com/2121CST/SPY.GIF recent 2006 vers-Peerless signals http://tigersoft.com/PEERLESS/2006vers.jpg USO-CrudeOil DBO FAS GLD BBH IBB JETS JNUG KOL NUGT OIH PALL RSX RETL SDS AGQ SLV SOXL TECL TLT TMF TNA UGA (gasoline) USO (oil) and China: YINN CHAU Commodities: CANE CORN DBC JJC, NIB, CHOC CORN, CUT (paper) MOO, SOYB WEAT UUP (Dollar) LIT (Lithium) Stocks AAPL ADBE ALXN AMAT AMGN AMD AMZN AXP BA BABA BAC BIDU BLDP CAT CVX CMG DE ENPH FB GILD GOOG GS HD IBM INTU JPM LRCX M (Macy's) MSFT NEM NFLX NKE NVDA PG REGN SO SQ QCOM QDEL TSLA TXN XOM V VRTX WFC WMT TOWN New highs and Bullish MAXCPs http://tigersoft.com/MAXCP/5-26/BULLISH.htm Bearish MAXCPs - http://tigersoft.com/MINCP/5-26/BEARISH.htm |
Table 1
5/26/2018 QUICKSILVER on DJI-30 STOCKS.
Considering just those stocks whose IP21 + ITRS score is >+.25 or <-.25
4 Bullish (NKE DOW
97 39 = 136
6 Bearish (BA JPM KO MRK UTX VZ
-145 -96 -46 -77 -86 -54 = -404
--------------------------- 136
Vitality Score = -268
Note that AAPL now shows highest AI/200 stock here. STOCKS CLOSE CHANGE PIVOT-P 5-dma AROC CL-PWR Candl AI/200 IP21 ITRS --------------------------------------------------------------------------------------- --------------------------------------------------------------------------------------- AAPL 316.73 -2.16 313.14 28% Bullish RED 157 .12 .061 --------------------------------------------------------------------- AXP 94.32 4.99 87.26 331.6% Bullish BLUE 82 .058 -.131 --------------------------------------------------------------------- BA 144.73 7.2 130.44 343.7% ------- RED 63 -.074 -.228 Bearish --------------------------------------------------------------------- CAT 117.41 4.94 112.08 104.9% Bearish BLUE 142 .019 .1 --------------------------------------------------------------------- CSCO 44.84 -.06 44.6 -24.5% ------- RED 78 -.091 .113 --------------------------------------------------------------------- CVX 93.3 3.02 89.62 41% Bearish BLUE 80 -.063 .04 --------------------------------------------------------------------- DIS 120.95 2.93 114.37 174.6% Bullish ---- 86 .097 .102 --------------------------------------------------------------------- GS 196.06 16.13 177.83 393.4% Bullish BLUE 103 .016 .028 --------------------------------------------------------------------- HD 242.48 .6 238.1 -59.6% Bullish RED 134 -.043 .101 --------------------------------------------------------------------- IBM 121.76 3.37 120.29 8.3% Bearish BLUE 138 -.152 .05 --------------------------------------------------------------------- INTC 62.34 .08 60.29 196.7% Bearish RED 120 .011 .067 --------------------------------------------------------------------- JNJ 144.56 .19 149.02 -201.8% Bearish RED 124 -.166 -.002 --------------------------------------------------------------------- JPM 95.82 6.35 88.67 298.3% ------- BLUE 95 -.171 -.156 Bearish --------------------------------------------------------------------- KO 46.09 1.06 44.54 124.1% Bearish RED 107 -.288 -.127 Bearish --------------------------------------------------------------------- MCD 184.84 .43 179.57 137.2% ------- RED 106 -.011 -.035 --------------------------------------------------------------------- MMM 152.08 5.64 148.38 95% Bearish BLUE 95 .036 -.005 --------------------------------------------------------------------- MRK 77.26 .89 77.55 -158.9% ------- RED 87 -.191 -.072 Bearish --------------------------------------------------------------------- MSFT 181.57 -1.94 183.63 -90.6% ------- RED 153 -.023 .065 --------------------------------------------------------------------- NKE 96.62 2.87 91.51 301% Bullish BLUE 115 .103 .2 Bullish --------------------------------------------------------------------- PFE 37.49 -.01 37.68 -77.1% ------- RED 54 -.08 .068 --------------------------------------------------------------------- PG 112.03 -.57 112.44 -184.6% Bearish RED 89 -.127 -.096 --------------------------------------------------------------------- TRV 103.36 3.26 93.27 416.9% ------- RED 97 .013 -.116 --------------------------------------------------------------------- UNH 294.89 4.95 289.05 26.4% ------- RED 126 -.242 .006 --------------------------------------------------------------------- UTX 86.01 -5.36 97.15 -958.4% Bullish RED 114 .144 -.519 Bearish --------------------------------------------------------------------- V 193.22 2.36 189.36 48.1% Bullish RED 123 -.057 .021 --------------------------------------------------------------------- VZ 54.3 .2 54.38 -130.3% Bearish RED 131 -.226 -.076 Bearish --------------------------------------------------------------------- WBA 42.16 2.56 39.77 162.4% Bearish BLUE 81 .015 -.165 --------------------------------------------------------------------- WMT 123.86 -.47 124.95 -151.4% Bearish RED 83 -.246 .007 --------------------------------------------------------------------- XOM 45.91 1.31 43.94 63.7% Bearish BLUE 45 -.084 .126 --------------------------------------------------------------------- DOW 38.79 2.67 35.64 283.9% ------- BLUE 66 .002 .432 Bullish |
Table 2 QUICKSILVER on ETFS - 05/26/20 Bullish = RETL and OIH
Bearish = FAS
ETF CLOSE CHANGE PIVOT-PT 5-dma AROC CL-PWR CANDLE IP21 ITRS --------------------------------------------------------------------------------------------- --------------------------------------------------------------------------------------------- DIA 250.25 5.37 242.22 88.3% ------- RED -.084 ----- --------------------------------------------------------------------------------------------- SPY 299.08 3.64 291.97 69.2% ------- RED -.041 .032 --------------------------------------------------------------------------------------------- QQQ 229.04 -.62 226.86 35.2% ------- RED .029 .113 --------------------------------------------------------------------------------------------- MDY 319.85 10.82 301.26 234.5% Bullish RED .01 .056 --------------------------------------------------------------------------------------------- IWM 138.78 3.89 130.06 229% ------- RED .114 .083 --------------------------------------------------------------------------------------------- FAS 31.06 3.25 26.38 571.7% ------- BLUE-.004 -.316 Bearish --------------------------------------------------------------------------------------------- RETL 125.18 9.93 106.04 667.6% Bullish RED .102 .352 Bullish --------------------------------------------------------------------------------------------- SOXL 147.01 4.42 136.83 299.6% ------- RED -.14 .053 --------------------------------------------------------------------------------------------- TECL 186.68 .02 180.76 101.6% ------- RED .019 .111 --------------------------------------------------------------------------------------------- IBB 130.81 -2.53 131.21 -111.7% Bearish RED -.106 .184 --------------------------------------------------------------------------------------------- GLD 160.89 -2.32 164.26 -55.1% ------- RED .13 .045 --------------------------------------------------------------------------------------------- OIH 117.68 6.23 108.15 165.1% ------- BLUE .14 .241 Bullish --------------------------------------------------------------------------------------------- |
Table 4 Count of Stocks in Key Directories
20200526
-------------------------------
NEWHIGHS 167 Bullish
NEWLOWS 14
MAXCP 31
MINCP 20
TTTNH 32
TTTNL 29
FASTUP 329
FASTDOWN 22
CPCROSSA 151
CPCROSSD 148
BIGVOLUP 15
BIGVODN 11
ACCUMVER 2
HIGHIP21 11
HIUPPCT 6
REDSELL 108
AUGSELS7 103
TRAPDOOR 19
|
Table 4 RANKING OF KEY DIRECTORIES BASED PCT.OF STOCKS ABOVE 65-DMA
5/26/20
Bullish = 42
Bearish = 4
---------------------------------------------------------------------------------------
Directory Current day-1 day-2 day-3 day-4 day-5
----------------------------------------------------------------------------------------
COPPER 1 1 1 1 .875 1
EDU 1 1 1 1 1 1
GAMING .952 .857 .904 .904 .761 .761
HACKERS .95 .95 .85 .9 .8 .85
NIFTY .934 .913 .913 .891 .913 .891
CHEM .918 .836 .836 .816 .693 .714
SEMI .914 .847 .857 .895 .79 .809
NASD-100 .909 .858 .818 .848 .808 .808
AUTO .9 .825 .8 .8 .625 .725
GOLD .897 .897 .897 .897 .897 .897
SOFTWARE .866 .883 .783 .85 .7 .7
ELECTRON .865 .771 .765 .791 .711 .731
BIGBANKS .857 .285 .285 .285 .142 .285
COMPUTER .85 .75 .7 .8 .7 .75
DJI-13 .846 .615 .692 .769 .461 .692
BIOTECH .837 .829 .813 .808 .765 .784
HOMEBLDG .823 .823 .823 .823 .764 .823
SOLAR .812 .75 .812 .812 .812 .75
GUNS .8 .533 .466 .533 .466 .533
INFRA .8 .628 .628 .6 .342 .371
TRANSP .8 .45 .5 .5 .45 .5
FIDSTKS .79 .677 .615 .644 .581 .621
INDEXES .788 .684 .695 .717 .625 .684
INDMATER .786 .666 .733 .706 .6 .626
ETFS .785 .571 .589 .66 .535 .571
SP500 .768 .608 .572 .583 .528 .568
DOWJONES .766 .6 .633 .666 .533 .7
GREEN .761 .714 .714 .714 .714 .714
HOSPITAL .761 .714 .619 .571 .571 .571
SP-100 .758 .615 .604 .615 .538 .615
RUS-1000 .745 .588 .566 .568 .5 .546
COAL .714 .571 .571 .571 .571 .571
OILGAS .671 .618 .587 .618 .534 .557
INSURANC .653 .307 .269 .153 .115 .153
REGBANKS .653 .269 .307 .346 .153 .269
FINANCE .619 .273 .285 .273 .202 .261
RETAIL .58 .56 .54 .52 .48 .46
COMODITY .564 .487 .512 .512 .41 .461
MILITARY .555 .481 .407 .296 .37 .37
BEVERAGE .533 .533 .466 .533 .533 .6
BONDFUND .524 .425 .297 .287 .237 .217
FOOD .509 .433 .452 .452 .377 .415
=================================================================================================
JETS .428 0 0 0 0 0
REIT .425 .226 .17 .141 .12 .134
UTILITY .41 .205 .153 .179 .179 .179
CHINA .372 .254 .45 .529 .49 .529
|
====================================================================
5/22/2020
The openings tomorrow will probably be 2% higher. This
- despite all the
warnings about a second Covud-19 wave and the reports that states like Georgia
and Florida are falsifying their Covid-19 death reports. A market that
goes up despite all the dangers and fears is a force to be reckoned with.
Even poll reports that Trump is falling behind Biden are not helding the
market back.
I would take the key resistance to be the round number
25000.
Not only would that be a breakout above flat resistance,
it would come after 11 days in the last two months where the
number of advances was more than 5x the number of decliners
in the NYSE. This should be bullish and will require closing
out short positions on DIA. The long positions in the NASDAQ
and QQQ should more than make up for the DIA short loss

We have never seen a "V" bottom after a 30%
decline. But that is what the
FED is seeking. Powell says there is no limit to how far he will go to boost
Wall Street in this dangerous situtation. There seems to be no political limits
to his political powers. He realizes that. He is not a trained economist. He
is
a Washington lawyer, highly experienced in power-plays and knowing where
his loyalties must lie. He even warns that "working people" will
long be under significant
financial pressure now. But that he says is Congress'es job. He is busy
helping
Wall Street.
The economic slow-down is probably ending. Thus, the plain fact is that most
working folks can't afford to not go back to work even if many of their associates
are untested and don't keep 6' away. Small businesses, too, are re-opening step
by step. They have to. So, of course, the market rises. How can it not,
especially with trillions being pumped into its bonds. People hope Trump is right.
The warm sunshine of Summer will kill the virus.

Our best way of recognizing a Fed-induced bull
market in these curcumstances,
I have argued, is with the many days where the NYSE advances to declines ratio
is better than 5:1. When we look back at past
occasions where there have been
a series of such 5:1 Adv/Dec days, we find only isolated cases before 2006. But
starting at the end of 2008, they pop up in bullish waves that precede much higher
prices..
See http://tigersoft.com/Five2One/INDEX.htm
There have been Eleven (11) 5:1 Adv:Dec Buy B4s since the March bottom
when the Fed announced they would put trillions into buying corporate bonds.
This is comparable to the March-May period of 2009, the May to August period in
2010 and the August to December period in 2011. Each would have been a very
good time to buy stocks.
In this way we can see what the FED is up to and how
savvy big traders are
responding. This is the track of the FED I have argued. On
any given day,
there sometimes is such bullish news that it brings a 5:1 day. But when we see
11 such days in three months, clearly it is not a random piece of news. It is
serial buying by informed insiders who know the Fed has their back.
When you look at all the 5:1 clusters since 2006, which I identify individually
as "B4s" on the DJI charts of these years, you will see see that they always
seem
to bring much higher prices. That is the lesson now, at least until the NYSE
A/D Line uptrend or the DJI's well-tested support is violated.
Regrettably, we have not had any BUY B20s. These might
have caught such
aggressive buying by well-informed insiders this year. There are several reasons:
1) We have never had so many 5:1 days in a two month period.
2) In 2020, they tended to occur way above the 2% band and so were not
allowed as Buy B20s and 3) Our IP21 has been negative on much of the advance.
But now with the DJI making a breakout above its recent flat top, with the OBV-Pct
and P-I clearly positive and so many 5:1 Adv/Decl B4, I think we have to create a
special B4 for any breakout above 24500 tomorrow.
I have urged any short positions in DIA be made up for with long positions in
the NASDAQ and QQQ. I have also suggested a long position in IBB. Gold
ought to keep rising, because all the FED's magic money means more debt.
So holding GLD is OK, too.
But if the DJI makes its breakout, close out the DIA short sale. We will stick
with the longs just mentioned so long as the A/D Line uptrend is strong and there
is no Sell S9 based on a serious breadth divergence. For now, appreciate that
more than 60% of all stocks are now above their 65-dma.
|
Charts 5/22/2020 (Click on Underlined link.) 2020 PEERLESS DJI, Signals, Indicators Daily DJI Volume 10-DayUp/Down Vol Stoch-20 Inverted Traders Index Graph of Pct of All Stocks above 65-dma Cum. Inverted Traders Index NASDAQ S&P OEX NYSE COMPQX DJI-15 DJI-20 DJI-30 DIA QQQ MDY IWM TNA Short-Term Rates SPY http://tigersoft.com/2121CST/SPY.GIF recent 2006 vers-Peerless signals http://tigersoft.com/PEERLESS/2006vers.jpg USO-CrudeOil DBO FAS GLD BBH IBB JETS JNUG KOL NUGT OIH PALL RSX RETL SDS AGQ SLV SOXL TECL TLT TMF TNA UGA (gasoline) USO (oil) and China: YINN CHAU Commodities: CANE CORN DBC JJC, NIB, CHOC CORN, CUT (paper) MOO, SOYB WEAT UUP (Dollar) LIT (Lithium) Stocks AAPL ADBE ALXN AMAT AMGN AMD AMZN AXP BA BABA BAC BIDU BLDP CAT CVX CMG DE ENPH FB GILD GOOG GS HD IBM INTU JPM LRCX M (Macy's) MSFT NEM NFLX NKE NVDA PG REGN SO SQ QCOM QDEL TSLA TXN XOM V VRTX WFC WMT TOWN New highs and Bullish MAXCPs http://tigersoft.com/MAXCP/5-23/BULLISH.htm Bearish MAXCPs - http://tigersoft.com/MINCP/5-22/BEARISH.htm |
Table 1
5/22/2018 QUICKSILVER on DJI-30 STOCKS.
Considering just those stocks whose IP21 + ITRS score is >+.25 or <-.25
4 Bullish (AAPL DIS INTC DOW
315 118 62 36 = 531
7 Bearish (BA JPM KO MRK UNH UTX VZ
-138 -89 -45 -76 -289 -86 -54 = -777
---------------------------
Vitality Score = -246
Note that AAPL now shows highest AI/200 stock here. STOCKS CLOSE CHANGE PIVOT-P 5-dma AROC CL-PWR Candl AI/200 IP21 ITRS --------------------------------------------------------------------------------------- --------------------------------------------------------------------------------------- AAPL 318.89 2.04 314.96 177.8% Bullish BLUE 156 .203 .13 Bullish --------------------------------------------------------------------- AXP 89.33 -.5 88.41 405.4% ------- RED 82 .058 -.085 --------------------------------------------------------------------- BA 137.53 -1.47 135.44 665.8% Bearish RED 64 -.131 -.29 Bearish --------------------------------------------------------------------- CAT 112.47 -1.59 115.02 201.4% Bearish RED 142 .041 .065 --------------------------------------------------------------------- CSCO 44.9 .26 45.06 70.3% ------- BLUE 78 -.038 .198 --------------------------------------------------------------------- CVX 90.28 -1.76 92.55 61.4% Bearish RED 81 -.075 .029 --------------------------------------------------------------------- DIS 118.02 .19 116.85 388% Bullish BLUE 86 .126 .131 Bullish --------------------------------------------------------------------- GS 179.93 -.17 181.88 225.6% ------- RED 103 -.046 .04 --------------------------------------------------------------------- HD 241.88 1 245.35 53% Bullish BLUE 135 .024 .115 --------------------------------------------------------------------- IBM 118.39 -.73 121.56 58.8% Bearish RED 139 -.104 -.003 --------------------------------------------------------------------- INTC 62.26 .28 59.92 327.8% Bullish BLUE 119 .142 .213 Bullish --------------------------------------------------------------------- JNJ 144.37 -2.34 150.52 -203.9% Bearish RED 124 -.135 -.003 --------------------------------------------------------------------- JPM 89.47 -.7 90.45 199.9% Bearish RED 96 -.185 -.138 Bearish --------------------------------------------------------------------- KO 45.03 -.14 44.97 197.7% Bearish RED 107 -.252 -.2 Bearish --------------------------------------------------------------------- MCD 184.41 -.67 179.83 293.7% ------- RED 107 .059 -.083 --------------------------------------------------------------------- MMM 146.44 .63 149.27 264.7% Bearish BLUE 95 .029 -.058 --------------------------------------------------------------------- MRK 76.37 -.18 79.72 -218.3% ------- BLUE 88 -.159 -.129 Bearish --------------------------------------------------------------------- MSFT 183.51 .08 184.91 9.5% Bullish BLUE 154 .064 .165 --------------------------------------------------------------------- NKE 93.75 -.51 91.04 370% ------- RED 114 .092 .109 --------------------------------------------------------------------- PFE 37.5 .24 38.07 -34.5% ------- BLUE 54 -.012 .095 --------------------------------------------------------------------- PG 112.6 .98 116.21 -88.4% Bearish BLUE 89 -.135 -.049 --------------------------------------------------------------------- TRV 100.1 .93 95.3 516.8% ------- BLUE 96 .079 -.175 --------------------------------------------------------------------- UNH 289.94 3.03 293.36 -17.6% ------- BLUE 127 -.218 -.062 Bearish --------------------------------------------------------------------- UTX 86.01 -5.36 97.15 -958.4% Bullish RED 114 .144 -.595 Bearish --------------------------------------------------------------------- V 190.86 .24 191.38 194.2% Bullish RED 124 -.007 .038 --------------------------------------------------------------------- VZ 54.1 .13 55.72 -55.9% Bearish BLUE 131 -.136 -.098 --------------------------------------------------------------------- WBA 39.6 -.15 40.86 150.8% Bearish RED 80 -.012 -.189 --------------------------------------------------------------------- WMT 124.33 -.66 127.66 -64% Bearish RED 84 -.21 .04 --------------------------------------------------------------------- XOM 44.6 .04 45.34 293.8% Bearish BLUE 45 -.101 .045 --------------------------------------------------------------------- DOW 36.12 .3 36.74 359.7% ------- BLUE 66 -.01 .371 Bullish |
Table 2 QUICKSILVER on ETFS - 05/22/20 Bullish = RETL and TECL
Bearish = FAS
ETF CLOSE CHANGE PIVOT-PT 5-dma AROC CL-PWR CANDLE IP21 ITRS --------------------------------------------------------------------------------------------- --------------------------------------------------------------------------------------------- DIA 244.88 -.14 245.93 163.9% ------- -----.021 ---- --------------------------------------------------------------------------------------------- SPY 295.44 .56 295 158.7% ------- BLUE-.013 .036 --------------------------------------------------------------------------------------------- QQQ 229.66 .79 227.43 140.4% Bullish BLUE .094 .141 --------------------------------------------------------------------------------------------- MDY 309.03 -.28 305.47 347.4% Bullish ---- .046 .043 --------------------------------------------------------------------------------------------- IWM 134.89 .65 132.68 373.8% Bullish BLUE .112 .023 --------------------------------------------------------------------------------------------- FAS 27.81 .19 27.91 667.1% ------- ---- .008 -.277 Bearish --------------------------------------------------------------------------------------------- RETL 115.25 1.64 110.43 838.8% ------- BLUE .137 .409 Bullish --------------------------------------------------------------------------------------------- SOXL 142.59 2.04 138.49 764.8% ------- BLUE-.069 .243 --------------------------------------------------------------------------------------------- TECL 186.66 1.55 182.91 454.9% Bullish BLUE .093 .457 Bullish --------------------------------------------------------------------------------------------- IBB 133.34 .87 133.78 41.1% ------- BLUE-.005 .213 --------------------------------------------------------------------------------------------- GLD 163.21 .96 162.69 -22% ------- BLUE .197 -.05 --------------------------------------------------------------------------------------------- OIH 111.45 -3.22 113.96 461.9% Bearish RED .085 .239 --------------------------------------------------------------------------------------------- |
Table 3 Count of Stocks in Key Directories
20200521
-------------------------------
NEWHIGHS 98
NEWLOWS 17
MAXCP 60
MINCP 24
TTTNH 23
TTTNL 31
FASTUP 394
FASTDOWN 26
CPCROSSA 82
CPCROSSD 102
BIGVOLUP 9
BIGVODN 8
ACCUMVER 2
HIGHIP21 12
HIUPPCT 5
VHIP21 41
LOWACCUM 145
REDSELL 110
AUGSELS7 2
TRAPDOOR 18
|
Table 4 RANKING OF KEY DIRECTORIES BASED PCT.OF STOCKS ABOVE 65-DMA
5/22/20
Bullish = 33
Bearish = 13
---------------------------------------------------------------------------------------
Directory Current day-1 day-2 day-3 day-4 day-5
----------------------------------------------------------------------------------------
COPPER 1 1 1 .875 1 .625
EDU 1 1 1 1 1 1
HACKERS .95 .9 .9 .8 .85 .75
NIFTY .913 .913 .891 .913 .891 .695
GOLD .897 .897 .897 .897 .897 .897
SOFTWARE .883 .8 .85 .7 .683 .633
NASD-100 .858 .828 .858 .808 .808 .636
GAMING .857 .904 .904 .761 .666 .523
SEMI .847 .857 .895 .79 .78 .609
CHEM .836 .836 .816 .693 .693 .428
BIOTECH .83 .811 .811 .768 .784 .712
AUTO .825 .8 .8 .625 .675 .4
HOMEBLDG .823 .823 .823 .764 .823 .47
ELECTRON .771 .765 .791 .711 .711 .523
COMPUTER .75 .7 .8 .7 .75 .55
SOLAR .75 .812 .812 .812 .75 .5
GREEN .714 .714 .714 .714 .714 .38
HOSPITAL .714 .619 .571 .571 .571 .238
INDEXES .684 .695 .717 .625 .657 .434
FIDSTKS .677 .615 .644 .581 .615 .429
INDMATER .666 .733 .706 .6 .6 .306
INFRA .628 .628 .6 .342 .342 .142
OILGAS .618 .587 .618 .534 .541 .312
DJI-13 .615 .692 .769 .461 .692 .384
SP-100 .615 .604 .615 .538 .604 .417
SP500 .608 .574 .583 .528 .557 .385
DOWJONES .6 .633 .666 .533 .7 .466
RUS-1000 .588 .568 .568 .5 .532 .348
COAL .571 .571 .571 .571 .571 .142
ETFS .571 .589 .66 .535 .571 .285
RETAIL .56 .54 .52 .48 .44 .3
BEVERAGE .533 .466 .533 .533 .6 .466
GUNS .533 .466 .533 .466 .466 .333
===============================================================================================
COMODITY .487 .512 .512 .41 .435 .282
MILITARY .481 .407 .296 .37 .37 .111
TRANSP .45 .5 .5 .45 .5 .2
FOOD .433 .452 .452 .377 .396 .264
BONDFUND .425 .297 .287 .237 .207 .158
INSURANC .307 .269 .153 .115 .115 .076
BIGBANKS .285 .285 .285 .142 .285 0
FINANCE .273 .285 .273 .202 .226 .142
REGBANKS .269 .307 .346 .153 .23 .038
CHINA .254 .45 .529 .49 .529 .352
REIT .226 .17 .141 .12 .12 .049
UTILITY .205 .153 .179 .179 .153 .102
JETS 0 0 0 0 0 0
|
====================================================================
5/21/2020 Don't be fooled by a pre-Memorial Day bounce.
The recent Peerless Sell S5-S9V call for a DJI
decline towards
lower 3.5% band. The technicals suggest this. Our DJI-Vitality Index
has turned quite negative. More and more leading stocks show IP21 values
below their 21-dma. The DJI's reaching the steeply falling 65-dma coupled
with a negative IP21 reliably predicts a decline to the lower band, at least.


But the NYSE A/D Line is still rising and now a majority of all stocks
are above their 65-dma. Important, tooo, the series of super 5:1 advances
to decline days since the bottom reminds us that a massive bailout of Wall Street
by the FED has historically succeeded and declines like the current one usually
stop at the previous lows. I will post the proof of this soon. The B4s on this
"Tracking the Fed" Peerless chart simply show 5:1 adv/decline days on NYSE.

We must watch GLD and UUP (Dollar). Gold's strength again this morning is a
warning that the FED may not be able keep printing enough "magic money" to
save
Wall Street. The same message can be inferred from the fact that
bank stocks remain so weak. This was an important sign of dire trouble in
2008. It is worth reminding readers that Peerless and the stock market (DJIA)
more closely correlate with big banks and brokerages than any industry group.

The problem, as in 2008, there are just too many individual and corporate debtors
who may not be able to keep paying off their debts to banks. Much will depend on
whether American businesses can really return to normal and, more important, will
their customers return. Right now, stock profits are going into speculation on Wall
Street more than retaining the very workers who will need the money to re-start the
economy. Whether there will be a business revival soon will also depend on
how
safe people feel. And that will depend on future pandemic statistics, on a vacine's
development and whether we as a country have learned anythng about the spread
of this virus using social distancing, masks and washing our hands thoroughly.
The easy money has been made in this Fed-backed stock market recovery. So,
watch Gold, the Dollar and bank stocks closely now because new circumstances
may arise that will prevent the Fed from creating trillions by keystroke.
|
Charts 5/21/2020 (Click on Underlined link.) 2020 PEERLESS DJI, Signals, Indicators Daily DJI Volume 10-DayUp/Down Vol Stoch-20 Inverted Traders Index Graph of Pct of All Stocks above 65-dma Cum. Inverted Traders Index NASDAQ S&P OEX NYSE COMPQX DJI-15 DJI-20 DJI-30 DIA QQQ MDY IWM TNA Short-Term Rates SPY http://tigersoft.com/2121CST/SPY.GIF recent 2006 vers-Peerless signals http://tigersoft.com/2121CST/2006vers.jpg USO-CrudeOil DBO FAS GLD BBH IBB JETS JNUG KOL NUGT OIH PALL RSX RETL SDS AGQ SLV SOXL TECL TLT TMF TNA UGA (gasoline) USO (oil) and China: YINN CHAU Commodities: CANE CORN DBC JJC, NIB, CHOC CORN, CUT (paper) MOO, SOYB WEAT UUP (Dollar) LIT (Lithium) Stocks AAPL ADBE ALXN AMAT AMGN AMD AMZN AXP BA BABA BAC BIDU BLDP CAT CVX CMG DE ENPH FB GILD GOOG GS HD IBM INTU JPM LRCX M (Macy's) MSFT NEM NFLX NKE NVDA PG REGN SO SQ QCOM QDEL TSLA TXN XOM V VRTX WFC WMT TOWN New highs and Bullish MAXCPs http://tigersoft.com/MAXCP/5-21/BULLISH.htm Bearish MAXCPs - http://tigersoft.com/MINCP/5-21/BEARISH.htm |
Table 1
5/21/2018 QUICKSILVER on DJI-30 STOCKS.
Considering just those stocks whose IP21 + ITRS score is >+.25 or <-.25
0 Bullish
= 0
5 Bearish (BA JPM KO UTX VZ
-139 -90 -45 -86 -54 = -414
---------------------------
Vitality Score = -414
Note that AAPL now shows highest AI/200 stock here. STOCKS CLOSE CHANGE PIVOT-P 5-dma AROC CL-PWR Candl AI/200 IP21 ITRS --------------------------------------------------------------------------------------- --------------------------------------------------------------------------------------- AAPL 316.85 -2.38 307.71 116.8% Bullish RED 155 .137 .111 --------------------------------------------------------------------- AXP 89.83 -.9 82.22 348% ------- RED 82 .027 -.097 --------------------------------------------------------------------- BA 139 5.68 120 642% Bearish BLUE 64 -.138 -.304 Bearish --------------------------------------------------------------------- CAT 114.06 -1.63 107.92 353.3% Bearish RED 142 .045 .094 --------------------------------------------------------------------- CSCO 44.64 -.8 44.27 88.5% ------- RED 78 -.09 .166 --------------------------------------------------------------------- CVX 92.04 -.96 89.16 109.5% Bearish RED 82 -.075 .07 --------------------------------------------------------------------- DIS 117.83 -2.09 109.05 526.4% Bullish RED 86 .117 .075 --------------------------------------------------------------------- GS 180.1 -1.34 171.87 159.2% Bearish RED 104 -.087 .009 --------------------------------------------------------------------- HD 240.88 2.69 239.33 133.8% Bullish BLUE 135 -.023 .093 --------------------------------------------------------------------- IBM 119.12 -2.26 116.98 90.8% Bearish RED 140 -.085 -.029 --------------------------------------------------------------------- INTC 61.98 -1.12 58.28 241.1% Bullish RED 118 .067 .161 --------------------------------------------------------------------- JNJ 146.71 -.97 150.44 -31.2% Bearish RED 124 -.097 .074 --------------------------------------------------------------------- JPM 90.17 -1.16 85.9 149.3% Bearish RED 97 -.212 -.099 Bearish --------------------------------------------------------------------- KO 45.17 -.72 43.26 165.3% Bearish RED 107 -.294 -.174 Bearish --------------------------------------------------------------------- MCD 185.08 .98 173.81 270.8% ------- BLUE 107 .009 -.056 --------------------------------------------------------------------- MMM 145.81 -3.87 138.69 340% Bearish RED 95 -.021 -.049 --------------------------------------------------------------------- MRK 76.55 -.34 79.78 -222.1% ------- RED 89 -.165 -.073 --------------------------------------------------------------------- MSFT 183.43 -2.23 183.16 79% ------- RED 153 .029 .155 --------------------------------------------------------------------- NKE 94.26 1.31 86.99 429.2% ------- BLUE 113 .066 .083 --------------------------------------------------------------------- PFE 37.26 -.37 37.76 -87.3% ------- RED 54 -.052 .119 --------------------------------------------------------------------- PG 111.62 -1.66 114.61 -96% Bearish RED 89 -.062 -.039 --------------------------------------------------------------------- TRV 99.17 3.63 90.31 481.6% ------- BLUE 95 0 -.158 --------------------------------------------------------------------- UNH 286.91 -1.08 290.96 -63.7% Bearish BLUE 128 -.225 -.006 --------------------------------------------------------------------- UTX 86.01 -5.36 97.15 -958.4% Bullish RED 114 .144 -.48 Bearish --------------------------------------------------------------------- V 190.62 -3.24 183.49 258.8% Bullish RED 125 -.071 .063 --------------------------------------------------------------------- VZ 53.97 -.29 54.71 -85.8% Bearish RED 131 -.202 -.055 Bearish --------------------------------------------------------------------- WBA 39.75 -.39 38.4 113.6% Bearish RED 80 -.017 -.176 --------------------------------------------------------------------- WMT 124.99 -.46 125.94 62.6% Bearish BLUE 84 -.222 .053 --------------------------------------------------------------------- XOM 44.56 -.81 42 258% Bearish RED 45 -.141 -.006 --------------------------------------------------------------------- DOW 35.82 -.36 33.56 328.8% ------- RED 66 -.041 .241 |
Table 2 QUICKSILVER on ETFS - 05/21/20 Bullish = ---
Bearish = FAS
ETF CLOSE CHANGE PIVOT-PT 5-dma AROC CL-PWR CANDLE IP21 ITRS --------------------------------------------------------------------------------------------- --------------------------------------------------------------------------------------------- DIA 245.02 -.71 236.91 171.2% ------- RED -.1 ----- --------------------------------------------------------------------------------------------- SPY 294.88 -2.05 286.14 170.3% ------- RED -.084 .036 --------------------------------------------------------------------------------------------- QQQ 228.87 -2.52 223.27 155.6% Bullish RED .026 .133 --------------------------------------------------------------------------------------------- MDY 309.31 1.51 288.02 396.8% Bullish BLUE .015 .032 --------------------------------------------------------------------------------------------- IWM 134.24 .24 125.08 431% Bullish BLUE .056 .027 --------------------------------------------------------------------------------------------- FAS 27.62 -.41 24.23 608.9% ------- RED -.048 -.409 Bearish --------------------------------------------------------------------------------------------- RETL 113.61 6.59 97.32 1072.3% ------- BLUE .116 -.057 --------------------------------------------------------------------------------------------- SOXL 140.55 -11.84 121.49 402.9% ------- RED -.125 -.08 --------------------------------------------------------------------------------------------- TECL 185.11 -7.15 170.08 473.9% Bullish RED .015 .089 --------------------------------------------------------------------------------------------- IBB 132.47 -1.44 132.25 130.6% ------- RED -.071 .199 --------------------------------------------------------------------------------------------- GLD 162.25 -2.4 163.93 -23.2% ------- RED .224 .015 --------------------------------------------------------------------------------------------- OIH 114.67 -.52 101.23 636.7% ------- RED .134 .184 --------------------------------------------------------------------------------------------- GASL 3440 285 3685 -325.1% ------- RED -.021 .074 --------------------------------------------------------------------------------------------- |
Table 3 Count of Stocks in Key Directories
20200521
-------------------------------
NEWHIGHS 88
NEWLOWS 19
MAXCP 41
MINCP 11
TTTNH 20
TTTNL 19
FASTUP 474
FASTDOWN 33
CPCROSSA 82
CPCROSSD 102
BIGVOLUP 9
BIGVODN 8
ACCUMVER 2
HIGHIP21 9
HIUPPCT 4
VHIP21 42
LOWACCUM 145
REDSELL 112
AUGSELS7 42
TRAPDOOR 17
|
Table 4 RANKING OF KEY DIRECTORIES BASED PCT.OF STOCKS ABOVE 65-DMA
5/21/20
Bullish = 32
Bearish = 13
---------------------------------------------------------------------------------------
Directory Current day-1 day-2 day-3 day-4 day-5
----------------------------------------------------------------------------------------
COPPER 1 1 .875 1 .5 .375
EDU 1 1 1 1 1 .8
NIFTY .913 .891 .913 .891 .695 .76
GAMING .904 .904 .761 .666 .523 .333
HACKERS .9 .95 .8 .85 .75 .75
GOLD .897 .897 .897 .897 .877 .775
SEMI .857 .895 .79 .78 .59 .657
CHEM .836 .816 .693 .693 .428 .346
NASD-100 .828 .868 .818 .808 .636 .666
HOMEBLDG .823 .823 .764 .823 .47 .294
SOLAR .812 .812 .812 .75 .5 .5
BIOTECH .806 .803 .773 .787 .709 .632
AUTO .8 .8 .625 .675 .4 .3
SOFTWARE .8 .866 .7 .683 .616 .6
ELECTRON .765 .791 .711 .711 .523 .563
INDMATER .733 .706 .6 .6 .293 .253
GREEN .714 .714 .714 .714 .38 .38
COMPUTER .7 .8 .7 .75 .55 .45
DJI-13 .692 .769 .461 .692 .384 .384
INDEXES .688 .709 .618 .65 .424 .387
DOWJONES .633 .666 .533 .7 .466 .433
^^^^^
INFRA .628 .6 .342 .342 .142 .114
HOSPITAL .619 .571 .571 .571 .238 .238
FIDSTKS .615 .644 .581 .615 .429 .423
SP-100 .604 .615 .538 .604 .406 .406
ETFS .589 .66 .535 .571 .285 .321
OILGAS .587 .618 .534 .541 .305 .267
SP500 .574 .585 .528 .557 .381 .37
COAL .571 .571 .571 .571 .142 .142
RUS-1000 .568 .569 .5 .532 .339 .325
RETAIL .54 .52 .48 .44 .3 .28
COMODITY .512 .512 .41 .435 .282 .282
------------------------------------------------------------------------------------------
TRANSP .5 .5 .45 .5 .2 .25
------------------------------------------------------------------------------------------
BEVERAGE .466 .533 .533 .6 .4 .4
GUNS .466 .533 .466 .466 .333 .333
FOOD .452 .452 .377 .396 .245 .245
CHINA .45 .529 .49 .529 .352 .352
MILITARY .407 .296 .37 .37 .111 .111
REGBANKS .307 .346 .153 .23 .038 0
BONDFUND .297 .287 .237 .207 .158 .158
BIGBANKS .285 .285 .142 .285 0 0
FINANCE .285 .273 .202 .226 .142 .13
INSURANC .269 .153 .115 .115 .076 .038
REIT .17 .141 .12 .12 .042 .042
UTILITY .153 .179 .179 .153 .076 .128
JETS 0 0 0 0 0 0
|
====================================================================
5/20/2020 The recent Sell S5-S9V call for a DJI decline towards lower 3.5% band.
The DJI is losing momentum and Volume, but the P-I and OBV-PCT
are still quite positive, so, I would think the lasest Sell S5 and S9v
signals from Peerless will not bring a DJI retreat much below the
current 65-dma. If you are short DIA, you might consider hedging
with the NASDAQ (COMPQX), since it currently is out-performing
the DJI by more than 14% over the last 50 trading days.


|
DJI's Upward Momentum is weakening noticeably. Was the rally above the 65-dma, just an effort to get shorts to cover? Today's up-day volume was low and the ratio of advancers to decliners was not as good as on most other recent rallies.     |
|
NASDAQ (and QQQ) are out-performing DJI. We can make money hedging; long NASDAQ and short DJIA.  |
Watch to see what happens to Short-Term Rates later this
week. Will they start falling again and help boost dividend and
utility plays? Or must they start to rise because the Dollar can no
longer stay above the support-line shown below. Our Gold Stock ETF
(NUGT) is starting to weaken at its falling 65-dma. That was our target.
So, it's best to lock in nice profits here.
|
Dollar Versus Gold A Dollar violation of support may force FED to ease up on the printing of so much "magic money".  |
|
Take Profits in NUGT. Falling 65-dma has been reached and is acting as resistance.  |
I have been working on the charts since 1965 that
show all the 5:1
advances: decline days. I will be posting them as soon as they are
done. To repreat myself, the lessons hereare that coming after a big
sell-off, a ratio of 8:1 (daily advances: declines) often marks a key bottom
while clusters of 5:1 days when the OBVPct and P-I are positive
are usually reliable Buy signals, especially on subsequent weakness
to the lower band. That would apply here on the drop to the lower band,
just as it did two weeks ago near 23000.
|
Charts 5/20/2020 (Click on Underlined link.) 2020 PEERLESS DJI, Signals, Indicators Daily DJI Volume 10-DayUp/Down Vol Stoch-20 Inverted Traders Index Graph of Pct of All Stocks above 65-dma Cum. Inverted Traders Index NASDAQ S&P OEX NYSE COMPQX DJI-15 DJI-20 DJI-30 DIA QQQ MDY IWM TNA Short-Term Rates SPY http://tigersoft.com/2121CST/SPY.GIF recent 2006 vers-Peerless signals http://tigersoft.com/2121CST/2006vers.bmp USO-CrudeOil DBO FAS GLD BBH IBB JETS JNUG KOL NUGT OIH PALL RSX RETL SDS AGQ SLV SOXL TECL TLT TMF TNA UGA (gasoline) USO (oil) and China: YINN CHAU Commodities: CANE CORN DBC JJC, NIB, CHOC CORN, CUT (paper) MOO, SOYB WEAT UUP (Dollar) LIT (Lithium) Stocks AAPL ADBE ALXN AMAT AMGN AMD AMZN AXP BA BABA BAC BIDU BLDP CAT CVX CMG DE ENPH FB GILD GOOG GS HD IBM INTU JPM LRCX M (Macy's) MSFT NEM NFLX NKE NVDA PG REGN SO SQ QCOM QDEL TSLA TXN XOM V VRTX WFC WMT TOWN New highs and Bullish MAXCPs http://tigersoft.com/MAXCP/5-20/BULLISH.htm Bearish MAXCPs - http://tigersoft.com/MINCP/5-20/BEARISH.htm |
Table 1
5/20/2018 QUICKSILVER on DJI-30 STOCKS.
Considering just those stocks whose IP21 + ITRS score is >+.25 or <-.25
3 Bullish (AAPL INTC MSFT)
+319 +63 +186 = 568
5 Bearish (BA JPM KO TRV UTX
-133 -91 -46 -93 -86 = -449
219
---------------------------
Vitality Score = +219
Note that AAPL now shows highest AI/200 stock here. STOCKS CLOSE CHANGE PIVOT-P 5-dma AROC CL-PWR Candl AI/200 IP21 ITRS --------------------------------------------------------------------------------------- --------------------------------------------------------------------------------------- AAPL 319.23 6.09 309.54 186.4% Bullish BLUE 154 .172 .138 Bullish --------------------------------------------------------------------- AXP 90.73 3.47 83.81 756.4% ------- BLUE 82 .034 -.103 --------------------------------------------------------------------- BA 133.32 2.88 122.52 469.1% Bearish BLUE 65 -.151 -.404 --------------------------------------------------------------------- CAT 115.69 3.61 106.19 513.6% Bearish BLUE 142 .062 .105 --------------------------------------------------------------------- CSCO 45.44 .84 43.85 397.1% ------- BLUE 78 -.044 .153 --------------------------------------------------------------------- CVX 93 3.38 90.05 238.8% Bearish BLUE 83 -.051 .113 --------------------------------------------------------------------- DIS 119.92 5.55 105.91 774% Bullish BLUE 86 .108 .095 --------------------------------------------------------------------- GS 181.44 3.61 174.45 274.5% ------- BLUE 105 -.109 .003 --------------------------------------------------------------------- HD 238.19 .09 234.48 170.3% Bullish RED 136 -.047 .074 --------------------------------------------------------------------- IBM 121.38 1.09 116.95 238.8% ------- BLUE 141 -.029 -.008 --------------------------------------------------------------------- INTC 63.1 2.81 59.08 453.8% Bullish BLUE 117 .136 .188 Bullish --------------------------------------------------------------------- JNJ 147.68 -1.34 147.64 18.5% Bearish RED 124 -.097 .062 --------------------------------------------------------------------- JPM 91.33 2.66 87.52 418% ------- BLUE 98 -.226 -.074 Bearish --------------------------------------------------------------------- KO 45.89 1.35 43.7 221.2% Bearish BLUE 107 -.285 -.126 Bearish --------------------------------------------------------------------- MCD 184.1 4.53 175.41 319.9% ------- BLUE 106 .014 -.06 --------------------------------------------------------------------- MMM 149.68 1.3 135.99 478.5% Bearish RED 95 .015 -.005 --------------------------------------------------------------------- MRK 76.89 -.66 80.05 -63.3% ------- RED 89 -.139 -.044 --------------------------------------------------------------------- MSFT 185.66 2.03 180.53 162% Bullish BLUE 152 .096 .173 Bullish --------------------------------------------------------------------- NKE 92.95 1.44 86.55 391.9% ------- RED 112 .044 .072 --------------------------------------------------------------------- PFE 37.63 -.05 37.92 76.9% ------- RED 54 -.069 .107 --------------------------------------------------------------------- PG 113.28 .84 113.81 -28% Bearish BLUE 89 -.043 -.041 --------------------------------------------------------------------- TRV 95.54 2.27 90.22 309.4% ------- BLUE 95 -.054 -.182 --------------------------------------------------------------------- UNH 287.99 -1.06 290.61 173.2% Bearish RED 129 -.252 .047 --------------------------------------------------------------------- UTX 86.01 -5.36 97.15 -958.4% Bullish RED 114 .144 -.422 Bearish --------------------------------------------------------------------- V 193.86 4.5 180.9 454.6% Bullish BLUE 126 .002 .081 --------------------------------------------------------------------- VZ 54.26 -.12 54.91 -53.7% Bearish RED 131 -.159 -.021 --------------------------------------------------------------------- WBA 40.14 .37 38.85 228% Bearish RED 80 .028 -.165 --------------------------------------------------------------------- WMT 125.45 .5 123.42 69.5% Bearish RED 84 -.197 .066 --------------------------------------------------------------------- XOM 45.37 1.43 42.3 399.1% Bearish BLUE 45 -.137 .064 --------------------------------------------------------------------- DOW 36.18 .54 33.51 557.3% ------- RED 66 .01 .171 |
Table 2Table 2 QUICKSILVER on ETFS - 05/20/20 Bullish = GLD
Bearish = FAS
ETF CLOSE CHANGE PIVOT-PT 5-dma AROC CL-PWR CANDLE IP21 ITRS --------------------------------------------------------------------------------------------- --------------------------------------------------------------------------------------------- DIA 245.73 3.51 236.75 270.2% ------- BLUE-.088 0 --------------------------------------------------------------------------------------------- SPY 296.93 4.96 284.97 266.2% ------- BLUE-.067 .048 --------------------------------------------------------------------------------------------- QQQ 231.39 4.53 221.83 269.3% Bullish BLUE .077 .153 --------------------------------------------------------------------------------------------- MDY 307.8 6.54 285.69 432.2% Bullish BLUE-.012 .014 --------------------------------------------------------------------------------------------- IWM 134 3.94 123.12 445% Bullish BLUE .023 .016 --------------------------------------------------------------------------------------------- FAS 28.03 1.65 24.43 998.4% ------- BLUE-.043 -.447 Bearish --------------------------------------------------------------------------------------------- RETL 107.02 .98 91.63 847.9% ------- RED .1 -.255 --------------------------------------------------------------------------------------------- SOXL 152.39 15.56 129.61 1251.9% Bullish BLUE-.063 -.118 --------------------------------------------------------------------------------------------- TECL 192.26 11.5 168.16 890.4% Bullish BLUE .072 .029 --------------------------------------------------------------------------------------------- IBB 133.91 2.7 129.02 164.3% ------- BLUE-.058 .211 ------------------------------------------------------------------------------------ -------- GLD 164.65 .39 163.01 94.1% Bullish BLUE .284 .085 Bullish --------------------------------------------------------------------------------------------- OIH 115.19 7.04 100.93 754.3% ------- BLUE .106 .127 --------------------------------------------------------------------------------------------- GASL 3440 285 3685 -325.1% ------- RED -.021 .132 --------------------------------------------------------------------------------------------- |
Table 3 Count of Stocks in Key Directories
20200520
-------------------------------
NEWHIGHS 122
NEWLOWS 22
MAXCP 65
MINCP 19
TTTNH 43
TTTNL 12
FASTUP 624
FASTDOWN 29
CPCROSSA 118
CPCROSSD 40
BIGVOLUP 11
BIGVODN 8
ACCUMVER 1
HIGHIP21 9
HIUPPCT 3
VHIP21 44
LOWACCUM 151
REDSELL 118
AUGSELS7 31
TRAPDOOR 18
|
Table 4 RANKING OF KEY DIRECTORIES BASED PCT.OF STOCKS ABOVE 65-DMA
5/20/20
Bullish = 34
Bearish = 10
---------------------------------------------------------------------------------------
Directory Current day-1 day-2 day-3 day-4 day-5
----------------------------------------------------------------------------------------
COPPER 1 .875 1 .5 .375 .25
EDU 1 1 1 1 .8 .8
HACKERS .95 .85 .85 .75 .7 .75
GAMING .904 .761 .666 .523 .333 .333
GOLD .897 .897 .897 .877 .775 .795
SEMI .895 .79 .78 .59 .647 .6
NIFTY .891 .913 .891 .695 .76 .63
NASD-100 .868 .828 .818 .636 .666 .575
SOFTWARE .866 .716 .683 .616 .6 .6
HOMEBLDG .823 .764 .823 .47 .294 .294
CHEM .816 .693 .693 .428 .346 .326
SOLAR .812 .812 .75 .5 .5 .437
AUTO .8 .625 .675 .4 .3 .25
COMPUTER .8 .7 .75 .55 .45 .5
BIOTECH .798 .765 .784 .709 .634 .645
ELECTRON .791 .711 .711 .523 .55 .489
DJI-13 .769 .461 .692 .384 .384 .384
GREEN .714 .714 .714 .38 .38 .38
INDEXES .709 .618 .65 .424 .387 .349
INDMATER .706 .6 .6 .293 .253 .253
DOWJONES .666 .533 .7 .466 .433 .366
^^^^^
ETFS .66 .535 .571 .285 .285 .321
FIDSTKS .644 .581 .615 .429 .418 .401
OILGAS .618 .534 .541 .305 .251 .236
SP-100 .615 .538 .604 .406 .395 .329
INFRA .6 .342 .342 .142 .114 .028
SP500 .585 .53 .557 .381 .362 .324
COAL .571 .571 .571 .142 .142 .142
HOSPITAL .571 .571 .571 .238 .238 .238
RUS-1000 .569 .502 .532 .339 .319 .284
BEVERAGE .533 .533 .6 .4 .4 .4
GUNS .533 .466 .466 .333 .333 .333
CHINA .529 .49 .529 .352 .313 .333
RETAIL .52 .48 .44 .3 .28 .26
============================================================================================
COMODITY .5 .4 .425 .275 .275 .275
TRANSP .5 .45 .5 .2 .25 .25
============================================================================================
FOOD .444 .37 .388 .24 .24 .24
REGBANKS .346 .153 .23 .038 0 0
MILITARY .296 .37 .37 .111 .111 .111
BONDFUND .287 .237 .207 .158 .148 .178
BIGBANKS .285 .142 .285 0 0 0
FINANCE .273 .202 .226 .142 .13 .107
UTILITY .179 .179 .153 .076 .128 .102
INSURANC .153 .115 .115 .076 .038 .038
REIT .141 .12 .12 .042 .042 .042
JETS 0 0 0 0 0 0
|
====================================================================
5/19/2020 The DJI seems stuck in a trading range between 23000-25000. The A/D
Decline
Line is rising but may not confirm a breakout over 25000. The V-Indicator and IP21
are negative. Since we are now well into May, we did get a Sell S9-Vs on Monday's
jump to the upper band. Note also that the P-Indicator has weakened significantly
since the last advance. That is the reason for the Sell S5. And were it not for
AAPL,
our DJI-30 Vitality Index would be very negative. Were AAPL to weaken suddenly, the
DJI's picture would darken abruptly. |


The NASDAQ continues to outperform the DJI. May I suggest being long it and
short the DJI? From the ITRS score, you can see that hedging like this would have
gained more than 14% over the last 50 trading days.

Bullshly, the DJI's OBV-Pct is positive and so is the P-I. This shows us that the
"5:1"
bullish ratio of advances to decline on a daily basis remain bullish. I discussed
this
last night. These signals when they appear in bunches, shows the track of the
bullish FED interventions. They show uptrends which once started do not quickly
come to an end. In other words, since 2009, it has definitely not paid to fight a
Fed armed with Trillion Dollar magic-money at the stroke of a key.
Tracking the Trillions

See in yesterday's Hotline how well the "5:1 Buy B4s" have worked since March
2009.
I believe that they are the direct result of the FED support for big banks and they
reflect the many "Quantitative Easing" subsidies since 2008. There have
been lots|
of these 2009-2019 "5:1 Buy B4s". They are especially reliable when
the
DJI is above its 65-dma and we see a positive P-I and a positive OBV-Pct.
So, either cover the short in DIA or hedge it with a long position in the NASDAQ.
.
Unopposed, tte FED's deterimination to bring about a "V" bottom is too much
for us now, I would say.
As I have said, "5:1 Buy B4s" before 2006 are quite scarce. For example, there
were no "5:1" days from March 1994 to December 2005. They are a product of
computerized trading armed with the knowledge that the FED is "back-stopping
the market" with vast amounts of money. Other thatthese 5:1 Buys, let me
note
in the more distant past, they occurred primarily right at market bottoms with a
Adv/Decl rato more like 7:1 and sometimes much higher. I will show all these amazing
"Bugle-Call Buy B4s/B12s in an abbreviated version of my new book soon.

"The Silver Lining"
Our long position in NUGT (2x gold miners) has more than made up for the
loss in the DIA short. NUGT has reached its falling 65-dma. I would still hold
it.
Gold is about to make a new recovery high. This would seem to put 2000 within
easy reach for it. The rally in Gold is the price the FED must pay for creating
trillions in
new Debt and "magic money". Short of prohibiting private ownership
in Gold,
as FDR did in 1933, it would seem Gold must keep rising. Gold is the "Silver
lining"
of this rally.
The Dollar is still above its support. This gives the FED
confidence to continue
to shore up the markets buying bonds and making loans to big corporation. A break
in the Dollar's support level might cause the FED to slow down its "magic money"
creation. That would also boost Gold.
Conclusion:
The DJI's pullback today still leaves it above its falling 65-dma. The many
bunches of bullish 5:1 (Advances to Declines) since March should be weighted
in our decision making. The FED is throwing trillions of Dollars to try to
bring about a V-Bottom. The history of these special 5:1 days is quite clear and
forceful. As long as our PI-I and OBV-Pct stay positive when they occur,
they are very likely to bring about higher DJI prices, though when they occur
at the upper 2.5% band or higher, a correction to the lower band often occurs.
These new signal have come into their own since 2009. So has Fed intervention
to butress the stock market. See their charts 2009-2020 at this link (to be done
soon). Understand that the Buy signal for these 5:1 days is designated a
"B4".
|
Charts 5/19/2020 (Click on Underlined link.) 2020 PEERLESS DJI, Signals, Indicators Daily DJI Volume 10-DayUp/Down Vol Stoch-20 Inverted Traders Index Graph of Pct of All Stocks above 65-dma Cum. Inverted Traders Index NASDAQ S&P OEX NYSE COMPQX DJI-15 DJI-20 DJI-30 DIA QQQ MDY IWM TNA Short-Term Rates SPY http://tigersoft.com/2121CST/SPY.GIF recent 2006 vers-Peerless signals http://tigersoft.com/2121CST/2006vers.bmp USO-CrudeOil DBO FAS GLD BBH IBB JETS JNUG KOL NUGT OIH PALL RSX RETL SDS AGQ SLV SOXL TECL TLT TMF TNA UGA (gasoline) USO (oil) and China: YINN CHAU Commodities: CANE CORN DBC JJC, NIB, CHOC CORN, CUT (paper) MOO, SOYB WEAT UUP (Dollar) LIT (Lithium) Stocks AAPL ADBE ALXN AMAT AMGN AMD AMZN AXP BA BABA BAC BIDU BLDP CAT CVX CMG DE ENPH FB GILD GOOG GS HD IBM INTU JPM LRCX M (Macy's) MSFT NEM NFLX NKE NVDA PG REGN SO SQ QCOM QDEL TSLA TXN XOM V VRTX WFC WMT TOWN New highs and Bullish MAXCPs http://tigersoft.com/MAXCP/5-19/BULLISH.htm Bearish MAXCPs - http://tigersoft.com/MINCP/5-19/BEARISH.htm |
Table 1
5/19/2018 QUICKSILVER on DJI-30 STOCKS.
Considering just those stocks whose IP21 + ITRS score is >+.25 or <-.25
1 Bullish (AAPL )
+308 = 0
5 Bearish (BA JPM KO TRV UTX
-130 -89 -45 -93 -96 = -453
308
---------------------------
Vitality Score = -145
Note that AAPL now shows highest AI/200 stock here. STOCKS CLOSE CHANGE PIVOT-P 5-dma AROC CL-PWR Candl AI/200 IP21 ITRS --------------------------------------------------------------------------------------- --------------------------------------------------------------------------------------- AAPL 313.14 -1.82 307.65 27.9% Bullish RED 153 .109 .162 Bullish --------------------------------------------------------------------- AXP 87.26 -1.15 78.03 247.8% ------- RED 81 .033 -.127 --------------------------------------------------------------------- BA 130.44 -5 121.5 208.9% Bearish RED 66 -.178 -.44 Bearish --------------------------------------------------------------------- CAT 112.08 -2.94 104.48 328.6% Bearish RED 142 .055 .062 --------------------------------------------------------------------- CSCO 44.6 -.46 41.95 158% ------- RED 78 -.097 .16 --------------------------------------------------------------------- CVX 89.62 -2.93 88.7 -81.9% Bearish RED 83 -.072 .096 --------------------------------------------------------------------- DIS 114.37 -2.48 102.92 454.8% Bullish RED 85 .068 .081 --------------------------------------------------------------------- GS 177.83 -4.05 171.8 17.7% ------- RED 106 -.149 .014 --------------------------------------------------------------------- HD 238.1 -7.25 230.1 110% Bullish RED 137 -.063 .117 --------------------------------------------------------------------- IBM 120.29 -1.27 115.73 1.3% ------- RED 141 .088 .006 --------------------------------------------------------------------- INTC 60.29 .37 57.74 161.9% ------- BLUE 116 .06 .171 --------------------------------------------------------------------- JNJ 149.02 -1.5 147.13 63.3% ------- RED 124 -.086 .078 --------------------------------------------------------------------- JPM 88.67 -1.78 84.03 94.3% Bearish RED 99 -.249 -.066 Bearish --------------------------------------------------------------------- KO 44.54 -.43 43.94 -31.7% Bearish RED 107 -.323 -.156 Bearish --------------------------------------------------------------------- MCD 179.57 -.26 172.82 86.2% Bearish RED 105 -.033 -.054 --------------------------------------------------------------------- MMM 148.38 -.89 136.12 244.4% Bearish RED 94 .03 .015 --------------------------------------------------------------------- MRK 77.55 -2.17 77.89 22.8% ------- RED 89 -.163 -.033 --------------------------------------------------------------------- MSFT 183.63 -1.28 179.75 30.7% ------- RED 151 .022 .204 --------------------------------------------------------------------- NKE 91.51 .47 86.02 185.1% ------- BLUE 111 .026 .073 --------------------------------------------------------------------- PFE 37.68 -.39 37.05 42.5% ------- RED 54 -.048 .101 --------------------------------------------------------------------- PG 112.44 -3.77 113.92 -92% ------- RED 89 -.04 -.046 --------------------------------------------------------------------- TRV 93.27 -2.03 89.86 -37.5% ------- RED 95 -.071 -.212 Bearish --------------------------------------------------------------------- UNH 289.05 -4.31 278 23.4% ------- RED 130 -.261 .042 --------------------------------------------------------------------- UTX 86.01 -5.36 97.15 -958.4% Bullish RED 114 .144 -.455 Bearish --------------------------------------------------------------------- V 189.36 -2.02 177.09 271% Bullish RED 126 -.013 .092 --------------------------------------------------------------------- VZ 54.38 -1.34 54.85 -98% Bearish RED 131 -.166 -.041 --------------------------------------------------------------------- WBA 39.77 -1.09 38.35 -96.5% Bearish RED 79 .065 -.194 --------------------------------------------------------------------- WMT 124.95 -2.71 123.71 46.8% Bearish RED 84 -.203 .052 --------------------------------------------------------------------- XOM 43.94 -1.4 41.93 -20.9% Bearish RED 45 -.146 .035 --------------------------------------------------------------------- DOW 35.64 -1.1 32.35 272.1% Bullish RED 65 .061 .153 |
Table 2 QUICKSILVER on ETFS - 05/19/20 Bullish = GLD
Bearish = FAS
ETF CLOSE CHANGE PIVOT-PT 5-dma AROC CL-PWR CANDLE IP21 ITRS --------------------------------------------------------------------------------------------- --------------------------------------------------------------------------------------------- DIA 242.22 -3.71 232.82 86.9% ------- RED -.127 ---- --------------------------------------------------------------------------------------------- SPY 291.97 -3.03 281.6 92.4% ------- RED -.114 .05 --------------------------------------------------------------------------------------------- QQQ 226.86 -.57 219.34 106.4% ------- RED -.006 .157 --------------------------------------------------------------------------------------------- MDY 301.26 -4.21 282.51 151.5% Bullish RED -.018 -.001 --------------------------------------------------------------------------------------------- IWM 130.06 -2.62 122.72 122.5% ------- RED .009 -.02 --------------------------------------------------------------------------------------------- FAS 26.38 -1.53 23 274.9% ------- RED -.076 -.429 Bearish --------------------------------------------------------------------------------------------- RETL 106.04 -4.39 90.21 412.2% Bullish RED .113 -.261 --------------------------------------------------------------------------------------------- SOXL 136.83 -1.66 120.02 392% ------- RED -.132 -.092 --------------------------------------------------------------------------------------------- TECL 180.76 -2.15 161.51 302.7% Bullish RED -.002 .115 --------------------------------------------------------------------------------------------- IBB 131.21 -2.57 129.6 6.1% ------- RED -.123 .178 --------------------------------------------------------------------------------------------- GLD 164.26 1.57 161.58 130% Bullish BLUE .287 .026 Bullish --------------------------------------------------------------------------------------------- OIH 108.15 -5.81 99.39 -24.8% ------- RED .044 .071 --------------------------------------------------------------------------------------------- GASL 3440 285 3685 -325.1% ------- RED -.021 .099 --------------------------------------------------------------------------------------------- |
Table 3 Count of Stocks in Key Directories
20200519
-------------------------------
NEWHIGHS 99
NEWLOWS 20
MAXCP 43
MINCP 27
TTTNH 40
TTTNL 16
FASTUP 213
FASTDOWN 95
CPCROSSA 68
CPCROSSD 188
BIGVOLUP 10
BIGVODN 14
ACCUMVER 1
HIGHIP21 6
HIUPPCT 3
REDSELL 120
AUGSELS7 36
TRAPDOOR 17
|
RANKING OF KEY DIRECTORIES BASED PCT.OF STOCKS ABOVE 65-DMA 5/19/20 --------------------------------------------------------------------------------------- Directory Current day-1 day-2 day-3 day-4 day-5 ---------------------------------------------------------------------------------------- EDU 1 1 1 .8 .8 .8 NIFTY .913 .891 .695 .76 .63 .739 GOLD .897 .897 .877 .775 .775 .755 COPPER .875 1 .5 .375 .25 .25 HACKERS .85 .9 .75 .7 .7 .8 NASD-100 .828 .828 .646 .666 .565 .656 SOLAR .812 .75 .5 .5 .437 .5 SEMI .79 .78 .59 .647 .6 .704 BIOTECH .767 .781 .711 .64 .648 .708 HOMEBLDG .764 .823 .47 .294 .294 .47 GAMING .761 .666 .523 .333 .285 .476 SOFTWARE .716 .7 .616 .6 .533 .666 GREEN .714 .714 .38 .38 .38 .38 ELECTRON .711 .711 .523 .55 .489 .604 COMPUTER .7 .75 .55 .45 .4 .55 CHEM .693 .693 .428 .346 .306 .387 AUTO .625 .675 .4 .3 .2 .4 INDEXES .618 .65 .424 .387 .344 .456 INDMATER .6 .6 .293 .253 .24 .306 FIDSTKS .581 .615 .429 .418 .384 .446 COAL .571 .571 .142 .142 .142 .142 HOSPITAL .571 .571 .238 .238 .238 .38 SP-100 .538 .604 .406 .395 .318 .406 ETFS .535 .571 .285 .285 .303 .303 OILGAS .534 .541 .305 .251 .206 .343 BEVERAGE .533 .6 .4 .4 .4 .533 DOWJONES .533 .7 .466 .433 .366 .4 SP500 .53 .56 .381 .362 .315 .385 RUS-1000 .502 .533 .339 .319 .272 .357 CHINA .49 .529 .352 .313 .313 .392 RETAIL .48 .44 .3 .28 .24 .32 GUNS .466 .466 .333 .333 .333 .333 DJI-13 .461 .692 .384 .384 .384 .384 TRANSP .45 .5 .2 .25 .2 .25 COMODITY .4 .425 .275 .275 .225 .25 FOOD .37 .388 .24 .24 .203 .222 MILITARY .37 .37 .111 .111 .111 .148 INFRA .342 .342 .142 .114 .028 .085 BONDFUND .237 .207 .158 .148 .158 .178 FINANCE .202 .226 .142 .13 .107 .119 UTILITY .179 .153 .076 .128 .102 .102 REGBANKS .153 .23 .038 0 0 .038 BIGBANKS .142 .285 0 0 0 0 REIT .12 .12 .042 .042 .035 .042 INSURANC .115 .115 .076 .038 .038 .076 JETS 0 0 0 0 0 0 |
====================================================================
5/18/2020 The DJI roared up beyond its falling 65-dma. This will force us
cover our shorts on DIA on the next pullback. It seems best to wait
because there are multiple non-confirmations of the DJI's recovery
high today. See in the DJI chart below how the P-I will fail to
confirm the next higher closing. This produced a Sell S5 tonight.
All past wide non-confirmations like this at or above the 65-dma,
by the P-I have brought tradeable declines. Two weeks ago I showed that
every DJI move past a steeply falling 65-dma (AROC under -50%) coupled
with a negative Accum. has always brought a substantial decline, to at least
the DJI's lower 3% band.
Let's see how the market digests its big advance today and
hold
the Biotechs and Gold long positions.


We did see a decline last week. Note how the positive
OBVPct (OP21)
can be used in May and June in a Presidential Election year to cover DIA
on such a decline. With the floor of the NYSE again opening, we may now
see more trading volume. That will be important. New research below
shows
how we can use the OBVPct to confirm superb breadth days.

Volume Confirmed Superb Breadth
Can Over-Ride Negative IP21 (S12s).
New research done tonight shows the importance of 5:1
breadth days
and how such days can over-ride negative IP21 as long as both the
P-I and OBVPct are positive, just like now, or when there are a string
of such 5:1 breadth days provided the DJI is not above the 2% upper band.
Such super-breadth days were rare until 2006. But they then start appearing
in bunches. This is a big topic and will need some time to explain it here.
Suffice it now for me to show some of the recent 5:1 superb breadth days.
Clearly, such superb breadth "strings" are related to how the Fed is boosting
the markets as well as all the computerized Buy programs.
 |
 |
 |
Peerless S5s - Positive P-I NC of DJI rally to upper band. 1929-2020 19340619 S5 99.00 .08 perfect 0
----------------------------------------------------------------------------
19390605 S5 137.1 .031 140.1 -.0218 6/9
----------------------------------------------------------------------------
19460529 S5 212.5 .232 none 0
----------------------------------------------------------------------------
19560404 S5 518.7 .079 521.1 -.0046 4/6
----------------------------------------------------------------------------
19780606 S5 866.51 .05 perfect 0
----------------------------------------------------------------------------
19840501 S5 1182.89 .081 1186.56 -.0031 5/2
----------------------------------------------------------------------------
19860602 S5 1861.95 .019 1909.03 -.0252 7/2
----------------------------------------------------------------------------
19880408 S5 2090.19 .063 2110.08 -.0095 4/12
-----------------------------------------------------------------------------
19880705 S5 2158.61 .058 none 0
-----------------------------------------------------------------------------
19900719 S5 2993.81 .181 none 0
-----------------------------------------------------------------------------
19910603 S5 3035.33 .04 none 0
-----------------------------------------------------------------------------
19920421 S5 3343.25 .025 3413.21 -.0209 6/1
-----------------------------------------------------------------------------
19990706 S5 11135.12 .043 11209.8 -.0067 7/16
-----------------------------------------------------------------------------
20070716 S5 13950.98 .047 14000.4 -.0035 7/19
-----------------------------------------------------------------------------
20090608 S5 8764.49 .053 none 0
-----------------------------------------------------------------------------
20110503 S5 12807.51 .051 none 0
-----------------------------------------------------------------------------
20130715 S5 15484.26 .034 15658.3 -.0112 8/2
-----------------------------------------------------------------------------
Totals S5 Avg.=7.1% No Losses Paper Loss Avg=0.6%
Median = 5.2%
Mays are the most successful
20200518 S5 24597.37
|
|
Charts 5/18/2020 (Click on Underlined link.) 2020 PEERLESS DJI, Signals, Indicators Daily DJI Volume 10-DayUp/Down Vol Stoch-20 Inverted Traders Index Graph of Pct of All Stocks above 65-dma Cum. Inverted Traders Index NASDAQ S&P OEX NYSE COMPQX DJI-15 DJI-20 DJI-30 DIA QQQ MDY IWM TNA Short-Term Rates SPY http://tigersoft.com/2121CST/SPY.GIF 2006 vers-Peerless signals http://tigersoft.com/2121CST/PEER2006.bmp USO-CrudeOil DBO FAS GLD BBH IBB JETS JNUG KOL NUGT OIH PALL RSX RETL SDS AGQ SLV SOXL TECL TLT TMF TNA UGA (gasoline) USO (oil) and China: YINN CHAU Commodities: CANE CORN DBC JJC, NIB, CHOC CORN, CUT (paper) MOO, SOYB WEAT UUP (Dollar) LIT (Lithium) Stocks AAPL ADBE ALXN AMAT AMGN AMD AMZN AXP BA BABA BAC BIDU BLDP CAT CVX CMG DE ENPH FB GILD GOOG GS HD IBM INTU JPM LRCX M (Macy's) MSFT NEM NFLX NKE NVDA PG REGN SO SQ QCOM QDEL TSLA TXN XOM V VRTX WFC WMT TOWN New highs and Bullish MAXCPs http://tigersoft.com/MAXCP/5-18/BULLISH.htm Bearish MAXCPs - http://tigersoft.com/MINCP/5-18/BEARISH.htm |
Table 1
5/18/2018 QUICKSILVER on DJI-30 STOCKS.
Considering just those stocks whose IP21 + ITRS score is >+.25 or <-.25
0 Bullish ( )
0 = 0
4 Bearish (BA JPM KO
-135 -90 -45 = -270
---------------------------
Vitality Score = -270
Note that AAPL now shows highest AI/200 stock here. STOCKS CLOSE CHANGE PIVOT-P 5-dma AROC CL-PWR Candl AI/200 IP21 ITRS --------------------------------------------------------------------------------------- AAPL 314.96 7.25 311.41 -.8% Bullish BLUE 152 .098 .14 --------------------------------------------------------------------- AXP 88.41 6.19 83.14 186.7% ------- BLUE 81 .054 -.133 --------------------------------------------------------------------- BA 135.44 15.44 125.22 264.1% ------- BLUE 67 -.17 -.434 Bearish --------------------------------------------------------------------- CAT 115.02 7.1 105 301.1% ------- BLUE 142 .089 -.003 --------------------------------------------------------------------- CSCO 45.06 .79 43.22 200.8% ------- ---- 78 -.08 .185 --------------------------------------------------------------------- CVX 92.55 3.39 91.1 -45.3% Bearish ---- 83 -.065 .021 --------------------------------------------------------------------- DIS 116.85 7.8 104.56 428.1% Bullish BLUE 85 .054 .064 --------------------------------------------------------------------- GS 181.88 10.01 177.21 -36.4% ------- BLUE 107 -.142 -.007 --------------------------------------------------------------------- HD 245.35 6.02 232.9 187.3% Bullish RED 138 -.026 .124 --------------------------------------------------------------------- IBM 121.56 4.58 120.26 -43.5% ------- BLUE 141 .105 .002 --------------------------------------------------------------------- INTC 59.92 1.64 58.39 -17.9% ------- BLUE 116 .055 .124 --------------------------------------------------------------------- JNJ 150.52 .08 147.14 47.5% ------- RED 124 -.058 .11 --------------------------------------------------------------------- JPM 90.45 4.55 87.03 27.6% ------- BLUE 100 -.229 -.113 Bearish --------------------------------------------------------------------- KO 44.97 1.71 44.82 -64.4% Bearish BLUE 107 -.337 -.136 Bearish --------------------------------------------------------------------- MCD 179.83 6.02 176.54 -29.8% Bearish RED 105 -.067 -.046 --------------------------------------------------------------------- MMM 149.27 10.58 141.52 126.8% Bearish BLUE 93 .021 .021 --------------------------------------------------------------------- MRK 79.72 -.06 77.19 115.2% ------- RED 89 -.106 .02 --------------------------------------------------------------------- MSFT 184.91 1.75 182.51 -50.1% ------- RED 150 .007 .194 --------------------------------------------------------------------- NKE 91.04 4.05 88.26 6.3% Bearish BLUE 110 .02 .08 --------------------------------------------------------------------- PFE 38.07 .31 37.36 -4% ------ RED 54 -.094 .137 --------------------------------------------------------------------- PG 116.21 1.6 114.55 39.3% ------- BLUE 89 -.055 .005 --------------------------------------------------------------------- TRV 95.3 4.99 93.96 -11.4% ------- BLUE 95 -.049 -.187 --------------------------------------------------------------------- UNH 293.36 2.4 287.7 81.3% ------- RED 131 -.261 .083 --------------------------------------------------------------------- UTX 86.01 -5.36 97.15 -958.4% Bullish RED 114 .144 -.391 --------------------------------------------------------------------- V 191.38 7.89 179.47 216.1% Bullish BLUE 127 -.004 .088 --------------------------------------------------------------------- VZ 55.72 1.01 55.46 -61.5% Bearish BLUE 131 - .144 .03 --------------------------------------------------------------------- WBA 40.86 2.46 40.53 -107.4% Bearish BLUE 78 .065 -.141 --------------------------------------------------------------------- WMT 127.66 1.72 123.78 160.8% ------- BLUE 85 -.131 .139 --------------------------------------------------------------------- XOM 45.34 3.34 44.12 -46.3% Bearish BLUE 45 -.133 .001 --------------------------------------------------------------------- DOW 36.74 3.18 33.79 424.9% Bullish BLUE 64 .037 -.007 |
Table 2 QUICKSILVER on ETFS - 05/18/20 Bullish = GLD
Bearish = FAS SOXL
ETF CLOSE CHANGE PIVOT-PT 5-dma AROC CL-PWR CANDLE IP21 ITRS --------------------------------------------------------------------------------------------- DIA 245.93 9.02 238.08 71% ------- BLUE-.145 ---- --------------------------------------------------------------------------------------------- SPY 295 8.86 286.67 43.6% ------- BLUE-.112 .042 --------------------------------------------------------------------------------------------- QQQ 227.43 4.16 222.12 12.6% ------- BLUE-.008 .143 --------------------------------------------------------------------------------------------- MDY 305.47 17.45 292.45 31.5% Bullish BLUE 0 -.02 --------------------------------------------------------------------------------------------- IWM 132.68 7.6 126.97 38.9% Bullish BLUE .037 -.031 --------------------------------------------------------------------------------------------- FAS 27.91 3.68 25.01 92.7% ------- BLUE-.055 -.506 Bearish --------------------------------------------------------------------------------------------- RETL 110.43 13.11 98 190.1% Bullish BLUE .119 -.289 --------------------------------------------------------------------------------------------- SOXL 138.49 17 126.85 -4.3% ------- BLUE-.128 -.253 Bearish --------------------------------------------------------------------------------------------- TECL 182.91 12.83 170.43 19.1% Bullish BLUE-.007 -.063 --------------------------------------------------------------------------------------------- IBB 133.78 1.53 131.05 -4.6% ------- RED -.081 .183 --------------------------------------------------------------------------------------------- GLD 162.69 -1.24 160.04 101.2% Bullish RED .276 .083 Bullish --------------------------------------------------------------------------------------------- OIH 113.96 12.73 108.67 282.2% ------- BLUE .092 -.175 --------------------------------------------------------------------------------------------- |
Table 3 Count of Stocks in Key Directories
20200518
-------------------------------
NEWHIGHS 152
NEWLOWS 19
MAXCP 80
MINCP 13
TTTNH 52
TTTNL 10
FASTUP 170
FASTDOWN 568
CPCROSSA 289
CPCROSSD 67
BIGVOLUP 9
BIGVODN 8
ACCUMVER 1
HIGHIP21 5
HIUPPCT 5
REDSELL 122
AUGSELS7 28
TRAPDOOR 20
|
Table 4 RANKING OF KEY DIRECTORIES BASED PCT.OF STOCKS ABOVE 65-DMA
5/18/20
Bullish = 31
Bearish = 15
---------------------------------------------------------------------------------------
Directory Current day-1 day-2 day-3 day-4 day-5
----------------------------------------------------------------------------------------
COPPER 1 .5 .375 .25 .125 .375
EDU 1 1 .8 .8 .8 1
HACKERS .9 .8 .7 .7 .8 .8
GOLD .897 .877 .775 .775 .755 .775
NIFTY .891 .695 .76 .63 .717 .869
NASD-100 .828 .656 .676 .565 .646 .747 HOMEBLDG .823 .47 .294 .294 .411 .529 SEMI .78 .59 .647 .6 .685 .819 BIOTECH .779 .705 .64 .648 .713 .739 COMPUTER .75 .55 .45 .4 .55 .7 SOLAR .75 .5 .5 .437 .437 .687 GREEN .714 .38 .38 .38 .38 .571 ELECTRON .711 .523 .55 .489 .59 .711 DOWJONES .7 .466 .433 .366 .4 .466 SOFTWARE .7 .633 .6 .533 .666 .666 CHEM .693 .428 .346 .306 .367 .448 DJI-13 .692 .384 .384 .384 .384 .384 AUTO .675 .4 .3 .2 .375 .5 GAMING .666 .523 .333 .285 .428 .428 INDEXES .65 .424 .387 .344 .413 .516 FIDSTKS .615 .429 .418 .384 .446 .519 SP-100 .604 .406 .395 .318 .395 .483 BEVERAGE .6 .4 .4 .4 .533 .6 INDMATER .6 .293 .253 .24 .28 .386 COAL .571 .142 .142 .142 .142 .142 ETFS .571 .285 .285 .303 .303 .339 HOSPITAL .571 .238 .238 .238 .38 .38 SP500 .56 .383 .362 .315 .37 .467 OILGAS .537 .303 .25 .212 .303 .333 RUS-1000 .533 .341 .319 .272 .346 .436 CHINA .529 .352 .313 .313 .372 .431 ============================================================================================= TRANSP .5 .2 .25 .2 .25 .35 GUNS .466 .333 .333 .333 .333 .333 RETAIL .44 .3 .28 .24 .32 .38 COMODITY .425 .275 .275 .225 .225 .325 FOOD .388 .24 .24 .203 .203 .277 MILITARY .37 .111 .111 .111 .148 .185 INFRA .342 .142 .114 .028 .028 .2 BIGBANKS .285 0 0 0 0 0 REGBANKS .23 .038 0 0 .038 .038 FINANCE .226 .142 .13 .107 .119 .13 BONDFUND .207 .158 .148 .158 .158 .138 UTILITY .153 .076 .128 .102 .102 .102 REIT .12 .042 .042 .035 .042 .127 INSURANC .115 .076 .038 .038 .076 .115 JETS 0 0 0 0 0 0 |
=======================================================================
5/15/2020 It looks like Fed Chairman's assurances on the popular TV
show 60-Minutes are boosting the market this morning. The interviewer
did not ask how long money would be going to Wall Street or big corporations,
he did not ask him what was the legal basis for the FED buying private
corporate bonds, who in the public interest is watching how this money is used
to help the economy or how the Public can have any confidence
that the "who gets what" on Wall Street will ever be known. Since
Powell says he expects the Virus'es horrors may continue for a long time,
it seems apparent that he is quite willing to provide trillions more to Wall Street.
I think we can assume it will be only a matter of time before the Fed
starts to buy Index ETFs. There seems to be no organized opposition
to this coup.
So, maybe the 2006 Peerless is right to issue a Buy B20,
based on
how the market with the help of the FED usually is well-supported
on any weakness down towards the lower band from May onwards
in a Presidential Election year. I recently presented the case for a treating
a May decline to the lower band support as a Buy, but also showed
that there were cases outside the purview of the 2006 Peerless program's
data base where this would have failed, most noticeably in 1940 and 2008
That leaves us with a 2006 program that gave a Buy signal with the DJI
having recovered up from the well-tested support and with a positive OBV-Pct.
showing that heavy selling was easing off the market. So, another test of
the rapidly falling 65-dma with a still negative IP21 looms ahead. Our
Vitality Index is still negative, though if tomorrow AAPL has a strong
day will turn positive. In this situation, I think we
have to wait to see if
the DIA can breakout above its falling 65-dma to cover it. Meanwhile
I would be long IBB, bullish MAXCP biotechs, GLD and NUGT.
If the Covid-19 pandemic continues for more than
another 6 months, the
cost to the Government will be very, very big. In this, it will be not
unlike in the American Civil War, which was first expected to be short,
but then as it dragged on and on, forced the US Government to print
lots and lots of Greenbacks (fiat paper money). Between 1860 and
1864, the price of Gold doubled despite the California Gold Rush.
Gold would seem to be a good investment now.
DJIA Chart - Current Peerless Signals
Note: (1) lagging NYSE A/D Line.
(2) negative IP21 (Current AI)
(3) 65-dma is falling at 90% annualized rate.


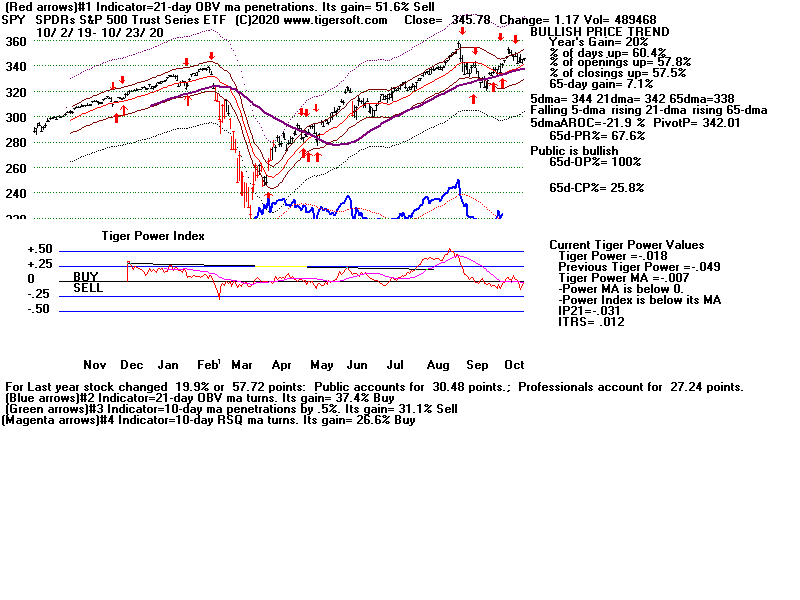
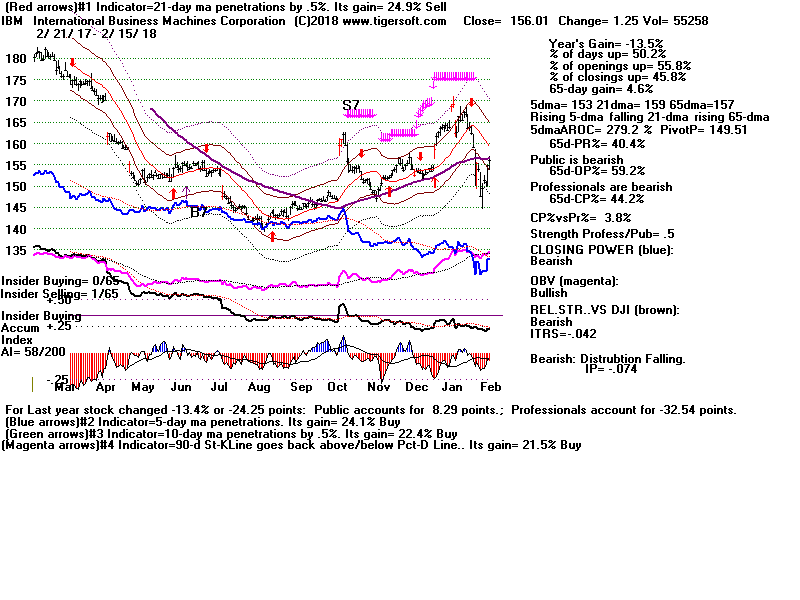
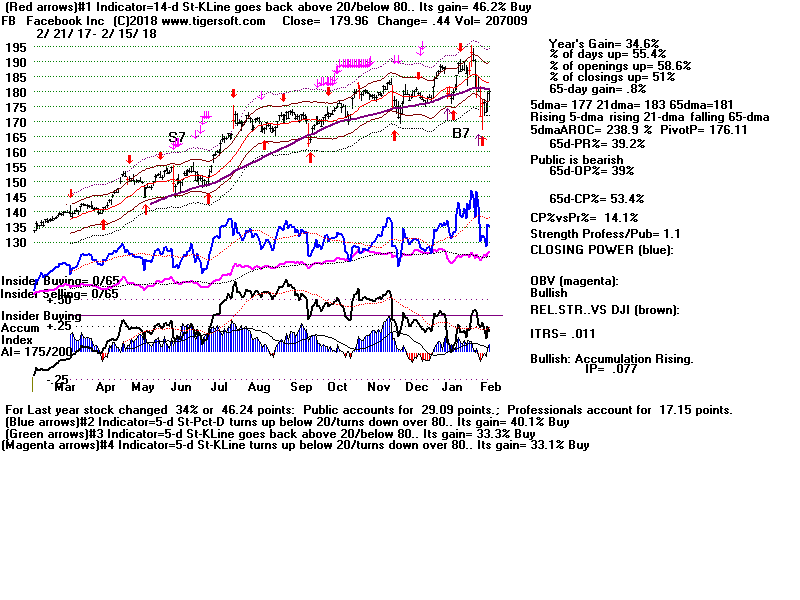
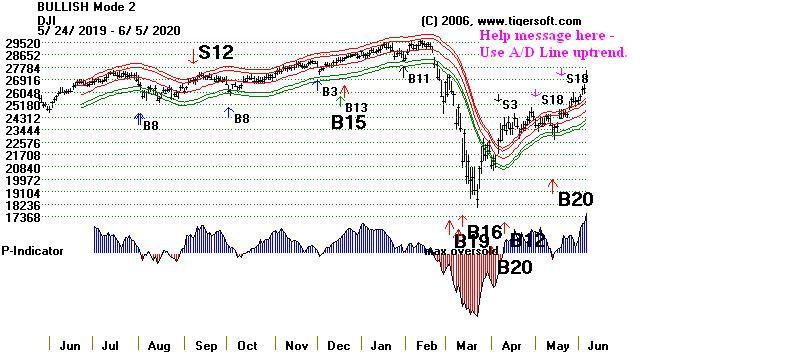
|
May Bottoms in a Presidential Election Year? 8 Cases: 1888-2016 The problem with buying on weakness in May even when the OBVPct was positive, at the May 1988 bottom was that there was a 5% lower bottom to be had in the June 1928 case even though the positive OBVPct was positive in May All 8 earlier May cases produced a good rally. Only one of the eight. In 4 of the 8, OBVPct was above -.140 In 4 of 7 cases, interest rates were falling or Fed was supporting market. Current 2020 5/13 .976 OBVPct = +.039 IP21= -.122 PI=-99 (-182) 65dma AROC=-96% Fed supporting market: 1924, 1952 Recovery after 6 tests of 23000. ======================================================================= Bottoms 8 cases 1904 5/18 .981 DJI rose from from 47 to >70. OBVPct= -.333 65-daymaAROC= -3.5% On 6/10/1904 DJI surpassed 65-dma and then rose strongly. --- Teddy Roosevelt secretly accepted campaign contributions from big banker JP Morgan and, in return, did not try to break up his big trusts. --------------------------------------------------------------------------------------------------------------------------------- 1920 5/19 .935 87.40 to 94.30 in a month, then bear mkt resumed. OBVPct= -.318 DJI rose up to falling 65-dma (65-daymaAROC= -20.5%) and turned back down. --- Fed was raising rates at this time, unlike now! --------------------------------------------------------------------------------------------------------------------------------- 1924 5/20 .943 13% correction. OBVPct = -.052 Up, up! 88 to 120 at year's end. --- Fed soon started cutting rates and inserting new liquidity into banks by buying their Gov't bonds. -------------------------------------------------------------------------------------------------------------------------------- 1952 5/1 .979 256.4 to 280.3 on 8/11 OBVPct = -.396 IP21= -.054 PI=-171 (-7) 65dma AROC=-25% -- Discount Rate = 1.75%! (Very low) -------------------------------------------------------------------------------------------------------------------------------- 1956 5/18 .942 468.8 to 521.0 on 8/2. OBVPct = -.604 IP21= -.241 PI=-197 (-47) 65dma AROC=-3.5% short-term rates were rising, but still below 4%. -------------------------------------------------------------------------------------------------------------------------------- 1988 5/23 .969 1941.48 to 2158.61 on 7/5 Fed supporting market. OBVPct = +.075 IP21= -.017 PI=-81 (+24) 65dma AROC=+7.0% Trading range. -------------------------------------------------------------------------------------------------------------------------------- 2000 5/25 .972 10323.92 to 11310.64 on 9/6 OBVPct = -.144 IP21= -063 PI=-161 (+24) 65dma AROC=+7.05% Short-term rates were rising Rally from 5x tested support. -------------------------------------------------------------------------------------------------------------------------------- 2004 5/17 .967 9906.91 to 10479.57 on 6/23 OBVPct = -.137 IP21= -081 PI=-525 (-132) 65dma AROC=-30% ========================================================================= ========================================================================= June Bottoms - Did May bottom fail? Year Date LA/MA Outcome
---------------------------------------------------------------------------
1888 6/12 .975 77.12 to 88.10 on 10/1
A May 28th bottom 78.60 (.971) with OP=-.334 would have had small paper loss.
1900 6/25 .956 rally only to UBand
A May 5th bottom 59.26 (.962) with OP=-.103 would have had 10%, paper loss
59.26 to 53.68 .
1908 6/23 .981 77 to 84 on 8/10.
No loss if DJI bought on May weakness below 21-dma.
1928 6/19 .952 up, up! 202 to 300 at year's end.
Buying on 5/22 with DJI 1.8% below 21-dma and an OBVPct of +.212
would have meant buying at 211.7 and suffering a 5% paper loss when
DJI fell to 202.
1940 6/10 .931 111.8 to 137.8! 11/7/1940.
DJI fell from 137.6 on May 13 to 111.8 Big loss. The OBVPct was <-.32
on the May weakness
1964 6/8 .978 800.3 to 895.4 on 11/17
No loss if DJI bought on May weakness
1976 6/7 .974 958.09 to 1014.79 on 9/21
Very small 1% loss if DJI bought on May weakness. OBVPct was -.193
1992 6/18 .972 3274.12 to only 3395.54 on 8/3
Very small 1% loss if DJI bought on May weakness.
|
Table 1
5/15/2018 QUICKSILVER on DJI-30 STOCKS.
Considering just those stocks whose IP21 + ITRS score is >+.25 or <-.25
0 Bullish ( )
0 = 0
4 Bearish (BA JPM KO
-120 -86 -43 = -249
---------------------------
Vitality Score = -249
Note that AAPL now shows highest AI/200 stock here. STOCKS CLOSE CHANGE PIVOT-P 5-dma AROC CL-PWR Candl AI/200 IP21 ITRS --------------------------------------------------------------------------------------- AAPL 307.71 -1.83 315.01 -38.9% Bullish BLUE 151 .086 .144 --------------------------------------------------------------------- AXP 82.22 -1.59 85.33 -433.5% ------- RED 81 .079 -.165 --------------------------------------------------------------------- BA 120 -2.52 128.91 -532% Bearish BLUE 67 -.146 -.445 Bearish --------------------------------------------------------------------- CAT 107.92 1.73 108.61 -195.3% Bearish BLUE 142 .088 -.021 --------------------------------------------------------------------- CSCO 44.27 .42 43.32 148.6% ------- BLUE 78 -.069 .213 --------------------------------------------------------------------- CVX 89.16 -.89 93.37 -343.9% ------- RED 83 -.012 .011 --------------------------------------------------------------------- DIS 109.05 3.14 107.77 -5.2% Bullish BLUE 85 .103 .051 --------------------------------------------------------------------- GS 171.87 -2.58 183.16 -378.9% Bearish RED 108 -.147 -.042 --------------------------------------------------------------------- HD 239.33 4.85 236.56 104.8% Bullish BLUE 139 .039 .113 --------------------------------------------------------------------- IBM 116.98 .03 122.59 -251% Bearish BLUE 141 .124 -.003 --------------------------------------------------------------------- INTC 58.28 -.8 60.13 -117.8% Bearish BLUE 116 .016 .117 --------------------------------------------------------------------- JNJ 150.44 2.8 149.11 58.8% ------- BLUE 124 .031 .153 --------------------------------------------------------------------- JPM 85.9 -1.62 89.97 -385.3% Bearish RED 101 -.215 -.152 Bearish --------------------------------------------------------------------- KO 43.26 -.44 45.54 -317.9% Bearish RED 107 -.34 -.144 Bearish --------------------------------------------------------------------- MCD 173.81 -1.6 180.88 -209.2% ------- BLUE 105 -.015 -.03 --------------------------------------------------------------------- MMM 138.69 2.7 145.73 -346.8% Bearish BLUE 93 -.048 .01 --------------------------------------------------------------------- MRK 79.78 -.27 77.91 217% ------- RED 89 -.069 .072 --------------------------------------------------------------------- MSFT 183.16 2.63 186.74 -41.6% ------- BLUE 149 .035 .195 --------------------------------------------------------------------- NKE 86.99 .44 90.93 -196.2% Bearish BLUE 109 .036 .054 --------------------------------------------------------------------- PFE 37.76 -.16 38.1 71.9% ------- RED 54 -.058 .159 --------------------------------------------------------------------- PG 114.61 .8 115.31 -58.4% ------- BLUE 90 -.001 .036 --------------------------------------------------------------------- TRV 90.31 .09 95.51 -376.4% ------- BLUE 95 -.023 -.201 --------------------------------------------------------------------- UNH 290.96 .35 288.69 69.1% ------- RED 132 -.265 .122 --------------------------------------------------------------------- UTX 86.01 -5.36 97.15 -958.4% Bullish RED 114 .144 -.347 --------------------------------------------------------------------- V 183.49 2.59 183.56 -44.1% Bullish BLUE 128 .007 .075 --------------------------------------------------------------------- VZ 54.71 -.2 56.4 -205.5% Bearish BLUE 131 -.126 .051 --------------------------------------------------------------------- WBA 38.4 -.45 41.71 -406.5% Bearish RED 77 .038 -.119 --------------------------------------------------------------------- WMT 125.94 2.52 123.67 121.5% ------- BLUE 86 -.125 .18 --------------------------------------------------------------------- XOM 42 -.3 45.74 -474.4% Bearish RED 45 -.104 -.068 --------------------------------------------------------------------- DOW 33.56 .05 33.9 -114.7% ------- BLUE 63 .05 -.069 |
Table 2 QUICKSILVER on ETFS - 05/15/20 Bullish = GLD
Bearish = FAS SOXL
ETF CLOSE CHANGE PIVOT-PT 5-dma AROC CL-PWR CANDLE IP21 ITRS --------------------------------------------------------------------------------------------- DIA 236.91 .16 242.56 -140.5% ------- BLUE-.109 ----- --------------------------------------------------------------------------------------------- SPY 286.14 1.17 292.5 -109.5% ------- BLUE-.067 .04 --------------------------------------------------------------------------------------------- QQQ 223.27 1.44 226.87 -35.6% ------- BLUE .012 .149 --------------------------------------------------------------------------------------------- MDY 288.02 2.33 303.64 -301.9% Bullish BLUE-.053 -.043 --------------------------------------------------------------------------------------------- IWM 125.08 1.96 131.7 -285.8% Bullish BLUE .04 -.057 --------------------------------------------------------------------------------------------- FAS 24.23 -.2 27.45 -863.4% ------- BLUE-.055 -.552 Bearish --------------------------------------------------------------------------------------------- RETL 97.32 5.69 106.75 -489.3% Bullish BLUE .112 -.343 --------------------------------------------------------------------------------------------- SOXL 121.49 -8.12 138.6 -668.5% ------- BLUE-.159 -.331 Bearish --------------------------------------------------------------------------------------------- TECL 170.08 1.92 182.26 -244.5% ------- BLUE .016 -.132 --------------------------------------------------------------------------------------------- IBB 132.25 3.23 133.9 147.2% ------- BLUE .037 .2 --------------------------------------------------------------------------------------------- GLD 163.93 .92 159.42 109.1% Bullish RED .284 .135 Bullish --------------------------------------------------------------------------------------------- OIH 101.23 .3 108.11 -425.7% ------- BLUE .104 -.293 --------------------------------------------------------------------------------------------- |
Table 3 Count of Stocks in Key Directories
20200515
-------------------------------
NEWHIGHS 87 (NYSE and NASDAQ)
NEWLOWS 39
MAXCP 83
MINCP 22
TTTNH 55
TTTNL 37
FASTUP 93
FASTDOWN 568
CPCROSSA 176
CPCROSSD 26
BIGVOLUP 13
BIGVODN 25
ACCUMVER 2
HIGHIP21 9
HIUPPCT 5
REDSELL 124
AUGSELS7 19
TRAPDOOR 22
|
RANKING OF KEY DIRECTORIES BASED PCT.OF STOCKS ABOVE 65-DMA 5/15/20 --------------------------------------------------------------------------------------- Directory Current day-1 day-2 day-3 day-4 day-5 ---------------------------------------------------------------------------------------- EDU 1 .8 .8 .8 1 1 GOLD .877 .775 .775 .755 .775 .795 HACKERS .8 .75 .7 .8 .8 .85 BIOTECH .701 .633 .647 .713 .741 .69 NIFTY .695 .76 .63 .717 .869 .847 NASD-100 .656 .686 .575 .646 .717 .767 SOFTWARE .633 .616 .533 .666 .65 .75 SEMI .59 .647 .6 .685 .809 .866 COMPUTER .55 .45 .4 .55 .65 .65 ELECTRON .523 .55 .489 .59 .704 .738 GAMING .523 .333 .285 .428 .428 .523 COPPER .5 .375 .25 .125 .375 .75 SOLAR .5 .5 .437 .437 .687 .75 HOMEBLDG .47 .294 .294 .411 .529 .529 DOWJONES .466 .433 .366 .4 .466 .533 FIDSTKS .429 .418 .384 .446 .508 .519 CHEM .428 .346 .306 .367 .448 .469 INDEXES .419 .387 .344 .413 .5 .548 SP-100 .406 .395 .318 .395 .472 .483 AUTO .4 .3 .2 .375 .45 .5 BEVERAGE .4 .4 .4 .533 .6 .6 DJI-13 .384 .384 .384 .384 .384 .538 SP500 .383 .364 .315 .37 .458 .473 GREEN .38 .38 .38 .38 .571 .571 CHINA .352 .313 .313 .372 .431 .431 RUS-1000 .341 .32 .272 .346 .426 .448 GUNS .333 .333 .333 .333 .333 .4 OILGAS .303 .25 .212 .303 .325 .356 RETAIL .3 .28 .24 .32 .38 .4 INDMATER .293 .253 .24 .28 .386 .48 ETFS .285 .285 .303 .303 .339 .392 COMODITY .275 .275 .225 .225 .275 .275 FOOD .24 .24 .203 .203 .222 .24 HOSPITAL .238 .238 .238 .38 .333 .428 TRANSP .2 .25 .2 .25 .35 .35 BONDFUND .158 .148 .158 .158 .138 .148 COAL .142 .142 .142 .142 .142 .285 FINANCE .142 .13 .107 .119 .13 .19 INFRA .142 .114 .028 .028 .2 .228 MILITARY .111 .111 .111 .148 .185 .185 INSURANC .076 .038 .038 .076 .076 .038 UTILITY .076 .128 .102 .102 .102 .102 REIT .042 .042 .035 .042 .127 .141 REGBANKS .038 0 0 .038 .038 .076 BIGBANKS 0 0 0 0 0 .142 JETS 0 0 0 0 0 0 |
=====================================================================
5/14/2020 The current version of Peerless remains on a Sell S12. All the
technical factors mentioned last night still apply. In particular,
we see the DJI's 65-dma still falling at a scary pace, -81%
annualized, the IP21 is quite negative, the DJI has the potential
of completing a bearish head and shoulders pattern, the DJI-30
Vitality Index is still below zero, with only one DJI-30 stocks
rated as "bullish" by Table 1 and the DIA's Closing Power is
in a steep downtrend. Stay short DIA and some of the financials
among our bearish MINCPs. Hold long only Gold stocks or Gold ETFs
and IBB (Biotechs)
DJI's critical neckline support is at 22766.
A clear penetration of that would be considered
a "judged Sell S10".

But what about a Presidential Election Rally?
These rallies from the lower 3.5% bands are most likely to
occur in June and July, not from a bottom in May. See the
list of such bottoms below tonight.

Our 2006 version of Peerless did just issue a Buy B20.
The Help Routine for this software says that it works out 90%
of the time and is based on buying on a recovery from the lower
band in the middle of a Presidential Election year when presumably
the FED and Congress want to shore up the market for political
reasons. As we know, there is a lot of truth in this hypothesis.
When I wrote the 2006 version of Peerless, I was aware of the
strong tendency of the DJI not to fall much in the second half of a
Presidential Election Year from 1968 to 2004. Of course, I had
no way of knowing how bad the market would be in the 2008
Presidential Election Year and since we did not use the data before
1965 at that time, I was unaware of the selloffs in the second half
in the Presdiential Election years of 1892, 1896,1920 or 1960.
Well, we have that data now and we can see how well a May
buy at the lower band would have worked for ALL of the Presidential
Election years starting in 1888. The answer is not, at all, badly if
we can buy near the 3.0% lower band (la/ma = .97) but without
a head/shoulders pattern having just been completed. These two
conditions make the current 2006 version's Buy B20 problematic.
In addition, I would prefer to buy at a bottom in June or July. There
are many more of these than May bottoms.
When was it a good time to buy in
a Presidential Election Year?
April Bottoms 3 cases
May Bottoms 8 cases
1904 5/18 .981 DJI rose strongly from 47 to >70.
1920 5/19 .935 87.40 to 94.30 in a month, then bear mkt resumed.
1924 5/20 .974 up, up! 88 to 120 at year's end.
1952 5/1 .979 256.4 to 280.3 on 8/11
1956 5/18 .942 468.8 to 521.0 on 8/2.
1988 5/23 .969 1941.48 to 2158.61 on 7/5
2000 5/25 .972 10323.92 to 11310.64 on 9/6
2004 5/17 .967 9906.91 to 10479.57 on 6/23
All 8 produced a good rally. Only one of the eight
bottoms took place above the 2% lower band.
June Bottoms 10 cases
July Bottom 9 cases
August Bottoms 2 cases
September Bottom 1 case
Year Date LA/MA Outcome --------------------------------------------------------------------------- 1888 6/12 .975 77.12 to 88.10 on 10/1 1892 7/6 .982 rally only to UBand on 10/1 1896 8/8 .913 58% rally until 11/12 1900 6/25 .956 rally only to UBand 1904 5/18 .981 DJI rose strongly from 47 to >70. 1908 6/23 .981 77 to 84 on 8/10. 1912 7/12 .976 88 to 94 on 10/1. 1916 7/13 .964 86 to 110 on 11/21 1920 5/19 .935 87.40 to 94.30 in a month, then bear mkt resumed. 1924 5/20 .974 up, up! 88 to 120 at year's end. 1928 6/19 .952 up, up! 202 to 300 at year's end. 1932 7/11 .941 42.90 to 79.90! 9/7/1932. 1936 4/29 .921 143.7 to 184.9! 11/17/1936. 1940 6/10 .931 111.8 to 137.8! 11/7/1940. 1944 4/25 .983 135.1 to 150.4 on 7/18. 1948 9/27 .973 176 to 189.3 on 10/27 1952 5/1 .979 256.4 to 280.3 on 8/11 1956 5/18 .942 468.8 to 521.0 on 8/2. 1960 7/25 .951 601.7 to only 641.5 on 8/24, then more new lows. 1964 6/8 .978 800.3 to 895.4 on 11/17 1968 8/2 .966 871.77 to 985.21 on 12/3. 1972 7/19 .984 916.69 to 973.51 on 8/14 1976 6/7 .974 958.09 to 1014.79 on 9/21 1980 4/21 .978 959.13 to 974.57 on 9/22 1984 7/23 .980 1096.62 to 1239.73 on 8/21 1988 5/23 .969 1941.48 to 2158.61 on 7/5 1992 6/18 .972 3274.12 to only 3395.54 on 8/3 1996 7/15 .950 5349.51 to 6858.41 on 11/26 2000 5/25 .972 10323.92 to 11310.64 on 9/6 2004 5/17 .967 9906.91 to only 10479.57 on 6/23 2008 7/15 .951 10962.52 to only 11782.35 on 8/11 2012 6/4 .961 12101.46 to 13610.15 on 10/5 2016 6/27 .964 17140.24 to 18559.01 on 7/19 |
|
Charts 5/14/2020 (Click on Underlined link.) 2020 PEERLESS DJI, Signals, Indicators Daily DJI Volume 10-DayUp/Down Vol Stoch-20 Inverted Traders Index Graph of Pct of All Stocks above 65-dma Cum. Inverted Traders Index NASDAQ S&P OEX NYSE COMPQX DJI-15 DJI-20 DJI-30 DIA QQQ MDY IWM TNA Short-Term Rates SPY http://tigersoft.com/2121CST/SPY.GIF 2006 vers-Peerless signals http://tigersoft.com/2121CST/PEER2006.bmp USO-CrudeOil DBO FAS GLD BBH IBB JETS JNUG KOL NUGT OIH PALL RSX RETL SDS AGQ SLV SOXL TECL TLT TMF TNA UGA (gasoline) USO (oil) and China: YINN CHAU Commodities: CANE CORN DBC JJC, NIB, CHOC CORN, CUT (paper) MOO, SOYB WEAT UUP (Dollar) LIT (Lithium) Stocks AAPL ADBE ALXN AMAT AMGN AMD AMZN AXP BA BABA BAC BIDU BLDP CAT CVX CMG DE ENPH FB GILD GOOG GS HD IBM INTU JPM LRCX M (Macy's) MSFT NEM NFLX NKE NVDA PG REGN SO SQ QCOM QDEL TSLA TXN XOM V VRTX WFC WMT TOWN New highs and Bullish MAXCPs http://tigersoft.com/MAXCP/5-14/BULLISH.htm Bearish MAXCPs - http://tigersoft.com/MINCP/5-14/BEARISH.htm |
Table 1
5/14/2018 QUICKSILVER on DJI-30 STOCKS.
Considering just those stocks whose IP21 + ITRS score is >+.25 or <-.25
1 Bullish (MSFT +181 )
0 = +181
4 Bearish (BA JPM KO TRV
-123 -88 -44 -90 = -325
---------------------------
Vitality Score = -144 weakening
Note that AAPL now shows highest AI/200 stock here. STOCKS CLOSE CHANGE PIVOT-P 5-dma AROC CL-PWR Candl AI/200 IP21 ITRS --------------------------------------------------------------------------------------- AAPL 309.54 1.89 310.13 93.7% Bullish BLUE 151 .061 .148 --------------------------------------------------------------------- AXP 83.81 5.78 89.5 -172.7% ------- BLUE 81 .059 -.15 --------------------------------------------------------------------- BA 122.52 1.02 133.44 -240.3% Bearish BLUE 68 -.198 -.441 Bearish --------------------------------------------------------------------- CAT 106.19 1.71 112.11 -51.2% Bearish BLUE 142 .076 -.04 --------------------------------------------------------------------- CSCO 43.85 1.9 42.99 291.3% Bearish BLUE 78 -.098 .185 --------------------------------------------------------------------- CVX 90.05 1.35 95.47 -140.4% ------- BLUE 84 .005 .04 --------------------------------------------------------------------- DIS 105.91 2.99 109.16 16% Bullish BLUE 85 .036 .015 --------------------------------------------------------------------- GS 174.45 2.65 185.39 -218.6% Bearish BLUE 109 -.094 -.038 --------------------------------------------------------------------- HD 234.48 4.38 234.43 108.1% Bullish BLUE 139 .009 .099 --------------------------------------------------------------------- IBM 116.95 1.22 122.99 -177.5% Bearish BLUE 141 .071 -.003 --------------------------------------------------------------------- INTC 59.08 1.34 59.67 -7.6% Bearish BLUE 116 .017 .133 --------------------------------------------------------------------- JNJ 147.64 .51 148.7 1.7% ------- BLUE 123 .01 .155 --------------------------------------------------------------------- JPM 87.52 3.49 92.7 -207.3% Bearish BLUE 102 -.247 -.144 Bearish --------------------------------------------------------------------- KO 43.7 -.24 46.11 -100% Bearish BLUE 108 -.29 -.132 Bearish --------------------------------------------------------------------- MCD 175.41 2.59 181.23 -159.9% Bearish BLUE 106 .014 -.027 --------------------------------------------------------------------- MMM 135.99 -.13 148.51 -339.7% Bearish BLUE 94 -.177 .009 --------------------------------------------------------------------- MRK 80.05 2.16 76.4 289% ------- BLUE 89 -.059 .091 --------------------------------------------------------------------- MSFT 180.53 .78 184.68 -83.7% Bearish BLUE 149 .077 .185 Bullish --------------------------------------------------------------------- NKE 86.55 .53 90.46 -113.1% Bearish BLUE 108 .034 .049 --------------------------------------------------------------------- PFE 37.92 .87 37.22 128.6% ------- BLUE 54 -.061 .168 --------------------------------------------------------------------- PG 113.81 -.11 115.95 71.7% ------- BLUE 91 -.033 .04 --------------------------------------------------------------------- TRV 90.22 .36 97.34 -295.3% ------- BLUE 96 -.122 -.188 Bearish --------------------------------------------------------------------- UNH 290.61 12.61 287 98.3% ------- BLUE 133 -.075 .13 --------------------------------------------------------------------- UTX 86.01 -5.36 97.15 -958.4% Bullish RED 114 .144 -.315 --------------------------------------------------------------------- V 180.9 3.81 185.09 -50.1% ------- BLUE 128 -.06 .057 --------------------------------------------------------------------- VZ 54.91 .06 57 -60% Bearish BLUE 131 -.126 .071 --------------------------------------------------------------------- WBA 38.85 .5 41.67 -223% Bearish BLUE 76 -.065 -.076 --------------------------------------------------------------------- WMT 123.42 -.29 122.94 62.1% Bearish RED 87 -.139 .183 --------------------------------------------------------------------- XOM 42.3 .37 46.18 -218.3% Bearish BLUE 46 -.111 -.067 --------------------------------------------------------------------- DOW 33.51 1.16 34.33 98.7% ------- BLUE 62 .038 -.074 |
Table 2 QUICKSILVER on ETFS - 05/14/20
Bullish = 1 GLD
Bearish = 5 RETL, SOXL, OIH, USO, JETS
ETF CLOSE CHANGE PIVOT-PT 5-dma AROC CL-PWR CANDLE IP21 ITRS --------------------------------------------------------------------------------------------- DIA 236.75 3.93 243.62 -45.2% Bearish BLUE-.112 ----- --------------------------------------------------------------------------------------------- SPY 284.97 3.37 292.44 -47% ------- BLUE-.077 .037 --------------------------------------------------------------------------------------------- QQQ 221.83 2.49 224.86 .2% ------- BLUE-.01 .143 --------------------------------------------------------------------------------------------- MDY 285.69 3.18 305.77 -160.7% ------- BLUE-.063 -.049 --------------------------------------------------------------------------------------------- IWM 123.12 .4 132.36 -168.4% ------- BLUE .014 -.065 --------------------------------------------------------------------------------------------- FAS 24.43 1.43 28.67 -527.3% ------- BLUE-.106 -.559 Bearish --------------------------------------------------------------------------------------------- RETL 91.63 1.42 106.98 -157.5% Bullish BLUE .094 -.402 Bearish --------------------------------------------------------------------------------------------- SOXL 129.61 9.59 138.98 69% ------- BLUE-.165 -.316 Bearish --------------------------------------------------------------------------------------------- TECL 168.16 6.65 178.5 -90.9% ------- BLUE .024 -.183 --------------------------------------------------------------------------------------------- IBB 129.02 -.58 128.41 71.1% ------- BLUE .017 .186 --------------------------------------------------------------------------------------------- GLD 163.01 1.43 160.42 50.4% Bullish BLUE .285 .183 Bullish --------------------------------------------------------------------------------------------- USO 21.45 .85 21.47 234.0% Bearish BLUE -.205 -.602 Bearish --------------------------------------------------------------------------------------------- OIH 100.93 1.54 110.21 -18.9% Bearish BLUE .061 -.296 --------------------------------------------------------------------------------------------- JETS 12.15 0 13.84 -251.9% Bearish BLUE -.056 -.364 Bearish |
Table 3 Count of Stocks in Key Directories
20200514
-------------------------------
NEWHIGHS 37
NEWLOWS 218 (increasing)
MAXCP 30
MINCP 19
TTTNH 23
TTTNL 47
FASTUP 93
FASTDOWN 344
CPCROSSA 225
CPCROSSD 24
BIGVOLUP 10
BIGVODN 16
ACCUMVER 4
HIGHIP21 7
HIUPPCT 7
REDSELL 127
AUGSELS7 22
TRAPDOOR 21
|
Table 4 RANKING OF KEY DIRECTORIES BASED PCT.OF STOCKS ABOVE 65-DMA
5/14/20
Bullish = 9
Bearish = 36
---------------------------------------------------------------------------------------
Directory Current day-1 day-2 day-3 day-4 day-5
----------------------------------------------------------------------------------------
EDU .8 .8 .8 1 1 .8
GOLD .775 .775 .755 .775 .795 .734
NIFTY .76 .63 .717 .869 .847 .739
HACKERS .75 .75 .8 .8 .85 .8
NASD-100 .686 .585 .656 .717 .767 .676
^^^^^^^^
SEMI .647 .6 .685 .809 .847 .723
BIOTECH .632 .644 .714 .742 .694 .666
SOFTWARE .616 .55 .666 .65 .716 .65
ELECTRON .55 .489 .59 .704 .731 .61
=============================================================================================
SOLAR .5 .437 .437 .687 .75 .562
=============================================================================================
COMPUTER .45 .4 .55 .65 .65 .55
DOWJONES .433 .366 .4 .466 .5 .366
^^^^^^^^
FIDSTKS .418 .384 .446 .508 .508 .429
BEVERAGE .4 .4 .533 .6 .6 .466
SP-100 .395 .318 .395 .472 .472 .406
INDEXES .387 .344 .413 .5 .537 .419
DJI-13 .384 .384 .384 .384 .461 .384
GREEN .38 .38 .38 .571 .571 .38
COPPER .375 .25 .125 .375 .75 .375
SP500 .364 .317 .37 .458 .463 .387
^^^^^
CHEM .346 .306 .367 .448 .448 .265
GAMING .333 .285 .428 .428 .523 .428
GUNS .333 .333 .333 .333 .333 .266
RUS-1000 .32 .273 .346 .426 .437 .352
^^^^^^^^
CHINA .313 .313 .372 .431 .431 .294
AUTO .3 .2 .375 .45 .475 .275
HOMEBLDG .294 .294 .411 .529 .529 .47
ETFS .285 .303 .303 .339 .357 .232
RETAIL .28 .24 .32 .38 .36 .3
COMODITY .275 .225 .225 .275 .275 .25
INDMATER .253 .24 .28 .386 .466 .32
OILGAS .25 .212 .303 .325 .356 .265
TRANSP .25 .2 .25 .35 .35 .3
FOOD .24 .203 .203 .222 .24 .203
HOSPITAL .238 .238 .38 .333 .38 .285
BONDFUND .148 .158 .158 .138 .148 .158
COAL .142 .142 .142 .142 .285 .142
FINANCE .132 .108 .12 .132 .168 .12
UTILITY .128 .102 .102 .102 .102 .076
INFRA .114 .028 .028 .2 .2 .114
MILITARY .111 .111 .148 .185 .185 .185
REIT .042 .035 .042 .127 .141 .092
INSURANC .038 .038 .076 .076 .038 .038
BIGBANKS 0 0 0 0 0 0
JETS 0 0 0 0 0 0
REGBANKS 0 0 .038 .038 .076 .038
|
=====================================================================
5/13/2020 Sell S12 - A DJI re-test of 19000 cannot be ruled out.
Note the A/D Line trend-break, the head/shoulders pattern,
the very negative IP21 (-.122), the now negative P-I (-99),
the rising down volume (VI=-146) and the accelerating weakness
of the 65-dma (now showing an AROC of -91%).

Today's decline was quite broad. There were 8x more NYSE decliners
than advancers. The decline was led by the already weakest groups,
financials and airlines. Shorting the weakest stocks and ETFs among the
Bearish MINCPs is essential in here along with shorting DIA. Look also
at how weak the Closing Powers are for all the major market ETFs, shown
below. Professionals are looking past the bailout and worrying now that what
will follow will be a long-lasting economic slow-down.

Peerless shows the last signal to be a Sell S12. But
just our research on what
happens after a 30% recovery when the IP21 is bearish should have made
us all nervous this past weekend. And we know the odds heavily favor a decline
by the DJI to below the lower band when it tags a 65-dma that is falling at the rate
of more than -50% annualized AND also shows a negatuve IP21 (Accumulation
Index.). Add to this the bearish now in the DJI's continuation head.shoulders
and the fact that our DJI-30 Vitality Index is quite negative now and falling.
Short more DIA.
I think we can still hold long Biotech and Golds, but AAPL is
no longer rated
as "bullish" in Table 1. I see it weakening more because Warren Buffett
followers
will need to raise margin- money because of how their hero has failed them
regarding airlines and Wells Fargo. So, it seems best to get out of AAPL
(another of his favorites) if you are a trader. We can re-examine it if it
successfully
tests its 65-dma.
Closing Power weakness like we are now seeing
should make traders very wary of buying into opening strength.


=====================================================================

Today's sell-off started when Fed Chairman Powell
warned that his multi-trillion
Dollar bailout may not be enough to save to broader economy from the depression-
producing effects of the Cover-19 virus in the US. New fiscal relief and employment
creating policies are likely to be needed. Longer unemployment benefits, more
Federal help for States and even Publics Works jobs to combat are likely to be
need soon. In this, Powell seems to be seeking a new alliance with the Democrats
against the Senate Republicans.
At the same time, most of the CDC spokesmen are warning that the contagion cannot
be stopped by re-starting the economy too soon now. This contradicts the
Administration's back-to-work policies even before testing facilities are available.
The partisan warfare is inevitable this year. What is the truth? The
pandemic's death
toll will tell soon enough. Right now, the death toll rate is rising only in Texas
and
Arizona, as far as I can detect today. Most states show either flat or decliing
Covid-19 Deaths.
Texas - rising steadily for last month.
Arizona - rising
Colorado - rising recently.
Illinois - swinging wildly.
California - flat
Connecticut - flat
New Mexico - flat
Ohio - flat
Oregon - flat
Utah - flat
Georgia - going sidewise
Florida - flat/declining
Florida - flat/declining
South Carolina - flat/declining
Missouri - decliing.
New York - declining
Pennysylvania - declining for a month.
Michigan - declining
Washington - decliing
Hawaii - decliining and low.
|
Charts 5/13/2020 (Click on Underlined link.) 2020 PEERLESS DJI, Signals, Indicators Daily DJI Volume 10-DayUp/Down Vol Stoch-20 Inverted Traders Index Graph of Pct of All Stocks above 65-dma Cum. Inverted Traders Index NASDAQ S&P OEX NYSE COMPQX DJI-15 DJI-20 DJI-30 DIA QQQ MDY IWM TNA Short-Term Rates SPY http://tigersoft.com/2121CST/SPY.GIF 2006 vers-Peerless signals http://tigersoft.com/2121CST/PEER2006.bmp USO-CrudeOil DBO FAS GLD BBH IBB JETS JNUG KOL NUGT OIH PALL RSX RETL SDS AGQ SLV SOXL TECL TLT TMF TNA UGA (gasoline) USO (oil) and China: YINN CHAU Commodities: CANE CORN DBC JJC, NIB, CHOC CORN, CUT (paper) MOO, SOYB WEAT UUP (Dollar) LIT (Lithium) Stocks AAPL ADBE ALXN AMAT AMGN AMD AMZN AXP BA BABA BAC BIDU BLDP CAT CVX CMG DE ENPH FB GILD GOOG GS HD IBM INTU JPM LRCX M (Macy's) MSFT NEM NFLX NKE NVDA PG REGN SO SQ QCOM QDEL TSLA TXN XOM V VRTX WFC WMT TOWN New highs and Bullish MAXCPs http://tigersoft.com/MAXCP/5-13/BULLISH.htm Bearish MAXCPs - http://tigersoft.com/MINCP/5-13/BEARISH.htm |
Table 1
5/13/2018 QUICKSILVER on DJI-30 STOCKS.
Considering just those stocks whose IP21 + ITRS score is >+.25 or <-.25
0 Bullish ( )
0 = 0
6 Bearish (BA CSCO JPM KO TRV WBA
-125 -42 -84 -44 -90 -38 = -423
---------------------------
Vitality Score = -423 weakening
Note that AAPL now shows highest AI/200 stock here. STOCKS CLOSE CHANGE PIVOT-P 5-dma AROC CL-PWR Candl AI/200 IP21 ITRS --------------------------------------------------------------------------------------- AAPL 307.65 -3.76 303.74 113.9% Bullish RED 151 .027 .165 --------------------------------------------------------------------- AXP 78.03 -5.11 86.73 -348.1% Bearish RED 81 .009 -.175 --------------------------------------------------------------------- BA 121.5 -3.72 128.65 -14.1% Bearish RED 69 -.216 -.465 Bearish --------------------------------------------------------------------- CAT 104.48 -.52 107.29 -147.5% Bearish RED 142 .021 -.058 --------------------------------------------------------------------- CSCO 41.95 -1.27 41.37 94.3% Bearish RED 78 -.112 .15 Bearish --------------------------------------------------------------------- CVX 88.7 -2.4 92.64 -73% ------- RED 84 .009 .042 --------------------------------------------------------------------- DIS 102.92 -1.64 105.57 96.6% Bearish RED 85 -.03 -.014 --------------------------------------------------------------------- GS 171.8 -5.41 182.32 -141.4% Bearish RED 110 -.105 -.053 --------------------------------------------------------------------- HD 230.1 -2.8 229.45 133.5% Bullish RED 139 -.071 .112 --------------------------------------------------------------------- IBM 115.73 -4.53 121.23 -304.8% Bearish RED 141 .035 0 --------------------------------------------------------------------- INTC 57.74 -.65 59.17 -121.4% Bearish RED 116 -.038 .134 --------------------------------------------------------------------- JNJ 147.13 -.01 147.59 -32.1% ------- BLUE 122 .03 .187 --------------------------------------------------------------------- JPM 84.03 -3 91.21 -345.8% Bearish RED 103 -.328 -.179 Bearish --------------------------------------------------------------------- KO 43.94 -.88 44.6 -89.7% Bearish RED 109 -.323 -.114 Bearish --------------------------------------------------------------------- MCD 172.82 -3.72 181.12 -115.7% Bearish RED 106 -.072 -.032 --------------------------------------------------------------------- MMM 136.12 -5.4 145.74 -346.3% Bearish RED 95 -.3 .039 --------------------------------------------------------------------- MRK 77.89 .7 75.6 50.1% ------- BLUE 90 -.093 .086 --------------------------------------------------------------------- MSFT 179.75 -2.76 183.6 -75.8% Bearish RED 149 .043 .195 --------------------------------------------------------------------- NKE 86.02 -2.24 88.56 -135.5% Bearish RED 107 -.003 .048 --------------------------------------------------------------------- PFE 37.05 -.31 36.96 -194% Bearish RED 54 -.095 .182 --------------------------------------------------------------------- PG 113.92 -.63 112.17 35.9% Bearish RED 92 -.069 .066 --------------------------------------------------------------------- TRV 89.86 -4.1 95.8 -180.2% Bearish RED 97 -.22 -.181 Bearish --------------------------------------------------------------------- UNH 278 -9.7 285 -187.3% Bearish RED 134 -.055 .166 --------------------------------------------------------------------- UTX 86.01 -5.36 97.15 -958.4% Bullish RED 114 .144 -.339 --------------------------------------------------------------------- V 177.09 -2.38 182.72 -46.4% ------- RED 129 -.128 .056 --------------------------------------------------------------------- VZ 54.85 -.61 55.58 -70.5% Bearish RED 131 -.214 .087 --------------------------------------------------------------------- WBA 38.35 -2.18 40.66 -346.3% Bearish RED 76 -.195 -.066 Bearish --------------------------------------------------------------------- WMT 123.71 -.07 121.89 16.7% Bearish BLUE 88 -.145 .198 --------------------------------------------------------------------- XOM 41.93 -2.19 44.24 -229.6% Bearish RED 47 -.125 -.081 --------------------------------------------------------------------- DOW 32.35 -1.44 32.85 58.4% Bearish RED 62 -.046 -.1 |
Table 2 QUICKSILVER on ETFS - 05/13/20
Bullish = 1 GLD
Bearish = 4
ETF CLOSE CHANGE PIVOT-PT 5-dma AROC CL-PWR CANDLE IP21 ITRS --------------------------------------------------------------------------------------------- DIA 232.82 -5.26 238.91 -84.2% Bearish RED -.161 ---- --------------------------------------------------------------------------------------------- SPY 281.6 -5.07 287.68 -45.9% Bearish RED -.155 .04 --------------------------------------------------------------------------------------------- QQQ 219.34 -2.78 221.82 7.6% Bearish RED -.066 .149 --------------------------------------------------------------------------------------------- MDY 282.51 -9.94 295.2 -132.8% Bearish RED -.132 -.054 --------------------------------------------------------------------------------------------- IWM 122.72 -4.25 127.44 -116.4% Bearish RED -.055 -.068 --------------------------------------------------------------------------------------------- FAS 23 -2.01 27.2 -443.2% Bearish RED -.216 -.571 Bearish --------------------------------------------------------------------------------------------- RETL 90.21 -7.79 94.76 -159.5% Bearish RED .067 -.394 Bearish --------------------------------------------------------------------------------------------- SOXL 120.02 -6.83 127.81 -158.1% Bearish RED -.219 -.305 Bearish --------------------------------------------------------------------------------------------- TECL 161.51 -8.92 171.3 -55.1% Bearish RED -.016 -.145 --------------------------------------------------------------------------------------------- IBB 129.6 -1.45 127.17 100.4% ------- RED -.013 .217 --------------------------------------------------------------------------------------------- GLD 161.58 1.54 161.39 82.2% Bullish BLUE .256 .152 Bullish --------------------------------------------------------------------------------------------- OIH 99.39 -9.28 101.33 88% Bearish RED .048 -.331 Bearish --------------------------------------------------------------------------------------------- |
Table 3 Count of Stocks in Key Directories
20200513
-------------------------------
NEWHIGHS 58
NEWLOWS 168 (NL rose by 100 above yesterday's number)
MAXCP 17
MINCP 296 Bearish >10:1 MAXCPs
TTTNH 16
TTTNL 167
FASTUP 127
FASTDOWN 216
CPCROSSA 11
CPCROSSD 188
BIGVOLUP 5
BIGVODN 17
ACCUMVER 5
HIGHIP21 5
HIUPPCT 8
VHIP21 50
LOWACCUM 158
REDSELL 131
AUGSELS7 60
TRAPDOOR 19
|
Table 4 RANKING OF KEY DIRECTORIES BASED PCT.OF STOCKS ABOVE 65-DMA
5/13/20
Bullish = 8
Bearish = 38
---------------------------------------------------------------------------------------
Directory Current day-1 day-2 day-3 day-4 day-5
----------------------------------------------------------------------------------------
EDU .8 .8 1 1 .8 .8
GOLD .775 .755 .775 .795 .734 .734
HACKERS .75 .85 .8 .85 .8 .8
BIOTECH .632 .702 .737 .688 .653 .641
NIFTY .63 .717 .869 .847 .739 .695
SEMI .6 .685 .809 .847 .714 .676
NASD-100 .585 .666 .727 .767 .666 .565
SOFTWARE .55 .683 .65 .716 .65 .6
===================================================================================================
ELECTRON .493 .594 .709 .736 .608 .567
SOLAR .437 .437 .687 .75 .5 .437
BEVERAGE .4 .533 .6 .6 .466 .4
COMPUTER .4 .55 .65 .65 .5 .45
DJI-13 .384 .384 .384 .461 .384 .384
FIDSTKS .384 .446 .508 .508 .429 .384
GREEN .38 .38 .571 .571 .38 .38
DOWJONES .366 .4 .466 .5 .366 .366
INDEXES .344 .413 .5 .537 .413 .327
GUNS .333 .333 .333 .333 .266 .333
SP-100 .318 .395 .472 .472 .406 .329
SP500 .317 .372 .458 .463 .381 .343
CHINA .313 .372 .431 .431 .294 .215
CHEM .306 .367 .448 .448 .265 .285
ETFS .303 .303 .339 .357 .232 .16
HOMEBLDG .294 .411 .529 .529 .411 .352
GAMING .285 .428 .428 .523 .428 .428
RUS-1000 .273 .348 .426 .437 .342 .309
COPPER .25 .125 .375 .75 .375 .125
INDMATER .24 .28 .386 .466 .32 .28
RETAIL .24 .32 .38 .36 .3 .32
HOSPITAL .238 .38 .333 .38 .285 .285
COMODITY .225 .225 .275 .275 .25 .225
OILGAS .212 .303 .325 .356 .257 .196
FOOD .203 .203 .222 .24 .203 .185
AUTO .2 .375 .45 .475 .275 .25
TRANSP .2 .25 .35 .35 .25 .25
BONDFUND .158 .158 .138 .148 .158 .079
COAL .142 .142 .142 .285 .142 .142
MILITARY .111 .148 .185 .185 .185 .148
FINANCE .108 .12 .132 .168 .12 .108
UTILITY .102 .102 .102 .102 .076 .076
INSURANC .038 .076 .076 .038 .038 0
REIT .035 .042 .127 .141 .092 .063
INFRA .028 .028 .2 .2 .114 .057
BIGBANKS 0 0 0 0 0 0
JETS 0 0 0 0 0 0
REGBANKS 0 .038 .038 .076 .038 .038
|
=======================================================================
5/12/2020 A 3 Trillion Dollar stimulus bill is being proposed by House Democrats
to prevent states, hospitals and individuals from running out of money.
It would be financed by more borrowing at record low interest rates. The
Republican Senate will have its say soon enough. But the proposal is lifting the
general market nicely this morning. That should give us a chance to sell AAPL
near its 220 highs.
The operative Peerless remains a Sell S12. The DJI's swiftly falling 65-dma
acts as resistance still and our IP21 is negative. With the DJI up 30% from its
low of March this is distinctly bearish. And it was also a bad day for the
DJI-30
as viewed from the vantage point of Table 1 below. AAPL's internals slipped
back
a lot it is no longer considered as "bullish" in this table. That has
caused our DJI-30
Vitality to turn negative. Only MSFT in this group is considered
"bullish". A DJI decline
to the lower 3.5% band would seem to be a minimal bearish expectation now. The
downtrending Closing Power on DIA tells to not trust up-openings too much at this stage.


It appears that Financials generally are on the defensive
again. We know that
Warren Buffett has been a big holder of Wells Fargo. Having dumped his Airlines
stocks at big losses, one wonders if he will be under pressure to sell WFC. It still
pays a big dividend, but its price breakdown is now confirmed by all our internal
strength indicators. Nor is it alone in the group. The leveraged FAS looks
vulnerable
and just gave a new red Sell, thereby inviting short sales again.


|
Charts 5/12/2020 (Click on Underlined link.) 2020 PEERLESS DJI, Signals, Indicators Daily DJI Volume 10-DayUp/Down Vol Stoch-20 Inverted Traders Index Graph of Pct of All Stocks above 65-dma Cum. Inverted Traders Index NASDAQ S&P OEX NYSE COMPQX DJI-15 DJI-20 DJI-30 DIA QQQ MDY IWM TNA Short-Term Rates SPY http://tigersoft.com/2121CST/SPY.GIF 2006 vers-Peerless signals http://tigersoft.com/2121CST/PEER2006.bmp USO-CrudeOil DBO FAS GLD BBH IBB JETS JNUG KOL NUGT OIH PALL RSX RETL SDS AGQ SLV SOXL TECL TLT TMF TNA UGA (gasoline) USO (oil) and China: YINN CHAU Commodities: CANE CORN DBC JJC, NIB, CHOC CORN, CUT (paper) MOO, SOYB WEAT UUP (Dollar) LIT (Lithium) Stocks AAPL ADBE ALXN AMAT AMGN AMD AMZN AXP BA BABA BAC BIDU BLDP CAT CVX CMG DE ENPH FB GILD GOOG GS HD IBM INTU JPM LRCX M (Macy's) MSFT NEM NFLX NKE NVDA PG REGN SO SQ QCOM QDEL TSLA TXN XOM V VRTX WFC WMT TOWN New highs and Bullish MAXCPs http://tigersoft.com/MAXCP/5-12/BULLISH.htm Bearish MAXCPs - http://tigersoft.com/MINCP/5-12/BEARISH.htm |
Table 1
5/12/2018 QUICKSILVER on DJI-30 STOCKS.
Considering just those stocks whose IP21 + ITRS score is >+.25 or <-.25
1 Bullish ( MSFT )
183 = 183
5 Bearish (BA and JPM KO TRV)
125 + 87 +45 +94 = 351
---------------------------
Vitality Score = -168 weakening
Note that AAPL now shows highest AI/200 stock here. STOCKS CLOSE CHANGE PIVOT-P 5-dma AROC CL-PWR Candl AI/200 IP21 ITRS --------------------------------------------------------------------------------------- AAPL 311.41 -3.6 300.63 226.7% Bullish RED 151 .094 .151 (Not bullish) --------------------------------------------------------------------- AXP 83.14 -2.19 84 -208.2% ------- RED 81 .05 -.161 --------------------------------------------------------------------- BA 125.22 -3.69 121.86 -7.1% Bearish RED 70 -.245 -.459 Bearish --------------------------------------------------------------------- CAT 105 -3.61 107.67 -179.5% Bearish RED 142 .011 -.069 --------------------------------------------------------------------- CSCO 43.22 -.1 41.15 209.2% ------- RED 78 -.033 .158 --------------------------------------------------------------------- CVX 91.1 -2.27 90.05 -96.4% ------- RED 84 -.039 .052 --------------------------------------------------------------------- DIS 104.56 -3.21 100.88 166.8% Bearish RED 86 -.018 -.02 --------------------------------------------------------------------- GS 177.21 -5.95 176.92 -30.1% Bearish RED 111 -.081 -.046 --------------------------------------------------------------------- HD 232.9 -3.66 223.92 158.5% Bullish RED 140 -.008 .121 --------------------------------------------------------------------- IBM 120.26 -2.33 123.17 -94.7% Bearish RED 141 .069 .004 --------------------------------------------------------------------- INTC 58.39 -1.74 59.18 -30.3% Bearish RED 117 .006 .112 --------------------------------------------------------------------- JNJ 147.14 -1.97 148.08 -79.4% Bearish RED 121 .05 .159 --------------------------------------------------------------------- JPM 87.03 -2.94 90.27 -272.4% Bearish RED 104 -.326 -.175 Bearish --------------------------------------------------------------------- KO 44.82 -.72 44.75 -64% Bearish RED 110 -.259 -.09 Bearish --------------------------------------------------------------------- MCD 176.54 -4.34 176.97 -75% Bearish RED 107 -.027 -.02 --------------------------------------------------------------------- MMM 141.52 -4.21 146.2 -201.4% Bearish RED 96 -.247 .033 --------------------------------------------------------------------- MRK 77.19 -.72 77.12 -53.2% ------- RED 91 -.065 .057 --------------------------------------------------------------------- MSFT 182.51 -4.23 182.54 47.6% ------- RED 149 .114 .165 Bullish --------------------------------------------------------------------- NKE 88.26 -2.67 88.44 59.5% Bearish RED 108 .045 .061 --------------------------------------------------------------------- PFE 37.36 -.74 38.51 -151.9% Bearish RED 54 -.07 .18 --------------------------------------------------------------------- PG 114.55 -.76 113.1 -63.8% Bearish RED 93 .005 .067 --------------------------------------------------------------------- TRV 93.96 -1.55 93.29 -150.9% Bearish RED 98 -.175 -.156 Bearish --------------------------------------------------------------------- UNH 287.7 -.99 288.77 -92.5% ------- RED 135 -.014 .162 --------------------------------------------------------------------- UTX 86.01 -5.36 97.15 -958.4% Bullish RED 114 .144 -.332 --------------------------------------------------------------------- V 179.47 -4.09 178.78 28.3% ------- RED 130 -.083 .042 --------------------------------------------------------------------- VZ 55.46 -.94 55.64 -93.4% Bearish RED 132 -.154 .076 --------------------------------------------------------------------- WBA 40.53 -1.18 41.2 -179.7% Bearish RED 77 -.088 -.049 --------------------------------------------------------------------- WMT 123.78 .11 123.3 -38.5% Bearish RED 89 -.075 .177 --------------------------------------------------------------------- XOM 44.12 -1.62 43.99 -78.9% Bearish RED 48 -.111 -.073 --------------------------------------------------------------------- DOW 33.79 -.11 31.96 63.1% Bearish RED 62 -.069 -.076 |
Table 2 QUICKSILVER on ETFS - 05/08/20
Bullish = 2 IBB an GLD
Bearish = 4 FAS, RETL, SOXL, OIH
ETF CLOSE CHANGE PIVOT-PT 5-dma AROC CL-PWR CANDLE IP21 ITRS ---------------------------------------------------------------------------------------------- DIA 238.08 -4.48 236.86 -15% Bearish RED -.103 0 --------------------------------------------------------------------------------------------- SPY 286.67 -5.83 284.25 8.3% Bearish RED -.099 .036 --------------------------------------------------------------------------------------------- QQQ 222.12 -4.75 219 100.4% ------- RED .011 .135 --------------------------------------------------------------------------------------------- MDY 292.45 -11.19 290.41 -3.5% Bearish RED -.11 -.037 --------------------------------------------------------------------------------------------- IWM 126.97 -4.73 125.72 12.4% ------- RED -.05 -.051 --------------------------------------------------------------------------------------------- FAS 25.01 -2.44 25.37 -290.2% ------- RED -.189 -.567 Bearish --------------------------------------------------------------------------------------------- RETL 98 -8.75 93.4 269.9% Bullish RED .103 -.38 Bearish --------------------------------------------------------------------------------------------- SOXL 126.85 -11.75 124.17 263.3% Bearish RED -.15 -.329 Bearish --------------------------------------------------------------------------------------------- TECL 170.43 -11.83 163.42 296.5% ------- RED .061 -.191 --------------------------------------------------------------------------------------------- IBB 131.05 -2.85 127 158.1% Bullish RED .058 .206 Bullish --------------------------------------------------------------------------------------------- GLD 160.04 .62 158.95 -30.6% Bullish RED .187 .181 Bullish --------------------------------------------------------------------------------------------- OIH 108.67 .56 97.54 318.7% Bearish RED .08 -.3 Bearish --------------------------------------------------------------------------------------------- |
Table 3 Count of Stocks in Key Directories
20200512
-------------------------------
NEWHIGHS 152 (NYSE + NASDAQ)
NEWLOWS 68 (up 49 from yesterday)
MAXCP 24
MINCP 140
TTTNH 30
TTTNL 74
FASTUP 190
FASTDOWN 158
CPCROSSA 29
CPCROSSD 355
BIGVOLUP 13
BIGVODN 28
ACCUMVER 4
HIGHIP21 6
HIUPPCT 10
REDSELL 131
AUGSELS7 44
TRAPDOOR 16
|
Table 3 RANKING OF KEY DIRECTORIES BASED PCT.OF STOCKS ABOVE 65-DMA
Bullish = 11
Bearish = 35
5/12/20
---------------------------------------------------------------------------------------
Directory Current day-1 day-2 day-3 day-4 day-5
----------------------------------------------------------------------------------------
HACKERS .85 .85 .85 .8 .8 .75
EDU .8 1 1 .8 .8 .8
GOLD .755 .775 .795 .734 .734 .755
NIFTY .717 .869 .847 .739 .695 .717
BIOTECH .698 .73 .687 .652 .64 .643
SEMI .685 .809 .847 .714 .666 .609
SOFTWARE .683 .666 .716 .65 .6 .566
NASD-100 .666 .737 .777 .666 .555 .575
ELECTRON .59 .704 .731 .604 .55 .51
COMPUTER .55 .65 .65 .5 .45 .4
BEVERAGE .533 .6 .6 .466 .4 .333
===============================================================================================
FIDSTKS .446 .508 .508 .429 .378 .406
SOLAR .437 .687 .75 .5 .437 .312
GAMING .428 .428 .523 .428 .428 .38
INDEXES .413 .5 .537 .413 .333 .338
HOMEBLDG .411 .529 .529 .411 .294 .294
DOWJONES .4 .466 .5 .366 .366 .4
SP-100 .395 .472 .472 .406 .318 .351
DJI-13 .384 .384 .461 .384 .384 .461
GREEN .38 .571 .571 .38 .38 .333
HOSPITAL .38 .333 .38 .285 .285 .333
AUTO .375 .45 .475 .275 .25 .2
CHINA .372 .431 .431 .294 .215 .098
SP500 .372 .461 .463 .381 .33 .351
CHEM .367 .448 .448 .265 .285 .306
RUS-1000 .348 .427 .437 .342 .298 .319
GUNS .333 .333 .333 .266 .333 .333
RETAIL .32 .38 .36 .3 .32 .32
ETFS .303 .339 .357 .232 .142 .107
OILGAS .303 .325 .356 .257 .189 .227
INDMATER .28 .386 .466 .32 .28 .306
TRANSP .25 .35 .35 .25 .2 .3
COMODITY .225 .275 .275 .25 .225 .2
FOOD .203 .222 .24 .203 .185 .166
BONDFUND .158 .138 .148 .158 .069 .099
MILITARY .148 .185 .185 .185 .148 .185
COAL .142 .142 .285 .142 .142 .142
COPPER .125 .375 .75 .375 .125 .125
FINANCE .119 .13 .166 .119 .107 .107
UTILITY .102 .102 .102 .076 .076 .076
INSURANC .076 .076 .038 .038 0 .038
REIT .042 .127 .141 .092 .063 .07
REGBANKS .038 .038 .076 .038 .038 .038
INFRA .028 .2 .2 .114 .057 .085
BIGBANKS 0 0 0 0 0 0
JETS 0 0 0 0 0 0
|
========================================================================
5/11/2020 The DJI and the NASDAQ are headed in two different directions.
Peerless
with its Sell S12 is telling the DJI to fall back from its falling 65-dma. But a new
Biotech boom is telling the NASDAQ to forget fears of another sell-off
and partake in the profitable search for a cure for the Covid-19 virus.

Far more attention-getting, are the Biotechs that are making new highs. They are
justifiably excited by the prospects of big profits from Covid-test kits, new
anti-virus treatments and vacines are experiencing. Expect this speculative
boom to get a lot more exciting. I predict it will continue for months more,
until this dreadful virus is contained. Immediately, I would think that the NASDAQ
will return to its February highs. We have usually found it best to not argue with
the such strong trends. Or with the Fed, which says it will start tomorrow to
buy corporate bond ETFs. BIB below has just made a classic flat-top breakout
and should be bought..

Recently, the strongest MAXCPs have included a number of biotechs, none
of which has been stonger than QDEL. This is a fairly big San Diego company.
It has
1250 full time employees. https://www.quidel.com/
The FDA has just approved its Covid-19
test procedure. Some have called its test a "game changer". The
market for this
is huge and the fight for it has just begun. Right now, QDEL is the leader. My
sense
is that every hot-shot performance fund will want some of this. So, will the Big
Pharmas.
Its advance, we may guess, is probably in its early stages. With the FED doing all
it can
to "back-stop" the overall market, speculators will feel doubly secure.
Quidel (QDEL) received this
weekend FDA Emergency Use Authorization
for its Sofia 2 SARS Antigen FIA, a rapid point-of-care test for suspected
COVID-19 infection.
https://finance.yahoo.com/news/quidels-recently-approved-antigen-test-104041798.html

|
Charts 5/11/2020 (Click on Underlined link.) 2020 PEERLESS DJI, Signals, Indicators Daily DJI Volume 10-DayUp/Down Vol Stoch-20 Inverted Traders Index Graph of Pct of All Stocks above 65-dma Cum. Inverted Traders Index NASDAQ S&P OEX NYSE COMPQX DJI-15 DJI-20 DJI-30 DIA QQQ MDY IWM TNA Short-Term Rates SPY http://tigersoft.com/2121CST/SPY.GIF 2006 vers-Peerless signals http://tigersoft.com/2121CST/PEER2006.bmp USO-CrudeOil DBO FAS GLD BBH IBB JETS JNUG KOL NUGT OIH PALL RSX RETL SDS AGQ SLV SOXL TECL TLT TMF TNA UGA (gasoline) USO (oil) and China: YINN CHAU Commodities: CANE CORN DBC JJC, NIB, CHOC CORN, CUT (paper) MOO, SOYB WEAT UUP (Dollar) LIT (Lithium) Stocks AAPL ADBE ALXN AMAT AMGN AMD AMZN AXP BA BABA BAC BIDU BLDP CAT CVX CMG DE ENPH FB GILD GOOG GS HD IBM INTU JPM LRCX M (Macy's) MSFT NEM NFLX NKE NVDA PG REGN SO SQ QCOM QDEL TSLA TXN XOM V VRTX WFC WMT TOWN New highs and Bullish MAXCPs http://tigersoft.com/MAXCP/5-11/BULLISH.htm Bearish MAXCPs - http://tigersoft.com/MINCP/5-11/BEARISH.htm |
Table 1
5/11/2018 QUICKSILVER on DJI-30 STOCKS.
Considering just those stocks whose IP21 + ITRS score is >+.25 or <-.25
2 Bullish (AAPL MSFT )
315 187 = 502
5 Bearish (BA and JPM KO TRV UTX)
119 + 93 +45 +96 +86 = 439
---------------------------
Vitality Score = +63 weakening
Note that AAPL now shows highest AI/200 stock here. STOCKS CLOSE CHANGE PIVOT-P 5-dma AROC CL-PWR Candl AI/200 IP21 ITRS --------------------------------------------------------------------------------------- AAPL 315.01 4.88 297.56 362.9% Bullish BLUE 151 .179 .2 Bullish --------------------------------------------------------------------- AXP 85.33 -4.17 86.74 -60.6% ------- RED 81 .085 -.177 --------------------------------------------------------------------- BA 128.91 -4.53 125.4 -99.5% Bearish RED 70 -.241 -.484 Bearish --------------------------------------------------------------------- CAT 108.61 -3.5 108.91 40.9% Bearish RED 142 -.037 -.079 --------------------------------------------------------------------- CSCO 43.32 .33 41.46 236.4% Bearish BLUE 78 .045 .132 --------------------------------------------------------------------- CVX 93.37 -2.1 92.89 104.3% ------- RED 85 -.02 .047 --------------------------------------------------------------------- DIS 107.77 -1.39 101.06 220.7% Bullish RED 87 .043 -.037 --------------------------------------------------------------------- GS 183.16 -2.23 178.3 198.3% ------- BLUE 112 -.101 -.041 --------------------------------------------------------------------- HD 236.56 2.13 225.61 324.2% Bullish BLUE 141 .052 .133 --------------------------------------------------------------------- IBM 122.59 -.4 122.58 37.2% ------- BLUE 141 .137 -.011 --------------------------------------------------------------------- INTC 60.13 .46 58.75 181.5% ------- BLUE 117 .077 .13 --------------------------------------------------------------------- JNJ 149.11 .41 149.5 28.3% Bullish BLUE 120 .086 .156 --------------------------------------------------------------------- JPM 89.97 -2.73 92 -118.4% Bearish RED 105 -.311 -.178 Bearish --------------------------------------------------------------------- KO 45.54 -.57 45.4 44.2% Bearish RED 111 -.252 -.101 Bearish --------------------------------------------------------------------- MCD 180.88 -.35 179.24 -27.5% ------- BLUE 108 .016 -.021 --------------------------------------------------------------------- MMM 145.73 -2.78 147.43 -90.7% Bearish RED 97 -.218 .024 --------------------------------------------------------------------- MRK 77.91 1.51 78.01 68.4% Bearish BLUE 92 -.044 .065 --------------------------------------------------------------------- MSFT 186.74 2.06 180.76 216.9% Bullish BLUE 149 .196 .2 Bullish --------------------------------------------------------------------- NKE 90.93 .47 87.2 294% ------- BLUE 108 .059 .064 --------------------------------------------------------------------- PFE 38.1 .88 38.51 63.6% Bearish BLUE 55 -.046 .187 --------------------------------------------------------------------- PG 115.31 -.64 116.01 -20.1% ------- RED 93 .043 .066 --------------------------------------------------------------------- TRV 95.51 -1.83 96.85 -72.9% Bearish RED 99 -.154 -.156 Bearish --------------------------------------------------------------------- UNH 288.69 1.69 293.04 19.9% Bullish BLUE 136 .052 .179 --------------------------------------------------------------------- UTX 86.01 -5.36 97.15 -958.4% Bullish RED 114 .144 -.394 Bearish --------------------------------------------------------------------- V 183.56 -1.53 178.44 205.6% ------- RED 131 -.052 .057 --------------------------------------------------------------------- VZ 56.4 -.6 56.51 14.2% Bearish RED 133 -.133 .088 --------------------------------------------------------------------- WBA 41.71 .04 42.02 -88.9% Bearish RED 78 -.042 -.041 --------------------------------------------------------------------- WMT 123.67 .73 124.73 -1.2% ------- BLUE 90 -.002 .196 --------------------------------------------------------------------- XOM 45.74 -.44 44.83 95.9% Bearish RED 49 -.09 -.064 --------------------------------------------------------------------- DOW 33.9 -.43 33.37 126.8% Bearish RED 63 -.052 -.114 |
Table 2 QUICKSILVER on ETFS - 05/08/20
Bullish = 2 IBB an GLD
Bearish = 3 FAS, SOXL, OIH
ETF CLOSE CHANGE PIVOT-PT 5-dma AROC CL-PWR CANDLE IP21 ITRS ---------------------------------------------------------------------------------------------- DIA 242.56 -1.06 238.8 107.5% Bearish BLUE-.04 ----- --------------------------------------------------------------------------------------------- SPY 292.5 .06 286.19 155.7% ------- BLUE-.038 .034 --------------------------------------------------------------------------------------------- QQQ 226.87 2.01 217.66 265.1% Bullish BLUE .092 .15 --------------------------------------------------------------------------------------------- MDY 303.64 -2.13 292.66 233.4% ------- BLUE-.076 -.036 --------------------------------------------------------------------------------------------- IWM 131.7 -.66 126.65 235.9% ------- BLUE-.021 -.053 --------------------------------------------------------------------------------------------- FAS 27.45 -1.22 26.58 205% ------- RED -.171 -.545 Bearish --------------------------------------------------------------------------------------------- RETL 106.75 -.23 92.66 890.5% Bullish BLUE .15 -.371 --------------------------------------------------------------------------------------------- SOXL 138.6 -.38 120.01 974.9% ------- BLUE-.08 -.277 Bearish --------------------------------------------------------------------------------------------- TECL 182.26 3.76 160.28 886.3% Bullish BLUE .152 -.075 --------------------------------------------------------------------------------------------- IBB 133.9 5.49 126.98 368.6% Bullish BLUE .193 .223 Bullish --------------------------------------------------------------------------------------------- GLD 159.42 -1 161.02 -28.7% Bullish RED .237 .122 Bullish --------------------------------------------------------------------------------------------- OIH 108.11 -2.1 102.05 200.4% Bearish RED .072 -.351 Bearish --------------------------------------------------------------------------------------------- |
Table 3 Count of Stocks in Key Directories
20200511
-------------------------------
NEWHIGHS 153
NEWLOWS 19
MAXCP 122
MINCP 46
TTTNH 63
TTTNL 32
FASTUP 288
FASTDOWN 103
CPCROSSA 128
CPCROSSD 130
BIGVOLUP 13
BIGVODN 15
ACCUMVER 6
HIGHIP21 10
HIUPPCT 11
REDSELL 135
AUGSELS7 25
TRAPDOOR 17
|
Table 4 RANKING OF KEY DIRECTORIES BASED PCT.OF STOCKS ABOVE 65-DMA
5/11/20
Bullish = 15
Bearish = 30
---------------------------------------------------------------------------------------
Directory Current day-1 day-2 day-3 day-4 day-5
----------------------------------------------------------------------------------------
EDU 1 1 .8 .8 .8 .8
NIFTY .869 .847 .739 .695 .695 .565
HACKERS .85 .9 .8 .8 .7 .55
SEMI .809 .847 .714 .666 .609 .495
GOLD .775 .795 .734 .734 .755 .775
NASD-100 .737 .787 .676 .555 .575 .484
BIOTECH .728 .681 .652 .64 .637 .57
ELECTRON .704 .731 .604 .55 .496 .422
SOLAR .687 .75 .5 .437 .312 .312
SOFTWARE .666 .733 .65 .6 .566 .483
COMPUTER .65 .65 .5 .45 .35 .4
BEVERAGE .6 .6 .466 .4 .333 .333
GREEN .571 .571 .38 .38 .285 .285
HOMEBLDG .529 .529 .411 .294 .294 .176
FIDSTKS .508 .508 .429 .378 .395 .31
==============================================================================================
INDEXES .5 .537 .413 .333 .338 .322
==============================================================================================
SP-100 .472 .472 .406 .318 .34 .263
DOWJONES .466 .5 .366 .366 .4 .3
SP500 .461 .465 .381 .33 .345 .273
AUTO .45 .475 .275 .25 .2 .225
CHEM .448 .448 .265 .285 .306 .265
CHINA .44 .44 .3 .22 .1 .04
GAMING .428 .523 .428 .428 .38 .333
RUS-1000 .427 .438 .342 .298 .309 .251
INDMATER .386 .466 .32 .28 .306 .333
DJI-13 .384 .461 .384 .384 .461 .461
RETAIL .38 .36 .3 .32 .32 .3
COPPER .375 .75 .375 .125 .125 .125
TRANSP .35 .35 .25 .2 .3 .15
ETFS .339 .357 .232 .142 .107 .089
GUNS .333 .333 .266 .333 .333 .333
HOSPITAL .333 .38 .285 .285 .285 .238
OILGAS .325 .356 .257 .189 .204 .212
COMODITY .275 .275 .25 .225 .2 .225
FOOD .222 .24 .203 .185 .166 .185
INFRA .2 .2 .114 .057 .085 .114
MILITARY .185 .185 .185 .148 .148 .148
COAL .142 .285 .142 .142 .142 .142
BONDFUND .14 .15 .16 .07 .09 .08
FINANCE .13 .166 .119 .107 .107 .071
REIT .127 .141 .092 .063 .07 .063
UTILITY .102 .102 .076 .076 .076 .076
INSURANC .076 .038 .038 0 .038 0
REGBANKS .038 .076 .038 .038 .038 .076
BIGBANKS 0 0 0 0 0 0
JETS 0 0 0 0 0 0
|
========================================================================
5/8/2020 We definitely
want to remain short DIA, but stay hedged with long positions in
AAPL (or the NASDAQ) and NUGT (or Gold). Table 1 shows that the DJI
is being boosted now primarily by only two high-priced stocks with "bullish"
internals.
Wells Fargo's internal weakness is a stand-out problem for the financial section.
One wonders if Warren Buffet is selling it. A breakdown by WFC could create
a new crisis. As of now, the Dollar is still holding up, despite the ballooning
trillions in deficits.

Peerless produced a new Sell S12 with Friday's advance of 450 to
the 2.1% upper band. Our Tiger Accumulation Index (AKA IP21) slipped
to -.07. The DJI closed only 68 points below the
resistance of its rapidly
falling 65-dma (-78% annualized.) That we see both a negative IP21 and such a
quickly falling 65-dma must be construed to be bearish based on the research shown
here last week. Even if there is a slight advance above the 65-dma, a belated
sell-off
should be expected and it might not stop at the lower band.
The breadth has been good but new research tonight shows that
rallies up 31% or
more from their lows require very positive Accumulation Index readings to keep
the rally going. Perhaps, there will be legal opposition, after all, to Fed
Chairman's Powell
decision to buy more than a trillion dollars worth of private corporate debt. After
that, surely will come Index funds and stocks... It's a "brave new world".
https://wallstreetonparade.com/2020/04/gundlach-feds-corporate-bond-buying-program-is-illegal-fed-says-program-isnt-operational/
https://www.thestreet.com/mishtalk/economics/there-are-no-temporary-measures-just-permanent-lies

The DJI is now up 31% from its low closing at 18592. This was the day before the FED
announced it planned to buy trillions of dollars of private corporate bonds to shore
up the marlet. A DJI 31 % recovery rally has precedent, for sure, but only when our
Accumulation Index was above +.096. Certainly, there are no cases for more than a
31% DJI recovery when the IP21 was a negative IP21. Below are all the relevant
cases.
IP21>+.09 + 31% Advance from Bottom Leads to Higher
Prices
1) With an IP21 of +.097, on 1/28/1930, the DJI rose
31% up from its 1929 bottom
and went on to rally +13.6% more on 4/14/1930.
2) With an IP21 of +.199, on 8/1/1932, the DJI rose
31% up from its 1932 bottom
and went on to rally +41.2% more on 9/8/1932.
3) With an IP21 of +.195, on 6/24/1938, the DJI rose
31% up from its 1938 bottom
and went on to rally +12.2% more on 7/25/1938.
4) With an IP21 of +.139, on 2/2/1971, the DJI rose
31% up from its 1970 bottom
and went on to rally +8.3% more on 4/28/1971.
5) With an IP21 of +.132, on 3/4/1975, the DJI rose
31% up from its 1974 bottom
and went on to rally +16.2% more on 7/15/1975.
6) With an IP21 of +.103, on 11/3/2003, the DJI rose
31% up from its 2003 bottom
and went on to rally +8.9%. more on 2/11/2004.
IP21<+.08 Brings A DJI decline after 30% Rally from its
Lows.
A) But on 11/19/1980, with an IP21 of -.063, the DJI rose 31%
up from its
1980 low and then dropped back 9% to a bottom below its lower band.
B) on 3/18/2002 with an IP21 of +.07, the DJI achieved a 30% recovery from
its 2001 low only to abruptly turn back down and make new bear market lows.
C) on 6/1/2009 with an IP21 of +.042, the DJI achieved a 32% recovery from
its 2009 low only to decline back below its lower band.
|
Charts 5/8/2020 (Click on Underlined link.) 2020 PEERLESS DJI, Signals, Indicators Daily DJI Volume 10-DayUp/Down Vol Stoch-20 Inverted Traders Index Graph of Pct of All Stocks above 65-dma Cum. Inverted Traders Index NASDAQ S&P OEX NYSE COMPQX DJI-15 DJI-20 DJI-30 DIA QQQ MDY IWM TNA Short-Term Rates SPY http://tigersoft.com/2121CST/SPY.GIF 2006 vers-Peerless signals http://tigersoft.com/2121CST/PEER2006.bmp USO-CrudeOil DBO FAS GLD BBH IBB JETS JNUG KOL NUGT OIH PALL RSX RETL SDS AGQ SLV SOXL TECL TLT TMF TNA UGA (gasoline) USO (oil) and China: YINN CHAU Commodities: CANE CORN DBC JJC, NIB, CHOC CORN, CUT (paper) MOO, SOYB WEAT UUP (Dollar) LIT (Lithium) Stocks AAPL ADBE ALXN AMAT AMGN AMD AMZN AXP BA BABA BAC BIDU BLDP CAT CVX CMG DE ENPH FB GILD GOOG GS HD IBM INTU JPM LRCX M (Macy's) MSFT NEM NFLX NKE NVDA PG REGN SO SQ QCOM TSLA TXN XOM V VRTX WFC WMT TOWN New highs and Bullish MAXCPs http://tigersoft.com/MAXCP/5-8/BULLISH.htm Bearish MAXCPs - http://tigersoft.com/MINCP/5-8/BEARISH.htm |
Table 1
5/8/2018 QUICKSILVER on DJI-30 STOCKS.
Considering just those stocks whose IP21 + ITRS score is >+.25 or <-.25
3 Bullish (AAPL MSFT )
310 185 = 495
3 Bearish (BA and JPM KO TRV)
133 + 93 +46 +97 = 329
---------------------------
Vitality Score = +166 weakening
Note that AAPL now shows highest AI/200 stock here. STOCKS CLOSE CHANGE PIVOT-P 5-dma AROC CL-PWR Candl AI/200 IP21 ITRS --------------------------------------------------------------------------------------- AAPL 310.13 6.39 293.16 354.7% Bullish BLUE 151 .162 .188 Bullish --------------------------------------------------------------------- AXP 89.5 2.77 86.38 68.3% ------- BLUE 81 .106 -.153 --------------------------------------------------------------------- BA 133.44 4.79 131.46 2.7% Bearish BLUE 70 -.253 -.482 Bearish --------------------------------------------------------------------- CAT 112.11 4.82 107.72 56.7% Bearish BLUE 143 -.028 -.037 --------------------------------------------------------------------- CSCO 42.99 1.62 41.35 250.9% Bearish BLUE 77 -.007 .128 --------------------------------------------------------------------- CVX 95.47 2.83 91.44 330.3% ------- BLUE 86 -.02 .068 --------------------------------------------------------------------- DIS 109.16 3.59 103.18 177.3% ------- BLUE 87 -.007 -.021 --------------------------------------------------------------------- GS 185.39 3.07 176.03 232.7% ------- BLUE 113 -.081 -.045 --------------------------------------------------------------------- HD 234.43 4.98 221.84 354.2% Bullish BLUE 141 .037 .097 --------------------------------------------------------------------- IBM 122.99 1.76 121.68 45.9% ------- BLUE 141 .122 -.022 --------------------------------------------------------------------- INTC 59.67 .5 57.99 188% Bearish ---- 117 .053 .123 --------------------------------------------------------------------- JNJ 148.7 1.11 148.27 13.8% Bearish RED 119 .048 .123 --------------------------------------------------------------------- JPM 92.7 1.49 92.14 -30% ------- RED 106 -.24 -.182 Bearish --------------------------------------------------------------------- KO 46.11 1.51 45.14 56.5% Bearish BLUE 112 -.222 -.107 Bearish --------------------------------------------------------------------- MCD 181.23 .11 181.87 -39.6% Bearish RED 108 .035 -.044 --------------------------------------------------------------------- MMM 148.51 2.77 148.4 -3.1% Bearish BLUE 98 -.189 .043 --------------------------------------------------------------------- MRK 76.4 .8 76.86 -82.4% Bearish ---- 93 -.052 .032 --------------------------------------------------------------------- MSFT 184.68 1.08 178.84 280.7% ------- RED 149 .161 .221 Bullish --------------------------------------------------------------------- NKE 90.46 1.9 85.75 282.4% Bearish BLUE 108 .063 .075 --------------------------------------------------------------------- PFE 37.22 .26 37.62 -55.5% Bearish ---- 56 -.075 .145 --------------------------------------------------------------------- PG 115.95 3.78 115.77 -37.9% ------- BLUE 93 .004 .075 --------------------------------------------------------------------- TRV 97.34 1.54 96.91 67.3% Bearish RED 100 -.134 -.162 Bearish --------------------------------------------------------------------- UNH 287 2 287.54 43.3% Bearish RED 136 .012 .184 --------------------------------------------------------------------- UTX 86.01 -5.36 97.15 -958.4% Bullish RED 114 .144 -.387 --------------------------------------------------------------------- V 185.09 2.37 176.15 266.9% ------- BLUE 132 -.095 .082 --------------------------------------------------------------------- VZ 57 1.42 56.24 15.1% Bearish BLUE 133 -.115 .089 --------------------------------------------------------------------- WBA 41.67 1.01 42.45 1.2% Bearish BLUE 78 -.039 -.045 --------------------------------------------------------------------- WMT 122.94 1.05 123.7 .8% ------- BLUE 91 .033 .167 --------------------------------------------------------------------- XOM 46.18 1.94 44.88 343.8% Bearish BLUE 49 -.113 -.019 --------------------------------------------------------------------- DOW 34.33 1.48 33.06 60.5% Bearish BLUE 64 -.067 -.078 |
Table 2 QUICKSILVER on ETFS - 05/08/20
Bullish = 2 IBB an GLD
Bearish = 4
ETF CLOSE CHANGE PIVOT-PT 5-dma AROC CL-PWR CANDLE IP21 ITRS --------------------------------------------------------------------------------------------- DIA 243.62 4.71 237.42 133.3% Bearish BLUE-.056 0 --------------------------------------------------------------------------------------------- SPY 292.44 4.76 283.57 169.4% Bearish BLUE-.049 .037 --------------------------------------------------------------------------------------------- QQQ 224.86 3.04 215.22 278.9% Bullish BLUE .061 .147 --------------------------------------------------------------------------------------------- MDY 305.77 10.57 289.88 278.7% ------- BLUE-.095 -.041 --------------------------------------------------------------------------------------------- IWM 132.36 4.92 125.68 286.2% ------- BLUE .006 -.058 --------------------------------------------------------------------------------------------- FAS 28.67 1.47 26.35 391.7% ------- BLUE-.123 -.547 Bearish --------------------------------------------------------------------------------------------- RETL 106.98 12.22 89.74 1046.1% Bullish BLUE .123 -.375 Bearish --------------------------------------------------------------------------------------------- SOXL 138.98 11.17 114.22 1166.9% ------- BLUE-.129 -.219 Bearish --------------------------------------------------------------------------------------------- TECL 178.5 7.2 152.96 985.1% ------- BLUE .098 -.063 --------------------------------------------------------------------------------------------- IBB 128.41 1.24 124.55 299.6% Bearish RED .145 .186 Bullish --------------------------------------------------------------------------------------------- GLD 160.42 -.97 160.34 20% Bullish RED .288 .096 Bullish --------------------------------------------------------------------------------------------- OIH 110.21 8.88 103.98 457.6% Bearish BLUE .008 -.319 Bearish --------------------------------------------------------------------------------------------- |
Table 3 Count of Stocks in Key Directories
20200507
-------------------------------
NEWHIGHS 118
NEWLOWS 17
MAXCP 59
MINCP 15
TTTNH 40
TTTNL 12
FASTUP 318
FASTDOWN 67
CPCROSSA 190
CPCROSSD 44
BIGVOLUP 10
BIGVODN 12
ACCUMVER 6
HIGHIP21 15
HIUPPCT 10
VHIP21 52
LOWACCUM 141
REDSELL 131
AUGSELS7 37
TRAPDOOR 19
|
RANKING OF KEY DIRECTORIES BASED PCT.OF STOCKS ABOVE 65-DMA
5/8/20
Bullish = 18
Bearish = 28
---------------------------------------------------------------------------------------
Directory Current day-1 day-2 day-3 day-4 day-5
----------------------------------------------------------------------------------------
EDU 1 .833 .833 .833 .833 .666
HACKERS .9 .85 .8 .7 .55 .6
NIFTY .847 .739 .695 .695 .565 .478
SEMI .847 .714 .666 .609 .495 .504
GOLD .795 .734 .734 .755 .775 .755
NASD-100 .787 .686 .565 .575 .484 .434
COPPER .75 .375 .125 .125 0 0
SOLAR .75 .5 .437 .312 .312 .25
SOFTWARE .733 .666 .6 .566 .483 .4
ELECTRON .731 .604 .55 .496 .422 .436
BIOTECH .697 .661 .649 .646 .577 .498
COMPUTER .65 .5 .45 .35 .4 .4
BEVERAGE .6 .466 .4 .333 .266 .2
GREEN .571 .38 .38 .285 .285 .285
INDEXES .537 .413 .333 .338 .322 .306
HOMEBLDG .529 .411 .294 .294 .176 .235
GAMING .523 .428 .428 .38 .333 .428
FIDSTKS .511 .432 .382 .398 .308 .303
================================================================================================
DOWJONES .5 .366 .366 .4 .3 .333
AUTO .475 .275 .25 .2 .225 .175
SP-100 .472 .406 .318 .34 .252 .274
INDMATER .466 .32 .28 .306 .293 .293
SP500 .466 .384 .331 .346 .271 .275
DJI-13 .461 .384 .384 .461 .461 .461
CHEM .448 .265 .285 .306 .224 .224
RUS-1000 .439 .344 .299 .31 .245 .25
CHINA .431 .294 .215 .098 .058 .039
HOSPITAL .38 .285 .285 .285 .238 .238
RETAIL .36 .3 .32 .32 .3 .28
ETFS .357 .232 .142 .107 .089 .035
OILGAS .356 .257 .189 .204 .196 .159
TRANSP .35 .25 .2 .3 .15 .3
GUNS .333 .266 .333 .333 .333 .333
COAL .285 .142 .142 .142 .142 .142
COMODITY .275 .25 .225 .2 .225 .225
FOOD .24 .203 .185 .166 .185 .185
INFRA .2 .114 .057 .085 .085 .142
MILITARY .185 .185 .148 .148 .148 .148
FINANCE .166 .119 .107 .107 .071 .095
BONDFUND .15 .16 .07 .09 .08 .07
REIT .141 .092 .063 .07 .063 .078
UTILITY .102 .076 .076 .076 .076 .076
REGBANKS .076 .038 .038 .038 .076 .076
INSURANC .038 .038 0 .038 0 .038
BIGBANKS 0 0 0 0 0 0
JETS 0 0 0 0 0 0
|
====================================================================
5/7/2020 Peerless remains on its Sells and the DJI is still 650 points
below
the resistance of its rapidly falling 65-dma. But the Opening Power
keeps lifting the DJI further than it can fall back after the opening.
As long as we see strong openings, it looks like the DJI will move
higher. In Table 1 below, we see that there are actually now more
"bearish" DJIA stocks than "bullish" ones, but the index continues to
rise because the strongest stocks (AAPL, UNH and MSFT) are
much higher priced. As you know, the Dow Jones Company weights
the individual DJI components only by price.
The SP-500 has closed a little above its 65-dma. In doing so, it has
joined QQQ and the NASDAQ. In
the COMPQX (NASDAQ)
chart below we see that 58% of its daily openings for the last year have
been up and from its "ITRS", we see that it has outperformed the DJI
by 11.4% over the last 50 tradings days. Hedging a short position on DIA
with a long NASDAQ position would have produced a solid gain.
I doubt if this differential will soon close.


Peerless believers should be short DIA along with the weakest
stocks
and ETFs, like JETS and WFC. Bounces up from the recent lows
are a definite possibility for the shorts. So, hedging by being long AAPL,
NUGT, the NASDAQ and some of the Bullish MAXCPs seems a good idea.
The pandemic is splintering the market into new groups of winners and losers. Today
we learned our favorite restaurant, the Soup Plantation, will probably
be closing permanently. They are saying the FDA will not be allowing
buffets to re-open. This is doubly painful for me because it may mean
that seafood buffets that feature Snow Crab may not re-open. But don't
be depressed by CNN and the bad Jobs' report Friday morning.
From the bullish MAXCPs will come some big gainers.
QDEL
illustrates that. On February. 22, the company
announced that it had
applied for authorization for an upgraded test, its Lyra Direct
SARS-CoV-2 Assay, from the Food and Drug Administration.
The compnay claimed that it was currently manufacturing 500,000 tests
per week See below how that has boosted the stock and how the
technicals looked on its earlier breakout above 100. We want to try to find
others in this field that show the same patterns.

Today there were 93 NYSE and NASDAQ stocks made new highs.
Speculators are returning to this market en masse. Below are some
of the biomed stocks making new highs with links to their stories.
https://finance.yahoo.com/news/kala-pharmaceuticals-reports-first-quarter-110000332.html
 |
https://finance.yahoo.com/news/natera-reports-first-quarter-2020-200500164.html
 |
https://finance.yahoo.com/news/meridian-bioscience-partners-quantumdx-covid-120010290.html
 |
|
Charts 5/7/2020 (Click on Underlined link.) 2020 PEERLESS DJI, Signals, Indicators Daily DJI Volume 10-DayUp/Down Vol Stoch-20 Inverted Traders Index Graph of Pct of All Stocks above 65-dma Cum. Inverted Traders Index NASDAQ S&P OEX NYSE COMPQX DJI-15 DJI-20 DJI-30 DIA QQQ MDY IWM TNA Short-Term Rates SPY http://tigersoft.com/2121CST/SPY.GIF 2006 vers-Peerless signals http://tigersoft.com/2121CST/PEER2006.bmp USO-CrudeOil DBO FAS GLD BBH IBB JETS JNUG KOL NUGT OIH OIL PALL RSX RETL SDS AGQ SLV SOXL TECL TLT TMF TNA UGA (gasoline) and China: YINN CHAU Commodities: CANE CORN DBC JJC, NIB, CHOC CORN, CUT (paper) MOO, SOYB WEAT UUP (Dollar) LIT (Lithium) Stocks AAPL ADBE ALXN AMAT AMGN AMD AMZN AXP BA BABA BAC BIDU BLDP CAT CVX DE FB GILD GOOG GS HD IBM INTU JPM M (Macy's) MSFT NEM NFLX NKE NVDA PG REGN QCOM TSLA TXN XOM V VRTX WMT CMG , LRCX, SQ TOWN New highs and Bullish MAXCPs http://tigersoft.com/MAXCP/5-7/BULLISH.htm Bearish MAXCPs - http://tigersoft.com/MINCP/5-7/BEARISH.htm |
Table 1
5/7/2018 QUICKSILVER on DJI-30 STOCKS.
Considering just those stocks whose IP21 + ITRS score is >+.25 or <-.25
3 Bullish (AAPL MSFT UNH)
303 183 + 185 = 671
4 Bearish (BA and JPM KO TRV)
129 + 91 +45 +96 = 361
---------------------------
Vitality Score = +310 weakening
Note that AAPL now shows highest AI/200 stock here. STOCKS CLOSE CHANGE PIVOT-P 5-dma AROC CL-PWR Candl AI/200 IP21 ITRS
---------------------------------------------------------------------------------------
AAPL 303.74 3.11 289.07 168.6% Bullish BLUE 151 .15 .152 Bullish
^^^^^^ ^^^
---------------------------------------------------------------------
AXP 86.73 2.73 88.32 -258.8% ------- BLUE 81 .108 -.154
---------------------------------------------------------------------
BA 128.65 6.79 133.37 -473.5% Bearish BLUE 71 -.274 -.465 Bearish
---------------------------------------------------------------------
CAT 107.29 -.38 110.88 -412% Bearish RED 144 -.029 -.049
---------------------------------------------------------------------
CSCO 41.37 .22 40.92 -121.8% Bearish RED 77 -.039 .096
---------------------------------------------------------------------
CVX 92.64 2.59 89.44 35.1% ------- RED 87 -.01 .059
---------------------------------------------------------------------
DIS 105.57 4.69 105.5 -124.3% ------- BLUE 88 -.048 -.03
---------------------------------------------------------------------
GS 182.32 5.4 177.1 -30.8% ------- BLUE 114 -.046 -.041
---------------------------------------------------------------------
HD 229.45 5.53 218.57 216.7% Bullish BLUE 141 .031 .09
---------------------------------------------------------------------
IBM 121.23 -1.94 121.87 -176.1% Bullish RED 140 .119 -.018
---------------------------------------------------------------------
INTC 59.17 -.01 57.47 -69% Bearish RED 117 .042 .106
---------------------------------------------------------------------
JNJ 147.59 -.49 148.29 -82.3% ------- RED 118 .08 .142
---------------------------------------------------------------------
JPM 91.21 .94 93.25 -245.5% Bearish RED 107 -.187 -.165 Bearish
---------------------------------------------------------------------
KO 44.6 -.15 45.6 -142.2% Bearish RED 113 -.217 -.111 Bearish
---------------------------------------------------------------------
MCD 181.12 4.15 182.66 -177.3% Bullish BLUE 108 .059 -.024
---------------------------------------------------------------------
MMM 145.74 -.46 148.6 -208.1% Bearish RED 99 -.17 .093
---------------------------------------------------------------------
MRK 75.6 -1.52 77.67 -240.4% Bearish RED 94 -.028 .06
---------------------------------------------------------------------
MSFT 183.6 1.06 174.57 122.5% ------- RED 148 .137 .193 Bullish
---------------------------------------------------------------------
NKE 88.56 .12 85.54 79.5% Bearish RED 107 .064 .077
---------------------------------------------------------------------
PFE 36.96 -1.55 37.64 -183.6% Bearish RED 57 -.04 .179
---------------------------------------------------------------------
PG 112.17 -.93 116.82 -245.9% Bearish RED 92 -.017 .048
---------------------------------------------------------------------
TRV 95.8 2.51 96.05 -279.3% Bearish BLUE 101 -.123 -.141 Bearish
---------------------------------------------------------------------
UNH 285 -3.77 284.51 -129.1% ------- RED 136 .085 .198 Bullish
---------------------------------------------------------------------
UTX 86.01 -5.36 97.15 -958.4% Bullish RED 114 .144 -.326
---------------------------------------------------------------------
V 182.72 3.94 175.57 112.7% ------- BLUE 133 -.069 .09
---------------------------------------------------------------------
VZ 55.58 -.06 56.83 -165.4% Bearish RED 133 -.105 .087
---------------------------------------------------------------------
WBA 40.66 -.54 41.66 -312.2% Bearish RED 79 -.057 -.033
---------------------------------------------------------------------
WMT 121.89 -1.41 122.92 13.8% ------- RED 91 -.013 .186
---------------------------------------------------------------------
XOM 44.24 .25 43.14 -249.7% Bearish RED 49 -.097 -.051
---------------------------------------------------------------------
DOW 32.85 .89 33.93 -568% ------- BLUE 65 -.048 -.123
|
Table 2 QUICKSILVER on ETFS - 05/07/20
Bullish = 2 IBB an GLD
Bearish = 4
ETF CLOSE CHANGE PIVOT-PT 5-dma AROC CL-PWR CANDLE IP21 ITRS --------------------------------------------------------------------------------------------- DIA 238.91 2.05 237.28 -90.3% Bearish RED -.036 ----- --------------------------------------------------------------------------------------------- SPY 287.68 3.43 282.79 -49% Bearish RED -.024 .038 --------------------------------------------------------------------------------------------- QQQ 221.82 2.82 212.74 67.1% Bullish ---- .067 .139 --------------------------------------------------------------------------------------------- MDY 295.2 4.79 289.52 -78.8% ------- BLUE-.102 -.043 --------------------------------------------------------------------------------------------- IWM 127.44 1.72 125.14 -113.3% ------- ---- .015 -.061 --------------------------------------------------------------------------------------------- FAS 27.2 1.83 26.6 -400.4% Bearish BLUE-.085 -.556 Bearish --------------------------------------------------------------------------------------------- RETL 94.76 1.36 87.8 -106.4% Bullish RED .115 -.423 Bearish --------------------------------------------------------------------------------------------- SOXL 127.81 3.64 111.1 -133.2% ------- RED -.125 -.311 Bearish --------------------------------------------------------------------------------------------- TECL 171.3 7.88 147.17 331.6% ------- BLUE .083 -.176 --------------------------------------------------------------------------------------------- IBB 127.17 .17 120.9 127.1% ------- RED .175 .189 BULLISH --------------------------------------------------------------------------------------------- GLD 161.39 2.44 159.78 81% Bullish BLUE .294 .162 BULLISH --------------------------------------------------------------------------------------------- OIH 101.33 3.79 100.95 -410.8% Bearish BLUE 0 -.342 Bearish --------------------------------------------------------------------------------------------- |
Table 3 Count of Stocks in Key Directories
20200507
-------------------------------
NEWHIGHS 93 NYSE + NASDAQ
NEWLOWS 29
MAXCP 65
MINCP 43
TTTNH 42
TTTNL 23
FASTUP 140
FASTDOWN 346
CPCROSSA 147
CPCROSSD 59
BIGVOLUP 7
BIGVODN 9
ACCUMVER 9
HIGHIP21 13
HIUPPCT 8
REDSELL 125
AUGSELS7 30
TRAPDOOR 17
|
RANKING OF KEY DIRECTORIES BASED PCT.OF STOCKS ABOVE 65-DMA 5/7/20 --------------------------------------------------------------------------------------- Directory Current day-1 day-2 day-3 day-4 day-5 ---------------------------------------------------------------------------------------- HACKERS .85 .85 .7 .55 .6 .65 EDU .8 .8 .8 .8 .6 .8 NIFTY .739 .695 .695 .565 .456 .76 GOLD .734 .734 .755 .775 .734 .734 SEMI .714 .666 .609 .495 .495 .714 NASD-100 .686 .575 .585 .484 .414 .595 SOFTWARE .666 .616 .566 .483 .4 .616 BIOTECH .644 .635 .638 .571 .501 .612 ELECTRON .604 .55 .496 .422 .429 .604 COMPUTER .5 .45 .35 .4 .4 .5 SOLAR .5 .437 .312 .312 .25 .312 BEVERAGE .466 .4 .333 .266 .2 .333 FIDSTKS .432 .382 .398 .308 .303 .404 GAMING .428 .428 .38 .333 .428 .38 INDEXES .413 .333 .338 .322 .317 .43 HOMEBLDG .411 .294 .294 .176 .176 .294 SP-100 .406 .318 .34 .252 .274 .384 DJI-13 .384 .384 .461 .461 .461 .461 SP500 .384 .334 .346 .271 .266 .376 GREEN .38 .38 .285 .285 .285 .476 COPPER .375 .125 .125 0 0 0 DOWJONES .366 .366 .4 .3 .333 .5 RUS-1000 .344 .3 .31 .245 .243 .361 INDMATER .32 .28 .306 .293 .266 .36 CHINA .307 .23 .096 .057 .038 .384 RETAIL .3 .32 .32 .3 .26 .36 HOSPITAL .285 .285 .285 .238 .238 .333 AUTO .275 .25 .2 .225 .175 .325 CHEM .27 .291 .312 .229 .208 .458 GUNS .266 .333 .333 .333 .333 .333 OILGAS .257 .189 .204 .196 .159 .257 COMODITY .25 .225 .2 .225 .225 .225 TRANSP .25 .2 .3 .15 .3 .35 ETFS .232 .142 .107 .089 .035 .178 FOOD .203 .185 .166 .185 .185 .185 MILITARY .185 .148 .148 .148 .148 .185 BONDFUND .16 .07 .09 .08 .07 .09 COAL .142 .142 .142 .142 .142 .142 FINANCE .119 .107 .107 .071 .095 .178 INFRA .114 .057 .085 .085 .114 .142 REIT .092 .063 .07 .063 .078 .134 UTILITY .076 .076 .076 .076 .076 .128 INSURANC .038 0 .038 0 .038 .038 REGBANKS .038 .038 .038 .076 .076 .192 BIGBANKS 0 0 0 0 0 0 JETS 0 0 0 0 0 .076 |
====================================================================
5/6/2020 Today
there are reports of a possible anti-virus vaccine coming out of Italy.
This helps explain the DJI being up more than 300 now before the opening..
https://www.youtube.com/watch?v=X8GCRYl4X4o


The daily volatility continues; so does the tug of war between the Bulls and Bears.
Down volume on the NYSE is again gaining sway but Opening Power remains
in a bullish uptrend. The DJI's negative Accumulation and bearish Closing Power
suggests that the battle for control of the 65-dma, whether it will be resistance or
support, is far from over and could continue for some time.
Let me remind folks, that that we do not have to play only the DJI or DIA,
either 100% long or 100% short. The
strongest and weakest stock and
ETF trends are our friends. That is why we post the
Bullish MAXCPs and
Bearish MINCPs each night.
Shorting only DIA now when the FED is pumping $5 to $8
tillion dollars into
Wall Street's biggest corporations is frustrating and also needless. Instead, we
can use the Bullish MAXCPs to be long those stocks that are the leaders and
the Bearish MINCPs to be simultanously short those stocks that are the weakest.
At the very least, I have suggested holding long AAPL (our Tiger "Tahiti" stock)
and GLD (or NUGT) if DIA is shorted. Shorting JETs (or BA) and FAS (or WFC)
is in keeping with hedging with very strongest and weakest stocks. BA and WFC
do show heavy red Distribution now are very close to breaking down to new
lows.
But, of course, the FED will try very hard to prevent breakdowns here.
The FED's power may be supreme this year. But even they
have limited power.
It may be a long time before airlines' traffic returns to "normal".
Meanwhile, the airlines
are losing billions each month.
https://www.reuters.com/article/us-health-coronavirus-iata/global-airlines-estimated-coronavirus-losses-rise-to-314-billion-iata-idUSKCN21W1LN
Consumer debt, especially mortgage payments, are going to be
in arrears for a long time.
Too many people live paycheck to paycheck. Rents were already impossibly
high in many big cities. How are small landlords to pay their bills? Total
Consumer
debt was estimated to be $14.3 Trillion in March. A long-term economic slowdown
would probably require the FED pumping trillions more per year. How long can it
do that? This saga is just beginning.
https://www.businessinsider.com/us-consumer-debt-hit-record-q1-before-coronavirus-pandemic-fed-2020-5
At present, the Covid-19 death rates are not rising in South
Carolina, Georgia
and Tennessee.
https://www.google.com/search?source=hp&ei=e4qwXsT5OIHY-wSs2ajIBA&q=georgia+death+rate+covid-19&oq=georgia+death+rate+covid-19&gs_lcp=CgZwc3ktYWIQAzoOCAAQ6gIQtAIQmgEQ5QI6BQgAEIMBOgIIADoICCEQFhAdEB5Q7CVY8IQBYN6KAWgDcAB4AIABhQKIAd8UkgEGMjMuMy4ymAEAoAEBqgEHZ3dzLXdperABBg&sclient=psy-ab&ved=0ahUKEwiEo-bolJvpAhUB7J4KHawsCkkQ4dUDCAg&uact=5
While undemiably, there is pent-up demand for sunshine,
beaches, Las Vegas,
hair-cuts and sporting events, it may a long time before air travel or cruise ships
are considered safe. Ordering on line will surely become much more commonplace,
thereby hurting many retailers. And people are re-discovering the joys of cooking
healthy food for themselves. Many restaurants will never recover.
|
Charts 5/6/2020 (Click on Underlined link.) 2020 PEERLESS DJI, Signals, Indicators Daily DJI Volume 10-DayUp/Down Vol Stoch-20 Inverted Traders Index Graph of Pct of All Stocks above 65-dma Cum. Inverted Traders Index NASDAQ S&P OEX NYSE COMPQX DJI-15 DJI-20 DJI-30 DIA QQQ MDY IWM TNA Short-Term Rates SPY http://tigersoft.com/2121CST/SPY.GIF 2006 vers-Peerless signals http://tigersoft.com/2121CST/PEER2006.bmp USO-CrudeOil DBO FAS GLD BBH IBB JETS JNUG KOL NUGT OIH OIL PALL RSX RETL SDS AGQ SLV SOXL TECL TLT TMF TNA UGA (gasoline) and China: YINN CHAU Commodities: CANE CORN DBC JJC, NIB, CHOC CORN, CUT (paper) MOO, SOYB WEAT UUP (Dollar) LIT (Lithium) Stocks AAPL ADBE ALXN AMAT AMGN AMD AMZN AXP BA BABA BAC BIDU BLDP CAT CVX DE FB GILD GOOG GS HD IBM INTU JPM M (Macy's) MSFT NEM NFLX NKE NVDA PG REGN QCOM TSLA TXN XOM V VRTX WMT CMG , LRCX, SQ TOWN New highs and Bullish MAXCPs http://tigersoft.com/MAXCP/5-6/BULLISH.htm Bearish MAXCPs - http://tigersoft.com/MINCP/5-6/BEARISH.htm |
Table 1
5/6/2018 QUICKSILVER on DJI-30 STOCKS.
Considering just those stocks whose IP21 + ITRS score is >+.25 or <-.25
4 Bullish (AAPL JNJ MSFT UNH)
301 148 + 183 +289 = 921
4 Bearish (BA and JPM KO TRV)
122 + 90 +45 +93 = 370
---------------------------
Vitality Score = +551
Note that AAPL now shows highest AI/200 stock here. STOCKS CLOSE CHANGE PIVOT-P 5-dma AROC CL-PWR Candl AI/200 IP21 ITRS --------------------------------------------------------------------------------------- AAPL 300.63 3.07 293.8 220.7% Bullish BLUE 151 .083 .169 Bullish --------------------------------------------------------------------- AXP 84 -2.74 91.25 -675.1% ------- RED 80 .033 -.18 --------------------------------------------------------------------- BA 121.86 -3.54 141.02 -639.3% Bearish RED 72 -.349 -.474 Bearish --------------------------------------------------------------------- CAT 107.67 -1.24 116.38 -549.3% Bearish RED 145 -.051 -.04 --------------------------------------------------------------------- CSCO 41.15 -.31 42.38 -261.4% Bearish RED 77 -.079 .088 --------------------------------------------------------------------- CVX 90.05 -2.84 92 -248.2% Bearish RED 88 -.055 .019 --------------------------------------------------------------------- DIS 100.88 -.18 108.15 -536.2% ------- RED 89 -.132 -.088 --------------------------------------------------------------------- GS 176.92 -1.38 183.42 -362.2% Bearish RED 115 -.056 -.062 --------------------------------------------------------------------- HD 223.92 -1.69 219.83 47.6% Bullish RED 141 -.033 .068 --------------------------------------------------------------------- IBM 123.17 .59 125.56 -222.4% Bullish RED 139 .099 -.006 --------------------------------------------------------------------- INTC 59.18 .43 59.98 -221.3% ------- BLUE 117 -.005 .116 --------------------------------------------------------------------- JNJ 148.08 -1.42 150.04 -72.4% Bullish RED 117 .045 .149 Bullish --------------------------------------------------------------------- JPM 90.27 -1.73 95.76 -402.9% Bearish RED 107 -.209 -.16 Bearish --------------------------------------------------------------------- KO 44.75 -.65 45.89 -258.6% Bearish RED 114 -.233 -.101 Bearish --------------------------------------------------------------------- MCD 176.97 -2.27 187.56 -295.1% ------- RED 108 -.04 -.041 --------------------------------------------------------------------- MMM 146.2 -1.23 151.92 -334.2% Bearish RED 100 -.217 .121 --------------------------------------------------------------------- MRK 77.12 -.89 79.34 -232.4% Bearish RED 95 -.024 .086 --------------------------------------------------------------------- MSFT 182.54 1.78 179.21 143.4% ------- BLUE 147 .065 .211 Bullish --------------------------------------------------------------------- NKE 88.44 1.24 87.18 21.3% ------- BLUE 106 .021 .077 --------------------------------------------------------------------- PFE 38.51 0 38.36 51.2% Bearish RED 58 -.026 .26 --------------------------------------------------------------------- PG 113.1 -2.91 117.87 -170.5% Bearish RED 93 -.049 .056 --------------------------------------------------------------------- TRV 93.29 -3.56 101.21 -639.3% Bearish RED 102 -.162 -.162 Bearish --------------------------------------------------------------------- UNH 288.77 -4.27 292.47 19.4% ------- RED 136 .068 .221 Bullish --------------------------------------------------------------------- UTX 86.01 -5.36 97.15 -958.4% Bullish RED 114 .144 -.316 --------------------------------------------------------------------- V 178.78 .34 178.72 -84.5% ------- RED 134 -.109 .074 --------------------------------------------------------------------- VZ 55.64 -.87 57.45 -217.4% Bearish RED 133 -.111 .099 --------------------------------------------------------------------- WBA 41.2 -.82 43.29 -484.2% Bearish RED 79 -.053 -.008 --------------------------------------------------------------------- WMT 123.3 -1.43 121.55 -12.2% Bullish RED 91 -.041 .203 --------------------------------------------------------------------- XOM 43.99 -.84 46.47 -382.5% Bearish RED 49 -.139 -.063 --------------------------------------------------------------------- DOW 31.96 -1.41 36.69 -789.3% Bearish RED 66 -.095 -.148 |
Table 2 QUICKSILVER on ETFS - 05/06/20
Bullish = 2 IBB an GLD
Bearish = 4
ETF CLOSE CHANGE PIVOT-PT 5-dma AROC CL-PWR CANDLE IP21 ITRS --------------------------------------------------------------------------------------------- . DIA 236.86 -1.94 243.22 -199.3% Bearish RED -.101 ----- ---------------------------------------------------------------------------------------------. SPY 284.25 -1.94 290.48 -156% Bearish RED -.082 .034 --------------------------------------------------------------------------------------------- QQQ 219 1.34 218.91 0% ------- RED -.004 .142 --------------------------------------------------------------------------------------------- MDY 290.41 -2.25 299.81 -321% Bearish RED -.119 -.059 --------------------------------------------------------------------------------------------- IWM 125.72 -.93 130.31 -378.6% Bearish RED -.04 -.071 --------------------------------------------------------------------------------------------- FAS 25.37 -1.21 29.35 -1091.7% Bearish RED -.155 -.576 Bearish --------------------------------------------------------------------------------------------- RETL 93.4 .74 96.72 -787.4% Bullish RED .097 -.449 Bearish --------------------------------------------------------------------------------------------- SOXL 124.17 4.16 131.01 -892.4% ------- BLUE-.18 -.312 Bearish --------------------------------------------------------------------------------------------- TECL 163.42 3.14 160.89 5.4% ------- RED .001 -.191 --------------------------------------------------------------------------------------------- IBB 127 .02 124 48.2% Bearish RED .128 .212 Bullish --------------------------------------------------------------------------------------------- GLD 158.95 -2.07 158.8 -86.7% Bullish ---- .301 .162 Bullish --------------------------------------------------------------------------------------------- OIH 97.54 -4.51 109.78 -771.7% Bearish RED -.03 -.367 Bearish --------------------------------------------------------------------------------------------- GASL 3440 285 3685 -325.1% ------- RED -.021 .238 --------------------------------------------------------------------------------------------- |
Table 3 Count of Stocks in Key Directories
20200506
-------------------------------
NEWHIGHS 85
NEWLOWS 51
MAXCP 47
MINCP 86
TTTNH 31
TTTNL 51
FASTUP 94
FASTDOWN 758
CPCROSSA 44
CPCROSSD 195
BIGVOLUP 9
BIGVODN 9
ACCUMVER 10
HIGHIP21 7
HIUPPCT 7.
REDSELL 123
AUGSELS7 28
TRAPDOOR 25
|
Table 3 RANKING OF KEY DIRECTORIES BASED PCT.OF STOCKS ABOVE 65-DMA
5/6/20
Bullish = 9
Bearish = 37 (Airlines and Big Banks are lowest)
---------------------------------------------------------------------------------------
Directory Current day-1 day-2 day-3 day-4 day-5
----------------------------------------------------------------------------------------
HACKERS .85 .75 .55 .6 .65 .7
EDU .8 .8 .8 .6 .8 .8
GOLD .734 .755 .775 .734 .734 .775
NIFTY .695 .695 .565 .456 .739 .847
SEMI .666 .609 .495 .495 .704 .857
BIOTECH .632 .635 .568 .501 .609 .685
SOFTWARE .616 .583 .483 .4 .616 .65
NASD-100 .575 .595 .494 .414 .595 .686
^^^^Y^
ELECTRON .55 .496 .422 .429 .604 .718
============================================================================================
COMPUTER .473 .368 .421 .421 .473 .631
SOLAR .437 .312 .312 .25 .312 .687
GAMING .428 .38 .333 .428 .38 .428
BEVERAGE .4 .333 .266 .2 .266 .466
DJI-13 .384 .461 .461 .461 .461 .615
FIDSTKS .382 .398 .308 .303 .393 .477
GREEN .38 .285 .285 .285 .476 .619
DOWJONES .366 .4 .3 .333 .4 .6
^^^^^
SP500 .334 .348 .271 .266 .363 .462
^^^^^
GUNS .333 .333 .333 .333 .333 .533
INDEXES .329 .335 .318 .313 .416 .486
RETAIL .32 .32 .3 .26 .36 .38
SP-100 .318 .34 .252 .274 .351 .483
^^^^
RUS-1000 .3 .311 .245 .243 .351 .436
HOMEBLDG .294 .294 .176 .176 .294 .47
CHEM .285 .306 .224 .204 .387 .632
HOSPITAL .285 .285 .238 .238 .333 .428
INDMATER .28 .306 .293 .266 .346 .573
AUTO .25 .2 .225 .175 .325 .4
CHINA .226 .094 .056 .037 .358 .547
COMODITY .225 .2 .225 .225 .225 .275
TRANSP .2 .3 .15 .3 .35 .4
OILGAS .189 .204 .196 .159 .242 .295
FOOD .185 .166 .185 .185 .185 .222
MILITARY .148 .148 .148 .148 .148 .222
COAL .142 .142 .142 .142 .142 .142
ETFS .142 .107 .089 .035 .178 .303
COPPER .125 .125 0 0 0 .625
FINANCE .107 .107 .071 .095 .166 .25
UTILITY .076 .076 .076 .076 .128 .102
BONDFUND .07 .09 .08 .07 .08 .09
REIT .063 .07 .063 .078 .134 .156
INFRA .057 .085 .085 .114 .142 .342
REGBANKS .038 .038 .076 .076 .192 .5
BIGBANKS 0 0 0 0 0 0
INSURANC 0 .038 0 .038 .038 .115
JETS 0 0 0 0 .076 .153
|
====================================================================
5/5/2020 The FED has staged a
multi-trillion dollar coup'd'tat and
Wall Street is the clear winner. AAPL is Wall Street's darling.
It is also our "Tahiti" stock, showing the highest AI/200 score
in the DJI-30. It is over its 65-dma and should be held long
now as a hedge for our short in DIA. But one thing the FED
cannot
do - is print more Gold. I would think GOLD will keep rallying.
That should allow depressed and previouly recommended NUGT
(3x Gold Miners' ETF) to continue to rise even after it reaches the
top of its price channel of 80.
AAPL - highest AI/200 DJI-30 stock

DJIA on Sell S9-S12
and still below falling 65-dma

NUGT - A leveraged gold play

Peerless remains on its Sell S9-S12 and below its fast-falling
65-dma. But the DJI found
support at its still rapidly rising 21-dma.
The DJI is as divided in its prospects as any of the other averages.
But one thing the DJI has going for it is how its highest price
components are most heavily weighted. Thus though less than
half of the DJI stocks are abve their key 65-dma, all of the
five highest priced DJI stocks are: (AAPL-298, UNH-293),
HD-226), MSFT-181 and V-178). Together, these five stocks
are given a weight of 33% of the total DJI. In other words,
though Boeing could crack its key support and start another
leg down, its price of 125 does not allow it to have nearly as much
influence as Tahiti-stock AAPL at 296 or UNH at 293.

When we breakdown the individual DJI stocks by whether they
are individually on TigerSoft Buys or Sells, we do see by a slight majoity,
16 to 14, there are more on optimized TigerSoft Sells. But
that seems less important now than that the DJI-30 Vitality Index
has risen to over +800. Only two DJI stocks show a combined
IP21 (accumulation) + ITRS (rel.strength) score below -.25.
AAPL, the big Pharma's, MSFT and WMT) must be seen
as technically bullish. So, at this stage, it still looks like the
DJI must again challenge its falling 65-dma.
The FED will probably just keep pumping more and more magic money
into Wall Street's biggest 2000 corporation for months more. There
is no organized opposition to this within Congress. Democrat Biden is
loudly silent. So is CNN. The legal basis for such an unprecedented
largesse - more than a Billion Dollars on average for 2000 corpoations -
is not even stated. When you think about it, Wall Street has staged a
trillion coup'd'tat. So, why should its stocks not celebrate.
|
Charts 5/5/2020 (Click on Underlined link.) 2020 PEERLESS DJI, Signals, Indicators Daily DJI Volume 10-DayUp/Down Vol Stoch-20 Inverted Traders Index Graph of Pct of All Stocks above 65-dma Cum. Inverted Traders Index NASDAQ S&P OEX NYSE COMPQX DJI-15 DJI-20 DJI-30 DIA QQQ MDY IWM TNA Short-Term Rates SPY http://tigersoft.com/2121CST/SPY.GIF 2006 vers-Peerless signals http://tigersoft.com/2121CST/PEER2006.bmp USO-CrudeOil DBO FAS GLD BBH IBB JETS JNUG KOL NUGT OIH OIL PALL RSX RETL SDS AGQ SLV SOXL TECL TLT TMF TNA UGA (gasoline) and China: YINN CHAU Commodities: CANE CORN DBC JJC, NIB, CHOC CORN, CUT (paper) MOO, SOYB WEAT UUP (Dollar) LIT (Lithium) Stocks AAPL ADBE ALXN AMAT AMGN AMD AMZN AXP BA BABA BAC BIDU BLDP CAT CVX DE FB GILD GOOG GS HD IBM INTU JPM M (Macy's) MSFT NEM NFLX NKE NVDA PG REGN QCOM TSLA TXN XOM V VRTX WMT CMG , LRCX, SQ TOWN New highs and Bullish MAXCPs http://tigersoft.com/MAXCP/5-5/BULLISH.htm Bearish MAXCPs - http://tigersoft.com/MINCP/5-5/BEARISH.htm |
Table 1
5/1/2018 QUICKSILVER on DJI-30 STOCKS.
Considering just those stocks whose IP21 + ITRS score is >+.25 or <-.25
6 Bullish (AAPL JNJ MSFT PFE UNH WMT)
297 149 + 181 +39 +293 +125 = 1084
2 Bearish (BA and JPM)
125 + 92 = 217
---------------------------
Vitality Score = +867 (big improvement)
Note that AAPL now shows highest AI/200 stock here. STOCKS CLOSE CHANGE PIVOT-P 5-dma AROC CL-PWR Candl AI/200 IP21 ITRS --------------------------------------------------------------------------------------- AAPL 297.56 4.4 287.73 329% Bullish BLUE 150 .146 .144 Bullish --------------------------------------------------------------------- AXP 86.74 .36 96.12 -80.5% ------- RED 79 .123 -.178 --------------------------------------------------------------------- BA 125.4 -6.06 139 -218.1% Bearish RED 73 -.25 -.46 Bearish --------------------------------------------------------------------- CAT 108.91 1.19 120.06 -287% Bearish RED 146 -.018 -.03 --------------------------------------------------------------------- CSCO 41.46 .11 43.34 -122.3% Bearish RED 77 -.008 .088 --------------------------------------------------------------------- CVX 92.89 1.45 94.62 162.9% ------- RED 88 .027 .033 --------------------------------------------------------------------- DIS 101.06 -2.12 112.25 -240.5% ------- RED 90 -.052 -.094 --------------------------------------------------------------------- GS 178.3 2.27 190.03 -238.3% ------- RED 116 0 -.06 --------------------------------------------------------------------- HD 225.61 3.77 221.81 181.4% Bullish BLUE 141 .044 .087 --------------------------------------------------------------------- IBM 122.58 .9 128.69 -147.8% Bullish RED 138 .138 -.017 --------------------------------------------------------------------- INTC 58.75 .76 61.8 0% ------- BLUE 118 .054 .097 --------------------------------------------------------------------- JNJ 149.5 1.23 150.24 -63.1% Bullish BLUE 116 .109 .17 Bullish --------------------------------------------------------------------- JPM 92 -.14 97.86 -173.4% ------- RED 107 -.173 -.158 Bearish --------------------------------------------------------------------- KO 45.4 .26 47.12 -145.3% Bearish BLUE 114 -.156 -.08 --------------------------------------------------------------------- MCD 179.24 -2.63 187.82 -180.6% Bullish RED 109 .066 -.015 --------------------------------------------------------------------- MMM 147.43 -.97 156.26 -333.6% Bearish RED 100 -.131 .112 --------------------------------------------------------------------- MRK 78.01 1.15 80.77 -200.2% Bearish BLUE 96 .054 .105 --------------------------------------------------------------------- MSFT 180.76 1.92 177.43 311.1% ------- ---- 146 .125 .204 Bullish --------------------------------------------------------------------- NKE 87.2 1.45 88.07 -91.9% Bearish BLUE 105 .048 .055 --------------------------------------------------------------------- PFE 38.51 .89 38.12 79.1% Bearish RED 58 .054 .257 Bullish --------------------------------------------------------------------- PG 116.01 .24 117.08 -37.6% Bullish BLUE 94 .016 .087 --------------------------------------------------------------------- TRV 96.85 -.06 106 -368.7% Bearish RED 103 -.08 -.132 --------------------------------------------------------------------- UNH 293.04 5.5 287.65 81.2% ------- BLUE 136 .145 .201 Bullish --------------------------------------------------------------------- UTX 86.01 -5.36 97.15 -958.4% Bullish RED 114 .144 -.295 --------------------------------------------------------------------- V 178.44 2.29 181.79 203.5% Bearish RED 135 -.045 .043 --------------------------------------------------------------------- VZ 56.51 .27 58.12 -115.2% Bearish BLUE 133 -.032 .12 --------------------------------------------------------------------- WBA 42.02 -.43 45.36 -302.4% Bearish RED 79 .067 .003 --------------------------------------------------------------------- WMT 124.73 1.03 123.6 -131.9% Bullish BLUE 92 .051 .218 Bullish --------------------------------------------------------------------- XOM 44.83 -.05 47.46 -15.4% Bearish RED 50 -.077 -.059 --------------------------------------------------------------------- DOW 33.37 .31 37.47 -353.1% ------- RED 66 -.047 -.133 |
Table 2 QUICKSILVER on ETFS - 06/05/20
Bullish = 2 IBB an GLD
Bearish = 4
ETF CLOSE CHANGE PIVOT-PT 5-dma AROC CL-PWR CANDLE IP21 ITRS --------------------------------------------------------------------------------------------- DIA 238.8 1.38 246.45 -47.5% Bearish RED -.016 ------ --------------------------------------------------------------------------------------------- SPY 286.19 2.62 293.21 8% ------- RED -.015 .033 --------------------------------------------------------------------------------------------- QQQ 217.66 2.44 219 142.9% Bullish BLUE .053 .129 --------------------------------------------------------------------------------------------- MDY 292.66 2.78 309.43 -72.2% ------- RED -.05 -.06 --------------------------------------------------------------------------------------------- IWM 126.65 .97 135.46 -95.2% ------- RED .017 -.073 --------------------------------------------------------------------------------------------- FAS 26.58 .23 31.5 -354.6% Bearish RED -.074 -.574 Bearish --------------------------------------------------------------------------------------------- RETL 92.66 2.92 108.37 -320.9% Bullish RED .134 -.475 Bearish --------------------------------------------------------------------------------------------- SOXL 120.01 5.79 146.4 -317.9% ------- RED -.104 -.36 Bearish --------------------------------------------------------------------------------------------- TECL 160.28 7.32 163.25 484% ------- BLUE .063 -.247 --------------------------------------------------------------------------------------------- IBB 126.98 2.43 125.8 87.5% ------- BLUE .204 .205 Bullish --------------------------------------------------------------------------------------------- GLD 161.02 .68 161.73 5.6% Bullish BLUE .343 .177 Bullish --------------------------------------------------------------------------------------------- OIH 102.05 -1.93 113.92 82.2% Bearish RED .016 -.345 Bearish --------------------------------------------------------------------------------------------- |
Table 3 Count of Stocks in Key Directories
20200505
-------------------------------
NEWHIGHS 70 (NYSE + NASDAQ)
NEWLOWS 22
MAXCP 63
MINCP 42
TTTNH 37
TTTNL 26
FASTUP 134
FASTDOWN 183
CPCROSSA 85
CPCROSSD 162
BIGVOLUP 8
BIGVODN 16
ACCUMVER 7
HIGHIP21 19
HIUPPCT 7
REDSELL 116
AUGSELS7 23
TRAPDOOR 27
|
Table 4 RANKING OF KEY DIRECTORIES BASED PCT.OF STOCKS ABOVE 65-DMA
5/5/20
Bullish = 8
Bearish = 38
---------------------------------------------------------------------------------------
Directory Current day-1 day-2 day-3 day-4 day-5
----------------------------------------------------------------------------------------
EDU .8 .8 .6 .8 .8 .6
GOLD .765 .787 .744 .744 .765 .723
HACKERS .75 .6 .6 .65 .7 .6
NIFTY .695 .565 .456 .739 .847 .586
BIOTECH .632 .565 .498 .609 .682 .603
SEMI .609 .495 .495 .704 .809 .619
NASD-100 .595 .505 .424 .595 .686 .545
^^^^^
SOFTWARE .583 .5 .4 .616 .65 .5
-----------------------------------------------------------------------------------------------
ELECTRON .496 .422 .429 .604 .677 .53
DJI-13 .461 .461 .461 .461 .615 .384
DOWJONES .4 .3 .333 .4 .566 .433
^^^^^
FIDSTKS .398 .308 .303 .393 .466 .314
GAMING .38 .333 .428 .38 .428 .428
COMPUTER .368 .421 .421 .473 .631 .421
SP500 .348 .273 .266 .363 .455 .338
^^^^^
SP-100 .34 .252 .274 .351 .472 .34
INDEXES .335 .318 .313 .416 .475 .329
BEVERAGE .333 .266 .2 .266 .466 .466
GUNS .333 .333 .333 .333 .533 .466
RETAIL .32 .3 .26 .36 .38 .36
SOLAR .312 .312 .25 .312 .625 .25
RUS-1000 .311 .247 .243 .351 .432 .31
CHEM .306 .224 .204 .387 .612 .285
INDMATER .306 .293 .266 .346 .533 .333
TRANSP .3 .15 .3 .35 .35 .25
HOMEBLDG .294 .176 .176 .294 .47 .117
GREEN .285 .285 .285 .476 .571 .428
HOSPITAL .285 .238 .238 .333 .38 .238
OILGAS .204 .196 .159 .242 .257 .166
AUTO .2 .225 .175 .325 .35 .25
COMODITY .2 .225 .225 .225 .25 .225
FOOD .166 .185 .185 .185 .203 .185
MILITARY .148 .148 .148 .148 .185 .185
COAL .142 .142 .142 .142 .142 .142
COPPER .125 0 0 0 .5 .25
ETFS .107 .089 .035 .178 .285 .089
FINANCE .107 .071 .095 .166 .25 .095
CHINA .094 .056 .037 .358 .528 .245
BONDFUND .09 .08 .07 .08 .09 .07
INFRA .085 .085 .114 .142 .314 .171
UTILITY .076 .076 .076 .128 .102 .102
REIT .07 .063 .078 .134 .148 .127
INSURANC .038 0 .038 .038 .115 .076
REGBANKS .038 .076 .076 .192 .5 .115
BIGBANKS 0 0 0 0 0 0
JETS 0 0 0 .076 .153 0
|
====================================================================
5/4/2020 Peerless remains on its Sell
S9-S12 and below its fast-falling
65-dma. Even the 2006 Peerless gave a new SELL, which
its Help routine predicts a decline to the lower 3.5% band.
The Closing Powers for DIA and SPY did turn up, but they remain
in downtrends. So, I would hold short DIA and each of the
other short sales provided they do not get red Buys or turn up,
like AMD did, from above the 65-dma.
Table 4 and DATA65 ( Graph of Pct of All Stocks above
65-dma )
show that while the NASDAQ and QQQ are still trying to lead the
stock market higher, the broader market remains considerably weaker.
NYSE, IWM and MDY like the DJI have not surpassed their key
65-dma resistance.
DJIA and Signals - Current Peerless  |
|
DJIA and Signals - 2006 Version of Peerless |
DIA and Closing Power (still falling) |
SPY and Closing Power (still falling) |
Word on the Street is that the FED will be soon pumping
another trillion dollars of its "magic money" into corporate
"Junk Bonds". Today this lifted the DJI up from its rising
21-day and turned the NASDAQ and QQQ up from above their
65-dma. Another rally to the DJI's falling 65-dma now at 24689
seems to lie just ahead.
History does show that even when the DJI's 65-dma is
falling very
rapidly and its IP21 is negative, the DJIA can still rise a little
above the 65-dma before falling. So, a rally is likely. Table 1
below shows an improving and positive Vitality score.

For this advance to fail, we would have to see dangerous
price
breakdowns by Boeing (BA), the ETF JET and big banks
like Wells Fargo to re-start the decline.


The FED's balance sheet shows nearly $7 trillion, much of it
in
questionable corporate assets if the economy does not turn around.
Theirs is a big gamble. Right now, the investors are reasonably
optimistic in that the Dollar remains above its own key support,
at its 65-dma. We should continue to watch the Dollar closely.
A breakdown below its key support would be a sign that foreign
confidence in the FED's huge wager is starting to become shredded.

Wall Street Socialism

Until the 2008 financial crisis, interest rate changes were the primary way the
FED influences the economy and the stock market. In the 2008 bear market,
rates dropped to zero, at which point the FED began purchasing mortgage-
backed securities and some other unconventional assets. Now in 2020, with
rates again at zero, the FED has used trillions to buy corporate bonds,
including those that are deemed "junk", like those of cruise lines and
restaurant
chains, because of the coronavirus pandemic. It is difficult to dig out from
what the FED publishes, just which companies' bonds it has bought. But it
appears that the FED did not bother to set out any conditions for such purchases
(i.e. that the money should be used for hiring workers and not paying CEOs
bloated salaries and bonuses). It can probably be assumed that a lot of this
money is being used to support stocks prices and buy-backs. But we really do
not know, because the FED is not saying. What it is reporting, because it has
to, is that the FED now has almost $7 trillion worth of debt on its balance sheet
and that the amount of the debt has risen From February 24 to April 27, the
Fed
added $2.5 trillion to its balance sheet. It amounts now to about 30% of the
pre-Covid-13 US GNP. This collossal sum is going to only about 2,000 American
corporations. It could just as easily have been a loan of $20,000 to every American
citizen. JP Morgan economists said recently that the central bank's purchases show
"no signs of stopping, with five of its nine lending facilities yet to begin
operations...
Experts expect the Fed's holdings to land between $7 trillion $10 trillion by the end
of the year". With nowhere safe in the current economy to invest, not
surprisingly
much of the FED's loans end up creating a speculative boom in the stock market.
The buyers are apparently hopeful that they can get out, because of their inside
contacts within the FED, before the FED starts to "unwind" these
purchases.
https://markets.businessinsider.com/news/stocks/federal-reserve-corporate-bond-buying-balance-sheet-expansion-historic-role-2020-5-1029157427
|
Charts 5/4/2020 (Click on Underlined link.) 2020 PEERLESS DJI, Signals, Indicators Daily DJI Volume 10-DayUp/Down Vol Stoch-20 Inverted Traders Index Graph of Pct of All Stocks above 65-dma Cum. Inverted Traders Index NASDAQ S&P OEX NYSE COMPQX DJI-15 DJI-20 DJI-30 DIA QQQ MDY IWM TNA Short-Term Rates SPY http://tigersoft.com/2121CST/SPY.GIF 2006 vers-Peerless signals http://tigersoft.com/2121CST/PEER2006.bmp USO-CrudeOil DBO FAS GLD BBH IBB JETS JNUG KOL NUGT OIH OIL PALL RSX RETL SDS AGQ SLV SOXL TECL TLT TMF TNA UGA (gasoline) and China: YINN CHAU Commodities: CANE CORN DBC JJC, NIB, CHOC CORN, CUT (paper) MOO, SOYB WEAT UUP (Dollar) LIT (Lithium) Stocks AAPL ADBE ALXN AMAT AMGN AMD AMZN AXP BA BABA BAC BIDU BLDP CAT CVX DE FB GILD GOOG GS HD IBM INTU JPM M (Macy's) MSFT NEM NFLX NKE NVDA PG REGN QCOM TSLA TXN XOM V VRTX WMT CMG , LRCX, SQ TOWN New highs and Bullish MAXCPs http://tigersoft.com/MAXCP/5-4/BULLISH.htm Bearish MAXCPs - http://tigersoft.com/MINCP/5-4/BEARISH.htm |
Table 1
5/1/2018 QUICKSILVER on DJI-30 STOCKS.
Considering just those stocks whose IP21 + ITRS score is >+.25 or <-.25
-2 today --->4 Bullish (AAPL JNJ MSFT PFE WMT)
293 148 + 179 +38 +124 = 782
2 Bearish (BA and JPM)
131 + 92 = 223
---------------------------
Vitality Score = +559 (big improvement)
Note that AAPL now shows highest AI/200 stock here. STOCKS CLOSE CHANGE PIVOT-P 5-dma AROC CL-PWR Candl AI/200 IP21 ITRS --------------------------------------------------------------------------------------- AAPL 293.16 4.09 278.58 174.4% Bullish BLUE 149 .138 .117 Bullish --------------------------------------------------------------------- AXP 86.38 -1.94 88.19 73.5% ------- BLUE 78 .105 -.179 --------------------------------------------------------------------- BA 131.46 -1.91 131.3 103.2% Bearish BLUE 74 -.239 -.422 Bearish --------------------------------------------------------------------- CAT 107.72 -3.16 115.46 -323.5% Bearish RED 147 .014 -.034 --------------------------------------------------------------------- CSCO 41.35 .43 42.49 -201.5% Bearish BLUE 77 -.002 .074 --------------------------------------------------------------------- CVX 91.44 2 89.91 94.9% ------- BLUE 87 .051 .019 --------------------------------------------------------------------- DIS 103.18 -2.32 106.21 -133.8% ------- BLUE 91 -.008 -.077 --------------------------------------------------------------------- GS 176.03 -1.07 187.01 -203.8% ------- BLUE 116 .024 -.056 --------------------------------------------------------------------- HD 221.84 3.27 217.63 93.1% Bullish BLUE 140 .064 .085 --------------------------------------------------------------------- IBM 121.68 -.19 126.27 -168.7% Bullish BLUE 137 .149 -.007 --------------------------------------------------------------------- INTC 57.99 .52 58.75 -124.4% Bullish BLUE 118 .064 .082 --------------------------------------------------------------------- JNJ 148.27 -.02 151.39 -199.5% Bullish RED 115 .14 .17 Bullish --------------------------------------------------------------------- JPM 92.14 -1.11 95.29 -130% ------- BLUE 107 -.158 -.141 Bearish --------------------------------------------------------------------- KO 45.14 -.46 46.74 -176.6% Bearish RED 114 -.139 -.069 --------------------------------------------------------------------- MCD 181.87 -.79 185.93 -108.1% Bullish BLUE 109 .119 .023 --------------------------------------------------------------------- MMM 148.4 -.2 157.61 -170.9% Bearish RED 100 -.134 .126 --------------------------------------------------------------------- MRK 76.86 -.81 81.18 -441.8% Bearish RED 96 .043 .114 --------------------------------------------------------------------- MSFT 178.84 4.27 169.81 136.8% ------- BLUE 145 .13 .182 Bullish --------------------------------------------------------------------- NKE 85.75 .21 88.8 -206.2% Bearish BLUE 105 .051 .036 --------------------------------------------------------------------- PFE 37.62 -.02 37.91 -97.2% ------- ---- 57 .1 .234 Bullish --------------------------------------------------------------------- PG 115.77 -1.05 116.89 -71.7% Bullish RED 94 .034 .094 --------------------------------------------------------------------- TRV 96.91 .86 104.29 -292.9% Bearish BLUE 104 -.063 -.102 --------------------------------------------------------------------- UNH 287.54 3.03 288.36 -111.3% ------- BLUE 136 .105 .134 --------------------------------------------------------------------- UTX 86.01 -5.36 97.15 -958.4% Bullish RED 114 .144 -.26 --------------------------------------------------------------------- V 176.15 .58 171.25 124.8% ------- BLUE 136 -.029 .024 --------------------------------------------------------------------- VZ 56.24 -.59 57.83 -136.3% Bearish RED 133 -.04 .147 --------------------------------------------------------------------- WBA 42.45 .79 44.65 -225.6% Bearish BLUE 78 .139 .006 --------------------------------------------------------------------- WMT 123.7 .78 128 -184.2% Bullish RED 92 .069 .224 Bullish --------------------------------------------------------------------- XOM 44.88 1.74 44.97 104% Bearish BLUE 51 -.083 -.06 --------------------------------------------------------------------- DOW 33.06 -.87 35.87 -193.4% ------- BLUE 66 -.023 -.135 |
Table 2 QUICKSILVER on ETFS - 06/04/20
Bullish = 2 IBB an GLD
Bearish = 5
ETF CLOSE CHANGE PIVOT-PT 5-dma AROC CL-PWR CANDLE IP21 ITRS --------------------------------------------------------------------------------------------- DIA 237.42 .14 241.09 -80.6% Bearish BLUE -.011 ------ --------------------------------------------------------------------------------------------- SPY 283.57 .78 285.73 -60.4% Bearish BLUE -.027 .031 --------------------------------------------------------------------------------------------- QQQ 215.22 2.48 211.5 -7.9% Bullish BLUE .057 .115 --------------------------------------------------------------------------------------------- MDY 289.88 .36 296.95 -66.6% Bullish BLUE -.034 -.056 --------------------------------------------------------------------------------------------- IWM 125.68 .54 129.11 -61% Bullish BLUE .029 -.067 --------------------------------------------------------------------------------------------- FAS 26.35 -.25 28.6 -279.5% ------- BLUE -.052 -.566 Bearish --------------------------------------------------------------------------------------------- RETL 89.74 1.94 98.84 -287.4% Bullish BLUE .182 -.491 Bearish --------------------------------------------------------------------------------------------- SOXL 114.22 3.12 128.03 -612.4% ------- BLUE -.099 -.416 Bearish --------------------------------------------------------------------------------------------- TECL 152.96 5.79 145.38 43.6% ------- BLUE .066 -.313 Bearish --------------------------------------------------------------------------------------------- IBB 124.55 3.65 124.81 -119.6% Bearish BLUE .186 .193 BULLISH --------------------------------------------------------------------------------------------- GLD 160.34 .56 160.84 -38% Bullish ---- .321 .217 BULLISH --------------------------------------------------------------------------------------------- OIH 103.98 3.03 100.31 388.8% Bearish BLUE .045 -.338 --------------------------------------------------------------------------------------------- |
Table 3 Count of Stocks in Key Directories
20200504
-------------------------------
NEWHIGHS 24
NEWLOWS 26
MAXCP 55
MINCP 21
TTTNH 28
TTTNL 15
FASTUP 160
FASTDOWN 107
CPCROSSA 197
CPCROSSD 40
BIGVOLUP 13
BIGVODN 7
ACCUMVER 6
HIGHIP21 11
HIUPPCT 6
REDSELL 105
AUGSELS7 14
TRAPDOOR 29
|
Table 4 RANKING OF KEY DIRECTORIES BASED PCT.OF STOCKS ABOVE 65-DMA
5/4/20
Bullish = 6 (Including QQQ)
Bearish = 39
---------------------------------------------------------------------------------------
Directory Current day-1 day-2 day-3 day-4 day-5
----------------------------------------------------------------------------------------
EDU .8 .6 .8 .8 .6 .8
GOLD .775 .734 .734 .755 .714 .673
HACKERS .6 .65 .65 .7 .55 .65
NIFTY .565 .456 .739 .847 .586 .63
BIOTECH .562 .495 .606 .682 .6 .618
NASD-100 .505 .434 .606 .686 .535 .535
^^^^^
===========================================================================================
SOFTWARE .5 .416 .616 .65 .483 .483
===========================================================================================
SEMI .495 .495 .704 .809 .619 .6
DJI-13 .461 .461 .461 .615 .384 .307
ELECTRON .422 .429 .604 .677 .523 .489
COMPUTER .421 .421 .473 .631 .421 .421
GAMING .333 .428 .38 .428 .38 .428
GUNS .333 .333 .333 .533 .466 .4
INDEXES .318 .313 .416 .475 .329 .362
SOLAR .312 .25 .312 .625 .25 .187
FIDSTKS .308 .303 .393 .466 .308 .342
DOWJONES .3 .333 .4 .566 .433 .4
^^^^^
RETAIL .3 .26 .36 .38 .36 .36
INDMATER .293 .266 .346 .533 .32 .306
GREEN .285 .285 .476 .571 .428 .285
SP500 .273 .268 .363 .455 .331 .317
^^^^^
BEVERAGE .266 .2 .266 .466 .466 .333
SP-100 .252 .274 .351 .472 .34 .362
RUS-1000 .247 .244 .351 .432 .303 .284
HOSPITAL .238 .238 .333 .38 .238 .285
AUTO .225 .175 .325 .35 .175 .2
COMODITY .225 .225 .225 .25 .225 .225
CHEM .224 .204 .387 .612 .285 .244
OILGAS .196 .159 .242 .257 .166 .121
FOOD .185 .185 .185 .203 .185 .185
HOMEBLDG .176 .176 .294 .47 .117 .117
TRANSP .15 .3 .35 .35 .25 .25
MILITARY .148 .148 .148 .185 .185 .111
COAL .142 .142 .142 .142 .142 .142
ETFS .089 .035 .178 .285 .053 .089
INFRA .085 .114 .142 .314 .142 .057
BONDFUND .08 .07 .08 .09 .07 .07
REGBANKS .076 .076 .192 .5 .076 .076
UTILITY .076 .076 .128 .102 .102 .102
FINANCE .071 .095 .166 .25 .095 .071
REIT .063 .078 .134 .148 .127 .092
CHINA .056 .037 .358 .528 .245 .301
BIGBANKS 0 0 0 0 0 0
COPPER 0 0 0 .5 .25 0
INSURANC 0 .038 .038 .115 .076 .076
JETS 0 0 .076 .153 0 0
|