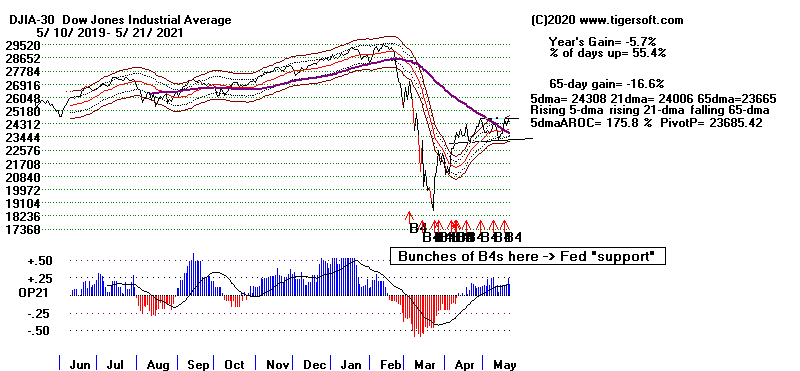
     Tracking the Trillions

           There have been Ten (10)  5:1 Adv:Dec Buy B4s since the March bottom
           when the Fed announced they would put trillions in buying corporate
           bonds.  This is comparable to the March-May period of 2009, the May to
           August period in 2010 and the August to December period in 2011.  Each
           would have been a good time to buy stocks.
A
"5:1" daily ratio of advances to declines is generally bullish. All such
occurrences
since 1965 are shown below.
They are marked as Buy B4s. Since 2006 and expecially
since 2009 they have started
to appear in bunches. I believe these bunches are a direct result
of the FED support.
They represent Wall Street appreciation for how bullish FED RESERVE
"Quantitative
Easing" subsidies have been since 2008. Since March 2020, the Wall Street
buying respresents the
confidence and bullishness born from the FEDs announcement that
they will be buying trillions
of Dollars worth of Corporate Bonds, high and medium grade.
It will be shown later that
individual "5:1 Buy B4s" are especially reliable when the DJI is above
its 65-dma and we see a
positive P-I and a positive OBV-Pct.
It is significant that
"5:1 Buy B4s" are scarce before 2006. For example, there were no
"5:1"
days from March 1994 to
December 2005. So, it seems fair to hypothesize that they are the
product of computerized
buy programs which is armed with the knowledge that the FED is
committed to
"back-stopping the market" with vast amounts of money. An isolated
"5:1 Buy B4
can occur for many reasons,
but a series of them such as we see in 2020 is almost certainly a
direct result of FED
intervention.
Another thing to note, and
this will be shown in detail later on, these 5:1 Buys often occurred
right at significant market
bottoms. In fact, you will see that these "Bugle-Call Buy B4s/B12s
take place when the
adv:decline or the up/down volume ratios are much higher. More on this
in my new Peerless book.
First, see below the
"5:1 Buy B4s" since 2006. After that, see all the 5:1 Buy B4s since 1965.
We start there because
earlier breadth and volume is not so reliably reported.
2006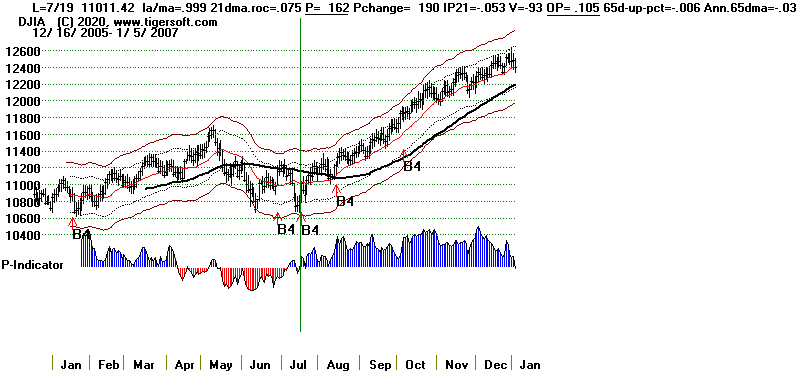 |
| 2007 2007-2008 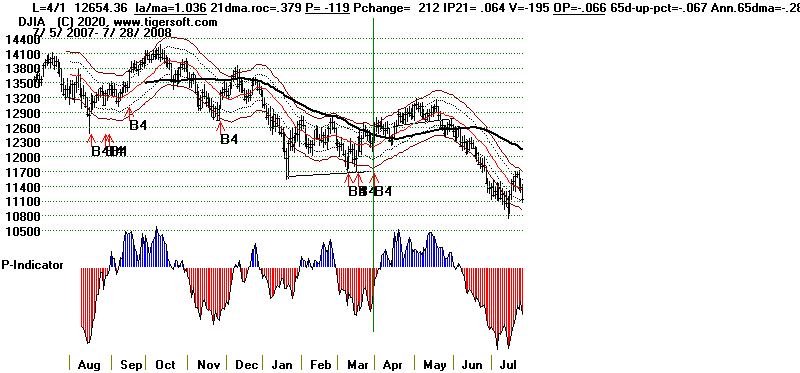 |
2008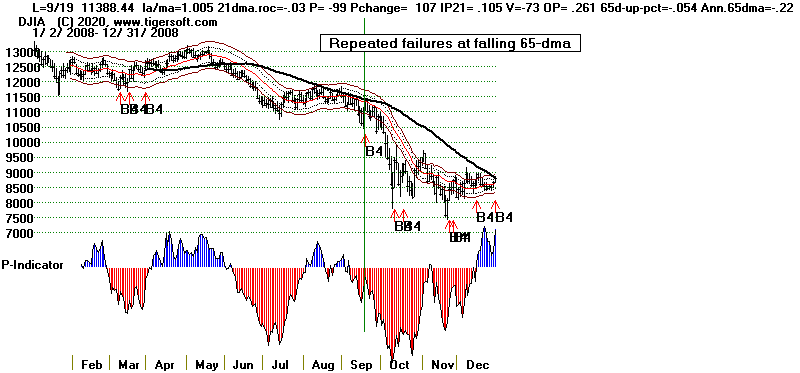 |
2009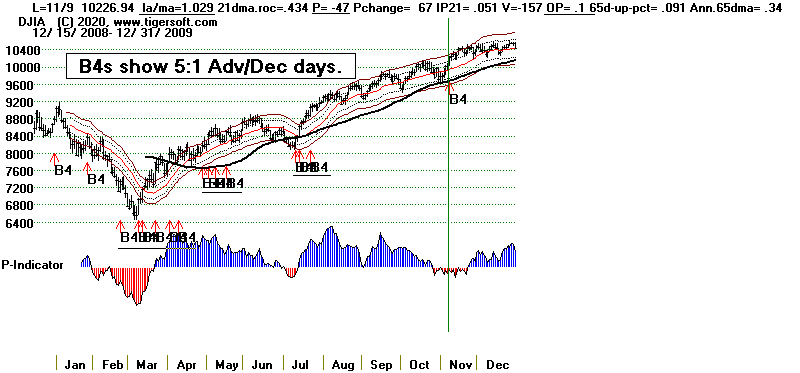 |
2010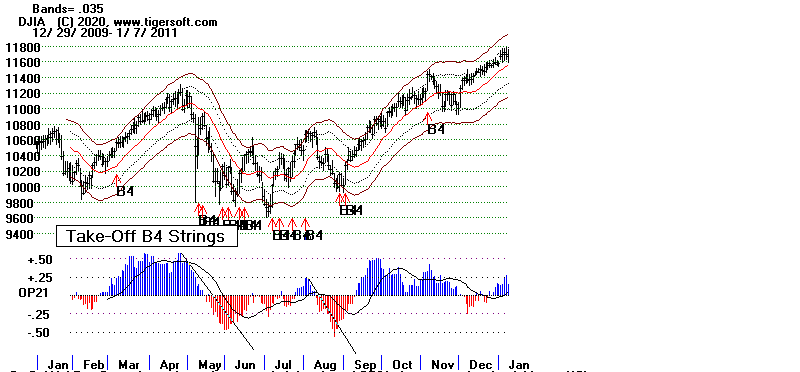 |
2011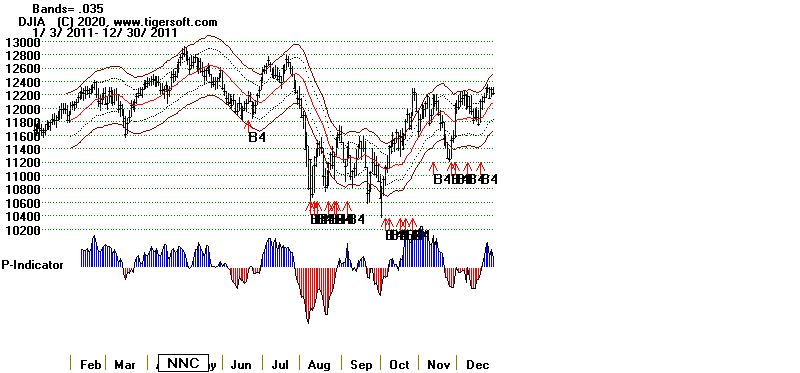 2011-2012  |
2012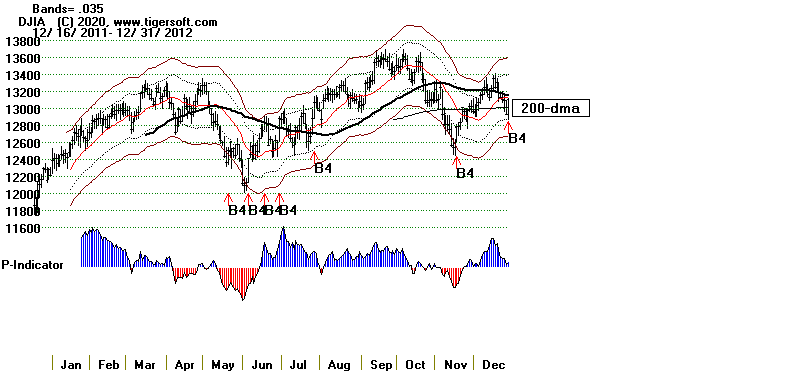 |
2013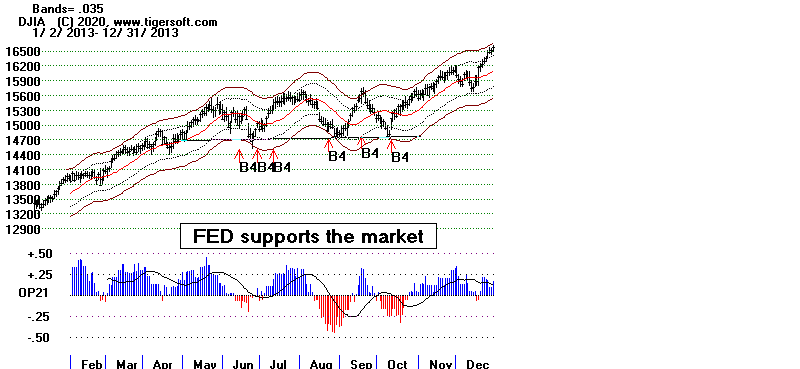
|
2014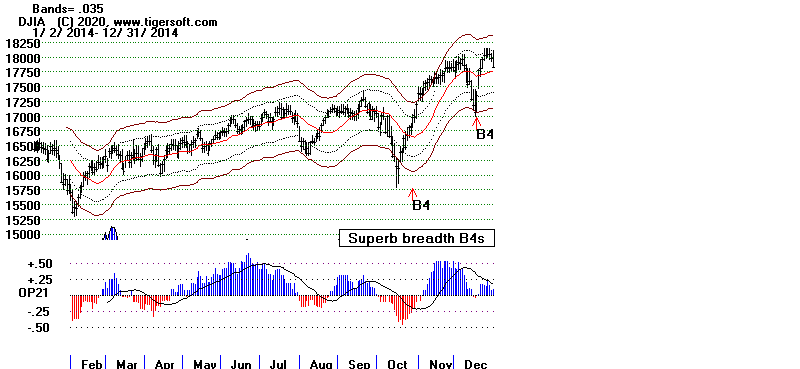 |
2015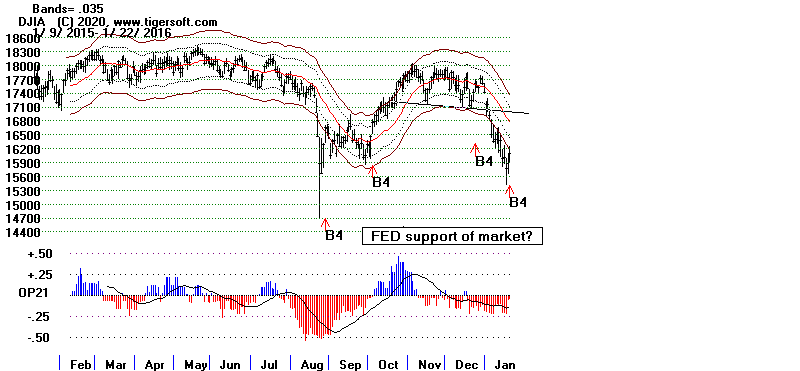 2015-2016 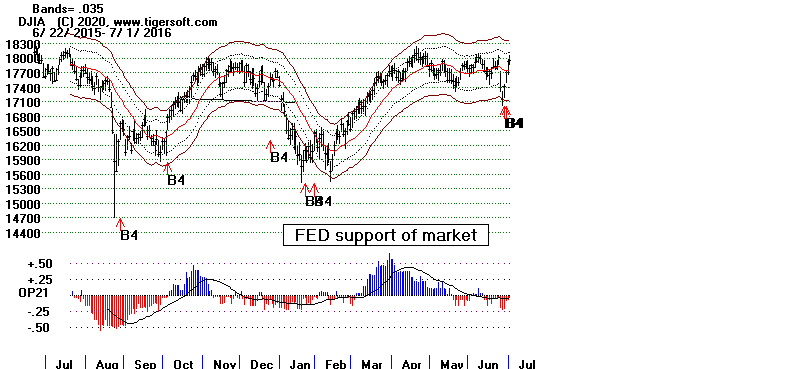 |
2016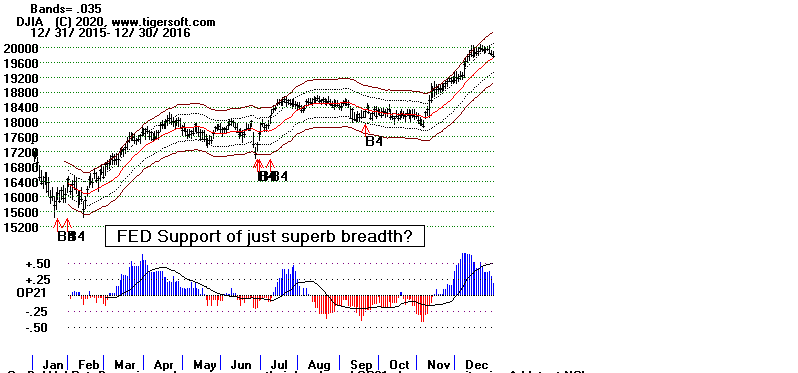 2016-2017 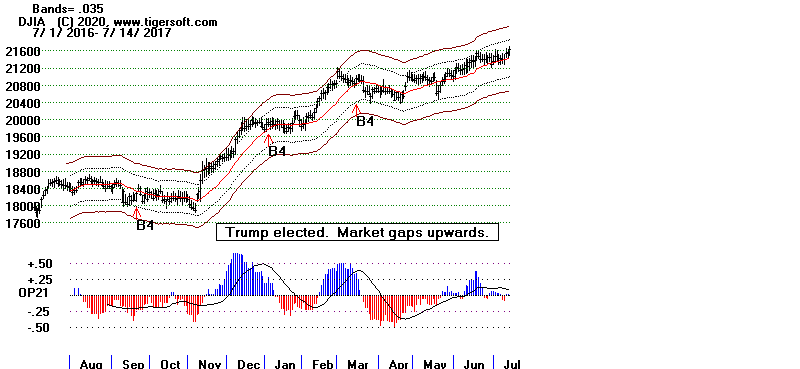 |
| 2017 2017-2018 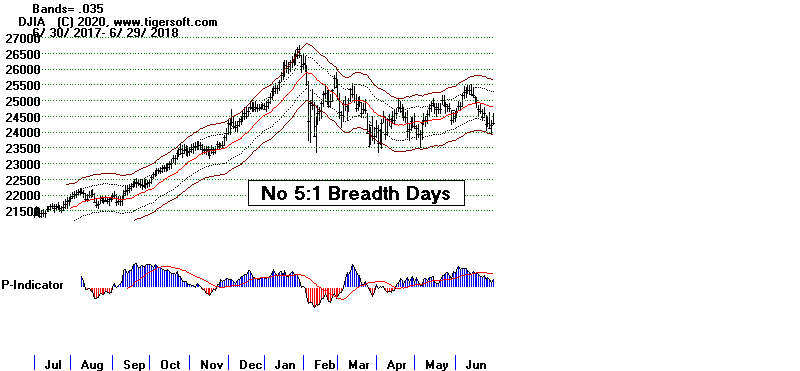 |
2018 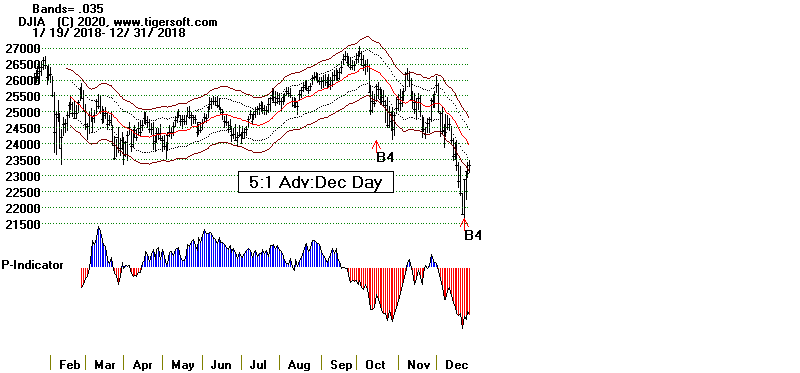 2018-2019 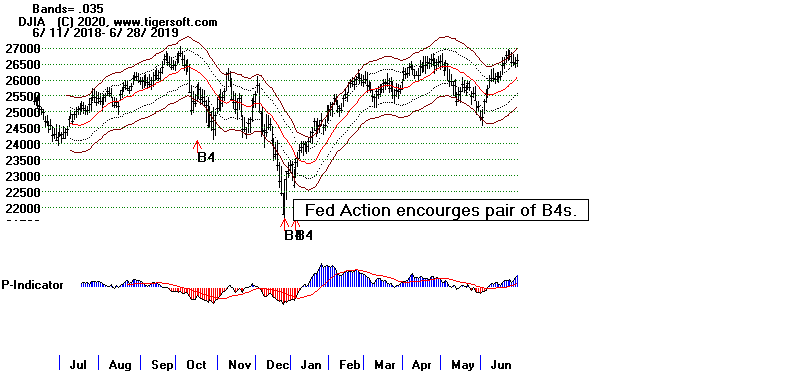 |
2019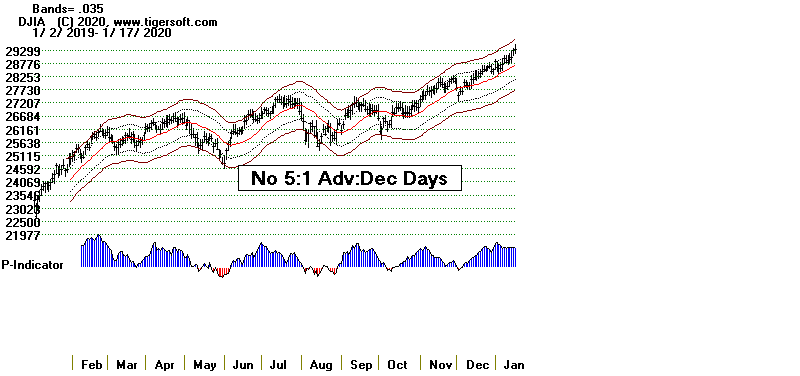 2019-2020 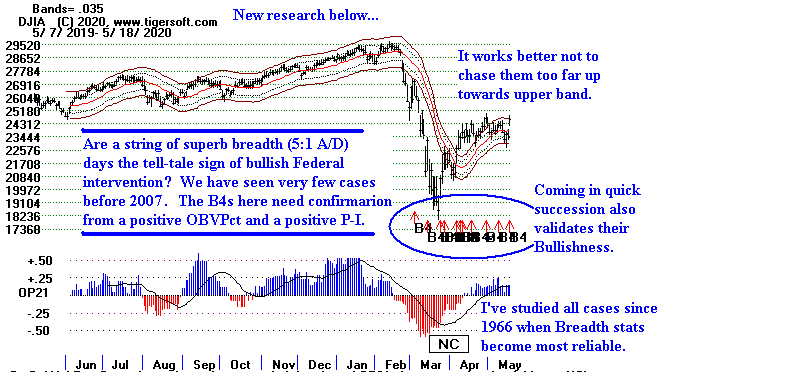 |
| 2020 |