---- TIGERSOFT/PEERLESS HOTLINE ----
(C)
1985-2019 William Schmidt, Ph.D. www.tigersoft.com
All rights strictly reserved.
---> THIS FRIDAY MORNING OUR HOTLINE'S ADDRESS WILL CHANGE....
Check your EMAIL for new Hotline address.
If you did not get an email, let me know.
william_schmidt@hotmail.com
+++++++++++++++++++++++++++++++++++++++++++++++++
IMPORTANT - Always CLICK REFRESH.
Data used through 8/28/2019
8/29/2019 5:00 AM
-----------------------------------------------------------------------------------------------------------------------
Earlier Hotlines
www.tigersoft.com/77HLZ/INDEX.htm
www.tigersoft.com/44THL/INDEX.htm
www.tigersoft.com/21PEY3/INDEX-2.htm
(most recent Hotlines before
current ones)
......................................................................
www.tigersoft.com/19HLK5/INDEX.htm
www.tigersoft.com/44UHL/INDEX.htm
www.tigersoft.com/NHLP/INDEX.htm
www.tigersoft.com/7LHL/INDEX.htm
www.tigersoft.com/NHL718/INDEX.htm
www.tigersoft.com/21MAY18/INDEX.htm
www.tigersoft.com/55HEP/INDEX.htm
www.tigersoft.com/44H4L/INDEX2.htm
Earlier still: Go here...
HELP
A Guide
To Profitably Using The Tiger Nightly HOTLINE
Introduction to Tiger/Peerless Buys and
Sells.
Peerless Buy and
Sell Signals: 1928-2016
Individual Peerless signals explained:
http://tigersoftware.com/PeerlessStudies/Signals-Res/index.htm
http://www.tigersoft.com/PeerInst-2012-2013/
Explanation of each Peerless signal. http://www.tigersoft.com/PeerInst-2012-2013/
Different Types of
TigerSoft/Peerless CHARTS, Signals and Indicators
-----> More HELP LINKS
Documentation for
TigerSoft Automatic and Optimized Signals.
How reliable support is the
DJI's rising 200-day ma?
SPY Charts since
1994: Advisory Closing Power S7s, Accum. Index, 65-dma, Optimized Signals.
^^^^^^^^^^^^^^^^^^^^^^^^^^^^^^^^^^^^^^^^^^^^^^^^
1/19/2016 ---> Corrections,Deeper
Declines and Bear Markets since 1945.
1/21/2016
---> High
Velocity Declines since 1929
2/12/2016 ---> Presidential
Elections Years and Bullish IP21 Positive Non-Confirmations at Lower Band.
2/12/2016 ---> OBV NNCs on DJI's Rally to
2.7% Upper Band when DJI's 65-dma is falling.
11/6/2016 --->
Killer Short Selling
Techniques: ===> Order Here ($42.50)
It's As Easy as 1,2,3
TigerSoft "Combination" Short-Selling... Easy as 1-2-3 Short Sales
Earlier Q-Answers
QuickSilver Documentation (1/11/2016)
Our Different
Signals
Better understand the difference between
Peerless DJI-based signals,
the one-year optimized red Signals and the fixed signals based
on technical developments.
Introduction to Tiger/Peerless Buys and Sells.
Different Types of
TigerSoft/Peerless CHARTS, Signals and Indicators
New TigerPeerless Installation and
Basic Uses' Instruction
See the re-written materials on TigerSoft Buys and Sells.
Study- Trading SPY
WITHOUT Peerless - Some Guidelines.
When completed this will be a new Tiger Trading E-Book.
Study- Examples of
"Hands above the Head" top patterns.
Study- 9/3/2017 TigerSoft (not
Peerless) charts of Major Tops as they occurred.
===> Please report any broken or out-of-date links. william_schmidt@hotmail.com
====================================================================
====================================================================
8/28/2019 Another +200 point DJI opening
is shaping up. This happens a lot
at the end of the week leading up to a Labor Day weekend. Unfortunately,
the market often gives it all back in the following week. But there is good news
in the years before a Presidential Election. Septembers in these years
(1967, 1971, 1975, 1979, 1983...1915) do much better, rising 75% of
the time with the DJI gaining 2.1% on average. Hold QQQ long at this
time. Buy AWK and SLV. Hold GLD. Silver is very thinly traded and
could go wildly up if it gets past $20.

The headlines are filled with bearish news and commentary. Still the
DJI wants to rally and lift the other ETFs. 26500 is the expected
resistance again. But a breakout above that level would be quite bullish.
This is a good environment to become familiar with our "BOTHUP"
and "BOTHDOWN" concept. See further below how we want to
apply it to better screen the Bullish MAXCPs and Bearish MINCPs.


Right now the major ETFs are being fueled by higher openings and a
very strong Dollar that keeps lifting the many bond funds, utilities and
safer blue chips that pay a dividend. These attrubutes appeal to fleet-footed
global investors. Much of their buying of US bonds and blue chips is
reflected in overnight trading. Also boosting the Futures market is the
buying of those clever fellows who want to manipulate the US markets higher
either for political reasons or to unload the inventory of stocks they bought
when the DJI was down at its 26500 support and its 200-day ma. The
investing "public" may be at work, too, at the openings. Though foreigners
and the US Public are often wrong at major tops, they can still run up prices
in the short-term. I showed how true this was for QQQ, for example, in
the first quarter of 2000. So, that is what I believe is happening now. The
top will most likely come when the Openings start to be weak (thus causing
the Opening Powers to break their uptrends and/or when NY Professionals
become heavy sellers and our Closing Power breaks below its recent
support. These contradictory forces (rising Opening Power and falling
Closing Power) ares very apparent now in the DJI, NASDAQ, QQQ, SP-500
as well as MDY and IWM.
Buy BOTHUP and Sell Short BOTHDOWN
Use this concept to get Augmented Selections from our
MAXCPs and MINCPS. See the examples below.
More money is often made buying those stocks or ETFs where BOTH the Opening
Power and Closing Power are rising or selling short the stocks or ETFs where
both the Opening and Closing Power are falling. We can screen for the |
"BOTHUP" or "BOTHDOWN" in any Tiger stock directory. This is
useful.
But my suggestion for traders is the find the strongest and weakest industry
groupings from our MAXCPs and MINCPs and then run the Power Ranker
against them. The top and lowest ranked stocks can then be examined. If
both their Opening and Closing Powers are rising and the IP21 is not negative,
Buy and trade them on the long side. By this approach, GLD, SLV and AWK
should be bought even now.


See below how we can find the weakest stocks using the Both Down approach.
I would suggest staying short them as long as their Closing Power trends
are down. We can also lock in profits when their 5-dma turns up. Starting
tomorrow night, I will apply this additional BOTHDOWN screen to the
BEARISH MINCPs.


|
Charts 8/28/2019 Click Refresh if current chart does not appear. 2019 PEERLESS DJI, Signals, Indicators Daily DJI Volume 10-DayUp/Down Vol A/D Line for All Stocks NASDAQ S&P OEX NYSE COMPQX DJI-15 DJI-20 DJI-30 DIA SPY QQQ MDY IWM TNA Short-Term Rates USO-CrudeOil DBO FAS GLD BBH IBB JETS JNUG KOL NUGT OIH OIL RSX RETL SDS AGQ SLV SOXL TECL TLT TMF TNA UGA (gasoline) XIV and China: YINN CHAU Commodities: CANE CORN DBC JJC, NIB, CORN, CUT (paper) MOO, SOYB WEAT UUP (Dollar) LIT (Lithium) AAPL ADBE ALXN AMAT AMGN AMD AMZN BA BABA BAC BIDU CAT CVX DE FB GOOG GS HD IBM INTU JPM M (Macy's) MSFT NFLX NVDA PG QCOM TSLA TXN XOM WMT CMG , LRCX, SWKS, MDGL SPPI WATT SQ TOWN 8/28/19 (Click on Underlined link.) Bullish MAXCPs - http://tigersoft.com/MAXCPS/Aug-28/BULLISH.htm Bearish MAXCPs - http://tigersoft.com/MINCPs/Aug-28/BEARISH.htm |
Table 1 QUICKSILVER on ETFS - 08/28/19 ETF CLOSE CHANGE PIVOT-PT 5-dma AROC CL-PWR CANDLE IP21 ITRS --------------------------------------------------------------------------------------------- DIA 260.39 2.59 262.56 -31.6% Bearish BLUE .006 ----- --------------------------------------------------------------------------------------------- BA 359.97 5.24 354.41 283.1% Bullish BLUE-.016 -.019 --------------------------------------------------------------------------------------------- SPY 288.89 2.02 292.36 -61.6% Bearish BLUE .029 .007 --------------------------------------------------------------------------------------------- QQQ 185.09 .66 188.02 -95.4% Bearish BLUE-.012 .012 --------------------------------------------------------------------------------------------- MDY 337.32 3.19 344.36 -99.8% Bearish BLUE-.069 -.02 --------------------------------------------------------------------------------------------- IWM 146.54 1.69 150.03 -130.1% Bearish BLUE-.099 -.03 --------------------------------------------------------------------------------------------- FAS 69.5 1.28 72.35 -133.5% ------- BLUE .056 -.026 --------------------------------------------------------------------------------------------- RETL 18.73 1.41 19.76 -16.5% Bearish BLUE-.06 -.197 --------------------------------------------------------------------------------------------- SOXL 142.69 2.57 158.75 -550.1% Bearish BLUE-.098 .09 --------------------------------------------------------------------------------------------- TECL 153.18 .39 163.71 -371.2% Bearish BLUE .026 .013 --------------------------------------------------------------------------------------------- IBB 102.88 .66 105.17 -152.2% Bearish BLUE-.036 -.025 --------------------------------------------------------------------------------------------- GLD 145.16 -.41 141.4 118.5% Bullish RED .093 .161 --------------------------------------------------------------------------------------------- OIH 11.91 -.37 12.55 -429.3% Bearish RED -.058 -.095 --------------------------------------------------------------------------------------------- GASL 8.78 .9 9.11 -555.2% Bearish BLUE -.119 -.533 --------------------------------------------------------------------------------------------- RSX 21.87 .15 22.08 -29.7% Bearish BLUE -.095 -.041 |
  Table 2  Count of Stocks in Key Directories
           20190828
-------------------------------
NEWHIGHS       134
NEWLOWS        32
MAXCP          10
MINCP          13
TTTNH          3
TTTNL          36
FASTUP         38
FASTDOWN       153
CPCROSSA       85
CPCROSSD       11
BIGVOLUP       4
BIGVODN        7
ACCUMVER       7
HIGHIP21       1
HIUPPCT        16
LOWACCUM       90
REDSELL        138
AUGSELS7       34
TRAPDOOR       47
|
Table 3 RANKING OF KEY DIRECTORIES BASED PCT.OF STOCKS ABOVE 65-DMA
              8/28/19
Bullish = 6 Bearish = 39 --------------------------------------------------------------------------------------- Directory Current day-1 day-2 day-3 day-4 day-5 ---------------------------------------------------------------------------------------- BONDFUND .951 .941 .922 .893 .902 .902 GOLD .78 .8 .76 .74 .76 .76 HOMEBLDG .764 .764 .823 .764 .823 .764 UTILITY .575 .575 .625 .45 .675 .7 SOLAR .538 .538 .5 .538 .538 .576 COMPUTER .523 .523 .571 .523 .619 .619 ================================================================================================ EDU .5 .5 .5 .5 .5 .5 ================================================================================================ SEMI .462 .462 .49 .481 .583 .629 NASD-100 .448 .438 .469 .316 .53 .571 INSURANC .447 .447 .447 .447 .5 .473 MILITARY .428 .392 .5 .464 .535 .5 REIT .424 .41 .486 .431 .554 .506 SOFTWARE .416 .433 .45 .416 .466 .516 BEVERAGE .411 .411 .411 .352 .411 .411 NIFTY .41 .446 .464 .428 .517 .535 SP500 .403 .378 .403 .331 .467 .459 SP-100 .4 .377 .388 .322 .422 .411 FIDSTKS .384 .373 .379 .296 .434 .428 GREEN .384 .346 .423 .384 .461 .5 ELECTRON .374 .361 .4 .374 .522 .548 DOWJONES .366 .366 .333 .3 .366 .3 RUS-1000 .363 .337 .374 .309 .445 .426 RETAIL .333 .254 .294 .235 .372 .352 CHINA .315 .298 .28 .175 .263 .403 AUTO .307 .282 .282 .256 .333 .333 DJI-13 .307 .307 .307 .307 .384 .23 GAMING .304 .304 .347 .304 .434 .478 TRANSP .3 .15 .25 .1 .35 .3 BIOTECH .298 .278 .316 .293 .359 .399 INDEXES .295 .274 .284 .263 .37 .397 CHEM .291 .25 .229 .229 .291 .312 COMODITY .268 .317 .341 .317 .341 .317 INDMATER .25 .236 .21 .21 .263 .263 FOOD .24 .277 .296 .277 .296 .277 FINANCE .186 .162 .174 .162 .232 .29 COAL .166 .166 .166 .166 .166 .166 OILGAS .166 .152 .137 .144 .202 .21 INFRA .138 .138 .138 .138 .194 .194 HOSPITAL .136 .136 .318 .318 .318 .409 GUNS .125 .125 .125 .125 .125 .125 HACKERS .1 .15 .25 .25 .25 .3 JETS .1 .1 .1 .1 .2 .2 REGBANKS .074 .037 .074 .037 .185 .222 ETFS .034 .034 .034 .017 .103 .189 BIGBANKS 0 0 0 0 .142 0 COPPER 0 0 0 0 0 .2 |
====================================================================
8/27/2019 The market is trying to holding up
despite the widespread pessimism,
the bearish headlines, the talk of recession, trade war and the growing war
of words between Trump and the Federal Reserve who are unwilling to
lower rates again, Our Peerless Buys are facing very weak technical
action. Honor the Peerless Buys with only a small position in QQQ
and Gold Stocks, but not much else. Shorting more Bearish MINCPs is
advised. Hedging is needed now.
(Tomorrow night use the new Hotline Address.)
Current DJI

Except for the still rising NYSE A/D Line and the Peerless
Buy B20
signal which derives from the positive breadth, not much looks good
technically. The steady stream of higher openings and closings lower than
the openings usually ends badly, as in 2000. We see this pattern for
all the major ETFs and Indexes. A break in either the
Opening Power
uptrend or a break in the Closing Power support would be quite bearish in
this technical environment. Watch the NASDAQ for this, as well as
the DIA, SPY and QQQ.

Besides the higher openings, we still have the bullish seasonality just
before Labor Day. Since this falls on next Monday, the market is
running out of time. The still unbroken support near the DJI's 200-
dma at 25600 is now only 178 points below our close. The fellows
who are trying to rig a rally and make the market look better than it really
is by running up the big indexes in the thinner trading before the Opening
are running out of time. They are also running dangerously low on
"fire-power".
That is the meaning why the red down-day volumes are so much higher than
the blue up-days' volumes. And what is worse? Our Closing Powers for
DIA, SPY, the NASDAQ and QQQ have fallen to their flat support levels.
Another heavy round of selling would mean their Closing Power supports would
be violated as has already occurred in the broader based MDY and IWM.
Watch QQQ for another bad Closing.
This would break the Closing Power Support.

Look below at Tables 2, 3 and 4. What besides Gold, Bonds and
Utilities is strong enough to encourage us to buy? Should we
even try to be making any money in QQQ at this stage. As the high-priest
of Peerless, I have to trust the Buy B2 and B20..., at least for the rest of this
week and only if 25500 is not closed below.
Short some of the many of Bearish MINCPs. Hold Gold long a while longer.
But notice how the big advance by NUGT and a number of the mining stocks
now is producing negative IP21s (Current Accumulation Index) readings. This
is a dangerous development. Back in 1987, our favorite gold stock NEM had
just doubled and in September its Accumulation turned negative. It hung
in there another two weeks and then utterly collapsed along with the rest of the
market. The negative IP21 readings in a gold stock or ETF should get us
both to take some profits in these stocks and provide warning for the general
market.
NEM's NNC IP21 TOP in October 1987 |
NUGT's NNC IP21 NH - 2019 |
ALL GOLD NNC IP21 NH - 2019 |
Short Selling Suggestions
Some of you may not want to sell short our Bearish MINCP stocks. I think
in the present curcumstances that is probably a mistake. Study our MINCPs.
These are weakest our software can find in terns of negative IP21s, low AI/200,
Closing Power new lows and very weak price action. If you use our software
look also at the nightly REDSELLs for new price 12-month lows, especially if five
year new lows are also neing made. Here are some examples tonight. It is
recommended that you read our Killer Short Sales before undertaking much
short selling.
 |
 |
|
Charts 8/27/2019 2019 PEERLESS DJI, Signals, Indicators Daily DJI Volume 10-DayUp/Down Vol A/D Line for All Stocks NASDAQ S&P OEX NYSE COMPQX DJI-15 DJI-20 DJI-30 DIA SPY QQQ MDY IWM TNA Short-Term Rates USO-CrudeOil DBO FAS GLD BBH IBB JETS JNUG KOL NUGT OIH OIL RSX RETL SDS AGQ SLV SOXL TECL TLT TMF TNA UGA (gasoline) XIV and China: YINN CHAU Commodities: CANE CORN DBC JJC, NIB, CORN, CUT (paper) MOO, SOYB WEAT UUP (Dollar) LIT (Lithium) AAPL ADBE ALXN AMAT AMGN AMD AMZN BA BABA BAC BIDU CAT CVX DE FB GOOG GS HD IBM INTU JPM M (Macy's) MSFT NFLX NVDA PG QCOM TSLA TXN XOM WMT CMG , LRCX, SWKS, MDGL SPPI WATT SQ TOWN 8/27/19 (Click on Underlined link.) Bullish MAXCPs - http://tigersoft.com/MAXCPS/Aug-27/BULLISH.htm Bearish MAXCPs - http://tigersoft.com/MINCPs/Aug-27/BEARISH.htm |
Table 1 QUICKSILVER on ETFS - 08/27/19 ETF CLOSE CHANGE PIVOT-PT 5-dma AROC CL-PWR CANDLE IP21 ITRS --------------------------------------------------------------------------------------------- DIA 257.8 -1.3 262.03 -36.4% Bearish RED -.011 ---- --------------------------------------------------------------------------------------------- BA 354.73 -4.31 339.99 329.9% Bullish RED .007 .014 --------------------------------------------------------------------------------------------- SPY 286.87 -1.13 292.45 -55.6% Bearish RED .014 .006 --------------------------------------------------------------------------------------------- QQQ 184.43 -.39 188.63 -68.2% ------- RED -.032 .019 --------------------------------------------------------------------------------------------- MDY 334.13 -3.88 344.09 -117.7% Bearish RED -.043 -.022 --------------------------------------------------------------------------------------------- IWM 144.85 -2.18 150.38 -144.9% Bearish RED -.075 -.034 --------------------------------------------------------------------------------------------- FAS 68.22 -1.06 71.36 -143.4% Bearish RED .039 -.027 --------------------------------------------------------------------------------------------- RETL 17.32 -.67 18.79 -114.7% Bearish RED -.086 -.252 --------------------------------------------------------------------------------------------- SOXL 140.12 -1.48 158.92 -479.4% Bearish RED -.114 .204 --------------------------------------------------------------------------------------------- TECL 152.79 -.78 164.8 -215.7% ------- RED .006 .059 --------------------------------------------------------------------------------------------- IBB 102.22 -.94 106.04 -137% Bearish RED -.004 -.022 --------------------------------------------------------------------------------------------- GLD 145.57 1.38 141.76 117.7% Bullish BLUE .108 .166(Strong) --------------------------------------------------------------------------------------------- OIH 11.91 -.37 12.55 -429.3% Bearish RED -.058 -.099 --------------------------------------------------------------------------------------------- GASL 7.88 -.21 9.73 -1100.6% Bearish RED -.128 -.559(Weak) --------------------------------------------------------------------------------------------- RSX 21.72 -.14 22 -6.9% Bearish ---- -.102 -.037 |
Table 2    Count of Stocks in Key Directories
           20190827
-------------------------------
NEWHIGHS       141
NEWLOWS        136  growing in numbers
MAXCP          34
MINCP          156  Professionals are bearish.
TTTNH          27
TTTNL          272  Day Traders are bearish.
FASTUP         39
FASTDOWN       147  Swing Tradders are bearish
CPCROSSA       21
CPCROSSD       86
BIGVOLUP       5
BIGVODN        6
ACCUMVER       6
HIGHIP21       2
HIUPPCT        16
LOWACCUM       92
REDSELL        132
AUGSELS7       29
TRAPDOOR       46
|
Table 3       RANKING OF KEY DIRECTORIES BASED PCT.OF STOCKS ABOVE 65-DMA
              8/27/19
Bullish = 5
Bearish = 39
---------------------------------------------------------------------------------------
Directory     Current       day-1         day-2         day-3         day-4         day-5
----------------------------------------------------------------------------------------
BONDFUND       .941          .922          .893          .902          .902          .893
GOLD           .8            .76           .74           .76           .76           .74
HOMEBLDG       .764          .823          .764          .823          .823          .764
UTILITY        .575          .625          .45           .675          .7            .65
COMPUTER       .523          .571          .523          .619          .619          .619
SOLAR          .52           .48           .52           .52           .56           .52
------------------------------------------------------------------------------------------------
EDU            .5            .5            .5            .5            .5            .5
================================================================================================
SEMI           .462          .49           .481          .583          .629          .583
NIFTY          .456          .473          .438          .526          .543          .508
INSURANC       .447          .447          .447          .5            .473          .473
NASD-100       .438          .469          .316          .53           .591          .5
SOFTWARE       .433          .45           .416          .466          .533          .433
BEVERAGE       .411          .411          .352          .411          .411          .352
REIT           .41           .486          .431          .554          .513          .506
MILITARY       .392          .5            .464          .535          .5            .464
DOWJONES       .379          .344          .31           .379          .31           .31
SP500          .378          .403          .331          .467          .465          .43
SP-100         .377          .388          .322          .422          .411          .388
FIDSTKS        .373          .379          .296          .434          .434          .384
ELECTRON       .361          .4            .374          .522          .548          .464
GREEN          .346          .423          .384          .461          .5            .461
RUS-1000       .337          .374          .309          .445          .429          .403
COMODITY       .317          .341          .317          .341          .317          .317
DJI-13         .307          .307          .307          .384          .23           .23
GAMING         .304          .347          .304          .434          .478          .434
CHINA          .298          .28           .175          .263          .403          .298
AUTO           .282          .282          .256          .333          .333          .307
BIOTECH        .278          .316          .293          .359          .399          .373
FOOD           .277          .296          .277          .296          .277          .277
INDEXES        .274          .284          .263          .37           .403          .327
RETAIL         .254          .294          .235          .372          .352          .254
CHEM           .25           .229          .229          .291          .312          .291
INDMATER       .236          .21           .21           .263          .263          .276
COAL           .166          .166          .166          .166          .166          .166
FINANCE        .162          .174          .162          .232          .29           .255
OILGAS         .151          .136          .143          .201          .208          .201
HACKERS        .15           .25           .25           .25           .35           .2
TRANSP         .15           .25           .1            .35           .3            .25
INFRA          .138          .138          .138          .194          .194          .194
HOSPITAL       .136          .318          .318          .318          .409          .363
GUNS           .125          .125          .125          .125          .125          .125
JETS           .1            .1            .1            .2            .2            .1
REGBANKS       .037          .074          .037          .185          .222          .148
ETFS           .034          .034          .017          .103          .189          .103
BIGBANKS       0             0             0             .142          0             0
COPPER         0             0             0             0             .2            0
|
====================================================================
8/26/2019
The indexes did not sell off
today even when Chinese officials denied
the President's claim that they had phoned him Sunday to restart the
trade negotiations. This tends to confirm my belief that the market
should again rebound back upto the resistance at the 65-dma. That would
be consistent with the still active Peerless Buy signals and the uptrending
Opening Power. It would take into account the normally bullish period
at the end of August and into September until just after Labor Day.
Accordingly, buy QQQ but only if you are short an equal amount of Bearish Mincps
as a hedge. Many of them drop most every day. Hold GLD and the Gold
Stocks. Expect a weak rally on relatively low volume. Note that we cannot rule
out more bearish surprises or another bout of selling from Professionals.
QQQ's Opening Power is in an uptrend and its Closing Power trend is
falling. This is reminiscent of the last stage of QQQ's advance in 2000
before the start of its deep bear market. Again, do not buy QQQ unless
you are hedged with Bearish MINCPs. See below how high the Red Down
Day volume is compared to the Blue Up-Day volume is. QQQ should
probably be sold at 187. This makes only a trade for very short-term
traders. Such is the market right now. Things will change soon, I expect.
With Autumn coming, the risks will go up a lot.
QQQ's rising Opening Power and
falling Closing Power are at war.


The last QQQ leg up in 2000 was powered almost
entirely higher openings against an incoming tide of
of lower Closings. That appears to be the situation
we are in now.
QQQ - 2000

In the event of another plunge below DJI - 26400 and the 200-day ma,
we would probably get a new Peerless Sell S10 and the Sell S21 discussed
last night would have to be deployed.

|
Charts 8/26/2019 2019 PEERLESS DJI, Signals, Indicators Daily DJI Volume 10-DayUp/Down Vol Hourly DJIA A/D Line for All Stocks Inverted Traders Index NASDAQ S&P OEX NYSE COMPQX DJI-15 DJI-20 DJI-30 DIA SPY QQQ MDY IWM TNA Short-Term Rates USO-CrudeOil DBO FAS GLD BBH IBB JETS JNUG KOL NUGT OIH OIL RSX RETL SDS AGQ SLV SOXL TECL TLT TMF TNA UGA (gasoline) XIV and China: YINN CHAU Commodities: CANE CORN DBC JJC, NIB, CHOC CORN, CUT (paper) MOO, SOYB WEAT UUP (Dollar) LIT (Lithium) AAPL ADBE ALXN AMAT AMGN AMD AMZN BA BABA BAC BIDU CAT CVX DE FB GOOG GS HD IBM INTU JPM M (Macy's) MSFT NFLX NVDA PG QCOM TSLA TXN XOM WMT CMG , LRCX, SWKS, MDGL SPPI WATT SQ TOWN 8/26/19 (Click on Underlined link.) Bullish MAXCPs - http://tigersoft.com/MAXCPS/Aug-26/BULLISH.htm Bearish MAXCPs - http://tigersoft.com/MINCPs/Aug-26/BEARISH.htm |
Table 1 QUICKSILVER on ETFS - 08/23/19 ETF CLOSE CHANGE PIVOT-PT 5-dma AROC CL-PWR CANDLE IP21 ITRS --------------------------------------------------------------------------------------------- DIA 259.1 2.81 259.69 -43% Bearish BLUE .008 ----- --------------------------------------------------------------------------------------------- BA 359.04 3.03 331.75 368% Bullish RED .005 .043 --------------------------------------------------------------------------------------------- SPY 288 3.15 290.09 -74.5% Bearish BLUE .034 .005 --------------------------------------------------------------------------------------------- QQQ 184.82 2.75 186.97 -96.6% ------- BLUE -.006 .021 --------------------------------------------------------------------------------------------- MDY 338.01 3.03 342.15 -100.1% Bearish BLUE -.039 -.016 --------------------------------------------------------------------------------------------- IWM 147.03 1.6 149.15 -104% Bearish BLUE -.042 -.022 --------------------------------------------------------------------------------------------- FAS 69.28 2.1 70.23 -212.9% Bearish BLUE .037 -.031 --------------------------------------------------------------------------------------------- RETL 17.99 .72 17.74 -87.1% Bearish BLUE -.045 -.226 --------------------------------------------------------------------------------------------- SOXL 141.6 3.42 154.54 -502.7% Bearish RED -.084 .187 --------------------------------------------------------------------------------------------- TECL 153.57 5.86 159.6 -261.7% ------- BLUE .03 .064 --------------------------------------------------------------------------------------------- IBB 103.16 .75 105.08 -142.9% Bullish ---- .032 .01 --------------------------------------------------------------------------------------------- GLD 144.19 .02 142.21 108.4% Bullish RED .097 .149 --------------------------------------------------------------------------------------------- OIH 11.91 -.37 12.55 -429.3% Bearish RED -.058 -.105 --------------------------------------------------------------------------------------------- RSX 21.86 .12 21.75 75.6% Bearish ---- -.094 -.032 |
Table 3
  Count of Stocks in Key Directories
           20190826
-------------------------------
NEWHIGHS       96
NEWLOWS        52
MAXCP          12
MINCP          81
TTTNH          11
TTTNL          180
FASTUP         43
FASTDOWN       104
CPCROSSA       52
CPCROSSD       32
BIGVOLUP       8
BIGVODN        2
ACCUMVER       7
HIGHIP21       4
HIUPPCT        17
LOWACCUM       83
REDSELL        133
AUGSELS7       22
TRAPDOOR       49
|
 Table 4   RANKING OF KEY DIRECTORIES BASED PCT.OF STOCKS ABOVE 65-DMA
             8/26/19
 Bullish = 5
 Bearish = 40
---------------------------------------------------------------------------------------
Directory     Current       day-1         day-2         day-3         day-4         day-5
----------------------------------------------------------------------------------------
BONDFUND       .922          .893          .902          .902          .893          .893
HOMEBLDG       .823          .764          .823          .823          .764          .823
GOLD           .76           .74           .76           .76           .74           .72
UTILITY        .625          .45           .675          .7            .65           .675
COMPUTER       .571          .523          .619          .619          .619          .571
=============================================================================================
EDU            .5            .5            .5            .5            .5            .5
==============================================================================================
MILITARY       .5            .464          .535          .5            .464          .464
SEMI           .49           .481          .583          .629          .592          .601
REIT           .486          .431          .554          .513          .513          .547
SOLAR          .48           .52           .52           .56           .52           .56
NASD-100       .469          .316          .53           .591          .51           .551
NIFTY          .464          .428          .517          .535          .5            .5
SOFTWARE       .45           .416          .466          .533          .433          .45
INSURANC       .447          .447          .5            .473          .473          .526
GREEN          .423          .384          .461          .5            .461          .5
BEVERAGE       .411          .352          .411          .411          .352          .352
SP500          .403          .331          .467          .465          .436          .463
ELECTRON       .4            .374          .522          .548          .47           .509
SP-100         .388          .322          .422          .411          .388          .444
FIDSTKS        .379          .296          .434          .434          .39           .428
RUS-1000       .374          .309          .445          .429          .407          .445
GAMING         .347          .304          .434          .478          .434          .391
DOWJONES       .344          .31           .379          .31           .31           .413
COMODITY       .341          .317          .341          .317          .317          .341
HOSPITAL       .318          .318          .318          .409          .363          .409
BIOTECH        .316          .293          .359          .399          .373          .385
DJI-13         .307          .307          .384          .23           .23           .307
FOOD           .296          .277          .296          .277          .277          .296
RETAIL         .294          .235          .372          .352          .274          .294
INDEXES        .284          .263          .37           .403          .333          .413
AUTO           .282          .256          .333          .333          .307          .358
CHINA          .28           .175          .263          .403          .298          .28
HACKERS        .25           .25           .25           .35           .2            .3
TRANSP         .25           .1            .35           .3            .25           .3
CHEM           .229          .229          .291          .312          .291          .333
INDMATER       .21           .21           .263          .263          .276          .263
FINANCE        .174          .162          .232          .29           .255          .372
COAL           .166          .166          .166          .166          .166          .166
INFRA          .138          .138          .194          .194          .194          .222
OILGAS         .136          .143          .201          .208          .201          .179
GUNS           .125          .125          .125          .125          .125          .125
JETS           .1            .1            .2            .2            .1            .2
REGBANKS       .074          .037          .185          .222          .148          .259
ETFS           .034          .017          .103          .189          .103          .103
BIGBANKS       0             0             .142          0             0             .142
COPPER         0             0             0             .2            0             .2
|
====================================================================
8/23/2019
The President
ultimately will do whatever he can to hold the market up.
So, will his big backers on Wall Street. DJI 25000-25500 is key support
but 26400 is resistance. QQQ can still be traded this way. But the
big changes at the openings should not be chased or believed
unless one is hedged with Gold Stocks and short some Bearish MINCPs.
A close by the DJI below 25000 would get me to invoke the new Sell S21,
which is occasioned by two August failures of the DJI to get past its 65-dma,
each separated by 7 days and showing heavy selling pressure (low V-I
readings).
Predict the President and you can make a lot of short-term money in this
market. Sunday, just before Trump tweeted that trade talks
with China would resume, the DJI was down more than 200, now minutes
later, it is up 200. We many choose to think of him as a poker-playing
negotiator, where the tough talk, whether bluff or not, comes before the
deal or agreement. But there is no question that he is "playing with
fire",
as they say, and it is all of us who will get burned if he fails.
Instead of trying to get into Trump's psyche and negotiating motives, simple
technical analysis of the DJI and DIA can help a lot, too. Clearly, traders
will continue to follow each of Trump's tweets as long as he is President.
Any expression of hope in the on-going trade negotiations with China and
any limited or well-tempered Chinese response is apt to cause the market
to rise. Oppositely, Trump's "Double-downing" and tariff-rate hikes
immediately send prices reeling. All this is very obvious. Traders' extreme
sensitivity to Trump's tweeting will almost certainly continue as long
as he is President. But I would suggest it may be a distraction from other more
important considerations, some fundamental and some technical, that
will move the market more.
Traders do become obsessed from time to time with
something that
only has a big short-term effect on prices. Back during the War in Vietnam,
any movement in the peace-talks had a similar bullish short-term effect,
while each escalation depressed prices. Everyone knew this. But as it turned
out, the key to the markets was not the Vietnam War. Ultimately, interest rates and
economic policies by the FED and the the President held more sway from
1968-1972. In 1973, war in the Middle East brought oil shortages,
severe inflation, much higher interest rates, recession and then the impeachment
of Nixon. The irony here was that the US-Vietnamese Peace Treaty was
signed in January 1973, the top before the DJI fell 40%.
So, let's look at the stock market
technically. That was all that was needed
from 1968 to 1975 to make a lot of money. Perhaps, that is all that is needed
now.
The first thing we should see when looking at the
Peerless DJI chart is
the steadily rising A/D Line. This tells us interest rates are low. A recession
is not something the FED is now going to engineer to head off inflation, as they
did under Arthur Burns in late 1968, 1969 or 1973. The
second thing we
should see is that the DJI is down to the key support, 25000-25500. It is
in this zone that shorts will tend cover while the bulls will act to support the
market. This is also when Wall Street moguls who back the President
will do their best to bring about rallies, partly because they can make a lot
more money in bull markets than bear markets and, secondly, because they would
very much like Trump to stay in office for another term. They want his tax cut
and de-regulation policies to continue. They do not mind all the military spending.
They love a strong Dollar and they like it a lot when US growth and the policies
that are causing it are held up as a model for Eutopean governments. Nor
would they be made unhappy if Social Security pay-outs and Medicare are cut,
as Trump suggests he would attempt in a second term.
Remember, Trump's
popularity has its best Electoral chance of success if pension funds are rising
and if the US stock market can make a fantastic breakout back over 27000.
Trump and Wall Street know this. Do not rule out another attempt to breakout
over 27000.
Daily Peerless DJI Chart

Weekly DJI Chart

Daily NASDAQ (COMPQX)
Opening Power rules now. But for how long?

Daily QQQ

But the breakout has not happened yet. The
polls, if we can believe them,
show more disapproval than approval for Trump. The DJI keeps
facing a wall of resistance at 26300-26400. Big
sellers are using ALL
rallies to the DJI's 65-dma to distribute lots of shares of stock. In the past,
such steady distribution at the 50-dma or the 65-dma was often quite bearish.
See 1931, 1974, 2001 and 2008 below.
Moreover, the bulls are being forced to resort to
driving up prices
in the thinner, more easily manipulated, lighter trading before the NYSE
opens. Thus, all our key ETFs now show higher
Openings and the Opening
Power lifting and dominating prices. Closing Power and what happens on the
NYSE has become less important, with Friday's sell-off being a notable
exception. As I've shown, in the past a sustained period of higher openings
and lower closings usually brings the stock market to a bad end. The tops
in 2000 are probably the clearest cases.
Two Scenarios
If the DJI can rise clearly back above its 65-dma
resistance, as it did in
1975, 2006 or even August 2007, higher prices will surely follow. But
if the DJI fails to get past its 65-dma, the danger is very high. I have
created a new but very simple Sell S21 that could be applied now if the DJI
were to close clearly (say, by 1%) below its 200-day ma. This particular Sell
S21 has only appeared twice before in August, but always before a terrible
bear market: 1931 and 2008. The same pattern - repeated failures by the DJI
to get past its 65-dma - was very much evident in July and August, in the 1974
bear market. And if we use repeated failures by the DJI to get past its 50-day ma,
we see a pattern that forewarned us of the 2001 9/11 Crash.
Conclusion
If you are very nimble, can trade in the Futures market and
can stand
this volatility, buy more QQQ Monday on the apparent reversal up
from key support. The seasonality is bullish before Labor Day. But
sell it if the DJI again cannot get past its 65-dma at 26400. Gold stocks
and GLD will continue to be a good way to hedge, as will be some
our bearish MINCPs. If DJI prices go below 25000, I think we have to
assume that a lot of very bad economic news will soon be unfolding. In that
case, I would want to hold very few long positions, except among Gold
stocks.
1931 Steady resistance in August at 65-dma - Note
Sell S21. |
1974 - Steady resistance at 50-dma in June, July
and August. |
2001 - Steady resistance at 50-dma in July, August
and September. |
2008 - Repeated failures to get past
falling 65-dma set up Financial Collapse. |
|
Charts 8/23/2019 2019 PEERLESS DJI, Signals, Indicators Daily DJI Volume 10-DayUp/Down Vol Hourly DJIA A/D Line for All Stocks Inverted Traders Index NASDAQ S&P OEX NYSE COMPQX DJI-15 DJI-20 DJI-30 DIA SPY QQQ MDY IWM TNA Short-Term Rates USO-CrudeOil DBO FAS GLD BBH IBB JETS JNUG KOL NUGT OIH OIL RSX RETL SDS AGQ SLV SOXL TECL TLT TMF TNA UGA (gasoline) XIV and China: YINN CHAU Commodities: CANE CORN DBC JJC, NIB, CHOC CORN, CUT (paper) MOO, SOYB WEAT UUP (Dollar) LIT (Lithium) AAPL ADBE ALXN AMAT AMGN AMD AMZN BA BABA BAC BIDU CAT CVX DE FB GOOG GS HD IBM INTU JPM M (Macy's) MSFT NFLX NVDA PG QCOM TSLA TXN XOM WMT CMG , LRCX, SWKS, MDGL SPPI WATT SQ TOWN 8/26/19 (Click on Underlined link.) Bullish MAXCPs - http://tigersoft.com/MAXCPS/Aug-23/BULLISH.htm Bearish MAXCPs - http://tigersoft.com/MINCPs/Aug-23/BEARISH.htm |
Table 1 QUICKSILVER on ETFS - 08/23/19 ETF CLOSE CHANGE PIVOT-PT 5-dma AROC CL-PWR CANDLE IP21 ITRS --------------------------------------------------------------------------------------------- DIA 256.29 -6.27 261.34 -49.6% Bearish RED -.006 0 --------------------------------------------------------------------------------------------- BA 356.01 1.6 333.78 378% Bullish BLUE .031 .041 --------------------------------------------------------------------------------------------- SPY 284.85 -7.51 292.33 -68.7% Bearish RED .017 .004 --------------------------------------------------------------------------------------------- QQQ 182.07 -5.95 188.43 -90.9% ------- RED -.024 .013 --------------------------------------------------------------------------------------------- MDY 334.98 -9.38 344.86 -97.5% ------- RED -.049 -.021 --------------------------------------------------------------------------------------------- IWM 145.43 -4.6 150.13 -106.9% Bearish RED -.056 -.03 --------------------------------------------------------------------------------------------- FAS 67.18 -5.17 72.29 -225% Bearish RED .038 -.042 --------------------------------------------------------------------------------------------- RETL 17.27 -2.49 18.31 -108.4% Bearish RED -.026 -.247 --------------------------------------------------------------------------------------------- SOXL 138.18 -20.57 157.03 -331.7% Bearish RED -.095 .078 --------------------------------------------------------------------------------------------- TECL 147.71 -16 161.92 -218.1% ------- RED -.01 .007 --------------------------------------------------------------------------------------------- IBB 102.41 -2.76 106.16 -121.3% Bullish RED .068 .004 --------------------------------------------------------------------------------------------- GLD 144.17 2.77 141.11 49% Bullish BLUE .1 .159 --------------------------------------------------------------------------------------------- OIH 11.91 -.37 12.55 -429.3% Bearish RED -.058 -.094 --------------------------------------------------------------------------------------------- GASL 7.97 -1.14 10.16 -629.8% Bearish RED -.103 -.561 --------------------------------------------------------------------------------------------- RSX 21.74 -.34 21.53 62% Bearish RED -.109 -.029 |
Table 2 Count of Stocks in Key Directories
20190823
-------------------------------
NEWHIGHS 68
NEWLOWS 129
MAXCP 27
MINCP 118
TTTNH 29
TTTNL 190
FASTUP 45
FASTDOWN 77
CPCROSSA 25
CPCROSSD 284
BIGVOLUP 2
BIGVODN 8
ACCUMVER 5
HIGHIP21 3
HIUPPCT 16
LOWACCUM 102
REDSELL 126
AUGSELS7 14
TRAPDOOR 57
|
  Table 3    RANKING OF KEY DIRECTORIES BASED PCT.OF STOCKS ABOVE 65-DMA
             8/23/19
Bullish = 5 Bearish = 40 --------------------------------------------------------------------------------------- Directory Current day-1 day-2 day-3 day-4 day-5 ---------------------------------------------------------------------------------------- BONDFUND .893 .902 .902 .893 .902 .902 HOMEBLDG .764 .823 .823 .764 .823 .588 GOLD .74 .76 .76 .74 .72 .74 COMPUTER .523 .619 .619 .619 .571 .523 SOLAR .52 .52 .56 .52 .6 .52 -------------------------------------------------------------------------------------------- EDU .5 .5 .5 .5 .5 .5 -------------------------------------------------------------------------------------------- SEMI .481 .583 .629 .592 .611 .592 MILITARY .464 .535 .5 .464 .464 .392 UTILITY .45 .675 .7 .65 .675 .6 INSURANC .447 .5 .473 .473 .526 .526 NIFTY .438 .526 .543 .508 .526 .473 REIT .431 .554 .513 .513 .547 .5 SOFTWARE .416 .466 .533 .433 .45 .433 GREEN .384 .461 .5 .461 .538 .538 ELECTRON .374 .522 .548 .47 .516 .483 BEVERAGE .352 .411 .411 .352 .352 .411 SP500 .331 .467 .465 .436 .463 .414 SP-100 .322 .422 .411 .388 .433 .377 HOSPITAL .318 .318 .409 .363 .409 .363 COMODITY .317 .341 .317 .317 .341 .292 NASD-100 .316 .53 .591 .51 .551 .52 RUS-1000 .309 .445 .429 .407 .448 .401 DJI-13 .307 .384 .23 .23 .307 .153 GAMING .304 .434 .478 .434 .391 .391 DOWJONES .3 .366 .3 .3 .366 .3 FIDSTKS .296 .434 .434 .39 .428 .384 BIOTECH .293 .359 .399 .373 .385 .336 FOOD .277 .296 .277 .277 .296 .259 INDEXES .263 .37 .403 .333 .424 .301 AUTO .256 .333 .333 .307 .358 .307 HACKERS .25 .25 .35 .2 .3 .25 RETAIL .235 .372 .352 .274 .274 .215 CHEM .229 .291 .312 .291 .333 .312 INDMATER .21 .263 .263 .276 .263 .25 CHINA .175 .263 .403 .298 .28 .228 COAL .166 .166 .166 .166 .166 0 FINANCE .162 .232 .29 .255 .372 .313 INFRA .138 .194 .194 .194 .222 .194 OILGAS .137 .195 .202 .195 .173 .123 GUNS .125 .125 .125 .125 .125 .125 JETS .1 .2 .2 .1 .2 .2 TRANSP .1 .35 .3 .25 .3 .3 REGBANKS .037 .185 .222 .148 .259 .185 ETFS .017 .103 .189 .103 .103 .034 BIGBANKS 0 .142 0 0 .142 0 COPPER 0 0 .2 0 .2 .2 |
====================================================================
8/22/2019
The DJI keeps
advancing towards a breakout above the resistance
of its recent peaks and its nested 21-dma and 65-dma about 100 points
higher. The earlier B2 and newer B20 tells us the odds are good that
the DJI will reach the upper band, now about 3.7% away. Historically,
since 1967, the DJI has risen 75% of the time over the next 10 trading
days in the year before a Presidential Election and averaged a very good
+1.6%. If we go back further and look at these years, 1915, 1919, 1923...
throught 1963, we can find only two cases where there was no rally. Those
were in 1931 (which was a very bad year) and 1959 (just before the
falling 1960. Keeping in mind how August marked a major
top in 1987,
it is important that the market keep moving up for the next two weeks.
As might be expected now with interest rates so low,
Bond Funds, Utilities and Reits are in much demand.
They account for the good NYSE breadth statistics.
And it is a fact, that in a rising market, rates have always
had to rise to 4% or higher to bring a bear market. But
last year's 19% decline is proof that that any signs of
tightening by Powell could spell "TROUBLE"

See in the chart of the NASDAQ (COMPQX) how much
the chart's volatility owes to sequences of higher and lower
openings. Our Closing Power for this chart is actually very
flat. Unless we have entered a new era, when the Futures Markets
dictate all price movements, we must be on guard for when either
the Futures' market turns bearish or NY Professionals start
dumping large blocks of stock.
COMPQX 2018-2019

COMPQX - 2007-2008

Watch Home Depot tomorrow to see how it reacts to Powell's
speech
about interest rates. Home Depot (HD) has shown three or four head/
shoulders patterns in the past year, just as the DJI has. The appearance
of head/shoulders tops in HD, especially when coupled with a break in
DJI's simple price-uptrend and a Peerless Sell S9 have very often called
for a significant market correction or bear market.
See new charts of HD and DJI-30 at Tops: 1987-2019
http://tigersoft.com/HomeDepot/INDEX.htm
Home Depot is triply important now: first, because interest
rates heavily
impact home builders; second, because so much of their inventory is
made in China and third, because of how quickly their sales are impacted
by a slow-down in home construction.

|
Charts 8/22/2019 2019 PEERLESS DJI, Signals, Indicators Daily DJI Volume 10-DayUp/Down Vol Hourly DJIA A/D Line for All Stocks Inverted Traders Index NASDAQ S&P OEX NYSE COMPQX DJI-15 DJI-20 DJI-30 DIA SPY QQQ MDY IWM TNA Short-Term Rates USO-CrudeOil DBO FAS GLD BBH IBB JETS JNUG KOL NUGT OIH OIL RSX RETL SDS AGQ SLV SOXL TECL TLT TMF TNA UGA (gasoline) XIV and China: YINN CHAU Commodities: CANE CORN DBC JJC, NIB, CHOC CORN, CUT (paper) MOO, SOYB WEAT UUP (Dollar) LIT (Lithium) AAPL ADBE ALXN AMAT AMGN AMD AMZN BA BABA BAC BIDU CAT CVX DE FB GOOG GS HD IBM INTU JPM M (Macy's) MSFT NFLX NVDA PG QCOM TSLA TXN XOM WMT CMG , LRCX, SWKS, MDGL SPPI WATT SQ TOWN 8/22/19 (Click on Underlined link.) Bullish MAXCPs - http://tigersoft.com/MAXCPS/Aug-22/BULLISH.htm Bearish MAXCPs - http://tigersoft.com/MINCPs/Aug-22/BEARISH.htm |
Table 1 QUICKSILVER on ETFS - 08/22/19 ETF CLOSE CHANGE PIVOT-PT 5-dma AROC CL-PWR CANDLE IP21 ITRS --------------------------------------------------------------------------------------------- DIA 262.56 .53 258.88 119.4% Bearish RED .04 ----- --------------------------------------------------------------------------------------------- BA 354.41 14.42 330.45 396.8% Bullish BLUE .062 .013 --------------------------------------------------------------------------------------------- SPY 292.36 -.09 288.85 133.1% ------- RED .069 .006 --------------------------------------------------------------------------------------------- QQQ 188.02 -.61 185.48 146.7% ------- RED .015 .023 --------------------------------------------------------------------------------------------- MDY 344.36 .27 341.68 144.2% ------- RED -.003 -.016 --------------------------------------------------------------------------------------------- IWM 150.03 -.35 148.63 152.6% ------- RED -.028 -.018 --------------------------------------------------------------------------------------------- FAS 72.35 .99 70.39 354.8% ------- BLUE .072 .003 --------------------------------------------------------------------------------------------- RETL 19.76 .97 17.67 854.6% Bearish BLUE .049 -.14 --------------------------------------------------------------------------------------------- SOXL 158.75 -.17 148.5 710.1% ------- RED -.052 .23 --------------------------------------------------------------------------------------------- TECL 163.71 -1.09 154.73 538.5% ------- RED .037 .095 --------------------------------------------------------------------------------------------- IBB 105.17 -.87 104.97 118.6% Bullish RED .049 .01 --------------------------------------------------------------------------------------------- GLD 141.4 -.36 142.78 -80.8% ------- ---- .027 .116 --------------------------------------------------------------------------------------------- OIH 11.91 -.37 12.55 -429.3% Bearish RED -.058 -.122 --------------------------------------------------------------------------------------------- GASL 9.11 -.62 9.18 461.2% Bearish RED -.082 -.498 --------------------------------------------------------------------------------------------- RSX 22.08 .08 21.47 110.8% Bearish -----.108 -.029 |
Table 2 Count of Stocks in Key Directories
20190822
-------------------------------
NEWHIGHS 151
NEWLOWS 24
MAXCP 28
MINCP 33
TTTNH 18
TTTNL 72
FASTUP 108
FASTDOWN 31
CPCROSSA 25
CPCROSSD 124
BIGVOLUP 1
BIGVODN 7
ACCUMVER 8
HIGHIP21 2
HIUPPCT 20
LOWACCUM 86
REDSELL 123
AUGSELS7 13
TRAPDOOR 57
|
Table 3RANKING OF KEY DIRECTORIES BASED PCT.OF STOCKS ABOVE 65-DMA 8/22/19 --------------------------------------------------------------------------------------- Directory Current day-1 day-2 day-3 day-4 day-5 ---------------------------------------------------------------------------------------- BONDFUND .902 .902 .893 .902 .902 .893 HOMEBLDG .823 .823 .764 .823 .588 .529 GOLD .76 .76 .74 .72 .74 .74 UTILITY .675 .7 .65 .675 .6 .475 COMPUTER .619 .619 .619 .571 .523 .476 SEMI .583 .629 .592 .611 .592 .444 REIT .554 .513 .513 .547 .493 .41 SOLAR .538 .576 .538 .615 .538 .461 MILITARY .535 .5 .464 .464 .392 .392 NASD-100 .53 .591 .51 .551 .52 .346 NIFTY .526 .543 .508 .526 .473 .35 ELECTRON .522 .548 .47 .516 .483 .361 EDU .5 .5 .5 .5 .5 .5 INSURANC .5 .473 .473 .526 .526 .421 SP500 .467 .465 .436 .463 .414 .335 SOFTWARE .466 .533 .433 .45 .433 .383 GREEN .461 .5 .461 .538 .538 .423 RUS-1000 .445 .429 .407 .448 .399 .31 FIDSTKS .434 .434 .39 .428 .384 .285 GAMING .434 .478 .434 .391 .391 .217 SP-100 .422 .411 .388 .433 .377 .288 BEVERAGE .411 .411 .352 .352 .411 .294 DJI-13 .384 .23 .23 .307 .153 .153 DOWJONES .379 .31 .31 .379 .31 .241 RETAIL .372 .352 .274 .274 .215 .156 INDEXES .37 .403 .333 .424 .301 .258 BIOTECH .359 .399 .373 .385 .339 .29 TRANSP .35 .3 .25 .3 .3 .15 COMODITY .341 .317 .317 .341 .292 .317 AUTO .333 .333 .307 .358 .333 .282 HOSPITAL .318 .409 .363 .409 .363 .363 FOOD .296 .277 .277 .296 .259 .277 CHEM .291 .312 .291 .333 .312 .229 CHINA .263 .403 .298 .28 .228 .14 INDMATER .263 .263 .276 .263 .25 .223 HACKERS .25 .35 .2 .3 .25 .3 FINANCE .232 .29 .255 .372 .313 .197 OILGAS .201 .208 .201 .179 .122 .107 JETS .2 .2 .1 .2 .2 .1 INFRA .194 .194 .194 .222 .194 .138 REGBANKS .185 .222 .148 .259 .185 .074 COAL .166 .166 .166 .166 0 0 BIGBANKS .142 0 0 .142 0 0 GUNS .125 .125 .125 .125 .125 .125 ETFS .103 .189 .103 .103 .034 .034 COPPER 0 .2 0 .2 .2 0 |
====================================================================
8/21/2019
By means of a
series of higher +200 point openings, the DJI has
rebounded to its 65-dma. Since Peerless shows an earlier Buy B2 and a
newer Buy B20, the likelihood is good that we will see a breakout
above the 65-dma resistance with the DJI then running up to the
upper band at 27000. I showed last night how the movement by
the 10-day ma of NYSE Up Volume above Down Volume in August
reliably predicts this. But there could easily be another pull-back.
That should give us a chance to buy more QQQ, the strongest of
major ETFs. Let's wait and see. QQQ should have good support
at its 65-dma.
DJI's 65-dma is now at 26358.


The Closing Powers are still bearish (See Table 1) and the DJI's 65-dma
resistance at 26400 still stands for now, even though the QQQ and SPY
have surpassed it slightly. A lot depends on what Fed Chairman
Powell says tomorrow. The Chairman has a habit of spooking the market.
So, another pullback should be of no surprise. The 10-day ma of NYSE
Volume is only slightly above Down Volume and August has a nasty habit
of not letting the DJI easily get past the 65-dma.
Breadth is good now. But the 1975 case shows that a rising A/D
Line can still bring yet another decline to the lower band in August. Apart from
breadth, the closest parallel to now that I can find was in the Summer of 2007.
See the chart below. Like now, there had been a July Sell S9 and the DJI retreated
quickly. But then it turned up and the rally was boosted by a Peerless Buy 20.
This helped the DJI finally breakout above its 65-dma.
But the lurch upwards
was quickly greeted by two Sells at the upper band in September and then
in October. Note that the Closing Power broke its uptrend two weeks before
the Opening Power did. A quick head and shoulders then added to the bearishness.
The Opening Power started this final rally, perhaps like now.
The severe bear market of 2007-2009 followed a dominant, rising Opening Power.
That is what we have been seeing now for four months in 2019. As in the year 2000,
which I showed last night, a market can only rise just so far when its strength comes
almost entirely from higher openings. Look below at two more examples tonight.
Why is a rise based primarily on Opening Power dangerous? In 1999-2000, it
showed dangerous Public participation. The broader public tends to buy at the
opening. They do not have time to watch the market all day, as Professionals do.
So, the 1999-2000 huge Opening Power run-up reflected the steady stream
public speculation in internet stocks and biotechs. In 2007-2008, an oil stock
bubble helped hide a nearly fatal weakness in bank stocks. And now in.
2019, we must wonder if it is the steady foreign buying of blue chips that seeks
to take advantage of the strong Dollar and the higher interest rates in the US
that is causing a different type of bubble. As long as the Dollar keeps rising,
there should be no problem, but what happens afterwards?
See below how the green Opening Power line stayed in a
rising trend throughout 2007. It was the Peerless Sell signals
and the turns down by the Closing Power that told us
correctly to Sell.

And to make the point again, about how the dangers of
a market whose
strength comes only from higher openings, look also at the DJI
chart of 2015
and note the severe bearish divergences between the rising Opening Power
and Falling Closing Power from April to the top in August.

|
Charts 8/21/2019 2019 PEERLESS DJI, Signals, Indicators Daily DJI Volume 10-DayUp/Down Vol Hourly DJIA A/D Line for All Stocks Inverted Traders Index NASDAQ S&P OEX NYSE COMPQX DJI-15 DJI-20 DJI-30 DIA SPY QQQ MDY IWM TNA Short-Term Rates USO-CrudeOil DBO FAS GLD BBH IBB JETS JNUG KOL NUGT OIH OIL RSX RETL SDS AGQ SLV SOXL TECL TLT TMF TNA UGA (gasoline) XIV and China: YINN CHAU Commodities: CANE CORN DBC JJC, NIB, CHOC CORN, CUT (paper) MOO, SOYB WEAT UUP (Dollar) LIT (Lithium) AAPL ADBE ALXN AMAT AMGN AMD AMZN BA BABA BAC BIDU CAT CVX DE FB GOOG GS HD IBM INTU JPM M (Macy's) MSFT NFLX NVDA PG QCOM TSLA TXN XOM WMT CMG , LRCX, SWKS, MDGL SPPI WATT SQ TOWN 8/21/19 (Click on Underlined link.) Bullish MAXCPs - http://tigersoft.com/MAXCPS/Aug-21/BULLISH.htm Bearish MAXCPs - http://tigersoft.com/MINCPs/Aug-21/BEARISH.htm |
Table 1    QUICKSILVER on ETFS - 08/21/19
           The Closing Powers are all still falling or neutral..
ETF CLOSE CHANGE PIVOT-PT 5-dma AROC CL-PWR CANDLE IP21 ITRS --------------------------------------------------------------------------------------------- DIA 262.03 2.34 256.36 134.5% Bearish BLUE .053 ----- --------------------------------------------------------------------------------------------- BA 339.99 8.24 328 297.5% Bearish BLUE -.064 -.031 --------------------------------------------------------------------------------------------- SPY 292.45 2.36 284.65 148.5% Bearish ---- .092 .008 --------------------------------------------------------------------------------------------- QQQ 188.63 1.66 182.55 158.4% Bearish ---- .043 .024 --------------------------------------------------------------------------------------------- MDY 344.09 1.94 334.51 133.8% ------- RED .035 -.014 --------------------------------------------------------------------------------------------- IWM 150.38 1.23 145.49 145.7% ------- RED .016 -.01 --------------------------------------------------------------------------------------------- FAS 71.36 1.13 67.36 385.5% Bearish RED .097 -.019 --------------------------------------------------------------------------------------------- RETL 18.79 1.05 16.71 395.7% Bearish ---- .012 -.19 --------------------------------------------------------------------------------------------- SOXL 158.92 4.38 137.27 696.9% Bearish RED -.003 .148 --------------------------------------------------------------------------------------------- TECL 164.8 5.2 146.74 559.3% Bearish BLUE .061 .087 --------------------------------------------------------------------------------------------- IBB 106.04 .96 102.68 144.2% Bullish BLUE .088 .028 --------------------------------------------------------------------------------------------- GLD 141.76 -.45 143.7 -34.7% ------- BLUE .034 .128 --------------------------------------------------------------------------------------------- OIH 11.91 -.37 12.55 -429.3% Bearish RED -.058 -.118 --------------------------------------------------------------------------------------------- GASL 9.73 -.12 8.24 742.4% Bearish RED -.061 -.51 --------------------------------------------------------------------------------------------- RSX 22 .25 21.6 60.1% Bearish ---- -.136 -.039 |
Table 2   Count of Stocks in Key Directories
          20190821
-------------------------------
NEWHIGHS       173
NEWLOWS        25
MAXCP          37
MINCP          30
TTTNH          26
TTTNL          57   Day Traders remain net bearish.
FASTUP         84
FASTDOWN       43
CPCROSSA       47
CPCROSSD       50
BIGVOLUP       3
BIGVODN        8
ACCUMVER       6
HIGHIP21       4
HIUPPCT        19
LOWACCUM       84
REDSELL        124
AUGSELS7       13
TRAPDOOR       57
|
 Table 3   RANKING OF KEY DIRECTORIES BASED PCT.OF STOCKS ABOVE 65-DMA
               8/21/19
 Bullish = 12
 Bearish = 31
---------------------------------------------------------------------------------------
Directory     Current       day-1         day-2         day-3         day-4         day-5
----------------------------------------------------------------------------------------
BONDFUND       .902          .893          .902          .902          .893          .912
HOMEBLDG       .823          .764          .823          .588          .529          .529
GOLD           .76           .74           .72           .74           .74           .76
UTILITY        .7            .65           .675          .6            .5            .425
SEMI           .629          .592          .611          .592          .453          .462
COMPUTER       .619          .619          .571          .523          .476          .428
NASD-100       .591          .51           .551          .52           .346          .357
SOLAR          .576          .538          .615          .538          .5            .461
ELECTRON       .551          .474          .519          .487          .37           .402
NIFTY          .535          .5            .517          .464          .339          .357
SOFTWARE       .533          .433          .45           .433          .383          .383
REIT           .513          .513          .547          .493          .41           .39
N=12
==============================================================================================
EDU            .5            .5            .5            .5            .5            .5
GREEN          .5            .461          .538          .538          .423          .384
MILITARY       .5            .464          .464          .392          .392          .357
==============================================================================================
GAMING         .478          .434          .391          .391          .217          .217
INSURANC       .473          .473          .526          .526          .421          .394
SP500          .465          .436          .463          .414          .337          .302
FIDSTKS        .434          .39           .428          .384          .285          .28
RUS-1000       .429          .407          .448          .399          .312          .296
BEVERAGE       .411          .352          .352          .411          .294          .235
SP-100         .411          .388          .433          .377          .288          .277
HOSPITAL       .409          .363          .409          .363          .363          .363
CHINA          .403          .298          .28           .228          .157          .122
INDEXES        .403          .333          .424          .301          .263          .263
BIOTECH        .399          .373          .385          .339          .29           .298
RETAIL         .352          .274          .274          .215          .156          .176
HACKERS        .35           .2            .3            .25           .3            .3
AUTO           .333          .307          .358          .333          .282          .307
COMODITY       .317          .317          .341          .292          .317          .292
CHEM           .312          .291          .333          .312          .229          .291
DOWJONES       .31           .31           .379          .31           .241          .241
TRANSP         .3            .25           .3            .3            .15           .15
FINANCE        .29           .255          .372          .313          .197          .197
FOOD           .277          .277          .296          .259          .277          .259
INDMATER       .263          .276          .263          .25           .223          .236
DJI-13         .23           .23           .307          .153          .153          .153
REGBANKS       .222          .148          .259          .185          .074          .111
OILGAS         .207          .2            .178          .121          .107          .121
COPPER         .2            0             .2            .2            0             0
JETS           .2            .1            .2            .2            .1            .1
INFRA          .194          .194          .222          .194          .138          .111
ETFS           .189          .103          .103          .034          .034          .017
COAL           .166          .166          .166          0             0             0
GUNS           .125          .125          .125          .125          .125          .062
BIGBANKS       0             0             .142          0             0             0
|
====================================================================
8/20/2019
The
operative Peerless signals are the earlier B2 and yesterday's
B20, which is based on four of the last eight trading days having
a ratio of NYSE advances to declines being better than 2.5:1.
Sell-offs like the DJI's today in the last 30 minutes are
often
"manipulation" to make the market seem more bearish than it
really is. Buy QQQ below 188. Its 65-dma at 186 should be
considered support now. Its goal is now 195.

At this time, seasonality is still generally bullish. The DJI
has risen 75%
of the time over the month following August 20th in the year before
the Presidential Election. The DJI's average gain is 2.1%.


I think that we
should expect the DJI to rally up to 27000 at the least.
See in the charts below how when the 10-day ma of NYSE Up Volume
rises above the 10-day ma of NYSE Down Volume the upper band
is reached. Eight times this has happened from the end of July to the
end of August. Each time the DJI soon broke out above its 65-dma.
But only thrice (1965, 1968 and 1973) did the DJI move significantly
above the upper band.
The Crossing of Up-Volume
over Down-Volume
in August Tells Us To Expect The DJI To Move up
above the 65-dma. That has just happened in our chart now.
1965 |
1968 |
1972 |
1973 |
1983 |
1988 |
1997 |
2008 |
|
Charts 8/20/2019 2019 PEERLESS DJI, Signals, Indicators Daily DJI Volume 10-DayUp/Down Vol Hourly DJIA A/D Line for All Stocks Inverted Traders Index NASDAQ S&P OEX NYSE COMPQX DJI-15 DJI-20 DJI-30 DIA SPY QQQ MDY IWM TNA Short-Term Rates USO-CrudeOil DBO FAS GLD BBH IBB JETS JNUG KOL NUGT OIH OIL RSX RETL SDS AGQ SLV SOXL TECL TLT TMF TNA UGA (gasoline) XIV and China: YINN CHAU Commodities: CANE CORN DBC JJC, NIB, CHOC CORN, CUT (paper) MOO, SOYB WEAT UUP (Dollar) LIT (Lithium) AAPL ADBE ALXN AMAT AMGN AMD AMZN BA BABA BAC BIDU CAT CVX DE FB GOOG GS HD IBM INTU JPM M (Macy's) MSFT NFLX NVDA PG QCOM TSLA TXN XOM WMT CMG , LRCX, SWKS, MDGL SPPI WATT SQ TOWN 8/20/19 (Click on Underlined link.) Bullish MAXCPs - http://tigersoft.com/MAXCPS/Aug-20/BULLISH.htm Bearish MAXCPs - http://tigersoft.com/MINCPs/Aug-20/BEARISH.htm |
Table 1 QUICKSILVER on ETFS - 08/20/19 ETF CLOSE CHANGE PIVOT-PT 5-dma AROC CL-PWR CANDLE IP21 ITRS
---------------------------------------------------------------------------------------------
DIA 259.69 -1.65 255.08 -67.2% Bearish RED .07 ----
---------------------------------------------------------------------------------------------
BA 331.75 -2.03 320.42 -16.9% Bearish RED -.085 -.057
---------------------------------------------------------------------------------------------
SPY 290.09 -2.24 283.9 -42.6% ------- RED .109 .009
---------------------------------------------------------------------------------------------
QQQ 186.97 -1.46 182.76 -38.3% Bearish RED .072 .026
---------------------------------------------------------------------------------------------
MDY 342.15 -2.71 335 -47.3% Bullish RED .09 -.009
---------------------------------------------------------------------------------------------
IWM 149.15 -.98 146.07 -37.8% ------- RED .035 -.012
---------------------------------------------------------------------------------------------
FAS 70.23 -2.06 66.02 -150.7% ------- RED .127 -.027
---------------------------------------------------------------------------------------------
SOXL 154.54 -2.49 138.41 61.7% ------- RED .024 .134
second highest
---------------------------------------------------------------------------------------------
TECL 159.6 -2.32 147.56 -83.4% Bearish RED .079 .063
---------------------------------------------------------------------------------------------
IBB 105.08 -1.08 103.03 -14.4% Bullish RED .087 .023
---------------------------------------------------------------------------------------------
GLD 142.21 1.1 142.75 15.1% ------- BLUE .011 .14
highest
---------------------------------------------------------------------------------------------
OIH 11.91 -.37 12.55 -429.3% Bearish RED -.058 -.109
---------------------------------------------------------------------------------------------
GASL 9.85 -.31 8.37 -38.2% Bearish ---- -.023 -.498 weakest
---------------------------------------------------------------------------------------------
RSX 21.75 .22 21.74 -151.7% Bearish ---- -.11 -.027
|
 Table 2  Count of Stocks in Key Directories
          20190820
-------------------------------
NEWHIGHS       110
NEWLOWS        35
MAXCP          19
MINCP          28
TTTNH          11
TTTNL          49
FASTUP         35
FASTDOWN       108
CPCROSSA       46
CPCROSSD       112
BIGVOLUP       2
BIGVODN        7
ACCUMVER       8
HIGHIP21       7
HIUPPCT        16
LOWACCUM       89
REDSELL        120
AUGSELS7       10
TRAPDOOR       58
|
 Table 3      RANKING OF KEY DIRECTORIES BASED PCT.OF STOCKS ABOVE 65-DMA
              8/20/19
 Bullish = 10
 Bearish = 35
---------------------------------------------------------------------------------------
Directory     Current       day-1         day-2         day-3         day-4         day-5
----------------------------------------------------------------------------------------
BONDFUND       .893          .902          .902          .893          .912          .932
HOMEBLDG       .764          .823          .588          .529          .529          .705
GOLD           .74           .72           .74           .74           .76           .78
UTILITY        .65           .675          .6            .5            .45           .55
COMPUTER       .619          .571          .523          .476          .476          .619
SEMI           .592          .611          .592          .453          .462          .574
SOLAR          .538          .615          .538          .5            .461          .576
REIT           .513          .547          .493          .41           .39           .506
NASD-100       .51           .551          .52           .346          .367          .571
NIFTY          .508          .526          .473          .35           .385          .543
=============================================================================================
EDU            .5            .5            .5            .5            .5            .5
=============================================================================================
INSURANC       .473          .526          .526          .421          .394          .631
ELECTRON       .47           .516          .483          .367          .406          .516
MILITARY       .464          .464          .392          .392          .357          .428
GREEN          .461          .538          .538          .423          .384          .5
SP500          .436          .463          .414          .337          .308          .467
GAMING         .434          .391          .391          .217          .217          .347
SOFTWARE       .433          .45           .433          .383          .383          .483
RUS-1000       .407          .448          .399          .312          .3            .454
FIDSTKS        .39           .428          .384          .285          .291          .456
SP-100         .388          .433          .377          .288          .288          .444
BIOTECH        .373          .385          .339          .29           .293          .379
HOSPITAL       .363          .409          .363          .363          .363          .454
BEVERAGE       .352          .352          .411          .294          .235          .294
INDEXES        .333          .424          .301          .263          .263          .451
COMODITY       .317          .341          .292          .317          .292          .292
DOWJONES       .31           .379          .31           .241          .241          .413
AUTO           .307          .358          .333          .282          .307          .384
CHINA          .298          .28           .228          .157          .122          .157
CHEM           .291          .333          .312          .229          .291          .354
FOOD           .277          .296          .259          .277          .259          .259
INDMATER       .276          .263          .25           .223          .236          .315
RETAIL         .274          .274          .215          .156          .176          .313
FINANCE        .255          .372          .313          .197          .197          .348
TRANSP         .25           .3            .3            .15           .15           .3
DJI-13         .23           .307          .153          .153          .153          .461
HACKERS        .2            .3            .25           .3            .3            .5
OILGAS         .2            .178          .121          .107          .121          .185
INFRA          .194          .222          .194          .138          .111          .194
COAL           .166          .166          0             0             0             0
REGBANKS       .148          .259          .185          .074          .111          .259
GUNS           .125          .125          .125          .125          .062          .062
ETFS           .103          .103          .034          .034          .017          .137
JETS           .1            .2            .2            .1            .1            .3
BIGBANKS       0             .142          0             0             0             .142
COPPER         0             .2            .2            0             0             .2
|
====================================================================
8/17/2019
The new Buy B20
today may help the DJI soon rally past the 65-dma
resistance at 26347. But the B20 tables below show that the 3 past
August signals are among the weakest, averaging only +4.5%. So,
27000 should be our next DJI target if the DJI gets above 26400.
Unfortunately, another August retreat from the 65-dma cannot be ruled out.
Rallies based mainly on higher openings often do not last. But if 25500 is
again re-tested, perhaps, we can use to take new long positions.
Right now the market is moving up almost entirely because of higher openings.
The DIA has risen 7 points in the last 3 trading days, but only 2 points during the
normal NYSE trading hours. In the past, if this pattern continues for weeks or
months, it probably will mean a major top is near. Further below, compare the strong
Opening Power (from over-night gains) with the much weaker Closing Power
(gain during normal NYSE trading hours) in the first quarter of 2000 for DIA
and SPY when major tops were being made.
Perhaps, the bearish pundits will be right, after all when this rally ends:
(1) that consumers are tapped out,
(2) that the US Government is too deeply in debt to use new
deficit spending (public works or more tax cuts) to prevent the next deep
recession,
(3) the FED has used up all its monetary ammunition and may not be
able, for political reasons, be able to again bailout the big banks and
(4) overseas economic woes are going from bad to worse.
We also should not forget that September and October are the most dangerous
months of the year and the first quarter in a Presidential Election year has
a bearish tendency, too. So, time may be running out for the bull market.


Today, the DJI rose +250 on the back of new hopes for an
early ending
of the trade war with China and a realization that very low interest
rates make utilities, reits and dividend paying stocks look attractive
so long as there is no recession and provided rates do not go right back up.
In particular, the Dollar's strength invites overseas investments and the use of
the greenback as a reserve currency and is also a big factor in
keeping American blue-chips in their uptrend. We should now watch the
Dollar to see if it can breakout to a five-year high. That ought to continue to
keep the DJI's rally alive.

Though the DJI, MDY and IWM haved not risen back above their
65-dma yet.
the NASDAQ, SPY and QQQ bullishly did. So, if you "chased" any of these,
you should make a little money, as the NYSE Up Volume was very good today.
This sent out 10-day ma of NYSE Up-Volume above 10-day Down-Volume.
Such cross-overs often come before the DJI breakouts out above its 65-dma.
Look at Chinese stocks to see a big reason why the US
markets are recovering.
The President sent it down a week ago by belittling the importance of American
trade with China. Now Trump seems to be backtracking. This lifted AAPL and
lots
of big tech stocks today. But what we tweet tomorrow. Watch CHAU to see
if it can get back above the resistance of its falling 65-dma.

NYSE breadth was again very good, too. Today
there were 1505
more up than down. Yesterday there was bullish plurality of +1722.
Monday, a week ago, it was +1308. And on August 8th, there were
a whopping 1951 more up than down. This means that that four of
the last eight trading days showed a bullish breadth ratio of more than
2.5:1. Since it is not September soon after a Sell S12, Peerless gave
a new Buy B20 today.
Strong Opening Power and Weak Closing Called 2000 Tops: DIA
and SPY  |
Peerless Buy B20s: 1929-2019
Date                          DJIA     Gain       Maximum Paper Loss
                                                           Pct.Loss
-------------------------------------------------------------------------------
19310721      B20            146.7    -.034       134.1    -.0858    8/5
19340817      B20             91.1     .016       90.4     -.0076    8/20
19351122      B20            144.6    -.011       138.90   -.0394    12/19
19380922      B20            137.4     .146       129.9    -.0545   9/26
19380928      B20            133.7     .178       none      0
19390202      B20            144.3     .036       none      0
19431110      B20            132.7     .236       129.6    -.0233  11/30  164
19431207      B20            133.4     .229       none      0
19451205      B20            193.1     .032       189.1    -.0207    12/21
19461204      B20            170.3     .078       none      0
19470529 B20 169.3 .092 none 0 19500720 B20 207.7 .247 203.8 -.0187 7/25 (19500727 B20 also) 19501109 B20 227.2 .14 222.3 -.0215 12/2 19540112 B20 281.5 .664 none 0 19580122 B20 445.7 .459 436.9 -.0197 2/25 20070831 B20 13357.74 .034 13113.3 -.0182 9/17 20111101 B20 11657.55 .038 11257.5 -.0343 11/23 20130701 B20 14974.96 .032 none 0 20131017 B20 15371.65 .074 none 0 20140213 B20 16027.59 .060 none 0 20140818 B20 16838.74 .085 none 0
20151223 B20 17602.61 .007 none 0
20160629 B20 17694.68 .036 none 0
20180404 B20 24505.22 .022 23932.76 -.0234 4/6
-----------------------------------------------------------------------------
Totals N = 24 .12 -.016
     Analysis of Buy B20s
     --------------------
     Biggest Gains: 5 of 24  (>20%)       Gain      Significant Paper Loss
     -----------------------------------------------------------------
                         19431110         .236       129.6    -.0233  11/30  164
                         19431207         .229
                         19500720         .247
                         19540112         .664
                         19580122         .459
                         (All before 1959)
     Maximum Paper Losses
     --------------------
       Biggest = 8.6% (7/21/1931) on 8/5/1931
       4 losses greater than 3.0%  (4/24)
       8 losses greater than 2.0%  (8/24)
       12 - no paper losses. (12/24)
       Ratio avg.gain/avg paper loss = .120/.017
     Returns by Year            No.          Avg.Gain
     ---------------          ----         ---------
     Pres.Election Year         1             .036
     Year after Election Year   3             .046
     Mid-Term Election Year    11             .190   (very high)
     Year before Elect.Yr.   9           .070
     ------------------------------------------------
                  Total        24             .120
     Returns by Month          No.          Avg.Gain
     ---------------          ----         ---------
         January                2            .561
         February               2            .048
         March                  0            -----
         April                  1            .021
         May                    1            .091
         June                   1            .035
         July                   3            .081
         August              3           .045
         September              2            .161
         October                1            .073
         November               4            .100
         December               4            .088
         ------------------------------------------
                  Total        24            .120
|
|
Charts 8/19/2019 2019 PEERLESS DJI, Signals, Indicators Daily DJI Volume 10-DayUp/Down Vol Hourly DJIA A/D Line for All Stocks Inverted Traders Index NASDAQ S&P OEX NYSE COMPQX DJI-15 DJI-20 DJI-30 DIA SPY QQQ MDY IWM TNA Short-Term Rates USO-CrudeOil DBO FAS GLD BBH IBB JETS JNUG KOL NUGT OIH OIL RSX RETL SDS AGQ SLV SOXL TECL TLT TMF TNA UGA (gasoline) XIV and China: YINN CHAU Commodities: CANE CORN DBC JJC, NIB, CHOC CORN, CUT (paper) MOO, SOYB WEAT UUP (Dollar) LIT (Lithium) AAPL ADBE ALXN AMAT AMGN AMD AMZN BA BABA BAC BIDU CAT CVX DE FB GOOG GS HD IBM INTU JPM M (Macy's) MSFT NFLX NVDA PG QCOM TSLA TXN XOM WMT CMG , LRCX, SWKS, MDGL SPPI WATT SQ TOWN 8/19/19 (Click on Underlined link.) Bullish MAXCPs - http://tigersoft.com/MAXCPS/Aug-19/BULLISH.htm Bearish MAXCPs - http://tigersoft.com/MINCPs/Aug-19/BEARISH.htm |
Table 1 QUICKSILVER on ETFS - 08/19/19 ETF CLOSE CHANGE PIVOT-PT 5-dma AROC CL-PWR CANDLE IP21 ITRS --------------------------------------------------------------------------------------------- DIA 261.34 2.46 263.17 38.7% ------- RED .095 ---- --------------------------------------------------------------------------------------------- BA 333.78 3.33 332.86 13.7% Bearish RED -.121 -.061 --------------------------------------------------------------------------------------------- SPY 292.33 3.48 292.55 75.1% Bullish BLUE .138 .012 ----------------------------------------------------------------------- ---------------------- QQQ 188.43 2.95 188.39 110.4% Bullish BLUE .109 .037 --------------------------------------------------------------------------------------------- MDY 344.86 3.18 345.37 48.4% Bullish RED .088 -.005 --------------------------------------------------------------------------------------------- IWM 150.13 1.5 150.27 49.4% Bullish RED .037 -.009 --------------------------------------------------------------------------------------------- FAS 72.29 1.9 72.33 152.3% Bullish RED .158 .009 --------------------------------------------------------------------------------------------- RETL 18.31 .64 19.96 -195.6% Bearish ---- -.054 -.17 --------------------------------------------------------------------------------------------- SOXL 157.03 8.53 152.73 581.7% Bullish RED .054 .233 --------------------------------------------------------------------------------------------- TECL 161.92 7.19 162.18 352.2% ------- RED .119 .101 --------------------------------------------------------------------------------------------- IBB 106.16 1.19 105.38 96.1% Bullish BLUE .117 .018 --------------------------------------------------------------------------------------------- GLD 141.11 -1.67 141.78 -52.5% ------- RED -.022 .111 --------------------------------------------------------------------------------------------- OIH 11.91 -.37 12.55 -429.3% Bearish RED -.058 -.118 --------------------------------------------------------------------------------------------- GASL 10.16 .98 9.92 219.9% Bearish BLUE -.035 -.507 --------------------------------------------------------------------------------------------- RSX 21.53 .06 22.41 -184.8% Bearish ---- -.145 -.04 |
Table 2    Count of Stocks in Key Directories
           20190819
-------------------------------
NEWHIGHS       201  Bullish
NEWLOWS        11
MAXCP          43
MINCP          19
TTTNH          20
TTTNL          35   Day Traders are net bearish.
FASTUP         53
FASTDOWN       89
CPCROSSA       45
CPCROSSD       73
BIGVOLUP       4
BIGVODN        5
ACCUMVER       11
HIGHIP21       7
HIUPPCT        19
VHIP21         106
REDSELL        116
AUGSELS7       7
TRAPDOOR       58
|
Table 3   RANKING OF KEY DIRECTORIES BASED PCT.OF STOCKS ABOVE 65-DMA
              8/19/19
Bullish = 13
Bearish = 32
---------------------------------------------------------------------------------------
Directory     Current       day-1         day-2         day-3         day-4         day-5
----------------------------------------------------------------------------------------
BONDFUND       .902          .902          .893          .912          .932          .922
HOMEBLDG       .823          .588          .529          .529          .705          .647
GOLD           .72           .74           .74           .76           .78           .8
UTILITY        .675          .6            .5            .45           .55           .575
SOLAR          .615          .538          .5            .461          .615          .5
SEMI           .611          .592          .453          .462          .574          .518
COMPUTER       .571          .523          .476          .476          .619          .571
NASD-100       .551          .52           .346          .367          .571          .469
REIT           .547          .493          .41           .39           .506          .506
GREEN          .538          .538          .423          .384          .5            .461
INSURANC       .526          .526          .421          .394          .631          .473
NIFTY          .517          .464          .339          .375          .535          .446
ELECTRON       .516          .483          .367          .406          .509          .47
N= 13
===============================================================================================
EDU            .5            .5            .5            .5            .5            .5
===============================================================================================
MILITARY       .464          .392          .392          .357          .428          .428
SP500          .463          .414          .337          .308          .465          .401
SOFTWARE       .45           .433          .383          .383          .483          .433
RUS-1000       .448          .399          .312          .3            .452          .39
SP-100         .433          .377          .288          .288          .444          .377
FIDSTKS        .428          .384          .285          .291          .456          .368
INDEXES        .424          .301          .263          .263          .446          .311
HOSPITAL       .409          .363          .363          .363          .454          .272
GAMING         .391          .391          .217          .217          .347          .347
BIOTECH        .385          .339          .29           .293          .376          .336
DOWJONES       .379          .31           .241          .241          .413          .31
FINANCE        .372          .313          .197          .197          .36           .279
AUTO           .358          .333          .282          .307          .384          .358
BEVERAGE       .352          .411          .294          .235          .294          .235
COMODITY       .341          .292          .317          .292          .292          .317
CHEM           .333          .312          .229          .291          .354          .312
DJI-13         .307          .153          .153          .153          .461          .23
HACKERS        .3            .25           .3            .3            .5            .4
TRANSP         .3            .3            .15           .15           .3            .3
FOOD           .296          .259          .277          .259          .259          .277
CHINA          .28           .228          .157          .122          .157          .105
RETAIL         .274          .215          .156          .176          .294          .215
INDMATER       .263          .25           .223          .236          .328          .263
REGBANKS       .259          .185          .074          .111          .259          .185
INFRA          .222          .194          .138          .111          .194          .166
COPPER         .2            .2            0             0             .2            0
JETS           .2            .2            .1            .1            .3            .3
OILGAS         .178          .121          .107          .121          .185          .178
COAL           .166          0             0             0             0             0
BIGBANKS       .142          0             0             0             .142          0
GUNS           .125          .125          .125          .062          .062          .125
ETFS           .103          .034          .034          .017          .137          .103
N=32
|
====================================================================
====================================================================
8/16/2019
Short-term, the uptrend is based on
rising openings and a rising A/D Line
and should continue. Trump knows how to pressure the Big Banks and
get the word out that the economy is still in very good shape. Whatever
you do, do not go to this scary site: https://www.usdebtclock.org/
This is why Gold looks good!
It's a good bet that the DJI will rally back up to its 65-dma, but what will
happen next is unclear. As I've shown previously, there are a number of
cases where in August the DJI falls back from this barrier, which
is now near 26400 on the DJI: 1971, 1975, 1976, 1985, 1992, 2001,
2002, 2007 and 2008 (9 cases since 1965). There are 5 cases where
the DJI gets past the 65-dma in August and starts a really good run (1965,
1968, 1982, 1983 and 1984) but there are also 5 instances where the
DJI breakout over the 65-dma led to a very limited rally to the upper band
and then a decline to the lower band (1972, 1986, 1999, 2004 and 2014).
More NYSE Up-Volume will be needed, not just higher openings. At the
DJI's 65-dma we will have to be on guard for another ambush by sellers there.
Because the DJI may be able to get past 26400, Buy QQQ at mid-day.
And hold GLD.


QQQ is close to its 65-dma
It could get back above it with
just one more good day. In
Table 2, we see its ITRS and IP21
are both positive.

Always watch how the Market Responds
to Efforts to Scare Investors...
Lots of cross currents now. Right now, the Media seem to be unendingly
trying to get stock prices to fall by heavily focusing on the "inversion of
interest rates" and how Trump's tariffs create too much uncertainty
for businesses to plan and stocks to rally. But the DJI refuses to break below
its key 200-day ma. This is bullish...
Not one to sit still very long, President Trump privately blasted Jamie Dimon
and the other bankers, I surmise, for letting their teams of day traders
drive down the DJI down 800 points on Wednesday. Knowing that they
need White House support, Jamie and the other pillars of Wall Street told their
hot-shot traders to stay away from the short side and run the market
back up. The cheapest way to do this, of course, is in the Futures market
when there are a lot fewer players who could start selling and disrupt
their plans to drive the key indexes back up.
This is all conjecture, I admit. But the big banks do usually run the show
most of the time. So, a recovery back up to the 65-dma is expected. And
that's also what I wrote Thursday night when I re-instated the Buy B2 because
the 200-day ma held.
As you can see from the Peerless chart of the A/D Line. the DJI's
decline
on
Wednesday was also slightly unconfirmed by the NYSE A/D Line and
the
Accumulation Index. Both indicators failed to make new lows. In some
circumstances,
especially with bigger non-confirmations, this would also have brought a
Buy B11 and a Buy B17. So, this helps the market technically. But not so
much
as to guarantee a move by the DJI past the 65-dma yet. I would suggest.
The more basic technical problems for market now still
overhang and limit
the upside poteential. What I did for tonight's Hotline is to look back over
past tests of the lower 3.5% band in August. What I discovered was that
repeatedly the presence of the conditions below all make for much more
technical weakness and present "fair warning" that the Buy B2 is risky because
a bear market may be just around the corner.
(1) a recent Sell S9/S12.
(2) a completed head/shoulders,
(3) a breakdown by the DJI below its 65-dma,
(4) a deeply negative V-I (below -100) and
(5) the 10-day ma of Down NYSE Down Volume being above Up Volume
(The details of this study will be in my new Peerless book)
Really good breadth would help the market a lot know. The A/D Line will
thereby break its downtrend. Lots of NYSE Up-Volume will keep its
10-day ma rising and bring us closer to the point where th 10-day Up
Volume rises above the Down-Volume. Such a bullish juxtaposition
often starts a rally of a month or longer. Note that we also want to see strong
closings, showing that Professionals are buying, too.
My guess is that Trump will now do his part to keep
the rally going and will be
silent about the Trade War with China and how ready he is "double-down".
Buy QQQ. It is the major ETF closest to breaking above its 65-dma.
Hold long GLD, too.
|
Charts 8/16/2019 2019 PEERLESS DJI, Signals, Indicators Daily DJI Volume 10-DayUp/Down Vol Hourly DJIA A/D Line for All Stocks Inverted Traders Index NASDAQ S&P OEX NYSE COMPQX DJI-15 DJI-20 DJI-30 DIA SPY QQQ MDY IWM TNA Short-Term Rates USO-CrudeOil DBO FAS GLD BBH IBB JETS JNUG KOL NUGT OIH OIL RSX RETL SDS AGQ SLV SOXL TECL TLT TMF TNA UGA (gasoline) XIV and China: YINN CHAU Commodities: CANE CORN DBC JJC, NIB, CHOC CORN, CUT (paper) MOO, SOYB WEAT UUP (Dollar) LIT (Lithium) AAPL ADBE ALXN AMAT AMGN AMD AMZN BA BABA BAC BIDU CAT CVX DE FB GOOG GS HD IBM INTU JPM M (Macy's) MSFT NFLX NVDA PG QCOM TSLA TXN XOM WMT CMG , LRCX, SWKS, MDGL SPPI WATT SQ TOWN 8/16/19 (Click on Underlined link.) Bullish MAXCPs - http://tigersoft.com/MAXCPS/Aug-16/BULLISH.htm Bearish MAXCPs - http://tigersoft.com/MINCPs/Aug-16/BEARISH.htm |
Table 1 QUICKSILVER on ETFS - 08/16/19 ETF CLOSE CHANGE PIVOT-PT 5-dma AROC CL-PWR CANDLE IP21 ITRS --------------------------------------------------------------------------------------------- DIA 258.88 2.52 259.34 -82.9% ------- BLUE .073 ---- --------------------------------------------------------------------------------------------- BA 330.45 2.45 332.88 -107.5% Bearish RED -.04 -.062 weak --------------------------------------------------------------------------------------------- SPY 288.85 4.2 288.01 -48.1% ------- BLUE .093 .01 --------------------------------------------------------------------------------------------- QQQ 185.48 2.93 184.35 -27.3% ------- BLUE .062 .04 --------------------------------------------------------------------------------------------- MDY 341.68 7.17 341.57 -69.6% Bullish BLUE .083 -.01 mixed --------------------------------------------------------------------------------------------- IWM 148.63 3.14 148.67 -67.1% ------- BLUE .02 -.012 mixed --------------------------------------------------------------------------------------------- FAS 70.39 3.03 70.18 -229.6% Bullish BLUE .148 -.013 mixed --------------------------------------------------------------------------------------------- RETL 17.67 .96 19.02 -651.9% Bearish BLUE -.026 -.173 weak --------------------------------------------------------------------------------------------- SOXL 148.5 11.23 140.34 102.9% Bullish BLUE .042 .202 --------------------------------------------------------------------------------------------- TECL 154.73 7.99 151.18 -79.4% ------- BLUE .065 .11 --------------------------------------------------------------------------------------------- IBB 104.97 2.29 104.16 -24.5% Bullish BLUE .032 .023 --------------------------------------------------------------------------------------------- GLD 142.78 -.92 142.61 53.4% ------- ---- -.04 .13 --------------------------------------------------------------------------------------------- OIH 11.91 -.37 12.55 -429.3% Bearish RED -.058 -.118 weak --------------------------------------------------------------------------------------------- GASL 9.18 .94 9.76 -511.6% Bearish BLUE -.075 -.56 weakest --------------------------------------------------------------------------------------------- RSX 21.47 -.13 22.34 -205.9% Bearish ---- -.178 -.039 |
 Table 2   Count of Stocks in Key Directories
           20190816
-------------------------------
NEWHIGHS       166
NEWLOWS        17
MAXCP          52
MINCP          20
TTTNH          27
TTTNL          16
FASTUP         23
FASTDOWN       152
CPCROSSA       225
CPCROSSD       95
BIGVOLUP       2
BIGVODN        6
ACCUMVER       11
HIGHIP21       6
HIUPPCT        20
LOWACCUM       95
REDSELL        124
AUGSELS7       12
TRAPDOOR       59
|
Table 3   RANKING OF KEY DIRECTORIES BASED PCT.OF STOCKS ABOVE 65-DMA
              8/16/19
 Bullish = 10
 Bearish = 35
---------------------------------------------------------------------------------------
Directory     Current       day-1         day-2         day-3         day-4         day-5
----------------------------------------------------------------------------------------
BONDFUND       .902          .893          .912          .932          .922          .922
GOLD           .74           .74           .76           .78           .8            .78
UTILITY        .6            .5            .45           .55           .575          .625
SEMI           .592          .453          .462          .574          .518          .555
HOMEBLDG       .588          .529          .529          .705          .647          .705
GREEN          .538          .423          .384          .5            .461          .5
SOLAR          .538          .5            .461          .615          .5            .538
INSURANC       .526          .421          .394          .631          .473          .605
COMPUTER       .523          .476          .476          .619          .571          .571
NASD-100       .52           .346          .367          .571          .469          .561
N=10
================================================================================================
EDU            .5            .5            .5            .5            .5            .5
================================================================================================
REIT           .493          .41           .39           .506          .5            .554
ELECTRON       .483          .367          .406          .509          .464          .503
NIFTY          .473          .35           .385          .543          .456          .526
SOFTWARE       .433          .383          .383          .483          .433          .466
SP500          .414          .337          .308          .465          .403          .472
BEVERAGE       .411          .294          .235          .294          .235          .294
RUS-1000       .399          .312          .3            .452          .391          .468
MILITARY       .392          .392          .357          .428          .428          .464
GAMING         .391          .217          .217          .347          .347          .347
FIDSTKS        .384          .285          .291          .456          .368          .461
SP-100         .377          .288          .288          .444          .377          .455
HOSPITAL       .363          .363          .363          .454          .272          .454
BIOTECH        .339          .29           .293          .376          .327          .364
AUTO           .333          .282          .307          .384          .358          .384
FINANCE        .313          .197          .197          .36           .279          .383
CHEM           .312          .229          .291          .354          .312          .416
DOWJONES       .31           .241          .241          .413          .31           .448
INDEXES        .301          .263          .263          .446          .311          .451
TRANSP         .3            .15           .15           .3            .3            .4
COMODITY       .292          .317          .292          .292          .341          .365
FOOD .259 .277 .259 .259 .296 .314 HACKERS .25 .3 .3 .5 .4 .5 INDMATER .25 .223 .236 .328 .263 .355 CHINA .228 .157 .122 .157 .105 .105 RETAIL .215 .156 .176 .294 .215 .274 COPPER .2 0 0 .2 0 0 JETS .2 .1 .1 .3 .3 .6 INFRA .194 .138 .111 .194 .166 .194 REGBANKS .185 .074 .111 .259 .185 .296 DJI-13 .153 .153 .153 .461 .23 .538 GUNS .125 .125 .062 .062 .125 .125 OILGAS .121 .107 .121 .185 .164 .207 ETFS .034 .034 .017 .137 .103 .137 BIGBANKS 0 0 0 .142 0 .142 COAL 0 0 0 0 0 0 N=35 |
====================================================================
8/15/2019
New research tonight shows
that 3% declines are nearly 4x more likely
to bring a good rally if they occur with the DJI still above the 200-day ma.
So no short selling, for now. And take profits in the bond funds. Hold
Gold, some bearish MINCPs and let's see if the over-night rally can
get past the usual Monday "blues".
New Sell S6s should probably not be given with the
DJI at or above the 200-day ma.

Yesterday, the DJI began a recovery from 25500 just minutes after
I posted my hotline. Had I known the DJI would not break 25500,
I would have been more cautious about announcing a new Sell S6
with the DJI still sitting on the support of its still rising 200-day ma.
Both of the earlier cases of this new type of August-only Sell S6 occurred
with the DJI well below its longer term 200-day ma. I probably should add
the requirment that the DJI must be clearly below its 200-day is. As it is,
the Hotline here would have sold DIA and SPY at the openings today at
256.22 and 284.89 but now the Futures show them up 0.9% higher over night.
Since SPY's falling 65-dma may well act as resistance again, only very nimble
traders should try to play the small difference up to their 65-dma, 264 for DIA
and 291 for SPY.

Blame the full moon. Yesterday's 800 point DJI panic
was caused, they say,
by wealthy investors dumping their stocks and buying longer term bonds. With
market makers loaded up with stocks, an over-night rally does not come as a
surprise. But will it last? Will there not be another wave of sellers coming
in at the 65-dma. A lot will also depend on whether the weekend brings
another "crisis".
|
Charts 8/15/2019 2019 PEERLESS DJI, Signals, Indicators Daily DJI Volume 10-DayUp/Down Vol Hourly DJIA A/D Line for All Stocks Inverted Traders Index NASDAQ S&P OEX NYSE COMPQX DJI-15 DJI-20 DJI-30 DIA SPY QQQ MDY IWM TNA Short-Term Rates USO-CrudeOil DBO FAS GLD BBH IBB JETS JNUG KOL NUGT OIH OIL RSX RETL SDS AGQ SLV SOXL TECL TLT TMF TNA UGA (gasoline) XIV and China: YINN CHAU Commodities: CANE CORN DBC JJC, NIB, CHOC CORN, CUT (paper) MOO, SOYB WEAT UUP (Dollar) LIT (Lithium) AAPL ADBE ALXN AMAT AMGN AMD AMZN BA BABA BAC BIDU CAT CVX DE FB GOOG GS HD IBM INTU JPM M (Macy's) MSFT NFLX NVDA PG QCOM TSLA TXN XOM WMT CMG , LRCX, SWKS, MDGL SPPI WATT SQ TOWN 8/15/19 (Click on Underlined link.) Bullish MAXCPs - http://tigersoft.com/MAXCPS/Aug-15/BULLISH.htm Bearish MAXCPs - http://tigersoft.com/MINCPs/Aug-15/BEARISH.htm |
The Aftermath of 3% Declines Help Define The
Trend:
Recoveries suggest an intermediate-term correction but
follow-throughs can signify a bear market.
The 800 point DJI loss yesterday was actually
"only" a 3% loss. There have
been 101 3% one-day declines since 1980. Many occurred
in bear market years.
1987 and 2008 alone showed 29 instances, with 23 bringing significantly more
weakness. In Table 4 below I rate them for their
success in bringing about
additional declines, year by year. 49 predicted additional weakness but 52
saw the DJI turn up immediately. The years ( 1983-1986,
1988-1989, 1991-1997,
1999-2000, 2004-2006, 2010-2019) where there was no on-going
bear market, showed only 5 cases of additional DJI weakness after a 3% one-day
decline while 19 were quickly followed by a good rally.
This mean that
such panics more are nearly 4x more likely to bring a rally than an additional
DJI decline. Just by itself this makes a rally likely so long as the 200-day ma
is not broken.
Bond Funds Seem Very Risky Now.
Sell Them is my suggestion.
The rush into Bonds and Bond Funds has reached a point that seems to
make a mockery of sane investing. Why would anyone want to lock up
their money for 10 years in a US Treasury Bond with a 1.5% yield? They
would have to not only think that there is no safety in stocks for ten years,
they would have to think that the 23 TRILLION in Government Debt does
matter and they they would have to be true believers of DEFLATION,
such that the prices of real estate, rare paintings, coins, cars, stamps...
will be lower in 10-years. That seems crazy. So, I suggest selling Bond
Funds. Of course, you might wait for the Yield downtrends in the 3-months'
and 10-year bonds to be violated, but I would not. (It also
makes no sense
to me why the 10-year Bond rates, which necessarily involve more uncertainty,
would drop below those for 3-months.) They say that such an "inversion" is
super-bearish, but all the past cases they look at involved much higher interest rates
that were well above 4%.
3-Month Rates


Table 1 QUICKSILVER on ETFS - 08/15/19 ETF CLOSE CHANGE PIVOT-PT 5-dma AROC CL-PWR CANDLE IP21 ITRS --------------------------------------------------------------------------------------------- DIA 256.36 1.28 263.18 -148.9% ------- BLUE .064 0 --------------------------------------------------------------------------------------------- BA 328 7.58 337.55 -125.7% Bearish BLUE-.088 -.062 --------------------------------------------------------------------------------------------- SPY 284.65 .75 291.62 -154.7% ------- RED .081 .004 --------------------------------------------------------------------------------------------- QQQ 182.55 -.21 186.49 -153.5% ------- RED .068 .034 --------------------------------------------------------------------------------------------- MDY 334.51 -.49 346.42 -242.4% Bearish RED .06 -.025 --------------------------------------------------------------------------------------------- IWM 145.49 -.58 150.62 -235.6% Bearish RED -.001 -.034 --------------------------------------------------------------------------------------------- FAS 67.36 1.34 73.6 -497.1% Bullish BLUE .141 -.039 --------------------------------------------------------------------------------------------- RETL 16.71 -.69 20.1 -1244% Bearish RED -.099 -.225 --------------------------------------------------------------------------------------------- SOXL 137.27 -1.14 145.56 -578.1% ------- RED .039 .159 --------------------------------------------------------------------------------------------- TECL 146.74 -.82 157.16 -520.4% Bearish RED .064 .089 --------------------------------------------------------------------------------------------- IBB 102.68 -.35 105.48 -152.7% Bullish RED .014 -.007 --------------------------------------------------------------------------------------------- GLD 143.7 .95 141.26 69.4% ------- BLUE -.002 .143 --------------------------------------------------------------------------------------------- OIL 143.7 .95 141.26 69.4% Bullish BLUE -.028 13.601 --------------------------------------------------------------------------------------------- OIH 11.91 -.37 12.55 -429.3% Bearish RED -.058 -.116 --------------------------------------------------------------------------------------------- GASL 8.24 -.13 10.13 -1116.5% Bearish RED -.162 -.597 --------------------------------------------------------------------------------------------- UGA 8.24 -.13 10.13 -1116.5% Bullish RED -.173 -.734 --------------------------------------------------------------------------------------------- UUP 26.64 .02 26.46 28.3% Bullish ---- .308 .013 --------------------------------------------------------------------------------------------- IEF 26.64 .02 26.46 28.3% Bearish ---- .346 -.76 --------------------------------------------------------------------------------------------- CORN 26.64 .02 26.46 28.3% ------- ---- .322 .63 --------------------------------------------------------------------------------------------- WEAT 26.64 .02 26.46 28.3% ------- ---- .339 3.789 --------------------------------------------------------------------------------------------- YINN 26.64 .02 26.46 28.3% Bullish ---- .088 .201 --------------------------------------------------------------------------------------------- RSX 21.6 -.14 22.38 -244.3% Bearish RED -.102 -.021 |
 Table 2   Count of Stocks in Key Directories
           20190815
-------------------------------
NEWHIGHS       152
NEWLOWS        183
MAXCP          28
MINCP          94
TTTNH          15
TTTNL          145
FASTUP         26
FASTDOWN       280
CPCROSSA       50
CPCROSSD       73
BIGVOLUP       2
BIGVODN        10
ACCUMVER       16
HIGHIP21       6
HIUPPCT        16
LOWACCUM       109
REDSELL        131
AUGSELS7       10
TRAPDOOR       59
|
Table 3  RANKING OF KEY DIRECTORIES BASED PCT.OF STOCKS ABOVE 65-DMA
              8/15/19
  Bullish = 3
  Bearish = 40
---------------------------------------------------------------------------------------
Directory     Current       day-1         day-2         day-3         day-4         day-5
----------------------------------------------------------------------------------------
BONDFUND       .893          .912          .932          .922          .922          .961
GOLD           .74           .76           .78           .8            .78           .82
HOMEBLDG       .529          .529          .705          .647          .705          .764
==============================================================================================
EDU            .5            .5            .5            .5            .5            .5
SOLAR          .5            .461          .615          .5            .538          .653
UTILITY        .5            .45           .55           .575          .6            .625
==============================================================================================
COMPUTER       .476          .476          .619          .571          .571          .619
SEMI           .453          .462          .574          .518          .555          .601
GREEN          .423          .384          .5            .461          .5            .576
INSURANC       .421          .394          .631          .473          .631          .526
REIT           .41           .39           .506          .5            .554          .582
MILITARY       .392          .357          .428          .428          .464          .571
SOFTWARE       .383          .383          .483          .433          .45           .433
ELECTRON       .367          .406          .509          .464          .503          .548
HOSPITAL       .363          .363          .454          .272          .454          .5
NIFTY          .35           .385          .543          .456          .526          .578
NASD-100       .346          .367          .571          .469          .561          .602
SP500          .337          .308          .465          .403          .474          .517
COMODITY       .317          .292          .292          .341          .365          .341
RUS-1000       .312          .3            .452          .391          .469          .508
HACKERS        .3            .3            .5            .4            .5            .5
BEVERAGE       .294          .235          .294          .235          .294          .411
BIOTECH        .29           .293          .376          .327          .364          .385
SP-100         .288          .288          .444          .377          .455          .477
FIDSTKS        .285          .291          .456          .368          .461          .483
AUTO           .282          .307          .384          .358          .384          .435
FOOD           .277          .259          .259          .296          .314          .314
INDEXES        .263          .263
|
| Table 4 > 3% DJI One-Day Sell-offs Additional DJI Decline Bottom: Time to Buy -------------------------------------------------------------------------------- 1980-1981 None 1982 1 1983-1985 None 1986 1 1 1987 6 3 1988 2 1989 1 --------------------------------------------------------------------------- 1980-1989 7 9 1990 1 1 1992-1995 None 1996 1 1997 2 1998 2 2 1999 1 --------------------------------------------------------------------------- 10 16 2000 3 2001 3 1 2002 2 2 2003 1 2004-7 None 2008 17 3 2009 5 7 ----------------------------------------------------------------------------- 28 16 2010 3 2011 2 4 2012-2014 None 2015 1 2016 1 2017 None 2018 1 1 2019 2 ------------------------------------------------------------------------------ 4 11 |
=====================================================================
8/14/2019
The Wealthy who buy bonds are in Panic Mode. Why? The inverted
yield curve is a symptom, not a cause, of their malaise. Populism as
in Argentina could be coming there way, especially if the stock market
and the economy do not hold up Trump's prospects in the US. Presumably,
the Wall Street elite is smart enough to not let the stock market crash.
But a quick and scary 20% decline may come first.
Today's violent reversal down from the 65-dma must be taken as a
revised Sell S6. These
Peerless sell signals occur when the DJI rallies strongly
one day and then falls violently the next. Big money is so eager to get out of the
market that they do not even give the market a second day to rally further
and sell out immediately into the first day's strength. That is exactly what
happened as the DJI rose 400 on the hopes of a tariff war postponement.
As you can see below this is the type of signal that occurs in very dangerous
times, as in 1931 and 2008. So, we must sell our DIA
and SPY positions.
Hold long only GLD some bond funds. Hold some bearish MINCPs short.
There are lots of good candidates.
2019 DJI - Peerless Signals and
Indicators
A 10% decline would bring a re-test of 24600 while a 20% drop
would take the DJI back its December low of 22000. I commented
yesterday on the bearishness of failed rallies in August to the 65-dma
and the existence of multiple head/shoulders patterns. It now appears
that the market most closely resembles August 1898. If so we will
see the DJI fall 20% from its highs. Because of how much easier it is to
employ leveraged short trading vehicles, the decline we are about to
see could be quite dramatic. "Fasten your seat-belt".


Below are the past Sell S6s. The new ones are based on the DJI being
near the 65-dma in August and rising more than 1.5% one day and falling
more than 2% the next day. To prevent selling on too much weakness,
the AROC (annualized rate of change of 21-dma) value must not below
-1.00. As you can see there are no earlier Sell S6s in August. Given how
often the 65-dma turns back rallies in August, this looks like a good addition
to Peerless.
NewType of August Sell S6s:
8/17/1931 and 8/25/2008 and August 14, 2019


                  Peerless Sell S6s: 1929-2019
           (New August Sell S6s are not included in this list.)
Date                          DJIA     Gain       Maximum Paper Loss
                                        Pct                Pct.Loss
-------------------------------------------------------------------------------
19300611      S6             249.1     .082       none       0
19320428      S6              58.2     .187       59.0     -.0137     5/6
19320509      S6              57.0     .170       59.0     -.035      5/6
19320929      S6              71.5     .108       none       0
19371101      S6             135.9     .131       none       0
19380316      S6             122.9     .195       none       0
19460218      S6             201.6     .03        none       0
19480205      S6             170.9     .032       none       0
20080922      S6           11015.69    .148       11143.1  -.0115     9/26
20081021      S6            9033.66   -.003       9065.12  -.0034     10/21
20081114 S6 8497.31 .111 none 0
20090129 S6 8149.01 .191 8280.59 -.0161 2/6
20160125 S6 15885.22 .014 16449.1 -.0355 2/1
-------------------------------------------------------------------------------
Totals: N = 13 .107 -.009
                  Analysis of Sell S6s
                  ====================
Median Gain = 11.1% Median Paper Loss = 0% (very low) Biggest Gains: 4 of 13 (>17%) Gain Significant Paper Loss
-----------------------------------------------------------------------
19320428 .187 59.0 -.0137 5/6
19320509 .170 59.0 -.035 5/6
19380316 .195
20090129 .191 8280.59 -.0161 2/6
-----------------------------------------------------------------------
     8 of 18 cases showed gains which above 10%.
     Only 4 of 13 showed gains which were below 8%
     Maximum Paper Losses
     --------------------
       Biggest = 3.55% (1/25/2016)
2 paper losses were greater than 3.0% (2/13)
       7 - no paper losses. (7/13)
       Ratio avg.gain/avg paper loss = .107/.009
    Returns by Size         No.          Pct.of total
    ---------------         ----         ------------
       Gains over 20%        0             ----
       Gains 10%-19.9%       8             8/13
       Gains 5%-9.9%         1             1/13
       Gains 0%-4.9%         3             3/13
       Losses                1             1/13
       ----------------------------------------------
                            13
    Returns by Year             No.          Avg.Gain
    ---------------            ----         ------------
       Presid.Election Year     8              .096
       Year after Election Year 2              .161
       Mid-Term Election Year   3              .102
       Year before Pres.E.Yr.   0              ----
       ----------------------------------------------
                               13              .107
    Returns by Month            No.          Avg.Gain
    ---------------            ----         ------------
            January             2             .102
            February            2             .03
            March               1             .195
            April               1             .186
            May                 1             .17
            June                1             .082
            September           2             .128
            October             1            -.004
            November            2             .12
    -------------------------------------------------
                               13             .107
|
1998 Now Looks Like Closest Historical
Parallel
The DJIA and the market now bears closest remblance to August
1998.
The DJI did not stop falling until October 1998 and not until it fell very nearly 20%.
1998 Chart

In the 1998 DJI chart I showed last night and just below, notice the earler Sell S9s,
Sell S12s, the false breakout and the decline that could not be stopped by
the lower band. What I did not know last night when I
mentioned the parallel
between then and now was how fast bond yields were also falling then, how weak
oil prices were just like now and finally how strong Gold was back then. See the
1998 charts below, particularly how the yield on the 10 year bond fell in August
as big investors rushed to sell their stocks and buy safer bonds. In addition, see
how my surrogate for GLD, Newmont Mining (NEM) doubled in price as the
panic spread over Russia's impending default on its loans in the Fall of 1989.
It was at this time, that Crude Oil fell, from 38.95 at the beginning of 1997 to 17.75
in late 1998. The one difference between 1998 and 2019 was that the NYSE
A/D Line did not confirm the July high in 1998. Ours now is stronger.
1998 Falling Interest Rates - Wealthy Investors Panic - DJI falls 20% |
 |
                                                                       Charts 8/14/2019
                              2019 PEERLESS DJI, Signals, Indicators    Daily DJI Volume   10-DayUp/Down Vol
                              Hourly DJIA    A/D Line for All Stocks      Inverted Traders Index
                              NASDAQ   S&P    OEX    NYSE    COMPQX   DJI-15   DJI-20   DJI-30
                              DIA   SPY   QQQ   MDY   IWM     TNA       Short-Term Rates

                              USO-CrudeOil  DBO  FAS   GLD  BBH  IBB  JETS  JNUG  KOL  NUGT  OIH   OIL   RSX   RETL
                              SDS   AGQ    SLV  SOXL   TECL  TLT  TMF  TNA   UGA  (gasoline) XIV  and China: YINN   CHAU

                               Commodities:   CANE  CORN  DBC JJC, NIB, CHOC  CORN, CUT (paper)
                               MOO, SOYB  WEAT  UUP (Dollar) LIT (Lithium)

                                AAPL  ADBE  ALXN  AMAT  AMGN  AMD AMZN   BA  BABA  BAC  BIDU   CAT   CVX   DE
                                FB  GOOG   GS  HD   IBM   INTU  JPM  M (Macy's)  MSFT   NFLX  NVDA  PG  QCOM   TSLA
                                TXN   XOM  WMT CMG , LRCX,  SWKS,  MDGL   SPPI  WATT  SQ  TOWN

                                8/14/19  (Click on Underlined link.)
                                Bullish MAXCPs -   http://tigersoft.com/MAXCPS/Aug-14/BULLISH.htm
                                Bearish MAXCPs -  http://tigersoft.com/MINCPs/Aug-14/BEARISH.htm
|
Table 1 QUICKSILVER on ETFS - 08/14/19 ETF CLOSE CHANGE PIVOT-PT 5-dma AROC CL-PWR CANDLE IP21 ITRS --------------------------------------------------------------------------------------------- DIA 255.08 -8.09 264.13 -98.5% ------- RED .014 ---- --------------------------------------------------------------------------------------------- BA 320.42 -12.44 336.35 -164% Bearish RED -.096 -.076 --------------------------------------------------------------------------------------------- SPY 283.9 -8.65 293.62 -70% ------- RED .036 .006 --------------------------------------------------------------------------------------------- QQQ 182.76 -5.63 188.26 -40% ------- RED .04 .039 --------------------------------------------------------------------------------------------- MDY 335 -10.37 351.18 -127% Bearish RED .05 -.023 --------------------------------------------------------------------------------------------- IWM 146.07 -4.2 152.54 -108.1% Bearish RED -.002 -.033 --------------------------------------------------------------------------------------------- FAS 66.02 -6.31 74.45 -328% ------- RED .101 -.031 --------------------------------------------------------------------------------------------- RETL 17.4 -2.56 21.59 -794.7% Bearish RED -.258 -.236 Very Weak -------------------------------------------------------------------------------------------- SOXL 138.41 -14.32 154.18 -140.1% Bullish RED .043 .142 --------------------------------------------------------------------------------------------- TECL 147.56 -14.62 163 -142.3% Bearish RED .039 .138 --------------------------------------------------------------------------------------------- IBB 103.03 -2.35 105.88 -47.2% Bullish RED .025 -.005 --------------------------------------------------------------------------------------------- GLD 142.75 .97 141.73 61.1% ------- RED .01 .135 --------------------------------------------------------------------------------------------- OIH 11.91 -.37 12.55 -429.3% Bearish RED -.058 -.119 Weak -------------------------------------------------------------------------------------------- RSX 21.74 -.67 22.69 -184.6% Bearish RED -.131 -.02 |
Table 2 Count of Stocks in Key Directories
20190814
-------------------------------
NEWHIGHS 89
NEWLOWS 222
MAXCP 13
MINCP 88
TTTNH 16
TTTNL 105
FASTUP 40
FASTDOWN 202
CPCROSSA 26
CPCROSSD 345
BIGVOLUP 4
BIGVODN 17
ACCUMVER 13
HIGHIP21 6
HIUPPCT 15
VHIP21 110
LOWACCUM 15
REDSELL 126
AUGSELS7 15
TRAPDOOR 59
|
Table 3RANKING OF KEY DIRECTORIES BASED PCT.OF STOCKS ABOVE 65-DMA
8/14/19
Bullish = 3
Bearish = 42
---------------------------------------------------------------------------------------
Directory Current day-1 day-2 day-3 day-4 day-5
----------------------------------------------------------------------------------------
BONDFUND .912 .932 .922 .922 .961 .941
GOLD .76 .78 .8 .78 .82 .8
HOMEBLDG .529 .705 .647 .705 .764 .588
==========================================================================================
EDU .5 .5 .5 .5 .5 .333
==========================================================================================
COMPUTER .476 .619 .571 .571 .619 .523
SOLAR .461 .615 .5 .538 .692 .538
SEMI .457 .57 .514 .551 .607 .514
UTILITY .45 .55 .575 .6 .625 .5
ELECTRON .405 .509 .464 .503 .549 .47
INSURANC .394 .631 .473 .631 .526 .421
REIT .39 .506 .5 .554 .582 .465
NIFTY .385 .543 .456 .526 .578 .421
GREEN .384 .5 .461 .5 .576 .5
SOFTWARE .383 .483 .433 .45 .433 .283
NASD-100 .367 .571 .469 .561 .591 .397
HOSPITAL .363 .454 .272 .454 .5 .454
MILITARY .357 .428 .428 .464 .571 .5
SP500 .308 .465 .403 .474 .515 .389
AUTO .307 .384 .358 .384 .435 .333
HACKERS .3 .5 .4 .5 .5 .25
RUS-1000 .3 .452 .391 .469 .503 .382
BIOTECH .293 .376 .327 .364 .382 .336
COMODITY .292 .292 .341 .365 .341 .341
CHEM .291 .354 .312 .416 .458 .25
FIDSTKS .291 .456 .368 .461 .483 .368
SP-100 .288 .444 .377 .455 .477 .388
INDEXES .263 .446 .311 .456 .602 .327
FOOD .259 .259 .296 .314 .314 .296
INDMATER .236 .328 .263 .342 .394 .263
BEVERAGE .235 .294 .235 .294 .411 .294
DOWJONES .233 .4 .3 .433 .466 .4
GAMING .217 .347 .347 .347 .478 .347
FINANCE .197 .36 .279 .383 .395 .302
RETAIL .176 .294 .215 .274 .392 .294
DJI-13 .153 .461 .23 .538 .538 .384
TRANSP .15 .3 .3 .4 .4 .35
CHINA .122 .157 .105 .105 .122 .105
OILGAS .121 .185 .164 .2 .192 .185
INFRA .111 .194 .166 .194 .222 .194
REGBANKS .111 .259 .185 .296 .222 .185
JETS .1 .3 .3 .6 .6 .5
GUNS .062 .062 .125 .125 .25 .187
ETFS .017 .14 .105 .122 .175 .087
BIGBANKS 0 .142 0 .142 .142 .142
COAL 0 0 0 0 0 0
COPPER 0 .2 0 0 .2 0
|
======================================================================
8/13/2019
The
operative Peerless signal remains a Buy B2. But Down-Volume remains high
and the DJI's AROC (21-dma) momentum is still bearishly falling. Besides the
multiple head/shoulders, the DJI is showing important
weakness by not being
able to get past the resistance of its 65-dma. This is recurring problem in August
as you can see in a number of DJI charts. Below are
examples since 1991.
We have no Sell signal for this, but the examples below show how such August
rally failures often are valid warnings. And even when the 65-dma is overcome,
often that only leads to a September top.


The lesson here would seem to be that we should not be in any hurry to
take leveraged ETF positions and we should be hedged by shorting some
Bearish MINCP stocks. It remains to be seen if the DJI's recent support
around 25500 will hold or there shall have to be a test of 24500, which
would amount to a 10% decline from the DJI's July highs. The QQQ
did do a little better than than the DJI, but its volatility is greater and
its risk is higher if the 25500 support does not hold. Hold
long only DIA
and SPY as well as GLD and some bond funds.
What Do Failed Attempts to
Get Past the
the DJI's 65-dma in August Mean?
1975 shows repeated failures to get past the 65-dma in
August simply allowed
a bigger base to be built up which allowed a powerful breakout in 1976, the
Presidential Election year. Realistically, this may be the most likely bullish
scenario now. But the 1975 case also shows that a 10% retreat from the highs
is probably needed if the 65-dma turns back the DJI repeatedly.
1975 - 10% Pullback Needed.

1998, 2001, 2002 and 2008 show the worst case
scenarios. Notice the false breakout
(but no B10) in 1998. Also see how much weaker the A/D Line was back then
compared to ours now. In other years, the DJI
succeeds in finally getting back
above its flat or falling 65-dma, only to top out badly in September. See this in
the years: 1976, 2012, 2013 and 2014. Really bullish Augusts do exist! 1982 is
the best example. In good years the DJI stays mostly above its rising 65-dma.
Example: 1995.
1998 Case

2001 also showed multiple failures to get above its 65-dma in
August after
completing an earlier head/shoulders top. In this case, the rising NYSE A/D Line
did not protect the market from a big decline. Note the very negative V-I readings
in August.
2001 Case

Bear Market Examples....2002 and 2008


|
Charts 8/13/2019 2019 PEERLESS DJI, Signals, Indicators Daily DJI Volume 10-DayUp/Down Vol Hourly DJIA A/D Line for All Stocks Inverted Traders Index NASDAQ S&P OEX NYSE COMPQX DJI-15 DJI-20 DJI-30 DIA SPY QQQ MDY IWM TNA Short-Term Rates USO-CrudeOil DBO FAS GLD BBH IBB JETS JNUG KOL NUGT OIH OIL RSX RETL SDS AGQ SLV SOXL TECL TLT TMF TNA UGA (gasoline) XIV and China: YINN CHAU Commodities: CANE CORN DBC JJC, NIB, CHOC CORN, CUT (paper) MOO, SOYB WEAT UUP (Dollar) LIT (Lithium) AAPL ADBE ALXN AMAT AMGN AMD AMZN BA BABA BAC BIDU CAT CVX DE FB GOOG GS HD IBM INTU JPM M (Macy's) MSFT NFLX NVDA PG QCOM TSLA TXN XOM WMT CMG , LRCX, SWKS, MDGL SPPI WATT SQ TOWN 8/13/19 (Click on Underlined link.) Bullish MAXCPs - http://tigersoft.com/MAXCPS/Aug-13/BULLISH.htm Bearish MAXCPs - http://tigersoft.com/MINCPs/Aug-13/BEARISH.htm |
Table 1 QUICKSILVER on ETFS - 08/13/19 ETF CLOSE CHANGE PIVOT-PT 5-dma AROC CL-PWR CANDLE IP21 ITRS
---------------------------------------------------------------------------------------------
DIA 263.17 3.83 260.24 55.1% ------- BLUE .102 ----
---------------------------------------------------------------------------------------------
BA 332.86 -.02 331.38 6.1% Bearish BLUE-.056 -.077
---------------------------------------------------------------------------------------------
SPY 292.55 4.54 287.97 82% ------- BLUE .101 .006
---------------------------------------------------------------------------------------------
QQQ 188.39 4.04 184.25 138.4% Bullish BLUE .092 .048
---------------------------------------------------------------------------------------------
MDY 345.37 3.8 343.78 32.3% Bullish BLUE .105 -.021
---------------------------------------------------------------------------------------------
IWM 150.27 1.6 149.32 30.3% Bullish BLUE .032 -.032
---------------------------------------------------------------------------------------------
FAS 72.33 2.15 70.76 88.9% Bullish BLUE .176 .077
high
---------------------------------------------------------------------------------------------
SOXL 152.73 12.39 142.53 454.9% Bullish BLUE .084 .368
---------------------------------------------------------------------------------------------
TECL 162.18 11 152.03 417.4% ------- BLUE .07 .323
---------------------------------------------------------------------------------------------
IBB 105.38 1.22 104.02 78.4% Bullish BLUE .039 -.016
--------------------------------------------------------------------------------------------
GLD 141.78 -.83 141.02 101.7% Bullish RED .009 .074
---------------------------------------------------------------------------------------------
OIH 11.91 -.37 12.55 -429.3% Bearish RED -.058 -.173
---------------------------------------------------------------------------------------------
RSX 22.41 .07 22.57 -26.7% Bearish BLUE-.12 -.044
|
 Table 2   Count of Stocks in Key Directories
           20190813
-------------------------------
NEWHIGHS       140
NEWLOWS        42
MAXCP          57
MINCP          26
TTTNH          36
TTTNL          14
FASTUP         68
FASTDOWN       137
CPCROSSA       173
CPCROSSD       37
BIGVOLUP       5
BIGVODN        12
ACCUMVER       20
HIGHIP21       6
HIUPPCT        17
LOWACCUM       110
REDSELL        127
AUGSELS7       15
TRAPDOOR       55
|
Table 1 QUICKSILVER on ETFS - 08/13/19 ETF CLOSE CHANGE PIVOT-PT 5-dma AROC CL-PWR CANDLE IP21 ITRS --------------------------------------------------------------------------------------------- DIA 263.17 3.83 260.24 55.1% ------- BLUE .102 ---- --------------------------------------------------------------------------------------------- BA 332.86 -.02 331.38 6.1% Bearish BLUE-.056 -.077 --------------------------------------------------------------------------------------------- SPY 292.55 4.54 287.97 82% ------- BLUE .101 .006 --------------------------------------------------------------------------------------------- QQQ 188.39 4.04 184.25 138.4% Bullish BLUE .092 .048 --------------------------------------------------------------------------------------------- MDY 345.37 3.8 343.78 32.3% Bullish BLUE .105 -.021 --------------------------------------------------------------------------------------------- IWM 150.27 1.6 149.32 30.3% Bullish BLUE .032 -.032 --------------------------------------------------------------------------------------------- FAS 72.33 2.15 70.76 88.9% Bullish BLUE .176 .077 --------------------------------------------------------------------------------------------- SOXL 152.73 12.39 142.53 454.9% Bullish BLUE .084 .368 --------------------------------------------------------------------------------------------- TECL 162.18 11 152.03 417.4% ------- BLUE .07 .323 --------------------------------------------------------------------------------------------- IBB 105.38 1.22 104.02 78.4% Bullish BLUE .039 -.016 -------------------------------------------------------------------------------------------- GLD 141.78 -.83 141.02 101.7% Bullish RED .009 .074 --------------------------------------------------------------------------------------------- OIH 11.91 -.37 12.55 -429.3% Bearish RED -.058 -.173 --------------------------------------------------------------------------------------------- RSX 22.41 .07 22.57 -26.7% Bearish BLUE-.12 -.044 |
====================================================================
8/12/2019
The operative Peerless
signal remains a Buy B2. August Buy B2s generally
bring little or no paper loss. The biggest exception was the Buy B2 just before
Germany invaded Poland and World War II began. Let's hope nothing like
that occurs in our time. The news of 50% decline in leading Argentine Bank
Stocks, continued chaos in Hong Kong and more heat than resolution in Trump's
trade war with China sent the DJI down today to a re-test of the two previous
daily lows at 25400-25500.
If 25400 does not hold, 24600 will likely be next support.
Tuesdays do often bring turn-arounds after a weak Monday,
but the many head/shoulders patterns and the failure
of the last rally up to the 65-dma should still make us cautious.
The 65-dma at 26331 will likely be the acting barrier for the
next rally unless there is a breakthrough in the realm of tariffs.
Unless you are a short-term trader, you probably want 1000
DJI points of upside potential. So, if 26330 does turn back the
next rally, my guess is that we will have to buy next at 24600.

Buy B2s in August are unusually reliable, but the US markets
have risen for a
long time and a long ways, so profit-taking has to be expected when the news is
scary over the weekend. Apart from the mini-head and shoulders at the DJI's
top above 27000, which tends to work against a simple one-time test of the
lower band, Peerless has to consider the current decline will likely end up
being a good buying opportunity. But not until the key ETFs' Closing Powers
stop falling and the new NYSE A/D Line downtrend is broken. Until then,
hold only DIA and SPY as well as GOLD (GLD) and some Bond Funds, which
did very well today.
         All August Peerless Buy B2s: 1929-2019
 Total N = 112      Avg.  .092     Max Paper Loss Avg. = -.008
August Buy B2s Date DJIA Gain Maximum Paper Loss
Pct.Loss
-------------------------------------------------------------------------------
19310810 B2 134.3 .055 none 0
(Bear Market, Year before Pres. Election)
19360821 B2 160.8 .178 perfect 0
(Bull Market)
19380815 B2 136.9 .045 none 0
19380829 B2 137.1 .044 perfect 0
19390810 B2 137.3 .122 131.3 -.0436 8/24
(War about to start in Europe.)
19400816      B2             121.3     .114       none      0
19550809      B2             448.8     .046       perfect   0
 (Bull Market, Year before Pres. Election)
19680808      B2             870.37    .123       869.65   -.0008     8/9
 (Bull Market)
19700813      B2             707.35    .325       perfect   0
19730823      B2             864.46    .04        none      0
19760826 B2 960.44 .051 none 0 (Bull Market) 19830808 B2 1163.06 .097 perfect 0 (Bull Market, Year before Pres Election) 19880810 B2 2034.14 .073 1990.22 -.0215 8/22 19880818 B2 2027.03 .077 1990.22 -.0181 8/22 19920821 B2 3254.10 .038 3232.22 -.0067 8/25 (Bull Market) 20100827 B2 10150.65 .262 none 0
20130826 B2 14946.46 .016 14776.1 -.0113 8/27
(Bull Market)
==========================================================================
20190806 B2 26029.52 .965 open
==========================================================================
Total N = 17 Avg. 10.0% Median Gain = 7.3%
11/17 show no paper loss.
One paper loss was big, -4.4% (Was started in Europe. Poland invaded.)
All Year before Election Year N=23 Avg.Gain =.086
All Bull Market Augusts = +.178 + .046 + .123 + .051 +.097 +.038 + .016
N = 7 Avg.=7.8% Mean Gain = 5.1% 5/8 show no paper losses 2 showed 1.1% and 2.2%
|
DIA |
SPY |
DOLLAR |
GLD - Gold |
TMF - Leveraged Play on US 20 - Year Bonds |
|
Charts 8/12/2019 2019 PEERLESS DJI, Signals, Indicators Daily DJI Volume 10-DayUp/Down Vol Hourly DJIA A/D Line for All Stocks Inverted Traders Index NASDAQ S&P OEX NYSE COMPQX DJI-15 DJI-20 DJI-30 DIA SPY QQQ MDY IWM TNA Short-Term Rates USO-CrudeOil DBO FAS GLD BBH IBB JETS JNUG KOL NUGT OIH OIL RSX RETL SDS AGQ SLV SOXL TECL TLT TMF TNA UGA (gasoline) XIV and China: YINN CHAU Commodities: CANE CORN DBC JJC, NIB, CHOC CORN, CUT (paper) MOO, SOYB WEAT UUP (Dollar) LIT (Lithium) AAPL ADBE ALXN AMAT AMGN AMD AMZN BA BABA BAC BIDU CAT CVX DE FB GOOG GS HD IBM INTU JPM M (Macy's) MSFT NFLX NVDA PG QCOM TSLA TXN XOM WMT CMG , LRCX, SWKS, MDGL SPPI WATT SQ TOWN 8/12/19 (Click on Underlined link.) Bullish MAXCPs - http://tigersoft.com/MAXCPS/Aug-12/BULLISH.htm Bearish MAXCPs - http://tigersoft.com/MINCPs/Aug-12/BEARISH.htm |
Table 1 QUICKSILVER on ETFS - 08/12/19 ETF CLOSE CHANGE PIVOT-PT 5-dma AROC CL-PWR CANDLE IP21 ITRS
---------------------------------------------------------------------------------------------
DIA 259.18 -4 260.29 39.8% ------- RED .107 -----
---------------------------------------------------------------------------------------------
BA 332.88 -4.67 332.45 27.3% Bearish RED -.027 -.07
---------------------------------------------------------------------------------------------
SPY 288.08 -3.54 287.8 73.7% ------- RED .077 .002
---------------------------------------------------------------------------------------------
QQQ 184.35 -2.14 183.26 98.1% Bearish RED .085 .016
---------------------------------------------------------------------------------------------
MDY 341.52 -4.9 343.14 38.6% ------- RED .081 -.01
---------------------------------------------------------------------------------------------
IWM 148.67 -1.95 149.36 22.3% ------- RED .006 -.025
---------------------------------------------------------------------------------------------
FAS 70.17 -3.43 71.05 143.2% ------- RED .126 .058
---------------------------------------------------------------------------------------------
SOXL 140.34 -5.22 139.59 214.4% Bearish RED .048 .28
---------------------------------------------------------------------------------------------
TECL 151.18 -5.98 149.28 297.3% Bearish RED .011 .175
---------------------------------------------------------------------------------------------
IBB 104.16 -1.32 103.74 89.7% Bullish RED .045 -.002
---------------------------------------------------------------------------------------------
GLD 142.59 1.33 138.91 171.3% Bullish BLUE-.002 .112
warning
---------------------------------------------------------------------------------------------
OIH 14.64 -.34 14.58 0% Bearish RED .038 -.131
---------------------------------------------------------------------------------------------
RSX 23.75 -.18 24.12 -14.6% ------- ---- .059 .057
|
Table 2 Count of Stocks in Key Directories
20190812
-------------------------------
NEWHIGHS 166
NEWLOWS 134
MAXCP 26
MINCP 72
TTTNH 22
TTTNL 151
FASTUP 78
FASTDOWN 151
CPCROSSA 61
CPCROSSD 306
BIGVOLUP 12
BIGVODN 12
ACCUMVER 11
HIGHIP21 7
HIUPPCT 13
VHIP21 107
LOWACCUM 104
REDSELL 125
AUGSELS7 12
TRAPDOOR 55
|
Table 3  RANKING OF KEY DIRECTORIES BASED PCT.OF STOCKS ABOVE 65-DMA
               8/12/19
    Bullish = 6
    Bearish = 38
---------------------------------------------------------------------------------------
Directory     Current       day-1         day-2         day-3         day-4         day-5
----------------------------------------------------------------------------------------
BONDFUND       .922          .922          .961          .941          .961          .961
GOLD           .8            .78           .82           .8            .8            .82
HOMEBLDG       .647          .705          .764          .588          .529          .47
UTILITY        .575          .6            .625          .5            .475          .4
COMPUTER       .571          .571          .619          .523          .476          .333
SEMI           .518          .555          .611          .527          .49           .444
N = 6
=============================================================================================
EDU            .5            .5            .5            .333          .166          .166
REIT           .5            .554          .582          .465          .39           .28
=============================================================================================
SOLAR          .48           .52           .68           .52           .52           .44
INSURANC       .473          .631          .526          .447          .552          .394
NASD-100       .469          .561          .591          .418          .377          .306
ELECTRON       .464          .503          .548          .477          .445          .412
GREEN          .461          .5            .576          .5            .5            .307
NIFTY          .456          .526          .578          .438          .403          .333
SOFTWARE       .433          .45           .433          .316          .3            .216
MILITARY       .428          .464          .571          .5            .571          .392
SP500          .403          .474          .515          .395          .362          .308
HACKERS        .4            .5            .5            .3            .3            .25
RUS-1000       .391          .469          .503          .384          .36           .289
SP-100         .377          .455          .477          .388          .411          .3
FIDSTKS        .368          .461          .483          .373          .373          .274
AUTO           .358          .384          .435          .333          .41           .358
GAMING         .347          .347          .478          .347          .478          .434
COMODITY       .341          .365          .341          .341          .317          .317
BIOTECH        .327          .364          .382          .339          .313          .267
CHEM           .312          .416          .458          .25           .25           .208
INDEXES        .311          .456          .602          .327          .29           .231
DOWJONES       .31           .448          .482          .413          .448          .206
JETS           .3            .6            .6            .5            .5            .4
TRANSP         .3            .4            .4            .35           .35           .3
FOOD           .296          .314          .314          .296          .277          .277
FINANCE        .279          .383          .395          .302          .36           .244
HOSPITAL       .272          .454          .5            .454          .318          .318
INDMATER       .263          .342          .394          .263          .25           .197
BEVERAGE       .235          .294          .411          .294          .235          .235
DJI-13         .23           .538          .538          .384          .461          .23
RETAIL         .215          .274          .392          .294          .235          .196
REGBANKS       .185          .296          .222          .185          .259          .111
INFRA          .166          .194          .222          .194          .194          .194
OILGAS         .164          .2            .192          .185          .178          .15
GUNS           .125          .125          .25           .187          .125          .125
CHINA          .105          .105          .122          .105          .105          .07
ETFS           .105          .122          .175          .087          .087          .07
BIGBANKS       0             .142          .142          .142          .285          0
COAL           0             0             0             0             0             0
COPPER         0             0             .2            0             .2            0
=============================================================================================
|
====================================================================
8/9/2019 The operative Peerless signal is a Buy
B2. The failed breakout at 27000
will likely act as resistance to the next good rally, while 25500-25600 is
the current zone of support. The likelihood of the US-China trade war
continuing and even heating up does not bode well for the World Economy.
This will mean more weak openings, like today's appear to be. If the Dollar
stays strong, foreign "hot" money will continue to flow into US blue chips
and prop up stock prices. But we are running out of time. The bearish
months of September and October are getting closer. Stay long only SPY,
DIA, GLD and some bond funds.
Right now the DJI is trying to get past its 65-dma resistance.
A turn down
tomorrow will have the effect of causing the 65-dma to fall and act as resistance.
A weak close will keep the Closing Power falling. That combination will likely
bring a test of 25500 and make the mini-head/shoulders top look more
menacing.
But assuming, the rally continues after another weak Monday, the next upside target
will be the DJI's falling 21-dma at 26900. We will need to see strong closes
so that the Tiger Closing Power turns bullish on the main ETFs' charts.
We also will need prices to be strong enough to turn back up the now
flat 65-dma. A failure of this rally at a falling 65-dma would be bearish.
This is one of the surest "tells" that a serious decline is in the making.
See the
second set of charts below.
By my reckoning from the history of third years in a four year Presidential
cycle, the odds are good that the market will likely hit a new peak and then
turn down in late August or September. That means this is a trading
rally and we should look at some of the leading
charts from last October to
to see how we might spot a market top in case the rally does not reach the
2% upper band where Peerless would most easily give a Sell. Of course,
last October did give a near-perfect Sell S9. See the second set of charts
below.
|
DIA must not stall out here at its flat 65-dma and it must
have its Closing Power get bullishly back above its falling 21-dma. Even so, expect resistance at its now falling 21-dma.  |
 |
 |
 |
Even without Peerless, you should be able to call the next
top. Look for
the following:
1) A rally that ends when the steep Closing Power uptrend-line is broken.
2) Price break their own uptrend and then drop significantly below the 65-dma
3) The Closing Power trend (21-dma) points bearishly down.
4) Prices cannot get back above the falling 65-dma and then give way badly.
You will see a sequence of events similar to the ones outlined above for most
big stocks and ETFs. Smaller ones are often so polite, They may not have
rallies back to their falling 65-dma for long time. This will depend on the amount
of "dumping", "distribution" (insider selling) and market conditions.
Calling Last October's Top in SPY, BA, MSFT, VISA.
 |
 |
 |
 |
A bearish Head/Shoulder like APPL showed last September
can cause so much price weakness that there is no "last chance"
to sell at a falling 65-dma. The same is true if there is heavy
distribution, as shown in the case of ADM
 |
 |
|
Charts 8/9/2019 2019 PEERLESS DJI, Signals, Indicators Daily DJI Volume 10-DayUp/Down Vol Hourly DJIA A/D Line for All Stocks Inverted Traders Index NASDAQ S&P OEX NYSE COMPQX DJI-15 DJI-20 DJI-30 DIA SPY QQQ MDY IWM TNA Short-Term Rates USO-CrudeOil DBO FAS GLD BBH IBB JETS JNUG KOL NUGT OIH OIL RSX RETL SDS AGQ SLV SOXL TECL TLT TMF TNA UGA (gasoline) XIV and China: YINN CHAU Commodities: CANE CORN DBC JJC, NIB, CHOC CORN, CUT (paper) MOO, SOYB WEAT UUP (Dollar) LIT (Lithium) AAPL ADBE ALXN AMAT AMGN AMD AMZN BA BABA BAC BIDU CAT CVX DE FB GOOG GS HD IBM INTU JPM M (Macy's) MSFT NFLX NVDA PG QCOM TSLA TXN XOM WMT CMG , LRCX, SWKS, MDGL SPPI WATT SQ TOWN 8/9/19 (Click on Underlined link.) Bullish MAXCPs - http://tigersoft.com/MAXCPS/Aug-9/BULLISH.htm Bearish MAXCPs - http://tigersoft.com/MINCPs/Aug-9/BEARISH.htm |
Table 1    QUICKSILVER on ETFS - 08/9/19

  All 5-dma are falling except GLD and IBB.
  FAS and SOXL are most bullish.
  OIH is most bearish.
ETF CLOSE CHANGE PIVOT-PT 5-dma AROC CL-PWR CANDLE IP21 ITRS
---------------------------------------------------------------------------------------------
DIA 263.18 -.95 257.1 -31.2% ------- RED .172 -------
---------------------------------------------------------------------------------------------
BA 337.55 1.2 331.06 -30.1% Bearish BLUE .016 -.08
---------------------------------------------------------------------------------------------
SPY 291.62 -2 283.82 -17.3% ------- RED .123 0
---------------------------------------------------------------------------------------------
QQQ 186.49 -1.77 180.73 -23.3% ------- RED .124 .01
---------------------------------------------------------------------------------------------
MDY 346.42 -4.76 338.86 -33.6% Bullish RED .125 -.006
---------------------------------------------------------------------------------------------
IWM 150.62 -1.92 148 -65.2% ------- RED .042 -.027
---------------------------------------------------------------------------------------------
FAS 73.6 -.85 68.12 -106.4% Bullish BLUE .205 .078
high
---------------------------------------------------------------------------------------------
SOXL 145.56 -8.62 134.2 -303.8% Bullish RED .104 .269
high
---------------------------------------------------------------------------------------------
TECL 157.16 -5.84 142.1 -153.6% ------- RED .056 .16
---------------------------------------------------------------------------------------------
IBB 105.48 -.4 102.29 19.7% Bullish BLUE .056 -.009
---------------------------------------------------------------------------------------------
GLD 141.26 -.47 137.79 193.1% Bullish ---- .01 .116
slipping
---------------------------------------------------------------------------------------------
OIH 11.91 -.37 12.55 -429.3% Bearish RED -.058 -.159
---------------------------------------------------------------------------------------------
RSX 22.38 -.31 22.2 -42.2% Bearish RED -.13 -.014
|
 Table 2   Count of Stocks in Key Directories
           20190809
-------------------------------
NEWHIGHS       153
NEWLOWS        89
MAXCP          56
MINCP          55
TTTNH          32
TTTNL          113 Day Traders remain bearish.
FASTUP         86
FASTDOWN       199 Swing  Traders are net bearish.
CPCROSSA       225
CPCROSSD       33
BIGVOLUP       4
BIGVODN        12
ACCUMVER       12
HIGHIP21       9
HIUPPCT        13
LOWACCUM       115
REDSELL        120
AUGSELS7       16
TRAPDOOR       49
|
 Table 3    RANKING OF KEY DIRECTORIES BASED PCT.OF STOCKS ABOVE 65-DMA
              8/9/19
 Bullish = 14
 Bearish = 29
---------------------------------------------------------------------------------------
Directory     Current       day-1         day-2         day-3         day-4         day-5
----------------------------------------------------------------------------------------
BONDFUND       .922          .961          .941          .961          .961          .97
GOLD           .78           .82           .8            .8            .82           .82
HOMEBLDG       .705          .764          .588          .529          .47           .529
INSURANC       .631          .526          .447          .552          .394          .605
JETS           .6            .6            .5            .5            .4            .7
UTILITY        .6            .625          .5            .475          .4            .675
COMPUTER       .571          .619          .523          .476          .333          .571
NASD-100       .561          .591          .418          .377          .295          .551
SEMI           .555          .611          .527          .49           .416          .666
REIT           .554          .582          .465          .39           .287          .486
DJI-13         .538          .538          .384          .461          .23           .461
NIFTY          .526          .578          .438          .403          .333          .561
SOLAR          .52           .68           .52           .52           .44           .64
              slipped.
ELECTRON       .506          .551          .48           .448          .389          .59
-------------------------------------------------------------------------------------------------
EDU            .5            .5            .333          .166          .166          .166
GREEN          .5            .576          .5            .5            .307          .538
HACKERS        .5            .5            .3            .3            .25           .5
-------------------------------------------------------------------------------------------------
SP500          .474          .515          .395          .362          .308          .503
RUS-1000       .469          .503          .384          .36           .288          .473
MILITARY       .464          .571          .5            .571          .392          .428
FIDSTKS        .461          .483          .373          .373          .28           .505
INDEXES        .459          .605          .329          .291          .227          .524
SOFTWARE       .457          .44           .322          .305          .22           .423
SP-100         .455          .477          .388          .411          .288          .5
HOSPITAL       .454          .5            .454          .318          .318          .409
DOWJONES       .433          .466          .4            .433          .2            .566
^^^^^^^^^^^^^^^^^^^^^^^^^^^^^^^^^^^^^^^^^^^^^^^^^^^^^^^^^^^^^^^^^^^^^^^^^^^^
CHEM           .416          .458          .25           .25           .208          .312
TRANSP         .4            .4            .35           .35           .3            .55
AUTO           .384          .435          .333          .41           .358          .461
FINANCE        .383          .395          .302          .36           .232          .441
BIOTECH        .365          .383          .34           .314          .276          .354
COMODITY       .365          .341          .341          .317          .317          .341
GAMING         .347          .478          .347          .478          .434          .565
INDMATER       .342          .394          .263          .25           .197          .289
FOOD           .314          .314          .296          .277          .277          .296
REGBANKS       .296          .222          .185          .259          .111          .444
BEVERAGE       .294          .411          .294          .235          .235          .294
RETAIL         .274          .392          .294          .235          .196          .254
OILGAS         .2            .192          .185          .178          .15           .257
INFRA          .194          .222          .194          .194          .194          .25
BIGBANKS       .142          .142          .142          .285          0             .571
GUNS           .125          .25           .187          .125          .125          .312
ETFS           .122          .175          .087          .087          .07           .228
CHINA          .105          .122          .105          .105          .07           .14
COAL           0             0             0             0             0             0
COPPER         0             .2            0             .2            0             .2
|
======================================================================
8/8/2019
The 300+ DJI rally slightly breached the now falling 65-dma
resistance
today. Now we need to see the Closing Powers for DIA, SPY and
QQQ turn bullish. Another really good day like today would make me
a believer that 27000 will be reached before 26000 is again seen. But
right now the DJI futures are down 100. So more base-building is
probably needed.
Stay long DIA, SPY, GLD and some bond funds. We will do
more
buying if the DJI gives a new buy signal below 26000. The operative
Peerless signal is the recent Buy B2. Regarding short sales,
as long as
the shorted stock's Closing Power stays below its 21-dma,
it can be held short for hedging purposes, though that is also the purpose
of being long GLD and some bond funds.


|
Charts 8/8/2019 2019 PEERLESS DJI, Signals, Indicators Daily DJI Volume 10-DayUp/Down Vol Hourly DJIA A/D Line for All Stocks Inverted Traders Index NASDAQ S&P OEX NYSE COMPQX DJI-15 DJI-20 DJI-30 DIA SPY QQQ MDY IWM TNA Short-Term Rates USO-CrudeOil DBO FAS GLD BBH IBB JETS JNUG KOL NUGT OIH OIL RSX RETL SDS AGQ SLV SOXL TECL TLT TMF TNA UGA (gasoline) XIV and China: YINN CHAU Commodities: CANE CORN DBC JJC, NIB, CHOC CORN, CUT (paper) MOO, SOYB WEAT UUP (Dollar) LIT (Lithium) AAPL ADBE ALXN AMAT AMGN AMD AMZN BA BABA BAC BIDU CAT CVX DE FB GOOG GS HD IBM INTU JPM M (Macy's) MSFT NFLX NVDA PG QCOM TSLA TXN XOM WMT CMG , LRCX, SWKS, MDGL SPPI WATT SQ TOWN 8/8/19 (Click on Underlined link.) Bullish MAXCPs - http://tigersoft.com/MAXCPS/Aug-8/BULLISH.htm Bearish MAXCPs - http://tigersoft.com/MINCPs/Aug-8/BEARISH.htm |
Trade War Theater
Today, the DJI seems to be falling back as the US takes another step
to escalate the trade war with China as retaliation for their reducing the
value of the Yuan. It seems like political theater. It is a strange, macabre
dance with a lot of risk if it causes a recession. So far, the US has avoided
that. But China is not without dangerous cards it could play.
When I was in college, the US history professors made fun of Andrew
Jackson for his very public, good vs evil, populist war with the central
US bank of the day. President Trump is doing the same with the Chinese now,
it seems to me. Aside from the fact that so much US manufacturing has long
been shuttered and stood idle for years, no one put a gun to the head of Apple,
Walmart or Home Depot and told them that they must set up factories
in China or buy Cinese goods instead of American manufactured ones.
So, this all looks a lot like political theater and it could well continue a lot
longer, even well into 2020. (I was much more bullish a few months ago when
it seemed the trade talks would not carry on so long, simply as a way to
propel the stock market up this Summer. Apparently, I was mistaken.)
In time, Wall Street will get used to the trade war skirmishes, adjust and
shrug it all off. But for now the DJI seems locked in a
trading range
between 26000 and 27000.
As a result, let me suggest that we look at the best Sector ETFS for
trading the Peerless Buys and Sells. We can employ the ETFs with
very good Peerless record on the long side this year to plan what to
buy when the DJI falls again to 25500-26000. And we can use
the Sector ETFs with the best short-sale record when Peerless gives a
Sell to pick which ETFs to choose from when the DJI seems to peak
near 27000. Of course, the next year could be completely different,
so proceed cautiously. They also show how much more risk there
normally is using leveraged ETFS.
DRN is an important exception. I think we should buy it
on market weakness, perhaps near Monday's close, assuming the
pattern of Monday weakness and Tuesday strength persist.
Not shown below is how well FAS does as a short sale when Peerless
gives a Sell. Its gain this past year as a short sale on Peerless Sells is 55%
with the biggest paper loss being 11%. FAS should have, at least, been
Sold when we sold DIA at the start of the August sell-off when the B10
breakout failed.
The best ETFs to
buy are when Peerless gives reversing Buy:
Symbol Peerless Buys to Peerless Sells
One-Yr.Gain Biggest Paper Loss
-------------------------------------------------------
LEVERAGED
SOXL +121.6%
32.7%
DRN +104%
8.1% (low)
TQQQ +95%
12%
FAS +91.6 %
15.8%
................................................................
REGULAR
QQQ +27.4%
8.1%
SPY +22.9%
6.2%
DIA
+20.1% 5.3%
And the best ETFs to sell short on Peerless Sell are:
Symbol Peerless Sells to Peerless
Buys
One-Yr.Gain Biggest Paper Loss
-------------------------------------------------------
LEVERAGED
LABU +115.0%
30.6%
URTY +86.3%
14.7% (low)
ERX +76.5 %
21.0%
................................................................
REGULAR
IWM +28.2%
4.6%
QQQ +24.3%
5.8%
SPY +21.5%
3.9%
DIA
+21.3% 3.9%
BUYS on PEERLESS BUYS ....
    Short Sales on Peerless Sells    |
Table 1 QUICKSILVER on ETFS - 08/8/19 ETF CLOSE CHANGE PIVOT-PT 5-dma AROC CL-PWR CANDLE IP21 ITRS
---------------------------------------------------------------------------------------------
DIA 264.13 3.89 264.81 -31.1% ------- BLUE .198 ----
---------------------------------------------------------------------------------------------
BA 336.35 4.97 339.56 30.9% Bearish BLUE .047 -.087
---------------------------------------------------------------------------------------------
SPY 293.62 5.65 292.62 -21.1% ------- BLUE .14 .004
---------------------------------------------------------------------------------------------
QQQ 188.26 4.01 187.35 -51% ------- BLUE .118 .018
---------------------------------------------------------------------------------------------
MDY 351.18 7.4 348.74 -17.7% Bullish BLUE .141 -.001
---------------------------------------------------------------------------------------------
IWM 152.54 3.22 152.58 -58.1% ------- BLUE .054 -.023
---------------------------------------------------------------------------------------------
FAS 74.45 3.69 75.13 -104.6% Bullish BLUE .218 .079
high
---------------------------------------------------------------------------------------------
SOXL 154.18 11.65 154.37 -265.5% Bullish BLUE .129 .372
high
---------------------------------------------------------------------------------------------
TECL 163 10.97 161.88 -256.7% ------- BLUE .062 .222
---------------------------------------------------------------------------------------------
IBB 105.88 1.86 105.07 -24% Bullish BLUE .026 -.011
---------------------------------------------------------------------------------------------
GLD 141.73 .71 135.89 192.7% Bullish BLUE .01 .121
---------------------------------------------------------------------------------------------
OIH 12.28 .14 12.98 -499.4% Bearish ---- -.025 -.155
---------------------------------------------------------------------------------------------
RSX 22.69 .12 22.57 -59.8% Bearish BLUE -.117 -.007
|
Table 2 Count of Stocks in Key Directories
20190808
-------------------------------
NEWHIGHS 295
NEWLOWS 34
MAXCP 95
MINCP 21
TTTNH 56
TTTNL 66
FASTUP 86
FASTDOWN 199
CPCROSSA 225
CPCROSSD 33
BIGVOLUP 4
BIGVODN 15
ACCUMVER 15
HIGHIP21 6
HIUPPCT 13
LOWACCUM 123
REDSELL 120
AUGSELS7 18
TRAPDOOR 45
|
Table 3
       RANKING OF KEY DIRECTORIES BASED PCT.OF STOCKS ABOVE 65-DMA
              8/8/19
Bullish = 19
Bearish = 24
---------------------------------------------------------------------------------------
Directory     Current       day-1         day-2         day-3         day-4         day-5
----------------------------------------------------------------------------------------
BONDFUND       .961          .941          .961          .961          .97           .961
GOLD           .82           .8            .8            .82           .82           .82
HOMEBLDG       .764          .588          .529          .47           .529          .647
          (big jump)
SOLAR          .692          .538          .538          .461          .653          .653
          (big jump)
UTILITY        .625          .5            .475          .4            .675          .625
COMPUTER       .619          .523          .476          .333          .571          .714
SEMI           .611          .527          .49           .416          .666          .694
INDEXES        .605          .329          .291          .227          .524          .735
JETS           .6            .5            .5            .4            .7            .7
NASD-100       .591          .418          .377          .295          .551          .612
REIT           .582          .465          .39           .287          .486          .452
NIFTY          .578          .438          .403          .333          .561          .666
GREEN          .576          .5            .5            .307          .576          .615
MILITARY       .571          .5            .571          .392          .428          .5
ELECTRON       .548          .477          .445          .387          .593          .625
DJI-13         .538          .384          .461          .23           .461          .615
INSURANC       .526          .447          .552          .394          .605          .578
SP500          .516          .396          .363          .309          .5            .57
RUS-1000       .504          .385          .361          .288          .471          .534
N=19
===================================================================================================
EDU            .5            .333          .166          .166          .166          .333
HACKERS        .5            .3            .3            .25           .5            .6
HOSPITAL       .5            .454          .318          .318          .409          .545
===================================================================================================
FIDSTKS        .486          .377          .377          .284          .497          .579
SP-100         .483          .395          .417          .296          .505          .604
DOWJONES       .482          .413          .448          .206          .586          .655
GAMING         .478          .347          .478          .434          .565          .608
CHEM           .458          .25           .25           .208          .312          .395
INDMATER       .437          .343          .343          .218          .343          .406
AUTO           .435          .333          .41           .358          .461          .435
SOFTWARE       .433          .316          .3            .216          .416          .516
BEVERAGE       .411          .294          .235          .235          .294          .294
TRANSP         .4            .35           .35           .3            .55           .55
FINANCE        .395          .302          .36           .232          .441          .558
RETAIL         .392          .294          .235          .196          .254          .274
BIOTECH        .382          .339          .313          .275          .35           .41
COMODITY       .341          .341          .317          .317          .341          .39
FOOD           .314          .296          .277          .277          .296          .333
GUNS           .25           .187          .125          .125          .312          .375
INFRA          .222          .194          .194          .194          .25           .361
REGBANKS       .222          .185          .259          .111          .37           .555
COPPER         .2            0             .2            0             .2            .2
OILGAS         .198          .191          .184          .156          .255          .297
ETFS           .175          .087          .087          .07           .21           .315
BIGBANKS       .142          .142          .285          0             .571          .714
CHINA          .107          .089          .089          .053          .125          .142
COAL           0             0             0             0             0             0
N = 24
|
====================================================================
8/7/2019
Today's was a highly rigged market. The DJI opened
exactly
down 2% (more than 500 points) and at its recent low. Then it
steadily clawed its way back to unchanged. It did
nicely accomodate
our new Peerless Buy B2 announced last night and gave us ample
chance to buy the recommended SPY or DIA when the DJI had
more than 1000 points upside potential if we assume DJI-27000
will now be resistance. Today's 2%
"CLIMB-BACK" is bullish,
but with the DJI below its 65-dma and 63% of all stocks below
their individal 65-dma, there is probably no need to buy aggressively.
On another successful test of today's low, we should buy more
DIA and SPY because of the Buy B2's past reliability.
Down day volume is still suspiciously high. This shows more vulnerability,
as do the falling Closing Powers and Day Traders' Tools for the key
ETFs. I would also like to see DIA's 5-day ma be penetrated and turn
up. It would also be helpful to see the downtrend of the Opening Power
for DIA and the other big ETFS to break its down-trend.
Suggestion: Do not chase a Buy Recommendation here
The reversal days for Gold and Bonds after much higher openings
is actually bullish for normal stocks and bearish short-term for GLD
and Bonds. Readers should appreciate that I cannot anticipate when
I write this several hours or more before the opening, where the
opening will actually be. Do not chase when a buy recommendation
when the opening is much higher. Often there is a pullback and we get
another chance to buy about where prices were on the previous day's
close.


6-month DIA chart shows falling 5-dma and much heavier down (red) day
volume recently than (blue) up-day volume. We have to be cautious.

===============================================================================
BULLISH SPECIAL SITUATIONS
Truly bullish special situations like ENPH, which is based on fast growth and
big growth potential, are rare. They make new highs on high volume AND
show very high IP21 (>.45) and ITRS (>+.30) readings. Our research shows
that the optimum holding time for them, assuming they are bought on the first Buy B12,
is about a year. Dips to their lower band when their Closing Power hooks back up
make for good additional buy-points, as do new high breakouts. Gold stocks
now comprise a high percentage of all recent Buy B12s. ENPH is a solar energy
play that specializes in converters from DC to AC.


|
Charts 8/7/2019 2019 PEERLESS DJI, Signals, Indicators Daily DJI Volume 10-DayUp/Down Vol Hourly DJIA A/D Line for All Stocks Inverted Traders Index NASDAQ S&P OEX NYSE COMPQX DJI-15 DJI-20 DJI-30 DIA SPY QQQ MDY IWM TNA Short-Term Rates USO-CrudeOil DBO FAS GLD BBH IBB JETS JNUG KOL NUGT OIH OIL RSX RETL SDS AGQ SLV SOXL TECL TLT TMF TNA UGA (gasoline) XIV and China: YINN CHAU Commodities: CANE CORN DBC JJC, NIB, CHOC CORN, CUT (paper) MOO, SOYB WEAT UUP (Dollar) LIT (Lithium) AAPL ADBE ALXN AMAT AMGN AMD AMZN BA BABA BAC BIDU CAT CVX DE FB GOOG GS HD IBM INTU JPM M (Macy's) MSFT NFLX NVDA PG QCOM TSLA TXN XOM WMT CMG , LRCX, SWKS, MDGL SPPI WATT SQ TOWN 8/7/19 (Click on Underlined link.) Bullish MAXCPs - http://tigersoft.com/MAXCPS/Aug-7/BULLISH.htm Bearish MAXCPs - http://tigersoft.com/MINCPs/Aug-7/BEARISH.htm |
Table 1 QUICKSILVER on ETFS - 08/7/19 The 5-day moving averages are all still falling except for Gold. ETF CLOSE CHANGE PIVOT-PT 5-dma AROC CL-PWR CANDLE IP21 ITRS
---------------------------------------------------------------------------------------------
DIA 260.24 -.05 265.76 -157.2% ------- BLUE .134 ----
---------------------------------------------------------------------------------------------
BA 331.38 -1.07 334.29 -146% Bearish BLUE -.003 -.093
---------------------------------------------------------------------------------------------
SPY 287.97 .17 294.84 -162.4% ------- BLUE .08 .001
---------------------------------------------------------------------------------------------
QQQ 184.25 .99 190.15 -183.6% Bearish BLUE .079 .011
---------------------------------------------------------------------------------------------
MDY 343.78 .64 352.4 -203% Bearish BLUE .052 -.004
---------------------------------------------------------------------------------------------
IWM 149.32 -.04 154.29 -237.9% Bearish BLUE .012 -.029
---------------------------------------------------------------------------------------------
FAS 70.76 -.29 75.96 -579% ------- BLUE .141 .036
highest
---------------------------------------------------------------------------------------------
RETL 20.62 -.21 21.83 -851.5% Bearish BLUE-.138 -.113
---------------------------------------------------------------------------------------------
SOXL 142.53 2.94 161.96 -976.2% ------- BLUE .022 .307
highest
---------------------------------------------------------------------------------------------
TECL 152.03 2.75 170.97 -669.5% Bearish BLUE-.013 .14
---------------------------------------------------------------------------------------------
IBB 104.02 .28 106.38 -78.4% ------- BLUE-.017 -.016
---------------------------------------------------------------------------------------------
GLD 141.02 2.11 136.41 286.2% Bullish RED .049 .14
---------------------------------------------------------------------------------------------
OIH 12.14 -.22 13.55 -865.5% Bearish BLUE-.014 -.142
---------------------------------------------------------------------------------------------
RSX 22.57 .04 22.96 -206.6% Bearish BLUE-.142 .028
|
Table 2   Count of Stocks in Key Directories
          20190807
-------------------------------
NEWHIGHS       185
NEWLOWS        107
MAXCP          53   Professionals shifting to bullish side.
MINCP          36
TTTNH          36
TTTNL          124  Day Traders are net bearish.
FASTUP         66
FASTDOWN       374  Swing traders are bearish.
CPCROSSA       183
CPCROSSD       28
BIGVOLUP       7
BIGVODN        20
ACCUMVER       13
HIGHIP21       4
HIUPPCT        12
LOWACCUM       124
REDSELL        120
AUGSELS7       12
TRAPDOOR       41
|
Table 3 RANKING OF KEY DIRECTORIES BASED PCT.OF STOCKS ABOVE 65-DMA
              8/7/19
 Bullish = 5
 Bearish = 37
---------------------------------------------------------------------------------------
Directory     Current       day-1         day-2         day-3         day-4         day-5
----------------------------------------------------------------------------------------
BONDFUND       .941          .961          .961          .97           .961          .951
GOLD           .8            .8            .82           .82           .82           .86
HOMEBLDG       .588          .529          .47           .529          .588          .588
SOLAR          .538          .538          .461          .653          .692          .653
SEMI           .527          .49           .416          .666          .685          .712
COMPUTER       .523          .476          .333          .571          .714          .714
============================================================================================
GREEN          .5            .5            .307          .576          .615          .615
JETS           .5            .5            .4            .7            .7            .7
MILITARY       .5            .571          .392          .428          .5            .607
UTILITY        .5            .475          .4            .675          .625          .575
============================================================================================
ELECTRON       .477          .445          .387          .593          .619          .638
REIT           .465          .39           .287          .486          .452          .506
HOSPITAL       .454          .318          .318          .409          .545          .545
INSURANC       .447          .552          .394          .605          .631          .71
NIFTY          .438          .403          .333          .561          .666          .736
NASD-100       .418          .377          .295          .551          .602          .693
DOWJONES       .4            .433          .2            .566          .6            .733
SP500          .396          .363          .309          .5            .564          .675
SP-100         .395          .417          .296          .505          .593          .714
RUS-1000       .385          .361          .288          .471          .524          .643
DJI-13         .384          .461          .23           .461          .538          .769
FIDSTKS        .377          .377          .284          .497          .562          .655
TRANSP         .35           .35           .3            .55           .55           .7
GAMING         .347          .478          .434          .565          .608          .608
COMODITY       .341          .317          .317          .341          .39           .39
BIOTECH        .339          .313          .275          .35           .396          .408
AUTO           .333          .41           .358          .461          .435          .641
EDU            .333          .166          .166          .166          .333          .166
INDEXES        .327          .29           .225          .521          .731          .731
SOFTWARE       .316          .3            .216          .416          .516          .583
FINANCE        .302          .36           .232          .441          .546          .709
FOOD           .301          .283          .283          .301          .339          .358
HACKERS        .3            .3            .25           .5            .6            .7
BEVERAGE       .294          .235          .235          .294          .294          .47
RETAIL         .294          .235          .196          .254          .274          .47
INDMATER       .263          .25           .197          .289          .355          .513
CHEM           .25           .25           .208          .312          .375          .479
INFRA          .194          .194          .194          .25           .305          .555
OILGAS         .191          .184          .156          .255          .29           .361
GUNS           .187          .125          .125          .312          .375          .562
REGBANKS       .185          .259          .111          .37           .555          .777
BIGBANKS       .142          .285          0             .571          .714          1
CHINA          .089          .089          .053          .125          .142          .321
ETFS           .087          .087          .07           .21           .315          .456
COAL           0             0             0             0             0             .166
COPPER         0             .2            0             .2            .2            .4
|
====================================================================
8/6/2019
Bull Markets do not end easily. Today's Buy B2
faces nearby over-head resistance. But these August Buy B2s
are particularly safe. The Weekly DJI chart shows DJI
must rise this week to keep long-term trend of NYSE
rising. A conservative China seems reluctant to hurt the
US stock market more than to just warn Trump about what
it could do. For now expect the DJI to zig-zag back up, moved
as much as anything by the ups and downs of the Chinese YUAN
currency. "Caution" is still the watch word. 64% of all the
stocks and ETFs we track are below their 65-dma. As shown in
Table 1, only GLD among the key ETFs has a rising 5-day ma
and according to Table 2, Professionals, Day-Traders and
Swing-Traders are now preponderately bearish. It will take
some time for the market to mend its weak technicals and
rebuild their confidence.
New Buy B2 today. They are reliable.

Weekly DJI's A/D Line is at key uptrendline.
So, this week is technically very important.

Today brought a new Peerless Buy B2. This occurs when
the
the DJI closes near the lower 3.5% band. The 112 Buy B2 signals
since 1928 have gained 9.2% and show an average paper loss of 0.8%.
As you can see below, the August Buy B2s are particularly reliable. There
are 17 such cases. They average a +10% gain on the DJI when reversed and
suffered no paper losses in 11 of the 18 occurrences. 4 of the 11
did give a paper loss of between 1% and 4.4%. The biggest paper
loss took place in August 1939 as it became clear that Hitler would
soon attack Poland and thereby start a second world war. The trade
differences with China will be peacefully resolved!
My belief is that China will be very cautious in the Trade War. It
is confident that history, long-term planning, infrastructure gains
and a hard-working population much bigger than the US's all give it
the eventual advantage. So, I do not think that it will sell much of its one
trillion
dollar position in US Treasuries. But it may periodically let the YUAN
fall to keep the export-industry to the US thriving. Each time that will put
downward pressure on the US stock market. Trump, meantime, has
little to show for the higher tariffs and a lot of mid-Western farmers are upset
because world demand for their crops has fallen sharply.

A falling YUAN may not boost the Dollar because of how the uncertainties
of a trade war effect the US economy. But it will boost Gold as will even lower
interest rates, too. So, along with buying more Gold stocks and buying
bond funds like those listed among the MAXCPs, I have to recommend
buying back DIA and SPY because of the new Buy B2. I think the new
volatility, both up and down will make buying back FAS or even QQQ quite
hard on the nerves. In addition, I suspect the overhead potential for the DJI
and SPY will be limited by their 65-dma. It would be seem better to buy near
DJI- 24900, so that there is the potential for a 1000 points gain in the DJI if
the 27000 resistance is reached again, perhaps when the FED again stops its
Federal Funds Rate to 2% in September.. So hold back some funds. It would
be even better to get the DJI (DIA) down a full 10% from ts highs, but that
will only occur if the trade war gets much worse, something that I do not to
happen now, though perhaps in September if the negotiators try again and fail.
(All this is speculative. One Trump "tweet" can change everything!).
   All August Peerless Buy B2s: 1929-2019
 Total N = 112      Avg.  .092     Max Paper Loss Avg. = -.008
August Buy B2s Date DJIA Gain Maximum Paper Loss
Pct.Loss
-------------------------------------------------------------------------------
19310810 B2 134.3 .055 none 0
(Bear Market, Year before Pres. Election)
19360821 B2 160.8 .178 perfect 0
(Bull Market)
19380815 B2 136.9 .045 none 0
19380829 B2 137.1 .044 perfect 0
19390810 B2 137.3 .122 131.3 -.0436 8/24
19400816      B2             121.3     .114       none      0
19550809      B2             448.8     .046       perfect   0
 (Bull Market, Year before Pres. Election)
19680808      B2             870.37    .123       869.65   -.0008     8/9
 (Bull Market)
19700813      B2             707.35    .325       perfect   0
19730823      B2             864.46    .04        none      0
19760826 B2 960.44 .051 none 0 (Bull Market) 19830808 B2 1163.06 .097 perfect 0 (Bull Market, Year before Pres Election) 19880810 B2 2034.14 .073 1990.22 -.0215 8/22 19880818 B2 2027.03 .077 1990.22 -.0181 8/22 19920821 B2 3254.10 .038 3232.22 -.0067 8/25 (Bull Market) 20100827 B2 10150.65 .262 none 0
20130826 B2 14946.46 .016 14776.1 -.0113 8/27
(Bull Market)
==========================================================================
Total N = 17 Avg. 10.0% Median Gain = 7.3%
11/17 show no paper loss.
One paper loss was big, -4.4% (Was started in Europe. Poland invaded.)
All Year before Election Year N=23 Avg.Gain =.086
All Bull Market Augusts = +.178 + .046 + .123 + .051 +.097 +.038 + .016
N = 7 Avg.=7.8% Mean Gain = 5.1% 5/8 show no paper losses 2 showed 1.1% and 2.2%
|
|
Charts 8/6/2019 2019 PEERLESS DJI, Signals, Indicators Daily DJI Volume 10-DayUp/Down Vol Hourly DJIA A/D Line for All Stocks Inverted Traders Index NASDAQ S&P OEX NYSE COMPQX DJI-15 DJI-20 DJI-30 DIA SPY QQQ MDY IWM TNA Short-Term Rates USO-CrudeOil DBO FAS GLD BBH IBB JETS JNUG KOL NUGT OIH OIL RSX RETL SDS AGQ SLV SOXL TECL TLT TMF TNA UGA (gasoline) XIV and China: YINN CHAU Commodities: CANE CORN DBC JJC, NIB, CHOC CORN, CUT (paper) MOO, SOYB WEAT UUP (Dollar) LIT (Lithium) AAPL ADBE ALXN AMAT AMGN AMD AMZN BA BABA BAC BIDU CAT CVX DE FB GOOG GS HD IBM INTU JPM M (Macy's) MSFT NFLX NVDA PG QCOM TSLA TXN XOM WMT CMG , LRCX, SWKS, MDGL SPPI WATT SQ TOWN 8/6/19 (Click on Underlined link.) Bullish MAXCPs - http://tigersoft.com/MAXCPS/Aug-6/BULLISH.htm Bearish MAXCPs - http://tigersoft.com/MINCPs/Aug-6/BEARISH.htm |
Table 1 QUICKSILVER on ETFS - 08/6/19 The 5-day moving averages are all still falling except for Gold. ETF CLOSE CHANGE PIVOT-PT 5-dma AROC CL-PWR CANDLE IP21 ITRS --------------------------------------------------------------------------------------------- DIA 260.29 3.19 268.52 -218.7% Bearish BLUE .085 0 --------------------------------------------------------------------------------------------- BA 332.45 1.39 341.18 -221.6% Bearish RED .012 -.08 --------------------------------------------------------------------------------------------- SPY 287.8 3.98 297.43 -219.8% Bearish BLUE .036 .001 --------------------------------------------------------------------------------------------- QQQ 183.26 2.53 191.1 -278.9% Bearish BLUE .039 .012 --------------------------------------------------------------------------------------------- MDY 343.14 4.28 357.92 -268.1% Bearish BLUE .03 -.007 --------------------------------------------------------------------------------------------- IWM 149.36 1.36 156.56 -275.6% Bearish BLUE-.004 -.026 --------------------------------------------------------------------------------------------- FAS 71.05 2.93 79.32 -640% Bearish BLUE .119 .026 --------------------------------------------------------------------------------------------- SOXL 139.59 5.39 172.3 -1571.2% Bearish RED -.005 .254 --------------------------------------------------------------------------------------------- TECL 149.28 7.18 173.39 -978.5% Bearish BLUE-.055 .116 --------------------------------------------------------------------------------------------- IBB 103.74 1.45 105.66 -124.6% ------- BLUE-.001 -.021 --------------------------------------------------------------------------------------------- GLD 138.91 1.12 133.21 144.9% Bullish BLUE .149 .129 most bullish --------------------------------------------------------------------------------------------- OIH 12.36 -.19 14.42 -715.3% Bearish RED -.036 -.121 --------------------------------------------------------------------------------------------- RSX 22.53 .33 23.51 -237.2% Bearish -----.216 .026 |
Table 2 Count of Stocks in Key Directories
20190806
-------------------------------
NEWHIGHS 144
NEWLOWS 101
MAXCP 28
MINCP 108 Professionals remain bearish
TTTNH 18
TTTNL 215 Day Traders are bearish
FASTUP 46
FASTDOWN 394 Swing-Traders are Bearish.
CPCROSSA 142
CPCROSSD 208
BIGVOLUP 7
BIGVODN 15
ACCUMVER 17
HIGHIP21 7
HIUPPCT 12
VHIP21 106
LOWACCUM 117
REDSELL 114
AUGSELS7 19
TRAPDOOR 36
|
 RANKING OF KEY DIRECTORIES BASED PCT.OF STOCKS ABOVE 65-DMA
               8/6/19
 Bullish = 6
 Bearish = 38
---------------------------------------------------------------------------------------
Directory     Current       day-1         day-2         day-3         day-4         day-5
----------------------------------------------------------------------------------------
BONDFUND       .961          .961          .97           .961          .961          .951
GOLD           .8            .82           .82           .82           .86           .9
SOLAR          .705          .588          .764          .764          .764          .823
MILITARY       .571          .392          .428          .5            .607          .642
INSURANC       .552          .394          .605          .631          .71           .815
HOMEBLDG       .529          .47           .529          .588          .647          .705
--------------------------------------------------------------------------------------------
JETS           .5            .4            .7            .7            .7            .7
--------------------------------------------------------------------------------------------
SEMI .49 .416 .666 .685 .712 .777 GAMING .478 .434 .565 .608 .608 .652 COMPUTER .476 .333 .571 .714 .714 .714 UTILITY .475 .4 .675 .625 .575 .625 DJI-13 .461 .23 .461 .538 .769 .769 DOWJONES .448 .206 .586 .62 .758 .793 ELECTRON .445 .387 .593 .619 .638 .722 SP-100 .417 .296 .505 .593 .714 .791 AUTO .41 .358 .461 .435 .641 .641 GREEN .409 .181 .5 .545 .545 .545 NIFTY .403 .333 .561 .666 .736 .789 REIT .39 .287 .486 .452 .506 .575 FIDSTKS .377 .284 .497 .562 .661 .737 NASD-100 .377 .295 .551 .602 .693 .765 SP500 .363 .309 .5 .564 .673 .745 RUS-1000 .361 .288 .471 .524 .643 .7 FINANCE .36 .232 .441 .546 .697 .79 TRANSP .35 .3 .55 .55 .7 .75 HOSPITAL .318 .318 .409 .545 .545 .5 COMODITY .317 .317 .341 .39 .39 .56 BIOTECH .313 .275 .35 .396 .405 .454 HACKERS .3 .25 .5 .6 .7 .8 SOFTWARE .3 .216 .416 .516 .6 .616 INDEXES .29 .225 .521 .731 .736 .72 BIGBANKS .285 0 .571 .714 1 1 FOOD .283 .283 .301 .339 .358 .49 REGBANKS .259 .111 .37 .555 .74 .888 CHEM .25 .208 .312 .375 .479 .604 INDMATER .25 .197 .289 .355 .513 .605 RETAIL .25 .211 .269 .288 .48 .48 BEVERAGE .235 .235 .294 .294 .411 .588 INFRA .194 .194 .25 .305 .555 .638 OILGAS .184 .156 .255 .29 .361 .326 EDU .166 .166 .166 .333 .333 .666 GUNS .125 .125 .312 .375 .562 .562 CHINA .089 .053 .125 .142 .321 .321 ETFS .087 .07 .21 .315 .438 .578 COAL 0 0 0 0 .166 .333 |
====================================================================
8/5/2019
Was Yesterday, China's shot across the bow?
Is Wall Street back in control? We will need a very
positive up-day today get a Buy B19 (two-day reversal day).
Stick with the new Sell S20 (failed B10 breakout).
The DJI's 700-point decline took that key average down more than
1000 points below the likely overhead resistance at 27000. After 5 straight
down days, some traders are eager to see if they can get the DJI to rally,
especially since the DJI closed today at the rising-200 day ma support. This level
often acts as a turn-around level as long as the Weekly A/D Line confirmed
the most recent high, something which is true here. But
Peerless did not
give a buy signal today; the decline is too swift. So, we must wait.
At this writing, the DJI is up 220 after being down more than
300 more
points yesterday after the close. Perhaps, this means that Trump is preparing
to back away from a trade war with China and insiders are buying. Perhaps,
it means that professional traders see that now China is supporting the YUAN,
not driving it down, and interest rates in the US are falling some more, thus
showing that China is not selling large blocks of US Treasuries, as some feared.
Perhaps, the sharp drop in the YUAN yesterday was just
China's way of showing
what it could do and how much it could hurt Wall Street if the US did not come to
terms. No way of knowing these things, of course, but
we should watch tomorrow
for a very lopsided breadth and volume UP-day because this could bring a
new and reversing Peerless Buy B19 (two-day reversal day). The ratio of advances
to declines and Up Volume to Down Volume would have to better than 4:1.
(See http://tigersoft.com/PeerInst-2012-2013/-B19.htm
)
At the same time, we have to be on guard for significant
renewed selling after
mid-day. That is what the steeply falling Closing Powers and Tiger Day Traders'
Tool are warning us to be wary of.
Having sold everything except Gold (GLD) and some gold stocks
here, I think most of us
should simply wait for a new Peerless Buy signal. A rally tomorrow will bring a
a short-term Buy "b" signal. But without a regular Peerless buy signal, I
would guess
that the overhead resistance, now the 65-dma at 26200, will act as resistance if there
is a bounce. Only
very-short-term traders should try to play this rally until we get a
regular Peerless Buy signal.
![]() DJI is now 4.8% below 210dma. All
key indicators are negative or falling..
DJI is now 4.8% below 210dma. All
key indicators are negative or falling..

NASDAQ also fell to support , its rising uptrend-line.

SPY may try to get back up to its broken 65-dma.

We should watch FAS because of how closely it follows the DJIA

|
Charts 8/5/2019 2019 PEERLESS DJI, Signals, Indicators Daily DJI Volume 10-DayUp/Down Vol Hourly DJIA A/D Line for All Stocks Inverted Traders Index NASDAQ S&P OEX NYSE COMPQX DJI-15 DJI-20 DJI-30 DIA SPY QQQ MDY IWM TNA Short-Term Rates USO-CrudeOil DBO FAS GLD BBH IBB JETS JNUG KOL NUGT OIH OIL RSX RETL SDS AGQ SLV SOXL TECL TLT TMF TNA UGA (gasoline) XIV and China: YINN CHAU Commodities: CANE CORN DBC JJC, NIB, CHOC CORN, CUT (paper) MOO, SOYB WEAT UUP (Dollar) LIT (Lithium) AAPL ADBE ALXN AMAT AMGN AMD AMZN BA BABA BAC BIDU CAT CVX DE FB GOOG GS HD IBM INTU JPM M (Macy's) MSFT NFLX NVDA PG QCOM TSLA TXN XOM WMT CMG , LRCX, SWKS, MDGL SPPI WATT SQ TOWN 8/5/19 (Click on Underlined link.) Bullish MAXCPs - http://tigersoft.com/MAXCPS/Aug-5/BULLISH.htm Bearish MAXCPs - http://tigersoft.com/MINCPs/Aug-5/BEARISH.htm |
Table 1 QUICKSILVER on ETFS - 08/5/19 ETF CLOSE CHANGE PIVOT-PT 5-dma AROC CL-PWR CANDLE IP21 ITRS --------------------------------------------------------------------------------------------- DIA 257.1 -7.71 271.91 -279.8% Bearish RED .019 ----- --------------------------------------------------------------------------------------------- BA 331.06 -8.5 347.46 -134.3% Bearish RED .011 -.065 --------------------------------------------------------------------------------------------- SPY 283.82 -8.8 300.72 -296.6% Bearish RED -.043 -.003 --------------------------------------------------------------------------------------------- QQQ 180.73 -6.62 193.78 -362.9% Bearish RED .02 .005 --------------------------------------------------------------------------------------------- MDY 338.86 -9.88 362.01 -291.6% Bearish RED -.039 -.007 --------------------------------------------------------------------------------------------- IWM 148 -4.58 157.84 -262.1% Bearish RED -.059 -.018 --------------------------------------------------------------------------------------------- FAS 68.12 -7.01 80.76 -817.4% Bearish RED .076 .009 --------------------------------------------------------------------------------------------- RETL 19.93 -1.51 24.19 -1091.6% Bearish RED -.213 -.143 --------------------------------------------------------------------------------------------- SOXL 134.2 -20.17 190.72 -1658.9% Bearish RED .009 .18 --------------------------------------------------------------------------------------------- TECL 142.1 -19.78 181.77 -1245.1% Bearish RED -.081 .07 --------------------------------------------------------------------------------------------- IBB 102.29 -2.78 106.36 -147.5% ------- RED -.042 -.023 --------------------------------------------------------------------------------------------- GLD 137.79 1.9 134.98 120.7% Bullish RED .088 .128 strong --------------------------------------------------------------------------------------------- OIH 12.55 -.43 14.3 -427.7% Bearish RED -.034 -.113 --------------------------------------------------------------------------------------------- RSX 22.2 -.37 23.62 -326.5% Bearish RED -.184 .028 |
Table 2    Count of Stocks in Key Directories
           20190805
-------------------------------
NEWHIGHS       123
NEWLOWS        164
MAXCP          22
MINCP          102  Professionals are bearish
TTTNH          23
TTTNL          286  Day Traders are bearish.
FASTUP         57
FASTDOWN       343  Swing traders are bearish.
CPCROSSA       18
CPCROSSD       175
BIGVOLUP       2
BIGVODN        13
ACCUMVER       14
HIGHIP21       11
HIUPPCT        11
LOWACCUM       131
REDSELL        109
AUGSELS7       19
TRAPDOOR       36
|
Table 3     RANKING OF KEY DIRECTORIES BASED PCT.OF STOCKS ABOVE 65-DMA
              8/5/19
 Bullish = 3
 Bearish = 42
---------------------------------------------------------------------------------------
Directory     Current       day-1         day-2         day-3         day-4         day-5
----------------------------------------------------------------------------------------
BONDFUND       .961          .97           .961          .961          .951          .941
GOLD           .82           .82           .82           .86           .9            .92
SOLAR          .588          .764          .764          .764          .823          .823
=============================================================================================
HOMEBLDG       .47           .529          .588          .647          .705          .588
GAMING         .434          .565          .608          .608          .652          .652
SEMI           .416          .666          .685          .712          .777          .74
JETS           .4            .7            .7            .7            .7            .7
UTILITY        .4            .675          .625          .575          .625          .65
INSURANC       .394          .605          .631          .71           .815          .815
MILITARY       .392          .428          .5            .607          .607          .607
ELECTRON       .387          .593          .619          .638          .722          .67
AUTO           .358          .461          .435          .641          .615          .692
COMPUTER       .333          .571          .714          .714          .714          .666
NIFTY          .321          .553          .66           .732          .767          .785
HOSPITAL       .318          .409          .545          .545          .5            .5
COMODITY       .317          .341          .39           .39           .56           .585
SP500          .309          .5            .564          .673          .739          .737
TRANSP         .3            .55           .55           .7            .75           .8
SP-100         .296          .505          .593          .714          .769          .791
NASD-100       .295          .551          .602          .693          .755          .755
RUS-1000       .288          .471          .524          .643          .696          .677
REIT           .287          .486          .452          .506          .575          .527
FIDSTKS        .284          .497          .562          .661          .732          .726
FOOD           .283          .301          .339          .358          .49           .584
BIOTECH        .275          .35           .396          .405          .451          .399
HACKERS        .25           .5            .6            .7            .8            .8
BEVERAGE       .235          .294          .294          .411          .588          .588
FINANCE        .232          .441          .546          .697          .767          .779
DJI-13         .23           .461          .538          .769          .769          .846
INDEXES        .225          .521          .731          .736          .709          .698
SOFTWARE       .216          .416          .516          .6            .616          .616
RETAIL         .211          .269          .288          .48           .461          .519
CHEM           .208          .312          .375          .479          .604          .5
DOWJONES       .2            .566          .6            .733          .766          .833
INDMATER       .197          .289          .355          .513          .605          .526
INFRA          .194          .25           .305          .555          .638          .694
GREEN          .181          .5            .545          .545          .545          .5
EDU            .166          .166          .333          .333          .666          .666
OILGAS         .156          .255          .29           .361          .326          .29
GUNS           .125          .312          .375          .562          .562          .562
REGBANKS       .111          .37           .555          .74           .851          .777
ETFS           .07           .21           .315          .438          .578          .719
CHINA          .053          .125          .142          .321          .321          .375
BIGBANKS       0             .571          .714          1             1             1
COAL           0             0             0             .166          .333          0
|
=======================================================================
8/2/2019 The failed
breakout (Buy B10) forces us to revert back to the
previous Peerless signal, the Sell S4 on July 3rd just below 27000. The two
previous reversing B10s produced nice gains in 1972 and 1996. But this time,
the B10 signal has clearly failed. The DJI, as I write, has now knifed down
below its
65-dma. This is a dangerous situation because we cannot easily get a new Buy signal
with the DJI falling so fast. In addition, the DJI's mini-head and shoulders has a
bearish track-record this past year for all to see. Note the three head/shoulders on
our current DJI chart. The A/D Line will probably break its uptrend tomorrow, too.
The Closing Powers are rated bearish for the NASDAQ, DIA, SPY and QQQ.
The Tiger Day Traders' tool has broken down for each of these key ETFs.
Finally, note that Peerless Sell S4s can be quite bearish, averaging declines of
9.4%. One in
August 1987 called the top then and brought about a 37% decline in only two months.

|
Peerless Sell S4s: 1929-2019 Date DJIA Gain Maximum Paper Loss Pct.Loss ------------------------------------------------------------------------------- 19290814 S4 354.9 . 409 381.1 -.0738 9/3 19310707 S4 145.9 .027 none 0 19370803 S4 185.9 .365 189.3 -.0182 8/13 19380119 S4 130.1 .053 none 0 19401003 S4 135.1 .025 137.8 -.0199 11/17 19410711 S4 127.9 .135 130.1 -.0172 7/28 19460611 S4 209.1 .22 210.6 -.0071 6/13 19470711 S4 184.8 .105 186.9 -.0113 7/24 19471022 S4 184.4 .103 none 0 19510917 S4 275.1 .053 275.9 -.0029 10/3 19550922 S4 486.0 .092 487.5 -.003 9/23 19570711 S4 518 .178 520.8 -.0054 7/12 19610518 S4 701.1 .014 none 0 19660110 S4 985.41 .213 994.2 -.0089 1/18 19730109 S4 1047.11 .104 1051.70 -.0043 1/11 19761222 S4 984.54 .051 1004.65 -.0204 12/31 19800116 S4 865.19 .101 903.84 -.0446 2/13 19810326 S4 1005.76 .032 1024.05 -.0181 4/27 19831122 S4 1275.81 .031 1287.30 -.009 11/29 19850208 S4 1289.97 .033 1299.36 -.0072 3/1 19870826 S4 2701.85 .052 none 0 19890209 S4 2323.04 .031 2324.82 -.0007 2/17 19940203 S4 3967.66 .074 none 0 19970207 S4 6855.8 .036 7085.16 -.0334 3/11 20000111 S4 11511.08 .13 11722.9 -.0184 1/14 20000906 S4 11310.64 .095 none 0 20010517 S4 11248.58 .268 11301.7 -.0047 5/18 20031015 S4 9803.05 .018 9858.46 -.0056 11/3 20050308 S4 10912.47 .064 none 0 20071005 S4 14066.01 .079 14164.5 -.007 10/9 20080421 S4 12825.02 .112 13040.0 -.0167 5/1 20090105 S4 8952.89 .081 none 0 20090603 S4 8675.24 .041 8763.13 -.0101 6/5 20120921 S4 13579.47 .056 13610.1 -.0022 10/5 20170428 S4 20940.51 -.013 21206.2 -.0126 6/2 20190703 S4 26966.00 -.005 27088.08 -.0045 7/11 =============================================================================== Totals: N = 36 Avg: .096 -.011 |
Trump Is on the Spot Now.
The failure of the B10 coincides with the apparent failure of Trump's negotiations
with China for a new, more balanced trade relationship. Inevitably, people are
starting to look back and count the number of Trump bankruptcies (six) and wonder
where his stand-off with China will lead. After all, China can simply lower the
exchange rate for its YUAN and still get its goods into the US. Meanwhile, it can
ban the imports of US agricultural goods and the export of rare earths the US needs.
And, if it really wanted to hurt the US, it could start selling some of its huge
US Treasuries position, thus driving up US interest rates.
What To Do.
With 27000 now resistance, traders will probably need
to see more than 1000
points minimum head room before they do much buying. I suggested selling MSFT,
QQQ and HIG Friday. FAS should be sold mid-day Monday. Add to your bearish
MINCP positions. (A strong Dollar does buffer FAS against a big decline, but
last year's sell-offs hurt the leveraged FAS and the Peerless Buys gave good
re-entry points.)
DJI |
NASDAQ's Day Traders' Tool |
SPY |
QQQ  |
|
Charts 8/2/2019 2019 PEERLESS DJI, Signals, Indicators Daily DJI Volume 10-DayUp/Down Vol Hourly DJIA A/D Line for All Stocks Inverted Traders Index NASDAQ S&P OEX NYSE COMPQX DJI-15 DJI-20 DJI-30 DIA SPY QQQ MDY IWM TNA Short-Term Rates Tiger Day-Traders Index: DIA, SPY and QQQ. USO-CrudeOil DBO FAS GLD BBH IBB JETS JNUG KOL NUGT OIH OIL RSX RETL SDS AGQ SLV SOXL TECL TLT TMF TNA UGA (gasoline) XIV and China: YINN CHAU Commodities: CANE CORN DBC JJC, NIB, CHOC CORN, CUT (paper) MOO, SOYB WEAT UUP (Dollar) LIT (Lithium) AAPL ADBE ALXN AMAT AMGN AMD AMZN BA BABA BAC BIDU CAT CVX DE FB GOOG GS HD IBM INTU JPM M (Macy's) MSFT NFLX NVDA PG QCOM TSLA TXN XOM WMT CMG , LRCX, SWKS, MDGL SPPI WATT SQ TOWN 8/1/19 (Click on Underlined link.) Bullish MAXCPs - http://tigersoft.com/MAXCPS/Aug-2/BULLISH.htm Bearish MAXCPs - http://tigersoft.com/MINCPs/Aug-2/BEARISH.htm |
Table 1 QUICKSILVER on ETFS - 08/3/19 ETF CLOSE CHANGE PIVOT-PT 5-dma AROC CL-PWR CANDLE IP21 ITRS
---------------------------------------------------------------------------------------------
DIA 264.81 -.95 272.13 -130.5% Bearish RED .096 0
---------------------------------------------------------------------------------------------
BA 339.56 5.27 340.21 -79.6% Bearish BLUE .012 -.065
---------------------------------------------------------------------------------------------
SPY 292.62 -2.22 301.46 -156.9% Bearish RED .038 -.004
---------------------------------------------------------------------------------------------
QQQ 187.35 -2.8 194.62 -205.7% Bearish RED .086 .007
---------------------------------------------------------------------------------------------
MDY 348.74 -3.66 359.63 -176.1% Bearish RED .016 -.013
---------------------------------------------------------------------------------------------
IWM 152.58 -1.71 156.15 -147.7% Bearish RED -.024 -.028
---------------------------------------------------------------------------------------------
FAS 75.13 -.83 80.94 -444% Bearish BLUE .146 .053
highest
---------------------------------------------------------------------------------------------
RETL 21.44 -.39 25.03 -717.3% Bearish RED -.151 -.135
---------------------------------------------------------------------------------------------
SOXL 154.37 -7.59 192.02 -996.6% ------- RED .068 .271
---------------------------------------------------------------------------------------------
TECL 161.88 -9.09 185.61 -667.6% Bearish RED -.01 .137
---------------------------------------------------------------------------------------------
IBB 105.07 -1.31 105.41 -11.8% ------- RED -.088 -.024
---------------------------------------------------------------------------------------------
GLD 135.89 -.52 134.53 83.6% Bullish BLUE .133 .102 strong
---------------------------------------------------------------------------------------------
OIH 12.98 -.57 13.73 -427.5% Bearish RED -.013 -.147
---------------------------------------------------------------------------------------------
RSX 22.57 -.39 23.72 -227.8% Bearish RED -.17 .012
|
Table 2   Count of Stocks in Key Directories
          20190802
-------------------------------
NEWHIGHS       151
NEWLOWS        92
MAXCP          27
MINCP          83
TTTNH          25
TTTNL          158
FASTUP         46
FASTDOWN       179
CPCROSSA       55
CPCROSSD       100
BIGVOLUP       2
BIGVODN        17
ACCUMVER       19
HIGHIP21       4
HIUPPCT        11
LOWACCUM       121
REDSELL        109
AUGSELS7       26
TRAPDOOR       36
|
Table 3       RANKING OF KEY DIRECTORIES BASED PCT.OF STOCKS ABOVE 65-DMA
              8/2/19
 Bullish = 20
 Bearish = 24
---------------------------------------------------------------------------------------
Directory     Current       day-1         day-2         day-3         day-4         day-5
----------------------------------------------------------------------------------------
BONDFUND       .97           .961          .961          .951          .941          .951
GOLD           .82           .82           .86           .9            .92           .92
SOLAR          .764          .764          .764          .823          .823          .823
JETS           .7            .7            .7            .7            .7            .8
UTILITY        .675          .625          .575          .625          .65           .675
SEMI           .663          .682          .71           .775          .738          .728
INSURANC       .605          .631          .71           .815          .842          .815
ELECTRON       .59           .616          .636          .72           .668          .662
DOWJONES       .586          .62           .758          .793          .862          .827
BIGBANKS       .571          .714          1             1             1             1
COMPUTER .571 .714 .714 .714 .666 .666 GAMING .565 .608 .608 .652 .652 .652 NIFTY .561 .666 .736 .771 .789 .807 NASD-100 .551 .602 .693 .755 .765 .755 TRANSP .55 .55 .7 .75 .8 .85 HOMEBLDG .529 .588 .647 .705 .588 .647 INDEXES .521 .731 .736 .709 .698 .709 SP-100 .505 .593 .714 .769 .791 .78 GREEN .5 .545 .545 .545 .5 .5 HACKERS .5 .6 .7 .8 .8 .8 -------------------------------------------------------------------------------------------- SP500 .5 .564 .673 .739 .739 .745 -------------------------------------------------------------------------------------------- FIDSTKS .497 .562 .661 .732 .726 .754 REIT .486 .452 .506 .575 .527 .479 RUS-1000 .471 .524 .643 .696 .678 .688 AUTO .461 .435 .641 .615 .692 .717 DJI-13 .461 .538 .769 .769 .846 .846 FINANCE .441 .546 .697 .767 .779 .79 MILITARY .428 .5 .607 .607 .607 .607 SOFTWARE .416 .516 .6 .616 .616 .616 HOSPITAL .409 .545 .545 .5 .5 .5 REGBANKS .37 .555 .74 .851 .814 .888 BIOTECH .35 .396 .405 .451 .396 .416 COMODITY .341 .39 .39 .56 .585 .536 CHEM .312 .375 .479 .604 .5 .583 GUNS .312 .375 .562 .562 .562 .562 FOOD .296 .333 .351 .481 .574 .481 BEVERAGE .294 .294 .411 .588 .588 .529 INDMATER .289 .355 .513 .605 .526 .565 RETAIL .269 .288 .48 .461 .519 .538 OILGAS .255 .29 .361 .326 .297 .319 INFRA .25 .305 .555 .638 .694 .694 ETFS .21 .315 .438 .578 .719 .736 EDU .2 .4 .4 .8 .8 .8 CHINA .14 .157 .333 .333 .385 .421 COAL 0 0 .166 .333 0 .166 |
===================================================================
8/1/2019 The failed
Buy B10 now makes DJI - 27000 the likely new resistance while
26400 may be the new support. But that support will need to be tested.
If you take President Trump at his word, then the 26400 support looks
quite flimsy and thin. With the breakout clearly having failed, revert back
to the previous Sells for now, unless I can write a special new Sell Signal
for failed breakouts. That means we should reduce all long positions except
GLD and FAS on the next rally.
"Fine with me" if China doesn't trade with us anymore.
Most of Wall Street considers Trump's decision to raise
Chinese tariffs/taxes
to be highly disruptive of long-standing trade connections as well as being
deflationary from Wall Street's point of view. So, of course, the market sold
off
badly in the last few hours of tradings, which was all the time traders had to
react to the apparent breakdown in trade talks. Of course, Trump might
just be posturing to get a better deal. But his statement seems to be one
of frustration that he can't bend the Chinese negotiators to his way of thinking.
At least, I think is what we must assume.
Now what are the implications of that? I would think that we have to expect more
and possibly much more of a decline. The rising 65-dma (now 26341) was the
DJI's downside potential I expected BEFORE Trump's announcement. We cannot
now assume it will be held. Penetration of this moving average will also mean
the DJI's lower band - support will be broken. Given how the DJI fell 12% in early
2018 when Trump simply announced the beginning of his tariffs' war, I would
think we could see a much bigger decline now.
Our Accumulation Index readings are still high. So there will be some support
below us, especially if the market decides to applaud a very positive July Jobs'
number, over +175,000, tomorrow. But the first rally or two cannot be trusted now.
Not until Peerless gives a Buy signal or the DJI rises back above 27000 or
the Closing Power, the Tiger Day Traders' Tool and the Candle-Stick charts
stop falling so steeply, break their downtrends and in the case of the candle-sticks
show a lot of "blue" instead of red.
Accordingly, I suggested selling DIA last night. Tonight, I have to add MSFT,
HIG and QQQ to that list. Do the selling on mid-day strength, rather than on a weak
opening
tomorrow. FAS is a leveraged play on the big banks. They always seem to
come back. Hold FAS if you are already short some of our bearish MINCPs.
Breakout Box Morphed into a Completed Mini-Head/Shoulders
Technically, a what turns out to being a false Buy B10 breakout that then morphs
into a mini-head shoulders pattern, like we see now on the DJI, should be
treated
as a Judged "Sell". ( It has to be judged because I cannot easily program the
Sell
and we must judge its occurrence by comparing it with past instances.) These are
quite rare patterns. I can only find four clear-cut cases. In the past, half
of these
bearish "BOX-MORPH>H/S" (completed) patterns have brought only declines to
the 65-dma but half brought declines to the DJI's 3 month-lows. See the current
DJI and compare them with these earlier patterns.

DJI - Note Breakout BOX pattern
which has now morped into a bearish
H/S pattern, the still rising 65-dma, the
positive Accumulation and the now oversold
Inverted Traders' Index. Short-term, we will know
it's time to cover some of our MINCP shorts when
the DJI's "b" Buy appears, based on the oversold
Inverted Traders Index turning up.
If support at the lower band does occur, we
will probably get a Buy "b", B2 or B9. That may
only bring a rally back the 27000 resistance, thereby
forming a larger head/shoulders pattern.
![]()


"BOX MORPHS into H/S"
Patterns in the past.
1929

1961-1962

1980-1981

1982-1983

The Key ETFs' Closing Powers, Day Traders' Tools
and Candle Stick charts still warn us to distrust early
strength. If the Opening Powers also turn down, the
market will be in for a bigger decline.
DIA  |
SPY |
QQQ  |
|
Charts 8/1/2019 2019 PEERLESS DJI, Signals, Indicators Daily DJI Volume 10-DayUp/Down Vol Hourly DJIA A/D Line for All Stocks Inverted Traders Index NASDAQ S&P OEX NYSE COMPQX DJI-15 DJI-20 DJI-30 DIA SPY QQQ MDY IWM TNA Short-Term Rates USO-CrudeOil DBO FAS GLD BBH IBB JETS JNUG KOL NUGT OIH OIL RSX RETL SDS AGQ SLV SOXL TECL TLT TMF TNA UGA (gasoline) XIV and China: YINN CHAU Commodities: CANE CORN DBC JJC, NIB, CHOC CORN, CUT (paper) MOO, SOYB WEAT UUP (Dollar) LIT (Lithium) AAPL ADBE ALXN AMAT AMGN AMD AMZN BA BABA BAC BIDU CAT CVX DE FB GOOG GS HD IBM INTU JPM M (Macy's) MSFT NFLX NVDA PG QCOM TSLA TXN XOM WMT CMG , LRCX, SWKS, MDGL SPPI WATT SQ TOWN 8/1/19 (Click on Underlined link.) Bullish MAXCPs - http://tigersoft.com/MAXCPS/Aug-1/BULLISH.htm Bearish MAXCPs - http://tigersoft.com/MINCPs/Aug-1/BEARISH.htm |
Table 1 QUICKSILVER on ETFS - 08/1/19 ETF CLOSE CHANGE PIVOT-PT 5-dma AROC CL-PWR CANDLE IP21 ITRS --------------------------------------------------------------------------------------------- DIA 265.76 -2.76 271.86 -103.8% ------- RED .08 ----- --------------------------------------------------------------------------------------------- BA 334.29 -6.89 345 -200.4% Bearish RED -.008 -.095 --------------------------------------------------------------------------------------------- SPY 294.84 -2.59 302.01 -85.9% ------- RED .069 .002 --------------------------------------------------------------------------------------------- QQQ 190.15 -.95 195.29 -81.3% Bullish RED .144 .019 --------------------------------------------------------------------------------------------- MDY 352.4 -5.52 361.37 -76% Bearish RED .055 -.01 --------------------------------------------------------------------------------------------- IWM 154.29 -2.27 157.2 -34.2% Bearish RED -.007 -.024 --------------------------------------------------------------------------------------------- FAS 75.96 -3.36 82.22 -244.3% ------- RED .172 .061 --------------------------------------------------------------------------------------------- SOXL 161.96 -10.34 190.55 -767.1% ------- RED .087 .251 --------------------------------------------------------------------------------------------- TECL 170.97 -2.42 185.85 -319% Bearish RED .033 .184 --------------------------------------------------------------------------------------------- IBB 106.38 .72 105.32 103.4% ------- BLUE-.065 -.008 --------------------------------------------------------------------------------------------- GLD 136.41 3.2 133.64 111.6% Bullish BLUE .144 .106 --------------------------------------------------------------------------------------------- OIH 13.55 -.87 14.18 -222.4% Bearish RED .047 -.14 --------------------------------------------------------------------------------------------- RSX 22.96 -.55 23.64 -139.7% Bearish RED -.115 .038 |
 Table 2   Count of Stocks in Key Directories
           20190801
-------------------------------
NEWHIGHS       190
NEWLOWS        81
MAXCP          39
MINCP          84   Professionals are net bearish.
TTTNH          40
TTTNL          149  Day Traders are Bearish.
FASTUP         61
FASTDOWN       104
CPCROSSA       107
CPCROSSD       246
BIGVOLUP       1
BIGVODN        28
ACCUMVER       18
HIGHIP21       7
HIUPPCT        11
LOWACCUM       132
REDSELL        102
AUGSELS7       24
TRAPDOOR       32
|
Table 3 RANKING OF KEY DIRECTORIES BASED PCT.OF STOCKS ABOVE 65-DMA
Bullish = 28
Bearish = 16
8/1/19
---------------------------------------------------------------------------------------
Directory Current day-1 day-2 day-3 day-4 day-5
----------------------------------------------------------------------------------------
BONDFUND .961 .961 .951 .941 .951 .961
GOLD .82 .86 .9 .92 .92 .92
SOLAR .764 .764 .823 .823 .823 .764
INDEXES .741 .736 .709 .698 .698 .693
BIGBANKS .714 1 1 1 1 1
COMPUTER .714 .714 .714 .666 .666 .619
JETS .7 .7 .7 .7 .8 .8
SEMI .685 .712 .777 .74 .731 .731
NIFTY .666 .736 .771 .789 .807 .807
INSURANC .631 .71 .815 .842 .842 .868
UTILITY .625 .575 .625 .65 .675 .65
DOWJONES .62 .758 .793 .862 .862 .862
ELECTRON .619 .638 .722 .67 .658 .664
GAMING .608 .608 .652 .652 .652 .521
NASD-100 .602 .693 .755 .765 .755 .744
HACKERS .6 .7 .8 .8 .8 .75
SP-100 .593 .714 .769 .791 .791 .747
HOMEBLDG .588 .647 .705 .588 .647 .647
SP500 .564 .673 .739 .739 .747 .735
FIDSTKS .562 .661 .732 .726 .754 .759
REGBANKS .555 .74 .851 .814 .888 .666
TRANSP .55 .7 .75 .8 .85 .85
FINANCE .546 .697 .767 .779 .79 .72
GREEN .545 .545 .545 .5 .545 .5
HOSPITAL .545 .545 .5 .5 .5 .454
DJI-13 .538 .769 .769 .846 .846 .846
RUS-1000 .524 .643 .696 .678 .686 .673
SOFTWARE .516 .6 .616 .616 .616 .583
=============================================================================================
MILITARY .5 .607 .607 .607 .607 .642
=============================================================================================
REIT .452 .506 .575 .527 .479 .458
AUTO .435 .641 .615 .692 .717 .717
BIOTECH .396 .405 .451 .396 .419 .39
COMODITY .39 .39 .56 .585 .56 .609
CHEM .375 .479 .604 .5 .583 .562
GUNS .375 .562 .562 .562 .562 .562
INDMATER .355 .513 .605 .526 .578 .578
EDU .333 .333 .666 .666 .666 .666
FOOD .333 .351 .481 .574 .537 .611
ETFS .315 .438 .578 .719 .736 .719
INFRA .305 .555 .638 .694 .694 .638
BEVERAGE .294 .411 .588 .588 .529 .47
OILGAS .29 .361 .326 .297 .319 .333
RETAIL .288 .48 .461 .519 .519 .5
CHINA .157 .333 .333 .385 .421 .403
COAL 0 .166 .333 0 .166 0
|
====================================================================
7/31/2019 Our
Buy B10 signal has just suffered a "false breakout". This means that DJI-
27000 will now be resistance. Given the absence of a new Peerless Sell signal,
it means that the DJI may have to retest its rising 65-dma if the A/D Line
uptrend shown below is broken.

Weakness after the Opening is a big problem.
Our Tiger Day Traders' Tool is now testing the December lows.
A violation of that low would be dismaying and a bearish sign.

The DJI's
box pattern has quickly turned into a minor head and shoulders
pattern. This is short-term bearish. In addition, our Day Traders' Tool
has broken down for DIA, but not for SPY and QQQ. I would not think
that the DJI will fall below 26400. Its Accumulation Index is too positive.
I think it is also worth noting that twice before Peerless gave a Buy B10
that reversed the previous Sell S9-V. After some hesitation, in both those
earlier cases, 1973 and 1996, the DJI rose again.
Traders took profits not so much on the news of the rate cut
as Powell's
side-comment that there would be no more. In doing so, they dropped the
DJI back below 27000. This warns us that there could be a further drop
to the next support, the DJI's rising 65-dma, near 26400. The 1/4% drop
in rates really only achnowledged the defacto decline in interest rates.
So, it was disappointing to those who hoped for a 1/2% cut and something
closer to the very low rates in Europe.
This will shake up the market for a while. Friday's
Job numbers will now
take on extra importance, as we see if the economy is, indeed, weakening.
But remember, the bullish seasonality is still at work in August, as are the now
even lower rates, a Dollar at another new high helping bank stocks and FAS...
We have a strong bond market and a still rising A/D Line. Hedging with some
bearish MINCPs short sales is now recommended. Selling DIA is probably
a good idea until the DJI can get back above 27000. With GLD's uptrend
broken, NUGT is too vulnerable to hold, but I would not sell GLD. QQQ
shows a high Accumulation reading and has not broken its recent support
and so should be held long. MSFT, HIG and FAS should also be held long.
The NASDAQ and QQQ are stronger than DJI
and most often top out after the DJIA does.

|
Charts 7/31/2019 2019 PEERLESS DJI, Signals, Indicators Daily DJI Volume 10-DayUp/Down Vol Hourly DJIA A/D Line for All Stocks Inverted Traders Index NASDAQ S&P OEX NYSE COMPQX DJI-15 DJI-20 DJI-30 DIA SPY QQQ MDY IWM TNA Short-Term Rates USO-CrudeOil DBO FAS GLD BBH IBB JETS JNUG KOL NUGT OIH OIL RSX RETL SDS AGQ SLV SOXL TECL TLT TMF TNA UGA (gasoline) XIV and China: YINN CHAU Commodities: CANE CORN DBC JJC, NIB, CHOC CORN, CUT (paper) MOO, SOYB WEAT UUP (Dollar) LIT (Lithium) AAPL ADBE ALXN AMAT AMGN AMD AMZN BA BABA BAC BIDU CAT CVX DE FB GOOG GS HD IBM INTU JPM M (Macy's) MSFT NFLX NVDA PG QCOM TSLA TXN XOM WMT CMG , LRCX, SWKS, MDGL SPPI WATT SQ TOWN 7/31/19 (Click on Underlined link.) Bullish MAXCPs - http://tigersoft.com/MAXCPS/Jul-31/BULLISH.htm Bearish MAXCPs - http://tigersoft.com/MINCPs/Jul-31/BEARISH.htm |
Table 1 QUICKSILVER on ETFS - 07/31/19 Explanation: Pivot-point is price past which the ETF's 5-dma will change direction. 5-dmaAROC is the annualized rate of change of the ETF's 5-day moving average. Closing Power is bullish when it is above its rising 21-dma and it is bearish when it is below its 5-dma. Closing Power is the cumulative change from opening to close each day. Since it does not factor in changes at the opening, it tends to reflect NYSE professionals who trade the market when the NYSE is open. "Candle" color is blue when last close was above the opening, thus showing Professional net buying, which tends to be bullish. It is red when the close is below the opening, which tends to be bearish. IP21 is the current value of the Tiger Accumulation Index. Above +.15 tends to be bullish and below -.15 tends to be bearish until reversed. ITRS is the percent rise of the ETF over 50-days less the percent rise of the DIA (DJIA) over 50 trading days. The strongest ITRS ETFs tend to keep rising and the lowest ITRS ETFs tend to keep falling. Add ITRS and IP21 to get a composite measure of intermediate-term strength. ETF CLOSE CHANGE PIVOT-PT 5-dma AROC CL-PWR CANDLE IP21 ITRS --------------------------------------------------------------------------------------------- DIA 268.52 -3.39 271.39 -75.2% Bullish RED .29 ---- --------------------------------------------------------------------------------------------- BA 341.18 -6.28 348.09 -290.6% ------- RED .032 -.079 --------------------------------------------------------------------------------------------- SPY 297.43 -3.29 300 -66.6% Bullish RED .228 .001 --------------------------------------------------------------------------------------------- QQQ 191.1 -2.68 193.3 -104.2% Bullish RED .285 .016 --------------------------------------------------------------------------------------------- MDY 357.92 -4.09 357.87 -49.2% Bullish RED .178 0 --------------------------------------------------------------------------------------------- IWM 156.56 -1.28 155.36 -22.3% Bullish RED .067 -.015 --------------------------------------------------------------------------------------------- FAS 79.32 -1.44 79.9 -128.9% Bullish RED .267 .117 --------------------------------------------------------------------------------------------- RETL 24.31 .12 24.39 -185.9% ------- BLUE -.056 -.057 --------------------------------------------------------------------------------------------- SOXL 172.3 -18.42 190.69 -740.5% Bullish RED .143 .399 --------------------------------------------------------------------------------------------- TECL 173.39 -8.38 182.57 -371.4% Bullish RED .16 .226 --------------------------------------------------------------------------------------------- IBB 105.66 -.7 104.2 -.9% ------- RED -.024 -.014 --------------------------------------------------------------------------------------------- GLD 133.21 -1.77 133.42 -43.2% ------- RED .078 .058 --------------------------------------------------------------------------------------------- OIH 14.42 .12 14.18 -80.9% ------- BLUE .061 -.089 --------------------------------------------------------------------------------------------- RSX 23.51 -.11 23.62 -12.7% Bearish RED -.044 .062 |
Table 2    Count of Stocks in Key Directories
           20190731
-------------------------------
NEWHIGHS       153
NEWLOWS        38
MAXCP          21
MINCP          32
TTTNH          21
TTTNL          108  Day Traders distinctly bearish.
FASTUP         53
FASTDOWN       87
CPCROSSA       43
CPCROSSD       185
BIGVOLUP       2
BIGVODN        24
ACCUMVER       15
HIGHIP21       6
HIUPPCT        11
VHIP21         110
LOWACCUM       135
REDSELL        96
AUGSELS7       15
TRAPDOOR       25
|
 Table 3   RANKING OF KEY DIRECTORIES BASED PCT.OF STOCKS ABOVE 65-DMA
             7/31/19
 Bullish = 34
 Bearish = 11
---------------------------------------------------------------------------------------
Directory     Current       day-1         day-2         day-3         day-4         day-5
----------------------------------------------------------------------------------------
BIGBANKS       1             1             1             1             1             1
BONDFUND       .961          .951          .941          .951          .961          .941
GOLD           .86           .9            .92           .92           .92           .92
DJI-13         .769          .769          .846          .846          .846          .923
SOLAR          .764          .823          .823          .823          .764          .764
REGBANKS       .74           .851          .814          .888          .666          .777
INDEXES        .736          .709          .698          .698          .682          .758
DOWJONES       .733          .766          .833          .833          .833          .9
NIFTY          .732          .767          .785          .803          .803          .857
COMPUTER       .714          .714          .666          .666          .619          .666
SP-100         .714          .769          .791          .791          .747          .78
SEMI           .712          .777          .74           .731          .74           .768
INSURANC       .71           .815          .842          .842          .868          .868
HACKERS        .7            .8            .8            .8            .75           .8
JETS           .7            .7            .7            .8            .8            .8
TRANSP         .7            .75           .8            .85           .85           .85
FINANCE        .697          .767          .779          .79           .732          .848
NASD-100       .693          .755          .765          .755          .744          .775
SP500          .673          .739          .739          .747          .737          .758
FIDSTKS        .661          .732          .726          .754          .759          .786
HOMEBLDG       .647          .705          .588          .647          .647          .588
RUS-1000       .644          .696          .679          .687          .673          .708
AUTO           .641          .615          .692          .717          .717          .794
ELECTRON       .641          .724          .673          .66           .673          .685
GAMING         .608          .652          .652          .652          .521          .565
MILITARY       .607          .607          .607          .607          .642          .714
SOFTWARE       .606          .622          .622          .622          .59           .672
UTILITY        .575          .625          .65           .675          .65           .65
GUNS           .562          .562          .562          .562          .562          .687
INFRA          .555          .638          .694          .694          .638          .777
GREEN          .545          .545          .5            .545          .5            .545
HOSPITAL       .545          .5            .5            .5            .454          .454
INDMATER       .513          .605          .526          .578          .578          .644
REIT           .506          .575          .527          .479          .458          .506
N=34
============================================================================================
RETAIL         .48           .461          .519          .519          .5            .538
CHEM           .479          .604          .5            .583          .562          .687
ETFS           .438          .578          .719          .736          .719          .789
BEVERAGE       .411          .588          .588          .529          .47           .47
BIOTECH        .405          .451          .396          .419          .387          .448
COMODITY       .39           .56           .585          .56           .609          .658
OILGAS         .361          .326          .297          .319          .333          .39
FOOD           .351          .481          .574          .537          .611          .629
CHINA          .333          .333          .385          .421          .368          .421
EDU            .333          .666          .666          .666          .666          .666
COAL           .166          .333          0             .166          0             0
N=11
|
====================================================================
7/30/2019 Stick with the Buy B10 and hold all recommended long positions.
The NYSE A/D Line is uptrending. Flat-top "BOX" patterns usually bring
upside breakouts until Peerless gives a Sell. Tops usually do not come
at this time of year until late August or September. Going just by history
since 1967, we see that the DJI rises 75% of the time over the next month
and averages a gain of +2.1%. And if the FED should
actually lower
the overnight inter-bank lending rate by 1/4% tomorrow, history shows us
three very bullish aftermaths when the market is already making
new highs. These occurred in 1915, 1927 and 1954. Are their lessons
still
relevant. As a historian, I would say "Yes".

|
Charts 7/30/2019 2019 PEERLESS DJI, Signals, Indicators Daily DJI Volume 10-DayUp/Down Vol Hourly DJIA A/D Line for All Stocks Inverted Traders Index NASDAQ S&P OEX NYSE COMPQX DJI-15 DJI-20 DJI-30 DIA SPY QQQ MDY IWM TNA Short-Term Rates USO-CrudeOil DBO FAS GLD BBH IBB JETS JNUG KOL NUGT OIH OIL RSX RETL SDS AGQ SLV SOXL TECL TLT TMF TNA UGA (gasoline) XIV and China: YINN CHAU Commodities: CANE CORN DBC JJC, NIB, CHOC CORN, CUT (paper) MOO, SOYB WEAT UUP (Dollar) LIT (Lithium) AAPL ADBE ALXN AMAT AMGN AMD AMZN BA BABA BAC BIDU CAT CVX DE FB GOOG GS HD IBM INTU JPM M (Macy's) MSFT NFLX NVDA PG QCOM TSLA TXN XOM WMT CMG , LRCX, SWKS, MDGL SPPI WATT SQ TOWN 7/30/19 (Click on Underlined link.) Bullish MAXCPs - http://tigersoft.com/MAXCPS/Jul-30/BULLISH.htm Bearish MAXCPs - http://tigersoft.com/MINCPs/Jul-30/BEARISH.htm |
What about the FED?
A Rate Cut Tomorrow should be bullish.
But no Rate Cut should help all our positions,
except Gold and NUGT. With the Federal
Funds rate now 2.4%, a drop by 1/4% would
be nothing more than a re-allignment with
the de facto, market set 10-year and 3-month rates.
The stock market will probably be much relieved when
all uncertainty created by these intermittent FOMC
meetings is over until September, once again. .
We may be on the cusp of seeing the FED make monetary history. I doubt if investors
appreciate how bullish market history suggests a rate cut now would be with the
DJI so close to making a new all-time high. Most of the time, and certainly after
1956, the FED has avoided moving rates lower in a rising market once prices
get back to their old highs, either because it fears Inflation, excessive Stock
Speculation
or because it wants to have monetary ammunition available, i.e. rate cuts and
increased Fed buying of government securities from big banks, in case there is a steep
stock market sell-off or an economic slow-down. A good introductory history is seen at https://fraser.stlouisfed.org/files/docs/publications/frbslreview/pages/1965-1969/62472_1965-1969.pdf
I have found that one really has to go back to 1915, 1927 and 1953-1953 to find
examples of the FED cutting rates in a strong bull market close to its highs. It is much
more normal to see the FED raising rates, except that it has few excuses because Inflation
(apart from apartment rents, health care and prescribed drugs) is so low and the Dollar is
so strong. For the FED not to raise rates now would put even more pressure on
countries
overseas that have have big debts in Dollars to US banks. That would increase the odds
of a global recession, pushed along by trade wars.
But note that in our strange world, now, a Fed decision NOT to raise rates would
also help American bonds, blue chips and ETFs in the eyes of overseas investors.
In particular, it would almost certainly further weaken the falling Pound even more.
"Hot" funds would leave the "City" in London and the new Conservative
Government
will have to revert to raising their interest rates, thereby weakening their economy
and their ability to import from America instead of Europe, just to give an example.
So, either way, our Buy B10 ought to prove correct for many of the blue chip banks
represented by FAS.
 |
 |
 |
Table 1 QUICKSILVER on ETFS - 7/30/2019 Explanation: Pivot-point is price past which the ETF's 5-dma will change direction. 5-dmaAROC is the annualized rate of change of the ETF's 5-day moving average. Closing Power is bullish when it is above its rising 21-dma and it is bearish when it is below its 5-dma. Closing Power is the cumulative change from opening to close each day. Since it does not factor in changes at the opening, it tends to reflect NYSE professionals who trade the market when the NYSE is open. "Candle" color is blue when last close was above the opening, thus showing Professional net buying, which tends to be bullish. It is red when the close is below the opening, which tends to be bearish. IP21 is the current value of the Tiger Accumulation Index. Above +.15 tends to be bullish and below -.15 tends to be bearish until reversed. ITRS is the percent rise of the ETF over 50-days less the percent rise of the DIA (DJIA) over 50 trading days. The strongest ITRS ETFs tend to keep rising and the lowest ITRS ETFs tend to keep falling. Add ITRS and IP21 to get a composite measure of intermediate-term strength. ETF CLOSE CHANGE PIVOT-PT 5-dmaAROC CL-PWR CANDLE IP21 ITRS ------------------------------------------------------------------------------------------- DIA 271.91 -.22 272.61 -26.4% Bullish BLUE .328 ---- --------------------------------------------------------------------------------------------- BA 347.46 7.25 361.43 -362.2% ------- BLUE .052 -.078 --------------------------------------------------------------------------------------------- SPY 300.72 -.74 301.44 11.5% Bullish BLUE .261 -.004 --------------------------------------------------------------------------------------------- QQQ 193.78 -.84 195.15 -.3% Bullish BLUE .302 .002 --------------------------------------------------------------------------------------------- MDY 362.01 2.38 361.47 78.3% Bullish BLUE .199 -.005 --------------------------------------------------------------------------------------------- IWM 157.84 1.69 157.26 100.6% Bullish BLUE .099 -.023 --------------------------------------------------------------------------------------------- FAS 80.76 -.18 81.41 60.6% Bullish BLUE .284 .121 --------------------------------------------------------------------------------------------- SOXL 190.72 -1.3 200.88 172.7% Bullish BLUE .139 .351 --------------------------------------------------------------------------------------------- TECL 181.77 -3.84 187.1 -17.1% Bullish BLUE .196 .207 --------------------------------------------------------------------------------------------- IBB 106.36 .95 105.68 46.1% ------- BLUE-.012 -.031 --------------------------------------------------------------------------------------------- GLD 134.98 .45 134.37 48.2% ------- BLUE .099 .063 --------------------------------------------------------------------------------------------- OIH 14.3 .57 14.65 -98.1% ------- BLUE .018 -.109 --------------------------------------------------------------------------------------------- RSX 23.62 -.1 23.57 -25.4% ------- RED -.087 .061 |
 Table 3   Count of Stocks in Key Directories
           20190730
-------------------------------
NEWHIGHS       222  Bullish
NEWLOWS        12
MAXCP          45
MINCP          11
TTTNH          20
TTTNL          42
FASTUP         60
FASTDOWN       66
CPCROSSA       177
CPCROSSD       38
BIGVOLUP       9
BIGVODN        14
ACCUMVER       7
HIGHIP21       23
HIUPPCT        15
LOWACCUM       124
REDSELL        96
AUGSELS7       18
TRAPDOOR       23
|
Table 3  RANKING OF KEY DIRECTORIES BASED PCT.OF STOCKS ABOVE 65-DMA
              7/30/19
  Bullish  = 38
  Bearish = 6
---------------------------------------------------------------------------------------
Directory     Current       day-1         day-2         day-3         day-4         day-5
----------------------------------------------------------------------------------------
BIGBANKS       1             1             1             1             1             1
BONDFUND       .951          .941          .951          .961          .941          .932
GOLD           .9            .92           .92           .92           .92           .92
REGBANKS       .851          .814          .888          .666          .74           .592
SOLAR          .823          .823          .823          .764          .764          .764
INSURANC       .815          .842          .842          .868          .868          .815
HACKERS        .8            .8            .8            .75           .8            .75
DOWJONES       .793          .862          .862          .862          .896          .862
SEMI           .777          .74           .731          .74           .768          .712
NIFTY          .771          .789          .807          .807          .859          .859
DJI-13         .769          .846          .846          .846          .923          .846
SP-100         .769          .791          .791          .747          .78           .791
FINANCE        .767          .779          .79           .732          .837          .697
NASD-100       .755          .765          .755          .744          .775          .765
TRANSP         .75           .8            .85           .85           .85           .85
SP500          .739          .739          .747          .737          .756          .741
FIDSTKS        .733          .728          .755          .76           .788          .771
ELECTRON       .724          .673          .66           .673          .685          .628
COMPUTER       .714          .666          .666          .619          .666          .666
INDEXES        .709          .698          .698          .682          .747          .72
HOMEBLDG       .705          .588          .647          .647          .588          .529
JETS           .7            .7            .8            .8            .8            .8
RUS-1000       .696          .679          .687          .673          .704          .672
EDU            .666          .666          .666          .666          .666          .666
GAMING         .652          .652          .652          .521          .565          .434
INFRA          .638          .694          .694          .638          .75           .666
UTILITY        .625          .65           .675          .65           .65           .675
SOFTWARE       .622          .622          .622          .59           .672          .606
AUTO           .615          .692          .717          .717          .769          .717
MILITARY       .607          .607          .607          .642          .714          .714
INDMATER       .605          .526          .578          .578          .631          .605
CHEM           .604          .5            .583          .562          .687          .583
BEVERAGE       .588          .588          .529          .47           .47           .47
ETFS           .578          .719          .736          .719          .789          .807
REIT           .575          .527          .479          .458          .506          .486
GUNS           .562          .562          .562          .562          .687          .625
COMODITY       .56           .585          .56           .609          .658          .682
GREEN          .545          .5            .545          .5            .545          .454
----------------------------------------------------------------------------------------------
HOSPITAL       .5            .5            .5            .454          .454          .454
----------------------------------------------------------------------------------------------
FOOD           .481          .574          .537          .611          .629          .629
RETAIL         .461          .519          .519          .5            .538          .5
BIOTECH        .451          .396          .419          .387          .448          .413
CHINA          .333          .385          .421          .368          .421          .403
COAL           .333          0             .166          0             0             0
OILGAS         .326          .297          .319          .333          .375          .347
|
====================================================================
====================================================================
7/29/2019 Stick with the Buy B10 and hold all recommended long positions.
The market seems to be somewhat nervous about the FOMC's lowering of
the Federal Funds' Borrowing Rate. But so long as the NYSE A/D Line is
in a rising trend, it's hard to see much of a decline ahead even if they fail to
lower rates, despite the markedly lower real (not pegged) 10-year and 3-month
rates now. Gold did turn up today. So, by my counsel, we are still long
GLD and NUGT. I see no reason to get out of QQQ, MSFT, HIG or FAS.
It's true that Boeing may weigh down the DJI and it's also true that it's hard
to see where among the DJI-30, the next big move up is going to come from.
But somehow, the DJI-30 always finds a way, doesn't it?
 |
|
Charts 7/29/2019 2019 PEERLESS DJI, Signals, Indicators Daily DJI Volume 10-DayUp/Down Vol Hourly DJIA A/D Line for All Stocks Inverted Traders Index NASDAQ S&P OEX NYSE COMPQX DJI-15 DJI-20 DJI-30 DIA SPY QQQ MDY IWM TNA Short-Term Rates USO-CrudeOil DBO FAS GLD BBH IBB JETS JNUG KOL NUGT OIH OIL RSX RETL SDS AGQ SLV SOXL TECL TLT TMF TNA UGA (gasoline) XIV and China: YINN CHAU Commodities: CANE CORN DBC JJC, NIB, CHOC CORN, CUT (paper) MOO, SOYB WEAT UUP (Dollar) LIT (Lithium) AAPL ADBE ALXN AMAT AMGN AMD AMZN BA BABA BAC BIDU CAT CVX DE FB GOOG GS HD IBM INTU JPM M (Macy's) MSFT NFLX NVDA PG QCOM TSLA TXN XOM WMT CMG , LRCX, SWKS, MDGL SPPI WATT SQ TOWN 7/29/19 (Click on Underlined link.) Bullish MAXCPs - http://tigersoft.com/MAXCPS/Jul-29/BULLISH.htm Bearish MAXCPs - http://tigersoft.com/MINCPs/Jul-29/BEARISH.htm |
Significance of "Box" Pattern in DJI
The DJI's flat-top "BOX" pattern is
piggy-backed on top of a breakout
Buy B10. What is the significance of this? I've mentioned before in connection
with weekly charts that such tight trading ranges after an upside breakout mainly serve
to build up more upside pressure when the higher, minor box pattern is finally
broken above. (See the weekly DJI chart below. See the extra hesitation in
the DJI four years ago and how quickly the market rose when a second new
high was made.)

Tonight, I simply looked for tightly formed box patterns made at a DJI new
yearly high in the daily charts. What I found was that (1) as long as the NYSE A/D
Line
is rising, like now, (2) as long as Peerless does not produce a new Sell, and (3) as long
as the current "BOX" pattern does not morph into a head/shoulders formation,
we should see either a powerful upside breakout this coming month or a
minor decline to the rising 65-dma at most and then another very good rally.
Bullish Outcomes from "BOX" pattern: 1928, 1929, 1954, 1995
Bearish Outcome when Peerless gives a Sell or the Box Pattern morphs
into a head/shoulders and the A/D Line uptrend is broken:
1961-1962, 1963, 1984-1985. 2013.


Table 1 QUICKSILVER on ETFS - 7/29/2019 Explanation: Pivot-point is price past which the ETF's 5-dma will change direction. 5-dmaAROC is the annualized rate of change of the ETF's 5-day moving average. Closing Power is bullish when it is above its rising 21-dma and it is bearish when it is below its 5-dma. Closing Power is the cumulative change from opening to close each day. Since it does not factor in changes at the opening, it tends to reflect NYSE professionals who trade the market when the NYSE is open. "Candle" color is blue when last close was above the opening, thus showing Professional net buying, which tends to be bullish. It is red when the close is below the opening, which tends to be bearish. IP21 is the current value of the Tiger Accumulation Index. Above +.15 tends to be bullish and below -.15 tends to be bearish until reversed. ITRS is the percent rise of the ETF over 50-days less the percent rise of the DIA (DJIA) over 50 trading days. The strongest ITRS ETFs tend to keep rising and the lowest ITRS ETFs tend to keep falling. Add ITRS and IP21 to get a composite measure of intermediate-term strength. ETF CLOSE CHANGE PIVOT-PT 5-dmaAROC CL-PWR CANDLE IP21 ITRS ------------------------------------------------------------------------------------------- DIA 272.13 .27 273.35 8.8% Bullish BLUE .313 ---- --------------------------------------------------------------------------------------------- BA 340.21 -4.79 373.07 -461% Bearish RED .009 -.088 --------------------------------------------------------------------------------------------- SPY 301.46 -.55 300.03 59.3% Bullish RED .254 -.002 --------------------------------------------------------------------------------------------- QQQ 194.62 -.67 193.79 53.9% Bullish RED .31 .002 --------------------------------------------------------------------------------------------- MDY 359.63 -1.74 356.38 98.9% Bullish RED .175 -.019 --------------------------------------------------------------------------------------------- IWM 156.15 -1.05 154.7 79.3% ------- RED .085 -.043 --------------------------------------------------------------------------------------------- FAS 80.94 -1.28 79.78 211.4% Bullish RED .304 .11 --------------------------------------------------------------------------------------------- SOXL 192.02 1.47 184.1 388.7% Bullish BLUE .092 .283 --------------------------------------------------------------------------------------------- TECL 185.61 -.24 182.4 160.5% Bullish RED .216 .206 --------------------------------------------------------------------------------------------- IBB 105.41 .09 105.39 13.8% ------- RED .026 -.041 --------------------------------------------------------------------------------------------- GLD 134.53 .89 133.69 3% ------- BLUE .102 .057 --------------------------------------------------------------------------------------------- OIH 13.73 -.45 14.58 -229.2% Bearish RED -.002 -.169 (weak) --------------------------------------------------------------------------------------------- RSX 23.72 .08 23.74 38.1% Bearish BLUE -.126 .067 |
 Table 2   Count of Stocks in Key Directories
           20190729
-------------------------------
NEWHIGHS       207
NEWLOWS        35
MAXCP          25
MINCP          55  Professionals are net bearish.
TTTNH          16
TTTNL          102 Day Traders are net bearish.
FASTUP         47
FASTDOWN       85
CPCROSSA       61
CPCROSSD       94
BIGVOLUP       5
BIGVODN        6
ACCUMVER       6
HIGHIP21       12
HIUPPCT        15
LOWACCUM       122
REDSELL        95
AUGSELS7       17
TRAPDOOR       22
|
 Table 3  RANKING OF KEY DIRECTORIES BASED PCT.OF STOCKS ABOVE 65-DMA
              7/29/19
 Bullish = 38
 Bearish = 4
---------------------------------------------------------------------------------------
Directory     Current       day-1         day-2         day-3         day-4         day-5
----------------------------------------------------------------------------------------
BIGBANKS       1             1             1             1             1             .857
BONDFUND       .941          .951          .961          .941          .941          .932
GOLD           .92           .92           .92           .92           .92           .94
DOWJONES       .862          .862          .862          .896          .862          .862
DJI-13         .846          .846          .846          .923          .846          .846
INSURANC       .842          .842          .868          .868          .815          .868
SOLAR          .823          .823          .764          .764          .764          .823
REGBANKS       .814          .888          .666          .74           .592          .592
HACKERS        .8            .8            .75           .8            .75           .8
TRANSP         .8            .85           .85           .85           .85           .85
SP-100         .791          .791          .747          .78           .791          .736
NIFTY          .789          .807          .807          .859          .859          .824
FINANCE        .779          .79           .732          .837          .697          .581
NASD-100       .765          .755          .744          .775          .765          .755
SEMI           .74           .731          .74           .768          .712          .685
SP500          .739          .747          .737          .756          .741          .704
FIDSTKS        .728          .755          .76           .788          .766          .728
ETFS           .719          .736          .719          .789          .789          .684
JETS           .7            .8            .8            .8            .8            .8
INDEXES        .698          .698          .682          .747          .715          .672
INFRA          .694          .694          .638          .75           .666          .583
AUTO           .692          .717          .717          .769          .717          .564
RUS-1000       .679          .687          .673          .704          .673          .634
ELECTRON       .673          .66           .673          .685          .628          .602
COMPUTER       .666          .666          .619          .666          .666          .666
EDU            .666          .666          .666          .666          .666          .666
GAMING         .652          .652          .521          .565          .434          .434
UTILITY        .65           .675          .65           .65           .675          .675
SOFTWARE       .622          .622          .59           .672          .606          .622
MILITARY       .607          .607          .642          .714          .714          .678
BEVERAGE       .588          .529          .47           .47           .47           .411
HOMEBLDG       .588          .647          .647          .588          .529          .647
COMODITY       .585          .56           .609          .658          .682          .609
FOOD           .574          .537          .611          .629          .629          .574
GUNS           .562          .562          .562          .687          .625          .625
REIT           .527          .479          .458          .506          .5            .363
INDMATER       .526          .578          .578          .631          .605          .565
RETAIL         .519          .519          .5            .538          .5            .5
===========================================================================================
CHEM           .5            .583          .562          .687          .562          .416
GREEN          .5            .545          .5            .545          .454          .409
HOSPITAL       .5            .5            .454          .454          .454          .409
===========================================================================================
BIOTECH        .398          .421          .389          .449          .421          .421
CHINA          .385          .421          .368          .421          .403          .315
OILGAS         .297          .319          .333          .375          .34           .326
COAL           0             .166          0             0             0             0
|
====================================================================
7/26/2019 The DJI would have closed 200 points higher
if Boeing's 32 point, one-week sell-off,
had not weighed it down. In effect, the DJI is now disguising the strength shown
elsewhere. As long as the NYSE A/D Line remains in an uptrend, our historical
studies
tell us from 1976 and 2002 to trust the rising ADL. And of course, if the FED does
come
through and lower interest rates as the DJI is making a new all-time high, we could have a
repeat of what happened in the Summer of 1927: namely, a surge in stock speculation
that lasted two more years. Wouldn't that be something!?
Expect higher prices, possibly much high prices. The Buy B10 is reliably
bullish.
Under Trump, Buy B10s have worked out very well. As long as the economy
provides so many jobs, history suggests his re-election is highly probable. Wall
Street
knows this very well. They fully appreciate how much Trump has benefitted them.
And we should expect them now to do all they can to keep the bull market alive.
Signals
DJI Pct.Gain
Maximum Paper Loss
--------------------------------------------------------------------
20170125 B10 20068.51
.027 none 0
20170602 B10 21206.29
.230 none 0
20170727 B10 21796.55
.197 21674.51 -.0060 8/18
20171128 B10 23836.41
.094 none 0
--------------------------------------------------------------------
Avg.= +13.7%
-0.15


|
Charts 7/26/2019 2019 PEERLESS DJI, Signals, Indicators Daily DJI Volume 10-DayUp/Down Vol Hourly DJIA A/D Line for All Stocks Inverted Traders Index NASDAQ S&P OEX NYSE COMPQX DJI-15 DJI-20 DJI-30 DIA SPY QQQ MDY IWM TNA Short-Term Rates USO-CrudeOil DBO FAS GLD BBH IBB JETS JNUG KOL NUGT OIH OIL RSX RETL SDS AGQ SLV SOXL TECL TLT TMF TNA UGA (gasoline) XIV and China: YINN CHAU Commodities: CANE CORN DBC JJC, NIB, CHOC CORN, CUT (paper) MOO, SOYB WEAT UUP (Dollar) LIT (Lithium) AAPL ADBE ALXN AMAT AMGN AMD AMZN BA BABA BAC BIDU CAT CVX DE FB GOOG GS HD IBM INTU JPM M (Macy's) MSFT NFLX NVDA PG QCOM TSLA TXN XOM WMT CMG , LRCX, SWKS, MDGL SPPI WATT SQ TOWN 7/26/19 (Click on Underlined link.) Bullish MAXCPs - http://tigersoft.com/MAXCPS/Jul-26/BULLISH.htm Bearish MAXCPs - http://tigersoft.com/MINCPs/Jul-26/BEARISH.htm |
The general market, as measured by the major ETFs like SPY,
QQQ and the NASDAQ are making Summer new highs. The
DJI usually does not end its Summer rally until late August or
September. So, the DJI could easily rally another month. And
since the QQQ most often tops out after the DJI, the odds of
another month's rally are excellent. Certainly, that is what
the rising number of new highs and flat-top breakouts we are
now seeing among our Bullish MAXCPs.
The Dollar made another new high on Friday. This works against
our GLD and NUGT long positions. Since GLD has just broken its
price uptrend, I have to suggest taking profits in NUGT and
GLD if they do not rally Monday. But the Dollar's strengh has been a big booster
for financials and our position in FAS. FAS is the 3x-times leveraged Financials'
ETF. It is most heavily invested in JPMorgan and the major credit
card companies as well as Berkshire Hathaway. As I see it, political
talk of America's consumer debt problem will only become a problem
when debtors fail en masse to make their monthly payments to their
banks and credit card companies. Some weakness is becoming apparent in
the area of car loans now, but all the other debt just means bigger and more
profits for the stocks represented by FAS. If anything, the new
tariffs will increase what consumers have to borrow on their
cards and that is bullish for Visa, Master Card... and FAS. All the
while, the strong Dollar lures foreign capital investments into US
bonds, blue chips and the major market ETFs.
Why Buy FAS? FAS and the DJI have been
found to be closely linked over time,
just as the Fidelity Sector Fund for Financials was the single Fidelity select fund
most profitably traded using Peerless in the 1980s and 1990s.
My history of what fundamentally has moved stocks the most since 1886
clearly shows that Wall Street - as represented by the big banks and
insurance companies and signified by the Dow Jones Industrial Average - has
been the premier powerhouse of the Economy. The national economy depend
upon Wall Street. That makes it more powerful than the White House and
Congress in many ways. Factoring in campaign contributions and we begin
to see how powerful Wall Street is. Given this, it behooves us as traders
using Peerless Stock Market Timing to appreciate just how close a connection there
is between the Peerless Buys and Sells, on the one hand, and FAS, representing
Wall Street, on the other hand.
FAS began trading at the end of the 2008 bear market. Buying it when Peerless
gives a Buy signal is highly recommended. But selling it when Peerless gives a Sell
should be seen as a necessary precaution. See how fast it fell in 2008!

Yearly Gains Using Peerless Buys and Sells on FAS:
Long Positions Only: 2009-2018
1) Positions taken at opening day after Peerless Buy signal.
2) It is assumed $10,000 is invested and proceeds are kept
fully invested for year year, while Peerless is on a Buy.
3) Commissions of $40 per trade are subtracted from gains.
Year Percent Gain
Biggest Paper Loss
-------- -------------
--------------------
2009 608.1%
18.3%
2010 231.9%
31.5%
2011 76.7%
23.1%
2012 124.5%
7.1%
2013 106.5%
9.8%
2014 114.0%
1.9%
2015
24.6%
10.6%
2016 106.2%
19.7%
2017
42.8%
13.5%
2018
73.0%
15.8%
(Details will be presented in Peerless Stock Market
Timing,
1929-2019: Charts, Signals and Profitable Uses to be
released very soon. Results shown here taken from TigerSoft
charts of FAS with Peerless signals super-imposed...)
Table 1 QUICKSILVER on ETFS - 7/26/2019 Explanation: Pivot-point is price past which the ETF's 5-dma will change direction. 5-dmaAROC is the annualized rate of change of the ETF's 5-day moving average. Closing Power is bullish when it is above its rising 21-dma and it is bearish when it is below its 5-dma. Closing Power is the cumulative change from opening to close each day. Since it does not factor in changes at the opening, it tends to reflect NYSE professionals who trade the market when the NYSE is open. "Candle" color is blue when last close was above the opening, thus showing Professional net buying, which tends to be bullish. It is red when the close is below the opening, which tends to be bearish. IP21 is the current value of the Tiger Accumulation Index. Above +.15 tends to be bullish and below -.15 tends to be bearish until reversed. ITRS is the percent rise of the ETF over 50-days less the percent rise of the DIA (DJIA) over 50 trading days. The strongest ITRS ETFs tend to keep rising and the lowest ITRS ETFs tend to keep falling. Add ITRS and IP21 to get a composite measure of intermediate-term strength. ETF CLOSE CHANGE PIVOT-PT 5-dmaAROC CL-PWR CANDLE IP21 ITRS ------------------------------------------------------------------------------------------- DIA 271.86 .47 271.65 7.5% Bullish BLUE .308 0 --------------------------------------------------------------------------------------------- BA 345 -3.09 373.42 -441.3% Bearish RED -.014 -.06 --------------------------------------------------------------------------------------------- SPY 302.01 2.01 297.9 80.9% Bullish BLUE .253 .001 --------------------------------------------------------------------------------------------- QQQ 195.29 1.99 192.53 110.8% Bullish BLUE .297 .008 --------------------------------------------------------------------------------------------- MDY 361.37 3.5 352.55 120.9% Bullish BLUE .265 -.015 --------------------------------------------------------------------------------------------- IWM 157.2 1.84 153.68 109.1% Bullish BLUE .154 -.038 --------------------------------------------------------------------------------------------- FAS 82.22 2.32 77.55 316.4% Bullish BLUE .356 .157 --------------------------------------------------------------------------------------------- SOXL 190.55 -.14 177.35 624.9% Bullish RED .078 .198 --------------------------------------------------------------------------------------------- TECL 185.85 3.28 179.72 348.9% Bullish BLUE .183 .239 --------------------------------------------------------------------------------------------- IBB 105.32 1.12 105.12 20.9% ------- BLUE .043 -.039 --------------------------------------------------------------------------------------------- GLD 133.64 .22 134.45 -31% ------- RED .097 .034 --------------------------------------------------------------------------------------------- OIH 14.18 0 14.39 41.7% Bearish ---- .008 -.142 --------------------------------------------------------------------------------------------- RSX 23.64 .02 23.54 -4.2% Bearish RED -.16 .059 |
 Table 2   Count of Stocks in Key Directories
           20190726
-------------------------------
NEWHIGHS       328  Bullish
NEWLOWS        31
MAXCP          46
MINCP          42
TTTNH          33
TTTNL          73
FASTUP         50
FASTDOWN       71
CPCROSSA       182
CPCROSSD       36
BIGVOLUP       4
BIGVODN        11
ACCUMVER       10
HIGHIP21       13
HIUPPCT        18
LOWACCUM       123
REDSELL        99
AUGSELS7       16
TRAPDOOR       22
|
Table 3   RANKING OF KEY DIRECTORIES BASED PCT.OF STOCKS ABOVE 65-DMA
              7/26/19
Bullish = 39
Bearish = 6
---------------------------------------------------------------------------------------
Directory     Current       day-1         day-2         day-3         day-4         day-5
----------------------------------------------------------------------------------------
BIGBANKS       1             1             1             1             .857          .857
BONDFUND       .951          .961          .941          .941          .941          .941
GOLD           .921          .921          .921          .921          .921          .941
REGBANKS       .892          .678          .75           .607          .571          .642
DOWJONES       .862          .862          .896          .862          .862          .827
TRANSP         .85           .85           .85           .85           .8            .75
DJI-13         .846          .846          .923          .846          .846          .769
INSURANC       .842          .868          .868          .815          .868          .868
NIFTY          .807          .807          .859          .859          .824          .807
HACKERS        .8            .75           .8            .75           .8            .8
JETS           .8            .8            .8            .8            .8            .7
FINANCE        .795          .738          .84           .704          .59           .636
SP-100         .791          .747          .78           .791          .736          .681
SOLAR          .777          .722          .722          .722          .777          .722
FIDSTKS        .755          .76           .788          .766          .728          .733
NASD-100       .755          .744          .775          .765          .755          .755
SP500          .747          .737          .755          .741          .702          .704
ETFS           .736          .719          .789          .789          .649          .736
SEMI           .729          .738          .765          .711          .684          .63
AUTO           .717          .717          .769          .717          .564          .589
INDEXES        .698          .682          .747          .715          .672          .704
INFRA          .694          .638          .75           .666          .583          .611
RUS-1000       .683          .67           .701          .671          .629          .629
UTILITY        .675          .65           .65           .675          .675          .75
COMPUTER       .666          .619          .666          .666          .666          .666
EDU            .666          .666          .666          .666          .666          .666
ELECTRON       .656          .668          .681          .624          .598          .547
GAMING         .652          .521          .565          .434          .434          .434
HOMEBLDG       .647          .647          .588          .529          .588          .647
SOFTWARE       .622          .59           .672          .606          .622          .639
MILITARY       .607          .642          .714          .714          .678          .642
CHEM           .576          .557          .673          .557          .423          .442
INDMATER       .575          .575          .625          .6            .537          .575
GUNS           .562          .562          .687          .625          .625          .625
COMODITY       .56           .609          .658          .682          .609          .682
FOOD           .547          .622          .641          .641          .584          .66
GREEN          .545          .5            .545          .454          .409          .409
BEVERAGE       .529          .47           .47           .47           .411          .529
RETAIL         .509          .49           .528          .49           .49           .509
N=39
=============================================================================================
HOSPITAL       .478          .478          .478          .478          .478          .565
REIT           .472          .452          .5            .493          .364          .351
BIOTECH        .425          .398          .456          .428          .425          .425
CHINA          .421          .368          .421          .403          .28           .35
OILGAS         .319          .333          .375          .34           .319          .305
COAL           .166          0             0             0             0             0
N=6
|
====================================================================
7/25/2019
Minor moves back and forth within the DJI's "box" pattern are not
considered significant. Usually, these patterns bring upside breakouts.
Of course, the FED must still not disappoint in next week's FOMC
meeting. Keep in mind that nearly all of the Buy B10s are profitable
when finally reversed. Stay long DIA, QQQ, FAS, MSFT, HIG,
NUGT and GLD. Usually Peerless does not give a Sell signal
in the Summer until late August or September.


Today, let's look a little closer at one of our best technical tools, one that warrants
more discussion on a quiet day, like Friday would seem to be.
Tiger Day Traders' Tool - No Sell Yet.


Day traders who thrive must pay close attention to the news
and to the
market's technicals. So, their bullishness or bearishness is an important
clue for us. TigerSoft has it own cumulative measure of how
bullish or bearish this group is. We call it the Tiger Day Traders' Tool,
Each day the maximum intra-day decline from the opening to the day's
low is subtracted from the distance from the opening to the day's high
and added to a running total. So, if a stock opened at 42 and hit a high
of 43 afterwards and a low of 40 also after the opening, a -1 would
be added to the running sum. Right now, the Day Traders' Tool for
DIA, SPY and QQQ are flat and have been so for several months.
Day traders as a whole are in an undecided mood about the market.
What we have to watch out for is a breakout or breakdown from the horizontal
action. An upside breakout would be bullish, but a breakdown would likely be
quite bearish. See below how the QQQ Day Traders' Tool breakdowns
correctly warned in 2007, 2008, 2011, 2014-2015 and 2018 of bigger
declines. Only in early 2000 was this DTT breakdown significantly premature.
And in that case, the day traders who stuck with the shorting of openings were
soon richly rewarded, as the declines after the opening were much deeper than
miniscule early rallies.
QQQ - 2000 |
QQQ - 2007 |
QQQ - 2008 |
QQQ - 2015-2016 |
QQQ - 2018 |
|
Charts 7/25/2019 2019 PEERLESS DJI, Signals, Indicators Daily DJI Volume 10-DayUp/Down Vol Hourly DJIA A/D Line for All Stocks Inverted Traders Index NASDAQ S&P OEX NYSE COMPQX DJI-15 DJI-20 DJI-30 DIA SPY QQQ MDY IWM TNA Short-Term Rates USO-CrudeOil DBO FAS GLD BBH IBB JETS JNUG KOL NUGT OIH OIL RSX RETL SDS AGQ SLV SOXL TECL TLT TMF TNA UGA (gasoline) XIV and China: YINN CHAU Commodities: CANE CORN DBC JJC, NIB, CHOC CORN, CUT (paper) MOO, SOYB WEAT UUP (Dollar) LIT (Lithium) AAPL ADBE ALXN AMAT AMGN AMD AMZN BA BABA BAC BIDU CAT CVX DE FB GOOG GS HD IBM INTU JPM M (Macy's) MSFT NFLX NVDA PG QCOM TSLA TXN XOM WMT CMG , LRCX, SWKS, MDGL SPPI WATT SQ TOWN 7/25/19 (Click on Underlined link.) Bullish MAXCPs - http://tigersoft.com/MAXCPS/Jul-25/BULLISH.htm Bearish MAXCPs - http://tigersoft.com/MINCPs/Jul-25/BEARISH.htm |
Table 1 QUICKSILVER on ETFS - 7/25/2019 Explanation: Pivot-point is price past which the ETF's 5-dma will change direction. 5-dmaAROC is the annualized rate of change of the ETF's 5-day moving average. Closing Power is bullish when it is above its rising 21-dma and it is bearish when it is below its 5-dma. Closing Power is the cumulative change from opening to close each day. Since it does not factor in changes at the opening, it tends to reflect NYSE professionals who trade the market when the NYSE is open. "Candle" color is blue when last close was above the opening, thus showing Professional net buying, which tends to be bullish. It is red when the close is below the opening, which tends to be bearish. IP21 is the current value of the Tiger Accumulation Index. Above +.15 tends to be bullish and below -.15 tends to be bearish until reversed. ITRS is the percent rise of the ETF over 50-days less the percent rise of the DIA (DJIA) over 50 trading days. The strongest ITRS ETFs tend to keep rising and the lowest ITRS ETFs tend to keep falling. Add ITRS and IP21 to get a composite measure of intermediate-term strength. ETF CLOSE CHANGE PIVOT-PT 5-dmaAROC CL-PWR CANDLE IP21 ITRS ------------------------------------------------------------------------------------------- DIA 271.39 -1.22 271.45 -16.2% Bullish RED .234 ----- --------------------------------------------------------------------------------------------- BA 348.09 -13.34 377.36 -176.3% Bearish RED -.007 -.046 --------------------------------------------------------------------------------------------- SPY 300 -1.44 297.17 19.6% Bullish RED .178 -.002 --------------------------------------------------------------------------------------------- QQQ 193.3 -1.85 191.01 22.8% Bullish RED .237 .01 --------------------------------------------------------------------------------------------- MDY 357.87 -3.6 352.76 56.4% Bullish RED .188 -.025 --------------------------------------------------------------------------------------------- IWM 155.36 -1.9 153.82 21% Bullish RED .08 -.049 --------------------------------------------------------------------------------------------- FAS 79.9 -1.51 77.21 60.8% Bullish RED .271 .123 (bullish) --------------------------------------------------------------------------------------------- SOXL 190.69 -10.19 167.54 612.9% Bullish RED .125 .227 (bulllish) --------------------------------------------------------------------------------------------- TECL 182.57 -4.53 173.22 176.9% Bullish RED .143 .251 (bullish) --------------------------------------------------------------------------------------------- IBB 104.2 -1.48 104.88 -106.6% ------- RED -.017 -.044 --------------------------------------------------------------------------------------------- GLD 133.42 -.95 134.47 -113.6% ------- RED .119 .029 --------------------------------------------------------------------------------------------- OIH 14.18 -.47 14.06 104.8% Bearish RED -.001 -.137 ---------------------------------------------------------------------------------------------- RSX 23.62 .05 23.66 -57% ------- RED -.125 .056 |
 Table 2   Count of Stocks in Key Directories
           20190725
-------------------------------
NEWHIGHS       127
NEWLOWS        37
MAXCP          20
MINCP          50  Bearish
TTTNH          15
TTTNL          96
FASTUP         43
FASTDOWN       88
CPCROSSA       41
CPCROSSD       186
BIGVOLUP       2
BIGVODN        17
ACCUMVER       10
HIGHIP21       14
HIUPPCT        18
LOWACCUM       129
REDSELL        103
AUGSELS7       21
TRAPDOOR       19
|
Table 3       RANKING OF KEY DIRECTORIES BASED PCT.OF STOCKS ABOVE 65-DMA
              7/25/19
 Bullish = 36
 Bearish = 8
---------------------------------------------------------------------------------------
Directory     Current       day-1         day-2         day-3         day-4         day-5
----------------------------------------------------------------------------------------
BIGBANKS       1             1             1             .857          .714          .857
BONDFUND       .961          .941          .941          .941          .941          .941
GOLD           .921          .921          .921          .921          .941          .921
INSURANC       .868          .868          .815          .868          .868          .894
DOWJONES       .862          .896          .862          .862          .827          .827
TRANSP         .85           .85           .85           .8            .75           .6
DJI-13         .846          .923          .846          .846          .769          .769
NIFTY          .807          .859          .859          .824          .807          .824
JETS           .8            .8            .8            .8            .7            .8
FIDSTKS        .76           .788          .766          .728          .733          .733
HACKERS        .75           .8            .75           .8            .8            .8
SP-100         .747          .78           .791          .736          .681          .703
NASD-100       .744          .775          .765          .755          .755          .816
FINANCE        .738          .84           .704          .59           .625          .59
SEMI           .738          .765          .711          .684          .639          .639
SP500          .737          .755          .741          .702          .7            .708
SOLAR          .722          .722          .722          .777          .722          .722
ETFS           .719          .789          .789          .649          .684          .771
AUTO           .717          .769          .717          .564          .589          .564
INDEXES        .682          .747          .715          .672          .704          .709
REGBANKS       .678          .75           .607          .571          .642          .535
RUS-1000       .67           .701          .67           .63           .629          .64
ELECTRON       .668          .681          .624          .598          .554          .56
EDU            .666          .666          .666          .666          .666          .666
UTILITY        .65           .65           .675          .675          .75           .775
HOMEBLDG       .647          .588          .529          .588          .588          .764
MILITARY       .642          .714          .714          .678          .642          .642
INFRA          .638          .75           .666          .583          .611          .555
FOOD           .622          .641          .641          .584          .66           .547
COMPUTER       .619          .666          .666          .666          .666          .666
COMODITY       .609          .658          .682          .609          .682          .585
SOFTWARE       .59           .672          .606          .622          .639          .655
INDMATER       .575          .625          .6            .537          .562          .512
GUNS           .562          .687          .625          .625          .625          .625
CHEM           .557          .673          .557          .423          .461          .442
GAMING         .521          .565          .434          .434          .434          .434
N=36
============================================================================================
GREEN          .5            .545          .454          .409          .409          .5
============================================================================================
RETAIL         .49           .528          .49           .49           .509          .49
BEVERAGE       .47           .47           .47           .411          .529          .588
REIT           .452          .5            .493          .364          .358          .513
HOSPITAL       .434          .478          .478          .478          .565          .521
BIOTECH        .395          .456          .428          .425          .425          .456
CHINA          .368          .421          .403          .28           .35           .315
OILGAS         .333          .375          .34           .319          .298          .312
COAL           0             0             0             0             0             0
N=8
|
=====================================================================
7/24/2019 Stick with the Buy B10. The NYSE A/D Line, QQQ and NASDAQ
made new highs. Big jumps were made by many mid-caps and stocks
in the Russell-2000. The DJI's IP21(Accumulation Index) and V-Indicator
have turned positive, thus making it less likely that the next rally to the
upper band will bring a Sell S12 or a Sell S9-v.

For now hold long:
DIA 272.61-0.74 (-0.27%) overnight +0.37
MSFT 140.72+1.43 (+1.03%) overnight +0.28
QQQ 195.15+1.36 (+0.70%) overnight -0.02
FAS 81.41+1.63 (+2.04%)
NUGT 35.61+0.96 (+2.77%)
overnight -.08
GLD 134.37+0.68 (+0.51%) overnight
+.18
HIG 57.53+0.63 (+1.11%)
New Highs: NASDAQ, QQQ , FAS,
TECL
Usually breakouts into all-time high territory are followed by
additional rises in prices. That we now see this for the NASDAQ,
QQQ, FAS and TECL is almost certainly bullish for general
market. SPY did make a marginal new high today, too.


Seasonal Bullishness
The general seasonal bullishness now from late July until September
can be seen in the history of Peerless Sells that occurred in past years
before a Presidential Election from 1931...1935...1939 to 2015 and also
how the market behaved in 1915...1919...1923...1927 before Peerless
signals appeared. There have
been 25 such past years. Only in 8 of the
25 cases did the DJI reach a peak in the Summer before August 24th,
one month from now: 1919, 1923, 1931, 1955, 1959,
1983, 2007 and
2011.
(Two of these 8 cases occurred in falling markets, not bull
markets like now.)
DJI History in Summers: 1915,
1919, 1923-2015
1915: DJI rose steadily from 70 (Jul 12) to 99
at end of
year with only brief DJI dips to rising 21-dma. Low interest
rates and arms-building for European combatants in WW!.
1919: DJI fell 12% from 7/15 DJI peak in post-war
boom.
occurring Decline seems to have taken place as a result of
uncertainties created by anarchist bombings in June.
Major
peak was made on 11/3. Sharply higher interest rates and
Red Scare started 2-year long bear market.
1923: Market fell because of Teapot Dome scandal and
higher
interest rates. Peak in downtrend made on 8/29.
1927: DJI rose from 166 on 6/27 to 198.90 as FED lowered
interest rates.
Peerless Signals: 1931-2015
(in years before Presidential Election Year)
Gain Paper Loss and Final Top
-------------------------------------------------------------------------------------
19310819 S9 141.7 .299
(On going bear market)
19350909 S2 132.5 .033
19390913 S9 154.1 .049
19430920 S2 141.8 .071
19471022 S4 184.4 .103
19510917 S4 275.1 .053
19550727 S9
468.5 .042
^^^^
19550901 S7
469.6 .061 487.5 -.0381 9/23
19590803 S9 678.1 .06
(On going bear market)
1963 - steadily rising DJI
19670918 S2 938.74 .084
19710816 S12 888.95 .083 920.93 -.0359 9/7
19750829 S9 835.34 .061 838.31 -.0035 9/4
19790921 S9 893.94 .096
19830726 S9 1243.69 .065
^^^^
19870826 S4 2701.85 .052
19871001 S9 2639.2 .341
19910905 S1 3008.50 .041
1995 take off - no Sells
19990817 S9 11117.07 .099 11326.0 -.0187 8/25
2003 take off - no Sells
20070723 S9 13943.42 .047
^^^^
20110721 S9 12724.41 .098
^^^^
20150824 S13 15871.35 .013 16643.0 -.0486 8/28
----------------------------------------------------------------------------------------
|
Charts 7/24/2019 2019 PEERLESS DJI, Signals, Indicators Daily DJI Volume 10-DayUp/Down Vol Hourly DJIA A/D Line for All Stocks Inverted Traders Index NASDAQ S&P OEX NYSE COMPQX DJI-15 DJI-20 DJI-30 DIA SPY QQQ MDY IWM TNA Short-Term Rates USO-CrudeOil DBO FAS GLD BBH IBB JETS JNUG KOL NUGT OIH OIL RSX RETL SDS AGQ SLV SOXL TECL TLT TMF TNA UGA (gasoline) XIV and China: YINN CHAU Commodities: CANE CORN DBC JJC, NIB, CHOC CORN, CUT (paper) MOO, SOYB WEAT UUP (Dollar) LIT (Lithium) AAPL ADBE ALXN AMAT AMGN AMD AMZN BA BABA BAC BIDU CAT CVX DE FB GOOG GS HD IBM INTU JPM M (Macy's) MSFT NFLX NVDA PG QCOM TSLA TXN XOM WMT CMG , LRCX, SWKS, MDGL SPPI WATT SQ TOWN 7/24/19 (Click on Underlined link.) Bullish MAXCPs - http://tigersoft.com/MAXCPS/Jul-24/BULLISH.htm Bearish MAXCPs - http://tigersoft.com/MINCPs/Jul-24/BEARISH.htm |
Table 1 QUICKSILVER on ETFS - 7/24/2019 Explanation: Pivot-point is price past which the ETF's 5-dma will change direction. 5-dmaAROC is the annualized rate of change of the ETF's 5-day moving average. Closing Power is bullish when it is above its rising 21-dma and it is bearish when it is below its 5-dma. Closing Power is the cumulative change from opening to close each day. Since it does not factor in changes at the opening, it tends to reflect NYSE professionals who trade the market when the NYSE is open. "Candle" color is blue when last close was above the opening, thus showing Professional net buying, which tends to be bullish. It is red when the close is below the opening, which tends to be bearish. IP21 is the current value of the Tiger Accumulation Index. Above +.15 tends to be bullish and below -.15 tends to be bearish until reversed. ITRS is the percent rise of the ETF over 50-days less the percent rise of the DIA (DJIA) over 50 trading days. The strongest ITRS ETFs tend to keep rising and the lowest ITRS ETFs tend to keep falling. Add ITRS and IP21 to get a composite measure of intermediate-term strength. ETF CLOSE CHANGE PIVOT-PT 5-dmaAROC CL-PWR CANDLE IP21 ITRS
-------------------------------------------------------------------------------------------
DIA 272.61 -.74 272.27 6.1% Bullish BLUE .08 -----
---------------------------------------------------------------------------------------------
BA 361.43 -11.64 361.11 -109.1% ------- RED .033 -.004
---------------------------------------------------------------------------------------------
SPY 301.44 1.41 298.83 62% Bullish BLUE .107 -.002
---------------------------------------------------------------------------------------------
QQQ 195.15 1.36 192.42 76.7% Bullish BLUE .196 .017
jump
---------------------------------------------------------------------------------------------
MDY 361.47 5.09 353.86 123.6% Bullish BLUE .196 -.019
jump
---------------------------------------------------------------------------------------------
IWM 157.26 2.56 154.71 101.5% Bullish BLUE .077 -.038
jump
---------------------------------------------------------------------------------------------
FAS 81.41 1.63 78.94 255.8% Bullish BLUE .252 .161 (bullish)
---------------------------------------------------------------------------------------------
SOXL 200.88 16.78 168.66 1152.9% Bullish BLUE .12 .378
^^^^
---------------------------------------------------------------------------------------------
TECL 187.1 4.7 176.21 419.8% Bullish BLUE .081 .334
^^^^
---------------------------------------------------------------------------------------------
IBB 105.68 .29 106.45 4.7% ------- BLUE .005 -.032
---------------------------------------------------------------------------------------------
GLD 134.37 .68 136.48 -7.8% Bullish RED .119 .02
---------------------------------------------------------------------------------------------
OIH 14.65 .07 13.88 243.4% Bearish BLUE .041 -.088
---------------------------------------------------------------------------------------------
RSX 23.57 -.17 23.89 -29.5% ------- RED -.12 .065
|
Table 2 Count of Stocks in Key Directories
20190724
-------------------------------
NEWHIGHS 353 Bullish
NEWLOWS 21
MAXCP 69
MINCP 15
TTTNH 52
TTTNL 67
FASTUP 71
FASTDOWN 75
CPCROSSA 299
CPCROSSD 45
BIGVOLUP 3
BIGVODN 16
ACCUMVER 10
HIGHIP21 7
HIUPPCT 19
LOWACCUM 133
REDSELL 105
AUGSELS7 18
TRAPDOOR 11
|
Table 3       RANKING OF KEY DIRECTORIES BASED PCT.OF STOCKS ABOVE 65-DMA
              7/24/19
Bullish = 38
Bearish = 6
---------------------------------------------------------------------------------------
Directory     Current       day-1         day-2         day-3         day-4         day-5
----------------------------------------------------------------------------------------
BIGBANKS       1             1             .857          .714          .714          .714
BONDFUND       .941          .941          .941          .941          .951          .951
DJI-13         .923          .846          .846          .769          .769          .769
GOLD           .921          .921          .921          .941          .921          .901
DOWJONES       .896          .862          .862          .827          .827          .827
INSURANC       .868          .815          .868          .868          .894          .868
NIFTY          .859          .859          .824          .807          .824          .824
TRANSP         .85           .85           .8            .75           .6            .6
FINANCE        .84           .704          .59           .625          .579          .522
HACKERS        .8            .75           .8            .8            .8            .75
JETS           .8            .8            .8            .7            .8            .8
ETFS           .789          .789          .649          .684          .736          .719
FIDSTKS        .788          .766          .728          .733          .733          .711
SP-100         .78           .791          .736          .681          .692          .626
NASD-100       .775          .765          .755          .755          .816          .775
AUTO           .769          .717          .564          .589          .538          .589
SEMI           .765          .711          .684          .639          .639          .585
SP500          .755          .741          .702          .7            .702          .694
INFRA          .75           .666          .583          .611          .555          .666
REGBANKS       .75           .607          .571          .642          .535          .428
INDEXES        .747          .715          .672          .704          .709          .698
SOLAR          .722          .722          .777          .722          .722          .777
MILITARY       .714          .714          .678          .642          .642          .607
RUS-1000       .701          .67           .629          .63           .636          .62
GUNS           .687          .625          .625          .625          .625          .625
ELECTRON       .685          .628          .602          .557          .564          .532
CHEM           .673          .557          .423          .461          .461          .442
SOFTWARE       .672          .606          .622          .639          .655          .655
COMPUTER       .666          .666          .666          .666          .666          .666
EDU            .666          .666          .666          .666          .666          .666
COMODITY       .658          .682          .609          .682          .56           .658
UTILITY        .65           .675          .675          .75           .775          .775
FOOD           .641          .641          .584          .66           .528          .66
INDMATER       .625          .6            .537          .562          .512          .487
HOMEBLDG       .588          .529          .588          .588          .705          .764
GAMING         .565          .434          .434          .434          .434          .521
GREEN          .545          .454          .409          .409          .5            .545
RETAIL         .528          .49           .49           .509          .49           .49
============================================================================================
REIT           .5            .493          .364          .358          .506          .493
============================================================================================
BEVERAGE       .47           .47           .411          .529          .588          .529
BIOTECH        .455          .43           .428          .428          .453          .433
HOSPITAL       .434          .478          .478          .565          .521          .565
CHINA          .421          .403          .28           .35           .28           .28
OILGAS         .375          .34           .319          .298          .305          .298
COAL           0             0             0             0             0             0
|
=========================================================================
7/23/2019 Stick with the Buy B10 for now. The NYSE A/D Line continues to rise.
It remains
stronger than the DJI. It tells us NYSE stocks generally will probably keep rising
because of low interest rates. But it may be constructive now if the DJI does pull
back
here, as the Futures this morning suggest. That is because a 270 point rally from
here
by the DJI from here right away could bring a Sell S12 (if the Accumulation Index-IP21)
stays negative or bring a Sell S9-V (if the NYSE Up volume remains weak and the
V-I stays negative). But don't assume a Sell yet. With the DJI near an
all-time high,
we should respect the market's bullish potential.
Keep in mind that seasonality remains quite bullish, first because it is important for
Republicans to keep the rally going and they call most of the shots now in the
Fed as well as in the Administration and, secondly, because we see a bullish seasonal
pattern after August 23rd for the DJI generally since 1965. From
1965-2018, the DJI
rose 65% of the time in the two weeks following August 23rd and 60.4% of the time
both over the next month and two months, when the DJI avereraged gain of +1.4%
and +2.3%, respectively.

For now hold long:
DIA
273.35+1.70 (+0.63%)
overnight -0.43
MSFT 139.29+0.86 (+0.62%)
overnight -0.39
QQQ 193.79+1.26 (+0.65%) overnight
-0.91
FAS 79.78+2.23 (+2.88%)
NUGT 34.65-1.24 (-3.45%)
overnight +0.47
GLD 133.69-0.76 (-0.57%) overnight
+0.74
HIG 56.90-0.14 (-0.25%)
Traders should consider buying SNPS and XLNX for quick trades. These are the
highest Tiger Power-ranked stocks in our NIFTY-High-Volume-Techs and the QQQ.
Note that 86% of the "NIFTY" stocks are above the 65-dma, placing them near the
top of Table 3's ranking.


|
Charts 7/23/2019 2019 PEERLESS DJI, Signals, Indicators Daily DJI Volume 10-DayUp/Down Vol Hourly DJIA A/D Line for All Stocks Inverted Traders Index NASDAQ S&P OEX NYSE COMPQX DJI-15 DJI-20 DJI-30 DIA SPY QQQ MDY IWM TNA Short-Term Rates USO-CrudeOil DBO FAS GLD BBH IBB JETS JNUG KOL NUGT OIH OIL RSX RETL SDS AGQ SLV SOXL TECL TLT TMF TNA UGA (gasoline) XIV and China: YINN CHAU Commodities: CANE CORN DBC JJC, NIB, CHOC CORN, CUT (paper) MOO, SOYB WEAT UUP (Dollar) LIT (Lithium) AAPL ADBE ALXN AMAT AMGN AMD AMZN BA BABA BAC BIDU CAT CVX DE FB GOOG GS HD IBM INTU JPM M (Macy's) MSFT NFLX NVDA PG QCOM TSLA TXN XOM WMT CMG , LRCX, SWKS, MDGL SPPI WATT SQ TOWN 7/23/19 (Click on Underlined link.) Bullish MAXCPs - http://tigersoft.com/MAXCPS/Jul-23/BULLISH.htm Bearish MAXCPs - http://tigersoft.com/MINCPs/Jul-23/BEARISH.htm |
Table 1 QUICKSILVER on ETFS - 7/23/2019 Explanation: Pivot-point is price past which the ETF's 5-dma will change direction. 5-dmaAROC is the annualized rate of change of the ETF's 5-day moving average. Closing Power is bullish when it is above its rising 21-dma and it is bearish when it is below its 5-dma. Closing Power is the cumulative change from opening to close each day. Since it does not factor in changes at the opening, it tends to reflect NYSE professionals who trade the market when the NYSE is open. "Candle" color is blue when last close was above the opening, thus showing Professional net buying, which tends to be bullish. It is red when the close is below the opening, which tends to be bearish. IP21 is the current value of the Tiger Accumulation Index. Above +.15 tends to be bullish and below -.15 tends to be bearish until reversed. ITRS is the percent rise of the ETF over 50-days less the percent rise of the DIA (DJIA) over 50 trading days. The strongest ITRS ETFs tend to keep rising and the lowest ITRS ETFs tend to keep falling. Add ITRS and IP21 to get a composite measure of intermediate-term strength. ETF CLOSE CHANGE PIVOT-PT 5-dmaAROC CL-PWR CANDLE IP21 ITRS ------------------------------------------------------------------------------------------- DIA 273.35 1.7 272.28 -1.3% Bullish BLUE .028 ---- -------------------------------------------------------------------------------------------- BA 373.07 -.35 369.52 139.9% Bullish RED .099 0 --------------------------------------------------------------------------------------------- SPY 300.03 2.13 297.74 5.4% ------- BLUE .033 -.01 --------------------------------------------------------------------------------------------- QQQ 193.79 1.26 192.2 16.6% ------- BLUE .125 -.004 --------------------------------------------------------------------------------------------- MDY 356.38 3.83 352.73 13% ------- BLUE .088 -.04 --------------------------------------------------------------------------------------------- IWM 154.7 1.02 154.13 -17.5% Bearish BLUE -.041 -.064 --------------------------------------------------------------------------------------------- FAS 79.78 2.23 77.41 53.8% Bullish BLUE .14 .078 positive --------------------------------------------------------------------------------------------- SOXL 184.1 6.75 161.27 723.9% Bullish BLUE .041 .093 --------------------------------------------------------------------------------------------- TECL 182.4 2.68 172.26 253.7% ------- RED .024 .168 NH --------------------------------------------------------------------------------------------- IBB 105.39 .27 105.58 -3.8% ------- ---- -.087 -.048 --------------------------------------------------------------------------------------------- GLD 133.69 -.76 134.58 48% Bullish RED .182 .049 positive --------------------------------------------------------------------------------------------- OIH 14.58 .19 13.96 63.7% Bearish BLUE .02 -.11 --------------------------------------------------------------------------------------------- RSX 26.46 .12 26.3 20.9% Bearish ---- .126 .134 |
Table 2   Count of Stocks in Key Directories
          20190723
-------------------------------
NEWHIGHS       165   Bullish
NEWLOWS        22
MAXCP          28
MINCP          21
TTTNH          28
TTTNL          67
FASTUP         41
FASTDOWN       112
CPCROSSA       113
CPCROSSD       57
BIGVOLUP       3
BIGVODN        7
ACCUMVER       15
HIGHIP21       8
HIUPPCT        19
LOWACCUM       138
REDSELL        115
AUGSELS7       30
TRAPDOOR       20
|
Table 3       RANKING OF KEY DIRECTORIES BASED PCT.OF STOCKS ABOVE 65-DMA
              7/23/19
Bullish = 35
Bearish = 10
---------------------------------------------------------------------------------------
Directory     Current       day-1         day-2         day-3         day-4         day-5
----------------------------------------------------------------------------------------
BIGBANKS       1             .857          .714          .714          .714          .714
********
BONDFUND       .941          .941          .941          .951          .951          .961
GOLD           .921          .921          .941          .921          .901          .882
****
DOWJONES       .862          .862          .827          .827          .827          .896
********
NIFTY          .859          .824          .807          .824          .807          .807
-----
TRANSP         .85           .8            .75           .6            .55           .9
DJI-13         .846          .846          .769          .769          .769          .846
INSURANC       .815          .868          .868          .894          .868          .894
JETS           .8            .8            .7            .8            .8            .8
SP-100         .791          .736          .681          .692          .615          .758
ETFS           .789          .649          .684          .736          .719          .736
FIDSTKS        .766          .728          .733          .733          .695          .755
NASD-100       .765          .755          .755          .816          .765          .816
SOLAR          .764          .823          .764          .764          .823          .705
HACKERS        .75           .8            .8            .8            .75           .7
SP500          .742          .701          .701          .703          .678          .771
INDEXES        .718          .675          .708          .713          .702          .74
AUTO           .717          .564          .589          .538          .564          .615
MILITARY       .714          .678          .642          .642          .607          .714
FINANCE        .704          .59           .625          .579          .534          .579
SEMI           .702          .684          .639          .639          .576          .558
COMODITY       .682          .609          .682          .56           .658          .707
UTILITY        .675          .675          .75           .775          .775          .775
RUS-1000       .67           .629          .629          .636          .612          .686
COMPUTER       .666          .666          .666          .666          .666          .666
EDU            .666          .666          .666          .666          .666          .666
INFRA          .666          .583          .611          .555          .666          .722
FOOD           .629          .574          .648          .518          .648          .685
GUNS           .625          .625          .625          .625          .625          .625
ELECTRON       .617          .598          .554          .56           .515          .541
REGBANKS       .607          .571          .642          .535          .428          .464
SOFTWARE       .606          .622          .639          .655          .639          .622
INDMATER       .6            .537          .562          .512          .475          .6
CHEM           .557          .423          .461          .461          .461          .538
HOMEBLDG       .529          .588          .588          .705          .764          .882
====================================================================================================
RETAIL         .49           .49           .509          .49           .49           .528
REIT           .486          .364          .358          .506          .493          .527
HOSPITAL       .478          .478          .565          .521          .565          .608
BEVERAGE       .47           .411          .529          .588          .529          .529
GREEN          .454          .409          .409          .5            .545          .545
GAMING         .434          .434          .434          .434          .521          .565
BIOTECH        .425          .425          .425          .45           .428          .447
CHINA          .403          .28           .35           .28           .28           .298
OILGAS         .347          .326          .304          .312          .297          .368
COAL           0             0             0             0             0             0
|
====================================================================
====================================================================
7/22/2019
Overseas currencies are rallying this morning. A reduction in American
interest rates is expected. Stick with the Buy B10. The Fed is now
under pressure to lower rates from Pres. Trump and Democrat Elizabeth
Warren who claims to be seeing the same flashing warning signs about
the economy she saw before the 2007-2009 financial melt-down.
Expect the FED to do whatever is necessary to keep the rally in blue chips
advancing. Of course, a rally in blue chips and dividend stocks does not mean
that all boats will rise in the stock market. So, right now we want to
focus on the ETFs with the highest IP21 (Accumulation) and ITRS (relative
strength readings. Gold stocks ought to keep zig-zagging upwards
as long as GLD's closes show an uptrend.
![]()

This is not a market for broad speculation on smaller NASDAQ stocks.
That is why the ITRS Relative Strength Indicators for IWM and MDY
are negative. And today there were 115 new 12-month lows on the NASDAQ
and only 69 new highs. Table 2 below also shows more MINCPs (Closing Power
new lows) than MAXCPs (Closing Power new highs). And only 55% of
all stocks and ETFs are above their 65-dma. So some nervousness is
reasonble.
And what will the Fed or the Trump Administration do to boost the market
after a 1/4 percent rate cut? I hear that Trump will be proposing a cut
in taxes on capital gains. We will just have to watch the technicals this week.
A rally to the upper 2.5% band with the V-Indicator or IP21 (Accumulation Index)
negative, could bring a Sell S9-V or Sell S12.
For now Hold long
DIA 271.65+0.20 (+0.07%) overnight + 1.03
MSFT 138.43+1.81 (+1.32%)
overnight + 0.82
QQQ 192.53+1.52 (+0.80%) overnight + 0.85
FAS 77.55+0.34 (+0.44%)
NUGT 35.87+0.86 (+2.46%) overnight - 0.79
GLD 134.45-0.02 (-0.01%) overnight - 0.62
HIG 57.04-0.07 (-0.12%)
Trust that the FED will do whatever is necessary to keep the rally in blue chips
advancing.
Gold's Uptrend

|
Charts 7/22/2019 2019 PEERLESS DJI, Signals, Indicators Daily DJI Volume 10-DayUp/Down Vol Hourly DJIA A/D Line for All Stocks Inverted Traders Index NASDAQ S&P OEX NYSE COMPQX DJI-15 DJI-20 DJI-30 DIA SPY QQQ MDY IWM TNA Short-Term Rates USO-CrudeOil DBO FAS GLD BBH IBB JETS JNUG KOL NUGT OIH OIL RSX RETL SDS AGQ SLV SOXL TECL TLT TMF TNA UGA (gasoline) XIV and China: YINN CHAU Commodities: CANE CORN DBC JJC, NIB, CHOC CORN, CUT (paper) MOO, SOYB WEAT UUP (Dollar) LIT (Lithium) AAPL ADBE ALXN AMAT AMGN AMD AMZN BA BABA BAC BIDU CAT CVX DE FB GOOG GS HD IBM INTU JPM M (Macy's) MSFT NFLX NVDA PG QCOM TSLA TXN XOM WMT CMG , LRCX, SWKS, MDGL SPPI WATT SQ TOWN 7/22/19 (Click on Underlined link.) Bullish MAXCPs - http://tigersoft.com/MAXCPS/Jul-22/BULLISH.htm Bearish MAXCPs - http://tigersoft.com/MINCPs/Jul-22/BEARISH.htm |
Table 1 QUICKSILVER on ETFS - 7/22/2019 Explanation: Pivot-point is price past which the ETF's 5-dma will change direction. 5-dmaAROC is the annualized rate of change of the ETF's 5-day moving average. Closing Power is bullish when it is above its rising 21-dma and it is bearish when it is below its 5-dma. Closing Power is the cumulative change from opening to close each day. Since it does not factor in changes at the opening, it tends to reflect NYSE professionals who trade the market when the NYSE is open. "Candle" color is blue when last close was above the opening, thus showing Professional net buying, which tends to be bullish. It is red when the close is below the opening, which tends to be bearish. IP21 is the current value of the Tiger Accumulation Index. Above +.15 tends to be bullish and below -.15 tends to be bearish until reversed. ITRS is the percent rise of the ETF over 50-days less the percent rise of the DIA (DJIA) over 50 trading days. The strongest ITRS ETFs tend to keep rising and the lowest ITRS ETFs tend to keep falling. Add ITRS and IP21 to get a composite measure of intermediate-term strength. ETF CLOSE CHANGE PIVOT-PT 5-dmaAROC CL-PWR CANDLE IP21 ITRS ------------------------------------------------------------------------------------------- DIA 271.65 .2 273.42 -35.8% ------- RED -.065 ---- --------------------------------------------------------------------------------------------- BA 373.42 -3.94 362.75 161.1% Bullish RED .054 .003 --------------------------------------------------------------------------------------------- SPY 297.9 .73 299.71 -47.7% ------- BLUE -.062 -.012 --------------------------------------------------------------------------------------------- QQQ 192.53 1.52 193.15 -42.1% ------- BLUE .037 -.009 --------------------------------------------------------------------------------------------- MDY 352.55 -.21 355.46 -38% Bearish RED -.015 -.047 --------------------------------------------------------------------------------------------- IWM 153.68 -.14 155.24 -52.1% Bearish RED -.111 -.067 --------------------------------------------------------------------------------------------- FAS 77.55 .34 78.94 -142.8% ------- BLUE .051 .067 (bullish) --------------------------------------------------------------------------------------------- SOXL 177.35 9.81 159.93 366.8% Bullish BLUE -.04 .054 --------------------------------------------------------------------------------------------- TECL 179.72 6.5 173.52 36.6% ------- BLUE -.049 .161 --------------------------------------------------------------------------------------------- IBB 105.12 .24 105.47 -45.4% ------- BLUE -.064 -.053 --------------------------------------------------------------------------------------------- GLD 134.45 -.02 132.4 34.3% Bullish RED .253 .058 (highest) --------------------------------------------------------------------------------------------- OIH 14.39 .33 14.4 -88.1% Bearish BLUE -.007 -.136 --------------------------------------------------------------------------------------------- RSX 23.54 -.12 23.75 -82% ------- RED -.056 .084 |
 Table 2   Count of Stocks in Key Directories
          20190722
-------------------------------
NEWHIGHS       123
NEWLOWS        46
MAXCP          18
MINCP          45 Professionals are net bearish.
TTTNH          27
TTTNL          101 Day Traders are net bearish.
FASTUP         42
FASTDOWN       117  Swing traders are net bearish.
CPCROSSA       61
CPCROSSD       121
BIGVOLUP       2
BIGVODN        8
ACCUMVER       7
HIGHIP21       10
HIUPPCT        16
LOWACCUM       136
REDSELL        114
AUGSELS7       29
TRAPDOOR       10
|
Table 3       RANKING OF KEY DIRECTORIES BASED PCT.OF STOCKS ABOVE 65-DMA
              7/22/19
Bullish = 34
Bearish = 11
---------------------------------------------------------------------------------------
Directory     Current       day-1         day-2         day-3         day-4         day-5
----------------------------------------------------------------------------------------
BONDFUND       .941          .941          .951          .951          .961          .961
GOLD           .921          .941          .921          .901          .882          .823
INSURANC       .868          .868          .894          .868          .894          .894
DOWJONES       .862          .827          .827          .827          .862          .931
BIGBANKS       .857          .714          .714          .714          .714          .857
DJI-13         .846          .769          .769          .769          .846          .846
NIFTY          .821          .803          .821          .803          .785          .803
HACKERS        .8            .8            .8            .75           .7            .75
JETS           .8            .7            .8            .8            .8            .7
TRANSP         .8            .75           .6            .55           .9            .75
SOLAR          .777          .722          .722          .777          .666          .722
NASD-100       .755          .755          .816          .765          .806          .846
SP-100         .736          .681          .692          .615          .736          .736
FIDSTKS        .728          .733          .733          .695          .744          .76
SP500          .702          .7            .702          .679          .759          .767
SEMI           .684          .639          .639          .576          .558          .585
MILITARY       .678          .642          .642          .607          .714          .714
INDEXES        .675          .708          .713          .702          .74           .767
UTILITY        .675          .75           .775          .775          .775          .75
COMPUTER       .666          .666          .666          .666          .666          .666
EDU            .666          .666          .666          .666          .666          .666
ETFS           .649          .684          .736          .719          .736          .754
RUS-1000       .629          .629          .636          .612          .678          .669
GUNS           .625          .625          .625          .625          .625          .625
SOFTWARE       .622          .639          .655          .639          .606          .639
COMODITY       .609          .682          .56           .658          .658          .731
ELECTRON       .598          .554          .56           .515          .541          .547
FINANCE        .59           .625          .579          .534          .579          .602
HOMEBLDG       .588          .588          .705          .764          .882          .823
INFRA          .583          .611          .555          .666          .722          .666
FOOD           .574          .648          .518          .648          .648          .703
REGBANKS       .571          .642          .535          .428          .464          .428
AUTO           .564          .589          .538          .564          .615          .589
INDMATER       .537          .562          .512          .475          .6            .537
==============================================================================================
RETAIL         .49           .509          .49           .49           .528          .528
GAMING         .434          .434          .434          .521          .565          .521
HOSPITAL       .434          .565          .521          .565          .608          .608
BIOTECH        .423          .425          .45           .428          .436          .436
CHEM           .423          .461          .461          .461          .557          .5
BEVERAGE       .411          .529          .588          .529          .529          .647
GREEN          .409          .409          .5            .545          .545          .5
REIT           .364          .358          .506          .493          .513          .533
OILGAS         .319          .298          .305          .291          .361          .368
CHINA          .28           .35           .28           .28           .298          .298
COAL           0             0             0             0             0             0
|
====================================================================
====================================================================
7/19/2019 Stick with the Buy B10. Hold long DIA, QQQ, MSFT, FAS
NUGT, GLD and HIG. I suspect the FED will do whatever is
necessary
to keep the rally in blue chips advancing. A
new DJI breakout now
over 27500 would be very bullish.


Friday was weak technically. Without Boeing's 16 point
leap
upwards on Friday, the DJI would have fallen more than 150
and be back down to the key support at 27000, the previous
point of breakout. Friday's weakness may owe to fears of a war
between US and Iraq. But then why is Oil so weak? See below how
the Closing Power for oil's ETF UCO has just made a
a 12-month low. Some say UCO's weakness owes to falling Global
demand because overseas' economies are weak. But then why is our
Tiger Index of Foreign ETFs so close to making its own 12-month highs.
Perhaps, Oil is in decline more because Green Energy is catching on
as fears of Global Warming spread. I would not expect Wall Street
pundits to talk about this. Oil weakness now given talk of war with
Iran and Gold's strength is quite striking. There are lots of oil stocks
among our bearish MINCPs now.


Watch what the Fed does, don't listen to what they
say.
The current weakness in real interest rates may have a better explanation.
The FED is expected to lower rates because it in not independent. History
shows this many times, 1924, 1927, 1970, 1972-1973... Despite Powell's
assertions to the contrary, I would argue that the FED knows its job now
very well. That job is to boost the stock market this Summer, thereby
helping the economy stay strong and ultimately helping Trump, Republicans and
the powers-that-be next year. Rationalization abound. For this purpose,
the uncertainties about the global economy and the trade war's consequences
are very handy. The Bond markets understand this. That is why there is such
a big gap between the the Fed's own Federal Funds' rate which they set and
the actual rates for 3 months and 10 year bonds. If I am right then the FED
will formally lower its rates soon. It will not want to take any chances.
So what does this mean for stocks? Perhaps, not so much
for many smaller
stocks. But it is clearly bullish, probably very bullish, for the
big American blue chips in the DJI and leading tech stocks, the very
stocks that "hot" overseas money invests in while the Dollar and
Blue Chips are strong. So, I would continue to trust the Buy B10. This
is a bullish signal. And seasonality is very bullish. The powers-that-be
want a strong economy going into the Presidential Election. What
better way to ensure this, than to lower interest rates just as the
DJI makes a new all-time high. This is exactly what the FED did
in the Summer of 1927, just before the DJI went into "warp" speed
upwards for two more years.
|
2019 PEERLESS DJI, Signals,
Indicators Daily DJI Volume 10-DayUp/Down Vol Hourly DJIA A/D Line for All Stocks Inverted Traders Index NASDAQ S&P OEX NYSE COMPQX DJI-15 DJI-20 DJI-30 DIA SPY QQQ MDY IWM TNA Short-Term Rates USO-CrudeOil DBO FAS GLD BBH IBB JETS JNUG KOL NUGT OIH OIL RSX RETL SDS AGQ SLV SOXL TECL TLT TMF TNA UGA (gasoline) XIV and China: YINN CHAU Commodities: CANE CORN DBC JJC, NIB, CHOC CORN, CUT (paper) MOO, SOYB WEAT UUP (Dollar) LIT (Lithium) AAPL ADBE ALXN AMAT AMGN AMD AMZN BA BABA BAC BIDU CAT CVX DE FB GOOG GS HD IBM INTU JPM M (Macy's) MSFT NFLX NVDA PG QCOM TSLA TXN XOM WMT CMG , LRCX, SWKS, MDGL SPPI WATT SQ TOWN 7/19/19 (Click on Underlined link.) Bullish MAXCPs - http://tigersoft.com/MAXCPS/Jul-19/BULLISH.htm Bearish MAXCPs - http://tigersoft.com/MINCPs/Jul-19/BEARISH.htm |
Table 1 QUICKSILVER on ETFS - 7/19/2019 Explanation: Pivot-point is price past which the ETF's 5-dma will change direction. 5-dmaAROC is the annualized rate of change of the ETF's 5-day moving average. Closing Power is bullish when it is above its rising 21-dma and it is bearish when it is below its 5-dma. Closing Power is the cumulative change from opening to close each day. Since it does not factor in changes at the opening, it tends to reflect NYSE professionals who trade the market when the NYSE is open. "Candle" color is blue when last close was above the opening, thus showing Professional net buying, which tends to be bullish. It is red when the close is below the opening, which tends to be bearish. IP21 is the current value of the Tiger Accumulation Index. Above +.15 tends to be bullish and below -.15 tends to be bearish until reversed. ITRS is the percent rise of the ETF over 50-days less the percent rise of the DIA (DJIA) over 50 trading days. The strongest ITRS ETFs tend to keep rising and the lowest ITRS ETFs tend to keep falling. Add ITRS and IP21 to get a composite measure of intermediate-term strength. ETF CLOSE CHANGE PIVOT-PT 5-dmaAROC CL-PWR CANDLE IP21 ITRS ------------------------------------------------------------------------------------------ DIA 271.45 -.82 273.6 -35.5% ------- RED -.026 ----- --------------------------------------------------------------------------------------------- BA 377.36 16.25 361.61 165.2% Bullish BLUE .117 .004 --------------------------------------------------------------------------------------------- SPY 297.17 -1.66 300.75 -58.1% Bearish RED .007 -.012 --------------------------------------------------------------------------------------------- QQQ 191.01 -1.41 194.15 -65.3% Bearish RED .043 -.017 --------------------------------------------------------------------------------------------- MDY 352.76 -1.1 355.24 -60.9% Bearish RED .038 -.044 --------------------------------------------------------------------------------------------- IWM 153.82 -.89 155.29 -73.8% Bearish RED -.087 -.064 --------------------------------------------------------------------------------------------- FAS 77.21 -1.73 79.79 -202.9% Bearish RED .077 .067 --------------------------------------------------------------------------------------------- SOXL 167.54 -1.12 165.28 184.3% Bearish RED -.116 -.038 --------------------------------------------------------------------------------------------- TECL 173.22 -2.99 178.44 -108.8% ------- RED -.043 .099 --------------------------------------------------------------------------------------------- IBB 104.88 -1.57 106.08 -30.2% ------- RED -.071 -.052 --------------------------------------------------------------------------------------------- GLD 134.47 -2.01 133.53 35% Bullish RED .29 .067 (strongest) --------------------------------------------------------------------------------------------- OIH 14.06 .18 14.64 -320.1% Bearish BLUE .011 -.156 --------------------------------------------------------------------------------------------- RSX 23.66 -.23 23.93 -54.5% ------- RED -.017 .073 |
Table 2   Count of Stocks in Key Directories
          20190719
-------------------------------
NEWHIGHS       76   Slipping back
NEWLOWS        27
MAXCP          13
MINCP          39   Professionals are new bearish.
TTTNH          16
TTTNL          98
FASTUP         37
FASTDOWN       104  Bearish Swing-traders.
CPCROSSA       68
CPCROSSD       263
BIGVOLUP       1
BIGVODN        16
ACCUMVER       16
HIGHIP21       12
HIUPPCT        16
REDSELL        111
AUGSELS7       26
TRAPDOOR       9
|
Table 3
              RANKING OF KEY DIRECTORIES BASED PCT.OF STOCKS ABOVE 65-DMA
              7/19/19
Bullish = 37
Bearish = 8
---------------------------------------------------------------------------------------
Directory     Current       day-1         day-2         day-3         day-4         day-5
----------------------------------------------------------------------------------------
BONDFUND       .941          .951          .951          .961          .961          .97
GOLD           .941          .921          .901          .882          .823          .843
^^^^           ^^^^
INSURANC       .868          .894          .868          .894          .894          .894
DOWJONES       .833          .833          .8            .866          .9            .833
NIFTY          .807          .824          .807          .789          .789          .789
HACKERS        .8            .8            .75           .7            .75           .75
DJI-13         .769          .769          .769          .846          .846          .846
NASD-100       .755          .816          .765          .806          .826          .816
UTILITY        .75           .775          .775          .775          .75           .75
TRANSP         .75           .6            .55           .9            .75           .75
FIDSTKS        .733          .733          .695          .744          .755          .766
SOLAR          .722          .722          .777          .666          .722          .666
BIGBANKS       .714          .714          .714          .714          .857          1
INDEXES        .704          .709          .698          .736          .763          .741
JETS           .7            .8            .8            .8            .8            .8
SP500          .7            .702          .679          .759          .761          .776
ETFS           .684          .736          .719          .736          .736          .666
COMODITY       .682          .56           .658          .658          .707          .756
SP-100         .681          .692          .615          .736          .736          .769
COMPUTER       .666          .666          .666          .666          .666          .666
EDU            .666          .666          .666          .666          .666          .5
FOOD           .648          .518          .648          .648          .685          .759
MILITARY       .642          .642          .607          .714          .714          .75
REGBANKS       .642          .535          .428          .464          .464          .642
SEMI           .639          .639          .576          .558          .576          .576
SOFTWARE       .639          .655          .639          .606          .639          .672
RUS-1000       .629          .636          .61           .679          .667          .682
FINANCE        .625          .579          .534          .579          .59           .704
GUNS           .625          .625          .625          .625          .625          .562
INFRA          .611          .555          .666          .722          .666          .722
AUTO           .589          .538          .564          .615          .589          .641
HOMEBLDG       .588          .705          .764          .882          .823          .882
INDMATER       .562          .512          .475          .6            .525          .587
ELECTRON       .554          .56           .515          .541          .541          .535
BEVERAGE       .529          .588          .529          .529          .647          .647
HOSPITAL       .521          .521          .565          .608          .608          .521
RETAIL         .509          .49           .49           .528          .528          .547
N=37
=============================================================================================
CHEM           .461          .461          .461          .557          .519          .538
GAMING         .434          .434          .521          .565          .521          .478
BIOTECH        .423          .45           .428          .436          .436          .42
GREEN          .409          .5            .545          .545          .5            .545
REIT           .36           .51           .496          .517          .537          .578
CHINA          .35           .28           .28           .298          .298          .14
OILGAS         .298          .305          .291          .361          .354          .416
COAL           0             0             0             0             0             0
N=8
|
====================================================================
7/18/2019 We are seeing a pullback and a testing of the DJI's 27000-27100 breakout
level. Trust the current Buy B10. The key NYSE A/D Line continues to be
in an uptrend. Buy B10s do often bring re-tests of their point of breakout.
It is usually quite bullish when these tests are over. Even if the DJI were to
drop below 27000, without a fresh Peerless Sell signal, I would expect any
decline to be shallow. A paper loss of 2% to 4% after a Buy B10 was seen in
in only 8 (16%) of the earlier 48 Buy B10s not occurring right after a bear market.
So, there is some risk If this is too great a risk, then consider shorting some of
the
Bearish MINCPs that show an AI/200 under 60, an IP21 under -.15 and
an ITRS below -.15. The most bearish of these are:
Bearish MINCPs
Stock AI/200
IP21 Price
-----------------------------------------
RRC 32
-.283
5.23
XOP 47
-.173
24.65
FRA 57
-.323
6.08
http://tigersoft.com/MINCPs/Jul-18/BEARISH.htm
Short-term interest rates fell sharply today. Again, there is talk of an
"inverted yield" curve being bearish for the general market. Possibly, but
all the earlier cases back to 1960 occurred when short-term interest
rates were above 4%. With the Dollar strong, overseas "hot" money will
certainly keep coming into US bonds and blue chips. And that means
the uptrend will likley continue unless President Trump starts a war or
raises tariffs sharply higher against Chinese or European imports. That
is the "wild-card" and it is the main reason Gold is being bought as a hedge
now.
Stay long the positions below. Today GOLD and NUGT were again good
hedges. Gold stocks have often rallied when a market top was nearing. This
was true repeatedly between 1968 and 2008. But this approach did not work
well in 2016 when the Dollar was strong and interest rates were coming down.
So, I see gold and NUGT continuing to move up more. Silver stocks are
joining in, too. But watch the simple price uptrend of GLD. When that uptrend
is broken, I would want to sell it and NUGT. The volatility of NUGT makes
it dangerous day-to day. Most of us will do better setting an upside target
with it based on a percentage profit like 50% or drawing lines through its recent
highs. See the NUGT chart of 2016 to get some ideas about how to trade it.
And see my original study of big Gold and NEM advances as signs of an
imminent market top. The clearest example comes from NEM's chart of 1987.
See => http://www.tigersoftware.com/TigerBlogs/02-21-2008/index.html
Today's Action and Our Longs
DIA 272.27 unchanged...
QQQ 192.42 +0.11%
FAS 78.94 +1.98%
MSFT 136.42 +0.15% 3% higher opening expected..
NUGT 36.11 +12.84%
GLD. 136.48 +1.41%
HIG 57.90 +0.42%.
Current Peerless - DJIA and NYSE A/D Line |
Current NASD-100 TigerSoft Chart and QQQ A/D Line |
Current Weekly - MSFT #1 Power Ranked DJI-30 |
Trading Gold Stocks - Part 1
Booming NUGT and GLD (Gold) |
NUGT and GLD (2016) |
|
NEM and DJI (1987) If rates were going back up, Gold's rise and Dollar's falling would be dangerous. Fortunately, short-term rates are falling and Dollar is still close to its 12-month highs.  |
|
Charts 7/18/2019 2019 PEERLESS DJI, Signals, Indicators Daily DJI Volume 10-DayUp/Down Vol Hourly DJIA A/D Line for All Stocks Inverted Traders Index NASDAQ S&P OEX NYSE COMPQX DJI-15 DJI-20 DJI-30 DIA SPY QQQ MDY IWM TNA Short-Term Rates USO-CrudeOil DBO FAS GLD BBH IBB JETS JNUG KOL NUGT OIH OIL RSX RETL SDS AGQ SLV SOXL TECL TLT TMF TNA UGA (gasoline) XIV and China: YINN CHAU Commodities: CANE CORN DBC JJC, NIB, CHOC CORN, CUT (paper) MOO, SOYB WEAT UUP (Dollar) LIT (Lithium) AAPL ADBE ALXN AMAT AMGN AMD AMZN BA BABA BAC BIDU CAT CVX DE FB GOOG GS HD IBM INTU JPM M (Macy's) MSFT NFLX NVDA PG QCOM TSLA TXN XOM WMT CMG , LRCX, SWKS, MDGL SPPI WATT SQ TOWN 7/18/19 (Click on Underlined link.) Bullish MAXCPs - http://tigersoft.com/MAXCPS/Jul-18/BULLISH.htm Bearish MAXCPs - http://tigersoft.com/MINCPs/Jul-18/BEARISH.htm |
Table 1 QUICKSILVER on ETFS - 7/18/2019 Explanation: Pivot-point is price past which the ETF's 5-dma will change direction. 5-dmaAROC is the annualized rate of change of the ETF's 5-day moving average. Closing Power is bullish when it is above its rising 21-dma and it is bearish when it is below its 5-dma. Closing Power is the cumulative change from opening to close each day. Since it does not factor in changes at the opening, it tends to reflect NYSE professionals who trade the market when the NYSE is open. "Candle" color is blue when last close was above the opening, thus showing Professional net buying, which tends to be bullish. It is red when the close is below the opening, which tends to be bearish. IP21 is the current value of the Tiger Accumulation Index. Above +.15 tends to be bullish and below -.15 tends to be bearish until reversed. ITRS is the percent rise of the ETF over 50-days less the percent rise of the DIA (DJIA) over 50 trading days. The strongest ITRS ETFs tend to keep rising and the lowest ITRS ETFs tend to keep falling. Add ITRS and IP21 to get a composite measure of intermediate-term strength. ETF CLOSE CHANGE PIVOT-PT 5-dmaAROC CL-PWR CANDLE IP21 ITRS ------------------------------------------------------------------------------------------ DIA 272.27 -.01 273.39 24.8% Bullish BLUE .026 ---- --------------------------------------------------------------------------------------------- BA 361.11 -8.41 365.33 29% ------- RED -.023 -.038 --------------------------------------------------------------------------------------------- SPY 298.83 1.09 300.65 -8% Bearish BLUE .09 -.011 --------------------------------------------------------------------------------------------- QQQ 192.42 .22 193.53 0% ------- BLUE .129 -.016 --------------------------------------------------------------------------------------------- MDY 353.86 1.13 357.08 6.5% Bearish BLUE .104 -.047 --------------------------------------------------------------------------------------------- IWM 154.71 .58 156.11 -6.4% Bearish BLUE -.007 -.067 --------------------------------------------------------------------------------------------- FAS 78.94 1.53 80.42 -35.3% ------- BLUE .08 .082 bullish --------------------------------------------------------------------------------------------- RETL 23.94 -.41 25.35 -38.3% Bearish RED -.132 -.216 --------------------------------------------------------------------------------------------- SOXL 168.66 7.39 161.52 495.4% Bearish BLUE -.089 -.06 --------------------------------------------------------------------------------------------- TECL 176.21 3.95 177.04 87.8% Bullish BLUE .066 .111 --------------------------------------------------------------------------------------------- IBB 106.45 .87 105.52 -25% ------- BLUE .009 -.041 --------------------------------------------------------------------------------------------- GLD 136.48 1.9 133.53 141.7% Bullish BLUE .374 .077 bullish --------------------------------------------------------------------------------------------- OIH 13.88 -.08 14.98 -383.7% Bearish RED -.04 -.176 --------------------------------------------------------------------------------------------- RSX 23.89 .18 23.92 -8.4% Bullish BLUE .018 .08 |
Table 2 Count of Stocks in Key Directories
20190717
-------------------------------
NEWHIGHS 137
NEWLOWS 37
MAXCP 27
MINCP 66 Professionals are not convinced of mkt's bullishness.
TTTNH 35
TTTNL 91
FASTUP 46
FASTDOWN 103
CPCROSSA 154
CPCROSSD 58
BIGVOLUP 9
BIGVODN 12
ACCUMVER 11
HIGHIP21 13
HIUPPCT 17
LOWACCUM 129
REDSELL 107
AUGSELS7 16
TRAPDOOR 10
|
Table 3 RANKING OF KEY DIRECTORIES BASED PCT.OF STOCKS ABOVE 65-DMA
7/18/19
Bullish = 36
Bearish = 8
---------------------------------------------------------------------------------------
Directory Current day-1 day-2 day-3 day-4 day-5
----------------------------------------------------------------------------------------
BONDFUND .951 .951 .961 .961 .97 .97
GOLD .921 .901 .882 .823 .843 .803
INSURANC .894 .868 .894 .894 .894 .868
DOWJONES .833 .8 .866 .9 .833 .8
NIFTY .824 .807 .789 .789 .789 .701
NASD-100 .816 .765 .806 .826 .816 .775
HACKERS .8 .75 .7 .75 .75 .7
JETS .8 .8 .8 .8 .8 .7
UTILITY .775 .775 .775 .75 .75 .775
DJI-13 .769 .769 .846 .846 .846 .769
ETFS .736 .719 .736 .736 .649 .649
FIDSTKS .733 .695 .744 .755 .766 .744
SOLAR .722 .777 .666 .722 .666 .611
BIGBANKS .714 .714 .714 .857 1 .857
INDEXES .709 .698 .736 .763 .736 .704
HOMEBLDG .705 .764 .882 .823 .823 .647
SP500 .702 .679 .759 .761 .77 .718
SP-100 .692 .615 .736 .736 .769 .714
COMPUTER .666 .666 .666 .666 .666 .619
EDU .666 .666 .666 .666 .5 .5
SOFTWARE .655 .639 .606 .639 .672 .672
SEMI .645 .581 .563 .581 .581 .49
MILITARY .642 .607 .714 .714 .75 .678
RUS-1000 .636 .61 .678 .669 .679 .618
GUNS .625 .625 .625 .625 .562 .562
TRANSP .6 .55 .9 .75 .75 .5
BEVERAGE .588 .529 .529 .647 .647 .647
FINANCE .579 .534 .579 .59 .715 .613
ELECTRON .564 .519 .544 .544 .538 .461
COMODITY .56 .658 .658 .707 .756 .731
INFRA .555 .666 .722 .666 .722 .583
AUTO .538 .564 .615 .589 .641 .538
REGBANKS .535 .428 .464 .464 .642 .5
FOOD .518 .648 .648 .685 .74 .74
INDMATER .512 .475 .6 .525 .587 .45
REIT .506 .493 .513 .533 .574 .554
============================================================================================
GREEN .5 .545 .545 .5 .545 .545
============================================================================================
RETAIL .49 .49 .528 .528 .547 .433
HOSPITAL .478 .565 .608 .608 .521 .565
CHEM .461 .461 .557 .519 .557 .346
BIOTECH .447 .428 .436 .436 .412 .439
GAMING .434 .521 .565 .521 .478 .478
OILGAS .305 .291 .361 .354 .402 .381
CHINA .28 .28 .298 .298 .14 .105
COAL 0 0 0 0 0 0
|
====================================================================
7/17/2019 Though we are seeing a pullback, the active Peerless signal is
still a Buy B10. Nearly all of the Buy B10s were profitable when
finally reversed. About 25% of them gained more than 10%. The
median gain was 5%. Paper losses between 2% and 4.9% occurred
in 10 of the past 50 Buy B10s. But it should be noted that two of the
biggest paper losses occurred in a rebound after a bear market, a condition
which clearly is different than our situation now. See the table for all
B10s at the bottom of this page.
Stay long the positions below. Today GOLD and NUGT were good
hedges. Gold stocks feed on uncertainty and the prospects of falling
interest rates.
Today's ActionL
DIA 272.25 -0.43%
QQQ 192.20 -0.49%
FAS 77.41 -1.53%
MSFT 136.27 -0.59%
NUGT 32.00 +11.81%
GLD. 134.48 +2.18%
HIG 57.66 -0.67%.


Most often the DJI finds support at the previous point of breakout. See
how powerfully the DJI rebounded once the support at this key inflection
point held in 1995. If 27000 holds on the current test, there is a good chance the
very bullish 1995 scenario will play out here, at least for the leading ETFs. If
27000
does not hold, the risk is that the DJI will have to re-test 26300 and the
rising 65-dma. If this risk seems to great, I would suggest hedging with
some Gold stocks or by shorting other stocks in our bearish MINCPs tonight.
Gold's uptrend is accelerating. This often occurs when the general market
is coming closer to some kind of a top. It is right to be worried by Gold's
rise. (More on this warning tomorrow night.)
Why Is Gold So Strong? The Dollar is still near
its 12 month highs. It must be the fears of Brexit and
and an intensification of the US-China trade war. I
suppose it could also mean that the US is going to
Venezuela or Iran.

PULLBACKS AFTER BUY B10 BREAKOUTS
Bullish Scenario: Support at point of
breakout holds
and the maximum paper loss is zero or less than 1%.

With the market so "mature", I understand that there is a lot of concern
about whether the expected support at 27000, the earlier point of breakout
will hold. Looking back at the charts of past breakout failures and pullbacks
we see that usually Peerless gives a sell signal before the breakout fails and
prices drop below the point of breakout. This was true, for example in 1929.
and in September 2012.
Usually Peerless gives a sell signal after
a breakout that will prove to be false.

As long as NYSE A/D Line remains in an uptrend,
look for support of DJI at rising 65-dma if point
of breakout fails to act as good support. This was
also true in November 1950, March 1985, Jul 1993
and Deceber 2013.

Evem when A/D Line uptrend is
broken, we should still
look for support of DJI at rising 65-dma if there is no
Peerless Sell.

|
Charts 7/17/2019 2019 PEERLESS DJI, Signals, Indicators Daily DJI Volume 10-DayUp/Down Vol Hourly DJIA A/D Line for All Stocks Inverted Traders Index NASDAQ S&P OEX NYSE COMPQX DJI-15 DJI-20 DJI-30 DIA SPY QQQ MDY IWM TNA Short-Term Rates USO-CrudeOil DBO FAS GLD BBH IBB JETS JNUG KOL NUGT OIH OIL RSX RETL SDS AGQ SLV SOXL TECL TLT TMF TNA UGA (gasoline) XIV and China: YINN CHAU Commodities: CANE CORN DBC JJC, NIB, CHOC CORN, CUT (paper) MOO, SOYB WEAT UUP (Dollar) LIT (Lithium) AAPL ADBE ALXN AMAT AMGN AMD AMZN BA BABA BAC BIDU CAT CVX DE FB GOOG GS HD IBM INTU JPM M (Macy's) MSFT NFLX NVDA PG QCOM TSLA TXN XOM WMT CMG , LRCX, SWKS, MDGL SPPI WATT SQ TOWN 7/17/19 (Click on Underlined link.) Bullish MAXCPs - http://tigersoft.com/MAXCPS/Jul-17/BULLISH.htm Bearish MAXCPs - http://tigersoft.com/MINCPs/Jul-17/BEARISH.htm |
Table 1 QUICKSILVER on ETFS - 7/17/2019 Explanation: Pivot-point is price past which the ETF's 5-dma will change direction. 5-dmaAROC is the annualized rate of change of the ETF's 5-day moving average. Closing Power is bullish when it is above its rising 21-dma and it is bearish when it is below its 5-dma. Closing Power is the cumulative change from opening to close each day. Since it does not factor in changes at the opening, it tends to reflect NYSE professionals who trade the market when the NYSE is open. "Candle" color is blue when last close was above the opening, thus showing Professional net buying, which tends to be bullish. It is red when the close is below the opening, which tends to be bearish. IP21 is the current value of the Tiger Accumulation Index. Above +.15 tends to be bullish and below -.15 tends to be bearish until reversed. ITRS is the percent rise of the ETF over 50-days less the percent rise of the DIA (DJIA) over 50 trading days. The strongest ITRS ETFs tend to keep rising and the lowest ITRS ETFs tend to keep falling. Add ITRS and IP21 to get a composite measure of intermediate-term strength. ETF CLOSE CHANGE PIVOT-PT 5-dmaAROC CL-PWR CANDLE IP21 ITRS ------------------------------------------------------------------------------------------ DIA 272.28 -1.14 270.92 66% ------- RED .075 ----- --------------------------------------------------------------------------------------------- BA 369.52 6.77 359 239% Bullish BLUE .095 -.036 --------------------------------------------------------------------------------------------- SPY 297.74 -1.97 299.31 -14.5% Bearish RED .066 -.014 --------------------------------------------------------------------------------------------- QQQ 192.2 -.95 192.42 -9.3% Bearish RED .074 -.018 --------------------------------------------------------------------------------------------- MDY 352.73 -2.73 353.4 -20.7% Bearish RED .078 -.051 --------------------------------------------------------------------------------------------- IWM 154.13 -1.11 154.91 -49.5% Bearish RED -.016 -.071 --------------------------------------------------------------------------------------------- FAS 77.41 -1.53 79.5 -90.6% Bearish RED .054 .024 --------------------------------------------------------------------------------------------- SOXL 161.27 1.34 152.79 304.3% Bearish RED -.059 -.153 --------------------------------------------------------------------------------------------- TECL 172.26 -1.26 173.14 32.3% Bearish RED .06 .029 --------------------------------------------------------------------------------------------- IBB 105.58 .11 106.98 -138.5% Bearish BLUE-.009 -.06 --------------------------------------------------------------------------------------------- GLD 134.58 2.18 132.7 28.2% Bullish BLUE .319 .084 Bullish --------------------------------------------------------------------------------------------- OIH 13.96 -.44 15 -381.2% Bearish RED -.043 -.174 --------------------------------------------------------------------------------------------- YINN 26.3 -.05 26.24 11.4% ------- -----.267 .437 --------------------------------------------------------------------------------------------- RSX 23.71 -.04 23.93 -85.7% Bullish RED .031 .078 |
 Table 2   Count of Stocks in Key Directories
           20190717
-------------------------------
NEWHIGHS       137
NEWLOWS        36
MAXCP          27
MINCP          66  Bearish Plurality: Professionals are new bearish.
TTTNH          13
TTTNL          100 Day Traders are new bearish.
FASTUP         37
FASTDOWN       78
CPCROSSA       58
CPCROSSD       200
BIGVOLUP       7
BIGVODN        18
ACCUMVER       14
HIGHIP21       13
HIUPPCT        14
LOWACCUM       137
REDSELL        98
AUGSELS7       16
TRAPDOOR       8
|
Table 3    RANKING OF KEY DIRECTORIES BASED PCT.OF STOCKS ABOVE 65-DMA
               7/17/19
Bullish = 36
Bearish = 9
---------------------------------------------------------------------------------------
Directory     Current       day-1         day-2         day-3         day-4         day-5
----------------------------------------------------------------------------------------
BONDFUND       .951          .961          .961          .97           .97           .97
GOLD           .901          .882          .823          .843          .803          .843
INSURANC       .868          .894          .894          .894          .868          .868
NIFTY          .807          .789          .789          .789          .684          .666
DOWJONES       .8            .866          .9            .833          .8            .8
JETS           .8            .8            .8            .8            .7            .8
SOLAR          .777          .666          .722          .666          .611          .722
UTILITY        .775          .775          .75           .75           .775          .8
DJI-13         .769          .846          .846          .846          .769          .769
NASD-100       .765          .806          .826          .816          .775          .775
HOMEBLDG       .764          .882          .823          .823          .705          .705
HACKERS        .75           .7            .75           .75           .7            .65
ETFS           .719          .736          .736          .649          .649          .666
BIGBANKS       .714          .714          .857          1             .857          .857
INDEXES        .698          .736          .763          .736          .704          .736
FIDSTKS        .695          .744          .755          .766          .739          .739
SP500          .679          .759          .761          .77           .716          .708
COMPUTER       .666          .666          .666          .666          .619          .666
EDU            .666          .666          .666          .5            .5            .5
INFRA          .666          .722          .666          .722          .583          .583
COMODITY       .658          .658          .707          .756          .731          .756
FOOD           .648          .648          .685          .74           .722          .74
SOFTWARE       .639          .606          .639          .672          .672          .639
GUNS           .625          .625          .625          .562          .562          .5
SP-100         .615          .736          .736          .769          .714          .681
RUS-1000       .61           .678          .667          .681          .62           .612
MILITARY       .607          .714          .714          .75           .678          .75
SEMI           .576          .558          .576          .576          .486          .522
AUTO           .564          .615          .589          .641          .538          .538
TRANSP         .55           .9            .75           .75           .5            .4
GREEN          .545          .545          .5            .545          .545          .59
FINANCE        .534          .579          .59           .715          .613          .59
BEVERAGE       .529          .529          .647          .647          .647          .588
GAMING         .521          .565          .521          .478          .478          .434
HOSPITAL       .521          .608          .608          .521          .565          .565
ELECTRON       .519          .544          .544          .538          .448          .474
===============================================================================================
REIT           .493          .513          .533          .574          .554          .635
RETAIL         .49           .528          .528          .547          .433          .433
INDMATER       .475          .6            .525          .587          .45           .5
CHEM           .452          .566          .509          .547          .339          .396
REGBANKS       .428          .464          .464          .642          .5            .464
BIOTECH        .427          .438          .438          .413          .438          .452
OILGAS         .291          .361          .354          .402          .381          .381
CHINA          .28           .298          .298          .14           .087          .175
COAL           0             0             0             0             0             0
|
      Buy B10 Gains and Maximum Paper Losses
                 1929-2019
  50 past B10s
  In 27/50 cases, there was no paper loss.
  Paper Losses between 4% and 5.0% = 1 (just after a mini-bear market)
                       3% and 4% = 4 (1 just after a bear market)
                       2% and 3% = 5
                       1% and 2% = 5
  Gains greater than 10% = 12/50
  Gains greater than 5% = 25/50
  Losses = 3/50
Gain Maximum Paper Loss Comments ======================================================================= 19341108 B10 97.3 .069 99.6 -.0237 12/20 over 2% ======================================================================= 19440308 B10 139.5 .176 135.0 -.0322 4/24 over 3% ======================================================================= 19441208 B10 150.5 .090 148.7 -.0119 12/27 ======================================================================= 19490805 B10 179.1 .232 177.8 -.0072 8/29 ======================================================================= 19500315 B10 207.5 .063 206.1 -.0067 3/31 ======================================================================= 19521126 B10 282.4 .034 none 0 ======================================================================= 19540302 B10 297.5 .575 none 0 ======================================================================= 19550415 B10 376.7 .244 none 0 ======================================================================= 19560305 B10 491.7 .055 none 0 ======================================================================= 19570611 B10 509.5 .015 497.1 -.0243 6/24 over 2% ======================================================================= 19580203 B10 454.0 .432 436.9 -.0376 2/25 over 3% (bear market) ======================================================================= 19590224 B10 602.9 .078 none 0 ======================================================================= 19611114 B10 732.6 -.002 720.1 -.017 11/14 ======================================================================= 19640701 B10 838.1 .120 823.4 -.0175 8/6 ======================================================================= 19640909 B10 855.6 .097 none 0 ======================================================================= 19650817 B10 894.3 .084 887.1 -.008 8/23 ======================================================================= 19650916 B10 931.2 .041 926.5 -.005 9/21 ======================================================================= 19680924 B10 938.28 .042 933.24 -.0053 9/26 ======================================================================= 19730926 B10 949.5 .04 none 0 ======================================================================= 19790115 B10 848.67 .032 807 -.0491 2/7 over 4% (bear market) ======================================================================= 19790815 B10 885.84 .009 none 0 ======================================================================== 19840802 B10 1166.07 .106 none 0 ======================================================================== 19850121 B10 1261.37 .023 none 0 ======================================================================== 19881020 B10 2181.19 .001 none 0 ======================================================================== 19890714 B10 2554.82 .078 none 0 ======================================================================== 19911227 B10 3101.52 .081 none 0 ======================================================================== 19930526 B10 3540.16 .121 -.025 7/6 3449.92 ======================================================================== 19950215 B10 3989.17 .391 none 0 ======================================================================== 19950914 B10 4801.8 .156 4703.82 -.0204 10/26 over 2% paper loss ======================================================================== 19960129 B10 5304.98 .046 none 0 ======================================================================== 19960912 B10 5771.94 .188 none 0 ======================================================================== 20030819 B10 9428.90 .04 9275.06 -.0163 9/30 ======================================================================== 20041108 B10 10391.31 .05 none 0 ======================================================================== 20050304 B10 10940.85 -.003 ---- -.003 ======================================================================== 20060109 B10 11011.9 .051 10667.3 -.0312 1/20 over 3% paper loss ======================================================================== 20061214 B10 12416.76 -.002 none 0 ======================================================================== 20070712 B10 13861.73 .006 none 0 ======================================================================== 20120314 B10 13194.10 -.005 13124.6 -.0052 ======================================================================== 20120913 B10 13539.86 .003 none 0 ======================================================================== 20130122 B10 13712.21 .107 none 0 ======================================================================== 20131114 B10 15821.63 .040 15739.4 -.0051 ======================================================================== 20140513 B10 16715.44 .016 16374.3 -.0204 over 2% paper loss ======================================================================== 20140918 B10 17265.99 .001 none 0 ======================================================================== 20150224 B10 18209.19 .006 17635.3 -.0319 3/11 over 3% ======================================================================== 20160419 B10 18053.60 .002 none 0 ======================================================================== 20160711 B10 18226.93 .006 18034.7 -.0105 9/14 ======================================================================== 20170125 B10 20068.51 .027 none 0 ======================================================================== 20170602 B10 21206.29 .110 none 0 ======================================================================== 20170727 B10 21796.55 .080 none 0 ======================================================================== 20171128 B10 23836.41 .094 none 0 ======================================================================== 20190711 B10 27088.08 open.... |
====================================================================
7/16/2019 The Peerless Buy B10 should keep us bullish and
long DIA, QQQ, FAS, MSFT, NUGT and GLD.
Buy HIG in the very strong Insurance group.

Look at Table 3 below. Notice that Insurance
Stocks are among
the groups showing nearly 90% of their stocks above the
65-dma. If there is a pullback, plan to buy one of the top
Power Ranked insurance stocks, ERIE. HIG should be bought now.


|
Charts 7/16/2019 2019 PEERLESS DJI, Signals, Indicators Daily DJI Volume 10-DayUp/Down Vol Hourly DJIA A/D Line for All Stocks Inverted Traders Index NASDAQ S&P OEX NYSE COMPQX DJI-15 DJI-20 DJI-30 DIA SPY QQQ MDY IWM TNA Short-Term Rates USO-CrudeOil DBO FAS GLD BBH IBB JETS JNUG KOL NUGT OIH OIL RSX RETL SDS AGQ SLV SOXL TECL TLT TMF TNA UGA (gasoline) XIV and China: YINN CHAU Commodities: CANE CORN DBC JJC, NIB, CHOC CORN, CUT (paper) MOO, SOYB WEAT UUP (Dollar) LIT (Lithium) AAPL ADBE ALXN AMAT AMGN AMD AMZN BA BABA BAC BIDU CAT CVX DE FB GOOG GS HD IBM INTU JPM M (Macy's) MSFT NFLX NVDA PG QCOM TSLA TXN XOM WMT CMG , LRCX, SWKS, MDGL SPPI WATT SQ TOWN 7/16/19 (Click on Underlined link.) Bullish MAXCPs - http://tigersoft.com/MAXCPS/Jul-16/BULLISH.htm Bearish MAXCPs - http://tigersoft.com/MINCPs/Jul-16/BEARISH.htm |
Table 1 QUICKSILVER on ETFS - 7/16/2019 Explanation: Pivot-point is price past which the ETF's 5-dma will change direction. 5-dmaAROC is the annualized rate of change of the ETF's 5-day moving average. Closing Power is bullish when it is above its rising 21-dma and it is bearish when it is below its 5-dma. Closing Power is the cumulative change from opening to close each day. Since it does not factor in changes at the opening, it tends to reflect NYSE professionals who trade the market when the NYSE is open. "Candle" color is blue when last close was above the opening, thus showing Professional net buying, which tends to be bullish. It is red when the close is below the opening, which tends to be bearish. IP21 is the current value of the Tiger Accumulation Index. Above +.15 tends to be bullish and below -.15 tends to be bearish until reversed. ITRS is the percent rise of the ETF over 50-days less the percent rise of the DIA (DJIA) over 50 trading days. The strongest ITRS ETFs tend to keep rising and the lowest ITRS ETFs tend to keep falling. Add ITRS and IP21 to get a composite measure of intermediate-term strength. ETF CLOSE CHANGE PIVOT-PT 5-dmaAROC CL-PWR CANDLE IP21 ITRS ------------------------------------------------------------------------------------------ DIA 273.42 -.18 268.69 102.6% ------- RED .102 -------- --------------------------------------------------------------------------------------------- BA 362.75 1.14 352.3 134.8% Bullish BLUE .085 -.068 --------------------------------------------------------------------------------------------- SPY 299.71 -1.04 298.61 42.1% ------- RED .081 -.013 --------------------------------------------------------------------------------------------- QQQ 193.15 -1 192.56 64.6% ------- RED .115 -.021 --------------------------------------------------------------------------------------------- MDY 355.46 .22 354.2 12.5% Bearish BLUE .078 -.047 --------------------------------------------------------------------------------------------- IWM 155.24 -.05 155.67 -5.1% Bearish BLUE 0 -.065 --------------------------------------------------------------------------------------------- FAS 78.94 -.85 78.85 -12.6% ------- RED .047 .031 --------------------------------------------------------------------------------------------- RETL 25.26 .29 24.11 189.2% Bearish BLUE -.013 -.218 --------------------------------------------------------------------------------------------- SOXL 159.93 -5.35 151.64 365.8% Bearish RED -.079 -.205 --------------------------------------------------------------------------------------------- TECL 173.52 -4.92 171.13 179.9% ------- RED .08 .011 --------------------------------------------------------------------------------------------- IBB 105.47 -.61 108.53 -157.2% Bearish RED .029 -.055 --------------------------------------------------------------------------------------------- GLD 132.4 -1.13 133.83 24.4% ------- RED .281 .065 Bullish --------------------------------------------------------------------------------------------- OIH 14.4 -.24 15.09 -60.6% ------- RED .042 -.151 --------------------------------------------------------------------------------------------- RSX 23.75 -.18 24.12 -14.6% Bullish ---- .059 .07 Bullish |
 Table 2  Count of Stocks in Key Directories
          20190716
-------------------------------
NEWHIGHS       139
NEWLOWS        20
MAXCP          20
MINCP          40  Professionals are net Bearish
TTTNH          22
TTTNL          61
FASTUP         42
FASTDOWN       61  Swing traders are net bearish.
CPCROSSA       94
CPCROSSD       76
BIGVOLUP       6
BIGVODN        12
ACCUMVER       17
HIGHIP21       13
HIUPPCT        15
LOWACCUM       138
REDSELL        95
AUGSELS7       15
TRAPDOOR       8
|
Table 3
              RANKING OF KEY DIRECTORIES BASED PCT.OF STOCKS ABOVE 65-DMA
              7/16/19
---------------------------------------------------------------------------------------
Directory     Current       day-1         day-2         day-3         day-4         day-5
----------------------------------------------------------------------------------------
BONDFUND       .961          .961          .97           .97           .97           .961
TRANSP         .9            .75           .75           .5            .4            .4
INSURANC       .888          .888          .888          .851          .851          .851
GOLD           .882          .823          .843          .803          .843          .843
^^^^
HOMEBLDG       .882          .823          .823          .705          .705          .705
DOWJONES       .862          .931          .862          .827          .827          .793
^^^^^^^^
DJI-13         .846          .846          .846          .769          .769          .769
NASD-100       .806          .826          .816          .775          .775          .775
^^^^^^^^
JETS           .8            .8            .8            .7            .8            .7
NIFTY          .789          .789          .789          .684          .666          .631
UTILITY        .775          .75           .75           .775          .8            .8
SP500          .759          .761          .77           .716          .706          .706
FIDSTKS        .744          .755          .766          .739          .739          .722
ETFS           .736          .736          .649          .649          .649          .614
SP-100         .736          .736          .769          .714          .681          .692
INDEXES        .735          .762          .735          .702          .724          .686
INFRA          .722          .666          .722          .583          .583          .638
BIGBANKS       .714          .857          1             .857          .857          .857
MILITARY       .714          .714          .75           .678          .75           .75
HACKERS        .7            .75           .75           .7            .65           .65
RUS-1000       .678          .667          .679          .621          .612          .62
COMPUTER       .666          .666          .666          .619          .666          .666
EDU            .666          .666          .5            .5            .5            .5
SOLAR          .666          .722          .666          .611          .722          .722
COMODITY       .658          .707          .756          .731          .756          .585
FOOD           .648          .685          .74           .722          .74           .592
GUNS           .625          .625          .562          .562          .5            .5
AUTO           .615          .589          .641          .538          .512          .538
HOSPITAL       .608          .608          .521          .565          .521          .565
SOFTWARE       .606          .639          .672          .672          .639          .606
INDMATER       .6            .525          .587          .45           .5            .537
FINANCE        .579          .59           .715          .613          .59           .636
GAMING         .565          .521          .478          .478          .434          .521
SEMI           .558          .576          .576          .486          .522          .513
CHEM           .557          .519          .557          .346          .403          .5
GREEN          .545          .5            .545          .545          .59           .59
ELECTRON       .541          .541          .535          .445          .471          .458
BEVERAGE       .529          .647          .647          .647          .588          .529
RETAIL         .528          .528          .547          .433          .433          .415
REIT           .513          .533          .574          .554          .635          .614
==============================================================================================
REGBANKS       .464          .464          .642          .5            .464          .607
BIOTECH        .435          .438          .413          .438          .449          .463
OILGAS         .361          .354          .402          .381          .368          .277
CHINA          .298          .298          .14           .087          .14           .175
COAL           0             0             0             0             0             0
|
====================================================================
7/15/2019 The Peerless Buy B10 should keep us bullish and
long DIA, QQQ, FAS, MSFT, NUGT and GLD.
The FOMC will meet at the end of July. If they lower
interest rates with the key indexes making new highs,
we could well be seeing a powerful new leg up. And
even if they do not lower rates, the uptrend should keep
rising until a bad Jobs' number comes out. Inflation is low,
the Dollar is strong and wages are rising more slowly than
productivity. Bears will need something new to seize upon.
It's not clear what that will be unless Gold zooms upward
as a warning about the Dollar this autumn.

This is not yet a broad advance. Only 60% of all stocks and
ETFs
are above their 65-dma. The main general market ETFs and
their stocks are the leaders now. As long as the NYSE A/D Line is
moving to new highs, too, I would think that DIA, SPY and QQQ leadership
is fine for now. Only if the NYSE A/D Line starts lagging, could we see
a top and even then 27000 should be good support now.
It is certainly bullish now that both the Opening and Closing Power for the
SP-500 are in rising trends. Prices could soon be opening higher and then
move up even more by the close.
Let us keep an eye on the A/D Line of the stocks that make up these
all-important ETFs. Right now, their A/D Lines, which are shown below,
are each soaring to 12-month highs. This is bullish. Pullbacks most often
occur when these A/D Lines start lagging and then break their uptrends.
 |
 |
 |
|
Charts 7/15/2019 2019 PEERLESS DJI, Signals, Indicators Daily DJI Volume 10-DayUp/Down Vol Hourly DJIA A/D Line for All Stocks Inverted Traders Index NASDAQ S&P OEX NYSE COMPQX DJI-15 DJI-20 DJI-30 DIA SPY QQQ MDY IWM TNA Short-Term Rates USO-CrudeOil DBO FAS GLD BBH IBB JETS JNUG KOL NUGT OIH OIL RSX RETL SDS AGQ SLV SOXL TECL TLT TMF TNA UGA (gasoline) XIV and China: YINN CHAU Commodities: CANE CORN DBC JJC, NIB, CHOC CORN, CUT (paper) MOO, SOYB WEAT UUP (Dollar) LIT (Lithium) AAPL ADBE ALXN AMAT AMGN AMD AMZN BA BABA BAC BIDU CAT CVX DE FB GOOG GS HD IBM INTU JPM M (Macy's) MSFT NFLX NVDA PG QCOM TSLA TXN XOM WMT CMG , LRCX, SWKS, MDGL SPPI WATT SQ TOWN 7/15/19 (Click on Underlined link.) Bullish MAXCPs - http://tigersoft.com/MAXCPS/Jul-15/BULLISH.htm Bearish MAXCPs - http://tigersoft.com/MINCPs/Jul-15/BEARISH.htm |
Table 1 QUICKSILVER on ETFS - 7/15/2019 Explanation: Pivot-point is price past which the ETF's 5-dma will change direction. 5-dmaAROC is the annualized rate of change of the ETF's 5-day moving average. Closing Power is bullish when it is above its rising 21-dma and it is bearish when it is below its 5-dma. Closing Power is the cumulative change from opening to close each day. Since it does not factor in changes at the opening, it tends to reflect NYSE professionals who trade the market when the NYSE is open. "Candle" color is blue when last close was above the opening, thus showing Professional net buying, which tends to be bullish. It is red when the close is below the opening, which tends to be bearish. IP21 is the current value of the Tiger Accumulation Index. Above +.15 tends to be bullish and below -.15 tends to be bearish until reversed. ITRS is the percent rise of the ETF over 50-days less the percent rise of the DIA (DJIA) over 50 trading days. The strongest ITRS ETFs tend to keep rising and the lowest ITRS ETFs tend to keep falling. Add ITRS and IP21 to get a composite measure of intermediate-term strength. ETF CLOSE CHANGE PIVOT-PT 5-dmaAROC CL-PWR CANDLE IP21 ITRS ------------------------------------------------------------------------------------------ DIA 273.6 .21 267.86 102.7% Bullish ---- .112 ----- --------------------------------------------------------------------------------------------- BA 361.61 -3.72 353.09 147.3% ------- BLUE .089 -.079 --------------------------------------------------------------------------------------------- SPY 300.75 .1 297.19 65.8% Bullish RED .106 -.008 --------------------------------------------------------------------------------------------- QQQ 194.15 .62 190.66 115.8% Bullish BLUE .132 -.009 --------------------------------------------------------------------------------------------- MDY 355.24 -1.84 354.57 10.4% Bearish RED .04 -.042 --------------------------------------------------------------------------------------------- IWM 155.29 -.82 155.4 3.2% Bearish RED -.027 -.055 --------------------------------------------------------------------------------------------- FAS 79.79 -.63 79.14 106.7% ------- RED .078 .058 bullish --------------------------------------------------------------------------------------------- SOXL 165.28 3.76 148.52 661.8% Bearish BLUE -.062 -.169 --------------------------------------------------------------------------------------------- TECL 178.44 1.4 167.28 374% Bullish BLUE .123 .062 bullish --------------------------------------------------------------------------------------------- IBB 106.08 .56 108.84 -77.2% ------- BLUE .046 -.04 --------------------------------------------------------------------------------------------- GLD 133.53 0 131.75 84.5% Bullish BLUE .276 .073 bullish --------------------------------------------------------------------------------------------- OIH 14.64 -.34 14.58 0% Bearish RED .038 -.127 --------------------------------------------------------------------------------------------- RSX 23.93 .01 23.82 -14.6% Bullish RED .059 .081 bullish |
Table 2    Count of Stocks in Key Directories
           20190715
-------------------------------
NEWHIGHS       244
NEWLOWS        31
MAXCP          27
MINCP          30  Bearish - Professionals are still hedging.
TTTNH          7
TTTNL          55  Day Traders are net sellers at openings.
FASTUP         39
FASTDOWN       56
CPCROSSA       51
CPCROSSD       190
BIGVOLUP       5
BIGVODN        9
ACCUMVER       15
HIGHIP21       14
HIUPPCT        16
LOWACCUM       136
REDSELL        96
AUGSELS7       16
TRAPDOOR       8
|
 Table 3      RANKING OF KEY DIRECTORIES BASED PCT.OF STOCKS ABOVE 65-DMA
              7/15/19
 Bullish = 39
 Bearish = 5
---------------------------------------------------------------------------------------
Directory     Current       day-1         day-2         day-3         day-4         day-5
----------------------------------------------------------------------------------------
BONDFUND       .961          .97           .97           .97           .961          .961
DOWJONES       .931          .862          .827          .827          .793          .827
INSURANC       .888          .888          .851          .851          .851          .888
BIGBANKS       .857          1             .857          .857          .857          .857
DJI-13         .846          .846          .769          .769          .769          .769
NASD-100       .826          .816          .775          .775          .775          .755
GOLD           .823          .843          .803          .843          .843          .843
HOMEBLDG       .823          .823          .705          .705          .647          .647
JETS           .8            .8            .7            .8            .7            .8
NIFTY          .789          .789          .684          .666          .631          .649
INDEXES        .766          .739          .701          .722          .679          .673
SP500          .761          .77           .716          .706          .706          .712
FIDSTKS        .755          .766          .739          .739          .722          .739
HACKERS        .75           .75           .7            .65           .65           .5
UTILITY        .75           .75           .775          .8            .8            .825
TRANSP         .75           .75           .5            .4            .4            .65
ETFS           .736          .649          .649          .649          .614          .614
SP-100         .736          .769          .714          .681          .692          .692
SOLAR          .722          .666          .611          .722          .722          .777
MILITARY       .714          .75           .678          .75           .75           .75
COMODITY       .707          .756          .731          .756          .56           .609
FOOD           .679          .735          .716          .735          .566          .603
RUS-1000       .667          .679          .62           .613          .621          .634
COMPUTER       .666          .666          .619          .666          .666          .714
EDU            .666          .5            .5            .5            .5            .5
INFRA          .666          .722          .583          .583          .638          .583
BEVERAGE       .647          .647          .647          .588          .529          .588
SOFTWARE       .639          .672          .672          .639          .606          .573
GUNS           .625          .562          .562          .5            .5            .625
HOSPITAL       .608          .521          .565          .521          .565          .521
FINANCE        .59           .715          .613          .59           .636          .613
AUTO           .589          .641          .538          .512          .538          .615
SEMI           .576          .576          .486          .522          .513          .486
ELECTRON       .541          .535          .445          .471          .458          .439
REIT           .533          .574          .554          .635          .614          .574
RETAIL         .528          .547          .433          .433          .415          .49
INDMATER       .525          .587          .45           .5            .537          .55
GAMING         .521          .478          .478          .434          .478          .521
CHEM           .509          .547          .339          .396          .509          .509
=================================================================================================
GREEN          .5            .545          .545          .59           .59           .59
=================================================================================================
REGBANKS       .464          .642          .5            .464          .607          .571
BIOTECH        .435          .413          .438          .449          .46           .43
OILGAS         .354          .402          .381          .368          .277          .243
CHINA          .298          .14           .087          .14           .175          .122
COAL           0             0             0             0             0             0
|
====================================================================
7/12/2019 The DJI's flat-top breakout into all-time high territory has
produced
a major Buy B10. The path of least resistance is up, though on the
weekly DJI chart we see that prices have reached the last clear barrier.
Stay long DIA, QQQ, FAS, MSFT, NUGT and GLD. If you are
short a stock, I would suggest covering it. We may now be entering
an exciting "vertical ascent - take-off". It took 18 months for the
DJI to build the base it is breaking out of. We may not see another
bullish technical setup like this for a long time.


Based on the 5000+ point height of the DJI's pattern for
the last year
before last week's breakout, I would reckon we now have an upside
target above 32,000! Sounds preposterous to some, for sure.
But if the FED does lower interest rates at the next FOMC meeting,
it will be with the DJI soaring in all-time high territory. The same thing
happened in July 1927 when the Government also had already done everything
that Wall Street wanted (de-regulation, tax cuts, tariffs, suppress unions...)
The FED then cut the Discount Rate in July 1927. Over the
next two years, the DJI doubled. It should be noted that the FED lost
control of the speculative bubble that resulted and the "little guy" was
enticed back into the market by how the stock prices of familiar names he
knew kept rising and rising.
DJI - 1927 and Bullish Rate Cut in July
It is counter-intuitive to chase stocks, I realize, but if I
am right it is exactly those
stocks that are now in strong weekly uptrends and above all their resistance
levels and uptrend-lines that are likely to do the best. Performance funds must
buy them and the poor shorts in them will have no choice but to cover at higher
and higher levels. I searched through the weekly 5-year charts of all the stocks
making new 12-month highs. Here are the strongest stocks I could find. See
http://tigersoft.com/RUNWILD/INDEX.htm
|
Charts 7/12/2019 2019 PEERLESS DJI, Signals, Indicators Daily DJI Volume 10-DayUp/Down Vol Hourly DJIA A/D Line for All Stocks Inverted Traders Index NASDAQ S&P OEX NYSE COMPQX DJI-15 DJI-20 DJI-30 DIA SPY QQQ MDY IWM TNA Short-Term Rates USO-CrudeOil DBO FAS GLD BBH IBB JETS JNUG KOL NUGT OIH OIL RSX RETL SDS AGQ SLV SOXL TECL TLT TMF TNA UGA (gasoline) XIV and China: YINN CHAU Commodities: CANE CORN DBC JJC, NIB, CHOC CORN, CUT (paper) MOO, SOYB WEAT UUP (Dollar) LIT (Lithium) AAPL ADBE ALXN AMAT AMGN AMD AMZN BA BABA BAC BIDU CAT CVX DE FB GOOG GS HD IBM INTU JPM M (Macy's) MSFT NFLX NVDA PG QCOM TSLA TXN XOM WMT CMG , LRCX, SWKS, MDGL SPPI WATT SQ TOWN 7/12/19 (Click on Underlined link.) Bullish MAXCPs - http://tigersoft.com/MAXCPS/Jul-12/BULLISH.htm Bearish MAXCPs - http://tigersoft.com/MINCPs/Jul-12/BEARISH.htm |
Table 1 QUICKSILVER on ETFS - 7/12/2019 Explanation: Pivot-point is price past which the ETF's 5-dma will change direction. 5-dmaAROC is the annualized rate of change of the ETF's 5-day moving average. Closing Power is bullish when it is above its rising 21-dma and it is bearish when it is below its 5-dma. Closing Power is the cumulative change from opening to close each day. Since it does not factor in changes at the opening, it tends to reflect NYSE professionals who trade the market when the NYSE is open. "Candle" color is blue when last close was above the opening, thus showing Professional net buying, which tends to be bullish. It is red when the close is below the opening, which tends to be bearish. IP21 is the current value of the Tiger Accumulation Index. Above +.15 tends to be bullish and below -.15 tends to be bearish until reversed. ITRS is the percent rise of the ETF over 50-days less the percent rise of the DIA (DJIA) over 50 trading days. The strongest ITRS ETFs tend to keep rising and the lowest ITRS ETFs tend to keep falling. Add ITRS and IP21 to get a composite measure of intermediate-term strength. ETF CLOSE CHANGE PIVOT-PT 5-dmaAROC CL-PWR CANDLE IP21 ITRS ------------------------------------------------------------------------------------------ DIA 273.39 2.47 268.06 76.6% Bullish BLUE .087 ---- --------------------------------------------------------------------------------------------- BA 365.33 6.33 351.12 133.7% ------- BLUE .099 -.065 --------------------------------------------------------------------------------------------- SPY 300.65 1.34 296.82 36.7% Bullish BLUE .116 -.005 --------------------------------------------------------------------------------------------- QQQ 193.53 1.11 189.71 64.8% Bullish BLUE .112 -.011 --------------------------------------------------------------------------------------------- MDY 357.08 3.68 354.5 -11.4% ------- BLUE .083 -.029 --------------------------------------------------------------------------------------------- IWM 156.11 1.2 155.19 -18.3% Bearish BLUE .024 -.039 --------------------------------------------------------------------------------------------- FAS 80.42 .92 78.1 93.1% Bullish BLUE .103 .075 Bullish --------------------------------------------------------------------------------------------- SOXL 161.52 8.73 145.17 426.8% Bearish BLUE -.05 -.154 --------------------------------------------------------------------------------------------- TECL 177.04 3.9 165.66 214.9% Bullish BLUE .118 .041 Bullish --------------------------------------------------------------------------------------------- IBB 105.52 -1.46 107.74 -170.9% ------- RED .054 -.035 --------------------------------------------------------------------------------------------- GLD 133.53 .83 131.29 52.5% Bullish BLUE .27 .074 Bullish --------------------------------------------------------------------------------------------- OIH 14.98 -.02 14.64 121.7% ------- ---- .145 -.107 --------------------------------------------------------------------------------------------- GASL 19.81 .22 19.65 -194.4% ------- BLUE -.045 -.418 --------------------------------------------------------------------------------------------- RSX 23.92 -.01 24 14.6% Bullish BLUE .061 .087 Bullish |
Table 2   Count of Stocks in Key Directories
           20190712
-------------------------------
NEWHIGHS       323  Bullish >10:1 New lows
NEWLOWS        22
MAXCP          39   Low.
MINCP          11
TTTNH          16
TTTNL          39
FASTUP         34
FASTDOWN       57
CPCROSSA       168
CPCROSSD       64
BIGVOLUP       3
BIGVODN        12
ACCUMVER       10
HIGHIP21       14
HIUPPCT        15
VHIP21         116
REDSELL        95
AUGSELS7       17
TRAPDOOR       10
|
 Table 3   RANKING OF KEY DIRECTORIES BASED PCT.OF STOCKS ABOVE 65-DMA
              7/12/19
 Bullish = 39
 Bearish = 5
---------------------------------------------------------------------------------------
Directory     Current       day-1         day-2         day-3         day-4         day-5
----------------------------------------------------------------------------------------
BIGBANKS       1             .857          .857          .857          .857          .857
BONDFUND       .97           .97           .97           .961          .961          .97
INSURANC       .888          .851          .851          .851          .888          .888
DJI-13         .846          .769          .769          .769          .769          .769
GOLD           .843          .803          .843          .843          .823          .843
DOWJONES       .833          .8            .8            .766          .8            .8
HOMEBLDG       .823          .705          .705          .647          .647          .647
NASD-100       .816          .775          .775          .775          .734          .785
JETS           .8            .7            .8            .7            .8            .8
NIFTY          .789          .684          .666          .631          .614          .684
SP500          .77           .716          .706          .706          .704          .737
SP-100         .769          .714          .681          .692          .692          .703
FIDSTKS        .766          .739          .739          .722          .733          .755
COMODITY       .756          .731          .756          .56           .585          .609
HACKERS        .75           .7            .65           .65           .5            .6
MILITARY       .75           .678          .75           .75           .75           .75
UTILITY        .75           .775          .8            .8            .825          .775
TRANSP         .75           .5            .4            .4            .6            .75
FOOD           .74           .722          .74           .574          .592          .611
INDEXES        .736          .698          .725          .682          .672          .731
INFRA          .722          .583          .583          .638          .583          .666
FINANCE        .715          .613          .59           .636          .613          .761
RUS-1000       .679          .62           .612          .622          .63           .66
SOFTWARE       .672          .672          .639          .606          .573          .639
COMPUTER       .666          .619          .666          .666          .714          .761
SOLAR          .666          .611          .722          .722          .777          .777
ETFS           .649          .649          .649          .614          .614          .807
BEVERAGE       .647          .647          .588          .529          .588          .647
REGBANKS       .642          .5            .464          .607          .571          .821
AUTO           .641          .538          .512          .538          .589          .666
INDMATER       .587          .45           .5            .537          .55           .575
SEMI           .576          .486          .522          .513          .486          .54
REIT           .574          .554          .635          .614          .567          .547
GUNS           .562          .562          .5            .5            .562          .562
CHEM           .547          .339          .396          .509          .528          .566
RETAIL         .547          .433          .433          .415          .49           .452
GREEN          .545          .545          .59           .59           .59           .59
ELECTRON       .535          .445          .471          .458          .439          .503
HOSPITAL       .521          .565          .521          .565          .521          .565
==================================================================================================
EDU            .5            .5            .5            .5            .5            .5
==================================================================================================
GAMING         .478          .478          .434          .478          .521          .478
BIOTECH        .41           .438          .449          .46           .427          .46
OILGAS         .402          .381          .368          .277          .243          .263
CHINA          .14           .087          .14           .175          .105          .245
COAL           0             0             0             0             0             0
|
====================================================================
7/11/2019 Today the DJI made its flat-top breakout into all-time high
territory. This
produced a reversing and automatic Buy B10 from our Peerless sogtware.
Cover shorts in DIA and go long is the message the B10 brings. These are
reliably bullish signals. See the track record of Summer Buy B10s below.
our larger study of all Buy B10s here:
http://www.tigersoft.com/PeerInst-2012-2013/-Buy-B10.htm
Close out most short positions if their
Closing Power downtrends are
broken. Buy more MSFT. Buy FAS. Hold long DIA and QQQ as well as
NUGT and GLD.

Since 1929, there have been 15 Summer automatic Buy
B10s. The
median gain on the DJI when reversed was 8.5%, but the last 5 occurrences
brought only one gain of 8%. In 4 of the 15 cases, the Buy B10 was
very quickly reversed by a Sell signal. Fortunately, in 8 cases, there
was never any paper loss and in only 3 instances was the maximum
paper loss above 1.6% with the biggest loss being only 2.5%.
The current level of our Accumulation Index for the Peerless DJI chart is
only +.011. That may not matter, as the median gain for the Buy B10s
where the IP21 was below .039 was +9.75%. This is actually higher
than the gains for all Summer B10s.
Chasing a breakout may seem counter-intuitive, but qualified
breakout
B10s show that a good rally is most apt to occur now. Perhaps, this is
because traders expect the next FOMC to cut nterest rates by 1/4%.
The bullishness now certainly has to do with the Summer's bullish seasonality.
Since 1967, in the the third years of the four-year Presidential cycle, the DJI
has gained +2.1%, +4.2% and +6% over the next 21, 42 and 65 trading days,
respectively. It has been higher in 75% of all these periods of time.
It is bullish that the NASDAQ, QQQ, SPY and DIA have now all broken
out to new all-time highs. The sellers at the old highs appear to have been
overcome. That means prices should rise more easily now.


Summer Buy B10s: 1929-2019
Summer Buy B10s: 1929-2019 19490805 B10 179.1 .232 177.8 -.0072 8/29
la/ma=1.023 aroc = .552 P=+144(+20) IP21=.279 V=+127 OP=.294
-------------------------------------------------------------------------------
19640701 B10 838.1 .120 823.4 -.0175 8/6
la/ma=1.024 aroc = .354 P=+74(+36) IP21=.006 V=-17 OP=+.456
-------------------------------------------------------------------------------
19640909 B10 855.6 .097 none 0
la/ma=1.018 aroc = .372 P=+67(+4) IP21=.038 V=-22 OP=+.282
-------------------------------------------------------------------------------
19650817 B10 894.3 .084 887.1 -.008 8/23
la/ma=1.019 aroc = .19 P=+88(+7) IP21=.011 V=+4 OP=+.272
-------------------------------------------------------------------------------
19650916 B10 931.2 .041 926.5 -.005 9/21
la/ma=1.031 aroc = .487 P=+92(+9) IP21=.05 V=+8 OP=+.413
-------------------------------------------------------------------------------
19790815 B10 885.84 .009 none 0
la/ma=1.044 aroc =.807 P=+232(+49) IP21=.317 V=+5 OP=+.476
-------------------------------------------------------------------------------
19840802 B10 1166.07 .106 none 0
la/ma=1.046 aroc =.340 P=-33(+48) IP21=.106 V=0 OP=+.10
-------------------------------------------------------------------------------
19890714 B10 2554.82 .078 none 0
la/ma=1.025 aroc =.246 P=+56(+6) IP21=.092 V=2 OP=+.023
-------------------------------------------------------------------------------
19930819 B10 3612.12 .098 3527.23 -.025
la/ma=1.013 aroc =.189 P=+113(+6) IP21=.013 V=3 OP=+.217
-------------------------------------------------------------------------------
19960912 B10 5771.94 .188 none 0
la/ma=1.014 aroc =.261 P=+129(+60) IP21=.117 V=+8 OP=+.258
-------------------------------------------------------------------------------
20030819 B10 9428.90 .04 9275.06 -.0163 9/30
la/ma=1.022 aroc =.430 P=+147(+120) IP21=.082 V=+1 OP=+.292
-------------------------------------------------------------------------------
20070712 B10 13861.73 .006 none 0
la/ma=1.024 aroc =.500 P=+283(+189) IP21=.035 V=+25 OP=+.097
-------------------------------------------------------------------------------
20120913 B10 13539.86 .003 none 0
la/ma=1.026 aroc =.332 P=+403(+86) IP21=.06 V=+59 OP=+.136
-------------------------------------------------------------------------------
20140918 B10 17265.99 .001 none 0
la/ma=1.011 aroc =.242 P=-35(-8) IP21=.103 V=-28 OP=+.236
-------------------------------------------------------------------------------
20170727 B10 21796.55 .080 none 0
La/ma=1.013 aroc =.269 P=+275(+30) IP21=.007 V=-5 OP=+.137
===============================================================================
N=15 Median Gain = 8.4%
9 of 15 showed no paper loss. Biggest paper loss was 2.5%
20190711 B10 27088.08 open
la/ma=1.018 aroc =.466 P=+284(-1) IP21=.011 V=+22 OP=+.125
===============================================================================
|
What To Do?
I would suggest covering most short sales and buying the
highest Tiger Power ranked
stocks in some of the more volatile industry groups with an IP21 value above +.12.
Buy more MSFT.
Group
Top Power Ranked Stock
----------------------------------------------------------------
DJI-30
MSFT 138.4 V(Visa) 180.74
SP-500
MSFT
138.4 ABT 85.77
NASD-100 MSFT 138.4 XEL
61.19 SNPS 136.44 PYPL 120.65
Semi-Conductor LSCC 16.25 ENPH 19.48 SNPS
136.44
Solar
RUN 19.64
Biotech
IDXX
285.46
Another approach is to go long the major ETF with
the biggest gains while
Peerless is on a Buy signal and smallest Paper Loss. That would be FAS
now. It is 3x leveraged, so its huge +71.4% gain over the last 10 months may
not be surprising, but its biggest paper loss is only 15.8%. Buy FAS.


|
Charts 7/11/2019 2019 PEERLESS DJI, Signals, Indicators Daily DJI Volume 10-DayUp/Down Vol Hourly DJIA A/D Line for All Stocks Inverted Traders Index NASDAQ S&P OEX NYSE COMPQX DJI-15 DJI-20 DJI-30 DIA SPY QQQ MDY IWM TNA Short-Term Rates USO-CrudeOil DBO FAS GLD BBH IBB JETS JNUG KOL NUGT OIH OIL RSX RETL SDS AGQ SLV SOXL TECL TLT TMF TNA UGA (gasoline) XIV and China: YINN CHAU Commodities: CANE CORN DBC JJC, NIB, CHOC CORN, CUT (paper) MOO, SOYB WEAT UUP (Dollar) LIT (Lithium) AAPL ADBE ALXN AMAT AMGN AMD AMZN BA BABA BAC BIDU CAT CVX DE FB GOOG GS HD IBM INTU JPM M (Macy's) MSFT NFLX NVDA PG QCOM TSLA TXN XOM WMT CMG , LRCX, SWKS, MDGL SPPI WATT SQ TOWN 7/11/19 (Click on Underlined link.) Bullish MAXCPs - http://tigersoft.com/MAXCPS/Jul-11/BULLISH.htm Bearish MAXCPs - http://tigersoft.com/MINCPs/Jul-11/BEARISH.htm |
T
able 1   QUICKSILVER on ETFS - 7/11/2019
Explanation: Pivot-point is price past which the ETF's 5-dma will change direction. 5-dmaAROC is the annualized rate of change of the ETF's 5-day moving average. Closing Power is bullish when it is above its rising 21-dma and it is bearish when it is below its 5-dma. Closing Power is the cumulative change from opening to close each day. Since it does not factor in changes at the opening, it tends to reflect NYSE professionals who trade the market when the NYSE is open. "Candle" color is blue when last close was above the opening, thus showing Professional net buying, which tends to be bullish. It is red when the close is below the opening, which tends to be bearish. IP21 is the current value of the Tiger Accumulation Index. Above +.15 tends to be bullish and below -.15 tends to be bearish until reversed. ITRS is the percent rise of the ETF over 50-days less the percent rise of the DIA (DJIA) over 50 trading days. The strongest ITRS ETFs tend to keep rising and the lowest ITRS ETFs tend to keep falling. Add ITRS and IP21 to get a composite measure of intermediate-term strength. ETF CLOSE CHANGE PIVOT-PT 5-dmaAROC CL-PWR CANDLE IP21 ITRS ------------------------------------------------------------------------------------------ DIA 270.92 2.23 269.27 25.3% Bullish BLUE .038 ----- --------------------------------------------------------------------------------------------- BA 359 6.7 355.86 64.1% ------- BLUE .07 -.069 --------------------------------------------------------------------------------------------- SPY 299.31 .7 298.46 8.6% Bullish ---- .079 -.001 --------------------------------------------------------------------------------------------- QQQ 192.42 -.14 191.05 25.6% Bullish RED .054 -.004 --------------------------------------------------------------------------------------------- MDY 353.4 -.8 357.89 -58.6% Bearish RED .054 -.035 --------------------------------------------------------------------------------------------- IWM 154.91 -.76 156.68 -43.3% Bearish RED .022 -.041 --------------------------------------------------------------------------------------------- FAS 79.5 .65 78.95 59.7% Bullish BLUE .049 .053 --------------------------------------------------------------------------------------------- SOXL 152.79 1.15 148.77 54% Bearish RED -.13 -.207 --------------------------------------------------------------------------------------------- TECL 173.14 2.01 169.76 82.3% Bullish BLUE .067 .025 --------------------------------------------------------------------------------------------- IBB 106.98 -1.55 109.22 -181.1% Bullish RED .085 -.014 --------------------------------------------------------------------------------------------- GLD 132.7 -1.13 132.14 -35.1% ------- RED .247 .076 (highest) --------------------------------------------------------------------------------------------- OIH 15 -.09 14.62 177.1% Bearish RED .102 -.119 --------------------------------------------------------------------------------------------- RSX 23.93 -.19 23.85 -6.3% Bullish ---- .003 .092 |
Table 2 Count of Stocks in Key Directories
20190711
-------------------------------
NEWHIGHS 259 Bullish
NEWLOWS 32
MAXCP 23
MINCP 29
TTTNH 14
TTTNL 68
FASTUP 45
FASTDOWN 53
CPCROSSA 51
CPCROSSD 149
BIGVOLUP 3
BIGVODN 10
ACCUMVER 11
HIGHIP21 11
HIUPPCT 16
VHIP21 118
LOWACCUM 147
REDSELL 91
AUGSELS7 16
TRAPDOOR 10
|
 Table 3
          RANKING OF KEY DIRECTORIES BASED PCT.OF STOCKS ABOVE 65-DMA
              7/11/19
 Bullish = 32
 Bearish = 10
---------------------------------------------------------------------------------------
Directory     Current       day-1         day-2         day-3         day-4         day-5
----------------------------------------------------------------------------------------
BONDFUND       .97           .97           .96           .96           .97           .98
BIGBANKS       .857          .857          .857          .857          .857          .857
INSURANC       .851          .851          .851          .888          .888          .851
GOLD           .803          .843          .843          .823          .843          .901
DOWJONES       .8            .8            .766          .8            .8            .833
NASD-100       .775          .775          .775          .734          .775          .826
UTILITY        .775          .8            .8            .825          .775          .825
DJI-13         .769          .769          .769          .769          .769          .846
FIDSTKS        .739          .739          .722          .733          .75           .771
COMODITY       .731          .756          .56           .585          .609          .658
FOOD           .722          .74           .574          .592          .611          .666
SP500          .716          .706          .706          .704          .733          .759
SP-100         .714          .681          .692          .692          .703          .736
HOMEBLDG       .705          .705          .647          .647          .647          .705
INDEXES        .702          .724          .681          .675          .724          .74
HACKERS        .7            .65           .65           .5            .6            .6
JETS           .7            .8            .7            .8            .8            .8
NIFTY          .684          .666          .631          .614          .649          .684
MILITARY       .678          .75           .75           .75           .75           .714
SOFTWARE       .672          .639          .606          .573          .639          .655
ETFS           .649          .649          .614          .614          .807          .877
BEVERAGE       .647          .588          .529          .588          .647          .647
RUS-1000       .62           .612          .621          .632          .66           .664
COMPUTER       .619          .666          .666          .714          .761          .761
FINANCE        .613          .59           .636          .613          .75           .659
SOLAR          .611          .722          .722          .777          .777          .777
INFRA          .583          .583          .638          .583          .666          .638
HOSPITAL       .565          .521          .565          .521          .565          .565
GUNS           .562          .5            .5            .562          .562          .625
REIT           .554          .635          .614          .567          .547          .54
GREEN          .545          .59           .59           .59           .59           .545
AUTO           .538          .512          .538          .589          .666          .692
N=32
==============================================================================================
EDU            .5            .5            .5            .5            .5            .5
REGBANKS       .5            .464          .607          .571          .821          .678
TRANSP         .5            .4            .4            .6            .7            .75
==============================================================================================
SEMI           .486          .522          .513          .486          .531          .567
GAMING         .478          .434          .478          .521          .478          .565
INDMATER       .45           .5            .537          .55           .575          .575
ELECTRON       .445          .471          .458          .439          .496          .528
BIOTECH        .435          .449          .46           .427          .457          .476
RETAIL         .433          .433          .415          .49           .452          .433
OILGAS         .381          .368          .277          .243          .256          .263
CHEM           .339          .396          .509          .528          .584          .584
CHINA          .087          .14           .175          .105          .245          .333
COAL           0             0             0             0             0             0
N=10
|
=====================================================================
7/10/2019 Peerless remains on a combination Sell S12, S9-V, S4. But new high
breakouts
into all-time high territory were made today above flat resistance by the NASDAQ,
SP-500, SPY and QQQ. For them, this is a very bullish development.
Since the the NASDAQ and QQQ can sometimes top out two months AFTER
the DJI does, I think we should take a long
position in QQQ even as we hold
short DIA. Note how broad is the advance within the 100 QQQ stocks. This
also gives us a better way to play the bullish seasonality now beyond just holding
a long position in MSFT, the highest Power-Ranked stock in the QQQ.
See below how QQQ peaked 10 weeks after the DJI did in the year 2000. DIA
is being significantly held back by Boeing. I don't see that situation changing
soon.


Hold DIA Short. Hold long MSFT, NUGT and GLD
For now the DJI has stayed beneath 27050, where its flat resistance-line crosses.
But if the DJI closes above 27050 and shows an IP21 above, say, +.05, I think
we will have to grant such a breakout the status of a judged Buy B10 and cover
the DIA shorts at a loss. But I believe we shouId require the DJI's IP21 to shift
(IP21 is our Tiger Accumulation Index.) into clearly positive territory, say, above
+.05. Immediately below is the DJI chart currently. Just below is the DJI
chart for 1995. I show the 1995 chart to let you see how important a confirmed
DJI breakout into all-time high territory above flat resistance is. The 1995
breakout
launched the take-off that became the very bullish 1995-2000 bull market. Once
prices move into all-time high territory, they can run more freely, as there are no
more resistance-levels based on past highs where sell orders can be congregated.


Powell's Testimony Today
I listened to
most of Fed Chairman Powell's testimony in House of Representatives
today. When pressed, he finally let slip that his biggest concern is overseas
economic
weakness. (Our composite foreign ETFs' chart has already turned up with some
conviction.) He also said that a US Debt crisis is many years away because the
Dollar
is the reserve currency for much of the rest of the world. (He did not mention how strong
Gold and crypto-currencies have become). He assured us that he has all the tools he
needs to manage the next financial down-turn, which seems quite distant given how good
all his economic indicators look. (He did not address any signs that big money is
selling
a lot of stock now or that some brokerages see a bear market not far ahead). And he
assured us that while there is mounting inequality, the Fed did not create it, there are
lots of new jobs and in any case the Fed is not in the business of picking winners and
losers. He seems oblivious to the Populist critique that argues the FED always
places
a strong Dollar above low interest rates, especially on credit cards. He
emphatically
did not want to make low-interest rate loans to state governments, like Michigan,
instead of big banks. Nor did he want to predict what would happen to the economy
if the tariff war with China continues or Congress boosts the minimum pay for the first
time in ten years. Powell has become, I conclude, a much better booster for stocks
than
he was last Fall. I enjoyed listening, but I noted he seems to cough out of some
nervousness.
I suspect the cough shows that he knows a lot more than he is saying! I will listen
tomorrow and see if his cough goes away.
|
Charts 7/10/2019 2019 PEERLESS DJI, Signals, Indicators Daily DJI Volume 10-DayUp/Down Vol Hourly DJIA A/D Line for All Stocks Inverted Traders Index NASDAQ S&P OEX NYSE COMPQX DJI-15 DJI-20 DJI-30 DIA SPY QQQ MDY IWM TNA Short-Term Rates USO-CrudeOil DBO FAS GLD BBH IBB JETS JNUG KOL NUGT OIH OIL RSX RETL SDS AGQ SLV SOXL TECL TLT TMF TNA UGA (gasoline) XIV and China: YINN CHAU Commodities: CANE CORN DBC JJC, NIB, CHOC CORN, CUT (paper) MOO, SOYB WEAT UUP (Dollar) LIT (Lithium) AAPL ADBE ALXN AMAT AMGN AMD AMZN BA BABA BAC BIDU CAT CVX DE FB GOOG GS HD IBM INTU JPM M (Macy's) MSFT NFLX NVDA PG QCOM TSLA TXN XOM WMT CMG , LRCX, SWKS, MDGL SPPI WATT SQ TOWN 7/10/19 (Click on Underlined link.) Bullish MAXCPs - http://tigersoft.com/MAXCPS/Jul-10/BULLISH.htm Bearish MAXCPs - http://tigersoft.com/MINCPs/Jul-10/BEARISH.htm |
Table 1 QUICKSILVER on ETFS - 7/10/2019 Explanation: Pivot-point is price past which the ETF's 5-dma will change direction. 5-dmaAROC is the annualized rate of change of the ETF's 5-day moving average. Closing Power is bullish when it is above its rising 21-dma and it is bearish when it is below its 5-dma. Closing Power is the cumulative change from opening to close each day. Since it does not factor in changes at the opening, it tends to reflect NYSE professionals who trade the market when the NYSE is open. "Candle" color is blue when last close was above the opening, thus showing Professional net buying, which tends to be bullish. It is red when the close is below the opening, which tends to be bearish. IP21 is the current value of the Tiger Accumulation Index. Above +.15 tends to be bullish and below -.15 tends to be bearish until reversed. ITRS is the percent rise of the ETF over 50-days less the percent rise of the DIA (DJIA) over 50 trading days. The strongest ITRS ETFs tend to keep rising and the lowest ITRS ETFs tend to keep falling. Add ITRS and IP21 to get a composite measure of intermediate-term strength. ETF CLOSE CHANGE PIVOT-PT 5-dmaAROC CL-PWR CANDLE IP21 ITRS ------------------------------------------------------------------------------------------ DIA 268.69 .83 269.56 19.2% Bearish RED .015 0 --------------------------------------------------------------------------------------------- BA 352.3 -.79 354.47 -26.3% Bearish RED -.003 -.083 --------------------------------------------------------------------------------------------- SPY 298.61 1.42 298.8 36.6% ------- BLUE .029 .004 --------------------------------------------------------------------------------------------- QQQ 192.56 1.9 191.44 66.9% ------- BLUE .021 -.004 --------------------------------------------------------------------------------------------- MDY 354.2 -.37 357.57 -2.2% Bearish RED .037 -.028 --------------------------------------------------------------------------------------------- IWM 155.67 .27 156.26 16.7% Bearish RED .01 -.033 --------------------------------------------------------------------------------------------- FAS 78.85 -.29 78.56 150.2% ------- RED .013 .066 --------------------------------------------------------------------------------------------- SOXL 151.64 3.12 151.18 -64.6% Bearish RED -.157 -.188 (weakest) --------------------------------------------------------------------------------------------- TECL 171.13 3.85 170.36 122.9% ------- BLUE .042 .026 --------------------------------------------------------------------------------------------- IBB 108.53 -.31 110.93 -51.2% Bullish RED .075 -.001 --------------------------------------------------------------------------------------------- GLD 133.83 2.08 133.63 15.9% Bullish BLUE .271 .095 (strongest) --------------------------------------------------------------------------------------------- OIH 15.09 .51 14.48 223.3% ------- BLUE .086 -.135 --------------------------------------------------------------------------------------------- RSX 24.12 .3 23.96 71.2% Bullish ---- .011 .108 (highest ITRS) |
Table 2    Count of Stocks in Key Directories
           20190710
-------------------------------
NEWHIGHS       301 Bullish
NEWLOWS        21
MAXCP          37
MINCP          20
TTTNH          19
TTTNL          47
FASTUP         50
FASTDOWN       59
CPCROSSA       61
CPCROSSD       161 Bearish plurality vs CPCROSSA
BIGVOLUP       3
BIGVODN        7
ACCUMVER       12
HIUPPCT        15
VHIP21         119
LOWACCUM       145
REDSELL        88
AUGSELS7       19
TRAPDOOR       10
|
Table 3 RANKING OF KEY DIRECTORIES BASED PCT.OF STOCKS ABOVE 65-DMA
        7/10/19
 Bullish = 32
 Bearish = 13
---------------------------------------------------------------------------------------
Directory     Current       day-1         day-2         day-3         day-4         day-5
----------------------------------------------------------------------------------------
BONDFUND       .97           .96           .96           .97           .98           .99
BIGBANKS       .857          .857          .857          .857          .857          .857
INSURANC       .851          .851          .888          .888          .888          .851
GOLD           .843          .843          .823          .843          .882          .882
DOWJONES       .827          .793          .827          .827          .862          .827
JETS           .8            .7            .8            .8            .8            .8
UTILITY        .8            .8            .825          .775          .825          .75
NASD-100       .77           .76           .729          .77           .791          .75
DJI-13         .769          .769          .769          .769          .846          .769
COMODITY       .756          .56           .585          .609          .658          .634
MILITARY       .75           .75           .75           .75           .714          .714
FOOD           .74           .574          .592          .611          .666          .629
FIDSTKS        .739          .722          .733          .75           .766          .722
SOLAR          .722          .722          .777          .777          .777          .777
INDEXES        .711          .679          .673          .722          .744          .701
SP500          .706          .706          .704          .733          .755          .706
HOMEBLDG       .705          .647          .647          .647          .705          .588
SP-100         .681          .692          .692          .703          .725          .714
COMPUTER       .666          .666          .714          .761          .761          .714
NIFTY          .66           .625          .607          .642          .66           .66
HACKERS        .65           .65           .5            .6            .6            .6
ETFS           .649          .614          .614          .807          .877          .859
SOFTWARE       .639          .606          .573          .639          .655          .606
REIT           .635          .614          .567          .547          .547          .432
RUS-1000       .612          .621          .63           .661          .664          .612
FINANCE        .59           .636          .613          .75           .659          .602
GREEN          .59           .59           .59           .59           .545          .545
BEVERAGE       .588          .529          .588          .647          .647          .588
INFRA          .583          .638          .583          .666          .638          .611
SEMI           .522          .513          .486          .531          .567          .585
HOSPITAL       .521          .565          .521          .565          .565          .565
AUTO           .512          .538          .589          .666          .692          .666
================================================================================================
EDU            .5            .5            .5            .5            .5            .5
GUNS           .5            .5            .562          .562          .625          .562
INDMATER       .5            .537          .55           .575          .575          .562
================================================================================================
ELECTRON       .474          .461          .442          .5            .532          .532
REGBANKS       .464          .607          .571          .821          .678          .464
BIOTECH        .446          .46           .427          .457          .468          .457
GAMING         .434          .478          .521          .478          .565          .478
RETAIL         .433          .415          .49           .452          .433          .396
TRANSP         .4            .4            .6            .7            .75           .6
CHEM           .396          .509          .528          .584          .603          .566
OILGAS         .368          .277          .243          .256          .256          .243
CHINA          .14           .175          .105          .245          .333          .315
COAL           0             0             0             0             0             0
Bearish = 10
|
====================================================================
7/9/2019 The operative Peerless Sell signals' history we now see in
our Peerless DJI charts is quite bearish. The 11 Summer Sells
S4s show a median decline of 10.5% at the time of their
reversal. Most had a maximum paper loss of less than 1%. Independent
Summer S12s show a median decline of 11.3%. (The Summer
Sell S12 and S4 results' tables are shown further below).
Conclusion: Hold short DIA and some of the stocks mentioned last night
and some of the bearish MINCPs short. Hold long GLD, NUGT and MSFT.
Stocks and ETFs that break below or are below their 65-dma at this time
seem especially vulnerable if Powell and the Federal Reserve
do not lower rates very soon. And even if they do drop the Federal Funds
Rate down to 2%, it may be seen as a sign of weakness in the general
US economy.
Until the NYSE A/D Line and the DJI's price uptrends
are broken, more sidewise trading could continue a while
longer. Patience is needed for now.
S12 S4

For now our Sells are battling a number of bullish factors, namely:
record corporate share-buy-backs, low interest rates, the bullish
seasonality of the Summer in the third year of the four year Presidential
cycle and the strong Dollar which draws overseas money into US bonds
and blue chips.
When we consider all these bullish factors, it is actually quite
surprising that we have any Sell signals, at all. But, of course
Peerless does not read the newspapers. Each day that
27000 is not taken, it becomes a more significant barrier and
clearly "big money" is doing a lot of selling into strength above
26000. That is the meaning behind the negative Accumulation
Index readings, the Sell S12s and the Sell S4.
Will this big money distribution on strength turn into a market
decline? It will, I think, if the price uptrends for the key indexes
are broken and 27050 is not closed above. And it will if the past
record of Summer "independent S12s", those with simultaneously
high P-I readings, plays out. And they will if the past Summer
Sell S4s have anything like their usual bearish meaning in 2019.
The SP-500 and NASDAQ have been
stronger than the DJI. These two indexes
will need to break their green price uptrends if
we are going to see a DJI drop to its lower
band.


|
Charts 7/9/2019 2019 PEERLESS DJI, Signals, Indicators Daily DJI Volume 10-DayUp/Down Vol Hourly DJIA A/D Line for All Stocks Inverted Traders Index NASDAQ S&P OEX NYSE COMPQX DJI-15 DJI-20 DJI-30 DIA SPY QQQ MDY IWM TNA Short-Term Rates USO-CrudeOil DBO FAS GLD BBH IBB JETS JNUG KOL NUGT OIH OIL RSX RETL SDS AGQ SLV SOXL TECL TLT TMF TNA UGA (gasoline) XIV and China: YINN CHAU Commodities: CANE CORN DBC JJC, NIB, CHOC CORN, CUT (paper) MOO, SOYB WEAT UUP (Dollar) LIT (Lithium) AAPL ADBE ALXN AMAT AMGN AMD AMZN BA BABA BAC BIDU CAT CVX DE FB GOOG GS HD IBM INTU JPM M (Macy's) MSFT NFLX NVDA PG QCOM TSLA TXN XOM WMT CMG , LRCX, SWKS, MDGL SPPI WATT SQ TOWN 7/9/19 (Click on Underlined link.) Bullish MAXCPs - http://tigersoft.com/MAXCPS/Jul-09/BULLISH.htm Bearish MAXCPs - http://tigersoft.com/MINCPs/Jul-09/BEARISH.htm |
Table 1 QUICKSILVER on ETFS - 7/9/2019 Explanation: Pivot-point is price past which the ETF's 5-dma will change direction. 5-dmaAROC is the annualized rate of change of the ETF's 5-day moving average. Closing Power is bullish when it is above its rising 21-dma and it is bearish when it is below its 5-dma. Closing Power is the cumulative change from opening to close each day. Since it does not factor in changes at the opening, it tends to reflect NYSE professionals who trade the market when the NYSE is open. "Candle" color is blue when last close was above the opening, thus showing Professional net buying, which tends to be bullish. It is red when the close is below the opening, which tends to be bearish. IP21 is the current value of the Tiger Accumulation Index. Above +.15 tends to be bullish and below -.15 tends to be bearish until reversed. ITRS is the percent rise of the ETF over 50-days less the percent rise of the DIA (DJIA) over 50 trading days. The strongest ITRS ETFs tend to keep rising and the lowest ITRS ETFs tend to keep falling. Add ITRS and IP21 to get a composite measure of intermediate-term strength. ETF CLOSE CHANGE PIVOT-PT 5-dmaAROC CL-PWR CANDLE IP21 ITRS ------------------------------------------------------------------------------------------ DIA 267.86 -.2 267.66 16.6% Bearish BLUE -.027 ----- --------------------------------------------------------------------------------------------- BA 353.09 1.97 354.16 -47.5% Bearish BLUE -.01 -.082 --------------------------------------------------------------------------------------------- SPY 297.19 .37 296.43 25.7% Bearish BLUE -.008 .003 --------------------------------------------------------------------------------------------- QQQ 190.66 .95 190.01 36.8% ------- BLUE -.018 -.009 --------------------------------------------------------------------------------------------- MDY 354.57 .07 354.36 -10% Bearish BLUE .042 -.023 --------------------------------------------------------------------------------------------- IWM 155.4 .21 155.15 -22.5% Bearish BLUE -.022 -.028 --------------------------------------------------------------------------------------------- FAS 79.14 1.04 76.5 209.4% Bearish BLUE -.005 .09 --------------------------------------------------------------------------------------------- SOXL 148.52 3.35 153.57 -387.7% Bearish BLUE -.106 -.206 (weakest) --------------------------------------------------------------------------------------------- TECL 167.28 1.62 167 45.6% ------- BLUE .014 .006 --------------------------------------------------------------------------------------------- IBB 108.84 1.1 109.65 -40.7% Bullish BLUE .041 .004 --------------------------------------------------------------------------------------------- GLD 131.75 .46 133.41 42.7% Bullish BLUE .225 .076 (Strongest) --------------------------------------------------------------------------------------------- OIH 14.58 -.06 14.44 -116.3% Bearish ---- .001 -.167 --------------------------------------------------------------------------------------------- RSX 23.82 -.18 23.78 -12.6% ------- RED .043 .103 |
Table 2   Count of Stocks in Key Directories
          20190709
-------------------------------
NEWHIGHS       183  Bullish
NEWLOWS        15
MAXCP          45
MINCP          12
TTTNH          27
TTTNL          33
FASTUP         41
FASTDOWN       58
CPCROSSA       123
CPCROSSD       59
BIGVOLUP       2
BIGVODN        12
ACCUMVER       11
HIUPPCT        14
VHIP21         120
LOWACCUM       141
REDSELL        88
AUGSELS7       18
TRAPDOOR       10
|
 Table 3    RANKING OF KEY DIRECTORIES BASED PCT.OF STOCKS ABOVE 65-DMA
              7/9/19
 Bullish = 35
 Bearish = 7
---------------------------------------------------------------------------------------
Directory     Current       day-1         day-2         day-3         day-4         day-5
----------------------------------------------------------------------------------------
BONDFUND       .961          .961          .97           .98           .99           .951
BIGBANKS       .857          .857          .857          .857          .857          .857
INSURANC       .851          .888          .888          .888          .851          .814
GOLD           .843          .823          .843          .882          .882          .803
UTILITY        .8            .825          .775          .825          .75           .7
DOWJONES       .793          .827          .827          .862          .827          .758
DJI-13         .769          .769          .769          .846          .769          .769
NASD-100       .76           .729          .77           .791          .75           .75
MILITARY       .75           .75           .75           .714          .714          .714
FIDSTKS        .722          .733          .75           .766          .722          .744
SOLAR          .722          .777          .777          .777          .777          .777
SP500          .706          .704          .733          .755          .706          .716
JETS           .7            .8            .8            .8            .8            .8
SP-100         .692          .692          .703          .725          .714          .703
INDEXES        .677          .677          .725          .741          .704          .731
COMPUTER       .666          .714          .761          .761          .714          .714
HACKERS        .65           .5            .6            .6            .6            .5
HOMEBLDG       .647          .647          .647          .705          .588          .47
INFRA          .638          .583          .666          .638          .611          .666
FINANCE        .636          .613          .75           .659          .602          .727
NIFTY          .625          .607          .642          .66           .66           .696
RUS-1000       .621          .63           .66           .665          .613          .61
ETFS           .614          .614          .807          .877          .859          .824
REIT           .614          .567          .547          .547          .445          .351
REGBANKS       .607          .571          .821          .678          .464          .678
SOFTWARE       .606          .573          .639          .655          .622          .573
GREEN          .59           .59           .59           .545          .545          .545
FOOD           .574          .592          .611          .666          .629          .629
HOSPITAL       .565          .521          .565          .565          .565          .565
COMODITY       .56           .585          .609          .658          .634          .609
AUTO           .538          .589          .666          .692          .666          .666
INDMATER       .537          .55           .575          .575          .562          .612
BEVERAGE       .529          .588          .647          .647          .588          .529
SEMI           .513          .486          .531          .567          .585          .648
CHEM           .509          .528          .584          .603          .584          .603
Bullish = 35
==============================================================================================
EDU            .5            .5            .5            .5            .5            .5
GAMING         .5            .545          .5            .59           .5            .545
GUNS           .5            .562          .562          .625          .562          .562
==============================================================================================
ELECTRON       .458          .439          .496          .528          .535          .598
BIOTECH        .457          .427          .457          .468          .457          .476
RETAIL         .415          .49           .452          .433          .377          .358
TRANSP         .4            .6            .7            .75           .6            .7
OILGAS         .279          .244          .258          .258          .244          .293
CHINA          .175          .105          .245          .333          .315          .315
COAL           0             0             0             0             0             .142
Bearish = 7
|
One thing that needs more discussion is the technical battle now going
on between the rising NYSE A/D Line and the very positive P-Indicator
(21-dma of NYSE advances-declines) on the one hand and the
negative Accumulation Index (IP21). Tonight I show the track
record of the "independent Summer S12s.
|
Independent Summer Sell S12s:
1929-2019 (Those with very positive (breadth) P-I readings) All eventually brought gains to short sellers: +.083, +.136, +.055, +.127, +.172, +.054, +.113, +.017, +.135 5 of 9 brought a decline of more than 11%. Median gain on short sale after Sell S12 was .113 (11.3%) Paper losses: None = 5 of 9 cases but in 3 of 9 cases, the paper losses were between 3.2% and 6.4%, The huge paper loss occurred when AROC was over 1.35 (135%). Ours in 2019 was not like this. --------------------------------------------------------------------------------
#1 Signal DJI GAIN Paper Loss
19320909 S12 76.2 .083 none 0
la/ma=1.054 AROC= 1.125 PI=85(-35) IP21=-.05 V=+189 OP=.098
19320913 B7 69.9 .023 65.1 -.0686 9/19
---------------------------------------------------------------------------------
#2
19330705 S12 102.2 .136 108.7 -.0636 7/18
^^^^^^
la/ma=1.074 AROC= 1.352 PI=25(-20) IP21=-.064 V=-165 OP=.179
(very high)
19330719 S12 103.6 .144 none 0
la/ma=1.022 AROC= .907 PI=37(-65) IP21=-.146 V=-90 OP=.159
19330721 B5 88.7 .121 none 0
---------------------------------------------------------------------------------
#3
19380805 S12 144.5 .055 perfect - no paper loss
la/ma=1.029 AROC= 0.595 PI=40(+10) IP21=-.024 V=+28 OP=.029
19380812 B7 136.5 .048 perfect 0
----------------------------------------------------------------------------------
#4
19780908 S12 907.74 .127 perfect - no paper loss
la/ma=1.019 AROC= 0.216 PI=109(+6) IP21=-.062 V=+3 OP=.080
19780913 S1 899.6 .120 none 0
19781010 S9 891.63 .112 901.42 -.0109 10/11
19781113 B3 792.01 .106 785.26 -.0085 11/14
------------------------------------------------------------------------------------
#5
19810615 S12 1011.99 .172 perfect - no paper loss
la/ma=1.021 AROC= 0.469 PI=146(+0) IP21=-.001 V=+3 OP=.013
19811009 S9 873.00 .04 none 0
19811023 B9 873.99 .04 830.96 -.0492 10/26
-------------------------------------------------------------------------------------
#6
19970918 S12 7922.71 .054 8178.31 -.0322 10/7
^^^^^^
la/ma=1.013 AROC= 0.007 PI=259(-33) IP21=-.001 V=0 OP=-.103
19970929 S12 7991.43 .062 8178.31 -.0233 10/7
la/ma=1.018 AROC= 0.451 PI=335(+27) IP21=-.017 V=+19 OP=-.063
19971028 B19 7598.32 .225 7381.67 -.0285 10/30
-------------------------------------------------------------------------------------
#7
20110705 S12 S9V 12569.87 .113 12724 -.01
la/ma=1.037 AROC= 0.412 PI=239(+57) IP21=-.034 V=-48 OP=.085
20110811 B14 11143.31 .037
--------------------------------------------------------------------------------------
#8
20130910 S12 15191.06 .017 15676.9 -.0319 9/18
^^^^^^
la/ma=1.012 AROC= 0.412 PI=239(+57) IP21=-.034 V=-48 OP=.085
20130920 S17 15451.09 .033 none 0
20131007 B9 14936.24 .105 14776.5 -.0106 10/8
-------------------------------------------------------------------------------
#9
20150716 S12 18120.25 .135 none 0
la/ma=1.014 AROC= 0.144 PI=79(+18) IP21=-.193 V=-129 OP=.163
20150824 S13 15871.35 .013 16643.0 -.0486 8/28
20150825 B16 15666.44 .131 none 0
-------------------------------------------------------------------------------
#10
20190611 S12 26048.51 open 26966 (918/26048)=.029
la/ma=1.020 AROC= 0.049 PI=97(-42) IP21=-.016 V=-82 OP=.07
20190703 S4 26966.00 open
--------------------------------------------------------------------------------
|
Summer Sell S4s
Gains .409, .027, .365, .135.
.222, .105, .053, .178 , 052, .095, .056
All 11 were profitable.
6 of 11 bought gains above 10.%
Median gain was 10.5%
Paper Losses
.0738, 0, .0182, .0172,.0171, .0113, .0029, .0054, none,
none,.0022
1 of 11 brought a big paper loss. (In 1929)
6 of 11 saw a maximum paper loss of less than 1%
|
Sell 4s: 1929-2019 Date DJI Short Sale Max. Paper Loss Gain 19290814 S4 354.9 .409 381.1 -.0738 9/3 (bull market - 1929 Crash about to occur) -------------------------------------------------------------- 19310707 S4 145.9 .027 none 0 (bear market) (Sell before bear market started...) -------------------------------------------------------------- 19370803 S4 185.9 .365 189.3 -.0182 (bull market - 1937 Crash about to occur) -------------------------------------------------------------- 19380119 S4 130.1 .053 none 0 (bear market - not considered in calculations of results here.) -------------------------------------------------------------- 19401003 S4 135.1 .025 137.8 -.0199 11/17 (bull market - very timely because WWII about to start in earnest,) Not Summer S4 -------------------------------------------------------------------- 19410711 S4 127.9 .135 130.1 -.0172 7/28 (bull market - very timely because Pearl Harbor scenario coming on.) ---------------------------------------------------------------------- 19460611 S4 209.1 .22 210.6 -.0071 6/13 (bull market) (Considered a Summer S4) ---------------------------------------------------------------------- 19470711 S4 184.8 .105 186.9 -.0113 7/24 (bull market) 19471022 S4 184.4 . 103 none 0 (bull market) --------------------------------------------------------------------- 19510917 S4 275.1 .053 275.9 -.0029 10/3 (bull market) --------------------------------------------------------------------- 19550922 S4 486.0 .092 487.5 -.003 9/23 (bull market - not Summer S4) -------------------------------------------------------------------- 19570711 S4 518 .178 520.8 -.0054 7/12 (bull market) (Sell before near-bear market started...) ------------------------------------------------------------------ 19610518 S4 701.1 .014 none 0 (bull market) (Not Summer S4)) ------------------------------------------------------------------ 19660110 S4 985.41 .213 994.2 -.0089 1/18 (bull market) (Sell before bear market started...) (Not Summer S4) ----------------------------------------------------------------- 19730109 S4 1047.11 .104 1051.70 -.0043 1/11 (bull market) (Sell before bear market started...) Not Summer S4) ------------------------------------------------------------------ 19761222 S4 984.54 .051 1004.65 -.0204 12/31 (bull market) (Sell before bear market started...) Not Summer S4) ------------------------------------------------------------------ 19800116 S4 865.19 .101 903.84 -.0446 2/13 (bull market) ( Not Summer S4) ------------------------------------------------------------------- 19810326 S4 1005.76 .032 1024.05 -.0181 4/27 (bull market) (Sell before bear market started...) ( Not Summer S4) -------------------------------------------------------------------- 19831122 S4 1275.81 .031 1287.30 -.009 11/29 (bull market) Not Summer S4) -------------------------------------------------------------------- 19850208 S4 1289.97 .033 1299.36 -.0072 3/1 (bull market) ( Not Summer S4) ------------------------------------------------------------------- 19870826 S4 2701.85 .052 none 0 (bull market) (Sell before bear market started...) ------------------------------------------------------------------- 19890209 S4 2323.04 .031 2324.82 -.0007 2/17 (bull market) ( Not Summer S4) ------------------------------------------------------------------- 19940203 S4 3967.66 .074 none 0 (bull market) ( Not Summer S4) ------------------------------------------------------------------- 19970207 S4 6855.8 .036 7085.16 -.0334 3/11 (bull market) ( Not Summer S4) ------------------------------------------------------------------- 20000111 S4 11511.08 .13 11722.9 -.0184 1/14 (bull market) (Sell before bear market started...) (Not Summer S4) ------------------------------------------------------------------- 20000906 S4 11310.64 .095 none 0 (bull market) (Sell before bear market started...) ------------------------------------------------------------------- 20010517 S4 11248.58 .268 11301.7 -.0047 5/18 (bull market) (Sell before bear market started...) (Not Summer S4) ------------------------------------------------------------------- 20031015 S4 9803.05 .018 9858.46 -.0056 11/3 (bull market) (Not Summer S4) ------------------------------------------------------------------- 20050308 S4 10912.47 .064 none 0 (bull market) (Not Summer S4) -------------------------------------------------------------------- 20071005 S4 14066.01 .079 14164.5 -.007 10/9 (bull market) (Sell before bear market started...) (Not Summer S4) ------------------------------------------------------------------- 20080421 S4 12825.02 .112 13040.0 -.0167 5/1 (bear market) (Sell before bear market started...) (Not Summer S4) ------------------------------------------------------------------- 20090105 S4 8952.89 .081 none 0 (bear market) (Sell before bear market started...) (Not Summer S4) ------------------------------------------------------------------ 20090603 S4 8675.24 .041 8763.13 -.0101 6/5 (bull market) (Not Summer S4) ------------------------------------------------------------------ 20120921 S4 13579.47 .056 13610.1 -.0022 10/5 (bull market) -------------------------------------------------------------------- 20170428 S4 20940.51 -.013 21206.2 -.0126 6/2 (bull market) (Not Summer S4) |
====================================================================
7/8/2019 The operative automatic Peerless sells have been capped off with
a
very bearish Sell
S4.

What Is To Be Done?
Because of how often this signal leads to a DJI
decline of more than
9% and often a bear market, we should do some selling in stocks that
drop below the support of their 65-dma, especially if their Accumulation
Index is negative. So, we have to sell YINN, even though a deal between
Trump and China would seem to be politically wise.
Second, I have suggested shorting DIA or SPY. This is simple and
relatively safe, especially if one is ready to cover the shorts if the
DJI breaks out with any conviction over 27000. When you graph
DIA, SPY or anything else, you have the ability using TigerSoft
to superimpose the Peerless signals on the graph and then under
"Operations", see what the trading results would be selling short
at the next day's opening following a recersin Peerless signal. Below
are the displays for DIA and SPY currently. The gains are modest
and the losses are small.
Gains for DIA shorting Peerless Reversing Sells

Another approach that usually works well is to go short FAS
(which represents 3x leveraged bank stocks). Over the years,
its moves correlate closely with the DJIA. This sharply increases
the potential gain, but raises the risk of a paper loss of 10%.
The ratio of gain to paper loss is still 4:1. That would seem
to make this option attractive.

Shorting SOXL (semi-conductors) because that is the weakest
ETF in Table 1 also might be undertaken now. But notice how
high the biggest paper loss is.

The best way to reduce the paper loss and
still go short a high-potential
stock is to make a listing of the results from all the Peerless trades for each stock
in your chosen directory. This done from Operations and fourth item down
from main Tiger screen (Tiger menacing bull and bear). As a result of
looking at the Russell-1000 list, I came up with these ideas: BBBY and
RRC


|
Charts 7/8/2019 2019 PEERLESS DJI, Signals, Indicators Daily DJI Volume 10-DayUp/Down Vol Hourly DJIA A/D Line for All Stocks Inverted Traders Index NASDAQ S&P OEX NYSE COMPQX DJI-15 DJI-20 DJI-30 DIA SPY QQQ MDY IWM TNA Short-Term Rates USO-CrudeOil DBO FAS GLD BBH IBB JETS JNUG KOL NUGT OIH OIL RSX RETL SDS AGQ SLV SOXL TECL TLT TMF TNA UGA (gasoline) XIV and China: YINN CHAU Commodities: CANE CORN DBC JJC, NIB, CHOC CORN, CUT (paper) MOO, SOYB WEAT UUP (Dollar) LIT (Lithium) AAPL ADBE ALXN AMAT AMGN AMD AMZN BA BABA BAC BIDU CAT CVX DE FB GOOG GS HD IBM INTU JPM M (Macy's) MSFT NFLX NVDA PG QCOM TSLA TXN XOM WMT CMG , LRCX, SWKS, MDGL SPPI WATT SQ TOWN 7/8/19 (Click on Underlined link.) Bullish MAXCPs - http://tigersoft.com/MAXCPS/Jul-08/BULLISH.htm Bearish MAXCPs - http://tigersoft.com/MINCPs/Jul-08/BEARISH.htm |
Table 1 QUICKSILVER on ETFS - 7/8/2019 Explanation: Pivot-point is price past which the ETF's 5-dma will change direction. 5-dmaAROC is the annualized rate of change of the ETF's 5-day moving average. Closing Power is bullish when it is above its rising 21-dma and it is bearish when it is below its 5-dma. Closing Power is the cumulative change from opening to close each day. Since it does not factor in changes at the opening, it tends to reflect NYSE professionals who trade the market when the NYSE is open. "Candle" color is blue when last close was above the opening, thus showing Professional net buying, which tends to be bullish. It is red when the close is below the opening, which tends to be bearish. IP21 is the current value of the Tiger Accumulation Index. Above +.15 tends to be bullish and below -.15 tends to be bearish until reversed. ITRS is the percent rise of the ETF over 50-days less the percent rise of the DIA (DJIA) over 50 trading days. The strongest ITRS ETFs tend to keep rising and the lowest ITRS ETFs tend to keep falling. Add ITRS and IP21 to get a composite measure of intermediate-term strength. ETF CLOSE CHANGE PIVOT-PT 5-dmaAROC CL-PWR CANDLE IP21 ITRS ------------------------------------------------------------------------------------------ DIA 268.06 -1.21 266.97 41.3% Bearish BLUE -.022 ---- --------------------------------------------------------------------------------------------- BA 351.12 -4.74 356.46 -180.5% Bearish BLUE -.054 -.096 --------------------------------------------------------------------------------------------- SPY 296.82 -1.64 295.66 64.4% Bearish RED -.015 .003 --------------------------------------------------------------------------------------------- QQQ 189.71 -1.34 189.26 78.3% Bearish RED .002 -.017 --------------------------------------------------------------------------------------------- MDY 354.5 -3.39 355.28 -1.3% Bearish RED 0 -.018 --------------------------------------------------------------------------------------------- IWM 155.19 -1.49 156.1 -9.9% Bearish RED -.045 -.023 --------------------------------------------------------------------------------------------- FAS 78.1 -.85 75.89 268.3% Bearish ---- -.056 .097 --------------------------------------------------------------------------------------------- SOXL 145.17 -3.6 160.29 -102.3% Bearish BLUE -.106 -.248 (weakest) --------------------------------------------------------------------------------------------- TECL 165.66 -4.1 165.75 212.9% Bearish ---- .019 -.019 --------------------------------------------------------------------------------------------- IBB 107.74 -1.48 109.73 -62% Bullish RED .019 -.004 --------------------------------------------------------------------------------------------- GLD 131.29 -.85 130.62 -72% Bullish RED .204 .076 (strongest) --------------------------------------------------------------------------------------------- OIH 14.64 .02 14.92 -61.4% Bearish BLUE -.005 -.171 --------------------------------------------------------------------------------------------- RSX 24 .15 23.88 77.7% Bullish BLUE .025 .103 |
Table 2    Count of Stocks in Key Directories
           20190708
-------------------------------
NEWHIGHS       114  Bullish ratio to new lows.
NEWLOWS        14
MAXCP          19   But Professionals are chasing very few new highs.
MINCP          19
TTTNH          11
TTTNL          41   Day Traders are bearish.
FASTUP         47
FASTDOWN       61   Swing-traders are new bearish.
CPCROSSA       42
CPCROSSD       159
BIGVOLUP       3
BIGVODN        11
ACCUMVER       11
HIGHIP21       12
HIUPPCT        14
LOWACCUM       146
REDSELL        84
AUGSELS7       23
TRAPDOOR       11
|
 Table 3 RANKING OF KEY DIRECTORIES BASED PCT.OF STOCKS ABOVE 65-DMA
              7/8/19
 Bullish = 36
 Bearosh = 7
---------------------------------------------------------------------------------------
Directory     Current       day-1         day-2         day-3         day-4         day-5
----------------------------------------------------------------------------------------
BONDFUND       .961          .97           .98           .99           .951          .961
INSURANC       .888          .888          .888          .851          .814          .814
BIGBANKS       .857          .857          .857          .857          .857          .857
DOWJONES       .827          .827          .862          .827          .758          .724
UTILITY        .825          .775          .825          .75           .7            .7
GOLD           .823          .843          .882          .882          .823          .882
JETS           .8            .8            .8            .8            .8            .8
SOLAR          .777          .777          .777          .777          .777          .777
DJI-13         .769          .769          .846          .769          .769          .769
MILITARY       .75           .75           .714          .714          .714          .714
FIDSTKS        .733          .75           .766          .722          .739          .711
NASD-100       .729          .77           .791          .75           .75           .687
COMPUTER       .714          .761          .761          .714          .714          .619
SP500          .704          .733          .756          .706          .713          .682
SP-100         .692          .703          .725          .714          .692          .67
INDEXES        .673          .722          .744          .701          .728          .766
HOMEBLDG       .647          .647          .705          .588          .47           .588
RUS-1000       .631          .66           .664          .615          .611          .591
ETFS           .614          .807          .877          .859          .824          .649
NIFTY          .614          .649          .666          .666          .701          .596
FINANCE        .613          .75           .659          .602          .738          .647
TRANSP         .6            .7            .75           .6            .7            .7
FOOD           .592          .611          .666          .629          .629          .666
GREEN          .59           .59           .545          .545          .545          .545
AUTO           .589          .666          .692          .666          .666          .692
BEVERAGE       .588          .647          .647          .588          .529          .47
COMODITY       .585          .609          .658          .634          .609          .658
INFRA          .583          .666          .638          .611          .666          .694
SOFTWARE       .58           .645          .661          .629          .58           .548
REGBANKS       .571          .821          .678          .464          .678          .607
REIT           .567          .547          .547          .445          .351          .371
GUNS           .562          .562          .625          .562          .562          .562
INDMATER       .55           .575          .575          .562          .612          .562
CHEM           .528          .584          .603          .584          .603          .566
GAMING         .521          .478          .565          .478          .521          .391
HOSPITAL       .521          .565          .565          .565          .565          .521
Bullish = 36
=============================================================================================
EDU            .5            .5            .5            .5            .5            .5
HACKERS        .5            .6            .6            .6            .5            .45
=============================================================================================
RETAIL         .49           .452          .433          .377          .358          .358
SEMI           .486          .531          .567          .585          .648          .504
ELECTRON       .442          .5            .532          .532          .602          .5
BIOTECH        .424          .457          .468          .457          .473          .476
OILGAS         .243          .256          .256          .243          .284          .284
CHINA          .122          .245          .333          .315          .28           .157
COAL           0             0             0             0             .142          .142
Bearish = 7
|
=====================================================================
7/5/2019
The operative
automatic Peerless sells have not been reversed. In fact,
Peerless gave a new Sell S4 on July 3rd, which we did not notice until
Friday when we updated using the data from Barrons, which was slightly
different than the Wall Street Journals for the third.
(Here are the two links I am now using:
http://www.wsj.com/mdc/public/page/2_3021-tradingdiary2.html
https://www.barrons.com/market-data/market-lab?mod=md_subnav
)

The past Sell S4s are very good at calling major tops. They occur because
the Accumulation Index drops below its 21-day ma. Add to your shorts
of DIA.
We are seeing a bigger flurry or burst of Peerless Sells than in any
Summer since 1929. Bearish Big money and Bullish Professionals are
fighting for control of the market. Meanwhile, interest rates are much
higher here than in Britain or Europe. That boosts the Dollar and causes
overseas money to keep boosting US bonds and blue chips. Trump keeps
complaining about the FED. Is that because he is afraid the market is
running out of steam? It's true the current bull market is old; there
has not been a 20% or more decline since March 2009. But the 1947-1961
bull market endured much longer and the 1990-2000 bull market was almost
as long-lived as ours now.
The biggest paper loss is a little over 2% on the earliest Sell in the current
cluster of Sells. In June 1929 and June 1987 the bigger paper losses reached
4.7% and 4.0% before a reversing Buy came in. We are in a bullish seasonal
period. That helps make the case for waiting for the NYSE A/D Line
uptrend to be broken before expecting a 10% decline from the DJI's peak.
I've done back over clusters of Peerless Sells that did not quickly bring
a decline. Waiting for the NYSE A/D Line to break its downtrend was
consistently a winning way to trade the short side in these cases. Since
there is still a good chance that the DJI will breakout over 27000 and
that will send most stocks higher, I would not yet go 100% on the short side
with the positive general market ETFs. If you
study past charts, you will
see that there are more flat-top breakouts into all-time high territory than
reversals back down. See the weekly charts of DJI to get a sense of the
importance of flat-top breakouts when they do occur.
http://www.tigersoft.com/weekdji/charts.htm
At the same time, the repeated failure to breakout above the well-tested
resistance at 27000 would become quite bearish. We are at what is called
a "high inflection point".
Conclusion: Short more DIA but hold long MSFT, GLD, NUGT, YINN.
Sell S4s - IP21 drops below its 21-dma after rally.
| Date
DJI Short Sale Max.
Paper Loss Gain 19290814 S4 354.9 .409 381.1 -.0738 9/3 (bull market - 1929 Crash about to occur) 19310707 S4 145.9 .027 none 0 (bear market) (Sell before bear market started...) 19370803 S4 185.9 .365 189.3 -.0182 (bull market - 1937 Crash about to occur) 19380119 S4 130.1 .053 none 0 (bear market) 19401003 S4 135.1 .025 137.8 -.0199 11/17 (bull market - very timely because WWII about to start in earnest,) 19410711 S4 127.9 .135 130.1 -.0172 7/28 (bull market - very timely because Pearl Harbor scenario coming on.) 19460611 S4 209.1 .22 210.6 -.0071 6/13 (bull market) 19470711 S4 184.8 .105 186.9 -.0113 7/24 (bull market) 19471022 S4 184.4 . 103 none 0 (bull market) 19510917 S4 275.1 .053 275.9 -.0029 10/3 (bull market) 19550922 S4 486.0 .092 487.5 -.003 9/23 (bull market) 19570711 S4 518 .178 520.8 -.0054 7/12 (bull market) (Sell before near-bear market started...) 19610518 S4 701.1 .014 none 0 (bull market) 19660110 S4 985.41 .213 994.2 -.0089 1/18 (bull market) (Sell before bear market started...) 19730109 S4 1047.11 .104 1051.70 -.0043 1/11 (bull market) (Sell before bear market started...) 19761222 S4 984.54 .051 1004.65 -.0204 12/31 (bull market) (Sell before bear market started...) 19800116 S4 865.19 .101 903.84 -.0446 2/13 (bull market) 19810326 S4 1005.76 .032 1024.05 -.0181 4/27 (bull market) (Sell before bear market started...) 19831122 S4 1275.81 .031 1287.30 -.009 11/29 (bull market) 19850208 S4 1289.97 .033 1299.36 -.0072 3/1 (bull market) 19870826 S4 2701.85 .052 none 0 (bull market) (Sell before bear market started...) 19890209 S4 2323.04 .031 2324.82 -.0007 2/17 (bull market) 19940203 S4 3967.66 .074 none 0 (bull market) 19970207 S4 6855.8 .036 7085.16 -.0334 3/11 (bull market) 20000111 S4 11511.08 .13 11722.9 -.0184 1/14 (bull market) (Sell before bear market started...) 20000906 S4 11310.64 .095 none 0 (bull market) (Sell before bear market started...) 20010517 S4 11248.58 .268 11301.7 -.0047 5/18 (bull market) (Sell before bear market started...) 20031015 S4 9803.05 .018 9858.46 -.0056 11/3 (bull market) 20050308 S4 10912.47 .064 none 0 (bull market) 20071005 S4 14066.01 .079 14164.5 -.007 10/9 (bull market) (Sell before bear market started...) 20080421 S4 12825.02 .112 13040.0 -.0167 5/1 (bear market) (Sell before bear market started...) 20090105 S4 8952.89 .081 none 0 (bear market) (Sell before bear market started...) 20090603 S4 8675.24 .041 8763.13 -.0101 6/5 (bull market) 20120921 S4 13579.47 .056 13610.1 -.0022 10/5 (bull market) 20170428 S4 20940.51 -.013 21206.2 -.0126 6/2 (bull market) ============================================== |
|
Charts 7/5/2019 2019 PEERLESS DJI, Signals, Indicators Daily DJI Volume 10-DayUp/Down Vol Hourly DJIA A/D Line for All Stocks Inverted Traders Index NASDAQ S&P OEX NYSE COMPQX DJI-15 DJI-20 DJI-30 DIA SPY QQQ MDY IWM TNA Short-Term Rates USO-CrudeOil DBO FAS GLD BBH IBB JETS JNUG KOL NUGT OIH OIL RSX RETL SDS AGQ SLV SOXL TECL TLT TMF TNA UGA (gasoline) XIV and China: YINN CHAU Commodities: CANE CORN DBC JJC, NIB, CHOC CORN, CUT (paper) MOO, SOYB WEAT UUP (Dollar) LIT (Lithium) AAPL ADBE ALXN AMAT AMGN AMD AMZN BA BABA BAC BIDU CAT CVX DE FB GOOG GS HD IBM INTU JPM M (Macy's) MSFT NFLX NVDA PG QCOM TSLA TXN XOM WMT CMG , LRCX, SWKS, MDGL SPPI WATT SQ TOWN 7/5/19 (Click on Underlined link.) Bullish MAXCPs - http://tigersoft.com/MAXCPS/Jul-05/BULLISH.htm Bearish MAXCPs - http://tigersoft.com/MINCPs/Jul-05/BEARISH.htm |
Table 1 QUICKSILVER on ETFS - 7/5/2019 Explanation: Pivot-point is price past which the ETF's 5-dma will change direction. 5-dmaAROC is the annualized rate of change of the ETF's 5-day moving average. Closing Power is bullish when it is above its rising 21-dma and it is bearish when it is below its 5-dma. Closing Power is the cumulative change from opening to close each day. Since it does not factor in changes at the opening, it tends to reflect NYSE professionals who trade the market when the NYSE is open. "Candle" color is blue when last close was above the opening, thus showing Professional net buying, which tends to be bullish. It is red when the close is below the opening, which tends to be bearish. IP21 is the current value of the Tiger Accumulation Index. Above +.15 tends to be bullish and below -.15 tends to be bearish until reversed. ITRS is the percent rise of the ETF over 50-days less the percent rise of the DIA (DJIA) over 50 trading days. The strongest ITRS ETFs tend to keep rising and the lowest ITRS ETFs tend to keep falling. Add ITRS and IP21 to get a composite measure of intermediate-term strength. ETF CLOSE CHANGE PIVOT-PT 5-dmaAROC CL-PWR CANDLE IP21 ITRS ------------------------------------------------------------------------------------------ DIA 269.27 -.29 265.85 77.1% ------- BLUE -.003 ----- --------------------------------------------------------------------------------------------- BA 355.86 1.39 364.01 -113.8% Bearish BLUE -.033 -.065 --------------------------------------------------------------------------------------------- SPY 298.46 -.34 293 117.9% ------- BLUE .023 .009 --------------------------------------------------------------------------------------------- QQQ 191.05 -.39 186.74 120.5% Bullish BLUE .013 -.006 --------------------------------------------------------------------------------------------- MDY 357.89 .32 354.59 112.5% Bearish BLUE .053 -.019 --------------------------------------------------------------------------------------------- IWM 156.68 .42 155.5 98.2% Bearish BLUE -.01 -.021 --------------------------------------------------------------------------------------------- FAS 78.95 .39 73.98 491.4% Bearish ---- -.03 .115 --------------------------------------------------------------------------------------------- SOXL 148.77 -2.41 148.29 35.8% Bearish BLUE -.081 -.271 (weak) (3x) --------------------------------------------------------------------------------------------- TECL 169.76 -.6 158.58 357.1% ------- BLUE .029 .004 (3x) --------------------------------------------------------------------------------------------- IBB 109.22 -1.71 109.1 88.7% Bullish RED -.009 .021 --------------------------------------------------------------------------------------------- GLD 132.14 -1.49 133.2 -26.4% Bullish BLUE .22 .084 (strong) --------------------------------------------------------------------------------------------- OIH 14.62 .14 14.82 34.2% Bearish BLUE .01 -.192 --------------------------------------------------------------------------------------------- RSX 23.85 -.11 23.63 4.2% Bearish RED .034 .091 |
Table 2 Count of Stocks in Key Directories
20190705
-------------------------------
NEWHIGHS 203 Bullish multiple of new lows
NEWLOWS 4
MAXCP 25 Bullish multiple of MINCPs
MINCP 6
TTTNH 9
TTTNL 19 Day Traders are net bearish.
FASTUP 34
FASTDOWN 35
CPCROSSA 131 Professionals were new buyers on Friday.
CPCROSSD 33
BIGVOLUP 3 Aggressive buying is low.
BIGVODN 7 Dumping is low.
HIGHIP21 8
HIUPPCT 17
VHIP21 116
LOWACCUM 121
REDSELL 83
AUGSELS7 18
TRAPDOOR 10
|
Table 3 RANKING OF KEY DIRECTORIES BASED PCT.OF STOCKS ABOVE 65-DMA
7/5/19
Bullish = 37
Bearish = 6
---------------------------------------------------------------------------------------
Directory Current day-1 day-2 day-3 day-4 day-5
----------------------------------------------------------------------------------------
BONDFUND .97 .98 .99 .951 .961 .97
(Most bullish)
INSURANC .888 .888 .851 .814 .814 .74
BIGBANKS .857 .857 .857 .857 .857 .428
GOLD .843 .882 .882 .823 .862 .862
DOWJONES .827 .862 .827 .758 .724 .724
REGBANKS .821 .678 .464 .678 .607 .392
ETFS .807 .877 .859 .824 .649 .578
JETS .8 .8 .8 .8 .8 .6
8 groups are rated most bullish
---------------------------------------------------------------------------------------------
SOLAR .777 .777 .777 .777 .777 .777
UTILITY .775 .825 .75 .7 .675 .675
NASD-100 .77 .791 .75 .75 .687 .593
DJI-13 .769 .846 .769 .769 .769 .769
COMPUTER .761 .761 .714 .714 .619 .619
FIDSTKS .75 .766 .722 .739 .717 .63
FINANCE .75 .659 .602 .738 .659 .556
MILITARY .75 .714 .714 .714 .714 .714
SP500 .733 .756 .706 .713 .68 .606
INDEXES .725 .747 .698 .731 .758 .677
SP-100 .703 .725 .714 .692 .67 .626
TRANSP .7 .75 .6 .7 .7 .35
AUTO .666 .692 .666 .666 .692 .615
INFRA .666 .638 .611 .666 .694 .611
RUS-1000 .66 .664 .614 .612 .592 .517
NIFTY .649 .666 .666 .701 .578 .561
BEVERAGE .647 .647 .588 .529 .529 .411
HOMEBLDG .647 .705 .588 .47 .588 .411
SOFTWARE .645 .661 .629 .58 .548 .435
FOOD .611 .666 .629 .629 .666 .685
COMODITY .609 .658 .634 .609 .658 .682
HACKERS .6 .6 .6 .5 .45 .35
GREEN .59 .545 .545 .545 .545 .545
CHEM .584 .603 .584 .603 .584 .49
INDMATER .575 .575 .562 .612 .562 .512
HOSPITAL .565 .565 .565 .565 .521 .521
GUNS .562 .625 .562 .562 .562 .5
REIT .547 .547 .445 .351 .371 .29
SEMI .531 .567 .585 .648 .504 .477
==============================================================================================
EDU .5 .5 .5 .5 .5 .5
ELECTRON .5 .532 .532 .602 .5 .435
==============================================================================================
GAMING .478 .565 .478 .521 .391 .478
BIOTECH .454 .468 .457 .473 .471 .41
RETAIL .452 .433 .377 .358 .358 .339
OILGAS .258 .258 .244 .286 .286 .237
CHINA .245 .333 .315 .28 .157 .157
COAL 0 0 0 .142 .142 0
N=6
|
====================================================================
7/3/2019
Consider a
close above 27000 to be a new Buy B10 ...
(flat topped breakout into all-time high territory) unless June Jobs'
Report is very weak or negative, which would be dangerous, as in
June-July 2007.
Note the new study below shows how the next 10 days is usually quite
bullish
even when a Peerless signals occurs. I argue that this seasonality in the past has
outweighed even a new high with a negative IP21, a negative V-I reading or a
negative P-I. So, right now, the odds favor still higher prices. Cover the
token DIA short and go long SPY (which has a positive ITRS) if the
DJI closes above 27000.
Tonight I make the case for considering the DJI's new all-time high
on July 3rd and the 100-day new high on July 2nd to be breakout
Buy B10s. This would allow us to play the strength shown by the
DJI and SP-500 and the NYSE A/D Line in this bullish time of the
year, but it would mean applying the Buy B10 when the IP21 (current
Accumulation) remains stubbornly negative. The past B10s (shown
at http://www.tigersoft.com/PeerInst-2012-2013/-Buy-B10.htm
)
have never had a B10 with a negative IP21. To be more certain, I think
we have to wait for a close above 27000, the psychologically significant
resistance point.
Tomorrow we see the June Job's numbers. May's figure dropped sharply
from a year ago and April's this year. A strong June recovery would be
bullish, but a slippage by June's numbers into negative territory would be
reminiscent of June 2007 just before a significant market decline. See the
most recent numbers below. The number for May 2019 was only +75,000.
This was 195,000 below May 2018.
Monthly Jobs' Figures from Dept. of
Labor in 1000's
(June's update wil be released
tomorrow before the opening.)
|
|||||||||||||||||||||||||||||||||||||||||||||||||||||||||||||||||||||||||||||||||||||||||||||||||||||||||||||||||||||||||||||||||||||||||||||||||||||||||||||||||||||||||||
Tonight I make the case for a new Buy B10 that disregards a slightly
negative IP21 (current Accumulation). Such a Buy B10 occurs
when the
DJI makes a closing new high, the P-I and the V-I are positive and the IP21 is
above
-.01 in the bullish period June 26th to July 10th in bull markets. To
be a little more confident, I think we should add the requirement that the
DJI close above the round number 27,000.
The DJI made a marginal all-time closing high on July 3rd. It is close to
decisively breaking above a flat resistance area into all-time high ground.
This is potentially very bullish. Being short DIA is not recommended. But
is it safe to buy DIA or SPY which made an all-time high two days in a row?
The answer is "NO" if you judge the situation by weighting more heavily
the still negative IP21.
The answer is "YES" if you go by the rising A/D Line, the very positive
P-Indicator and the rising and positive V-Indicator. It is also "YES" if
you
weight
seasonality heavily in your decision. After July 4th, the DJI has risen
75% of the time over the next 10, 21 and 42 trading days and gained +1.6%,
+2.1% and +4.2% over the same periods, respectively.
Even more significant is how bullish the period from June 26th to July
15th is
even when Peerless has given a Sell signal. Below are the cases of early July
Sells. Look at the size of the paper losses and see how often it was better
to wait to sell until July 15th or later. There were only only 13 Peerless Sells
from July 1 to July 14 in bull markets in the 90 years since 1929. Four closely
called a top, but in 9 instances it would have been better to wait until at least
July 15th to sell.
Given the matching new all-time highs by the
DJI and the SP-500,
the positive P-I, V-I, rising A/D line and the bullish seasonality until
the 15th of July, at least, I suggest buying SPY and closing out the
token short in DIA if 27000 if closed above. I would then consider
the operative Peerless signal to be a Buy B10, a breakout into new
all-tiime high territory. I would close out shorts if their Closing Power
downtrends are broken and consider buying some of the bullish MAXCPs.
Bull Market July Sells
Date Peerless Signal
Result
------------------------------------------------------------------------------
19330705 S12
DJI rose from 102.7 to 108.7 on 7/18..
A S12 on 7/19 was more timely.
-------------------------------------------------------------------------------
19470711 S4
DJI rose from 184.8 to 186.9 on 7/24.
-------------------------------------------------------------------------------
19570708 S9
DJI rose from 518.4 to 520.8 on 7/12
-------------------------------------------------------------------------------
19570708 S9
DJI rose from 518.4 to 520.8 on 7/12
--------------------------------------------------------------------------------
19590701 S9
DJI rose from 650.2 to 678.1 on 8/3,
where a more timely S9 occurred.
--------------------------------------------------------------------------------
19680711 S7
This was peak.
--------------------------------------------------------------------------------
19820712 S12
This was peak.
--------------------------------------------------------------------------------
19900712 S9
More timely S9 on 7/19 at
about same price.
--------------------------------------------------------------------------------
19980701 S12
DJI rose from 9048.67 to 9337.97 on 7/17
There was a more timely S12 on 7/8
--------------------------------------------------------------------------------
19990706 S9
DJI rose from 11135.12 to 11193.69 on 7/9,
where a more timely S9 occurred.
--------------------------------------------------------------------------------
20070713 S9
DJI rose from 13907.25 to 14000.41 on 7/19,
where a more timely S9 occurred.
--------------------------------------------------------------------------------
20110705 S9
DJI rose from 12569.87 to 12724.41 on 7/21,
where a more timely S9V occurred.
--------------------------------------------------------------------------------
20130711 S9
DJI rose from 15460.92 to 15484.26 on 7/15,
where a more timely S5 occurred.
--------------------------------------------------------------------------------
 |
 |
|
Charts 7/3/2019 2019 PEERLESS DJI, Signals, Indicators Daily DJI Volume 10-DayUp/Down Vol A/D Line for All Stocks Inverted Traders Index NASDAQ S&P OEX NYSE COMPQX DJI-15 DJI-20 DJI-30 DIA SPY QQQ MDY IWM TNA Short-Term Rates USO-CrudeOil DBO FAS GLD BBH IBB JETS JNUG KOL NUGT OIH OIL RSX RETL SDS AGQ SLV SOXL TECL TLT TMF TNA UGA (gasoline) XIV and China: YINN CHAU Commodities: CANE CORN DBC JJC, NIB, CHOC CORN, CUT (paper) MOO, SOYB WEAT UUP (Dollar) LIT (Lithium) AAPL ADBE ALXN AMAT AMGN AMD AMZN BA BABA BAC BIDU CAT CVX DE FB GOOG GS HD IBM INTU JPM M (Macy's) MSFT NFLX NVDA PG QCOM TSLA TXN XOM WMT CMG , LRCX, SWKS, MDGL SPPI WATT SQ TOWN 7/3/19 (Click on Underlined link.) Bullish MAXCPs - http://tigersoft.com/MAXCPS/Jul-03/BULLISH.htm Bearish MAXCPs - http://tigersoft.com/MINCPs/Jul-03/BEARISH.htm |
Table 1 QUICKSILVER on ETFS - 7/3/2019 ETF CLOSE CHANGE PIVOT-PT 5-dmaAROC CL-PWR CANDLE IP21 ITRS
------------------------------------------------------------------------------------------
DIA 269.56 1.9 265.15 81.5% ------- BLUE .01 ---
---------------------------------------------------------------------------------------------
BA 354.47 .31 364.02 -282.2% Bearish --- -.056 -.064
---------------------------------------------------------------------------------------------
SPY 298.8 2.37 291.5 142% Bearish BLUE .039 .009
---------------------------------------------------------------------------------------------
QQQ 191.44 1.43 186.5 150.5% ------- BLUE .025 -.006
---------------------------------------------------------------------------------------------
MDY 357.57 3.21 349.92 172.8% Bearish BLUE .046 -.015
---------------------------------------------------------------------------------------------
IWM 156.26 1.11 153.63 177% Bearish BLUE -.026 -.02
---------------------------------------------------------------------------------------------
FAS 78.56 2.06 71.55 591.4% ------- BLUE 0 .111
^^^^
---------------------------------------------------------------------------------------------
SOXL 151.18 -2.39 147.68 324.1% Bearish RED -.115 -.236
---------------------------------------------------------------------------------------------
TECL 170.36 3.36 158.05 417.7% Bearish BLUE .039 .009
---------------------------------------------------------------------------------------------
IBB 110.93 1.28 107.28 235.9% Bullish BLUE .083 .027
---------------------------------------------------------------------------------------------
GLD 133.63 .22 132.84 24.9% Bullish ---- .162 .101
^^^^^
---------------------------------------------------------------------------------------------
OIH 14.48 .04 14.52 -37.5% Bearish ---- -.031 -.231
---------------------------------------------------------------------------------------------
RSX 23.96 .18 23.83 27.3% Bearish BLUE .031 .079
^^^^^
|
Table 2 Count of Stocks in Key Directories
20190703
-------------------------------
NEWHIGHS 440 Bulliah
NEWLOWS 16
MAXCP 22
MINCP 26 Bearish
TTTNH 15
TTTNL 31
FASTUP 49
FASTDOWN 59
CPCROSSA 138
CPCROSSD 30
BIGVOLUP 3
BIGVODN 5
ACCUMVER 10
HIGHIP21 6
HIUPPCT 17
LOWACCUM 109
REDSELL 81
AUGSELS7 20
TRAPDOOR 10
|
Table 3 RANKING OF KEY DIRECTORIES BASED PCT.OF STOCKS ABOVE 65-DMA
7/3/19
Bullish = 39
Bearish = 5
---------------------------------------------------------------------------------------
Directory Current day-1 day-2 day-3 day-4 day-5
----------------------------------------------------------------------------------------
BONDFUND .98 .99 .951 .961 .97 .932
INSURANC .888 .851 .814 .814 .777 .74
GOLD .882 .882 .823 .862 .862 .882
ETFS .877 .859 .824 .649 .578 .526
DOWJONES .862 .827 .758 .724 .724 .689
BIGBANKS .857 .857 .857 .857 .428 .285
DJI-13 .846 .769 .769 .769 .769 .769
UTILITY .825 .75 .7 .675 .675 .7
JETS .8 .8 .8 .8 .6 .5
NASD-100 .791 .75 .75 .687 .593 .572
SOLAR .777 .777 .777 .777 .777 .777
FIDSTKS .766 .722 .739 .717 .63 .619
COMPUTER .761 .714 .714 .619 .619 .619
SP500 .756 .706 .713 .68 .608 .579
TRANSP .75 .6 .7 .7 .35 .25
INDEXES .741 .698 .731 .758 .688 .612
SP-100 .725 .714 .692 .67 .626 .637
MILITARY .714 .714 .714 .714 .714 .642
HOMEBLDG .705 .588 .47 .588 .411 .294
AUTO .692 .666 .666 .692 .615 .538
REGBANKS .678 .464 .678 .607 .392 .25
SOFTWARE .672 .639 .59 .557 .442 .409
FOOD .666 .629 .629 .666 .685 .629
NIFTY .666 .666 .701 .578 .561 .543
RUS-1000 .664 .614 .611 .594 .521 .486
FINANCE .659 .602 .738 .659 .568 .477
COMODITY .658 .634 .609 .658 .682 .634
BEVERAGE .647 .588 .529 .529 .411 .47
INFRA .638 .611 .666 .694 .611 .583
GUNS .625 .562 .562 .562 .5 .437
CHEM .615 .596 .615 .596 .519 .423
HACKERS .6 .6 .5 .45 .35 .3
INDMATER .575 .562 .612 .562 .512 .475
SEMI .567 .585 .648 .504 .477 .432
GAMING .565 .478 .521 .391 .478 .434
HOSPITAL .565 .565 .565 .521 .521 .478
REIT .547 .445 .351 .371 .29 .25
GREEN .545 .545 .545 .545 .545 .545
ELECTRON .529 .529 .6 .496 .438 .406
============================================================================================
EDU .5 .5 .5 .5 .5 .333
===========================================================================================
BIOTECH .465 .457 .473 .471 .402 .345
RETAIL .433 .377 .358 .358 .339 .283
CHINA .333 .315 .28 .157 .157 .105
OILGAS .258 .244 .286 .286 .237 .258
COAL 0 0 .142 .142 0 0
|
========================================================================
7/2/2019 The operative Peerless Sells have not been reversed.
But I have suggested
only small or token DIA short sale positions. Better, I said was to pick some
bearish MINCPs to short and then to be long GLD, NUGT, some other golds,
YINN (representing China) and MSFT (the strongest tech stock in the DJI.


The main reason we have taken only a token short
position in DIA is because
June S9s/S12s can bring losses on the first Sell S9 or S12 of more than 4%.
See the table of June S9s/S12s below. The June 1929 and June 1987 cases stand
out. They brought losses of more than 4% and then were followed by sizeable rises
in the market which could have been captured if the subsequent Buy B4 was used.
We must watch the DJI closely now for signs of an impending breakout above
the flat resistance at 27000 which would likely bring quick rises in the P-Indicator
or IP21 that could bring a Buy B4 or Buy B10. Note in the second table below
that July S9/S12s are quite reliable. None have brought losses when waiting for
a Peerless Buy signal to cover the short sales on the DJIA. But it looks like that
all three of our key indicators, P-I, IP21 and V-I may be positive. Wait and see
about that.
Meanwhile big money and Professionals are busy taking profits as the old
highs are being reached. We see this in the still negative IP21, the lagging
closing Powers and the red candle-stick charts, whose red color results from
closes below an opening.
Besides the two big losses (1929 and 1987) in June with S9s/S12s, there are several
other considerations that justify our waiting to go short DIA on the the current
Sells. We should delay, I think, because:
:
2) of how the DJI is drawn to the roof of its flat resistance
even when there are Peerless Sells lows and often will breakout above
flat resistance. (See the weekly charts of this a few nights ago).
3) of how very low interest rates make dividend stocks extra attractive.
And it is these defensive and dividend stocks that are letting the NYSE A/D Line
keep rising. Of course, if these dividend and blue chips stocks should fail to
maintain their upward momentum, which I discussed last night, then the market
would be without its leaders and would likely then fall back.
|
Past June S9-S9Vs/S12s Date Signal DJI Result when reversed. Gain Biggest Paper Loss 19290614 S9 313.7 -.047 328.6 -.0474 6/26 19290617 S12 319.3 -.029 328.6 -.0291 6/26 19290626 B4 328.6 .075 none 0 -------------------------------------------------------------------------------- 19340620 S9 98.3 .073 none 0 19340817 B20 91.1 .016 90.4 -.0076 8/20 -------------------------------------------------------------------------------- 19700617 S9 704.68 .05 716.11 -.0162 6/22 19700707 B2 669.36 .063 perfect 0 (Bear Market) -------------------------------------------------------------------------------- 19740607 S9 853.72 .271 859.67 -.0069 6/10 19740607 S12 853.72 .271 859.67 -.0069 6/10 19740611 S9 852.08 .270 none 0 19740807 S12 797.56 .220 none 0 19740823 S13 686.8 .094 none 0 19740927 B8 621.95 .053 584.56 -.0601 10/4 (Bear Market) -------------------------------------------------------------------------------- 19770621 S9 928.60 .131 929.70 -.0011 6/24 19771206 B9 806.91 -.017 793.49 -.0166 1/7 (Bear Market) -------------------------------------------------------------------------------- 19810615 S12 1011.99 .172 perfect 0 19811009 S9 873.00 .04 none 0 19811023 B9 873.99 .04 830.96 -.0492 10/26 -------------------------------------------------------------------------------- 19870608 S12 2351.64 -.04 2445.51 -.0399 6/22 19870609 S9 2352.7 -.039 2445.51 -.0394 6/22 19870610 S8 2353.61 -.039 2445.51 -.039 6/22 19870618 S8 2408.13 -.016 2445.51 -.0155 6/22 19870622 B4 2445.51 .105 2409.76 -.0146 7/1 -------------------------------------------------------------------------------- 19980701 S12 9048.67 .157 9337.97 -.0319 7/17 19980701 S9 9048.67 .157 9337.97 -.0319 7/17 19980708 S9 9174.97 .168 9337.97 -.0177 7/17 19980708 S12 9174.97 .168 9337.97 -.0177 7/17 19980904 S10 8487.31 .101 19980923 S9 8154.41 .064 none 0 19981001 B9 7632.53 .437 perfect 0 -------------------------------------------------------------------------------- 19990630 S9 10970.80 .029 11209.8 -.0217 7/16 19990706 S5 11135.12 .043 11209.8 -.0067 7/16 19990709 S9 11193.69 .105 11209.8 -.0014 7/16 19990730 B2 10655.14 .043 10645.9 -.0008 8/2 -------------------------------------------------------------------------------- 20040607 S9 10391.81 .058 10479.5 -.0084 6/23 20040726 B2 9961.92 .033 9814.66 -.0147 8/9 -------------------------------------------------------------------------------- 20090603 S9 8675.24 .041 8763.13 -.0101 6/5 20090608 S8 8764.49 .053 none 0 20090608 S5 8764.49 .053 none 0 20090610 S9 8739.02 .050 none 0 20090624 B5 8299.86 .237 perfect 0 -------------------------------------------------------------------------------- 20190611 S12 26048.51 ..... open 20190618 S9 26465.54 20190625 S12 26548.22 |
All 13 of the S9s/S12s in July would have brought gains.
|
Past July S9s/S12s Date Signal DJI Result when reversed. Gain Biggest Paper Loss 19570705 S9 516.9 .176 520.8 -.0075 7/12 19570711 S4 518 .178 520.8 -.0054 7/12 19570712 S7 520.8 .183 none 0 19570814 S10 485.9 .124 488.2 -.0047 8/16 19571217 B13 425.7 .527 perfect 0 -------------------------------------------------------------------------------- 19620705 S9 583.9 .009 615.5 -.0541 8/22 19620710 S12 586 .012 615.5 -.0503 8/22 19620716 S9 588.1 .016 615.5 -.0465 8/22 19621004 B1 582.4 .683 558.0 -.0418 10/23 -------------------------------------------------------------------------------- 19700715 S9 711.66 .006 735.56 -.0335 7/29 19700720 S12 733.91 .036 735.56 -.0022 7/29 19700723 S9 732.68 .035 735.56 -.0039 7/29 19700813 B2 707.35 .325 perfect 0 -------------------------------------------------------------------------------- 19730711 S9 908.19 .028 934.53 -.029 7/26 19730813 B17 883.20 .028 851.90 -.0354 8/22 -------------------------------------------------------------------------------- 19820712 S9 824.87 .058 833.43 -.0103 7/20 19820811 B8 777.21 .194 766.92 -.0132 8/12 -------------------------------------------------------------------------------- 19830726 S9 1243.69 .065 perfect 0 19830808 B2 1163.06 .097 perfect 0 -------------------------------------------------------------------------------- 19990709 S9 11193.69 .105 11209.8 -.0014 7/16 19990730 B2 10655.14 .043 10645.9 -.0008 8/2 -------------------------------------------------------------------------------- 20070713 S9 13907.25 .044 14000.4 -.0066 7/19 20070716 S5 13950.98 .047 14000.4 -.0035 7/19 20070723 S9 13943.42 .047 none 0 20070829 B14 13289.29 .040 13113.3 -.0132 9/17 -------------------------------------------------------------------------------- 20080723 S9 11632.38 .061 11782.3 -.0128 8/11 20080730 S9 11583.69 .058 11782.3 -.0171 8/11 20080808 S9 11734.32 .07 11782.3 -.004 8/11 20080915 B8 10917.51 .009 10609.6 -.0281 9/17 -------------------------------------------------------------------------------- 20100726 S9 10542.43 .026 10698.7 -.0148 8/9 20100809 S9 10698.75 .04 none 0 20100819 B17 10271.21 .247 9985.81 -.0277 8/26 -------------------------------------------------------------------------------- 20110705 S9 12569.87 .086 12724.4 -.0122 7/21 20110721 S9 12724.41 .098 none 0 20110815 B14 11482.9 .007 10817.6 -.0579 8/19 -------------------------------------------------------------------------------- 20130711 S9 15460.92 .032 15658.3 -.0127 8/2 20130712 S8 15464.30 .032 15658.3 -.0125 8/2 20130715 S5 15484.26 .034 15658.3 -.0112 8/2 20130822 B19 14963.74 .015 14776.1 -.0125 8/27 --------------------------------------------------------------------------------- 20150716 S12 18120.25 .135 none 0 20150824 S13 15871.35 .013 16643.0 -.0486 8/28 20150825 B16 15666.44 .131 none 0 --------------------------------------------------------------------------------- |
|
Charts 7/2/2019 2019 PEERLESS DJI, Signals, Indicators Daily DJI Volume 10-DayUp/Down Vol A/D Line for All Stocks Inverted Traders Index NASDAQ S&P OEX NYSE COMPQX DJI-15 DJI-20 DJI-30 DIA SPY QQQ MDY IWM TNA Short-Term Rates USO-CrudeOil DBO FAS GLD BBH IBB JETS JNUG KOL NUGT OIH OIL RSX RETL SDS AGQ SLV SOXL TECL TLT TMF TNA UGA (gasoline) XIV and China: YINN CHAU Commodities: CANE CORN DBC JJC, NIB, CHOC CORN, CUT (paper) MOO, SOYB WEAT UUP (Dollar) LIT (Lithium) AAPL ADBE ALXN AMAT AMGN AMD AMZN BA BABA BAC BIDU CAT CVX DE FB GOOG GS HD IBM INTU JPM M (Macy's) MSFT NFLX NVDA QCOM TSLA TXN XOM WMT CMG , LRCX, SWKS, MDGL SPPI WATT SQ TOWN 7/2/19 (Click on Underlined link.) Bullish MAXCPs - http://tigersoft.com/MAXCPS/Jul-02/BULLISH.htm Bearish MAXCPs - http://tigersoft.com/MINCPs/Jul-02/BEARISH.htm |
Table 1 QUICKSILVER on ETFS - 7/2/2019 ETF CLOSE CHANGE PIVOT-PT 5-dmaAROC CL-PWR CANDLE IP21 ITRS --------------------------------------------------------------------------------------------- DIA 267.66 .69 265.22 45.2% ------- BLUE .046 ---- --------------------------------------------------------------------------------------------- BA 354.16 -2.3 374.94 -207.2% ------- RED -.058 -.066 --------------------------------------------------------------------------------------------- SPY 296.43 .77 290.47 97% ------- BLUE .062 .011 --------------------------------------------------------------------------------------------- QQQ 190.01 .75 185.79 136.1% ------- BLUE .071 .001 --------------------------------------------------------------------------------------------- MDY 354.36 -.92 345.41 119.1% Bearish RED .057 -.01 --------------------------------------------------------------------------------------------- IWM 155.15 -.95 150.8 130.3% Bearish RED .005 -.01 --------------------------------------------------------------------------------------------- FAS 76.5 .61 69.86 387.2% ------- BLUE-.002 .107 --------------------------------------------------------------------------------------------- RETL 23.61 -.48 22.81 243.3% Bearish RED -.05 -.176 --------------------------------------------------------------------------------------------- SOXL 153.57 -6.72 141.44 834.9% Bearish RED -.018 -.198 --------------------------------------------------------------------------------------------- TECL 167 1.25 156.89 473% ------- BLUE .075 .025 --------------------------------------------------------------------------------------------- IBB 109.65 -.08 105.82 128.1% Bullish RED .1 .039 --------------------------------------------------------------------------------------------- GLD 133.41 2.79 132.97 -29.8% Bullish BLUE .175 .099 --------------------------------------------------------------------------------------------- OIH 14.44 -.48 14.59 68.4% Bearish RED -.039 -.229 --------------------------------------------------------------------------------------------- RSX 23.78 -.1 23.83 48.4% Bearish RED .03 .073 |
Table 2 Count of Stocks in Key Directories
20190702
-------------------------------
NEWHIGHS 266 Bullish
NEWLOWS 26
MAXCP 25 low for number of new highs,
MINCP 53 Bearish compared to number of MAXCPs
TTTNH 14
TTTNL 51 Bearish
FASTUP 68
FASTDOWN 37
CPCROSSA 97
CPCROSSD 87
BIGVOLUP 3
BIGVODN 9 Bearish
ACCUMVER 11
HIGHIP21 12
HIUPPCT 14
LOWACCUM 149
REDSELL 80
AUGSELS7 23
TRAPDOOR 10
|
Table 3 RANKING OF KEY DIRECTORIES BASED PCT.OF STOCKS ABOVE 65-DMA
7/2/19
Bullish = 38
Bearish = 8
---------------------------------------------------------------------------------------
Directory Current day-1 day-2 day-3 day-4 day-5
----------------------------------------------------------------------------------------
BONDFUND .99 .951 .961 .97 .922 .941
GOLD .882 .823 .862 .862 .882 .862
ETFS .859 .824 .649 .578 .526 .403
BIGBANKS .857 .857 .857 .428 .285 .285
INSURANC .851 .814 .814 .777 .74 .777
DOWJONES .827 .758 .724 .724 .689 .724
JETS .8 .8 .8 .6 .5 .5
SOLAR .777 .777 .777 .777 .777 .777
DJI-13 .769 .769 .769 .769 .769 .769
NASD-100 .75 .75 .687 .593 .572 .583
UTILITY .75 .7 .675 .675 .7 .8
FIDSTKS .722 .739 .717 .63 .614 .586
COMPUTER .714 .714 .619 .619 .619 .476
MILITARY .714 .714 .714 .714 .642 .678
SP-100 .714 .692 .67 .626 .637 .626
SP500 .706 .713 .68 .608 .577 .604
INDEXES .702 .729 .762 .691 .616 .583
AUTO .666 .666 .692 .615 .538 .512
NIFTY .666 .701 .578 .561 .543 .508
COMODITY .634 .609 .658 .682 .634 .634
FOOD .629 .629 .666 .685 .629 .629
SOFTWARE .629 .58 .548 .435 .403 .387
RUS-1000 .614 .611 .592 .522 .486 .517
INFRA .611 .666 .694 .611 .555 .5
FINANCE .602 .738 .659 .568 .477 .431
HACKERS .6 .5 .45 .35 .3 .2
TRANSP .6 .7 .7 .35 .25 .25
SEMI .59 .654 .509 .481 .436 .381
BEVERAGE .588 .529 .529 .411 .47 .47
HOMEBLDG .588 .47 .588 .411 .294 .411
CHEM .584 .603 .584 .509 .433 .433
HOSPITAL .565 .565 .521 .521 .478 .434
GUNS .562 .562 .562 .5 .437 .562
INDMATER .562 .612 .562 .512 .475 .437
GREEN .545 .545 .545 .545 .545 .545
ELECTRON .532 .608 .5 .435 .403 .358
N= 36
-------------------------------------------------------------------------------------------
EDU .5 .5 .5 .5 .333 .333
-------------------------------------------------------------------------------------------
GAMING .478 .521 .391 .478 .434 .434
REGBANKS .464 .678 .607 .392 .285 .214
BIOTECH .454 .471 .473 .402 .345 .367
REIT .445 .351 .371 .29 .25 .418
RETAIL .377 .358 .358 .339 .283 .301
CHINA .315 .28 .157 .157 .105 .087
OILGAS .243 .284 .284 .236 .25 .222
COAL 0 .142 .142 0 0 0
N=8
|
====================================================================
7/1/2019
The Sell S12 still rules,
since the DJI did not breakout above 27000.
Abide by the rising A/D Line and avoid shorting more DIA until the
A/D Line uptrend is broken. But deciding what to buy is a problem,

Normally, the DJI rises in July. Since 1965, the DJI has risen 67.3% of the
time and gains on average 1.2% over the 21 trading days following July 1.
It then gains 2.3% over the next 42 trading days and 3.3% over the next 65
trading days. Taking just the third years before a Presidential Election, the
probability of the DJI being up over these periods of time rises to 75% and the
average gains are 2.1%, 4.2% and 6.0% over a month, two months and three
months, respectively.
So then, why are the big boys still net sellers, based on our Accumulation Index (IP21)
standing now at -.02 for the DJI? Perhaps, they are sellers at this time of the
year for seasonal reasons? Perhaps, they like to go on vacation and sell some
shares at this time. In any case, about 25% of the new highs now show negative
IP21s.
This is not good. The IP21 is now -.028 for the Peerless DJI and for the QQQ
-.027. The SP-500's IP21 is only +.01 and it just made a new all-time high.
And why are Professionls, judging from our Closing Power numbers as a percentage
of the stocks making new highs, not more willing to chase? I reckon less than
20% of the stocks making new highs show Closing Powers near to or at a new highs.
(By our calculations tonight, there were 46 new closing highs and 225 new highs.)
Without Professionas and the "the big boys" (as measured by the Accumulation
Index)
more aggressive, how much higher can the market go? It does seem to come down
to interest rates? Perhaps, they will be formally lowered by the FED when the Jobs'
numbers for June come ouy on Friday.
In this environment should you commit much money to the long side? I can only
conclude it's probably a lot riskier than usual chasing the dividend stocks and bond
funds that the market now favors. My suggestion: either draw the price-uptrendlines
and sell if the stocks break them or watch their 5-day ma pivot points and sell when they
close below the pivot point. Consider PG and the DJ-15 Utilities now. They
both
show potential head/shoulders developing, broken Closing Power uptrends and falling
5-day ma. So, traders should be sellers of them.
Will a new groups of stocks emerge as leaders? I'm not sure which stocks they will
be.
Perhaps,
solar energy? The SP-500 made a new high today, but only 37 of these 500
stocks made new highs. Another cautionary sign: 28.7% of the SP-500 stocks are still
below the key support of their 65-dma. This compares with the 30% number when the
SP-500 was reaching its peak at the end of September before it fell 20% last year.
We need more evidence that it's safe to buy despite the bullish seasonality.

Use the Charts below tonight.
|
Charts 7/1/2019 2019 PEERLESS DJI, Signals, Indicators Daily DJI Volume 10-DayUp/Down Vol A/D Line for All Stocks Inverted Traders Index NASDAQ S&P OEX NYSE COMPQX DJI-15 DJI-20 DJI-30 DIA SPY QQQ MDY IWM TNA Short-Term Rates USO-CrudeOil DBO FAS GLD BBH IBB JETS JNUG KOL NUGT OIH OIL RSX RETL SDS AGQ SLV SOXL TECL TLT TMF TNA UGA (gasoline) XIV and China: YINN CHAU Commodities: CANE CORN DBC JJC, NIB, CHOC CORN, CUT (paper) MOO, SOYB WEAT UUP (Dollar) LIT (Lithium) AAPL ADBE ALXN AMAT AMGN AMD AMZN BA BABA BAC BIDU CAT CVX DE FB GOOG GS HD IBM INTU JPM M (Macy's) MSFT NFLX NVDA QCOM TSLA TXN XOM WMT CMG , LRCX, SWKS, MDGL SPPI WATT SQ TOWN 7/1/19 (Click on Underlined link.) Bullish MAXCPs - http://tigersoft.com/MAXCPS/Jul-01/BULLISH.htm Bearish MAXCPs - http://tigersoft.com/MINCPs/Jul-01/BEARISH.htm |
Table 1 QUICKSILVER on ETFS - 7/1/2019 ETF CLOSE CHANGE PIVOT-PT 5-dmaAROC CL-PWR CANDLE IP21 ITRS --------------------------------------------------------------------------------------------- DIA 266.97 1.12 265.26 -3.8% ------- RED .018 0 --------------------------------------------------------------------------------------------- BA 356.46 -7.55 369.32 -237.4% ------- RED .01 -.067 --------------------------------------------------------------------------------------------- SPY 295.66 2.66 290.76 34.6% Bearish RED .01 .014 --------------------------------------------------------------------------------------------- QQQ 189.26 2.52 184.93 29.5% Bearish RED -.027 .005 --------------------------------------------------------------------------------------------- MDY 355.28 .69 346.02 105.7% ------- RED .074 -.007 --------------------------------------------------------------------------------------------- IWM 156.1 .6 151.15 131.7% Bearish RED .014 -.002 --------------------------------------------------------------------------------------------- FAS 75.89 1.91 70.89 230.6% ------- --- -.017 .093 --------------------------------------------------------------------------------------------- SOXL 160.29 12 129.29 892.9% Bearish RED -.038 -.158 --------------------------------------------------------------------------------------------- TECL 165.75 7.17 152.03 152.6% Bearish RED .002 .028 --------------------------------------------------------------------------------------------- IBB 109.73 .63 106.89 121.7% Bullish RED .07 .044 --------------------------------------------------------------------------------------------- GLD 130.62 -2.58 134.2 -124.4% ------- RED .171 .08 --------------------------------------------------------------------------------------------- OIH 14.92 .1 14.24 238.3% Bearish RED .013 -.177 --------------------------------------------------------------------------------------------- RSX 23.88 .25 23.55 16.9% Bearish RED .027 .094 |
Table 2 Count of Stocks in Key Directories
20190701
-------------------------------
NEWHIGHS 225 (Bullish number and nh/nl ratio is bullish._
NEWLOWS 9
MAXCP 46 Professionals are not chasing most new highs.
MINCP 8
TTTNH 38
TTTNL 17
FASTUP 97 Most new highs are not advancing rapidly.
FASTDOWN 60
CPCROSSA 278
CPCROSSD 43
BIGVOLUP 35
BIGVODN 50 Dumping going on.
ACCUMVER 10
HIGHIP21 22
HIUPPCT 12
LOWACCUM 201
REDSELL 91
AUGSELS7 19
TRAPDOOR 10
|
Table 3 RANKING OF KEY DIRECTORIES BASED PCT.OF STOCKS ABOVE 65-DMA
7/1/19
Bullish = 36
Bearish = 7
---------------------------------------------------------------------------------------
Directory Current day-1 day-2 day-3 day-4 day-5
----------------------------------------------------------------------------------------
BONDFUND .951 .961 .97 .922 .941 .961
BIGBANKS .857 .857 .428 .285 .285 .428
ETFS .824 .649 .578 .526 .403 .561
GOLD .823 .862 .862 .882 .862 .882
INSURANC .814 .814 .777 .74 .777 .851
JETS .8 .8 .6 .5 .5 .5
SOLAR .777 .777 .777 .777 .777 .777
DJI-13 .769 .769 .769 .769 .769 .846
DOWJONES .758 .724 .724 .689 .724 .793
NASD-100 .75 .687 .593 .572 .572 .645
FIDSTKS .739 .717 .63 .614 .586 .63
FINANCE .738 .659 .568 .477 .443 .454
INDEXES .733 .766 .695 .619 .586 .619
COMPUTER .714 .619 .619 .619 .476 .523
MILITARY .714 .714 .714 .642 .678 .714
SP500 .713 .68 .608 .577 .604 .635
NIFTY .701 .578 .561 .543 .491 .578
UTILITY .7 .675 .675 .7 .8 .8
TRANSP .7 .7 .35 .25 .25 .3
SP-100 .692 .67 .626 .637 .637 .659
REGBANKS .678 .607 .392 .285 .25 .214
AUTO .666 .692 .615 .538 .512 .512
INFRA .666 .694 .611 .555 .527 .555
SEMI .648 .504 .477 .432 .387 .414
FOOD .629 .666 .685 .629 .611 .574
INDMATER .612 .562 .512 .475 .45 .425
RUS-1000 .61 .591 .521 .488 .518 .545
COMODITY .609 .658 .682 .634 .609 .585
CHEM .603 .584 .509 .433 .452 .433
ELECTRON .602 .493 .435 .403 .365 .384
SOFTWARE .58 .548 .435 .403 .37 .516
HOSPITAL .565 .521 .521 .478 .434 .391
GUNS .562 .562 .5 .437 .562 .687
GREEN .545 .545 .545 .545 .545 .545
BEVERAGE .529 .529 .411 .47 .47 .47
GAMING .521 .391 .478 .434 .434 .434
N=36
============================================================================================
EDU .5 .5 .5 .333 .333 .333
HACKERS .5 .45 .35 .3 .2 .35
============================================================================================
HOMEBLDG .47 .588 .411 .294 .411 .529
BIOTECH .468 .473 .402 .345 .361 .342
RETAIL .358 .358 .339 .283 .301 .32
REIT .351 .371 .29 .25 .425 .5
OILGAS .284 .284 .236 .25 .215 .201
CHINA .28 .157 .157 .105 .087 .122
COAL .142 .142 0 0 0 .142
N=7
=============================================================================================
|
=====================================================================|
6/28/2019
A truce in the trade war with China is one
of the things the market needs
to breakout over 27000. Another is a cut by interest rates in the FED.
With the interest on 10-year notes falling to only 2%, stocks are made
to look much more attractive, especially if they can rise 2% just on Monday.
Treat a DJI breakout over 27000 as being very bullish as long as the NYSE
A/D Line is rising.
 |
 |
 |
Peerless know nothing of this news, but it does factor in the
bullishness of the
third year in a Presidential Election. And so should we. A breakout above
27000 would have be considered quite bullish given how well flat top breakouts
in the past have worked. I produced a number of historic 5-year breakout-charts
below to demonstrate this.
 |
 |
 |
 |
 |
 |
 |
Of course, this is now a much more speculative market. If interest rates were
to go back up, it would be bad news for all the defensive stocks that are
being boosted by the quick fall in interest rates. Another sign of the speculative
juices that are surging now is how Openings are becoming more important than Closes
in moving the short-term. In additon, the DJI has a broadening pattern in the weekly
chart shown below. It's really quite surprising, but the main object of all
this speculation is the group of normally safe blue-chip dividend stocks.
Imagine a bull market led by PG and MCD!
I think that the market can go considerably higher if the
breadth of the rally expands.
So, as long as the NYSE A/D Line is rising, do not sell short. This is the 1976
and 2002 scenario. Many Democrats do not trust the Trump bull market. They
can hardly believe it. And certainly, the perma-bears won't easily admit it, but the
trend is up and even the heavy selling by "big money" as the old highs have been
reached is not enough to hold the market back.
So, there's no point in being short DIA, unless it is a token position to honor the
Sell S12. Note that the V-Indicator has turned positive. It is not to late to
buy if
the market can catch more public participation. Buy some of the middle-sized
stocks that have recently jumped back above their 65-dma and have positive IP21
readings. Some examples are ALE, AMPH, ATUS, CLH, CORE, CPF, EGP,
FGEN and FRME.
|
Charts 6/28/2019 2019 PEERLESS DJI, Signals, Indicators Daily DJI Volume 10-DayUp/Down Vol Hourly DJIA A/D Line for All Stocks Inverted Traders Index NASDAQ S&P OEX NYSE COMPQX DJI-15 DJI-20 DJI-30 DIA SPY QQQ MDY IWM TNA Short-Term Rates USO-CrudeOil DBO FAS GLD BBH IBB JETS JNUG KOL NUGT OIH OIL RSX RETL SDS AGQ SLV SOXL TECL TLT TMF TNA UGA (gasoline) XIV and China: YINN CHAU Commodities: CANE CORN DBC JJC, NIB, CHOC CORN, CUT (paper) MOO, SOYB WEAT UUP (Dollar) LIT (Lithium) AAPL ADBE ALXN AMAT AMGN AMD AMZN BA BABA BAC BIDU CAT CVX DE FB GOOG GS HD IBM INTU JPM M (Macy's) MSFT NFLX NVDA QCOM TSLA TXN XOM WMT CMG , LRCX, SWKS, MDGL SPPI WATT SQ TOWN 6/28/19 (Click on Underlined link.) Bullish MAXCPs - http://tigersoft.com/MAXCPS/Jun-28/BULLISH.htm Bearish MAXCPs - http://tigersoft.com/MINCPs/Jun-28/BEARISH.htm |
Table 1 QUICKSILVER on ETFS - 6/28/2019 ETF CLOSE CHANGE PIVOT-PT 5-dmaAROC CL-PWR CANDLE IP21 ITRS --------------------------------------------------------------------------------------------- DIA 265.85 .7 267.17 -23.5% ------- RED -.036 0 --------------------------------------------------------------------------------------------- BA 364.01 -.01 373.99 -105.6% ------- BLUE .013 -.041 --------------------------------------------------------------------------------------------- SPY 293 1.5 293.64 -17.1% ------- BLUE-.05 .007 --------------------------------------------------------------------------------------------- QQQ 186.74 .24 188.16 -49% Bearish RED -.073 -.007 --------------------------------------------------------------------------------------------- MDY 354.59 4.67 347.91 55.7% Bullish BLUE .084 -.006 --------------------------------------------------------------------------------------------- IWM 155.5 1.87 152.08 50.9% ------- BLUE .017 -.009 --------------------------------------------------------------------------------------------- FAS 73.98 2.43 72.58 35.6% ------- BLUE-.046 .062 --------------------------------------------------------------------------------------------- RETL 24.06 .36 22.98 -23.7% ------- BLUE .163 -.221 --------------------------------------------------------------------------------------------- SOXL 148.29 .61 135.22 507.3% Bearish RED -.056 -.22 --------------------------------------------------------------------------------------------- TECL 158.58 .53 160.95 -47% Bearish RED -.037 -.008 --------------------------------------------------------------------------------------------- IBB 109.1 1.82 107.12 -16.3% Bullish BLUE .033 .033 --------------------------------------------------------------------------------------------- GLD 133.2 .36 133.94 45.8% Bullish BLUE .282 .102 --------------------------------------------------------------------------------------------- OIH 14.82 .3 14.23 124.9% Bearish BLUE .05 -.193 --------------------------------------------------------------------------------------------- RSX 23.63 -.2 23.8 -6.3% ------- RED .053 .079 |
Table 2 Count of Stocks in Key Directories
20190628
-------------------------------
NEWHIGHS 225
NEWLOWS 9 (low)
MAXCP 46
MINCP 8
TTTNH 38
TTTNL 16
FASTUP 97
FASTDOWN 60
CPCROSSA 278
CPCROSSD 43
BIGVOLUP 35
BIGVODN 50
ACCUMVER 10
HIGHIP21 22
HIUPPCT 12
LOWACCUM 201
REDSELL 91
AUGSELS7 19
TRAPDOOR 10
|
Table 3
RANKING OF KEY DIRECTORIES BASED PCT.OF STOCKS ABOVE 65-DMA
6/28/19
Bullish = 35
Bearish = 9
---------------------------------------------------------------------------------------
Directory Current day-1 day-2 day-3 day-4 day-5
----------------------------------------------------------------------------------------
BONDFUND .961 .97 .922 .941 .97 .961
GOLD .862 .862 .882 .862 .882 .803
BIGBANKS .857 .428 .285 .285 .428 .428
INSURANC .814 .777 .74 .777 .851 .888
JETS .8 .6 .5 .5 .5 .5
SOLAR .777 .777 .777 .777 .777 .777
DJI-13 .769 .769 .769 .769 .846 .769
INDEXES .763 .693 .612 .58 .618 .677
DOWJONES .724 .724 .689 .724 .793 .758
MILITARY .724 .724 .655 .689 .724 .689
FIDSTKS .717 .63 .614 .586 .641 .673
TRANSP .7 .35 .25 .25 .3 .45
INFRA .694 .611 .555 .527 .555 .555
AUTO .692 .615 .538 .512 .512 .538
NASD-100 .687 .593 .572 .572 .635 .656
SP500 .68 .609 .578 .605 .64 .66
UTILITY .675 .675 .7 .8 .8 .825
SP-100 .67 .626 .637 .637 .67 .681
FOOD .666 .685 .629 .611 .574 .574
FINANCE .659 .568 .477 .443 .477 .5
COMODITY .658 .682 .634 .609 .585 .585
ETFS .649 .578 .526 .403 .561 .526
COMPUTER .619 .619 .619 .476 .523 .523
REGBANKS .607 .392 .285 .25 .25 .285
RUS-1000 .592 .521 .487 .52 .548 .58
GUNS .588 .529 .47 .588 .705 .588
HOMEBLDG .588 .411 .294 .411 .529 .529
CHEM .584 .509 .433 .452 .471 .452
NIFTY .578 .561 .543 .491 .578 .578
INDMATER .562 .512 .475 .45 .425 .487
SOFTWARE .548 .435 .403 .37 .516 .532
GREEN .545 .545 .545 .545 .545 .545
BEVERAGE .529 .411 .47 .47 .47 .47
HOSPITAL .521 .521 .478 .434 .391 .434
SEMI .504 .477 .432 .387 .423 .441
N=35
===============================================================================================
EDU .5 .5 .333 .333 .333 .5
===============================================================================================
ELECTRON .496 .433 .401 .363 .388 .407
BIOTECH .471 .402 .345 .361 .339 .41
HACKERS .45 .35 .3 .2 .35 .4
GAMING .391 .478 .434 .434 .434 .391
REIT .371 .29 .25 .425 .5 .56
RETAIL .358 .339 .283 .301 .32 .339
OILGAS .284 .236 .25 .215 .208 .243
CHINA .157 .157 .105 .087 .122 .122
COAL .142 0 0 0 .142 .142
N=9
|
========================================================================
6/27/2019
The Peerless S9Vs and S12s on the DJI
stand despite today's good breadth. There
were a whopping 1298 more up than down on the NYSE and IWM (Russell 2000)
climbed back above its 65-dma, despite the DJI's small loss, which was primarily due
to high priced BA's 10.92 decline. A short-term seasonal rally should be expected.
But after that, the DJI should still fall back to the to the lower band and honor
our S9-V and S12. But it looks like this will not happen in the next week.
Remember
that the DJI tends to be up around the July 4th holiday. Moreover, if the NYSE A/D
Line makes a new high, it would be best not to short any more DIA or even IWM
(which has a weaker relative strength and lower IP21 than the DJI) until the NYSE
A/D Line breaks its uptrend. See further below how well this strategy worked in 1976
when, like now, the DJI could not get past a round number (1000) but also would
not turn down until the strong A/D Line (like now) broke its uptrend.
For bears, the good news is that 56% of all stocks are now below their 65-dma and
the Closing Powers of all the major market ETFs have been broken. Professionals
are in new selling mode. So, higher openings are apt to be blunted by big-money
selling
on strength. That should limit the advance unless there is a US-China "deal" or
the FED lowers rates by one quarter percent or more.
So, stay short DIA, some bearish MINCPs and long GLD, NUGT, BA and YINN.
  |
| 1976 - Strong
A/D Line but DJI could not get past it flat well-tested resistance. Instead, NYSE broke its uptrendline and then the DJI fell back. Twice: July and August...  |
DIA |
SPY |
QQQ |
IWM |
|
Charts 6/27/2019 2019 PEERLESS DJI, Signals, Indicators Daily DJI Volume 10-DayUp/Down Vol Hourly DJIA A/D Line for All Stocks Inverted Traders Index NASDAQ S&P OEX NYSE COMPQX DJI-15 DJI-20 DJI-30 DIA SPY QQQ MDY IWM TNA Short-Term Rates USO-CrudeOil DBO FAS GLD BBH IBB JETS JNUG KOL NUGT OIH OIL RSX RETL SDS AGQ SLV SOXL TECL TLT TMF TNA UGA (gasoline) XIV and China: YINN CHAU Commodities: CANE CORN DBC JJC, NIB, CHOC CORN, CUT (paper) MOO, SOYB WEAT UUP (Dollar) LIT (Lithium) AAPL ADBE ALXN AMAT AMGN AMD AMZN BA BABA BAC BIDU CAT CVX DE FB GOOG GS HD IBM INTU JPM M (Macy's) MSFT NFLX NVDA QCOM TSLA TXN XOM WMT CMG , LRCX, SWKS, MDGL SPPI WATT SQ TOWN 6/27/19 (Click on Underlined link.) Bullish MAXCPs - http://tigersoft.com/MAXCPS/Jun-27/BULLISH.htm Bearish MAXCPs - http://tigersoft.com/MINCPs/Jun-27/BEARISH.htm |
Table 1 QUICKSILVER on ETFS - 6/27/2019 ETF CLOSE CHANGE PIVOT-PT 5-dmaAROC CL-PWR CANDLE IP21 ITRS
---------------------------------------------------------------------------------------------
DIA 265.15 -.07 267.1 -55% ------- RED -.026 ----
---------------------------------------------------------------------------------------------
BA 364.02 -10.92 371.84 -145.6% ------- RED .01 -.049
---------------------------------------------------------------------------------------------
SPY 291.5 1.03 294 -74.4% Bearish BLUE -.057 .002
---------------------------------------------------------------------------------------------
QQQ 186.5 .71 188.57 -62.7% ------- ---- -.065 -.002
---------------------------------------------------------------------------------------------
MDY 349.92 4.51 350.71 -62.9% Bearish BLUE .012 -.024
---------------------------------------------------------------------------------------------
IWM 153.63 2.83 153.95 -54.4% ------- BLUE -.043 -.027
---------------------------------------------------------------------------------------------
FAS 71.55 1.69 73.47 -206.9% Bearish BLUE -.111 .028
---------------------------------------------------------------------------------------------
RETL 23.7 .89 24.17 -100.8% ------- BLUE .051 -.228
---------------------------------------------------------------------------------------------
SOXL 147.68 6.24 134.33 388.2% ------- BLUE -.038 -.185
---------------------------------------------------------------------------------------------
TECL 158.05 1.16 160.06 -135.4% Bearish RED -.024 .007
---------------------------------------------------------------------------------------------
IBB 107.28 1.46 109.45 -62.3% Bullish BLUE -.062 -.022
---------------------------------------------------------------------------------------------
GLD 132.84 -.13 131.98 65.1% Bullish BLUE .295 .1
^^^^^^^^^^^^^
---------------------------------------------------------------------------------------------
OIH 14.52 -.07 14.46 45.2% Bearish RED -.033 -.209
---------------------------------------------------------------------------------------------
RSX 23.83 0 23.66 2.1% Bullish ---- .052 .096
|
TABLE 2 Count of Stocks in Key Directories
20190627
-------------------------------
NEWHIGHS 136
NEWLOWS 7
MAXCP 12
MINCP 13
TTTNH 9
TTTNL 25
FASTUP 50
FASTDOWN 101
CPCROSSA 250
CPCROSSD 36
BIGVOLUP 5
BIGVODN 12
ACCUMVER 7
HIGHIP21 11
HIUPPCT 10
LOWACCUM 151
REDSELL 99
AUGSELS7 19
TRAPDOOR 10
|
Table 3 RANKING OF KEY DIRECTORIES BASED PCT.OF STOCKS ABOVE 65-DMA
6/27/19
Bullish = 27
Bearish = 16
---------------------------------------------------------------------------------------
Directory Current day-1 day-2 day-3 day-4 day-5
----------------------------------------------------------------------------------------
BONDFUND .97 .922 .941 .97 .961 .932
GOLD .862 .882 .862 .882 .784 .784
INSURANC .777 .74 .777 .851 .888 .888
SOLAR .777 .777 .777 .777 .777 .777
DJI-13 .769 .769 .769 .846 .769 .769
DOWJONES .724 .689 .724 .793 .758 .758
MILITARY .724 .655 .689 .724 .689 .724
INDEXES .693 .612 .58 .618 .677 .655
COMODITY .682 .634 .609 .585 .585 .585
FOOD .679 .622 .603 .566 .566 .584
UTILITY .675 .7 .8 .8 .825 .85
FIDSTKS .63 .614 .586 .641 .668 .69
SP-100 .626 .637 .637 .67 .681 .67
COMPUTER .619 .619 .476 .523 .523 .571
AUTO .615 .538 .512 .512 .538 .564
INFRA .611 .555 .527 .555 .555 .555
SP500 .609 .578 .605 .64 .658 .666
JETS .6 .5 .5 .5 .5 .7
NASD-100 .593 .572 .572 .635 .645 .666
ETFS .578 .526 .403 .561 .526 .578
FINANCE .568 .477 .443 .477 .5 .522
NIFTY .561 .543 .491 .578 .578 .578
GREEN .545 .545 .545 .545 .545 .545
GUNS .529 .47 .588 .705 .588 .647
HOSPITAL .521 .478 .434 .391 .434 .478
RUS-1000 .521 .487 .519 .549 .58 .602
INDMATER .512 .475 .45 .425 .487 .5
CHEM .509 .433 .452 .471 .471 .49
------------------------------------------------------------------------------------
EDU .5 .333 .333 .333 .5 .5
------------------------------------------------------------------------------------
GAMING .478 .434 .434 .434 .347 .347
SEMI .477 .432 .387 .423 .441 .459
SOFTWARE .435 .403 .37 .516 .532 .58
ELECTRON .433 .401 .363 .388 .407 .42
BIGBANKS .428 .285 .285 .428 .428 .428
BEVERAGE .411 .47 .47 .47 .47 .47
HOMEBLDG .411 .294 .411 .529 .588 .705
BIOTECH .4 .345 .361 .339 .41 .394
REGBANKS .392 .285 .25 .25 .285 .285
HACKERS .35 .3 .2 .35 .4 .35
TRANSP .35 .25 .25 .3 .45 .5
RETAIL .339 .283 .301 .32 .339 .358
REIT .29 .25 .425 .5 .56 .722
OILGAS .236 .25 .215 .208 .243 .256
CHINA .157 .105 .087 .122 .122 .192
COAL 0 0 0 .142 .142 .142
|
========================================================================
6/26/2019 Our Peerless S9Vs and S12s typically bring a decline to the lower band,
at least. And though the NYSE A/D Line's uptrend is intact, the Closing Power
uptrends going back to January have now been broken for IWM, MDY, SPY,
OEX, QQQ and NASDAQ, but not the DJI. Apparently, NY Professionals
respect the DIA's role as the staunchest blue chip defender of the bull market.
Until the DIA's Closing Power breaks down, limit your short sales on it. The DJI
still
may be able to breakout in an isolated way above 27000. Such a move would
bring more Peerless Sells very likely. A trade deal with China could bring such a
rally.
On the other hand, Trumps public disparagement of Powell for not lowering rates
may mean rates will not be cut soon. Will that bring another sell-off if the next
Jobs' numbers do not jump back up? I would think so.

Hold present positions: Short DIA (limited position)
and some Bearish MINCPs.
Long BA, GLD, NUGT and YINN. IWM probably should have been shorted
instead of DIA because IWM shows a weaker IP21 and ITRS and lots of liquidity.
Avoid QQQ and the tech ETFs unless you are confident in your assessment of
how and when the US-China tariff conflict will be resolved.
But right now, there is not even a truce in the trade war and Professionals, who
who would be expected to be the first to know if there was about to be a trade deal,
sold the market off after hopes this morning rose that a deal was close. This sell-off
after the opening placed DIA and the other indexes significantly below their openings
today. And this was the fourth straight day we have seen such behavior this June.
To see what has happened in the past when our candle-sticks were red four
straight
days in the Summer in SPY, I put together a study-page on Summer SPY candle-sticks
that shows them year-by-year since 1993, the first year for which there is data.
This
will help in lots of candle-stick studies:
http://tigersoft.com/SPYCAND/SPYCAND.htm
For our purposes now, it shows that four straight red
candle-sticks by itself more often
shows an over-sold condition rather than special weakness, especially when SPY is
still above its 21-dma and 65-dma like now. But its short-term trend is down and
it needs, at least, to test its recent lows, I would think.
TIGER CANDLE-STICKS
Below are the Tiger candle-stock charts of the current
general market ETF's.
Study also the price-trends here, Closing Power (shorter term) and Accumulation
Index trends here. Except for DIA, they show downtrends and weakened Closing Power
and Accumulation.
DIA |
SPY |
QQQ |
IWM |
MDY |
|
Charts 6/26/2019 2019 PEERLESS DJI, Signals, Indicators Daily DJI Volume 10-DayUp/Down Vol Hourly DJIA A/D Line for All Stocks Inverted Traders Index NASDAQ S&P OEX NYSE COMPQX DJI-15 DJI-20 DJI-30 DIA SPY QQQ MDY IWM TNA Short-Term Rates USO-CrudeOil DBO FAS GLD BBH IBB JETS JNUG KOL NUGT OIH OIL RSX RETL SDS AGQ SLV SOXL TECL TLT TMF TNA UGA (gasoline) XIV and China: YINN CHAU Commodities: CANE CORN DBC JJC, NIB, CHOC CORN, CUT (paper) MOO, SOYB WEAT UUP (Dollar) LIT (Lithium) AAPL ADBE ALXN AMAT AMGN AMD AMZN BA BABA BAC BIDU CAT CVX DE FB GOOG GS HD IBM INTU JPM M (Macy's) MSFT NFLX NVDA QCOM TSLA TXN XOM WMT CMG , LRCX, SWKS, MDGL SPPI WATT SQ TOWN 6/26/19 (Click on Underlined link.) Bullish MAXCPs - http://tigersoft.com/MAXCPS/Jun-26/BULLISH.htm Bearish MAXCPs - http://tigersoft.com/MINCPs/Jun-26/BEARISH.htm |
Table 1 QUICKSILVER on ETFS - 6/26/2019 ETF CLOSE CHANGE PIVOT-PT 5-dmaAROC CL-PWR CANDLE IP21 ITRS
---------------------------------------------------------------------------------------------
DIA 265.22 -.04 268.08 -6.4% Bullish RED -.003 -----
---------------------------------------------------------------------------------------------
BA 374.94 5.62 374.88 85.8% Bullish BLUE .067 -.007
---------------------------------------------------------------------------------------------
SPY 290.47 -.29 295.86 -44.1% Bearish RED -.043 -.004
---------------------------------------------------------------------------------------------
QQQ 185.79 .86 188.85 -35.2% ------- RED -.064 -.006
---------------------------------------------------------------------------------------------
MDY 345.41 -.61 354.31 -93.7% Bearish RED -.006 -.039
---------------------------------------------------------------------------------------------
IWM 150.8 -.35 155.29 -122.6% Bearish RED -.078 -.046
---------------------------------------------------------------------------------------------
FAS 69.86 -1.03 74.54 -225.6% Bearish RED -.06 .013
---------------------------------------------------------------------------------------------
SOXL 141.44 12.15 137.16 298% Bullish BLUE-.017 -.148
---------------------------------------------------------------------------------------------
TECL 156.89 4.86 162.34 35.7% ------- BLUE-.011 .011
---------------------------------------------------------------------------------------------
IBB 105.82 -1.07 108.62 -108.7% ------- RED -.098 -.048
---------------------------------------------------------------------------------------------
GLD 132.97 -1.23 131.11 192.7% Bullish ---- .267 .088
^^^^^^^^^^^^
---------------------------------------------------------------------------------------------
OIH 14.59 .35 14.39 270.6% Bearish BLUE .015 -.19
---------------------------------------------------------------------------------------------
RSX 23.83 .28 23.82 116.4% Bullish BLUE .126 .106
^^^^^^^^^^^^
|
Table 2 Count of Stocks in Key Directories
20190626
-------------------------------
NEWHIGHS 56
NEWLOWS 28
MAXCP 8
MINCP 39
TTTNH 9
TTTNL 86
FASTUP 57
FASTDOWN 121
CPCROSSA 96
CPCROSSD 78
BIGVOLUP 5
BIGVODN 10
ACCUMVER 8
HIGHIP21 10
HIUPPCT 10
VHIP21 115
LOWACCUM 154
REDSELL 98
AUGSELS7 14
TRAPDOOR 10
|
Table 3 RANKING OF KEY DIRECTORIES BASED PCT.OF STOCKS ABOVE 65-DMA
6/26/19
Bearish = 23
Bullish = 21
---------------------------------------------------------------------------------------
Directory Current day-1 day-2 day-3 day-4 day-5
----------------------------------------------------------------------------------------
BONDFUND .922 .941 .97 .961 .932 .922
GOLD .882 .862 .882 .784 .784 .705
SOLAR .777 .777 .777 .777 .777 .777
DJI-13 .769 .769 .846 .769 .769 .615
INSURANC .74 .777 .851 .888 .888 .888
UTILITY .7 .8 .8 .825 .85 .825
DOWJONES .689 .724 .793 .758 .758 .655
MILITARY .655 .689 .724 .689 .724 .655
SP-100 .637 .637 .67 .681 .67 .626
COMODITY .634 .609 .585 .585 .585 .585
FOOD .622 .603 .566 .566 .584 .584
COMPUTER .619 .476 .523 .523 .571 .523
FIDSTKS .614 .586 .641 .668 .684 .652
INDEXES .607 .58 .618 .677 .655 .623
SP500 .578 .605 .64 .658 .666 .627
NASD-100 .572 .572 .635 .645 .666 .604
INFRA .555 .527 .555 .555 .555 .527
GREEN .545 .545 .545 .545 .545 .59
NIFTY .543 .491 .578 .578 .578 .526
AUTO .538 .512 .512 .538 .564 .512
ETFS .526 .403 .561 .526 .578 .421
--------------------------------------------------------------------------------------------
JETS .5 .5 .5 .5 .7 .7
--------------------------------------------------------------------------------------------
RUS-1000 .487 .519 .548 .581 .603 .56
HOSPITAL .478 .434 .391 .434 .478 .434
FINANCE .477 .443 .477 .5 .522 .522
INDMATER .475 .45 .425 .487 .5 .425
BEVERAGE .47 .47 .47 .47 .47 .411
GUNS .47 .588 .705 .588 .647 .588
SEMI .436 .39 .427 .445 .463 .427
GAMING .434 .434 .434 .347 .347 .391
CHEM .433 .452 .471 .471 .509 .433
ELECTRON .403 .365 .391 .41 .423 .384
SOFTWARE .403 .37 .516 .532 .58 .516
BIOTECH .342 .361 .339 .41 .391 .408
EDU .333 .333 .333 .5 .5 .5
HACKERS .3 .2 .35 .4 .35 .4
HOMEBLDG .294 .411 .529 .588 .705 .647
BIGBANKS .285 .285 .428 .428 .428 .428
REGBANKS .285 .25 .25 .285 .285 .321
RETAIL .283 .301 .32 .339 .358 .358
OILGAS .25 .215 .208 .243 .256 .194
REIT .25 .425 .5 .56 .722 .702
TRANSP .25 .25 .3 .45 .5 .4
CHINA .105 .087 .122 .122 .192 .105
COAL 0 0 .142 .142 .142 .142
|
=========================================================================
6/25/2019 The recent Sell S9v at the DJI's upper band was reinforced by a Sell S12
today..
So far, the NYSE A/D Line is still rising. Dividend stocks and bonds, blue chips
and some big insurance stocks (See Table 3) remain favored. This is a very defensive
market. Compare the DJI chart below and the charts our Nifty highs techs and the
NASDAQ, not to mention IWM or MDY, which are much weaker. This is the
type of market that the DJI-30 acts as leader. It attempts to prove by its good
behavior that all is well, even if elsehwere there are more sectors and stocks below their
65-dma supports than are above them.
Weak breadth from this point on would be a dangerous sign.
 |
 |
 |
The DJI and most of the other general market ETFs show Tiger Accumulation
readings which are negative despite being more than 2% above the 21-dma.
This shows "big money" used the last rally to do considerable selling.
While Bulls will take heart in the normal bullishmess in this the third year of the 4-year
Presidential cycle from June 26th through the July 4th holiday, Closing Power
uptrends were broken today for SPY and QQQ, adding to yesterday's similar
breakdowns for MDY and IWM. Only DIA's Closing Power is still in
and uptrend, and it - just barely.
The over-head resistance should contain any upside move until there has
been a successful re-test of the lows or the FED cuts rates dramatically.
 |
 |
 |
Powell's "Tell" Is He's Not Telling.
Why are Professionals worried? Certainly, the failure of the DJI to get above 27000
and the growing weakness in other sectors can be blamed. But I think the way
short-term rates are now below 2% while the Federal Funds rate remains at 2.4%
is scaring some, too. What's going on? Why is big money selling stocks and
rushing
to take long positions mostly in Gold and in short-term and 10-year Treasuries?
Fed Chairman Powell maddeningly refused to talk about this, or why he switched so
abruptly from hawk to dove last December or, even more basically, why his FOMC
has not already lowered rates given the low CPI numbers, the weak Jobs report for May,
the strong Dollar, productivity gains being above real wage gains and the new tariffs
acting as a fiscal drag on the economy.
Without a Fed rate cut soon, I would think the DJI will fall to the lower band again, at
the
least. My guess is that the market will have to do another attention-getting,
"cry baby"
routine in order to get a 1/4% drop in the Federal Funds rate and the Discunt Rate
in July. But such rate cuts should bring a very good rally in August. Perhaps,
President
(the populist) Trump will publicly scold Powell again. I personally would find this
very entertaining. And it may help Powell see the light, though his performance
today may have just been to make it seem that he is independent.
I would continue to hold YINN. I can't believe that the President wants to make a trade
war with China and a hot war with Iran at the very same time.
|
Charts 6/25/2019 2019 PEERLESS DJI, Signals, Indicators Daily DJI Volume 10-DayUp/Down Vol Hourly DJIA A/D Line for All Stocks Inverted Traders Index NASDAQ S&P OEX NYSE COMPQX DJI-15 DJI-20 DJI-30 DIA SPY QQQ MDY IWM TNA Short-Term Rates USO-CrudeOil DBO FAS GLD BBH IBB JETS JNUG KOL NUGT OIH OIL RSX RETL SDS AGQ SLV SOXL TECL TLT TMF TNA UGA (gasoline) XIV and China: YINN CHAU Commodities: CANE CORN DBC JJC, NIB, CHOC CORN, CUT (paper) MOO, SOYB WEAT UUP (Dollar) LIT (Lithium) AAPL ADBE ALXN AMAT AMGN AMD AMZN BA BABA BAC BIDU CAT CVX DE FB GOOG GS HD IBM INTU JPM M (Macy's) MSFT NFLX NVDA QCOM TSLA TXN XOM WMT CMG , LRCX, SWKS, MDGL SPPI WATT SQ TOWN 6/25/19 (Click on Underlined link.) Bullish MAXCPs - http://tigersoft.com/MAXCPS/Jun-25/BULLISH.htm Bearish MAXCPs - http://tigersoft.com/MINCPs/Jun-25/BEARISH.htm |
Table 1 QUICKSILVER on ETFS - 6/22/2019 ETF CLOSE CHANGE PIVOT-PT 5-dmaAROC CL-PWR CANDLE IP21 ITRS --------------------------------------------------------------------------------------------- DIA 265.26 -1.91 265.56 -1.3% Bearish RED -.035 ==== --------------------------------------------------------------------------------------------- BA 369.32 -4.67 368.56 -62.3% ------- RED .015 -.032 --------------------------------------------------------------------------------------------- SPY 290.76 -2.88 293.06 -27.9% Bearish RED -.058 -.002 --------------------------------------------------------------------------------------------- QQQ 184.93 -3.23 187.11 -39.4% ------- RED -.078 -.009 --------------------------------------------------------------------------------------------- MDY 346.02 -1.89 351.97 -69.9% Bearish RED -.007 -.038 --------------------------------------------------------------------------------------------- IWM 151.15 -.93 154.56 -92.9% Bearish RED -.074 -.046 --------------------------------------------------------------------------------------------- FAS 70.89 -1.69 73.15 -128.2% Bearish RED -.053 .015 --------------------------------------------------------------------------------------------- SOXL 129.29 -5.93 133.46 -145.2% Bearish RED -.063 -.237 weak...warning --------------------------------------------------------------------------------------------- TECL 152.03 -8.92 155.76 -61.2% ------- RED -.023 -.02 --------------------------------------------------------------------------------------------- IBB 106.89 -.23 108.17 -31% ------- RED -.115 -.042 --------------------------------------------------------------------------------------------- GLD 134.2 .26 127.89 271.5% Bullish RED .295 .097 strong...warning --------------------------------------------------------------------------------------------- OIH 14.24 .01 13.82 155.6% Bearish ---- .01 -.212 --------------------------------------------------------------------------------------------- RSX 23.55 -.25 23.28 63.7% ------- RED .067 .093 |
Table 2 Count of Stocks in Key Directories
20190625
-------------------------------
NEWHIGHS 80
NEWLOWS 38
MAXCP 9
MINCP 37
TTTNH 9
TTTNL 77
FASTUP 54
FASTDOWN 114
CPCROSSA 59
CPCROSSD 247
BIGVOLUP 6
BIGVODN 13
ACCUMVER 10
HIGHIP21 8
HIUPPCT 12
LOWACCUM 150
REDSELL 90
AUGSELS7 13
TRAPDOOR 9
|
Table 3 RANKING OF KEY DIRECTORIES BASED PCT.OF STOCKS ABOVE 65-DMA
6/25/19
Bullish = 20
Bearish = 24
---------------------------------------------------------------------------------------
Directory Current day-1 day-2 day-3 day-4 day-5
----------------------------------------------------------------------------------------
BONDFUND .941 .97 .961 .932 .922 .912
GOLD .862 .882 .784 .784 .686 .647
UTILITY .8 .8 .825 .85 .825 .7
INSURANC .777 .851 .888 .888 .925 .814
SOLAR .777 .777 .777 .777 .777 .777
DJI-13 .769 .846 .769 .769 .615 .615
DOWJONES .724 .793 .758 .758 .655 .689
MILITARY .689 .724 .689 .724 .655 .689
SP-100 .637 .67 .681 .67 .626 .626
COMODITY .609 .585 .585 .585 .585 .609
SP500 .605 .64 .658 .666 .627 .623
FOOD .603 .566 .566 .584 .584 .584
GUNS .588 .705 .588 .647 .588 .588
FIDSTKS .586 .641 .668 .684 .652 .646
INDEXES .58 .618 .677 .655 .629 .645
NASD-100 .572 .635 .645 .666 .604 .583
GREEN .545 .545 .545 .545 .545 .545
INFRA .527 .555 .555 .555 .527 .527
RUS-1000 .519 .548 .58 .605 .561 .557
AUTO .512 .512 .538 .564 .512 .512
============================================================================================
JETS .5 .5 .5 .7 .7 .7
============================================================================================
NIFTY .491 .578 .578 .578 .526 .456
COMPUTER .476 .523 .523 .571 .523 .476
BEVERAGE .47 .47 .47 .47 .411 .411
CHEM .452 .471 .471 .509 .452 .452
INDMATER .45 .425 .487 .5 .425 .425
FINANCE .443 .477 .5 .522 .522 .511
GAMING .434 .434 .347 .347 .391 .391
HOSPITAL .434 .391 .434 .478 .434 .347
REIT .425 .5 .56 .722 .702 .682
HOMEBLDG .411 .529 .588 .705 .647 .764
ETFS .403 .561 .526 .578 .421 .298
SEMI .387 .423 .441 .459 .423 .378
SOFTWARE .37 .516 .532 .58 .516 .5
ELECTRON .363 .388 .407 .42 .375 .356
BIOTECH .358 .339 .41 .391 .4 .372
EDU .333 .333 .5 .5 .5 .5
RETAIL .301 .32 .339 .358 .358 .377
BIGBANKS .285 .428 .428 .428 .428 .428
REGBANKS .25 .25 .285 .285 .321 .392
TRANSP .25 .3 .45 .5 .45 .5
OILGAS .215 .208 .243 .256 .187 .18
HACKERS .2 .35 .4 .35 .4 .4
CHINA .087 .122 .122 .192 .105 .122
COAL 0 .142 .142 .142 .142 0
|
=======================================================================
6/24/2019
Friday's Sell S9V
at the upper 3.9% band just below 27000 has stalled
the DJI's rally. The DJI's rally has failed to bring along small and medium
priced stocks most, so far. See how the Closing Powers of IWM and MDY have
broken their uptrends. Professionals are selling these. Without broader
participation
in the rally, the DJI will have a much harder time breaking out above 27000 without
just giving more Peerless Sells. The real story now, however, is not the DJI.

It is Gold's breakout above 1400, the Dollar's Head/Shoulder top and the
steep fall in 10-year and short-term rates. Something bearish usually befalls
the market when Gold rises by 20% or more over 3 months. And why is
Powell delivering an unscheduled speech tomorrow in New York? "Something
is up", to coin a phrase.
 |
 |
 |
Powell may try to weaken Gold tomorrow.
Use the 5-day ma methodology advocated
by our QUICKSILVER SYSTEM.
It appears highly likely that the FED will drop
interest rates unless the June jobs
numbers turn back up above +200,000, which right now seems unlikely. But
rather than guess about the FED, again consider buying GLD, if you have not
already. Something big is going on there. The story has not come out.
It has to
do with the FED's dropping interest rates and the Dollar being sold by
international traders. It has something to do with tensions in the middle
east. It
has something to do with the unknowns of an escalating war of tariffs. It may have
something to do with the Bank of England's refusal to send back to Venezuela its gold.
It may have something to do with Russia and other countries seeking to be paid in Gold
or in other currencies than the Dollar.


|
Charts 6/24/2019 2019 PEERLESS DJI, Signals, Indicators Daily DJI Volume 10-DayUp/Down Vol Hourly DJIA A/D Line for All Stocks Inverted Traders Index NASDAQ S&P OEX NYSE COMPQX DJI-15 DJI-20 DJI-30 DIA SPY QQQ MDY IWM TNA Short-Term Rates USO-CrudeOil DBO FAS GLD BBH IBB JETS JNUG KOL NUGT OIH OIL RSX RETL SDS AGQ SLV SOXL TECL TLT TMF TNA UGA (gasoline) XIV and China: YINN CHAU Commodities: CANE CORN DBC JJC, NIB, CHOC CORN, CUT (paper) MOO, SOYB WEAT UUP (Dollar) LIT (Lithium) AAPL ADBE ALXN AMAT AMGN AMD AMZN BA BABA BAC BIDU CAT CVX DE FB GOOG GS HD IBM INTU JPM M (Macy's) MSFT NFLX NVDA QCOM TSLA TXN XOM WMT CMG , LRCX, SWKS, MDGL SPPI WATT SQ TOWN 6/24/19 (Click on Underlined link.) Bullish MAXCPs - http://tigersoft.com/MAXCPS/Jun-24/BULLISH.htm Bearish MAXCPs - http://tigersoft.com/MINCPs/Jun-24/BEARISH.htm |
Table 1 QUICKSILVER on ETFS - 6/24/19 ETF CLOSE CHANGE PIVOT-PT 5-dmaAROC CL-PWR CANDLE IP21 ITRS
---------------------------------------------------------------------------------------------
DIA 267.17 .07 265.33 103.4% Bullish RED .068 ----
---------------------------------------------------------------------------------------------
BA 373.99 2.15 373.96 258.8% Bullish BLUE .001 -.012
---------------------------------------------------------------------------------------------
SPY 293.64 -.36 292.4 72.9% ------- RED -.021 -.003
---------------------------------------------------------------------------------------------
QQQ 188.16 -.41 186.41 118.2% ------- RED -.068 -.005
weak
---------------------------------------------------------------------------------------------
MDY 347.91 -2.8 350.93 13.5% Bearish RED .028 -.043
weak
---------------------------------------------------------------------------------------------
IWM 152.08 -1.87 154.01 -5.2% Bearish RED -.014 -.054
weak
---------------------------------------------------------------------------------------------
FAS 72.58 -.89 72.77 92.4% Bullish RED -.008 .066
---------------------------------------------------------------------------------------------
SOXL 135.22 .89 133.2 662.7% ------- --- -.069 -.186
weak
---------------------------------------------------------------------------------------------
TECL 160.95 .89 153.97 468.5% Bullish RED .006 .041
---------------------------------------------------------------------------------------------
IBB 107.12 -2.33 107.56 47.2% Bullish RED -.081 -.065
weak weak
---------------------------------------------------------------------------------------------
GLD 133.94 1.96 127.12 289.3% Bullish BLUE .362 .076
very strong
---------------------------------------------------------------------------------------------
OIH 14.23 -.23 13.8 260.8% Bearish RED -.033 -.23
very weak
---------------------------------------------------------------------------------------------
RSX 23.8 .14 23.25 192.5% Bullish BLUE .076 .093
strong
|
Table 2 Count of Stocks in Key Directories
20190624
-------------------------------
NEWHIGHS 151
NEWLOWS 36
MAXCP 15 weak
MINCP 35
TTTNH 13
TTTNL 64
FASTUP 80
FASTDOWN 77
CPCROSSA 44
CPCROSSD 210
BIGVOLUP 6
BIGVODN 9
ACCUMVER 6
HIGHIP21 13
HIUPPCT 13
LOWACCUM 152
REDSELL 91
AUGSELS7 8
TRAPDOOR 10
|
Table 3 RANKING OF KEY DIRECTORIES BASED PCT.OF STOCKS ABOVE 65-DMA
Bullish = 25
Bearish = 18
6/24/19
---------------------------------------------------------------------------------------
Directory Current day-1 day-2 day-3 day-4 day-5
----------------------------------------------------------------------------------------
BONDFUND .97 .961 .932 .922 .922 .922
GOLD .877 .775 .775 .693 .653 .632
INSURANC .851 .888 .888 .925 .814 .814
DJI-13 .846 .769 .769 .615 .615 .538
UTILITY .8 .825 .85 .825 .7 .725
DOWJONES .793 .758 .758 .655 .655 .62 SOLAR .777 .777 .777 .777 .777 .666 MILITARY .724 .689 .724 .655 .689 .482 GUNS .705 .588 .647 .588 .588 .588 SP-100 .67 .681 .67 .626 .604 .56 FIDSTKS .641 .668 .684 .652 .641 .586 SP500 .64 .658 .666 .627 .619 .564 NASD-100 .635 .645 .666 .604 .572 .5 INDEXES .618 .677 .655 .629 .655 .5 COMODITY .585 .585 .585 .585 .609 .487 NIFTY .578 .578 .578 .526 .456 .35 FOOD .566 .566 .584 .584 .584 .49 ETFS .561 .526 .578 .421 .298 .157 INFRA .555 .555 .555 .527 .527 .388 RUS-1000 .548 .58 .603 .562 .556 .498 GREEN .545 .545 .545 .545 .545 .5 HOMEBLDG .529 .588 .705 .647 .764 .764 COMPUTER .523 .523 .571 .523 .476 .428 SOFTWARE .516 .532 .58 .516 .5 .419 AUTO .512 .538 .564 .512 .538 .512 N=25 ============================================================================================= JETS .5 .5 .7 .7 .7 .7 REIT .5 .56 .722 .702 .689 .682 ============================================================================================= FINANCE .477 .5 .522 .522 .511 .431 CHEM .471 .471 .509 .452 .471 .433 BEVERAGE .47 .47 .47 .411 .411 .411 GAMING .434 .347 .347 .391 .391 .26 BIGBANKS .428 .428 .428 .428 .428 .428 INDMATER .425 .487 .5 .425 .425 .337 SEMI .423 .441 .459 .423 .378 .288 HOSPITAL .391 .434 .478 .434 .347 .26 ELECTRON .388 .407 .42 .375 .356 .273 HACKERS .35 .4 .35 .4 .4 .3 BIOTECH .336 .41 .391 .4 .361 .306 EDU .333 .5 .5 .5 .5 .5 RETAIL .32 .339 .358 .358 .377 .358 TRANSP .3 .45 .5 .45 .5 .35 REGBANKS .25 .285 .285 .321 .392 .285 OILGAS .208 .243 .256 .187 .18 .145 COAL .142 .142 .142 .142 0 0 CHINA .122 .122 .192 .105 .122 .087 N=18 |


(From Bloomberg)

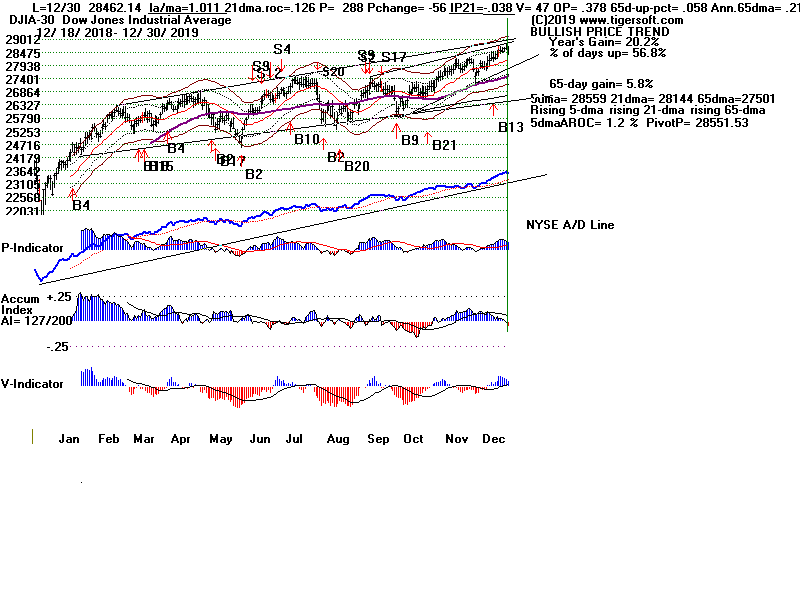
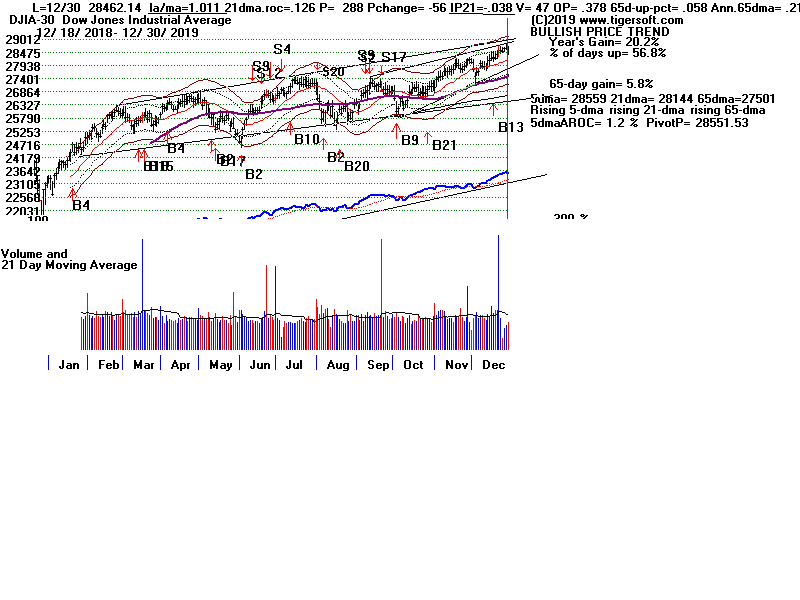
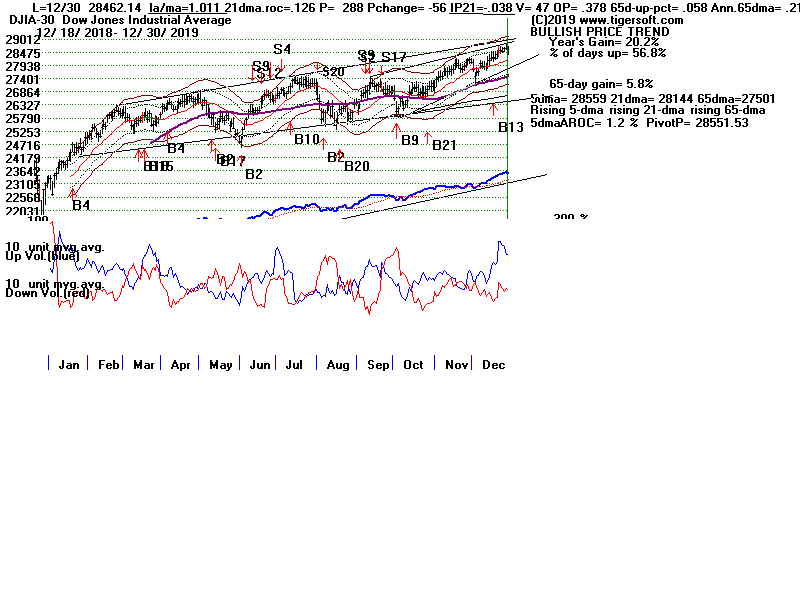
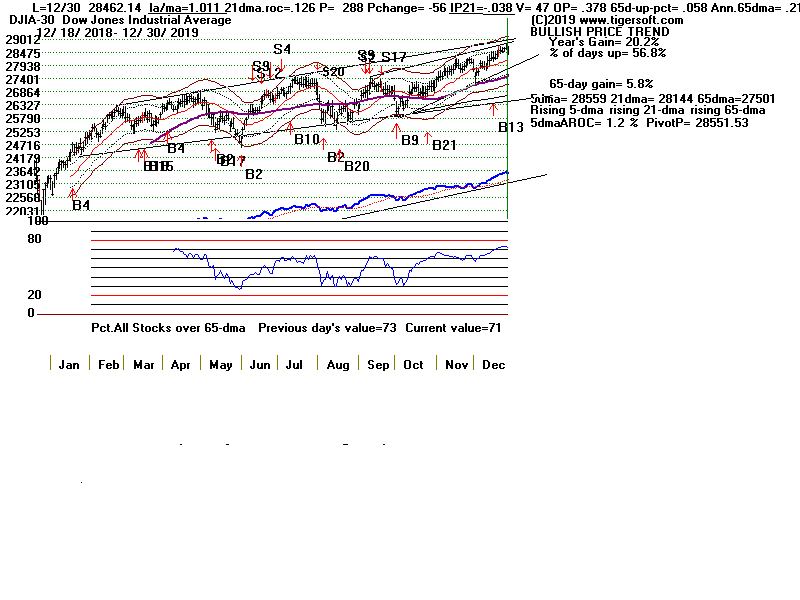
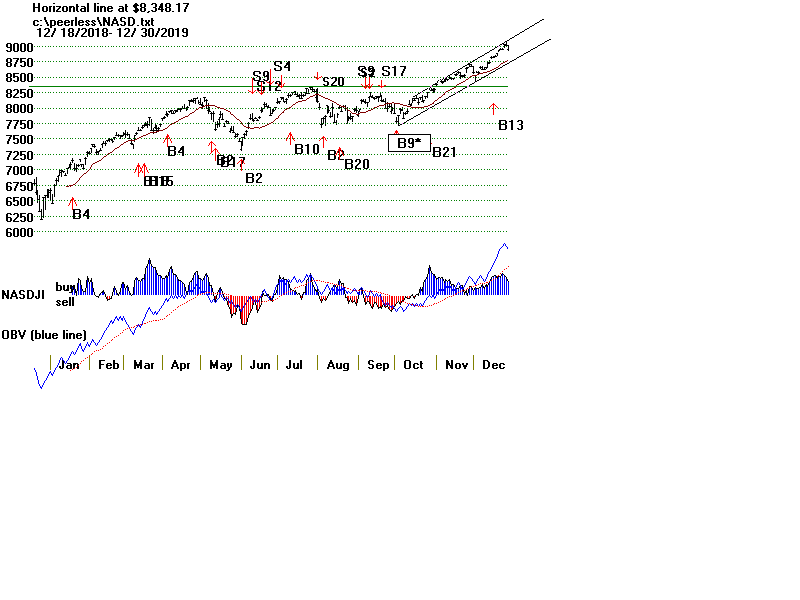
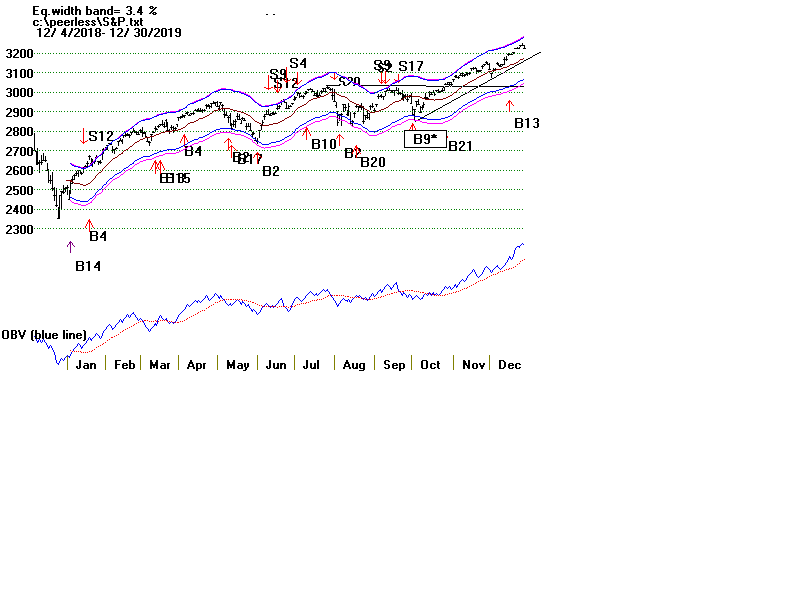
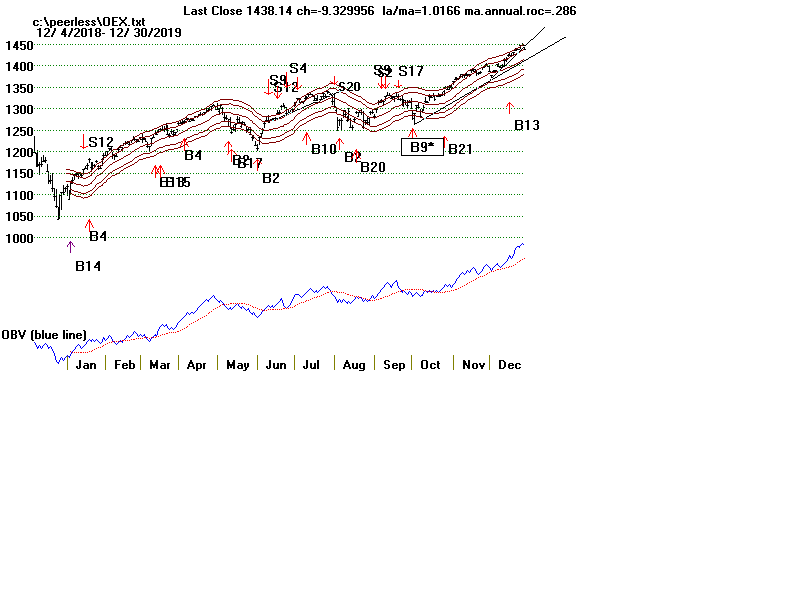
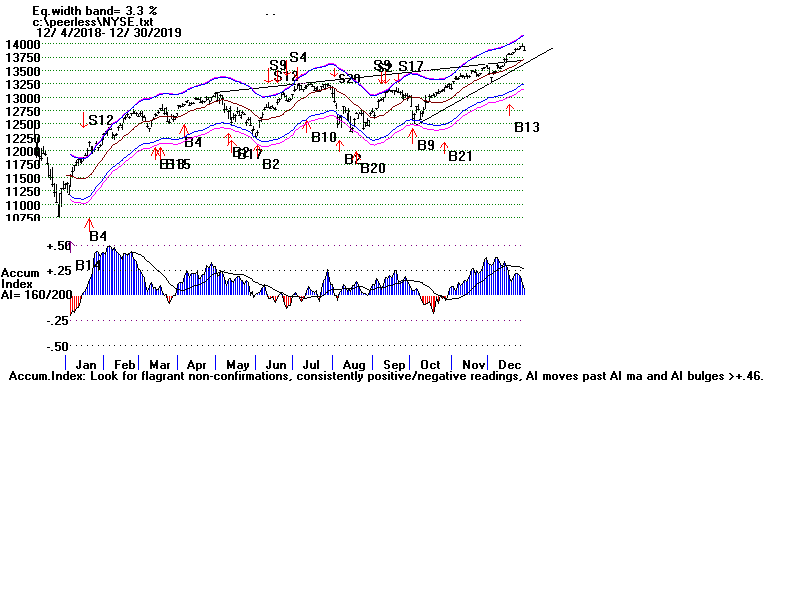
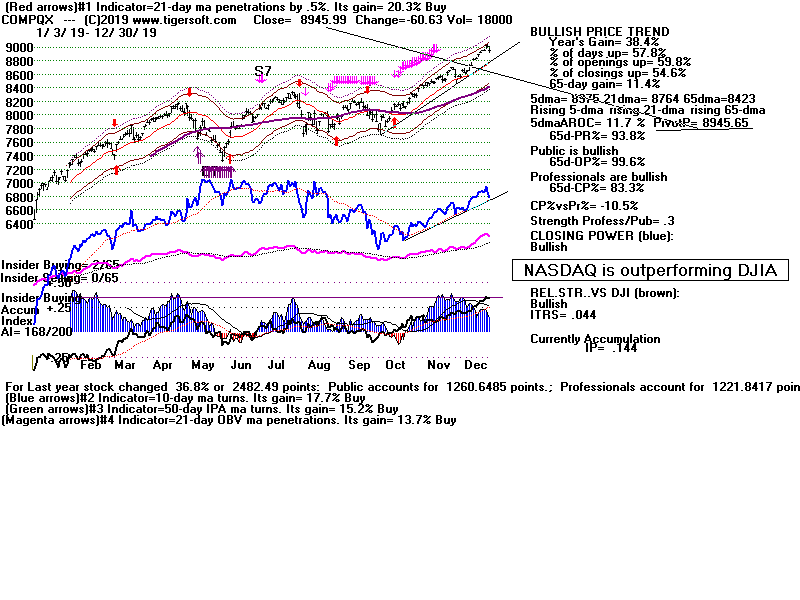
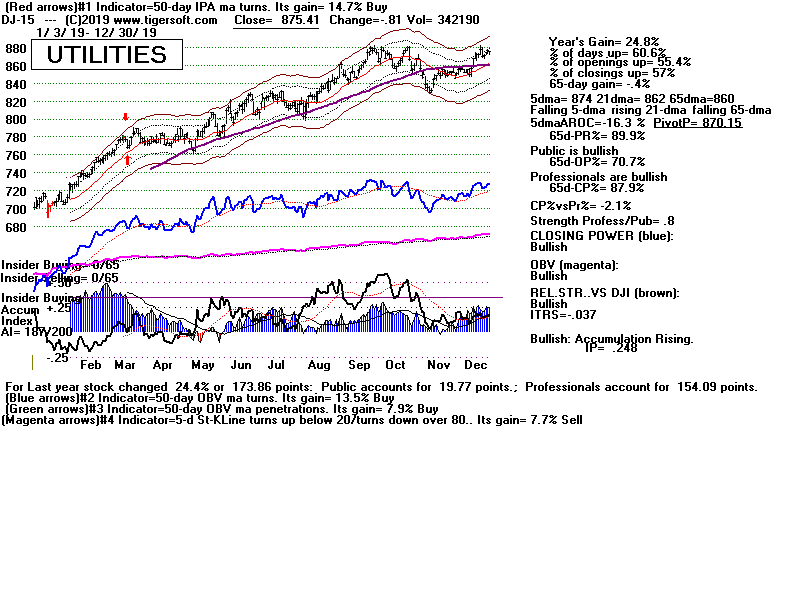
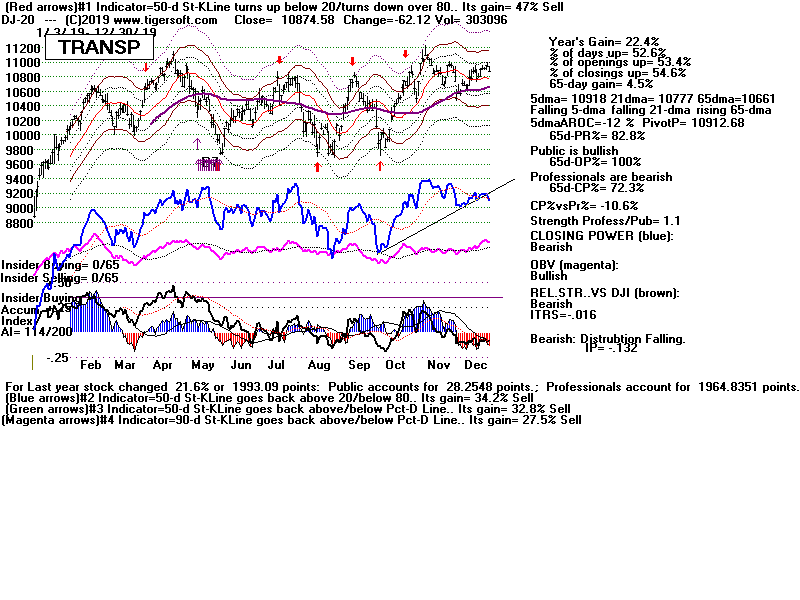
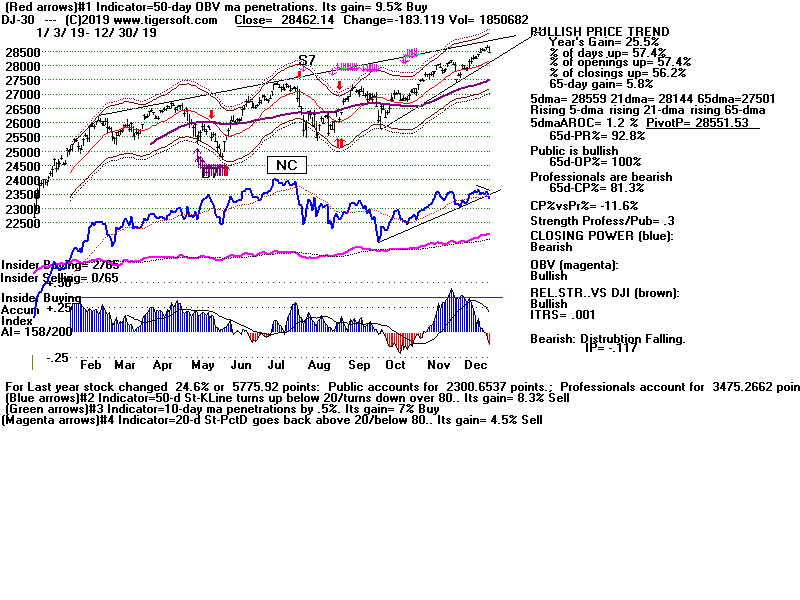
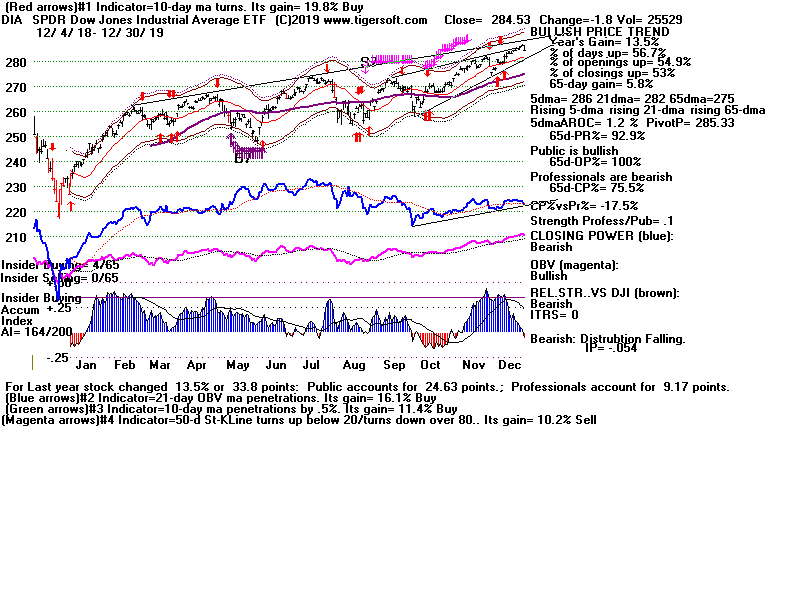
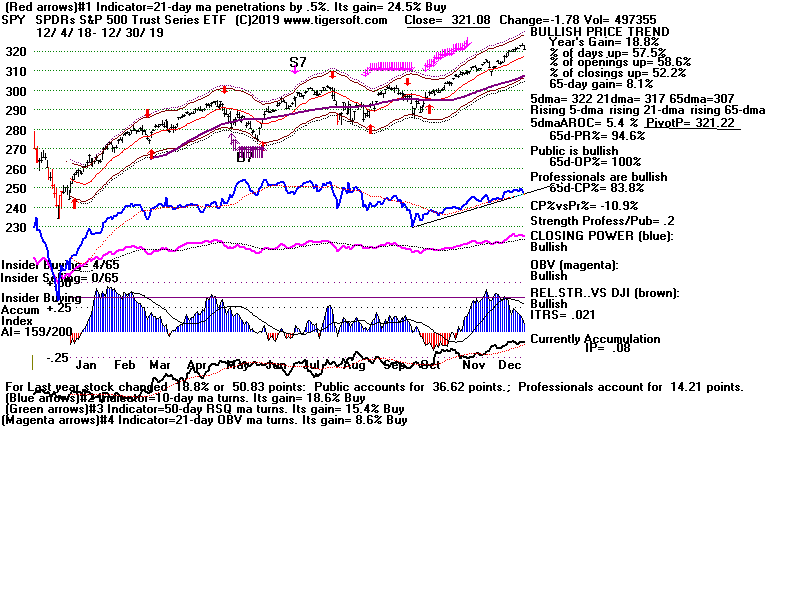
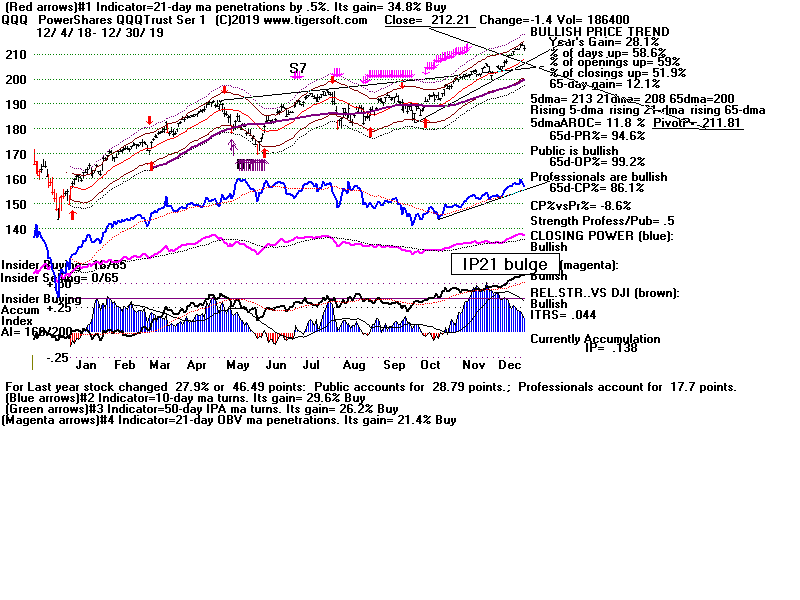
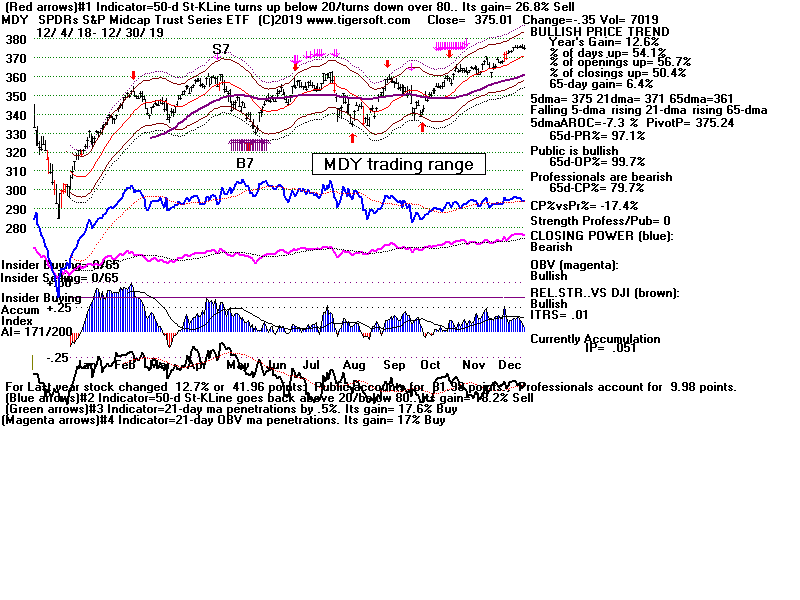
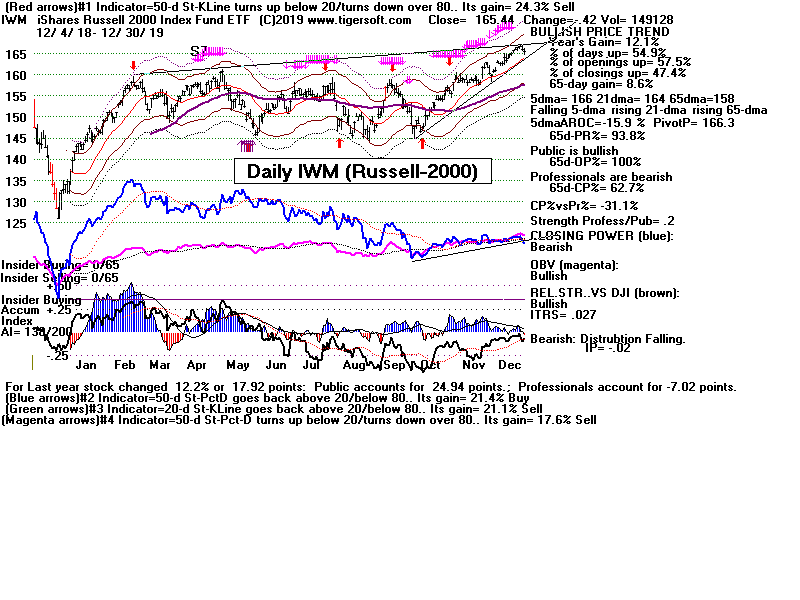
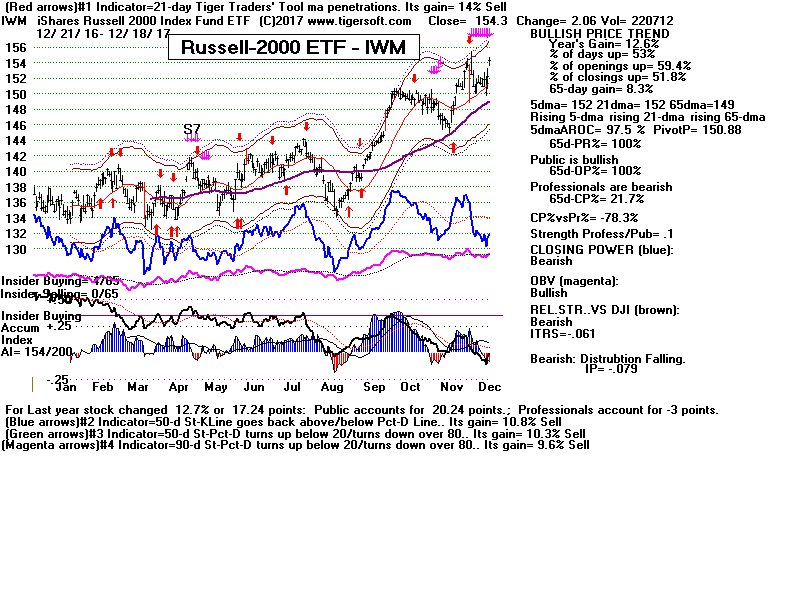
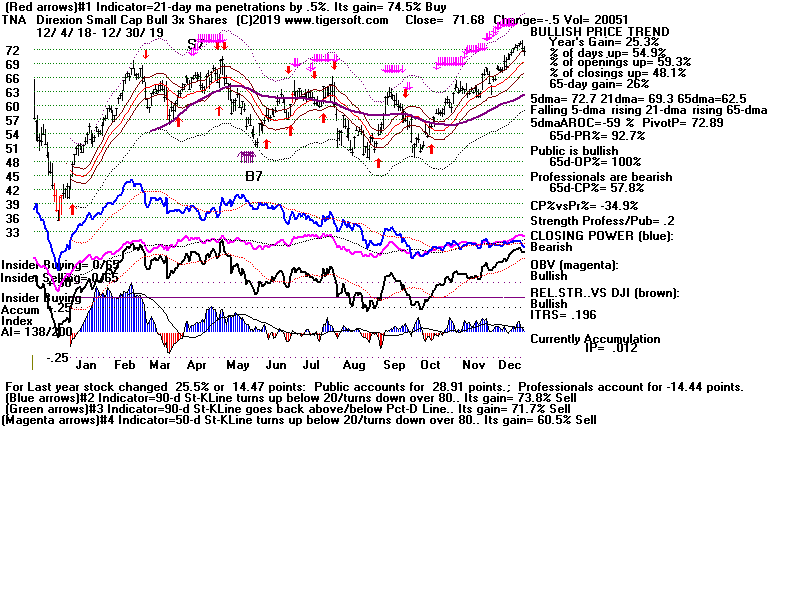
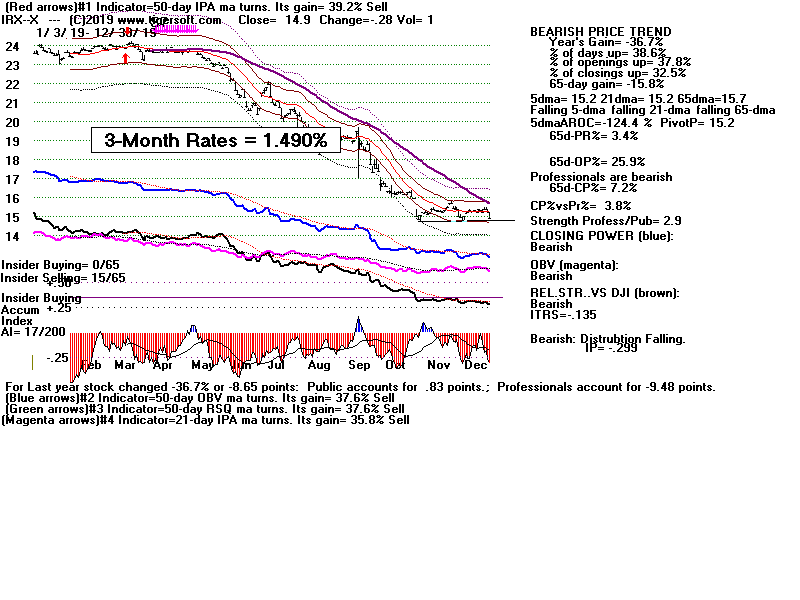
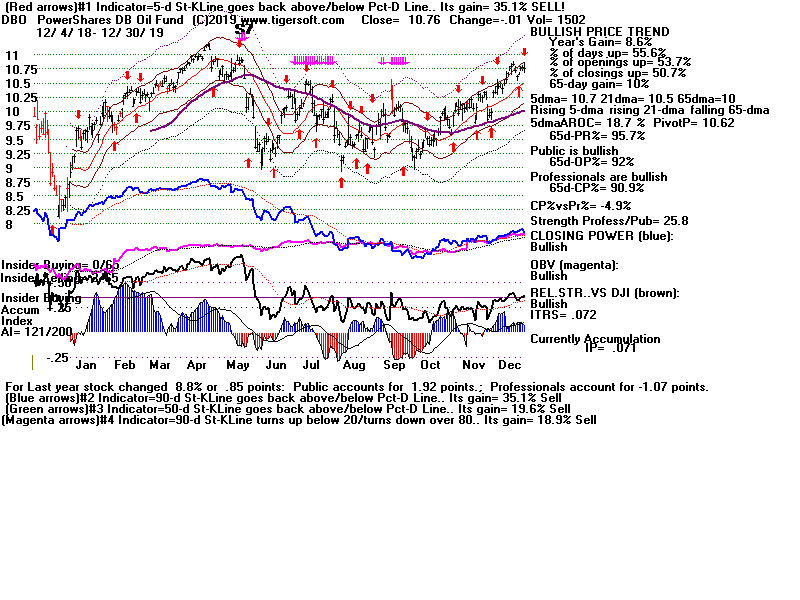
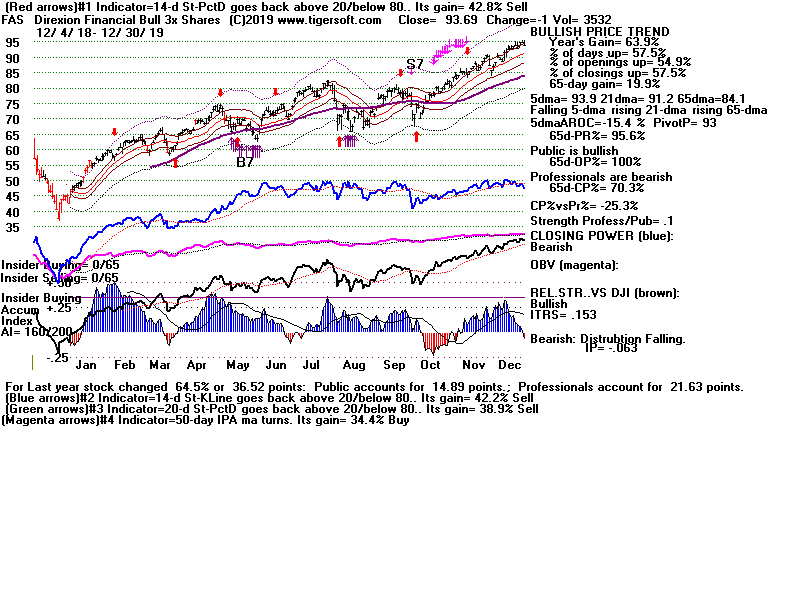
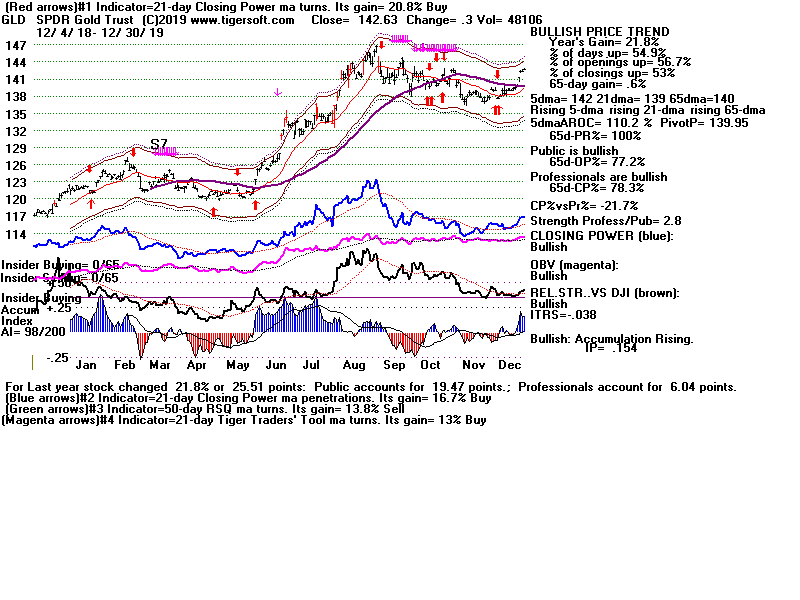
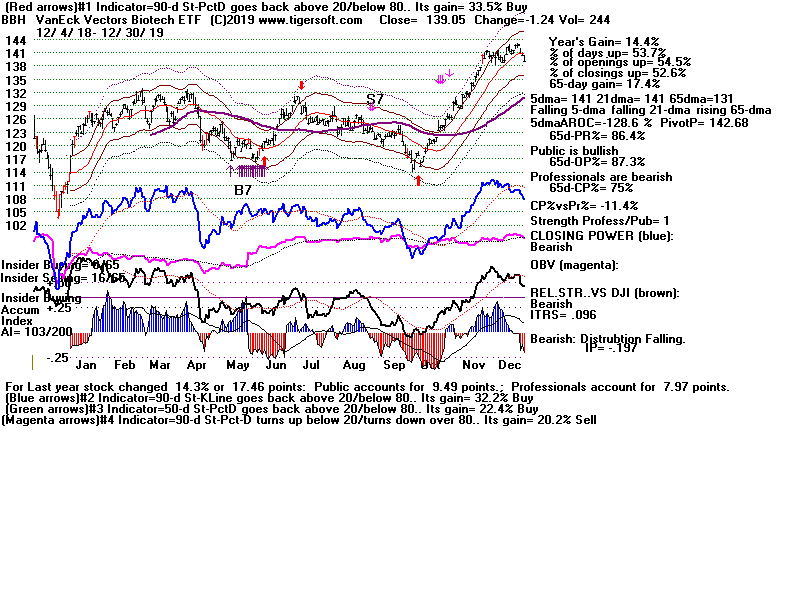
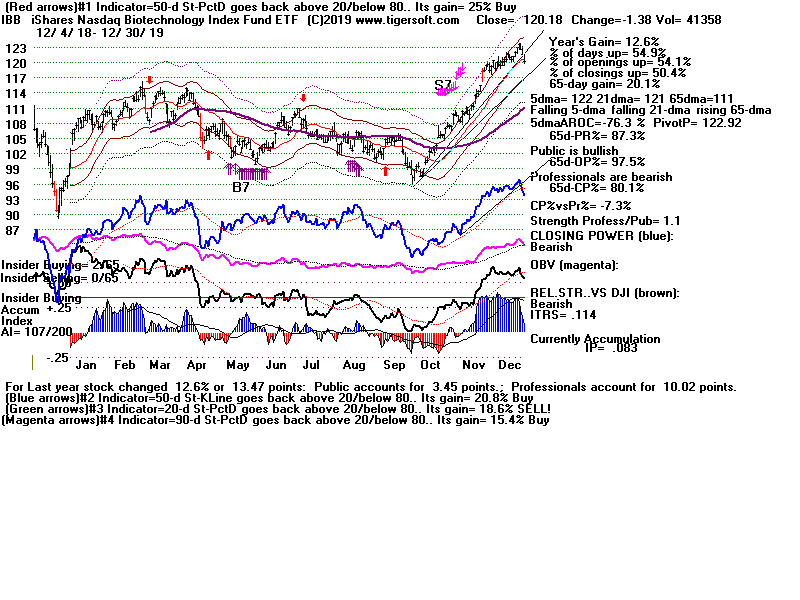
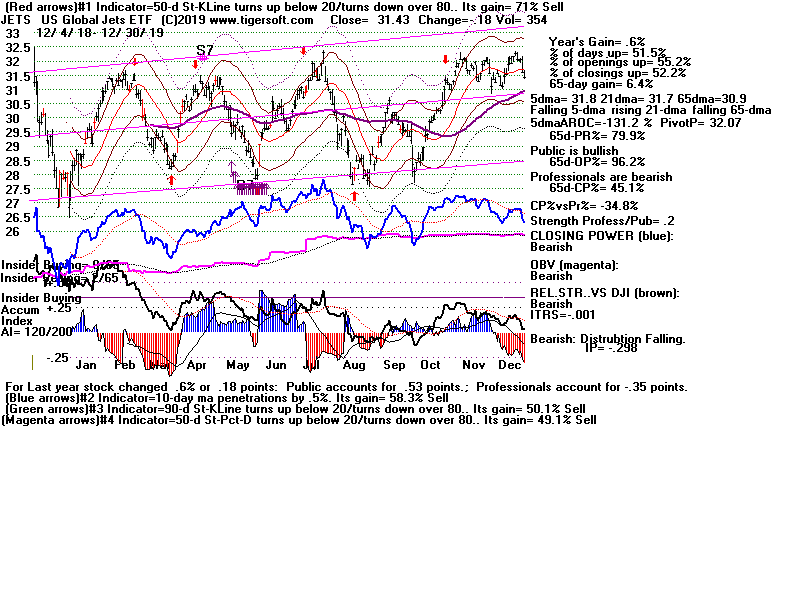
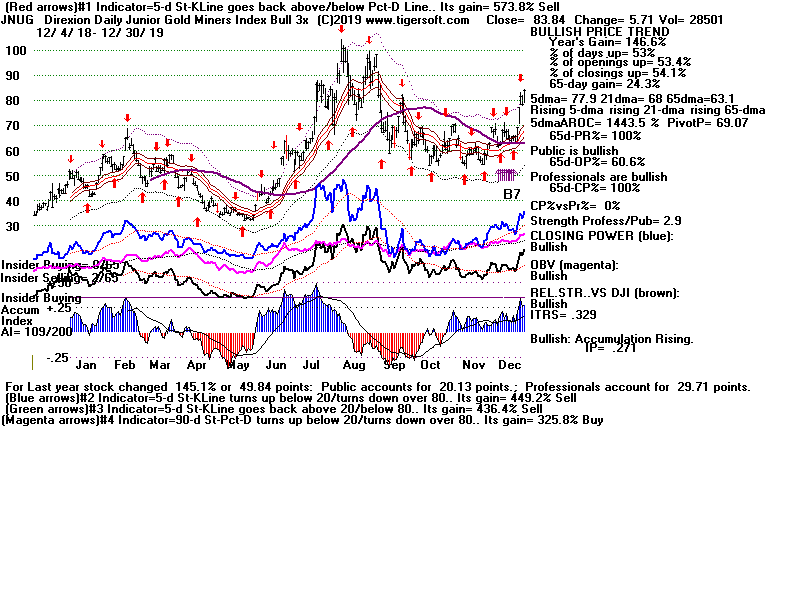
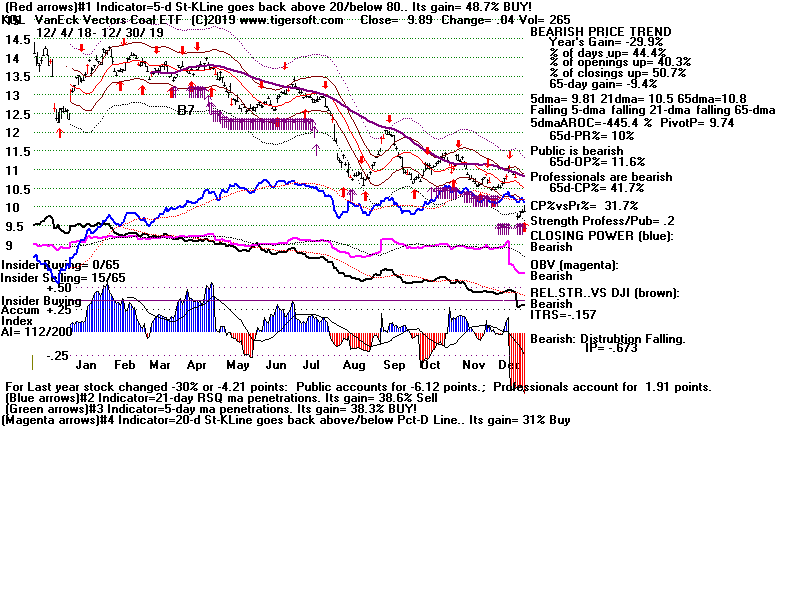
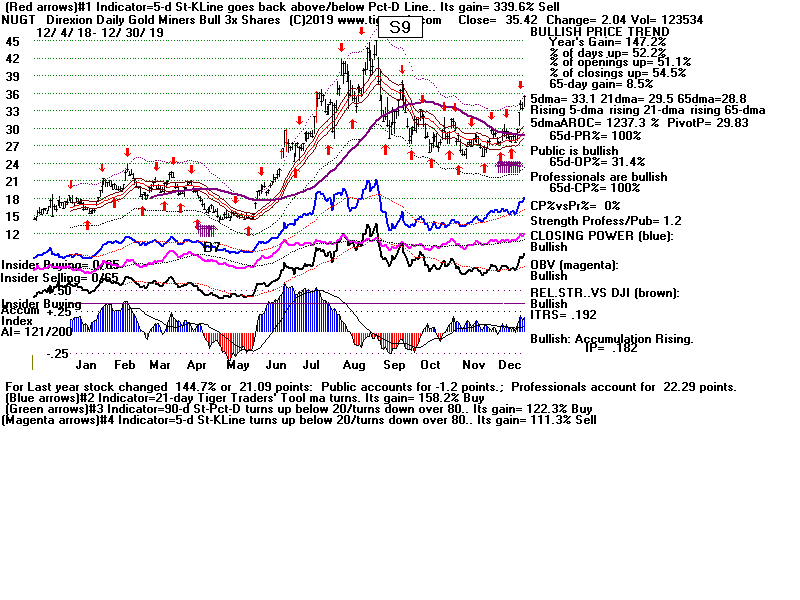
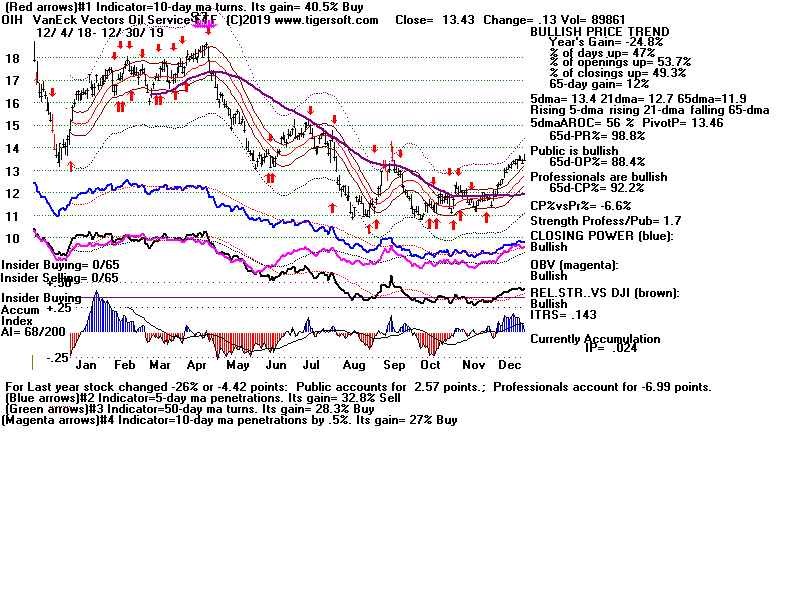
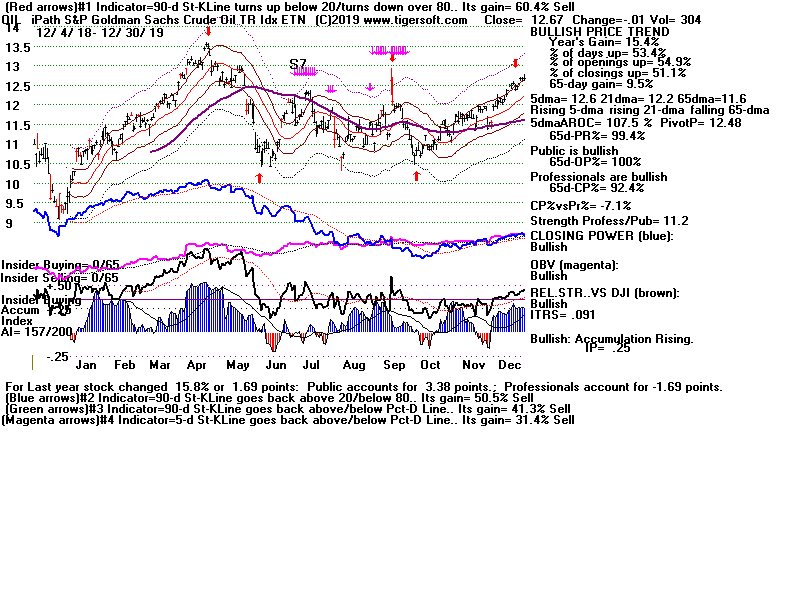
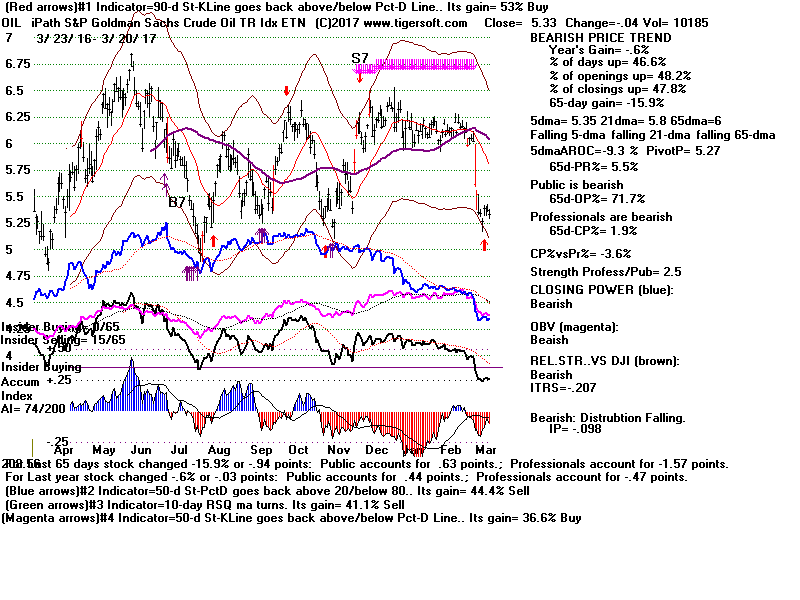
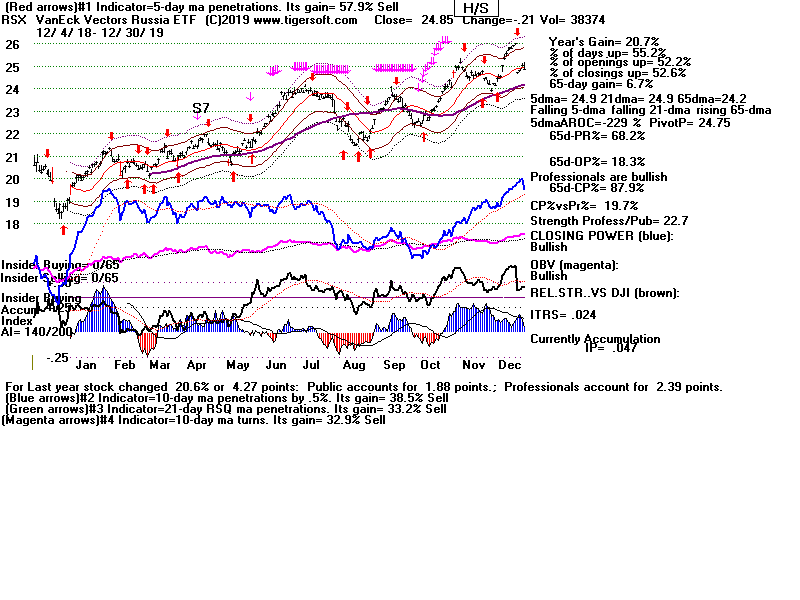
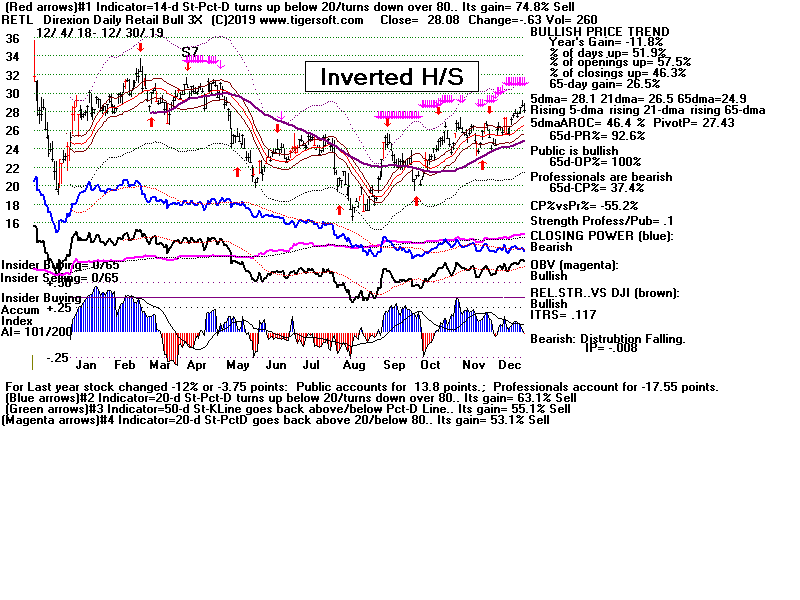
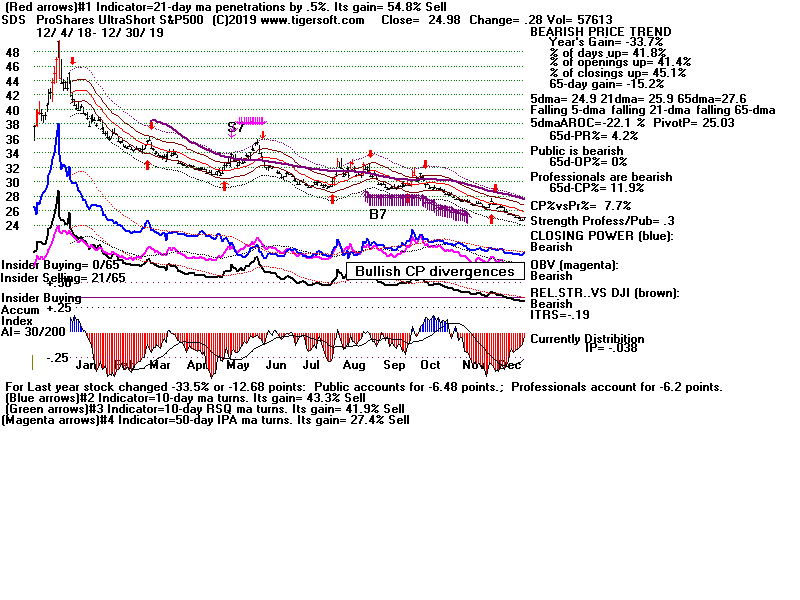
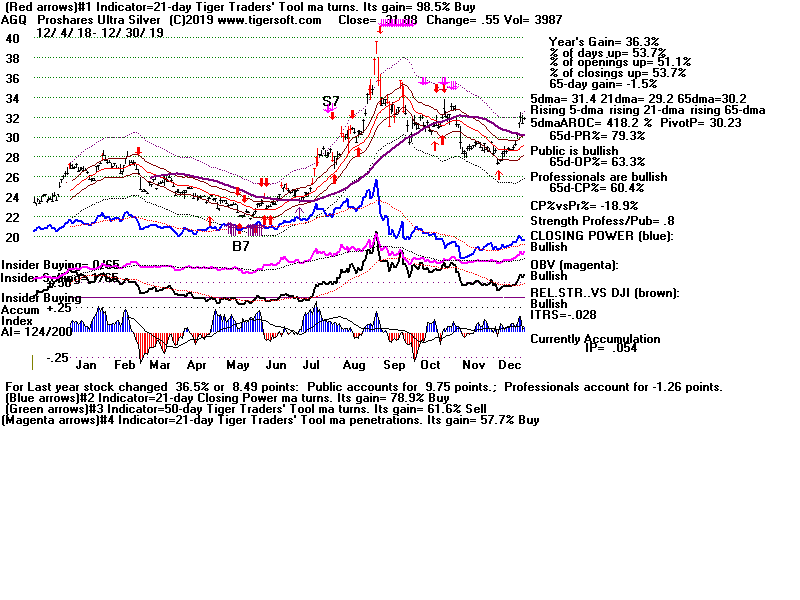
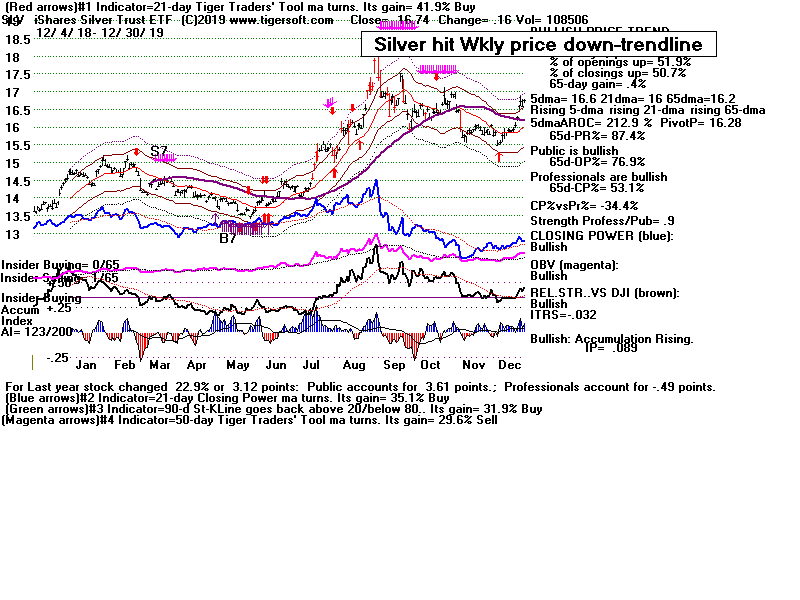
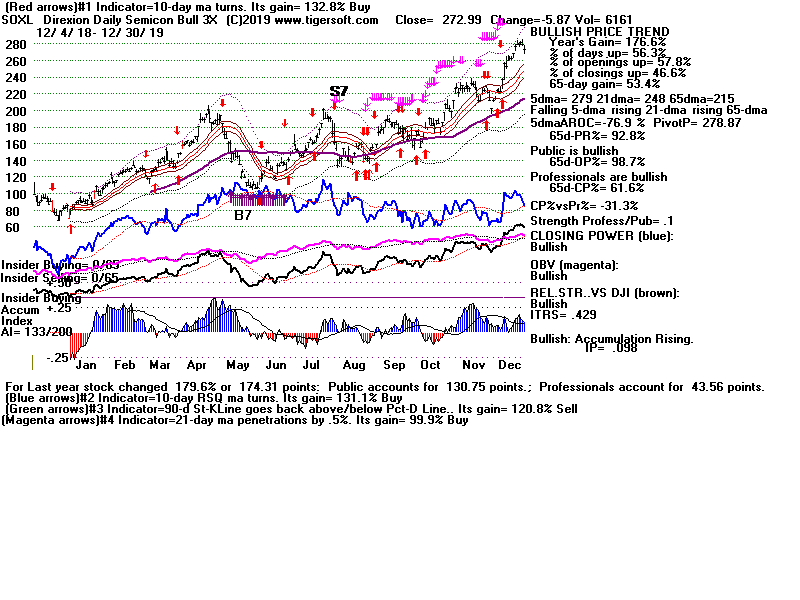
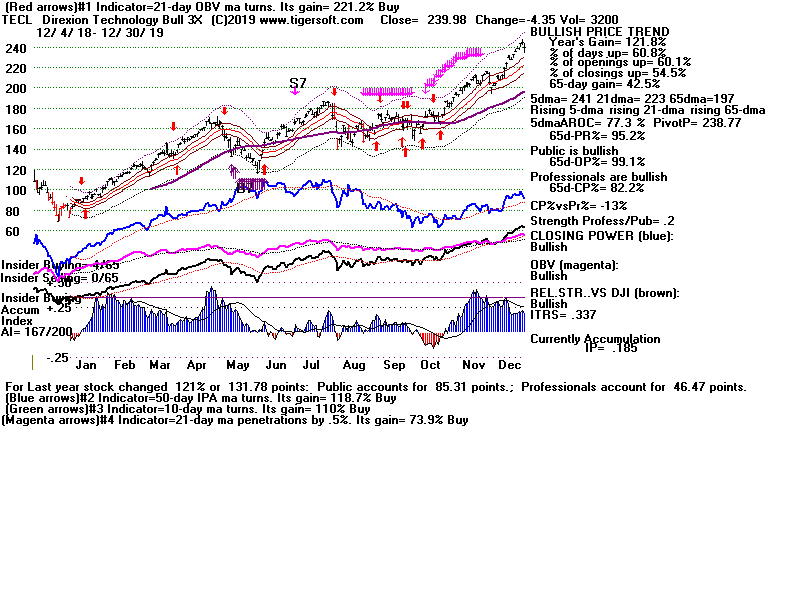
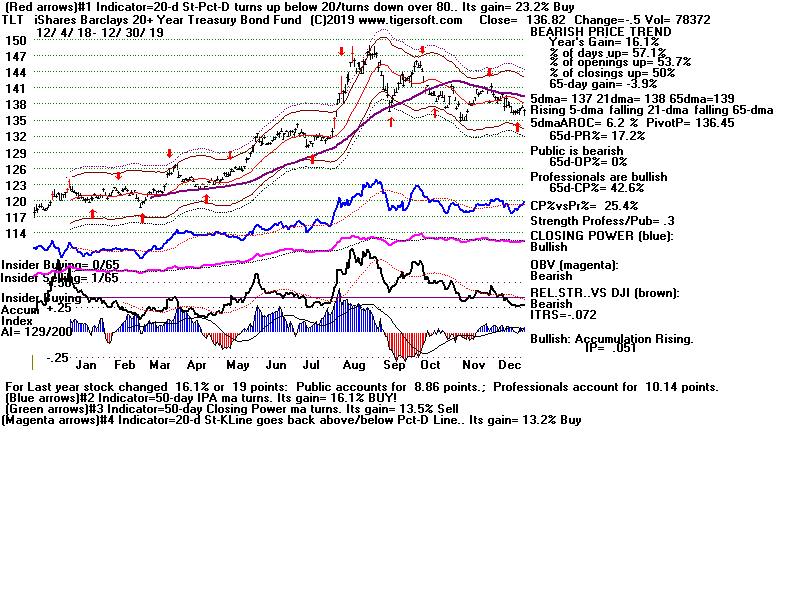
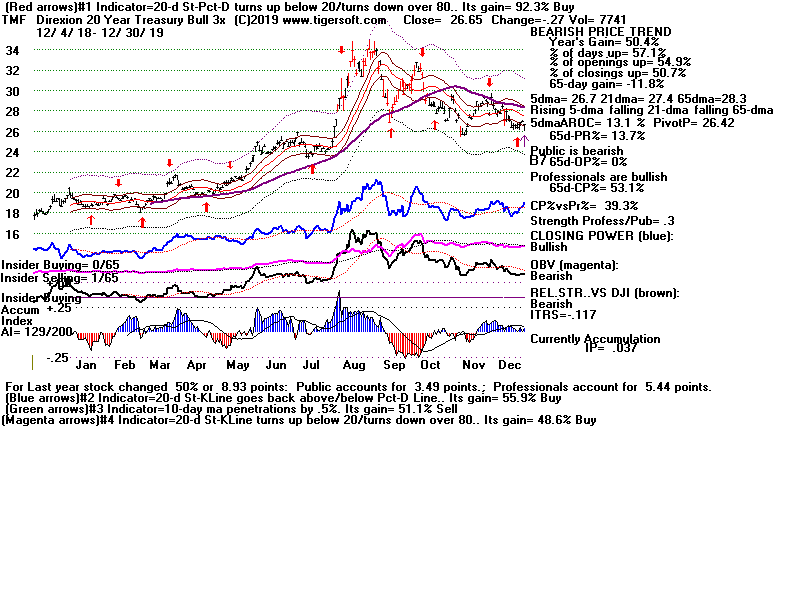
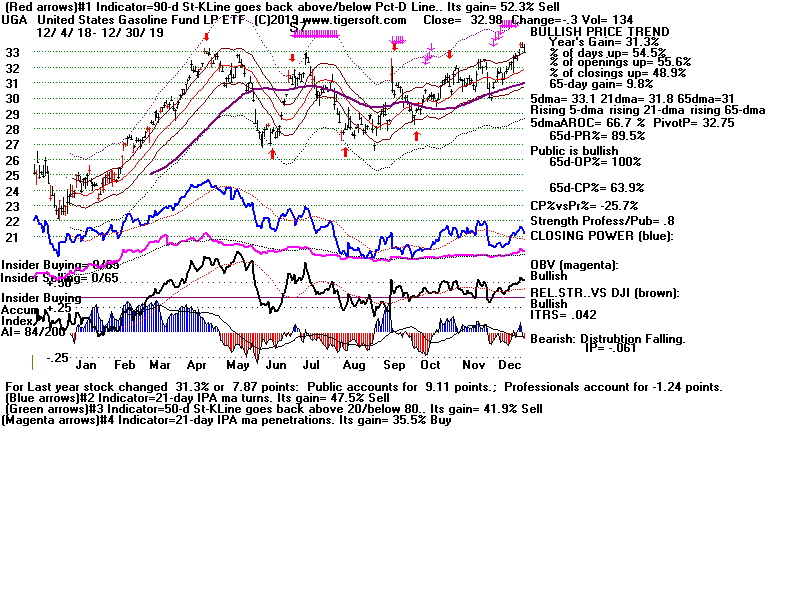
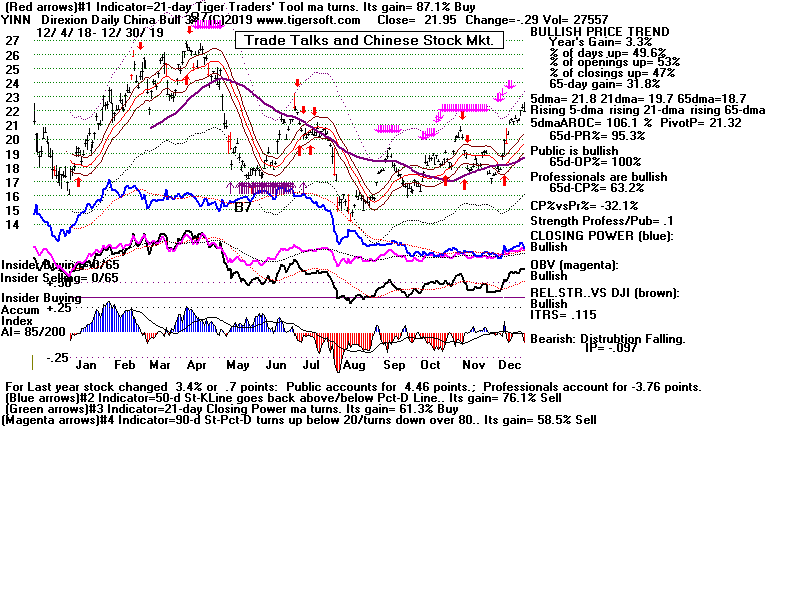
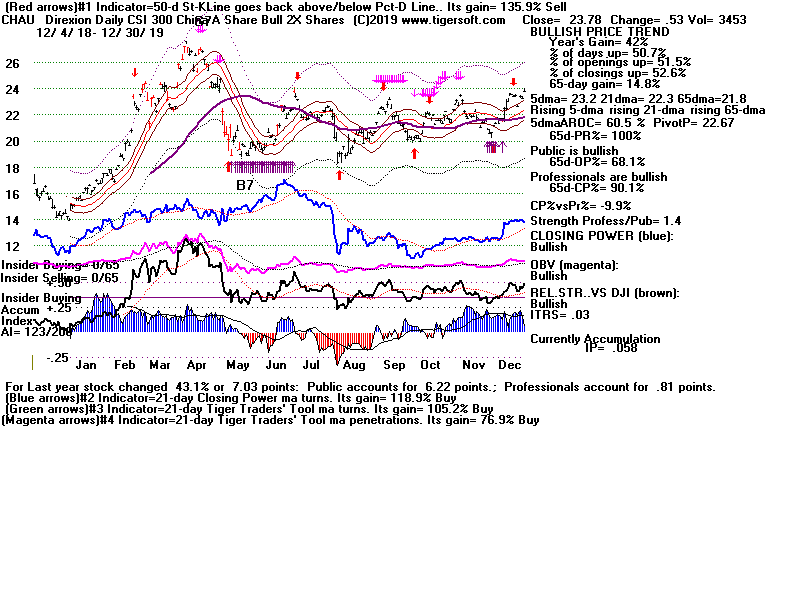
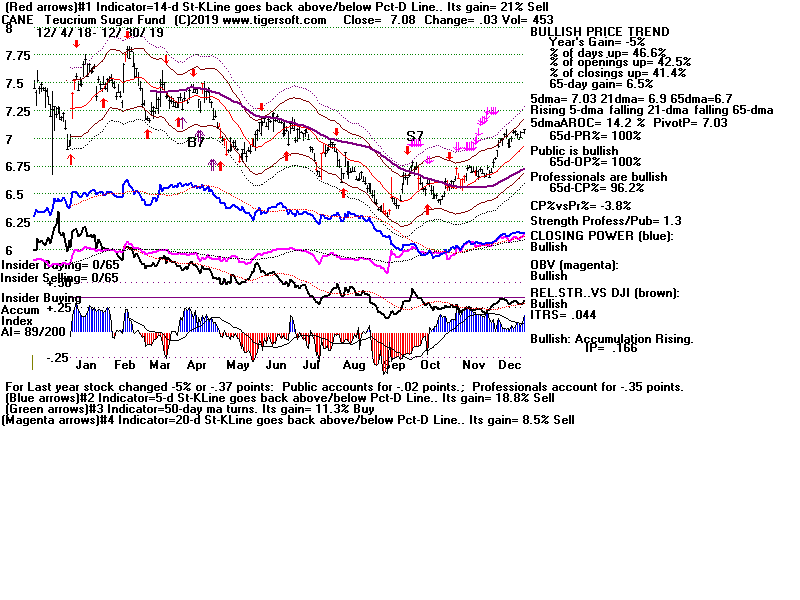
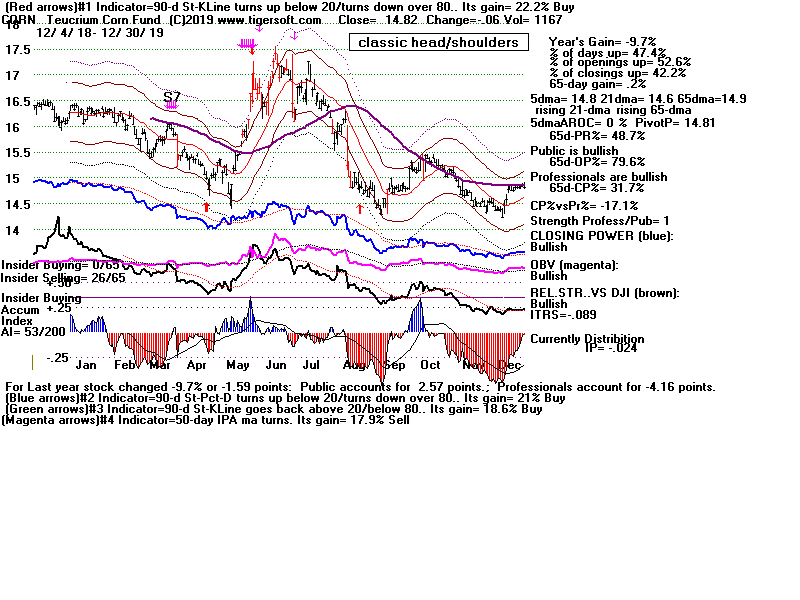
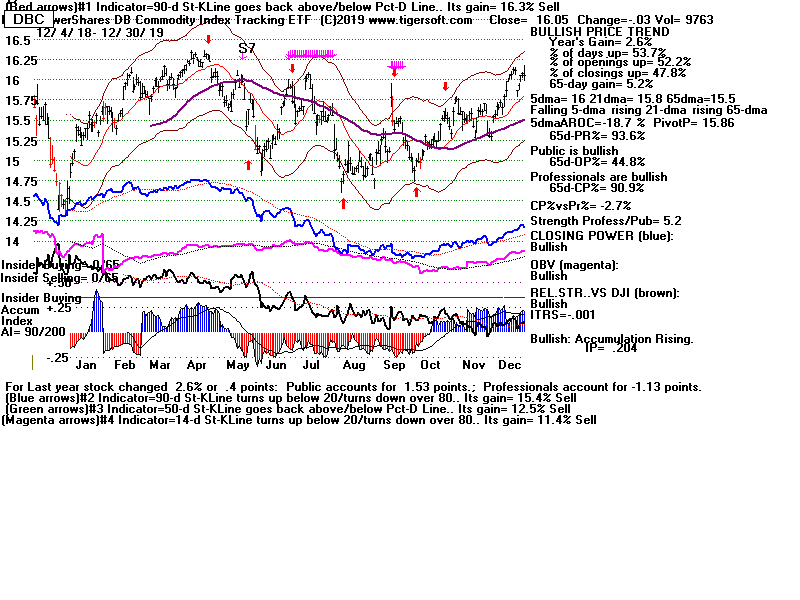
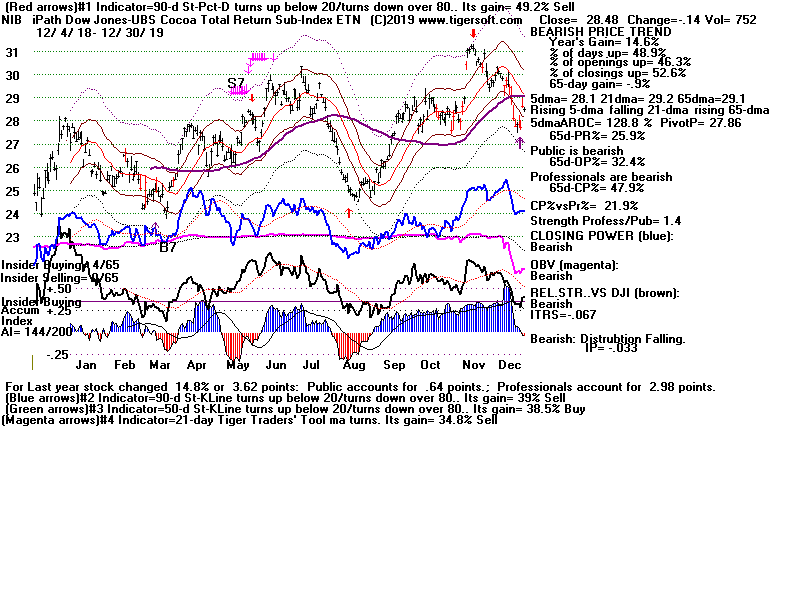
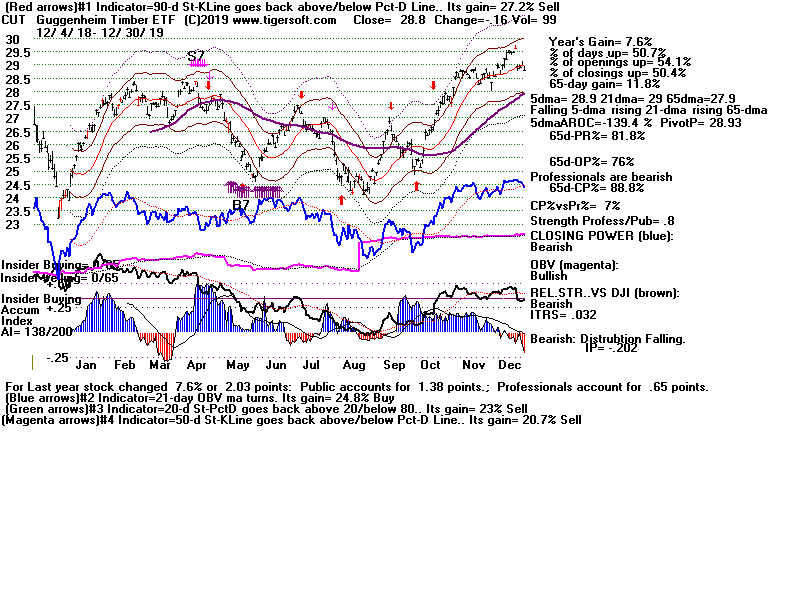
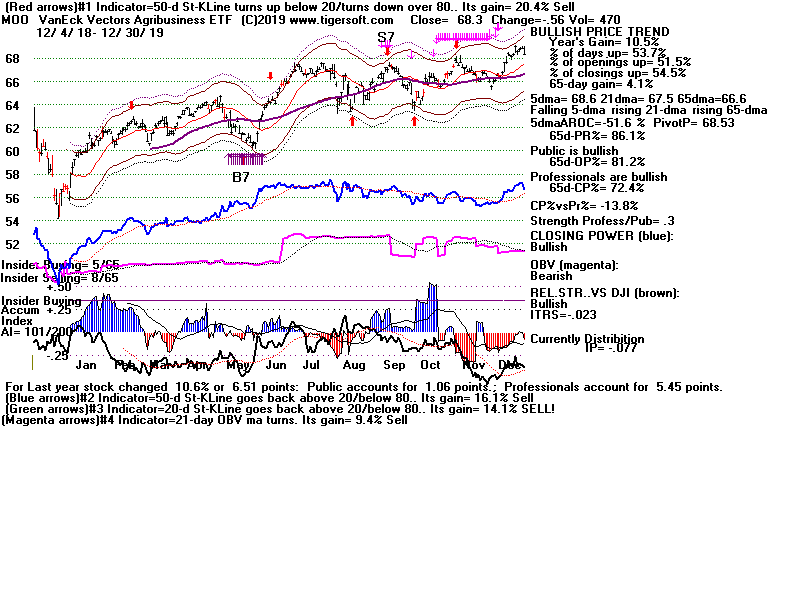
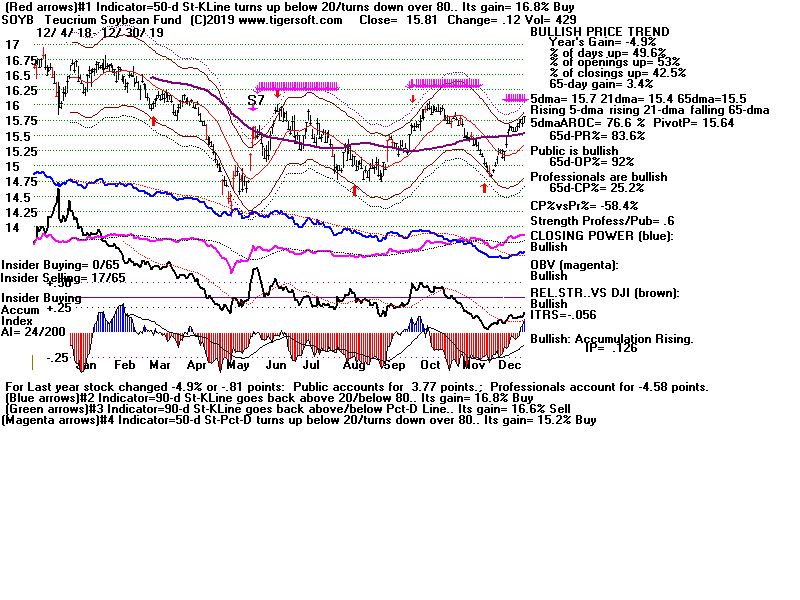
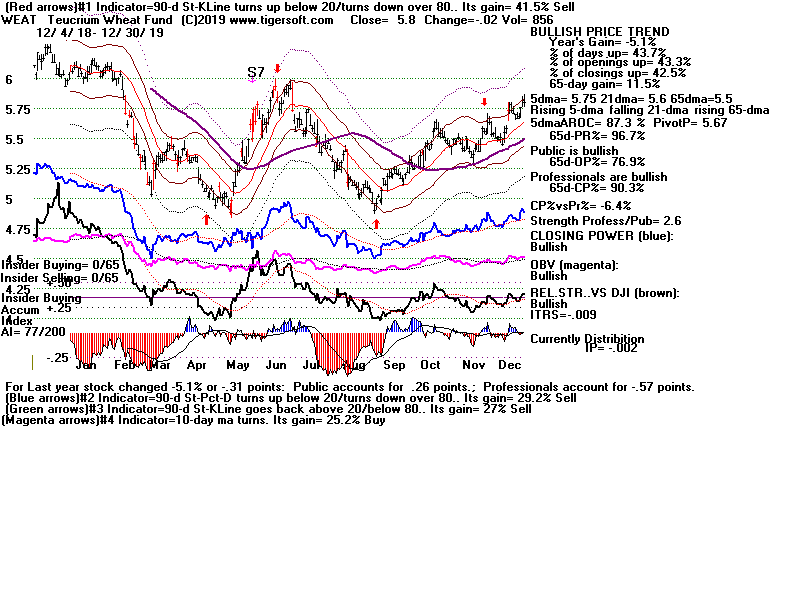
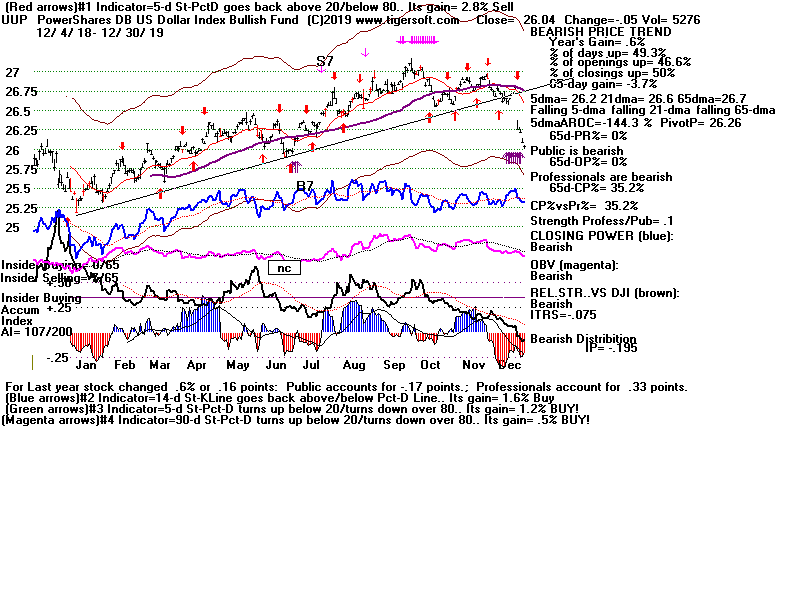
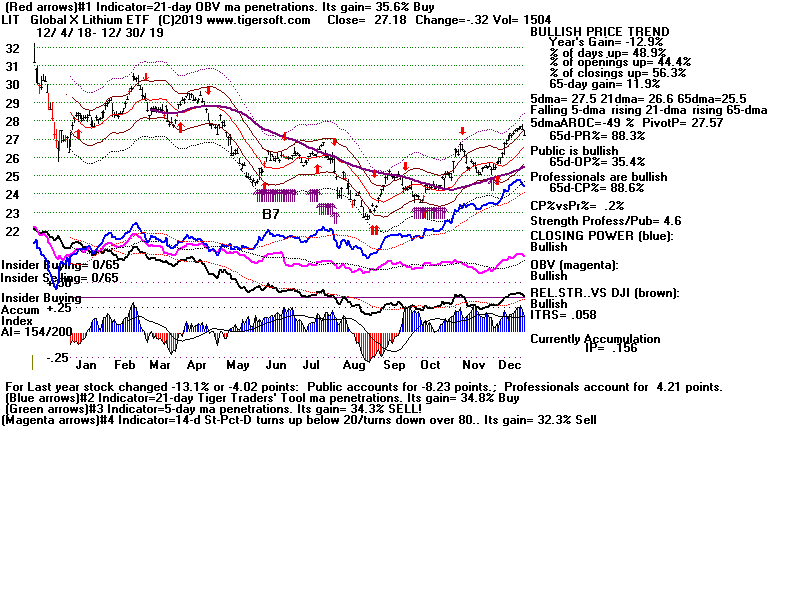
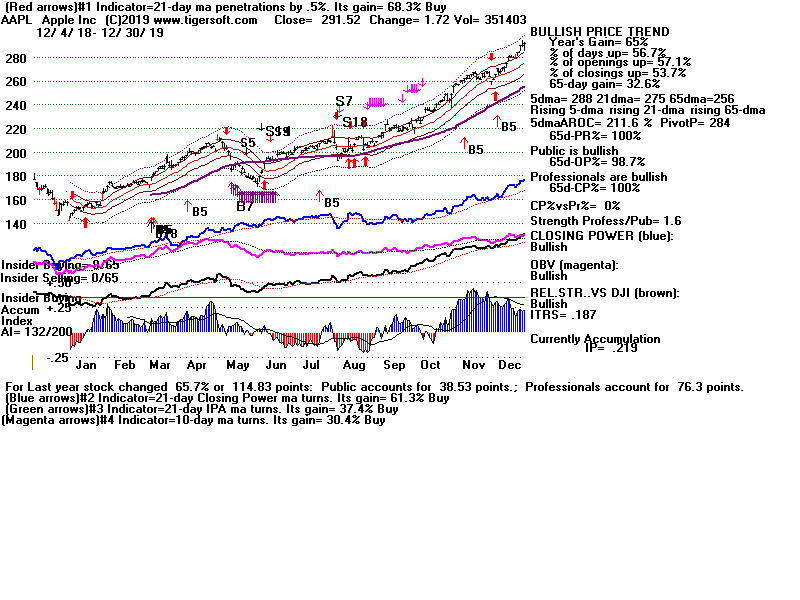
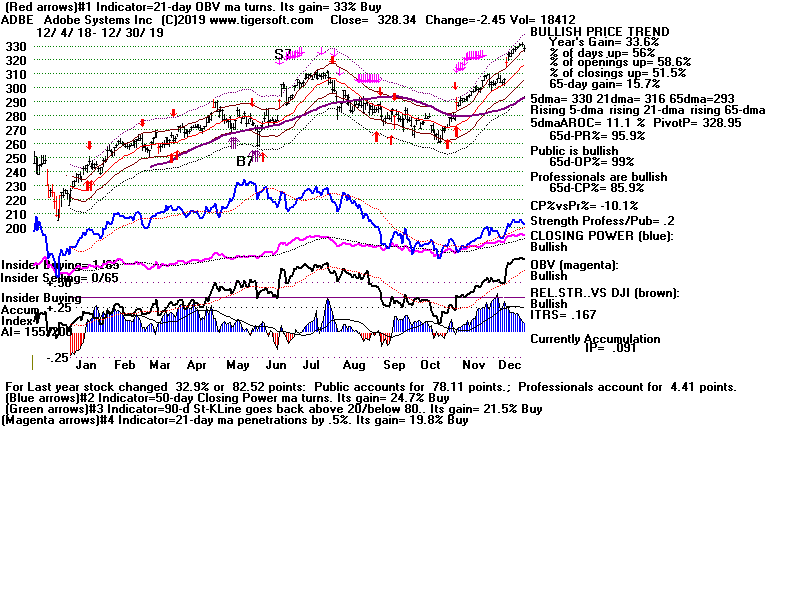
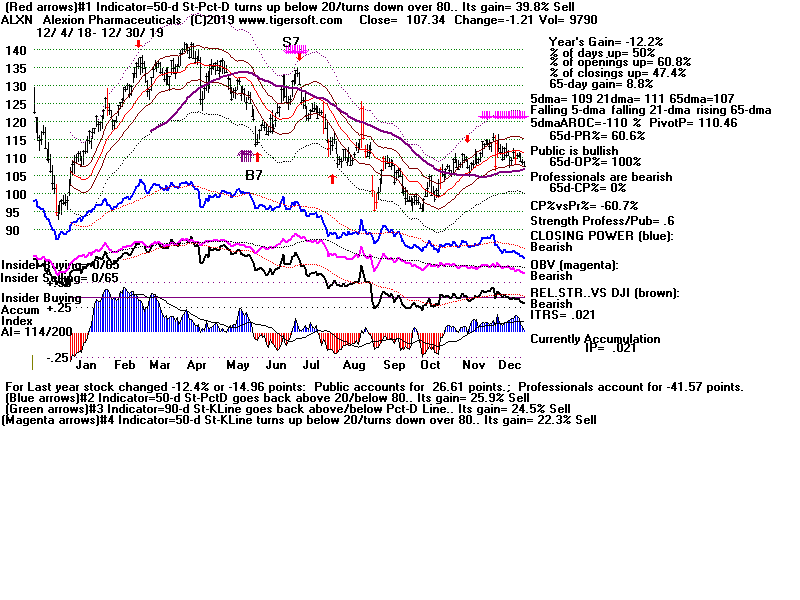
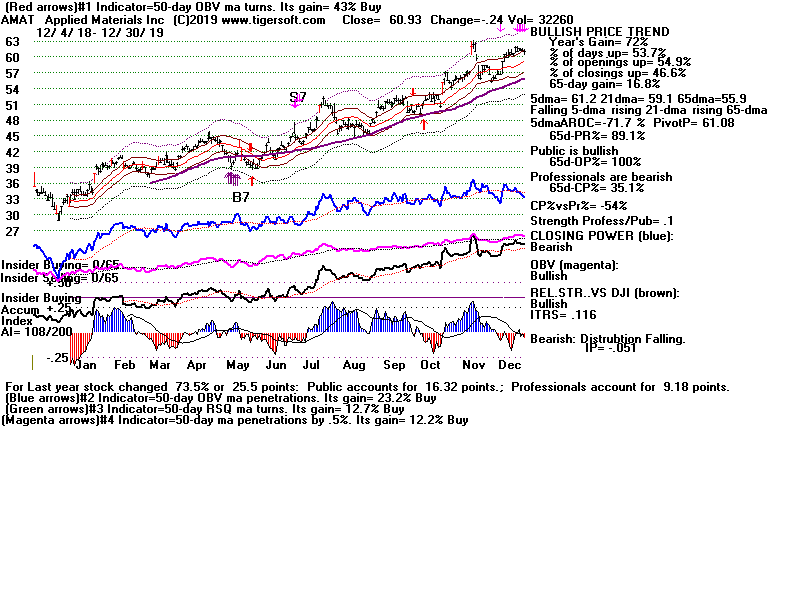
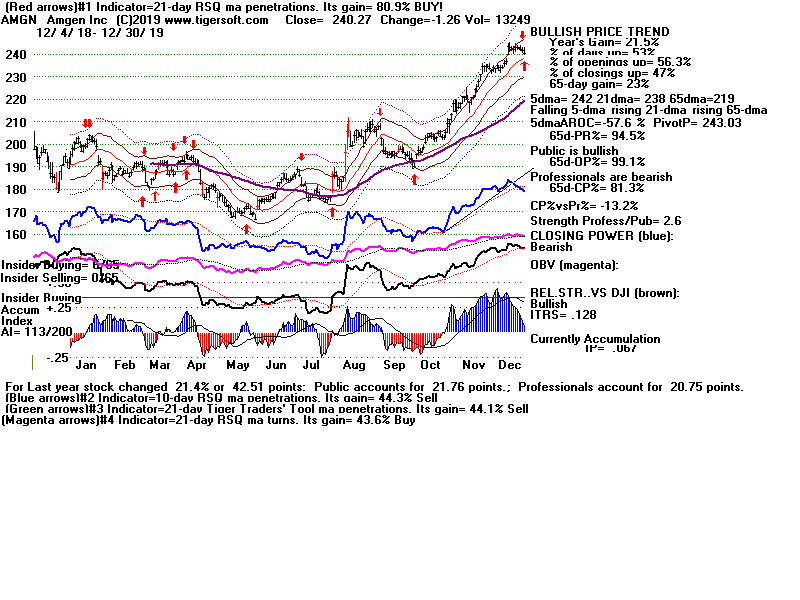
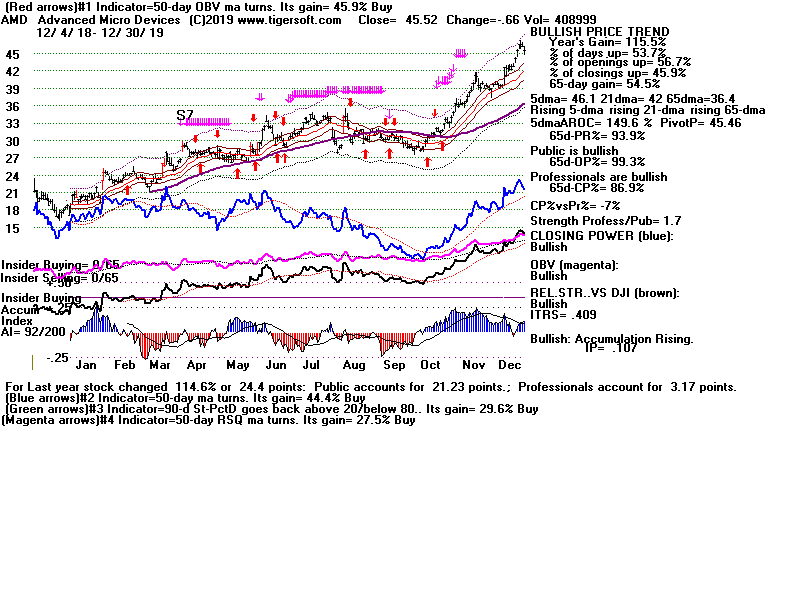
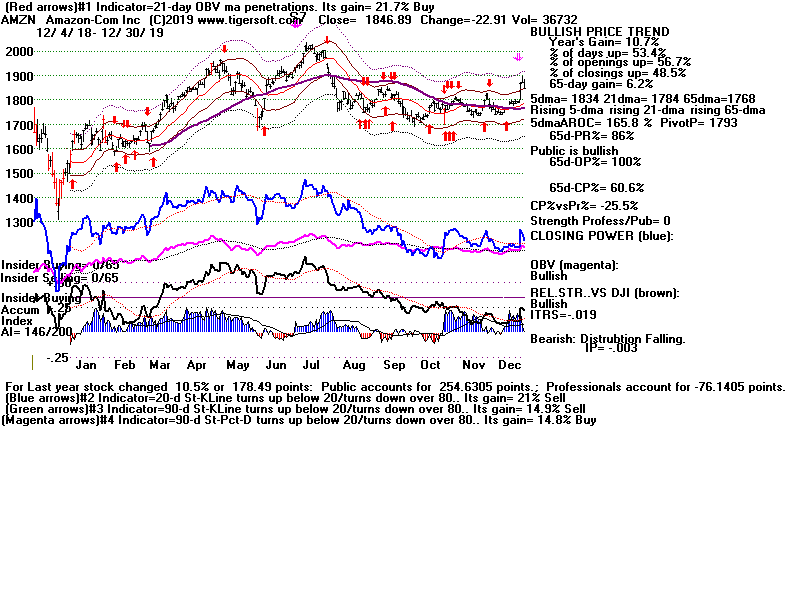
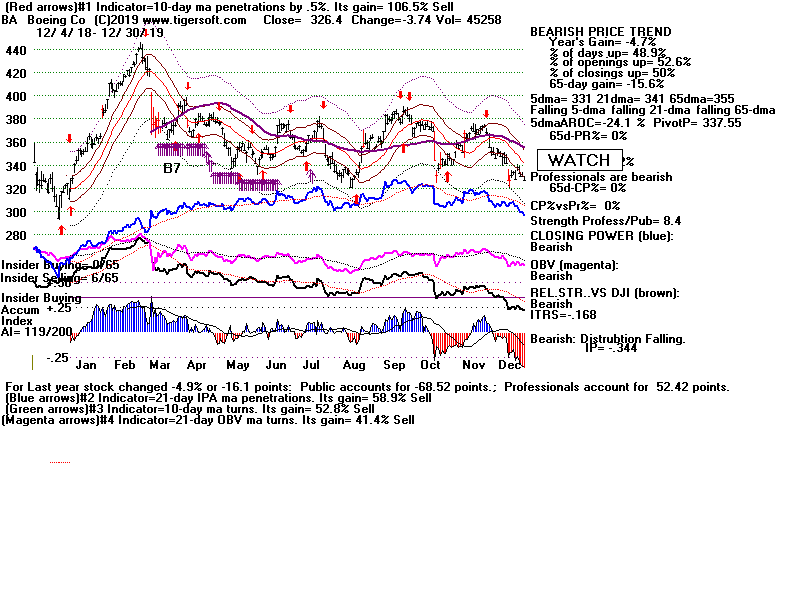
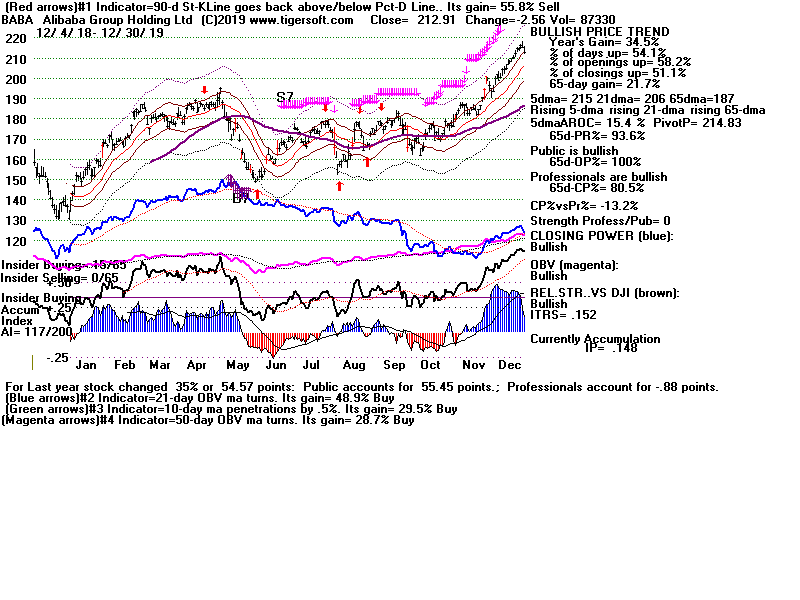
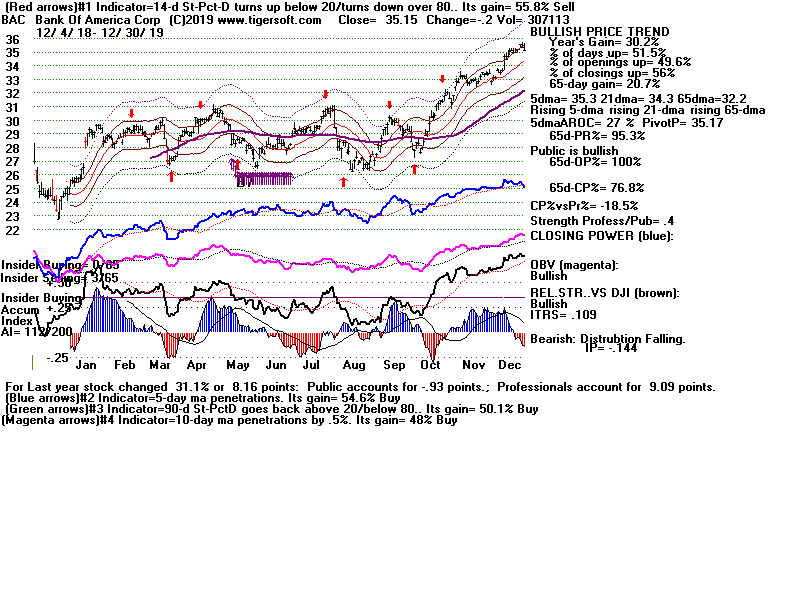
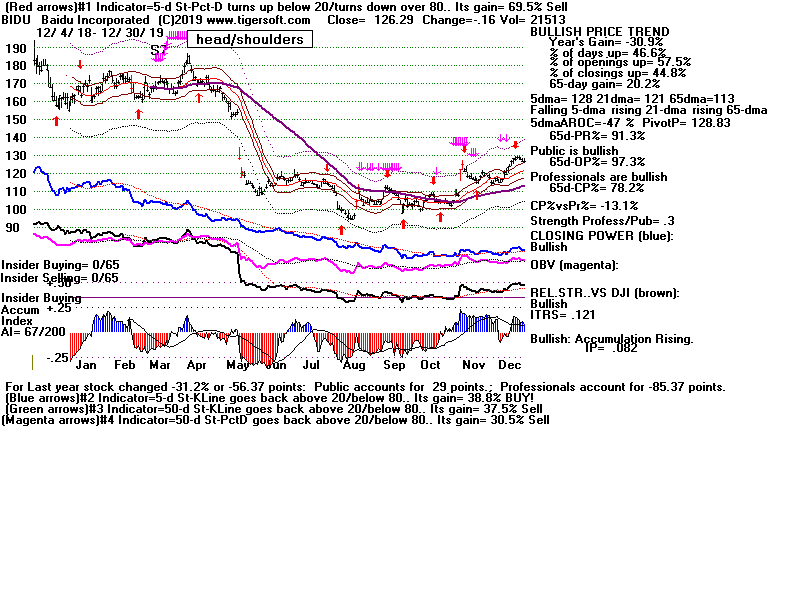
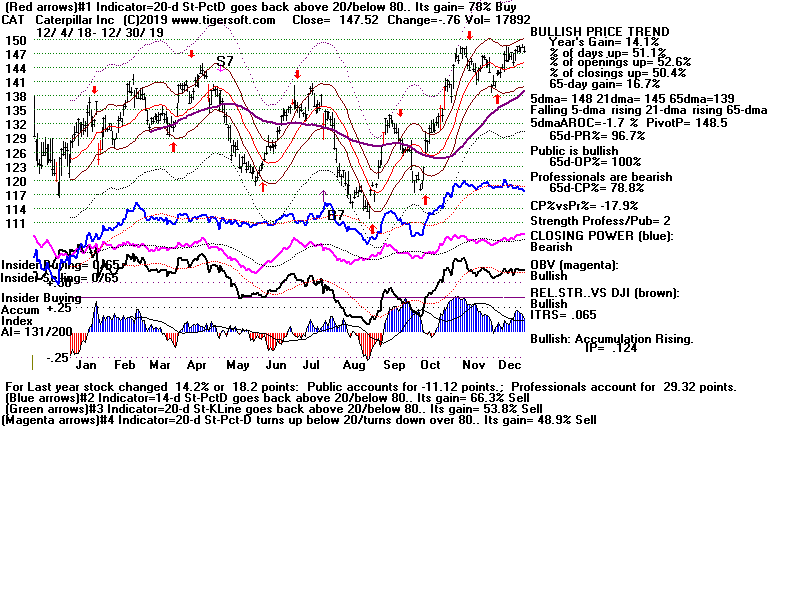
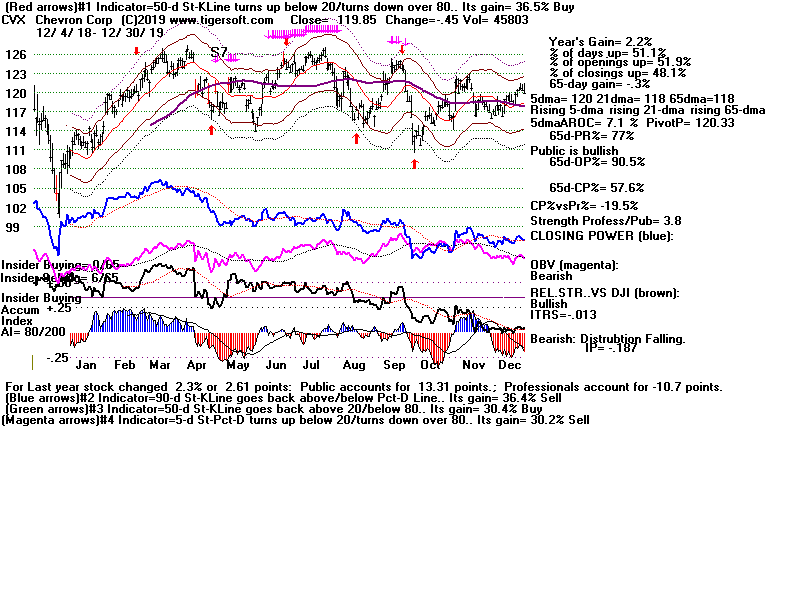
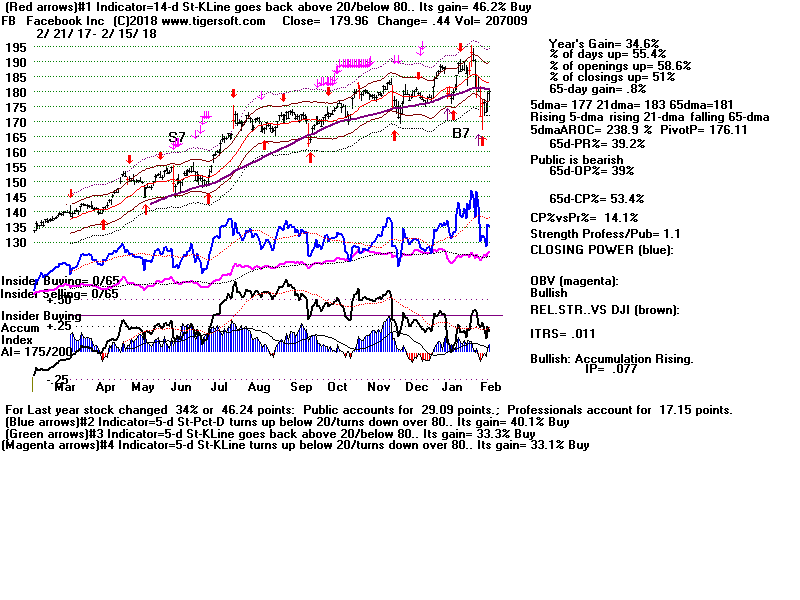
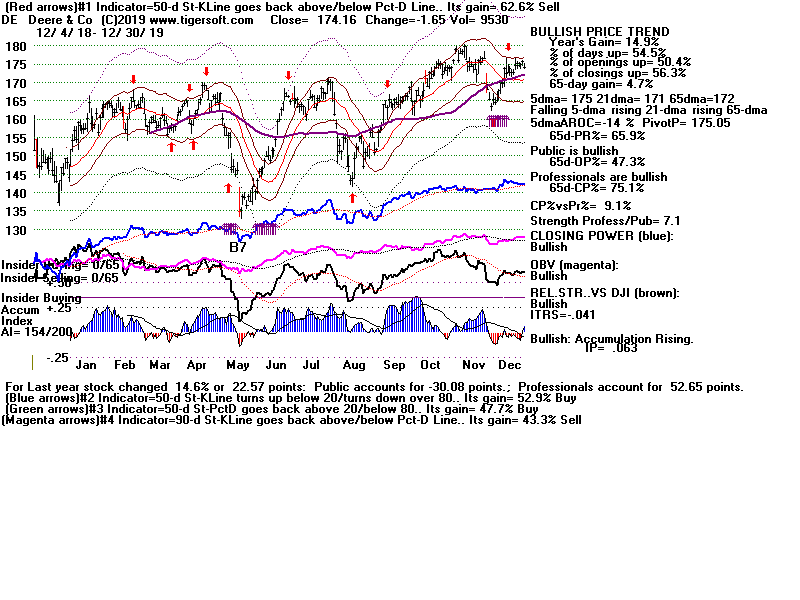
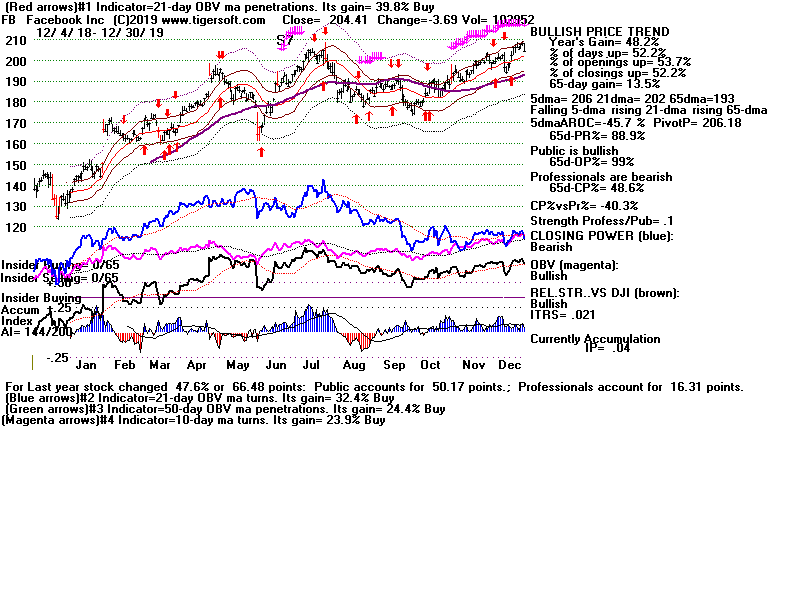
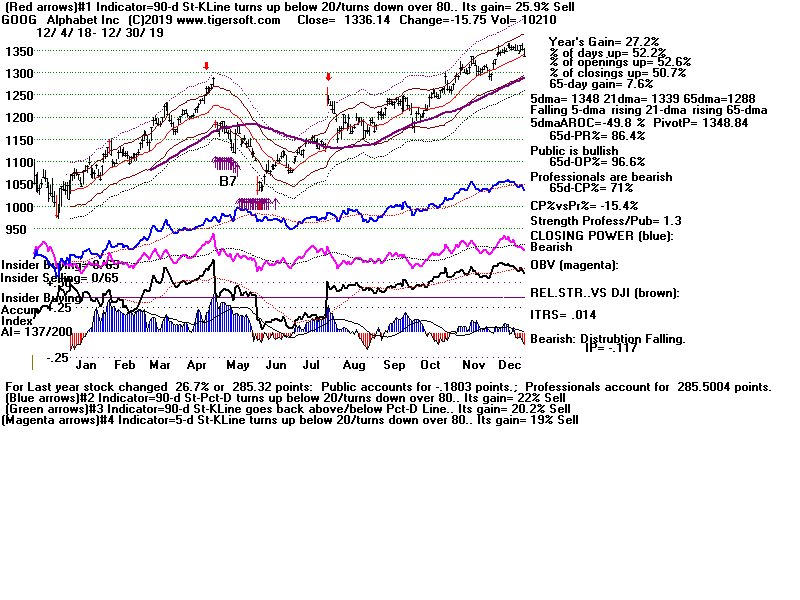
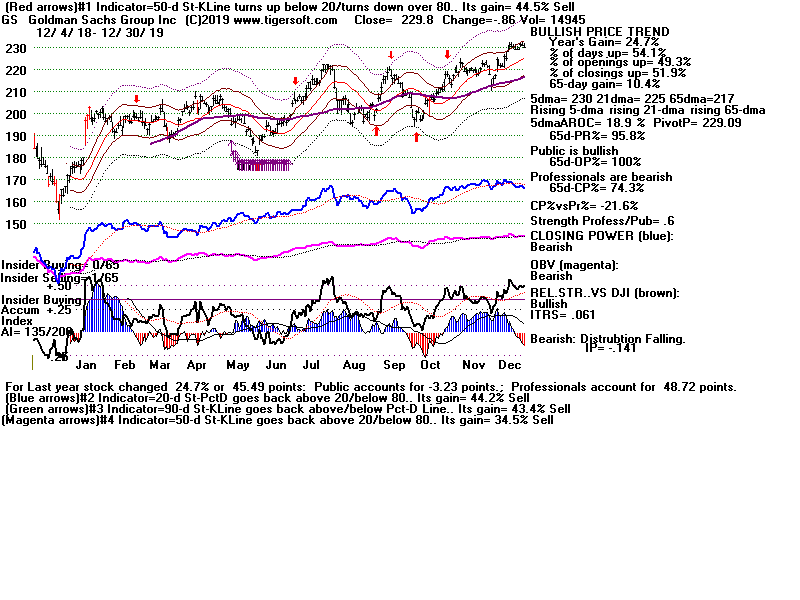
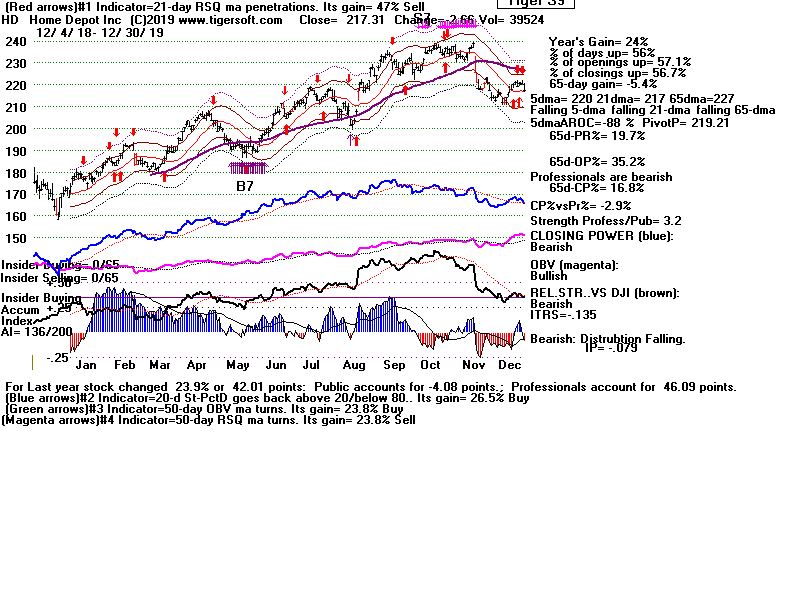
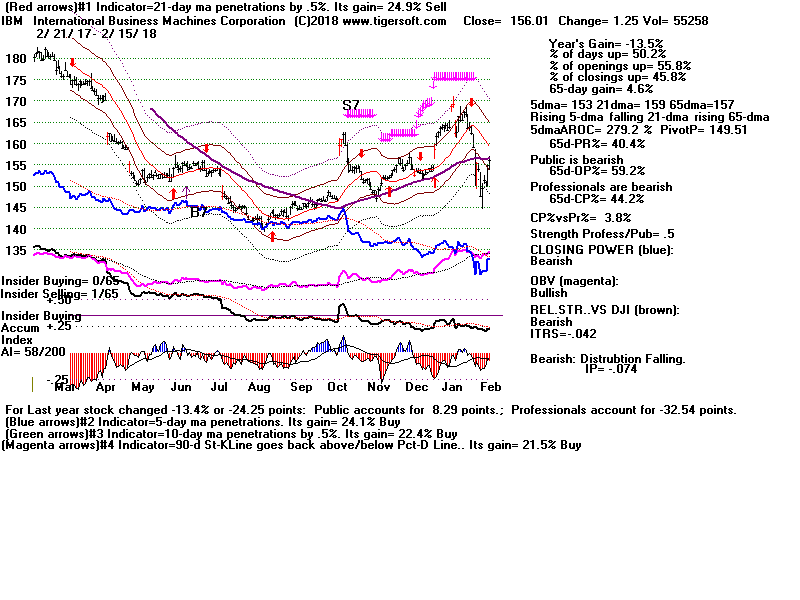
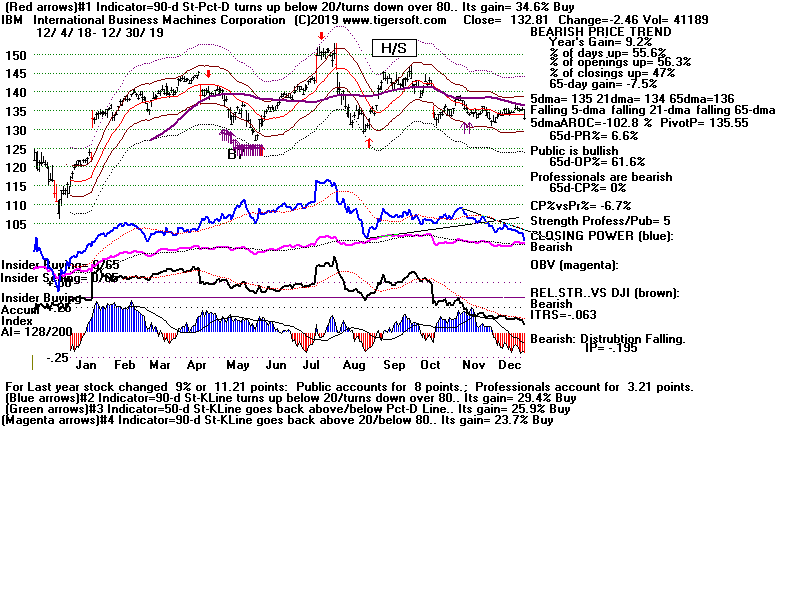
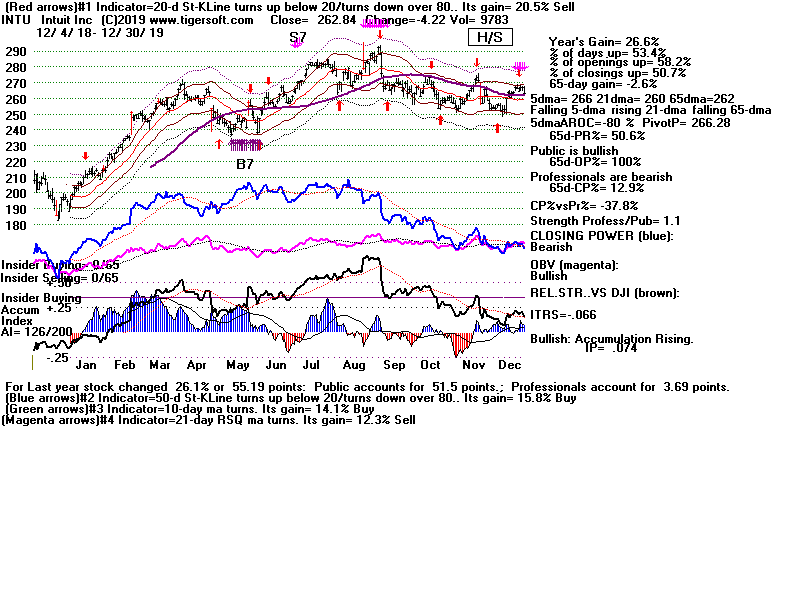
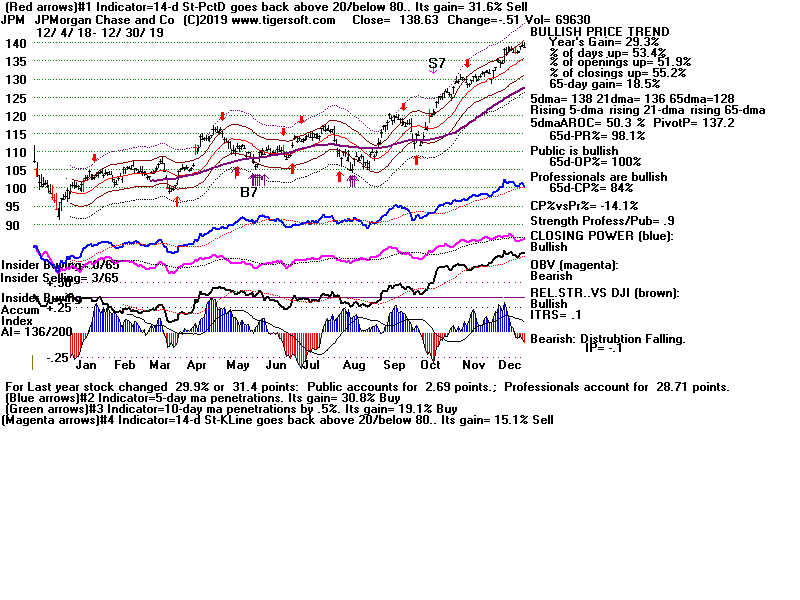
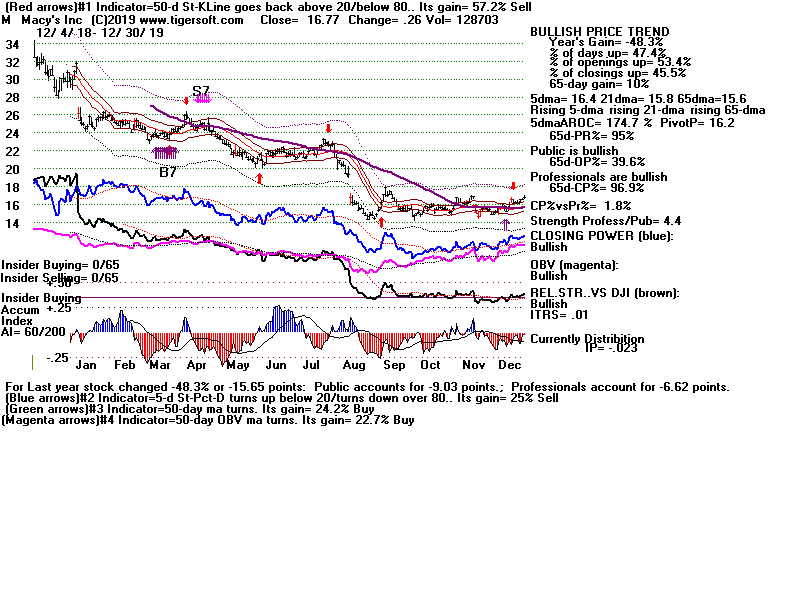
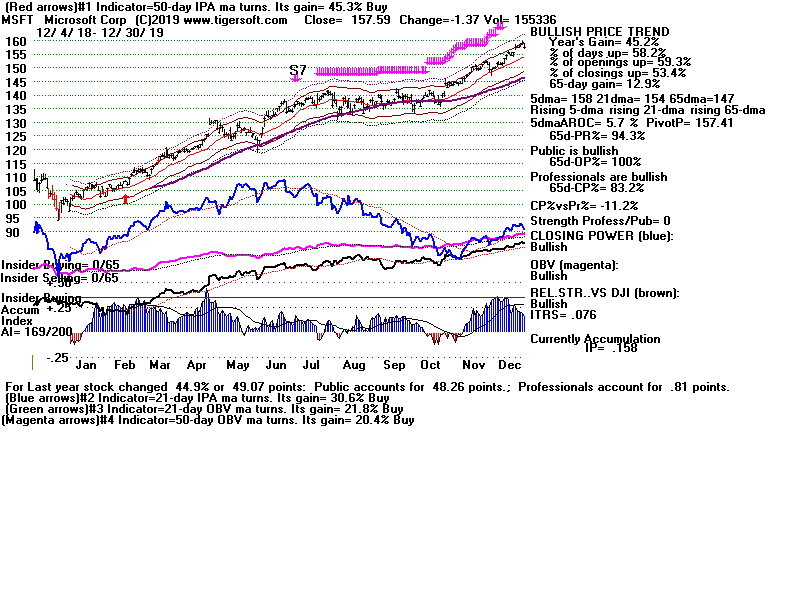
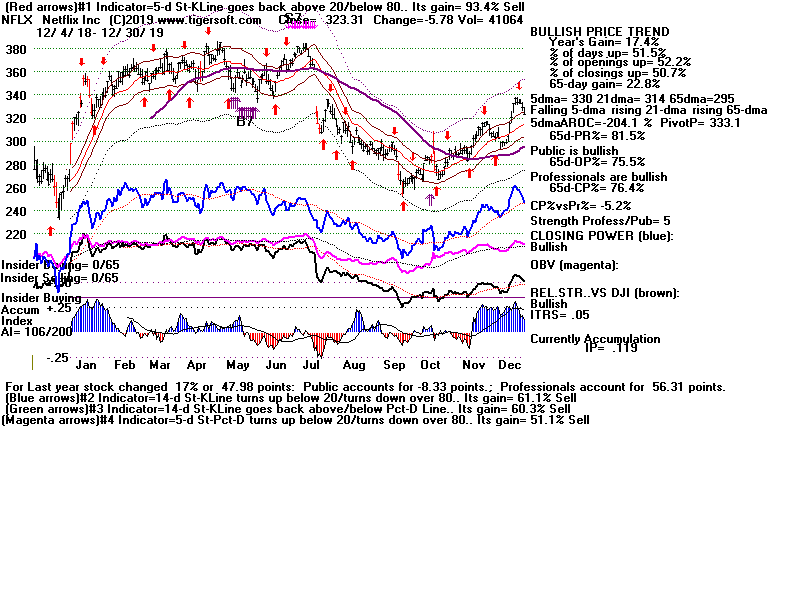
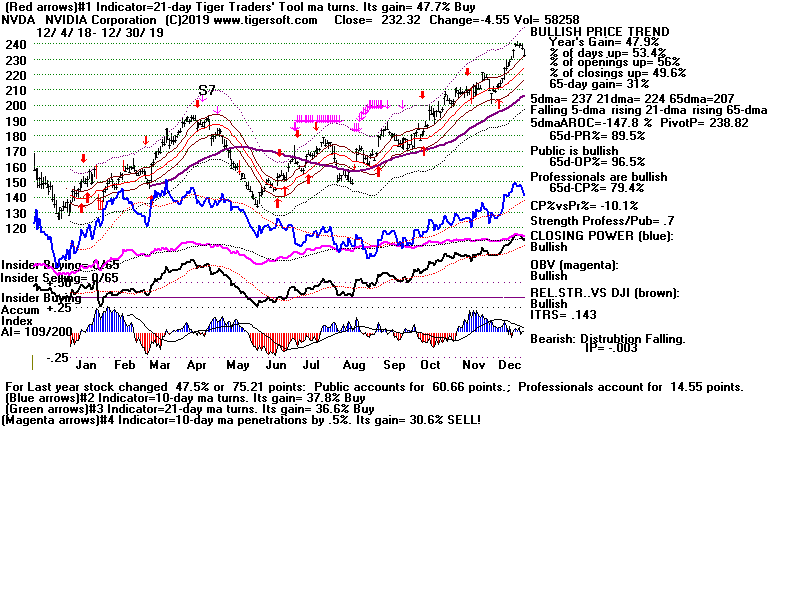
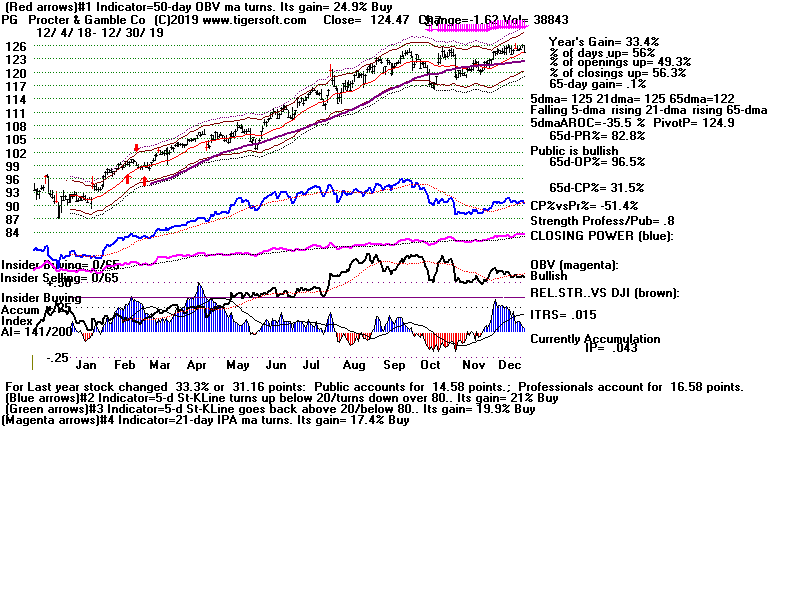
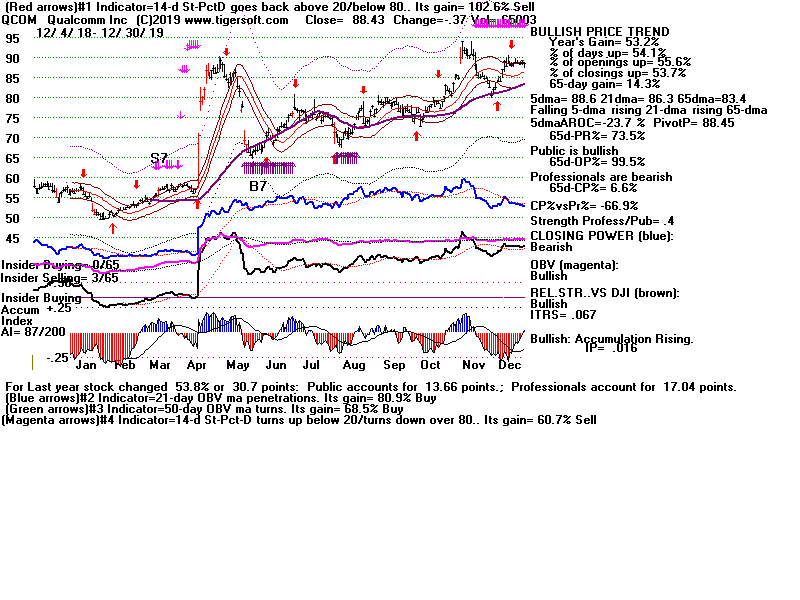
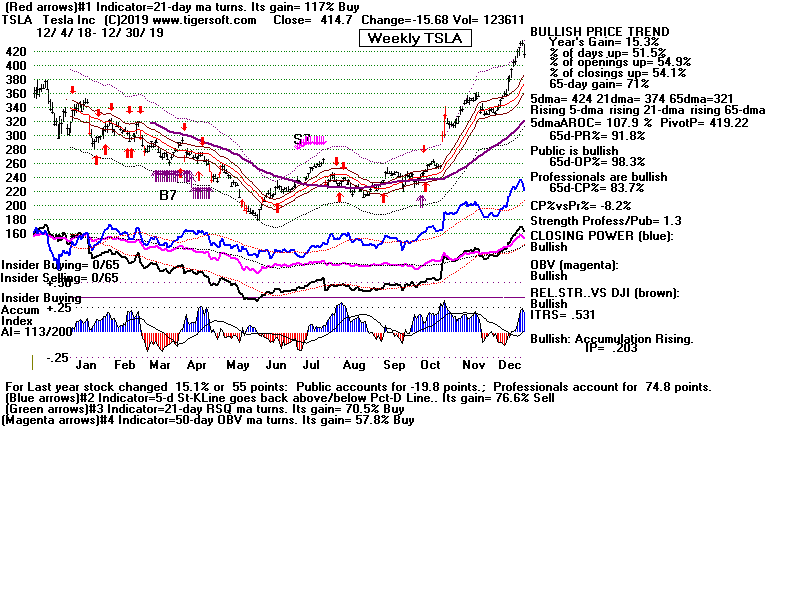
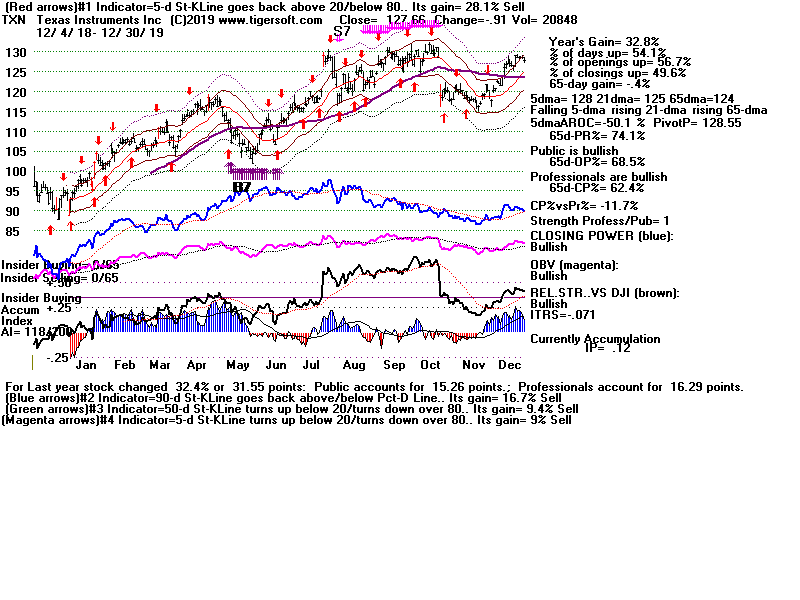
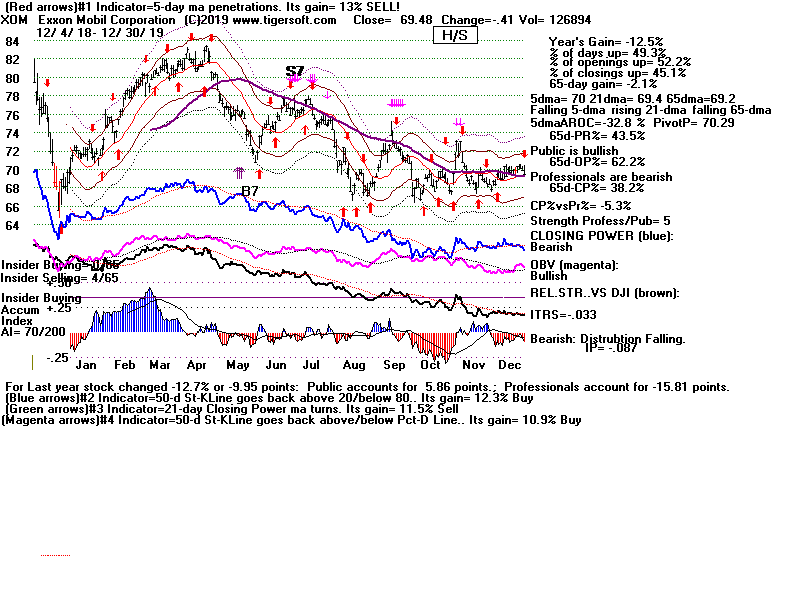
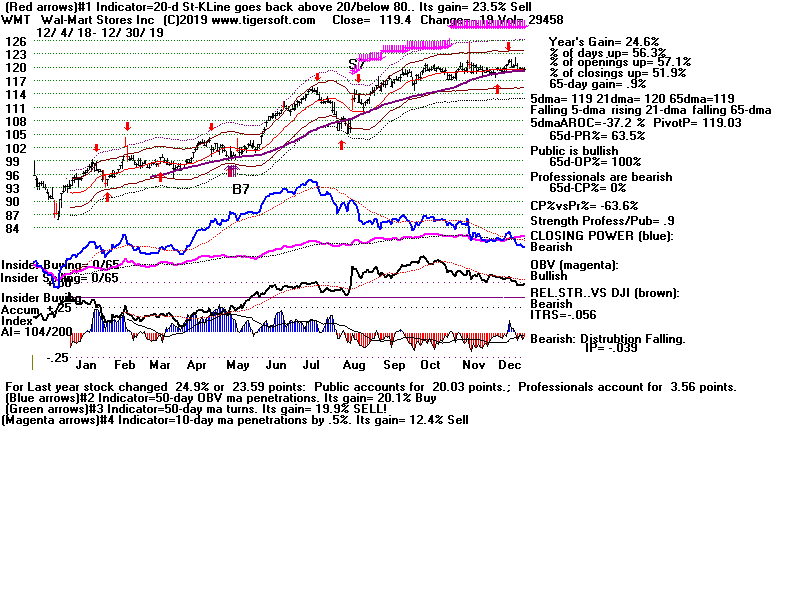
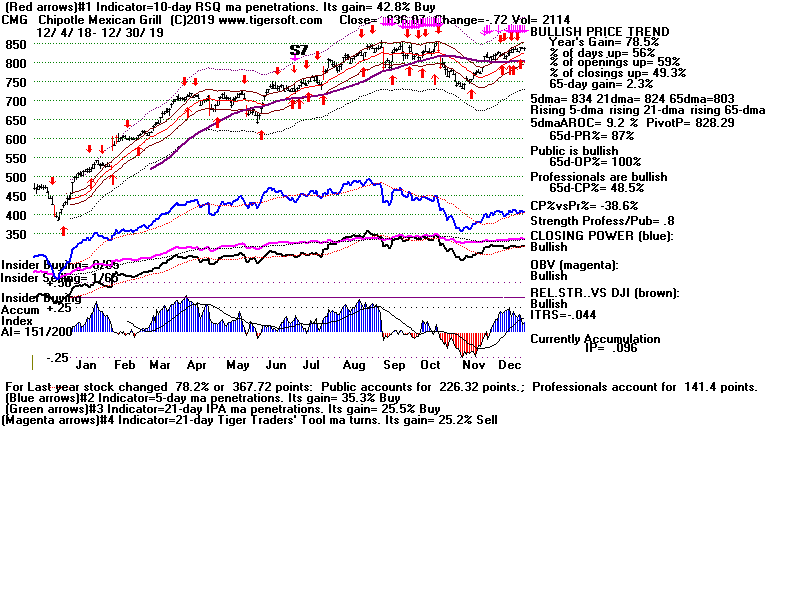
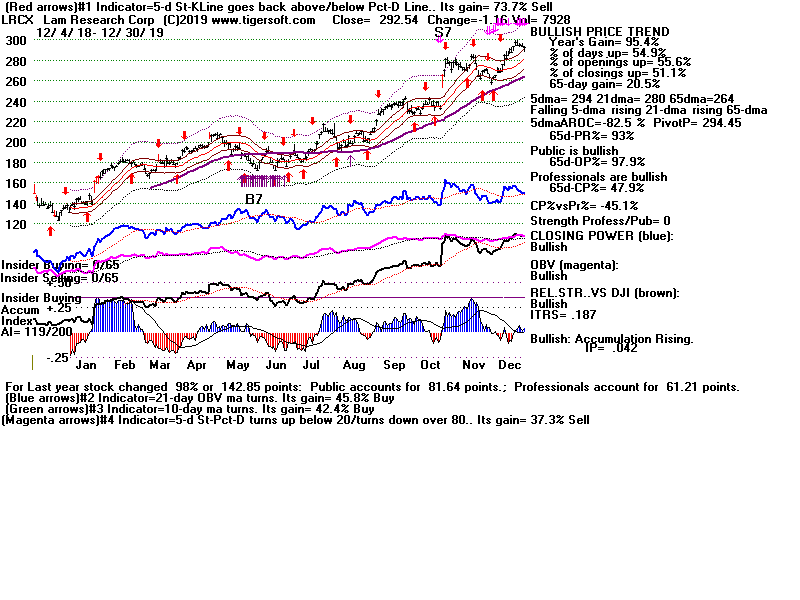
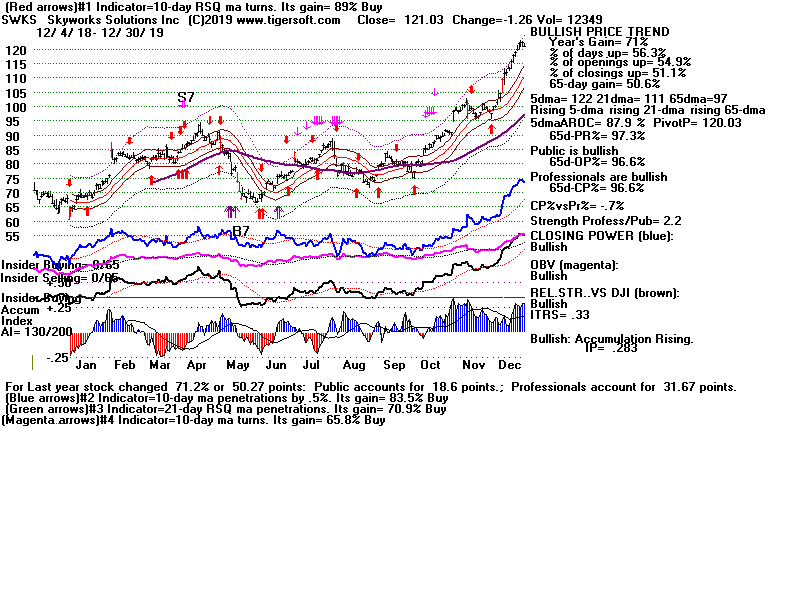
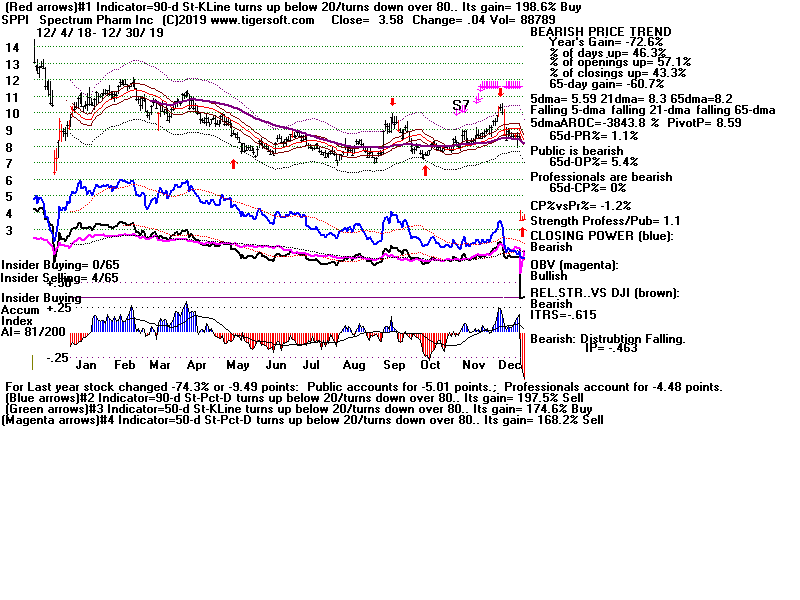
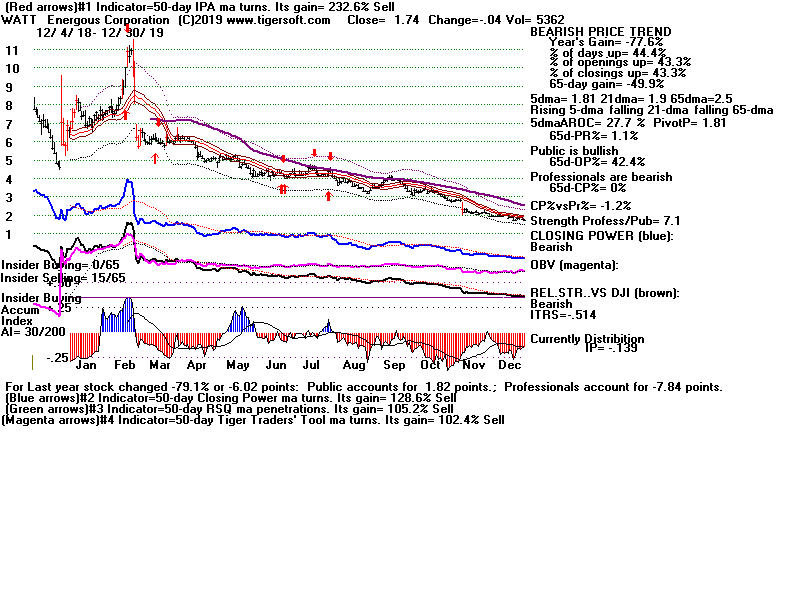
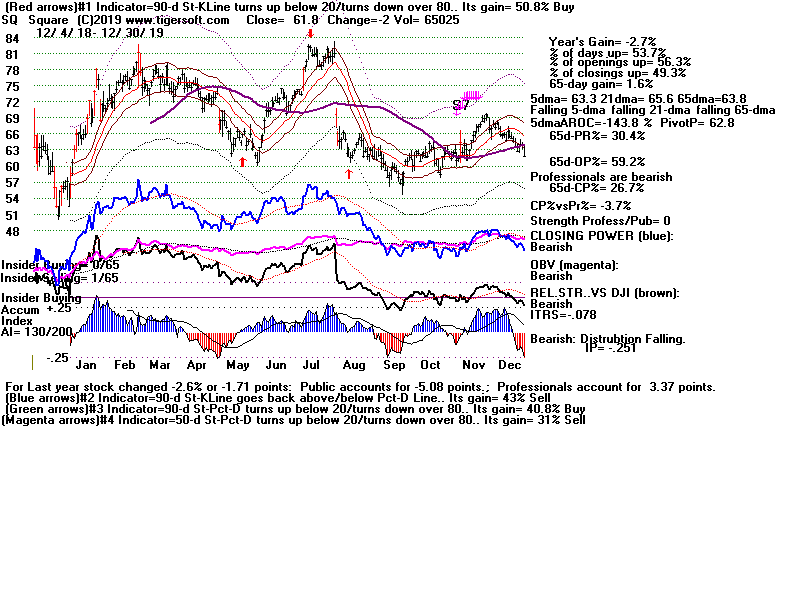
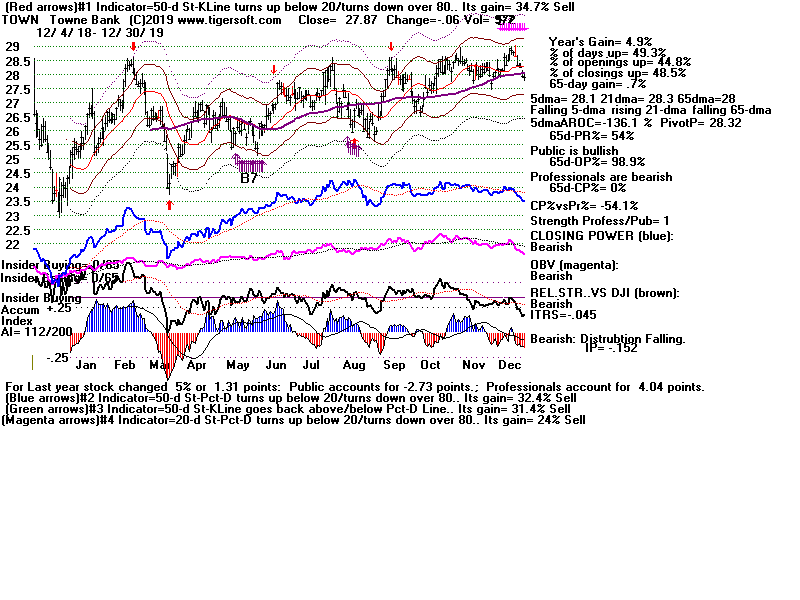