Earlier Hotlines www.tigersoft.com/44H4L/INDEX2.htm
Earlier still: Go
here...
HELP
A Guide
To Profitably Using The Tiger Nightly HOTLINE
Introduction to Tiger/Peerless Buys and
Sells.
Peerless Buy and
Sell Signals: 1928-2016
Individual Peerless signals explained:
http://tigersoftware.com/PeerlessStudies/Signals-Res/index.htm
http://www.tigersoft.com/PeerInst-2012-2013/
Explanation of each Peerless signal. http://www.tigersoft.com/PeerInst-2012-2013/
Different Types of
TigerSoft/Peerless CHARTS, Signals and Indicators
-----> More HELP LINKS
Documentation for TigerSoft
Automatic and Optimized Signals.
How reliable support is the
DJI's rising 200-day ma?
SPY Charts since
1994: Advisory Closing Power S7s, Accum. Index, 65-dma, Optimized Signals.
^^^^^^^^^^^^^^^^^^^^^^^^^^^^^^^^^^^^^^^^^^^^^^^^
1/19/2016 ---> Corrections,Deeper
Declines and Bear Markets since 1945.
1/21/2016
---> High
Velocity Declines since 1929
2/12/2016 ---> Presidential
Elections Years and Bullish IP21 Positive Non-Confirmations at Lower Band.
2/12/2016 ---> OBV NNCs on DJI's Rally to
2.7% Upper Band when DJI's 65-dma is falling.
11/6/2016 --->
Killer Short Selling
Techniques: ===> Order Here ($42.50)
It's As Easy as 1,2,3
TigerSoft "Combination" Short-Selling... Easy as 1-2-3 Short Sales
Earlier Q-Answers
QuickSilver Documentation (1/11/2016)
Our Different
Signals
Better understand the difference between
Peerless DJI-based signals,
the one-year optimized red Signals and the fixed signals based
on technical developments.
Introduction to Tiger/Peerless Buys and Sells.
Different Types of
TigerSoft/Peerless CHARTS, Signals and Indicators
New TigerPeerless Installation and
Basic Uses' Instruction (11/25/2016)
See the re-written materials on TigerSoft Buys and Sells.
A few more pages will be added. But users could print this
main Installation and Uses' Page for reference.
Study- Trading SPY
WITHOUT Peerless - Some Guidelines.
When completed this will be a new Tiger Trading E-Book.
Study- Examples of
"Hands above the Head" top patterns.
Study- 9/3/2017 TigerSoft (not
Peerless) charts of Major Tops as they occurred.
===> Please report any broken or out-of-date links. william_schmidt@hotmail.com
==============================================================================
==============================================================================
====>LOOK
An email was sent out give the new Hotline address to start this weekend.
An email giving new Data Page address will be sent out Sunday day afternoon.
The
new address will be used starting Monday.
If you do not get them, email us.
==============================================================================
5/10/2018 Our
Peerless Buy B9 still stands. So higher prices are
likely. In fact,
if Friday were to produce another rise just like today, there would be no
Sell even though the DJI would be closing above 25000. We have to
be pleased that not only has DIA (representing the DJI) and SPY (representing
SP-500) gotten back more convincingly above their 65-dma, but their
Closing Powers have now risen above their still falling Closing Powers.
This is good. But the most bullish aspect of the market now is that the NYSE
A/D Line has just made a new far ahead of the DJI. For the last few years, these
ADL NH's have been very reliable harbingers of much higher prices by the DJI.


Should we take profits in
IWM?

A small and brief pullback is certainly possible. IWM is back to its 159-160
resistance and the DJI has now risen 6 straight days. Still, I would suggest we simply
rely on Peerless when to sell.
What has been boosting IWM technically has been its many excellent looking breakouts
. Our Bullish MINCPS have pointed to them. But IWM's volume was
low today. That
will most likely not allow it to breakout over 160 right away. In addition, the
total
number of new highs today remained at Wednesday's levels, 345, rather than bullishly
expand as it has been doing since May 4th. Still, "345" is a very bullish
number. It
shows speculative enthusiasm is strong and it shows fears of interest rate rises is
still not a limiting factor. Earnings should keep rising and bonds are not a threat
to
stocks.
However, when we look at the Hourly DJI, we see that the OBV-DISI Line is
not matching the size of the DJI's advance. So, a brief retreat by the DJI would
be no surprise.
Because IWM's flat top "beckons for a breakout", as I like to say, and
because of the strong NYSE ADL and the operative B9, I think most traders will
want to just continue to hold IWM long in expectation of a bullish breakout run to new
highs. Our Bullish MAXCPs continue to do well. Let me call your attention to
a particularly bullish pattern of Accumulation, strong Closing Power the red
high volume breakout in MIXT, the top ranked Bullish MAXCP stock.

Short-term interest rates did not rise today. That will help the market. Oil
was strong
once again. Bullish performance-minded institutions must put their money into this
sector. So, once again I want to advocate on behalf of low priced oil stocks like
PES (5.0). I also want to point out the bearish potential in airlines' stocks.
In addition, note how the rising prices of Grains and Sugar are also pushing up
commodity prices. This explains the weakness in beverage and beer stocks. Stay
short
a few of these is my suggestion. This is a market tailor made for our Power Ranker
program run against MAXCPs and MINCPs.
If we are about to get a new leg up in more speculative stocks, let me suggest looking
at the NEWHIGHs download and then using the older charting program to inspect
the stocks that are up the biggest percentage and show a high IP21 (above +.35).
Ideally, they will also have an AI/200 above 147 and show a recent B24, B20 or
B12. These may become this year's Explosive Super Stocks.
Commands with TigerSoft
Peercomm
Select Folder
New Highs
Older Charting
Ranking Results
User Set Rankings
"1" + "1"
|
Charts 5/10/2018 PEERLESS DJI, Signals, Indicators Daily DJI Volume 10-DayUp/Down Vol V-Indicator Hourly DJIA A/D Line for All Stocks NASDAQ S&P OEX NYSE COMPQX DJI-15 DJI-20 DJI-30 DIA SPY QQQ MDY IWM TNA USO-CrudeOil FAS GLD BBH IBB JETS JNUG KOL NUGT OIH OIL RSX RETL SDS SLV SOXL TECL TMF TNA UGA (gasoline) XIV YINN Commodities: JJC, NIB, CHOC CORN, CUT (paper) WEAT UUP (Dollar) AAPL ADBE ALXN AMAT AMGN AMD AMZN BA BABA BAC BIDU CAT CVX DE FB GOOG GS HD IBM JPM M (Macy's) MSFT NFLX NVDA QCOM TSLA TXN XOM WMT ANDV (refinery), CMG (Chipotle), LRCX, SWKS, MDGL SPPI WATT SQ TOWN 5/10/2018 (Click on Underlined link.) Bullish MAXCPs - http://tigersoft.com/4XXH/MAXCPS/510/BULLISH.htm Bearish MAXCPs - http://tigersoft.com/4XXH/MINCPS/510/BEARISH.htm |
Table 1 QUICKSILVER on ETFS - 05/10/18 DIA and FAS show weak relative strength.
IWM has an ITRS, 7.2%, showing it is strongest general mkt ETF over last 50 trading days.
SPY now has the highest IP21 among the 6 general market ETFs.
ETF      CLOSE   CHANGE     PIVOT-PT  5-dma AROC    CL-PWR    CANDLE  IP21    ITRS
---------------------------------------------------------------------------------------------
---------------------------------------------------------------------------------------------
DIA       247.46    2.06     242.52        172.2%   ----      BLUE   .103     ----
---------------------------------------------------------------------------------------------
COMPQX    7404.97    65.06   7209.62       219%     ----      BLUE   .092     .029
---------------------------------------------------------------------------------------------
SPY       272.02    2.52     266.02        176.4%   ----      BLUE   .124     .012
---------------------------------------------------------------------------------------------
QQQ       169.62    1.74     164.87        236.4%   ----      BLUE   .102     .025
---------------------------------------------------------------------------------------------
MDY       352.55    2.6      345.19        172.7%   Bullish   BLUE   .029     .05
---------------------------------------------------------------------------------------------
IWM       159.53    .85      155.73        182.6%   Bullish   BLUE   .11      .072
---------------------------------------------------------------------------------------------
FAS       69.51    1.57      63.55         620.8%   ----      BLUE   .036     .005
---------------------------------------------------------------------------------------------
RETL      34.1    .06        33.66         139.2%   ----      BLUE  -.079    -.02
---------------------------------------------------------------------------------------------
SOXL      158.79    8.05     137.72        1078.7%   ----     BLUE   .107    -.049
---------------------------------------------------------------------------------------------
TECL      137.28    5.2      124.27        784.4%   Bullish   BLUE   .178     .058
                                                                     high
---------------------------------------------------------------------------------------------
IBB       103.73   -.06      102.35        119.4%   Bearish   RED   -.088    -.029
---------------------------------------------------------------------------------------------
GLD       125.18    .85      124.54        36.2%    Bullish   ----  -.076     .012
---------------------------------------------------------------------------------------------
OIL       7.61    .04        6.89          339.4%   Bullish   BLUE   .263     .072
                                                                     high
---------------------------------------------------------------------------------------------
OIH       28.17    .04       27.2          237%     Bullish   ----   .14      .197
---------------------------------------------------------------------------------------------
GASL      23    .12          20.46         831.2%   Bullish   RED    .053     .388
                                                                              high
---------------------------------------------------------------------------------------------
UGA       34.91    .29       33.7          227.4%   Bullish   BLUE   .431     .141
                                                                     high
---------------------------------------------------------------------------------------------
UUP       24.36   -.11       24.33         12.3%    Bullish   ----   .144     .039
---------------------------------------------------------------------------------------------
IEF       101.4    .21       101.64       -11.3%    Bearish   ----  -.106     .003
---------------------------------------------------------------------------------------------
XLU      50.31    .7         51.51        -95.6%    Bearish   BLUE  -.029     .036
---------------------------------------------------------------------------------------------
WEAT      6.69   -.04        6.88         -256%     Bullish   ----   .287     .014
                                                                     high
---------------------------------------------------------------------------------------------
YINN      35.05    1.28      32            500.3%   Bullish   BLUE   .223     .018
---------------------------------------------------------------------------------------------
RSX       21.67    .55       21.14         168.8%   Bullish   BLUE   .175    -.053
---------------------------------------------------------------------------------------------
AAPL      190.04    2.68     183.83        357.6%   Bullish   BLUE   .122     .078
---------------------------------------------------------------------------------------------
GOOG      1097.57    14.81   1048.21       350.8%   Bullish   BLUE   .021     .004
---------------------------------------------------------------------------------------------
MSFT      97.91    .97       95.16         200.8%   ----      BLUE   .133     .055
---------------------------------------------------------------------------------------------
AMZN      1609.08    1.08    1580.95       116.3%   Bearish   BLUE   .053     .075
---------------------------------------------------------------------------------------------
FB        185.53    2.87     176.61        323.2%   ----      BLUE   .058     .051
---------------------------------------------------------------------------------------------
NVDA     260.13    4.35      239.06        553%     Bullish   BLUE   .293     .086
---------------------------------------------------------------------------------------------
BA        344.07   -.43      334.43        198.1%   ----      BLUE   .129    -.039
---------------------------------------------------------------------------------------------
GS        243.44    1.71     234.94        211.7%   Bearish   BLUE  -.249    -.063
---------------------------------------------------------------------------------------------
HD        187.16    .8       185.03        107.5%   Bullish   BLUE   .192     .038
---------------------------------------------------------------------------------------------
CAT        153.97    1.36    146.37        343.1%   ----      BLUE  -.096     .007
|
Table 2 Count of Stocks in Key Directories
20180510
-------------------------------
NEWHIGHS 345 bullish...unchanged from previous day
NEWLOWS 36
MAXCP 135 Professions are switching sides!
MINCP 81
TTTNH 113 Day Traders are Bullish
TTTNL 98
FASTUP 320 Swing Traders are bullish
FASTDOWN 116
CPCROSSA 51
CPCROSSD 74 Some Pros are not convinced, still
BIGVOLUP 2
BIGVODN 11 Big money is still dumping, not chasing.
|
Table 3
         Count of Stocks and NEW HIGHS in Key Tiger Directories
                      Date = 180510
               No.           NHs           Pct.
===============================================================
MAXCP          135           99            73 %
NIFTY-30        30            9            30 %
HACKERS        24            7             29 %
HOSPITAL       7             2             29 %
SOFTWARE       65            19            29 %
COMPUTER       23            5             22 %
COMODITY       56            12            21 %
REGBANKS       33            7             21 %
NASD-100       89            16            18 %
DOWJONES       30            5             17 %
MILITARY       38            6             16 %
OILGAS         135           21            16 %
TRANSP         20            3             15 %
---------------------------------------------------
GAMING         28            4             14 %
SOLAR          21            3             14 %
FIDSTKS        189           25            13 %
FINANCE        91            10            11 %
ELECTRON       177           17            10 %
RUS-1000       825           80            10 %
SP-100         96            10            10 %
SP500          481           48            10 %
SEMI           129           11            9 %
CHINA          62            5             8 %
DJI-13         13            1             8 %
INDEXES        195           15            8 %
GREEN          30            2             7 %
BIG17          48            3             6 %
CHEM           71            4             6 %
INDMATER       85            5             6 %
INSURANC       32            2             6 %
BEVERAGE       20            1             5 %
BIOTECH        382           18            5 %
GOLD           50            2             4 %
REIT           175           7             4 %
RETAIL         53            2             4 %
AUTO           40            1             3 %
ETFS           61            1             2 %
UTILITY        42            1             2 %
|
Table 4
Count of Stocks and New Lows in Key Tiger Directories
             Date = 180510
               No.           NHs           Pct.
--------------------------------------------------
--------------------------------------------------
MINCP          81            15            19 %
CHEM           71            4             6 %
COMODITY       56            3             5 %
AUTO           40            1             3 %
BIOTECH        382           10            3 %
INFRA          35            1             3 %
MILITARY       38            1             3 %
NASD-100       89            3             3 %
FIDSTKS        189           3             2 %
GOLD           50            1             2 %
OILGAS         135           3             2 %
RETAIL         53            1             2 %
SOFTWARE       65            1             2 %
ELECTRON       177           1             1 %
REIT           175           1             1 %
SEMI           129           1             1 %
RUS-1000       825           4             0 %
SP500          481           2             0 %
|
Table 5 RANKING OF KEY DIRECTORIES BASED PCT.OF STOCKS ABOVE 65-DMA
5/10/18
Bullish = 34
Bearish = 12
---------------------------------------------------------------------------------------
Directory Current day-1 day-2 day-3 day-4 day-5
----------------------------------------------------------------------------------------
EDU 1 1 1 1 1 1
SOLAR .904 .714 .571 .571 .476 .476
REIT .868 .828 .8 .862 .8 .731
OILGAS .8 .777 .785 .74 .725 .696
HACKERS .791 .875 .791 .791 .75 .583
COMPUTER       .782          .782          .652          .652          .608          .565
NIFTY          .766          .666          .6            .6            .6            .5
SOFTWARE       .723          .723          .707          .723          .707          .615
BIGBANKS       .714          .285          .142          .142          0             0
HOSPITAL       .714          .714          .571          .714          .714          .714
GREEN .7 .7 .6 .566 .5 .466 COMODITY .678 .571 .571 .553 .535 .535 FOOD .666 .555 .666 .555 .555 .666 INDEXES .641 .569 .507 .482 .415 .271 GOLD .64 .56 .58 .58 .54 .56 GAMING .607 .571 .571 .571 .535 .357 NASD-100 .606 .528 .46 .471 .483 .382 REGBANKS .606 .606 .606 .575 .575 .393 RUS-1000 .601 .55 .523 .528 .495 .414 INDMATER .6 .576 .517 .494 .458 .411 SP-100 .583 .5 .447 .427 .416 .343 FINANCE .571 .45 .428 .439 .351 .307 INFRA .571 .514 .542 .4 .342 .342 UTILITY .571 .523 .523 .738 .785 .714 DOWJONES .566 .566 .466 .5 .433 .4 SP500 .565 .488 .453 .461 .455 .378 SEMI .558 .511 .434 .403 .395 .333 COAL .555 .555 .555 .555 .555 .333 GUNS .555 .5 .555 .555 .555 .444 CHEM .549 .521 .492 .478 .45 .394 FIDSTKS .544 .481 .417 .46 .439 .375 ELECTRON .542 .508 .423 .395 .389 .322 DJI-13 .538 .538 .384 .461 .384 .384 CHINA .532 .419 .435 .419 .403 .354 N = 34 ============================================================================================ TRANSP .5 .55 .45 .35 .45 .35 ============================================================================================ RETAIL .49 .49 .49 .452 .509 .49 ETFS .475 .393 .377 .36 .36 .344 MILITARY .473 .473 .421 .421 .315 .236 BIOTECH .442 .463 .418 .452 .397 .387 BIG17 .437 .437 .437 .479 .416 .395 PIPELINE .428 .428 .428 .428 .142 .142 HOMEBLDG .352 .352 .529 .588 .529 .588 AUTO .35 .325 .325 .3 .3 .25 BEVERAGE .35 .35 .35 .4 .3 .25 INSURANC .343 .312 .281 .25 .25 .187 BONDFUND .306 .225 .243 .243 .243 .216 JETS .2 .2 .2 .1 .3 .3 N=12 |
==============================================================================
==============================================================================
5/9/2018
Our Peerless Buy B9 tells us that higher prices are coming,
especially
if the DJI and SP-500 can convincingly get up past their rising 65-dma resistance
levels and their downtrends. The A/D Line rose bullishly today and could
make a 12-month high if we get another good day or two. Hold your
long positions. Meanwhile, some of our bearish MINCPs remain very
weak. The rising prices in Commodities and in Oil are bound to create new
big winners and losers. Interest rates are not yet so high as to be a threat.
Today's Producer Prices shows 2.6% inflation. This should be tolerable.
https://outlook.live.com/owa/?path=/mail/inbox/rp
But if our FOMC now acts like most of those in the past, it will pay more
attention to the rise in Crude Oil. So we must watch for signs that the Short
Term Interest Rate trend is accelerating.
The DJI's downtrend-line remains an obstacle. But history shows us examples
of the DJI moving higher after a 3-4 month delay even though there have been
Sell S9s after a very long uptrend. Unfortunately, two of the best examples
are
from 1929 and 1987. But the point here is that the DJI may surprise people and
rise to new highs. In both cases, it was the FED which decided to boost the
market.


Hold IWM. It remains the strongest major market ETF. See Table 1 below.
Hold the oil stocks, especially low priced ones like PTE. And continue to hold
a few bearish MINCPs. Some of these are being hit hard, as their weakness
becomes more and more apparent. The higher Oil prices are going to create
real problems for the airlines industry just as the higher prices for grains are
hurting brewers and higher sugar prices are hurting soft drink stocks. The Bearish
MINCPs and today's new lows reflect these higher commodity price
pressures.

|
Charts 5/9/2018 PEERLESS DJI, Signals, Indicators Daily DJI Volume 10-DayUp/Down Vol V-Indicator Hourly DJIA A/D Line for All Stocks NASDAQ S&P OEX NYSE COMPQX DJI-15 DJI-20 DJI-30 DIA SPY QQQ MDY IWM TNA USO-CrudeOil FAS GLD BBH IBB JETS JNUG KOL NUGT OIH OIL RSX RETL SDS SLV SOXL TECL TMF TNA UGA (gasoline) XIV YINN Commodities: JJC, NIB, CHOC CORN, CUT (paper) WEAT UUP (Dollar) AAPL ADBE ALXN AMAT AMGN AMD AMZN BA BABA BAC BIDU CAT CVX DE FB GOOG GS HD IBM JPM M (Macy's) MSFT NFLX NVDA QCOM TSLA TXN XOM WMT ANDV (refinery), CMG (Chipotle), LRCX, SWKS, MDGL SPPI WATT SQ TOWN 5/9/2018 (Click on Underlined link.) Bullish MAXCPs - http://tigersoft.com/4XXH/MAXCPS/509/BULLISH.htm Bearish MAXCPs - http://tigersoft.com/4XXH/MINCPS/509/BEARISH.htm |
Table 1 QUICKSILVER on ETFS - 05/09/18 DIA and FAS show weak relative strength.
IWM is 7.2% stronger over last 50 trading days. It has the highest IP21 among
the 6 general market ETFs at top in table below.
IWM remains favored.
ETF CLOSE CHANGE PIVOT-PT 5-dma AROC CL-PWR CANDLE IP21 ITRS --------------------------------------------------------------------------------------------- --------------------------------------------------------------------------------------------- DIA 245.4 1.98 239.1 130.2% ---- BLUE .053 ------ --------------------------------------------------------------------------------------------- COMPQX 7339.91 73.01 7088.15 166.3% ---- BLUE .061 .035 --------------------------------------------------------------------------------------------- SPY 269.5 2.58 262.62 118.8% ---- BLUE .058 .016 --------------------------------------------------------------------------------------------- QQQ 167.88 1.81 161.8 184.6% ---- BLUE .034 .031 --------------------------------------------------------------------------------------------- MDY 349.95 1.72 340.59 128.8% Bullish BLUE .015 .053 --------------------------------------------------------------------------------------------- IWM 158.68 .85 153.81 129.3% Bullish BLUE .118 .072 --------------------------------------------------------------------------------------------- --------------------------------------------------------------------------------------------- FAS 67.94 2.3 61.48 440.6% ---- BLUE -.027 -.025 --------------------------------------------------------------------------------------------- RETL 34.04 1.04 33.17 -28.4% Bearish BLUE -.129 .01 --------------------------------------------------------------------------------------------- SOXL 150.74 6.24 128.46 905.1% ---- BLUE .069 -.098 --------------------------------------------------------------------------------------------- TECL 132.08 4.7 117.57 630% ---- BLUE .112 .017 --------------------------------------------------------------------------------------------- IBB 103.79 1.38 101.28 54.2% Bearish BLUE -.073 -.024 --------------------------------------------------------------------------------------------- GLD 124.33 -.26 124.28 27.3% Bullish RED -.14 .027 --------------------------------------------------------------------------------------------- OIL 7.61 .04 6.89 339.4% Bullish BLUE .263 .095 --------------------------------------------------------------------------------------------- OIH 28.13 .54 26.87 180% Bullish BLUE .173 .18 --------------------------------------------------------------------------------------------- GASL 22.88 1.02 19.49 445.9% Bullish BLUE .092 .311 --------------------------------------------------------------------------------------------- UGA 34.62 .75 33.37 234% Bullish BLUE .391 .122 --------------------------------------------------------------------------------------------- UUP 24.47 0 24.3 14.4% Bullish ---- .17 .07 --------------------------------------------------------------------------------------------- IEF 101.19 -.23 101.63 -8.9% Bearish ---- -.124 .026 --------------------------------------------------------------------------------------------- XLU 49.61 -.35 51.28 -170.4% Bearish RED -.08 .038 --------------------------------------------------------------------------------------------- WEAT 6.73 -.07 7.04 -131% Bullish ---- .286 .068 --------------------------------------------------------------------------------------------- YINN 33.77 .99 31.81 210.2% Bullish BLUE .204 -.053 --------------------------------------------------------------------------------------------- RSX 21.12 .04 20.96 102.6% ---- ---- .211 -.073 --------------------------------------------------------------------------------------------- AAPL 187.36 1.31 176.89 296.9% Bullish BLUE .085 .084 --------------------------------------------------------------------------------------------- GOOG 1082.76 28.85 1023.72 280.4% Bullish BLUE -.02 .002 --------------------------------------------------------------------------------------------- MSFT 96.94 1.13 94.07 180.6% Bearish BLUE .075 .063 --------------------------------------------------------------------------------------------- AMZN 1608 15.61 1572.07 121% Bearish BLUE .028 .097 --------------------------------------------------------------------------------------------- FB 182.66 3.74 174.02 186.5% ---- BLUE .044 .04 --------------------------------------------------------------------------------------------- NVDA 255.78 5.38 232.99 615.3% Bullish BLUE .213 .073 --------------------------------------------------------------------------------------------- BA 344.5 6.13 330.69 304.4% ---- BLUE .108 -.022 --------------------------------------------------------------------------------------------- GS 241.73 4.73 233.41 163.2% Bearish BLUE -.244 -.064 --------------------------------------------------------------------------------------------- HD 186.36 1.32 183.19 12.2% Bullish BLUE .167 .041 --------------------------------------------------------------------------------------------- CAT 152.61 2.68 143.78 298.1% ---- BLUE -.106 -.02 |
Table 2 Count of Stocks in Key Directories
20180509
-------------------------------
NEWHIGHS 345 Bullish
NEWLOWS 75
MAXCP 138 Mildly Bullish
MINCP 122
TTTNH 112
TTTNL 151
FASTUP 250 Swing Traders are bullish.
FASTDOWN 133
CPCROSSA 90 Not enough improvement
CPCROSSD 83
BIGVOLUP 7 Big Buyers are becoming more aggressive.
BIGVODN 17
|
Table 3
         Count of Stocks and NEW HIGHS in Key Tiger Directories
                      Date = 180509
               No.           NHs           Pct.
===============================================================
MAXCP          138           101           73 %
HACKERS        24            9             38 %
COMPUTER       23            8             35 %
NIFTY          30            9             30 %
HOSPITAL       7             2             29 %
SOFTWARE       65            19            29 %
REGBANKS       33            7             21 %
COMODITY       56            11            20 %
NASD-100       89            16            18 %
DOWJONES       30            5             17 %
OILGAS         136           23            17 %
MILITARY       38            6             16 %
TRANSP         20            3             15 %
------------------------------------------------------
GAMING         28            4             14 %
FIDSTKS        189           24            13 %
FINANCE        91            12            13 %
RUS-1000       825           81            10 %
SP-100         96            9             9 %
SP500          481           45            9 %
BIG17          48            4             8 %
CHINA          62            5             8 %
DJI-13         13            1             8 %
BIOTECH        381           25            7 %
ELECTRON       177           11            6 %
INDEXES        195           12            6 %
INSURANC       32            2             6 %
RETAIL         53            3             6 %
INDMATER       85            4             5 %
SEMI           129           7             5 %
CHEM           62            2             3 %
REIT           175           6             3 %
GOLD           50            1             2 %
UTILITY        42            1             2 %
|
Table 4
Count of Stocks and New Lows in Key Tiger Directories
             Date = 180509
               No.           NHs           Pct.
--------------------------------------------------
MINCP          122           35            29 %
BEVERAGE       20            4             20 %
BONDFUND       111           8             7 %
COMODITY       56            3             5 %
BIOTECH        381           14            4 %
FIDSTKS        189           8             4 %
GAMING         28            1             4 %
SP-100         96            4             4 %
AUTO           40            1             3 %
DOWJONES       30            1             3 %
ELECTRON       177           5             3 %
ETFS           61            2             3 %
SEMI           129           4             3 %
CHEM           62            1             2 %
NASD-100       89            2             2 %
OILGAS         136           3             2 %
RETAIL         53            1             2 %
RUS-1000       825           16            2 %
SOFTWARE       65            1             2 %
SP500          481           12            2 %
UTILITY        42            1             2 %
INDMATER       85            1             1 %
INDEXES        195           2             1 %
|
 RANKING OF KEY DIRECTORIES BASED PCT.OF STOCKS ABOVE 65-DMA
               5/9/18
 Bullish = 28
---------------------------------------------------------------------------------------
Directory     Current       day-1         day-2         day-3         day-4         day-5
----------------------------------------------------------------------------------------
EDU            1             1             1             1             1             1
HACKERS        .875          .791          .791          .75           .625          .625
REIT           .828          .8            .862          .8            .731          .697
COMPUTER       .782          .652          .652          .608          .565          .521
OILGAS         .779          .779          .735          .72           .683          .735
SOFTWARE       .723          .707          .723          .707          .63           .646
HOSPITAL       .714          .571          .714          .714          .714          .714
SOLAR          .714          .571          .571          .476          .476          .476
GREEN          .7            .6            .566          .5            .466          .4
NIFTY          .666          .6            .6            .6            .5            .5
REGBANKS .606 .606 .575 .575 .393 .424 INDMATER .576 .517 .494 .458 .4 .4 COMODITY .571 .571 .553 .535 .535 .535 GAMING .571 .571 .571 .535 .357 .357 INDEXES .569 .507 .482 .415 .266 .312 DOWJONES .566 .466 .5 .433 .4 .433 GOLD .56 .58 .58 .54 .54 .5 COAL .555 .555 .555 .555 .333 .333 FOOD .555 .666 .555 .555 .666 .666 RUS-1000 .55 .523 .528 .495 .41 .426 TRANSP .55 .45 .35 .45 .35 .4 DJI-13 .538 .384 .461 .384 .384 .384 CHEM .532 .516 .483 .451 .37 .403 NASD-100 .528 .46 .471 .483 .393 .404 UTILITY .523 .523 .738 .785 .714 .738 INFRA .514 .542 .4 .342 .342 .314 SEMI .511 .434 .403 .395 .333 .31 ELECTRON .508 .423 .395 .389 .322 .327 N=28 ============================================================================================= GUNS .5 .555 .555 .555 .444 .388 SP-100 .5 .447 .427 .416 .343 .354 ============================================================================================= RETAIL .49 .49 .452 .509 .49 .547 SP500 .488 .453 .461 .455 .374 .39 FIDSTKS .481 .417 .46 .439 .37 .354 MILITARY .473 .421 .421 .315 .236 .21 BIOTECH .464 .419 .454 .398 .383 .422 FINANCE .45 .428 .439 .351 .307 .362 BIG17 .437 .437 .479 .437 .354 .416 PIPELINE .428 .428 .428 .142 .142 .285 CHINA .419 .435 .419 .403 .354 .338 ETFS .393 .377 .36 .36 .344 .295 HOMEBLDG .352 .529 .588 .529 .529 .411 BEVERAGE .35 .35 .4 .3 .25 .25 AUTO .325 .325 .3 .3 .25 .25 INSURANC .312 .281 .25 .25 .187 .218 BIGBANKS .285 .142 .142 0 0 0 BONDFUND .225 .243 .243 .243 .207 .18 JETS .2 .2 .1 .3 .3 .3 N=17 |
.
==============================================================================
5/8/2018
Our Peerless Buy B9 tells us that higher prices are coming,
especially
if the DJI and SP-500 can get up past their rising 65-dma resistance levels.
A good strong opening and close tomorrow may do that. Note also in the
DJI chart below how our IP21 and V-Indicators moved much closer to positive
territory today. If this internal improvement continues, there may well be no
Peerless
Sell signal at the upper 2.4% band. The DJI seems on target
to get back to 25000.
If the internals are good enough, we will not get a Sell signal there. Let's let
Peerless
tell us when to sell.

IWM is, by far the strongest of the major market ETFs.
It seems ready to
challenge its recent highs just above 160. Let's not sell it there yet.
Today's
market refused to sell off despite the sabre-rattling from Washington versus Iran
and despite the jump of short-term interest rates to a new high. Instead, our
examination of new highs tonight shows a number of bullish flat top breakouts
on (red) high volume. This often happens just as the market begins a new
surge.
Stay long IWM, WEAT, some low priced Oil stocks and the most bullish MAXCP
ETFs and stocks. Since many of our bearish MINCPs have remained quite weak,
hold a few of these as long as their Closing Powers stay below their 21-dma
and their IP21s do not turn positive.

|
Charts 5/8/2018 PEERLESS DJI, Signals, Indicators Daily DJI Volume 10-DayUp/Down Vol V-Indicator Hourly DJIA A/D Line for All Stocks NASDAQ S&P OEX NYSE COMPQX DJI-15 DJI-20 DJI-30 DIA SPY QQQ MDY IWM TNA USO-CrudeOil FAS GLD BBH IBB JETS JNUG KOL NUGT OIH OIL RSX RETL SDS SLV SOXL TECL TMF TNA UGA (gasoline) XIV YINN Commodities: JJC, NIB, CHOC CORN, CUT (paper) WEAT UUP (Dollar) AAPL ADBE ALXN AMAT AMGN AMD AMZN BA BABA BAC BIDU CAT CVX DE FB GOOG GS HD IBM JPM M (Macy's) MSFT NFLX NVDA QCOM TSLA TXN XOM WMT ANDV (refinery), CMG (Chipotle), LRCX, SWKS, MDGL SPPI WATT SQ TOWN 5/8/2018 (Click on Underlined link.) Bullish MAXCPs - http://tigersoft.com/4XXH/MAXCPS/508/BULLISH.htm Bearish MAXCPs - http://tigersoft.com/4XXH/MINCPS/508/BEARISH.htm |
Table 1 QUICKSILVER on ETFS - 05/08/18 DIA and FAS show weak relative strength.
IWM is 7.1% stronger over last 50 trading days. It has the highest IP21 among
the 6 general market ETFs at top in table below.
MDY and IWM show rising Closing Powers.
IWM remains favored.
ETF CLOSE CHANGE PIVOT-PT 5-dma AROC CL-PWR CANDLE IP21 ITRS --------------------------------------------------------------------------------------------- --------------------------------------------------------------------------------------------- DIA 243.42 0 239.11 55.2% Bearish BLUE .044 ----- --------------------------------------------------------------------------------------------- COMPQX 7266.9 1.69 7100.9 95.1% ---- BLUE .043 .032 --------------------------------------------------------------------------------------------- SPY 266.92 0 263.2 36.6% Bearish BLUE .056 .013 --------------------------------------------------------------------------------------------- QQQ 166.07 -.17 161.82 100.6% ---- BLUE .037 .027 --------------------------------------------------------------------------------------------- MDY 348.23 1.16 341.08 95% Bullish BLUE .019 .052 --------------------------------------------------------------------------------------------- IWM 157.83 .78 154.65 121.2% Bullish BLUE .126 .071 --------------------------------------------------------------------------------------------- --------------------------------------------------------------------------------------------- --------------------------------------------------------------------------------------------- FAS 65.64 .87 62.34 129.7% ---- BLUE -.073 -.066 --------------------------------------------------------------------------------------------- RETL 33 -.21 34.23 -129.4% Bearish ---- -.105 -.06 --------------------------------------------------------------------------------------------- SOXL 144.5 3.01 126.18 625.6% ---- BLUE .057 -.123 --------------------------------------------------------------------------------------------- TECL 127.38 .5 116.64 428.3% ---- BLUE .09 -.026 --------------------------------------------------------------------------------------------- IBB 102.41 -.59 102.68 -79.9% Bearish RED -.057 -.029 --------------------------------------------------------------------------------------------- GLD 124.59 .02 123.65 35.4% Bullish BLUE -.101 .038 --------------------------------------------------------------------------------------------- OIL 7.61 .04 6.89 339.4% Bullish BLUE .263 .114 --------------------------------------------------------------------------------------------- OIH 27.59 .26 27.15 125.5% Bullish BLUE .243 .158 --------------------------------------------------------------------------------------------- GASL 21.86 .98 21.03 140.6% Bullish BLUE .211 .202 --------------------------------------------------------------------------------------------- UGA 33.87 .12 33.05 85.2% Bullish RED .367 .106 --------------------------------------------------------------------------------------------- UUP 24.47 .09 24.4 37% Bullish ---- .144 .095 --------------------------------------------------------------------------------------------- IEF 101.42 -.17 101.37 3.4% Bearish ---- -.103 .044 --------------------------------------------------------------------------------------------- XLU 49.96 -1.28 51.35 -140.2% Bearish RED -.081 .048 --------------------------------------------------------------------------------------------- WEAT 6.8 .07 6.91 -101.4% Bullish BLUE .304 .104 --------------------------------------------------------------------------------------------- YINN 32.78 1.25 32.42 9.3% Bullish RED .199 -.169 --------------------------------------------------------------------------------------------- RSX 21.08 .2 20.69 47.8% ---- BLUE .281 -.08 --------------------------------------------------------------------------------------------- AAPL 186.05 .89 176.57 475.3% Bullish BLUE .069 .092 --------------------------------------------------------------------------------------------- GOOG 1053.91 -.88 1024.38 80% Bullish RED -.031 -.026 --------------------------------------------------------------------------------------------- MSFT 95.81 -.41 93.51 42.7% Bearish RED .054 .057 --------------------------------------------------------------------------------------------- AMZN 1592.39 -7.75 1569.68 32% Bearish RED .026 .099 --------------------------------------------------------------------------------------------- FB 178.92 .95 176.07 144% ---- BLUE .083 .02 --------------------------------------------------------------------------------------------- NVDA 250.4 1.72 226.31 495.2% Bullish BLUE .203 .068 --------------------------------------------------------------------------------------------- BA 338.37 -2.06 324.19 133% Bearish RED .116 -.017 --------------------------------------------------------------------------------------------- GS 237 -.2 234.05 7% Bearish RED -.297 -.074 --------------------------------------------------------------------------------------------- HD 185.04 1.48 185.91 11.1% Bullish BLUE .146 .034 --------------------------------------------------------------------------------------------- CAT 149.93 .11 143.86 189.2% Bearish RED -.11 -.032 |
Table 2 Count of Stocks in Key Directories
20180508
-------------------------------
NEWHIGHS 251 Bullish
NEWLOWS 95
MAXCP 105
MINCP 141 Professionals are still net bearish.
TTTNH 104
TTTNL 160 Day Traders are still net bearish
FASTUP 225 Swing-traders are bullish.
FASTDOWN 133
CPCROSSA 112 Professionals are shifting positively
CPCROSSD 106
BIGVOLUP 3
BIGVODN 22 Big Money is still dumping numerous stocks.
|
Table 3
         Count of Stocks and NEW HIGHS in Key Tiger Directories
                      Date = 180508
               No.           NHs           Pct.
===============================================================
MAXCP          105           64            61 %
COMPUTER       23            7             30 %
HACKERS        24            6             25 %
REGBANKS       33            7             21 %
SOFTWARE       65            13            20 %
NIFTY-30       29            5             17 %
MILITARY 38 6 16 % HOSPITAL 7 1 14 % FINANCE 91 10 11 % DOWJONES 30 3 10 % NASD-100 89 9 10 % OILGAS 135 14 10 % FIDSTKS 189 17 9 % DJI-13 13 1 8 % COMODITY 56 4 7 % BIG17 48 3 6 % RUS-1000 825 46 6 % SP-100 96 6 6 % BEVERAGE 20 1 5 % BIOTECH 382 20 5 % ELECTRON 177 9 5 % SP500 481 23 5 % TRANSP 20 1 5 % UTILITY 42 2 5 % GAMING 28 1 4 % SEMI 129 5 4 % CHEM 62 2 3 % INDEXES 195 6 3 % INSURANC 32 1 3 % REIT 175 5 3 % CHINA 62 1 2 % GOLD 50 1 2 % INDMATER 85 2 2 % |
Table 4
Count of Stocks and New Lows in Key Tiger Directories
             Date = 180508
               No.           NHs           Pct.
--------------------------------------------------
MINCP          141           53            38 %
BEVERAGE       20            3             15 %
PIPELINE       7             1             14 %
CHEM           62            5             8 %
DJI-13         13            1             8 %
DOWJONES       30            2             7 %
ETFS           61            4             7 %
SP-100         96            7             7 %
FIDSTKS        189           12            6 %
AUTO           40            2             5 %
BIOTECH        382           18            5 %
BONDFUND       111           4             4 %
GAMING         28            1             4 %
INDMATER       85            3             4 %
SP500          481           20            4 %
GREEN          30            1             3 %
INFRA          35            1             3 %
MILITARY       38            1             3 %
NASD-100       89            3             3 %
RUS-1000       825           28            3 %
ELECTRON       177           3             2 %
FINANCE        91            2             2 %
GOLD           50            1             2 %
RETAIL         53            1             2 %
INDEXES        195           2             1 %
OILGAS         135           2             1 %
SEMI           129           1             1 %
|
Table 5 RANKING OF KEY DIRECTORIES BASED PCT.OF STOCKS ABOVE 65-DMA
5/8/18
Bullish = 24
Bearish = 23
---------------------------------------------------------------------------------------
Directory Current day-1 day-2 day-3 day-4 day-5
----------------------------------------------------------------------------------------
EDU 1 1 1 1 1 .857
REIT .8 .862 .8 .731 .691 .714
HACKERS .791 .791 .75 .625 .625 .666
OILGAS .785 .74 .725 .688 .74 .733
SOFTWARE .707 .723 .707 .63 .646 .661
FOOD           .666          .555          .555          .666          .666          .666
COMPUTER       .652          .652          .608          .565          .521          .434
REGBANKS       .606          .575          .575          .393          .424          .515
GREEN          .6            .566          .5            .466          .366          .4
NIFTY          .586          .586          .586          .482          .482          .517
GOLD .58 .58 .54 .54 .5 .44 COMODITY .571 .553 .535 .535 .535 .517 GAMING .571 .571 .535 .357 .357 .321 HOSPITAL .571 .714 .714 .714 .714 .428 SOLAR .571 .571 .476 .476 .476 .476 COAL .555 .555 .555 .333 .333 .222 GUNS .555 .555 .555 .444 .388 .388 INFRA .542 .4 .342 .342 .314 .285 HOMEBLDG .529 .588 .529 .529 .411 .411 RUS-1000 .523 .528 .495 .41 .421 .466 UTILITY .523 .738 .785 .714 .738 .761 INDMATER .517 .494 .458 .4 .388 .388 CHEM .516 .483 .451 .37 .387 .403 INDEXES .507 .482 .415 .266 .307 .317 N=24 =========================================================================================== RETAIL .49 .452 .509 .49 .528 .584 DOWJONES .466 .5 .433 .4 .4 .4 NASD-100 .46 .471 .483 .393 .404 .438 SP500 .453 .461 .455 .374 .386 .451 TRANSP .45 .35 .45 .35 .4 .5 SP-100 .447 .427 .416 .343 .343 .395 BIG17 .437 .479 .437 .375 .395 .354 CHINA .435 .419 .403 .354 .338 .338 SEMI .434 .403 .395 .333 .31 .255 FINANCE .428 .439 .351 .307 .362 .34 PIPELINE .428 .428 .142 .142 .285 .285 ELECTRON .423 .395 .389 .322 .322 .271 MILITARY .421 .421 .315 .236 .236 .263 BIOTECH .418 .452 .397 .382 .421 .4 FIDSTKS .417 .46 .439 .37 .349 .417 DJI-13 .384 .461 .384 .384 .384 .307 ETFS .377 .36 .36 .344 .278 .278 BEVERAGE .35 .4 .3 .25 .25 .4 AUTO .325 .3 .3 .25 .25 .225 INSURANC .281 .25 .25 .187 .218 .343 BONDFUND .243 .243 .243 .207 .18 .18 JETS .2 .1 .3 .3 .3 .5 BIGBANKS .142 .142 0 0 0 .142 N=23 |
---------------------------------------------------------------------------------------------------------------------
5/7/2018
Our Peerless Buy B9 did bring a broad rally today. But as
was feared might
happen, the DJI and SP-500 seem to have hit a barrier at their falling 65-dma.
Now we must wait and see if they can regroup for another try to the upside.
That rally may well fail at the upper 2.4% band since the IP21 and V-I Indicators
may still be negative when the DJI gets there.

Fortunately, the Russell-2000's ETF, IWM, was our choice for playing the Buy
B9 as it was already above its own 65-dma and also showed better internals. Over
the last 50-days, IWM has out-performed the DJI by +5.7% and it is the only major
market ETF to show a positive IP21 (current Accummulation). IWM,
I suspect,
is more likely to rally now until it reaches its own resistance, which is based on
its recent highs.
Let's Plan to sell IWM at 159.5

Hang onto your longs. The average DJI gain after a Peerless Buy
signal is more
than 10%. A little sidewise digestion of the recent gains would be contructive.
Watch the number of the NYSE Advances and Declines. That is important now.
Today there were 784 more up than down. This reflects both good economic
growth and a view that much higher interest rates do not lie immediately ahead.
If rates stay low, that will help smaller companies and if inflation does heat up,
traders will need to play smaller growth stocks and bullish special situations,
like the oil stocks I have mentioned. 74% of the 135 Oil/Gas stocks we have
in that select directory are now above their 65-dma and the group is
out-performing the DJI by 7.4% over the last 50 trading days. In the past,
a good way to play the advance here is to watch Crude Oil. So long as
its IP21 is positive and it says above its 65-dma, look for higher prices.
|
Charts 5/7/2018 PEERLESS DJI, Signals, Indicators Daily DJI Volume 10-DayUp/Down Vol V-Indicator Hourly DJIA A/D Line for All Stocks NASDAQ S&P OEX NYSE COMPQX DJI-15 DJI-20 DJI-30 DIA SPY QQQ MDY IWM TNA USO-CrudeOil FAS GLD BBH IBB JETS JNUG KOL NUGT OIH OIL RSX RETL SDS SLV SOXL TECL TMF TNA UGA (gasoline) XIV YINN Commodities: JJC, NIB, CHOC CORN, CUT (paper) WEAT UUP (Dollar) AAPL ADBE ALXN AMAT AMGN AMD AMZN BA BABA BAC BIDU CAT CVX DE FB GOOG GS HD IBM JPM M (Macy's) MSFT NFLX NVDA QCOM TSLA TXN XOM WMT ANDV (refinery), CMG (Chipotle), LRCX, SWKS, MDGL SPPI WATT SQ TOWN 5/7/2018 (Click on Underlined link.) Bullish MAXCPs - http://tigersoft.com/4XXH/MAXCPS/507/BULLISH.htm Bearish MAXCPs - http://tigersoft.com/4XXH/MINCPS/507/BEARISH.htm |
A Wild Advance in Select Lower Priced Stocks May Be
Coming.
It has been a long time since low-priced stocks have caught the fancy of traders.
That occasionally happens at the end of a long bull markets (notably 1968 - electronics
stocks, 1976-1977 - oil stocks, 1999 - biotech and internet stocks and 2008 - oil stocks)
when the Public finally is invited to the party and gets excited about by the hype in
a particular industry. My guess now is that low-priced oil stocks are the most
likely
to play this role again.
A May 2008 TigerSoft Hotline shows the way Oil Stocks surged wildly
just as the
overall market was topping out.
http://www.tigersoftware.com/00XXX2008hlmarch/index.html
In the next chart, we see how easy it was to sell when to sell Crude Oil at or very
near the top in 2008. USO is still in the run-up stage now.


Low Priced stocks are still weak.

Our index of 225 Low Priced stocks still looks very
weak. Its own A/D Line
is falling and its IP21 (not shown here) has been negative for months. So, we are
not yet at a point we the Public is interested in speculating. Perhaps, they just
are too much in debt or lack the funds. This suggests to me that we should
simply be selling IWM on its rally up to its recent highs. (I do not have
a Tiger Index of the 2000 stocks that make up the Russell-2000.)
My Russell-1000 (actually only 800) Index chart also shows prices caught in a
trading range with very negative Accumulation).

Table 1 QUICKSILVER on ETFS - 05/07/18 Closing Powers are still apt to falter when they meet their
falling 21-dma.
       DIA and FAS show weak relative strength.
       IWM is 5.7% stronger over last 50 trading days. Only it has positive IP21
ETF CLOSE CHANGE PIVOT-PT 5-dma AROC CL-PWR CANDLE IP21 ITRS --------------------------------------------------------------------------------------------- --------------------------------------------------------------------------------------------- DIA 243.42 .9 240.76 39.1% Bearish RED -.021 ==== --------------------------------------------------------------------------------------------- COMPQX 7265.21 55.59 7130.7 139.7% Bearish BLUE -.03 .028 --------------------------------------------------------------------------------------------- SPY 266.92 .9 264.98 45.6% Bearish ---- -.003 .009 --------------------------------------------------------------------------------------------- QQQ 166.24 1.37 162.78 163.1% ---- BLUE -.019 .026 --------------------------------------------------------------------------------------------- MDY 347.07 1.88 341.71 96% Bullish BLUE -.054 .039 --------------------------------------------------------------------------------------------- IWM 157.05 1.32 154.07 120.9% Bullish BLUE .038 .057 --------------------------------------------------------------------------------------------- FAS 64.77 1.22 64 104% Bearish BLUE -.123 -.063 --------------------------------------------------------------------------------------------- RETL 33.21 -.45 33.87 -141.9% Bearish RED -.134 -.058 --------------------------------------------------------------------------------------------- SOXL 141.49 3.77 127.94 762.2% Bearish BLUE -.023 -.104 --------------------------------------------------------------------------------------------- TECL 126.88 2.61 117.06 600% ---- BLUE .023 -.001 --------------------------------------------------------------------------------------------- IBB 103 .65 104.05 -31.6% Bearish BLUE -.077 -.032 --------------------------------------------------------------------------------------------- GLD 124.57 .03 123.71 -.8% Bullish BLUE -.091 .025 --------------------------------------------------------------------------------------------- OIL 7.61 .04 6.89 339.4% Bullish BLUE .263 .099 --------------------------------------------------------------------------------------------- OIH 27.33 .13 26.91 35.1% Bullish RED .171 .134 --------------------------------------------------------------------------------------------- GASL 20.88 .42 21.28 -118.2% Bullish RED .062 .16 --------------------------------------------------------------------------------------------- UGA 33.75 .05 33.3 -22.4% Bullish RED .372 .095 --------------------------------------------------------------------------------------------- UUP 24.38 .05 24.29 51.5% Bullish ---- .172 .075 --------------------------------------------------------------------------------------------- IEF 101.59 -.05 101.35 -5.4% Bearish ---- -.066 .032 --------------------------------------------------------------------------------------------- XLU 51.24 -.27 51.4 -31.1% Bullish RED -.021 .055 --------------------------------------------------------------------------------------------- WEAT 6.73 -.15 6.94 7.2% Bullish RED .327 .101 --------------------------------------------------------------------------------------------- YINN 31.53 -.47 32.72 -199.4% Bullish BLUE .145 -.186 --------------------------------------------------------------------------------------------- RSX 20.88 -.26 20.88 -33.4% ---- RED .087 -.084 --------------------------------------------------------------------------------------------- AAPL 185.16 1.33 169.1 570.8% Bullish ---- .003 .093 --------------------------------------------------------------------------------------------- GOOG 1054.79 6.58 1037.31 181.8% Bullish BLUE -.07 -.026 --------------------------------------------------------------------------------------------- MSFT 96.22 1.06 95 143.2% Bearish BLUE -.006 .06 --------------------------------------------------------------------------------------------- AMZN 1600.14 19.19 1582.26 108% Bearish BLUE -.016 .104 --------------------------------------------------------------------------------------------- FB 177.97 1.36 173.86 171% ---- BLUE .052 .008 --------------------------------------------------------------------------------------------- NVDA 248.68 9.62 227.14 516.8% Bullish BLUE .111 .049 --------------------------------------------------------------------------------------------- BA 340.43 6 329.54 103.9% Bearish BLUE .081 -.008 --------------------------------------------------------------------------------------------- GS 237.2 2.26 236.67 -24% Bearish BLUE -.285 -.073 --------------------------------------------------------------------------------------------- HD 183.56 -1.47 184.63 -33.6% Bullish RED .059 .012 --------------------------------------------------------------------------------------------- CAT 149.82 3.45 144.42 188.9% Bearish BLUE -.142 -.04 |
    Count of Stocks in Key Directories
          20180507
---------------------- --------
NEWHIGHS       225   Bullish
NEWLOWS        63
MAXCP          79
MINCP          99    Professionals are still more bearish.
TTTNH          108
TTTNL          97
FASTUP         241   Swing traders are still bullish.
FASTDOWN       108
CPCROSSA       65
CPCROSSD       63
BIGVOLUP       0     There were none Monday.
BIGVODN        10
ACCUMVER       10
HIGHIP21       56
HIUPPCT        146
VHIP21         28
LOWACCUM       405
REDSELL        203
AUGSELS7       38
TRAPDOOR       34
|
Table 3
         Count of Stocks and NEW HIGHS in Key Tiger Directories
                      Date = 180507
               No.           NHs           Pct.
===============================================================-
MAXCP          79            54            68 %
COMPUTER       23            5             22 %
HACKERS        24            5             21 %
COMODITY       56            9             16 %
SOFTWARE       65            10            15 %
HOSPITAL       7             1             14 %
NIFTY          30            4             13 %
DOWJONES       30            3             10 %
NASD-100       89            8             9 %
REGBANKS       33            3             9 %
DJI-13         13            1             8 %
BIG17          46            3             7 %
FIDSTKS        189           13            7 %
OILGAS         135           10            7 %
INSURANC       32            2             6 %
BIOTECH        382           21            5 %
CHINA          62            3             5 %
FINANCE        91            5             5 %
MILITARY       38            2             5 %
REIT           176           9             5 %
RUS-1000       825           39            5 %
SP-100         96            5             5 %
UTILITY        42            2             5 %
GAMING         28            1             4 %
GOLD           50            2             4 %
SP500          481           20            4 %
CHEM           62            2             3 %
INDEXES        195           6             3 %
ELECTRON       177           4             2 %
INDMATER       85            2             2 %
RETAIL         53            1             2 %
SEMI           128           2             2 %
|
Table 4
Count of Stocks and New Lows in Key Tiger Directories
             Date = 180507
               No.           NHs           Pct.
--------------------------------------------------
PIPELINE       7             2             29 %
MINCP          99            29            29 %
ETFS           61            5             8 %
BEVERAGE       20            1             5 %
BONDFUND       111           5             5 %
COMODITY       56            3             5 %
INDMATER       85            4             5 %
GOLD           50            2             4 %
ELECTRON       177           5             3 %
INFRA          35            1             3 %
INSURANC       32            1             3 %
MILITARY       38            1             3 %
BIOTECH        382           9             2 %
CHEM           62            1             2 %
FIDSTKS        189           4             2 %
NASD-100       89            2             2 %
OILGAS         135           3             2 %
SEMI           128           3             2 %
SP500          481           9             2 %
FINANCE        91            1             1 %
INDEXES        195           1             1 %
RUS-1000       825           11            1 %
SP-100         96            1             1 %
|
 Table 4
      RANKING OF KEY DIRECTORIES BASED PCT.OF STOCKS ABOVE 65-DMA
              5/7/18
      Bearish = 26  - This is still a problem.
      Bullish = 20
---------------------------------------------------------------------------------------
Directory     Current       day-1         day-2         day-3         day-4         day-5
----------------------------------------------------------------------------------------
EDU            1             1             1             1             .857          .857
REIT           .863          .801          .732          .693          .71           .67
HACKERS        .791          .75           .625          .625          .625          .708
OILGAS         .74           .725          .688          .74           .725          .733
UTILITY        .738          .785          .714          .738          .761          .738
SOFTWARE       .723          .707          .63           .646          .661          .646
HOSPITAL       .714          .714          .714          .714          .428          .428
COMPUTER       .652          .608          .565          .521          .478          .391
NIFTY          .6            .6            .5            .5            .533          .466
HOMEBLDG       .588          .529          .529          .411          .411          .411
GOLD .58 .54 .54 .5 .4 .42 REGBANKS .575 .575 .393 .424 .484 .484 GAMING .571 .535 .357 .357 .321 .321 SOLAR .571 .476 .476 .476 .476 .523 GREEN .566 .5 .466 .366 .4 .433 COAL .555 .555 .333 .333 .222 .333 FOOD .555 .555 .666 .666 .666 .777 GUNS .555 .555 .444 .388 .388 .277 COMODITY .553 .535 .535 .535 .517 .517 RUS-1000 .528 .495 .41 .421 .463 .449 N=20 =============================================================================================== DOWJONES .5 .433 .4 .4 .366 .466 =============================================================================================== INDMATER .494 .458 .4 .388 .376 .388 CHEM .483 .451 .37 .387 .403 .338 INDEXES .482 .415 .266 .307 .312 .297 NASD-100 .471 .483 .393 .404 .438 .426 DJI-13 .461 .384 .384 .384 .307 .307 SP500 .461 .455 .374 .386 .446 .449 FIDSTKS .46 .439 .37 .349 .412 .407 BIG17 .456 .413 .347 .391 .326 .304 BIOTECH .452 .397 .382 .421 .392 .374 RETAIL .452 .509 .49 .528 .584 .622 FINANCE .439 .351 .307 .362 .34 .34 PIPELINE .428 .142 .142 .285 .285 .428 SP-100 .427 .416 .343 .343 .385 .437 MILITARY .421 .315 .236 .236 .263 .263 CHINA .419 .403 .354 .338 .338 .354 SEMI .406 .398 .335 .312 .25 .187 BEVERAGE .4 .3 .25 .25 .4 .4 INFRA .4 .342 .342 .314 .257 .314 ELECTRON .395 .389 .322 .322 .265 .203 ETFS .36 .36 .344 .278 .278 .327 TRANSP .35 .45 .35 .4 .5 .5 AUTO .282 .282 .23 .23 .205 .153 INSURANC .25 .25 .187 .218 .343 .343 BONDFUND .243 .243 .207 .18 .162 .126 BIGBANKS .142 0 0 0 .142 .142 JETS .1 .3 .3 .3 .5 .4 N=26 |
==============================================================================
5/4/2018 Our Peerless Buy B9 got a real nice boost Friday from the Jobs Report number,
+164,000, for April. The figure was not so high as to give the FED reason to rush to
raise rates or so low as to suggest the economy is slowing down dangerously.
Bullishly, the March jobs' estimate was revised up +32,000. The Public saw the
new 3.9% unemployment level and quickly concluded that this is bullish for the
market. For now they are right. But if the DJI closes 2.4% over the 21-day ma,
about 25,000, we will likely see a new S12 and an S9-V.
As I've been saying, there is considerably more upside potential elsewhere,
notably in IWM, in Oils and even the NASDAQ now.

Buy More IWM and Oil Stocks
Because of the B9, I recommended buying IWM on Wednesday. If
you bought it at the
opening the next day, you paid no more than 154.11. And I also suggested buying
more USO. It opened the next day at 13.63. On Friday, IWM moved back above
its 65-dma and USO made a bullish flat-top breakout. Both are looking good for
new week. The best stock recommendation here was in PES. This is a very, very
volatile oil stock. With Crude on the rise, its leverage should bring another move
back up
to resistance at $6.50. Of course, if oil can rise a little more and stay up there,
it will
go much higher. GTE is another small oil stock that typically rises and falls a lot
with oil prices. In 2008, with the DJI having topped out, oil stocks and Crude Oil
got a
very big run, as the "last game in town" for big institutions. I expect a
re-run of this.
PES was above $20 and GTE almost reached $9.00 back then.
 |
 |
  |
DJI's Target Now Is 25,000
Although, a Buy B9 brings an average DJI gain of more than
10%, we still have
to be concerned that DIA and SPY are below the resistance of their 65-dma. Profit-
taking there is certainly a possibility. But, for now, we have to be encouraged by
the fact
that the steep Closing Power downtrends for DIA and SPY have been broken.
As for what is bringing about the rally, let us hope that the market is correctly
anticipating peaceful changes on the Korean Penninsula. I'm also thinking that
Trumps recent appointments to the FOMC clearly understand the importance to
Trump and the Republican Party that the economy not be allowed to falter now
because of a market decline of more than 10% from its highs.
Whatever, the thinking behind the rally, most chartists have spotted the just completed
fifth
successful test of 23400-23500. There is no point in being short the general market.
We will cover most of our shorts on the Tiger Stocks' Hotline. Technically,
the market
must now rally to determine where the overhead resistance is.
Watch AAPL. This
stock played a big role in last week's turnaround. The news
there is that both Warren Buffett and AAPL itself are big buyers. It is reported
that the company has using its repartiated billions of dollars in overseas profits
to purchasing massive amounts of its own shares, more shares in the last three
months
than ever before. AAPL, of course, plays a big role in the QQQ and the NASDAQ,
both of which are bullishly back above their 65-dma and also in the DJIA. AAPL
made a new high on Friday but still shows a negative IP21. That makes it risky to
chase in here.
|
Charts 5/4/2018 PEERLESS DJI, Signals, Indicators Daily DJI Volume 10-DayUp/Down Vol V-Indicator Hourly DJIA A/D Line for All Stocks NASDAQ S&P OEX NYSE COMPQX DJI-15 DJI-20 DJI-30 DIA SPY QQQ MDY IWM TNA USO-CrudeOil FAS GLD BBH IBB JETS JNUG KOL NUGT OIH OIL RSX RETL SDS SLV SOXL TECL TMF TNA UGA (gasoline) XIV YINN Commodities: JJC, NIB, CHOC CORN, CUT (paper) WEAT UUP (Dollar) AAPL ADBE ALXN AMAT AMGN AMD AMZN BA BABA BAC BIDU CAT CVX DE FB GOOG GS HD IBM JPM M (Macy's) MSFT NFLX NVDA QCOM TSLA TXN XOM WMT ANDV (refinery), CMG (Chipotle), LRCX, SWKS, MDGL SPPI WATT SQ TOWN 5/4/2018 (Click on Underlined link.) Bullish MAXCPs - http://tigersoft.com/4XXH/MAXCPS/504/BULLISH.htm Bearish MAXCPs - http://tigersoft.com/4XXH/MINCPS/504/BEARISH.htm |
Table 1 QUICKSILVER on ETFS - 05/04/18 Closing Powers are still apt to falter when they meet their
falling 21-dma.
       DIA and FAS show weak relative strength.
       IWM is 5.2% stronger over last 50 trading days. Only it has positive IP21
ETF CLOSE CHANGE PIVOT-PT 5-dma AROC CL-PWR CANDLE IP21 ITRS --------------------------------------------------------------------------------------------- --------------------------------------------------------------------------------------------- DIA 242.52 3.42 241.54 -8.9% Bearish BLUE -.05 ------ --------------------------------------------------------------------------------------------- COMPQX 7209.62 121.47 7066.27 63.2% Bearish BLUE -.066 .028 --------------------------------------------------------------------------------------------- SPY 266.02 3.4 264.51 -10.2% Bearish BLUE -.05 .012 --------------------------------------------------------------------------------------------- QQQ 164.87 3.07 160.94 85.9% Bearish BLUE -.069 .028 --------------------------------------------------------------------------------------------- MDY 345.19 4.6 340.51 16% ---- BLUE -.077 .037 --------------------------------------------------- ------------------------------------------ IWM 155.73 1.92 153.32 33.7% ---- BLUE .006 .052 --------------------------------------------------------------------------------------------- FAS 63.55 2.07 63.46 -80.7% Bearish BLUE -.162 -.049 --------------------------------------------------------------------------------------------- RETL 33.66 .49 34.17 -251.7% Bearish BLUE -.149 -.014 --------------------------------------------------------------------------------------------- SOXL 137.72 9.26 121.91 461.1% Bearish BLUE -.057 -.082 --------------------------------------------------------------------------------------------- TECL 124.27 6.7 112.76 398.9% Bearish BLUE -.015 .027 --------------------------------------------------------------------------------------------- IBB 102.35 1.07 103.65 -157.6% Bearish BLUE -.119 -.028 --------------------------------------------------------------------------------------------- GLD 124.54 .26 124.59 -38.6% ---- BLUE -.093 .014 --------------------------------------------------------------------------------------------- OIL 7.61 .04 6.89 339.4% Bullish BLUE .263 .089 --------------------------------------------------------------------------------------------- OIH 27.2 .33 27.14 -3.7% Bullish BLUE .217 .146 --------------------------------------------------------------------------------------------- GASL 20.46 .97 21.37 -132% Bullish BLUE .074 .22 --------------------------------------------------------------------------------------------- UGA 33.7 .33 33.9 -17.9% Bullish BLUE .431 .1 --------------------------------------------------------------------------------------------- UUP 24.33 .03 24.13 61.9% Bullish RED .162 .065 --------------------------------------------------------------------------------------------- IEF 101.64 .01 101.7 2.5% Bearish RED -.026 .027 --------------------------------------------------------------------------------------------- XLU 51.51 .23 51.56 -19.4% Bullish BLUE -.035 .078 --------------------------------------------------------------------------------------------- WEAT 6.88 -.16 6.72 219.4% Bullish RED .43 .113 --------------------------------------------------------------------------------------------- YINN 32 .19 32.82 -104.6% Bullish BLUE .132 -.142 --------------------------------------------------------------------------------------------- RSX 21.14 .18 21.02 -35.8% ---- BLUE .075 -.082 --------------------------------------------------------------------------------------------- AAPL 183.83 6.94 165.26 632.5% Bullish BLUE .001 .094 --------------------------------------------------------------------------------------------- GOOG 1048.21 24.49 1017.33 88.5% ---- BLUE -.104 -.025 --------------------------------------------------------------------------------------------- MSFT 95.16 1.09 93.52 -35% Bearish BLUE -.05 .065 --------------------------------------------------------------------------------------------- AMZN 1580.95 8.88 1566.13 26.5% Bearish BLUE -.068 .092 --------------------------------------------------------------------------------------------- FB 176.61 2.59 172 86.8% ---- BLUE .007 .015 --------------------------------------------------------------------------------------------- NVDA 239.06 6.07 224.9 279.7% ---- BLUE .029 .015 --------------------------------------------------------------------------------------------- BA 334.43 3.74 333.56 -97.2% Bearish BLUE .043 -.032 --------------------------------------------------------------------------------------------- GS 234.94 1.53 238.33 -102.8% Bearish BLUE -.298 -.073 --------------------------------------------------------------------------------------------- HD 185.03 1.84 184.8 -38.6% Bullish BLUE .041 .026 --------------------------------------------------------------------------------------------- CAT 146.37 2.59 144.36 57.2% Bearish BLUE -.161 -.051 |
Table 2 Count of Stocks in Key Directories
20180504
-------------------------------
NEWHIGHS 190 OK
NEWLOWS 45
MAXCP 99 OK
MINCP 56
TTTNH 104 OK
TTTNL 84
FASTUP 159 positive
FASTDOWN 140
CPCROSSA 151 Bullish
CPCROSSD 27
BIGVOLUP 4
BIGVODN 10
|
Table 3
         Count of Stocks and NEW HIGHS in Key Tiger Directories
                      Date = 180504
               No.           NHs           Pct.
===============================================================
MAXCP          99            67            68 %
COMODITY       56            11            20 %
HACKERS        24            4             17 %
COMPUTER       23            3             13 %
SOFTWARE       65            8             12 %
OILGAS         136           12            9 %
DJI-13         13            1             8 %
DOWJONES       30            2             7 %
NIFTY          29            2             7 %
UTILITY        42            3             7 %
GOLD           50            3             6 %
INSURANC       32            2             6 %
NASD-100       89            5             6 %
BIOTECH        383           18            5 %
FIDSTKS        189           9             5 %
RUS-1000       825           41            5 %
TRANSP         20            1             5 %
FINANCE        91            4             4 %
GAMING         28            1             4 %
SP-100         96            4             4 %
SP500          481           21            4 %
CHEM           62            2             3 %
MILITARY       38            1             3 %
REGBANKS       33            1             3 %
REIT           176           6             3 %
CHINA          62            1             2 %
ELECTRON       177           4             2 %
RETAIL         53            1             2 %
SEMI           128           3             2 %
INDMATER       85            1             1 %
INDEXES        195           2             1 %
|
Table 4
Count of Stocks and New Lows in Key Tiger Directories
             Date = 180504
               No.           NHs           Pct.
--------------------------------------------------
MINCP          56            14            25 %
PIPELINE       7             1             14 %
BEVERAGE       20            1             5 %
COMODITY       56            3             5 %
MILITARY       38            2             5 %
SOFTWARE       65            3             5 %
ETFS           61            2             3 %
INFRA          35            1             3 %
INSURANC       32            1             3 %
BONDFUND       111           2             2 %
GOLD           50            1             2 %
INDMATER       85            2             2 %
RETAIL         53            1             2 %
SEMI           128           2             2 %
BIOTECH        383           5             1 %
ELECTRON       177           1             1 %
FIDSTKS        189           2             1 %
FINANCE        91            1             1 %
INDEXES        195           1             1 %
OILGAS         136           2             1 %
RUS-1000       825           10            1 %
SP500          481           4             1 %
|
 TABLE 5
RANKING OF KEY DIRECTORIES BASED PCT.OF STOCKS ABOVE 65-DMA
              5/4/18
  BEARISH = 28
  BULLISH = 18
---------------------------------------------------------------------------------------
Directory     Current       day-1         day-2         day-3         day-4         day-5
----------------------------------------------------------------------------------------
EDU            1             1             1             .857          .857          1
REIT           .801          .732          .693          .71           .659          .715
UTILITY        .785          .714          .738          .761          .738          .738
HACKERS        .75           .625          .625          .625          .708          .708
OILGAS         .72           .683          .735          .72           .727          .705
HOSPITAL .714 .714 .714 .428 .428 .571 SOFTWARE .707 .63 .646 .661 .646 .661 COMPUTER .608 .565 .521 .478 .391 .478 NIFTY .586 .482 .482 .517 .448 .551 REGBANKS .575 .393 .424 .484 .484 .545 COAL .555 .333 .333 .222 .333 .222 FOOD .555 .666 .666 .666 .777 .888 GUNS .555 .444 .388 .388 .277 .277 GOLD .54 .54 .5 .4 .42 .58 COMODITY .535 .535 .535 .517 .517 .571 GAMING .535 .357 .357 .321 .321 .285 HOMEBLDG .529 .529 .411 .411 .411 .647 RETAIL .509 .49 .528 .584 .622 .698 N=18 ============================================================================================ GREEN .5 .466 .366 .4 .433 .5 ============================================================================================ RUS-1000 .495 .41 .421 .463 .447 .496 NASD-100 .483 .393 .404 .438 .426 .46 SOLAR .476 .476 .476 .476 .523 .571 INDMATER .458 .4 .388 .376 .376 .423 SP500 .455 .374 .386 .446 .446 .48 CHEM .451 .37 .387 .403 .338 .451 TRANSP .45 .35 .4 .5 .5 .6 FIDSTKS .439 .37 .349 .412 .407 .423 DOWJONES .433 .4 .4 .366 .466 .5 SP-100 .416 .343 .343 .385 .427 .468 INDEXES .415 .266 .307 .312 .292 .348 BIG17 .413 .347 .391 .326 .304 .304 CHINA .403 .354 .338 .338 .338 .338 SEMI .398 .335 .312 .25 .171 .203 BIOTECH .396 .381 .422 .394 .37 .42 ELECTRON .389 .322 .322 .265 .192 .242 DJI-13 .384 .384 .384 .307 .307 .307 ETFS .36 .344 .278 .278 .311 .36 FINANCE .351 .307 .362 .34 .329 .439 INFRA .342 .342 .314 .257 .314 .314 MILITARY .315 .236 .236 .263 .263 .394 AUTO .3 .25 .25 .225 .175 .225 BEVERAGE .3 .25 .25 .4 .4 .4 JETS .3 .3 .3 .5 .4 .4 INSURANC .25 .187 .218 .343 .343 .437 BONDFUND .243 .207 .18 .162 .126 .126 PIPELINE .142 .142 .285 .285 .428 .285 BIGBANKS 0 0 0 .142 .142 .142 N=28 |
==============================================================================
5/3/2018 Yesterday's Buy B9 was repeated today. The track record
of Buy B9s
is very good, but as I noted last night, none of the past B9s in May had such
a low IP21 (current Accumulation Index reading). That could create a
problem here, just as the three S9s in the last three months might.
------------------------------------------------------------------------------------------------------------
Flash: Boosting the market today is the Labor Department's Job Report
Payroll
employment increases by 164,000 in April; unemployment rate edges down to 3.9%
---------------------------------------------------------------------------------------------------------------------------------

I also admit to being worried also by the fact that resistance posed the falling
65-dma in the DJI is not far enough overhead to permit much of a rally and
also by how quickly the DJI jumped up 350 points in only two hours from its
critical support level. It was as though someone with a lot of money drove the
DJI up away from the key support just so that that key level might not be taken
out by big sellers playing with leveraged ETFs and futures.
|
Charts 5/3/2018 PEERLESS DJI, Signals, Indicators Daily DJI Volume 10-DayUp/Down Vol V-Indicator Hourly DJIA A/D Line for All Stocks NASDAQ S&P OEX NYSE COMPQX DJI-15 DJI-20 DJI-30 DIA SPY QQQ MDY IWM TNA USO-CrudeOil FAS GLD BBH IBB JETS JNUG KOL NUGT OIH OIL RSX RETL SDS SLV SOXL TECL TMF TNA UGA (gasoline) XIV YINN Commodities: JJC, NIB, CHOC CORN, CUT (paper) WEAT UUP (Dollar) AAPL ADBE ALXN AMAT AMGN AMD AMZN BA BABA BAC BIDU CAT CVX DE FB GOOG GS HD IBM JPM M (Macy's) MSFT NFLX NVDA QCOM TSLA TXN XOM WMT ANDV (refinery), CMG (Chipotle), LRCX, SWKS, MDGL SPPI WATT SQ TOWN 5/2/2018 (Click on Underlined link.) Bullish MAXCPs - http://tigersoft.com/4XXH/MAXCPS/503/BULLISH.htm Bearish MAXCPs - http://tigersoft.com/4XXH/MINCPS/503/BEARISH.htm |
I would suggest that another test of 23200-23500 would seem likely. If you look
back at other recent cases where we had a highly visible, well-tested support, it may
be that the DJI will have to make a nominal new closing low just below the support
before it can turn up. This would be a "bear trap". See some
examples below.
2010
Bear Trap |
2011
Bear Trap |
2013
Bear Trap |
Another Failed Rally?
And who's to say, tomorrow will be an up-day. I keep
saying that Professionals
seem very bearish and are very quick to sell into all rallies. We see this in lots
of the statistics again tonight. Most of the recent Candle-Sticks for the major
market ETFs have been red (bearish). Secondly, the key ETFs' Closing Powers are
still in downtrends and at 12-month lows. Thirdly, the number of MINCPS still
dwarfes
the number of MAXCPs. Fourthly, Day Traders are bearish many more stocks than
they are bullish. And fifth, big down-day stocks vastly outnumber the stocks making
big gains on high volume. (See these statistics in Table 2).
Very Weak Closing Powers - Professional Selling
Strong Openings - Public Buying
Charts of DIA and SPY
 |
 |
Limited Upside Potential?
The increasing pace downward of the 65-dma for DIA, NASDAQ, QQQ
and SPY show that the upside potential now is strictly limited. It's not clear
at this point how Peerless can profitably get a Sell signal to reverse the
present Buy B9. As a result, I think that we should still want the CP
downtrend-
lines to break before we can turn bullish on a particular ETF, especially DIA.
There appears to be a lot more upside potential in Oil
Stocks. But that
will work against the general market because it signifies inflation and rising
interest rates.
Why Are Professionals Still Selling?
The reason is still not clear. More important is that
they are.
We can guess, though. Today's surprise admission by the President that he personally
was responsible for paying off a porn star right before the last election so she would
not reveal his infidelity to his family-values supporters and that his personal lawyer
lied about making the pay-off himself, brings, I would think, the Special
Prosecutor's
noose that much closer to Trump. This cannot help the market. Perhaps, this is
the
sort of news that Professionals are expecting.
But it may be something else is causing Prodessional selling. To impeach Trump in
1919 (and that's a year away), the Democrats will need to win back the House of
Representatives in the Fall. The President could still pull off two diplomatic
successes that would make all the talk about "Russia-Gate" pale. He just
might
be able to bring about the de-nuclearization of North Korea and he may gain
some bragging rights in the coming Chinese trade talks.
Most Americans vote their pocket books. If the DJI does
not hold above 23200-
23400, I would think it will fall back to 20500. That could lose the control of
the House for Republicans. So, a lot depends on whether this support that is
being tested will hold. And Wall Street is of two minds about it, right now.
The Oil stocks still look like the best longs. There remain lots of Bearish MINCPs
to hedge with while holding long IWM, because it has been the best perfoming
major market ETF for the last two months.
Table 1 QUICKSILVER on ETFS - 05/03/18 ETF CLOSE CHANGE PIVOT-PT 5-dma AROC CL-PWR CANDLE IP21 ITRS --------------------------------------------------------------------------------------------- --------------------------------------------------------------------------------------------- --------------------------------------------------------------------------------------------- DIA 239.1 -.01 242.95 -83.2% Bearish BLUE -.071 0 --------------------------------------------------------------------------------------------- COMPQX 7088.15 -12.75 7119.8 -21.5% Bearish BLUE -.101 .017 --------------------------------------------------------------------------------------------- SPY 262.62 -.58 266.56 -69.6% Bearish BLUE -.078 .007 --------------------------------------------------------------------------------------------- QQQ 161.8 -.02 162.09 -5.9% Bearish BLUE -.101 .016 --------------------------------------------------------------------------------------------- MDY 340.59 -.49 344.1 -59.3% Bearish BLUE -.082 .029 --------------------------------------------------------------------------------------------- IWM 153.81 -.84 154.69 -35.6% Bearish RED .009 .045 --------------------------------------------------------------------------------------------- FAS 61.48 -.86 64.57 -213.5% Bearish RED -.205 -.082 --------------------------------------------------------------------------------------------- RETL 33.17 -1.06 35.38 -165.7% Bearish RED -.116 -.027 --------------------------------------------------------------------------------------------- SOXL 128.46 2.28 126.09 -19% Bearish BLUE -.133 -.141 --------------------------------------------------------------------------------------------- TECL 117.57 .93 115.03 74.5% Bearish BLUE -.075 -.017 --------------------------------------------------------------------------------------------- IBB 101.28 -1.4 105.61 -192.8% Bearish RED -.178 -.037 --------------------------------------------------------------------------------------------- GLD 124.28 .63 125.5 -27.7% Bearish RED -.115 .024 --------------------------------------------------------------------------------------------- OIL 7.61 .04 6.89 339.4% Bullish BLUE .263 .096 --------------------------------------------------------------------------------------------- OIH 26.87 -.28 27.22 -93.9% Bullish RED .209 .165 --------------------------------------------------------------------------------------------- GASL 19.49 -1.54 21.01 -517% Bullish RED .112 .183 --------------------------------------------------------------------------------------------- UGA 33.37 .32 33.82 -56.6% Bullish BLUE .404 .111 --------------------------------------------------------------------------------------------- UUP 24.3 -.1 24.03 51.7% Bullish ---- .197 .068 --------------------------------------------------------------------------------------------- IEF 101.63 .26 101.59 10.3% Bearish ---- -.044 .035 --------------------------------------------------------------------------------------------- XLU 51.28 -.07 51.71 8.7% Bullish ---- .012 .085 --------------------------------------------------------------------------------------------- WEAT 7.04 .13 6.58 439% Bullish BLUE .477 .158 --------------------------------------------------------------------------------------------- YINN 31.81 -.61 32.68 -114.9% Bearish BLUE .085 -.155 --------------------------------------------------------------------------------------------- RSX 20.96 .27 21.29 -66.6% ---- ---- .068 -.063 --------------------------------------------------------------------------------------------- AAPL 176.89 .32 162.32 378.2% ---- BLUE -.079 .069 --------------------------------------------------------------------------------------------- GOOG 1023.72 -.66 1030.05 -79.2% Bearish BLUE -.165 -.044 --------------------------------------------------------------------------------------------- MSFT 94.07 .56 95.82 -10.1% Bearish BLUE -.071 .063 --------------------------------------------------------------------------------------------- AMZN 1572.07 2.39 1572.62 173.2% Bearish BLUE -.057 .095 --------------------------------------------------------------------------------------------- FB 174.02 -2.05 173.59 -4% Bearish RED -.008 .013 --------------------------------------------------------------------------------------------- NVDA 232.99 6.68 226.33 171.9% Bearish BLUE -.044 0 --------------------------------------------------------------------------------------------- BA 330.69 6.5 340.88 -181% Bearish BLUE .045 -.027 --------------------------------------------------------------------------------------------- GS 233.41 -.64 239.8 -140.5% Bearish BLUE -.306 -.079 --------------------------------------------------------------------------------------------- HD 183.19 -2.72 186.46 -68.2% ---- RED .037 .036 --------------------------------------------------------------------------------------------- CAT 143.78 -.08 144.72 -87.4% Bearish BLUE -.175 -.039 |
Table 2 Count of Stocks in Key Directories
20180503
-------------------------------
NEWHIGHS 107
NEWLOWS 124 ugh
MAXCP 77
MINCP 356 ugh
TTTNH 80
TTTNL 543 ugh
FASTUP 113
FASTDOWN 172 ugh
CPCROSSA 50
CPCROSSD 101 ugh
BIGVOLUP 1
BIGVODN 23 ugh
|
Table 3
         Count of Stocks and NEW HIGHS in Key Tiger Directories
                      Date = 180503
               No.           NHs           Pct.
===============================================================
MAXCP          77            41            53 %
EDU            7             1             14 %
HOSPITAL       7             1             14 %
HACKERS        24            3             13 %
SOFTWARE       65            6             9 %
OILGAS         137           9             7 %
TRANSP         20            1             5 %
BIG17          48            2             4 %
GAMING         28            1             4 %
GOLD           50            2             4 %
FIDSTKS        189           5             3 %
FINANCE        91            3             3 %
RUS-1000       825           28            3 %
SEMI           128           4             3 %
BIOTECH        383           9             2 %
CHEM           62            1             2 %
CHINA          62            1             2 %
COMODITY       56            1             2 %
ELECTRON       177           3             2 %
NASD-100       89            2             2 %
REIT           176           3             2 %
RETAIL         53            1             2 %
SP500          481           11            2 %
UTILITY        42            1             2 %
INDMATER       85            1             1 %
INDEXES        195           1             1 %
SP-100         96            1             1 %
|
Table 4
Count of Stocks and New Lows in Key Tiger Directories
             Date = 180503
               No.           NHs           Pct.
--------------------------------------------------
MINCP          356           78            22 %
BEVERAGE       20            4             20 %
PIPELINE       7             1             14 %
INSURANC       32            4             13 %
SP500          481           34            7 %
CHEM           62            4             6 %
INDMATER       85            5             6 %
SOFTWARE       65            4             6 %
AUTO           40            2             5 %
FIDSTKS        189           10            5 %
MILITARY       38            2             5 %
RUS-1000       825           45            5 %
SP-100         96            5             5 %
BIOTECH        383           17            4 %
COMPUTER       23            1             4 %
NASD-100       89            4             4 %
OILGAS         137           5             4 %
RETAIL         53            2             4 %
DOWJONES       30            1             3 %
ETFS           65            2             3 %
GREEN          30            1             3 %
INDEXES        195           6             3 %
INFRA          35            1             3 %
REGBANKS       33            1             3 %
BONDFUND       111           2             2 %
ELECTRON       177           3             2 %
GOLD           50            1             2 %
SEMI           128           2             2 %
FINANCE        91            1             1 %
REIT           176           1             1 %
|
Table 5 RANKING OF KEY DIRECTORIES BASED PCT.OF STOCKS ABOVE 65-DMA
5/3/18
   Bearish =  35
   Bullish = 12
---------------------------------------------------------------------------------------
Directory     Current       day-1         day-2         day-3         day-4         day-5
----------------------------------------------------------------------------------------
EDU            1             1             .857          .857          1             .857
REIT           .732          .693          .71           .659          .71           .568
HOSPITAL       .714          .714          .428          .428          .571          .428
UTILITY        .714          .738          .761          .738          .738          .714
OILGAS         .678          .729          .715          .722          .686          .693
|
FOOD           .666          .666          .666          .777          .888          .555
SOFTWARE       .63           .646          .661          .646          .661          .646
HACKERS        .625          .625          .625          .708          .708          .75
COMPUTER       .565          .521          .478          .391          .434          .434
GOLD           .54           .5            .4            .42           .58           .56
COMODITY .535 .535 .517 .517 .571 .535 HOMEBLDG .529 .411 .411 .411 .588 .588 ============================================================================================ RETAIL .49 .528 .584 .622 .679 .622 NIFTY .482 .482 .517 .448 .551 .586 SOLAR .476 .476 .476 .523 .571 .571 GREEN .466 .366 .4 .433 .5 .5 GUNS .444 .388 .388 .277 .277 .444 RUS-1000 .41 .421 .463 .447 .493 .48 DOWJONES .4 .4 .366 .466 .5 .5 INDMATER .4 .388 .376 .376 .435 .494 NASD-100 .393 .404 .438 .426 .46 .426 REGBANKS .393 .424 .484 .484 .545 .515 DJI-13 .384 .384 .307 .307 .307 .307 BIOTECH .381 .422 .394 .37 .415 .412 BIG17 .375 .416 .354 .333 .312 .354 SP500 .374 .386 .446 .446 .478 .453 CHEM .37 .387 .403 .338 .435 .5 FIDSTKS .37 .349 .412 .407 .423 .423 GAMING .357 .357 .321 .321 .285 .321 CHINA .354 .338 .338 .338 .338 .306 TRANSP .35 .4 .5 .5 .65 .45 SP-100 .343 .343 .385 .427 .468 .427 INFRA .342 .314 .257 .314 .314 .342 ETFS .338 .276 .276 .307 .353 .307 SEMI .335 .312 .25 .171 .21 .234 COAL .333 .333 .222 .333 .222 .222 ELECTRON .322 .322 .265 .192 .237 .259 FINANCE .307 .362 .34 .329 .417 .439 JETS .3 .3 .5 .4 .5 .2 INDEXES .266 .307 .312 .292 .328 .353 AUTO .25 .25 .225 .175 .225 .225 BEVERAGE .25 .25 .4 .4 .4 .4 MILITARY .236 .236 .263 .263 .394 .421 BONDFUND .207 .18 .162 .126 .117 .063 INSURANC .187 .218 .343 .343 .437 .468 PIPELINE .142 .285 .285 .428 .142 .285 BIGBANKS 0 0 .142 .142 .142 .142 N= 35 |
==============================================================================
5/2/2018 Today Peerless gave a Buy B9 The DJI closed 1.6% below a rising 21-dma
with the P-I still positive, +110. We also can see from our Peerless chart that
the three key indicators in the DJI chart are rising. Peerless users must now cover
their shorts of DIA. But a closer test of 23200-23400 would not be inconsistent
with the new Buy B9.

The sharply falling Closing Powers for DIA and SPY make me hesitate to recommend
them until their Closing Powers downtrend-lines are broken. DIA has been the
weakest major market ETF for the last month. All its rallies seem to quickly fail.
And of course, a breakdown below DIA-232 (or 23200-23400 for the DJI) would
have to be judged a Sell S10 and put all the major market ETFs at great risk.


Buy IWM and some of the oil stocks mentioned below.

BUY B9s Are Reliably Bullish.
My most recent study shows that there have been 58
Buy B9s (where the signals are
all separated from each other by at least a week) since 1928. They averaged a
gain of 10.8% at the time of the next Peerless Sell. Only 2 produced a loss.
Note
that 11 of the 58 Buy B9s would have have required a trader of the DJI to sustain
a paper loss 1% to 3.7%. In 27 cases, they called the bottom perfectly and there
was no paper loss. The other 20 would have brought a maximum paper loss of 1%.
May Buy B9s have all been profitable. The average gain was 7.3% and the
average Paper loss for May B9s was 1%. But none of the May B9s
occurred with an IP21 so negative. It is now -.096.
What To Do.
So, while traders should cover their shorts on DIA because of the Buy B9,
we have to be cautious about buying DIA. Instead, I would Buy IWM. Of
all the major market ETFs, it shows the most positive IP21 (current Accumulation)
and ITRS (stock's or ETF's 50-day pct change minus DJI's 50-day pct change.)
Stay short your bearish MINCPs. They remain weak. Buy some of the bullish
MAXCPs, low priced oil stocks like PES and LGCY and some of the oil refineries
that now could be takeover candidates: Delek Holdings (DK), Holly (HFC) and
VLO.
JUNE Buy B9s: 1929-2018
DJI Gain
Paper Loss
19350531 B9 110.64
.198 none
0
la/ma=.973 AROC=+.203 P=32 (-11) IP21= -.026 V=-32
-------------------------------------------------------------------
19670519 B9 874.55
.063 844.77
-.0340 6/5
la/ma=.981 AROC=-.054 P=+9 (-22) IP21= +.008 V=+5
-------------------------------------------------------------------
19750528 B9 817.04
.058 815.06
-.0024 5/29
la/ma=.978 AROC=+.100 P=+69 (-7 ) IP21= -.002 V=+0
-------------------------------------------------------------------
19770525 B9 903.24
.028 898.83
-.0048 5/27
la/ma=.971 AROC=-.158 P=+47 (-26 ) IP21= +.006 V=+0
-------------------------------------------------------------------
19960507 B9 5420.95 .06
none
0
la/ma=.979 AROC=-.372 P=+41 (+82 ) IP21=-.034 V=-4
--------------------------------------------------------------------
19990524 B9 10654.67 .030
10466.9 -.0176 5/27
la/ma=.978 AROC=-.038 P=+31 (-59 ) IP21=+.028 V=-37
------------------------------------------------------------------
Avg.Gain =.073 Avg.Paper Loss= .0103
5/1/2018 B9 23924.98
la/ma=.984 AROC= -.053 P=+110 (-74 ) IP21=-.096 V=-33
|
Charts 5/2/2018 PEERLESS DJI, Signals, Indicators Daily DJI Volume 10-DayUp/Down Vol V-Indicator Hourly DJIA A/D Line for All Stocks NASDAQ S&P OEX NYSE COMPQX DJI-15 DJI-20 DJI-30 DIA SPY QQQ MDY IWM TNA USO-CrudeOil FAS GLD BBH IBB JETS JNUG KOL NUGT OIH OIL RSX RETL SDS SLV SOXL TECL TMF TNA UGA (gasoline) XIV YINN Commodities: JJC, NIB, CHOC CORN, CUT (paper) WEAT UUP (Dollar) AAPL ADBE ALXN AMAT AMGN AMD AMZN BA BABA BAC BIDU CAT CVX DE FB GOOG GS HD IBM JPM M (Macy's) MSFT NFLX NVDA QCOM TSLA TXN XOM WMT ANDV (refinery), CMG (Chipotle), LRCX, SWKS, MDGL SPPI WATT SQ TOWN 5/2/2018 (Click on Underlined link.) Bullish MAXCPs - http://tigersoft.com/4XXH/MAXCPS/502/BULLISH.htm Bearish MAXCPs - http://tigersoft.com/4XXH/MINCPS/502/BEARISH.htm |
Table 1             QUICKSILVER on ETFS - 05/02/18
          The 5-dma trends are mixed.
          Most still show falling Cloing Powers.
          But now most of the major ETFs show a positive IP21 (except FAS, SOXL and TECL).
          IWM shows the highest ITRS and IP21 and shows a rising 5-dma.
ETF CLOSE CHANGE PIVOT-PT 5-dma AROC CL-PWR CANDLE IP21 ITRS --------------------------------------------------------------------------------------------- --------------------------------------------------------------------------------------------- DIA 239.11 -1.65 243.12 -32.9% Bearish RED -.056 None --------------------------------------------------------------------------------------------- COMPQX 7100.9 -29.8 7118.68 68.5% Bearish RED -.05 .023 --------------------------------------------------------------------------------------------- SPY 263.2 -1.78 266.31 -8.1% Bearish RED -.074 .011 --------------------------------------------------------------------------------------------- QQQ 161.82 -.96 161.99 98.3% Bearish RED -.081 .02 --------------------------------------------------------------------------------------------- MDY 341.08 -.63 344.65 -33% Bearish RED -.047 .034 --------------------------------------------------------------------------------------------- IWM 154.65 .58 154.91 14.6% ---- BLUE .047 .058 --------------------------------------------------------------------------------------------- FAS 62.34 -1.66 64.2 -61.8% Bearish RED -.198 -.075 --------------------------------------------------------------------------------------------- RETL 34.23 .36 34.31 196.3% Bullish BLUE -.005 .013 --------------------------------------------------------------------------------------------- SOXL 126.18 -1.76 128.94 186% Bearish RED -.118 -.177 --------------------------------------------------------------------------------------------- TECL 116.64 -.42 115.85 295.3% Bearish RED -.052 -.038 --------------------------------------------------------------------------------------------- IBB 102.68 -1.37 105.3 -27.8% Bearish RED -.098 -.019 --------------------------------------------------------------------------------------------- GLD 123.65 -.06 124.97 -70.5% Bearish RED -.125 .021 --------------------------------------------------------------------------------------------- OIL 7.61 .04 6.89 339.4% Bullish BLUE .263 .102 --------------------------------------------------------------------------------------------- OIH 27.15 .24 27.38 18.4% Bullish BLUE .256 .162 --------------------------------------------------------------------------------------------- GASL 21.03 -.25 21.69 11.8% Bullish RED .189 .175 --------------------------------------------------------------------------------------------- UGA 33.05 -.25 33.75 -49.1% Bullish BLUE .354 .109 --------------------------------------------------------------------------------------------- UUP 24.4 .11 24.05 95.5% Bullish BLUE .23 .082 --------------------------------------------------------------------------------------------- IEF 101.37 .02 101.42 11.8% Bearish ---- -.038 .036 --------------------------------------------------------------------------------------------- XLU 51.35 -.05 51.19 65.3% Bullish RED .024 .079 --------------------------------------------------------------------------------------------- WEAT 6.91 -.03 6.45 270.8% Bullish ---- .405 .134 --------------------------------------------------------------------------------------------- YINN 32.42 -.3 32.56 33.7% ---- RED .083 -.097 --------------------------------------------------------------------------------------------- RSX 20.69 -.19 21.24 -54.6% ---- RED .07 -.063 --------------------------------------------------------------------------------------------- AAPL 176.57 7.47 164.22 391.7% Bullish BLUE -.064 .069 --------------------------------------------------------------------------------------------- GOOG 1024.38 -12.93 1040.04 15.5% Bearish RED -.135 -.03 --------------------------------------------------------------------------------------------- MSFT 93.51 -1.49 94.26 63.7% Bearish RED -.039 .05 --------------------------------------------------------------------------------------------- AMZN 1569.68 -12.58 1517.96 355.6% Bearish RED -.035 .11 --------------------------------------------------------------------------------------------- FB 176.07 2.21 174.16 479.9% Bearish BLUE .05 .041 --------------------------------------------------------------------------------------------- NVDA 226.31 -.83 225.22 215.4% Bearish RED -.002 -.05 --------------------------------------------------------------------------------------------- BA 324.19 -5.35 342.79 -276.2% Bearish RED .076 -.041 --------------------------------------------------------------------------------------------- GS 234.05 -2.62 240.09 -108.4% Bearish RED -.328 -.075 --------------------------------------------------------------------------------------------- HD 185.91 1.28 185.72 231.8% Bullish BLUE .078 .037 --------------------------------------------------------------------------------------------- CAT 143.86 -.56 146.31 -45.9% Bearish RED -.168 -.034 |
Table 2 Count of Stocks in Key Directories
20180502
-------------------------------
NEWHIGHS 124 Bullish
NEWLOWS 102
MAXCP 64
MINCP 406 Professionals remain bearish.
TTTNH 78
TTTNL 366 Day Traders are Bearish
FASTUP 146 Swing Traders are more bullish than bearish.
FASTDOWN 135
CPCROSSA 136 Professions are becoming more bullish.
CPCROSSD 57
BIGVOLUP 6
BIGVODN 20
|
Table 3
         Count of Stocks and NEW HIGHS in Key Tiger Directories
                      Date = 180502
               No.           NHs           Pct.
===============================================================
MAXCP          64            26            41 %
EDU            7             2             29 %
HACKERS        24            5             21 %
HOSPITAL       7             1             14 %
SOFTWARE       66            5             8 %
BIG17          46            2             4 %
COMPUTER       23            1             4 %
GAMING         28            1             4 %
GOLD           50            2             4 %
OILGAS         137           5             4 %
AUTO           40            1             3 %
BIOTECH        383           12            3 %
FINANCE        91            3             3 %
REGBANKS       33            1             3 %
CHEM           62            1             2 %
ELECTRON       177           4             2 %
FIDSTKS        189           3             2 %
INDMATER       85            2             2 %
RETAIL         53            1             2 %
RUS-1000       825           20            2 %
SEMI           128           3             2 %
NASD-100       89            1             1 %
SP-100         96            1             1 %
SP500          481           7             1 %
|
Table 4
Count of Stocks and New Lows in Key Tiger Directories
             Date = 180502
               No.           NHs           Pct.
--------------------------------------------------
BEVERAGE       20            6             30 %
MINCP          406           69            17 %
COMPUTER       23            2             9 %
SP-100         96            8             8 %
DOWJONES       30            2             7 %
SP500          481           34            7 %
CHEM           62            4             6 %
FIDSTKS        189           12            6 %
AUTO           40            2             5 %
INDMATER       85            4             5 %
MILITARY       38            2             5 %
RUS-1000       825           43            5 %
BONDFUND       111           4             4 %
GAMING         28            1             4 %
NASD-100       89            4             4 %
BIOTECH        383           10            3 %
ETFS           65            2             3 %
GREEN          30            1             3 %
INDEXES        195           5             3 %
INFRA          35            1             3 %
INSURANC       32            1             3 %
REGBANKS       33            1             3 %
SOFTWARE       66            2             3 %
CHINA          62            1             2 %
ELECTRON       177           3             2 %
RETAIL         53            1             2 %
OILGAS         137           2             1 %
REIT           176           1             1 %
SEMI           128           1             1 %
BIG17          46                          0 %
BIGBANKS       7                           0 %
COAL           9                           0 %
COMODITY       56                          0 %
DJI-13         13                          0 %
EDU            7                           0 %
FIDELITY       41                          0 %
FINANCE        91                          0 %
FOOD           9                           0 %
GOLD           50                          0 %
HACKERS        24                          0 %
HOMEBLDG       17                          0 %
HOSPITAL       7                           0 %
JETS           10                          0 %
NIFTY          29                          0 %
PIPELINE       7                           0 %
SOLAR          21                          0 %
TRANSP         20                          0 %
UTILITY        42                          0 %
MAXCP          64                          0 %
|
Table 5 RANKING OF KEY DIRECTORIES BASED PCT.OF STOCKS ABOVE 65-DMA
5/2/18
Bearish = 35
Bullish = 11
---------------------------------------------------------------------------------------
Directory Current day-1 day-2 day-3 day-4 day-5
----------------------------------------------------------------------------------------
EDU 1 .857 .857 1 .857 1
UTILITY .738 .761 .738 .738 .714 .714
OILGAS .729 .715 .722 .686 .686 .686
HOSPITAL .714 .428 .428 .571 .428 .714
REIT .693 .71 .659 .71 .562 .437
FOOD .666 .666 .777 .888 .555 .555
SOFTWARE .636 .651 .636 .651 .636 .545
HACKERS .625 .625 .708 .708 .75 .708
COMODITY .535 .517 .517 .571 .535 .535
RETAIL .528 .584 .622 .679 .622 .471
COMPUTER .521 .478 .391 .434 .434 .434
N=11
============================================================================================
GOLD .5 .4 .42 .58 .56 .52
============================================================================================
NIFTY .482 .517 .448 .551 .586 .275
SOLAR .476 .476 .523 .571 .571 .428
REGBANKS .424 .484 .484 .545 .515 .575
BIOTECH .422 .394 .37 .415 .412 .383
RUS-1000 .421 .463 .447 .493 .478 .433
HOMEBLDG .411 .411 .411 .588 .588 .352
NASD-100 .404 .438 .426 .46 .426 .348
DOWJONES .4 .366 .466 .5 .5 .366
TRANSP .4 .5 .5 .65 .45 .6
BIG17 .391 .326 .304 .304 .304 .282
GUNS .388 .388 .277 .277 .388 .5
INDMATER .388 .376 .376 .435 .494 .447
CHEM .387 .403 .338 .435 .5 .483
SP500 .386 .446 .446 .478 .451 .407
DJI-13 .384 .307 .307 .307 .307 .23
GREEN .366 .4 .433 .5 .5 .433
FINANCE .362 .34 .329 .417 .428 .406
GAMING .357 .321 .321 .285 .321 .25
FIDSTKS .349 .412 .407 .423 .423 .38
SP-100 .343 .385 .427 .468 .427 .343
CHINA .338 .338 .338 .338 .306 .29
COAL .333 .222 .333 .222 .222 .222
ELECTRON .322 .265 .192 .237 .259 .242
INFRA .314 .257 .314 .314 .342 .257
SEMI .312 .25 .171 .21 .234 .195
INDEXES .307 .312 .292 .328 .348 .312
JETS .3 .5 .4 .5 .2 .4
PIPELINE .285 .285 .428 .142 .285 .142
ETFS .276 .276 .307 .353 .276 .2
AUTO .25 .225 .175 .225 .225 .225
BEVERAGE .25 .4 .4 .4 .4 .25
MILITARY .236 .263 .263 .394 .394 .5
INSURANC .218 .343 .343 .437 .437 .468
BONDFUND .18 .162 .126 .117 .063 .063
BIGBANKS 0 .142 .142 .142 .142 .142
N=35
|
==============================================================================
5/1/2018 Our Peerless
S9 still operates and the
Closing Powers for the major market ETFs
remain in falling trends. The DJI did rebound a little from its 2% lower band. This
is also approximately where its rising 200-dma crosses. So, one could take profits
from the S9 shorts with this support having held.
But for most of us, I think it would be better to be patient and stay short DIA
and some of the Bearish MINCPs. A breakdown below the 23200-23400 support
remains a distinctly bearish possibility, especially as the market moves towards the more
risky period after Mid-May. The chances are good that the next rally will fail just
the last one did. The key ETFs' Closing Powers are all falling and the falling
65-dma
will likely stop the next rally, should it advance that far.


|
Charts 5/1/2018 PEERLESS DJI, Signals, Indicators Daily DJI Volume 10-DayUp/Down Vol V-Indicator Hourly DJIA A/D Line for All Stocks NASDAQ S&P OEX NYSE COMPQX DJI-15 DJI-20 DJI-30 DIA SPY QQQ MDY IWM TNA USO-CrudeOil FAS GLD BBH IBB JETS JNUG KOL NUGT OIH OIL RSX RETL SDS SLV SOXL TECL TMF TNA UGA (gasoline) XIV YINN Commodities: JJC, NIB, CHOC CORN, CUT (paper) WEAT UUP (Dollar) AAPL ADBE ALXN AMAT AMGN AMD AMZN BA BABA BAC BIDU CAT CVX DE FB GOOG GS HD IBM JPM M (Macy's) MSFT NFLX NVDA QCOM TSLA TXN XOM WMT ANDV (refinery), CMG (Chipotle), LRCX, SWKS, MDGL SPPI WATT SQ TOWN 5/1/2018 (Click on Underlined link.) Bullish MAXCPs - http://tigersoft.com/4XXH/MAXCPS/501/BULLISH.htm Bearish MAXCPs - http://tigersoft.com/4XXH/MINCPS/501/BEARISH.htm |
Follow The DJI's Lead Is The Lesson of Peerless
Should we be worried by the fact that the DJI is weaker than SPY, QQQ or the NASDAQ?
"Not yet" is my answer. These other indexes are still below their falling
65-day moving
averages and show falling Closing Powers.
.
However, if Peerless gives a new Buy Signal and DIA's Closing Power breaks
its downtrend, then I would become bullish, close out the DIA shorts and probably
buy the strongest of the major ETFs, based on IP21 and ITRS levels. (See Table 1)
We learn from history. And market history shows that there are a number of cases
where
the DJI lead the rest of the market much lower. Another way of saying this is that
we just
can't always count on the DJI-30 staying strong until the bull market's "bitter
end" with
a lagging NYSE A/D Line telling us when to sell. There are a number of important
exceptions to this pattern showing the most common way market tops are formed.
By my thinking, we now have three Sell S9s. This shows the market is getting ripe for a
bigger decline. The bull market is now 8 years old. A wave of profit-taking
and a 20%
DJI decline is long over-due. In addition, a breakdown below the well-tested
23200-23400
flat support may, I've suggested, act much like the DJI's breaking a very visible neckline
in
a conspiculously bearish head and shoulders pattern. As I mentioned a few nights
ago,
head/shoulders patterns can by themselves produce major market tops in their own
right.
The bear markets of 1941, 1946, 1962 and 1971 all featured big and ugly head/shoulders
tops, not A/D line divergences.
Rising interest rates and oil prices are quite capable of producing big declines.
More than
Nixon's near impeachment, this is what caused the long bear market from from January
1973 to December 1974. In another case, that of the 1976-1978 bear market, the
DJI
fell for 18 months, even though many Oil and NASDAQ stocks made new highs and held
up very well for the first 8 or 9 months of the DJI's decline. And of course, Oil
stocks
kept rising 8 months after the DJI peaked on October 2007. So, stay long Oil stocks
for now.
Watch Short-Term Rates, Food Commodities and
Oil Most Closely
Today, short-term interest rates came bounding back to their
recent highs. We must also
keep watching the rise now in food commodites as well as oil prices. Their rises could
make the FED become quite "hawkish". What seems, so far, to have
saved the US Bull
Market here is that the Dollar has conveniently turned up as the Euro has become weak
and Gold and Silver are dawdling. (The weakness in the Euro may explain some
of the
over-night gains in the US market's Indexes.) But at some point, Gold will start
rising
and the signs of Inflation will be sufficiently clear to cause the Fed to rush up our
interest
rates and even as the Jobs Reports shows more and more lay-offs. It is this
combination
which will make the market become dangerous. But we are not there yet. Right
now, short-term rates are still 1 1/4% below what I take to be dangerous levels for them,
based on what stopped the Eisenhower bull market in July 1957.
The NASDAQ, QQQ and SPY remain vulnerable, too. They have been unable to rise
above their own 65-day moving averages. Each of their rallies to these levels seems
to
bring a reversal. This shows patient and well-planned big-money selling into
strength.
This is another way to detect important "Distribution". So, it's a
difficult market for most
stock traders on the long side unless they accept very small trading gains on most trades
or play with special situations (like oil refinery takeovers) or do some buying in the
Food ETNs, like CORN and WEAT, that have recently turned up convincingly from their
65-dma.
Table 1             QUICKSILVER on ETFS - 05/01/18
          The 5-dma trends and IP21s are mixed for the major ETFs,
          but most still show falling Cloing Powers.
ETF CLOSE CHANGE PIVOT-PT 5-dma AROC CL-PWR CANDLE IP21 ITRS --------------------------------------------------------------------------------------------- --------------------------------------------------------------------------------------------- DIA 240.76 -.78 240.7 13.9% Bearish BLUE .06 ====== --------------------------------------------------------------------------------------------- COMPQX 7130.7 64.43 7003.74 87.3% Bearish BLUE -.012 .029 --------------------------------------------------------------------------------------------- SPY 264.98 .47 263.63 37.8% Bearish BLUE .009 .015 --------------------------------------------------------------------------------------------- QQQ 162.78 1.84 158.65 134.6% Bearish BLUE -.003 .031 --------------------------------------------------------------------------------------------- MDY 341.71 1.2 W343.34 -21.9% ---- BLUE .045 .033 --------------------------------------------------------------------------------------------- IWM 154.07 .75 W154.2 -11.7% ---- BLUE .097 .049 --------------------------------------------------------------------------------------------- FAS 64 .54 63.13 43.9% Bearish BLUE -.127 -.06 --------------------------------------------------------------------------------------------- RETL 33.87 -.3 32.89 226.2% ---- ---- .024 -.056 --------------------------------------------------------------------------------------------- SOXL 127.94 6.03 121.52 241.4% Bearish BLUE -.068 -.122 --------------------------------------------------------------------------------------------- TECL 117.06 4.3 109.9 318.1% Bearish BLUE .03 -.026 --------------------------------------------------------------------------------------------- IBB 104.05 .4 103.26 37.4% Bearish BLUE -.037 -.013 --------------------------------------------------------------------------------------------- GLD 123.71 -.88 W125.41 -100.5% ---- RED -.081 .011 --------------------------------------------------------------------------------------------- OIL 7.61 .04 6.89 339.4% Bullish BLUE .263 .106 --------------------------------------------------------------------------------------------- OIH 26.91 -.23 W27.05 16.6% Bullish RED .284 .148 --------------------------------------------------------------------------------------------- GASL 21.28 -.09 20.98 211% Bullish ---- .274 .202 --------------------------------------------------------------------------------------------- UGA 33.3 -.6 W33.38 -14.9% Bullish RED .313 .12 --------------------------------------------------------------------------------------------- UUP 24.29 .16 23.94 93.8% Bullish ---- .169 .087 --------------------------------------------------------------------------------------------- IEF 101.35 -.35 101.13 0% Bearish RED -.067 .038 --------------------------------------------------------------------------------------------- XLU 51.4 -.16 50.68 71.3% Bullish RED .04 .07 --------------------------------------------------------------------------------------------- WEAT 6.94 .22 6.55 428.4% Bullish BLUE .422 .124 --------------------------------------------------------------------------------------------- YINN 32.72 -.1 32.2 -26% ---- BLUE .138 -.138 --------------------------------------------------------------------------------------------- RSX 20.88 -.14 W20.92 -21.3% Bullish RED .124 -.047 --------------------------------------------------------------------------------------------- AAPL 169.1 3.84 163.65 188.2% ---- BLUE -.072 .025 --------------------------------------------------------------------------------------------- GOOG 1037.31 19.98 1021.18 84.5% Bearish BLUE -.075 -.008 --------------------------------------------------------------------------------------------- MSFT 95 1.48 92.31 100.2% Bearish BLUE .03 .077 --------------------------------------------------------------------------------------------- AMZN 1582.26 16.13 1460.17 403.1% Bearish BLUE .013 .137 --------------------------------------------------------------------------------------------- FB 173.86 1.86 159.69 422.2% Bearish BLUE .086 .025 --------------------------------------------------------------------------------------------- NVDA 227.14 2.24 216.66 133.3% Bearish BLUE .001 -.024 --------------------------------------------------------------------------------------------- BA 329.54 -4.02 W342.86 7.1% Bearish RED .15 -.027 --------------------------------------------------------------------------------------------- GS 236.67 -1.66 W239.23 -121.3% Bearish RED -.27 -.071 --------------------------------------------------------------------------------------------- HD 184.63 -.17 177.39 229.8% Bullish BLUE .069 .032 --------------------------------------------------------------------------------------------- CAT 144.42 .06 W145.19 -.7% Bearish BLUE -.112 -.031 |
Table 2 Count of Stocks in Key Directories
20180501
Directory Number
-------------------------------
NEWHIGHS 92
NEWLOWS 85 Bears are not in control.
MAXCP          33
MINCP          248  Professionals are mostly bearish.
TTTNH 50 TTTNL 489 Day Traders are mostly bearish. FASTUP 110 FASTDOWN 132 Swing Traders are mixed. CPCROSSA 160 Professionals are not increasing in numbers. CPCROSSD 28 BIGVOLUP 3 BIGVODN 17 Dumping continues. TRAPDOOR 28 |
Table 3
         Count of Stocks and NEW HIGHS in Key Tiger Directories
Date = 180501
               No.           NHs           Pct.
MAXCP          33            18            55 %
HOSPITAL       7             1             14 %
FOOD           9             1             11 %
HACKERS        24            2             8 %
SOFTWARE       66            4             6 %
BIG17          48            2             4 %
BIOTECH        382           14            4 %
GAMING         28            1             4 %
AUTO           40            1             3 %
DOWJONES       30            1             3 %
INSURANC       32            1             3 %
NASD-100       89            3             3 %
NIFTY          29            1             3 %
CHEM           62            1             2 %
CHINA          62            1             2 %
COMODITY       55            1             2 %
FINANCE        91            2             2 %
GOLD           50            1             2 %
OILGAS         137           3             2 %
REIT           176           3             2 %
RUS-1000       825           14            2 %
ELECTRON       176           1             1 %
FIDSTKS        189           2             1 %
INDMATER       85            1             1 %
SEMI           127           1             1 %
SP-100         96            1             1 %
SP500          481           6             1 %
|
Table 4
Count of Stocks and New Lows in Key Tiger Directories
Date = 180501
It is bullish that new lows do not dominate any industry. No. NLs Pct. ------------------------------------------------------------------- ------------------------------------------------------------------- MINCP 248 46 19 % BEVERAGE 20 3 15 % CHEM 62 7 11 % AUTO 40 3 7 % GREEN 30 2 7 % HOMEBLDG 17 1 6 % INFRA 35 2 6 % SP-100 96 6 6 % BONDFUND 111 5 5 % INDMATER 85 4 5 % BIOTECH 382 14 4 % FIDSTKS 189 7 4 % GAMING 28 1 4 % GOLD 50 2 4 % RETAIL 53 2 4 % SP500 481 20 4 % DOWJONES 30 1 3 % ELECTRON 176 5 3 % RUS-1000 825 28 3 % ETFS 65 1 2 % OILGAS 137 3 2 % SEMI 127 2 2 % SOFTWARE 66 1 2 % FINANCE 91 1 1 % INDEXES 195 1 1 % NASD-100 89 1 1 % |
 RANKING OF KEY DIRECTORIES BASED PCT.OF STOCKS ABOVE 65-DMA
              5/1/18
 Bearish = 35
 Bullish = 10
---------------------------------------------------------------------------------------
Directory     Current       day-1         day-2         day-3         day-4         day-5
----------------------------------------------------------------------------------------
EDU            .857          .857          1             .857          1             1
UTILITY        .761          .738          .738          .714          .714          .714
OILGAS         .715          .722          .686          .686          .686          .664
REIT           .71           .659          .71           .562          .414          .431
FOOD           .666          .777          .888          .555          .555          .222
SOFTWARE       .651          .636          .651          .636          .545          .666
HACKERS        .625          .708          .708          .75           .708          .75
RETAIL         .584          .622          .679          .622          .452          .433
NIFTY          .517          .448          .551          .586          .275          .31
COMODITY       .509          .509          .563          .527          .545          .527
N=10
============================================================================================
JETS           .5            .4            .5            .2            .4            .3
TRANSP         .5            .5            .65           .45           .55           .3
--------------------------------------------------------------------------------------------
REGBANKS       .484          .484          .545          .515          .575          .636
COMPUTER       .478          .391          .434          .434          .434          .478
SOLAR          .476          .523          .571          .571          .428          .523
RUS-1000       .463          .447          .493          .478          .429          .416
SP500          .446          .446          .478          .451          .403          .382
NASD-100       .438          .426          .46           .426          .348          .337
HOSPITAL       .428          .428          .571          .428          .714          .714
FIDSTKS        .412          .407          .423          .423          .38           .391
HOMEBLDG       .411          .411          .588          .588          .294          .235
CHEM           .403          .338          .435          .5            .483          .435
BEVERAGE       .4            .4            .4            .4            .25           .35
GOLD           .4            .42           .58           .56           .5            .6
GREEN          .4            .433          .5            .5            .433          .433
BIOTECH        .392          .371          .416          .413          .384          .366
GUNS           .388          .277          .277          .388          .5            .444
SP-100         .385          .427          .468          .427          .343          .343
INDMATER       .376          .376          .435          .494          .447          .4
DOWJONES       .366          .466          .5            .5            .366          .4
BIG17          .354          .333          .333          .333          .291          .291
INSURANC       .343          .343          .437          .437          .468          .468
FINANCE        .34           .329          .417          .428          .406          .461
CHINA          .338          .338          .338          .306          .29           .29
GAMING         .321          .321          .285          .321          .25           .321
INDEXES        .312          .292          .328          .348          .317          .312
DJI-13         .307          .307          .307          .307          .23           .153
PIPELINE       .285          .428          .142          .285          .142          0
ETFS           .276          .307          .353          .276          .2            .23
ELECTRON       .267          .193          .238          .261          .244          .284
MILITARY       .263          .263          .394          .394          .526          .5
INFRA          .257          .314          .314          .342          .257          .228
SEMI           .251          .173          .212          .236          .196          .228
AUTO           .225          .175          .225          .225          .225          .225
COAL           .222          .333          .222          .222          .222          .222
BONDFUND       .162          .126          .117          .063          .054          .081
BIGBANKS       .142          .142          .142          .142          .142          .142
N=35
|
==============================================================================
4/30/2018 Professionals have some "dirt" on the market, to use Washington
DC terms.
The Peerless S9 still operates.
Professionals were quick to sell heavily once
again on a higher opening. The DJI turned a 160 point gain today into a 155
points loss. The QQQ was stopped cold at its falling 65-dma. Day Traders had
a wonderful day. They made money even going short when the DJI fell below
the previous close. They will now be emboldened to sell into any new rallies.
What is striking is that Professionals are now bearish on 10 times more stocks than
they are bullish. We see this in the lopsided 10:1 ratio of Closing Power new lows
to Closing Power new highs. We also see this in the fact that the major market ETFs'
Closing Powers (for DIA, SPY, QQQ, IWM, FAS, SOXL and TECL) each made
a 12 month-new low far ahead of their falling prices even though they are still holding
well above their key support levels. And we see it in the fact that the Hourly DJIA
volume expanded again on the decline. It is reliably bearish when the Hourly
DISI-OBV makes a new low far ahead of DJI prices


.
Professional Selling in Key ETFs is Quite Pronounced.
------------------------------------------------------
4/30 Key Support
------- --------------
DIA 241.54 232.50
CP new
12-mo low.
Note the developing continuing H/S in the Hourly DJI
and DIA neckline at 238.
SPY 264.51 253.30
CP new
12-mo low.
QQQ 160.94 150.00
P new
12-mo low.
IWM 153.32 142.62
CP new
12-mo low.
FAS 63.46 57.45
CP new
12-mo low
SOXL 121.91 115.84
CP new
12-mo low
TECL 112.76 94.69
CP new
12-mo low

Our Stocks' Hotline is short lots of the Bearish MINCPs. That is what I've
suggested here, besides shorting DIA. If you must be long, I have recommended
that it be in Oil ETFs and the highest IP21 Oil Stocks. That strategy paid off
nicely today, if you went long refiner ANDV when it made a new high at 125
last week with a confirming high IP21 of .292 and an AI/200 of 159.
Today, Marathon is reported to be bidding $150/share to take it over. There
may be other refiners who will be bid for. VLO is making new highs and
has an IP21 of .37. Look also at HFC. The Trump Administration will be
be very helpful here, posing no unforeseen anti-trust problems and no unduly
strict environmental requirements on this industry. Meanwhile, oil prices are rising
convincingly.


Another group for longs to consider is in food commodities. DBC, the ETN
for food commodites looks technically strong. Even better, I would say, is
WEAT. Note the cup and handle pattern, the B7 and rising Closing Power
plus the positive Accumulation Index. I would not buy CANE, despite its
price strength, because its IP21 is negative.


|
Charts 4/30/2018 PEERLESS DJI, Signals, Indicators Daily DJI Volume 10-DayUp/Down Vol V-Indicator Hourly DJIA A/D Line for All Stocks NASDAQ S&P OEX NYSE COMPQX DJI-15 DJI-20 DJI-30 DIA SPY QQQ MDY IWM TNA USO-CrudeOil FAS GLD BBH IBB JETS JNUG KOL NUGT OIH OIL RSX RETL SDS SLV SOXL TECL TMF TNA UGA (gasoline) XIV YINN Commodities: JJC, NIB, CHOC CORN, CUT (paper) WEAT UUP (Dollar) AAPL ADBE ALXN AMAT AMGN AMD AMZN BA BABA BAC BIDU CAT CVX DE FB GOOG GS HD IBM JPM M (Macy's) MSFT NFLX NVDA QCOM TSLA TXN XOM WMT ANDV (refinery), CMG (Chipotle), LRCX, SWKS, MDGL SPPI WATT SQ TOWN 4/30/2018 (Click on Underlined link.) Bullish MAXCPs - http://tigersoft.com/4XXH/MAXCPS/430/BULLISH.htm Bearish MAXCPs - http://tigersoft.com/4XXH/MINCPS/430/BEARISH.htm |
Table 1 QUICKSILVER on ETFS - 04/30/18 So many 5-dma and Bearish Closing Power Trends cannot be good! ETF CLOSE CHANGE PIVOT-PT 5-dma AROC CL-PWR CANDLE IP21 ITRS --------------------------------------------------------------------------------------------- DIA 241.54 -1.41 240.09 -58% Bearish RED -.002 0 --------------------------------------------------------------------------------------------- COMPQX 7066.27 -53.53 7007.35 -44% Bearish RED -.08 .017 --------------------------------------------------------------------------------------------- SPY 264.51 -2.05 262.98 -38.8% Bearish RED -.058 .012 --------------------------------------------------------------------------------------------- QQQ 160.94 -1.15 158.46 -29.6% Bearish RED -.077 .015 --------------------------------------------------------------------------------------------- MDY 340.51 -3.59 343.21 -76.8% Bearish RED -.044 .03 --------------------------------------------------------------------------------------------- IWM 153.32 -1.37 154.43 -64.6% Bearish RED -.003 .047 --------------------------------------------------------------------------------------------- FAS 63.46 -1.11 63.44 -93.8% Bearish RED -.172 -.066 --------------------------------------------------------------------------------------------- RETL 34.17 -1.21 32.34 302.3% Bearish RED -.051 -.05 --------------------------------------------------------------------------------------------- SOXL 121.91 -4.18 121.95 -123.5% Bearish RED -.136 -.171 --------------------------------------------------------------------------------------------- TECL 112.76 -2.27 109.89 -140.3% Bearish RED -.033 -.066 --------------------------------------------------------------------------------------------- IBB 103.65 -1.96 103.27 -54.6% Bearish RED -.118 -.021 --------------------------------------------------------------------------------------------- GLD 124.59 -.91 126.23 -41% Bullish BLUE -.044 .014 --------------------------------------------------------------------------------------------- OIL 7.61 .04 6.89 339.4% Bullish BLUE .263 .105 --------------------------------------------------------------------------------------------- OIH 27.14 -.08 26.82 20.3% Bullish ---- .258 .165 --------------------------------------------------------------------------------------------- GASL 21.37 .36 20.39 19% Bullish BLUE .19 .188 --------------------------------------------------------------------------------------------- UGA 33.9 .08 33.4 -20.8% Bullish BLUE .261 .146 --------------------------------------------------------------------------------------------- UUP 24.13 .1 23.84 54.3% Bullish ---- .162 .087 --------------------------------------------------------------------------------------------- IEF 101.7 .11 101.35 11.3% Bearish BLUE -.045 .043 --------------------------------------------------------------------------------------------- XLU 51.56 -.15 50.67 120.8% Bullish RED .037 .081 --------------------------------------------------------------------------------------------- WEAT 6.72 .14 6.38 341.2% Bullish BLUE .204 .082 --------------------------------------------------------------------------------------------- YINN 32.82 .14 32.89 158.8% ---- RED .086 -.135 --------------------------------------------------------------------------------------------- RSX 21.02 -.27 20.97 -7.1% Bullish RED .111 -.057 --------------------------------------------------------------------------------------------- AAPL 165.26 2.94 162.94 .6% Bearish BLUE -.149 -.001 --------------------------------------------------------------------------------------------- GOOG 1017.33 -12.72 1019.98 -242% Bearish RED -.123 -.023 --------------------------------------------------------------------------------------------- MSFT 93.52 -2.3 93.12 -97.2% Bearish RED -.036 .053 --------------------------------------------------------------------------------------------- AMZN 1566.13 -6.49 1460.09 160.3% Bearish RED -.057 .115 --------------------------------------------------------------------------------------------- FB 172 -1.59 159.69 184.9% Bearish RED .029 -.001 --------------------------------------------------------------------------------------------- NVDA 224.9 -1.43 221.2 22.9% Bearish RED -.069 -.044 --------------------------------------------------------------------------------------------- BA 333.56 -7.32 329.06 -77.9% Bearish RED .136 -.021 --------------------------------------------------------------------------------------------- GS 238.33 -1.47 242.49 -172.6% Bearish RED -.294 -.066 --------------------------------------------------------------------------------------------- HD 184.8 -1.66 176.26 197.6% Bullish RED .011 .041 --------------------------------------------------------------------------------------------- CAT 144.36 -.36 144.44 -327.7% Bearish RED -.164 -.054 |
Table 2 Count of Stocks in Key Directories
20180430
-------------------------------
NEWHIGHS 68
NEWLOWS 83 Bearish
MAXCP 45
MINCP 546 Professionals were very bearish.
TTTNH 69
TTTNL 500 Day Traders are also 10:1 bearish.
FASTUP 80
FASTDOWN 168 Swing traders are 2:1 bearish.
CPCROSSA 43
CPCROSSD 193 Professionals rushed to bearish side today.
BIGVOLUP 3
BIGVODN 20 Lots of stocks being dumped.
|
Table 3
         Count of Stocks and NEW HIGHS in Key Tiger Directories
Date = 180430
               No.           NHs           Pct.
-------------------------------------------------------------------
MAXCP          45            18            40 %
COMODITY       56            4             7 %
BEVERAGE       20            1             5 %
SOFTWARE       66            3             5 %
GOLD           50            2             4 %
HACKERS        24            1             4 %
OILGAS         137           6             4 %
AUTO           40            1             3 %
CHINA          62            2             3 %
GREEN          30            1             3 %
INSURANC       32            1             3 %
BIOTECH        381           8             2 %
RETAIL         53            1             2 %
ELECTRON       176           1             1 %
FIDSTKS        189           2             1 %
FINANCE        91            1             1 %
NASD-100       89            1             1 %
REIT           176           1             1 %
RUS-1000       825           7             1 %
SEMI           127           1             1 %
SP500          481           3             1 %
|
Table 4
Count of Stocks and New Lows in Key Tiger Directories
Date = 180430
               No.           NLs           Pct.
-------------------------------------------------------------------
-------------------------------------------------------------------
CHEM           62            7             11 %
MINCP          546           62            11 %
COAL           10            1             10 %
DJI-13         13            1             8 %
AUTO           40            3             7 %
GAMING         28            2             7 %
INFRA          35            2             6 %
INSURANC       32            2             6 %
SEMI           127           7             6 %
BEVERAGE       20            1             5 %
BIOTECH        381           18            5 %
BONDFUND       111           5             5 %
ELECTRON       176           9             5 %
INDMATER       86            4             5 %
SOLAR          21            1             5 %
SP-100         96            5             5 %
RETAIL         53            2             4 %
RUS-1000       825           29            4 %
SP500          481           20            4 %
DOWJONES       30            1             3 %
FIDSTKS        189           5             3 %
GREEN          30            1             3 %
REGBANKS       33            1             3 %
CHINA          62            1             2 %
ETFS           65            1             2 %
GOLD           50            1             2 %
SOFTWARE       66            1             2 %
FINANCE        91            1             1 %
NASD-100       89            1             1 %
OILGAS         137           2             1 %
REIT           176           2             1 %
|
 RANKING OF KEY DIRECTORIES BASED PCT.OF STOCKS ABOVE 65-DMA
              4/30/18
 Bearish = 36
 Bullish = 10
---------------------------------------------------------------------------------------
Directory     Current       day-1         day-2         day-3         day-4         day-5
----------------------------------------------------------------------------------------
EDU            .857          1             .857          1             1             .857
FOOD           .777          .888          .555          .555          .222          .222
UTILITY        .738          .738          .714          .714          .69           .69
OILGAS         .722          .686          .686          .686          .656          .686
HACKERS        .708          .708          .75           .708          .75           .791
REIT           .659          .71           .562          .414          .42           .357
SOFTWARE       .636          .651          .636          .545          .651          .681
RETAIL         .622          .679          .622          .452          .415          .452
SOLAR          .523          .571          .571          .428          .523          .523
COMODITY       .517          .571          .535          .553          .535          .482
N= 10
===============================================================================================
TRANSP         .5            .65           .45           .55           .3            .65
===============================================================================================
REGBANKS       .484          .545          .515          .575          .606          .545
DOWJONES       .466          .5            .5            .366          .4            .4
NIFTY          .448          .551          .586          .275          .31           .413
RUS-1000       .447          .493          .478          .429          .413          .456
SP500          .446          .478          .451          .403          .382          .432
GREEN          .433          .5            .5            .433          .433          .466
HOSPITAL       .428          .571          .428          .714          .714          .714
PIPELINE       .428          .142          .285          .142          0             .285
SP-100         .427          .468          .427          .343          .333          .416
NASD-100       .426          .46           .426          .348          .337          .404
GOLD           .42           .58           .56           .5            .6            .46
HOMEBLDG       .411          .588          .588          .294          .176          .176
FIDSTKS        .407          .423          .423          .38           .391          .465
BEVERAGE       .4            .4            .4            .25           .35           .35
JETS           .4            .5            .2            .4            .3            .5
COMPUTER       .391          .434          .434          .434          .478          .478
BIOTECH        .372          .417          .414          .385          .37           .398
INDMATER       .372          .43           .488          .441          .395          .453
INSURANC       .343          .437          .437          .468          .437          .5
CHEM           .338          .435          .5            .483          .435          .548
CHINA          .338          .338          .306          .29           .29           .306
FINANCE        .329          .417          .428          .406          .461          .461
GAMING         .321          .285          .321          .25           .321          .5
INFRA          .314          .314          .342          .257          .228          .228
DJI-13         .307          .307          .307          .23           .153          .153
ETFS           .307          .353          .276          .2            .215          .292
BIG17          .304          .304          .304          .282          .282          .347
COAL           .3            .2            .2            .2            .2            .3
INDEXES        .287          .328          .348          .317          .317          .374
GUNS           .277          .277          .388          .5            .444          .555
MILITARY       .263          .394          .394          .526          .5            .578
ELECTRON       .193          .238          .261          .244          .284          .289
AUTO           .175          .225          .225          .225          .225          .2
SEMI           .173          .212          .236          .196          .228          .212
BIGBANKS       .142          .142          .142          .142          .142          .142
BONDFUND       .126          .117          .063          .054          .081          .036
N = 36
|
==============================================================================
4/27/2018 The
Peerless S9 still operates. Be patient if you are
short. The S9 could fail.
But first we will need to see the DJI, the SP-500, NASDAQ and QQQ
get past the resistance of their falling 65-dma. In addition, I have to point
out that the key general market ETFs' Closing Powers are all still falling. So,
we must be particularly wary of declines following up-openings. The DJI's falling
resistance line is quite important.
We are not apt to see a fourth S9 if the DJI should rally to
the upper band
at 25000. But unless Boeing can destroy its own head/shoulders pattern, I doubt
if the DJI will advance much past its red resistance-line and its falling 65-dma
at 24600-24750. A reversal back down from there would likely re-ignite the
bears' aggressiveness and start another sell-off. So be patient. At the very
least, hedge your long positions with some of the many bearish MINCPs.
Most it is oil stocks which populate the Bullish MAXCPs.
Tomorrow watch: 1) what happens to BA, 2) if short-term interest rates pull back
any further and 3) at the Food Commodity ETNs. In one way another CORN,
WHEAT, SUGAR and SOYBEANS are each starting to look quite Bullish.
(See their charts in the CHARTS' SECTION below.)

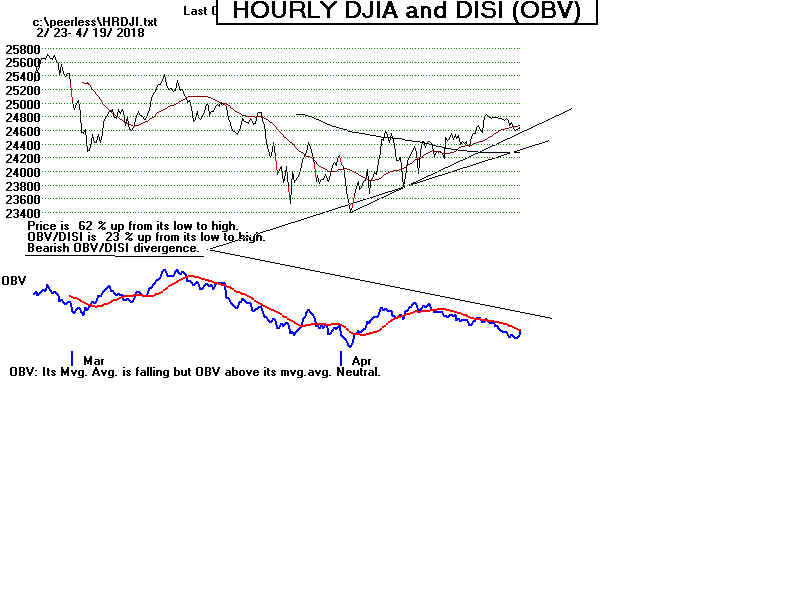
270 is SPY's key resistance. A reversal
down from this level would be bearish. A
breakout would likely lift it only to its upper
band, from which another retreat would seem
to be the most likely next development. Closing
Power here is still falling and the IP21 is
still negative.
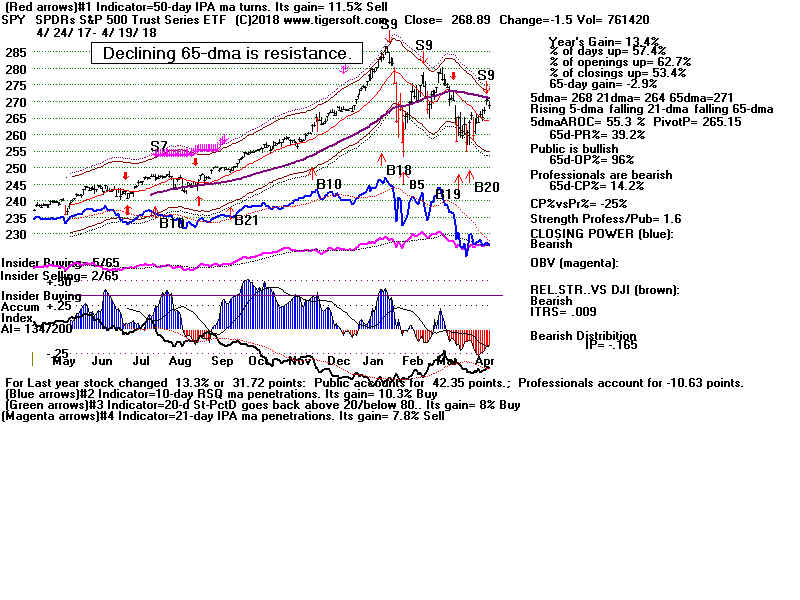

Two More Weeks of Mildly Bullish Seasonality
The first two weeks of May have since 1965 been mildly
bullish. The DJI has
rallied 63.5% of the time since April 30 over the following two weeks and
produced an average 0.5% gain over this period. But by May 10th, the odds
shift more towards favoring a decline. The two weeks thereafter brought
an average decline in the DJI of 0.2%. From May 15th until June 14th,
the DJI falls 55.8% of the time.
BOEING is The Most Important DJI Stock To
Watch Now.
I've mentioned that the highest priced DJI stocks (the
DJI-13) have much
the most weight. Of these Boeing is by far the most important. It has
stalled exactly at its 65-dma and is not yet suggesting the DJI will move
substantially higher. I would give a bullish interpretation to GS, IBM, UNH,
HD and CVX. The first two show recent red (automatic) Buys and
the last three are now moving up past theie 65-dma. On the other hand,
7 of the 13 highest priced DJI stocks are quite a distance below their
own 65-dma and are not likely to be of much help in bringing about
a DJI rally at this time. So, much will depend on how BA behaves. Watch
it closely.

|
Charts 4/27/2018 PEERLESS DJI, Signals, Indicators Daily DJI Volume 10-DayUp/Down Vol V-Indicator Hourly DJIA A/D Line for All Stocks NASDAQ S&P OEX NYSE COMPQX DJI-15 DJI-20 DJI-30 DIA SPY QQQ MDY IWM TNA USO-CrudeOil FAS GLD BBH IBB JETS JNUG KOL NUGT OIH OIL RSX RETL SDS SLV SOXL TECL TMF TNA UGA (gasoline) XIV YINN Commodities: JJC, NIB, CHOC CORN, CUT (paper) WEAT UUP (Dollar) AAPL ADBE ALXN AMAT AMGN AMD AMZN BA BABA BAC BIDU CAT CVX DE FB GOOG GS HD IBM JPM M (Macy's) MSFT NFLX NVDA QCOM TSLA TXN XOM WMT ANDV (refinery), CMG (Chipotle), LRCX, SWKS, MDGL SPPI WATT SQ TOWN 4/27/2018 (Click on Underlined link.) Bullish MAXCPs - http://tigersoft.com/4XXH/MAXCPS/427/BULLISH.htm Bearish MAXCPs - http://tigersoft.com/4XXH/MINCPS/427/BEARISH.htm |
Table 1
Table 1             QUICKSILVER on ETFS - 04/27/18
ETF CLOSE CHANGE PIVOT-PT 5-dma AROC CL-PWR CANDLE IP21 ITRS --------------------------------------------------------------------------------------------- --------------------------------------------------------------------------------------------- DIA 242.95 -.17 244.35 -31.5% Bearish ---- .042 ===== --------------------------------------------------------------------------------------------- COMPQX 7119.8 1.12 7128.6 -18.6% Bearish RED -.012 .022 --------------------------------------------------------------------------------------------- SPY 266.56 .25 266.57 -.9% Bearish RED -.005 .014 --------------------------------------------------------------------------------------------- QQQ 162.09 .1 161.89 -6.5% Bearish RED -.024 .022 --------------------------------------------------------------------------------------------- MDY 344.1 -.55 345.8 -25.1% ---- RED .043 .033 --------------------------------------------------------------------------------------------- IWM 154.69 -.22 155.32 -27.8% Bearish RED .027 .049 --------------------------------------------------------------------------------------------- FAS 64.57 .37 64.66 -21.1% Bearish BLUE -.125 -.048 --------------------------------------------------------------------------------------------- RETL 35.38 1.07 32.15 594.4% ---- BLUE .056 -.005 --------------------------------------------------------------------------------------------- SOXL 126.09 -2.85 124.99 -164.9% Bearish RED -.092 -.132 --------------------------------------------------------------------------------------------- TECL 115.03 -.82 115.94 -83.1% Bearish RED .017 -.016 --------------------------------------------------------------------------------------------- IBB 105.61 .31 104.79 31.2% Bearish BLUE -.081 -.012 --------------------------------------------------------------------------------------------- GLD 125.5 .53 125.62 -44.9% Bullish BLUE .014 .004 --------------------------------------------------------------------------------------------- OIL 7.61 .04 6.89 339.4% Bullish BLUE .263 .087 --------------------------------------------------------------------------------------------- OIH 27.22 -.16 27.03 70.3% Bullish BLUE .306 .144 --------------------------------------------------------------------------------------------- GASL 21.01 -.68 21.29 90.5% Bullish RED .219 .156 --------------------------------------------------------------------------------------------- UGA 33.82 .07 34.04 68.5% Bullish ---- .265 .137 --------------------------------------------------------------------------------------------- UUP 24.03 -.02 23.87 64.9% Bullish RED .156 .06 --------------------------------------------------------------------------------------------- IEF 101.59 .17 101.47 1% Bearish BLUE -.03 .024 --------------------------------------------------------------------------------------------- XLU 51.71 .52 50.33 139.2% Bullish BLUE .066 .089 --------------------------------------------------------------------------------------------- WEAT 6.58 .13 6.28 203.3% Bullish BLUE .199 .055 --------------------------------------------------------------------------------------------- YINN 32.68 .12 31.79 130.2% Bullish BLUE .148 -.092 --------------------------------------------------------------------------------------------- RSX 21.29 .05 21.05 68.9% Bullish ---- .16 -.052 --------------------------------------------------------------------------------------------- AAPL 162.32 -1.9 165.24 -103.4% Bearish RED -.203 -.005 --------------------------------------------------------------------------------------------- GOOG 1030.05 -9.99 1067.45 -205.4% Bearish RED -.054 -.012 --------------------------------------------------------------------------------------------- MSFT 95.82 1.56 95.35 43.6% Bearish RED .044 .081 --------------------------------------------------------------------------------------------- AMZN 1572.62 54.66 1517.86 150.8% Bearish RED .05 .109 --------------------------------------------------------------------------------------------- FB 173.59 -.57 165.84 221.3% Bearish RED .091 -.008 --------------------------------------------------------------------------------------------- NVDA 226.33 1.11 223.88 -53.3% Bearish RED -.01 -.037 --------------------------------------------------------------------------------------------- BA 340.88 -1.91 338.84 32.6% Bearish RED .184 .014 --------------------------------------------------------------------------------------------- GS 239.8 -.29 246.67 -249.1% Bearish RED -.237 -.061 --------------------------------------------------------------------------------------------- HD 186.46 .74 177.66 264.2% Bullish BLUE .085 .035 --------------------------------------------------------------------------------------------- CAT 144.72 -1.59 153.99 -286.9% Bearish RED -.144 -.059 |
 Table 2
   Count of Stocks in Key Directories
          20180427
-------------------------------
NEWHIGHS       104   BULLISH
NEWLOWS        50
MAXCP          31
MINCP          250   Professionals remain bearish.
TTTNH          56
TTTNL          351   Day Traders remain bearish.
FASTUP         80
FASTDOWN       149   Swing traders are bearish.
CPCROSSA       138   But there is a move to bullish side by Professionals.
CPCROSSD       49
BIGVOLUP       1
BIGVODN        7     Dumping continues.
|
Table 3
         Count of Stocks and NEW HIGHS in Key Tiger Directories
Date = 180427
               No.           NHs           Pct.
-------------------------------------------------------------------
-------------------------------------------------------------------
MAXCP          31            17            55 %
BEVERAGE       20            3             15 %
RETAIL         53            4             8 %
GREEN          30            2             7 %
INSURANC       32            2             6 %
REGBANKS       33            2             6 %
SOFTWARE       66            4             6 %
SOLAR          21            1             5 %
UTILITY        42            2             5 %
OILGAS         137           6             4 %
RUS-1000       825           31            4 %
SP500          481           21            4 %
CHINA          62            2             3 %
MILITARY       38            1             3 %
NASD-100       89            3             3 %
BIOTECH        382           9             2 %
CHEM           62            1             2 %
FIDSTKS        189           4             2 %
FINANCE        91            2             2 %
GOLD           50            1             2 %
SEMI           127           2             2 %
ELECTRON       176           1             1 %
REIT           176           1             1 %
|
Table 4
Count of Stocks and New Lows in Key Tiger Directories
Date = 180427
               No.           NLs           Pct.
-------------------------------------------------------------------
COAL           10            2             20 %
MINCP          250           32            13 %
HACKERS        24            2             8 %
GAMING         28            2             7 %
CHEM           62            4             6 %
AUTO           40            2             5 %
BEVERAGE       20            1             5 %
ELECTRON       176           9             5 %
SEMI           127           6             5 %
SOLAR          21            1             5 %
BONDFUND       111           4             4 %
BIOTECH        382           11            3 %
INFRA          35            1             3 %
INSURANC       32            1             3 %
SOFTWARE       66            2             3 %
CHINA          62            1             2 %
ETFS           66            1             2 %
FIDSTKS        189           3             2 %
GOLD           50            1             2 %
NASD-100       89            2             2 %
INDMATER       86            1             1 %
OILGAS         137           1             1 %
RUS-1000       825           12            1 %
SP-100         96            1             1 %
SP500          481           7             1 %
|
RANKING OF KEY DIRECTORIES BASED PCT.OF STOCKS ABOVE 65-DMA 4/27/18 --------------------------------------------------------------------------------------- Directory Current day-1 day-2 day-3 day-4 day-5 ---------------------------------------------------------------------------------------- EDU 1 .857 1 1 .857 1 FOOD .888 .555 .555 .222 .222 .333 UTILITY .738 .714 .714 .69 .69 .666 REIT .71 .562 .414 .42 .352 .346 HACKERS .708 .75 .708 .75 .791 .833 OILGAS .686 .686 .686 .656 .686 .671 RETAIL .679 .622 .452 .415 .433 .415 SOFTWARE .651 .636 .545 .651 .681 .666 TRANSP .65 .45 .55 .3 .65 .6 HOMEBLDG .588 .588 .294 .176 .176 .176 GOLD .58 .56 .5 .6 .46 .7 COMODITY .571 .535 .553 .535 .482 .66 HOSPITAL .571 .428 .714 .714 .714 .714 SOLAR .571 .571 .428 .523 .523 .523 NIFTY .551 .586 .275 .31 .413 .413 REGBANKS .545 .515 .575 .606 .545 .424 DOWJONES .5 .5 .366 .4 .4 .366 GREEN .5 .5 .433 .433 .466 .533 JETS .5 .2 .4 .3 .5 .5 RUS-1000 .493 .478 .429 .413 .45 .438 SP500 .478 .451 .403 .382 .428 .407 SP-100 .468 .427 .343 .333 .416 .385 NASD-100 .46 .426 .348 .337 .393 .359 INSURANC .437 .437 .468 .437 .5 .5 CHEM .435 .5 .483 .435 .532 .532 INDMATER .43 .488 .441 .395 .453 .5 FIDSTKS .423 .423 .38 .391 .455 .433 FINANCE .417 .428 .406 .461 .461 .406 BIOTECH .416 .413 .384 .369 .4 .39 COMPUTER .409 .409 .409 .454 .454 .5 BEVERAGE .4 .4 .25 .35 .35 .4 MILITARY .394 .394 .526 .5 .552 .605 ETFS .348 .287 .196 .227 .287 .287 CHINA .338 .306 .29 .29 .306 .306 INDEXES .328 .348 .317 .317 .364 .389 INFRA .314 .342 .257 .228 .228 .257 DJI-13 .307 .307 .23 .153 .153 .153 BIG17 .304 .304 .282 .282 .347 .347 GAMING .285 .321 .25 .321 .464 .392 GUNS .277 .388 .5 .444 .555 .5 ELECTRON .238 .261 .244 .284 .289 .335 AUTO .225 .225 .225 .225 .175 .15 SEMI .204 .228 .188 .22 .204 .244 COAL .2 .2 .2 .2 .3 .3 BIGBANKS .142 .142 .142 .142 .142 .142 PIPELINE .142 .285 .142 0 .285 .142 BONDFUND .117 .063 .054 .081 .036 .036 |
==============================================================================
4/26/2018 The
Peerless S9 still operates. The P-Indicator's rise
is bullish and
may give us a buy signal on a decline to the lower band. But the
DJI is quite capable of leading the market down when breadth
looked positive. Be patient, let the Peerless signals tell us what
to do. Right now, Peerless is saying wait for a decline to the
lower band, at least. Very few Sell S9s don't take the DJI down
to the 3% band, at a minimum. When they cluster as now, they
are much more dangerous.

We should be very careful of one-day jumps in the DJI that are quickly wiped
out by declines. This is one of the warnings given right before the crashes
of 1929, 1987 and 2008. See the days circled in red.
1929 |
1987 |
2008 |
I'm not saying a Crash is imminent. The internals of the current market
have not been negative for many, many months as is 1929. The A/D Line
was much worse in 1929 and 1987. But the IP21-Accumulation Index
was no worse in 2008. So stick with the S9 until it is reversed. And
definitely,
do not trust a quick one or two day jump in the market on mediocre volume
when the Closing Powers for the major market ETFs are all falling and the
DJI is still below its falling 65-dma.
The P-Indicator keeps rising. That may allow the market to
withstand
the DJI's steady dropping down to the critical 23400 support. But what
it will do there if the DJI breaks down, I cannot say for sure right now.
My fear is that fund managers will do what they did in October 1987 and
buy lots and lots of leveraged negative insurance. That will be very dangerous
and could easily cause a decline that would take the DJI down to 20,000.
At that point, it will be entering "bear market territory" and additional
selling
would likely follow.
But first, if the DJI is going to significantly violate 23200-23400,
other segments
of the market besides the Blue Chips, REITs and Bond Funds will need to
violate their key support levels. So, we should watch them closely again
tonight. They are:
Support Close Today
Semi-Conductors
(SOXL) 117
128.94 +7.42 CP falling IP21=-.105
Hospitals (Tiger Index)
350
343 -18
IP21=-.271
Cable-TVs (MG726)
860 881.14 -10.55
IP21=-.238
Softdrinks (MG349)
1900 1921.20 +20.55 IP21=-.130
Personal Products (MG324) 2950
2993.63 +17.26
IP21=-176
Consumer Durables (MG310) 410
412.65 -1.84
IP21=-.036
Conglomerates See below
1047
1035.55 -35.1
IP21=-.053
Pharmaceuticals (XPH)
39.80 40.76 +.30
IP21=-.064
Emerging Markets (FDC)
14.70 15.39 +.40
IP21=-.100
Home Building (XHB)
38.62 39.67 +.34
IP21= +.001
Conglomerates broke their support decisively today. |
|
Charts 4/26/2018 PEERLESS DJI, Signals, Indicators Daily DJI Volume 10-DayUp/Down Vol V-Indicator Hourly DJIA A/D Line for All Stocks NASDAQ S&P OEX NYSE COMPQX DJI-15 DJI-20 DJI-30 DIA SPY QQQ MDY IWM TNA USO-CrudeOil FAS GLD BBH IBB JETS JNUG KOL NUGT OIH OIL RSX RETL SDS SLV SOXL TECL TMF TNA UGA (gasoline) XIV YINN Commodities: JJC, NIB, CHOC CORN, CUT (paper) WEAT UUP (Dollar) AAPL ADBE ALXN AMAT AMGN AMD AMZN BA BABA BAC BIDU CAT CVX DE FB GOOG GS HD IBM JPM M (Macy's) MSFT NFLX NVDA QCOM TSLA TXN XOM WMT ANDV (refinery), CMG (Chipotle), LRCX, SWKS, MDGL SPPI WATT SQ TOWN 4/26/2018 (Click on Underlined link.) Bullish MAXCPs - http://tigersoft.com/4XXH/MAXCPS/426/BULLISH.htm Bearish MAXCPs - http://tigersoft.com/4XXH/MINCPS/426/BEARISH.htm |
Table 1
                  QUICKSILVER on ETFS - 04/26/18
ETF CLOSE CHANGE PIVOT-PT 5-dma AROC CL-PWR CANDLE IP21 ITRS --------------------------------------------------------------------------------------------- DIA 243.12 2.42 244.48 -70.9% Bearish BLUE .006 ----- --------------------------------------------------------------------------------------------- COMPQX 7118.68 114.94 7146.13 -84% Bearish BLUE -.011 .029 --------------------------------------------------------------------------------------------- SPY 266.31 2.68 266.61 -48.5% Bearish BLUE -.036 .015 --------------------------------------------------------------------------------------------- QQQ 161.99 3.34 162.3 -90.5% Bearish BLUE -.032 .028 --------------------------------------------------------------------------------------------- MDY 344.65 1.31 345.83 -47.5% ---- BLUE .042 .042 --------------------------------------------------------------------------------------------- IWM 154.91 .71 155.55 -47.7% Bearish BLUE .017 .057 --------------------------------------------------------------------------------------------- FAS 64.2 1.07 64.84 -70.8% Bearish BLUE -.125 -.016 --------------------------------------------------------------------------------------------- RETL 34.31 1.42 31.5 216.3% Bearish BLUE .022 .007 --------------------------------------------------------------------------------------------- SOXL 128.94 7.42 130.23 -242.2% Bearish BLUE -.104 -.067 --------------------------------------------------------------------------------------------- TECL 115.85 5.95 116.92 -283.9% Bearish BLUE .001 .033 --------------------------------------------------------------------------------------------- IBB 105.3 2.04 104.96 -28.2% Bearish BLUE -.081 -.007 --------------------------------------------------------------------------------------------- GLD 124.97 -.44 126.63 -104.1% Bearish RED -.045 .005 --------------------------------------------------------------------------------------------- OIL 7.61 .04 6.89 339.4% Bullish BLUE .263 .075 --------------------------------------------------------------------------------------------- OIH 27.38 .33 26.84 64.9% Bullish BLUE .271 .156 --------------------------------------------------------------------------------------------- GASL 21.69 .71 20.63 134.1% Bullish BLUE .167 .278 --------------------------------------------------------------------------------------------- UGA 33.75 .37 33.36 94.1% Bullish BLUE .285 .142 --------------------------------------------------------------------------------------------- UUP 24.05 .11 23.72 98.8% Bullish BLUE .231 .041 --------------------------------------------------------------------------------------------- IEF 101.42 .29 101.57 -24.1% Bearish ---- -.064 .005 --------------------------------------------------------------------------------------------- XLU 51.19 .51 50.3 42.5% Bullish BLUE .039 .055 --------------------------------------------------------------------------------------------- WEAT 6.45 -.1 6.32 -23.4% Bullish ---- .15 .014 --------------------------------------------------------------------------------------------- YINN 32.56 .36 31.84 -101.9% Bullish BLUE .144 -.029 --------------------------------------------------------------------------------------------- RSX 21.24 .32 21 -26.1% Bullish BLUE .151 -.04 --------------------------------------------------------------------------------------------- AAPL 164.22 .57 165.72 -258.3% Bearish BLUE -.226 .013 --------------------------------------------------------------------------------------------- GOOG 1040.04 18.86 1072.96 -226.1% Bearish BLUE -.022 .003 --------------------------------------------------------------------------------------------- MSFT 94.26 1.95 95 -98% Bearish BLUE .003 .063 --------------------------------------------------------------------------------------------- AMZN 1517.96 57.79 1527.49 -129.4% Bearish BLUE .161 .087 --------------------------------------------------------------------------------------------- FB 174.16 14.47 166.28 184.8% ---- BLUE .1 .02 --------------------------------------------------------------------------------------------- NVDA 225.22 8.56 228.71 -85.3% Bearish BLUE -.019 -.018 --------------------------------------------------------------------------------------------- BA 342.79 -.07 338.67 31.8% Bearish RED .199 .013 --------------------------------------------------------------------------------------------- GS 240.09 .86 251.96 -285.1% Bearish BLUE -.207 -.046 --------------------------------------------------------------------------------------------- HD 185.72 8.33 177.01 244% Bullish BLUE .035 .025 --------------------------------------------------------------------------------------------- CAT 146.31 1.12 153.25 -311.9% Bearish BLUE -.139 -.036 |
Table 2 Count of Stocks in Key Directories
20180426
-------------------------------
NEWHIGHS 120 Bullish
NEWLOWS 51
MAXCP 38
MINCP 233 Professionals remain solidly bearish.
TTTNH 50
TTTNL 321 Day Traders are clearly more bearish than bullish.
FASTUP 71
FASTDOWN 156 Swing traders are 2:1 bearish.
CPCROSSA 181 Professions did jump to positive side today.
CPCROSSD 46
BIGVOLUP 2
BIGVODN 21 Big Money Dumping is quite high.
|
Table 3Table 3
Count of Stocks and NEW HIGHS in Key Tiger Directories
Date = 180426
No. NHs Pct.
-------------------------------------------------------------------
MAXCP 38 30 79 %
OILGAS 137 18 13 %
RETAIL 53 4 8 %
GAMING 28 2 7 %
INSURANC 32 2 6 %
REGBANKS 33 2 6 %
SOFTWARE 66 4 6 %
BEVERAGE 20 1 5 %
FIDSTKS 189 7 4 %
HACKERS 24 1 4 %
RUS-1000 825 31 4 %
SP500 481 20 4 %
DOWJONES 30 1 3 %
FINANCE 91 3 3 %
GREEN 30 1 3 %
NIFTY 29 1 3 %
SP-100 96 3 3 %
BIOTECH 383 6 2 %
CHEM 62 1 2 %
CHINA 62 1 2 %
COMODITY 56 1 2 %
INDMATER 86 2 2 %
NASD-100 89 2 2 %
SEMI 128 2 2 %
UTILITY 42 1 2 %
ELECTRON 176 2 1 %
INDEXES 195 2 1 %
|
Table 5
Count of Stocks and New Lows in Key Tiger Directories
Date = 180426
               No.           NLs           Pct.
-------------------------------------------------------------------
COAL           10            2             20 %
MINCP          233           34            15 %
BONDFUND       111           15            14 %
HOSPITAL       7             1             14 %
CHEM           62            4             6 %
HOMEBLDG       17            1             6 %
INFRA          35            2             6 %
INSURANC       32            2             6 %
SOFTWARE       66            4             6 %
AUTO           39            2             5 %
BEVERAGE       20            1             5 %
BIOTECH        383           16            4 %
GAMING         28            1             4 %
ELECTRON       176           6             3 %
OILGAS         137           4             3 %
CHINA          62            1             2 %
COMODITY       56            1             2 %
ETFS           66            1             2 %
FINANCE        91            2             2 %
GOLD           50            1             2 %
INDMATER       86            2             2 %
RUS-1000       825           14            2 %
SEMI           128           2             2 %
SP-100         96            2             2 %
SP500          481           9             2 %
FIDSTKS        189           2             1 %
|
Table 6 RANKING OF KEY DIRECTORIES BASED PCT.OF STOCKS ABOVE 65-DMA
4/26/18
Bearish = 30
Bullish = 14
---------------------------------------------------------------------------------------
Directory Current day-1 day-2 day-3 day-4 day-5
----------------------------------------------------------------------------------------
EDU .857 1 1 .857 1 1
HACKERS .75 .708 .75 .791 .833 .875
UTILITY .714 .714 .69 .69 .666 .714
OILGAS .686 .686 .656 .686 .671 .686
SOFTWARE .636 .545 .651 .681 .666 .727
RETAIL .622 .452 .415 .433 .415 .471
HOMEBLDG .588 .294 .176 .176 .176 .235
NIFTY .586 .275 .31 .413 .413 .448
SOLAR .571 .428 .523 .523 .523 .571
REIT .562 .414 .42 .352 .34 .42
GOLD .56 .5 .6 .46 .7 .66
FOOD .555 .555 .222 .222 .333 .888
COMODITY .535 .553 .535 .482 .66 .732
REGBANKS .515 .575 .606 .545 .424 .363
N=14
==========================================================================================
CHEM .5 .483 .435 .532 .5 .564
DOWJONES .5 .366 .4 .4 .366 .433
GREEN .5 .433 .433 .466 .533 .6
==========================================================================================
INDMATER .488 .441 .395 .453 .476 .546
RUS-1000 .478 .429 .413 .45 .435 .477
SP500 .451 .403 .382 .428 .407 .461
TRANSP .45 .55 .3 .65 .6 .65
INSURANC .437 .468 .437 .5 .531 .5
COMPUTER .434 .434 .478 .478 .434 .608
FINANCE .428 .406 .461 .461 .406 .406
HOSPITAL .428 .714 .714 .714 .714 .714
SP-100 .427 .343 .333 .416 .385 .447
NASD-100 .426 .348 .337 .393 .359 .438
FIDSTKS .423 .38 .391 .455 .439 .486
BIOTECH .412 .383 .368 .399 .391 .43
BEVERAGE .4 .25 .35 .35 .4 .45
MILITARY .394 .526 .5 .552 .605 .631
GUNS .388 .5 .444 .555 .5 .555
INDEXES .348 .317 .317 .364 .394 .507
INFRA .342 .257 .228 .228 .257 .342
GAMING .321 .25 .321 .464 .392 .464
DJI-13 .307 .23 .153 .153 .153 .384
CHINA .306 .29 .29 .306 .306 .274
BIG17 .304 .282 .282 .347 .369 .369
ETFS .287 .196 .227 .287 .287 .363
PIPELINE .285 .142 0 .285 .142 0
ELECTRON .261 .244 .284 .289 .323 .369
SEMI .234 .195 .226 .21 .242 .281
AUTO .205 .205 .205 .153 .128 .179
COAL .2 .2 .2 .3 .3 .3
JETS .2 .4 .3 .5 .5 .5
BIGBANKS .142 .142 .142 .142 .142 .142
BONDFUND .063 .054 .081 .036 .036 .054
N=30
|
==============================================================================
4/25/2018 The
Peerless S9 still operates. Much now depends on
whether the DJI can
survive its next test of 23200-23400. A test of that seems very likely. The
warning signs I've mentioned in the last four or five Hotlines are all still present.
Suffice it to say here, without a new Peerless Buy signal and the Closing Powers
all still quite bearish, we should remain bearish even though the market deserves
a little short-term recovery.
What I am struck by tonight, and their charts are shown below, is just how many
sectors' charts have fallen to their own important flat support-levels. If the ETFs
and Index charts of Semi-Conductors, Hospitals, Cable-TVs, Softdrinks, Personal
Products, Consumer Durables, Conglomerates, Pharmaceuticals, Emerging Markets
and Home Building next show key breakdowns, the market will then be that much
more dangerous. We will watch these closely.
Flat Support (green) usually beckons for a test and very
often brings a breakdown. The P-Indicator is still positive.
Can the DJI still lead the general market significantly lower?
Yes, that had
happened in the past. Higher interest rates and
rising oil prices did that in 1977. So, the same combination
could produce a DJI-led bear market here.

|
Charts 4/25/2018 PEERLESS DJI, Signals, Indicators Daily DJI Volume 10-DayUp/Down Vol V-Indicator Hourly DJIA A/D Line for All Stocks NASDAQ S&P OEX NYSE COMPQX DJI-15 DJI-20 DJI-30 DIA SPY QQQ MDY IWM TNA USO-CrudeOil FAS GLD BBH IBB JETS JNUG KOL NUGT OIH OIL RSX RETL SDS SLV SOXL TECL TMF TNA UGA (gasoline) XIV YINN Commodities: JJC, NIB, CHOC CORN, CUT (paper) WEAT UUP (Dollar) AAPL ADBE ALXN AMAT AMGN AMD AMZN BA BABA BAC BIDU CAT CVX DE FB GOOG GS HD IBM JPM M (Macy's) MSFT NFLX NVDA QCOM TSLA TXN XOM WMT ANDV (refinery), CMG (Chipotle), LRCX, SWKS, MDGL SPPI WATT SQ TOWN 4/25/2018 (Click on Underlined link.) Bullish MAXCPs - http://tigersoft.com/4XXH/MAXCPS/425/BULLISH.htm Bearish MAXCPs - http://tigersoft.com/4XXH/MINCPS/425/BEARISH.htm |
What To Do Now? Hold Your Shorts and
Be Patient.
One question that may occur to readers is it too late now to go short? I would
say not if you are willing to cover if the Closing Power downtrend is broken. This
would apply to DIA or to some of the many Beairsh MINCPs. Should you buy
puts in expectation of a DJI breakdown? Perhaps, the October 1987 case shows
this could be immensely profitable. But breadth was worse then. So, there is
a better chance now in 2018 that the DJI's key support will not crack wide open
or even that there may be a false new low with a reversing Buy signal as there was
on 7/2/2010 when the P-I widely failed to confirm the new and the DJI quickly
turned right back up. But there is a big difference between now and then. That
bull market was only 15 months old. Ours is now more than 8 years old, which would
seem to make it ripe for a 20% decline, at the least. That would take it back to
20,000.

Groups Threatening To Break Their Flat
Support.
Another question worth considering... Are there new sectors that are breaking
below their own key support? A bear market would seem to need new fuel,
otherwise it will mainly be blue chips, bonds and REITs that are mostly falling.
I think that we would do well to watch the sectors represented below. They
are still above their own key flat support-levels. But not by much. If they break
down, it will make any DJI decline below 23200-23400 far less isolated and
much more dangerous.
 |
 |
 |
 |
 |
 |
 |
 |
 |
 |
Table 1
                  QUICKSILVER on ETFS - 04/25/18
ETF CLOSE CHANGE PIVOT-PT 5-dma AROC CL-PWR CANDLE IP21 ITRS --------------------------------------------------------------------------------------------- DIA 240.7 .61 246.57 -136.6% Bearish BLUE -.043 ---- --------------------------------------------------------------------------------------------- COMPQX 7003.74 -3.61 7238.06 -203.5% Bearish RED -.095 .025 --------------------------------------------------------------------------------------------- SPY 263.63 .65 268.89 -126.6% Bearish BLUE -.079 .016 --------------------------------------------------------------------------------------------- QQQ 158.65 .19 164.91 -239.3% Bearish RED -.099 .021 --------------------------------------------------------------------------------------------- MDY 343.34 .13 347.93 -92.5% Bearish BLUE -.038 .049 --------------------------------------------------------------------------------------------- IWM 154.2 -.23 156.39 -105.2% Bearish RED -.042 .063 --------------------------------------------------------------------------------------------- FAS 63.13 -.31 65.11 -53.6% Bearish RED -.154 -.01 --------------------------------------------------------------------------------------------- RETL 32.89 .55 32.91 -191.7% Bearish BLUE -.034 -.009 --------------------------------------------------------------------------------------------- SOXL 121.52 -.43 135.08 -1258.3% Bearish RED -.191 -.113 --------------------------------------------------------------------------------------------- TECL 109.9 .01 122.38 -710.1% Bearish RED -.073 -.005 --------------------------------------------------------------------------------------------- IBB 103.26 -.01 105.89 -194.3% Bearish ---- -.155 -.016 --------------------------------------------------------------------------------------------- GLD 125.41 -.82 127.6 -96.2% Bullish BLUE -.004 .023 --------------------------------------------------------------------------------------------- OIL 7.61 .04 6.89 339.4% Bullish BLUE .263 .084 --------------------------------------------------------------------------------------------- OIH 27.05 .23 27.03 -5.6% Bullish BLUE .227 .135 --------------------------------------------------------------------------------------------- GASL 20.98 .59 21.13 -126.3% Bullish BLUE .117 .195 --------------------------------------------------------------------------------------------- UGA 33.38 -.02 33.12 37.4% Bullish RED .237 .144 --------------------------------------------------------------------------------------------- UUP 23.94 .1 23.58 90.7% Bullish ---- .204 .039 --------------------------------------------------------------------------------------------- IEF 101.13 -.22 101.91 -52.1% Bearish RED -.028 .012 --------------------------------------------------------------------------------------------- XLU 50.68 .01 50.76 -10.9% Bullish BLUE .022 .058 --------------------------------------------------------------------------------------------- WEAT 6.55 .17 6.48 70.5% Bullish BLUE .135 .035 --------------------------------------------------------------------------------------------- YINN 32.2 -.69 33.22 -118.3% ---- ---- .089 -.032 --------------------------------------------------------------------------------------------- RSX 20.92 -.05 21.35 -139.3% Bullish ---- .104 -.035 --------------------------------------------------------------------------------------------- AAPL 163.65 .71 172.8 -420.1% Bearish BLUE -.249 .028 --------------------------------------------------------------------------------------------- GOOG 1021.18 1.2 1087.7 -239.2% Bearish RED -.094 -.007 --------------------------------------------------------------------------------------------- MSFT 92.31 -.81 96.11 -216.9% Bearish RED -.062 .058 --------------------------------------------------------------------------------------------- AMZN 1460.17 .08 1556.91 -222.9% Bearish BLUE .092 .076 --------------------------------------------------------------------------------------------- FB 159.69 0 168.1 -201.8% Bearish RED .003 -.073 --------------------------------------------------------------------------------------------- NVDA 216.66 -4.54 229.04 -432.5% Bearish RED -.108 -.028 --------------------------------------------------------------------------------------------- BA 342.86 13.8 340.64 27.5% Bearish BLUE .151 .019 --------------------------------------------------------------------------------------------- GS 239.23 -3.26 254.17 -295.6% Bearish RED -.24 -.033 --------------------------------------------------------------------------------------------- HD 177.39 1.13 177.08 -69.3% Bearish BLUE -.079 -.014 --------------------------------------------------------------------------------------------- CAT 145.19 .75 155.7 -352.4% Bearish BLUE -.184 -.024 |
| Table 2 Count of Stocks in Key Directories 20180425 ------------------------------- NEWHIGHS 79 NEWLOWS 140 MAXCP 30 MINCP 326 TTTNH 56 TTTNL 471 FASTUP 50 FASTDOWN 223 CPCROSSA 92 CPCROSSD 70 BIGVOLUP 3 BIGVODN 8 |
Table 3
         Count of Stocks and NEW HIGHS in Key Tiger Directories
Date = 180425
               No.           NHs           Pct.
MAXCP          30            20            67 %
FOOD           9             1             11 %
OILGAS         137           9             7 %
BEVERAGE       20            1             5 %
HACKERS        24            1             4 %
GREEN          30            1             3 %
REGBANKS       33            1             3 %
BIOTECH        383           6             2 %
CHEM           62            1             2 %
COMODITY       56            1             2 %
FINANCE        91            2             2 %
RETAIL         53            1             2 %
RUS-1000       826           17            2 %
SOFTWARE       66            1             2 %
SP500          481           9             2 %
UTILITY        42            1             2 %
ELECTRON       176           1             1 %
FIDSTKS        189           2             1 %
INDEXES        195           2             1 %
SP-100         96            1             1 %
|
Table 4
     Count of Stocks and New LOWS in Key Tiger Directories
     Bond funds are the leaders on downside.
     REITs are well-represented there, too.
Date = 180425
               No.           NLs           Pct.
-------------------------------------------------------------------
BONDFUND       111           59            53 %
MINCP          326           69            21 %
COAL           10            2             20 %
BEVERAGE       20            3             15 %
FOOD           9             1             11 %
AUTO           40            4             10 %
SEMI           128           12            9 %
REIT           176           12            7 %
CHEM           62            4             6 %
CHINA          62            4             6 %
ELECTRON       176           10            6 %
INSURANC       32            2             6 %
BIOTECH        383           19            5 %
SOFTWARE       66            3             5 %
GAMING         28            1             4 %
HACKERS        24            1             4 %
SP-100         96            4             4 %
DOWJONES       30            1             3 %
INFRA          35            1             3 %
OILGAS         137           4             3 %
REGBANKS       33            1             3 %
ETFS           66            1             2 %
FIDSTKS        189           4             2 %
GOLD           50            1             2 %
INDMATER       86            2             2 %
RETAIL         53            1             2 %
RUS-1000       826           15            2 %
SP500          481           11            2 %
UTILITY        42            1             2 %
FINANCE        91            1             1 %
INDEXES        195           1             1 %
NASD-100       89            1             1 %
|
Table 5RANKING OF KEY DIRECTORIES BASED PCT.OF STOCKS ABOVE 65-DMA 4/25/18 Bearish = 34 Bullish = 11 --------------------------------------------------------------------------------------- Directory Current day-1 day-2 day-3 day-4 day-5 ---------------------------------------------------------------------------------------- EDU 1 1 .857 1 1 1 HOSPITAL .714 .714 .714 .714 .714 .857 UTILITY .714 .69 .69 .666 .714 .785 HACKERS .708 .75 .791 .833 .875 .875 OILGAS .686 .656 .686 .671 .671 .7 REGBANKS .575 .606 .545 .424 .333 .242 FOOD .555 .222 .222 .333 .888 .888 COMODITY .553 .535 .482 .66 .732 .75 TRANSP .55 .3 .65 .6 .65 .7 SOFTWARE .545 .651 .681 .666 .727 .742 MILITARY .526 .5 .552 .605 .631 .631 N=11 ============================================================================================= GOLD .5 .6 .46 .7 .66 .66 GUNS .5 .444 .555 .5 .555 .555 ============================================================================================== CHEM .483 .435 .532 .5 .548 .629 INSURANC .468 .437 .5 .531 .5 .5 RETAIL .452 .415 .433 .415 .471 .49 INDMATER .441 .395 .453 .476 .534 .593 COMPUTER .434 .478 .478 .434 .565 .608 GREEN .433 .433 .466 .533 .6 .7 RUS-1000 .429 .414 .451 .435 .469 .521 SOLAR .428 .523 .523 .523 .571 .666 REIT .414 .42 .352 .34 .414 .534 FINANCE .406 .461 .461 .406 .406 .285 SP500 .403 .382 .428 .407 .449 .498 JETS .4 .3 .5 .5 .5 .5 BIOTECH .383 .368 .399 .391 .433 .464 FIDSTKS .38 .391 .455 .439 .476 .497 DOWJONES .366 .4 .4 .366 .433 .4 NASD-100 .348 .337 .393 .359 .415 .505 SP-100 .343 .333 .416 .385 .427 .437 INDEXES .323 .317 .364 .394 .502 .579 HOMEBLDG .294 .176 .176 .176 .235 .352 CHINA .29 .29 .306 .306 .274 .306 BIG17 .282 .282 .347 .369 .369 .369 NIFTY .275 .31 .413 .413 .448 .586 INFRA .257 .228 .228 .257 .342 .428 BEVERAGE .25 .35 .35 .4 .45 .5 GAMING .25 .321 .464 .392 .464 .535 ELECTRON .244 .284 .289 .323 .363 .477 DJI-13 .23 .153 .153 .153 .384 .384 AUTO .225 .225 .175 .15 .175 .3 COAL .2 .2 .3 .3 .3 .3 ETFS .196 .227 .287 .287 .363 .469 SEMI .195 .226 .21 .242 .273 .429 BIGBANKS .142 .142 .142 .142 0 0 PIPELINE .142 0 .285 .142 0 .142 BONDFUND .054 .081 .036 .036 .054 .081 N=35 |
==============================================================================
4/24/2018 The
dangers of the Peerless S9 should be apparent to us who use TigerSoft
and Peerless. This is the third S9 in just 3 months. It is reinforced by heavy
red
Disribution, an extremely weak Closing Powers and the failure of the DJI to get past
its falling 65-dma. These are all key components to a classic bearish ideal-type.
The only thing missing is a bearish NYSE A/D Line divergence. As far as the
missing head/shoulders pattern, which also often appears at a market top, I would
suggest the falling flat-bottomed triangle pattern in the DJI is the technical equivalent
of a bearish head/shoulders top.
It is not important that we know exactly why the market is selling off. That will
become apparent "in the fulness of time". What
is important is that we see Professionals
selling quickly into any and every rally now.
They want out. My guess is the stampede
has only started. At least, we cannot assume otherwise now. What we can see is
that
short-term interest rates are rising now every day. The Fed probably cannot stop
this decline
except by huge injections of money into the system, something which is politically very
hard
for them to do now. But without guarantees that the market will be stabilized by the
FED,
how will it hold up? And what if there is much worse news for the market? What
if
the Special Prosecutor is going to accuse the President of "obstruction of
justice"?
All we can know for sure is that there are huge sums of money in all sorts of Funds
run by worried money managers. In October 1987, the same guys rushed to buy OEX puts
when the key supports were broken. I fully expect the same thing to happen if
23200-23400
is broken. Our theories hold that flat tops and flat bottoms "beckon" for
breakouts and
breakdowns. So, hold DIA short (or its leveraged equivalents) and lots of bearish
MINCPs
short. Hold long only OIL stocks, and only so long as they hold above their own
65-dma.
The other important element here to appreciate is
that market history shows us that
important tops can indeed take place without a NYSE A/D Line divergence at the
top. Below are the main examples of important
tops where the NYSE A/D Line
confirmed or very nearly confirmed the DJI's top.
1) 5/28/1946 ---> 24% DJI decline followed. Sell S5/S4 +
Head/Shoulders.
2) 6/14/1948 DJI 192.9 ---> 6/13/1949 161.6 S2 + H/S
3) 11/5/1961 ---> 27% DJI decline followed. S16 + H/S
4) 1/18/1966 ---> bear market.
S4/S12 (la/ma=1.02 IP21=-.028)
5) 12/31/1976 ---> bear market led by DJI
S4/S12
6) 1/9/1984 ----> 15% mini-bear
S12 (la/ma=1.021 IP21= .007)
Within the DJI now, we see the most weakness in the higher priced (and most heavily
weighted DJI stocks). The first chart below is the DJI-13, representing the 13 highest
priced DJI-30 stocks. They led the DJI up in 2017. Now they are leading it
down
in 2018. Its bearish head/shoulders pattern has just been completed. This reinforces
my expectation that the DJI will soon be testing its key support at 23400 and will
most likely break down much further. See the second chart below.
The highest priced DJI-13 have much more weight in the
DJI's moves than the lower priced stocks in that Index.
One clue about the weakness in these 13 DJI stocks
is how low many of their current Accum. Index (IP21) values are.
The most important exception is Boeing, the highest priced
of these stocks. Its IP21 is still positive. But today, it turned
down from its 65-dma and fell 9.78.


Additional weakness by semi-conductors would cause this
market-leading group to break its neckline support. That
would be quite bearish for much of the tech sector and suggest
a much deeper retreat by the market as a whole. Watch this
group closely.

|
Charts 4/24/2018 PEERLESS DJI, Signals, Indicators Daily DJI Volume 10-DayUp/Down Vol V-Indicator Hourly DJIA A/D Line for All Stocks NASDAQ S&P OEX NYSE COMPQX DJI-15 DJI-20 DJI-30 DIA SPY QQQ MDY IWM TNA USO-CrudeOil FAS GLD BBH IBB JETS JNUG KOL NUGT OIH OIL RSX RETL SDS SLV SOXL TECL TMF TNA UGA (gasoline) XIV YINN Commodities: JJC, NIB, CHOC CORN, CUT (paper) WEAT UUP (Dollar) AAPL ADBE ALXN AMAT AMGN AMD AMZN BA BABA BAC BIDU CAT CVX DE FB GOOG GS HD IBM JPM M (Macy's) MSFT NFLX NVDA QCOM TSLA TXN XOM WMT ANDV (refinery), CMG (Chipotle), LRCX, SWKS, MDGL SPPI WATT SQ TOWN 4/24/2018 (Click on Underlined link.) Bullish MAXCPs - http://tigersoft.com/4XXH/MAXCPS/424/BULLISH.htm Bearish MAXCPs - http://tigersoft.com/4XXH/MINCPS/424/BEARISH.htm |
Table 1
                  QUICKSILVER on ETFS - 04/24/18
  Note that DIA's 50-day pct. price change is lower than COMPQX, SPY, QQQ, MDY and IWM
  as well as TECL.
All of key ETFS (except IWM +.01 IP21) show falling Closing Power and negative IP21. SOXL shows the most bearish accross-the-board internals. OIL shows bullish across-the-board internals. ETF CLOSE CHANGE PIVOT-PT 5-dma AROC CL-PWR CANDLE IP21 ITRS --------------------------------------------------------------------------------------------- --------------------------------------------------------------------------------------------- DIA 240.09 -4.26 247.38 -156.6% Bearish RED -.022 ---- --------------------------------------------------------------------------------------------- COMPQX 7007.35 -121.25 7295.24 -189.6% Bearish RED -.04 .027 --------------------------------------------------------------------------------------------- SPY 262.98 -3.59 270.39 -134.2% Bearish RED -.053 .014 --------------------------------------------------------------------------------------------- QQQ 158.46 -3.43 166.44 -232.5% Bearish RED -.075 .023 --------------------------------------------------------------------------------------------- MDY 343.21 -2.59 349.75 -77.1% Bearish RED -.001 .045 --------------------------------------------------------------------------------------------- IWM 154.43 -.89 157.48 -84.1% Bearish RED .001 .06 --------------------------------------------------------------------------------------------- FAS 63.44 -1.22 63.82 -65.1% Bearish RED -.115 .015 --------------------------------------------------------------------------------------------- RETL 32.34 .19 34.14 -286.5% Bearish RED -.012 -.041 --------------------------------------------------------------------------------------------- SOXL 121.95 -3.04 155.11 -1350.9% Bearish RED -.161 -.078 --------------------------------------------------------------------------------------------- TECL 109.89 -6.05 126.71 -727.9% Bearish RED -.021 .035 --------------------------------------------------------------------------------------------- IBB 103.27 -1.52 107.35 -189.1% Bearish RED -.106 -.015 --------------------------------------------------------------------------------------------- GLD 126.23 .61 127.85 -59.8% Bullish BLUE -.029 .02 --------------------------------------------------------------------------------------------- OIL 7.61 .04 6.89 339.4% Bullish BLUE .263 .069 --------------------------------------------------------------------------------------------- OIH 26.82 -.21 27.08 83.7% Bullish RED .225 .133 --------------------------------------------------------------------------------------------- GASL 20.39 -.9 21.51 126.9% Bullish RED .131 .24 --------------------------------------------------------------------------------------------- UGA 33.4 -.64 33.13 121.8% Bullish RED .209 .112 --------------------------------------------------------------------------------------------- UUP 23.84 -.03 23.51 80.4% Bullish ---- .172 .017 --------------------------------------------------------------------------------------------- IEF 101.35 -.12 102.19 -60.8% Bearish ---- -.069 0 --------------------------------------------------------------------------------------------- XLU 50.67 .34 50.79 -30.6% Bullish BLUE .039 .051 --------------------------------------------------------------------------------------------- WEAT 6.38 .1 6.46 23.5% Bullish BLUE .125 .026 --------------------------------------------------------------------------------------------- YINN 32.89 1.1 32.97 -38.4% ---- RED .122 .013 --------------------------------------------------------------------------------------------- RSX 20.97 -.08 21.51 63.9% Bullish RED .099 -.024 --------------------------------------------------------------------------------------------- AAPL 162.94 -2.3 177.84 -444.9% Bearish RED -.191 .05 --------------------------------------------------------------------------------------------- GOOG 1019.98 -47.47 1072.08 -252% Bearish RED -.027 -.009 --------------------------------------------------------------------------------------------- MSFT 93.12 -2.23 96.44 -154% Bearish RED -.006 .064 --------------------------------------------------------------------------------------------- AMZN 1460.09 -57.77 1527.84 -143.2% Bearish RED .102 .098 --------------------------------------------------------------------------------------------- FB 159.69 -6.15 166.36 -268.5% Bearish RED .101 -.085 --------------------------------------------------------------------------------------------- NVDA 221.2 -2.68 236.37 -353.5% Bearish RED -.068 -.039 --------------------------------------------------------------------------------------------- BA 329.06 -9.78 341 -112.9% Bearish RED .096 -.003 --------------------------------------------------------------------------------------------- GS 242.49 -4.18 254 -221% Bearish RED -.181 -.019 --------------------------------------------------------------------------------------------- HD 176.26 -1.4 179.85 38.1% Bearish RED -.057 -.035 --------------------------------------------------------------------------------------------- CAT 144.44 -9.55 155.95 -287.2% Bearish RED -.161 -.024 |
Table 2 Count of Stocks in Key Directories
20180424
-------------------------------
NEWHIGHS 72
NEWLOWS 117
MAXCP 32
MINCP 557 Professionals are very bearish.
TTTNH 46
TTTNL 579 Day Traders are very bearish.
FASTUP 57
FASTDOWN 191 Swing traders are now mostly bearish.
CPCROSSA 62
CPCROSSD 214 Professionals increasingly bearish.
BIGVOLUP 2
BIGVODN 14 Lots of trap-door stocks being heavily dumped.
|
Table 3
         Count of Stocks and NEW HIGHS in Key Tiger Directories
Date = 180423
               No.           NHs           Pct.
-------------------------------------------------------------------
MAXCP          32            14            44 %
FOOD           9             1             11 %
REGBANKS       33            2             6 %
BEVERAGE       20            1             5 %
COMODITY       56            2             4 %
HACKERS        24            1             4 %
GREEN          30            1             3 %
INSURANC       32            1             3 %
OILGAS         137           4             3 %
CHEM           62            1             2 %
CHINA          62            1             2 %
FINANCE        91            2             2 %
GOLD           50            1             2 %
RETAIL         53            1             2 %
SOFTWARE       66            1             2 %
UTILITY        42            1             2 %
BIOTECH        382           2             1 %
INDMATER       86            1             1 %
INDEXES        195           2             1 %
REIT           176           1             1 %
RUS-1000       826           8             1 %
SP500          481           1             0 %
|
Table 4
     Count of Stocks and New LOWS in Key Tiger Directories
     Bond funds are the leaders on downside.
     REITs are well-represented there, too.
Date = 180424
               No.           NLs           Pct.
-------------------------------------------------------------------
BONDFUND       111           35            32 %
COAL           10            3             30 %
BEVERAGE       20            3             15 %
MINCP          557           70            13 %
FOOD           9             1             11 %
SEMI           128           11            9 %
AUTO           40            3             7 %
ELECTRON       176           13            7 %
INDMATER       86            5             6 %
INFRA          35            2             6 %
BIOTECH        382           21            5 %
CHINA          62            3             5 %
SOLAR          21            1             5 %
FIDSTKS        189           7             4 %
GAMING         28            1             4 %
OILGAS         137           5             4 %
SP-100         96            4             4 %
SP500          481           19            4 %
CHEM           62            2             3 %
DOWJONES       30            1             3 %
GREEN          30            1             3 %
REIT           176           5             3 %
RUS-1000       826           23            3 %
SOFTWARE       66            2             3 %
ETFS           66            1             2 %
UTILITY        42            1             2 %
INDEXES        195           1             1 %
NASD-100       89            1             1 %
|
Table 5 RANKING OF KEY DIRECTORIES BASED PCT.OF STOCKS ABOVE 65-DMA
4/24/18
Bearish = 35
Bullish = 11
---------------------------------------------------------------------------------------
Directory Current day-1 day-2 day-3 day-4 day-5
----------------------------------------------------------------------------------------
EDU 1 .857 1 1 .857 1
HACKERS .75 .791 .833 .875 .875 .875
HOSPITAL .714 .714 .714 .714 .857 .714
UTILITY .69 .69 .666 .714 .785 .761
OILGAS .656 .686 .671 .671 .7 .613
SOFTWARE .651 .681 .666 .727 .742 .727
REGBANKS .606 .545 .424 .333 .242 .242
GOLD .6 .46 .7 .66 .66 .6
COMODITY .535 .482 .66 .732 .75 .642
SOLAR .523 .523 .523 .571 .619 .619
N=10
============================================================================================
MILITARY .5 .552 .605 .631 .631 .605
============================================================================================
COMPUTER .478 .478 .434 .565 .608 .608
FINANCE .461 .461 .406 .406 .285 .329
GUNS .444 .555 .5 .555 .555 .5
INSURANC .437 .5 .531 .5 .5 .5
CHEM .435 .532 .5 .548 .629 .564
GREEN .433 .466 .533 .6 .7 .666
REIT .42 .352 .34 .414 .517 .551
RETAIL .415 .433 .415 .471 .49 .509
RUS-1000 .414 .451 .435 .469 .514 .493
DOWJONES .4 .4 .366 .433 .4 .433
INDMATER .395 .453 .476 .534 .593 .488
FIDSTKS .391 .455 .439 .476 .502 .481
SP500 .382 .428 .407 .449 .49 .474
BIOTECH .366 .4 .392 .434 .468 .476
BEVERAGE .35 .35 .4 .45 .5 .55
NASD-100 .337 .393 .359 .415 .494 .505
SP-100 .333 .416 .385 .427 .437 .395
GAMING .321 .464 .392 .464 .535 .357
INDEXES .317 .364 .394 .502 .579 .533
NIFTY .31 .413 .413 .448 .551 .62
JETS .3 .5 .5 .5 .5 .3
TRANSP .3 .65 .6 .65 .7 .6
CHINA .29 .306 .306 .274 .306 .274
ELECTRON .284 .289 .323 .363 .465 .482
BIG17 .282 .347 .369 .369 .369 .369
INFRA .228 .228 .257 .342 .4 .342
ETFS .227 .287 .287 .363 .454 .378
SEMI .226 .21 .242 .273 .406 .453
AUTO .225 .175 .15 .175 .3 .275
FOOD .222 .222 .333 .888 .888 .666
COAL .2 .3 .3 .3 .3 .3
HOMEBLDG .176 .176 .176 .235 .352 .294
DJI-13 .153 .153 .153 .384 .384 .307
BIGBANKS .142 .142 .142 0 0 0
BONDFUND .081 .036 .036 .054 .081 .09
PIPELINE 0 .285 .142 0 .142 .142
|
==============================================================================
==============================================================================
==============================================================================
4/23/2018 I have stressed the dangers in the now active Peerless S9. It
appears we will see
a 100-point jump at the opening, spurred on hopes that there will be no trade war
with China and no shooting war with North Korea. Perhaps, these hopes will take the
DJI above the 25000 resistance and its 65-dma. But, we can't count on that yet.
There have been too many failed and snuffed out rallies these last two months.
Professionals, as shown by Closing Power, want out of this market. Either the
higher openings are a result of over-seas buying (which usually ends up being
wrong) or they are the result of manipulation (which is intended to mislead and
only temporarily holdup the market up now). This late in a bull market, there is
no other good interpretation.
My advise is not to try to play only the long side, except OILs now. There is
much more money to be made now in carefully chosen shorts.


Safe Stocks Are Not So Safe Anymore.
While More and more risky stocks are getting
really dangerous!
I mentioned Philip Morris yesterday. Look at what happened to Proctor & Gamble
today.


Why if the market is safe and in strong hands are we
see so many air-pockets
in stocks that are normally considered safe investments? See the Bearish MINCPs
today. http://tigersoft.com/4XXH/MINCPS/423/BEARISH.htm
Do a ranking of stocks in the DJI or the SP-500 for IP21 (current
Accumulation). It can not be good that we see so many low IP21s here:
PG -.19, IBM -.17, GS - .20, AAPL -.23, MCD -.23, HOG -.40, KT -.31.
Many semiconductors now show intense insider selling (IP21<-.25):
MCHP -.36, AMAT - .32, QCOM -.31 and WDC -.27. As semi-conductors
often lead the market, we have to be troubled by this.
I suggest staying short some of these low IP21 stocks and some of the Bearish
MINCP. Hold long mostly OIL ETFs and oil stocks with high IP21s.
Note the high IP21 levels for RIG +.36, VLO +.35, PSX +.31, DO +.27 and COP +.24.
Short-term interest rates rose again today. They have not reached levels yet that
will turn down the market. They are still a percent and a half below that level.
But the speed of their rise now is casting a bearish shadow over a lot more than
just Bond
Funds and Reits. There are more than 30 sectors now that show a majority of their
stocks below the 65-dma.
As I've said, the DJI's advance now is very heavily dependent upon higher openings.
This is very reminiscent of 1999-2000 before a major top. But perhaps, we
should be looking back at 2008, when Oil stocks were rising and Bank Stocks
were crumbling. The big banks have not broken support here yet, but Goldman
Sachs chart does not look good. The heavy red Distribution and falling Closing
Power are clearly bearish. One has to wonder if the cognoscenti there are
worried, too, about the general market's health.

|
Charts 4/23/2018 PEERLESS DJI, Signals, Indicators Daily DJI Volume 10-DayUp/Down Vol V-Indicator Hourly DJIA A/D Line for All Stocks NASDAQ S&P OEX NYSE COMPQX DJI-15 DJI-20 DJI-30 DIA SPY QQQ MDY IWM TNA USO-CrudeOil FAS GLD BBH IBB JETS JNUG KOL NUGT OIH OIL RSX RETL SDS SLV SOXL TECL TMF TNA UGA (gasoline) XIV YINN Commodities: JJC, NIB, CHOC CORN, CUT (paper) WEAT UUP (Dollar) AAPL ADBE ALXN AMAT AMGN AMD AMZN BA BABA BAC BIDU CAT CVX DE FB GOOG GS HD IBM JPM M (Macy's) MSFT NFLX NVDA QCOM TSLA TXN XOM WMT ANDV (refinery), CMG (Chipotle), LRCX, SWKS, MDGL SPPI WATT SQ TOWN 4/23/2018 (Click on Underlined link.) Bullish MAXCPs - http://tigersoft.com/4XXH/MAXCPS/423/BULLISH.htm Bearish MAXCPs - http://tigersoft.com/4XXH/MINCPS/423/BEARISH.htm |
Table 1
                  QUICKSILVER on ETFS - 04/23/18
  Note that DIA's 50-day pct. price change is lower than COMPQX, SPY, QQQ, MDY and IWM
  as well as TECL.
All of key ETFS show falling Closing Power and negative IP21. SOXL shows the most bearish accross-the-board internals. OIL shows bullish across-the-board internals. ETF CLOSE CHANGE PIVOT-PT 5-dma AROC CL-PWR CANDLE IP21 ITRS --------------------------------------------------------------------------------------------- DIA 244.35 -.13 247.8 -25.8% Bearish RED -.051 ----- --------------------------------------------------------------------------------------------- COMPQX 7128.6 -17.53 7281.1 -19.2% Bearish RED -.066 .028 --------------------------------------------------------------------------------------------- SPY 266.57 -.04 270.19 -14.1% Bearish RED -.102 .011 --------------------------------------------------------------------------------------------- QQQ 161.89 -.41 166.1 -21.6% Bearish RED -.106 .031 --------------------------------------------------------------------------------------------- MDY 345.8 -.03 348.57 -1.4% Bearish RED -.036 .032 --------------------------------------------------------------------------------------------- IWM 155.32 -.23 157.06 -1.6% Bearish RED -.057 .044 --------------------------------------------------------------------------------------------- FAS 64.66 -.18 64.28 86.3% Bearish RED -.171 .045 --------------------------------------------------------------------------------------------- RETL 32.15 .65 34.23 -198.5% Bearish BLUE -.043 -.059 --------------------------------------------------------------------------------------------- SOXL 124.99 -5.24 160.07 -906.4% Bearish RED -.18 -.002 --------------------------------------------------------------------------------------------- TECL 115.94 -.98 127.64 -201.4% Bearish RED -.057 .118 --------------------------------------------------------------------------------------------- IBB 104.79 -.17 107.28 -21.2% Bearish RED -.145 -.024 --------------------------------------------------------------------------------------------- GLD 125.62 -1.01 127.75 -78.8% Bearish ---- -.077 -.019 --------------------------------------------------------------------------------------------- OIL 7.61 .04 6.89 339.4% Bullish BLUE .263 .038 --------------------------------------------------------------------------------------------- OIH 27.03 .19 26.37 140.3% Bullish BLUE .191 .093 --------------------------------------------------------------------------------------------- GASL 21.29 .66 19.86 408.8% Bullish BLUE .097 .24 --------------------------------------------------------------------------------------------- UGA 34.04 .68 32.59 212.3% Bullish BLUE .27 .075 --------------------------------------------------------------------------------------------- UUP 23.87 .15 23.46 87.1% Bullish BLUE .165 -.012 --------------------------------------------------------------------------------------------- IEF 101.47 -.1 102.59 -51.9% ---- ---- -.037 -.033 --------------------------------------------------------------------------------------------- XLU 50.33 .03 50.98 -13.8% Bearish ---- -.016 .034 --------------------------------------------------------------------------------------------- WEAT 6.28 -.04 6.35 -54.8% Bullish ---- .135 -.038 --------------------------------------------------------------------------------------------- YINN 31.79 -.05 33.14 -196.3% Bullish BLUE .098 -.053 --------------------------------------------------------------------------------------------- RSX 21.05 .05 20.7 73.6% Bullish RED .091 -.046 --------------------------------------------------------------------------------------------- AAPL 165.24 -.48 178.24 -303.9% Bearish RED -.232 .041 --------------------------------------------------------------------------------------------- GOOG 1067.45 -5.51 1074.16 137.8% ---- RED -.012 .042 --------------------------------------------------------------------------------------------- MSFT 95.35 .35 96.07 61.7% Bearish RED -.033 .098 --------------------------------------------------------------------------------------------- AMZN 1517.86 -9.63 1503.83 252.6% Bearish RED .084 .1 --------------------------------------------------------------------------------------------- FB 165.84 -.44 168.66 30.3% ---- RED .07 -.057 --------------------------------------------------------------------------------------------- NVDA 223.88 -4.83 237.54 -163.6% Bearish RED -.101 .005 --------------------------------------------------------------------------------------------- BA 338.84 .17 336.72 104.7% Bearish RED .091 .004 --------------------------------------------------------------------------------------------- GS 246.67 -5.29 253.63 -220.4% Bearish RED -.199 -.022 --------------------------------------------------------------------------------------------- HD 177.66 .65 174.91 91.4% Bearish ---- -.088 -.043 --------------------------------------------------------------------------------------------- CAT 153.99 .74 153.31 60% Bearish RED -.022 .031 |
Table 2   Count of Stocks in Key Directories
          20180423
-------------------------------
NEWHIGHS       112
NEWLOWS        121
MAXCP          41
MINCP          291    Professionals remain bearish.
TTTNH          51
TTTNL          271    Day Traders reamin mostly bearish.
FASTUP         69
FASTDOWN       106    Swing traders are more cautious now.
CPCROSSA       30
CPCROSSD       156    Professionals became more bearish.
BIGVOLUP       3
BIGVODN        8
|
Table 3 Oil is the one group showing leadership now. Count of Stocks and NEW HIGHS in Key Tiger Directories
Date = 180423
               No.           NHs           Pct.
-------------------------------------------------------------------
MAXCP          41            28            68 %
COMODITY       56            8             14 %
COAL           10            1             10 %
OILGAS         136           11            8 %
REGBANKS       33            2             6 %
BEVERAGE       20            1             5 %
MILITARY       38            2             5 %
SOFTWARE       66            3             5 %
FINANCE        91            4             4 %
HACKERS        24            1             4 %
INDEXES        195           7             4 %
CHEM           62            2             3 %
GREEN          30            1             3 %
INDMATER       86            3             3 %
CHINA          62            1             2 %
FIDSTKS        189           4             2 %
RETAIL         53            1             2 %
RUS-1000       826           20            2 %
SEMI           128           2             2 %
SP-100         96            2             2 %
SP500          481           8             2 %
BIOTECH        383           5             1 %
|
Table 4
     Count of Stocks and New LOWS in Key Tiger Directories
     Bond funds are the leaders on downside.
     REITs are well-represented there, too.
Date = 180423
               No.           NLs           Pct.
-------------------------------------------------------------------
BONDFUND       111           50            45 %
COAL           10            3             30 %
MINCP          291           56            19 %
HOSPITAL       7             1             14 %
FOOD           9             1             11 %
BEVERAGE       20            2             10 %
REIT           177           16            9 %
SEMI           128           8             6 %
SP-100         96            6             6 %
AUTO           40            2             5 %
BIOTECH        383           19            5 %
COMODITY       56            3             5 %
ELECTRON       176           9             5 %
INDMATER       86            4             5 %
DOWJONES       30            1             3 %
ETFS           66            2             3 %
GREEN          30            1             3 %
INFRA          35            1             3 %
INSURANC       32            1             3 %
SOFTWARE       66            2             3 %
CHEM           62            1             2 %
CHINA          62            1             2 %
FIDSTKS        189           4             2 %
GOLD           50            1             2 %
OILGAS         136           3             2 %
RETAIL         53            1             2 %
RUS-1000       826           20            2 %
SP500          481           12            2 %
FINANCE        91            1             1 %
PIPELINE       7                           0 %
REGBANKS       33                          0 %
SOLAR          21                          0 %
TRANSP         20                          0 %
UTILITY        42                          0 %
MAXCP          41                          0 %
|
 Table 5
 RANKING OF KEY DIRECTORIES BASED PCT.OF STOCKS ABOVE 65-DMA
              4/23/18
 Bearish = 34
 Bullish = 12
---------------------------------------------------------------------------------------
Directory     Current       day-1         day-2         day-3         day-4         day-5
----------------------------------------------------------------------------------------
EDU            .857          1             1             .857          1             1
HACKERS        .791          .833          .875          .875          .875          .791
HOSPITAL       .714          .714          .714          .857          .714          .714
OILGAS         .691          .676          .676          .705          .61           .566
UTILITY        .69           .666          .714          .785          .761          .714
SOFTWARE       .681          .666          .727          .742          .727          .666
TRANSP         .65           .6            .65           .7            .6            .5
GUNS           .555          .5            .555          .555          .444          .444
MILITARY       .552          .605          .631          .631          .605          .605
REGBANKS       .545          .424          .333          .242          .242          .242
CHEM           .532          .5            .548          .629          .564          .419
SOLAR          .523          .523          .571          .619          .571          .523
N=12
------------------------------------------------------------------------------------------
INSURANC       .5            .531          .5            .5            .5            .468
JETS           .5            .5            .5            .5            .3            .2
------------------------------------------------------------------------------------------
COMODITY       .482          .66           .732          .75           .642          .571
COMPUTER       .478          .434          .565          .608          .608          .565
GREEN          .466          .533          .6            .7            .633          .533
GAMING         .464          .392          .464          .535          .392          .25
FINANCE        .461          .406          .406          .285          .329          .318
GOLD           .46           .7            .66           .66           .6            .56
FIDSTKS        .455          .439          .476          .502          .481          .391
INDMATER       .453          .476          .534          .593          .488          .383
RUS-1000       .451          .435          .469          .514          .489          .429
RETAIL         .433          .415          .471          .49           .49           .452
SP500          .428          .407          .449          .49           .465          .411
SP-100         .416          .385          .427          .437          .375          .364
NIFTY          .413          .413          .448          .551          .62           .482
DOWJONES       .4            .366          .433          .4            .4            .433
BIOTECH        .399          .391          .433          .467          .475          .402
NASD-100       .393          .359          .415          .494          .494          .426
INDEXES        .364          .394          .502          .579          .523          .42
REIT           .355          .344          .418          .519          .548          .435
BEVERAGE       .35           .4            .45           .5            .55           .55
BIG17          .347          .369          .369          .369          .391          .282
CHINA          .306          .306          .274          .306          .258          .258
COAL           .3            .3            .3            .3            .3            .3
ELECTRON       .289          .323          .363          .465          .477          .409
ETFS           .287          .287          .363          .454          .348          .333
PIPELINE       .285          .142          0             .142          0             0
INFRA          .228          .257          .342          .4            .342          .114
FOOD           .222          .333          .888          .888          .666          .333
SEMI           .21           .242          .273          .406          .453          .382
HOMEBLDG       .176          .176          .235          .352          .294          .294
AUTO           .175          .15           .175          .3            .25           .25
DJI-13         .153          .153          .384          .384          .307          .307
BIGBANKS       .142          .142          0             0             0             0
BONDFUND       .036          .036          .054          .081          .081          .081
|
==============================================================================
4/20/2018 The now active Peerless S9 should bring the
DJI down to its lower 3.5% band.
23400 may again act as support. But I would not count on it stopping there. The
Trump
economic stimulus is now pretty well discounted. A second big year for the DJI would
be asking a lot unless there is even a bigger Public Works stimulus passed by Congress.
I don't see that happening. The deficit is very big and many of the Democrats, now
that
the shoe is on the other foot, are now the budget-hawks, as well as being cold-warriors.
So, more than a token Public Works program seems improbable. But that is not the
problem now.
The DJI's technical weakness is of most concern. I am struck by the inherent
bearishness
of the DJI's falling flat-bottomed triangle. It's true that such a pattern did not
bring a collapse in
2011, but that was when Bernanke was still injecting massive funds into longer-term
mortgage
bonds to spur economic growth.
https://www.thebalance.com/federal-reserve-s-operation-twist-3305529
It's unlikely the current Fed will do anything like this. Their rates are tracking
higher.
The risk:reward ratio
favors shorting more now. The average S9
brings nearly
a 10% decline in the DJI. When we look at the handful of S9-S12 failures and losses
in bull markets since 1928, we see the biggest paper loss is about 4.9%. Certainly,
the S9 might fail here, too. But we will most likely get a Peerless Buy B4 before
much
damage is down. Below are the few cases where S9-S12s in a bull market would have
lost money for a short seller. For every one of these, there are five or six
successes
and some of them brought us huge short sale profits and very quickly. We remember
October 1987 well. But many of the younger traders and talking heads on TV were
not even in high school back in October 1987. That type of decline could certainly
happen again.
So, we are short DIA. You
can use leverage if you like. DIA is the
weakest of the
major ETFs. The negative IP21s, the falling Closing Powers and the failure to
get past
their falling 65-day moving averages makes DIA and SPY particularly vulnerable now,
especially with a dangerously flat and obvious support that beckons for a breakdown..
Stocks in this position, or slightly weaker and unable last week even to reach their
65-dma, are in considerable risk. See some examples of what has already
happened to some stocks like Black and Decker, Phllip Morris and Man Power,
shown further below, that recently stalled at their 65-dma and turned down.
But it is not just these stocks. The market looks technically quite dangerous. The
damage that could be done by leveraged negative ETFs may surprise pollyannas
just like it did in October 1987. I think
we would do well to get out of most
long positons, excepting oil-related MAXCPs.
The thinner issues could be particularly
risky.
Sell S9-S12 Losses: 1928-2018Losses Selling Short on S9s/S12s in a Bull Market The losses ranged from 0.1% to 4.9% A loss of more than 4.9% would put our Sell S9 out of the range of all past cases and warrant a covering of our shorts. Gain 19290614 S9 313.7 -.047 19290617 S12 319.3 -.029 19290626 B4 328.6 .075 ---------------------------------------------------- 19340925 S12 92.7 -.029 19340927 S9 93.4 -.025 19341005 S12 92.9 -.026 19341008 S9 92.5 -.03 19341016 B4 95.3 .091 ----------------------------------------- 19420511 S9 99.2 -.018 19420521 S9 99.7 -.013 19420528 B4 101.0 .410 ----------------------------------------- 19591209 S12 671.2 -.007 19591221 B13 675.9 .005 ----------------------------------------- 19670419 S12 873.94 -.001 19670427 S3 894.82 .023 19670519 B9 874.55 .063 ----------------------------------------- 19870608 S12 2351.64 -.04 19870609 S9 2352.7 -.039 19870610 S8 2353.61 -.039 19870618 S8 2408.13 -.016 19870622 B4 2445.51 .105 ----------------------------------------- 19960809 S9 5681.31 -.016 19960912 B10 5771.94 .188 ----------------------------------------- 19970422 S9 6833.59 -.049 19970509 B4 7169.53 .105 ----------------------------------------- 20161109 S9 18589.69 -.029 20161110 S12 18807.88 -.017 20161129 B4 19121.60 .078 |

The DJI looks technically quite
vulnerable. The P-Indicator is positive
but otherwise, the DJI's chart has some ugly similarities to the way
it looked in October 1987. A breaking of the key support would
set up a very dangerous situation.


|
Third
S9s are dangerous for: (1) stocks showing their own IP21 NNCs on new highs. (2) stocks that have them selves just stalled at their own falling 65-dma. and (3) even stocks that look pretty good technically and are just ripe for some big profit-taking.
|


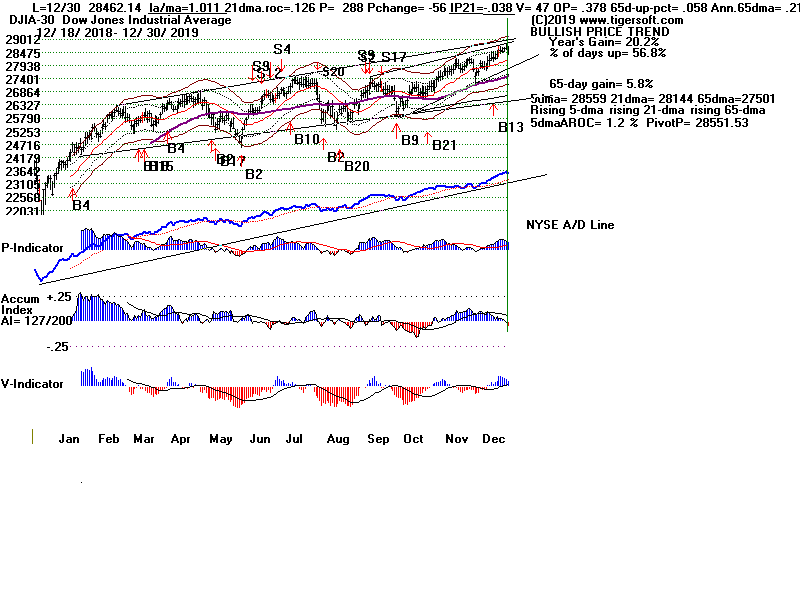
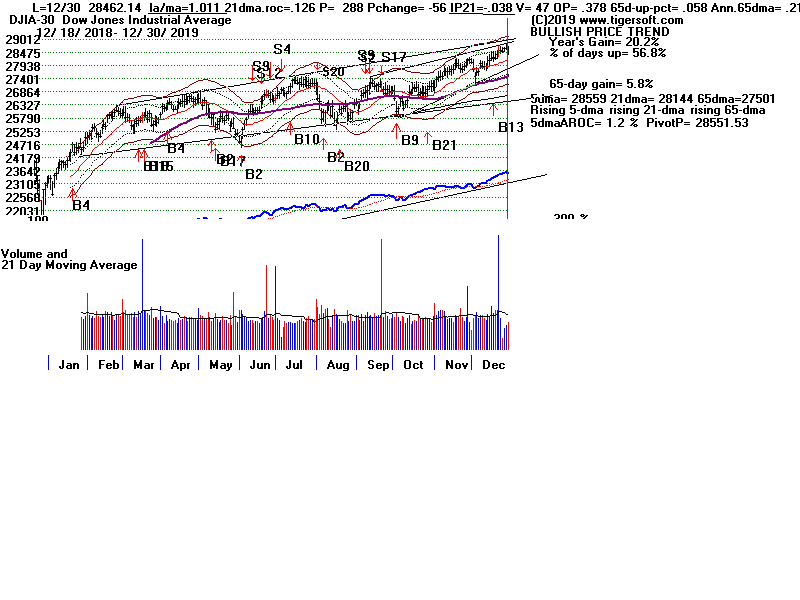
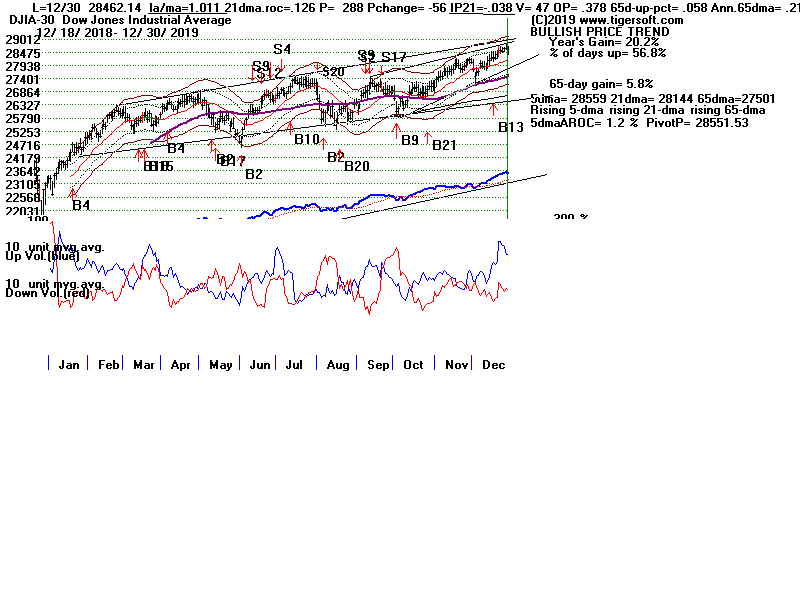
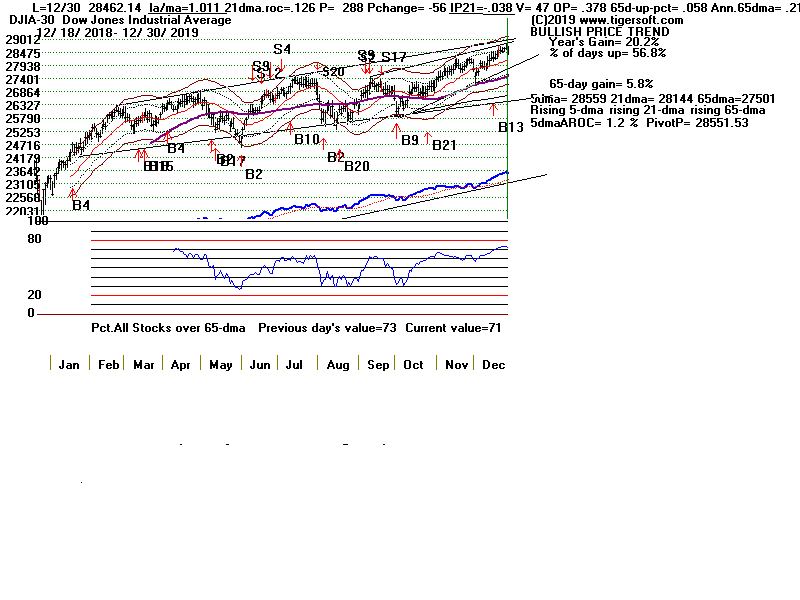
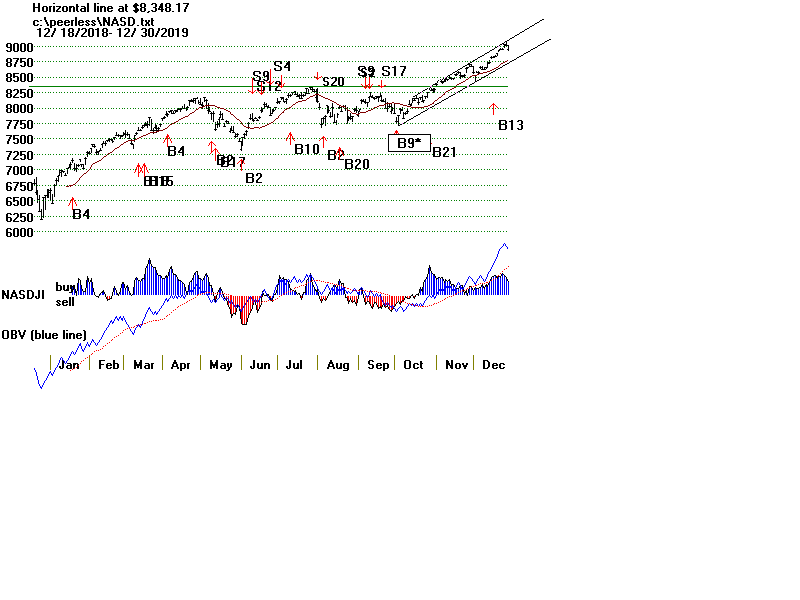
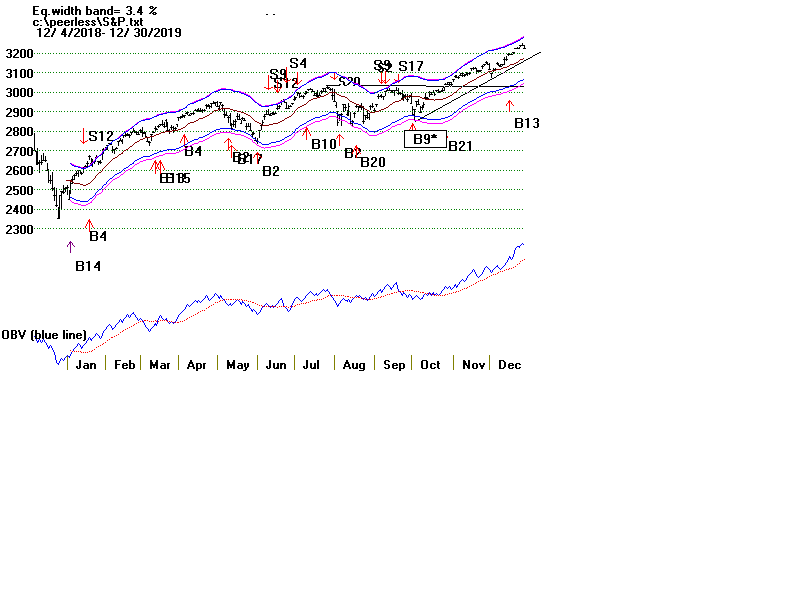
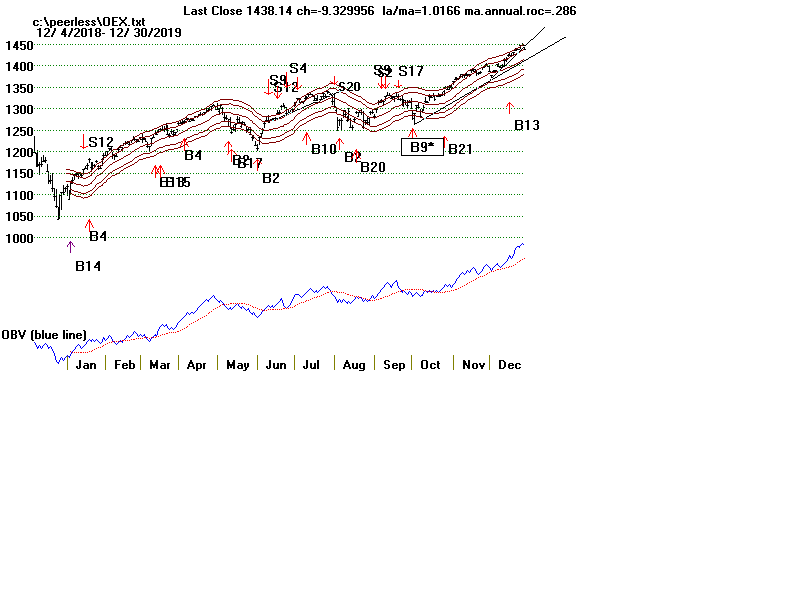
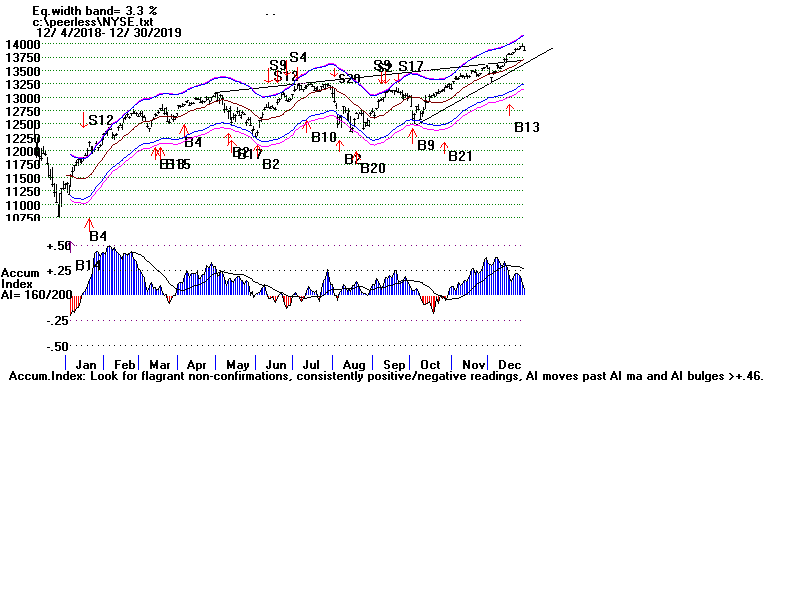
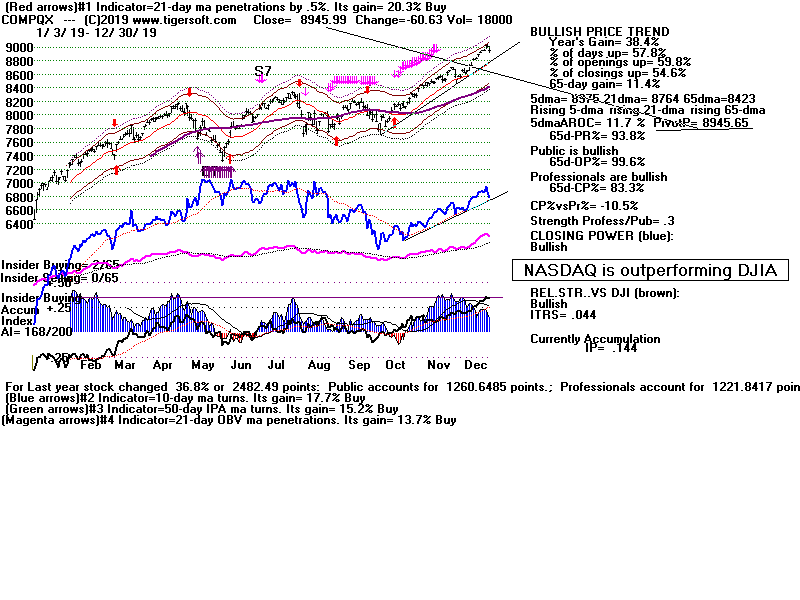
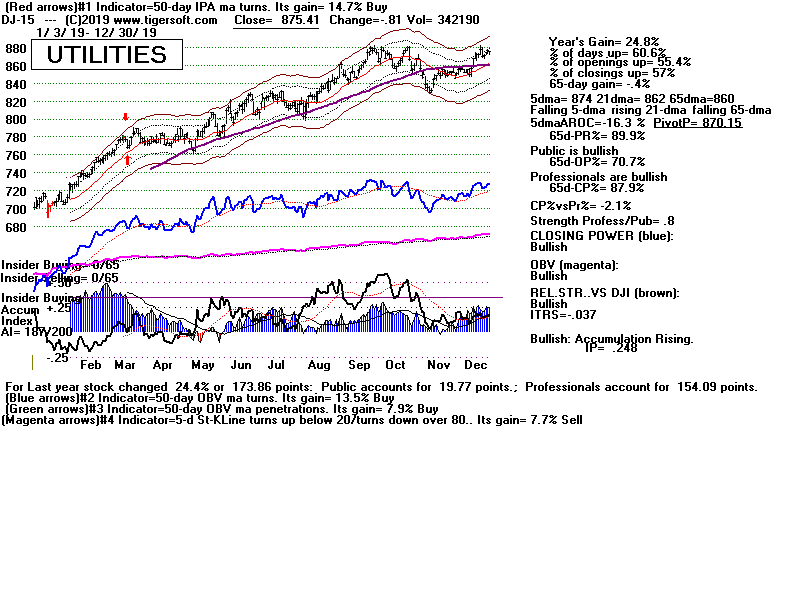
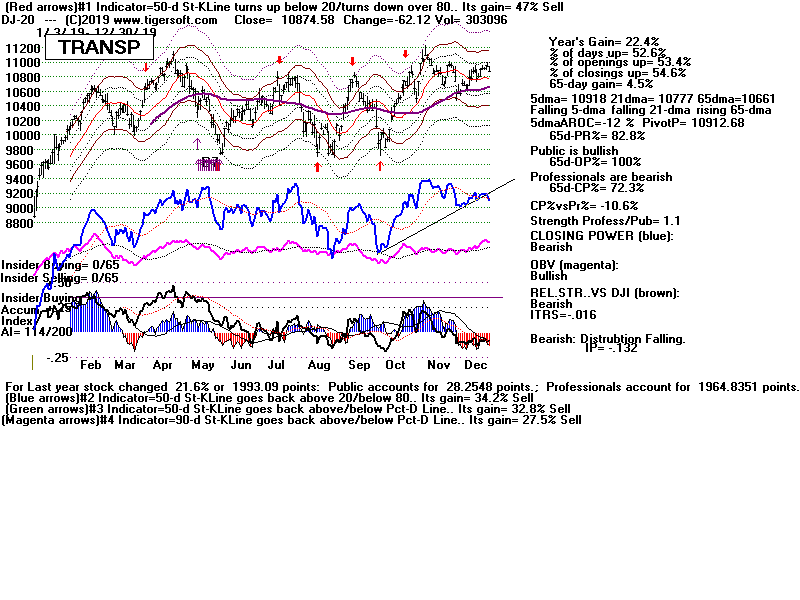
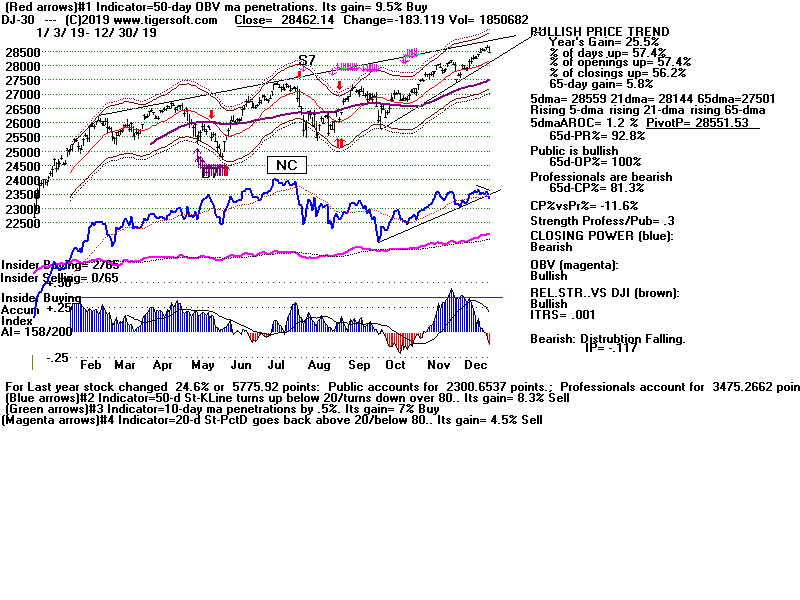
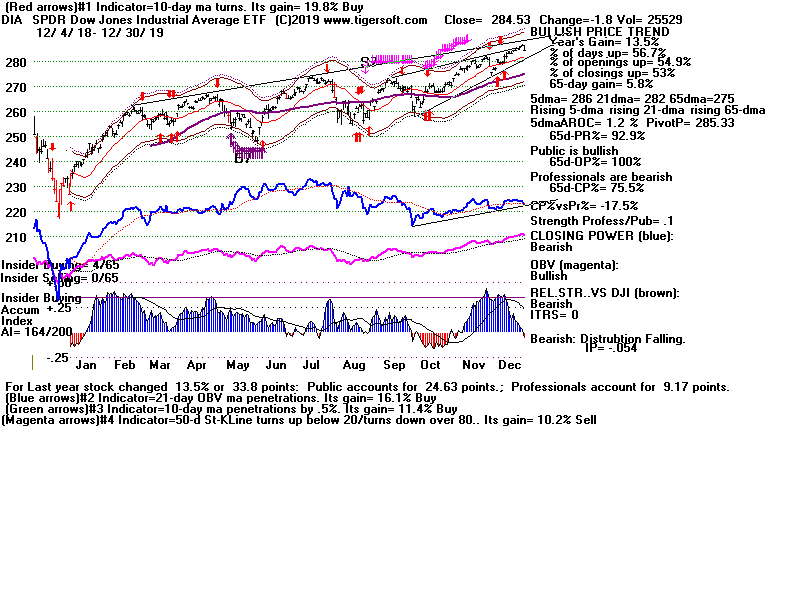
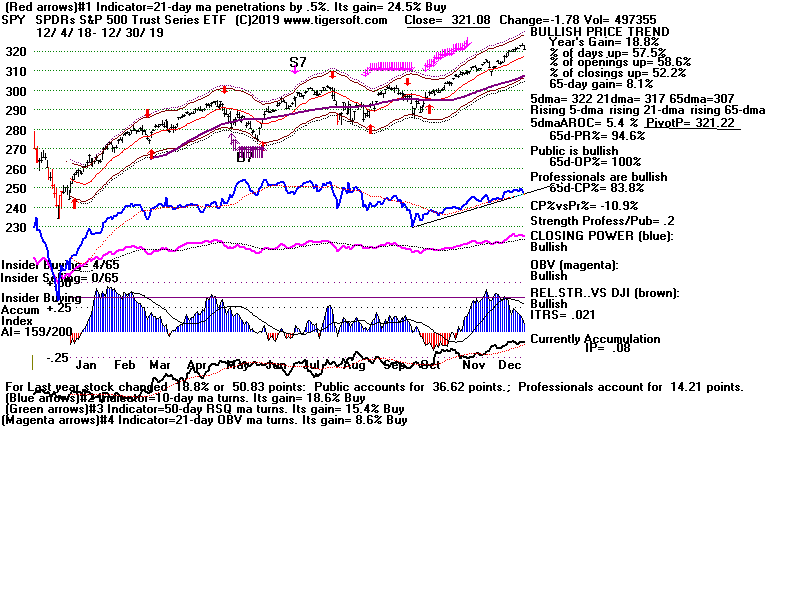
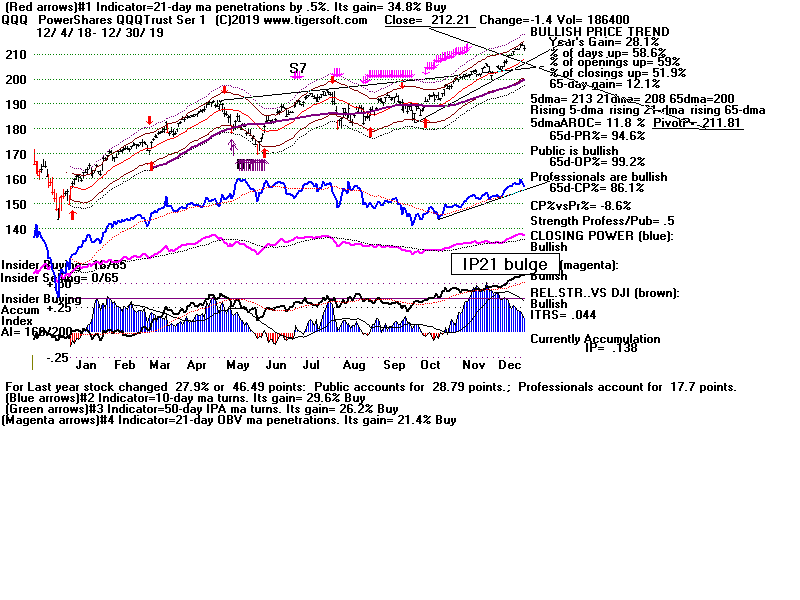
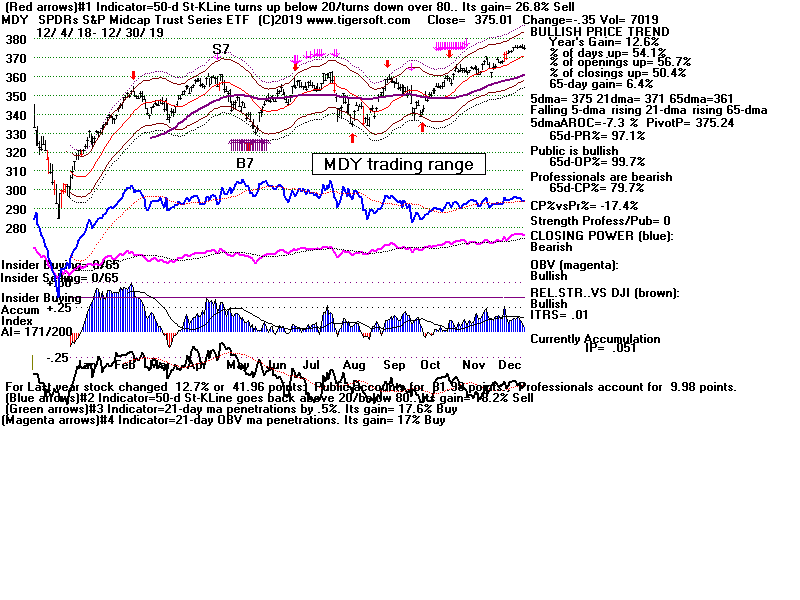
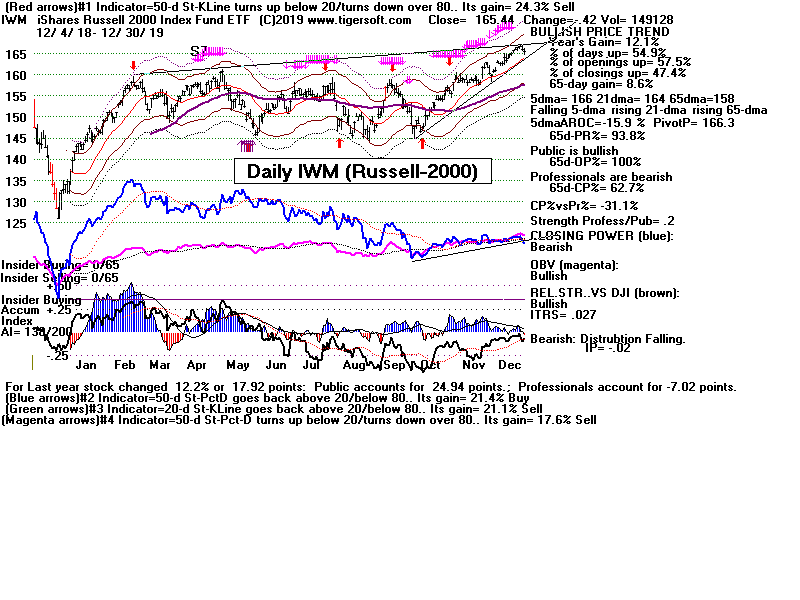
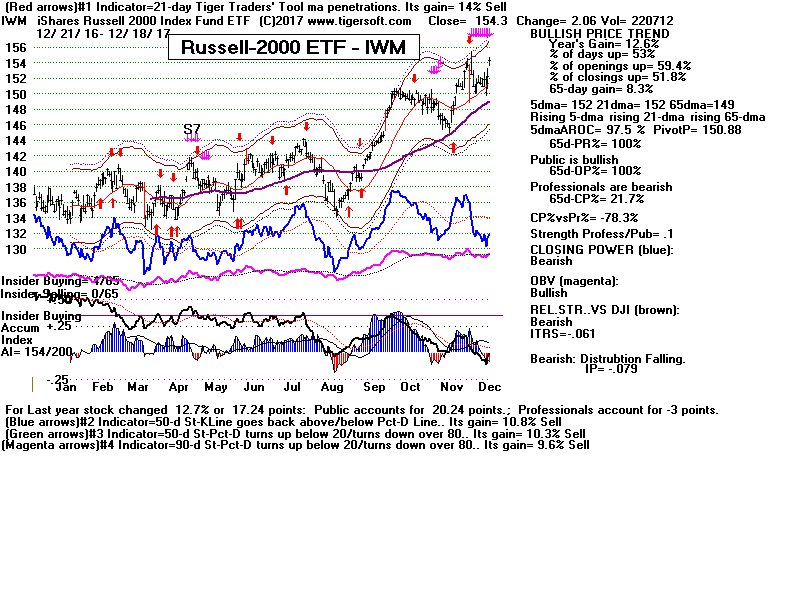
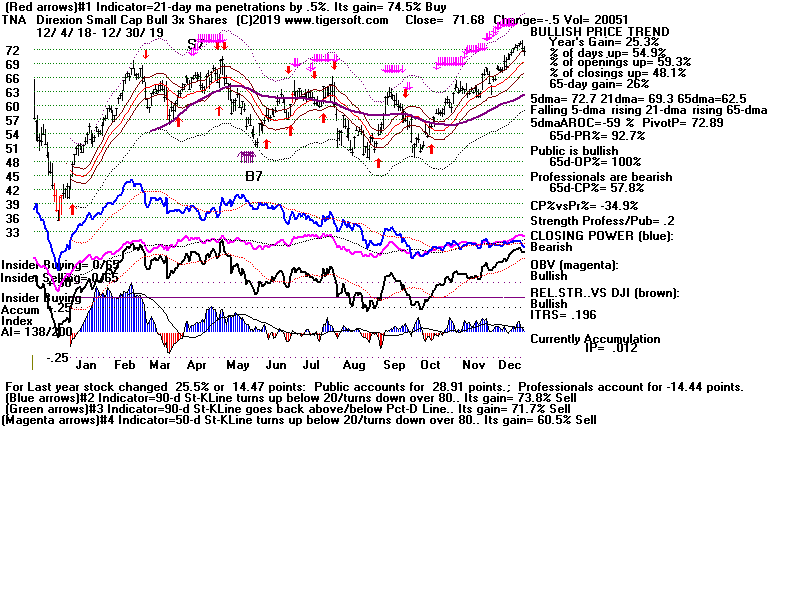
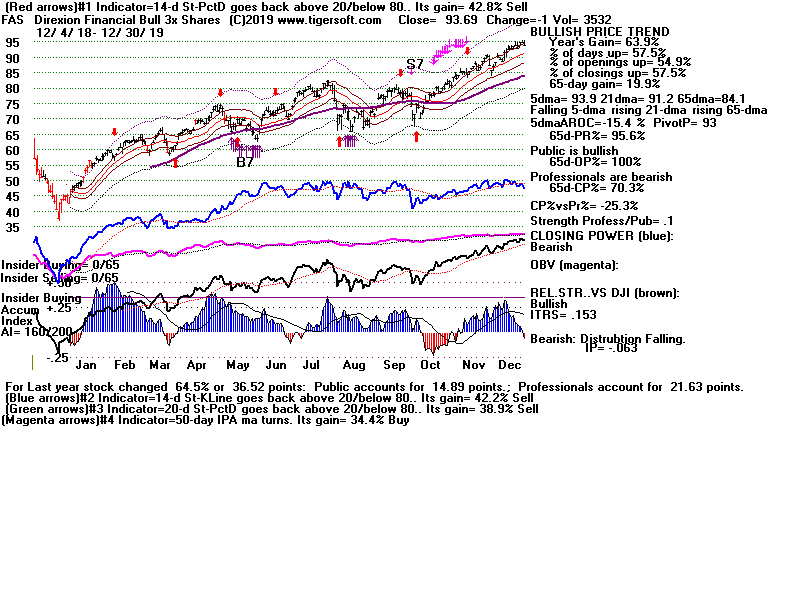
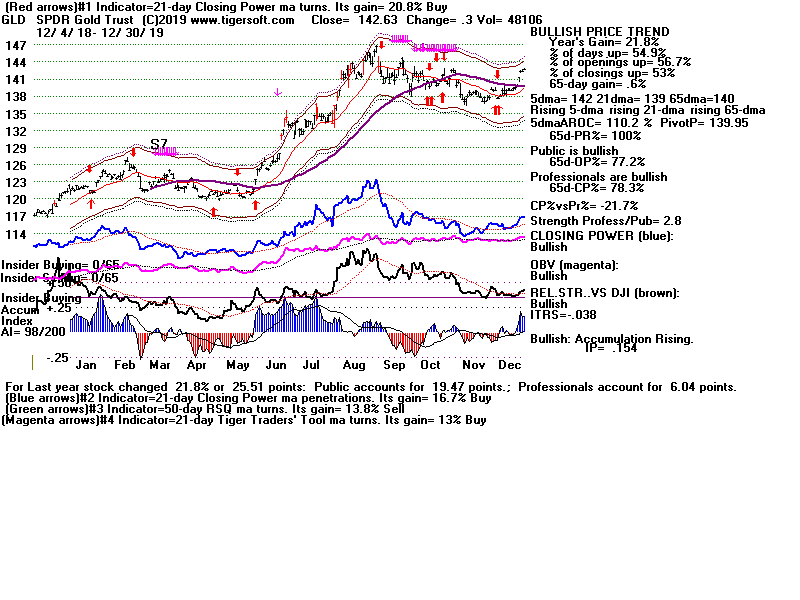
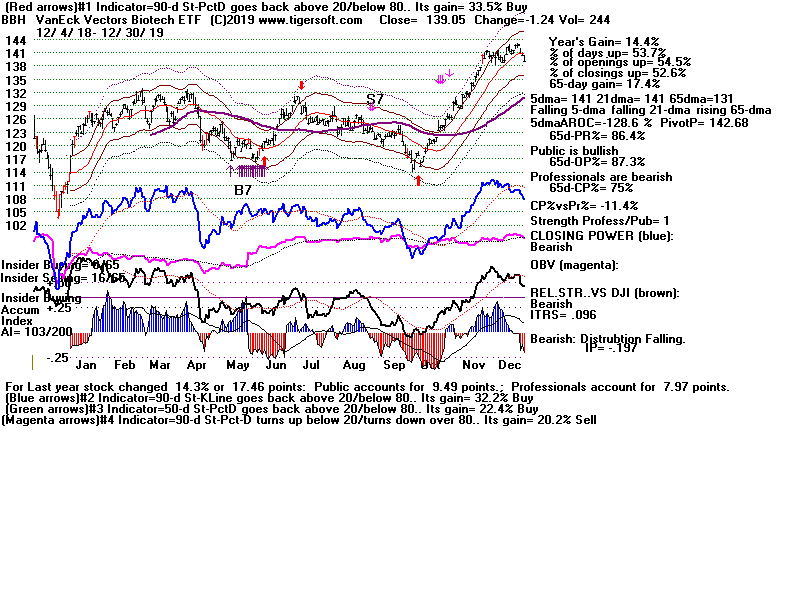
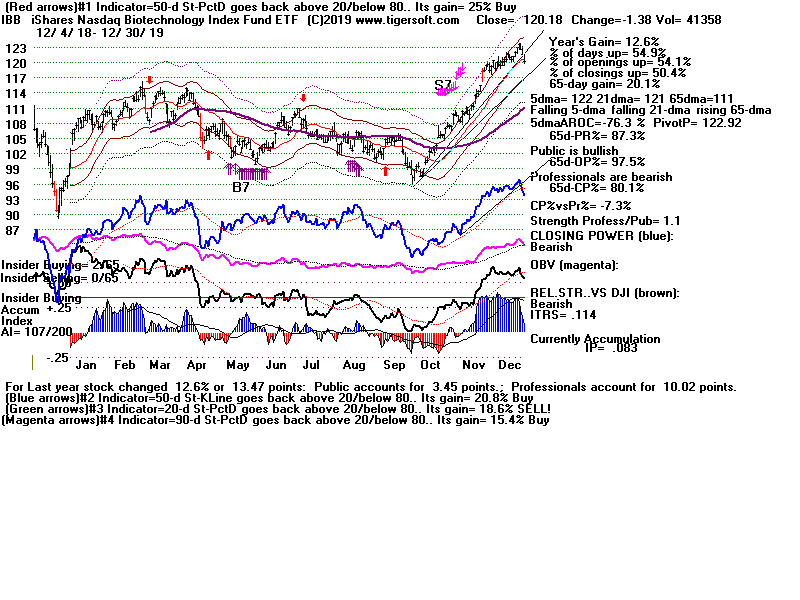
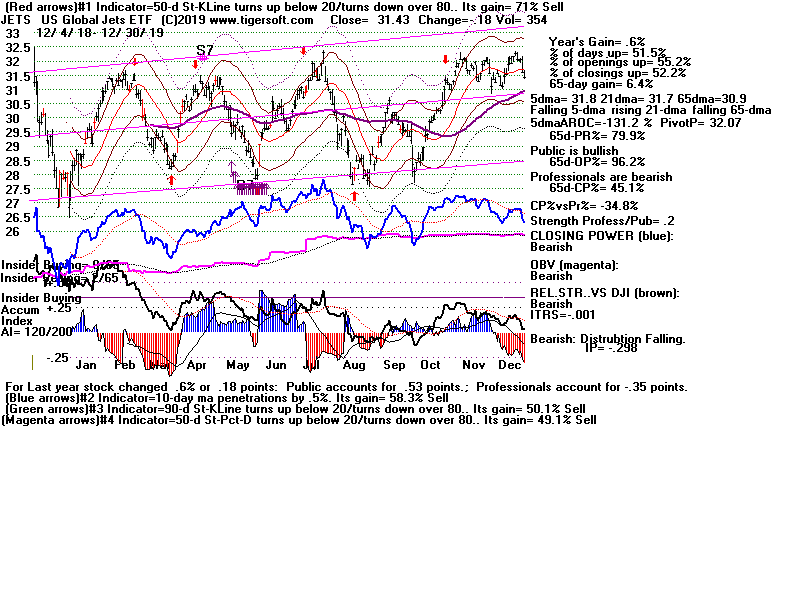
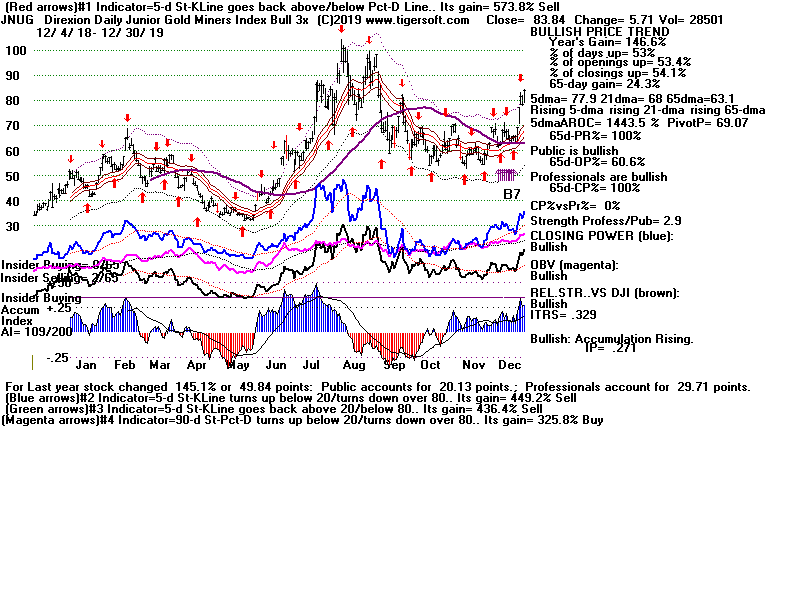
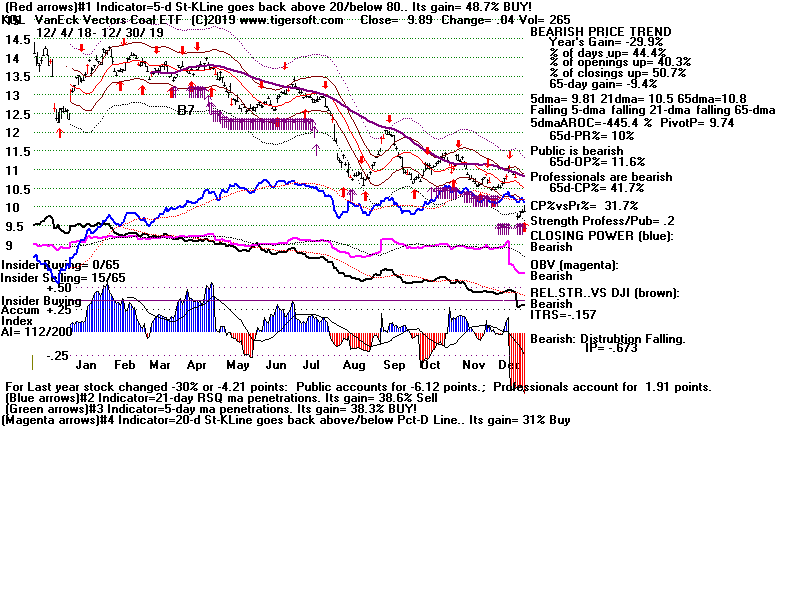
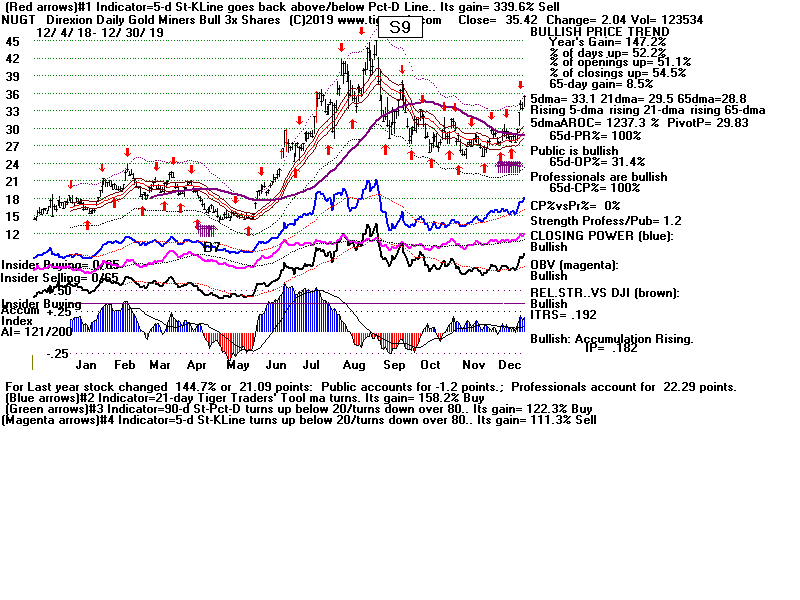
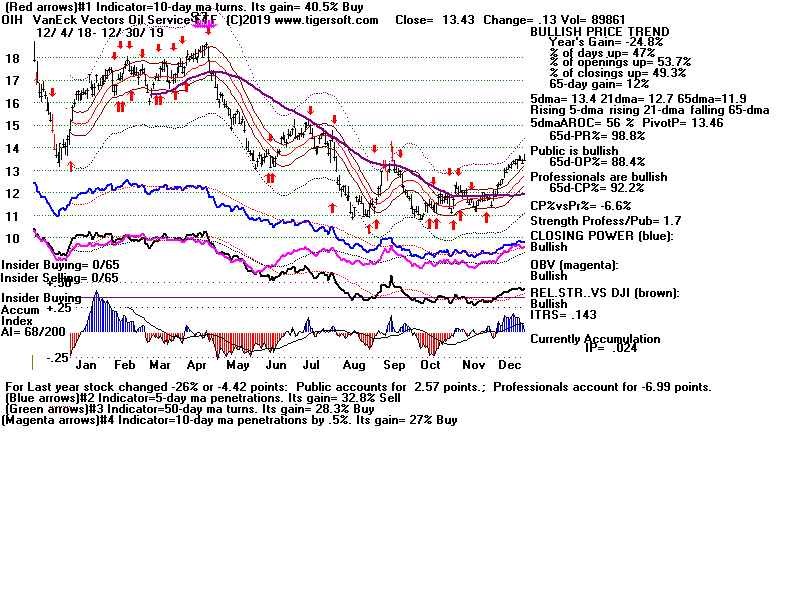
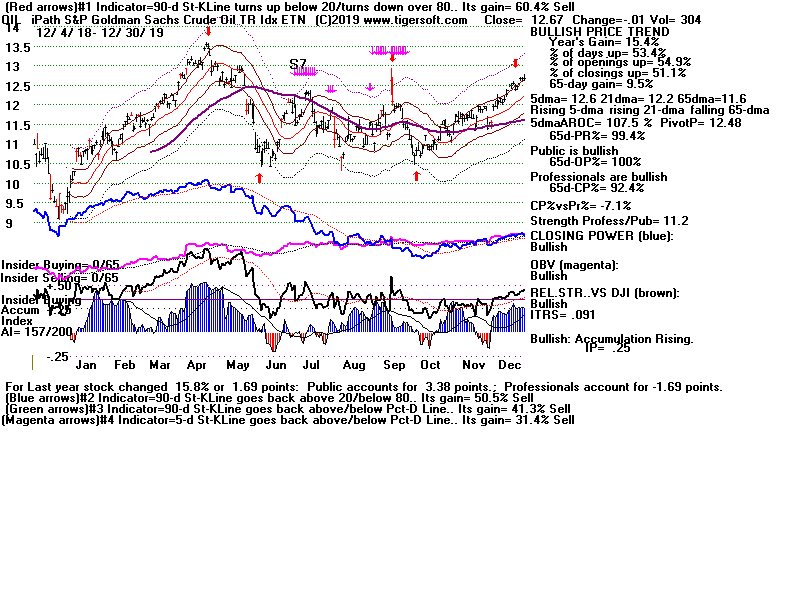
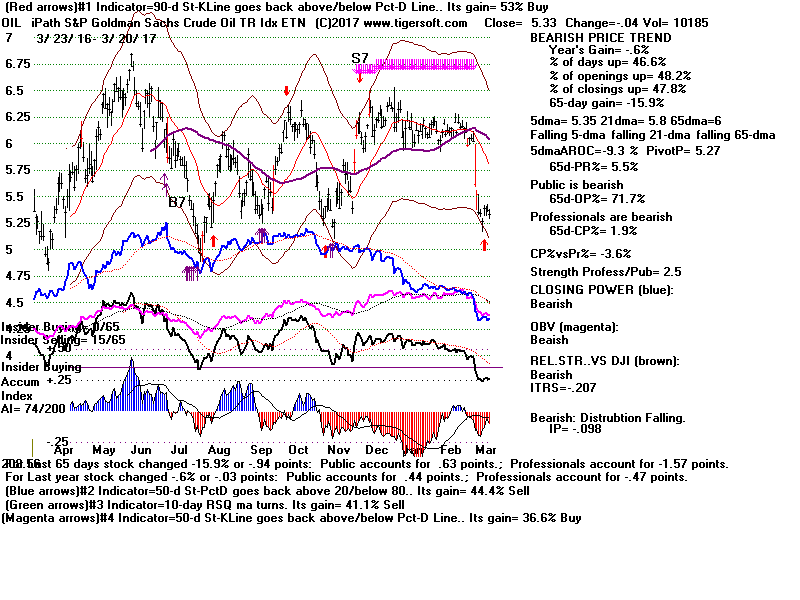
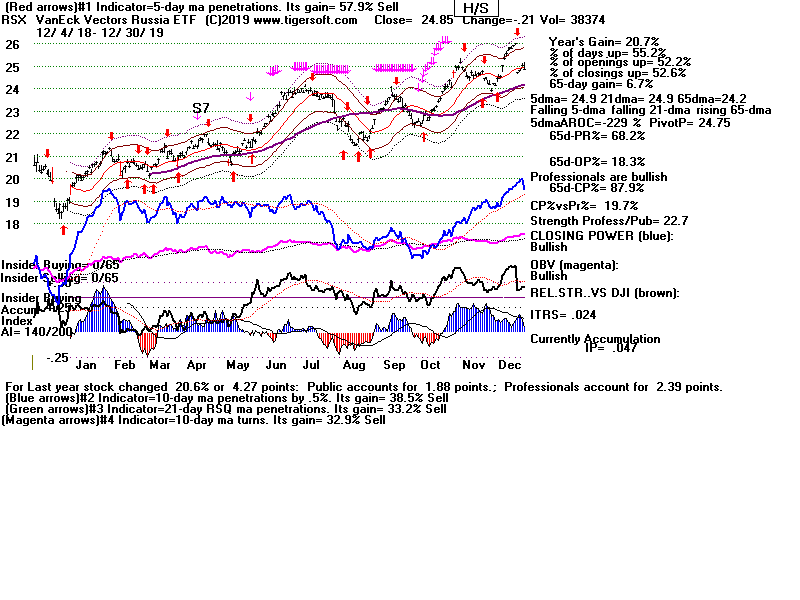
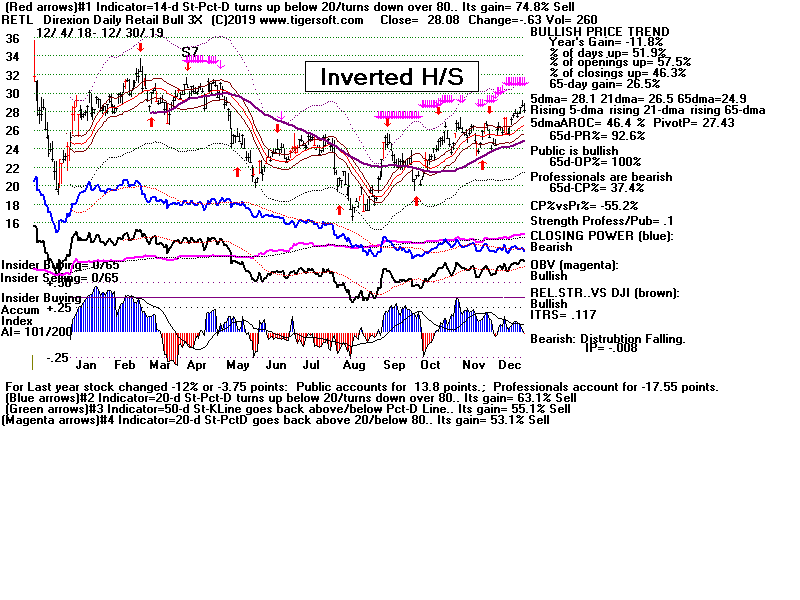
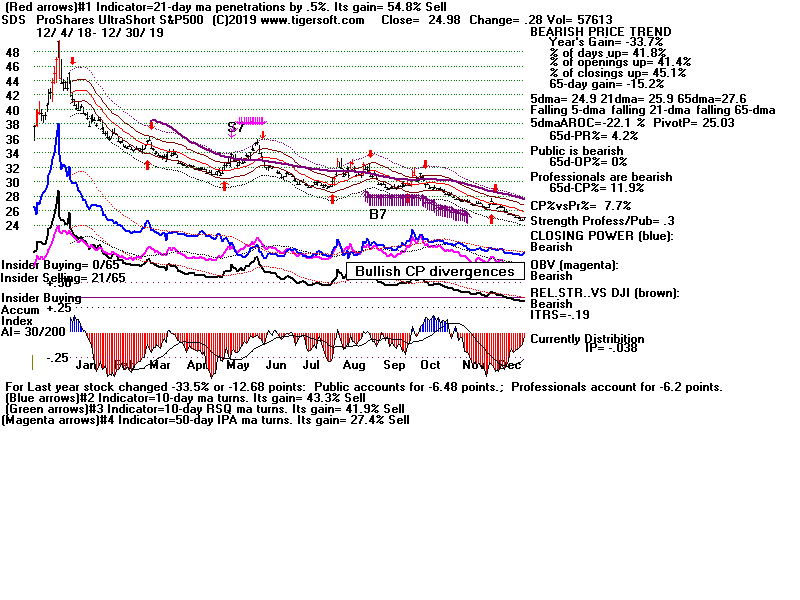
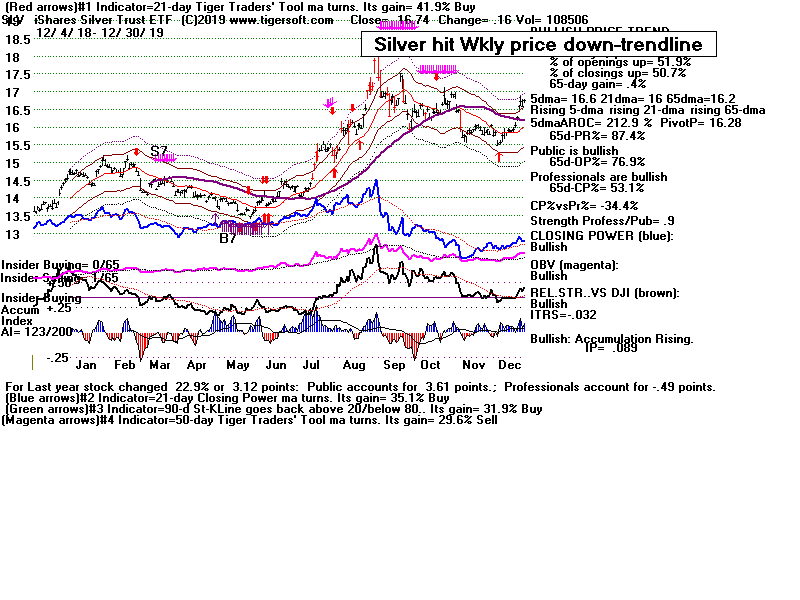
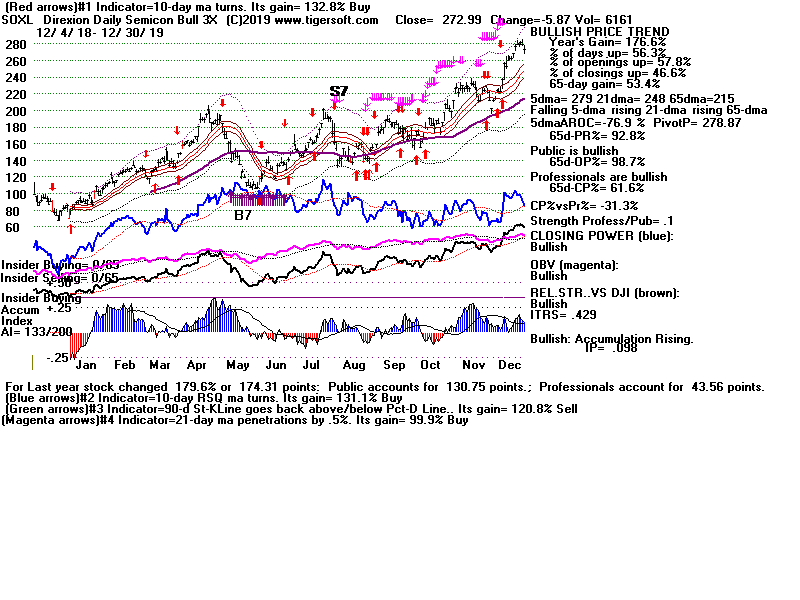
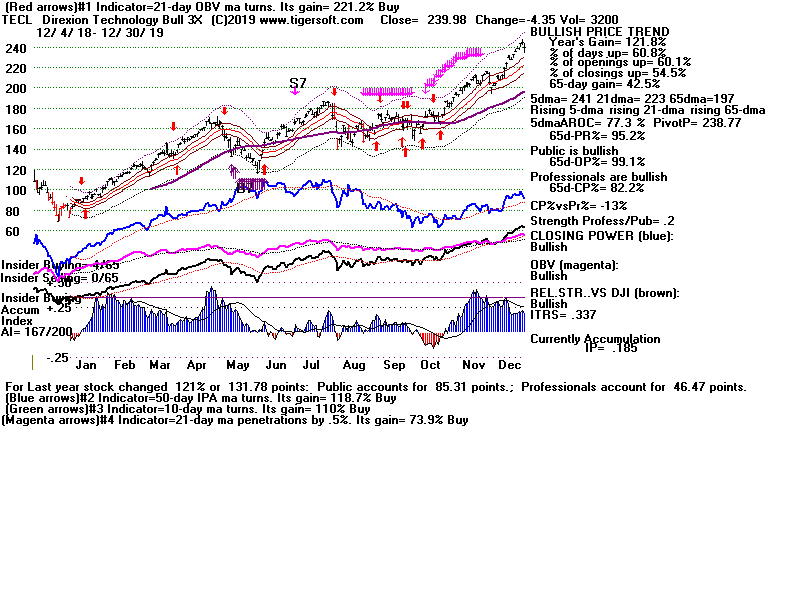
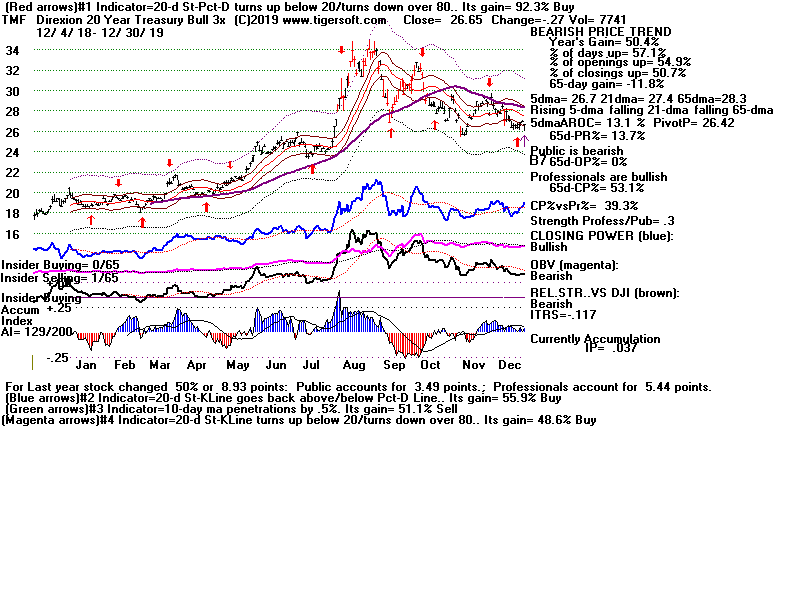
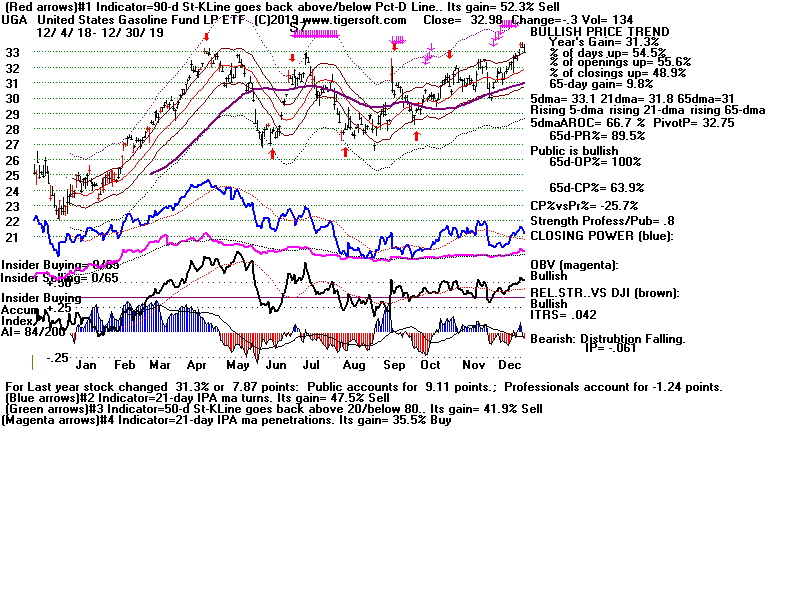
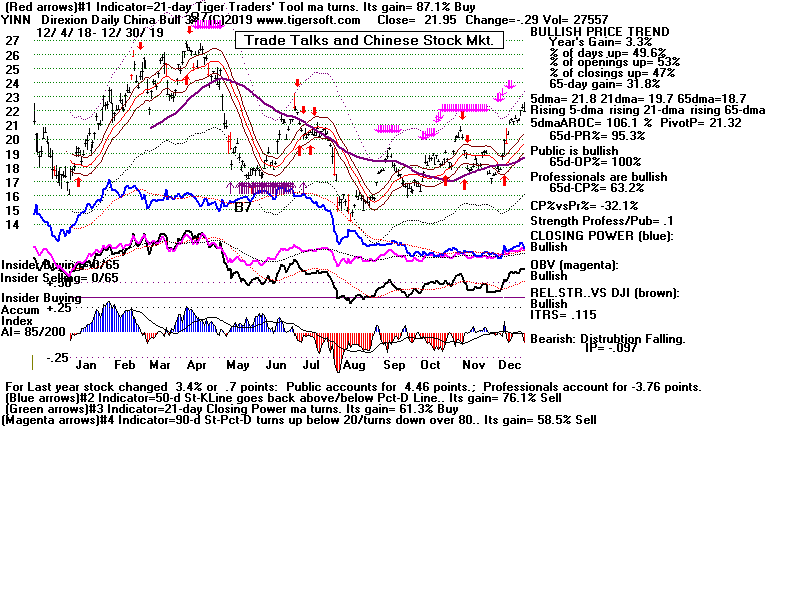
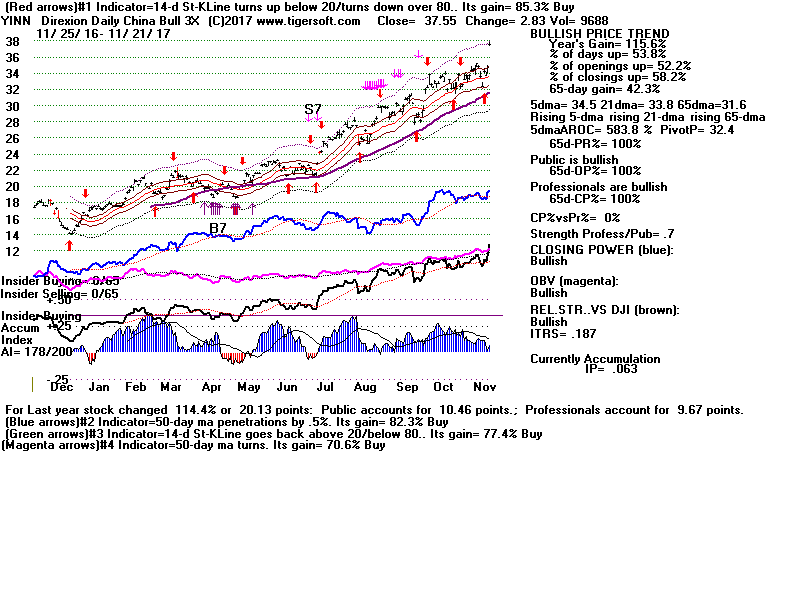
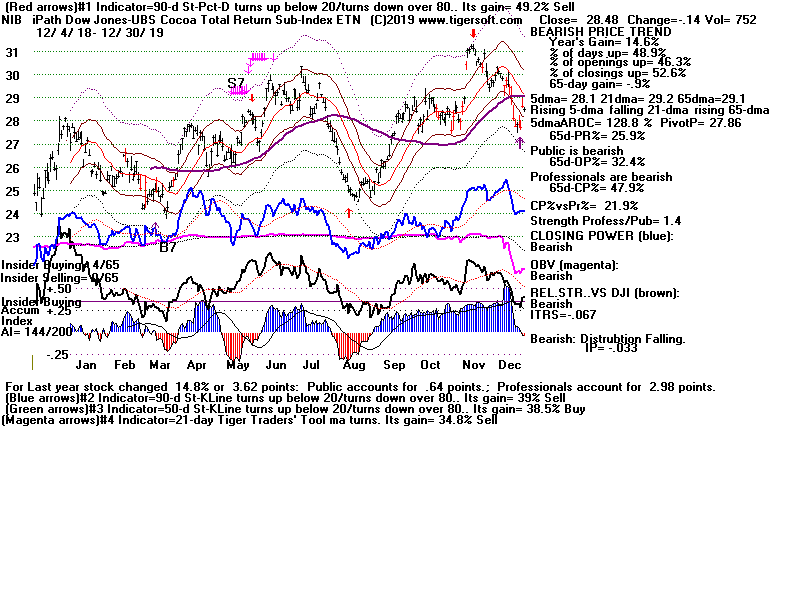
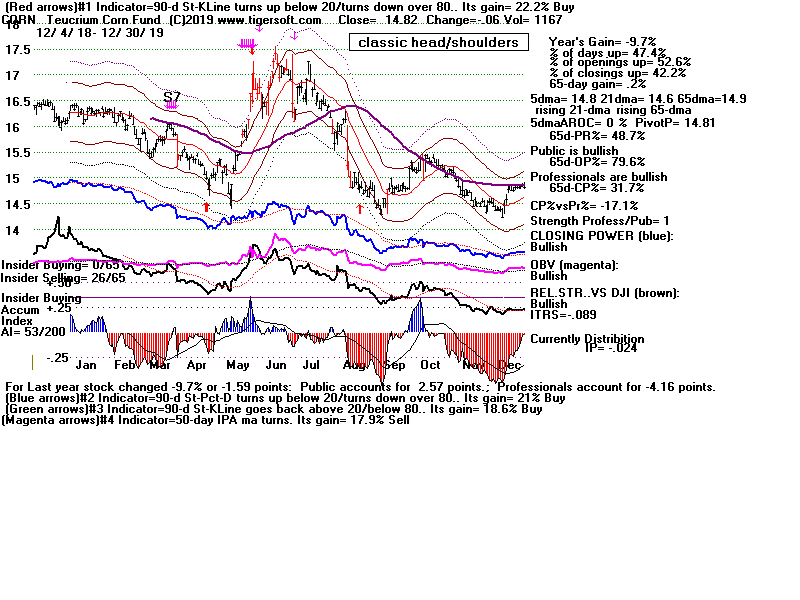
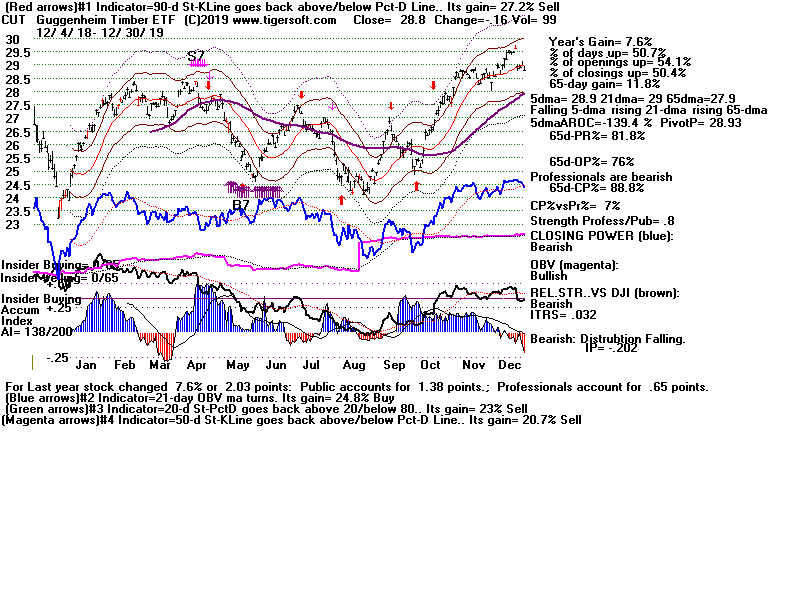
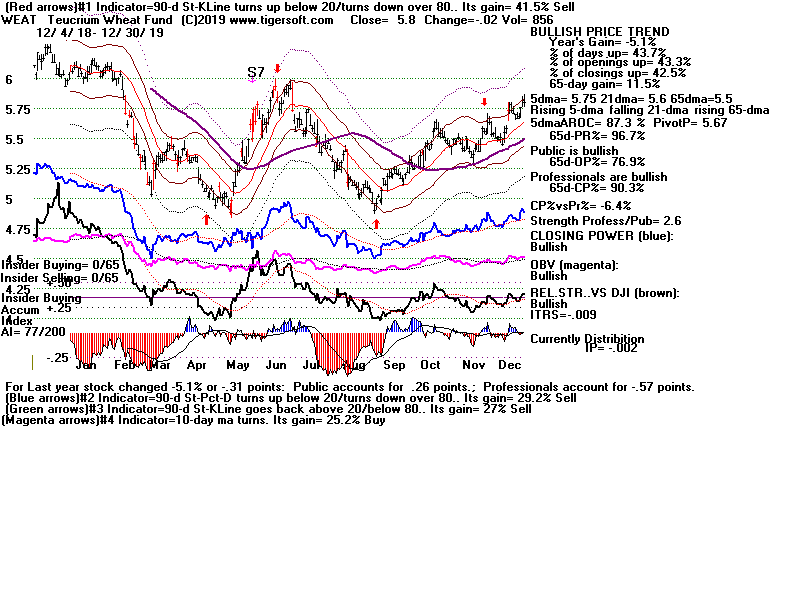
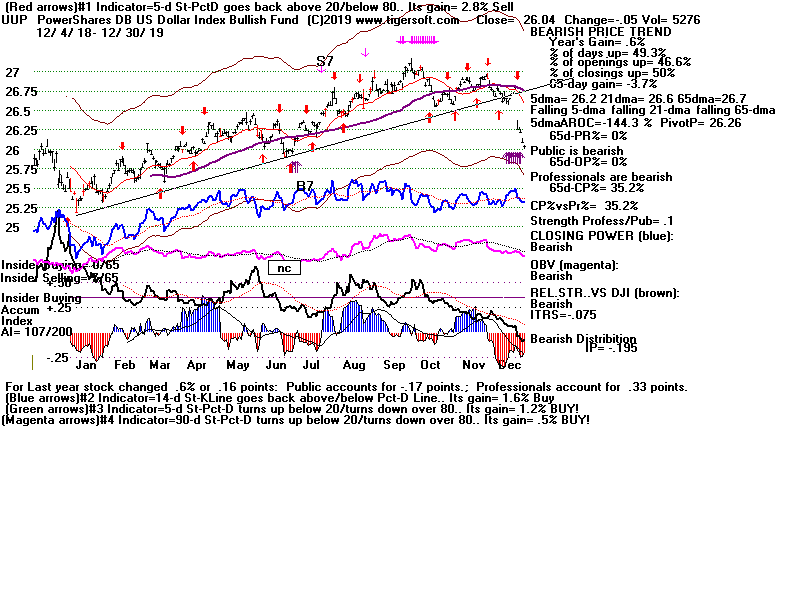
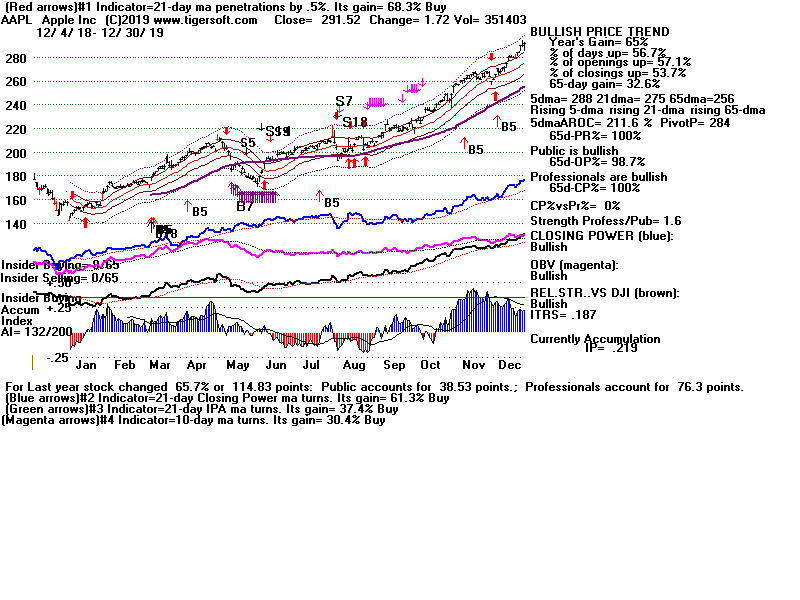
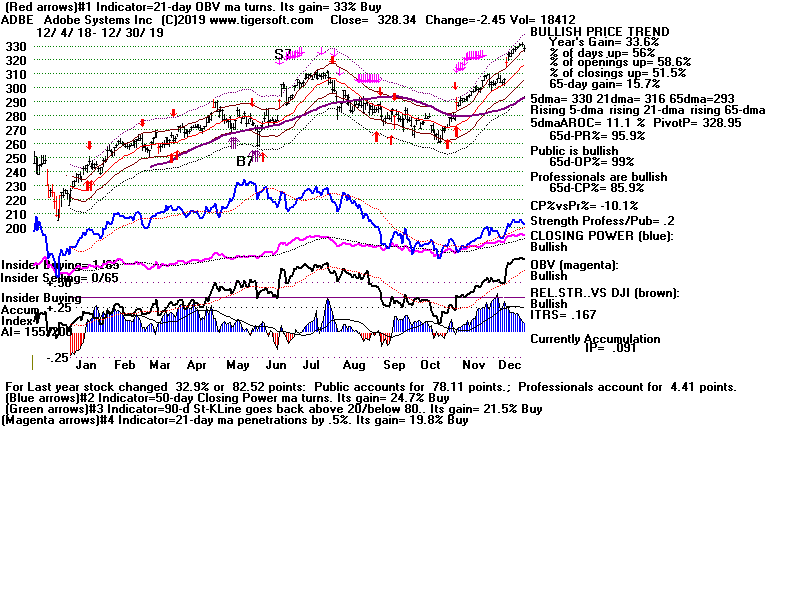
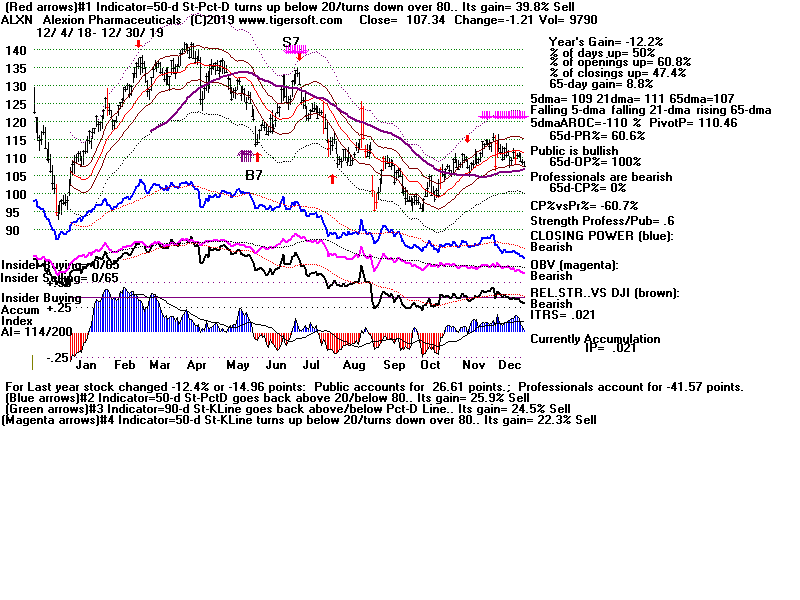
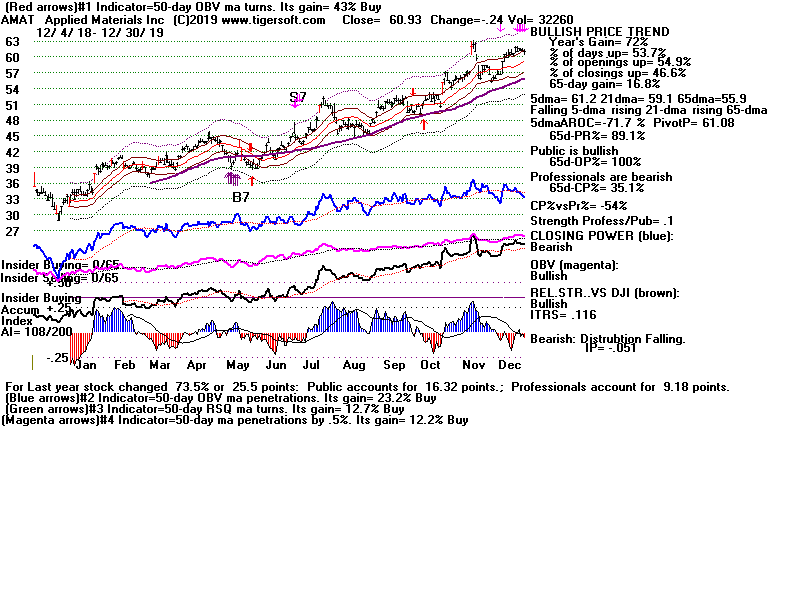
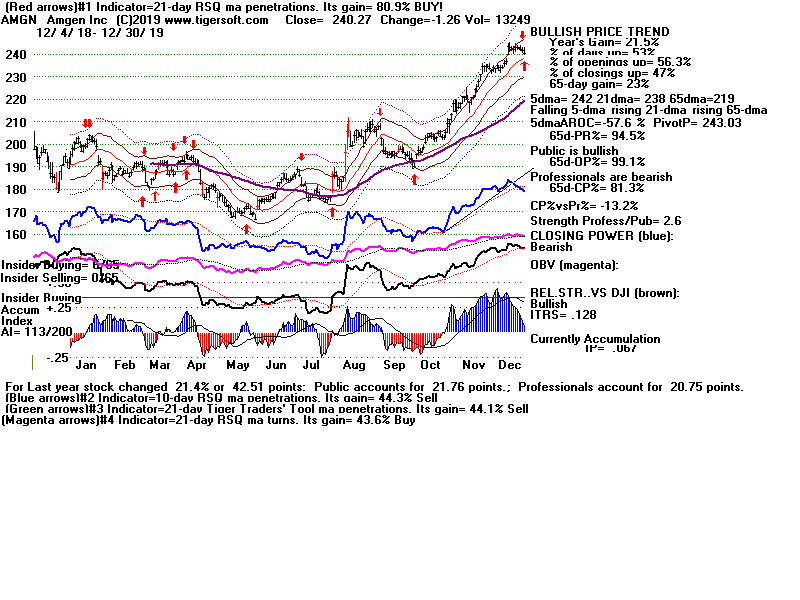
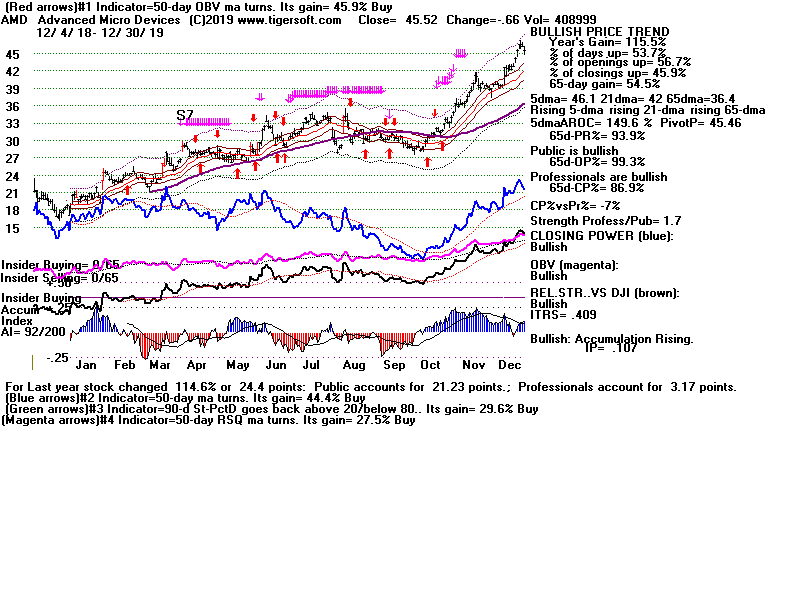
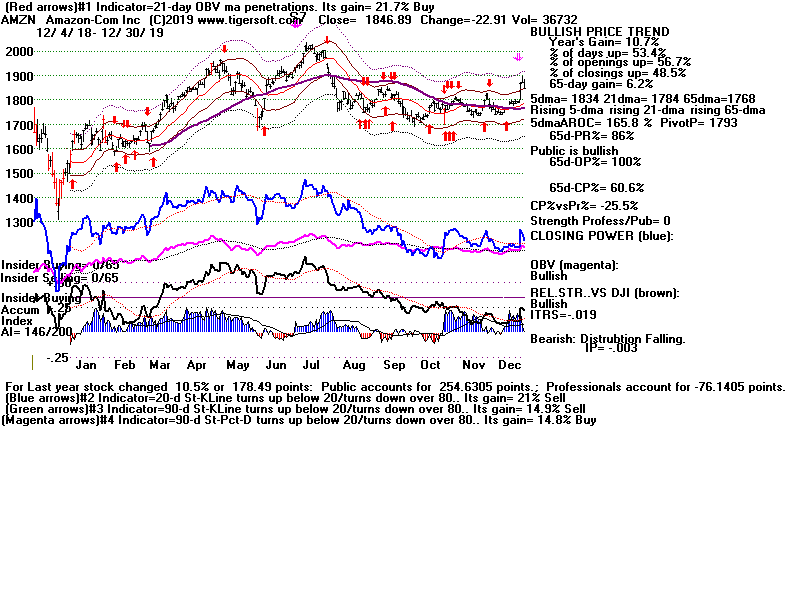
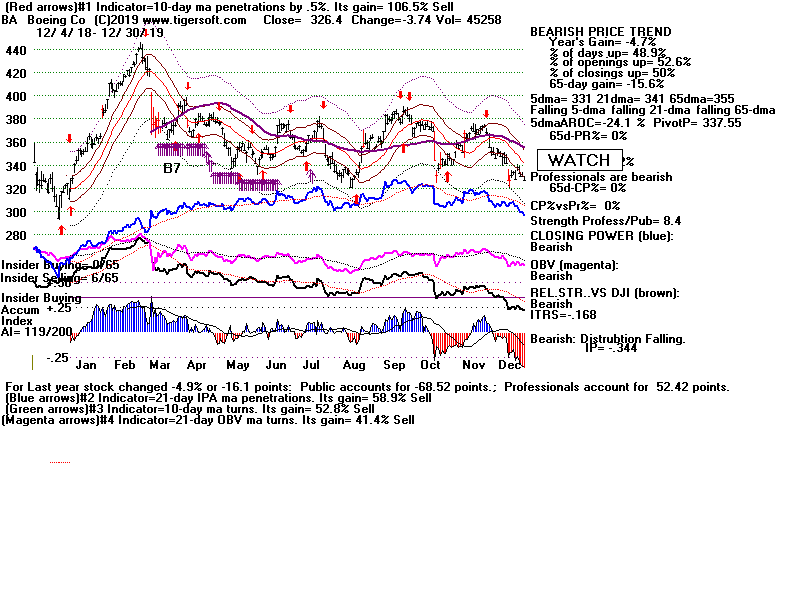
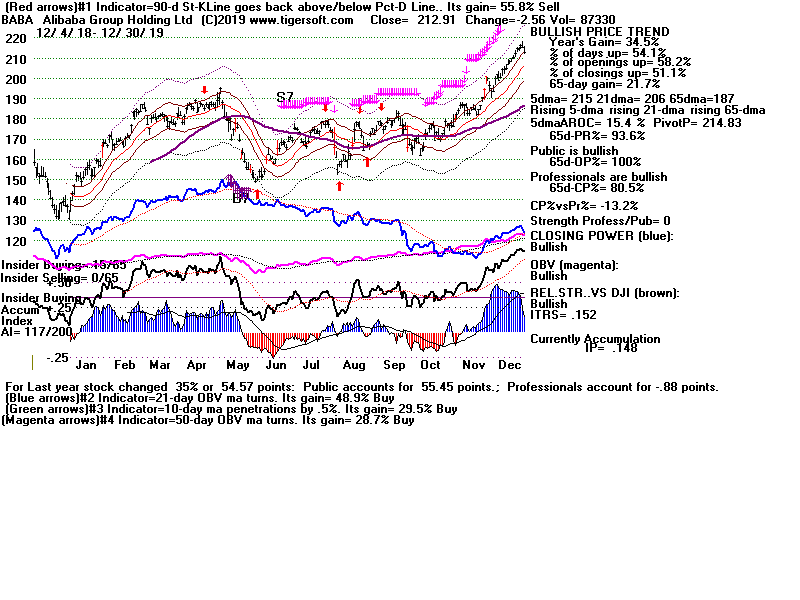
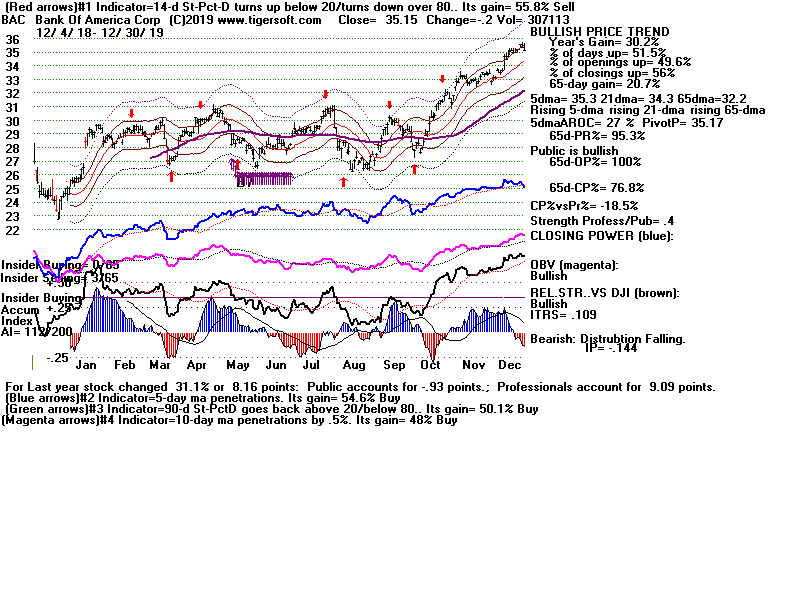
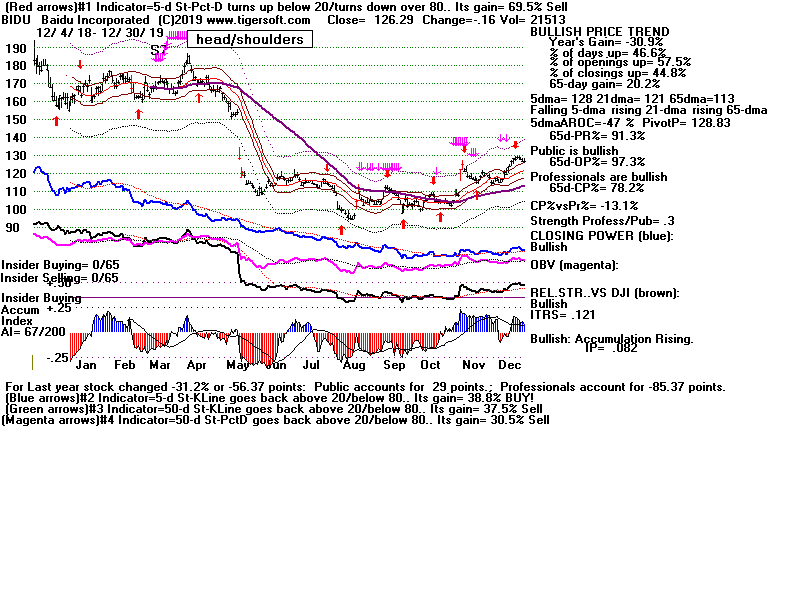
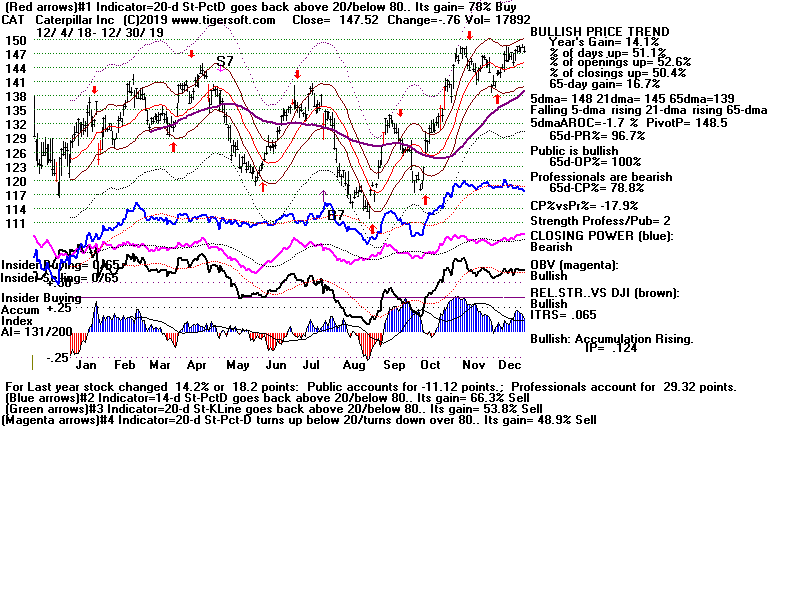
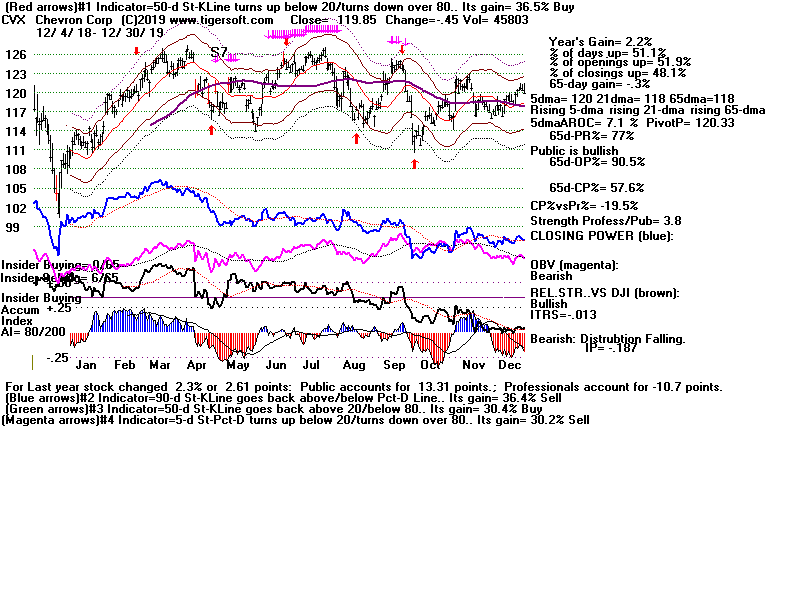
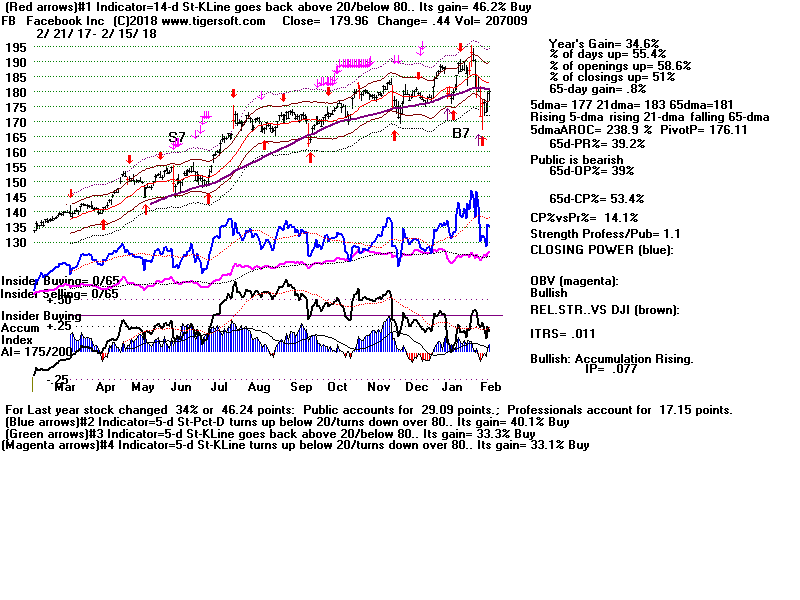
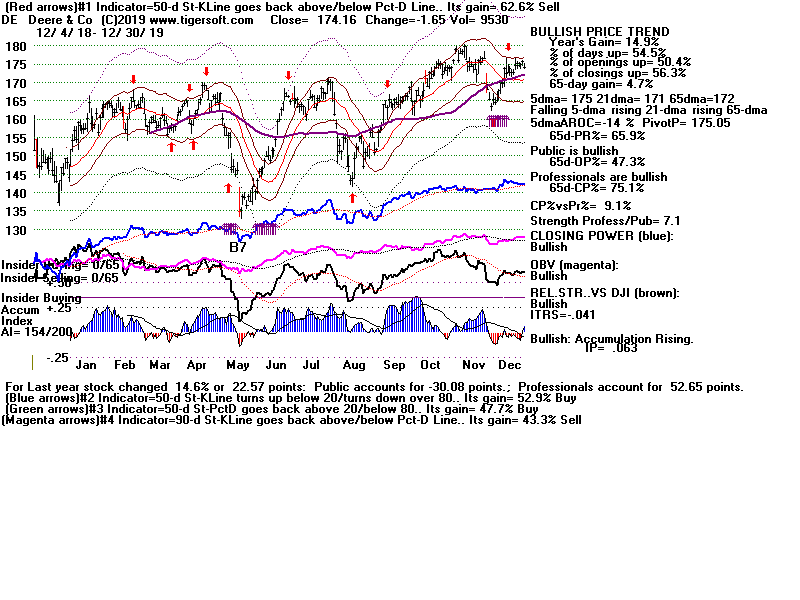
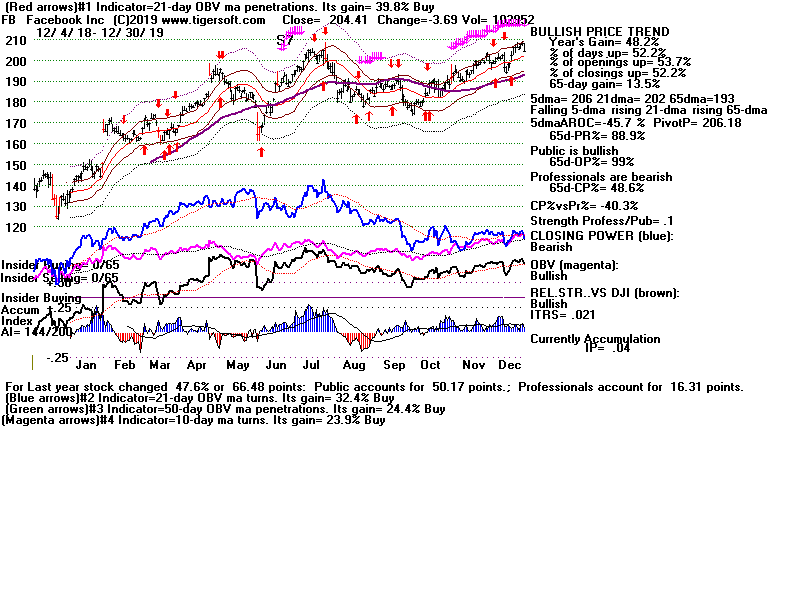
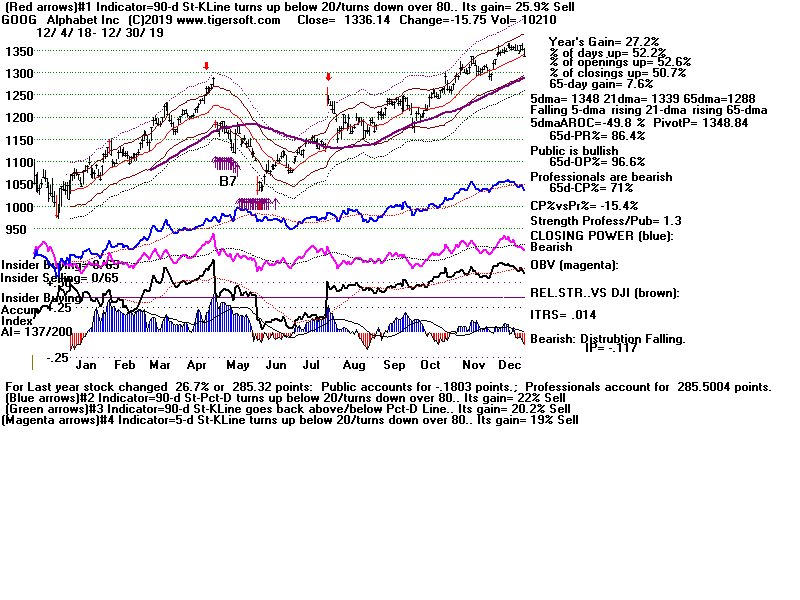
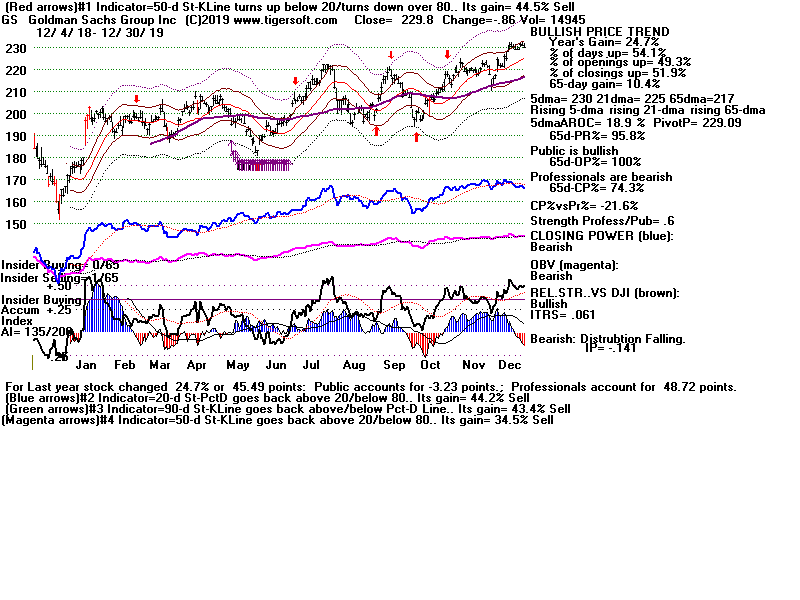
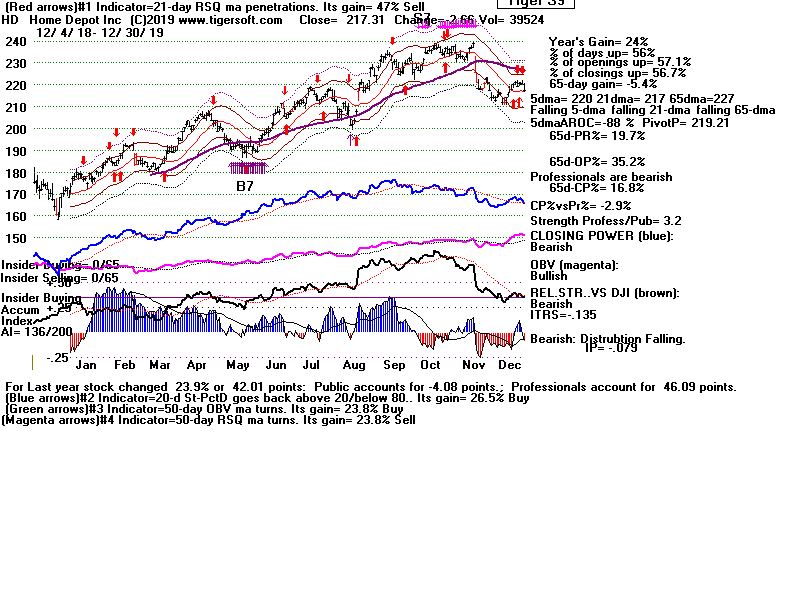
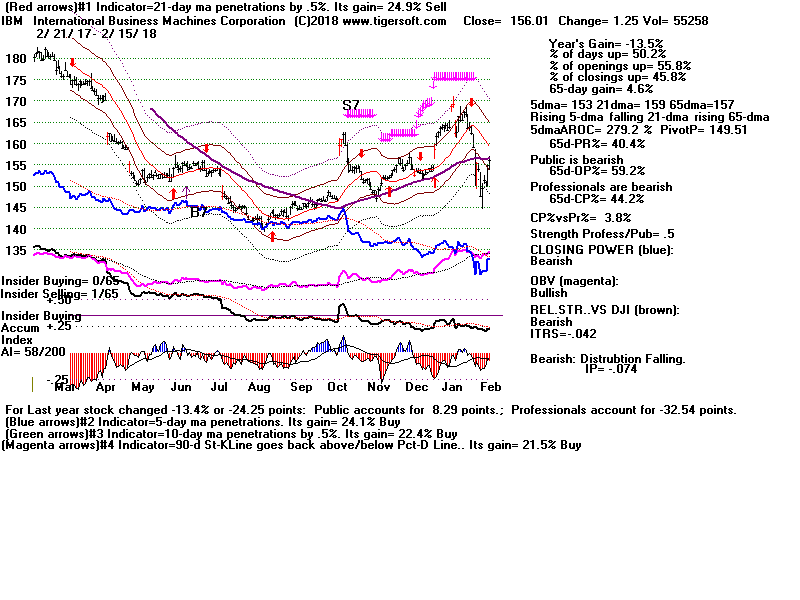
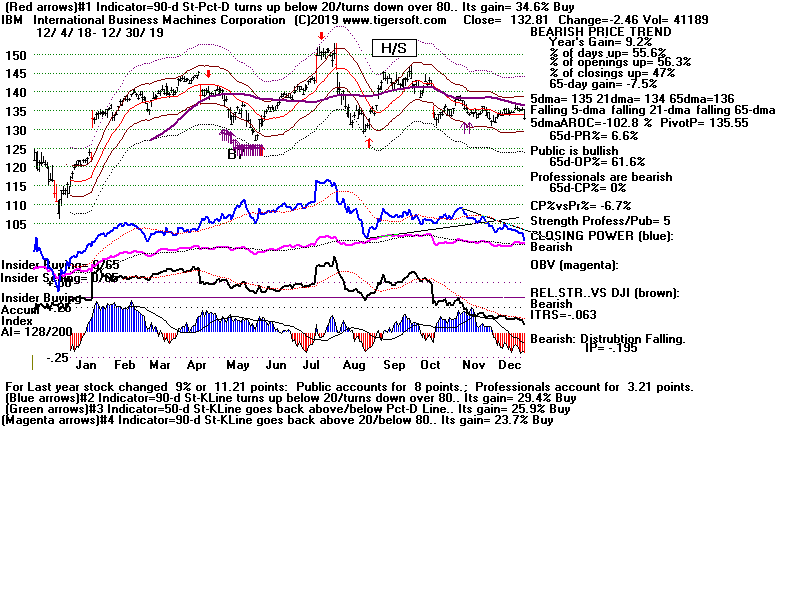
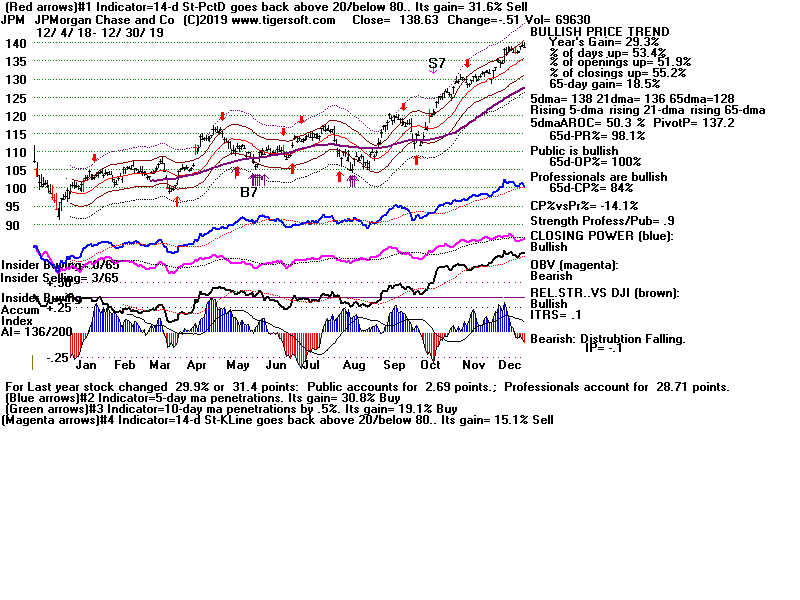
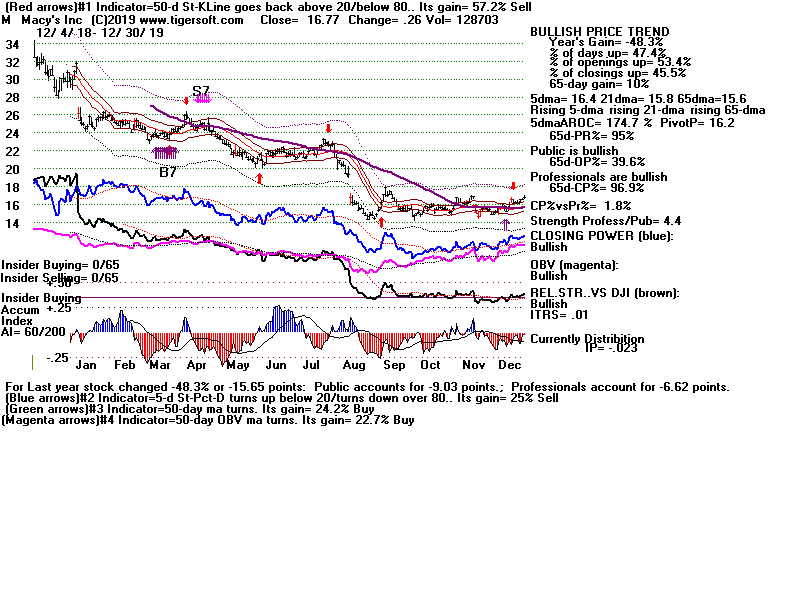
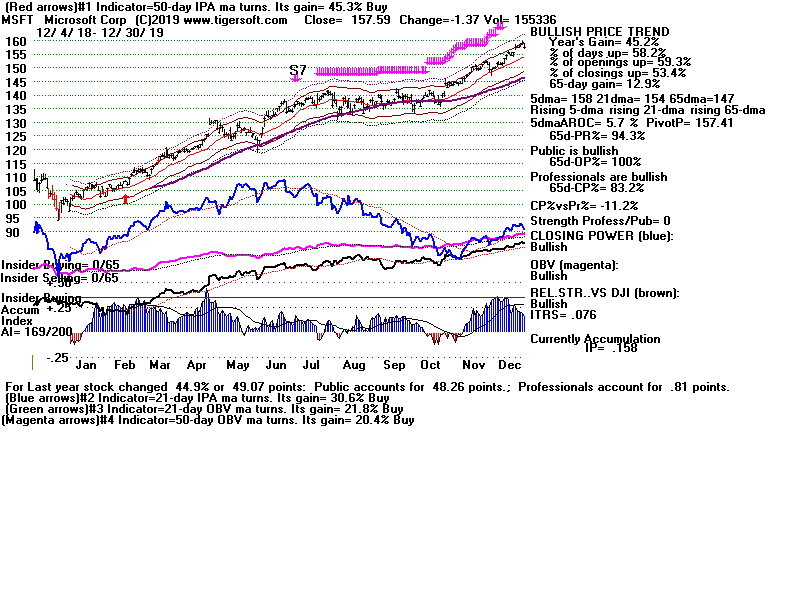
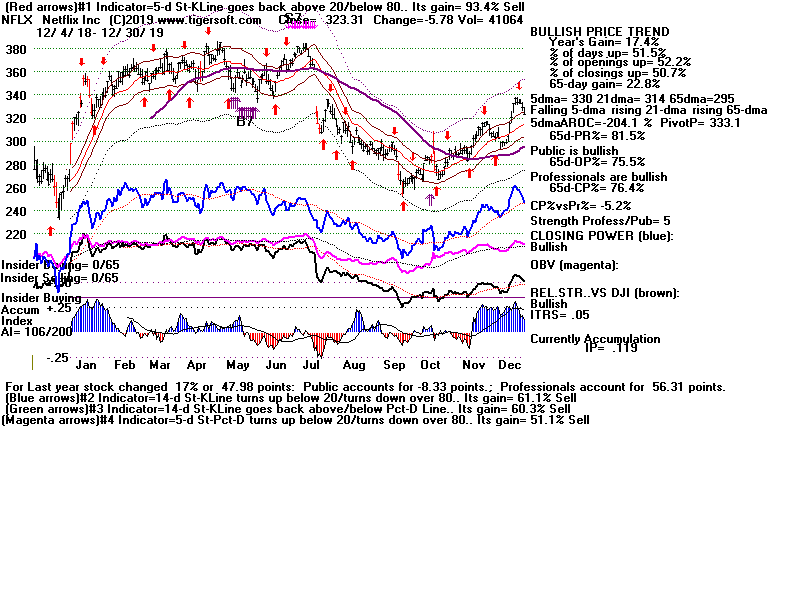
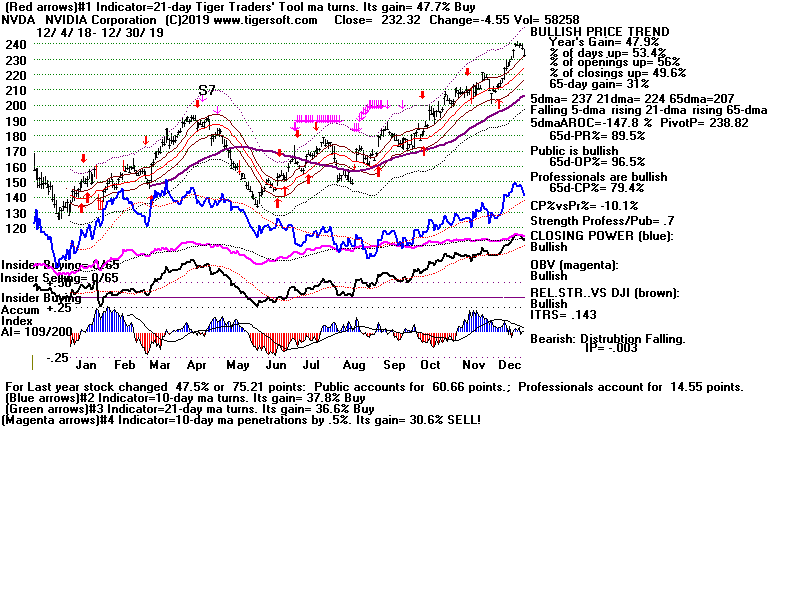
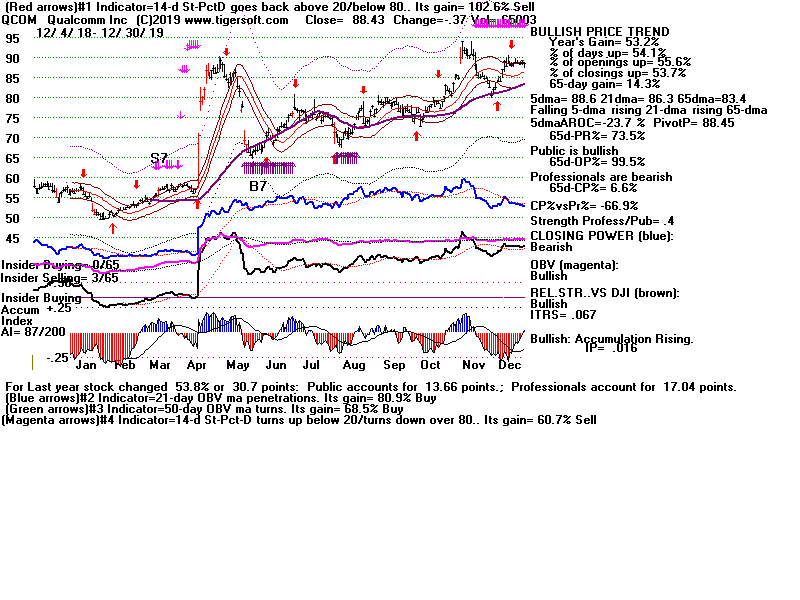
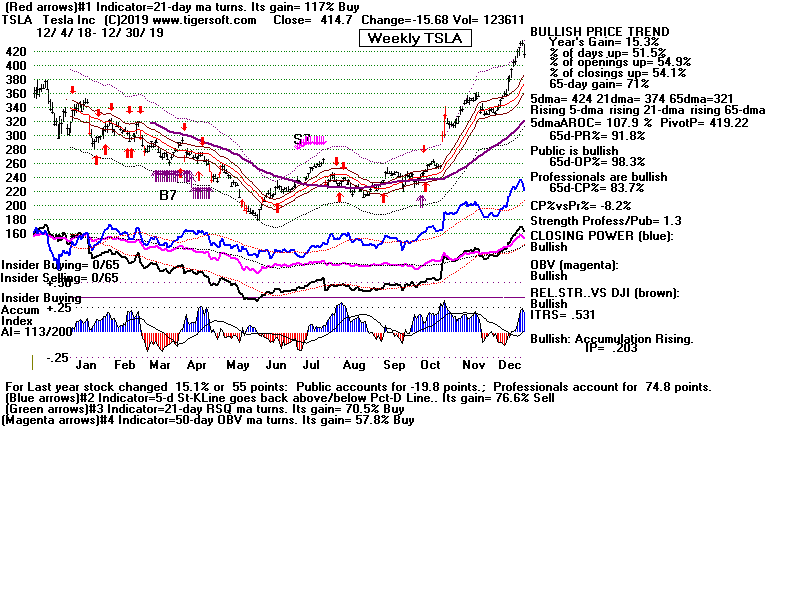
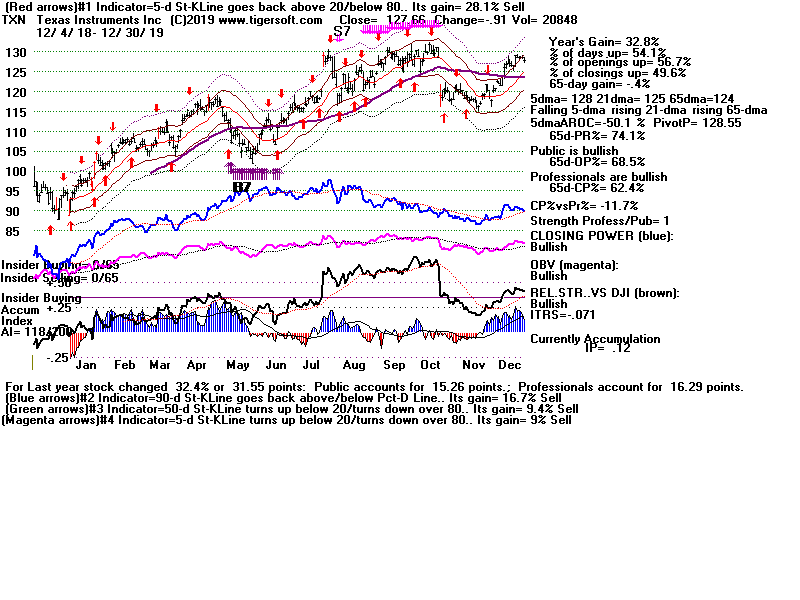
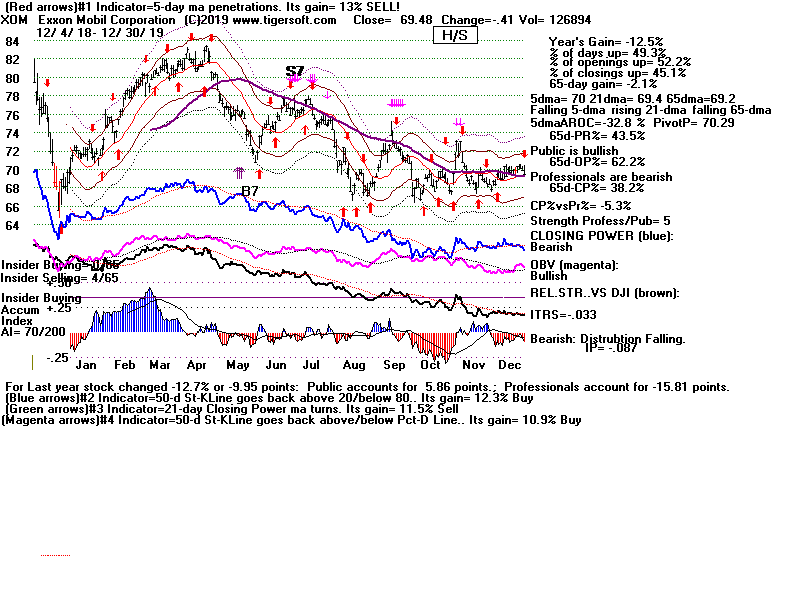
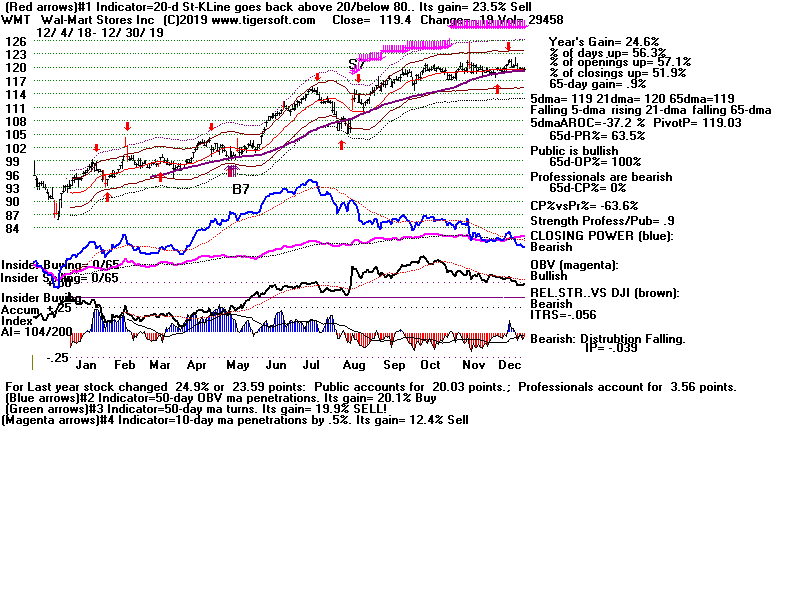
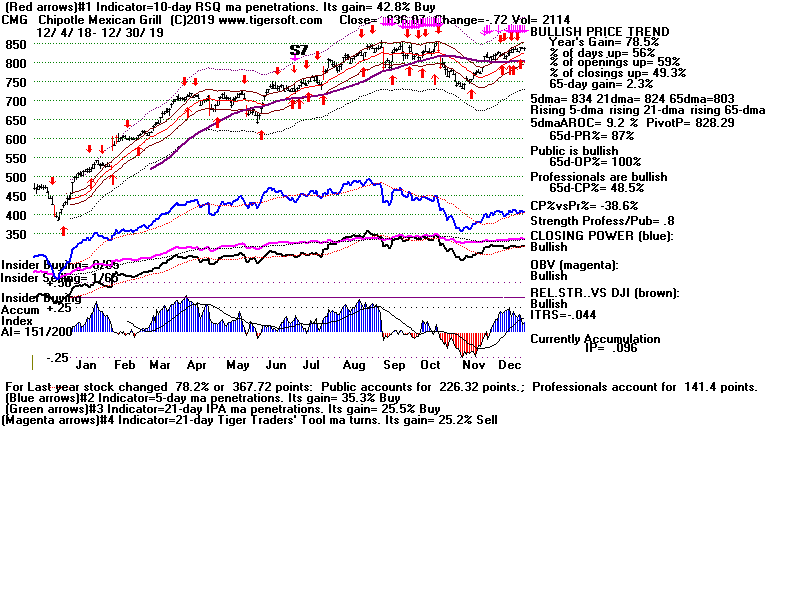
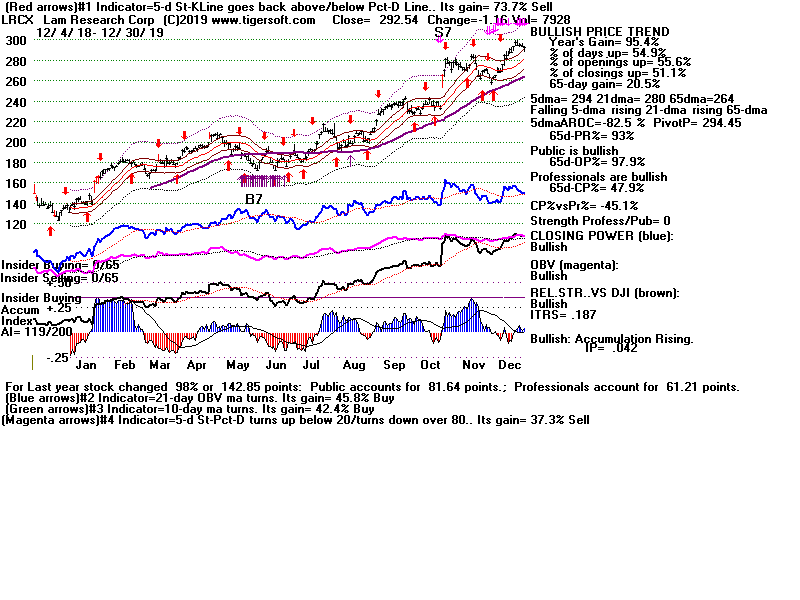
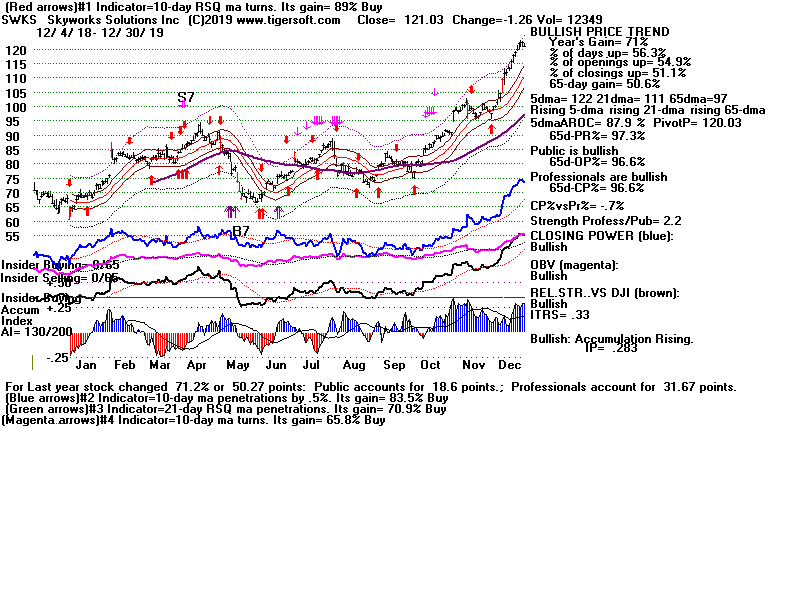
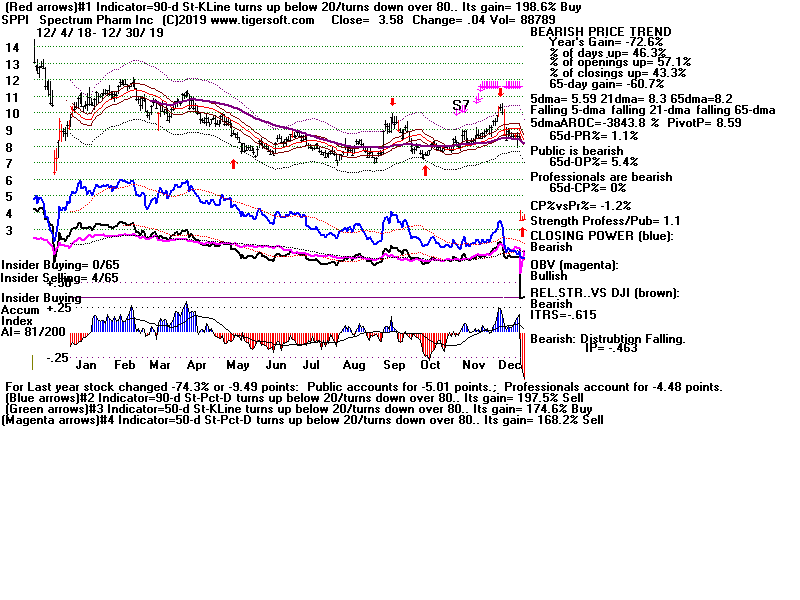
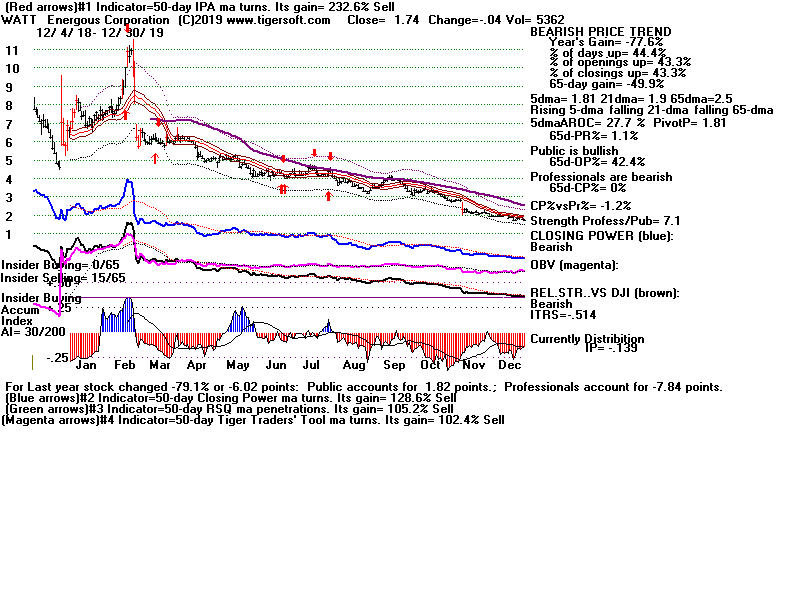
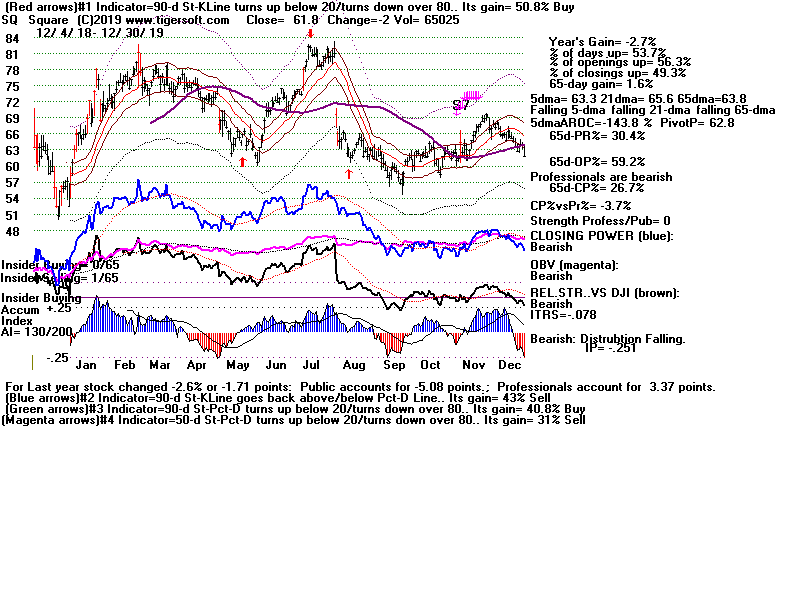
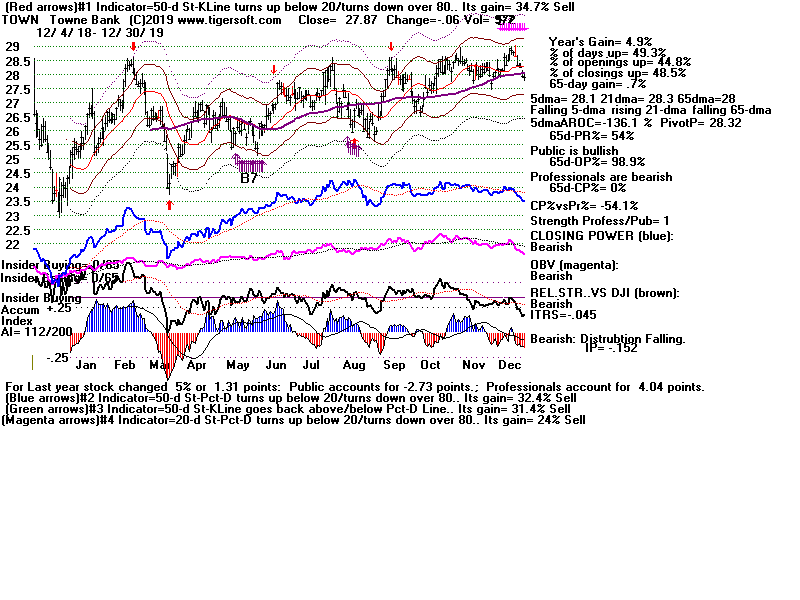
|
Charts 4/20/2018 PEERLESS DJI, Signals, Indicators Daily DJI Volume 10-DayUp/Down Vol V-Indicator Hourly DJIA A/D Line for All Stocks NASDAQ S&P OEX NYSE COMPQX DJI-15 DJI-20 DJI-30 DIA SPY QQQ MDY IWM TNA USO-CrudeOil FAS GLD BBH IBB JETS JNUG KOL NUGT OIH OIL RSX RETL SDS SLV SOXL TECL TMF TNA UGA (gasoline) XIV YINN Commodities: JJC, NIB, CHOC CORN, CUT (paper) WEAT UUP (Dollar) AAPL ADBE ALXN AMAT AMGN AMD AMZN BA BABA BAC BIDU CAT CVX DE FB GOOG GS HD IBM JPM M (Macy's) MSFT NFLX NVDA QCOM TSLA TXN XOM WMT ANDV (refinery), CMG (Chipotle), LRCX, SWKS, MDGL SPPI WATT SQ TOWN 4/20/2018 (Click on Underlined link.) Bullish MAXCPs - http://tigersoft.com/4XXH/MAXCPS/420/BULLISH.htm Bearish MAXCPs - http://tigersoft.com/4XXH/MINCPS/420/BEARISH.htm |
Table 1
                  QUICKSILVER on ETFS - 04/20/18
  Note that DIA's 50-day pct. price change is lower than COMPQX, SPY, QQQ, MDY and IWM
  as well as TECL.
All of key ETFS show falling Closing Power and very negative IP21 but the 5-day ma of DIA, COMPQX, SPY, QQQ, MDY, IWM and FAS are all still rising. RETL and SOXL show the most bearish accross-the-board internals. OIL shows bullish across-the-board internals. ETF CLOSE CHANGE PIVOT-PT 5-dma AROC CL-PWR CANDLE IP21 ITRS --------------------------------------------------------------------------------------------- --------------------------------------------------------------------------------------------- DIA 244.48 -2.09 245.62 18.3% Bearish RED -.109 ----- --------------------------------------------------------------------------------------------- COMPQX 7146.13 -91.93 7156.28 27.4% Bearish RED -.103 .031 --------------------------------------------------------------------------------------------- SPY 266.61 -2.28 267.33 27.2% Bearish RED -.153 .013 --------------------------------------------------------------------------------------------- QQQ 162.3 -2.61 162.6 28.3% Bearish RED -.143 .03 --------------------------------------------------------------------------------------------- MDY 345.83 -2.1 345.9 48.3% Bearish RED -.082 .039 --------------------------------------------------------------------------------------------- IWM 155.55 -.84 155.37 51.3% Bearish RED -.11 .055 --------------------------------------------------------------------------------------------- FAS 64.84 -.27 63.55 172.2% Bearish RED -.228 -.028 --------------------------------------------------------------------------------------------- RETL 31.5 -1.41 33.47 -186.6% Bearish RED -.065 -.123 --------------------------------------------------------------------------------------------- SOXL 130.23 -4.85 151.53 -675.5% Bearish RED -.187 -.053 --------------------------------------------------------------------------------------------- TECL 116.92 -5.46 120.89 -48.3% Bearish RED -.106 .042 --------------------------------------------------------------------------------------------- IBB 104.96 -.93 105.24 -47% Bearish RED -.185 -.023 --------------------------------------------------------------------------------------------- GLD 126.63 -.97 127.63 -32.1% Bearish RED -.094 .032 --------------------------------------------------------------------------------------------- OIL 7.61 .04 6.89 339.4% Bullish BLUE .263 .079 --------------------------------------------------------------------------------------------- OIH 26.84 -.19 26.28 103.3% Bullish ---- .113 .074 --------------------------------------------------------------------------------------------- GASL 20.63 -.5 19.61 365.4% Bullish RED .056 .091 --------------------------------------------------------------------------------------------- UGA 33.36 .24 32.64 65.4% Bullish BLUE .188 .082 --------------------------------------------------------------------------------------------- UUP 23.72 .14 23.46 38.3% Bullish ---- .087 .022 --------------------------------------------------------------------------------------------- IEF 101.57 -.34 102.53 -49.3% ---- RED -.08 .01 --------------------------------------------------------------------------------------------- XLU 50.3 -.46 50.47 50.4% ---- RED -.042 .063 --------------------------------------------------------------------------------------------- WEAT 6.32 -.16 6.35 -132.3% Bullish RED .167 -.001 --------------------------------------------------------------------------------------------- YINN 31.84 -1.38 33.08 -383.7% ---- RED .026 -.139 --------------------------------------------------------------------------------------------- RSX 21 -.35 20.74 148.1% Bullish RED .055 -.034 --------------------------------------------------------------------------------------------- AAPL 165.72 -7.08 175.82 -256.1% Bearish RED -.272 .056 --------------------------------------------------------------------------------------------- GOOG 1072.96 -14.74 1037.98 206% ---- RED -.04 .04 --------------------------------------------------------------------------------------------- MSFT 95 -1.11 94.17 100.9% ---- RED -.073 .077 --------------------------------------------------------------------------------------------- AMZN 1527.49 -29.42 1441.5 324% Bearish RED .057 .095 --------------------------------------------------------------------------------------------- FB 166.28 -1.82 164.83 52.9% ---- RED .031 -.06 --------------------------------------------------------------------------------------------- NVDA 228.71 -.33 231.49 -59.8% Bearish ---- -.101 .017 --------------------------------------------------------------------------------------------- BA 338.67 -1.97 331.77 139.8% Bearish RED .022 -.01 --------------------------------------------------------------------------------------------- GS 251.96 -2.21 257.88 -77.6% Bearish RED -.208 -.003 --------------------------------------------------------------------------------------------- HD 177.01 -.07 174.43 119.7% Bearish RED -.141 -.057 --------------------------------------------------------------------------------------------- CAT 153.25 -2.45 152.14 98.4% Bearish RED -.092 .01 |
Table 2 Count of Stocks in Key Directories
20180420
-------------------------------
NEWHIGHS 97 Still a lot of new highs.
NEWLOWS 117
MAXCP          41
MINCP          275    Bearish Professional
TTTNH 60 TTTNL 258 Bearish Day Traders FASTUP 95 FASTDOWN 94 CPCROSSA 22 CPCROSSD 178 Professionals were switching to bearish camp, BIGVOLUP 4 BIGVODN 15 |
Table 3Table 3 There is no one leadership group now. Count of Stocks and NEW HIGHS in Key Tiger Directories
Date = 180420
No. NHs Pct
-------------------------------------------------------------------
MAXCP 41 23 56 %
COAL 10 1 10 %
CHEM 62 4 6 %
OILGAS 136 8 6 %
REGBANKS 33 2 6 %
COMODITY 56 3 5 %
INDMATER 86 4 5 %
MILITARY 38 2 5 %
SOFTWARE 66 3 5 %
HACKERS 24 1 4 %
BIG17 46 1 2 %
BIOTECH 383 6 2 %
CHINA 62 1 2 %
FIDSTKS 189 3 2 %
GOLD 50 1 2 %
RETAIL 53 1 2 %
RUS-1000 827 14 2 %
ELECTRON 176 1 1 %
FINANCE 91 1 1 %
INDEXES 195 2 1 %
SP-100 96 1 1 %
SP500 481 7 1 %
|
Table 4Table 4 Count of Stocks and NEW LOWS in Key Tiger Directories Date = 180420 ------------------------------------------------------------------- BONDFUND 111 35 32 % COAL 10 2 20 % MINCP 275 53 19 % BEVERAGE 20 2 10 % REIT 177 18 10 % AUTO 40 3 7 % SP-100 96 7 7 % CHEM 62 3 5 % ELECTRON 176 8 5 % SEMI 128 6 5 % SP500 481 25 5 % BIOTECH 383 16 4 % FIDSTKS 189 7 4 % GAMING 28 1 4 % RETAIL 53 2 4 % RUS-1000 827 32 4 % DOWJONES 30 1 3 % GREEN 30 1 3 % MILITARY 38 1 3 % ETFS 66 1 2 % GOLD 50 1 2 % INDMATER 86 2 2 % SOFTWARE 66 1 2 % INDEXES 195 1 1 % NASD-100 89 1 1 % OILGAS 136 1 1 % |
Table 5 RANKING OF KEY DIRECTORIES BASED PCT.OF STOCKS ABOVE 65-DMA
4/20/18
Bearish = 31
Bullish = 13
---------------------------------------------------------------------------------------
Directory Current day-1 day-2 day-3 day-4 day-5
----------------------------------------------------------------------------------------
EDU 1 1 .857 1 1 1
HACKERS .833 .875 .875 .875 .75 .75
HOSPITAL .714 .714 .857 .714 .714 .571
GOLD .7 .66 .66 .6 .54 .6
OILGAS .676 .676 .705 .61 .566 .566
SOFTWARE .666 .727 .742 .727 .651 .606
UTILITY .666 .714 .785 .761 .714 .547
COMODITY .66 .732 .75 .642 .571 .571
MILITARY .605 .631 .631 .605 .605 .526
TRANSP .6 .65 .7 .6 .5 .25
GREEN .533 .6 .7 .633 .533 .466
INSURANC .531 .5 .5 .5 .5 .406
SOLAR .523 .571 .619 .571 .523 .523
N=13
============================================================================================
CHEM .5 .548 .629 .564 .419 .419
GUNS .5 .555 .555 .444 .444 .444
JETS .5 .5 .5 .3 .2 .1
============================================================================================
INDMATER .476 .534 .593 .488 .372 .337
FIDSTKS .439 .476 .502 .481 .386 .301
RUS-1000 .436 .47 .515 .489 .428 .363
COMPUTER .434 .565 .608 .608 .565 .434
NIFTY .433 .466 .566 .633 .5 .4
REGBANKS .424 .333 .242 .242 .242 .181
RETAIL .415 .471 .49 .49 .452 .452
SP500 .407 .449 .49 .465 .411 .334
FINANCE .406 .406 .285 .329 .318 .263
BEVERAGE .4 .45 .5 .55 .55 .5
INDEXES .394 .502 .579 .523 .425 .358
GAMING .392 .464 .535 .392 .285 .142
BIOTECH .391 .433 .467 .475 .404 .422
SP-100 .385 .427 .437 .375 .354 .281
BIG17 .369 .369 .369 .391 .304 .326
DOWJONES .366 .433 .4 .4 .4 .266
NASD-100 .359 .415 .494 .494 .426 .337
REIT .344 .418 .519 .548 .423 .333
FOOD .333 .888 .888 .666 .333 .555
ELECTRON .323 .363 .465 .477 .403 .38
CHINA .306 .274 .306 .258 .258 .258
COAL .3 .3 .3 .3 .3 .3
ETFS .287 .363 .454 .348 .318 .318
INFRA .257 .342 .4 .342 .114 .142
SEMI .242 .273 .406 .453 .375 .375
HOMEBLDG .176 .235 .352 .294 .294 .294
DJI-13 .153 .384 .384 .307 .307 .153
AUTO .15 .175 .3 .25 .25 .25
BIGBANKS .142 0 0 0 0 0
PIPELINE .142 0 .142 0 0 0
BONDFUND .036 .054 .081 .081 .072 .09
N=31
|