---- TIGERSOFT/PEERLESS HOTLINE ----
(C)
1985-2019 William Schmidt, Ph.D. www.tigersoft.com
william_schmidt@hotmail.com All rights strictly
reserved
www.tigersoft.com/4ACES1/INDEX.htm
and
www.tigersoft.com/4ACES2/INDEX.htm
IMPORTANT - Always
CLICK REFRESH.
+++++++++++++++++++++++
New HL ADDRESS -1/1/2020
===> I will be changing
the Hotline's Address
on New Year's
Day. Subscribers should get
an email giving the new
address Monday afternoon
or evening. Let
me know if you do not get one.
The New Year will be
much more challenging, I suspect.
And I want it to be
very profitable year for each of you,
so lots of new studies
will be released and the
new Peerless manuals
will be available soon.

Data used through
12/30/2019 Written 12/31/2019 5:30 AM
---------------------------------------------------------------------------------
Earlier Hotlines
www.tigersoft.com/48HLA/INDEX.htm
www.tigersoft.com/QUICKER/INDEX.htm
www.tigersoft.com/QUICK/INDEX.htm
www.tigersoft.com/77HLZ/INDEX.htm
www.tigersoft.com/44THL/INDEX.htm
www.tigersoft.com/21PEY3/INDEX-2.htm
(most recent Hotlines before
current ones)
......................................................................
www.tigersoft.com/19HLK5/INDEX.htm
www.tigersoft.com/44UHL/INDEX.htm
www.tigersoft.com/NHLP/INDEX.htm
www.tigersoft.com/7LHL/INDEX.htm
www.tigersoft.com/NHL718/INDEX.htm
www.tigersoft.com/21MAY18/INDEX.htm
www.tigersoft.com/55HEP/INDEX.htm
www.tigersoft.com/44H4L/INDEX2.htm
Earlier still: Go here...
HELP
A Guide
To Profitably Using The Tiger Nightly HOTLINE
Introduction to Tiger/Peerless Buys and
Sells.
Peerless Buy and
Sell Signals: 1928-2016
Individual Peerless signals explained:
http://tigersoftware.com/PeerlessStudies/Signals-Res/index.htm
http://www.tigersoft.com/PeerInst-2012-2013/
Explanation of each Peerless signal. http://www.tigersoft.com/PeerInst-2012-2013/
Different Types of
TigerSoft/Peerless CHARTS, Signals and Indicators
-----> More HELP LINKS
Documentation for
TigerSoft Automatic and Optimized Signals.
How reliable support is the
DJI's rising 200-day ma?
SPY Charts since
1994: Advisory Closing Power S7s, Accum. Index, 65-dma, Optimized Signals.
^^^^^^^^^^^^^^^^^^^^^^^^^^^^^^^^^^^^^^^^^^^^^^^^
1/19/2016 ---> Corrections,Deeper
Declines and Bear Markets since 1945.
1/21/2016
---> High
Velocity Declines since 1929
2/12/2016 ---> Presidential
Elections Years and Bullish IP21 Positive Non-Confirmations at Lower Band.
2/12/2016 ---> OBV NNCs on DJI's Rally to
2.7% Upper Band when DJI's 65-dma is falling.
11/6/2016 --->
Killer Short Selling
Techniques: ===> Order Here ($42.50)
It's As Easy as 1,2,3
TigerSoft "Combination" Short-Selling... Easy as 1-2-3 Short Sales
Earlier Q-Answers
QuickSilver Documentation (1/11/2016)
Our Different
Signals
Better understand the difference between
Peerless DJI-based signals,
the one-year optimized red Signals and the fixed signals based
on technical developments.
Introduction to Tiger/Peerless Buys and Sells.
Different Types of
TigerSoft/Peerless CHARTS, Signals and Indicators
New TigerPeerless Installation and
Basic Uses' Instruction
See the re-written materials on TigerSoft Buys and Sells.
Study- Trading SPY
WITHOUT Peerless - Some Guidelines.
When completed this will be a new Tiger Trading E-Book.
Study- Examples of
"Hands above the Head" top patterns.
Study- 9/3/2017 TigerSoft (not
Peerless) charts of Major Tops as they occurred.
===> Please report any broken or out-of-date links. william_schmidt@hotmail.com
====================================================================
====================================================================
12/30/2019
Peerless remains on Buys. However, I have looked back at all the turns
into
the next Presidential Election year and one thing stands out, namely how quickly
the DJI can pivot downward at the very start of the new year if the DJI has
just had a glorious year's advance, shows a rising wedge pattern and then
breaks its uptrend on relatively high volume. Because the DJI is in a rising wedge
pattern, it sometimes does not reach the upper 2.5% band when it turns down.
So, we will have to be on guard on the next rally.

Such a rising-wedge and reversal down is most clearly seen at the very start
of the Presidential Election Years of 1916, 1928 and 1984.
In many other of these new Presidential Election years, the DJI breaks its
uptrend in early January after failing to make a price breakout, after which it then
falls at least to the lower band.
There are also a few cases, notably 1972 and 1976, where falling interest rates
brought upside DJI breakouts on rising volume. In our case, there is no sign
of rising up-volume. Instead, Gold is rising and the Dollar shows a bearish
head/shoulders top and is falling, thus making another rate cut by the Fed very
likely.
Most likely we are seeing cautionary early profit-taking. Will the selling extend
into the new year without a new Sell Peerless? Not if Friday's Job Report is good,
I would think.
Will the current decline be worth while to trade? Most significant sell-offs
start after a Peerless Sell. Also, when the A/D Line is very strong for an
entire year, the January sell-offs tend to be quick-profit-taking affairs. So, do
some selling only if you are a trader.
Intermediate-term investors should
wait for a regular Peerless Sell in January.
Compare the DJI chart now, after its big rise, first with those of 1915-1916,
1927-1928 and 1983-1984, when we did get a January Sell S12 signal with the really
strong A/D Line wonder-years, 1954-1955 and 2017-2018 and the take-offs
of 1975-1976 when the FED like now sought to boost the market early
in a Presidential Election year despite increasing signs of inflation.
All in all, I would rather "wager on the strong" and the Federal Reserve
until there
are more signs of technical weakness. Sell
only IBB because it has broken
its recent price-uptrend. Hold DIA and QQQ.
1915-1916 |
1927-1928 1983-1984  |
1954-1955 |
2017-2018 |
1975-1976 Take off in January. |
2011-2012 |
|
Charts 12/30/2019 2019 PEERLESS DJI, Signals, Indicators Daily DJI Volume 10-DayUp/Down Vol Stoch-20 Hourly DJIA A/D Line for All Stocks Inverted Traders Index NASDAQ S&P OEX NYSE COMPQX DJI-15 DJI-20 DJI-30 DIA SPY QQQ MDY IWM TNA Short-Term Rates USO-CrudeOil DBO FAS GLD BBH IBB JETS JNUG KOL NUGT OIH OIL RSX RETL SDS AGQ SLV SOXL TECL TLT TMF TNA UGA (gasoline) XIV and China: YINN CHAU Commodities: CANE CORN DBC JJC, NIB, CHOC CORN, CUT (paper) MOO, SOYB WEAT UUP (Dollar) LIT (Lithium) AAPL ADBE ALXN AMAT AMGN AMD AMZN AXP BA BABA BAC BIDU CAT CVX DE FB GOOG GS HD IBM INTU JPM M (Macy's) MSFT NFLX NKE NVDA PG QCOM TSLA TXN XOM V WMT CMG , LRCX, SWKS, MDGL SPPI SQ TOWN 12/30/19 (Click on Underlined link.) New highs and Bullish MAXCPs - http://tigersoft.com/max/12-30/BULLISH.htm Bearish MAXCPs - http://tigersoft.com/min/12-30/BEARISH.htm |
 Table 1  QUICKSILVER on DJI-30 STOCKS 12/30/2019
 14 of 30 show rising 5-dma. A drop of -11
STOCKS CLOSE CHANGE PIVOT-PT 5-dma AROC CL-PWR CANDLE IP21 ITRS ---------------------------------------------------------------------------------------- AAPL 291.52 1.72 284 211.6% ------- BLUE .219 .187 Bullish --------------------------------------------------------------------- AXP 124.3 -.89 124.49 -58.7% ------- RED .043 -.009 --------------------------------------------------------------------- BA 326.4 -3.74 337.55 -24.1% Bearish RED -.343 -.168 Bearish --------------------------------------------------------------------- CAT 147.52 -.76 148.5 -1.7% Bearish RED .125 .065 --------------------------------------------------------------------- CSCO 47.59 -.18 48.1 14.6% Bearish RED -.072 -.04 --------------------------------------------------------------------- CVX 119.85 -.45 120.33 7.1% Bearish RED -.186 -.013 --------------------------------------------------------------------- DIS 143.77 -1.98 144.68 -106.8% Bearish RED -.217 .034 --------------------------------------------------------------------- GS 229.8 -.86 229.09 18.9% Bearish RED -.14 .061 --------------------------------------------------------------------- HD 217.31 -2.66 219.21 -88% Bearish RED -.079 -.135 --------------------------------------------------------------------- IBM 132.81 -2.46 135.55 -102.8% Bearish RED -.194 -.063 Bearish --------------------------------------------------------------------- INTC 59.62 -.46 59.23 56.3% Bearish RED -.017 .097 --------------------------------------------------------------------- JNJ 145.3 -.45 146.44 -26% ------- RED .083 .015 --------------------------------------------------------------------- JPM 138.63 -.51 137.2 50.3% ------- RED -.099 .1 --------------------------------------------------------------------- KO 55.27 -.08 54.91 27.3% ------- BLUE .185 -.025 --------------------------------------------------------------------- MCD 196.91 -1.26 196.2 -5.8% Bearish RED .044 -.1 --------------------------------------------------------------------- MMM 175.83 -1.43 178.47 13% ------- RED .18 .023 --------------------------------------------------------------------- MRK 91.03 -.47 91.74 -30% Bearish RED .069 .034 --------------------------------------------------------------------- MSFT 157.59 -1.37 157.41 5.7% ------- RED .159 .076 Bullish --------------------------------------------------------------------- NKE 100.8 -.77 100.04 41.8% ------- RED .257 .003 --------------------------------------------------------------------- PFE 38.91 -.41 39.32 -40.7% Bearish RED -.135 .015 --------------------------------------------------------------------- PG 124.47 -1.62 124.9 -35.5% ------- RED .043 .015 --------------------------------------------------------------------- TRV 136.49 -.31 136.23 2.2% Bearish RED .067 -.081 --------------------------------------------------------------------- UNH 293.85 -2.12 295.09 21.4% ------- RED -.054 .154 --------------------------------------------------------------------- UTX 149.88 -.4 149.82 13% Bearish RED -.166 .032 --------------------------------------------------------------------- V 187.83 -1.56 187.08 -4.5% ------- RED .103 .003 --------------------------------------------------------------------- VZ 61.21 -.32 61.4 -69.9% Bearish RED .152 -.039 --------------------------------------------------------------------- XOM falling --------------------------------------------------------------------- WBA 58.91 -.11 58.57 44.3% Bearish RED -.162 .001 --------------------------------------------------------------------- WMT 119.4 -.19 119.03 -37.2% Bearish RED -.039 -.056 --------------------------------------------------------------------- DOW 69.48 -.41 70.29 -32.8% Bearish RED -.086 -.033 |
Table 2 QUICKSILVER on ETFS - 12/30/19 ETF CLOSE CHANGE PIVOT-PT 5-dma AROC CL-PWR CANDLE IP21 ITRS --------------------------------------------------------------------------------------------- DIA 284.53 -1.8 285.33 1.2% Bearish RED -.053 0 --------------------------------------------------------------------------------------------- BA 326.4 -3.74 337.55 -24.1% Bearish RED -.343 -.168 bearish --------------------------------------------------------------------------------------------- SPY 321.08 -1.78 321.22 5.4% ------- RED .08 .021 --------------------------------------------------------------------------------------------- QQQ 212.21 -1.4 211.81 11.8% ------- RED .138 .044 --------------------------------------------------------------------------------------------- MDY 375.01 -.35 375.24 -7.3% Bearish RED .052 .01 --------------------------------------------------------------------------------------------- IWM 165.44 -.42 166.3 -15.9% Bearish RED -.019 .027 --------------------------------------------------------------------------------------------- FAS 93.69 -1 93 -15.4% Bearish RED -.062 .153 --------------------------------------------------------------------------------------------- RETL 28.08 -.63 27.43 46.4% Bearish RED -.007 .117 --------------------------------------------------------------------------------------------- SOXL 272.99 -5.87 278.87 -76.9% ------- RED .098 .429 --------------------------------------------------------------------------------------------- TECL 239.98 -4.35 238.77 77.3% ------- RED .186 .337 bullish --------------------------------------------------------------------------------------------- IBB 120.18 -1.38 122.92 -76.3% Bearish RED .083 .114 --------------------------------------------------------------------------------------------- GLD 142.63 .3 139.95 110.2% Bullish BLUE .154 -.038 --------------------------------------------------------------------------------------------- OIH 11.91 -.37 12.55 -429.3% Bearish RED -.058 -.166 bearish --------------------------------------------------------------------------------------------- GASL 9.34 .01 9.89 119.1% ------- RED .04 .354 --------------------------------------------------------------------------------------------- |
  Table 3  Count of Stocks in Key Directories
           20191230
-------------------------------
NEWHIGHS       120   Bullish
NEWLOWS        7     very low
MAXCP          25
MINCP          29    Bearish
TTTNH          18
TTTNL          46
FASTUP         69
FASTDOWN       49
CPCROSSA       49
CPCROSSD       172   Bearish
BIGVOLUP       7
BIGVODN        12
ACCUMVER       14
HIGHIP21       41
HIUPPCT        29
REDSELL        88
AUGSELS7       48
TRAPDOOR       16
|
Table 4  RANKING OF KEY DIRECTORIES BASED PCT.OF STOCKS ABOVE 65-DMA
             12/30/19
 Bullish = 44
 Bearish = 2
---------------------------------------------------------------------------------------
Directory     Current       day-1         day-2         day-3         day-4         day-5
----------------------------------------------------------------------------------------
BIGBANKS       1             1             1             1             1             1
COPPER         1             .875          .875          .875          .875          .875
REGBANKS       .923          .923          1             1             1             1
INDEXES        .897          .844          .838          .822          .822          .822
ETFS           .879          .931          .948          .913          .931          .931
DOWJONES       .866          .866          .833          .833          .8            .833
NASD-100       .865          .886          .896          .876          .865          .876
GAMING         .863          .863          .818          .818          .818          .863
FOOD           .851          .851          .833          .796          .74           .703
SP-100         .844          .855          .855          .833          .833          .811
SEMI           .83           .858          .83           .839          .82           .83
GOLD           .823          .803          .823          .803          .686          .45
NIFTY          .807          .824          .824          .824          .824          .824
COMODITY       .804          .804          .78           .731          .707          .658
JETS           .8            .9            .9            .9            .9            .9
ELECTRON       .796          .815          .815          .796          .769          .782
FIDSTKS        .793          .837          .837          .821          .826          .843
CHINA          .781          .763          .781          .763          .781          .727
FINANCE        .779          .802          .825          .825          .813          .837
SP500          .76           .779          .777          .779          .766          .789
RUS-1000       .751          .77           .769          .765          .759          .784
BEVERAGE       .75           .75           .75           .75           .687          .75
AUTO           .743          .743          .769          .769          .769          .82
UTILITY        .725          .725          .625          .65           .65           .825
INDMATER       .723          .736          .75           .776          .789          .736
GREEN          .72           .76           .8            .8            .76           .76
CHEM           .714          .734          .775          .775          .795          .775
HACKERS        .7            .7            .65           .65           .65           .65
TRANSP         .7            .8            .8            .7            .75           .75
DJI-13         .692          .692          .615          .615          .615          .615
GUNS           .687          .687          .75           .75           .687          .75
HOSPITAL       .681          .636          .636          .636          .681          .636
BIOTECH        .674          .689          .695          .718          .706          .677
INFRA          .666          .694          .722          .694          .694          .666
RETAIL         .666          .725          .764          .745          .725          .764
OILGAS         .661          .639          .691          .683          .683          .647
SOFTWARE       .65           .683          .7            .716          .716          .683
COMPUTER       .631          .684          .684          .684          .684          .631
EDU            .611          .666          .722          .666          .666          .722
MILITARY       .607          .607          .607          .607          .607          .571
BONDFUND       .598          .607          .598          .598          .526          .535
SOLAR          .576          .615          .615          .615          .615          .692
INSURANC       .567          .54           .513          .513          .513          .513
REIT           .544          .551          .517          .496          .489          .524
===========================================================================================
HOMEBLDG       .354          .387          .387          .354          .322          .451
COAL           .2            .2            .2            .2            .2            .2
|
=======================================================================
12/27/2019
Peerless remains on
Buys. Hold DIA, SPY and IBB as well as Bullish
MAXCPs. The Seasonality is still favorable. In years before a Presidential
Election since 1968, after December 29th, DJI rallied 76.9% of the time
over the next 5 trading days and rose on average 0.5%. The FED has promised
enormous cash injections in the Banking System until April and the Ten Year
rates fell back further below 2% on Friday. It's hard to see how the market can
decline
under these conditions, so long as the data on profits and jobs remain favorable.
But next year, we will have to pay more attention to Dollar, which is
weakneing, and to whether the CPI (12 month rate of Inflation) surpasses
4% as well as all the politcal campaigning. The DJI has averaged only about
+5% in Presidential Election Years since 1916. So, we will have to become
more guarded and happy with smaller trading gains unless Wall Street can create
a new speculative boom in smaller stocks. Watch IWM for evidence of that.
PEERLESS DJIA


Early Warning Signs?
The Dollar shows a bearish head/shoulders top.

We have to note, however, that Friday saw some deterioration in the
market's internals. There were more down than up on the NYSE on
Friday and our Tiger Accumulation Index turned negative even
though the DJI rose slightly and closed 1.7% above its 21-day ma.
This is more likely to become a problem and a Peerless Sell S12
early next year if it continues. You can from our history of Sell S12s
in late December and the first half of January (shown below) that there is
only one case of a December Sell S12 and it occurred in a deep bear
market (unlike now) and was better waited until January to be acted upon.
If we do get an early January S12, it will because the DJI has closed 2.5%
or more above the 21-day ma and our IP21 is negative. In the table
below we show January Sell S12 as Red) and the December case as
Maroon. A glance down the Gain/Loss column
shows that 20 of the
January S12s might have been employed to profitably short the DJI if one had
then used the next Peerless Buy signal to cover. Only in 3 cases, would
this approach have been unprofitable. In Presidential Election years,
as 2020 will be, the past gains would have been +.046 (1932), +.107 (1960),
+.086 (1968), +.108 (1984) and +.130 (2000) and averaged .096 or 9.6%.
Old Signal DJIA Gain/Loss
---- Subseq. Peak -------
Shorted Gain/Loss
Date
when
Reversed by
Peerless
19300110 S12
250.00 -.014
253.5 -.014
1/23
(DJI already in Bear Market already)
-------------------------------------------------------------------
19310105 S12
170.7 .046
173 -.0134 1/8
(DJI already in Bear Market already)
-------------------------------------------------------------------
PE 19320108
S12 81.8 .046
85.9 -.0501 1/15
(DJI already in Bear Market already)
-------------------------------------------------------------------
19330106 S12
62.9
.183
64.4 -.0238
1/10
(DJI already in Bear Market already)
-------------------------------------------------------------------
19341005 S12
92.9 -.026
92.5 -.0044 10/16
-------------------------------------------------------------------
19350104 S12
104.7 .067
107.2 -.0238
2/18
------------------------------------------------------------------
19380106 S12
128.9 .044
134.4 -.0426 1/11
------------------------------------------------------------------
19410103 S12
132
.092 133.6 -.0121 ?
-------------------------------------------------------------------
19420107 S12
113.1 .134
none 0 paper loss
(DJI already in Bear Market already)
-------------------------------------------------------------------
19490106 S12 180.2
.083
181.3 -.0061 1/7
-------------------------------------------------------------------
PE
19600105 S12
685.5 .107
none 0 paper loss
-------------------------------------------------------------------
19660106 S12
985.46 .213
994.2 -.0088
1/18
-------------------------------------------------------------------
PE
19680108 S12
908.92 .086
none 0 paper loss
-------------------------------------------------------------------
19700102 S12 809.7
.056
811.31 -.0019 1/05
(DJI already in Bear Market already)
------------------------------------------------------------------
19730111 S12 1051.7
.108
none
0 paper loss
------------------------------------------------------------------
19731228 S12 848.02 .031
880.23 -.0379
1/4
19740102 S12
855.32 .040
880.23 -.0291 1/4
(DJI already in Bear Market already)
------------------------------------------------------------------
19810102 S12 972.78
.042
1004.69 -.0328 1/6
------------------------------------------------------------------
19830106 S12 1070.92 .038
1092.35 -.02
1/10
------------------------------------------------------------------
PE
19840105 S12
1282.24 .108
1286.22 -.0031
1/9
-------------------------------------------------------------------|
PE
20000111 S12
11511.08 .13
11722.9 -.0184
1/14
-------------------------------------------------------------------
20010104 S12 10912.4 .129 10983.6
-.0065 2/1
-------------------------------------------------------------------
20090106 S12 9015.1
.087
none 0 paper loss
(DJI already in Bear Market already)
-------------------------------------------------------------------
20190115 S12 24065.59 -.013 24370.1
-.029
?
 |
|
Charts 12/27/2019 2019 PEERLESS DJI, Signals, Indicators Daily DJI Volume 10-DayUp/Down Vol Stoch-20 Hourly DJIA A/D Line for All Stocks Inverted Traders Index NASDAQ S&P OEX NYSE COMPQX DJI-15 DJI-20 DJI-30 DIA SPY QQQ MDY IWM TNA Short-Term Rates USO-CrudeOil DBO FAS GLD BBH IBB JETS JNUG KOL NUGT OIH OIL RSX RETL SDS AGQ SLV SOXL TECL TLT TMF TNA UGA (gasoline) XIV and China: YINN CHAU Commodities: CANE CORN DBC JJC, NIB, CHOC CORN, CUT (paper) MOO, SOYB WEAT UUP (Dollar) LIT (Lithium) AAPL ADBE ALXN AMAT AMGN AMD AMZN AXP BA BABA BAC BIDU CAT CVX DE FB GOOG GS HD IBM INTU JPM M (Macy's) MSFT NFLX NKE NVDA PG QCOM TSLA TXN XOM V WMT CMG , LRCX, SWKS, MDGL SPPI SQ TOWN 12/27/19 (Click on Underlined link.) New highs and Bullish MAXCPs - http://tigersoft.com/max/12-27/BULLISH.htm Bearish MAXCPs - http://tigersoft.com/min/12-27/BEARISH.htm |
 Table 1  QUICKSILVER on DJI-30 STOCKS 12/27/2019
 25 of 30 show rising 5-dma.
STOCKS CLOSE CHANGE PIVOT-PT 5-dma AROC CL-PWR CANDLE IP21 ITRS
----------------------------------------------------------------------------------------
AAPL 289.8 -.11 279.44 172.5% ------- RED .209 .176 Bullish
---------------------------------------------------------------------
AXP 125.19 -.22 125.77 14.4% ------- RED .112 .006
---------------------------------------------------------------------
BA 330.14 .22 328 -50.5% Bearish BLUE-.335 -.174 Bearish
Dangerous is it breaks below 320.
---------------------------------------------------------------------
CAT 148.28 .06 147.57 110.6% Bearish RED .18 .079
---------------------------------------------------------------------
CSCO 47.77 -.08 47.45 -11.5% Bearish RED -.061 -.039
---------------------------------------------------------------------
CVX 120.3 -.3 119.68 90.6% Bearish RED -.153 -.015
---------------------------------------------------------------------
DIS 145.75 .05 146.88 -13.7% Bearish RED -.21 .054
---------------------------------------------------------------------
GS 230.66 -.55 228.93 15.7% Bearish RED -.12 .052
---------------------------------------------------------------------
HD 219.97 -.85 221.19 -5.7% Bearish RED -.016 -.128
---------------------------------------------------------------------
IBM 135.27 .36 135.59 26.3% Bearish BLUE-.19 -.108 Bearish
---------------------------------------------------------------------
INTC 60.08 .26 58.95 179.4% Bearish BLUE .027 .086
---------------------------------------------------------------------
JNJ 145.75 -.08 146.06 13.7% ------- RED .107 .018
---------------------------------------------------------------------
JPM 139.14 .1 137.24 65% ------- RED -.071 .102
---------------------------------------------------------------------
KO 55.35 .33 54.97 94% ------- BLUE .19 -.025
---------------------------------------------------------------------
MCD 198.17 1.11 197.14 28.2% ------- BLUE .088 -.109
---------------------------------------------------------------------
MMM 177.26 .67 175.37 145.3% ------- BLUE .212 .033
---------------------------------------------------------------------
MRK 91.5 .16 91.58 82.8% ------- RED .093 .023
---------------------------------------------------------------------
MSFT 158.96 .29 157.41 103.3% ------- RED .192 .072 Bullish
---------------------------------------------------------------------
NKE 101.57 .86 99.96 20.9% ------- BLUE .281 .01
---------------------------------------------------------------------
PFE 39.32 -.06 39.23 44.6% Bearish RED -.076 .022
---------------------------------------------------------------------
PG 126.09 .87 125.36 46.8% ------- BLUE .064 .013
---------------------------------------------------------------------
TRV 136.8 .51 136.43 12.1% Bearish BLUE .066 -.101
---------------------------------------------------------------------
UNH 295.97 .32 292.59 22.9% ------- -----.026 .189
---------------------------------------------------------------------
UTX 150.28 -.43 149.49 52.5% Bearish RED -.132 .039
---------------------------------------------------------------------
V 189.39 .23 188 75.9% ------- RED .17 .005
---------------------------------------------------------------------
VZ 61.53 .24 62.07 59.5% ------- BLUE .16 -.04
---------------------------------------------------------------------
WBA 59.02 .12 58.39 108.7% Bearish BLUE-.095 .02
---------------------------------------------------------------------
WMT 119.59 .07 120.29 -20.5% Bearish RED -.065 -.059
---------------------------------------------------------------------
DOW 69.89 -.24 69.94 35.7% Bearish RED -.053 -.036
|
Table 2 QUICKSILVER on ETFS - 12/27/19 ETF CLOSE CHANGE PIVOT-PT 5-dma AROC CL-PWR CANDLE IP21 ITRS
---------------------------------------------------------------------------------------------
DIA 286.33 .27 284.46 32.8% Bearish RED .025 ------
---------------------------------------------------------------------------------------------
BA 330.14 .22 328 -50.5% Bearish BLUE -.335 -.174
---------------------------------------------------------------------------------------------
SPY 322.86 -.08 320.73 30.5% ------- RED .14 .022
healthy
---------------------------------------------------------------------------------------------
QQQ 213.61 -.18 211.71 64.9% ------- RED .186 .046 Bullish
healthy
---------------------------------------------------------------------------------------------
MDY 375.36 -.73 375.56 2.3% Bearish RED .087 .012
---------------------------------------------------------------------------------------------
IWM 165.86 -.82 165.97 3.9% Bearish RED .008 .034
---------------------------------------------------------------------------------------------
FAS 94.69 -.09 93.98 64.5% Bearish RED .009 .161
---------------------------------------------------------------------------------------------
RETL 28.71 .31 27.82 201.4% Bearish ---- .015 .177
---------------------------------------------------------------------------------------------
SOXL 278.86 -3.14 277.29 183.7% ------- RED .123 .469
---------------------------------------------------------------------------------------------
TECL 244.33 .3 236.26 246.5% ------- RED .215 .343 Bullish
healthy
---------------------------------------------------------------------------------------------
IBB 121.56 -1.02 122.05 16.7% ------- RED .163 .128
healthy
---------------------------------------------------------------------------------------------
GLD 142.33 -.05 139.52 105% Bullish BLUE .154 -.046
---------------------------------------------------------------------------------------------
OIH 11.91 -.37 12.55 -429.3% Bearish RED -.058 -.174 Bearish
---------------------------------------------------------------------------------------------
GASL 9.33 -.72 9.11 -67.1% ------- RED .086 .351
---------------------------------------------------------------------------------------------
|
Table 3    Count of Stocks in Key Directories
           20191227
-------------------------------
NEWHIGHS       235  Bullishly much higher than new lows.
NEWLOWS        7
MAXCP          28
MINCP          22
TTTNH          10
TTTNL          31
FASTUP         54
FASTDOWN       37
CPCROSSA       26
CPCROSSD       135
BIGVOLUP       7
BIGVODN        10
ACCUMVER       14
HIGHIP21       39
HIUPPCT        28
REDSELL        89
AUGSELS7       50
TRAPDOOR       16
|
Table 4  RANKING OF KEY DIRECTORIES BASED PCT.OF STOCKS ABOVE 65-DMA
              12/27/19
Bullish = 44
Bearish = 2
---------------------------------------------------------------------------------------
Directory     Current       day-1         day-2         day-3         day-4         day-5
----------------------------------------------------------------------------------------
BIGBANKS       1             1             1             1             1             1
ETFS           .931          .948          .913          .931          .931          .931
REGBANKS       .923          1             1             1             1             1
JETS           .9            .9            .9            .9            .9            .9
NASD-100       .886          .907          .886          .865          .876          .855
COPPER         .875          .875          .875          .875          .875          1
GAMING         .863          .818          .818          .818          .863          .772
DOWJONES       .862          .827          .827          .793          .827          .827
SEMI           .858          .83           .839          .82           .83           .82
SP-100         .855          .855          .833          .833          .811          .811
FOOD           .849          .83           .792          .735          .698          .698
INDEXES        .844          .838          .822          .822          .822          .817
FIDSTKS        .837          .837          .821          .826          .843          .832
NIFTY          .824          .824          .824          .824          .824          .842
ELECTRON       .81           .81           .79           .764          .771          .758
COMODITY       .804          .78           .731          .707          .658          .658
GOLD           .803          .823          .803          .686          .45           .568
FINANCE        .802          .825          .825          .813          .837          .837
TRANSP         .8            .8            .7            .75           .75           .75
SP500          .779          .779          .779          .766          .789          .754
RUS-1000       .771          .771          .765          .76           .783          .758
CHINA          .763          .781          .763          .781          .727          .69
GREEN          .76           .8            .8            .76           .76           .76
BEVERAGE       .75           .75           .75           .687          .75           .625
AUTO           .743          .769          .769          .769          .82           .897
INDMATER       .736          .75           .776          .789          .736          .71
CHEM           .734          .775          .775          .795          .775          .755
RETAIL         .725          .764          .745          .725          .764          .745
UTILITY        .725          .625          .65           .65           .8            .725
HACKERS        .7            .7            .65           .65           .65           .7
INFRA          .694          .722          .694          .694          .666          .694
DJI-13         .692          .615          .615          .615          .615          .615
GUNS           .687          .75           .75           .687          .75           .75
BIOTECH        .686          .692          .715          .706          .68           .668
COMPUTER       .684          .684          .684          .684          .631          .684
SOFTWARE       .683          .716          .716          .716          .683          .683
EDU            .666          .722          .666          .666          .722          .666
OILGAS         .639          .691          .683          .683          .647          .632
HOSPITAL       .636          .636          .636          .681          .636          .636
SOLAR          .615          .615          .615          .615          .692          .615
BONDFUND       .607          .598          .598          .526          .535          .58
MILITARY       .607          .607          .607          .607          .571          .535
REIT           .551          .517          .496          .489          .524          .496
INSURANC       .54           .513          .513          .513          .513          .54
==========================================================================================
HOMEBLDG       .387          .387          .354          .322          .451          .29
COAL           .2            .2            .2            .2            .2            .2
|
====================================================================
12/26/2019
Peerless remains on Buys based
on seasonality and the seemingly
ever-rising NYSE A/D Line. Since 1967, the DJI has risen 70% of the
time over the next ten trading days and gained 0.8%. But this is no
ordinary third Presidential Election year rally. The 10-year Bond still
yields less than 2% and Unemployment is near record lows when we
are at peace. Hold your longs. At some point, there may be a buying
panic.
It's true that the DJI's IP21 is not very positive when we use its hypothetical
highs and lows in its calculation. It stands at only .014. With the DJI 1.8%
over the 21-day ma, there is a chance we will get a Sell S12 next week. This
would be based on the DJI closing above 29000 with the IP21 negative.
But the DJI's other variables are all positive, so there may be not even
be a Sell S12 if the DJI's IP21 drops below zero. We must wait and
see what the technical readings are apt to be next week.

It is also true that that high priced Boeing could break badly below 320, but
even if we did get a Sell on the DJI and DIA next week, we will have to take
into account the way QQQ and the NASDAQ can sometimes top out
weeks after the DJI does. Moreover, look below at Table 2 at how
high the IP21 levels are for SPY (+.167), QQQ (+.211) and MDY (+118)
and how much better they are performing than the DJI, as measured by
our ITRS.
Hold DIA, QQQ and IWM as well as some of the high Accumulation/ITRS
stocks shown among the BULLISH MAXCPs. I believe the best of the
low-priced stocks, like BLDP, will enjoy new influxes of investment funds
at the start of the new year.
|
Charts 12/26/2019 2019 PEERLESS DJI, Signals, Indicators Daily DJI Volume 10-DayUp/Down Vol Stoch-20 Hourly DJIA A/D Line for All Stocks Inverted Traders Index NASDAQ S&P OEX NYSE COMPQX DJI-15 DJI-20 DJI-30 DIA SPY QQQ MDY IWM TNA Short-Term Rates USO-CrudeOil DBO FAS GLD BBH IBB JETS JNUG KOL NUGT OIH OIL RSX RETL SDS AGQ SLV SOXL TECL TLT TMF TNA UGA (gasoline) XIV and China: YINN CHAU Commodities: CANE CORN DBC JJC, NIB, CHOC CORN, CUT (paper) MOO, SOYB WEAT UUP (Dollar) LIT (Lithium) AAPL ADBE ALXN AMAT AMGN AMD AMZN AXP BA BABA BAC BIDU CAT CVX DE FB GOOG GS HD IBM INTU JPM M (Macy's) MSFT NFLX NKE NVDA PG QCOM TSLA TXN XOM V WMT CMG , LRCX, SWKS, MDGL SPPI SQ TOWN 12/26/19 (Click on Underlined link.) New highs and Bullish MAXCPs - http://tigersoft.com/max/12-26/BULLISH.htm Bearish MAXCPs - http://tigersoft.com/min/12-26/BEARISH.htm |
 Table 1  QUICKSILVER on DJI-30 STOCKS 12/26/2019
 27 of 30 show rising 5-dma.
STOCKS CLOSE CHANGE PIVOT-PT 5-dma AROC CL-PWR CANDLE IP21 ITRS --------------------------------------------------------------------- AAPL 289.91 5.64 280.02 180.6% Bullish BLUE .231 .173 Bullish --------------------------------------------------------------------- AXP 125.41 .67 124.83 46.1% ------- BLUE .078 .008 --------------------------------------------------------------------- BA 329.92 -3.08 333.5 -11.4% Bearish RED -.315 -.169 Bearish --------------------------------------------------------------------- CAT 148.22 .74 145.02 37.4% Bearish BLUE .187 .073 Bullish --------------------------------------------------------------------- CSCO 47.85 .07 47.88 127.2% Bearish BLUE-.098 -.026 --------------------------------------------------------------------- CVX 120.6 .26 118.13 85.8% Bearish RED -.129 -.022 --------------------------------------------------------------------- DIS 145.7 .41 146.15 -19.2% Bearish BLUE-.21 .064 --------------------------------------------------------------------- GS 231.21 1.3 229.94 16.5% Bearish BLUE-.07 .061 --------------------------------------------------------------------- HD 220.82 .15 220.22 64.1% ------- BLUE .076 -.121 --------------------------------------------------------------------- IBM 134.91 -.07 134.56 18.5% Bearish RED -.213 -.115 Bearish --------------------------------------------------------------------- INTC 59.82 .41 57.96 226.3% Bearish BLUE .056 .078 --------------------------------------------------------------------- JNJ 145.83 -.1 145.35 90.8% ------- RED .18 .039 --------------------------------------------------------------------- JPM 139.04 1.46 137.35 36.4% ------- BLUE-.025 .1 --------------------------------------------------------------------- KO 55.02 .31 54.32 101.7% ------ BLUE .218 -.03 --------------------------------------------------------------------- MCD 197.06 .39 197.06 36.4% ------- BLUE .127 -.108 --------------------------------------------------------------------- MMM 176.59 -.09 172.15 216.8% ------- BLUE .175 .025 --------------------------------------------------------------------- MRK 91.34 -.1 89.99 94.6% ------- RED .179 .015 --------------------------------------------------------------------- MSFT 158.67 1.29 155.71 137.4% ------- BLUE .201 .062 Bullish --------------------------------------------------------------------- NKE 100.71 .57 101.15 7% ------- BLUE .262 .004 --------------------------------------------------------------------- PFE 39.38 .09 38.97 62.6% Bearish BLUE-.066 .02 --------------------------------------------------------------------- PG 125.22 0 124.92 48.4% ------- BLUE .097 .01 --------------------------------------------------------------------- TRV 136.29 .46 136.47 22.8% ------- BLUE .099 -.108 --------------------------------------------------------------------- UNH 295.65 1.11 294.62 46.8% ------- BLUE-.022 .181 --------------------------------------------------------------------- UTX 150.71 1.14 148.71 100.6% Bearish BLUE-.099 .048 --------------------------------------------------------------------- V 189.16 1.59 186.54 114% ------- BLUE .182 0 --------------------------------------------------------------------- VZ 61.29 .01 60.8 35.1% ------- ---- .187 -.046 --------------------------------------------------------------------- WBA 58.9 .55 57.75 146.4% Bearish BLUE-.136 .022 --------------------------------------------------------------------- WMT 119.52 .01 120.08 -14.2% Bearish RED -.016 -.059 --------------------------------------------------------------------- DOW 70.13 .11 69.39 18.6% Bearish RED -.017 -.048 |
Table 2 QUICKSILVER on ETFS - 12/26/19 ETF CLOSE CHANGE PIVOT-PT 5-dma AROC CL-PWR CANDLE IP21 ITRS --------------------------------------------------------------------------------------------- DIA 286.06 1.05 284.46 50.1% ------- BLUE .046 ----- --------------------------------------------------------------------------------------------- BA 329.92 -3.08 333.5 -11.4% Bearish RED -.315 -.169 --------------------------------------------------------------------------------------------- SPY 322.94 1.71 320.9 52.2% ------- BLUE .168 .022 --------------------------------------------------------------------------------------------- QQQ 213.79 1.87 210.86 100.4% ------- BLUE .212 .046 Bullish --------------------------------------------------------------------------------------------- MDY 376.09 .83 375.19 33.9% ------- BLUE .119 .015 --------------------------------------------------------------------------------------------- IWM 166.68 0 165.73 50% Bearish RED .008 .042 --------------------------------------------------------------------------------------------- FAS 94.78 1.38 93.48 112% ------- BLUE .056 .159 --------------------------------------------------------------------------------------------- RETL 28.4 .59 27.59 221.3% Bearish BLUE .071 .184 --------------------------------------------------------------------------------------------- SOXL 282 1.06 268.66 356.5% ------- RED .142 .421 --------------------------------------------------------------------------------------------- TECL 244.03 5.04 232.59 338.2% ------- BLUE .203 .315 Bullish --------------------------------------------------------------------------------------------- IBB 122.58 -.92 121.15 82.8% ------- RED .221 .138 Bullish --------------------------------------------------------------------------------------------- GLD 142.38 1.11 139.38 120.1% Bullish BLUE .209 -.039 --------------------------------------------------------------------------------------------- OIH 11.91 -.37 12.55 -429.3% Bearish RED -.058 -.172 --------------------------------------------------------------------------------------------- GASL 10.05 .16 9.46 538.2% ------- RED .076 .417 --------------------------------------------------------------------------------------------- UGA 10.05 .16 9.46 538.2% ------- RED .088 -.732 --------------------------------------------------------------------------------------------- UUP 26.22 -.04 26.71 -92.3% ------- --- -.249 -.081 --------------------------------------------------------------------------------------------- |
  Table 3  Count of Stocks in Key Directories
          20191226
-------------------------------
NEWHIGHS       404  Bullish
NEWLOWS        14   Very low...
MAXCP          72
MINCP          23
TTTNH          28
TTTNL          18
FASTUP         97
FASTDOWN       39
CPCROSSA       62
CPCROSSD       65
BIGVOLUP       7
BIGVODN        11
ACCUMVER       12
HIGHIP21       48
HIUPPCT        27
REDSELL        91
AUGSELS7       40
TRAPDOOR       16
|
Table 4  RANKING OF KEY DIRECTORIES BASED PCT.OF STOCKS ABOVE 65-DMA
              12/26/19
Bullish = 44
Bearish = 2
---------------------------------------------------------------------------------------
Directory     Current       day-1         day-2         day-3         day-4         day-5
----------------------------------------------------------------------------------------
BIGBANKS       1             1             1             1             1             1
REGBANKS       1             1             1             1             1             1
ETFS           .948          .913          .931          .931          .931          .913
NASD-100       .907          .896          .876          .876          .855          .845
JETS           .9            .9            .9            .9            .9            .9
COPPER         .875          .875          .875          .875          1             1
SP-100         .855          .833          .833          .811          .811          .8
INDEXES        .838          .822          .822          .822          .817          .806
FIDSTKS        .837          .821          .826          .843          .826          .793
DOWJONES       .833          .833          .8            .833          .833          .8
FOOD           .83           .792          .735          .698          .698          .716
SEMI           .83           .839          .82           .83           .82           .811
FINANCE        .825          .825          .813          .837          .837          .837
NIFTY          .824          .824          .824          .824          .842          .807
GOLD           .823          .803          .686          .45           .568          .529
GAMING         .818          .818          .818          .863          .772          .863
ELECTRON       .81           .79           .764          .771          .764          .745
GREEN          .8            .8            .76           .76           .76           .72
TRANSP         .8            .7            .75           .75           .75           .7
CHINA          .781          .763          .781          .727          .69           .69
COMODITY       .78           .731          .707          .658          .658          .682
SP500          .779          .781          .766          .789          .754          .739
CHEM           .775          .775          .795          .775          .755          .755
RUS-1000       .771          .767          .76           .783          .758          .732
AUTO           .769          .769          .769          .82           .897          .897
RETAIL         .764          .745          .725          .764          .745          .745
BEVERAGE       .75           .75           .687          .75           .625          .625
GUNS           .75           .75           .687          .75           .75           .687
INDMATER       .75           .776          .789          .736          .71           .723
EDU            .722          .666          .666          .722          .666          .722
INFRA          .722          .694          .694          .666          .694          .694
SOFTWARE       .716          .733          .716          .683          .683          .666
HACKERS        .7            .7            .65           .65           .7            .7
OILGAS         .691          .683          .683          .647          .625          .639
BIOTECH        .689          .712          .703          .68           .671          .671
COMPUTER       .684          .684          .684          .631          .684          .578
HOSPITAL       .636          .636          .681          .636          .636          .636
UTILITY        .625          .65           .65           .8            .725          .65
DJI-13         .615          .615          .615          .615          .615          .615
SOLAR          .615          .615          .615          .692          .615          .692
MILITARY       .607          .607          .607          .571          .535          .571
BONDFUND       .598          .598          .526          .535          .589          .589
REIT           .517          .496          .489          .524          .496          .468
INSURANC       .513          .513          .513          .513          .54           .567
===============================================================================================
HOMEBLDG       .387          .354          .322          .451          .322          .354
COAL           .2            .2            .2            .2            .2            .2
|
====================================================================
12/24/2019
Peerless remains on Buys.
Gold has moved up above its 65-dma
and the Dollar has fallen below that moving average. This bears watching,
but the seasonality is very bullish and almost all our indicators are quite
bullish. Watch the positive role that fund-window dressing plays on the
leaders like AAPL and AMD. Window-Dressing in reverse may work to
depress Boeing and MCD in the DJI-30.
High Accumulation (presently and for last year) coupled with high relative
strength vs DJI (ITRS) should be a particularly reliable tool now and
as the new year starts. Our Bullish MAXCPs now include lots of low
priced stocks. There is ample precedent to lead us to expect low priced
stocks may take over the market's leadership as the new year starts.
QQQ is significantly out-performing the DJI and DIA.

QQQ is running in all-time high territory. The advance
is broad and not based on only AAPL and MSFT.

|
Charts 12/24/2019 2019 PEERLESS DJI, Signals, Indicators Daily DJI Volume 10-DayUp/Down Vol Stoch-20 Hourly DJIA A/D Line for All Stocks Inverted Traders Index NASDAQ S&P OEX NYSE COMPQX DJI-15 DJI-20 DJI-30 DIA SPY QQQ MDY IWM TNA Short-Term Rates USO-CrudeOil DBO FAS GLD BBH IBB JETS JNUG KOL NUGT OIH OIL RSX RETL SDS AGQ SLV SOXL TECL TLT TMF TNA UGA (gasoline) XIV and China: YINN CHAU Commodities: CANE CORN DBC JJC, NIB, CHOC CORN, CUT (paper) MOO, SOYB WEAT UUP (Dollar) LIT (Lithium) AAPL ADBE ALXN AMAT AMGN AMD AMZN AXP BA BABA BAC BIDU CAT CVX DE FB GOOG GS HD IBM INTU JPM M (Macy's) MSFT NFLX NKE NVDA PG QCOM TSLA TXN XOM V WMT CMG , LRCX, SWKS, MDGL SPPI SQ TOWN 12/24/19 (Click on Underlined link.) New highs and Bullish MAXCPs - http://tigersoft.com/max/12-24/BULLISH.htm Bearish MAXCPs - http://tigersoft.com/min/12-24/BEARISH.htm |
 Table 1     QUICKSILVER on DJI-30 STOCKS 12/24/2019
 Rising 5-dma = 22 of 30
SYMBOL CLOSE CHANGE PIVOT-PT 5-dma AROC CL-PWR CANDLE IP21 ITRS Remarks
TREND COLOR
-----------------------------------------------------------------------------------------
AAPL 284.27 .27 279.74 68.8% Bullish RED .226 .141 Bullish
---------------------------------------------------------------------
AXP 124.74 .25 124.26 -8.4% Bullish ---- .088 .008
---------------------------------------------------------------------
BA 333 -4.55 330.68 90.5% ------- RED -.278 -.172 Bearish
---------------------------------------------------------------------
CAT 147.48 -1.02 147.12 37.8% ------- RED .2 .085 Bullish
---------------------------------------------------------------------
CSCO 47.78 -.32 46.64 141.6% ------- RED -.072 -.026
---------------------------------------------------------------------
CVX 120.34 .01 118.55 73.1% ------- RED -.13 -.028
---------------------------------------------------------------------
DIS 145.29 .61 146.26 -83.4% Bearish BLUE-.186 .056
---------------------------------------------------------------------
GS 229.91 .82 230.45 -27% ------- BLUE-.063 .053
---------------------------------------------------------------------
HD 220.67 1.46 218 67.3% Bullish BLUE .116 -.122
---------------------------------------------------------------------
IBM 134.98 -.57 134.41 28.2% ------- RED -.169 -.114 Bearish
---------------------------------------------------------------------
INTC 59.41 .18 57.17 181.5% ------- BLUE .069 .086
---------------------------------------------------------------------
JNJ 145.93 -.51 143.19 81.8% Bullish RED .183 .052 Bullish
---------------------------------------------------------------------
JPM 137.58 .38 138.04 -21.8% Bullish BLUE-.052 .117
---------------------------------------------------------------------
KO 54.71 -.2 53.91 26.6% ------- RED .208 -.038
---------------------------------------------------------------------
MCD 196.67 .47 195.63 3.8% ------- BLUE .054 -.12
---------------------------------------------------------------------
MMM 176.68 -1.79 169.03 195.1% Bullish RED .19 .037
---------------------------------------------------------------------
MRK 91.44 -.3 89.62 133.9% ------- RED .157 .016
---------------------------------------------------------------------
MSFT 157.38 -.03 154.37 86.3% Bullish ---- .213 .064 Bullish
---------------------------------------------------------------------
NKE 100.14 .1 100.57 24.4% Bullish BLUE .205 -.009
---------------------------------------------------------------------
PFE 39.29 -.03 38.89 49.9% Bearish -----.057 .018
---------------------------------------------------------------------
PG 125.22 .32 124.01 -3.6% Bullish BLUE .107 -.021
---------------------------------------------------------------------
TRV 135.83 -.4 135.67 -42.5% Bullish RED .038 -.115
---------------------------------------------------------------------
UNH 294.54 -.55 292.9 69.4% Bullish RED .028 .271 Bullish
---------------------------------------------------------------------
UTX 149.57 -.25 147.71 31.9% ------- RED -.143 .036
---------------------------------------------------------------------
V 187.57 .49 184.9 55% Bullish BLUE .164 -.006
---------------------------------------------------------------------
VZ 61.28 -.12 60.86 -17.1% ------- RED .152 -.036
---------------------------------------------------------------------
WBA 58.35 -.22 57.2 109% Bearish RED -.18 .023
---------------------------------------------------------------------
WMT 119.51 .48 119.86 -73.7% ------- BLUE-.03 -.061
---------------------------------------------------------------------
DOW 70.02 -.27 69.87 24.3% ------- RED -.016 -.052
|
Table 2 QUICKSILVER on ETFS - 12/24/2019 ETF CLOSE CHANGE PIVOT-PT 5-dma AROC CL-PWR CANDLE IP21 ITRS --------------------------------------------------------------------------------------------- DIA 285.01 -.32 283.21 28.3% Bullish RED .065 ----- --------------------------------------------------------------------------------------------- BA 333 -4.55 330.68 90.5% ------- RED -.278 -.172 --------------------------------------------------------------------------------------------- SPY 321.23 .01 319.59 25.9% Bullish RED .18 .021 --------------------------------------------------------------------------------------------- QQQ 211.92 .11 209.55 60% Bullish RED .216 .045 --------------------------------------------------------------------------------------------- MDY 375.26 .02 373.55 25.1% Bullish RED .141 .016 --------------------------------------------------------------------------------------------- IWM 166.68 .38 165.02 59.8% Bullish BLUE .068 .045 --------------------------------------------------------------------------------------------- FAS 93.4 .4 92.69 22.5% Bullish BLUE .063 .17 --------------------------------------------------------------------------------------------- RETL 26.3 .48 23.82 295.3% Bearish BLUE .171 .067 --------------------------------------------------------------------------------------------- SOXL 280.94 2.07 262.49 334.6% Bullish BLUE .182 .506 --------------------------------------------------------------------------------------------- TECL 238.99 .22 228.14 234.4% Bullish RED .206 .326 --------------------------------------------------------------------------------------------- IBB 123.5 .58 120.56 103.3% Bullish BLUE .31 .163 --------------------------------------------------------------------------------------------- GLD 141.27 1.32 139.02 81.1% Bullish BLUE .125 -.059 --------------------------------------------------------------------------------------------- OIH 14.64 -.34 14.58 0% Bearish RED .038 -.151 --------------------------------------------------------------------------------------------- GASL 9.89 0 9.03 688.6% Bullish RED .136 .41 --------------------------------------------------------------------------------------------- |
 Table 3    Count of Stocks in Key Directories
            20191224
-------------------------------
NEWHIGHS       279   Bullish Ratio: NH/NL
NEWLOWS        13
MAXCP          33
MINCP          16
TTTNH          16
TTTNL          13
FASTUP         72
FASTDOWN       54
CPCROSSA       142
CPCROSSD       106
BIGVOLUP       1
BIGVODN        6
ACCUMVER       12
HIGHIP21       42
HIUPPCT        30
REDSELL        87
AUGSELS7       31
TRAPDOOR       15
|
Table 4   RANKING OF KEY DIRECTORIES BASED PCT.OF STOCKS ABOVE 65-DMA
             12/24/19
---------------------------------------------------------------------------------------
Directory     Current       day-1         day-2         day-3         day-4         day-5
----------------------------------------------------------------------------------------
BIGBANKS       1             1             1             1             1             1
REGBANKS       1             1             1             1             1             1
ETFS           .913          .931          .931          .931          .913          .896
JETS           .9            .9            .9            .9            .9            .9
NASD-100       .896          .886          .886          .855          .845          .824
COPPER         .875          .875          .875          1             1             1
SEMI           .849          .82           .83           .82           .811          .811
DOWJONES       .833          .8            .833          .833          .8            .8
SP-100         .833          .833          .811          .811          .8            .822
NIFTY          .824          .824          .824          .842          .807          .807
FINANCE        .823          .811          .835          .835          .835          .835
INDEXES        .822          .822          .822          .817          .806          .811
FIDSTKS        .821          .826          .843          .826          .793          .815
GAMING         .818          .818          .863          .772          .863          .909
GOLD           .803          .686          .45           .568          .529          .509
GREEN          .8            .76           .76           .76           .72           .68
ELECTRON       .797          .764          .771          .764          .745          .751
FOOD           .792          .735          .698          .698          .716          .735
SP500          .781          .768          .789          .754          .737          .72
INDMATER       .776          .789          .736          .71           .71           .71
CHEM           .775          .795          .775          .755          .734          .734
AUTO           .769          .769          .82           .897          .897          .871
RUS-1000       .765          .76           .782          .757          .73           .719
CHINA          .763          .781          .727          .69           .672          .654
BEVERAGE       .75           .687          .75           .625          .625          .625
GUNS           .75           .687          .75           .75           .687          .687
RETAIL         .745          .725          .764          .745          .745          .686
SOFTWARE       .733          .733          .683          .683          .666          .633
COMODITY       .731          .707          .658          .658          .682          .707
BIOTECH        .709          .7            .677          .671          .671          .671
HACKERS        .7            .7            .65           .7            .7            .65
TRANSP         .7            .75           .75           .75           .7            .8
INFRA          .694          .694          .666          .694          .694          .694
COMPUTER       .684          .684          .631          .684          .578          .578
OILGAS         .683          .683          .647          .625          .625          .595
EDU            .666          .666          .722          .666          .722          .777
UTILITY        .65           .65           .8            .725          .65           .625
HOSPITAL       .636          .681          .636          .636          .636          .636
DJI-13         .615          .615          .615          .615          .615          .615
SOLAR          .615          .615          .692          .615          .692          .692
MILITARY       .607          .607          .571          .535          .571          .642
BONDFUND       .594          .522          .531          .585          .594          .567
INSURANC       .513          .513          .513          .54           .567          .567
=============================================================================================
REIT           .496          .489          .524          .496          .475          .413
HOMEBLDG       .354          .322          .451          .322          .354          .483
COAL           .2            .2            .2            .2            .2            .2
|
====================================================================
12/23/2019 Peerless remains on
Buys. Most every indicator remains
bullish enough the allow the excelent year-end seasonality
play out. It's true the Dollar sold off vis-a-vid the Pound,
but that is not yet a problem for the stock market. Even the
firing of Boeing's CEO did not rattle the market.

The economic news is good, interest rates are very low and
it is believed the FED will inject liquidity until April. All this
is good reason why there are so few new lows and only
a dozen or so Bearish MINCPs and hundreds more new highs
and Bullish MAXCPs.

It increasingly looks like the small investor is getting the
message to come to the Party and buy some low-priced NASDAQ
stocks. The excitement could continue for months if Trump
escapes Impeachment and low-priced stocks, as whole,
are played aggressively by Funds, too. My guess is that the
market will not make a major top until 10-Year Treasuries
and the CPI's year-to-year percent-change both rise over 4%.
As long as the A/D Line keep making new highs, stocks
are winning the investment battle with bonds. The high Accumulation
levels now suggest that there is lots of Big-Money ready to swoop
in and buy on any weakness that takes the DJI down to the 2.5%
or 3% lower band.
|
Charts 12/23/2019 2019 PEERLESS DJI, Signals, Indicators Daily DJI Volume 10-DayUp/Down Vol Stoch-20 Hourly DJIA A/D Line for All Stocks Inverted Traders Index NASDAQ S&P OEX NYSE COMPQX DJI-15 DJI-20 DJI-30 DIA SPY QQQ MDY IWM TNA Short-Term Rates USO-CrudeOil DBO FAS GLD BBH IBB JETS JNUG KOL NUGT OIH OIL RSX RETL SDS AGQ SLV SOXL TECL TLT TMF TNA UGA (gasoline) XIV and China: YINN CHAU Commodities: CANE CORN DBC JJC, NIB, CHOC CORN, CUT (paper) MOO, SOYB WEAT UUP (Dollar) LIT (Lithium) AAPL ADBE ALXN AMAT AMGN AMD AMZN AXP BA BABA BAC BIDU CAT CVX DE FB GOOG GS HD IBM INTU JPM M (Macy's) MSFT NFLX NKE NVDA PG QCOM TSLA TXN XOM V WMT CMG , LRCX, SWKS, MDGL SPPI SQ TOWN 12/23/19 (Click on Underlined link.) New highs and Bullish MAXCPs - http://tigersoft.com/max/12-23/BULLISH.htm Bearish MAXCPs - http://tigersoft.com/min/12-23/BEARISH.htm |
 Table 1     QUICKSILVER on DJI-30 STOCKS 12/23/2019
 Rising 5-dma = 25 of 30
SYMBOL CLOSE CHANGE PIVOT-PT 5-dma AROC CL-PWR CANDLE IP21 ITRS Remarks
TREND COLOR
-----------------------------------------------------------------------------------------
AAPL 284 4.56 280.41 74% Bullish BLUE .21 .138 Bullish
---------------------------------------------------------------------
AXP 124.49 -1.28 124.95 32.5% ------- RED .102 .005
---------------------------------------------------------------------
BA 337.55 9.55 327 160.2% Bearish BLUE-.236 -.164 Bearish
---------------------------------------------------------------------
CAT 148.5 .93 146.37 107.3% Bearish BLUE .216 .093 Bullish
---------------------------------------------------------------------
CSCO 48.1 .65 46.44 226.1% Bearish BLUE-.076 -.031
---------------------------------------------------------------------
CVX 120.33 .65 118.6 40.8% Bearish BLUE-.158 -.028
---------------------------------------------------------------------
DIS 144.68 -2.2 147.73 -128.5% Bearish RED -.185 .049
---------------------------------------------------------------------
GS 229.09 .16 231.15 22.9% Bearish RED -.049 .055
---------------------------------------------------------------------
HD 219.21 -1.98 217.72 84.2% ------- RED .073 -.13
---------------------------------------------------------------------
IBM 135.55 -.04 134.22 52.8% Bearish RED -.141 -.115 Bearish
---------------------------------------------------------------------
INTC 59.23 .28 57.3 132.3% Bearish BLUE .029 .073
---------------------------------------------------------------------
JNJ 146.44 .38 143.56 161.5% Bullish BLUE .184 .051 Bullish
---------------------------------------------------------------------
JPM 137.2 -.04 138.18 -5.1% ------- RED -.056 .117
---------------------------------------------------------------------
KO 54.91 -.06 54.42 45% ------- RED .221 -.034
---------------------------------------------------------------------
MCD 196.2 -.94 196.52 -42.7% Bearish RED .067 -.125
---------------------------------------------------------------------
MMM 178.47 3.1 169.93 225.1% ------- BLUE .244 .065
---------------------------------------------------------------------
MRK 91.74 .16 89.02 136.3% Bullish ---- .121 .024
---------------------------------------------------------------------
MSFT 157.41 0 154.69 60.4% ------- RED .211 .063 Bullish
---------------------------------------------------------------------
NKE 100.04 .08 99.65 61.5% ------- RED .239 .002
---------------------------------------------------------------------
PFE 39.32 .09 38.9 23.1% ------- -----.008 .025
---------------------------------------------------------------------
PG 124.9 -.46 125.31 -26.4% ------- RED .109 -.033
---------------------------------------------------------------------
TRV 136.23 -.2 136.99 1.8% ------- RED .059 -.109
---------------------------------------------------------------------
UNH 295.09 2.5 290.47 52.3% ------- BLUE .043 .265 Bullish
---------------------------------------------------------------------
UTX 149.82 .33 148.62 12.1% Bearish RED -.136 .036
---------------------------------------------------------------------
V 187.08 -.92 185.52 22.6% Bullish RED .159 -.007
---------------------------------------------------------------------
VZ 61.4 -.67 61.49 13.9% ------- RED .123 -.04
---------------------------------------------------------------------
WBA 58.57 .18 57.09 66.8% Bearish RED -.185 .021
---------------------------------------------------------------------
WMT 119.03 -1.26 121.28 -62.7% Bearish RED -.075 -.074
---------------------------------------------------------------------
DOW 70.29 .35 69.68 20.8% Bearish BLUE-.044 -.045
|
Table 2 QUICKSILVER on ETFS - 12/23/2019 ETF CLOSE CHANGE PIVOT-PT 5-dma AROC CL-PWR CANDLE IP21 ITRS --------------------------------------------------------------------------------------------- DIA 285.33 .87 283.4 39.8% ------- ---- .096 0 --------------------------------------------------------------------------------------------- BA 337.55 9.55 327 160.2% Bearish BLUE-.236 -.164 --------------------------------------------------------------------------------------------- SPY 321.22 .49 319.57 26.9% ------- RED .196 .02 --------------------------------------------------------------------------------------------- QQQ 211.81 .1 209.39 60.4% ------- RED .293 .044 --------------------------------------------------------------------------------------------- MDY 375.24 -.32 373.38 42.1% ------- RED .154 .011 --------------------------------------------------------------------------------------------- IWM 166.3 .33 164.7 73.3% ------- BLUE .072 .043 --------------------------------------------------------------------------------------------- FAS 93 -.98 92.98 17.2% ------- RED .08 .171 --------------------------------------------------------------------------------------------- RETL 27.43 -.39 26.41 341.8% ------- RED .098 .142 --------------------------------------------------------------------------------------------- SOXL 278.87 1.58 262.87 364.6% Bullish RED .136 .494 --------------------------------------------------------------------------------------------- TECL 238.77 2.51 228.08 197.7% ------- RED .189 .324 --------------------------------------------------------------------------------------------- IBB 122.92 .87 120.99 54% ------- BLUE .345 .162 --------------------------------------------------------------------------------------------- GLD 139.95 .43 139.01 32.7% Bullish BLUE .06 -.065 --------------------------------------------------------------------------------------------- OIH 11.91 -.37 12.55 -429.3% Bearish RED -.058 -.178 --------------------------------------------------------------------------------------------- GASL 9.89 .78 8.62 1056.7% ------- BLUE .16 .331 --------------------------------------------------------------------------------------------- RSX 24.75 -1.25 25.83 -187.6% ------- BLUE .147 .016 |
  Table 3   Count of Stocks in Key Directories
            20191223
-------------------------------
NEWHIGHS       336   Bullish
NEWLOWS        19
MAXCP          64
MINCP          19
TTTNH          27
TTTNL          35
FASTUP         104
FASTDOWN       53
CPCROSSA       83
CPCROSSD       76
BIGVOLUP       2
BIGVODN        8
ACCUMVER       15
HIGHIP21       47
HIUPPCT        29
REDSELL        88
AUGSELS7       34
TRAPDOOR       16
|
 Table 4
 RANKING OF KEY DIRECTORIES BASED PCT.OF STOCKS ABOVE 65-DMA
              12/23/19
 Bullish = 43
 Bearish = 3
---------------------------------------------------------------------------------------
Directory     Current       day-1         day-2         day-3         day-4         day-5
----------------------------------------------------------------------------------------
BIGBANKS       1             1             1             1             1             1
REGBANKS       1             1             1             1             1             1
ETFS           .931          .931          .931          .913          .896          .913
JETS           .9            .9            .9            .9            .9            .9
NASD-100       .886          .896          .865          .845          .824          .835
COPPER         .875          .875          1             1             1             1
SP-100         .833          .811          .811          .8            .811          .822
FIDSTKS        .826          .843          .826          .793          .815          .81
SEMI           .82           .83           .82           .811          .811          .764
GAMING         .818          .863          .772          .863          .863          .818
NIFTY          .818          .818          .836          .8            .8            .781
FINANCE        .813          .837          .837          .837          .837          .825
INDEXES        .811          .822          .817          .806          .811          .811
DOWJONES       .8            .833          .833          .8            .8            .8
CHEM           .795          .775          .755          .734          .734          .693
INDMATER       .789          .736          .71           .71           .71           .671
CHINA          .781          .727          .69           .672          .654          .636
AUTO           .769          .82           .897          .897          .871          .846
SP500          .768          .792          .754          .737          .718          .728
ELECTRON       .764          .771          .764          .745          .751          .718
GREEN          .76           .76           .76           .72           .68           .68
RUS-1000       .76           .783          .757          .73           .719          .723
TRANSP         .75           .75           .75           .7            .8            .8
FOOD           .735          .698          .698          .716          .716          .735
SOFTWARE       .733          .7            .683          .666          .633          .616
RETAIL         .725          .764          .745          .745          .705          .725
COMODITY       .707          .658          .658          .682          .682          .707
HACKERS        .7            .7            .7            .7            .6            .65
BIOTECH        .697          .674          .668          .671          .674          .662
INFRA          .694          .666          .694          .694          .694          .666
BEVERAGE       .687          .75           .625          .625          .625          .687
GUNS           .687          .75           .75           .687          .687          .625
GOLD           .686          .45           .568          .529          .509          .529
COMPUTER       .684          .631          .684          .578          .578          .578
OILGAS         .683          .647          .625          .625          .573          .507
HOSPITAL       .681          .636          .636          .636          .636          .681
EDU            .666          .722          .666          .722          .777          .722
UTILITY        .65           .8            .725          .65           .625          .6
DJI-13         .615          .615          .615          .615          .615          .615
SOLAR          .615          .692          .615          .692          .653          .73
MILITARY       .607          .571          .535          .571          .642          .642
BONDFUND       .526          .535          .589          .598          .598          .526
INSURANC       .513          .513          .54           .567          .567          .54
=============================================================================================
REIT           .489          .524          .496          .475          .413          .448
HOMEBLDG       .322          .451          .322          .354          .483          .548
COAL           .2            .2            .2            .2            .2            .2
|
====================================================================
12/20/2019 Peerless remains on
Buys and, historically, the probability is very
good (69.2% since 1968) that the DJI will rise over the next ten
days in years before a Presidential Election. The average gain here
was 0.6%. Over the next 21 trading days, the DJI rose 1.5% on
average, but the percentage of years seeing a gain dropped somewhat
to 61.5%.

The potential weakness in high-priced Boeing is holding back the DJI, which.
is still having trouble getting past its rising resistance-lines. See below how
the DJI is showing mounting resistance as measured by out Tiger Support/Resistance
Line. The Peerless Buys, the bullish Seasonality, the steady uptrend of the
NYSE A/D Line and the minimum price objective of 288-290 are all
determinants that should keep us bullish DIA, QQQ and IBB. As you can
see in the key ETFs below, both the Opening and Closing Power remain in
uptrends.

QQQ and IBB do not show such high levels from Tiger's Support/Resistance Line.
Bullishly, they show rising Opening and Closing Powers as well as high
IP21 (current Accumulation). If IBB cam make a breakout, this will further
lift QQQ.


|
Charts 12/20/2019 2019 PEERLESS DJI, Signals, Indicators Daily DJI Volume 10-DayUp/Down Vol Stoch-20 Hourly DJIA A/D Line for All Stocks Inverted Traders Index NASDAQ S&P OEX NYSE COMPQX DJI-15 DJI-20 DJI-30 DIA SPY QQQ MDY IWM TNA Short-Term Rates USO-CrudeOil DBO FAS GLD BBH IBB JETS JNUG KOL NUGT OIH OIL RSX RETL SDS AGQ SLV SOXL TECL TLT TMF TNA UGA (gasoline) XIV and China: YINN CHAU Commodities: CANE CORN DBC JJC, NIB, CHOC CORN, CUT (paper) MOO, SOYB WEAT UUP (Dollar) LIT (Lithium) AAPL ADBE ALXN AMAT AMGN AMD AMZN AXP BA BABA BAC BIDU CAT CVX DE FB GOOG GS HD IBM INTU JPM M (Macy's) MSFT NFLX NKE NVDA PG QCOM TSLA TXN XOM V WMT CMG , LRCX, SWKS, MDGL SPPI SQ TOWN 12/20/19 (Click on Underlined link.) New highs and Bullish MAXCPs - http://tigersoft.com/max/12-20/BULLISH.htm Bearish MAXCPs - http://tigersoft.com/min/12-20/BEARISH.htm |
Table 1 QUICKSILVER on DJI-30 STOCKS 12/19/2019 29 of 30 show rising 5-day ma SYMBOL CLOSE CHANGE PIVOT-PT 5-dma AROC CL-PWR CANDLE IP21 ITRS Remarks
TREND COLOR
-----------------------------------------------------------------------------------------
AAPL 279.77 -.25 279.86 82.8% Bullish RED .191 .141 Bullish
---------------------------------------------------------------------
AXP 125.81 .98 123.68 43.8% ------- BLUE .091 .019
---------------------------------------------------------------------
BA 329.26 -4.24 327 -186.9% Bearish RED -.239 -.187 Bearish
---------------------------------------------------------------------
CAT 147.16 2.14 145.36 55.9% ------- RED .153 .125 Bullish
---------------------------------------------------------------------
CSCO 47.58 -.3 45.98 245.4% ------- RED -.086 -.044
---------------------------------------------------------------------
CVX 119.83 1.7 119.36 78.9% Bearish BLUE-.184 -.029
---------------------------------------------------------------------
DIS 146.85 .7 148.46 16% Bearish RED -.166 .061
---------------------------------------------------------------------
GS 229.27 -.67 228.04 93.3% Bearish RED -.007 .073
---------------------------------------------------------------------
HD 221.39 1.17 215.53 168.3% Bullish BLUE .034 -.119
---------------------------------------------------------------------
IBM 135.87 1.31 134.13 61.8% Bearish BLUE-.098 -.112 Bearish
---------------------------------------------------------------------
INTC 58.6 .64 57.7 70.3% Bearish BLUE .003 .072
---------------------------------------------------------------------
JNJ 146.37 1.02 141.79 174.4% Bullish BLUE .218 .06
---------------------------------------------------------------------
JPM 137.36 .01 137.34 20% ------- RED -.001 .128
---------------------------------------------------------------------
KO 55.06 .74 54.42 58.9% Bullish BLUE .241 -.048
---------------------------------------------------------------------
MCD 197.5 .44 197.88 9.7% Bearish RED .096 -.142
---------------------------------------------------------------------
MMM 174.84 2.69 170.75 177.8% ------- BLUE .111 .073
---------------------------------------------------------------------
MRK 91.62 1.63 89.29 135.9% Bullish RED .16 .019
---------------------------------------------------------------------
MSFT 157.12 1.41 155.53 83.6% Bullish RED .252 .055 Bullish
---------------------------------------------------------------------
NKE 100.16 -.99 98.81 120% Bullish RED .241 .002
---------------------------------------------------------------------
PFE 39.46 .49 39.14 145.4% Bullish BLUE .069 .028
---------------------------------------------------------------------
PG 126.35 1.43 125.56 35.2% Bullish BLUE .203 -.038
---------------------------------------------------------------------
TRV 136.95 .48 136.18 47.4% ------- BLUE .109 -.107
---------------------------------------------------------------------
UNH 293.58 -1.04 292.03 139.1% Bullish RED .098 .238 Bullish
---------------------------------------------------------------------
UTX 149.83 1.12 149.46 25.6% Bearish RED -.069 .044
---------------------------------------------------------------------
V 187.83 1.29 186.24 72.4% Bullish RED .145 -.001
---------------------------------------------------------------------
VZ 61.93 1.13 61.23 91.7% ------- BLUE .093 -.039
---------------------------------------------------------------------
WBA 58.47 .72 57.8 51.3% Bearish BLUE-.192 .03
---------------------------------------------------------------------
WMT 120.54 .46 120.54 10.4% Bearish RED .037 -.067
---------------------------------------------------------------------
DOW 70.18 .79 70 68.2% ------- BLUE-.041 -.046
|
Table 2 QUICKSILVER on ETFS - 12/20/2019 ETF CLOSE CHANGE PIVOT-PT 5-dma AROC CL-PWR CANDLE IP21 ITRS --------------------------------------------------------------------------------------------- DIA 284.77 .31 283.07 47% ------- ---- .184 ----- --------------------------------------------------------------------------------------------- BA 329.26 -4.24 327 -186.9% Bearish RED -.239 -.187 --------------------------------------------------------------------------------------------- SPY 321.16 .26 319.5 60.1% ------- BLUE .25 .021 --------------------------------------------------------------------------------------------- QQQ 211.74 .88 209.27 108.7% ------- RED .259 .048 Bullish --------------------------------------------------------------------------------------------- MDY 375.56 .37 372.09 76.7% ------- BLUE .132 .02 --------------------------------------------------------------------------------------------- IWM 166.04 .31 163.88 82.4% ------- RED .041 .049 --------------------------------------------------------------------------------------------- FAS 94.2 .72 92.68 146.2% ------- BLUE .108 .209 Bullish --------------------------------------------------------------------------------------------- RETL 27.78 .19 25.59 407.9% ------- RED .119 .231 Bullish --------------------------------------------------------------------------------------------- SOXL 275.47 6.81 259.46 443.6% Bullish BLUE .114 .568 Bullish --------------------------------------------------------------------------------------------- TECL 236.31 3.72 229.64 272.7% Bullish BLUE .193 .355 Bullish --------------------------------------------------------------------------------------------- IBB 121.94 .79 121.61 54.1% ------- BLUE .334 .157 Bullish --------------------------------------------------------------------------------------------- GLD 139.17 -.21 139.04 4.3% ------- RED -.042 -.086 --------------------------------------------------------------------------------------------- OIH 11.91 -.37 12.55 -429.3% Bearish RED -.058 -.188 --------------------------------------------------------------------------------------------- RSX 25.99 .07 25.72 79.5% ------- ---- .108 .065 |
 Table 3    Count of Stocks in Key Directories
            20191220
-------------------------------
NEWHIGHS       428  Bullish
NEWLOWS        15
MAXCP          57
MINCP          11
TTTNH          21
TTTNL          20
FASTUP         87
FASTDOWN       63
CPCROSSA       51
CPCROSSD       86
BIGVOLUP       2
BIGVODN        9
ACCUMVER       10
HIGHIP21       50
HIUPPCT        34
REDSELL        94
AUGSELS7       34
TRAPDOOR       15
|
Table 4 RANKING OF KEY DIRECTORIES BASED PCT.OF STOCKS ABOVE 65-DMA
Bullish = 43
Bearish = 3
12/20/19
---------------------------------------------------------------------------------------
Directory Current day-1 day-2 day-3 day-4 day-5
----------------------------------------------------------------------------------------
BIGBANKS 1 1 1 1 1 1
COPPER 1 1 1 1 1 1
REGBANKS 1 1 1 1 1 1
ETFS .931 .931 .913 .896 .913 .965
JETS .9 .9 .9 .9 .9 .8
NASD-100 .886 .876 .855 .824 .824 .752
GAMING .863 .772 .863 .863 .818 .772
FINANCE .837 .837 .837 .837 .825 .813
FIDSTKS .832 .826 .793 .815 .804 .743
SEMI .83 .82 .811 .811 .764 .745
DOWJONES .827 .827 .793 .793 .793 .724
INDEXES .827 .817 .806 .811 .811 .779
UTILITY .825 .725 .65 .625 .6 .425
NIFTY .824 .842 .807 .807 .789 .754
AUTO .82 .897 .897 .871 .846 .82
SP-100 .811 .811 .8 .811 .822 .755
SP500 .794 .756 .737 .718 .726 .684
RUS-1000 .783 .759 .73 .719 .719 .68
ELECTRON .764 .764 .745 .751 .718 .705
RETAIL .764 .745 .745 .705 .725 .627
GREEN .76 .76 .72 .68 .68 .64
CHEM .755 .755 .734 .734 .693 .693
BEVERAGE .75 .625 .625 .625 .687 .625
GUNS .75 .75 .687 .687 .625 .625
TRANSP .75 .75 .7 .8 .8 .6
CHINA .727 .69 .672 .654 .636 .636
INDMATER .723 .71 .71 .71 .671 .75
EDU .722 .666 .722 .777 .722 .666
HACKERS .7 .75 .7 .6 .65 .65
SOFTWARE .683 .7 .666 .633 .616 .566
SOLAR .68 .6 .68 .64 .72 .64
FOOD .679 .698 .716 .716 .735 .679
BIOTECH .674 .665 .668 .674 .668 .651
INFRA .666 .694 .694 .694 .666 .694
OILGAS .656 .627 .627 .576 .503 .423
HOSPITAL .636 .636 .636 .636 .681 .681
COMODITY .634 .658 .682 .682 .707 .634
COMPUTER .631 .684 .578 .578 .578 .526
DJI-13 .615 .615 .615 .615 .615 .615
REIT .572 .496 .475 .413 .448 .393
MILITARY .571 .535 .571 .642 .642 .678
BONDFUND .535 .589 .598 .598 .544 .598
INSURANC .513 .54 .567 .567 .54 .513
==========================================================================================
GOLD .47 .568 .529 .509 .529 .627
HOMEBLDG .419 .322 .354 .483 .548 .58
COAL .2 .2 .2 .2 .2 0
|
====================================================================
12/19/2019 Next week is a
particularly bullish time of the year. Since 1967,
the DJI has risen 84.6% of the time over the next five trading days and
gained 1.6% on average in the years before a Presidential Election. The
next ten days' gain is 1.9% with a rise taking place 67% of the time.
Looking at the DJI chart, we can reckon there was about 1400 points
between the 26000 support and the 27400 resistance. We can then project
up this height from the 27400 point of breakout and get a minimum upside
target of 28800. But with the DJI running in all-time high territory and the
A/D Line so strong, the market could certainly go much higher.

Peerless remains on Buys; the NYSE A/D Line made another new
high bullish
ahead of the DJI; our Accumulation Index improved; Boeing stayed above
its key 320 support and the volatile SOXL semiconductor ETF has made
a minor upside breakout and not turned down. All this bodes
well for the market through the end of the year. After that, we will have
be much more cautious because the DJI has not achieved a breakout
above its rising wedge-resistance which is now about 28600. Such a
pattern at the end of the year after a very big advance in stock prices
tends to invite new year profit-taking. (I showed this a few nights ago
in the DJI charts of 1915-1916, 1927-1928, 1951-1952, 1983-1984 and
1999-2000). The number of new lows is very small and shrinking. So, I expect
a very pleasant holiday season for Wall Street and shareholders. Hold DIA,
QQQ and IBB.
 |
|
Charts 12/19/2019 2019 PEERLESS DJI, Signals, Indicators Daily DJI Volume 10-DayUp/Down Vol Stoch-20 Hourly DJIA A/D Line for All Stocks Inverted Traders Index NASDAQ S&P OEX NYSE COMPQX DJI-15 DJI-20 DJI-30 DIA SPY QQQ MDY IWM TNA Short-Term Rates USO-CrudeOil DBO FAS GLD BBH IBB JETS JNUG KOL NUGT OIH OIL RSX RETL SDS AGQ SLV SOXL TECL TLT TMF TNA UGA (gasoline) XIV and China: YINN CHAU Commodities: CANE CORN DBC JJC, NIB, CHOC CORN, CUT (paper) MOO, SOYB WEAT UUP (Dollar) LIT (Lithium) AAPL ADBE ALXN AMAT AMGN AMD AMZN AXP BA BABA BAC BIDU CAT CVX DE FB GOOG GS HD IBM INTU JPM M (Macy's) MSFT NFLX NKE NVDA PG QCOM TSLA TXN XOM V WMT CMG , LRCX, SWKS, MDGL SPPI SQ TOWN 12/18/19 (Click on Underlined link.) New highs and Bullish MAXCPs - http://tigersoft.com/max/12-19/BULLISH.htm Bearish MAXCPs - http://tigersoft.com/min/12-19/BEARISH.htm |
Table 1 QUICKSILVER on DJI-30 STOCKS 12/19/2019 20 of 30 show rising 5-day ma SYMBOL CLOSE CHANGE PIVOT-PT 5-dma AROC CL-PWR CANDLE IP21 ITRS Remarks
TREND COLOR
-----------------------------------------------------------------------------------------
AAPL 280.02 .28 275.15 154.3% Bullish BLUE .24 .154
---------------------------------------------------------------------
AXP 124.83 .57 124.72 88.3% Bullish BLUE .059 .016
---------------------------------------------------------------------
BA 333.5 2.82 341.67 -191.2% Bearish BLUE-.169 -.19
---------------------------------------------------------------------
CAT 145.02 -2.1 145.53 -60.2% ------- RED .125 .134
---------------------------------------------------------------------
CSCO 47.88 1.24 45.3 240.2% ------- BLUE-.068 -.058
---------------------------------------------------------------------
CVX 118.13 -.42 117.96 -28.7% Bearish RED -.221 -.036
---------------------------------------------------------------------
DIS 146.15 -.11 146.38 -54.6% Bearish RED -.183 .05
---------------------------------------------------------------------
GS 229.94 -.51 225 85.3% ------- RED .027 .088
---------------------------------------------------------------------
HD 220.22 2.22 214.08 189.8% ------- BLUE-.057 -.118
---------------------------------------------------------------------
IBM 134.56 .15 134.21 -28.3% Bearish RED -.138 -.116
---------------------------------------------------------------------
INTC 57.96 .79 57.79 35.7% ------- BLUE-.014 .068
---------------------------------------------------------------------
JNJ 145.35 2.16 141.38 140.9% Bullish BLUE .251 .045
---------------------------------------------------------------------
JPM 137.35 -.69 136.81 -24.3% Bullish RED .039 .14
---------------------------------------------------------------------
KO 54.32 .41 54.42 16.6% Bullish BLUE .213 -.071
---------------------------------------------------------------------
MCD 197.06 1.43 197.12 19.1% Bearish BLUE .097 -.154
---------------------------------------------------------------------
MMM 172.15 3.12 168.79 106% ------- BLUE .04 .06
---------------------------------------------------------------------
MRK 89.99 .37 89.19 23.5% Bullish ---- .195 -.011
---------------------------------------------------------------------
MSFT 155.71 1.34 154.53 79.9% Bullish BLUE .267 .047
---------------------------------------------------------------------
NKE 101.15 .58 97.77 173.4% Bullish BLUE .218 .013
---------------------------------------------------------------------
PFE 38.97 .08 38.33 55.5% Bullish -----.011 .012
---------------------------------------------------------------------
PG 124.92 .91 125.47 14% Bullish BLUE .212 -.056
---------------------------------------------------------------------
TRV 136.47 .8 135.66 31.6% ------- BLUE .129 -.114
---------------------------------------------------------------------
UNH 294.62 1.72 285.48 190.6% Bullish RED .2 .247
---------------------------------------------------------------------
UTX 148.71 1 149.07 -23.5% Bearish BLUE-.083 .047
---------------------------------------------------------------------
V 186.54 1.64 185.14 105.5% Bullish BLUE .121 -.013
---------------------------------------------------------------------
VZ 60.8 -.06 60.81 -30.3% ------- RED .072 -.053
---------------------------------------------------------------------
WBA 57.75 .55 57.88 -71.9% Bearish BLUE-.157 .029
---------------------------------------------------------------------
WMT 120.08 .22 120.29 13.3% Bearish BLUE .044 -.07
---------------------------------------------------------------------
XOM 69.39 .48 69.23 -68% ------- RED -.08 -.051
---------------------------------------------------------------------
|
Table 2 QUICKSILVER on ETFS - 12/19/2019 ETF CLOSE CHANGE PIVOT-PT 5-dma AROC CL-PWR CANDLE IP21 ITRS --------------------------------------------------------------------------------------------- DIA 284.46 1.25 282.11 44.4% ------- BLUE .192 0 --------------------------------------------------------------------------------------------- BA 333.5 2.82 341.67 -191.2% Bearish BLUE-.169 -.19 --------------------------------------------------------------------------------------------- SPY 320.9 1.31 317.32 59.2% ------- BLUE .239 .022 --------------------------------------------------------------------------------------------- QQQ 210.86 1.31 207.19 104.4% Bullish BLUE .271 .046 --------------------------------------------------------------------------------------------- MDY 375.19 1.64 369.84 44.7% ------- BLUE .138 .02 --------------------------------------------------------------------------------------------- IWM 165.73 .71 163.33 53.9% ------- BLUE .048 .047 --------------------------------------------------------------------------------------------- FAS 93.48 .79 91.49 100.2% ------- BLUE .167 .222 --------------------------------------------------------------------------------------------- RETL 27.59 .41 25.62 70.1% ------- BLUE .102 .254 --------------------------------------------------------------------------------------------- SOXL 268.66 6.17 252.3 234.6% Bullish BLUE .085 .569 --------------------------------------------------------------------------------------------- TECL 232.59 4.45 223.85 291.4% Bullish BLUE .192 .355 --------------------------------------------------------------------------------------------- IBB 121.15 .59 120.63 35.6% ------- BLUE .303 .16 --------------------------------------------------------------------------------------------- GLD 139.38 .36 139.05 34.2% ------- BLUE-.015 -.099 --------------------------------------------------------------------------------------------- OIH 11.91 -.37 12.55 -429.3% Bearish RED -.058 -.194 --------------------------------------------------------------------------------------------- GASL 9.46 .43 7.36 933.8% ------- BLUE .175 .364 --------------------------------------------------------------------------------------------- |
Table 3   Count of Stocks in Key Directories
          20191219
-------------------------------
NEWHIGHS       417  Bullish Ratio: NH/NL
NEWLOWS        15
MAXCP          78
MINCP          13
TTTNH          29
TTTNL          13
FASTUP         86
FASTDOWN       64
CPCROSSA       107
CPCROSSD       54
BIGVOLUP       6
BIGVODN        14
ACCUMVER       17
HIGHIP21       36
HIUPPCT        28
REDSELL        92
AUGSELS7       34
TRAPDOOR       16
|
Table 4RANKING OF KEY DIRECTORIES BASED PCT.OF STOCKS ABOVE 65-DMA 12/19/19 --------------------------------------------------------------------------------------- Directory Current day-1 day-2 day-3 day-4 day-5 ---------------------------------------------------------------------------------------- BIGBANKS 1 1 1 1 1 1 COPPER 1 1 1 1 1 1 REGBANKS 1 1 1 1 1 1 ETFS .931 .913 .896 .913 .965 .965 JETS .9 .9 .9 .9 .8 .9 AUTO .897 .897 .871 .846 .82 .871 NASD-100 .876 .865 .835 .824 .752 .762 FINANCE .837 .837 .837 .825 .813 .813 NIFTY .836 .8 .8 .781 .745 .745 DOWJONES .827 .793 .793 .793 .724 .793 FIDSTKS .826 .793 .815 .804 .743 .776 SEMI .82 .811 .811 .764 .754 .754 INDEXES .817 .806 .811 .811 .779 .79 SP-100 .811 .8 .811 .822 .755 .777 GAMING .772 .863 .863 .818 .772 .772 ELECTRON .764 .745 .751 .718 .705 .725 GREEN .76 .72 .68 .68 .6 .56 RUS-1000 .759 .731 .719 .719 .677 .707 SP500 .756 .739 .718 .726 .684 .703 CHEM .755 .734 .734 .693 .693 .714 GUNS .75 .687 .687 .625 .562 .562 HACKERS .75 .75 .6 .65 .65 .65 TRANSP .75 .7 .8 .8 .6 .65 RETAIL .745 .745 .705 .725 .627 .745 UTILITY .725 .65 .625 .6 .425 .425 INDMATER .71 .71 .71 .671 .736 .75 FOOD .703 .722 .722 .74 .685 .629 SOFTWARE .7 .683 .633 .616 .566 .6 INFRA .694 .694 .694 .666 .666 .722 CHINA .69 .672 .654 .636 .636 .672 COMPUTER .684 .578 .578 .578 .526 .578 EDU .666 .722 .777 .722 .666 .666 BIOTECH .662 .665 .671 .668 .662 .674 COMODITY .658 .682 .682 .707 .634 .634 HOSPITAL .636 .636 .636 .681 .681 .727 OILGAS .627 .627 .576 .503 .43 .467 BEVERAGE .625 .625 .625 .687 .562 .5 DJI-13 .615 .615 .615 .615 .615 .615 SOLAR .615 .692 .653 .73 .653 .73 BONDFUND .589 .598 .598 .544 .616 .571 GOLD .568 .529 .509 .529 .627 .607 INSURANC .54 .567 .567 .54 .513 .54 MILITARY .535 .571 .642 .642 .678 .607 REIT .496 .475 .413 .448 .386 .427 HOMEBLDG .322 .354 .483 .548 .58 .58 COAL .2 .2 .2 .2 0 .2 |
=====================================================================
12/18/2019
Peerless remains on
its Buys. The NYSE A/D Line improved by
+687 today. NYSE UP- volume was 200 million higher than DOWN-volume.
On the NYSE, there were 170 new highs (not a lot), but only 8 new lows.
The low interest rates and huge monthly injections of liquidity are doing
exactly what they are supposed to. Wall Street is pleased with the
Jobs and Trade outlook. Only 3 of our 46 groups show a majority of
their stocks below a 65-dma. The only negative technicals are that the
the DJI cannot seem to surpass its rising resistance-line at 28500 and our
Tiger Accumulation Index is weakening from its earlier very high levels.
Expect more new highs this year is what our studies show is the greatest
likelihood. Don't sell DIA, QQQ or IWM too quickly.
even though the temptation to take profits may be very high for some
Big Money in January. As long as BA stays above
320 and SOXL does
not top out, the market as measured by the DJI, SPY and QQQ should
keep rising.

 |
 |
 |
|
Charts 12/18/2019 2019 PEERLESS DJI, Signals, Indicators Daily DJI Volume 10-DayUp/Down Vol Stoch-20 Hourly DJIA A/D Line for All Stocks Inverted Traders Index NASDAQ S&P OEX NYSE COMPQX DJI-15 DJI-20 DJI-30 DIA SPY QQQ MDY IWM TNA Short-Term Rates USO-CrudeOil DBO FAS GLD BBH IBB JETS JNUG KOL NUGT OIH OIL RSX RETL SDS AGQ SLV SOXL TECL TLT TMF TNA UGA (gasoline) XIV and China: YINN CHAU Commodities: CANE CORN DBC JJC, NIB, CHOC CORN, CUT (paper) MOO, SOYB WEAT UUP (Dollar) LIT (Lithium) AAPL ADBE ALXN AMAT AMGN AMD AMZN AXP BA BABA BAC BIDU CAT CVX DE FB GOOG GS HD IBM INTU JPM M (Macy's) MSFT NFLX NKE NVDA PG QCOM TSLA TXN XOM V WMT CMG , LRCX, SWKS, MDGL SPPI SQ TOWN 12/18/19 (Click on Underlined link.) New highs and Bullish MAXCPs - http://tigersoft.com/max/12-18/BULLISH.htm Bearish MAXCPs - http://tigersoft.com/min/12-18/BEARISH.htm |
Table 1 QUICKSILVER on DJI-30 STOCKS 12/18/2019 24 of 29 show rising 5-day ma, XOM was left out here. SYMBOL CLOSE CHANGE PIVOT-PT 5-dma AROC CL-PWR CANDLE IP21 ITRS Remarks
TREND COLOR
-----------------------------------------------------------------------------------------
AAPL 279.74 -.67 271.46 162.8% Bullish RED .234 .164 Bullish
---------------------------------------------------------------------
AXP 124.26 -.69 122.64 146.8% Bullish RED .009 .021
---------------------------------------------------------------------
BA 330.68 3.68 346.29 -285.5% Bearish BLUE-.194 -.199 Bearish
---------------------------------------------------------------------
CAT 147.12 .75 146.78 107.1% ------- BLUE .135 .164
---------------------------------------------------------------------
CSCO 46.64 .2 45.67 259.1% ------- BLUE-.1 -.077
---------------------------------------------------------------------
CVX 118.55 -.05 118.81 98.1% Bearish RED -.244 -.021
---------------------------------------------------------------------
DIS 146.26 -1.47 147.76 -45.1% Bearish RED -.174 .056
---------------------------------------------------------------------
GS 230.45 -.7 226.05 204.6% ------- RED .061 .085
---------------------------------------------------------------------
HD 218 .28 212.04 140% ------- RED -.164 -.121
---------------------------------------------------------------------
IBM 134.41 .19 135.32 24.2% Bearish RED -.195 -.111
---------------------------------------------------------------------
INTC 57.17 -.13 57.55 8.7% Bearish RED -.048 .067
---------------------------------------------------------------------
JNJ 143.19 -.37 141.34 77.9% Bullish RED .235 .003
---------------------------------------------------------------------
JPM 138.04 -.14 138.02 141% Bullish RED .055 .152
---------------------------------------------------------------------
KO 53.91 -.51 54.14 -3.7% Bullish RED .173 -.077
---------------------------------------------------------------------
MCD 195.63 -.89 196.31 23.2% Bearish RED .037 -.156
---------------------------------------------------------------------
MMM 169.03 -.9 168.56 8.6% Bearish RED .003 .039
---------------------------------------------------------------------
MRK 89.62 .6 89.57 35.9% Bullish BLUE .185 -.007
---------------------------------------------------------------------
MSFT 154.37 -.32 153.24 86.7% Bullish ---- .174 .055
---------------------------------------------------------------------
NKE 100.57 .92 97.72 172.6% ------- BLUE .117 .013
---------------------------------------------------------------------
PFE 38.89 -.01 38.54 86.7% Bullish RED .047 .015
---------------------------------------------------------------------
PG 124.01 -1.3 124.57 -26% Bullish RED .158 -.057
---------------------------------------------------------------------
TRV 135.67 -1.32 135.61 38.3% ------- RED .109 -.118
---------------------------------------------------------------------
UNH 292.9 2.43 283.61 216.5% Bullish BLUE .241 .248 Bullish
---------------------------------------------------------------------
UTX 147.71 -.91 149.41 14.8% Bearish RED -.161 .047
---------------------------------------------------------------------
V 184.9 -.62 182.64 78.4% Bullish RED .129 -.01
---------------------------------------------------------------------
VZ 60.86 -.63 61.17 -18% ------- RED .101 -.064
---------------------------------------------------------------------
WBA 57.2 .11 58.58 -70% Bearish -----.151 .015
---------------------------------------------------------------------
WMT 119.86 -1.42 119.76 35.8% Bearish RED .04 -.063
---------------------------------------------------------------------
DOW 69.87 .19 70.34 65.3% ------- BLUE-.083 -.035
|
Table 2 QUICKSILVER on ETFS - 12/18/2019 ETF CLOSE CHANGE PIVOT-PT 5-dma AROC CL-PWR CANDLE IP21 ITRS --------------------------------------------------------------------------------------------- DIA 283.21 -.19 281.95 61.9% Bearish RED .131 ----- --------------------------------------------------------------------------------------------- BA 330.68 3.68 346.29 -285.5% Bearish BLUE -.194 -.199 --------------------------------------------------------------------------------------------- SPY 319.59 .02 317.13 81.4% ------- RED .181 .025 --------------------------------------------------------------------------------------------- QQQ 209.55 .16 206.51 110.1% Bullish ---- .245 .047 --------------------------------------------------------------------------------------------- MDY 373.55 .17 371.86 76.1% ------- RED .112 .02 --------------------------------------------------------------------------------------------- IWM 165 .3 163.96 74.5% ------- RED .015 .044 --------------------------------------------------------------------------------------------- FAS 92.69 -.29 91.63 220.8% ------- RED .15 .241 --------------------------------------------------------------------------------------------- RETL 27.18 .77 27.22 275.7% Bearish BLUE .071 .267 --------------------------------------------------------------------------------------------- SOXL 262.49 -.38 256.52 497.1% Bullish RED .035 .609 --------------------------------------------------------------------------------------------- TECL 228.14 .06 219.43 350% Bullish RED .17 .385 --------------------------------------------------------------------------------------------- IBB 120.56 -.43 120.29 44.8% Bullish RED .3 .152 --------------------------------------------------------------------------------------------- GLD 139.02 .01 138.43 3.6% ------- BLUE -.024 -.103 --------------------------------------------------------------------------------------------- OIH 11.91 -.37 12.55 -429.3% Bearish RED -.058 -.197 --------------------------------------------------------------------------------------------- GASL 9.03 .41 7.93 1249.7% ------- BLUE .114 .283 --------------------------------------------------------------------------------------------- |
  Table 3  Count of Stocks in Key Directories
            20191218
-------------------------------
NEWHIGHS       332  Bullish
NEWLOWS        8
MAXCP          64
MINCP          11
TTTNH          30
TTTNL          15
FASTUP         106
FASTDOWN       68
CPCROSSA       65
CPCROSSD       103
BIGVOLUP       4
BIGVODN        12
ACCUMVER       19
HIGHIP21       24
HIUPPCT        27
REDSELL        98
AUGSELS7       33
TRAPDOOR       16
Table 4  RANKING OF KEY DIRECTORIES BASED PCT.OF STOCKS ABOVE 65-DMA
             12/18/19
  Bullish = 43
  Bearish = 3
---------------------------------------------------------------------------------------
Directory     Current       day-1         day-2         day-3         day-4         day-5
----------------------------------------------------------------------------------------
BIGBANKS       1             1             1             1             1             1
COPPER         1             1             1             1             1             1
REGBANKS       1             1             1             1             1             .923
ETFS           .913          .896          .913          .965          .965          .931
JETS           .9            .9            .9            .8            .9            .7
AUTO           .897          .871          .846          .82           .871          .871
NASD-100       .865          .845          .835          .752          .762          .711
GAMING         .863          .863          .818          .772          .772          .772
FINANCE        .837          .837          .825          .813          .813          .767
SEMI           .811          .811          .764          .754          .754          .716
INDEXES        .806          .811          .811          .779          .79           .763
DOWJONES       .8            .8            .8            .733          .8            .733
NIFTY          .8            .8            .781          .745          .745          .745
SP-100         .8            .811          .822          .755          .777          .766
FIDSTKS        .793          .815          .804          .743          .776          .737
HACKERS        .75           .65           .65           .65           .65           .65
ELECTRON       .745          .751          .718          .705          .725          .699
RETAIL         .745          .705          .725          .627          .745          .666
CHEM           .74           .74           .7            .7            .72           .58
SP500          .739          .72           .726          .684          .703          .672
RUS-1000       .731          .721          .719          .677          .706          .67
EDU            .722          .777          .722          .666          .666          .555
FOOD           .722          .722          .74           .685          .629          .592
GREEN          .72           .68           .68           .6            .56           .56
INDMATER       .71           .71           .671          .736          .75           .671
TRANSP         .7            .8            .8            .6            .65           .45
INFRA          .694          .694          .666          .666          .722          .583
SOLAR          .692          .653          .73           .653          .73           .692
GUNS           .687          .687          .625          .562          .562          .562
SOFTWARE       .683          .65           .616          .566          .6            .616
COMODITY       .682          .682          .707          .634          .634          .585
CHINA          .672          .654          .636          .636          .672          .654
BIOTECH        .662          .668          .665          .662          .674          .645
UTILITY        .65           .625          .6            .425          .425          .475
HOSPITAL       .636          .636          .681          .681          .727          .727
OILGAS         .627          .576          .503          .43           .467          .394
BEVERAGE       .625          .625          .687          .562          .5            .562
DJI-13         .615          .615          .615          .615          .615          .615
BONDFUND       .598          .598          .544          .616          .571          .776
COMPUTER       .578          .578          .578          .526          .578          .526
MILITARY       .571          .642          .642          .678          .607          .678
INSURANC       .567          .567          .54           .513          .54           .513
GOLD           .529          .509          .529          .627          .607          .666
===========================================================================================
REIT           .475          .413          .448          .386          .434          .531
HOMEBLDG       .354          .483          .548          .58           .58           .677
COAL           .2            .2            .2            0             .2            0
|
====================================================================
12/17/2019
Today Peerless gave us a new reason to be
bullish, namely a
Santa Claus Buy B13. From 1928 to 2012, these seasonal Buy
signals have averaged 7% gains on the DJI at the time of the next reversing
Sell Signal if they took place in the third year of a Presidential
Election. The 2015, which is not included in the study, showed a gain
of only 1% when it was reversed a few days later by a Sell S16. It is
excluded from these statistics because the DJI's internals were so much
weaker in this case than now. (My mouse is failing, so
I can provide
only the list linked to here. I cannot easily drag the cursor. Sorry.
See
http://tigersoft.com/PeerInst-2012-2013/Santa-Claus-B13/index.html

As long as Boeing does not break below its support at 320, 7
points
under today's close and SOXL does not reverse, as discussed last
night, I would think another challenge of its overhead resistance
at 28400 should come soon. There were an impressive 743
more up than
down on the NYSE and only 3 of the DJI-30 stocks shows a falling 5-day ma.
Just from "window-dressing" alone, I would think the leading DJI-30
stocks,
AAPL, MSFT and UNH will stay strong until the end of the year.
Meanwhile, the big bank stocks in the DJI like JPM and GS are apt
to continue to advance, blessed as they are with very cheap money by
the FED. Stay long DIA, QQQ and IWM.
|
Charts 12/17/2019 2019 PEERLESS DJI, Signals, Indicators Daily DJI Volume 10-DayUp/Down Vol Stoch-20 Hourly DJIA A/D Line for All Stocks Inverted Traders Index NASDAQ S&P OEX NYSE COMPQX DJI-15 DJI-20 DJI-30 DIA SPY QQQ MDY IWM TNA Short-Term Rates USO-CrudeOil DBO FAS GLD BBH IBB JETS JNUG KOL NUGT OIH OIL RSX RETL SDS AGQ SLV SOXL TECL TLT TMF TNA UGA (gasoline) XIV and China: YINN CHAU Commodities: CANE CORN DBC JJC, NIB, CHOC CORN, CUT (paper) MOO, SOYB WEAT UUP (Dollar) LIT (Lithium) AAPL ADBE ALXN AMAT AMGN AMD AMZN AXP BA BABA BAC BIDU CAT CVX DE FB GOOG GS HD IBM INTU JPM M (Macy's) MSFT NFLX NKE NVDA PG QCOM TSLA TXN XOM V WMT CMG , LRCX, SWKS, MDGL SPPI SQ TOWN 12/17/19 (Click on Underlined link.) New highs and Bullish MAXCPs - http://tigersoft.com/max/12-17/BULLISH.htm Bearish MAXCPs - http://tigersoft.com/min/12-17/BEARISH.htm |
Table 1 QUICKSILVER on DJI-30 STOCKS 12/17/2019 27 of 30 show rising 5-day ma SYMBOL CLOSE CHANGE PIVOT-PT 5-dma AROC CL-PWR CANDLE IP21 ITRS Remarks
TREND COLOR
-----------------------------------------------------------------------------------------
AAPL 280.41 .55 270.77 218.4% Bullish BLUE .302 .164 Bullish
---------------------------------------------------------------------
AXP 124.95 1.27 120.64 165.3% Bullish BLUE .008 .029
---------------------------------------------------------------------
BA 327 0 350 -305% Bearish BLUE-.203 -.202
---------------------------------------------------------------------
CAT 146.37 1.01 144 120.8% ------- BLUE .083 .147
---------------------------------------------------------------------
CSCO 46.44 .46 44.28 259.6% ------- BLUE-.08 -.098
---------------------------------------------------------------------
CVX 118.6 -.76 116.23 30.1% Bearish RED -.217 -.023
---------------------------------------------------------------------
DIS 147.73 -.73 147.59 55.3% Bearish RED -.085 .058
---------------------------------------------------------------------
GS 231.15 3.11 221.19 206.5% ------- BLUE .112 .083
---------------------------------------------------------------------
HD 217.72 2.19 212 42.5% ------- BLUE-.117 -.11
---------------------------------------------------------------------
IBM 134.22 .09 133.76 11.5% Bearish RED -.144 -.12
---------------------------------------------------------------------
INTC 57.3 -.4 57.07 61.9% Bearish RED -.022 .061
---------------------------------------------------------------------
JNJ 143.56 1.77 140.98 126.5% Bullish BLUE .27 .008
---------------------------------------------------------------------
JPM 138.18 .84 134.18 135.1% Bullish BLUE .123 .138
---------------------------------------------------------------------
KO 54.42 0 53.95 60% Bullish ---- .222 -.06
---------------------------------------------------------------------
MCD 196.52 -1.36 194.72 40% Bearish RED .015 -.143
---------------------------------------------------------------------
MMM 169.93 -.82 168.74 67.2% Bearish RED .022 .036
---------------------------------------------------------------------
MRK 89.02 -.27 88.98 -4.5% Bullish RED .155 -.016
---------------------------------------------------------------------
MSFT 154.69 -.84 151.7 116.2% Bullish RED .243 .058 Bullish
---------------------------------------------------------------------
NKE 99.65 .84 97.18 135.1% Bullish BLUE .13 -.001
---------------------------------------------------------------------
PFE 38.9 -.24 38.22 54.5% Bullish RED .043 .015
---------------------------------------------------------------------
PG 125.31 -.25 124.66 41.6% Bullish RED .231 -.05
---------------------------------------------------------------------
TRV 136.99 .81 134.63 53.5% ------- BLUE .139 -.114
---------------------------------------------------------------------
UNH 290.47 -1.56 280.5 192.6% Bullish RED .214 .242 Bullish
---------------------------------------------------------------------
UTX 148.62 -.84 147.27 109.7% Bearish RED -.128 .05
---------------------------------------------------------------------
V 185.52 -.72 182.01 88.8% Bullish RED .187 -.01
---------------------------------------------------------------------
VZ 61.49 .26 61.08 21.3% Bullish BLUE .223 -.05
---------------------------------------------------------------------
WBA 57.09 -.71 58.01 -113.5% Bearish RED -.162 .012
---------------------------------------------------------------------
WMT 121.28 .74 119 89.4% Bullish BLUE .121 -.036
---------------------------------------------------------------------
DOW 69.68 -.32 68.96 44.6% ------- RED -.098 -.046
|
Table 2 QUICKSILVER on ETFS - 12/13/2019 ETF CLOSE CHANGE PIVOT-PT 5-dma AROC CL-PWR CANDLE IP21 ITRS --------------------------------------------------------------------------------------------- DIA 283.4 .33 279.72 70% Bearish BLUE .192 ---- --------------------------------------------------------------------------------------------- BA 327 0 350 -305% Bearish BLUE-.203 -.202 --------------------------------------------------------------------------------------------- SPY 319.57 .07 314.42 95.5% ------- RED .243 .02 --------------------------------------------------------------------------------------------- QQQ 209.39 .12 204.98 133% Bullish RED .284 .042 --------------------------------------------------------------------------------------------- MDY 373.38 1.29 367.9 82.2% ------- BLUE .107 .012 --------------------------------------------------------------------------------------------- IWM 164.7 .82 162.56 64% ------- BLUE .01 .039 --------------------------------------------------------------------------------------------- FAS 92.98 .3 88.65 202.8% ------- RED .187 .192 --------------------------------------------------------------------------------------------- RETL 26.41 .82 25.74 19.2% Bearish BLUE .053 .181 --------------------------------------------------------------------------------------------- SOXL 262.87 3.41 237.27 818.3% Bullish RED .031 .468 --------------------------------------------------------------------------------------------- TECL 228.08 -1.56 212.55 452.1% Bullish RED .219 .318 --------------------------------------------------------------------------------------------- IBB 120.99 -.62 119.48 37% Bullish RED .301 .147 --------------------------------------------------------------------------------------------- GLD 139.01 -.03 138.92 37.5% ------- -----.017 -.082 --------------------------------------------------------------------------------------------- OIH 11.91 -.37 12.55 -429.3% Bearish RED -.058 -.184 --------------------------------------------------------------------------------------------- GASL 8.62 .6 7.08 923.7% ------- BLUE .043 .098 --------------------------------------------------------------------------------------------- |
 Table 3   Count of Stocks in Key Directories
           20191217
-------------------------------
NEWHIGHS       424   Bullish
NEWLOWS        16
MAXCP          74
MINCP          21
TTTNH          31
TTTNL          40
FASTUP         105
FASTDOWN       67
CPCROSSA       152
CPCROSSD       158
BIGVOLUP       3
BIGVODN        16
ACCUMVER       17
HIGHIP21       27
HIUPPCT        28
REDSELL        95
AUGSELS7       31
TRAPDOOR       16
|
Table 4      RANKING OF KEY DIRECTORIES BASED PCT.OF STOCKS ABOVE 65-DMA
             12/17/19
 Bullish = 43
 Bearish = 3
---------------------------------------------------------------------------------------
Directory     Current       day-1         day-2         day-3         day-4         day-5
----------------------------------------------------------------------------------------
BIGBANKS       1             1             1             1             1             1
COPPER         1             1             1             1             1             .875
REGBANKS       1             1             1             1             .923          .923
JETS           .9            .9            .8            .9            .7            .6
ETFS           .896          .913          .965          .965          .931          .827
AUTO           .871          .846          .82           .871          .871          .846
GAMING         .863          .818          .772          .772          .772          .818
NASD-100       .845          .845          .762          .762          .711          .67
FINANCE        .837          .825          .813          .813          .767          .755
FIDSTKS        .815          .804          .743          .776          .737          .72
INDEXES        .811          .811          .779          .79           .768          .747
SEMI           .811          .764          .754          .754          .716          .575
SP-100         .811          .822          .755          .777          .766          .755
NIFTY          .8            .781          .745          .745          .745          .672
TRANSP         .8            .8            .6            .65           .45           .4
DOWJONES       .793          .793          .724          .793          .724          .724
EDU            .777          .722          .666          .666          .555          .555
ELECTRON       .751          .718          .705          .725          .692          .601
CHEM           .734          .693          .693          .714          .571          .571
FOOD           .722          .74           .685          .629          .592          .592
RUS-1000       .721          .721          .677          .706          .669          .674
SP500          .72           .728          .684          .703          .67           .657
INDMATER       .71           .671          .736          .75           .671          .605
RETAIL         .705          .725          .627          .745          .666          .705
INFRA          .694          .666          .666          .722          .611          .555
GUNS           .687          .625          .562          .562          .562          .5
COMODITY       .682          .707          .634          .634          .585          .585
GREEN          .68           .68           .6            .56           .56           .52
BIOTECH        .665          .662          .659          .674          .645          .642
CHINA          .654          .636          .636          .672          .654          .563
SOLAR          .653          .73           .653          .73           .692          .615
HACKERS        .65           .7            .65           .65           .65           .65
SOFTWARE       .65           .633          .566          .6            .616          .6
MILITARY       .642          .642          .678          .607          .678          .642
HOSPITAL       .636          .681          .681          .727          .727          .772
BEVERAGE       .625          .687          .562          .5            .562          .437
UTILITY        .625          .6            .425          .425          .475          .45
DJI-13         .615          .615          .615          .615          .615          .615
BONDFUND       .598          .544          .616          .571          .767          .651
COMPUTER       .578          .578          .526          .578          .526          .526
OILGAS         .576          .503          .43           .467          .394          .379
INSURANC       .567          .54           .513          .54           .513          .513
GOLD           .509          .529          .627          .607          .666          .45
================================================================================================
HOMEBLDG       .483          .548          .58           .58           .677          .645
REIT           .413          .448          .386          .434          .531          .641
COAL           .2            .2            0             .2            0             0
|
====================================================================
12/16/2019
Peerless remains on a Buy signal and
December's normal end-of-month
seasonality remains quite favorable. Since 1965, the DJI has risen
73.6% of the time over the next ten trading days and averaged a rise
of 1.6% over this period. The DJI's probability of rising is the same
when it is the year before a Presidential Election. Note the continuing
strength in the NYSE A/D Line. This should act to keep the general
market rising until next month, at a minimum. But there are problems
starting to develop for the DJI in the form of Boeing's weakness and for
tech stocks if SOXL tops out.

Tomorrow it is very likely we will get a new Buy B13 from Peerless.
This is the Santa Claus Buy signal. But understand that the DJIA has a special
problem right now, namely the weakness in its highest priced component,
Boeing, which fell 14.67 today. It is at important support. Watch it tomorrow.

Some will say that the DJIA gave a very bullish performance today by rising
+100 despite Boeing's weakness. But I would note that the DJIA sold off all day and
closed at its low. Moreover, possibly the general market is becoming a little
too bullish in the short-term. Of the 46 groups we track each night only 2
of the 46 now show a majority of their stocks are below their 65-dma.
Another concern I have is that the DJIA, unlike the NASDAQ, QQQ
and SP-500 cannot seem to crack through their overhead resistance-line,
as shown below. Rising wedge patterns, I noted last night, are bearish
warning signs.
And there is another cause for concern. The very volatile, leveraged
Semi-Conductors ETF shows a negative non-confirmation from our
IP21 or Tiger Accumulation Index. As you can see in the chart below,
our IP21 (current Accumulation) is no longer positive despite SOXL being
14% above its 21-dma. This produces a Tiger-chart Sell S9, which is not
to be confused with the Peerless S9 on the DJI chart. Such negative
IP21 NCs are dangerous. See in the next chart, that for the leveraged
Gold Stocks ETF, NUGT, how such a negative non-confirmation perfectly
called its top a few months ago. And to show another example, look next
at the chart of the leveraged ETF, TECL (techs) back in 2018 and see how
an IP21 NNC called the top.
I want to make clear that right now we do not now see a negative NNC from
our IP21 for TECL. In fact, its leaders AAPL and MSFT are among the
strongest of all stocks. But I do want to warn that SOXL is also a leader
for the tech stocks and any reversal downward by SOXL, would be a clear
warning for us even though the odds favor no market top until next year, as
I showed last night. If you own SOXL, I think it's time to sell. But for
now I would still hold QQQ, IBB and DIA. Any dip in here by the DJI back
below 28000 will probably be place to some more buying.
 |
 |
 |
|
Charts 12/16/2019 2019 PEERLESS DJI, Signals, Indicators Daily DJI Volume 10-DayUp/Down Vol Stoch-20 Hourly DJIA A/D Line for All Stocks Inverted Traders Index NASDAQ S&P OEX NYSE COMPQX DJI-15 DJI-20 DJI-30 DIA SPY QQQ MDY IWM TNA Short-Term Rates USO-CrudeOil DBO FAS GLD BBH IBB JETS JNUG KOL NUGT OIH OIL RSX RETL SDS AGQ SLV SOXL TECL TLT TMF TNA UGA (gasoline) XIV and China: YINN CHAU Commodities: CANE CORN DBC JJC, NIB, CHOC CORN, CUT (paper) MOO, SOYB WEAT UUP (Dollar) LIT (Lithium) AAPL ADBE ALXN AMAT AMGN AMD AMZN AXP BA BABA BAC BIDU CAT CVX DE FB GOOG GS HD IBM INTU JPM M (Macy's) MSFT NFLX NKE NVDA PG QCOM TSLA TXN XOM V WMT CMG , LRCX, SWKS, MDGL SPPI SQ TOWN 12/16/19 (Click on Underlined link.) New highs and Bullish MAXCPs - http://tigersoft.com/max/12-16/BULLISH.htm Bearish MAXCPs - http://tigersoft.com/min/12-16/BEARISH.htm |
Table 1 QUICKSILVER on DJI-30 STOCKS 12/16/2019 27 of 30 show rising 5-day ma SYMBOL CLOSE CHANGE PIVOT-PT 5-dma AROC CL-PWR CANDLE IP21 ITRS Remarks
TREND COLOR
----------------------------------------------------------------------------------------------
AAPL 279.86 4.71 268.48 239.1% Bullish BLUE .349 .167 Bullish
---------------------------------------------------------------------
AXP 123.68 -1.04 120.9 132.1% ------- RED -.035 .015
---------------------------------------------------------------------
BA 327 -14.67 347.9 -348.4% Bearish RE D -.245 -.195
---------------------------------------------------------------------
CAT 145.36 -.17 142.87 87.6% ------- RED .082 .135
---------------------------------------------------------------------
CSCO 45.98 .68 44.1 232.9% Bearish BLUE -.135 -.098
---------------------------------------------------------------------
CVX 119.36 1.4 117.89 87.6% ------- BLUE -.191 -.017
---------------------------------------------------------------------
DIS 148.46 2.08 146.1 76.6% Bearish BLUE -.103 .074
---------------------------------------------------------------------
GS 228.04 3.04 221.88 139.6% Bullish RED .088 .07
---------------------------------------------------------------------
HD 215.53 1.45 215.9 -23.4% ------- BLUE -.119 -.12
---------------------------------------------------------------------
IBM 134.13 -.08 133.91 7.8% ------- RED -.169 -.127
---------------------------------------------------------------------
INTC 57.7 -.09 56.59 102.4% Bearish RED -.002 .068
---------------------------------------------------------------------
JNJ 141.79 .41 139.99 45.8% Bullish BLUE .311 -.005
---------------------------------------------------------------------
JPM 137.34 .53 134.5 80.7% Bullish RED .157 .133
---------------------------------------------------------------------
KO 54.42 0 53.77 32.4% ------- RED .264 -.068
---------------------------------------------------------------------
MCD 197.88 .76 194.95 81.8% Bearish ---- .059 -.131
---------------------------------------------------------------------
MMM 170.75 1.96 167.66 27.3% Bearish BLUE .044 .03
---------------------------------------------------------------------
MRK 89.29 .1 89.1 32% Bullish RED .125 -.015
---------------------------------------------------------------------
MSFT 155.53 1 151.13 136.8% Bullish BLUE .329 .061 Bullish
---------------------------------------------------------------------
NKE 98.81 1.04 97.01 112.1% Bullish BLUE .147 -.004
---------------------------------------------------------------------
PFE 39.14 .81 38.48 106.8% Bullish BLUE .149 .024
---------------------------------------------------------------------
PG 125.56 .09 124.27 27.7% Bullish BLUE .227 -.053
---------------------------------------------------------------------
TRV 136.18 .52 135.54 27% Bullish BLUE .081 -.126
---------------------------------------------------------------------
UNH 292.03 6.55 279.52 257.5% Bullish BLUE .265 .263 Bullish
---------------------------------------------------------------------
UTX 149.46 .39 145.37 109.9% Bearish RED -.111 .056
---------------------------------------------------------------------
V 186.24 1.1 182.26 90.7% Bullish BLUE .177 -.007
---------------------------------------------------------------------
VZ 61.23 .42 61.23 18% Bullish BLUE .285 -.043
---------------------------------------------------------------------
WBA 57.8 -.08 58.41 -78% Bearish RED -.158 .026
---------------------------------------------------------------------
WMT 120.54 .25 119.14 49.4% ------- BLUE .048 -.045
---------------------------------------------------------------------
DOW 70 .77 69.06 24.5% ------- BLUE -.055 -.051
|
Table 2 QUICKSILVER on ETFS - 12/13/2019 ETF CLOSE CHANGE PIVOT-PT 5-dma AROC CL-PWR CANDLE IP21 ITRS --------------------------------------------------------------------------------------------- DIA 283.07 .96 279.46 59% Bullish ---- .247 ----- --------------------------------------------------------------------------------------------- BA 327 -14.67 347.9 -348.4% Bearish RED -.245 -.195 --------------------------------------------------------------------------------------------- SPY 319.51 2.19 313.53 89.3% Bullish BLUE .315 .02 --------------------------------------------------------------------------------------------- QQQ 209.27 2.08 203.9 126.6% Bullish BLUE .324 .043 --------------------------------------------------------------------------------------------- MDY 372.09 2.25 367.3 62.1% ------- BLUE .093 .008 --------------------------------------------------------------------------------------------- IWM 163.88 .55 162.61 42% ------- RED -.019 .033 --------------------------------------------------------------------------------------------- FAS 92.68 1.19 89.3 153% Bullish RED .206 .177 --------------------------------------------------------------------------------------------- RETL 26.36 -.08 25.57 126.3% ------- ---- .227 .09 --------------------------------------------------------------------------------------------- SOXL 259.46 7.16 222.67 825.1% Bullish RED 0 .419 --------------------------------------------------------------------------------------------- TECL 229.64 5.79 208.3 502.2% Bullish BLUE .275 .314 Bullish --------------------------------------------------------------------------------------------- IBB 121.61 .98 120.1 91.7% Bullish BLUE .332 .156 Bulllsh --------------------------------------------------------------------------------------------- GLD 139.04 -.01 137.97 52.7% ------- RED -.001 -.086 --------------------------------------------------------------------------------------------- OIH 14.64 -.34 14.58 0% Bearish RED .038 -.152 --------------------------------------------------------------------------------------------- GASL 8.02 .66 7.23 703.7% Bullish BLUE .025 -.037 --------------------------------------------------------------------------------------------- |
 Table 3   Count of Stocks in Key Directories
          20191216
-------------------------------
NEWHIGHS       475  Bullish
NEWLOWS        20
MAXCP          63
MINCP          18
TTTNH          25
TTTNL          27
FASTUP         94
FASTDOWN       54
CPCROSSA       82
CPCROSSD       91
BIGVOLUP       1
BIGVODN        15
ACCUMVER       16
HIUPPCT        27
LOWACCUM       124
REDSELL        97
AUGSELS7       28
TRAPDOOR       16
|
Table 4  RANKING OF KEY DIRECTORIES BASED PCT.OF STOCKS ABOVE 65-DMA
             12/16/19
  Bullish = 44
  Bearish = 2
---------------------------------------------------------------------------------------
Directory     Current       day-1         day-2         day-3         day-4         day-5
----------------------------------------------------------------------------------------
BIGBANKS       1             1             1             1             1             1
COPPER         1             1             1             1             .875          .875
REGBANKS       1             1             1             .923          .923          .884
ETFS           .913          .965          .965          .931          .827          .775
JETS           .9            .8            .9            .7            .6            .6
AUTO           .846          .82           .871          .871          .846          .743
NASD-100       .845          .773          .773          .711          .67           .659
FINANCE        .835          .823          .823          .776          .764          .788
SP-100         .822          .755          .777          .766          .755          .755
GAMING         .818          .772          .772          .772          .818          .727
INDEXES        .811          .779          .79           .768          .747          .741
FIDSTKS        .804          .743          .776          .737          .72           .737
DOWJONES       .8            .733          .8            .733          .733          .733
TRANSP         .8            .6            .65           .45           .4            .5
NIFTY          .781          .745          .745          .745          .672          .654
SEMI           .764          .754          .754          .716          .566          .566
FOOD           .74           .685          .629          .592          .592          .555
SOLAR          .73           .653          .73           .692          .615          .615
SP500          .728          .686          .703          .67           .657          .67
RETAIL         .725          .627          .745          .666          .705          .666
EDU            .722          .666          .666          .555          .555          .444
RUS-1000       .721          .678          .706          .669          .673          .68
ELECTRON       .718          .705          .725          .692          .594          .588
COMODITY       .707          .634          .634          .585          .585          .56
HACKERS        .7            .7            .65           .65           .65           .65
CHEM           .693          .693          .714          .571          .571          .591
BEVERAGE       .687          .562          .5            .562          .437          .437
HOSPITAL       .681          .681          .727          .727          .772          .772
GREEN          .68           .6            .56           .56           .52           .52
INDMATER       .671          .736          .75           .671          .605          .578
INFRA          .666          .666          .722          .611          .555          .583
BIOTECH        .66           .657          .672          .646          .649          .634
MILITARY       .642          .678          .607          .678          .642          .714
CHINA          .636          .636          .672          .654          .563          .436
SOFTWARE       .633          .583          .6            .616          .6            .633
GUNS           .625          .562          .562          .562          .437          .625
DJI-13         .615          .615          .615          .615          .615          .615
UTILITY        .6            .425          .425          .475          .45           .45
COMPUTER       .578          .526          .578          .526          .526          .421
HOMEBLDG       .548          .58           .58           .677          .645          .677
BONDFUND       .544          .616          .571          .767          .651          .625
INSURANC       .54           .513          .54           .513          .513          .567
GOLD           .529          .627          .607          .666          .45           .45
OILGAS         .503          .43           .467          .394          .364          .379
=================================================================================================
REIT           .448          .386          .434          .531          .641          .641
COAL           .2            0             .2            0             0             0
|
====================================================================
12/13/2019
The Peerless Buys tell us not to sell
prematurely. In addition, the
second half of December is famously bullish. The driving factor
remains the Fed, in my opinion. That has allowed the NYSE
A/D Line to continue to make new highs. The Fed Chairman tells
us he will keep injectng $60 billion into US banks until April.
That's an awful lot of money! If he keeps his word, it's difficult to see
how the market can do more than temporarily sell off, perhaps in January,
and then come rebounding back very strongly.

When the NYSE A/D Line has risen in the past like it has this year,
and there are only a few such cases, notable 1954 and 2017,
there is no significant December decline. But January declines have
lots precedents, many presumably related to traders doing some
profit-taking in the new year based on tax comsiderations.
Such was the case in early 1955 after the spendid advance of 1954.
There was no Peerless Sell signal at the minor January 1955 top back
then, but there was a rising wedge pattern in the DJI, one that was not
very different than the one we now see in the DJI. The other case of
a super, strong A/D Line was in 2017. That also brought a January top.
It was on 1/26/2018.
I am concerned about the DJI's inability to get past 28400. Rising wedge
patterns also turned the DJI down after the very strong years of 1915,
1927 and 1983. Presumably, the urge to lock in very big gains is
unavoidable as the new year starts. See also the data further below showing
the frequency of January tops as a Presidential Election year starts.
1954 and 1954-1955 DJI charts.   |
A rising wedge pattern in the DJI coupled with weak
Volume
bought about a 13% decline in the DJI from the end of 1915.
Traders began to worry about the 1916 Elections. That was all the
excuse they needed to take profits. A rising wedge also called
the top in early January 1984. In this case, the Tiger Accumulation
Index was negative as the DJI tried to rally past the 1% upper band.
The IP21 now is much stronger.

Rising Wedge and Sell S16 in January 1984 started a seven month decline.

Rising wedge and jump in down-day volume brings a 6% decline
in early 1928.

Past Market Tops as a Presidential Election
Year Starts:
In 26 such year, we see:
Early December peaks = 2
Late December tops = 3
January Peaks = 8
February Peaks = 3
March = 2
No tops until after April or later = 8
Top
Result
Warnings
-------------------------------------------------------------------------------
1915-1916 12/28/1915 13% decline
Rising Wedge. OBVPct
NNC.
1918-1919
11/3/1919
Deep mkt follows. Inflation. Fed boosts interest rates sharply.
1923-1924 2/6/1924
13% decline Very high down-day
volume on 2/15.
1927-1928 1/3/1928
6% decline Very
high down-day volume on 1/10
1931-1932 3/8/1932
50% decline
Sell S4/S9/S12 Deep Bear Mkt.
1935-1936 4/6/1936 12% decline
Sell S9/S12/S15
1939-1940 1/4/1940 27% decline Sell S16 and very weak IPA.
1943-1944
1/5/1944 3% decline No Peerless
Sell. But no rally until April.
1947-1948 12/31/1947 8%
decline
H/S and Sell S10
1951-1952
1/22/1952 7% decline
H/S and Sell S1
1955-1956
12/30/1945 5% decline
Small H/S
1959-1960
1/5/1960 12.5% decline
Sell S9/S12/S15
1963-1964
DJI did not experience a 4% decline froma peak until Nov. 1964
1967-1968
1/9/1968 9% decline
Sell S12
1971-1972
4/18/1972 4% decline
Sell S9/S12 Fed busy lowering rates at end of year in time for '72 Election.
1975-1976
3/24/1976 4%
decline Breakout
surge as Fed lowers rates.
1979-1980
2/13/1980 16% decline Sell S9/S15
1983-1984
1/9/1984 16% decline
Sell S12
1987-1988
1/5/1984 8% decline
DJI reached 5.1% upper band and resistance from top of trading range after
October 1987 Crash.
1991-1992
DJI was strong until June 1992.
1995-1996
DJI was strong until 3/18/1992.
1999-2000
1/14/2000 16% decline
Sell S4/S9/S12/S15
2003-2004
2/11/2004 6% decline Sell S19
2007-2008
12/10/2007 Deep bear mkt.
Sell S12
2011-2012
DJI was strong until 5/1/2012.
2017-2018
DJI was strong all year.
|
Charts 12/13/2019 2019 PEERLESS DJI, Signals, Indicators Daily DJI Volume 10-DayUp/Down Vol Stoch-20 Hourly DJIA A/D Line for All Stocks Inverted Traders Index NASDAQ S&P OEX NYSE COMPQX DJI-15 DJI-20 DJI-30 DIA SPY QQQ MDY IWM TNA Short-Term Rates USO-CrudeOil DBO FAS GLD BBH IBB JETS JNUG KOL NUGT OIH OIL RSX RETL SDS AGQ SLV SOXL TECL TLT TMF TNA UGA (gasoline) XIV and China: YINN CHAU Commodities: CANE CORN DBC JJC, NIB, CHOC CORN, CUT (paper) MOO, SOYB WEAT UUP (Dollar) LIT (Lithium) AAPL ADBE ALXN AMAT AMGN AMD AMZN AXP BA BABA BAC BIDU CAT CVX DE FB GOOG GS HD IBM INTU JPM M (Macy's) MSFT NFLX NKE NVDA PG QCOM TSLA TXN XOM V WMT CMG , LRCX, SWKS, MDGL SPPI SQ TOWN 12/13/19 (Click on Underlined link.) New highs and Bullish MAXCPs - http://tigersoft.com/max/12-13/BULLISH.htm Bearish MAXCPs - http://tigersoft.com/min/12-13/BEARISH.htm |
Table 1 QUICKSILVER on DJI-30 STOCKS 12/13/2019 21 of 30 show rising 5-day ma (-5 on Friday) SYMBOL CLOSE CHANGE PIVOT-PT 5-dma AROC CL-PWR CANDLE IP21 ITRS Remarks
TREND COLOR
----------------------------------------------------------------------------------------------
AAPL 275.15 3.69 266.92 82.3% ------- BLUE .294 .169 Bullish
---------------------------------------------------------------------
AXP 124.72 2.08 120.46 169.8% Bullish BLUE .038 .031
---------------------------------------------------------------------
BA 341.67 -4.62 351.21 -177.5% Bearish RED -.062 -.158
---------------------------------------------------------------------
CAT 145.53 -1.25 142.83 97.7% ------- RED .085 .136
---------------------------------------------------------------------
CSCO 45.3 -.37 43.9 164.6% Bearish RED -.175 -.114
---------------------------------------------------------------------
CVX 117.96 -.85 117.3 -2.1% Bearish RED -.237 -.034
---------------------------------------------------------------------
DIS 146.38 -1.38 146.21 -43.5% Bearish RED -.202 .066
---------------------------------------------------------------------
GS 225 -1.05 221.81 8.7% ------- RED .166 .064
---------------------------------------------------------------------
HD 214.08 2.04 216.53 -4.7% Bearish BLUE-.111 -.133
---------------------------------------------------------------------
IBM 134.21 -1.11 133.92 36.9% Bearish RED -.118 -.132
---------------------------------------------------------------------
INTC 57.79 .24 56.53 86.1% Bearish BLUE .046 .078
---------------------------------------------------------------------
JNJ 141.38 .04 140.5 35.6% Bullish BLUE .347 .001
---------------------------------------------------------------------
JPM 136.81 -1.21 135.15 65.4% Bullish RED .24 .143
---------------------------------------------------------------------
KO 54.42 .28 54.07 0% Bullish BLUE .326 -.066
---------------------------------------------------------------------
MCD 197.12 .81 194.68 45.3% Bearish BLUE .007 -.138
---------------------------------------------------------------------
MMM 168.79 .23 169.83 -79.2% Bearish RED -.014 .011
---------------------------------------------------------------------
MRK 89.19 -.38 88.72 19.1% Bullish ---- .178 .001
---------------------------------------------------------------------
MSFT 154.53 1.29 151.36 91.5% Bullish BLUE .336 .057
---------------------------------------------------------------------
NKE 97.77 .05 96.63 39.6% ------- BLUE .131 -.017
---------------------------------------------------------------------
PFE 38.33 -.21 38.32 5.2% Bullish RED .135 .005
---------------------------------------------------------------------
PG 125.47 .9 124.87 51.4% Bullish BLUE .255 -.046
---------------------------------------------------------------------
TRV 135.66 .05 135.45 -2.2% ------- BLUE .09 -.12
---------------------------------------------------------------------
UNH 285.48 1.87 277.54 94.4% ------- BLUE .286 .249 Bullish
---------------------------------------------------------------------
UTX 149.07 -.34 146.22 70.7% Bearish BLUE-.07 .059
---------------------------------------------------------------------
V 185.14 2.5 182.92 81.4% Bullish BLU E .239 -.006
---------------------------------------------------------------------
VZ 60.81 -.36 61.01 -31.1% ------- RED .288 -.046
---------------------------------------------------------------------
WBA 57.88 -.7 58.71 -64.1% Bearish RED -.119 .024
---------------------------------------------------------------------
WMT 120.29 .53 119.36 21.4% Bearish BLUE -.041 -.042
---------------------------------------------------------------------
DOW 69.23 -1.11 69.66 -20.1% ------- RED -.069 -.058
|
Table 2 QUICKSILVER on ETFS - 12/13/2019 ETF CLOSE CHANGE PIVOT-PT 5-dma AROC CL-PWR CANDLE IP21 ITRS --------------------------------------------------------------------------------------------- --------------------------------------------------------------------------------------------- DIA 282.11 .16 279.76 25.2% ------- BLUE .321 ====== --------------------------------------------------------------------------------------------- BA 341.67 -4.62 351.21 -177.5% Bearish RED -.062 -.158 --------------------------------------------------------------------------------------------- SPY 317.25 .12 313.88 37.8% ------- BLUE .32 .016 --------------------------------------------------------------------------------------------- QQQ 207.19 .68 204.07 53.4% ------- BLUE .334 .037 --------------------------------------------------------------------------------------------- MDY 369.84 -2.02 367.51 8.5% ------- RED .15 .001 --------------------------------------------------------------------------------------------- IWM 163.33 -.63 162.51 17.8% Bearish RED .007 .029 --------------------------------------------------------------------------------------------- FAS 91.49 -.14 89.92 62.8% ------- BLUE .308 .206 Bullish --------------------------------------------------------------------------------------------- RETL 25.62 -1.6 26.4 -77.8% Bearish RED .063 .162 --------------------------------------------------------------------------------------------- SOXL 252.3 -4.22 220.22 609.6% Bullish RED .073 .445 --------------------------------------------------------------------------------------------- TECL 223.85 4.42 208.1 294.4% Bullish BLUE .335 .334 Bullish --------------------------------------------------------------------------------------------- IBB 120.63 .34 119.41 25% Bullish ---- .316 .144 --------------------------------------------------------------------------------------------- GLD 139.05 .62 137.58 51.8% ------- BLUE .019 -.097 --------------------------------------------------------------------------------------------- OIH 11.91 -.37 12.55 -429.3% Bearish RED -.058 -.191 --------------------------------------------------------------------------------------------- GASL 7.36 -.57 6.99 558.8% ------- RED -.008 -.137 --------------------------------------------------------------------------------------------- RSX 25.58 .22 24.48 224% ------- BLUE .135 .063 |
Table 3 Count of Stocks in Key Directories
20191213
-------------------------------
NEWHIGHS 302 Bullish
NEWLOWS 19
MAXCP 66
MINCP 23
TTTNH 29
TTTNL 34
FASTUP 76
FASTDOWN 57
CPCROSSA 93
CPCROSSD 137
BIGVOLUP 1
BIGVODN 13
ACCUMVER 15
HIGHIP21 33
HIUPPCT 23
LOWACCUM 119
REDSELL 105
AUGSELS7 20
TRAPDOOR 15
|
RANKING OF KEY DIRECTORIES BASED PCT.OF STOCKS ABOVE 65-DMA 12/13/19 Bearish = 4 Bullish = 42 --------------------------------------------------------------------------------------- Directory Current day-1 day-2 day-3 day-4 day-5 ---------------------------------------------------------------------------------------- BIGBANKS 1 1 1 1 1 1 COPPER 1 1 1 .875 .875 1 REGBANKS 1 1 .923 .923 .884 .884 ETFS .965 .965 .931 .827 .775 .827 AUTO .82 .871 .871 .846 .769 .846 FINANCE .813 .813 .767 .755 .779 .779 JETS .8 .9 .7 .6 .6 .6 INDEXES .779 .79 .768 .747 .747 .731 NASD-100 .773 .783 .721 .67 .659 .721 GAMING .772 .772 .772 .818 .727 .863 SP-100 .755 .777 .766 .755 .755 .766 NIFTY .754 .754 .754 .684 .666 .684 SEMI .754 .754 .716 .566 .566 .632 FIDSTKS .743 .776 .737 .72 .737 .759 INDMATER .736 .75 .671 .605 .578 .565 DOWJONES .733 .8 .733 .733 .733 .733 ELECTRON .705 .725 .692 .594 .588 .627 HACKERS .7 .7 .65 .65 .65 .7 CHEM .693 .714 .571 .571 .591 .571 SP500 .686 .705 .67 .657 .674 .693 FOOD .685 .629 .592 .592 .555 .555 HOSPITAL .681 .727 .727 .772 .772 .772 MILITARY .678 .607 .678 .642 .714 .821 RUS-1000 .678 .707 .669 .673 .682 .703 EDU .666 .666 .555 .555 .444 .444 INFRA .666 .722 .611 .555 .583 .583 BIOTECH .653 .668 .642 .648 .63 .624 SOLAR .653 .73 .692 .615 .615 .653 CHINA .636 .672 .654 .563 .436 .509 COMODITY .634 .634 .585 .585 .56 .56 GOLD .627 .607 .666 .45 .45 .431 RETAIL .627 .745 .666 .705 .666 .666 BONDFUND .616 .571 .767 .651 .598 .58 DJI-13 .615 .615 .615 .615 .615 .615 GREEN .6 .56 .56 .52 .52 .56 TRANSP .6 .65 .45 .4 .5 .6 SOFTWARE .583 .616 .616 .6 .633 .616 HOMEBLDG .58 .58 .677 .645 .677 .677 BEVERAGE .562 .5 .562 .437 .437 .437 GUNS .562 .562 .562 .437 .625 .562 COMPUTER .526 .578 .526 .526 .421 .473 INSURANC .513 .54 .513 .513 .567 .486 ============================================================================================ OILGAS .43 .467 .394 .364 .372 .386 UTILITY .425 .425 .475 .45 .475 .5 REIT .386 .434 .531 .641 .641 .62 COAL 0 .2 0 0 0 0 |
====================================================================
12/12/2019
Peerless remains on Buys and the December
bullishness should
bring more new highs. If there
is weakness in the DJI, we will see
a Santa Claus Buy B13 signal. But it the DJI runs up weakly after
December 25th, we may see a Sell S16. Breadth has been excellent.
The A/D Line made another new high today. Only 4 of the 46 stock
groups we use in Table 4 below show a plurality of their stocks
below their 65-dma. With the IP21 still very high for the major
market ETFs, there should be ample support for the market if
there is any significant profit-taking for the next week or two.

The victory of the pro-"City of London" financial community and
corporation Conservatives in the UK general elections has to have positive
ripple-effects on the US Stock Market. The victory does not
come as a surprise. Recent polls showed it was likely. But
now, we must wait and see this weekend if China and the
US reach a trade agreement. It seems safe to believe that White
House insiders would have passed on the word that the deal would
not be forthcoming if that were, if fact, true. So, my guess is the
market will reach a celebratory peak on schedule and in time to push
the market up for a few days after Christmas, but maybe not
quite till the end of the year. Interestingly, this is exactly the scenario
that our new Tiger Seasonality charts suggest for the DJI, the
SP-500 and FAS (financials) but not the NASDAQ, which
shows a pattern of late December highs that are then followed by
more January highs.
|
Charts 12/11/2019 2019 PEERLESS DJI, Signals, Indicators Daily DJI Volume 10-DayUp/Down Vol Stoch-20 Hourly DJIA A/D Line for All Stocks Inverted Traders Index NASDAQ S&P OEX NYSE COMPQX DJI-15 DJI-20 DJI-30 DIA SPY QQQ MDY IWM TNA Short-Term Rates USO-CrudeOil DBO FAS GLD BBH IBB JETS JNUG KOL NUGT OIH OIL RSX RETL SDS AGQ SLV SOXL TECL TLT TMF TNA UGA (gasoline) XIV and China: YINN CHAU Commodities: CANE CORN DBC JJC, NIB, CHOC CORN, CUT (paper) MOO, SOYB WEAT UUP (Dollar) LIT (Lithium) AAPL ADBE ALXN AMAT AMGN AMD AMZN AXP BA BABA BAC BIDU CAT CVX DE FB GOOG GS HD IBM INTU JPM M (Macy's) MSFT NFLX NKE NVDA PG QCOM TSLA TXN XOM V WMT CMG , LRCX, SWKS, MDGL SPPI SQ TOWN 12/11/19 (Click on Underlined link.) New highs and Bullish MAXCPs - http://tigersoft.com/max/12-12/BULLISH.htm Bearish MAXCPs - http://tigersoft.com/min/12-12/BEARISH.htm |
New TigerSoft Seasonality Software - $85
This includes current TigerSoft/Peerless Software
to current users..
The new Tiger Seasonality software uses historical TC-2000 data or data
which we can provide. It is stand-alone XP software. It does not need
other TigerSoft programs. It allows you to get Seasonality charts like
those shown below on just about any stock, index, ETF, commodity,
currency and Morningstar Sector fund. You may specify the
starting year if you do not want to go back to the first year (1915 for
the DJI and 1986 for most DJI-30 stocks) and to designate that you
only want to see the results for any or all of the Presidential Election years.
The software with Data is offered now until the end of the year for $85.
It will also be made available to those of you that have subscriptions to
our TigerSoft Elite Stock Professional (EPS) services on a new site at the
start of 2020. We offer it at a fair price. To my knowledge, Seasonality
software like this is quite rare even though it is frequently requested. I hope
some of you will want it. Let me know. I can answer any additional
questions you may have.
How good are Seasonality charts? Clearly, the more
years showing a
strong pattern, the more sigificant the results are. 2019 was a perfect example
of a bullish third year in the Presidential cycle and in this we have the
data back to 1915. The Seasonality chart for BLDP would also have
helped us if we had had it available. It showed the advisability of
selling in this stock in early November. Here we have back-data to 1995,
But with many of the newer ETFs, like SOXL, we have only about
19 years of data, Still, it is probably significant that the likehood is good
that late December weakness lies ahead.
Below is a good sampling of our new Seasonal charts. They show
considerable variation among them. My thinking is that we should use
them advisedly, when other technical evidence points in the same direction.
charts shown below
 |
 |
 |
 |
 |
 |
Table 2 QUICKSILVER on ETFS - 12/12/2019 ETF CLOSE CHANGE PIVOT-PT 5-dma AROC CL-PWR CANDLE IP21 ITRS --------------------------------------------------------------------------------------------- --------------------------------------------------------------------------------------------- DIA 281.95 2.23 280.7 82.1% ------- BLUE .378 ==== --------------------------------------------------------------------------------------------- BA 346.29 -3.71 354.09 8.7% Bearish RED -.039 -.139 --------------------------------------------------------------------------------------------- SPY 317.17 2.75 314.87 82.1% ------- BLUE .359 .02 --------------------------------------------------------------------------------------------- QQQ 206.51 1.53 205 90.1% ------- BLUE .353 .041 --------------------------------------------------------------------------------------------- MDY 371.86 3.96 369.21 85% ------- BLUE .254 .008 --------------------------------------------------------------------------------------------- IWM 163.96 1.4 162.75 93.1% ------- BLUE .05 .032 --------------------------------------------------------------------------------------------- FAS 91.63 2.98 90.36 193.2% ------- BLUE .322 .225 --------------------------------------------------------------------------------------------- RETL 27.22 1.48 26.03 562.9% ------- BLUE .163 .249 --------------------------------------------------------------------------------------------- SOXL 256.52 19.25 224 949.5% Bullish BLUE .154 .545 --------------------------------------------------------------------------------------------- TECL 219.43 6.88 211.37 356.5% Bullish BLUE .323 .353 --------------------------------------------------------------------------------------------- IBB 120.29 .81 120.03 59.8% Bullish BLUE .348 .156 --------------------------------------------------------------------------------------------- GLD 138.43 -.49 137.62 -20.6% ------- RED -.012 -.101 --------------------------------------------------------------------------------------------- OIH 11.91 -.37 12.55 -429.3% Bearish RED -.058 -.195 --------------------------------------------------------------------------------------------- GASL 7.93 .85 6.56 1479.7% ------- BLUE .017 -.017 --------------------------------------------------------------------------------------------- UGA 7.93 .85 6.56 1479.7% ------- BLUE .06 -.828 --------------------------------------------------------------------------------------------- |
Table 1 QUICKSILVER on DJI-30 STOCKS 12/12/2019 26 of 30 show rising 5-day ma SYMBOL CLOSE CHANGE PIVOT-PT 5-dma AROC CL-PWR CANDLE IP21 ITRS Remarks
TREND COLOR
----------------------------------------------------------------------------------------------
AAPL 271.46 .69 270.71 109.5% ------- BLUE .28 .158
---------------------------------------------------------------------
AXP 122.64 2 120.61 181.4% Bullish BLUE-.036 .005
---------------------------------------------------------------------
BA 346.29 -3.71 354.09 8.7% Bearish RED -.039 -.139
---------------------------------------------------------------------
CAT 146.78 2.78 142.72 200.8% Bullish BLUE .116 .142
---------------------------------------------------------------------
CSCO 45.67 1.39 43.84 244.7% ------- BLUE-.145 -.101
---------------------------------------------------------------------
CVX 118.81 2.58 118.01 105.8% ------- BLUE-.165 -.023
---------------------------------------------------------------------
DIS 147.76 .17 147.66 10.9% ------- RED .009 .063
---------------------------------------------------------------------
GS 226.05 4.86 224.61 201.3% ------- BLUE .212 .059
---------------------------------------------------------------------
HD 212.04 .04 214.28 -22.4% Bearish RED -.142 -.141
---------------------------------------------------------------------
IBM 135.32 1.56 133.22 127.9% Bearish BLUE-.103 -.126
---------------------------------------------------------------------
INTC 57.55 .48 56.81 129.8% ------- BLUE .087 .084
---------------------------------------------------------------------
JNJ 141.34 .36 140.38 63.4% Bullish ---- .348 -.011
---------------------------------------------------------------------
JPM 138.02 3.84 135.04 184.5% Bullish BLUE .294 .137
---------------------------------------------------------------------
KO 54.14 .19 54.42 -4.6% Bullish BLUE .338 -.061
---------------------------------------------------------------------
MCD 196.31 1.59 195.35 53.9% ------- BLUE .028 -.13
---------------------------------------------------------------------
MMM 168.56 -.18 171.47 124.4% ------- BLUE .01 .002
---------------------------------------------------------------------
MRK 89.57 .59 88.85 46.1% Bullish BLUE .182 .016
---------------------------------------------------------------------
MRK 153.24 1.54 151.75 109.5% Bullish BLUE .336 .057
---------------------------------------------------------------------
NKE 97.72 .54 97 99.8% Bullish BLUE .158 -.011
---------------------------------------------------------------------
PFE 38.54 .32 38.29 66.6% Bullish BLUE .133 .029
---------------------------------------------------------------------
PG 124.57 -.09 124.19 -2% Bullish RED .238 -.053
---------------------------------------------------------------------
TRV 135.61 .98 135.72 48.1% Bullish BLUE .119 -.129
---------------------------------------------------------------------
UNH 283.61 3.11 280.19 28.8% Bullish BLUE .263 .227
---------------------------------------------------------------------
UTX 149.41 2.14 146.99 141.9% Bearish BLUE-.04 .064
---------------------------------------------------------------------
V 182.64 .63 182.17 20.6% Bullish BLUE .202 -.006
---------------------------------------------------------------------
VZ 61.17 .09 61.19 28.7% Bullish BLUE .314 -.043
---------------------------------------------------------------------
WBA 58.58 .57 58.63 -44.4% Bearish BLUE-.092 .027
---------------------------------------------------------------------
WMT 119.76 .76 119.78 46.1% Bearish BLUE-.02 -.05
---------------------------------------------------------------------
DOW 70.34 1.38 69.51 139.6% Bullish BLUE-.042 -.034
|
 Table 3   Count of Stocks in Key Directories
          20191212
-------------------------------
NEWHIGHS       489  Bullish
NEWLOWS        13
MAXCP          135
MINCP          19
TTTNH          90
TTTNL          38
FASTUP         50
FASTDOWN       62
CPCROSSA       111
CPCROSSD       87
BIGVOLUP       7
BIGVODN        14
ACCUMVER       14
HIGHIP21       93
HIUPPCT        23
LOWACCUM       115
REDSELL        112
AUGSELS7       19
TRAPDOOR       14
|
Table 3   RANKING OF KEY DIRECTORIES BASED PCT.OF STOCKS ABOVE 65-DMA
             12/12/19
Bullish - 42 Bearish = 4 --------------------------------------------------------------------------------------- Directory Current day-1 day-2 day-3 day-4 day-5 ---------------------------------------------------------------------------------------- BIGBANKS 1 1 1 1 1 1 COPPER 1 1 .875 .875 1 .875 REGBANKS 1 .923 .923 .884 .884 .884 ETFS .965 .931 .827 .775 .827 .775 JETS .9 .7 .6 .6 .6 .5 AUTO .871 .871 .846 .769 .846 .692 FINANCE .813 .767 .755 .779 .779 .755 DOWJONES .8 .733 .733 .733 .733 .7 INDEXES .79 .768 .747 .747 .731 .731 NASD-100 .783 .731 .68 .659 .731 .659 SP-100 .777 .766 .755 .755 .766 .711 FIDSTKS .776 .737 .72 .737 .759 .715 GAMING .772 .772 .818 .727 .863 .818 SEMI .754 .716 .566 .566 .641 .537 INDMATER .75 .671 .605 .578 .565 .578 NIFTY .745 .745 .672 .654 .69 .654 RETAIL .745 .666 .705 .666 .666 .607 HOSPITAL .727 .727 .772 .772 .772 .727 ELECTRON .725 .692 .594 .588 .633 .562 INFRA .722 .611 .555 .583 .583 .583 SOLAR .72 .68 .6 .6 .64 .56 CHEM .714 .571 .571 .591 .571 .571 RUS-1000 .707 .67 .673 .682 .703 .639 SP500 .705 .672 .657 .674 .695 .642 HACKERS .7 .7 .65 .65 .7 .6 CHINA .672 .654 .563 .436 .509 .418 BIOTECH .666 .64 .646 .631 .631 .602 EDU .666 .555 .555 .444 .444 .388 TRANSP .65 .45 .4 .5 .6 .45 COMODITY .634 .585 .585 .56 .56 .536 FOOD .629 .592 .592 .555 .555 .518 SOFTWARE .616 .633 .6 .633 .616 .616 DJI-13 .615 .615 .615 .615 .615 .538 GOLD .607 .666 .45 .45 .431 .568 MILITARY .607 .678 .642 .714 .821 .678 HOMEBLDG .58 .677 .645 .677 .677 .677 COMPUTER .578 .526 .526 .421 .473 .473 BONDFUND .571 .767 .651 .598 .562 .571 GUNS .562 .562 .437 .625 .562 .437 GREEN .56 .56 .52 .52 .56 .48 INSURANC .54 .513 .513 .567 .486 .486 BEVERAGE .5 .562 .437 .437 .437 .437 =========================================================================================== OILGAS .467 .394 .364 .372 .379 .24 REIT .434 .531 .641 .641 .62 .606 UTILITY .425 .475 .45 .475 .5 .525 COAL .2 0 0 0 0 0 |
====================================================================
12/11/2019 Peerless remains on Buys and the
December bullishness should
bring more new highs. Even if there is a decline next week
because Wall Street does like the news about the British Election,
because the Trade Talks between the US and China remain deadlocked
after the December 15th American deadline or because the
stock market finally chooses to respond the to Trump's Impeachment,
Peerless will still be almost certainly be giving a Santa Claus Buy signal
after December 16th and they are very reliable.

Watch three items now: AAPL, AMGN and the Dollar. AAPL and
AMGN are close to breakouts. They are leaders and breakouts by them
will boost the confidence of traders who seem very cautious now. The
Dollar has dropped down to its uptrendline. A bigger decline may get the
FEDs to worry more about Inflation. But right now, I would not weight
such potential weakness too heavily: the reason being that today the NYSE
A/D Line made a new high.


As long as NYSE A/D Line keeps rising,
a weakening Dollar will not threaten stock market.

|
Charts 12/11/2019 2019 PEERLESS DJI, Signals, Indicators Daily DJI Volume 10-DayUp/Down Vol Stoch-20 Hourly DJIA A/D Line for All Stocks Inverted Traders Index NASDAQ S&P OEX NYSE COMPQX DJI-15 DJI-20 DJI-30 DIA SPY QQQ MDY IWM TNA Short-Term Rates USO-CrudeOil DBO FAS GLD BBH IBB JETS JNUG KOL NUGT OIH OIL RSX RETL SDS AGQ SLV SOXL TECL TLT TMF TNA UGA (gasoline) XIV and China: YINN CHAU Commodities: CANE CORN DBC JJC, NIB, CHOC CORN, CUT (paper) MOO, SOYB WEAT UUP (Dollar) LIT (Lithium) AAPL ADBE ALXN AMAT AMGN AMD AMZN AXP BA BABA BAC BIDU CAT CVX DE FB GOOG GS HD IBM INTU JPM M (Macy's) MSFT NFLX NKE NVDA PG QCOM TSLA TXN XOM V WMT CMG , LRCX, SWKS, MDGL SPPI SQ TOWN 12/11/19 (Click on Underlined link.) New highs and Bullish MAXCPs - http://tigersoft.com/max/12-11/BULLISH.htm Bearish MAXCPs - http://tigersoft.com/min/12-11/BEARISH.htm |
Table 1 QUICKSILVER on DJI-30 STOCKS 12/10/2019 24 of 30 show rising 5-day ma SYMBOL CLOSE CHANGE PIVOT-PT 5-dma AROC CL-PWR CANDLE IP21 ITRS Remarks
TREND COLOR
----------------------------------------------------------------------------------------------
AAPL 270.77 2.29 265.58 169.3% ------- BLUE .249 .152
---------------------------------------------------------------------
AXP 120.64 -.26 118.28 112.8% ------- RED -.067 -.02
---------------------------------------------------------------------
BA 350 2.1 345.68 16.6% Bearish BLUE -.056 -.12
---------------------------------------------------------------------
CAT 144 1.13 141.05 136.7% ------- BLUE .031 .123
---------------------------------------------------------------------
CSCO 44.28 .18 43.52 44.5% Bearish ---- -.205 -.126
---------------------------------------------------------------------
CVX 116.23 -1.66 116.33 -30.3% ------- RED -.233 -.052
---------------------------------------------------------------------
DIS 147.59 1.49 147.44 -23.4% ------- BLUE .045 .086
---------------------------------------------------------------------
GS 221.19 -.69 217.14 119.2% ------- RED .188 .038
---------------------------------------------------------------------
HD 212 -3.9 213 -48.9% Bearish BLUE -.136 -.136
---------------------------------------------------------------------
IBM 133.76 -.15 131.91 66.5% ------- RED -.163 -.122
---------------------------------------------------------------------
INTC 57.07 .48 56.08 93.1% ------- BLUE .047 .071
---------------------------------------------------------------------
JNJ 140.98 .99 139.56 57.2% Bullish ---- .339 .031
---------------------------------------------------------------------
JPM 134.18 -.32 133.06 68.6% Bullish RED .203 .108
---------------------------------------------------------------------
KO 53.95 .18 54.19 -31.4% Bullish ---- .334 -.066
---------------------------------------------------------------------
MCD 194.72 -.23 194.21 10.5% ------- RED .014 -.122
---------------------------------------------------------------------
MMM 168.74 1.08 164.37 47.6% ------- BLUE .004 .012
---------------------------------------------------------------------
MRK 88.98 -.12 88.75 17.5% Bullish RED .164 .011
---------------------------------------------------------------------
MRK 151.7 .57 149.93 61.3% Bullish ---- .305 .053
---------------------------------------------------------------------
NKE 97.18 .17 95.79 180.2% Bullish BLUE .112 0
---------------------------------------------------------------------
PFE 38.22 -.26 38.03 10.5% Bullish RED .125 .025
---------------------------------------------------------------------
PG 124.66 .39 124.62 5.2% Bullish BLUE .268 -.047
---------------------------------------------------------------------
TRV 134.63 -.91 134.31 -20% Bullish RED .121 -.129
---------------------------------------------------------------------
UNH 280.5 .98 282 21.1% Bullish BLUE .249 .238
---------------------------------------------------------------------
UTX 147.27 1.9 145.26 94.4% Bearish BLUE -.091 .047
---------------------------------------------------------------------
V 182.01 -.25 181.89 38.7% Bullish RED .168 -.009
---------------------------------------------------------------------
VZ 61.08 -.15 60.82 45.1% Bullish RED .326 -.033
---------------------------------------------------------------------
WBA 58.01 -.4 59.1 -76.6% Bearish RED -.02 .007
---------------------------------------------------------------------
WMT 119 -.14 118.66 13% Bearish RED -.056 -.044
---------------------------------------------------------------------
DOW 68.96 -.1 68.41 22.4% ------- BLUE -.131 -.053
|
Table 2 QUICKSILVER on ETFS - 12/10/2019 ETF CLOSE CHANGE PIVOT-PT 5-dma AROC CL-PWR CANDLE IP21 ITRS --------------------------------------------------------------------------------------------- DIA 279.72 .26 277.36 47.9% ------- BLUE .352 0 --------------------------------------------------------------------------------------------- BA 350 2.1 345.68 16.6% Bearish BLUE-.056 -.12 --------------------------------------------------------------------------------------------- SPY 313.44 -.04 312.02 31.6% Bullish RED .239 .015 --------------------------------------------------------------------------------------------- QQQ 204.98 1.08 202.83 62.6% Bullish BLUE .334 .041 --------------------------------------------------------------------------------------------- MDY 367.9 .6 365.61 38.4% ------- BLUE .14 .011 --------------------------------------------------------------------------------------------- IWM 162.56 -.05 160.94 55% ------- RED .012 .042 --------------------------------------------------------------------------------------------- FAS 88.65 -.65 88.18 86% ------- RED .222 .145 --------------------------------------------------------------------------------------------- RETL 25.74 -.57 24.32 225.2% Bearish RED .057 .099 --------------------------------------------------------------------------------------------- SOXL 237.27 14.6 214.05 589.5% ------- BLUE .059 .38 --------------------------------------------------------------------------------------------- TECL 212.55 4.25 204.53 243.8% Bullish BLUE .255 .256 --------------------------------------------------------------------------------------------- IBB 119.48 -.62 118.86 -38.4% Bullish RED .329 .166 --------------------------------------------------------------------------------------------- GLD 138.92 .95 139 0% Bullish BLUE .063 -.059 --------------------------------------------------------------------------------------------- OIH 11.91 -.37 12.55 -429.3% Bearish RED -.058 -.167 --------------------------------------------------------------------------------------------- GASL 7.08 -.15 5.93 731% Bearish RED -.046 -.179 --------------------------------------------------------------------------------------------- UGA 7.08 -.15 5.93 731% ------- RED -.009 -.827 --------------------------------------------------------------------------------------------- UUP 26.62 -.1 26.68 -22.4% ------- RED -.341 -.068 --------------------------------------------------------------------------------------------- IEF 26.62 -.1 26.68 -22.4% ------- RED -.227 -.814 --------------------------------------------------------------------------------------------- CORN 26.62 -.1 26.68 -22.4% Bullish RED -.346 .718 --------------------------------------------------------------------------------------------- WEAT 26.62 -.1 26.68 -22.4% ------- RED -.342 3.804 --------------------------------------------------------------------------------------------- YINN 26.62 -.1 26.68 -22.4% ------- RED -.243 .342 --------------------------------------------------------------------------------------------- RSX 25.03 .47 24.14 164.1% Bullish BLUE .115 .05 |
 Table 3   Count of Stocks in Key Directories
          20191211
-------------------------------
NEWHIGHS       235  Bullish
NEWLOWS        13
MAXCP          58
MINCP          26
TTTNH          20
TTTNL          36
FASTUP         77
FASTDOWN       62
CPCROSSA       111
CPCROSSD       87
BIGVOLUP       7
BIGVODN        14
ACCUMVER       11
HIGHIP21       22
HIUPPCT        23
LOWACCUM       115
REDSELL        120
AUGSELS7       18
TRAPDOOR       14
|
Table 4   RANKING OF KEY DIRECTORIES BASED PCT.OF STOCKS ABOVE 65-DMA
              12/11/19
 Bullish = 42
 Bearish = 4
---------------------------------------------------------------------------------------
Directory     Current       day-1         day-2         day-3         day-4         day-5
----------------------------------------------------------------------------------------
BIGBANKS       1             1             1             1             1             1
COPPER         1             .875          .875          1             .875          .875
ETFS           .931          .827          .775          .827          .775          .741
REGBANKS       .923          .923          .884          .884          .884          .846
AUTO           .871          .846          .769          .846          .692          .692
GAMING         .772          .818          .727          .863          .818          .772
INDEXES        .768          .747          .747          .731          .731          .752
BONDFUND       .767          .651          .598          .562          .553          .535
FINANCE        .767          .755          .779          .779          .755          .744
SP-100         .766          .755          .755          .766          .711          .7
NIFTY          .754          .684          .666          .701          .666          .666
FIDSTKS        .737          .72           .737          .759          .72           .703
DOWJONES       .733          .733          .733          .733          .7            .7
NASD-100       .731          .69           .67           .731          .659          .649
HOSPITAL       .727          .772          .772          .772          .727          .727
SEMI           .716          .566          .566          .641          .547          .537
HACKERS        .7            .7            .65           .7            .6            .6
JETS           .7            .6            .6            .6            .6            .5
ELECTRON       .697          .598          .592          .638          .578          .552
SOLAR          .68           .6            .6            .64           .56           .56
MILITARY       .678          .642          .714          .821          .678          .642
HOMEBLDG       .677          .645          .677          .677          .677          .645
SP500          .672          .659          .674          .695          .64           .64
INDMATER       .671          .605          .578          .565          .578          .513
RUS-1000       .67           .674          .682          .703          .639          .639
GOLD           .666          .45           .45           .431          .568          .549
RETAIL         .666          .705          .666          .666          .627          .705
CHINA          .654          .563          .436          .509          .418          .4
BIOTECH        .637          .643          .628          .631          .605          .628
SOFTWARE       .633          .616          .633          .616          .616          .633
DJI-13         .615          .615          .615          .615          .538          .615
INFRA          .611          .555          .583          .583          .583          .583
FOOD           .592          .592          .555          .555          .518          .555
COMODITY       .585          .585          .56           .56           .536          .536
CHEM           .571          .571          .591          .571          .571          .469
BEVERAGE       .562          .437          .437          .437          .437          .437
GUNS           .562          .437          .625          .562          .437          .5
GREEN          .56           .52           .52           .56           .48           .52
EDU            .555          .555          .444          .444          .388          .5
REIT           .531          .641          .641          .62           .606          .579
COMPUTER       .526          .526          .421          .473          .473          .473
INSURANC       .513          .513          .567          .486          .486          .486
--------------------------------------------------------------------------------------------
UTILITY        .475          .45           .475          .5            .525          .525
TRANSP         .45           .4            .5            .6            .5            .45
OILGAS         .394          .364          .372          .379          .248          .291
COAL           0             0             0             0             0             0
|
====================================================================
12/10/2019 Peerless remains on Buys and the December
bullishness should
bring more new highs. The magnificent A/D Line uptrend is still intact.
The Tiger Accumulation Index is very positive for the key indexes and ETFs.
And the month after December 10th has risen 76.9% of the time
with an average DJI gain of +2.8%. All these things suggest that
we should be patient.

But clearly, right now, the DJI's upward momentum is
waning.
The DJI is rising at an annualized rate of only 8.6%. A decline
by the DJI back to retest 27400-27500 cannot be ruled out.
And what if too many investors are looking forward to a late
December rally? What if none materializes? What if China and
the US breakdown badly? What if new and really damning
evidence surfaces in the Trump Impeachment proceedings? What
if the Dollar breaks down and the FED sees a need to raise
interest rates? Trust Peerless. That is my answer. We have
a variety of Sell Signals that cover most technical contingencies.
You know about our Sell S9s and Sell S12s. And you know
about the bearishness of head/shoulders pattern.
But do you know about our Sell S16 signals. They mark the
failure of a Santa Claus rally to appear. Sometime, Santa's failure is
no problem, as in December 1986, but at other times, a weak or
non-existent year-end rally produces a very dangerous situation.
There are many examples of this. The declines after the Peerless Sell
S16s that result from the non-appearance of a Santa Claus rally are
consistently significant: 1934 (S16's gain was 6.1%, 1938 (10%),
1941 (12%), 1952 (9.8%), 1956 (7.9%), 1959 (9.9%), 1961 (26.3%),
1970 (5.6%), 1976 (6.1%), 1981 (4.2%), 1990 (9.1%),
1999 (12.8%), 2013, (6.4%) and 2015 (9.2%)...
But let's consider another aspect of the markets behavior at
this
time of the year. How has the DJI behaved going into the new
Election Year when a Republican was in the White House?
I have marked in RED when there was a December peak,
fuschia when there was a January and
maroon when a February peak occurred.
Only in 2 of the 12 cases was there a December top
here.
There were five January peaks and three February tops.
Market Tops as Election Year Starts
when a Republican was President:
- A Top on 2/6/1924 was followed by a 13% DJI decline until mid May.
2. In 1928, the DJI hesitated and went sidewise
until its upside breakout
on March 9.
3. 1932: major three tops were made near 90, starting on 1/15/1932
before a 50% sell-off by July.
4. 1956: DJi peaked on 12/30/1955
and fell 5.5% before rallying 13%
and entering a year-long trading range with boundaries about 10% apart.
5. 1960: DJI peaked on 1/5/1960
with Peerless giving multiple sells.
DJI then fell 12% and began an 18% decline that did not end until
mid October.
6. 1972: Boosted by a lowering of rates,
the DJI rallied 10% until April 12
where a series of Sell S9s and a falling A/D Line confined the DJI until
a final October breakout until January 1973.
7. 1976: DJI rose sharply in January and
February.
8. 1984: DJI peaked on 1/6/1984.
Sell S12. Rising wedge. Trend-break
All of these brought about a 16% decline until August, 1984
9. 1988: DJI peaked on 1/5/1988
and fell 5% to lower band and
then began a gradual zigzagging advance powered by Fed injections
of money into Wall Street banks and brokerages.
10. 1992: DJI rose slowly until June
but NYSE A/D Line peaked on 2/12/1992.
The DJI rose only from approx. 3200 to 3400.
11. 2004: DJI peaked on 2/11/2004
and then fell until 9% October bottom.
12. 2008: DJI peaked 12/10/2007
with a Peerless Sell S9/S12.
|
Charts 12/10/2019 2019 PEERLESS DJI, Signals, Indicators Daily DJI Volume 10-DayUp/Down Vol Stoch-20 Hourly DJIA A/D Line for All Stocks Inverted Traders Index NASDAQ S&P OEX NYSE COMPQX DJI-15 DJI-20 DJI-30 DIA SPY QQQ MDY IWM TNA Short-Term Rates USO-CrudeOil DBO FAS GLD BBH IBB JETS JNUG KOL NUGT OIH OIL RSX RETL SDS AGQ SLV SOXL TECL TLT TMF TNA UGA (gasoline) XIV and China: YINN CHAU Commodities: CANE CORN DBC JJC, NIB, CHOC CORN, CUT (paper) MOO, SOYB WEAT UUP (Dollar) LIT (Lithium) AAPL ADBE ALXN AMAT AMGN AMD AMZN AXP BA BABA BAC BIDU CAT CVX DE FB GOOG GS HD IBM INTU JPM M (Macy's) MSFT NFLX NKE NVDA PG QCOM TSLA TXN XOM V WMT CMG , LRCX, SWKS, MDGL SPPI SQ TOWN 12/10/19 (Click on Underlined link.) New highs and Bullish MAXCPs - http://tigersoft.com/max/12-10/BULLISH.htm Bearish MAXCPs - http://tigersoft.com/min/12-10/BEARISH.htm |
Table 1 QUICKSILVER on DJI-30 STOCKS 12/10/2019 24 of 30 show rising 5-day ma SYMBOL CLOSE CHANGE PIVOT-PT 5-dma AROC CL-PWR CANDLE IP21 ITRS Remarks
TREND COLOR
----------------------------------------------------------------------------------------------
AAPL 268.48 1.56 261.74 170.5% ------- RED .256 .161 Bullish
---------------------------------------------------------------------
AXP 120.9 .44 117.94 182.3% ------- BLUE -.074 -.016
---------------------------------------------------------------------
BA 347.9 -3.31 348.84 -59.6% Bearish RED -.036 -.124
---------------------------------------------------------------------
CAT 142.87 .04 140.12 99.4% ------- BLUE .061 .093
---------------------------------------------------------------------
CSCO 44.1 .2 43.89 -20.5% Bearish BLUE -.191 -.146
---------------------------------------------------------------------
CVX 117.89 .59 116.94 85.5% ------- RED -.182 -.044
---------------------------------------------------------------------
DIS 146.1 -.11 148.28 -84% ------- BLUE .011 .083
---------------------------------------------------------------------
GS 221.88 .07 215.94 220.7% ------- BLUE .166 .033
---------------------------------------------------------------------
HD 215.9 -.63 214.1 44.3% Bearish RED -.126 -.108 Bearish
---------------------------------------------------------------------
IBM 133.91 -.01 131.99 67.5% Bearish ---- -.145 -.117 Bearish
---------------------------------------------------------------------
INTC 56.59 .06 56.02 46.2% Bearish RED .025 .06
---------------------------------------------------------------------
JNJ 139.99 -.51 139.38 101.5% Bullish RED .372 .044
---------------------------------------------------------------------
JPM 134.5 -.65 132.34 177.3% Bullish BLUE .257 .105 Bullish
---------------------------------------------------------------------
KO 53.77 -.3 54.29 -2.8% Bullish RED .298 -.05
---------------------------------------------------------------------
MCD 194.95 .27 194.31 47.1% ------- BLUE -.007 -.13
---------------------------------------------------------------------
MMM 167.66 -2.17 167.14 74.3% ------- RED -.065 -.018
---------------------------------------------------------------------
MRK 89.1 .38 88.67 97.2% Bullish BLUE .189 .02
---------------------------------------------------------------------
MSFT 151.13 -.23 149.85 60.5% Bullish ---- .295 .049
---------------------------------------------------------------------
NKE 97.01 .38 93.72 239.2% ------- BLUE .115 -.005
---------------------------------------------------------------------
PFE 38.48 .16 38.14 56.3% Bullish BLUE .169 .033
---------------------------------------------------------------------
PG 124.27 -.6 124.53 53.1% Bullish RED .255 -.039
---------------------------------------------------------------------
TRV 135.54 .09 135.17 34.1% Bullish BLUE .158 -.127
---------------------------------------------------------------------
UNH 279.52 1.98 279.32 37.2% Bullish BLUE .207 .248 Bullish
---------------------------------------------------------------------
UTX 145.37 -.85 144.52 56.4% Bearish RED -.122 .027
---------------------------------------------------------------------
V 182.26 -.66 180.6 9.9% Bullish RED .184 .021
---------------------------------------------------------------------
VZ 61.23 .22 60.53 89.7% Bullish BLUE .379 -.024
---------------------------------------------------------------------
WBA 58.41 -.3 58.91 -49.3% Bearish RED -.003 .018
---------------------------------------------------------------------
WMT 119.14 -.22 118.69 19.7% Bearish RED -.047 -.034
---------------------------------------------------------------------
DOW 69.06 -.6 68.65 85.7% ------- RED -.103 -.06
|
Table 2 QUICKSILVER on ETFS - 12/10/2019 ETF CLOSE CHANGE PIVOT-PT 5-dma AROC CL-PWR CANDLE IP21 ITRS --------------------------------------------------------------------------------------------- DIA 279.46 -.3 277.05 71% ------- RED .356 ---- --------------------------------------------------------------------------------------------- BA 347.9 -3.31 348.84 -59.6% Bearish RED -.036 -.124 --------------------------------------------------------------------------------------------- SPY 313.48 -.4 311.46 62.9% ------- RED .318 .018 --------------------------------------------------------------------------------------------- QQQ 203.9 -.17 202.43 61.3% ------- RED .332 .042 --------------------------------------------------------------------------------------------- MDY 367.3 -.21 365.08 71.2% ------- ---- .141 .004 --------------------------------------------------------------------------------------------- IWM 162.61 .1 160.78 90.8% ------- BLUE .034 .036 --------------------------------------------------------------------------------------------- FAS 89.3 -.62 87.12 209.7% ------- RED .256 .112 --------------------------------------------------------------------------------------------- RETL 26.31 -.09 24.59 450.6% Bearish ---- .076 .111 --------------------------------------------------------------------------------------------- SOXL 222.67 2.45 211.51 481.7% ------- RED .028 .27 --------------------------------------------------------------------------------------------- TECL 208.3 .2 202.46 193.1% ------- RED .249 .211 Bullish --------------------------------------------------------------------------------------------- IBB 120.1 .69 120.4 39.7% Bullish BLUE .365 .169 Bullish --------------------------------------------------------------------------------------------- GLD 137.97 .39 138.92 -41.2% Bullish RED .039 -.045 --------------------------------------------------------------------------------------------- OIH 11.91 -.37 12.55 -429.3% Bearish RED -.058 -.152 Bearish --------------------------------------------------------------------------------------------- GASL 7.23 .24 6.12 1382.2% Bearish BLUE-.067 -.245 Bearish --------------------------------------------------------------------------------------------- RSX 24.56 .08 24.23 134% Bullish ---- .101 .039 |
  Table 3   Count of Stocks in Key Directories
          20191210
-------------------------------
NEWHIGHS       152  Bullish
NEWLOWS        13
MAXCP          48
MINCP          25
TTTNH          19
TTTNL          29
FASTUP         108
FASTDOWN       56
CPCROSSA       70
CPCROSSD       72
BIGVOLUP       3
BIGVODN        11
ACCUMVER       19
HIGHIP21       35
HIUPPCT        23
LOWACCUM       123
REDSELL        119
AUGSELS7       22
TRAPDOOR       16
|
Table 4 RANKING OF KEY DIRECTORIES BASED PCT.OF STOCKS ABOVE 65-DMA
12/10/19
Bulliah = 39
Bearish = 7
---------------------------------------------------------------------------------------
Directory Current day-1 day-2 day-3 day-4 day-5
----------------------------------------------------------------------------------------
BIGBANKS 1 1 1 1 1 .857
REGBANKS .923 .884 .884 .884 .846 .807
COPPER .875 .875 1 .875 .875 .625
AUTO .846 .769 .846 .692 .692 .692
ETFS .827 .775 .827 .775 .741 .655
GAMING .818 .727 .863 .818 .772 .818
HOSPITAL .772 .772 .772 .727 .727 .727
FINANCE .755 .779 .779 .755 .755 .72
SP-100 .755 .755 .766 .711 .7 .622
INDEXES .741 .747 .731 .731 .752 .693
DOWJONES .733 .733 .733 .7 .7 .633
FIDSTKS .72 .737 .759 .72 .703 .664
RETAIL .705 .666 .666 .627 .705 .627
HACKERS .7 .7 .7 .6 .6 .65
NASD-100 .69 .68 .742 .659 .649 .597
NIFTY .684 .666 .701 .666 .666 .614
RUS-1000 .674 .684 .703 .639 .636 .604
SP500 .659 .676 .695 .64 .638 .59
BONDFUND .651 .598 .562 .553 .526 .571
HOMEBLDG .645 .677 .677 .677 .677 .645
MILITARY .642 .714 .821 .678 .642 .571
REIT .641 .641 .62 .606 .586 .558
BIOTECH .64 .625 .628 .605 .631 .608
SOFTWARE .616 .65 .616 .616 .633 .616
DJI-13 .615 .615 .615 .538 .615 .461
INDMATER .605 .578 .565 .578 .513 .513
JETS .6 .6 .6 .6 .5 .5
SOLAR .6 .6 .64 .56 .56 .56
ELECTRON .594 .588 .633 .575 .555 .516
FOOD .592 .555 .555 .518 .555 .425
COMODITY .585 .56 .56 .536 .536 .463
CHEM .571 .591 .571 .571 .469 .51
SEMI .566 .566 .641 .547 .537 .49
CHINA .563 .436 .509 .418 .4 .4
EDU .555 .444 .444 .388 .444 .444
INFRA .555 .583 .583 .583 .583 .555
COMPUTER .526 .421 .473 .473 .473 .473
GREEN .52 .52 .56 .48 .52 .52
INSURANC .513 .567 .486 .486 .486 .405
=============================================================================================
GOLD .45 .45 .431 .568 .549 .568
UTILITY .45 .475 .5 .525 .525 .45
BEVERAGE .437 .437 .437 .437 .437 .375
GUNS .437 .625 .562 .437 .5 .375
TRANSP .4 .5 .6 .5 .45 .4
OILGAS .364 .372 .379 .248 .291 .24
COAL 0 0 0 0 0 0
|
====================================================================
12/9/2019 The Peerless Buys tells us to be patient. More new highs lie
ahead. While a retreat back to 27500 cannot be ruled out, the
the seasonality for the next five, ten and twenty-one days
says otherwise. Since 1967 in the third years of the four-year
cycle, the DJI has risen 61.5%,84.6% and 76.9% of the time,
gaining 0.4%, +1.8% and +2.6% of the time. We do not see
head and shoulders tops. We still see rising Opening and Closing
Power in SPY and QQQ. And we see very high Accumulation
and excellent breadth. Thus, for example, though the DJI fell
more than 100 today, there were still +26 more advancers
than decliners on the NYSE.


No stock is more significant than AAPL for the key
general mrket ETFs.

|
Charts 12/9/2019 2019 PEERLESS DJI, Signals, Indicators Daily DJI Volume 10-DayUp/Down Vol Stoch-20 Hourly DJIA A/D Line for All Stocks Inverted Traders Index NASDAQ S&P OEX NYSE COMPQX DJI-15 DJI-20 DJI-30 DIA SPY QQQ MDY IWM TNA Short-Term Rates USO-CrudeOil DBO FAS GLD BBH IBB JETS JNUG KOL NUGT OIH OIL RSX RETL SDS AGQ SLV SOXL TECL TLT TMF TNA UGA (gasoline) XIV and China: YINN CHAU Commodities: CANE CORN DBC JJC, NIB, CHOC CORN, CUT (paper) MOO, SOYB WEAT UUP (Dollar) LIT (Lithium) AAPL ADBE ALXN AMAT AMGN AMD AMZN AXP BA BABA BAC BIDU CAT CVX DE FB GOOG GS HD IBM INTU JPM M (Macy's) MSFT NFLX NKE NVDA PG QCOM TSLA TXN XOM V WMT CMG , LRCX, SWKS, MDGL SPPI SQ TOWN 12/9/19 (Click on Underlined link.) New highs and Bullish MAXCPs - http://tigersoft.com/max/12-9/BULLISH.htm Bearish MAXCPs - http://tigersoft.com/min/12-9/BEARISH.htm |
Table 1 QUICKSILVER on DJI-30 STOCKS 12/9/2019 20 of 30 show rising 5-day ma SYMBOL CLOSE CHANGE PIVOT-PT 5-dma AROC CL-PWR CANDLE IP21 ITRS Remarks
TREND COLOR
----------------------------------------------------------------------------------------------
AAPL 266.92 -3.79 259.45 52.2% ------- RED .278 .176 Bullish
---------------------------------------------------------------------
AXP 120.46 -.15 116.57 135.4% ------- --- -.074 -.028
---------------------------------------------------------------------
BA 351.21 -2.88 352.08 -56.5% Bearish RED -.041 -.127
---------------------------------------------------------------------
CAT 142.83 .11 140.06 -4.6% ------- RED .103 .084
---------------------------------------------------------------------
CSCO 43.9 .06 44.28 -90.8% Bearish --- -.196 -.145
---------------------------------------------------------------------
CVX 117.3 -.71 115.89 21.4% ------ BLUE -.192 -.055
---------------------------------------------------------------------
DIS 146.21 -1.45 148.58 -148.5% ------- RED -.02 .081
---------------------------------------------------------------------
GS 221.81 -2.8 212.24 95.9% ------- RED .188 .018
---------------------------------------------------------------------
HD 216.53 2.25 214 -25.4% Bearish BLUE -.12 -.102
---------------------------------------------------------------------
IBM 133.92 .7 132.12 38.1% Bearish BLUE -.089 -.109
---------------------------------------------------------------------
INTC 56.53 -.28 56.07 -100% Bearish ---- .07 .069
---------------------------------------------------------------------
JNJ 140.5 .12 137.16 113.1% Bullish BLUE .444 .049 Bullish
---------------------------------------------------------------------
JPM 135.15 .11 129.78 139% Bullish BLUE .276 .104
---------------------------------------------------------------------
KO 54.07 -.35 53.8 29.6% Bullish RED .315 -.048
---------------------------------------------------------------------
MCD 194.68 -.67 193.12 -12.9% ------- RED -.042 -.131
---------------------------------------------------------------------
MMM 169.83 -1.64 165.17 46.6% ------- BLUE -.051 -.012
---------------------------------------------------------------------
MRK 88.72 -.13 87.38 95.3% Bullish RED .214 .026
---------------------------------------------------------------------
MSFT 151.36 -.39 149.31 60.3% Bullish BLUE .35 .055 Bullish
---------------------------------------------------------------------
NKE 96.63 -.37 92.46 162.4% Bearish RED .122 .003
---------------------------------------------------------------------
PFE 38.32 .03 38.05 3.9% Bullish BLUE .165 .014
---------------------------------------------------------------------
PG 124.87 .68 122.95 86.8% Bullish BLUE .271 -.042
---------------------------------------------------------------------
TRV 135.45 -.27 134.62 7% Bullish BLUE .153 -.129
---------------------------------------------------------------------
UNH 277.54 -2.65 277.44 -37.9% ------- RED .18 .245 Bullish
---------------------------------------------------------------------
UTX 146.22 -.77 143.73 42.4% Bearish RED -.041 .028
---------------------------------------------------------------------
V 182.92 .75 181.9 31.1% Bullish BLUE .225 .007
---------------------------------------------------------------------
VZ 61.01 -.18 60.14 86.7% Bullish ---- .293 -.032
---------------------------------------------------------------------
WBA 58.71 .08 58.99 -47.5% Bearish BLUE .042 .035
---------------------------------------------------------------------
WMT 119.36 -.42 118.67 3.4% Bearish RED -.043 -.036
---------------------------------------------------------------------
DOW 69.66 .15 67.88 90.4% ------- BLUE -.115 -.069
|
Table 2 QUICKSILVER on ETFS - 12/9/2019 ETF CLOSE CHANGE PIVOT-PT 5-dma AROC CL-PWR CANDLE IP21 ITRS --------------------------------------------------------------------------------------------- DIA 279.76 -.94 275.51 28.1% ------- RED .378 ------ --------------------------------------------------------------------------------------------- BA 351.21 -2.88 352.08 -56.5% Bearish RED -.041 -.127 --------------------------------------------------------------------------------------------- SPY 313.88 -.99 309.55 35.9% ------- RED .376 .019 --------------------------------------------------------------------------------------------- QQQ 204.07 -.93 201.41 26.4% ------- RED .399 .047 --------------------------------------------------------------------------------------------- MDY 367.51 -1.7 362.09 46% ------- RED .17 .006 --------------------------------------------------------------------------------------------- IWM 162.51 -.24 159.68 72.1% ------- RED .048 .031 --------------------------------------------------------------------------------------------- FAS 89.92 -.44 85.6 144.2% ------- RED .298 .118 --------------------------------------------------------------------------------------------- RETL 26.4 .37 24.05 249.7% Bearish BLUE .049 .146 --------------------------------------------------------------------------------------------- SOXL 220.22 -3.78 202.02 200.3% ------- RED .072 .291 --------------------------------------------------------------------------------------------- TECL 208.1 -3.27 200.37 57.8% ------- RED .302 .242 --------------------------------------------------------------------------------------------- IBB 119.41 -.62 119.15 40.2% Bullish RED .375 .159 --------------------------------------------------------------------------------------------- GLD 137.58 -.04 139.11 -7.6% Bullish RED -.04 -.069 --------------------------------------------------------------------------------------------- OIH 11.91 -.37 12.55 -429.3% Bearish RED -.058 -.158 --------------------------------------------------------------------------------------------- GASL 6.99 .43 5.51 1046.6% Bearish BLUE-.068 -.306 --------------------------------------------------------------------------------------------- |
  Table 3  Count of Stocks in Key Directories
           20191209
-------------------------------
NEWHIGHS       152   Bullish <10:1 ratio
NEWLOWS        8
MAXCP          48
MINCP          17
TTTNH          20
TTTNL          21
FASTUP         98
FASTDOWN       55
CPCROSSA       67
CPCROSSD       70
BIGVOLUP       5
BIGVODN        14
ACCUMVER       17
HIGHIP21       48
HIUPPCT        22
VHIP21         86
LOWACCUM       114
REDSELL        121
AUGSELS7       18
TRAPDOOR       19
|
Table 4 RANKING OF KEY DIRECTORIES BASED PCT.OF STOCKS ABOVE 65-DMA 12/9/19 Bullish = 37 Bearish = 8 --------------------------------------------------------------------------------------- Directory Current day-1 day-2 day-3 day-4 day-5 ---------------------------------------------------------------------------------------- BIGBANKS 1 1 1 1 .857 1 REGBANKS .884 .884 .884 .846 .807 .923 COPPER .875 1 .875 .875 .625 1 FINANCE .779 .779 .755 .755 .732 .755 ETFS .775 .827 .775 .741 .655 .706 HOSPITAL .772 .772 .727 .727 .727 .727 AUTO .769 .846 .692 .692 .692 .769 SP-100 .755 .766 .711 .7 .622 .711 INDEXES .747 .731 .731 .752 .704 .72 FIDSTKS .737 .759 .72 .703 .67 .709 DOWJONES .733 .733 .7 .7 .633 .666 GAMING .727 .863 .818 .772 .818 .727 MILITARY .714 .821 .678 .642 .571 .607 HACKERS .7 .75 .6 .6 .65 .65 RUS-1000 .684 .704 .639 .636 .605 .65 NASD-100 .68 .752 .67 .649 .597 .649 HOMEBLDG .677 .677 .677 .677 .677 .645 SP500 .676 .697 .64 .638 .592 .64 RETAIL .666 .666 .627 .705 .627 .725 NIFTY .654 .69 .654 .654 .6 .654 SOFTWARE .65 .633 .616 .633 .616 .65 REIT .641 .62 .606 .586 .565 .565 GUNS .625 .562 .437 .5 .375 .437 BIOTECH .622 .625 .602 .631 .614 .599 DJI-13 .615 .615 .538 .615 .461 .615 JETS .6 .6 .6 .5 .5 1 SOLAR .6 .64 .56 .56 .56 .48 BONDFUND .598 .562 .553 .526 .553 .321 CHEM .591 .571 .571 .469 .53 .53 ELECTRON .588 .633 .575 .555 .516 .549 INFRA .583 .583 .583 .583 .555 .611 INDMATER .578 .565 .578 .513 .526 .526 INSURANC .567 .486 .486 .486 .405 .486 SEMI .566 .641 .547 .537 .49 .528 COMODITY .56 .56 .536 .536 .463 .439 FOOD .555 .555 .518 .555 .444 .425 GREEN .52 .56 .48 .52 .52 .44 =========================================================================================== TRANSP .5 .6 .5 .45 .4 .65 =========================================================================================== UTILITY .475 .5 .525 .525 .45 .4 GOLD .45 .431 .568 .549 .568 .411 EDU .444 .444 .388 .444 .444 .5 BEVERAGE .437 .437 .437 .437 .375 .375 CHINA .436 .509 .418 .4 .4 .418 COMPUTER .421 .473 .473 .473 .473 .526 OILGAS .372 .379 .248 .291 .24 .248 COAL 0 0 0 0 0 0 |
====================================================================
12/6/2019 The Peerless Buys are intact. The DJI is still bullishly configured
above its
flat resistance and running close to all-time highs. Breadth remains superb.
And the stready winds of bullish seasonality keep the bull market's sails
full and flush with power. The low interest rates and the robust economy
are allowing our DJI now to continue to outperform its normally bullish average
rate of ascent in this the third years in the 4-year Presidential cycle. It is now
up
20.3% for the year. Since 1915, the average gain of the DJI in third years from
January 1 to December 8th is only 13.7%. Moreover, while the average DJI trades
flat between October 31st and December 14th in the third year, in our case the
DJI is up 3.6% since the end of October. This is one more reason to remain
bullish.


|
Charts 12/6/2019 2019 PEERLESS DJI, Signals, Indicators Daily DJI Volume 10-DayUp/Down Vol Stoch-20 Hourly DJIA A/D Line for All Stocks Inverted Traders Index NASDAQ S&P OEX NYSE COMPQX DJI-15 DJI-20 DJI-30 DIA SPY QQQ MDY IWM TNA Short-Term Rates USO-CrudeOil DBO FAS GLD BBH IBB JETS JNUG KOL NUGT OIH OIL RSX RETL SDS AGQ SLV SOXL TECL TLT TMF TNA UGA (gasoline) XIV and China: YINN CHAU Commodities: CANE CORN DBC JJC, NIB, CHOC CORN, CUT (paper) MOO, SOYB WEAT UUP (Dollar) LIT (Lithium) AAPL ADBE ALXN AMAT AMGN AMD AMZN AXP BA BABA BAC BIDU CAT CVX DE FB GOOG GS HD IBM INTU JPM M (Macy's) MSFT NFLX NKE NVDA PG QCOM TSLA TXN XOM V WMT CMG , LRCX, SWKS, MDGL SPPI SQ TOWN 12/6/19 (Click on Underlined link.) New highs and Bullish MAXCPs - http://tigersoft.com/max/12-6/BULLISH.htm Bearish MAXCPs - http://tigersoft.com/min/12-6/BEARISH.htm |
Table 1 QUICKSILVER on DJI-30 STOCKS 12/6/2019 17 of 30 show rising 5-day ma SYMBOL CLOSE CHANGE PIVOT-PT 5-dma AROC CL-PWR CANDLE IP21 ITRS Remarks
TREND COLOR
----------------------------------------------------------------------------------------------
AAPL 270.71 5.13 264.16 65.6% ------- BLUE .312 .187 Bullish (IP21+ITRS)>.40
---------------------------------------------------------------------
AXP 120.61 2.33 117.26 20.8% Bullish BLUE -.047 -.03
---------------------------------------------------------------------
BA 354.09 8.41 355.18 -171% Bearish BLUE -.034 -.129
---------------------------------------------------------------------
CAT 142.72 1.67 142.96 -70.9% Bearish RED .056 .085
---------------------------------------------------------------------
CSCO 43.84 .32 44.7 -165.8% Bearish ---- -.193 -.146
---------------------------------------------------------------------
CVX 118.01 1.68 116.8 37.7% Bearish BLUE -.161 -.062
---------------------------------------------------------------------
DIS 147.66 .22 150.62 -131.3% ------- RED .009 .081
---------------------------------------------------------------------
GS 224.61 7.47 217.64 75.2% ------- BLUE .254 .035
---------------------------------------------------------------------
HD 214.28 1.28 217.62 -144.3% Bearish BLUE -.145 -.111 Bearish
---------------------------------------------------------------------
IBM 133.22 1.31 132.91 -46.4% Bearish BLUE -.134 -.116 Bearish
---------------------------------------------------------------------
INTC 56.81 .73 57.66 -109.2% Bearish BLUE .085 .072
---------------------------------------------------------------------
JNJ 140.38 .82 137.36 104.6% Bullish BLUE .415 .046 Bullish
---------------------------------------------------------------------
JPM 135.04 1.98 131.47 124.5% ------- BLUE .188 .11
---------------------------------------------------------------------
KO 54.42 .23 53.75 94.6% Bullish BLUE .332 -.043
---------------------------------------------------------------------
MCD 195.35 1.14 195.18 22.4% Bearish BLUE -.062 -.125
---------------------------------------------------------------------
MMM 171.47 7.1 168.27 50.9% ------- BLUE -.076 .003
---------------------------------------------------------------------
MRK 88.85 .1 87.04 95.1% Bullish RED .161 .015
---------------------------------------------------------------------
MSFT 151.75 1.82 149.55 12.3% ------- BLUE .355 .044
---------------------------------------------------------------------
NKE 97 1.21 93.56 187.1% Bearish BLUE .174 .008
---------------------------------------------------------------------
PFE 38.29 .26 38.29 -30.1% ------- ---- .098 .026
---------------------------------------------------------------------
PG 124.19 -.43 122.72 86.3% Bullish RED .244 -.045
---------------------------------------------------------------------
TRV 135.72 1.41 135.26 -37% ------- BLUE .115 -.128
---------------------------------------------------------------------
UNH 280.19 -1.81 279.66 5.7% ------- RED .257 .256 Bullish
---------------------------------------------------------------------
UTX 146.99 1.73 144.99 -46.4% Bearish RED -.035 .025
---------------------------------------------------------------------
V 182.17 .28 181.79 -64.2% ------- RED .176 -.007
---------------------------------------------------------------------
VZ 61.19 .37 59.96 78.7% Bullish BLUE .336 -.032
---------------------------------------------------------------------
WBA 58.63 -.47 59.27 -82% Bearish RED -.037 .04
---------------------------------------------------------------------
WMT 119.78 1.12 119.28 29% Bearish BLUE -.025 -.031
---------------------------------------------------------------------
DOW 69.51 1.1 68.42 101% Bearish BLUE -.083 -.065
|
Table 2 QUICKSILVER on ETFS - 12/6/2019 ETF CLOSE CHANGE PIVOT-PT 5-dma AROC CL-PWR CANDLE IP21 ITRS --------------------------------------------------------------------------------------------- DIA 280.7 3.34 278.2 -4.5% ------- BLUE .363 ----- --------------------------------------------------------------------------------------------- BA 354.09 8.41 355.18 -171% Bearish BLUE -.034 -.129 --------------------------------------------------------------------------------------------- SPY 314.87 2.85 311.64 9% ------- BLUE .372 .016 --------------------------------------------------------------------------------------------- QQQ 205 2.17 203 -2.5% ------- BLUE .409 .039 --------------------------------------------------------------------------------------------- MDY 369.21 3.6 364.15 35.2% ------- BLUE .151 .004 --------------------------------------------------------------------------------------------- IWM 162.75 1.81 160.19 30.5% ------- BLUE .056 .024 --------------------------------------------------------------------------------------------- FAS 90.36 2.18 87.39 14.8% ------- BLUE .23 .112 --------------------------------------------------------------------------------------------- RETL 26.03 1.71 25.16 6% Bearish BLUE-.025 .129 --------------------------------------------------------------------------------------------- SOXL 224 9.95 211.7 60.3% Bearish BLUE .069 .215 --------------------------------------------------------------------------------------------- TECL 211.37 6.84 205.73 -71.3% ------- BLUE .295 .211 --------------------------------------------------------------------------------------------- IBB 120.03 1.17 118.45 15.9% Bullish BLUE .397 .155 --------------------------------------------------------------------------------------------- GLD 137.62 -1.38 137.79 -8.7% ------- RED -.084 -.073 --------------------------------------------------------------------------------------------- OIH 11.91 -.37 12.55 -429.3% Bearish RED -.058 -.158 --------------------------------------------------------------------------------------------- GASL 6.56 .63 5.74 591.4% Bearish BLUE-.136 -.356 --------------------------------------------------------------------------------------------- |
Table 3    Count of Stocks in Key Directories
          20191206
-------------------------------
NEWHIGHS       273  Bullish
NEWLOWS        4
MAXCP          60
MINCP          11
TTTNH          23
TTTNL          18
FASTUP         75
FASTDOWN       64
CPCROSSA       133
CPCROSSD       65
BIGVOLUP       3
BIGVODN        8
ACCUMVER       22
HIGHIP21       50
HIUPPCT        23
LOWACCUM       117
REDSELL        114
AUGSELS7       15
TRAPDOOR       23
|
 Table 4  RANKING OF KEY DIRECTORIES BASED PCT.OF STOCKS ABOVE 65-DMA
              12/6/19
 Bullish = 38
 Bearish = 7
---------------------------------------------------------------------------------------
Directory     Current       day-1         day-2         day-3         day-4         day-5
----------------------------------------------------------------------------------------
BIGBANKS       1             1             1             .857          1             1
COPPER         1             .875          .875          .625          1             1
REGBANKS       .888          .888          .851          .814          .925          .925
GAMING         .863          .818          .772          .818          .772          .818
AUTO           .846          .692          .692          .692          .769          .82
ETFS           .827          .775          .741          .655          .706          .706
MILITARY       .821          .678          .642          .571          .607          .75
FINANCE        .779          .755          .755          .732          .767          .779
HOSPITAL       .772          .727          .727          .727          .727          .727
SP-100         .766          .711          .7            .622          .7            .744
FIDSTKS        .762          .723          .707          .674          .707          .762
NASD-100       .752          .68           .659          .597          .649          .731
HACKERS        .75           .65           .6            .65           .65           .7
INDEXES        .731          .731          .752          .704          .725          .688
DOWJONES       .724          .689          .689          .62           .655          .724
RUS-1000       .705          .641          .637          .606          .649          .696
NIFTY          .701          .666          .666          .614          .666          .771
SP500          .698          .644          .64           .594          .644          .69
HOMEBLDG       .677          .677          .677          .677          .645          .709
RETAIL         .666          .627          .705          .627          .725          .705
SOLAR          .653          .576          .576          .576          .5            .5
SEMI           .641          .547          .537          .49           .528          .584
ELECTRON       .633          .575          .555          .516          .549          .62
SOFTWARE       .633          .633          .633          .616          .65           .733
BIOTECH        .622          .599          .628          .614          .602          .622
REIT           .62           .606          .586          .565          .565          .613
DJI-13         .615          .538          .615          .461          .615          .692
JETS           .6            .6            .5            .5            1             1
TRANSP         .6            .5            .45           .4            .7            .85
INFRA          .583          .583          .583          .555          .611          .638
CHEM           .571          .571          .469          .53           .53           .551
INDMATER       .565          .578          .513          .526          .526          .539
BONDFUND       .562          .553          .526          .553          .321          .455
GUNS           .562          .437          .5            .375          .437          .562
COMODITY       .56           .536          .536          .463          .463          .487
GREEN          .56           .48           .52           .52           .44           .48
FOOD           .555          .518          .555          .444          .444          .5
CHINA          .509          .418          .4            .4            .4            .454
===========================================================================================
UTILITY        .5            .525          .525          .45           .4            .425
===========================================================================================
INSURANC       .486          .486          .486          .405          .486          .54
COMPUTER       .473          .473          .473          .473          .526          .578
EDU            .444          .388          .444          .444          .444          .5
BEVERAGE       .437          .437          .437          .375          .25           .375
GOLD           .431          .568          .549          .568          .411          .392
OILGAS         .379          .248          .291          .24           .248          .284
COAL           0             0             0             0             0             0
|
=====================================================================
12/5/2019 Stick with the Peerless Buys. Once the 5-day moving averages turn
up,
expect more new highs and quite possibly a run to 29000 to fulfill the DJI's
trading range breakout's minimum objective. This will most likely take
place in the second half of December.
The NYSE A/D Line has been exceptionally strong all year. This reflects low
interest rates and rising corporate profits. When the A/D Line is this strong, it
typically causes the rally to continue until mid-January or February, at the earliest,
before there is decline to the lower band. And of course, breakouts above
flat tops into all-time high territory are usually quite bullish.
If we were at or near a top, we would see Sell S9s, S12s,
Sell S4s and their
technical antecedents, weakening breadth and falling or negative P-I and
IP21 values or else a head and shoulders top. Very likely, the FED would
be talking about raising interest rates or actually doing it and the Dollar
would be under pressure, too. None of these bearish conditions are present
now, though, I suppose, Trump's trade war could heat-up and the Jobs' Report
could conceivably show negative growth, as it did in July 2007.

Seasonality in the third year of the four-year Presidential cycle
is especially
bullish all year. (This is the year in which the Fed is most accomodative, usually
for political reasons). See the new Seasonality chart below. It shows
the average percent change from the end of the previous year to each day of the new
year for 1915, 1919, 1923, 1927 ... 2015.

(I will post the other years' Seasonality charts here in a few days.)
High Accumulation Is Usually Bullish

Big Money Remains Quite Bullish,
judging from the very high levels of Tiger Accumulation (IP21)
We should also give the market a chance to show why
the levels of our
Accumulation Index are so high even as prices still lie below their 21-dma.
These very high readings usually show us that big money is regularly buying on
intra-day weakness and driving prices back toward's their daily highs. This is
usually
done by those with a lot of money who are following a careful plan of accumulation
because they anticipate much higher prices months away. From the point of view of
Peerless the very high Accumulation means no Sell S12s and probably no Sell S4s.
High Accumulation also tends to prevent developing head and shoulders
price patterns from being fulfilled on the downside and then forces renewed surges
of short-covering when prices do make new highs.
IP21
DJI (Peerless) +.084 <1>
DJ-30
+.356
DIA
+.399
DJ-65
+.264
NASDAQ +.337
SP-500
+.435
SPY
+.383
QQQ
+.407
---- Dow Jones -----------
DJ - US - Financials +.346
DJ - US - HC +.378
DJ - US - NC +.399
DJ - US - PR +.354
DJ - US - TL +.356
DJ - US - WC +.366
---- Morningstar ----------
526 Medical Lab +.430
769 Research Services +.390
820 Computer Software +.390
825 Information Technology +.380
827 Business Software +.380
824 Security Software +.355
<1> The Peerless DJIA Uses theoretical rather than actual trading highs and
lows.
|
Charts 12/5/2019 2019 PEERLESS DJI, Signals, Indicators Daily DJI Volume 10-DayUp/Down Vol Stoch-20 Hourly DJIA A/D Line for All Stocks Inverted Traders Index NASDAQ S&P OEX NYSE COMPQX DJI-15 DJI-20 DJI-30 DIA SPY QQQ MDY IWM TNA Short-Term Rates USO-CrudeOil DBO FAS GLD BBH IBB JETS JNUG KOL NUGT OIH OIL RSX RETL SDS AGQ SLV SOXL TECL TLT TMF TNA UGA (gasoline) XIV and China: YINN CHAU Commodities: CANE CORN DBC JJC, NIB, CHOC CORN, CUT (paper) MOO, SOYB WEAT UUP (Dollar) LIT (Lithium) AAPL ADBE ALXN AMAT AMGN AMD AMZN AXP BA BABA BAC BIDU CAT CVX DE FB GOOG GS HD IBM INTU JPM M (Macy's) MSFT NFLX NKE NVDA PG QCOM TSLA TXN XOM V WMT CMG , LRCX, SWKS, MDGL SPPI SQ TOWN 12/5/19 (Click on Underlined link.) New highs and Bullish MAXCPs - http://tigersoft.com/max/12-5/BULLISH.htm Bearish MAXCPs - http://tigersoft.com/min/12-5/BEARISH.htm |
Table 1 QUICKSILVER on DJI-30 STOCKS 12/5/2019 8 of 30 show rising 5-day ma. This will have to improve. SYMBOL CLOSE CHANGE PIVOT-PT 5-dma AROC CL-PWR CANDLE IP21 ITRS Remarks
TREND COLOR
----------------------------------------------------------------------------------------------
AAPL 265.58 3.84 267.25 -42.8% ------- BLUE .299 .173 Bullish (IP21+ITRS)
-------------------------------------------------------------------------------------------------
AXP 118.28 .34 120.12 -86.5% Bullish BLUE -.004 -.036
--------------------------------------------------------------------------------------------------
BA 345.68 -3.16 366.18 -311.7% Bearish RED -.083 -.134
--------------------------------------------------------------------------------------------------
CAT 141.05 .93 144.73 -162.6% Bearish BLUE .051 .085
--------------------------------------------------------------------------------------------------
CSCO 43.52 -.37 45.31 -192.5% Bearish RED -.178 -.151
---------------------------------------------------------------------------------------------------
CVX 116.33 -.61 117.13 -74.4% Bearish RED -.195 -.087
---------------------------------------------------------------------------------------------------
DIS 147.44 -.84 151.58 -134.6% ------- RED .019 .079
---------------------------------------------------------------------------------------------------
GS 217.14 1.2 221.35 -133.2% ------- ---- .212 .005
----------------------------------------------------------------------------------------------------
HD 213 -1.1 220.51 -229.5% Bearish RED -.107 -.095
-----------------------------------------------------------------------------------------------------
IBM 131.91 -.08 134.45 -69.9% Bearish RED -.058 -.107
-----------------------------------------------------------------------------------------------------
INTC 56.08 .06 58.05 -212.2% Bearish RED .103 .07
-----------------------------------------------------------------------------------------------------
JNJ 139.56 .18 137.49 65.7% Bullish BLUE .442 .037 Bullish
------------------------------------------------------------------------------------------------------
JPM 133.06 .72 131.76 38% ------- BLUE .211 .099
-------------------------------------------------------------------------------------------------------
KO 54.19 -.1 53.4 22.3% Bullish ---- .36 -.028
--------------------------------------------------------------------------------------------------------
MCD 194.21 -.1 194.48 -53.7% Bearish RED -.08 -.115
---------------------------------------------------------------------------------------------------------
MMM 164.37 -2.77 169.77 -185.5% Bearish RED -.123 -.027
----------------------------------------------------------------------------------------------------------
MRK 88.75 .08 87.18 65.1% Bullish BLUE .143 .039
----------------------------------------------------------------------------------------------------------
MSFT 149.93 .08 151.38 -79.4% ------- RED .335 .047 Bullish
----------------------------------------------------------------------------------------------------------
NKE 95.79 2.07 93.49 88.3% Bearish RED .137 .026
----------------------------------------------------------------------------------------------------------
PFE 38.03 -.11 38.52 -78.3% Bullish RED .127 .03
-----------------------------------------------------------------------------------------------------------
PG 124.62 .09 122.06 116.4% Bullish BLUE .331 -.016
-----------------------------------------------------------------------------------------------------------
TRV 134.31 -.86 136.72 -93.2% ------- RED .133 -.114
-----------------------------------------------------------------------------------------------------------
UNH 282 2.68 279.87 23.8% Bullish BLUE .274 .24 Most Bullish
-----------------------------------------------------------------------------------------------------------
UTX 145.26 .74 148.34 -121.9% Bearish RED .002 .033
------------------------------------------------------------------------------------------------------------
V 181.89 1.29 184.51 -67.9% ------- BLUE .182 .009
------------------------------------------------------------------------------------------------------------
VZ 60.82 .29 60.24 59.8% Bullish BLUE .357 -.02
-------------------------------------------------------------------------------------------------------------
WBA 59.1 .19 59.6 -85.1% Bearish ---- -.053 .058
---------------------------------------------------------------------
WMT 118.66 -.03 119.09 -4.2% Bearish BLUE -.038 -.027
---------------------------------------------------------------------
DOW 68.41 -.24 68.13 -21.2% Bearish RED -.135 -.07
|
Table 2 QUICKSILVER on ETFS - 12/5/2019 ETF CLOSE CHANGE PIVOT-PT 5-dma AROC CL-PWR CANDLE IP21 ITRS --------------------------------------------------------------------------------------------- DIA 277.36 .31 280.95 -81.6% ------- RED .34 ---- --------------------------------------------------------------------------------------------- BA 345.68 -3.16 366.18 -311.7% Bearish RED -.083 -.134 --------------------------------------------------------------------------------------------- SPY 312.02 .56 314.31 -55.4% ------- RED .384 .02 --------------------------------------------------------------------------------------------- QQQ 202.83 .4 205.1 -78.8% ------- RED .407 .038 --------------------------------------------------------------------------------------------- MDY 365.61 .53 366.64 -67% Bearish RED .158 .003 --------------------------------------------------------------------------------------------- IWM 160.94 .16 161.77 -58.7% Bearish RED .066 .016 --------------------------------------------------------------------------------------------- FAS 88.18 1.06 90.1 -143.5% ------- BLUE .268 .099 --------------------------------------------------------------------------------------------- RETL 24.32 -.27 26 -476.2% Bearish RED -.044 .05 --------------------------------------------------------------------------------------------- SOXL 214.05 2.54 221.44 -343.8% Bearish RED .064 .178 --------------------------------------------------------------------------------------------- TECL 204.53 2.07 214.3 -287.9% ------- ---- .292 .189 --------------------------------------------------------------------------------------------- IBB 118.86 -1.54 119.65 -22.2% Bullish RED .335 .135 --------------------------------------------------------------------------------------------- GLD 139 .08 137.86 72% Bullish BLUE-.079 -.049 --------------------------------------------------------------------------------------------- OIH 11.91 -.37 12.55 -429.3% Bearish RED -.058 -.143 --------------------------------------------------------------------------------------------- GASL 5.93 -.19 5.87 -371.5% Bearish RED -.245 -.455 --------------------------------------------------------------------------------------------- |
Table 3    Count of Stocks in Key Directories
          20191205
-------------------------------
NEWHIGHS       116
NEWLOWS        14
MAXCP          45
MINCP          41
TTTNH          24
TTTNL          49
FASTUP         55
FASTDOWN       50
CPCROSSA       68
CPCROSSD       93
BIGVOLUP       2
BIGVODN        13
ACCUMVER       25
HIGHIP21       19
HIUPPCT        22
LOWACCUM       109
REDSELL        117
AUGSELS7       14
TRAPDOOR       24
|
RANKING OF KEY DIRECTORIES BASED PCT.OF STOCKS ABOVE 65-DMA 12/5/19 --------------------------------------------------------------------------------------- Directory Current day-1 day-2 day-3 day-4 day-5 ---------------------------------------------------------------------------------------- BIGBANKS 1 1 .857 1 1 1 REGBANKS .888 .851 .814 .925 .925 .925 COPPER .875 .875 .625 1 1 1 GAMING .818 .772 .818 .772 .818 .772 ETFS .775 .741 .655 .706 .706 .793 FINANCE .755 .755 .732 .767 .779 .79 INDEXES .731 .752 .704 .725 .688 .688 HOSPITAL .727 .727 .727 .727 .727 .727 FIDSTKS .723 .707 .674 .707 .762 .795 SP-100 .711 .7 .622 .7 .744 .766 DOWJONES .7 .7 .633 .666 .733 .766 AUTO .692 .692 .692 .769 .82 .846 NASD-100 .68 .67 .608 .649 .731 .742 MILITARY .678 .642 .571 .607 .75 .785 HOMEBLDG .677 .677 .677 .645 .709 .709 NIFTY .666 .666 .614 .666 .771 .789 HACKERS .65 .65 .65 .65 .7 .7 SP500 .644 .642 .594 .644 .692 .721 RUS-1000 .641 .639 .606 .649 .697 .728 SOFTWARE .633 .65 .616 .65 .733 .733 RETAIL .627 .705 .627 .725 .705 .725 REIT .606 .586 .565 .565 .62 .662 JETS .6 .5 .5 1 1 1 BIOTECH .596 .625 .611 .602 .628 .619 INFRA .583 .583 .555 .611 .638 .666 INDMATER .578 .513 .526 .526 .539 .592 ELECTRON .575 .555 .516 .549 .62 .653 CHEM .571 .469 .53 .53 .551 .591 GOLD .568 .549 .568 .411 .392 .333 SOLAR .56 .56 .56 .48 .48 .52 BONDFUND .553 .526 .553 .321 .437 .401 SEMI .547 .537 .49 .528 .584 .622 DJI-13 .538 .615 .461 .615 .692 .692 COMODITY .536 .536 .463 .463 .487 .56 UTILITY .525 .525 .45 .4 .425 .45 FOOD .518 .555 .444 .444 .5 .574 TRANSP .5 .45 .4 .7 .85 .9 INSURANC .486 .486 .405 .486 .54 .567 GREEN .48 .52 .52 .44 .48 .56 COMPUTER .473 .473 .473 .526 .578 .578 BEVERAGE .437 .437 .375 .25 .375 .5 GUNS .437 .5 .375 .437 .562 .625 CHINA .418 .4 .4 .4 .454 .618 EDU .388 .444 .444 .444 .5 .555 OILGAS .248 .291 .24 .248 .277 .321 COAL 0 0 0 0 0 0 |
====================================================================
12/4/2019 The operative Peerless signal remains the earlier Buy B21s. Today
the
DJI recovered further back above the expected 27400-27500 support from
its recent flat-top breakout there. Below that, is the support of its 65-dma.
Patience is advised here. Not only is the NYSE A/D Line uptrend strong,
but short-term rates even fell a little today while the Dollar stood firm. There's
no telling what Trump and the Chinese Premier might say or do next in their
Trade War. But, Seasonality is bullish and my studies show Decembers are
usually quite bullish as long as Interest Rates are not going up as in 1968,
1980 or 2018 or we are not attacked and at war (1941). (See below the
new TigerSoft Seasonal DJI charts based on data since 1915.)
For the next three weeks, I suspect that performance-pressured money managers
will steer new funds into the best performing DJI stocks like AAPL, even at its
current heights, until then end of the year. Meanwhile, more and more individuals
will be buying into low-priced stocks that seem to trending upwards. Our Bullish
MAXCPs in this field should do well.

|
Charts 12/4/2019 2019 PEERLESS DJI, Signals, Indicators Daily DJI Volume 10-DayUp/Down Vol Stoch-20 Hourly DJIA A/D Line for All Stocks Inverted Traders Index NASDAQ S&P OEX NYSE COMPQX DJI-15 DJI-20 DJI-30 DIA SPY QQQ MDY IWM TNA Short-Term Rates USO-CrudeOil DBO FAS GLD BBH IBB JETS JNUG KOL NUGT OIH OIL RSX RETL SDS AGQ SLV SOXL TECL TLT TMF TNA UGA (gasoline) XIV and China: YINN CHAU Commodities: CANE CORN DBC JJC, NIB, CHOC CORN, CUT (paper) MOO, SOYB WEAT UUP (Dollar) LIT (Lithium) AAPL ADBE ALXN AMAT AMGN AMD AMZN AXP BA BABA BAC BIDU CAT CVX DE FB GOOG GS HD IBM INTU JPM M (Macy's) MSFT NFLX NKE NVDA PG QCOM TSLA TXN XOM V WMT CMG , LRCX, SWKS, MDGL SPPI SQ TOWN 12/4/19 (Click on Underlined link.) New highs and Bullish MAXCPs - http://tigersoft.com/max/12-4/BULLISH.htm Bearish MAXCPs - http://tigersoft.com/min/12-4/BEARISH.htm |
NEW SEASONAL CHARTS
When we look at the DJI's data since 1965, we see from our Peerless program
that in the third years of the 4-year Presidential cycle, the DJI does often show
some weakness for the next two weeks after December 4th. But then it usually
closes the month strongly, rising 3.2% on average in the month after December 4th
and ending up higher 76.9% of the time.
Another way to look at Seasonality and the DJI's price behavior is to study how
much it rises or falls from each day of the year over the next ten days. I have
written software to do this with the DJIA data since 1915, as conveniently provided
by TC-2000. Eventually, I will make this software availble to those getting
all our program updates. Right now I can show you below how varied is the
10-day performance of the DJI over the span of the year, but also from year to
year in the Presidential cycle. Some of you might want to save the graphs below.
They are handy and offered nowhere else.
1915-2018 DJI Data
10-day DJI Pct Change during the year
All years taken together. Often misleading in my opinion, when this data
is compared with the data broken out for each of the four years in the
Presidential cycle. Even so, one of the verities of the All-Data chart
below that holds true for each of the four years in the cycle is December's
strength in its last two weeks. But even here, there is considerable
variation between the four years of the cycle. The third year's Christmas
rally is reliable, but less powerful than in the other years.

PE3- Third Year in Pres. Election Cycle - like now.

PE or PE4 - Presidential Election Year - like next year.

PE1 - Year after Presidential Election Year.

PE2 - Mid-Term Election Year.

 |
Table 1 QUICKSILVER on DJI-30 STOCKS 12/4/2019 8/30 show rising 5-day ma SYMBOL CLOSE CHANGE PIVOT-PT 5-dma AROC CL-PWR CANDLE IP21 ITRS Remarks
TREND COLOR
----------------------------------------------------------------------------------------------
AAPL 261.74 2.29 267.84 -48.2% ------- BLUE .26 .169 Bullish (IP21+ITRS)
---------------------------------------------------------------------
AXP 117.94 1.37 120.33 -77.9% ------- BLUE -.044 -.036
---------------------------------------------------------------------
BA 348.84 -3.24 368 -339.8% Bearish RED -.026 -.12
---------------------------------------------------------------------
CAT 140.12 .06 145.69 -207.4% Bearish RED -.012 .078
---------------------------------------------------------------------
CSCO 43.89 -.39 45.24 -157.9% Bearish RED -.129 -.14 Bearish
---------------------------------------------------------------------
CVX 116.94 1.05 118.07 -36.3% Bearish BLUE -.137 -.089 Bearish
---------------------------------------------------------------------
DIS 148.28 -.3 151.48 -111.4% ------- RED .023 .09
---------------------------------------------------------------------
GS 215.94 3.7 222.95 -148.4% ------- BLUE .133 .006
---------------------------------------------------------------------
HD 214.1 .1 223 -151.9% Bearish BLUE -.11 -.084
---------------------------------------------------------------------
IBM 131.99 -.13 133.77 -116% Bearish RED -.049 -.102
---------------------------------------------------------------------
INTC 56.02 -.05 58.51 -249% Bearish RED .082 .091
---------------------------------------------------------------------
JNJ 139.38 2.22 137.75 80.4% Bullish BLUE .398 .026
---------------------------------------------------------------------
JPM 132.34 2.56 132.06 25.5% Bullish BLUE .15 .094
---------------------------------------------------------------------
KO 54.29 .49 53.95 36.3% Bullish BLUE .304 -.034
---------------------------------------------------------------------
MCD 194.31 1.19 196.3 7.7% Bearish BLUE -.021 -.117
---------------------------------------------------------------------
MMM 167.14 1.97 170.61 -62% ------- BLUE -.065 -.019
---------------------------------------------------------------------
MRK 88.67 1.29 87.61 76.2% Bullish BLUE .063 .027
---------------------------------------------------------------------
MSFT 149.85 .54 152.32 -72.2% ------- RED .332 .057 Bullish
---------------------------------------------------------------------
NKE 93.72 1.26 94.14 20.9% Bearish BLUE .084 .041
---------------------------------------------------------------------
PFE 38.14 .09 38.63 -19.6% ------- ---- .083 .025
---------------------------------------------------------------------
PG 124.53 1.58 121.76 92.8% Bullish BLUE .27 -.026
---------------------------------------------------------------------
TRV 135.17 .55 136.84 -55.5% Bullish BLUE .175 -.113
---------------------------------------------------------------------
UNH 279.32 1.88 280.67 -37.2% Bullish RED .177 .208 Bullish
---------------------------------------------------------------------
UTX 144.52 .79 148.82 -122.6% Bearish RED -.001 .033
---------------------------------------------------------------------
V 180.6 -1.3 184.37 -53.3% ------- RED .126 .001
---------------------------------------------------------------------
VZ 60.53 .39 60.1 53.3% Bullish BLUE .305 -.034
---------------------------------------------------------------------
WBA 58.91 -.08 60.11 -60.5% Bearish RED -.097 .065
---------------------------------------------------------------------
WMT 118.69 .02 118.76 -21% Bearish RED -.042 -.031
---------------------------------------------------------------------
DOW 68.65 .77 68.7 -5.9% Bearish BLUE -.058 -.069
|
Table 2 QUICKSILVER on ETFS - 12/4/2019 ETF CLOSE CHANGE PIVOT-PT 5-dma AROC CL-PWR CANDLE IP21 ITRS --------------------------------------------------------------------------------------------- DIA 277.05 1.54 281.91 -77.1% ------- ---- .31 ---- --------------------------------------------------------------------------------------------- BA 348.84 -3.24 368 -339.8% Bearish RED -.026 -.12 --------------------------------------------------------------------------------------------- SPY 311.46 1.91 315.48 -41.9% ------- BLUE .339 .019 --------------------------------------------------------------------------------------------- QQQ 202.43 1.02 206.04 -53.4% ------- ---- .399 .043 --------------------------------------------------------------------------------------------- MDY 365.08 2.99 370.51 -39.6% Bearish BLUE .122 .008 --------------------------------------------------------------------------------------------- IWM 160.78 1.1 162.83 -28.2% Bearish BLUE .04 .021 --------------------------------------------------------------------------------------------- FAS 87.12 1.52 90.71 -131.4% ------- BLUE .213 .099 --------------------------------------------------------------------------------------------- RETL 24.59 .54 26.73 -333.4% Bearish BLUE 0 .086 --------------------------------------------------------------------------------------------- SOXL 211.51 9.49 228.84 -287.9% Bearish BLUE .053 .219 --------------------------------------------------------------------------------------------- TECL 202.46 2.09 216.5 -245.8% ------- RED .259 .214 --------------------------------------------------------------------------------------------- IBB 120.4 1.25 119.39 80.7% Bullish BLUE .362 .142 --------------------------------------------------------------------------------------------- GLD 138.92 -.19 137.01 42.8% ------- RED -.092 -.073 --------------------------------------------------------------------------------------------- OIH 11.91 -.37 12.55 -429.3% Bearish RED -.058 -.148 --------------------------------------------------------------------------------------------- GASL 6.12 .61 6.37 -16.9% Bearish BLUE -.249 -.452 --------------------------------------------------------------------------------------------- |
Table 3   Count of Stocks in Key Directories
          20191204
-------------------------------
NEWHIGHS       112   Bullish
NEWLOWS        6
MAXCP          51
MINCP          12
TTTNH          18
TTTNL          19
FASTUP         71
FASTDOWN       46
CPCROSSA       123
CPCROSSD       44
BIGVOLUP       6
BIGVODN        12
ACCUMVER       24
HIGHIP21       38
HIUPPCT        20
LOWACCUM       116
REDSELL        119
AUGSELS7       17
TRAPDOOR       24
|
Table 4       RANKING OF KEY DIRECTORIES BASED PCT.OF STOCKS ABOVE 65-DMA
              12/4/19
  Bullish = 35
  Bearish = 9
---------------------------------------------------------------------------------------
Directory     Current       day-1         day-2         day-3         day-4         day-5
----------------------------------------------------------------------------------------
BIGBANKS       1             .857          1             1             1             1
COPPER         .875          .625          1             1             1             1
REGBANKS       .851          .814          .925          .925          .925          .925
GAMING         .772          .818          .772          .818          .727          .727
FINANCE        .755          .732          .767          .779          .79           .813
INDEXES        .752          .704          .725          .688          .688          .666
ETFS           .741          .655          .706          .706          .793          .793
HOSPITAL       .727          .727          .727          .727          .727          .681
FIDSTKS        .707          .674          .707          .762          .795          .773
RETAIL         .705          .627          .725          .705          .725          .705
DOWJONES       .7            .633          .666          .733          .766          .766
SP-100         .7            .622          .7            .744          .766          .755
AUTO           .692          .692          .769          .82           .846          .846
HOMEBLDG       .677          .677          .645          .709          .709          .709
NASD-100       .67           .618          .659          .731          .742          .711
NIFTY          .666          .614          .666          .771          .789          .754
HACKERS        .65           .7            .65           .7            .7            .7
SOFTWARE       .65           .633          .65           .733          .733          .716
SP500          .643          .593          .645          .693          .727          .706
MILITARY       .642          .571          .607          .75           .785          .785
RUS-1000       .64           .605          .651          .698          .733          .713
BIOTECH        .622          .608          .599          .628          .625          .605
DJI-13         .615          .461          .615          .692          .692          .692
REIT           .586          .565          .565          .62           .662          .586
INFRA          .583          .555          .611          .638          .722          .694
SOLAR          .56           .56           .48           .48           .56           .48
ELECTRON       .555          .516          .549          .62           .653          .633
GOLD           .549          .568          .411          .392          .333          .372
FOOD           .547          .433          .433          .49           .566          .603
SEMI           .537          .49           .528          .584          .622          .594
COMODITY       .536          .463          .463          .487          .56           .585
BONDFUND       .526          .553          .321          .437          .401          .392
UTILITY        .525          .45           .4            .425          .45           .425
GREEN          .52           .52           .44           .48           .56           .52
INDMATER       .513          .526          .526          .539          .592          .618
============================================================================================
GUNS           .5            .375          .437          .562          .625          .625
JETS           .5            .5            1             1             1             1
============================================================================================
INSURANC       .486          .405          .486          .54           .594          .567
COMPUTER       .473          .473          .526          .578          .578          .578
CHEM           .469          .53           .53           .551          .591          .612
TRANSP         .45           .4            .7            .85           .9            .9
EDU            .444          .444          .444          .5            .555          .555
BEVERAGE       .437          .375          .25           .375          .5            .437
CHINA          .4            .4            .4            .454          .618          .618
OILGAS         .291          .24           .248          .277          .321          .291
COAL           0             0             0             0             0             0
|
====================================================================
12/3/2019 The DJI closed
back slightly above the 27400-27500
support. Was this just another shake out born from the bluster of
of Trump's bargaining with China over trade? Probably. The NYSE
A/D Line uptrend remains intact, no new Peerless Sells were given
and the 27400-27500 support seems to have held.

Again I went over the back data to 1965 to see what significance we
should attach to the P-Indicator's clear non-confirmation of the DJI's
last new high. That was really the only serious technical warning we
had before the recent decline. I found 10 similar bearish divergences
of a new DJI high by the P-I between November 25th and December
16th. As a whole, these old "S8s" were not reliable Sells. Only 3
brought tradeable declines (11/25/1968, 12/13/2004 and 11/28/2014).
Two brought very small gains of 1%-3% (11/25/2009, 11/25/2013).
But five others would have brought rallies and significant losses to a
short seller (11/25/1986, 12/7/1994, 12/3/1999, 12/14/2010
and 11/27/2017). Thusm, the bullish seasonality of December usually
prevails.
Now another bullish note. The older 2016 Peerless program
(which was only back-tested from 1965-2006), in fact, gave a Buy B3
yesterday as the DJI closed at its 21-day ma. This is a simple price-
momentum system based on the fact that the 21-dma has been rising for 30
straight days and the A/D Line is in an uptrend. How did it do in November
and December? Mostly, it succeeded. It would have utterly failed once,
in December 1968, as interest rates were being aggressively moved up by
the FED. With the Presidential Election over; the Fed sought to arrest what
it considered to be excessive speculation in stocks and excessive Inflation
from the US war in Vietnam. This started the 1968-1970 bear market.
Otherwise, this old B3 was nearly perfect on 12/3/1975 and 11/15/2017
and it was only a few days early on 12/18/1972 and 11/12/2010. So,
except for the 1968 case, the DJI always found support in December.
with the worst case decline being an intra-day tagging of its 2.5% lower band.
That level now is 27115.
Of course, if the Trump Trade War with China intensifies or widens and
there is retaliation against US multi-nationals, there will be more stock price
weakness. In addition, Trump's optimistic statements earlier will then leave
some bad feelings among traders. These traders will then be less inclined to
trade on any optimistic statements he might make. So, it's important, I think,
that the market recovers for the rest of the month. Failure to go up in December
is often a bearish sign. For now, I would avoid leveraged, long ETFs and be
satisfied holding DIA, QQQ, IBB and some of the bullish MAXCP special
situations. Short sales should be avoided because of the seasonality.

|
Charts 12/3/2019 2019 PEERLESS DJI, Signals, Indicators Daily DJI Volume 10-DayUp/Down Vol Stoch-20 Hourly DJIA A/D Line for All Stocks Inverted Traders Index NASDAQ S&P OEX NYSE COMPQX DJI-15 DJI-20 DJI-30 DIA SPY QQQ MDY IWM TNA Short-Term Rates USO-CrudeOil DBO FAS GLD BBH IBB JETS JNUG KOL NUGT OIH OIL RSX RETL SDS AGQ SLV SOXL TECL TLT TMF TNA UGA (gasoline) XIV and China: YINN CHAU Commodities: CANE CORN DBC JJC, NIB, CHOC CORN, CUT (paper) MOO, SOYB WEAT UUP (Dollar) LIT (Lithium) AAPL ADBE ALXN AMAT AMGN AMD AMZN AXP BA BABA BAC BIDU CAT CVX DE FB GOOG GS HD IBM INTU JPM M (Macy's) MSFT NFLX NKE NVDA PG QCOM TSLA TXN XOM V WMT CMG , LRCX, SWKS, MDGL SPPI SQ TOWN 12/3/19 (Click on Underlined link.) New highs and Bullish MAXCPs - http://tigersoft.com/max/12-3/BULLISH.htm Bearish MAXCPs - http://tigersoft.com/min/12-3/BEARISH.htm |
Table 1 QUICKSILVER on DJI-30 STOCKS 12/3/2019 6 of 30 show rising 5-day ma SYMBOL CLOSE CHANGE PIVOT-PT 5-dma AROC CL-PWR CANDLE IP21 ITRS Remarks
TREND COLOR
----------------------------------------------------------------------------------------------
AAPL 259.45 -4.71 264.29 -130.1% ------- BLUE .302 .163 Most Bullish
---------------------------------------------------------------------
AXP 116.57 -.69 119.79 -168.5% Bearish BLUE-.061 -.037
---------------------------------------------------------------------
BA 352.08 -3.1 373.51 -286.6% ------- BLUE .042 -.089
---------------------------------------------------------------------
CAT 140.06 -2.9 146.09 -219% ------- ---- .102 .068
---------------------------------------------------------------------
CSCO 44.28 -.42 45.31 -129.4% Bearish RED -.109 -.127
---------------------------------------------------------------------
CVX 115.89 -.91 117.79 -105.8% ------- RED -.064 -.095
---------------------------------------------------------------------
DIS 148.58 -2.04 151.64 -36.8% ------- BLUE .029 .099
---------------------------------------------------------------------
GS 212.24 -5.4 222.45 -237.3% Bearish RED .123 -.029
---------------------------------------------------------------------
HD 214 -3.62 220.76 -100% Bearish RED -.125 -.077
---------------------------------------------------------------------
IBM 132.12 -.79 135.09 -143.2% Bearish BLUE .047 -.093
---------------------------------------------------------------------
INTC 56.07 -1.59 58.9 -234.6% ------- RED .15 .079
---------------------------------------------------------------------
JNJ 137.16 -.2 137.17 -.7% ------- BLUE .329 .018
---------------------------------------------------------------------
JPM 129.78 -1.69 131.67 -64.9% ------- BLUE .086 .069
---------------------------------------------------------------------
KO 53.8 .05 53.9 54.1% Bearish ---- .197 -.029
---------------------------------------------------------------------
MCD 193.12 -2.06 194.01 31.6% Bearish RED -.093 -.11
---------------------------------------------------------------------
MMM 165.17 -3.1 169.23 -149.4% Bearish RED .025 -.032
---------------------------------------------------------------------
MRK 87.38 .34 87.34 96.6% Bearish BLUE-.025 .013
---------------------------------------------------------------------
MSFT 149.31 -.24 152.03 -63.4% ------- BLUE .315 .05
---------------------------------------------------------------------
NKE 92.46 -1.1 93.33 -23.5% Bearish ---- .037 .032
---------------------------------------------------------------------
PFE 38.05 -.24 38.29 -81.9% Bearish BLUE .033 .027
---------------------------------------------------------------------
PG 122.95 .23 122.26 100.1% Bearish BLUE .144 -.025
---------------------------------------------------------------------
TRV 134.62 -.64 136.68 -15.1% ------- RED .119 -.104
---------------------------------------------------------------------
UNH 276.9 -2.76 281.4 -102.7% ------- RED .172 .188
---------------------------------------------------------------------
UTX 143.73 -1.26 148.12 -128.4% Bearish RED .074 .037
---------------------------------------------------------------------
V 181.9 .11 182.55 25.4% Bullish BLUE .15 .017
---------------------------------------------------------------------
VZ 60.14 .18 59.89 63.4% Bearish BLUE .255 -.024
---------------------------------------------------------------------
WBA 58.99 -.28 59.63 -140.3% Bearish BLUE-.037 .063
---------------------------------------------------------------------
WMT 118.67 -.61 119.19 -10.5% Bearish BLUE-.059 -.014
---------------------------------------------------------------------
DOW 67.88 -.54 68.73 -75.1% ------- RED -.035 -.082
|
Table 2 QUICKSILVER on ETFS - 12/3/2019 ETF CLOSE CHANGE PIVOT-PT 5-dma AROC CL-PWR CANDLE IP21 ITRS --------------------------------------------------------------------------------------------- DIA 275.51 -2.69 281.36 -94.2% ------- BLUE .328 ---- --------------------------------------------------------------------------------------------- BA 352.08 -3.1 373.51 -286.6% ------- BLUE .042 -.089 --------------------------------------------------------------------------------------------- SPY 309.55 -2.09 314.08 -60.9% ------- BLUE .311 .015 --------------------------------------------------------------------------------------------- QQQ 201.41 -1.59 204.61 -68.7% ------- BLUE .434 .034 --------------------------------------------------------------------------------------------- MDY 362.09 -2.06 367.98 -61.6% Bearish BLUE .14 -.001 --------------------------------------------------------------------------------------------- IWM 159.68 -.51 161.69 -58.8% Bearish BLUE .026 .005 --------------------------------------------------------------------------------------------- FAS 85.6 -1.79 89.45 -160.8% ------- BLUE .135 .066 --------------------------------------------------------------------------------------------- RETL 26.77 1.12 24.47 334.5% ------- BLUE .34 .465 --------------------------------------------------------------------------------------------- SOXL 202.02 -9.68 224.04 -563.5% Bearish BLUE .085 .114 --------------------------------------------------------------------------------------------- TECL 200.37 -5.36 212.78 -287.5% ------- BLUE .249 .174 --------------------------------------------------------------------------------------------- IBB 119.15 .7 118.48 37.9% ------- BLUE .305 .116 --------------------------------------------------------------------------------------------- GLD 139.11 1.32 137.74 73.8% ------- BLUE-.095 -.055 --------------------------------------------------------------------------------------------- OIH 14.64 -.34 14.58 0% Bearish RED .038 -.11 --------------------------------------------------------------------------------------------- GASL 5.51 -.23 6.14 -1004.2% Bearish RED -.227 -.552 --------------------------------------------------------------------------------------------- |
 Table 3   Count of Stocks in Key Directories
           20191203
-------------------------------
NEWHIGHS       65
NEWLOWS        27
MAXCP          49
MINCP          34
TTTNH          18
TTTNL          60
FASTUP         73
FASTDOWN       67
CPCROSSA       139
CPCROSSD       55
BIGVOLUP       5
BIGVODN        11
ACCUMVER       20
HIGHIP21       37
HIUPPCT        19
LOWACCUM       112
REDSELL        119
AUGSELS7       12
TRAPDOOR       25
|
Table 3 RANKING OF KEY DIRECTORIES BASED PCT.OF STOCKS ABOVE 65-DMA
              12/3/19
 Bullish = 31
 Bearish = 14
---------------------------------------------------------------------------------------
Directory     Current       day-1         day-2         day-3         day-4         day-5
----------------------------------------------------------------------------------------
BIGBANKS       .857          1             1             1             1             1
GAMING         .818          .772          .818          .727          .772          .727
REGBANKS       .814          .925          .925          .925          .925          .925
FINANCE        .732          .767          .779          .79           .825          .813
HOSPITAL       .727          .727          .727          .727          .727          .727
HACKERS        .7            .7            .7            .7            .7            .65
INDEXES        .698          .725          .688          .688          .666          .682
AUTO           .692          .769          .82           .846          .846          .82
HOMEBLDG       .677          .645          .709          .709          .709          .709
FIDSTKS        .674          .707          .762          .795          .773          .779
ETFS           .655          .706          .706          .793          .793          .862
DOWJONES       .633          .666          .733          .766          .766          .666
SOFTWARE       .633          .666          .733          .733          .7            .733
RETAIL         .627          .725          .705          .725          .705          .784
COPPER         .625          1             1             1             1             1
SP-100         .622          .7            .744          .766          .755          .744
NASD-100       .618          .67           .742          .742          .731          .721
NIFTY          .614          .666          .771          .789          .771          .789
BIOTECH        .606          .597          .626          .626          .609          .597
RUS-1000       .605          .652          .698          .733          .718          .704
SP500          .593          .647          .693          .727          .712          .702
MILITARY       .571          .607          .75           .785          .785          .75
GOLD           .568          .411          .392          .333          .352          .235
REIT           .565          .565          .62           .662          .6            .558
SOLAR          .56           .48           .48           .56           .48           .44
INFRA          .555          .611          .638          .722          .694          .638
BONDFUND       .553          .321          .437          .401          .392          .303
INDMATER       .532          .532          .545          .597          .623          .636
CHEM           .53           .53           .551          .591          .612          .612
GREEN          .52           .44           .48           .56           .52           .48
ELECTRON       .516          .549          .62           .653          .633          .673
==========================================================================================
JETS           .5            1             1             1             1             .9
==========================================================================================
SEMI           .49           .528          .584          .622          .603          .622
COMPUTER       .473          .526          .578          .578          .578          .578
COMODITY       .463          .463          .487          .56           .585          .536
DJI-13         .461          .615          .692          .692          .692          .692
UTILITY        .45           .4            .425          .45           .425          .425
EDU            .444          .444          .5            .555          .5            .5
FOOD           .433          .433          .49           .566          .603          .584
INSURANC       .405          .486          .54           .594          .567          .513
CHINA          .4            .4            .454          .618          .618          .527
TRANSP         .4            .7            .85           .9            .9            .85
BEVERAGE       .375          .25           .375          .5            .437          .312
GUNS           .375          .437          .562          .625          .625          .562
OILGAS         .24           .248          .277          .321          .291          .401
COAL           0             0             0             0             0             0
|
====================================================================
12/2/2019 27400-27500 should be good support. But an intensification
of the Trade Wars rather than a ratification of a trade deal will
spook the market. Will China wait and see who wins the 2020
Presidential Election? Trump is warning them not to do this.
Typically, even if there is weakness in early December, the DJI
recovers and advances to new highs by the end of the year. There
was a P-Indicator non-confirmation a few days ago. In the older 2006 software
this brings a Sell S8. But normally these S8s do not produce big declines from
early December peaks, especially if there has recently been a flat-top
breakout. More recently, it takes an Accumulation Index negative
non-confirmation to cause a deeper sell-off.
Past verbal sparring by the President has only had a short-term effect
on the market. Unless 27400 is closed below, I think we have to remain
optimistic that the market will right itself on a successful re-test of 27400.
Hold all our long positions except SOXL (which is too volatile). Leveraged
ETFs are not safe now.


|
Charts 12/2/2019 2019 PEERLESS DJI, Signals, Indicators Daily DJI Volume 10-DayUp/Down Vol Stoch-20 Hourly DJIA A/D Line for All Stocks Inverted Traders Index NASDAQ S&P OEX NYSE COMPQX DJI-15 DJI-20 DJI-30 DIA SPY QQQ MDY IWM TNA Short-Term Rates USO-CrudeOil DBO FAS GLD BBH IBB JETS JNUG KOL NUGT OIH OIL RSX RETL SDS AGQ SLV SOXL TECL TLT TMF TNA UGA (gasoline) XIV and China: YINN CHAU Commodities: CANE CORN DBC JJC, NIB, CHOC CORN, CUT (paper) MOO, SOYB WEAT UUP (Dollar) LIT (Lithium) AAPL ADBE ALXN AMAT AMGN AMD AMZN AXP BA BABA BAC BIDU CAT CVX DE FB GOOG GS HD IBM INTU JPM M (Macy's) MSFT NFLX NKE NVDA PG QCOM TSLA TXN XOM V WMT CMG , LRCX, SWKS, MDGL SPPI SQ TOWN 12/2/19 (Click on Underlined link.) New highs and Bullish MAXCPs - http://tigersoft.com/max/12-2/BULLISH.htm Bearish MAXCPs - http://tigersoft.com/min/12-2/BEARISH.htm |
Table 1 QUICKSILVER on DJI-30 STOCKS 12/2/2019 14/30 show rising 5-day ma (-10) SYMBOL CLOSE CHANGE PIVOT-PT 5-dma AROC CL-PWR CANDLE IP21 ITRS Remarks
TREND COLOR
----------------------------------------------------------------------------------------------
AAPL 264.16 -3.09 266.37 44.8% ------- RED .316 .18
---------------------------------------------------------------------
AXP 117.26 -2.86 120.6 -75% ------- RED -.104 -.029
---------------------------------------------------------------------
BA 355.18 -11 373.13 -218.1% ------- RED .076 -.097
---------------------------------------------------------------------
CAT 142.96 -1.77 146.42 -31.6% Bullish RED .153 .082
---------------------------------------------------------------------
CSCO 44.7 -.61 45.45 -16.6% Bearish RED -.132 -.132
---------------------------------------------------------------------
CVX 116.8 -.33 118.38 -77.5% ------- RED .012 -.094
---------------------------------------------------------------------
DIS 150.62 -.96 149.69 77.4% ------- RED .04 .105
---------------------------------------------------------------------
GS 217.64 -3.71 222.75 -59.5% ------- RED .176 -.015
---------------------------------------------------------------------
HD 217.62 -2.89 218.4 -9.3% Bearish RED -.087 -.065
---------------------------------------------------------------------
IBM 132.91 -1.54 135.97 -53.1% ------- RED .057 -.096
---------------------------------------------------------------------
INTC 57.66 -.39 58.81 4.3% Bullish RED .227 .104
---------------------------------------------------------------------
JNJ 137.36 -.13 137.18 -25.8% Bullish RED .265 .01
---------------------------------------------------------------------
JPM 131.47 -.29 131.49 25.8% Bullish RED .096 .072
---------------------------------------------------------------------
KO 53.75 .35 53.22 67.3% ------- BLUE .112 -.036
---------------------------------------------------------------------
MCD 195.18 .7 191.89 52.6% ------- ---- -.115 -.101
---------------------------------------------------------------------
MMM 168.27 -1.5 170.24 19.8% ------- RED .089 -.024
---------------------------------------------------------------------
MSFT 87.04 -.14 85.7 91.7% ------- RED -.108 -.011
---------------------------------------------------------------------
MRK 149.55 -1.83 151.23 -1.3% ------- RED .262 .039
---------------------------------------------------------------------
NKE 93.56 .07 92.9 11.8% Bearish RED -.042 .046
---------------------------------------------------------------------
PFE 38.29 -.23 38.68 -5.2% ------- RED -.016 .01
---------------------------------------------------------------------
PG 122.72 .66 120.51 100.1% ------- BLUE .079 -.029
---------------------------------------------------------------------
TRV 135.26 -1.46 135.03 4.8% Bullish RED .103 -.109
---------------------------------------------------------------------
UNH 279.66 -.21 282.67 50.3% Bullish RED .118 .168
---------------------------------------------------------------------
UTX 144.99 -3.35 147.52 -91.5% ------- RED .12 .036
---------------------------------------------------------------------
V 181.79 -2.72 180.97 63.6% Bullish RED .149 .011
---------------------------------------------------------------------
VZ 59.96 -.28 59.38 17.5% ------- RED .188 -.039
---------------------------------------------------------------------
WBA 59.27 -.33 60.67 -110.6% Bearish ---- -.023 .044
---------------------------------------------------------------------
WMT 119.28 .19 118.92 -3.4% Bearish BLUE -.087 -.014
---------------------------------------------------------------------
DOW 68.42 .29 68.91 -69.1% ------- ---- .021 -.084
|
Table 2 QUICKSILVER on ETFS - 11/30/2019 ETF CLOSE CHANGE PIVOT-PT 5-dma AROC CL-PWR CANDLE IP21 ITRS --------------------------------------------------------------------------------------------- DIA 278.2 -2.75 280.8 -11.8% ------- RED .326 ---- --------------------------------------------------------------------------------------------- BA 355.18 -11 373.13 -218.1% ------- RED .076 -.097 --------------------------------------------------------------------------------------------- SPY 311.64 -2.67 313.37 10.8% ------- RED .31 .012 --------------------------------------------------------------------------------------------- QQQ 203 -2.1 204.22 28.6% ------- RED .419 .031 --------------------------------------------------------------------------------------------- MDY 364.15 -2.49 366.61 27.8% Bearish RED .142 -.003 --------------------------------------------------------------------------------------------- IWM 160.19 -1.58 161.58 61.1% Bearish RED .055 -.003 --------------------------------------------------------------------------------------------- FAS 87.39 -2.71 88.47 37.6% ------- RED .142 .082 --------------------------------------------------------------------------------------------- RETL 25.16 -.84 25.82 110.1% Bearish RED .129 .112 --------------------------------------------------------------------------------------------- SOXL 211.7 -9.74 227.11 -.2% Bearish RED .07 .195 --------------------------------------------------------------------------------------------- TECL 205.73 -8.57 212.58 40.1% ------- RED .256 .206 --------------------------------------------------------------------------------------------- IBB 118.45 -1.2 118.25 128.6% Bullish RED .312 .089 --------------------------------------------------------------------------------------------- GLD 137.79 -.07 137.08 1.8% ------- BLUE-.049 -.069 --------------------------------------------------------------------------------------------- OIL 137.79 -.07 137.08 1.8% ------- BLUE-.076 13.365 --------------------------------------------------------------------------------------------- OIH 11.91 -.37 12.55 -429.3% Bearish RED -.058 -.147 --------------------------------------------------------------------------------------------- GASL 5.74 -.13 6.75 -616.1% Bearish RED -.17 -.546 --------------------------------------------------------------------------------------------- UGA 5.74 -.13 6.75 -616.1% ------- RED -.267 -.843 --------------------------------------------------------------------------------------------- UUP 26.8 -.11 26.93 -20.4% Bullish RED -.094 -.034 --------------------------------------------------------------------------------------------- IEF 26.8 -.11 26.93 -20.4% ------- RED -.057 -.794 --------------------------------------------------------------------------------------------- CORN 26.8 -.11 26.93 -20.4% Bullish RED -.067 .708 --------------------------------------------------------------------------------------------- WEAT 26.8 -.11 26.93 -20.4% Bullish RED -.061 3.787 --------------------------------------------------------------------------------------------- YINN 26.8 -.11 26.93 -20.4% ------- RED -.089 .392 --------------------------------------------------------------------------------------------- RSX 24.2 -.06 24.79 -87.7% ------- RED .247 0 |
Table 3    Count of Stocks in Key Directories
           20191202
-------------------------------
NEWHIGHS       53
NEWLOWS        20
MAXCP          26
MINCP          54
TTTNH          9
TTTNL          73
FASTUP         81
FASTDOWN       45
CPCROSSA       31
CPCROSSD       204
BIGVOLUP       5
BIGVODN        9
ACCUMVER       22
HIGHIP21       35
HIUPPCT        24
LOWACCUM       117
REDSELL        121
AUGSELS7       27
TRAPDOOR       26
|
TABLE 4 RANKING OF KEY DIRECTORIES BASED PCT.OF STOCKS ABOVE 65-DMA 12/2/19 --------------------------------------------------------------------------------------- Directory Current day-1 day-2 day-3 day-4 day-5 ---------------------------------------------------------------------------------------- BIGBANKS 1 1 1 1 1 1 COPPER 1 1 1 1 1 .875 JETS 1 1 1 1 .9 .7 REGBANKS .925 .925 .925 .925 .962 .925 GAMING .772 .818 .727 .772 .727 .772 AUTO .769 .82 .846 .846 .846 .769 FINANCE .767 .779 .79 .825 .813 .802 HOSPITAL .727 .727 .727 .727 .727 .727 RETAIL .725 .705 .725 .705 .784 .627 INDEXES .72 .688 .688 .666 .682 .688 FIDSTKS .707 .762 .795 .773 .779 .756 ETFS .706 .706 .793 .793 .862 .879 HACKERS .7 .75 .7 .7 .65 .6 SP-100 .7 .744 .766 .755 .744 .766 TRANSP .7 .85 .9 .9 .85 .8 NASD-100 .67 .752 .752 .731 .721 .628 SOFTWARE .666 .75 .733 .7 .733 .65 DOWJONES .655 .724 .758 .758 .655 .724 NIFTY .654 .763 .781 .763 .781 .672 RUS-1000 .652 .7 .733 .718 .706 .677 SP500 .647 .695 .727 .712 .704 .675 HOMEBLDG .645 .709 .709 .709 .709 .677 DJI-13 .615 .692 .692 .692 .692 .692 INFRA .611 .638 .722 .694 .638 .666 MILITARY .607 .75 .785 .785 .75 .678 BIOTECH .596 .625 .625 .611 .608 .555 REIT .565 .62 .662 .6 .558 .496 ELECTRON .549 .62 .653 .633 .673 .568 INDMATER .532 .545 .597 .623 .636 .571 CHEM .53 .551 .591 .612 .612 .612 SEMI .528 .584 .622 .603 .622 .528 COMPUTER .526 .578 .578 .578 .578 .526 INSURANC .486 .54 .594 .567 .513 .486 SOLAR .48 .48 .56 .48 .44 .44 COMODITY .463 .487 .56 .585 .536 .536 EDU .444 .5 .555 .5 .5 .444 GREEN .44 .48 .56 .52 .52 .52 GUNS .437 .562 .625 .625 .562 .562 FOOD .433 .49 .566 .603 .584 .547 GOLD .411 .392 .333 .352 .235 .274 CHINA .4 .454 .618 .618 .545 .436 UTILITY .4 .425 .45 .425 .425 .45 BONDFUND .321 .437 .401 .392 .294 .303 BEVERAGE .25 .375 .5 .437 .312 .312 OILGAS .248 .277 .321 .291 .401 .343 COAL 0 0 0 0 0 0 |
====================================================================
11/29/2019
Enter December - Usually
A Very Bullish Month,
especially after December 17th.

Looking only at Third Years in the Four Year
Presidential Cycle,
our current Peerless program shows that since 1968 the DJI has
69.2% of the time over the 21 trading days after December 1st.
New software indicates that from 1915 to 2015, in the third years,
the DJI has gained +13.1% from the end of the previous year to
December 1st and then keeps rising until the average gain is +15.5%
at the third year's end. (I am working on graphs that show these gains
for each day of the year, as well as the Percent Up over the next ten
trading days and the ten-day average gain also over this period.)
Friday's bout of profit-taking is not likely
to be significant. Peerless remains
on its Buys. The year-long NYSE A/D Line is still rising. So are
both the Opening and Closing Powers, which is extra bullish short-term
for DIA, SPY, QQQ, NASDAQ, TECL, IWM, MDY and IBB
(biotechs). SOXL (semi-conductors) and NAIL (homebuilders) only show
rising Opening Power trends. Very important, the FED seems fixed
and on path to continue QE-3 until some time in April. This has posed
no problem for the Dollar, which is very important to the big bankers.
Visa is challenging its highs, so the holiday Retail sales' outlook looks good.
|
Charts 11/29/2019 2019 PEERLESS DJI, Signals, Indicators Daily DJI Volume 10-DayUp/Down Vol Stoch-20 Hourly DJIA A/D Line for All Stocks Inverted Traders Index NASDAQ S&P OEX NYSE COMPQX DJI-15 DJI-20 DJI-30 DIA SPY QQQ MDY IWM TNA Short-Term Rates USO-CrudeOil DBO FAS GLD BBH IBB JETS JNUG KOL NUGT OIH OIL RSX RETL SDS AGQ SLV SOXL TECL TLT TMF TNA UGA (gasoline) XIV and China: YINN CHAU Commodities: CANE CORN DBC JJC, NIB, CHOC CORN, CUT (paper) MOO, SOYB WEAT UUP (Dollar) LIT (Lithium) AAPL ADBE ALXN AMAT AMGN AMD AMZN AXP BA BABA BAC BIDU CAT CVX DE FB GOOG GS HD IBM INTU JPM M (Macy's) MSFT NFLX NKE NVDA PG QCOM TSLA TXN XOM V WMT CMG , LRCX, SWKS, MDGL SPPI SQ TOWN 11/29/19 (Click on Underlined link.) New highs and Bullish MAXCPs - http://tigersoft.com/max/11-29/BULLISH.htm Bearish MAXCPs - http://tigersoft.com/min/11-29/BEARISH.htm |
Ever On Guard
Still, Decembers can bring declines: most recently, December 2007,
2015 and 2018. In all three cases, the Accumulation Index stayed
negative as the DJI rallied. That is not true now. Still, our A/D Line
has weakened quite noticeably when measured by the P-Indicator.
I see two other potential problems for the market. The first would be a
breakdown in the trade talks with China. We should keep
an eye
on YANG (3x ETF for Chinese stocks). It shows a potential
head/shoulders pattern.
The second problem is the DJIA's dependence on a relatively
few
stocks as it scores new highs. We know that the highest priced DJI-30|
stocks are weighted the most and go a long ways in controlling how
that Index moves. Our Nifty-13 DJI stocks should probably now be shrunk
to a "Nifty-7". Among the DJI stocks over $140, only AAPL, CAT, GS,
MSFT, UTX, UNX and V are at or making new their hights. As long as this
group stays strong, there is no problem. But they are the leaders and
they must not falter without one of the other high priced DJI stocks
picking up the slack.
Our Tiger Index of Nifty-7 DJI Stocks.

Our Tiger Index of all 30 DJI Stocks is still in a Trading Range

Table 1 QUICKSILVER on DJI-30 STOCKS 11/30/2019 Bullish = AAPL 24/30 show rising 5-day ma (-2) SYMBOL CLOSE CHANGE PIVOT-PT 5-dma AROC CL-PWR CANDLE IP21 ITRS Remarks
TREND COLOR
----------------------------------------------------------------------------------------------
AAPL 267.25 -.59 261.78 99.1% ------- BLUE .409 .174 BULLISH
---------------------------------------------------------------------
AXP 120.12 -.21 119.06 55.1% ------- BLUE -.03 -.015
---------------------------------------------------------------------
BA 366.18 -1.82 371.34 -3.5% ------- RED .092 -.083
---------------------------------------------------------------------
CAT 144.73 -.96 143.88 47.2% ------- BLUE .172 .077 bullish
---------------------------------------------------------------------
CSCO 45.31 .07 44.85 52.1% Bearish BLUE -.084 -.114
---------------------------------------------------------------------
CVX 117.13 -.94 118.63 -69.3% ------- RED .081 -.088
---------------------------------------------------------------------
DIS 151.58 .1 148.29 156.4% ------- BLUE .064 .102
---------------------------------------------------------------------
GS 221.35 -1.6 220.28 70.5% ------- BLUE .216 -.007
---------------------------------------------------------------------
HD 220.51 -2.49 218.03 44.8% Bearish RED -.058 -.068 weak
---------------------------------------------------------------------
IBM 134.45 .68 134.34 22.7% Bearish BLUE .057 -.095
---------------------------------------------------------------------
INTC 58.05 -.46 57.61 -14.6% ------- RED .313 .091 bullish
---------------------------------------------------------------------
JNJ 137.49 -.26 138.07 38.2% ------- RED .268 .022
---------------------------------------------------------------------
JPM 131.76 -.3 130.79 69.7% ------- RED .137 .069
---------------------------------------------------------------------
KO 53.4 -.55 53.03 41.2% Bearish RED .097 -.056
---------------------------------------------------------------------
MCD 194.48 -1.82 193.14 55% Bearish RED -.136 -.111 Bearish
---------------------------------------------------------------------
MMM 169.77 -.84 167.6 137.3% Bearish RED .111 -.019
---------------------------------------------------------------------
MRK 87.18 -.43 85.45 99.6% Bearish ---- -.058 .003
---------------------------------------------------------------------
MSFT 151.38 -.94 149.59 62.9% ------- RED .243 .038
---------------------------------------------------------------------
NKE 93.49 -.65 93.34 71.4% Bearish RED -.047 .031
---------------------------------------------------------------------
PFE 38.52 -.11 38.33 101.7% Bearish --- - .01 .02
---------------------------------------------------------------------
PG 122.06 .3 120.29 71.1% Bearish BLUE .039 -.034
---------------------------------------------------------------------
TRV 136.72 -.12 135.13 74.8% ------- RED .222 -.105
---------------------------------------------------------------------
UNH 279.87 -.8 276.84 59.4% ------- BLUE .127 .167
---------------------------------------------------------------------
UTX 148.34 -.48 147.7 35.2% ------- BLUE .22 .043
---------------------------------------------------------------------
V 184.51 .14 179.47 127.3% ------- BLUE .157 .013
---------------------------------------------------------------------
VZ 60.24 .14 59.75 52.7% Bearish BLUE .183 -.031
---------------------------------------------------------------------
WBA 59.6 -.51 60.6 -84.5% Bearish RED -.048 .057
---------------------------------------------------------------------
WMT 119.09 .33 119.36 -32.3% Bearish BLUE -.144 -.018
---------------------------------------------------------------------
DOW 68.13 -.57 69.37 -111.5% ------- RED .085 -.093
|
Table 2 QUICKSILVER on ETFS - 11/30/2019 ETF CLOSE CHANGE PIVOT-PT 5-dma AROC CL-PWR CANDLE IP21 ITRS --------------------------------------------------------------------------------------------- DIA 280.95 -.96 278.86 57.7% ------- RED .394 ---- --------------------------------------------------------------------------------------------- BA 366.18 -1.82 371.34 -3.5% ------- RED .092 -.083 --------------------------------------------------------------------------------------------- SPY 314.31 -1.17 310.96 64.6% ------- RED .382 .009 --------------------------------------------------------------------------------------------- QQQ 205.1 -.94 201.83 83.5% ------- RED .466 .028 --------------------------------------------------------------------------------------------- MDY 366.64 -3.87 362.11 74% ------- RED .178 -.006 --------------------------------------------------------------------------------------------- IWM 161.77 -1.06 158.22 125.9% ------- RED .113 .003 --------------------------------------------------------------------------------------------- FAS 90.1 -.61 86.72 252.3% ------- RED .22 .096 --------------------------------------------------------------------------------------------- RETL 24.52 .98 26.38 -247.5% ------- BLUE .155 .206 --------------------------------------------------------------------------------------------- SOXL 221.44 -7.4 211.71 217.9% Bearish RED .144 .178 --------------------------------------------------------------------------------------------- TECL 214.3 -2.2 204.03 225.3% ------- RED .322 .209 --------------------------------------------------------------------------------------------- IBB 119.65 .26 115.41 228.3% ------- BLUE .356 .108 --------------------------------------------------------------------------------------------- GLD 137.86 .85 137.74 -5.1% ------- BLUE-.046 -.059 --------------------------------------------------------------------------------------------- OIL 9.85 -.44 10.24 -218.9% ------- RED .041 -.054 --------------------------------------------------------------------------------------------- OIH 14.64 -.34 14.58 0% Bearish RED .038 -.122 --------------------------------------------------------------------------------------------- GASL 5.87 -.5 6.52 -335.1% Bearish RED -.12 -.534 --------------------------------------------------------------------------------------------- UGA 30.65 -1.43 31.97 -259.5% Bearish RED .013 -.041 --------------------------------------------------------------------------------------------- UUP 26.58 -.01 26.71 -28.1% ------- -----.001 -.038 --------------------------------------------------------------------------------------------- IEF 111.57 -.09 111.69 -6.3% Bullish ---- .121 -.033 --------------------------------------------------------------------------------------------- CORN 14.52 .19 14.45 6.9% Bearish BLUE-.414 -.055 --------------------------------------------------------------------------------------------- WEAT 5.67 .14 5.45 254.5% Bullish BLUE .1 .053 --------------------------------------------------------------------------------------------- YINN 17.56 -1.51 18.13 -163% Bearish RED .012 -.045 --------------------------------------------------------------------------------------------- RSX 24.75 .67 24.01 132.6% ------- BLUE .207 .086 |
 Table 3   Count of Stocks in Key Directories
           20191129
-------------------------------
NEWHIGHS       96
NEWLOWS        18
MAXCP          30
MINCP          13
TTTNH          9
TTTNL          19
FASTUP         70
FASTDOWN       42
CPCROSSA       39
CPCROSSD       90
BIGVOLUP       2
BIGVODN        9
ACCUMVER       7
HIGHIP21       39
HIUPPCT        27
LOWACCUM       78
REDSELL        117
AUGSELS7       15
TRAPDOOR       30
|
 Table 4 RANKING OF KEY DIRECTORIES BASED PCT.OF STOCKS ABOVE 65-DMA
              11/29/19
 Bullish = 34
 Bearish = 11
---------------------------------------------------------------------------------------
Directory     Current       day-1         day-2         day-3         day-4         day-5
----------------------------------------------------------------------------------------
BIGBANKS       1             1             1             1             1             1
COPPER         1             1             1             1             .875          .75
JETS           1             1             1             .9            .7            .8
REGBANKS       .925          .925          .925          .962          .925          .925
TRANSP         .85           .9            .9            .85           .8            .65
AUTO           .82           .846          .846          .846          .769          .769
GAMING         .818          .727          .772          .727          .772          .727
FINANCE        .779          .79           .825          .813          .802          .813
NIFTY          .771          .789          .771          .789          .684          .736
FIDSTKS        .762          .795          .773          .779          .756          .718
NASD-100       .752          .762          .742          .721          .628          .639
HACKERS        .75           .75           .7            .65           .6            .6
MILITARY       .75           .785          .785          .75           .678          .785
SOFTWARE       .75           .75           .7            .733          .65           .7
SP-100         .744          .766          .755          .744          .766          .744
DOWJONES       .733          .766          .766          .666          .733          .7
HOSPITAL       .727          .727          .727          .727          .727          .681
DJI-13         .714          .714          .714          .714          .714          .714
HOMEBLDG       .709          .709          .709          .709          .677          .709
ETFS           .706          .793          .793          .862          .913          .896
RETAIL         .705          .725          .705          .784          .627          .588
RUS-1000       .7            .735          .718          .706          .677          .654
SP500          .695          .729          .712          .704          .675          .652
INDEXES        .688          .688          .666          .682          .688          .693
INFRA          .638          .722          .694          .638          .666          .611
BIOTECH        .62           .62           .606          .606          .565          .559
ELECTRON       .62           .653          .633          .673          .568          .549
REIT           .62           .662          .6            .558          .496          .489
SEMI           .584          .622          .603          .622          .528          .528
COMPUTER       .578          .578          .578          .578          .526          .526
GUNS           .562          .625          .625          .562          .562          .562
CHEM           .551          .591          .612          .612          .612          .632
INDMATER       .545          .597          .623          .636          .571          .584
INSURANC       .54           .594          .567          .513          .486          .486
===========================================================================================
EDU            .5            .555          .5            .5            .444          .388
===========================================================================================
FOOD           .49           .566          .603          .584          .566          .547
COMODITY       .487          .56           .585          .536          .56           .585
GREEN          .48           .56           .52           .52           .52           .48
SOLAR          .48           .56           .48           .44           .44           .48
CHINA          .454          .618          .618          .545          .436          .545
BONDFUND       .437          .401          .392          .294          .303          .232
UTILITY        .425          .45           .425          .425          .45           .425
GOLD           .392          .333          .352          .235          .254          .372
BEVERAGE       .375          .5            .437          .312          .312          .312
OILGAS         .277          .321          .291          .401          .343          .357
COAL           0             0             0             0             0             0
N=11
|
====================================================================
11/27/2019
My suggestion is not to
take profits too quickly in here.
How much higher might we go? The point-count for the
DJI using
the height of the previous DJI's trading range offers a minimum
target of
29500. Moreover, since
1967, the DJI has risen 69.2% over the next
ten trading days when it was the third year of the four-year
Presidential cycle and 76.9% over the next month, with typical
gains of +1.2% and +3.2%, respectively.

Eventually, the DJI will make a move up that is widely
unconfirmed by either the P-Indicator or our IP21 (Accumulation
Index). But we do not see that yet. Decembers are the second
most bullish month of the year, after Aprils. And, most important,
there is no indication by the FED of any change in their current QE-IV.
Usually it was a tightening of rates that turned the market down in
past Decembers. Not much short of an attack and a world war
(1941) or a looming financial panic (2007) or a wildly excessive
speculative excess (1968 or 1999) can set up a big December -
January decline.

The strength in FAS (representing big banks) along with the very low
interest rates now argue that we are not anywhere close to the circumstances
of 2007 or 2018. Instead, we are seeing a broad advance. The A/D Line
has been rising all year. I shown that this suggests no top this year and
perhaps only a quick "shake-out" in late January or February before
a renewed surge to more new highs..
Sure, there can be December peaks. But the
ones of 2007, 2015
and 2018 showed much weaker A/D Lines. Right now only four of our
investment sectors in Table 4 display a majority of their stocks below
their 65-dma. The rising tide is now lifting nearly all boats. There
is even a rise in speculation, something that has been absent for
a long time. Once started, this last development is hard to turn off.
So, stay long and avoid the short side. The new strength in biotechs
suggests new buyers are entering the market. This will boost the
NASDAQ, QQQ and also IWM, which has finally broken out above
its set of flat earlier peaks.
QQQ - Usually very high IP21 on a breakout is quite
bullish. |
 |
 |
|
Charts 11/27/2019 2019 PEERLESS DJI, Signals, Indicators Daily DJI Volume 10-DayUp/Down Vol Stoch-20 Hourly DJIA A/D Line for All Stocks Inverted Traders Index NASDAQ S&P OEX NYSE COMPQX DJI-15 DJI-20 DJI-30 DIA SPY QQQ MDY IWM TNA Short-Term Rates USO-CrudeOil DBO FAS GLD BBH IBB JETS JNUG KOL NUGT OIH OIL RSX RETL SDS AGQ SLV SOXL TECL TLT TMF TNA UGA (gasoline) XIV and China: YINN CHAU Commodities: CANE CORN DBC JJC, NIB, CHOC CORN, CUT (paper) MOO, SOYB WEAT UUP (Dollar) LIT (Lithium) AAPL ADBE ALXN AMAT AMGN AMD AMZN AXP BA BABA BAC BIDU CAT CVX DE FB GOOG GS HD IBM INTU JPM M (Macy's) MSFT NFLX NKE NVDA PG QCOM TSLA TXN XOM V WMT CMG , LRCX, SWKS, MDGL SPPI SQ TOWN 11/27/19 (Click on Underlined link.) New highs and Bullish MAXCPs - http://tigersoft.com/max/11-27/BULLISH.htm Bearish MAXCPs - http://tigersoft.com/min/11-27/BEARISH.htm |
Table 1 QUICKSILVER on DJI-30 STOCKS 11/26/2019 Bullish = AAPL and INTC 26/30 show rising 5-day ma SYMBOL CLOSE CHANGE PIVOT-PT 5-dma AROC CL-PWR CANDLE IP21 ITRS Remarks
TREND COLOR
----------------------------------------------------------------------------------------------
AAPL 267.84 3.55 262.01 88.2% ------- BLUE .39 .166 Most bullish
---------------------------------------------------------------------
AXP 120.33 .54 118.8 43.1% Bullish BLUE .024 -.023
---------------------------------------------------------------------
BA 368 -5.51 366.44 -39.2% ------- RED .097 -.084
---------------------------------------------------------------------
CAT 145.69 -.4 143.36 144.5% Bullish BLUE .167 .075
---------------------------------------------------------------------
CSCO 45.24 -.07 44.84 17.7% ------- RED -.056 -.12
---------------------------------------------------------------------
CVX 118.07 .28 118.77 30.9% Bullish BLUE .076 -.086
---------------------------------------------------------------------
DIS 151.48 -.16 146.9 153% Bullish RED .061 .071
---------------------------------------------------------------------
GS 222.95 .5 218.23 114.4% ------- RED .217 -.01
---------------------------------------------------------------------
HD 223 2.24 218.54 47.9% Bearish BLUE -.018 -.07
---------------------------------------------------------------------
IBM 133.77 -1.32 133.84 21.2% ------- RED .064 -.096
---------------------------------------------------------------------
INTC 58.51 -.39 58.22 52.3% Bullish ---- .347 .094 bullish
---------------------------------------------------------------------
JNJ 137.75 .58 136.44 66.1% Bullish BLUE .277 .02
---------------------------------------------------------------------
JPM 132.06 .39 129.93 93% Bullish RED .155 .066
---------------------------------------------------------------------
KO 53.95 .05 52.96 68.5% ------- ---- .131 -.042
---------------------------------------------------------------------
MCD 196.3 2.29 192.35 56.2% ------- BLUE -.05 -.104 bearish
---------------------------------------------------------------------
MMM 170.61 1.38 165.14 84.5% ------- BLUE .139 -.018
---------------------------------------------------------------------
MRK 87.61 .27 85.46 136.3% ------- BLUE -.002 .019
---------------------------------------------------------------------
MSFT 152.32 .29 149.48 89.8% Bullish ---- .29 .063
---------------------------------------------------------------------
NKE 94.14 .81 92.16 58.6% Bearish BLUE .029 .032
---------------------------------------------------------------------
PFE 38.63 .34 37.74 207.8% ------- BLUE .015 .025
---------------------------------------------------------------------
PG 121.76 -.5 120.34 -21.9% ------- RED .07 -.034
---------------------------------------------------------------------
TRV 136.84 .16 134.69 52.1% Bullish RED .24 -.102
---------------------------------------------------------------------
UNH 280.67 -.73 276.55 91.7% Bullish RED .146 .181 bullish
---------------------------------------------------------------------
UTX 148.82 .7 147.3 73.6% ------- BLUE .234 .045
---------------------------------------------------------------------
V 184.37 1.82 179.89 74.9% Bullish BLUE .175 .015
---------------------------------------------------------------------
VZ 60.1 .21 59.61 52% ------- BLUE .209 -.034
---------------------------------------------------------------------
WBA 60.11 .48 60.62 -101.5% Bearish BLUE -.043 .068
---------------------------------------------------------------------
WMT 118.76 -.43 119.86 -15.5% Bearish RED -.113 -.023
---------------------------------------------------------------------
DOW 68.7 -.03 69.67 48.6% ------- RED .091 -.093
|
Table 2 QUICKSILVER on ETFS - 11/27/2019 ETF CLOSE CHANGE PIVOT-PT 5-dma AROC CL-PWR CANDLE IP21 ITRS DIA 281.91 .55 277.72 66.4% ------- BLUE .435 0
*****
---------------------------------------------------------------------------------------------
BA 368 -5.51 366.44 -39.2% ------- RED .097 -.084
---------------------------------------------------------------------------------------------
SPY 315.48 1.4 310.27 75.5% Bullish BLUE .427 .011
*****
---------------------------------------------------------------------------------------------
QQQ 206.04 1.43 201.7 95.9% ------- BLUE .51 .034 Bullish
*****
---------------------------------------------------------------------------------------------
MDY 370.51 2.53 361.23 91.8% Bullish BLUE .24 .002
---------------------------------------------------------------------------------------------
IWM 162.83 1.14 157.73 135.4% Bullish BLUE .155 .004
---------------------------------------------------------------------------------------------
FAS 90.71 1.26 85.65 202.9% Bullish BLUE .257 .097
---------------------------------------------------------------------------------------------
RETL 26.73 .43 23.69 585.7% Bearish BLUE .197 .149
---------------------------------------------------------------------------------------------
SOXL 228.84 4.8 211.82 217.8% Bearish BLUE .156 .198
---------------------------------------------------------------------------------------------
TECL 216.5 3.72 204.83 213.8% Bullish BLUE .365 .229 Bullish
*****
---------------------------------------------------------------------------------------------
IBB 119.39 .91 114.3 233.9% Bullish BLUE .37 .107
*****
---------------------------------------------------------------------------------------------
GLD 137.01 -.73 138 -63.5% Bearish -----.013 -.063
---------------------------------------------------------------------------------------------
OIH 11.91 -.37 12.55 -429.3% Bearish RED -.058 -.15
---------------------------------------------------------------------------------------------
GASL 6.37 .23 6.3 243.9% Bearish BLUE-.128 -.523
---------------------------------------------------------------------------------------------
|
   Table 3
          Count of Stocks in Key Directories
          20191127
-------------------------------
NEWHIGHS       430  Bullish >10:1
NEWLOWS        19
MAXCP          70
MINCP          15
TTTNH          12
TTTNL          26
FASTUP         87
FASTDOWN       45
CPCROSSA       74
CPCROSSD       57
BIGVOLUP       3
BIGVODN        11
ACCUMVER       10
HIGHIP21       68
HIUPPCT        32
LOWACCUM       95
REDSELL        115
AUGSELS7       22
TRAPDOOR       33
|
 Table 4 RANKING OF KEY DIRECTORIES BASED PCT.OF STOCKS ABOVE 65-DMA
              11/27/19
 Bullish = 41
 Bearish = 4
---------------------------------------------------------------------------------------
Directory     Current       day-1         day-2         day-3         day-4         day-5
----------------------------------------------------------------------------------------
BIGBANKS       1             1             1             1             1             1
COPPER         1             1             1             .8            .8            .8
JETS           1             1             .9            .7            .8            .7
REGBANKS       .925          .925          .962          .925          .925          .962
TRANSP         .9            .9            .85           .8            .65           .65
AUTO           .846          .846          .846          .769          .769          .769
FIDSTKS        .795          .773          .779          .756          .723          .712
ETFS           .793          .793          .862          .913          .896          .862
FINANCE        .79           .825          .813          .802          .802          .79
NIFTY          .789          .771          .789          .684          .736          .754
MILITARY       .785          .785          .75           .678          .785          .857
DOWJONES       .766          .766          .666          .733          .733          .7
SP-100         .766          .755          .744          .766          .755          .7
NASD-100       .762          .752          .731          .628          .639          .659
HACKERS        .75           .75           .65           .6            .6            .65
SOFTWARE       .75           .716          .733          .65           .7            .733
RUS-1000       .735          .72           .706          .677          .656          .682
SP500          .729          .714          .704          .675          .656          .677
GAMING         .727          .772          .727          .772          .727          .772
HOSPITAL       .727          .727          .727          .727          .727          .681
RETAIL         .725          .705          .784          .627          .588          .627
INFRA          .722          .694          .638          .666          .638          .638
HOMEBLDG       .709          .709          .709          .677          .709          .709
DJI-13         .692          .692          .692          .692          .692          .692
INDEXES        .688          .666          .682          .688          .693          .693
REIT           .662          .6            .558          .496          .489          .579
ELECTRON       .653          .633          .673          .568          .562          .607
GUNS           .625          .625          .562          .562          .562          .625
SEMI           .622          .603          .622          .528          .528          .556
BIOTECH        .618          .603          .603          .565          .565          .571
CHINA          .618          .618          .545          .436          .545          .545
INDMATER       .597          .623          .636          .571          .584          .597
INSURANC       .594          .567          .513          .486          .486          .567
CHEM           .591          .612          .612          .612          .632          .632
COMPUTER       .578          .578          .578          .526          .526          .578
FOOD           .574          .611          .592          .574          .555          .555
COMODITY       .56           .585          .536          .56           .585          .536
GREEN          .56           .52           .52           .52           .48           .48
SOLAR          .56           .48           .44           .44           .48           .48
EDU            .555          .5            .5            .444          .388          .333
===========================================================================================
BEVERAGE       .5            .437          .312          .312          .312          .25
===========================================================================================
UTILITY        .45           .425          .425          .45           .425          .375
BONDFUND       .401          .392          .294          .303          .223          .366
GOLD           .333          .352          .235          .254          .372          .431
OILGAS         .321          .291          .401          .343          .357          .299
COAL           0             0             0             0             0             0
|
====================================================================
11/26/2019
Our multiple Buy B21s, the flat-top breakout past
27500,
the very year-long strong NYSE A/D Line, QE-IV until April,
the extra bullish seasonality of the 3rd year in the Presidential
4-year cycle and more talk of a US-China trade deal should
keep us bullish until the end of the year at least. Window-dressing
should keep the strongest stocks running. Performance-minded
funds and individual investors will keep the new highs growing
on flat-top breakouts. And speculation is growing. All this is
an excellent environment, we expect, in the items recommended
here, especially DIA, QQQ and SOXL. And now we have
breakouts looming for BBH (biotechs), mid-caps (MDY) and
IWM (Russell-2000).

|
Charts 11/26/2019
2019 PEERLESS DJI, Signals, Indicators Daily DJI Volume 10-DayUp/Down Vol Stoch-20 Hourly DJIA A/D Line for All Stocks Inverted Traders Index NASDAQ S&P OEX NYSE COMPQX DJI-15 DJI-20 DJI-30 DIA SPY QQQ MDY IWM TNA Short-Term Rates USO-CrudeOil DBO FAS GLD BBH IBB JETS JNUG KOL NUGT OIH OIL RSX RETL SDS AGQ SLV SOXL TECL TLT TMF TNA UGA (gasoline) XIV and China: YINN CHAU Commodities: CANE CORN DBC JJC, NIB, CHOC CORN, CUT (paper) MOO, SOYB WEAT UUP (Dollar) LIT (Lithium) AAPL ADBE ALXN AMAT AMGN AMD AMZN AXP BA BABA BAC BIDU CAT CVX DE FB GOOG GS HD IBM INTU JPM M (Macy's) MSFT NFLX NKE NVDA PG QCOM TSLA TXN XOM V WMT CMG , LRCX, SWKS, MDGL SPPI SQ TOWN 11/26/19 (Click on Underlined link.) New highs and Bullish MAXCPs - http://tigersoft.com/max/11-26/BULLISH.htm Bearish MAXCPs - http://tigersoft.com/min/11-26/BEARISH.htm |
What Is To Be
Done? Don't Sell To Quickly.
You May End up Buying back at Higher Prices.
Have I over-stated the bullish case? The markets are
now up to
their last important resistance levels, seemingly over-bought and
I am told the Volatility Index is too low for comfort. So, perhaps,
between now and our next Buy signal, the Buy B13 (Santa Claus
buy) after December 16th, there may be some subsidence. If
so, I think we should use that the buy either BBH, IBB or some
of the low priced, high Accumulation stocks like BLDP or the
biotechs among our MAXCPs. The spectacular performance of
ARWR is sure to lure aggressive, performance money into these
stocks.
ARWR - Super Stock making All-Time Highs.
Arrowhead Pharmaceuticals is focusing on gene therapy and the
concept of RNA interference, which acts to silence, or turn off,
certain genes that are known to cause disease. Arrowhead currently
has partnerships with Johnson & Johnson and Amgen to help them
develop and commercialize various drugs based off of the company's technology.

BLDP AI/200=197!

MNDO - very thin. But that can be a big positive with it breaking out of its base.

SGEN

Table 1 QUICKSILVER on DJI-30 STOCKS 11/26/2019 Bullish = AAPL (IP21 and ITRS both >.20 19/30 show rising 5-day ma SYMBOL CLOSE CHANGE PIVOT-PT 5-dma AROC CL-PWR CANDLE IP21 ITRS Remarks
TREND COLOR
----------------------------------------------------------------------------------------------
AAPL 264.29 -2.08 263.19 -37.9% ------- RED .293 .161 Most Bullish
---------------------------------------------------------------------
AXP 119.79 -.81 119.3 -8.8% Bullish RED -.06 -.03
---------------------------------------------------------------------
BA 373.51 .38 370.91 88% Bullish RED .173 -.064
---------------------------------------------------------------------
CAT 146.09 -.33 141.52 101.3% Bullish RED .183 .069
---------------------------------------------------------------------
CSCO 45.31 -.14 45.08 -17.7% ------- RED -.059 -.119
---------------------------------------------------------------------
CVX 117.79 -.59 117.34 56.8% ------- RED .065 -.085
---------------------------------------------------------------------
DIS 151.64 1.95 146.93 110.1% Bullish RED .045 .076
---------------------------------------------------------------------
GS 222.45 -.3 217.91 54.8% ------- RED .212 -.006
---------------------------------------------------------------------
HD 220.76 2.36 220.9 -115.7% Bearish BLUE -.088 -.077
---------------------------------------------------------------------
IBM 135.09 -.88 133.2 21.2% ------- RED .064 -.086
---------------------------------------------------------------------
INTC 58.9 .09 57.9 47.3% Bullish ---- .263 .098 Bullish
---------------------------------------------------------------------
JNJ 137.17 -.01 135.94 86.1% Bullish BLUE .263 .022
---------------------------------------------------------------------
JPM 131.67 .18 129.63 41.8% Bullish RED .134 .074
---------------------------------------------------------------------
KO 53.9 .68 53.22 77.2% ------- BLUE .107 -.042
---------------------------------------------------------------------
MCD 194.01 2.12 194.13 14.8% ------- BLUE -.067 -.112 Most Bearish
---------------------------------------------------------------------
MMM 169.23 -1.01 167.77 -43.1% ------- RED .134 -.029
---------------------------------------------------------------------
MRK 87.34 1.64 85.27 157.7% Bullish BLUE .034 .022
---------------------------------------------------------------------
MSFT 152.03 .8 149.62 54.6% Bullish BLUE .226 .07 Bullish
---------------------------------------------------------------------
NKE 93.33 .43 93.05 -15.1% Bearish ---- -.044 .029
---------------------------------------------------------------------
PFE 38.29 -.39 37.05 83.1% ------- RED -.028 .013
---------------------------------------------------------------------
PG 122.26 1.75 122.29 34.7% ------- BLUE .053 -.027
---------------------------------------------------------------------
TRV 136.68 1.65 135.43 45.1% Bullish BLUE .208 -.108
---------------------------------------------------------------------
UNH 281.4 -1.27 275.56 129.3% Bullish RED .169 .174 Bullish
---------------------------------------------------------------------
UTX 148.12 .6 146.65 -8.5% Bullish BLUE .163 .043
---------------------------------------------------------------------
V 182.55 1.58 181.66 -6.1% ------- BLUE .066 -.002
---------------------------------------------------------------------
VZ 59.89 .51 59.48 32.7% ------- BLUE .214 -.036
---------------------------------------------------------------------
WBA 59.63 -1.04 61.34 -149.3% Bearish RED -.045 .051
---------------------------------------------------------------------
WMT 119.19 .27 119.13 -29.3% Bearish BLUE -.121 -.013
---------------------------------------------------------------------
DOW 68.73 -.18 68.03 66.2% ------- RED .068 -.097
|
Table 2 QUICKSILVER on ETFS - 11/25/2019 ETF CLOSE CHANGE PIVOT-PT 5-dma AROC CL-PWR CANDLE IP21 ITRS --------------------------------------------------------------------------------------------- DIA 281.36 .56 278.2 36.4% Bullish BLUE .372 ---- --------------------------------------------------------------------------------------------- BA 373.51 .38 370.91 88% Bullish RED .173 -.064 --------------------------------------------------------------------------------------------- SPY 314.08 .71 310.77 34.5% Bullish BLUE .367 .008 --------------------------------------------------------------------------------------------- QQQ 204.61 .39 202.15 30.6% Bullish BLUE .419 .026 --------------------------------------------------------------------------------------------- MDY 367.98 1.37 363.82 41.4% Bullish BLUE .219 -.007 --------------------------------------------------------------------------------------------- IWM 161.69 .11 158.51 81.1% Bullish RED .138 -.009 --------------------------------------------------------------------------------------------- FAS 89.45 .98 87.16 82.6% Bullish BLUE .195 .085 --------------------------------------------------------------------------------------------- RETL 26.3 .48 23.82 295.3% ------- BLUE .171 .095 --------------------------------------------------------------------------------------------- SOXL 224.04 -3.07 219.31 -70.2% ------- RED .09 .175 --------------------------------------------------------------------------------------------- TECL 212.78 .2 207.59 23.8% Bullish RED .274 .21 highest IP21+ITRS --------------------------------------------------------------------------------------------- IBB 118.48 .23 113.96 218.6% Bullish RED .343 .09 --------------------------------------------------------------------------------------------- GLD 137.74 .66 138.76 -34.4% Bearish BLUE-.009 -.063 --------------------------------------------------------------------------------------------- OIH 11.91 -.37 12.55 -429.3% Bearish RED -.058 -.15 --------------------------------------------------------------------------------------------- GASL 6.14 -.61 6.06 166.3% Bearish RED -.134 -.567 weakest --------------------------------------------------------------------------------------------- |
Table 3   Count of Stocks in Key Directories
          20191126
-------------------------------
NEWHIGHS       362   Bullish >10:1 vs NEWLOWS
NEWLOWS        23
MAXCP          72    Bullish >2:1 vs MINCPS
MINCP          33
TTTNH          21
TTTNL          32
FASTUP         71
FASTDOWN       60
CPCROSSA       129
CPCROSSD       78
BIGVOLUP       3
BIGVODN        27
ACCUMVER       11
HIGHIP21       50
HIUPPCT        26
LOWACCUM       107
REDSELL        108
AUGSELS7       21
TRAPDOOR       33
|
 Table 4  RANKING OF KEY DIRECTORIES BASED PCT.OF STOCKS ABOVE 65-DMA
              11/26/19
 Bullish = 37
 Bearish = 6
---------------------------------------------------------------------------------------
Directory     Current       day-1         day-2         day-3         day-4         day-5
----------------------------------------------------------------------------------------
BIGBANKS       1             1             1             1             1             1
COPPER         1             1             .8            .8            .8            1
JETS           1             .9            .7            .8            .8            1
REGBANKS       .925          .962          .925          .925          .962          1
TRANSP         .9            .85           .8            .65           .65           .8
AUTO           .846          .846          .769          .769          .769          .82
FINANCE        .825          .813          .802          .802          .779          .837
ETFS           .793          .862          .913          .896          .862          .879
MILITARY       .785          .75           .678          .785          .857          .857
FIDSTKS        .773          .779          .756          .723          .712          .745
GAMING         .772          .727          .772          .727          .772          .772
NIFTY          .771          .789          .684          .736          .754          .789
DOWJONES       .766          .666          .733          .733          .7            .7
SP-100         .755          .744          .766          .755          .7            .711
NASD-100       .752          .742          .639          .639          .649          .68
HACKERS        .75           .7            .6            .6            .65           .65
HOSPITAL       .727          .727          .727          .727          .681          .681
RUS-1000       .72           .708          .677          .656          .683          .7
SOFTWARE       .716          .75           .65           .7            .7            .716
SP500          .714          .706          .675          .656          .677          .695
HOMEBLDG       .709          .709          .677          .709          .709          .774
RETAIL         .705          .784          .627          .588          .627          .745
INFRA          .694          .638          .666          .638          .666          .666
DJI-13         .692          .692          .692          .692          .692          .692
INDEXES        .666          .682          .688          .693          .688          .682
ELECTRON       .633          .673          .568          .562          .607          .653
GUNS           .625          .562          .562          .562          .625          .687
INDMATER       .623          .636          .571          .584          .597          .61
CHINA          .618          .545          .436          .545          .563          .563
CHEM           .612          .612          .612          .632          .632          .673
FOOD           .611          .592          .574          .555          .555          .574
SEMI           .603          .622          .528          .528          .556          .613
BIOTECH        .6            .6            .562          .565          .568          .553
REIT           .6            .558          .496          .489          .579          .62
COMODITY       .585          .536          .56           .585          .536          .536
COMPUTER       .578          .578          .526          .526          .578          .578
INSURANC       .567          .513          .486          .486          .567          .567
GREEN          .52           .52           .52           .48           .48           .52
============================================================================================
EDU            .5            .5            .444          .388          .333          .5
SOLAR          .5            .461          .461          .5            .5            .461
============================================================================================
BEVERAGE       .437          .312          .312          .312          .25           .25
UTILITY        .425          .425          .45           .425          .375          .325
BONDFUND       .392          .294          .303          .223          .357          .267
GOLD           .352          .235          .254          .372          .431          .411
OILGAS         .291          .401          .343          .357          .299          .299
COAL           0             0             0             0             0             0
|
====================================================================
11/25/2019
"Peerless remains on multiple Buy
B21s. We are entering the bullish
period of trading right before Thanksgiving and then comes the bullish month
of December. Since 1965, the DJI has risen 84.6% of the time over
the next 21-trading days. (If there is a more bullish period, I do not know what
it is). It has shown an average gain of +3.5% for the next 21-trading days and
+4.6% over the next 42-trading days." (from Sunday
night's Hotline)

Just below, see that even stronger than the DJI today was the NASDAQ.
But the NASDJI line (showing relative) strength versus the DJI will need
to start rising.

What lifted the NASDAQ today was Biotechs, more than anything else.
So watch the more speculative Russell-2000 in its flat-top breakout attempt
now and Biotechs represented by BBH. These could well be on their
way to be becoming the market's new leaders. Imagine, if today's action becomes
typical for even a month or two, we could see a market of vertical ascents in biotechs,
like we last saw from October 1999 to March 2000.


Investing in wild low-priced stock by the general public is exactly what History
shows is the ultimate likely outcome of a very accomodating FED when the DJI
and the big caps have been on a long advance. Think 1927-1929! In July 1927,
the FED cut interest rates just as the DJI was making all-time highs. The FED
has done the same in 2019, another year before a Presidential Election.
This is exactly what I saw happen long ago in 1967 and again in 1968 when I
was first enticed to Wall Street and away from Academia by the euphoric
investing in the "cats and dogs" of the day, This was also the the type of
action
that got Nicolas Darvas, the inventor of the "box system" of flat-topped
breakouts,
to write "How I Made A Million in The Stock Market in 1959 (also the third year
in the four year Presidential cycle).
( https://en.wikipedia.org/wiki/Nicolas_Darvas )
The point is that a bigger and much more speculative advance
is exactly
what History teaches us to expect if the FED and Powell keep their promise
and inject $60 billion per month into the banking system until April. In effect,
they are "back-stopping" the market. So, let's watch now to see if things
play out this way. First, let's see if the key indexes can get past their last,
rising resistance lines.
And be sure that the Biotechs, especially BBH, IBB and the handful of biotechs
among our favorite MAXCPs can stay in their steep uptrends. Any minor
weakness in BBH or IBB should be used to take new positions in them. For now
hold DIA, QQQ, SOXL and some of the high Accumulation low-priced stocks
among our MAXCPs. I would avoid the short-side altogether.
IWM Breakout was not confirmed
by a similar Closing Power Breakout.


|
Charts 11/25/2019
2019 PEERLESS DJI, Signals, Indicators Daily DJI Volume 10-DayUp/Down Vol Stoch-20 Hourly DJIA A/D Line for All Stocks Inverted Traders Index NASDAQ S&P OEX NYSE COMPQX DJI-15 DJI-20 DJI-30 DIA SPY QQQ MDY IWM TNA Short-Term Rates USO-CrudeOil DBO FAS GLD BBH IBB JETS JNUG KOL NUGT OIH OIL RSX RETL SDS AGQ SLV SOXL TECL TLT TMF TNA UGA (gasoline) XIV and China: YINN CHAU Commodities: CANE CORN DBC JJC, NIB, CHOC CORN, CUT (paper) MOO, SOYB WEAT UUP (Dollar) LIT (Lithium) AAPL ADBE ALXN AMAT AMGN AMD AMZN AXP BA BABA BAC BIDU CAT CVX DE FB GOOG GS HD IBM INTU JPM M (Macy's) MSFT NFLX NKE NVDA PG QCOM TSLA TXN XOM V WMT CMG , LRCX, SWKS, MDGL SPPI SQ TOWN 11/25/19 (Click on Underlined link.) New highs and Bullish MAXCPs - http://tigersoft.com/max/11-25/BULLISH.htm Bearish MAXCPs - http://tigersoft.com/min/11-25/BEARISH.htm |
Table 1 QUICKSILVER on DJI-30 STOCKS 11/25/2019 Bullish = AAPL (IP21 and ITRS both >.20 10/30 show falling 5-day ma SYMBOL CLOSE CHANGE PIVOT-PT 5-dma AROC CL-PWR CANDLE IP21 ITRS Remarks
TREND COLOR
----------------------------------------------------------------------------------------------------
AAPL 266.37 4.59 266.29 -13.8% Bullish BLUE .345 .176 Most Bullish
---------------------------------------------------------------------
AXP 120.6 1.54 120 39.4% Bullish BLUE 0 -.01
---------------------------------------------------------------------
BA 373.13 1.79 367 49.7% Bullish BLUE .148 -.051
---------------------------------------------------------------------
CAT 146.42 2.54 143.18 98.9% Bullish BLUE .161 .064
---------------------------------------------------------------------
CSCO 45.45 .6 45.47 33.3% ------- BLUE -.027 -.126
---------------------------------------------------------------------
CVX 118.38 -.25 116.45 -7.2% Bullish ---- .076 -.082
---------------------------------------------------------------------
DIS 149.69 1.4 148.38 69.1% Bullish BLUE .053 .067
---------------------------------------------------------------------
GS 222.75 2.47 220.04 68.9% ------- BLUE .2 -.01
---------------------------------------------------------------------
HD 218.4 .37 225.86 -455.6% Bearish BLUE -.162 -.09
---------------------------------------------------------------------
IBM 135.97 1.63 134.52 61.9% ------- BLUE .089 -.081
---------------------------------------------------------------------
INTC 58.81 1.2 58.35 48.2% Bullish BLUE .305 .091
---------------------------------------------------------------------
JNJ 137.18 -.89 134.82 86.4% Bullish BLUE .195 .023
---------------------------------------------------------------------
JPM 131.49 .7 130.58 33.4% Bullish BLUE .06 .068
---------------------------------------------------------------------
KO 53.22 .19 53.08 17.9% ------- RED .044 -.049
---------------------------------------------------------------------
MCD 191.89 -1.25 193.44 -61.8% Bearish RED -.163 -.11 Most Bearish
---------------------------------------------------------------------
MMM 170.24 2.64 170.68 -8.9% Bullish BLUE .186 -.032
---------------------------------------------------------------------
MRK 85.7 .25 84.65 92.4% Bearish RED -.036 .009
---------------------------------------------------------------------
MRK 151.23 1.64 150.39 29.7% Bullish BLUE .173 .074
---------------------------------------------------------------------
NKE 92.9 -.44 93.61 -68.6% Bearish RED -.028 .029
---------------------------------------------------------------------
PFE 38.68 .35 37.66 194.1% Bullish BLUE 0 .015
---------------------------------------------------------------------
PG 120.51 .22 121.42 -56.9% ------- ---- .003 -.029
---------------------------------------------------------------------
TRV 135.03 -.1 135.46 27.4% Bullish RED .109 -.113
---------------------------------------------------------------------
UNH 282.67 5.83 274.23 176.9% Bullish BLUE .171 .17
---------------------------------------------------------------------
UTX 147.52 -.18 148.37 -53.8% Bullish RED .138 .033
---------------------------------------------------------------------
V 180.97 1.5 182.77 36.2% ------- BLUE .081 -.008
---------------------------------------------------------------------
VZ 59.38 -.37 59.5 -5% Bearish RED .129 -.038
---------------------------------------------------------------------
WBA 60.67 .07 61.45 -103.8% ------- ---- -.032 .061
---------------------------------------------------------------------
WMT 118.92 -.44 119.89 -55.6% Bearish RED -.158 -.007
---------------------------------------------------------------------
DOW 68.91 -.46 67.82 28.4% ------- RED .033 -.101
|
laterTable 2 QUICKSILVER on ETFS - 11/25/2019 ETF CLOSE CHANGE PIVOT-PT 5-dma AROC CL-PWR CANDLE IP21 ITRS --------------------------------------------------------------------------------------------- DIA 280.8 1.94 279.33 9.5% Bullish BLUE .346 ==== --------------------------------------------------------------------------------------------- BA 373.13 1.79 367 49.7% Bullish BLUE .148 -.051 --------------------------------------------------------------------------------------------- SPY 313.37 2.41 311.93 21.7% Bullish BLUE .336 .008 --------------------------------------------------------------------------------------------- QQQ 204.22 2.39 203.37 28.4% Bullish BLUE .429 .03 --------------------------------------------------------------------------------------------- MDY 366.61 4.5 364.97 33.3% Bullish BLUE .17 -.014 --------------------------------------------------------------------------------------------- IWM 161.58 3.36 159.11 96.6% Bullish BLUE .173 -.012 --------------------------------------------------------------------------------------------- FAS 88.47 1.75 88.01 92.1% Bullish BLUE .133 .085 --------------------------------------------------------------------------------------------- RETL 25.82 1.23 24.85 -109.5% Bearish BLUE .128 .046 --------------------------------------------------------------------------------------------- SOXL 227.11 15.4 227.12 -81.3% ------- BLUE .132 .203 --------------------------------------------------------------------------------------------- TECL 212.58 8.55 211.79 50.1% Bullish BLUE .328 .222 --------------------------------------------------------------------------------------------- IBB 118.25 2.84 113.45 308.3% Bullish BLUE .36 .089 --------------------------------------------------------------------------------------------- GLD 137.08 -.66 138.69 -55.7% Bearish RED -.056 -.066 --------------------------------------------------------------------------------------------- OIH 11.91 -.37 12.55 -429.3% Bearish RED -.058 -.149 --------------------------------------------------------------------------------------------- GASL 6.75 .23 5.93 183.5% Bearish BLUE-.139 -.595 --------------------------------------------------------------------------------------------- |
  Table 3  Count of Stocks in Key Directories
          20191125
-------------------------------
NEWHIGHS       348
NEWLOWS        20
MAXCP          69
MINCP          16
TTTNH          20
TTTNL          33
FASTUP         86
FASTDOWN       51
CPCROSSA       253
CPCROSSD       32
BIGVOLUP       4
BIGVODN        12
ACCUMVER       12
HIGHIP21       44
HIUPPCT        26
LOWACCUM       99
REDSELL        108
AUGSELS7       28
TRAPDOOR       33
|
Table 4    RANKING OF KEY DIRECTORIES BASED PCT.OF STOCKS ABOVE 65-DMA
             11/25/19
Bullish = 37
Bearish = 6
---------------------------------------------------------------------------------------
Directory     Current       day-1         day-2         day-3         day-4         day-5
----------------------------------------------------------------------------------------
BIGBANKS       1             1             1             1             1             1
COPPER         1             .8            .8            .8            1             1
REGBANKS       .962          .925          .925          .962          1             .962
JETS           .9            .7            .8            .8            1             1
ETFS           .862          .913          .896          .862          .879          .896
TRANSP         .85           .8            .65           .65           .85           .9
AUTO           .846          .769          .769          .769          .82           .846
FINANCE        .823          .811          .811          .788          .847          .823
NIFTY          .789          .684          .736          .754          .789          .789
RETAIL         .784          .627          .588          .627          .745          .843
FIDSTKS        .779          .756          .723          .712          .745          .74
MILITARY       .75           .678          .785          .857          .821          .857
SOFTWARE       .75           .666          .7            .7            .716          .683
SP-100         .744          .766          .755          .7            .722          .744
NASD-100       .742          .649          .649          .649          .69           .639
GAMING         .727          .772          .727          .772          .772          .772
HOSPITAL       .727          .727          .727          .681          .681          .636
HOMEBLDG       .709          .677          .709          .709          .774          .806
RUS-1000       .708          .678          .656          .683          .704          .708
SP500          .706          .677          .656          .677          .7            .695
HACKERS        .7            .65           .6            .65           .65           .6
DJI-13         .692          .692          .692          .692          .692          .769
INDEXES        .682          .688          .693          .688          .677          .688
ELECTRON       .673          .568          .562          .607          .666          .64
DOWJONES       .666          .733          .733          .7            .733          .733
INFRA          .638          .666          .638          .666          .666          .638
INDMATER       .636          .571          .584          .597          .61           .675
SEMI           .622          .528          .528          .556          .622          .594
CHEM           .612          .612          .632          .632          .673          .693
BIOTECH        .597          .559          .562          .568          .559          .516
FOOD           .592          .574          .555          .555          .592          .574
COMPUTER       .578          .526          .526          .578          .578          .578
GUNS           .562          .562          .562          .625          .687          .625
REIT           .558          .496          .489          .579          .62           .641
CHINA          .545          .436          .545          .563          .563          .581
COMODITY       .536          .56           .585          .536          .56           .536
GREEN          .52           .52           .48           .48           .52           .44
INSURANC       .513          .486          .486          .567          .567          .567
============================================================================================
EDU            .5            .444          .388          .333          .444          .333
============================================================================================
SOLAR          .461          .461          .5            .5            .461          .423
UTILITY        .425          .45           .425          .375          .325          .325
OILGAS         .401          .343          .357          .299          .299          .335
BEVERAGE       .312          .312          .312          .25           .25           .187
BONDFUND       .294          .303          .223          .357          .267          .223
GOLD           .235          .254          .372          .431          .411          .431
COAL           0             0             0             0             0             .2
|
====================================================================
11/22/2019 Peerless remains on
multiple Buy B21s. We are entering the bullish
period of trading right before Thanksgiving and then comes the bullish month
of December. Since 1965, the DJI has risen 84.6% of the time over
the next 21-trading days. (If there is a more bullish period, I do not know what
it is). It has shown an average gain of +3.5% for the next 21-trading days and
+4.6% over the next 42-trading days. After that, the first and second Quarter
sluggishness of the Presidential Election year. Window-dressing will probably
more than counteract profit-taking from fear of higher tax rates in 2020 if Democrats
win the next Election. Fear of that, I would suggest, is guiding Fed policy-making
now. ( There are ample cases of FED politicking in the past, as I will show in my
forth-coming Untold History of The Stock Market: 1886-2019.)
|
Charts 11/22/2019
2019 PEERLESS DJI, Signals, Indicators Daily DJI Volume 10-DayUp/Down Vol Stoch-20 Hourly DJIA A/D Line for All Stocks Inverted Traders Index NASDAQ S&P OEX NYSE COMPQX DJI-15 DJI-20 DJI-30 DIA SPY QQQ MDY IWM TNA Short-Term Rates USO-CrudeOil DBO FAS GLD BBH IBB JETS JNUG KOL NUGT OIH OIL RSX RETL SDS AGQ SLV SOXL TECL TLT TMF TNA UGA (gasoline) XIV and China: YINN CHAU Commodities: CANE CORN DBC JJC, NIB, CHOC CORN, CUT (paper) MOO, SOYB WEAT UUP (Dollar) LIT (Lithium) AAPL ADBE ALXN AMAT AMGN AMD AMZN AXP BA BABA BAC BIDU CAT CVX DE FB GOOG GS HD IBM INTU JPM M (Macy's) MSFT NFLX NKE NVDA PG QCOM TSLA TXN XOM V WMT CMG , LRCX, SWKS, MDGL SPPI SQ TOWN 11/22/19 (Click on Underlined link.) New highs and Bullish MAXCPs - http://tigersoft.com/max/11-22/BULLISH.htm Bearish MAXCPs - http://tigersoft.com/min/11-22/BEARISH.htm |
When the A/D Line rises all year, as it has this year, we have to
remain bullish
until January, at the least. Examples of this are:
Powerful, Year-Long A/D Line Uptrends:
1954. The subsequent 1/3/1955 top did bring a quick decline
to the 3% lower band and again on 3/3/1955. No Peerless
Sell in January 1954.
1958. A subsequent 1/21/1959 top did bring a quick decline
to the 3.5% lower band. No Peerless Sell in January 1959.
1995. 3/18/1996 brought a Sell S1 and a quick decline to
the 3.5% lower band.
2003. 2/12/2004 peak soon brought a Sell S19 and a decline to
the 4.5% lower band.
2017. 1/30/2018 Sell S9 started a quick 10% correction.

Seasonality
Seasonality is an important forecasting tool for Peerless users. Our Buy and Sell
sell signals incorporate the seasonals trends that have appeared since 1965 and 1915
in particular signals. We are about to begin the second most bullish individual
month.
All Decembers since 1965 have produced an average DJI gain of +1.9% and
rose 71.7% of the time. April's results are generally the best. A second
lesson:
Generally speaking it seems best to buy on November 1st and sell on Apriil 30th.
Interestingly, it also seems to work out particularly well to buy October 1st in the
Second
year of the Presidential Election Year and Sell on April 30th of the Third year
of the Presidential Election Year, but not when the FED begins tightening, as
it did in Octobber 2018. A third rule: always watch for when the expected
does not happen. Thus a failure of a good Santa Cluas rally in late December
in December would be most troubling, as in 2007 and 2015 and can bring a
Sell S16 signal.
The table below shows that we really must distinguish which year we are talking
about in the four-year cycle. The average annual gains as well as month-to-month
gains are much greater in the Third year of the 4-year Presidential Cycle, in fact,
almost 3x higher than any of the three other years. There are many possible
explanations why these patterns are present. I credit/blame the Federal Reserve
most. The Fed wants to inject liquidity and increase stocks prices in April when
folks pay their income taxes and, despite protestations of independence, it does
play political favorites.
But the real test of whether these seasonal patterns are valid comes from
studies of long periods of time and estimates of whether the Federal Reserve will stay
on the same path and generally try to boost stock prices going into a Presidential
Election. We have to stay alert to changes that might affect these seasonal
patterns. Thus, we notice that the 2007, 2011 and 2015 third year gains were
much smaller than normal, respectively +6.4%), +5.5% and -2.2%. 2019,
on the other hand, so far, is considerably strong, showing a yearly gain to date
of +17%. The FED's Open Market Committee in 2019 has been behaving in
exactly the way our Seasonal model would predict.
Some tell us that Globalization will change these trends. If the Dollar lost its
status as the dominant global currency, things might be very different. But from
what I can see, Peerless Buy and Sell signals work well in most overseas markets,
most of the time. The biggest foreign companies' stocks that take comprise
foreign
ETFs seem to take their cues overwhelming from New York. The exceptions
come about when their currencies become very weak and they are forced
to choose between hyper-Inflation and IMF-imposed Austerity. See
http://www.tigersoft.com/Tiger-Blogs/11-29-2007/index.html
(Argentina)
http://www.tigersoft.com/SPANISH/index.htm
http://www.tigersoft.com/RUSSIA/Russian-Introduction/index.html
http://www.tigersoft.com/France/Introduction/index.html
http://www.tigersoft.com/GERMANY/DIscussion-in-German/index.html
http://tigersoft.com/BRAZIL/index.html
http://www.tigersoftware.com/TigerBlogs/May-16-2009/index.html
(Mexico)
http://www.tigersoft.com/Australia/
http://www.tigersoftware.com/TigerBlogs/March-27-2010/index.html
(India)
Keep the Table below handy is my suggestion.
Peerless
Seasonality: Performance of DJI by Months:
From the First if the Month to 21-trading days later:
Avg. DJI Pct Gain and Pct. of Time DJI rises:
1965-2018
(c) 2019 - www.tigersoft.com
| All: '65,'66,'67... | PE + 1 Yr. after Pres. Election Yr. ('65,'69,'73...) |
PE + 2 Mid-Term Election Yr. ('66,'70,'74) |
PE +3 Yr. before Pres. Election Yr. ('67,'71,'75) |
PE +4 Pres. Election Yr. ('68,'72,'76) |
|
| January | .01 (1.0%) 63% |
+.007 (+0.7%) 57.1% |
-.014 (-1.4%) 50.0% |
+.038 (3.8%) 84.6% |
+.012 (+1.2%) 61.5% |
| February | .006 (0.6%) 59.3% |
-.005 (-0.5%) 50.0% |
+.011 (+1.1%) 64.3% |
+.019 (+1.9%) 61.5% |
-.001 (-0.1%) 61.5% |
| March | .01 (1.0%) 66.7% |
+.004 (+0.4%) 50.0% |
+.007 (+0.7%) 57.1% |
+.025 (+2.5%) 92.3% |
+.006 (+0.6%) 67.2% |
| April | +.021 (+2.1%) 72.2% |
+.022 (+2.2%) 71.4% |
+.010 (+1.0%) 64.3% |
+.042 (3.8%) 92.3% |
.009 (0.9%) 61.5% |
| May | -.001 (-0.1%) 44.4% |
+.014 (+1.4%) 64.3% |
-.010 (-1.0%) 35.7% |
0 38.5% |
-.010 (-1.0%) 38.5% |
| June | -.005 (-0.5%) 44.4% |
-.014 (-1.4%) 28.6% |
-.017 (-1.7%) 21.4% |
+.009 (+0.9%) 61.5% |
+.004 (+0.4%) 69.2% |
| July | .005 (0.5%) 50.9% |
+.020 (+2.0%) 71.4% |
.004 (0.4%) 38.5% |
+.00 (+0.0%) 46.2% |
-.005 (-0.5%) 46.2% |
| August | -.004 (-0.4%) 54.7% |
-.016 (-1.6%) 35.7% |
-.008 (-0.8%) 61.5% |
-.002 (-0.2%) 53.8% |
+.011 (+1.1%) 69.2% |
| September | -.005 (-0.5%) 45.3% |
+.001 (+0.1%) 57.1% |
-.021 (-2.1%) 30.8% |
-.004 (-0.4%) 53.8% |
.003 (0.3%) 38.5% |
| October | .006 (0.6%) 60.4% |
.008 (0.8%) 71.4% |
+.042 (4.2%) 76.9% |
-.008 (-0.8%) 46.2% |
-.013 (-1.3%) 46.2% |
| November | .008 (0.8%) 64.2% |
.012 (1.2%) 78.6% |
.007 (0.7%) 69.2% |
.005 (0.5%) 53.8% |
.008 (0.8%) 53.8% |
| December | .019 (1.9%) 71.7% |
.018 (1.8%) 57.1% |
.014 (1.4%) 76.9% |
+.024 (+2.4%) 69.2% |
+.021 (+2.1%) 61.5% |
Third Years in the Four-Year Cycle
Regularly Produce The Biggest
Annual DJI Percent Gains
Third Years
Pres.Election Year Year After
Second Year
------------
------------------- -----------
--------------
1915 81.7%
1916 -4.2%
1917 -21.7% 1918
10.5%
1919 30.5%
1920 -32.9%
1921 12.7% 1922
21.7%
1923 -3.3%
1924 26.2%
1925 30.0% 1926
0.3%
1927 28.8%
1928 48.2%
1929 -17.2% 1930 -33.8%
1931 -52.7%
1932 -23.1%
1933 +66.8% 1934
4.1%
1935 38.6%
1936 24.8%
1937 -32.8% 1938 28.0%
1939 -3.0%
1940 -12.7%
1941 -15.3% 1942
7.6%
1943 13.8%
1944 12.1%
1945 26.7% 1946
-8.1%
1947 2.2%
1948 -2.1%
1949 13.1% 1950
17.4%
1951 14.4%
1952 8.4%
1953 -3.8% 1954
44.0%
1955 20.8%
1956 2.3%
1957 -12.8% 1958 34.0%
1959 16.4%
1960 -9.3%
1961 18.7% 1962 -10.8%
1963 17.0%
1964 14.6%
1965 10.9% 1966 -18.9%
1967 15.2%
1968 4.3%
1969 -15.2% 1970 4.8%
1971 6.1%
1972 14.6%
1973 -16.6% 1974 -27.6%
1975 38.3%
1976 17.9%
1977 -17.3% 1978 -3.1%
1979 4.2%
1980 14.9%
1981 -9.2% 1982
19.6%
1983 20.3%
1984 -3.7%
1985 27.7% 1986
22.6%
1987 2.3%
1988 11.8%
1989 27.0% 1990
-4.3%
1991 20.3%
1992 4.2%
1993 13.7% 1994
2.1%
1995 33.5%
1996 26.0%
1997 22.6% 1998
16.1%
1999 25.2%
2000 -6.2%
2001 -7.1% 2002
-16.8%
2003 25.3%
2004 3.1%
2005 -0.6% 2006
16.3%
2007 6.4%
2008 -33.8%
2009 18.8% 2010 11.0%
2011 5.5%
2012 7.3%
2013 26.5% 2014
7.5%
2015 -2.2%
2016 13.4%
2017 5.2% 2018
-5.6%
---------------------------------------------------------------------
Avg. +15.6%
+5.6%
+5.7% +5.4%
22 up
4 down 17 up 9 down 14 up 12 down
17 up 9 down
(From forthcoming Peerless Stock
Market Timing: 1915-2019
Table 1 QUICKSILVER on DJI-30 STOCKS 11/22/2019 Bullish = AAPL (IP21 and ITRS both >.20 17/30 show falling 5-day ma (no change) from day before) SYMBOL CLOSE CHANGE PIVOT-PT 5-dma AROC CL-PWR CANDLE IP21 ITRS Remarks
TREND COLOR
----------------------------------------------------------------------------------------------------
AAPL 261.78 -.23 267.1 -75.1% ------- RED .341 .174 highest IP21+ITRS
----------------------------------------------------------------------------------------------------
AXP 119.06 .26 119.66 -71% ------- RED -.008 -.024
----------------------------------------------------------------------------------------------------
BA 371.34 4.9 369.46 -4.6% ------- BLUE .104 -.045
----------------------------------------------------------------------------------------------------
CAT 143.88 .52 143.59 -49.9% ------- ---- .211 .053
----------------------------------------------------------------------------------------------------
CSCO 44.85 .01 45.15 -26.6% ------- RED -.033 -.127
----------------------------------------------------------------------------------------------------
CVX 118.63 -.14 118.55 -84.9% ------- RED .117 -.047
----------------------------------------------------------------------------------------------------
DIS 148.29 1.39 147.65 123.2% Bullish BLUE .033 .051
----------------------------------------------------------------------------------------------------
GS 220.28 2.05 219.73 .7% ------- BLUE .219 -.021
----------------------------------------------------------------------------------------------------
HD 218.03 -.51 238.85 -421.8% Bearish RED -.25 -.091 Weak
----------------------------------------------------------------------------------------------------
IBM 134.34 .5 134.31 -2.2% Bearish BLUE .07 -.088
----------------------------------------------------------------------------------------------------
INTC 57.61 -.61 58.25 -30.1% Bullish RED .372 .074 Bullish
----------------------------------------------------------------------------------------------------
JNJ 138.07 1.63 134.83 115.6% Bullish BLUE .187 .033
----------------------------------------------------------------------------------------------------
JPM 130.79 .86 130.62 48.4% ------- BLUE .074 .065
----------------------------------------------------------------------------------------------------
KO 53.03 .07 53.03 34% Bearish BLUE -.011 -.046
----------------------------------------------------------------------------------------------------
MCD 193.14 .79 194.28 -21.4% Bearish ---- -.169 -.102 Weak
----------------------------------------------------------------------------------------------------
MMM 167.6 2.46 170.54 -126.5% ------- BLUE .166 -.045
----------------------------------------------------------------------------------------------------
MRK 85.45 -.01 84.13 32.4% ------- RED -.036 .011
----------------------------------------------------------------------------------------------------
MRK 149.59 .11 150.34 -12.7% ------- RED .162 .066
----------------------------------------------------------------------------------------------------
NKE 93.34 1.18 94.18 16.1% Bearish BLUE -.04 .046
----------------------------------------------------------------------------------------------------
PFE 38.33 .59 37.22 140.4% Bullish BLUE .019 .016
----------------------------------------------------------------------------------------------------
PG 120.29 -.05 121.89 -10.3% Bearish ---- -.043 -.038
----------------------------------------------------------------------------------------------------
TRV 135.13 .44 134.29 57.9% ------- BLUE .134 -.099
----------------------------------------------------------------------------------------------------
UNH 276.84 .29 272.93 135.9% Bullish BLUE .142 .162 Bullish
----------------------------------------------------------------------------------------------------
UTX 147.7 .4 149.11 -56% ------- RED .113 .047
----------------------------------------------------------------------------------------------------
V 179.47 -.42 179.66 -8.3% Bullish RED .101 -.011
----------------------------------------------------------------------------------------------------
VZ 59.75 .14 59.44 20.2% Bearish BLUE .171 -.026
----------------------------------------------------------------------------------------------------
WBA 60.6 -.02 61.94 -125.2% ------- RED .005 .059
----------------------------------------------------------------------------------------------------
WMT 119.36 -.5 120.25 20.5% Bearish RED -.15 -.007
----------------------------------------------------------------------------------------------------
DOW 69.37 -.3 68.52 13.1% ------- RED .056 -.068
|
Table 2 QUICKSILVER on ETFS - 11/22/2019 ETF CLOSE CHANGE PIVOT-PT 5-dma AROC CL-PWR CANDLE IP21 ITRS --------------------------------------------------------------------------------------------- DIA 278.86 1.14 280.27 -19.3% ------- BLUE .33 ---- --------------------------------------------------------------------------------------------- BA 371.34 4.9 369.46 -4.6% ------- BLUE .104 -.045 --------------------------------------------------------------------------------------------- SPY 310.96 .69 312.02 -13.3% ------- RED .318 .01 --------------------------------------------------------------------------------------------- QQQ 201.83 .13 203.07 -26.6% ------- RED .434 .025 --------------------------------------------------------------------------------------------- MDY 362.11 .88 364.19 -37.1% ------- RED .144 -.013 --------------------------------------------------------------------------------------------- IWM 158.22 .49 158.52 -22.1% ------- RED .126 -.017 --------------------------------------------------------------------------------------------- FAS 86.72 1.07 86.87 23.6% ------- BLUE .116 .073 --------------------------------------------------------------------------------------------- RETL 26.38 .62 24.81 495.8% Bullish BLUE .136 .47 --------------------------------------------------------------------------------------------- SOXL 211.71 -.11 230.69 -454.7% Bearish RED .144 .108 --------------------------------------------------------------------------------------------- TECL 204.03 -.8 210.5 -109.5% ------- RED .335 .176 --------------------------------------------------------------------------------------------- IBB 115.41 1.11 111.24 173.2% Bullish BLUE .344 .085 --------------------------------------------------------------------------------------------- GLD 137.74 -.26 138.62 -17% Bearish RED -.04 -.04 --------------------------------------------------------------------------------------------- OIH 14.64 -.34 14.58 0% Bearish RED .038 -.11 --------------------------------------------------------------------------------------------- GASL 6.52 .22 6.52 -765.8% Bearish BLUE-.159 -.457 --------------------------------------------------------------------------------------------- |
 Table 3   Count of Stocks in Key Directories
          20191122
-------------------------------
NEWHIGHS       108
NEWLOWS        12
MAXCP          33
MINCP          35
TTTNH          10
TTTNL          62
FASTUP         49
FASTDOWN       94
CPCROSSA       75
CPCROSSD       41
BIGVOLUP       3
BIGVODN        10
ACCUMVER       9
HIGHIP21       41
HIUPPCT        24
LOWACCUM       91
REDSELL        110
AUGSELS7       28
TRAPDOOR       34
|
 Table 4  RANKING OF KEY DIRECTORIES BASED PCT.OF STOCKS ABOVE 65-DMA
             11/22/19
 Bullish = 35
 Bearish = 11
---------------------------------------------------------------------------------------
Directory     Current       day-1         day-2         day-3         day-4         day-5
----------------------------------------------------------------------------------------
BIGBANKS       1             1             1             1             1             1
REGBANKS       .925          .925          .962          1             .962          1
ETFS           .913          .896          .862          .879          .896          .931
FINANCE        .802          .802          .779          .837          .813          .802
COPPER         .8            .8            .8            1             1             1
TRANSP         .8            .65           .65           .85           .9            .85
GAMING         .772          .727          .772          .772          .772          .727
AUTO           .769          .769          .769          .82           .846          .82
SP-100         .766          .755          .7            .722          .744          .777
FIDSTKS        .756          .723          .712          .745          .74           .751
DOWJONES       .733          .733          .7            .733          .733          .766
HOSPITAL       .727          .727          .681          .681          .636          .636
JETS           .7            .8            .8            1             1             1
DJI-13         .692          .692          .692          .692          .769          .769
INDEXES        .688          .693          .688          .677          .688          .709
NIFTY          .684          .736          .754          .789          .789          .824
MILITARY       .678          .785          .857          .821          .857          .857
RUS-1000       .678          .658          .683          .704          .708          .732
HOMEBLDG       .677          .709          .709          .774          .806          .741
SP500          .677          .658          .677          .7            .695          .716
INFRA          .666          .638          .666          .666          .638          .666
SOFTWARE       .666          .716          .7            .716          .683          .7
HACKERS        .65           .65           .65           .65           .6            .7
NASD-100       .649          .659          .659          .69           .639          .67
RETAIL         .627          .588          .627          .745          .843          .862
CHEM           .612          .632          .632          .673          .693          .714
FOOD           .574          .555          .555          .592          .574          .685
INDMATER       .571          .584          .597          .61           .675          .662
ELECTRON       .568          .562          .607          .666          .64           .692
GUNS           .562          .562          .625          .687          .625          .625
COMODITY       .56           .585          .536          .56           .536          .634
BIOTECH        .556          .559          .565          .559          .521          .527
SEMI           .528          .528          .556          .622          .594          .66
COMPUTER       .526          .526          .578          .578          .578          .631
GREEN          .52           .48           .48           .52           .44           .48
N=35
==============================================================================================
REIT           .496          .489          .579          .62           .641          .634
INSURANC       .486          .486          .567          .567          .567          .513
UTILITY        .45           .425          .375          .325          .325          .375
EDU            .444          .388          .333          .444          .333          .333
SOLAR          .44           .48           .48           .44           .4            .4
CHINA          .436          .545          .563          .563          .581          .581
OILGAS         .343          .357          .299          .299          .335          .445
BEVERAGE       .312          .312          .25           .25           .25           .25
BONDFUND       .303          .223          .357          .267          .214          .232
GOLD           .254          .372          .431          .411          .431          .352
COAL           0             0             0             0             .2            .2
N=11
|
====================================================================
11/21/2019
Peerless refuses to give an automatic Sell despite
the new high four
days ago which showed an A/D Non-Confirmation and a negative V-I
reading. I went over the data since 1965 tonight. I found a good
number of November peaks and declines then to the lower band,
but not when the DJI was making clear new highs. In particular,
even a negative V-Indicator with the DJI 2.4% or more above the
21-dma does not reliably predict a November peak and sell-off.
You can see these failures of what I have called "old Sell S13s" in
November on 11/27/90, 11/15/1994, 11/6/1996, 11/20, 1997, 11/5/2000,
11/06/2001, 11/01/2002, 11/04/2004, 11/09/2009, 11/03/2014
and 11/2012 and 11/30/2016.
But that does not mean we won't see the DJI re-test 27400-27500.
Classic technical analysis considers broken resistance, such as we
have had recently at 26500, reliable support for at least one or two
tests.
Right now there are more DJI stocks with falling short-term
5-day moving averages. Moreover, the NASDAQ and DJI could
easily break their recent price uptrends. Even so, the odds favor a
resumption of the uptrend at this time of year and certainly with the
FED's unofficial "QE-4" still in play. Might Powell and the Federal
Reserve
change their mind? Sure, but look back at the October 2018 top
and the way the DJI and the market sold off when last the FOMC turned
unexpectedly bearish. This is not how the market looks now. So,
let's hold our long positions and expect more new highs, if not in
November, then in December.
DJI top in late 2018 when FOMC turned bearish. |
DJI now |
NASDAQ now |
|
Charts 11/21/2019
2019 PEERLESS DJI, Signals, Indicators Daily DJI Volume 10-DayUp/Down Vol Stoch-20 Hourly DJIA A/D Line for All Stocks Inverted Traders Index NASDAQ S&P OEX NYSE COMPQX DJI-15 DJI-20 DJI-30 DIA SPY QQQ MDY IWM TNA Short-Term Rates USO-CrudeOil DBO FAS GLD BBH IBB JETS JNUG KOL NUGT OIH OIL RSX RETL SDS AGQ SLV SOXL TECL TLT TMF TNA UGA (gasoline) XIV and China: YINN CHAU Commodities: CANE CORN DBC JJC, NIB, CHOC CORN, CUT (paper) MOO, SOYB WEAT UUP (Dollar) LIT (Lithium) AAPL ADBE ALXN AMAT AMGN AMD AMZN AXP BA BABA BAC BIDU CAT CVX DE FB GOOG GS HD IBM INTU JPM M (Macy's) MSFT NFLX NKE NVDA PG QCOM TSLA TXN XOM V WMT CMG , LRCX, SWKS, MDGL SPPI SQ TOWN 11/21/19 (Click on Underlined link.) New highs and Bullish MAXCPs - http://tigersoft.com/max/11-21/BULLISH.htm Bearish MAXCPs - http://tigersoft.com/min/11-21/BEARISH.htm |
Table 1 QUICKSILVER on DJI-30 STOCKS 11/21/2019 Bullish = AAPL (IP21 and ITRS both >.20 17/30 show falling 5-day ma (-2) from day before) SYMBOL CLOSE CHANGE PIVOT-PT 5-dma AROC CL-PWR CANDLE IP21 ITRS Remarks
TREND COLOR
----------------------------------------------------------------------------------------------------
AAPL 262.01 -1.18 265.76 -11.9% ------- RED .353 .155 Most Bullish
---------------------------------------------------------------------
AXP 118.8 -.5 120.76 -88.7% ------- RED -.04 -.022
---------------------------------------------------------------------
BA 366.44 -4.47 371.68 -13.5% ------- RED .127 -.044
---------------------------------------------------------------------
CAT 143.36 1.84 145.31 -2.8% ------- BLUE .202 .068
---------------------------------------------------------------------
CSCO 44.84 -.24 45.09 -7.8% Bullish RED -.037 -.122
---------------------------------------------------------------------
CVX 118.77 1.43 120.64 -134% ------- BLUE .135 -.042
---------------------------------------------------------------------
DIS 146.9 -.03 144.67 -8.5% Bullish RED .017 .049
---------------------------------------------------------------------
GS 218.23 .32 220.25 -27.3% ------- RED .189 -.022
---------------------------------------------------------------------
HD 218.54 -2.36 237.29 -388.3% Bearish RED -.227 -.085 Mpst bearish
---------------------------------------------------------------------
IBM 133.84 .64 134.4 -6% Bearish BLUE .046 -.088
---------------------------------------------------------------------
INTC 58.22 .32 57.96 35.3% Bullish BLUE .433 .078 highest IP21
---------------------------------------------------------------------
JNJ 136.44 .5 134.94 204% Bullish BLUE .118 .026
---------------------------------------------------------------------
JPM 129.93 .3 129.53 51.2% ------- BLUE .057 .082
---------------------------------------------------------------------
KO 52.96 -.26 52.67 31.2% Bearish RED -.035 -.059
---------------------------------------------------------------------
MCD 192.35 -1.78 193.97 -42.5% Bearish RED -.218 -.113
---------------------------------------------------------------------
MMM 165.14 -2.63 171.88 -169.9% Bearish RED .077 -.052
---------------------------------------------------------------------
MRK 85.46 .19 84.9 53.7% ------- RED -.016 .006
---------------------------------------------------------------------
MRK 149.48 -.14 149.97 47.4% Bullish ---- .19 .067
---------------------------------------------------------------------
NKE 92.16 -.89 93.04 47.8% Bearish RED -.107 .031
---------------------------------------------------------------------
PFE 37.74 .69 37.28 160.2% ------- BLUE -.048 -.007
---------------------------------------------------------------------
PG 120.34 -1.95 120.54 -6.6% Bearish RED -.047 -.04
---------------------------------------------------------------------
TRV 134.69 -.74 133.57 27.5% Bullish RED .095 -.112
---------------------------------------------------------------------
UNH 276.55 .99 269.4 384.3% Bullish BLUE .104 .182
---------------------------------------------------------------------
UTX 147.3 .65 149.36 -27.3% ------- BLUE .181 .052
---------------------------------------------------------------------
V 179.89 -1.77 179.77 3.9% Bullish RED .131 -.009
---------------------------------------------------------------------
VZ 59.61 .13 59.51 22.7% Bearish RED .172 -.033
---------------------------------------------------------------------
WBA 60.62 -.72 62.14 -106.9% ------- RED .013 .071
---------------------------------------------------------------------
WMT 119.86 .73 118.87 -33% Bearish BLUE -.12 .005
---------------------------------------------------------------------
DOW 69.67 1.64 69.19 85.5% ------- BLUE .067 -.052
|
Table 2 QUICKSILVER on ETFS - 11/21/2019 ETF CLOSE CHANGE PIVOT-PT 5-dma AROC CL-PWR CANDLE IP21 ITRS --------------------------------------------------------------------------------------------- DIA 277.72 -.48 279.94 -9.1% ------- RED .298 ----- --------------------------------------------------------------------------------------------- BA 366.44 -4.47 371.68 -13.5% ------- RED .127 -.044 --------------------------------------------------------------------------------------------- SPY 310.27 -.5 311.79 11.6% ------- RED .302 .01 --------------------------------------------------------------------------------------------- QQQ 201.7 -.45 202.91 6.7% ------- RED .454 .024 --------------------------------------------------------------------------------------------- MDY 361.23 -2.59 364.81 -24.2% ------- RED .13 -.012 --------------------------------------------------------------------------------------------- IWM 157.73 -.78 158.92 -11.7% ------- RED .104 -.015 --------------------------------------------------------------------------------------------- FAS 85.65 -1.51 86.31 8.6% ------- RED .116 .067 --------------------------------------------------------------------------------------------- RETL 25.76 .84 23.91 549.8% Bullish BLUE .142 .522 --------------------------------------------------------------------------------------------- SOXL 211.82 -7.49 232.1 -317.1% ------- RED .217 .102 --------------------------------------------------------------------------------------------- TECL 204.83 -2.76 208.6 25.2% ------- RED .378 .158 --------------------------------------------------------------------------------------------- IBB 114.3 .34 111.5 198.7% Bullish ---- .313 .078 --------------------------------------------------------------------------------------------- GLD 138 -.76 138.21 -20.2% Bearish RED .003 -.043 --------------------------------------------------------------------------------------------- OIH 14.64 -.34 14.58 0% Bearish RED .038 -.107 --------------------------------------------------------------------------------------------- GASL 6.3 .24 7.51 -589.1% Bearish BLUE -.187 -.441 --------------------------------------------------------------------------------------------- |
 Table 3   Count of Stocks in Key Directories
           20191121
-------------------------------
NEWHIGHS       62
NEWLOWS        24
MAXCP          21
MINCP          50 Bearish
TTTNH          6
TTTNL          59 Day Traders are net bearish.
FASTUP         50
FASTDOWN       103  Swing traders are net bearish.
CPCROSSA       54
CPCROSSD       112
BIGVOLUP       3
BIGVODN        11
ACCUMVER       15
HIGHIP21       36
HIUPPCT        23
VHIP21         65
LOWACCUM       92
REDSELL        111
AUGSELS7       18
TRAPDOOR       34
|
 Table 4  RANKING OF KEY DIRECTORIES BASED PCT.OF STOCKS ABOVE 65-DMA
             11/21/19
 Bullish = 35 (Big Banks 1re 100%)
 Bearish 10 including Utilities and REITS
---------------------------------------------------------------------------------------
Directory     Current       day-1         day-2         day-3         day-4         day-5
----------------------------------------------------------------------------------------
BIGBANKS       1             1             1             1             1             1
REGBANKS       .925          .962          1             .962          1             1
ETFS           .896          .862          .879          .896          .931          .844
FINANCE        .802          .779          .837          .813          .802          .825
COPPER         .8            .8            1             1             1             1
JETS           .8            .8            1             1             1             1
MILITARY       .785          .857          .821          .857          .857          .821
AUTO           .769          .769          .82           .846          .82           .82
SP-100         .755          .7            .722          .744          .777          .766
DOWJONES       .733          .7            .733          .733          .766          .733
GAMING         .727          .772          .772          .772          .727          .727
HOSPITAL       .727          .681          .681          .636          .636          .681
NIFTY          .727          .745          .781          .781          .818          .781
FIDSTKS        .723          .712          .745          .74           .751          .74
SOFTWARE       .716          .716          .716          .683          .7            .666
HOMEBLDG       .709          .709          .774          .806          .741          .774
INDEXES        .693          .688          .677          .688          .709          .672
DJI-13         .692          .692          .692          .769          .769          .769
NASD-100       .659          .67           .701          .639          .67           .659
RUS-1000       .658          .685          .704          .708          .733          .702
SP500          .658          .679          .7            .695          .716          .691
HACKERS        .65           .7            .65           .6            .7            .6
TRANSP         .65           .65           .85           .9            .9            .9
INFRA          .638          .666          .666          .638          .666          .638
CHEM           .632          .632          .673          .693          .714          .734
RETAIL         .588          .627          .745          .843          .862          .843
COMODITY       .585          .536          .56           .536          .634          .609
INDMATER       .584          .597          .61           .675          .662          .714
ELECTRON       .562          .607          .666          .64           .692          .679
GUNS           .562          .625          .687          .625          .625          .687
BIOTECH        .556          .562          .556          .521          .527          .478
FOOD           .555          .555          .592          .574          .685          .666
CHINA          .545          .563          .563          .581          .581          .563
SEMI           .528          .556          .622          .594          .66           .65
COMPUTER       .526          .578          .578          .578          .631          .631
===========================================================================================
SOLAR          .5            .5            .461          .423          .384          .423
===========================================================================================
REIT           .489          .579          .62           .641          .634          .586
INSURANC       .486          .567          .567          .567          .513          .54
GREEN          .48           .48           .52           .44           .48           .44
UTILITY        .425          .375          .325          .325          .375          .375
EDU            .388          .333          .444          .333          .333          .388
GOLD           .372          .431          .411          .431          .352          .45
OILGAS         .357          .299          .299          .335          .452          .416
BEVERAGE       .312          .25           .25           .25           .25           .25
BONDFUND       .223          .357          .267          .214          .241          .276
COAL           0             0             0             .2            .2            .2
|
====================================================================
11/20/2019
The operative Buy B21s tell us to look for more new highs by
the
DJI and expect a breakout above the last resistance-line on the charts
of the DJI, the NASDAQ and QQQ. This could also lead to breakouts
above the remaining resistance for MDY (Mid-caps) and IWM. But
clearly, the failure, so far, of MDY and IWM to make breakouts is a
definite technical negative. It shows the advance wasl not broad enough
for comfort and we cannot just comfortably stop watching for signs of
impending trouble.
Still the DJI and the NASDAQ have usually been the leaders. Often
they reach their peaks without being accompanied by IWM. And as
long as the DJI stays above the recent point of breakout, 27400-27500,
I think we have to believe in the DJI's uptrend. As I showed yesterday,
a DJI uptrend tends to negate the importance of a minor A/D Line non-
confirmation in November. Of course, if the breakout fails, then the DJI
will probably have to test its lower band, now at 26500. A drop to the
lower band is about all the damage that the old S13s in November can
accomplish.
Note that the negative V-I reading now is not a danger-sign, but
the serious decline in the P-I is of concern. The most bullish thing
the market can do now is to quickly turn around on very good breadth
and bring along more than just the blue chips, dividend stocks and
a handful of the big tech stocks. A move that simultaneously lifts
these favorites and MDY and IWM, as well, to new highs would be
quite bullish. Too often, I get the feeling that the "big boys" pushing
the market up are simply jumping around sector to sector. A really
broad advance would lift all boats.


Watch the breadth, daily NYSE advances minus declines. It has been
negative for 9 of the last 12 trading days. If this continues, the bull market
will soon be in trouble. The P-Indicator now stands at only +86. It has
dropped 321 from ten days ago. So, it is possible that the P-I could be
negative if the DJI were to rally back to the 2.4% upper band and a
November or December Sell S9 could be rendered. See that this
occasionally happened before:
November-December Sell S9s in
Bull Markets
Red means decline followed
Blue means advance followed.
Date
Gain Maximum Paper Loss
--------------------------------------------------------------
19561206 S9-S12
492.7 .072
499.5 -.0138 12/31
la/ma=1.029 AROC = -83 P= -83 IP21=-.078
------------------------------------------------------------------
19801114 S9
986.35 .071 1000.17 -.014 11/20
la/ma=1.042 AROC =.175 P= -9 IP21=-.11
------------------------------------------------------------------
19821207 S9
1056.94
.061 perfect 0
la/ma=1.028 AROC =.06 P= +21 IP21=-.05
-------------------------------------------------------------------
PE+3 19991206 S9
11225.01 -.003
11257.4 -.0028 12/17
la/ma=1.029 AROC=+.641 P=-47 IP21=.018
-------------------------------------------------------------------
19991228 S9
11476.71
.128 11722.9 -.0214 1/14
la/ma=1.026 AROC=+.520 P=-315 IP21=-.052
-------------------------------------------------------------------
PE+3
20071206 S12-S9 13619.89
.099 13727.0 -.0078 12/10
la/ma=1.035 AROC=-.037 P=-146
IP21=-.075
-------------------------------------------------------------------
20091113 S9
10270.47 -.020
10471.5 -.0195 12/01
la/ma=1.029 AROC=+.641 P=-47 IP21=.018
-------------------------------------------------------------------
PE+3 20111205 S9
12097.83
.027 12196.3 -.0081 12/7
la/ma=1.022 AROC= .054 P=-62
IP21=-.006
------------------------------------------------------------------
20161109 S9-S12 18589.69
-.029 19121.6 -.0286 11/29
la/ma=1.024 AROC=+.303 P=-132 IP21=.022
------------------------------------------------------------------
20181107 S9
26180.30
.065 none 0
la/ma=1.036 AROC=-.118 P=-53
IP21= .004
------------------------------------------------------------------
20181203 S9
25826.43
.156 none 0
la/ma=1.02 AROC= .210 P= 49
IP21= .116
------------------------------------------------------------------
8 of the 11 S9s could have been profitable points to sell short.
|
Charts 11/20/2019
2019 PEERLESS DJI, Signals, Indicators Daily DJI Volume 10-DayUp/Down Vol Stoch-20 Hourly DJIA A/D Line for All Stocks Inverted Traders Index NASDAQ S&P OEX NYSE COMPQX DJI-15 DJI-20 DJI-30 DIA SPY QQQ MDY IWM TNA Short-Term Rates USO-CrudeOil DBO FAS GLD BBH IBB JETS JNUG KOL NUGT OIH OIL RSX RETL SDS AGQ SLV SOXL TECL TLT TMF TNA UGA (gasoline) XIV and China: YINN CHAU Commodities: CANE CORN DBC JJC, NIB, CHOC CORN, CUT (paper) MOO, SOYB WEAT UUP (Dollar) LIT (Lithium) AAPL ADBE ALXN AMAT AMGN AMD AMZN AXP BA BABA BAC BIDU CAT CVX DE FB GOOG GS HD IBM INTU JPM M (Macy's) MSFT NFLX NKE NVDA PG QCOM TSLA TXN XOM V WMT CMG , LRCX, SWKS, MDGL SPPI SQ TOWN 11/20/19 (Click on Underlined link.) New highs and Bullish MAXCPs - http://tigersoft.com/max/11-20/BULLISH.htm Bearish MAXCPs - http://tigersoft.com/min/11-20/BEARISH.htm |
Table 1 QUICKSILVER on DJI-30 STOCKS 11/20/2019 Bullish = AAPL (IP21 and ITRS both >.20 14/30 show rising 5-day ma (-2) from day before) SYMBOL CLOSE CHANGE PIVOT-PT 5-dma AROC CL-PWR CANDLE IP21 ITRS Remarks
TREND COLOR
----------------------------------------------------------------------------------------------------
AAPL 263.19 -3.1 262.64 -24.1% ------- RED .421 .153 Most Bullish
---------------------------------------------------------------------
AXP 119.3 -.7 120.93 -39.9% ------- RED -.057 -.013
---------------------------------------------------------------------
BA 370.91 3.91 367.44 114.4% Bullish BLUE .094 -.055
---------------------------------------------------------------------
CAT 141.52 -1.66 143.44 -103.1% ------- RED .257 .039
---------------------------------------------------------------------
CSCO 45.08 -.39 44.91 -368.9% ------- RED -.04 -.123
---------------------------------------------------------------------
CVX 117.34 .89 121.96 -205.9% ------- BLUE .128 -.056
---------------------------------------------------------------------
DIS 146.93 -1.45 147.15 -60.8% Bullish RED .003 .055
---------------------------------------------------------------------
GS 217.91 -2.13 219.43 -32.1% ------- RED .204 -.019
---------------------------------------------------------------------
HD 220.9 -4.96 236.55 -296.2% Bearish RED -.167 -.075
---------------------------------------------------------------------
IBM 133.2 -1.32 134 -47.6% Bearish RED .067 -.096
---------------------------------------------------------------------
INTC 57.9 -.45 57.81 .9% Bullish RED .415 .073
---------------------------------------------------------------------
JNJ 135.94 1.12 130.96 175.1% Bullish BLUE .101 .012
---------------------------------------------------------------------
JPM 129.63 -.95 128.6 44.4% ------- RED .105 .082
---------------------------------------------------------------------
KO 53.22 .14 52.63 76.8% Bearish BLUE .012 -.052
---------------------------------------------------------------------
MCD 194.13 .69 194 -22.4% Bearish BLUE-.197 -.1 Most Bearish
---------------------------------------------------------------------
MMM 167.77 -2.91 170.93 -81.3% ------- RED .158 -.026
---------------------------------------------------------------------
MRK 85.27 .62 84.55 26.6% Bullish BLUE .007 .004
---------------------------------------------------------------------
MSFT 149.62 -.77 148.06 77.4% Bullish RED .216 .075
---------------------------------------------------------------------
NKE 93.05 -.56 91.27 95% Bearish RED -.142 .049
---------------------------------------------------------------------
PFE 37.05 -.61 36.55 60.7% ------- RED -.044 -.034
---------------------------------------------------------------------
PG 122.29 .87 120.5 67.8% ------- BLUE .015 -.016
---------------------------------------------------------------------
TRV 135.43 -.03 133.95 48.4% Bullish BLUE .132 -.098
---------------------------------------------------------------------
UNH 275.56 1.33 255.83 414.6% Bullish BLUE .059 .153
---------------------------------------------------------------------
UTX 146.65 -1.72 148.11 -55.8% ------- RED .148 .055
---------------------------------------------------------------------
V 181.66 -1.11 179.75 62.4% Bullish RED .154 .014
---------------------------------------------------------------------
VZ 59.48 -.02 59.34 5.9% Bearish ---- .145 -.035
---------------------------------------------------------------------
WBA 61.34 -.11 61.94 -73.5% Bullish BLUE .048 .033
---------------------------------------------------------------------
WMT 119.13 -.76 120.65 -77% Bearish RED -.148 .003
---------------------------------------------------------------------
DOW 68.03 .21 68.5 -56.2% ------- BLUE .052 -.078
|
Table 2 QUICKSILVER on ETFS - 11/20/2019 ETF CLOSE CHANGE PIVOT-PT 5-dma AROC CL-PWR CANDLE IP21 ITRS --------------------------------------------------------------------------------------------- DIA 278.2 -1.13 278.23 2.7% ------- RED .306 0 --------------------------------------------------------------------------------------------- BA 370.91 3.91 367.44 114.4% Bullish BLUE .094 -.055 --------------------------------------------------------------------------------------------- SPY 310.77 -1.16 309.55 26.9% ------- RED .333 .011 --------------------------------------------------------------------------------------------- QQQ 202.15 -1.22 201.43 13.8% Bullish RED .48 .027 --------------------------------------------------------------------------------------------- MDY 363.82 -1.15 362.99 23.2% ------- BLUE .191 -.009 --------------------------------------------------------------------------------------------- IWM 158.51 -.6 158.1 11.4% ------- ---- .14 -.014 --------------------------------------------------------------------------------------------- FAS 87.16 -.85 85.5 154.2% ------- RED .185 .106 --------------------------------------------------------------------------------------------- RETL 24.92 -.22 23.08 188.1% Bullish RED .082 .408 --------------------------------------------------------------------------------------------- SOXL 219.31 -7.81 226.22 -192.1% ------- RED .234 .147 --------------------------------------------------------------------------------------------- TECL 207.59 -4.2 203.78 71% Bullish RED .427 .189 --------------------------------------------------------------------------------------------- IBB 113.96 .51 109.85 151.8% Bullish BLUE .252 .064 --------------------------------------------------------------------------------------------- GLD 138.76 .07 138.56 28.2% Bearish BLUE-.01 -.04 --------------------------------------------------- ------------------------------------------ OIL 10.07 .28 10.07 -29.9% ------- BLUE-.011 .013 --------------------------------------------------------------------------------------------- OIH 14.64 -.34 14.58 0% Bearish RED .038 -.111 --------------------------------------------------------------------------------------------- GASL 6.06 .13 7.08 -916.8% Bearish ---- -.202 -.502 --------------------------------------------------------------------------------------------- UGA 31.55 1.01 30.91 45.2% ------- BLUE .105 .067 --------------------------------------------------------------------------------------------- UUP 26.7 .08 26.55 9.4% Bearish BLUE .017 -.021 --------------------------------------------------------------------------------------------- IEF 111.99 .41 111.27 57.5% Bullish BLUE .111 -.022 --------------------------------------------------------------------------------------------- CORN 14.45 -.14 14.71 -71.9% Bearish RED -.323 -.028 --------------------------------------------------------------------------------------------- WEAT 5.45 .03 5.39 27.8% Bullish ---- -.027 .04 --------------------------------------------------------------------------------------------- YINN 18.3 -.26 17.79 108.1% Bearish RED 0 -.037 --------------------------------------------------------------------------------------------- RSX 23.87 .28 23.02 167.6% Bullish ---- -.006 .074 |
Table 3 Count of Stocks in Key Directories
20191120
-------------------------------
NEWHIGHS 114
NEWLOWS 29
MAXCP 51
MINCP 56
TTTNH 12
TTTNL 59
FASTUP 62
FASTDOWN 113
CPCROSSA 79
CPCROSSD 46
BIGVOLUP 4
BIGVODN 12
ACCUMVER 14
HIGHIP21 49
HIUPPCT 28
VHIP21 66
REDSELL 105
AUGSELS7 20
TRAPDOOR 34
|
 Table 4      RANKING OF KEY DIRECTORIES BASED PCT.OF STOCKS ABOVE 65-DMA
              11/20/19
 Bullish = 37
 Bearish = 8
---------------------------------------------------------------------------------------
Directory     Current       day-1         day-2         day-3         day-4         day-5
----------------------------------------------------------------------------------------
BIGBANKS       1             1             1             1             1             1
REGBANKS       .962          1             .962          1             1             1
ETFS           .862          .879          .896          .931          .844          .913
MILITARY       .857          .821          .857          .857          .821          .785
COPPER         .8            1             1             1             1             1
JETS           .8            1             1             1             1             1
FINANCE        .779          .837          .813          .802          .825          .837
GAMING         .772          .772          .772          .727          .727          .636
AUTO           .769          .82           .846          .82           .82           .846
NIFTY          .745          .781          .781          .818          .8            .781
SOFTWARE       .716          .733          .683          .7            .666          .7
FIDSTKS        .714          .747          .741          .752          .741          .73
HOMEBLDG       .709          .774          .806          .741          .774          .741
DOWJONES       .7            .733          .733          .766          .733          .8
HACKERS        .7            .7            .6            .7            .6            .7
SP-100         .7            .722          .744          .777          .766          .811
DJI-13         .692          .692          .769          .769          .769          .769
INDEXES        .688          .677          .688          .709          .682          .704
RUS-1000       .685          .705          .708          .734          .705          .693
HOSPITAL       .681          .681          .636          .636          .681          .636
SP500          .679          .702          .696          .717          .692          .679
NASD-100       .673          .714          .653          .673          .663          .653
INFRA          .666          .666          .638          .666          .638          .638
TRANSP         .65           .85           .9            .9            .9            .9
CHEM           .632          .673          .693          .714          .734          .755
RETAIL         .627          .745          .843          .862          .843          .764
GUNS           .625          .687          .625          .625          .687          .687
ELECTRON       .607          .666          .64           .692          .692          .692
INDMATER       .597          .61           .675          .662          .714          .701
REIT           .579          .62           .641          .634          .593          .572
COMPUTER       .578          .578          .578          .631          .631          .631
INSURANC       .567          .567          .567          .513          .54           .567
CHINA          .563          .563          .581          .581          .563          .618
BIOTECH        .561          .555          .52           .529          .491          .511
SEMI           .556          .622          .594          .66           .66           .669
FOOD           .547          .584          .566          .679          .66           .679
COMODITY       .536          .56           .536          .634          .609          .634
==============================================================================================
SOLAR          .5            .461          .423          .384          .423          .423
==============================================================================================
GREEN          .48           .52           .44           .48           .44           .48
GOLD           .431          .411          .431          .352          .45           .333
UTILITY        .375          .325          .325          .375          .375          .35
BONDFUND       .357          .267          .214          .241          .276          .285
EDU            .333          .444          .333          .333          .388          .388
OILGAS         .299          .299          .335          .452          .416          .437
BEVERAGE       .25           .25           .25           .25           .25           .25
COAL           0             0             .2            .2            .2            .2
|
======================================================================
11/19/2019 Let's hold our long positions and buy more early next week.
I've carefully checked out the November history of our 2006-Peerless
Sell S13 which popped up yesterday. I said yesterday that it does not appear
if you judge the DJI to be in an up-trend and not in a trading range. The
signal is based on the failure of the A/D Line to make a new high to
confirm a DJI advance to its upper 2.4% upper band or higher. My study
of these occurrences in November reinforces yesterday's warning that
this Sell S13 from the 2006 version always fails when the DJI is or has
just made a clear breakout above well-tested flat resistance. In fact,
these Sell S13s would have lead to some dreadful losses if these signals were
used to establish short positions in the DJI during the 8 November breakouts
of 1970, 1972, 1985, 1995, 2001, 2005, 2009 and 2016.
Oppositely, November Sell S13s did much better when the DJI stayed
below the resistence near its 12-month high. In these cases, a decline
to the lower band usually followed.
My conclusion is that as long as the DJI says above 27400-27500, we
must assume Peerless is in a bullish, not a trading range, mode AND
the current decline will stop near 27500. I think this conclusion is supported
by the still rising Closing Powers among the key ETFs as well as the
very bullish seasonality for the next two months because this is the
third year in the 4-year Presidential cycle. But watch the NYSE A/D Line.
if it continues to sag, it may mean that FED Chairman Powell is again
changing his mind. Home Depot's 13-point decline accounted for 88
of the DJI's 102 point decline. Home Depot's profits are, of course,
much influenced by interest rates and home-building. My belief is
still that as long the 10-year bonds' yield is far below 4%, there should
not be much of a problem. But these yields will bear watching, along with
the DJ-Utility Average. In any case, the DJI usually gets a nice
bounce at Thanksgiving (next Thursday) and from December 17th
until early January. So, I doubt it the DJI will fall below 27500. After
that, it should be making more new highs at the end of 2019. The
only thing that might cause problems with this bullish scenario would
be Powell and serious profit-taking. These negative forces should
be countered by "window-dressing", as funds dress up their portfolios
with the biggest winners.
A/D Line NCs with the DJI more than 2.4% over 21-dma
====================================================
Failures to produce a decline are much more likely when DJI is breaking out past previous well-tested resistance. This was a prominent characteristic of the failures of old S13s to produce a decline to the lower band, at least. In these cases, prices usually kept rising a long ways. 11/30/1970 Breakout after bear market 11/16/1972 Breakout after bear market 11/5/1985 Breakout and huge advance. 11/15/1995 Breakout and big advance. 11/19/2001 Rally continued a long ways. 11/11/2005 Breakout and good rally. 11/12/2009 Breakout and slow advance for two months. 11/10/2016 Breakout and big advance. But there were many declines to the lower band after November Sell S13s, as long as DJI did not make a clear breakout or was below its previous highs. Unless noted otherwise, DJI then rallied from lower band back to upper band and higher. 11/13/1980 Rally 2% higher and then decline to lower band. 11/22/1983 4% decline almost to lower band. 11/6/1984 Immediate decline to lower band, 6.5%. 11/3/1986 Immediate decline to lower band, 5%. 11/1/2000 Immediate decline to lower band 5% 11/16/2015 Decline to a point 11% below S13. There were also many cases where DJI rose another 3% before falling to lower band or lower. E 11/18/1996 Immediate 3% rally and then decline to a point just slightly below S13. E 11/20/1997 Immediate 3% rally and then decline to a point 2% slightly below S13. E 11/19/1998 Immediate 5% rally and then decline to a point 2% slightly below S13. E 11/13/2014 Immediate 2% rally and then decline to a point 3% slightly below S13. |
 |
 |
 |
 |
|
Charts 11/19/2019
2019 PEERLESS DJI, Signals, Indicators Daily DJI Volume 10-DayUp/Down Vol Stoch-20 Hourly DJIA A/D Line for All Stocks Inverted Traders Index NASDAQ S&P OEX NYSE COMPQX DJI-15 DJI-20 DJI-30 DIA SPY QQQ MDY IWM TNA Short-Term Rates USO-CrudeOil DBO FAS GLD BBH IBB JETS JNUG KOL NUGT OIH OIL RSX RETL SDS AGQ SLV SOXL TECL TLT TMF TNA UGA (gasoline) XIV and China: YINN CHAU Commodities: CANE CORN DBC JJC, NIB, CHOC CORN, CUT (paper) MOO, SOYB WEAT UUP (Dollar) LIT (Lithium) AAPL ADBE ALXN AMAT AMGN AMD AMZN AXP BA BABA BAC BIDU CAT CVX DE FB GOOG GS HD IBM INTU JPM M (Macy's) MSFT NFLX NKE NVDA PG QCOM TSLA TXN XOM V WMT CMG , LRCX, SWKS, MDGL SPPI SQ TOWN 11/19/19 (Click on Underlined link.) New highs and Bullish MAXCPs - http://tigersoft.com/max/11-19/BULLISH.htm Bearish MAXCPs - http://tigersoft.com/min/11-19/BEARISH.htm |
Table 1 QUICKSILVER on DJI-30 STOCKS 11/19/2019 Bullish = AAPL (IP21 and ITRS both >.20 19 show rising 5-day ma (-2) from day before) SYMBOL CLOSE CHANGE PIVOT-PT 5-dma AROC CL-PWR CANDLE IP21 ITRS Remarks
TREND COLOR
----------------------------------------------------------------------------------------------------
AAPL   266.29 -.81           264.47        81.9% Bullish    RED    .396   .192    Bullish
---------------------------------------------------------------------
AXP    120  .34              120.26       -36.9% Bullish    ----  -.064  -.014
---------------------------------------------------------------------
BA     367 -2.46             362.5         56.2% Bullish    RED    .037  -.044
---------------------------------------------------------------------
CAT    143.18 -.41           144.49       -109.2% Bullish   RED    .284   .062
---------------------------------------------------------------------
CSCO   45.47  .32            48.46        -312.5% Bullish   BLUE  -.025  -.113
---------------------------------------------------------------------
CVX    116.45 -2.1           122.28       -186.6% -------   RED    .127  -.081
---------------------------------------------------------------------
DIS    148.38  .73           148.72        337.1% Bullish   BLUE  -.01    .056
---------------------------------------------------------------------
GS     220.04  .31           219.32       -8.4%   Bullish   RED    .196  -.016
---------------------------------------------------------------------
HD     225.86 -12.99         234.8        -153.7% Bearish   RED   -.066  -.068
              Big Decline
---------------------------------------------------------------------
IBM    134.52  .21           134.48       -39.8%  -------   RED    .153  -.109
---------------------------------------------------------------------
INTC   58.35  .1             57.89         12.9%  Bullish   RED    .403   .089
---------------------------------------------------------------------
JNJ    134.82 -.01           131.27        130.8% Bullish   RED    .06    .004
---------------------------------------------------------------------
JPM    130.58 -.04           128.48        54.9%  Bullish   RED    .153   .08
---------------------------------------------------------------------
KO     53.08  .05            52.41         130.5% -------   ---   -.021  -.061
---------------------------------------------------------------------
MCD    193.44 -.84           195           4.1%   Bearish   RED   -.264  -.114  Bearish
---------------------------------------------------------------------
MMM    170.68  .14           170.55       -4.7% Bullish     RED    .194  -.026
---------------------------------------------------------------------
MRK    84.65  .52            84.82         31.4% -------    BLUE  -.029  -.001
---------------------------------------------------------------------
MRK    150.39  .05           147.31        111.7% Bullish   RED   .162   .068
---------------------------------------------------------------------
NKE    93.61 -.57            91.29         223.7% Bearish   RED  -.147   .041
---------------------------------------------------------------------
PFE    37.66  .44            36.6          93.4% -------    BLUE -.012  -.029
---------------------------------------------------------------------
PG     121.42 -.47           120.65        89.2% -------    RED  -.082  -.024
---------------------------------------------------------------------
TRV    135.46  1.17          134.13        78.8% Bullish    BLUE  .005  -.113
---------------------------------------------------------------------
UNH    274.23  1.3           253.57        363.1% Bullish   RED   .054   .143
---------------------------------------------------------------------
UTX    148.37 -.74           148.31       -.7% Bullish      RED   .215   .071
---------------------------------------------------------------------
V      182.77  3.11          179.41        84.3% Bullish    BLUE .089   0
---------------------------------------------------------------------
VZ     59.5  .06             59.41         15.2% Bearish    RED  .115  -.04
---------------------------------------------------------------------
WBA    61.45 -.49            62.25        -102.1% Bullish   RED  .043   .043
---------------------------------------------------------------------
WMT    119.89 -.36           120.98        32.1% Bearish    RED -.149  -.004
---------------------------------------------------------------------
DOW    67.82 -.7             68.8         -112.5% -------   RED  .035  -.096
|
Table 2 QUICKSILVER on ETFS - 11/19/2019 ETF CLOSE CHANGE PIVOT-PT 5-dma AROC CL-PWR CANDLE IP21 ITRS --------------------------------------------------------------------------------------------- DIA 279.33 -.94 278.05 36.6% Bullish RED .237 0 --------------------------------------------------------------------------------------------- BA 367 -2.46 362.5 56.2% Bullish RED .037 -.044 --------------------------------------------------------------------------------------------- SPY 311.93 -.09 309.1 47.2% Bullish RED .283 .009 --------------------------------------------------------------------------------------------- QQQ 203.37 .3 201.59 45.3% Bullish RED .438 .03 --------------------------------------------------------------------------------------------- MDY 364.97 .78 362.13 29.2% Bullish RED .169 -.005 --------------------------------------------------------------------------------------------- IWM 159.11 .59 158.15 8.8% Bullish ---- .126 -.003 --------------------------------------------------------------------------------------------- FAS 88.01 1.14 84.5 179.3% Bullish BLUE .13 .114 --------------------------------------------------------------------------------------------- RETL 24.85 -1.51 25.23 -139.2% Bullish RED .185 -.032 --------------------------------------------------------------------------------------------- SOXL 227.12 -3.57 228.1 -24.2% Bullish RED .222 .23 --------------------------------------------------------------------------------------------- TECL 211.79 1.29 204.64 215.9% Bullish RED .382 .238 --------------------------------------------------------------------------------------------- IBB 113.45 2.21 110.58 138.7% Bullish BLUE .116 .065 --------------------------------------------------------------------------------------------- GLD 138.69 .07 137.98 45.6% Bearish BLUE-.009 -.048 --------------------------------------------------------------------------------------------- OIH 11.91 -.37 12.55 -429.3% Bearish RED -.058 -.151 --------------------------------------------------------------------------------------------- GASL 5.93 -.59 7.32 -1224.7% Bearish RED -.196 -.516 --------------------------------------------------------------------------------------------- |
  Table 3  Count of Stocks in Key Directories
          20191119
-------------------------------
NEWHIGHS       223
NEWLOWS        39
MAXCP          46
MINCP          71  Bearish
TTTNH          17
TTTNL          58  Day Traders are net bearish.
FASTUP         56
FASTDOWN       131  Swing-Traders are net bearish
CPCROSSA       31
CPCROSSD       64
BIGVOLUP       1
BIGVODN        19
ACCUMVER       9
HIGHIP21       36
HIUPPCT        25
LOWACCUM       97
REDSELL        107
AUGSELS7       27
TRAPDOOR       33
|
RANKING OF KEY DIRECTORIES BASED PCT.OF STOCKS ABOVE 65-DMA 11/19/19 --------------------------------------------------------------------------------------- Directory Current day-1 day-2 day-3 day-4 day-5 ---------------------------------------------------------------------------------------- BIGBANKS 1 1 1 1 1 1 COPPER 1 1 1 1 1 1 JETS 1 1 1 1 .9 1 REGBANKS 1 .962 1 1 1 1 ETFS .879 .896 .931 .844 .913 .965 TRANSP .85 .9 .9 .9 .85 .95 FINANCE .837 .813 .802 .825 .837 .825 MILITARY .821 .857 .857 .821 .785 .75 AUTO .82 .846 .82 .82 .846 .871 NIFTY .781 .781 .818 .8 .8 .836 HOMEBLDG .774 .806 .741 .774 .741 .741 GAMING .772 .772 .727 .727 .636 .636 FIDSTKS .747 .741 .752 .741 .73 .747 RETAIL .745 .843 .862 .843 .764 .862 DOWJONES .733 .733 .766 .733 .8 .766 SOFTWARE .733 .7 .7 .666 .7 .733 SP-100 .722 .744 .777 .766 .811 .833 NASD-100 .714 .663 .683 .663 .663 .693 RUS-1000 .705 .709 .734 .705 .695 .699 SP500 .702 .698 .717 .692 .681 .681 HACKERS .7 .65 .7 .6 .7 .75 DJI-13 .692 .769 .769 .769 .769 .769 GUNS .687 .625 .625 .687 .687 .687 HOSPITAL .681 .636 .636 .681 .636 .636 INDEXES .677 .688 .709 .682 .704 .709 CHEM .673 .693 .714 .734 .755 .775 ELECTRON .666 .64 .692 .692 .699 .718 INFRA .666 .638 .666 .638 .638 .694 SEMI .622 .594 .66 .66 .679 .688 REIT .62 .641 .634 .593 .572 .524 INDMATER .61 .675 .662 .714 .701 .714 FOOD .584 .566 .679 .66 .679 .679 COMPUTER .578 .578 .631 .631 .631 .684 INSURANC .567 .567 .513 .54 .567 .594 CHINA .563 .581 .581 .563 .618 .709 COMODITY .56 .536 .634 .609 .634 .634 BIOTECH .552 .517 .526 .491 .517 .497 GREEN .52 .44 .48 .44 .48 .52 SOLAR .461 .423 .384 .423 .423 .461 EDU .444 .333 .333 .388 .388 .444 GOLD .411 .431 .352 .45 .333 .313 UTILITY .325 .325 .375 .375 .35 .275 OILGAS .299 .335 .452 .416 .437 .503 BONDFUND .267 .214 .241 .276 .285 .276 BEVERAGE .25 .25 .25 .25 .25 .25 COAL 0 .2 .2 .2 .2 .2 |
====================================================================
11/18/2019
The multiple October B21 reinforced by the flat top
breakouts
and the bullish Seasonality should keep us long DIA, QQQ, SOXL and
TECL. Today the
DJI made another new high but breadth was
negative by 407 (not a small margin) and the A/D Line failed to
confirm the DJI's own new all-time high. The 2006 version of
Peerless accorded this action to be a Sell S13 if a trading range
is assumed to be present. But not so if one considers the breakout
above 27500 to mean that the DJI is in a very bullish uptrend.
The DJI, NASDAQ and SPY have now reached the last potential
barriers to a quickening of the rally we have seen so far. Seasonality
should let them continue to rally.


The Very Bullish Seasonality Continues
The 2006 Peerless also does not take into account
how bullish is the
third year in the 4-year Presidential cycle. Nearly eeverywhere we look
since 1915, we see how bullish the third year is compared to the other
years. Consider the data 1965 to 2018, which is what our Peerless program
lets users study. See what happens to the DJI after November 18th over the
next 10, 21 and 42 trading days. This amounts to looking out 2 weeks,
one and then two months. Further compare the results when we only
look at the first year, the second year, the third year in the Presidential
Election cycle, then the Presidential Election year and then all years since
1965. In Third Years.
such as ours, the DJI rises more than 75% of the
time over any of these periods of time.
What Happens to the DJI after November 18th, 1965-2018
10-days
21-days
42-days
% gain % up
% gain % up %
gain % up
-------------------------------------------------------------------------
ALL 0.0%
58.5%
-0.3% 58.5% +1.5%
67.9%
YEARS
First 0.1%
40%
0.8%
60.0% +0.0% 60.0%
Year
Second 0.3% 58.8%
-0.5% 58.8%
+0.2% 47.1%
Year
THIRD 1.6%
77.5%
+2.1% 75%
+4.2% 75%
YEAR
Pres.Elect. 0.4% 60.0%
0.7% 53.3%
+0.6% 66.7%
Year
|
Charts 11/18/2019
2019 PEERLESS DJI, Signals, Indicators Daily DJI Volume 10-DayUp/Down Vol Stoch-20 Hourly DJIA A/D Line for All Stocks Inverted Traders Index NASDAQ S&P OEX NYSE COMPQX DJI-15 DJI-20 DJI-30 DIA SPY QQQ MDY IWM TNA Short-Term Rates USO-CrudeOil DBO FAS GLD BBH IBB JETS JNUG KOL NUGT OIH OIL RSX RETL SDS AGQ SLV SOXL TECL TLT TMF TNA UGA (gasoline) XIV and China: YINN CHAU Commodities: CANE CORN DBC JJC, NIB, CHOC CORN, CUT (paper) MOO, SOYB WEAT UUP (Dollar) LIT (Lithium) AAPL ADBE ALXN AMAT AMGN AMD AMZN AXP BA BABA BAC BIDU CAT CVX DE FB GOOG GS HD IBM INTU JPM M (Macy's) MSFT NFLX NKE NVDA PG QCOM TSLA TXN XOM V WMT CMG , LRCX, SWKS, MDGL SPPI SQ TOWN 11/18/19 (Click on Underlined link.) New highs and Bullish MAXCPs - http://tigersoft.com/max/11-18/BULLISH.htm Bearish MAXCPs - http://tigersoft.com/min/11-18/BEARISH.htm |
Table 1 QUICKSILVER on DJI-30 STOCKS 11/18/2019 Bullish = AAPL (IP21 and ITRS both >.20 21 show rising 5-day ma (+1) from day before) SYMBOL CLOSE CHANGE PIVOT-PT 5-dma AROC CL-PWR CANDLE IP21 ITRS Remarks
TREND COLOR
----------------------------------------------------------------------------------------------------
AAPL 267.1 1.34 261.96 93% Bullish BLUE .438 .204
---------------------------------------------------------------------
AXP 119.66 -1.1 120.89 -51.3% ------- RED .009 -.045
---------------------------------------------------------------------
BA 369.46 -2.22 362.88 34.1% Bullish RED .09 -.013
---------------------------------------------------------------------
CAT 143.59 -1.72 146.34 -151.5% Bullish RED .279 .086
---------------------------------------------------------------------
CSCO 45.15 .06 48.37 -313.9% Bullish BLUE-.028 -.113
---------------------------------------------------------------------
CVX 118.55 -2.09 120.96 -93.1% ------- RED .22 -.05
---------------------------------------------------------------------
DIS 147.65 2.98 138.58 381% Bullish BLUE-.037 .021
---------------------------------------------------------------------
GS 219.73 -.52 220.41 15.9% ------- ---- .176 -.006
---------------------------------------------------------------------
HD 238.85 1.56 233.12 150.2% ------- BLUE .149 -.017
---------------------------------------------------------------------
IBM 134.31 -.09 135.59 -43% ------- ---- .224 -.101
---------------------------------------------------------------------
INTC 58.25 .29 58.2 -8.6% Bullish BLUE .42 .086
---------------------------------------------------------------------
JNJ 134.83 -.11 131.35 107.9% ------- BLUE .023 .019
---------------------------------------------------------------------
JPM 130.62 1.09 129.16 27.1% ------- BLUE .205 .089
---------------------------------------------------------------------
KO 53.03 .36 51.71 113.9% Bearish BLUE-.004 -.07
---------------------------------------------------------------------
MCD 194.28 .31 193.28 42.3% Bearish BLUE-.246 -.148
---------------------------------------------------------------------
MMM 170.54 -1.34 170.84 12.6% ------- RED .217 -.015
---------------------------------------------------------------------
MRK 84.13 -.77 84.12 50.4% Bearish RED -.051 -.035
---------------------------------------------------------------------
MRK 150.34 .37 147.07 143.2% Bullish BLUE .235 .051
---------------------------------------------------------------------
NKE 94.18 1.14 89.5 226.8% ------- BLUE-.127 .019
---------------------------------------------------------------------
PFE 37.22 -.06 36.97 39.3% Bearish RED -.076 -.032
---------------------------------------------------------------------
PG 121.89 1.35 119.27 106.6% Bearish BLUE-.011 -.045
---------------------------------------------------------------------
TRV 134.29 .72 133.35 28% ------- BLUE-.019 -.143
---------------------------------------------------------------------
UNH 272.93 3.53 255.25 365.6% Bullish BLUE .035 .14
---------------------------------------------------------------------
UTX 149.11 -.25 148.39 30% Bullish ---- .253 .069
---------------------------------------------------------------------
V 179.66 -.11 179.74 3.3% ------- BLUE .066 -.053
---------------------------------------------------------------------
VZ 59.44 -.07 59.32 -14.3% Bearish ---- .084 -.029
---------------------------------------------------------------------
WBA 61.94 -.2 62.72 -24.9% ------- RED .035 .072
---------------------------------------------------------------------
WMT 120.25 1.38 119.12 50.5% Bearish BLUE-.11 -.009
---------------------------------------------------------------------
DOW 68.52 -.67 69.37 -131.4% ------- RED .109 -.084
|
Table 2 QUICKSILVER on ETFS - 11/18/2019 ETF CLOSE CHANGE PIVOT-PT 5-dma AROC CL-PWR CANDLE IP21 ITRS --------------------------------------------------------------------------------------------- DIA 280.27 .33 277.29 55.9% Bullish BLUE .286 0 --------------------------------------------------------------------------------------------- BA 369.46 -2.22 362.88 34.1% Bullish RED .09 -.013 --------------------------------------------------------------------------------------------- SPY 312.02 .23 309 59.3% Bullish BLUE .317 .004 --------------------------------------------------------------------------------------------- QQQ 203.07 .16 201.54 52.3% Bullish BLUE .461 .019 --------------------------------------------------------------------------------------------- MDY 364.19 -.62 362.85 9.8% ------- RED .104 -.007 --------------------------------------------------------------------------------------------- IWM 158.52 -.4 158.83 -8.2% ------- RED .071 .001 --------------------------------------------------------------------------------------------- FAS 86.87 .56 84.94 101.4% ------- BLUE .169 .077 --------------------------------------------------------------------------------------------- RETL 24.81 .9 23.21 418.6% Bullish BLUE .012 .262 --------------------------------------------------------------------------------------------- SOXL 230.69 -1.41 228.23 97.7% Bullish RED .284 .261 --------------------------------------------------------------------------------------------- TECL 210.5 1.9 202.89 228.4% Bullish BLUE .414 .203 --------------------------------------------------------------------------------------------- IBB 111.24 -.26 110.38 54.3% Bullish RED .087 .05 --------------------------------------------------------------------------------------------- GLD 138.62 .41 137.43 56.6% Bearish BLUE-.055 -.062 --------------------------------------------------------------------------------------------- OIH 14.64 -.34 14.58 0% Bearish RED .038 -.129 --------------------------------------------------------------------------------------------- GASL 6.52 -.99 7.7 -855.4% Bearish RED -.142 -.469 --------------------------------------------------------------------------------------------- |
 Table 3   Count of Stocks in Key Directories
           20191118
-------------------------------
NEWHIGHS       246
NEWLOWS        37
MAXCP          75
MINCP          60
TTTNH          19
TTTNL          46
FASTUP         57
FASTDOWN       141
CPCROSSA       56
CPCROSSD       59
BIGVOLUP       4
BIGVODN        11
ACCUMVER       11
HIGHIP21       47
HIUPPCT        25
LOWACCUM       94
REDSELL        112
AUGSELS7       25
TRAPDOOR       33
|
 Table 4 RANKING OF KEY DIRECTORIES BASED PCT.OF STOCKS ABOVE 65-DMA
              11/18/19
 Bullish = 37
 Bearish = 9
---------------------------------------------------------------------------------------
Directory     Current       day-1         day-2         day-3         day-4         day-5
----------------------------------------------------------------------------------------
BIGBANKS       1             1             1             1             1             1
COPPER         1             1             1             1             1             1
JETS           1             1             1             .9            1             1
REGBANKS       .962          1             1             1             1             1
TRANSP         .9            .9            .9            .85           .95           .95
ETFS           .896          .931          .844          .913          .965          .965
MILITARY       .857          .857          .821          .785          .75           .785
AUTO           .846          .82           .82           .846          .871          .897
RETAIL         .843          .862          .843          .764          .843          .803
FINANCE        .811          .8            .823          .835          .835          .823
HOMEBLDG       .806          .741          .774          .741          .741          .741
NIFTY          .789          .824          .807          .807          .824          .807
GAMING         .772          .727          .727          .636          .636          .727
DJI-13         .769          .769          .769          .769          .769          .769
SP-100         .744          .777          .766          .811          .811          .8
FIDSTKS        .741          .752          .741          .73           .736          .747
DOWJONES       .733          .766          .733          .8            .766          .8
RUS-1000       .709          .735          .705          .695          .696          .708
SOFTWARE       .7            .716          .666          .7            .716          .716
SP500          .698          .719          .692          .681          .677          .669
CHEM           .693          .714          .734          .755          .775          .857
INDEXES        .688          .709          .682          .704          .709          .715
INDMATER       .675          .662          .714          .701          .714          .779
NASD-100       .663          .693          .673          .663          .673          .683
HACKERS        .65           .75           .6            .7            .75           .7
REIT           .641          .634          .593          .572          .524          .606
ELECTRON       .64           .692          .692          .699          .718          .718
INFRA          .638          .666          .638          .638          .694          .777
HOSPITAL       .636          .636          .681          .636          .636          .636
GUNS           .625          .625          .687          .687          .687          .687
SEMI           .594          .66           .66           .679          .688          .688
CHINA          .581          .581          .563          .618          .709          .709
COMPUTER       .578          .631          .631          .631          .684          .684
INSURANC       .567          .513          .54           .567          .594          .567
FOOD           .566          .679          .66           .679          .679          .698
COMODITY       .536          .634          .609          .634          .634          .658
BIOTECH        .514          .523          .488          .517          .497          .508
============================================================================================
GREEN          .44           .48           .44           .48           .52           .48
GOLD           .431          .352          .45           .333          .313          .313
SOLAR          .423          .384          .423          .423          .461          .384
OILGAS         .335          .452          .416          .437          .503          .518
EDU            .333          .333          .388          .388          .444          .444
UTILITY        .325          .375          .375          .35           .275          .25
BEVERAGE       .25           .25           .25           .25           .25           .187
BONDFUND       .214          .241          .276          .285          .276          .348
COAL           .2            .2            .2            .2            .2            .4
|
====================================================================
11/15/2019 The multiple October B21
reinforced by the flat top breakouts
and the bullish Seasonality should keep us long DIA, QQQ and
TECL.
Compare the DJI's breakouts recently with the one Trump's
election
started. Wall Street is not betting on the Democrats' impeachment
efforts' success. Or else, it believes what the Fed is doing to promote
higher stock prices is more important. Either way, Peerless is on
a buy and the minimum upside target is near 29000 on the DJI AND
we are seeing lots of attractive, high accumulation breakouts.
Speculators should do some reading about little-known BLDP,
a Canadian lithium and hydrogen battery maker. Buy it.
 |
 |
 |
|
Charts 11/15/2019
2019 PEERLESS DJI, Signals, Indicators Daily DJI Volume 10-DayUp/Down Vol Stoch-20 Hourly DJIA A/D Line for All Stocks Inverted Traders Index NASDAQ S&P OEX NYSE COMPQX DJI-15 DJI-20 DJI-30 DIA SPY QQQ MDY IWM TNA Short-Term Rates USO-CrudeOil DBO FAS GLD BBH IBB JETS JNUG KOL NUGT OIH OIL RSX RETL SDS AGQ SLV SOXL TECL TLT TMF TNA UGA (gasoline) XIV and China: YINN CHAU Commodities: CANE CORN DBC JJC, NIB, CHOC CORN, CUT (paper) MOO, SOYB WEAT UUP (Dollar) LIT (Lithium) AAPL ADBE ALXN AMAT AMGN AMD AMZN AXP BA BABA BAC BIDU CAT CVX DE FB GOOG GS HD IBM INTU JPM M (Macy's) MSFT NFLX NKE NVDA PG QCOM TSLA TXN XOM V WMT CMG , LRCX, SWKS, MDGL SPPI SQ TOWN 11/15/19 (Click on Underlined link.) New highs and Bullish MAXCPs - http://tigersoft.com/max/11-15/BULLISH.htm Bearish MAXCPs - http://tigersoft.com/min/11-15/BEARISH.htm |
BUY NVDA and Why Investors Are Very Happy
with
The Text-book Coup d'é·tat in Far-away Bolivia
Bolivia's high-elevation deserts hold 50% to 75% of
the world's lithium reserves.
Socialist President Evo Morales announced a few weeks ago that he
he wanted to have lithium batteries made in his country instead of having its
lithium exported. Big Mistake. He boldly claimed that the country's
vast lithium reserves should be used for the benefit of all Bolivians and, in
particular, help the many Bolivian farmers whose water supplies would be
disrupted by the water-intensive lithium extraction process. That was his
undoing. Less than a week later a military coup forced him to flee for his
life and a new Conservative President took over. Just a coincidence?
Somehow, this is a part of the story that CNN and MSNBC misseed.
More coincidence, no doubt.
The coup has put into power a lithium-export friendly acting President.
The coup has been a catalyst to investors who are aware of a small Canadian
lithium battery maker, Ballard Power Systems, whose stock has been
under massive Accumulation under $5/share. Now its accelerating
uptrend is breaking out to the upside. Such super-bullish technical
patterns are very rare. The last one I recall was QPSA under $3 on
its way quickly to $10.
In any case, BLDP's stock looks superb. High and accelerating Tiger
Accumulation and clear breakout above rising resistance. The shorts
can no long control the stock. And historically, the stock can be explosive,
as in 2000 when it rose above $150/share. Moreover,
history shows us
a lot about how to trade it and when to sell.
BLDP - Now - Ideally Bullish!

BLDP in 1999-2000 - High Volume and Steep Rally. Note
B26 and B20.
But at 110, there is an uptrend-break and a steady decline back to earth begins
in 2000-2001. Just another "Pump and Dump"!


BLDP - 1996 - Breakout Advance and Top.

BLDP - 1997 - Breakout Advance.

BLDP - 1997-1998 - How BLDP tops out.

More on BLDP: https://en.wikipedia.org/wiki/Ballard_Power_Systems
More on Explosive Super Stocks
http://www.tigersoft.com/PageThreeTigerSoft/Page-3-TigerSoft.htm

More on lithium and the coup in Bolivia.
https://newrepublic.com/article/155753/climate-changes-great-lithium-problem
https://www.commondreams.org/views/2019/11/12/after-morales-ousted-coup-lithium-question-looms-large-bolivia
https://www.rt.com/op-ed/473560-bolivia-coup-morales-resources/
Table 1 QUICKSILVER on DJI-30 STOCKS 11/15/2019 Bullish (4) = AAPL CAT JPM (IP21 and ITRS both >.20 20 show rising 5-day ma (+4) from day before) SYMBOL CLOSE CHANGE PIVOT-PT 5-dma AROC CL-PWR CANDLE IP21 ITRS Remarks
TREND COLOR
----------------------------------------------------------------------------------------------------
AAPL 265.76 3.12 262.2 107.1% Bullish BLUE .416 .203 Most Bullish
---------------------------------------------------------------------
AXP 120.76 -.17 120.9 -29.4% ------- RED -.065 -.039
---------------------------------------------------------------------
BA 371.68 4.24 366.96 285.5% ------- BLUE -.004 -.019
---------------------------------------------------------------------
CAT 145.31 1.87 148 -97.5% Bullish BLUE .271 .141
---------------------------------------------------------------------
CSCO 45.09 .18 48.1 -391.8% Bullish ---- -.11 -.12
---------------------------------------------------------------------
CVX 120.64 -1.32 120.81 -11.9% Bullish RED .192 -.023
---------------------------------------------------------------------
DIS 144.67 -2.48 136.74 236.6% Bearish RED -.096 -.007
---------------------------------------------------------------------
GS 220.25 .82 219.03 -60.4% ------- BLUE .145 .02
---------------------------------------------------------------------
HD 237.29 .74 231.8 95.2% Bearish RED .127 -.017
---------------------------------------------------------------------
IBM 134.4 .4 135.47 -118.5% ------- ---- .243 -.087
---------------------------------------------------------------------
INTC 57.96 .15 58.35 -26.7% Bullish RED .392 .095
---------------------------------------------------------------------
JNJ 134.94 3.98 131.98 73.6% ------- BLUE-.163 .009
---------------------------------------------------------------------
JPM 129.53 .93 129.92 -32.9% Bullish BLUE .176 .107
---------------------------------------------------------------------
KO 52.67 .04 51.84 44.1% Bearish -----.024 -.09
---------------------------------------------------------------------
MCD 193.97 -.03 192.64 9.3% Bearish RED -.215 -.162 Most Bearish
---------------------------------------------------------------------
MMM 171.88 .95 170.11 -37.1% ------- BLUE .162 .005
---------------------------------------------------------------------
MRK 84.9 .35 83.28 77.9% ------- BLUE-.005 -.063
---------------------------------------------------------------------
MRK 149.97 1.91 146.11 136.5% Bullish BLUE .164 .035
---------------------------------------------------------------------
NKE 93.04 1.77 90.05 178.7% Bearish BLUE-.145 .006
---------------------------------------------------------------------
PFE 37.28 .73 36.93 31.2% ------- BLUE-.092 -.022
---------------------------------------------------------------------
PG 120.54 .04 119.33 35% Bearish RED .007 -.062
---------------------------------------------------------------------
TRV 133.57 -.38 133.54 10.5% ------- RED .002 -.169
---------------------------------------------------------------------
UNH 269.4 13.57 254.09 243.6% Bullish BLUE .088 .133
---------------------------------------------------------------------
UTX 149.36 1.25 148.22 16.2% ------- BLUE .193 .074
---------------------------------------------------------------------
V 179.77 .02 179.54 22.3% ------- RED .051 -.075
---------------------------------------------------------------------
VZ 59.51 .17 59.61 13.5% Bearish ---- .077 -.036
---------------------------------------------------------------------
WBA 62.14 .2 62.25 235.1% Bullish BLUE .017 .139
---------------------------------------------------------------------
WMT 118.87 -1.78 119.04 -23.8% Bearish RED -.192 -.007
---------------------------------------------------------------------
DOW 69.19 .69 70.34 -113.6% ------- BLUE .06 -.068
|
Table 2 QUICKSILVER on ETFS - 11/15/2019 ETF CLOSE CHANGE PIVOT-PT 5-dma AROC CL-PWR CANDLE IP21 ITRS
---------------------------------------------------------------------------------------------
DIA 279.94 1.71 277.16 51.7% ------- BLUE .204 -----
---------------------------------------------------------------------------------------------
BA 371.68 4.24 366.96 285.5% ------- BLUE-.004 -.019
---------------------------------------------------------------------------------------------
SPY 311.79 2.24 308.35 46.1% ------- BLUE .273 .003
---------------------------------------------------------------------------------------------
QQQ 202.91 1.48 200.96 41.7% ------- BLUE .398 .016
high
---------------------------------------------------------------------------------------------
MDY 364.81 1.82 363.48 8.1% ------- RED .093 .003
---------------------------------------------------------------------------------------------
IWM 158.92 .82 158.78 -5% ------- RED .06 .017
---------------------------------------------------------------------------------------------
FAS 86.31 .81 85.14 61.7% ------- BLUE .154 .08
---------------------------------------------------------------------------------------------
RETL 23.91 .83 22.85 416.9% Bullish BLUE .02 .146
--------------------------------------------------------------------------------------------
SOXL 232.1 5.88 226.23 46.8% Bullish RED .276 .287 Bullish
---------------------------------------------------------------------------------------------
TECL 208.6 4.82 201.17 192.2% Bullish BLUE .37 .165 Bullish
---------------------------------------------------------------------------------------------
IBB 111.5 1.65 110.04 51.7% Bullish BLUE .076 .047
---------------------------------------------------------------------------------------------
GLD 138.21 -.35 137.06 29.8% Bearish BLUE-.071 -.069
---------------------------------------------------------------------------------------------
OIH 14.64 -.34 14.58 0% Bearish RED .038 -.13
---------------------------------------------------------------------------------------------
GASL 7.51 .43 7.8 -777% Bearish BLUE-.146 -.264
---------------------------------------------------------------------------------------------
|
Table 3    Count of Stocks in Key Directories
           20191115
-------------------------------
NEWHIGHS       292
NEWLOWS        27
MAXCP          67
MINCP          31
TTTNH          15
TTTNL          32
FASTUP         50
FASTDOWN       134
CPCROSSA       63
CPCROSSD       57
BIGVOLUP       3
BIGVODN        21
ACCUMVER       8
HIGHIP21       36
HIUPPCT        26
VHIP21         62
REDSELL        103
AUGSELS7       29
TRAPDOOR       32
|
Table 4 RANKING OF KEY DIRECTORIES BASED PCT.OF STOCKS ABOVE 65-DMA
              11/15/19
 Bullish = 37
 Bearish = 9
---------------------------------------------------------------------------------------
Directory     Current       day-1         day-2         day-3         day-4         day-5
----------------------------------------------------------------------------------------
BIGBANKS       1             1             1             1             1             1
COPPER         1             1             1             1             1             1
JETS           1             1             .9            1             1             1
REGBANKS       1             1             1             1             1             1
ETFS           .931          .844          .913          .965          .965          .965
TRANSP         .9            .9            .85           .95           .95           .95
RETAIL         .862          .843          .764          .843          .823          .843
MILITARY       .857          .821          .785          .75           .785          .75
NIFTY          .824          .807          .807          .824          .807          .807
AUTO           .82           .82           .846          .871          .897          .897
FINANCE        .802          .825          .837          .825          .813          .813
SP-100         .777          .766          .811          .811          .8            .811
DJI-13         .769          .769          .769          .769          .769          .692
DOWJONES       .766          .733          .8            .766          .8            .766
FIDSTKS        .752          .741          .73           .736          .752          .769
HACKERS        .75           .65           .7            .75           .7            .7
HOMEBLDG       .741          .774          .741          .741          .741          .677
GAMING         .739          .739          .652          .652          .739          .739
RUS-1000       .735          .707          .695          .696          .708          .713
SP500          .719          .694          .681          .677          .667          .681
SOFTWARE       .716          .683          .7            .716          .716          .683
CHEM           .714          .734          .755          .775          .857          .857
INDEXES        .709          .682          .704          .709          .72           .72
NASD-100       .693          .683          .673          .673          .693          .693
ELECTRON       .692          .692          .699          .718          .718          .725
FOOD           .679          .66           .679          .679          .698          .698
INFRA          .666          .638          .638          .694          .777          .722
INDMATER       .662          .714          .701          .714          .779          .753
SEMI           .66           .66           .679          .688          .688          .707
HOSPITAL       .636          .681          .636          .636          .636          .636
COMODITY       .634          .609          .634          .634          .658          .658
REIT           .634          .593          .572          .524          .613          .579
COMPUTER       .631          .631          .631          .684          .684          .631
GUNS           .625          .687          .687          .687          .687          .687
CHINA          .581          .563          .618          .709          .709          .727
BIOTECH        .52           .485          .514          .497          .514          .497
INSURANC       .513          .54           .567          .594          .594          .567
===============================================================================================
GREEN          .48           .44           .48           .52           .48           .48
OILGAS         .452          .416          .437          .503          .51           .554
SOLAR          .384          .423          .423          .461          .384          .423
UTILITY        .375          .375          .35           .275          .25           .325
GOLD           .352          .45           .333          .313          .313          .235
EDU            .333          .388          .388          .444          .444          .388
BEVERAGE       .25           .25           .25           .25           .187          .125
BONDFUND       .245          .28           .289          .28           .35           .324
COAL           .2            .2            .2            .2            .4            .4
|
====================================================================
11/14/2019 The multiple October B21
reinforced by the flat top breakouts
and the bullish Seasonality should keep us long DIA, QQQ and
SOXL. The DJI has risen
75% of the time since 1967 over the
next month and shown an average +2.1% gain. Right now, both
Opening and CLosing Powers are rising for the major market ETFs.
This is especially bullish if a breakout can be made into all-time
high territory and the NYSE breadth is very positive.
 |
 |
|
Charts 11/14/2019 2019 PEERLESS DJI, Signals, Indicators Daily DJI Volume 10-DayUp/Down Vol Stoch-20 Hourly DJIA A/D Line for All Stocks Inverted Traders Index NASDAQ S&P OEX NYSE COMPQX DJI-15 DJI-20 DJI-30 DIA SPY QQQ MDY IWM TNA Short-Term Rates USO-CrudeOil DBO FAS GLD BBH IBB JETS JNUG KOL NUGT OIH OIL RSX RETL SDS AGQ SLV SOXL TECL TLT TMF TNA UGA (gasoline) XIV and China: YINN CHAU Commodities: CANE CORN DBC JJC, NIB, CHOC CORN, CUT (paper) MOO, SOYB WEAT UUP (Dollar) LIT (Lithium) AAPL ADBE ALXN AMAT AMGN AMD AMZN AXP BA BABA BAC BIDU CAT CVX DE FB GOOG GS HD IBM INTU JPM M (Macy's) MSFT NFLX NKE NVDA PG QCOM TSLA TXN XOM V WMT CMG , LRCX, SWKS, MDGL SPPI WATT SQ TOWN 11/14/19 (Click on Underlined link.) New highs and Bullish MAXCPs - http://tigersoft.com/max/11-14/BULLISH.htm Bearish MAXCPs - http://tigersoft.com/min/11-14/BEARISH.htm |
When To Sell A Stock? Example
ARWR: 2006-2019
Super Stock or "Pump and Dumper"?

The most frequently asked question I hear is when to
Sell. With
the strongest ETFs, Peerless should give us a timely Sell signal.
With individual stocks, we have to be much more careful. If you
are in some of our Bullish MAXCPs (potential "explosive super stocks"),
see first the TigerSoft Help Routine entitled "when to sell". See the
similarly
titled Chapter in my Explosive Super Stocks book. And thirdly, study what I
present tonight, namely the chart history of a somtimes "explosive super stock"
ARWR, as you can see below frequently has turned into the "pump and dump"
variant.
Its history offers lots of ways to spot how tops in it and other stocks like it occur
Take profits when there are:
1) breaks in extended price up-trends.
2) Closing Power and or IP21 Non-Confirmations (of new highs)
3) Price and Closing Power Head/Shoulders.
4) High (red) volume churning and reversal days after big jump.
But first, note how far you stock has already risen.
Taking a 50% or 100%
profit is usually reasonable. Already ARWR is up 273% for the year. Look
at the Buy signals that started the move. You will want to see major Tiger-
Soft buys and confirming internal and relative strength like we discussed last night.
Without such a foundation, the advance can fall back very quickly.
How far a stock will run depends on many factors, of course. The general
market is probably the most important. How much prior Accumulation the
the stock as shown is very important. Momentum is a key element, too.
But trying to get the last Dollar in a big advance is not prudent. Too many
stocks fall all the way back to what they were at the start of their move,
or even go lower. This is especially true of unseasoned new issues. I quickly
counted just as many "pump and dumpers" among the current new issues
as there were that held their very good gains. Study the former: AMBO,
ANCN, APTX, ARLO, APM, AXNX, BAND, BFRA, BYND, CGC, CLPG,
CRON, CRWD, CTK, DSP, DNLI, FNKO...ZUO.
| ARWR: 2006-2018 |
2006 |
2007 |
2008 |
2009 |
2010 |
2011 |
2012 |
2013 |
2014 |
2015 |
2016 |
2017 |
2018 |
Table 1QUICKSILVER on DJI-30 STOCKS 11/14/2019 Bullish (4) = AAPL CAT INTC JPM (IP21 and ITRS both >.20 16 show rising 5-day ma (-6) from day before) SYMBOL CLOSE CHANGE PIVOT-PT 5-dma AROC CL-PWR CANDLE IP21 ITRS Remarks
TREND COLOR
----------------------------------------------------------------------------------------------------
AAPL 262.64 -1.83 260.14 61.3% Bullish RED .384 .192 BULLISH
---------------------------------------------------------------------
AXP 120.93 .67 121.47 -14.5% Bullish BLUE-.021 -.037
---------------------------------------------------------------------
BA 367.44 4.94 351 140.6% ------- BLUE-.03 -.02
---------------------------------------------------------------------
CAT 143.44 -1.05 148.16 -121.6% ------- RED .279 .127 BULLISH
---------------------------------------------------------------------
CSCO 44.91 -3.55 48.83 -362.3% Bullish RED -.079 -.112
---------------------------------------------------------------------
CVX 121.96 -.32 120.93 2.9% ------- BLUE .195 -.003
---------------------------------------------------------------------
DIS 147.15 -1.57 137.96 510.5% Bearish RED -.053 .02
---------------------------------------------------------------------
GS 219.43 .11 222.91 -87.3% ------- BLUE .129 .02
---------------------------------------------------------------------
HD 236.55 1.75 232.84 77.4% Bearish BLUE .121 -.003
---------------------------------------------------------------------
IBM 134 -.48 137.61 -135.5% ------- RED .197 -.089
---------------------------------------------------------------------
INTC 57.81 -.08 58.27 -20.6% Bullish BLUE .392 .114 Bulllish
---------------------------------------------------------------------
JNJ 130.96 -.31 133 -17.8% ------- RED -.239 -.021
---------------------------------------------------------------------
JPM 128.6 .12 130.38 -54% Bullish BLUE .108 .105 Bullish
---------------------------------------------------------------------
KO 52.63 .22 52.21 32.6% ------- BLUE-.071 -.085
---------------------------------------------------------------------
MCD 194 -1 193.61 23.8% ------- RED -.239 -.156 Bearish
---------------------------------------------------------------------
MMM 170.93 .38 173.15 -104.5% Bullish BLUE .14 .001
---------------------------------------------------------------------
MRK 84.55 -.27 83.59 99.7% ------- RED -.015 -.057
---------------------------------------------------------------------
MSFT 148.06 .75 145.96 130% Bearish BLUE .095 .018
---------------------------------------------------------------------
NKE 91.27 -.02 89.81 48.2% Bearish RED -.158 -.007
---------------------------------------------------------------------
PFE 36.55 -.05 37.05 -48.8% Bearish RED -.171 -.034
---------------------------------------------------------------------
PG 120.5 -.15 119.7 36.8% ------- -----.032 -.058
---------------------------------------------------------------------
TRV 133.95 -.18 133.29 35.2% Bullish BLUE-.001 -.157
---------------------------------------------------------------------
UNH 255.83 2.26 256.97 -12.3% ------- BLUE .104 .075
---------------------------------------------------------------------
UTX 148.11 -.2 148.88 -20.9% ------- BLUE .189 .074
---------------------------------------------------------------------
V 179.75 .34 178.97 36.8% ------- BLUE .043 -.066
---------------------------------------------------------------------
VZ 59.34 -.07 59.35 -99.8% ------- BLUE .059 -.027
---------------------------------------------------------------------
WBA 61.94 -.31 59.24 267.9% Bullish RED .05 .144
---------------------------------------------------------------------
WMT 120.65 -.33 119.44 17.5% ------- RED -.14 .006
---------------------------------------------------------------------
DOW 68.5 -.3 70.77 -320% ------- RED -.001 -.065
|
Table 2 QUICKSILVER on ETFS - 11/14/2019 ETF CLOSE CHANGE PIVOT-PT 5-dma AROC CL-PWR CANDLE IP21 ITRS --------------------------------------------------------------------------------------------- DIA 278.23 .18 277.07 21.3% ------- BLUE .149 ----- --------------------------------------------------------------------------------------------- BA 367.44 4.94 351 140.6% ------- BLUE-.03 -.02 --------------------------------------------------------------------------------------------- SPY 309.55 .45 308.94 22.2% ------- BLUE .221 0 --------------------------------------------------------------------------------------------- QQQ 201.43 -.16 201.23 24.9% Bullish BLUE .343 .011 --------------------------------------------------------------------------------------------- MDY 362.99 .86 364.22 -2.5% ------- BLUE .118 0 --------------------------------------------------------------------------------------------- IWM 158.1 -.05 159.08 -17.3% ------- BLUE .086 .01 --------------------------------------------------------------------------------------------- FAS 85.5 1 85.26 20.6% ------- BLUE .111 .075 --------------------------------------------------------------------------------------------- RETL 25.68 .45 25.76 -107% Bullish BLUE .199 .196 --------------------------------------------------------------------------------------------- SOXL 226.22 -1.88 229.97 -3.1% Bullish BLUE .28 .263 Bullish --------------------------------------------------------------------------------------------- TECL 203.78 -.86 200.81 155.7% Bullish BLUE .314 .135 --------------------------------------------------------------------------------------------- IBB 109.85 -.73 110.36 68.2% ------- RED .037 .033 --------------------------------------------------------------------------------------------- GLD 138.56 .58 137.39 10.5% Bearish BLUE-.093 -.071 --------------------------------------------------------------------------------------------- OIH 11.91 -.37 12.55 -429.3% Bearish RED -.058 -.153 --------------------------------------------------------------------------------------------- GASL 7.08 -.24 8.71 -910.9% Bearish RED -.153 -.334 --------------------------------------------------------------------------------------------- RSX 24.49 -.04 24.97 -141.1% Bullish BLUE .229 .028 |
Table 3    Count of Stocks in Key Directories
           20191114
-------------------------------
NEWHIGHS       169
NEWLOWS        37
MAXCP          84
MINCP          47
TTTNH          29
TTTNL          39
FASTUP         59
FASTDOWN       155
CPCROSSA       75
CPCROSSD       49
BIGVOLUP       3
BIGVODN        17
ACCUMVER       7
HIGHIP21       27
HIUPPCT        24
REDSELL        94
AUGSELS7       25
TRAPDOOR       32
|
Table 4 RANKING OF KEY DIRECTORIES BASED PCT.OF STOCKS ABOVE 65-DMA
              11/14/19
Bullish = 36
Bearish = 10
---------------------------------------------------------------------------------------
Directory     Current       day-1         day-2         day-3         day-4         day-5
----------------------------------------------------------------------------------------
BIGBANKS       1             1             1             1             1             1
COPPER         1             1             1             1             1             1
JETS           1             .9            1             1             1             1
REGBANKS       1             1             1             1             1             1
TRANSP         .9            .85           .95           .95           .95           .95
ETFS           .844          .913          .965          .965          .965          .965
RETAIL         .843          .764          .843          .823          .843          .882
FINANCE        .825          .837          .825          .813          .813          .825
MILITARY       .821          .785          .75           .785          .75           .75
AUTO           .82           .846          .871          .897          .897          .871
NIFTY          .807          .807          .824          .807          .807          .789
HOMEBLDG       .774          .741          .741          .741          .709          .677
DJI-13         .769          .769          .769          .769          .692          .615
SP-100         .766          .811          .811          .8            .811          .733
FIDSTKS        .741          .73           .736          .752          .769          .736
GAMING         .739          .652          .652          .739          .739          .739
CHEM           .734          .755          .775          .857          .857          .857
DOWJONES       .733          .8            .766          .8            .766          .733
INDMATER       .714          .701          .714          .779          .753          .792
RUS-1000       .707          .696          .696          .708          .713          .707
ELECTRON       .697          .703          .723          .723          .73           .73
SP500          .694          .683          .677          .667          .681          .673
GUNS           .687          .687          .687          .687          .687          .687
NASD-100       .683          .683          .683          .693          .693          .673
SOFTWARE       .683          .716          .716          .716          .683          .7
INDEXES        .682          .704          .709          .72           .72           .715
HOSPITAL       .681          .636          .636          .636          .636          .636
FOOD           .666          .685          .685          .703          .703          .703
SEMI           .66           .679          .688          .688          .707          .707
HACKERS        .65           .75           .75           .7            .7            .65
INFRA          .638          .638          .694          .777          .722          .75
COMPUTER       .631          .631          .684          .684          .631          .631
COMODITY       .609          .634          .634          .658          .658          .682
REIT           .593          .572          .524          .613          .593          .613
CHINA          .563          .618          .709          .709          .727          .763
INSURANC       .54           .567          .594          .594          .567          .567
============================================================================================
BIOTECH        .482          .511          .494          .514          .502          .45
GOLD           .45           .333          .313          .313          .235          .313
GREEN          .44           .48           .52           .48           .48           .48
OILGAS         .416          .437          .503          .51           .554          .562
SOLAR          .4            .4            .44           .36           .4            .44
EDU            .388          .388          .444          .444          .388          .388
UTILITY        .375          .35           .275          .25           .325          .35
BONDFUND       .28           .289          .28           .35           .324          .298
BEVERAGE       .25           .25           .25           .187          .125          .062
COAL           .166          .166          .166          .333          .333          .333
|
====================================================================
11/13/2019 The multiple October B21
reinforced by the flat top breakouts
and the bullish Seasonality should keep us long DIA, QQQ and
SOXL. But there's no
denying that the DJI is struggling to move
up and the P-I is dropping, as the NYSE A/D Line is starting to
to show a clear bearish divergence from the DJI's action. Why?
One reason is that the latest one year change in the CPI (Consumer
Price Index) was 4.0%. It will be hard to sell 10-year bonds below
2% much longer if the rate of Inflation rises above 4% for very long
and that could kill the long advance. Thus, the 1949-1957 bull market
was finally stopped in July 1957 by a A/D Line divergence, a Sell S9
and the CPI rising sharply a few months earlier to 4%. In 1956 the
CPI's average annual rise had only been 1.49%

|
Charts 11/13/2019 2019 PEERLESS DJI, Signals, Indicators Daily DJI Volume 10-DayUp/Down Vol Stoch-20 Hourly DJIA A/D Line for All Stocks Inverted Traders Index NASDAQ S&P OEX NYSE COMPQX DJI-15 DJI-20 DJI-30 DIA SPY QQQ MDY IWM TNA Short-Term Rates USO-CrudeOil DBO FAS GLD BBH IBB JETS JNUG KOL NUGT OIH OIL RSX RETL SDS AGQ SLV SOXL TECL TLT TMF TNA UGA (gasoline) XIV and China: YINN CHAU Commodities: CANE CORN DBC JJC, NIB, CHOC CORN, CUT (paper) MOO, SOYB WEAT UUP (Dollar) LIT (Lithium) AAPL ADBE ALXN AMAT AMGN AMD AMZN AXP BA BABA BAC BIDU CAT CVX DE FB GOOG GS HD IBM INTU JPM M (Macy's) MSFT NFLX NKE NVDA PG QCOM TSLA TXN XOM V WMT CMG , LRCX, SWKS, MDGL SPPI WATT SQ TOWN 11/13/19 (Click on Underlined link.) New highs and Bullish MAXCPs - http://tigersoft.com/max/11-13/BULLISH.htm Bearish MAXCPs - http://tigersoft.com/min/11-13/BEARISH.htm |
Low Price Stock Breakouts:
IP21 Confirmed B26 Breakouts.
I can't repeat what is in my Explosive Stocks Book. Read that. A lot
of thought went into it. And a lot of experience.... The main idea
there was to buy tech stocks breaking out of a base with high Accumulation
(above +.35) and high volume and high Relative Strength (ITRS>+.30).
Google "TigerSoft" and "Explosive Super Stocks" and you will lots of
historical examples. A few of the MAXCPs here also show these
qualitities. See also all the major TigerSoft Buy signals. Use the HELP
routines in the software to look up their details.
Tonight I want to show you how the ten best performing low-priced
stocks might have been spotted simply with our ITRS rising above +.30 and
our IP21 (current Accumulation being well above +.20). I would also
want them to breakout above a 3- or 6-month base and not break a simple
price uptrendline. ITRS shows the stock's 50-day pct gain minus the
DJI's 50-day pct gain. A Buy B26 occurs when ITRS crosses above +.30.,
i.e. the stock is outperforming the DJI by 30%.
Most Recent 100-day Gains of More than 100%
(Just 10 of 441 low priced stocks)
DRRX + 222%
BASI + 168%
SSI + 168%
ICON + 147%
DRN + 137%
GNC + 136%
ACVN +127%
JCS +123%
XNET +119%
KDMN +109%
 |
 |
 |
 |
 |
 |
 |
Table A QUICKSILVER on DJI-30 STOCKS 11/13/2019 Bullish (7) = AAPL CAT GS INTC JPM UNH UTX 22 show rising 5-day ma (+1) from day before) SYMBOL CLOSE CHANGE PIVOT-PT 5-dma AROC CL-PWR CANDLE IP21 ITRS Remarks
TREND COLOR
----------------------------------------------------------------------------------------------------
AAPL 264.47 2.51 259.43 138.9% Bullish BLUE .42 .211 Most bullish
---------------------------------------------------------------------
AXP 120.26 -.63 121.28 23.6% Bullish ---- -.061 -.038
---------------------------------------------------------------------
BA 362.5 -.38 357.31 115.9% ------- BLUE -.066 -.037
---------------------------------------------------------------------
CAT 144.49 -1.85 147.01 -34% Bullish BLUE .267 .16 Bullish
---------------------------------------------------------------------
CSCO 48.46 .09 48.42 19.6% Bullish BLUE .053 -.029
---------------------------------------------------------------------
CVX 122.28 1.32 121.89 98.4% Bullish BLUE .176 -.011
---------------------------------------------------------------------
DIS 148.72 10.14 132.96 643.9% ------- BLUE .018 .025
---------------------------------------------------------------------
GS 219.32 -1.09 223.29 20.4% ------- BLUE .122 .034 Positive
---------------------------------------------------------------------
HD 234.8 1.68 232.94 17% ------- BLUE .125 -.006
---------------------------------------------------------------------
IBM 134.48 -1.11 137.69 -156.9% Bullish RED .172 -.067
---------------------------------------------------------------------
INTC 57.89 -.31 58.05 25% Bullish --- -.406 .13
---------------------------------------------------------------------
JNJ 131.27 -.08 131.43 11.8% ------- BLUE -.237 -.035
---------------------------------------------------------------------
JPM 128.48 -.68 130 -31.6% Bullish BLUE .056 .116 Positive
---------------------------------------------------------------------
KO 52.41 .7 52.29 -37.4% Bearish BLUE -.067 -.114
---------------------------------------------------------------------
MCD 195 1.72 193.08 21.2% Bearish BLUE -.222 -.161
---------------------------------------------------------------------
MMM 170.55 -.29 174.52 -100% Bullish BLUE .111 .012
---------------------------------------------------------------------
MRK 84.82 .7 82.88 94.1% ------- BLUE -.048 -.068
---------------------------------------------------------------------
MRK 147.31 .24 144.26 111.7% ------- BLUE .086 .017
---------------------------------------------------------------------
NKE 91.29 1.79 90.4 100.7% Bearish BLUE -.137 .004
---------------------------------------------------------------------
PFE 36.6 -.37 36.91 -136.1% ------- RED -.21 -.032
---------------------------------------------------------------------
PG 120.65 1.38 119.62 13.8% Bearish BLUE .011 -.074
---------------------------------------------------------------------
TRV 134.13 .78 133.01 66.9% ------- BLUE .01 -.16
---------------------------------------------------------------------
UNH 253.57 -1.68 256.46 59.9% Bullish RED .129 .065 Positive
---------------------------------------------------------------------
UTX 148.31 -.08 148.73 0% Bullish BLUE .19 .078 Bullish
---------------------------------------------------------------------
V 179.41 -.33 178.43 73.9% ------- BLUE .004 -.066
---------------------------------------------------------------------
VZ 59.41 .09 60.53 -60.2% Bearish BLUE .039 -.032
---------------------------------------------------------------------
WBA 62.25 -.47 58.67 228.2% Bullish RED .057 .157 Bullish
---------------------------------------------------------------------
WMT 120.98 1.86 120.23 61.9% Bearish BLUE -.026 -.01
---------------------------------------------------------------------
DOW 68.8 -.57 73.01 -189.4% ------- RED -.031 -.061
|
Table 2 QUICKSILVER on ETFS - 11/13/2019 ETF CLOSE CHANGE PIVOT-PT 5-dma AROC CL-PWR CANDLE IP21 ITRS --------------------------------------------------------------------------------------------- DIA 278.05 .76 277.05 58.7% Bullish BLUE .125 0 --------------------------------------------------------------------------------------------- BA 362.5 -.38 357.31 115.9% ------- BLUE-.066 -.037 --------------------------------------------------------------------------------------------- SPY 309.1 .1 308.18 32.4% Bullish BLUE .167 -.002 --------------------------------------------------------------------------------------------- QQQ 201.59 .05 200.43 45.6% Bullish BLUE .311 .017 --------------------------------------------------------------------------------------------- MDY 362.13 -.72 363.17 -7.8% Bullish BLUE .078 .002 --------------------------------------------------------------------------------------------- IWM 158.15 -.68 158.65 -2.5% Bullish BLUE .093 .016 --------------------------------------------------------------------------------------------- FAS 84.5 -.44 85.15 29.4% Bullish BLUE .078 .093 --------------------------------------------------------------------------------------------- RETL 24.01 .8 22.74 609% ------- BLUE-.045 .111 --------------------------------------------------------------------------------------------- SOXL 228.1 -.13 226.36 134.6% Bullish BLUE .195 .382 --------------------------------------------------------------------------------------------- TECL 204.64 1.75 197.51 283.2% Bullish BLUE .29 .201 --------------------------------------------------------------------------------------------- IBB 110.58 .2 108.35 103.7% Bullish BLUE .01 .039 --------------------------------------------------------------------------------------------- GLD 137.98 .55 138.27 -89.4% Bearish BLUE-.051 -.113 --------------------------------------------------------------------------------------------- OIH 14.64 -.34 14.58 0% Bearish RED .038 -.14 --------------------------------------------------------------------------------------------- GASL 7.32 -.38 8.54 -513.3% Bearish RED -.149 -.271 --------------------------------------------------------------------------------------------- RSX 23.09 .04 22.92 61.4% Bearish -----.11 -.03 |
Table 3   Count of Stocks in Key Directories
          20191113
-------------------------------
NEWHIGHS       164
NEWLOWS        38
MAXCP          79
MINCP          39
TTTNH          24
TTTNL          39
FASTUP         60
FASTDOWN       165
CPCROSSA       83
CPCROSSD       44
BIGVOLUP       7
BIGVODN        15
ACCUMVER       7
HIGHIP21       25
HIUPPCT        19
REDSELL        87
AUGSELS7       27
TRAPDOOR       32
|
Table 4       RANKING OF KEY DIRECTORIES BASED PCT.OF STOCKS ABOVE 65-DMA
              11/13/19
Bullish = 37
Bearish = 9
---------------------------------------------------------------------------------------
Directory     Current       day-1         day-2         day-3         day-4         day-5
----------------------------------------------------------------------------------------
BIGBANKS       1             1             1             1             1             1
COPPER         1             1             1             1             1             1
REGBANKS       1             1             1             1             1             1
ETFS           .913          .965          .965          .965          .965          .965
JETS           .9            1             1             1             1             1
TRANSP         .85           .95           .95           .95           .95           .95
AUTO           .846          .871          .897          .897          .871          .923
FINANCE        .837          .825          .813          .813          .825          .767
SP-100         .811          .811          .8            .811          .733          .733
NIFTY          .807          .824          .807          .807          .789          .754
DOWJONES       .8            .766          .8            .766          .733          .733
MILITARY       .785          .75           .785          .75           .714          .678
DJI-13         .769          .769          .769          .692          .615          .615
RETAIL         .764          .843          .823          .843          .882          .862
CHEM           .755          .775          .857          .857          .836          .775
HACKERS        .75           .8            .7            .7            .65           .65
HOMEBLDG       .741          .741          .741          .709          .677          .774
FIDSTKS        .73           .736          .752          .769          .736          .725
SOFTWARE       .716          .733          .716          .683          .7            .733
INDEXES        .704          .709          .72           .72           .72           .72
INDMATER       .701          .714          .779          .753          .792          .779
ELECTRON       .699          .718          .718          .725          .725          .712
RUS-1000       .696          .697          .708          .713          .701          .716
GUNS           .687          .687          .687          .687          .687          .687
FOOD           .685          .685          .703          .703          .703          .722
NASD-100       .683          .693          .704          .693          .663          .704
SP500          .683          .679          .667          .681          .669          .679
SEMI           .679          .688          .688          .707          .707          .698
GAMING         .652          .652          .739          .739          .739          .695
INFRA          .638          .694          .777          .722          .722          .75
HOSPITAL       .636          .636          .636          .636          .636          .636
COMODITY       .634          .634          .658          .658          .682          .682
COMPUTER       .631          .684          .684          .631          .631          .736
CHINA          .618          .709          .709          .727          .745          .709
REIT           .572          .524          .613          .593          .6            .717
INSURANC       .567          .594          .594          .567          .567          .621
BIOTECH        .508          .491          .511          .502          .456          .468
N=37
===========================================================================================
GREEN          .48           .52           .48           .48           .48           .48
OILGAS         .437          .503          .51           .554          .554          .518
SOLAR          .4            .44           .36           .4            .44           .44
EDU            .388          .444          .444          .388          .388          .333
UTILITY        .35           .275          .25           .325          .35           .4
GOLD           .333          .313          .313          .235          .313          .49
BONDFUND       .289          .28           .35           .324          .298          .368
BEVERAGE       .25           .25           .187          .125          .062          .125
COAL           .166          .166          .333          .333          .333          .333
N=9
|
====================================================================
11/12/2019 The multiple October B21
reinforced by the flat top breakouts
and the bullish Seasonality should keep us long DIA, QQQ and
TECL. The Impeachment hearings will work against the DJI's
advance this week. But Peerless stresses the strong NYSE A/D Line and
the powerful role of the FED in moving the market at these times.
As long as DJI 27400 support holds and the NYSE A/D Line uptrend
is not broken, there should be higher prices. Notice that there are many
more low priced stocks among the Bullish MAXCPs. This is a
natural development when confidence is growing and the FED says it
will "backstop" the general market using all its monetary tools.
Low Priced Stocks Are Flowering
Low priced stocks require high selectivity. Nearly
60% of low priced
stocks are still below their 65-dma despite the year-long advances by
the major market indexes. We will be watching the A/D Line (below) of our
list of 443 stocks between $1 and 5$. It could break either way. My
study of the best performers in this group this year have behaved very
much like those in similar past years' list as shown here and in our
"Explosive Super Stocks".

 |
  |
|
Charts 11/12/2019 2019 PEERLESS DJI, Signals, Indicators Daily DJI Volume 10-DayUp/Down Vol Stoch-20 Hourly DJIA A/D Line for All Stocks Inverted Traders Index NASDAQ S&P OEX NYSE COMPQX DJI-15 DJI-20 DJI-30 DIA SPY QQQ MDY IWM TNA Short-Term Rates USO-CrudeOil DBO FAS GLD BBH IBB JETS JNUG KOL NUGT OIH OIL RSX RETL SDS AGQ SLV SOXL TECL TLT TMF TNA UGA (gasoline) XIV and China: YINN CHAU Commodities: CANE CORN DBC JJC, NIB, CHOC CORN, CUT (paper) MOO, SOYB WEAT UUP (Dollar) LIT (Lithium) AAPL ADBE ALXN AMAT AMGN AMD AMZN AXP BA BABA BAC BIDU CAT CVX DE FB GOOG GS HD IBM INTU JPM M (Macy's) MSFT NFLX NKE NVDA PG QCOM TSLA TXN XOM V WMT CMG , LRCX, SWKS, MDGL SPPI WATT SQ TOWN 11/12/19 (Click on Underlined link.) New highs and Bullish MAXCPs - http://tigersoft.com/max/11-11/BULLISH.htm Bearish MAXCPs - http://tigersoft.com/min/11-12/BEARISH.htm |
Table 1 QUICKSILVER on DJI-30 STOCKS 11/12/2019 Bullish (7) = AAPL CAT GS INTC JPM UNH UTX Weak = (8) AXP BA DIS, KO MCD PG TRV WMT 21 show rising 5-day ma (+0 from day before) SYMBOL CLOSE CHANGE PIVOT-PT 5-dma AROC CL-PWR CANDLE IP21 ITRS Remarks
TREND COLOR
----------------------------------------------------------------------------------------------------
AAPL 261.96 -.24 257.24 93.2% Bullish BLUE .348 .215 Bullish
----------------------------------------------------------------------------------------------------
AXP 120.89 -.01 119.69 88% Bullish ---- -.032 -.03 weak
----------------------------------------------------------------------------------------------------
BA 362.88 -4.08 354.19 64.2% Bearish RED -.069 -.034 weak
----------------------------------------------------------------------------------------------------
CAT 146.34 -1.66 145.49 -1% Bullish RED .299 .192 Bullish
---------------------------------------------------------------------
CSCO 48.37 .27 48.27 63.2% Bullish BLUE .076 -.018
-----------------------------------------------------------------------------------------------------
CVX 120.96 .15 119.9 -40.5% Bullish RED .12 -.018
-----------------------------------------------------------------------------------------------------
DIS 138.58 1.84 131.27 265.9% Bearish BLUE -.192 -.042 weak
-----------------------------------------------------------------------------------------------------
GS 220.41 1.38 218.42 40.1% ------- BLUE .184 .049 Bullish
-----------------------------------------------------------------------------------------------------
HD 233.12 1.32 234.01 19.8% Bearish BLUE .072 -.018
-----------------------------------------------------------------------------------------------------
IBM 135.59 .12 138.78 -83.6% Bullish RED .189 -.047
---------------------------------------------------------------------
INTC 58.2 -.15 57.6 56.1% Bullish RED .388 .181 Bullish
-----------------------------------------------------------------------------------------------------
JNJ 131.35 -.63 130.96 35.3% Bearish RED -.264 -.038 weak
-----------------------------------------------------------------------------------------------------
JPM 129.16 -.76 129.3 2.3% Bullish RED .047 .131
-----------------------------------------------------------------------------------------------------
KO 51.71 -.13 52.8 -67.9% Bearish RED -.106 -.123 Bearish
-----------------------------------------------------------------------------------------------------
MCD 193.28 .64 194.18 28.5% Bearish BLUE -.264 -.168 Bearish
------------------------------------------------------------------------------------------------------
MMM 170.84 .73 174 -127.7% Bullish BLUE .136 .019
------------------------------------------------------------------------------------------------------
MRK 84.12 .84 83.25 72.1% ------- BLUE -.043 -.087 weak
-------------------------------------------------------------------------------------------------------
MSFT 147.07 .96 144.06 90% ------- BLUE .09 .023
-------------------------------------------------------------------------------------------------------
NKE 89.5 -.55 89.48 -21.1% Bearish RED -.162 -.001
---------------------------------------------------------------------
PFE 36.97 .04 37.61 -68.6% ------- BLUE -.228 -.035 Bearish
-------------------------------------------------------------------------------------------------------
PG 119.27 -.06 120.32 15.5% Bearish RED -.059 -.075 weak
--------------------------------------------------------------------------------------------------------
TRV 133.35 -.19 132.35 78.4% ------- RED -.036 -.155 weak
--------------------------------------------------------------------------------------------------------
UNH 255.25 1.16 250.52 97.6% Bullish BLUE .26 .049 Bullish
---------------------------------------------------------------------------------------------------------
UTX 148.39 .17 148.31 18.2% Bullish ---- .134 .092 Bullish
---------------------------------------------------------------------------------------------------------
V 179.74 .2 176.77 94.7% ------- RED .013 -.055
----------------------------------------------------------------------------------------------------------
VZ 59.32 -.29 60.13 -15% Bearish RED .045 -.036
---------------------------------------------------------------------
WBA 62.72 .47 59.49 125.5% Bullish BLUE .068 .185 Bullish
----------------------------------------------------------------------------------------------------------
WMT 119.12 .08 119.5 10.9% Bearish RED -.086 -.019 weak
----------------------------------------------------------------------------------------------------------
DOW 69.37 -.97 71.49 -259.3% Bullish RED -.023 -.046
|
Table 1 QUICKSILVER on ETFS - 11/12/2019 ETF CLOSE CHANGE PIVOT-PT 5-dma AROC CL-PWR CANDLE IP21 ITRS --------------------------------------------------------------------------------------------- DIA 277.29 .13 274.8 44.9% ------- RED .096 0 --------------------------------------------------------------------------------------------- BA 362.88 -4.08 354.19 64.2% Bearish RED -.069 -.034 --------------------------------------------------------------------------------------------- SPY 309 .65 307.1 31.8% Bullish BLUE .16 .005 --------------------------------------------------------------------------------------------- QQQ 201.54 .58 199.76 33.2% Bullish BLUE .316 .027 --------------------------------------------------------------------------------------------- MDY 362.85 -.63 362.7 -19% ------- RED .083 .012 --------------------------------------------------------------------------------------------- IWM 158.83 .05 158.23 -10.1% ------- RED .091 .025 --------------------------------------------------------------------------------------------- FAS 84.94 -.2 84 99.3% ------- RED .089 .132 --------------------------------------------------------------------------------------------- RETL 23.21 .36 21.28 575.1% Bearish BLUE-.098 .056 --------------------------------------------------------------------------------------------- SOXL 228.23 2 222 24.5% Bullish RED .222 .495 Bullish --------------------------------------------------------------------------------------------- TECL 202.89 1.72 193.36 246.2% Bullish BLUE .286 .249 Bullish --------------------------------------------------------------------------------------------- IBB 110.38 .34 108.31 39.3% Bullish BLUE .022 .033 --------------------------------------------------------------------------------------------- GLD 137.43 .37 140.45 -87.3% Bearish BLUE -.077 -.115 --------------------------------------------------------------------------------------------- OIH 14.64 -.34 14.58 0% Bearish RED .038 -.145 --------------------------------------------------------------------------------------------- GASL 7.7 -.1 8.16 -584.9% Bearish RED -.127 -.161 --------------------------------------------------------------------------------------------- RSX 23.05 .33 22.81 125.5% Bearish BLUE-.104 -.035 |
 Table 3   Count of Stocks in Key Directories
          20191112
-------------------------------
NEWHIGHS       221
NEWLOWS        40
MAXCP          42
MINCP          48 Bearish
TTTNH          26
TTTNL          62 Bearish
FASTUP         68
FASTDOWN       176 Bearish
CPCROSSA       52
CPCROSSD       54
BIGVOLUP       2
BIGVODN        13
ACCUMVER       7
HIGHIP21       23
HIUPPCT        16
VHIP21         64
REDSELL        84
AUGSELS7       30
TRAPDOOR       31
|
 Table 4 RANKING OF KEY DIRECTORIES BASED PCT.OF STOCKS ABOVE 65-DMA
              11/12/19
 Bullish = 38
 Bearish = 8
---------------------------------------------------------------------------------------
Directory     Current       day-1         day-2         day-3         day-4         day-5
----------------------------------------------------------------------------------------
BIGBANKS       1             1             1             1             1             1
COPPER         1             1             1             1             1             1
JETS           1             1             1             1             1             1
REGBANKS       1             1             1             1             1             1
ETFS           .965          .965          .965          .965          .965          .965
TRANSP         .95           .95           .95           .95           .95           .95
AUTO           .871          .897          .897          .871          .923          .923
RETAIL         .843          .823          .843          .882          .862          .901
FINANCE        .825          .813          .813          .825          .767          .767
NIFTY          .818          .8            .8            .781          .745          .727
SP-100         .811          .8            .811          .733          .733          .688
HACKERS        .8            .75           .7            .65           .65           .6
CHEM           .775          .857          .857          .836          .795          .857
DJI-13         .769          .769          .692          .615          .615          .538
DOWJONES       .766          .8            .766          .733          .733          .633
MILITARY       .75           .785          .75           .714          .678          .714
HOMEBLDG       .741          .741          .709          .677          .774          .677
FIDSTKS        .736          .752          .769          .736          .725          .719
SOFTWARE       .733          .733          .683          .7            .733          .65
ELECTRON       .718          .718          .725          .725          .718          .732
INDMATER       .714          .779          .753          .792          .779          .818
CHINA          .709          .709          .727          .745          .709          .763
INDEXES        .709          .72           .72           .72           .72           .736
RUS-1000       .697          .709          .713          .701          .717          .717
INFRA          .694          .777          .722          .722          .75           .777
NASD-100       .693          .714          .704          .663          .704          .683
SEMI           .688          .688          .707          .707          .707          .707
GUNS           .687          .687          .687          .687          .687          .687
FOOD           .685          .703          .703          .703          .722          .722
COMPUTER       .684          .684          .631          .631          .736          .736
SP500          .679          .669          .681          .669          .681          .681
GAMING         .652          .739          .739          .739          .695          .739
HOSPITAL       .636          .636          .636          .636          .636          .636
COMODITY       .634          .658          .658          .682          .682          .682
INSURANC       .594          .594          .567          .567          .621          .513
GREEN          .52           .48           .48           .48           .48           .48
REIT           .52           .611          .59           .597          .722          .68
OILGAS         .503          .51           .554          .554          .525          .591
==========================================================================================
BIOTECH        .489          .51           .501          .457          .475          .521
EDU            .444          .444          .388          .388          .333          .333
SOLAR          .44           .36           .4            .44           .44           .4
GOLD           .313          .313          .235          .313          .47           .392
BONDFUND       .28           .35           .324          .298          .368          .263
UTILITY        .275          .25           .325          .35           .4            .4
BEVERAGE       .25           .187          .125          .062          .125          .125
COAL           .166          .333          .333          .333          .333          .5
|
====================================================================
11/11/2019 Monday's decline was shallow, but NYSE
decliners have outnmbered
advancers for the fourth out of five days. Perhaps, we will see a serious
P-I divergence at the upper 3.5% band. Right now the operative Peerless
signal is the multiple October B21 reinforced by the flat top breakouts
and the bullish Seasonality. DIA's chart (third below) shows a
completed bullish inverted head/shoulders and that both Opening and
Closing Power are rising. Stick with the longs suggested, QQQ, SOXL
and DIA. Take heart in the steady improvement of most of the indexes'
Accumulation Index values and the way the market is shrugging off
concerns about Impeachment and higher tax rates if Democrats were
to win big in 2020 and also change the Senate's rules of voting.
Boeing just by itself contributed more than 90 points to the DJI's turn-around.
Watch it tomorrow. Bulls will want it not to slip back more than 7 because
that would take it back below its key 65-dma support.
SOXL's Weekly Chart looks very bullish.
Aggressive investors should buy more.

 |
 |
|
Charts 11/11/2019 2019 PEERLESS DJI, Signals, Indicators Daily DJI Volume 10-DayUp/Down Vol Stoch-20 Hourly DJIA A/D Line for All Stocks Inverted Traders Index NASDAQ S&P OEX NYSE COMPQX DJI-15 DJI-20 DJI-30 DIA SPY QQQ MDY IWM TNA Short-Term Rates USO-CrudeOil DBO FAS GLD BBH IBB JETS JNUG KOL NUGT OIH OIL RSX RETL SDS AGQ SLV SOXL TECL TLT TMF TNA UGA (gasoline) XIV and China: YINN CHAU Commodities: CANE CORN DBC JJC, NIB, CHOC CORN, CUT (paper) MOO, SOYB WEAT UUP (Dollar) LIT (Lithium) AAPL ADBE ALXN AMAT AMGN AMD AMZN AXP BA BABA BAC BIDU CAT CVX DE FB GOOG GS HD IBM INTU JPM M (Macy's) MSFT NFLX NKE NVDA PG QCOM TSLA TXN XOM V WMT CMG , LRCX, SWKS, MDGL SPPI WATT SQ TOWN 11/11/19 (Click on Underlined link.) New highs and Bullish MAXCPs - http://tigersoft.com/max/11-11/BULLISH.htm Bearish MAXCPs - http://tigersoft.com/min/11-11/BEARISH.htm |
Table A QUICKSILVER on DJI-30 STOCKS 11/11/2019 Strongest = AAPL CAT INTC JPM UNH UTX Weak = AXP BA DIS, KO MCD PG TRV 21 show rising 5-day ma (+0 from day before) SYMBOL CLOSE CHANGE PIVOT-PT 5-dma AROC CL-PWR CANDLE IP21 ITRS Remarks
TREND COLOR
----------------------------------------------------------------------------------------------------
AAPL 262.2 2.06 257.13 91% Bullish BLUE .326 .207 Bullish
---------------------------------------------------------------------
AXP 120.9 -.57 118.77 53.3% ------- BLUE -.043 -.045 weak
---------------------------------------------------------------------
BA 366.96 15.96 358.29 223.9% Bearish BLUE -.077 -.041 weak
---------------------------------------------------------------------
CAT 148 -.16 146.37 36.8% ------- BLUE .345 .194 Bullish
---------------------------------------------------------------------
CSCO 48.1 -.73 47.76 64.4% Bullish BLUE .048 -.022
---------------------------------------------------------------------
CVX 120.81 -.12 121.94 -31.3% ------- BLUE .154 -.023
---------------------------------------------------------------------
DIS 136.74 -1.22 131.45 143.3% Bearish RED -.25 -.053 weak
---------------------------------------------------------------------
GS 219.03 -3.88 218.64 -19% Bullish RED .197 .025
---------------------------------------------------------------- -----
HD 231.8 -1.04 232.2 -66.8% Bearish BLUE .045 -.032
---------------------------------------------------------------------
IBM 135.47 -2.14 137.89 -79.8% ------- RED .209 -.05
---------------------------------------------------------------------
INTC 58.35 .08 57.55 64% Bullish BLUE .394 .181 Bullish
---------------------------------------------------------------------
JNJ 131.98 -1.02 130.42 66.7% ------- RED -.264 -.021
---------------------------------------------------------------------
JPM 129.92 -.46 129.1 42.5% Bullish BLUE .094 .133 firm
---------------------------------------------------------------------
KO 51.84 -.37 52.42 -123.6% Bearish RED -.116 -.107 Bearish
---------------------------------------------------------------------
MCD 192.64 -.97 192.18 103.5% Bearish RED -.274 -.168 Bearish
---------------------------------------------------------------------
MMM 170.11 -3.04 175.27 -137.4% ------- RED .158 .003
---------------------------------------------------------------------
MRK 83.28 -.31 82.92 -37.2% ------- BLUE -.038 -.086
---------------------------------------------------------------------
MSFT 146.11 .15 144.46 53.9% Bearish BLUE .053 .011
---------------------------------------------------------------------
NKE 90.05 .24 89.88 10.6% Bearish BLUE -.121 .016
---------------------------------------------------------------------
PFE 36.93 -.12 37.48 -147% ------- ---- -.228 -.011
---------------------------------------------------------------------
PG 119.33 -.37 118.9 10.9% ------- RED -.095 -.057 weak
---------------------------------------------------------------------
TRV 133.54 .25 131.27 126.5% ------- BLUE -.039 -.141 weak
---------------------------------------------------------------------
UNH 254.09 -2.88 250.3 56.1% ------- RED .212 .037
---------------------------------------------------------------------
UTX 148.22 -.66 147.85 23.9% ------- BLUE .142 .089 Bullish
---------------------------------------------------------------------
V 179.54 .57 176.37 16.6% Bearish BLUE -.01 -.056
---------------------------------------------------------------------
VZ 59.61 .26 59.5 -21.7% ------- BLUE .039 -.024
---------------------------------------------------------------------
WBA 62.25 3.01 61.21 217.9% Bullish RED .041 .167
---------------------------------------------------------------------
WMT 119.04 -.4 118.86 61.7% ------- BLUE -.107 -.007
---------------------------------------------------------------------
DOW 70.34 -.43 73.09 -92.4% ------- BLUE .016 -.022
|
Table 1 QUICKSILVER on ETFS - 11/11/2019 ETF CLOSE CHANGE PIVOT-PT 5-dma AROC CL-PWR CANDLE IP21 ITRS --------------------------------------------------------------------------------------------- DIA 277.16 .09 274.81 47.3% ------- BLUE .089 0 --------------------------------------------------------------------------------------------- BA 366.96 15.96 358.29 223.9% Bearish BLUE -.077 -.041 --------------------------------------------------------------------------------------------- SPY 308.35 -.59 307.04 15.9% ------- BLUE .149 .005 --------------------------------------------------------------------------------------------- QQQ 200.96 -.27 200.21 21.5% ------- BLUE .309 .023 --------------------------------------------------------------------------------------------- MDY 363.48 -.74 364.23 1.8% ------- BLUE .128 .01 --------------------------------------------------------------------------------------------- IWM 158.78 -.3 159.15 -5.4% ------- BLUE .155 .017 --------------------------------------------------------------------------------------------- FAS 85.14 -.12 83.26 72.9% ------- BLUE .136 .125 --------------------------------------------------------------------------------------------- RETL 25.71 -.05 26.77 11.5% ------- BLUE .215 .312 --------------------------------------------------------------------------------------------- SOXL 226.23 -3.74 227.12 9.1% ------- BLUE .253 .411 --------------------------------------------------------------------------------------------- TECL 201.17 .36 193.18 183.4% ------- BLUE .262 .202 --------------------------------------------------------------------------------------------- IBB 110.04 -.32 109.52 24.7% ------- BLUE .032 .02 --------------------------------------------------------------------------------------------- GLD 137.06 -.33 139.85 -182.3% Bearish RED -.11 -.096 --------------------------------------------------------------------------------------------- OIH 11.91 -.37 12.55 -429.3% Bearish RED -.058 -.163 --------------------------------------------------------------------------------------------- GASL 7.8 -.91 8.68 -457% Bearish RED -.09 -.186 --------------------------------------------------------------------------------------------- RSX 24.83 -.14 24.99 -32% Bullish BLUE .253 .066 |
Table 3 Count of Stocks in Key Directories
20191111
-------------------------------
NEWHIGHS 166
NEWLOWS 23
MAXCP 81
MINCP 48
TTTNH 26
TTTNL 58
FASTUP 64
FASTDOWN 172
CPCROSSA 140
CPCROSSD 77
BIGVOLUP 3
BIGVODN 8
ACCUMVER 2
HIGHIP21 33
HIUPPCT 14
LOWACCUM 82
REDSELL 85
AUGSELS7 26
TRAPDOOR 31
|
Table 4 RANKING OF KEY DIRECTORIES BASED PCT.OF STOCKS ABOVE 65-DMA
              11/11/19
 Bullish = 38
 Bearish = 8
---------------------------------------------------------------------------------------
Directory     Current       day-1         day-2         day-3         day-4         day-5
----------------------------------------------------------------------------------------
BIGBANKS       1             1             1             1             1             1
COPPER         1             1             1             1             1             1
JETS           1             1             1             1             1             1
REGBANKS       1             1             1             1             1             1
ETFS           .965          .965          .965          .965          .965          .965
TRANSP         .95           .95           .95           .95           .95           .95
AUTO           .897          .897          .871          .923          .923          .871
CHEM           .857          .857          .836          .795          .857          .857
FINANCE        .823          .823          .835          .776          .776          .835
RETAIL         .823          .843          .882          .862          .901          .862
DOWJONES       .8            .766          .733          .733          .633          .666
NIFTY          .8            .8            .781          .745          .727          .727
SP-100         .8            .811          .733          .733          .688          .733
MILITARY       .785          .75           .714          .678          .714          .75
INDMATER       .779          .753          .792          .779          .818          .805
INFRA          .777          .722          .722          .75           .777          .861
DJI-13         .769          .692          .615          .615          .538          .615
FIDSTKS        .752          .769          .736          .725          .719          .736
HACKERS        .75           .75           .65           .65           .6            .55
HOMEBLDG       .741          .709          .677          .774          .677          .774
GAMING         .739          .739          .739          .695          .739          .739
SOFTWARE       .733          .7            .7            .733          .65           .633
ELECTRON       .718          .725          .725          .718          .725          .732
INDEXES        .716          .716          .716          .716          .732          .77
NASD-100       .714          .714          .673          .704          .683          .714
CHINA          .709          .727          .745          .709          .763          .763
RUS-1000       .709          .715          .701          .717          .716          .744
FOOD           .703          .703          .703          .722          .722          .814
SEMI           .688          .707          .707          .707          .698          .707
GUNS           .687          .687          .687          .687          .687          .687
COMPUTER       .684          .631          .631          .736          .736          .684
SP500          .669          .683          .669          .681          .679          .704
COMODITY       .658          .658          .682          .682          .682          .78
HOSPITAL       .636          .636          .636          .636          .636          .681
REIT           .613          .593          .6            .724          .689          .806
INSURANC       .594          .567          .567          .621          .513          .594
OILGAS         .51           .554          .554          .525          .598          .562
BIOTECH        .505          .497          .453          .473          .52           .531
==========================================================================================
GREEN          .48           .48           .48           .48           .52           .48
EDU            .444          .388          .388          .333          .333          .333
SOLAR          .384          .423          .461          .461          .384          .423
BONDFUND       .35           .324          .298          .368          .271          .254
COAL           .333          .333          .333          .333          .5            .333
GOLD           .313          .235          .313          .47           .392          .607
UTILITY        .25           .325          .35           .4            .4            .55
BEVERAGE       .187          .125          .062          .125          .125          .187
|
====================================================================
11/8/2019 The operative Peerless signal is the multiple
October B21 reinforced
by the flat top breakouts and the bullish Seasonality. The DJI has rallied
75% of the time over the next ten trading days since 1967 and gained on
average +1.6%. But this morning, it looks like Trump's warnings - that there will
be no back-stepping on his tariff plans for trade with China - may bring a
testing of the DJI's recent flat-resistance zone between 27350 and 27500.
Ordinarily, the recent Accumulation Index reading below zero would be seen as
a problem. But recently, these Monday declines have been shallow and quickly
end.


|
Charts 11/8/2019 2019 PEERLESS DJI, Signals, Indicators Daily DJI Volume 10-DayUp/Down Vol Stoch-20 Hourly DJIA A/D Line for All Stocks Inverted Traders Index NASDAQ S&P OEX NYSE COMPQX DJI-15 DJI-20 DJI-30 DIA SPY QQQ MDY IWM TNA Short-Term Rates USO-CrudeOil DBO FAS GLD BBH IBB JETS JNUG KOL NUGT OIH OIL RSX RETL SDS AGQ SLV SOXL TECL TLT TMF TNA UGA (gasoline) XIV and China: YINN CHAU Commodities: CANE CORN DBC JJC, NIB, CHOC CORN, CUT (paper) MOO, SOYB WEAT UUP (Dollar) LIT (Lithium) AAPL ADBE ALXN AMAT AMGN AMD AMZN AXP BA BABA BAC BIDU CAT CVX DE FB GOOG GS HD IBM INTU JPM M (Macy's) MSFT NFLX NKE NVDA PG QCOM TSLA TXN XOM V WMT CMG , LRCX, SWKS, MDGL SPPI WATT SQ TOWN 11/8/19 (Click on Underlined link.) New highs and Bullish MAXCPs - http://tigersoft.com/max/11-8/BULLISH.htm Bearish MAXCPs - http://tigersoft.com/min/11-8/BEARISH.htm |
More Upside...
Some of you may want to play it safe, given the fact that the DJI is already up
much more than the typical 15+% gain achieved in this the third year of the Four
year cycle. But I think we should still be optimistic. Wall Street and the FED
have
good reason to keep the advance going. The majority on the FOMC have shown
that they willing to "back-stop" the market, especially if the tariff wars
continue.
Most important, the NYSE A/D Line is still uptrending in a powerfully bullish
fashion. Stocks would seem to be a much better bargain the 10-year bonds
priced to yield 1.6%.
But beyond all this, let's look back at the bull markets in the third
year of the four year Presidential cycle where the DJI is making new highs
in November. Such a study shows that when a DJI advance lasts until November
in these years, it nearly always continues late in December and even
when the Accumulation is negative with the DJI near the upper band.
History Shows These Year-3 Rallies
That Stay Strong until November
Keep Advancing until the End of December.
We have no Accumulation readings for years before 1929, but it's probably
worth noting that the super-strong 1915 and 1927
advances rallied until the
the end of the year. 1935
did bring a November peak, but that was because
the DJI had just advanced 16% from its September lows. There were no
significant non-confirmations and there were no Peerless Sells. The DJI
retreated then to its rising 65-dma and took off again to the upside. In 1955
the DJI was at its year's high at the end of December. In 1959 and also in
1999 the DJI kept rising in November and December to new
highs despite weak
internals, including negative Accumulation readings and a somewhat premature
Peerless Sells. Back in late 1959, the FED was raising rates and Nixon was
grumbling about how this would hurt his Election chances in 1960 with whomever
the Democrats picked to be President. In 1963, the DJI rose in late November
after JFK's assassination until the end of the year, despite weak and negative internal
strength readings. In 1967, the
DJI had already peaked in September because the
FED was raising interest rates. In 1983, the DJI did peak temporarily on 11/29/1983.
Interestingly, the 4% retreat that followed then was signalled by an obvious
NYSE A/D Line NC, not Accumulation Index weakness. The DJI was below its
high in November 1987. In 1991, it did fall back to its lower band, having failed
to breakout of a nine-month long trading range. In 1995, the DJI hit a minor top on
12/13, having risen 11% in the previous six weeks. A comparable rally here would
require the DJI to reach 28900. In 2003, the DJI advanced until year's end. In
2007, 2011 and 2015, the DJI was not near its highs in November or December.
DJI Percent Gains in the Third Year
of the Four Year Cycle: 1951-2019
Yr. Pct
1951 14.4
1955 20.8
1959 16.4
1963 17.0
1967 15.2
1971 6.1
1975 38.3
1979 4.2
1983 20.3
1987 2.3
1991 20.3
1995 33.5
1999 25.2
2003 25.3
2007 6.4
2011 5.5
2015 -2.2
-----------
Avg.= 15.8% N= 17
2019=18.7% (through 11/8/2019)
Table A QUICKSILVER on DJI-30 STOCKS 11/8/2019 Strongest = AAPL CAT INTC UNH UTX Weak = BA KO MCD PG TRV 21 show rising 5-day ma (-1 from day before) IP21>+.10 AAPL, CAT, CVX, GS, IBM, INTC, MMM, UNH, UTX (9 cases) IP21<-.10 = BA, DIS, JNJ, KO, MCD, MRK, NKE, PFE (8 cases) SYMBOL CLOSE CHANGE PIVOT-PT 5-dma AROC CL-PWR CANDLE IP21 ITRS Remarks
TREND COLOR
----------------------------------------------------------------------------------------------------
AAPL 260.14 .71 257.5 83.9% ------- BLUE .316 .195 Strong
---------------------------------------------------------------------
AXP 121.47 .19 119.62 97.3% Bullish BLUE -.064 -.044
---------------------------------------------------------------------
BA 351 -6.31 351.09 82.2% Bearish RED -.147 -.082 Weak
---------------------------------------------------------------------
CAT 148.16 1.15 146.92 125.6% Bullish BLUE .326 .208 Strong
---------------------------------------------------------------------
CSCO 48.83 .41 47.48 188.3% ------- BLUE -.016 -.017
---------------------------------------------------------------------
CVX 120.93 -.96 121.57 196.2% Bullish ---- .143 -.021
---------------------------------------------------------------------
DIS 137.96 5 132.92 196.9% Bearish RED -.24 -.049
---------------------------------------------------------------------
GS 222.91 -.38 219.87 125.7% ------- RED .2 .046
---------------------------------------------------------------------
HD 232.84 -.1 234.92 -96% Bearish ---- -.005 -.026
---------------------------------------------------------------------
IBM 137.61 -.08 137.67 75.6% Bullish BLUE .197 -.03
---------------------------------------------------------------------
INTC 58.27 .22 57.61 153.1% Bullish BLUE .341 .193 Strong
---------------------------------------------------------------------
JNJ 133 1.57 130.23 68.8% Bearish BLUE -.28 -.013
---------------------------------------------------------------------
JPM 130.38 .38 128.82 100% Bullish BLUE .026 .144
---------------------------------------------------------------------
KO 52.21 -.08 53.14 -159.7% Bearish RED -.114 -.101 Weak
---------------------------------------------------------------------
MCD 193.61 .53 188.66 -8.6% Bearish RED -.28 -.172 Very weak
---------------------------------------------------------------------
MMM 173.15 -1.37 174.9 88.1% Bullish RED .213 .03
---------------------------------------------------------------------
MRK 83.59 .71 83.9 -80.8% Bearish BLUE -.065 -.086
---------------------------------------------------------------------
MRK 145.96 1.7 144.55 77.7% Bearish BLUE -.008 .007
---------------------------------------------------------------------
NKE 89.81 -.59 89.86 35.1% Bearish RED -.154 .002
---------------------------------------------------------------------
PFE 37.05 .14 38.03 -177.8% Bearish BLUE -.276 -.001
---------------------------------------------------------------------
PG 119.7 .08 119.07 -173.2% Bearish RED -.105 -.062 Weak
---------------------------------------------------------------------
TRV 133.29 .28 130.2 97.7% Bearish BLUE -.079 -.143 Weak
---------------------------------------------------------------------
UNH 256.97 .51 251.25 94.4% ------- BLUE .155 .064 Strong
---------------------------------------------------------------------
UTX 148.88 .15 147.51 74.4% Bullish BLUE .135 .1 Strong
---------------------------------------------------------------------
V 178.97 .54 178.95 -55% Bearish BLUE -.065 -.062
---------------------------------------------------------------------
VZ 59.35 -1.18 59.87 -84.9% Bearish RED -.024 -.026
---------------------------------------------------------------------
WBA 59.24 .57 59.65 156.9% Bullish BLUE .04 .125
---------------------------------------------------------------------
WMT 119.44 -.79 117.57 76.6% Bearish RED -.072 -.003
---------------------------------------------------------------------
DOW 70.77 -2.24 71.67 81.5% ------- RED -.02 -.016
|
Table 2 QUICKSILVER on ETFS - 11/8/2019 ETF CLOSE CHANGE PIVOT-PT 5-dma AROC CL-PWR CANDLE IP21 ITRS --------------------------------------------------------------------------------------------- DIA 277.07 .02 274.55 67.8% ------- RED .005 ----- --------------------------------------------------------------------------------------------- BA 351 -6.31 351.09 82.2% Bearish RED -.147 -.082 --------------------------------------------------------------------------------------------- SPY 309 .82 307.37 46.6% ------- BLUE .034 .006 --------------------------------------------------------------------------------------------- QQQ 201.23 .8 200.1 59% ------- BLUE .214 .021 --------------------------------------------------------------------------------------------- MDY 364.22 1.05 363.35 39.5% ------- BLUE .089 .014 --------------------------------------------------------------------------------------------- IWM 159.08 .43 158.95 30.9% ------- BLUE .137 .017 --------------------------------------------------------------------------------------------- FAS 85.26 .11 83.91 107.8% ------- ---- .004 .131 --------------------------------------------------------------------------------------------- RETL 21.99 -.75 20.14 210% Bearish RED -.134 -.024 --------------------------------------------------------------------------------------------- SOXL 229.97 3.61 225.82 404.9% Bullish BLUE .177 .46 --------------------------------------------------------------------------------------------- TECL 200.81 3.3 193.99 253.3% ------- BLUE .166 .196 Bullish --------------------------------------------------------------------------------------------- IBB 110.36 2.01 109.5 23.4% Bullish BLUE-.01 .015 --------------------------------------------------------------------------------------------- GLD 137.39 -.88 142.15 -183.8% Bearish RED -.047 -.097 --------------------------------------------------------------------------------------------- OIH 14.64 -.34 14.58 0% Bearish RED .038 -.137 --------------------------------------------------------------------------------------------- RSX 22.58 -.34 22.38 6.6% Bearish RED -.112 -.049 |
Table 3  Count of Stocks in Key Directories
             20191108
-------------------------------
NEWHIGHS       304
NEWLOWS        32
MAXCP          61
MINCP          42
TTTNH          21
TTTNL          65
FASTUP         99
FASTDOWN       139
CPCROSSA       166
CPCROSSD       38
BIGVOLUP       8
BIGVODN        17
ACCUMVER       5
HIGHIP21       24
LOWACCUM       80
REDSELL        84
AUGSELS7       41
TRAPDOOR       32
|
 Table 4
 RANKING OF KEY DIRECTORIES BASED PCT.OF STOCKS ABOVE 65-DMA
             11/8/19
Bullish = 37 Bearish = 9 --------------------------------------------------------------------------------------- Directory Current day-1 day-2 day-3 day-4 day-5 ---------------------------------------------------------------------------------------- BIGBANKS 1 1 1 1 1 1 COPPER 1 1 1 1 1 1 JETS 1 1 1 1 1 .9 REGBANKS 1 1 1 1 1 1 ETFS .965 .965 .965 .965 .965 .931 TRANSP .95 .95 .95 .95 .95 .85 AUTO .897 .871 .923 .923 .897 .871 CHEM .857 .836 .795 .857 .857 .795 RETAIL .843 .882 .862 .901 .882 .843 FINANCE .813 .825 .767 .767 .825 .813 SP-100 .811 .733 .733 .688 .733 .744 NIFTY .807 .789 .754 .736 .754 .736 FIDSTKS .769 .736 .725 .719 .736 .719 DOWJONES .766 .733 .733 .633 .666 .7 INDMATER .753 .792 .779 .818 .805 .74 HACKERS .75 .7 .65 .6 .55 .65 MILITARY .75 .714 .678 .714 .75 .642 GAMING .739 .739 .695 .739 .739 .695 ELECTRON .73 .73 .717 .723 .736 .664 CHINA .727 .745 .709 .763 .763 .745 INFRA .722 .722 .75 .777 .861 .805 INDEXES .721 .716 .716 .732 .764 .775 RUS-1000 .715 .703 .717 .716 .747 .735 NASD-100 .714 .683 .714 .683 .724 .724 SEMI .714 .714 .704 .695 .714 .676 HOMEBLDG .709 .677 .774 .677 .774 .87 FOOD .703 .703 .722 .722 .814 .888 SOFTWARE .7 .716 .733 .65 .65 .65 DJI-13 .692 .615 .615 .538 .615 .615 GUNS .687 .687 .687 .687 .687 .75 SP500 .683 .671 .681 .679 .708 .715 COMODITY .658 .682 .682 .682 .78 .853 HOSPITAL .636 .636 .636 .636 .681 .681 COMPUTER .631 .631 .736 .736 .684 .578 REIT .593 .6 .724 .689 .8 .82 INSURANC .567 .567 .621 .513 .594 .54 OILGAS .554 .554 .525 .598 .562 .437 N= 37 ============================================================================================== BIOTECH .494 .45 .47 .52 .534 .52 GREEN .48 .48 .48 .52 .48 .4 SOLAR .4 .44 .44 .4 .44 .44 EDU .388 .388 .333 .333 .333 .388 COAL .333 .333 .333 .5 .333 .5 UTILITY .325 .35 .4 .4 .575 .725 BONDFUND .324 .298 .368 .271 .254 .298 GOLD .235 .313 .47 .392 .607 .647 BEVERAGE .125 .062 .125 .125 .187 .187 N=9 |
====================================================================
11/7/2019 The operative Peerless signal is the
multiple October B21 reinforced
by the flat top breakouts. So long as there are no new Peerless Sell
or the NYSE A/D Line breaks its uptrend and the DJI falls back below
27500, let's allow the key Indexes to run. A break in the Opening Power
uptrends of the individual general market ETFs would also be be bearish.
Opening Power is "king" right now.
Today's 280 point early DJI advance did lose 100 points, but it still ended
up +180 and well above the 27500 resistance it broke out of. More disappointing
was the fact that there were 220 more down than up. This probably owed
to today's advance in interest rates, itself a result of traders' thinking that
an end of the trade war with China would take away one of their major
excuses for keeping rates low. But another way to see all this is that
traders are becoming more inclined to shed their defensive positions and
take more aggressive speculative ones.


Peerless is of two minds. On the one hand it cannot give a new and bullish
Buy B10 to the breakout. But on the other hand, it is not giving a sell either.
So, the rising powers of higher Openings are still in contol. The game of
big banks' Funds buying general market futures before the opening and
then selling on the strength their early buying creates continues. And so
does the rising trend continue. The last three day's total - 400 breadth
plurality is not yet significant.
Hold QQQ, SOXL and DIA. Give the market every chance to run
to the upside now.


|
Charts 11/7/2019 2019 PEERLESS DJI, Signals, Indicators Daily DJI Volume 10-DayUp/Down Vol Stoch-20 Hourly DJIA A/D Line for All Stocks Inverted Traders Index NASDAQ S&P OEX NYSE COMPQX DJI-15 DJI-20 DJI-30 DIA SPY QQQ MDY IWM TNA Short-Term Rates USO-CrudeOil DBO FAS GLD BBH IBB JETS JNUG KOL NUGT OIH OIL RSX RETL SDS AGQ SLV SOXL TECL TLT TMF TNA UGA (gasoline) XIV and China: YINN CHAU Commodities: CANE CORN DBC JJC, NIB, CHOC CORN, CUT (paper) MOO, SOYB WEAT UUP (Dollar) LIT (Lithium) AAPL ADBE ALXN AMAT AMGN AMD AMZN AXP BA BABA BAC BIDU CAT CVX DE FB GOOG GS HD IBM INTU JPM M (Macy's) MSFT NFLX NKE NVDA PG QCOM TSLA TXN XOM V WMT CMG , LRCX, SWKS, MDGL SPPI WATT SQ TOWN 11/7/19 (Click on Underlined link.) New highs and Bullish MAXCPs - http://tigersoft.com/max/11-7/BULLISH.htm Bearish MAXCPs - http://tigersoft.com/min/11-7/BEARISH.htm |
Table A QUICKSILVER on DJI-30 STOCKS 11/7/2019 Strongest = AAPL CAT INTC UTX 23 show rising 5-day ma (+5 from day before) IP21>+.10 AAPL, CAT, CVX, GS, IBM, INTC, MMM, UNH, UTX (9 cases) IP21<-.10 = BA, DIS, JNJ, MCD, MRK, NKE, PFE (7 cases) SYMBOL CLOSE CHANGE PIVOT-PT 5-dma AROC CL-PWR CANDLE IP21 ITRS Remarks
TREND COLOR
----------------------------------------------------------------------------------------------------
AAPL 259.43 2.19 255.82 209% Bullish BLUE .324 .198 Strong
----------------------------------------------------------------------------------------------------
AXP 121.28 1.59 119.14 168.2% Bullish BLUE -.065 -.046 weak
----------------------------------------------------------------------------------------------------
BA 357.31 3.12 345.19 248.8% Bearish BLUE -.14 -.071 weak
----------------------------------------------------------------------------------------------------
CAT 147.01 1.52 144.49 319.3% ------- RED .323 .216 Strong
---------------------------------------------------------------------
CSCO 48.42 .15 47.03 95.6% Bearish RED .004 -.031
---------------------------------------------------------------------
CVX 121.89 1.99 116.21 241.3% ------- BLUE .151 -.021
---------------------------------------------------------------------
DIS 132.96 1.69 132.75 115.4% Bearish BLUE -.231 -.09 weak
---------------------------------------------------------------------
GS 223.29 4.87 217.39 227.8% Bullish BLUE .186 .05 Bullish
---------------------------------------------------------------------
HD 232.94 -1.07 237.34 -35% Bearish RED .01 -.014
---------------------------------------------------------------------
IBM 137.69 -1.09 135.53 144.8% ------- RED .183 -.027
---------------------------------------------------------------------
INTC 58.05 .45 56.51 133% Bullish ---- .313 .204 Strong
---------------------------------------------------------------------
JNJ 131.43 .47 131.2 -23.3% ------- RED -.319 -.043 weak
---------------------------------------------------------------------
JPM 130 .7 127.8 198.5% Bullish RED -.007 .153
---------------------------------------------------------------------
KO 52.29 -.51 53.9 -200.6% ------- RED -.09 -.115
---------------------------------------------------------------------
MCD 193.08 -1.1 193.94 -93.7% Bearish RED -.282 -.179 Bearish
---------------------------------------------------------------------
MMM 174.52 .52 170.09 277.3% Bullish RED .229 .044
---------------------------------------------------------------------
MRK 82.88 -.37 84.94 -224.1% ------- RED -.124 -.106 weak
---------------------------------------------------------------------
MSFT 144.26 .2 143.72 30.9% Bearish BLUE -.034 0
---------------------------------------------------------------------
NKE 90.4 .92 89.18 47.4% Bearish RED -.163 .019 Distribution
---------------------------------------------------------------------
PFE 36.91 -.7 38.39 -192.2% Bearish RED -.311 -.012 Distribution
---------------------------------------------------------------------
PG 119.62 -.7 123.87 -201.5% ------- RED -.082 -.079 weak
---------------------------------------------------------------------
TRV 133.01 .66 130.72 74.4% ------- BLUE -.088 -.155
---------------------------------------------------------------------
UNH 256.46 5.94 252.21 74.8% Bullish BLUE .196 .064
---------------------------------------------------------------------
UTX 148.73 .42 146.68 175.4% ------- RED .144 .108 strong
---------------------------------------------------------------------
V 178.43 1.66 180.93 -12.1% Bearish BLUE -.072 -.065 weak
---------------------------------------------------------------------
VZ 60.53 .4 60.37 5% Bullish BLUE .031 -.019
---------------------------------------------------------------------
WBA 58.67 -.82 57.38 332.5% Bullish RED .026 .111
---------------------------------------------------------------------
WMT 120.23 .73 117.62 125.7% ------- BLUE -.019 .003
---------------------------------------------------------------------
DOW 73.01 1.52 69.6 384.8% Bullish BLUE .049 .015
|
Table 1 QUICKSILVER on ETFS - 11/7/2019 ETF CLOSE CHANGE PIVOT-PT 5-dma AROC CL-PWR CANDLE IP21 ITRS --------------------------------------------------------------------------------------------- DIA 277.05 2.25 273.34 120.1% ------- BLUE -.002 --- --------------------------------------------------------------------------------------------- BA 357.31 3.12 345.19 248.8% Bearish BLUE -.14 -.071 weak --------------------------------------------------------------------------------------------- SPY 308.18 1.08 306.14 79.2% ------- RED .012 .003 --------------------------------------------------------------------------------------------- QQQ 200.43 .67 198.87 84.1% ------- RED .195 .019 --------------------------------------------------------------------------------------------- MDY 363.17 .47 361.35 96% ------- RED .064 .013 --------------------------------------------------------------------------------------------- IWM 158.65 .42 158.1 101.3% ------- RED .102 .019 --------------------------------------------------------------------------------------------- FAS 85.15 1.15 83.45 252.7% Bullish BLUE-.01 .161 --------------------------------------------------------------------------------------------- RETL 26.23 -.07 24.52 530.4% ------- RED .214 .336 strong --------------------------------------------------------------------------------------------- SOXL 226.36 4.36 211.94 647.1% ------- RED .137 .522 strong --------------------------------------------------------------------------------------------- TECL 197.51 4.15 190.99 339.7% ------- BLUE .147 .225 bullish --------------------------------------------------------------------------------------------- IBB 108.35 .04 109.85 46.4% ------- RED -.023 -.011 --------------------------------------------------------------------------------------------- GLD 138.27 -2.18 142.56 -147% Bearish RED -.015 -.111 --------------------------------------------------------------------------------------------- OIH 11.91 -.37 12.55 -429.3% Bearish RED -.058 -.178 --------------------------------------------------------------------------------------------- RSX 25.19 .22 24.75 224.2% Bullish RED .245 .088 Bullish |
 Table 2   Count of Stocks in Key Directories
          20191107
-------------------------------
NEWHIGHS       305
NEWLOWS        31
MAXCP          42
MINCP          77
TTTNH          26
TTTNL          101
FASTUP         165
FASTDOWN       92
CPCROSSA       59
CPCROSSD       102
BIGVOLUP       1
BIGVODN        26
ACCUMVER       6
HIGHIP21       19
HIUPPCT        16
LOWACCUM       80
REDSELL        87
AUGSELS7       41
TRAPDOOR       30
|
 Table 3     RANKING OF KEY DIRECTORIES BASED PCT.OF STOCKS ABOVE 65-DMA
             11/7/19
Bullish = 37
Bearish =  9
---------------------------------------------------------------------------------------
Directory     Current       day-1         day-2         day-3         day-4         day-5
----------------------------------------------------------------------------------------
BIGBANKS       1             1             1             1             1             1
COPPER         1             1             1             1             1             1
JETS           1             1             1             1             .9            .9
REGBANKS       1             1             1             1             1             .962
ETFS           .965          .965          .965          .965          .931          .931
TRANSP         .95           .95           .95           .95           .85           .75
RETAIL         .882          .862          .901          .882          .843          .784
AUTO           .871          .923          .923          .897          .871          .82
CHEM           .836          .795          .857          .857          .795          .693
FINANCE        .825          .767          .767          .825          .813          .732
INDMATER       .792          .779          .818          .805          .74           .584
NIFTY          .789          .754          .736          .754          .719          .684
CHINA          .745          .709          .763          .763          .745          .6
GAMING         .739          .695          .739          .739          .695          .739
FIDSTKS        .736          .725          .719          .736          .714          .67
DOWJONES       .733          .733          .633          .666          .7            .7
SP-100         .733          .733          .688          .733          .744          .644
ELECTRON       .725          .718          .725          .738          .673          .62
INFRA          .722          .75           .777          .861          .805          .694
INDEXES        .721          .716          .732          .764          .77           .716
SOFTWARE       .716          .75           .65           .65           .633          .65
MILITARY       .714          .678          .714          .75           .642          .535
SEMI           .707          .707          .698          .716          .679          .641
RUS-1000       .703          .719          .716          .747          .734          .681
HACKERS        .7            .7            .6            .55           .65           .55
FOOD           .698          .716          .716          .811          .886          .867
GUNS           .687          .687          .687          .687          .75           .625
NASD-100       .683          .724          .693          .724          .714          .683
COMODITY       .682          .682          .682          .78           .853          .853
HOMEBLDG       .677          .774          .677          .774          .87           .838
SP500          .671          .683          .679          .708          .715          .677
HOSPITAL       .636          .636          .636          .681          .681          .681
COMPUTER       .631          .736          .736          .684          .578          .631
DJI-13         .615          .615          .538          .615          .615          .615
REIT           .6            .724          .689          .8            .82           .813
INSURANC       .567          .621          .513          .594          .54           .513
OILGAS         .554          .525          .598          .562          .445          .313
N = 37
=================================================================================================
GREEN          .48           .48           .52           .48           .4            .4
SOLAR          .461          .461          .384          .423          .423          .461
BIOTECH        .446          .466          .515          .533          .524          .472
EDU            .388          .333          .333          .333          .388          .333
UTILITY        .35           .4            .4            .575          .725          .675
COAL           .333          .333          .5            .333          .5            .333
GOLD           .313          .47           .392          .607          .647          .647
BONDFUND       .298          .368          .271          .254          .298          .35
BEVERAGE       .062          .125          .125          .187          .187          .187
N = 9
|
====================================================================
11/6/2019 Give the market every chance to run to the
upside now. The best
Flat-top breakouts above well-tetsed resistance take months to form,
We do not want to be way too quick to sell. A nearly year-long rising
NYSE A/D Line is also a rare event and always quite bullish.

The gains after months' long, flat resistance November
Breakouts
have mostly been very fine. We do want to sell prematurely.
1953 Nov flat-topped breakout started a stunning 3 1/2 year
advance.

1972 Nov flat-topped breakout succeeded

1985 Nov flat topped breakout led to new leg up in
major bull market.

2016 Nov breakout started a major advance. Trump victory.

The DJI and the market are shrugging off pundits'
assertions that
Republicans could lose control of White House in a year. This morning
the DJI is up +100 before the opening after a seemingly dangerous
stalling out at resistance. A bullish flat topped breakout by the DJI
seems to be occurring to confirm similar early breakouts by SP-500,
NASDAQ, QQQ, OEX and Semi-condusts. The advance is broad
enough now to be pressuring even short sellers of stocks that have fallen
a long ways but are now breaking above their 65-dma. Nor can those
who have been mechanically trading the Stochastic-20 with JETS,
DJI-Transports or IWM now safely stay short.
Hold long QQQ, DIA and SOXL. Generally, we want to buy stocks
now that have resistance either far away or, because new all-times
highs are being made, where the cannot be determined easily. Surges of IP21
on the breakout are very important. Much more on this
Sunday night.

|
Charts 11/6/2019 2019 PEERLESS DJI, Signals, Indicators Daily DJI Volume 10-DayUp/Down Vol Stoch-20 Hourly DJIA A/D Line for All Stocks Inverted Traders Index NASDAQ S&P OEX NYSE COMPQX DJI-15 DJI-20 DJI-30 DIA SPY QQQ MDY IWM TNA Short-Term Rates USO-CrudeOil DBO FAS GLD BBH IBB JETS JNUG KOL NUGT OIH OIL RSX RETL SDS AGQ SLV SOXL TECL TLT TMF TNA UGA (gasoline) XIV and China: YINN CHAU Commodities: CANE CORN DBC JJC, NIB, CHOC CORN, CUT (paper) MOO, SOYB WEAT UUP (Dollar) LIT (Lithium) AAPL ADBE ALXN AMAT AMGN AMD AMZN AXP BA BABA BAC BIDU CAT CVX DE FB GOOG GS HD IBM INTU JPM M (Macy's) MSFT NFLX NKE NVDA PG QCOM TSLA TXN XOM V WMT CMG , LRCX, SWKS, MDGL SPPI WATT SQ TOWN 11/6/19 (Click on Underlined link.) New highs and Bullish MAXCPs - http://tigersoft.com/max/11-6/BULLISH.htm Bearish MAXCPs - http://tigersoft.com/min/11-6/BEARISH.htm |
Table A QUICKSILVER on DJI-30 STOCKS 11/6/2019 Strongest = AAPL CAT INTC WBA 18 show rising 5-day ma (-5 from day before) SYMBOL CLOSE CHANGE PIVOT-PT 5-dma AROC CL-PWR CANDLE IP21 ITRS Remarks
TREND COLOR
----------------------------------------------------------------------------------------------------
AAPL 257.24 .11 248.76 276.8% ------- BLUE .329 .194 Strong
---------------------------------------------------------------------
AXP 119.69 .92 117.28 68.3% Bullish BLUE-.071 -.049
---------------------------------------------------------------------
BA 354.19 -4.1 339.91 116.8% Bearish RED -.149 -.067
---------------------------------------------------------------------
CAT 145.49 -.88 137.8 179.8% Bullish RED .361 .217 Strong
---------------------------------------------------------------------
CSCO 48.27 .51 47.51 74.8% Bearish BLUE .011 -.034
---------------------------------------------------------------------
CVX 119.9 -2.04 116.14 149.4% Bullish RED .099 -.031
---------------------------------------------------------------------
DIS 131.27 -.18 129.92 63.6% Bearish RED -.253 -.09
---------------------------------------------------------------------
GS 218.42 -.22 213.38 60.1% ------- BLUE .129 .037 good
---------------------------------------------------------------------
HD 234.01 1.81 234.58 -47.4% Bearish BLUE .06 .006
---------------------------------------------------------------------
IBM 138.78 .89 133.73 129.8% Bullish BLUE .223 -.008
---------------------------------------------------------------------
INTC 57.6 .05 56.53 87.8% Bullish BLUE .336 .192 Strong
---------------------------------------------------------------------
JNJ 130.96 .54 132.04 -71.6% Bearish BLUE-.324 -.056
---------------------------------------------------------------------
JPM 129.3 .2 124.92 140.2% Bullish BLUE .041 .157 good
---------------------------------------------------------------------
KO 52.8 .38 54.43 -106.4% Bearish BLUE-.07 -.101
---------------------------------------------------------------------
MCD 194.18 2 196.7 -70% Bearish BLUE-.261 -.167 Bearish
---------------------------------------------------------------------
MMM 174 -1.27 164.99 164.9% Bullish RED .214 .051 Strong
---------------------------------------------------------------------
MRK 83.25 .33 86.66 -174.9% Bearish RED -.085 -.092 weak
---------------------------------------------------------------------
MRK 144.06 -.4 143.37 -19.1% Bearish -----.01 -.005
---------------------------------------------------------------------
NKE 89.48 -.4 89.55 -39.6% Bearish RED -.185 .025
---------------------------------------------------------------------
PFE 37.61 .13 38.37 -114% Bearish --- -.268 .029
---------------------------------------------------------------------
PG 120.32 1.42 124.51 -188.9% ------- BLUE-.083 -.068 weak
---------------------------------------------------------------------
TRV 132.35 1.08 131.06 98.4% Bearish BLUE-.067 -.166 weak
---------------------------------------------------------------------
UNH 250.52 .22 252.7 -84.8% ------- BLUE .167 .058 good
---------------------------------------------------------------------
UTX 148.31 .46 143.58 153.2% Bullish BLUE .164 .125 Bullish
---------------------------------------------------------------------
V 176.77 .4 178.86 -69.3% Bearish BLUE-.062 -.075 weak
---------------------------------------------------------------------
VZ 60.13 .63 60.47 -57.3% ------- BLUE-.017 -.014
---------------------------------------------------------------------
WBA 59.49 -1.72 54.78 314.1% Bullish RED .061 .137 Bullish
---------------------------------------------------------------------
WMT 119.5 .64 117.26 59.4% ------- BLUE .001 -.003
---------------------------------------------------------------------
DOW 71.49 -1.6 67.57 269.6% ------- RED -.004 -.002
|
Table 1 QUICKSILVER on ETFS - 11/6/2019 ETF CLOSE CHANGE PIVOT-PT 5-dma AROC CL-PWR CANDLE IP21 ITRS
---------------------------------------------------------------------------------------------
DIA 274.8 -.01 270.48 56% ------- RED .024 0
---------------------------------------------------------------------------------------------
BA 354.19 -4.1 339.91 116.8% Bearish RED -.149 -.067
---------------------------------------------------------------------------------------------
SPY 307.1 .07 303.33 48.4% ------- ---- .06 .005
---------------------------------------------------------------------------------------------
QQQ 199.76 -.45 197.08 69.7% ------- RED .207 .017
high
---------------------------------------------------------------------------------------------
MDY 362.7 -1.53 356.23 54.2% ------- RED .101 .02
---------------------------------------------------------------------------------------------
IWM 158.23 -.92 155.45 60.3% ------- RED .123 .026
---------------------------------------------------------------------------------------------
FAS 84 .74 80.95 112.4% ------- BLUE .038 .165
---------------------------------------------------------------------------------------------
RETL 21.28 .59 21.11 142.2% Bearish BLUE-.24 -.191
---------------------------------------------------------------------------------------------
SOXL 222 -5.12 198.27 467.7% Bullish RED .151 .518 Strong
---------------------------------------------------------------------------------------------
TECL 193.36 .18 184.52 220.5% ------- RED .184 .2 Strong
---------------------------------------------------------------------------------------------
IBB 108.31 -1.21 107.34 33.1% ------- RED -.038 -.006
---------------------------------------------------------------------------------------------
GLD 140.45 .6 142.43 -20.1% Bearish BLUE .031 -.101
---------------------------------------------------------------------------------------------
OIH 14.64 -.34 14.58 0% Bearish RED .038 -.153
---------------------------------------------------------------------------------------------
GASL 8.16 -.52 6.59 971.7% Bearish RED -.054 -.03
---------------------------------------------------------------------------------------------
|
 Table 3   Count of Stocks in Key Directories
           20191106
-------------------------------
NEWHIGHS       194  Bullish
NEWLOWS        20
MAXCP          57
MINCP          48
TTTNH          23
TTTNL          53
FASTUP         107
FASTDOWN       76
CPCROSSA       57
CPCROSSD       105
BIGVOLUP       3
BIGVODN        22
ACCUMVER       3
HIGHIP21       21
HIUPPCT        17
LOWACCUM       79
REDSELL        96
AUGSELS7       32
TRAPDOOR       26
|
Table 4  RANKING OF KEY DIRECTORIES BASED PCT.OF STOCKS ABOVE 65-DMA
            11/6/19
 Bullish = 39
 Bearish = 7
---------------------------------------------------------------------------------------
Directory     Current       day-1         day-2         day-3         day-4         day-5
----------------------------------------------------------------------------------------
BIGBANKS       1             1             1             1             1             1
COPPER         1             1             1             1             1             .8
JETS           1             1             1             .9            .9            .9
REGBANKS       1             1             1             1             .962          1
ETFS           .965          .965          .965          .931          .931          .931
TRANSP         .95           .95           .95           .85           .75           .8
AUTO           .923          .923          .897          .871          .794          .846
RETAIL         .862          .901          .882          .843          .784          .803
CHEM           .795          .857          .857          .795          .693          .755
INDMATER       .779          .818          .805          .74           .584          .649
HOMEBLDG       .774          .677          .774          .87           .838          .903
FINANCE        .767          .767          .825          .813          .732          .813
NIFTY          .754          .736          .754          .719          .666          .684
INFRA          .75           .777          .861          .805          .694          .833
SOFTWARE       .75           .666          .65           .633          .633          .633
COMPUTER       .736          .736          .684          .578          .631          .684
DOWJONES       .733          .633          .666          .7            .7            .666
SP-100         .733          .688          .733          .744          .644          .655
FIDSTKS        .725          .719          .736          .714          .664          .681
NASD-100       .724          .704          .734          .714          .673          .683
REIT           .722          .687          .798          .819          .819          .84
RUS-1000       .719          .717          .747          .734          .678          .708
ELECTRON       .718          .725          .738          .673          .62           .66
FOOD           .716          .716          .811          .886          .867          .773
INDEXES        .716          .732          .764          .77           .711          .716
CHINA          .709          .763          .763          .745          .581          .581
SEMI           .707          .698          .716          .679          .641          .669
HACKERS        .7            .65           .55           .65           .55           .5
GAMING         .695          .739          .739          .695          .739          .782
GUNS           .687          .687          .687          .75           .625          .625
SP500          .683          .681          .708          .715          .673          .696
COMODITY       .682          .682          .78           .853          .853          .78
MILITARY       .678          .714          .75           .642          .5            .5
HOSPITAL       .636          .636          .681          .681          .681          .727
INSURANC       .621          .513          .594          .54           .513          .594
DJI-13         .615          .538          .615          .615          .615          .615
OILGAS         .525          .598          .562          .445          .313          .343
============================================================================================
GREEN          .48           .52           .48           .4            .4            .44
GOLD           .47           .392          .607          .647          .647          .392
BIOTECH        .463          .513          .53           .524          .472          .457
SOLAR          .461          .384          .423          .423          .461          .5
UTILITY        .4            .4            .575          .725          .675          .7
BONDFUND       .368          .271          .254          .298          .359          .166
COAL           .333          .5            .333          .5            .333          .333
EDU            .333          .333          .333          .388          .333          .444
BEVERAGE       .125          .125          .187          .187          .187          .062
|
====================================================================
11/5/2019 Give the DJI more chance to breakout but do
not add to long positions
at this time. My review tonight of Novembers when DJI is near or at its
highs shows a 10 excellent flat-topped breakouts but only four that failed.
All the failures resumed their uptrends after pullbacks to the rising
65-dma or the lower band.

Of course, we can not help noting the failure of our Accumulation Index
to turn positive on this advance. This is a result of the big money selling into
the early strength created by a steady stream of higher openings. This
forces the question: Who's in charge? Those who buy before and at the
opening? Or those who sell into early strength? It may well be the very same
traders are involved. I've suggested it's big money selling because they fear a
change in tax policies if Democrats win big in 2020. Perhaps, big money also
fears that interest rates can only go up from here.
DJI Peaks and Breakout Failures vs Valid Breakouts in Novembers 1915-2019
My new survey of what happens to
Novembers when they face well-tested resistance,
like now, On 4 times the breakout failed
or failed to be achieved and the DJI fell
back to the lower band or the rising
65-dma, but no lower. On
10 occasions, a good-sized
advance followed a well-tested flat
top-breakout. In this count I leave out the 3% advance
in 1915.
1915 Breakout above flat, well-tested resistance. But
only 3% advance by end of year.
1919 Serious decline from early Nov peak following steep advance. 120 to 93 in Feb 1920.
Fed rapidly raising rates. Red Scare. Post-war boom and bust.
1925 Nov peak after steep advance. DJI fell back to rising 65-dma.
1928 November flat topped breakout. DJI rose
vertically 10+% in a month.
1935 Nov peak after steep advance. DJI fell back to rising 65-dma.
1936 Nov peak after steep advance. DJI fell back 4%.
1938 Nov peak called by S12 and DJI fell back from 158 to 140
and rising 200-dma.
1942 Nov. breakout began long advance after shallow
retreat to point of
breakout.
1950 False Nov. flat top breakout. NKorean
early successes. DJI fell back
to rising 65-dma and resumed strong uptrend.
1953 Nov breakout led to 8 weeks' sidewise movement
and then major bull market.
1954 Nov flat top breakout led to big advance.
1958 Nov peak after steep advance. DJI fell back to rising 65-dma
1961 Nov. peak and DJI fell back 8% from upper band. No Sell.
1963 Nov. peak and DJI fell back 6% from upper band. No Sell. JFK
assassination.
1964 Nov. peak after DJI rally to only 1.8% upper band. DJI fell 4%. No Sell.
1965 Nov. peak after DJI rally to only 1.4% upper band. DJI fell to
rising 65-dma
1972 Nov flat-topped breakout succeeded
1980 Nov S9/S12 brought about a 9% decline. Also H/S..
1982 Nov peak. DJI fell back from 3.9% band to lower band. No Sell.
1983 Nov Sell S4 peak brought decline to lower band.
1984 Nov Failure to breakout on 4th test of flat
resistance led to decline
to lower band. No Sell.
1992 Nov peak and shallow retreat after multiple NCs at 1% upper band.
1985 Nov flat topped breakout led to new leg up in
major bull market.
1986 Nov Failure to breakout on 4th test of
flat resistance led to decline
to rising 65-dma. No Sell.
1991 Nov Failure to breakout on 5th test of
flat resistance led to decline
to lower band. No Sell.
1995 Nov flat topped breakout led to new leg up in
major bull market.
1996 Nov peak after steep advance. DJI fell to lower
band. No Sell.
2010 Nov breakout over only 2x tested flat resistance failed and DJI fell
to rising 65-dma.
2013 Nov breakout above flat-rising resistance
started new advance after
a month's delay.
2016 Nov breakout started a major advance.
Trump victory.
2017 November flat topped breakout brought strong two
month advance.
|
Charts 11/5/2019 2019 PEERLESS DJI, Signals, Indicators Daily DJI Volume 10-DayUp/Down Vol Stoch-20 Hourly DJIA A/D Line for All Stocks Inverted Traders Index NASDAQ S&P OEX NYSE COMPQX DJI-15 DJI-20 DJI-30 DIA SPY QQQ MDY IWM TNA Short-Term Rates USO-CrudeOil DBO FAS GLD BBH IBB JETS JNUG KOL NUGT OIH OIL RSX RETL SDS AGQ SLV SOXL TECL TLT TMF TNA UGA (gasoline) XIV and China: YINN CHAU Commodities: CANE CORN DBC JJC, NIB, CHOC CORN, CUT (paper) MOO, SOYB WEAT UUP (Dollar) LIT (Lithium) AAPL ADBE ALXN AMAT AMGN AMD AMZN AXP BA BABA BAC BIDU CAT CVX DE FB GOOG GS HD IBM INTU JPM M (Macy's) MSFT NFLX NKE NVDA PG QCOM TSLA TXN XOM V WMT CMG , LRCX, SWKS, MDGL SPPI WATT SQ TOWN 11/5/19 (Click on Underlined link.) New highs and Bullish MAXCPs - http://tigersoft.com/max/11-5/BULLISH.htm Bearish MAXCPs - http://tigersoft.com/min/11-5/BEARISH.htm |
Table A QUICKSILVER on DJI-30 STOCKS 11/5/2019 Strongest = AAPL CAT INTC WBA(+2) 23 show rising 5-day ma 11 have rising Closing Powers 6 have bullish IP21s > .07 19 show bearish IP21s < -.07
SYMBOL CLOSE   CHANGE  PIVOT-PT   5-dma AROC  CL-PWR TREND  CANDLE  IP21  ITRS   Remarks
                                                            COLOR
----------------------------------------------------------------------------------------------------
AAPL   257.13 -.37     243.26        277.1%   ------- ---- .244   .185
---------------------------------------------------------------------
AXP    118.77 -.85     118.07        57.1%    Bullish RED -.129  -.059
---------------------------------------------------------------------
BA     358.29  7.2     346.06        135.2%   Bearish BLUE-.117  -.063
---------------------------------------------------------------------
CAT    146.37 -.55     140.34        177.2%   Bullish RED  .343   .219
---------------------------------------------------------------------
CSCO   47.76  .28       47.56         54.9%   Bearish BLUE-.062  -.047
---------------------------------------------------------------------
CVX    121.94  .37     116.36        161.9%   Bullish BLUE .108  -.007
---------------------------------------------------------------------
DIS    131.45 -1.47    129.6         75.2%    Bearish RED -.296  -.084
---------------------------------------------------------------------
GS     218.64 -1.23    215.81        23.1%    ------- RED  .109   .034
---------------------------------------------------------------------
HD     232.2 -2.72     236.24       -41.2%    Bearish RED  .005   .001
---------------------------------------------------------------------
IBM    137.89  .22     135.25        150.5%   Bullish BLUE .144   0
---------------------------------------------------------------------
INTC   57.55 -.06       56.6          106.7%  Bullish BLUE .275   .203
---------------------------------------------------------------------
JNJ    130.42  .19     132.84         49.6%   Bearish BLUE-.355  -.04
---------------------------------------------------------------------
JPM    129.1  .28      125.73        105.3%   Bullish RED -.002   .147
---------------------------------------------------------------------
KO     52.42 -.72       53.94        -92.1%   Bearish RED -.155  -.1
---------------------------------------------------------------------
MCD    192.18  3.52    196.89       -11.4%    Bearish BLUE-.276  -.175
---------------------------------------------------------------------
MMM    175.27  .37     168.37        190.6%   Bullish BLUE .165   .062
---------------------------------------------------------------------
MRK    82.92 -.98       86.22        -127.7%  Bearish RED -.074  -.095
---------------------------------------------------------------------
MSFT   144.46 -.09     144.61        56.7%    Bearish RED -.07   .006
---------------------------------------------------------------------
NKE    89.88  .02       90.19         33.5%   Bearish RED -.165   .032
---------------------------------------------------------------------
PFE    37.48 -.55       38.48        -95.3%   ------- RED -.325   .015
---------------------------------------------------------------------
PG     118.9 -.17      124.94       -190.7%   Bearish BLUE-.159  -.064
---------------------------------------------------------------------
TRV    131.27  1.07    129.78        89.9%    Bearish BLUE-.142  -.17
---------------------------------------------------------------------
UNH    250.3 -.95      254.8        -39.4%    Bullish RED  .161   .023
---------------------------------------------------------------------
UTX    147.85  .34     143.84        202.1%   Bullish BLUE .106   .118
---------------------------------------------------------------------
V      176.37 -2.58    179.25       -35.2%    Bearish RED -.066  -.068
---------------------------------------------------------------------
VZ     59.5 -.37        60.82        -57.2%   Bearish RED -.059  -.011
---------------------------------------------------------------------
WBA    61.21  1.56      55.86         435%    Bullish BLUE .095   .163
---------------------------------------------------------------------
WMT    118.86  1.29    118.1         72.7%    ------- BLUE-.035   .001
---------------------------------------------------------------------
DOW    73.09  1.42      67.72         337%    Bullish BLUE-.002   .017
|
Table 1 QUICKSILVER on ETFS - 11/5/2019 ETF CLOSE CHANGE PIVOT-PT 5-dma AROC CL-PWR CANDLE IP21 ITRS --------------------------------------------------------------------------------------------- DIA 274.81 .26 271.74 72.4% ------- RED -.048 ---- --------------------------------------------------------------------------------------------- BA 358.29 7.2 346.06 135.2% Bearish BLUE-.117 -.063 --------------------------------------------------------------------------------------------- SPY 307.03 -.34 304.14 62.7% ------- RED -.049 .005 --------------------------------------------------------------------------------------------- QQQ 200.21 .11 196.99 105.4% ------- RED .112 .023 --------------------------------------------------------------------------------------------- MDY 364.23 .88 358.79 61.1% Bullish RED .041 .017 --------------------------------------------------------------------------------------------- IWM 159.15 .2 156.33 73.2% ------- RED .1 .022 --------------------------------------------------------------------------------------------- FAS 83.26 -.65 82.14 98.3% ------- RED -.078 .141 --------------------------------------------------------------------------------------------- RETL 20.69 .55 20.69 55.6% Bearish -----.12 -.205 --------------------------------------------------------------------------------------------- SOXL 227.12 1.3 202.07 602.8% Bullish RED .059 .543 --------------------------------------------------------------------------------------------- TECL 193.18 -.81 185 311.7% Bearish RED .088 .197 --------------------------------------------------------------------------------------------- IBB 109.52 .02 107.59 95.1% Bullish RED -.035 .001 --------------------------------------------------------------------------------------------- GLD 139.85 -2.3 141.02 -14.1% Bearish RED .047 -.091 --------------------------------------------------------------------------------------------- OIH 14.64 -.34 14.58 0% Bearish RED .038 -.147 --------------------------------------------------------------------------------------------- GASL 8.68 .1 6.69 770% Bearish RED -.064 .012 --------------------------------------------------------------------------------------------- |
 Table 2   Count of Stocks in Key Directories
          20191105
-------------------------------
NEWHIGHS       303  Bullish
NEWLOWS        16
MAXCP          69
MINCP          30
TTTNH          29
TTTNL          85
FASTUP         123
FASTDOWN       68
CPCROSSA       46
CPCROSSD       110
BIGVOLUP       4
BIGVODN        15
ACCUMVER       4
HIGHIP21       19
HIUPPCT        15
LOWACCUM       77
REDSELL        105
AUGSELS7       41
TRAPDOOR       22
|
 RANKING OF KEY DIRECTORIES BASED PCT.OF STOCKS ABOVE 65-DMA
              11/5/19
Bullish = 39
Bearish = 6
---------------------------------------------------------------------------------------
Directory     Current       day-1         day-2         day-3         day-4         day-5
----------------------------------------------------------------------------------------
BIGBANKS       1             1             1             1             1             1
COPPER         1             1             1             1             .8            1
JETS           1             1             .9            .9            .9            .9
REGBANKS       1             1             1             .962          1             1
ETFS           .965          .965          .931          .931          .931          .913
TRANSP         .95           .95           .85           .75           .8            .9
AUTO           .923          .897          .871          .794          .846          .871
RETAIL         .901          .882          .843          .784          .803          .862
CHEM           .857          .857          .795          .693          .755          .693
INDMATER       .818          .805          .74           .584          .636          .662
INFRA          .777          .861          .805          .694          .777          .833
FINANCE        .776          .835          .823          .741          .811          .811
CHINA          .763          .763          .745          .581          .581          .709
GAMING         .739          .739          .695          .739          .782          .739
COMPUTER       .736          .684          .578          .631          .684          .631
NIFTY          .736          .754          .719          .666          .684          .631
INDEXES        .732          .764          .77           .711          .716          .737
ELECTRON       .725          .738          .673          .62           .66           .653
FIDSTKS        .719          .736          .714          .664          .686          .664
RUS-1000       .717          .748          .734          .678          .705          .705
FOOD           .716          .811          .886          .867          .773          .773
MILITARY       .714          .75           .642          .5            .5            .535
NASD-100       .704          .744          .724          .673          .704          .663
SEMI           .698          .716          .679          .641          .669          .632
REIT           .689          .8            .82           .82           .841          .82
SP-100         .688          .733          .744          .644          .666          .688
GUNS           .687          .687          .75           .625          .625          .687
COMODITY       .682          .78           .853          .853          .78           .756
SP500          .681          .711          .715          .673          .698          .683
HOMEBLDG       .677          .774          .87           .838          .903          .903
SOFTWARE       .666          .666          .633          .633          .633          .583
HACKERS        .65           .6            .65           .55           .5            .45
HOSPITAL       .636          .681          .681          .681          .681          .681
DOWJONES       .633          .666          .7            .7            .666          .633
OILGAS         .598          .562          .445          .313          .321          .416
DJI-13         .538          .615          .615          .615          .615          .615
GREEN          .52           .48           .4            .4            .44           .48
INSURANC       .513          .594          .54           .513          .594          .567
BIOTECH        .51           .527          .521          .472          .46           .463
COAL           .5            .333          .5            .333          .333          .333
=========================================================================================
UTILITY        .4            .575          .725          .675          .7            .6
GOLD           .392          .607          .647          .647          .372          .392
SOLAR          .384          .423          .423          .461          .5            .5
EDU            .333          .333          .388          .333          .444          .388
BONDFUND       .271          .254          .298          .359          .175          .105
BEVERAGE       .125          .187          .187          .187          .062          .187
|
====================================================================
11/4/2019 Give the DJI more chance to breakout. That is
the lesson of the
very strong A/D Line and October Buy B21s. A target 2000 points
higher can be calculated based on the height (in points) of the trading
range that the DJI is now moving up from. Notice also the smaller
"continuation inverted head/shoulders" that has developed over the
the last two months.

The advance is broad enough to remain optimistic that the DJI will
soon follow the other Indexes and make a clear breakout above its
highest previous hypothetical highs and surpass 27500. See all the
Indexes making new highs. Breakouts like these into all-time high
territory reliably achieve at least a run upwards to their minimum objectives,
the height of their previous trading ranges added to the point of breakouts.
With the FED "back-stopping" the stock market, investment and
performance funds seem bound to become more aggressive. So, SOXL
(semi-conductors) and QQQ should do well now. SOXL's price target
is now almost 50% higher.

President Trump knows his re-election chances will best be served by a
strong stock market advance between now and the Election. It is, therefore,
likely that there will be no more U.S. initiated untoward developments in the
realm of the US-China trade war/talks. Expect the DJI to follow the other
indexes and the NYSE A/D Line to rise much more in keeping also with the
Bullish Seasonality.
As discussed last night, there is reason for thinking the red Distribution
will only slow the advance, not reverse it. My thinking here is that "Big
Money",
as represented by the negative IP21, is not worried about the economy or of
a change in monetary policy. Rather, the super wealthy want to lock in some
profits in 2019 just in case the Democrats win in the Elections of November 2020
and quickly enact new and higher capital gains' taxes in 2021 for 2020.
 |
 |
 |
|
Charts 11/4/2019 2019 PEERLESS DJI, Signals, Indicators Daily DJI Volume 10-DayUp/Down Vol Stoch-20 Hourly DJIA A/D Line for All Stocks Inverted Traders Index NASDAQ S&P OEX NYSE COMPQX DJI-15 DJI-20 DJI-30 DIA SPY QQQ MDY IWM TNA Short-Term Rates USO-CrudeOil DBO FAS GLD BBH IBB JETS JNUG KOL NUGT OIH OIL RSX RETL SDS AGQ SLV SOXL TECL TLT TMF TNA UGA (gasoline) XIV and China: YINN CHAU Commodities: CANE CORN DBC JJC, NIB, CHOC CORN, CUT (paper) MOO, SOYB WEAT UUP (Dollar) LIT (Lithium) AAPL ADBE ALXN AMAT AMGN AMD AMZN AXP BA BABA BAC BIDU CAT CVX DE FB GOOG GS HD IBM INTU JPM M (Macy's) MSFT NFLX NKE NVDA PG QCOM TSLA TXN XOM V WMT CMG , LRCX, SWKS, MDGL SPPI WATT SQ TOWN 11/4/19 (Click on Underlined link.) New highs and Bullish MAXCPs - http://tigersoft.com/max/11-4/BULLISH.htm Bearish MAXCPs - http://tigersoft.com/min/11-4/BEARISH.htm |
Table A QUICKSILVER on DJI-30 STOCKS 11/4/2019 Strongest IP21 and ITRS = AAPL (257+1), CAT (147+2), INTC (+1), WBA(+2) 21 show rising 5-day ma (-4 from day before) Only 3 have rising Closing Powers (Drop of 10 from day before) 9 have bullish IP21s > .07 14 have bearish IP21s < -.07 SYMBOL CLOSE CHANGE PIVOT-PT 5-dma AROC CL-PWR TREND CANDLE IP21 ITRS Remarks
COLOR
-----------------------------------------------------------------------------------------------
AAPL 257.23 1.41 243.29 164.9% ------- RED .209 .199 Very bullish
----------------------------------------------------------------------------------------------------
AXP 119.55 .41 117.42 41.1% ------- ---- -.166 -.056 Weak
-----------------------------------------------------------------------------------------------------
BA 350.64 5.45 348.93 141.8% Bearish BLUE -.134 -.086 Weak
------------------------------------------------------------------------------------------------------
CAT 146.65 2.16 141.33 234% ------- BLUE .339 .215 Very Bullish
------------------------------------------------------------------------------------------------------
CSCO 47.44 .41 47.24 28.5% Bearish ---- -.084 -.053
------------------------------------------------------------------------------------------------------
CVX 121.68 5.47 118.13 136.7% ------- BLUE .027 -.014
-------------------------------------------------------------------------------------------------------
DIS 132.88 .13 129.48 90.1% Bearish RED -.26 -.062 Weak
--------------------------------------------------------------------------------------------------------
GS 219.93 2.54 217.64 50.4% Bullish BLUE .137 .05
--------------------------------------------------------------------------------------------------------
HD 234.61 -2.73 234.14 -46.4% Bearish RED -.003 .008
---------------------------------------------------------------------------------------------------------
IBM 137.62 2.09 133.82 61.2% ------- BLUE .131 -.009
----------------------------------------------------------------------------------------------------------
INTC 57.58 1.07 56.34 72.5% Bullish BLUE .268 .21
-----------------------------------------------------------------------------------------------------------
JNJ 130.29 -.91 129.12 42.4% Bearish RED -.338 -.051 Weak
-----------------------------------------------------------------------------------------------------------
JPM 128.87 1.07 126.43 93.4% ------- RED .025 .145
-----------------------------------------------------------------------------------------------------------
KO 53.09 -.81 53.41 -44.6% Bearish RED -.159 -.083
-----------------------------------------------------------------------------------------------------------
MCD 188.45 -5.49 192.62 -85.7% Bearish RED -.372 -.193 Very weak
-----------------------------------------------------------------------------------------------------------
MMM 174.71 4.62 168.81 167.9% ------- BLUE .086 .05
----------------------------------------------------------------------------------------------------------
MRK 83.95 -.99 85.1 102.9% Bearish RED -.036 -.082
----------------------------------------------------------------------------------------------------------
MSFT 144.41 .69 142.83 7.7% Bearish RED -.105 .012
----------------------------------------------------------------------------------------------------------
NKE 89.79 .61 89.28 -59% Bearish RED -.165 .045
----------------------------------------------------------------------------------------------------------
PFE 38.08 -.31 38.21 104.9% Bearish RED -.296 .038
----------------------------------------------------------------------------------------------------------
PG 118.99 -4.88 123.6 -180.9% Bearish RED -.182 -.057 Weak
-----------------------------------------------------------------------------------------------------------
TRV 130.16 -.56 128.93 33.1% Bearish RED -.184 -.171
----------------------------------------------------------------------------------------------------------
UNH 251.32 -.89 252.29 84.8% ------- RED .225 .019
--------------------------------------------------------------------------------------------------------------
UTX 147.37 .69 142 150.5% ------- RED .072 .123
-------------------------------------------------------------------------------------------------------
V 178.9 -2.03 177.63 -26.2% Bearish RED -.023 -.05
---------------------------------------------------------------------------------------------------------
VZ 59.81 -.56 60.19 -30.6% Bearish BLUE -.04 -.001
----------------------------------------------------------------------------------------------------------
WBA 59.79 2.41 56.27 356.1% Bullish BLUE .175 .142 Bullish
----------------------------------------------------------------------------------------------------------
WMT 117.38 -.24 117.15 -78.1% Bearish RED -.099 -.012
---------------------------------------------------------------------------------------------------------
DOW 71.66 2.06 68.44 220.8% ------- BLUE -.129 -.009
|
Table 1 QUICKSILVER on ETFS - 11/4/2019 ETF CLOSE CHANGE PIVOT-PT 5-dma AROC CL-PWR CANDLE IP21 ITRS --------------------------------------------------------------------------------------------- DIA 274.42 1.08 270.87 66.5% ------- RED -.067 ---- --------------------------------------------------------------------------------------------- BA 350.64 5.45 348.93 141.8% Bearish BLUE -.134 -.086 weak. --------------------------------------------------------------------------------------------- SPY 307.19 1.05 303.21 64% ------- RED -.084 .008 --------------------------------------------------------------------------------------------- QQQ 199.94 1.07 196.04 60.1% ------- RED .062 .027 --------------------------------------------------------------------------------------------- MDY 363.58 2.23 359.83 65.5% ------- BLUE .054 .015 --------------------------------------------------------------------------------------------- IWM 158.99 .89 156.85 84.6% ------- RED .103 .023 --------------------------------------------------------------------------------------------- FAS 83.92 .47 81.64 168.6% ------- RED -.099 .178 --------------------------------------------------------------------------------------------- RETL 25.66 1.14 25.12 -145.1% ------- BLUE .309 .415 Very Strong --------------------------------------------------------------------------------------------- SOXL 225.6 13.66 202.04 443.3% ------- BLUE .038 .562 --------------------------------------------------------------------------------------------- TECL 193.71 2.72 181.51 191.1% ------- RED .05 .241 --------------------------------------------------------------------------------------------- IBB 109.44 -.41 107.46 113.1% ------- RED -.049 -.002 --------------------------------------------------------------------------------------------- GLD 142.12 -.44 140.25 52.3% ------- RED .059 -.085 --------------------------------------------------------------------------------------------- OIH 11.91 -.37 12.55 -429.3% Bearish RED -.058 -.185 --------------------------------------------------------------------------------------------- GASL 8.57 1.29 7.55 1177.6% Bearish BLUE -.024 .005 --------------------------------------------------------------------------------------------- RSX 24.98 .23 24.1 199.9% Bullish ---- .2 .078 |
Table 3 Count of Stocks in Key Directories
20191104
-------------------------------
NEWHIGHS 394
NEWLOWS 18
MAXCP 76
MINCP 20
TTTNH 19
TTTNL 60
FASTUP 115
FASTDOWN 79
CPCROSSA 62
CPCROSSD 127
BIGVOLUP 4
BIGVODN 16
ACCUMVER 9
HIGHIP21 17
HIUPPCT 15
LOWACCUM 74
REDSELL 109
AUGSELS7 37
TRAPDOOR 20
|
Table 3 RANKING OF KEY DIRECTORIES BASED PCT.OF STOCKS ABOVE 65-DMA
11/4/19
Bullish = 40
Bearish = 6
---------------------------------------------------------------------------------------
Directory Current day-1 day-2 day-3 day-4 day-5
----------------------------------------------------------------------------------------
BIGBANKS 1 1 1 1 1 1
COPPER 1 1 1 .8 1 1
JETS 1 .9 .9 .9 .9 .9
REGBANKS 1 1 .962 1 1 .962
TRANSP .95 .85 .75 .8 .9 .9
ETFS .948 .931 .931 .931 .913 .931
AUTO .897 .871 .794 .846 .871 .871
RETAIL .882 .843 .784 .803 .862 .843
INFRA .861 .805 .694 .777 .833 .916
CHEM .857 .795 .693 .755 .673 .734
FINANCE .835 .823 .741 .8 .788 .788
FOOD .811 .886 .867 .773 .735 .792
INDMATER .805 .74 .584 .636 .662 .701
REIT .793 .82 .82 .841 .82 .806
COMODITY .78 .853 .853 .78 .731 .756
HOMEBLDG .774 .87 .838 .903 .903 .967
INDEXES .768 .774 .715 .72 .725 .731
CHINA .767 .75 .589 .571 .696 .785
MILITARY .75 .642 .5 .5 .535 .5
RUS-1000 .747 .735 .678 .705 .7 .681
FIDSTKS .741 .714 .664 .686 .648 .653
GAMING .739 .695 .739 .782 .739 .826
NIFTY .736 .719 .666 .684 .631 .684
NASD-100 .734 .734 .683 .704 .642 .642
SP-100 .733 .744 .644 .666 .688 .633
ELECTRON .732 .673 .62 .66 .64 .666
SP500 .708 .717 .673 .698 .675 .656
SEMI .707 .679 .641 .669 .622 .66
GUNS .687 .75 .625 .625 .625 .625
COMPUTER .684 .578 .631 .684 .631 .631
HOSPITAL .681 .681 .681 .681 .636 .59
DOWJONES .666 .7 .7 .666 .633 .6
SOFTWARE .65 .65 .633 .633 .583 .55
DJI-13 .615 .615 .615 .615 .615 .615
GOLD .607 .647 .647 .372 .392 .352
HACKERS .6 .7 .55 .5 .45 .4
INSURANC .594 .54 .513 .594 .567 .432
OILGAS .576 .445 .313 .321 .416 .386
UTILITY .575 .725 .675 .7 .6 .575
BIOTECH .533 .518 .469 .46 .472 .46
===================================================================================
GREEN .48 .4 .4 .44 .48 .48
SOLAR .461 .423 .461 .5 .5 .5
COAL .333 .5 .333 .333 .333 .166
EDU .333 .388 .333 .444 .388 .388
BONDFUND .254 .298 .359 .175 .114 .114
BEVERAGE .187 .187 .187 .062 .187 .187
|
====================================================================
11/1/2019 Expect the DJI to breakout
over 27500. Hold long QQQ. Buy SOXL.
and more of the Bullish MAXCPs. Buy DIA, too, out of respect for
Peerless, the bullish seasonality and the low interest rates. Cover short sales
whose Closing Power turns up above CP down-trendline. A breakout run
to 29,500 seems a good possibility. We are coming up out of a trading
range with a width of 2000 points. Adding that number to 27500 gives
us a minimum upside point-count of 29500.


If there is a breakout by the DJI, it will bring very bullish headlines and probably
cause renewed interest in speculative growth stocks, semi-conductors and
some small stocks that catch the eye of aggressive traders of usual strength.
It will be important if the DJI does surpass 27500 to see if the number of new
highs on the NASDAQ expand. If not, the advance will have to be considered
as not so much a new leg up for most stocks, as more of the same, namely a
continued rise in dividend stocks, REITS, Utilities and blue chips.
What about the Low "IP21" Readings?
Even if the DJI's Accumulation Index drops back into negative territory,
a breakout run from here will probably not produce a Sell S12 or any other
Sell, so long as breadth remains quite positive. My general sense is that it is
usually not such a good idea to buy breakouts, even those above inviting
flat tops, if the Tiger Accumulation Index (IP21) is negative. It is probably
better to buy the ETFs that are breaking out with positive IP21. If so, that
makes QQQ and even SOXL safer than DIA and SPY. IWM's IP21 is
also positive, but it has not yet broken out.
"IP21" shows the trading beliefs of "big money". Their
negativity on DIA,
and SPY shows either that they are not convinced that a new "leg up" is at hand
or that they want to lock in their trading profits this year in case the Democrats
win in the Fall Elections of 2020 and enact much higher capital gains taxes that
apply to 2020 trading. Tricky stuff - this. Wall Street and the FED understand
such worries. That is why there may be more rate cuts ahead.
 |
 |
 |
 |
We Have To Be Bullish
The October Jobs' Report of 128,000 fared better
than many dared hope
considering the UAW strike of 40,000 GM workers. In addition, the Jobs
numbers were revised upwards by 95,000 for July and August. With
wages now rising at 3%, the economy seems quite strong, perhaps,
even too strong for the FED. Dare we hope for any more rate cuts?
In any case, the general market ETFs were also in strong demand with
the SP-500, NASDAQ and QQQ making new all-time highs. Another
very good day will cause the all-important DJI to breakout over its
flat resistance at 27500.
We have to be bullish. Breakouts when the NYSE A/D Line and the P-Indicator
are as strong as they are now is reliably bullish. One of the lessons of the new
October B21 is that a breakout right after a B21 is especially bullish. Another
is that multiple B21s are extra-bullish.
A more general lesson is that the advances that come from flat-top breakouts
can be quite exciting. When you look at thousands and thousands of charts,
as I have, you realize that the breakouts ordinarily bring a "mark-up" phase to
the market and a high portion of the total gains in any one year often come
in the mark up phases.
Seasonality is remains quite bullish. Since
1967, the next three months
have produce a DJI gain 81% of the time in the years before a Presidential
Election. The average gain is 6%. The notable exceptions are in 1967 when
US was at war in Vietnam and the FED was busy raising interest rates
to try to limit Inflation and in 2007 when the Housing Bubble was starting
to break wide open. Perhaps, any more political weakening of President Trump
will have bad consequences for Wall Street in 2021, but right now business
is good and Wall Street senses if has the Bears on the run. What better way
to boost Trump's poll standings than to lift millions of Reirement Accounts
and possibly stir up the speculative juices that have long been absent among
small investors.
|
Charts 11/1/2019 2019 PEERLESS DJI, Signals, Indicators Daily DJI Volume 10-DayUp/Down Vol Stoch-20 Hourly DJIA A/D Line for All Stocks Inverted Traders Index NASDAQ S&P OEX NYSE COMPQX DJI-15 DJI-20 DJI-30 DIA SPY QQQ MDY IWM TNA Short-Term Rates USO-CrudeOil DBO FAS GLD BBH IBB JETS JNUG KOL NUGT OIH OIL RSX RETL SDS AGQ SLV SOXL TECL TLT TMF TNA UGA (gasoline) XIV and China: YINN CHAU Commodities: CANE CORN DBC JJC, NIB, CHOC CORN, CUT (paper) MOO, SOYB WEAT UUP (Dollar) LIT (Lithium) AAPL ADBE ALXN AMAT AMGN AMD AMZN AXP BA BABA BAC BIDU CAT CVX DE FB GOOG GS HD IBM INTU JPM M (Macy's) MSFT NFLX NKE NVDA PG QCOM TSLA TXN XOM V WMT CMG , LRCX, SWKS, MDGL SPPI WATT SQ TOWN 11/1/19 (Click on Underlined link.) New highs and Bullish MAXCPs - http://tigersoft.com/max/11-1/BULLISH.htm Bearish MAXCPs - http://tigersoft.com/min/11-1/BEARISH.htm |
Table A QUICKSILVER on DJI-30 STOCKS 11/1/2019 Strongest = AAPL (256+7), CAT (144+7), INTC (57) Solid = JPM (128+3), WBA (53+3) Weak = AXP(+2), BA(+5), DIS (+3), JNJ(-1), MCD (-3), TRV 25 show rising 5-day ma Only 13 have rising Closing Powers 8 have bullish IP21s > .07 10 have bearish IP21s < -.07 SYMBOL CLOSE CHANGE PIVOT-PT 5-dma AROC CL-PWR TREND CANDLE IP21 ITRS Remarks
COLOR
---------------------------------------------------------------------------------------
AAPL 255.82 7.06 249.05 187.7% ------- BLUE .228 .163 Very Strong
---------------------------------------------------------------------
AXP 119.14 1.86 118.58 37.3% Bullish BLUE -.117 -.067 weak
---------------------------------------------------------------------
BA 345.19 5.28 340.88 78.1% Bearish BLUE -.143 -.067 weak
---------------------------------------------------------------------
CAT 144.49 6.69 140.06 170.2% Bullish BLUE .337 .185 Very Strong
---------------------------------------------------------------------
CSCO 47.03 -.48 47.17 13.7% Bearish BLUE -.029 -.065
---------------------------------------------------------------------
CVX 116.21 .07 118.48 -104.6% Bullish BLUE -.015 -.054
---------------------------------------------------------------------
DIS 132.75 2.83 130.53 71.1% Bearish BLUE -.209 -.066 Weak.Heavy Distrib.
---------------------------------------------------------------------
GS 217.39 4.01 217.75 73.2% ------- BLUE .169 .033
---------------------------------------------------------------------
HD 237.34 2.76 236.8 62.9% ------- BLUE .012 .033
---------------------------------------------------------------------
IBM 135.53 1.8 135.97 3.3% Bullish BLUE .13 -.032
---------------------------------------------------------------------
INTC 56.51 -.02 56.76 4.4% Bullish BLUE .278 .167 Strong
---------------------------------------------------------------------
JNJ 131.2 -.84 129.18 109.4% Bearish RED -.276 -.042 Very weak. Heavy Distrib.
---------------------------------------------------------------------
JPM 127.8 2.88 126.51 70.3% Bullish BLUE .066 .134 Solid
---------------------------------------------------------------------
KO 53.9 -.53 53.57 13.9% ------- RED -.067 -.052
---------------------------------------------------------------------
MCD 193.94 -2.76 191.78 -17.2% Bearish RED -.327 -.157 Very weak. News about CEO out.
---------------------------------------------------------------------
MMM 170.09 5.1 169.06 119.4% Bullish BLUE .065 .016
---------------------------------------------------------------------
MRK 84.94 -1.72 82.2 158.6% Bullish RED .039 -.062
---------------------------------------------------------------------
MSFT 143.72 .35 144.19 104.4% Bearish RED -.05 .002
---------------------------------------------------------------------
NKE 89.18 -.37 90.85 -96.5% Bearish RED -.129 .029
---------------------------------------------------------------------
PFE 38.39 .02 37.28 214.2% Bullish RED -.214 .053
---------------------------------------------------------------------
PG 123.87 -.64 123.48 25% ------- RED -.102 -.004
---------------------------------------------------------------------
TRV 130.72 -.34 129.3 11.2% ------- RED -.125 -.157 Weak
---------------------------------------------------------------------
UNH 252.21 -.49 247.05 145.8% Bullish RED .267 .042 High Accum.
---------------------------------------------------------------------
UTX 146.68 3.1 143.04 130% Bullish BLUE .089 .105 Solid
---------------------------------------------------------------------
V 180.93 2.07 179.84 86.2% ------- BLUE .027 -.036
---------------------------------------------------------------------
VZ 60.37 -.1 60.18 0% Bullish RED .014 .022
---------------------------------------------------------------------
WBA 57.38 2.6 55.8 176.2% Bullish BLUE .138 .085 Solid
---------------------------------------------------------------------
WMT 117.62 .36 119.22 -60.1% ------- RED -.018 .01
---------------------------------------------------------------------
DOW 69.6 2.03 68.64 25.6% ------- BLUE -.137 -.041
----------------------------------------------------------------------------------------
|
Table 1Table 1 QUICKSILVER on ETFS - 11/1/2019 ETF CLOSE CHANGE PIVOT-PT 5-dma AROC CL-PWR CANDLE IP21 ITRS --------------------------------------------------------------------------------------------- DIA 273.34 2.86 270.81 69.1% Bullish BLUE-.019 ---- --------------------------------------------------------------------------------------------- BA 345.19 5.28 340.88 78.1% Bearish BLUE-.143 -.067 --------------------------------------------------------------------------------------------- SPY 306.14 2.81 303.3 74.9% Bullish BLUE-.02 .006 --------------------------------------------------------------------------------------------- QQQ 198.87 1.79 197.57 82.1% Bullish BLUE .1 .017 --------------------------------------------------------------------------------------------- MDY 361.35 5.12 358.88 64.2% Bullish BLUE .091 .008 --------------------------------------------------------------------------------------------- IWM 158.1 2.65 156.34 99.4% Bullish BLUE .157 .013 --------------------------------------------------------------------------------------------- FAS 83.45 2.5 81.16 187.1% Bullish BLUE-.005 .112 --------------------------------------------------------------------------------------------- RETL 21.1 -.01 22.33 -418.6% Bearish BLUE .201 -.193 --------------------------------------------------------------------------------------------- SOXL 211.94 13.67 207.48 367.4% Bullish BLUE .054 .294 --------------------------------------------------------------------------------------------- TECL 190.99 6.47 186.61 304.4% Bullish BLUE .121 .126 --------------------------------------------------------------------------------------------- IBB 109.85 2.51 107 199.1% Bullish BLUE .026 .003 --------------------------------------------------------------------------------------------- GLD 142.56 .13 140.64 24.8% Bearish BLUE .074 -.033 --------------------------------------------------------------------------------------------- OIH 14.64 -.34 14.58 0% Bearish RED .038 -.128 --------------------------------------------------------------------------------------------- GASL 7.28 .69 6.92 -14.3% Bearish BLUE-.077 -.242 --------------------------------------------------------------------------------------------- RSX 22.55 .04 22.68 -57.6% Bearish -----.049 -.087 |
Table 2 Count of Stocks in Key Directories
20191101
-------------------------------
NEWHIGHS 355 Bullish
NEWLOWS 25
MAXCP 80 Bullish
MINCP 15
TTTNH 18
TTTNL 41
FASTUP 96
FASTDOWN 82
CPCROSSA 185
CPCROSSD 37
BIGVOLUP 8
BIGVODN 13
ACCUMVER 9
HIGHIP21 19
HIUPPCT 10
LOWACCUM 75
REDSELL 113
AUGSELS7 19
TRAPDOOR 19
|
 RANKING OF KEY DIRECTORIES BASED PCT.OF STOCKS ABOVE 65-DMA
              11/1/19
 Bullish - 39
 Bearish -  6
---------------------------------------------------------------------------------------
Directory     Current       day-1         day-2         day-3         day-4         day-5
----------------------------------------------------------------------------------------
BIGBANKS       1             1             1             1             1             1
COPPER         1             1             .8            1             1             1
REGBANKS       1             .962          1             1             .962          .962
ETFS           .931          .931          .931          .913          .913          .913
JETS           .9            .9            .9            .9            .9            .8
FOOD           .888          .87           .777          .74           .796          .833
AUTO           .871          .794          .846          .871          .871          .846
HOMEBLDG       .87           .838          .903          .903          .967          1
COMODITY       .853          .853          .78           .731          .756          .829
TRANSP         .85           .75           .8            .9            .9            .9
RETAIL         .843          .784          .803          .862          .843          .901
REIT           .82           .82           .841          .82           .806          .779
FINANCE        .813          .732          .802          .79           .779          .732
INFRA          .805          .694          .777          .833          .916          .805
CHEM           .795          .693          .755          .673          .714          .673
INDEXES        .768          .715          .72           .725          .72           .72
CHINA          .75           .589          .571          .696          .75           .642
GUNS           .75           .625          .625          .625          .625          .562
SP-100         .744          .644          .666          .688          .633          .622
INDMATER       .74           .584          .636          .662          .688          .649
RUS-1000       .735          .678          .705          .7            .677          .665
NASD-100       .734          .683          .704          .642          .632          .591
UTILITY        .725          .675          .7            .6            .575          .675
NIFTY          .719          .666          .684          .631          .684          .649
SP500          .717          .673          .698          .675          .65           .644
FIDSTKS        .714          .664          .686          .648          .637          .615
DOWJONES       .7            .7            .666          .633          .6            .633
HACKERS        .7            .55           .5            .45           .4            .35
GAMING         .695          .739          .782          .739          .826          .695
HOSPITAL       .681          .681          .681          .636          .545          .59
SEMI           .679          .641          .669          .622          .66           .65
ELECTRON       .673          .62           .66           .64           .666          .647
SOFTWARE       .65           .633          .633          .583          .55           .516
GOLD           .647          .647          .372          .392          .372          .529
MILITARY       .642          .5            .5            .535          .5            .464
DJI-13         .615          .615          .615          .615          .615          .615
COMPUTER       .578          .631          .684          .631          .631          .578
INSURANC       .54           .513          .594          .567          .432          .432
BIOTECH        .515          .466          .457          .472          .455          .411
==============================================================================================
COAL           .5            .333          .333          .333          .166          .333
==============================================================================================
OILGAS         .445          .313          .321          .416          .386          .408
SOLAR          .423          .461          .5            .5            .5            .461
GREEN          .4            .4            .44           .48           .48           .44
EDU            .388          .333          .444          .388          .388          .388
BONDFUND       .298          .359          .175          .114          .114          .149
BEVERAGE       .187          .187          .062          .187          .187          .312
|
====================================================================
10/31/2019 A breakout by all the major indexes seems
to be coming, though
the DJI is lagging. Not enough individual DJI-30 stocks appear
strong enough at this time to support a big advance. See the
new QUICKSILVER key values for the DJI-30 stocks in Table A
further below. Consider buying QQQ or the NASDAQ if
these two can move up decisively to new highs. They have a history of
rising for a month or two even when the DJI lollygags. The unusually
strong A/D Line we see now is reminscent of powerful bull markets that run at
least a year.
 |
 |
The A/D Line is the DJI's best predictor.
Looking back with the help of the new October Buy B21, we that a strongly
rising A/D Line for nine months or more eventually takes the DJI above
resistance even when the Accumulation Index is slightly negative, at first.
In addition, except for September 1976, there seems always to have been an
upside breakout past well-tested flat resistance when the A/D Line is as strong
as now. See the charts of 1954, 1958, 1995, 2003 and 2017
below. And, even when we look closely at th3 1976 case's failure to breakout,
we can see that the NYSE A/D Line was essentially flat for most of 1976. This
is completely different than what we see now when the NYSE A/D Line has been
rising for the entire year.
2019 - The rising NYSE A/D Line is the most
prominent characteristic since last December when the
Fed Chairman converted to "dovishness"
The ADL's continuing strength this year is reminiscent of
some of the most important past bull markets: 1954, 1958,
1995, 2003 and 2017. There is one difference. In these
very bullish years, the DJi always found support at the
rising 65-dma. Our DJI this year needed to test its rising
200-dma. The DJI's trend unlike in those earlier years
has been flat since June.

1976 - Showed an essential flat A/D Line

Super DJI Strength was associated with steadily
rising NYSE A/D Line in the very bullish years of
1954, 1958, 1995, 2003 and 2017.
 |
 |
 |
 |
 |
|
Charts 10/31/2019 2019 PEERLESS DJI, Signals, Indicators Daily DJI Volume 10-DayUp/Down Vol Stoch-20 Hourly DJIA A/D Line for All Stocks Inverted Traders Index NASDAQ S&P OEX NYSE COMPQX DJI-15 DJI-20 DJI-30 DIA SPY QQQ MDY IWM TNA Short-Term Rates USO-CrudeOil DBO FAS GLD BBH IBB JETS JNUG KOL NUGT OIH OIL RSX RETL SDS AGQ SLV SOXL TECL TLT TMF TNA UGA (gasoline) XIV and China: YINN CHAU Commodities: CANE CORN DBC JJC, NIB, CHOC CORN, CUT (paper) MOO, SOYB WEAT UUP (Dollar) LIT (Lithium) AAPL ADBE ALXN AMAT AMGN AMD AMZN AXP BA BABA BAC BIDU CAT CVX DE FB GOOG GS HD IBM INTU JPM M (Macy's) MSFT NFLX NKE NVDA PG QCOM TSLA TXN XOM V WMT CMG , LRCX, SWKS, MDGL SPPI WATT SQ TOWN 10/31/19 (Click on Underlined link.) New highs and Bullish MAXCPs - http://tigersoft.com/max/10-31/BULLISH.htm Bearish MAXCPs - http://tigersoft.com/min/10-31/BEARISH.htm |
| Table A QUICKSILVER on DJI-30 STOCKS 10/31/2019 Strongest = AAPL (249), CAT (137), INTC (57) Weakest = MCD (197) and TRV (131) 17 show rising 5-day ma Only 4 have rising Closing Powers 11 have bullish IP21s > .07 AAPL, CAT, GS, IBM, INTC, MMM, MRK, UNH, UTX, VZ, WBA 9 have bearish IP21s < -.07 AXP, BA, DIS, JNJ, MCD, PFE, PG, TRV, DOW SYMBOL CLOSE CHANGE PIVOT-PT 5-dma AROC CL-PWR TREND CANDLE IP21 ITRS Remarks
COLOR
------------------------------------------------------------------------------
AAPL 248.76 5.5 246.58 105.6% ------- BLUE .215 .138 Strong
------------------------------------------------------------------------------
AXP 117.28 -.79 118.26 36.9% ------- RED -.099 -.075
-------------------------------------------------------------------------------
BA 339.91 -6.15 339.83 -67.4% Bearish RED -.153 -.032
-------------------------------------------------------------------------------
CAT 137.8 -2.54 139.73 142% ------- RED .318 .139 Strongest
-------------------------------------------------------------------------------
CSCO 47.51 -.05 46.9 116.9% Bearish RED .022 -.058
-------------------------------------------------------------------------------
CVX 116.14 -.22 118.67 -61.1% ------- BLUE -.017 -.047
-------------------------------------------------------------------------------
DIS 129.92 .32 130.9 -13.1% Bearish BLUE -.277 -.075
------------------------------------------------------------------------------
GS 213.38 -2.43 214.23 54.1% ------- RED .167 .031 Positive
-------------------------------------------------------------------------------
HD 234.58 -1.66 234.38 14.7% ------- RED .026 .032 Positive
-------------------------------------------------------------------------------
IBM 133.73 -1.52 135.44 -12.6% ------- RED .128 -.036
-------------------------------------------------------------------------------
INTC 56.53 -.07 56.46 386.1% ------- BLUE .286 .167 Strong
-------------------------------------------------------------------------------
JNJ 132.04 -.8 128.35 175.4% Bearish RED -.247 -.028
-------------------------------------------------------------------------------
JPM 124.92 -.81 126.03 -4.4% ------- RED .046 .129 Positive
-------------------------------------------------------------------------------
KO 54.43 .49 53.75 -16.7% ------- BLUE .025 -.026
-------------------------------------------------------------------------------
MCD 196.7 -.19 194.61 17.5% Bearish RED -.254 -.141 Weak
-------------------------------------------------------------------------------
MMM 164.99 -3.38 166.09 92.9% ------- RED .07 -.008
-------------------------------------------------------------------------------
MRK 86.66 .44 82.26 243.8% Bullish BLUE .111 -.035
-------------------------------------------------------------------------------
MMM 143.37 -1.24 140.73 120.4% Bearish RED -.017 .001
-------------------------------------------------------------------------------
NKE 89.55 -.64 90.92 -107.7% Bearish RED -.062 .05
-------------------------------------------------------------------------------
PFE 38.37 -.11 36.77 264.5% Bullish ---- -.101 .068
-------------------------------------------------------------------------------
PG 124.51 -.43 123.25 -11.3% ------- RED -.086 .012
-------------------------------------------------------------------------------
TRV 131.06 1.28 130.43 -14.2% Bearish BLUE -.117 -.141 Weak
-------------------------------------------------------------------------------
UNH 252.7 -2.1 244.91 164.6% ------- RED .309 .019
-------------------------------------------------------------------------------
UTX 143.58 -.26 142.96 4.9% ------- BLUE .074 .095
-------------------------------------------------------------------------------
V 178.86 -.39 177.85 75.8% ------- RED .045 -.044
-------------------------------------------------------------------------------
VZ 60.47 -.35 60.37 -9.1% ------- RED .071 .036
-------------------------------------------------------------------------------
WBA 54.78 -1.08 55.42 29.7% Bullish RED .092 .044
-------------------------------------------------------------------------------
WMT 117.26 -.84 119.04 -77.6% Bullish RED .011 .015
-------------------------------------------------------------------------------
DOW 67.57 -.15 69.25 -110.7% ------- BLUE -.154 -.063 Negative
|
Table 1 QUICKSILVER on ETFS - 10/30/2019 ETF CLOSE CHANGE PIVOT-PT 5-dma AROC CL-PWR CANDLE IP21 ITRS --------------------------------------------------------------------------------------------- DIA 270.48 -1.26 269.6 46.3% ------- RED .031 --- --------------------------------------------------------------------------------------------- BA 339.91 -6.15 339.83 -67.4% Bearish RED -.153 -.032 --------------------------------------------------------------------------------------------- SPY 303.33 -.81 301.6 48.9% ------- RED -.001 .005 --------------------------------------------------------------------------------------------- QQQ 197.08 .09 195.64 76.2% ------- RED .129 .013 --------------------------------------------------------------------------------------------- MDY 356.23 -2.56 356.75 18% ------- RED .123 .003 --------------------------------------------------------------------------------------------- IWM 155.45 -.88 155 40.8% ------- RED .171 .001 --------------------------------------------------------------------------------------------- FAS 80.95 -1.19 80.41 64.2% ------- RED .008 .102 --------------------------------------------------------------------------------------------- RETL 23.54 -.93 25.76 -272.4% ------- RED .178 .221 Strongest --------------------------------------------------------------------------------------------- SOXL 198.27 -3.8 197.14 315.8% ------- RED .073 .215 Bullish --------------------------------------------------------------------------------------------- TECL 184.52 -.48 179.82 298.4% ------- RED .119 .087 Bullish --------------------------------------------------------------------------------------------- IBB 107.34 -.25 105.59 75% ------- ---- .047 -.02 --------------------------------------------------------------------------------------------- GLD 142.43 1.41 141.86 31.9% ------- BLUE .029 -.028 --------------------------------------------------------------------------------------------- OIH 11.91 -.37 12.55 -429.3% Bearish RED -.058 -.146 --------------------------------------------------------------------------------------------- GASL 6.59 -.1 7.3 -106.5% Bearish RED -.101 -.355 Weakest --------------------------------------------------------------------------------------------- RSX 24.08 -.31 24.11 43.6% Bullish RED .154 .062 Bullish |
 Table 3  Count of Stocks in Key Directories
          20191031
-------------------------------
NEWHIGHS       141
NEWLOWS        25
MAXCP          58
MINCP          57
TTTNH          13
TTTNL          71
FASTUP         72
FASTDOWN       97
CPCROSSA       75
CPCROSSD       92
BIGVOLUP       5
BIGVODN        31
ACCUMVER       7
HIGHIP21       26
HIUPPCT        12
LOWACCUM       71
REDSELL        105
AUGSELS7       10
TRAPDOOR       20
|
 Table 3 RANKING OF KEY DIRECTORIES BASED PCT.OF STOCKS ABOVE 65-DMA
             10/31/19
 Bullish = 37
 Bearish = 8
---------------------------------------------------------------------------------------
Directory     Current       day-1         day-2         day-3         day-4         day-5
----------------------------------------------------------------------------------------
BIGBANKS       1             1             1             1             .857          .857
COPPER         1             .8            1             1             1             .8
REGBANKS       .962          1             1             .962          .962          .925
ETFS           .931          .931          .913          .913          .913          .913
JETS           .9            .9            .9            .9            .8            .8
FOOD           .87           .777          .74           .796          .833          .796
COMODITY       .853          .78           .731          .756          .829          .804
HOMEBLDG       .838          .903          .903          .967          1             1
REIT           .82           .841          .82           .806          .779          .827
AUTO           .794          .846          .871          .871          .897          .82
RETAIL         .784          .803          .862          .843          .901          .882
TRANSP         .75           .8            .9            .9            .9            .85
GAMING         .739          .782          .739          .826          .695          .695
FINANCE        .732          .802          .79           .779          .732          .755
INDEXES        .709          .72           .725          .72           .72           .672
DOWJONES       .7            .666          .633          .6            .6            .566
INFRA          .694          .777          .833          .916          .805          .833
CHEM           .693          .755          .673          .714          .673          .612
NASD-100       .683          .704          .642          .632          .591          .612
HOSPITAL       .681          .681          .636          .545          .59           .545
RUS-1000       .678          .705          .7            .677          .655          .647
UTILITY        .675          .7            .6            .575          .675          .75
SP500          .673          .698          .675          .65           .64           .648
FIDSTKS        .664          .686          .648          .637          .604          .604
NIFTY          .654          .672          .618          .672          .636          .6
GOLD           .647          .372          .392          .372          .529          .411
SP-100         .644          .666          .688          .633          .6            .577
SEMI           .641          .669          .622          .66           .65           .632
SOFTWARE       .633          .633          .583          .55           .483          .466
COMPUTER       .631          .684          .631          .631          .578          .578
GUNS           .625          .625          .625          .625          .625          .625
ELECTRON       .62           .66           .64           .666          .653          .64
DJI-13         .615          .615          .615          .615          .615          .461
CHINA          .589          .571          .696          .75           .642          .589
INDMATER       .584          .636          .662          .688          .649          .597
HACKERS        .55           .5            .45           .4            .3            .3
INSURANC       .513          .594          .567          .432          .459          .54
N=37
---------------------------------------------------------------------------------------------
MILITARY       .5            .5            .535          .5            .464          .5
---------------------------------------------------------------------------------------------
SOLAR          .48           .52           .52           .52           .48           .52
BIOTECH        .463          .455          .469          .455          .414          .382
GREEN          .4            .44           .48           .48           .44           .4
BONDFUND       .359          .175          .114          .114          .157          .219
COAL           .333          .333          .333          .166          .333          .166
EDU            .333          .444          .388          .388          .388          .444
OILGAS         .318          .326          .42           .391          .405          .362
BEVERAGE       .187          .062          .187          .187          .312          .375
N=8
|
====================================================================
10/30/2019 All the key Indexes except the DJI
have all reached their old highs'
resistance.
A shallow retreat should not come as surprise. The DJI's
Accumulation Index did finally turned very slightly positive. But not
enough to give a breakout by the DJI, if it comes, much hope of being
the start of a new leg up. Bulls will need to show Patience now. They
should take heart in the continuing trend up by the NYSE A/D Line
and the fact that multiple Buy B21's like we now see are more
bullish. Let's watch the Utilities' Average. It is poised for another
bounce up off its rising 65-dma. That suggests the FED will be lowering
rates, as expected.

The new October Buy B21s on the DJI's chart do promise
an eventual breakout, but when the IP21 is low like now, a retreat
from resistance is more likely than not and the final gain
from the B21 is more likely to be limited. See the
tables from last night. I will post a link to all their charts
later tonight. www.tigersoft.com/OCTB21s/OCTB21s.htm

NYSE's IP21 is rising and positive.

S&P's IP21 is not confirming
its breakout by a wide margin.

We will need to see clear breakouts by both the
NASDAQ and
QQQ before suggesting going long QQQ, especially since the latter's
Accumulation Index is still lagging... Hedging some longs from the
Bullish MAXCPs with some shorts from the MINCPs has been mostly
profitable and should continue to be.


|
Charts 10/30/2019 2019 PEERLESS DJI, Signals, Indicators Daily DJI Volume 10-DayUp/Down Vol Stoch-20 Hourly DJIA A/D Line for All Stocks Inverted Traders Index NASDAQ S&P OEX NYSE COMPQX DJI-15 DJI-20 DJI-30 DIA SPY QQQ MDY IWM TNA Short-Term Rates USO-CrudeOil DBO FAS GLD BBH IBB JETS JNUG KOL NUGT OIH OIL RSX RETL SDS AGQ SLV SOXL TECL TLT TMF TNA UGA (gasoline) XIV and China: YINN CHAU Commodities: CANE CORN DBC JJC, NIB, CHOC CORN, CUT (paper) MOO, SOYB WEAT UUP (Dollar) LIT (Lithium) AAPL ADBE ALXN AMAT AMGN AMD AMZN AXP BA BABA BAC BIDU CAT CVX DE FB GOOG GS HD IBM INTU JPM M (Macy's) MSFT NFLX NKE NVDA PG QCOM TSLA TXN XOM V WMT CMG , LRCX, SWKS, MDGL SPPI WATT SQ TOWN 10/30/19 (Click on Underlined link.) New highs and Bullish MAXCPs - http://tigersoft.com/max/10-30/BULLISH.htm Bearish MAXCPs - http://tigersoft.com/min/10-30/BEARISH.htm |
Table 1 QUICKSILVER on ETFS - 10/30/2019 ETF CLOSE CHANGE PIVOT-PT 5-dma AROC CL-PWR CANDLE IP21 ITRS --------------------------------------------------------------------------------------------- DIA 271.74 .87 267.98 64.9% Bullish BLUE-.032 0 --------------------------------------------------------------------------------------------- BA 346.06 -2.87 344.55 81.1% Bearish RED -.13 -.003 --------------------------------------------------------------------------------------------- SPY 304.2 .99 300.37 71.8% Bullish BLUE-.055 .002 --------------------------------------------------------------------------------------------- QQQ 196.97 .93 194.09 121.7% Bullish BLUE .045 .007 --------------------------------------------------------------------------------------------- MDY 358.79 -1.04 354.94 55% Bullish RED .123 .002 --------------------------------------------------------------------------------------------- IWM 156.38 -.47 154.18 63.7% Bullish RED .197 .002 --------------------------------------------------------------------------------------------- FAS 82.14 .5 79.91 201.5% Bullish BLUE-.04 .123 --------------------------------------------------------------------------------------------- RETL 20.69 .23 22.19 -342.9% Bearish BLUE .19 -.226 --------------------------------------------------------------------------------------------- SOXL 201.81 -.23 185.71 742.1% Bullish RED .038 .259 --------------------------------------------------------------------------------------------- TECL 185 3.49 173.7 515.9% Bullish BLUE .075 .113 --------------------------------------------------------------------------------------------- IBB 107.59 .13 105.74 91.7% Bullish RED .044 -.023 --------------------------------------------------------------------------------------------- GLD 141.02 .77 141.53 17.4% Bearish BLUE .023 -.055 --------------------------------------------------------------------------------------------- OIH 14.64 -.34 14.58 0% Bearish RED .038 -.133 --------------------------------------------------------------------------------------------- GASL 6.69 -.86 6.74 -127.2% Bearish RED -.153 -.367 --------------------------------------------------------------------------------------------- RSX 22.44 -.02 22.98 -183.9% Bearish BLUE-.048 -.094 |
  Table 2  Count of Stocks in Key Directories
           20191030
-------------------------------
NEWHIGHS       268
NEWLOWS        29
MAXCP          69
MINCP          51
TTTNH          19
TTTNL          39
FASTUP         69
FASTDOWN       90
CPCROSSA       94
CPCROSSD       124
BIGVOLUP       5
BIGVODN        18
ACCUMVER       9
HIGHIP21       17
HIUPPCT        13
LOWACCUM       67
REDSELL        102
AUGSELS7       6
TRAPDOOR       18
|
Table 3 RANKING OF KEY DIRECTORIES BASED PCT.OF STOCKS ABOVE 65-DMA
              10/30/19
 Bullish = 33
 Bearish = 10
---------------------------------------------------------------------------------------
Directory     Current       day-1         day-2         day-3         day-4         day-5
----------------------------------------------------------------------------------------
BIGBANKS       1             1             1             .857          .857          1
REGBANKS       1             1             .962          .962          .925          1
ETFS           .931          .913          .913          .913          .913          .896
HOMEBLDG       .903          .903          .967          1             1             1
JETS           .9            .9            .9            .8            .8            .8
AUTO           .846          .871          .871          .897          .82           .897
REIT           .841          .82           .806          .779          .82           .855
FINANCE        .811          .8            .788          .741          .752          .776
RETAIL         .803          .862          .843          .901          .882          .901
COPPER         .8            1             1             1             .8            1
TRANSP         .8            .9            .9            .9            .85           .85
GAMING         .782          .739          .826          .695          .695          .739
COMODITY       .78           .731          .756          .829          .829          .707
FOOD           .777          .74           .796          .833          .833          .722
INFRA          .777          .833          .916          .805          .833          .861
CHEM           .755          .673          .714          .673          .632          .673
INDEXES        .72           .725          .72           .72           .677          .688
RUS-1000       .705          .7            .677          .655          .641          .658
NASD-100       .704          .642          .632          .591          .602          .551
UTILITY        .7            .6            .575          .675          .75           .725
SP500          .698          .675          .65           .64           .642          .652
FIDSTKS        .686          .648          .637          .604          .582          .587
COMPUTER       .684          .631          .631          .578          .578          .473
NIFTY          .684          .631          .684          .649          .596          .456
HOSPITAL       .681          .636          .545          .59           .545          .5
SEMI           .669          .622          .66           .65           .622          .566
DOWJONES       .666          .633          .6            .6            .533          .566
SP-100         .666          .688          .633          .6            .566          .633
ELECTRON       .664          .644          .671          .651          .651          .611
INDMATER       .636          .662          .688          .649          .597          .636
SOFTWARE       .633          .583          .55           .483          .466          .35
GUNS           .625          .625          .625          .625          .625          .562
DJI-13         .615          .615          .615          .615          .461          .461
INSURANC       .594          .567          .432          .459          .54           .621
CHINA          .571          .696          .75           .642          .571          .517
==============================================================================================
HACKERS        .5            .45           .4            .3            .3            .2
MILITARY       .5            .535          .5            .464          .5            .392
SOLAR          .5            .5            .5            .461          .5            .461
===========================================================================================
BIOTECH        .456          .465          .453          .415          .386          .395
EDU            .444          .388          .388          .388          .444          .444
GREEN          .44           .48           .48           .44           .4            .4
GOLD           .372          .392          .372          .529          .47           .235
COAL           .333          .333          .166          .333          .166          .166
OILGAS         .326          .42           .391          .405          .362          .398
BONDFUND       .175          .114          .114          .157          .219          .192
BEVERAGE       .062          .187          .187          .312          .375          .375
N= 10
|
=====================================================================
10/29/2019 Stalemate a while
longer. Low interest rates are bullish and
overseas
buying of rising US stocks early in the day continues. But then NYSE
Professionals and 'big money' resume their profit-taking from mid-day
to close. To become bullish, we need to see not only breakouts, but
the Closing Powers turn up and the IP21 (Accumulation) values turn positive
DJI
See how the rising ADL fights with the negative IP21 for control.

DIA - IP21 = - .122 vs rising Opening Power

SPY

NASDAQ

QQQ

-------------------------------------------------------------------------------------
Who Will Win? The Bulls or The Bears?
. In the short-term, we must watch the FED and next Friday's Job Report. The
market
seems to assume Trump will be impeached by the House but not found guilty
by the Senate. So, watch the FED and the Economy, not CNN or FOX.
Low IP21 Is A Problem.
Last Friday's Buy B21 shows how bullish superb
breadth can be, But
closer inspection of its past data demonstrates that a weak IP21 value most
often forces a retreat from resistance (like the DJI has up to 27500) and a
regrouping for another try. I post below the table I shown last night with
only
the weak IP21 cases. If we consider only the cases where the B21 took place,
like our own on Friday, with the DJI between the 21-dma and the 1.9%
upper band, then we see the average gain here is only +6.2% .
October B21 with IP21<.04
            Gain   PI/       Comments
                   adv+decl
-----------------------------------------------------
10/28/1938  .042  .1972      Advanced only 8 more days and Sell S12.
                             weak: IP21=.03
--------------------------------------------------------------------
10/28/1940  .002  .0627      Advanced only 7 more days and Sell S12.
                             weak: IP21=.036
--------------------------------------------------------------------
10/27/1943  .176  .0823      weak: IP21=-.018 and falling
                             65-dma.  Initial decline
                             from 139.4 to 129.6
--------------------------------------------------------------------
10/29/1965  .026  .0618      weak: IP21=-.032. 2% re-test of
                             rising 65-dma.
-----------------------------------------------------
N= 5  Avg.=  6.2%
10/25/2019 ??? .0718 IP21= -.052 |
Our B10s normally eliminate cases with an
IP21 below 0.
There was only one such case in the past. That was in 2006.
It ended up gaining 5.1%, but first showed a paper loss of 3.1%
I would expect the same subversive effect of a negative IP21 on a
breakout Buy B10 above 27500 even if good breadth and
a very positive P-I are present. A negative IP21 (current Accumulation
below zero) means that 'big money' is selling into price strength. Of
course, Big Money can be wrong especially in the short tern,
but they have a habit of limiting any advance. That is why our past B10s
show only one case of a negative IP21 and it should probably be
ruled out.
Peerless Buy B10s: 1929-2019 (edited 10/29/2019)
             IP21<.011
Date                          DJIA     Gain       Maximum Paper Loss
                   PI  IP21                                           Pct.Loss  PI
-------------------------------------------------------------------------------
19640701      B10  74  .006  838.1     .120       823.4    -.018    8/6
19650817      B10  88  .011  894.3     .084       887.1    -.008    8/23
20060109      B10 376 -.021 11011.9    .051       10667.3  -.031    1/20
20170727      B10 275  .007 21796.55   .197       21674.51 -.006    8/18 (VI=-5)
20190711      B10 284  .008 27088.08  -.019                -.019
-----------------------------------------------------------------------------
B10            5                       .09                 -.016
|
As if to prove this, QQQ's breakout yesterday could not be confirmed an additional
rise today by the NASDAQ and a breakout by it. The result was a sell-off
by leader AAPL and renewed fears that the Trade War will not be quickly
ended.
|
Charts 10/29/2019 2019 PEERLESS DJI, Signals, Indicators Daily DJI Volume 10-DayUp/Down Vol Stoch-20 Hourly DJIA A/D Line for All Stocks Inverted Traders Index NASDAQ S&P OEX NYSE COMPQX DJI-15 DJI-20 DJI-30 DIA SPY QQQ MDY IWM TNA Short-Term Rates USO-CrudeOil DBO FAS GLD BBH IBB JETS JNUG KOL NUGT OIH OIL RSX RETL SDS AGQ SLV SOXL TECL TLT TMF TNA UGA (gasoline) XIV and China: YINN CHAU Commodities: CANE CORN DBC JJC, NIB, CHOC CORN, CUT (paper) MOO, SOYB WEAT UUP (Dollar) LIT (Lithium) AAPL ADBE ALXN AMAT AMGN AMD AMZN AXP BA BABA BAC BIDU CAT CVX DE FB GOOG GS HD IBM INTU JPM M (Macy's) MSFT NFLX NKE NVDA PG QCOM TSLA TXN XOM V WMT CMG , LRCX, SWKS, MDGL SPPI WATT SQ TOWN 10/29/19 (Click on Underlined link.) New highs and Bullish MAXCPs - http://tigersoft.com/max/10-29/BULLISH.htm Bearish MAXCPs - http://tigersoft.com/min/10-29/BEARISH.htm |
Table 1 QUICKSILVER on ETFS - 10/28/2019 Professional bearishness no longer dominate. ETF CLOSE CHANGE PIVOT-PT 5-dma AROC CL-PWR CANDLE IP21 ITRS --------------------------------------------------------------------------------------------- DIA 270.87 .06 268.24 56.7% Bearish BLUE-.122 ----- --------------------------------------------------------------------------------------------- BA 348.93 8.05 340.5 175.2% Bearish BLUE-.151 .009 --------------------------------------------------------------------------------------------- SPY 303.21 -.09 299.87 69.8% ------- BLUE-.149 .001 --------------------------------------------------------------------------------------------- QQQ 196.04 -1.53 192.22 107.8% ------- RED -.02 .004 --------------------------------------------------------------------------------------------- MDY 359.83 .95 354.86 75% ------- BLUE .014 .007 --------------------------------------------------------------------------------------------- IWM 156.85 .51 154.4 85.3% ------- BLUE .079 .008 --------------------------------------------------------------------------------------------- FAS 81.64 .48 78.9 209.4% Bearish BLUE-.129 .093 --------------------------------------------------------------------------------------------- RETL 25.12 -1.26 25.14 61% ------- RED .071 .335 --------------------------------------------------------------------------------------------- SOXL 202.04 -5.44 173.15 480.3% ------- RED .004 .25 --------------------------------------------------------------------------------------------- TECL 181.51 -5.1 166.67 438.4% Bearish RED -.006 .085 --------------------------------------------------------------------------------------------- IBB 107.46 .46 105.64 102% ------- BLUE-.034 -.024 --------------------------------------------------------------------------------------------- GLD 140.25 -.39 140.53 1.8% Bearish BLUE .021 -.043 --------------------------------------------------------------------------------------------- OIH 11.91 -.37 12.55 -429.3% Bearish RED -.058 -.15 --------------------------------------------------------------------------------------------- GASL 7.55 .63 6.87 802.2% Bearish BLUE-.126 -.293 ----------------------------------------------------------------------------------------- RSX 24.1 .09 23.59 140.7% ------- ---- .092 .083 |
Table 2 Count of Stocks in Key Directories
20191029
-------------------------------
NEWHIGHS 216 Bullish >10:1 (new lows)
NEWLOWS 16
MAXCP 56
MINCP 35
TTTNH 27
TTTNL 30
FASTUP 75
FASTDOWN 85
CPCROSSA 50
CPCROSSD 72
BIGVOLUP 3
BIGVODN 17
ACCUMVER 8
HIGHIP21 12
HIUPPCT 12
LOWACCUM 63
REDSELL 110
AUGSELS7 19
TRAPDOOR 16
|
RANKING OF KEY DIRECTORIES BASED PCT.OF STOCKS ABOVE 65-DMA 10/29/19 --------------------------------------------------------------------------------------- Directory Current day-1 day-2 day-3 day-4 day-5 ---------------------------------------------------------------------------------------- BIGBANKS 1 1 .857 .857 1 1 COPPER 1 1 1 .8 1 1 REGBANKS 1 .962 .962 .925 1 1 ETFS .913 .913 .913 .913 .896 .879 HOMEBLDG .903 .967 1 1 1 1 JETS .9 .9 .8 .8 .8 .8 TRANSP .9 .9 .9 .85 .85 .85 AUTO .871 .871 .897 .82 .871 .871 RETAIL .862 .843 .901 .882 .901 .882 INFRA .833 .916 .805 .833 .861 .888 REIT .82 .806 .779 .82 .855 .848 FINANCE .79 .779 .732 .744 .767 .755 FOOD .74 .796 .833 .833 .722 .648 GAMING .739 .826 .695 .695 .739 .695 COMODITY .731 .756 .829 .829 .707 .682 INDEXES .725 .72 .72 .677 .682 .634 RUS-1000 .7 .677 .655 .641 .654 .634 CHINA .696 .75 .642 .571 .517 .517 SP-100 .688 .633 .6 .566 .633 .588 SP500 .675 .65 .64 .642 .648 .623 CHEM .673 .714 .673 .632 .653 .612 INDMATER .657 .684 .644 .605 .618 .552 FIDSTKS .648 .637 .604 .582 .582 .565 NASD-100 .642 .632 .591 .602 .551 .561 ELECTRON .64 .666 .653 .647 .594 .64 HOSPITAL .636 .545 .59 .545 .5 .59 DOWJONES .633 .6 .6 .533 .566 .5 COMPUTER .631 .631 .578 .578 .473 .578 GUNS .625 .625 .625 .625 .5 .562 SEMI .622 .66 .65 .622 .566 .613 NIFTY .618 .672 .636 .581 .436 .472 DJI-13 .615 .615 .615 .461 .461 .461 UTILITY .6 .575 .675 .75 .725 .725 SOFTWARE .583 .55 .483 .466 .35 .366 INSURANC .567 .432 .459 .54 .621 .621 MILITARY .535 .5 .464 .5 .392 .357 SOLAR .5 .5 .461 .5 .461 .461 GREEN .48 .48 .44 .4 .4 .4 BIOTECH .462 .444 .409 .386 .401 .395 HACKERS .45 .4 .3 .3 .2 .2 OILGAS .42 .391 .405 .362 .391 .347 GOLD .392 .372 .529 .47 .235 .156 EDU .388 .388 .388 .444 .444 .333 COAL .333 .166 .333 .166 .166 .166 BEVERAGE .187 .187 .312 .375 .375 .375 BONDFUND .114 .114 .157 .219 .192 .175 |
=====================================================================
10/28/2019 Friday's Buy B21 signal is based simply on
the 21-day ma of NYSE Advances-
minus declines being quite strong at the end of October. (There is a similar
B21 for the end of September). Such seasonal strength is unusual. Instead
of raising rates as the FED often does at this time of the year, the rising NYSE
ADL shows the FED is pursuing a very "dovish" or accomodative set of monetary
policies. To underlay this determination, Fed Chairman Powell says this will
continue until next Spring. He clearly wants the market to go up ahead of the
Election. Pay no attention to his frequent assurances that he is apolitical.
"Me thinks, ... he protesteth too much" ...
https://en.wikipedia.org/wiki/The_lady_doth_protest_too_much,_methinks
Our job is to play the trends the FED causes and pick
the groups that will do the
best. He has vrtually told investors that he will not allow a big decline.
In
view of that, it is easy to see how speculation in more volatile stocks, especially
techs, will grow and grow for a while.
DJI's Resistance at 27500 needs to be overcome.
The IP21 is negative and the Closing Power keeps
refuses to turn up for DIA.

The average gain of all 17 of the new October B21s is
+8 .8% when finally
reversed. These B21's strack record give us hope the DJI will breakout above
its flat top high ground and the markets will soon soar. That is what the FED
is hoping, too.
QQQ and The NASDAQ should be bought
if the NASDAQ goes higher at the close tomorrow.
The DJI is lagging. And the weakness in the Utilities
should be watched.
But "Big Money" as represented by our DJI's IP21
(current Accumulation Index value)
is not yet convinced, nor have NYSE Professionals jumped aboard of the breakouts.
However, QQQ's marginal breakout today shows that Professionals can quickly
turn bullish. See how QQQ's Closing Power is now rated as Bullish along with its
Opening Power. QQQ is the vehicle longs should play now. There is precedent
for
the QQQ and the NASDAQ making flat top breakout runs for some time even
when the DJI lags. Let me show you past examples of such isolated NASDAQ
and QQQ strength.


On 8/14/1991, the NASDAQ made a flat-topped breakout that was not confirmed
by the DJI making a corresponding high.

In April 1996, we see another example. The NASDAQ (COMPQX)
rose 10% in a month while the DJI languished.

And of course, the QQQ ran wildly up in January and February 2000, even
as the DJI declined.

THE DJI IS STILL NOT OVER 27500.
My reading of the past October Buy B21 charts shows us that
an IP21 confirmed
breakout
above 27500 would be quite bullish. See what happened in the case of
the October
1985 Buy B21. But otherwise, there are quite a few cases where
a negative
IP21 shows that a move above the upper band is not coming soon.
(The
software for the October B21 ill be posted soon on the ESP page. )
rose 1
New October B21 - October 25, 2019 Gain PI/ Comments
adv+decl
-----------------------------------------------------
10/28/1938 .042 .1972 Advanced only 8 more days and Sell S12.
weak: IP21=.03
--------------------------------------------------------------------
10/28/1940 .002 .0627 Advanced only 7 more days and Sell S12.
weak: IP21=.036
--------------------------------------------------------------------
10/27/1942 .302 .1280 Strong IP21=.107, big advance.
--------------------------------------------------------------------
10/27/1943 .176 .0823 weak: IP21=-.018 and falling
65-dma. Initial decline
from 139.4 to 129.6
--------------------------------------------------------------------
10/25/1945 .086 .0795 Strong IP21=.169, Earlier B21s
--------------------------------------------------------------------
10/28/1947 -.039 .0938 Soon after Sell S4. 65-dma falling.
--------------------------------------------------------------------
10/28/1948 -.040 .1140 Two days after Sell S2 at upper band.
Failed to overcome resistance.
IP21=.144
Truman surprise victory.
--------------------------------------------------------------------
10/25/1949 .175 .0937 Strong IP21=.203. Prices soaring...
--------------------------------------------------------------------
10/25/1950 .119 .0702 Initial 3.5% pullback from resistance.
IP21=.049
--------------------------------------------------------------------
10/30/1956 .013 .0626 Falling 65-dma.4% retest
of trading range support.
Suez Canal invasion.
-----------------------------------------------------
10/29/1965 .026 .0618 IP21=-.032. 2% re-test of
rising 65-dma.
-----------------------------------------------------
10/26/1981 .022 .0687 Bear Market. Falling 65-dma
IP21=+.069
-----------------------------------------------------
10/28/1982 .067 .1804 IP21=+.102 Quick trade.
-----------------------------------------------------
10/29/1985 .334 .0658 Breakout just after B21.
IP21=.08
-----------------------------------------------------
10/27/2003 .105 .1194 Bullish IP21=.09.
New Bull Market.
-----------------------------------------------------
10/26/2004 .104 .0751 1.3% below 21-dma
IP21=+.023. Also Buy B9.
-----------------------------------------------------
10/25/2010 .182 .1038 IP21=.053. Brief hesitation
at resistance.
-------------------------
N= 8 Avg.= 8.8%
8 of 17 saw a gain of more than 10% after October B21.
10/25/2019 ??? .0718 IP21= -.052 |
|
Charts 10/28/2019 2019 PEERLESS DJI, Signals, Indicators Daily DJI Volume 10-DayUp/Down Vol Stoch-20 Hourly DJIA A/D Line for All Stocks Inverted Traders Index NASDAQ S&P OEX NYSE COMPQX DJI-15 DJI-20 DJI-30 DIA SPY QQQ MDY IWM TNA Short-Term Rates USO-CrudeOil DBO FAS GLD BBH IBB JETS JNUG KOL NUGT OIH OIL RSX RETL SDS AGQ SLV SOXL TECL TLT TMF TNA UGA (gasoline) XIV and China: YINN CHAU Commodities: CANE CORN DBC JJC, NIB, CHOC CORN, CUT (paper) MOO, SOYB WEAT UUP (Dollar) LIT (Lithium) AAPL ADBE ALXN AMAT AMGN AMD AMZN AXP BA BABA BAC BIDU CAT CVX DE FB GOOG GS HD IBM INTU JPM M (Macy's) MSFT NFLX NKE NVDA PG QCOM TSLA TXN XOM V WMT CMG , LRCX, SWKS, MDGL SPPI WATT SQ TOWN 10/28/19 (Click on Underlined link.) New highs and Bullish MAXCPs - http://tigersoft.com/max/10-28/BULLISH.htm Bearish MAXCPs - http://tigersoft.com/min/10-28/BEARISH.htm |
Table 1 QUICKSILVER on ETFS - 10/28/2019 Professional bearishness STILL predominates judging by falling Closing Powers ETF CLOSE CHANGE PIVOT-PT 5-dma AROC CL-PWR CANDLE IP21 ITRS --------------------------------------------------------------------------------------------- DIA 270.81 1.21 267.82 48.4% Bearish ---- -.117 ---- --------------------------------------------------------------------------------------------- BA 340.88 1.05 337 145% Bearish RED -.204 -.015 --------------------------------------------------------------------------------------------- SPY 303.3 1.7 299.01 55.1% ------- BLUE -.129 .004 --------------------------------------------------------------------------------------------- QQQ 197.57 1.93 191.85 108% Bullish BLUE .048 .019 --------------------------------------------------------------------------------------------- MDY 358.88 2.13 354.49 60.8% ------- BLUE .024 .004 --------------------------------------------------------------------------------------------- IWM 156.34 1.34 154.21 74.5% ------- BLUE .055 .006 --------------------------------------------------------------------------------------------- FAS 81.16 .75 78.3 51.5% Bearish RED -.134 .107 --------------------------------------------------------------------------------------------- RETL 26.38 .62 24.81 495.8% ------- BLUE .136 .447 --------------------------------------------------------------------------------------------- SOXL 207.48 10.34 183.84 518.3% ------- BLUE .051 .351 --------------------------------------------------------------------------------------------- TECL 186.61 6.79 166.2 386.8% ------- BLUE .045 .16 --------------------------------------------------------------------------------------------- IBB 107 1.41 105.3 162.6% ------- BLUE-.041 -.027 --------------------------------------------------------------------------------------------- GLD 140.64 -1.22 140.2 30.2% Bearish RED -.003 -.061 --------------------------------------------------------------------------------------------- OIH 11.91 -.37 12.55 -429.3% Bearish RED -.058 -.16 --------------------------------------------------------------------------------------------- GASL 6.92 -.38 6.45 559.2% Bearish RED -.183 -.292 --------------------------------------------------------------------------------------------- RSX 24.01 -.1 23.43 164.9% ------- RED .04 .072 |
Table 2 Count of Stocks in Key Directories
20191028
-------------------------------
NEWHIGHS 242 Bullish
NEWLOWS 20
MAXCP 51
MINCP 37
TTTNH 25
TTTNL 46
FASTUP 87
FASTDOWN 69
CPCROSSA 55
CPCROSSD 91
BIGVOLUP 3
BIGVODN 11
ACCUMVER 8
HIGHIP21 7
HIUPPCT 11
VHIP21 85
LOWACCUM 68
REDSELL 111
AUGSELS7 18
TRAPDOOR 13
|
Table 3 RANKING OF KEY DIRECTORIES BASED PCT.OF STOCKS ABOVE 65-DMA
10/28/19
Bullish = 35
Bearish = 10
---------------------------------------------------------------------------------------
Directory Current day-1 day-2 day-3 day-4 day-5
----------------------------------------------------------------------------------------
BIGBANKS 1 .857 .857 1 .857 1
COPPER 1 1 .8 1 1 1
HOMEBLDG .967 1 1 1 1 1
REGBANKS .962 .962 .925 1 1 .925
INFRA .916 .805 .833 .861 .888 .833
ETFS .913 .913 .913 .896 .879 .879
JETS .9 .8 .8 .8 .8 .7
TRANSP .9 .9 .85 .85 .85 .85
AUTO .871 .897 .82 .871 .871 .871
RETAIL .843 .901 .882 .901 .882 .823
GAMING .826 .695 .695 .739 .739 .782
REIT .806 .779 .82 .855 .841 .834
FOOD .796 .833 .833 .722 .666 .629
FINANCE .779 .732 .744 .767 .755 .767
COMODITY .756 .829 .829 .707 .682 .634
CHINA .75 .642 .571 .517 .517 .517
INDEXES .72 .72 .677 .682 .634 .65
CHEM .714 .673 .632 .653 .612 .612
INDMATER .688 .649 .597 .623 .558 .584
NIFTY .684 .649 .596 .456 .491 .614
RUS-1000 .677 .655 .641 .654 .63 .645
ELECTRON .666 .653 .647 .594 .64 .653
SEMI .66 .65 .622 .566 .613 .65
SP500 .65 .64 .642 .648 .619 .636
FIDSTKS .637 .604 .582 .582 .549 .587
SP-100 .633 .6 .566 .633 .577 .6
NASD-100 .632 .591 .602 .551 .571 .612
COMPUTER .631 .578 .578 .473 .578 .578
GUNS .625 .625 .625 .5 .562 .5
DJI-13 .615 .615 .461 .461 .461 .538
DOWJONES .6 .6 .533 .566 .5 .566
UTILITY .575 .675 .75 .725 .725 .65
SOFTWARE .55 .483 .466 .35 .366 .483
HOSPITAL .545 .59 .545 .5 .59 .545
SOLAR .52 .48 .52 .48 .48 .52
-----------------------------------------------------------------------------------------
MILITARY .5 .464 .5 .392 .357 .392
-----------------------------------------------------------------------------------------
GREEN .48 .44 .4 .4 .36 .48
BIOTECH .446 .405 .382 .402 .397 .394
INSURANC .432 .459 .54 .621 .621 .756
HACKERS .4 .3 .3 .2 .2 .25
OILGAS .391 .405 .362 .391 .34 .282
EDU .388 .388 .444 .444 .333 .444
GOLD .372 .529 .47 .235 .156 .196
BEVERAGE .187 .312 .375 .375 .375 .437
COAL .166 .333 .166 .166 .166 .166
BONDFUND .114 .157 .219 .192 .184 .166
|
====================================================================
10/25/2019 The key indexes are way too strong for
Peerless to be on a Sell. The SP-500.
NASDAQ, QQQ and SOXL are on the verge of bullish flat-topped breakouts
into all-time higher territory.
The A/D Line is making new highs. It has completely disregarded the potential
bearishness of October or the potential damage done to Republicans by the
impending Impeachment. It refuses to yield to the spate of bearish comments
about an economic slow-down or about PE's and Debt being too high. The
market wants to go higher, not unlike how it did from July 1927 to September 1929.
Consider adapting a new Buy B9* and a new Buy B21 with
Friday's close. See the details below.
It's time to recognize just how powerfully bullish
low interest rates are even
if Trump's future is uncertain. We have been pointing out how the NYSE AD-Line's
steady stream of daily new highs are a direct result of the low interest rates and
extra monthly liquidity the FED has promised the financial system until next
Spring. But we need a way to see this bullishness in how we use the P-Indicator.
The P-I is our main tool here. Instead of looking at our P-Indicator mostly
in terms of whether it is positive at the lower band, measure HOW POSITIVE
is, too.
The best way I can easily do this is by dividing the P-I value by
the number of NYSE advances and decline.
Call this "Normalized P-I" NPI(i) =
PI(i)/(Adv(i)+Dec(i))
Factoring in just HOW positive the P-I is would have
given us a fairly reliable Buy B9
on October 2nd. Instead of using a Stochastic-20 trading buy, we would have had
a revised Buy B9. It can only occur from September 29th to October 31st . It
simply requires the the DJI close 2.5% below the 21-day ma with the Normalized P-I
being above +.04 Nothing more than that. It could hardly be
simpler. But there
are only four earlier cases. Note that our fifth case this month would have had a
slightly lower IP21 (Current Accumulation) than any of the other cases.
|
Earlier Revised October Buy B9* Gain Normalized la/ma 21 P-I ch IP21 V-I OBCPct 65-day 65-day PI AROC % change AROC PI/(adv+dec) 10/26/1981 .022 .0687 .972 .097 100 +46 .069 2 -.067 -.113 -.46 --------------------------------------------------------------------------------------------------------------------- 9/30/2003 .057 .0546 .977 -.176 177 -52 -.009 -113 -.056 .031 .11 --------------------------------------------------------------------------------------------------------------------- 10/22/2004 .118 .0401 .973 -.333 128 -28 -.039 -134 -.176 -.03 -.12 --------------------------------------------------------------------------------------------------------------------- 10/7/2013 .105 .0428 .977 .011 132 -106 -.057 -69 -.15 -.014 -.06 --------------------------------------------------------------------------------------------------------------------- Current Case 10/2/2019 .0418 .970 -.017 123 -48 -.088 -82 .114 -.024 -.10 |
We now have a new October Buy B21. In these cases, the Normalized P-I must be
above +.05 from October 25th to October 31st and the DJI must be below its 2%
upper band. There were many cases.
New Oct B21 Gain PI/ la/ma AROC P-I ch IP21 VI OBVPct 65-day
adv+decl % Ch AROC
---------------------------------------------------------------------------------------------
10/28/1938 .042 .1972 1.012 1.395 134 -36 .03 149 .213 .077 .290
10/28/1940 .002 .0627 .997 0.0 31 14 .036 14 .316 .079 .316
10/27/1942 .302 .1280 1.009 .475 79 -22 .107 57 .308 .07 .260
10/27/1943 .0823 1.007 0.0 53 29 -.018 10 .145 -.02 -.08
(139.4 to 129.6 and then to 164.0)
10/25/1945 .086 .0795 1.002 .33 61 8 .169 21 .081 .135 .480 10/28/1947 -.039 .0938 1.001 .546 73 4 .095 17 .322 -.018 -.07 10/28/1948 -.040 .1140 1.018 .66 92 -28 .144 44 .357 .008 .03 10/25/1949 .175 .0937 1.016 .413 72 1 .203 33 .298 .075 .28 10/25/1950 .119 .0702 1.011 .281 63 -1 .049 6 .327 .118 .42 10/30/1956 .013 .0626 1.004 .438 55 24 .093 9 .031 -.051 -.21 10/29/1965 .026 .0618 1.017 .382 70 14 -.032 8 .240 .099 .36 10/26/1981 .022 .0687 .972 .097 100 +46 .069 2 -.067 -.113 -.46 10/28/1982 .067 .1804 1.007 1.029 289 17 .109 14 .237 .220 .76 10/29/1985 .334 .0658 1.014 .354 101 19 .080 6 .126 .011 .04 10/27/2003 .105 .1194 .998 .365 381 88 .099 13 .122 .034 .13 10/26/2004 .104 .0751 .987 -.119 228 109 .023 -73 -.164 -.008 -.03 10/25/2010 .182 .1038 1.016 .33 313 -67 .053 16 .139 .070 .26 10/25/2019 ??? .0718 1.01 .030 +204 +36 -.052 -15 +.032 -.007 -.03 |
|
Charts 10/25/2019 2019 PEERLESS DJI, Signals, Indicators Daily DJI Volume 10-DayUp/Down Vol Stoch-20 Hourly DJIA A/D Line for All Stocks Inverted Traders Index NASDAQ S&P OEX NYSE COMPQX DJI-15 DJI-20 DJI-30 DIA SPY QQQ MDY IWM TNA Short-Term Rates USO-CrudeOil DBO FAS GLD BBH IBB JETS JNUG KOL NUGT OIH OIL RSX RETL SDS AGQ SLV SOXL TECL TLT TMF TNA UGA (gasoline) XIV and China: YINN CHAU Commodities: CANE CORN DBC JJC, NIB, CHOC CORN, CUT (paper) MOO, SOYB WEAT UUP (Dollar) LIT (Lithium) AAPL ADBE ALXN AMAT AMGN AMD AMZN AXP BA BABA BAC BIDU CAT CVX DE FB GOOG GS HD IBM INTU JPM M (Macy's) MSFT NFLX NKE NVDA PG QCOM TSLA TXN XOM V WMT CMG , LRCX, SWKS, MDGL SPPI WATT SQ TOWN 10/25/19 (Click on Underlined link.) New highs and Bullish MAXCPs - http://tigersoft.com/max/10-25/BULLISH.htm Bearish MAXCPs - http://tigersoft.com/min/10-25/BEARISH.htm |
Table 1 QUICKSILVER on ETFS - 10/25/2019 Professional bearishness STILL predominates judging by falling Closing Powers ETF CLOSE CHANGE PIVOT-PT 5-dma AROC CL-PWR CANDLE IP21 ITRS --------------------------------------------------------------------------------------------- DIA 269.6 1.62 268.21 36.6% Bearish BLUE -.129 ---- --------------------------------------------------------------------------------------------- BA 339.83 -4.72 331.06 -61.4% Bearish RED -.207 -.016 --------------------------------------------------------------------------------------------- SPY 301.6 1.23 299.99 60.6% Bearish BLUE -.133 .008 --------------------------------------------------------------------------------------------- QQQ 195.64 1.55 193.39 102.5% ------- BLUE -.001 .02 --------------------------------------------------------------------------------------------- MDY 356.75 1.81 354.56 58.3% Bearish BLUE .023 .015 --------------------------------------------------------------------------------------------- IWM 155 .82 154.04 77.7% Bearish BLUE .011 .014 --------------------------------------------------------------------------------------------- FAS 80.41 .5 80.34 161.3% Bearish BLUE -.118 .142 --------------------------------------------------------------------------------------------- RETL 25.76 .84 23.91 549.8% ------- BLUE .142 .49 --------------------------------------------------------------------------------------------- SOXL 197.14 11.43 188.24 523.3% ------- BLUE -.012 .385 --------------------------------------------------------------------------------------------- TECL 179.82 6.12 173.31 360.2% Bearish BLUE -.007 .174 --------------------------------------------------------------------------------------------- IBB 105.59 -.15 103.58 158.8% ------- BLUE -.095 -.023 --------------------------------------------------------------------------------------------- GLD 141.86 .33 139.79 49.8% Bearish RED .02 -.064 --------------------------------------------------------------------------------------------- OIH 11.91 -.37 12.55 -429.3% Bearish RED -.058 -.165 --------------------------------------------------------------------------------------------- GASL 7.3 .56 6.17 976.1% Bearish BLUE -.112 -.166 --------------------------------------------------------------------------------------------- RSX 24.11 .24 23.23 232.6% ------- BLUE .038 .065 |
Table 2 Count of Stocks in Key Directories
20191025
-------------------------------
NEWHIGHS 178
NEWLOWS 20
MAXCP 53
MINCP 29
TTTNH 25
TTTNL 42
FASTUP 97
FASTDOWN 61
CPCROSSA 77
CPCROSSD 86
BIGVOLUP 3
BIGVODN 14
ACCUMVER 3
HIGHIP21 7
HIUPPCT 11
LOWACCUM 65
REDSELL 117
AUGSELS7 22
TRAPDOOR 13
|
Table 3 RANKING OF KEY DIRECTORIES BASED PCT.OF STOCKS ABOVE 65-DMA 10/25/19 Copper being #1 is not bullish. Copper often is one of last groups
to top out. But Home-builders being #1 shows us interest rates are
not likley to rise very fast.
Bullish = 33 Bearish = 13 10/25/19 --------------------------------------------------------------------------------------- Directory Current day-1 day-2 day-3 day-4 day-5 ---------------------------------------------------------------------------------------- COPPER 1 .8 1 1 1 .8 HOMEBLDG 1 1 1 1 1 1 REGBANKS .962 .925 1 1 .925 .851 ETFS .913 .913 .896 .879 .844 .862 RETAIL .901 .882 .901 .882 .823 .745 TRANSP .9 .85 .85 .85 .85 .75 AUTO .897 .82 .871 .871 .871 .871 BIGBANKS .857 .857 1 .857 .857 .714 FOOD .833 .833 .722 .666 .592 .592 COMODITY .829 .829 .707 .682 .585 .585 INFRA .805 .833 .861 .888 .805 .722 JETS .8 .8 .8 .8 .7 .6 REIT .779 .82 .855 .841 .834 .772 FINANCE .732 .744 .767 .755 .767 .709 INDEXES .715 .677 .682 .634 .634 .596 GAMING .695 .695 .739 .739 .782 .652 CHEM .687 .645 .666 .625 .625 .604 UTILITY .675 .75 .725 .725 .675 .65 ELECTRON .655 .649 .597 .642 .655 .642 RUS-1000 .655 .641 .654 .63 .638 .585 SEMI .654 .626 .57 .616 .654 .626 INDMATER .649 .597 .623 .558 .584 .545 NIFTY .649 .596 .456 .491 .596 .526 CHINA .642 .571 .517 .517 .517 .517 SP500 .64 .642 .648 .619 .632 .573 GUNS .625 .625 .5 .562 .5 .5 DJI-13 .615 .461 .461 .461 .538 .307 FIDSTKS .604 .582 .582 .549 .582 .532 DOWJONES .6 .533 .566 .5 .566 .466 SP-100 .6 .566 .633 .577 .588 .488 NASD-100 .591 .602 .551 .571 .622 .581 HOSPITAL .59 .545 .5 .59 .545 .59 COMPUTER .578 .578 .473 .578 .578 .526 GOLD .529 .47 .235 .156 .196 .235 N=33 ============================================================================================ SOFTWARE .483 .466 .35 .366 .483 .4 SOLAR .48 .52 .48 .48 .52 .56 MILITARY .464 .5 .392 .357 .392 .321 INSURANC .459 .54 .621 .621 .729 .675 GREEN .44 .4 .4 .36 .48 .4 BIOTECH .405 .376 .4 .397 .397 .371 OILGAS .405 .362 .391 .34 .282 .231 EDU .388 .444 .444 .333 .444 .444 COAL .333 .166 .166 .166 .166 .166 BEVERAGE .312 .375 .375 .375 .437 .375 HACKERS .3 .3 .2 .2 .25 .2 BONDFUND .157 .219 .192 .184 .166 .245 N=13 |
====================================================================
10/24/2019 The operative Peerless sell signals are
still calling for a DJI decline,
presumably to only the lower band since the P-Indicator is quite positive
and the bearish seasonity at the beginning of October is past. But even
before there is a pull-back, we continue to see unusual strength in home-builders
and REITs because of the FED Chairman Powell's verbal guarantee that
rates will stay low and the FED will be pumping in $60/billion a month
into banks until April, at least.

"Big money"as represented by our IP21 (Current
TigerSoft Accumulation
reading) and our Adjusted Volume Indicator remain net sellers of the
blue chip DJI-30 (except for 'big' Apple). That the DJI can not breakout
above 27500 when so much money is being made available to the banks
who are playing the market with a Fed "back-up" should be viewed as
disconcerting if you only want to play DIA long. So, I think we have to consider
diversifying now.
Apparently, hedge funds, performance funds and
not a few traders who
specialize in DIA are starting to view the DJ-30 "blue chips" as being tired
and a spent force. The same folks seem to prefer the SP-500, the NASDAQ,
bank stocks and even the leading semi-conductors now. See how close these
Indexes and their ETFs are to bullishly breaking out above their flat resistance
into all-time high territory.
 |
 |
 |
 |
History Sides with the Bulls.
History does offer some warnings, notably from late 1976 to mid-1977
that a rising A/D Line and a strong NASDAQ can eventually break down
and experience bear markets themselves when the A/D Line breaks its
uptrend and the DJI falls more than 10% from its high. But right now the
NYSE A/D Line is in a powerful uptrend and the FED is not being forced
by weakness in the Dollar or by Inflation to backtrack from its stated plan
of providing maximum liquidity. The decline in 1977 owed a lot to President
Carter's highly publicized shift to austerity to fight the Inflation caused by
OPEC. I see no reason to expect the US to pursue a policy of austerity
this year or next. Moreover, I remind readers that when the FED did the
same thing (lowering rates and providing extra liquidity into the banking
system) back in July 1927, also with the DJI being just a little shy of
an all-time high, the DJI then doubled over the next two years in a wild,
speculative orgy. Once the bulls were set in motion, there was little that
the FED could do to stop their stampede. Something like that may lie ahead.
|
Charts 10/24/2019 2019 PEERLESS DJI, Signals, Indicators Daily DJI Volume 10-DayUp/Down Vol Stoch-20 Hourly DJIA A/D Line for All Stocks Inverted Traders Index NASDAQ S&P OEX NYSE COMPQX DJI-15 DJI-20 DJI-30 DIA SPY QQQ MDY IWM TNA Short-Term Rates USO-CrudeOil DBO FAS GLD BBH IBB JETS JNUG KOL NUGT OIH OIL RSX RETL SDS AGQ SLV SOXL TECL TLT TMF TNA UGA (gasoline) XIV and China: YINN CHAU Commodities: CANE CORN DBC JJC, NIB, CHOC CORN, CUT (paper) MOO, SOYB WEAT UUP (Dollar) LIT (Lithium) AAPL ADBE ALXN AMAT AMGN AMD AMZN AXP BA BABA BAC BIDU CAT CVX DE FB GOOG GS HD IBM INTU JPM M (Macy's) MSFT NFLX NKE NVDA PG QCOM TSLA TXN XOM V WMT CMG , LRCX, SWKS, MDGL SPPI WATT SQ TOWN 10/24/19 (Click on Underlined link.) New highs and Bullish MAXCPs - http://tigersoft.com/max/10-24/BULLISH.htm Bearish MAXCPs - http://tigersoft.com/min/10-24/BEARISH.htm |
Table 1 QUICKSILVER on ETFS - 10/24/2019 Professional bearishness STILL predominates judging by falling Closing Powers ETF CLOSE CHANGE PIVOT-PT 5-dma AROC CL-PWR CANDLE IP21 ITRS --------------------------------------------------------------------------------------------- DIA 267.98 -.26 267.64 -44.7% Bearish RED -.149 ----- --------------------------------------------------------------------------------------------- BA 344.55 4.05 344 -355.9% Bearish BLUE-.174 .025 --------------------------------------------------------------------------------------------- SPY 300.37 .5 297.97 18.2% Bearish RED -.135 .007 --------------------------------------------------------------------------------------------- QQQ 194.09 1.87 191.69 14% Bearish BLUE-.017 .011 --------------------------------------------------------------------------------------------- MDY 354.94 .08 352.62 28.8% Bearish RED .006 .009 --------------------------------------------------------------------------------------------- IWM 154.18 -.22 152.61 27.3% Bearish RED -.032 .005 --------------------------------------------------------------------------------------------- FAS 79.91 1.01 77.86 139.3% Bearish BLUE-.129 .16 --------------------------------------------------------------------------------------------- RETL 24.92 -.22 23.08 188.1% ------- RED .082 .382 --------------------------------------------------------------------------------------------- SOXL 185.71 12.56 178.11 39.9% Bearish BLUE-.05 .291 --------------------------------------------------------------------------------------------- TECL 173.7 7.03 167.61 29.8% Bearish BLUE-.037 .127 --------------------------------------------------------------------------------------------- IBB 105.74 .1 102.27 130.3% Bearish RED -.152 -.024 --------------------------------------------------------------------------------------------- GLD 141.53 1 140.46 32.8% ------- BLUE .005 -.059 --------------------------------------------------------------------------------------------- OIH 11.91 -.37 12.55 -429.3% Bearish RED -.058 -.164 --------------------------------------------------------------------------------------------- GASL 6.74 -.13 6.04 77.7% Bearish RED -.171 -.245 --------------------------------------------------------------------------------------------- |
Table 2 Count of Stocks in Key Directories
20191024
-------------------------------
NEWHIGHS 174 Bullish
NEWLOWS 22
MAXCP 31
MINCP 40 Net Bearish Professionals still
TTTNH 10
TTTNL 46
FASTUP 50
FASTDOWN 73
CPCROSSA 40
CPCROSSD 166
BIGVOLUP 2
BIGVODN 17
ACCUMVER 6
HIGHIP21 7
HIUPPCT 13
LOWACCUM 65
REDSELL 124
AUGSELS7 22
TRAPDOOR 11
|
Table 4 RANKING OF KEY DIRECTORIES BASED PCT.OF STOCKS ABOVE 65-DMA
10/24/19
Bullish = 33
Bearish = 11
---------------------------------------------------------------------------------------
Directory Current day-1 day-2 day-3 day-4 day-5
----------------------------------------------------------------------------------------
HOMEBLDG 1 1 1 1 1 1
REGBANKS .925 1 1 .925 .851 .814
ETFS .913 .896 .879 .844 .844 .827
RETAIL .882 .901 .882 .823 .745 .843
BIGBANKS .857 1 .857 .857 .714 .714
TRANSP .85 .85 .85 .85 .75 .8
FOOD .833 .722 .666 .592 .592 .629
INFRA .833 .861 .888 .805 .75 .638
COMODITY .829 .707 .682 .585 .585 .634
AUTO .82 .871 .871 .871 .871 .794
REIT .82 .855 .841 .834 .772 .772
COPPER .8 1 1 1 .8 .4
JETS .8 .8 .8 .7 .6 .5
UTILITY .75 .725 .725 .675 .65 .65
FINANCE .744 .767 .755 .767 .697 .686
GAMING .695 .739 .739 .782 .652 .739
INDEXES .672 .682 .634 .634 .591 .612
ELECTRON .651 .6 .645 .658 .645 .664
SP500 .642 .648 .619 .632 .569 .586
RUS-1000 .641 .654 .63 .638 .581 .599
CHEM .632 .653 .612 .612 .571 .591
SEMI .626 .57 .616 .654 .626 .654
GUNS .625 .5 .562 .5 .5 .5
NASD-100 .602 .551 .571 .622 .581 .632
INDMATER .597 .623 .558 .584 .519 .519
NIFTY .596 .456 .491 .596 .508 .649
FIDSTKS .582 .582 .549 .582 .532 .571
COMPUTER .578 .473 .578 .578 .526 .631
CHINA .571 .517 .517 .517 .517 .607
SP-100 .566 .633 .577 .588 .488 .522
HOSPITAL .545 .5 .59 .545 .59 .5
INSURANC .54 .621 .621 .729 .675 .621
DOWJONES .533 .566 .5 .566 .466 .533
N=33
=============================================================================================
MILITARY .5 .392 .357 .392 .321 .5
SOLAR .5 .461 .461 .5 .538 .5
=============================================================================================
GOLD .47 .235 .156 .196 .235 .235
SOFTWARE .466 .35 .366 .483 .383 .516
DJI-13 .461 .461 .461 .538 .307 .538
EDU .444 .444 .333 .444 .444 .444
GREEN .4 .4 .36 .48 .4 .36
BIOTECH .376 .394 .394 .397 .373 .388
BEVERAGE .375 .375 .375 .437 .375 .375
OILGAS .362 .391 .34 .282 .231 .268
HACKERS .3 .2 .2 .25 .2 .3
BONDFUND .219 .192 .184 .166 .245 .289
COAL .166 .166 .166 .166 .166 .333
N=11
|
====================================================================
10/23/2019 Still no Buy signals from Peerless. The NYSE A/D Line stayed strong.
There were a healthy 798 more up than down on the NYSE but only
143 NYSE new highs. Selectivity is required. We should not use
Peerless to deny the NYSE A/D Line's new highs, the bullish seasonality
and FED's clear desire to keep the markets rising cannot be denied. Only
a retreat to 26000 can be predicted for the DJI if 26700 is violated.
The flat top at 27500 still "beckons for a breakout into
all time high territory. The red Distribution by Big Money
and heavy negative Down Volume have been holding the
DJI back. There are probably still too many technically
weak individual DJI-30 stocks to allow a new leg up right
now. But we see signs of improvement in the DJI's IP21
and V-I readings.

Watch the PEERLESS DJIA's IP21 (Acc.Index)
The Peerless Sells signals have warned us that the DJI would be too much
selling pressure above 27000 and there would be no breakout yet above 27500.
But now we are seeing a quick rise in our Accumulation Index. It was -.156 on
the 18th and is now -.054 on the 23rd. If this improvement continues at this rate
for another week or two, we will likely get a Peerless Buy B4 if the V-Indicator
turns positive. Notice that the OBVPct is now positive.
But right now, we can't assume any of these things. Too many DJI stocks over
90/share are in technical trouble. I have rated 11 of these stocks as Bullish
and 9 as Bearish. Our TigerSoft optimized Buys and Sells show 18 are on
Buys and 12 on Sells.
Buy More Homebuilders
All 100% of the home-building stocks are above their 65-dma. Consider
buying some of the 3x leveraged ETF, NAIL. See below that the A/D Line
for only the stocks that make up the SP-500 made a clear new high today.
The DJI-30's A/D Line is not far behind and might well breakout soon,
even as the DJIA languishes. The QQQ has lagged more recently, but
its A/D Line is in a steady uptrend, too.
A/D Line for Home-Building 30 Stocks is making new highs.
100% of its stocks are above their 65-dma.

A/D Line for SP-500 Stocks is making new highs.
64.9% of its stocks are above their
65-dma.

A/D Line for DJ-30 Stocks is close to making a new high.
56.7% of its stocks are above their 65-dma.

QQQ Stocks' A/D Line is in a long uptrend, too.
But is is lagging the other indexes.

Technical Conditions of DJI-30 Stocks over
$90/share
AAPL (+3.22) NH. Both up. IP21= .097
ITRS=+.144
AXP (-2.12) - Sell S7 at falling 65-dma with very
negative IP21(-.252)
BA (+3.52) - a small recovery after its head/shoulder
breakdown.
CAT (+1.65) - rising in the tracks of DE. Still
on its Stochastic-20 Buy within its
trading range, whose resistance is 9 points higher.
CVX - bearishly faces keen resistance at 65-dma and
shows very
negative IP21 of -.29.
DIS (-1.27) - H/S. Slipping down from falling 65-dma
with IP21 of -.143
GS (+1.71. Above 65-dma and shows rising
Closing Power. 20 points below high.
HD (-2.5). Bearish TigerSoft S9 (IP21 NNC) having
some effect. Still uptrending
IBM (+.42) H/S . IP21=+.156. Could close gap of 5
points up to falling 65-dma.
JNJ (+.7) Sell S7. At falling 65-dma and negative
IP21= -.325.
JPM (+.33) Still rising after a breakout but
IP21=-.078. Still uptrending.
MCD (-.06) H/S. Falling 65-dma. IP21= -.259
MMM (+1.22) Back above 65-dma. Rising Closing
Power. IP21= -.058
MSFT (+.87) Just below 65-dma. Falling
Closing Power. IP21=-.024
NKE (-3.28) Earlier Sell S9 (IP21 NNC) taking effect.
PG (+.82) 3 points below its 12-mo high. IP21=- 141,
Falling Cl.Pwr.
TRV (+2.01). Below neckline of H/S. IP21=-.148.
Falling CP.
UNH (-1.68) Above 65-dma. IP21= +.13. Rising
CP.
UTX (-1.5). Challenging 12-mo high 4 points higher.
Flat CP.
V (+.46) At support but IP21=-.134 and CP falling.
WMT (-.23) Consolidating tightly a point below
NH. IP21=-.073
-----------------------------------------------------------------------------------------------------------

|
Charts 10/23/2019 2019 PEERLESS DJI, Signals, Indicators Daily DJI Volume 10-DayUp/Down Vol Stoch-20 Hourly DJIA A/D Line for All Stocks Inverted Traders Index NASDAQ S&P OEX NYSE COMPQX DJI-15 DJI-20 DJI-30 DIA SPY QQQ MDY IWM TNA Short-Term Rates USO-CrudeOil DBO FAS GLD BBH IBB JETS JNUG KOL NUGT OIH OIL RSX RETL SDS AGQ SLV SOXL TECL TLT TMF TNA UGA (gasoline) XIV and China: YINN CHAU Commodities: CANE CORN DBC JJC, NIB, CHOC CORN, CUT (paper) MOO, SOYB WEAT UUP (Dollar) LIT (Lithium) AAPL ADBE ALXN AMAT AMGN AMD AMZN AXP BA BABA BAC BIDU CAT CVX DE FB GOOG GS HD IBM INTU JPM M (Macy's) MSFT NFLX NKE NVDA PG QCOM TSLA TXN XOM V WMT CMG , LRCX, SWKS, MDGL SPPI WATT SQ TOWN 10/23/19 (Click on Underlined link.) New highs and Bullish MAXCPs - http://tigersoft.com/max/10-23/BULLISH.htm Bearish MAXCPs - http://tigersoft.com/min/10-23/BEARISH.htm |
Table 1 QUICKSILVER on ETFS - 10/23/2019 Professional bearishness STILL predominates judging by falling Closing Powers ETF CLOSE CHANGE PIVOT-PT 5-dma AROC CL-PWR CANDLE IP21 ITRS --------------------------------------------------------------------------------------------- DIA 268.24 .42 270.38 -34.2% Bearish BLUE -.113 ---- --------------------------------------------------------------------------------------------- BA 340.5 3.5 369.06 -455.2% Bearish RED -.224 .004 --------------------------------------------------------------------------------------------- SPY 299.87 .86 299.28 24.6% Bearish BLUE -.099 .006 --------------------------------------------------------------------------------------------- QQQ 192.22 .37 193.55 -21.3% Bearish BLUE .003 .001 --------------------------------------------------------------------------------------------- MDY 354.86 .37 352.9 68.7% Bearish BLUE .059 .008 --------------------------------------------------------------------------------------------- IWM 154.4 .19 153.34 93% Bearish BLUE .018 .008 --------------------------------------------------------------------------------------------- FAS 78.9 .6 77.72 87.4% Bearish BLUE -.126 .072 --------------------------------------------------------------------------------------------- RETL 25.14 .33 24.01 405.4% ------- BLUE .098 .24 --------------------------------------------------------------------------------------------- SOXL 173.15 -10.69 184.26 -250.9% Bearish RED -.061 .114 --------------------------------------------------------------------------------------------- TECL 166.67 .47 172.69 -217.2% Bearish BLUE -.041 .008 --------------------------------------------------------------------------------------------- IBB 105.64 .34 103.03 159.2% Bearish BLUE -.177 -.017 --------------------------------------------------------------------------------------------- GLD 140.53 .33 140.61 4.3% ------- RED -.057 -.028 --------------------------------------------------------------------------------------------- OIH 11.91 -.37 12.55 -429.3% Bearish RED -.058 -.133 --------------------------------------------------------------------------------------------- GASL 6.87 .42 6.64 203.7% Bearish BLUE -.148 -.327 --------------------------------------------------------------------------------------------- |
Table 2 Count of Stocks in Key Directories
20191023
-------------------------------
NEWHIGHS 167
NEWLOWS 6
MAXCP 48
MINCP 25
TTTNH 18
TTTNL 27
FASTUP 61
FASTDOWN 45
CPCROSSA 67
CPCROSSD 66
BIGVOLUP 5
BIGVODN 9
ACCUMVER 4
HIGHIP21 7
HIUPPCT 13
REDSELL 128
AUGSELS7 18
TRAPDOOR 10
|
RANKING OF KEY DIRECTORIES BASED PCT.OF STOCKS ABOVE 65-DMA 10/23/19 --------------------------------------------------------------------------------------- Directory Current day-1 day-2 day-3 day-4 day-5 ---------------------------------------------------------------------------------------- BIGBANKS 1 .857 .857 .714 .714 .714 COPPER 1 1 1 .8 .4 .4 HOMEBLDG 1 1 1 1 1 1 REGBANKS 1 1 .925 .851 .814 .777 RETAIL .901 .882 .823 .745 .843 .803 ETFS .896 .879 .844 .844 .827 .81 AUTO .871 .871 .871 .871 .794 .717 INFRA .861 .888 .805 .75 .638 .611 REIT .854 .84 .833 .77 .763 .729 TRANSP .85 .85 .85 .75 .8 .7 JETS .8 .8 .7 .6 .5 .6 FINANCE .767 .755 .767 .697 .686 .686 GAMING .739 .739 .782 .652 .739 .695 UTILITY .725 .725 .675 .65 .65 .6 FOOD .722 .666 .592 .592 .685 .537 COMODITY .707 .682 .585 .585 .707 .536 INDEXES .682 .634 .634 .591 .612 .543 CHEM .666 .625 .625 .583 .604 .604 RUS-1000 .654 .63 .638 .581 .595 .576 SP500 .648 .619 .632 .569 .582 .58 SP-100 .633 .577 .588 .488 .522 .555 INDMATER .631 .565 .592 .526 .513 .513 INSURANC .621 .621 .729 .675 .621 .621 ELECTRON .597 .642 .655 .642 .662 .629 FIDSTKS .582 .549 .582 .532 .565 .543 SEMI .57 .616 .654 .626 .654 .654 DOWJONES .566 .5 .566 .466 .533 .6 NASD-100 .551 .571 .622 .581 .632 .622 CHINA .517 .517 .517 .517 .607 .589 EDU .5 .5 .5 .5 .5 .5 GUNS .5 .562 .5 .5 .5 .437 HOSPITAL .5 .59 .545 .59 .5 .5 COMPUTER .473 .578 .578 .526 .631 .526 DJI-13 .461 .461 .538 .307 .538 .615 SOLAR .461 .461 .5 .538 .5 .538 NIFTY .456 .491 .596 .508 .649 .614 GREEN .4 .36 .48 .4 .36 .32 BIOTECH .394 .388 .394 .373 .394 .347 MILITARY .392 .357 .392 .321 .5 .571 OILGAS .391 .34 .282 .231 .26 .239 BEVERAGE .375 .375 .437 .375 .375 .312 SOFTWARE .35 .366 .483 .383 .516 .483 GOLD .235 .156 .196 .235 .274 .098 HACKERS .2 .2 .25 .2 .3 .3 BONDFUND .192 .184 .166 .245 .289 .368 COAL .166 .166 .166 .166 .333 .166 |
======================================================================
10/22/2019 Still no Buy signals from
Peerless. Once again NYSE breadth (+502)
was very good but the DJI again slipped back. All the DJI's 175-point decline
occurred in the last two hours. This has the effect of turning down our
Closing
Power and making the DJI's Tiger Candle-stick red for another day since it was
turned back down from 27100. The minor support down to 26500 may now
hold, but Seasonality is usually favorable at this time. We are not at the end
of this battle between rising Openings and weaker Closings and between the
strong NYSE A/D Line and the red Distribution by "Big Money". That should
contain the DJI but also let home-builders rise more, as "blue chip" money is
shifted in their direction.
.
The DJI's next support down is at 26576, where the 65-dma
crosses.
But I suspect the DJI will need to fall to 26000 again before big traders re-enter
their long positions in DIA; a thousand points of upside "head-room" is needed..


The good breadth again especially benefitted REITs and
Homebulders.
Interest rates are being kept low quite deliberately by the FED. Unless
the Dollar becomes much weaker or the pubished Inflation numbers
rise to 3% or higher, the 10-year rates will probably stay where they are
or even go lower. The demand for more affordable housing is very strong
now. The low rates are an accomodation.

DJI-30 Bearishness Is Growing
Extreme stocks' weakness, such as we are now seeing,
is mainly focused
in the field of oil and gas stocks. But I've mentioned the many important
stocks with falling Closing Power and negative IP21 even as they make
new highs. Big banks, JPM and BAC, are two clear examples of
TigerSoft Sell S9s (IP21 NNC) on new highs. The Fed has gone out
of its way recently to ensure these big banks have enough liquidity to maintain
their trading accounts, no matter what the markets do. A failure by JPM
to stay above could signify a dangerous false breakout here and possibly
mean another 180-degree reversal by the FED. Bulls should watch JPM
and BAC closely.

Tonight, another two categories of stocks' weakness is
becoming
apparent. See www.tigersoft.com/HS/hs.htm
Bearish looking head and shoulders
patterns are now seen in BA, ECL, FISV, HSY, ICE, INTU, LMT, MCD
and MDT in SP-500 stocks. TigerSoft Sell S7s (failures at a
falling 65-dma
with a negative IP21) make AXP, AMZN, F, GE, HLT, MSCI, MTD and V
look dangerous and certainly likely to require a test of their 200-day moving
averages.
Head/Shoulders

TigerSoft S7


|
Charts 10/22/2019 2019 PEERLESS DJI, Signals, Indicators Daily DJI Volume 10-DayUp/Down Vol Stoch-20 Hourly DJIA A/D Line for All Stocks Inverted Traders Index NASDAQ S&P OEX NYSE COMPQX DJI-15 DJI-20 DJI-30 DIA SPY QQQ MDY IWM TNA Short-Term Rates USO-CrudeOil DBO FAS GLD BBH IBB JETS JNUG KOL NUGT OIH OIL RSX RETL SDS AGQ SLV SOXL TECL TLT TMF TNA UGA (gasoline) XIV and China: YINN CHAU Commodities: CANE CORN DBC JJC, NIB, CHOC CORN, CUT (paper) MOO, SOYB WEAT UUP (Dollar) LIT (Lithium) AAPL ADBE ALXN AMAT AMGN AMD AMZN BA BABA BAC BIDU CAT CVX DE FB GOOG GS HD IBM INTU JPM M (Macy's) MSFT NFLX NKE NVDA PG QCOM TSLA TXN XOM WMT CMG , LRCX, SWKS, MDGL SPPI WATT SQ TOWN 10/22/19 (Click on Underlined link.) New highs and Bullish MAXCPs - http://tigersoft.com/max/10-22/BULLISH.htm Bearish MAXCPs - http://tigersoft.com/min/10-22/BEARISH.htm |
Table 1 QUICKSILVER on ETFS - 10/22/2019 Professional bearishness STILL predominates judging by falling Closing Powers ETF CLOSE CHANGE PIVOT-PT 5-dma AROC CL-PWR CANDLE IP21 ITRS --------------------------------------------------------------------------------------------- DIA 267.82 -.39 270.08 -44.6% Bearish RED -.138 --- --------------------------------------------------------------------------------------------- BA 337 5.94 372.43 -475% Bearish BLUE-.154 -.02 --------------------------------------------------------------------------------------------- SPY 299.01 -.98 298.4 2.2% Bearish RED -.154 .005 --------------------------------------------------------------------------------------------- QQQ 191.85 -1.54 193.04 -43.3% Bearish RED -.063 .008 --------------------------------------------------------------------------------------------- MDY 354.49 -.07 350.01 59.4% Bearish RED .011 .005 --------------------------------------------------------------------------------------------- IWM 154.21 .17 151.55 92.4% Bearish ---- -.04 .005 --------------------------------------------------------------------------------------------- FAS 78.3 -2.04 77.53 31.3% Bearish RED -.167 .083 --------------------------------------------------------------------------------------------- RETL 24.81 .9 23.21 418.6% ------- BLUE .012 .272 --------------------------------------------------------------------------------------------- SOXL 183.84 -4.4 182.35 -184.1% Bearish RED -.088 .277 --------------------------------------------------------------------------------------------- TECL 166.2 -7.11 174.09 -329.7% Bearish RED -.119 .067 --------------------------------------------------------------------------------------------- IBB 105.3 1.72 102.35 138.2% Bearish RED -.204 -.022 --------------------------------------------------------------------------------------------- GLD 140.2 .41 140.41 21% Bearish BLUE .004 -.05 --------------------------------------------------------------------------------------------- OIH 11.91 -.37 12.55 -429.3% Bearish RED -.058 -.147 --------------------------------------------------------------------------------------------- |
Table 2 Count of Stocks in Key Directories
20191022
-------------------------------
NEWHIGHS 142 Bullish
NEWLOWS 5
MAXCP 32
MINCP 26
TTTNH 13
TTTNL 62
FASTUP 58
FASTDOWN 58
CPCROSSA 43
CPCROSSD 174
BIGVOLUP 2
BIGVODN 12
ACCUMVER 6
HIGHIP21 6
HIUPPCT 14
REDSELL 137
AUGSELS7 28
TRAPDOOR 12
|
Table 3 RANKING OF KEY DIRECTORIES BASED PCT.OF STOCKS ABOVE 65-DMA
10/22/19
---------------------------------------------------------------------------------------
Directory Current day-1 day-2 day-3 day-4 day-5
----------------------------------------------------------------------------------------
COPPER 1 1 .8 .4 .4 .8
HOMEBLDG 1 1 1 1 1 1
REGBANKS 1 .925 .851 .814 .777 .814
INFRA .888 .805 .75 .638 .611 .666
RETAIL .882 .823 .745 .843 .803 .745
ETFS .879 .844 .844 .827 .758 .724
AUTO .871 .871 .871 .794 .692 .666
BIGBANKS .857 .857 .714 .714 .714 .714
TRANSP .85 .85 .75 .8 .65 .75
REIT .841 .834 .772 .765 .724 .71
JETS .8 .7 .6 .5 .5 .5
FINANCE .755 .767 .697 .686 .674 .674
GAMING .739 .782 .652 .739 .695 .695
UTILITY .725 .675 .65 .65 .6 .6
COMODITY .682 .585 .585 .707 .536 .585
FOOD .666 .592 .592 .685 .537 .592
ELECTRON .645 .658 .645 .664 .632 .658
INDEXES .634 .634 .591 .612 .543 .553
RUS-1000 .63 .638 .581 .595 .572 .566
CHEM .625 .625 .583 .604 .583 .625
INSURANC .621 .729 .675 .621 .621 .594
SP500 .619 .632 .569 .582 .58 .588
SEMI .616 .654 .626 .654 .663 .672
HOSPITAL .59 .545 .59 .5 .5 .454
COMPUTER .578 .578 .526 .631 .526 .631
SP-100 .577 .588 .488 .522 .555 .555
NASD-100 .571 .622 .581 .632 .622 .653
INDMATER .565 .592 .526 .513 .5 .539
GUNS .562 .5 .5 .5 .375 .375
FIDSTKS .549 .582 .532 .565 .543 .565
CHINA .517 .517 .517 .607 .571 .535
N=
--------------------------------------------------------------------------------------------
DOWJONES .5 .566 .466 .533 .6 .6
EDU .5 .5 .5 .5 .5 .5
--------------------------------------------------------------------------------------------
NIFTY .491 .596 .508 .649 .614 .649
DJI-13 .461 .538 .307 .538 .615 .615
SOLAR .461 .5 .538 .5 .538 .576
BIOTECH .388 .388 .371 .394 .353 .327
BEVERAGE .375 .437 .375 .375 .312 .312
SOFTWARE .366 .483 .383 .516 .483 .5
GREEN .36 .48 .4 .36 .32 .4
MILITARY .357 .392 .321 .5 .535 .5
OILGAS .34 .282 .231 .26 .231 .268
HACKERS .2 .25 .2 .3 .3 .35
BONDFUND .184 .166 .245 .289 .377 .403
COAL .166 .166 .166 .333 .166 .166
GOLD .156 .196 .235 .274 .117 .078
N=13
|
====================================================================
10/21/2019 The absence of Peerless
Buy signals continues to hold back the DJI.
but more and more stocks are hearing the call of low interest rates.
The DJI is stalled but the NYSE A/D Line is roaring ahead. Today NYSE
advancers were nearly double the declines (1952 to 998) and there were
177 new highs and only 30 new lows there.

|
Charts 10/21/2019 2019 PEERLESS DJI, Signals, Indicators Daily DJI Volume 10-DayUp/Down Vol Stoch-20 Hourly DJIA A/D Line for All Stocks Inverted Traders Index NASDAQ S&P OEX NYSE COMPQX DJI-15 DJI-20 DJI-30 DIA SPY QQQ MDY IWM TNA Short-Term Rates USO-CrudeOil DBO FAS GLD BBH IBB JETS JNUG KOL NUGT OIH OIL RSX RETL SDS AGQ SLV SOXL TECL TLT TMF TNA UGA (gasoline) XIV and China: YINN CHAU Commodities: CANE CORN DBC JJC, NIB, CHOC CORN, CUT (paper) MOO, SOYB WEAT UUP (Dollar) LIT (Lithium) AAPL ADBE ALXN AMAT AMGN AMD AMZN BA BABA BAC BIDU CAT CVX DE FB GOOG GS HD IBM INTU JPM M (Macy's) MSFT NFLX NKE NVDA PG QCOM TSLA TXN XOM WMT CMG , LRCX, SWKS, MDGL SPPI WATT SQ TOWN 10/21/19 (Click on Underlined link.) New highs and Bullish MAXCPs - http://tigersoft.com/max/10-21/BULLISH.htm Bearish MAXCPs - http://tigersoft.com/min/10-21/BEARISH.htm |
 |
Watch the 10-year government bond rates chart.
Shown above, it is sitting
on its downtrend. It may be in the process of breaking its downtrend, so there
is some risk in chasing the many rising dividend stocks with high PEs and dividends
of 2%-3%. A good many of the stocks making new highs still show falling Closing
Power and (red) negative Accumulation. I can most comfortably recommend buying
some of most heavily Accumulated home developers and REITs provided they
show very high positive consistency, i.e., their AI/200 scores are above 180 and
they show high current Accumulation. Let's also watch how their earnings work
out this week and next.
High Accumulation REITS
Stock
AI/200 IP21 PE
Yield Earnings Due
--------------------------------------------------------------------
MAA 190
+.252 66
2.84% Oct. 30
SUI 186
+.184 103 3.0%
Oct 23
AVB 189
+.435 34 2.76%
Oct 28
EQR 179
+.193 44 2,57%
Oct 22
Because so many REITs are making new highs, we may surmise that
they are "over-bought". But stock selection in the roaring 1980s
and 1990s has taught us the benefit of focusing on the strongest
groups and those individual stocks showing very high AI/200 scores.
Buying them on dips to their 21-day ma or to their 65-dma after their
Closing Power turns up would be ideal.
REIT New Highs:
AHH, AIV, ARE, BRT, BRX, CNS,CPT, DLR, DRE,
3x-leveraged DRN, EGP, EQR, ESS, FR, FRI, FRT,
ICF, Global ETF - IFGL, IRET, IRT, JRS, KIM, KRG,
MAA, NNN, O, REXR,RNP, RQI, Global REIR -RWO,
RWR. RWX, SCHH, URE, VNQ...
It has to be bullish that several of the most important
stocks made new highs,
AAPL, JP Morgan and John Deer. Moreover, when we go through the
the list of new highs, we do not just see the many REITS, other stocks
and groups appear. Among the semi-conductors making new highs are
AMKR, JBL and MX. Among the retailers and specialized apparel stocks
are AAN, BOOT, CROX, DLA, NKE and TGT.
Do not overlook on our MAXCP page the new highs in previously
recommended home-builders and real-estate developers (AVB, BLDR,
INVH, STRL, SUI). And note even a few speculative, low-priced stocks
like AQZP, BASI, BLDP, RVP, SMTT,and SRC are making new highs.
Table 1 QUICKSILVER on ETFS - 10/21/2019 Professional bearishness STILL predominates judging by falling Closing Powers ETF CLOSE CHANGE PIVOT-PT 5-dma AROC CL-PWR CANDLE IP21 ITRS --------------------------------------------------------------------------------------------- DIA 268.21 .57 270.22 6.5% Bearish BLUE-.092 ----- --------------------------------------------------------------------------------------------- BA 331.06 -12.94 370.96 -575.5% Bearish RED -.141 -.038 --------------------------------------------------------------------------------------------- SPY 299.99 2.02 298.88 67.8% Bearish BLUE-.121 .01 --------------------------------------------------------------------------------------------- QQQ 193.39 1.7 193.52 59.7% Bearish BLUE-.024 .018 --------------------------------------------------------------------------------------------- MDY 354.56 1.94 350.31 99.7% Bearish RED .032 .004 --------------------------------------------------------------------------------------------- IWM 154.04 1.43 151.39 122.2% Bearish RED -.028 .004 --------------------------------------------------------------------------------------------- FAS 80.34 2.48 77.81 301.3% Bearish BLUE -.13 .072 --------------------------------------------------------------------------------------------- RETL 23.91 .83 22.85 416.9% ------- BLUE .02 .17 --------------------------------------------------------------------------------------------- SOXL 188.24 10.13 190.64 255.1% Bearish BLUE -.05 .274 --------------------------------------------------------------------------------------------- TECL 173.31 5.7 177.61 39.1% Bearish BLUE -.082 .084 --------------------------------------------------------------------------------------------- IBB 103.58 1.31 102.46 144.9% Bearish BLUE -.156 -.037 --------------------------------------------------------------------------------------------- GLD 139.79 -.67 139.61 -28.5% Bearish RED .016 -.03 --------------------------------------------------------------------------------------------- OIH 11.91 -.37 12.55 -429.3% Bearish RED -.058 -.133 --------------------------------------------------------------------------------------------- GASL 6.17 .13 6.81 -411.5% Bearish BLUE -.227 -.41 --------------------------------------------------------------------------------------------- |
Table 2 Count of Stocks in Key Directories
20191021
-------------------------------
NEWHIGHS 220 Bullish
NEWLOWS 14
MAXCP 38
MINCP 22
TTTNH 10
TTTNL 33
FASTUP 55
FASTDOWN 43
CPCROSSA 49
CPCROSSD 108
BIGVOLUP 1
BIGVODN 11
ACCUMVER 7
HIGHIP21 7
HIUPPCT 14
LOWACCUM 75
REDSELL 128
AUGSELS7 28
TRAPDOOR 13
|
Table 3 RANKING OF KEY DIRECTORIES BASED PCT.OF STOCKS ABOVE 65-DMA
10/21/19
Bullish = 30
Bearish = 10
---------------------------------------------------------------------------------------
Directory Current day-1 day-2 day-3 day-4 day-5
----------------------------------------------------------------------------------------
COPPER 1 .8 .4 .4 .4 .8
HOMEBLDG 1 1 1 1 1 .965
REGBANKS .925 .851 .814 .777 .814 .592
AUTO .871 .871 .794 .692 .666 .538
BIGBANKS .857 .714 .714 .714 .714 .571
TRANSP .85 .75 .8 .65 .65 .5
ETFS .844 .844 .827 .758 .706 .672
REIT .834 .772 .765 .724 .71 .675
RETAIL .823 .745 .843 .803 .745 .686
INFRA .805 .75 .638 .611 .666 .638
GAMING .782 .652 .739 .695 .695 .652
FINANCE .767 .697 .686 .674 .674 .534
INSURANC .729 .675 .621 .621 .621 .594
JETS .7 .6 .5 .5 .5 .4
UTILITY .675 .65 .65 .6 .6 .65
ELECTRON .658 .645 .664 .632 .658 .561
SEMI .654 .626 .654 .663 .672 .626
RUS-1000 .638 .581 .595 .572 .561 .508
INDEXES .634 .591 .612 .543 .553 .494
SP500 .632 .569 .582 .58 .575 .509
CHEM .625 .583 .604 .583 .625 .625
NASD-100 .622 .581 .632 .622 .642 .551
NIFTY .596 .508 .649 .614 .631 .543
INDMATER .592 .526 .513 .5 .526 .578
SP-100 .588 .488 .522 .555 .544 .466
COMODITY .585 .585 .707 .536 .585 .658
FOOD .584 .584 .679 .528 .584 .641
FIDSTKS .582 .532 .565 .543 .56 .467
COMPUTER .578 .526 .631 .526 .631 .578
DOWJONES .566 .466 .533 .6 .6 .566
HOSPITAL .545 .59 .5 .5 .454 .409
DJI-13 .538 .307 .538 .615 .615 .461
CHINA .517 .517 .607 .571 .535 .5
N=33
--------------------------------------------------------------------------------------------
EDU .5 .5 .5 .5 .5 .5
GUNS .5 .5 .5 .375 .375 .437
SOLAR .5 .538 .5 .538 .576 .538
--------------------------------------------------------------------------------------------
SOFTWARE .483 .383 .516 .483 .5 .466
GREEN .48 .4 .36 .32 .4 .28
BEVERAGE .437 .375 .375 .312 .312 .25
MILITARY .392 .321 .5 .535 .5 .464
BIOTECH .39 .367 .393 .355 .332 .254
OILGAS .282 .231 .26 .231 .26 .231
HACKERS .25 .2 .3 .3 .35 .3
GOLD .196 .235 .274 .117 .078 .254
BONDFUND .166 .245 .289 .377 .403 .517
COAL .166 .166 .333 .166 .166 .166
N=10
|
====================================================================
10/18/2019 We have no Peerless Buy
signals and the market have now had their
rallies back up to resistance with their 20-day Stochastics rising above
the 80% levels and now falling back. A decline to test support is now due.
26000 is the obvious support level on the DJI. The DJI's weakness
should also weaken the other general market indexes. After that, seasonal
strength coupled with the rising NYSE A/D Line may bring another
recovery. The pervasive (red) negative Distribution we accord to "big
money" selling. Such selling is usually well-informed, patient and ultimately
proven correct. With stocks showing so much appeal because of low
interest rates, I am left feeling that "Big Money" doubts how much longer
the Dollar can stay so strong and interest rates stay low low.


|
Charts 10/18/2019 2019 PEERLESS DJI, Signals, Indicators Daily DJI Volume 10-DayUp/Down Vol Stoch-20 Hourly DJIA A/D Line for All Stocks Inverted Traders Index NASDAQ S&P OEX NYSE COMPQX DJI-15 DJI-20 DJI-30 DIA SPY QQQ MDY IWM TNA Short-Term Rates USO-CrudeOil DBO FAS GLD BBH IBB JETS JNUG KOL NUGT OIH OIL RSX RETL SDS AGQ SLV SOXL TECL TLT TMF TNA UGA (gasoline) XIV and China: YINN CHAU Commodities: CANE CORN DBC JJC, NIB, CHOC CORN, CUT (paper) MOO, SOYB WEAT UUP (Dollar) LIT (Lithium) AAPL ADBE ALXN AMAT AMGN AMD AMZN BA BABA BAC BIDU CAT CVX DE FB GOOG GS HD IBM INTU JPM M (Macy's) MSFT NFLX NKE NVDA PG QCOM TSLA TXN XOM WMT CMG , LRCX, SWKS, MDGL SPPI WATT SQ TOWN 10/18/19 (Click on Underlined link.) New highs and Bullish MAXCPs - http://tigersoft.com/max/10-18/BULLISH.htm Bearish MAXCPs - http://tigersoft.com/min/10-18/BEARISH.htm |
On Friday, both TC-2000 and Dial Data showed that DIA had an intra-day
high of 275. I can find no evidence that DIA actually traded that high on the
NYSE. But the effect of the false data is to underline 27500 and 275 as
really key resistance levels. Perhaps, that was the intent of whoever posted
the spurious data.

Individual DJI Stock Internal Weakness
The DJI's 250 point decline on Friday was primarily the
result of the
25 point in high-priced Boeing and the 8 point sell-off in Johnson and
Johnson. That, at least, was the immediate cause of the decline. But there
is more trouble ahead for the DJI and DIA judging from the technical weakness
in many of the individual DJI stocks over $90. There is no other way to forcefully
demonstrate this than to show the technical weaknesses of these DJI stocks,
one by one. Even the three strong stocks, AAPL, HD and NKE that are close
to their 12-month highs are now showing heavy bearish red Distribution.
BA - All indicators rated bearish and Head/shoulders
pattern.
CAT - At well-tested resistance. IP21 NNC
(Tiger Sell S9).
CVX - All indicators but Opening Power are negative
and falling or bearish.
DIS - Bearish Head/shoulders pattern. Red
distrubution and falling Closing Power.
IBM - Head/shoulders pattern. All indicators rated
"bearish".
JNJ - IP21 NNC (Tiger S9) and all indicators but
Opening Power rates "bearish".
JPM - At well-tested resistance with very negative
Accummulation Index.
MCD - Head and shoulders pattern. All
indicators rated "bearish".
TRV - Head/Shoulders. All indicators but Opening
Power are rated "bearish".
UTX - At resistance with Red Distribution, IP21 NNC
(Tiger S9)
V - Fell below falling 65-dma with negative IP21 and
falling Closing Power.
 |
 |
 |
 |
 |
 |
 |
 |
 |
 |
Table 1 QUICKSILVER on ETFS - 10/18/2019 Professional bearishness STILL predominates judging by falling Closing Powers ETF CLOSE CHANGE PIVOT-PT 5-dma AROC CL-PWR CANDLE IP21 ITRS --------------------------------------------------------------------------------------------- DIA 267.7 -2.68 267.86 -7.1% Bearish RED -.152 ----- --------------------------------------------------------------------------------------------- BA 344 -25.06 373.18 -415.5% Bearish RED -.275 .009 --------------------------------------------------------------------------------------------- SPY 297.97 -1.31 295.95 28.4% Bearish RED -.162 .001 --------------------------------------------------------------------------------------------- QQQ 191.69 -1.86 191.09 15.1% Bearish RED -.072 .005 --------------------------------------------------------------------------------------------- MDY 352.62 -.28 347.57 51.3% Bearish BLUE .029 -.009 --------------------------------------------------------------------------------------------- IWM 152.61 -.73 150.33 78.9% Bearish RED -.002 -.013 --------------------------------------------------------------------------------------------- FAS 77.86 .14 75.68 166.6% Bearish BLUE -.19 .032 --------------------------------------------------------------------------------------------- RETL 23.08 -.93 21.99 74% ------- RED -.018 .055 --------------------------------------------------------------------------------------------- SOXL 178.11 -6.15 178.91 -22.7% Bearish RED -.107 .142 --------------------------------------------------------------------------------------------- TECL 167.61 -5.08 171.96 -127.2% Bearish RED -.142 .015 --------------------------------------------------------------------------------------------- IBB 102.27 -.76 100.62 99.8% Bearish RED -.141 -.048 --------------------------------------------------------------------------------------------- GLD 140.46 -.15 140.59 15.3% Bullish RED .088 -.022 --------------------------------------------------------------------------------------------- OIH 11.91 -.37 12.55 -429.3% Bearish RED -.058 -.127 --------------------------------------------------------------------------------------------- GASL 6.04 -.6 6.71 -775.3% Bearish RED -.253 -.433 --------------------------------------------------------------------------------------------- |
Table 2 Count of Stocks in Key Directories
20191018
-------------------------------
NEWHIGHS 161 Bullish
NEWLOWS 17
MAXCP 49
MINCP 48
TTTNH 12
TTTNL 48
FASTUP 43
FASTDOWN 55
CPCROSSA 61
CPCROSSD 151
BIGVOLUP 1
BIGVODN 10
ACCUMVER 3
HIGHIP21 3
HIUPPCT 14
VHIP21 87
LOWACCUM 80
REDSELL 124
AUGSELS7 21
TRAPDOOR 12
|
Table 3 RANKING OF KEY DIRECTORIES BASED PCT.OF STOCKS ABOVE 65-DMA
10/18/19
Bullish = 34
Bearish = 14
--------------------------------------------------------------------------------------- Directory Current day-1 day-2 day-3 day-4 day-5 ---------------------------------------------------------------------------------------- HOMEBLDG 1 1 1 1 .965 .931 AUTO .871 .794 .692 .666 .538 .564 REGBANKS .851 .814 .777 .814 .629 .666 ETFS .844 .827 .758 .706 .655 .689 COPPER .8 .4 .4 .4 .8 .8 REIT .772 .765 .724 .71 .675 .675 INFRA .75 .638 .611 .666 .611 .694 TRANSP .75 .8 .65 .65 .5 .5 RETAIL .745 .843 .803 .745 .686 .764 BIGBANKS .714 .714 .714 .714 .571 .571 FINANCE .697 .686 .674 .674 .523 .546 INSURANC .675 .621 .621 .621 .594 .567 GAMING .652 .739 .695 .695 .652 .695 UTILITY .65 .65 .6 .6 .65 .725 ELECTRON .649 .668 .636 .662 .564 .597 SEMI .626 .654 .663 .672 .626 .644 JETS .6 .5 .5 .5 .4 .4 CHEM .595 .617 .595 .638 .638 .617 FOOD .592 .685 .537 .592 .629 .666 INDEXES .591 .612 .543 .553 .494 .51 HOSPITAL .59 .5 .5 .454 .409 .363 COMODITY .585 .707 .536 .585 .634 .658 NASD-100 .581 .632 .622 .642 .53 .561 RUS-1000 .581 .595 .572 .561 .502 .526 SP500 .569 .582 .58 .575 .509 .534 SOLAR .56 .52 .56 .6 .56 .56 FIDSTKS .532 .565 .543 .56 .461 .494 COMPUTER .526 .631 .526 .631 .526 .526 INDMATER .526 .513 .5 .526 .578 .592 CHINA .517 .607 .571 .535 .482 .517 N=30 ============================================================================================ EDU .5 .5 .5 .5 .5 .5 GUNS .5 .5 .375 .375 .437 .5 ============================================================================================ NIFTY .49 .636 .6 .618 .509 .509 SP-100 .488 .522 .555 .544 .466 .488 DOWJONES .466 .533 .6 .6 .566 .566 GREEN .4 .36 .32 .4 .28 .36 SOFTWARE .383 .516 .483 .5 .466 .466 BEVERAGE .375 .375 .312 .312 .25 .437 BIOTECH .367 .387 .352 .332 .26 .277 MILITARY .321 .5 .535 .5 .464 .464 DJI-13 .307 .538 .615 .615 .461 .461 BONDFUND .247 .292 .38 .407 .548 .513 GOLD .235 .274 .117 .078 .254 .156 OILGAS .231 .26 .231 .26 .224 .268 HACKERS .2 .3 .3 .35 .3 .35 COAL .166 .333 .166 .166 .166 .166 N=14 |
====================================================================
10/17/2019 Look for the Stochastic-20 K-Line for SPY
and the DJI to reach 90%.
A close near the 27100 resistance would achieve that. Unless the Closing
Power decisively breaks its minor uptrends for DIA and SPY, I would
think the market will move a little higher. The strong A/D Line and
the steadily higher openings are bullish enough to bring somewhat
higher prices, even though NYSE volume is clearly lower on up-days
than down-days. The heavy red Distribution by "Big Money" will, at the
same time, very likely contain any advance.
See below how the NYSE AD-Line is making new highs while the DJI's
IP21, V-I and OBVPct are all quite negative. This is a rare set of internal
strength contradictions.
Right now the 5-day moving averages (Table 1) are still rising and
I look for the DIA's and SPY's Stoch-K-Line to reach 90% before peaking
just as the DJI reaches 27100-27500. Another element to watch is
Opening Power. As long as it keep rising and the K-Lines stay above Pct-Ds
for
DIA and SPY, the A/D Line's bullishness should rule. But once the
K-Line breaks the Pct-D now that we have reached "over-bough" territory,
there should be a subsidence in prices and a re-grouping for another attack
on the overhead supply of stock over 27000...


Use Stochastics in trading ranges....
Peerless still sits on its earlier Sells. The only way we could consider
Peerless is on a buy now would have had us invent a new Buy B9 for
the data for October 2nd when the DJI closed 3% below the 21-day
ma with the P= +123 even though the IP21 was -.088 and the V-I
was a -82 and it was only the beginning of October. As I explained
at the time, this was not acceptable. But a trading range bounce
was not ruled out when the Stochastic-20 K-Line turned up from
11% and then jumped above the DJI's Pct-D. At this point, we have had our
trading range bounce and the DJI's Stochastic-20 K-Line has risen
back up to 83% and is rapidly approaching an "over-bought" condition
equal to its "over-sold" condition on Ocober 2nd.


Negative IP21 = Red Distrbution by "Big
Money".
Most of the major market ETFs and many of the leading
stocks
show a very red and negative Distribution despite their rallies 2%-4%
over the 21-day. Today's theoretical high was above the 2% upper
band, yet the IP21 (current Accumulation) has sunk to a very low,
-.159. Normally, with these numbers we would be preparing for a
bearish Sell S12, but the A/D Line is making new highs and Octobers
after the middle of the month usually bring rallies, especially in the
year before a Presidential Election Year.
Still the IP21 is so low, below -.15, I decided to see
if there were
any past cases where the IP21 was this low in October on a tagging
of the 2% upper band. I found only two cases. In the first, back on
October 11, 1935, deep in the Depression, we got such a glaring IP21
"NNC" (negative non-confirmation) along with the NYSE A/D Line
simultanously rising to new highs, like now. The bullish breadth won
out and the DJI kept rising until the end of the year. "Big money" was
wrong here. They were selling for ideological reasons. They hated
FDR. They did not appreciate that he was busy saving capitalism.
1935 Good breadth was more important than IP21 and V-I
NNC

In the other case, 10/9/1978, we also got a Sell S9 based on
bad breadth
besides
the Sell S12 (IP21 NNC). This case was significantly different.
When
looked at more closely, we see that Inflation was of concern and
the
FED had suddenly started to raise interest rates.
1978 - October Sell-Off triggered by S9/S12. A/D Line was also very weak.

But what about the weak volume numbers now?
The OBVPct and V-I
are both negative. Well, I've suggested this the result of more and more
of the trading taking place before the NYSE opens. If so, it places
increasing importance on our Opening Power's trend. If the Opening
Power uptrend should be violated, a new decline back 26000 would
seem likely. And without a jump in all our internal strength indicators,
including IP21, V-I and OBVPct, I don't think we can trust a breakout
above 27500-27600.
The Dollar weakened again today and the 10-year Bond rates have
reached their downtrends. A breakdown by the Dollar below its
uptrend and by 10-year rates above their downtrend might bring
a market retreat back to 26000. More on this Sunday night.


|
Charts 10/17/2019 2019 PEERLESS DJI, Signals, Indicators Daily DJI Volume 10-DayUp/Down Vol Stoch-20 Hourly DJIA A/D Line for All Stocks Inverted Traders Index NASDAQ S&P OEX NYSE COMPQX DJI-15 DJI-20 DJI-30 DIA SPY QQQ MDY IWM TNA Short-Term Rates USO-CrudeOil DBO FAS GLD BBH IBB JETS JNUG KOL NUGT OIH OIL RSX RETL SDS AGQ SLV SOXL TECL TLT TMF TNA UGA (gasoline) XIV and China: YINN CHAU Commodities: CANE CORN DBC JJC, NIB, CHOC CORN, CUT (paper) MOO, SOYB WEAT UUP (Dollar) LIT (Lithium) AAPL ADBE ALXN AMAT AMGN AMD AMZN BA BABA BAC BIDU CAT CVX DE FB GOOG GS HD IBM INTU JPM M (Macy's) MSFT NFLX NKE NVDA PG QCOM TSLA TXN XOM WMT CMG , LRCX, SWKS, MDGL SPPI WATT SQ TOWN 10/17/19 (Click on Underlined link.) New highs and Bullish MAXCPs - http://tigersoft.com/max/10-17/BULLISH.htm Bearish MAXCPs - http://tigersoft.com/min/10-17/BEARISH.htm |
Table 1 QUICKSILVER on ETFS - 10/17/2019 Professional bearishness STILL predominates judging by falling Closing Powers ETF CLOSE CHANGE PIVOT-PT 5-dma AROC CL-PWR CANDLE IP21 ITRS Stoch-20 K --------------------------------------------------------------------------------------------- DIA 270.38 .3 268.16 100.1% Bearish RED -.161 ---- 90% +10 --------------------------------------------------------------------------------------------- BA 369.06 -3.37 374.92 -26% Bearish RED -.136 .075 --------------------------------------------------------------------------------------------- SPY 299.28 .88 296.28 101.8% Bearish RED -.186 0 91% +15 --------------------------------------------------------------------------------------------- QQQ 193.55 .51 191.11 127.2% Bearish RED -.08 .012 93% +1 --------------------------------------------------------------------------------------------- MDY 352.9 2.89 349.03 140.2% Bearish BLUE -.022 -.012 81% +22 --------------------------------------------------------------------------------------------- IWM 153.34 1.79 150.22 187% Bearish BLUE -.048 -.012 72% +21 --------------------------------------------------------------------------------------------- FAS 77.72 .19 75.3 285.1% Bearish RED -.227 .059 81% +7 --------------------------------------------------------------------------------------------- RETL 24.01 .8 22.74 609% Bearish BLUE -.045 .125 99% +12 --------------------------------------------------------------------------------------------- SOXL 184.26 1.91 178.94 461.3% Bearish RED -.124 .254 81% +5 --------------------------------------------------------------------------------------------- TECL 172.69 -1.4 172.03 216% Bearish RED -.159 .097 81% -4 --------------------------------------------------------------------------------------------- IBB 103.03 .68 100.24 199.6% Bearish BLUE -.155 -.048 70% +6 --------------------------------------------------------------------------------------------- GLD 140.61 .2 140.03 -7.1% Bullish BLUE .08 -.042 --------------------------------------------------------------------------------------------- OIH 11.91 -.37 12.55 -429.3% Bearish RED -.058 -.153 --------------------------------------------------------------------------------------------- GASL 6.64 .03 7.09 7.4% Bearish ---- -.191 -.361 --------------------------------------------------------------------------------------------- |
Table 2 Count of Stocks in Key Directories
20191017
-------------------------------
NEWHIGHS 164 Bullish
NEWLOWS 15
MAXCP 35
MINCP 28
TTTNH 8
TTTNL 26
FASTUP 90 Bullish
FASTDOWN 31
CPCROSSA 59
CPCROSSD 83
BIGVOLUP 5
BIGVODN 7
ACCUMVER 5
HIGHIP21 2
HIUPPCT 13
LOWACCUM 73
REDSELL 122
AUGSELS7 27
TRAPDOOR 12
|
Table 3 RANKING OF KEY DIRECTORIES BASED PCT.OF STOCKS ABOVE 65-DMA
10/17/19
Bullish = 32
Bearish = 9
---------------------------------------------------------------------------------------
Directory Current day-1 day-2 day-3 day-4 day-5
----------------------------------------------------------------------------------------
HOMEBLDG 1 1 1 .965 .931 .896
RETAIL .843 .803 .745 .686 .764 .647
ETFS .827 .758 .706 .655 .672 .396
(ETFs rising quickly.)
REGBANKS .814 .777 .814 .629 .666 .259
TRANSP .8 .65 .65 .5 .55 .4
AUTO .794 .692 .666 .538 .564 .435 REIT .765 .724 .71 .675 .668 .627 GAMING .727 .681 .681 .636 .59 .454 BIGBANKS .714 .714 .714 .571 .571 .428 COMODITY .707 .536 .585 .634 .658 .536 FINANCE .686 .674 .674 .523 .523 .383 FOOD .685 .537 .592 .629 .666 .555 ELECTRON .668 .636 .662 .564 .597 .506 SEMI .654 .663 .672 .626 .644 .551 UTILITY .65 .6 .6 .65 .725 .7 NIFTY .649 .614 .631 .526 .526 .421 INFRA .638 .611 .666 .611 .638 .472 NASD-100 .632 .622 .642 .53 .561 .438 COMPUTER .631 .526 .631 .526 .526 .421 INSURANC .621 .621 .621 .594 .567 .486 INDEXES .612 .543 .553 .494 .516 .306 CHINA .607 .571 .535 .482 .5 .339 CHEM .604 .583 .625 .625 .604 .312 RUS-1000 .594 .571 .56 .501 .52 .398 SP500 .58 .578 .574 .508 .526 .4 FIDSTKS .565 .543 .56 .461 .5 .351 DJI-13 .538 .615 .615 .461 .461 .384 DOWJONES .533 .6 .6 .566 .566 .366 SP-100 .522 .555 .544 .466 .5 .388 SOLAR .52 .56 .6 .56 .56 .44 SOFTWARE .516 .483 .5 .466 .466 .416 INDMATER .513 .5 .526 .578 .592 .355 N=32 ============================================================================================== EDU .5 .5 .5 .5 .5 .5 GUNS .5 .375 .375 .437 .5 .187 HOSPITAL .5 .5 .454 .409 .363 .272 JETS .5 .5 .5 .4 .4 .3 MILITARY .5 .535 .5 .464 .464 .392 ============================================================================================== COPPER .4 .4 .4 .8 .8 .4 BIOTECH .387 .346 .329 .26 .286 .225 BEVERAGE .375 .312 .312 .25 .437 .312 GREEN .36 .32 .4 .28 .36 .24 COAL .333 .166 .166 .166 .166 0 HACKERS .3 .3 .35 .3 .35 .3 BONDFUND .289 .377 .403 .543 .508 .745 GOLD .274 .117 .078 .254 .156 .392 OILGAS .26 .231 .26 .224 .231 .188 N=9 |
====================================================================
10/16/2019 Without a new Peerless Buy
signal, it will be hard to have the DJI
get past 27500. But the A/D Line's uptrend is the key here. As long
as it is uptrending, it a big decline is also unlikely.
NYSE A/D Line uptrending. Will that lead the
DJI to a breakout past 27600? Volume and IP21
are still negative. History instructs us not to expect
a big breakout advance while IP21, VI and OBVPct
are all negative. They should be surging into positive
territory.


It is the higher Openings that are propelling the markets higher. The
precedents for this, 2000 and 2007, warn that this is a temporary
and dangerous condition. My belief is that what we are seeing
now is Big Bank pools using their increased FED subsidies to rig
the Index Futures' market upwards in the hours before trading starts
in New York. This makes the upward trend of our Opening Power
the "king" of trading now.

Also bullish, in Table 1, just below, we see that the 5-day moving
averages are all still rising. Our "QuickSilver" short-term trends are
still up.
But, on the far right of Table 1, see that the 20-day Stochastic K-lines for
DIA and SPY (the two most important ETFs) are rapidly rising up to the
90% "over-bought" level while QQQ, SOXL and TECL actually reached
this status yesterday. Everything, or so it seems, still depends on the rising
trend of higher openings, as Professionals are not yet bullish and the
Closing Powers' trends are all rated as "falling" or "bearish".
Big money continues to sell into the strength shown by the DJI just above
2700. We see negative red Distribution and IP21 negative non-confirmations
abound on the many of the key ETFs for the major markets' ETFs. Look at
all the leading stocks with negative IP21 NNCs now: AAPL, AMAT, AMGN,
BAC, CAT, FAS, JPM, NVDA, QQQ, SOXL, TECL, WMT and NKE.
Table 1 QUICKSILVER on ETFS - 10/16/2019 Professional bearishness STILL predominates judging by falling Closing Powers
But all these ETFs show rising 5-day ma trends (AROC).
A 20-day Stochastic K-line reading over 90% shows "over-bought" status.
This is true for SPY, SOXL and TECL and their K-Line fell today.
Not shown below are their support and resistance levels...
and their chart patterns. Ascending flat-topped triangles are usually
bullish. SPY, TXN (Texas Instruments in Semi-Conductors) show these.
ETF CLOSE CHANGE PIVOT-PT 5-dma AROC CLOS-PWR CANDLE IP21 La/Ma S20-K ITRS ------------------------------------------------------------------------------------------------ DIA 270.08 -.14 265.01 124.6% Bearish BLUE -.115 1.011 80(-1) --- ------------------------------------------------------------------------------------------------ SPY 298.4 -.48 293.24 120.8% Bearish ---- -.134 1.010 76(-3) -.001 ------------------------------------------------------------------------------------------------ QQQ 193.04 -.48 188.68 152.6% Bearish BLUE -.032 1.020 92(-4) .016 ------------------------------------------------------------------------------------------------ MDY 350.01 -.3 343.14 129.8% Bearish BLUE -.032 1.004 59(-2) -.018 ------------------------------------------------------------------------------------------------ IWM 151.55 .16 147.72 148% Bearish BLUE -.062 1.004 51(+1) -.023 ------------------------------------------------------------------------------------------------ FAS 77.53 -.28 73.39 381% Bearish RED -.178 1.024 73(-2) .054 ------------------------------------------------------------------------------------------------ RETL 23.21 .36 21.28 575.1% Bearish BLUE -.098 1.060 87(+9) .077 ------------------------------------------------------------------------------------------------ SOXL 182.35 -8.29 167.68 552% Bearish RED -.087 1.055 75(-23) .269 ------------------------------------------------------------------------------------------------ TECL 174.09 -3.52 165.25 351.9% Bearish RED -.11 1.048 85(-12) .129 ------------------------------------------------------------------------------------------------ |
Look at Table 3 below. Finally, we are seeing more
industry groups with the
majority of their stocks above their 65-dma. No doubt traders are encouraged
by the market's ability to hold up this October and despite the seemingly endless
disaparagement of President Trump for enlisting foreign governments into his own
political camapign, for incompetence in national security matters, betraying the Kurds,
and for repeated obstruction.. The stock market just does not want to go down.
I would suggest that all this is exactly what you get when interest rates are so low
and stocks are made to look so relatively cheap. It is what you get when big banks
are given for small change $60 billion a month to play with in their own personal
trading accounts, without restrictions. And it is what you get when earnings
look
solid and can always be boosted by more big share buy-backs. So, the flat top at
27500-27600 is the door to a breakout into all-time high territory. It
"beckons",
as we like to say, for a powerful breakout, just as it did November 2016 when Trump
was first elected President.
The polls for the President are not good now. But they were also not
good for Trump in November 2016 just before the Election. What if the
Economy were really really jumping next year, because DJI breakout big-time
and the lure of the stock market becomes irresistable for the small
investor just as it was in 1928-1929 and 1967-1968 and 1999-2000.
start booming. What then? Trump would probably be re-elected. This is
what the Fed really wants, despite their frequent declarations of political
independence!
|
Charts 10/16/2019 2019 PEERLESS DJI, Signals, Indicators Daily DJI Volume 10-DayUp/Down Vol Stoch-20 Hourly DJIA A/D Line for All Stocks Inverted Traders Index NASDAQ S&P OEX NYSE COMPQX DJI-15 DJI-20 DJI-30 DIA SPY QQQ MDY IWM TNA Short-Term Rates USO-CrudeOil DBO FAS GLD BBH IBB JETS JNUG KOL NUGT OIH OIL RSX RETL SDS AGQ SLV SOXL TECL TLT TMF TNA UGA (gasoline) XIV and China: YINN CHAU Commodities: CANE CORN DBC JJC, NIB, CHOC CORN, CUT (paper) MOO, SOYB WEAT UUP (Dollar) LIT (Lithium) AAPL ADBE ALXN AMAT AMGN AMD AMZN BA BABA BAC BIDU CAT CVX DE FB GOOG GS HD IBM INTU JPM M (Macy's) MSFT NFLX NKE NVDA PG QCOM TSLA TXN XOM WMT CMG , LRCX, SWKS, MDGL SPPI WATT SQ TOWN 10/16/19 (Click on Underlined link.) New highs and Bullish MAXCPs - http://tigersoft.com/max/10-16/BULLISH.htm Bearish MAXCPs - http://tigersoft.com/min/10-16/BEARISH.htm |
Table 2 Count of Stocks in Key Directories
20191016
-------------------------------
NEWHIGHS 97 Bullish
NEWLOWS 12
MAXCP 31
MINCP 21
TTTNH 10
TTTNL 33
FASTUP 84 Swing Traders are net bullish.
FASTDOWN 44
CPCROSSA 53
CPCROSSD 98
BIGVOLUP 5
BIGVODN 9
ACCUMVER 6
HIGHIP21 2
HIUPPCT 9
LOWACCUM 73
REDSELL 126
AUGSELS7 23
TRAPDOOR 12
|
Table 3 RANKING OF KEY DIRECTORIES BASED PCT.OF STOCKS ABOVE 65-DMA
10/16/19
---------------------------------------------------------------------------------------
Directory Current day-1 day-2 day-3 day-4 day-5
----------------------------------------------------------------------------------------
HOMEBLDG 1 1 .965 .931 .896 .931
RETAIL .803 .745 .686 .764 .666 .607
REGBANKS .777 .814 .629 .666 .259 .222
ETFS .758 .706 .655 .672 .396 .189
REIT .724 .71 .675 .668 .627 .641
BIGBANKS .714 .714 .571 .571 .428 .142
GAMING .695 .695 .652 .608 .478 .478
AUTO .692 .666 .538 .564 .435 .333
FINANCE .674 .674 .523 .523 .36 .22
SEMI .663 .672 .626 .644 .551 .523
TRANSP .65 .65 .5 .55 .4 .3 ELECTRON .632 .658 .561 .593 .503 .47 NASD-100 .622 .642 .53 .561 .459 .418 INSURANC .621 .621 .594 .567 .486 .459 DJI-13 .615 .615 .461 .461 .384 .307 NIFTY .614 .631 .526 .526 .421 .403 INFRA .611 .666 .611 .638 .472 .444 DOWJONES .6 .6 .566 .566 .366 .366 UTILITY .6 .6 .65 .725 .7 .625 CHEM .583 .625 .625 .604 .312 .312 SP500 .578 .574 .508 .526 .408 .373 CHINA .571 .535 .482 .5 .339 .214 RUS-1000 .571 .56 .501 .52 .404 .361 SOLAR .56 .6 .56 .56 .44 .44 SP-100 .555 .544 .466 .5 .388 .355 FIDSTKS .543 .56 .461 .5 .357 .324 INDEXES .543 .553 .494 .516 .306 .284 FOOD .537 .592 .629 .666 .555 .574 COMODITY .536 .585 .634 .658 .536 .536 MILITARY .535 .5 .464 .464 .392 .357 COMPUTER .526 .631 .526 .526 .473 .368 N=31 ================================================================================================== EDU .5 .5 .5 .5 .5 .5 HOSPITAL .5 .454 .409 .363 .272 .272 INDMATER .5 .526 .578 .592 .342 .302 JETS .5 .5 .4 .4 .3 .3 ================================================================================================== SOFTWARE .483 .5 .466 .466 .416 .383 COPPER .4 .4 .8 .8 .2 .2 BONDFUND .377 .403 .543 .508 .754 .824 GUNS .375 .375 .437 .5 .187 .187 BIOTECH .346 .323 .257 .286 .231 .219 GREEN .32 .4 .28 .36 .24 .2 BEVERAGE .312 .312 .25 .437 .312 .375 HACKERS .3 .35 .3 .35 .3 .25 OILGAS .231 .26 .224 .231 .188 .195 COAL .166 .166 .166 .166 0 0 GOLD .117 .078 .254 .156 .392 .411 N=11 |
========================================================================
10/15/2019 The same technical
problems for a breakout above 27500 remain. Namely,
there is still red Distribution from Big Money, Professionals on the NYSE are
not yet ready to get aboard and volume continues to increase on down-days.
But let's appreciate that the DJI has made it through the scary first half of
October and paid no heed that I can see to President Trump's mounting
difficulties. So, even with Peerless on Sells, I have suggested we give the
DJI a chance to rise to 27200. It did tag that level briefly Friday, but I think it
will still challenge it again.
Of course, really devastating news for Trump on the Impeachment front
would jar the bullish expectations on Wall Street that he cannot be removed
from office because of the Senate's composition and the 2/3 rules for impeachment.
Another thing. We still have to be selective, however. HD, which I've
suggested buying, has reached its upper band with the Tiger Accumulation
now negative. Prudence requires us selling it now and honoring the current
Peerless Sells by holding some of the many Bearish MINCPs short.
The rising AD-Line (which is heavily influenced by short-term rates) is still
rising.
The DJI's Volume-indicators are negative, showing that NYSE traders are net
sellers. Until the Peerless volume indicators improve, I suspect the DJI will
only nuzzle up to the 27200-27500 resistance level and then pull-back, waiting
for NYSE traders to become big buyers, possibly for a year-ending breakout.


I have four reasons for expecting another DJI push up to 27200.
(1) We should probably respect the dynamics of the many trading ranges
in which Stochastic Buys and Sells comprise the optimum TigerSoft trading
system. See for example, the chart of MDY and the many others shown
last night. Their Stoch-20 K-Lines are expected to reach 90% before
turning down much.


(2) We must now appreciate how ardently the FED wishes to keep the rally
alive and how bullish it ought to be that the big banks will receive $15 billion
a week for their holdings of government securities until next Spring. As long
as the market's trend is up, expect the big banks' government-subsidized trading
pools to continue what has worked quite well for them, namely doing heavy
buying of Index Futures before the Opening and then supporting them on
weakness if there does happen to be an early sell-off. See how steeply the
Opening Power is rising even as the Closing Power is now trying to weakly
turn up. Let's see if the K-Line for DIA and SPY can rise up to the "overbought"
90% level..


(3) We need also understand the bullish seasonality now. This is true
for all years since 1965 and even more for the years since 1967 in the years
before a Presidential Election.
Pct of Years the DJI is Up after Oct. 15
After One Month After Two Months After Three Months
------------------ ------------------- --------------------
All Years 62.3%
56.6%
67.9%
Avg.Gain +1.3%
+1.0%
+2.7%
Years before 75.0%
75.06%
81.3%
Pres. Election.
Avg.Gain +2.1%
+4.2%
+6.21%
Said differently, as long as the NYSE A/D Line's trend is rising, I have
suggested we respect the bullishness of the massive infusion of FED
capital into the banks now. This should give prices a very chance to
reach the top of their last 20-day's trading even without much NYSE
volume. .
We should also not be in a hurry to jump to conclusions about Peerless giving
a Sell S12 now that we have reached the middle of October, a month that is
famous for marking the end of many intermediate-term selloffs and not a few
bear markets, too. Peerless now takes this into account. With the current
version of Peerless, there have only been 3 Sell S12s (IP21 NNC's at the upper
2% band or higher) in the second half of October. All three occurred in
on-going bear markets, not in rising bull markets, like now. For example, there
were no Sell S12s in bull markets despite the IP21 being negative as the DJI
reached the upper band in these cases:
Bull Market IP21-NNCs
with Positive P-I
Date la/ma AROC P-I IP21
V-I OBVPct
--------------------------------------------------------------------
1935 10/16 1.031 .235 29
-.094 -68 +.249 .
(No Sell - Year before Presidential Election.
DJI rose from 136.7 steadily to 148.4 on 11/19
1936 10/19 1.033 .771 28 -.051 -47
+.506
(No Sell - Presidential Election.
DJI rose from 177.4 steadily to 184.9 on 11/17
1965 10/27 1.019 .299 46 -.084
+6 +.118
(No Sell -
DJI fell from 959.11 to 939.53 on 12/6/1965 (rising 65-dma)
|
Charts 10/15/2019 2019 PEERLESS DJI, Signals, Indicators Daily DJI Volume 10-DayUp/Down Vol Stoch-20 Hourly DJIA A/D Line for All Stocks Inverted Traders Index NASDAQ S&P OEX NYSE COMPQX DJI-15 DJI-20 DJI-30 DIA SPY QQQ MDY IWM TNA Short-Term Rates USO-CrudeOil DBO FAS GLD BBH IBB JETS JNUG KOL NUGT OIH OIL RSX RETL SDS AGQ SLV SOXL TECL TLT TMF TNA UGA (gasoline) XIV and China: YINN CHAU Commodities: CANE CORN DBC JJC, NIB, CHOC CORN, CUT (paper) MOO, SOYB WEAT UUP (Dollar) LIT (Lithium) AAPL ADBE ALXN AMAT AMGN AMD AMZN BA BABA BAC BIDU CAT CVX DE FB GOOG GS HD IBM INTU JPM M (Macy's) MSFT NFLX NKE NVDA PG QCOM TSLA TXN XOM WMT CMG , LRCX, SWKS, MDGL SPPI WATT SQ TOWN 10/154/19 (Click on Underlined link.) New highs and Bullish MAXCPs - http://tigersoft.com/max/10-15/BULLISH.htm Bearish MAXCPs - http://tigersoft.com/min/10-15/BEARISH.htm |
Table 1 QUICKSILVER on ETFS - 10/15/2019 Professional bearishness STILL predominates judging by falling Closing Powers ETF CLOSE CHANGE PIVOT-PT 5-dma AROC CL-PWR CANDLE IP21 ITRS --------------------------------------------------------------------------------------------- DIA 270.22 2.36 263.43 162.9% Bearish BLUE-.097 ---- --------------------------------------------------------------------------------------------- BA 370.96 -2.22 374.96 -42% Bearish RED .004 .069 --------------------------------------------------------------------------------------------- SPY 298.88 2.93 291.27 176.6% Bearish BLUE-.104 .002 --------------------------------------------------------------------------------------------- QQQ 193.52 2.43 187.23 214.6% Bearish BLUE-.003 .02 --------------------------------------------------------------------------------------------- MDY 350.31 2.74 341.02 168.4% Bearish BLUE-.009 -.017 --------------------------------------------------------------------------------------------- IWM 151.39 1.06 147.13 166.1% Bearish BLUE-.01 -.028 --------------------------------------------------------------------------------------------- FAS 77.81 2.13 71.83 533.2% Bearish BLUE-.157 .091 --------------------------------------------------------------------------------------------- RETL 22.85 .86 20.69 634.1% Bearish BLUE-.112 .095 --------------------------------------------------------------------------------------------- SOXL 190.64 11.73 162.94 1052.6% Bearish BLUE-.034 .37 --------------------------------------------------------------------------------------------- TECL 177.61 5.65 162.14 669.1% Bearish BLUE-.107 .199 --------------------------------------------------------------------------------------------- IBB 102.46 1.84 97.75 244.8% Bearish BLUE-.132 -.049 --------------------------------------------------------------------------------------------- GLD 139.61 -.98 142.05 -81.9% ------- RED .025 -.038 --------------------------------------------------------------------------------------------- OIH 11.91 -.37 12.55 -429.3% Bearish RED -.058 -.165 --------------------------------------------------------------------------------------------- GASL 6.81 .1 6.55 148.9% Bearish BLUE-.228 -.406 --------------------------------------------------------------------------------------------- RSX 22.72 .14 22.48 75.1% ------- BLUE-.142 -.028 |
Table 2 Count of Stocks in Key Directories
20191015
-------------------------------
NEWHIGHS 113 Bullish
NEWLOWS 17
MAXCP 25
MINCP 19
TTTNH 87
TTTNL 30
FASTUP 104 Bullish
FASTDOWN 62
CPCROSSA 82
CPCROSSD 40
BIGVOLUP 4
BIGVODN 4
ACCUMVER 5
HIGHIP21 4
HIUPPCT 10
LOWACCUM 74
REDSELL 126
AUGSELS7 21
TRAPDOOR 15
|
Table 3 RANKING OF KEY DIRECTORIES BASED PCT.OF STOCKS ABOVE 65-DMA
10/15/19
Bullish = 31
Bearish = 11
---------------------------------------------------------------------------------------
Directory Current day-1 day-2 day-3 day-4 day-5
----------------------------------------------------------------------------------------
HOMEBLDG 1 .965 .931 .896 .931 .931
REGBANKS .814 .629 .666 .259 .222 .148
RETAIL .745 .686 .764 .666 .607 .568
BIGBANKS .714 .571 .571 .428 .142 .142
REIT .71 .675 .668 .627 .641 .648
ETFS .706 .655 .672 .396 .172 .155
GAMING .695 .652 .608 .478 .478 .434
FINANCE .674 .523 .523 .36 .232 .162
SEMI .672 .626 .644 .551 .523 .457
AUTO .666 .538 .564 .435 .333 .205
INFRA .666 .611 .638 .472 .416 .388
ELECTRON .658 .561 .593 .503 .464 .412
TRANSP .65 .5 .55 .4 .3 .3
NASD-100 .642 .53 .561 .459 .418 .275
COMPUTER .631 .526 .526 .473 .368 .368
NIFTY .631 .526 .526 .421 .403 .35
CHEM .625 .625 .604 .312 .333 .312
INSURANC .621 .594 .567 .486 .459 .405
DJI-13 .615 .461 .461 .384 .384 .23
DOWJONES .6 .566 .566 .366 .4 .3
SOLAR .6 .56 .56 .44 .44 .4
UTILITY .6 .65 .725 .7 .625 .65
FOOD .592 .629 .666 .555 .555 .537
COMODITY .585 .634 .658 .536 .536 .536
SP500 .574 .508 .526 .408 .375 .317
INDEXES .569 .494 .516 .306 .279 .258
FIDSTKS .56 .461 .5 .357 .329 .285
RUS-1000 .56 .501 .52 .404 .359 .319
SP-100 .544 .466 .5 .388 .366 .277
CHINA .535 .482 .5 .339 .214 .196
INDMATER .526 .578 .592 .342 .289 .315
N=31
=============================================================================================
EDU .5 .5 .5 .5 .5 .5
JETS .5 .4 .4 .3 .3 .3
MILITARY .5 .464 .464 .392 .357 .321
SOFTWARE .5 .466 .466 .416 .383 .3
============================================================================================
HOSPITAL .454 .409 .363 .272 .272 .181
BONDFUND .403 .543 .508 .754 .824 .833
COPPER .4 .8 .8 .2 .2 0
GREEN .4 .28 .36 .24 .2 .2
GUNS .375 .437 .5 .187 .187 .187
HACKERS .35 .3 .35 .3 .25 .15
BIOTECH .323 .251 .283 .231 .225 .21
BEVERAGE .312 .25 .437 .312 .375 .25
OILGAS .26 .224 .231 .188 .195 .173
COAL .166 .166 .166 0 0 0
GOLD .078 .254 .156 .392 .411 .529
N=11
|
=======================================================================
10/14/2019 Another strong up-opening is
taking shape. Opening Power is clearly in control.
(The NYSE may have to start opening earlier. Big Money never sleeps.)
Our Tiger Accumulation Index is almost everywhere still bearish. But note
that a
negative Accumulation Index is most important for the DJI only when the DJI
reaches an over-bought position, say, 2% or more above the DJI's 21-day ma.
In the meantime, the market is moving up with the conviction born of knowing
that the Fed is clearly on the side of the Bulls, that the last 10 weeks of the year
before a Presidential Election Year are usually up nicely and, as important, as anything,
that lots and lots of indexes, ETFs and sectors are in the process of searching for
resistance having found good support.


Weak MINCPs continue to decline. Short them to hedge. Home-building
and shipping stocks are the strongest groups to be long. Avoid Biotechs
and study the usefullness of trading the 20-day Stochastic with all those
vehicles below that show by their charts' top-lines that the Stochastic
20 is the optimized system now. FAS and JETs are leveraged ETFs on
red Stochastic Buys that look like they must get back to the top of their
20-day trading ranges. See the same in MDY and IWM.


|
Charts 10/14/2019 2019 PEERLESS DJI, Signals, Indicators Daily DJI Volume 10-DayUp/Down Vol Stoch-20 Hourly DJIA A/D Line for All Stocks Inverted Traders Index NASDAQ S&P OEX NYSE COMPQX DJI-15 DJI-20 DJI-30 DIA SPY QQQ MDY IWM TNA Short-Term Rates USO-CrudeOil DBO FAS GLD BBH IBB JETS JNUG KOL NUGT OIH OIL RSX RETL SDS AGQ SLV SOXL TECL TLT TMF TNA UGA (gasoline) XIV and China: YINN CHAU Commodities: CANE CORN DBC JJC, NIB, CHOC CORN, CUT (paper) MOO, SOYB WEAT UUP (Dollar) LIT (Lithium) AAPL ADBE ALXN AMAT AMGN AMD AMZN BA BABA BAC BIDU CAT CVX DE FB GOOG GS HD IBM INTU JPM M (Macy's) MSFT NFLX NKE NVDA PG QCOM TSLA TXN XOM WMT CMG , LRCX, SWKS, MDGL SPPI WATT SQ TOWN 10/14/19 (Click on Underlined link.) New highs and Bullish MAXCPs - http://tigersoft.com/max/10-14/BULLISH.htm Bearish MAXCPs - http://tigersoft.com/min/10-14/BEARISH.htm |
Don't Fight The Fed until the NYSE A/D Uptrend is Broken.
Yes, the DJI remains on a Sell. But who wants to argue
with those who
expect a trade deal with China and a Fed Chairman who has again done
a complete turn-around? A month ago short-term rates were 1/4% higher
and the Fed was taking up banking slack by selling $50 billion in government
bonds, now it is adding $60 billion to banking liquidity by buying that amount
of goverment bonds. This is quite a turn-around.
It matches what I have read about what moved the 1924 trading range into
a very big-take-off. And an even bigger rally was started in the middle of
1932 (the DJI nearly doubled in 10 weeks) when the FED became a very
big buyer of bonds from banks.
1932 - "During the first nine months of 1932, the Reserve Banks bought
an unprecedented $1 billion of securities, but this additional liquidity
was quickly absorbed by the parched banking system."
https://www.chicagofed.org/utilities/about-us/history/chicago-fed-history-1915-1939
So, let's not argue with the FED's ability now to boost the market, at least not
until the NYSE A/D Line breaks its uptrend, as in early 2002.
A Sample of Sector Funds Traded Now Best with Stochastic-20s
Look at all the stocks, ETFs and sectors that are now best
traded with
a Stochastic-20 because they are in trading ranges. The main theme here
is that we should expect them to rise to the top of their last days' trading. There
are lots and lots of examples of this now, certainly as many as I have ever
seen since the red optimized Tiger signals were invented in 2001.


Table 1 QUICKSILVER on ETFS - 10/14/2019 Professional bearishness STILL predominates judging by falling Closing Powers ETF CLOSE CHANGE PIVOT-PT 5-dma AROC CL-PWR CANDLE IP21 ITRS --------------------------------------------------------------------------------------------- DIA 267.86 -.3 261.58 59% Bearish BLUE -.133 ===== --------------------------------------------------------------------------------------------- BA 373.18 -1.74 374.1 -44.9% Bearish RED .041 .087 --------------------------------------------------------------------------------------------- SPY 295.95 -.33 288.53 49.1% Bearish ---- -.122 0 --------------------------------------------------------------------------------------------- QQQ 191.09 -.02 185.42 75.7% Bearish BLUE -.021 .008 --------------------------------------------------------------------------------------------- MDY 347.57 -1.46 338.73 39.3% Bearish RED -.004 -.015 --------------------------------------------------------------------------------------------- IWM 150.33 .11 146.46 62.2% Bearish BLUE -.015 -.026 --------------------------------------------------------------------------------------------- FAS 75.68 .38 70 140% Bearish BLUE -.157 -.004 --------------------------------------------------------------------------------------------- RETL 23.25 -.62 25.26 -298.7% ------- RED .236 -.076 --------------------------------------------------------------------------------------------- SOXL 178.91 -.03 155.12 241.8% Bearish BLUE -.08 .147 --------------------------------------------------------------------------------------------- TECL 171.96 -.07 155.48 234.1% Bearish BLUE -.119 .051 --------------------------------------------------------------------------------------------- IBB 100.62 .38 97.61 61.2% Bearish BLUE -.129 -.054 --------------------------------------------------------------------------------------------- GLD 140.59 .56 141.92 -3.5% ------- BLUE .021 .023 --------------------------------------------------------------------------------------------- OIH 14.64 -.34 14.58 0% Bearish RED .038 -.098 --------------------------------------------------------------------------------------------- GASL 6.71 -.38 6.61 -488.9% Bearish RED -.162 -.457 --------------------------------------------------------------------------------------------- RSX 23.7 -.34 23.3 117% Bullish RED .186 -.024 |
Table 2 Count of Stocks in Key Directories
20191014
-------------------------------
NEWHIGHS 50 Bullish
NEWLOWS 17
MAXCP 9
MINCP 45 Professionals remain net bearish.
TTTNH 3
TTTNL 44 Day Traders remain net bearish.
FASTUP 38
FASTDOWN 93 Swing Traders remain net bearish.
CPCROSSA 48
CPCROSSD 68
BIGVOLUP 4
BIGVODN 6
ACCUMVER 4
HIGHIP21 3
HIUPPCT 12
LOWACCUM 68
REDSELL 118
AUGSELS7 19
TRAPDOOR 15
|
Table 3 RANKING OF KEY DIRECTORIES BASED PCT.OF STOCKS ABOVE 65-DMA
10/14/19
Bullish = 29
Bearish = 17
---------------------------------------------------------------------------------------
Directory Current day-1 day-2 day-3 day-4 day-5
----------------------------------------------------------------------------------------
HOMEBLDG .965 .931 .896 .931 .931 .965
COPPER .8 .8 .2 .2 0 .2
RETAIL .686 .764 .666 .607 .568 .666
REIT .675 .668 .627 .641 .648 .696
ETFS .655 .672 .396 .172 .155 .206
GAMING .652 .608 .478 .478 .434 .434
UTILITY .65 .725 .7 .625 .625 .725
CHEM .638 .617 .319 .34 .319 .468
COMODITY .634 .658 .536 .536 .536 .463
FOOD .629 .666 .555 .555 .537 .481
REGBANKS .629 .666 .259 .222 .148 .481
SEMI .626 .644 .551 .523 .457 .607
INFRA .611 .638 .472 .416 .388 .416
INSURANC .594 .567 .486 .459 .405 .567
INDMATER .578 .592 .342 .289 .315 .342
BIGBANKS .571 .571 .428 .142 .142 .428
DOWJONES .566 .566 .366 .4 .3 .466
ELECTRON .561 .593 .503 .464 .412 .541
SOLAR .56 .56 .44 .44 .4 .44
BONDFUND .539 .504 .752 .823 .84 .814
AUTO .538 .564 .435 .333 .23 .384
NASD-100 .53 .561 .459 .418 .275 .459
COMPUTER .526 .526 .473 .368 .368 .578
NIFTY .526 .526 .421 .403 .35 .456
FINANCE .523 .523 .36 .232 .162 .313
SP500 .508 .526 .408 .375 .313 .441
RUS-1000 .501 .52 .404 .359 .319 .431
N=27
=========================================================================================
EDU .5 .5 .5 .5 .5 .5
TRANSP .5 .55 .4 .3 .3 .3
=========================================================================================
INDEXES .494 .516 .306 .279 .263 .301
CHINA .482 .5 .339 .214 .196 .25
SOFTWARE .466 .466 .416 .383 .3 .383
SP-100 .466 .5 .388 .366 .277 .433
MILITARY .464 .464 .392 .357 .321 .428
DJI-13 .461 .461 .384 .384 .23 .384
FIDSTKS .461 .5 .357 .329 .285 .395
GUNS .437 .5 .187 .187 .187 .187
HOSPITAL .409 .363 .272 .272 .181 .227
JETS .4 .4 .3 .3 .3 .2
HACKERS .3 .35 .3 .25 .15 .3
GREEN .28 .36 .24 .2 .2 .2
GOLD .254 .156 .392 .411 .549 .294
BIOTECH .251 .277 .228 .225 .216 .251
BEVERAGE .25 .437 .312 .375 .25 .25
OILGAS .224 .231 .188 .195 .173 .224
COAL .166 .166 0 0 0 0
N=17
|
=======================================================================
10/11/2019
Friday's 320 point gain was
flawed. Though breadth was reasonably good,
with 713 more up than down on the NYSE, there was a last hour sell-off of
nearly 200 points and that left our Accumulation a very negative -.108, the
Adjusted Up-Down Volume Indicator, V-I, a negative -126 and even OBV-
Pct stands at a -.074. Moreover, the various major ETFs' Closing Powers
are still below their falling 21-day ma. So, Big Money and New York Professionals
remain
unconvinced that there will be a valid breakout to new highs. With Peerless
still on its earlier Sells and the DJI positioned to post a new Sell S12 if the it should
rally 2% higher, we should cautious, prudent nd restrained in our enthusiasm
for stocks. In fact, I have limited my long suggestions to Home Depot, homebuilders
and a handful of low-priced oil tanker stocks. That's the best we can do now
without stretching our luck too far. When we have to look and look for stocks
that might be good enough to recommend, it is usually best to hold off on new
long recommendations.
While Peerless remains on Sells, I would suggest that the market is
being boosted
too much at the opening to fight the current upswing by staying short DIA. Shorting
some of the very weak MINCPs makes more sense, I think.
If the DJI were about to breakout decisively above 27600,
we
would probably not be seeing falling Closing Powers, negative
Accumulation Index readings and a negative VI and OBVPct.
The 2% upper band a little above 27350 is expected to stop
any rallies until these internal indicators look much better. Moreover,
a rally above 27400 will probably give us a Sell S12.
There are a number of past cases, where a Buy B9 or a decline
to the 3% lower band with a positive P-I, like we have just seen,
does rally, but often only to the 2%-3% upper band. That seems a
likely scenario now.


Higher Openings are in control of all the major ETFs. As long as the
Opening Power is this strong, the market should hold up and may
challenge its recent highs. But NYSE Professionals are not convinced
that the rally is worth chasing.

The DJI has averaged a +15% gain in years before a Presidential Election.
This is almost 3x higher than in other years. The reason for this should
be clear enough. Presidents want to be re-elected and will do all they
can to boost the market in hopes that this will keep the Economy strong.
In keeping with this lofty goal, President Trump knows he needs a very strong
market to get re-elected. So a completed trade deal with China and an end
of the trade war should be expected before too long.
Making the market zoom upwards, too, Fed Chairman Powell has decided
not to argue with the President. Powell, in fact, has done another 180 degree
turn-around to appease Trump and the Doves. Last December, after the SP-500
had dropped 20%, Powell suddenly stopped his campaign to raise rates and
promptly lowered them. When this happened, trading volume surged, Professionals
also did a complete turnaround, too, as indicated by the way the previously falling
Closing Power zoomed up instead of down. Similarly, our Accumulation Index
surged and made a tell-tale bulge. Powell's 180 degree turn-around certainly
worked its magic as intended with the DJI and the SP-500 even making
nominal new highs this past Summer.
Powell is trying the same magic trick again. A few weeks ago, he tried to cast
another spell on the market, just as the DJI fell to the lower band. The FOMC,
in effect, complied with Trump's wishes and lowered the Federal Funds
rate by 1/4%. But there's more. At the end of this last week, the FED went
from selling $50 billion in Treasuries per month to buying $60 billion in Treasuries
from the big banks. They do not want the big banks to be caught short of cash and
have to sell lot of the stock they are trading. Bullishly, Powell said the FED
would continue to inject $60 billion per month into the banking system until April
nexy year. Intriguingly, he continues to affirm his political independence and deny
that he has embarked on a new "QE IV". Don't believe him for a second.
A concerted campaign to get the DJI to breakout over 27600 is clearly under
way. No surprise. This is the third year in the Presidential 4-year cycle.
It
is what the Fed has done many times before.
In one particularly important case, back in the
Summer of 1927, the FED
dropped rates aggressively even with the DJI just below its all-time high. The
result was predictable. The DJI shot upwards in an over-speculated bubble.
In two years, it was up 100% from its level in July 1927. History rhymes rather
than repeating perfectly. But I would speculate, that the Fed and President Trump
are only beginning to use all the tools at their disposal to send the DJI up to
30,000. Think about all the "bragging rights" they will get if this
happens about
this time next year.
OBVPct was positive on the breakout to new highs in
July 1926. But all is not well now. Right now the OBVPct
(aka "OP") is quite negative. Apparently, there are lots of NYSE
traders who do not yet believe the DJI will succeed in breaking out.

If I am right, expect the Opening Power to continue to lead
the advance. NYSE
volume will probably lag. But I would expect our Accumulation Index to switch
from being negative, as it is now, and soon turn positive, if the DJI is going to
breakout past 27600. This is what happened last January after Powell's
"180-turn around then. It is also is what happened in 1967 (also a year before
the Election) when the FED suddenly decided to cut short-term rates despite
the growing Inflation from the War in Vietnam. And it is also what happened in
1971 (also a year before a Presidential Election), when Fed Chairman Burns
acquiesced to pressure from President Nixon.
1966-1967

1971-1972

But lowering rates and injecting liquidity does not always
work. It does not
always bring about a strong DJI advance. Greenspan tried it repeatedly in
2002. The Economy was by then already too weak and once the
NYSE A/D Line uptrend was broken, a deep bear market ensued. In 2002,
negative readings from our Tiger Accumulation Index warned that lower rates
would not save the situation. Of
course, the next year was not a Presidential
Election year. So, in 2003, Bush Jr. did away with the Estate taxes, sharply
cut the rate of taxation on high incomes and also started the Iraq War. He
needed to find a way to boost the stock market if he wanted to be re-elected.
His actions worked very well, much better than Greenspan's, and the DJI turned
up sharply in the Second Quarter of 2003. Our Accumulation Index , V-I
and OBV-Pct Indicators each bulged as the DJI ended its bear market
in April and May 2003.

DJI 2003

|
Charts 10/11/2019 2019 PEERLESS DJI, Signals, Indicators Daily DJI Volume 10-DayUp/Down Vol Stoch-20 Hourly DJIA A/D Line for All Stocks Inverted Traders Index NASDAQ S&P OEX NYSE COMPQX DJI-15 DJI-20 DJI-30 DIA SPY QQQ MDY IWM TNA Short-Term Rates USO-CrudeOil DBO FAS GLD BBH IBB JETS JNUG KOL NUGT OIH OIL RSX RETL SDS AGQ SLV SOXL TECL TLT TMF TNA UGA (gasoline) XIV and China: YINN CHAU Commodities: CANE CORN DBC JJC, NIB, CHOC CORN, CUT (paper) MOO, SOYB WEAT UUP (Dollar) LIT (Lithium) AAPL ADBE ALXN AMAT AMGN AMD AMZN BA BABA BAC BIDU CAT CVX DE FB GOOG GS HD IBM INTU JPM M (Macy's) MSFT NFLX NKE NVDA PG QCOM TSLA TXN XOM WMT CMG , LRCX, SWKS, MDGL SPPI WATT SQ TOWN 10/11/19 (Click on Underlined link.) New highs and Bullish MAXCPs - http://tigersoft.com/max/10-11/BULLISH.htm Bearish MAXCPs - http://tigersoft.com/min/10-11/BEARISH.htm |
Table 1 QUICKSILVER on ETFS - 10/11/2019 Professional bearishness STILL predominates judging by falling Closing Powers ETF CLOSE CHANGE PIVOT-PT 5-dma AROC CL-PWR CANDLE IP21 ITRS --------------------------------------------------------------------------------------------- DIA 268.16 3.15 264.74 47.3% Bearish BLUE-.146 0 --------------------------------------------------------------------------------------------- BA 374.92 3.92 376.54 -10.4% Bullish BLUE .074 .113 --------------------------------------------------------------------------------------------- SPY 296.28 3.04 293.08 33% Bearish --- -.123 -.004 --------------------------------------------------------------------------------------------- QQQ 191.11 2.43 188.24 61.3% Bearish BLUE-.04 -.004 --------------------------------------------------------------------------------------------- MDY 349.03 5.89 344.87 36.6% Bearish BLUE-.049 -.019 --------------------------------------------------------------------------------------------- IWM 150.22 2.5 148.49 36.5% Bearish BLUE-.091 -.035 --------------------------------------------------------------------------------------------- FAS 75.3 1.91 73.64 47.5% Bearish RED -.181 -.018 --------------------------------------------------------------------------------------------- RETL 22.74 1.46 21.1 390.6% Bearish BLUE-.183 .033 --------------------------------------------------------------------------------------------- SOXL 178.94 11.26 170.83 124.2% Bearish BLUE-.092 .096 --------------------------------------------------------------------------------------------- TECL 172.03 6.78 164.29 171.8% Bearish BLUE-.128 -.003 --------------------------------------------------------------------------------------------- IBB 100.24 1.24 99.41 36% Bearish BLUE-.152 -.067 --------------------------------------------------------------------------------------------- GLD 140.03 -.78 140.69 -66.1% ------- BLUE-.036 .018 --------------------------------------------------------------------------------------------- OIH 11.91 -.37 12.55 -429.3% Bearish RED -.058 -.123 --------------------------------------------------------------------------------------------- GASL 7.09 .46 7.38 -507.6% Bearish BLUE-.182 -.432 --------------------------------------------------------------------------------------------- RSX 22.92 .11 22.55 90.9% ------- -----.044 -.011 |
Table 2 Count of Stocks in Key Directories
20191011
-------------------------------
NEWHIGHS 78
NEWLOWS 5
MAXCP 11
MINCP 30
TTTNH 8
TTTNL 18
FASTUP 42
FASTDOWN 83
CPCROSSA 55
CPCROSSD 75
BIGVOLUP 3
BIGVODN 8
ACCUMVER 5
HIGHIP21 2
HIUPPCT 11
LOWACCUM 83
REDSELL 113
AUGSELS7 24
TRAPDOOR 17
|
Table 3 RANKING OF KEY DIRECTORIES BASED PCT.OF STOCKS ABOVE 65-DMA
10/11/19
Bullish = 29
Bearish = 12
---------------------------------------------------------------------------------------
Directory Current day-1 day-2 day-3 day-4 day-5
----------------------------------------------------------------------------------------
HOMEBLDG .931 .896 .931 .931 .965 .965
COPPER .8 .2 .2 0 .2 .2
RETAIL .764 .666 .607 .568 .647 .627
UTILITY .725 .7 .625 .625 .7 .75
ETFS .672 .396 .172 .155 .206 .241
REIT .668 .627 .641 .648 .696 .682
REGBANKS .666 .259 .222 .148 .481 .481
FOOD .66 .547 .547 .528 .471 .528
COMODITY .658 .536 .536 .536 .463 .512
SEMI .644 .551 .523 .457 .607 .626
INFRA .638 .472 .416 .388 .416 .444
GAMING .608 .478 .478 .434 .434 .478
CHEM .604 .312 .333 .312 .437 .479
ELECTRON .593 .503 .464 .412 .541 .548
INDMATER .592 .342 .289 .315 .342 .342
BIGBANKS .571 .428 .142 .142 .428 .428
INSURANC .567 .486 .459 .405 .567 .621
DOWJONES .566 .366 .4 .3 .466 .5
AUTO .564 .435 .333 .23 .384 .435
NASD-100 .561 .459 .418 .275 .448 .489
TRANSP .55 .4 .3 .3 .3 .3
SOLAR .538 .423 .423 .384 .423 .423
COMPUTER .526 .473 .368 .368 .578 .526
NIFTY .526 .421 .403 .35 .456 .473
SP500 .526 .408 .375 .313 .435 .477
FINANCE .523 .36 .232 .162 .313 .36
RUS-1000 .52 .404 .359 .319 .424 .452
INDEXES .516 .306 .279 .263 .29 .349
BONDFUND .508 .754 .824 .842 .815 .877
N=29
===========================================================================================
CHINA .5 .339 .214 .196 .232 .232
EDU .5 .5 .5 .5 .5 .5
FIDSTKS .5 .357 .329 .285 .395 .417
GUNS .5 .187 .187 .187 .187 .312
SP-100 .5 .388 .366 .277 .433 .466
===========================================================================================
SOFTWARE .466 .416 .383 .3 .4 .4
MILITARY .464 .392 .357 .321 .428 .321
DJI-13 .461 .384 .384 .23 .384 .461
BEVERAGE .437 .312 .375 .25 .25 .375
JETS .4 .3 .3 .3 .2 .2
HOSPITAL .363 .272 .272 .181 .227 .227
GREEN .36 .24 .2 .2 .2 .28
HACKERS .35 .3 .25 .15 .3 .3
BIOTECH .277 .222 .222 .216 .26 .26
OILGAS .231 .188 .195 .173 .217 .239
COAL .166 0 0 0 0 0
GOLD .156 .392 .411 .549 .294 .333
N=12
|
=====================================================================
10/10/2019
Peerless remains on Sells.
But the DJI seems determined to test its overhead
resistance at its 65-dma (26620 ) and then its 21-dma (26764).
Do not
let a profit turn into a loss is a good adage to appy here if you are still
short DIA. Cover DIA. We will short it on the next Peerless Sell. Right
now another big jump in the market is shaping up.
Volume and breadth did improve today, showing that the rumors of a partial
trade agreement would be most welcome on Wall Street. Look at
the 6-day Inverted MKDS (Traders' Index) below. It does seem as if
the selling pressure is coming off the market. No doubt, short-term traders
expect a run back to 27300, but the P-I and IP21 are still negative and
V-I shows heavy selling still. There are now four DJI-30 stocks either
making or about to make yearly new highs. But look at them, AAPL,
HD, NKE and WMT. They all still show either falling Closing Powers
or red Distribution.


Without a new Peerless Buy signal, it's not clear how the DJI will mount a
big advance past 27300. It will have to come from take-off advances by a few
DJI-30 stocks, such as BA, AAPL, HD, MSFT, NKE and WMT. But
all these potential leaders in the DJI, apart from BA, show either falling
Closing Powers or red Distribution. This will tend to blunt any advance.
 |
 |
 |
 |
.
The basic problem is that the over-all market still shows more than 60%
of all stocks below their 65-dma. And from Table 1 we see that Professionals
remain net bearish on all the major ETFs. Add to that the still very negative
V-I and IP21 (current Accumulation) and it's hard to make a good case for
buying more than a small handful of stocks at this time.
Strongest Group - Home Builders

As you can see from the Bullish MAXCPs' and Low Priced Breakouts' list,
aggressive buying seems mostly limited to some low-priced, oil tanker stocks,
stocks heavily invested in renting apartments and home-building but
not much else, at this stage. Provided you use simple price-uptrend-lines,
these look like reasonable speculations. But the general impression remains
that there are a lot more bearish looking stocks than bullish ones, outside the
realm of defensive Utility and consumer staples' stocks.
|
Charts 10/10/2019 2019 PEERLESS DJI, Signals, Indicators Daily DJI Volume 10-DayUp/Down Vol Stoch-20 Hourly DJIA A/D Line for All Stocks Inverted Traders Index NASDAQ S&P OEX NYSE COMPQX DJI-15 DJI-20 DJI-30 DIA SPY QQQ MDY IWM TNA Short-Term Rates USO-CrudeOil DBO FAS GLD BBH IBB JETS JNUG KOL NUGT OIH OIL RSX RETL SDS AGQ SLV SOXL TECL TLT TMF TNA UGA (gasoline) XIV and China: YINN CHAU Commodities: CANE CORN DBC JJC, NIB, CHOC CORN, CUT (paper) MOO, SOYB WEAT UUP (Dollar) LIT (Lithium) AAPL ADBE ALXN AMAT AMGN AMD AMZN BA BABA BAC BIDU CAT CVX DE FB GOOG GS HD IBM INTU JPM M (Macy's) MSFT NFLX NKE NVDA PG QCOM TSLA TXN XOM WMT CMG , LRCX, SWKS, MDGL SPPI WATT SQ TOWN 10/10/19 (Click on Underlined link.) New highs and Bullish MAXCPs - http://tigersoft.com/max/10-10/BULLISH.htm Bearish MAXCPs - http://tigersoft.com/min/10-10/BEARISH.htm |
Table 1 QUICKSILVER on ETFS - 10/10/2019 Professional bearishness predominates judging by falling Closing Powers ETF CLOSE CHANGE PIVOT-PT 5-dma AROC CL-PWR CANDLE IP21 ITRS --------------------------------------------------------------------------------------------- DIA 265.01 1.58 265.66 56.9% Bearish BLUE -.121 0 --------------------------------------------------------------------------------------------- BA 371 -3.96 375.7 -14.3% Bearish RED .004 .1 --------------------------------------------------------------------------------------------- SPY 293.24 1.97 294.35 48.4% Bearish BLUE -.077 -.001 --------------------------------------------------------------------------------------------- QQQ 188.68 1.45 188.81 69.7% Bearish BLUE -.035 0 --------------------------------------------------------------------------------------------- MDY 343.14 2.12 346.52 -1.7% Bearish BLUE -.026 -.028 --------------------------------------------------------------------------------------------- IWM 147.72 .59 149.14 -.7% Bearish BLUE -.08 -.043 --------------------------------------------------------------------------------------------- FAS 73.39 1.56 74.61 144.6% Bearish BLUE -.059 -.062 --------------------------------------------------------------------------------------------- RETL 24.68 .18 22.82 849.8% ------- ---- .233 .035 --------------------------------------------------------------------------------------------- SOXL 167.68 4.74 174.81 56.1% Bearish BLUE -.059 -.014 --------------------------------------------------------------------------------------------- TECL 165.25 3.11 166.44 205.1% Bearish BLUE -.099 -.034 --------------------------------------------------------------------------------------------- IBB 99 1.25 99.53 10.6% Bearish BLUE -.16 -.05 --------------------------------------------------------------------------------------------- GLD 140.81 -1.24 141.9 -38.5% Bearish RED -.12 .07 --------------------------------------------------------------------------------------------- OIH 14.64 -.34 14.58 0% Bearish RED .038 -.074 --------------------------------------------------------------------------------------------- GASL 6.63 .08 7.8 -829.4% Bearish ---- -.2 -.545 --------------------------------------------------------------------------------------------- RSX 23.61 .17 23.09 116.3% Bullish BLUE .089 -.002 |
Table 2 Count of Stocks in Key Directories
20191010
-------------------------------
NEWHIGHS 64 Bullish
NEWLOWS 23
MAXCP 21
MINCP 58 Bearish
TTTNH 8
TTTNL 44
FASTUP 28
FASTDOWN 103 Swing Traders are net bearish.
CPCROSSA 100
CPCROSSD 37
BIGVOLUP 5
BIGVODN 5
ACCUMVER 4
HIGHIP21 1
HIUPPCT 12
LOWACCUM 76
REDSELL 102
AUGSELS7 14
TRAPDOOR 17
|
Table 3 RANKING OF KEY DIRECTORIES BASED PCT.OF STOCKS ABOVE 65-DMA
10/10/19
Bullish = 10
Bearish = 35
---------------------------------------------------------------------------------------
Directory Current day-1 day-2 day-3 day-4 day-5
----------------------------------------------------------------------------------------
HOMEBLDG .897 .882 .882 .882 .882 .882
BONDFUND .754 .824 .842 .815 .877 .842
UTILITY .7 .625 .625 .7 .75 .7
RETAIL .666 .607 .568 .647 .627 .529
REIT .627 .641 .648 .696 .682 .648
SEMI .551 .523 .457 .607 .616 .57
FOOD .547 .547 .528 .471 .528 .547
COMODITY .536 .536 .536 .463 .512 .512
ELECTRON .506 .467 .415 .545 .551 .48
N=10
============================================================================================
EDU .5 .5 .5 .5 .5 .166
============================================================================================
INSURANC .486 .459 .405 .567 .621 .405
GAMING .478 .478 .434 .434 .478 .434
COMPUTER .473 .368 .368 .578 .526 .368
INFRA .472 .416 .388 .416 .444 .361
NASD-100 .459 .418 .275 .448 .469 .377
AUTO .435 .333 .23 .384 .435 .333
BIGBANKS .428 .142 .142 .428 .428 .142
SOLAR .423 .423 .384 .423 .423 .423
SP500 .408 .375 .313 .435 .475 .369
RUS-1000 .402 .358 .318 .423 .452 .353
NIFTY .4 .381 .327 .436 .418 .345
SOFTWARE .4 .366 .283 .383 .366 .283
TRANSP .4 .3 .3 .3 .3 .2
ETFS .396 .172 .155 .206 .241 .189
GOLD .392 .411 .549 .294 .352 .254
MILITARY .392 .357 .321 .428 .392 .285
SP-100 .388 .366 .277 .433 .466 .333
DJI-13 .384 .384 .23 .384 .461 .307
DOWJONES .366 .4 .3 .466 .5 .333
FINANCE .36 .232 .162 .313 .348 .22
FIDSTKS .357 .329 .285 .395 .423 .313
INDMATER .342 .289 .315 .342 .342 .302
CHINA .339 .214 .196 .232 .232 .214
BEVERAGE .312 .375 .25 .25 .375 .25
CHEM .312 .333 .312 .437 .479 .437
INDEXES .306 .279 .263 .29 .344 .258
HACKERS .3 .25 .15 .3 .25 .2
JETS .3 .3 .3 .2 .2 .1
HOSPITAL .272 .272 .181 .227 .227 .136
REGBANKS .259 .222 .148 .481 .481 .259
GREEN .24 .2 .2 .2 .28 .16
BIOTECH .222 .216 .213 .26 .271 .242
COPPER .2 .2 0 .2 .2 0
OILGAS .188 .195 .173 .217 .246 .202
GUNS .187 .187 .187 .187 .312 .125
COAL 0 0 0 0 0 0
|
====================================================================
10/9/2019
Peerless remains on
Sells and no Buy signal seems immediately in sight.
The DJI could not hold onto its early 200-point gain and after the close
was briefly down more than 200. More and more wild trading is
occurring while the NYSE is closed. This trading is being driven by
rumors, as much as anything, presently they concern the trade talks.
Resistance for the DJI is at its 65-dma 26626.
Support is now at 25500.

If we put aside the Public and overseas' jitters, we are left with three
strong impressions about the market.
First, the FED wants to hold up the market, one way or another, and the
chief beneficiaries of either lower interest rates in the US or the FED's buying
back of bonds are the same NYSE dividend-paying stocks that the rising
NYSE A/D Line measures. Keep watching the ADL. It is not a perfect
predictor, but it is very good. Before there can be a big sell-off, there
will have to a sharp deterioration in breadth. Today's +911 NYSE breadth
still looks pretty good.
Second, NYSE Professionals remain steady sellers. The ETFs we track
in Table 1 shows nearly all now have falling Closing Powers. In Table 2,
we see that there are also many more Closing Power new lows than new highs.
And even if we inspect the 13 highest priced Dow Jones stocks, "the bluest of
the blue chips", we find 11 show bearish Closing Power trends. The only
exceptions
are AAPL and very high priced Boeing, which at $375/share, counts as more
than the 7 lowest priced DJI stocks in the movements of the Dow Jones Average
and our DIA short sale.
Thirdly, daily volume on the NYSE is heavier on
down-days and the V-Indicator
now stands at a bearish -150. And among the "super blue chips", the
DJI-13,
the very highest priced DJI stocks, we see IP21 (current Accumulation) values
that are negative in only two cases, BA and MSFT.
It's tempting to recommend more shorting of DIA and going
long some BA.
But let's just stay short DIA a little longer. All this selling pressure may well
mean that the 25500-25700 support will not hold. I suspect that we will be
given advance notice that a breakdown below 25500 is imminent by sell-offs
in BA, AAPL and HD, the three most stubbornly bullish DJI-30 stocks right now.
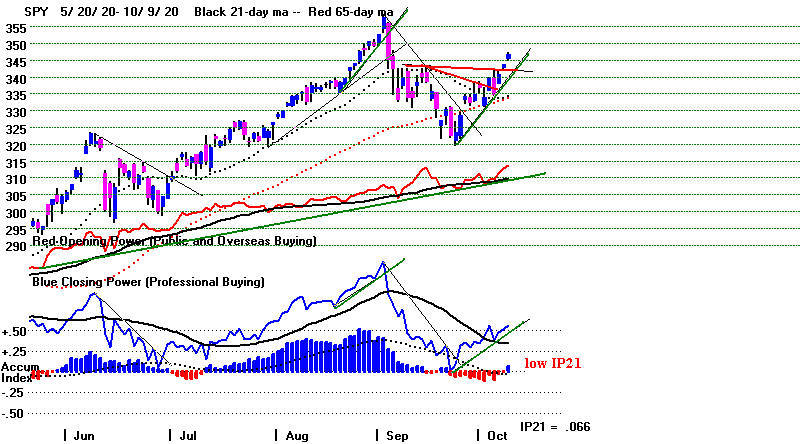
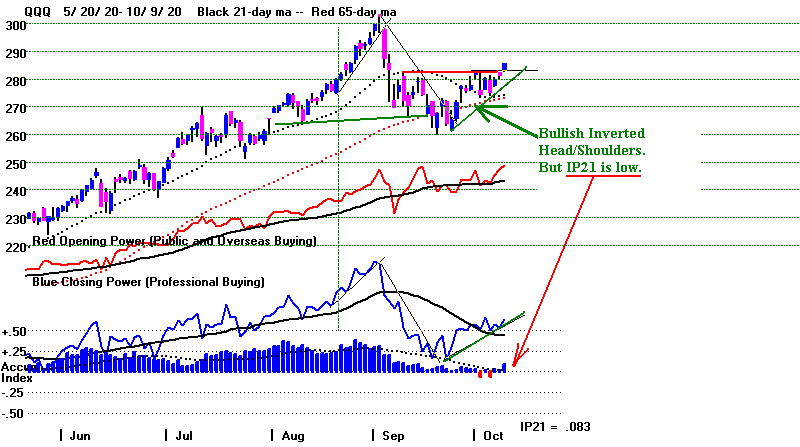
|
Charts 10/9/2019 2019 PEERLESS DJI, Signals, Indicators Daily DJI Volume 10-DayUp/Down Vol Stoch-20 Hourly DJIA A/D Line for All Stocks Inverted Traders Index NASDAQ S&P OEX NYSE COMPQX DJI-15 DJI-20 DJI-30 DIA SPY QQQ MDY IWM TNA Short-Term Rates USO-CrudeOil DBO FAS GLD BBH IBB JETS JNUG KOL NUGT OIH OIL RSX RETL SDS AGQ SLV SOXL TECL TLT TMF TNA UGA (gasoline) XIV and China: YINN CHAU Commodities: CANE CORN DBC JJC, NIB, CHOC CORN, CUT (paper) MOO, SOYB WEAT UUP (Dollar) LIT (Lithium) AAPL ADBE ALXN AMAT AMGN AMD AMZN BA BABA BAC BIDU CAT CVX DE FB GOOG GS HD IBM INTU JPM M (Macy's) MSFT NFLX NKE NVDA PG QCOM TSLA TXN XOM WMT CMG , LRCX, SWKS, MDGL SPPI WATT SQ TOWN 10/9/19 (Click on Underlined link.) New highs and Bullish MAXCPs - http://tigersoft.com/max/10-9/BULLISH.htm Bearish MAXCPs - http://tigersoft.com/min/10-9/BEARISH.htm |
Table 1 QUICKSILVER on ETFS - 10/9/2019 Professional bearishness predominates judging by falling Closing Powers ETF CLOSE CHANGE PIVOT-PT 5-dma AROC CL-PWR CANDLE IP21 ITRS --------------------------------------------------------------------------------------------- DIA 263.43 1.85 262.01 51.5% Bearish -.102 --- --------------------------------------------------------------------------------------------- BA 374.96 .86 372.07 101.8% ------- RED .133 .11 --------------------------------------------------------------------------------------------- SPY 291.27 2.74 290.42 55.2% Bearish BLUE-.047 0 --------------------------------------------------------------------------------------------- QQQ 187.23 1.81 186.07 85.2% Bearish BLUE-.012 -.003 --------------------------------------------------------------------------------------------- MDY 341.02 2.29 343.26 -3.1% Bearish RED .037 -.027 --------------------------------------------------------------------------------------------- IWM 147.13 .67 147.74 -4.1% Bearish RED .01 -.037 --------------------------------------------------------------------------------------------- FAS 71.83 1.83 71.3 118.9% Bearish BLUE-.011 -.079 --------------------------------------------------------------------------------------------- RETL 24.5 -.76 20.67 814% Bearish RED .198 .069 --------------------------------------------------------------------------------------------- SOXL 162.94 7.82 165.82 157.4% Bearish BLUE-.015 -.114 --------------------------------------------------------------------------------------------- TECL 162.14 6.66 158.63 288.3% Bearish BLUE-.074 -.077 --------------------------------------------------------------------------------------------- IBB 97.75 .14 98.79 25.9% Bearish RED -.142 -.05 --------------------------------------------------------------------------------------------- GLD 142.05 .13 141.9 27.9% ------- RED -.078 .084 --------------------------------------------------------------------------------------------- OIH 14.64 -.34 14.58 0% Bearish RED .038 -.056 --------------------------------------------------------------------------------------------- GASL 6.55 -.06 7.83 -607% Bearish RED -.222 -.52 --------------------------------------------------------------------------------------------- RSX 23.44 .14 23.07 108.2% ------- BLUE .012 .017 |
Table 2 Count of Stocks in Key Directories
20191009
-------------------------------
NEWHIGHS 55 Bullish
NEWLOWS 30
MAXCP 8
MINCP 100 Bearish
TTTNH 10
TTTNL 111 Bearish
FASTUP 37
FASTDOWN 85 Bearish
CPCROSSA 53
CPCROSSD 63
BIGVOLUP 2
BIGVODN 5
ACCUMVER 2
HIGHIP21 1
HIUPPCT 9
VHIP21 96
LOWACCUM 69
REDSELL 93
AUGSELS7 7
TRAPDOOR 16
|
Table 3 RANKING OF KEY DIRECTORIES BASED PCT.OF STOCKS ABOVE 65-DMA
10/9/19
Bullish = 8
Bearish = 37
---------------------------------------------------------------------------------------
Directory Current day-1 day-2 day-3 day-4 day-5
----------------------------------------------------------------------------------------
HOMEBLDG .882 .882 .882 .882 .882 .882
BONDFUND .824 .842 .815 .877 .842 .815
REIT .641 .648 .696 .682 .648 .613
UTILITY .625 .625 .7 .75 .7 .725
RETAIL .607 .568 .647 .627 .529 .568
FOOD .547 .528 .471 .528 .547 .547
COMODITY .536 .536 .463 .512 .512 .512
SEMI .523 .457 .607 .616 .579 .485
N=8
=========================================================================================
EDU .5 .5 .5 .5 .166 .333
=========================================================================================
GAMING .478 .434 .434 .478 .434 .434
ELECTRON .467 .415 .545 .551 .487 .448
INSURANC .459 .405 .567 .621 .432 .432
SOLAR .44 .4 .44 .44 .44 .44
NASD-100 .418 .275 .448 .469 .377 .306
INFRA .416 .388 .416 .444 .361 .333
GOLD .411 .549 .294 .352 .254 .294
DOWJONES .4 .3 .466 .5 .333 .366
NIFTY .381 .327 .436 .418 .345 .272
BEVERAGE .375 .25 .25 .375 .25 .25
SP500 .375 .313 .435 .475 .369 .338
COMPUTER .368 .368 .578 .526 .368 .368
SOFTWARE .366 .283 .383 .366 .283 .216
SP-100 .366 .277 .433 .466 .333 .311
RUS-1000 .358 .318 .423 .452 .357 .339
MILITARY .357 .321 .428 .392 .285 .285
AUTO .333 .23 .384 .435 .358 .461
CHEM .333 .312 .437 .479 .416 .395
FIDSTKS .329 .285 .395 .423 .313 .291
DJI-13 .307 .307 .461 .461 .307 .384
JETS .3 .3 .2 .2 .1 .1
TRANSP .3 .3 .3 .3 .2 .2
INDMATER .289 .315 .342 .342 .302 .236
INDEXES .279 .263 .29 .344 .258 .22
HOSPITAL .272 .181 .227 .227 .136 .136
HACKERS .25 .15 .3 .25 .2 .15
FINANCE .232 .162 .313 .348 .232 .174
REGBANKS .222 .148 .481 .481 .296 .333
BIOTECH .216 .208 .257 .271 .248 .213
CHINA .214 .196 .232 .232 .214 .214
COPPER .2 0 .2 .2 0 0
GREEN .2 .2 .2 .28 .16 .2
OILGAS .195 .173 .217 .246 .202 .166
GUNS .187 .187 .187 .312 .125 .125
ETFS .172 .155 .206 .241 .189 .12
BIGBANKS .142 .142 .428 .428 .142 .285
COAL 0 0 0 0 0 0
N=37
|
====================================================================
10/8/2019
Peerless remains on
its Sells. No new Buy signal is immediately in sight.
The technicals we emphasize call for caution. Intermediate-term traders
should hold DIA short. Another short-lived bounce seems at hand.

Trading Ranges to Watch:
FAS and IWM.


Confusion and Contradictions.
Hopes that China will be willing to make some un-named concessions to
the US in the on-going trade war is sending the main general market ETFs
up +200 over-night. Let's hope. I found out that simple walking sneakers
at a local shoe store start at $90. But while consumers in the US may be paying
more, producers are paying less, if we trust todays' Produce Price Index decline
of 3%. Crude Oil and natural gas prices are dropping but not prices at the
pump. What is the FED to make of such reports? Lower rates would seem
logical. How strong does the Dollar need to be? Strong enough to hold the
stock market up is one answer. If all this sounds too contradictory and
complicated, you are probably right. It's better to judge the market by its own
statistics.
What is the price trend? What does the NYSE AD-Line show?
What are insiders and New York Professionals doing? And what does seasonality
suggest?
The DJI's price trend is Down
judging from our 5-day, 21-day and 65-day
moving averages. But it is UP based on the 200-day ma. This IS complicated
and contradictory. Waiting for a resolution or a move down to better support
to be buyers again seems sensible and is exactly what Peerless, which remains on
Sells, seems to want us to do.
"Big Money" is still doing some heavy selling. Hence the "V-I"
is well below
-100. Our Accumulation Index shows red Distribution. And the Closing
Powers are all falling, show that Professionals remain bearish. Again, here
we see no reason to rush to buy.
The NYSE A/D Line has been in a bullish uptrend. But
today the P-Indicator
turned negative and the NYSE ADL slightly broke its uptrend. This calls for
caution now. A break in an ADL uptrend is known for starting big market
sell-offs when the ADL was previously the leader. (See the 1976, 1977 and
2002 Peerless charts.) One
more reason for caution now.
"Both Down"
Here's something rather new. Another reason for caution
is that as of
today both Opening and Closing Powers for the DIA, SPY, QQQ, COMPQX
and FAS as well as their leveraged counter-parts are all in downtrends, i.e.
they are below their fallign 21-day moving averages. This is bearish
"Both Down" condition. Our "Basis of Move" charts under
Indicators-3
gives you the average daily percent change while a stock or an ETF
shows both Opening and Closing Power falling. The "Both Down" daily
percent change for the last year for the key ETFs are shown below:
No. of Occurrences Both Down Daily Percent
Change
--------------------
-----------------------------------
DJIA
48
-.005 (-5.0%), i.e. about 130 pointsz
DIA
35
-.004 (-0.4%), i.e. about 1 point
SPY
30
-.007 (-0.7%), i.e. about 2 points
NASDAQ 27
-.007 (-0.7%), i.e. about 56 points
QQQ
31
-.007 (-0.7%), i.e. about 1.3 points
IWM
46
-.007 (-0.7%), i.e. about 1 points
FAS
37
-.022 (-2.2%), i.e. about 1.4 points
Let's put these statistics in some historical prespective. The Both Down Daily
Percent changes do vary a lot for DIA year by year. In a seemingly secure
market, the number goes down to -.002 in 2005 and 2017. In a bear market year,
the number jumps as high as -.013, as in 2008 or -.01 in 1998. The number we
see now, -.04, could go either way. This was the number at the end of 2000
(a bearish point in time) and also at the end of 2009, 2012, 2014 and 2016
(all generally bullish points of time.)
Seasonality Is Not Yet Bullish
Seasonally, we know that Octobers often market the
bottom of bear markets
and corrections and a year-end rally is highly likely after Thanksgiving.
Right now, the seasonality is slightly bearish for the next week. Since 1965,
the DJI has risen 49.1% of the time over the next 5 trading days and 54.7%
over the next 10 trading days. Over the next month, it is up 69.8% of
the time and averages a 1.4% gain. Then there is weakness for a month, to
December 8th, there is weakness. Soon afterwards begins the bullishness
of the last two week of December.
|
Charts 10/8/2019 2019 PEERLESS DJI, Signals, Indicators Daily DJI Volume 10-DayUp/Down Vol Stoch-20 Hourly DJIA A/D Line for All Stocks Inverted Traders Index NASDAQ S&P OEX NYSE COMPQX DJI-15 DJI-20 DJI-30 DIA SPY QQQ MDY IWM TNA Short-Term Rates USO-CrudeOil DBO FAS GLD BBH IBB JETS JNUG KOL NUGT OIH OIL RSX RETL SDS AGQ SLV SOXL TECL TLT TMF TNA UGA (gasoline) XIV and China: YINN CHAU Commodities: CANE CORN DBC JJC, NIB, CHOC CORN, CUT (paper) MOO, SOYB WEAT UUP (Dollar) LIT (Lithium) AAPL ADBE ALXN AMAT AMGN AMD AMZN BA BABA BAC BIDU CAT CVX DE FB GOOG GS HD IBM INTU JPM M (Macy's) MSFT NFLX NKE NVDA PG QCOM TSLA TXN XOM WMT CMG , LRCX, SWKS, MDGL SPPI WATT SQ TOWN 10/8/19 (Click on Underlined link.) New highs and Bullish MAXCPs - http://tigersoft.com/max/10-8/BULLISH.htm Bearish MAXCPs - http://tigersoft.com/min/10-8/BEARISH.htm |
Table 1 QUICKSILVER on ETFS - 10/8/2019 ETF CLOSE CHANGE PIVOT-PT dma AROC CL-PWR CANDLE IP21 ITRS --------------------------------------------------------------------------------------------- DIA 261.58 -3.16 260.72 -74.3% Bearish RED -.065 ---- --------------------------------------------------------------------------------------------- BA 374.1 -2.44 367.36 -11.3% Bullish BLUE .2 .138 --------------------------------------------------------------------------------------------- SPY 288.53 -4.55 288.06 -80.7% Bearish RED -.029 -.004 --------------------------------------------------------------------------------------------- QQQ 185.42 -2.82 184.05 -49.5% Bearish RED .023 -.009 --------------------------------------------------------------------------------------------- MDY 338.73 -6.14 341.23 -101.9% Bearish RED .067 -.019 --------------------------------------------------------------------------------------------- IWM 146.46 -2.03 147.25 -64.4% Bearish RED .065 -.023 --------------------------------------------------------------------------------------------- FAS 70 -3.64 70.12 -271.6% Bearish RED -.003 -.096 --------------------------------------------------------------------------------------------- RETL 20.14 -.96 20.46 -518% Bearish RED .108 -.157 --------------------------------------------------------------------------------------------- SOXL 155.12 -15.71 157.75 -312.7% Bearish RED .015 -.153 --------------------------------------------------------------------------------------------- TECL 155.48 -8.81 152.94 -213.4% Bearish RED -.044 -.124 --------------------------------------------------------------------------------------------- IBB 97.61 -1.8 97.24 -19.8% Bearish RED -.084 -.035 --------------------------------------------------------------------------------------------- GLD 141.92 1.23 141.26 81.2% Bearish RED -.128 .094 --------------------------------------------------------------------------------------------- OIH 11.91 -.37 12.55 -429.3% Bearish RED -.058 -.075 --------------------------------------------------------------------------------------------- GASL 6.61 -.77 7.45 -966% Bearish RED -.264 -.422 --------------------------------------------------------------------------------------------- RSX 22.38 -.17 22.46 -66.6% Bearish -----.069 -.018 |
Table 2 Count of Stocks in Key Directories
20191008
-------------------------------
NEWHIGHS 36
NEWLOWS 73 bearish
MAXCP 12
MINCP 89 bearish
TTTNH 4
TTTNL 114 bearish
FASTUP 44
FASTDOWN 114 bearish
CPCROSSA 41
CPCROSSD 87
BIGVOLUP 2
BIGVODN 7
ACCUMVER 4
HIGHIP21 1
HIUPPCT 9
VHIP21 99
LOWACCUM 77
REDSELL 83
AUGSELS7 1
TRAPDOOR 15
|
Table 3 RANKING OF KEY DIRECTORIES BASED PCT.OF STOCKS ABOVE 65-DMA
10/8/19
Bullish = 8
Bearish = 37
---------------------------------------------------------------------------------------
Directory Current day-1 day-2 day-3 day-4 day-5
----------------------------------------------------------------------------------------
HOMEBLDG .882 .882 .882 .882 .882 .882
BONDFUND .842 .815 .877 .842 .815 .771
REIT .648 .696 .682 .648 .613 .627
UTILITY .625 .7 .75 .7 .725 .775
RETAIL .568 .647 .627 .529 .549 .647
GOLD .549 .294 .352 .254 .294 .215
COMODITY .536 .463 .512 .512 .512 .487
FOOD .528 .471 .528 .547 .547 .49
N=8
============================================================================================
EDU .5 .5 .5 .166 .333 .333
============================================================================================
SEMI .457 .607 .616 .579 .495 .598
GAMING .434 .434 .478 .434 .434 .391
ELECTRON .412 .541 .548 .483 .451 .522
INSURANC .405 .567 .621 .432 .432 .54
INFRA .388 .416 .444 .361 .333 .472
SOLAR .384 .423 .423 .423 .461 .461
COMPUTER .368 .578 .526 .368 .368 .421
NIFTY .35 .456 .438 .368 .298 .368
MILITARY .321 .428 .392 .285 .285 .357
RUS-1000 .318 .423 .452 .357 .339 .455
INDMATER .315 .342 .342 .302 .236 .355
SP500 .313 .435 .475 .369 .338 .464
CHEM .312 .437 .479 .416 .395 .604
DJI-13 .307 .461 .461 .307 .384 .384
DOWJONES .3 .466 .5 .333 .366 .433
JETS .3 .2 .2 .1 .1 .3
TRANSP .3 .3 .3 .2 .2 .4
BEVERAGE .294 .294 .411 .294 .294 .352
FIDSTKS .285 .395 .423 .313 .291 .384
SOFTWARE .283 .383 .366 .283 .233 .266
SP-100 .277 .433 .466 .333 .311 .411
NASD-100 .275 .448 .469 .377 .306 .438
INDEXES .263 .29 .344 .258 .22 .284
AUTO .23 .384 .435 .358 .461 .589
BIOTECH .208 .251 .268 .248 .216 .228
GREEN .2 .2 .28 .16 .2 .24
CHINA .196 .232 .232 .214 .214 .214
GUNS .187 .187 .312 .125 .125 .25
HOSPITAL .181 .227 .227 .136 .136 .227
OILGAS .175 .218 .248 .204 .167 .226
FINANCE .162 .313 .348 .232 .174 .337
ETFS .155 .206 .241 .189 .12 .258
HACKERS .15 .3 .25 .2 .15 .25
REGBANKS .148 .481 .481 .296 .333 .481
BIGBANKS .142 .428 .428 .142 .285 .428
COAL 0 0 0 0 0 0
COPPER 0 .2 .2 0 0 .2
N= 37
|
========================================================================
10/7/2019
The Sell S9-V, S2, S17
remain in effect. Short-term traders may have chosen
to cover the DIA short when DIA's Stochastic Pct-D turned up from below
20% with the K-Line above the Pct-D. But Peerless did not give a Buy
signal and so I assume intermediate-term traders are still short DIA.
SPY stalled out today at its now falling 65-dma.
A decline back to 285 would be typical as prices
search for support and renewed buying interest.

Most important, it is by no means certain that another test of 25800 will bring a
Buy B9. The IP21 and V-I readings now are probably too low for this.
And if the NYSE A/D Line's 21-day ma were to turn decisively down,
it is possible we will see a 10% DJI decline back down to 24500 and not
a bottom at 25500.


As you can see from our Peerless chart, though the AD-Line trend is still
up and the P-Indicator is still positive, the V-I (Adjusted Up-Down Volume)
is now well below -100. This makes buying on weakness much more risky
and will render a Buy B9 very difficult to obtain, especially with the current
Accumulation Index less than -.05. We still could get a Buy B1, a Stochastic-
20-based Peerless signal in late October if the DJI's Stochastic-20 Pct D (blue)
line drops below 15%. At this stage, there still seems too much resistance just
overhead to be buyers of DIA. Only one in four of our Tiger groupings shows
a majority of its components are now above the 65-dma. Two thirds of all
stocks are below the resistance of their 65-dma. Down-day Volume is regularly
above up-day volume. And while Opening Powers are still rising, one or two
more weak openings could put us in the situation where both Opening and
Closing Power are falling. This could lead to a later than usual October selling
climax.
FAS (Big Banks Stocks) is on an Optimized
Stochastic (red) Buy. Very good results with
this for the last year.

The problem with Stochastic-Buy signals up from support when Peerless does
does not give a Buy is that the resistance at the 65-dma and point of recent
breakdown are apt to bring a reversal back down and that will mean another
more thorough test of the lows. The general limitation with Stochastic Buys
is that they work best in trading ranges. That means if the trading range
support levels fail, they can quickly lose money. With that in mind look
at and watch closely the support levels for some of the recent Red Optimized
Buys using 20-day stochastics, especially, FAS, GS and JPM. As big bank|
stocks, they are in many ways the key to predicting the DJI-30 and the
NYSE. Also watch IWM to make sure that even with its optimized red
Stochastic-20 Buys working well, it does not drop below its key support.

|
Charts 10/7/2019 2019 PEERLESS DJI, Signals, Indicators Daily DJI Volume 10-DayUp/Down Vol Hourly DJIA A/D Line for All Stocks Inverted Traders Index NASDAQ S&P OEX NYSE COMPQX DJI-15 DJI-20 DJI-30 DIA SPY QQQ MDY IWM TNA Short-Term Rates USO-CrudeOil DBO FAS GLD BBH IBB JETS JNUG KOL NUGT OIH OIL RSX RETL SDS AGQ SLV SOXL TECL TLT TMF TNA UGA (gasoline) XIV and China: YINN CHAU Commodities: CANE CORN DBC JJC, NIB, CHOC CORN, CUT (paper) MOO, SOYB WEAT UUP (Dollar) LIT (Lithium) AAPL ADBE ALXN AMAT AMGN AMD AMZN BA BABA BAC BIDU CAT CVX DE FB GOOG GS HD IBM INTU JPM M (Macy's) MSFT NFLX NKE NVDA PG QCOM TSLA TXN XOM WMT CMG , LRCX, SWKS, MDGL SPPI WATT SQ TOWN 10/7/19 (Click on Underlined link.) New highs and Bullish MAXCPs - http://tigersoft.com/max/10-7/BULLISH.htm Bearish MAXCPs - http://tigersoft.com/min/10-7/BEARISH.htm |
Table 1 QUICKSILVER on ETFS - 10/7/2019 ETF CLOSE CHANGE PIVOT-PT dma AROC CL-PWR CANDLE IP21 ITRS --------------------------------------------------------------------------------------------- DIA 264.74 -.92 265.5 -83.9% Bearish RED -.017 0 --------------------------------------------------------------------------------------------- BA 376.54 .84 374.94 -52.5% ------- BLUE .203 .118 --------------------------------------------------------------------------------------------- SPY 293.08 -1.27 293.24 -63.1% Bearish RED .032 -.003 --------------------------------------------------------------------------------------------- QQQ 188.24 -.57 187.27 -15.2% Bearish ---- .068 -.01 --------------------------------------------------------------------------------------------- MDY 344.87 -1.65 345.75 -109.9% Bearish RED .149 -.019 --------------------------------------------------------------------------------------------- IWM 148.88 -.26 148.37 -82.7% Bearish BLUE .133 -.027 --------------------------------------------------------------------------------------------- FAS 73.64 -.97 73.95 -272% Bearish RED .1 -.078 --------------------------------------------------------------------------------------------- RETL 24.72 1.9 18.68 1656.3% ------- BLUE .16 .054 --------------------------------------------------------------------------------------------- SOXL 170.83 -3.98 165.56 18.3% Bearish RED .102 -.077 --------------------------------------------------------------------------------------------- TECL 164.29 -2.15 162.35 -77.4% Bearish RED 0 -.09 --------------------------------------------------------------------------------------------- IBB 99.41 -.12 98 -4.6% Bearish BLUE -.042 -.03 --------------------------------------------------------------------------------------------- GLD 140.69 -1.21 139.63 64.7% ------- RED -.177 .079 --------------------------------------------------------------------------------------------- OIH 14.64 -.34 14.58 0% Bearish RED .038 -.061 --------------------------------------------------------------------------------------------- GASL 7.38 -.42 8.1 -1073.5% Bearish RED -.167 -.409 --------------------------------------------------------------------------------------------- RSX 23.15 .06 23 113.3% Bullish BLUE .052 .006 |
Table 2 Count of Stocks in Key Directories
20191007
-------------------------------
NEWHIGHS 56 Bullish
NEWLOWS 21
MAXCP 24
MINCP 39 Net Bearish
TTTNH 6
TTTNL 50 Day Traders are net bearish
FASTUP 38
FASTDOWN 135 Bearish Swing Traders
CPCROSSA 72
CPCROSSD 46
BIGVOLUP 6
BIGVODN 7
ACCUMVER 5
HIGHIP21 1
HIUPPCT 9
LOWACCUM 85
REDSELL 79
AUGSELS7 6
TRAPDOOR 15
|
Table 3 RANKING OF KEY DIRECTORIES BASED PCT.OF STOCKS ABOVE 65-DMA
10/7/19
Bullish = 9
Bearish = 36
---------------------------------------------------------------------------------------
Directory Current day-1 day-2 day-3 day-4 day-5
----------------------------------------------------------------------------------------
HOMEBLDG .882 .882 .882 .882 .882 .941
BONDFUND .815 .877 .842 .815 .789 .736
UTILITY .7 .75 .7 .725 .775 .775
REIT .696 .682 .648 .613 .627 .758
RETAIL .647 .627 .529 .549 .647 .705
SEMI .607 .616 .579 .495 .57 .635
COMPUTER .578 .526 .368 .368 .421 .473
INSURANC .567 .621 .432 .432 .54 .648
ELECTRON .541 .548 .483 .451 .503 .587
===========================================================================================
EDU .5 .5 .166 .333 .333 .333
REGBANKS .481 .481 .296 .333 .444 .666
FOOD .471 .528 .547 .547 .528 .339
DOWJONES .466 .5 .333 .366 .433 .6
COMODITY .463 .512 .512 .512 .512 .39
DJI-13 .461 .461 .307 .384 .384 .538
NASD-100 .448 .469 .377 .306 .438 .52
CHEM .437 .479 .416 .395 .52 .687
NIFTY .436 .418 .345 .272 .345 .381
SP500 .435 .475 .369 .338 .462 .605
GAMING .434 .478 .434 .434 .391 .478
SP-100 .433 .466 .333 .311 .411 .577
BIGBANKS .428 .428 .142 .285 .428 .571
MILITARY .428 .392 .285 .285 .357 .571
RUS-1000 .423 .452 .357 .339 .454 .595
SOLAR .423 .423 .423 .461 .461 .538
INFRA .416 .444 .361 .333 .472 .583
FIDSTKS .395 .423 .313 .291 .384 .516
AUTO .384 .435 .358 .461 .589 .641
SOFTWARE .383 .366 .283 .233 .283 .416
INDMATER .342 .342 .302 .236 .328 .473
FINANCE .317 .352 .235 .176 .341 .6
HACKERS .3 .25 .2 .15 .25 .25
TRANSP .3 .3 .2 .2 .4 .5
BEVERAGE .294 .411 .294 .294 .352 .47
GOLD .294 .352 .254 .294 .235 .078
INDEXES .286 .345 .259 .221 .281 .497
BIOTECH .251 .263 .248 .216 .228 .289
CHINA .232 .232 .214 .214 .214 .25
HOSPITAL .227 .227 .136 .136 .227 .227
OILGAS .217 .246 .202 .166 .224 .333
ETFS .206 .241 .189 .12 .258 .482
COPPER .2 .2 0 0 .2 .2
GREEN .2 .28 .16 .2 .24 .32
JETS .2 .2 .1 .1 .3 .3
GUNS .187 .312 .125 .125 .25 .312
COAL 0 0 0 0 0 0
|
=======================================================================
10/4/2019
The Sell S9-V, S2, S17
remain in effect. Traders may have chosen
to cover the DIA short when DIA's Stochastic Pct-D turned up from below
20% with the K-Line above the Pct-D, courtesy of the satisfactory
September Jobs' Report.
SPY's 20-day Pct-D dropped below 20% and then turned up.
At support, this is a reliable short-term Buy signal.

We need a Peerless
Buy Signal To Become Bullish.
But we have no Peerless Buy signal yet, so I am assuming we are still short
DIA on an intermediate-term basis, despite the DJI's decline to the
lower band with a positive P-I (21-day ma of advances-declines)..


The reasons for not getting a Peerless Buy signal last week were: 1) the program
wants to wait until October 7th, at the earliest in October; 2) the program
does not want to see a negative IP21 at this time of year and 3) the program
dislikes buying on weakness where the V-I (21-day ma of adjusted daily NYSE
up volume minus daily down volume) is below -100.
See in the Table just below the few past cases in
October where the DJI in
an on-going bull market declined to the 1.98% band or lower with a positive
P-I reading. Only in one of the five cases, did the DJI quickly turn up. In
the other four
cases, the DJI first needed to fall 5% (1943), 5% (1955), 1.5% (2004), 3.9%
(2012) before rallying.
So, there is some risk immediately ahead. Another test of 25500 would seem
reasonable. But after the October weakness is over, we should see another rally
back to 27000-27500. Without more up volume, a breakout above that level or
zone will be difficult. November and December gains would be typical but the
first quarter in a Presidential Election Year is often weak.
When the NYSE A/D Line is this strong (and interest rates are this low), the
market as measured by the blue chips in the DJI, by blue chip utilities and
solid dividend stocks should not go down much. Going all the way back to
1929, only twice did the DJI enter a bear market when the Advance-Decline
Line was as strong as it is now. Statistically, this means that the DJI and the
general market will probably not drop significantly this month and afterwards,
there should be a good recovery.
But let's consider the two exceptions. The first occurrence was in late Fall 1976
through the middle of 1977. In that period, the NYSE A/D Line stayed quite
strong. But finally when the DJI declined more than 10%, the ADL broke
its uptrend and a bear market followed for 8 more months. Gathering inflation
and the Carter Adminstration's austerity lay behnd the 1976-1978 bear
market. We do not have inflation, of course, now and the Federal Budget is far
from balanced. So, the 1976-1978 bear market scenario should not play out.
The second case of a bear market is a more plausible scenario now. In 2002,
the FED lowered rates aggressively to lift a faltering economy. Once the
NYSE A/D Line uptrend was decisively broken, the DJI and the rest of the
market sold off badly. That would be the scenario we have to worry about
now. More about this case, later this week.
2002 Bear Market starts when A/D Line turns down.

October Positive P-I NCs at Lower Band Date LA/MA P-I IP21 V-I OPMA Outcome
(Close/21-dma)
Current
20191002 .97 +123 -.088 -82 +.114 ??????
20191003 .975 +74 -.068 -94 +.116
20191004 .989 +100 -.040 -96 +.109
----------------------------------------------------------------------
Historical
19431007 .98(2% lower band) +41 -.025 +12 -.05 DJI fell from 136.4 to 129.6 before rallying.
5% additional decline.
-------------------------------------------------------------------------------------------------
19551005 .972(2.8% lb) +10 +.047 -271 +.068 DJI fell from 461.7 to 438.7 before rallying.
5% additional decline.
-----------------------------------------------------------------------------------------------
20041014 .978 +114 -.054 -142 -.049 DJI fell from 9894.45 to 9749.99 (10/25)
1.5% additional decline.
20041019 .982 +90 -.046 -161 -.061 DJI fell from 9897.62 to 9749.99 (10/25)
20041022 .973 +128 -.039 -134 -.176 DJI fell from 9757.81 to 9749.99 (10/25)
20041025 .973 +119 -.032 -141 -.26 Bottom. DJI rallied past upper band.
-----------------------------------------------------------------------------------------------
20121024 .974 +12 -.127 -80 -.075 DJI fell from 13077 to 12571 before rallying to 13400.
3.9% additional decline.
------------------------------------------------------------------------------------------------------
20131007 .977 +132 -.057 -69 -.15 DJI fell from 14936 to 14803 (10/9) before rallying.
0.9% additional decline.
|
|
Charts 10/4/2019 2019 PEERLESS DJI, Signals, Indicators Daily DJI Volume 10-DayUp/Down Vol Hourly DJIA A/D Line for All Stocks Inverted Traders Index NASDAQ S&P OEX NYSE COMPQX DJI-15 DJI-20 DJI-30 DIA SPY QQQ MDY IWM TNA Short-Term Rates USO-CrudeOil DBO FAS GLD BBH IBB JETS JNUG KOL NUGT OIH OIL RSX RETL SDS AGQ SLV SOXL TECL TLT TMF TNA UGA (gasoline) XIV and China: YINN CHAU Commodities: CANE CORN DBC JJC, NIB, CHOC CORN, CUT (paper) MOO, SOYB WEAT UUP (Dollar) LIT (Lithium) AAPL ADBE ALXN AMAT AMGN AMD AMZN BA BABA BAC BIDU CAT CVX DE FB GOOG GS HD IBM INTU JPM M (Macy's) MSFT NFLX NKE NVDA PG QCOM TSLA TXN XOM WMT CMG , LRCX, SWKS, MDGL SPPI WATT SQ TOWN 10/4/19 (Click on Underlined link.) New highs and Bullish MAXCPs - http://tigersoft.com/max/10-4/BULLISH.htm Bearish MAXCPs - http://tigersoft.com/min/10-4/BEARISH.htm |
Table 1 QUICKSILVER on ETFS - 10/4/2019 ETF CLOSE CHANGE PIVOT-PT dma AROC CL-PWR CANDLE IP21 ITRS --------------------------------------------------------------------------------------------- DIA 265.66 3.65 269.18 -43.9% Bearish BLUE .007 ----- --------------------------------------------------------------------------------------------- BA 375.7 3.63 380.47 -95.3% Bullish BLUE .204 .1 --------------------------------------------------------------------------------------------- SPY 294.35 3.93 296.77 -17.9% Bearish BLUE .06 .002 --------------------------------------------------------------------------------------------- QQQ 188.81 2.74 188.81 47.7% Bearish BLUE .085 -.002 --------------------------------------------------------------------------------------------- MDY 346.52 3.26 352.47 -49.1% Bearish BLUE .142 -.011 --------------------------------------------------------------------------------------------- IWM 149.14 1.4 151.34 -67.7% Bearish BLUE .114 -.019 --------------------------------------------------------------------------------------------- FAS 74.61 3.31 77.64 -188.3% Bearish BLUE .129 -.045 --------------------------------------------------------------------------------------------- RETL 21.11 .42 22.9 -248.7% Bearish BLUE .139 -.113 --------------------------------------------------------------------------------------------- SOXL 174.81 8.99 170.22 297.5% Bearish BLUE .151 -.062 --------------------------------------------------------------------------------------------- TECL 166.44 7.81 166.79 144.5% Bearish BLUE .028 -.067 --------------------------------------------------------------------------------------------- IBB 99.53 .74 99.5 11.7% Bearish BLUE -.05 -.024 --------------------------------------------------------------------------------------------- GLD 141.9 0 138.87 29.9% ------- BLUE -.218 .085 --------------------------------------------------------------------------------------------- OIH 11.91 -.37 12.55 -429.3% Bearish RED -.058 -.093 --------------------------------------------------------------------------------------------- GASL 7.8 -.03 9.11 -995% ------- RED -.131 -.426 --------------------------------------------------------------------------------------------- RSX 22.51 .07 22.81 -103.6% ------- ---- -.02 -.026 |
Table 2 Count of Stocks in Key Directories
20191004
-------------------------------
NEWHIGHS 109 Bullish
NEWLOWS 11
MAXCP 41
MINCP 22
TTTNH 12
TTTNL 58
FASTUP 30
FASTDOWN 126 Day Traders remain net bearish.
CPCROSSA 191
CPCROSSD 17
BIGVOLUP 4
BIGVODN 6
ACCUMVER 8
HIGHIP21 2
HIUPPCT 9
VHIP21 103
LOWACCUM 76
REDSELL 78
AUGSELS7 10
TRAPDOOR 15
|
Table 3 RANKING OF KEY DIRECTORIES BASED PCT.OF STOCKS ABOVE 65-DMA
Bullish = 11
Bearish = 33
10/4/19
---------------------------------------------------------------------------------------
Directory Current day-1 day-2 day-3 day-4 day-5
----------------------------------------------------------------------------------------
HOMEBLDG .882 .882 .882 .882 .941 .882
BONDFUND .877 .842 .815 .789 .736 .675
UTILITY .75 .7 .725 .775 .775 .775
REIT .682 .648 .613 .627 .751 .765
RETAIL .627 .529 .549 .647 .705 .666
INSURANC .621 .432 .432 .54 .648 .621 SEMI .616 .579 .495 .57 .644 .635 ELECTRON .545 .48 .448 .5 .59 .577 FOOD .537 .555 .537 .518 .37 .407 COMPUTER .526 .368 .368 .421 .473 .526 COMODITY .512 .512 .512 .512 .439 .414 ============================================================================================== DOWJONES .5 .333 .366 .433 .6 .5 EDU .5 .166 .333 .333 .333 .333 ============================================================================================== REGBANKS .481 .296 .333 .444 .666 .777 CHEM .479 .416 .395 .52 .687 .645 SP500 .475 .369 .338 .462 .597 .582 NASD-100 .469 .377 .306 .438 .51 .479 SP-100 .466 .333 .311 .411 .566 .555 DJI-13 .461 .307 .384 .384 .538 .384 GAMING .454 .409 .409 .363 .454 .454 RUS-1000 .452 .357 .339 .454 .59 .575 INFRA .444 .361 .333 .472 .583 .555 SOLAR .44 .44 .44 .44 .52 .48 AUTO .435 .358 .461 .589 .641 .615 BIGBANKS .428 .142 .285 .428 .571 .714 FIDSTKS .423 .313 .291 .384 .516 .467 NIFTY .418 .345 .272 .345 .381 .381 BEVERAGE .411 .294 .294 .352 .411 .352 MILITARY .392 .285 .285 .357 .571 .5 SOFTWARE .366 .283 .233 .283 .4 .333 FINANCE .352 .235 .176 .341 .576 .647 GOLD .352 .254 .294 .235 .137 .411 INDEXES .349 .258 .22 .279 .489 .44 INDMATER .342 .302 .236 .328 .447 .407 GUNS .312 .125 .125 .25 .312 .375 TRANSP .3 .2 .2 .4 .5 .35 GREEN .28 .16 .2 .24 .32 .28 BIOTECH .263 .242 .216 .228 .286 .315 HACKERS .25 .2 .15 .25 .25 .25 OILGAS .246 .202 .166 .224 .333 .289 ETFS .241 .189 .12 .258 .465 .413 CHINA .232 .214 .214 .214 .25 .232 HOSPITAL .227 .136 .136 .227 .272 .227 COPPER .2 0 0 .2 .2 .2 JETS .2 .1 .1 .3 .3 .2 COAL 0 0 0 0 0 0 |
====================================================================
10/3/2019
The Sell S9-V, S2, S17
remain in effect. Hold DIA
short. We got
no B2 or B9 today despite the DJI's intra-day reversal up from its 200-day
ma at 25870. With the DJI 2.5% below the 21-day ma and Peerless P-Indicator
a +74, one might hope for a Buy B9 soon. But that will be diffcult
until next week, especially with the IP21 a -.068 and the V-I showing
a -94. Tomorrow, expect some extra volatility due to the Jobs' Report.
A very low September Jobs' number, below, say, 70,000 would be
unsettling. It was the steep turn down in the Jobs number below 70,000
and then below 0 in June and July 2007 that foretold the coming
bear market. See this below. The August 2019 number was +130,000
(https://www.bls.gov/news.release/empsit.nr0.htm
)
Monthy New Jobs in 1000s - 2004-2009
|
| http://tigersoftware.com/PeerlessStudies/JobsR/index.html |
Professionals Remain Net Bearish.
The Closing Power downtrends are still in place. We will need to see
more buying after the opening. Today was a good start. But more such
upwards reversal days are needed.
I think we should wait for current Peerless to give a new Buy signal.
Next Monday, we will get a Buy B9 if the IP21 (current Accumulation
Index) were to rise to +.001, the P-Indicator stays positve and the
DJI remains down here 2.5% below the 21-day ma. (You can add or
change the values in c:\peerless\DATA.txt and
see how this affects the
signals given). It may take two more reversals like we saw today from early
weakness to effect such an improvement in our IP21.
The recent DJI formation going back to May looks to me
like a two winged monster with a very small head. Chart
theorists will call this a "diamond formation".
left wing
right
wing
head

"Diamond Formation"
I cannot recall the DJI forming a Diamond Formation in the past,
but the presence of so many previous head/shoulders patterns is
a warning that the 25500 support cannot be guaranteed. And the
"Diamond" formation after a long advance is known in classic chart
theory to be more likely to bring a price-breakdown than a price-breakout.
I was taught at Harris, Upham on Wall Street by men like Alan Shaw
who were Point/Figure chartists. This approach emphasizes how much
backing and filling takes place at the bottom and at the top of a trading range.
The more backing and filling before a breakdown, the more bearish
the (potential) "point-count" becomes. Usually, the amount of
backing
and filling is about the same in a trend-less trading range. For that to occur
in the present trading range, we will need to see another week of quick
reversals near 26000 that go nowhere. All this is another reason to wait for
a Buy B9 near 25500-25800. But a closing below this support should be
considered quite bearish.

"A diamond top formation
is a technical analysis pattern that often occurs at,
or near, market tops and can signal a reversal of an uptrend.
It is so named
because the trendlines connecting the peaks and troughs carved out by
the
security's price action form the shape of a diamond."
https://www.investopedia.com/articles/forex/05/diamondbear.asp

SHORT TERM TRADING TOOLS
A generally reliable short-term trading approach requires looking at the Stochastic-20
Pct-D charts of DIA, SPY, QQQ and IWM. First, inspect them see if they are
showing red arrowed short-term optimized Buys or Sells. Only IWM has
given a Buy on this decline, so far. Second, wait for the Blue 20-day Stochastic
Pct-D at the bottom of each chart to turn up from below 20%. This will work
well as long as key support has not been broken and prices are not downtrending.
 |
 |
 |
 |
|
Charts 10/3/2019 2019 PEERLESS DJI, Signals, Indicators Daily DJI Volume 10-DayUp/Down Vol Hourly DJIA A/D Line for All Stocks Inverted Traders Index NASDAQ S&P OEX NYSE COMPQX DJI-15 DJI-20 DJI-30 DIA SPY QQQ MDY IWM TNA Short-Term Rates USO-CrudeOil DBO FAS GLD BBH IBB JETS JNUG KOL NUGT OIH OIL RSX RETL SDS AGQ SLV SOXL TECL TLT TMF TNA UGA (gasoline) XIV and China: YINN CHAU Commodities: CANE CORN DBC JJC, NIB, CHOC CORN, CUT (paper) MOO, SOYB WEAT UUP (Dollar) LIT (Lithium) AAPL ADBE ALXN AMAT AMGN AMD AMZN BA BABA BAC BIDU CAT CVX DE FB GOOG GS HD IBM INTU JPM M (Macy's) MSFT NFLX NKE NVDA PG QCOM TSLA TXN XOM WMT CMG , LRCX, SWKS, MDGL SPPI WATT SQ TOWN 10/3/19 (Click on Underlined link.) New highs and Bullish MAXCPs - http://tigersoft.com/max/10-3/BULLISH.htm Bearish MAXCPs - http://tigersoft.com/min/10-3/BEARISH.htm |
Table 1 QUICKSILVER on ETFS - 10/3/2019 ETF CLOSE CHANGE PIVOT-PT dma AROC CL-PWR CANDLE IP21 ITRS --------------------------------------------------------------------------------------------- DIA 262.01 1.29 267.99 -128.9% Bearish BLUE -.026 0 --------------------------------------------------------------------------------------------- BA 372.07 4.71 382.86 -195.8% Bullish BLUE .154 .068 --------------------------------------------------------------------------------------------- SPY 290.42 2.36 295.4 -111.9% Bearish BLUE .029 .002 --------------------------------------------------------------------------------------------- QQQ 186.07 2.02 187.03 -88.4% Bearish BLUE .07 -.008 --------------------------------------------------------------------------------------------- MDY 343.26 2.03 349.92 -130.2% Bearish BLUE .115 -.011 --------------------------------------------------------------------------------------------- IWM 147.74 .49 151.16 -154.6% Bearish BLUE .08 -.022 --------------------------------------------------------------------------------------------- FAS 71.3 1.18 77.4 -454.6% Bearish BLUE .051 -.085 --------------------------------------------------------------------------------------------- RETL 20.69 .23 22.19 -342.9% Bearish BLUE .19 -.141 --------------------------------------------------------------------------------------------- SOXL 165.82 8.07 165 -363.1% Bearish BLUE .091 -.136 --------------------------------------------------------------------------------------------- TECL 158.63 5.69 161.8 -299.8% Bearish BLUE .007 -.113 --------------------------------------------------------------------------------------------- IBB 98.79 1.55 99.3 -65.3% Bearish BLUE -.064 -.026 --------------------------------------------------------------------------------------------- GLD 141.9 .64 141.06 3.9% ------- BLUE -.241 .095 --------------------------------------------------------------------------------------------- OIH 11.91 -.37 12.55 -429.3% Bearish RED -.058 -.075 --------------------------------------------------------------------------------------------- GASL 7.83 .38 9.47 -973.4% Bearish BLUE -.151 -.471 weak --------------------------------------------------------------------------------------------- RSX 22.44 -.02 22.98 -183.9% Bearish BLUE -.048 -.009 |
Table 2 Count of Stocks in Key Directories
20191003
-------------------------------
NEWHIGHS 41
NEWLOWS 27
MAXCP 20
MINCP 33
TTTNH 18
TTTNL 141 Bearish
FASTUP 29
FASTDOWN 170 Bearish
CPCROSSA 118
CPCROSSD 13
BIGVOLUP 3
BIGVODN 11
ACCUMVER 13
HIGHIP21 2
HIUPPCT 8
LOWACCUM 87
REDSELL 79
AUGSELS7 12
TRAPDOOR 15
|
Table 3 RANKING OF KEY DIRECTORIES BASED PCT.OF STOCKS ABOVE 65-DMA
10/3/19
Bullish = 8
Bearish = 38
---------------------------------------------------------------------------------------
Directory Current day-1 day-2 day-3 day-4 day-5
----------------------------------------------------------------------------------------
HOMEBLDG .882 .882 .882 .941 .882 .882
BONDFUND .842 .815 .789 .736 .692 .596
UTILITY .7 .725 .775 .775 .775 .8
REIT .648 .613 .627 .751 .765 .793
SEMI .579 .495 .57 .644 .626 .7
FOOD .555 .537 .518 .37 .407 .407
RETAIL .529 .549 .647 .705 .666 .686
COMODITY .512 .512 .512 .439 .414 .439
N=8
=============================================================================================
ELECTRON .483 .451 .503 .593 .574 .645
GAMING .434 .434 .391 .478 .434 .565
INSURANC .432 .432 .54 .648 .621 .702
SOLAR .423 .461 .461 .538 .461 .576
CHEM .416 .395 .52 .687 .625 .604
NASD-100 .377 .306 .438 .51 .479 .54
SP500 .369 .338 .462 .597 .585 .603
COMPUTER .368 .368 .421 .473 .473 .421
INFRA .361 .333 .472 .583 .5 .583
AUTO .358 .461 .589 .641 .615 .615
RUS-1000 .357 .339 .454 .59 .572 .594
NIFTY .345 .272 .345 .381 .381 .472
DOWJONES .333 .366 .433 .6 .533 .5
SP-100 .333 .311 .411 .566 .566 .544
FIDSTKS .313 .291 .384 .516 .467 .51
DJI-13 .307 .384 .384 .538 .461 .384
INDMATER .302 .236 .328 .447 .394 .407
REGBANKS .296 .333 .444 .666 .777 .74
BEVERAGE .294 .294 .352 .411 .352 .529
MILITARY .285 .285 .357 .571 .535 .571
SOFTWARE .283 .233 .283 .4 .333 .416
INDEXES .258 .22 .279 .489 .446 .532
GOLD .254 .294 .235 .137 .411 .549
BIOTECH .242 .21 .228 .286 .315 .32
FINANCE .235 .176 .341 .576 .647 .647
CHINA .214 .214 .214 .25 .214 .321
OILGAS .204 .167 .226 .335 .291 .284
HACKERS .2 .15 .25 .25 .25 .25
TRANSP .2 .2 .4 .5 .35 .5
ETFS .189 .12 .258 .465 .379 .448
EDU .166 .333 .333 .333 .333 .333
GREEN .16 .2 .24 .32 .28 .32
BIGBANKS .142 .285 .428 .571 .857 .571
HOSPITAL .136 .136 .227 .272 .227 .272
GUNS .125 .125 .25 .312 .375 .437
JETS .1 .1 .3 .3 .2 .3
COAL 0 0 0 0 0 0
COPPER 0 0 .2 .2 .2 .2
N=38
|
====================================================================
10/2/2019 The Sell
S9-V, S2, S17 remain in effect. Hold
DIA short. We got
no B2 or B9 today despite the DJI's close 3% below the 21-day ma with the
P-I still a very positive +133. The Peerless program did not allow
the Buy B9 because it was too early in the month of October after
too steep a decline with a too low IP21 reading of -.088. So, most likely
the DJI will need to go down to at least its rising 200-day ma, now at
25840, which is in the expected zone of support between 25500 and 26000.
The 2006 version of Peerless gave a Buy B8, based on positive P-Indicator,
but that version did not have the advantage of having all the data between
1929 and 1965 to examine and learn from. We need to wait for a Peerless
Buy signal from the current version of the software, I believe, or at the
very least, for quick traders, some reliable short-term Buy signals, as discussed
last night and in more detail tonight.
 |
This last week Professionals have
been heavy sellers into any opening strength.
There is no evidence that they have shifted to buying. We could easily
see another false rally at the opening tomorrow. See the falling Closing
Power below in the SPY, QQQ and IWM.
SPY is important to watch now. It has fallen to important (green) support.
The other key ETFs are not yet at well-tested support.
SPY is at important (green) support now. |
 |
 |
Trading Range Short-Term Buys are still
Missing.
Our 6-day Inverted Traders Index is oversold, but
could go lower and
in any case, is still declining. Below, see that three of other most useful trading
range
indicators I mentioned last night are not yet in a position to give a reliable
Buy signal. The Stochastic-20 Pct-D is still well above 20%, the MACD Lines
are separated too far and the RSI is at, at but not below 20. The CCI is,
however, at a very oversold -333. Such weakness by the CCI in October
did not produce a good rally to trade when the same thing was seen
in the Octobers of 1987, 1997 or 2018. In all three cases, it would have been
better to have waited for a CCI non-confirmation of another new DJI low.
Short-Term Indicators and DJI
     |
October Peerless Buy B9s: 1929-2019 Date DJIA Gain Maximum Paper Loss
Pct.Loss
-------------------------------------------------------------------------------
19761005 B9 966.76 .018 924.04 -.0441 11/10
19801028 B9 932.59 .058 924.49 -.0086 10/31
19811023 B9 873.99 .04 830.96 -.0492 10/26
(After 19% decline)
19981001 B9 7632.53 .437 perfect 0
(After 19% decline)
20041014 B9 9894.45 .103 9749.99 -.0146 10/25
20041022 B9 9757.81 .118 9749.99 -.0008 10/25
20131007 B9 14936.24 .105 14776.5 -.0106 10/8
-----------------------------------------------------------------------------
No. 7 .125 Median =-.0106
Analysis of Buy B9 Results
==========================
All B9s
Totals N = 76 .108 -.011
Paper Losses
------------
Biggest = 7.7% in 1932 (extreme bear market)
5 losses greater than 4% (5/76) - warning...
32 no paper losses. (32/76)
51 showed maximum paper losse more than 1%.
Ratio avg.gain/avg paper loss = .108/.011
Returns by Size No. Pct/
---------------
Gains over 20% 10 10/76
Gains 10%-19.9% 25 25/76
Gains 5%-9.9% 23 23/76
Gains 0%-4.9% 17 17/76
Losses 1 1/76
-------------------------------------------
Total 76
Returns by Year No. Avg.Gain
--------------------- ---- --------
Year before Election Year 16 .134
------------------------------------------------
Total 76 .108
Returns by Month No. Avg.Gain
--------------------- ---- --------
October 7 .125
|
|
Charts 10/2/2019 2019 PEERLESS DJI, Signals, Indicators Daily DJI Volume 10-DayUp/Down Vol Hourly DJIA A/D Line for All Stocks Inverted Traders Index NASDAQ S&P OEX NYSE COMPQX DJI-15 DJI-20 DJI-30 DIA SPY QQQ MDY IWM TNA Short-Term Rates USO-CrudeOil DBO FAS GLD BBH IBB JETS JNUG KOL NUGT OIH OIL RSX RETL SDS AGQ SLV SOXL TECL TLT TMF TNA UGA (gasoline) XIV and China: YINN CHAU Commodities: CANE CORN DBC JJC, NIB, CHOC CORN, CUT (paper) MOO, SOYB WEAT UUP (Dollar) LIT (Lithium) AAPL ADBE ALXN AMAT AMGN AMD AMZN BA BABA BAC BIDU CAT CVX DE FB GOOG GS HD IBM INTU JPM M (Macy's) MSFT NFLX NKE NVDA PG QCOM TSLA TXN XOM WMT CMG , LRCX, SWKS, MDGL SPPI WATT SQ TOWN 10/2/19 (Click on Underlined link.) New highs and Bullish MAXCPs - http://tigersoft.com/max/10-2/BULLISH.htm Bearish MAXCPs - http://tigersoft.com/min/10-2/BEARISH.htm |
Table 1 QUICKSILVER on ETFS - 10/2/2019 ETF CLOSE CHANGE PIVOT-PT dma AROC CL-PWR CANDLE IP21 ITRS --------------------------------------------------------------------------------------------- DIA 260.72 -4.78 268.88 -165.2% Bearish RED -.085 ---- --------------------------------------------------------------------------------------------- BA 367.36 -7.58 386.89 -246.4% Bullish RED .128 .031 --------------------------------------------------------------------------------------------- SPY 288.06 -5.18 297 -161.5% Bearish RED .004 .006 --------------------------------------------------------------------------------------------- QQQ 184.05 -3.22 189.38 -159.9% Bearish RED .039 -.004 --------------------------------------------------------------------------------------------- MDY 341.23 -4.52 352.33 -188.3% Bearish RED .087 .004 --------------------------------------------------------------------------------------------- IWM 147.25 -1.12 152.38 -226.1% Bearish RED .042 -.002 --------------------------------------------------------------------------------------------- FAS 70.12 -3.83 78.16 -524.2% Bearish RED .011 -.075 --------------------------------------------------------------------------------------------- RETL 20.46 -1.87 22.2 -465.8% Bearish RED .175 -.093 --------------------------------------------------------------------------------------------- SOXL 157.75 -7.81 177.97 -574.1% Bearish RED .096 -.097 --------------------------------------------------------------------------------------------- TECL 152.94 -9.41 168.37 -455.1% Bearish RED -.016 -.115 --------------------------------------------------------------------------------------------- IBB 97.24 -.76 100.08 -245% Bearish RED -.127 -.031 --------------------------------------------------------------------------------------------- GLD 141.26 1.63 141.79 -20.3% Bearish BLUE-.187 .103 (strong) --------------------------------------------------------------------------------------------- OIH 11.91 -.37 12.55 -429.3% Bearish RED -.058 -.068 --------------------------------------------------------------------------------------------- GASL 7.45 -.65 9.53 -1552.1% Bearish RED -.2 -.486 (very weak) --------------------------------------------------------------------------------------------- RSX 22.46 -.22 23.28 -158.8% Bearish RED -.019 -.008 |
Table 2 Count of Stocks in Key Directories
20191002
-------------------------------
NEWHIGHS 30
NEWLOWS 48
MAXCP 5
MINCP 122 Bearish
TTTNH 17
TTTNL 244 Bearish
FASTUP 23
FASTDOWN 210 Bearish
CPCROSSA 19
CPCROSSD 130
BIGVOLUP 4
BIGVODN 5
ACCUMVER 14
HIGHIP21 2
HIUPPCT 9
LOWACCUM 86
REDSELL 79
AUGSELS7 14
TRAPDOOR 17
|
Table 3 RANKING OF KEY DIRECTORIES BASED PCT.OF STOCKS ABOVE 65-DMA
10/2/19
Bullish = 7
Bearish = 38
---------------------------------------------------------------------------------------
Directory Current day-1 day-2 day-3 day-4 day-5
----------------------------------------------------------------------------------------
HOMEBLDG .882 .882 .941 .882 .882 .882
BONDFUND .815 .789 .736 .692 .622 .517
UTILITY .725 .775 .775 .775 .8 .8
REIT .613 .627 .751 .765 .8 .758
RETAIL .549 .647 .705 .666 .686 .666
FOOD .537 .518 .37 .407 .407 .425
COMODITY .512 .512 .439 .414 .439 .487
============================================================================================
SEMI .495 .57 .644 .626 .7 .747
AUTO .461 .589 .641 .615 .615 .641
SOLAR .461 .461 .538 .461 .576 .692
ELECTRON .451 .503 .593 .574 .638 .67
GAMING .434 .391 .478 .434 .565 .608
INSURANC .432 .54 .648 .621 .702 .702
CHEM .395 .52 .687 .625 .604 .625
DJI-13 .384 .384 .538 .461 .384 .538
COMPUTER .368 .421 .473 .473 .421 .526
DOWJONES .366 .433 .6 .533 .5 .566
RUS-1000 .339 .454 .59 .572 .594 .607
SP500 .338 .462 .597 .585 .603 .62
EDU .333 .333 .333 .333 .333 .333
INFRA .333 .472 .583 .5 .583 .611
REGBANKS .333 .444 .666 .777 .74 .888
SP-100 .311 .411 .566 .566 .544 .577
NASD-100 .306 .438 .51 .479 .54 .53
NIFTY .298 .368 .403 .403 .491 .526
BEVERAGE .294 .352 .411 .352 .529 .529
GOLD .294 .235 .137 .411 .549 .647
FIDSTKS .291 .384 .516 .467 .51 .538
BIGBANKS .285 .428 .571 .857 .571 .857
MILITARY .285 .357 .571 .535 .571 .714
INDMATER .236 .328 .447 .394 .381 .486
SOFTWARE .233 .283 .4 .333 .416 .466
INDEXES .22 .279 .489 .446 .532 .596
CHINA .214 .214 .25 .214 .321 .41
BIOTECH .208 .22 .284 .313 .318 .382
GREEN .2 .24 .32 .28 .32 .44
TRANSP .2 .4 .5 .35 .5 .6
FINANCE .176 .341 .576 .647 .635 .729
OILGAS .166 .224 .333 .289 .275 .34
HACKERS .15 .25 .25 .25 .25 .3
HOSPITAL .136 .227 .272 .227 .272 .454
GUNS .125 .25 .312 .375 .437 .437
ETFS .12 .258 .465 .379 .448 .379
JETS .1 .3 .3 .2 .3 .5
COAL 0 0 0 0 0 0
COPPER 0 .2 .2 .2 .2 .2
|
====================================================================
10/1/2019 The Sell S9-V, S2,
S17 remain in effect. Hold DIA
short. We may
get a Buy B9 on a close below 26250, but that remains to be seen.
The positive P-Indicator usually brings a reliable Buy signal when DJI
closes 2% to 5% below its 21-dma. But this is October and the first
week of October to the 20th is quite capable of producing a market
panic. Watch the downtrending Closing Powers for clues about
when Professionals are coming back in the market, having become
net sellers when DJI was above 27000. Since 27000 will probably
act as resistance on the next rally, it would be best to wait to buy
near the 25500-26000 zone of support.


A big sell-off seems unlikely, first, because of the low interest rate
and strong Dollar environment, second, because of the still strong P-Indicator
and still rising NYSE A/D Line, third, because tech stocks, as shown in
TECL, are not under heavy selling pressure, fourth, because only Macdonald's
in DJI-30 shows a big and bearish head and shoulders pattern and fifth, because
our bell-weather Debt stock, VISA, is still in an uptrend.


|
Charts 10/1/2019 2019 PEERLESS DJI, Signals, Indicators Daily DJI Volume 10-DayUp/Down Vol Hourly DJIA A/D Line for All Stocks Inverted Traders Index NASDAQ S&P OEX NYSE COMPQX DJI-15 DJI-20 DJI-30 DIA SPY QQQ MDY IWM TNA Short-Term Rates USO-CrudeOil DBO FAS GLD BBH IBB JETS JNUG KOL NUGT OIH OIL RSX RETL SDS AGQ SLV SOXL TECL TLT TMF TNA UGA (gasoline) XIV and China: YINN CHAU Commodities: CANE CORN DBC JJC, NIB, CHOC CORN, CUT (paper) MOO, SOYB WEAT UUP (Dollar) LIT (Lithium) AAPL ADBE ALXN AMAT AMGN AMD AMZN BA BABA BAC BIDU CAT CVX DE FB GOOG GS HD IBM INTU JPM M (Macy's) MSFT NFLX NKE NVDA PG QCOM TSLA TXN XOM WMT CMG , LRCX, SWKS, MDGL SPPI WATT SQ TOWN 10/1/19 (Click on Underlined link.) New highs and Bullish MAXCPs - http://tigersoft.com/max/10-1/BULLISH.htm Bearish MAXCPs - http://tigersoft.com/min/10-1/BEARISH.htm |
Technical Tools for Trading Ranges

The market is now pretty clearly in a trading range. We have lots of good
tools to see when a trading range decline is over. For example, look the
Tiger Index of Big Banks and FAS now, which represents big banks and
financials. Their optimumized trading system are now a Stochastics. I would
think it will give new Red buy signals when the market is ready to rally.


Look at the MACD on the SPY chart. It should give a nice and timely Buy
when SPY is ready to rally.

And don't forget the CCI and RSI indicators on the DJI. They ought to
fall into over-sold territory and then turn up at the bottom in a trading range.


Table 1 QUICKSILVER on ETFS - 10/1/2019 ETF CLOSE CHANGE PIVOT-PT dma AROC CL-PWR CANDLE IP21 ITRS --------------------------------------------------------------------------------------------- DIA 265.5 -3.68 269.58 -46% Bearish RED .006 ----- --------------------------------------------------------------------------------------------- BA 374.94 -5.53 386.2 -87.5% Bullish RED .17 .027 --------------------------------------------------------------------------------------------- SPY 293.24 -3.53 297.62 -44.3% Bearish RED .056 .007 --------------------------------------------------------------------------------------------- QQQ 187.27 -1.54 190.08 -18.6% Bearish RED .062 -.005 --------------------------------------------------------------------------------------------- MDY 345.75 -6.72 354.45 -65.5% Bearish RED .086 .003 --------------------------------------------------------------------------------------------- IWM 148.37 -2.97 154.1 -133.3% Bearish RED -.001 -.012 --------------------------------------------------------------------------------------------- FAS 73.95 -3.69 78.2 -188.7% Bearish RED .076 -.024 --------------------------------------------------------------------------------------------- RETL 22.33 -.57 22.55 82.7% ------- RED .211 -.022 --------------------------------------------------------------------------------------------- SOXL 165.56 -4.66 177.41 -93.7% Bearish RED .1 -.044 --------------------------------------------------------------------------------------------- TECL 162.35 -4.44 168 4.2% Bearish RED -.012 -.074 --------------------------------------------------------------------------------------------- IBB 98 -1.5 102.13 -219.5% Bearish RED -.206 -.045 --------------------------------------------------------------------------------------------- GLD 139.63 .76 141.83 -172.3% Bearish BLUE-.164 .061 --------------------------------------------------------------------------------------------- OIH 11.91 -.37 12.55 -429.3% Bearish RED -.058 -.091 --------------------------------------------------------------------------------------------- GASL 8.1 -1.01 10.34 -1235.5% Bearish RED -.114 -.458 --------------------------------------------------------------------------------------------- RSX 22.68 -.13 23.19 -110.4% Bearish RED .038 -.014 |
Table 2 Count of Stocks in Key Directories
20191001
-------------------------------
NEWHIGHS 31
NEWLOWS 38
MAXCP 5
MINCP 127 Bearish
TTTNH 12
TTTNL 192 Bearish
FASTUP 26
FASTDOWN 179 Bearish
CPCROSSA 19
CPCROSSD 130
BIGVOLUP 4
BIGVODN 17
ACCUMVER 14
HIGHIP21 5
HIUPPCT 9
LOWACCUM 86
REDSELL 81
AUGSELS7 15
TRAPDOOR 17
|
Table 3 RANKING OF KEY DIRECTORIES BASED PCT.OF STOCKS ABOVE 65-DMA
10/1/19
Bullish = 12
Bearish = 34
---------------------------------------------------------------------------------------
Directory Current day-1 day-2 day-3 day-4 day-5
----------------------------------------------------------------------------------------
HOMEBLDG .882 .941 .882 .882 .882 .882
BONDFUND .789 .736 .692 .622 .526 .64
UTILITY .775 .775 .775 .8 .775 .8
RETAIL .647 .705 .666 .686 .666 .588
REIT .627 .751 .765 .8 .758 .717
AUTO .589 .641 .615 .615 .615 .564
SEMI .57 .644 .626 .7 .747 .663
INSURANC .54 .648 .621 .702 .702 .648
CHEM .52 .687 .625 .604 .625 .541
FOOD .518 .37 .407 .407 .425 .481
COMODITY .512 .439 .414 .439 .487 .536
ELECTRON .503 .593 .574 .638 .67 .638
N=12
==============================================================================================
INFRA .472 .583 .5 .583 .611 .555
SP500 .462 .597 .585 .603 .616 .56
SOLAR .461 .538 .461 .576 .692 .692
RUS-1000 .454 .59 .572 .594 .606 .551
REGBANKS .444 .666 .777 .74 .888 .74
NASD-100 .438 .51 .479 .54 .53 .5
DOWJONES .433 .6 .533 .5 .566 .5
BIGBANKS .428 .571 .857 .571 .857 .428
SP-100 .411 .566 .566 .544 .577 .533
TRANSP .4 .5 .35 .5 .6 .45
GAMING .391 .478 .434 .565 .608 .608
COMPUTER .388 .444 .444 .388 .5 .555
DJI-13 .384 .538 .461 .384 .538 .461
FIDSTKS .384 .516 .467 .51 .538 .494
MILITARY .357 .571 .535 .571 .714 .571
BEVERAGE .352 .411 .352 .529 .529 .47
NIFTY .345 .381 .381 .472 .509 .4
EDU .333 .333 .333 .333 .333 .333
FINANCE .329 .576 .635 .623 .729 .611
INDMATER .328 .447 .394 .381 .473 .381
JETS .3 .3 .2 .3 .5 .4
SOFTWARE .283 .4 .333 .416 .466 .383
HOSPITAL .272 .272 .227 .272 .454 .409
INDEXES .268 .489 .446 .532 .591 .537
ETFS .258 .465 .379 .448 .379 .448
GUNS .25 .312 .375 .437 .437 .25
HACKERS .25 .25 .25 .25 .3 .25
GREEN .24 .32 .28 .32 .44 .44
GOLD .235 .137 .411 .549 .647 .784
OILGAS .224 .333 .289 .275 .34 .347
BIOTECH .22 .278 .313 .318 .388 .388
CHINA .214 .25 .214 .321 .41 .339
COPPER .2 .2 .2 .2 .2 .2
COAL 0 0 0 0 0 0
N-34
|
====================================================================
9/30/2019 The Sell S9-V, S2, S17
remain in effect. But also present is the
normally bullish rising NYSE A/D Line. With the Dollar so strong,
overseas buyers remain quite aggressive. How long can this last?
The DJI shows a mini-head/shoulders pattern now. I've circled it
in magenta. A close below 26550 would complete it and likely bring
a decline somewhat below 26000. On the other hand a DJI breakout
above 27100 should nullify the H/S pattern and cause short covering
to send the DJI up to 27500. While the market may seem dull and uninspiring,
it is probably getting ready to spring from the coil it is forming.

The campaign against President Trump is very heated. But the US stock market
is shrugging the vitriolics off. That has to be bullish. But can it last?
My guess is the
economics of the situation will be the prime determinant and they look good.
But first, we need another pullback to the lower band to buy. Either that, or
Professionals will have to start showing more aggressive buying after an
up-opening. That, too, would also cause enough of a shift in momentum and bring
a challenge of 27500. But right now the Closing Powers of the major markets are
all declining and I would not argue with their thinking so near resistance and with
the sometimes deadly month of October coming up. See the charts linked to here
for
DIA SPY QQQ MDY IWM and COMPQX (Nasdaq).
|
Charts 9/30/2019 2019 PEERLESS DJI, Signals, Indicators Daily DJI Volume 10-DayUp/Down Vol Hourly DJIA A/D Line for All Stocks Inverted Traders Index NASDAQ S&P OEX NYSE COMPQX DJI-15 DJI-20 DJI-30 DIA SPY QQQ MDY IWM TNA Short-Term Rates USO-CrudeOil DBO FAS GLD BBH IBB JETS JNUG KOL NUGT OIH OIL RSX RETL SDS AGQ SLV SOXL TECL TLT TMF TNA UGA (gasoline) XIV and China: YINN CHAU Commodities: CANE CORN DBC JJC, NIB, CHOC CORN, CUT (paper) MOO, SOYB WEAT UUP (Dollar) LIT (Lithium) AAPL ADBE ALXN AMAT AMGN AMD AMZN BA BABA BAC BIDU CAT CVX DE FB GOOG GS HD IBM INTU JPM M (Macy's) MSFT NFLX NKE NVDA PG QCOM TSLA TXN XOM WMT CMG , LRCX, SWKS, MDGL SPPI WATT SQ TOWN 9/30/19 (Click on Underlined link.) New highs and Bullish MAXCPs - http://tigersoft.com/max/9-30/BULLISH.htm Bearish MAXCPs - http://tigersoft.com/min/9-30/BEARISH.htm |
Today's A/D Line did not make a new high and the current Accumulation Index
(IP21) stayed negative. So, today's bounce did not bring a new Peerless Buy B21.
That means that the Peerless Sells remain in place and it will either take a DJI
breakout over 27500 or a decline back to 26200 to give us a Buy B10 or a Buy B9,
respectively. The Dollar has run to another new high while Gold has formed a
bearish looking head/shoulders pattern. If the US were on a bring of a Civil War,
Gold would not look this toppy. Instead, the market is marking time, presumably
waiting for this Friday's Jobs Report. The strength we are seeing going into October
is unusual. Profits and Jobs are not expected to disappoint.
But Octobers can be problematic. History-minded Peerless
users have a difficult time
not dismissing how badly the bull charts of 1929, 1937, 1957, 1978, 1979, 1987,
and 2007-2008 turned out at this time of year. But all in all, since 1947, the years
before a Presidential Election have shown an equal number of gains and losses.
Morover,
since 1999, there was only one of these Octobers before a Presidential Election that
was down while the rest of these Octobers saw DJI rallies. See Table A below.
Why Are Professionals Still Net Bearish?
Why Is our Accumulation Index Negative and in A Downtrend?
The openings have been strong, but the Closings have generally been weak.
That means it's probably not a good idea to chase stocks at the opening. And
since Professionals are right a lot more than those who buy at the opening,
if we study the main ETFs as far back as they have data, we still should stay
short DIA and buy on more of a pullback. With volume generally much higher
on the downside and with our Accumulation Index in a downtrend, I don't
think we can be sure enough of an upside breakout coming before a pullback.
I think this hesitation in the market will come to an end once we get into the
second half of October.
Table A - How Did DJI Fare in Years before a Presidential
Election?
Year
End of Septem. End
of Octob.
DJIA
DJIA
-------------------------------------------------------
1947 D
177.5
181.8
1951 D
271.21
262.4
1955 R
466.6
454.9
1959 R
631.7
646.6
1963 D
723.8
755.2
1967 D
926.66
879.74
1971 R
887.19
839.30
1975 R
793.88
836.04
1979 D
878.58
815.7
1983 R
1233.13
1225.20
1987 R
2596.28
1993.53
1991 R
3015.77
3069.10
1995 D
4789.08
4755.48
1999 D
10275.53
10729.95
2003 R
9275.06
9801.12
2007 R
13895.63
10930.01
2011 D
10913.38
11955.01
2015 D
16284.70
17663.54
Table 1 QUICKSILVER on ETFS - 09/28/19 ETF CLOSE CHANGE PIVOT-PT dma AROC CL-PWR CANDLE IP21 ITRS --------------------------------------------------------------------------------------------- DIA 269.18 1.19 267.97 -3.3% Bearish BLUE .061 ----- --------------------------------------------------------------------------------------------- BA 380.47 -2.39 381.65 44.9% ------- RED .198 .017 --------------------------------------------------------------------------------------------- SPY 296.77 1.37 295.87 -24.3% Bearish BLUE .104 .007 --------------------------------------------------------------------------------------------- QQQ 188.81 1.78 187.97 -44.7% Bearish BLUE .102 -.003 --------------------------------------------------------------------------------------------- MDY 352.47 2.55 350.36 -27.4% ------- BLUE .164 .008 --------------------------------------------------------------------------------------------- IWM 151.34 .18 152.43 -129.7% Bearish ---- .054 -.008 --------------------------------------------------------------------------------------------- FAS 77.64 .24 76.88 -63.6% ------- RED .149 .014 --------------------------------------------------------------------------------------------- RETL 18.03 -.86 17.32 10.8% Bearish RED -.051 -.246 --------------------------------------------------------------------------------------------- SOXL 170.22 5.22 168.78 -215.1% Bearish BLUE .139 .024 --------------------------------------------------------------------------------------------- TECL 166.79 4.99 162.21 -18.1% Bearish BLUE .038 -.029 --------------------------------------------------------------------------------------------- IBB 99.5 .2 102.42 -252.2% Bearish -- -.161 -.043 --------------------------------------------------------------------------------------------- GLD 138.87 -2.19 144.51 -171.1% Bearish RED -.202 .041 --------------------------------------------------------------------------------------------- OIH 14.64 -.34 14.58 0% Bearish RED .038 -.078 --------------------------------------------------------------------------------------------- RSX 22.63 .37 21.72 175.3% Bullish BLUE .016 -.035 |
Table 2
Count of Stocks in Key Directories
20190930
-------------------------------
NEWHIGHS 92
NEWLOWS 14
MAXCP 19
MINCP 47
TTTNH 7
TTTNL 69
FASTUP 22
FASTDOWN 219
CPCROSSA 168
CPCROSSD 120
BIGVOLUP 3
BIGVODN 4
ACCUMVER 8
HIGHIP21 5
HIUPPCT 9
LOWACCUM 85
REDSELL 81
AUGSELS7 19
TRAPDOOR 16
|
Table 3 RANKING OF KEY DIRECTORIES BASED PCT.OF STOCKS ABOVE 65-DMA
9/30/19
Bullish = 24
Bearish = 21
---------------------------------------------------------------------------------------
Directory Current day-1 day-2 day-3 day-4 day-5
----------------------------------------------------------------------------------------
HOMEBLDG .941 .882 .882 .882 .882 .882
UTILITY .775 .775 .8 .775 .8 .8
REIT .751 .765 .8 .758 .717 .779
BONDFUND .736 .692 .622 .526 .649 .526
RETAIL .705 .666 .686 .666 .588 .686
CHEM .693 .632 .612 .632 .53 .673
REGBANKS .666 .777 .74 .888 .74 .814
INSURANC .648 .621 .702 .702 .648 .675
SEMI .644 .626 .7 .747 .672 .822
AUTO .641 .615 .615 .615 .564 .641
DOWJONES .6 .533 .5 .566 .5 .633
SP500 .597 .585 .603 .616 .558 .643
ELECTRON .59 .571 .636 .668 .629 .733
RUS-1000 .59 .572 .594 .606 .551 .637
INFRA .583 .5 .583 .611 .555 .694
FINANCE .576 .635 .623 .729 .611 .776
BIGBANKS .571 .857 .571 .857 .428 .857
MILITARY .571 .535 .571 .714 .571 .75
SP-100 .566 .566 .544 .577 .533 .633
DJI-13 .538 .461 .384 .538 .461 .615
SOLAR .538 .461 .576 .692 .692 .846
FIDSTKS .516 .467 .51 .538 .494 .593
NASD-100 .51 .479 .54 .53 .5 .591
INDEXES .505 .446 .532 .591 .548 .688
N=24
==============================================================================================
TRANSP .5 .35 .5 .6 .45 .5
===============================================================================================
GAMING .478 .434 .565 .608 .608 .652
COMPUTER .473 .473 .421 .526 .578 .631
ETFS .465 .379 .448 .379 .448 .655
INDMATER .447 .394 .381 .473 .368 .539
COMODITY .439 .414 .439 .487 .512 .634
BEVERAGE .411 .352 .529 .529 .47 .588
NIFTY .403 .403 .491 .526 .421 .596
SOFTWARE .4 .333 .416 .466 .383 .483
FOOD .37 .407 .407 .425 .462 .574
EDU .333 .333 .333 .333 .333 .333
OILGAS .333 .289 .275 .34 .326 .492
GREEN .32 .28 .32 .44 .44 .64
GUNS .312 .375 .437 .437 .25 .25
JETS .3 .2 .3 .5 .4 .4
BIOTECH .279 .309 .317 .387 .381 .451
HOSPITAL .272 .227 .272 .454 .409 .59
CHINA .25 .214 .321 .41 .339 .446
HACKERS .25 .25 .25 .3 .25 .25
COPPER .2 .2 .2 .2 .2 .2
GOLD .137 .411 .549 .647 .764 .784
COAL 0 0 0 0 0 .166
N=21
|
=====================================================================
9/27/2019 The
Peerless Sell signals are still in place, but showing how strong the NYSE
ADL is, on Friday there were only 243 more down than up even
though the
DJI fell 71. As long as the NYSE A/D Line uptrend continues, I think we
have to expect any DJI decline to be limited to 26300. But given the proven
resistance at 27500 and the falling Closing Powers, we have to wait for a
Peerless Buy signal to close out our DIA short and take many long positions.
Whatever happens in the uncivil American political wars, the US economy is still
producing big profits for the corporations that dominate the indexes of the
major ETFs. With the Dollar remaining so strong and interest rates at near record
new lows. All this is a potentially very bullish environment, at least that is the
message
given by the weekly DJI's potential inverted head and shoulders history AND the
usual end-result of such a strong NYSE A/D Line.

To get a Buy signal from Peerless, we will need only to see one of three
things happen. First, we will almost certainly get a Buy B9 if the DJI closes
2% lower and 2% below its 21-day ma. If the DJI had fallen to 26315 on Friday,
we would have gotten a Buy B9. Secondly, if the AD/Line can make another
new 12-month high on Monday, we will see Peerless give a Buy B21 if the
current Accumulation Index (IP21) also rises back above zero. Right now, that
seems unlikely, but it could happen. With the start of October, the Buy B21
based on the AD/Line making a new high, no longer becomes an option.
As I have shown, the first 10 days of October can be scary.
Assuming no Buy B9 or B21, we would then have wait
for a breakout above
27500 to bring a Peerless Buy B10. In the meantime, traders should be watching
how Professionals treat this market. Specificially, watch to see if the Closing
Power downtrends for DIA, SPY and QQQ can be broken to the upside.


Possibly a clue about what will transpire next comes from the
DJI chart for
the Autumn of 1943. Note the powerful ADL uptrend, the falling DJI and
then the breakout to the upside that completes a bullish inverted head/shoulders
pattern.

Might the DJI just keep falling despite the ADL's strength?
Eventually, the
weak DJI might win the contest. That is what happened in 1976, 1977 and 2001.
But before that the ADL would have to break its uptrend.
Buy B9s almost always work out well for a buyer. See Table 4 at the bottom
of this night's Hotline. The average paper loss with October B9s is 1.7%, a little
larger
than usual.
|
Charts 9/27/2019 2019 PEERLESS DJI, Signals, Indicators Daily DJI Volume 10-DayUp/Down Vol Hourly DJIA A/D Line for All Stocks Inverted Traders Index NASDAQ S&P OEX NYSE COMPQX DJI-15 DJI-20 DJI-30 DIA SPY QQQ MDY IWM TNA Short-Term Rates USO-CrudeOil DBO FAS GLD BBH IBB JETS JNUG KOL NUGT OIH OIL RSX RETL SDS AGQ SLV SOXL TECL TLT TMF TNA UGA (gasoline) XIV and China: YINN CHAU Commodities: CANE CORN DBC JJC, NIB, CHOC CORN, CUT (paper) MOO, SOYB WEAT UUP (Dollar) LIT (Lithium) AAPL ADBE ALXN AMAT AMGN AMD AMZN BA BABA BAC BIDU CAT CVX DE FB GOOG GS HD IBM INTU JPM M (Macy's) MSFT NFLX NKE NVDA PG QCOM TSLA TXN XOM WMT CMG , LRCX, SWKS, MDGL SPPI WATT SQ TOWN 9/27/19 (Click on Underlined link.) New highs and Bullish MAXCPs - http://tigersoft.com/max/9-27/BULLISH.htm Bearish MAXCPs - http://tigersoft.com/min/9-27/BEARISH.htm |
Table 1 QUICKSILVER on ETFS - 09/27/19 ETF CLOSE CHANGE PIVOT-PT dma AROC CL-PWR CANDLE IP21 ITRS --------------------------------------------------------------------------------------------- DIA 267.99 -.89 269.36 -23.4% Bearish RED .103 0 --------------------------------------------------------------------------------------------- BA 382.86 -4.03 377.03 45.4% Bullish RED .192 .076 --------------------------------------------------------------------------------------------- SPY 295.4 -1.6 298.21 -48.4% Bearish RED .127 .004 --------------------------------------------------------------------------------------------- QQQ 187.03 -2.35 190.5 -99.3% Bearish RED .1 -.012 --------------------------------------------------------------------------------------------- MDY 349.92 -2.41 354.4 -51.1% ------- RED .167 .005 --------------------------------------------------------------------------------------------- IWM 151.16 -1.22 155.31 -138.7% Bearish RED .091 -.007 --------------------------------------------------------------------------------------------- FAS 77.4 -.76 78.63 -60.2% ------- RED .18 -.004 --------------------------------------------------------------------------------------------- RETL 22.19 -.01 22.65 49.4% Bearish RED .224 -.057 --------------------------------------------------------------------------------------------- SOXL 165 -12.97 177.68 -211.9% Bearish RED .114 -.006 --------------------------------------------------------------------------------------------- TECL 161.8 -6.57 167.39 -126.2% Bearish RED .049 -.066 --------------------------------------------------------------------------------------------- IBB 99.3 -.78 104.63 -303.5% Bearish RED -.154 -.051 --------------------------------------------------------------------------------------------- GLD 141.06 -.73 143.75 -66.1% Bearish BLUE -.203 .049 --------------------------------------------------------------------------------------------- OIH 11.91 -.37 12.55 -429.3% Bearish RED -.058 -.098 --------------------------------------------------------------------------------------------- GASL 9.47 -.06 11.71 -1076.3% Bearish BLUE -.048 -.359 --------------------------------------------------------------------------------------------- RSX 22.98 -.3 23.61 -96.4% ------- RED .106 -.022 |
Table 2 Count of Stocks in Key Directories
20190927
-------------------------------
NEWHIGHS 53
NEWLOWS 18
MAXCP 5
MINCP 67
TTTNH 5
TTTNL 151
FASTUP 30
FASTDOWN 160
CPCROSSA 41
CPCROSSD 95
BIGVOLUP 1
BIGVODN 12
ACCUMVER 7
HIGHIP21 11
HIUPPCT 8
LOWACCUM 82
REDSELL 83
AUGSELS7 31
TRAPDOOR 17
|
Table 3 RANKING OF KEY DIRECTORIES BASED PCT.OF STOCKS ABOVE 65-DMA
9/27/19
Bullish= 18
Bearish= 27
---------------------------------------------------------------------------------------
Directory Current day-1 day-2 day-3 day-4 day-5
----------------------------------------------------------------------------------------
HOMEBLDG .882 .882 .882 .882 .882 .882
BIGBANKS .857 .571 .857 .428 .857 .857
REGBANKS .777 .74 .888 .74 .814 .777
UTILITY .775 .8 .775 .8 .8 .75
REIT .765 .8 .758 .717 .779 .793
BONDFUND .692 .622 .526 .649 .543 .517
RETAIL .666 .686 .666 .588 .666 .627
FINANCE .635 .623 .729 .611 .776 .752
SEMI .626 .7 .747 .672 .813 .757
CHEM .625 .604 .625 .541 .645 .666
INSURANC .621 .702 .702 .648 .675 .702
AUTO .615 .615 .615 .564 .641 .641
SP500 .585 .603 .616 .558 .639 .647
ELECTRON .574 .638 .67 .632 .729 .722
RUS-1000 .572 .594 .606 .551 .634 .633
SP-100 .566 .544 .577 .533 .622 .655
MILITARY .535 .571 .714 .571 .75 .714
DOWJONES .517 .482 .551 .517 .62 .62
N=18
=============================================================================================
INFRA .5 .583 .611 .555 .694 .722
=============================================================================================
NASD-100 .479 .54 .53 .5 .581 .581
COMPUTER .473 .421 .526 .578 .631 .578
FIDSTKS .467 .51 .538 .494 .587 .626
DJI-13 .461 .384 .538 .461 .615 .615
SOLAR .461 .576 .692 .692 .846 .769
INDEXES .446 .532 .591 .548 .688 .704
GAMING .434 .565 .608 .608 .652 .652
COMODITY .414 .439 .487 .512 .585 .585
GOLD .411 .549 .647 .764 .784 .686
FOOD .407 .407 .425 .462 .537 .537
INDMATER .394 .381 .473 .368 .526 .539
NIFTY .381 .472 .509 .4 .581 .527
ETFS .379 .448 .379 .448 .655 .62
GUNS .375 .437 .437 .25 .25 .312
BEVERAGE .352 .529 .529 .47 .588 .588
TRANSP .35 .5 .6 .45 .5 .6
EDU .333 .333 .333 .333 .333 .333
SOFTWARE .333 .416 .466 .383 .483 .483
BIOTECH .309 .317 .39 .384 .442 .465
OILGAS .289 .275 .34 .326 .485 .5
GREEN .28 .32 .44 .44 .64 .68
HACKERS .25 .25 .3 .25 .25 .35
HOSPITAL .227 .272 .454 .409 .59 .545
CHINA .214 .321 .41 .339 .464 .517
COPPER .2 .2 .2 .2 .2 .4
JETS .2 .3 .5 .4 .4 .4
COAL 0 0 0 0 .166 .166
N= 27
|
Table 4October Peerless Buy B9s: 1929-2019 Date DJIA Gain Maximum Paper Loss
Pct.Loss
-------------------------------------------------------------------------------
19801028 B9 932.59 .058 924.49 -.009 10/31
19811023 B9 873.99 .04 830.96 -.049 10/26
19981001 B9 7632.53 .437 perfect 0
20041014 B9 9894.45 .103 9749.99 -.014 10/25
20041022 B9 9757.81 .118 9749.99 -.001 10/25
20131007 B9 14936.24 .105 14776.5 -.011 10/8
-----------------------------------------------------------------------------
Totals N = 6 Mean = .104 Avg. = .017
All Buy B9s
Returns by Year No. Avg.Gain
--------------------- ---- --------
Presid.Election Year 24 .079
Year after Election Year 12 .120
Mid-Term Election Year 24 .116
Year before Election Year 16 .134
------------------------------------------------
Total 76 .108
All Buy B9s
Returns by Month No. Avg.Gain
--------------------- ---- --------
January 10 .119
February 5 .097
March 5 .093
April 3 .045
May 7 .078
June 2 .082
July 4 .078
August 1 .071
September 9 .106
October 7 .125
November 10 .134
December 13 .13
------------------------------------------------
Total 76 .108
|
======================================================================
9/26/2019 The
Peerless Sell signals are still in place. Today brought another mid-day decline
after
a brief advance. So, professionals still are net sellers. However, an up-day
with +572
more up than down on the NYSE will push the A/D-Line to new highs and
that will produce a Peerless Buy B21 as long as the IP21-AI stays positive.
It is now only +.01. So, let's wait until Monday so that we have a chance
to review the larger picture. The bearish seasonality of the next two weeks
remains my main concern. When you go back and look at each year's DJI chart
since 1929, you find that in 48% of all these, the DJI does not reach a bottom
until at least October 7th. While, it's also true that Octobers generally rose in 32.6%
of all these Octobers, the percentage was lower in on-going bull markets. For
some reason, October rallied in the bearish years of 1931, 1973, 1974, 1981,
1998 and 2001.
,
I have also warned readers that usually when the DJI (or index, ETF, stock or
commodity) find themselves unable to make a new high past resistance, normally
they must decline to well-tested support. Seldom do they retreat only to the 21-day
ma
or 65-dma, which is where the DJI is now sitting on.
The DJI chart shows another warning sign now. See in the DJI chart below the
numerous (pink) head/shoulders tops. The last has not been complete. Prices
are still above its neckline. But so many of these pattern in the last year is
typically a warning that significant big money Distribution is taking place and
the market is vulnerable. This bearishness of this Distribution is reinforced
by the falling Closing Powers. See DIA just below.


The Dollar made another new high and the Fed allowed the short-term rates that Banks
pay for very short-term funds to fall. This continued the rally in Utilities,
dividend
and many blue chip stocks. Trump's difficulties matter little to stock traders.
Instead,
the low interest rates and strong Dollar are serving to continue to boost dividend stocks.
Until either the Dollar turns weak or short-term rates start rising, it will be hard for
the
DJI to fall by much. Of course, the Jobs Report may cause nervousness next weak.

Much of today's weakness owned to high priced United Health Care's 6.69 point decline.
Four of the five bullish DJI-30 stocks I mentioned last night were up. But even
if AAPL joins these others, there is still considerable resistance overhead. So,
just hold DIA short for now.

OBV Leading Low Prices to Breakout and New
Highs.
Often in the later stages of a bull market, the Public feels
emboldened enough to
start buying low priced stocks.
Professionals will then try to buy these before there
is a clear breakout. We should be
looking for these now, not just by looking for
high Accumulation but also cases where
the OBV Line starts to make new yearly
highs way ahead of the stock itself.
See some examples below. The Tiger Power
Ranker can be used here to find stocks
that are near their highs and the OBV% is
100% (at its 100-day high) in the
low-priced stocks' directory.
 |
 |
 |
 |
|
Charts 9/26/2019 2019 PEERLESS DJI, Signals, Indicators Daily DJI Volume 10-DayUp/Down Vol Hourly DJIA A/D Line for All Stocks Inverted Traders Index NASDAQ S&P OEX NYSE COMPQX DJI-15 DJI-20 DJI-30 DIA SPY QQQ MDY IWM TNA Short-Term Rates USO-CrudeOil DBO FAS GLD BBH IBB JETS JNUG KOL NUGT OIH OIL RSX RETL SDS AGQ SLV SOXL TECL TLT TMF TNA UGA (gasoline) XIV and China: YINN CHAU Commodities: CANE CORN DBC JJC, NIB, CHOC CORN, CUT (paper) MOO, SOYB WEAT UUP (Dollar) LIT (Lithium) AAPL ADBE ALXN AMAT AMGN AMD AMZN BA BABA BAC BIDU CAT CVX DE FB GOOG GS HD IBM INTU JPM M (Macy's) MSFT NFLX NKE NVDA PG QCOM TSLA TXN XOM WMT CMG , LRCX, SWKS, MDGL SPPI WATT SQ TOWN 9/26/19 (Click on Underlined link.) New highs and Bullish MAXCPs - http://tigersoft.com/max/9-26/BULLISH.htm Bearish MAXCPs - http://tigersoft.com/min/9-26/BEARISH.htm |
Table 1 QUICKSILVER on ETFS - 09/26/19 ETF CLOSE CHANGE PIVOT-PT dma AROC CL-PWR CANDLE IP21 ITRS --------------------------------------------------------------------------------------------- DIA 268.88 -.7 269.25 -47.1% Bullish RED .166 ------ --------------------------------------------------------------------------------------------- BA 386.89 .69 379.39 32.1% Bullish RED .242 .059 Highest priced DJIA-30 --------------------------------------------------------------------------------------------- SPY 297 -.62 298.28 -68.4% ------- RED .182 .01 --------------------------------------------------------------------------------------------- QQQ 189.38 -.7 190.8 -90.8% Bearish RED .16 -.002 --------------------------------------------------------------------------------------------- MDY 352.33 -2.12 353.53 -53.4% Bullish RED .212 .011 --------------------------------------------------------------------------------------------- IWM 152.38 -1.72 155.43 -109.3% ------- RED .13 .001 --------------------------------------------------------------------------------------------- FAS 78.16 -.04 78.34 -96.4% ------- RED .231 .022 --------------------------------------------------------------------------------------------- RETL 22.2 -.35 21.97 11.2% ------- RED .27 -.076 --------------------------------------------------------------------------------------------- SOXL 177.97 .56 172.41 -131.4% ------- BLUE .194 .116 --------------------------------------------------------------------------------------------- TECL 168.37 .37 166 -114.3% Bearish BLUE .096 -.01 --------------------------------------------------------------------------------------------- IBB 100.08 -2.05 105.55 -219% Bearish RED -.103 -.04 --------------------------------------------------------------------------------------------- GLD 141.79 -.04 142.95 17.8% Bearish RED -.208 .066 --------------------------------------------------------------------------------------------- OIH 11.91 -.37 12.55 -429.3% Bearish RED -.058 -.101 --------------------------------------------------------------------------------------------- GASL 9.53 -.81 11.79 -972% Bearish RED -.038 -.374 --------------------------------------------------------------------------------------------- UGA 9.53 -.81 11.79 -972% Bullish RED -.071 -.661 --------------------------------------------------------------------------------------------- UUP 27.05 .07 26.83 54% Bullish BLUE .093 .041 --------------------------------------------------------------------------------------------- RSX 23.28 .09 23.43 -57.7% Bullish RED .152 -.006 |
Table 2 Count of Stocks in Key Directories
20190926
-------------------------------
NEWHIGHS 132 Bullish
NEWLOWS 22
MAXCP 23
MINCP 73 Bearish - net Professional Selling
TTTNH 6
TTTNL 119
FASTUP 30
FASTDOWN 160 Bearish - net Day Traders Selling
CPCROSSA 54
CPCROSSD 59
BIGVOLUP 3
BIGVODN 9
ACCUMVER 5
HIGHIP21 8
HIUPPCT 8
LOWACCUM 85
REDSELL 83
AUGSELS7 29
TRAPDOOR 17
|
Table 3 RANKING OF KEY DIRECTORIES BASED PCT.OF STOCKS ABOVE 65-DMA
9/26/19
Bullish = 25
Bearish = 19
---------------------------------------------------------------------------------------
Directory Current day-1 day-2 day-3 day-4 day-5
----------------------------------------------------------------------------------------
HOMEBLDG .882 .882 .882 .882 .882 .882
REIT .8 .758 .717 .779 .786 .758
UTILITY .8 .775 .8 .8 .75 .725
REGBANKS .74 .888 .74 .814 .777 .814
INSURANC .702 .702 .648 .675 .702 .648
SEMI .698 .745 .669 .811 .754 .792 RETAIL .686 .666 .588 .666 .607 .666 ELECTRON .636 .668 .629 .727 .72 .759 FINANCE .623 .729 .611 .776 .752 .741 BONDFUND .622 .526 .649 .543 .526 .394 AUTO .615 .615 .564 .641 .641 .666 CHEM .604 .625 .541 .645 .666 .687 SP500 .603 .616 .558 .639 .645 .672 RUS-1000 .594 .606 .551 .634 .63 .671 INFRA .583 .611 .555 .694 .722 .722 SOLAR .576 .692 .692 .846 .769 .846 BIGBANKS .571 .857 .428 .857 .857 .857 MILITARY .571 .714 .571 .75 .714 .785 GAMING .565 .608 .608 .652 .652 .782 GOLD .549 .647 .764 .784 .686 .647 SP-100 .544 .577 .533 .622 .655 .666 NASD-100 .54 .53 .5 .581 .581 .602 INDEXES .537 .591 .548 .688 .704 .682 BEVERAGE .529 .529 .47 .588 .588 .588 FIDSTKS .51 .538 .494 .587 .62 .653 N=25 ============================================================================================== DOWJONES .5 .566 .5 .633 .633 .6 TRANSP .5 .6 .45 .5 .6 .7 ============================================================================================== NIFTY .491 .526 .421 .596 .543 .596 ETFS .448 .379 .448 .655 .603 .603 COMODITY .439 .487 .512 .585 .585 .585 GUNS .437 .437 .25 .25 .312 .437 COMPUTER .421 .526 .578 .631 .578 .578 SOFTWARE .416 .466 .383 .483 .483 .516 FOOD .407 .425 .462 .537 .537 .537 DJI-13 .384 .538 .461 .615 .615 .615 INDMATER .381 .473 .368 .526 .539 .513 EDU .333 .333 .333 .333 .333 .333 CHINA .321 .41 .339 .464 .517 .589 GREEN .32 .44 .44 .64 .68 .68 BIOTECH .317 .387 .384 .442 .462 .465 JETS .3 .5 .4 .4 .4 .5 OILGAS .275 .34 .326 .485 .5 .507 HOSPITAL .272 .454 .409 .59 .545 .545 HACKERS .25 .3 .25 .25 .35 .35 COPPER .2 .2 .2 .2 .4 .4 COAL 0 0 0 .166 .166 .166 N=19 |
====================================================================
9/25/2019 The
breadth today mirrored the DJI's reversal upwards. There were
856 more up than down on the NYSE. This is an unusually positive
number for a first recovery day in what seemed like a decline from
resistance. The previous day there were 1116 more down than up. So,
this means the NYSE ADL will make a new high if there are 261 or more
up than down and our TigerSoft IP21 (Accumulation Index) rises from -.01
to above +0, then we will get a September Buy B21tomorrow.
For now, we have multiple Peerless Sells still operating. The big problem
if we do get a Buy B21 will likely be that there is still a lot of overhead resistance
for the DJI up to 27500 and my inspection of a hundred high cap stocks does
not suggest that there are many good-looking breakout stocks. So, hold DIA
short another day. If we do get a Buy signal, let's use the weekend to decide
what we will do with the exception of going long some of the bullish MAXCP
if the market is very strong tomorrow into the close without much of a pullback
after the middle of the day. Watch AAPL, BA, MSFT and HD to see
if they start to make breakouts that could make the DJI spike higher. At
present,
a move above 27550 seems unlikely.
The DJI's 5-dma will turn up if it rises by +125 or
more.

|
Charts 9/25/2019 2019 PEERLESS DJI, Signals, Indicators Daily DJI Volume 10-DayUp/Down Vol Hourly DJIA A/D Line for All Stocks Inverted Traders Index NASDAQ S&P OEX NYSE COMPQX DJI-15 DJI-20 DJI-30 DIA SPY QQQ MDY IWM TNA Short-Term Rates USO-CrudeOil DBO FAS GLD BBH IBB JETS JNUG KOL NUGT OIH OIL RSX RETL SDS AGQ SLV SOXL TECL TLT TMF TNA UGA (gasoline) XIV and China: YINN CHAU Commodities: CANE CORN DBC JJC, NIB, CHOC CORN, CUT (paper) MOO, SOYB WEAT UUP (Dollar) LIT (Lithium) AAPL ADBE ALXN AMAT AMGN AMD AMZN BA BABA BAC BIDU CAT CVX DE FB GOOG GS HD IBM INTU JPM M (Macy's) MSFT NFLX NKE NVDA PG QCOM TSLA TXN XOM WMT CMG , LRCX, SWKS, MDGL SPPI WATT SQ TOWN 9/25/19 (Click on Underlined link.) New highs and Bullish MAXCPs - http://tigersoft.com/max/9-25/BULLISH.htm Bearish MAXCPs - http://tigersoft.com/min/9-25/BEARISH.htm |
AAPL and BA seem like they have the most
bullish potential immediately ahead.
 |
 |
 |
 |
 |
Table 1 QUICKSILVER on ETFS - 09/25/19 ETF CLOSE CHANGE PIVOT-PT dma AROC CL-PWR CANDLE IP21 ITRS --------------------------------------------------------------------------------------------- DIA 269.58 1.61 271.42 -44.3% Bullish BLUE .137 ------ --------------------------------------------------------------------------------------------- BA 386.2 4.55 384.44 -2.8% Bullish BLUE .194 .079 --------------------------------------------------------------------------------------------- SPY 297.62 1.75 301.08 -58.2% ------- BLUE .14 .007 --------------------------------------------------------------------------------------------- QQQ 190.08 2.11 192.84 -63.9% Bearish BLUE .117 -.002 --------------------------------------------------------------------------------------------- MDY 354.45 4.09 356.11 -32.9% Bullish BLUE .192 .011 --------------------------------------------------------------------------------------------- IWM 154.1 1.67 155.76 -78% ------- BLUE .108 .007 --------------------------------------------------------------------------------------------- FAS 78.2 1.32 79.67 -113.7% ------- BLUE .193 .005 --------------------------------------------------------------------------------------------- RETL 22.55 .59 22.15 2.2% ------- BLUE .234 -.093 --------------------------------------------------------------------------------------------- SOXL 177.41 8.63 182.59 -225.5% ------- BLUE .147 .123 --------------------------------------------------------------------------------------------- TECL 168 5.79 172.19 -92.7% Bearish BLUE .066 -.018 --------------------------------------------------------------------------------------------- IBB 102.13 -.29 104.63 -110.7% Bearish RED -.089 -.018 --------------------------------------------------------------------------------------------- GLD 141.83 -2.68 141.28 39.3% Bearish RED -.146 .085 --------------------------------------------------------------------------------------------- OIH 11.91 -.37 12.55 -429.3% Bearish RED -.058 -.1 --------------------------------------------------------------------------------------------- GASL 10.34 -.18 11.71 -890.1% ------- BLUE -.041 -.38 --------------------------------------------------------------------------------------------- RSX 23.19 0 23.55 -95.8% ------- BLUE .148 -.01 |
Table 2 Count of Stocks in Key Directories
20190925
-------------------------------
NEWHIGHS 106 Bullish
NEWLOWS 5
MAXCP 30
MINCP 37
TTTNH 7
TTTNL 66
FASTUP 34
FASTDOWN 132
CPCROSSA 235
CPCROSSD 55
BIGVOLUP 2
BIGVODN 8
ACCUMVER 6
HIGHIP21 5
HIUPPCT 9
LOWACCUM 91
REDSELL 95
AUGSELS7 27
TRAPDOOR 17
|
Table 3 RANKING OF KEY DIRECTORIES BASED PCT.OF STOCKS ABOVE 65-DMA
9/25/19
Bullish = 30
Bearish = 15
---------------------------------------------------------------------------------------
Directory Current day-1 day-2 day-3 day-4 day-5
----------------------------------------------------------------------------------------
REGBANKS .888 .74 .814 .777 .814 .888
HOMEBLDG .882 .882 .882 .882 .882 .882
BIGBANKS .857 .428 .857 .857 .857 .857
UTILITY .775 .8 .8 .75 .725 .725
REIT .758 .717 .779 .786 .758 .751
SEMI .747 .672 .813 .757 .803 .803 FINANCE .729 .611 .776 .752 .741 .752 MILITARY .714 .571 .75 .714 .785 .785 INSURANC .702 .648 .675 .702 .648 .675 SOLAR .692 .692 .846 .769 .846 .73 ELECTRON .67 .632 .729 .722 .767 .761 RETAIL .666 .588 .666 .607 .666 .647 GOLD .647 .764 .784 .686 .666 .568 CHEM .625 .541 .645 .666 .666 .625 SP500 .616 .558 .639 .645 .67 .684 AUTO .615 .564 .641 .641 .666 .641 INFRA .611 .555 .694 .722 .722 .722 GAMING .608 .608 .652 .652 .782 .782 RUS-1000 .606 .551 .634 .63 .667 .673 TRANSP .6 .45 .5 .6 .65 .75 INDEXES .591 .548 .688 .704 .677 .698 SP-100 .577 .533 .622 .655 .666 .644 DOWJONES .566 .5 .633 .633 .6 .6 DJI-13 .538 .461 .615 .615 .615 .615 FIDSTKS .538 .494 .587 .62 .659 .675 NASD-100 .53 .5 .581 .581 .602 .612 BEVERAGE .529 .47 .588 .588 .588 .588 BONDFUND .526 .649 .543 .526 .403 .28 COMPUTER .526 .578 .631 .578 .578 .578 NIFTY .517 .41 .589 .535 .589 .607 N=30 -------------------------------------------------------------------------------------------- JETS .5 .4 .4 .4 .5 .6 -------------------------------------------------------------------------------------------- COMODITY .487 .512 .585 .585 .585 .585 INDMATER .473 .368 .526 .539 .513 .526 SOFTWARE .466 .383 .483 .483 .516 .533 HOSPITAL .454 .409 .59 .545 .59 .59 GREEN .44 .44 .64 .68 .68 .6 GUNS .437 .25 .25 .312 .437 .437 FOOD .425 .462 .537 .537 .537 .537 CHINA .41 .339 .464 .517 .571 .642 BIOTECH .387 .381 .442 .462 .462 .459 ETFS .379 .448 .655 .603 .603 .655 OILGAS .338 .323 .482 .496 .51 .517 EDU .333 .333 .333 .333 .333 .166 HACKERS .3 .25 .25 .35 .35 .4 COPPER .2 .2 .2 .4 .4 .2 COAL 0 0 .166 .166 .166 .166 N=15 |
====================================================================
9/24/2019 Stick
with the Peerless Sells. Hold DIA short. Avoid long side. Trading
dynamics rule. Beware of early openings that give way to heavy afternoon
selling. Until (green) well-tested support is reached, be expecially wary.
This can be a terrible time to own stocks, though usually we see ADL bearish
divergences first.

Today there were 1116 more down than up on the NYSE. That makes a Buy B21 based
on a NYSE A/D New High unlikely this week. The DJI is testing its support at its
65-dma.
Such support did not work on the last two tests. Instead, prices fell rapidly from
the top of
the trading range (27000-27500) to the bottom of it (24500-25000). Because traders
see these two levels as the obvious zones to place their sell and buy orders, prices
often move back and forth quite quickly through the middle of a well-defined
price range. To see how prices rapidly fall from well-tested resistance to
well-tested
support, see the charts of 1956 and 1986, as well as 2013 (the closest technical parallel
I can find to the market now).

Prices do not usually stop declining in the
middle of a price channel. They need to test
the well-tested support. If NYSE ADL is weak
and gave a Sell S9 (not an S9-v) the support
at bottom of channel may fail. That is NOT
our situation now.
1956 and 1986 - Trading Range Dynamics dictate price swings until Novermber.
The 65-dma is not support. Well-tested support must be re-tested
when resistance over-powers DJI rally.


1979 - Weak ADL, Sell S9 and lower band is broken below.

I should add, you can see uptrending channels at this time of year in the third year of
Presidential Election that saw serious breakdowns in October below the bottom
of their price channels (namely 1979, 1987 and 1999). But in these cases the NYSE
A/D Line was much weaker relative to the DJI than now, so I don't think that's what
we will see this October. More likely, we will see something like what develped in
the
September-October period of 2013.

Continue to hold DIA short and hold off on taking long positions is my counsel. The
period between now and October 20th is the most dangerous part of the year until
we see more NYSE ADL highs or new Peerless buys at the lower band..
Resistance is well defined at 27500. Support is
probably strongest near 25500.
.
The falling Tiger Day Traders Tool for
the DJI, the downtrending Closing Power
and the drop by DIA's 20-day Stochastic-K-Line decisively below 80
all served us well last night in warning that an early morning rally might fail
badly.
The failure of the early rally today is, perhaps, best seen in the huge "red
popsicle"
this action created in today's candle-sticks for the DIA, SPY and QQQ.


|
Charts 9/24/2019 2019 PEERLESS DJI, Signals, Indicators Daily DJI Volume 10-DayUp/Down Vol Hourly DJIA A/D Line for All Stocks Inverted Traders Index NASDAQ S&P OEX NYSE COMPQX DJI-15 DJI-20 DJI-30 DIA SPY QQQ MDY IWM TNA Short-Term Rates USO-CrudeOil DBO FAS GLD BBH IBB JETS JNUG KOL NUGT OIH OIL RSX RETL SDS AGQ SLV SOXL TECL TLT TMF TNA UGA (gasoline) XIV and China: YINN CHAU Commodities: CANE CORN DBC JJC, NIB, CHOC CORN, CUT (paper) MOO, SOYB WEAT UUP (Dollar) LIT (Lithium) AAPL ADBE ALXN AMAT AMGN AMD AMZN BA BABA BAC BIDU CAT CVX DE FB GOOG GS HD IBM INTU JPM M (Macy's) MSFT NFLX NVDA PG QCOM TSLA TXN XOM WMT CMG , LRCX, SWKS, MDGL SPPI WATT SQ TOWN 9/24/19 (Click on Underlined link.) New highs and Bullish MAXCPs - http://tigersoft.com/max/9-24/BULLISH.htm Bearish MAXCPs - http://tigersoft.com/min/9-24/BEARISH.htm |
Table 1 QUICKSILVER on ETFS - 09/24/19 ETF CLOSE CHANGE PIVOT-PT dma AROC CL-PWR CANDLE IP21 ITRS --------------------------------------------------------------------------------------------- DIA 267.97 -1.39 271.97 -66.3% Bullish RED .145 ----- --------------------------------------------------------------------------------------------- BA 381.65 4.62 386.41 -33.4% Bullish BLUE .174 .076 --------------------------------------------------------------------------------------------- SPY 295.87 -2.34 301.1 -84.2% Bearish RED .157 .004 --------------------------------------------------------------------------------------------- QQQ 187.97 -2.53 192.52 -120.7% Bearish RED .118 -.011 --------------------------------------------------------------------------------------------- MDY 350.36 -4.04 356.78 -102.2% ------- RED .179 .007 --------------------------------------------------------------------------------------------- IWM 152.43 -2.88 156.52 -162.1% Bearish RED .11 .002 --------------------------------------------------------------------------------------------- FAS 76.88 -1.75 79.99 -182.3% ------- RED .216 -.016 --------------------------------------------------------------------------------------------- RETL 21.96 -.69 22.54 -286.5% ------- RED .246 -.1 --------------------------------------------------------------------------------------------- SOXL 168.78 -8.9 185.41 -450.4% Bearish RED .087 .042 --------------------------------------------------------------------------------------------- TECL 162.21 -5.18 171.11 -251.9% Bearish RED .1 -.07 --------------------------------------------------------------------------------------------- IBB 102.42 -2.21 104.44 -132% Bearish RED -.082 -.014 --------------------------------------------------------------------------------------------- GLD 144.51 .76 140.71 102.4% Bearish BLUE-.135 .103 --------------------------------------------------------------------------------------------- OIH 11.91 -.37 12.55 -429.3% Bearish RED -.058 -.093 --------------------------------------------------------------------------------------------- GASL 10.52 -1.19 12.41 -1054.4% Bearish RED -.072 -.406 --------------------------------------------------------------------------------------------- UGA 10.52 -1.19 12.41 -1054.4% Bullish RED -.048 -.603 --------------------------------------------------------------------------------------------- UUP 26.77 -.1 26.82 9.3% ------- RED .059 .041 --------------------------------------------------------------------------------------------- RSX 23.19 -.42 23.64 -108.1% ------- RED .114 -.01 |
Table 2 Count of Stocks in Key Directories
20190924
-------------------------------
NEWHIGHS 83
NEWLOWS 12
MAXCP 18
MINCP 73
TTTNH 3
TTTNL 130
FASTUP 35
FASTDOWN 158
CPCROSSA 67
CPCROSSD 70
BIGVOLUP 5
BIGVODN 5
ACCUMVER 4
HIGHIP21 6
LOWACCUM 89
REDSELL 98
AUGSELS7 31
TRAPDOOR 18
|
Table 3 RANKING OF KEY DIRECTORIES BASED PCT.OF STOCKS ABOVE 65-DMA
9/24/19
Bullish = 24
Bearish = 21
---------------------------------------------------------------------------------------
Directory Current day-1 day-2 day-3 day-4 day-5
----------------------------------------------------------------------------------------
HOMEBLDG .882 .882 .882 .882 .882 .882
UTILITY .8 .8 .75 .725 .725 .75
GOLD .764 .784 .686 .666 .568 .686
REGBANKS .74 .814 .777 .814 .851 .851
REIT .717 .779 .786 .758 .751 .779
SOLAR .692 .846 .769 .846 .769 .846
SEMI .672 .813 .757 .803 .803 .813
BONDFUND .649 .543 .526 .403 .28 .228
INSURANC .648 .675 .702 .648 .675 .702
ELECTRON .632 .729 .722 .767 .761 .774
FINANCE .611 .776 .752 .741 .752 .752
GAMING .608 .652 .652 .782 .782 .782
COMPUTER .6 .65 .6 .6 .6 .65
RETAIL .588 .666 .607 .666 .647 .666
MILITARY .571 .75 .714 .785 .785 .821
AUTO .564 .641 .641 .666 .641 .743
SP500 .558 .639 .645 .67 .682 .688
INFRA .555 .694 .722 .722 .722 .722
RUS-1000 .551 .634 .63 .667 .672 .691
INDEXES .548 .688 .704 .677 .698 .752
CHEM .541 .645 .666 .666 .625 .645
SP-100 .533 .622 .655 .666 .644 .655
DOWJONES .517 .62 .62 .586 .586 .62
COMODITY .512 .585 .585 .585 .585 .609
N=24
==============================================================================================
NASD-100 .5 .581 .581 .602 .612
==============================================================================================
FIDSTKS .494 .587 .62 .659 .675 .697
BEVERAGE .47 .588 .588 .588 .588 .529
FOOD .462 .537 .537 .537 .537 .555
DJI-13 .461 .615 .615 .615 .615 .615
TRANSP .45 .5 .6 .65 .75 .85
ETFS .448 .655 .603 .603 .655 .689
GREEN .44 .64 .68 .68 .6 .68
BIGBANKS .428 .857 .857 .857 .857 .857
NIFTY .41 .589 .535 .589 .589 .589
HOSPITAL .409 .59 .545 .59 .59 .636
JETS .4 .4 .4 .5 .6 .6
SOFTWARE .383 .483 .483 .516 .516 .566
BIOTECH .381 .439 .462 .462 .453 .479
INDMATER .368 .526 .539 .513 .526 .592
CHINA .339 .464 .517 .571 .642 .642
EDU .333 .333 .333 .333 .166 .166
OILGAS .323 .482 .496 .51 .517 .553
GUNS .25 .25 .312 .437 .437 .437
HACKERS .25 .25 .35 .35 .4 .45
COPPER .2 .2 .4 .4 .2 .4
COAL 0 .166 .166 .166 .166 .166
N=21
|


(From Bloomberg)

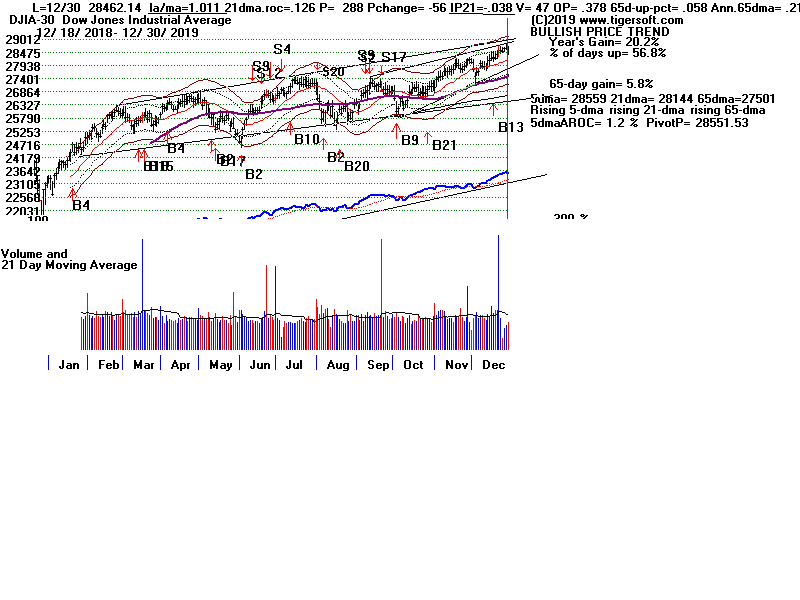
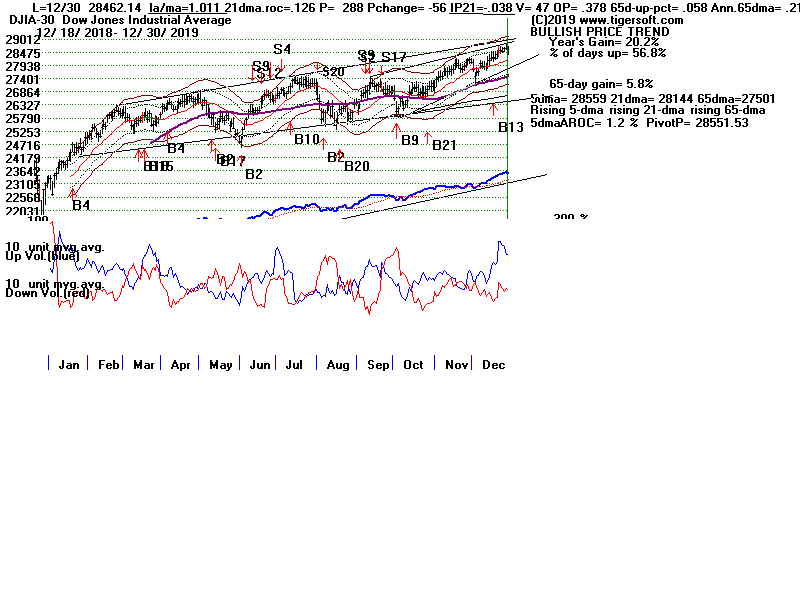
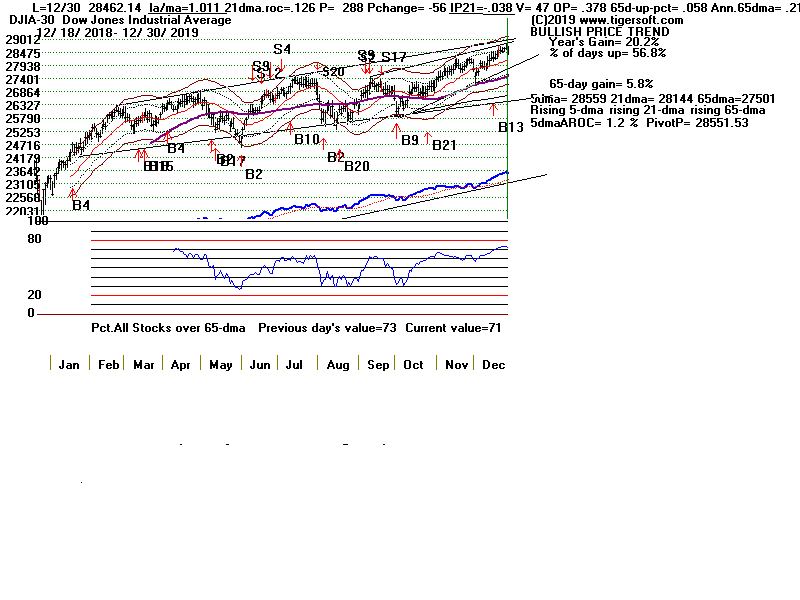
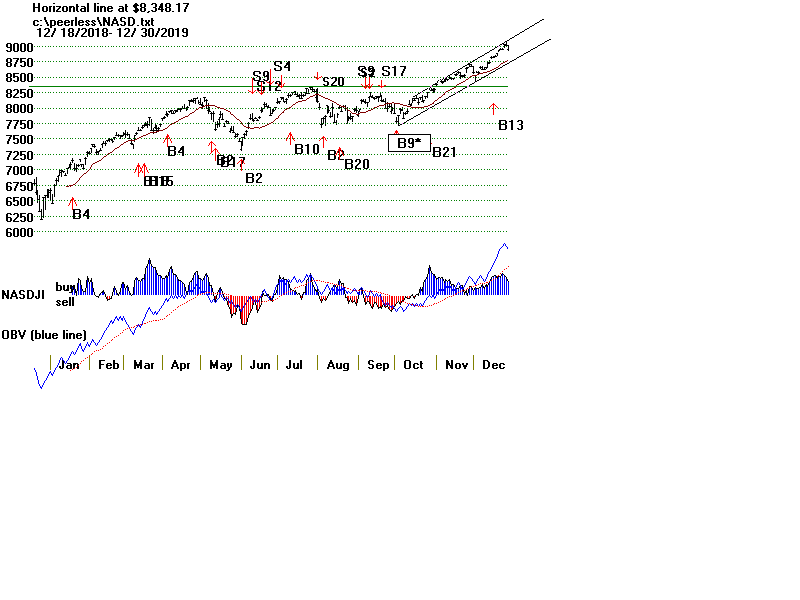
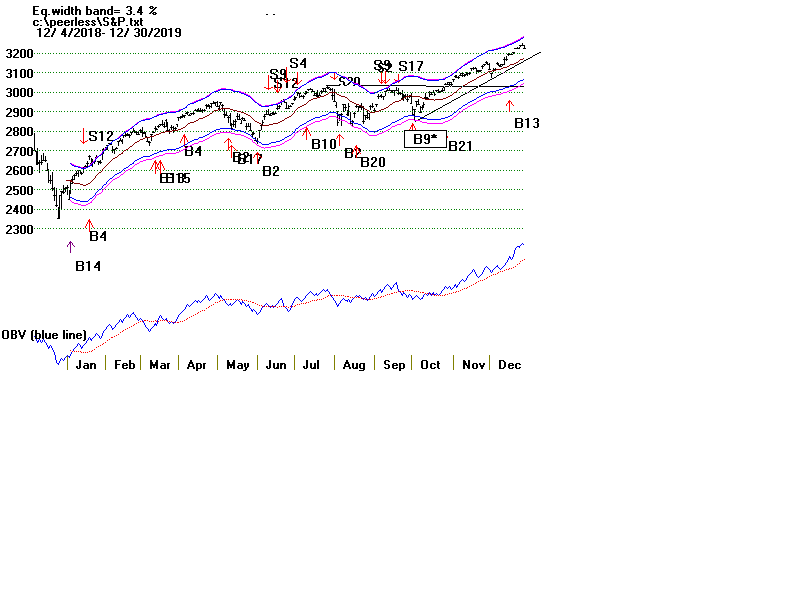
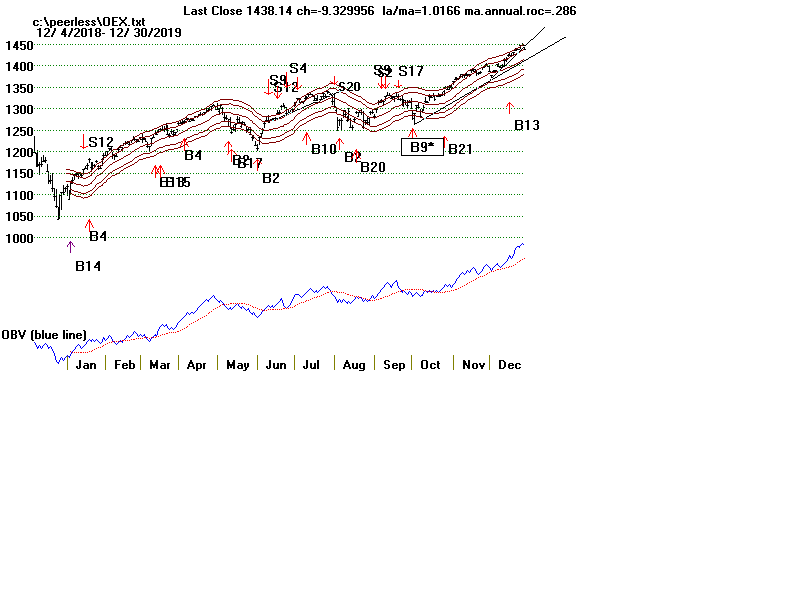
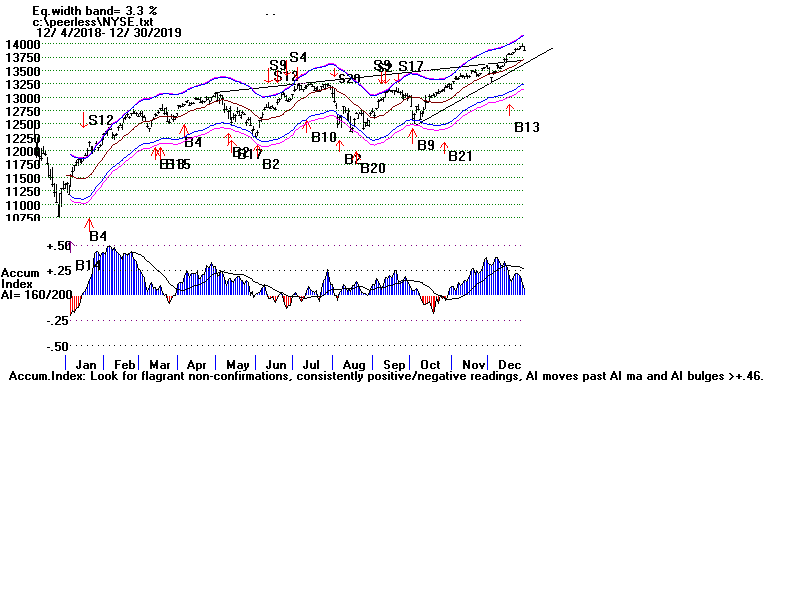
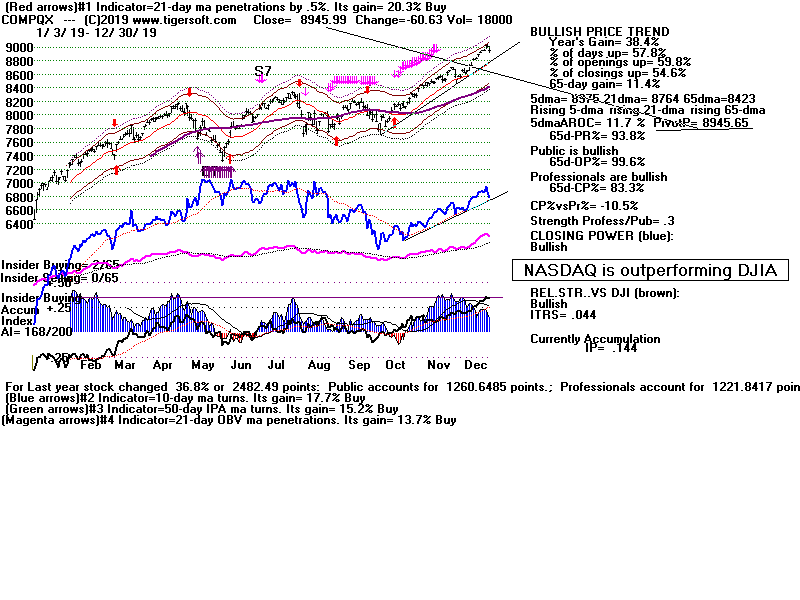
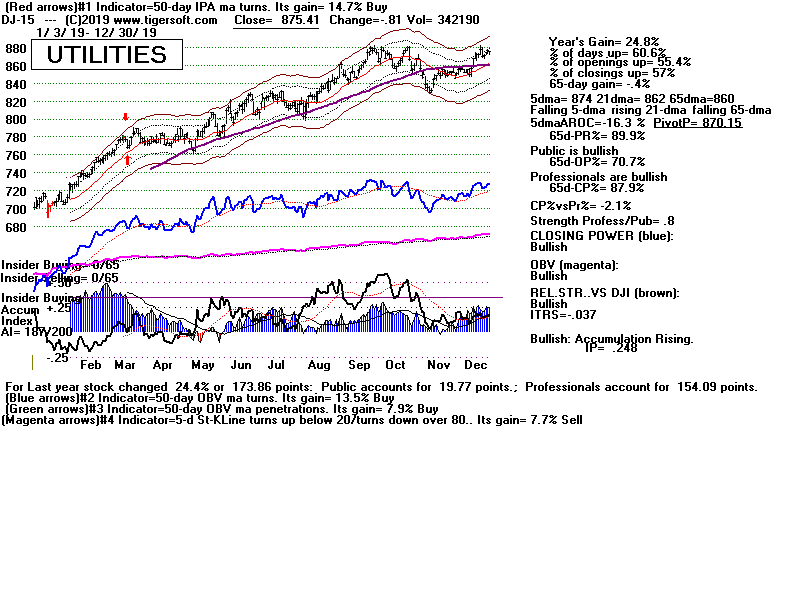
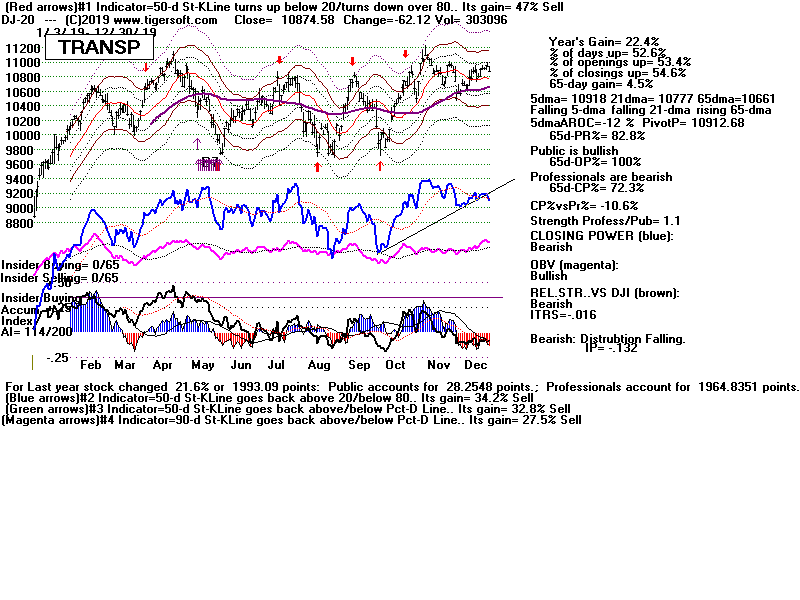
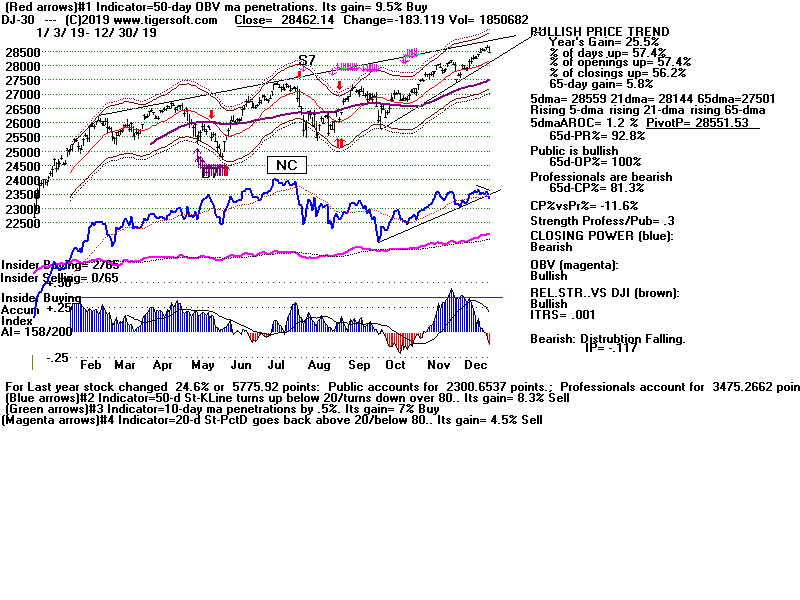
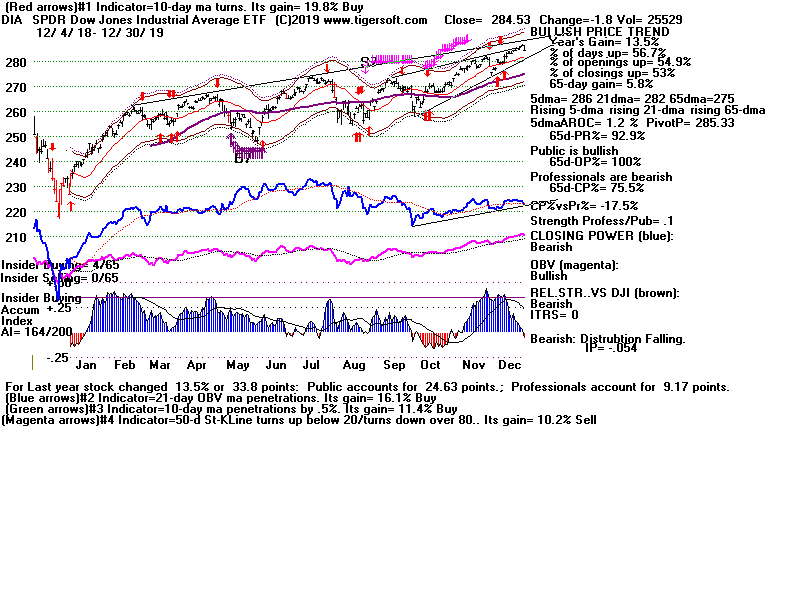
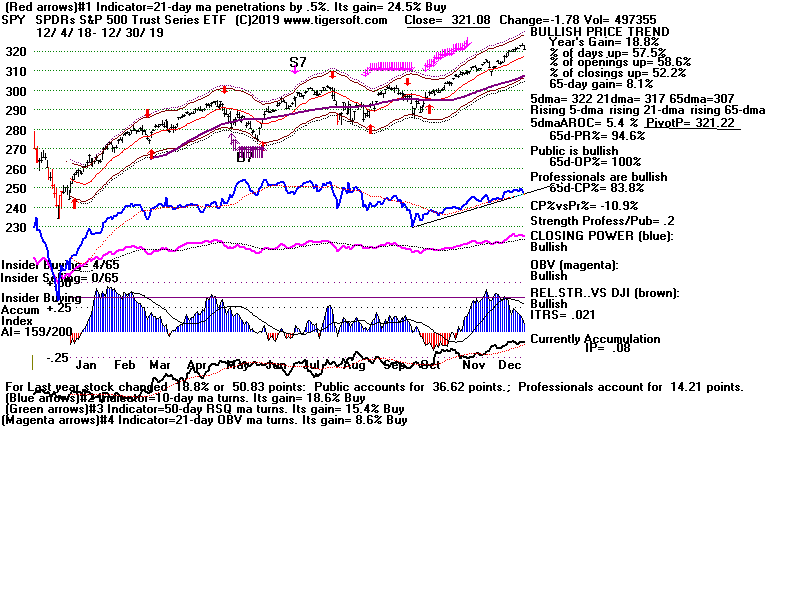
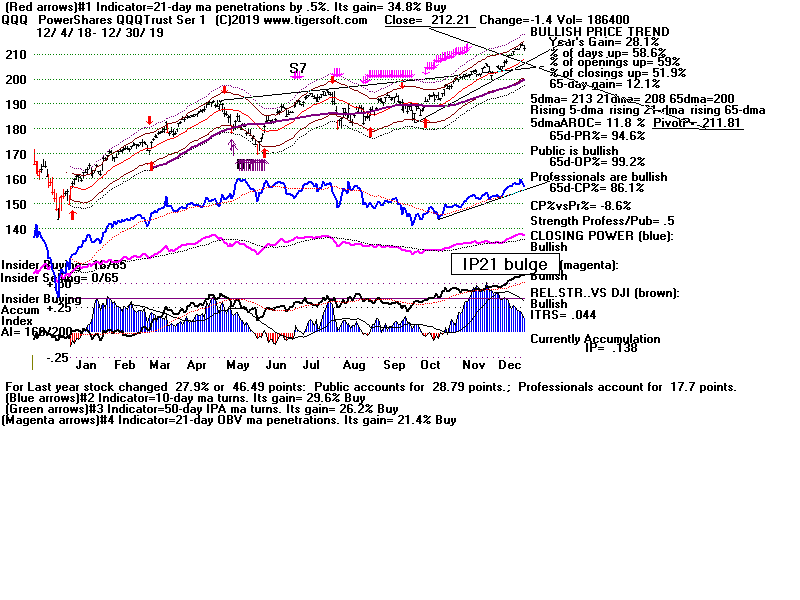
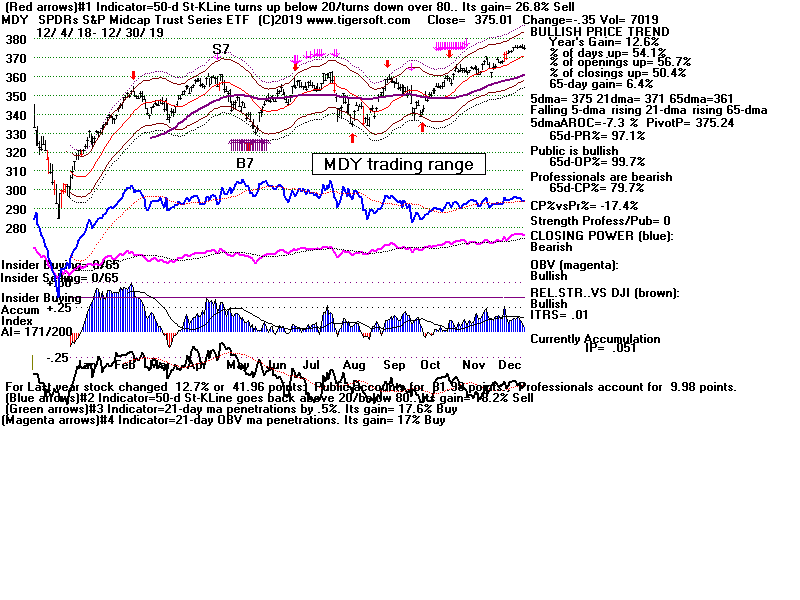
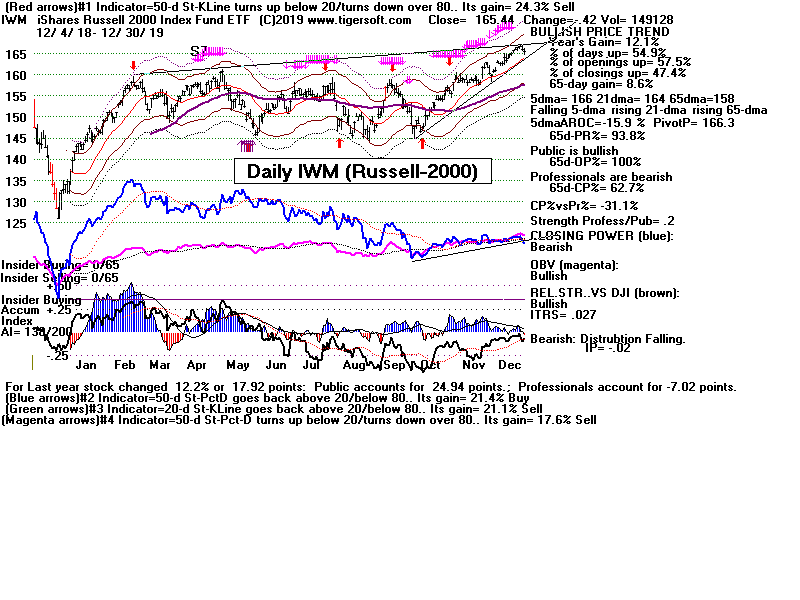
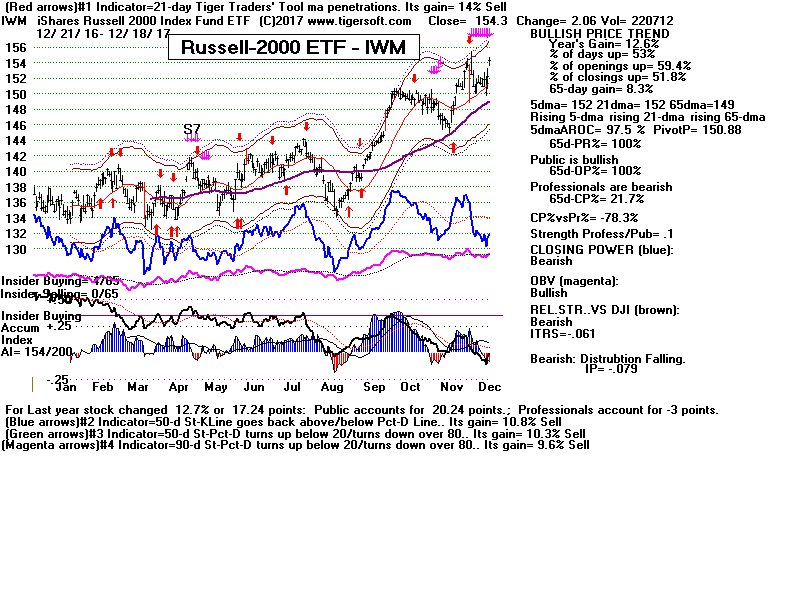
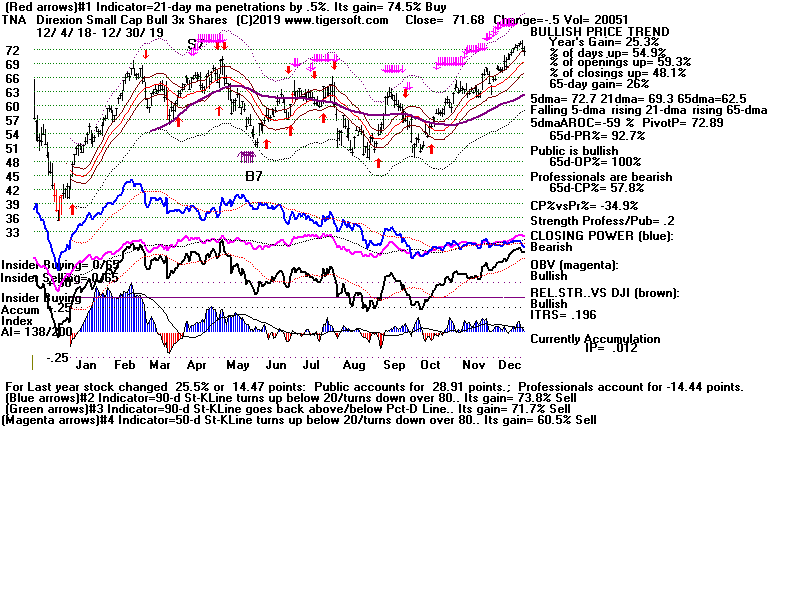
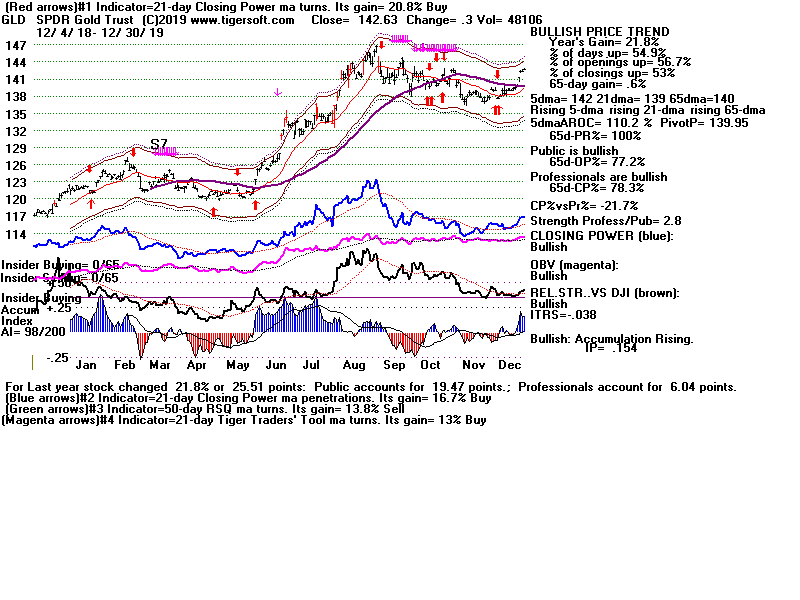
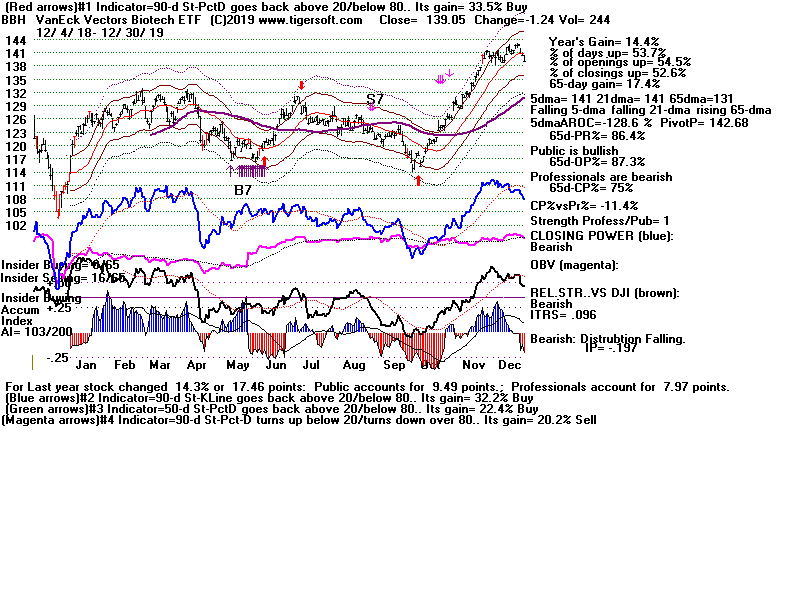
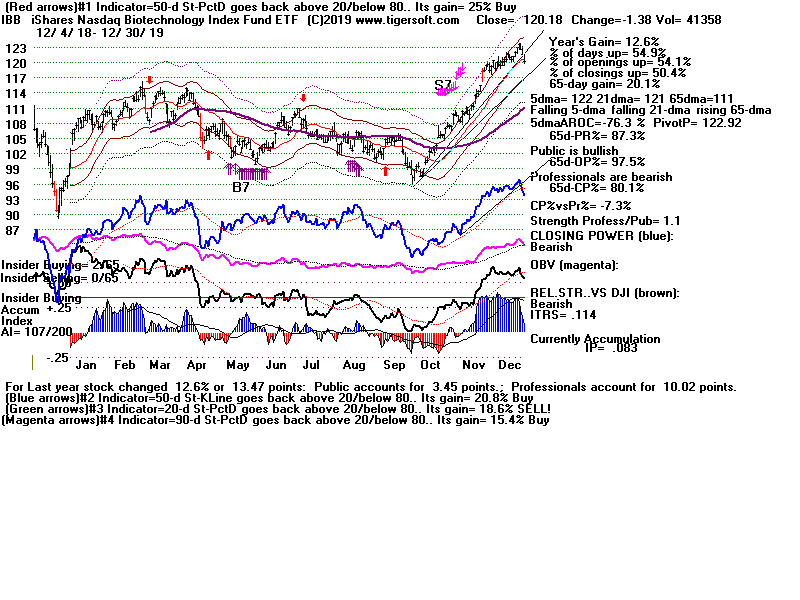
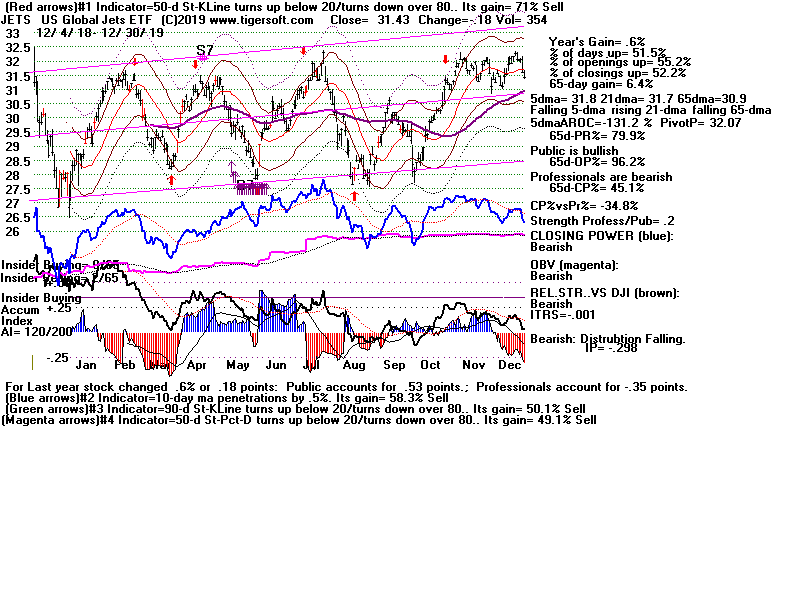
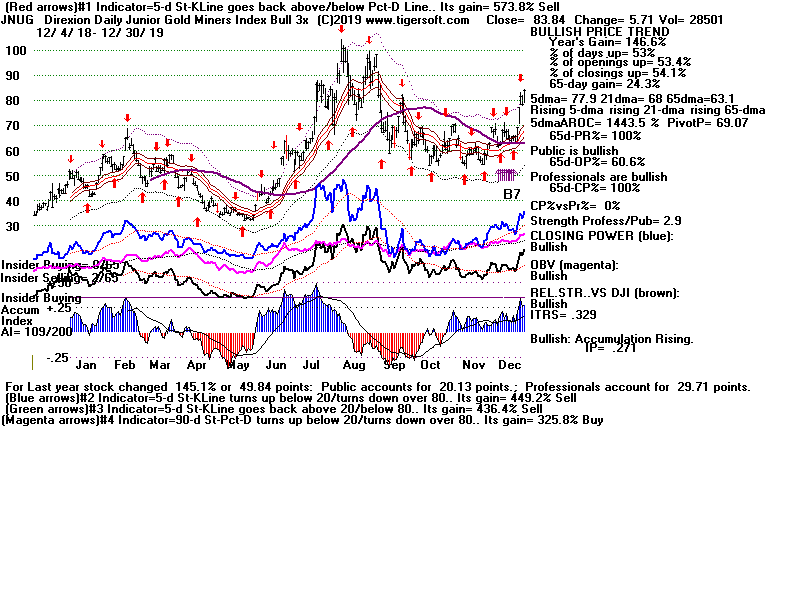
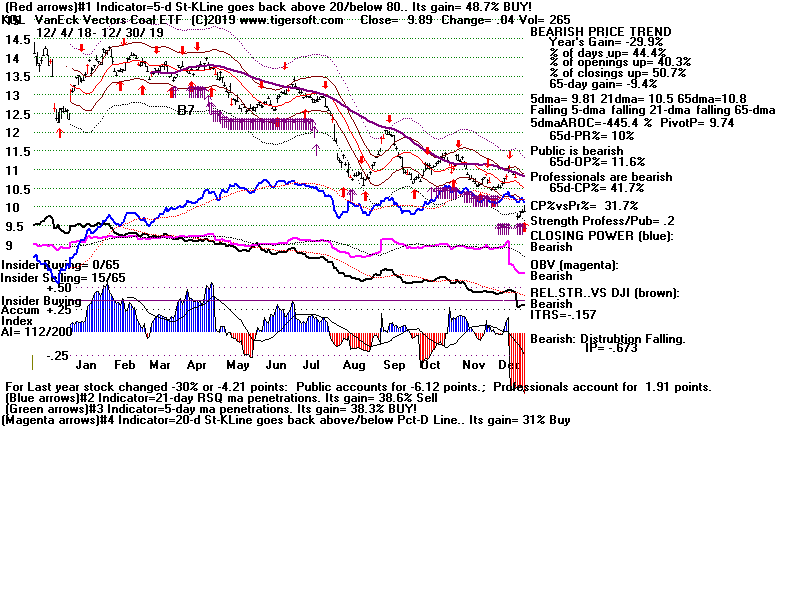
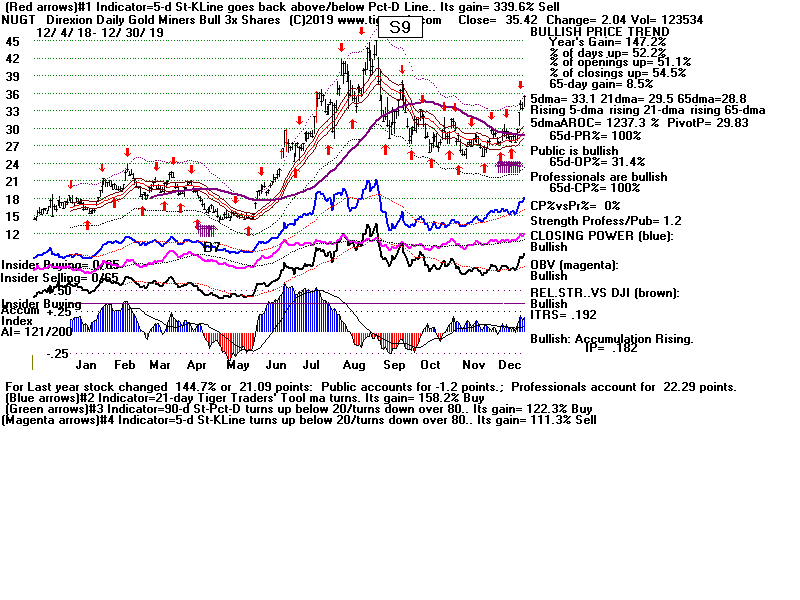
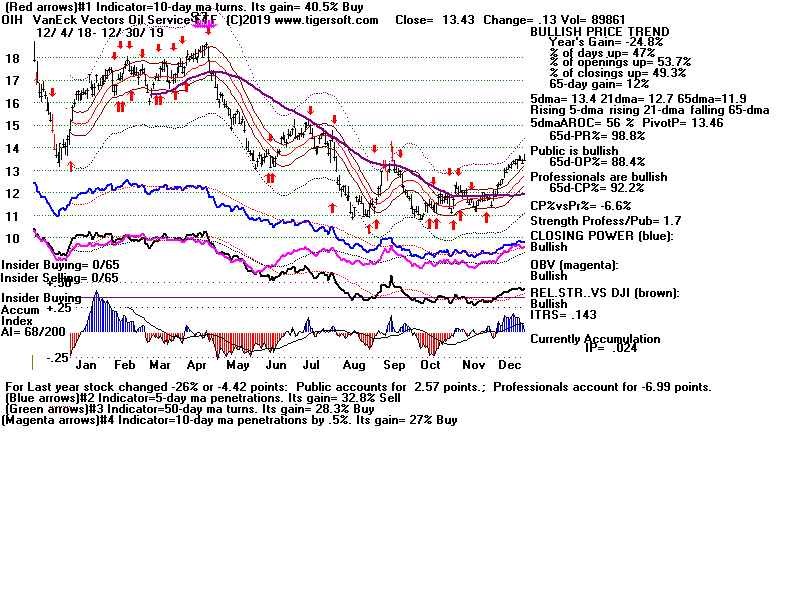
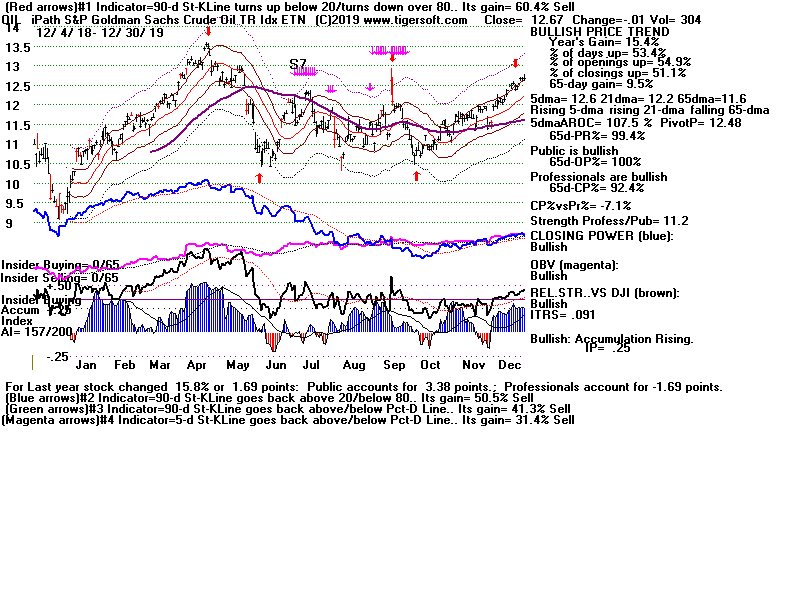
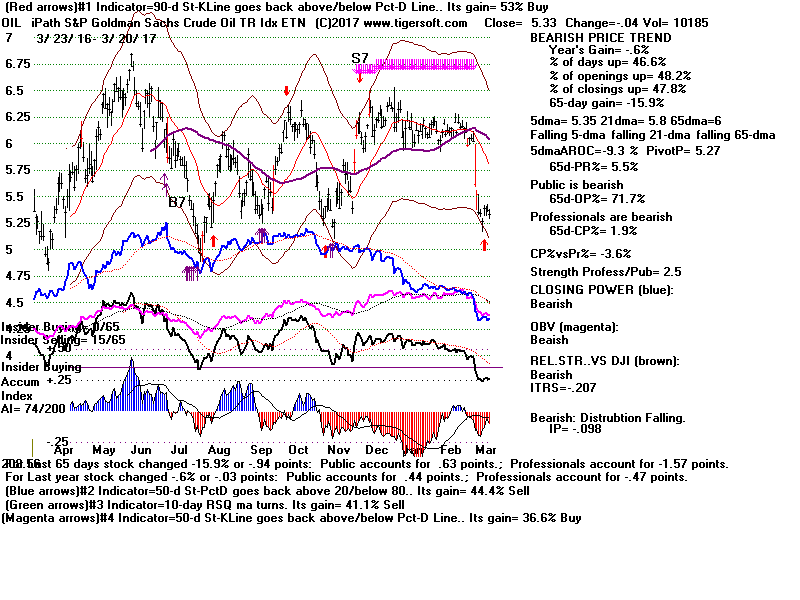
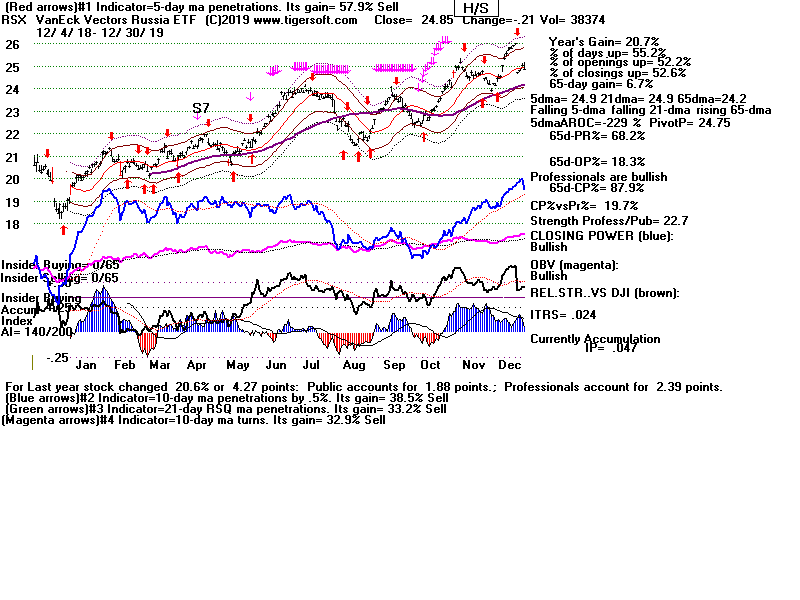
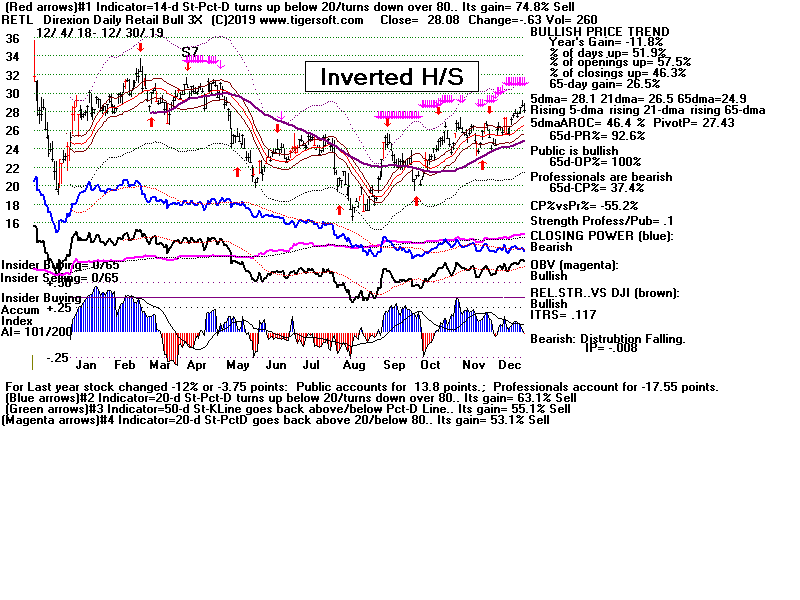
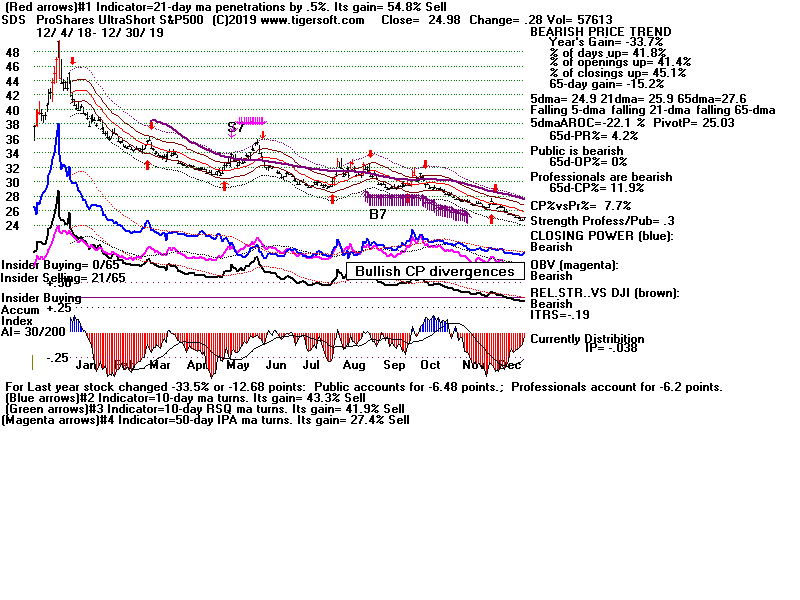
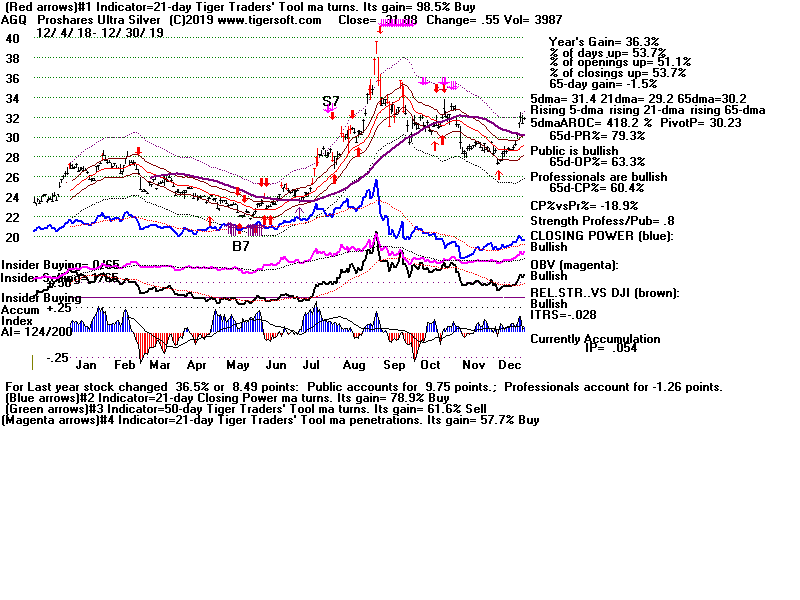
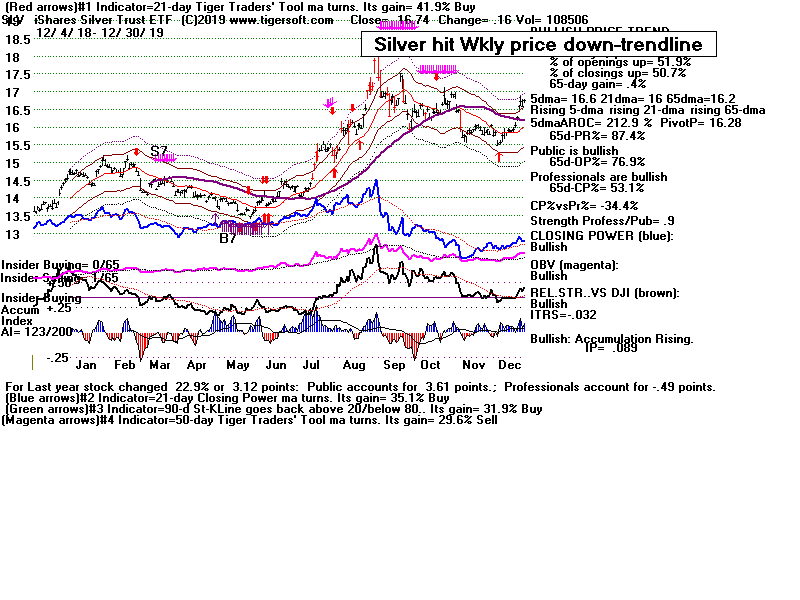
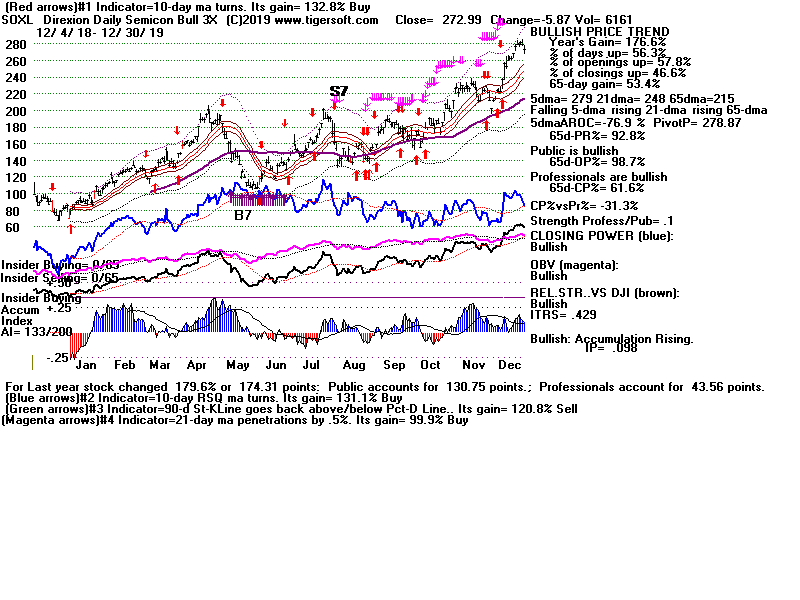
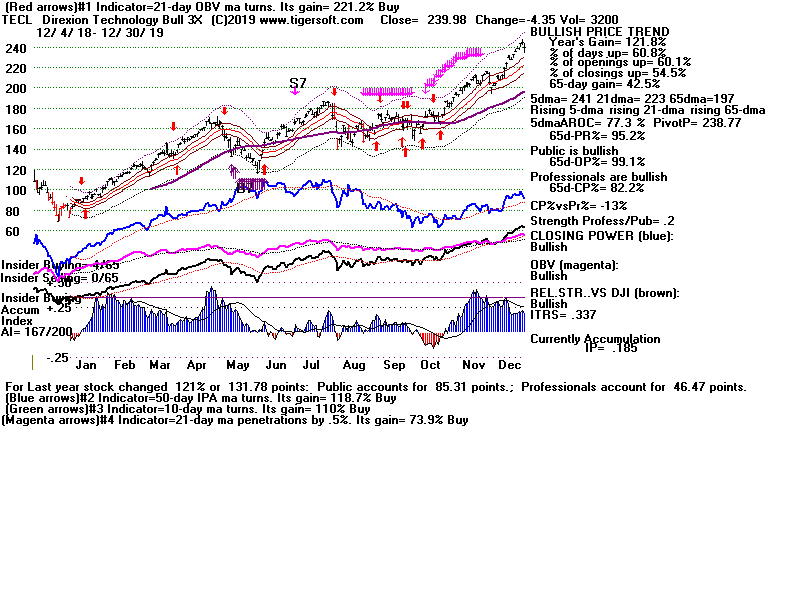
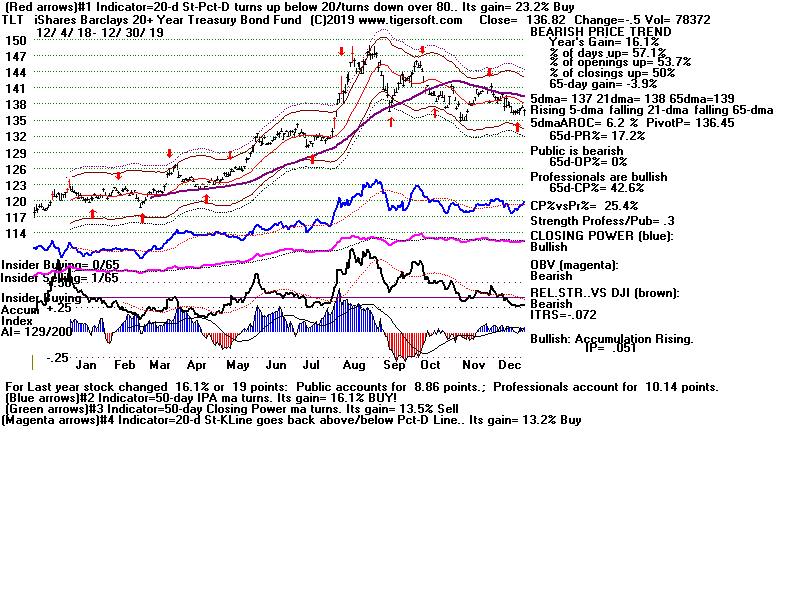
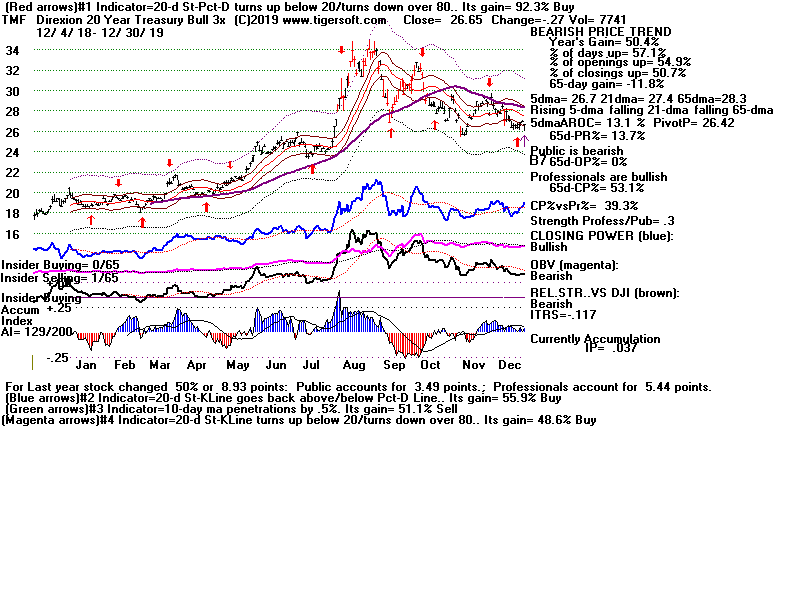
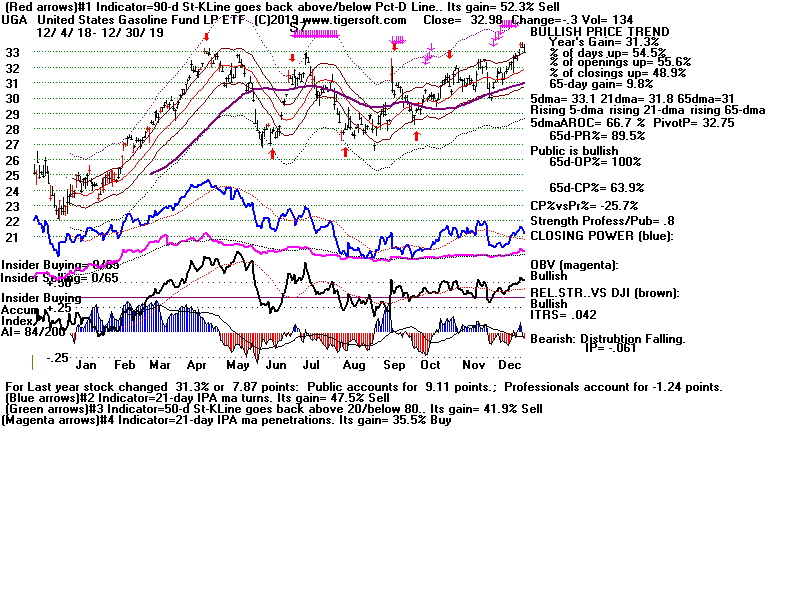
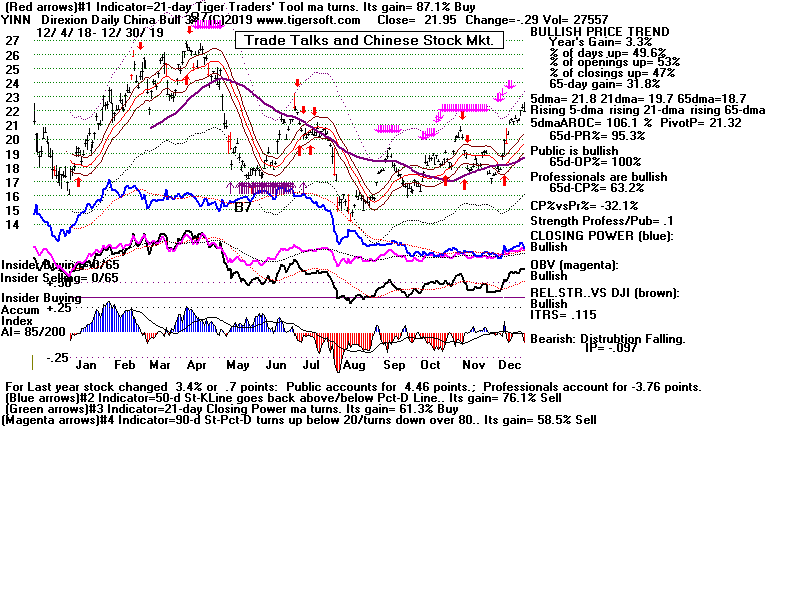
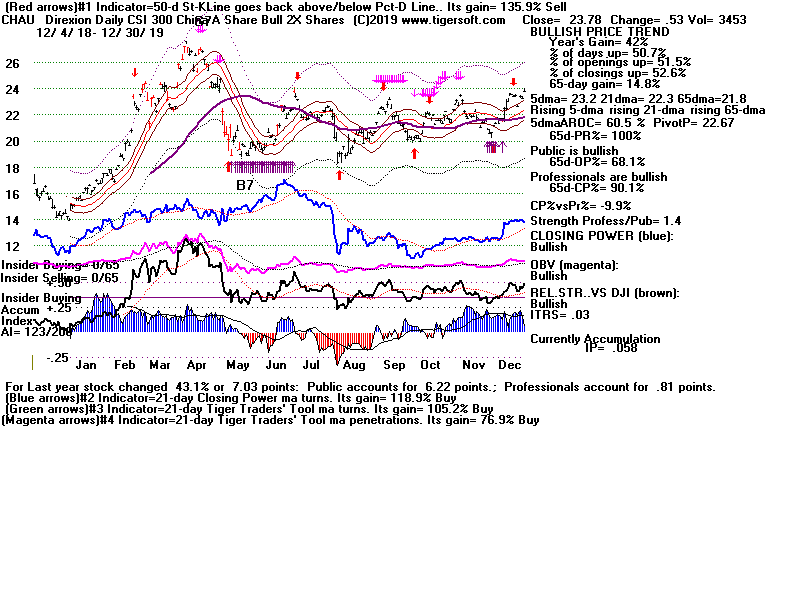
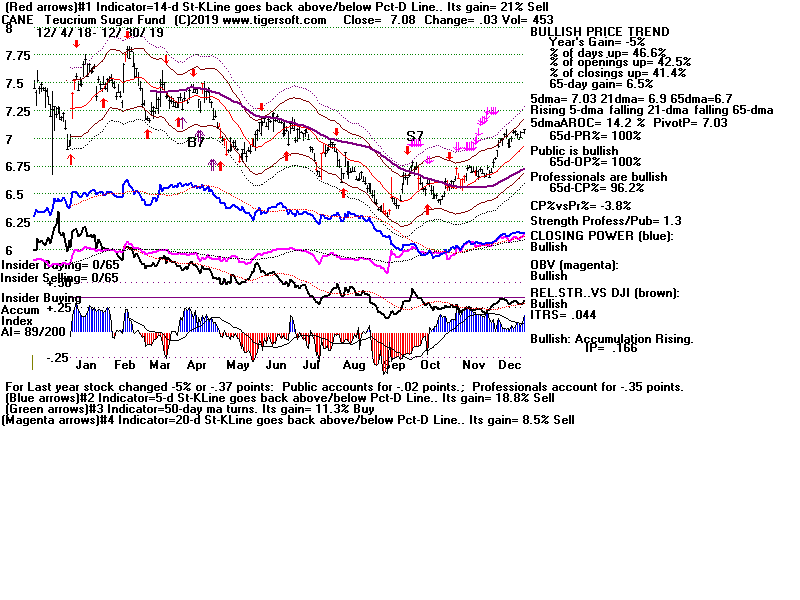
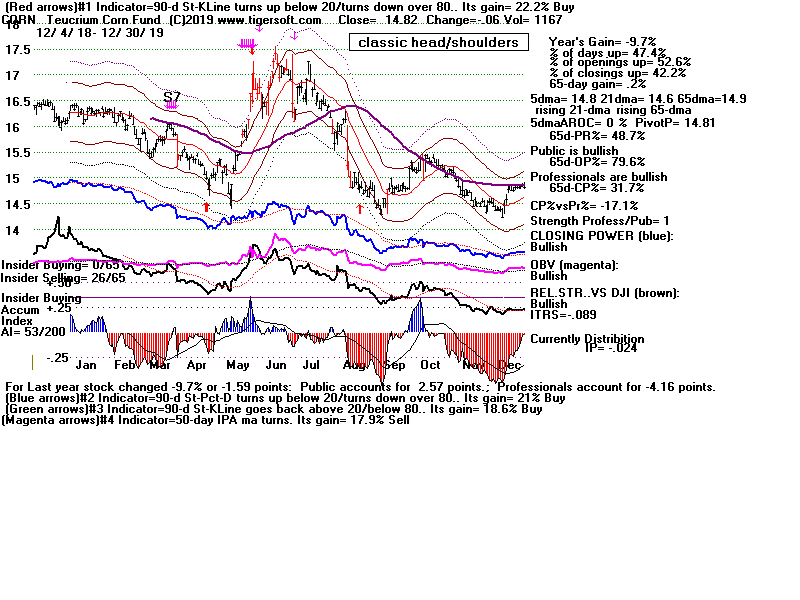
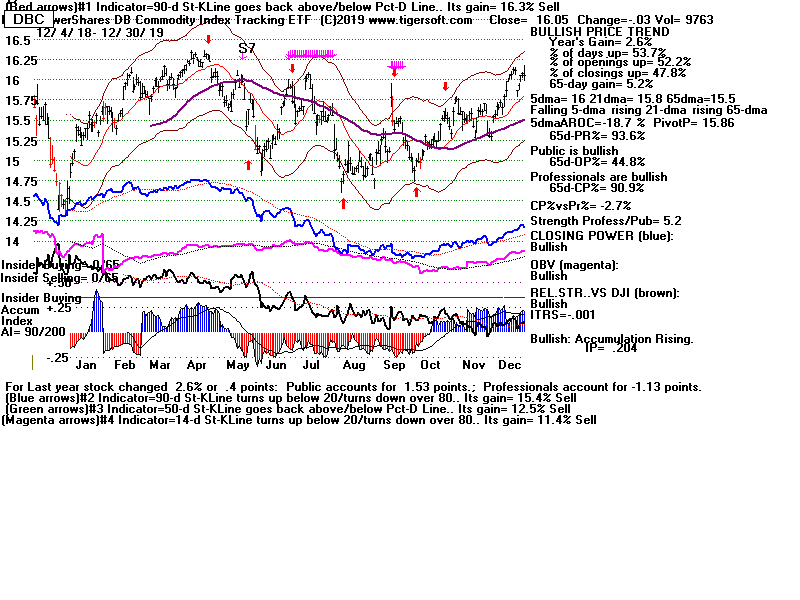
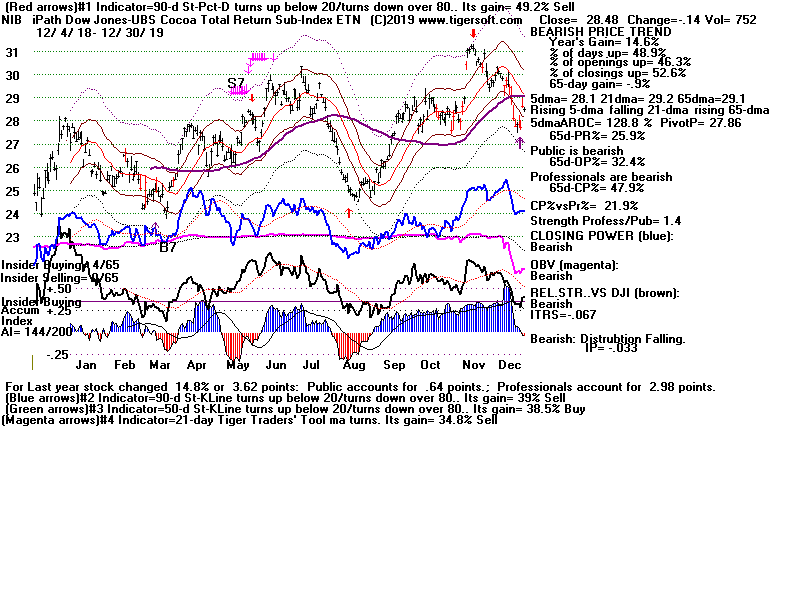
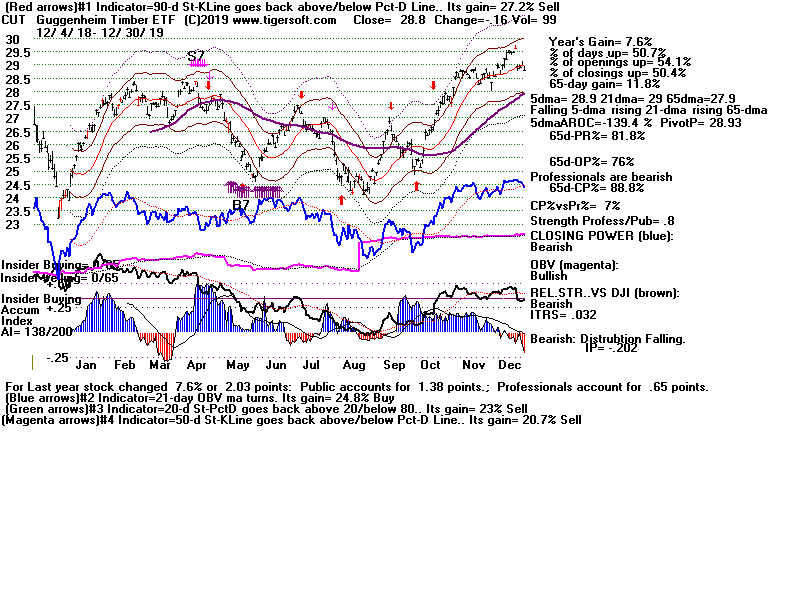
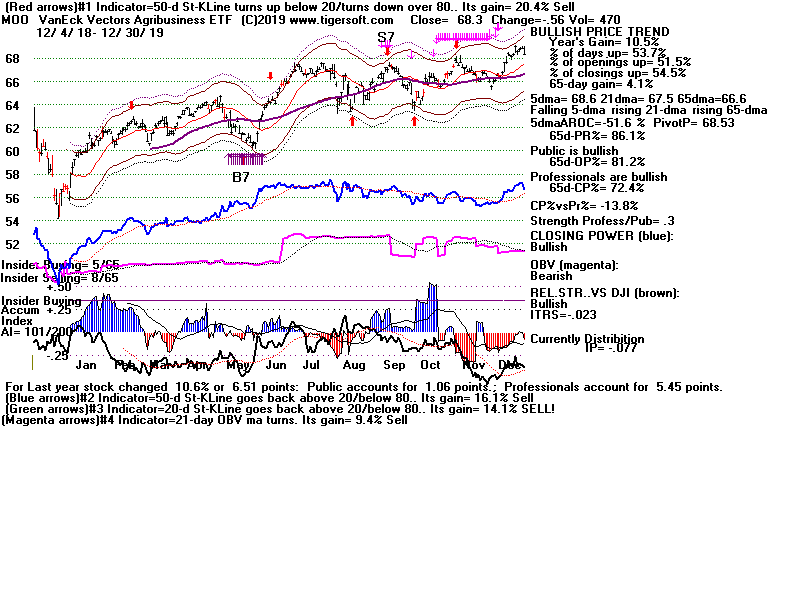
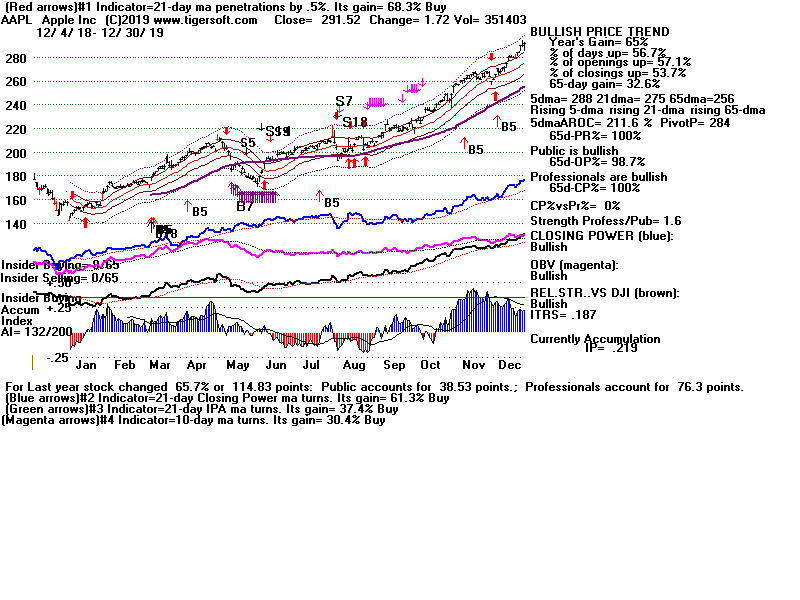
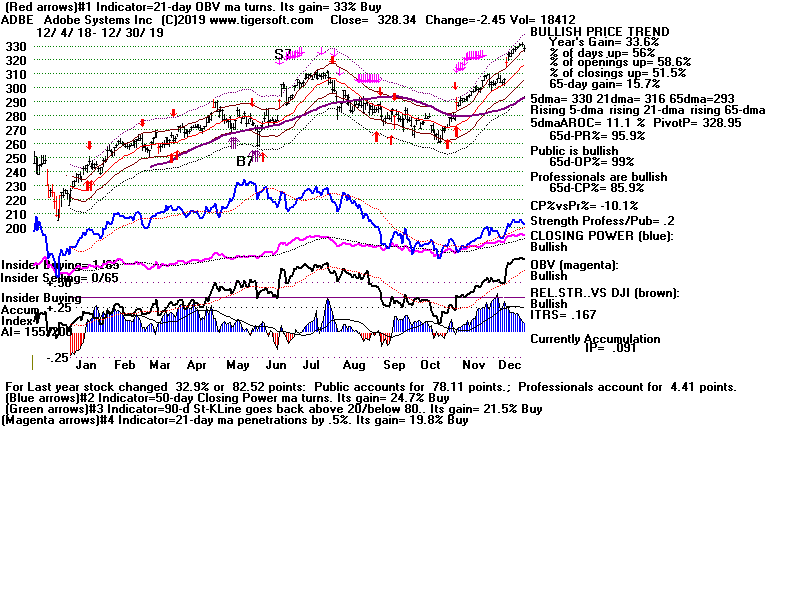
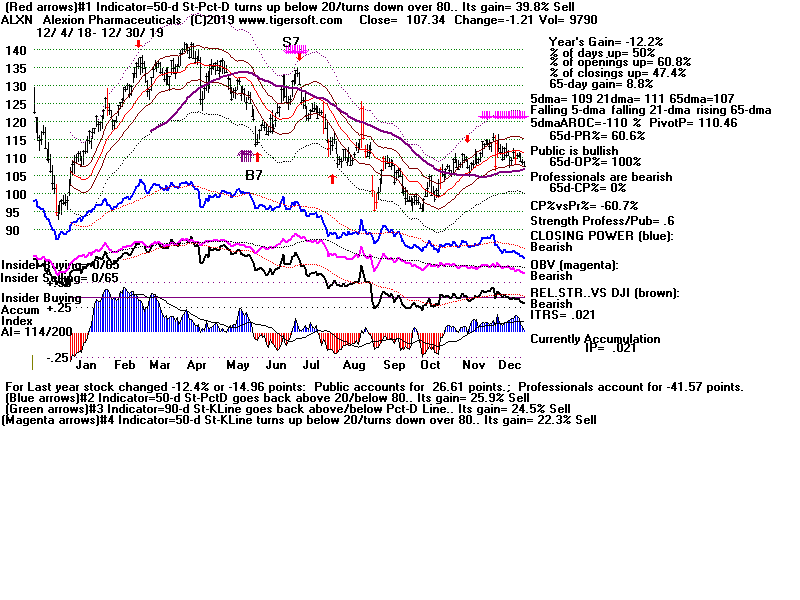
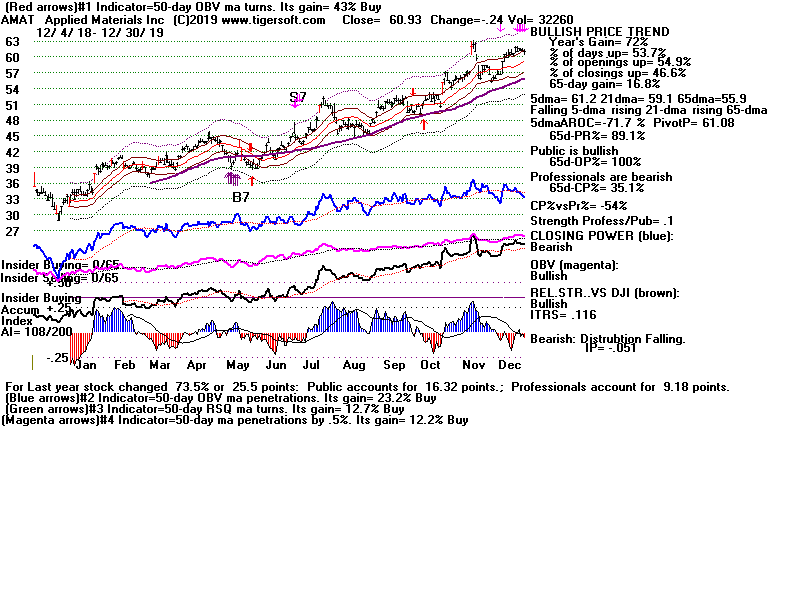
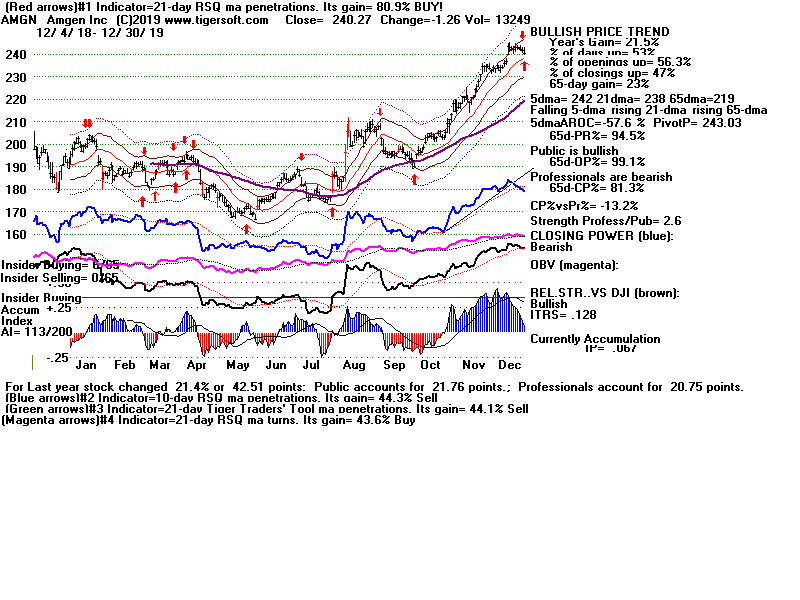
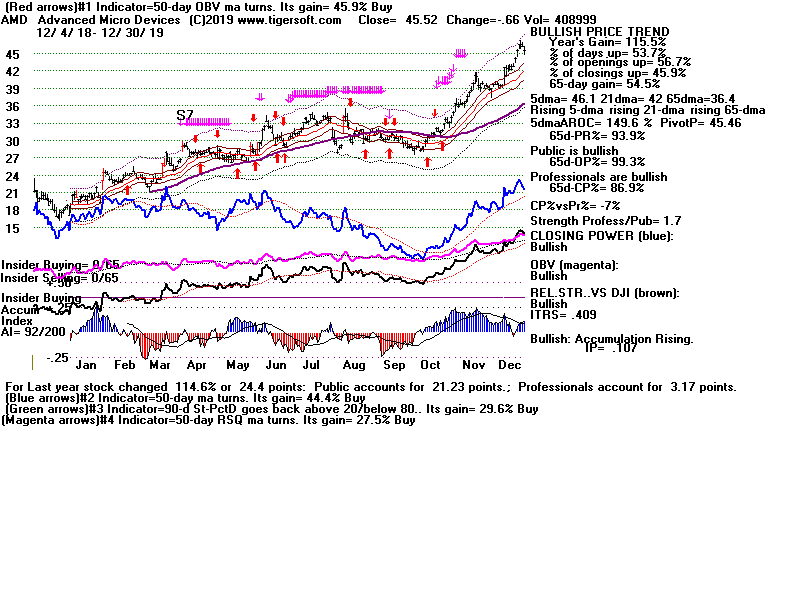
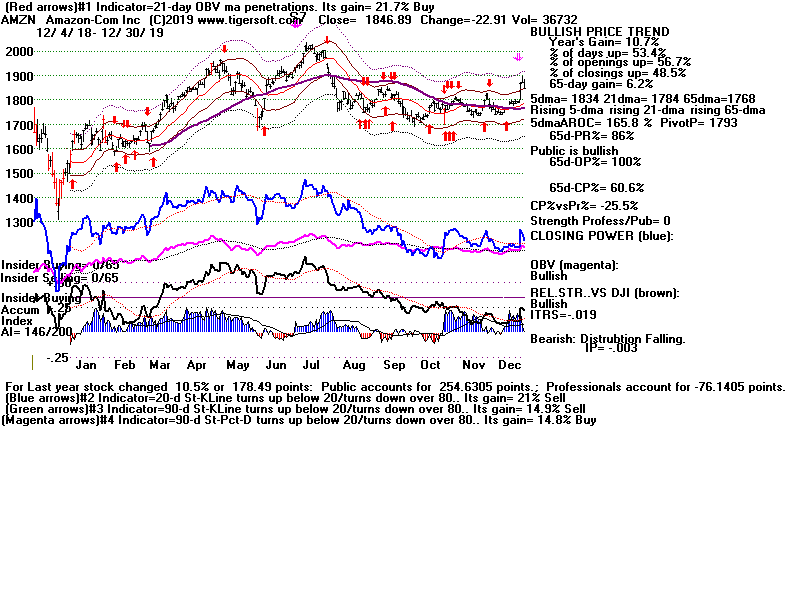
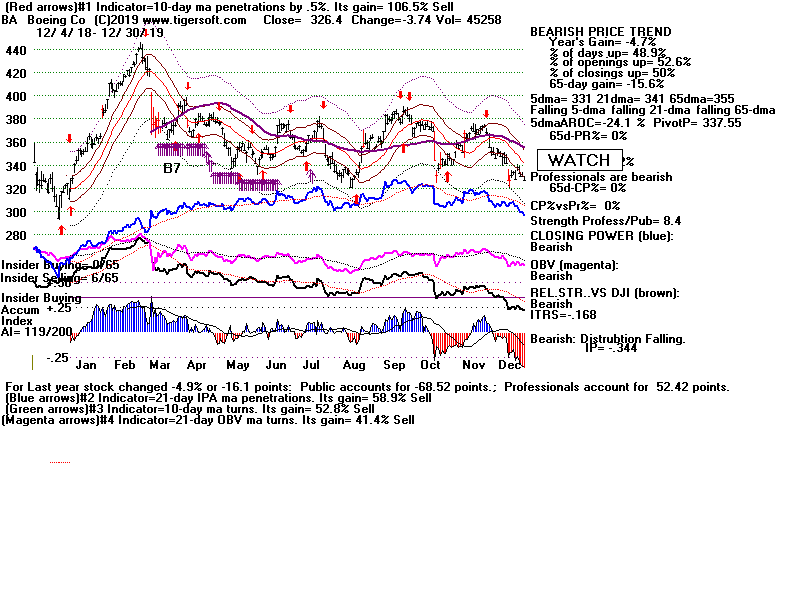
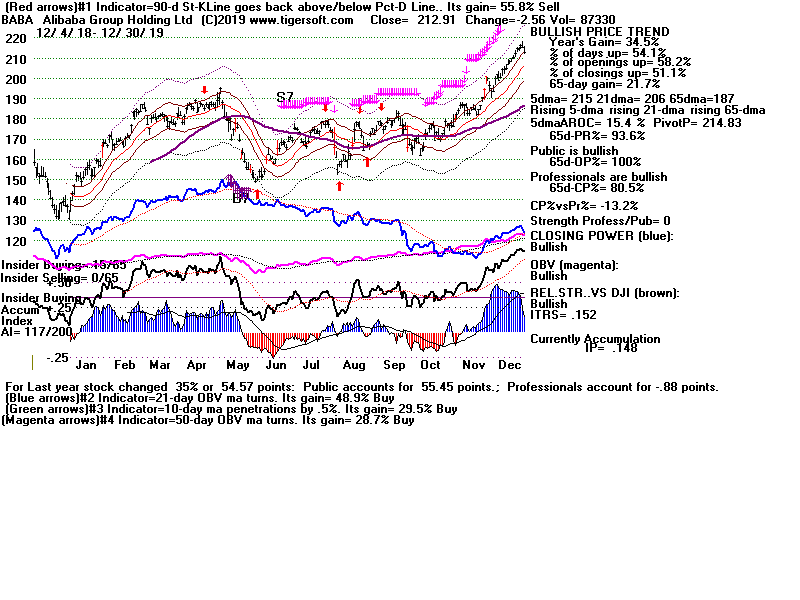
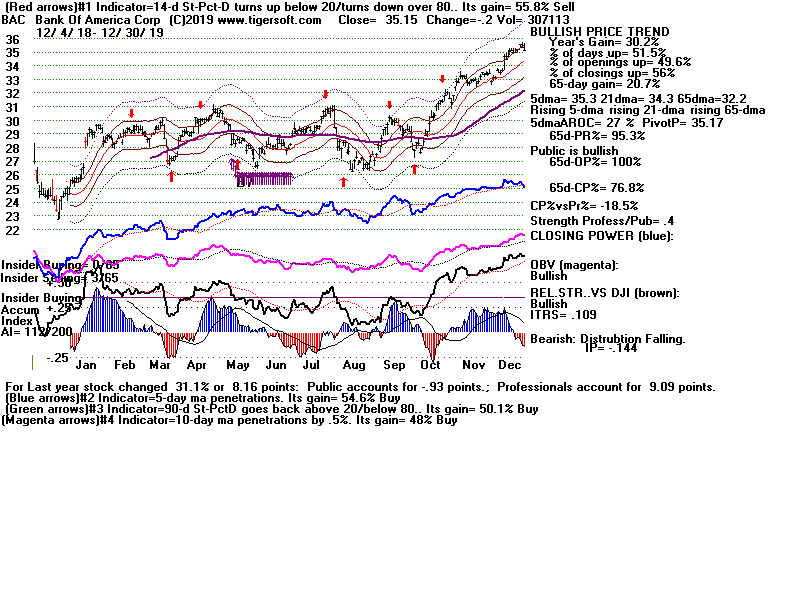
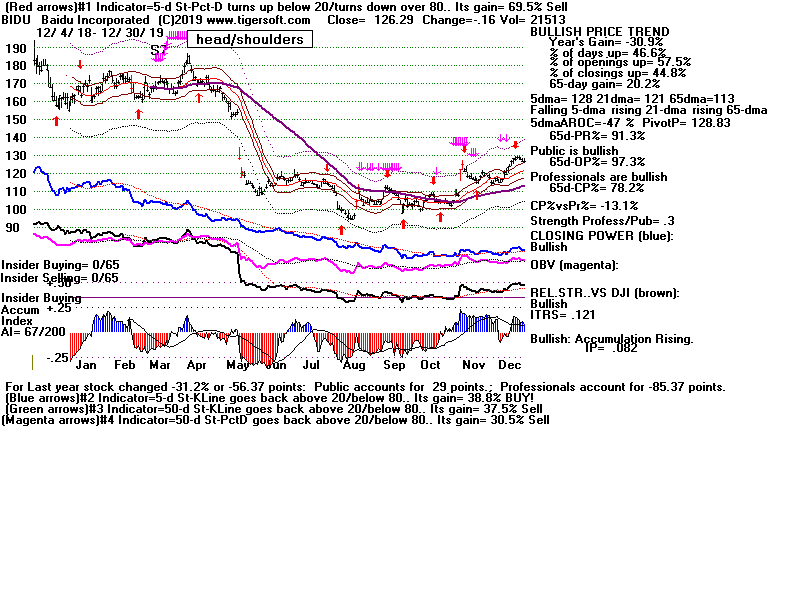
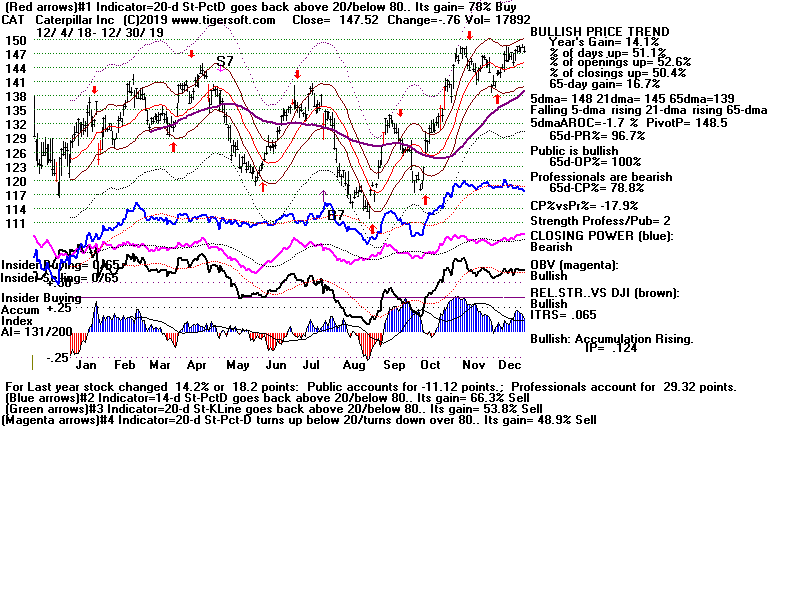
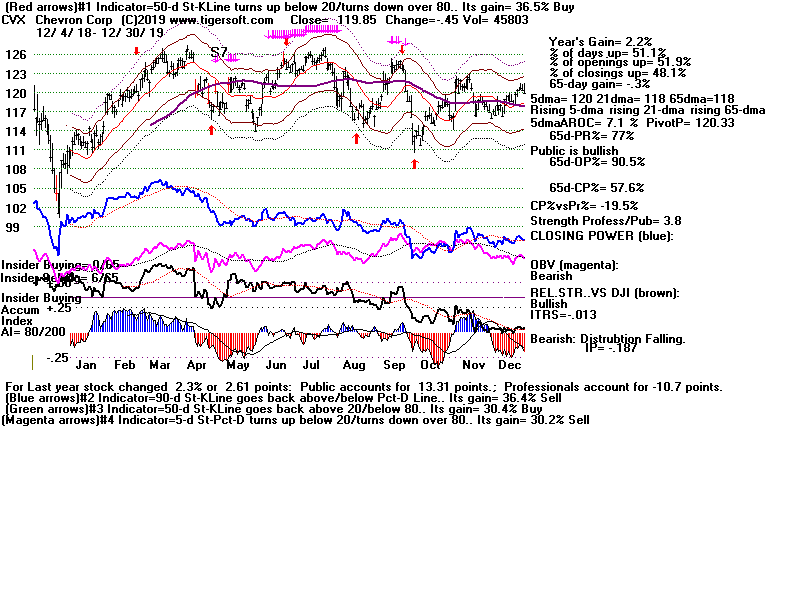
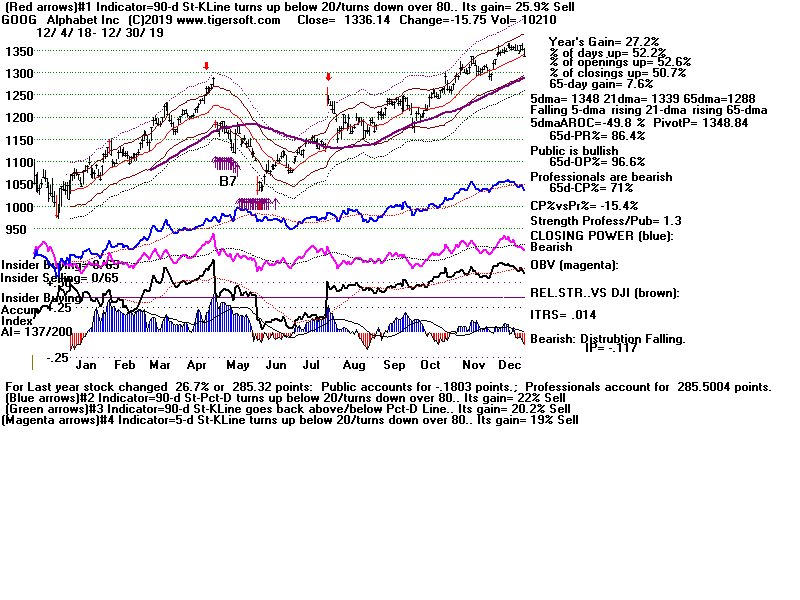
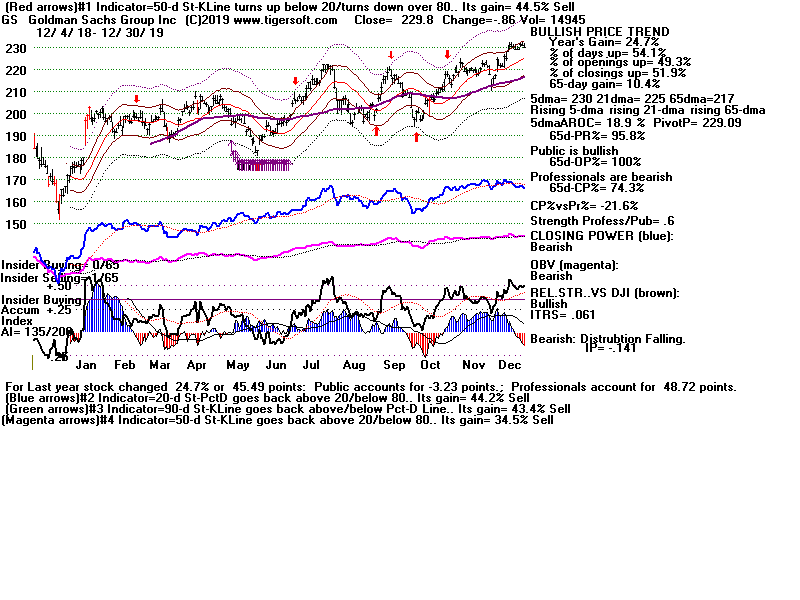
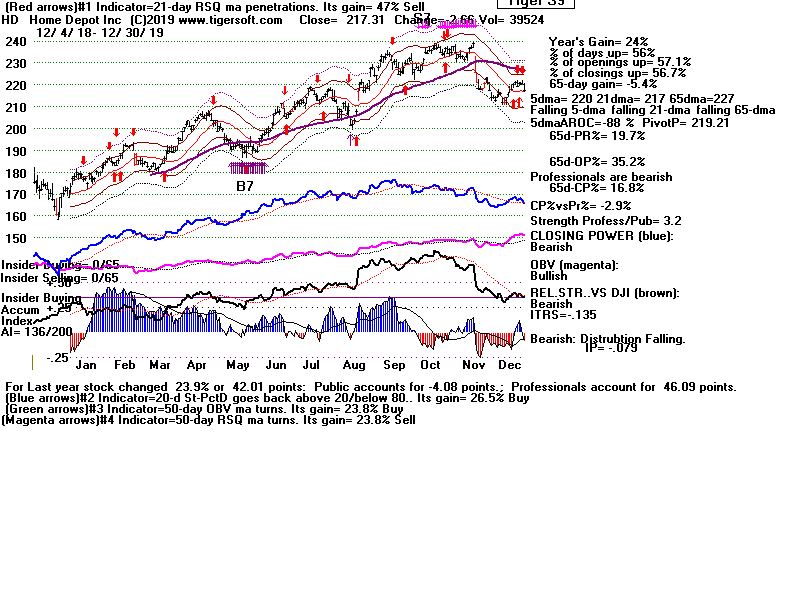
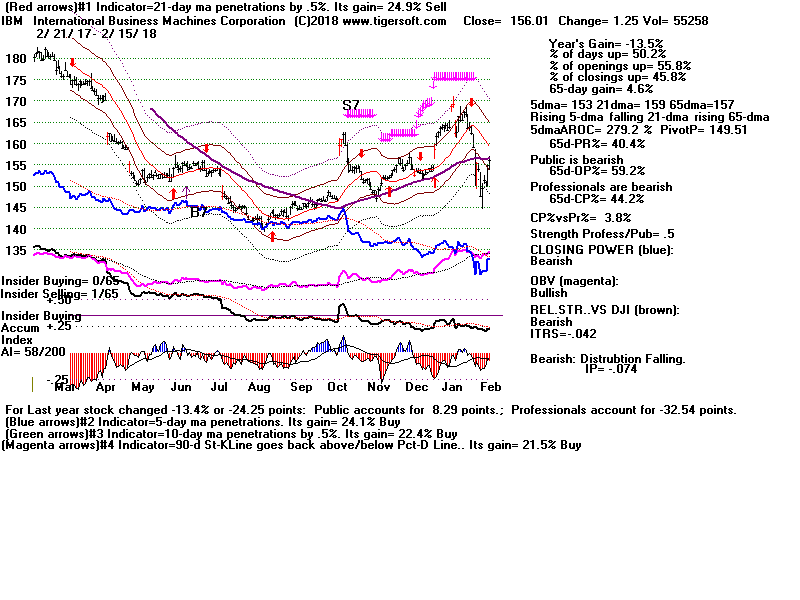
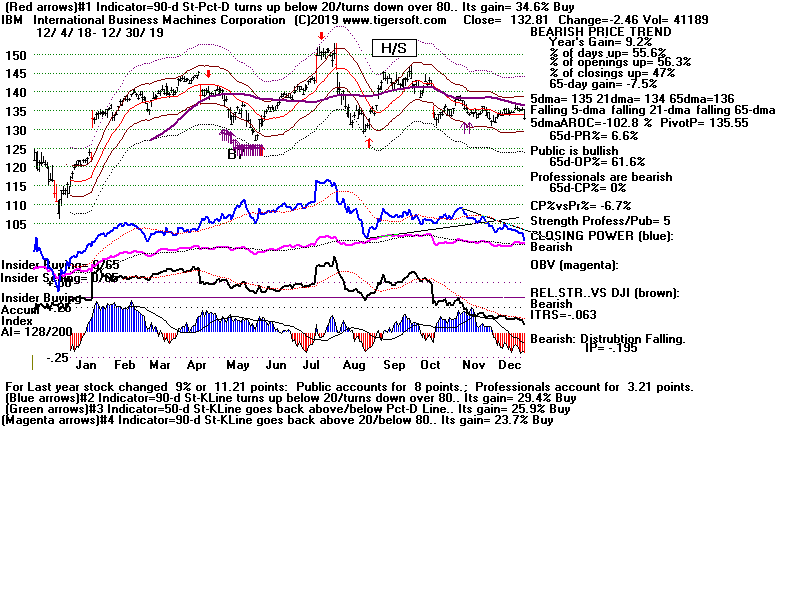
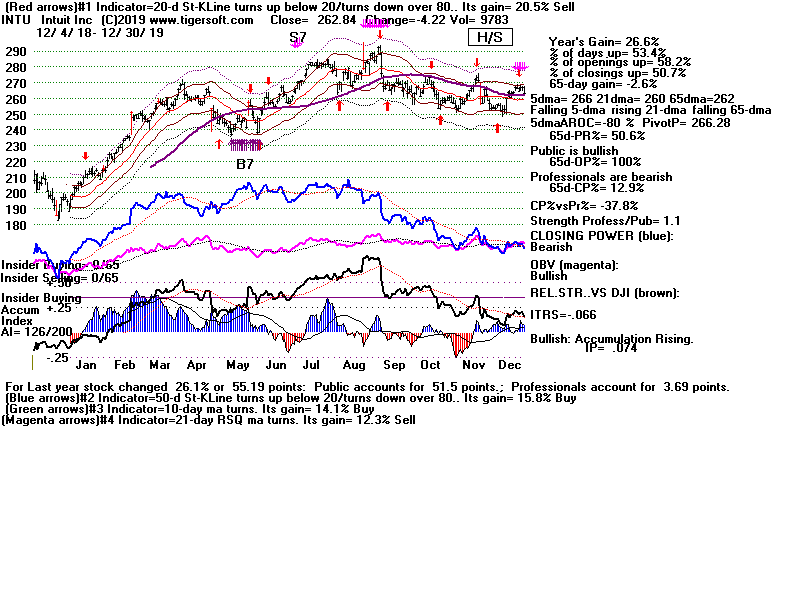
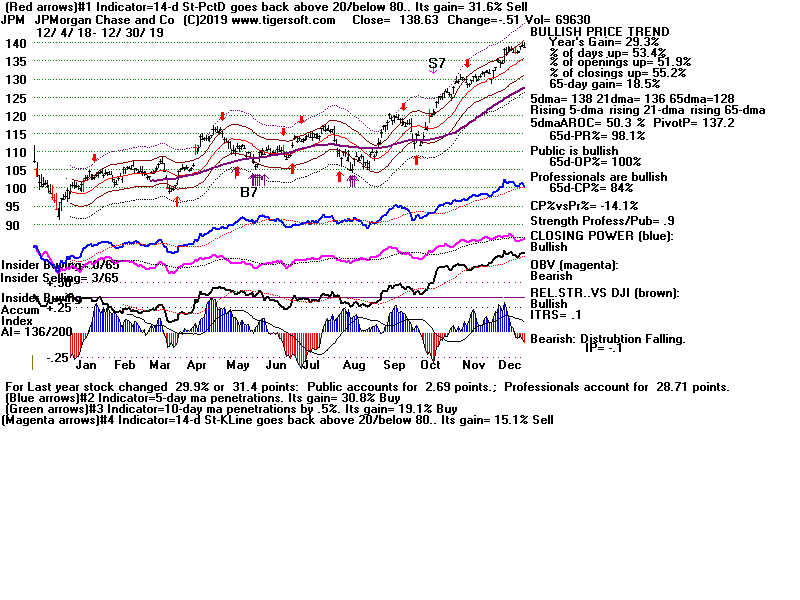
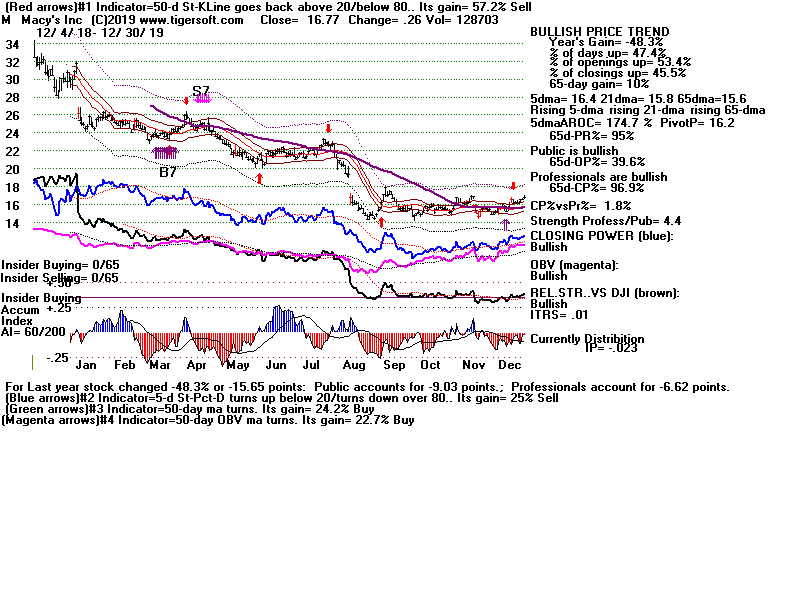
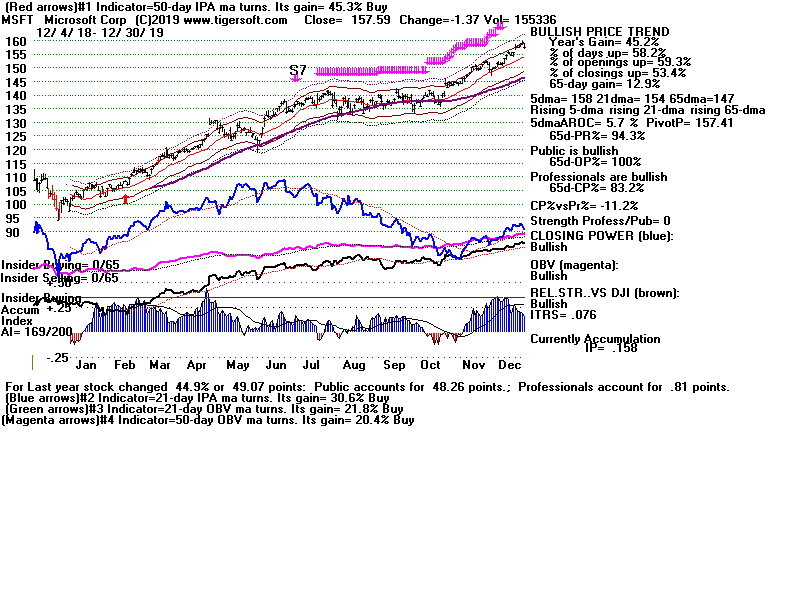
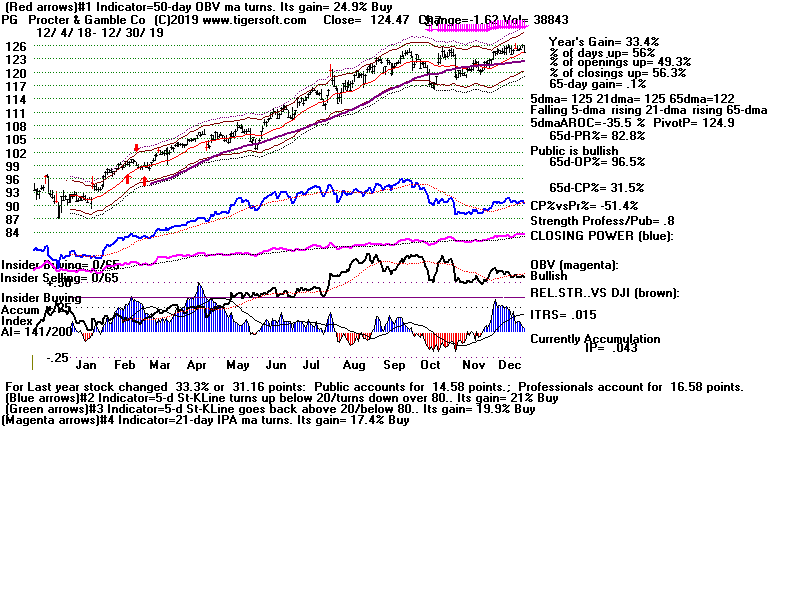
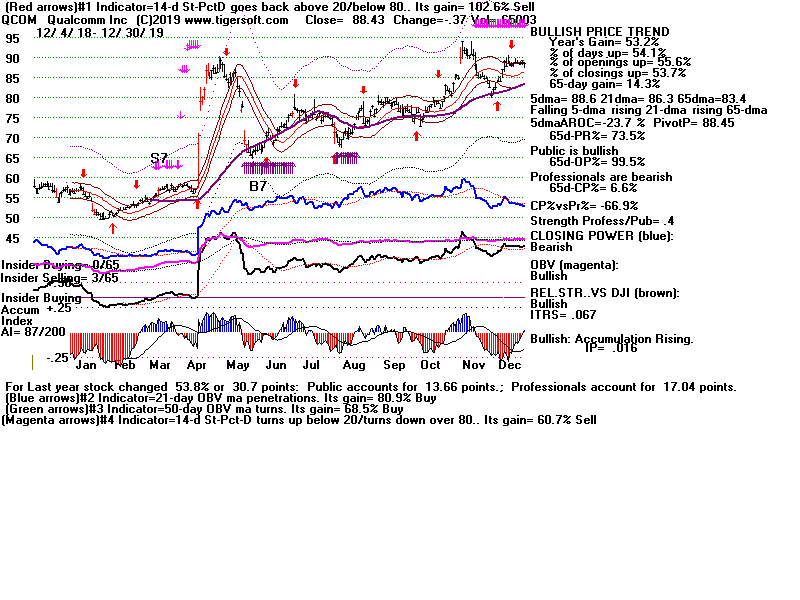
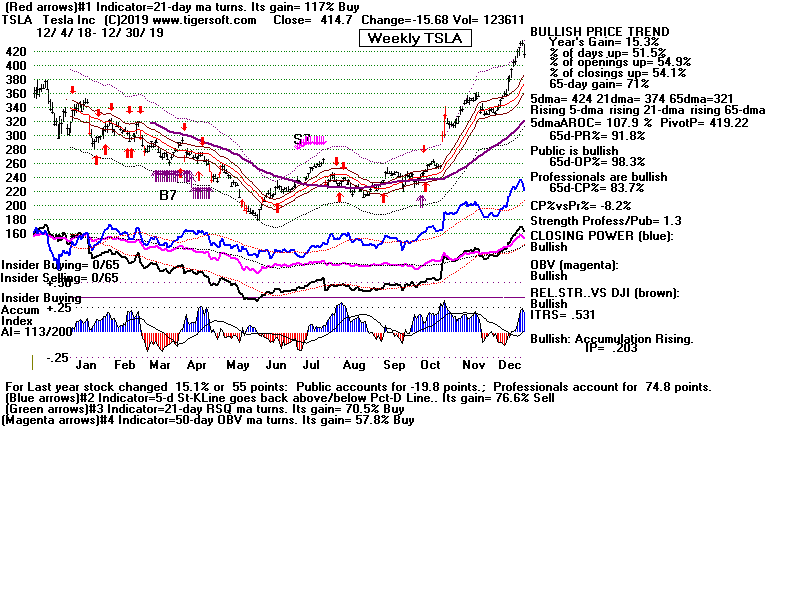
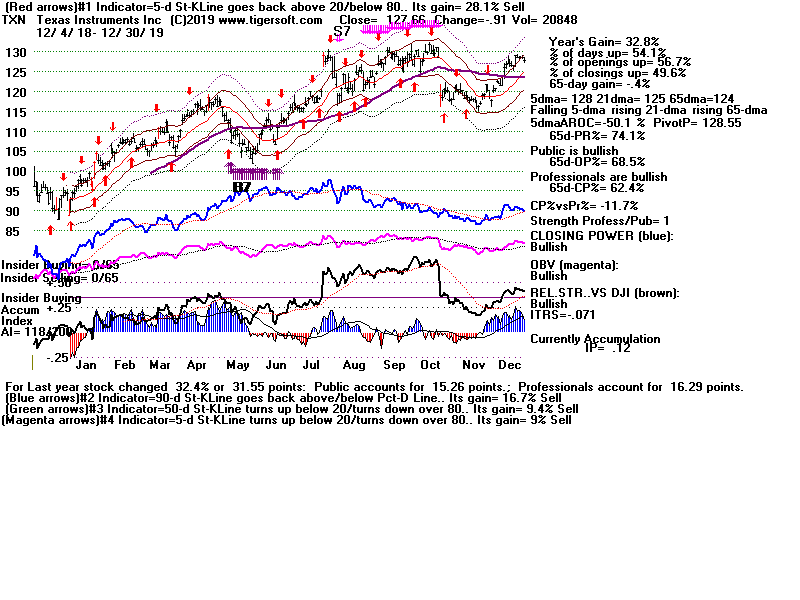
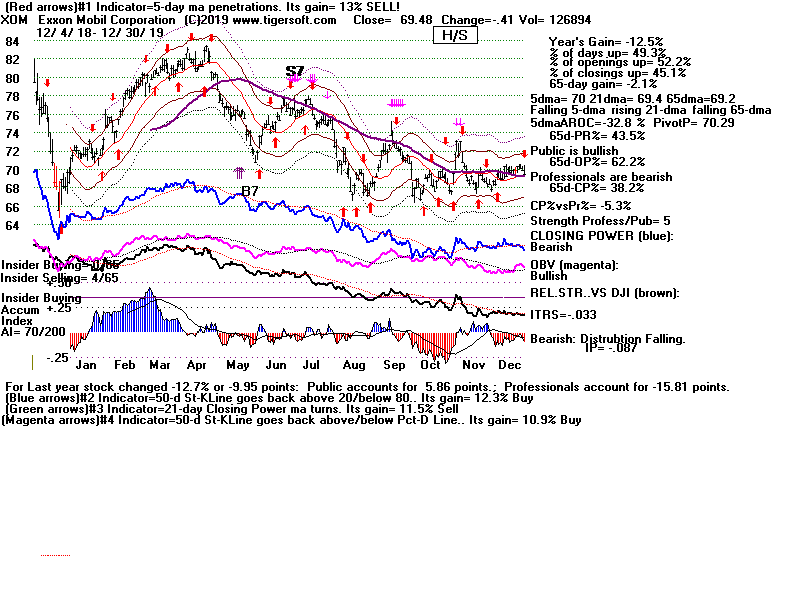
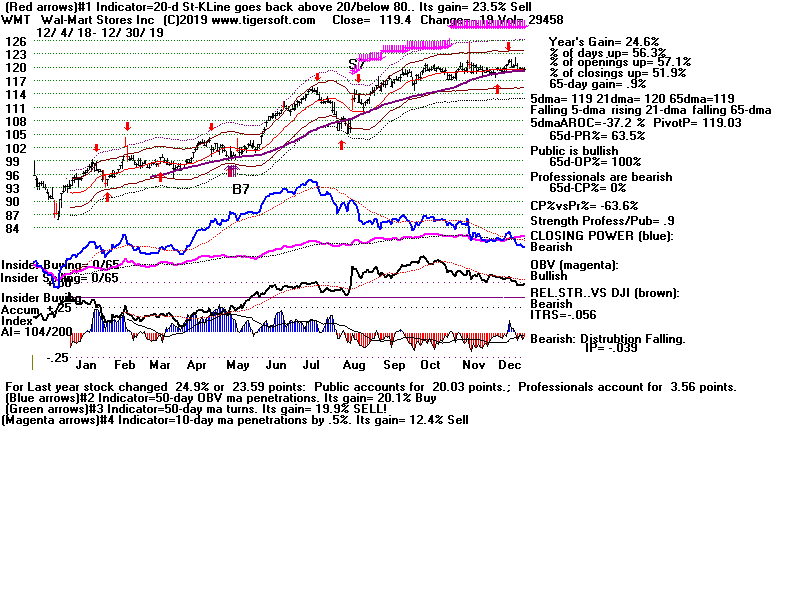
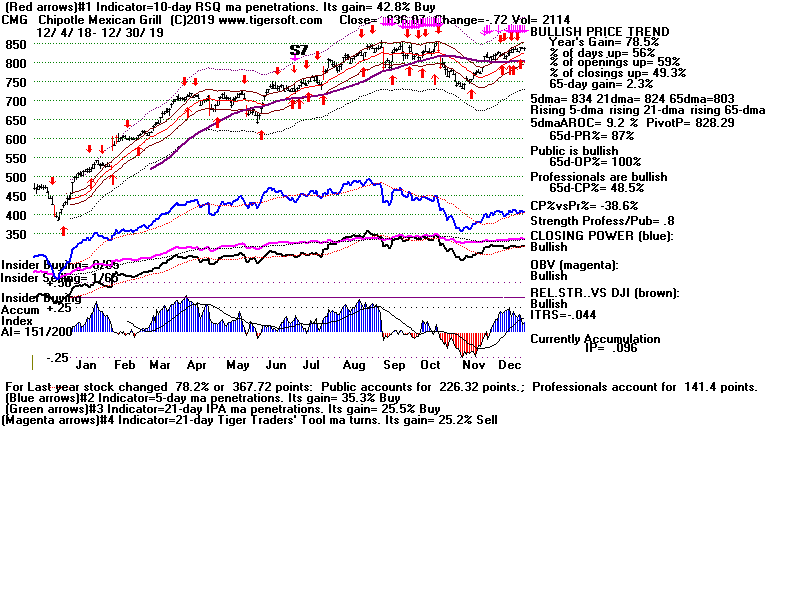
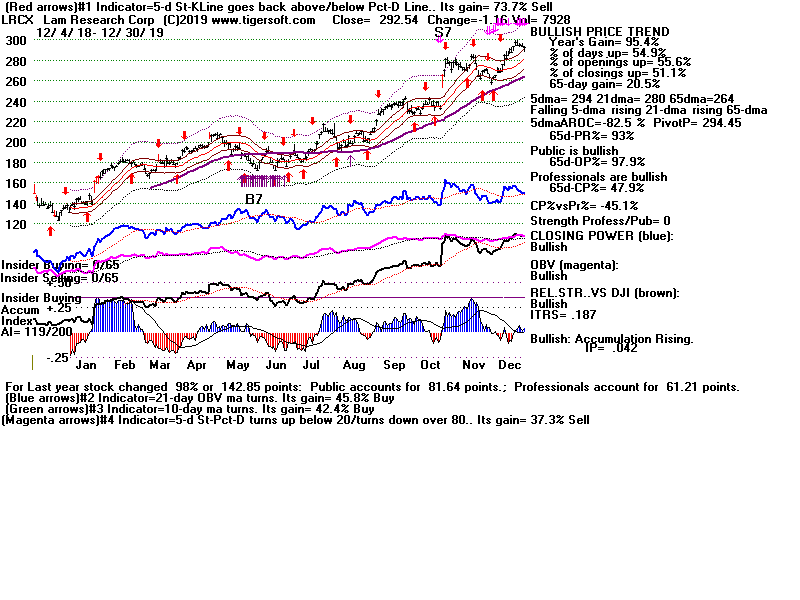
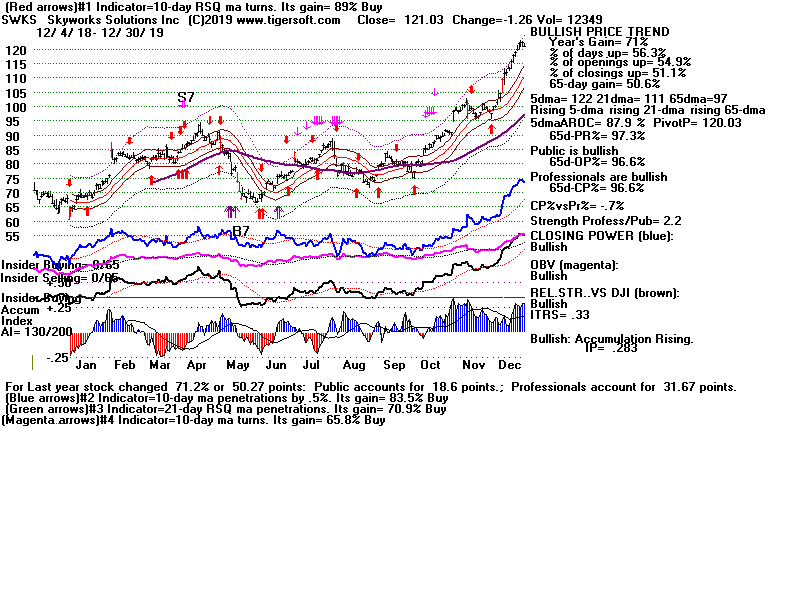
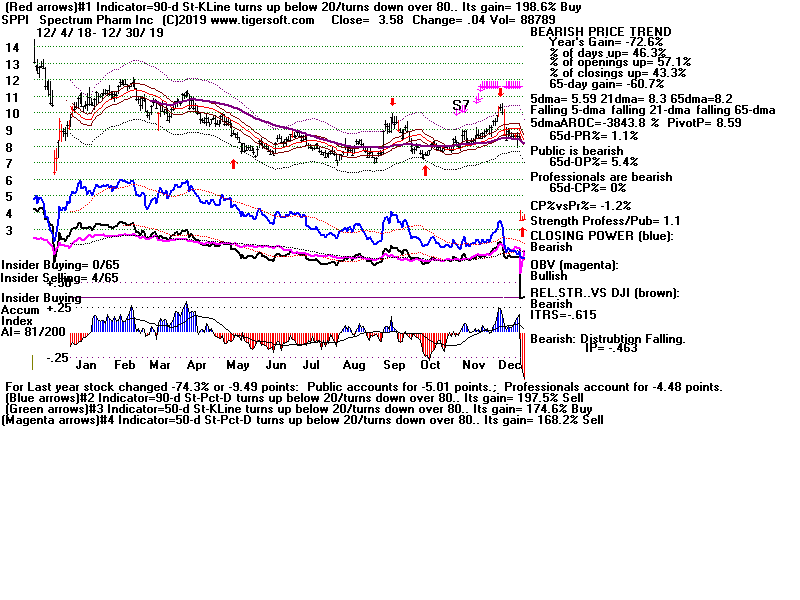
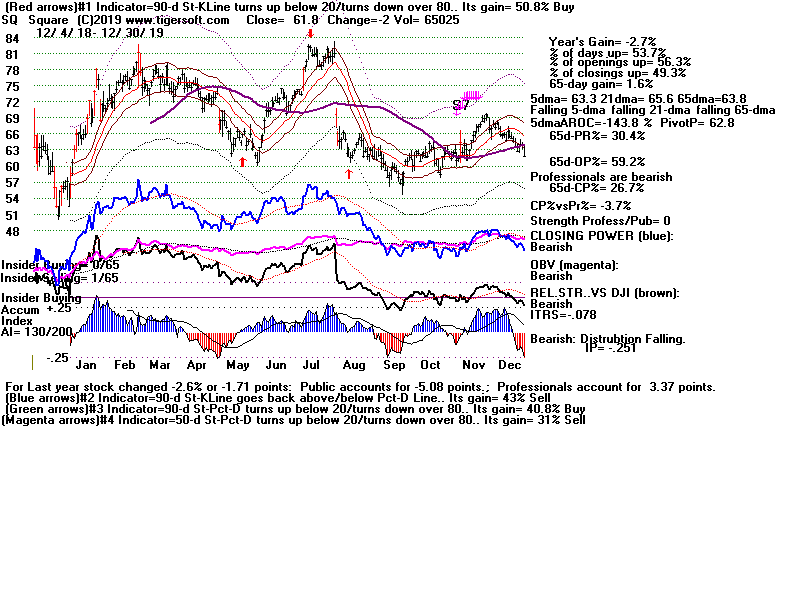
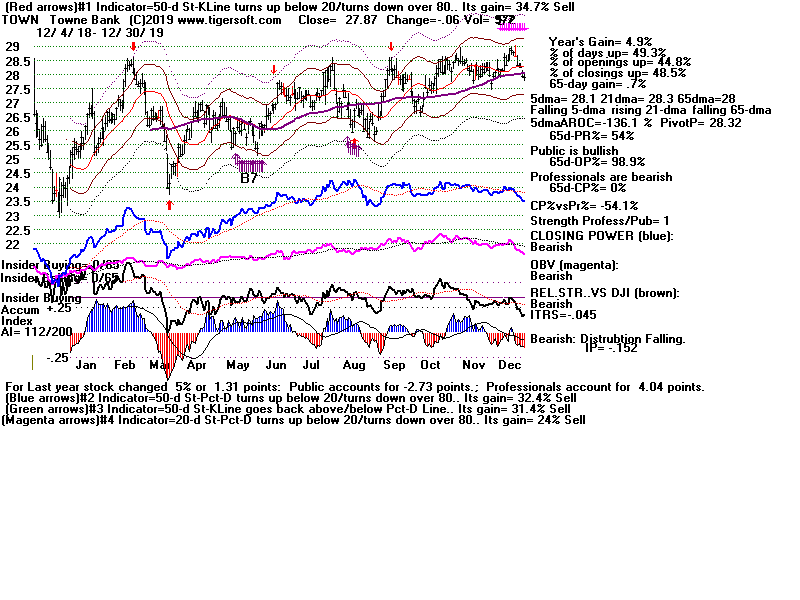
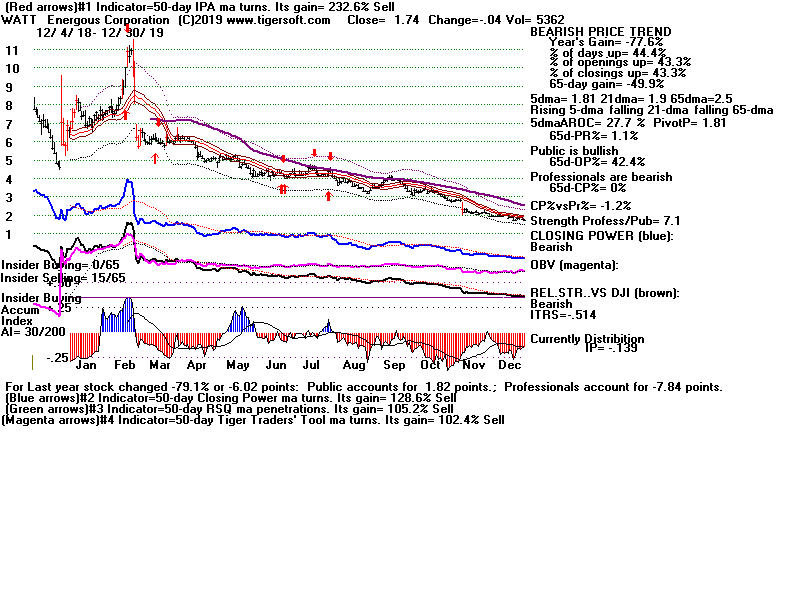