Earlier Hotlines
www.tigersoft.com/NHL718/INDEX.htm
www.tigersoft.com/21MAY18/INDEX.htm
www.tigersoft.com/55HEP/INDEX.htm
www.tigersoft.com/44H4L/INDEX2.htm
Earlier still: Go
here...
HELP
A Guide
To Profitably Using The Tiger Nightly HOTLINE
Introduction to Tiger/Peerless Buys and
Sells.
Peerless Buy and
Sell Signals: 1928-2016
Individual Peerless signals explained:
http://tigersoftware.com/PeerlessStudies/Signals-Res/index.htm
http://www.tigersoft.com/PeerInst-2012-2013/
Explanation of each Peerless signal. http://www.tigersoft.com/PeerInst-2012-2013/
Different Types of
TigerSoft/Peerless CHARTS, Signals and Indicators
-----> More HELP LINKS
Documentation for TigerSoft
Automatic and Optimized Signals.
How reliable support is the
DJI's rising 200-day ma?
SPY Charts since
1994: Advisory Closing Power S7s, Accum. Index, 65-dma, Optimized Signals.
^^^^^^^^^^^^^^^^^^^^^^^^^^^^^^^^^^^^^^^^^^^^^^^^
1/19/2016 ---> Corrections,Deeper
Declines and Bear Markets since 1945.
1/21/2016
---> High
Velocity Declines since 1929
2/12/2016 ---> Presidential
Elections Years and Bullish IP21 Positive Non-Confirmations at Lower Band.
2/12/2016 ---> OBV NNCs on DJI's Rally to
2.7% Upper Band when DJI's 65-dma is falling.
11/6/2016 --->
Killer Short Selling
Techniques: ===> Order Here ($42.50)
It's As Easy as 1,2,3
TigerSoft "Combination" Short-Selling... Easy as 1-2-3 Short Sales
Earlier Q-Answers
QuickSilver Documentation (1/11/2016)
Our Different
Signals
Better understand the difference between
Peerless DJI-based signals,
the one-year optimized red Signals and the fixed signals based
on technical developments.
Introduction to Tiger/Peerless Buys and Sells.
Different Types of
TigerSoft/Peerless CHARTS, Signals and Indicators
New TigerPeerless Installation and
Basic Uses' Instruction
See the re-written materials on TigerSoft Buys and Sells.
Study- Trading SPY
WITHOUT Peerless - Some Guidelines.
When completed this will be a new Tiger Trading E-Book.
Study- Examples of
"Hands above the Head" top patterns.
Study- 9/3/2017 TigerSoft (not
Peerless) charts of Major Tops as they occurred.
===> Please report any broken or out-of-date links. william_schmidt@hotmail.com
--->>> Order New E-Book: "New Tiger Tahiti
System's Stocks: 2000-2018", $50.00
> When to
start avoiding the long side altogether because of Peerless signals.
> When to
start buying Tahiti stocks after the start of a Bear Market.
> When to
avoid a weaker high AI/200 stock and use the second choice.
> When to exit
Tahiti stocks before the normal 21-month holding period is over.
> The special
benefits of working with major Tahiti tech stocks.
> Watch for Head/Shoulders tops with these stocks.
> Using the
90-day Stochastic to time the purchase of Safer Tahiti Stocks
> The Tahiti
Tech System's track record using these rules matches closely the 24%/year gain that
the
blue chip Tahiti system did between 1970 and 2000.
> Tiger Software 858-273-5900 PO Box 22784 San
Diego, CA 92192 Email william_schmidt@hotmail.com
====================================================================
====================================================================
8-23-2018 Volume remains low, but now our Accumulation Index (IP21) and
as
our V-I (Up minus Down Volume) in our Peerless
DJI
chart are both negative. In addition, the DISI-OBV Line on the
DJI is dangerously weak, almost making new lows ahead of price.
This adds a lot to the bearishness of the multiple Sell S9-V. Fortunately,
DIA's Closing Power is still up-trending and volatile stocks like AMD
and
NVDA are showing by their breakouts today that speculators are
still optimistic. And usually, when the NYSE A/D Line is able to make new
highs in August, the DJI does not top out until September or October.
It is these considerations which have caused me to recommend short sales
in
some of our fairly numerous Bearish MINCPs, rather than shorting DIA
right
now.
 |
 |
The price and internal weakness in the DJI-30 put
great pressure on
IWM, SPY and leading tech stocks to make new highs soon on their own.
If
they do not, the technical situation of the overall market will become
dangerous
and look even more like it did in mid 2011 just before a bad
sell-off.
Last night, I showed the 2011 DJI chart with its set of three S9-Vs, the last of
which took place with the NYSE ADL failing confirm.. Tonight look at the how
the failure by the NASDAQ, SPY, QQQ and IWM to breakout in July 2011
was quickly followed by the steep general market sell-off in August. See also
how in several instances, the Tiger Closing Power uptrends were each violated
following some CP non-confirmations of new price high. These added to our
certainty of a decline because it showed that Professionals had shifted decisively
from being bullish to bearish. I think we should use these insights to guide us
now.
4 Key Tops in 2011 - Each called by the 3rd S9V,
failures to make new highs, Closing Power non-confirmations
and then a breaking of steep CP uptrend just before
the big decline began.
Short-term, there is still a very good chance of a pre-Labor Day
rally.
To play it
long, I would look at our Bullish MAXCPs, IWM (providing it does not
fail its
recent breakout) and the most bullish of the "NIFTY" hightechs we use
in our
"TAHITI TECHs" system. Note that the highest Power Ranked is
not
usually the
same as the highest AI/200 ranked stock. The Power Ranker is more
short-term
term. It factors in relative strength as well as the current IP21 value
as much as
the long term positive consistency of our Accumulation. Index.
In any
case, cCompare the highest Power-Ranked with the lowest Power-Ranked
MINCP
stock. What a difference! Very often hedging works very well and both
sides are
profitable.

MOST BEARISH MINCP STOCK TODAY.

Charts 8/22/2018
PEERLESS DJI, Signals,
Indicators Daily DJI Volume 10-DayUp/Down Vol
Hourly DJIA A/D Line for All
Stocks
NASDAQ S&P OEX NYSE COMPQX DJI-15 DJI-20 DJI-30
DIA SPY QQQ MDY IWM TNA
Short-Term Rates
USO-CrudeOil FAS GLD BBH IBB JETS JNUG KOL NUGT OIH OIL RSX RETL
SDS SLV SOXL TECL TMF TNA UGA (gasoline) XIV YINN
Commodities: CANE
JJC, NIB, CHOC CORN, CUT (paper) WEAT UUP (Dollar)
AAPL ADBE ALXN AMAT AMGN AMD AMZN BA BABA BAC BIDU CAT CVX DE
FB GOOG GS HD IBM INTU (new) JPM M (Macy's) MSFT NFLX NVDA QCOM TSLA TXN
XOM WMT ANDV (refinery), CMG (Chipotle), LRCX, SWKS, MDGL
SPPI WATT
SQ TOWN
8/23/2018 (Click on Underlined link.)
Bullish MAXCPs - http://tigersoft.com/MAXCPZ/823/BULLISH.htm
Bearish MAXCPs - http://tigersoft.com/MINCPZ/823/BEARISH.htm
|
| |
Table 1 QUICKSILVER on ETFS - 08/23/18
ETF      CLOSE   CHANGE     PIVOT-PT  5-dma AROC    CL-PWR      CANDLE   IP21   ITRS
---------------------------------------------------------------------------------------------
---------------------------------------------------------------------------------------------
DIA       256.49   -.69      256.51        10.7%   Bullish      RED    .038     -----
---------------------------------------------------------------------------------------------
COMPQX    7878.46   -10.64   7816.33       45.9%   ----         RED    .037     .007
---------------------------------------------------------------------------------------------
SPY       285.79   -.38      285.06        30.3%   Bullish      RED    .016     .011
---------------------------------------------------------------------------------------------
QQQ       180.8   -.26       179.86        27.2%   ----         BLUE   .025     .011
---------------------------------------------------------------------------------------------
MDY       369.2   -1.29      366.22        65.7%   Bullish      RED    .041     0
---------------------------------------------------------------------------------------------
IWM       170.66   -.52      168.35        89.5%   Bullish      RED    .039     .006
---------------------------------------------------------------------------------------------
FAS       72.53   -.68       72.74         40.4%   Bullish      RED   -.104     .045
---------------------------------------------------------------------------------------------
RETL      51.92    .28       48.34         503.2%  Bullish      BLUE   .014     .144
---------------------------------------------------------------------------------------------
SOXL      152.61    .52      142.06        247.1%  Bullish      BLUE   .089    -.158
---------------------------------------------------------------------------------------------
TECL      155.7    .87       153.68        89.5%   Bullish      BLUE   .038     .043
---------------------------------------------------------------------------------------------
IBB       117.32   -.68      116.29        45%     Bullish      RED   -.009     .045
---------------------------------------------------------------------------------------------
GLD       112.2   -1.07      112.13        48.9%   Bearish      RED   -.412    -.106
---------------------------------------------------------------------------------------------
OIL       7.61    .04        6.89          339.4%  Bullish      BLUE   .263     .044
---------------------------------------------------------------------------------------------
OIH       24.93   -.18       24.02         229.5%  Bearish      ----  -.106    -.081
---------------------------------------------------------------------------------------------
GASL      21.41   -.44       19.44         544.4%  Bearish      RED   -.079    -.092
---------------------------------------------------------------------------------------------
UGA       33.64   -.11       32.3          179.7%  Bearish      BLUE  -.152    -.026
---------------------------------------------------------------------------------------------
UUP       25.32    .16       25.44        -49.3%   ----         ----   .081     .009
---------------------------------------------------------------------------------------------
 Table 2
    Count of Stocks in Key Directories
          20180823
-------------------------------
NEWHIGHS       212    Bullish
NEWLOWS        51
MAXCP          132    Bullish
MINCP          82
TTTNH          116
TTTNL          106
FASTUP         348    Swing Traders are quite bullish.
FASTDOWN       108
CPCROSSA       151
CPCROSSD       253
BIGVOLUP       2
BIGVODN        10
|
|
Table 3
Count of Stocks and New Highs in Key Tiger Directories
Date = 180822
               No.          NHs            Pct
-------------------------------------------------------------------
MAXCP          147           100           68 %
REGBANKS       30            6             20 %
HACKERS        22            4             18 %
COMPUTER       23            4             17 %
NIFTY          58            10            17 %
SOFTWARE       65            11            17 %
RETAIL         53            8             15 %
INDEXES        189           25            13 %
HOSPITAL       26            3             12 %
CHEM           61            5             8 %
BIOTECH        407           28            7 %
FINANCE        90            6             7 %
GAMING         28            2             7 %
GREEN          28            2             7 %
NASD-100       89            6             7 %
PIPELINE       29            2             7 %
BIG17          48            3             6 %
ELECTRON       170           10            6 %
RUS-1000       815           42            5 %
SP-100         94            5             5 %
TRANSP         20            1             5 %
INDMATER       82            3             4 %
SEMI           123           5             4 %
SP500          476           19            4 %
DOWJONES       30            1             3 %
FIDSTKS        186           6             3 %
INSURANC       30            1             3 %
OILGAS         155           3             2 %
REIT           172           4             2 %
UTILITY        41            1             2 %Count of Stocks and New Highs in Key Tiger Directories
Date = 180823
-------------------------------------------------------------------
MAXCP          132           93            70 %
RETAIL         53            15            28 %
HACKERS        22            5             23 %
COMPUTER       23            4             17 %
SOFTWARE       65            11            17 %
NIFTY          58            7             12 %
NASD-100       89            8             9 %
BIOTECH        407           28            7 %
GAMING         28            2             7 %
HOMEBLDG       17            1             6 %
ELECTRON       169           8             5 %
FIDSTKS        186           10            5 %
RUS-1000       814           44            5 %
SP500          476           25            5 %
BIG17          46            2             4 %
SP-100         94            4             4 %
AUTO           40            1             3 %
FINANCE        90            3             3 %
REGBANKS       30            1             3 %
SEMI           122           4             3 %
CHEM           60            1             2 %
INDEXES        189           3             2 %
REIT           170           4             2 %
UTILITY        41            1             2 %
OILGAS         155           2             1 %
BEVERAGE       18                          0 %
BIGBANKS       7                           0 %
BONDFUND       111                         0 %
CHINA          60                          0 %
COAL           8                           0 %
COMODITY       56                          0 %
DJI-13         13                          0 %
DOWJONES       30                          0 %
EDU            6                           0 %
ETFS           61                          0 %
FIDELITY       1                           0 %
FOOD           9                           0 %
GOLD           50                          0 %
GREEN          28                          0 %
HOSPITAL       26                          0 %
INDMATER       81                          0 %
INFRA          36                          0 %
INSURANC       30                          0 %
JETS           10                          0 %
MILITARY       37                          0 %
PIPELINE       29                          0 %
SOLAR          18                          0 %
TRANSP         20                          0 %
MINCP          82                          0 %
|
Table 4  Count of Stocks and New Lows in Key Tiger Directories
Date = 180823
               No           NLs            Pct
--------------------------------------------------------------------
MINCP          82            21            26 %
FOOD           9             2             22 %
GOLD           50            5             10 %
JETS           10            1             10 %
HOSPITAL       26            2             8 %
CHINA          60            4             7 %
SOLAR          18            1             6 %
UTILITY        41            2             5 %
BIOTECH        407           16            4 %
COMODITY       56            2             4 %
COMPUTER       23            1             4 %
GAMING         28            1             4 %
INDMATER       81            3             4 %
NASD-100       89            4             4 %
CHEM           60            2             3 %
ELECTRON       169           5             3 %
ETFS           61            2             3 %
INSURANC       30            1             3 %
MILITARY       37            1             3 %
PIPELINE       29            1             3 %
BIG17          46            1             2 %
BONDFUND       111           2             2 %
FIDSTKS        186           4             2 %
FINANCE        90            2             2 %
NIFTY          58            1             2 %
RETAIL         53            1             2 %
SEMI           122           3             2 %
SOFTWARE       65            1             2 %
OILGAS         155           1             1 %
RUS-1000       814           12            1 %
SP500          476           7             1 %
|
 Table 5
 RANKING OF KEY DIRECTORIES BASED PCT.OF STOCKS ABOVE 65-DMA
              8/23/18
 Bullish = 29  Bearish = 17
---------------------------------------------------------------------------------------
Directory     Current       day-1         day-2         day-3         day-4         day-5
----------------------------------------------------------------------------------------
BIGBANKS       .857          .857          .857          .857          .857          .714
INSURANC       .833          .833          .833          .833          .833          .833
DOWJONES       .8            .833          .866          .866          .8            .8
TRANSP         .8            .9            .9            .85           .7            .7
PIPELINE       .793          .793          .793          .827          .793          .724
GUNS           .777          .833          .833          .722          .777          .722
RETAIL         .773          .735          .773          .735          .698          .66
UTILITY        .756          .78           .804          .829          .853          .878
REIT           .705          .741          .752          .776          .788          .735
SP-100         .702          .723          .734          .744          .723          .702
REGBANKS       .7            .833          .8            .733          .733          .7
COMPUTER       .695          .695          .652          .652          .652          .652
DJI-13         .692          .769          .846          .846          .692          .692
FIDSTKS        .672          .715          .715          .698          .672          .655
EDU            .666          .666          .666          .666          .666          .833
SP500          .649          .678          .693          .676          .657          .621
SOFTWARE       .646          .646          .661          .584          .584          .569
NIFTY          .637          .637          .62           .551          .5            .551
HACKERS        .636          .545          .59           .5            .5            .5
RUS-1000       .622          .654          .667          .647          .628          .589
INDEXES        .619          .65           .629          .592          .576          .576
BEVERAGE       .611          .611          .666          .666          .666          .555
JETS           .6            .6            .6            .6            .5            .5
MILITARY       .594          .594          .675          .675          .567          .513
NASD-100       .584          .629          .617          .595          .573          .584
HOSPITAL       .576          .576          .538          .5            .5            .538
GREEN          .535          .5            .571          .428          .392          .392
FINANCE        .522          .555          .611          .588          .6            .544
BONDFUND       .504          .603          .603          .612          .567          .531
N=29
=========================================================================================
BIG17          .5            .5            .456          .413          .434          .413
==========================================================================================
CHEM           .483          .5            .566          .5            .483          .45
HOMEBLDG       .47           .47           .588          .411          .352          .352
GAMING         .464          .464          .428          .392          .321          .357
AUTO           .45           .5            .55           .5            .475          .425
ELECTRON       .449          .455          .443          .384          .384          .396
BIOTECH        .444          .471          .434          .405          .415          .402
OILGAS         .419          .438          .361          .303          .277          .225
INFRA          .416          .5            .5            .416          .416          .361
SEMI           .352          .368          .368          .295          .295          .303
COMODITY       .321          .285          .178          .196          .196          .178
INDMATER       .32           .37           .395          .345          .32           .32
ETFS           .278          .311          .295          .245          .229          .196
COAL           .25           .375          .375          .375          .25           .375
FOOD           .222          .222          .222          .222          .222          .111
SOLAR          .166          .166          .166          .166          .111          .111
CHINA          .133          .15           .133          .116          .083          .083
GOLD           .02           .06           .02           .04           .04           .06
N=17
|
=========================================================================
8-22-2018
Volume is low and the DJI seems stalled below the last
apparent
resistance level below its January peak at 26616.71. See the chart
below. On this chart, the recent Peerless Sell S9-V (negative V-I at 2.4%
upper band above 21-dma) and the now negative IP21 (current Accumulation
Index) warn that any DJI rally now of about 300 points will probably
bring a new Peerless S9-V. All
this should limit the DJI's upside potential
to about 3%.
Current Peerless DJI Chart.
The DJI is 1% over its 21-dma and the V-Indicator remains negative.
Though the P-I shows positive breadth, the current Accumulation
Index stands only at +.007. It will be hard for the DJI to make
much upside progress. It is the rising NYSE ADL which keeps
saving the market in here. As long as interest rates do not get
pushed up much, the ADL should stay in its uptrend. But a rise
in interest rates or an intensification of Trump's tariff wars would
be very problematic. These
developments might break the ADL's
uptrend. On the other hand, Professionals are still bullish. They
apparently do not foresell problems here.

Most likely, the DJI's downside is also
probably limited.
More DJI zig-zags higher seem likely until we see a new September
or October DJI peak, in which the NYSE A/D Line fails to make a
corresponding new high on its own and then breaks its own uptrend.
See in the 2011 Peerless chart below, it was the third Sell S9-V on a
DJI new high which was not confirmed by a confirming A/D Line that
brought on the DJI's rapid 17% decline. in 2011.
2011 Peerless Chart of DJI.

.
What The Bulls Need To Accomplish Now.
What would help the overall market's resilience now would be if the
broader market (represented by IWM, the NASDAQ, the SP-500
and MDY) get past their recent peaks and make breakout runs
in all-time high territory. IWM has done that hesitatingly. Now
we must wait and see if the NASDAQ and SPY can do the same.
If they fail to breakout, it will be a bearish sign. When they failed to
breakout and the A/D Line broke its steep uptrend, the DJI plunged
18% very quickly in the Summer of 2011.
Watch the Professionals closely now.
They have the best insider information direct from the White House and
the Federal Reserve. They are also the ones that can rig higher or lower
openings to serve their needs to distribute or accumulate. And they have,
I have argued, more than most others, a vested interest in having the
stock market make new highs as the November Elections take place.
Instead of playing the DJI's (or DIA's) small zigs and zags, I would suggest
shorting those bearish MINCP (Closing Power new lows and steady
red Distribution) and holding them short so long as their Closing Powers
remain at below the 21-dma. And at the same time, I would prefer to
buy IWM, which has made a flat-topped breakout into all-time high territory
and buy some of the bullish MAXCPs and stay long them so long as their
Closing Powers are in uptrends.

Our reliance now is on trends of Tiger's Closing Power. We do this
out of the belief that this is a market controlled by Professionals who are
most likely to be busy buying all-day long when they are very bullish and
most likely to be busy selling all-day long when they are very bearish.
The openings are less important to them unless they are manipulated.
Candle-stick charts by their color show this on a day to day basis, but
we are more interested in the short-term and intermediate-term trends.

When we look at DIA, SPY, QQQ, MDY, IWM and TECL, we
see
Closing Power uptrends. These are summarized in Table 1 below and each
night. From this, I would conclude Professionals are still bullish. So, we
should be, too. But I must add, now we must not see IWM fail its
breakout. That would be a bearish development.

Charts 8/22/2018
PEERLESS DJI, Signals,
Indicators Daily DJI Volume 10-DayUp/Down Vol
Hourly DJIA A/D Line for All
Stocks
NASDAQ S&P OEX NYSE COMPQX DJI-15 DJI-20 DJI-30
DIA SPY QQQ MDY IWM TNA
Short-Term Rates
USO-CrudeOil FAS GLD BBH IBB JETS JNUG KOL NUGT OIH OIL RSX RETL
SDS SLV SOXL TECL TMF TNA UGA (gasoline) XIV YINN
Commodities: CANE
JJC, NIB, CHOC CORN, CUT (paper) WEAT UUP (Dollar)
AAPL ADBE ALXN AMAT AMGN AMD AMZN BA BABA BAC BIDU CAT CVX DE
FB GOOG GS HD IBM INTU (new) JPM M (Macy's) MSFT NFLX NVDA QCOM TSLA TXN
XOM WMT ANDV (refinery), CMG (Chipotle), LRCX, SWKS, MDGL
SPPI WATT
SQ TOWN
8/22/2018 (Click on Underlined link.)
Bullish MAXCPs - http://tigersoft.com/MAXCPZ/822/BULLISH.htm
Bearish MAXCPs - http://tigersoft.com/MINCPZ/822/BEARISH.htm
|
Table 1             QUICKSILVER on ETFS - 08/21/18

Explanation:
 Pivot-Point is the price at which the short-term 5-dma will change direction.
 Cl-Pwr = 21-dma trend of Closing Power.
 Candle = red means close below opening today and blue means close was above opening.
 IP21 is our proprietary Accum. Index.  It ranges from -1.0 to +1.0.
 ITRS shows the 50-day rate of change for the ETF minus the DJI's 50-day pct. change.
 We sometimes combine IP21 and ITRS to find the most powerful but keep in mind some
 of the ETFs (SOXL and TECL) are leveraged.
ETF      CLOSE   CHANGE     PIVOT-PT  5-dma AROC    CL-PWR      CANDLE   IP21   ITRS
---------------------------------------------------------------------------------------------
---------------------------------------------------------------------------------------------
DIA       257.18   -.89      255.94        105.9%   Bullish      RED    .103     ----
---------------------------------------------------------------------------------------------
COMPQX    7889.1    29.93    7806.52       73.6%    Bullish      BLUE   .107     .009
---------------------------------------------------------------------------------------------
SPY       286.17   -.17      284.06        77.1%    Bullish      BLUE   .085     .011
---------------------------------------------------------------------------------------------
QQQ       181.06    .7       179.82        50.9%    Bullish      BLUE   .091     .014
---------------------------------------------------------------------------------------------
MDY       370.49   -.05      364.37        124.4%   Bullish      BLUE   .105    -.001
---------------------------------------------------------------------------------------------
IWM       171.18    .42      167.63        151.2%   Bullish      BLUE   .095     .006
---------------------------------------------------------------------------------------------
FAS       73.21   -.41       71.94         242.9%   Bullish      BLUE  -.018     .039
---------------------------------------------------------------------------------------------
RETL      51.64    .04       46.91         512.4%   Bullish      RED    .025     .098
---------------------------------------------------------------------------------------------
SOXL      152.09    1.97     145.38        196%     Bullish      BLUE   .183    -.162
---------------------------------------------------------------------------------------------
TECL      154.83    1.34     152.95        117.8%   Bullish      BLUE   .077     .022
---------------------------------------------------------------------------------------------
IBB       118    .83         116.27        112.7%   Bullish      BLUE   .044     .049
---------------------------------------------------------------------------------------------
GLD       113.27    .25      111.1         92.8%    Bearish      RED   -.367    -.093
---------------------------------------------------------------------------------------------
OIL       7.61    .04        6.89          339.4%   Bullish      BLUE   .263     .046
---------------------------------------------------------------------------------------------
OIH       25.11    .37       23.81         292.3%   Bearish      BLUE  -.073    -.077
---------------------------------------------------------------------------------------------
GASL      21.85    1.14      19.21         762.4%   Bearish      BLUE  -.058    -.072
---------------------------------------------------------------------------------------------
UGA       33.75    .96       32.46         167.1%   Bearish      BLUE  -.17    -.004
---------------------------------------------------------------------------------------------
UUP       25.16   -.07       25.57        -84.5%    Bearish      ----   .028     .003
---------------------------------------------------------------------------------------------
|
Explanation:
Tiger has directories populated as shown by certain groups of stocks.
Thus, a ratio of 10:1 of new highs is bullish. Table 2
Count of Stocks in Key Directories
20180822
-------------------------------
NEWHIGHS 282 Quite Bullish
NEWLOWS 20
MAXCP 147 Professionals are bullish
MINCP 25
TTTNH 128 Professionals are
TTTNL 39
FASTUP 201 Swing Traders are Bullish
FASTDOWN 52
CPCROSSA 126
CPCROSSD 140
BIGVOLUP 3
BIGVODN 5 Big Money Dumping is lessening.
|
Explanation:
We want to see which groups of stocks show the most new highs.
One day's results are less significant than seeing a pattern here over time.Table 3
Count of Stocks and New Highs in Key Tiger Directories
Date = 180822
No. NHs Pct
-------------------------------------------------------------------
MAXCP 147 100 68 %
REGBANKS 30 6 20 %
HACKERS 22 4 18 %
COMPUTER 23 4 17 %
NIFTY 58 10 17 %
SOFTWARE 65 11 17 %
RETAIL 53 8 15 %
INDEXES 189 25 13 %
HOSPITAL 26 3 12 %
CHEM 61 5 8 %
BIOTECH 407 28 7 %
FINANCE 90 6 7 %
GAMING 28 2 7 %
GREEN 28 2 7 %
NASD-100 89 6 7 %
PIPELINE 29 2 7 %
BIG17 48 3 6 %
ELECTRON 170 10 6 %
RUS-1000 815 42 5 %
SP-100 94 5 5 %
TRANSP 20 1 5 %
INDMATER 82 3 4 %
SEMI 123 5 4 %
SP500 476 19 4 %
DOWJONES 30 1 3 %
FIDSTKS 186 6 3 %
INSURANC 30 1 3 %
OILGAS 155 3 2 %
REIT 172 4 2 %
UTILITY 41 1 2 %
|
Table 4  Count of Stocks and New Lows in Key Tiger Directories
Date = 180822
               No           NLs            Pct
--------------------------------------------------------------------
MINCP          25            4             16 %
JETS           10            1             10 %
HOSPITAL       26            2             8 %
SOLAR          18            1             6 %
BONDFUND       111           4             4 %
GAMING         28            1             4 %
CHINA          60            2             3 %
MILITARY       37            1             3 %
BIG17          48            1             2 %
BIOTECH        407           8             2 %
ELECTRON       170           4             2 %
ETFS           61            1             2 %
NASD-100       89            2             2 %
NIFTY          58            1             2 %
RETAIL         53            1             2 %
SEMI           123           2             2 %
SOFTWARE       65            1             2 %
RUS-1000       815           5             1 %
SP500          476           3             1 %
|
 Table 5
 Explanation:  We want to see which groups of stocks show the most
 above and below their 65-dma and what the trend is here...

 RANKING OF KEY DIRECTORIES BASED PCT.OF STOCKS ABOVE 65-DMA
               8/22/18
               Bullish = 30
               Bearish = 14
---------------------------------------------------------------------------------------
Directory     Current       day-1         day-2         day-3         day-4         day-5
----------------------------------------------------------------------------------------
TRANSP         .9            .9            .85           .7            .7            .65
BIGBANKS       .857          .857          .857          .857          .714          .428
DOWJONES       .833          .866          .866          .8            .8            .666
GUNS           .833          .833          .722          .777          .722          .666
INSURANC       .833          .833          .833          .833          .833          .766
REGBANKS       .833          .8            .733          .733          .7            .5
PIPELINE       .793          .793          .827          .793          .724          .655
UTILITY        .78           .804          .829          .853          .853          .878
DJI-13         .769          .846          .846          .692          .692          .461
REIT           .744          .755          .779          .79           .744          .68
RETAIL         .735          .773          .735          .698          .66           .622
SP-100         .723          .734          .744          .723          .702          .627
FIDSTKS        .715          .715          .698          .672          .655          .575
COMPUTER       .695          .652          .652          .652          .652          .565
SP500          .678          .693          .676          .657          .623          .567
EDU            .666          .666          .666          .666          .833          .833
RUS-1000       .655          .667          .647          .629          .592          .549
INDEXES        .65           .629          .592          .576          .571          .582
SOFTWARE       .646          .661          .584          .584          .569          .569
NIFTY          .637          .62           .551          .5            .551          .568
NASD-100       .629          .617          .595          .573          .584          .595
BEVERAGE       .611          .666          .666          .666          .555          .555
BONDFUND       .603          .603          .612          .567          .54           .603
JETS           .6            .6            .6            .5            .5            .5
MILITARY       .594          .675          .675          .567          .513          .54
HOSPITAL       .576          .538          .5            .5            .538          .461
FINANCE        .555          .611          .588          .6            .544          .444
HACKERS        .545          .59           .5            .5            .5            .363
BIG17          .52           .479          .437          .458          .416          .437
CHEM           .508          .573          .508          .475          .442          .377
N=25
=============================================================================================
AUTO           .5            .55           .5            .475          .425          .375
GREEN          .5            .571          .428          .392          .392          .392
INFRA          .5            .5            .416          .416          .361          .388
============================================================================================
BIOTECH        .471          .434          .405          .415          .405          .385
HOMEBLDG       .47           .588          .411          .352          .352          .294
GAMING         .464          .428          .392          .321          .357          .285
ELECTRON       .452          .441          .382          .382          .4            .394
OILGAS         .438          .361          .303          .277          .232          .206
INDMATER       .378          .402          .353          .317          .317          .292
COAL           .375          .375          .375          .25           .375          .375
SEMI           .365          .365          .292          .292          .308          .317
ETFS           .311          .295          .245          .229          .196          .147
COMODITY       .285          .178          .196          .196          .178          .178
FOOD           .222          .222          .222          .222          .111          .111
SOLAR          .166          .166          .166          .111          .111          .055
CHINA          .15           .133          .116          .083          .083          .066
GOLD           .06           .02           .04           .04           .06           .06
N=14
|
=======================================================================
8-21-2018
The Peerless-S9V still remains at odds with the very strong
NYSE A/D Line.
The V-I was negative for another day, but there were 853 more up than
down even when short-term interest rates rose back above 2%, Such a
a clash by these indicators in August is usually not resolved until September
or October with a DJI decline to the lower band. For the Sell-S9V to win
the battle at this time, I would require the Closing Powers of the major market
ETFs to break their uptrends AND for the NYSE A/F Line to break its 6-month
uptrend.


The News Is Misleading... Be Cynical.
As for all the news about political corruption, the market does not seem much
concerned. If anything, as Wall Street represents those most able to do the
corrupting, the news today can be viewed as yet one more sign that Wall Street
has everything under control and the news is to get the "little people" to sell.
(Compare this with Leona
Helmsley's famous remark: "We don't pay taxes;
only the little people pay taxes.")
Wall Street Professionals seem not to care tha the
President's
campaign manager has been found guilty by a jury of eight felonies
that could put him in jail a long, long time and that Trump's
personal lawyer has plead guilty to misusing Campaign funds
to pay off one Trump's consorts just as the President, himself, had ordered.
Complain as much as you may about a "witch hunt" or "fake
news", Mueller's investigations are producing convictions which
are getting closer and closer to the big man himself.
But as both the Special Prosecutor's Office and the Republicans in Congress
know full well, the President himself is safe as long as the House of Represtatives
does not swing Democratic this Fall. Even then, it takes a 2/3 Senate Vote to
actually impeach. So Impeachment seems unlikely.
Even so, all this makes the November Election very important. Wall Street
and the Federal Reserve, too, know that the best way
for the Republicans
to be kept in office in sufficient numbers to fend off an Impeachment is to keep
the economy strong and the stock market making new highs. You can bet that
enormous pressure behind the scenes is being placed on the FED. We will be
eager to see tomorrow what the most recent FOMC minutes reveal.
Professionals mostly are Republican. Nearly all support his lower
taxes and reduced regulation. By persuasion, they want not to believe
Trump should be impeached and by interest, they are very likely
to do all they can to support the market and keep their Buy Programs
running just as they have since our Buy B9 on July 3rd. As a result,
I doubt if our key Closing Powers will break their uptrend even
with today's double victory for the Special Prosecutor.
Buy IWM
It's true that the DJI is still below its January peak by 3%, but today
IWM, representing the Russell-2000 broke very bullishly above its
flat resistance into all-time high territory, thereby earning it a trading
Buy from us even without our Sell S9-V on the DJI having been reversed.
IWM's strength shows speculative energies are still very much alive.

Charts 8/21/2018
PEERLESS DJI, Signals,
Indicators Daily DJI Volume 10-DayUp/Down Vol
Hourly DJIA A/D Line for All
Stocks
NASDAQ S&P OEX NYSE COMPQX DJI-15 DJI-20 DJI-30
DIA SPY QQQ MDY IWM TNA
Short-Term Rates
USO-CrudeOil FAS GLD BBH IBB JETS JNUG KOL NUGT OIH OIL RSX RETL
SDS SLV SOXL TECL TMF TNA UGA (gasoline) XIV YINN
Commodities: CANE
JJC, NIB, CHOC CORN, CUT (paper) WEAT UUP (Dollar)
AAPL ADBE ALXN AMAT AMGN AMD AMZN BA BABA BAC BIDU CAT CVX DE
FB GOOG GS HD IBM INTU (new) JPM M (Macy's) MSFT NFLX NVDA QCOM TSLA TXN
XOM WMT ANDV (refinery), CMG (Chipotle), LRCX, SWKS, MDGL
SPPI WATT
SQ TOWN
8/21/2018 (Click on Underlined link.)
Bullish MAXCPs - http://tigersoft.com/MAXCPZ/821/BULLISH.htm
Bearish MAXCPs - http://tigersoft.com/MINCPZ/821/BEARISH.htm
|
Table 1 QUICKSILVER on ETFS - 08/21/18
ETF      CLOSE   CHANGE     PIVOT-PT  5-dma AROC    CL-PWR      CANDLE   IP21   ITRS
---------------------------------------------------------------------------------------------
---------------------------------------------------------------------------------------------
DIA       258.07    .64      251.76        95.3%    Bullish      BLUE   .167     ----
---------------------------------------------------------------------------------------------
COMPQX    7859.17    38.16   7774.12      -7.5%     ----         BLUE   .053     .008
---------------------------------------------------------------------------------------------
SPY       286.34    .67      281.78        42.9%    Bullish      BLUE   .084     .009
---------------------------------------------------------------------------------------------
QQQ       180.36    .66      179.23       -30.3%    ----         BLUE   .051     .013
---------------------------------------------------------------------------------------------
MDY       370.54    2.95     361.38        78.8%    Bullish      BLUE   .087    -.002
---------------------------------------------------------------------------------------------
IWM       170.76    1.94     166.09        76.3%    Bullish      BLUE   .037     .005
---------------------------------------------------------------------------------------------
FAS       73.62    .35       69.7          204.4%   Bullish      BLUE  -.056     .04
---------------------------------------------------------------------------------------------
RETL      51.6    1.16       46.64         111.2%   ----         BLUE   .034     .104
---------------------------------------------------------------------------------------------
SOXL      150.12    8.39     146.4        -88.2%    ----         BLUE   .098    -.163
---------------------------------------------------------------------------------------------
TECL      153.49    .62      151.23       -60%      Bullish      RED    .034     .021
---------------------------------------------------------------------------------------------
IBB       117.17    1.08     115.38       -1.7%     Bullish      BLUE  -.016     .047
---------------------------------------------------------------------------------------------
GLD       113.02    .33      111.19       -2.2%     Bearish      BLUE  -.387    -.101
---------------------------------------------------------------------------------------------
OIL       7.61    .04        6.89          339.4%   Bullish      BLUE   .263     .043
---------------------------------------------------------------------------------------------
OIH       24.74    .41       23.7         -12.4%    Bearish      BLUE  -.154    -.102
---------------------------------------------------------------------------------------------
GASL      20.71    .89       18.86        -81.3%    Bearish      BLUE  -.113    -.111
---------------------------------------------------------------------------------------------
UGA       32.79   -.03       32.66        -73.4%    Bearish      RED   -.314    -.042
---------------------------------------------------------------------------------------------
UUP       25.23   -.15       25.59        -70.5%    Bearish      RED    .073     .005
---------------------------------------------------------------------------------------------
|
Table 2   Count of Stocks in Key Directories
          20180821
-------------------------------
NEWHIGHS       382   Bullish Ratio.
NEWLOWS        28
MAXCP          156   Professionals are bullish
MINCP          35
TTTNH          154   Day Traders are bullish
TTTNL          43
FASTUP         101
FASTDOWN       89
CPCROSSA       144
CPCROSSD       96
BIGVOLUP       4
BIGVODN        14
|
Table 3
Count of Stocks and New Highs in Key Tiger Directories
Date = 180821
               No.          NHs            Pct
-------------------------------------------------------------------
MAXCP          156           115           74 %
EDU            6             2             33 %
REGBANKS       30            9             30 %
TRANSP         20            5             25 %
RETAIL         53            12            23 %
COMPUTER       23            5             22 %
JETS           10            2             20 %
INDEXES        189           33            17 %
NIFTY          58            8             14 %
INSURANC       30            4             13 %
FINANCE        90            11            12 %
SOFTWARE       65            8             12 %
MILITARY       37            4             11 %
DOWJONES       30            3             10 %
RUS-1000       815           78            10 %
SP-100         94            8             9 %
FIDSTKS        184           14            8 %
NASD-100       89            7             8 %
SP500          476           39            8 %
AUTO           40            3             7 %
GREEN          28            2             7 %
REIT           172           12            7 %
BIOTECH        407           24            6 %
ELECTRON       170           10            6 %
HOMEBLDG       17            1             6 %
SEMI           123           7             6 %
HACKERS        22            1             5 %
BIG17          46            2             4 %
GAMING         28            1             4 %
HOSPITAL       26            1             4 %
CHEM           61            2             3 %
INFRA          36            1             3 %
OILGAS         155           3             2 %
UTILITY        41            1             2 %
INDMATER       82            1             1 %
|
Table 4  Count of Stocks and New Lows in Key Tiger Directories
Date = 180821
               No           NLs            Pct
--------------------------------------------------------------------
MINCP          35            6             17 %
HOSPITAL       26            3             12 %
MILITARY       37            2             5 %
GAMING         28            1             4 %
PIPELINE       29            1             3 %
BIG17          46            1             2 %
BIOTECH        407           9             2 %
CHEM           61            1             2 %
CHINA          60            1             2 %
ELECTRON       170           3             2 %
GOLD           50            1             2 %
INDMATER       82            2             2 %
RETAIL         53            1             2 %
SEMI           123           2             2 %
UTILITY        41            1             2 %
BONDFUND       111           1             1 %
INDEXES        189           1             1 %
NASD-100       89            1             1 %
OILGAS         155           1             1 %
RUS-1000       815           2             0 %
SP500          476           1             0 %
|
 Table 5
 RANKING OF KEY DIRECTORIES BASED PCT.OF STOCKS ABOVE 65-DMA
              8/21/18
 Bullish = 32  Bearish = 14
---------------------------------------------------------------------------------------
Directory     Current       day-1         day-2         day-3         day-4         day-5
----------------------------------------------------------------------------------------
TRANSP         .9            .85           .7            .7            .65           .7
DOWJONES       .866          .866          .8            .8            .666          .666
BIGBANKS       .857          .857          .857          .714          .428          .571
DJI-13         .846          .846          .692          .692          .461          .384
GUNS           .833          .722          .777          .722          .666          .666
INSURANC       .833          .833          .833          .833          .766          .733
UTILITY        .804          .829          .853          .853          .878          .878
REGBANKS       .8            .733          .733          .7            .5            .7
PIPELINE       .793          .827          .793          .724          .655          .793
RETAIL         .773          .735          .698          .66           .622          .773
REIT           .755          .779          .79           .744          .691          .633
SP-100         .734          .744          .723          .702          .627          .648
FIDSTKS        .717          .701          .673          .657          .576          .635
SP500          .693          .676          .657          .623          .567          .602
MILITARY       .675          .675          .567          .513          .54           .594
RUS-1000       .667          .647          .629          .592          .549          .59
BEVERAGE       .666          .666          .666          .555          .555          .722
EDU            .666          .666          .666          .833          .833          .833
SOFTWARE       .661          .584          .584          .569          .584          .6
COMPUTER       .652          .652          .652          .652          .565          .608
INDEXES        .629          .592          .576          .571          .587          .571
NIFTY          .62           .551          .5            .551          .568          .637
NASD-100       .617          .595          .573          .584          .595          .606
FINANCE        .611          .588          .6            .544          .433          .544
BONDFUND       .603          .612          .567          .54           .621          .522
JETS           .6            .6            .5            .5            .5            .5
HACKERS        .59           .5            .5            .5            .363          .454
HOMEBLDG       .588          .411          .352          .352          .294          .352
CHEM           .573          .508          .475          .442          .377          .459
GREEN          .571          .428          .392          .392          .392          .464
AUTO           .55           .5            .475          .425          .375          .4
HOSPITAL       .538          .5            .5            .538          .461          .461
N=32
============================================================================================
INFRA          .5            .416          .416          .361          .388          .416
============================================================================================
BIG17          .456          .413          .434          .413          .413          .478
ELECTRON       .441          .382          .382          .4            .388          .458
BIOTECH        .434          .405          .415          .405          .39           .432
GAMING         .428          .392          .321          .357          .285          .285
INDMATER       .402          .353          .317          .317          .292          .353
COAL           .375          .375          .25           .375          .375          .375
SEMI           .365          .292          .292          .308          .317          .373
OILGAS         .361          .303          .277          .232          .193          .309
ETFS           .295          .245          .229          .196          .147          .245
FOOD           .222          .222          .222          .111          .111          .111
COMODITY       .178          .196          .196          .178          .178          .16
SOLAR          .166          .166          .111          .111          .055          .055
CHINA          .133          .116          .083          .083          .066          .066
GOLD           .02           .04           .04           .06           .06           .06
N=14
|
======================================================================
8-20-2018
For several weeks I have opined that the current S9-V was not strong
enough to short DIA or any other other major ETFs. Weak MINCPs
were preferred for shorting. Until we get another Sell S9v, I would avoid
shorting the major market ETFs. Professionals are too bullish. See the
rising
Closing Powers and the statistics in Table 2.
(The DJI chart below uses trading highs and lows, unlike the
normal Peerless chart further down.)

To cause a Sell S9v tomorrow, the DJI would need to rally about 270 points
on mediocre volume. Below is normal Peerless chart using DJI's hypothetical
highs and lows. An advance tomorrow should put the DJI decisively above
the top of its resistance zone and launch the DJI upwards to 26700. It is
not clear if the DJI's advance will bring along the NASDAQ and tech stocks.
Watch the Closing Powers for TECL and QQQ, shown below.
 |
SPY - rising Closing Power
 |
QQQ - rising Closing Power trend.
 |
TECL - rising Closing Power
 |
Most Professionals on Wall Street want the DJI in all-time high
ground when
the November election comes around. At least, that is the script that
the market seems to be following. But they may not be all-powerful. So,
we should watch the uptrendlines of the Closing Power of the DJI and
NYSE A/D Line to see if there is any sudden change of plan.
With the DJI now almost clearly above its well-tested resistance, 25650-25750,
it seems likely the DJI will next rise 3.3% over the next month and reach
its January peak of 26616.71. More than that seems unlikely. Volume remains
low and the V-I is still negative. When we study what happens when the A/D
Line is making new highs in August, as now we find 19 cases since 1965.
Six (31.6%) of these immediately peaked and then declined to the lower
band. But of these six, in only two instances did the DJI make their peaks
late in the month of August, which is what we must be concerned about.
Five times (26.3%) the DJI did not peak until September (9/7 to 9/25).
Four times (21.1%), the DJI did not peak until Octover. And on four
occasions (21.1%), the DJI kept rising.
| |
August A/D NH
Next Top and Decline to Lower Band.
8/29/2018 25759 P=162 IP21=.039 V=-22 ?????????????????????????
---------------------------------------------------------------------------------------------------
1 8/9/1967 927 P=73, IP21=.068,
VI=+8 9/25/1967 943 Sell S2 ---> LB
very small additional advance before decline
---------------------------------------------------------------------------------------------------
2 8/25/1978 906 P=238 IP21=-.036 VI=+6
9/11/1978
908 Sell S12 ---->LB
very small additional advance before decline
---------------------------------------------------------------------------------------------------
3 8/22/1979 886 P=246 IP21=.263
VI=+6 10/5/1979 898 Sell S9 ->11% fall
very small additional advance before big decline
-----------------------------------------------------------------------------------------------------
4 8/15/1980 967 P=93 IP21=.153
VI=+2 10/16/1980 959 Sell S9 ---> LB
No additional DJI gains before decline.
-----------------------------------------------------------------------------------------------------
5 8/25/1987
2680 P=109 IP21=.241 VI=+21 8/26/1987 2702 Sell S4 ->8-9% fall
very small additional advance before big decline
--------------------------------------------------------------------------------------------------------
6 8/9/1989 2686 P=130
IP21=.171 VI=+16 10/09/1989 2791
Sell S9 ->8% fall
very small additional advance before big decline
--------------------------------------------------------------------------------------------------------
7 8/28/1991 3055 P=83
IP21=.032 VI=+6 10/31/1991 3069 Earl S1 ->5.5% fall
No additional DJI gains before decline.
--------------------------------------------------------------------------------------------------------
8 8/24/1993 3639 P=132 IP21=.074 VI=+5 8/26/1993
3648 no Sell ->3.5%
No additional DJI gains before decline.
--------------------------------------------------------------------------------------------------------
9 8/21/1995
4615 P=113 IP21=-.024 V=+1
9/14/1995 B10 6 mo. flat, then up.
--------------------------------------------------------------------------------------------------------
10 8/6/1997 8259 P=213 IP21=.105 V=+17 8/6/1996 No Sell. --> 7%
fall.
No additional DJI gains before decline.
--------------------------------------------------------------------------------------------------------
11
8/16/2001 10393 P=176 IP21=.024 V=-94 8/16/2001 (9/11 Crash to 8400.)
No additional DJI gains before very big decline.
--------------------------------------------------------------------------------------------------------
12 8/20/2004 10110 P=209 IP21=.108 V=-101 9/7/2004 10343 S9-V ---->LB.
very small additional advance before big decline
-------------------------------------------------------------------------------------------------------
13
8/2/2005 10698 P=396 IP21=.076 V=+47 8/9/2005 10615 No Sell --->5% fall.
No additional DJI gains before decline.
-------------------------------------------------------------------------------------------------------
14 8/29/2006 11370
P=+294 IP21=.051 V=-21 B21 and B18 brought rally to Dec.
-----------------------------------------------------------------------------------------------------
15 8/13/2009 9398
P=+625 IP21=.206 V=175 B14 launched rally to year-end.
-----------------------------------------------------------------------------------------------------
16
8/9/2010 10699 P=+477 IP21=.246 V=-15 8/9/2010 S9V ---->LB.
No additional DJI gains before decline
-----------------------------------------------------------------------------------------------------
17 8/16/2012 13250 P=+155 IP21=.007 V=-23 9/14/2012 13593 S4/S8->7.5% down
Very small additional advance before decline
-----------------------------------------------------------------------------------------------------
18 8/25/2014 17077 P=148 IP21=-.019 V=-43 9/19/2014 17280 S17 -->7% down.
Very small additional advance before decline
-----------------------------------------------------------------------------------------------------
19 8/1/2017
21964 P=274 IP21=.045 V=-20 9/13/2017 breakout /big advance.
|
Charts 8/20/2018
PEERLESS DJI, Signals,
Indicators Daily DJI Volume 10-DayUp/Down Vol
Hourly DJIA A/D Line for All
Stocks
NASDAQ S&P OEX NYSE COMPQX DJI-15 DJI-20 DJI-30
DIA SPY QQQ MDY IWM TNA
Short-Term Rates
USO-CrudeOil FAS GLD BBH IBB JETS JNUG KOL NUGT OIH OIL RSX RETL
SDS SLV SOXL TECL TMF TNA UGA (gasoline) XIV YINN
Commodities: CANE
JJC, NIB, CHOC CORN, CUT (paper) WEAT UUP (Dollar)
AAPL ADBE ALXN AMAT AMGN AMD AMZN BA BABA BAC BIDU CAT CVX DE
FB GOOG GS HD IBM INTU (new) JPM M (Macy's) MSFT NFLX NVDA QCOM TSLA TXN
XOM WMT ANDV (refinery), CMG (Chipotle), LRCX, SWKS, MDGL
SPPI WATT
SQ TOWN
8/20/2018 (Click on Underlined link.)
Bullish MAXCPs - http://tigersoft.com/MAXCPZ/820/BULLISH.htm
Bearish MAXCPs - http://tigersoft.com/MINCPZ/820/BEARISH.htm
|
Table 1 QUICKSILVER on ETFS - 08/20/18
ETF      CLOSE   CHANGE     PIVOT-PT  5-dma AROC    CL-PWR      CANDLE   IP21   ITRS
---------------------------------------------------------------------------------------------
---------------------------------------------------------------------------------------------
DIA       257.43    .92      253.21        106.1%   Bullish      BLUE   .191     ----
---------------------------------------------------------------------------------------------
COMPQX    7821.01    4.68    7870.89       .8%      ----         RED    .098     .007
---------------------------------------------------------------------------------------------
SPY       285.67    .61      283.9         63%      Bullish      BLUE   .121     .01
---------------------------------------------------------------------------------------------
QQQ       179.7   -.16       181.45       -17.2%    ----         RED    .102     .014
---------------------------------------------------------------------------------------------
MDY       367.59    1.37     364.79        84.4%    Bullish      BLUE   .076    -.008
---------------------------------------------------------------------------------------------
IWM       168.82    .47      168.2         67.8%    ----         ----   .024    -.003
---------------------------------------------------------------------------------------------
FAS       73.27    .53       70.69         289.4%   Bullish      BLUE   .024     .03
---------------------------------------------------------------------------------------------
RETL      50.44    2.1       50.52         330.6%   ----         BLUE  -.002     .117
---------------------------------------------------------------------------------------------
SOXL      141.73   -.33      152.69       -386%     Bearish      RED    .097    -.215
---------------------------------------------------------------------------------------------
TECL      152.87   -.81      155.33        9.8%     Bullish      RED    .094     .027
---------------------------------------------------------------------------------------------
IBB       116.09   -.2       117.21       -20.2%    Bullish      RED   -.05      .038
---------------------------------------------------------------------------------------------
GLD       112.69    .56      113.07       -12%      Bearish      BLUE  -.418    -.1
---------------------------------------------------------------------------------------------
OIL       7.61    .04        6.89          339.4%   Bullish      BLUE   .263     .045
---------------------------------------------------------------------------------------------
OIH       24.33    .31       24.8         -101.1%   Bearish      BLUE  -.183    -.118
---------------------------------------------------------------------------------------------
GASL      19.82    .38       21.03        -209.2%   Bearish      BLUE  -.144    -.117
---------------------------------------------------------------------------------------------
UGA       32.82    .52       33.27        -35.1%    Bearish      BLUE  -.25    -.045
---------------------------------------------------------------------------------------------
UUP       25.38   -.06       25.59        -21.5%    ----         RED    .108     .014
---------------------------------------------------------------------------------------------
|
 Table 2
   Count of Stocks in Key Directories
          20180820
-------------------------------
NEWHIGHS       291    Sizeable Bullish Plurality
NEWLOWS        33
MAXCP          135    2:1 Professional Bullishness.
MINCP          62
TTTNH          131    Daya Traders are net bullish.
TTTNL          92
FASTUP         88
FASTDOWN       119    Swing traders are still more bearish.
CPCROSSA       57
CPCROSSD       60
BIGVOLUP       4
BIGVODN        2
|
Table 3
Count of Stocks and New Highs in Key Tiger Directories
Date = 180820
               No.          NHs            Pct
-------------------------------------------------------------------
MAXCP          135           84            62 %
JETS           10            3             30 %
TRANSP         20            5             25 %
RETAIL         53            11            21 %
EDU            6             1             17 %
AUTO           40            6             15 %
INDEXES        189           27            14 %
INSURANC       30            4             13 %
REGBANKS       30            4             13 %
GREEN          28            3             11 %
SP-100         94            10            11 %
DOWJONES       30            3             10 %
NIFTY          58            6             10 %
RUS-1000       815           83            10 %
SP500          476           48            10 %
COMPUTER       23            2             9 %
NASD-100       89            8             9 %
SOFTWARE       65            6             9 %
MILITARY       37            3             8 %
REIT           171           12            7 %
CHEM           61            3             5 %
FIDSTKS        184           9             5 %
HACKERS        22            1             5 %
ELECTRON       170           7             4 %
FINANCE        90            4             4 %
HOSPITAL       26            1             4 %
BIOTECH        407           14            3 %
PIPELINE       29            1             3 %
BIG17          46            1             2 %
ETFS           61            1             2 %
SEMI           123           3             2 %
UTILITY        41            1             2 %
OILGAS         155           2             1 %
|
Table 4  Count of Stocks and New Lows in Key Tiger Directories
Date = 180820
               No           NLs            Pct
--------------------------------------------------------------------
MINCP          62            17            27 %
FOOD           9             1             11 %
BIOTECH        407           23            6 %
HOMEBLDG       17            1             6 %
GAMING         28            1             4 %
GOLD           50            2             4 %
HOSPITAL       26            1             4 %
RETAIL         53            2             4 %
SEMI           123           5             4 %
CHINA          60            2             3 %
PIPELINE       29            1             3 %
BONDFUND       111           2             2 %
CHEM           61            1             2 %
COMODITY       56            1             2 %
ELECTRON       170           4             2 %
ETFS           61            1             2 %
FINANCE        90            2             2 %
INDMATER       82            2             2 %
OILGAS         155           3             2 %
SOFTWARE       65            1             2 %
FIDSTKS        184           1             1 %
INDEXES        189           2             1 %
NASD-100       89            1             1 %
RUS-1000       815           4             0 %
SP500          476           1             0 %
|
Table 5 RANKING OF KEY DIRECTORIES BASED PCT.OF STOCKS ABOVE 65-DMA
8/20/18
Bullish = 27 Bearish = 17
---------------------------------------------------------------------------------------
Directory Current day-1 day-2 day-3 day-4 day-5
----------------------------------------------------------------------------------------
DOWJONES .866 .8 .8 .666 .666 .633
BIGBANKS .857 .857 .714 .428 .571 .571
TRANSP .85 .7 .7 .65 .7 .65
DJI-13 .846 .692 .692 .461 .384 .384
INSURANC .833 .833 .833 .766 .733 .766
UTILITY        .829          .853          .853          .878          .878          .756
PIPELINE       .827          .793          .724          .655          .793          .758
REIT           .783          .795          .748          .69           .631          .584
SP-100         .744          .723          .702          .627          .659          .617
RETAIL         .735          .698          .66           .622          .773          .754
REGBANKS       .733          .733          .7            .5            .666          .533
GUNS           .722          .777          .722          .666          .666          .666
FIDSTKS        .701          .673          .657          .576          .63           .614
SP500          .676          .657          .623          .567          .605          .565
MILITARY       .675          .567          .513          .54           .594          .54
BEVERAGE       .666          .666          .555          .555          .722          .444
EDU            .666          .666          .833          .833          .833          .833
COMPUTER       .652          .652          .652          .565          .652          .608
RUS-1000       .647          .629          .592          .549          .588          .555
BONDFUND       .612          .567          .54           .621          .522          .594
JETS           .6            .5            .5            .5            .5            .5
NASD-100       .595          .573          .584          .595          .606          .595
INDEXES        .592          .576          .571          .587          .571          .592
FINANCE        .588          .6            .544          .433          .522          .444
SOFTWARE       .584          .584          .569          .584          .6            .6
NIFTY          .551          .5            .551          .568          .637          .62
CHEM           .508          .475          .442          .377          .459          .442
N=27
=============================================================================================
AUTO           .5            .475          .425          .375          .4            .375
HACKERS        .5            .5            .5            .363          .454          .5
HOSPITAL       .5            .5            .538          .461          .5            .5
=============================================================================================
GREEN          .428          .392          .392          .392          .464          .5
INFRA          .416          .416          .361          .388          .416          .416
BIG17          .413          .434          .413          .413          .478          .434
HOMEBLDG       .411          .352          .352          .294          .352          .352
BIOTECH        .405          .415          .405          .39           .432          .425
GAMING         .392          .321          .357          .285          .285          .25
ELECTRON       .382          .382          .4            .388          .464          .447
COAL           .375          .25           .375          .375          .375          .375
INDMATER       .353          .317          .317          .292          .353          .341
OILGAS         .303          .277          .232          .193          .309          .264
SEMI           .292          .292          .308          .317          .373          .373
ETFS           .245          .229          .196          .147          .213          .18
FOOD           .222          .222          .111          .111          .111          .111
COMODITY       .196          .196          .178          .178          .178          .125
SOLAR          .166          .111          .111          .055          .055          .055
CHINA          .116          .083          .083          .066          .066          .05
GOLD           .04           .04           .06           .06           .06           .06
M=17
|
=======================================================================
8-17-2018
The Sell S9-V is not working right now.
I show below that there is
some precedent for this, though it is abnormal. The DJI seems bent
on getting back to its high. This has become a dividend-paying, blue-chip
and defensive stock rally. Watch the NASDAQ and tech stocks, other than
AAPL and BA, to see if there really is enough money still coming into the
market to lift both tech stocks and defensive stocks after another boosted
opening.
So long as the Closing Powers for DIA, SPY and QQQ are in
rising
trends and the A/D Line is in its uptend, I would expect the current rally
to zig-zag higher until after Labor Day. But September does usually
bring a decline. So, the gains are apt to be small playing DIA, SPY and QQQ.
Watch their Closing Power trends. I would suggest being long some of the
Bullish MAXCPs that have recently made breakouts above flat tops.
The NYSE Adv-Decl. Line made a new all-time high Friday. There have
been 19 cases of ADL new highs in August since 1965. In 15 cases (79%),
the DJI topped out either immediately, in September or by the end of October
and then fell, at least, to the lower 3% lower band. The additional gains in
all these cases where the DJI soon topped out were under 2%. But note
that there were four cases when the DJI kept rising and two of these were
cases where the V-I was negative and one was last year.
(See the next Table where these are posted in green.) So, as long as the ADL
is in a rising trend, I think we must give the DJI more room to advance.
Only Bearish MINCPs are recommended as shorts at this point, not DIA...
But know that we willlikely get a new Sell S9-V if the DJI closes 2.4%
over the 21-dma. That is about 1.3% higher than where we closed today.
This would seem to limit the upside for now.

There 7 instances cases where the V-I was negative, as now, as the
the A/D Line made a new high in August. In 5 cases, the DJI quickly
declines to the lower band, at least. But in 2 cases, 2006 and 2017,
the DJI made a series of new highs and kept rising through the end
of the year.
August A/D NH
Next Top and Decline to Lower Band.
8/17/2018 25669 P=101 IP21=.044 V=-35 ?????????????????????????
---------------------------------------------------------------------------------------------------
1 8/9/1967 927 P=73, IP21=.068,
VI=+8 9/25/1967 943 Sell S2 ---> LB
very small additional advance before decline
---------------------------------------------------------------------------------------------------
2 8/25/1978 906 P=238 IP21=-.036 VI=+6
9/11/1978 908 Sell S12 ---->LB
very small additional advance before decline
---------------------------------------------------------------------------------------------------
3 8/22/1979 886 P=246 IP21=.263
VI=+6 10/5/1979 898 Sell S9 ->11% fall
very small additional advance before big decline
-----------------------------------------------------------------------------------------------------
4 8/15/1980 967 P=93 IP21=.153
VI=+2 10/16/1980 959 Sell S9 ---> LB
No additional DJI gains before decline.
-----------------------------------------------------------------------------------------------------
5 8/25/1987 2680 P=109 IP21=.241 VI=+21
8/26/1987 2702 Sell S4 ->8-9% fall
very small additional advance before big decline
--------------------------------------------------------------------------------------------------------
6 8/9/1989 2686 P=130
IP21=.171 VI=+16 10/09/1989 2791 Sell S9 ->8% fall
very small additional advance before big decline
--------------------------------------------------------------------------------------------------------
7 8/28/1991 3055 P=83
IP21=.032 VI=+6 10/31/1991 3069 Earl S1 ->5.5% fall
No additional DJI gains before decline.
--------------------------------------------------------------------------------------------------------
8 8/24/1993 3639 P=132 IP21=.074
VI=+5 8/26/1993 3648 no Sell ->3.5%
No additional DJI gains before decline.
--------------------------------------------------------------------------------------------------------
9 8/21/1995
4615 P=113 IP21=-.024 V=+1
9/14/1995 B10 6 mo. flat, then up.
--------------------------------------------------------------------------------------------------------
10 8/6/1997 8259
P=213 IP21=.105 V=+17 8/6/1996 No Sell. --> 7% fall.
No additional DJI gains before decline.
--------------------------------------------------------------------------------------------------------
11 8/16/2001 10393 P=176 IP21=.024 V=-94 8/16/2001 (9/11 Crash to
8400.)
No additional DJI gains before very big decline.
--------------------------------------------------------------------------------------------------------
12 8/20/2004 10110 P=209 IP21=.108 V=-101 9/7/2004 10343 S9-V ---->LB.
very small additional advance before big decline
-------------------------------------------------------------------------------------------------------
13 8/2/2005 10698 P=396 IP21=.076 V=+47
8/9/2005 10615 No Sell --->5% fall.
No additional DJI gains before decline.
-------------------------------------------------------------------------------------------------------
14 8/29/2006 11370
P=+294 IP21=.051 V=-21 B21 and B18 brought rally to Dec.
-----------------------------------------------------------------------------------------------------
15 8/13/2009 9398
P=+625 IP21=.206 V=175 B14 launched rally to year-end.
-----------------------------------------------------------------------------------------------------
16 8/9/2010 10699 P=+477 IP21=.246 V=-15 8/9/2010 S9V ---->LB.
No additional DJI gains before decline
-----------------------------------------------------------------------------------------------------
17 8/16/2012 13250 P=+155 IP21=.007 V=-23 9/14/2012 13593 S4/S8->7.5%
down
Very small additional advance before decline
-----------------------------------------------------------------------------------------------------
18 8/25/2014 17077 P=148 IP21=-.019 V=-43 9/19/2014 17280 S17
-->7% down.
Very small additional advance before decline
-----------------------------------------------------------------------------------------------------
19 8/1/2017
21964 P=274 IP21=.045 V=-20 9/13/2017 breakout /big advance.
==================================================================================
The Fed is slow to raise rates. Hence the strength in Utilities and REITs,
as well as the A/D line. Watch the Professionals action in SPY, DIA and QQQ.
Do not fight the the FED or these Professionals, at this time.
The odds do favor the DJI stalling out in the next month without much additional
gain. But the cases of 2006 and 2017 show that it is possible for the DJI to
keep rising
even in the normally bearish month of September. We can understand this to be the
result of the strong Dollar and the limited rise in interest rates, so far. Weakness
in mnay foreign markets right now is attracting foreign funds and also allowing the
Big Banks and performance-minded fund managers to keep the bull market going,
for at least a while longer.
Charts 8/17/2018
PEERLESS DJI, Signals,
Indicators Daily DJI Volume 10-DayUp/Down Vol
Hourly DJIA A/D Line for All
Stocks
NASDAQ S&P OEX NYSE COMPQX DJI-15 DJI-20 DJI-30
DIA SPY QQQ MDY IWM TNA
Short-Term Rates
USO-CrudeOil FAS GLD BBH IBB JETS JNUG KOL NUGT OIH OIL RSX RETL
SDS SLV SOXL TECL TMF TNA UGA (gasoline) XIV YINN
Commodities: CANE
JJC, NIB, CHOC CORN, CUT (paper) WEAT UUP (Dollar)
AAPL ADBE ALXN AMAT AMGN AMD AMZN BA BABA BAC BIDU CAT CVX DE
FB GOOG GS HD IBM INTU (new) JPM M (Macy's) MSFT NFLX NVDA QCOM TSLA TXN
XOM WMT ANDV (refinery), CMG (Chipotle), LRCX, SWKS, MDGL
SPPI WATT
SQ TOWN
8/17/2018 (Click on Underlined link.)
Bullish MAXCPs - http://tigersoft.com/MAXCPZ/817/BULLISH.htm
Bearish MAXCPs - http://tigersoft.com/MINCPZ/817/BEARISH.htm
|
Table 1 QUICKSILVER on ETFS - 08/17/18
ETF      CLOSE   CHANGE     PIVOT-PT  5-dma AROC    CL-PWR      CANDLE   IP21   ITRS
---------------------------------------------------------------------------------------------
---------------------------------------------------------------------------------------------
DIA       256.51    .57      252.04        63.4%   Bullish      BLUE   .187     ----
---------------------------------------------------------------------------------------------
COMPQX    7816.33    9.81    7819.71      -14.6%   ----         BLUE   .05      .008
---------------------------------------------------------------------------------------------
SPY       285.06    1        282.1         33.6%   Bullish      BLUE   .066     .012
---------------------------------------------------------------------------------------------
QQQ       179.86    .04      180.32       -18.3%   Bullish      BLUE   .064     .015
---------------------------------------------------------------------------------------------
MDY       366.22    1.85     361.45        40.2%   Bullish      BLUE  -.005    -.006
---------------------------------------------------------------------------------------------
IWM       168.35    .72      166.55        24.5%   ----         BLUE  -.023    -.002
---------------------------------------------------------------------------------------------
FAS       72.74    .8        69.17         153.4%  Bullish      BLUE   .033     .033
---------------------------------------------------------------------------------------------
RETL      48.34    1.43      47.27         28.2%   Bearish      BLUE  -.152     .101
---------------------------------------------------------------------------------------------
SOXL      142.06   -3.32     153.15       -349.6%  Bearish      BLUE   .081    -.233
---------------------------------------------------------------------------------------------
TECL      153.68    .73      152.57        17%     Bullish      BLUE   .072     .032
---------------------------------------------------------------------------------------------
IBB       116.29    .02      116.56       -18.9%   Bullish      BLUE  -.054     .044
---------------------------------------------------------------------------------------------
GLD       112.13    1.03     112.96       -113.7%  Bearish      BLUE  -.422    -.103 very Weak.
---------------------------------------------------------------------------------------------
OIL       7.61    .04        6.89          339.4%  Bullish      BLUE   .263     .046
---------------------------------------------------------------------------------------------
OIH       24.02    .21       24.82        -297.7%  Bearish      BLUE  -.225    -.144
---------------------------------------------------------------------------------------------
GASL      19.44    .23       20.65        -650.5%  Bearish      RED   -.171    -.149
---------------------------------------------------------------------------------------------
UGA       32.3   -.16        33.05        -153.3%  Bearish      RED   -.222    -.062
---------------------------------------------------------------------------------------------
|
Table 2 Count of Stocks in Key Directories
20180817
-------------------------------
NEWHIGHS 261 Bullish ratio.
NEWLOWS 43
MAXCP 171 Bullish Plurality.
MINCP 57
TTTNH 152 Even day traders are optimistic.
TTTNL 92
FASTUP 65
FASTDOWN 211 Swing Traders are still bearish.
CPCROSSA 128 Professionals are busy buying again.
CPCROSSD 39
BIGVOLUP 1
BIGVODN 8
|
Table 3
Count of Stocks and New Highs in Key Tiger Directories
Date = 180817
               No.          NHs            Pct
-------------------------------------------------------------------
MAXCP          171           100           58 %
HOSPITAL       7             3             43 %
REGBANKS       30            5             17 %
RETAIL         53            8             15 %
COMPUTER       23            3             13 %
DOWJONES       30            4             13 %
NASD-100       89            11            12 %
REIT           172           21            12 %
SP-100         94            11            12 %
UTILITY        41            5             12 %
RUS-1000       815           82            10 %
SP500          476           48            10 %
HACKERS        22            2             9 %
SOFTWARE       65            6             9 %
DJI-13         13            1             8 %
INDEXES        189           16            8 %
MILITARY       37            3             8 %
AUTO           40            3             7 %
FIDSTKS        184           13            7 %
GREEN          28            2             7 %
NIFTY          58            4             7 %
HOMEBLDG       17            1             6 %
TRANSP         20            1             5 %
GAMING         28            1             4 %
BIOTECH        407           14            3 %
CHEM           61            2             3 %
INSURANC       30            1             3 %
ELECTRON       170           4             2 %
ETFS           61            1             2 %
FINANCE        90            2             2 %
INDMATER       82            1             1 %
OILGAS         155           2             1 %
SEMI           123           1             1 %
|
Table 4  Count of Stocks and New Lows in Key Tiger Directories
Date = 180817
               No           NLs            Pct
--------------------------------------------------------------------
MINCP          57            21            37 %
HOMEBLDG       17            2             12 %
FOOD           9             1             11 %
PIPELINE       29            2             7 %
BIOTECH        407           25            6 %
CHINA          60            3             5 %
GAMING         28            1             4 %
SEMI           123           5             4 %
AUTO           40            1             3 %
BONDFUND       111           3             3 %
ELECTRON       170           5             3 %
FINANCE        90            3             3 %
CHEM           61            1             2 %
COMODITY       56            1             2 %
NASD-100       89            2             2 %
RETAIL         53            1             2 %
SOFTWARE       65            1             2 %
FIDSTKS        184           2             1 %
INDMATER       82            1             1 %
INDEXES        189           2             1 %
OILGAS         155           1             1 %
RUS-1000       815           8             1 %
SP500          476           4             1 %
|
Table 5 RANKING OF KEY DIRECTORIES BASED PCT.OF STOCKS ABOVE 65-DMA
8/17/18
Bullish = 25
Bearish = 19
---------------------------------------------------------------------------------------
Directory Current day-1 day-2 day-3 day-4 day-5
----------------------------------------------------------------------------------------
BIGBANKS .857 .714 .428 .571 .571 .571
UTILITY .853 .853 .878 .878 .756 .804
INSURANC .833 .833 .766 .733 .766 .8
DOWJONES .8 .8 .666 .666 .633 .766
PIPELINE .793 .724 .655 .793 .758 .793
REIT           .79           .744          .691          .633          .581          .616
GUNS           .777          .722          .666          .666          .666          .666
REGBANKS       .733          .7            .5            .666          .533          .566
SP-100         .723          .702          .627          .659          .617          .68
HOSPITAL       .714          .714          .714          .714          .714          .714
TRANSP         .7            .7            .65           .7            .65           .65
RETAIL         .698          .66           .622          .773          .754          .716
DJI-13         .692          .692          .461          .384          .384          .615
FIDSTKS        .673          .657          .576          .63           .614          .668
BEVERAGE       .666          .555          .555          .722          .5            .555
EDU            .666          .833          .833          .833          .833          .833
SP500          .657          .623          .567          .605          .567          .621
COMPUTER       .652          .652          .565          .652          .608          .695
RUS-1000       .629          .592          .549          .588          .557          .593
FINANCE        .6            .544          .433          .522          .444          .455
SOFTWARE       .584          .569          .584          .6            .6            .615
INDEXES        .576          .571          .587          .571          .587          .576
NASD-100       .573          .584          .595          .606          .595          .606
BONDFUND       .567          .54           .621          .522          .585          .594
MILITARY       .567          .513          .54           .594          .54           .513
N=25
===============================================================================================
HACKERS        .5            .5            .363          .454          .5            .59
JETS           .5            .5            .5            .5            .5            .5
NIFTY          .5            .551          .568          .637          .62           .637
===============================================================================================
AUTO           .475          .425          .375          .4            .375          .5
CHEM           .475          .442          .377          .459          .442          .475
BIG17          .434          .413          .413          .478          .434          .478
INFRA          .416          .361          .388          .416          .416          .444
BIOTECH        .415          .405          .39           .432          .434          .444
GREEN          .392          .392          .392          .464          .5            .535
ELECTRON       .382          .4            .388          .464          .452          .482
HOMEBLDG       .352          .352          .294          .352          .352          .47
GAMING         .321          .357          .285          .285          .25           .25
INDMATER       .317          .317          .292          .353          .341          .353
SEMI           .292          .308          .317          .373          .373          .455
OILGAS         .277          .232          .193          .309          .264          .367
COAL           .25           .375          .375          .375          .375          .375
ETFS           .229          .196          .147          .213          .18           .229
FOOD           .222          .111          .111          .111          .111          .222
COMODITY       .196          .178          .178          .178          .125          .196
SOLAR          .111          .111          .055          .055          .055          .166
CHINA          .083          .083          .066          .066          .05           .066
GOLD           .04           .06           .06           .06           .06           .12
N=19
|
====================================================================
====================================================================
8-16-2018
Our Peerless S9-v still operates. The
V-Indicator is still
quite negative; so with the DJI back to its recent highs, it will
be much harder for the DJI to advance unless there is concrete
evidence that the trade wars are actually ending.
But make no mistake about it, the big Banks do not want much of
a sell-off now before the November Election. They apparently,
do not want to take a chance on even a small decline. Hence, the
manipulated, much higher opening today using the highest priced
DJI stocks as their agents. With Professionals doing their best
to hold the DIA up, I would prefer not to short DIA in these conditions.

The NASDAQ and tech stocks made much smaller gains. ADBE,
FB, GOOG, NFLX, NVDA and most semi-conductors fell today.
The SP-500 and SPY have reached the apex of potential head/shoulders.
They would seem more vulnerable than the DJI. But I would prefer
to short the weakest MINCPs and use breaks of the Closing Power
downtrends with these to tell us when to cover.

NASDAQ is in a narrowing trading range. Support is at its rising 65-dma
but there is a lot of resistance at 8000. Our Nifty Tech Stocks show quite
similar boundaries, for now. 

Manipulation?
How dare we say that the market is being heavily "manipulated" now?
Perhaps, the big DJI gain today was simply the result of relief
that there might be a cessation in the trade war, which would especially
hurt many big DJI stocks like BA and CAT. That could also explain why
the DJI's rise was much bigger than the other indexes'.
I still favor the "manipulation" explanation.
1) The Big Banks have a vested interest in keeping Trumps' supporters
in Congress for another term. The strong "economy" is their most
compelling argument. Why risk a market melt-down?
2) Is there any proof that the Big Banks' trading for their own accounts is
seriously limited or regulated? There is no public scrutiny. And
they have virtually unlimited trading funds, also courtesy of the FED.
3) They only need to buy in the lighter-trading Futures market and then
later push up the prices of a handful of individual DJI stocks at the
opening in collusion with market makers to bring about a big advance.
I think that's what we saw today "in spades"!
Most of today's big rally took place because of just five stocks in the DJIA:
(BA +14.20), WMT (8.42), CAT (4.24), GS (+3.75) and AAPL (+3.08).
These accounted for 229 of the DJI's 398 point rise. One other stock,
WMT (+8.42) added 51 more points to the DJIA.
Short Sales Anyone?
Gold fell again today. I would hold by my
asessment that a number of foreign
countries
are slipping closer to recession. The decline in Gold reflects
their
need to raise funds. I would put India, Japan and Russia in that camp.
More
weakness in Gold, Oil and Gas, which Russia produces a lot of,
could easily cause another recession there. Putin recently has had to increase
the retirement age, all the while he must spend very large sums to match
the Americans' build-up. All this should make RSX a good short sale. It
could collapse again, as it did in 1998. In general, look at the stocks making
new lows for ideas here. The Closing Power should be making a new low.
Ideally, the AI/200 should be below 65 and the IP21 should be below its
own 21-dma.
| |
Table 1 QUICKSILVER on ETFS - 08/16/18
ETF      CLOSE   CHANGE     PIVOT-PT  5-dma AROC    CL-PWR      CANDLE   IP21   ITRS
---------------------------------------------------------------------------------------------
---------------------------------------------------------------------------------------------
DIA       255.94    4.18     253.3         15.4%   Bullish      BLUE   .149    -----
---------------------------------------------------------------------------------------------
COMPQX    7806.52    32.4    7839.11      -54.4%   Bearish      RED    .012    -.002
---------------------------------------------------------------------------------------------
SPY       284.06    2.28     283.16       -17.8%   Bullish      BLUE   .032     .006
---------------------------------------------------------------------------------------------
QQQ       179.82    .59      180.52       -57.8%   ----         RED    .013     .005
---------------------------------------------------------------------------------------------
MDY       364.37    2.99     363.3        -13.8%   Bullish      BLUE  -.005    -.012
---------------------------------------------------------------------------------------------
IWM       167.63    1.54     167.53       -11.1%   ----         BLUE  -.013    -.013
---------------------------------------------------------------------------------------------
FAS       71.94    2.24      70.58        -38.3%   Bullish      BLUE  -.032     .015
---------------------------------------------------------------------------------------------
RETL      46.91    .27       48.07        -101.9%  Bearish      RED   -.163     .087
---------------------------------------------------------------------------------------------
SOXL      145.38   -1.02     152.55       -636.6%  Bearish      RED    .046    -.238
---------------------------------------------------------------------------------------------
TECL      152.95    1.72     153.16       -126.8%  Bullish      RED    .038    -.003
---------------------------------------------------------------------------------------------
IBB       116.27    .89      116.73       -47.1%   Bullish      BLUE  -.033     .034
---------------------------------------------------------------------------------------------
GLD       111.1   -.09       114.69       -160.6%  Bearish      RED   -.459    -.114
---------------------------------------------------------------------------------------------
OIL       7.61    .04        6.89          339.4%  Bullish      BLUE   .263     .044
---------------------------------------------------------------------------------------------
OIH       23.81    .11       25.48        -278.2%  Bearish      RED   -.264    -.136
---------------------------------------------------------------------------------------------
GASL      19.21    .35       22.09        -610.7%  Bearish      BLUE  -.117    -.106
---------------------------------------------------------------------------------------------
|
  Table 2  Count of Stocks in Key Directories
          20180816
-------------------------------
NEWHIGHS       190    Bullish
NEWLOWS        59
MAXCP          105    modestly bullish
MINCP          96
TTTNH          108
TTTNL          109
FASTUP         74
FASTDOWN       282    swing-traders are bearish
CPCROSSA       104    Pros switching to bullish for some stocks
CPCROSSD       48
BIGVOLUP       2
BIGVODN        9
|
Table 3
Count of Stocks and New Highs in Key Tiger Directories
Date = 180816
               No.          NHs            Pct
-------------------------------------------------------------------
MAXCP          105           56            53 %
EDU            6             1             17 %
REGBANKS       30            5             17 %
HOSPITAL       7             1             14 %
INSURANC       30            4             13 %
DOWJONES       30            3             10 %
JETS           10            1             10 %
TRANSP         20            2             10 %
COMPUTER       23            2             9 %
DJI-13         13            1             8 %
NASD-100       89            7             8 %
AUTO           40            3             7 %
REIT           172           12            7 %
RUS-1000       815           54            7 %
SP500          476           32            7 %
UTILITY        41            3             7 %
HOMEBLDG       17            1             6 %
NIFTY          51            3             6 %
RETAIL         53            3             6 %
SOFTWARE       65            4             6 %
SP-100         94            6             6 %
FIDSTKS        184           10            5 %
HACKERS        22            1             5 %
INDEXES        189           9             5 %
MILITARY       37            2             5 %
BIG17          48            2             4 %
COMODITY       56            2             4 %
FINANCE        90            4             4 %
GREEN          28            1             4 %
BIOTECH        407           12            3 %
CHEM           61            1             2 %
ELECTRON       171           1             1 %
OILGAS         155           1             1 %
SEMI           124           1             1 %
|
Table 4  Count of Stocks and New Lows in Key Tiger Directories
Date = 180816
               No           NLs            Pct
--------------------------------------------------------------------
GOLD           50            31            62 %
MINCP          96            28            29 %
COMODITY       56            9             16 %
HOMEBLDG       17            2             12 %
FOOD           9             1             11 %
SOLAR          18            2             11 %
SEMI           124           10            8 %
CHINA          60            4             7 %
PIPELINE       29            2             7 %
BIOTECH        407           24            6 %
INDMATER       82            5             6 %
INDEXES        189           11            6 %
BONDFUND       111           5             5 %
ELECTRON       171           8             5 %
COMPUTER       23            1             4 %
GAMING         28            1             4 %
RETAIL         53            2             4 %
NASD-100       89            3             3 %
SOFTWARE       65            2             3 %
BIG17          48            1             2 %
CHEM           61            1             2 %
FINANCE        90            2             2 %
FIDSTKS        184           2             1 %
OILGAS         155           2             1 %
RUS-1000       815           12            1 %
SP500          476           3             1 %
|
Table 5 RANKING OF KEY DIRECTORIES BASED PCT.OF STOCKS ABOVE 65-DMA
8/16/18
Bullish = 26
Bearish = 18
---------------------------------------------------------------------------------------
Directory Current day-1 day-2 day-3 day-4 day-5
----------------------------------------------------------------------------------------
UTILITY .853 .878 .878 .756 .804 .878
EDU .833 .833 .833 .833 .833 .5
INSURANC .833 .766 .733 .766 .8 .8
DOWJONES .8 .666 .666 .633 .766 .8
REIT .744 .691 .633 .581 .616 .68
PIPELINE       .724          .655          .793          .758          .793          .827
GUNS           .722          .666          .666          .666          .666          .777
BIGBANKS       .714          .428          .571          .571          .571          .857
HOSPITAL       .714          .714          .714          .714          .714          .571
SP-100         .702          .627          .659          .617          .68           .712
REGBANKS       .7            .5            .666          .533          .566          .6
TRANSP         .7            .65           .7            .65           .65           .7
DJI-13         .692          .461          .384          .384          .615          .692
RETAIL         .66           .622          .773          .754          .754          .735
FIDSTKS        .657          .576          .63           .614          .652          .711
COMPUTER       .652          .565          .652          .608          .695          .652
SP500          .623          .567          .605          .567          .623          .665
RUS-1000       .592          .549          .588          .557          .593          .638
NASD-100       .584          .595          .606          .595          .606          .662
INDEXES        .571          .587          .571          .587          .576          .597
SOFTWARE       .569          .584          .6            .6            .615          .63
BEVERAGE       .555          .555          .722          .5            .555          .666
FINANCE        .544          .433          .522          .444          .433          .544
BONDFUND       .54           .621          .522          .585          .594          .45
MILITARY       .513          .54           .594          .54           .513          .648
NIFTY          .509          .529          .607          .588          .607          .686
N=26
============================================================================================
HACKERS        .5            .363          .454          .5            .59           .5
JETS           .5            .5            .5            .5            .5            .5
============================================================================================
CHEM           .442          .377          .459          .442          .475          .508
BIG17          .437          .437          .5            .458          .479          .437
AUTO           .425          .375          .4            .375          .5            .5
BIOTECH        .405          .39           .432          .434          .442          .434
ELECTRON       .397          .385          .461          .45           .485          .561
GREEN          .392          .392          .464          .5            .5            .571
COAL           .375          .375          .375          .375          .375          .375
INFRA          .361          .388          .416          .416          .444          .5
GAMING         .357          .285          .285          .25           .25           .285
HOMEBLDG       .352          .294          .352          .352          .47           .47
INDMATER       .317          .292          .353          .341          .353          .39
SEMI           .306          .314          .37           .37           .459          .548
OILGAS         .232          .193          .309          .264          .38           .406
ETFS           .196          .147          .213          .18           .229          .36
COMODITY       .178          .178          .178          .125          .196          .232
FOOD           .111          .111          .111          .111          .222          .333
SOLAR          .111          .055          .055          .055          .166          .333
CHINA          .083          .066          .066          .05           .066          .083
GOLD           .06           .06           .06           .06           .12           .2
N=18
|
=========================================================================
8-15-2018 Our Peerless S9-v still operates and warns that any rally back to
25500 will have a difficult time because NYSE Up Volume is
probably not high enough to bring a breakout. So, stay short a selection
of our recent Bearish MINCPs. The Futures are up +200. But if
there is a DJI rally up close to 25500 -25500, we will considering going
short DIA or SPY.
Will "Tahiti" Techs Turn Around Tomorrow?

Watch the big techs tomorrow. Our Index shows that they have fallen
to their rising 65-dma. This past year they have always turned up at
this point.

With the Dollar very strong and intgrest rates not so high yet as to
cause a recession in the US, Professionals came back into the market
to buy after an hour and a half of trading. A lot is at stake because of
the Congressional elections this Fall. Wall Street's big banks
have their own strong interest in propping up the general market.
It will be important to see if the big jump today can be built upon
after the opening. If not, it will be a sign of weakness, I would say.

Today's late recovery in the Blue Chips, big Techs
and the major
market ETFs must soon begin spreading to other stocks. This
will be difficult. Our Table 5 below shows that a majority of the sectors we
follow now have most of their stocks below the key support of the 65-dma.
Many will have trouble getting up past that resistance. In addition, our
Table 2 below shows bearish ratios of 2:1 for new highs to new lows,
Closing Power new highs to CP new lows and Day Trader Tool new lows
to new highs. So, any major market ETF rally now may be limited in the
number of stocks and sectors it brings along.
That should not adversely affect our short sales in the Bearish MINCPs.
But it should let the "Tahiti" tech stocks in our "NIFTY" data base
advance.
US as The "Last Man Standing"
The big weakness again today was mostly in Gold,
Foreign ETFs and
now Oil stocks. The Dollar's strength will act to draw in more foreign money
into US stocks and bonds. But Gold's extreme weakness almost certainly shows
that one or more overseas' governments are desperately raising funds because of
their financial problems. The new US tariffs on these countries goods will surely
hurt their economies. If this trend worsens, Trump tariffs could end up
causing a world-wide recession. With US tech stocks and major market ETFs
being priced for strong growth for at least two more years, serious economic
weakness in Europe, Japan, Latin America, China and Russia could be very
hurtful to the US in the end. The Trump tax cuts have increased buying power,
but probably not as much as they have caused stocks to rise. The basic problem
of the 1920s could well repeat. With no sign that workers' real wages are rising
as fast as Inflation, it is unclear who exactly will be the consumers for what our
factories are making.
Let's keep watching the Tiger Index of Foreign ETFs,
YINN (China) and the
charts of Ford and Caterpillar, two important US manufacturers.
Charts 8/15/2018
PEERLESS DJI, Signals,
Indicators Daily DJI Volume 10-DayUp/Down Vol
Hourly DJIA A/D Line for All
Stocks
NASDAQ S&P OEX NYSE COMPQX DJI-15 DJI-20 DJI-30
DIA SPY QQQ MDY IWM TNA
Short-Term Rates
USO-CrudeOil FAS GLD BBH IBB JETS JNUG KOL NUGT OIH OIL RSX RETL
SDS SLV SOXL TECL TMF TNA UGA (gasoline) XIV YINN
Commodities: CANE
JJC, NIB, CHOC CORN, CUT (paper) WEAT UUP (Dollar)
AAPL ADBE ALXN AMAT AMGN AMD AMZN BA BABA BAC BIDU CAT CVX DE
FB GOOG GS HD IBM INTU (new) JPM M (Macy's) MSFT NFLX NVDA QCOM TSLA TXN
XOM WMT ANDV (refinery), CMG (Chipotle), LRCX, SWKS, MDGL
SPPI WATT
SQ TOWN
8/15/2018 (Click on Underlined link.)
Bullish MAXCPs - http://tigersoft.com/MAXCPZ/815/BULLISH.htm
Bearish MAXCPs - http://tigersoft.com/MINCPZ/815/BEARISH.htm
|
Table 1 QUICKSILVER on ETFS - 08/15/18
ETF      CLOSE   CHANGE     PIVOT-PT  5-dma AROC    CL-PWR      CANDLE   IP21   ITRS
---------------------------------------------------------------------------------------------
---------------------------------------------------------------------------------------------
DIA       251.76   -1.45     255.16       -76%      Bullish      ----   .122     -----
---------------------------------------------------------------------------------------------
COMPQX    7774.12   -96.77   7891.78      -72.6%    ----         RED    .076     .003
---------------------------------------------------------------------------------------------
SPY       281.78   -2.12     285.07       -64.8%    Bullish      RED    .069     .01
---------------------------------------------------------------------------------------------
QQQ       179.23   -2.22     181.91       -77%      Bullish      RED    .034     .011
---------------------------------------------------------------------------------------------
MDY       361.38   -3.41     365.37       -59%      Bullish      RED    .023    -.009
---------------------------------------------------------------------------------------------
IWM       166.09   -2.11     168          -44.2%    Bearish      RED    .008    -.012
---------------------------------------------------------------------------------------------
FAS       69.7   -.99        72.48        -242.2%   ----         ----   .011     .032
---------------------------------------------------------------------------------------------
RETL      46.64   -3.88      47.89        -64.3%    Bearish      RED   -.094     .101
---------------------------------------------------------------------------------------------
SOXL      146.4   -6.29      164.98       -751.3%   ----         RED    .098    -.215
---------------------------------------------------------------------------------------------
TECL      151.23   -4.1      156.85       -175.3%   Bullish      RED    .073     .006
---------------------------------------------------------------------------------------------
IBB       115.38   -1.83     117.37       -92.7%    Bullish      RED   -.024     .042
---------------------------------------------------------------------------------------------
GLD       111.19   -1.88     114.74       -163.1%   Bearish      RED   -.38     -.109   Worst
---------------------------------------------------------------------------------------------
OIL       7.61    .04        6.89          339.4%   Bullish      BLUE   .263     .047   Best
---------------------------------------------------------------------------------------------
OIH       23.7   -1.1        25.19        -391%     Bearish      RED   -.22    -.131
---------------------------------------------------------------------------------------------
GASL      18.86   -2.17      21.76        -698.4%   Bearish      RED   -.082    -.107
---------------------------------------------------------------------------------------------
|
Table 2 Count of Stocks in Key Directories
20180815
-------------------------------
NEWHIGHS 96
NEWLOWS 203 Bearish >2:1 plurality.
MAXCP 86
MINCP 191 Bearish >2:1 plurality.
TTTNH 82
TTTNL 242 Bearish >2:1 plurality.
FASTUP 87
FASTDOWN 325 Bearish >2:1 plurality.
CPCROSSA 56
CPCROSSD 160 Bearish >2:1 plurality.
BIGVOLUP 2
BIGVODN 13
|
Table 3
Count of Stocks and New Highs in Key Tiger Directories
Date = 180815
               No.          NHs            Pct
-------------------------------------------------------------------
MAXCP          86            38            44 %
INSURANC       30            3             10 %
JETS           10            1             10 %
COMPUTER       23            2             9 %
DJI-13         13            1             8 %
COMODITY       56            4             7 %
DOWJONES       30            2             7 %
NASD-100       89            5             6 %
RETAIL         53            3             6 %
HACKERS        22            1             5 %
SOFTWARE       64            3             5 %
SP500          476           22            5 %
TRANSP         20            1             5 %
UTILITY        41            2             5 %
GREEN          28            1             4 %
SP-100         94            4             4 %
AUTO           40            1             3 %
FIDSTKS        184           6             3 %
RUS-1000       815           28            3 %
BIG17          48            1             2 %
ETFS           61            1             2 %
NIFTY          51            1             2 %
REIT           172           4             2 %
BIOTECH        406           4             1 %
ELECTRON       171           1             1 %
FINANCE        90            1             1 %
INDEXES        189           1             1 %
OILGAS         155           1             1 %
SEMI           124           1             1 %
|
Table 4  Count of Stocks and New Lows in Key Tiger Directories
Date = 180815
               No           NLs            Pct
--------------------------------------------------------------------
GOLD           50            34            68 %
CHINA          60            25            42 %
ETFS           61            25            41 %
MINCP          191           76            40 %
COMODITY       56            22            39 %
FOOD           9             2             22 %
HOMEBLDG       17            3             18 %
SOLAR          18            3             17 %
AUTO           40            6             15 %
INDMATER       82            12            15 %
GAMING         28            4             14 %
COAL           8             1             13 %
SEMI           124           15            12 %
SOFTWARE       64            7             11 %
JETS           10            1             10 %
BIOTECH        406           35            9 %
COMPUTER       23            2             9 %
HACKERS        22            2             9 %
NASD-100       89            8             9 %
ELECTRON       171           14            8 %
INFRA          36            3             8 %
GREEN          28            2             7 %
PIPELINE       29            2             7 %
FINANCE        90            5             6 %
INDEXES        189           12            6 %
CHEM           61            3             5 %
FIDSTKS        184           7             4 %
OILGAS         155           6             4 %
RETAIL         53            2             4 %
RUS-1000       815           29            4 %
SP500          476           13            3 %
BIG17          48            1             2 %
BONDFUND       111           2             2 %
SP-100         94            2             2 %
|
Table 5 RANKING OF KEY DIRECTORIES BASED PCT.OF STOCKS ABOVE 65-DMA
8/15/18
Bearish = 23
Bullish = 22
---------------------------------------------------------------------------------------
Directory Current day-1 day-2 day-3 day-4 day-5
----------------------------------------------------------------------------------------
UTILITY .878 .878 .756 .804 .878 .829
EDU .833 .833 .833 .833 .666 .666
INSURANC .766 .733 .766 .8 .8 .8
HOSPITAL .714 .714 .714 .714 .571 .714
REIT .691 .633 .581 .616 .68 .68
DOWJONES       .666          .666          .633          .766          .8            .8
GUNS           .666          .666          .666          .666          .777          .777
PIPELINE       .655          .793          .758          .793          .827          .793
TRANSP         .65           .7            .65           .65           .7            .7
SP-100         .627          .659          .617          .68           .712          .734
RETAIL         .622          .773          .754          .754          .735          .66
BONDFUND       .621          .522          .585          .594          .459          .45
NASD-100       .595          .606          .595          .606          .651          .662
INDEXES        .587          .571          .587          .576          .603          .624
SOFTWARE       .578          .609          .593          .625          .64           .609
FIDSTKS        .576          .63           .614          .652          .711          .695
SP500          .567          .605          .567          .623          .663          .676
COMPUTER       .565          .652          .608          .695          .652          .652
BEVERAGE       .555          .722          .5            .555          .666          .611
RUS-1000       .549          .588          .557          .593          .638          .646
MILITARY       .54           .594          .54           .513          .648          .675
NIFTY          .529          .607          .588          .607          .666          .666
N=22
=========================================================================================
JETS           .5            .5            .5            .5            .5            .5
REGBANKS       .5            .666          .533          .566          .6            .6
=========================================================================================
DJI-13         .461          .384          .384          .615          .692          .692
BIG17          .437          .5            .458          .5            .395          .458
FINANCE        .433          .522          .444          .433          .555          .544
BIGBANKS       .428          .571          .571          .571          .857          .857
GREEN          .392          .464          .5            .5            .571          .607
BIOTECH        .389          .431          .433          .44           .435          .44
INFRA          .388          .416          .416          .444          .5            .527
ELECTRON       .385          .461          .45           .485          .561          .578
CHEM           .377          .459          .442          .475          .508          .557
AUTO           .375          .4            .375          .5            .5            .55
COAL           .375          .375          .375          .375          .375          .5
HACKERS        .363          .454          .5            .59           .5            .545
SEMI           .314          .37           .37           .459          .548          .556
HOMEBLDG       .294          .352          .352          .47           .47           .47
INDMATER       .292          .353          .341          .353          .39           .414
GAMING         .285          .285          .25           .25           .285          .285
OILGAS         .193          .309          .264          .38           .419          .38
COMODITY       .178          .178          .125          .196          .232          .267
ETFS           .147          .213          .18           .229          .36           .377
FOOD           .111          .111          .111          .222          .333          .333
CHINA          .066          .066          .05           .066          .083          .083
GOLD           .06           .06           .06           .12           .2            .14
SOLAR          .055          .055          .055          .166          .277          .388
N=23
|
====================================================================
8-14-2018 The Sell S9-V still stands and urges us to be very cautious
and
do some more hedging with our Bearish MINCPs.
The
futures are down, suggesting that we are returning to the pattern
where big Money has no patience and wants out quickly. Will
Professionals move in later tomorrow to support the market.
Wall Street does not want a big decline before the November Election.
But have they still the power to hold things together?
Breadth today turned positive and the DJI rallied to try to
close its
gap down last week. A rally to 25500 and reversal back down would
set up a right shoulder in a bearish-looking head/shoulders pattern.
See DIA chart just below for this. Because the V-I in the DJIA chart remains
negative, a rally beyond 25550 would only bring another Sell S9-v
and very likely not a valid breakout. See the V-I in the second chart
below.


Short-term interest rates moved above 2%. The Dollar responded by
making a 12-month new high. This delighted the shareholders in the big
banks. GS recovered 2.7. The strong Dollar also helping some retailers
buy goods overseas more cheaply despite the Trump tariffs. But for construction
and housing stocks, it was not good news. For Gold stocks it was the worst
of all worlds. The decline in foreign ETFs continues and could easily worsen
given the rising interest rates in the US and the strong Dollar..
No doubt, the US is the haven for hot, worried international money. The
money is not going only into Bonds as a haven, it is flowing into the booming tech
sector. Our Index of 41 big tech stocks still shows a steady up-trend, though
this does seem to have stalled, at least temporarily.


And for Gold stocks, it was the worst of all worlds: 1) a rising Dollar, 2) rising
short-term rates and 3) apparently no serious inflation (leaving out stocks, real estate,
rents and health care!). I have been reluctant to recommend shorting Gold stocks,
but as long as you cover short sales when their Closing Power downtrends are
broken, such shorting has limited risks. Since big declines usually see strong rises
in gold prices for at least a month or two prior to the DJI top, it would seem the
stock market has limited downside risk. But until Peerless gives a new Buy signal,
I think we should be hedged.
Trump's tariff wall could cause our previous trading
partners into a recession.
That would hurt American exports. In the end, we would be importing their
recession, just at the time when our stocks are being priced for lots more
growth!

Charts 8/14/2018
PEERLESS DJI, Signals,
Indicators Daily DJI Volume 10-DayUp/Down Vol
Hourly DJIA A/D Line for All
Stocks
NASDAQ S&P OEX NYSE COMPQX DJI-15 DJI-20 DJI-30
DIA SPY QQQ MDY IWM TNA
Short-Term Rates
USO-CrudeOil FAS GLD BBH IBB JETS JNUG KOL NUGT OIH OIL RSX RETL
SDS SLV SOXL TECL TMF TNA UGA (gasoline) XIV YINN
Commodities: CANE
JJC, NIB, CHOC CORN, CUT (paper) WEAT UUP (Dollar)
AAPL ADBE ALXN AMAT AMGN AMD AMZN BA BABA BAC BIDU CAT CVX DE
FB GOOG GS HD IBM INTU (new) JPM M (Macy's) MSFT NFLX NVDA QCOM TSLA TXN
XOM WMT ANDV (refinery), CMG (Chipotle), LRCX, SWKS, MDGL
SPPI WATT
SQ TOWN
8/14/2018 (Click on Underlined link.)
Bullish MAXCPs - http://tigersoft.com/MAXCPZ/814/BULLISH.htm
Bearish MAXCPs - http://tigersoft.com/MINCPZ/814/BEARISH.htm
|
Table 1 QUICKSILVER on ETFS - 08/14/18
ETF      CLOSE   CHANGE     PIVOT-PT  5-dma AROC    CL-PWR      CANDLE   IP21   ITRS
---------------------------------------------------------------------------------------------
---------------------------------------------------------------------------------------------
DIA       253.21    1.17     255.62       -57.2%   Bullish      BLUE   .103     ------
---------------------------------------------------------------------------------------------
COMPQX    7870.89    51.18   7888.33      -8.1%    Bullish      BLUE   .106     .015
---------------------------------------------------------------------------------------------
SPY       283.9    1.8       285.46       -29.5%   Bullish      BLUE   .069     .013
---------------------------------------------------------------------------------------------
QQQ       181.45    1.13     182.02       -9.7%    Bullish      BLUE   .077     .021
---------------------------------------------------------------------------------------------
MDY       364.79    3.34     365.68       -26.1%   Bullish      BLUE   .039    -.003
---------------------------------------------------------------------------------------------
IWM       168.2    1.65      167.57        14.3%   Bullish      BLUE   .041     .001
---------------------------------------------------------------------------------------------
FAS       70.69    1.52      73.15        -152.8%  Bullish      BLUE   .006     .034
---------------------------------------------------------------------------------------------
RETL      50.52    3.25      47.26         356.7%  Bullish      BLUE   .044     .252 strongest
---------------------------------------------------------------------------------------------
SOXL      152.69   -.46      170.25       -502.2%  Bullish      RED    .147    -.175
---------------------------------------------------------------------------------------------
TECL      155.33    2.76     156.66       -5.8%    Bullish      BLUE   .102     .041
---------------------------------------------------------------------------------------------
IBB       117.21    .65      117.55       -49.9%   Bullish      BLUE   .006     .054
---------------------------------------------------------------------------------------------
GLD       113.07    .11      114.91       -66.4%   Bearish      RED   -.358    -.096 weakest
---------------------------------------------------------------------------------------------
OIL       7.61    .04        6.89          339.4%  Bullish      BLUE   .263     .041
---------------------------------------------------------------------------------------------
OIH       24.8   -.02        25.67        -181.3%  Bearish      RED   -.174    -.09
---------------------------------------------------------------------------------------------
GASL      21.03    .38       21.86        -373.8%  Bearish      RED   -.028    -.006
---------------------------------------------------------------------------------------------
|
Table 2 Count of Stocks in Key Directories
20180814
-------------------------------
NEWHIGHS 249 Bulls back on top
NEWLOWS 77
MAXCP 136 Pros marginally bullish
MINCP 119
TTTNH 165 Day Traders are marginally bullish
TTTNL 134
FASTUP 129
FASTDOWN 238 Swing trader remain bearish.
CPCROSSA 165
CPCROSSD 44
BIGVOLUP 3
BIGVODN 5
|
Table 3
Count of Stocks and New Highs in Key Tiger Directories
Date = 180814
               No.          NHs            Pct
-------------------------------------------------------------------
MAXCP          136           93            68 %
RETAIL         53            14            26 %
REGBANKS       30            5             17 %
DJI-13         13            2             15 %
HOSPITAL       7             1             14 %
MILITARY       37            5             14 %
SOFTWARE       64            8             13 %
NASD-100       89            10            11 %
NIFTY          51            5             10 %
COMPUTER       23            2             9 %
HACKERS        22            2             9 %
DOWJONES       30            2             7 %
INSURANC       30            2             7 %
RUS-1000       815           58            7 %
SP500          476           34            7 %
FIDSTKS        184           11            6 %
AUTO           40            2             5 %
ELECTRON       171           8             5 %
INDEXES        189           10            5 %
SEMI           124           6             5 %
SP-100         94            5             5 %
TRANSP         20            1             5 %
BIOTECH        407           18            4 %
COMODITY       56            2             4 %
GAMING         28            1             4 %
GREEN          28            1             4 %
CHEM           61            2             3 %
FINANCE        90            3             3 %
INFRA          36            1             3 %
BIG17          46            1             2 %
ETFS           61            1             2 %
GOLD           50            1             2 %
INDMATER       82            2             2 %
OILGAS         154           3             2 %
REIT           172           4             2 %
UTILITY        41            1             2 %
|
Table 4  Count of Stocks and New Lows in Key Tiger Directories
Date = 180814
               No           NLs            Pct
--------------------------------------------------------------------
GOLD           50            21            42 %
MINCP          119           41            34 %
CHINA          60            11            18 %
COAL           8             1             13 %
COMODITY       56            6             11 %
FOOD           9             1             11 %
ETFS           61            6             10 %
HACKERS        22            2             9 %
GAMING         28            2             7 %
GREEN          28            2             7 %
BIOTECH        407           25            6 %
INDEXES        189           12            6 %
NASD-100       89            5             6 %
SOFTWARE       64            4             6 %
SOLAR          18            1             6 %
BONDFUND       111           6             5 %
INDMATER       82            4             5 %
SEMI           124           6             5 %
ELECTRON       171           6             4 %
CHEM           61            2             3 %
INFRA          36            1             3 %
INSURANC       30            1             3 %
OILGAS         154           4             3 %
PIPELINE       29            1             3 %
FINANCE        90            2             2 %
RETAIL         53            1             2 %
UTILITY        41            1             2 %
FIDSTKS        184           2             1 %
RUS-1000       815           9             1 %
SP-100         94            1             1 %
SP500          476           5             1 %
|
Table 5 RANKING OF KEY DIRECTORIES BASED PCT.OF STOCKS ABOVE 65-DMA
8/14/18
Bullish = 26
Bearish = 21
---------------------------------------------------------------------------------------
Directory Current day-1 day-2 day-3 day-4 day-5
----------------------------------------------------------------------------------------
UTILITY .878 .756 .804 .878 .829 .853
EDU .833 .833 .833 .666 .666 .666
PIPELINE .793 .758 .793 .827 .793 .793
RETAIL .773 .754 .754 .735 .66 .622
INSURANC .733 .766 .8 .8 .8 .8
BEVERAGE       .722          .5            .555          .666          .611          .611
HOSPITAL       .714          .714          .714          .571          .714          .714
TRANSP         .7            .65           .65           .7            .7            .75
DOWJONES       .666          .633          .766          .8            .8            .833
GUNS           .666          .666          .666          .777          .777          .777
REGBANKS       .666          .533          .566          .6            .6            .566
SP-100         .659          .617          .68           .712          .734          .744
COMPUTER       .652          .608          .695          .652          .652          .652
REIT           .633          .581          .616          .68           .674          .709
FIDSTKS        .63           .614          .652          .711          .695          .701
SOFTWARE       .609          .593          .625          .64           .625          .609
NIFTY          .607          .588          .607          .666          .666          .705
NASD-100       .606          .595          .606          .651          .662          .696
SP500          .605          .567          .623          .663          .674          .693
MILITARY       .594          .54           .513          .648          .675          .621
RUS-1000       .588          .557          .593          .638          .646          .658
BIGBANKS       .571          .571          .571          .857          .857          .857
INDEXES        .571          .587          .576          .603          .624          .624
BONDFUND       .522          .585          .594          .459          .459          .513
FINANCE        .522          .444          .433          .555          .544          .477
JETS           .5            .5            .5            .5            .5            .5
N=26
======================================================================================
BIG17          .478          .434          .478          .391          .434          .478
GREEN          .464          .5            .5            .571          .607          .607
ELECTRON       .461          .45           .485          .561          .584          .561
CHEM           .459          .442          .475          .508          .557          .524
HACKERS        .454          .5            .59           .5            .545          .5
BIOTECH        .432          .434          .442          .437          .449          .454
INFRA          .416          .416          .444          .5            .527          .5
AUTO           .4            .375          .5            .5            .55           .6
DJI-13         .384          .384          .615          .692          .692          .769
COAL           .375          .375          .375          .375          .5            .375
SEMI           .37           .37           .459          .548          .564          .532
INDMATER       .353          .341          .353          .39           .414          .426
HOMEBLDG       .352          .352          .47           .47           .47           .47
OILGAS         .311          .266          .383          .422          .383          .435
GAMING         .285          .25           .25           .285          .285          .285
ETFS           .213          .18           .229          .36           .36           .426
COMODITY       .178          .125          .196          .232          .267          .339
FOOD           .111          .111          .222          .333          .333          .333
CHINA          .066          .05           .066          .083          .066          .083
GOLD           .06           .06           .12           .2            .14           .16
SOLAR          .055          .055          .166          .277          .388          .277
N=21
|
====================================================================
8-13-2018
The Sell S9-V still stands. Its bearish
outcomes in the
Summers of 1997, 1998 and 2011 should keep us very cautious,
though I believe the market will do all it can to simply
go sidewise until the November Election is over. But what
if the Big Boys lose control.... For now, do some more
hedging with our Bearish MINCPs. If there is a brief rally
as the DJI tries to close Friday's gap down, we should sell short DIA.
More and more stocks are dropping below the support of their
65-dma.
The percentage of all stocks above that key ma has fallen to 49%.
As a result, the NYSE ADL has broken its steep 3-month up-trend. Following
Sell S9-Vs in the Summers of 1997, 1998 and 2011 this soon
was followed by 11%-17% declines from the DJI's recent peak.
Anything more than 8% decline from the DJI's recent peak would
bring a new closing for the year. This would be quite dangerous,
as there have been multiple tests of the 23400-23500 support.
And I think we can be sure that any such rupture of 23200 would cause a
big rush into leveraged shorts on the big index funds.
The Peerless key internal strength indicators worsened.
The P-I
has turned negative. This will make it harder to get a buy signal
on a decline to the lower band. The Accumulation Index has dropped
below its 21-dma. Big money can no longer be counted on to support
the market. The taxcut buy-backs are losing their lifting power.
And the V-I worsened, making any quick DJI rally to the upper
band now (in an effort to masquerade the market as stronger than
it really is) will likely fail miserably as we go into the normally
bearish period from September to early October.
 |
 |
Immediately ahead, the DJI may try to rally. It has
fallen four
straight days and Tuesday's do often bring "turn-arounds". But, the
Hourly DJI chart below shows that a rally of 200 or 300 points could
bring the DJI back up to the resistance of a right-shoulder apex
in a potential head/shoulders pattern. If the DJI then started another
decline at this point, the Hourly DJI would show a bearish head/shoulders
pattern. We will closely watch the Hourly volume on the rally. It must
improve considerably to maintain an uptrend.
How dangerous is
the situation now? Professionals usually know
best.
There are still lots of stocks that they are buying. They key ETFs'
Closing Powers are still above their 21-dma. See Table 1. From this
vantage point, a lot will depend on whether Professionals turn bearish
on SPY (whose Closing Power is now sitting on its uptrendline) and on the
elite high-volume tech stocks which still enjoy a rising and ADL uptrend.
See these charts below.
SPY
 |
NIFTY-TECHS
 |
Other Technical Considerations
Two more things, if the market were about to collapse, we
should see
more head/shoulders patterns in the DJI-30 stocks. Perhaps, 11 or 13.
Right now, the count is only IBM, INTC, MMM, CAT and possibly
BA (which must be watched.)
Lastly, if the market were about suffer a big
decline, Gold should be advancing.
But that is just not so now. The CPI is not rising fast enough and performance-
minded fund managers want nothing to do with Gold in its doldrums. But
perhaps, the CPI is hopelessly mis-calculated and the dumping in Gold
is by countries, like Russia, which are experiencing severe economic problems.
See its massive head/shoulders.
Charts 8/13/2018
PEERLESS DJI, Signals,
Indicators Daily DJI Volume 10-DayUp/Down Vol
Hourly DJIA A/D Line for All
Stocks
NASDAQ S&P OEX NYSE COMPQX DJI-15 DJI-20 DJI-30
DIA SPY QQQ MDY IWM TNA
Short-Term Rates
USO-CrudeOil FAS GLD BBH IBB JETS JNUG KOL NUGT OIH OIL RSX RETL
SDS SLV SOXL TECL TMF TNA UGA (gasoline) XIV YINN
Commodities: CANE
JJC, NIB, CHOC CORN, CUT (paper) WEAT UUP (Dollar)
AAPL ADBE ALXN AMAT AMGN AMD AMZN BA BABA BAC BIDU CAT CVX DE
FB GOOG GS HD IBM INTU (new) JPM M (Macy's) MSFT NFLX NVDA QCOM TSLA TXN
XOM WMT ANDV (refinery), CMG (Chipotle), LRCX, SWKS, MDGL
SPPI WATT
SQ TOWN
8/13/2018 (Click on Underlined link.)
Bullish MAXCPs - http://tigersoft.com/MAXCPZ/813/BULLISH.htm
Bearish MAXCPs - http://tigersoft.com/MINCPZ/813/BEARISH.htm
|
Table 1 QUICKSILVER on ETFS - 08/13/18
ETF      CLOSE   CHANGE     PIVOT-PT  5-dma AROC    CL-PWR      CANDLE   IP21   ITRS
---------------------------------------------------------------------------------------------
---------------------------------------------------------------------------------------------
DIA       252.04   -1.26     256.12       -55.1%   Bullish      RED    .107     ----
---------------------------------------------------------------------------------------------
COMPQX    7819.71   -19.4    7883.66      -25.4%   Bullish      RED    .055     .012
---------------------------------------------------------------------------------------------
SPY       282.1   -1.06      285.58       -44.6%   Bullish      RED    .046     .008
---------------------------------------------------------------------------------------------
QQQ       180.32   -.2       181.8        -22.6%   Bullish      RED    .042     .021
---------------------------------------------------------------------------------------------
MDY       361.45   -1.85     366.69       -58.8%   Bullish      RED    0       -.009
---------------------------------------------------------------------------------------------
IWM       166.55   -.98      167.72       -23%     Bearish      RED    .007    -.007
---------------------------------------------------------------------------------------------
FAS       69.17   -1.41      72.88        -208.3%   ----        RED    .051     .028
---------------------------------------------------------------------------------------------
RETL      47.27   -.8        47.13         131.1%  Bearish      RED   -.022     .25
---------------------------------------------------------------------------------------------
SOXL      153.15    .6       168.96       -358.1%  Bullish      RED    .141    -.154
---------------------------------------------------------------------------------------------
TECL      152.57   -.59      155.51       -44.1%   Bullish      RED    .054     .043
---------------------------------------------------------------------------------------------
IBB       116.56   -.17      118.38       -16.2%   Bullish      ----  -.005     .038
---------------------------------------------------------------------------------------------
GLD       112.96   -1.73     114.59       -59.7%   Bearish      RED   -.336    -.101  weakest
---------------------------------------------------------------------------------------------
OIL       7.61    .04        6.89          339.4%  Bullish      BLUE   .263     .038  strongest
---------------------------------------------------------------------------------------------
OIH       24.82   -.66       25.72        -131.3%  Bearish      RED   -.12     -.106
---------------------------------------------------------------------------------------------
GASL      20.65   -1.44      22.66        -498.9%  Bearish      RED   -.002    -.113
---------------------------------------------------------------------------------------------
|
Table 2 Count of Stocks in Key Directories
20180813
-------------------------------
NEWHIGHS 91
NEWLOWS 156 Bearish
MAXCP 55
MINCP 177 Professionals are 3x more bearish.
TTTNH 83
TTTNL 194 Day Traders are bearish.
FASTUP 147
FASTDOWN 256 Swing Traders are bearish
CPCROSSA 38
CPCROSSD 142 Lots of Professional selling today.
BIGVOLUP 1
BIGVODN 10 Big Money Dumping
|
Table 3
Count of Stocks and New Highs in Key Tiger Directories
Date = 180813
               No.          NHs            Pct
-------------------------------------------------------------------
MAXCP          55            26            47 %
MILITARY       37            3             8 %
INSURANC       30            2             7 %
COMODITY       56            3             5 %
TRANSP         20            1             5 %
DOWJONES       30            1             3 %
ELECTRON       171           5             3 %
NASD-100       89            3             3 %
PIPELINE       29            1             3 %
REGBANKS       30            1             3 %
RUS-1000       815           22            3 %
SP500          476           12            3 %
BIOTECH        407           10            2 %
CHEM           61            1             2 %
ETFS           61            1             2 %
FIDSTKS        184           3             2 %
NIFTY          51            1             2 %
SEMI           124           3             2 %
SP-100         94            2             2 %
UTILITY        41            1             2 %
INDEXES        189           2             1 %
OILGAS         154           1             1 %
REIT           172           1             1 %
|
Table 4  Count of Stocks and New Lows in Key Tiger Directories
Date = 180813
               No           NLs            Pct
--------------------------------------------------------------------
GOLD           50            23            46 %
MINCP          177           77            44 %
COMODITY       56            17            30 %
ETFS           61            11            18 %
HOMEBLDG       17            3             18 %
CHINA          60            10            17 %
GAMING         28            4             14 %
AUTO           39            5             13 %
COAL           8             1             13 %
FOOD           9             1             11 %
FINANCE        90            8             9 %
BIOTECH        407           27            7 %
INDEXES        189           13            7 %
PIPELINE       29            2             7 %
INFRA          36            2             6 %
NASD-100       89            5             6 %
RETAIL         53            3             6 %
SOFTWARE       64            4             6 %
SOLAR          18            1             6 %
HACKERS        22            1             5 %
INDMATER       82            4             5 %
OILGAS         154           7             5 %
UTILITY        41            2             5 %
COMPUTER       23            1             4 %
RUS-1000       815           30            4 %
BONDFUND       111           3             3 %
CHEM           61            2             3 %
INSURANC       30            1             3 %
MILITARY       37            1             3 %
REGBANKS       30            1             3 %
SEMI           124           4             3 %
SP-100         94            3             3 %
SP500          476           15            3 %
BIG17          46            1             2 %
ELECTRON       171           4             2 %
FIDSTKS        184           4             2 %
|
Table 5 RANKING OF KEY DIRECTORIES BASED PCT.OF STOCKS ABOVE 65-DMA
8/13/18
---------------------------------------------------------------------------------------
Directory Current day-1 day-2 day-3 day-4 day-5
----------------------------------------------------------------------------------------
EDU .833 .833 .666 .666 .666 .833
INSURANC .766 .8 .8 .8 .8 .833
PIPELINE .758 .793 .827 .793 .793 .827
UTILITY .756 .804 .878 .829 .853 .878
RETAIL .754 .754 .735 .66 .622 .584
HOSPITAL       .714          .714          .571          .714          .714          .857
GUNS           .666          .666          .777          .777          .777          .722
TRANSP         .65           .65           .7            .7            .75           .75
DOWJONES       .633          .766          .8            .8            .833          .766
SP-100         .617          .68           .712          .734          .744          .702
FIDSTKS        .614          .652          .711          .695          .701          .663
COMPUTER       .608          .695          .652          .652          .652          .608
NASD-100       .595          .606          .651          .662          .696          .674
SOFTWARE       .593          .625          .64           .625          .625          .609
NIFTY          .588          .607          .666          .666          .705          .666
INDEXES        .587          .576          .603          .624          .629          .619
BONDFUND       .585          .594          .459          .459          .522          .54
REIT           .581          .616          .68           .674          .703          .75
BIGBANKS       .571          .571          .857          .857          .857          .857
SP500          .567          .623          .663          .674          .695          .67
RUS-1000       .557          .593          .638          .646          .662          .642
MILITARY       .54           .513          .648          .675          .648          .513
REGBANKS       .533          .566          .6            .6            .566          .5
N=23
=========================================================================================
BEVERAGE       .5            .555          .666          .611          .666          .666
GREEN          .5            .5            .571          .607          .607          .535
HACKERS        .5            .59           .5            .545          .5            .454
JETS           .5            .5            .5            .5            .5            .5
=========================================================================================
ELECTRON       .45           .485          .561          .584          .555          .543
FINANCE        .444          .433          .555          .544          .488          .477
CHEM           .442          .475          .508          .557          .524          .508
BIG17          .434          .478          .391          .434          .478          .478
BIOTECH        .434          .442          .437          .449          .454          .429
INFRA          .416          .444          .5            .527          .5            .5
DJI-13         .384          .615          .692          .692          .769          .692
COAL           .375          .375          .375          .5            .375          .25
SEMI           .37           .459          .548          .564          .524          .54
AUTO           .358          .487          .487          .538          .589          .512
HOMEBLDG       .352          .47           .47           .47           .47           .411
INDMATER       .341          .353          .39           .414          .426          .439
OILGAS         .266          .383          .422          .383          .435          .428
GAMING         .25           .25           .285          .285          .285          .357
ETFS           .18           .229          .36           .36           .426          .344
COMODITY       .125          .196          .232          .267          .339          .214
FOOD           .111          .222          .333          .333          .333          .333
GOLD           .06           .12           .2            .14           .16           .16
SOLAR          .055          .166          .277          .388          .277          .222
CHINA          .05           .066          .083          .066       .083          .083
N-20
|
====================================================================
8-10-2018
The Sell S9-V still stands and urges us
to be very cautious
and do some more hedging with our Bearish MINCPs.
The DJI and the other key indexes have shown themselves
unable to overcome their overhead resistance. The Peerless
S9-V and negative V-I allowed only nominal recovery new highs.
So, now with fears of a Democratic come-back in November
growing, a Trump shut-down of the Federal Goverment still
looming and foreign ETFs getting slugged by sellers <1>, US
indexes, ETFs, stocks and commodities are now being subjected
to new waves of selling; hence the gap downwards Friday on increased
volume and the weakness in the futures this morning.
<1> Interest rates are well over 20% in
Turkey. https://www.nytimes.com/2018/08/11/business/turkey-lira-crisis.html?emc=edit_th_180813&nl=todaysheadlines&nlid=582238940813
I've been saying since 2011, when S9-Vs were invented, that these
Sells can bring significant declines to the DJI even when the NYSE
A/D Line seems strong if the DJI fails to breakout (like it did do
in 1996) and, instead, the A/D Line and the NASDAQ
break their uptrends. It is the ruptures of the A/D
Line and
NASDAQ uptrends that we must be on the watch for now.
If the
experiences of 1997, 1998, 2001 and 2011 play out here, we will
be lucky to see only a 10% decline in the next two months.
We should sell TECL. It gave a red Sell at the close on Friday.
Short more of the Bearish MINCPs is my advise and take trading
profits in some of the long MAXCPs if they break their CP uptrends.
It will be quite interesting to see if Professionals rescue the key
ETFs on Monday or Tuesday this coming week and they show
big advances after early weakness. When the intermediate-term uptrend
was alive and well, that is what they did. But it's not so clear that
they will do this now.
DJI - watch NYSE breadth on Monday. It will determine if
the four-month A/D Line uptrend will be violated. 
DIA - watch to see if we get a bullish closing far above the opening
on our candle-stick chart and the CP uptrendline is saved from being
violated.


More To Worry about!
We knew that market participants would start worrying about
the outcome of this November's mid-term Elections. But now
there are other concerns. First and foremost, is the acellerating
decline of some "emerging" fianancial markets, especially
Turkey. Second, is President Trump's continuing obsession with
building a new and higher Wall on our southern border with Mexico
even though American tax payers must pay for it. He threatens
to not sign a new Budget unless he gets his Wall. So, this raises the
again the issue of a Government Shut-Down. How would such an
event affect US Government Credit and interest rates? The best
parallels to these events are seen in 1997, 1998 and 2011. Similar
events in those years brought DJI declines of 13%-19%. And what
if China decides to sell even a small portion of its holding in US
Treasuries out of pique with the new American tariffs?
What I draw from all this is that we should take seriously the lessons
offered by the Peerless charts for 1997, 1998 and 2011, namely that
serious trouble for the market began in the Summer in these years
when the previously strong NYSE A/D Line uptrend was violated.
1997 (Summer '97 "Asian contagion")
See https://en.wikipedia.org/wiki/1997_Asian_financial_crisis

1998 (Russian financial collapse under Yeltsin and "Oligarchs")
See https://en.wikipedia.org/wiki/1998_Russian_financial_crisis

2011

 |
Table 1 QUICKSILVER on ETFS - 08/10/18
ETF      CLOSE   CHANGE     PIVOT-PT  5-dma AROC    CL-PWR      CANDLE   IP21   ITRS   IP+ITRS
---------------------------------------------------------------------------------------------
---------------------------------------------------------------------------------------------
DIA       253.3   -1.86      254.85       -21.4%   Bullish      RED    .175     ----
---------------------------------------------------------------------------------------------
COMPQX    7839.11   -52.67   7859.68       17.2%   Bullish      BLUE   .099     .016
---------------------------------------------------------------------------------------------
SPY       283.16   -1.91     284.64       -7.7%    Bullish      RED    .105     .008
---------------------------------------------------------------------------------------------
QQQ       180.52   -1.39     181.14        12.1%   Bullish      RED    .091     .024
---------------------------------------------------------------------------------------------
MDY       363.3   -2.07      365.75       -9%      Bullish      BLUE  -.006    -.013
---------------------------------------------------------------------------------------------
IWM       167.53   -.47      167.32        34.1%   Bullish      BLUE  -.012    -.008
---------------------------------------------------------------------------------------------
FAS       70.58   -1.9       72.18        -63.5%   Bullish      RED    .095     .063
---------------------------------------------------------------------------------------------
RETL      48.07    .18       46.03         310.5%  Bearish      BLUE   .011     .278  +.289
---------------------------------------------------------------------------------------------
SOXL      152.55   -12.43    164.92       -284.3%  Bullish      RED    .166    -.114
---------------------------------------------------------------------------------------------
TECL      153.16   -3.69     153.94        56.8%   Bullish      RED    .102     .089  +.191
---------------------------------------------------------------------------------------------
IBB       116.73   -.64      116.94       -18.7%   Bullish      RED   -.012     .039
---------------------------------------------------------------------------------------------
GLD       114.69   -.05      114.33       -10%     Bearish      RED   -.29     -.106
---------------------------------------------------------------------------------------------
OIL       7.61    .04        6.89          339.4%  Bullish      BLUE   .263     .024  +.187
---------------------------------------------------------------------------------------------
OIH       25.48    .29       25.49        -3.9%    Bullish      BLUE  -.086    -.099
---------------------------------------------------------------------------------------------
|
Table 2 Count of Stocks in Key Directories
20180810
-------------------------------
NEWHIGHS 140 Bullish Plurality
NEWLOWS 113 Very high considering SP-500 close to 12-mo high.
MAXCP 114
MINCP 132 Professionals are net bearish.
TTTNH 142
TTTNL 138
FASTUP 169
FASTDOWN 202 Swing Traders are net bearish.
CPCROSSA 87
CPCROSSD 88
BIGVOLUP 2
BIGVODN 27 Dumping is getting heavy.
|
Table 3
Count of Stocks and New Highs in Key Tiger Directories
Date = 180810
               No.          NHs            Pct
-------------------------------------------------------------------
MAXCP          114           60            53 %
RETAIL         53            8             15 %
HACKERS        22            3             14 %
HOSPITAL       7             1             14 %
PIPELINE       29            3             10 %
SOFTWARE       64            6             9 %
MILITARY       37            3             8 %
GAMING         28            2             7 %
REGBANKS       30            2             7 %
HOMEBLDG       17            1             6 %
NASD-100       89            5             6 %
BIOTECH        407           18            4 %
ELECTRON       171           6             4 %
NIFTY          51            2             4 %
AUTO           40            1             3 %
INFRA          36            1             3 %
INSURANC       30            1             3 %
RUS-1000       815           26            3 %
SP500          476           14            3 %
ETFS           61            1             2 %
FIDSTKS        184           3             2 %
INDMATER       82            2             2 %
SEMI           124           2             2 %
INDEXES        189           1             1 %
REIT           172           2             1 %
SP-100         94            1             1 %
|
Table 4  Count of Stocks and New Lows in Key Tiger Directories
Date = 180810
               No           NLs            Pct
--------------------------------------------------------------------
MINCP          132           47            36 %
GOLD           50            11            22 %
AUTO           40            5             13 %
CHINA          60            7             12 %
HOMEBLDG       17            2             12 %
ETFS           61            7             11 %
FOOD           9             1             11 %
JETS           10            1             10 %
COMPUTER       23            2             9 %
BIOTECH        407           28            7 %
CHEM           61            4             7 %
GAMING         28            2             7 %
INFRA          36            2             6 %
NASD-100       89            5             6 %
SOFTWARE       64            4             6 %
SOLAR          18            1             6 %
HACKERS        22            1             5 %
INDEXES        189           9             5 %
UTILITY        41            2             5 %
COMODITY       56            2             4 %
ELECTRON       171           6             4 %
FINANCE        90            4             4 %
GREEN          28            1             4 %
INDMATER       82            3             4 %
RETAIL         53            2             4 %
INSURANC       30            1             3 %
MILITARY       37            1             3 %
REGBANKS       30            1             3 %
RUS-1000       815           26            3 %
SEMI           124           4             3 %
SP500          476           14            3 %
FIDSTKS        184           3             2 %
OILGAS         154           3             2 %
SP-100         94            1             1 %
|
 Table 5
 RANKING OF KEY DIRECTORIES BASED PCT.OF STOCKS ABOVE 65-DMA
              8/10/18
 Bullish = 26
 Bearish = 18
---------------------------------------------------------------------------------------
Directory     Current       day-1         day-2         day-3         day-4         day-5
----------------------------------------------------------------------------------------
EDU            .833          .666          .666          .666          .833          .666
UTILITY        .804          .878          .829          .853          .853          .853
INSURANC       .8            .8            .8            .8            .833          .833
PIPELINE       .793          .827          .793          .793          .827          .827
DOWJONES       .766          .8            .8            .833          .766          .733
RETAIL         .754          .735          .66           .622          .584          .584
HOSPITAL       .714          .571          .714          .714          .857          .857
COMPUTER       .695          .652          .652          .652          .608          .608
SP-100         .68           .712          .734          .744          .702          .68
GUNS           .666          .777          .777          .777          .722          .722
FIDSTKS        .652          .711          .695          .701          .668          .657
TRANSP         .65           .7            .7            .75           .75           .7
SOFTWARE       .625          .64           .625          .625          .625          .546
SP500          .623          .663          .674          .695          .672          .661
REIT           .616          .68           .674          .703          .761          .738
DJI-13         .615          .692          .692          .769          .692          .692
NIFTY          .607          .666          .666          .705          .666          .549
NASD-100       .606          .651          .662          .696          .674          .629
BONDFUND       .594          .459          .459          .522          .54           .504
RUS-1000       .593          .638          .646          .662          .646          .624
HACKERS        .59           .5            .545          .5            .5            .363
INDEXES        .576          .603          .624          .629          .619          .597
BIGBANKS       .571          .857          .857          .857          .857          .714
REGBANKS       .566          .6            .6            .566          .5            .533
BEVERAGE       .526          .631          .578          .631          .631          .631
MILITARY       .513          .648          .675          .648          .594          .486
N = 26
==============================================================================================
AUTO           .5            .5            .55           .6            .55           .5
GREEN          .5            .571          .607          .607          .535          .464
JETS           .5            .5            .5            .5            .5            .5
==============================================================================================
ELECTRON       .485          .561          .584          .555          .549          .497
BIG17          .478          .391          .434          .478          .456          .391
CHEM           .475          .508          .557          .524          .508          .491
HOMEBLDG       .47           .47           .47           .47           .411          .411
SEMI           .459          .548          .564          .524          .532          .491
INFRA          .444          .5            .527          .5            .5            .472
BIOTECH        .442          .437          .449          .454          .434          .41
FINANCE        .433          .555          .544          .488          .466          .488
OILGAS         .383          .422          .383          .435          .428          .428
COAL           .375          .375          .5            .375          .25           .25
INDMATER       .353          .39           .414          .426          .426          .439
GAMING         .25           .285          .285          .285          .357          .357
ETFS           .229          .36           .36           .426          .344          .36
FOOD           .222          .333          .333          .333          .333          .333
COMODITY       .196          .232          .267          .339          .232          .214
SOLAR          .166          .277          .388          .277          .222          .166
GOLD           .12           .2            .14           .16           .12           .16
CHINA          .066          .083          .066          .083          .1            .116
N = 18
|
====================================================================
8-9-2018
The DJI seems unable to get past its red
resistance shown below.
This invites more selling in big blue chips. The Sell S9-V has not
been reversed and the V-I worsened. But the NYSE A/D Line is
still rising and the our short-term indicators for the key ETFs remain
in uptrends. These are the 5-day moving averages and the Closing
Powers. So, the DJI may try again to make another try to fet past
its resistance. But I would by surprised if it can get past 26000. The
Peerless V-I is still negative and the Hourly DISI-OBV is noticeably
weaker than the Hourly DJI itself.


Naturally, our Peerless must be concerned with the DJI's likely moves.
But these would appear to be getting smaller and smaller. That is the reason
our Hotline is paying more and more attention, first, to the much stronger,
high Accumulation, high volume tech stocks represented by the "Tahiti
Tech" favorites, now INTU and AMZN as well as TECL. These
show exceptionally prolonged and positive institutional Accumulation.
We reason that they are nightly held and are probably Buys at the
the support of their rising 65-dma.
TECL is a good alternative to the DJI and DIA. But we want to traded it
with our Tiger tools and it's automatic Red signals if they have been very
effective, as now. Note that TECL may get an optimized red Sell tomorrow if
its Stochastic-14 drop should drop back below 80. Any decline by it
would do this. This would mean we should take trading profits in it even
though its CLosing Power and 5-day ma would still be rising.
Secondly, we watch the Bullish MAXCPs for explosive super stocks
showing breakouts, major Tiger Buys and high Accumulation. These
are often special situations that can go up even in a down general market.
The mining for these stocks in such a long bull market is difficult. So, we
want to be very fussy. XENE has the best chart I can find tonight. But,
it turns out that it has just reported a big earnings deficit. That complicates
the stock's outlook and so it probably should be avoided.
https://finance.yahoo.com/news/xenon-pharmaceuticals-xene-reports-q2-223510258.html

Thirdly, we I recommend shorting some of the Bearish MINCPs
that have just broken below price support..

Table 1 QUICKSILVER on ETFS - 08/9/18
ETF      CLOSE   CHANGE     PIVOT-PT  5-dma AROC    CL-PWR      CANDLE   IP21   ITRS   IP+ITRS
---------------------------------------------------------------------------------------------
---------------------------------------------------------------------------------------------
DIA       255.16   -.46      254.39        40.4%   Bullish      RED    .202     -------
---------------------------------------------------------------------------------------------
COMPQX    7891.78    3.45    7812.01       56.8%   Bullish      BLUE   .15     .023
------------------------------------------------------------------------------- --------------
SPY       285.07   -.39      283.6         47.1%   Bullish      RED    .157     .011
---------------------------------------------------------------------------------------------
QQQ       181.91   -.11      180.08        65.8%   Bullish      ----   .132     .035
---------------------------------------------------------------------------------------------
MDY       365.37   -.31      363.96        33.4%   Bullish      RED    .024    -.015
---------------------------------------------------------------------------------------------
IWM       168    .43         166.39        30.8%   ----         BLUE   .036    -.01
---------------------------------------------------------------------------------------------
FAS       72.48   -.67       71.5          143%    Bullish      RED    .127     .074
---------------------------------------------------------------------------------------------
RETL      47.89    .63       45.17         391.5%  Bearish      BLUE   .039     .205
---------------------------------------------------------------------------------------------
SOXL      164.98   -5.27     162           113.9%  Bullish      RED    .264    -.057
---------------------------------------------------------------------------------------------
TECL      156.85    .19      151.4         229%    Bullish      RED    .181     .12  +.301 highest
---------------------------------------------------------------------------------------------
IBB       117.37   -.18      117.17       -28.9%   Bullish      BLUE   .057     .047
---------------------------------------------------------------------------------------------
GLD       114.74   -.17      114.92        9.6%    Bearish      RED   -.248    -.104
---------------------------------------------------------------------------------------------
OIL       7.61    .04        6.89          339.4%  Bullish      BLUE   .263     .027 +.290
---------------------------------------------------------------------------------------------
OIH       25.19   -.48       25.5         -78.1%   Bearish      RED   -.121    -.123
---------------------------------------------------------------------------------------------
GASL      21.76   -.1        22.55        -344.3%  Bearish      RED    .05    -.106
---------------------------------------------------------------------------------------------
|
Table 2   Count of Stocks in Key Directories
          20180809
-------------------------------
NEWHIGHS       190   Bullish
NEWLOWS        48
MAXCP          92
MINCP          111   Pros - New Bearish
TTTNH          109
TTTNL          123   Day Traders - New Bearish
FASTUP         189
FASTDOWN       182
CPCROSSA       82
CPCROSSD       77
BIGVOLUP       3
BIGVODN        17
|
Table 3
Count of Stocks and New Highs in Key Tiger Directories
Date = 180809
               No.          NHs            Pct
-------------------------------------------------------------------
MAXCP          92            56            61 %
HACKERS        22            4             18 %
RETAIL         52            9             17 %
GREEN          28            4             14 %
SOFTWARE       64            7             11 %
DJI-13         13            1             8 %
NASD-100       89            7             8 %
NIFTY          51            4             8 %
DOWJONES       30            2             7 %
REGBANKS       30            2             7 %
FIDSTKS        184           11            6 %
HOMEBLDG       17            1             6 %
RUS-1000       815           46            6 %
SEMI           124           7             6 %
SP-100         94            6             6 %
SP500          476           28            6 %
ELECTRON       171           9             5 %
UTILITY        41            2             5 %
BIOTECH        407           15            4 %
COMPUTER       23            1             4 %
GAMING         28            1             4 %
INDMATER       82            3             4 %
INDEXES        189           8             4 %
AUTO           40            1             3 %
CHEM           61            2             3 %
INFRA          36            1             3 %
INSURANC       30            1             3 %
MILITARY       37            1             3 %
BIG17          46            1             2 %
ETFS           61            1             2 %
FINANCE        90            2             2 %
GOLD           50            1             2 %
REIT           172           3             2 %
OILGAS         154           1             1 %
|
Table 4  Count of Stocks and New Lows in Key Tiger Directories
Date = 180809
               No           NLs            Pct
--------------------------------------------------------------------
MINCP          111           24            22 %
JETS           10            1             10 %
COMPUTER       23            2             9 %
GOLD           50            4             8 %
GAMING         28            2             7 %
SOFTWARE       64            4             6 %
AUTO           40            2             5 %
BIOTECH        407           22            5 %
HACKERS        22            1             5 %
MILITARY       37            2             5 %
GREEN          28            1             4 %
BONDFUND       111           3             3 %
CHEM           61            2             3 %
ELECTRON       171           5             3 %
NASD-100       89            3             3 %
REGBANKS       30            1             3 %
RETAIL         52            1             2 %
SEMI           124           3             2 %
UTILITY        41            1             2 %
FIDSTKS        184           2             1 %
FINANCE        90            1             1 %
INDMATER       82            1             1 %
INDEXES        189           2             1 %
OILGAS         154           2             1 %
REIT           172           2             1 %
RUS-1000       815           11            1 %
SP500          476           6             1 %
|
| |
 RANKING OF KEY DIRECTORIES BASED PCT.OF STOCKS ABOVE 65-DMA
               8/9/18
    Bullish = 29
    Bearish = 14
---------------------------------------------------------------------------------------
Directory     Current       day-1         day-2         day-3         day-4         day-5
----------------------------------------------------------------------------------------
PIPELINE       1             1             1             1             1             .833
UTILITY        .878          .829          .853          .853          .829          .731
BIGBANKS       .857          .857          .857          .857          .714          .857
DOWJONES       .8            .8            .833          .766          .766          .666
INSURANC       .8            .8            .8            .833          .833          .866
GUNS           .777          .777          .777          .722          .722          .722
RETAIL         .75           .673          .634          .596          .615          .596
SP-100         .712          .734          .744          .702          .691          .67
FIDSTKS        .711          .695          .701          .668          .657          .641
TRANSP         .7            .7            .75           .75           .7            .75
DJI-13         .692          .692          .769          .692          .692          .615
REIT           .68           .674          .703          .761          .75           .767
EDU            .666          .666          .666          .833          .666          .666
NIFTY          .666          .666          .705          .666          .549          .568
SP500          .663          .674          .695          .672          .665          .634
COMPUTER       .652          .652          .652          .608          .608          .478
NASD-100       .651          .662          .696          .674          .64           .606
MILITARY       .648          .675          .648          .594          .486          .54
SOFTWARE       .64           .625          .625          .625          .546          .578
RUS-1000       .638          .646          .662          .646          .628          .606
BEVERAGE       .631          .578          .631          .631          .631          .736
INDEXES        .603          .624          .629          .619          .603          .597
REGBANKS       .6            .6            .566          .5            .533          .6
GREEN          .571          .607          .607          .535          .464          .464
HOSPITAL       .571          .714          .714          .857          .857          .857
ELECTRON       .561          .584          .555          .549          .497          .479
FINANCE        .555          .544          .488          .466          .488          .522
SEMI           .548          .564          .524          .532          .491          .467
CHEM           .508          .557          .524          .508          .491          .508
N=29
=============================================================================================
AUTO           .5            .55           .6            .55           .5            .45
HACKERS        .5            .545          .5            .5            .363          .454
INFRA          .5            .527          .5            .5            .5            .5
JETS           .5            .5            .5            .5            .5            .5
=============================================================================================
HOMEBLDG       .47           .47           .47           .411          .411          .411
BONDFUND       .459          .459          .522          .54           .495          .513
BIOTECH        .437          .449          .454          .434          .42           .474
OILGAS         .422          .383          .435          .428          .422          .428
BIG17          .391          .434          .478          .456          .391          .456
INDMATER       .39           .414          .426          .426          .439          .451
COAL           .375          .5            .375          .25           .25           .25
ETFS           .36           .36           .426          .344          .36           .327
FOOD           .333          .333          .333          .333          .333          .333
GAMING         .285          .285          .285          .357          .357          .214
SOLAR          .277          .388          .277          .222          .166          .277
COMODITY       .232          .267          .339          .232          .214          .196
GOLD           .2            .14           .16           .12           .16           .16
CHINA          .083          .066          .083          .1            .1            .1
N=13
|
======================================================================
8-8-2018
Our short-term indicators
remain in uptrends but Peerless stubbornly
still shows a Sell S9-V. In the Summer, this is a signal that can bring
a top and big decline even when the NYSE A/D Line is making new
highs. (See the 2011 chart below). But this combination can also
produce a high volume breakout, as in 1996, which sends the
market and especially the NASDAQ much higher. It is this
example that sparks our interest in TECL and the Tahiti tech
stocks.
Right now volume is low and there appears still to be considerable
DJI resistance just overhead. But with the NASDAQ clearly in an
uptrend, there remains a reasonable chance that DJI will belatedly
be able to breakout above its red resistance shown below. And
even if it does not breakout, some will say that the NASDAQ is
more important anyway, just as they did in 2000 when the NASDAQ
rose for ten weeks longer than the DJI did.
If the bullish 1996 example of a B10 over-riding the S9-V is valid here,
then the V-Indicator will need to turn positive soon. That's one
the indicators we should watch closely now. Alternatively, a failure
by the DJI to breakout and a rupture by the NASDAQ of its uptrendline
would make the market resemble 2011 right before it dropped 17% as
a government shut-down threatened to hurt US Treasuries' credit rating.
For the present, DIA, the DJI, NASDAQ, QQQ and TECL show
rising 5-day moving averages that cannot easily turn down tomorrow
and all their Closing Powers are in rising trends. Let's see if there
is more ujpside potential. The NIFTY-TECH chart could also breakout
for a spectacular and climactic advance. So, the Tahiti tech stocks
must be held.
But for those of you who want to hedge, look at how very weak many
of our BEARISH MINCPs were today. Trump's economics are creating
two camps of stocks. On the one hand the best of the tech stocks are
doing very well because of the tax cuts and the economc growth. On the
other hand, there are some others that are sliding down quite dangerously,
partly part because of tariffs partly because interest rate rises will hurt
their ability to finance their considerable debt, present and prospective
and partly because their over-extended customers are become cautious.


Charts 8/8/2018
PEERLESS DJI, Signals,
Indicators Daily DJI Volume 10-DayUp/Down Vol
Hourly DJIA A/D Line for All
Stocks
NASDAQ S&P OEX NYSE COMPQX DJI-15 DJI-20 DJI-30
DIA SPY QQQ MDY IWM TNA
Short-Term Rates
USO-CrudeOil FAS GLD BBH IBB JETS JNUG KOL NUGT OIH OIL RSX RETL
SDS SLV SOXL TECL TMF TNA UGA (gasoline) XIV YINN
Commodities: CANE
JJC, NIB, CHOC CORN, CUT (paper) WEAT UUP (Dollar)
AAPL ADBE ALXN AMAT AMGN AMD AMZN BA BABA BAC BIDU CAT CVX DE
FB GOOG GS HD IBM INTU (new) JPM M (Macy's) MSFT NFLX NVDA QCOM TSLA TXN
XOM WMT ANDV (refinery), CMG (Chipotle), LRCX, SWKS, MDGL
SPPI WATT
SQ TOWN
8/08/2018 (Click on Underlined link.)
Bullish MAXCPs - http://tigersoft.com/MAXCPZ/808/BULLISH.htm
Bearish MAXCPs - http://tigersoft.com/MINCPZ/808/BEARISH.htm
|
Table 1 QUICKSILVER on ETFS - 08/8/18
ETF      CLOSE   CHANGE     PIVOT-PT  5-dma AROC    CL-PWR      CANDLE   IP21   ITRS   IP+ITRS
---------------------------------------------------------------------------------------------
---------------------------------------------------------------------------------------------
DIA       255.62   -.5       253.1         49.3%    Bullish      RED    .185     0
---------------------------------------------------------------------------------------------
COMPQX    7888.33    4.67    7802.69       115.9%   Bullish      BLUE   .165     .016
---------------------------------------------------------------------------------------------
SPY       285.46   -.12      282.39        81.2%    Bullish      BLUE   .138     .011
---------------------------------------------------------------------------------------------
QQQ       182.02    .22      179.53        136.2%   Bullish      BLUE   .14      .027
---------------------------------------------------------------------------------------------
MDY       365.68   -1.01     362.93        79.2%    Bullish      RED    .009    -.015
---------------------------------------------------------------------------------------------
IWM       167.57   -.15      166.97        54.2%    ----         RED   -.015    -.013
---------------------------------------------------------------------------------------------
FAS       73.15    .27       70.42         213.5%   Bullish      BLUE   .145     .123
---------------------------------------------------------------------------------------------
RETL      47.26    .13       44.29         499.2%   Bearish      ----   .093     .22
---------------------------------------------------------------------------------------------
SOXL      170.25    1.29     161.21        426.9%   Bullish      BLUE   .201    -.022
---------------------------------------------------------------------------------------------
TECL      156.66    1.15     149.82        414.3%   Bullish      BLUE   .199     .128   +.327 highest
---------------------------------------------------------------------------------------------
IBB       117.55   -.83      118.05        16.2%    Bullish      RED    .078     .048
---------------------------------------------------------------------------------------------
GLD       114.91    .32      114.52       -10%      Bearish      BLUE  -.27     -.117
---------------------------------------------------------------------------------------------
OIL       7.61    .04        6.89          339.4%   Bullish      BLUE   .263     .011
---------------------------------------------------------------------------------------------
OIH       25.67   -.05       25.59        -23.4%    ----         ----  -.122    -.098
---------------------------------------------------------------------------------------------
GASL      21.86   -.8        23.32        -234%     Bearish      RED    .017    -.023
---------------------------------------------------------------------------------------------
|
Table 2 Count of Stocks in Key Directories
20180808
-------------------------------
NEWHIGHS 192 Bullish
NEWLOWS 51
MAXCP 104
MINCP 107
TTTNH 80
TTTNL 129 Day Traders still net bearish.
FASTUP 188
FASTDOWN 178
CPCROSSA 88
CPCROSSD 101
BIGVOLUP 4
BIGVODN 16
|
Table 3
Count of Stocks and New Highs in Key Tiger Directories
Date = 180808
               No.          NHs            Pct
-------------------------------------------------------------------
MAXCP          104           76            73 %
JETS           10            2             20 %
RETAIL         53            8             15 %
GREEN          28            3             11 %
DOWJONES       30            3             10 %
REGBANKS       30            3             10 %
TRANSP         20            2             10 %
COMPUTER       23            2             9 %
SP-100         94            8             9 %
DJI-13         13            1             8 %
ELECTRON       171           14            8 %
MILITARY       37            3             8 %
NASD-100       89            7             8 %
CHEM           61            4             7 %
FIDSTKS        184           13            7 %
SEMI           124           9             7 %
INFRA          36            2             6 %
NIFTY          51            3             6 %
RUS-1000       815           48            6 %
SOFTWARE       64            4             6 %
SP500          476           29            6 %
AUTO           40            2             5 %
INDEXES        189           10            5 %
UTILITY        41            2             5 %
BIOTECH        407           11            3 %
INSURANC       30            1             3 %
BIG17          48            1             2 %
FINANCE        90            2             2 %
GOLD           50            1             2 %
INDMATER       82            2             2 %
REIT           172           3             2 %
|
Table 4  Count of Stocks and New Lows in Key Tiger Directories
Date = 180808
               No           NLs            Pct
--------------------------------------------------------------------
MINCP          107           29            27 %
GOLD           50            6             12 %
GAMING         28            3             11 %
CHINA          60            5             8 %
SOLAR          18            1             6 %
BIOTECH        407           21            5 %
SOFTWARE       64            3             5 %
COMPUTER       23            1             4 %
GREEN          28            1             4 %
BONDFUND       111           3             3 %
FINANCE        90            3             3 %
INFRA          36            1             3 %
BIG17          48            1             2 %
CHEM           61            1             2 %
ELECTRON       171           3             2 %
SEMI           124           2             2 %
FIDSTKS        184           1             1 %
INDMATER       82            1             1 %
NASD-100       89            1             1 %
OILGAS         154           2             1 %
REIT           172           1             1 %
RUS-1000       815           6             1 %
SP500          476           4             1 %
|
Table 5 RANKING OF KEY DIRECTORIES BASED PCT.OF STOCKS ABOVE 65-DMA
8/8/18
Bullish = 31
Bearish = 13
---------------------------------------------------------------------------------------
Directory Current day-1 day-2 day-3 day-4 day-5
----------------------------------------------------------------------------------------
PIPELINE 1 1 1 1 .833 .833
BIGBANKS .857 .857 .857 .714 .857 .714
UTILITY .829 .853 .853 .829 .731 .707
DOWJONES .8 .833 .766 .766 .7 .733
INSURANC .8 .8 .833 .833 .866 .833
GUNS           .777          .777          .722          .722          .722          .777
SP-100         .734          .744          .702          .691          .68           .67
HOSPITAL       .714          .714          .857          .857          .857          .857
TRANSP         .7            .75           .75           .7            .75           .6
FIDSTKS        .695          .701          .668          .657          .646          .63
DJI-13         .692          .769          .692          .692          .692          .692
MILITARY       .675          .648          .594          .486          .567          .594
REIT           .674          .703          .761          .75           .761          .784
SP500          .674          .695          .672          .665          .636          .632
EDU            .666          .666          .833          .666          .666          .666
NIFTY          .666          .705          .666          .549          .588          .509
NASD-100       .662          .696          .674          .64           .617          .595
RETAIL         .66           .622          .584          .603          .584          .528
COMPUTER       .652          .652          .608          .608          .478          .478
RUS-1000       .646          .662          .646          .628          .608          .59
SOFTWARE       .625          .625          .625          .546          .578          .515
INDEXES        .619          .629          .619          .603          .603          .624
GREEN          .607          .607          .535          .464          .428          .392
REGBANKS       .6            .566          .5            .533          .633          .6
ELECTRON       .584          .555          .549          .497          .479          .444
BEVERAGE       .578          .631          .631          .631          .736          .631
SEMI           .564          .524          .532          .491          .467          .403
CHEM           .557          .524          .508          .491          .524          .606
AUTO           .55           .6            .55           .5            .45           .425
HACKERS        .545          .5            .5            .363          .454          .318
FINANCE        .544          .488          .466          .488          .522          .544
INFRA          .527          .5            .5            .5            .5            .472
N= 31
===========================================================================================
COAL           .5            .375          .25           .25           .25           .25
JETS           .5            .5            .5            .5            .5            .4
===========================================================================================
HOMEBLDG       .47           .47           .411          .411          .411          .411
BONDFUND       .459          .522          .54           .495          .513          .441
BIG17          .458          .5            .479          .416          .458          .5
BIOTECH        .449          .454          .434          .42           .476          .452
INDMATER       .414          .426          .426          .439          .451          .524
SOLAR          .388          .277          .222          .166          .222          .222
OILGAS         .383          .435          .428          .422          .422          .448
ETFS           .36           .426          .344          .36           .295          .426
FOOD           .333          .333          .333          .333          .333          .333
GAMING         .285          .285          .357          .357          .214          .25
COMODITY       .267          .339          .232          .214          .196          .16
GOLD           .14           .16           .12           .16           .16           .18
CHINA          .066          .083          .1            .1            .1            .116
N=13
|
========================================================================
8-7-2018
The DJI opened above
the 25550 resistance but could not make any
further headway. The SP-500 is still below its 12 high and the Midcap
MDY also failed to achieve a breakout. So, no judged Buy B10 can
be granted. A clear breakout above the DJI's flat resistance is needed.
Bearishly, the V-I Indicator is negative and today there were only 184
more up than down on the NYSE as Short-term interest rates rose above
2% for the first time in years. At least, the trade wars are quiet.

As you can see from Table 1, the key ETFs 5-day moving averages
and Closing Powers are all still rising. Traders should give the market
more chance to advance.
TECL should be held still. It has the highest IP21 + ITRS total among the
major ETFs. It should be helped if SOXL and the semi-conductors rise
further. Tahiti Techs rose today. NVDA is close to aborting its head/
shoulders pattern. This should cause a new rush of short-covering and
boost TECL more. The two highest AI/200 big techs at the end of June
2018 were INTU and AMZN. They rose nicely today.
 |
 |
In all this, our Sell S9 has not been reversed and there were many
more attractive short sales among the Bearish MINCPs than
bullish-looking longs among the MAXCPs. Hedging with some Bearish
MINCPs seems a good idea while we wait and see if there is more to
the August rally.
Charts 8/7/2018
PEERLESS DJI, Signals,
Indicators Daily DJI Volume 10-DayUp/Down Vol
Hourly DJIA A/D Line for All
Stocks
NASDAQ S&P OEX NYSE COMPQX DJI-15 DJI-20 DJI-30
DIA SPY QQQ MDY IWM TNA
Short-Term Rates
USO-CrudeOil FAS GLD BBH IBB JETS JNUG KOL NUGT OIH OIL RSX RETL
SDS SLV SOXL TECL TMF TNA UGA (gasoline) XIV YINN
Commodities: CANE
JJC, NIB, CHOC CORN, CUT (paper) WEAT UUP (Dollar)
AAPL ADBE ALXN AMAT AMGN AMD AMZN BA BABA BAC BIDU CAT CVX DE
FB GOOG GS HD IBM INTU (new) JPM M (Macy's) MSFT NFLX NVDA QCOM TSLA TXN
XOM WMT ANDV (refinery), CMG (Chipotle), LRCX, SWKS, MDGL
SPPI WATT
SQ TOWN
8/06/2018 (Click on Underlined link.)
Bullish MAXCPs - http://tigersoft.com/MAXCPZ/807/BULLISH.htm
Bearish MAXCPs - http://tigersoft.com/MINCPZ/807/BEARISH.htm
|
Table 1 QUICKSILVER on ETFS - 08/7/18
ETF      CLOSE   CHANGE     PIVOT-PT  5-dma AROC    CL-PWR      CANDLE   IP21   ITRS   IP+ITRS
---------------------------------------------------------------------------------------------
---------------------------------------------------------------------------------------------
DIA       256.12    1.27     253.11        38.4%    Bullish      BLUE   .216     -----
---------------------------------------------------------------------------------------------
COMPQX    7883.66    23.98   7707.29       136.3%   Bullish      BLUE   .161     .025  +.186
---------------------------------------------------------------------------------------------
SPY       285.58    .94      280.86        75.2%    Bullish      BLUE   .166     .014
---------------------------------------------------------------------------------------------
QQQ       181.8    .66       177.12        149.6%   Bullish      BLUE   .131     .036  +.167
---------------------------------------------------------------------------------------------
MDY       366.69    .94      359.92        77.5%    Bullish      ----   .003    -.001
---------------------------------------------------------------------------------------------
IWM       167.72    .4       165.76        50.8%    ----         RED   -.038     .002
---------------------------------------------------------------------------------------------
FAS       72.88    .7        70.1          237.5%   Bullish      BLUE   .119     .053  +.272 2nd highest
---------------------------------------------------------------------------------------------
RETL      47.13    1.1       42.76         312.2%   Bearish      BLUE  -.096     .227
---------------------------------------------------------------------------------------------
SOXL      168.96    4.04     156.36        366.1%   Bullish      BLUE   .215    -.035
---------------------------------------------------------------------------------------------
TECL      155.51    1.57     144.15        501.4%   Bullish      BLUE   .18      .112  +.292 highest
---------------------------------------------------------------------------------------------
IBB       118.38    1.44     117.17        80.7%    Bullish      BLUE   .087     .065  +.152
---------------------------------------------------------------------------------------------
GLD       114.59    .26      115.14       -60.9%    Bearish      RED   -.276    -.105
---------------------------------------------------------------------------------------------
OIL       7.61    .04        6.89          339.4%   Bullish      BLUE   .263     .026  +.289
---------------------------------------------------------------------------------------------
OIH       25.72    .23       25.79        -52.6%    ----         RED   -.15     -.086
---------------------------------------------------------------------------------------------
GASL      22.66   -.21       22.93        -212.5%   Bearish      RED   -.032     .024
---------------------------------------------------------------------------------------------
HD        197.05    1.36     196.3        -12%      ----         BLUE   .052     .019
---------------------------------------------------------------------------------------------
CAT        142.38    2.9     138.54       -50.8%   Bearish       BLUE  -.007    -.122
|
 RANKING OF KEY DIRECTORIES BASED PCT.OF STOCKS ABOVE 65-DMA
               8/7/18
Bullish = 30
Bearish = 14
---------------------------------------------------------------------------------------
Directory     Current       day-1         day-2         day-3         day-4         day-5
----------------------------------------------------------------------------------------
PIPELINE       1             1             1             .833          .833          .833
BIGBANKS       .857          .857          .714          .857          .714          .714
UTILITY        .853          .853          .829          .731          .707          .78
DOWJONES       .833          .766          .766          .7            .733          .833
INSURANC       .8            .833          .833          .866          .833          .833
GUNS           .777          .722          .722          .722          .777          .777
DJI-13         .769          .692          .692          .692          .692          .846
TRANSP         .75           .75           .7            .75           .65           .8
SP-100         .744          .702          .691          .68           .67           .734
HOSPITAL       .714          .857          .857          .857          .857          .857
NIFTY          .705          .666          .549          .588          .509          .509
REIT           .703          .761          .75           .761          .784          .779
FIDSTKS        .701          .668          .657          .646          .63           .679
NASD-100       .696          .674          .64           .617          .595          .629
SP500          .695          .672          .665          .636          .63           .695
EDU            .666          .833          .666          .666          .666          .666
RUS-1000       .662          .646          .628          .608          .591          .645
COMPUTER       .652          .608          .608          .478          .478          .478
MILITARY       .648          .594          .486          .567          .594          .621
BEVERAGE       .631          .631          .631          .736          .631          .736
INDEXES        .629          .619          .603          .603          .624          .645
SOFTWARE       .625          .625          .546          .578          .531          .468
RETAIL         .622          .584          .603          .584          .528          .603
GREEN          .607          .535          .464          .428          .392          .5
AUTO           .6            .55           .5            .45           .45           .525
REGBANKS       .566          .5            .533          .633          .6            .566
ELECTRON       .555          .549          .497          .479          .438          .397
CHEM           .524          .508          .491          .524          .606          .655
SEMI           .524          .532          .491          .467          .403          .338
BONDFUND       .522          .54           .495          .513          .45           .513
N=30
----------------------------------------------------------------------------------------------
HACKERS        .5            .5            .363          .454          .363          .409
INFRA          .5            .5            .5            .5            .472          .555
JETS           .5            .5            .5            .5            .4            .5
----------------------------------------------------------------------------------------------
FINANCE        .488          .466          .488          .522          .544          .511
BIG17          .478          .456          .391          .456          .478          .434
HOMEBLDG       .47           .411          .411          .411          .411          .411
BIOTECH        .455          .435          .421          .477          .458          .428
OILGAS         .435          .428          .422          .422          .461          .558
ETFS           .426          .344          .36           .295          .393          .393
INDMATER       .426          .426          .439          .451          .524          .56
COAL           .375          .25           .25           .25           .25           .25
COMODITY       .339          .232          .214          .196          .16           .285
FOOD           .333          .333          .333          .333          .333          .222
GAMING         .285          .357          .357          .214          .25           .321
SOLAR          .277          .222          .166          .222          .222          .166
GOLD           .16           .12           .16           .16           .18           .24
CHINA          .083          .1            .1            .1            .116          .133
N=14
|
    Count of Stocks in Key Directories
          20180807
-------------------------------
NEWHIGHS       221
NEWLOWS        46
MAXCP          110
MINCP          92
TTTNH          88
TTTNL          111
FASTUP         192
FASTDOWN       171
CPCROSSA       70
CPCROSSD       115
BIGVOLUP       4
BIGVODN        14
|
Table 3
Count of Stocks and New Highs in Key Tiger Directories
Date = 180807
               No.          NHs            Pct
-------------------------------------------------------------------
MAXCP          110           60            55 %
JETS           10            2             20 %
TRANSP         20            4             20 %
HOSPITAL       7             1             14 %
RETAIL         53            7             13 %
SP-100         94            10            11 %
DOWJONES       30            3             10 %
INDEXES        189           19            10 %
COMPUTER       23            2             9 %
HACKERS        22            2             9 %
CHEM           61            5             8 %
NASD-100       89            7             8 %
SOFTWARE       64            5             8 %
AUTO           40            3             7 %
GAMING         28            2             7 %
GREEN          28            2             7 %
RUS-1000       815           53            7 %
ELECTRON       171           10            6 %
SEMI           124           8             6 %
SP500          476           30            6 %
FIDSTKS        184           10            5 %
MILITARY       37            2             5 %
BIOTECH        406           18            4 %
NIFTY          51            2             4 %
OILGAS         154           4             3 %
REGBANKS       30            1             3 %
REIT           172           6             3 %
COMODITY       56            1             2 %
INDMATER       82            2             2 %
UTILITY        41            1             2 %
|
Table 4  Count of Stocks and New Lows in Key Tiger Directories
Date = 180807
               No           NLs            Pct
--------------------------------------------------------------------
GOLD           50            13            26 %
MINCP          92            24            26 %
COMPUTER       23            2             9 %
GREEN          28            2             7 %
SOLAR          18            1             6 %
BIOTECH        406           19            5 %
MILITARY       37            2             5 %
SOFTWARE       64            3             5 %
UTILITY        41            2             5 %
BIG17          46            2             4 %
GAMING         28            1             4 %
INDEXES        189           7             4 %
ELECTRON       171           5             3 %
NASD-100       89            3             3 %
REGBANKS       30            1             3 %
SEMI           124           4             3 %
BONDFUND       111           2             2 %
CHEM           61            1             2 %
CHINA          60            1             2 %
COMODITY       56            1             2 %
INDMATER       82            2             2 %
OILGAS         154           3             2 %
FIDSTKS        184           1             1 %
REIT           172           1             1 %
RUS-1000       815           7             1 %
SP500          476           5             1 %
|
Table 5 RANKING OF KEY DIRECTORIES BASED PCT.OF STOCKS ABOVE 65-DMA
8/7/18
Bullish = 30
Bearish = 14
---------------------------------------------------------------------------------------
Directory Current day-1 day-2 day-3 day-4 day-5
----------------------------------------------------------------------------------------
PIPELINE 1 1 1 .833 .833 .833
BIGBANKS .857 .857 .714 .857 .714 .714
UTILITY .853 .853 .829 .731 .707 .78
DOWJONES .833 .766 .766 .7 .733 .833
INSURANC .8 .833 .833 .866 .833 .833
GUNS           .777          .722          .722          .722          .777          .777
DJI-13         .769          .692          .692          .692          .692          .846
TRANSP         .75           .75           .7            .75           .65           .8
SP-100         .744          .702          .691          .68           .67           .734
HOSPITAL       .714          .857          .857          .857          .857          .857
NIFTY          .705          .666          .549          .588          .509          .509
REIT           .703          .761          .75           .761          .784          .779
FIDSTKS        .701          .668          .657          .646          .63           .679
NASD-100       .696          .674          .64           .617          .595          .629
SP500          .695          .672          .665          .636          .63           .695
EDU            .666          .833          .666          .666          .666          .666
RUS-1000       .662          .646          .628          .608          .591          .645
COMPUTER       .652          .608          .608          .478          .478          .478
MILITARY       .648          .594          .486          .567          .594          .621
BEVERAGE       .631          .631          .631          .736          .631          .736
INDEXES        .629          .619          .603          .603          .624          .645
SOFTWARE       .625          .625          .546          .578          .531          .468
RETAIL         .622          .584          .603          .584          .528          .603
GREEN          .607          .535          .464          .428          .392          .5
AUTO           .6            .55           .5            .45           .45           .525
REGBANKS       .566          .5            .533          .633          .6            .566
ELECTRON       .555          .549          .497          .479          .438          .397
CHEM           .524          .508          .491          .524          .606          .655
SEMI           .524          .532          .491          .467          .403          .338
BONDFUND       .522          .54           .495          .513          .45           .513
N=30
----------------------------------------------------------------------------------------------
HACKERS        .5            .5            .363          .454          .363          .409
INFRA          .5            .5            .5            .5            .472          .555
JETS           .5            .5            .5            .5            .4            .5
----------------------------------------------------------------------------------------------
FINANCE        .488          .466          .488          .522          .544          .511
BIG17          .478          .456          .391          .456          .478          .434
HOMEBLDG       .47           .411          .411          .411          .411          .411
BIOTECH        .455          .435          .421          .477          .458          .428
OILGAS         .435          .428          .422          .422          .461          .558
ETFS           .426          .344          .36           .295          .393          .393
INDMATER       .426          .426          .439          .451          .524          .56
COAL           .375          .25           .25           .25           .25           .25
COMODITY       .339          .232          .214          .196          .16           .285
FOOD           .333          .333          .333          .333          .333          .222
GAMING         .285          .357          .357          .214          .25           .321
SOLAR          .277          .222          .166          .222          .222          .166
GOLD           .16           .12           .16           .16           .18           .24
CHINA          .083          .1            .1            .1            .116          .133
N=14
|
====================================================================
8-6-2018
Cover the DIA Short.
The DJI and MDY seem on the verge flat
top breakouts. SPY is only two points from its January high closing.
The NASDAQ is about 70 points from its yearly high of a week ago.
QQQ only needs to rise by 1.62 to make its own all-time high. With the
A/D Line rising steadily, it seems best to close out our DIA short.
A close above 25550 by the DJI should be judged a Buy B10 breakout.
Note the flat resistance zone on the chart below. It's true the V-I is
negative, but the short-term trend is clearly up, whether because
interest rates will not be raised for a while or because oil prices will
be going up sharply as the Trump Adm. re-imposes sanctions
on Iran. (This usually lifts CVX and XOM in the DJI-30.) I admit
Volume could certainly be higher, but the flat top breakout
cannot be safely ignored. With DIA's Closing Power and 5-dma
both rising, the short-trend is UP and a breakout-run looms likely.
Watch the MDY to see if it can achieve a flat-top breakout. It will
also not take much of an advance tomorrow to bring in a lot of short-
covering. This will almost certainly benefit the Tahiti high techs.


Stay long TECL. It is our preferred long ETF here. In Table 1
below, you can see that it has the highest IP21 + ITRS score
followed by OIL and FAS. IBB has lagged recently, but should
play catchup.
Watch MDY. It is on the verge of a flat-top breakout into
all-time high territory, where it more can easily run.

Our NIFTY-50 TECHS chart beckons for its
own flat top-breakout.

Table 1 QUICKSILVER on ETFS - 08/6/18
ETF      CLOSE   CHANGE     PIVOT-PT  5-dma AROC    CL-PWR      CANDLE   IP21   ITRS   IP+ITRS
---------------------------------------------------------------------------------------------
---------------------------------------------------------------------------------------------
DIA       254.85    .46      254.17        39%      Bullish      BLUE   .26     -----
---------------------------------------------------------------------------------------------
COMPQX    7859.68    47.67   7671.79       148.7%   Bullish      BLUE   .205     .031   .236
---------------------------------------------------------------------------------------------
SPY       284.64    1.04     281.33        83.3%    Bullish      BLUE   .206     .015   .231
---------------------------------------------------------------------------------------------
QQQ       181.14    1.06     176.45        169.7%   Bullish      BLUE   .158     .04    .198
---------------------------------------------------------------------------------------------
MDY       365.75    1.79     361.07        110.6%   Bullish      BLUE   .08      .001
---------------------------------------------------------------------------------------------
IWM       167.32    .93      166.03        94%      ----         BLUE   .029     .005
---------------------------------------------------------------------------------------------
FAS       72.18    .68       69.52         169.4%   Bullish      BLUE   .2       .041   .241 #3
---------------------------------------------------------------------------------------------
RETL      46.03    .86       44.35         224.4%   Bearish      BLUE  -.107     .201
---------------------------------------------------------------------------------------------
SOXL      164.92    2.92     157.22        334.3%   Bullish      BLUE   .213    -.027
---------------------------------------------------------------------------------------------
TECL      153.94    2.54     140.67        497.6%   Bullish      BLUE   .226     .105   .327  #1
---------------------------------------------------------------------------------------------
IBB       116.94   -.23      116.49        120.5%   Bullish      RED    .122     .061   .183
---------------------------------------------------------------------------------------------
GLD       114.33   -.59      115.99       -57.3%    Bearish      RED   -.296    -.103
---------------------------------------------------------------------------------------------
OIL       7.61    .04        6.89          339.4%   Bullish      BLUE   .263     .033   .293  #2
---------------------------------------------------------------------------------------------
OIH       25.49   -.01       25.99        -116.3%   Bullish      RED   -.061    -.123
---------------------------------------------------------------------------------------------
GASL      22.87    .32       23.64        -95%      Bearish      ----   .053    -.035
---------------------------------------------------------------------------------------------
|
    Count of Stocks in Key Directories
          20180806
-------------------------------
NEWHIGHS       203    Bullish Ratio
NEWLOWS        56
MAXCP          131    Bullish
MINCP          82
TTTNH          91
TTTNL          95     Day Traders are skeptical
FASTUP         210    Swing Traders are Bullish.
FASTDOWN       137
CPCROSSA       115    Bullish Professionals
CPCROSSD       62
BIGVOLUP       4
BIGVODN        6
|
Table 3
Count of Stocks and New Highs in Key Tiger Directories
Date = 180806
               No.          NHs            Pct
-------------------------------------------------------------------
MAXCP          131           80            61 %
TRANSP         20            3             15 %
HOSPITAL       7             1             14 %
DOWJONES       30            4             13 %
FOOD           9             1             11 %
RETAIL         53            6             11 %
JETS           10            1             10 %
SP-100         94            9             10 %
COMPUTER       23            2             9 %
HACKERS        22            2             9 %
SOFTWARE       64            6             9 %
DJI-13         13            1             8 %
COMODITY       56            4             7 %
GAMING         28            2             7 %
NASD-100       89            6             7 %
RUS-1000       815           53            7 %
INDEXES        189           12            6 %
INFRA          36            2             6 %
SP500          476           28            6 %
AUTO           40            2             5 %
CHEM           61            3             5 %
ELECTRON       171           8             5 %
REIT           172           8             5 %
UTILITY        41            2             5 %
FIDSTKS        184           8             4 %
GREEN          28            1             4 %
NIFTY          51            2             4 %
BIOTECH        407           14            3 %
MILITARY       37            1             3 %
OILGAS         154           5             3 %
SEMI           124           4             3 %
BIG17          48            1             2 %
ETFS           61            1             2 %
FINANCE        90            1             1 %
INDMATER       82            1             1 %
|
Table 4  Count of Stocks and New Lows in Key Tiger Directories
Date = 180806
               No           NLs            Pct
--------------------------------------------------------------------
MINCP          82            24            29 %
GOLD           50            14            28 %
COMODITY       56            11            20 %
CHINA          60            11            18 %
GREEN          28            3             11 %
HOMEBLDG       17            1             6 %
SOLAR          18            1             6 %
BIOTECH        407           22            5 %
SEMI           124           6             5 %
COMPUTER       23            1             4 %
ELECTRON       171           7             4 %
INDEXES        189           8             4 %
AUTO           40            1             3 %
ETFS           61            2             3 %
INFRA          36            1             3 %
MILITARY       37            1             3 %
REGBANKS       30            1             3 %
CHEM           61            1             2 %
SOFTWARE       64            1             2 %
INDMATER       82            1             1 %
NASD-100       89            1             1 %
RUS-1000       815           7             1 %
SP500          476           1             0 %
|
 RANKING OF KEY DIRECTORIES BASED PCT.OF STOCKS ABOVE 65-DMA
                8/6/18
   Bullish = 30
   Bearish = 13
---------------------------------------------------------------------------------------
Directory     Current       day-1         day-2         day-3         day-4         day-5
----------------------------------------------------------------------------------------
PIPELINE       1             1             .833          .833          .833          .833
BIGBANKS       .857          .714          .857          .714          .714          .714
HOSPITAL       .857          .857          .857          .857          .857          .857
UTILITY        .853          .829          .731          .707          .78           .756
EDU            .833          .666          .666          .666          .666          .666
INSURANC       .833          .833          .866          .833          .833          .833
DOWJONES       .766          .766          .7            .733          .833          .866
REIT           .761          .75           .761          .784          .779          .686
TRANSP         .75           .7            .75           .65           .8            .65
GUNS           .722          .722          .722          .777          .777          .777
SP-100         .702          .691          .68           .67           .734          .723
DJI-13         .692          .692          .692          .692          .846          .846
NASD-100       .674          .64           .617          .595          .629          .595
SP500          .672          .665          .636          .63           .695          .653
FIDSTKS        .668          .657          .646          .63           .684          .657
NIFTY          .666          .549          .588          .509          .509          .431
RUS-1000       .646          .628          .608          .591          .647          .597
BEVERAGE       .631          .631          .736          .631          .736          .684
SOFTWARE       .625          .546          .578          .531          .468          .484
INDEXES        .619          .603          .603          .624          .645          .65
COMPUTER       .608          .608          .478          .478          .478          .434
MILITARY       .594          .486          .567          .594          .621          .567
RETAIL         .584          .603          .584          .528          .603          .603
AUTO           .55           .5            .45           .45           .525          .475
ELECTRON       .549          .497          .479          .438          .415          .385
BONDFUND       .54           .495          .513          .45           .513          .477
GREEN          .535          .464          .428          .392          .5            .392
SEMI           .532          .491          .467          .403          .354          .346
CHEM           .508          .491          .524          .606          .655          .557
N=30
--------------------------------------------------------------------------------------------------------
HACKERS        .5            .363          .454          .363          .409          .409
INFRA          .5            .5            .5            .472          .555          .555
JETS           .5            .5            .5            .4            .5            .5
REGBANKS       .5            .533          .633          .6            .6            .6
--------------------------------------------------------------------------------------------------------
FINANCE        .466          .488          .522          .544          .5            .533
BIOTECH        .434          .42           .476          .457          .429          .4
OILGAS         .428          .422          .422          .461          .564          .545
INDMATER       .426          .439          .451          .524          .56           .56
HOMEBLDG       .411          .411          .411          .411          .411          .47
GAMING         .357          .357          .214          .25           .321          .214
ETFS           .344          .36           .295          .393          .393          .377
FOOD           .333          .333          .333          .333          .222          .222
COAL           .25           .25           .25           .25           .25           .25
COMODITY       .232          .214          .196          .16           .285          .339
SOLAR          .222          .166          .222          .222          .222          .166
GOLD           .12           .16           .16           .18           .24           .26
CHINA          .1            .1            .1            .116          .133          .1
N=13
|
------------------------------------------------------------------------------------------------------
8-3-2018
Hold DIA Short.
I take the Peerless S9-V to still stand.
The V-I on the DJI chart is now negative and will probably
worsen given the days that we will be dropping off in its
21-day ma. calculations. Without more Up Volume, it will be
hard for the DJI to surpass 25550.

Besides being long some of our bullish MAXCPs and short
some of the MINCPs, consider owning TECL (representing
big tech stocks) or IBB (biotechs) . They typically top out
after the DJI. They have the highest combination, IP21 + ITRS.
(See Table 1). We should closely watch the 14-day Stochastic for TECL.
Its signals have been particularly good over the last year. There
can be no guarantee for the future, of course, but traders using
this Stochastic appear to be in control of TECL.


Bullishly, the Nifty Index has just risen back above its rising 65-dma.
Note that the highest AI/200 stock in our Nifty-54 is now INTU. It is
our current "Tahiti Tech" pick.

I would be a lot more bearish, except that the S9s are not based
breadth divergences. In fact, the breadth-based P-I has shown real
resiliency, being positive for more than 44 straight days. I
think this shows that the FED is not going to raise rates soon.
They want the market to remain strong going into the November
Election. Friday's unexpectedly weaker Jobs number for July gives
the "doves" on the FOMC the ammunition they need to delaying more hikes.
This will help dividend stocks, bonds, utilites and REITs and
this, in turn, keeps the NYSE A/D Line rising which makes traders
content.
My judgement is that there still may be a decline to the lower band
coming up. The reason: there still remains the partisan fear on
Wall Street that the Republican control of Congress might be reversed.
That uncertainty is actually normal and helps explain why the DJI's
behavior is much more mediocre in August in the years of a mid-term
Election than otherwise since 1965.
Percent of Time DJI Rises
Average DJI Gain
8-5 to 8-19 8-5 to 9-4 8-5 to 10-5
8-5 to 8-19 8-5 to 9-4 8-5 to 10-5
--------------------------------------- ------
-------------------------------
Mid-Term Election Years:
1966, 1970, 1974, 1978,
1982, 1986, 1990, 1994,
1998, 2002, 2006, 2001,
56.3% 56.3%
43.8%
0%
-0.9%
0.2%
2014... 2018?
1965-2017 (All years)
65.4% 67.3%
59.6%
+1.1%
+1.5% +2.1%
Charts 8/3/2018
PEERLESS DJI, Signals,
Indicators Daily DJI Volume 10-DayUp/Down Vol
Hourly DJIA A/D Line for All
Stocks
NASDAQ S&P OEX NYSE COMPQX DJI-15 DJI-20 DJI-30
DIA SPY QQQ MDY IWM TNA
Short-Term Rates
USO-CrudeOil FAS GLD BBH IBB JETS JNUG KOL NUGT OIH OIL RSX RETL
SDS SLV SOXL TECL TMF TNA UGA (gasoline) XIV YINN
Commodities: CANE
JJC, NIB, CHOC CORN, CUT (paper) WEAT UUP (Dollar)
AAPL ADBE ALXN AMAT AMGN AMD AMZN BA BABA BAC BIDU CAT CVX DE
FB GOOG GS HD IBM INTU (new) JPM M (Macy's) MSFT NFLX NVDA QCOM TSLA TXN
XOM WMT ANDV (refinery), CMG (Chipotle), LRCX, SWKS, MDGL
SPPI WATT
SQ TOWN
8/03/2018 (Click on Underlined link.)
Bullish MAXCPs - http://tigersoft.com/MAXCPZ/803/BULLISH.htm
Bearish MAXCPs - http://tigersoft.com/MINCPZ/803/BEARISH.htm
|
Table 1 QUICKSILVER on ETFS - 08/3/18
ETF      CLOSE   CHANGE     PIVOT-PT  5-dma AROC   CL-PWR      CANDLE   IP21   ITRS   IP+ITRS
---------------------------------------------------------------------------------------------
---------------------------------------------------------------------------------------------
DIA       254.39    1.29     252.87        2.6%    Bullish      BLUE   .264     0
---------------------------------------------------------------------------------------------
COMPQX    7812.01    9.32    7630          48.4%   Bullish      RED    .189     .029
---------------------------------------------------------------------------------------------
SPY       283.6    1.21      279.95        38.8%   Bullish      BLUE   .221     .014
---------------------------------------------------------------------------------------------
QQQ       180.08    .55      175.11        69.4%   Bullish      BLUE   .17      .039  +20.9
---------------------------------------------------------------------------------------------
MDY       363.96    1.03     357.76        63.3%   Bullish      BLUE   .082     .002
---------------------------------------------------------------------------------------------
IWM       166.39   -.58      164.2         34.1%   Bearish      RED    .037     .004
---------------------------------------------------------------------------------------------
FAS       71.5    1.08       69.8          60.6%   Bullish      BLUE   .213     .02   +21.5
---------------------------------------------------------------------------------------------
RETL      45.17    .88       44.05         182.6%  Bearish      BLUE  -.105     .214
---------------------------------------------------------------------------------------------
SOXL      162    .79         154.34        99.6%   Bullish      BLUE   .238    -.03
---------------------------------------------------------------------------------------------
TECL      151.4    1.58      139.5         184.3%  Bullish      BLUE   .235     .087  +32.2 Best
---------------------------------------------------------------------------------------------
IBB       117.17   -.88      114.13        75.7%   Bullish      RED    .179     .069  +24.5 2nd best
---------------------------------------------------------------------------------------------
GLD       114.92    .4       115.65       -39.4%   Bearish      RED   -.264    -.085
---------------------------------------------------------------------------------------------
OIL       7.61    .04        6.89          339.4%  Bullish      BLUE   .263     .038
---------------------------------------------------------------------------------------------
OIH       25.5   -.09        26.09        -29%     Bullish      ----  -.014    -.134
---------------------------------------------------------------------------------------------
GASL      22.55   -.77       23.31         17.3%   ----         RED    .099    -.089
---------------------------------------------------------------------------------------------
|
Table 2 Count of Stocks in Key Directories
20180803
-------------------------------
NEWHIGHS 146 Bullish
NEWLOWS 51
MAXCP 104
MINCP 96
TTTNH 83
TTTNL 126 Day Traders are net bearish
FASTUP 157
FASTDOWN 154
CPCROSSA 108
CPCROSSD 78
BIGVOLUP 2
BIGVODN 15 Big Money Dumping
|
Table 3

Count of Stocks and New Highs in Key Tiger Directories
Date = 180803
-------------------------------------------------------------------
MAXCP          104           55            53 %
HOSPITAL       7             2             29 %
DOWJONES       30            3             10 %
SP-100         94            9             10 %
TRANSP         20            2             10 %
COMPUTER       23            2             9 %
DJI-13         13            1             8 %
RETAIL         53            4             8 %
CHEM           61            4             7 %
GAMING         28            2             7 %
INFRA          36            2             6 %
AUTO           40            2             5 %
FIDSTKS        184           9             5 %
REIT           172           8             5 %
RUS-1000       815           41            5 %
SOFTWARE       64            3             5 %
SP500          476           22            5 %
UTILITY        41            2             5 %
GREEN          28            1             4 %
INDMATER       82            3             4 %
INDEXES        189           8             4 %
NIFTY          54            2             4 %
BIOTECH        407           14            3 %
NASD-100       89            3             3 %
ETFS           61            1             2 %
ELECTRON       171           2             1 %
OILGAS         155           2             1 %
SEMI           124           1             1 %
MINCP          96            1             1 %
|
Table 4
Count of Stocks and New Lows in Key Tiger Directories
Date = 180803
               No           NLs            Pct
--------------------------------------------------------------------
MINCP          96            27            28 %
CHINA          60            12            20 %
GREEN          28            3             11 %
COMPUTER       23            2             9 %
BIOTECH        407           29            7 %
GOLD           50            3             6 %
SOLAR          18            1             6 %
AUTO           40            2             5 %
HACKERS        22            1             5 %
SEMI           124           6             5 %
SOFTWARE       64            3             5 %
ELECTRON       171           6             4 %
GAMING         28            1             4 %
BONDFUND       111           3             3 %
MILITARY       37            1             3 %
REGBANKS       30            1             3 %
ETFS           61            1             2 %
INDEXES        189           3             2 %
NASD-100       89            2             2 %
OILGAS         155           3             2 %
UTILITY        41            1             2 %
FIDSTKS        184           1             1 %
FINANCE        90            1             1 %
INDMATER       82            1             1 %
SP500          476           3             1 %
MAXCP          104           1             1 %
RUS-1000       815           3             0 %
|
| |
 Table 5
 RANKING OF KEY DIRECTORIES BASED PCT.OF STOCKS ABOVE 65-DMA
               8/3/18
 Bullish = 23
 Bearish = 21
---------------------------------------------------------------------------------------
Directory     Current       day-1         day-2         day-3         day-4         day-5
----------------------------------------------------------------------------------------
PIPELINE       1             .833          .833          .833          .833          .833
HOSPITAL       .857          .857          .857          .857          .857          .857
INSURANC       .833          .866          .833          .833          .833          .833
UTILITY        .829          .731          .707          .78           .756          .756
DOWJONES       .766          .7            .733          .833          .866          .866
REIT           .75           .761          .784          .779          .703          .622
GUNS           .722          .722          .777          .777          .777          .777
BIGBANKS       .714          .857          .714          .714          .714          .857
TRANSP         .7            .75           .65           .8            .65           .65
DJI-13         .692          .692          .692          .846          .846          .846
SP-100         .691          .68           .67           .734          .723          .776
EDU            .666          .666          .666          .666          .666          .666
SP500          .665          .636          .63           .695          .657          .689
FIDSTKS        .657          .646          .63           .684          .663          .722
NASD-100       .64           .617          .595          .629          .606          .707
BEVERAGE       .631          .736          .631          .736          .684          .684
RUS-1000       .628          .608          .591          .647          .603          .633
COMPUTER       .608          .478          .478          .478          .478          .521
INDEXES        .603          .603          .624          .645          .656          .634
RETAIL         .603          .584          .528          .603          .622          .566
NIFTY          .555          .592          .518          .518          .462          .666
SOFTWARE       .546          .578          .531          .468          .484          .625
REGBANKS       .533          .633          .6            .6            .6            .633
N=23
===========================================================================================
AUTO           .5            .45           .45           .525          .5            .375
INFRA          .5            .5            .472          .555          .555          .611
JETS           .5            .5            .4            .5            .5            .5
===========================================================================================
ELECTRON       .497          .479          .438          .415          .391          .467
BONDFUND       .495          .513          .45           .513          .495          .576
CHEM           .491          .524          .606          .655          .557          .573
SEMI           .491          .467          .403          .354          .346          .427
FINANCE        .488          .522          .544          .5            .544          .588
MILITARY       .486          .567          .594          .621          .567          .621
GREEN          .464          .428          .392          .5            .392          .428
INDMATER       .439          .451          .524          .56           .56           .548
BIOTECH        .42           .476          .457          .429          .398          .432
OILGAS         .419          .419          .458          .561          .541          .503
HOMEBLDG       .411          .411          .411          .411          .47           .47
BIG17          .391          .456          .478          .434          .391          .478
HACKERS        .363          .454          .363          .409          .409          .5
ETFS           .36           .295          .393          .393          .377          .36
GAMING         .357          .214          .25           .321          .214          .357
FOOD           .333          .333          .333          .222          .222          .222
COAL           .25           .25           .25           .25           .25           .375
COMODITY       .214          .196          .16           .285          .339          .303
SOLAR          .166          .222          .222          .222          .166          .166
GOLD           .16           .16           .18           .24           .26           .2
CHINA          .1            .1            .116          .133          .1            .15
N=21
|
====================================================================
8-2-2018
Hold DIA Short.
I take the Peerless S9-V to still
be standing.

But Buy TECL, IBB and some of the very high
Accumulation/high relative strength tech stocks.
We came
very close to getting a Peerless Buy B18 oday. See more
below).
Our Tiger "Tahiti" (It can be traded casually from a pleasant
vacation home.) does not yet show top formations here and now
the P-Indicator has been positive for 42 straight days. Interestingly,
both the number of NASDAQ new highs (96) and NASDAQ new lows (100)
today were sufficiently high to make hedging with our MAXCPs
and MINCPs look mutually and simultaneously profitable.
Tomorrow we get to see July's US Job's Report.
A number higher than
the 213,000 reported last month for June would normally be expected to give
a big jump to the stock market as bulls show off their enthusiasm and optimism.
Some worry that too good a number will cause the Fed to raise rates in
September. But my guess is that the FED will keep rates unchanged until after
the November Election. The bigger concern, I think, is that a big rise in jobs
and profits has already been built into the DJIA. So, another good economic
report is apt to bring some profit-taking on the news, at least in the DJI.
But tech stocks are another matter. They are rising, if I am right, because
performance-minded fund managers are unusually confident and because they
must chase the strongest stocks. In addition, more and more investors see the
fast-growing NASDAQ tech stocks as the best way to cope with the coming
Inflation, inevitably born of an economic boom, tighter labor markets, new tariffs
and also higher interest rates (which just get passed onto consumers).
Buy TECL and IBB


The Tech Boom Should Continue.
There is no doubt that the magificent performance of AMZN, AAPL, NVDA and
INTU creates a bubble of speculative confidence which cannot easily be ended.
Typically, such stocks show blatant IP21 negative non-confirmations and head
shoulders before they can reverse. We do not see that in these stocks.
As long as the NYSE A/D Line stays in its uptrend, we have credible evidence
that interest rates are not going to be raised in a way that puts the market at
risk. In that environment, the highest AI/200 (most consistently accumulated
tech stocks should keep rising. Consider using the list of the top
"Tahiti" tech stocks
since the end of 2016 as the stocks which should be very good performers
for 21 months after their appearance in our ranking OR until Peerless gives a
breadth based Sell S9 OR the NYSE A/D Line uptrend is violated after
an S9-V.
Recent Tahiti DJI-30 and Tech Stocks
A/I 200 Price
Price Now
12/31/2016 NVDA 187
106.74
250.62 + 4.15
INTC 167
36.87
49.48
+.67
3/31/2017 AAPL 164
143.66
207.39 +5.89
NVDA 176
108.93
250.62 + 4.15
6/30/2017 AAPL 172
144.08
207.39 +5.89
KLAC 178
91.51
118.47 +.176
NVDA 167
144.56
250.62 + 4.15
9/30/2017 AAPL 162
154.12
207.39 +5.89
FB 182
170.87
176.37 +4.72
INTU 164
142.13
205.73 +1.47
(To be continued this weekend... Get our Tahiti Tech book for $50.)
Stay short DIA but also be long some of the high Accumulation Tahiti techs
shown above and among the Bullish MAXCPs.
Why Stay Short DIA?
The Peerless Sell S9 still stands, assuming you use the current version of Peerless.
But note that pre-July 2018 versions of Peerless did get Buy B18 with today's data
because the P-Indicator achieved 42 straight days of being positive today
and the V-I is positive. The reason why we got no such B18 (though we can
factor that in by buying tech stocks) is because older versions of Peerless did not
produce a Sell S9-V on 7/18/2018. It is the presence recently of that signal that
prevents the B18 on our current software.
I recommend trusting the current version of Peerless. First, it has
been back-tested
much more fully. Secondly, the 7/18/2018 S9-V looks valid. On that date,
the
DJI closed 2.44% over the 21-dma and showed a negative V-I (-27) and
a negative IP21 (current Accumulation of -.002). Thirdly, I see the nearly negative
V-I as a bearish sign which warns that the DJI is not likely to get past its resistance
25550, at least, not so easily as IBB and TECL can run into all-time high ground.
The DJI chart of 2005 below shows how difficult it is to overcome resistance
in August when the V-I is negative or nearly so..
2
months' straight positive P-I in early August with overhead-resistance
and low V-I Readings required another test of lower band before DJI and
market could make a good rally.
X 20050801 B18 10623.15
 |
Charts 8/2/2018
PEERLESS DJI, Signals,
Indicators Daily DJI Volume 10-DayUp/Down Vol
Hourly DJIA A/D Line for All
Stocks
NASDAQ S&P OEX NYSE COMPQX DJI-15 DJI-20 DJI-30
DIA SPY QQQ MDY IWM TNA
Short-Term Rates
USO-CrudeOil FAS GLD BBH IBB JETS JNUG KOL NUGT OIH OIL RSX RETL
SDS SLV SOXL TECL TMF TNA UGA (gasoline) XIV YINN
Commodities: CANE
JJC, NIB, CHOC CORN, CUT (paper) WEAT UUP (Dollar)
AAPL ADBE ALXN AMAT AMGN AMD AMZN BA BABA BAC BIDU CAT CVX DE
FB GOOG GS HD IBM INTU (new) JPM M (Macy's) MSFT NFLX NVDA QCOM TSLA TXN
XOM WMT ANDV (refinery), CMG (Chipotle), LRCX, SWKS, MDGL
SPPI WATT
SQ TOWN
8/02/2018 (Click on Underlined link.)
Bullish MAXCPs - http://tigersoft.com/MAXCPZ/802/BULLISH.htm
Bearish MAXCPs - http://tigersoft.com/MINCPZ/802/BEARISH.htm
|
Table 1 QUICKSILVER on ETFS - 08/2/18
ETF      CLOSE   CHANGE     PIVOT-PT  5-dma AROC   CL-PWR      CANDLE   IP21   ITRS
---------------------------------------------------------------------------------------------
---------------------------------------------------------------------------------------------
DIA       253.1   -.01       254.26       -39.8%   Bullish      BLUE   .272     ----
---------------------------------------------------------------------------------------------
COMPQX    7802.69    95.4    7737.42      -32.1%   Bullish      BLUE   .21      .038
---------------------------------------------------------------------------------------------
SPY       282.39    1.53     281.42       -16.9%   Bullish      BLUE   .224     .016
---------------------------------------------------------------------------------------------
QQQ       179.53    2.41     177.62       -14.7%   Bullish      BLUE   .168     .048
---------------------------------------------------------------------------------------------
MDY       362.93    3.01     359.4        -6.8%    Bullish      BLUE   .116     .003
---------------------------------------------------------------------------------------------
IWM       166.97    1.21     165.26       -43.1%   ----         BLUE   .096     .012
---------------------------------------------------------------------------------------------
FAS       70.42    .32       70.65        -69.7%   Bullish      BLUE   .214     .001
---------------------------------------------------------------------------------------------
RETL      44.29    1.53      43.57        -164.4%  Bearish      BLUE  -.095     .225
---------------------------------------------------------------------------------------------
SOXL      161.21    4.85     158.86        1%      Bullish      BLUE   .265    -.015
---------------------------------------------------------------------------------------------
TECL      149.82    5.67     146.09       -158%    Bullish      BLUE   .231     .104 highest
---------------------------------------------------------------------------------------------
IBB       118.05    .88      115.41        8.6%    Bullish      BLUE   .222     .086 2nd highest
---------------------------------------------------------------------------------------------
GLD       114.52   -.62      115.83       -54%     Bearish      RED   -.226    -.084
---------------------------------------------------------------------------------------------
OIL       7.61    .04        6.89          339.4%  Bullish      BLUE   .263     .042
---------------------------------------------------------------------------------------------
OIH       25.59   -.2        25.65         54.3%   Bullish      BLUE   .003    -.136
---------------------------------------------------------------------------------------------
GASL      23.32    .39       22.47        -326.4%  Bullish      BLUE   .101    -.071
---------------------------------------------------------------------------------------------
|
Table 2   Count of Stocks in Key Directories
          20180802
-------------------------------
NEWHIGHS       192   Bullish
NEWLOWS        66
MAXCP          145   Professionals turned net bullish today.
MINCP          87
TTTNH          107
TTTNL          111   Day Traders are NOT bullish.
FASTUP         114
FASTDOWN       219   Swing Traders remain net bearish.
CPCROSSA       309   Professionals turned net bullish today.
CPCROSSD       42
BIGVOLUP       2
BIGVODN        19    More dumping continues.
|
Table 3
Count of Stocks and New Highs in Key Tiger Directories
Date = 180802
               No.          NHs            Pct
-------------------------------------------------------------------
MAXCP          145           77            53 %
HOSPITAL       7             2             29 %
PIPELINE       6             1             17 %
HACKERS        22            3             14 %
REGBANKS       30            3             10 %
DJI-13         13            1             8 %
GREEN          28            2             7 %
AUTO           40            2             5 %
BIOTECH        407           21            5 %
CHEM           61            3             5 %
NIFTY          40            2             5 %
SOFTWARE       64            3             5 %
TRANSP         20            1             5 %
COMODITY       56            2             4 %
COMPUTER       23            1             4 %
ELECTRON       171           7             4 %
FIDSTKS        184           8             4 %
FINANCE        90            4             4 %
GAMING         28            1             4 %
INDMATER       82            3             4 %
INDEXES        189           8             4 %
OILGAS         155           6             4 %
RETAIL         53            2             4 %
RUS-1000       815           36            4 %
SP500          476           19            4 %
DOWJONES       30            1             3 %
INFRA          36            1             3 %
MILITARY       37            1             3 %
NASD-100       89            3             3 %
SEMI           124           4             3 %
SP-100         94            3             3 %
BIG17          46            1             2 %
ETFS           61            1             2 %
REIT           172           4             2 %
UTILITY        41            1             2 %
|
Table 4
Table 4  Count of Stocks and New Lows in Key Tiger Directories
Date = 180802
               No           NLs            Pct
--------------------------------------------------------------------
MINCP          87            29            33 %
GOLD           50            16            32 %
CHINA          60            12            20 %
COMODITY       56            9             16 %
COMPUTER       23            2             9 %
GAMING         28            2             7 %
GREEN          28            2             7 %
HOMEBLDG       17            1             6 %
SOLAR          18            1             6 %
BIOTECH        407           19            5 %
BONDFUND       111           5             5 %
MILITARY       37            2             5 %
SEMI           124           6             5 %
ELECTRON       171           6             4 %
AUTO           40            1             3 %
CHEM           61            2             3 %
INDEXES        189           5             3 %
REGBANKS       30            1             3 %
SOFTWARE       64            2             3 %
BIG17          46            1             2 %
ETFS           61            1             2 %
FINANCE        90            2             2 %
INDMATER       82            2             2 %
NASD-100       89            2             2 %
RETAIL         53            1             2 %
FIDSTKS        184           2             1 %
OILGAS         155           2             1 %
REIT           172           1             1 %
RUS-1000       815           12            1 %
SP500          476           5             1 %
|
Table 5 RANKING OF KEY DIRECTORIES BASED PCT.OF STOCKS ABOVE 65-DMA
8/2/18
Bullish = 26
Bearish = 19
---------------------------------------------------------------------------------------
Directory Current day-1 day-2 day-3 day-4 day-5
----------------------------------------------------------------------------------------
INSURANC .866 .833 .833 .833 .833 .833
BIGBANKS .857 .714 .714 .714 .857 .857
HOSPITAL .857 .857 .857 .857 .857 .857
PIPELINE .833 .833 .833 .833 .833 .833
REIT .761 .784 .779 .703 .627 .732
TRANSP .75 .65 .8 .65 .65 .7
BEVERAGE .736 .631 .736 .684 .684 .842
UTILITY .731 .707 .78 .756 .756 .756
GUNS .722 .777 .777 .777 .777 .833
DOWJONES .7 .733 .833 .866 .866 .833
DJI-13 .692 .692 .846 .846 .846 .769
SP-100 .68 .67 .734 .723 .776 .765
EDU .666 .666 .666 .666 .666 .666
FIDSTKS .646 .63 .684 .663 .722 .739
SP500 .636 .63 .695 .657 .691 .731
REGBANKS .633 .6 .6 .6 .633 .633
NASD-100 .617 .595 .629 .606 .707 .752
RUS-1000 .608 .591 .647 .603 .634 .684
INDEXES .603 .624 .645 .656 .634 .682
RETAIL .584 .528 .603 .622 .584 .66
SOFTWARE .578 .531 .468 .484 .625 .734
NIFTY .575 .5 .5 .425 .6 .625
MILITARY .567 .594 .621 .567 .621 .675
CHEM .524 .606 .655 .557 .573 .639
FINANCE .522 .544 .5 .544 .588 .622
BONDFUND .513 .45 .513 .495 .585 .576
N= 26
==============================================================================================
INFRA .5 .472 .555 .555 .611 .611
JETS .5 .4 .5 .5 .5 .5
==============================================================================================
ELECTRON .479 .438 .415 .391 .485 .573
COMPUTER .478 .478 .478 .478 .521 .608
BIOTECH .476 .457 .429 .398 .439 .525
SEMI .467 .403 .354 .346 .435 .524
BIG17 .456 .478 .434 .391 .5 .543
HACKERS .454 .363 .409 .409 .5 .681
INDMATER .451 .524 .56 .56 .548 .621
AUTO .45 .45 .525 .5 .375 .35
GREEN .428 .392 .5 .392 .428 .464
OILGAS .419 .458 .561 .541 .516 .58
HOMEBLDG .411 .411 .411 .47 .47 .47
FOOD .333 .333 .222 .222 .222 .222
ETFS .295 .393 .393 .377 .36 .327
COAL .25 .25 .25 .25 .375 .625
SOLAR .222 .222 .222 .166 .166 .222
GAMING .214 .25 .321 .214 .357 .535
COMODITY .196 .16 .285 .339 .303 .285
GOLD .16 .18 .24 .26 .2 .14
CHINA .1 .116 .133 .1 .15 .15
N= 19
|
-------------------------------------------------------------------------------------------------------
8/1/2018 The Peerless
Sell S9-V stands. Same
message as last night. Stay short DIA.
It's short-term price uptrend has been violated. See DIA's red candle-sticks now.
Hedge by being long some of the Bullish MAXCP Biotechs and short some
of the many very weak Bearish MINCPs.
Remember that the DJI is quite capable of leading the general market
down after S9-Vs, especially if the uptrend of the NYSE A/D line is violated.
The best examples of this are in the Summer of 2001 and 2011. I show their
charts below the DJI's and DIA' just below.
The NASDAQ's relative strength versus the DJI is in a downtrend. Speculators
are nervous and profit-taking in the super techs is likely to continue.
 |
Candlestick "Red Popcicles" are warnings that
Professionals are bearish.
Look also at Table 2 for confirming evidence.
 |
2002 S9V + A/D Line Break bring on Bear
Market
 |
2011 S9V + A/D Line Break bring on Bear
Market
 |
Charts 8/1/2018
PEERLESS DJI, Signals,
Indicators Daily DJI Volume 10-DayUp/Down Vol
Hourly DJIA A/D Line for All
Stocks
NASDAQ S&P OEX NYSE COMPQX DJI-15 DJI-20 DJI-30
DIA SPY QQQ MDY IWM TNA
Short-Term Rates
USO-CrudeOil FAS GLD BBH IBB JETS JNUG KOL NUGT OIH OIL RSX RETL
SDS SLV SOXL TECL TMF TNA UGA (gasoline) XIV YINN
Commodities: CANE
JJC, NIB, CHOC CORN, CUT (paper) WEAT UUP (Dollar)
AAPL ADBE ALXN AMAT AMGN AMD AMZN BA BABA BAC BIDU CAT CVX DE
FB GOOG GS HD IBM INTU (new) JPM M (Macy's) MSFT NFLX NVDA QCOM TSLA TXN
XOM WMT ANDV (refinery), CMG (Chipotle), LRCX, SWKS, MDGL
SPPI WATT
SQ TOWN
8/01/2018 (Click on Underlined link.)
Bullish MAXCPs - http://tigersoft.com/MAXCPZ/801/BULLISH.htm
Bearish MAXCPs - http://tigersoft.com/MINCPZ/801/BEARISH.htm
|
Table 1 QUICKSILVER on ETFS - 08/1/18
ETF CLOSE CHANGE PIVOT-PT 5-dma AROC CL-PWR CANDLE IP21 ITRS
---------------------------------------------------------------------------------------------
---------------------------------------------------------------------------------------------
DIA 253.11 -1.06 255.12 -17.9% Bullish RED .2 -----
---------------------------------------------------------------------------------------------
COMPQX 7707.29 35.5 7852.18 -144.9% ---- BLUE .138 .03
---------------------------------------------------------------------------------------------
SPY 280.86 -.47 283.34 -55.8% Bullish RED .162 .015
---------------------------------------------------------------------------------------------
QQQ 177.12 .67 180.05 -159.7% ---- BLUE .082 .039
---------------------------------------------------------------------------------------------
MDY 359.92 -1.15 363.42 -27.4% ---- RED .05 -.005
---------------------------------------------------------------------------------------------
IWM 165.76 -.27 168.4 -52.3% Bearish BLUE .044 .005
---------------------------------------------------------------------------------------------
FAS 70.1 .58 71.4 -123.9% Bullish BLUE .179 .014
---------------------------------------------------------------------------------------------
RETL 42.76 -1.59 45.74 -208% Bearish RED -.116 .125
---------------------------------------------------------------------------------------------
SOXL 156.36 -.86 161.18 111.2% Bullish RED .202 -.022
---------------------------------------------------------------------------------------------
TECL 144.15 3.48 154.4 -587.7% ---- BLUE .166 .063
---------------------------------------------------------------------------------------------
IBB 117.17 .68 117.85 -92.6% Bullish BLUE .188 .089 (best)
---------------------------------------------------------------------------------------------
GLD 115.14 -.85 115.77 -66.4% Bearish RED -.201 -.073
---------------------------------------------------------------------------------------------
OIL 7.61 .04 6.89 339.4% Bullish BLUE .263 .049
---------------------------------------------------------------------------------------------
OIH 25.79 -.2 25.31 177.8% Bullish BLUE -.043 -.139
---------------------------------------------------------------------------------------------
GASL 22.93 -.71 24.85 -407.1% ---- ---- .038 -.129
---------------------------------------------------------------------------------------------
UGA 33.33 -.63 34.53 -115.1% Bearish RED -.183 -.088
---------------------------------------------------------------------------------------------
UUP 25.01 .03 25.05 26% ---- ---- .045 .003
---------------------------------------------------------------------------------------------
IEF 101.34 -.44 101.61 -18.7% Bearish BLUE -.054 -.008
|
Table 2 Count of Stocks in Key Directories
20180801
-------------------------------
NEWHIGHS 125 Still a bull market
NEWLOWS 62
MAXCP 52
MINCP 130 Bearish Professionals
TTTNH 48
TTTNL 173 Bearish Day Traders dominate
FASTUP 110
FASTDOWN 229 Bearish Swing Traders
CPCROSSA 140
CPCROSSD 106
BIGVOLUP 3
BIGVODN 16 Bearish Big Dumping
|
Table 3
Count of Stocks and New Highs in Key Tiger Directories
Date = 180801
No. NHs Pct
-------------------------------------------------------------------
MAXCP 52 27 52 %
PIPELINE 6 1 17 %
EDU 7 1 14 %
HOSPITAL 7 1 14 %
DJI-13 13 1 8 %
DOWJONES 30 2 7 %
GREEN 28 2 7 %
INSURANC 30 2 7 %
CHEM 61 3 5 %
COMODITY 56 3 5 %
BIOTECH 408 18 4 %
COMPUTER 23 1 4 %
GAMING 28 1 4 %
SP-100 94 4 4 %
FIDSTKS 184 6 3 %
FINANCE 90 3 3 %
MILITARY 37 1 3 %
NIFTY 40 1 3 %
OILGAS 155 4 3 %
REGBANKS 30 1 3 %
REIT 173 5 3 %
BIG17 46 1 2 %
INDMATER 82 2 2 %
NASD-100 89 2 2 %
RUS-1000 815 20 2 %
SP500 476 11 2 %
ELECTRON 171 2 1 %
INDEXES 189 2 1 %
SEMI 124 1 1 %
|
Table 4 Count of Stocks and New Lows in Key Tiger Directories
Date = 180801
No NLs Pct
--------------------------------------------------------------------
GOLD 50 14 28 %
MINCP 130 29 22 %
COMODITY 56 9 16 %
COAL 8 1 13 %
BONDFUND 111 12 11 %
FOOD 9 1 11 %
CHINA 60 6 10 %
GAMING 28 2 7 %
HOMEBLDG 17 1 6 %
SOLAR 18 1 6 %
BIOTECH 408 16 4 %
COMPUTER 23 1 4 %
INDMATER 82 3 4 %
AUTO 40 1 3 %
INDEXES 189 6 3 %
INFRA 36 1 3 %
SOFTWARE 64 2 3 %
BIG17 46 1 2 %
ELECTRON 171 3 2 %
NASD-100 89 2 2 %
RETAIL 53 1 2 %
SEMI 124 3 2 %
FIDSTKS 184 2 1 %
FINANCE 90 1 1 %
OILGAS 155 1 1 %
RUS-1000 815 8 1 %
SP-100 94 1 1 %
SP500 476 5 1 %
|
Table 5 RANKING OF KEY DIRECTORIES BASED PCT.OF STOCKS ABOVE 65-DMA
8/1/18
Bullish = 24 Bearish = 21
---------------------------------------------------------------------------------------
Directory Current day-1 day-2 day-3 day-4 day-5
----------------------------------------------------------------------------------------
HOSPITAL .857 .857 .857 .857 .857 .857
INSURANC .833 .833 .833 .833 .833 .666
PIPELINE .833 .833 .833 .833 .833 .833
REIT .78 .774 .699 .624 .739 .716
GUNS .777 .777 .777 .777 .833 .833
DOWJONES .733 .833 .866 .866 .833 .8
BIGBANKS .714 .714 .714 .857 .714 .857
EDU .714 .714 .714 .714 .714 .714
UTILITY .707 .78 .756 .756 .756 .756
DJI-13 .692 .846 .846 .846 .769 .692
SP-100 .67 .734 .723 .776 .755 .755
TRANSP .65 .8 .65 .65 .7 .6
BEVERAGE .631 .736 .684 .684 .842 .947
FIDSTKS .63 .684 .663 .722 .744 .69
SP500 .63 .695 .657 .691 .733 .682
INDEXES .624 .645 .656 .634 .682 .645
CHEM .606 .655 .557 .573 .639 .54
REGBANKS .6 .6 .6 .633 .633 .633
NASD-100 .595 .629 .606 .707 .764 .741
MILITARY .594 .621 .567 .621 .675 .648
RUS-1000 .591 .647 .603 .634 .687 .646
FINANCE .544 .5 .544 .588 .611 .633
SOFTWARE .531 .468 .484 .625 .75 .75
RETAIL .528 .603 .622 .584 .66 .66
INDMATER .524 .56 .56 .548 .621 .585
N=24
============================================================================================
NIFTY .5 .5 .425 .6 .65 .6
============================================================================================
BIG17 .478 .434 .391 .5 .5 .521
COMPUTER .478 .478 .478 .521 .652 .565
INFRA .472 .555 .555 .611 .611 .666
BIOTECH .458 .431 .399 .441 .526 .531
OILGAS .458 .561 .541 .516 .593 .554
AUTO .45 .525 .5 .375 .35 .325
BONDFUND .45 .513 .495 .585 .585 .639
ELECTRON .438 .415 .391 .485 .584 .52
HOMEBLDG .411 .411 .47 .47 .47 .411
SEMI .403 .354 .346 .435 .524 .483
JETS .4 .5 .5 .5 .5 .3
ETFS .393 .393 .377 .36 .311 .377
GREEN .392 .5 .392 .428 .464 .464
HACKERS .363 .409 .409 .5 .681 .636
FOOD .333 .222 .222 .222 .222 .222
COAL .25 .25 .25 .375 .625 .625
GAMING .25 .321 .214 .357 .535 .642
SOLAR .222 .222 .166 .166 .222 .277
GOLD .18 .24 .26 .2 .14 .22
COMODITY .16 .285 .339 .303 .285 .303
CHINA .116 .133 .1 .15 .15 .183
N=21
|
|
====================================================================
7/31/2018 The Peerless
Sell S9-V stands. Stay
short DIA. Hedge by being long
some of the Bullish MAXCP and short some of the Bearish MINCPs.
The DJI is near its apparent ceiling of 25550.
A retreat back to 24500 would seem likely.
 |
 |
"Tahiti" Stock Picks.
The data is in for 2000-2018. The "Tahiti" picks using our new system
work very well. But I have revised some aspects of trading with it.
Get the E-Book for $50 and see for yourself.
BA is now the highest AI/200 DJI stock. As the DJI-30's "Tahiti" stock,
it should probably be bought at its rising 65-dma at 349, seven points lower.
Wild swinging AMZN and INTU are the top "Tahiti" tech stocks at this
juncture. The best place to buy AMZN is probably at its rising 65-dma,
which is 100 points lower than today's close. INTU has also been a star
performer for a long time. It is now sitting right on its rising 65-dma and
would seem to be an attractive long-term Tahiti holding if its Closing Power
will hook back up now. The new Tahiti Tech research suggests that most
of these super-strong high AI/200 stocks need to form a head/shoulders
top before they can go into a tail-spin of profit-taking. INTU's AI/200 score
is also very high, at 188. That should help hold it up, too. Of course, if the
NYSE A/D Line were to break its longer-term uptrendline, I would hold off
buying in view of the Peerless Sell S9-V.
AI/200 of 188 is very high for INTU

While we do see a series of S9-Vs on the DJI chart, they are not based on any
serious breadth divergences yet. Meanwhile, the DJI's IP21 is quite high and
the NYSE A/D Line is still in an uptrend. As a consequence, I suspect
the Professional selling (See Table 2) will be over in a week or two.
Yahoo has been running articles again which have been telling investors
that a Crash lies just ahead. The Trump Administration obviously wants
to avoid this. So, we hear new talk from them about another tax cut plus
tariff reductions, not tariff increases. This is meant to shore up the stock
market before the Fall Election. Whether it will actually become more
than talk seems doubtful. I suspect Wall Street is getting a little unnerved by
the desperation this talk suggests. And that is how I would interpret the
now active Peerless Sell S9-V. But will Trump's pro-Wall Street
agenda will lose many votes? No one knows. That uncertainty suggests
the tendency to take profits on strength in the DJI near 25500 will continue.
Professional waiting to buy until the DJI falls back to 24000 could well maintain
the existing trading range right up to the actual Election.
Wall Street has every right to be concerned about the
potential of Inflation,
about the near certainty of higher interest rates and about the exhausted American
Consumer who is loaded up with too much debt. But fortunately for Wall Street,
most Democrats are not "populists" and are only too happy to take money from
the "fat cats" there while basing most of their criticism of Trump on his desire
to get along with the Russians. While the new "cold-war" is certainly the
main
theme most every day of the NY Times, of nearly all CNN and MSNBC
commentators, I get the sense that this theme is not getting Democrats
many new votes. People tend to vote their pocket-books and Trump's bull
market and the good Job market will count for more in November than
anti-Russian fear-mongering.
Our preferred trading posture is to remain short DIA and some
of the ugliest
(most bearish looking) MINCPs and long some of best performing Biotechs.
This group did move up today. It's also true that many oversold NASDAQ
tech stocks did rally today, "turn around" Tuesday. But the many recent
"false breakouts" among them should keep traders nervous and cautious.
Charts 7/31/2018
PEERLESS DJI, Signals,
Indicators Daily DJI Volume 10-DayUp/Down Vol
Hourly DJIA A/D Line for All
Stocks
NASDAQ S&P OEX NYSE COMPQX DJI-15 DJI-20 DJI-30
DIA SPY QQQ MDY IWM TNA
Short-Term Rates
USO-CrudeOil FAS GLD BBH IBB JETS JNUG KOL NUGT OIH OIL RSX RETL
SDS SLV SOXL TECL TMF TNA UGA (gasoline) XIV YINN
Commodities: CANE
JJC, NIB, CHOC CORN, CUT (paper) WEAT UUP (Dollar)
AAPL ADBE ALXN AMAT AMGN AMD AMZN BA BABA BAC BIDU CAT CVX DE
FB GOOG GS HD IBM JPM M (Macy's) MSFT NFLX NVDA QCOM TSLA TXN
XOM WMT ANDV (refinery), CMG (Chipotle), LRCX, SWKS, MDGL
SPPI WATT
SQ TOWN
7/31/2018 (Click on Underlined link.)
Bullish MAXCPs - http://tigersoft.com/MAXCPZ/731/BULLISH.htm
Bearish MAXCPs -
http://tigersoft.com/MINCPZ/731/BEARISH.htm
|
Table 1 QUICKSILVER on ETFS - 07/31/18
ETF CLOSE CHANGE PIVOT-PT 5-dma AROC CL-PWR CANDLE IP21 ITRS
---------------------------------------------------------------------------------------------
---------------------------------------------------------------------------------------------
DIA 254.17 1.3 254.02 38.6% Bullish BLUE .269 0
---------------------------------------------------------------------------------------------
COMPQX 7671.79 41.79 7932.24 -108.3% ---- BLUE .175 .014
---------------------------------------------------------------------------------------------
SPY 281.33 1.38 284.01 -5% Bullish BLUE .216 .008
---------------------------------------------------------------------------------------------
QQQ 176.45 1.34 182.82 -107.4% ---- BLUE .11 .025
---------------------------------------------------------------------------------------------
MDY 361.07 3.31 361.9 4.7% ---- BLUE .088 -.009
---------------------------------------------------------------------------------------------
IWM 166.03 1.83 167.5 -25.8% ---- BLUE .081 -.003
---------------------------------------------------------------------------------------------
FAS 69.52 -.28 71.85 -79% Bullish RED .221 .012
---------------------------------------------------------------------------------------------
RETL 44.35 .3 44.61 97.1% Bearish BLUE -.029 .162
---------------------------------------------------------------------------------------------
SOXL 157.22 2.88 152.87 215.7% Bullish BLUE .251 -.002
---------------------------------------------------------------------------------------------
TECL 140.67 1.17 161.6 -506.2% ---- RED .209 .047
---------------------------------------------------------------------------------------------
IBB 116.49 2.36 119.33 -65.4% Bullish BLUE .203 .052
---------------------------------------------------------------------------------------------
GLD 115.99 .34 116.68 -2.2% Bearish BLUE -.216 -.081
---------------------------------------------------------------------------------------------
OIL 7.61 .04 6.89 339.4% Bullish BLUE .263 .032
---------------------------------------------------------------------------------------------
OIH 25.99 -.1 24.88 224.8% ---- ---- -.099 -.141
---------------------------------------------------------------------------------------------
GASL 23.64 .33 24.87 -123.2% Bearish BLUE -.011 -.072
---------------------------------------------------------------------------------------------
|
Table 2 Count of Stocks in Key Directories
20180731
-------------------------------
NEWHIGHS 127
NEWLOWS 36
MAXCP 52
MINCP 117 Bearish Professionals
TTTNH 66
TTTNL 161 Bearish Day Traders
FASTUP 105
FASTDOWN 196 Bearish Swing Traders
CPCROSSA 207
CPCROSSD 35
BIGVOLUP 5
BIGVODN 14
|
Table 3
Count of Stocks and New Highs in Key Tiger Directories
Date = 180731
No. NHs Pct
-------------------------------------------------------------------
MAXCP 52 24 46 %
CHEM 61 6 10 %
DOWJONES 30 2 7 %
FIDSTKS 184 12 7 %
GAMING 28 2 7 %
GREEN 28 2 7 %
INDMATER 82 6 7 %
SP-100 94 7 7 %
OILGAS 155 9 6 %
SP500 476 25 5 %
RUS-1000 815 35 4 %
AUTO 40 1 3 %
BIOTECH 408 12 3 %
INDEXES 189 6 3 %
INFRA 36 1 3 %
INSURANC 30 1 3 %
MILITARY 37 1 3 %
COMODITY 55 1 2 %
ELECTRON 171 3 2 %
FINANCE 90 2 2 %
GOLD 50 1 2 %
NASD-100 89 2 2 %
REIT 173 4 2 %
RETAIL 53 1 2 %
SOFTWARE 64 1 2 %
UTILITY 41 1 2 %
SEMI 124 1 1 %
|
Table 4 Count of Stocks and New Lows in Key Tiger Directories
Date = 180731
No NLs Pct
--------------------------------------------------------------------
MINCP 117 20 17 %
COAL 8 1 13 %
FOOD 9 1 11 %
GAMING 28 3 11 %
CHINA 60 5 8 %
REGBANKS 30 2 7 %
HOMEBLDG 17 1 6 %
SOLAR 18 1 6 %
AUTO 40 2 5 %
BONDFUND 111 6 5 %
BIG17 46 2 4 %
BIOTECH 408 17 4 %
ELECTRON 171 6 4 %
INFRA 36 1 3 %
SEMI 124 4 3 %
SOFTWARE 64 2 3 %
COMODITY 55 1 2 %
GOLD 50 1 2 %
INDMATER 82 1 1 %
INDEXES 189 1 1 %
NASD-100 89 1 1 %
OILGAS 155 2 1 %
REIT 173 1 1 %
RUS-1000 815 7 1 %
SP-100 94 1 1 %
SP500 476 2 0 %
|
Table 5 RANKING OF KEY DIRECTORIES BASED PCT.OF STOCKS ABOVE 65-DMA
7/31/18
Bullish = 27 Bearish = 16
---------------------------------------------------------------------------------------
Directory Current day-1 day-2 day-3 day-4 day-5
----------------------------------------------------------------------------------------
HOSPITAL .857 .857 .857 .857 .857 .714
DJI-13 .846 .846 .846 .769 .692 .692
DOWJONES .833 .866 .866 .833 .8 .8
INSURANC .833 .833 .833 .833 .666 .633
PIPELINE .833 .833 .833 .833 .833 .833
TRANSP .8 .65 .65 .7 .6 .4
UTILITY .78 .756 .756 .756 .731 .682
GUNS .777 .777 .777 .833 .833 .722
REIT .774 .699 .624 .739 .716 .71
BEVERAGE .736 .684 .684 .842 .947 .736
SP-100 .734 .723 .776 .755 .755 .723
BIGBANKS .714 .714 .857 .714 .857 .714
EDU .714 .714 .714 .714 .714 .714
SP500 .695 .657 .691 .733 .684 .644
FIDSTKS .684 .663 .722 .744 .69 .635
CHEM .655 .557 .573 .639 .54 .524
INDEXES .65 .656 .634 .682 .661 .624
RUS-1000 .647 .603 .634 .687 .649 .624
NASD-100 .629 .606 .707 .764 .752 .685
MILITARY .621 .567 .621 .675 .648 .594
RETAIL .603 .622 .584 .66 .679 .641
REGBANKS .6 .6 .633 .633 .633 .666
OILGAS .561 .541 .516 .593 .574 .522
INDMATER .56 .56 .548 .621 .585 .548
INFRA .555 .555 .611 .611 .694 .666
AUTO .525 .5 .375 .35 .325 .375
BONDFUND .513 .495 .585 .585 .639 .639
N=27
--------------------------------------------------------------------------------------------
FINANCE .5 .544 .588 .611 .622 .666
GREEN .5 .392 .428 .464 .5 .428
JETS .5 .5 .5 .5 .3 .1
NIFTY .5 .425 .6 .65 .625 .55
--------------------------------------------------------------------------------------------
COMPUTER .478 .478 .521 .652 .565 .565
SOFTWARE .468 .484 .625 .75 .765 .687
BIG17 .434 .391 .5 .5 .5 .456
BIOTECH .431 .399 .441 .526 .529 .517
ELECTRON .415 .391 .485 .584 .514 .555
HOMEBLDG .411 .47 .47 .47 .411 .352
HACKERS .409 .409 .5 .681 .636 .59
ETFS .393 .377 .36 .311 .36 .295
SEMI .354 .346 .435 .524 .483 .508
GAMING .321 .214 .357 .535 .678 .642
COMODITY .29 .345 .309 .29 .309 .181
COAL .25 .25 .375 .625 .625 .625
GOLD .24 .26 .2 .14 .22 .2
FOOD .222 .222 .222 .222 .222 .111
SOLAR .222 .166 .166 .222 .277 .222
CHINA .133 .1 .15 .15 .2 .15
N=16
|
====================================================================
7/30/2018 The
Peerless Sell S9-V Continues. It's "turnaround Tuesday"
and
the DJI may try to rally again, but I would not expect much more than
a bounce If Peerless is right, the whole market, including the DJI, too,
needs to pullback to better support now that there has been a false breakout
by the DJI over 25500 resistance and now that there have been so many false
breakouts by TECL, QQQ and the leading tech stocks. In addition, the
the V-I is just barely positive. So, I suspect that the the uncertainties of the
Fall Election will increasingly weigh on the market.and we will see more weakness.
It may be only profit-taking. But that remains to be seen. The
weakest internal
strength readings are now seen in IWM and MDY in Table 1. For those who
trade the general market ETFs, I suggest it would probably be good to short
them if there is no "Tuesday turnaround" tomorrow.

To turn the market up Tuesday, we will need to see the NYSE A/D Line rise
convincingly from its rising support line and not break it. Today, there were
only 261 more down than up on the NYSE. The chart above shows the
A/D Line resting on its steep uptrend.
Watch the Closing Power for DIA and the DJIA tomorrow. It is still rising.
Lots of weakness tomorrow after an up-opening would be quite bearish.
It would make the Closing Power fall and break its uptrend.

Note, too, that it would take a DJI decline of more than 70 tomorrow to turn
this short-term momentum indicator down.
Finally note also that the IP21 of DIA is now a relatively high +.219. This is the
highest reading for this indicator of likely support on weakness among all the key major
market ETFs. From this, it follows that DIA may be held up a while longer
even if ETFs with much lower IP21 and ITRS numbers drop more and
possibly even if the techs break their key supports and their 65-dma supports.
For a bigger decline to take place, we need to see the following other negative
technicals occur.
1) The V-Indicator on the Peerless chart will need to drop back below 0.
2) The NYSE A/D Line will need to turn much more negative that today and
bring about a break in its uptrend.
3) The highest AI stocks, INTU (AI/200=190), POOL (AI/200=181),
HUBS (AI/200=173) and GDDY (AI/200=171) will need to fall convincingly
below the support of their 65-dma. If they do not do this, it will appear that
their current declines are simple profit-taking. See their charts among the
Bullish MAXCPs today.

4) QQQ, TECL, IWM and MDY will need to break decisively below their
65-dma.


Charts 7/30/2018
PEERLESS DJI, Signals,
Indicators Daily DJI Volume 10-DayUp/Down Vol
Hourly DJIA A/D Line for All
Stocks
NASDAQ S&P OEX NYSE COMPQX DJI-15 DJI-20 DJI-30
DIA SPY QQQ MDY IWM TNA
Short-Term Rates
USO-CrudeOil FAS GLD BBH IBB JETS JNUG KOL NUGT OIH OIL RSX RETL
SDS SLV SOXL TECL TMF TNA UGA (gasoline) XIV YINN
Commodities: CANE
JJC, NIB, CHOC CORN, CUT (paper) WEAT UUP (Dollar)
AAPL ADBE ALXN AMAT AMGN AMD AMZN BA BABA BAC BIDU CAT CVX DE
FB GOOG GS HD IBM JPM M (Macy's) MSFT NFLX NVDA QCOM TSLA TXN
XOM WMT ANDV (refinery), CMG (Chipotle), LRCX, SWKS, MDGL
SPPI WATT
SQ TOWN
7/30/2018 (Click on Underlined link.)
Bullish MAXCPs - http://tigersoft.com/MAXCPZ/730/BULLISH.htm
Bearish MAXCPs -
http://tigersoft.com/MINCPZ/730/BEARISH.htm
|
Table 1 QUICKSILVER on ETFS - 07/30/18
ETF CLOSE CHANGE PIVOT-PT 5-dma AROC CL-PWR CANDLE IP21 ITRS
---------------------------------------------------------------------------------------------
---------------------------------------------------------------------------------------------
DIA 252.87 -1.39 252.21 51.5% Bullish RED .219 ----
---------------------------------------------------------------------------------------------
COMPQX 7630 -107.42 7840.77 -135.1% ---- RED .163 .013
---------------------------------------------------------------------------------------------
SPY 279.95 -1.47 281.61 -4.4% Bullish RED .135 .008
---------------------------------------------------------------------------------------------
QQQ 175.11 -2.51 180.3 -123.6% ---- RED .049 .02
---------------------------------------------------------------------------------------------
MDY 357.76 -1.64 360.73 -78.4% ---- RED -.005 -.012
---------------------------------------------------------------------------------------------
IWM 164.2 -1.06 166.89 -134.2% Bearish RED .006 -.005
---------------------------------------------------------------------------------------------
FAS 69.8 -.85 70.64 -54.9% Bullish RED .178 .008
---------------------------------------------------------------------------------------------
RETL 44.05 .48 43.49 -172.6% Bearish BLUE -.051 .131
---------------------------------------------------------------------------------------------
SOXL 154.34 -4.52 150.51 -38.2% Bullish RED .236 -.055
---------------------------------------------------------------------------------------------
TECL 139.5 -6.59 156.01 -448.2% ---- RED .144 .033
---------------------------------------------------------------------------------------------
IBB 114.13 -1.28 118.02 -172.4% ---- RED .178 .04
---------------------------------------------------------------------------------------------
GLD 115.65 -.18 116.04 -15.1% Bearish RED -.214 -.076
---------------------------------------------------------------------------------------------
OIL 7.61 .04 6.89 339.4% Bullish BLUE .263 .041
---------------------------------------------------------------------------------------------
OIH 26.09 .44 24.85 236.9% ---- BLUE -.152 -.135
---------------------------------------------------------------------------------------------
GASL 23.31 .84 24.23 -122.6% Bearish BLUE -.078 -.106
---------------------------------------------------------------------------------------------
UGA 34.47 -.07 33.61 133.5% Bearish RED -.16 -.059
---------------------------------------------------------------------------------------------
UUP 24.93 -.09 25 -12% Bearish ---- -.09 -.007
---------------------------------------------------------------------------------------------
IEF 101.64 -.13 101.79 -3.9% Bearish BLUE -.193 -.008
---------------------------------------------------------------------------------------------
XLU 52.32 -.32 52.1 38.2% Bullish RED .193 .047
---------------------------------------------------------------------------------------------
WEAT 6.85 .17 6.48 255.9% Bullish BLUE -.098 .024
---------------------------------------------------------------------------------------------
YINN 25.65 -.23 26.36 300.2% Bullish RED .292 -.276
---------------------------------------------------------------------------------------------
RSX 21.57 .17 21.04 124.5% ---- RED .153 -.011
---------------------------------------------------------------------------------------------
AAPL 189.91 -1.07 193 -44.1% ---- RED .066 -.005
---------------------------------------------------------------------------------------------
GOOG 1219.74 -18.76 1248.08 57.2% Bullish RED .178 .11
---------------------------------------------------------------------------------------------
MSFT 105.37 -2.31 107.66 -119.5% ---- RED -.043 .075
---------------------------------------------------------------------------------------------
AMZN 1779.22 -38.05 1829.24 -62.4% Bearish RED -.042 .104
---------------------------------------------------------------------------------------------
FB 171.06 -3.83 214.67 -1002% ---- RED .017 -.09
---------------------------------------------------------------------------------------------
NVDA 244.13 -7.89 248.71 -105% Bearish RED .071 -.035
---------------------------------------------------------------------------------------------
BA 351.06 -9.59 358.27 -30.9% Bullish RED .21 -.001
---------------------------------------------------------------------------------------------
|
Table 1 Count of Stocks in Key Directories
20180730
-------------------------------
NEWHIGHS 63
NEWLOWS 70 Bearish
MAXCP 31
MINCP 179 Bearish Professionals
TTTNH 52
TTTNL 269 Bearish Day Traders
FASTUP 79
FASTDOWN 333 Bearish Swing Traders
CPCROSSA 60
CPCROSSD 90 Bearish Professionals
BIGVOLUP 3
BIGVODN 12 Bearish Big Money Dumping
ACCUMVER 14
HIGHIP21 66
HIUPPCT 139
VHIP21 35
LOWACCUM 344
REDSELL 100
AUGSELS7 20
TRAPDOOR 14
|
Table 3
Count of Stocks and New Highs in Key Tiger Directories
Date = 180730
No. NHs Pct
-------------------------------------------------------------------
MAXCP 31 12 39 %
RETAIL 53 3 6 %
COMODITY 55 3 5 %
OILGAS 155 7 5 %
GREEN 28 1 4 %
SP-100 94 4 4 %
AUTO 40 1 3 %
FIDSTKS 184 6 3 %
NIFTY 40 1 3 %
SP500 476 12 3 %
CHEM 61 1 2 %
ELECTRON 171 3 2 %
RUS-1000 815 16 2 %
SEMI 124 2 2 %
UTILITY 41 1 2 %
BIOTECH 408 3 1 %
INDEXES 189 1 1 %
NASD-100 89 1 1 %
REIT 173 2 1 %
|
Table 4 Count of Stocks and New Lows in Key Tiger Directories
Date = 180730
No NLs Pct
-------------------------------------------------------------------
GOLD 50 13 26 %
MINCP 179 44 25 %
SOLAR 18 4 22 %
COAL 8 1 13 %
COMODITY 55 7 13 %
BONDFUND 111 9 8 %
CHINA 60 5 8 %
BIOTECH 408 29 7 %
GAMING 28 2 7 %
ELECTRON 171 11 6 %
SEMI 124 6 5 %
BIG17 46 2 4 %
COMPUTER 23 1 4 %
GREEN 28 1 4 %
NASD-100 89 3 3 %
REGBANKS 30 1 3 %
FIDSTKS 184 3 2 %
INDMATER 82 2 2 %
REIT 173 3 2 %
RETAIL 53 1 2 %
SOFTWARE 64 1 2 %
UTILITY 41 1 2 %
INDEXES 189 2 1 %
OILGAS 155 2 1 %
RUS-1000 815 10 1 %
SP500 476 2 0 %
|
Table 5 RANKING OF KEY DIRECTORIES BASED PCT.OF STOCKS ABOVE 65-DMA
7/30/18
Bullish = 26 Bearish = 19
---------------------------------------------------------------------------------------
Directory Current day-1 day-2 day-3 day-4 day-5
----------------------------------------------------------------------------------------
DOWJONES .866 .866 .833 .8 .8 .733
HOSPITAL .857 .857 .857 .857 .714 .714
DJI-13 .846 .846 .769 .692 .692 .615
INSURANC .833 .833 .833 .666 .633 .6
PIPELINE .833 .833 .833 .833 .833 .833
GUNS .777 .777 .833 .833 .666 .611
UTILITY .756 .756 .756 .731 .682 .707
SP-100 .723 .776 .755 .755 .723 .691
BIGBANKS .714 .857 .714 .857 .714 .714
EDU .714 .714 .714 .714 .714 .714
REIT .699 .624 .739 .716 .728 .774
BEVERAGE .684 .684 .842 .947 .684 .789
FIDSTKS .663 .722 .744 .69 .635 .673
SP500 .657 .691 .733 .684 .642 .64
INDEXES .656 .634 .682 .661 .629 .656
TRANSP .65 .65 .7 .6 .4 .55
RETAIL .622 .584 .66 .679 .641 .754
NASD-100 .606 .707 .764 .752 .696 .741
RUS-1000 .603 .634 .687 .649 .624 .645
REGBANKS .6 .633 .633 .633 .666 .733
MILITARY .567 .621 .675 .648 .594 .567
INDMATER .56 .548 .621 .585 .548 .426
CHEM .557 .573 .639 .54 .524 .508
INFRA .555 .611 .611 .694 .666 .611
FINANCE .544 .588 .611 .622 .666 .711
OILGAS .541 .516 .593 .574 .529 .47
N=26
=========================================================================================
AUTO .5 .375 .35 .325 .375 .3
JETS .5 .5 .5 .3 .1 .2
=========================================================================================
BONDFUND .495 .585 .585 .639 .648 .621
SOFTWARE .484 .625 .75 .765 .703 .75
COMPUTER .478 .521 .652 .565 .565 .652
HOMEBLDG .47 .47 .47 .411 .352 .47
NIFTY .425 .6 .65 .625 .575 .65
HACKERS .409 .5 .681 .636 .636 .772
BIOTECH .399 .441 .526 .529 .522 .566
GREEN .392 .428 .464 .5 .428 .5
BIG17 .391 .5 .5 .5 .456 .521
ELECTRON .391 .485 .584 .514 .549 .596
ETFS .377 .36 .311 .36 .278 .18
SEMI .346 .435 .524 .483 .5 .58
COMODITY .345 .309 .29 .309 .181 .127
GOLD .26 .2 .14 .22 .2 .12
COAL .25 .375 .625 .625 .625 .625
FOOD .222 .222 .222 .222 .111 0
GAMING .214 .357 .535 .678 .642 .642
SOLAR .166 .166 .222 .277 .222 .222
CHINA .1 .15 .15 .2 .166 .166
N=19
|
| |
====================================================================
7/27/2018 The
Peerless Sell S9-V still stands. There was no "judged B10" because
the marginal DJI breakout over the 25500 resistance failed on Friday.
With the V-I still only barely positive, do not expect the DJI to quickly
surpass 25550. On the
other hand, the NYSE A/D Line uptrend and the
DJI's positive Accumulation Index will work to support the DJI in here.
So, we will need to see more weak DJI closings vis-a-vis their openings to
show that bearish Professionals are in control. That there will be more
post-opening weakness, see Table 1 where Professionals are shown to
be mostly net bearish and see the Bullish MAXCPs today and how
unimpressive they look compared to most days or the Bearish MINCPs.
If the expected weakness at the close does develop,
short more of the MINCPs.
The Trading Range Is Likely To Contain the DJI
until we get closer to the November Election.

Friday was a very bad day for most of the
leading Tech stocks. As they have
been
the leaders, a new round of larger profit-taking seems to have started. This will
hurt
the general market. Most of these big tech stocks like AAPL, ADBE, ALXN, AMZN,
BABA, BBH, BIDU ... showed big and bearish (short-term) "red popcicles on
Friday.
QQQ and TECL also produced classic red popsicles on Friday. This caused their
steep Closing Power uptrend to be violated. But there is hope. Many of these
show
high Accumulation and their technicals could look much worse. If QQQ and the big
techs
also showed head/shoulders patterns and red Distribution, the future here would look a
lot more bearish. Intermediate-term and longer term declines most often show these
addtional characteristics. For the most part QQQ tech stocks do not show them.
So, most likely, we will only see a week of short-term profit-taking.

Thursday night, I warned that we must watch the tech ETF TECL, representing these
tech stocks, to see if would hold or fail last week's breakout. If it failed badly
and closed
below its point of breakout, I warned that this would nullify its marginal breakout
and be
a real sign of danger for the general market since it has been the big tech stocks like
these
that have been the backbone of the advance and the best performers for the last
five years. A profit-taking retreat by them is probably now underway. It will
be up
to the DJI, especially the big banks and Boeing, to hold up the appearance that all is
still well. But since the DJI could
not hold the 25500 level, I think we have to again
go short the DJI out of respect to the S9-V, which is still considered extant and intact,
Again, there there was no successful judged B10 breakout. Judged B10s so not
incorporate
declines back below the point of breakout. They must be immediately successful.

Charts 7/27/2018
PEERLESS DJI, Signals,
Indicators Daily DJI Volume 10-DayUp/Down Vol
Hourly DJIA A/D Line for All
Stocks
NASDAQ S&P OEX NYSE COMPQX DJI-15 DJI-20 DJI-30
DIA SPY QQQ MDY IWM TNA
Short-Term Rates
USO-CrudeOil FAS GLD BBH IBB JETS JNUG KOL NUGT OIH OIL RSX RETL
SDS SLV SOXL TECL TMF TNA UGA (gasoline) XIV YINN
Commodities: CANE
JJC, NIB, CHOC CORN, CUT (paper) WEAT UUP (Dollar)
AAPL ADBE ALXN AMAT AMGN AMD AMZN BA BABA BAC BIDU CAT CVX DE
FB GOOG GS HD IBM JPM M (Macy's) MSFT NFLX NVDA QCOM TSLA TXN
XOM WMT ANDV (refinery), CMG (Chipotle), LRCX, SWKS, MDGL
SPPI WATT
SQ TOWN
7/27/2018 (Click on Underlined link.)
Bullish MAXCPs - http://tigersoft.com/MAXCPZ/727/BULLISH.htm
Bearish MAXCPs -
http://tigersoft.com/MINCPZ/727/BEARISH.htm
|
Table 1 QUICKSILVER on ETFS - 07/27/18
ETF CLOSE CHANGE PIVOT-PT 5-dma AROC CL-PWR CANDLE IP21 ITRS
---------------------------------------------------------------------------------------------
---------------------------------------------------------------------------------------------
DIA 254.26 -.86 250.26 75.7% Bullish RED .295 ----
---------------------------------------------------------------------------------------------
COMPQX 7737.42 -114.76 7841.87 -52.7% ---- RED .234 .02
---------------------------------------------------------------------------------------------
SPY 281.42 -1.92 280.2 30.9% Bullish RED .185 .008
---------------------------------------------------------------------------------------------
QQQ 177.62 -2.43 179.56 -38% Bullish RED .133 .026
---------------------------------------------------------------------------------------------
MDY 359.4 -4.02 363.43 -55.2% ---- RED .084 -.01
---------------------------------------------------------------------------------------------
IWM 165.26 -3.14 168.69 -95.8% ---- RED .092 .002
---------------------------------------------------------------------------------------------
FAS 70.65 -.75 70.58 127.4% Bullish RED .233 .012
---------------------------------------------------------------------------------------------
RETL 43.57 -2.17 45.59 -231% Bearish RED -.046 .116
---------------------------------------------------------------------------------------------
SOXL 158.86 -2.32 155.53 128.4% Bullish RED .288 -.043
---------------------------------------------------------------------------------------------
TECL 146.09 -8.31 153.33 -160.4% Bullish RED .217 .061
---------------------------------------------------------------------------------------------
IBB 115.41 -2.44 118.19 -120.4% Bullish RED .236 .048
---------------------------------------------------------------------------------------------
GLD 115.83 .06 116 -31.4% Bearish RED -.2 -.078
---------------------------------------------------------------------------------------------
OIL 7.61 .04 6.89 339.4% Bullish BLUE .263 .036
---------------------------------------------------------------------------------------------
OIH 25.65 .34 24.9 33.9% Bearish BLUE -.108 -.138
---------------------------------------------------------------------------------------------
GASL 22.47 -2.38 23.9 -376.6% Bearish RED -.059 -.091
---------------------------------------------------------------------------------------------
UUP 25.02 -.03 24.99 14% Bearish ---- -.067 -.007
---------------------------------------------------------------------------------------------
AAPL 190.98 -3.23 191.61 -11.9% Bullish RED .112 -.01
---------------------------------------------------------------------------------------------
GOOG 1238.5 -29.83 1205.5 217.1% Bullish RED .214 .12
---------------------------------------------------------------------------------------------
MSFT 107.68 -1.94 107.97 65% ---- RED .014 .083
---------------------------------------------------------------------------------------------
AMZN 1817.27 9.27 1802 9.8% ---- RED .037 .12
---------------------------------------------------------------------------------------------
FB 174.89 -1.37 210.91 -851.3% Bullish RED .03 -.071
---------------------------------------------------------------------------------------------
NVDA 252.02 -2.82 249.41 22.5% Bullish RED .153 -.001
---------------------------------------------------------------------------------------------
BA 360.65 1.33 353.27 80.7% Bullish RED .279 .032
---------------------------------------------------------------------------------------------
GS 237.64 .53 233.76 126.6% Bullish RED .093 -.039
---------------------------------------------------------------------------------------------
HD 197.14 -2.26 202.23 -131.8% Bearish RED -.004 .032
---------------------------------------------------------------------------------------------
CAT 142.56 -.02 136.28 206.7% Bullish RED .166 -.098
|
Table 2 Count of Stocks in Key Directories
20180727
-------------------------------
NEWHIGHS 53
NEWLOWS 53
MAXCP 25
MINCP 164 Bearish Professionals dominate.
TTTNH 37
TTTNL 269 Bearish Day Traders Dominate.
FASTUP 66
FASTDOWN 239 Bearish Swing Traders Dominate
CPCROSSA 48
CPCROSSD 178 Pros shifting to bearish camp.
BIGVOLUP 5
BIGVODN 19
ACCUMVER 13
HIGHIP21 84
HIUPPCT 149
VHIP21 35
LOWACCUM 348
REDSELL 103
AUGSELS7 14
TRAPDOOR 14
|
Table 3
Count of Stocks and New Highs in Key Tiger Directories
Date = 180727
No. NHs Pct
-------------------------------------------------------------------
MAXCP 25 12 48 %
JETS 10 1 10 %
TRANSP 20 2 10 %
SP-100 94 5 5 %
COMPUTER 23 1 4 %
GREEN 28 1 4 %
DOWJONES 30 1 3 %
NIFTY 40 1 3 %
COMODITY 54 1 2 %
ELECTRON 171 4 2 %
FIDSTKS 184 4 2 %
FINANCE 90 2 2 %
OILGAS 155 3 2 %
RETAIL 53 1 2 %
RUS-1000 815 16 2 %
SEMI 124 2 2 %
SP500 476 11 2 %
BONDFUND 111 1 1 %
INDEXES 189 1 1 %
REIT 173 1 1 %
BIOTECH 408 1 0 %
|
Table 4 Count of Stocks and New Lows in Key Tiger Directories
Date = 180727
No NLs Pct
-------------------------------------------------------------------
MINCP 164 35 21 %
SOLAR 18 3 17 %
GOLD 50 7 14 %
COAL 8 1 13 %
GAMING 28 3 11 %
BIOTECH 408 28 7 %
HOMEBLDG 17 1 6 %
RETAIL 53 3 6 %
AUTO 40 2 5 %
BONDFUND 111 5 5 %
ELECTRON 171 8 5 %
SEMI 124 6 5 %
BIG17 46 2 4 %
COMODITY 54 2 4 %
COMPUTER 23 1 4 %
GREEN 28 1 4 %
CHINA 60 2 3 %
REGBANKS 30 1 3 %
INDEXES 189 3 2 %
NASD-100 89 2 2 %
SOFTWARE 64 1 2 %
UTILITY 41 1 2 %
FIDSTKS 184 2 1 %
OILGAS 155 2 1 %
REIT 173 2 1 %
RUS-1000 815 5 1 %
SP500 476 3 1 %
|
Table 5 RANKING OF KEY DIRECTORIES BASED PCT.OF STOCKS ABOVE 65-DMA
7/27/18
Bullish = 30 Bearish = 14
---------------------------------------------------------------------------------------
Directory Current day-1 day-2 day-3 day-4 day-5
----------------------------------------------------------------------------------------
DOWJONES .866 .833 .8 .8 .733 .733
BIGBANKS .857 .714 .857 .714 .714 .571
HOSPITAL .857 .857 .857 .714 .714 .571
DJI-13 .846 .769 .692 .692 .615 .615
INSURANC .833 .833 .666 .633 .6 .566
PIPELINE .833 .833 .833 .833 .833 .833
GUNS .777 .833 .833 .666 .611 .722
SP-100 .776 .755 .755 .723 .691 .702
UTILITY .756 .756 .731 .682 .707 .731
FIDSTKS .722 .744 .69 .635 .673 .695
EDU .714 .714 .714 .714 .714 .714
NASD-100 .707 .764 .752 .696 .741 .752
SP500 .691 .733 .684 .642 .642 .659
BEVERAGE .684 .842 .947 .684 .789 .684
TRANSP .65 .7 .6 .4 .55 .55
INDEXES .64 .682 .661 .629 .65 .645
RUS-1000 .634 .687 .649 .624 .646 .663
REGBANKS .633 .633 .633 .666 .733 .7
SOFTWARE .625 .75 .765 .703 .75 .75
REIT .624 .739 .716 .728 .774 .797
MILITARY .621 .675 .648 .594 .567 .675
INFRA .611 .611 .694 .666 .611 .583
NIFTY .6 .65 .625 .575 .65 .725
FINANCE .588 .611 .622 .666 .711 .6
BONDFUND .585 .585 .639 .648 .63 .738
RETAIL .584 .66 .679 .641 .754 .735
CHEM .573 .639 .54 .524 .524 .622
INDMATER .548 .621 .585 .548 .439 .512
COMPUTER .521 .652 .565 .565 .652 .608
OILGAS .516 .593 .574 .529 .47 .509
N=30
==============================================================================================
BIG17 .5 .5 .5 .456 .5 .456
HACKERS .5 .681 .636 .636 .772 .727
JETS .5 .5 .3 .1 .2 .2
==============================================================================================
ELECTRON .485 .584 .514 .549 .602 .614
HOMEBLDG .47 .47 .411 .352 .47 .529
BIOTECH .441 .526 .529 .522 .563 .561
SEMI .435 .524 .483 .5 .58 .596
GREEN .428 .464 .5 .428 .5 .5
AUTO .375 .35 .325 .375 .3 .35
COAL .375 .625 .625 .625 .625 .625
ETFS .36 .311 .36 .278 .196 .196
GAMING .357 .535 .678 .642 .642 .642
COMODITY .314 .296 .314 .185 .129 .092
FOOD .222 .222 .222 .111 0 0
GOLD .2 .14 .22 .2 .12 .22
SOLAR .166 .222 .277 .222 .222 .222
CHINA .15 .15 .2 .166 .166 .15
N=14
|
============================================================
7/26/2018 The Peerless
Sell S9-V is not doing much to hold back the market. Today, Facebook
fell 20% and the DJI, SP-500, OEX and NYSE refused to be shaken up.
I think realism requires us to view the DJI now as probably headed back to its peak of
this past January above 26500. The key internal strength indicators we use, the A/D
Line,
our P-I, IP21 and V-I, are all in rising trends. So is the Closing Power for
each of
major market ETFs (DIA, SPY, QQQ and IWM). The 5-dma are all rising, too.
See Table 1 below. And now the DJI has closed above its 25500 resistance.
So, I would suggest that traders close out their DIA
short positions and not initiate
them again until we see new signs of market weakness.
There are still plenty
of bearish-looking MINCPs to short as hedges. But as for the DJIA, at the very
least,
we will need to see the V-I turn back into negative territory and for DIA to close below
its
previous day's close after a big rise at the opening. This would produce a bearish
"red popsicle" on our Candle Stick charts and also cause a big drop by the DIA's
Closing"
Power. Actually, I would prefer to see a new Peerless Sell, too. As you can
see,
the rally this week has failed to generate a new Peerless Sell. The V-I has turned
positive. If you want to, you can say that today's rally by the DJI has produced a
"judged Buy B10". I will talk about this more on Sunday.
Buy B10s are confirmed flat-topped breakouts.
The
DJI has marginally achieved the judged B10 today. The
NYSE has done so by a wider margin. We need to watch TECL's flat
top
breakout. A failure by it tomorrow, namely a drop below its
point of breakout, will be a bearish sign, but a recovery by it would be bullish
and boost the odds of the other indexes making sustained advances.


Politics Rule
What has caused the market's recovery? I would guess
it's Wall Street's
new sense that policy-makers in the White House have seen the Light and now
appreciate how much a rising bull market can help an incumbent's political party.
In other words, "let the stock market rally". Get re-relected and then
experiment
with tariffs, if you must. This would account for the White House's apparent
decision to tone down all rhetoric about tariffs and Trump's decision this week to
delay meeting Putin to avoid seeming "soft" on Russia.
My own guess is that Wall Street Seers believe that the FED
will avoid
raising rates aggressively this Summer. Trump's new appointees to the
FOMB will want to keep the market advancing strongly. Only if Inflation
surpasses 3.5% or the Dollar weakens a lot will they act aggressively to raise
rates.
And as a bonus to boost the market, I would expect new White House talk of
more tax cuts. Democrats, of course, will claim them to be "unfair", but
the truth
is that many blue-collar voters will gladly take a Republican tax-cut in place of a
Democrat promise of a new social program. Only a market collapse and economic
slow-down would change that calculus.
Table 1 QUICKSILVER on ETFS - 07/26/18
ETF CLOSE CHANGE PIVOT-PT 5-dma AROC CL-PWR CANDLE IP21 ITRS
---------------------------------------------------------------------------------------------
---------------------------------------------------------------------------------------------
DIA 255.12 1.1 250.44 86.1% Bullish BLUE .238 ----
---------------------------------------------------------------------------------------------
COMPQX 7852.18 -80.06 7820.2 17.1% Bullish BLUE .162 .037
---------------------------------------------------------------------------------------------
SPY 283.34 -.67 279.68 59.4% Bullish BLUE .131 .014
---------------------------------------------------------------------------------------------
QQQ 180.05 -2.77 178.99 28.3% Bullish RED .111 .041
---------------------------------------------------------------------------------------------
MDY 363.42 1.52 363.4 -30.3% Bullish BLUE .072 .003
---------------------------------------------------------------------------------------------
IWM 168.4 .9 168.48 -22.9% Bullish BLUE .081 .026
---------------------------------------------------------------------------------------------
FAS 71.4 -.45 68.85 185.3% Bullish RED .185 .018
---------------------------------------------------------------------------------------------
RETL 45.74 1.13 45.65 -174.3% Bearish ---- -.045 .23
---------------------------------------------------------------------------------------------
SOXL 161.18 8.31 154.88 129.7% Bullish BLUE .252 .006
---------------------------------------------------------------------------------------------
TECL 154.4 -7.2 151.07 100.2% Bullish ---- .197 .132
---------------------------------------------------------------------------------------------
IBB 117.85 -1.48 118.26 -21.1% Bullish RED .226 .074
---------------------------------------------------------------------------------------------
GLD 115.77 -.91 116.56 -1.7% Bearish RED -.2 -.086
---------------------------------------------------------------------------------------------
OIL 7.61 .04 6.89 339.4% Bullish BLUE .263 .03
---------------------------------------------------------------------------------------------
OIH 25.31 .43 25.48 -63.6% Bearish BLUE -.142 -.142
---------------------------------------------------------------------------------------------
GASL 24.85 -.02 24.31 -14.3% Bullish BLUE -.01 .029
---------------------------------------------------------------------------------------------
|
Table 2
Count of Stocks in Key Directories
20180726
-------------------------------
NEWHIGHS 218 Bullish
NEWLOWS 40
MAXCP 97 Professionals are net bullish now.
MINCP 83
TTTNH 93
TTTNL 106 Day Traders are net bearish.
FASTUP 103
FASTDOWN 144 Swing Traders are net bearish.
CPCROSSA 120
CPCROSSD 95
BIGVOLUP 3
BIGVODN 27
ACCUMVER 16
|
Table 3
Count of Stocks and New Highs in Key Tiger Directories
Date = 180726
No. NHs Pct
-------------------------------------------------------------------
MAXCP 97 67 69 %
EDU 7 3 43 %
HOSPITAL 7 3 43 %
TRANSP 20 2 10 %
FIDSTKS 184 17 9 %
HACKERS 22 2 9 %
RETAIL 53 5 9 %
CHEM 61 5 8 %
FINANCE 90 7 8 %
MILITARY 37 3 8 %
NASD-100 89 7 8 %
SP500 476 36 8 %
GAMING 28 2 7 %
NIFTY 29 2 7 %
REGBANKS 30 2 7 %
RUS-1000 815 53 7 %
INDEXES 189 12 6 %
SOFTWARE 64 4 6 %
SOLAR 18 1 6 %
SP-100 94 6 6 %
ELECTRON 171 8 5 %
INDMATER 82 4 5 %
BIOTECH 408 18 4 %
COMODITY 55 2 4 %
COMPUTER 23 1 4 %
GREEN 28 1 4 %
AUTO 40 1 3 %
DOWJONES 30 1 3 %
INFRA 36 1 3 %
INSURANC 30 1 3 %
OILGAS 155 4 3 %
SEMI 124 4 3 %
BIG17 46 1 2 %
UTILITY 41 1 2 %
REIT 173 1 1 %
|
Table 4 Count of Stocks and New Lows in Key Tiger Directories
Date = 180726
No NLs Pct
-------------------------------------------------------------------
MINCP 83 17 20 %
GOLD 50 9 18 %
COMODITY 55 6 11 %
GAMING 28 3 11 %
SOLAR 18 1 6 %
AUTO 40 2 5 %
BONDFUND 111 5 5 %
BIOTECH 408 15 4 %
RETAIL 53 2 4 %
CHINA 60 2 3 %
REGBANKS 30 1 3 %
SOFTWARE 64 2 3 %
BIG17 46 1 2 %
CHEM 61 1 2 %
ELECTRON 171 4 2 %
NASD-100 89 2 2 %
SEMI 124 3 2 %
UTILITY 41 1 2 %
FIDSTKS 184 1 1 %
FINANCE 90 1 1 %
INDMATER 82 1 1 %
INDEXES 189 1 1 %
RUS-1000 815 8 1 %
SP-100 94 1 1 %
SP500 476 6 1 %
|
Table 5 RANKING OF KEY DIRECTORIES BASED PCT.OF STOCKS ABOVE 65-DMA
7/26/18
Bullish = 36 Bearish = 9
---------------------------------------------------------------------------------------
Directory Current day-1 day-2 day-3 day-4 day-5
----------------------------------------------------------------------------------------
HOSPITAL .857 .857 .714 .714 .571 .571
BEVERAGE .842 .947 .684 .789 .684 .684
DOWJONES .833 .8 .8 .733 .733 .733
GUNS .833 .833 .666 .611 .722 .666
INSURANC .833 .666 .633 .6 .566 .566
PIPELINE .833 .833 .833 .833 .833 .833
DJI-13 .769 .692 .692 .615 .615 .615
NASD-100 .764 .752 .696 .741 .752 .741
UTILITY .756 .731 .682 .707 .731 .756
SP-100 .755 .755 .723 .691 .702 .68
SOFTWARE .75 .765 .703 .75 .75 .765
FIDSTKS .744 .69 .635 .673 .695 .701
REIT .739 .716 .728 .774 .803 .855
SP500 .733 .684 .642 .642 .655 .672
NIFTY .724 .758 .724 .793 .862 .896
BIGBANKS .714 .857 .714 .714 .571 .571
EDU .714 .714 .714 .714 .714 .714
TRANSP .7 .6 .4 .55 .55 .75
RUS-1000 .687 .649 .624 .646 .66 .687
INDEXES .682 .661 .629 .65 .645 .634
HACKERS .681 .636 .636 .772 .727 .681
MILITARY .675 .648 .594 .567 .675 .621
RETAIL .66 .679 .641 .754 .735 .754
COMPUTER .652 .565 .565 .652 .608 .739
CHEM .639 .54 .524 .524 .622 .606
REGBANKS .633 .633 .666 .733 .7 .733
COAL .625 .625 .625 .625 .625 .625
INDMATER .621 .585 .548 .439 .5 .475
FINANCE .611 .622 .666 .711 .588 .533
INFRA .611 .694 .666 .611 .583 .583
OILGAS .593 .574 .529 .47 .503 .554
BONDFUND .585 .639 .648 .63 .738 .774
ELECTRON .584 .514 .549 .602 .619 .654
GAMING .535 .678 .642 .642 .642 .642
BIOTECH .526 .529 .522 .563 .556 .583
SEMI .524 .483 .5 .58 .604 .645
N = 36
----------------------------------------------------------------------------------------------
BIG17 .5 .5 .456 .5 .456 .456
JETS .5 .3 .1 .2 .2 .5
----------------------------------------------------------------------------------------------
HOMEBLDG .47 .411 .352 .47 .47 .764
GREEN .464 .5 .428 .5 .5 .5
AUTO .35 .325 .375 .3 .35 .4
ETFS .311 .36 .278 .196 .196 .163
COMODITY .29 .309 .181 .127 .09 .09
FOOD .222 .222 .111 0 0 0
SOLAR .222 .277 .222 .222 .222 .222
CHINA .15 .2 .166 .166 .15 .133
GOLD .14 .22 .2 .12 .22 .18
N=9
|
====================================================================
7/25/2018 The DJI rose
200+, most of if coming in the last hour as Trump gave
traders hope that a tariff war with Europe was avoidable. Who knows
if there will be substance here? I expect the market by its behavior and
by its internal action to be our best clues. Clearly, Wall Street likes
"free" trade.
The Peerless V-I turned positive today, thereby preventing a new Sell S9-V.
A confirmed breakout above 25500 will have to be treated as a Buy B10,
much like the one in 1996 that over-turned a Sell S9V back then.
https://www.nytimes.com/2018/07/25/us/politics/trump-europe-trade.html?emc=edit_th_180726&nl=todaysheadlines&nlid=582238940726

After after the market closed, Facebook told investors that its future revenues
would be much lower than was expected. Facebook's announcement will, no
doubt, ripple bearishly through the high-flying tech world tomorrow. So, it's still
possible that our Peerless Sell-S9V may work out. But this will depend on whether
the DJI's resistance at 25500 holds. Right now, the Closing Powers, 5-day moving
averages, AD Line, P-I and IP21 are all rising. Even the V-I turned positive today,
though it's falling back into negative territory would be a bearish sign.
When the DJI is near an all-time high (26616.71 ) or could
make a
price-breakout that could produce a run back to the old highs, I think
we should be especially vigilant. New all-time highs in the DJI have a way of
rising much farther and longer than most shorts can hold their positions. Whether
this is a result "irrational exuberance" (Greenspan), "animal spirits"
(Keynes),
or political pump-priming in an election year (by the Fed or by Congress),
it does not matter, we have to be able to switch our trading positions in
a timely fashion.
There are three cases where Sell S9-Vs failed in the Summer:
1929, 1987 and 1996. Let's look here at the key values when Peerless gave
reversing Buy B4 (steep rise price, P-I or IP21) or a B10 price breakout.
Probably, the 1996 breakout in September would compare best of these
if the DJI were to clearly surpass 25500, though 26500 would also act
as resistance.
6/26/1929 -
Steep rise in price and P-I. DJI rose above 3.5% band.
328.6 la/ma=1.054 aroc=1.352 P=26 (+33), IP21=.079 VI=-81
OP=.498
DJI rose until 381.2 on 9/3/1929 when Livermore and others got wind of
Bank of England's plan to raise key lending rate sharply.
---------------------------------------------------------------------------------
6/22/1987 - Steep rise in price and IP21. DJI rose above 3.5% band.
2446 la/ma=1.042 aroc=1.12 P=232 (-7), IP21=.156 VI=+25
OP=.768
DJI rose until 2772 on 8/25/1987 when the Fed and Greenspan became
spooked by gold's rise and the Dollar's sudden 7% drop in two weeks and
began raising rates abruptly.
---------------------------------------------------------------------------------
9/12/1996 - Price breakout above 5x -tested flat resistance just below 5800.
5772 la/ma=1.014 aroc=0.261 P=129 (+60), IP21=.117 VI=+8
OP=.258
DJI rose steadily for the rest of the year from one all-time high to another.
The Dollar had just crossed back above its 65-dma. Gold stocks like NEM
had just failed to rise above their falling 65-dma. Clinton - the ally of Big
Bankers
and Free Trade was leading handily in the Presidential Polls.
Note flat-top breakout into all-time high territory.
Also a bullish, inverted H/S pattern formed.

A Suggestion for Longs
Who Want To Buy Cheap
Look for stocks whose Stochastic-90 K-Line rises back above 10,
has a rising 200-day ma and whose Closing Power breaks its downtrend.
There are quite a few stocks like this a important bottoms. I will post
a nightly download, called STOCH90 and ALLS90 in a day or two.
Below are three examples, JPM, AAPL and BIIS. I discuss this much more
in my new Tahiti Stocks: 2000-2017 E book. The trick here is knowing
when to get out because the market or the stock has become much too
weak. Our "Tahiti" E-Book takes up this theme.
 |
 |
 |
A
Suggestion for Longs
Who Want To The Top Tahiti Stocks
Tahiti Stocks: 2000-2018 ($50 new E-book)
I'm about to release an update study of the Tiger's
"Tahiti" stocks.
These were the stocks between 1970 and 2000 that you could make
about 25% a year on simply by buying at the end of each quarter
and holding 21 months or until Peerless gave a fourth Sell S9 based
on lagging breadth. There some other factors, too. But the essential
idea here was that we could safely buy the most Accumulated blue chip
stocks.
My study of the results of this system since 2000 off some important
refinements. First, we must watch out for head/shoulders patterns in
these stocks. Second, we must be willing to sell on a run-up in the sixth
or seventh quarter if the Closing Power breaks its uptrend. Thirdly, in
a bear market, we should simply wait for the DJI to come back above
its 200-day ma before buying these stocks again. And fourthly, and most
important, we should probably focus most of our energies buying blue
chip TECH stocks. We got our best gains in the period since 2000 in
stocks like Hewlett Packard, Apple and recently Microsoft. The new
E-book will also show how to use the 90-day Stochastic with these stocks.
It will be released next week and may be obtained by sending a check
for $50 to William Schmidt, PO Box 22784 San Diego, CA 92192

Charts 7/25/2018
PEERLESS DJI, Signals,
Indicators Daily DJI Volume 10-DayUp/Down Vol
Hourly DJIA A/D Line for All
Stocks
NASDAQ S&P OEX NYSE COMPQX DJI-15 DJI-20 DJI-30
DIA SPY QQQ MDY IWM TNA
Short-Term Rates
USO-CrudeOil FAS GLD BBH IBB JETS JNUG KOL NUGT OIH OIL RSX RETL
SDS SLV SOXL TECL TMF TNA UGA (gasoline) XIV YINN
Commodities: CANE
JJC, NIB, CHOC CORN, CUT (paper) WEAT UUP (Dollar)
AAPL ADBE ALXN AMAT AMGN AMD AMZN BA BABA BAC BIDU CAT CVX DE
FB GOOG GS HD IBM JPM M (Macy's) MSFT NFLX NVDA QCOM TSLA TXN
XOM WMT ANDV (refinery), CMG (Chipotle), LRCX, SWKS, MDGL
SPPI WATT
SQ TOWN
7/25/2018 (Click on Underlined link.)
Bullish MAXCPs - http://tigersoft.com/MAXCPZ/725/BULLISH.htm
Bearish MAXCPs -
http://tigersoft.com/MINCPZ/725/BEARISH.htm
|
Table 1 QUICKSILVER on ETFS - 07/25/18
ETF CLOSE CHANGE PIVOT-PT 5-dma AROC CL-PWR CANDLE IP21 ITRS
---------------------------------------------------------------------------------------------
---------------------------------------------------------------------------------------------
DIA 254.02 1.81 250.79 39.6% Bullish BLUE .212 -----
---------------------------------------------------------------------------------------------
COMPQX 7932.24 91.47 7825.3 49.6% Bullish BLUE .175 .051
---------------------------------------------------------------------------------------------
SPY 284.01 2.4 280 52.6% Bullish BLUE .148 .021
---------------------------------------------------------------------------------------------
QQQ 182.82 2.52 179.03 80.5% Bullish BLUE .135 .058
---------------------------------------------------------------------------------------------
MDY 361.9 1.17 365.62 -29.6% Bullish BLUE .067 .008
---------------------------------------------------------------------------------------------
IWM 167.5 .61 169.17 -14.3% ---- BLUE .099 .033
---------------------------------------------------------------------------------------------
FAS 71.85 1.21 68.8 100.9% Bullish BLUE .209 .024
---------------------------------------------------------------------------------------------
RETL 44.61 1.12 47.32 -136% Bearish BLUE -.015 .217
---------------------------------------------------------------------------------------------
SOXL 152.87 2.36 157.18 -176.1% Bullish BLUE .192 -.07
---------------------------------------------------------------------------------------------
TECL 161.6 5.59 151.3 286.4% Bullish BLUE .178 .164
---------------------------------------------------------------------------------------------
IBB 119.33 1.31 118.35 46.5% Bullish BLUE .206 .089
---------------------------------------------------------------------------------------------
GLD 116.68 .64 115.81 15.9% Bearish RED -.171 -.082
---------------------------------------------------------------------------------------------
OIL 7.61 .04 6.89 339.4% Bullish BLUE .263 .042
---------------------------------------------------------------------------------------------
OIH 24.88 .03 25.63 -179.6% Bearish ---- -.139 -.137
---------------------------------------------------------------------------------------------
GASL 24.87 .64 24.92 168.8% Bullish BLUE .069 .053
---------------------------------------------------------------------------------------------
XLU 52.25 .15 52.66 6.7% Bullish BLUE .192 .022
---------------------------------------------------------------------------------------------
|
Table 2 Count of Stocks in Key Directories
20180725
-------------------------------
NEWHIGHS 231 Bullish
NEWLOWS 67
MAXCP 112
MINCP 116 Net Bearish
TTTNH 77
TTTNL 188 Bearish
FASTUP 88
FASTDOWN 119 Bearish
CPCROSSA 179 Pros rush to join Bullish camp.
CPCROSSD 75
BIGVOLUP 1
BIGVODN 22 Big Money Dumping continues.
|
Table 3
Count of Stocks and New Highs in Key Tiger Directories
Date = 180725
No. NHs Pct
-------------------------------------------------------------------
MAXCP 112 78 70 %
HOSPITAL 7 3 43 %
NIFTY 29 10 34 %
NASD-100 89 15 17 %
FIDSTKS 184 29 16 %
SP-100 94 15 16 %
EDU 7 1 14 %
COMPUTER 23 3 13 %
SOFTWARE 64 8 13 %
INDEXES 189 23 12 %
RETAIL 53 6 11 %
DOWJONES 30 3 10 %
SP500 476 48 10 %
TRANSP 20 2 10 %
HACKERS 22 2 9 %
DJI-13 13 1 8 %
MILITARY 37 3 8 %
RUS-1000 815 65 8 %
FINANCE 90 6 7 %
GAMING 28 2 7 %
BIOTECH 408 23 6 %
SOLAR 18 1 6 %
CHEM 61 3 5 %
ETFS 61 3 5 %
BIG17 46 2 4 %
GREEN 28 1 4 %
INSURANC 30 1 3 %
REGBANKS 30 1 3 %
ELECTRON 171 3 2 %
INDMATER 82 2 2 %
OILGAS 155 3 2 %
REIT 173 2 1 %
SEMI 124 1 1 %
|
Table 4 Count of Stocks and New Lows in Key Tiger Directories
Date = 180725
No NLs Pct
-------------------------------------------------------------------
MINCP 116 33 28 %
SOLAR 18 2 11 %
JETS 10 1 10 %
AUTO 40 3 7 %
HOMEBLDG 17 1 6 %
BONDFUND 111 6 5 %
TRANSP 20 1 5 %
ELECTRON 171 7 4 %
GREEN 28 1 4 %
SEMI 124 5 4 %
BIOTECH 408 12 3 %
REGBANKS 30 1 3 %
SOFTWARE 64 2 3 %
FIDSTKS 184 3 2 %
GOLD 50 1 2 %
UTILITY 41 1 2 %
FINANCE 90 1 1 %
INDEXES 189 1 1 %
NASD-100 89 1 1 %
RUS-1000 815 12 1 %
SP-100 94 1 1 %
SP500 476 3 1 %
|
Table 5 RANKING OF KEY DIRECTORIES BASED PCT.OF STOCKS ABOVE 65-DMA
7/25/18
Bullish =35
Bearish =10
---------------------------------------------------------------------------------------
Directory Current day-1 day-2 day-3 day-4 day-5
----------------------------------------------------------------------------------------
BEVERAGE .947 .684 .789 .684 .684 .631
BIGBANKS .857 .714 .714 .571 .571 .571
HOSPITAL .857 .714 .714 .571 .571 .571
GUNS .833 .666 .611 .722 .666 .666
PIPELINE .833 .833 .833 .833 .833 .666
DOWJONES .8 .8 .733 .733 .733 .8
SOFTWARE .765 .703 .75 .75 .765 .765
NIFTY .758 .724 .793 .862 .896 .896
SP-100 .755 .723 .691 .702 .68 .765
NASD-100 .752 .696 .741 .752 .741 .775
UTILITY .731 .682 .707 .731 .756 .707
REIT .716 .728 .774 .803 .855 .774
EDU .714 .714 .714 .714 .714 .714
INFRA .694 .666 .611 .583 .583 .638
DJI-13 .692 .692 .615 .615 .615 .692
FIDSTKS .69 .635 .673 .695 .701 .728
SP500 .684 .642 .642 .655 .668 .682
RETAIL .679 .641 .754 .735 .754 .735
GAMING .678 .642 .642 .642 .642 .642
INSURANC .666 .633 .6 .566 .566 .7
INDEXES .661 .629 .65 .645 .634 .666
RUS-1000 .649 .624 .646 .66 .684 .677
MILITARY .648 .594 .567 .675 .621 .648
BONDFUND .639 .648 .63 .738 .765 .72
HACKERS .636 .636 .772 .727 .727 .727
REGBANKS .633 .666 .733 .7 .733 .633
COAL .625 .625 .625 .625 .625 .625
FINANCE .622 .666 .711 .588 .533 .577
TRANSP .6 .4 .55 .55 .75 .5
INDMATER .585 .548 .439 .5 .475 .524
OILGAS .574 .529 .47 .503 .554 .529
COMPUTER .565 .565 .652 .608 .739 .739
CHEM .54 .524 .524 .622 .606 .639
BIOTECH .529 .522 .563 .556 .585 .566
ELECTRON .514 .549 .602 .619 .66 .637
N=35
=========================================================================================
BIG17 .5 .456 .5 .456 .456 .521
GREEN .5 .428 .5 .5 .5 .428
=========================================================================================
SEMI .483 .5 .58 .604 .645 .637
HOMEBLDG .411 .352 .47 .47 .764 .764
ETFS .36 .278 .196 .196 .163 .196
AUTO .325 .375 .3 .35 .4 .4
COMODITY .309 .181 .127 .09 .09 .09
JETS .3 .1 .2 .2 .5 .3
SOLAR .277 .222 .222 .222 .222 .222
FOOD .222 .111 0 0 0 0
GOLD .22 .2 .12 .22 .2 .24
CHINA .2 .166 .166 .15 .15 .15
N=10
|
====================================================================
7/23/2018 The Peerless S9-V
still governs our view of the market. Though the DJI
jumped up 200 in early trading, at the close there were 355 more down than
up on the NYSE and the DJI could not muscle up past 25265. In addition,
IBB (biotechs) fell fractionally for the day. While the NASDAQ, QQQ, SPY
and OEX did rise, only TECL made a 12-month high, but its Closing Power
and IP21 are not rising convincingly.
I think we have to conclude that the rally is sputtering out of desperation.
It is not firing on all cylinders. Traders can only nervously switch
their funds
back and forth between the various sectors. Worse, Table 2 below shows
that
Professionals, Day Traders and Swing Traders are now net bearish. The most
important number here is that MINCPs outnumber MAXCPs by more than 4:1,
136 to 33. There are a lot more bearish looking stocks now than bullish ones.
The DJI-30 may be able to hold up the charade that all is well a while longer,
but we can see the internal deterioration that contradicts the public pretense.
That Professionals are net bearish confounds the normal Summer bullishness.
Since 1965. the DJI has risen 71.2% of the time over the month following
July 24th and averaged a gain of 1.9% over this period. These traders, I believe,
are made cautious by the political situation and the big question, namely, can
the Republicans hold their Congressional majorities. That this is so, we should
note that the DJI rises in the second-year of the four year Presdiential cycle
only 43.8% of the time over the next two months and falls on average 0.9%
over the next month.


In this situation, I would stay short DIA, but would play the market
with
a mixture of the bullish MAXCPs on the long side and some of bearish MINCPs
on the short side.

Charts 7/24/2018
PEERLESS DJI, Signals,
Indicators Daily DJI Volume 10-DayUp/Down Vol
Hourly DJIA A/D Line for All
Stocks
NASDAQ S&P OEX NYSE COMPQX DJI-15 DJI-20 DJI-30
DIA SPY QQQ MDY IWM TNA
Short-Term Rates
USO-CrudeOil FAS GLD BBH IBB JETS JNUG KOL NUGT OIH OIL RSX RETL
SDS SLV SOXL TECL TMF TNA UGA (gasoline) XIV YINN
Commodities: CANE
JJC, NIB, CHOC CORN, CUT (paper) WEAT UUP (Dollar)
AAPL ADBE ALXN AMAT AMGN AMD AMZN BA BABA BAC BIDU CAT CVX DE
FB GOOG GS HD IBM JPM M (Macy's) MSFT NFLX NVDA QCOM TSLA TXN
XOM WMT ANDV (refinery), CMG (Chipotle), LRCX, SWKS, MDGL
SPPI WATT
SQ TOWN
7/24/2018 (Click on Underlined link.)
Bullish MAXCPs - http://tigersoft.com/MAXCPZ/724/BULLISH.htm
Bearish MAXCPs -
http://tigersoft.com/MINCPZ/724/BEARISH.htm
|
Table 1 QUICKSILVER on ETFS - 07/24/18
ETF CLOSE CHANGE PIVOT-PT 5-dma AROC CL-PWR CANDLE IP21 ITRS
---------------------------------------------------------------------------------------------
DIA 252.21 1.95 252.03 18.5% Bullish BLUE .132 ---
---------------------------------------------------------------------------------------------
COMPQX 7840.77 -1.1 7854.44 -9.2% Bullish RED .106 .044
---------------------------------------------------------------------------------------------
SPY 281.61 1.41 281.06 20.3% Bullish RED .083 .017
---------------------------------------------------------------------------------------------
QQQ 180.3 .74 179.93 .8% Bullish RED .055 .049
---------------------------------------------------------------------------------------------
MDY 360.73 -2.7 364.05 -28.7% Bearish RED -.047 .008
---------------------------------------------------------------------------------------------
IWM 166.89 -1.8 167.98 -18.4% Bearish RED .016 .029
---------------------------------------------------------------------------------------------
FAS 70.64 .06 70.44 162.8% Bullish RED .151 .003
---------------------------------------------------------------------------------------------
RETL 43.49 -2.1 45.85 -208.9% Bearish RED -.074 .236
---------------------------------------------------------------------------------------------
SOXL 150.51 -5.02 158.34 -143.4% ---- RED .108 -.044
---------------------------------------------------------------------------------------------
TECL 156.01 2.68 152.84 81.7% Bullish RED .109 .126
---------------------------------------------------------------------------------------------
IBB 118.02 -.17 118.23 -14.8% Bullish RED .15 .093
---------------------------------------------------------------------------------------------
GLD 116.04 .04 116.31 -10.3% Bearish RED -.229 -.086
---------------------------------------------------------------------------------------------
OIL 7.61 .04 6.89 339.4% Bullish BLUE .263 .047
---------------------------------------------------------------------------------------------
OIH 24.85 -.05 25.79 -201.7% Bearish RED -.192 -.129
---------------------------------------------------------------------------------------------
GASL 24.23 .33 24.05 70.2% Bullish BLUE -.003 .069
---------------------------------------------------------------------------------------------
UGA 33.61 .05 32.95 169.4% Bearish ---- -.065 -.048
---------------------------------------------------------------------------------------------
UUP 25 .01 25.1 -14% ---- ---- -.01 .013
---------------------------------------------------------------------------------------------
---------------------------------------------------------------------------------------------
BA 358.27 5 360.23 19.5% Bullish BLUE .068 .031
---------------------------------------------------------------------------------------------
GS 235.88 2.12 231.24 105% Bullish BLUE .001 -.044
---------------------------------------------------------------------------------------------
|
Table 2 Count of Stocks in Key Directories
20180724
-------------------------------
NEWHIGHS 93 Bullish
NEWLOWS 48
MAXCP 33
MINCP 136 Bearish Professionals
TTTNH 42
TTTNL 200 Bearish Day Traders
FASTUP 72
FASTDOWN 97 Bearish Swing Traders
CPCROSSA 39
CPCROSSD 320 Bearish Professional switch
BIGVOLUP 3
BIGVODN 19 Bearish Dumping.
|
Table 3
Count of Stocks and New Highs in Key Tiger Directories
Date = 180724
No. NHs Pct
-------------------------------------------------------------------
MAXCP 33 22 67 %
REGBANKS 30 4 13 %
NIFTY 29 3 10 %
SP-100 94 8 9 %
NASD-100 89 6 7 %
FIDSTKS 184 11 6 %
INDEXES 189 9 5 %
GAMING 28 1 4 %
FINANCE 90 3 3 %
INSURANC 30 1 3 %
SP500 476 15 3 %
BIOTECH 408 10 2 %
CHEM 61 1 2 %
COMODITY 55 1 2 %
INDMATER 82 2 2 %
RETAIL 53 1 2 %
RUS-1000 815 17 2 %
SOFTWARE 64 1 2 %
ELECTRON 171 1 1 %
SEMI 124 1 1 %
MINCP 136 0 %
|
Table 4 Count of Stocks and New Lows in Key Tiger Directories
Date = 180724
No NLs Pct
-------------------------------------------------------------------
PIPELINE 6 1 17 %
MINCP 136 22 16 %
SOLAR 18 2 11 %
JETS 10 1 10 %
RETAIL 53 3 6 %
TRANSP 20 1 5 %
BIOTECH 408 17 4 %
COMPUTER 23 1 4 %
ELECTRON 171 6 4 %
GOLD 50 2 4 %
AUTO 40 1 3 %
NASD-100 89 3 3 %
REGBANKS 30 1 3 %
SEMI 124 4 3 %
SOFTWARE 64 2 3 %
BIG17 46 1 2 %
CHEM 61 1 2 %
CHINA 60 1 2 %
RUS-1000 815 13 2 %
UTILITY 41 1 2 %
BONDFUND 111 1 1 %
FIDSTKS 184 2 1 %
OILGAS 155 2 1 %
SP-100 94 1 1 %
SP500 476 5 1 %
|
Table 5 RANKING OF KEY DIRECTORIES BASED PCT.OF STOCKS ABOVE 65-DMA
7/24/18
Bullish = 34
Bearish = 12
---------------------------------------------------------------------------------------
Directory Current day-1 day-2 day-3 day-4 day-5
----------------------------------------------------------------------------------------
PIPELINE .833 .833 .833 .833 .666 .666
DOWJONES .8 .733 .733 .733 .8 .733
REIT .728 .774 .803 .855 .791 .82
NIFTY .724 .793 .862 .896 .896 .896
SP-100 .723 .691 .702 .68 .765 .712
BIGBANKS .714 .714 .571 .571 .571 .571
EDU .714 .714 .714 .714 .714 .714
HOSPITAL .714 .714 .571 .571 .571 .571
SOFTWARE .703 .75 .75 .765 .765 .781
NASD-100 .696 .741 .752 .741 .786 .764
DJI-13 .692 .615 .615 .615 .692 .538
BEVERAGE .684 .789 .684 .684 .631 .736
UTILITY .682 .707 .731 .756 .731 .731
FINANCE .666 .711 .588 .533 .577 .566
GUNS .666 .611 .722 .666 .666 .611
REGBANKS .666 .733 .7 .733 .633 .566
BONDFUND .648 .63 .738 .765 .72 .666
INFRA .647 .588 .558 .558 .617 .529
GAMING .642 .642 .642 .642 .642 .642
SP500 .642 .642 .655 .668 .686 .668
RETAIL .641 .754 .735 .754 .754 .716
HACKERS .636 .772 .727 .727 .727 .727
FIDSTKS .635 .673 .695 .701 .728 .684
INSURANC .633 .6 .566 .566 .7 .566
INDEXES .629 .65 .645 .634 .677 .613
COAL .625 .625 .625 .625 .625 .625
RUS-1000 .624 .646 .66 .684 .68 .653
MILITARY .594 .567 .675 .621 .648 .621
COMPUTER .565 .652 .608 .739 .739 .608
ELECTRON .549 .602 .619 .66 .643 .578
INDMATER .548 .439 .5 .475 .512 .475
OILGAS .529 .47 .503 .554 .541 .529
CHEM .524 .524 .622 .606 .622 .639
BIOTECH .522 .563 .556 .585 .566 .573
N=34
============================================================================================
SEMI .5 .58 .604 .645 .629 .572
============================================================================================
BIG17 .456 .5 .456 .456 .5 .521
GREEN .428 .5 .5 .5 .428 .5
TRANSP .4 .55 .55 .75 .5 .4
AUTO .375 .3 .35 .4 .4 .425
HOMEBLDG .352 .47 .47 .764 .764 .764
ETFS .278 .196 .196 .163 .196 .196
SOLAR .222 .222 .222 .222 .222 .222
GOLD .2 .12 .22 .2 .24 .22
COMODITY .181 .127 .09 .09 .09 .09
CHINA .166 .166 .15 .15 .15 .133
FOOD .111 0 0 0 0 0
JETS .1 .2 .2 .5 .3 .2
N=12
|
====================================================================
7/23/2018
It was another dull day of trading
today. Despite the S9-V, my suggestion
is to look more to individual stocks if you want volatility at this time. As for
the DJIA, our current S9-V tells us that any month-end rally now as July comes to
an end will be quite limited. But a short-rally in the DJI does seem to be shaping
up if the DJI can close above its 5-dma pivot point of 25120 tomorrow. Note
that a number of the tech ETFs are close to making 12-month high breakouts.
Simultaneous new 12-month highs by the NASDAQ, QQQ, TECL and IBB
would likely get me to recommend covering the short in DIA while we wait and
see if a Summer Rally develops..
Traders undoubtedly noticed today that the rising NYSE A/D Line
remains in its uptrend as do the Closing Powers of all the major ETFs,
except RETL. In addition, all the key ETFs' short-term 5-day moving
averages are still rising, except DIA. (See the 5-dma AROC numbers in the next
table below.
So, it looks like we shall see a rally tomorrow. While
Day Traders are not
convinced that it will hold its gains, we can't help noting from Table 1 below
that the Relative Strength (ITRS) for DJI remains below all the other major
ETFs' ITRSes. Only the leveraged Semi-conductors' ETF, SOXL, has a
lower ITRS, 50-day rate of change.
Let me suggest that it is also important that all these ETFs except MDY and
RETL show positive current Accumulation (IP21) values. I think that this means
that there is still considerable underlying support for most of these ETFs. It
will likely take another failed rally to cause traders to become discouraged
enough sell.
Watch tomorrow to see if the NASDAQ, QQQ, IWM, TECL
and IBB can
breakout above the resistance they show just above and make 12-month highs..
If they all do this at once, that would be quite bullish. At that point, assuming
the DJI closes above its 5-dma pivot point, I would recommend covering the
short in DIA.
ITRS
IP21 Closing Power
5-dma Price
Trend AROC
Resistance
-------------------------------------------------------------------------------------------
DIA
---
+.081
Rising -8.2%
NASDAQ +.048
+ .083 Rising
+23.1% 22 points
above
SPY
+.019
+.058 Rising
+15.4%
QQQ
+.047
+.066 Rising
+10.6% 1.14
pts.above.
MDY
+.020
-.093
Rising
+31.1% 3.23 pts
above
IWM
+.046
+.016
Rising +57.1%
1.43 pts above
FAS
+.004
+.162
Rising +179.2%
RETL
+.326
-.047
Falling
+185.2% 3.21 pts above
SOXL
-.032
+.136
Rising +230.0% at 65dma
TECL
+.106
+.127
Rising +97.2%
1.03 pts above
IBB
+.128
+.188 Rising to NHs +29.6%
1.34 pts above.
(2nd highes) (highest)
The NYSE A/D Line remains in an uptrend but our
V-Indicator is still negative.
I would interpret this to mean that Big Money is coming out of the biggest blue
chips and going into smaller stocks. Our Bullish MAXCPs have shown Biotechs
are one of the big beneficiaries of this movement of money.
Let's use our short-term QuickSilver against the MAXCPs and MINCPs
to get ideas for long and shorts that we might be able to profitably trading
simply by play the trend of the 5-day ma and the 5-dma pivot point.
QuickSilver ranks the stocks in a Directory for the annualized rate
of change of their 5-day ma. (Tiger Commands: Peercomm + Charts 2017-8 +
Run/Setups + Run QuickSilver). Below are the biggest advancers and two
of the beggest decliners shown in this manner.
|
Most Bullish and Bearish QuickSilver MAXCP and MINCP Stocks
|
Table 1 QUICKSILVER on ETFS - 07/23/18
ETF CLOSE CHANGE PIVOT-PT 5-dma AROC CL-PWR CANDLE IP21 ITRS
---------------------------------------------------------------------------------------------
DIA 250.26 -.18 251.28 -8.2% Bullish ---- .081 0
---------------------------------------------------------------------------------------------
COMPQX 7841.87 21.67 7855.12 23.1% Bullish BLUE .083 .048
---------------------------------------------------------------------------------------------
SPY 280.2 .52 280.47 15.4% Bullish BLUE .058 .019
---------------------------------------------------------------------------------------------
QQQ 179.56 .57 180.27 10.6% Bullish BLUE .066 .047
---------------------------------------------------------------------------------------------
MDY 363.43 .03 362.82 31.1% ---- RED -.093 .02
---------------------------------------------------------------------------------------------
IWM 168.69 .21 167.51 57.1% ---- BLUE .016 .046
---------------------------------------------------------------------------------------------
FAS 70.58 1.73 68.38 179.2% Bullish BLUE .162 .004
---------------------------------------------------------------------------------------------
RETL 45.59 -.06 45.41 185.2% Bearish RED -.047 .326
---------------------------------------------------------------------------------------------
SOXL 155.53 .65 154.99 230% ---- BLUE .136 -.032
---------------------------------------------------------------------------------------------
TECL 153.33 2.26 153.52 97.2% Bullish BLUE .127 .106
---------------------------------------------------------------------------------------------
IBB 118.19 -.07 118.37 29.6% Bullish RED .188 .128
---------------------------------------------------------------------------------------------
GLD 116 -.56 116.28 -66.5% Bearish RED -.194 -.085
---------------------------------------------------------------------------------------------
OIL 7.61 .04 6.89 339.4% Bullish BLUE .263 .05
---------------------------------------------------------------------------------------------
OIH 24.9 -.58 25.88 -213.5% Bearish RED -.178 -.127
---------------------------------------------------------------------------------------------
GASL 23.9 -.41 23.89 37.2% Bullish RED -.056 .028
---------------------------------------------------------------------------------------------
UGA 33.56 .35 32.49 190.5% ---- ---- .018 -.05
---------------------------------------------------------------------------------------------
GOOG 1205.5 20.59 1198.8 90.9% Bullish BLUE .066 .087
---------------------------------------------------------------------------------------------
|
Table 2 Count of Stocks in Key Directories
20180723
-------------------------------
NEWHIGHS 193 Bullish
NEWLOWS 46
MAXCP 111 Bullish
MINCP 79
TTTNH 64
TTTNL 110 Bearish Day Traders
FASTUP 92 Bullish
FASTDOWN 61
CPCROSSA 39
CPCROSSD 101 Bearish Professionals
BIGVOLUP 3
BIGVODN 14
ACCUMVER 9
HIGHIP21 67
HIUPPCT 138
VHIP21 36
LOWACCUM 328
REDSELL 122
AUGSELS7 13
TRAPDOOR 2
|
Table 3
Count of Stocks and New Highs in Key Tiger Directories
Date = 180723
No. NHs Pct
-------------------------------------------------------------------
MAXCP 111 76 68 %
EDU 7 2 29 %
HOSPITAL 7 2 29 %
REGBANKS 30 7 23 %
NIFTY 29 6 21 %
TRANSP 20 3 15 %
SOFTWARE 64 9 14 %
FINANCE 90 10 11 %
JETS 10 1 10 %
HACKERS 22 2 9 %
NASD-100 89 8 9 %
RETAIL 53 5 9 %
FIDSTKS 184 14 8 %
BIOTECH 408 23 6 %
INDEXES 189 11 6 %
SOLAR 18 1 6 %
SP-100 94 6 6 %
BEVERAGE 19 1 5 %
RUS-1000 815 42 5 %
SP500 476 24 5 %
BIG17 46 2 4 %
COMPUTER 23 1 4 %
GAMING 28 1 4 %
GREEN 28 1 4 %
INDMATER 82 3 4 %
AUTO 40 1 3 %
DOWJONES 30 1 3 %
INFRA 34 1 3 %
INSURANC 30 1 3 %
CHEM 61 1 2 %
COMODITY 56 1 2 %
ELECTRON 171 3 2 %
ETFS 61 1 2 %
REIT 173 1 1 %
SEMI 124 1 1 %
|
Table 4 Count of Stocks and New Lows in Key Tiger Directories
Date = 180723
No NLs Pct
-------------------------------------------------------------------
MINCP 79 18 23 %
PIPELINE 6 1 17 %
GOLD 50 6 12 %
SOLAR 18 1 6 %
COMPUTER 23 1 4 %
GREEN 28 1 4 %
RETAIL 53 2 4 %
AUTO 40 1 3 %
CHEM 61 2 3 %
MILITARY 37 1 3 %
NASD-100 89 3 3 %
OILGAS 155 5 3 %
REGBANKS 30 1 3 %
SOFTWARE 64 2 3 %
BIG17 46 1 2 %
BIOTECH 408 10 2 %
COMODITY 56 1 2 %
ETFS 61 1 2 %
FIDSTKS 184 3 2 %
RUS-1000 815 13 2 %
SP-100 94 2 2 %
SP500 476 8 2 %
BONDFUND 111 1 1 %
ELECTRON 171 1 1 %
INDEXES 189 2 1 %
SEMI 124 1 1 %
|
Table 5 RANKING OF KEY DIRECTORIES BASED PCT.OF STOCKS ABOVE 65-DMA
7/23/18
---------------------------------------------------------------------------------------
Directory Current day-1 day-2 day-3 day-4 day-5
----------------------------------------------------------------------------------------
PIPELINE .833 .833 .833 .666 .666 .666
NIFTY .793 .862 .896 .896 .862 .862
BEVERAGE .789 .684 .684 .631 .736 .684
REIT .774 .803 .855 .791 .826 .861
HACKERS .772 .727 .727 .727 .727 .727
RETAIL .754 .735 .754 .754 .716 .698
SOFTWARE .75 .75 .765 .765 .781 .781
NASD-100 .741 .752 .741 .786 .764 .741
DOWJONES .733 .733 .733 .8 .733 .7
REGBANKS .733 .7 .733 .633 .566 .566
BIGBANKS .714 .571 .571 .571 .571 .571
EDU .714 .714 .714 .714 .714 .714
HOSPITAL .714 .571 .571 .571 .571 .571
FINANCE .711 .588 .533 .577 .566 .533
UTILITY .707 .731 .756 .731 .707 .756
SP-100 .691 .702 .68 .765 .702 .67
FIDSTKS .673 .695 .701 .728 .684 .657
COMPUTER .652 .608 .739 .739 .608 .695
INDEXES .65 .645 .634 .677 .624 .592
RUS-1000 .646 .66 .684 .68 .652 .634
GAMING .642 .642 .642 .642 .642 .607
SP500 .642 .655 .668 .686 .665 .647
BONDFUND .63 .738 .765 .72 .675 .612
COAL .625 .625 .625 .625 .625 .625
DJI-13 .615 .615 .615 .692 .538 .538
GUNS .611 .722 .666 .666 .611 .555
ELECTRON .602 .619 .66 .643 .584 .555
INSURANC .6 .566 .566 .7 .566 .533
INFRA .588 .558 .558 .617 .529 .441
SEMI .58 .604 .645 .629 .572 .532
MILITARY .567 .675 .621 .648 .594 .54
BIOTECH .563 .556 .585 .566 .58 .546
TRANSP .55 .55 .75 .5 .4 .4
CHEM .524 .622 .606 .622 .622 .524
BIG17 .5 .456 .456 .5 .521 .521
GREEN .5 .5 .5 .428 .5 .392
HOMEBLDG .47 .47 .764 .764 .764 .705
OILGAS .47 .503 .554 .541 .535 .554
INDMATER .439 .5 .475 .512 .463 .378
AUTO .3 .35 .4 .4 .425 .325
SOLAR .222 .222 .222 .222 .222 .222
JETS .2 .2 .5 .3 .2 .2
ETFS .196 .196 .163 .196 .196 .18
CHINA .166 .15 .15 .15 .133 .133
COMODITY .125 .089 .089 .089 .071 .071
GOLD .12 .22 .2 .24 .22 .22
FOOD 0 0 0 0 0 0
|
| |
=========================================================================
7/20/2018
NYSE Down Volume rose significantly on Friday.
This gives weight to our Sell S9v
and
makes a DJI decline to the lower band near 24000 the likely downside target.
But, at this point, the charts of SPY and QQQ still appear much stronger than the DJI.
Support is likely to come in sooner for them than the DJI. Watch their Closing
Powers.
The breaking of the CP uptrends for SPY and QQQ is needed now to confirm a move down
by the general market. So, is a breaking of the NYSE A/D Line uptrend. Without
these developments, I can only predict a decline by the DJI and the weakest MINCP
stocks. Stay long some of the Biotechs appearing in the MAXCPs is my suggestion,
too.


 |
 |
So far, the biggest decliners, those down more than 40% in
the last 100 trading
days, have been limited in numbers. But the multiple Peerless S9s, the
heavy red NYSE Down Volume, the multiple Sell S9s and the probably inexorable
rise of interest rates and inflation are all apt to increase the ranks of the stocks
falling sharply from distribution-tops in the months ahead. I have put together
tonight a study of these stocks. Avoid them or, better yet, sell some of them short.
STOCKS DOWN 40% IN LAST 100 TRADING DAYS
7- 20-2018
Study these stocks. Nearly all of these show
1. Multiple Tiger (not Peerless) S9s and S14s,
2. Price breakdowns below flat, well-tested support,
3. Heavy Red distribution,
4. Falling Closing Powers and magenta S7s
5. and Falling relative strength.
These are the main warning signs we should look for among our BEARISH MINCPS
and the NEW LOWS each day. But look also for the bearish head/shoulders
patterns
and the importance of the 65-dma giving way.
http://tigersoft.com/DOWN2018/BEARISH.htm

Charts 7/20/2018
PEERLESS DJI, Signals,
Indicators Daily DJI Volume 10-DayUp/Down Vol
Hourly DJIA A/D Line for All
Stocks
NASDAQ S&P OEX NYSE COMPQX DJI-15 DJI-20 DJI-30
DIA SPY QQQ MDY IWM
TNA
Short-Term Rates
USO-CrudeOil FAS GLD BBH IBB JETS JNUG KOL NUGT OIH OIL RSX RETL
SDS SLV SOXL TECL TMF TNA UGA (gasoline) XIV YINN
Commodities: CANE
JJC, NIB, CHOC
CORN,
CUT (paper) WEAT UUP (Dollar)
AAPL ADBE ALXN AMAT AMGN AMD AMZN BA BABA BAC BIDU CAT CVX DE
FB GOOG GS HD IBM JPM M (Macy's) MSFT NFLX NVDA QCOM TSLA TXN XOM WMT
ANDV (refinery), CMG (Chipotle), LRCX, SWKS, MDGL
SPPI WATT
SQ TOWN
7/20/2018 (Click on Underlined link.)
Bullish MAXCPs - http://tigersoft.com/MAXCPZ/720/BULLISH.htm
Bearish MAXCPs - http://tigersoft.com/MINCPZ/720/BEARISH.htm
|
Table 1 QUICKSILVER on ETFS - 07/20/18
ETF CLOSE CHANGE PIVOT-PT 5-dma AROC CL-PWR CANDLE IP21 ITRS
---------------------------------------------------------------------------------------------
DIA 250.44 -.35 250.67 4.8% Bullish BLUE .047 0
---------------------------------------------------------------------------------------------
COMPQX 7820.2 -5.1 7805.72 -3.7% ---- RED .006 .045
---------------------------------------------------------------------------------------------
SPY 279.68 -.32 279.34 1.6% Bullish RED .009 .017
---------------------------------------------------------------------------------------------
QQQ 178.99 -.04 179.18 -17.3% Bullish RED -.004 .046
---------------------------------------------------------------------------------------------
MDY 363.4 -2.22 361.17 4.4% ---- RED -.122 .018
---------------------------------------------------------------------------------------------
IWM 168.48 -.69 166.77 31.6% ---- RED -.02 .041
---------------------------------------------------------------------------------------------
FAS 68.85 .05 68.11 187.1% ---- BLUE .127 -.007
---------------------------------------------------------------------------------------------
RETL 45.65 -1.67 43.9 217.8% Bearish RED -.111 .321
---------------------------------------------------------------------------------------------
SOXL 154.88 -2.3 148.41 190.8% ---- RED .059 .007
---------------------------------------------------------------------------------------------
TECL 151.07 -.23 150.38 -11.2% Bullish RED .058 .123
---------------------------------------------------------------------------------------------
IBB 118.26 -.09 117.49 -3.8% Bullish BLUE .165 .119
---------------------------------------------------------------------------------------------
GLD 116.56 .75 117.55 -45% Bearish BLUE -.192 -.083
---------------------------------------------------------------------------------------------
OIL 7.61 .04 6.89 339.4% Bullish BLUE .263 .041
---------------------------------------------------------------------------------------------
OIH 25.48 -.15 26 -160.1% Bearish RED -.161 -.115
---------------------------------------------------------------------------------------------
GASL 24.31 -.61 23.72 -137.8% Bullish RED -.072 .042
---------------------------------------------------------------------------------------------
UGA 33.21 .17 32.31 -83.6% ---- RED .006 -.061
---------------------------------------------------------------------------------------------
UUP 24.95 -.2 24.96 -10% Bearish ---- -.141 -.001
---------------------------------------------------------------------------------------------
---------------------------------------------------------------------------------------------
FB 209.94 1.85 207.23 62.9% Bullish BLUE .136 .129
|
Table 2 Count of Stocks in Key Directories
20180720
-------------------------------
NEWHIGHS 162 Bullish
NEWLOWS 39
MAXCP 94 Professionals still net bullish
MINCP 62
TTTNH 79
TTTNL 88 Day traders are switching to bearish stance.
FASTUP 76
FASTDOWN 94 Swing-traders are turning bearish.
CPCROSSA 24
CPCROSSD 131 Professionals are turning bearish.
BIGVOLUP 3
BIGVODN 7
ACCUMVER 16
HIGHIP21 62
HIUPPCT 133
VHIP21 34
LOWACCUM 322
REDSELL 119
AUGSELS7 15
TRAPDOOR 3
|
Table 3
Count of Stocks and New Highs in Key Tiger Directories
Date = 180720
No. NHs Pct
-------------------------------------------------------------------
MAXCP 94 64 68 %
EDU 7 2 29 %
REGBANKS 30 6 20 %
TRANSP 20 3 15 %
HACKERS 22 3 14 %
HOSPITAL 7 1 14 %
NIFTY 29 4 14 %
FINANCE 90 9 10 %
JETS 10 1 10 %
SOFTWARE 64 6 9 %
DOWJONES 30 2 7 %
INSURANC 30 2 7 %
BIOTECH 408 23 6 %
BEVERAGE 19 1 5 %
MILITARY 37 2 5 %
BIG17 46 2 4 %
COMPUTER 23 1 4 %
NASD-100 89 4 4 %
SP-100 94 4 4 %
GREEN 29 1 3 %
INFRA 34 1 3 %
RUS-1000 815 28 3 %
SP500 476 14 3 %
ELECTRON 172 4 2 %
FIDSTKS 184 4 2 %
INDMATER 82 2 2 %
INDEXES 189 4 2 %
RETAIL 52 1 2 %
SEMI 125 2 2 %
OILGAS 155 1 1 %
REIT 173 1 1 %
|
Table 4 Count of Stocks and New Lows in Key Tiger Directories
Date = 180720
No NLs Pct
-------------------------------------------------------------------
MINCP 62 15 24 %
AUTO 40 3 7 %
GAMING 28 2 7 %
SOLAR 19 1 5 %
COMPUTER 23 1 4 %
GOLD 50 2 4 %
RETAIL 52 2 4 %
BIOTECH 408 11 3 %
CHINA 60 2 3 %
MILITARY 37 1 3 %
OILGAS 155 4 3 %
REGBANKS 30 1 3 %
SOFTWARE 64 2 3 %
BIG17 46 1 2 %
BONDFUND 111 2 2 %
CHEM 60 1 2 %
ELECTRON 172 3 2 %
INDMATER 82 2 2 %
INDEXES 189 4 2 %
SEMI 125 3 2 %
SP500 476 8 2 %
FIDSTKS 184 2 1 %
NASD-100 89 1 1 %
REIT 173 1 1 %
RUS-1000 815 11 1 %
SP-100 94 1 1 %
|
Table 5
RANKING OF KEY DIRECTORIES BASED PCT.OF STOCKS ABOVE 65-DMA
7/20/18
---------------------------------------------------------------------------------------
Directory Current day-1 day-2 day-3 day-4 day-5
----------------------------------------------------------------------------------------
NIFTY .862 .896 .896 .862 .862 .896
PIPELINE .833 .833 .666 .666 .666 .666
REIT .803 .855 .791 .826 .867 .89
NASD-100 .752 .741 .786 .764 .741 .764
SOFTWARE .75 .765 .765 .781 .781 .796
BONDFUND .738 .765 .72 .675 .612 .666
DOWJONES .733 .733 .8 .733 .7 .666
UTILITY .731 .756 .731 .707 .756 .756
RETAIL .73 .75 .75 .711 .692 .692
HACKERS .727 .727 .727 .727 .727 .863
GUNS .722 .666 .666 .611 .555 .666
EDU .714 .714 .714 .714 .714 .714
SP-100 .702 .68 .765 .702 .67 .648
REGBANKS .7 .733 .633 .566 .6 .466
FIDSTKS .695 .701 .728 .684 .652 .635
BEVERAGE .684 .684 .631 .736 .684 .736
MILITARY .675 .621 .648 .594 .513 .513
RUS-1000 .66 .684 .68 .652 .634 .656
SP500 .655 .668 .686 .665 .647 .655
GAMING .642 .642 .642 .642 .642 .642
INDEXES .64 .634 .677 .624 .587 .592
COAL .625 .625 .625 .625 .625 .5
ELECTRON .622 .662 .645 .587 .558 .587
CHEM .616 .6 .616 .616 .516 .566
DJI-13 .615 .615 .692 .538 .538 .538
COMPUTER .608 .739 .739 .608 .695 .739
SEMI .608 .648 .632 .576 .536 .544
FINANCE .588 .533 .577 .566 .533 .466
BIGBANKS .571 .571 .571 .571 .571 .142
HOSPITAL .571 .571 .571 .571 .571 .571
INSURANC .566 .566 .7 .566 .533 .4
INFRA .558 .558 .617 .529 .441 .5
BIOTECH .556 .585 .566 .58 .558 .6
TRANSP .55 .75 .5 .4 .4 .4
GREEN .517 .517 .448 .517 .413 .482
OILGAS .503 .554 .541 .535 .561 .6
N = 36
=========================================================================================
INDMATER .5 .475 .512 .463 .378 .426
==========================================================================================
HOMEBLDG .47 .764 .764 .764 .705 .705
BIG17 .456 .456 .5 .521 .543 .5
AUTO .35 .4 .4 .425 .325 .35
SOLAR .263 .263 .263 .263 .263 .263
GOLD .22 .2 .24 .22 .22 .24
JETS .2 .5 .3 .2 .2 .2
ETFS .196 .163 .196 .196 .18 .196
CHINA .15 .15 .15 .133 .133 .15
COMODITY .089 .089 .089 .071 .071 .196
FOOD 0 0 0 0 0 0
N = 10
|
| |
=====================================================================
7/19/2018
On the DJI's chart, the V-Indicator and IP21
are negative. These indicators
should hold the DJI back and not allow it to surpass the red resistance at 25500.
Though the NYSE A/D Line is still rising, it can only be bearish that we see so
many Sell S9s this year on our Peerless DJI chart. So, in deference to the
current current S9-V, stay short DIA. Other sectors are still in uptrends and
in better positions to challenge their overhead resistance levels. Biotechs
look the most bullish.

Wednesday's Peerless Sell S9-V did drop the DJI, Bank Stocks, SPY, TECL,
Timber, Silver and semi-conductors today, but not IBB, IBM (+4.72),
IWM (+1.19), MDY (+1.57) and RETL (+1.47). This mixed action should not
come as a surprise, first, because the A/D Line for the NYSE is uptrending,
second, because the President has started to complain publicly about rising
interest rates and, third, because recent S9Vs in July have tended to bring
on a churning in the market for a week or two before there was a bigger and
broader decline.
The Closing Powers are still rising for IBB, IWM, MDY and RETL. I think
we should watch now for signs that they are topping out. The breaking of
their Closing Powers is what I would expect to see when they are ready to
join in the DJI's decline. Even as they churn or perhaps move somewhat higher,
I expect DIA is likely to keep eroding. The history of July S9s is quite bearish.
So, we should stay short it.
To take-off, IBB must surpass 120. See its chart just below.
Our long positions in
small biotechs would benefit from this. And this may happen even as the DJI pulls
back.
IWM, MDY and RETL, on the other hand, show weaker internals, Accumulation and
relative strength. They should have a much harder time making any big gains in here.
 |
 |
 |
 |
Charts 7/19/2018
PEERLESS DJI, Signals,
Indicators Daily DJI Volume 10-DayUp/Down Vol
Hourly DJIA A/D Line for All
Stocks
NASDAQ S&P OEX NYSE COMPQX DJI-15 DJI-20 DJI-30
DIA SPY QQQ MDY IWM
TNA
Short-Term Rates
USO-CrudeOil FAS GLD BBH IBB JETS JNUG KOL NUGT OIH OIL RSX RETL
SDS SLV SOXL TECL TMF TNA UGA (gasoline) XIV YINN
Commodities: CANE
JJC, NIB, CHOC
CORN,
CUT (paper) WEAT UUP (Dollar)
AAPL ADBE ALXN AMAT AMGN AMD AMZN BA BABA BAC BIDU CAT CVX DE
FB GOOG GS HD IBM JPM M (Macy's) MSFT NFLX NVDA QCOM TSLA TXN XOM WMT
ANDV (refinery), CMG (Chipotle), LRCX, SWKS, MDGL
SPPI WATT
SQ TOWN
7/19/2018 (Click on Underlined link.)
Bullish MAXCPs - http://tigersoft.com/MAXCPZ/719/BULLISH.htm
Bearish MAXCPs - http://tigersoft.com/MINCPZ/719/BEARISH.htm
|
Table 1 QUICKSILVER on ETFS - 07/19/18
ETF CLOSE CHANGE PIVOT-PT 5-dma AROC CL-PWR CANDLE IP21 ITRS
---------------------------------------------------------------------------------------------
DIA 250.79 -1.24 250.2 29.7% ---- RED .007 0
---------------------------------------------------------------------------------------------
COMPQX 7825.3 -29.14 7825.98 .9% Bullish RED .041 .047
---------------------------------------------------------------------------------------------
SPY 280 -1.06 279.59 11.3% Bullish RED .035 .019
---------------------------------------------------------------------------------------------
QQQ 179.03 -.9 179.61 -12% Bullish RED .026 .048
---------------------------------------------------------------------------------------------
MDY 365.62 1.57 363.08 33.2% ---- BLUE -.043 .02
---------------------------------------------------------------------------------------------
IWM 169.17 1.19 167.42 37.3% ---- BLUE .034 .042
---------------------------------------------------------------------------------------------
FAS 68.8 -1.64 66.29 107.9% ---- RED .097 .018
---------------------------------------------------------------------------------------------
RETL 47.32 1.47 43.68 496% Bearish BLUE -.054 .404
---------------------------------------------------------------------------------------------
SOXL 157.18 -1.16 149.02 204.5% ---- BLUE .06 .057
---------------------------------------------------------------------------------------------
TECL 151.3 -1.54 151.41 -17.4% Bullish RED .052 .158
---------------------------------------------------------------------------------------------
IBB 118.35 .12 118.35 8.5% Bullish BLUE .22 .125
---------------------------------------------------------------------------------------------
GLD 115.81 -.5 117.61 -99% Bearish BLUE -.239 -.101
---------------------------------------------------------------------------------------------
OIL 7.61 .04 6.89 339.4% Bullish BLUE .263 .031
---------------------------------------------------------------------------------------------
OIH 25.63 -.16 26.31 -109.5% Bearish ---- -.112 -.101
---------------------------------------------------------------------------------------------
GASL 24.92 .87 24.98 49.5% Bullish BLUE -.023 .11
---------------------------------------------------------------------------------------------
UUP 25.15 .05 25 24% Bearish RED -.105 -.002
---------------------------------------------------------------------------------------------
|
Table 2 Count of Stocks in Key Directories
20180719
-------------------------------
NEWHIGHS 196 Bullish
NEWLOWS 51
MAXCP 117 Bullish
MINCP 37
TTTNH 88 Bullish
TTTNL 61
FASTUP 67
FASTDOWN 102 Bearish
CPCROSSA 128 Bullish
CPCROSSD 89
BIGVOLUP 1
BIGVODN 7
ACCUMVER 16
HIGHIP21 66
HIUPPCT 145
VHIP21 35
LOWACCUM 336
REDSELL 118
AUGSELS7 17
TRAPDOOR 5
|
Table 3
Count of Stocks and New Highs in Key Tiger Directories
Date = 180719
No. NHs Pct
-------------------------------------------------------------------
MAXCP 117 73 62 %
EDU 7 3 43 %
TRANSP 20 3 15 %
HOSPITAL 7 1 14 %
RETAIL 52 6 12 %
JETS 10 1 10 %
HACKERS 22 2 9 %
BIOTECH 408 31 8 %
MILITARY 37 3 8 %
SOFTWARE 64 5 8 %
BIG17 46 3 7 %
COMODITY 56 4 7 %
HOMEBLDG 17 1 6 %
INDEXES 189 11 6 %
AUTO 40 2 5 %
BEVERAGE 19 1 5 %
CHEM 62 3 5 %
FINANCE 90 4 4 %
GAMING 28 1 4 %
RUS-1000 816 36 4 %
SP-100 94 4 4 %
SP500 476 19 4 %
ELECTRON 172 5 3 %
FIDSTKS 185 6 3 %
INFRA 34 1 3 %
INSURANC 30 1 3 %
NASD-100 89 3 3 %
NIFTY 29 1 3 %
ETFS 61 1 2 %
INDMATER 82 2 2 %
REIT 173 3 2 %
SEMI 125 3 2 %
UTILITY 41 1 2 %
BONDFUND 111 1 1 %
OILGAS 156 2 1 %
|
| |
Table 4 Count of Stocks and New Lows in Key Tiger Directories
Date = 180719
No NLs Pct
-------------------------------------------------------------------
COMODITY 56 16 29 %
MINCP 37 10 27 %
GOLD 50 13 26 %
PIPELINE 7 1 14 %
CHINA 60 6 10 %
JETS 10 1 10 %
GAMING 28 2 7 %
AUTO 40 2 5 %
ETFS 61 3 5 %
SOLAR 19 1 5 %
UTILITY 41 2 5 %
BIOTECH 408 11 3 %
CHEM 62 2 3 %
OILGAS 156 4 3 %
REGBANKS 30 1 3 %
BIG17 46 1 2 %
FIDSTKS 185 3 2 %
NASD-100 89 2 2 %
SOFTWARE 64 1 2 %
SP-100 94 2 2 %
BONDFUND 111 1 1 %
ELECTRON 172 1 1 %
INDMATER 82 1 1 %
INDEXES 189 1 1 %
RUS-1000 816 7 1 %
SEMI 125 1 1 %
SP500 476 4 1 %
|
Table 5
RANKING OF KEY DIRECTORIES BASED PCT.OF STOCKS ABOVE 65-DMA
7/19/18
Bullish = 37
Bearish = 9
---------------------------------------------------------------------------------------
Directory Current day-1 day-2 day-3 day-4 day-5
----------------------------------------------------------------------------------------
NIFTY .896 .896 .862 .862 .896 .862
PIPELINE .857 .714 .714 .714 .714 .714
REIT .855 .791 .826 .867 .89 .89
BONDFUND .765 .72 .675 .612 .657 .657
SOFTWARE .765 .765 .781 .781 .796 .781
HOMEBLDG .764 .764 .764 .705 .705 .705
UTILITY .756 .731 .707 .756 .756 .78
RETAIL .75 .75 .711 .692 .692 .692
TRANSP .75 .5 .4 .4 .4 .4
NASD-100 .741 .786 .764 .741 .764 .764
COMPUTER .739 .739 .608 .695 .739 .695
DOWJONES .733 .8 .733 .7 .666 .633
REGBANKS .733 .633 .566 .6 .466 .6
HACKERS .727 .727 .727 .727 .863 .818
EDU .714 .714 .714 .714 .714 .714
FIDSTKS .702 .729 .686 .654 .637 .675
RUS-1000 .685 .681 .653 .633 .655 .651
BEVERAGE .684 .631 .736 .684 .736 .789
SP-100 .68 .765 .702 .67 .648 .659
SP500 .668 .686 .665 .647 .657 .653
GUNS .666 .666 .611 .555 .666 .611
ELECTRON .662 .645 .587 .558 .587 .593
SEMI .648 .632 .576 .536 .544 .552
GAMING .642 .642 .642 .642 .642 .642
INDEXES .634 .677 .624 .587 .592 .597
COAL .625 .625 .625 .625 .5 .5
MILITARY .621 .648 .594 .513 .513 .513
DJI-13 .615 .692 .538 .538 .538 .538
CHEM .612 .629 .629 .532 .564 .58
BIOTECH .585 .566 .58 .558 .607 .617
BIGBANKS .571 .571 .571 .571 .142 .142
HOSPITAL .571 .571 .571 .571 .571 .571
INSURANC .566 .7 .566 .533 .4 .5
INFRA .558 .617 .529 .441 .529 .558
OILGAS .557 .544 .538 .564 .602 .602
FINANCE .533 .577 .566 .533 .477 .522
GREEN .517 .448 .517 .413 .482 .517
N=37
===========================================================================================
JETS .5 .3 .2 .2 .2 .1
===========================================================================================
INDMATER .475 .512 .463 .378 .426 .463
BIG17 .456 .5 .521 .543 .5 .543
AUTO .4 .4 .425 .325 .35 .3
SOLAR .263 .263 .263 .263 .263 .263
GOLD .2 .24 .22 .22 .24 .28
ETFS .163 .196 .196 .18 .18 .18
CHINA .15 .15 .133 .133 .15 .183
COMODITY .089 .089 .071 .071 .196 .196
FOOD 0 0 0 0 0 0
N=9
|
====================================================================
7/18/2018
A new Peerless Sell S9 occurred today. The
DJI closed 2.4% over the 21-dma
and shows a negative V-I. The 21-dma of NYSE Adjusted Up Volume minus
Down Volume now stands at -27. In addition, our current Accumulation Index now
stands at -.002. So, we have an IP21 NNC (negative non-confirmation) of the DJI's
move
to the upper band, too. The data for July S9Vs below suggest to me that the
still positive P-Indicator (21-dma of NYSE advances minus declines) cannot save the
situation. The same data does not suggest a summer breakout above 25500. Most
likely, we will re-visit the DJI's lower 2.5%-3% band. If the P-Indicator is still
positive
at that point, there will be another tradeable rally. If not, the vital 23300-23500
support
will have to be tested.

First, look below at the list of earlier July
Sell S9 (noticing where V-I was negative) since 1929
when the DJI was not simply making a recovery in a bear market back to the upper band.
There
were 14 bull market S9s. The average decline after a bull market July S9 was 10% at
the
time of the next Peerless Buy signal. Only in 3 cases, was the paper loss when short
selling
here more than 1.8%. The biggest paper loss was 4.3%. All of these bull market
July S9s
would have been reversed profitably, though in recent years (1990, 1998, 2007 and 2011)
it was common for the DJI to churn at its current levels for at least a week longer before
turning down quite steeply. The next table shows that July S9s in already existing
bear
markets were much less bearish and also brought much bigger paper losses.
This data must lead to a bearish conclusion. We could wait for the signal to be
"clinched".
By this, we mean that the number of NYSE decliners should be more than 25 the
number of NYSE advancers tomorrow before going short DIA, as the major market
ETF with the weakest performance for the last 5- trading days.
But I suggest selling DIA short tomorrow as well as more bearish MINCPs.
Hold long the highest Accumulation biotechs whose Closing Powers are still above
their rising 21-day ma. Many of these have shown a tendency to rally on days when
the DJI falls.
July Bull Market S9s
Date Signals DJI Gain Max.Paper Loss
=========================================================================
20180718 S9 25199.29
la/ma= 1.024 aroc=+0.103 PI=+138 (05) IP21= -.002 VI=-27 OP=+.349
----------------------------------------------------------------------
19550727 S8-S9V? 468.5 .042 perfect 0
la/ma= 1.018 aroc=+0.482 PI=+11 (+1) IP21= +.041 VI=-157 OP=+.412
----------------------------------------------------------------------
19570708 S9 518.4 .176 520.8 -.008 7/12
la/ma= 1.022 aroc=+0.324 PI=-27 (+4) IP21= +.038 VI=-188 OP=+.360
----------------------------------------------------------------------
19590701 S9 650.2 .019 678.1 -.043 8/3
la/ma= 1.030 aroc=+0.240 PI=-2 (+38) IP21= -.062 VI=-177 OP=+.177
----------------------------------------------------------------------
19830726 S9 1243.69 .065 perfect 0
la/ma= 1.024 aroc=+0.020 PI=-73 (+21) IP21= +.058 VI=-4 OP=+.193
----------------------------------------------------------------------
19900712 S9 2999.75 .174 2999.75 0 7/16
la/ma= 1.025 aroc=+0.150 PI=-45 (-2) IP21= +.052 VI=-10 OP=+.246
----------------------------------------------------------------------
19900719 S9 2993.81 .181 none 0
la/ma= 1.027 aroc=+0.410 PI= 0 (-16) IP21= +.065 VI=-5 OP=+.407
----------------------------------------------------------------------
19980701 S9 9048.67 .157 9337.97 -.032 7/17
la/ma= 1.019 aroc=-0.211 PI=+16(+56) IP21= -.028 VI=-8 OP=+.145
----------------------------------------------------------------------
19980708 S9 9174.97 .168 9337.97 -.018 7/17
la/ma= 1.030 aroc=+0.141 PI=+2 (+7) IP21= -.025 VI=-17 OP=+.061
----------------------------------------------------------------------
19990709 S9 11193.69 .105 11209.8 -.001 7/16
la/ma= 1.034 aroc=+0.555 PI=+69 (+39) IP21= +.085 VI=-6 OP=+.263
----------------------------------------------------------------------
20070713 S9 13907.25 .044 14000.4 -.007 7/19
la/ma= 1.026 aroc=+0.374 PI=+192(-91) IP21= +.005 VI=-15 OP=+.090
----------------------------------------------------------------------
20070723 S9 13943.42 .047 none 0
la/ma= 1.021 aroc=+0.347 PI=-69(-22) IP21= +.019 VI=-174 OP=+.042
----------------------------------------------------------------------
20110705 S9 12569.87 .086 12724.4 -.012 7/21
la/ma= 1.037 aroc=+0.412 PI=+239(+57) IP21= -.034 VI=-48 OP=+.085
----------------------------------------------------------------------
20110721 S9 12724.41 .098 none 0
la/ma= 1.025 aroc=+0.513 PI=+269(-16) IP21= +.085 VI=-51 OP=+.005
----------------------------------------------------------------------
20130711 S9 15460.92 .032 15658.3 -.013 8/2
la/ma= 1.028 aroc=+0.268 PI=+258(+217) IP21= -.044 VI=-25 OP=+.188
============================================================================
N=14 Avg Gain Short Selling=.100
Avg. Paper loss = .001
July Bear (X) Market S9s
============================================================================
Date Signals DJI Gain Max.Paper Loss
=========================================================================
X19620705 S9 583.9 .009 615.5 -.054 8/22
X19620716 S9 588.1 .016 615.5 -.047 8/22
X19700723 S9 732.68 .035 735.56 -.004 7/29
X19730711 S9 908.19 .028 934.53 -.029 7/26
X20080723 S9 11632.38 .061 11782.3 -.013 8/11
X20080730 S9 11583.69 .058 11782.3 -.017 8/11
X19820712 S9 824.87 .058 833.43 -.010 7/20
X20100726 S9 10542.43 .026 10698.7 -.015 8/9
------------------------------------------------------------------------------
N=7
Watch to see if SP-500, NYSE (and OEX) stay within their trading ranges.
New highs by them would suggest the DJI may still move higher. TECL,
representing tech stocks is much stronger. Watch to see if its rising Closing
Power can be broken or if it tries to sail to new highs, regardless of the
Sell S9.
 |
 |
 |
Charts 7/18/2018
PEERLESS DJI, Signals,
Indicators Daily DJI Volume 10-DayUp/Down Vol
Hourly DJIA A/D Line for All
Stocks
NASDAQ S&P OEX NYSE COMPQX DJI-15 DJI-20 DJI-30
DIA SPY QQQ MDY IWM
TNA
Short-Term Rates
USO-CrudeOil FAS GLD BBH IBB JETS JNUG KOL NUGT OIH OIL RSX RETL
SDS SLV SOXL TECL TMF TNA UGA (gasoline) XIV YINN
Commodities: CANE
JJC, NIB, CHOC
CORN,
CUT (paper) WEAT UUP (Dollar)
AAPL ADBE ALXN AMAT AMGN AMD AMZN BA BABA BAC BIDU CAT CVX DE
FB GOOG GS HD IBM JPM M (Macy's) MSFT NFLX NVDA QCOM TSLA TXN XOM WMT
ANDV (refinery), CMG (Chipotle), LRCX, SWKS, MDGL
SPPI WATT
SQ TOWN
7/18/2018 (Click on Underlined link.)
Bullish MAXCPs - http://tigersoft.com/MAXCPZ/718/BULLISH.htm
Bearish MAXCPs - http://tigersoft.com/MINCPZ/718/BEARISH.htm
|
QUICKSILVER on ETFS - 07/18/18
ETF CLOSE CHANGE PIVOT-PT 5-dma AROC CL-PWR CANDLE IP21 ITRS
---------------------------------------------------------------------------------------------
DIA 252.03 .75 249.3 99.1% Bullish BLUE .062 0
---------------------------------------------------------------------------------------------
COMPQX 7854.44 -.68 7823.92 88.3% Bullish RED .083 .046
---------------------------------------------------------------------------------------------
SPY 281.06 .59 279.37 75.2% Bullish BLUE .094 .018
---------------------------------------------------------------------------------------------
QQQ 179.93 -.34 179.46 98.1% Bullish RED .101 .047
---------------------------------------------------------------------------------------------
MDY 364.05 1.23 363.21 26.8% ---- BLUE -.013 .014
---------------------------------------------------------------------------------------------
IWM 167.98 .47 167.92 26% ---- BLUE .042 .034
---------------------------------------------------------------------------------------------
FAS 70.44 2.06 67.33 283.6% Bullish BLUE .163 .052
---------------------------------------------------------------------------------------------
RETL 45.85 .44 42.92 262% Bearish BLUE -.02 .345
---------------------------------------------------------------------------------------------
SOXL 158.34 3.35 150.95 351.5% ---- BLUE .116 .084
---------------------------------------------------------------------------------------------
TECL 152.84 -.68 151.83 273.7% Bullish RED .125 .169
---------------------------------------------------------------------------------------------
IBB 118.23 -.14 118.15 83.2% Bullish ---- .238 .112
---------------------------------------------------------------------------------------------
GLD 116.31 .03 118.13 -56.6% Bearish BLUE -.26 -.102
---------------------------------------------------------------------------------------------
OIL 7.61 .04 6.89 339.4% Bullish BLUE .263 .026
---------------------------------------------------------------------------------------------
OIH 25.79 -.09 26.2 -109% Bearish ---- -.077 -.092
---------------------------------------------------------------------------------------------
GASL 24.05 .16 24.68 -155.6% Bullish BLUE -.021 .116
---------------------------------------------------------------------------------------------
UUP 25.1 .03 25.03 18% Bullish ---- -.13 -.006
---------------------------------------------------------------------------------------------
|
Table 2 Count of Stocks in Key Directories
20180718
-------------------------------
NEWHIGHS 175 Bullish
NEWLOWS 42
MAXCP 90 Bullish
MINCP 54
TTTNH 47
TTTNL 66 Net Bearish
FASTUP 74
FASTDOWN 92
CPCROSSA 73
CPCROSSD 61
BIGVOLUP 1
BIGVODN 5
|
Table 3
Count of Stocks and New Highs in Key Tiger Directories
Date = 180718
No. NHs Pct
-------------------------------------------------------------------
MAXCP 90 60 67 %
EDU 7 2 29 %
SOFTWARE 64 10 16 %
TRANSP 20 3 15 %
NIFTY 29 4 14 %
GAMING 28 3 11 %
JETS 10 1 10 %
HACKERS 22 2 9 %
BIG17 46 3 7 %
DOWJONES 30 2 7 %
INDEXES 189 14 7 %
INSURANC 30 2 7 %
NASD-100 89 6 7 %
FIDSTKS 185 12 6 %
FINANCE 90 5 6 %
RETAIL 52 3 6 %
SP-100 94 6 6 %
SP500 476 27 6 %
BIOTECH 404 22 5 %
RUS-1000 816 38 5 %
COMODITY 56 2 4 %
AUTO 40 1 3 %
ELECTRON 172 6 3 %
INFRA 34 1 3 %
MILITARY 37 1 3 %
REGBANKS 30 1 3 %
SEMI 125 3 2 %
OILGAS 156 1 1 %
|
Table 4 Count of Stocks and New Lows in Key Tiger Directories
Date = 180718
No NLs Pct
-------------------------------------------------------------------
MINCP 54 13 24 %
COMODITY 56 12 21 %
GOLD 50 7 14 %
PIPELINE 7 1 14 %
FOOD 9 1 11 %
UTILITY 41 2 5 %
BIOTECH 404 15 4 %
AUTO 40 1 3 %
CHINA 60 2 3 %
BIG17 46 1 2 %
SEMI 125 2 2 %
SOFTWARE 64 1 2 %
ELECTRON 172 2 1 %
FIDSTKS 185 2 1 %
INDEXES 189 2 1 %
NASD-100 89 1 1 %
OILGAS 156 2 1 %
REIT 173 1 1 %
RUS-1000 816 2 0 %
|
Table 5 RANKING OF KEY DIRECTORIES BASED PCT.OF STOCKS ABOVE 65-DMA
7/18/18 Bullish = 36 Bearish = 9
---------------------------------------------------------------------------------------
Directory Current day-1 day-2 day-3 day-4 day-5
----------------------------------------------------------------------------------------
NIFTY .896 .862 .862 .896 .862 .758
DOWJONES .8 .733 .7 .666 .633 .6
REIT .791 .826 .867 .89 .89 .901
NASD-100 .786 .764 .741 .764 .764 .719
SOFTWARE .765 .781 .781 .796 .781 .75
SP-100 .765 .702 .67 .648 .67 .648
HOMEBLDG .764 .764 .705 .705 .705 .705
RETAIL .75 .711 .692 .692 .692 .692
COMPUTER .739 .608 .695 .739 .739 .695
UTILITY .731 .707 .756 .756 .78 .756
FIDSTKS .729 .686 .654 .637 .681 .659
HACKERS .727 .727 .727 .863 .818 .727
BONDFUND .72 .675 .612 .657 .657 .648
EDU .714 .714 .714 .714 .714 .714
PIPELINE .714 .714 .714 .714 .714 .714
INSURANC .7 .566 .533 .4 .5 .5
DJI-13 .692 .538 .538 .538 .538 .461
SP500 .686 .665 .647 .657 .655 .636
RUS-1000 .681 .653 .633 .655 .653 .632
INDEXES .677 .624 .587 .592 .603 .582
GUNS .666 .611 .555 .666 .611 .555
MILITARY .648 .594 .513 .513 .513 .324
ELECTRON .645 .587 .558 .587 .593 .552
GAMING .642 .642 .642 .642 .642 .571
REGBANKS .633 .566 .6 .466 .666 .7
SEMI .632 .576 .536 .544 .552 .504
BEVERAGE .631 .736 .684 .736 .789 .789
CHEM .629 .629 .532 .564 .58 .596
COAL .625 .625 .625 .5 .5 .625
INFRA .617 .529 .441 .529 .558 .529
FINANCE .577 .566 .533 .477 .522 .533
BIGBANKS .571 .571 .571 .142 .142 .142
HOSPITAL .571 .571 .571 .571 .571 .571
BIOTECH .569 .581 .559 .608 .611 .599
OILGAS .544 .538 .564 .602 .608 .621
INDMATER .512 .463 .378 .426 .463 .439
N=36
------------------------------------------------------------------------------------------
BIG17 .5 .521 .543 .5 .543 .543
TRANSP .5 .4 .4 .4 .4 .4
------------------------------------------------------------------------------------------
GREEN .448 .517 .413 .482 .517 .517
AUTO .4 .425 .325 .35 .3 .3
JETS .3 .2 .2 .2 .1 .1
SOLAR .263 .263 .263 .263 .263 .263
GOLD .24 .22 .22 .24 .28 .24
ETFS .196 .196 .18 .18 .18 .163
CHINA .15 .133 .133 .15 .183 .116
COMODITY .089 .071 .071 .196 .196 .142
FOOD 0 0 0 0 0 0
N=9
|
====================================================================
7/17/2018
The Peerless Buy B9 still operates.
But a DJI close 56 points higher
tomorrow will bring a new and reversing Sell S9-V. I would attach special
credence to any July 17th Sell S9 now. They have produced some very nasty declines.
I list below only the four since 1990. We could easily find quite a few others from
earlier years: such as July 17 1930, July 17 1933... When you think of bear markets,
you probably think of Octobers. We should also watch for tops in July!
7/17/1990 Sell S9V la/ma= 1.032 P=-1 IP21=.024 V--4
Bear market followed.
7/17/1998 S9V/S12 a week earlier, la/ma=1.03 P=+2 IP21=-.025
V=-17
19% decline quickly followed.
7/16/1999 S9V/S5 a week earlier, la/ma=1.034 P=+69 IP21=
+.085 V=-6
Quick decline to lower 3.5% band.
7/17/1999 S9V/S5 la/ma=1.028 P=-27 IP21= -.003 V= -121
10% decline quickly followed.
But we still do not see the Sell S9-V.
And, as I said yesterday, I believe the
market is doing very well considering all the blasting President Trump is getting
from much of the media for tariffs and also for "high crimes and treason"
because he
dared talk privately to Russian President Putin for two hours and admitted very
publicly that the CIA had engaged in over-throwing democratically governments
and arranging the assassinations of too many foreign leaders to count. Considering
the endless attacks on Trump, the stock market is doing amazingly well. It is even
ignoring the rise in short-term rates to another new high today to nearly 2.0%.
But I want to be neither a hero nor a fool. With the DJI so close to a July Sell S9v,
I suggested taking profits today in IWM and IBB as well as hedging with some shorts
in our bearish MINCPs. That may prove to be early in here. Still, today, the
2006
version of the Peerless software did yield an old-style Sell S8 based on the recently
weakening breadth. Since the year 1998, there have been four of these older July
Sell S8s. Each of them showed a red (negative) V-I reading like we see now.
But
each also showed a negative IP21 (Current Accumulation). Our IP21 now is a
+.011.
Two of these July S8s from the older software occurred 2.2% above the 21-dma,
which is where we are now, but the other two were much closer to the full 3% upper
band.
So, the new Peerless wants the DJI to go higher before giving a Sell. It also wants
to
give the market a little more chance to make a decisive upside breakout past the
resistance
lines we now see in all the key ETFs. This is important. Our Help section for
these older-type
Sell S8s warns us to be especially careful if the DJI succeeds in breaking above its flat
resistance
either just before or after a Sell S8. Look at out charts. That could be what
develops here
if the DJI were to surpass 25500. Such a breakout would almost certainly help
some of the
explosive-super-stock Biotechs we have bought and are still holding.

Old Sell S8s
Gain using la/ma aroc
P-I
IP21 V-I OBVPct
Current Peerless
------------------------------------------------------------------------------------------
7/17/2018
??????
1.022 +.014
+143 (+27) +.011 -24
+.259
-------------------------------------------------------------------------------------------
7/16/2007
+.047
1.028
+.349 +88 (-105) -.003
-60 +.088
DJI churned here a few days and then fell 10%. Also an S9-V/S5.
-------------------------------------------------------------------------------------------
7/3/2006
+.038
1.022
-.022 -129 (+21) -.077
-246 -.164
DJI immediately fell to lower band. There was no new Peerless Sell here.
-------------------------------------------------------------------------------------------
7/13/2000
+.051
1.022
.188 +116 (-24)
-.054 -60 +.292
DJI immediately fell from 10788 to 10521 and then rose to 11311 on 9/6 before
falling below lower band.
--------------------------------------------------------------------------------------------
7/8/1998
+.168
1.030 +.141
+2 (+7)
-.025 -17 +.061
DJI rose a 2% more over the next week and then collapsed nearly 20%.
This was also an S9/S12.
Charts 7/17/2018
PEERLESS DJI, Signals,
Indicators Daily DJI Volume 10-DayUp/Down Vol
Hourly DJIA A/D Line for All
Stocks
NASDAQ S&P OEX NYSE COMPQX DJI-15 DJI-20 DJI-30
DIA SPY QQQ MDY IWM
TNA
Short-Term Rates
USO-CrudeOil FAS GLD BBH IBB JETS JNUG KOL NUGT OIH OIL RSX RETL
SDS SLV SOXL TECL TMF TNA UGA (gasoline) XIV YINN
Commodities: CANE
JJC, NIB, CHOC
CORN,
CUT (paper) WEAT UUP (Dollar)
AAPL ADBE ALXN AMAT AMGN AMD AMZN BA BABA BAC BIDU CAT CVX DE
FB GOOG GS HD IBM JPM M (Macy's) MSFT NFLX NVDA QCOM TSLA TXN XOM WMT
ANDV (refinery), CMG (Chipotle), LRCX, SWKS, MDGL
SPPI WATT
SQ TOWN
7/17/2018 (Click on Underlined link.)
Bullish MAXCPs - http://tigersoft.com/MAXCPZ/717/BULLISH.htm
Bearish MAXCPs - http://tigersoft.com/MINCPZ/717/BEARISH.htm
|
Table 1 QUICKSILVER on ETFS - 07/17/18
ETF CLOSE CHANGE PIVOT-PT 5-dma AROC CL-PWR CANDLE IP21 ITRS
---------------------------------------------------------------------------------------------
DIA 251.28 .61 247.08 41.1% Bullish BLUE .08 ------
---------------------------------------------------------------------------------------------
COMPQX 7855.12 49.4 7716.61 61.6% Bullish BLUE .125 .053
---------------------------------------------------------------------------------------------
SPY 280.47 1.13 276.86 28.2% Bullish BLUE .1 .018
---------------------------------------------------------------------------------------------
QQQ 180.27 1.09 176.42 82.7% Bullish BLUE .134 .057
---------------------------------------------------------------------------------------------
MDY 362.82 1.65 362.11 -34.7% ---- BLUE -.012 .015
---------------------------------------------------------------------------------------------
IWM 167.51 .74 167.11 -30.7% Bearish BLUE .055 .04
---------------------------------------------------------------------------------------------
FAS 68.38 .27 66.62 96.9% Bullish BLUE .146 .04
---------------------------------------------------------------------------------------------
RETL 45.41 1.51 43.55 78.8% Bearish BLUE -.003 .313
---------------------------------------------------------------------------------------------
SOXL 154.99 6.58 147.78 -172.9% ---- BLUE .124 .089
---------------------------------------------------------------------------------------------
TECL 153.52 3.14 144.61 222.4% Bullish BLUE .158 .199
---------------------------------------------------------------------------------------------
IBB 118.37 .88 116.27 75% Bullish BLUE .263 .12
---------------------------------------------------------------------------------------------
GLD 116.28 -1.27 117.64 -112.3% Bearish RED -.312 -.102
---------------------------------------------------------------------------------------------
OIL 7.61 .04 6.89 339.4% Bullish BLUE .263 .025
---------------------------------------------------------------------------------------------
OIH 25.88 -.12 26.36 -231.1% Bearish ---- -.084 -.085
---------------------------------------------------------------------------------------------
GASL 23.89 .17 24.81 -533.1% Bullish BLUE -.026 .132
---------------------------------------------------------------------------------------------
UGA 32.49 .18 33.33 -327.1% Bearish BLUE -.064 -.072
---------------------------------------------------------------------------------------------
UUP 25.07 .11 25.01 46.1% Bullish BLUE -.168 -.006
---------------------------------------------------------------------------------------------
IEF 102.38 -.06 102.48 5.4% Bullish RED -.126 -.029
---------------------------------------------------------------------------------------------
---------------------------------------------------------------------------------------------
GOOG 1198.8 14.94 1153.9 196% Bullish BLUE .062 .108
---------------------------------------------------------------------------------------------
MSFT 105.95 1.04 101.98 184.6% Bullish BLUE .13 .077
---------------------------------------------------------------------------------------------
AMZN 1843.93 21.44 1755 282.4% Bullish BLUE .165 .13
---------------------------------------------------------------------------------------------
FB 209.99 2.76 202.54 156.9% Bullish BLUE .258 .153
---------------------------------------------------------------------------------------------
|
Table 2 Count of Stocks in Key Directories
20180717
-------------------------------
NEWHIGHS 194 Bullish
NEWLOWS 47
MAXCP 95 Bullish
MINCP 58
TTTNH 62
TTTNL 66
FASTUP 52
FASTDOWN 119 Swing traders are net bearish.
CPCROSSA 112
CPCROSSD 43
BIGVOLUP 4
BIGVODN 9
----------------------------------------------------
|
Table 3
Count of Stocks and New Highs in Key Tiger Directories
Date = 180717
No. NHs Pct
-------------------------------------------------------------------
MAXCP 95 64 67 %
NIFTY 29 6 21 %
SOFTWARE 64 12 19 %
EDU 7 1 14 %
GAMING 28 4 14 %
HACKERS 22 3 14 %
HOSPITAL 7 1 14 %
BIG17 48 6 13 %
INDEXES 189 21 11 %
NASD-100 89 10 11 %
FIDSTKS 185 14 8 %
MILITARY 37 3 8 %
COMODITY 56 4 7 %
INSURANC 30 2 7 %
BIOTECH 401 25 6 %
AUTO 39 2 5 %
SP500 476 22 5 %
RETAIL 52 2 4 %
RUS-1000 816 34 4 %
SP-100 94 4 4 %
DOWJONES 30 1 3 %
ELECTRON 172 5 3 %
INFRA 34 1 3 %
CHEM 62 1 2 %
GOLD 50 1 2 %
BONDFUND 111 1 1 %
FINANCE 90 1 1 %
OILGAS 156 2 1 %
REIT 173 1 1 %
SEMI 125 1 1 %
-------------------------------------------------------
|
Table 4 Count of Stocks and New Lows in Key Tiger Directories
Date = 180717
No NLs Pct
-------------------------------------------------------------------
MINCP 58 14 24 %
COMODITY 56 13 23 %
GOLD 50 11 22 %
GREEN 29 2 7 %
AUTO 39 1 3 %
BIOTECH 401 14 3 %
CHEM 62 2 3 %
SOFTWARE 64 1 2 %
UTILITY 41 1 2 %
BONDFUND 111 1 1 %
ELECTRON 172 2 1 %
FIDSTKS 185 1 1 %
FINANCE 90 1 1 %
INDEXES 189 1 1 %
NASD-100 89 1 1 %
OILGAS 156 1 1 %
REIT 173 1 1 %
RUS-1000 816 6 1 %
SEMI 125 1 1 %
SP500 476 2 0 %
--------------------------------------------------------------------
|
Table 5 RANKING OF KEY DIRECTORIES BASED PCT.OF STOCKS ABOVE 65-DMA
7/17/18
Bullish = 37
Bearish = 10
---------------------------------------------------------------------------------------
Directory Current day-1 day-2 day-3 day-4 day-5
----------------------------------------------------------------------------------------
NIFTY .862 .862 .896 .862 .758 .896
REIT .826 .867 .89 .89 .907 .901
SOFTWARE .781 .781 .796 .781 .75 .765
HOMEBLDG .764 .705 .705 .705 .705 .647
NASD-100 .764 .741 .764 .764 .719 .786
BEVERAGE .736 .684 .736 .789 .789 .789
DOWJONES .733 .7 .666 .633 .566 .666
HACKERS .727 .727 .863 .818 .727 .681
EDU .714 .714 .714 .714 .714 .714
PIPELINE .714 .714 .714 .714 .714 .714
RETAIL .711 .692 .692 .692 .711 .73
UTILITY .707 .756 .756 .78 .756 .78
SP-100 .702 .67 .648 .67 .638 .723
FIDSTKS .686 .654 .637 .681 .654 .718
BONDFUND .675 .612 .657 .657 .648 .63
SP500 .665 .647 .657 .655 .634 .703
RUS-1000 .653 .633 .655 .653 .629 .696
GAMING .642 .642 .642 .642 .571 .607
CHEM .629 .532 .564 .58 .596 .612
COAL .625 .625 .5 .5 .625 .75
INDEXES .624 .587 .592 .603 .587 .693
GUNS .611 .555 .666 .611 .555 .611
COMPUTER .608 .695 .739 .739 .652 .695
MILITARY .594 .513 .513 .513 .324 .513
ELECTRON .587 .558 .587 .593 .552 .616
BIOTECH .583 .561 .61 .613 .603 .615
SEMI .576 .536 .544 .552 .512 .6
BIGBANKS .571 .571 .142 .142 .142 .142
HOSPITAL .571 .571 .571 .571 .571 .571
FINANCE .566 .533 .477 .522 .544 .566
INSURANC .566 .533 .4 .5 .5 .5
REGBANKS .566 .6 .466 .666 .7 .766
BIG17 .541 .562 .52 .562 .541 .583
DJI-13 .538 .538 .538 .538 .384 .538
OILGAS .538 .564 .602 .608 .621 .692
INFRA .529 .441 .529 .558 .529 .617
GREEN .517 .413 .482 .517 .517 .551
==========================================================================================
INDMATER .463 .378 .426 .463 .439 .585
AUTO .41 .307 .333 .282 .282 .435
TRANSP .4 .4 .4 .4 .4 .65
SOLAR .263 .263 .263 .263 .263 .315
GOLD .22 .22 .24 .28 .24 .48
JETS .2 .2 .2 .1 .1 .3
ETFS .196 .18 .18 .18 .163 .213
CHINA .133 .133 .15 .183 .116 .133
COMODITY .071 .071 .196 .196 .142 .321
FOOD 0 0 0 0 0 .111
N=10
|
====================================================================
7/16/2018
The Peerless Buy B9 still operates. But we
are probably only 80 points
away from a new Peerless Sell. The DJI closed 1.9% over the 21-dma. A rally
to the 2.25% upper band will likely bring a reversing Sell S9-V. Our favorite
ETFs, IBB and IWM, declined today. Their Closing Power uptrends were violated
as a result of their failure Friday and Monday to make new highs. Take profits
in them. Their upside potential would seem to be limited now.
Bearishly, there were almost twice as many NYSE decliners as advances. By itself
this is only a warning until we see somewhat higher DJI prices.
Short term rates are approaching 2% and the 12-mo CPI inflation rate is almost 3%.
The Dollar is even starting to look a little "toppy". Small wonder, the
NYSE fell
again on another weak Monday.

The Market Did Well To Hold Up.
When you think about it, the market held up very well today. But for how long?
We will probably get a reversing July Sell S9-V based on the technicals.
A most uncivil war of words is breaking out in New York and Washington. Numerous
network pundits and their cold war allies from the CIA today declared President Trump
to be a "traitor" for daring to talk privately with Putin of Russia. How
dare he raise doubts
about the CIA's credibility or make references to its own history of interfering in
other coutries or employing assassinations? Only a few, like Ron Paul and
Russian scholar Stephen Cohen, asked the question: "Isn't Peace with Russia worth
discussing?...After all, they're not Communists."
The no longer staid and sedate NY Times would not hear any of this. It did not mince
words tonight.
"Trump
Sheds All Notions of How a President Should Conduct Himself Abroad...Rather than
defend America against those who would threaten it, he attacked his own citizens and
institutions while hailing the leader of a hostile power."
It's Not Clear Where The
Next Big Bounce Come from?
Today Boeing and the Biggest Banks rose in tandem. This helped brace the DJI
on a day when most stocks fell. But there is probably only limited upside potential
now. Check out the overhead resistance lines in SPY, QQQ, TECL, IWM and MDY
linked to below. And loooking at the most weighty, high priced DJI stocks, we see
that only
United Health is at an all-time high, thus facing less overhead resistance. BA could
run a little more before it faces its overhead resistance. But the other very high
priced
DJI-30 stocks, GS and MMM, must still cope with their falling 65-dma. So, it will
probably
be very hard for the DJI to make a big run. The upper 2.5% band should bracket it
for now.
The multiple Sell S9s here are certainly a
warning, too. A set of four Sell S9s appeared
in 1929, 1972-1973, 1980-1981, 1987, 1999-2000 and 2007-2008 just before
bear markets followed. But in each of these cases the NYSE A/D Line had been
lagging the DJI's new high for months. So, perhaps, we will have to wait for such a
divergence to appear before becoming really anxious.
It's my guess that the trading range we see in the DJI
now will probably continue
another month, until the market gets a "read" on what will happen in the
November
elections.
Perhaps, then the current bull market, now 9 years and 4 months old, will be ready to
experience
a decline of 20% from its highs. Julys can bring reversals down but so can
Septembers.
In any case, without a new Peerless Sell, I would be patient. Hedging with some
Bearish MINCPs is recommended. That is what the Professionals seem to be doing,
judging from Table 2. But hold some of the very high Accumulation biotechs,
especially
those that show a tendency to rally on days when the DJI declines. Study their Tiger
Aynchronicity Indicator and Relative Strenth trands.
A bear market now, I cannot predict. After all, the DJI rose from November 1946 to
November 1961, all of 15 years, without the DJI declining as much as 20%. And
short-term rates had to rise to 3 1/2% in mid 1957, before a 19% DJI decline then
began.
Table 1 QUICKSILVER on ETFS - 07/16/18
ETF CLOSE CHANGE PIVOT-PT 5-dma AROC CL-PWR CANDLE IP21 ITRS
---------------------------------------------------------------------------------------------
DIA 250.67 .47 249.23 56.9% Bullish BLUE .098 -----
---------------------------------------------------------------------------------------------
COMPQX 7805.72 -20.26 7759.2 31.8% Bullish RED .133 .053
---------------------------------------------------------------------------------------------
SPY 279.34 -.25 278.9 25.9% Bullish RED .124 .015
---------------------------------------------------------------------------------------------
QQQ 179.18 -.43 177.32 55.9% Bullish RED .127 .059
---------------------------------------------------------------------------------------------
MDY 361.17 -1.91 365.34 -58% Bearish RED .004 .012
---------------------------------------------------------------------------------------------
IWM 166.77 -.65 168.54 -75.6% Bearish RED .093 .036
---------------------------------------------------------------------------------------------
FAS 68.11 1.82 67.08 45.5% Bullish BLUE .168 .059
---------------------------------------------------------------------------------------------
RETL 43.9 .22 44.72 -190.5% Bearish RED -.016 .275
---------------------------------------------------------------------------------------------
SOXL 148.41 -.61 160.22 -227.6% Bearish RED .119 .107
---------------------------------------------------------------------------------------------
TECL 150.38 -1.03 146.89 152.2% Bullish RED .153 .231
---------------------------------------------------------------------------------------------
IBB 117.49 -.86 116.61 29% Bullish RED .25 .112
---------------------------------------------------------------------------------------------
GLD 117.55 -.06 118.93 -67.6% Bearish ---- -.289 -.103
---------------------------------------------------------------------------------------------
OIL 7.61 .04 6.89 339.4% Bullish BLUE .263 .013
---------------------------------------------------------------------------------------------
OIH 26 -.31 27.1 -158.1% Bearish BLUE -.117 -.081
---------------------------------------------------------------------------------------------
GASL 23.72 -1.26 26.55 -548.8% Bullish RED -.122 .169
---------------------------------------------------------------------------------------------
UGA 32.31 -1.45 34.68 -338.9% Bearish RED -.224 -.08
---------------------------------------------------------------------------------------------
UUP 24.96 -.04 24.84 26.1% ---- ---- -.194 -.021
---------------------------------------------------------------------------------------------
FB 207.23 -.09 203.54 60.7% Bullish RED .218 .142
---------------------------------------------------------------------------------------------
NVDA 248.2 -1.12 253.25 -21% Bearish RED -.089 .017
---------------------------------------------------------------------------------------------
BA 356.1 5.31 347.16 205.3% ---- BLUE -.011 .028
---------------------------------------------------------------------------------------------
GS 231.44 5.03 226.85 76% ---- BLUE .023 -.057
---------------------------------------------------------------------------------------------
|
Table 2 Count of Stocks in Key Directories
20180716
-------------------------------
NEWHIGHS 88 Bullish Plurality
NEWLOWS 57
MAXCP 37
MINCP 139 Bearish
TTTNH 26
TTTNL 193 Bearish
FASTUP 45
FASTDOWN 159 Bearish
CPCROSSA 37
CPCROSSD 159 Bearish
BIGVOLUP 1
BIGVODN 5
ACCUMVER 21
HIGHIP21 86
HIUPPCT 126
|
Table 3
Count of Stocks and New Highs in Key Tiger Directories
Date = 180716
No. NHs Pct
-------------------------------------------------------------------
MAXCP 37 24 65 %
HOSPITAL 7 1 14 %
SOFTWARE 64 7 11 %
HACKERS 22 2 9 %
INSURANC 30 2 7 %
NIFTY 29 2 7 %
NASD-100 89 5 6 %
COMODITY 56 3 5 %
BIG17 48 2 4 %
GAMING 28 1 4 %
AUTO 40 1 3 %
CHEM 61 2 3 %
FIDSTKS 185 5 3 %
INDEXES 189 5 3 %
MILITARY 37 1 3 %
REGBANKS 30 1 3 %
SP500 476 13 3 %
BIOTECH 401 10 2 %
ELECTRON 172 3 2 %
GOLD 50 1 2 %
INDMATER 82 2 2 %
RETAIL 52 1 2 %
RUS-1000 816 19 2 %
FINANCE 90 1 1 %
OILGAS 156 2 1 %
REIT 173 2 1 %
SP-100 94 1 1 %
UTILITY 41 0 %
MINCP 139 0 %
|
Table 4 Count of Stocks and New Lows in Key Tiger Directories
Date = 180716
No NLs Pct
-------------------------------------------------------------------
MINCP 139 31 22 %
HOSPITAL 7 1 14 %
GOLD 50 6 12 %
COMODITY 56 6 11 %
SOLAR 19 2 11 %
CHINA 60 4 7 %
GAMING 28 2 7 %
UTILITY 41 3 7 %
AUTO 40 2 5 %
BIOTECH 401 20 5 %
HACKERS 22 1 5 %
SOFTWARE 64 3 5 %
BONDFUND 111 4 4 %
CHEM 61 2 3 %
GREEN 29 1 3 %
SEMI 125 4 3 %
BIG17 48 1 2 %
ELECTRON 172 4 2 %
INDMATER 82 2 2 %
FIDSTKS 185 1 1 %
FINANCE 90 1 1 %
INDEXES 189 1 1 %
OILGAS 156 1 1 %
RUS-1000 816 10 1 %
SP500 476 3 1 %
|
Table 5
RANKING OF KEY DIRECTORIES BASED PCT.OF STOCKS ABOVE 65-DMA
7/16/18
Bullish = 35 Bearish = 11
---------------------------------------------------------------------------------------
Directory Current day-1 day-2 day-3 day-4 day-5
----------------------------------------------------------------------------------------
REIT .867 .89 .89 .907 .901 .924
NIFTY .862 .896 .862 .758 .896 .862
SOFTWARE .781 .796 .781 .75 .765 .781
UTILITY .756 .756 .78 .756 .78 .731
NASD-100 .741 .764 .764 .719 .786 .764
HACKERS .727 .863 .818 .727 .681 .681
EDU .714 .714 .714 .714 .714 .714
PIPELINE .714 .714 .714 .714 .714 .714
HOMEBLDG .705 .705 .705 .705 .647 .647
DOWJONES .7 .666 .633 .566 .666 .633
COMPUTER .695 .739 .739 .652 .695 .695
RETAIL .692 .692 .692 .711 .73 .73
BEVERAGE .684 .736 .789 .789 .789 .789
SP-100 .67 .648 .67 .638 .723 .691
FIDSTKS .654 .637 .681 .654 .724 .708
SP500 .647 .657 .655 .634 .707 .684
GAMING .642 .642 .642 .571 .607 .607
RUS-1000 .633 .655 .653 .629 .696 .687
COAL .625 .5 .5 .625 .75 .75
BONDFUND .612 .657 .657 .648 .63 .585
REGBANKS .6 .466 .666 .7 .766 .766
INDEXES .587 .592 .603 .587 .698 .693
BIGBANKS .571 .142 .142 .142 .142 .285
HOSPITAL .571 .571 .571 .571 .571 .571
OILGAS .564 .602 .608 .621 .692 .666
BIG17 .562 .52 .562 .562 .562 .583
BIOTECH .561 .61 .613 .603 .618 .638
ELECTRON .558 .587 .593 .552 .616 .604
GUNS .555 .666 .611 .555 .611 .611
CHEM .54 .573 .59 .606 .639 .639
DJI-13 .538 .538 .538 .384 .538 .461
SEMI .536 .544 .552 .512 .6 .584
FINANCE .533 .477 .522 .544 .566 .611
INSURANC .533 .4 .5 .5 .5 .466
MILITARY .513 .513 .513 .324 .54 .513
N=35
===========================================================================================
INFRA .441 .529 .558 .529 .617 .558
GREEN .413 .482 .517 .517 .551 .517
TRANSP .4 .4 .4 .4 .65 .6
INDMATER .378 .426 .463 .439 .597 .548
AUTO .325 .35 .3 .3 .45 .525
SOLAR .263 .263 .263 .263 .315 .21
GOLD .22 .24 .28 .24 .46 .42
JETS .2 .2 .1 .1 .3 .3
ETFS .18 .18 .18 .163 .196 .18
CHINA .133 .15 .183 .116 .133 .15
COMODITY .071 .196 .196 .142 .321 .321
FOOD 0 0 0 0 .111 .111
N=11
|
| |
-----------------------------------------------------------------------------------------------------
7/13/2018 The Peerless Buy B9
still operates. But there were more down than
up on the
NYSE on Friday. The strength was limited and involved the highly visible
"Fang"
stocks, AMZN, FB and GOOG. A number of key ETFs did not make new highs:
MDY 363.08 -.13
IWM 167.42 -.5
FAS 66.29 -1.04
SOXL 149.02 -1.93
TECL 151.41 -.42
This makes the rally suspect. And in fact, an advance of 200 DJI points will likely
bring a new Peerless Sell S9V and a Sell S5. If that should occur, we might still
want
to wait for NYSE decliners to be greater than advancers by 30 or more at the close
to view the Sell S9V "clinched".
25500 appears to be the resistance level that is most likely
to stop the DJI.
Watch to see if SPY and TECL can get past their resistance-levels just overhead.


Biotechs are favored.
More than 1/2 of all the stocks up more than 100% in the last 72 trading days
are Biotechs or medical appliance stocks. Most of these winners showed the
"explosive super stocks" characteristics that we have come to expect. Buy
B20s
following breakouts are particularly common. And another sign we should be
looking for in these: strength on days the DJI is down; thus the ITRS rising above
+.30 and the pink Asnchronicity Index beong above the blue Synchronicity Index.
And as we've seen for some time, biotechs make up a large percentage of the
Bullish MAXCPs again tonight. Watch this week to see if IBB can make a bullish
flat topped breakout.

C:\biotech Days back= 72
4 / 2 / 2018 - 7 / 13 / 2018
29 Biotechs up more than 85% in this period.
Rank Symbol Name Price Pct.Gain
--------- ----------------------------------- ---------- ------------
1 HEAR Turtle Beach Corp 23.58 821%
2 SLDB --- 42.35 477%
3 TNDM Tandem Diabetes Care Inc 25.89 428%
4 BLFS BioLife Solutions` Inc. 19.79 220%
5 GLMD Galmed Pharmaceuticals Ltd 15.24 202%
6 VSTM Verastem Inc 8.5 195%
7 EOLS --- 26.17 189%
8 MDGL Madrigal Pharm 296.75 174%
9 RGNX REGENXBIO Inc 77.35 171%
10 VKTX Viking Therapeutics Inc 10.74 148%
11 NTRA Natera Inc 21.59 144%
12 ARWR Arrowhead Pharmaceuticals 16.41 139%
13 ABUS Arbutus Biopharma Corp 11.7 127%
14 VVUS Vivus Inc .77 126%
15 STAA Staar Surgical Co 32.45 123%
16 AXON Axovant Sciences Ltd 2.67 117%
17 XENE XENON PHARMACEUTICALS INC 10.55 117%
18 ELOX --- 18.86 115%
19 MRNS Marinus Pharmaceuticals Inc 8.14 114%
20 ECYT Endocyte` Inc 17.26 109%
21 NSTG NanoString Technologies` Inc. 15.01 105%
22 NIHD NII Holdings Inc 4.15 103%
23 ENDP Endo International PLC 11.12 96%
24 SRPT Sarepta Therapeutics Inc 139.42 94%
25 OPK Opko Health Inc. 5.86 92%
26 VCYT Veracyte Inc 10.31 91%
27 FMI Foundation Medicine` Inc. 136.7 90%
28 RYTM Rhythm Pharmaceuticals Inc 32.31 89%
29 DCPH Deciphera Pharmaceuticals 37.56 87%
|


|
Table 1 QUICKSILVER on ETFS - 07/13/18
ETF CLOSE CHANGE PIVOT-PT 5-dma AROC CL-PWR CANDLE IP21 ITRS
---------------------------------------------------------------------------------------------
DIA 250.2 .9 247.84 113.1% ---- BLUE .051 ----
---------------------------------------------------------------------------------------------
COMPQX 7825.98 2.06 7756.2 88.8% Bullish RED .18 .056
---------------------------------------------------------------------------------------------
SPY 279.59 .22 277.9 75.1% Bullish BLUE .124 .016
---------------------------------------------------------------------------------------------
QQQ 179.61 .15 177.19 112.9% Bullish BLUE .164 .064
---------------------------------------------------------------------------------------------
MDY 363.08 -.13 365.39 18% Bullish BLUE .061 .018
---------------------------------------------------------------------------------------------
IWM 167.42 -.5 169.31 -24.7% Bearish RED .135 .036
---------------------------------------------------------------------------------------------
FAS 66.29 -1.04 67.5 132.1% ---- RED .089 .017
---------------------------------------------------------------------------------------------
RETL 43.68 .76 45.58 -147.7% Bearish BLUE -.046 .23
---------------------------------------------------------------------------------------------
SOXL 149.02 -1.93 155.36 -113.8% Bearish RED .142 .135
---------------------------------------------------------------------------------------------
TECL 151.41 -.42 145.87 299.2% Bullish RED .166 .252
---------------------------------------------------------------------------------------------
IBB 118.35 .2 116.81 91.6% Bullish BLUE .275 .106
---------------------------------------------------------------------------------------------
GLD 117.61 -.52 119.15 -52.7% Bearish ---- -.34 -.095
---------------------------------------------------------------------------------------------
OIL 7.61 .04 6.89 339.4% Bullish BLUE .263 .015
---------------------------------------------------------------------------------------------
OIH 26.31 .11 26.84 28.3% Bearish BLUE -.162 -.077
---------------------------------------------------------------------------------------------
GASL 24.98 .3 26.52 3.9% ---- BLUE -.169 .141
---------------------------------------------------------------------------------------------
UGA 33.76 .46 34.61 -22.1% Bearish BLUE -.237 -.025
---------------------------------------------------------------------------------------------
UUP 25 -.03 24.83 36.1% Bullish RED -.02 -.022
---------------------------------------------------------------------------------------------
|
Table 2 Count of Stocks in Key Directories
20180713
-------------------------------
NEWHIGHS 180 Bullish
NEWLOWS 46
MAXCP 71
MINCP 99 Pros are net bearish.
TTTNH 53
TTTNL 135 Day Traders are net bearish.
FASTUP 59
FASTDOWN 100 Swing traders are net bearish.
CPCROSSA 65
CPCROSSD 66
BIGVOLUP 3
BIGVODN 5
|
Table 3
Count of Stocks and New Highs in Key Tiger Directories
Date = 180713
No. NHs Pct.
-------------------------------------------------------------------
-------------------------------------------------------------------
MAXCP 71 51 72 %
NIFTY 29 8 28 %
GAMING 28 5 18 %
NASD-100 89 13 15 %
EDU 7 1 14 %
HACKERS 22 3 14 %
HOSPITAL 7 1 14 %
SOFTWARE 64 9 14 %
SP-100 94 11 12 %
CHEM 61 6 10 %
FIDSTKS 186 19 10 %
INDEXES 189 17 9 %
DJI-13 13 1 8 %
SP500 476 38 8 %
BIG17 46 3 7 %
DOWJONES 30 2 7 %
RUS-1000 816 54 7 %
RETAIL 52 3 6 %
BEVERAGE 19 1 5 %
BIOTECH 402 21 5 %
MILITARY 37 2 5 %
SOLAR 19 1 5 %
TRANSP 20 1 5 %
COMPUTER 23 1 4 %
INDMATER 82 3 4 %
OILGAS 156 7 4 %
AUTO 40 1 3 %
INFRA 34 1 3 %
INSURANC 30 1 3 %
COMODITY 56 1 2 %
ELECTRON 172 1 1 %
REIT 173 2 1 %
|
Table 4
Count of Stocks and New Lows in Key Tiger Directories
Date = 180713
No. NH Pct
=====================================================
FOOD 9 2 22 %
MINCP 99 19 19 %
HOSPITAL 7 1 14 %
GOLD 50 5 10 %
COMODITY 56 5 9 %
AUTO 40 2 5 %
BONDFUND 111 4 4 %
SEMI 125 5 4 %
ELECTRON 172 5 3 %
FINANCE 90 3 3 %
MILITARY 37 1 3 %
NIFTY 29 1 3 %
REGBANKS 31 1 3 %
BIOTECH 402 9 2 %
CHEM 61 1 2 %
CHINA 60 1 2 %
INDMATER 82 2 2 %
NASD-100 89 2 2 %
UTILITY 41 1 2 %
FIDSTKS 186 1 1 %
INDEXES 189 1 1 %
REIT 173 1 1 %
RUS-1000 816 7 1 %
SP500 476 4 1 %
|
Table 5 RANKING OF KEY DIRECTORIES BASED PCT.OF STOCKS ABOVE 65-DMA
7/13/18
Bullish = 30
Bearish = 15
---------------------------------------------------------------------------------------
Directory Current day-1 day-2 day-3 day-4 day-5
----------------------------------------------------------------------------------------
NIFTY .896 .862 .758 .896 .896 .793
REIT .89 .89 .907 .901 .924 .942
HACKERS .863 .818 .727 .681 .681 .681
SOFTWARE .796 .781 .75 .765 .781 .75
NASD-100 .764 .764 .719 .786 .775 .707
UTILITY .756 .78 .756 .78 .731 .756
COMPUTER .739 .739 .652 .695 .695 .695
BEVERAGE .736 .789 .789 .789 .789 .789
EDU .714 .714 .714 .714 .714 .714
PIPELINE .714 .714 .714 .714 .714 .714
HOMEBLDG .705 .705 .705 .647 .647 .529
RETAIL .692 .692 .711 .73 .73 .692
DOWJONES .666 .633 .566 .666 .633 .5
GUNS .666 .611 .555 .611 .611 .5
BONDFUND .657 .657 .648 .63 .585 .621
SP500 .657 .655 .634 .707 .686 .602
RUS-1000 .655 .653 .629 .696 .688 .618
SP-100 .648 .67 .638 .723 .691 .574
GAMING .642 .642 .571 .607 .607 .607
FIDSTKS .634 .677 .65 .72 .704 .623
BIOTECH .611 .614 .604 .619 .639 .624
OILGAS .602 .608 .621 .692 .666 .647
INDEXES .592 .603 .587 .698 .693 .608
ELECTRON .587 .593 .552 .616 .616 .569
CHEM .573 .59 .606 .639 .639 .606
HOSPITAL .571 .571 .571 .571 .571 .571
SEMI .544 .552 .512 .6 .592 .544
DJI-13 .538 .538 .384 .538 .461 .384
INFRA .529 .558 .529 .617 .558 .529
MILITARY .513 .513 .324 .54 .54 .378
N=30
============================================================================================
BIG17 .5 .543 .543 .565 .565 .565
COAL .5 .5 .625 .75 .75 .75
============================================================================================
GREEN .482 .517 .517 .551 .517 .517
FINANCE .477 .522 .544 .566 .622 .5
REGBANKS .451 .645 .677 .741 .741 .612
INDMATER .426 .463 .439 .597 .548 .512
INSURANC .4 .5 .5 .5 .466 .433
TRANSP .4 .4 .4 .65 .6 .5
AUTO .35 .3 .3 .45 .525 .4
SOLAR .263 .263 .263 .315 .21 .21
GOLD .24 .28 .24 .46 .42 .52
JETS .2 .1 .1 .3 .3 .3
COMODITY .196 .196 .142 .321 .321 .303
ETFS .18 .18 .163 .196 .18 .18
CHINA .15 .183 .116 .133 .15 .166
BIGBANKS .142 .142 .142 .142 .285 .142
FOOD 0 0 0 .111 .111 0
N=15
|
| |
====================================================================
7/12/2018 The Peerless Buy B9
still operates. Hold IBB and IWM. But note that another
one percent higher close by the DJI will probably bring a new Sell S9-V and possibly
even a Sell S12. This is because the DJI's chart shows a negative V-I and and the
IP21
reading is only slightly positive. The NASDAQ, QQQ and Biotechs are much
stronger
and made new yearly highs today. (See Table 1) Instead of selling them on a
Sell S9-V
right away, I would suggest waiting to sell them when they close below their opening on
the next trading day after a Peerless Sell S9 or Sell S12.
What are the chances of a bullish breakout above
25500 by the DJI? Since 1965, there
have been only 5 July or August breakouts that then led to 10% or bigger DJI
advances. Much
more common are reversals down in July. I count no less than 8 in just July alone.
Nearly all
gave timely Sells. Usually it was a Sell S9.
.
Examples: 7/11/1968 Sell S7 at 1.17% upper band and decline to
lower 3.5% band.
8/2/1972 Sell S9 at 1.19% upper band and decline to lower 3.0% band.
6/23/1975 ES18 at 3.37% upper band and 10% decline.
7/12/1976 ES S5 at 1.14% upper band and decline to lower 2.5% band.
7/26/1983 Sell S9 at 1.24% upper band and decline to lower 3.5% band.
7/16/1986 No Sell at 2.20% upper band and 5% decline.
7/13/1990 Sell S9 at 2.80% upper band and bear market follows.
7/8/1998 Sell S9 at 3.00% upper band and bear market follows.
7/6/1999 Sell S9 at 3.40% upper band and decline to lower 3.5% band
follows
7/17/2007 Sell S9 at 2.80% upper band and 10% decline follows.
7/20/2011 Sell S9 at 1.40% upper band and 17% decline follows.
7/11/2013 Sell S9 at 2.8% upper band and decline to lower 3.5% band.
7/16/2004 Top at 1.2% upper band and decline to lower 3.5% band follows.
7/16/2015 Sell S12 at 1.4% upper band and then 14% decline..
What Peerless Internals Predict A Vigorous Summer
Rally in On-Going
Bull Market: 1965 to 2017? Only 1 of the 5
breakouts that led to a 10% gain
showed a negative OBVPct. That could be a problem for us now. None showed
a V-Indicator reading below -30, which is what we now see.
la/ma aroc P-I
IP21 V-I
OPct
#1
Inverted H/S
Breakout on 8/16/1965 B10 1.017 .145 +80 (+8)
+.001 +4 +.194
DJI rose 10% by January 1966.
------------------------------------------------------------------------------------------
Recovery flat-top breakout 7/19/1967 1.032
.256 +60 (2) +.005 +7
-.051
DJI rose from 903.32 to 929.44 (Sell S2) on 9/14/1967. (Limited advance).
------------------------------------------------------------------------------------------
Recovery flat-top breakout 7/31/1978
1.038 .583 +167 (17) +.167 +3 +.256
DJI rose from 862.27 to 907.74 (Sell S9) on 9/8/1978. (5% advance).
------------------------------------------------------------------------------------------
Recovery flat-top breakout 8/8/1979
1.028 .182
+76 (26) +.184 +1 +.177
DJI rose from 863.14 to 893.94 (Sell S9) on 9/21/1979. (3.8% advance).
------------------------------------------------------------------------------------------
Recovery flat-top breakout 7/18/1980
1.040 .565 +156
(21) +.014 +4 +.151
DJI rose from 923.98 to 974.57 (no sell) on 9/22/1980. (5% advance).
------------------------------------------------------------------------------------------
#2
Buy B4 and flat-top Breakout
on 6/22/1987 1.042 1.120 +232 (-7) +.156 +25 +.531
DJI rose 10% by August 25, 1987 (S4).
------------------------------------------------------------------------------------------
#3
Recovery flat-top breakout
7/19/1989 1.032 .498
+98 (30) +.136 +8 +.241
DJI rose from 2584 to 2786 (S9l) on 10/6/1989. (12%
advance).
------------------------------------------------------------------------------------------
Recovery flat-top breakout 8/8/1979
1.028 .182
+76 (26) +.184 +1 +.177
DJI rose from 863.14 to 893.94 (Sell S9) on 9/21/1979. (3.8% advance).
------------------------------------------------------------------------------------------
#4
Recovery flat-top breakout 8/17/2006
1.017 .346 +330 (-103) +.037 -30 -.047
DJI rose from 11335 to 12463 by year-end. No Sell. (12%
advance).
------------------------------------------------------------------------------------------
#5
Buy B10 and flat-top Breakout on 7/28/2017
1.013 .208 +211 (-64) +.014 -30 +.132
(DJI rose nearly 20% by year end.) (No sells).
 |
Charts 7/12/2018
PEERLESS DJI, Signals,
Indicators Daily DJI Volume 10-DayUp/Down Vol
Hourly DJIA A/D Line for All
Stocks
NASDAQ S&P OEX NYSE COMPQX DJI-15 DJI-20 DJI-30
DIA SPY QQQ MDY IWM
TNA
Short-Term Rates
USO-CrudeOil FAS GLD BBH IBB JETS JNUG KOL NUGT OIH OIL RSX RETL
SDS SLV SOXL TECL TMF TNA UGA (gasoline) XIV YINN
Commodities: CANE
JJC, NIB, CHOC
CORN,
CUT (paper) WEAT UUP (Dollar)
AAPL ADBE ALXN AMAT AMGN AMD AMZN BA BABA BAC BIDU CAT CVX DE
FB GOOG GS HD IBM JPM M (Macy's) MSFT NFLX NVDA QCOM TSLA TXN XOM WMT
ANDV (refinery), CMG (Chipotle), LRCX, SWKS, MDGL
SPPI WATT
SQ TOWN
7/12/2018 (Click on Underlined link.)
Bullish MAXCPs - http://tigersoft.com/MAXCPZ/712/BULLISH.htm
Bearish MAXCPs - http://tigersoft.com/MINCPZ/712/BEARISH.htm
|
Table 1 QUICKSILVER on ETFS - 07/12/18
Ranked as most bullish are COMPQX (NASDAQ), QQQ, TECL and IBB.
ETF CLOSE CHANGE PIVOT-PT 5-dma AROC CL-PWR CANDLE IP21 ITRS
---------------------------------------------------------------------------------------------
DIA 249.3 2.22 244.6 116.7% ---- BLUE -.002 -----
------------------ ---------------------------------------------------------------------------
COMPQX 7823.92 107.31 7688.39 154.2% Bullish BLUE .139 .062
---------------------------------------------------------------------------------------------
SPY 279.37 2.51 275.42 113.2% Bullish BLUE .07 .019
---------------------------------------------------------------------------------------------
QQQ 179.46 3.04 175.61 185.9% Bullish BLUE .122 .067
---------------------------------------------------------------------------------------------
MDY 363.21 1.1 361.77 55.7% ---- RED .042 .027
---------------------------------------------------------------------------------------------
IWM 167.92 .81 168.25 32.1% Bearish RED .141 .054
---------------------------------------------------------------------------------------------
FAS 67.33 .71 64.53 283.2% ---- RED .026 .017
---------------------------------------------------------------------------------------------
RETL 42.92 -.63 44.99 -93.2% Bearish RED -.09 .232
---------------------------------------------------------------------------------------------
SOXL 150.95 3.17 152.51 130.8% Bearish BLUE .127 .144
---------------------------------------------------------------------------------------------
TECL 151.83 7.22 142.65 493.2% Bullish BLUE .112 .262
---------------------------------------------------------------------------------------------
IBB 118.15 1.88 116.21 266.9% Bullish BLUE .238 .1
---------------------------------------------------------------------------------------------
GLD 118.13 .49 118.86 -38.7% Bearish BLUE -.314 -.081
---------------------------------------------------------------------------------------------
OIL 7.61 .04 6.89 339.4% Bullish BLUE .263 .026
---------------------------------------------------------------------------------------------
OIH 26.2 -.16 26.16 79.4% Bearish RED -.17 -.062
---------------------------------------------------------------------------------------------
GASL 24.68 -.13 24.96 183.7% Bearish RED -.168 .124
---------------------------------------------------------------------------------------------
UGA 33.3 -.03 33.91 -146.3% Bearish RED -.21 -.035
---------------------------------------------------------------------------------------------
UUP 25.03 .02 24.82 26.1% Bullish ---- -.037 -.005
---------------------------------------------------------------------------------------------
IEF 102.44 -.04 102.61 -3.9% ---- BLUE -.161 -.025
---------------------------------------------------------------------------------------------
|
Table 2
Count of Stocks in Key Directories
20180712
No.
-------------------------------
NEWHIGHS 228 Bullish
NEWLOWS 33
MAXCP 69
MINCP 93 Pros remain net sellers.
TTTNH 50
TTTNL 188 Day Traders remain net sellers.
FASTUP 98
FASTDOWN 74
CPCROSSA 59
CPCROSSD 91 Pros remain net sellers.
BIGVOLUP 3
BIGVODN 3
|
Table 3
Count of Stocks and New Highs in Key Tiger Directories
Date = 180712
No. NHs Pct.
-------------------------------------------------------------------
-------------------------------------------------------------------
MAXCP 69 50 72 %
EDU 7 4 57 %
NIFTY 30 9 30 %
SOFTWARE 64 18 28 %
HACKERS 22 6 27 %
NASD-100 89 18 20 %
GAMING 28 5 18 %
HOSPITAL 7 1 14 %
FIDSTKS 186 25 13 %
SP-100 94 11 12 %
SOLAR 19 2 11 %
DOWJONES 30 3 10 %
INDEXES 189 18 10 %
SP500 476 43 9 %
DJI-13 13 1 8 %
BIOTECH 409 29 7 %
CHEM 61 4 7 %
GREEN 29 2 7 %
RUS-1000 816 60 7 %
BEVERAGE 19 1 5 %
BIG17 48 2 4 %
COMPUTER 23 1 4 %
FINANCE 90 4 4 %
OILGAS 156 6 4 %
RETAIL 52 2 4 %
INFRA 34 1 3 %
MILITARY 37 1 3 %
REGBANKS 31 1 3 %
INDMATER 82 2 2 %
ELECTRON 172 2 1 %
REIT 173 2 1 %
SEMI 125 1 1 %
=========================================================================================================
Table 4
Count of Stocks and New Lows in Key Tiger Directories
Date = 180712
No. NH Pct
=====================================================
MINCP 93 18 19 %
FOOD 9 1 11 %
GAMING 28 2 7 %
AUTO 40 2 5 %
COMODITY 56 3 5 %
SOFTWARE 64 3 5 %
SOLAR 19 1 5 %
BIOTECH 409 12 3 %
CHINA 60 2 3 %
FINANCE 90 3 3 %
MILITARY 37 1 3 %
NIFTY 30 1 3 %
SEMI 125 4 3 %
BONDFUND 111 2 2 %
CHEM 61 1 2 %
ELECTRON 172 4 2 %
ETFS 61 1 2 %
FIDSTKS 186 1 1 %
NASD-100 89 1 1 %
RUS-1000 816 7 1 %
SP500 476 4 1 %
|
| |
Table 5 RANKING OF KEY DIRECTORIES BASED PCT.OF STOCKS ABOVE 65-DMA
7/12/18
Bullish = 34
Bearish = 11
---------------------------------------------------------------------------------------
Directory Current day-1 day-2 day-3 day-4 day-5
----------------------------------------------------------------------------------------
REIT .89 .907 .901 .924 .936 .924
NIFTY .866 .766 .9 .9 .8 .733
HACKERS .818 .727 .681 .681 .681 .636
BEVERAGE .789 .789 .789 .789 .789 .736
SOFTWARE .781 .75 .765 .781 .75 .671
UTILITY .78 .756 .78 .731 .756 .756
NASD-100 .764 .719 .786 .775 .707 .64
COMPUTER .739 .652 .695 .695 .695 .695
EDU .714 .714 .714 .714 .714 .714
PIPELINE .714 .714 .714 .714 .857 .857
HOMEBLDG .705 .705 .647 .647 .47 .529
RETAIL .692 .711 .73 .73 .711 .673
FIDSTKS .677 .65 .72 .704 .623 .58
SP-100 .67 .638 .723 .691 .574 .553
BONDFUND .657 .648 .63 .585 .612 .594
SP500 .655 .634 .707 .686 .602 .569
RUS-1000 .653 .629 .696 .688 .618 .577
REGBANKS .645 .677 .741 .741 .612 .612
GAMING .642 .571 .607 .607 .607 .571
DOWJONES .633 .566 .666 .633 .5 .5
GUNS .611 .555 .611 .611 .5 .444
OILGAS .608 .621 .692 .666 .653 .602
BIOTECH .606 .594 .606 .63 .613 .589
INDEXES .603 .587 .698 .693 .603 .613
ELECTRON .593 .552 .616 .616 .569 .517
CHEM .59 .606 .639 .639 .606 .606
HOSPITAL .571 .571 .571 .571 .571 .571
BIG17 .562 .562 .583 .583 .562 .562
INFRA .558 .529 .617 .558 .529 .441
SEMI .552 .512 .6 .592 .544 .464
DJI-13 .538 .384 .538 .461 .384 .384
FINANCE .522 .544 .566 .622 .5 .433
GREEN .517 .517 .551 .517 .517 .448
MILITARY .513 .324 .54 .54 .378 .351
N=34
------------------------------------------------------------------------------------------
COAL .5 .625 .75 .75 .75 .75
INSURANC .5 .5 .5 .466 .433 .4
------------------------------------------------------------------------------------------
INDMATER .463 .439 .597 .548 .524 .439
TRANSP .4 .4 .65 .6 .5 .45
AUTO .3 .3 .45 .525 .4 .4
GOLD .28 .24 .46 .42 .52 .46
SOLAR .263 .263 .315 .21 .21 .21
COMODITY .196 .142 .321 .321 .303 .303
CHINA .183 .116 .133 .15 .166 .1
ETFS .18 .163 .196 .18 .18 .163
BIGBANKS .142 .142 .142 .285 .142 .142
JETS .1 .1 .3 .3 .3 .3
FOOD 0 0 .111 .111 0 0
N=11
|
=======================================================================
7/11/2018 The Peerless Buy B9
still operates. Hold IBB and IWM. The Trump-tariff market
dumps will probably continue. This is apt to forestall and delay any Summer Rally in
the DJI.
But biotechs and smaller growth stocks may do much better. Tariff wars will have far
less
impact on them, I would suggest.
The new Trump tariffs' sell-off in the DJI today to 24700 did not worsen much during the
actual trading in New York. I think we have to take that as a good sign. Now
we will see
if the markets can rally again. That is the message I get from the rising NYSE A/D Line
and the current Buy B9.
But, sad to have to report, the DJI's upper 2.3% band at about 25300 seems likely to bring
another Sell S9-V, which might force the DJI to remain locked in its current trading range
until late August. Perhaps, this should not be a surprise. This will be an
important Election
year and the markets will need to base more before moving up strongly if Republicans can
hold onto their majorities in Congress.
Public Fear Is Usually Bullish.
On the big Los Angeles New radio station, I keep hearing bearish stock market advisors
who want to show the Public how to avoid a 2008-like market collapse. This is
something
they assure listeners is right around the corner. Generally, I would be dubious
about heeding
warnings of coming market calamities that the general public is fed in the mass media like
this.
But a rally to 25500 followed by a decline back to 24000 could be in the
cards.
 |
Matching "IP21" with "ITRS"
For us, until Peerless gives a new Sell, I think we just have
to wait to sell. And I would
prefer to stay long those ETFS in Table 1 below which have higher IP21s and ITRS reading
than DIA shows. Tiger's "IP21" shows
current big-money Accumulation and "ITRS" compares
the ETF's gain over the last 50 trading days with the DJI's. DIA's IP21 is actually
negative.
It's ITRS is zero because its 50-day pct change and the DJI's are the same.
Table 1
QUICKSILVER on ETFS - 07/11/18
ETF CLOSE CHANGE PIVOT-PT 5-dma AROC CL-PWR CANDLE IP21 ITRS
---------------------------------------------------------------------------------------------
DIA 247.08 -2.15 243.55 110.4% ---- RED -.012 ----
---------------------------------------------------------------------------------------------
COMPQX 7716.61 -42.59 7586.43 139.7% Bullish BLUE .132 .069
---------------------------------------------------------------------------------------------
SPY 276.86 -2.04 273.11 108.3% ---- RED .047 .024
---------------------------------------------------------------------------------------------
QQQ 176.42 -.9 172.92 160.8% Bullish BLUE .106 .073
---------------------------------------------------------------------------------------------
MDY 362.11 -3.23 359.17 84.6% ---- RED .034 .04
---------------------------------------------------------------------------------------------
IWM 167.11 -1.43 166.84 64.1% ---- RED .128 .067
---------------------------------------------------------------------------------------------
FAS 66.62 -.46 63.6 315.9% ---- BLUE -.009 .027
---------------------------------------------------------------------------------------------
RETL 43.55 -1.17 43.75 117.4% Bearish RED -.104 .252
---------------------------------------------------------------------------------------------
SOXL 147.78 -12.44 146.96 393.5% Bearish RED .105 .189
---------------------------------------------------------------------------------------------
TECL 144.61 -2.28 137.67 438.8% Bullish BLUE .083 .26
---------------------------------------------------------------------------------------------
IBB 116.27 -.34 111.98 248.2% Bullish BLUE .231 .099
---------------------------------------------------------------------------------------------
GLD 117.64 -1.29 119.05 -42.5% Bearish RED -.331 -.079
---------------------------------------------------------------------------------------------
OIL 7.61 .04 6.89 339.4% Bullish BLUE .263 .038
---------------------------------------------------------------------------------------------
OIH 26.36 -.74 25.78 113.9% Bearish RED -.185 -.052
---------------------------------------------------------------------------------------------
GASL 24.81 -1.74 23.75 215.1% Bullish RED -.176 .138
---------------------------------------------------------------------------------------------
FB 202.54 -1 198.45 244.6% Bullish BLUE .211 .155
---------------------------------------------------------------------------------------------
NVDA 247.53 -5.72 242.73 217.4% Bearish RED -.063 .078
---------------------------------------------------------------------------------------------
BA 340.6 -6.56 333.18 113.5% Bearish RED -.131 -.002
---------------------------------------------------------------------------------------------
GS 225.66 -1.19 220.74 118.1% Bearish RED -.133 -.076
---------------------------------------------------------------------------------------------
HD 196.95 -.66 194.41 85.3% Bearish RED .065 .043
---------------------------------------------------------------------------------------------
CAT 136.76 -4.49 135.81 106.6% Bearish RED -.199 -.076
|

The annual rate of inflation when based on the
Producer Price Index is now 3.6%. This
makes the 10-year Bond's yield of 2.856% seem quite unappealing and makes many stocks
seem that much more attractive. With China and Russia also reducing their
positions in US
Government Debt instruments, it would seem only a matter of time before US interest rates
go significantly higher. Short-term rates, I have said, probably must go over 3%
before bonds
can draw money out of the stock market and higher rates will significantly start to slow
down
the Economy. Note that US rates are still well above those in Europe. All this
has helped the
Dollar and a strong Dollar also makes holdings in US stocks seem attractive.
Watch Gold and NEM for A Tell-Tale Rally
Perhaps, this is why Gold and Silver cannot get traction and
were weak again today.
I want to stress that Bulls are correct in watching Gold stocks. As long as they do
not run-up,
a major top in the market is not near. When I wrote a Blog about this in February 2008.
http://www.tigersoftware.com/TigerBlogs/02-21-2008/index.html
In this Blog, I gave lots of earlier examples of how run-ups
in Gold led to market sell-off.
I focused on NEM, Newmont Gold. NEM's price action in late 2007 turned out to be
quite significant. It correctly predicted a bear market in 2008. See in the
chart below how
NEM jumped uncharacteristically from 38 in August 2007 to 56 in November 2007.
We
want to watch NEM now. I suspect it will make another upside breakout and surge
before
there is a new general market sell-off. See also how this happened in December
2017 and
January 2018 just before the DJI's February sell-off.
 |
 |
Table 2 Count of Stocks in Key Directories
20180711
-------------------------------
NEWHIGHS 97 Bullish
NEWLOWS 36
MAXCP 51
MINCP 88 Pros now are net Bearish
TTTNH 57
TTTNL 127 Day Traders are net bearish
FASTUP 91 Swing traders remain Bullish
FASTDOWN 67
CPCROSSA 70
CPCROSSD 182 Professionals turn more Bearish
BIGVOLUP 4
BIGVODN 10
ACCUMVER 11
HIGHIP21 86
HIUPPCT 131
VHIP21 35
LOWACCUM 303
REDSELL 107
AUGSELS7 12
TRAPDOOR 5
|
Table 3
Count of Stocks and New Highs in Key Tiger Directories
Date = 180711
No. NHs Pct.
-------------------------------------------------------------------
-------------------------------------------------------------------
MAXCP 51 28 55 %
EDU 7 3 43 %
HOSPITAL 7 1 14 %
NIFTY 29 4 14 %
GAMING 28 3 11 %
NASD-100 89 5 6 %
SOFTWARE 64 4 6 %
FIDSTKS 186 10 5 %
SOLAR 19 1 5 %
BIG17 48 2 4 %
BIOTECH 410 18 4 %
COMPUTER 23 1 4 %
HACKERS 23 1 4 %
SP500 476 18 4 %
DOWJONES 30 1 3 %
OILGAS 156 4 3 %
RUS-1000 816 26 3 %
SP-100 94 3 3 %
CHEM 62 1 2 %
COMODITY 56 1 2 %
FINANCE 90 2 2 %
RETAIL 52 1 2 %
ELECTRON 172 1 1 %
REIT 173 2 1 %
SEMI 125 1 1 %
|
Table 4
Count of Stocks and New Lows in Key Tiger Directories
Date = 180711
No. NH Pct
=====================================================
FOOD 9 5 56 %
MINCP 88 18 20 %
COMODITY 56 8 14 %
HOSPITAL 7 1 14 %
HACKERS 23 2 9 %
ETFS 61 3 5 %
BIOTECH 410 16 4 %
BONDFUND 111 3 3 %
CHINA 60 2 3 %
SOFTWARE 64 2 3 %
GOLD 50 1 2 %
UTILITY 41 1 2 %
FIDSTKS 186 1 1 %
FINANCE 90 1 1 %
INDMATER 82 1 1 %
NASD-100 89 1 1 %
REIT 173 1 1 %
RUS-1000 816 2 0 %
SP500 476 1 0 %
|
Table 5
RANKING OF KEY DIRECTORIES BASED PCT.OF STOCKS ABOVE 65-DMA
7/11/18
Bullish = 33
Bearish = 13
---------------------------------------------------------------------------------------
Directory Current day-1 day-2 day-3 day-4 day-5
----------------------------------------------------------------------------------------
REIT .907 .901 .924 .936 .93 .919
BEVERAGE .789 .789 .789 .789 .736 .684
NIFTY .758 .896 .896 .793 .758 .689
UTILITY .756 .78 .731 .756 .756 .756
SOFTWARE .75 .765 .781 .75 .687 .64
NASD-100 .719 .786 .775 .707 .651 .573
EDU .714 .714 .714 .714 .714 .714
PIPELINE .714 .714 .714 .857 .857 .714
RETAIL .711 .73 .73 .711 .673 .692
HOMEBLDG .705 .647 .647 .47 .529 .411
HACKERS .695 .652 .652 .652 .608 .608
REGBANKS .677 .741 .741 .612 .612 .516
COMPUTER .652 .695 .695 .695 .695 .652
FIDSTKS .65 .72 .704 .623 .591 .526
BONDFUND .648 .63 .585 .612 .594 .63
SP-100 .638 .723 .691 .574 .574 .521
SP500 .634 .707 .686 .602 .577 .535
RUS-1000 .629 .696 .688 .618 .582 .536
COAL .625 .75 .75 .75 .75 .625
OILGAS .621 .692 .666 .653 .615 .608
CHEM .596 .629 .629 .596 .596 .612
BIOTECH .592 .604 .629 .612 .587 .553
INDEXES .587 .698 .693 .603 .608 .587
GAMING .571 .607 .607 .607 .571 .535
HOSPITAL .571 .571 .571 .571 .571 .571
DOWJONES .566 .666 .633 .5 .533 .5
BIG17 .562 .583 .583 .583 .541 .562
GUNS .555 .611 .611 .5 .444 .388
ELECTRON .552 .616 .616 .569 .529 .436
FINANCE .544 .566 .622 .5 .466 .388
INFRA .529 .617 .558 .529 .47 .411
GREEN .517 .551 .517 .517 .448 .413
SEMI .512 .6 .592 .544 .472 .36"
N=33
=========================================================================================
INSURANC .5 .5 .466 .433 .4 .3
=========================================================================================
INDMATER .439 .597 .548 .524 .451 .439
TRANSP .4 .65 .6 .5 .45 .35
DJI-13 .384 .538 .461 .384 .384 .384
MILITARY .324 .54 .54 .378 .351 .486
AUTO .3 .45 .525 .4 .425 .3
SOLAR .263 .315 .21 .21 .21 .21
GOLD .24 .46 .42 .52 .48 .36
ETFS .163 .196 .18 .18 .163 .049
BIGBANKS .142 .142 .285 .142 .142 .142
COMODITY .142 .321 .321 .303 .303 .321
CHINA .116 .133 .15 .166 .116 .116
JETS .1 .3 .3 .3 .3 .1
FOOD 0 .111 .111 0 0 0
N=13
|
====================================================================
7/10/2018 The Peerless Buy B9
still operates. The NYSE A/D made another new high today
and in Table 5 below, we see that only 9 of the 47 sectors we follow show a majority
of their stocks below the key support of the 65-dma.
But there clearly is a problem. Trump's new tariffs on China
are getting bigger, not
smaller. We are still in the dangerous double-downing phase. This has spooked
the
market after the close today. Trump giveth and he taketh away. The
head/shoulders
pattern in the DJI spotlights the dangers that could hit the biggest multinationals in the
DJI.
Short-term rates hit another new high today. What if China unloads its US Treasuries
en masse. All these fears have sent the DJI down 233 as I write this, despite the
earlier bounce-backs on similar occasions. We can hope that the market will act like
it has after other Administration tariff announcements recently and will slowly claw back
towards even later tomorrow. If this happens, then today's early sell-off will not
hurt
our IBB and IWM very much and they should make new highs.
DIA and the DJI are more problematic. The DJI's head/shoulders pattern is still
extant and
the biggest DJI stocks, as a group, continue to under-perform. DJI Head/shoulders
patterns
when completed are reliably bearish and warn that the market must cope with unexpected
bearish news. That is why it is important that we see the DJI recover here.

We will be watching the Big Bank stocks, especially BAC and GS. They are weakest in
this
kewy group. If they were to break below their key support levels, it would be a troubling
development for the market as a whole. Oppositely, I would say that the most bullish
development
would be the NASDAQ, QQQ, SOXL, TECL and IBB closing way up off their lows
tomorrow. This would mean that Professionals are taking advantage of Public and
Overseas'
Selling because they are looking forward to a much more speculative Summer Rally.
Fortunately, the Closing Powers and 5-dma are rising. SPY,
QQQ, OEX, MDY,
NYSE, IBB, TECL and SOXL each show positive ITRS values, meaning that they
are up quite a bit more than the DJI in the last 50 trading days. Their IP21s
(current
Accumulation) are all more positive than DIA's. See Table 1. But Table 2 shows
that
Professionals shifted to more bearish positions today. News of the Administration's
new tariffs was leaked, I would suggest. That is why we pay much more attention to
Closing Power than Opening Power.
Charts 7/10/2018
PEERLESS DJI, Signals,
Indicators Daily DJI Volume 10-DayUp/Down Vol
Hourly DJIA A/D Line for All
Stocks
NASDAQ S&P OEX NYSE COMPQX DJI-15 DJI-20 DJI-30
DIA SPY QQQ MDY IWM
TNA
Short-Term Rates
USO-CrudeOil FAS GLD BBH IBB JETS JNUG KOL NUGT OIH OIL RSX RETL
SDS SLV SOXL TECL TMF TNA UGA (gasoline) XIV YINN
Commodities: CANE
JJC, NIB, CHOC
CORN,
CUT (paper) WEAT UUP (Dollar)
AAPL ADBE ALXN AMAT AMGN AMD AMZN BA BABA BAC BIDU CAT CVX DE
FB GOOG GS HD IBM JPM M (Macy's) MSFT NFLX NVDA QCOM TSLA TXN XOM WMT
ANDV (refinery), CMG (Chipotle), LRCX, SWKS, MDGL
SPPI WATT
SQ TOWN
7/10/2018 (Click on Underlined link.)
Bullish MAXCPs - http://tigersoft.com/MAXCPZ/710/BULLISH.htm
Bearish MAXCPs - http://tigersoft.com/MINCPZ/710/BEARISH.htm
|
Table 1
QUICKSILVER on ETFS - 07/10/18
Bullish = 37
Bearish = 7
ETF CLOSE CHANGE PIVOT-PT 5-dma AROC CL-PWR CANDLE IP21 ITRS
---------------------------------------------------------------------------------------------
DIA 249.23 1.39 241.66 133.2% ---- BLUE -.008 ------
---------------------------------------------------------------------------------------------
COMPQX 7759.2 3 7502.67 125.7% Bullish RED .139 .064
---------------------------------------------------------------------------------------------
SPY 278.9 1 270.9 128.5% ---- BLUE .055 .02
---------------------------------------------------------------------------------------------
QQQ 177.32 .13 170.8 130% Bullish RED .114 .068
---------------------------------------------------------------------------------------------
MDY 365.34 -.05 355.99 143% ---- RED .041 .036
---------------------------------------------------------------------------------------------
IWM 168.54 -.77 164.96 109.1% Bullish RED .183 .064
---------------------------------------------------------------------------------------------
FAS 67.08 -.42 62.51 265.7% Bearish RED -.045 .013
---------------------------------------------------------------------------------------------
RETL 44.72 -.86 42.51 347.8% Bearish RED -.05 .238
---------------------------------------------------------------------------------------------
SOXL 160.22 4.86 135.96 548% Bearish BLUE .176 .245
---------------------------------------------------------------------------------------------
TECL 146.89 1.02 132.23 345.7% Bullish BLUE .105 .251
---------------------------------------------------------------------------------------------
IBB 116.61 -.2 110.59 261.4% Bullish RED .217 .078
---------------------------------------------------------------------------------------------
GLD 118.93 -.22 118.65 62% Bearish BLUE -.291 -.078
---------------------------------------------------------------------------------------------
OIL 7.61 .04 6.89 339.4% Bullish BLUE .263 .036
---------------------------------------------------------------------------------------------
OIH 27.1 .26 25.76 297.9% ---- ---- -.142 -.03
---------------------------------------------------------------------------------------------
GASL 26.55 .03 23.73 712.9% Bullish RED -.13 .238
---------------------------------------------------------------------------------------------
UGA 34.68 .07 33.78 124.7% Bullish RED -.225 0
---------------------------------------------------------------------------------------------
UUP 24.84 .01 24.98 -44.1% ---- RED -.051 .008
---------------------------------------------------------------------------------------------
IEF 102.27 -.08 102.51 1% ---- ---- -.17 -.019
---------------------------------------------------------------------------------------------
XLU 52.02 .49 52.48 -29.5% Bullish BLUE .288 -.02
---------------------------------------------------------------------------------------------
WEAT 6.27 -.19 6.25 110.3% Bearish RED -.077 -.073
---------------------------------------------------------------------------------------------
YINN 25.5 -.38 23.86 308% Bearish BLUE .118 -.246
---------------------------------------------------------------------------------------------
RSX 22.33 .12 21 292.9% Bullish BLUE .235 .023
|
Table 2 Count of Stocks in Key Directories
20180710
-------------------------------
NEWHIGHS 163 Bullish
NEWLOWS 11
MAXCP 46
MINCP 51 Professionals slightly net Bearish.
TTTNH 57
TTTNL 94 Swing-Traders are net Bearish
FASTUP 163
FASTDOWN 55
CPCROSSA 61
CPCROSSD 140 Professionals switched to Bearish side.
BIGVOLUP 1
BIGVODN 7
|
Table 3
Count of Stocks and New Highs in Key Tiger Directories
Date = 180710
No. NHs Pct.
-------------------------------------------------------------------
-------------------------------------------------------------------
MAXCP 46 36 78 %
EDU 7 4 57 %
OILGAS 157 27 17 %
COAL 8 1 13 %
NIFTY 29 3 10 %
SP-100 94 8 9 %
CHEM 62 5 8 %
INDMATER 82 6 7 %
INDEXES 189 12 6 %
SOFTWARE 64 4 6 %
SEMI 125 6 5 %
SOLAR 19 1 5 %
SP500 476 24 5 %
TRANSP 20 1 5 %
BIOTECH 410 17 4 %
ELECTRON 172 7 4 %
FIDSTKS 186 8 4 %
GAMING 28 1 4 %
HACKERS 23 1 4 %
RUS-1000 817 36 4 %
DOWJONES 30 1 3 %
FINANCE 90 3 3 %
INFRA 34 1 3 %
MILITARY 37 1 3 %
COMODITY 55 1 2 %
NASD-100 89 2 2 %
REIT 173 1 1 %
|
Table 4
Count of Stocks and New Lows in Key Tiger Directories
Date = 180710
No. NH Pct
=====================================================
FOOD 9 2 22 %
HOSPITAL 7 1 14 %
MINCP 51 4 8 %
COMODITY 55 3 5 %
BIOTECH 410 15 4 %
MILITARY 37 1 3 %
BONDFUND 111 2 2 %
CHEM 62 1 2 %
CHINA 60 1 2 %
RETAIL 52 1 2 %
UTILITY 41 1 2 %
ELECTRON 172 1 1 %
OILGAS 157 1 1 %
SEMI 125 1 1 %
RUS-1000 817 3 0 %
|
Table 5 RANKING OF KEY DIRECTORIES BASED PCT.OF STOCKS ABOVE 65-DMA
7/10/18
Bullish = 37 Bearish = 9
---------------------------------------------------------------------------------------
Directory Current day-1 day-2 day-3 day-4 day-5
----------------------------------------------------------------------------------------
REIT .901 .924 .936 .93 .919 .89
NIFTY .896 .896 .793 .758 .689 .724
BEVERAGE .789 .789 .789 .736 .684 .631
NASD-100 .786 .775 .707 .651 .584 .64
UTILITY .78 .731 .756 .756 .756 .756
SOFTWARE .765 .781 .75 .687 .64 .64
COAL .75 .75 .75 .75 .625 .625
REGBANKS .741 .741 .612 .612 .516 .548
RETAIL .73 .73 .711 .673 .692 .673
SP-100 .723 .691 .574 .574 .521 .542
FIDSTKS .72 .704 .623 .591 .526 .548
EDU .714 .714 .714 .714 .714 .714
PIPELINE .714 .714 .857 .857 .714 .571
SP500 .707 .686 .602 .577 .537 .552
INDEXES .698 .693 .603 .608 .587 .566
COMPUTER .695 .695 .695 .695 .652 .652
RUS-1000 .695 .687 .618 .581 .538 .545
OILGAS .687 .662 .649 .611 .63 .573
DOWJONES .666 .633 .5 .533 .5 .5
HACKERS .652 .652 .652 .608 .608 .608
TRANSP .65 .6 .5 .45 .35 .4
HOMEBLDG .647 .647 .47 .529 .411 .411
BONDFUND .63 .585 .612 .594 .63 .72
CHEM .629 .629 .596 .596 .612 .596
INFRA .617 .558 .529 .47 .411 .352
ELECTRON .616 .616 .569 .529 .436 .511
GUNS .611 .611 .5 .444 .444 .388
GAMING .607 .607 .607 .571 .535 .5
BIOTECH .604 .629 .612 .587 .556 .539
SEMI .6 .592 .544 .472 .36 .472
INDMATER .597 .548 .524 .451 .439 .378
HOSPITAL .571 .571 .571 .571 .571 .571
FINANCE .566 .622 .5 .466 .388 .422
BIG17 .565 .565 .565 .543 .543 .478
GREEN .551 .517 .517 .448 .448 .448
MILITARY .54 .54 .378 .351 .486 .405
DJI-13 .538 .461 .384 .384 .384 .307
N=37
===========================================================================================
INSURANC .5 .466 .433 .4 .266 .266
===========================================================================================
GOLD .46 .42 .52 .48 .36 .22
AUTO .45 .525 .4 .425 .3 .275
COMODITY .327 .327 .309 .309 .327 .309
SOLAR .315 .21 .21 .21 .21 .21
JETS .3 .3 .3 .3 .1 .1
ETFS .196 .18 .18 .163 .049 .081
BIGBANKS .142 .285 .142 .142 .142 .142
CHINA .133 .15 .166 .116 .133 .116
FOOD .111 .111 0 0 0 0
N= 9
|
====================================================================
7/9/2018 The Peerless Buy B9
now operates. The median gain for a Buy B9 is 7.5%
at the time of the next reversing sell. June and July B9s average 7% gains. Such
a rise here would take the DJI to a recovery new high and 25800. That a gain
like this very likely, we see that the NYSE A/D Line made another all-time high.
It is also a positive that the DJI came alive today. It was led by BA, CAT and
the
lagging big banks, GS and JPM.

We might ask if the DJI's rally was simply a technical rebound from an oversold condition
or is it the beginning of a much bigger Summer rally, sparked by a quieting down of the
tariff wars
and a re-thinkiing by the FED about the need for several more rate-hikes this year?
And is the gravitation of big money into speculative sectors, like biotechs, apt to
continue?
Such action is the result of growing investor confidence and also occurs when such
growth investments take on an appeal as Inflation develops. Volume might seem
to need to be higher for a 10%+ Summer Rally. But that may come in later. Wall
Street,
just like the President and the Republican Party, have a lot to gain from keeping this
bull market
going so as to keep the Democrats defensively on their heels when it comes to the
all-important economic question, "Are you better off now under Trump than you were
under Obama?"
One issue did emerge today. That was the big drop by utilities. I could not
find
news to explain it, but both Bonds and REITs were down today. We will need to
watch our short-term rates chart closely. For now, I take it as a bullish sign that
defensive money wants to become a lot more aggressive.
In addition, let's see if the DJI's can destroy its box-like pattern and move oast 26500.
It looks like it will destroy its nascent H/S pattern if it can rise tomorrow.

Right now, I think we should expect higher prices. The
uptrend of the NASDAQ looks
particularly inviting. In addition, the key ETFs' rising Closing Powers and 5-day
moving
averages cannot easily turn down, so that even though the 5-day Stochastic are now in
short-term over-bought territory, I would expct the Biotechs, large and small as well as
IWM to surpass the resistance from their last peaks.

I have been impressed that so many important stocks
and key general market ETFs
have destroyed their potential head/shoulders price patterns by rallying up past the
apexes
of their impending right shoulders. This bullish development describes the price
action in
AAPL, AMD, APH, CSX, GOOG. IDX, MDY, SPY, SQ, TECL and UNH But
going through all the SP-500 stocks, I can still find some charts where the H/S pattern
still menaces. We will want to see these stocks surpass the right shoulder
peaks.
ABT needs to surpass 62.5
ADD at 97.18 needs to surpass 99.
ADP at 134.22 needs to surpass 136.
EXPD at 73.3 needs to surpass 74.
MCO at 175.45 needs to surpass 176
MOS at 28.36 needs to surpass 29.0
OXY at 85.85 needs to surpass 86.5
Charts 7/09/2018
PEERLESS DJI, Signals,
Indicators Daily DJI Volume 10-DayUp/Down Vol
Hourly DJIA A/D Line for All
Stocks
NASDAQ S&P OEX NYSE COMPQX DJI-15 DJI-20 DJI-30
DIA SPY QQQ MDY IWM
TNA
Short-Term Rates
USO-CrudeOil FAS GLD BBH IBB JETS JNUG KOL NUGT OIH OIL RSX RETL
SDS SLV SOXL TECL TMF TNA UGA (gasoline) XIV YINN
Commodities: CANE
JJC, NIB, CHOC
CORN,
CUT (paper) WEAT UUP (Dollar)
AAPL ADBE ALXN AMAT AMGN AMD AMZN BA BABA BAC BIDU CAT CVX DE
FB GOOG GS HD IBM JPM M (Macy's) MSFT NFLX NVDA QCOM TSLA TXN XOM WMT
ANDV (refinery), CMG (Chipotle), LRCX, SWKS, MDGL
SPPI WATT
SQ TOWN
7/09/2018 (Click on Underlined link.)
Bullish MAXCPs - http://tigersoft.com/MAXCPZ/709/BULLISH.htm
Bearish MAXCPs - http://tigersoft.com/MINCPZ/709/BEARISH.htm
|
Table 1
QUICKSILVER on ETFS - 07/09/18
ETF CLOSE CHANGE PIVOT-PT 5-dma AROC CL-PWR CANDLE IP21 ITRS
---------------------------------------------------------------------------------------------
---------------------------------------------------------------------------------------------
DIA 247.84 3.24 242.73 105.1% Bearish BLUE .011 ----
---------------------------------------------------------------------------------------------
COMPQX 7756.2 67.81 7567.69 162.4% Bullish BLUE .163 .07
---------------------------------------------------------------------------------------------
SPY 277.9 2.48 271.86 121.5% Bullish BLUE .071 .024
---------------------------------------------------------------------------------------------
QQQ 177.19 1.58 172.8 160.3% Bullish BLUE .126 .074
---------------------------------------------------------------------------------------------
MDY 365.39 3.62 355.06 145.1% Bullish BLUE .125 .041
---------------------------------------------------------------------------------------------
IWM 169.31 1.06 164.9 167.1% Bullish BLUE .22 .074
---------------------------------------------------------------------------------------------
FAS 67.5 2.97 63.66 354.6% ---- BLUE .001 .032
---------------------------------------------------------------------------------------------
RETL 45.58 .59 41.68 415.2% Bearish RED .111 .309
---------------------------------------------------------------------------------------------
SOXL 155.36 2.85 144.11 480.6% Bearish RED .173 .185
---------------------------------------------------------------------------------------------
TECL 145.87 3.22 137.27 460.4% Bullish BLUE .132 .24
---------------------------------------------------------------------------------------------
IBB 116.81 .6 110.69 312.4% Bullish BLUE .223 .09
---------------------------------------------------------------------------------------------
GLD 119.15 .29 117.46 21.1% Bearish RED -.309 -.066
---------------------------------------------------------------------------------------------
OIL 7.61 .04 6.89 339.4% Bullish BLUE .263 .042
---------------------------------------------------------------------------------------------
OIH 26.84 .68 25.55 110% ---- BLUE -.156 -.039
---------------------------------------------------------------------------------------------
GASL 26.52 1.56 23.07 454.7% Bullish BLUE -.106 .203
---------------------------------------------------------------------------------------------
UGA 34.61 .7 33.83 14.7% Bullish BLUE -.202 .006
---------------------------------------------------------------------------------------------
UUP 24.83 .01 25.06 -22.1% Bullish BLUE -.041 .013
---------------------------------------------------------------------------------------------
IEF 102.35 -.26 102.25 -7.8% Bearish ---- -.217 -.01
---------------------------------------------------------------------------------------------
XLU 51.53 -1.64 52.33 -40.9% Bullish RED .249 -.013
---------------------------------------------------------------------------------------------
WEAT 6.46 -.06 6.13 63.2% Bearish ---- -.052 -.018
---------------------------------------------------------------------------------------------
YINN 25.88 1.54 24 98.9% Bearish BLUE .091 -.225
---------------------------------------------------------------------------------------------
RSX 22.21 .4 21.07 227.5% Bullish BLUE .219 .026
|
Table 2 Count of Stocks in Key Directories
20180709
-------------------------------
NEWHIGHS 258 Bullish
NEWLOWS 20
MAXCP 76 Predominately bullish
MINCP 45
TTTNH 74 Mixed
TTTNL 67
FASTUP 182 Swingers are bullish
FASTDOWN 55
CPCROSSA 111 Pros became more bullish
CPCROSSD 61
BIGVOLUP 5
BIGVODN 1
|
Table 3
Count of Stocks and New Highs in Key Tiger Directories
Date = 180709
No. NHs Pct.
-------------------------------------------------------------------
-------------------------------------------------------------------
MAXCP 76 59 78 %
OILGAS 157 24 15 %
EDU 7 1 14 %
NIFTY 29 4 14 %
COAL 8 1 13 %
SOLAR 19 2 11 %
FINANCE 90 9 10 %
INDEXES 189 17 9 %
CHEM 62 5 8 %
FIDSTKS 186 14 8 %
BIOTECH 410 27 7 %
NASD-100 89 6 7 %
SP-100 94 7 7 %
INDMATER 82 5 6 %
REGBANKS 31 2 6 %
RUS-1000 818 50 6 %
SOFTWARE 64 4 6 %
SP500 477 29 6 %
BEVERAGE 20 1 5 %
MILITARY 37 2 5 %
TRANSP 20 1 5 %
COMPUTER 23 1 4 %
SEMI 125 5 4 %
AUTO 40 1 3 %
GREEN 29 1 3 %
INFRA 34 1 3 %
INSURANC 30 1 3 %
REIT 173 5 3 %
BIG17 46 1 2 %
ELECTRON 172 4 2 %
GOLD 50 1 2 %
RETAIL 52 1 2 %
|
Table 4
Count of Stocks and New Lows in Key Tiger Directories
Date = 180709
No. NH Pct
=====================================================
MINCP 45 8 18 %
PIPELINE 7 1 14 %
SOLAR 19 1 5 %
BONDFUND 111 4 4 %
GAMING 28 1 4 %
HACKERS 23 1 4 %
AUTO 40 1 3 %
INFRA 34 1 3 %
BIOTECH 410 10 2 %
CHEM 62 1 2 %
UTILITY 41 1 2 %
ELECTRON 172 1 1 %
OILGAS 157 2 1 %
SEMI 125 1 1 %
RUS-1000 818 1 0 %
|
TABLE 5
RANKING OF KEY DIRECTORIES BASED PCT.OF STOCKS ABOVE 65-DMA
7/9/18
---------------------------------------------------------------------------------------
Directory Current day-1 day-2 day-3 day-4 day-5
----------------------------------------------------------------------------------------
REIT .924 .936 .93 .919 .89 .878
NIFTY .896 .793 .758 .689 .724 .689
BEVERAGE .8 .8 .75 .7 .65 .65
SOFTWARE .781 .75 .687 .64 .64 .562
NASD-100 .775 .707 .651 .584 .64 .617
COAL .75 .75 .75 .625 .625 .75
REGBANKS .741 .612 .612 .516 .548 .387
UTILITY .731 .756 .756 .756 .756 .707
RETAIL .73 .711 .673 .692 .673 .73
EDU .714 .714 .714 .714 .714 .714
PIPELINE .714 .857 .857 .714 .571 .714
FIDSTKS .704 .623 .591 .526 .553 .548
COMPUTER .695 .695 .695 .652 .652 .565
INDEXES .693 .603 .608 .587 .571 .55
SP-100 .691 .574 .574 .521 .553 .553
RUS-1000 .688 .618 .581 .539 .552 .544
SP500 .687 .603 .578 .538 .555 .559
OILGAS .662 .649 .611 .63 .598 .656
HACKERS .652 .652 .608 .608 .608 .565
HOMEBLDG .647 .47 .529 .411 .411 .47
DOWJONES .633 .5 .533 .5 .533 .533
BIOTECH .629 .612 .587 .556 .541 .519
CHEM .629 .596 .596 .612 .596 .612
FINANCE .622 .5 .466 .388 .422 .344
ELECTRON .616 .569 .529 .436 .511 .441
GUNS .611 .5 .444 .444 .388 .555
GAMING .607 .607 .571 .535 .5 .571
TRANSP .6 .5 .45 .35 .4 .3
SEMI .592 .544 .472 .36 .472 .416
BONDFUND .585 .612 .594 .63 .72 .675
HOSPITAL .571 .571 .571 .571 .571 .428
BIG17 .565 .565 .543 .543 .478 .434
INFRA .558 .529 .47 .411 .382 .382
INDMATER .548 .524 .451 .439 .414 .463
MILITARY .54 .378 .351 .486 .405 .378
AUTO .525 .4 .425 .3 .325 .275
GREEN .517 .517 .448 .448 .448 .413
INSURANC .466 .433 .4 .266 .233 .266
DJI-13 .461 .384 .384 .384 .384 .384
GOLD .42 .52 .48 .36 .26 .3
COMODITY .327 .309 .309 .327 .309 .327
JETS .3 .3 .3 .1 .1 .1
BIGBANKS .285 .142 .142 .142 .142 .142
SOLAR .21 .21 .21 .21 .21 .21
ETFS .18 .18 .163 .049 .081 .131
CHINA .15 .166 .116 .133 .116 .133
FOOD .111 0 0 0 0 0
|
====================================================================
7/6/2018 The Peerless Buy B9
now operates. The NYSE A/D Line's new high is
a bullish
sign. Now we should watch to see if the SP-500 can abort its potential head/shoulders
pattern by continuing to rally. It should be bullish that the rising tech stocks in
TECL
on Friday have seemingly voided a similar pattern. On the night of the Buy B9,
I
suggested buying IBB and IWM. They continue to rise more rapidly than the DJI
and DIA. Hold them for higher prices. This may be the beginning of a Summer
Rally,
fueled, perhaps, by the Fed's reluctance to run the risks of raising rates aggressively.
No doubt, the FED's decision here may hinge on signs of inflation. The CPI numbers
will
come out, I believe, in the middle of this coming week.
 |
 |
 |
119-120 will likely bring profit-taking and might be used as our
target. But Friday's gap could be a breakaway gap. So, let's not
be in a hurry to sell here.
 |
 |
|
1926's Experience Suggests a Very
Good Summer Rally in 2018.
In Feb. 1926, taxes were cut sharply.
See https://en.wikipedia.org/wiki/Revenue_Act_of_1926
As such, 1926's stock market fluctuations may seem a model for 2018.
There is no doubt that cuts in corporate tax rates drive up profits and
increases corporate buy backs and other investments. Cuts in investors'
taxes means a lot more money to buy and invest with.
But there are lots of differences between 1926 and 2018. We should
make some allowance for them, of course.
The mid-1920s economy was driven by consumer spending on lots of
new consumer items: especially cars, radio, records, refrigerators,
washing machines, sewing machines and movies. Our consumers
are more tapped out than consumers were in 1926. We are hooked
on government spending, especially for the military and for health care.
Perhaps, that provides more stability to the stock market..
Second, investor confidence got a severe set back in early 1926 when
the Florida Land boom burst. Thus, the steeper first quarter correction
back then.
But Trump's trade war now will hurt many DJI-30 stocks. There was
no trade war in 1926. And a trade war is very problematic, especially
for some of the big blue chips in the DJI-30. Fears of deeper retaliation
will hold the DJIA back, I would guess. Beyond that, so much industry
has already left the US, it is not clear that a trade imbalance of $350 billion
a year with China can be restored simply by tariffs, which in the meantime
will drive up American prices and make for lots of politcal "heat", Add to
that how good the multinationals have gotten at relocating abroad and the Fed's
dependency on China to buy a hefty portion of its bonds/bills and you probably
get a market that is more at risk than it was in 1926 even with the bursting of
the Florida land-speculation bubble.
Still, we should look back at 1926 for guidance now.
First, compare our recent sell-off with the DJI's 17% drop from Feb 11 to
March 30 in 1926. This was due to a combination of tax cut profit-taking
and the Florida land bust.
As now, the market turned up for a Summer Rally, which lasted to Sept 7
and brought about a 17% gain as the DJI rose to new highs.
Then the DJI dropped 12% to a bottom on October 19th and was moving up at year end.
In 1927, the DJI started making new highs again. One might have expected the
FED to start raising rates. They did the exact opposite and lower rates. In
doing
this, they yielded to a request from the head of Bank of England to lower rates
so that the Pound would be not become still weaker. It is this action, as much as
anything, which caused the stock market to run wildly higher. In 1928, the bubble
in stocks was increasing so fast that the FED had lost control. Could this happen
again? Might the FED actually lower rates again. Possibly. Either
because they
want to help the Republicans politically or because the Fed starts to worry that
rate increases will cause great damage to currencies in Latin America and elsewhere
in the Developing World.
 |
Table 1
Table 1
QUICKSILVER on ETFS - 07/06/18
ETF CLOSE CHANGE PIVOT-PT 5-dma AROC CL-PWR CANDLE IP21 ITRS
---------------------------------------------------------------------------------------------
DIA 244.6 1.05 242.73 51.9% Bearish BLUE -.022 0
---------------------------------------------------------------------------------------------
COMPQX 7688.39 101.96 7510.3 122.6% Bullish BLUE .109 .082
---------------------------------------------------------------------------------------------
SPY 275.42 2.31 271.28 83.4% Bearish BLUE .044 .029
---------------------------------------------------------------------------------------------
QQQ 175.61 2.69 171.65 128.6% Bullish BLUE .077 .091
---------------------------------------------------------------------------------------------
MDY 361.77 2.6 355.02 100.7% ---- BLUE .099 .037
---------------------------------------------------------------------------------------------
IWM 168.25 1.41 163.77 132.5% Bullish BLUE .177 .075
---------------------------------------------------------------------------------------------
FAS 64.53 .93 63 123.5% Bearish BLUE -.081 .006
---------------------------------------------------------------------------------------------
RETL 44.99 1.24 42.01 180.4% Bearish BLUE .053 .352
---------------------------------------------------------------------------------------------
SOXL 152.51 5.55 141.5 409.8% Bearish BLUE .137 .239
---------------------------------------------------------------------------------------------
TECL 142.65 4.98 133.29 328.9% ---- BLUE .075 .282
---------------------------------------------------------------------------------------------
IBB 116.21 4.23 109.82 374.8% Bullish BLUE .17 .109
---------------------------------------------------------------------------------------------
GLD 118.86 -.19 118.65 27% Bearish RED -.288 -.068
---------------------------------------------------------------------------------------------
OIL 7.61 .04 6.89 339.4% Bullish BLUE .263 .045
---------------------------------------------------------------------------------------------
OIH 26.16 .38 26.27 -36.6% Bearish BLUE -.181 -.049
---------------------------------------------------------------------------------------------
GASL 24.96 1.21 24.34 151.1% Bullish BLUE -.089 .174
---------------------------------------------------------------------------------------------
|
Table 2 Count of Stocks in Key Directories
20180706
-------------------------------
NEWHIGHS 243 Bullish
NEWLOWS 21
MAXCP 125 Bullish
MINCP 33
TTTNH 89
TTTNL 74
FASTUP 177 Bullish
FASTDOWN 53
CPCROSSA 154 Bullish
CPCROSSD 18
BIGVOLUP 3
BIGVODN 6
ACCUMVER 16
HIGHIP21 92
HIUPPCT 158
VHIP21 34
LOWACCUM 315
REDSELL 102
AUGSELS7 15
TRAPDOOR 7
|
Table 5
Count of Stocks and New Lows in Key Tiger Directories
Date = 180706
No. NLs Pct.
--------------------------------------------------
MINCP 33 7 21 %
PIPELINE 7 1 14 %
BONDFUND 111 7 6 %
SOLAR 19 1 5 %
ETFS 61 2 3 %
INFRA 34 1 3 %
BIOTECH 410 10 2 %
CHEM 62 1 2 %
CHINA 60 1 2 %
COMODITY 55 1 2 %
INDMATER 82 2 2 %
OILGAS 157 3 2 %
ELECTRON 173 1 1 %
FINANCE 90 1 1 %
SEMI 126 1 1 %
RUS-1000 819 3 0 %
SP500 477 2 0 %
|
Table 3
Count of Stocks and New Highs in Key Tiger Directories
Date = 180706
No. NHs Pct.
-------------------------------------------------------------------
-------------------------------------------------------------------
MAXCP 125 92 74 %
EDU 7 3 43 %
CHEM 62 6 10 %
REIT 173 18 10 %
UTILITY 41 4 10 %
HACKERS 23 2 9 %
SOFTWARE 64 5 8 %
BIOTECH 410 28 7 %
NIFTY 29 2 7 %
OILGAS 157 10 6 %
FIDSTKS 186 10 5 %
MILITARY 37 2 5 %
RUS-1000 819 43 5 %
SOLAR 19 1 5 %
SP500 477 25 5 %
BIG17 48 2 4 %
COMPUTER 23 1 4 %
FINANCE 90 4 4 %
GOLD 50 2 4 %
INDMATER 82 3 4 %
SEMI 126 5 4 %
SP-100 94 4 4 %
ELECTRON 173 5 3 %
GREEN 29 1 3 %
INDEXES 189 6 3 %
INFRA 34 1 3 %
REGBANKS 31 1 3 %
CHINA 60 1 2 %
NASD-100 89 2 2 %
RETAIL 52 1 2 %
|
RANKING OF KEY DIRECTORIES BASED PCT.OF STOCKS ABOVE 65-DMA
7/6/18
Bullish = 31
Bearish = 12
---------------------------------------------------------------------------------------
Directory Current day-1 day-2 day-3 day-4 day-5
----------------------------------------------------------------------------------------
REIT .936 .93 .919 .89 .878 .872
PIPELINE .857 .857 .714 .571 .714 .714
BEVERAGE .8 .75 .7 .65 .65 .65
NIFTY .793 .758 .689 .724 .689 .655
UTILITY .756 .756 .756 .756 .707 .707
COAL .75 .75 .625 .625 .75 .75
SOFTWARE .75 .687 .64 .64 .562 .531
EDU .714 .714 .714 .714 .714 .714
RETAIL .711 .673 .692 .673 .73 .711
NASD-100 .707 .651 .584 .64 .617 .595
COMPUTER .695 .695 .652 .652 .565 .565
HACKERS .652 .608 .608 .608 .565 .521
OILGAS .649 .611 .63 .598 .662 .63
FIDSTKS .623 .591 .526 .553 .548 .516
RUS-1000 .619 .582 .539 .553 .544 .532
BIOTECH .612 .587 .556 .541 .519 .502
BONDFUND .612 .594 .63 .72 .666 .594
REGBANKS .612 .612 .516 .548 .387 .548
GAMING .607 .571 .535 .5 .571 .5
INDEXES .603 .608 .587 .571 .55 .555
SP500 .603 .578 .538 .555 .557 .549
CHEM .596 .596 .612 .596 .612 .58
BIG17 .583 .562 .562 .5 .437 .458
SP-100 .574 .574 .521 .553 .553 .542
ELECTRON .572 .531 .439 .514 .445 .445
HOSPITAL .571 .571 .571 .571 .428 .428
SEMI .547 .476 .365 .476 .42 .428
INFRA .529 .47 .411 .382 .352 .352
INDMATER .524 .451 .439 .414 .451 .426
GOLD .52 .48 .36 .26 .28 .22
GREEN .517 .448 .448 .448 .413 .379
N=31
==========================================================================================
DOWJONES .5 .533 .5 .533 .533 .566
FINANCE .5 .466 .388 .422 .344 .355
GUNS .5 .444 .444 .388 .555 .555
TRANSP .5 .45 .35 .4 .3 .25
==========================================================================================
HOMEBLDG .47 .529 .411 .411 .47 .411
INSURANC .433 .4 .266 .233 .266 .166
AUTO .4 .425 .3 .325 .275 .325
DJI-13 .384 .384 .384 .384 .384 .384
MILITARY .378 .351 .486 .405 .378 .378
COMODITY .309 .309 .327 .309 .327 .309
JETS .3 .3 .1 .1 .1 0
SOLAR .21 .21 .21 .21 .21 .21
ETFS .18 .163 .049 .081 .131 .065
CHINA .166 .116 .133 .116 .133 .116
BIGBANKS .142 .142 .142 .142 .142 .142
FOOD 0 0 0 0 0 0
N=12
|
| |
7/5/2018 The Peerless Buy B9
now operates.

I have suggested buying IWM, IBB and biotechs among the MAXCP
breakouts. Many of you would rather not buy high-flying breakouts.
Fair enough. Consider some other ideas that involve beaten-down stocks.
First, REGN among the big biotechs shows a bullish inverted head and
shoulders. Second, NUGT, a
leveraged gold stocks' ETF, seems to
be rising above its 65-dma, could soon break a year-long downtrend,
shows Bullish CP divergence B7s and steady positive accumulation.
Third, SPPI
, a smaller biotech, shows a flat top that
"beckons for a
breakout".

TRADE WARFARE
Much Higher Tariffs did not create bear markers under
Coolidge
when the Economy was strong, but they were a disaster in 1930
under Harding when the market and the economy were very weak.
Today the US trade war with China turned a new page, as $34 billion
in tariffs were imposed by each side on the others' imports. This was
widely expected. It represents about 6.7% of the value of Chinese exports
to the US and about 26.2% of the value of US exports to China. Trump's
efforts to balance the US trade imbalance with China, which was $376 billion
in 2017, laudable as the goal seems to be, will result in fewer American
corporations being hit much harder than it will hit Chinese corporations exporting
here. Thus, it would seem that Trump's economic nationalism will have a
hard time quickly solving the imbalance of many years' creation and
dealing with such contradictions as how multinational (US in name) corporations
can be expected to stay in the US given these Chinese tariffs and how
China can still be expected to keep on buying up huge amounts of US Treasuries
and so, how can the US Economy not contract when interest rates rise
accordingly..
In these circumstances, it is vital that the US economy stays strong so that
the seeming inevitable weakness in the big multinationals in the DJI do not
drag the market down. This makes tomorrow's Jobs' report very important.
So is the need for most other stocks to stay strong. The NYSE A/D Line's
new high today is a very good sign. But also we do not want to see more key
stocks break down and form technically hard-to-repair downtrends. Bulls
will want to watch closely now a number of ETFs and stocks that could now
be forming head/shoulders patterns. In particular, they will be rooting for
these vehicles to move above their right shoulder apexes and thus destroy
the potential bearish of these patterns. So, watch what happens to the
sample of stocks and ETFs just below.
| |
US Monthly JOBs Reports - Net New Jobs in 1000s
| Year |
Jan |
Feb |
Mar |
Apr |
May |
Jun |
Jul |
Aug |
Sep |
Oct |
Nov |
Dec |
| 2008 |
8 |
-81 |
-55 |
-229 |
-184 |
-154 |
-213 |
-277 |
-443 |
-475 |
-759 |
-707 |
| 2009 |
-787 |
-704 |
-802 |
-704 |
-354 |
-469 |
-342 |
-196 |
-229 |
-209 |
12 |
-277 |
| 2010 |
18 |
-73 |
193 |
221 |
522 |
-140 |
-78 |
-16 |
-63 |
267 |
129 |
73 |
| 2011 |
44 |
182 |
254 |
323 |
81 |
234 |
72 |
112 |
233 |
209 |
145 |
201 |
| 2012 |
348 |
233 |
264 |
72 |
117 |
68 |
156 |
173 |
194 |
153 |
130 |
243 |
| 2013 |
207 |
265 |
156 |
179 |
240 |
158 |
111 |
260 |
201 |
210 |
221 |
93 |
| 2014 |
174 |
182 |
261 |
311 |
252 |
306 |
196 |
226 |
284 |
255 |
307 |
251 |
| 2015 |
211 |
267 |
78 |
282 |
326 |
191 |
256 |
164 |
88 |
351 |
264 |
234 |
| 2016 |
103 |
257 |
235 |
174 |
34 |
285 |
325 |
175 |
264 |
140 |
172 |
180 |
| 2017 |
259 |
200 |
73 |
175 |
155 |
239 |
190 |
221 |
14 |
271 |
216 |
175 |
| 2018 |
176 |
324 |
155 |
159(P) |
223(P) |
|
|
|
|
|
|
|
|
|
The bottom of the 2007-2009 bear market occurred a few weeks before the worst
Jobs numbers of that decline were reported. That was the April 2009 report of a
one month jobs' loss of 802,000 in March 2009. If the same thing occurs at a market
top now, we might see a seemingly super number above +326,000 might surprisingly
signal a top. Such a really high Jobs number would boost the strength of the Federal
Reserve Hawks who want to speed up the rate of interest rate rises. A lower number,
still above 200,000 new jobs would probably be viewed as a healthy, "Goldilocks"
number, neither too high nor too low. On the other hand, a June number below 150,000
woud be making a 9-month low. That would worry many traders, I believe, that the
economy's strength may now be showing the signs of impending weakness and cause
more profit-taking in the stock market. |
Table 1
QUICKSILVER on ETFS - 07/05/18
ETF CLOSE CHANGE PIVOT-PT 5-dma AROC CL-PWR CANDLE IP21 ITRS
---------------------------------------------------------------------------------------------
DIA 243.55 1.89 242.08 50.2% Bearish BLUE .001 ----
---------------------------------------------------------------------------------------------
COMPQX 7586.43 83.76 7503.68 94.2% Bearish BLUE .12 .068
---------------------------------------------------------------------------------------------
SPY 273.11 2.21 270.89 69.4% Bearish BLUE .049 .024
---------------------------------------------------------------------------------------------
QQQ 172.92 2.12 171.19 93.1% Bearish BLUE .067 .077
---------------------------------------------------------------------------------------------
MDY 359.17 3.18 354.6 84.6% Bearish BLUE .112 .032
---------------------------------------------------------------------------------------------
IWM 166.84 1.88 163.88 105.4% Bullish BLUE .18 .066
---------------------------------------------------------------------------------------------
FAS 63.6 1.09 62.97 182.6% Bearish BLUE -.028 -.012
---------------------------------------------------------------------------------------------
RETL 43.75 1.24 43.45 35.2% Bearish BLUE .036 .338
---------------------------------------------------------------------------------------------
SOXL 146.96 11 140.88 341.1% Bearish BLUE .122 .191
---------------------------------------------------------------------------------------------
TECL 137.67 5.44 133.78 316.5% Bearish BLUE .092 .238
---------------------------------------------------------------------------------------------
IBB 111.98 1.39 107.95 212.3% Bullish BLUE .134 .07
---------------------------------------------------------------------------------------------
GLD 119.05 .4 118.22 19.9% Bearish BLUE -.289 -.071
---------------------------------------------------------------------------------------------
OIL 7.61 .04 6.89 339.4% Bullish BLUE .263 .047
---------------------------------------------------------------------------------------------
OIH 25.78 .02 26.35 -126.6% Bearish RED -.167 -.053
---------------------------------------------------------------------------------------------
GASL 23.75 .02 24.24 -96.2% ---- RED -.114 .15
---------------------------------------------------------------------------------------------
UGA 34.3 .52 33.9 78% Bullish RED -.166 .013
---------------------------------------------------------------------------------------------
UUP 24.9 -.08 25.14 -47.9% ---- ---- .036 .03
---------------------------------------------------------------------------------------------
IEF 102.52 .01 102.59 -8.3% Bullish ---- -.201 -.003
---------------------------------------------------------------------------------------------
XLU 52.76 .28 51.88 82.5% Bullish BLUE .206 .027
---------------------------------------------------------------------------------------------
YINN 23.68 -.18 24.43 -41.1% Bearish RED .02 -.294
---------------------------------------------------------------------------------------------
RSX 21.47 .47 20.85 212.4% Bullish BLUE .104 .009
---------------------------------------------------------------------------------------------
|
Table 2
Count of Stocks in Key Directories
20180705
-------------------------------
NEWHIGHS 179 Bullish
NEWLOWS 21
MAXCP 80
MINCP 134 Professionals still cautious.
TTTNH 58
TTTNL 194 Day Traders are still bearish.
FASTUP 147
FASTDOWN 61
CPCROSSA 132 Professionals are rapidly switching to bullish side.
CPCROSSD 27
BIGVOLUP 6
BIGVODN 1
|
Table 3
Count of Stocks and New Highs in Key Tiger Directories
Date = 180705
No. NHs Pct.
-------------------------------------------------------------------
-------------------------------------------------------------------
MAXCP 80 56 70 %
EDU 7 2 29 %
BEVERAGE 20 3 15 %
REIT 173 17 10 %
CHEM 62 5 8 %
UTILITY 41 3 7 %
BIOTECH 410 20 5 %
COMPUTER 22 1 5 %
MILITARY 37 2 5 %
SOLAR 19 1 5 %
HACKERS 23 1 4 %
ELECTRON 173 5 3 %
FIDSTKS 186 5 3 %
INFRA 34 1 3 %
OILGAS 157 4 3 %
REGBANKS 31 1 3 %
RUS-1000 819 21 3 %
SEMI 125 4 3 %
SP500 477 13 3 %
BIG17 46 1 2 %
CHINA 60 1 2 %
GOLD 50 1 2 %
SOFTWARE 64 1 2 %
SP-100 94 2 2 %
INDMATER 82 1 1 %
INDEXES 189 1 1 %
|
Table 4
Count of Stocks and New Lows in Key Tiger Directories
Date = 180705
No. NLs Pct.
--------------------------------------------------
FOOD 9 3 33 %
PIPELINE 7 1 14 %
CHINA 60 7 12 %
MINCP 134 10 7 %
BONDFUND 111 6 5 %
ETFS 61 3 5 %
COMODITY 55 2 4 %
GAMING 28 1 4 %
BIOTECH 410 14 3 %
CHEM 62 1 2 %
INDMATER 82 2 2 %
SOFTWARE 64 1 2 %
UTILITY 41 1 2 %
ELECTRON 173 1 1 %
FINANCE 90 1 1 %
INDEXES 189 1 1 %
OILGAS 157 2 1 %
SEMI 125 1 1 %
RUS-1000 819 1 0 %
|
Table 5
RANKING OF KEY DIRECTORIES BASED PCT.OF STOCKS ABOVE 65-DMA
7/5/18
Bullish = 28
Bearish = 19
---------------------------------------------------------------------------------------
Directory Current day-1 day-2 day-3 day-4 day-5
----------------------------------------------------------------------------------------
REIT .93 .919 .89 .878 .878 .895
PIPELINE .857 .714 .571 .714 .714 .571
NIFTY .758 .689 .724 .689 .655 .689
UTILITY .756 .756 .756 .707 .707 .707
BEVERAGE .75 .7 .65 .65 .7 .55
COAL .75 .625 .625 .75 .75 .75
COMPUTER .727 .681 .681 .59 .636 .636
EDU .714 .714 .714 .714 .714 .714
SOFTWARE .687 .64 .64 .562 .531 .468
RETAIL .673 .692 .673 .73 .711 .788
NASD-100 .651 .584 .64 .617 .595 .528
REGBANKS .612 .516 .548 .387 .548 .516
OILGAS .611 .63 .598 .662 .636 .668
HACKERS .608 .608 .608 .565 .521 .391
INDEXES .608 .587 .571 .55 .566 .481
CHEM .596 .612 .596 .612 .596 .612
BONDFUND .594 .63 .72 .666 .594 .603
FIDSTKS .591 .526 .553 .548 .516 .473
BIOTECH .587 .556 .541 .519 .502 .502
RUS-1000 .582 .539 .553 .544 .537 .522
SP500 .578 .538 .555 .557 .551 .528
SP-100 .574 .521 .553 .553 .542 .489
GAMING .571 .535 .5 .571 .5 .5
HOSPITAL .571 .571 .571 .428 .428 .428
BIG17 .543 .543 .478 .434 .434 .434
DOWJONES .533 .5 .533 .533 .566 .5
ELECTRON .531 .439 .514 .445 .445 .427
HOMEBLDG .529 .411 .411 .47 .411 .411
N= 28
============================================================================================
GOLD .48 .36 .26 .28 .22 .24
SEMI .48 .368 .48 .424 .424 .376
INFRA .47 .411 .382 .352 .382 .352
FINANCE .466 .388 .422 .344 .355 .311
INDMATER .451 .439 .414 .451 .439 .426
TRANSP .45 .35 .4 .3 .25 .3
GREEN .448 .448 .448 .413 .379 .517
GUNS .444 .444 .388 .555 .555 .666
AUTO .41 .282 .307 .256 .307 .358
INSURANC .4 .266 .233 .266 .166 .133
DJI-13 .384 .384 .384 .384 .384 .307
MILITARY .351 .486 .405 .378 .378 .378
COMODITY .309 .327 .309 .327 .309 .29
JETS .3 .1 .1 .1 0 .1
SOLAR .21 .21 .21 .21 .21 .263
ETFS .163 .049 .081 .131 .098 .049
BIGBANKS .142 .142 .142 .142 .142 0
CHINA .116 .133 .116 .133 .116 .133
FOOD 0 0 0 0 0 0
N=19
|
====================================================================
7/3/2018 Tuesday the DJI
gave a reversing Peerless Buy B9. The median
gain for a
Buy B9 is 7.5% at the time of the next reversing sell. The average paper loss
is about 1%.
Past Buy B9 Statistics: June-July Buy B9s: 1928-2018
DJIA Gain Max. Paper Loss
low pct. date
19330724 B9 94.3 .054 90.8 -.04 7/31
la/ma= 0.932 aroc=-0.165 PI=+12 (+49) IP21= -.145 VI=-528 OP=+.082
=================================================================================
19860709 B9 1826.07 .005 1769.97 -.03 8/4
la/ma= 0.978 aroc=-.090 PI=-13 (+77) IP21= +.050 VI=-3 OP=+.093
=================================================================================
20000616 B9 10449.30 .040 10376.1 -.01 6/22
la/ma= 0.985 aroc=-.359 PI=+93 (+27) IP21= -.079 VI=-68 OP=-.014
=================================================================================
20050624 B9 10297.84 .124 10216.9 -.01 10/12
la/ma= 0.979 aroc=-0.181 PI=+358 (+17) IP21= -.125 VI=+11 OP=-.207
=================================================================================
20060718 B9 10799.23 .148 none 0
la/ma= 0.980 aroc=-0.232 PI=-28 (+55) IP21= +.124 VI=-200 OP=+.000
=================================================================================
20170703
la/ma= 0.977 aroc=-0.307 PI=+105 (-6) IP21= +.016 VI=-68 OP=+.136
ALL CLOSED OUT BUY B9s'
AVERAGE GAIN WHEN REVERSED
Mean: 0.106 (+10.6%)
Median: .074
Mode: .063, .048, .040, .058, each appeared 3 times
Largest: +.459
Smallest:-.017
Count: 71
Cases:
.459, .324, .26, .249, .245, .225, .215, .207, .207, .203, .198, .183,
.183, .179, .154, .151, .15, .148, .148, .142, .135, .126, .125, .124,
.124, .122, .118, .105, .103, .103, .100, .100, .092, .087, .077, .074,
.07, .067, .063, .063, .063, .06, .059, .058, .058, .058, .057, .057,
.056, .054, .052, .048, .048, .048, .045, .045, .044, .042, .040, .040,
.040, .038, .038, .035, .034, .033, .022, .018, .017, .005, -.017
|
Peerless Buy B9s consider a positive NYSE breadth reading from the P-Indicator
to be more important than the negative V-I (significant down-volume). Thus, we see
just above where the V-I was as negative as it is now and still the DJI in each of the
June-July B9s ended up rising at least 4% at the time of the next Peerless
Sell. That
would easily take the DJI back up to its red resistance at 25500.

The SP-500 is still boxed in by a head/shoulders pattern. See Monday's discussion.
It needs to destroy this pattern and rise above the potential right shoulder peak in the
chart shown below. There are also a number of stocks in this situation. We will
report
on them in coming days. Until these H/S patterns are destroyed and the NYSE ADL
makes a new high, we cannot rule out another closer test of 24000, first because
we still do not know what China and Europe will do in retaliation to the Trump tariffs
and, second, because short-term interest rates rose to a new high on Tuesday. I do
believe that Friday's very good Job numbers for June may give the market a good
boost.
We must watch to see if SPY can rise above 275
and destroy its H/S pattern.

What about the predominant Professional selling?
We shall soon see if Peerless is
correct. We do need to see the key ETFs' Closing Powers break above their CP
downtrends. We can't rule out another wave of Professional selling into the higher
openings later this week. That is partly why I would pefer to buy IBB or IWM
now. Their steep Closing Power downtrends have already been broken.
Seasonality?
Since 1965, the DJI has risen 73.1% of the time over the next month
and the average gain is 1.5%. Over the next two months, the DJI typically gains
2.9%.
Unfortunately, Summer Rallies are much scarcer in years of mid-term Elections. The
DJI does rally 56.3% of the time over the next month, but only 43.8% of the time
over the next two months. So, a rally past the red resistance at 25500 may
be difficult.
Before doing the research tonight on what followed past down-days on the DJI right
before July fourth, I was a little anxious about the Buy new B9. I still recall the
8% sell-off
right after July 4th in 1986. But that was when the DJI was near the upper
band
Conclusion.
The track-record of all past 71 Buy B9s and all the Buy B9s in June and
July is solidly bullish. Expect another recovery back to the green resistance line shown
below,
at the least.. Hold back a little. Higher openings are not to be trusted when
trading the
major market ETFs. Recently, there has been an almost fixed determination by
Professionals
to sell immediately after each higher opening. That could still be a problem.
Fortunately,
the paper losses with earlier B9s are usually quite limited, so buying more at closes
has to be encouraged.
What to do? I suspect that biotech upside breakouts and IWM will do better
than the DJI. See Table 1, Table 3 below and the biotechs listed among the
Bullish MAXCPs. The seemingly endless and meaningless ups and downs of the DJI
while it is stuck in its own little box of 24000-25000 should not get you down.
Consider some of our bullish MAXCPs and confirmed biotech breakouts.
.


Charts 7/03/2018
PEERLESS DJI, Signals,
Indicators Daily DJI Volume 10-DayUp/Down Vol
Hourly DJIA A/D Line for All
Stocks
NASDAQ S&P OEX NYSE COMPQX DJI-15 DJI-20 DJI-30
DIA SPY QQQ MDY IWM
TNA
Short-Term Rates
USO-CrudeOil FAS GLD BBH IBB JETS JNUG KOL NUGT OIH OIL RSX RETL
SDS SLV SOXL TECL TMF TNA UGA (gasoline) XIV YINN
Commodities: CANE
JJC, NIB, CHOC
CORN,
CUT (paper) WEAT UUP (Dollar)
AAPL ADBE ALXN AMAT AMGN AMD AMZN BA BABA BAC BIDU CAT CVX DE
FB GOOG GS HD IBM JPM M (Macy's) MSFT NFLX NVDA QCOM TSLA TXN XOM WMT
ANDV (refinery), CMG (Chipotle), LRCX, SWKS, MDGL
SPPI WATT
SQ TOWN
7/03/2018 (Click on Underlined link.)
Bullish MAXCPs - http://tigersoft.com/MAXCPZ/703/BULLISH.htm
Bearish MAXCPs - http://tigersoft.com/MINCPZ/703/BEARISH.htm
|
Table 1
QUICKSILVER on ETFS - 07/03/18
ETF CLOSE CHANGE PIVOT-PT 5-dma AROC CL-PWR CANDLE IP21 ITRS
---------------------------------------------------------------------------------------------
DIA 241.66 -1.07 241.12 -20.8% Bearish RED -.014 0
---------------------------------------------------------------------------------------------
COMPQX 7502.67 -65.02 7445.08 -39.2% Bearish RED .115 .063
---------------------------------------------------------------------------------------------
SPY 270.9 -.96 269.35 -12.9% Bearish RED .028 .027
---------------------------------------------------------------------------------------------
QQQ 170.8 -2 169.73 -37% Bearish RED .047 .066
---------------------------------------------------------------------------------------------
MDY 355.99 .93 353.17 -15.2% Bearish RED .101 .04
---------------------------------------------------------------------------------------------
IWM 164.96 .06 163.38 -32.8% ---- BLUE .17 .073
---------------------------------------------------------------------------------------------
FAS 62.51 -1.15 61.31 -81.1% Bearish RED -.044 -.022
---------------------------------------------------------------------------------------------
RETL 42.51 .83 43.45 -341.4% Bearish BLUE .041 .333
---------------------------------------------------------------------------------------------
SOXL 135.96 -8.15 137.41 -433.9% Bearish RED .085 .099
---------------------------------------------------------------------------------------------
TECL 132.23 -5.04 129.24 -91.7% Bearish RED .087 .152
---------------------------------------------------------------------------------------------
IBB 110.59 -.1 107.34 46.8% Bullish RED .095 .066
---------------------------------------------------------------------------------------------
GLD 118.65 1.19 118.58 -25.8% Bearish BLUE -.275 -.044
---------------------------------------------------------------------------------------------
OIL 7.61 .04 6.89 339.4% Bullish BLUE .263 .072
---------------------------------------------------------------------------------------------
OIH 25.76 .21 26.44 -5.8% Bearish RED -.13 -.036
---------------------------------------------------------------------------------------------
GASL 23.73 .66 24.21 39.8% ---- RED -.093 .126
---------------------------------------------------------------------------------------------
UGA 33.78 -.05 33.77 105% Bullish RED -.123 .003
---------------------------------------------------------------------------------------------
UUP 24.98 -.08 25.14 -2% ---- ---- .033 .058
---------------------------------------------------------------------------------------------
IEF 102.51 .26 102.69 10.2% Bullish BLUE -.194 .021
---------------------------------------------------------------------------------------------
XLU 52.48 .15 51.9 79.9% Bullish BLUE .161 .054
---------------------------------------------------------------------------------------------
WEAT 6.25 .12 6.22 48.3% Bearish ---- -.186 .006
---------------------------------------------------------------------------------------------
YINN 23.86 -.14 23.88 -438.4% Bearish RED .021 -.238
---------------------------------------------------------------------------------------------
|
Table 2 Count of Stocks in Key Directories
20180703
-------------------------------
NEWHIGHS 98 Bullish
NEWLOWS 54
MAXCP 46
MINCP 141 Professionals are still bearish.
TTTNH 58
TTTNL 131 Day Traders are bearish.
FASTUP 68
FASTDOWN 110
CPCROSSA 76 Swing Traders are Bullish
CPCROSSD 48
BIGVOLUP 3
BIGVODN 6
|
Table 3
Count of Stocks and New Highs in Key Tiger Directories
Date = 180703
No. NHs Pct.
-------------------------------------------------------------------
-------------------------------------------------------------------
MAXCP 46 30 65 %
EDU 7 2 29 %
REIT 173 10 6 %
SOLAR 19 1 5 %
BIOTECH 410 15 4 %
OILGAS 157 6 4 %
GREEN 29 1 3 %
REGBANKS 31 1 3 %
SOFTWARE 64 2 3 %
BIG17 46 1 2 %
CHEM 62 1 2 %
CHINA 60 1 2 %
GOLD 50 1 2 %
UTILITY 41 1 2 %
ELECTRON 173 2 1 %
FINANCE 90 1 1 %
INDEXES 189 1 1 %
NASD-100 89 1 1 %
RUS-1000 819 7 1 %
SEMI 126 1 1 %
SP500 477 3 1 %
|
Table 4
Count of Stocks and New Lows in Key Tiger Directories
Date = 180703
No. NLs Pct.
-------------------------------------------------
MINCP 141 33 23 %
FOOD 9 2 22 %
SOLAR 19 3 16 %
AUTO 40 6 15 %
BIGBANKS 7 1 14 %
HOSPITAL 7 1 14 %
PIPELINE 7 1 14 %
CHINA 60 4 7 %
GAMING 28 2 7 %
SEMI 126 9 7 %
ELECTRON 173 10 6 %
ETFS 61 3 5 %
SOFTWARE 64 3 5 %
BONDFUND 111 4 4 %
BIOTECH 410 11 3 %
CHEM 62 2 3 %
FIDSTKS 186 5 3 %
FINANCE 90 3 3 %
INFRA 34 1 3 %
SP500 477 12 3 %
COMODITY 55 1 2 %
GOLD 50 1 2 %
OILGAS 157 3 2 %
RUS-1000 819 16 2 %
UTILITY 41 1 2 %
INDMATER 82 1 1 %
INDEXES 189 1 1 %
NASD-100 89 1 1 %
REIT 173 1 1 %
SP-100 94 1 1 %
|
Table 4 RANKING OF KEY DIRECTORIES BASED PCT.OF STOCKS ABOVE 65-DMA
7/3/18
Bullish = 25
Bearish = 21
---------------------------------------------------------------------------------------
Directory Current day-1 day-2 day-3 day-4 day-5
----------------------------------------------------------------------------------------
REIT .913 .884 .878 .878 .895 .913
UTILITY .756 .756 .707 .707 .707 .707
EDU .714 .714 .714 .714 .714 .571
PIPELINE .714 .571 .714 .714 .571 .857
BEVERAGE .7 .65 .65 .7 .55 .75
RETAIL .692 .673 .73 .711 .788 .807
NIFTY30 .689 .724 .689 .655 .689 .724
COMPUTER .652 .652 .565 .608 .608 .652
SOFTWARE .64 .64 .562 .531 .468 .578
BONDFUND .63 .72 .666 .594 .603 .567
OILGAS .63 .598 .662 .636 .681 .63
COAL .625 .625 .75 .75 .75 .75
CHEM .612 .596 .612 .596 .612 .629
HACKERS .608 .608 .565 .521 .391 .521
INDEXES .587 .571 .55 .566 .507 .534
NASD-100 .584 .64 .617 .595 .528 .617
HOSPITAL .571 .571 .428 .428 .428 .571
BIOTECH .556 .541 .519 .502 .497 .587
BIG17 .543 .478 .434 .434 .434 .456
RUS-1000 .538 .551 .544 .537 .525 .588
SP500 .538 .555 .557 .551 .53 .587
GAMING .535 .5 .571 .5 .5 .642
FIDSTKS .526 .553 .548 .516 .473 .548
SP-100 .521 .553 .553 .542 .489 .574
REGBANKS .516 .548 .387 .548 .516 .677
N = 25
==========================================================================================
DOWJONES .5 .533 .533 .566 .5 .633
==========================================================================================
MILITARY .486 .405 .378 .378 .378 .486
GREEN .448 .448 .413 .379 .517 .551
GUNS .444 .388 .555 .555 .666 .666
ELECTRON .439 .514 .445 .445 .427 .531
INDMATER .439 .414 .451 .439 .451 .439
HOMEBLDG .411 .411 .47 .411 .411 .411
INFRA .411 .382 .352 .382 .382 .47
FINANCE .388 .422 .344 .355 .322 .488
DJI-13 .384 .384 .384 .384 .307 .384
SEMI .365 .476 .42 .42 .38 .492
GOLD .36 .26 .28 .22 .24 .28
TRANSP .35 .4 .3 .25 .3 .4
COMODITY .327 .309 .327 .309 .29 .254
AUTO .3 .325 .275 .325 .375 .425
INSURANC .29 .258 .29 .193 .161 .225
SOLAR .21 .21 .21 .21 .263 .315
BIGBANKS .142 .142 .142 .142 0 0
CHINA .133 .116 .133 .116 .133 .216
JETS .1 .1 .1 0 .1 .1
ETFS .049 .081 .131 .098 .049 .081
FOOD 0 0 0 0 0 0
N=21
|
=====================================================================
7/2/2018 The operative Peerless signal remains a Sell S9V.
Today, the DJI
bounced up off the 24000 support. Because of the bullish seasonality, the
the day before and the day after the Fourth of July, expect the DJI to rally to
its 21-day ma, now at 24775. Because there has been no Peerless Buy
signal yet, I would think the DJI will again need to test 24000. The positives
here are the rising A/D Line and the rising 200-day ma. The negatives are
the still red Volume-Indicator and the tendency of the DJI not to be
able to advance much after a strong opening because there remains a lot
of shares that big institutions are seeking to get out of, especially in many of
the higher priced (and more weighty) blue chips, like CAT, GS, JPM and
BA.
The back and forth period in the major market that we are now seeing is
frustrating for anyone wanting sustained and bigger moves in the major ETFs.
I would suggest now might be a time to follow a hedging approach with
our MAXCPs and MINCPs or, if you have the time, get to know the
biotechs. Among them, we seem always to be able to find excellent
and confirmed breakouts above flat tops and confirmed breakdowns
below the neckline-supports in bearish head/shoulders pattern. Get our
Explosive Super Stocks, Killer Short Sales, and Closing Power books
out and look for examples among biotechs. As I show below, you can
be long and short at the same time and still make regular profits.

The SP-500 is a little stronger than the DJI. But it, too, is caught and
boxed in. It found support at its 65-dma today, as it has on each recent dip
to this level. This has created a neckline-support there. A failed rally
by it
over the next week or two could allow it to form and complete a
bearish head/shoulders pattern. See the chart below. Trading SPY now
will require a lot of speed and dexterity. Just keep in mind the support
and resistance levels shown below.

A number of NASDAQ stocks, like GOOG, could be forming their own bearish
head/shoulders patterns. But a good rally by them now would push their prices
above the apexes of their potential right shoulder in this formation and should
then cause a rush of short covering. It is not clear whether these NASDAQ stocks
will breakout above their head/shoulders right-shoulder pivot points. We should
watch them for the next few trading days to get a better idea of the market's
strength. Watch these stocks.
7/2 Price Pivot-Point
AAPL 187.18
189
ADBE 243.26
246
ADP 134.86
137
EXPD 73.37
75
HEDGING: Long and Short at Same Time
The media is generally telling us that Trump's trade war will hurt many companies
and cause inflation. But the opposite may be true for companies that manufacture
in the US and do mostly domestic business. Possibly some of our really
bullish-looking MAXCPs will benefit from such protection. Thus, hedging using
longs on bullish our MAXCPs and shorts on our MINCPs seems particularly
appropriate now that the DJI and SP-500 are narrowly confined and the
"nifty" high tech leaders are so richly priced and could be forming
head.shoulders
patterns. But as good as our Power Ranker is with the MAXCPs and MINCPs,
it will pay to study the volatile Biotech charts themselves using our Buy and Sell
signals, chart patterns and Closing Power. Look for very bullish breakouts and
very bearish head/shoulders pattern breakdowns. See how differently two biotechs
(BLFS and JNCE) have moved recently to demonstrate this.
Bullish Breakout

Bearish Breakdown
 |
Charts 7/02/2018
PEERLESS DJI, Signals,
Indicators Daily DJI Volume 10-DayUp/Down Vol V-Indicator
Hourly DJIA A/D Line for All
Stocks
NASDAQ S&P OEX NYSE COMPQX DJI-15 DJI-20 DJI-30
DIA SPY QQQ MDY IWM
TNA
Short-Term Rates
USO-CrudeOil FAS GLD BBH IBB JETS JNUG KOL NUGT OIH OIL RSX RETL
SDS SLV SOXL TECL TMF TNA UGA (gasoline) XIV YINN
Commodities: CANE
JJC, NIB, CHOC
CORN,
CUT (paper) WEAT UUP (Dollar)
AAPL ADBE ALXN AMAT AMGN AMD AMZN BA BABA BAC BIDU CAT CVX DE
FB GOOG GS HD IBM JPM M (Macy's) MSFT NFLX NVDA QCOM TSLA TXN XOM WMT
ANDV (refinery), CMG (Chipotle), LRCX, SWKS, MDGL
SPPI WATT
SQ TOWN
7/02/2018 (Click on Underlined link.)
Bullish MAXCPs - http://tigersoft.com/MAXCPZ/702/BULLISH.htm
Bearish MAXCPs - http://tigersoft.com/MINCPZ/702/BEARISH.htm
|
Table 1
QUICKSILVER on ETFS - 07/02/18
ETF CLOSE CHANGE PIVOT-PT 5-dma AROC CL-PWR CANDLE IP21 ITRS
---------------------------------------------------------------------------------------------
DIA 242.73 0 242.67 8.7% Bearish BLUE .016 ----
---------------------------------------------------------------------------------------------
COMPQX 7567.69 57.39 7561.63 23.8% ---- BLUE .179 .066
---------------------------------------------------------------------------------------------
SPY 271.86 .58 271.6 15.9% Bearish BLUE .055 .027
---------------------------------------------------------------------------------------------
QQQ 172.8 1.15 172.07 41.8% Bullish BLUE .102 .072
---------------------------------------------------------------------------------------------
MDY 355.06 .04 357.07 -20.5% ---- BLUE .166 .034
---------------------------------------------------------------------------------------------
IWM 164.9 1.13 166.04 -5.5% ---- BLUE .215 .067
---------------------------------------------------------------------------------------------
FAS 63.66 .66 63.53 -12.7% Bearish BLUE -.002 -.011
---------------------------------------------------------------------------------------------
RETL 41.68 -.33 45.46 -376.1% ---- BLUE .082 .33
---------------------------------------------------------------------------------------------
SOXL 144.11 2.61 148.32 -93.4% Bearish BLUE .163 .114
---------------------------------------------------------------------------------------------
TECL 137.27 3.98 134.68 153.6% ---- BLUE .139 .181
---------------------------------------------------------------------------------------------
IBB 110.69 .87 109.57 22.5% Bullish BLUE .127 .062
---------------------------------------------------------------------------------------------
GLD 117.46 -1.19 119.26 -102.2% Bearish RED -.301 -.065
---------------------------------------------------------------------------------------------
OIL 7.61 .04 6.89 339.4% Bullish BLUE .263 .069
---------------------------------------------------------------------------------------------
OIH 25.55 -.72 25.79 9.6% Bearish RED -.122 -.041
---------------------------------------------------------------------------------------------
GASL 23.07 -1.27 23.54 219.7% Bearish RED -.131 .125
---------------------------------------------------------------------------------------------
UGA 33.83 -.68 33.07 162.2% Bullish RED -.102 .021
---------------------------------------------------------------------------------------------
UUP 25.06 .12 24.99 40% Bullish ---- .087 .064
---------------------------------------------------------------------------------------------
IEF 102.25 -.26 102.3 0% Bearish RED -.247 .014
---------------------------------------------------------------------------------------------
XLU 52.33 .37 51.65 71.4% Bullish BLUE .121 .048
---------------------------------------------------------------------------------------------
WEAT 6.13 -.25 6.19 -120.1% Bearish RED -.229 -.023
---------------------------------------------------------------------------------------------
YINN 24 -1.4 26.03 -419.1% Bearish ---- .067 -.239
---------------------------------------------------------------------------------------------
RSX 21.07 -.17 20.64 50.4% Bullish RED .109 .01
---------------------------------------------------------------------------------------------
AAPL 187.18 2.07 184.43 135.9% ---- BLUE -.031 .137
---------------------------------------------------------------------------------------------
GOOG 1127.46 11.81 1118.46 11.9% Bullish BLUE .057 .058
---------------------------------------------------------------------------------------------
MSFT 100.01 1.4 99.08 82.3% Bearish BLUE -.049 .06
---------------------------------------------------------------------------------------------
AMZN 1713.78 13.98 1691.09 150.4% ---- BLUE .118 .129
---------------------------------------------------------------------------------------------
FB 197.36 3.04 199 25.7% Bullish BLUE .172 .194
---------------------------------------------------------------------------------------------
NVDA 242.24 5.34 241.99 65.3% Bearish BLUE -.008 .066
---------------------------------------------------------------------------------------------
BA 336.08 .57 331.3 73.4% Bearish BLUE -.133 0
---------------------------------------------------------------------------------------------
GS 223.26 2.69 221.58 38.8% Bearish BLUE -.119 -.107
---------------------------------------------------------------------------------------------
HD 194.02 -1.08 196.36 -60.3% ---- BLUE .194 .103
---------------------------------------------------------------------------------------------
CAT 136.29 .62 135.54 -10.7% Bearish BLUE -.265 -.104
|
Table 2
Count of Stocks in Key Directories
20180702
-------------------------------
NEWHIGHS 103
NEWLOWS 100
MAXCP 67
MINCP 97 Professionals still more bearish than bullish.
TTTNH 64
TTTNL 142 Day Traders are 2:1 bearish.
FASTUP 82
FASTDOWN 126 Swing traders are net bearish.
CPCROSSA 228 Big improvment in Professional bullishness.
CPCROSSD 66
BIGVOLUP 9
BIGVODN 11
|
Table 3
Count of Stocks and New Highs in Key Tiger Directories
Date = 180702
No. NHs Pct.
-------------------------------------------------------------------
-------------------------------------------------------------------
MAXCP 67 39 58 %
EDU 7 2 29 %
COMPUTER 23 2 9 %
GREEN 29 2 7 %
SOFTWARE 64 4 6 %
BEVERAGE 20 1 5 %
TRANSP 20 1 5 %
UTILITY 41 2 5 %
HACKERS 23 1 4 %
BIOTECH 410 13 3 %
CHEM 62 2 3 %
ELECTRON 173 5 3 %
FIDSTKS 186 5 3 %
BIG17 46 1 2 %
CHINA 60 1 2 %
INDMATER 82 2 2 %
NASD-100 89 2 2 %
SEMI 126 2 2 %
FINANCE 90 1 1 %
INDEXES 189 1 1 %
OILGAS 157 2 1 %
REIT 173 2 1 %
RUS-1000 819 10 1 %
SP-100 94 1 1 %
SP500 477 6 1 %
|
Table 4
Count of Stocks and New Lows in Key Tiger Directories
Date = 180702
No. NLs Pct.
-------------------------------------------------
FOOD 9 5 56 %
MINCP 97 41 42 %
BIGBANKS 7 1 14 %
HOSPITAL 7 1 14 %
PIPELINE 7 1 14 %
COMODITY 55 7 13 %
CHINA 60 7 12 %
AUTO 40 3 7 %
FINANCE 90 5 6 %
ETFS 61 3 5 %
SOLAR 19 1 5 %
GAMING 28 1 4 %
HACKERS 23 1 4 %
BIOTECH 410 12 3 %
FIDSTKS 186 5 3 %
INFRA 34 1 3 %
OILGAS 157 4 3 %
BONDFUND 111 2 2 %
ELECTRON 173 3 2 %
SEMI 126 2 2 %
SOFTWARE 64 1 2 %
SP500 477 10 2 %
UTILITY 41 1 2 %
INDMATER 82 1 1 %
INDEXES 189 2 1 %
NASD-100 89 1 1 %
REIT 173 1 1 %
RUS-1000 819 12 1 %
SP-100 94 1 1 %
|
Table 5
RANKING OF KEY DIRECTORIES BASED PCT.OF STOCKS ABOVE 65-DMA
7/2/18
Bullish = 25
Bearish = 22
---------------------------------------------------------------------------------------
Directory Current day-1 day-2 day-3 day-4 day-5
----------------------------------------------------------------------------------------
REIT .884 .878 .878 .895 .913 .924
UTILITY .756 .707 .707 .707 .707 .682
NIFTY .724 .689 .655 .689 .724 .689
BONDFUND .72 .666 .594 .603 .558 .531
EDU .714 .714 .714 .714 .571 .571
RETAIL .673 .73 .711 .788 .807 .846
COMPUTER .652 .565 .608 .608 .695 .652
BEVERAGE .65 .65 .7 .55 .75 .75
NASD-100 .64 .617 .595 .528 .617 .606
SOFTWARE .64 .562 .531 .468 .578 .578
COAL .625 .75 .75 .75 .75 .625
HACKERS .608 .565 .521 .391 .521 .478
OILGAS .598 .662 .636 .681 .636 .522
CHEM .596 .612 .596 .612 .629 .596
INDEXES .576 .55 .566 .507 .529 .55
HOSPITAL .571 .428 .428 .428 .571 .571
PIPELINE .571 .714 .714 .571 .857 .571
SP500 .555 .557 .551 .53 .584 .584
FIDSTKS .553 .548 .516 .473 .543 .553
SP-100 .553 .553 .542 .489 .574 .595
RUS-1000 .551 .544 .537 .525 .586 .584
REGBANKS .548 .387 .548 .516 .677 .709
BIOTECH .541 .519 .502 .497 .587 .57
DOWJONES .533 .533 .566 .5 .633 .6
ELECTRON .514 .445 .445 .427 .531 .468
N==25
--------------------------------------------------------------------------------------------
GAMING .5 .571 .5 .5 .642 .571
BIG17 .478 .434 .434 .434 .456 .456
SEMI .476 .42 .42 .38 .492 .436
GREEN .448 .413 .379 .517 .551 .482
FINANCE .422 .344 .355 .322 .466 .5
INDMATER .414 .451 .439 .451 .439 .39
HOMEBLDG .411 .47 .411 .411 .411 .411
MILITARY .405 .378 .378 .378 .486 .432
TRANSP .4 .3 .25 .3 .4 .4
GUNS .388 .555 .555 .666 .666 .666
DJI-13 .384 .384 .384 .307 .384 .307
INFRA .382 .352 .382 .382 .47 .352
AUTO .325 .275 .325 .375 .425 .425
COMODITY .309 .327 .309 .29 .254 .218
GOLD .26 .28 .22 .24 .28 .26
INSURANC .258 .29 .193 .161 .193 .258
SOLAR .21 .21 .21 .263 .315 .263
BIGBANKS .142 .142 .142 0 0 .142
CHINA .116 .133 .116 .133 .216 .216
JETS .1 .1 0 .1 .1 .1
ETFS .081 .131 .098 .049 .081 .081
FOOD 0 0 0 0 0 0
|
====================================================================
6/28/2018 The operative Peerless signal remains a Sell S9V. The DJI is down
200 as I write this. This seems to be a response to Canada's retaliatory tariffs
on the US exports. This was highly predictable. The big questions remain
what will be Europe's and China's response to the Trump tariffs and will
Peerless give a reversing Buy B2 or B9 on a DJI close near 24000. First,
I think we can safely surmise that the response of Europe and China to Trump's
tariffs will be a lot more hostile. But Peerless does not know any of this and will
almost certainly give a Buy B2 or Buy B9 on a close near 24000. However, a
decline tomorrow much lower, may scare Peerless away from giving a Buy signal.
Ordinarily, we would expect a rally this week because of Independence Day
(Wednesday). That was the primary reason for covering the DIA short on Friday.
But this seasonal bounce is running out of time.
Let's look back at earlier Buy B2s and Buy B9s (The P-Indicator remains positive,
so a B9 is likley.) when they occur at the end of June. We find no less than
five successful B2s and B9s since 1929. Each of these suffered a small paper
loss. It is important, I think, that none of them took place with the DJI down much
more than 3.1% below their 21-dma. That roughly corresponds to 24000.
From all these factors, I would suggest that a drop tomorrow much below 24000
may well bring another test of 23500. That will certainly be interesting. The
flat,
well-tested support there is of great technical importance. A close below 23300
will bring a Sell S10, one way or another, computed or judged.
The Tiger Stocks' Hotline on our Elite Page is short 10 stocks and long none.
End of June Buy B2s/B9s
Gain Paper la/ma aroc P-I
IP21 V-I OPct
Loss
-----------------------------------------------------------------------
B2 6/28/1939 +.16 -.02
.969 -.434 -57 -.003 -69 .153
B2 6/28/1951 +.13 -.01
.977 -.210 -105
+.094 -239 -.145
B2 6/23/1978 +.10 -.03
.970 -.203 -114 -.110 -1 .072
B2 6/24/1991 +.03 -.01
.978 .052 -47 +.113 -9 .017
B9 6/24/2005 +.12 -.01
.979 -.181 +356-.121 +13 .215
*B9 7/2/2018 ??? ???
.969 -.305 +37 -.016 -87
-.152
(*This is based on a close at 24000 with 1300 more down than up and
NYSE Down volume 3x Up Volume.
Any close much below 24000 would drop the "la/ma" below the .969
level in the cases above and make any B2 or B9 look more risky. Traders
may not want to buy until the Chinese and Europeons respond to Trump's
latets tariffs.
Professional Selling
Friday's big jump in prices at the opening was crushed once again. Big supplies
of institutional stock for sale continue to overhang the market and aggressive
Institutional sell orders again dominated at the close. That is the main meaning I
make of the failures of the market to hold its big early big gains. The DJI's
negative V-Indicator, the way the Hourly DISI (OBV) is making new lows
ahead of prices and the falling Closing powers are warnings that we cannot yet
trust the potential Buy B2 occurring if the DJI comes down closer to the
lower 3% band.

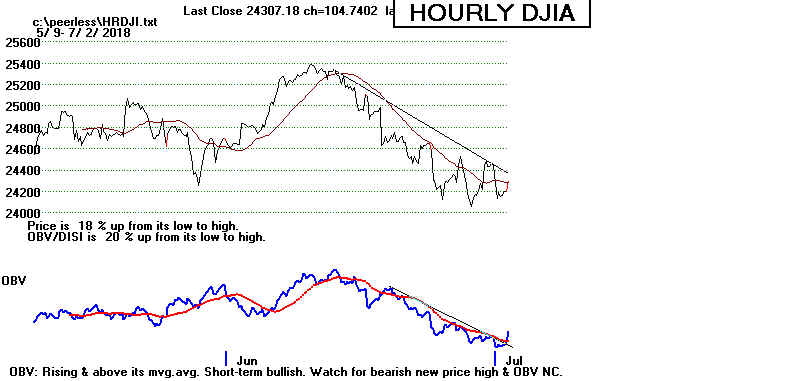
SPY must hold above
268.

Winners and Losers
The tariffs' wars make for new winners and losers. The
best way I know to
distinguish them is to watch the Bullish MAXCPs and BEARISH MINCPs.
Biotechs, Crude Oil, Gold and Silver seem to be favored now by bulls. Tariffs
will have little effect on Biotechs. Crude Oil looks technically strong. And
Gold
and Silver are over-sold and should rally unless the Fed becomes very aggressive
with interest rates, something the White House will discourage more and more
as the political wars leading up to the November Election heat up.
We see lots of Latin American stocks among the bearish MINCPs. Exporting
to the US is getting more expensive. That also makes the currencies of many
countries overseas weak against the Dollar. That the rising domestic and
international debts are showing more delinquencies is very unsettling to American
banks. Thus, we see much weakness in the big banks, like BAC and JPM. Adding
to that is the fear that there will be no big domestic infrastructure undertaking by
the Federal Goverment because the US Debt is too large. Will the US economy
as a whole start to slow down? We should watch a number of key stocks now
to see if they can stay above their important support levels. This will tell us
if these anxieties are growing and are likely to drop the DJI down to 23400-23500.
The Janaury lows there offer critical support.
6/29 Stock
Important Support Comments
-----------------------------------------------------------
14.99 AMD
14.64 Semi-Conductors often lead the market.
28.19 BAC
28.00
Bank of America is very big US bank stock.
135.67 CAT 137.5
CAT represents a big bet on Infrastructure
world-wide.
186.65 BRKB 188.0
Berks.Hathaway represents value investors'
confidence.
194.32 FB
193.00
FaceBook is a internet stock.
104.2 JPM
103.85
JP Morgan has dominated US banking for 120 years.
271.2 SPY
268.14
SP-500's support is at its flat 65-dma
61.64 SQ
60.
Square represents small business in US
133.29 TECL 129.00
Tech ETF hovering just above 65-dma.
Charts 6/29/2018
PEERLESS DJI, Signals,
Indicators Daily DJI Volume 10-DayUp/Down Vol V-Indicator
Hourly DJIA A/D Line for All
Stocks
NASDAQ S&P OEX NYSE COMPQX DJI-15 DJI-20 DJI-30
DIA SPY QQQ MDY IWM
TNA
Short-Term Rates
USO-CrudeOil FAS GLD BBH IBB JETS JNUG KOL NUGT OIH OIL RSX RETL
SDS SLV SOXL TECL TMF TNA UGA (gasoline) XIV YINN
Commodities: CANE
JJC, NIB, CHOC
CORN,
CUT (paper) WEAT UUP (Dollar)
AAPL ADBE ALXN AMAT AMGN AMD AMZN BA BABA BAC BIDU CAT CVX DE
FB GOOG GS HD IBM JPM M (Macy's) MSFT NFLX NVDA QCOM TSLA TXN XOM WMT
ANDV (refinery), CMG (Chipotle), LRCX, SWKS, MDGL
SPPI WATT
SQ TOWN
6/29/2018 (Click on Underlined link.)
Bullish MAXCPs - http://tigersoft.com/MAXCPZ/629/BULLISH.htm
Bearish MAXCPs - http://tigersoft.com/MINCPZ/629/BEARISH.htm
|
Table 1
QUICKSILVER on ETFS - 06/29/18
ETF CLOSE CHANGE PIVOT-PT 5-dma AROC CL-PWR CANDLE IP21 ITRS
---------------------------------------------------------------------------------------------
DIA 242.73 .65 242.31 -61% Bearish RED -.019 -----
---------------------------------------------------------------------------------------------
COMPQX 7510.3 6.62 7532.01 -120.9% ---- RED .182 .053
---------------------------------------------------------------------------------------------
SPY 271.28 .39 271 -63.7% Bearish RED .047 .024
---------------------------------------------------------------------------------------------
QQQ 171.65 .46 171.37 -106.7% ---- RED .113 .056
---------------------------------------------------------------------------------------------
MDY 355.02 .42 356.52 -93.4% Bearish RED .112 .036
---------------------------------------------------------------------------------------------
IWM 163.77 -.11 165.08 -122.5% Bearish RED .168 .063
---------------------------------------------------------------------------------------------
FAS 63 .03 63.82 -241.6% Bearish RED -.051 -.017
---------------------------------------------------------------------------------------------
RETL 42.01 -1.44 44.98 -555% ---- RED .026 .292
---------------------------------------------------------------------------------------------
SOXL 141.5 .62 146.78 -663.8% Bearish RED .197 .063
---------------------------------------------------------------------------------------------
TECL 133.29 -.49 133.19 -322.5% ---- RED .164 .105
---------------------------------------------------------------------------------------------
IBB 109.82 1.87 110.2 -110.1% Bullish BLUE .127 .053
---------------------------------------------------------------------------------------------
GLD 118.65 .43 119.89 -70.9% Bearish BLUE -.286 -.055
---------------------------------------------------------------------------------------------
OIL 7.61 .04 6.89 339.4% Bullish BLUE .263 .077
---------------------------------------------------------------------------------------------
OIH 26.27 -.08 25.5 17.3% Bearish RED -.1 -.013
---------------------------------------------------------------------------------------------
GASL 24.34 .1 22.03 183% ---- BLUE -.133 .167
---------------------------------------------------------------------------------------------
UGA 34.51 .61 32.74 222.2% Bullish BLUE -.084 .058
---------------------------------------------------------------------------------------------
UUP 24.94 -.2 24.86 8% Bullish RED .087 .073
---------------------------------------------------------------------------------------------
IEF 102.51 -.08 102.25 19.5% Bearish RED -.201 .021
---------------------------------------------------------------------------------------------
XLU 51.96 .08 51.59 117.4% Bullish BLUE .058 .039
---------------------------------------------------------------------------------------------
WEAT 6.38 .22 6.28 -24% Bearish BLUE -.19 0
---------------------------------------------------------------------------------------------
YINN 25.4 .97 26.11 -462.1% Bearish RED .06 -.22
---------------------------------------------------------------------------------------------
RSX 21.24 .39 20.86 86.7% Bullish BLUE .136 .01
---------------------------------------------------------------------------------------------
AAPL 185.11 -.39 182.17 5.2% Bearish RED -.018 .087
---------------------------------------------------------------------------------------------
GOOG 1115.65 1.43 1124.81 -177.3% ---- RED .094 .041
---------------------------------------------------------------------------------------------
MSFT 98.61 -.02 98.39 -91.1% Bearish RED -.033 .042
---------------------------------------------------------------------------------------------
AMZN 1699.8 -1.65 1663.15 -47.1% Bearish RED .085 .107
---------------------------------------------------------------------------------------------
FB 194.32 -1.91 196.35 -187.5% ---- RED .161 .172
---------------------------------------------------------------------------------------------
NVDA 236.9 -3.96 239.12 -290.6% Bearish RED -.005 .05
---------------------------------------------------------------------------------------------
BA 335.51 .86 331.2 -51% Bearish RED -.157 .001
---------------------------------------------------------------------------------------------
GS 220.57 -2.85 221.54 -122.4% Bearish RED -.184 -.117
---------------------------------------------------------------------------------------------
HD 195.1 -.11 196.38 -58.9% ---- RED .15 .117
---------------------------------------------------------------------------------------------
CAT 135.67 -.36 136.58 -156.4% Bearish RED -.289 -.113
|
Table 2 Count of Stocks in Key Directories
20180629
-------------------------------
NEWHIGHS 81
NEWLOWS 67
MAXCP 47
MINCP 232 Bearish
TTTNH 76
TTTNL 228 Bearish
FASTUP 71
FASTDOWN 243 Bearish
CPCROSSA 68
CPCROSSD 37
BIGVOLUP 8
BIGVODN 10
|
Table 3
Count of Stocks and New Highs in Key Tiger Directories
Date = 180628
No. NHs Pct.
-------------------------------------------------------------------
-------------------------------------------------------------------
MAXCP 47 30 64 %
CHEM 62 3 5 %
COMODITY 55 3 5 %
COMPUTER 23 1 4 %
HACKERS 23 1 4 %
OILGAS 157 7 4 %
DOWJONES 30 1 3 %
GREEN 29 1 3 %
MILITARY 37 1 3 %
SOFTWARE 64 2 3 %
BIG17 46 1 2 %
CHINA 61 1 2 %
NASD-100 89 2 2 %
REIT 173 4 2 %
SP-100 94 2 2 %
UTILITY 41 1 2 %
BIOTECH 410 6 1 %
ELECTRON 174 2 1 %
FIDSTKS 186 2 1 %
INDMATER 82 1 1 %
INDEXES 189 1 1 %
RUS-1000 819 10 1 %
SEMI 127 1 1 %
SP500 477 6 1 %
|
Table 4
Count of Stocks and New Lows in Key Tiger Directories
Date = 180628
No. NLs Pct.
-------------------------------------------------
MINCP 232 43 19 %
SOLAR 20 3 15 %
BIGBANKS 7 1 14 %
HOSPITAL 7 1 14 %
FOOD 9 1 11 %
AUTO 40 3 7 %
BIOTECH 410 21 5 %
COMODITY 55 3 5 %
SEMI 127 6 5 %
FINANCE 90 4 4 %
GAMING 28 1 4 %
HACKERS 23 1 4 %
CHINA 61 2 3 %
ELECTRON 174 6 3 %
INFRA 34 1 3 %
REGBANKS 31 1 3 %
CHEM 62 1 2 %
FIDSTKS 186 3 2 %
OILGAS 157 3 2 %
RETAIL 52 1 2 %
SOFTWARE 64 1 2 %
SP500 477 10 2 %
UTILITY 41 1 2 %
BONDFUND 111 1 1 %
INDEXES 189 1 1 %
NASD-100 89 1 1 %
REIT 173 1 1 %
RUS-1000 819 12 1 %
SP-100 94 1 1 %
|
Table 5 RANKING OF KEY DIRECTORIES BASED PCT.OF STOCKS ABOVE 65-DMA
6/29/18
Bullish = 24
Bearish = 23
---------------------------------------------------------------------------------------
Directory Current day-1 day-2 day-3 day-4 day-5
----------------------------------------------------------------------------------------
REIT .878 .878 .895 .913 .93 .936
COAL .75 .75 .75 .75 .625 .75
RETAIL .73 .711 .788 .807 .846 .846
EDU .714 .714 .714 .571 .571 .714
PIPELINE .714 .714 .571 .857 .571 .714
UTILITY .707 .707 .707 .707 .682 .609
NIFTY .689 .655 .689 .724 .689 .827
BONDFUND .666 .594 .603 .558 .531 .594
OILGAS .662 .636 .681 .636 .535 .681
BEVERAGE .65 .7 .55 .75 .75 .7
NASD-100 .617 .595 .528 .617 .606 .685
CHEM .612 .596 .612 .629 .596 .629
GAMING .571 .5 .5 .642 .571 .678
COMPUTER .565 .608 .608 .695 .652 .695
HACKERS .565 .521 .391 .521 .521 .565
SOFTWARE .562 .531 .468 .578 .578 .703
SP500 .557 .551 .53 .584 .587 .631
GUNS .555 .555 .666 .666 .666 .611
SP-100 .553 .542 .489 .574 .595 .627
FIDSTKS .548 .516 .473 .543 .553 .618
RUS-1000 .544 .537 .525 .586 .586 .648
INDEXES .539 .566 .507 .529 .555 .64
DOWJONES .533 .566 .5 .633 .6 .6
BIOTECH .519 .502 .497 .587 .57 .636
N=24
==========================================================================================
HOMEBLDG .47 .411 .411 .411 .411 .411
INDMATER .451 .439 .451 .439 .39 .56
ELECTRON .442 .442 .425 .528 .465 .586
BIG17 .434 .434 .434 .456 .456 .5
HOSPITAL .428 .428 .428 .571 .571 .857
SEMI .417 .417 .377 .488 .425 .559
GREEN .413 .379 .517 .551 .482 .551
REGBANKS .387 .548 .516 .677 .709 .87
DJI-13 .384 .384 .307 .384 .307 .461
MILITARY .378 .378 .378 .486 .432 .54
INFRA .352 .382 .382 .47 .352 .588
FINANCE .344 .355 .322 .466 .511 .644
COMODITY .327 .309 .29 .254 .218 .29
TRANSP .3 .25 .3 .4 .4 .5
INSURANC .29 .193 .161 .193 .258 .354
GOLD .28 .22 .24 .28 .26 .32
AUTO .275 .325 .375 .425 .425 .55
SOLAR .2 .2 .25 .3 .25 .3
BIGBANKS .142 .142 0 0 .142 .142
CHINA .131 .114 .131 .213 .213 .278
ETFS .131 .098 .049 .081 .081 .131
JETS .1 0 .1 .1 .1 .2
FOOD 0 0 0 0 0 .111
|
| |
====================================================================
6/28/2018 The operative Peerless signal remains a Sell S9V. The very
negative V-I readings prevent our getting a Buy B2 now and
the S9s prevent a Stochastic-20 Buy B3. And it remains to be
seen if the sellers that have regularly come forward after an up-opening,
will allow a multiple day rally unfold.
Still, I would cover the shorts in DIA and buy some of the Bullish MAXCPs.
Today the lower band and 24000 held on the DJI. A typical rally going into
Independence Day (July Fourth) is developing.
I would now expect the DJI to rally to its 21-dma. After that, it may top out
and threaten to complete a bearish head/shoulders pattern. So might the SP-500.
Supporting that scenario is the relatively low volume on today's rally. But the
news of the retirement of Justice Kennedy from the Supreme Court is very bullish.
It should give business interests a majority there for a decade.
See
https://www.nytimes.com/2018/06/28/opinion/sunday/supreme-court-kennedy-roberts.html
Importantly, the Big Banks (BAC and JPM) did not break below their well-tested
support today even though Thursday's decline at the close looked quite menacing.
It was also significant that the SP-500 and TECL (representing tech stocks) did not
break below their 65-dma. If their Closing Power downtrends can be broken,
a rally back to their upper bands this Summer would seem very likely. But
first, they must rise above the resistance of their 5-day ma pivot-points.
Very Negative V-I Over-Rides
Positive PI and IP21 Readings at Lower Band
Though I would like to, I cannot accord the market a Buy B2 now even though
it could be argued that we should work with a narrower lower band, just as
we used a narrower upper band to get the last Sell S9-V. The reason is that
the bearishness of the currently very negative V-Indicator historically
overrides the presence of both a positive P-Indicator and a positive
Accumulation Index (IP21) when the DJI is 2.3% below the 21-day
in May, June and July. A brief rally may occur but a much bigger decline
occurred in 3 of 4 cases where these conditions were present. In particular,
we have to become concerned if the DJI were to form a bearish head and
shoulders pattern, as occurred at the tops in 2001, 2002 and 2008.
The 2006 version of Peerless does give a Buy B2. But that was
before the V-Indicator's negativity was much factored in This
began in July 2011.
Date
DJI
LA/MA P-I
IP21 V-I Outcome
------------------------------------------------------------------
5/24/1999 10655 .978
+31
+.028 -37
DJI fell to 10467 (2%) and then
rallied to 10971.
------------------------------------------------------------------
6/14/2001 12690 .967 +50 +.034
-119
DJI immediately completed head/shoulders and fell to
8376 on 9/20/2001.
------------------------------------------------------------------
5/21/2008 12601 .978 +194 +.039
-52
DJI immediately completed head/shoulders and fell to
7552 on 11/20/2002.
------------------------------------------------------------------
6/2/2008 12504 .978
+35
+.016 -125
DJI immediately fell to 7552 on 11/20/2008.
------------------------------------------------------------------
6/25/2018 24253 .976 +154 +.086
-84
NOW
6/28/2018
24216 .977 +98 +.020 -82
The Heavier NYSE Down Volume Needs to Dimminish
The Closing Power Down-Trends Must Be Broken
on DIA, SPY and QQQ
Charts 6/28/2018
PEERLESS DJI, Signals,
Indicators Daily DJI Volume 10-DayUp/Down Vol V-Indicator
Hourly DJIA A/D Line for All
Stocks
NASDAQ S&P OEX NYSE COMPQX DJI-15 DJI-20 DJI-30
DIA SPY QQQ MDY IWM
TNA
Short-Term Rates
USO-CrudeOil FAS GLD BBH IBB JETS JNUG KOL NUGT OIH OIL RSX RETL
SDS SLV SOXL TECL TMF TNA UGA (gasoline) XIV YINN
Commodities: CANE
JJC, NIB, CHOC
CORN,
CUT (paper) WEAT UUP (Dollar)
AAPL ADBE ALXN AMAT AMGN AMD AMZN BA BABA BAC BIDU CAT CVX DE
FB GOOG GS HD IBM JPM M (Macy's) MSFT NFLX NVDA QCOM TSLA TXN XOM WMT
ANDV (refinery), CMG (Chipotle), LRCX, SWKS, MDGL
SPPI WATT
SQ TOWN
6/28/2018 (Click on Underlined link.)
Bullish MAXCPs - http://tigersoft.com/MAXCPZ/628/BULLISH.htm
Bearish MAXCPs - http://tigersoft.com/MINCPZ/628/BEARISH.htm
|
Table 1
The 5-day ma pivot-points should act as resistance on rally.
QUICKSILVER on ETFS - 06/28/18
ETF CLOSE CHANGE PIVOT-PT 5-dma AROC CL-PWR CANDLE IP21 ITRS
---------------------------------------------------------------------------------------------
DIA 242.08 .96 245.69 -49.7% Bearish BLUE -.009 ----
---------------------------------------------------------------------------------------------
COMPQX 7503.68 58.6 7692.82 -137.9% ---- BLUE .183 .05
---------------------------------------------------------------------------------------------
SPY 270.89 1.54 274.74 -61.5% Bearish BLUE .078 .023
---------------------------------------------------------------------------------------------
QQQ 171.19 1.46 175.32 -130.8% ---- BLUE .124 .05
---------------------------------------------------------------------------------------------
MDY 354.6 1.43 361.68 -94.6% Bearish BLUE .066 .035
---------------------------------------------------------------------------------------------
IWM 163.88 .5 167.82 -135.4% Bearish BLUE .171 .062
---------------------------------------------------------------------------------------------
FAS 62.97 1.66 66.07 -280.1% Bearish BLUE -.007 .008
---------------------------------------------------------------------------------------------
RETL 43.45 0 46.99 -470.2% ---- BLUE .028 .294
---------------------------------------------------------------------------------------------
SOXL 140.88 3.47 161 -789.2% Bearish BLUE .205 -.07
---------------------------------------------------------------------------------------------
TECL 133.78 4.54 141.97 -353.8% ---- BLUE .179 .077
---------------------------------------------------------------------------------------------
IBB 107.95 .61 112.23 -211.1% ---- BLUE .118 .027
---------------------------------------------------------------------------------------------
GLD 118.22 -.36 120.34 -76.5% Bearish RED -.353 -.054
---------------------------------------------------------------------------------------------
OIL 7.61 .04 6.89 339.4% Bullish BLUE .263 .083
---------------------------------------------------------------------------------------------
OIH 26.35 -.09 26.18 203.2% Bearish RED -.096 -.006
---------------------------------------------------------------------------------------------
GASL 24.24 .03 23.48 466% ---- RED -.135 .148
---------------------------------------------------------------------------------------------
UGA 33.9 .13 33.03 280.9% Bullish ---- -.102 .045
---------------------------------------------------------------------------------------------
UUP 25.14 0 24.9 30% Bullish ---- .07 .091
---------------------------------------------------------------------------------------------
IEF 102.59 -.1 102.11 24.4% ---- RED -.177 .025
---------------------------------------------------------------------------------------------
XLU 51.88 -.02 50.75 144.4% Bullish RED .051 .043
---------------------------------------------------------------------------------------------
WEAT 6.16 -.06 6.41 -229.8% Bearish RED -.229 -.025
---------------------------------------------------------------------------------------------
YINN 24.43 .55 27.77 -493.1% Bearish BLUE .087 -.238
---------------------------------------------------------------------------------------------
RSX 20.85 .27 20.88 99.1% ---- BLUE .019 -.009
---------------------------------------------------------------------------------------------
AAPL 185.5 1.34 184.92 1.1% Bearish BLUE -.035 .064
---------------------------------------------------------------------------------------------
GOOG 1114.22 10.24 1155.48 -191.9% ---- BLUE .136 .061
------------------------------------------------------------------ ---------------------------
MSFT 98.63 1.09 100.41 -126.4% Bearish BLUE -.042 .044
---------------------------------------------------------------------------------------------
AMZN 1701.45 40.94 1715.67 -85% ---- BLUE .127 .135
---------------------------------------------------------------------------------------------
FB 196.23 .39 201.74 -132.5% Bullish BLUE .235 .201
---------------------------------------------------------------------------------------------
NVDA 240.86 5.14 250.95 -331.7% Bearish BLUE .009 .04
---------------------------------------------------------------------------------------------
BA 334.65 4.83 338.91 -45.1% Bearish BLUE -.162 .003
---------------------------------------------------------------------------------------------
GS 223.42 3.24 226.02 -79.7% Bearish BLUE -.137 -.099
---------------------------------------------------------------------------------------------
HD 195.21 .19 197.41 -129.4% ---- BLUE .201 .107
---------------------------------------------------------------------------------------------
CAT 136.03 1.42 139.94 -127.5% Bearish BLUE -.285 -.106
|
Table 2 Count of Stocks in Key Directories
20180628
-------------------------------
NEWHIGHS 75
NEWLOWS 107 Still Bearish
MAXCP 48
MINCP 200 Still Bearish
TTTNH 68
TTTNL 272 Still Bearish
FASTUP 95
FASTDOWN 253 Still Bearish
CPCROSSA 133 Professionals shifting to bullish side.
CPCROSSD 45
BIGVOLUP 2
BIGVODN 14
|
Table 3
Count of Stocks and New Highs in Key Tiger Directories
Date = 180628
No. NHs Pct.
-------------------------------------------------------------------
-------------------------------------------------------------------
MAXCP 48 29 60 %
CHEM 62 4 6 %
SOFTWARE 64 3 5 %
HACKERS 23 1 4 %
OILGAS 157 7 4 %
MILITARY 37 1 3 %
NASD-100 89 3 3 %
REIT 173 6 3 %
COMODITY 56 1 2 %
ETFS 61 1 2 %
UTILITY 41 1 2 %
BIOTECH 410 5 1 %
ELECTRON 174 1 1 %
FIDSTKS 186 1 1 %
INDMATER 82 1 1 %
INDEXES 189 1 1 %
RUS-1000 819 12 1 %
SP-100 94 1 1 %
SP500 477 7 1 %
|
Table 4
Count of Stocks and New Lows in Key Tiger Directories
Date = 180628
No. NLs Pct.
-------------------------------------------------
MINCP 200 56 28 %
FOOD 9 2 22 %
SOLAR 20 3 15 %
HOSPITAL 7 1 14 %
PIPELINE 7 1 14 %
GOLD 50 6 12 %
ETFS 61 7 11 %
AUTO 40 4 10 %
COMODITY 56 5 9 %
HACKERS 23 2 9 %
BIOTECH 410 30 7 %
INFRA 34 2 6 %
BEVERAGE 20 1 5 %
SEMI 127 6 5 %
FINANCE 90 4 4 %
INDMATER 82 3 4 %
CHINA 61 2 3 %
DOWJONES 30 1 3 %
ELECTRON 174 6 3 %
MILITARY 37 1 3 %
OILGAS 157 4 3 %
SOFTWARE 64 2 3 %
SP500 477 13 3 %
BIG17 46 1 2 %
CHEM 62 1 2 %
FIDSTKS 186 4 2 %
INDEXES 189 3 2 %
NASD-100 89 2 2 %
RUS-1000 819 18 2 %
UTILITY 41 1 2 %
BONDFUND 111 1 1 %
SP-100 94 1 1 %
|
Table 5
RANKING OF KEY DIRECTORIES BASED PCT.OF STOCKS ABOVE 65-DMA
6/28/18
Bullish = 24
Bearish = 22
---------------------------------------------------------------------------------------
Directory Current day-1 day-2 day-3 day-4 day-5
----------------------------------------------------------------------------------------
REIT .878 .895 .913 .93 .936 .919
COAL .75 .75 .75 .625 .75 .75
EDU .714 .714 .571 .571 .714 .571
PIPELINE .714 .571 .857 .571 .714 .571
RETAIL .711 .788 .807 .846 .846 .865
UTILITY .707 .707 .707 .682 .609 .56
BEVERAGE .7 .55 .75 .75 .7 .6
NIFTY .655 .689 .724 .689 .827 .862
OILGAS .636 .681 .636 .535 .675 .579
COMPUTER .608 .608 .695 .652 .695 .695
CHEM .596 .612 .629 .596 .612 .596
NASD-100 .595 .528 .617 .606 .685 .685
BONDFUND .594 .603 .558 .531 .585 .576
DOWJONES .566 .5 .633 .6 .6 .433
INDEXES .566 .507 .529 .555 .629 .576
GUNS .555 .666 .666 .666 .666 .666
SP500 .551 .53 .584 .587 .631 .61
REGBANKS .548 .516 .677 .709 .87 .838
SP-100 .542 .489 .574 .595 .627 .553
RUS-1000 .537 .525 .586 .586 .648 .625
SOFTWARE .531 .468 .578 .578 .703 .75
HACKERS .521 .391 .521 .521 .608 .695
FIDSTKS .516 .473 .543 .553 .618 .586
BIOTECH .502 .497 .587 .57 .634 .619
n=24
===========================================================================================
GAMING .5 .5 .642 .571 .678 .714
===========================================================================================
ELECTRON .442 .425 .528 .465 .586 .614
INDMATER .439 .451 .439 .39 .56 .487
BIG17 .434 .434 .456 .456 .5 .565
HOSPITAL .428 .428 .571 .571 .857 .857
SEMI .417 .377 .488 .425 .559 .582
HOMEBLDG .411 .411 .411 .411 .411 .47
DJI-13 .384 .307 .384 .307 .461 .23
INFRA .382 .382 .47 .352 .588 .411
GREEN .379 .517 .551 .482 .551 .551
MILITARY .378 .378 .486 .432 .567 .513
FINANCE .355 .322 .466 .511 .644 .611
AUTO .325 .375 .425 .425 .525 .55
COMODITY .303 .285 .25 .214 .303 .214
TRANSP .25 .3 .4 .4 .5 .65
GOLD .22 .24 .28 .26 .32 .28
SOLAR .2 .25 .3 .25 .3 .35
INSURANC .193 .161 .193 .258 .354 .29
BIGBANKS .142 0 0 .142 .142 .142
CHINA .114 .131 .213 .213 .278 .262
ETFS .098 .049 .081 .081 .131 .098
FOOD 0 0 0 0 .111 .111
JETS 0 .1 .1 .1 .2 .5
n=22
|
====================================================================
6/27/2018 The operative Peerless signal remains a Sell S9V. Stay short
DIA.
While we may now get a brief seasonal rally going into July 4th, it may not
rise very far. No one know just how China or Europe will react to Trump
tariffs. Since 1966, the DJI has risen 68.8% of the time over the next 3 trading days
in the year of mid-term Elections (1966, 1970, 1974...) But this rally typically
lasts only for a week. After that, the seasonality turns bearish. .
The DJI closed 3% below the 21-day ma. It will only take a further
decline of 75 points tomorrow to bring a Buy B2. Such Buy signals are reliable
and we will act on it. But be careful about anticipating the Buy signal. I
think
we should play the odds as Peerless presents them. (The situation is not
unlike playing the card game Blackjack. One can play by hunches or one
can play using the optimal system of betting. In other words, we can depend
on luck or we can employ what has worked best over all the cases since 1929.)
The very negative V-Indicator and multiple Sell S9s that we see us
now are still telling us that a bear market is still a distinct possibility. Without
a Buy B2, bear markets soon followed the tagging of the lower band back
at June 2001, June 2002 and June 2008. Thus, it is significant, I believe, that all
the major market ETFs show downtrending Closing Powers, that the Hourly
DJI chart shows both falling price and Hourly DJI price and DISI trends and
it is downright dangerous, the way institutions and traders alike have been very
quick to sell into and overwhelm each and every recent rally. Higher openings
that give way to much lower closing definitely dismay the bulls. So, I would
expect more weakness tomorrow. We see this as "red popsicles" in our
TigerSoft candle-stick charts.
I am concerned that a rally now could set up more bearish head/shoulders in a week.
But a decline by SPY, TECL and FAS now could bring a much deeper decline as
they break key support levels. There does not appear an easy way out of the current
weakness. So, any Buy B2 will be worrisome. More on this if it occurs
tomorrow.
For now, note that there are some positive technicals. The long-term trend of
the A/D Line is still rising. The current Accumulation Index remains positive for
most of the major ETFs. The Dollar is strong. It made a 12-month high today.
What will need to see are some closing above the openings, in other words, some
blue Tiger candlesticks and a break in the Closing Power downtrends. Professionals
will have to stop their steady selling into strength and become net buyers.
DIA now
 |
SPY is at key support.
 |
QQQ
 |
TECL is at key support
 |
 |
| |
Charts 6/27/2018
PEERLESS DJI, Signals,
Indicators Daily DJI Volume 10-DayUp/Down Vol V-Indicator
Hourly DJIA A/D Line for All
Stocks
NASDAQ S&P OEX NYSE COMPQX DJI-15 DJI-20 DJI-30
DIA SPY QQQ MDY IWM
TNA
Short-Term Rates
USO-CrudeOil FAS GLD BBH IBB JETS JNUG KOL NUGT OIH OIL RSX RETL
SDS SLV SOXL TECL TMF TNA UGA (gasoline) XIV YINN
Commodities: CANE
JJC, NIB, CHOC
CORN,
CUT (paper) WEAT UUP (Dollar)
AAPL ADBE ALXN AMAT AMGN AMD AMZN BA BABA BAC BIDU CAT CVX DE
FB GOOG GS HD IBM JPM M (Macy's) MSFT NFLX NVDA QCOM TSLA TXN XOM WMT
ANDV (refinery), CMG (Chipotle), LRCX, SWKS, MDGL
SPPI WATT
SQ TOWN
6/27/2018 (Click on Underlined link.)
Bullish MAXCPs - http://tigersoft.com/MAXCPZ/627/BULLISH.htm
Bearish MAXCPs - http://tigersoft.com/MINCPZ/627/BEARISH.htm
|
Table 1
Weak as DJI is weaker are FAS, SOXL, GLD and YINN.
Accumulation is still positive for NASDAQ, QQQ, MDY, IWM, SOXL and TECL.
QUICKSILVER on ETFS - 06/27/18
ETF CLOSE CHANGE PIVOT-PT 5-dma AROC CL-PWR CANDLE IP21 ITRS
---------------------------------------------------------------------------------------------
DIA 241.12 -1.55 244.5 -109.3% Bearish RED -.006 ----
---------------------------------------------------------------------------------------------
COMPQX 7445.08 -116.55 7712.95 -219.7% ---- RED .18 .049
---------------------------------------------------------------------------------------------
SPY 269.35 -2.25 274.24 -121% Bearish RED .083 .024
---------------------------------------------------------------------------------------------
QQQ 169.73 -2.34 175.71 -215.7% ---- RED .11 .049
---------------------------------------------------------------------------------------------
MDY 353.17 -3.9 361.37 -149.3% Bearish RED .082 .04
---------------------------------------------------------------------------------------------
IWM 163.38 -2.66 168.38 -196.8% Bearish RED .172 .067
---------------------------------------------------------------------------------------------
FAS 61.31 -2.22 66.57 -435% Bearish RED .002 -.019
---------------------------------------------------------------------------------------------
RETL 43.45 -2.01 47.75 -443.6% ---- RED .031 .296
---------------------------------------------------------------------------------------------
SOXL 137.41 -10.91 164.82 -1067.7% Bearish RED .157 -.115
---------------------------------------------------------------------------------------------
TECL 129.24 -5.44 143.44 -631.9% Bearish RED .172 .039
---------------------------------------------------------------------------------------------
IBB 107.34 -2.23 112.61 -293.6% ---- RED .12 .028
---------------------------------------------------------------------------------------------
GLD 118.58 -.68 120.05 -70% Bearish RED -.343 -.045
---------------------------------------------------------------------------------------------
OIL 7.61 .04 6.89 339.4% Bullish BLUE .263 .088
---------------------------------------------------------------------------------------------
OIH 26.44 .65 25.3 112.7% Bearish BLUE -.089 .03
---------------------------------------------------------------------------------------------
GASL 24.21 .67 22.09 179% Bullish BLUE -.081 .246
---------------------------------------------------------------------------------------------
UGA 33.77 .7 32.05 225.2% Bullish BLUE -.046 .063
---------------------------------------------------------------------------------------------
UUP 25.14 .15 24.99 16% Bullish BLUE .021 .099
---------------------------------------------------------------------------------------------
IEF 102.69 .39 102.09 42.6% Bullish BLUE -.165 .028
---------------------------------------------------------------------------------------------
XLU 51.9 .25 50.4 164% Bullish BLUE .11 .045
---------------------------------------------------------------------------------------------
WEAT 6.22 .03 6.45 -126.1% Bearish ---- -.185 .006
---------------------------------------------------------------------------------------------
YINN 23.88 -2.15 27.01 -950.6% Bearish RED .05 -.252
---------------------------------------------------------------------------------------------
RSX 20.58 -.06 20.44 12.1% Bearish RED .032 .021
---------------------------------------------------------------------------------------------
|
Table 2 Count of Stocks in Key Directories
20180627
-------------------------------
NEWHIGHS 52
NEWLOWS 167 Bearish
MAXCP 36
MINCP 395 Bearish
TTTNH 55
TTTNL 521 Bearish
FASTUP 64
FASTDOWN 362 Bearish
CPCROSSA 23
CPCROSSD 121 Bearish
BIGVOLUP 2
BIGVODN 14 Bearish
ACCUMVER 37
HIGHIP21 77
HIUPPCT 127
VHIP21 32
LOWACCUM 322
REDSELL 98
AUGSELS7 13
TRAPDOOR 9
|
Table 3
Count of Stocks and New Highs in Key Tiger Directories
Date = 180627
No. NHs Pct.
-------------------------------------------------------------------
-------------------------------------------------------------------
MAXCP 36 17 47 %
UTILITY 41 3 7 %
OILGAS 157 8 5 %
CHEM 62 2 3 %
MILITARY 37 1 3 %
ETFS 61 1 2 %
FIDSTKS 186 4 2 %
SP-100 94 2 2 %
SP500 477 8 2 %
BIOTECH 409 5 1 %
INDMATER 82 1 1 %
INDEXES 189 1 1 %
NASD-100 89 1 1 %
REIT 173 1 1 %
RUS-1000 819 10 1 %
|
Table 4
Count of Stocks and New Lows in Key Tiger Directories
Date = 180627
No. NLs Pct.
-------------------------------------------------
BIGBANKS 7 2 29 %
MINCP 395 112 28 %
ETFS 61 15 25 %
CHINA 61 11 18 %
PIPELINE 7 1 14 %
AUTO 39 5 13 %
INSURANC 31 4 13 %
FINANCE 90 11 12 %
FOOD 9 1 11 %
GAMING 28 3 11 %
GOLD 50 5 10 %
JETS 10 1 10 %
SOLAR 20 2 10 %
UTILITY 41 4 10 %
DJI-13 13 1 8 %
SEMI 127 10 8 %
BIOTECH 409 27 7 %
COMODITY 56 4 7 %
FIDSTKS 186 13 7 %
INDMATER 82 6 7 %
ELECTRON 174 10 6 %
HOMEBLDG 17 1 6 %
INFRA 34 2 6 %
BEVERAGE 20 1 5 %
CHEM 62 3 5 %
MILITARY 37 2 5 %
RUS-1000 819 38 5 %
SP-100 94 5 5 %
SP500 477 26 5 %
COMPUTER 23 1 4 %
HACKERS 23 1 4 %
DOWJONES 30 1 3 %
INDEXES 189 6 3 %
NIFTY 29 1 3 %
REGBANKS 31 1 3 %
SOFTWARE 64 2 3 %
NASD-100 89 2 2 %
OILGAS 157 3 2 %
|
Table 5 RANKING OF KEY DIRECTORIES BASED PCT.OF STOCKS ABOVE 65-DMA
6/27/18
Bearish =26
Bullish =19
---------------------------------------------------------------------------------------
Directory Current day-1 day-2 day-3 day-4 day-5
----------------------------------------------------------------------------------------
REIT .895 .913 .93 .936 .919 .919
RETAIL .788 .807 .846 .846 .865 .884
COAL .75 .75 .625 .75 .875 .75
EDU .714 .571 .571 .714 .571 .714
UTILITY .707 .707 .682 .609 .56 .536
NIFTY .689 .724 .689 .827 .862 .862
OILGAS .681 .636 .535 .675 .573 .675
GUNS .666 .666 .666 .666 .666 .722
CHEM .612 .629 .596 .612 .596 .629
COMPUTER .608 .695 .652 .695 .695 .782
BONDFUND .603 .558 .531 .585 .576 .504
PIPELINE .571 .857 .571 .714 .571 .714
BEVERAGE .55 .75 .75 .7 .6 .65
SP500 .53 .584 .587 .631 .607 .668
NASD-100 .528 .617 .606 .685 .685 .764
RUS-1000 .525 .586 .586 .648 .623 .684
GREEN .517 .551 .482 .551 .551 .551
REGBANKS .516 .677 .709 .87 .838 .838
INDEXES .507 .529 .555 .629 .582 .645
==========================================================================================
DOWJONES .5 .633 .6 .6 .433 .6
GAMING .5 .642 .571 .678 .714 .714
==========================================================================================
BIOTECH .498 .589 .572 .635 .613 .672
SP-100 .489 .574 .595 .627 .553 .648
FIDSTKS .473 .543 .553 .618 .586 .672
SOFTWARE .468 .578 .578 .703 .75 .781
INDMATER .451 .439 .39 .56 .5 .524
BIG17 .434 .456 .456 .5 .565 .586
HOSPITAL .428 .571 .571 .857 .857 .857
ELECTRON .425 .528 .465 .586 .609 .632
HOMEBLDG .411 .411 .411 .411 .47 .47
HACKERS .391 .521 .521 .608 .695 .695
INFRA .382 .47 .352 .588 .411 .558
MILITARY .378 .486 .432 .567 .513 .594
SEMI .377 .488 .425 .559 .574 .622
AUTO .358 .41 .41 .512 .538 .615
FINANCE .322 .466 .511 .644 .611 .633
DJI-13 .307 .384 .307 .461 .23 .461
TRANSP .3 .4 .4 .5 .65 .75
COMODITY .285 .25 .214 .303 .214 .232
SOLAR .25 .3 .25 .3 .35 .3
GOLD .24 .28 .26 .32 .28 .3
INSURANC .161 .193 .258 .354 .29 .387
CHINA .131 .213 .213 .278 .262 .311
JETS .1 .1 .1 .2 .5 .6
ETFS .049 .081 .081 .131 .098 .131
BIGBANKS 0 0 .142 .142 .142 .142
FOOD 0 0 0 .111 .111 .111
|
| |
| |
| |
====================================================================
6/26/2018 The operative Peerless signal remains a Sell S9V. Stay short DIA.
I keep saying the DJI is quite capable of leading the broader market and
and the NASDAQ into a bear market. Such were the cases in 1977, 2001 and
2002. There is a real danger that some of the big banks (BAC and JPM)
and other key blue chips like CAT and IBM will break down below the
vital support levels that they are now hovering just above. It has to be very
significant that Warren Buffet's Value-oriented BRKB has already broken
below such support. And of course, Peerless users know that a multitude
of Sell S9s set the stage for some of the biggest declines in market history,
1929, 1969, 1973, 1981, 1987, 2000-2002 and 2007-2008.
So, the recent S9 helps our software delay in getting a buy signal in here.
So do the negative V-I and OBVPct, which act to over-rule the positive
P-I and IP21 until the DJI is more oversold or we see an improvement in
the Peerless Indicators on a new low closing.
Should Traders Act Now on a
Stochastic-20 Buy
without a Peerless Buy Signal?
It would be unwise to Buy in here until Peerless gives a Buy signal.
Today I looked back at past Junes back to 1990 to see if we
should even go long as traders now that the DJI is 2% below the 21-day ma
if the Stochastic-20 (K-Line) were to rise back above the 20-level. What I
found
was that when the V-Indicator was very negative, there were very trade-worthy
bounces if Peerless gave Buy signals, but without these Buys, there was a very
real danger of a serious market decline.
Signal Result Date
PI IP21
VI
OBVPct
B2 A recovery 6/23/1994
-145 -.018
-31 -.009
B2 A recovery 6/15/1998 -383
-.123 -110
-.238
B9 A recovery 6/22/2000 +117
-.060 -51
+.073
S9 Very bad
6/15/2001 -14
-.023 -172 +.051
S9 Very bad 6/17/2002
-175 -.010 -271
-.079
S9 Very bad 6/16/2008
-239 -.079
-227 -.079
B5 Premature
6/22/2009 +49 -.003
-134 +.038
B8 A
recovery 6/29/2010 -51 -.069
-191 -.103
B7 A recovery 6/15/2011
-177 -.127
-185 -.149
B19 A recovery 6/20/2013 -522
-.144 -177
-.187
B3 A recovery 6/28/2016
+155 -.024 -108
-.193
S9 ?????????? 6/26/2018
+194 +.079
-68 -.171
Wall Street Is Scared of Something!
Trump's tariffs do scare Wall Street. But even more scary is what will
happen if Interest Rates rise rapidly given the trillions and trillions of dollars
in consumer debt. That is what I believe is really causing the weakness in the
big banks. A decisive price breakdown by the big banks would be too
reminscent of 2007 for traders and hedge funds to ignore.

 |
Table 1
QUICKSILVER on ETFS - 06/26/18
ETF CLOSE CHANGE PIVOT-PT 5-dma AROC CL-PWR CANDLE IP21 ITRS
---------------------------------------------------------------------------------------------
DIA 242.67 .36 246.46 -85.9% Bearish RED .025 ----
---------------------------------------------------------------------------------------------
COMPQX 7561.63 29.62 7781.51 -106.6% ---- BLUE .231 .069
---------------------------------------------------------------------------------------------
SPY 271.6 .6 275.97 -71.1% Bearish ---- .125 .028
---------------------------------------------------------------------------------------------
QQQ 172.07 .7 177.25 -112.2% ---- BLUE .18 .07
---------------------------------------------------------------------------------------------
MDY 357.07 .55 363.92 -70.2% ---- BLUE .114 .044
---------------------------------------------------------------------------------------------
IWM 166.04 .96 169.97 -76.5% ---- BLUE .248 .081
---------------------------------------------------------------------------------------------
FAS 63.53 -.29 67 -245.3% Bearish RED .001 .012
---------------------------------------------------------------------------------------------
RETL 45.46 .48 47.58 -73.9% ---- BLUE .07 .37
---------------------------------------------------------------------------------------------
SOXL 148.32 1.54 171.24 -623.7% Bearish RED .21 -.009
---------------------------------------------------------------------------------------------
TECL 134.68 1.49 146.94 -391.8% ---- BLUE .231 .126
---------------------------------------------------------------------------------------------
IBB 109.57 -.63 113.9 -110.1% Bullish RED .198 .053
---------------------------------------------------------------------------------------------
GLD 119.26 -.63 120.26 -64% Bearish ---- -.3 -.054
---------------------------------------------------------------------------------------------
OIL 7.61 .04 6.89 339.4% Bullish BLUE .263 .073
---------------------------------------------------------------------------------------------
OIH 25.79 .29 25.86 -1.9% Bearish BLUE -.035 -.007
---------------------------------------------------------------------------------------------
GASL 23.54 1.51 23.39 293.7% Bullish BLUE -.028 .212
---------------------------------------------------------------------------------------------
UGA 33.07 .33 32.3 67.6% Bullish BLUE -.046 .025
---------------------------------------------------------------------------------------------
UUP 24.99 .13 25.06 -10% Bullish BLUE .007 .077
---------------------------------------------------------------------------------------------
IEF 102.3 .05 101.82 7.8% ---- ---- -.104 .01
---------------------------------------------------------------------------------------------
XLU 51.65 .06 50.23 144.2% Bullish BLUE .074 .035
---------------------------------------------------------------------------------------------
WEAT 6.19 -.09 6.38 -94.3% Bearish RED -.149 -.013
---------------------------------------------------------------------------------------------
YINN 26.03 -.08 29.05 -618.6% Bearish ---- .108 -.201
---------------------------------------------------------------------------------------------
RSX 20.64 -.22 20.53 82.5% ---- ---- .047 .007
---------------------------------------------------------------------------------------------
|
Table 2 Count of Stocks in Key Directories
20180626
-------------------------------
NEWHIGHS 94 Bullish
NEWLOWS 67
MAXCP 54
MINCP 181 Bearish
TTTNH 53
TTTNL 317 Bearish
FASTUP 79
FASTDOWN 144 Bearish
CPCROSSA 148 Bullish Shift
CPCROSSD 28
BIGVOLUP 3
BIGVODN 7
|
Table 3
Count of Stocks and New Highs in Key Tiger Directories
Date = 180625
No. NHs Pct.
-------------------------------------------------------------------
-------------------------------------------------------------------
MAXCP 54 35 65 %
BEVERAGE 20 1 5 %
SOLAR 20 1 5 %
UTILITY 41 2 5 %
BIOTECH 410 11 3 %
CHEM 62 2 3 %
GREEN 29 1 3 %
MILITARY 37 1 3 %
REIT 173 6 3 %
ELECTRON 174 4 2 %
OILGAS 156 3 2 %
SEMI 127 2 2 %
SOFTWARE 64 1 2 %
FIDSTKS 186 2 1 %
FINANCE 90 1 1 %
NASD-100 89 1 1 %
RUS-1000 819 7 1 %
SP500 477 5 1 %
|
Table 4
Count of Stocks and New Lows in Key Tiger Directories
Date = 180626
No. NLs Pct.
-------------------------------------------------
FOOD 9 2 22 %
MINCP 181 39 22 %
ETFS 61 6 10 %
INSURANC 31 3 10 %
JETS 10 1 10 %
CHINA 61 4 7 %
GAMING 28 2 7 %
UTILITY 41 3 7 %
GOLD 50 3 6 %
AUTO 40 2 5 %
SOLAR 20 1 5 %
FINANCE 90 4 4 %
HACKERS 23 1 4 %
FIDSTKS 186 5 3 %
INFRA 34 1 3 %
MILITARY 37 1 3 %
NIFTY 29 1 3 %
SP500 477 12 3 %
BIOTECH 410 10 2 %
CHEM 62 1 2 %
COMODITY 56 1 2 %
ELECTRON 174 3 2 %
INDMATER 82 2 2 %
INDEXES 189 3 2 %
NASD-100 89 2 2 %
RUS-1000 819 20 2 %
SEMI 127 2 2 %
SOFTWARE 64 1 2 %
OILGAS 156 1 1 %
SP-100 94 1 1 %
|
Table 5
RANKING OF KEY DIRECTORIES BASED PCT.OF STOCKS ABOVE 65-DMA
6/26/18
Bullish = 28 Bearish = 19
---------------------------------------------------------------------------------------
Directory Current day-1 day-2 day-3 day-4 day-5
----------------------------------------------------------------------------------------
REIT .913 .93 .936 .919 .919 .901
PIPELINE .857 .571 .714 .571 .714 .714
RETAIL .807 .846 .846 .865 .903 .865
BEVERAGE .75 .75 .7 .6 .65 .6
COAL .75 .625 .75 .875 .75 .75
NIFTY .724 .689 .827 .862 .862 .758
UTILITY .707 .682 .609 .56 .536 .512
COMPUTER .695 .652 .695 .695 .782 .782
REGBANKS .677 .709 .87 .838 .838 .838
GUNS .666 .666 .666 .666 .722 .666
GAMING .642 .571 .678 .714 .714 .678
OILGAS .641 .538 .679 .576 .692 .647
DOWJONES .633 .6 .6 .433 .6 .633
CHEM .629 .596 .612 .596 .629 .629
NASD-100 .617 .606 .685 .685 .764 .674
BIOTECH .587 .57 .634 .612 .665 .617
RUS-1000 .586 .586 .648 .623 .684 .67
SP500 .584 .587 .631 .607 .666 .645
SOFTWARE .578 .578 .703 .75 .781 .781
SP-100 .574 .595 .627 .553 .638 .638
EDU .571 .571 .714 .571 .714 .714
HOSPITAL .571 .571 .857 .857 .857 .857
BONDFUND .558 .531 .585 .576 .495 .522
GREEN .551 .482 .551 .551 .586 .62
FIDSTKS .543 .553 .618 .586 .666 .661
INDEXES .529 .555 .629 .582 .645 .645
ELECTRON .528 .465 .586 .609 .632 .603
HACKERS .521 .521 .608 .695 .695 .695
N=28
------------------------------------------------------------------------------------------
SEMI .488 .425 .559 .574 .622 .582
MILITARY .486 .432 .567 .513 .594 .54
INFRA .47 .352 .588 .411 .558 .529
FINANCE .466 .511 .644 .611 .622 .6
BIG17 .456 .456 .5 .565 .608 .565
INDMATER .439 .39 .56 .5 .536 .56
AUTO .425 .425 .525 .55 .6 .575
HOMEBLDG .411 .411 .411 .47 .47 .47
TRANSP .4 .4 .5 .65 .75 .7
DJI-13 .384 .307 .461 .23 .461 .461
SOLAR .3 .25 .3 .35 .3 .3
GOLD .28 .26 .32 .28 .3 .3
COMODITY .25 .214 .303 .214 .25 .214
CHINA .213 .213 .278 .262 .311 .295
INSURANC .193 .258 .354 .29 .387 .483
JETS .1 .1 .2 .5 .6 .7
ETFS .081 .081 .131 .098 .131 .098
BIGBANKS 0 .142 .142 .142 .142 .142
FOOD 0 0 .111 .111 .111 .111
N=19
|
====================================================================
6/25/2018 The operative Peerless signal remains a Sell S9V. Stay short DIA.
There were a number of bearish technical developments that suggest
a deeper decline than just to the lower 3.5% band at 24000.
The DJI has fallen back to its rising 200-day ma. That should bring
in some automatic buying. If it does not, that will be a bearish sign.
Without a Peerless Buy signal, I think we must just stay short DIA.
The NYSE A/D Line broke its uptrend-line. I have been warnng that
this could unleash a new round of selling in groups that have held up
to this point. Tech stocks were particularly weak today. See
the
NASDAQ chart below. AAPL now shows a bearish H/S. Even
mighty AMZN got hit hard. Value-Investing is now on the defensive,
judging from the breakdown in Berkshire Hathaway's stock below
very well-tested support. See its chart further below. Mergers may be
in trouble, considering how weak oil refiners have been for the last week
or two. And the big bank stocks are close to serious breakdowns. See
the charts of BAC and JPM below.
All this weakness will likely make it hard for the DJI and the market
to put in a bottom until prices go lower.


As was expected, because this is what happened in 2000 and
2008,
the NASDAQ and QQQ are playing "catchup" with the DJI's downside.


We may or may not get a Peerless Buy B2 signal at 24000 and
the lower 3.5%
band. We will have to wait and see. But there's no getting around the
signs that both Big Money and Professionals are beating a hasty retreat
from the blue chips and there are ample precedents for the DJI leading
the entire market lower. (This has been a running theme in recent Hotlines.)
Whether it is the fears of a wild and unpredictable gunfight
in the arena
of international trade or its the growing sense that the Debt held by the US
Government, by US Consumers and by folks buying houses, car loans or
paying off their student loans is reaching unsustainable levels, we will
find out. Either of these high anxieties are enough to bring profit-taking.
And the profit-taking is now causing real technical damage. Moreover,
I can't help noting the reports that debt delinquncies are on the rise. This also
occurred in 2007. And it was big Bank stocks' tops back then that
were the first important signs of big trouble. Moreover, the Dollar
broke its uptrend today. Is this a sign that China may be selling a lot
more US Treasuries?
Look belolw at how JPM and BAC are sitting precariously at
their
well-tested flat price-supports. If these key bank stocks do what CAT
and Bershire Hathaway did today, they will break below their key supports.
That will bring about a new wave of technical selling. And if the mutual funds,
as a result of this, start loading up on leveraged Index shorts as insurance
against a much bigger decline, then we are bound to see a test of the
February lows at 23400-23500.
 |
 |
 |
 |
Charts 6/25/2018
PEERLESS DJI, Signals,
Indicators Daily DJI Volume 10-DayUp/Down Vol V-Indicator
Hourly DJIA A/D Line for All
Stocks
NASDAQ S&P OEX NYSE COMPQX DJI-15 DJI-20 DJI-30
DIA SPY QQQ MDY IWM
TNA
Short-Term Rates
USO-CrudeOil FAS GLD BBH IBB JETS JNUG KOL NUGT OIH OIL RSX RETL
SDS SLV SOXL TECL TMF TNA UGA (gasoline) XIV YINN
Commodities: CANE
JJC, NIB, CHOC
CORN,
CUT (paper) WEAT UUP (Dollar)
AAPL ADBE ALXN AMAT AMGN AMD AMZN BA BABA BAC BIDU CAT CVX DE
FB GOOG GS HD IBM JPM M (Macy's) MSFT NFLX NVDA QCOM TSLA TXN XOM WMT
ANDV (refinery), CMG (Chipotle), LRCX, SWKS, MDGL
SPPI WATT
SQ TOWN
6/25/2018 (Click on Underlined link.)
Bullish MAXCPs - http://tigersoft.com/4XXH/MAXCPS/625/BULLISH.htm
Bearish MAXCPs - http://tigersoft.com/4XXH/MINCPS/625/BEARISH.htm
|
Table 1
QUICKSILVER on ETFS - 06/25/18
ETF CLOSE CHANGE PIVOT-PT 5-dma AROC CL-PWR CANDLE IP21 ITRS
---------------------------------------------------------------------------------------------
DIA 242.31 -3.38 246.88 -150.4% Bearish RED .04 ------
---------------------------------------------------------------------------------------------
COMPQX 7532.01 -160.81 7725.58 -139% ---- RED .232 .065
---------------------------------------------------------------------------------------------
SPY 271 -3.74 275.5 -100.9% Bearish RED .126 .027
---------------------------------------------------------------------------------------------
QQQ 171.37 -3.95 176 -145.6% ---- RED .189 .067
---------------------------------------------------------------------------------------------
MDY 356.52 -5.16 362.14 -84.7% ---- RED .105 .046
---------------------------------------------------------------------------------------------
IWM 165.08 -2.74 168.61 -104.3% ---- RED .233 .078
---------------------------------------------------------------------------------------------
FAS 63.82 -2.25 66.77 -277% Bearish RED .007 .024
---------------------------------------------------------------------------------------------
RETL 44.98 -2.01 46.15 -75.8% ---- RED .061 .379
---------------------------------------------------------------------------------------------
SOXL 146.78 -14.22 168.59 -830.6% Bearish RED .245 -.02
---------------------------------------------------------------------------------------------
TECL 133.19 -8.78 145.83 -529.1% ---- RED .243 .133
---------------------------------------------------------------------------------------------
IBB 110.2 -2.03 112.04 -10.2% Bullish RED .224 .045
---------------------------------------------------------------------------------------------
GLD 119.89 -.45 120.8 -50.6% Bearish RED -.34 -.054
---------------------------------------------------------------------------------------------
OIL 7.61 .04 6.89 339.4% Bullish BLUE .263 .067
---------------------------------------------------------------------------------------------
OIH 25.5 -.68 25.8 -79.4% Bearish RED -.081 -.025
---------------------------------------------------------------------------------------------
GASL 22.03 -1.45 22.21 77.5% Bearish RED -.047 .156
---------------------------------------------------------------------------------------------
UGA 32.74 -.29 32.63 -9.2% ---- BLUE -.143 -.001
---------------------------------------------------------------------------------------------
UUP 24.86 -.04 25.04 -22% Bullish ---- -.019 .061
---------------------------------------------------------------------------------------------
IEF 102.25 .14 102.14 18.1% ---- ---- -.088 .002
---------------------------------------------------------------------------------------------
XLU 51.59 .84 50.19 188% Bullish BLUE .087 .041
---------------------------------------------------------------------------------------------
WEAT 6.28 -.13 6.31 -117.3% Bearish ---- -.104 -.027
---------------------------------------------------------------------------------------------
YINN 26.11 -1.66 29.48 -858.8% Bearish RED .133 -.236
---------------------------------------------------------------------------------------------
RSX 20.86 -.02 20.3 141.6% ---- BLUE .015 .029
---------------------------------------------------------------------------------------------
AAPL 182.17 -2.75 185.69 -176.4% Bearish RED .006 .048
---------------------------------------------------------------------------------------------
GOOG 1124.81 -30.67 1168.06 -208.8% Bullish RED .184 .098
---------------------------------------------------------------------------------------------
MSFT 98.39 -2.02 100.86 -122.2% Bearish RED .021 .062
---------------------------------------------------------------------------------------------
AMZN 1663.15 -52.52 1734.78 -175.2% ---- RED .175 .168
---------------------------------------------------------------------------------------------
FB 196.35 -5.39 197.49 -48.9% Bullish RED .252 .199
---------------------------------------------------------------------------------------------
NVDA 239.12 -11.83 260.17 -501.1% ---- RED .093 .038
---------------------------------------------------------------------------------------------
BA 331.2 -7.71 341.12 -343.1% Bearish RED -.095 .011
---------------------------------------------------------------------------------------------
GS 221.54 -4.48 228.32 -215.9% Bearish RED -.132 -.129
---------------------------------------------------------------------------------------------
HD 196.38 -1.03 199.21 -108.1% Bullish RED .233 .142
---------------------------------------------------------------------------------------------
CAT 136.58 -3.36 143.3 -423.3% Bearish RED -.247 -.086
|
Table 2 Count of Stocks in Key Directories
20180625
-------------------------------
NEWHIGHS 65
NEWLOWS 109 Bearish
MAXCP 29
MINCP 258 Bearish
TTTNH 41
TTTNL 471 Bearish
FASTUP 73
FASTDOWN 214 Bearish
CPCROSSA 25
CPCROSSD 168 Bearish
BIGVOLUP 3
BIGVODN 14
|
Table 3
Count of Stocks and New Highs in Key Tiger Directories
Date = 180625
No. NHs Pct.
-------------------------------------------------------------------
-------------------------------------------------------------------
MAXCP 29 21 72 %
UTILITY 41 4 10 %
BEVERAGE 20 1 5 %
SOLAR 21 1 5 %
RETAIL 52 2 4 %
GREEN 30 1 3 %
REIT 173 5 3 %
BIOTECH 410 9 2 %
CHEM 62 1 2 %
CHINA 61 1 2 %
FIDSTKS 186 3 2 %
SEMI 128 2 2 %
SP500 477 8 2 %
ELECTRON 175 2 1 %
NASD-100 89 1 1 %
OILGAS 157 1 1 %
RUS-1000 819 10 1 %
SP-100 94 1 1 %
|
Table 4
Count of Stocks and New Lows in Key Tiger Directories
Date = 180625
No. NLs Pct.
-------------------------------------------------
FOOD 9 3 33 %
MINCP 258 60 23 %
PIPELINE 7 1 14 %
HOMEBLDG 17 2 12 %
ETFS 61 6 10 %
JETS 10 1 10 %
SOLAR 21 2 10 %
CHINA 61 5 8 %
DJI-13 13 1 8 %
FINANCE 90 6 7 %
GAMING 28 2 7 %
AUTO 40 2 5 %
ELECTRON 175 9 5 %
SEMI 128 7 5 %
BIOTECH 410 17 4 %
COMODITY 56 2 4 %
COMPUTER 23 1 4 %
GOLD 50 2 4 %
HACKERS 23 1 4 %
DOWJONES 30 1 3 %
FIDSTKS 186 6 3 %
INFRA 34 1 3 %
INSURANC 31 1 3 %
MILITARY 37 1 3 %
NIFTY 29 1 3 %
OILGAS 157 4 3 %
RUS-1000 819 22 3 %
SP500 477 12 3 %
CHEM 62 1 2 %
SOFTWARE 64 1 2 %
SP-100 94 2 2 %
UTILITY 41 1 2 %
BONDFUND 111 1 1 %
INDMATER 82 1 1 %
INDEXES 189 2 1 %
|
Table 5 RANKING OF KEY DIRECTORIES BASED PCT.OF STOCKS ABOVE 65-DMA
6/25/18
---------------------------------------------------------------------------------------
Directory Current day-1 day-2 day-3 day-4 day-5
----------------------------------------------------------------------------------------
REIT .93 .936 .919 .919 .901 .913
RETAIL .846 .846 .865 .903 .865 .865
BEVERAGE .75 .7 .6 .65 .6 .55
REGBANKS .709 .87 .838 .838 .838 .838
NIFTY .689 .827 .862 .862 .758 .793
UTILITY .682 .609 .56 .536 .512 .365
GUNS .666 .666 .666 .722 .666 .666
COMPUTER .652 .695 .695 .782 .782 .782
COAL .625 .75 .875 .75 .75 .875
NASD-100 .606 .685 .685 .764 .674 .73
DOWJONES .6 .6 .433 .6 .633 .666
CHEM .596 .612 .596 .629 .629 .677
SP-100 .595 .627 .553 .638 .638 .659
SP500 .587 .631 .607 .666 .643 .67
RUS-1000 .586 .648 .623 .684 .667 .688
SOFTWARE .578 .703 .75 .781 .781 .796
EDU .571 .714 .571 .714 .714 .714
GAMING .571 .678 .714 .714 .678 .678
HOSPITAL .571 .857 .857 .857 .857 .857
PIPELINE .571 .714 .571 .714 .714 .714
BIOTECH .57 .634 .612 .665 .614 .624
INDEXES .56 .629 .582 .645 .645 .634
FIDSTKS .553 .618 .586 .666 .655 .672
OILGAS .535 .675 .573 .687 .643 .687
BONDFUND .531 .585 .576 .495 .522 .405
HACKERS .521 .608 .695 .695 .695 .695
FINANCE .511 .644 .611 .622 .6 .666
N=27
===========================================================================================
GREEN .466 .533 .533 .566 .6 .633
ELECTRON .462 .582 .605 .628 .6 .651
BIG17 .456 .5 .565 .608 .565 .565
MILITARY .432 .567 .513 .594 .54 .648
AUTO .425 .525 .55 .6 .575 .625
SEMI .421 .554 .57 .617 .578 .632
HOMEBLDG .411 .411 .47 .47 .47 .47
TRANSP .4 .5 .65 .75 .65 .75
INDMATER .39 .56 .5 .536 .56 .609
INFRA .352 .588 .411 .558 .529 .676
DJI-13 .307 .461 .23 .461 .461 .538
GOLD .26 .32 .28 .3 .3 .36
INSURANC .258 .354 .29 .387 .483 .419
SOLAR .238 .285 .333 .285 .285 .285
COMODITY .214 .303 .214 .25 .214 .321
CHINA .213 .278 .262 .311 .295 .459
BIGBANKS .142 .142 .142 .142 .142 .142
JETS .1 .2 .5 .6 .6 .7
ETFS .081 .131 .098 .131 .098 .196
FOOD 0 .111 .111 .111 .111 .222
N=20
|


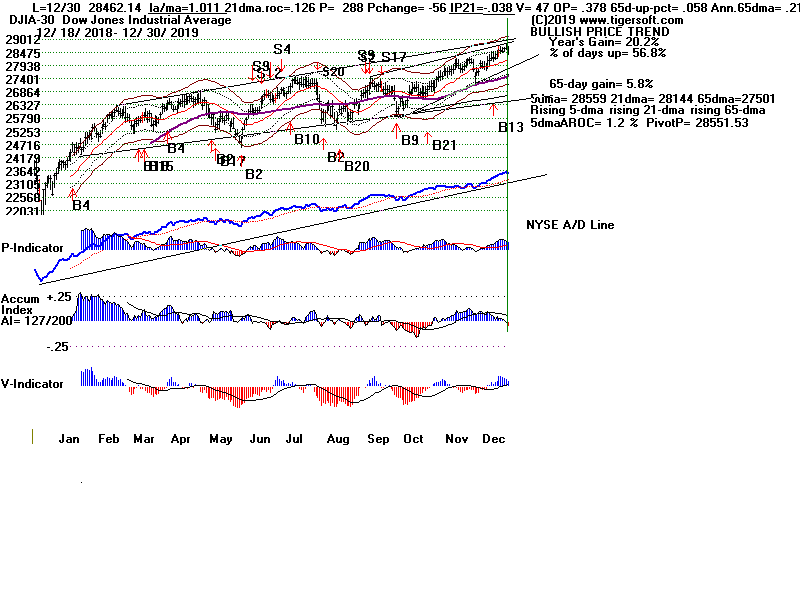
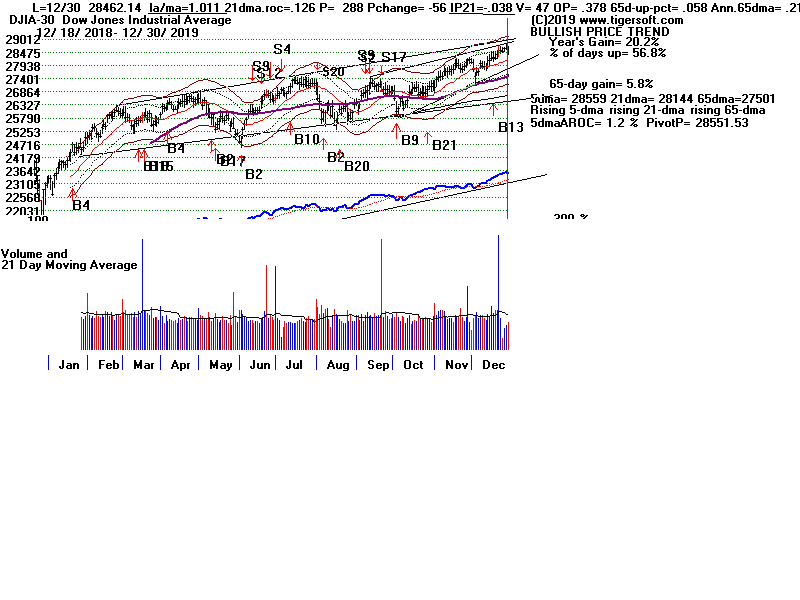
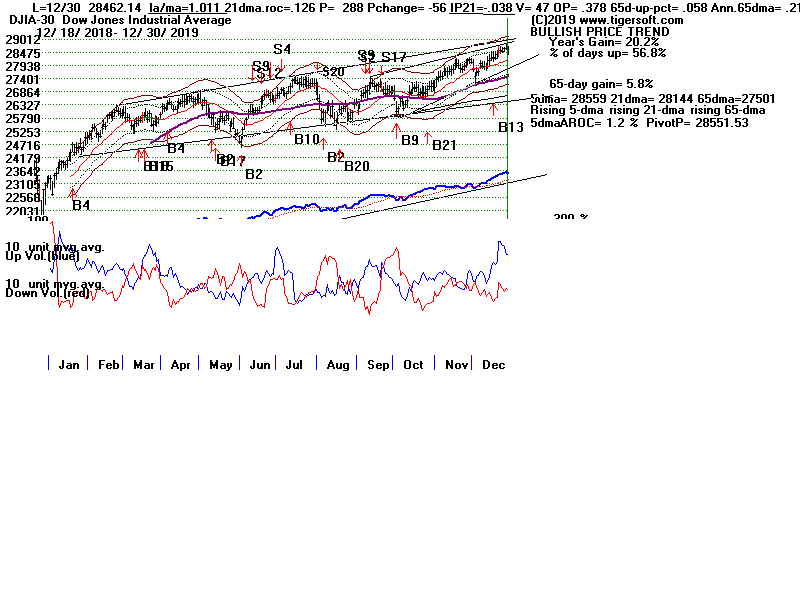
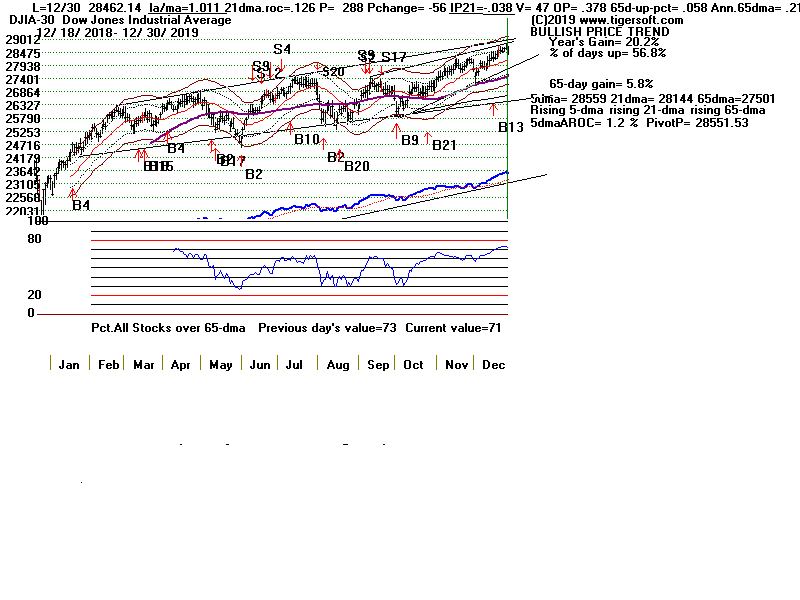
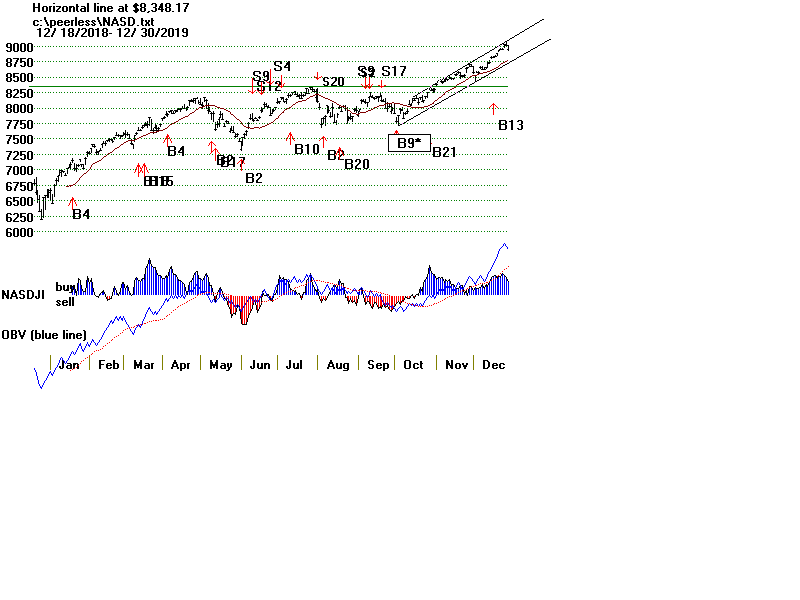
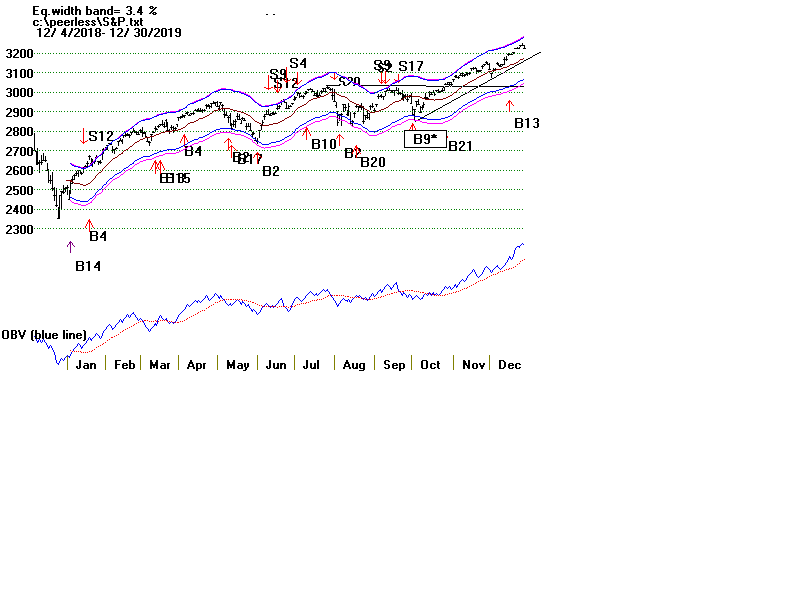
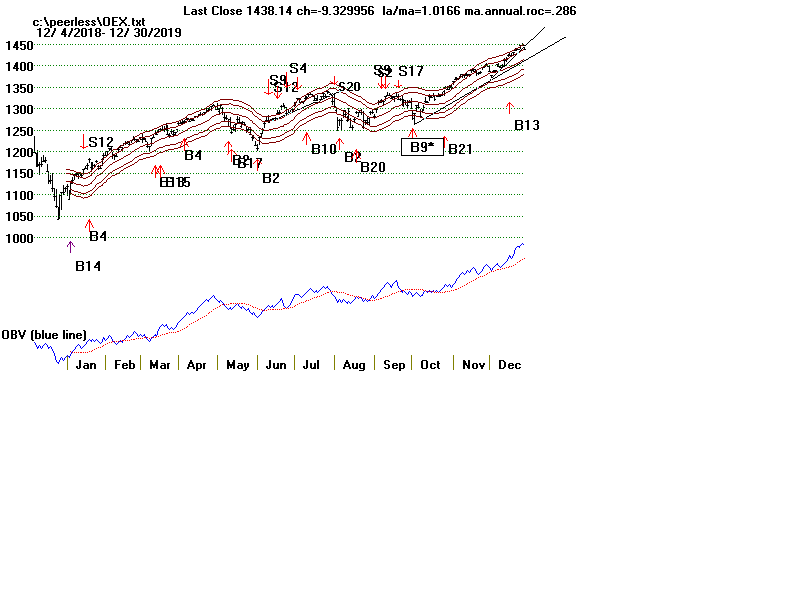
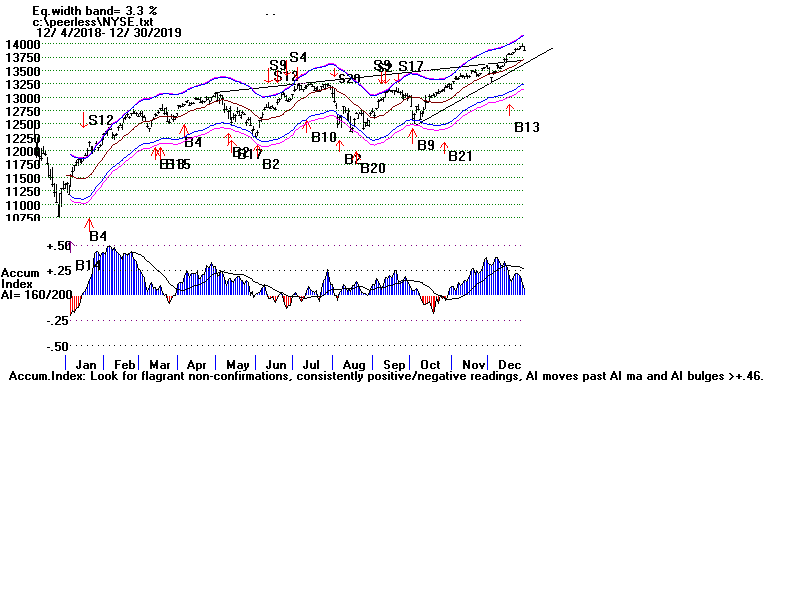
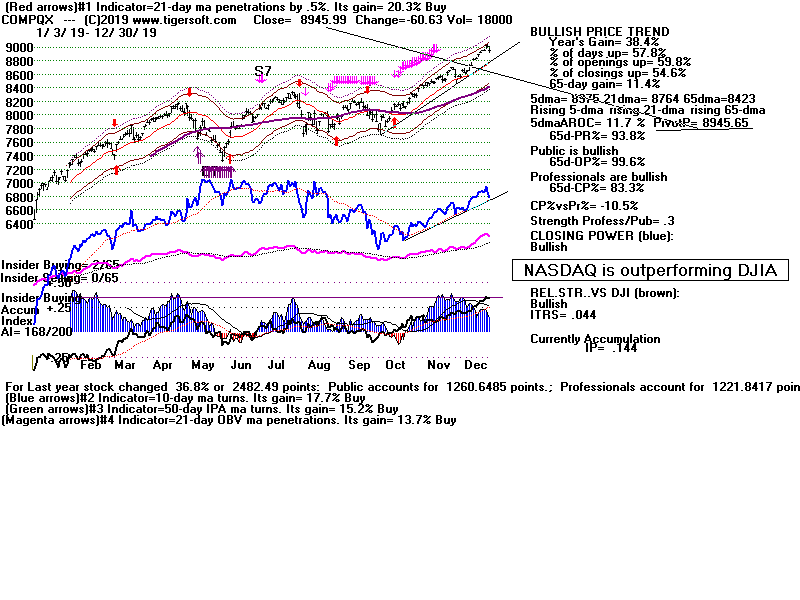
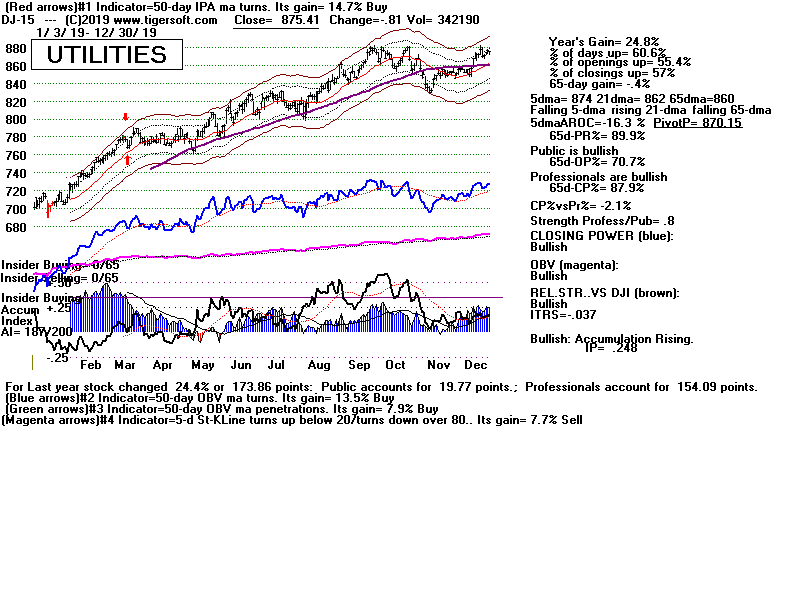
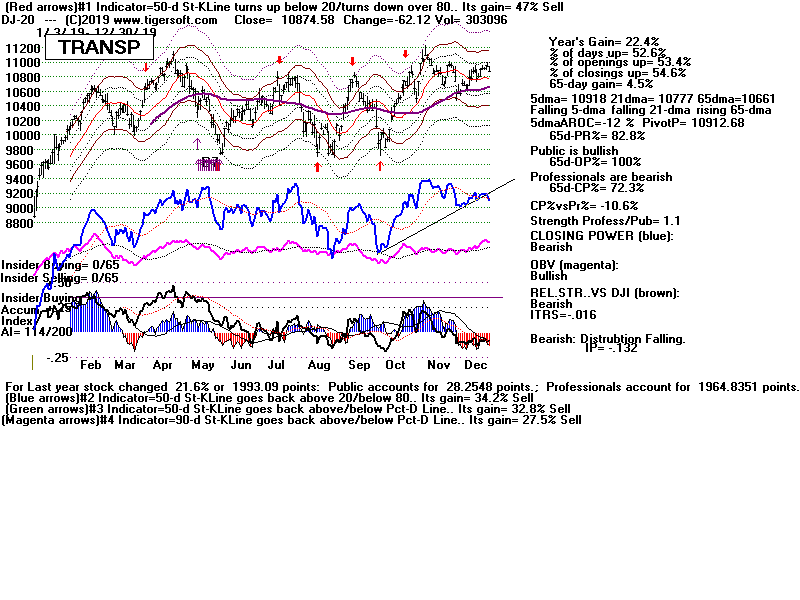
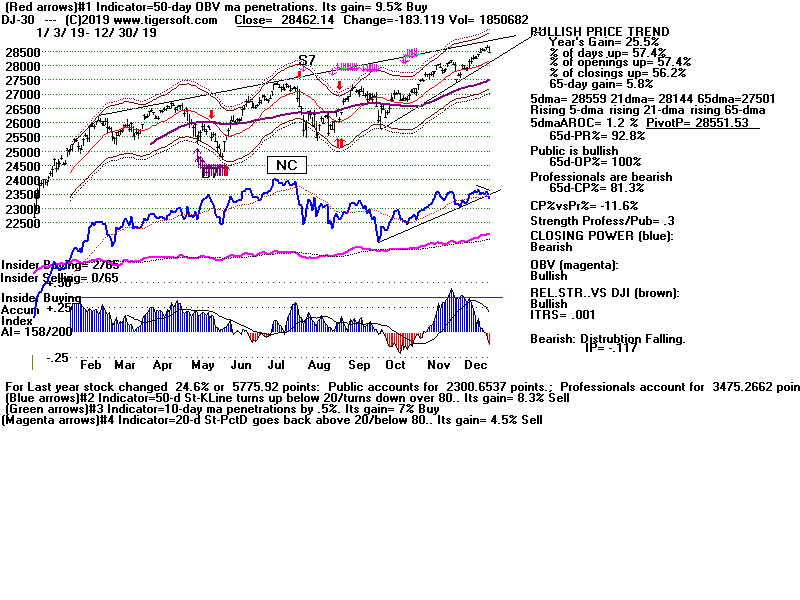
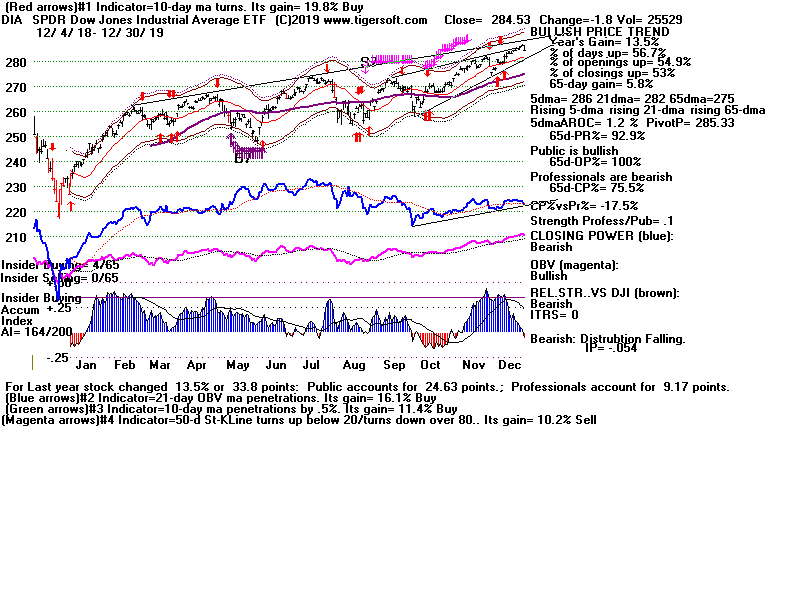
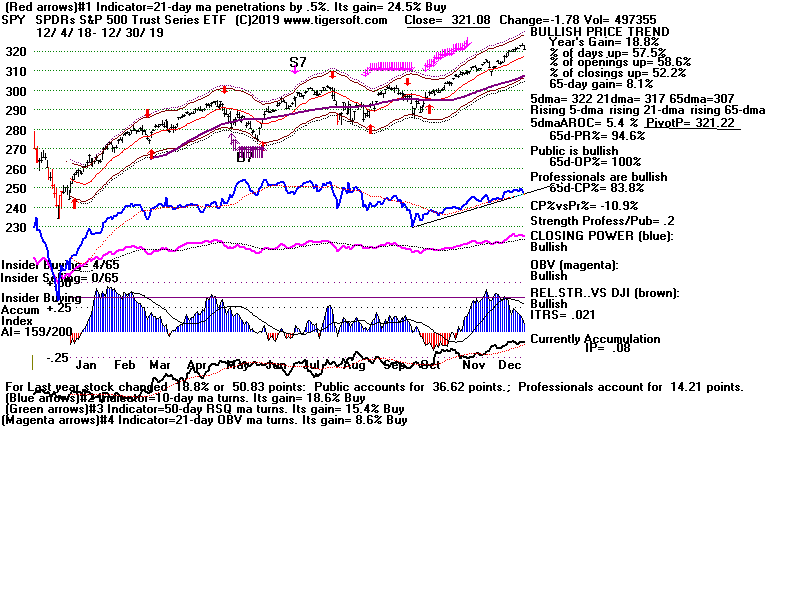
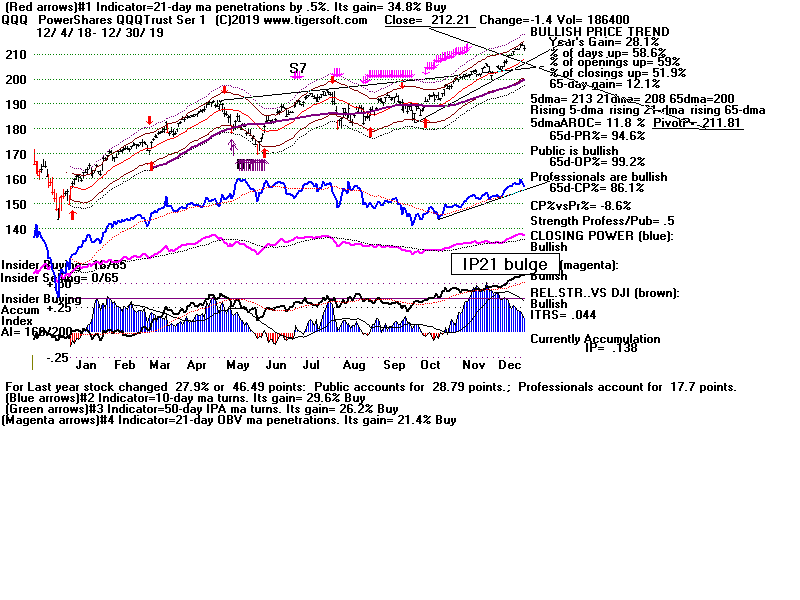
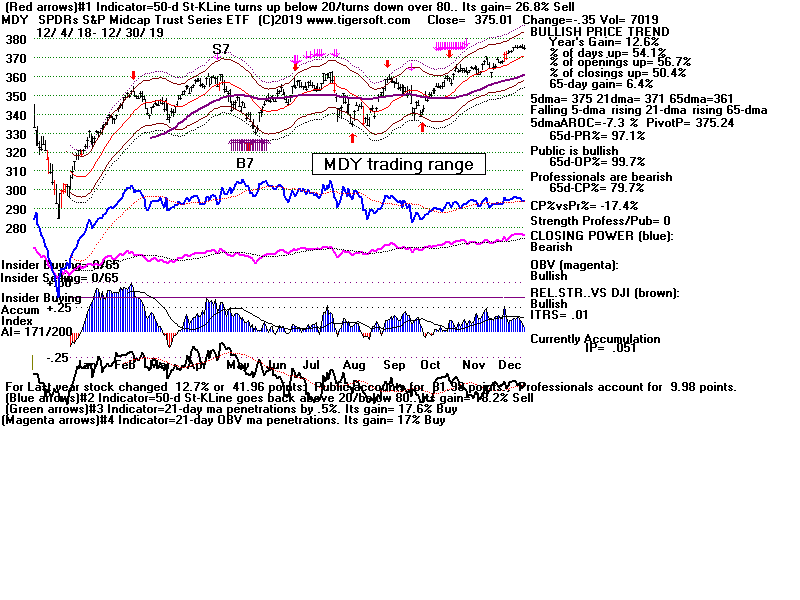
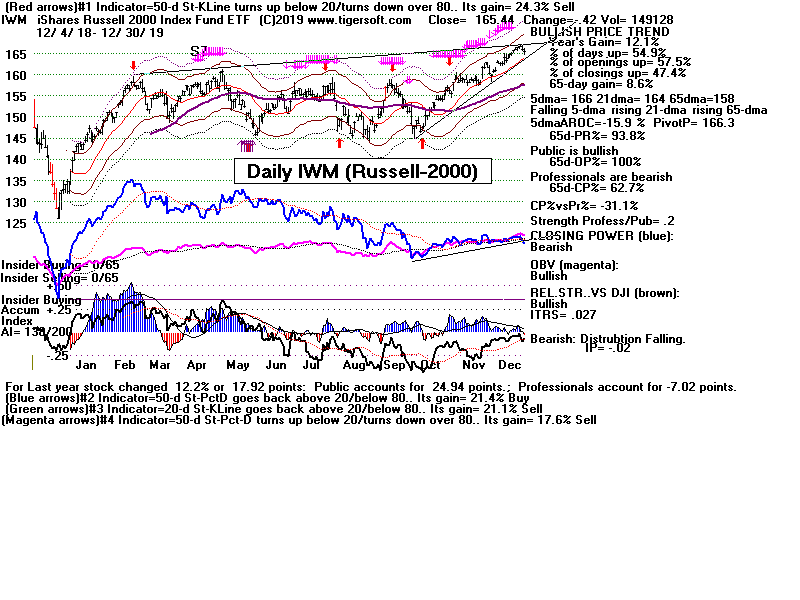
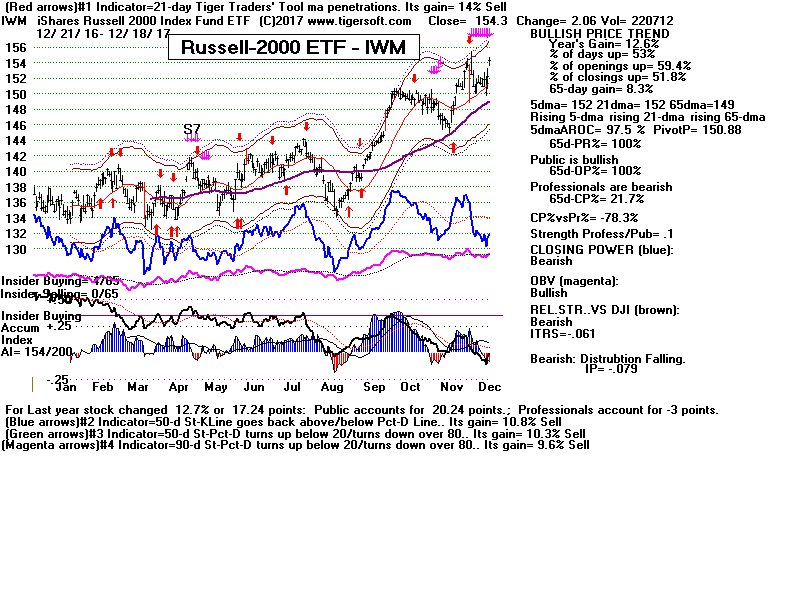
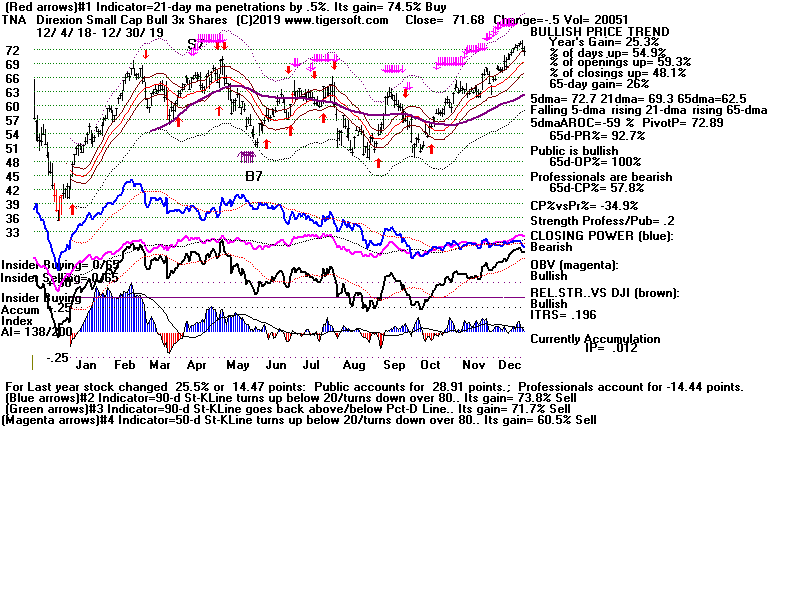
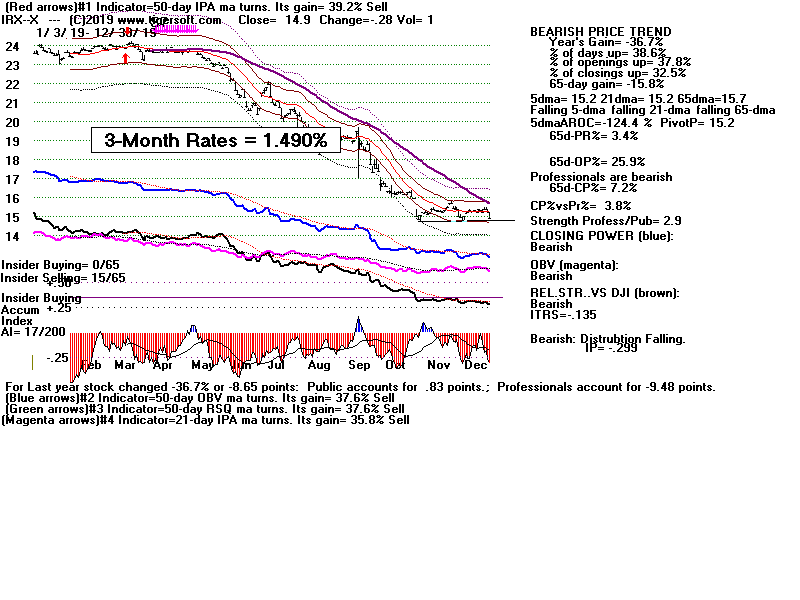
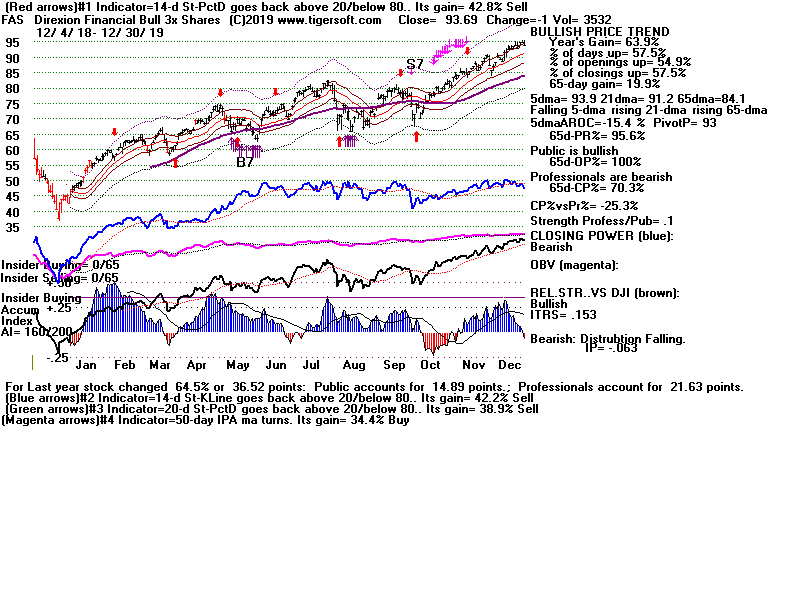
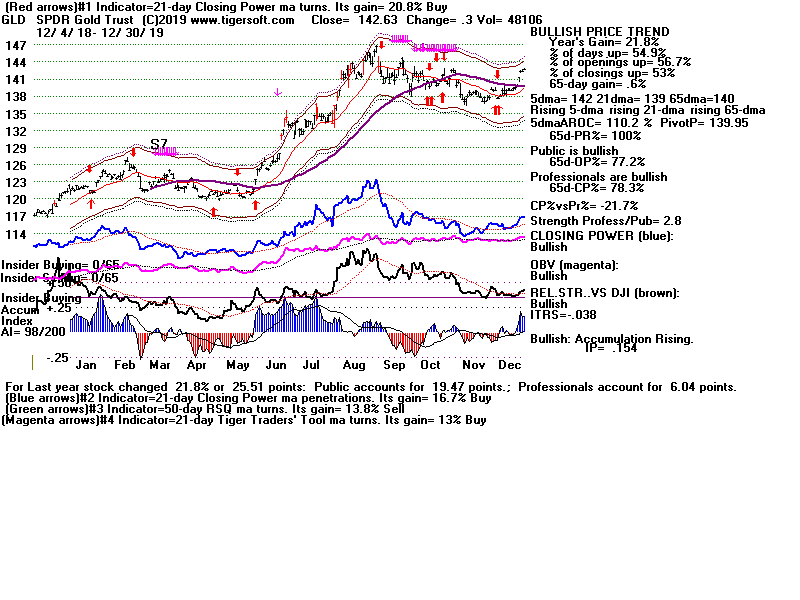
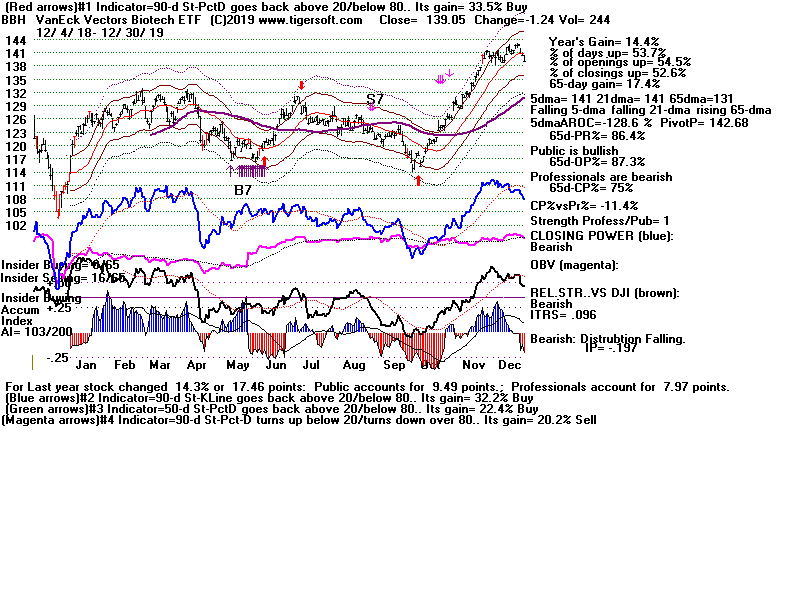
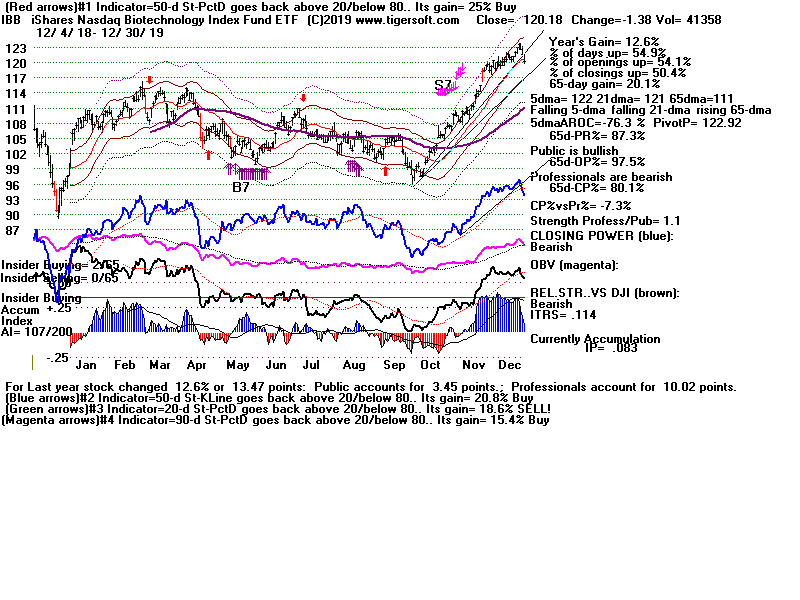
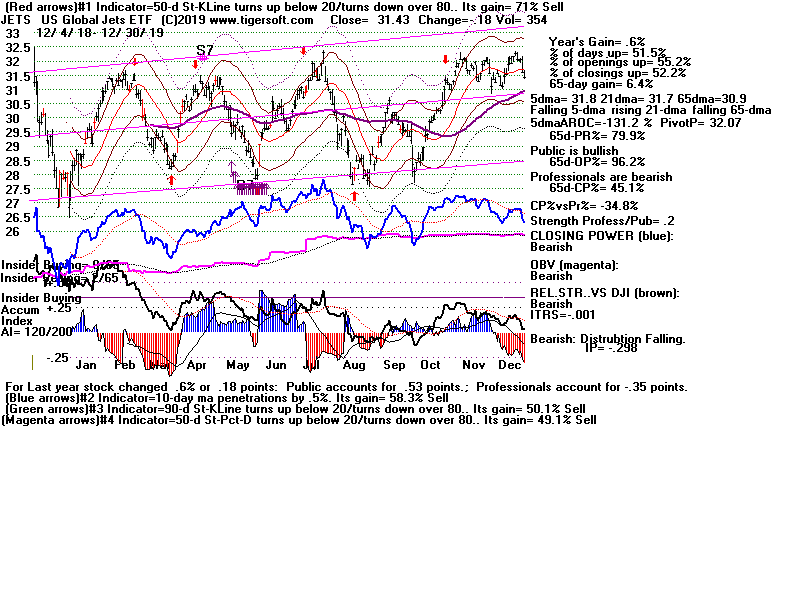
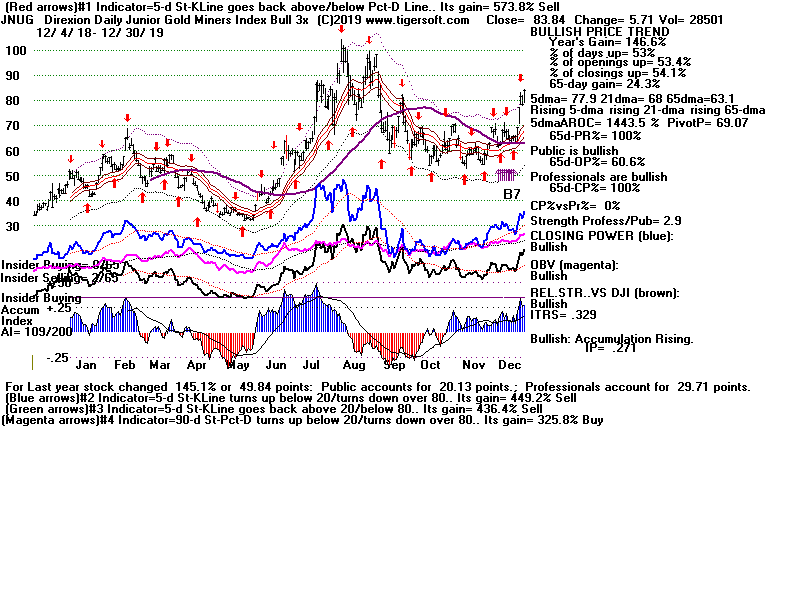
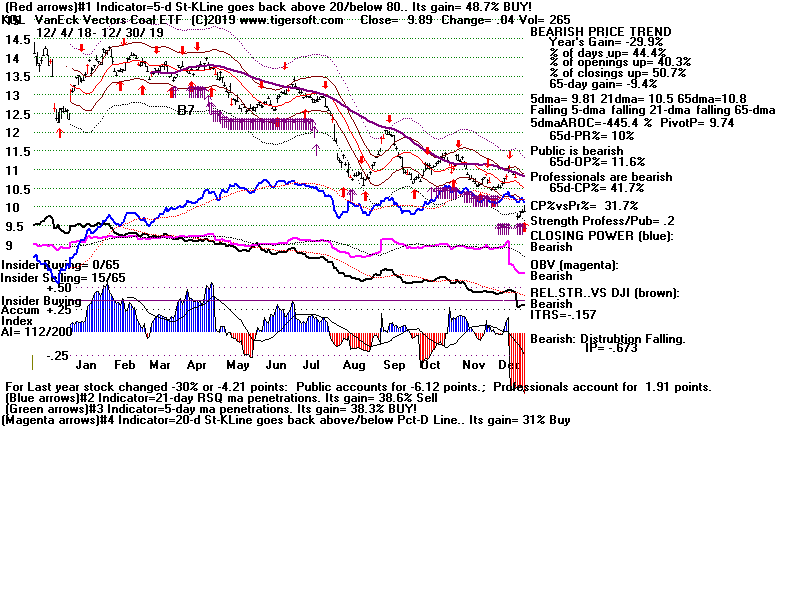
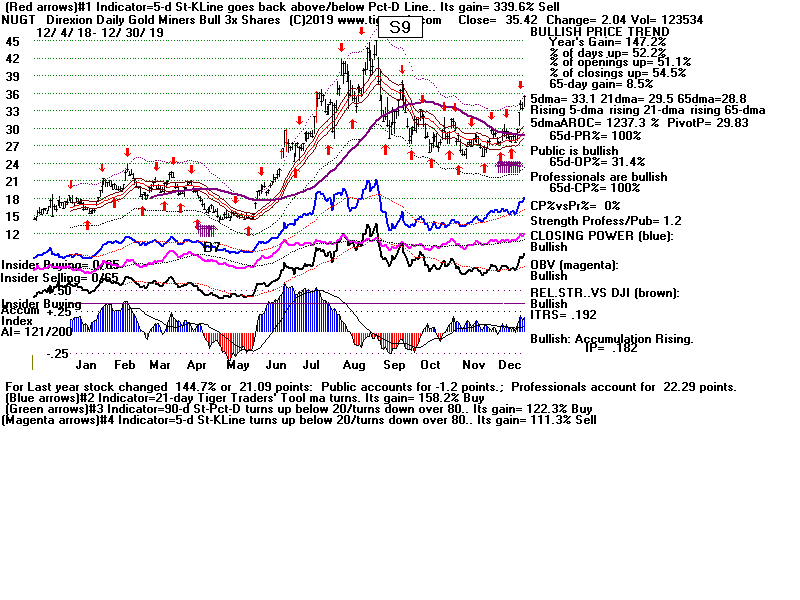
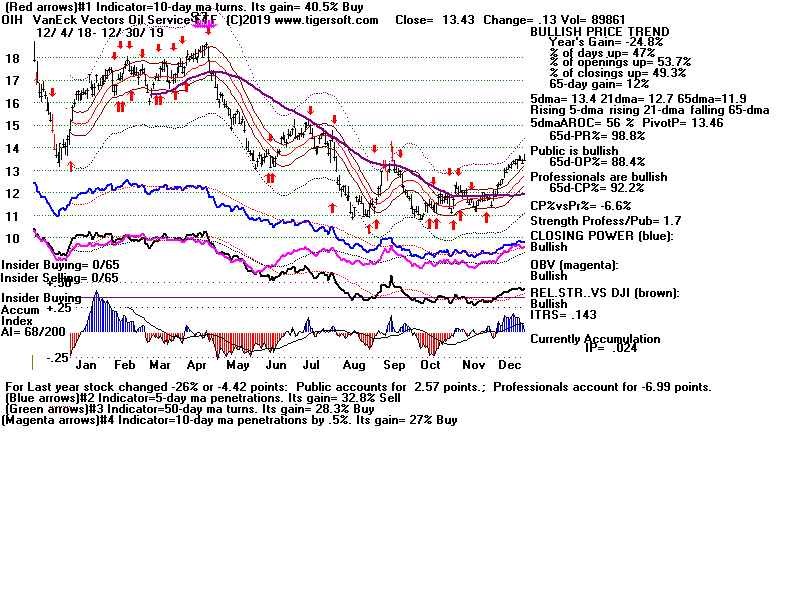
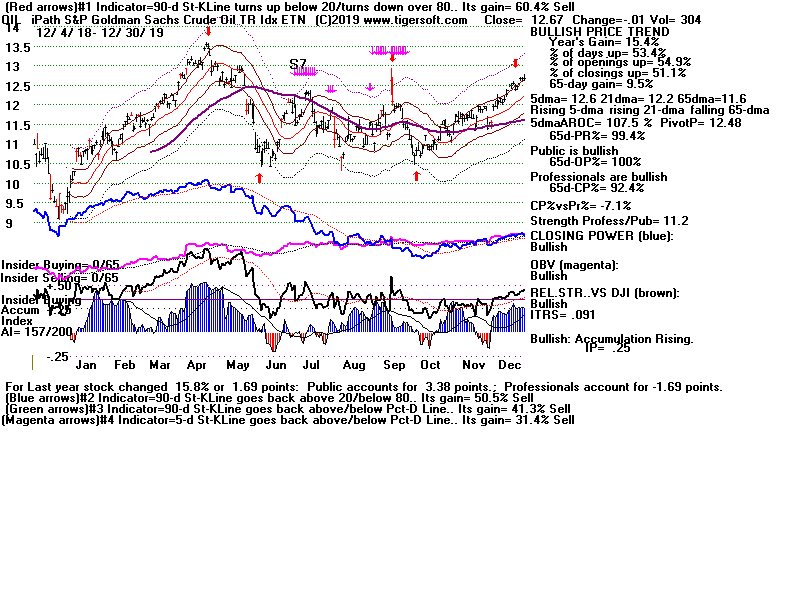
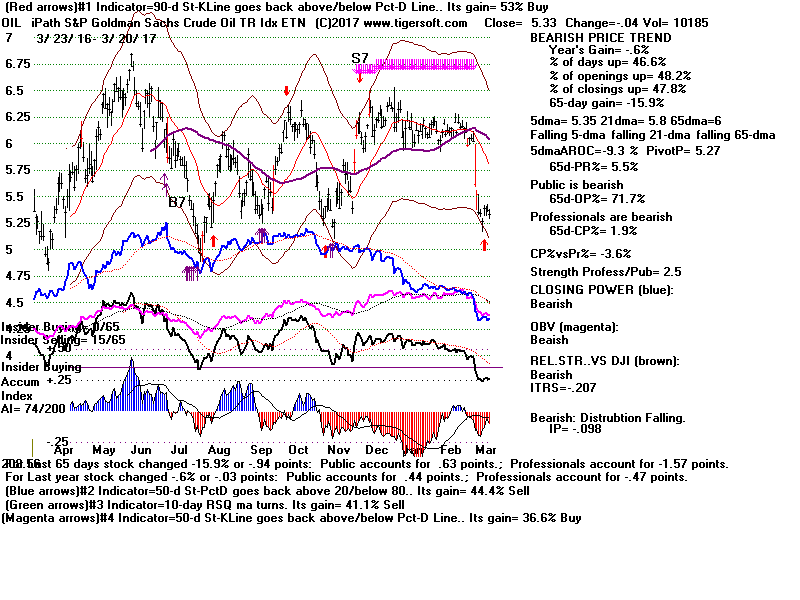
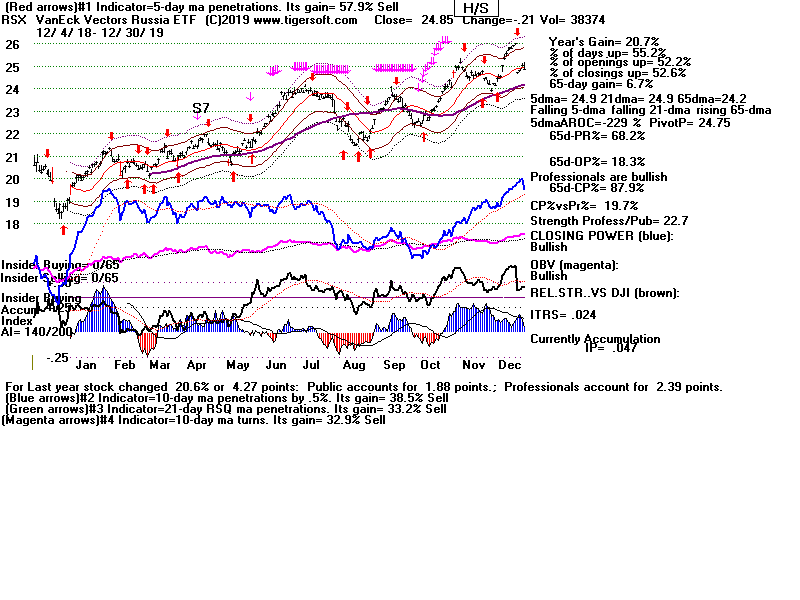
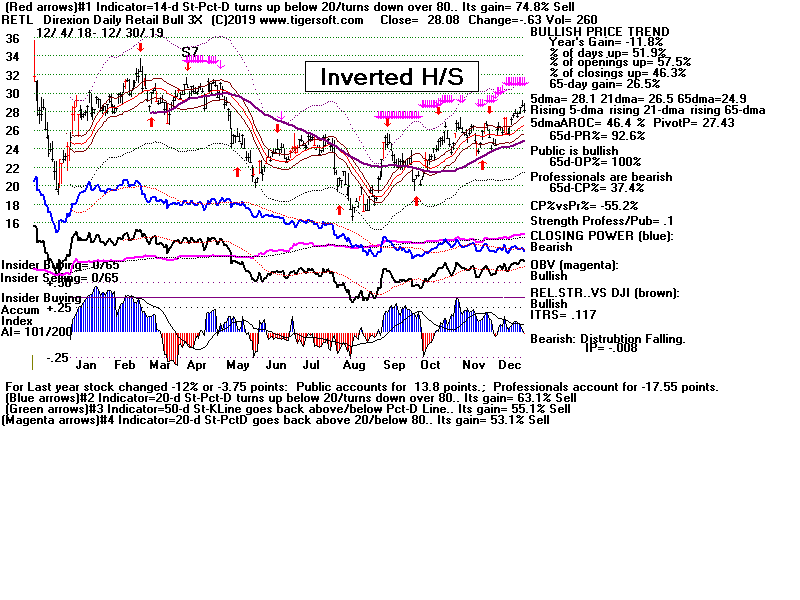
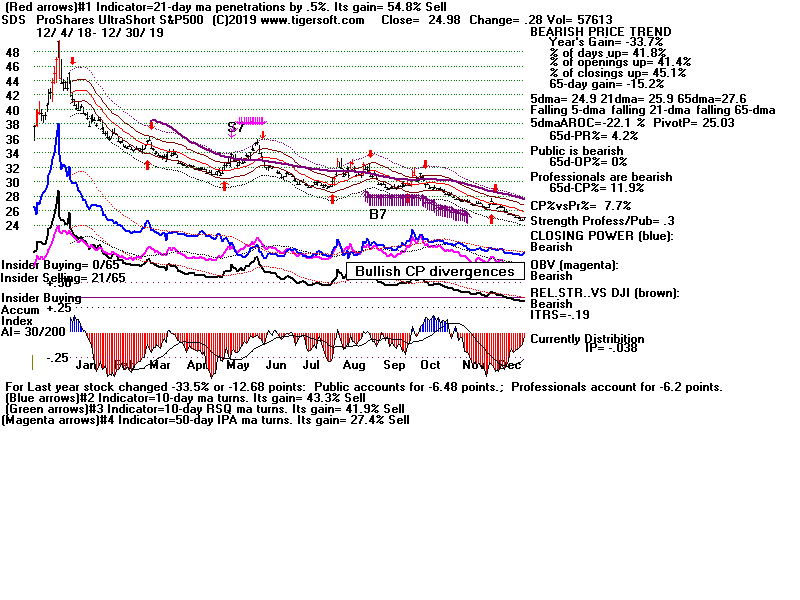
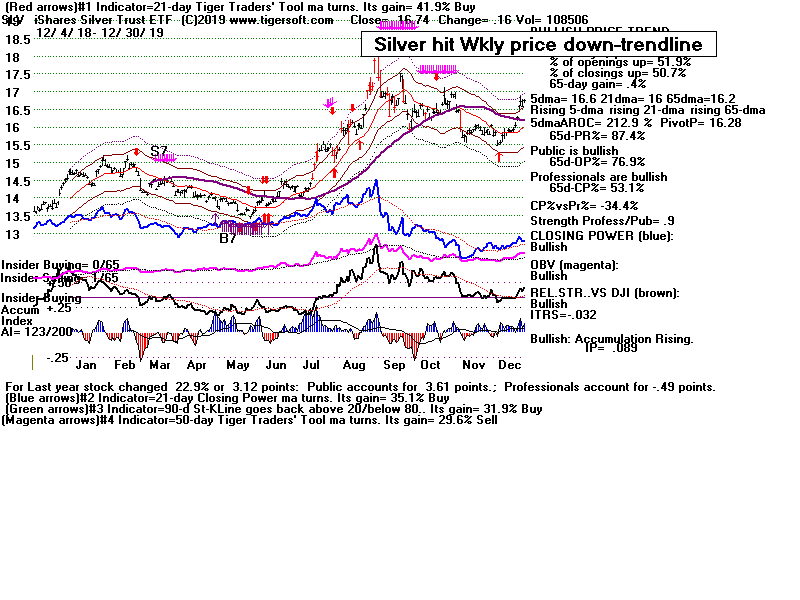
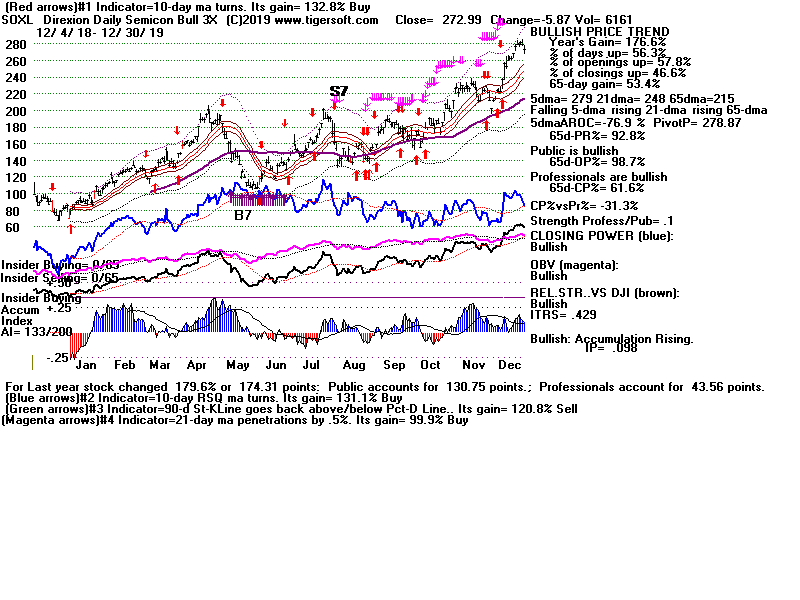
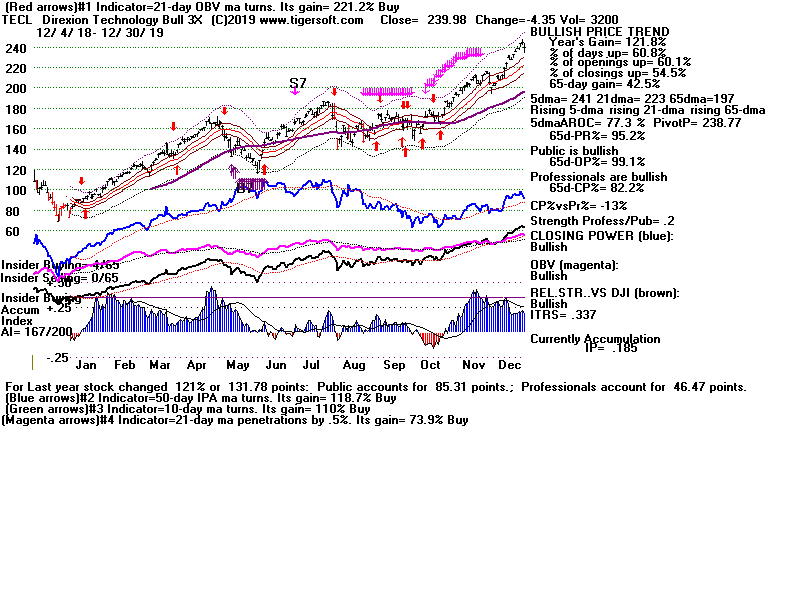
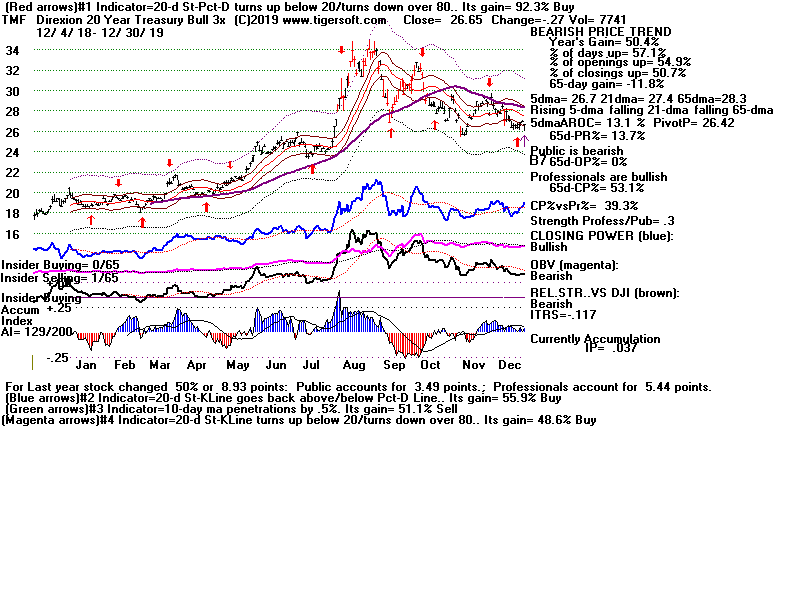
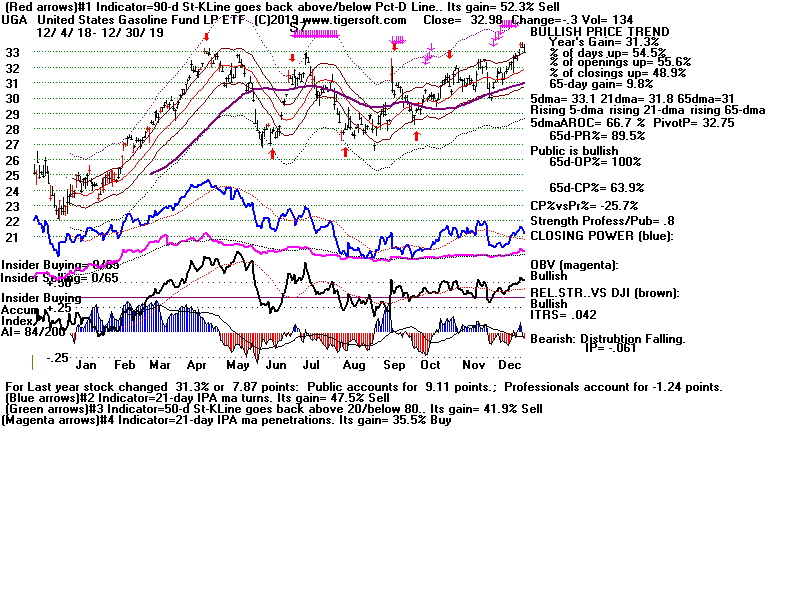
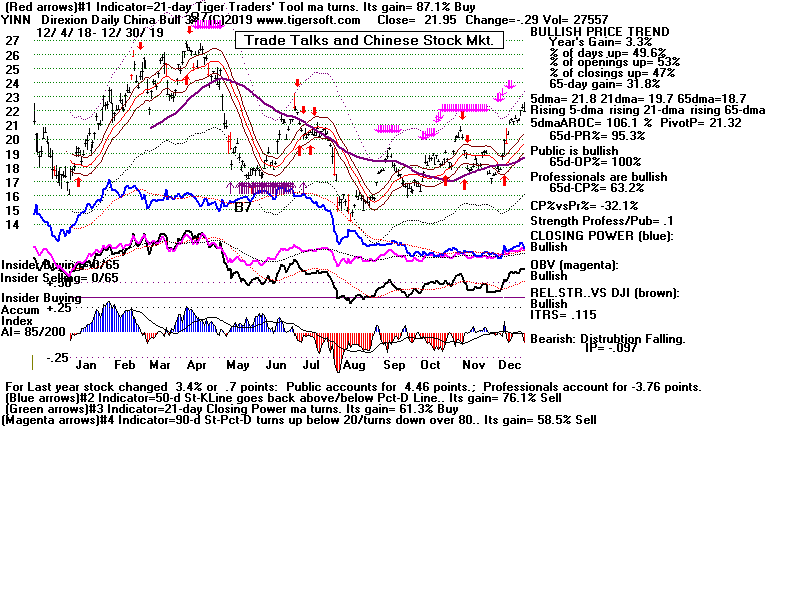
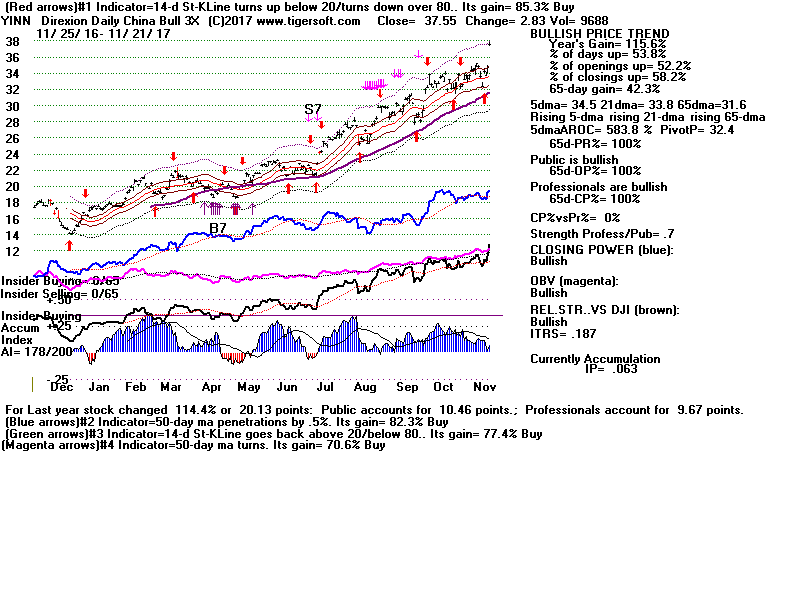
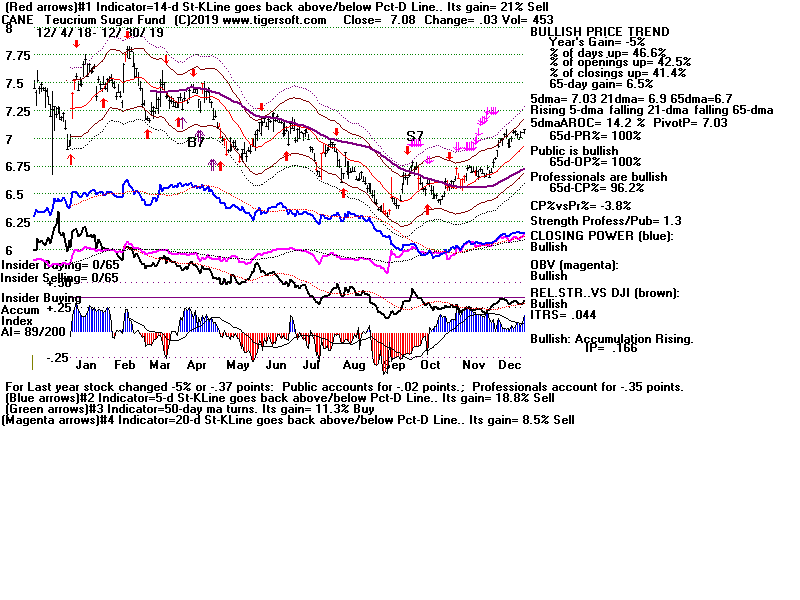
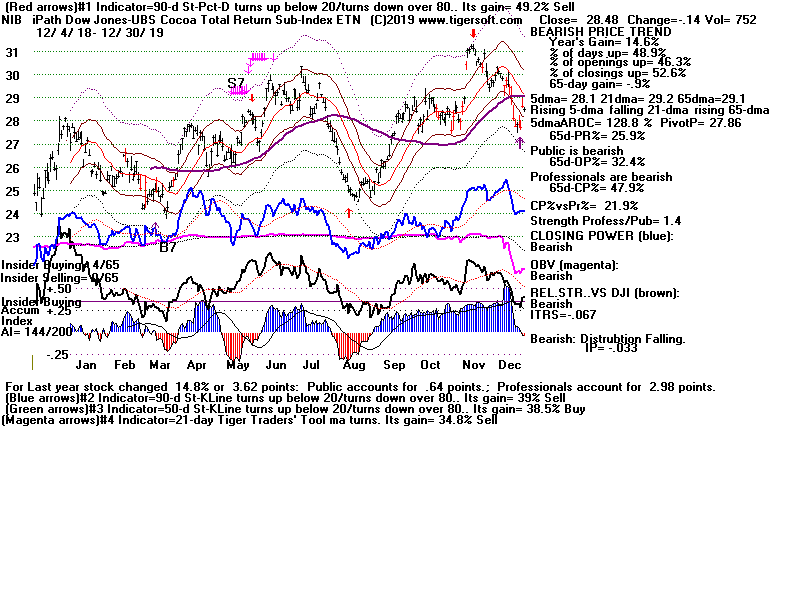
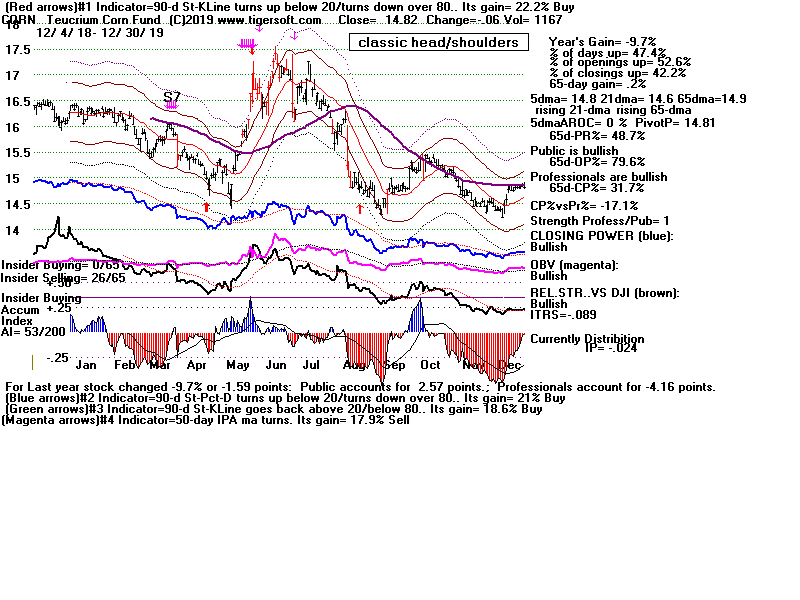
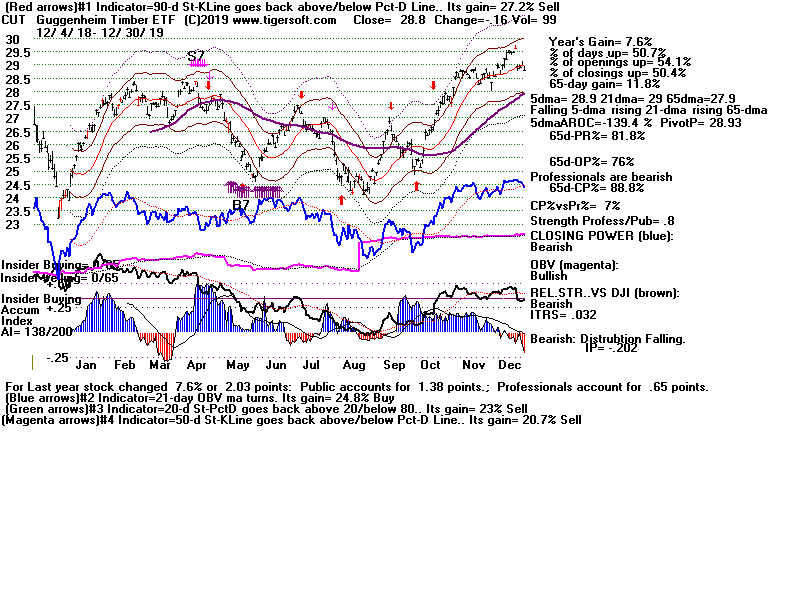
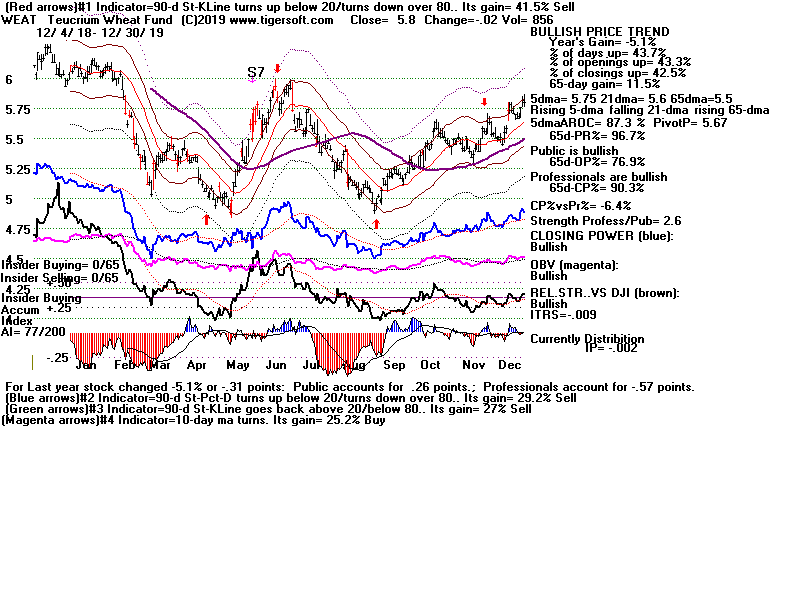
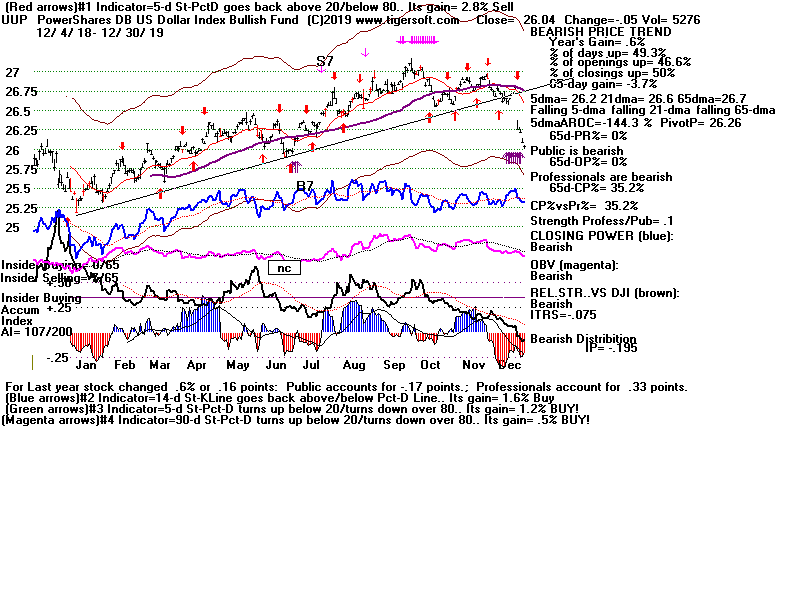
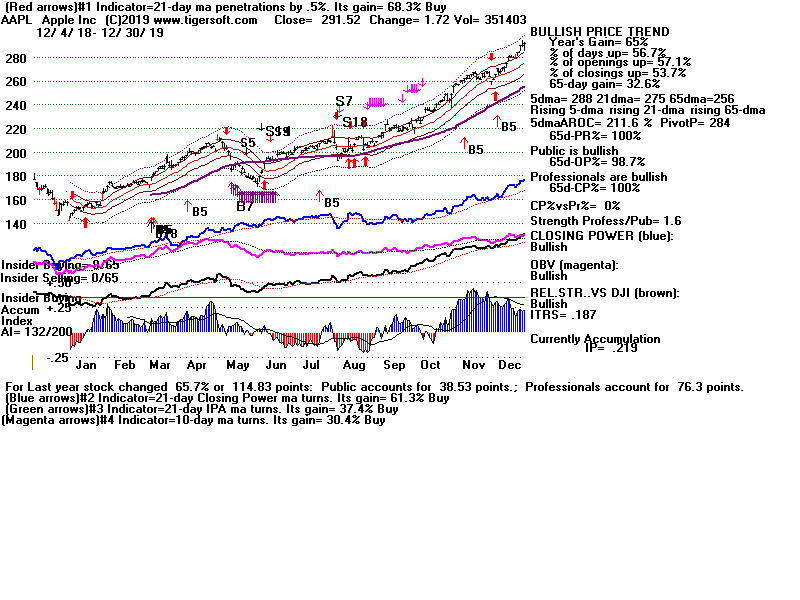
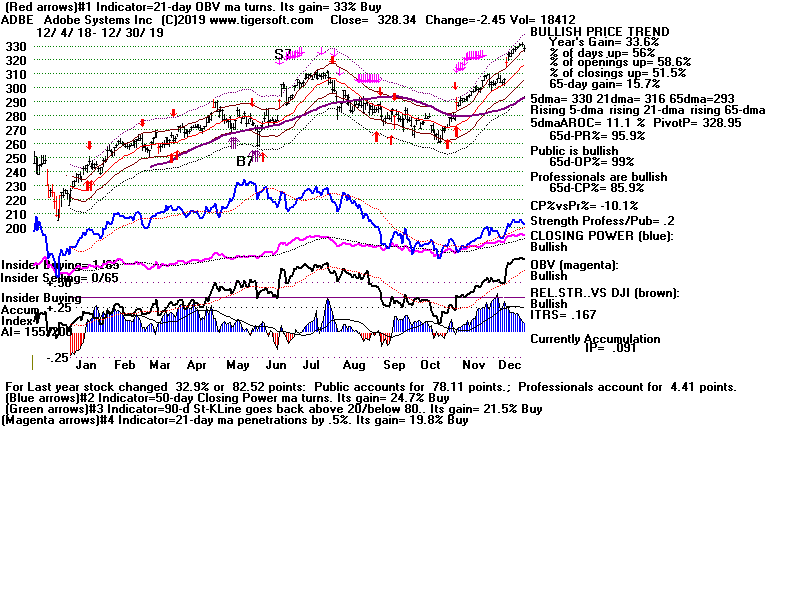
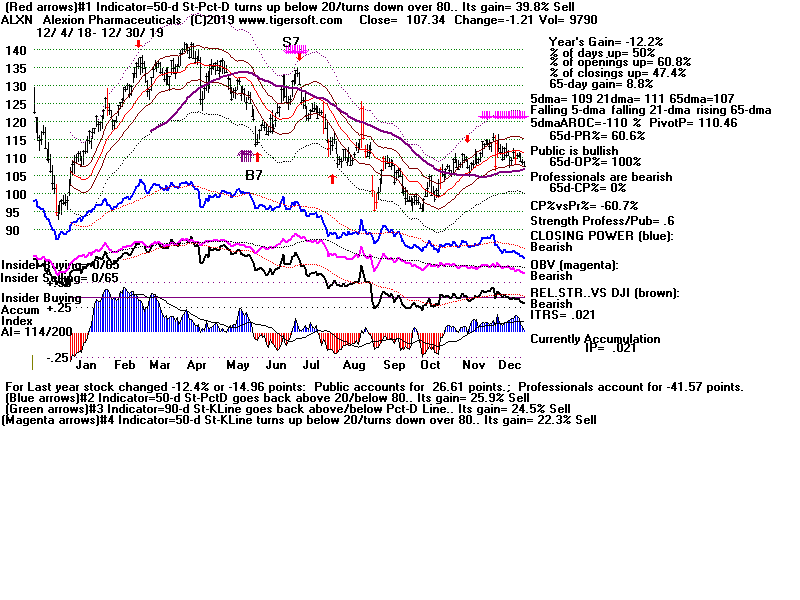
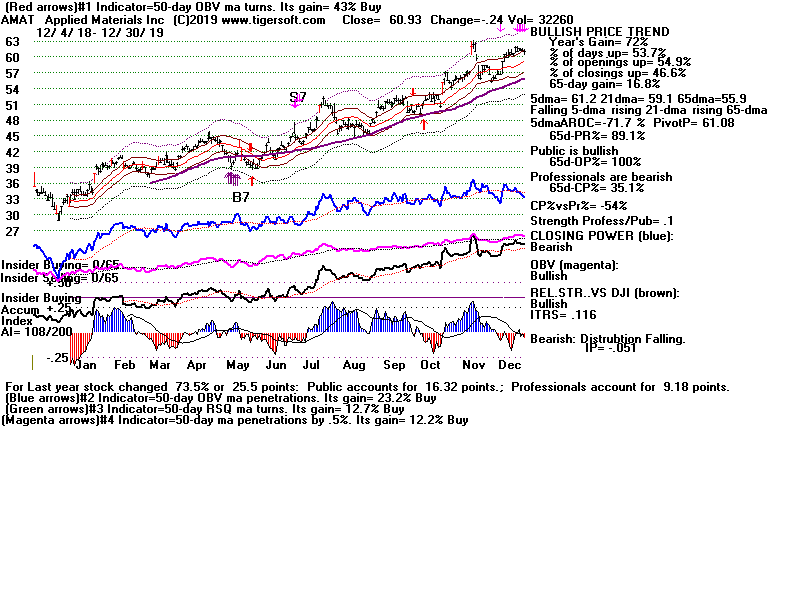
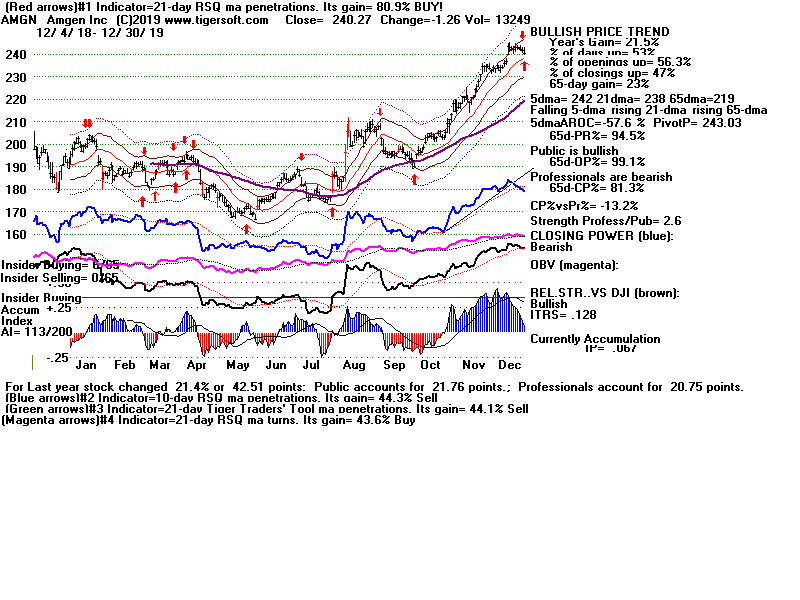
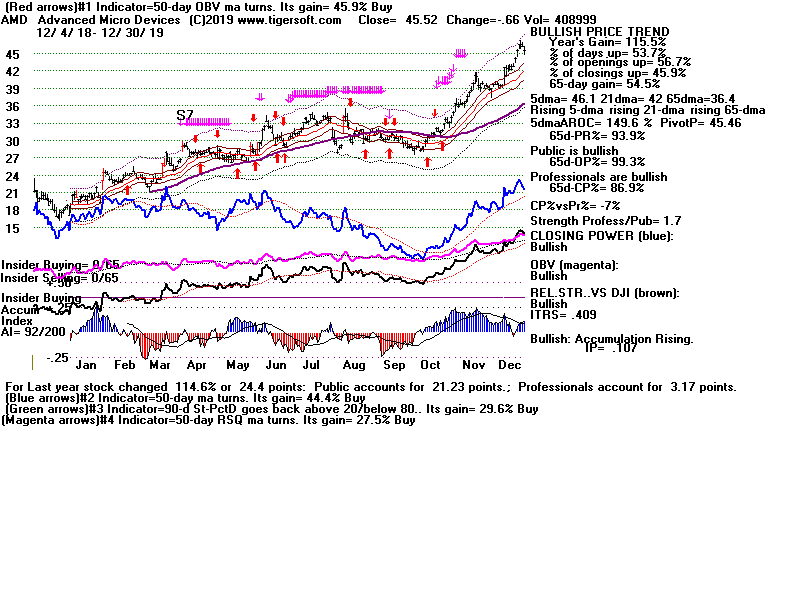
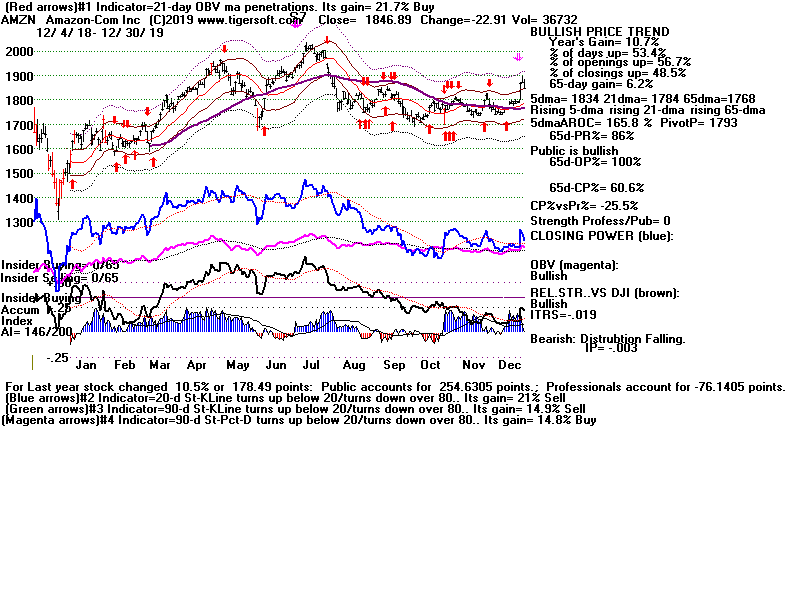
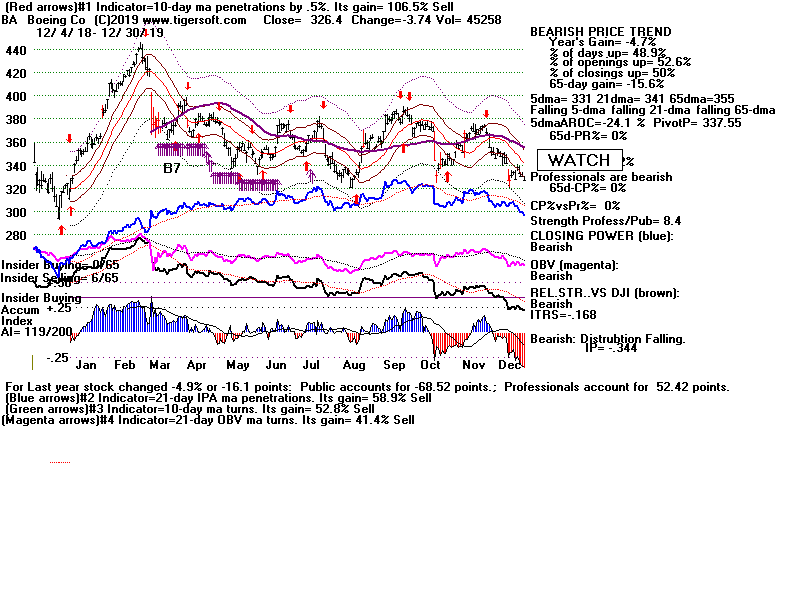
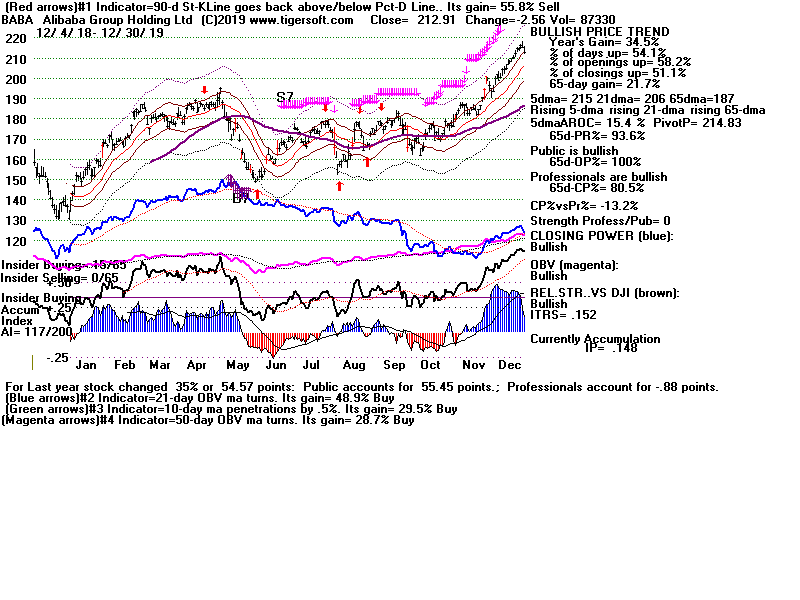
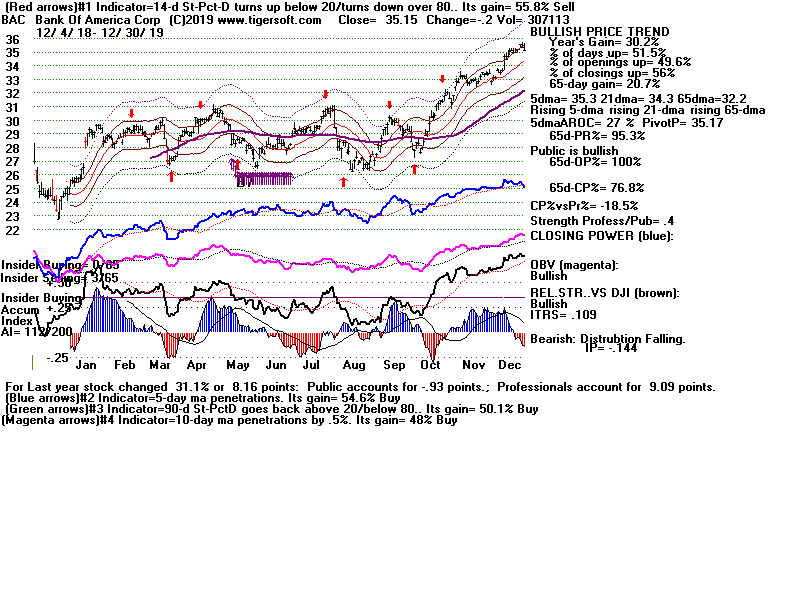
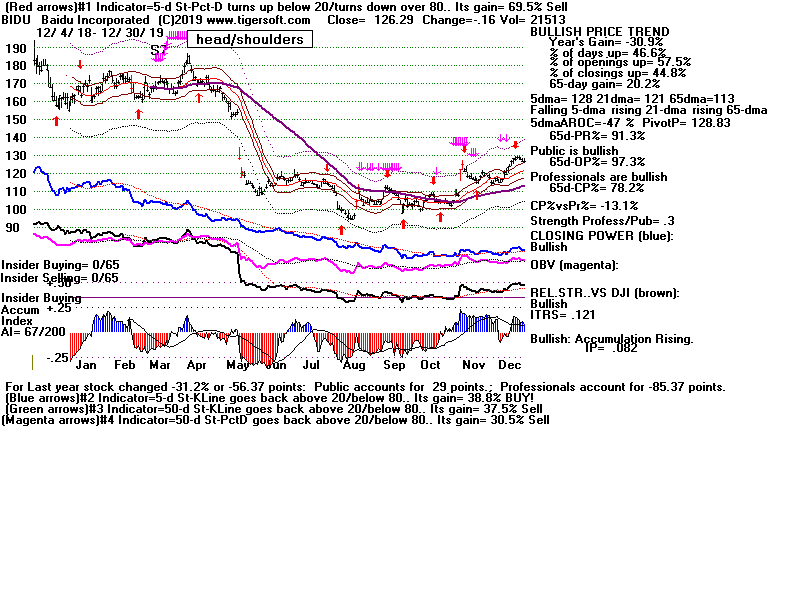
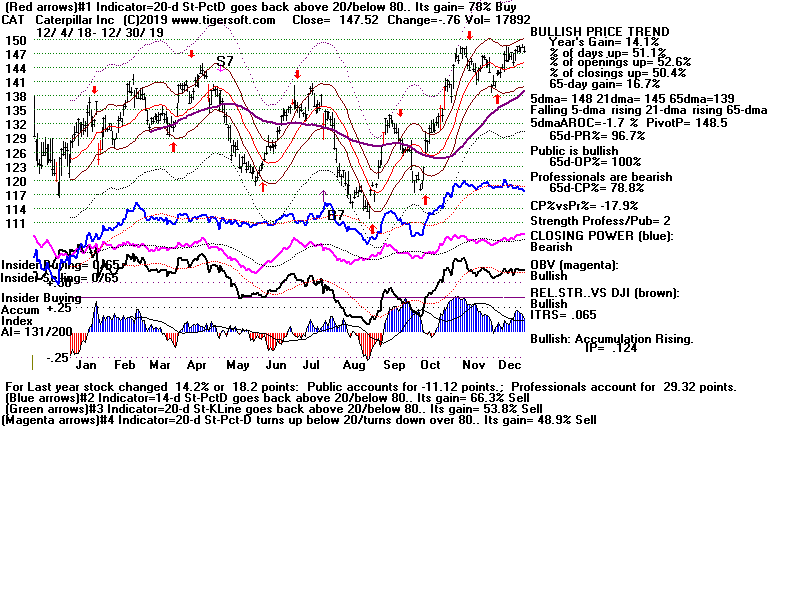
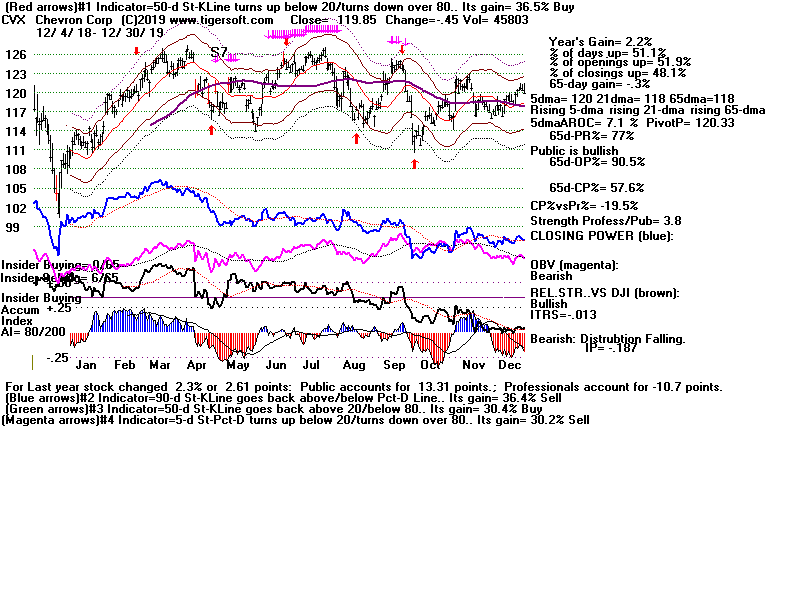
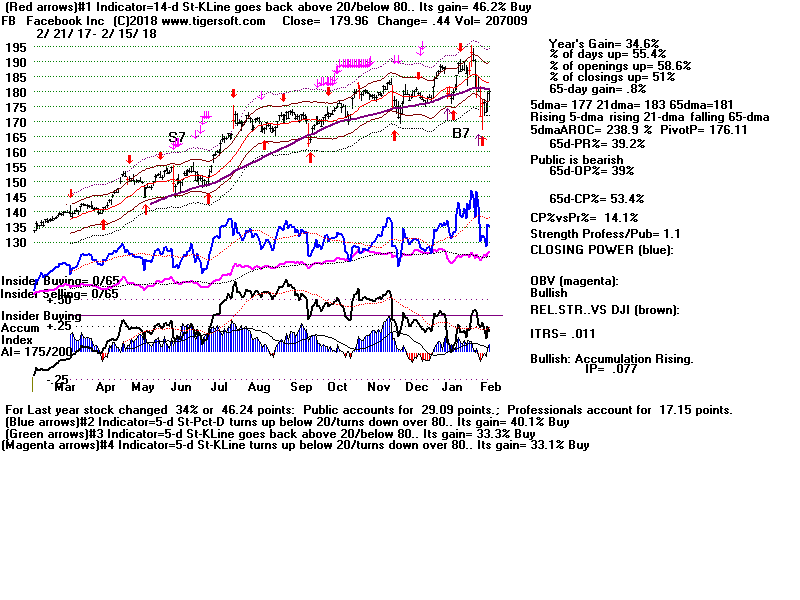
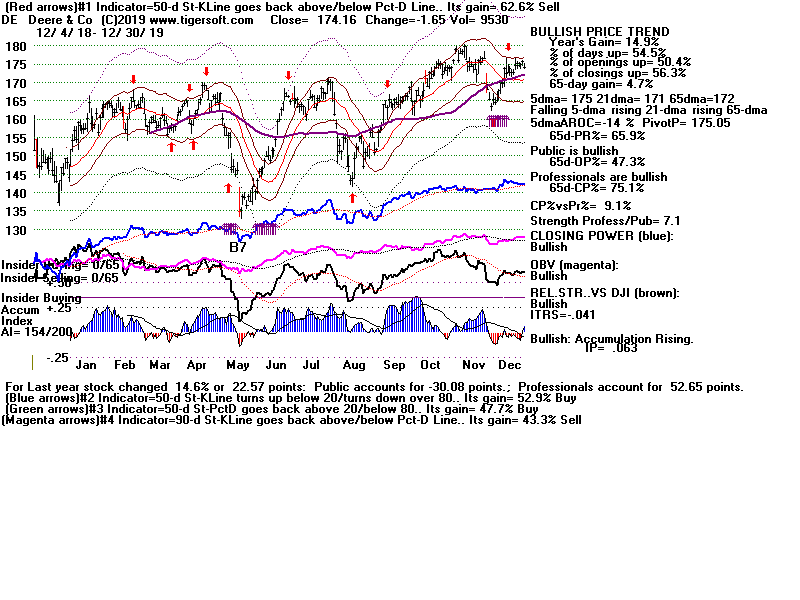
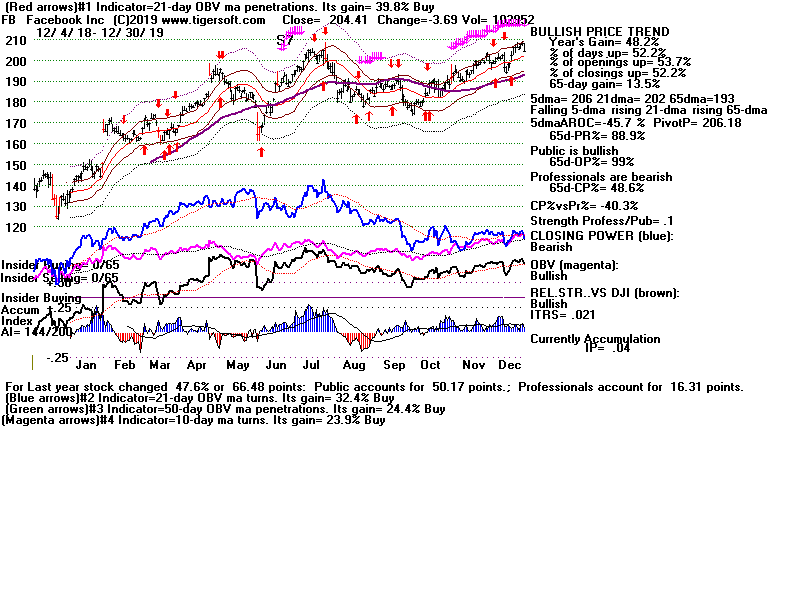
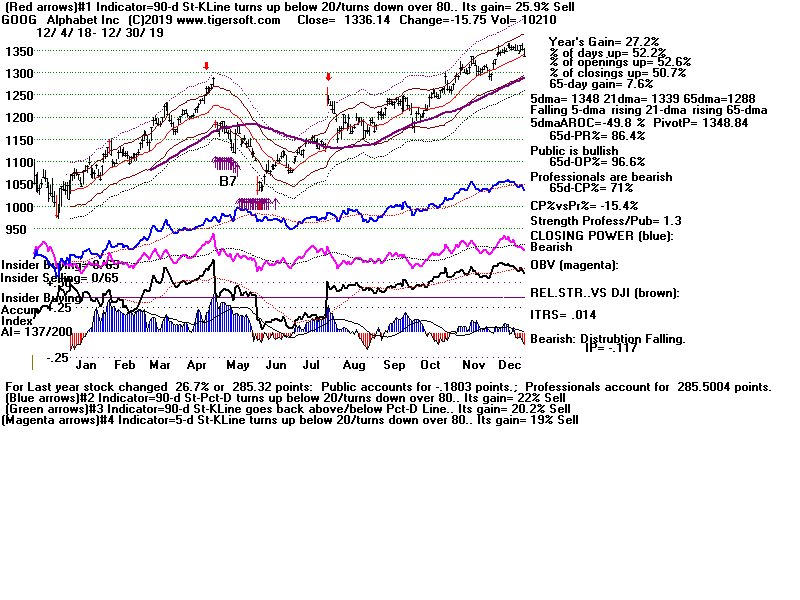
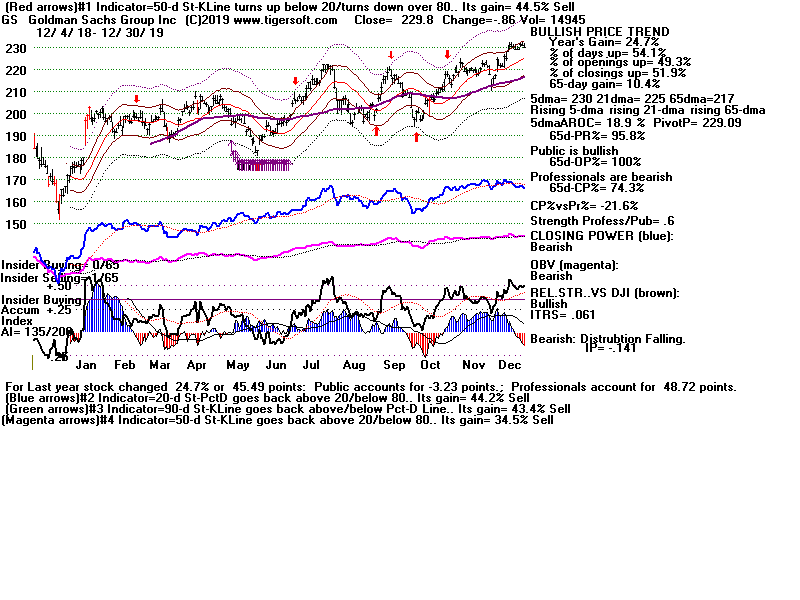
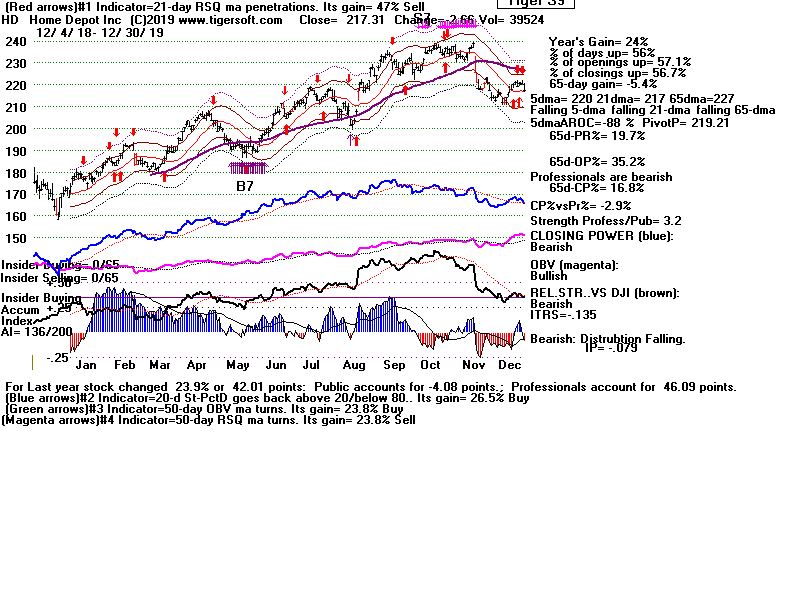
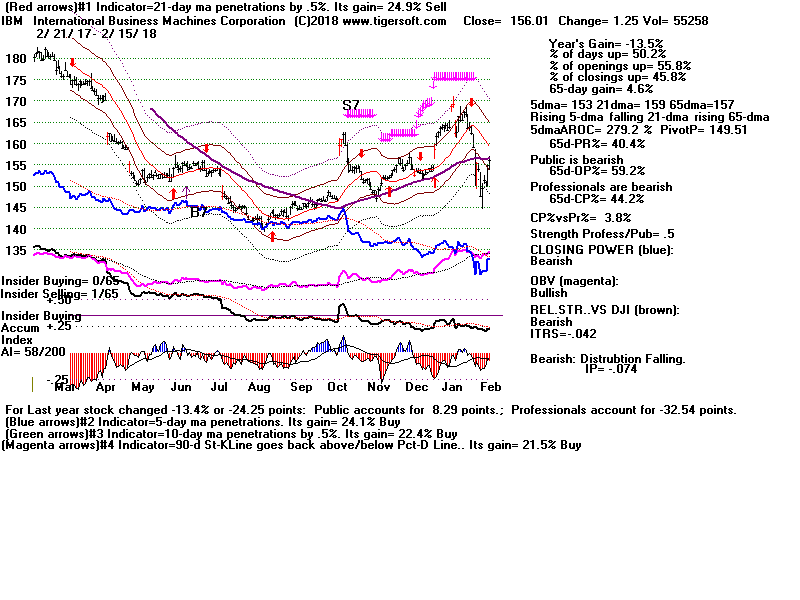
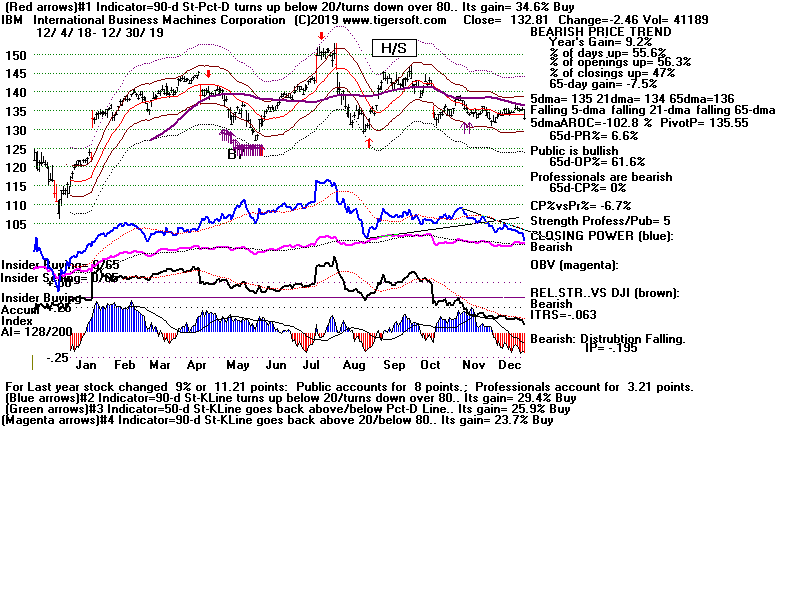
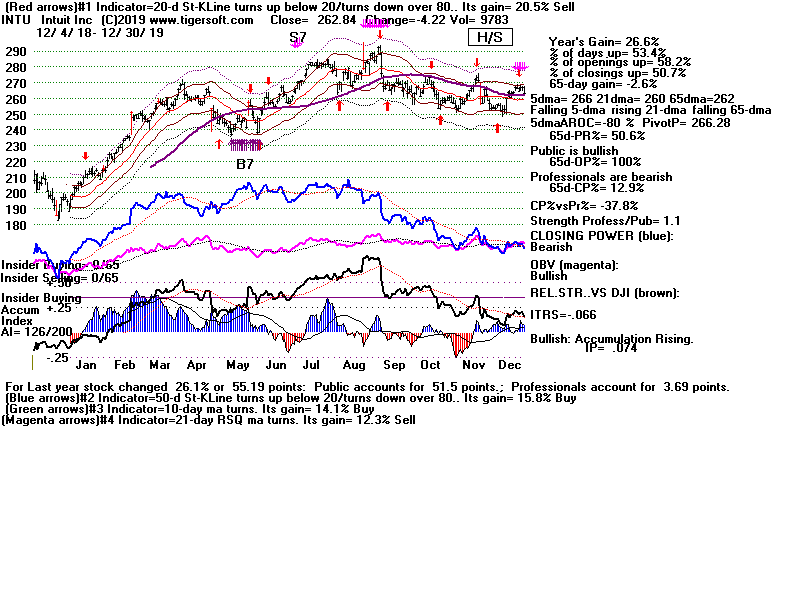
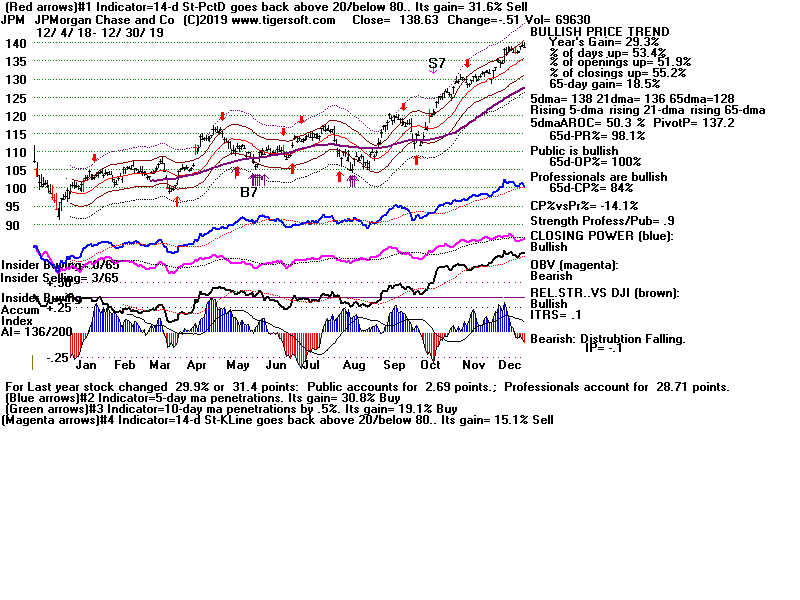
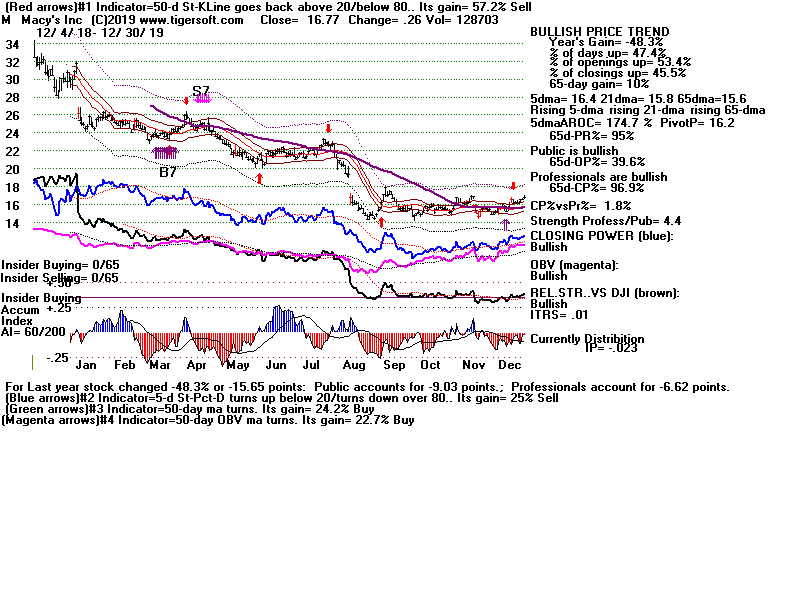
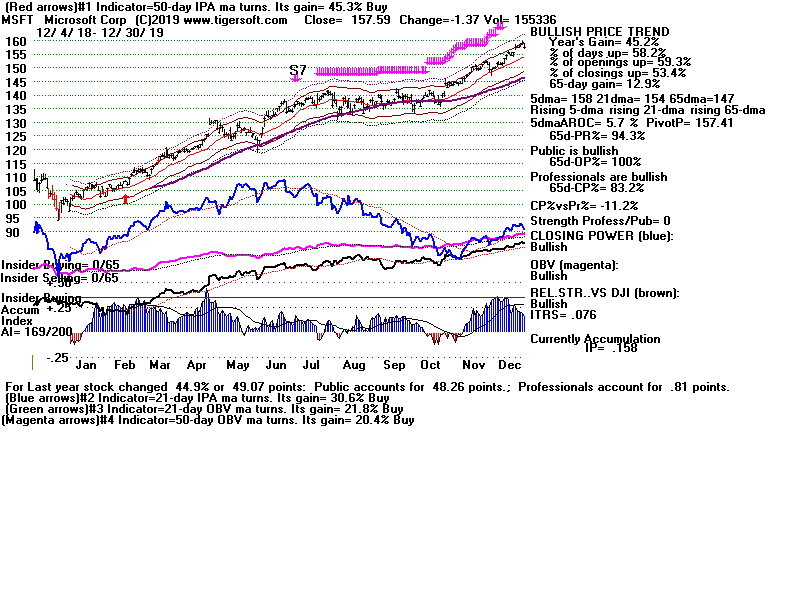
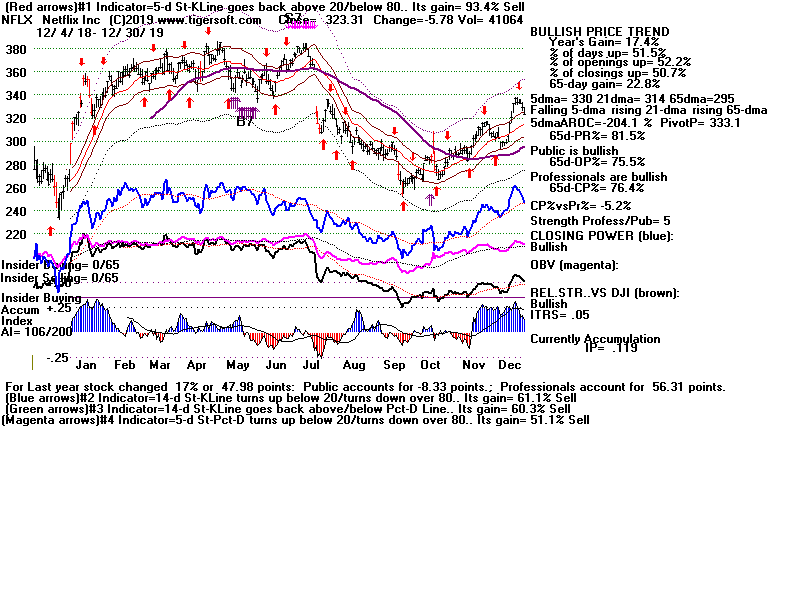
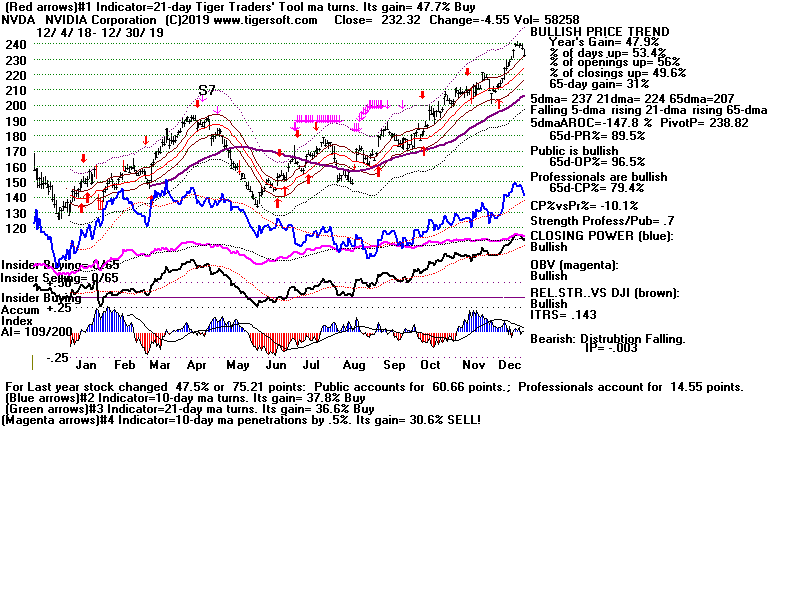
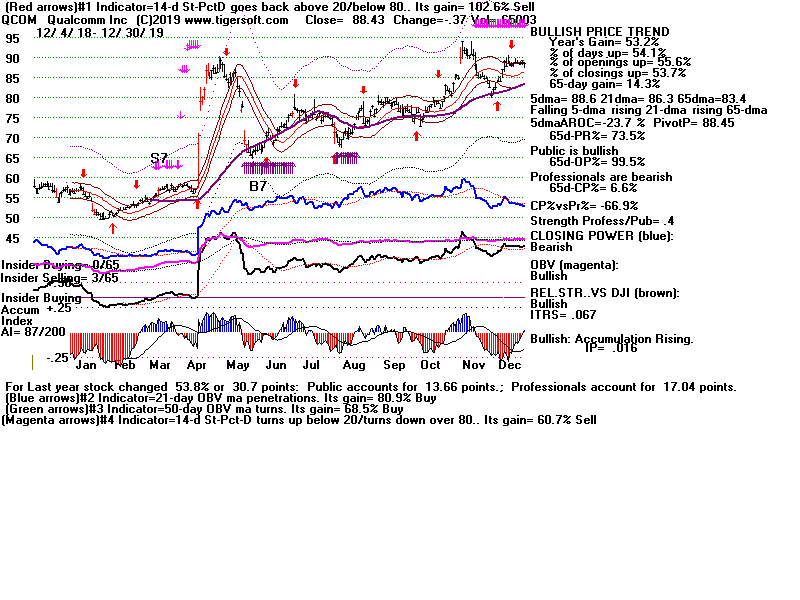
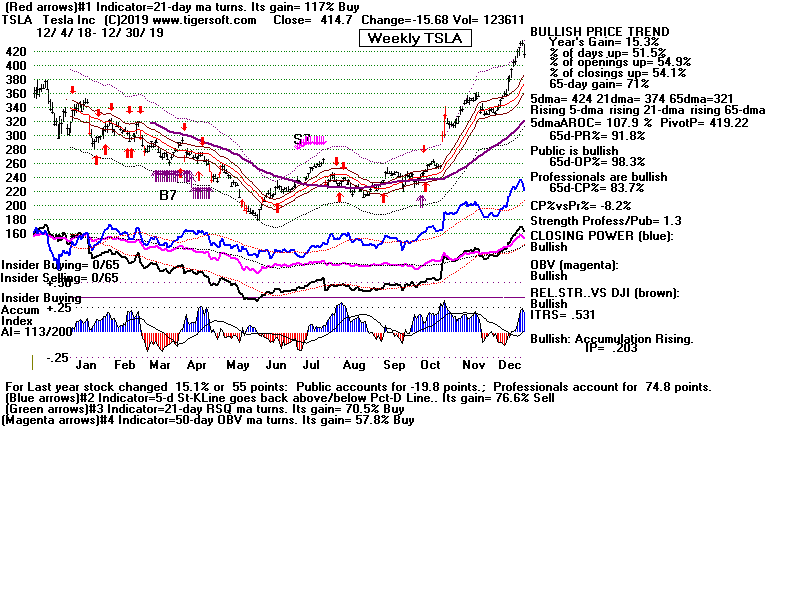
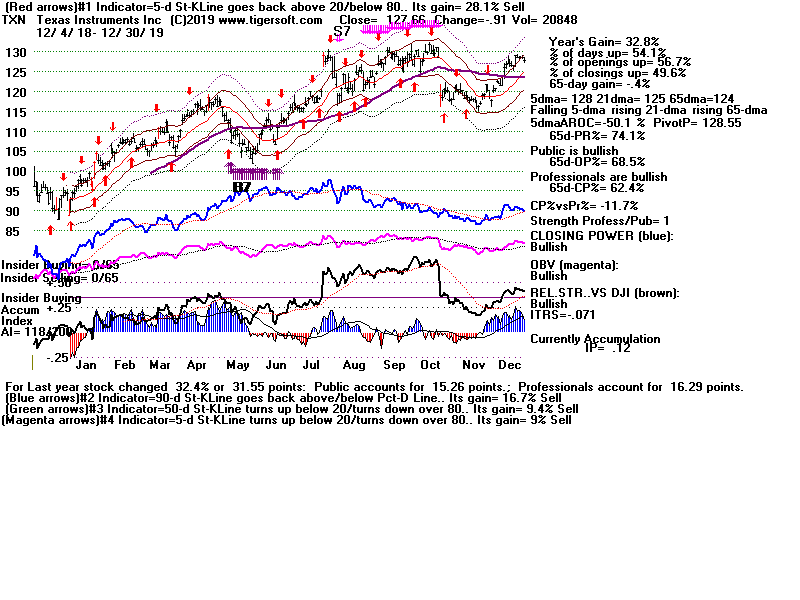
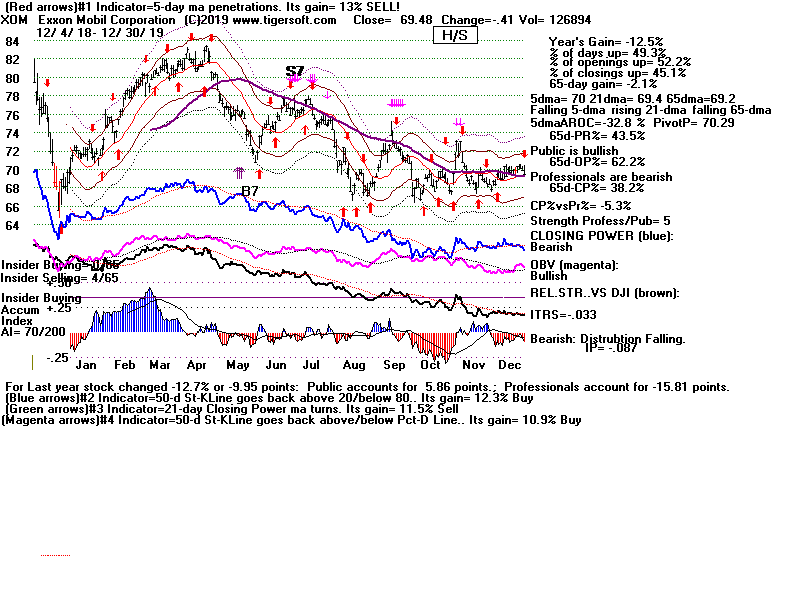
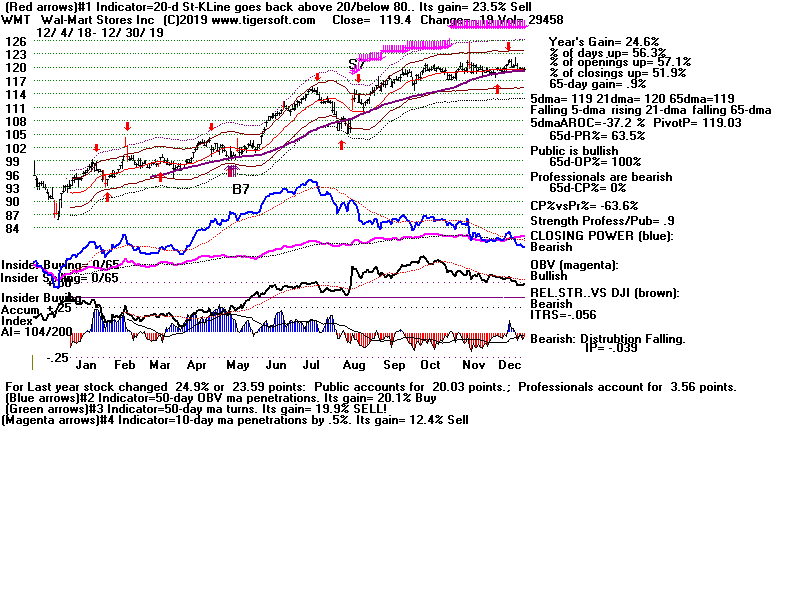
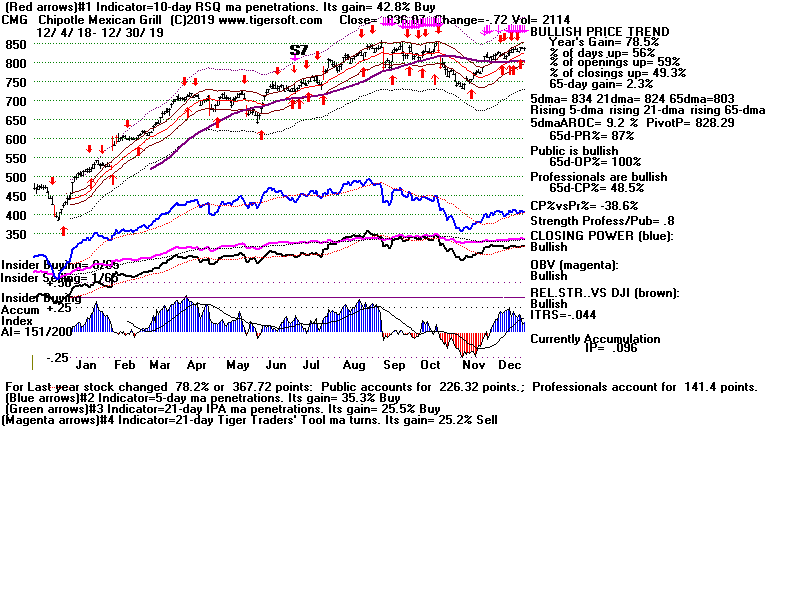
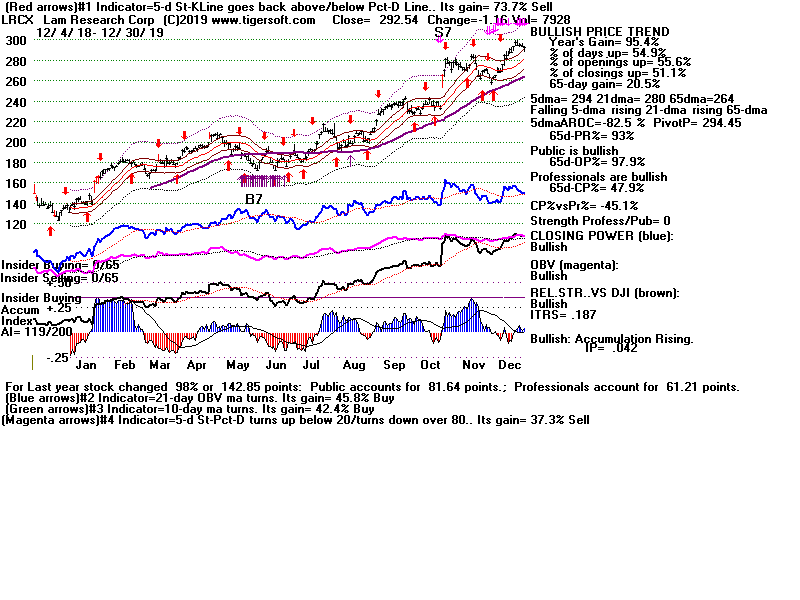
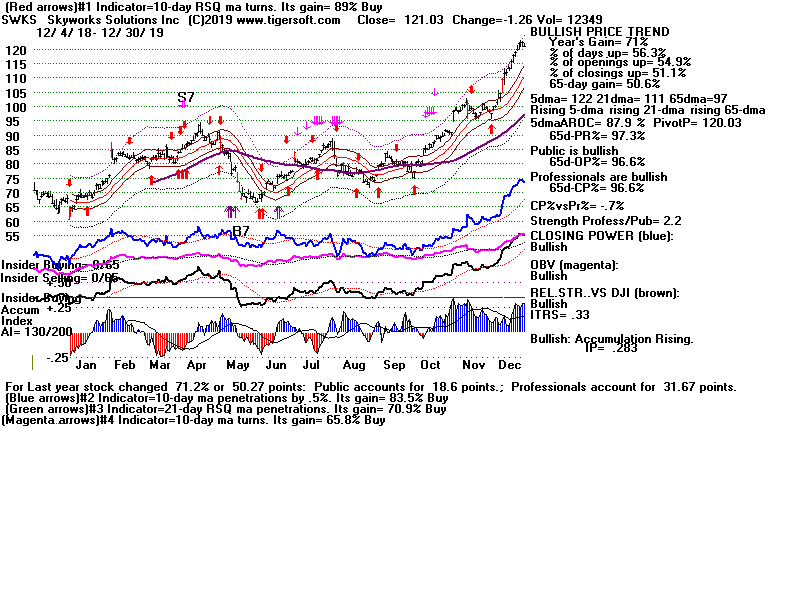
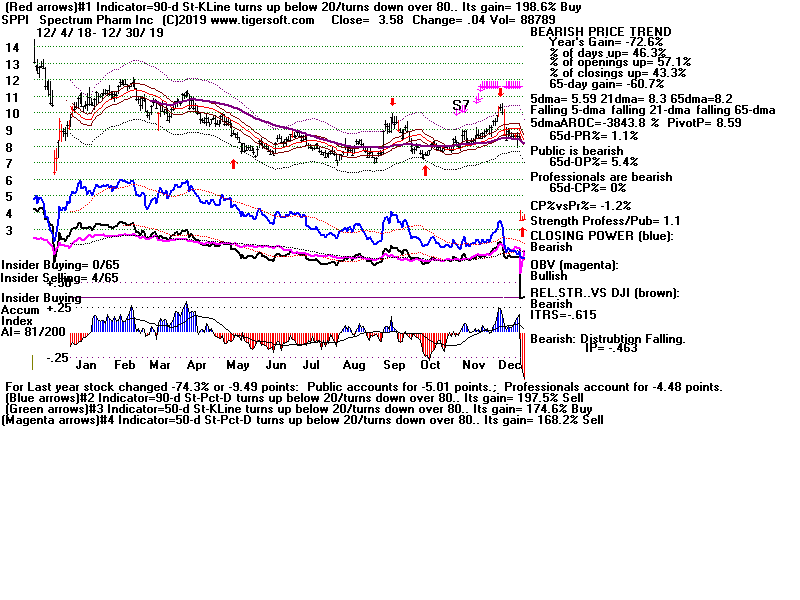
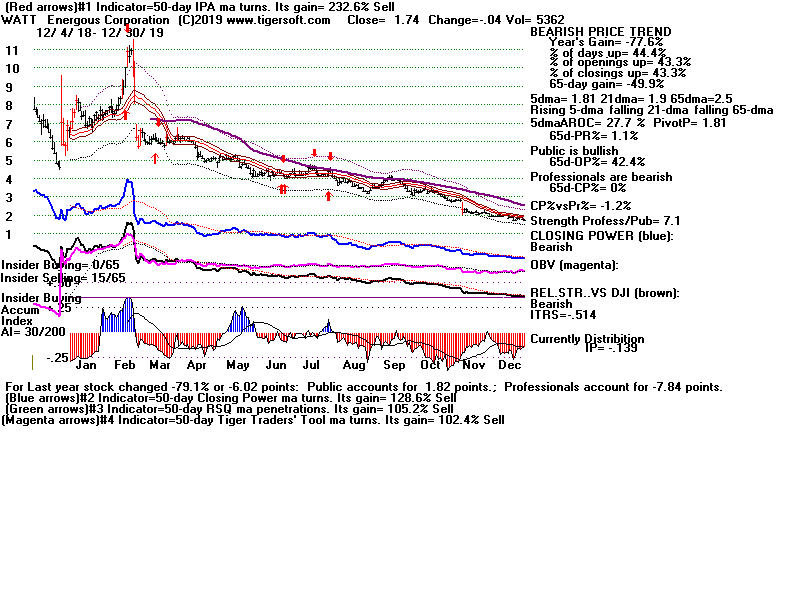
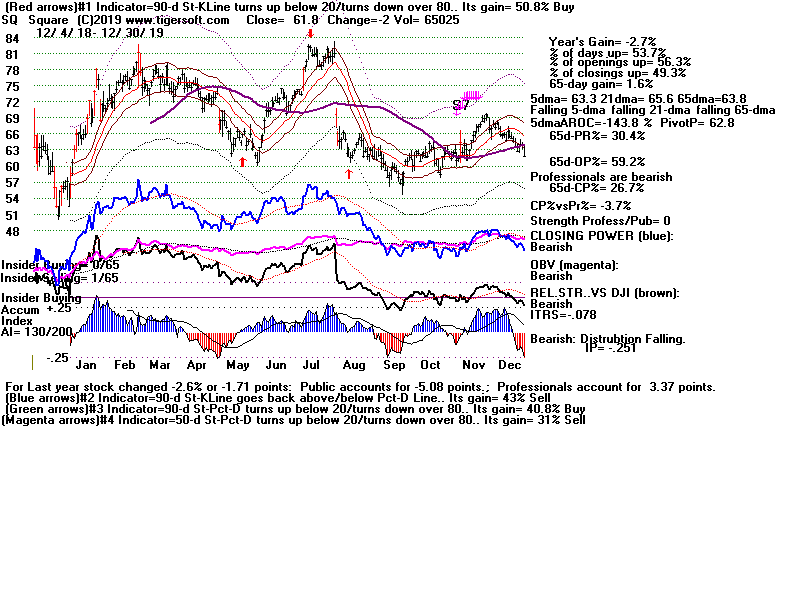
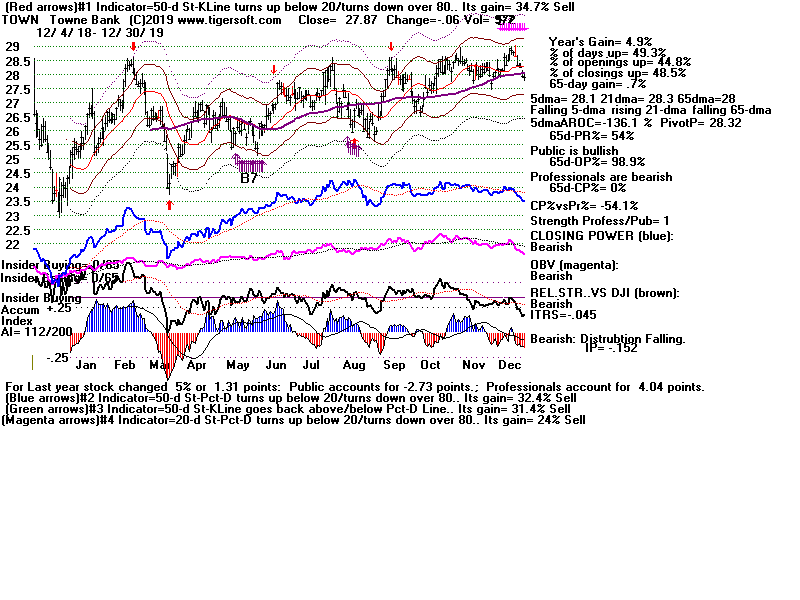