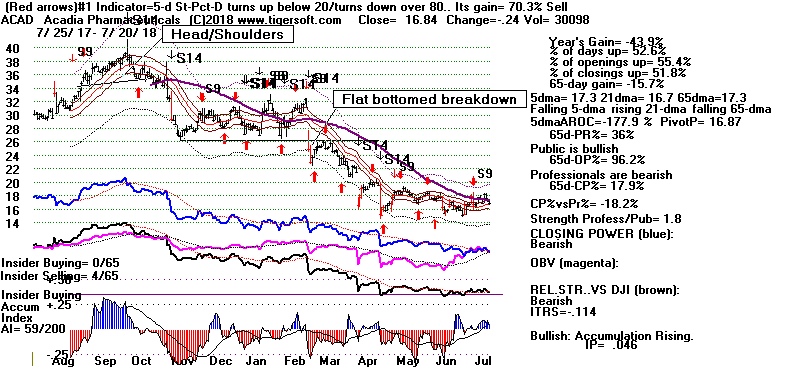
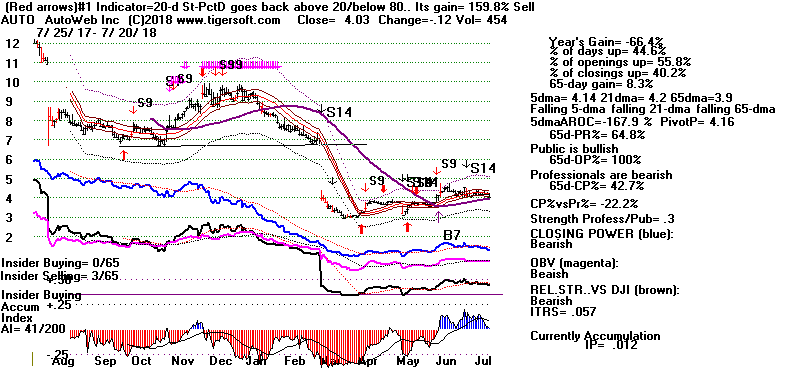
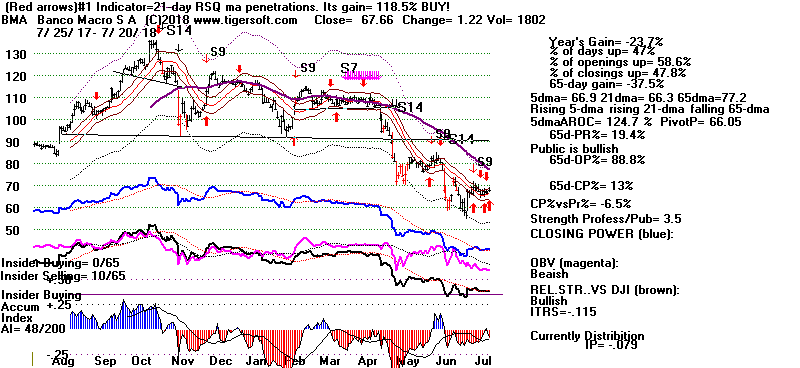
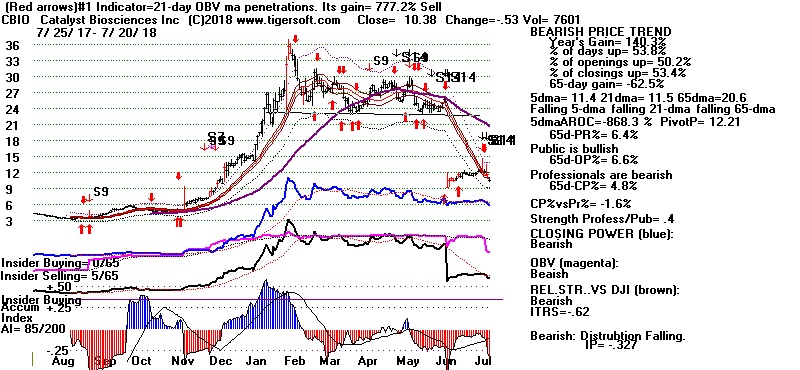
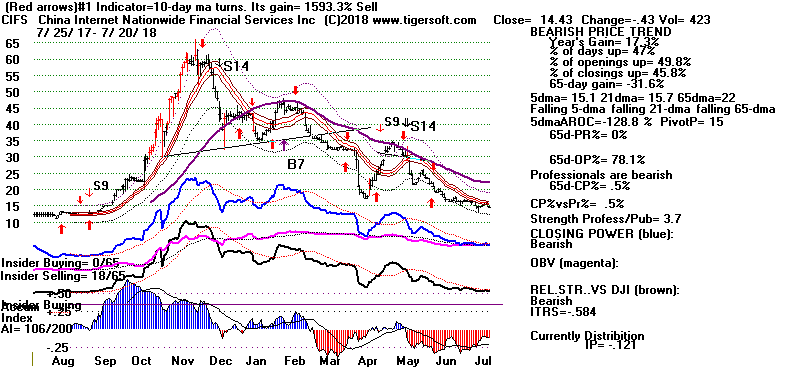
STOCKS DOWN 40% IN LAST 100 TRADING DAYS
7- 20-2018
Study these stocks. Nearly all of these show
1. multiple S9s and S14s,
2. breakdowns below flat, well-tested support,
3. heavy Red distribution,
4. falling Closing Powers and
magenta S7s
5. and falling relative strength.
These are the main warning signs we should look for among our BEARISH MINCPS
and the NEW LOWS each day. But look also for the bearish head/shoulders
patterns
and the importance of the 65-dma giving way.
Note the number of foreign stocks here.
Lots more examples and ideas are to be seen in my E-book
Killer Short Sales in Any Market" ($42.50)
More examples of ideal-type short sales.
http://www.tigersoft.com/PageFourTigerSoft/index.html
