Earlier Hotlines
www.tigersoft.com/21MAY18/INDEX.htm
www.tigersoft.com/55HEP/INDEX.htm
www.tigersoft.com/44H4L/INDEX2.htm
Earlier still: Go
here...
HELP
A Guide
To Profitably Using The Tiger Nightly HOTLINE
Introduction to Tiger/Peerless Buys and
Sells.
Peerless Buy and
Sell Signals: 1928-2016
Individual Peerless signals explained:
http://tigersoftware.com/PeerlessStudies/Signals-Res/index.htm
http://www.tigersoft.com/PeerInst-2012-2013/
Explanation of each Peerless signal. http://www.tigersoft.com/PeerInst-2012-2013/
Different Types of
TigerSoft/Peerless CHARTS, Signals and Indicators
-----> More HELP LINKS
Documentation for TigerSoft
Automatic and Optimized Signals.
How reliable support is the
DJI's rising 200-day ma?
SPY Charts since
1994: Advisory Closing Power S7s, Accum. Index, 65-dma, Optimized Signals.
^^^^^^^^^^^^^^^^^^^^^^^^^^^^^^^^^^^^^^^^^^^^^^^^
1/19/2016 ---> Corrections,Deeper
Declines and Bear Markets since 1945.
1/21/2016
---> High
Velocity Declines since 1929
2/12/2016 ---> Presidential
Elections Years and Bullish IP21 Positive Non-Confirmations at Lower Band.
2/12/2016 ---> OBV NNCs on DJI's Rally to
2.7% Upper Band when DJI's 65-dma is falling.
11/6/2016 --->
Killer Short Selling
Techniques: ===> Order Here ($42.50)
It's As Easy as 1,2,3
TigerSoft "Combination" Short-Selling... Easy as 1-2-3 Short Sales
Earlier Q-Answers
QuickSilver Documentation (1/11/2016)
Our Different
Signals
Better understand the difference between
Peerless DJI-based signals,
the one-year optimized red Signals and the fixed signals based
on technical developments.
Introduction to Tiger/Peerless Buys and Sells.
Different Types of
TigerSoft/Peerless CHARTS, Signals and Indicators
New TigerPeerless Installation and
Basic Uses' Instruction
See the re-written materials on TigerSoft Buys and Sells.
Study- Trading SPY
WITHOUT Peerless - Some Guidelines.
When completed this will be a new Tiger Trading E-Book.
Study- Examples of
"Hands above the Head" top patterns.
Study- 9/3/2017 TigerSoft (not
Peerless) charts of Major Tops as they occurred.
===> Please report any broken or out-of-date links. william_schmidt@hotmail.com
====================================================================
====================================================================
The next Hotline will be posted on the evening of July 4th at the
new site..
Have a Happy Fourth Of July.
7/2/2018 The operative Peerless signal remains a Sell S9V.
Today, the DJI
bounced up off the 24000 support. Because of the bullish seasonality, the
the day before and the day after the Fourth of July, expect the DJI to rally to
its 21-day ma, now at 24775. Because there has been no Peerless Buy
signal yet, I would think the DJI will again need to test 24000. The positives
here are the rising A/D Line and the rising 200-day ma. The negatives are
the still red Volume-Indicator and the tendency of the DJI not to be
able to advance much after a strong opening because there remains a lot
of shares that big institutions are seeking to get out of, especially in many of
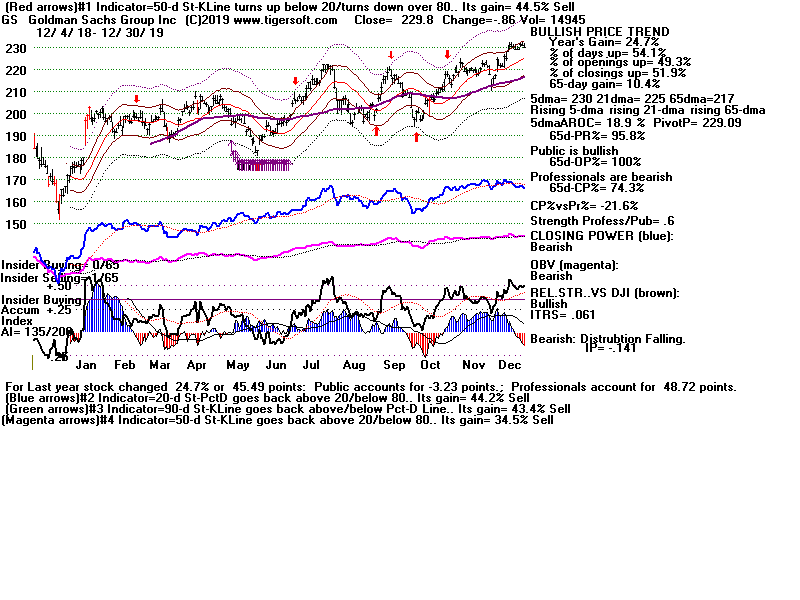
the higher priced (and more weighty) blue chips, like CAT, GS, JPM and
BA.
The back and forth period in the major market that we are now seeing is
frustrating for anyone wanting sustained and bigger moves in the major ETFs.
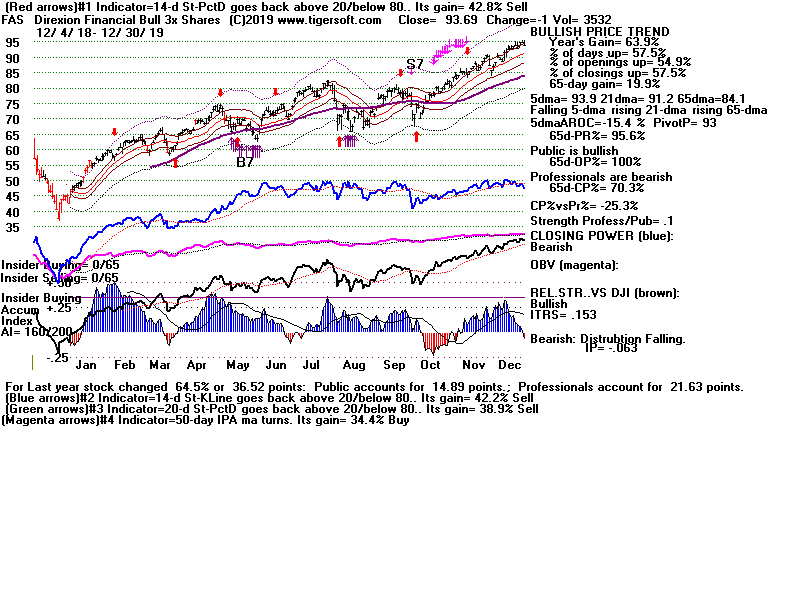
I would suggest now might be a time to follow a hedging approach with
our MAXCPs and MINCPs or, if you have the time, get to know the
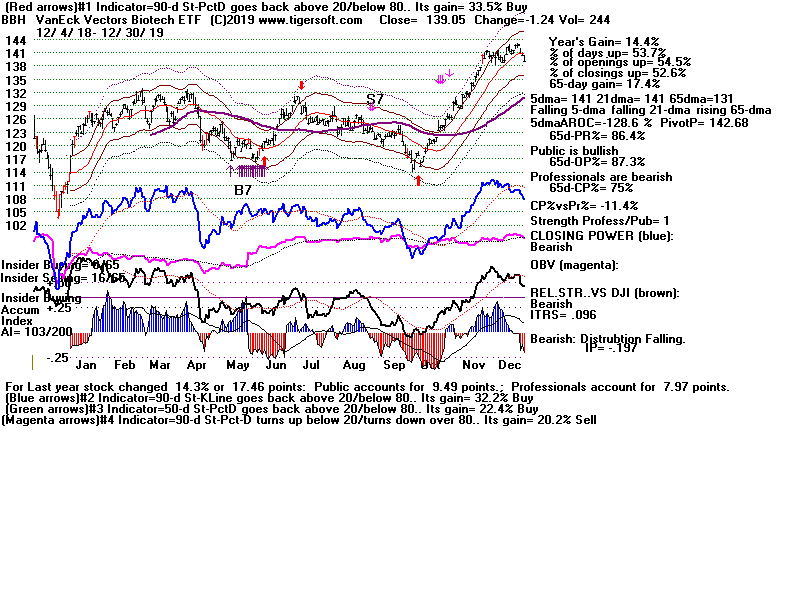
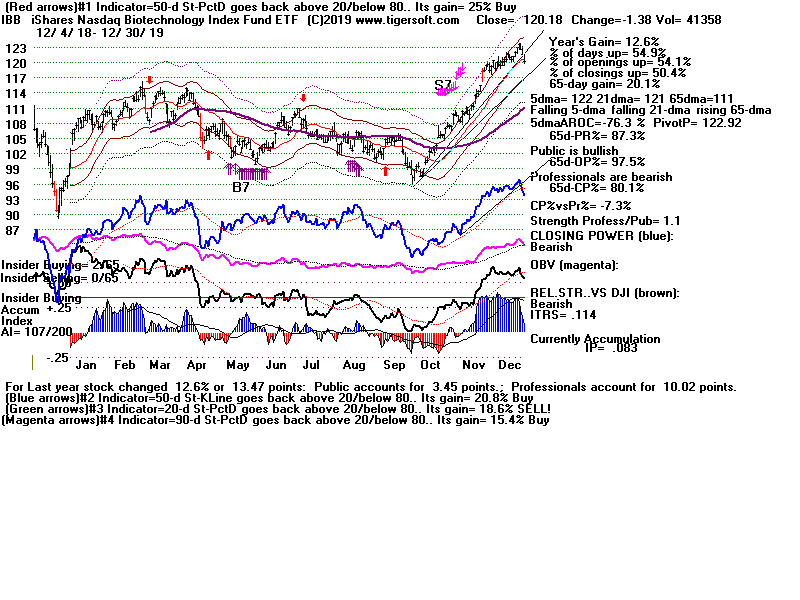
biotechs. Among them, we seem always to be able to find excellent
and confirmed breakouts above flat tops and confirmed breakdowns
below the neckline-supports in bearish head/shoulders pattern. Get our
Explosive Super Stocks, Killer Short Sales, and Closing Power books
out and look for examples among biotechs. As I show below, you can
be long and short at the same time and still make regular profits.

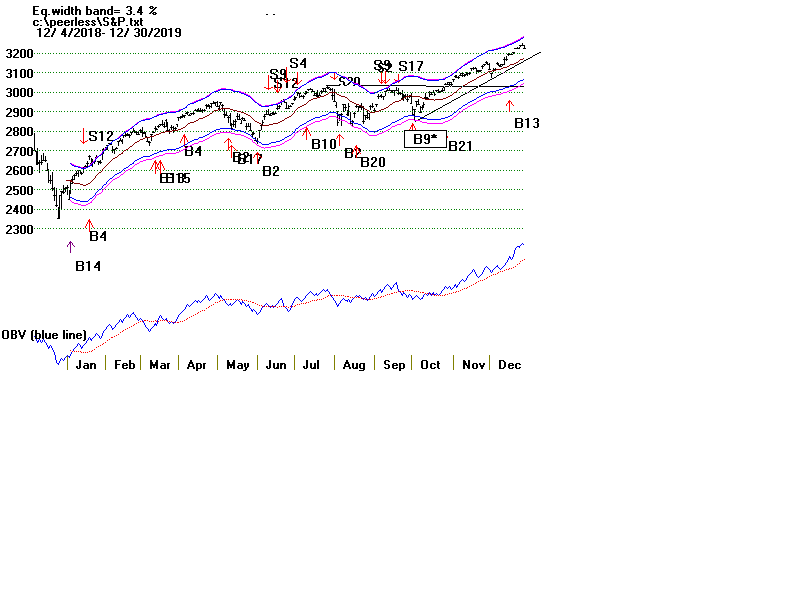
The SP-500 is a little stronger than the DJI. But it, too, is caught and
boxed in. It found support at its 65-dma today, as it has on each recent dip
to this level. This has created a neckline-support there. A failed rally
by it
over the next week or two could allow it to form and complete a
bearish head/shoulders pattern. See the chart below. Trading SPY now
will require a lot of speed and dexterity. Just keep in mind the support
and resistance levels shown below.

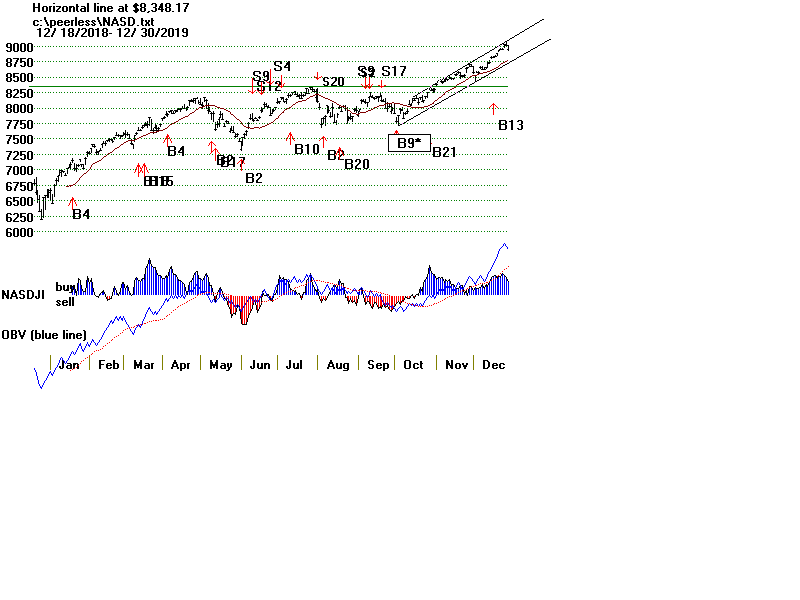
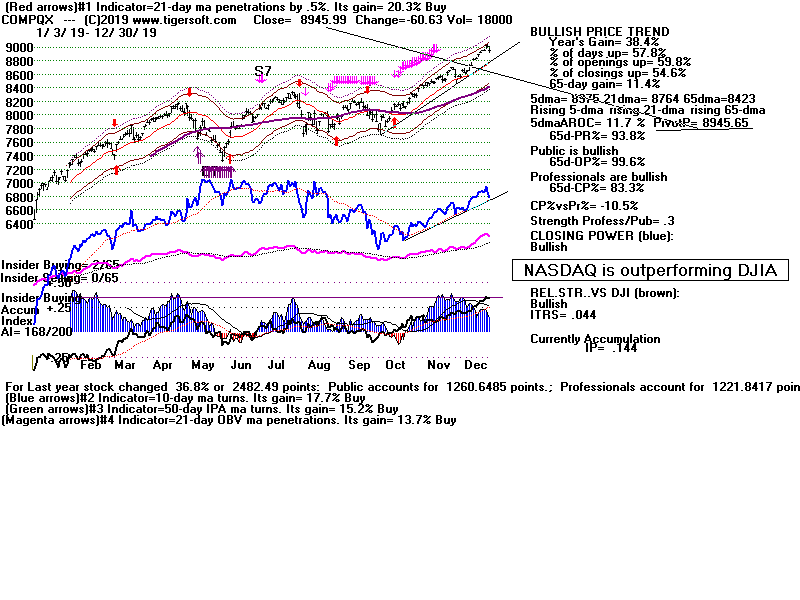
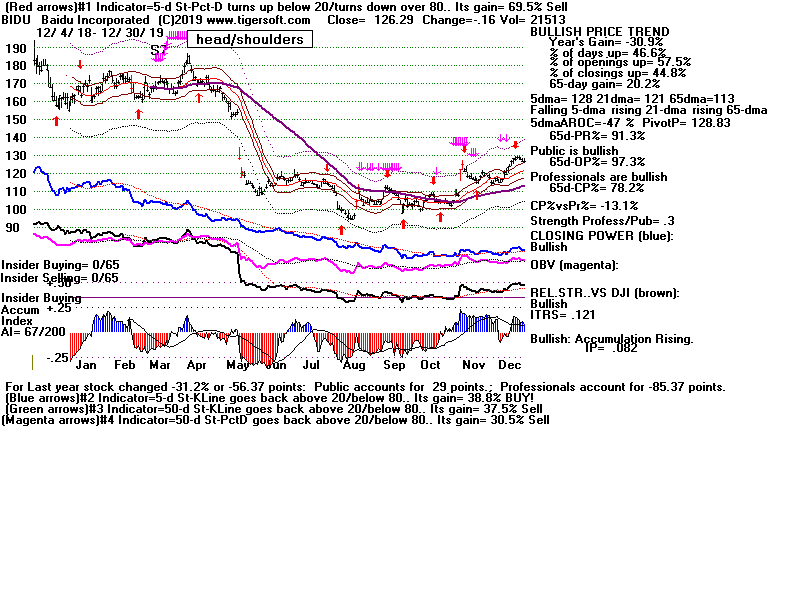
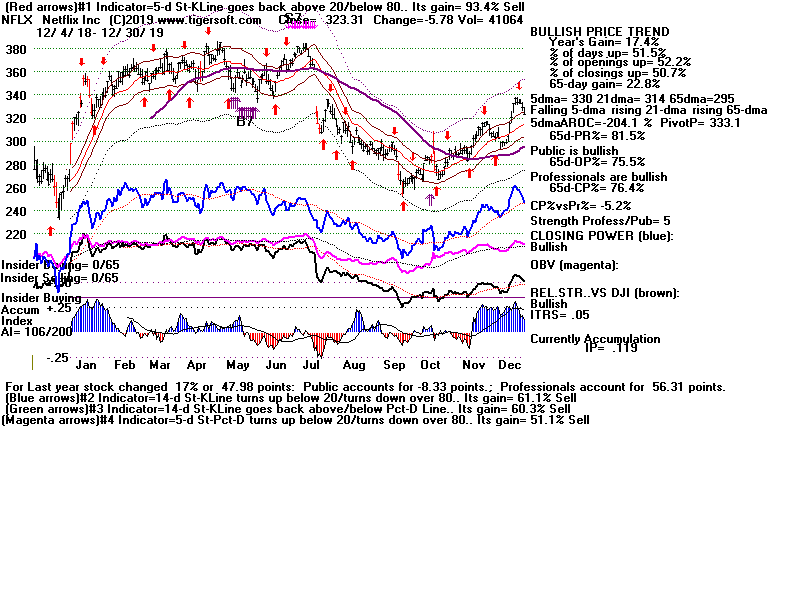
A number of NASDAQ stocks, like GOOG, could be forming their own bearish
head/shoulders patterns. But a good rally by them now would push their prices
above the apexes of their potential right shoulder in this formation and should
then cause a rush of short covering. It is not clear whether these NASDAQ stocks
will breakout above their head/shoulders right-shoulder pivot points. We should
watch them for the next few trading days to get a better idea of the market's
strength. Watch these stocks.
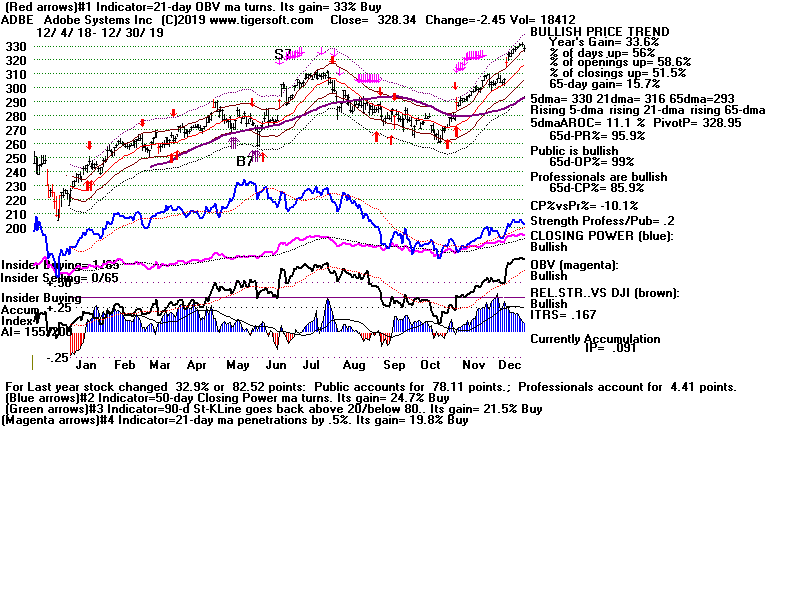
7/2 Price Pivot-Point
AAPL 187.18
189
ADBE 243.26
246
ADP 134.86
137
EXPD 73.37
75
HEDGING: Long and Short at Same Time
The media is generally telling us that Trump's trade war will hurt many companies
and cause inflation. But the opposite may be true for companies that manufacture
in the US and do mostly domestic business. Possibly some of our really
bullish-looking MAXCPs will benefit from such protection. Thus, hedging using
longs on bullish our MAXCPs and shorts on our MINCPs seems particularly
appropriate now that the DJI and SP-500 are narrowly confined and the
"nifty" high tech leaders are so richly priced and could be forming
head.shoulders
patterns. But as good as our Power Ranker is with the MAXCPs and MINCPs,
it will pay to study the volatile Biotech charts themselves using our Buy and Sell
signals, chart patterns and Closing Power. Look for very bullish breakouts and
very bearish head/shoulders pattern breakdowns. See how differently two biotechs
(BLFS and JNCE) have moved recently to demonstrate this.
Bullish Breakout Bearish Breakdown  |
|
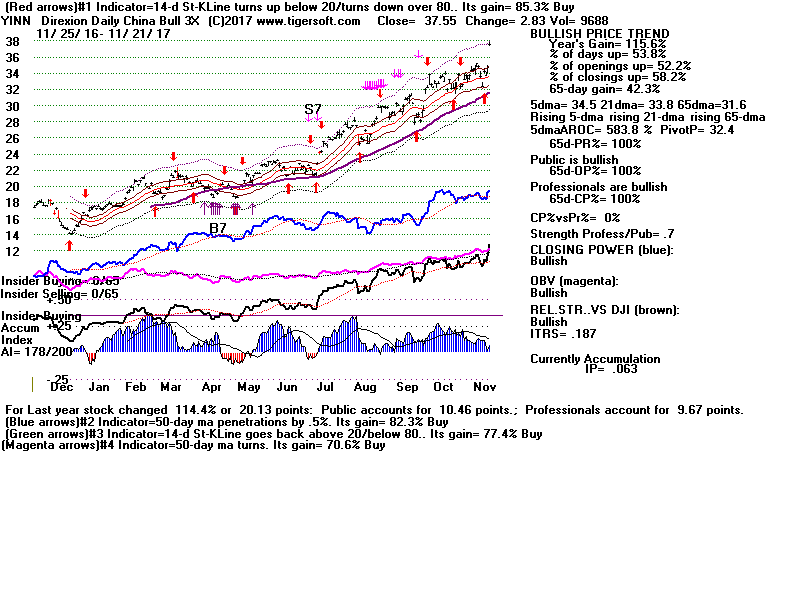
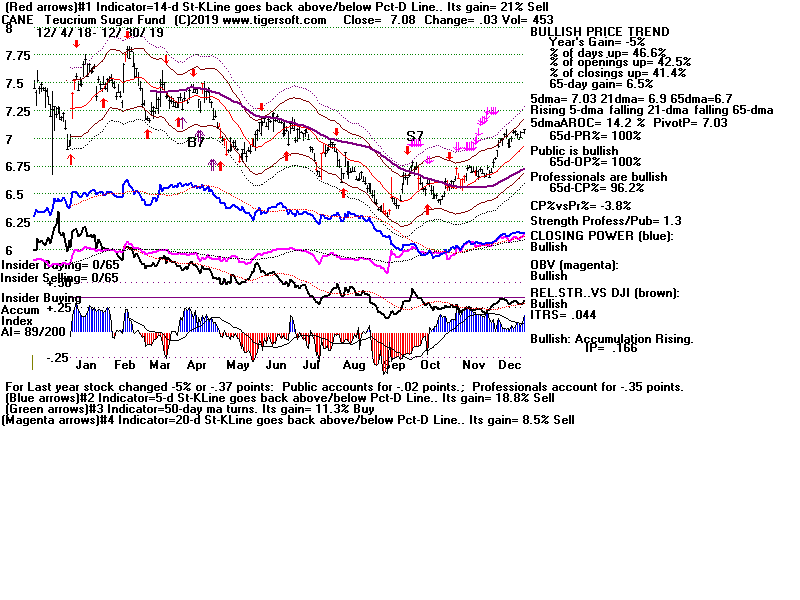
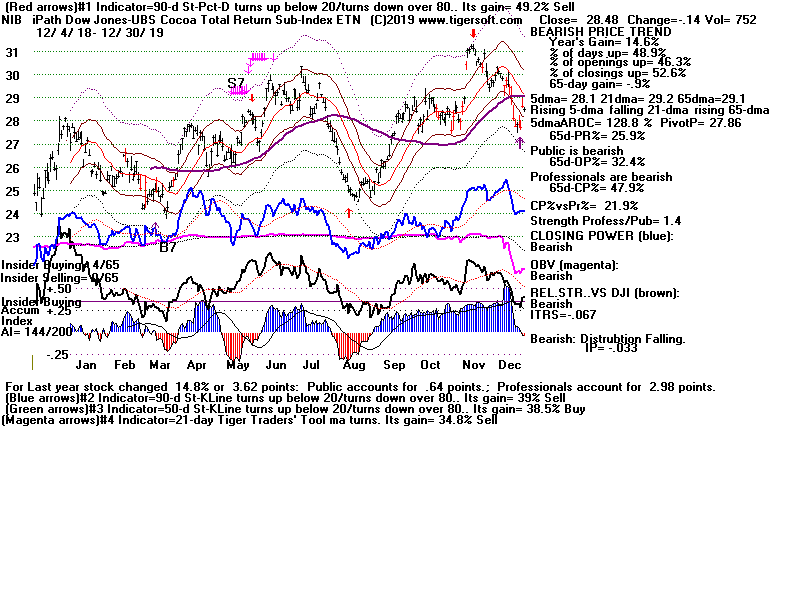
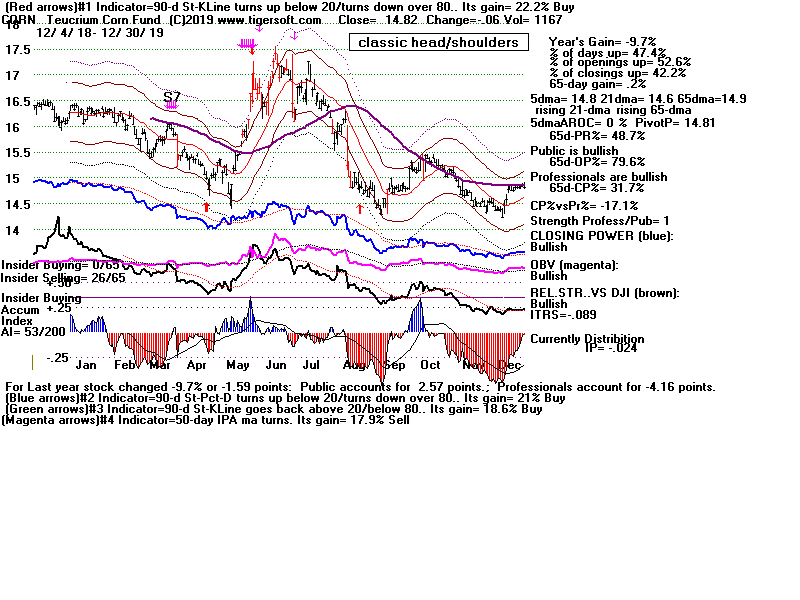
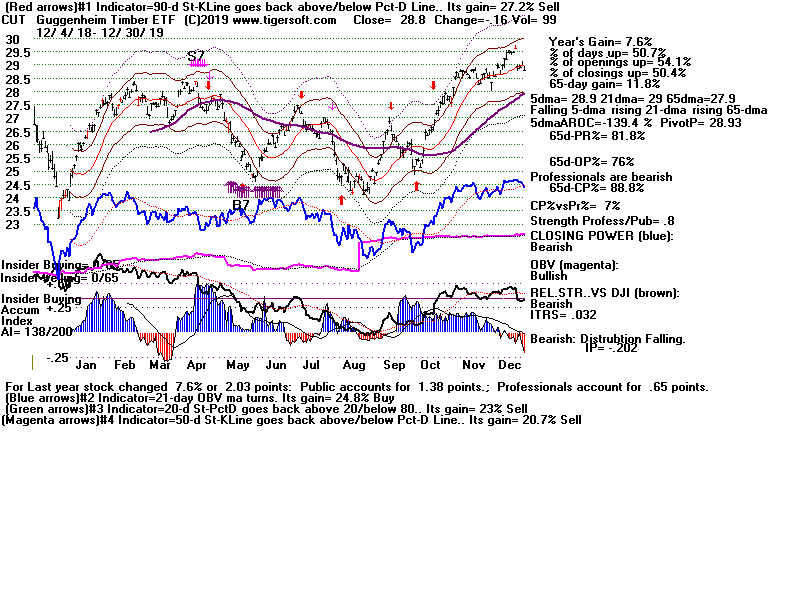
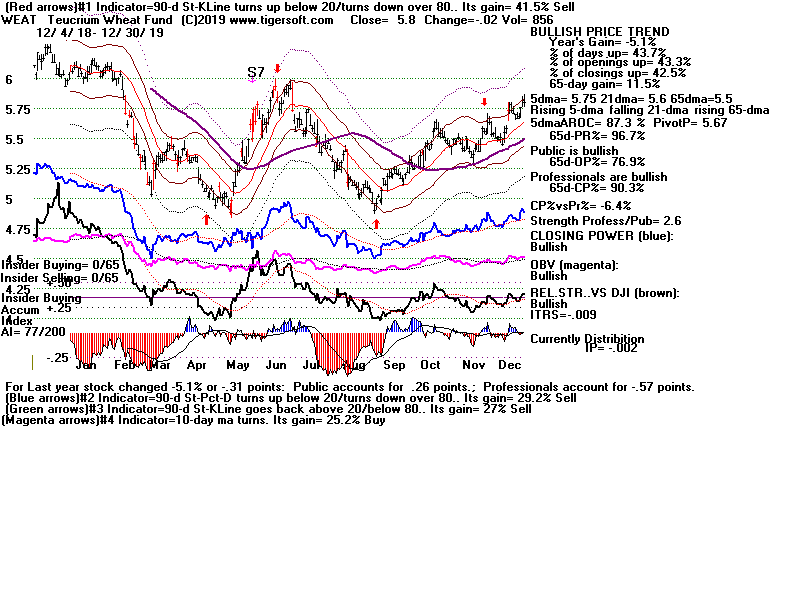
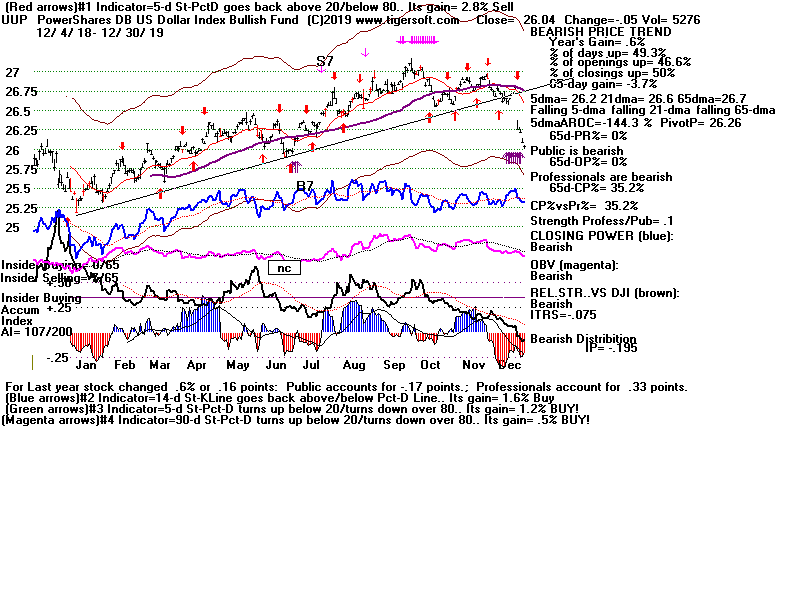
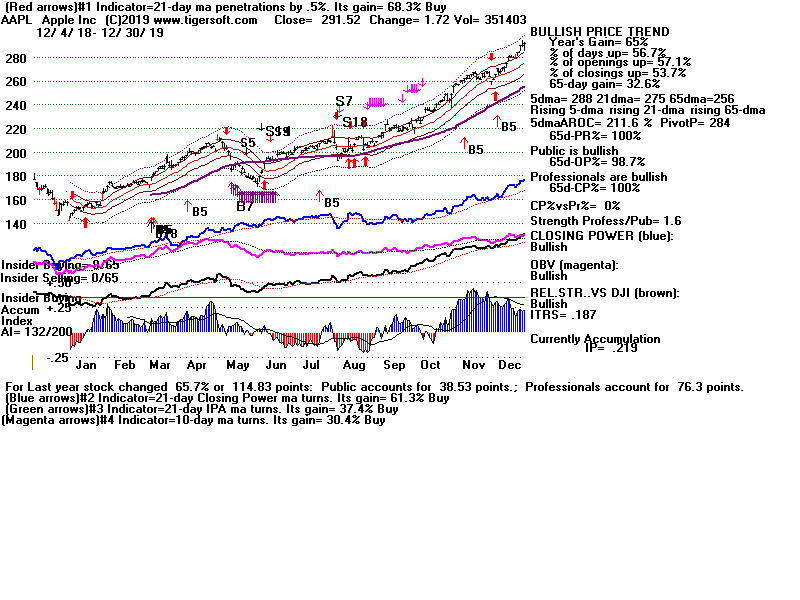
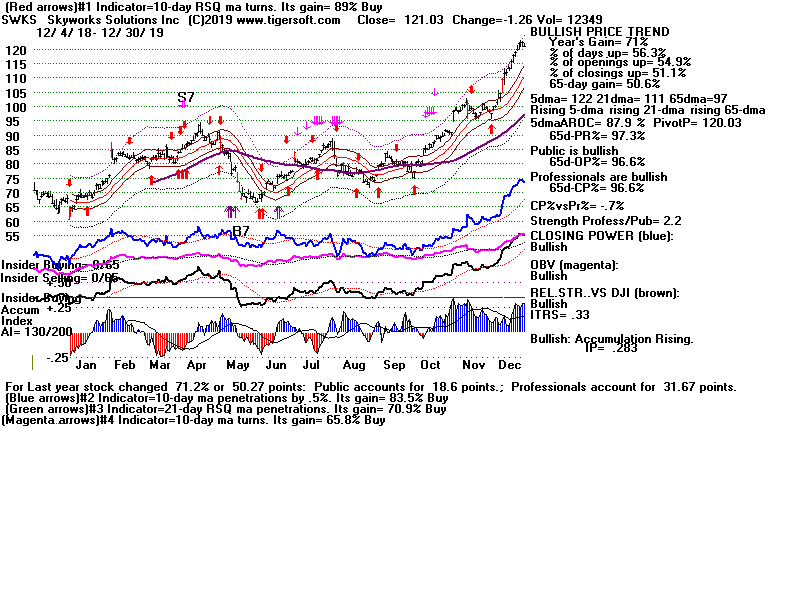
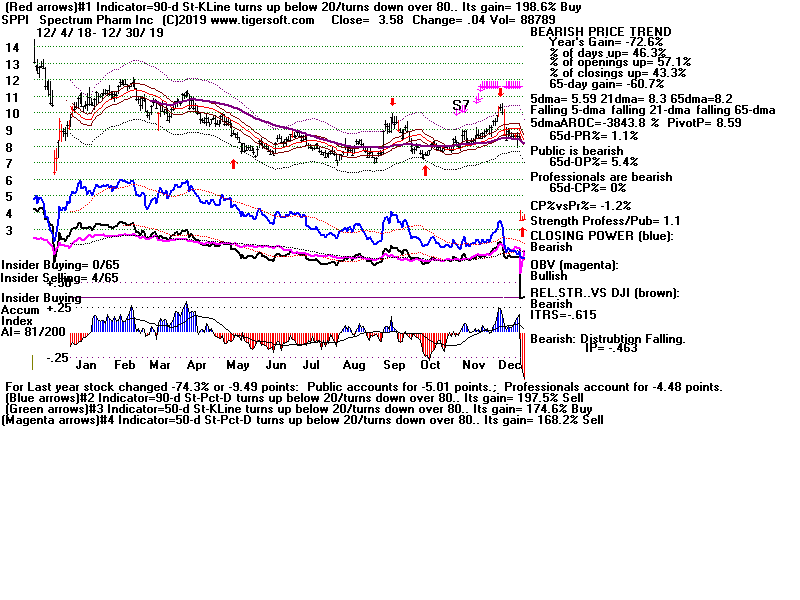
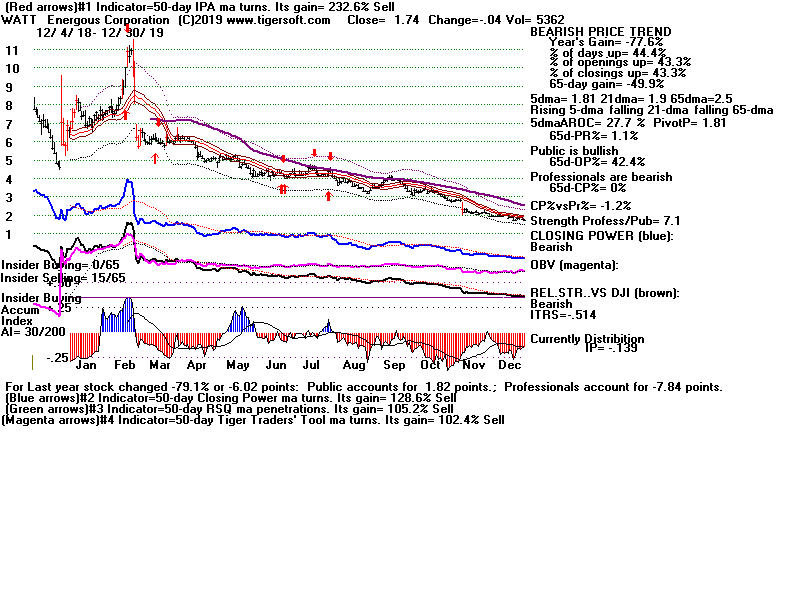
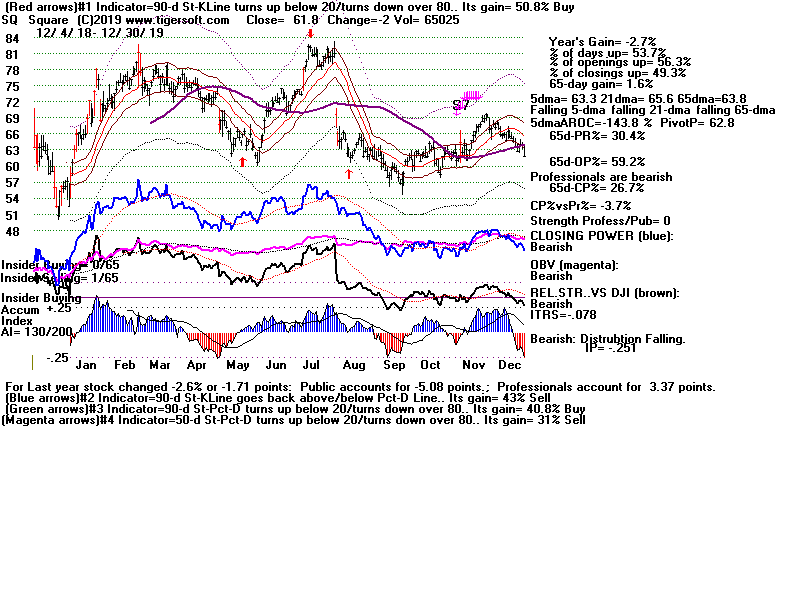
Charts 7/02/2018 PEERLESS DJI, Signals, Indicators Daily DJI Volume 10-DayUp/Down Vol V-Indicator Hourly DJIA A/D Line for All Stocks NASDAQ S&P OEX NYSE COMPQX DJI-15 DJI-20 DJI-30 DIA SPY QQQ MDY IWM TNA Short-Term Rates USO-CrudeOil FAS GLD BBH IBB JETS JNUG KOL NUGT OIH OIL RSX RETL SDS SLV SOXL TECL TMF TNA UGA (gasoline) XIV YINN Commodities: CANE JJC, NIB, CHOC CORN, CUT (paper) WEAT UUP (Dollar) AAPL ADBE ALXN AMAT AMGN AMD AMZN BA BABA BAC BIDU CAT CVX DE FB GOOG GS HD IBM JPM M (Macy's) MSFT NFLX NVDA QCOM TSLA TXN XOM WMT ANDV (refinery), CMG (Chipotle), LRCX, SWKS, MDGL SPPI WATT SQ TOWN 7/02/2018 (Click on Underlined link.) Bullish MAXCPs - http://tigersoft.com/MAXCPZ/702/BULLISH.htm Bearish MAXCPs - http://tigersoft.com/MINCPZ/702/BEARISH.htm |
Table 1
               QUICKSILVER on ETFS - 07/02/18
ETF CLOSE CHANGE PIVOT-PT 5-dma AROC CL-PWR CANDLE IP21 ITRS --------------------------------------------------------------------------------------------- DIA 242.73 0 242.67 8.7% Bearish BLUE .016 ---- --------------------------------------------------------------------------------------------- COMPQX 7567.69 57.39 7561.63 23.8% ---- BLUE .179 .066 --------------------------------------------------------------------------------------------- SPY 271.86 .58 271.6 15.9% Bearish BLUE .055 .027 --------------------------------------------------------------------------------------------- QQQ 172.8 1.15 172.07 41.8% Bullish BLUE .102 .072 --------------------------------------------------------------------------------------------- MDY 355.06 .04 357.07 -20.5% ---- BLUE .166 .034 --------------------------------------------------------------------------------------------- IWM 164.9 1.13 166.04 -5.5% ---- BLUE .215 .067 --------------------------------------------------------------------------------------------- FAS 63.66 .66 63.53 -12.7% Bearish BLUE -.002 -.011 --------------------------------------------------------------------------------------------- RETL 41.68 -.33 45.46 -376.1% ---- BLUE .082 .33 --------------------------------------------------------------------------------------------- SOXL 144.11 2.61 148.32 -93.4% Bearish BLUE .163 .114 --------------------------------------------------------------------------------------------- TECL 137.27 3.98 134.68 153.6% ---- BLUE .139 .181 --------------------------------------------------------------------------------------------- IBB 110.69 .87 109.57 22.5% Bullish BLUE .127 .062 --------------------------------------------------------------------------------------------- GLD 117.46 -1.19 119.26 -102.2% Bearish RED -.301 -.065 --------------------------------------------------------------------------------------------- OIL 7.61 .04 6.89 339.4% Bullish BLUE .263 .069 --------------------------------------------------------------------------------------------- OIH 25.55 -.72 25.79 9.6% Bearish RED -.122 -.041 --------------------------------------------------------------------------------------------- GASL 23.07 -1.27 23.54 219.7% Bearish RED -.131 .125 --------------------------------------------------------------------------------------------- UGA 33.83 -.68 33.07 162.2% Bullish RED -.102 .021 --------------------------------------------------------------------------------------------- UUP 25.06 .12 24.99 40% Bullish ---- .087 .064 --------------------------------------------------------------------------------------------- IEF 102.25 -.26 102.3 0% Bearish RED -.247 .014 --------------------------------------------------------------------------------------------- XLU 52.33 .37 51.65 71.4% Bullish BLUE .121 .048 --------------------------------------------------------------------------------------------- WEAT 6.13 -.25 6.19 -120.1% Bearish RED -.229 -.023 --------------------------------------------------------------------------------------------- YINN 24 -1.4 26.03 -419.1% Bearish ---- .067 -.239 --------------------------------------------------------------------------------------------- RSX 21.07 -.17 20.64 50.4% Bullish RED .109 .01 --------------------------------------------------------------------------------------------- AAPL 187.18 2.07 184.43 135.9% ---- BLUE -.031 .137 --------------------------------------------------------------------------------------------- GOOG 1127.46 11.81 1118.46 11.9% Bullish BLUE .057 .058 --------------------------------------------------------------------------------------------- MSFT 100.01 1.4 99.08 82.3% Bearish BLUE -.049 .06 --------------------------------------------------------------------------------------------- AMZN 1713.78 13.98 1691.09 150.4% ---- BLUE .118 .129 --------------------------------------------------------------------------------------------- FB 197.36 3.04 199 25.7% Bullish BLUE .172 .194 --------------------------------------------------------------------------------------------- NVDA 242.24 5.34 241.99 65.3% Bearish BLUE -.008 .066 --------------------------------------------------------------------------------------------- BA 336.08 .57 331.3 73.4% Bearish BLUE -.133 0 --------------------------------------------------------------------------------------------- GS 223.26 2.69 221.58 38.8% Bearish BLUE -.119 -.107 --------------------------------------------------------------------------------------------- HD 194.02 -1.08 196.36 -60.3% ---- BLUE .194 .103 --------------------------------------------------------------------------------------------- CAT 136.29 .62 135.54 -10.7% Bearish BLUE -.265 -.104 |
Table 2
    Count of Stocks in Key Directories
          20180702
-------------------------------
NEWHIGHS       103
NEWLOWS        100
MAXCP          67
MINCP          97    Professionals still more bearish than bullish.
TTTNH          64
TTTNL          142   Day Traders are 2:1 bearish.
FASTUP         82
FASTDOWN       126   Swing traders are net bearish.
CPCROSSA       228   Big improvment in Professional bullishness.
CPCROSSD       66
BIGVOLUP       9
BIGVODN        11
|
Table 3
Count of Stocks and New Highs in Key Tiger Directories
Date = 180702
               No.           NHs           Pct.
-------------------------------------------------------------------
-------------------------------------------------------------------
MAXCP          67            39            58 %
EDU            7             2             29 %
COMPUTER       23            2             9 %
GREEN          29            2             7 %
SOFTWARE       64            4             6 %
BEVERAGE       20            1             5 %
TRANSP         20            1             5 %
UTILITY        41            2             5 %
HACKERS        23            1             4 %
BIOTECH        410           13            3 %
CHEM           62            2             3 %
ELECTRON       173           5             3 %
FIDSTKS        186           5             3 %
BIG17          46            1             2 %
CHINA          60            1             2 %
INDMATER       82            2             2 %
NASD-100       89            2             2 %
SEMI           126           2             2 %
FINANCE        90            1             1 %
INDEXES        189           1             1 %
OILGAS         157           2             1 %
REIT           173           2             1 %
RUS-1000       819           10            1 %
SP-100         94            1             1 %
SP500          477           6             1 %
|
Table 4
Count of Stocks and New Lows in Key Tiger Directories
Date = 180702
               No.           NLs           Pct.
-------------------------------------------------
FOOD           9             5             56 %
MINCP          97            41            42 %
BIGBANKS       7             1             14 %
HOSPITAL       7             1             14 %
PIPELINE       7             1             14 %
COMODITY       55            7             13 %
CHINA          60            7             12 %
AUTO           40            3             7 %
FINANCE        90            5             6 %
ETFS           61            3             5 %
SOLAR          19            1             5 %
GAMING         28            1             4 %
HACKERS        23            1             4 %
BIOTECH        410           12            3 %
FIDSTKS        186           5             3 %
INFRA          34            1             3 %
OILGAS         157           4             3 %
BONDFUND       111           2             2 %
ELECTRON       173           3             2 %
SEMI           126           2             2 %
SOFTWARE       64            1             2 %
SP500          477           10            2 %
UTILITY        41            1             2 %
INDMATER       82            1             1 %
INDEXES        189           2             1 %
NASD-100       89            1             1 %
REIT           173           1             1 %
RUS-1000       819           12            1 %
SP-100         94            1             1 %
|
Table 5
RANKING OF KEY DIRECTORIES BASED PCT.OF STOCKS ABOVE 65-DMA
              7/2/18
 Bullish = 25
 Bearish = 22
---------------------------------------------------------------------------------------
Directory     Current       day-1         day-2         day-3         day-4         day-5
----------------------------------------------------------------------------------------
REIT           .884          .878          .878          .895          .913          .924
UTILITY        .756          .707          .707          .707          .707          .682
NIFTY          .724          .689          .655          .689          .724          .689
BONDFUND       .72           .666          .594          .603          .558          .531
EDU            .714          .714          .714          .714          .571          .571
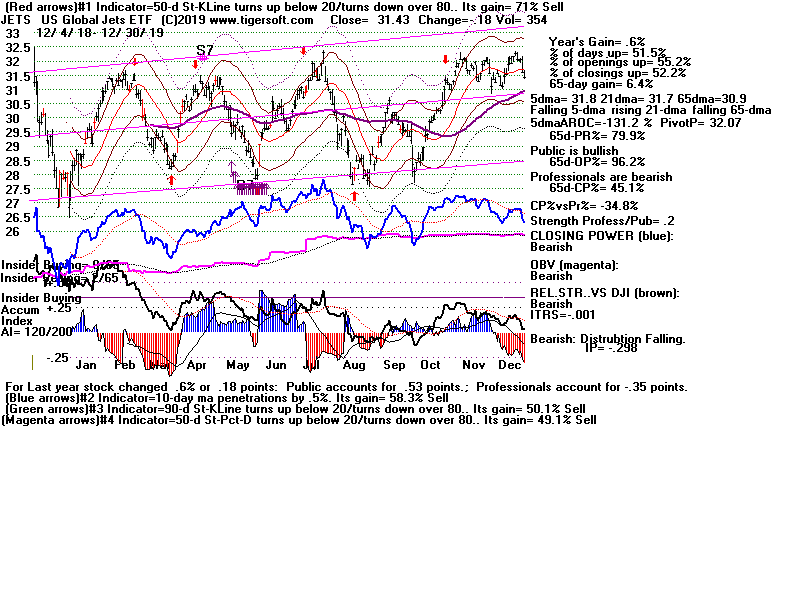
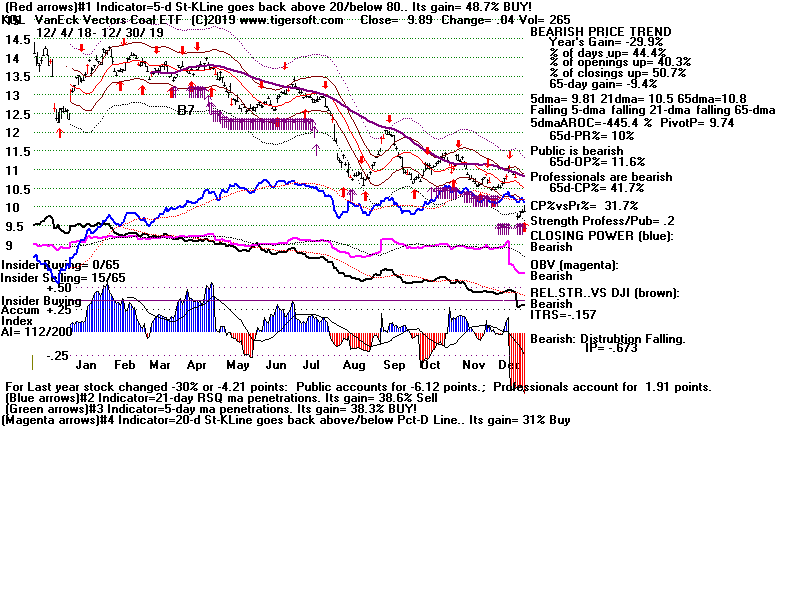
RETAIL         .673          .73           .711          .788          .807          .846
COMPUTER       .652          .565          .608          .608          .695          .652
BEVERAGE       .65           .65           .7            .55           .75           .75
NASD-100       .64           .617          .595          .528          .617          .606
SOFTWARE       .64           .562          .531          .468          .578          .578
COAL .625 .75 .75 .75 .75 .625 HACKERS .608 .565 .521 .391 .521 .478 OILGAS .598 .662 .636 .681 .636 .522 CHEM .596 .612 .596 .612 .629 .596 INDEXES .576 .55 .566 .507 .529 .55 HOSPITAL .571 .428 .428 .428 .571 .571 PIPELINE .571 .714 .714 .571 .857 .571 SP500 .555 .557 .551 .53 .584 .584 FIDSTKS .553 .548 .516 .473 .543 .553 SP-100 .553 .553 .542 .489 .574 .595 RUS-1000 .551 .544 .537 .525 .586 .584 REGBANKS .548 .387 .548 .516 .677 .709 BIOTECH .541 .519 .502 .497 .587 .57 DOWJONES .533 .533 .566 .5 .633 .6 ELECTRON .514 .445 .445 .427 .531 .468 N==25 -------------------------------------------------------------------------------------------- GAMING .5 .571 .5 .5 .642 .571 BIG17 .478 .434 .434 .434 .456 .456 SEMI .476 .42 .42 .38 .492 .436 GREEN .448 .413 .379 .517 .551 .482 FINANCE .422 .344 .355 .322 .466 .5 INDMATER .414 .451 .439 .451 .439 .39 HOMEBLDG .411 .47 .411 .411 .411 .411 MILITARY .405 .378 .378 .378 .486 .432 TRANSP .4 .3 .25 .3 .4 .4 GUNS .388 .555 .555 .666 .666 .666 DJI-13 .384 .384 .384 .307 .384 .307 INFRA .382 .352 .382 .382 .47 .352 AUTO .325 .275 .325 .375 .425 .425 COMODITY .309 .327 .309 .29 .254 .218 GOLD .26 .28 .22 .24 .28 .26 INSURANC .258 .29 .193 .161 .193 .258 SOLAR .21 .21 .21 .263 .315 .263 BIGBANKS .142 .142 .142 0 0 .142 CHINA .116 .133 .116 .133 .216 .216 JETS .1 .1 0 .1 .1 .1 ETFS .081 .131 .098 .049 .081 .081 FOOD 0 0 0 0 0 0 |
====================================================================
6/28/2018 The operative Peerless signal remains a Sell S9V. The DJI is down
200 as I write this. This seems to be a response to Canada's retaliatory tariffs
on the US exports. This was highly predictable. The big questions remain
what will be Europe's and China's response to the Trump tariffs and will
Peerless give a reversing Buy B2 or B9 on a DJI close near 24000. First,
I think we can safely surmise that the response of Europe and China to Trump's
tariffs will be a lot more hostile. But Peerless does not know any of this and will
almost certainly give a Buy B2 or Buy B9 on a close near 24000. However, a
decline tomorrow much lower, may scare Peerless away from giving a Buy signal.
Ordinarily, we would expect a rally this week because of Independence Day
(Wednesday). That was the primary reason for covering the DIA short on Friday.
But this seasonal bounce is running out of time.
Let's look back at earlier Buy B2s and Buy B9s (The P-Indicator remains positive,
so a B9 is likley.) when they occur at the end of June. We find no less than
five successful B2s and B9s since 1929. Each of these suffered a small paper
loss. It is important, I think, that none of them took place with the DJI down much
more than 3.1% below their 21-dma. That roughly corresponds to 24000.
From all these factors, I would suggest that a drop tomorrow much below 24000
may well bring another test of 23500. That will certainly be interesting. The
flat,
well-tested support there is of great technical importance. A close below 23300
will bring a Sell S10, one way or another, computed or judged.
The Tiger Stocks' Hotline on our Elite Page is short 10 stocks and long none.
End of June Buy B2s/B9s
Gain Paper la/ma aroc P-I
IP21 V-I OPct
Loss
-----------------------------------------------------------------------
B2 6/28/1939 +.16 -.02
.969 -.434 -57 -.003 -69 .153
B2 6/28/1951 +.13 -.01
.977 -.210 -105
+.094 -239 -.145
B2 6/23/1978 +.10 -.03
.970 -.203 -114 -.110 -1 .072
B2 6/24/1991 +.03 -.01
.978 .052 -47 +.113 -9 .017
B9 6/24/2005 +.12 -.01
.979 -.181 +356-.121 +13 .215
*B9 7/2/2018 ??? ???
.969 -.305 +37 -.016 -87
-.152
(*This is based on a close at 24000 with 1300 more down than up and
NYSE Down volume 3x Up Volume.
Any close much below 24000 would drop the "la/ma" below the .969
level in the cases above and make any B2 or B9 look more risky. Traders
may not want to buy until the Chinese and Europeons respond to Trump's
latets tariffs.
Professional Selling
Friday's big jump in prices at the opening was crushed once again. Big supplies
of institutional stock for sale continue to overhang the market and aggressive
Institutional sell orders again dominated at the close. That is the main meaning I
make of the failures of the market to hold its big early big gains. The DJI's
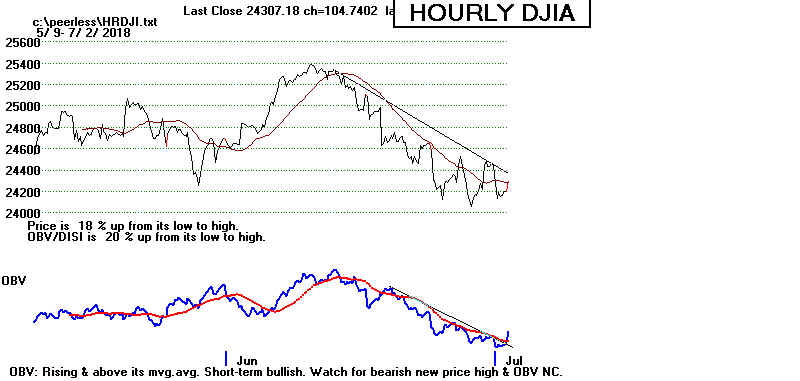
negative V-Indicator, the way the Hourly DISI (OBV) is making new lows
ahead of prices and the falling Closing powers are warnings that we cannot yet
trust the potential Buy B2 occurring if the DJI comes down closer to the
lower 3% band.

SPY must hold above
268.

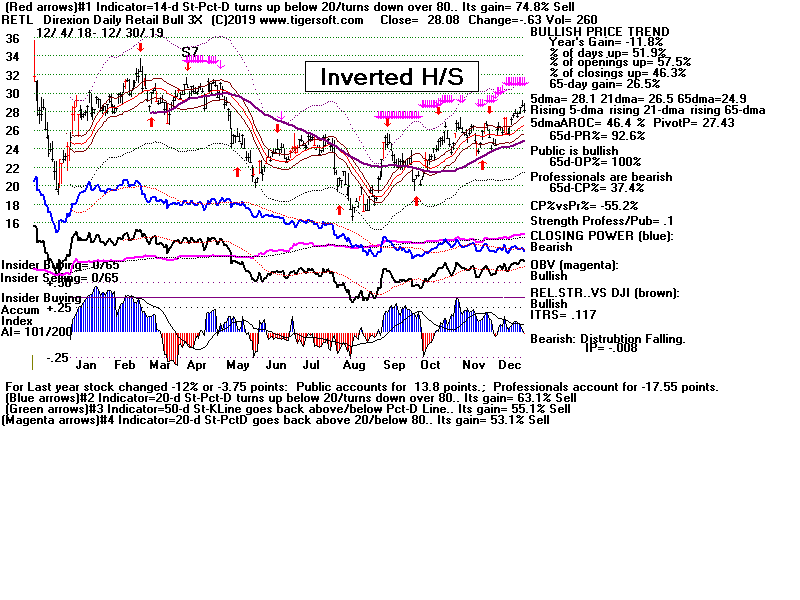
Winners and Losers
The tariffs' wars make for new winners and losers. The
best way I know to
distinguish them is to watch the Bullish MAXCPs and BEARISH MINCPs.
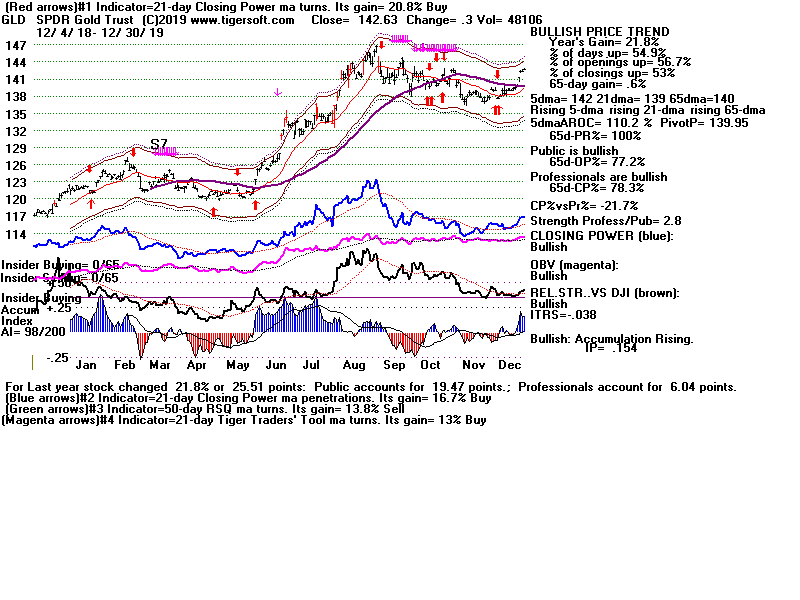
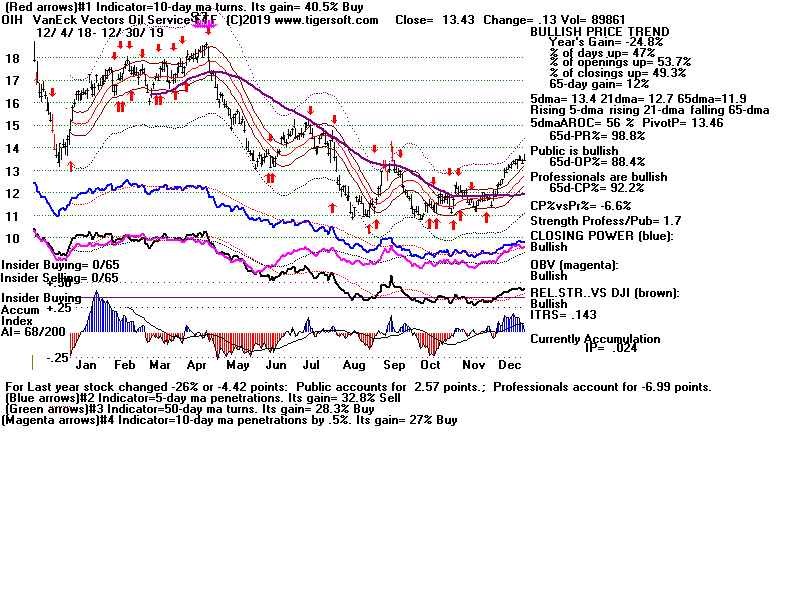
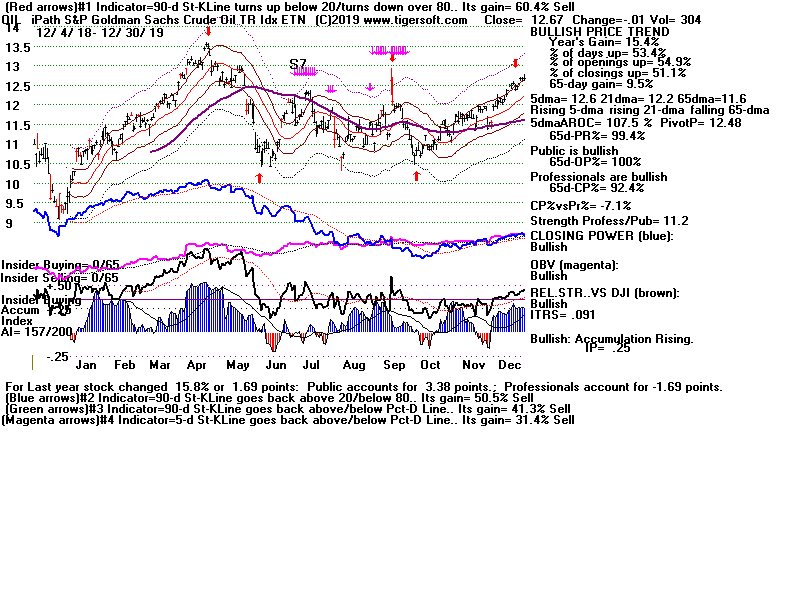
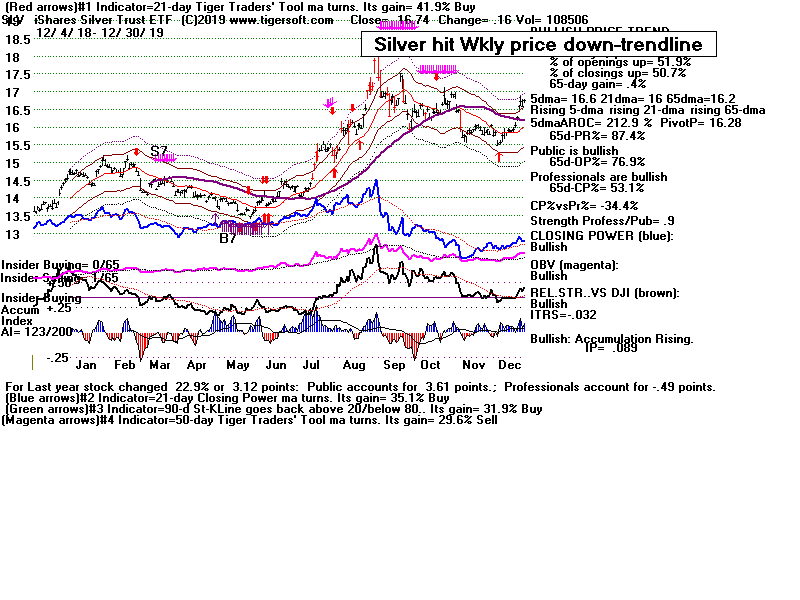
Biotechs, Crude Oil, Gold and Silver seem to be favored now by bulls. Tariffs
will have little effect on Biotechs. Crude Oil looks technically strong. And
Gold
and Silver are over-sold and should rally unless the Fed becomes very aggressive
with interest rates, something the White House will discourage more and more
as the political wars leading up to the November Election heat up.
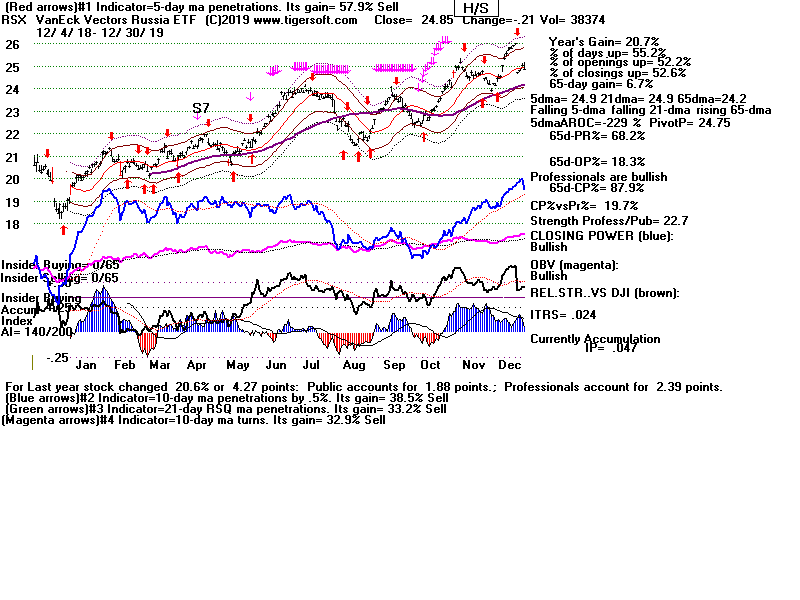
We see lots of Latin American stocks among the bearish MINCPs. Exporting
to the US is getting more expensive. That also makes the currencies of many
countries overseas weak against the Dollar. That the rising domestic and
international debts are showing more delinquencies is very unsettling to American
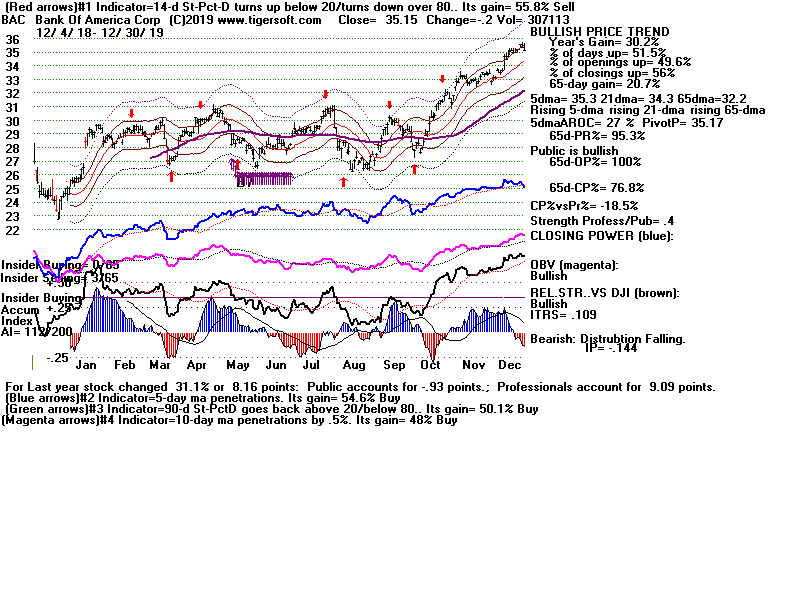
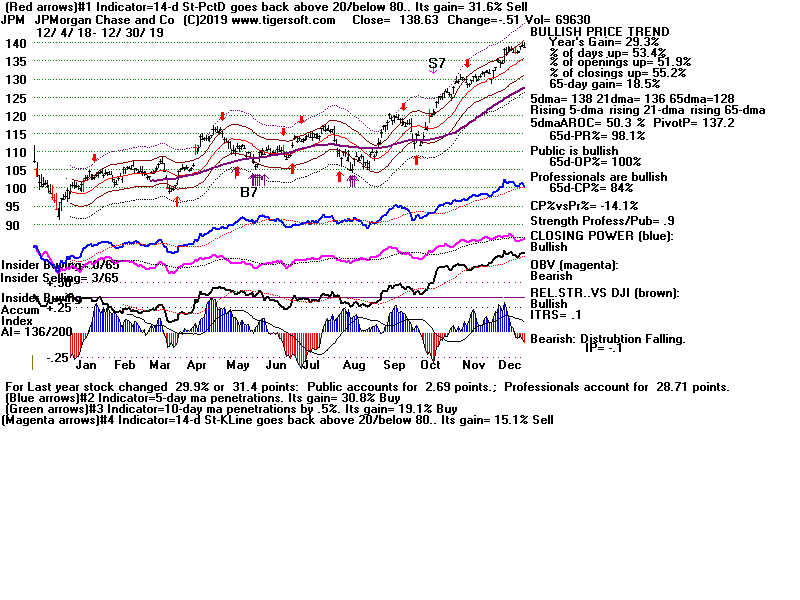
banks. Thus, we see much weakness in the big banks, like BAC and JPM. Adding
to that is the fear that there will be no big domestic infrastructure undertaking by
the Federal Goverment because the US Debt is too large. Will the US economy
as a whole start to slow down? We should watch a number of key stocks now
to see if they can stay above their important support levels. This will tell us
if these anxieties are growing and are likely to drop the DJI down to 23400-23500.
The Janaury lows there offer critical support.
6/29 Stock
Important Support Comments
-----------------------------------------------------------
14.99 AMD
14.64 Semi-Conductors often lead the market.
28.19 BAC
28.00
Bank of America is very big US bank stock.
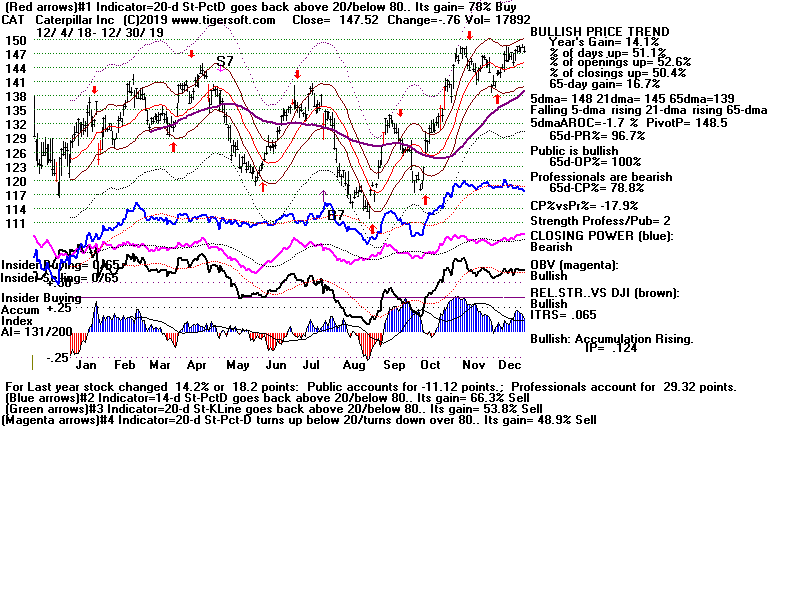
135.67 CAT 137.5
CAT represents a big bet on Infrastructure
world-wide.
186.65 BRKB 188.0
Berks.Hathaway represents value investors'
confidence.
194.32 FB
193.00
FaceBook is a internet stock.
104.2 JPM
103.85
JP Morgan has dominated US banking for 120 years.
271.2 SPY
268.14
SP-500's support is at its flat 65-dma
61.64 SQ
60.
Square represents small business in US
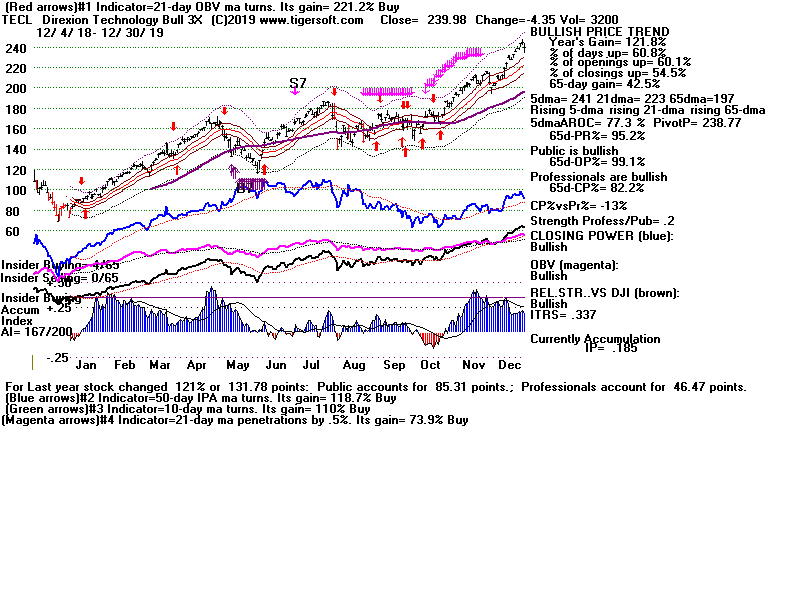
133.29 TECL 129.00
Tech ETF hovering just above 65-dma.
|
Charts 6/29/2018 PEERLESS DJI, Signals, Indicators Daily DJI Volume 10-DayUp/Down Vol V-Indicator Hourly DJIA A/D Line for All Stocks NASDAQ S&P OEX NYSE COMPQX DJI-15 DJI-20 DJI-30 DIA SPY QQQ MDY IWM TNA Short-Term Rates USO-CrudeOil FAS GLD BBH IBB JETS JNUG KOL NUGT OIH OIL RSX RETL SDS SLV SOXL TECL TMF TNA UGA (gasoline) XIV YINN Commodities: CANE JJC, NIB, CHOC CORN, CUT (paper) WEAT UUP (Dollar) AAPL ADBE ALXN AMAT AMGN AMD AMZN BA BABA BAC BIDU CAT CVX DE FB GOOG GS HD IBM JPM M (Macy's) MSFT NFLX NVDA QCOM TSLA TXN XOM WMT ANDV (refinery), CMG (Chipotle), LRCX, SWKS, MDGL SPPI WATT SQ TOWN 6/29/2018 (Click on Underlined link.) Bullish MAXCPs - http://tigersoft.com/MAXCPZ/629/BULLISH.htm Bearish MAXCPs - http://tigersoft.com/MINCPZ/629/BEARISH.htm |
Table 1
               QUICKSILVER on ETFS - 06/29/18
ETF CLOSE CHANGE PIVOT-PT 5-dma AROC CL-PWR CANDLE IP21 ITRS --------------------------------------------------------------------------------------------- DIA 242.73 .65 242.31 -61% Bearish RED -.019 ----- --------------------------------------------------------------------------------------------- COMPQX 7510.3 6.62 7532.01 -120.9% ---- RED .182 .053 --------------------------------------------------------------------------------------------- SPY 271.28 .39 271 -63.7% Bearish RED .047 .024 --------------------------------------------------------------------------------------------- QQQ 171.65 .46 171.37 -106.7% ---- RED .113 .056 --------------------------------------------------------------------------------------------- MDY 355.02 .42 356.52 -93.4% Bearish RED .112 .036 --------------------------------------------------------------------------------------------- IWM 163.77 -.11 165.08 -122.5% Bearish RED .168 .063 --------------------------------------------------------------------------------------------- FAS 63 .03 63.82 -241.6% Bearish RED -.051 -.017 --------------------------------------------------------------------------------------------- RETL 42.01 -1.44 44.98 -555% ---- RED .026 .292 --------------------------------------------------------------------------------------------- SOXL 141.5 .62 146.78 -663.8% Bearish RED .197 .063 --------------------------------------------------------------------------------------------- TECL 133.29 -.49 133.19 -322.5% ---- RED .164 .105 --------------------------------------------------------------------------------------------- IBB 109.82 1.87 110.2 -110.1% Bullish BLUE .127 .053 --------------------------------------------------------------------------------------------- GLD 118.65 .43 119.89 -70.9% Bearish BLUE -.286 -.055 --------------------------------------------------------------------------------------------- OIL 7.61 .04 6.89 339.4% Bullish BLUE .263 .077 --------------------------------------------------------------------------------------------- OIH 26.27 -.08 25.5 17.3% Bearish RED -.1 -.013 --------------------------------------------------------------------------------------------- GASL 24.34 .1 22.03 183% ---- BLUE -.133 .167 --------------------------------------------------------------------------------------------- UGA 34.51 .61 32.74 222.2% Bullish BLUE -.084 .058 --------------------------------------------------------------------------------------------- UUP 24.94 -.2 24.86 8% Bullish RED .087 .073 --------------------------------------------------------------------------------------------- IEF 102.51 -.08 102.25 19.5% Bearish RED -.201 .021 --------------------------------------------------------------------------------------------- XLU 51.96 .08 51.59 117.4% Bullish BLUE .058 .039 --------------------------------------------------------------------------------------------- WEAT 6.38 .22 6.28 -24% Bearish BLUE -.19 0 --------------------------------------------------------------------------------------------- YINN 25.4 .97 26.11 -462.1% Bearish RED .06 -.22 --------------------------------------------------------------------------------------------- RSX 21.24 .39 20.86 86.7% Bullish BLUE .136 .01 --------------------------------------------------------------------------------------------- AAPL 185.11 -.39 182.17 5.2% Bearish RED -.018 .087 --------------------------------------------------------------------------------------------- GOOG 1115.65 1.43 1124.81 -177.3% ---- RED .094 .041 --------------------------------------------------------------------------------------------- MSFT 98.61 -.02 98.39 -91.1% Bearish RED -.033 .042 --------------------------------------------------------------------------------------------- AMZN 1699.8 -1.65 1663.15 -47.1% Bearish RED .085 .107 --------------------------------------------------------------------------------------------- FB 194.32 -1.91 196.35 -187.5% ---- RED .161 .172 --------------------------------------------------------------------------------------------- NVDA 236.9 -3.96 239.12 -290.6% Bearish RED -.005 .05 --------------------------------------------------------------------------------------------- BA 335.51 .86 331.2 -51% Bearish RED -.157 .001 --------------------------------------------------------------------------------------------- GS 220.57 -2.85 221.54 -122.4% Bearish RED -.184 -.117 --------------------------------------------------------------------------------------------- HD 195.1 -.11 196.38 -58.9% ---- RED .15 .117 --------------------------------------------------------------------------------------------- CAT 135.67 -.36 136.58 -156.4% Bearish RED -.289 -.113 |
Table 2   Count of Stocks in Key Directories
          20180629
-------------------------------
NEWHIGHS       81
NEWLOWS        67
MAXCP          47
MINCP          232  Bearish
TTTNH          76
TTTNL          228  Bearish
FASTUP         71
FASTDOWN       243  Bearish
CPCROSSA       68
CPCROSSD       37
BIGVOLUP       8
BIGVODN        10
|
Table 3
Count of Stocks and New Highs in Key Tiger Directories
Date = 180628
               No.           NHs           Pct.
-------------------------------------------------------------------
-------------------------------------------------------------------
MAXCP          47            30            64 %
CHEM           62            3             5 %
COMODITY       55            3             5 %
COMPUTER       23            1             4 %
HACKERS        23            1             4 %
OILGAS         157           7             4 %
DOWJONES       30            1             3 %
GREEN          29            1             3 %
MILITARY       37            1             3 %
SOFTWARE       64            2             3 %
BIG17          46            1             2 %
CHINA          61            1             2 %
NASD-100       89            2             2 %
REIT           173           4             2 %
SP-100         94            2             2 %
UTILITY        41            1             2 %
BIOTECH        410           6             1 %
ELECTRON       174           2             1 %
FIDSTKS        186           2             1 %
INDMATER       82            1             1 %
INDEXES        189           1             1 %
RUS-1000       819           10            1 %
SEMI           127           1             1 %
SP500          477           6             1 %
|
Table 4
Count of Stocks and New Lows in Key Tiger Directories
Date = 180628
               No.           NLs           Pct.
-------------------------------------------------
MINCP          232           43            19 %
SOLAR          20            3             15 %
BIGBANKS       7             1             14 %
HOSPITAL       7             1             14 %
FOOD           9             1             11 %
AUTO           40            3             7 %
BIOTECH        410           21            5 %
COMODITY       55            3             5 %
SEMI           127           6             5 %
FINANCE        90            4             4 %
GAMING         28            1             4 %
HACKERS        23            1             4 %
CHINA          61            2             3 %
ELECTRON       174           6             3 %
INFRA          34            1             3 %
REGBANKS       31            1             3 %
CHEM           62            1             2 %
FIDSTKS        186           3             2 %
OILGAS         157           3             2 %
RETAIL         52            1             2 %
SOFTWARE       64            1             2 %
SP500          477           10            2 %
UTILITY        41            1             2 %
BONDFUND       111           1             1 %
INDEXES        189           1             1 %
NASD-100       89            1             1 %
REIT           173           1             1 %
RUS-1000       819           12            1 %
SP-100         94            1             1 %
|
Table 5  RANKING OF KEY DIRECTORIES BASED PCT.OF STOCKS ABOVE 65-DMA
               6/29/18
Bullish = 24
Bearish = 23
---------------------------------------------------------------------------------------
Directory     Current       day-1         day-2         day-3         day-4         day-5
----------------------------------------------------------------------------------------
REIT           .878          .878          .895          .913          .93           .936
COAL           .75           .75           .75           .75           .625          .75
RETAIL         .73           .711          .788          .807          .846          .846
EDU            .714          .714          .714          .571          .571          .714
PIPELINE       .714          .714          .571          .857          .571          .714
UTILITY .707 .707 .707 .707 .682 .609 NIFTY .689 .655 .689 .724 .689 .827 BONDFUND .666 .594 .603 .558 .531 .594 OILGAS .662 .636 .681 .636 .535 .681 BEVERAGE .65 .7 .55 .75 .75 .7 NASD-100 .617 .595 .528 .617 .606 .685 CHEM .612 .596 .612 .629 .596 .629 GAMING .571 .5 .5 .642 .571 .678 COMPUTER .565 .608 .608 .695 .652 .695 HACKERS .565 .521 .391 .521 .521 .565 SOFTWARE .562 .531 .468 .578 .578 .703 SP500 .557 .551 .53 .584 .587 .631 GUNS .555 .555 .666 .666 .666 .611 SP-100 .553 .542 .489 .574 .595 .627 FIDSTKS .548 .516 .473 .543 .553 .618 RUS-1000 .544 .537 .525 .586 .586 .648 INDEXES .539 .566 .507 .529 .555 .64 DOWJONES .533 .566 .5 .633 .6 .6 BIOTECH .519 .502 .497 .587 .57 .636 N=24 ========================================================================================== HOMEBLDG .47 .411 .411 .411 .411 .411 INDMATER .451 .439 .451 .439 .39 .56 ELECTRON .442 .442 .425 .528 .465 .586 BIG17 .434 .434 .434 .456 .456 .5 HOSPITAL .428 .428 .428 .571 .571 .857 SEMI .417 .417 .377 .488 .425 .559 GREEN .413 .379 .517 .551 .482 .551 REGBANKS .387 .548 .516 .677 .709 .87 DJI-13 .384 .384 .307 .384 .307 .461 MILITARY .378 .378 .378 .486 .432 .54 INFRA .352 .382 .382 .47 .352 .588 FINANCE .344 .355 .322 .466 .511 .644 COMODITY .327 .309 .29 .254 .218 .29 TRANSP .3 .25 .3 .4 .4 .5 INSURANC .29 .193 .161 .193 .258 .354 GOLD .28 .22 .24 .28 .26 .32 AUTO .275 .325 .375 .425 .425 .55 SOLAR .2 .2 .25 .3 .25 .3 BIGBANKS .142 .142 0 0 .142 .142 CHINA .131 .114 .131 .213 .213 .278 ETFS .131 .098 .049 .081 .081 .131 JETS .1 0 .1 .1 .1 .2 FOOD 0 0 0 0 0 .111 |
====================================================================
6/28/2018 The operative Peerless signal remains a Sell S9V. The very
negative V-I readings prevent our getting a Buy B2 now and
the S9s prevent a Stochastic-20 Buy B3. And it remains to be
seen if the sellers that have regularly come forward after an up-opening,
will allow a multiple day rally unfold.
Still, I would cover the shorts in DIA and buy some of the Bullish MAXCPs.
Today the lower band and 24000 held on the DJI. A typical rally going into
Independence Day (July Fourth) is developing.
I would now expect the DJI to rally to its 21-dma. After that, it may top out
and threaten to complete a bearish head/shoulders pattern. So might the SP-500.
Supporting that scenario is the relatively low volume on today's rally. But the
news of the retirement of Justice Kennedy from the Supreme Court is very bullish.
It should give business interests a majority there for a decade.
See
https://www.nytimes.com/2018/06/28/opinion/sunday/supreme-court-kennedy-roberts.html
Importantly, the Big Banks (BAC and JPM) did not break below their well-tested
support today even though Thursday's decline at the close looked quite menacing.
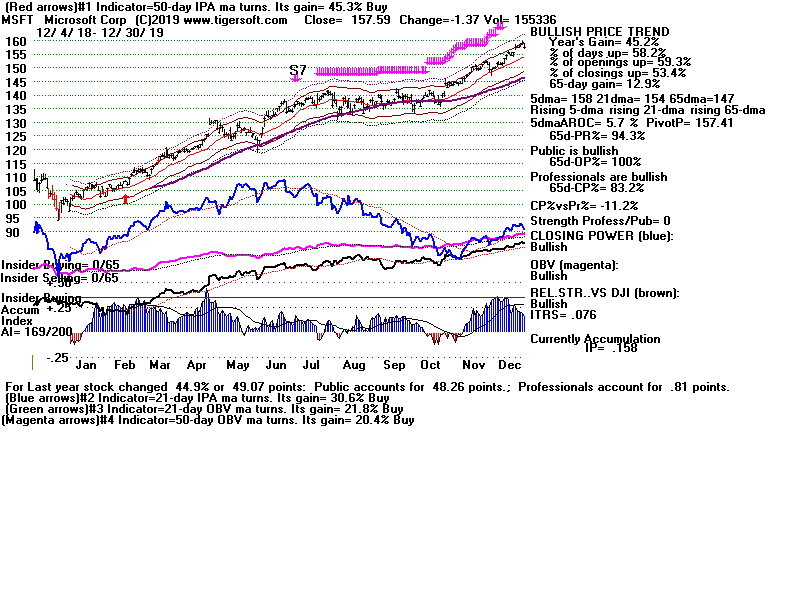
It was also significant that the SP-500 and TECL (representing tech stocks) did not
break below their 65-dma. If their Closing Power downtrends can be broken,
a rally back to their upper bands this Summer would seem very likely. But
first, they must rise above the resistance of their 5-day ma pivot-points.
Very Negative V-I Over-Rides
Positive PI and IP21 Readings at Lower Band
Though I would like to, I cannot accord the market a Buy B2 now even though
it could be argued that we should work with a narrower lower band, just as
we used a narrower upper band to get the last Sell S9-V. The reason is that
the bearishness of the currently very negative V-Indicator historically
overrides the presence of both a positive P-Indicator and a positive
Accumulation Index (IP21) when the DJI is 2.3% below the 21-day
in May, June and July. A brief rally may occur but a much bigger decline
occurred in 3 of 4 cases where these conditions were present. In particular,
we have to become concerned if the DJI were to form a bearish head and
shoulders pattern, as occurred at the tops in 2001, 2002 and 2008.
The 2006 version of Peerless does give a Buy B2. But that was
before the V-Indicator's negativity was much factored in This
began in July 2011.
Date
DJI
LA/MA P-I
IP21 V-I Outcome
------------------------------------------------------------------
5/24/1999 10655 .978
+31
+.028 -37
DJI fell to 10467 (2%) and then
rallied to 10971.
------------------------------------------------------------------
6/14/2001 12690 .967 +50 +.034
-119
DJI immediately completed head/shoulders and fell to
8376 on 9/20/2001.
------------------------------------------------------------------
5/21/2008 12601 .978 +194 +.039
-52
DJI immediately completed head/shoulders and fell to
7552 on 11/20/2002.
------------------------------------------------------------------
6/2/2008 12504 .978
+35
+.016 -125
DJI immediately fell to 7552 on 11/20/2008.
------------------------------------------------------------------
6/25/2018 24253 .976 +154 +.086
-84
NOW
6/28/2018
24216 .977 +98 +.020 -82
The Heavier NYSE Down Volume Needs to Dimminish
  |
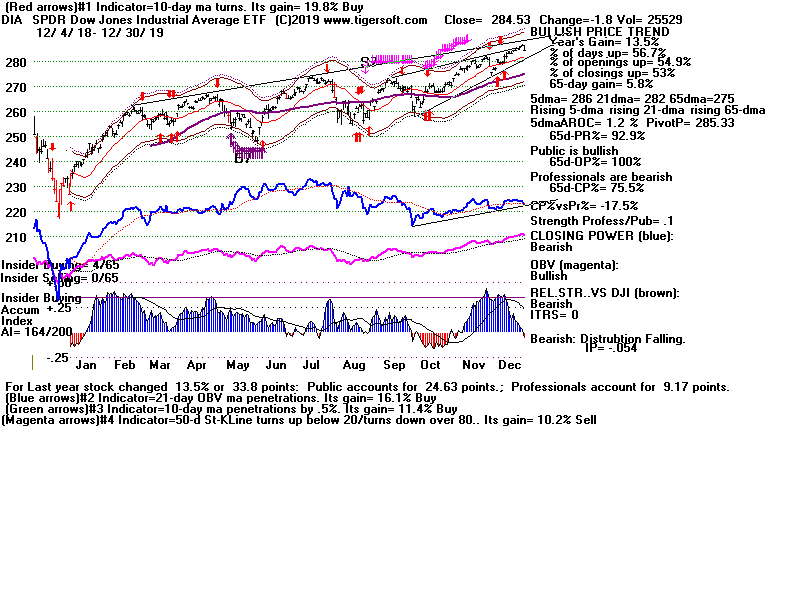
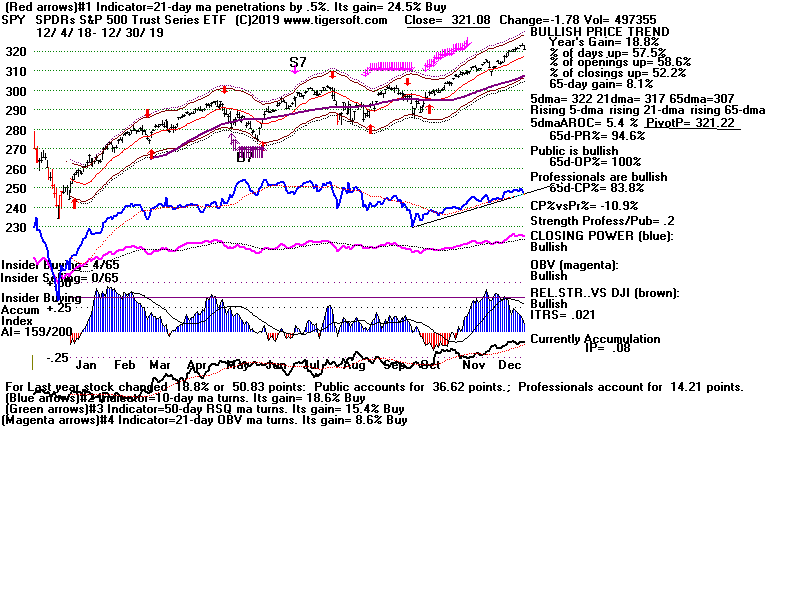
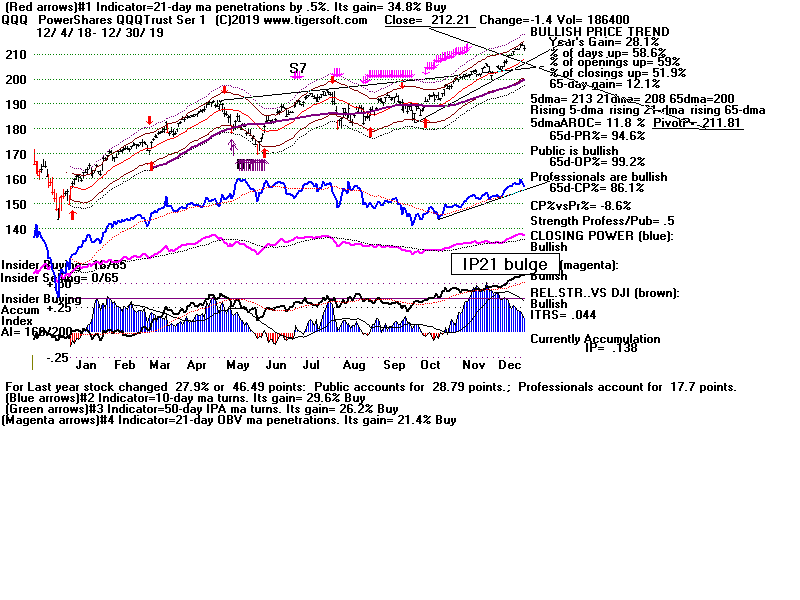
The Closing Power Down-Trends Must Be Broken
on DIA, SPY and QQQ
DIA |
SPY |
QQQ |
|
Charts 6/28/2018 PEERLESS DJI, Signals, Indicators Daily DJI Volume 10-DayUp/Down Vol V-Indicator Hourly DJIA A/D Line for All Stocks NASDAQ S&P OEX NYSE COMPQX DJI-15 DJI-20 DJI-30 DIA SPY QQQ MDY IWM TNA Short-Term Rates USO-CrudeOil FAS GLD BBH IBB JETS JNUG KOL NUGT OIH OIL RSX RETL SDS SLV SOXL TECL TMF TNA UGA (gasoline) XIV YINN Commodities: CANE JJC, NIB, CHOC CORN, CUT (paper) WEAT UUP (Dollar) AAPL ADBE ALXN AMAT AMGN AMD AMZN BA BABA BAC BIDU CAT CVX DE FB GOOG GS HD IBM JPM M (Macy's) MSFT NFLX NVDA QCOM TSLA TXN XOM WMT ANDV (refinery), CMG (Chipotle), LRCX, SWKS, MDGL SPPI WATT SQ TOWN 6/28/2018 (Click on Underlined link.) Bullish MAXCPs - http://tigersoft.com/MAXCPZ/628/BULLISH.htm Bearish MAXCPs - http://tigersoft.com/MINCPZ/628/BEARISH.htm |
Table 1 The 5-day ma pivot-points should act as resistance on rally.
QUICKSILVER on ETFS - 06/28/18
ETF CLOSE CHANGE PIVOT-PT 5-dma AROC CL-PWR CANDLE IP21 ITRS --------------------------------------------------------------------------------------------- DIA 242.08 .96 245.69 -49.7% Bearish BLUE -.009 ---- --------------------------------------------------------------------------------------------- COMPQX 7503.68 58.6 7692.82 -137.9% ---- BLUE .183 .05 --------------------------------------------------------------------------------------------- SPY 270.89 1.54 274.74 -61.5% Bearish BLUE .078 .023 --------------------------------------------------------------------------------------------- QQQ 171.19 1.46 175.32 -130.8% ---- BLUE .124 .05 --------------------------------------------------------------------------------------------- MDY 354.6 1.43 361.68 -94.6% Bearish BLUE .066 .035 --------------------------------------------------------------------------------------------- IWM 163.88 .5 167.82 -135.4% Bearish BLUE .171 .062 --------------------------------------------------------------------------------------------- FAS 62.97 1.66 66.07 -280.1% Bearish BLUE -.007 .008 --------------------------------------------------------------------------------------------- RETL 43.45 0 46.99 -470.2% ---- BLUE .028 .294 --------------------------------------------------------------------------------------------- SOXL 140.88 3.47 161 -789.2% Bearish BLUE .205 -.07 --------------------------------------------------------------------------------------------- TECL 133.78 4.54 141.97 -353.8% ---- BLUE .179 .077 --------------------------------------------------------------------------------------------- IBB 107.95 .61 112.23 -211.1% ---- BLUE .118 .027 --------------------------------------------------------------------------------------------- GLD 118.22 -.36 120.34 -76.5% Bearish RED -.353 -.054 --------------------------------------------------------------------------------------------- OIL 7.61 .04 6.89 339.4% Bullish BLUE .263 .083 --------------------------------------------------------------------------------------------- OIH 26.35 -.09 26.18 203.2% Bearish RED -.096 -.006 --------------------------------------------------------------------------------------------- GASL 24.24 .03 23.48 466% ---- RED -.135 .148 --------------------------------------------------------------------------------------------- UGA 33.9 .13 33.03 280.9% Bullish ---- -.102 .045 --------------------------------------------------------------------------------------------- UUP 25.14 0 24.9 30% Bullish ---- .07 .091 --------------------------------------------------------------------------------------------- IEF 102.59 -.1 102.11 24.4% ---- RED -.177 .025 --------------------------------------------------------------------------------------------- XLU 51.88 -.02 50.75 144.4% Bullish RED .051 .043 --------------------------------------------------------------------------------------------- WEAT 6.16 -.06 6.41 -229.8% Bearish RED -.229 -.025 --------------------------------------------------------------------------------------------- YINN 24.43 .55 27.77 -493.1% Bearish BLUE .087 -.238 --------------------------------------------------------------------------------------------- RSX 20.85 .27 20.88 99.1% ---- BLUE .019 -.009 --------------------------------------------------------------------------------------------- AAPL 185.5 1.34 184.92 1.1% Bearish BLUE -.035 .064 --------------------------------------------------------------------------------------------- GOOG 1114.22 10.24 1155.48 -191.9% ---- BLUE .136 .061 ------------------------------------------------------------------ --------------------------- MSFT 98.63 1.09 100.41 -126.4% Bearish BLUE -.042 .044 --------------------------------------------------------------------------------------------- AMZN 1701.45 40.94 1715.67 -85% ---- BLUE .127 .135 --------------------------------------------------------------------------------------------- FB 196.23 .39 201.74 -132.5% Bullish BLUE .235 .201 --------------------------------------------------------------------------------------------- NVDA 240.86 5.14 250.95 -331.7% Bearish BLUE .009 .04 --------------------------------------------------------------------------------------------- BA 334.65 4.83 338.91 -45.1% Bearish BLUE -.162 .003 --------------------------------------------------------------------------------------------- GS 223.42 3.24 226.02 -79.7% Bearish BLUE -.137 -.099 --------------------------------------------------------------------------------------------- HD 195.21 .19 197.41 -129.4% ---- BLUE .201 .107 --------------------------------------------------------------------------------------------- CAT 136.03 1.42 139.94 -127.5% Bearish BLUE -.285 -.106 |
Table 2   Count of Stocks in Key Directories
          20180628
-------------------------------
NEWHIGHS       75
NEWLOWS        107   Still Bearish
MAXCP          48
MINCP          200   Still Bearish
TTTNH          68
TTTNL          272   Still Bearish
FASTUP         95
FASTDOWN       253   Still Bearish
CPCROSSA       133   Professionals shifting to bullish side.
CPCROSSD       45
BIGVOLUP       2
BIGVODN        14
|
Table 3
Count of Stocks and New Highs in Key Tiger Directories
Date = 180628
               No.           NHs           Pct.
-------------------------------------------------------------------
-------------------------------------------------------------------
MAXCP          48            29            60 %
CHEM           62            4             6 %
SOFTWARE       64            3             5 %
HACKERS        23            1             4 %
OILGAS         157           7             4 %
MILITARY       37            1             3 %
NASD-100       89            3             3 %
REIT           173           6             3 %
COMODITY       56            1             2 %
ETFS           61            1             2 %
UTILITY        41            1             2 %
BIOTECH        410           5             1 %
ELECTRON       174           1             1 %
FIDSTKS        186           1             1 %
INDMATER       82            1             1 %
INDEXES        189           1             1 %
RUS-1000       819           12            1 %
SP-100         94            1             1 %
SP500          477           7             1 %
|
Table 4
Count of Stocks and New Lows in Key Tiger Directories
Date = 180628
               No.           NLs           Pct.
-------------------------------------------------
MINCP          200           56            28 %
FOOD           9             2             22 %
SOLAR          20            3             15 %
HOSPITAL       7             1             14 %
PIPELINE       7             1             14 %
GOLD           50            6             12 %
ETFS           61            7             11 %
AUTO           40            4             10 %
COMODITY       56            5             9 %
HACKERS        23            2             9 %
BIOTECH        410           30            7 %
INFRA          34            2             6 %
BEVERAGE       20            1             5 %
SEMI           127           6             5 %
FINANCE        90            4             4 %
INDMATER       82            3             4 %
CHINA          61            2             3 %
DOWJONES       30            1             3 %
ELECTRON       174           6             3 %
MILITARY       37            1             3 %
OILGAS         157           4             3 %
SOFTWARE       64            2             3 %
SP500          477           13            3 %
BIG17          46            1             2 %
CHEM           62            1             2 %
FIDSTKS        186           4             2 %
INDEXES        189           3             2 %
NASD-100       89            2             2 %
RUS-1000       819           18            2 %
UTILITY        41            1             2 %
BONDFUND       111           1             1 %
SP-100         94            1             1 %
|
 Table 5
 RANKING OF KEY DIRECTORIES BASED PCT.OF STOCKS ABOVE 65-DMA
              6/28/18
 Bullish = 24
 Bearish = 22
---------------------------------------------------------------------------------------
Directory     Current       day-1         day-2         day-3         day-4         day-5
----------------------------------------------------------------------------------------
REIT           .878          .895          .913          .93           .936          .919
COAL           .75           .75           .75           .625          .75           .75
EDU            .714          .714          .571          .571          .714          .571
PIPELINE       .714          .571          .857          .571          .714          .571
RETAIL         .711          .788          .807          .846          .846          .865
UTILITY        .707          .707          .707          .682          .609          .56
BEVERAGE       .7            .55           .75           .75           .7            .6
NIFTY          .655          .689          .724          .689          .827          .862
OILGAS         .636          .681          .636          .535          .675          .579
COMPUTER       .608          .608          .695          .652          .695          .695
CHEM .596 .612 .629 .596 .612 .596 NASD-100 .595 .528 .617 .606 .685 .685 BONDFUND .594 .603 .558 .531 .585 .576 DOWJONES .566 .5 .633 .6 .6 .433 INDEXES .566 .507 .529 .555 .629 .576 GUNS .555 .666 .666 .666 .666 .666 SP500 .551 .53 .584 .587 .631 .61 REGBANKS .548 .516 .677 .709 .87 .838 SP-100 .542 .489 .574 .595 .627 .553 RUS-1000 .537 .525 .586 .586 .648 .625 SOFTWARE .531 .468 .578 .578 .703 .75 HACKERS .521 .391 .521 .521 .608 .695 FIDSTKS .516 .473 .543 .553 .618 .586 BIOTECH .502 .497 .587 .57 .634 .619 n=24 =========================================================================================== GAMING .5 .5 .642 .571 .678 .714 =========================================================================================== ELECTRON .442 .425 .528 .465 .586 .614 INDMATER .439 .451 .439 .39 .56 .487 BIG17 .434 .434 .456 .456 .5 .565 HOSPITAL .428 .428 .571 .571 .857 .857 SEMI .417 .377 .488 .425 .559 .582 HOMEBLDG .411 .411 .411 .411 .411 .47 DJI-13 .384 .307 .384 .307 .461 .23 INFRA .382 .382 .47 .352 .588 .411 GREEN .379 .517 .551 .482 .551 .551 MILITARY .378 .378 .486 .432 .567 .513 FINANCE .355 .322 .466 .511 .644 .611 AUTO .325 .375 .425 .425 .525 .55 COMODITY .303 .285 .25 .214 .303 .214 TRANSP .25 .3 .4 .4 .5 .65 GOLD .22 .24 .28 .26 .32 .28 SOLAR .2 .25 .3 .25 .3 .35 INSURANC .193 .161 .193 .258 .354 .29 BIGBANKS .142 0 0 .142 .142 .142 CHINA .114 .131 .213 .213 .278 .262 ETFS .098 .049 .081 .081 .131 .098 FOOD 0 0 0 0 .111 .111 JETS 0 .1 .1 .1 .2 .5 n=22 |
====================================================================
6/27/2018 The operative Peerless signal remains a Sell S9V. Stay short
DIA.
While we may now get a brief seasonal rally going into July 4th, it may not
rise very far. No one know just how China or Europe will react to Trump
tariffs. Since 1966, the DJI has risen 68.8% of the time over the next 3 trading days
in the year of mid-term Elections (1966, 1970, 1974...) But this rally typically
lasts only for a week. After that, the seasonality turns bearish. .
The DJI closed 3% below the 21-day ma. It will only take a further
decline of 75 points tomorrow to bring a Buy B2. Such Buy signals are reliable
and we will act on it. But be careful about anticipating the Buy signal. I
think
we should play the odds as Peerless presents them. (The situation is not
unlike playing the card game Blackjack. One can play by hunches or one
can play using the optimal system of betting. In other words, we can depend
on luck or we can employ what has worked best over all the cases since 1929.)
The very negative V-Indicator and multiple Sell S9s that we see us
now are still telling us that a bear market is still a distinct possibility. Without
a Buy B2, bear markets soon followed the tagging of the lower band back
at June 2001, June 2002 and June 2008. Thus, it is significant, I believe, that all
the major market ETFs show downtrending Closing Powers, that the Hourly
DJI chart shows both falling price and Hourly DJI price and DISI trends and
it is downright dangerous, the way institutions and traders alike have been very
quick to sell into and overwhelm each and every recent rally. Higher openings
that give way to much lower closing definitely dismay the bulls. So, I would
expect more weakness tomorrow. We see this as "red popsicles" in our
TigerSoft candle-stick charts.
I am concerned that a rally now could set up more bearish head/shoulders in a week.
But a decline by SPY, TECL and FAS now could bring a much deeper decline as
they break key support levels. There does not appear an easy way out of the current
weakness. So, any Buy B2 will be worrisome. More on this if it occurs
tomorrow.
For now, note that there are some positive technicals. The long-term trend of
the A/D Line is still rising. The current Accumulation Index remains positive for
most of the major ETFs. The Dollar is strong. It made a 12-month high today.
What will need to see are some closing above the openings, in other words, some
blue Tiger candlesticks and a break in the Closing Power downtrends. Professionals
will have to stop their steady selling into strength and become net buyers.
DIA now |
SPY is at key support. |
QQQ  |
TECL is at key support |
 |
|
Charts 6/27/2018 PEERLESS DJI, Signals, Indicators Daily DJI Volume 10-DayUp/Down Vol V-Indicator Hourly DJIA A/D Line for All Stocks NASDAQ S&P OEX NYSE COMPQX DJI-15 DJI-20 DJI-30 DIA SPY QQQ MDY IWM TNA Short-Term Rates USO-CrudeOil FAS GLD BBH IBB JETS JNUG KOL NUGT OIH OIL RSX RETL SDS SLV SOXL TECL TMF TNA UGA (gasoline) XIV YINN Commodities: CANE JJC, NIB, CHOC CORN, CUT (paper) WEAT UUP (Dollar) AAPL ADBE ALXN AMAT AMGN AMD AMZN BA BABA BAC BIDU CAT CVX DE FB GOOG GS HD IBM JPM M (Macy's) MSFT NFLX NVDA QCOM TSLA TXN XOM WMT ANDV (refinery), CMG (Chipotle), LRCX, SWKS, MDGL SPPI WATT SQ TOWN 6/27/2018 (Click on Underlined link.) Bullish MAXCPs - http://tigersoft.com/MAXCPZ/627/BULLISH.htm Bearish MAXCPs - http://tigersoft.com/MINCPZ/627/BEARISH.htm |
Table 1 Weak as DJI is weaker are FAS, SOXL, GLD and YINN. Accumulation is still positive for NASDAQ, QQQ, MDY, IWM, SOXL and TECL. QUICKSILVER on ETFS - 06/27/18 ETF CLOSE CHANGE PIVOT-PT 5-dma AROC CL-PWR CANDLE IP21 ITRS --------------------------------------------------------------------------------------------- DIA 241.12 -1.55 244.5 -109.3% Bearish RED -.006 ---- --------------------------------------------------------------------------------------------- COMPQX 7445.08 -116.55 7712.95 -219.7% ---- RED .18 .049 --------------------------------------------------------------------------------------------- SPY 269.35 -2.25 274.24 -121% Bearish RED .083 .024 --------------------------------------------------------------------------------------------- QQQ 169.73 -2.34 175.71 -215.7% ---- RED .11 .049 --------------------------------------------------------------------------------------------- MDY 353.17 -3.9 361.37 -149.3% Bearish RED .082 .04 --------------------------------------------------------------------------------------------- IWM 163.38 -2.66 168.38 -196.8% Bearish RED .172 .067 --------------------------------------------------------------------------------------------- FAS 61.31 -2.22 66.57 -435% Bearish RED .002 -.019 --------------------------------------------------------------------------------------------- RETL 43.45 -2.01 47.75 -443.6% ---- RED .031 .296 --------------------------------------------------------------------------------------------- SOXL 137.41 -10.91 164.82 -1067.7% Bearish RED .157 -.115 --------------------------------------------------------------------------------------------- TECL 129.24 -5.44 143.44 -631.9% Bearish RED .172 .039 --------------------------------------------------------------------------------------------- IBB 107.34 -2.23 112.61 -293.6% ---- RED .12 .028 --------------------------------------------------------------------------------------------- GLD 118.58 -.68 120.05 -70% Bearish RED -.343 -.045 --------------------------------------------------------------------------------------------- OIL 7.61 .04 6.89 339.4% Bullish BLUE .263 .088 --------------------------------------------------------------------------------------------- OIH 26.44 .65 25.3 112.7% Bearish BLUE -.089 .03 --------------------------------------------------------------------------------------------- GASL 24.21 .67 22.09 179% Bullish BLUE -.081 .246 --------------------------------------------------------------------------------------------- UGA 33.77 .7 32.05 225.2% Bullish BLUE -.046 .063 --------------------------------------------------------------------------------------------- UUP 25.14 .15 24.99 16% Bullish BLUE .021 .099 --------------------------------------------------------------------------------------------- IEF 102.69 .39 102.09 42.6% Bullish BLUE -.165 .028 --------------------------------------------------------------------------------------------- XLU 51.9 .25 50.4 164% Bullish BLUE .11 .045 --------------------------------------------------------------------------------------------- WEAT 6.22 .03 6.45 -126.1% Bearish ---- -.185 .006 --------------------------------------------------------------------------------------------- YINN 23.88 -2.15 27.01 -950.6% Bearish RED .05 -.252 --------------------------------------------------------------------------------------------- RSX 20.58 -.06 20.44 12.1% Bearish RED .032 .021 --------------------------------------------------------------------------------------------- |
Table 2    Count of Stocks in Key Directories
           20180627
-------------------------------
NEWHIGHS       52
NEWLOWS        167   Bearish
MAXCP          36
MINCP          395   Bearish
TTTNH          55
TTTNL          521   Bearish
FASTUP         64
FASTDOWN       362   Bearish
CPCROSSA       23
CPCROSSD       121   Bearish
BIGVOLUP       2
BIGVODN        14    Bearish
ACCUMVER       37
HIGHIP21       77
HIUPPCT        127
VHIP21         32
LOWACCUM       322
REDSELL        98
AUGSELS7       13
TRAPDOOR       9
|
Table 3
Count of Stocks and New Highs in Key Tiger Directories
Date = 180627
               No.           NHs           Pct.
-------------------------------------------------------------------
-------------------------------------------------------------------
MAXCP          36            17            47 %
UTILITY        41            3             7 %
OILGAS         157           8             5 %
CHEM           62            2             3 %
MILITARY       37            1             3 %
ETFS           61            1             2 %
FIDSTKS        186           4             2 %
SP-100         94            2             2 %
SP500          477           8             2 %
BIOTECH        409           5             1 %
INDMATER       82            1             1 %
INDEXES        189           1             1 %
NASD-100       89            1             1 %
REIT           173           1             1 %
RUS-1000       819           10            1 %
|
Table 4
Count of Stocks and New Lows in Key Tiger Directories
Date = 180627
               No.           NLs           Pct.
-------------------------------------------------
BIGBANKS       7             2             29 %
MINCP          395           112           28 %
ETFS           61            15            25 %
CHINA          61            11            18 %
PIPELINE       7             1             14 %
AUTO           39            5             13 %
INSURANC       31            4             13 %
FINANCE        90            11            12 %
FOOD           9             1             11 %
GAMING         28            3             11 %
GOLD           50            5             10 %
JETS           10            1             10 %
SOLAR          20            2             10 %
UTILITY        41            4             10 %
DJI-13         13            1             8 %
SEMI           127           10            8 %
BIOTECH        409           27            7 %
COMODITY       56            4             7 %
FIDSTKS        186           13            7 %
INDMATER       82            6             7 %
ELECTRON       174           10            6 %
HOMEBLDG       17            1             6 %
INFRA          34            2             6 %
BEVERAGE       20            1             5 %
CHEM           62            3             5 %
MILITARY       37            2             5 %
RUS-1000       819           38            5 %
SP-100         94            5             5 %
SP500          477           26            5 %
COMPUTER       23            1             4 %
HACKERS        23            1             4 %
DOWJONES       30            1             3 %
INDEXES        189           6             3 %
NIFTY          29            1             3 %
REGBANKS       31            1             3 %
SOFTWARE       64            2             3 %
NASD-100       89            2             2 %
OILGAS         157           3             2 %
|
 Table 5  RANKING OF KEY DIRECTORIES BASED PCT.OF STOCKS ABOVE 65-DMA
              6/27/18
 Bearish =26
 Bullish =19
---------------------------------------------------------------------------------------
Directory     Current       day-1         day-2         day-3         day-4         day-5
----------------------------------------------------------------------------------------
REIT           .895          .913          .93           .936          .919          .919
RETAIL         .788          .807          .846          .846          .865          .884
COAL           .75           .75           .625          .75           .875          .75
EDU            .714          .571          .571          .714          .571          .714
UTILITY        .707          .707          .682          .609          .56           .536
NIFTY          .689          .724          .689          .827          .862          .862
OILGAS         .681          .636          .535          .675          .573          .675
GUNS           .666          .666          .666          .666          .666          .722
CHEM           .612          .629          .596          .612          .596          .629
COMPUTER       .608          .695          .652          .695          .695          .782
BONDFUND .603 .558 .531 .585 .576 .504 PIPELINE .571 .857 .571 .714 .571 .714 BEVERAGE .55 .75 .75 .7 .6 .65 SP500 .53 .584 .587 .631 .607 .668 NASD-100 .528 .617 .606 .685 .685 .764 RUS-1000 .525 .586 .586 .648 .623 .684 GREEN .517 .551 .482 .551 .551 .551 REGBANKS .516 .677 .709 .87 .838 .838 INDEXES .507 .529 .555 .629 .582 .645 ========================================================================================== DOWJONES .5 .633 .6 .6 .433 .6 GAMING .5 .642 .571 .678 .714 .714 ========================================================================================== BIOTECH .498 .589 .572 .635 .613 .672 SP-100 .489 .574 .595 .627 .553 .648 FIDSTKS .473 .543 .553 .618 .586 .672 SOFTWARE .468 .578 .578 .703 .75 .781 INDMATER .451 .439 .39 .56 .5 .524 BIG17 .434 .456 .456 .5 .565 .586 HOSPITAL .428 .571 .571 .857 .857 .857 ELECTRON .425 .528 .465 .586 .609 .632 HOMEBLDG .411 .411 .411 .411 .47 .47 HACKERS .391 .521 .521 .608 .695 .695 INFRA .382 .47 .352 .588 .411 .558 MILITARY .378 .486 .432 .567 .513 .594 SEMI .377 .488 .425 .559 .574 .622 AUTO .358 .41 .41 .512 .538 .615 FINANCE .322 .466 .511 .644 .611 .633 DJI-13 .307 .384 .307 .461 .23 .461 TRANSP .3 .4 .4 .5 .65 .75 COMODITY .285 .25 .214 .303 .214 .232 SOLAR .25 .3 .25 .3 .35 .3 GOLD .24 .28 .26 .32 .28 .3 INSURANC .161 .193 .258 .354 .29 .387 CHINA .131 .213 .213 .278 .262 .311 JETS .1 .1 .1 .2 .5 .6 ETFS .049 .081 .081 .131 .098 .131 BIGBANKS 0 0 .142 .142 .142 .142 FOOD 0 0 0 .111 .111 .111 |
====================================================================
6/26/2018 The operative Peerless signal remains a Sell S9V. Stay short DIA.
I keep saying the DJI is quite capable of leading the broader market and
and the NASDAQ into a bear market. Such were the cases in 1977, 2001 and
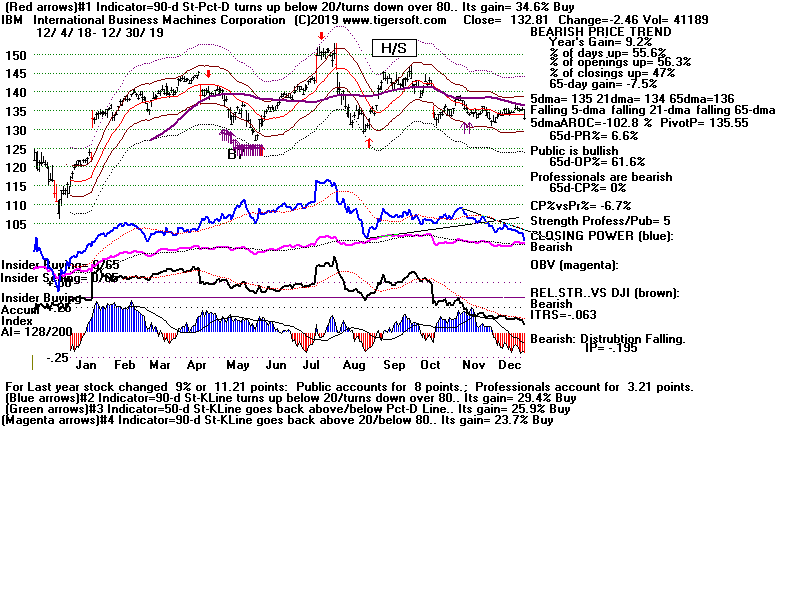
2002. There is a real danger that some of the big banks (BAC and JPM)
and other key blue chips like CAT and IBM will break down below the
vital support levels that they are now hovering just above. It has to be very
significant that Warren Buffet's Value-oriented BRKB has already broken
below such support. And of course, Peerless users know that a multitude
of Sell S9s set the stage for some of the biggest declines in market history,
1929, 1969, 1973, 1981, 1987, 2000-2002 and 2007-2008.
So, the recent S9 helps our software delay in getting a buy signal in here.
So do the negative V-I and OBVPct, which act to over-rule the positive
P-I and IP21 until the DJI is more oversold or we see an improvement in
the Peerless Indicators on a new low closing.
|
Charts 6/26/2018 PEERLESS DJI, Signals, Indicators Daily DJI Volume 10-DayUp/Down Vol V-Indicator Hourly DJIA A/D Line for All Stocks NASDAQ S&P OEX NYSE COMPQX DJI-15 DJI-20 DJI-30 DIA SPY QQQ MDY IWM TNA Short-Term Rates USO-CrudeOil FAS GLD BBH IBB JETS JNUG KOL NUGT OIH OIL RSX RETL SDS SLV SOXL TECL TMF TNA UGA (gasoline) XIV YINN Commodities: CANE JJC, NIB, CHOC CORN, CUT (paper) WEAT UUP (Dollar) AAPL ADBE ALXN AMAT AMGN AMD AMZN BA BABA BAC BIDU CAT CVX DE FB GOOG GS HD IBM JPM M (Macy's) MSFT NFLX NVDA QCOM TSLA TXN XOM WMT ANDV (refinery), CMG (Chipotle), LRCX, SWKS, MDGL SPPI WATT SQ TOWN 6/26/2018 (Click on Underlined link.) Bullish MAXCPs - http://tigersoft.com/MAXCPZ/626/BULLISH.htm Bearish MAXCPs - http://tigersoft.com/MINCPZ/626/BEARISH.htm |
Should Traders Act Now on a
Stochastic-20 Buy
without a Peerless Buy Signal?
It would be unwise to Buy in here until Peerless gives a Buy signal.
Today I looked back at past Junes back to 1990 to see if we
should even go long as traders now that the DJI is 2% below the 21-day ma
if the Stochastic-20 (K-Line) were to rise back above the 20-level. What I
found
was that when the V-Indicator was very negative, there were very trade-worthy
bounces if Peerless gave Buy signals, but without these Buys, there was a very
real danger of a serious market decline.
Signal Result Date
PI IP21
VI
OBVPct
B2 A recovery 6/23/1994
-145 -.018
-31 -.009
B2 A recovery 6/15/1998 -383
-.123 -110
-.238
B9 A recovery 6/22/2000 +117
-.060 -51
+.073
S9 Very bad
6/15/2001 -14
-.023 -172 +.051
S9 Very bad 6/17/2002
-175 -.010 -271
-.079
S9 Very bad 6/16/2008
-239 -.079
-227 -.079
B5 Premature
6/22/2009 +49 -.003
-134 +.038
B8 A
recovery 6/29/2010 -51 -.069
-191 -.103
B7 A recovery 6/15/2011
-177 -.127
-185 -.149
B19 A recovery 6/20/2013 -522
-.144 -177
-.187
B3 A recovery 6/28/2016
+155 -.024 -108
-.193
S9 ?????????? 6/26/2018
+194 +.079
-68 -.171
Wall Street Is Scared of Something!
Trump's tariffs do scare Wall Street. But even more scary is what will
happen if Interest Rates rise rapidly given the trillions and trillions of dollars
in consumer debt. That is what I believe is really causing the weakness in the
big banks. A decisive price breakdown by the big banks would be too
reminscent of 2007 for traders and hedge funds to ignore.

  |
 |
 |
Table 1
                     QUICKSILVER on ETFS - 06/26/18
ETF CLOSE CHANGE PIVOT-PT 5-dma AROC CL-PWR CANDLE IP21 ITRS --------------------------------------------------------------------------------------------- DIA 242.67 .36 246.46 -85.9% Bearish RED .025 ---- --------------------------------------------------------------------------------------------- COMPQX 7561.63 29.62 7781.51 -106.6% ---- BLUE .231 .069 --------------------------------------------------------------------------------------------- SPY 271.6 .6 275.97 -71.1% Bearish ---- .125 .028 --------------------------------------------------------------------------------------------- QQQ 172.07 .7 177.25 -112.2% ---- BLUE .18 .07 --------------------------------------------------------------------------------------------- MDY 357.07 .55 363.92 -70.2% ---- BLUE .114 .044 --------------------------------------------------------------------------------------------- IWM 166.04 .96 169.97 -76.5% ---- BLUE .248 .081 --------------------------------------------------------------------------------------------- FAS 63.53 -.29 67 -245.3% Bearish RED .001 .012 --------------------------------------------------------------------------------------------- RETL 45.46 .48 47.58 -73.9% ---- BLUE .07 .37 --------------------------------------------------------------------------------------------- SOXL 148.32 1.54 171.24 -623.7% Bearish RED .21 -.009 --------------------------------------------------------------------------------------------- TECL 134.68 1.49 146.94 -391.8% ---- BLUE .231 .126 --------------------------------------------------------------------------------------------- IBB 109.57 -.63 113.9 -110.1% Bullish RED .198 .053 --------------------------------------------------------------------------------------------- GLD 119.26 -.63 120.26 -64% Bearish ---- -.3 -.054 --------------------------------------------------------------------------------------------- OIL 7.61 .04 6.89 339.4% Bullish BLUE .263 .073 --------------------------------------------------------------------------------------------- OIH 25.79 .29 25.86 -1.9% Bearish BLUE -.035 -.007 --------------------------------------------------------------------------------------------- GASL 23.54 1.51 23.39 293.7% Bullish BLUE -.028 .212 --------------------------------------------------------------------------------------------- UGA 33.07 .33 32.3 67.6% Bullish BLUE -.046 .025 --------------------------------------------------------------------------------------------- UUP 24.99 .13 25.06 -10% Bullish BLUE .007 .077 --------------------------------------------------------------------------------------------- IEF 102.3 .05 101.82 7.8% ---- ---- -.104 .01 --------------------------------------------------------------------------------------------- XLU 51.65 .06 50.23 144.2% Bullish BLUE .074 .035 --------------------------------------------------------------------------------------------- WEAT 6.19 -.09 6.38 -94.3% Bearish RED -.149 -.013 --------------------------------------------------------------------------------------------- YINN 26.03 -.08 29.05 -618.6% Bearish ---- .108 -.201 --------------------------------------------------------------------------------------------- RSX 20.64 -.22 20.53 82.5% ---- ---- .047 .007 --------------------------------------------------------------------------------------------- |
Table 2   Count of Stocks in Key Directories
          20180626
-------------------------------
NEWHIGHS       94         Bullish
NEWLOWS        67
MAXCP          54
MINCP          181        Bearish
TTTNH          53
TTTNL          317        Bearish
FASTUP         79
FASTDOWN       144        Bearish
CPCROSSA       148        Bullish Shift
CPCROSSD       28
BIGVOLUP       3
BIGVODN        7
|
Table 3
Count of Stocks and New Highs in Key Tiger Directories
Date = 180625
               No.           NHs           Pct.
-------------------------------------------------------------------
-------------------------------------------------------------------
MAXCP          54            35            65 %
BEVERAGE       20            1             5 %
SOLAR          20            1             5 %
UTILITY        41            2             5 %
BIOTECH        410           11            3 %
CHEM           62            2             3 %
GREEN          29            1             3 %
MILITARY       37            1             3 %
REIT           173           6             3 %
ELECTRON       174           4             2 %
OILGAS         156           3             2 %
SEMI           127           2             2 %
SOFTWARE       64            1             2 %
FIDSTKS        186           2             1 %
FINANCE        90            1             1 %
NASD-100       89            1             1 %
RUS-1000       819           7             1 %
SP500          477           5             1 %
|
Table 4
Count of Stocks and New Lows in Key Tiger Directories
Date = 180626
               No.           NLs           Pct.
-------------------------------------------------
FOOD           9             2             22 %
MINCP          181           39            22 %
ETFS           61            6             10 %
INSURANC       31            3             10 %
JETS           10            1             10 %
CHINA          61            4             7 %
GAMING         28            2             7 %
UTILITY        41            3             7 %
GOLD           50            3             6 %
AUTO           40            2             5 %
SOLAR          20            1             5 %
FINANCE        90            4             4 %
HACKERS        23            1             4 %
FIDSTKS        186           5             3 %
INFRA          34            1             3 %
MILITARY       37            1             3 %
NIFTY          29            1             3 %
SP500          477           12            3 %
BIOTECH        410           10            2 %
CHEM           62            1             2 %
COMODITY       56            1             2 %
ELECTRON       174           3             2 %
INDMATER       82            2             2 %
INDEXES        189           3             2 %
NASD-100       89            2             2 %
RUS-1000       819           20            2 %
SEMI           127           2             2 %
SOFTWARE       64            1             2 %
OILGAS         156           1             1 %
SP-100         94            1             1 %
|
 Table 5
 RANKING OF KEY DIRECTORIES BASED PCT.OF STOCKS ABOVE 65-DMA
               6/26/18
Bullish = 28 Bearish = 19 --------------------------------------------------------------------------------------- Directory Current day-1 day-2 day-3 day-4 day-5 ---------------------------------------------------------------------------------------- REIT .913 .93 .936 .919 .919 .901 PIPELINE .857 .571 .714 .571 .714 .714 RETAIL .807 .846 .846 .865 .903 .865 BEVERAGE .75 .75 .7 .6 .65 .6 COAL .75 .625 .75 .875 .75 .75 NIFTY .724 .689 .827 .862 .862 .758 UTILITY .707 .682 .609 .56 .536 .512 COMPUTER .695 .652 .695 .695 .782 .782 REGBANKS .677 .709 .87 .838 .838 .838 GUNS .666 .666 .666 .666 .722 .666 GAMING .642 .571 .678 .714 .714 .678 OILGAS .641 .538 .679 .576 .692 .647 DOWJONES .633 .6 .6 .433 .6 .633 CHEM .629 .596 .612 .596 .629 .629 NASD-100 .617 .606 .685 .685 .764 .674 BIOTECH .587 .57 .634 .612 .665 .617 RUS-1000 .586 .586 .648 .623 .684 .67 SP500 .584 .587 .631 .607 .666 .645 SOFTWARE .578 .578 .703 .75 .781 .781 SP-100 .574 .595 .627 .553 .638 .638 EDU .571 .571 .714 .571 .714 .714 HOSPITAL .571 .571 .857 .857 .857 .857 BONDFUND .558 .531 .585 .576 .495 .522 GREEN .551 .482 .551 .551 .586 .62 FIDSTKS .543 .553 .618 .586 .666 .661 INDEXES .529 .555 .629 .582 .645 .645 ELECTRON .528 .465 .586 .609 .632 .603 HACKERS .521 .521 .608 .695 .695 .695 N=28 ------------------------------------------------------------------------------------------ SEMI .488 .425 .559 .574 .622 .582 MILITARY .486 .432 .567 .513 .594 .54 INFRA .47 .352 .588 .411 .558 .529 FINANCE .466 .511 .644 .611 .622 .6 BIG17 .456 .456 .5 .565 .608 .565 INDMATER .439 .39 .56 .5 .536 .56 AUTO .425 .425 .525 .55 .6 .575 HOMEBLDG .411 .411 .411 .47 .47 .47 TRANSP .4 .4 .5 .65 .75 .7 DJI-13 .384 .307 .461 .23 .461 .461 SOLAR .3 .25 .3 .35 .3 .3 GOLD .28 .26 .32 .28 .3 .3 COMODITY .25 .214 .303 .214 .25 .214 CHINA .213 .213 .278 .262 .311 .295 INSURANC .193 .258 .354 .29 .387 .483 JETS .1 .1 .2 .5 .6 .7 ETFS .081 .081 .131 .098 .131 .098 BIGBANKS 0 .142 .142 .142 .142 .142 FOOD 0 0 .111 .111 .111 .111 N=19 |
====================================================================
6/25/2018 The operative Peerless signal remains a Sell S9V. Stay short DIA.
There were a number of bearish technical developments that suggest
a deeper decline than just to the lower 3.5% band at 24000.
The DJI has fallen back to its rising 200-day ma. That should bring
in some automatic buying. If it does not, that will be a bearish sign.
Without a Peerless Buy signal, I think we must just stay short DIA.
The NYSE A/D Line broke its uptrend-line. I have been warnng that
this could unleash a new round of selling in groups that have held up
to this point. Tech stocks were particularly weak today. See
the
NASDAQ chart below. AAPL now shows a bearish H/S. Even
mighty AMZN got hit hard. Value-Investing is now on the defensive,
judging from the breakdown in Berkshire Hathaway's stock below
very well-tested support. See its chart further below. Mergers may be
in trouble, considering how weak oil refiners have been for the last week
or two. And the big bank stocks are close to serious breakdowns. See
the charts of BAC and JPM below.
All this weakness will likely make it hard for the DJI and the market
to put in a bottom until prices go lower.


As was expected, because this is what happened in 2000 and
2008,
the NASDAQ and QQQ are playing "catchup" with the DJI's downside.


We may or may not get a Peerless Buy B2 signal at 24000 and
the lower 3.5%
band. We will have to wait and see. But there's no getting around the
signs that both Big Money and Professionals are beating a hasty retreat
from the blue chips and there are ample precedents for the DJI leading
the entire market lower. (This has been a running theme in recent Hotlines.)
Whether it is the fears of a wild and unpredictable gunfight
in the arena
of international trade or its the growing sense that the Debt held by the US
Government, by US Consumers and by folks buying houses, car loans or
paying off their student loans is reaching unsustainable levels, we will
find out. Either of these high anxieties are enough to bring profit-taking.
And the profit-taking is now causing real technical damage. Moreover,
I can't help noting the reports that debt delinquncies are on the rise. This also
occurred in 2007. And it was big Bank stocks' tops back then that
were the first important signs of big trouble. Moreover, the Dollar
broke its uptrend today. Is this a sign that China may be selling a lot
more US Treasuries?
Look belolw at how JPM and BAC are sitting precariously at
their
well-tested flat price-supports. If these key bank stocks do what CAT
and Bershire Hathaway did today, they will break below their key supports.
That will bring about a new wave of technical selling. And if the mutual funds,
as a result of this, start loading up on leveraged Index shorts as insurance
against a much bigger decline, then we are bound to see a test of the
February lows at 23400-23500.
 |
 |
 |
 |
|
Charts 6/25/2018 PEERLESS DJI, Signals, Indicators Daily DJI Volume 10-DayUp/Down Vol V-Indicator Hourly DJIA A/D Line for All Stocks NASDAQ S&P OEX NYSE COMPQX DJI-15 DJI-20 DJI-30 DIA SPY QQQ MDY IWM TNA Short-Term Rates USO-CrudeOil FAS GLD BBH IBB JETS JNUG KOL NUGT OIH OIL RSX RETL SDS SLV SOXL TECL TMF TNA UGA (gasoline) XIV YINN Commodities: CANE JJC, NIB, CHOC CORN, CUT (paper) WEAT UUP (Dollar) AAPL ADBE ALXN AMAT AMGN AMD AMZN BA BABA BAC BIDU CAT CVX DE FB GOOG GS HD IBM JPM M (Macy's) MSFT NFLX NVDA QCOM TSLA TXN XOM WMT ANDV (refinery), CMG (Chipotle), LRCX, SWKS, MDGL SPPI WATT SQ TOWN 6/25/2018 (Click on Underlined link.) Bullish MAXCPs - http://tigersoft.com/4XXH/MAXCPS/625/BULLISH.htm Bearish MAXCPs - http://tigersoft.com/4XXH/MINCPS/625/BEARISH.htm |
Table 1
                     QUICKSILVER on ETFS - 06/25/18
ETF CLOSE CHANGE PIVOT-PT 5-dma AROC CL-PWR CANDLE IP21 ITRS --------------------------------------------------------------------------------------------- DIA 242.31 -3.38 246.88 -150.4% Bearish RED .04 ------ --------------------------------------------------------------------------------------------- COMPQX 7532.01 -160.81 7725.58 -139% ---- RED .232 .065 --------------------------------------------------------------------------------------------- SPY 271 -3.74 275.5 -100.9% Bearish RED .126 .027 --------------------------------------------------------------------------------------------- QQQ 171.37 -3.95 176 -145.6% ---- RED .189 .067 --------------------------------------------------------------------------------------------- MDY 356.52 -5.16 362.14 -84.7% ---- RED .105 .046 --------------------------------------------------------------------------------------------- IWM 165.08 -2.74 168.61 -104.3% ---- RED .233 .078 --------------------------------------------------------------------------------------------- FAS 63.82 -2.25 66.77 -277% Bearish RED .007 .024 --------------------------------------------------------------------------------------------- RETL 44.98 -2.01 46.15 -75.8% ---- RED .061 .379 --------------------------------------------------------------------------------------------- SOXL 146.78 -14.22 168.59 -830.6% Bearish RED .245 -.02 --------------------------------------------------------------------------------------------- TECL 133.19 -8.78 145.83 -529.1% ---- RED .243 .133 --------------------------------------------------------------------------------------------- IBB 110.2 -2.03 112.04 -10.2% Bullish RED .224 .045 --------------------------------------------------------------------------------------------- GLD 119.89 -.45 120.8 -50.6% Bearish RED -.34 -.054 --------------------------------------------------------------------------------------------- OIL 7.61 .04 6.89 339.4% Bullish BLUE .263 .067 --------------------------------------------------------------------------------------------- OIH 25.5 -.68 25.8 -79.4% Bearish RED -.081 -.025 --------------------------------------------------------------------------------------------- GASL 22.03 -1.45 22.21 77.5% Bearish RED -.047 .156 --------------------------------------------------------------------------------------------- UGA 32.74 -.29 32.63 -9.2% ---- BLUE -.143 -.001 --------------------------------------------------------------------------------------------- UUP 24.86 -.04 25.04 -22% Bullish ---- -.019 .061 --------------------------------------------------------------------------------------------- IEF 102.25 .14 102.14 18.1% ---- ---- -.088 .002 --------------------------------------------------------------------------------------------- XLU 51.59 .84 50.19 188% Bullish BLUE .087 .041 --------------------------------------------------------------------------------------------- WEAT 6.28 -.13 6.31 -117.3% Bearish ---- -.104 -.027 --------------------------------------------------------------------------------------------- YINN 26.11 -1.66 29.48 -858.8% Bearish RED .133 -.236 --------------------------------------------------------------------------------------------- RSX 20.86 -.02 20.3 141.6% ---- BLUE .015 .029 --------------------------------------------------------------------------------------------- AAPL 182.17 -2.75 185.69 -176.4% Bearish RED .006 .048 --------------------------------------------------------------------------------------------- GOOG 1124.81 -30.67 1168.06 -208.8% Bullish RED .184 .098 --------------------------------------------------------------------------------------------- MSFT 98.39 -2.02 100.86 -122.2% Bearish RED .021 .062 --------------------------------------------------------------------------------------------- AMZN 1663.15 -52.52 1734.78 -175.2% ---- RED .175 .168 --------------------------------------------------------------------------------------------- FB 196.35 -5.39 197.49 -48.9% Bullish RED .252 .199 --------------------------------------------------------------------------------------------- NVDA 239.12 -11.83 260.17 -501.1% ---- RED .093 .038 --------------------------------------------------------------------------------------------- BA 331.2 -7.71 341.12 -343.1% Bearish RED -.095 .011 --------------------------------------------------------------------------------------------- GS 221.54 -4.48 228.32 -215.9% Bearish RED -.132 -.129 --------------------------------------------------------------------------------------------- HD 196.38 -1.03 199.21 -108.1% Bullish RED .233 .142 --------------------------------------------------------------------------------------------- CAT 136.58 -3.36 143.3 -423.3% Bearish RED -.247 -.086 |
 Table 2   Count of Stocks in Key Directories
          20180625
-------------------------------
NEWHIGHS       65
NEWLOWS        109    Bearish
MAXCP          29
MINCP          258    Bearish
TTTNH          41
TTTNL          471    Bearish
FASTUP         73
FASTDOWN       214    Bearish
CPCROSSA       25
CPCROSSD       168    Bearish
BIGVOLUP       3
BIGVODN        14
|
Table 3
Count of Stocks and New Highs in Key Tiger Directories
Date = 180625
               No.           NHs           Pct.
-------------------------------------------------------------------
-------------------------------------------------------------------
MAXCP          29            21            72 %
UTILITY        41            4             10 %
BEVERAGE       20            1             5 %
SOLAR          21            1             5 %
RETAIL         52            2             4 %
GREEN          30            1             3 %
REIT           173           5             3 %
BIOTECH        410           9             2 %
CHEM           62            1             2 %
CHINA          61            1             2 %
FIDSTKS        186           3             2 %
SEMI           128           2             2 %
SP500          477           8             2 %
ELECTRON       175           2             1 %
NASD-100       89            1             1 %
OILGAS         157           1             1 %
RUS-1000       819           10            1 %
SP-100         94            1             1 %
|
Table 4
Count of Stocks and New Lows in Key Tiger Directories
Date = 180625
               No.           NLs           Pct.
-------------------------------------------------
FOOD           9             3             33 %
MINCP          258           60            23 %
PIPELINE       7             1             14 %
HOMEBLDG       17            2             12 %
ETFS           61            6             10 %
JETS           10            1             10 %
SOLAR          21            2             10 %
CHINA          61            5             8 %
DJI-13         13            1             8 %
FINANCE        90            6             7 %
GAMING         28            2             7 %
AUTO           40            2             5 %
ELECTRON       175           9             5 %
SEMI           128           7             5 %
BIOTECH        410           17            4 %
COMODITY       56            2             4 %
COMPUTER       23            1             4 %
GOLD           50            2             4 %
HACKERS        23            1             4 %
DOWJONES       30            1             3 %
FIDSTKS        186           6             3 %
INFRA          34            1             3 %
INSURANC       31            1             3 %
MILITARY       37            1             3 %
NIFTY          29            1             3 %
OILGAS         157           4             3 %
RUS-1000       819           22            3 %
SP500          477           12            3 %
CHEM           62            1             2 %
SOFTWARE       64            1             2 %
SP-100         94            2             2 %
UTILITY        41            1             2 %
BONDFUND       111           1             1 %
INDMATER       82            1             1 %
INDEXES        189           2             1 %
|
Table 5 RANKING OF KEY DIRECTORIES BASED PCT.OF STOCKS ABOVE 65-DMA
                          6/25/18
---------------------------------------------------------------------------------------
Directory     Current       day-1         day-2         day-3         day-4         day-5
----------------------------------------------------------------------------------------
REIT           .93           .936          .919          .919          .901          .913
RETAIL         .846          .846          .865          .903          .865          .865
BEVERAGE       .75           .7            .6            .65           .6            .55
REGBANKS       .709          .87           .838          .838          .838          .838
NIFTY          .689          .827          .862          .862          .758          .793
UTILITY        .682          .609          .56           .536          .512          .365
GUNS           .666          .666          .666          .722          .666          .666
COMPUTER       .652          .695          .695          .782          .782          .782
COAL           .625          .75           .875          .75           .75           .875
NASD-100       .606          .685          .685          .764          .674          .73
DOWJONES .6 .6 .433 .6 .633 .666 CHEM .596 .612 .596 .629 .629 .677 SP-100 .595 .627 .553 .638 .638 .659 SP500 .587 .631 .607 .666 .643 .67 RUS-1000 .586 .648 .623 .684 .667 .688 SOFTWARE .578 .703 .75 .781 .781 .796 EDU .571 .714 .571 .714 .714 .714 GAMING .571 .678 .714 .714 .678 .678 HOSPITAL .571 .857 .857 .857 .857 .857 PIPELINE .571 .714 .571 .714 .714 .714 BIOTECH .57 .634 .612 .665 .614 .624 INDEXES .56 .629 .582 .645 .645 .634 FIDSTKS .553 .618 .586 .666 .655 .672 OILGAS .535 .675 .573 .687 .643 .687 BONDFUND .531 .585 .576 .495 .522 .405 HACKERS .521 .608 .695 .695 .695 .695 FINANCE .511 .644 .611 .622 .6 .666 N=27 =========================================================================================== GREEN .466 .533 .533 .566 .6 .633 ELECTRON .462 .582 .605 .628 .6 .651 BIG17 .456 .5 .565 .608 .565 .565 MILITARY .432 .567 .513 .594 .54 .648 AUTO .425 .525 .55 .6 .575 .625 SEMI .421 .554 .57 .617 .578 .632 HOMEBLDG .411 .411 .47 .47 .47 .47 TRANSP .4 .5 .65 .75 .65 .75 INDMATER .39 .56 .5 .536 .56 .609 INFRA .352 .588 .411 .558 .529 .676 DJI-13 .307 .461 .23 .461 .461 .538 GOLD .26 .32 .28 .3 .3 .36 INSURANC .258 .354 .29 .387 .483 .419 SOLAR .238 .285 .333 .285 .285 .285 COMODITY .214 .303 .214 .25 .214 .321 CHINA .213 .278 .262 .311 .295 .459 BIGBANKS .142 .142 .142 .142 .142 .142 JETS .1 .2 .5 .6 .6 .7 ETFS .081 .131 .098 .131 .098 .196 FOOD 0 .111 .111 .111 .111 .222 N=20 |