---- TIGERSOFT/PEERLESS
HOTLINE ----
(C)
1985-2020 William Schmidt, Ph.D. www.tigersoft.com
william_schmidt@hotmail.com All rights
strictly reserved
HOTLINE
IMPORTANT
- Always CLICK REFRESH.
Server problem
here? Old images of this page may appear.
Always refresh this page and any other page that
seems incomplete or not up to date...
To refresh - Point mouse
at page and Hold down Control Key and hit F-5.
======================================================
10/29/2020
(Data used) 10/30/2020 5:25 AM. DJI down 150.
======================================================
IMPORTANT
Earlier Hotlines:
www.tigersoft.com/1919H/OLDINDEX.htm
May - Oct 2020
www.tigersoft.com/777BLM/INDEX.htm
www.tigersoft.com/20HLM/INDEX.htm
www.tigersoft.com/2020NIGHT/INDEX.htm
www.tigersoft.com/4ACES1/INDEX.htm
www.tigersoft.com/48HLA/INDEX.htm
www.tigersoft.com/QUICKER/INDEX.htm
www.tigersoft.com/QUICK/INDEX.htm
www.tigersoft.com/77HLZ/INDEX.htm
www.tigersoft.com/44THL/INDEX.htm
www.tigersoft.com/21PEY3/INDEX-2.htm
www.tigersoft.com/19HLK5/INDEX.htm
www.tigersoft.com/44UHL/INDEX.htm
www.tigersoft.com/NHLP/INDEX.htm
www.tigersoft.com/7LHL/INDEX.htm
www.tigersoft.com/NHL718/INDEX.htm
www.tigersoft.com/21MAY18/INDEX.htm
www.tigersoft.com/55HEP/INDEX.htm
www.tigersoft.com/44H4L/INDEX2.htm
Earlier still: Go here...
HELP
A Guide
To Profitably Using The Tiger Nightly HOTLINE
Introduction to Tiger/Peerless Buys and
Sells.
Peerless Buy and
Sell Signals: 1928-2016
Individual Peerless signals explained:
http://tigersoftware.com/PeerlessStudies/Signals-Res/index.htm
http://www.tigersoft.com/PeerInst-2012-2013/
Explanation of each Peerless signal. http://www.tigersoft.com/PeerInst-2012-2013/
Different Types of
TigerSoft/Peerless CHARTS, Signals and Indicators
-----> More HELP LINKS
Documentation for
TigerSoft Automatic and Optimized Signals.
How reliable support is the
DJI's rising 200-day ma?
SPY Charts since
1994: Advisory Closing Power S7s, Accum. Index, 65-dma, Optimized Signals.
^^^^^^^^^^^^^^^^^^^^^^^^^^^^^^^^^^^^^^^^^^^^^^^^
1/19/2016 ---> Corrections,Deeper
Declines and Bear Markets since 1945.
1/21/2016
---> High
Velocity Declines since 1929
2/12/2016 ---> Presidential
Elections Years and Bullish IP21 Positive Non-Confirmations at Lower Band.
2/12/2016 ---> OBV NNCs on DJI's Rally to
2.7% Upper Band when DJI's 65-dma is falling.
11/6/2016 --->
Killer Short Selling
Techniques: ===> Order Here ($42.50)
It's As Easy as 1,2,3
TigerSoft "Combination" Short-Selling... Easy as 1-2-3 Short Sales
Earlier Q-Answers
QuickSilver Documentation (1/11/2016)
Our Different
Signals
Better understand the difference between
Peerless DJI-based signals,
the one-year optimized red Signals and the fixed signals based
on technical developments.
Introduction to Tiger/Peerless Buys and Sells.
Different Types of
TigerSoft/Peerless CHARTS, Signals and Indicators
New TigerPeerless Installation and
Basic Uses' Instruction
See the re-written materials on TigerSoft Buys and Sells.
Study- Trading SPY
WITHOUT Peerless - Some Guidelines.
When completed this will be a new Tiger Trading E-Book.
Study- Examples of
"Hands above the Head" top patterns.
Study- 9/3/2017 TigerSoft (not
Peerless) charts of Major Tops as they occurred.
===> Please report any broken or out-of-date links. william_schmidt@hotmail.com
====================================================================
====================================================================
10/29/2020 The 26000 support brought in
buyers before the opening Friday.
Early on, the DJI was down 500 points this morning. It is now
down only 224. But there is no well-tested support at 26000, so
we will probably need to see more backing and filling there.
Breadth was good on today's rebound. There were nearly 1000
more up than down on the NYSE and the A/D Line did not confirm
Wednesday's minor new low. This produced a Buy B11 on the
2006 version of Peerless. Our recent Buy B2 and Buy B21
are close to showing their past maximum paper losses. A decline to
26000 would achieve that and it would represent a 10% decline
from the recent high. Such a decline usually represents a good
buying opportunity.
But I worry that the market is making it too easy for us to
buy in here
and that another February-March decline might start if the round
number 26000 is decisively penetrated. Having grown up in the
1950s, it is not in my DNA to believe the country will fall apart
because Republicans and Democrats cannot agree on the outcome
of the Presidential Election, whatever it is. So,
buying near DJIA - 26000
or when the Closing Powers shown below break their downtrend-line seems
to be a good strategy now for adding to the strongest, high Accumulation
techs and ETFs, which have been shown among the bullish MAXCPs
recently. Stay short the bearish MINCPs and lowest Accumulation
big banks (like WFC) and oil stocks for now. Let's wait to buy these
when we see if the falling Closing Powers shown below are broken.
And if you want to play it safer, wait until we see how the Election
plays out on Tuesday.
Using the Candlestick charts lets us focus most easily
on the falling price and Closign Power trends. We need
to see more 'Blue' candle-sticks now.
DJIA and DIA  |
SPY |
QQQ |
NASDAQ (COMPQX) |
NASDAQ  |
|
Charts 10/29/2020 (Click on Underlined link.) 2020 PEERLESS DJI, Signals, Indicators Daily DJI Volume 10-DayUp/Down Vol Stoch-20 Inverted Traders Index Graph of Pct of All Stocks above 65-dma Cum. Inverted Traders Index NASDAQ S&P OEX NYSE COMPQX DJI-15 DJI-20 DJI-30 DIA QQQ MDY SPY IWM TNA Short-Term Rates DOLLAR-UUP recent 2006 vers-Peerless signals -- http://tigersoft.com/NEWPEER/UPD61029.BMP USO-CrudeOil DBO FAS GLD BBH IBB JETS JNUG KOL NUGT OIH PALL RSX RETL SDS AGQ SLV SOXL TAN TECL TLT TMF TNA UGA (gasoline) USO (oil) and China: YINN CHAU Commodities: CANE CORN DBC JJC, NIB CORN, CUT (paper) MOO, SOYB WEAT UUP (Dollar) LIT (Lithium) Stocks AAPL ADBE ALXN AMAT AMGN AMD AMZN AXP BA BABA BAC BIDU BLDP CAT CRM CVX CMG DE ENPH FB GILD GOOG GS HD IBM INTU JPM LRCX M (Macy's) MSFT NEM NFLX NKE NVDA PG REGN REV SO SQ QCOM QDEL TSLA TXN XOM V VRTX WFC WMT TOWN ZM New highs and Bullish MAXCPs http://tigersoft.com/UP/10-29/BULLISH.htm Bearish MAXCPs - http://tigersoft.com/DOWN/10-29/BEARISH.htm |
 Table 1
             10/29/2018   QUICKSILVER on DJI-30 STOCKS.
P21 + ITRS score >+.25 is bullish
             1  Bullish  ( TRV )
             9  Bearish (AMGN, BA, CSCO, MRK, IBM INTC JNJ MRK  WBA)
HIGHEST AI/200 = CRM STOCKS CLOSECHANGE PIVOT-PT 5-dma AROC CL-PWR CANDLE AI/200 IP21 ITRS ------------------------------------------------------------------------------------------------------- ------------------------------------------------------------------------------------------------------- AAPL 115.32 4.12 115.75 -18.7% Bearish BLUE 152 -.077 .036 ---------------------------------------------------------------------------------------------------------- AMGN 217.82 1.44 227.98 -226.8% Bearish BLUE 124 -.273 -.055 --- ---------------------------------------------------------------------------------------------------------- AXP 91.07 -.53 104.79 -701.2% Bearish RED 85 -.166 -.021 ---------------------------------------------------------------------------------------------------------- BA 148.29 .15 169.07 -648.9% Bearish BLUE 33 -.281 -.085 --- ---------------------------------------------------------------------------------------------------------- CAT 154.67 3.51 169.66 -462.4% Bullish BLUE 115 .009 .16 ---------------------------------------------------------------------------------------------------------- CRM 237.14 -1.29 249.67 -254.5% Bearish RED 189 -.133 .195 ---------------------------------------------------------------------------------------------------------- CSCO 35.69 -.02 38.82 -416.5% Bearish BLUE 109 -.181 -.109 --- ---------------------------------------------------------------------------------------------------------- CVX 68.8 1.92 73.4 -325.5% Bullish BLUE 77 -.074 -.165 ---------------------------------------------------------------------------------------------------------- DIS 121.54 3.07 127.56 -242.1% Bearish BLUE 102 -.05 -.01 ---------------------------------------------------------------------------------------------------------- DOW 46.25 1.07 48.82 -272% Bearish BLUE 59 -.157 .075 ---------------------------------------------------------------------------------------------------------- GS 189.94 .17 205.4 -387.7% Bearish BLUE 61 -.193 -.025 ---------------------------------------------------------------------------------------------------------- HD 269.63 -.09 281.16 -207.9% Bearish BLUE 151 -.117 -.008 ---------------------------------------------------------------------------------------------------------- HON 164.6 3.44 176.85 -360.1% Bullish BLUE 101 -.101 .088 ---------------------------------------------------------------------------------------------------------- IBM 108.91 2.26 115.76 -305.2% Bearish BLUE 106 -.339 -.081 --- ---------------------------------------------------------------------------------------------------------- INTC 44.11 -.14 53.9 -1025.3% ------- ---- 83 -.232 -.048 --- ---------------------------------------------------------------------------------------------------------- JNJ 137.19 -1.17 145.08 -275.6% Bearish RED 101 -.242 -.049 --- ------------------------------------------------------------------------------------------------------ --- JPM 97.17 .63 102.88 -283.3% Bullish BLUE 32 -.013 .025 ---------------------------------------------------------------------------------------------------------- KO 48.02 .06 50.68 -267.2% Bearish BLUE 77 -.106 .053 ---------------------------------------------------------------------------------------------------------- MCD 214.95 .26 229.15 -317% Bearish BLUE 126 -.071 .065 ---------------------------------------------------------------------------------------------------------- MMM 158.48 -.05 170.71 -370.1% ------- BLUE 86 -.193 .006 ---------------------------------------------------------------------------------------------------------- MRK 75.89 -.29 79.21 -211.7% Bearish RED 86 -.29 -.068 --- ---------------------------------------------------------------------------------------------------------- MSFT 204.72 2.04 214.89 -240.5% Bearish BLUE 152 -.06 .015 ---------------------------------------------------------------------------------------------------------- NKE 122.86 .78 130.02 -280.4% Bearish BLUE 121 -.04 .173 ---------------------------------------------------------------------------------------------------------- PG 137.57 -.09 141.45 -137.6% Bearish BLUE 98 -.078 .052 ---------------------------------------------------------------------------------------------------------- TRV 122.46 .96 126.14 -149.8% Bullish BLUE 80 .28 .121 ---------------------------------------------------------------------------------------------------------- UNH 303.68 -4.32 325.73 -342.8% Bullish RED 110 -.16 .002 ---------------------------------------------------------------------------------------------------------- V 184.87 4 197.99 -341.7% Bearish BLUE 89 -.118 -.041 ---------------------------------------------------------------------------------------------------------- VZ 56.76 .45 57.33 -49.7% Bearish BLUE 111 -.056 0 ---------------------------------------------------------------------------------------------------------- WBA 33.52 -1.07 37.51 -544% Bearish RED 82 -.164 -.128 --- ---------------------------------------------------------------------------------------------------------- WMT 139.92 -.12 143.55 -127.4% Bearish RED 128 -.151 .096 |
Table 2 QUICKSILVER on ETFS - 10/29/20 Bullish = 0
Bearish = 0
                ITRS + IP21>.25 is considered "Bullish"
                           <-.25 is considered bearish
ETF CLOSE CHANGE PIVOT-PT 5-dma AROC CL-PWR CANDLE IP21 ITRS --------------------------------------------------------------------------------------------- --------------------------------------------------------------------------------------------- DIA 266.59 1.11 283.34 -308.1% Bearish BLUE-.155 0 --------------------------------------------------------------------------------------------- SPY 329.98 3.32 345.78 -215.8% Bearish BLUE-.143 .018 --------------------------------------------------------------------------------------------- QQQ 276.39 4.75 284.74 -138.7% Bearish BLUE-.091 .04 --------------------------------------------------------------------------------------------- MDY 348.71 3.28 367.49 -230% ------- BLUE .057 .031 --------------------------------------------------------------------------------------------- IWM 155.14 1.83 163.07 -219.5% ------- BLUE .068 .031 --------------------------------------------------------------------------------------------- FAS 33.33 .77 39.8 -801.1% Bearish BLUE-.058 -.054 --------------------------------------------------------------------------------------------- SOXL 261.69 19.3 290.55 -605.9% Bearish BLUE-.05 .098 --------------------------------------------------------------------------------------------- TECL 274.71 13.37 315.99 -723% Bearish BLUE-.143 -.053 --------------------------------------------------------------------------------------------- IBB 133.06 .7 136.49 -114.3% Bearish BLUE-.035 .034 --------------------------------------------------------------------------------------------- GLD 175.4 -.73 178.64 -96.2% Bearish BLUE-.028 .002 --------------------------------------------------------------------------------------------- OIH 92.64 1.92 102.11 -446.6% Bullish BLUE .052 -.266 --------------------------------------------------------------------------------------------- |
Table 3    Count of Stocks in Key Directories
               20201029
-------------------------------
NEWHIGHS       60
NEWLOWS        174 fast growing
MAXCP          19
MINCP          49
TTTNH          17
TTTNL          47
FASTUP         49
FASTDOWN       264
CPCROSSA       271
CPCROSSD       18
BIGVOLUP       1
BIGVODN        8
ACCUMVER       153
HIGHIP21       10
HIUPPCT        46
VHIP21         112
LOWACCUM       213
REDSELL        126
AUGSELS7       36
TRAPDOOR       9
|
Table 3RANKING OF KEY DIRECTORIES BASED PCT.OF STOCKS ABOVE 65-DMA 10/29/20 --------------------------------------------------------------------------------------- Directory Current day-1 day-2 day-3 day-4 day-5 ---------------------------------------------------------------------------------------- SOLAR .818 .818 .818 .818 .818 .909 UTILITY .657 .657 .868 .894 .894 .868 INFRA .628 .485 .657 .714 .8 .8 SEMI .605 .423 .586 .644 .74 .769 CHEM .583 .375 .583 .687 .833 .791 REGBANKS .576 .384 .615 .692 .807 .807 AUTO .564 .41 .615 .743 .82 .82 CHINA .56 .52 .64 .62 .64 .64 INDMATER .56 .44 .6 .64 .706 .693 ELECTRON .557 .408 .591 .646 .741 .748 NIFTY .511 .355 .6 .622 .777 .755 COPPER .5 .5 .5 .5 .625 .625 RETAIL .489 .469 .551 .632 .795 .714 FINANCE .487 .414 .56 .658 .743 .719 GREEN .476 .476 .571 .619 .761 .761 NASD-100 .45 .28 .53 .54 .7 .68 SOFTWARE .45 .4 .483 .466 .616 .616 GUNS .428 .142 .428 .571 .571 .5 FOOD .415 .396 .509 .528 .584 .547 COMPUTER .4 .4 .5 .55 .7 .75 TRANSP .4 .25 .6 .85 .9 .9 COMODITY .39 .39 .512 .56 .609 .585 SP500 .371 .304 .474 .542 .672 .659 RUS-1000 .367 .298 .46 .532 .65 .631 BIOTECH .364 .335 .439 .426 .474 .482 INSURANC .346 .307 .384 .461 .653 .576 HOSPITAL .333 .333 .333 .619 .571 .571 INDEXES .322 .265 .576 .621 .723 .734 ETFS .321 .285 .5 .482 .678 .607 FIDSTKS .291 .222 .417 .445 .617 .588 COAL .285 .285 .285 .571 .571 .428 GAMING .285 .19 .333 .476 .619 .571 SP-100 .23 .208 .384 .439 .582 .593 BEVERAGE .214 .214 .357 .428 .571 .428 JETS .214 0 .5 .857 .928 .928 HACKERS .2 .2 .15 .15 .25 .3 OILGAS .196 .188 .236 .251 .291 .283 REIT .177 .113 .184 .29 .397 .361 HOMEBLDG .176 .176 .235 .294 .647 .47 DOWJONES .166 .166 .433 .466 .666 .7 EDU .166 .333 .333 .333 .333 .333 DJI-13 .153 .23 .461 .538 .769 .769 MILITARY .142 .071 .142 .214 .357 .321 GOLD .102 .081 .183 .163 .163 .163 BONDFUND .049 .059 .059 .089 .128 .138 BIGBANKS 0 0 .142 .285 .571 .571 |
========================================================================
10/28/2020 The Peerless Buys and the
generally strong NYSE A/D Line have
produced a premature Buy B21 and a Buy B2 in here. This was
not unexpected, given the price gaps down, the falling Closing Powers and
the dynamics of a broad trading range. 26000 in the DJI is where
support should be strongest. That is the level
that must not be
significantly broken.
Very real technical damage was done today. See in Table 3 the
big
jump in new yearly lows. Another sign that supports are breaking,
only 3 groups (Chinese, solar and utility stocks) show a majority of
their components are above their key 65-dma. Even AAPL has
fallen below its 65-dma.
The Buy B2-B21 is based on very good breadth at the 3.5% lower band.
But we are now 5.7% below the 21-day ma. None of the many B2s earlier
this year saw such a deep decline. In addition, the NYSE A/D Line
has bearishly broken its 7 month uptrend, as has the DJI's. Staying hedged
again seems best. A DJI drop much below 26000 on a closing basis
would produce a paper loss of more than 5% on the Peerless Sells.
This would be highly atypical and cast doubt on them. A close much below
26000 would have to be treated as a fail-safe Sell S10.
In a broad trading range, like we have now between 29000 and
26000,
which is 9%-10% wide, once prices start falling back from the top of
the range, they tend very easily to fall through the middle of the range
and test the bottom of the range. That is what is happening now.
Professionals have not stepped in and become buyers
yet. The
Closing Powers are all falling. The candle-sticks are red. So, I think we have
to wait another day, at least, to buy. A strong closing above the opening
would be bullish now. But it will likely take more backing and filling around
DJI-26000 to build a solid base. The oil stocks are very weak. Hold them
short and the big banks. Consumer debt is a very big problem for the banks.
Let's hold off on new buying another day.
A 38-year long Bull Market on Steroids and Stilts
Thirty eight years ago, back in August of 1982, the DJI was
below
800, now it's 25000+ points higher. That's a rise of more than 3100%.
In many ways, the market's phenomenol rise has been built on the Fed's
regular cuts in interest rates in this time, so that they are almost zero. They
can't go much lower. It's been built on business friendly tax cuts, deregulation,
anti-union policies and lots and lots of debt, consumer and governmental.
So, when I think of the DJI's rise, I picture a beach house on very high stilts.
It could all come tumbling down with a new Administration.
Dare the many friends of Wall Street in government really let that happen. Well,
it looks like they are taking really big chances now by not passing a new
Relief Bill through Congress. Is the Federal Debt now so high that they dare
not let it increase another $2 trillion? The risks are high if they sit on their
hands. So, we have plenty of drama now in what is playing out.
Take heart. History has a number of cases when an overextended DJI turns back up
one last time from key support in a broad 9%-10% trading range. In May
1929, May 1987 and October 2000 this is what happened. But the NYSE
A/D Line now is much stronger than in those cases. The A/D Line is not now
in a big downtrend. Such breadth is much more like it was in September
1986. That was a full year before an important market top. This should
give us so confidence now. Unfortunately, the February 2020 top was
quite sudden. News of the Covid-19 plague spread a panic. People tend
to have short memories. They remember the crushing series of big down-days
in late February and March. They naturally worry that we may see the same thing
here if the round-numbered support at 26000 fails. Those fears, justified or not,
are dangerous now.
|
Charts 10/28/2020 (Click on Underlined link.) 2020 PEERLESS DJI, Signals, Indicators Daily DJI Volume 10-DayUp/Down Vol Stoch-20 Inverted Traders Index Graph of Pct of All Stocks above 65-dma Cum. Inverted Traders Index NASDAQ S&P OEX NYSE COMPQX DJI-15 DJI-20 DJI-30 DIA QQQ MDY SPY IWM TNA Short-Term Rates DOLLAR-UUP recent 2006 vers-Peerless signals -- http://tigersoft.com/NEWPEER/UPD61028.BMP USO-CrudeOil DBO FAS GLD BBH IBB JETS JNUG KOL NUGT OIH PALL RSX RETL SDS AGQ SLV SOXL TAN TECL TLT TMF TNA UGA (gasoline) USO (oil) and China: YINN CHAU Commodities: CANE CORN DBC JJC, NIB CORN, CUT (paper) MOO, SOYB WEAT UUP (Dollar) LIT (Lithium) Stocks AAPL ADBE ALXN AMAT AMGN AMD AMZN AXP BA BABA BAC BIDU BLDP CAT CRM CVX CMG DE ENPH FB GILD GOOG GS HD IBM INTU JPM LRCX M (Macy's) MSFT NEM NFLX NKE NVDA PG REGN REV SO SQ QCOM QDEL TSLA TXN XOM V VRTX WFC WMT TOWN ZM New highs and Bullish MAXCPs http://tigersoft.com/UP/10-28/BULLISH.htm Bearish MAXCPs - http://tigersoft.com/DOWN/10-28/BEARISH.htm |
 Table 1
             10/28/2018   QUICKSILVER on DJI-30 STOCKS.
P21 + ITRS score >+.25 is bullish
             1  Bullish  ( TRV )
             6  Bearish (AMGN, BA, CSCO, CVX, MRK, IBM INTC)
HIGHEST AI/200 = CRM STOCKS CLOSECHANGE PIVOT-PT 5-dma AROC CL-PWR CANDLE AI/200 IP21 ITRS ------------------------------------------------------------------------------------------------------- ------------------------------------------------------------------------------------------------------- AAPL 111.2 -5.4 116.87 -244.7% Bearish RED 153 -.081 .008 ---------------------------------------------------------------------------------------------------------- AMGN 216.38 -7.08 228.97 -277.9% Bearish RED 125 -.268 -.058 ---------------------------------------------------------------------------------------------------------- AXP 91.6 -3.33 101.43 -492.5% Bearish RED 86 -.146 -.007 ---------------------------------------------------------------------------------------------------------- BA 148.14 -7.1 163.86 -481.4% Bearish RED 33 -.323 -.084 ---------------------------------------------------------------------------------------------------------- CAT 151.16 -6.75 167.4 -491.1% Bullish RED 115 -.036 .138 ---------------------------------------------------------------------------------------------------------- CRM 238.43 -11.87 254.23 -316.8% Bearish RED 190 -.067 .214 ---------------------------------------------------------------------------------------------------------- CSCO 35.71 -1.16 39.06 -437.9% Bearish RED 110 -.182 -.104 ---------------------------------------------------------------------------------------------------------- CVX 66.88 -2.63 70.87 -279.2% Bearish RED 77 -.137 -.191 ---------------------------------------------------------------------------------------------------------- DIS 118.47 -4.84 126.63 -323.9% Bearish RED 102 -.096 -.035 ---------------------------------------------------------------------------------------------------------- DOW 45.18 -1.39 48.55 -351.6% Bearish BLUE 59 -.21 .056 ---------------------------------------------------------------------------------------------------------- GS 189.77 -5.91 202.91 -325.2% Bearish RED 61 -.196 -.012 ---------------------------------------------------------------------------------------------------------- HD 269.72 -7.12 284.51 -263.8% Bearish RED 152 -.066 -.008 ---------------------------------------------------------------------------------------------------------- HON 161.16 -5.59 172.87 -339.5% Bearish RED 102 -.163 .07 ---------------------------------------------------------------------------------------------------------- IBM 106.65 -3.91 115.06 -369.1% Bearish RED 107 -.375 -.101 ---------------------------------------------------------------------------------------------------------- INTC 44.25 -1.39 53.5 -932.6% ------- RED 84 -.217 -.045 ---------------------------------------------------------------------------------------------------------- JNJ 138.36 -4.79 143.93 -193% Bearish RED 102 -.205 -.032 ---------------------------------------------------------------------------------------------------------- JPM 96.54 -2.79 99.37 -139.6% Bullish RED 32 -.029 .028 ---------------------------------------------------------------------------------------------------------- KO 47.96 -1.94 49.99 -202.3% Bearish RED 78 -.099 .036 ---------------------------------------------------------------------------------------------------------- MCD 214.69 -8.28 228.19 -297.8% Bearish RED 127 -.087 .067 ---------------------------------------------------------------------------------------------------------- MMM 158.53 -2.5 169.17 -317.9% ------- RED 87 -.22 .01 ---------------------------------------------------------------------------------------------------------- MRK 76.18 -1.81 78.07 -119.9% Bearish RED 87 -.273 -.053 ---------------------------------------------------------------------------------------------------------- MSFT 202.68 -10.57 214.8 -283.4% Bearish RED 153 -.02 .004 ---------------------------------------------------------------------------------------------------------- NKE 122.08 -5.91 129.43 -284.5% Bearish RED 122 -.095 .187 ---------------------------------------------------------------------------------------------------------- PG 137.66 -4.7 143.25 -196.6% Bearish RED 98 -.068 .054 ---------------------------------------------------------------------------------------------------------- TRV 121.5 2.41 125 -141.6% Bullish BLUE 80 .252 .103 ---------------------------------------------------------------------------------------------------------- UNH 308 -12.51 322.79 -227.9% Bullish RED 111 -.103 .018 ---------------------------------------------------------------------------------------------------------- V 180.87 -9.19 198.43 -449.1% Bearish RED 90 -.197 -.045 ---------------------------------------------------------------------------------------------------------- VZ 56.31 -1.07 56.75 -38.3% Bearish RED 111 -.047 -.003 ---------------------------------------------------------------------------------------------------------- WBA 34.59 -1.41 37.39 -376% Bearish RED 82 -.106 -.106 ---------------------------------------------------------------------------------------------------------- WMT 140.04 -2.83 144.4 -152.1% ------- RED 128 -.127 .085 |
Table 2 QUICKSILVER on ETFS - 10/28/20 Bullish = 0
Bearish = 1 OIH
ITRS + IP21>.25 is considered "Bullish"
<-.25 is considered bearish
ETF CLOSE CHANGE PIVOT-PT 5-dma AROC CL-PWR CANDLE IP21 ITRS --------------------------------------------------------------------------------------------- --------------------------------------------------------------------------------------------- DIA 265.48 -9.18 283.65 -294.3% Bearish RED -.178 0 --------------------------------------------------------------------------------------------- SPY 326.66 -11.56 344.61 -234.8% Bearish RED -.172 .01 --------------------------------------------------------------------------------------------- QQQ 271.64 -11.02 284.18 -221.5% Bearish RED -.109 .023 --------------------------------------------------------------------------------------------- MDY 345.43 -9.43 365.2 -189.7% ------- RED .009 .024 --------------------------------------------------------------------------------------------- IWM 153.31 -4.87 162.13 -189.1% ------- RED .017 .026 --------------------------------------------------------------------------------------------- FAS 32.56 -2.46 39.22 -632.3% Bearish RED -.089 -.08 --------------------------------------------------------------------------------------------- SOXL 242.39 -26.79 294.87 -905.5% Bearish RED -.089 .008 --------------------------------------------------------------------------------------------- TECL 261.34 -38.81 317.82 -980.8% Bearish RED -.148 -.096 --------------------------------------------------------------------------------------------- IBB 132.36 -3.51 136.15 -67.5% Bearish RED -.062 .025 --------------------------------------------------------------------------------------------- GLD 176.13 -2.89 178.83 -124.8% Bearish RED -.048 -.018 --------------------------------------------------------------------------------------------- OIH 90.72 -6.14 101.38 -416% Bearish RED -.038 -.277 Bearish --------------------------------------------------------------------------------------------- |
Table 3 Count of Stocks in Key Directories
20201028
-------------------------------
NEWHIGHS 35
NEWLOWS 232 big jump
MAXCP 12
MINCP 253
TTTNH 12
TTTNL 145
FASTUP 46
FASTDOWN 221
CPCROSSA 92
CPCROSSD 151
BIGVOLUP 1
BIGVODN 13
ACCUMVER 153
HIGHIP21 8
HIUPPCT 38
REDSELL 115
AUGSELS7 72
TRAPDOOR 8
|
Table 4 RANKING OF KEY DIRECTORIES BASED PCT.OF STOCKS ABOVE 65-DMA
10/28/20
Bullish = 3
Bearish = 42
---------------------------------------------------------------------------------------
Directory Current day-1 day-2 day-3 day-4 day-5
----------------------------------------------------------------------------------------
SOLAR .818 .818 .818 .818 .909 .909
UTILITY .657 .868 .894 .894 .868 .763
CHINA .51 .632 .612 .632 .632 .591
============================================================================================
COPPER .5 .5 .5 .625 .625 .625
===========================================================================================
INFRA .485 .657 .714 .8 .8 .771
GREEN .476 .571 .619 .761 .761 .761
RETAIL .469 .551 .632 .795 .734 .673
INDMATER .44 .6 .64 .706 .68 .653
SEMI .423 .586 .644 .74 .769 .73
FINANCE .414 .56 .658 .743 .719 .621
AUTO .41 .615 .743 .82 .82 .82
ELECTRON .408 .591 .646 .741 .748 .7
COMPUTER .4 .5 .55 .7 .75 .7
SOFTWARE .4 .5 .466 .616 .616 .616
FOOD .396 .509 .528 .584 .547 .566
COMODITY .39 .512 .56 .609 .585 .585
REGBANKS .384 .615 .692 .807 .807 .692
CHEM .375 .583 .687 .833 .812 .77
NIFTY .355 .6 .622 .777 .733 .755
BIOTECH .335 .439 .428 .474 .477 .418
EDU .333 .333 .333 .333 .333 .333
HOSPITAL .333 .333 .619 .619 .571 .571
INSURANC .307 .384 .461 .653 .576 .538
SP500 .304 .476 .542 .672 .659 .617
RUS-1000 .298 .462 .532 .65 .631 .583
COAL .285 .285 .571 .571 .428 .285
ETFS .285 .5 .482 .678 .625 .589
NASD-100 .28 .53 .54 .7 .68 .67
INDEXES .265 .576 .621 .723 .734 .723
TRANSP .25 .6 .85 .9 .9 .8
DJI-13 .23 .461 .538 .769 .769 .615
FIDSTKS .222 .417 .445 .617 .588 .537
BEVERAGE .214 .357 .428 .571 .428 .357
SP-100 .208 .384 .439 .582 .593 .527
HACKERS .2 .2 .15 .25 .3 .3
GAMING .19 .333 .476 .619 .571 .476
OILGAS .188 .236 .244 .291 .275 .244
HOMEBLDG .176 .235 .294 .647 .47 .705
DOWJONES .166 .433 .466 .666 .7 .6
GUNS .142 .428 .571 .571 .5 .5
REIT .113 .184 .29 .397 .361 .29
GOLD .081 .183 .163 .163 .163 .204
MILITARY .071 .142 .214 .357 .321 .178
BONDFUND .059 .059 .089 .128 .138 .168
BIGBANKS 0 .142 .285 .571 .571 .428
JETS 0 .5 .857 .928 .928 .714
|
=========================================================================
10/27/2020 Peerless Buy B2 from All
Versions of Peerless. But a test of
DJI-27000 and full 3.5% lower band is under way. Closing Powers
and Candle-Sticks advise waiting and staying hedged, as suggested belore.
The DJI zig-zagged lower all day and closed down at
the -2.5% lower
band. That produced a new Buy B2 to match yesterday's Buy B21.
The opening looks much lower. For several reasons, that it not surprising.
First, the Buy B21s and B2s together have paper losses 2/3 of the
time since the year, 2000. But, they all were eventually closed out at a profit.
See table just below. Second, the volume was very high in the last hour
of trading today. This shows the over-hang of stock to be sold was large.
Third, the Closing Powers are in downtrends, having broken to new lows.
Fourth, when we see a double-top, we should be ready for a test of
a developing trading range's lows and a full test of the 3.5% lower band.
And fifth, the DJI-30 is weaker than the NASDAQ, QQQ and SP-500.
It has now broken its long price-uptrendline and rising 65-dma. So,
a paper loss should come as no surprise in here, regardless of the
news. And the news about the Election, no fiscal relief in sight (McConnell
says it will not come until next year) and Covid's increase) is plenty
to worry about. What if Trump loses big? What if Trump wins?
There is precedent, 1938 for example, for having 5 successful Buy B2 signals
in one year. But there is no point in hurrying into the market now. We need
to see, at least, a good reversal up from a weak opening, to produce a big blue
candle-stick and then a break in the Closing Power downtrends. Stay hedged.
The oils and banks are under pressure and have not bottomed yet and
may be under increasing tax loss selling. Stay short them and some of
the bearish MINCPs. Stay long the highest AI/200 techs and Chinese stocks.
Do not let losses get to be more than 10%.
|
Buys B2s and Buy B21s since the Year 2000. Year Signal DJIA Gain Maximum Paper Loss ------------------------------------------------------------------------------------------------- 20000505 B2 10577.86 .038 paper loss -.0263 5/26 20001020 B2 10226.59 .06 none 0 20001122 B2 10399.32 .049 paper loss -.0077 12/20 20001220 B2 10318.93 .058 none 0 20011022 B21 9377.03 .079 paper loss -.0321 10/31 20021105 B21 8678.27 .011 paper loss -.0431 12/27 20021213 B2 8433.71 .040 paper loss -.0154 12/27 20040726 B2 9961.92 .033 paper loss -.0147 8/9 20041022 B2 9757.81 .118 paper loss -.0008 10/25 20060926 B21 11669.39 .062 none 0 20070301 B2 12234.34 .137 paper loss -.015 3/5 20091201 B21 10471.58 .052 none 0 20100520 B2 10068.01 .034 paper loss -.0249 6/7 20100827 B2 10150.65 .262 none 0 20100929 B21 10835.28 .182 paper loss -.0077 10/4 20101202 B21 11362.41 .127 none 0 20110603 B2 12151.26 .022 paper loss -.0209 6/15 20121112 B2 12815.08 .184 paper loss -.0212 11/15 20130826 B2 14946.46 .016 paper loss -.0113 8/27 20141111 B21 17614.90 .040 paper loss -.0309 12/16 20141212 B2 17280.83 .060 paper loss -.0122 12/16 20151026 B21 17623.05 .006 paper loss -.028 12/18 20151211 B2 17265.21 .026 paper loss -.0079 12/18 20170925 B21 22296.09 .170 none 0 20181120 B2 24465.64 .056 paper loss -.0074 11/23 20190509 B2 25967.73 .009 paper loss -.0443 6/3 20190603 B2 24819.78 .050 none 0 20190806 B2 26029.52 .031 paper loss -.023 20200624 B2 25445.92 .047 --------------------------------------------------------------------------------- 29 B2s and B210s - All were profitable when reversed, but 19 of 29, almost 2/3 were not reversed with out a paper loss of as much as 4.1 points, or moe than 1000 points here. 20201026 B21 27685.38 paper loss open 20201027 B2 27463.19 |
  |
  |
  |
|
Charts 10/27/2020 (Click on Underlined link.) 2020 PEERLESS DJI, Signals, Indicators Daily DJI Volume 10-DayUp/Down Vol Stoch-20 Inverted Traders Index Graph of Pct of All Stocks above 65-dma Cum. Inverted Traders Index NASDAQ S&P OEX NYSE COMPQX DJI-15 DJI-20 DJI-30 DIA QQQ MDY SPY IWM TNA Short-Term Rates DOLLAR-UUP recent 2006 vers-Peerless signals -- http://tigersoft.com/NEWPEER/UPD61027.BMP USO-CrudeOil DBO FAS GLD BBH IBB JETS JNUG KOL NUGT OIH PALL RSX RETL SDS AGQ SLV SOXL TAN TECL TLT TMF TNA UGA (gasoline) USO (oil) and China: YINN CHAU Commodities: CANE CORN DBC JJC, NIB CORN, CUT (paper) MOO, SOYB WEAT UUP (Dollar) LIT (Lithium) Stocks AAPL ADBE ALXN AMAT AMGN AMD AMZN AXP BA BABA BAC BIDU BLDP CAT CRM CVX CMG DE ENPH FB GILD GOOG GS HD IBM INTU JPM LRCX M (Macy's) MSFT NEM NFLX NKE NVDA PG REGN REV SO SQ QCOM QDEL TSLA TXN XOM V VRTX WFC WMT TOWN ZM New highs and Bullish MAXCPs http://tigersoft.com/UP/10-27/BULLISH.htm Bearish MAXCPs - http://tigersoft.com/DOWN/10-27/BEARISH.htm |
Table 1
10/27/2018 QUICKSILVER on DJI-30 STOCKS.
P21 + ITRS score >+.25 is bullish
1 Bullish ( CRM )
6 Bearish (AMGN, BA, CSCO, CVX, MRK, IBM )
HIGHEST AI/200 = CRM Second Highest Tied = AAPL and MSFT STOCKS CLOSECHANGE PIVOT-PT 5-dma AROC CL-PWR CANDLE AI/200 IP21 ITRS ------------------------------------------------------------------------------------------------------- ------------------------------------------------------------------------------------------------------- AAPL 116.6 1.55 117.51 -39.2% ------- BLUE 154 -.045 .033 ---------------------------------------------------------------------------------------------------------- AMGN 223.46 -1.43 231.1 -167.5% Bearish RED 126 -.207 -.065 --- ---------------------------------------------------------------------------------------------------------- AXP 94.93 -1.95 103.14 -404.7% Bearish RED 87 -.126 -.011 ---------------------------------------------------------------------------------------------------------- BA 155.24 -5.59 167.24 -362.2% Bearish RED 33 -.282 -.082 --- ---------------------------------------------------------------------------------------------------------- CAT 157.91 -5.29 168.99 -330.6% Bullish RED 116 .021 .154 ---------------------------------------------------------------------------------------------------------- CRM 250.3 8.32 255.97 -113.2% Bearish BLUE 191 .009 .288 +++ ---------------------------------------------------------------------------------------------------------- CSCO 36.87 -.8 39.2 -300.9% Bearish RED 111 -.123 -.109 --- ---------------------------------------------------------------------------------------------------------- CVX 69.51 -1.43 71.68 -150.9% Bearish RED 77 -.137 -.219 --- ---------------------------------------------------------------------------------------------------------- DIS 123.31 -.75 124.95 -64.9% Bearish RED 102 -.031 -.031 ---------------------------------------------------------------------------------------------------------- DOW 46.57 -.58 49.34 -285.7% Bearish RED 59 -.256 .063 ---------------------------------------------------------------------------------------------------------- GS 195.68 -5.46 208.03 -302% ------- RED 61 -.168 -.021 ---------------------------------------------------------------------------------------------------------- HD 276.84 .8 286.04 -163% Bearish RED 153 -.043 -.024 ---------------------------------------------------------------------------------------------------------- HON 166.75 -3.42 173.26 -187.4% Bearish RED 103 -.116 .066 ---------------------------------------------------------------------------------------------------------- IBM 110.56 -1.66 117.37 -295.4% Bearish RED 108 -.357 -.096 --- ---------------------------------------------------------------------------------------------------------- INTC 45.64 -1.08 53.43 -761.5% ------- RED 85 -.176 -.052 ---------------------------------------------------------------------------------------------------------- JNJ 143.15 -.82 144.55 -48.4% Bearish RED 103 -.144 -.024 ---------------------------------------------------------------------------------------------------------- JPM 99.33 -1.91 100.37 -51.2% Bullish RED 32 .01 .012 ---------------------------------------------------------------------------------------------------------- KO 49.9 .1 50.25 -34.8% Bearish BLUE 79 -.092 .05 ---------------------------------------------------------------------------------------------------------- MCD 222.97 -1.3 227.45 -98.4% Bearish RED 128 -.058 .084 ---------------------------------------------------------------------------------------------------------- MMM 161.03 -5.13 170.95 -292.9% ------- RED 88 -.183 -.007 ---------------------------------------------------------------------------------------------------------- MRK 77.99 -.85 78.27 -17.8% Bearish RED 87 -.263 -.064 --- ---------------------------------------------------------------------------------------------------------- MSFT 213.25 3.17 214.65 -32.7% ------- BLUE 154 .026 .03 ---------------------------------------------------------------------------------------------------------- NKE 127.99 -.38 128.49 -19.3% ------- RED 123 -.01 .227 ---------------------------------------------------------------------------------------------------------- PG 142.36 1.06 142.48 -4.2% ------- BLUE 98 -.026 .066 ---------------------------------------------------------------------------------------------------------- TRV 119.09 -2.45 118.11 39.7% Bullish RED 80 .174 .043 ---------------------------------------------------------------------------------------------------------- UNH 320.51 -2.55 323.41 -44.6% Bullish RED 111 -.035 .015 ---------------------------------------------------------------------------------------------------------- V 190.06 -3.01 197.7 -193.9% Bearish RED 91 -.197 -.032 ---------------------------------------------------------------------------------------------------------- VZ 57.38 -.43 57.25 11.3% ------- RED 111 -.016 -.008 ---------------------------------------------------------------------------------------------------------- WBA 36 -1.21 37.49 -198.5% ------- RED 82 -.093 -.11 ---------------------------------------------------------------------------------------------------------- WMT 142.87 .71 143.9 -35.9% Bullish BLUE 128 -.097 .069 |
Table 2 QUICKSILVER on ETFS - 10/27/20 Bullish = 0
Bearish = 1 OIH
ITRS + IP21>.25 is considered "Bullish"
<-.25 is considered bearish
ETF CLOSE CHANGE PIVOT-PT 5-dma AROC CL-PWR CANDLE IP21 ITRS --------------------------------------------------------------------------------------------- --------------------------------------------------------------------------------------------- DIA 274.66 -2.34 281.97 -147.1% Bearish RED -.115 ----- --------------------------------------------------------------------------------------------- SPY 338.22 -1.17 342.73 -75.2% Bearish RED -.119 .016 --------------------------------------------------------------------------------------------- QQQ 282.66 2.19 284.19 -30.9% Bearish BLUE -.071 .042 --------------------------------------------------------------------------------------------- MDY 354.86 -4.88 359.14 -91.6% Bullish RED .06 .011 --------------------------------------------------------------------------------------------- IWM 158.18 -1.37 159.38 -80.1% ------- RED .075 .017 --------------------------------------------------------------------------------------------- FAS 35.02 -2.2 37.33 -325.8% ------- RED -.081 -.058 --------------------------------------------------------------------------------------------- SOXL 269.18 -2.81 293.84 -534% Bearish RED -.057 .066 --------------------------------------------------------------------------------------------- TECL 300.15 4.75 322.21 -365.8% Bearish BLUE -.098 .013 --------------------------------------------------------------------------------------------- IBB 135.87 .76 134.19 -24.3% Bearish BLUE -.022 .014 --------------------------------------------------------------------------------------------- GLD 179.02 .47 180.6 -6.4% Bearish BLUE -.005 -.025 --------------------------------------------------------------------------------------------- OIH 96.86 -1.37 99 -169.7% Bearish RED -.007 -.282 Bearish --------------------------------------------------------------------------------------------- GASL 3440 285 3685 -325.1% ------- RED -.021 .129 --------------------------------------------------------------------------------------------- |
Table 3 Count of Stocks in Key Directories
20201027
-------------------------------
NEWHIGHS 74
NEWLOWS 98 Bearish plurality
MAXCP 18
MINCP 143
TTTNH 17
TTTNL 97
FASTUP 45
FASTDOWN 107
CPCROSSA 49
CPCROSSD 95
BIGVOLUP 2
BIGVODN 10
ACCUMVER 151
HIGHIP21 9
HIUPPCT 38
REDSELL 111
AUGSELS7 57
TRAPDOOR 9
|
RANKING OF KEY DIRECTORIES BASED PCT.OF STOCKS ABOVE 65-DMA 10/27/20 --------------------------------------------------------------------------------------- Directory Current day-1 day-2 day-3 day-4 day-5 ---------------------------------------------------------------------------------------- UTILITY .868 .894 .894 .868 .736 .815 SOLAR .818 .818 .818 .909 .909 .909 INFRA .657 .714 .8 .8 .771 .714 CHINA .632 .612 .632 .632 .591 .591 AUTO .615 .743 .82 .82 .82 .769 REGBANKS .615 .692 .807 .807 .692 .615 INDMATER .6 .64 .706 .68 .653 .64 NIFTY .6 .622 .777 .733 .755 .822 TRANSP .6 .85 .9 .9 .8 .8 ELECTRON .591 .646 .741 .748 .7 .734 SEMI .586 .644 .74 .769 .721 .769 CHEM .583 .687 .833 .812 .77 .75 INDEXES .576 .621 .723 .734 .723 .717 GREEN .571 .619 .761 .761 .761 .857 FINANCE .56 .658 .743 .719 .621 .597 RETAIL .551 .632 .795 .734 .673 .673 NASD-100 .53 .54 .7 .68 .67 .71 COMODITY .512 .56 .609 .585 .585 .585 FOOD .509 .528 .584 .547 .566 .584 COMPUTER .5 .55 .7 .75 .7 .75 COPPER .5 .5 .625 .625 .625 .5 ETFS .5 .482 .678 .625 .589 .607 JETS .5 .857 .928 .928 .714 .785 SOFTWARE .5 .483 .616 .616 .616 .616 SP500 .476 .544 .672 .659 .619 .632 RUS-1000 .462 .533 .65 .631 .592 .606 DJI-13 .461 .538 .769 .769 .615 .692 BIOTECH .44 .43 .478 .478 .413 .481 DOWJONES .433 .466 .666 .7 .6 .633 GUNS .428 .571 .571 .5 .5 .571 FIDSTKS .417 .445 .617 .588 .542 .577 INSURANC .384 .461 .653 .576 .576 .461 SP-100 .384 .439 .582 .593 .527 .56 BEVERAGE .357 .428 .571 .428 .357 .428 EDU .333 .333 .333 .333 .333 .333 GAMING .333 .476 .619 .571 .523 .476 HOSPITAL .333 .619 .619 .619 .571 .571 COAL .285 .571 .571 .428 .285 .285 OILGAS .236 .244 .283 .275 .244 .259 HOMEBLDG .235 .294 .647 .47 .705 .823 HACKERS .2 .2 .25 .3 .3 .3 REIT .184 .29 .397 .361 .297 .312 GOLD .183 .163 .163 .163 .204 .183 BIGBANKS .142 .285 .571 .571 .428 .571 MILITARY .142 .214 .357 .321 .214 .285 BONDFUND .059 .089 .128 .138 .168 .178 |
====================================================================
10/26/2020 Peerless Buy B21
(2020 version) Buy B20 (2006 version).
The DJI's big decline today took it down to a close 1.8% below the
21-day ma. Because we are in a normally bullish period of time at the
end of October and the P-Indicator stands at a very positive +163
and the V-Indicator is positive, Peerless generated a Buy B21 at the
close today. AAPL refused to break its rising 65-dma. When traders
saw this, they scrambled to buy again. A quick rally would seem to be
shaping up back to the price-downtrendlines shown in the DIA and
QQQ charts below.
 |
 |
 |
 |
Below are the Buy B21s since 1965. We have earlier Buy B21s
but the
data is not as reliable. Actually, I would pay most attention to the fact that
the average Buy B21 gained about 8% on average since 2000 and had
an average paper loss of only 1.2%. There were no losing trades. If the
DJI turns weak again, and the Closing Powers remain in a downtrend,
keep in mind that the QE-Infinity program will give a Buy B2 at the lower
3.5% band and we will probably get a Buy B9 on more weakness because
breadth remains very positive. Stay hedged a little
longer. The weakest
MINCPs will likely stay under pressure. There was only one PEY (Presideential
Election Year) Buy B21. It gained 6% and showed no paper loss.
Closed Out Buy B21s since 1965Date DJI Gain Biggest Paper Loss --------------------------------------------------------------------------- 19651029 B21 960.82 .026 926.5 -.038 9/21 19731001 B21 948.83 .04 none 0 19851111 B21 1440.02 .268 none 0 19861202 B21 1955.57 .230 1895.91 -.0305 12/31 19881219 PEY B21 2172.36 .069 none 0 20011022 B21 9377.03 .079 9075.14 -.0321 10/31 20021105 B21 8678.27 .011 8303.78 -.0431 12/27 20060926 B21 11669.39 .062 none 0 20091201 B21 10471.58 .052 none 0 20100929 B21 10835.28 .182 10751.2 -.0077 10/4 20101202 B21 11362.41 .127 none 0 20141111 B21 17614.90 .040 17068.8 -.0309 12/16 20151026 B21 17623.05 .006 17128.5 -.028 12/18 20170925 B21 22296.09 .170 none 0 ---------------------------------------------------------------------------------------------- |
|
Charts 10/26/2020 (Click on Underlined link.) 2020 PEERLESS DJI, Signals, Indicators Daily DJI Volume 10-DayUp/Down Vol Stoch-20 Inverted Traders Index Graph of Pct of All Stocks above 65-dma Cum. Inverted Traders Index NASDAQ S&P OEX NYSE COMPQX DJI-15 DJI-20 DJI-30 DIA QQQ MDY SPY IWM TNA Short-Term Rates DOLLAR-UUP recent 2006 vers-Peerless signals -- http://tigersoft.com/NEWPEER/UPD61026.BMP USO-CrudeOil DBO FAS GLD BBH IBB JETS JNUG KOL NUGT OIH PALL RSX RETL SDS AGQ SLV SOXL TAN TECL TLT TMF TNA UGA (gasoline) USO (oil) and China: YINN CHAU Commodities: CANE CORN DBC JJC, NIB CORN, CUT (paper) MOO, SOYB WEAT UUP (Dollar) LIT (Lithium) Stocks AAPL ADBE ALXN AMAT AMGN AMD AMZN AXP BA BABA BAC BIDU BLDP CAT CRM CVX CMG DE ENPH FB GILD GOOG GS HD IBM INTU JPM LRCX M (Macy's) MSFT NEM NFLX NKE NVDA PG REGN REV SO SQ QCOM QDEL TSLA TXN XOM V VRTX WFC WMT TOWN ZM New highs and Bullish MAXCPs http://tigersoft.com/UP/10-26/BULLISH.htm Bearish MAXCPs - http://tigersoft.com/DOWN/10-26/BEARISH.htm |
Table 1
10/26/2018 QUICKSILVER on DJI-30 STOCKS.
P21 + ITRS score >+.25 is bullish
1 Bullish ( CRM TRV)
1 Bearish (BA CVX, MRK, IBM )
HIGHEST AI/200 = CRM Second Highest Tied = AAPL and MSFT STOCKS CLOSECHANGE PIVOT-PT 5-dma AROC CL-PWR CANDLE AI/200 IP21 ITRS ------------------------------------------------------------------------------------------------------- ------------------------------------------------------------------------------------------------------- AAPL 115.05 .01 115.98 -40% Bearish BLUE 155 -.025 .011 ---------------------------------------------------------------------------------------------------------- AMGN 224.89 -2.27 230.71 -127% Bearish RED 127 -.178 -.052 ---------------------------------------------------------------------------------------------------------- AXP 96.88 -4.1 102.47 -272.5% Bearish RED 88 -.11 -.025 ---------------------------------------------------------------------------------------------------------- BA 160.83 -6.53 167.11 -188.1% Bearish RED 33 -.188 -.087 --- ---------------------------------------------------------------------------------------------------------- CAT 163.2 -5.39 167.53 -128.5% Bullish RED 116 .041 .176 ---------------------------------------------------------------------------------------------------------- CRM 241.98 -8.54 255.01 -257.4% Bearish RED 191 .003 .261 +++ ---------------------------------------------------------------------------------------------------------- CSCO 37.67 -1.15 39.3 -208.8% Bearish RED 112 -.073 -.104 ---------------------------------------------------------------------------------------------------------- CVX 70.94 -1.63 71.28 -23.6% ------- RED 77 -.08 -.205 --- ---------------------------------------------------------------------------------------------------------- DIS 124.06 -4.29 124.23 -6.7% Bearish RED 102 -.013 -.04 ---------------------------------------------------------------------------------------------------------- DOW 47.15 -1.38 48.84 -173.1% Bearish RED 59 -.224 .061 ---------------------------------------------------------------------------------------------------------- GS 201.14 -3.9 205.69 -110.8% ------- RED 62 -.131 -.023 ---------------------------------------------------------------------------------------------------------- HD 276.04 -6.96 283.73 -135.5% Bearish RED 154 -.011 -.006 ---------------------------------------------------------------------------------------------------------- HON 170.17 -5.37 171.59 -40.8% Bullish RED 104 -.078 .072 ---------------------------------------------------------------------------------------------------------- IBM 112.22 -3.78 125.52 -563.8% Bearish RED 109 -.331 -.094 --- ---------------------------------------------------------------------------------------------------------- INTC 46.72 -1.48 54.58 -745.4% Bullish RED 86 -.1 -.034 ---------------------------------------------------------------------------------------------------------- JNJ 143.97 -1.27 144.32 -12.1% Bearish RED 104 -.129 -.019 ---------------------------------------------------------------------------------------------------------- JPM 101.24 -2.57 99.8 71.1% Bullish RED 31 .062 -.001 ---------------------------------------------------------------------------------------------------------- KO 49.8 -.72 49.62 17.9% Bearish RED 80 -.112 .038 ---------------------------------------------------------------------------------------------------------- MCD 224.27 -4.44 226 -38% Bearish RED 129 -.035 .093 ---------------------------------------------------------------------------------------------------------- MMM 166.16 -3.64 169.55 -99.7% ------- RED 89 -.152 .01 ---------------------------------------------------------------------------------------------------------- MRK 78.84 -.99 78.67 10.8% Bearish RED 87 -.225 -.046 --- ---------------------------------------------------------------------------------------------------------- MSFT 210.08 -6.15 214.22 -96.3% Bearish RED 154 -.016 .016 ---------------------------------------------------------------------------------------------------------- NKE 128.37 -1.62 127.43 36.4% Bullish RED 124 -.027 .216 ---------------------------------------------------------------------------------------------------------- PG 141.3 -1.08 141.91 -21.4% ------- ---- 98 -.056 .056 ---------------------------------------------------------------------------------------------------------- TRV 121.54 -4.43 111.84 399.5% Bullish RED 80 .196 .035 ---------------------------------------------------------------------------------------------------------- UNH 323.06 -7.54 324.22 -17.8% Bullish RED 111 -.056 .008 ---------------------------------------------------------------------------------------------------------- V 193.07 -4.94 196.97 -98.6% Bearish RED 92 -.182 -.008 ---------------------------------------------------------------------------------------------------------- VZ 57.81 -.15 57.3 44.5% ------- BLUE 111 -.003 -.007 ---------------------------------------------------------------------------------------------------------- WBA 37.21 -.83 36.97 32% Bullish RED 82 -.067 -.102 ---------------------------------------------------------------------------------------------------------- WMT 142.16 -1.69 142.95 -27.5% Bullish RED 128 -.107 .082 |
Table 2 QUICKSILVER on ETFS - 10/23/20 Bullish = 0
Bearish = 1 OIH
ITRS + IP21>.25 is considered "Bullish"
ETF CLOSE CHANGE PIVOT-PT 5-dma AROC CL-PWR CANDLE IP21 ITRS --------------------------------------------------------------------------------------------- --------------------------------------------------------------------------------------------- DIA 283.34 -.31 282.03 -46.4% ------- RED -.022 ----- --------------------------------------------------------------------------------------------- SPY 345.78 1.17 342.01 -21.9% ------- RED -.031 .013 --------------------------------------------------------------------------------------------- QQQ 284.74 .56 283.8 -66.1% Bearish ---- .032 .031 --------------------------------------------------------------------------------------------- MDY 367.49 2.29 359.82 48.1% Bullish BLUE .158 .017 --------------------------------------------------------------------------------------------- IWM 163.07 .94 160.41 22.4% Bullish ---- .164 .023 --------------------------------------------------------------------------------------------- FAS 39.8 .58 36.59 207.8% Bullish BLUE .017 .029 --------------------------------------------------------------------------------------------- SOXL 290.55 -4.32 301.14 -259.3% ------- RED .062 .159 --------------------------------------------------------------------------------------------- TECL 315.99 -1.83 320.25 -352.1% ------- RED .029 .057 --------------------------------------------------------------------------------------------- IBB 136.49 .34 137.43 -117.7% Bearish RED .036 .005 --------------------------------------------------------------------------------------------- GLD 178.64 -.19 178.39 9.5% Bearish RED .058 -.04 --------------------------------------------------------------------------------------------- OIH 102.11 .73 96.99 253.2% Bullish BLUE-.012 -.276 Bearish --------------------------------------------------------------------------------------------- QUICKSILVER on ETFS - 10/26/20 ETF CLOSE CHANGE PIVOT-PT 5-dma AROC CL-PWR CANDLE IP21 ITRS --------------------------------------------------------------------------------------------- DIA 277 -6.34 282.95 -88.9% Bearish RED -.07 0 --------------------------------------------------------------------------------------------- BA 160.83 -6.53 167.24 -188.1% Bearish RED -.188 -.087 --------------------------------------------------------------------------------------------- SPY 339.39 -6.39 343.38 -38.1% ------- RED -.065 .018 --------------------------------------------------------------------------------------------- QQQ 280.47 -4.27 284.41 -58.6% Bearish RED -.02 .041 --------------------------------------------------------------------------------------------- MDY 359.74 -7.75 361.5 -1.1% Bullish RED .127 .022 --------------------------------------------------------------------------------------------- IWM 159.55 -3.52 160.76 -26.7% Bullish RED .136 .026 --------------------------------------------------------------------------------------------- FAS 37.22 -2.58 37.51 82.7% Bullish RED -.024 -.017 --------------------------------------------------------------------------------------------- RETL 259.16 -21.23 272.22 -181.5% Bearish RED .038 .062 --------------------------------------------------------------------------------------------- SOXL 271.99 -18.56 300.18 -492.2% Bearish RED .009 .112 --------------------------------------------------------------------------------------------- TECL 295.4 -20.59 323.19 -388.4% Bearish RED -.047 .013 --------------------------------------------------------------------------------------------- IBB 135.11 -1.38 136.53 -85.2% Bearish -----.019 .023 --------------------------------------------------------------------------------------------- GLD 178.55 -.09 179.25 4.5% Bearish RED .03 -.012 --------------------------------------------------------------------------------------------- OIL 178.55 -.09 179.25 4.5% Bullish RED -.06 24.887 --------------------------------------------------------------------------------------------- OIH 98.23 -3.88 100.26 62% ------- RED -.023 -.286 --------------------------------------------------------------------------------------------- GASL 3440 285 3685 -325.1% ------- RED -.021 .123 --------------------------------------------------------------------------------------------- UGA 3440 285 3685 -325.1% ------- RED -.614 186.068 --------------------------------------------------------------------------------------------- UUP 25.98 -.06 26.26 -53.5% ------- -----.019 -.011 --------------------------------------------------------------------------------------------- IEF 25.98 -.06 26.26 -53.5% Bullish ---- .079 -.777 --------------------------------------------------------------------------------------------- CORN 25.98 -.06 26.26 -53.5% ------- ---- .053 1.01 --------------------------------------------------------------------------------------------- WEAT 25.98 -.06 26.26 -53.5% ------- ---- .041 3.777 --------------------------------------------------------------------------------------------- YINN 25.98 -.06 26.26 -53.5% Bearish ---- .166 .708 --------------------------------------------------------------------------------------------- RSX 21.04 -.4 20.97 80.7% Bullish RED .054 -.095 |
Table 3 Count of Stocks in Key Directories
20201026
-------------------------------
NEWHIGHS 52
NEWLOWS 197
MAXCP 10
MINCP 104 Bearish 10x
TTTNH 9
TTTNL 87
FASTUP 46
FASTDOWN 68
CPCROSSA 42
CPCROSSD 114
BIGVOLUP 1
BIGVODN 8
ACCUMVER 149
HIGHIP21 11
HIUPPCT 41
REDSELL 99
AUGSELS7 57
TRAPDOOR 10
|
Table 4 RANKING OF KEY DIRECTORIES BASED PCT.OF STOCKS ABOVE 65-DMA
10/26/20
Bullish 27
Bearish 18
---------------------------------------------------------------------------------------
Directory Current day-1 day-2 day-3 day-4 day-5
----------------------------------------------------------------------------------------
UTILITY .894 .894 .868 .736 .789 .815
JETS .857 .928 .928 .714 .785 .642
TRANSP .85 .9 .9 .8 .8 .75
SOLAR .818 .818 .909 .909 .909 .909
AUTO .743 .82 .82 .82 .794 .717
INFRA .714 .8 .8 .771 .714 .714
REGBANKS .692 .807 .807 .692 .615 .5
CHEM .687 .833 .812 .77 .75 .75
FINANCE .654 .74 .728 .617 .604 .58
SEMI .644 .74 .769 .721 .769 .75
ELECTRON .643 .739 .746 .698 .732 .719
INDMATER .64 .706 .68 .653 .653 .613
RETAIL .632 .795 .734 .673 .673 .693
NIFTY .622 .777 .733 .755 .822 .777
INDEXES .621 .723 .734 .723 .717 .706
CHINA .62 .64 .64 .6 .6 .6
GREEN .619 .761 .761 .761 .809 .761
HOSPITAL .619 .619 .619 .619 .571 .619
COAL .571 .571 .428 .285 .285 .285
GUNS .571 .571 .5 .5 .571 .5
COMODITY .56 .609 .585 .585 .585 .585
COMPUTER .55 .7 .75 .7 .75 .8
SP500 .544 .674 .659 .619 .636 .617
NASD-100 .54 .7 .68 .67 .72 .7
DJI-13 .538 .769 .769 .615 .692 .692
RUS-1000 .533 .652 .631 .592 .608 .572
FOOD .528 .584 .547 .566 .584 .566
=================================================================================================
COPPER .5 .625 .625 .625 .5 .5
=================================================================================================
SOFTWARE .483 .633 .616 .616 .616 .6
ETFS .482 .678 .625 .589 .589 .535
GAMING .476 .619 .571 .523 .476 .476
DOWJONES .466 .666 .7 .6 .633 .633
INSURANC .461 .653 .576 .576 .461 .307
FIDSTKS .445 .617 .588 .542 .582 .565 SP-100 .439 .582 .593 .527 .56 .571 BEVERAGE .428 .571 .428 .357 .428 .357 BIOTECH .428 .477 .479 .412 .471 .498 EDU .333 .333 .333 .333 .333 .333 HOMEBLDG .294 .647 .47 .705 .823 .823 REIT .29 .397 .361 .297 .312 .241 BIGBANKS .285 .571 .571 .428 .571 .571 OILGAS .244 .283 .267 .244 .259 .251 MILITARY .214 .357 .321 .214 .285 .321 HACKERS .2 .3 .3 .3 .3 .3 GOLD .163 .163 .163 .204 .204 .122 BONDFUND .089 .128 .138 .168 .168 .118 |
=========================================================================
10/23/2020 Stay hedged. Combine the QE-Infinity signals with Peerless-2000.
The risk of a big Democrat victory has finally got Wall Street's attnetion.
The futures are down 200. The explosion of the Covid-19 is reason
to be plenty worried, too. A decline to the lower band is probably
on its way. Then at the lower band, the FED will likely provide
more liquidity to hold the market up. Stay hedged, as previously
suggested. Chinese stocks may provide as escape from the nervousness
of the DJIA.
Tonight I want to unveil our Tiger Power Index graph. Use its
trendlines and cross-over above and below zero. I think it
will turn volatility to our advantage a meaningful amount. Here is an example.
|
NEW TIGERSOFT Silver ETFS are very volatile. Use our Tiger Power Index to track and master them. The new ESP page has the new TigerSoftware to do this and produce the QE-Infinity signals. I've sent links to many of you to use this. If you did not get the link, I can supply it for $85.  |
Peerless
2020 and QE-Infinity Signals on DJI - 27000 seems a good target for this
decline. |
DIA-Candle-Stick |
QQQ-Candle-Stick. |
Chinese ETFs are at the top of our Bullish MAXCPs.
CHN |
Oil and Gas Funds are near the bottom of our internal strength rankings.
Sell Short BOIL |
New Tiger Power Index
The new oscillator, which is the first item under Indic-2, simply
combines ITRS and IP21. You can see their values on the right-most two
columns of table 1 (DJI-30 stocks) and 2 (major ETFs), below. The links
to the graphs tonight here just below show this indicator with many
comments on how to use it best.
|
Charts 10/23/2020 (Click on Underlined link.) 2020 PEERLESS DJI, Signals, Indicators Daily DJI Volume 10-DayUp/Down Vol Stoch-20 Inverted Traders Index Graph of Pct of All Stocks above 65-dma Cum. Inverted Traders Index NASDAQ S&P OEX NYSE COMPQX DJI-15 DJI-20 DJI-30 DIA QQQ MDY IWM TNA Short-Term Rates DOLLAR-UUP SPY http://tigersoft.com/2121CST/SPY.GIF recent 2006 vers-Peerless signals -- http://tigersoft.com/NEWPEER/UPD61023.BMP ------------------------------------ The charts below tonight show the Tiger Power Index ------------------------------------- (We will go back to the regular format tomorrow night) USO-CrudeOil DBO FAS GLD BBH IBB JETS JNUG KOL NUGT OIH PALL RSX RETL SDS AGQ SLV SOXL TAN TECL TLT TMF TNA UGA (gasoline) USO (oil) and China: YINN CHAU Commodities: CANE CORN DBC JJC, NIB, CHOC CORN, CUT (paper) MOO, SOYB WEAT UUP (Dollar) LIT (Lithium) Stocks AAPL ADBE ALXN AMAT AMGN AMD AMZN AXP BA BABA BAC BIDU BLDP CAT CRM CVX CMG DE ENPH FB GILD GOOG GS HD IBM INTU JPM LRCX M (Macy's) MSFT NEM NFLX NKE NVDA PG REGN REV SO SQ QCOM QDEL TSLA TXN XOM V VRTX WFC WMT TOWN ZM -------------------------- Resume regular TigerSoft Charts ---------------------------------------- New highs and Bullish MAXCPs http://tigersoft.com/UP/10-23/BULLISH.htm Bearish MAXCPs - http://tigersoft.com/DOWN/10-23/BEARISH.htm
|
How To Use The Tiger Power Index.
It is not meant
to replace the existing Power Ranker, which uses
the same concepts a little differently. We do want to use this Power
Index along with the other Tiger tools and signals. Since, it does
not factor in Opening and Closing Power, but combine IP21 (Accumulation)
and ITRS (relative strength versus the DJI), it can nicely supplement our
Opening and Closing Power concepts, as well as chart patterns and trends,
key moving averages, non-cofirmations, automatic signals, etc..
With high Accumulation stocks, when the new Power Index crosses
above +.5, we often see very big vertical advances. We should take
advantage of the steep Power Index uptrends as long as they last.
With the best of these stocks we will see flat-top breakouts and
both Opening and Closing Power rising and only small sized red
Tiger "popsicles" in our candle-stock charts. A change in the color
of the candle-stick from blue to red gives a good sell, especially if
the Power Index has failed to confirm a move to new highs. All this
will be familiar to traders using our "Explosive Super Stocks".ideas.
But there are two other major uses for the new Tiger Power Index chart.
Look for volatility in this indicator. We want to see declines in stocks
that previously showed Power Index readings above +.5 or -.5. Find those
stocks that have had their Tiger Power Index drop back slightly below 0
and then turn up past zero. Do not apply this if your chart gives
you a warning that there have been too many cross-overs around zero.
In this case, use the cross-over above zero by the Tiger Power Index's
pink 21-day ma. See the examples below.
Last and probably the most useful way to employ the new Tiger
Index is just to draw simple trendlines on it. Again, we want to see
past volatility, where the high was above +.5, and well-tested downtrend-
line breaks to the upside. In a bear market, the downtrend-line
break can occur way below zero. But in a bull market, it is best not
to buy stocks whose Tiger Index downtrend is broken below -.25.
Again volatility is our friend here. So is a rising 65-dma or a well-
tested support and a break in a Closing Power downtrend.
I have first drawn the Power Index using Ind-2 + Draw Power
Index.
Then I have drawn rubber-bandlines using Lines. Then I placed
buy and sell signals on these lines as I thought would be instructive.
 |
 |
 |
 |
 |
Table 3 Oct. 23 Count of Stocks in Key Directories
20201023
-------------------------------
NEWHIGHS 144
NEWLOWS 50
MAXCP 11
MINCP 38
TTTNH 12
TTTNL 36
FASTUP 105
FASTDOWN 60
CPCROSSA 99
CPCROSSD 31
BIGVOLUP 2
BIGVODN 6
ACCUMVER 148
HIGHIP21 11
HIUPPCT 52
REDSELL 99
AUGSELS7 131
TRAPDOOR 9
|
Table 4 RANKING OF KEY DIRECTORIES BASED PCT.OF STOCKS ABOVE 65-DMA
Bullish = 38
Bearish = 8
10/23/20
---------------------------------------------------------------------------------------
Directory Current day-1 day-2 day-3 day-4 day-5
----------------------------------------------------------------------------------------
JETS .928 .928 .714 .785 .714 .642
TRANSP .9 .9 .8 .8 .8 .75
UTILITY .894 .868 .736 .789 .815 .789
CHEM .833 .812 .77 .75 .77 .812
AUTO .82 .82 .82 .794 .717 .769
SOLAR .818 .909 .909 .909 .909 .909
REGBANKS .807 .807 .692 .615 .5 .692
INFRA .8 .8 .771 .714 .714 .742
RETAIL .795 .734 .673 .673 .673 .755
NIFTY .777 .733 .755 .822 .777 .777
DJI-13 .769 .769 .615 .692 .692 .692
GREEN .761 .761 .761 .809 .761 .809
FINANCE .743 .719 .621 .597 .573 .585
ELECTRON .741 .748 .7 .734 .721 .721
SEMI .74 .769 .721 .769 .75 .74
INDEXES .723 .734 .723 .717 .706 .717
INDMATER .706 .68 .653 .653 .626 .666
COMPUTER .7 .75 .7 .75 .8 .7
NASD-100 .7 .68 .67 .72 .7 .79
ETFS .678 .625 .589 .589 .535 .517
SP500 .674 .661 .619 .636 .623 .689
DOWJONES .666 .7 .6 .633 .633 .666
INSURANC .653 .576 .576 .461 .307 .5
RUS-1000 .652 .632 .592 .608 .575 .649
HOMEBLDG .647 .47 .705 .823 .823 .823
CHINA .64 .64 .6 .6 .6 .66
SOFTWARE .633 .633 .616 .616 .6 .666
COPPER .625 .625 .625 .5 .5 .5
GAMING .619 .571 .523 .476 .523 .523
HOSPITAL .619 .619 .619 .619 .619 .619
FIDSTKS .617 .588 .542 .582 .571 .634
COMODITY .609 .585 .585 .585 .585 .56
GUNS .6 .533 .533 .6 .6 .6
FOOD .584 .547 .566 .584 .566 .547
SP-100 .582 .593 .527 .56 .56 .637
BEVERAGE .571 .428 .357 .428 .357 .571
BIGBANKS .571 .571 .428 .571 .571 .571
COAL .571 .428 .285 .285 .285 .285
============================================================================================
BIOTECH .477 .479 .415 .471 .493 .554
REIT .397 .361 .297 .312 .241 .333
MILITARY .357 .321 .214 .285 .321 .321
EDU .333 .333 .333 .333 .333 .333
HACKERS .3 .35 .3 .3 .3 .45
OILGAS .285 .261 .23 .253 .246 .253
GOLD .163 .163 .204 .204 .142 .183
BONDFUND .128 .138 .168 .168 .118 .118
|
=====================================================================
10/22/2020 Stay hedged. Combine the QE-Infinity signals with Peerless-2020.
Trump says a Biden victory will crash the stock market. Big Money
agrees. But the FED will probably fight that and support the DJI at
the 3.5% lower band. Biden will also likely use a big Public Works'
program as a fiscal stimulus that Trump has avoided. The DJI can rally
when a Democrat wins. The rising markets in 1933, 1961, 1965, 1993,
1997 and 2013 show that. Don't bet on a big decline if Biden wins
unless we see new bearish technical readings. Perhaps, Wall Street
is giving Biden "access" contributions, but perhaps, too, it sees that Biden
will "heal" the country better than Trump.
Opening Powers and the NYSE A/D Line are rising but our
Accumulation Index is negative and the Closing Powers are downtrending.
There remains considerable resistance for the DJI at 29000 where we
see a double top. The long history of past Presidential Election years'
fourth quarter tops before 2000 shows that they mostly waited until
November
or later. I have ascribed this to the tendency of partisans to eagerly be
buyers
throughout October in anticipation of their favorite Presidential Candidate's
victory in the November Election.
But when we look at the behavior of the DJIA or DIA in the fourth quarter
of Presidential Election years only since 2000, we
see the odds are 3 of 5 that
there will be an October top. That is what happened in 2000, 2008 and 2012.
In the two cases, where there was no October top, 2004 and 2016, the DJI
shot upwards through flat resistance and ran upwards into the next year. These
two cases of October-November breakouts in DJIA-DIA show two technical
characteristics that are now missing. The first is an IP21 surge and the second is
a rising Closing Power. So, at this point, it seems quite possible that an
October top may already have been made.
I do not think we will see a big decline, however. The DJI is just too stymied
and stalemated by contradictory forces: on the one hand, we see heavy selling by
"big money" in anticipation of new taxes on corporations and the wealthy by a
President Biden in 2021 and, on the other hand, we note the unprecedented
readiness of the FED to support the market with QE infinity. It is this FED support
that has made every decline to the 3.5% lower band a very good time to buy
the DJI, DIA, SPY, QQQ or the most bullish stocks ever since March 2020.
New TigerSoft
Hedging continues to be called for, in my opinion, to take advantage of Tiger's
Power Ranker. At the same time, we do need a market timing program that
tests well since 1929. So, I have incorporated QE-Infinity signals into the
regular Peerless. I'm still adding some new ideas to it, including a graph
of a "Power Indicator", IP21 + ITRS. More on this next week.
Current DJI with all Peerless Signals - normal markets and QE- Infinity |
Current DIA Opening and Closing Power |
DIA Charts 2000, 2004, 2008, 2012 and 2016
Since 2000, the DJI has topped out in three of the five October. Let's look
at the DJI's of 2000, 2004, 2008, 2012 and 2016 along with the Closing
Power and Accumulation Index for DIA.
2000 |
2004 |
2008 |
2012 |
2016 |
|
Charts 10/22/2020 (Click on Underlined link.) 2020 PEERLESS DJI, Signals, Indicators Daily DJI Volume 10-DayUp/Down Vol Stoch-20 Inverted Traders Index Graph of Pct of All Stocks above 65-dma Cum. Inverted Traders Index NASDAQ S&P OEX NYSE COMPQX DJI-15 DJI-20 DJI-30 DIA QQQ MDY IWM TNA Short-Term Rates DOLLAR-UUP SPY http://tigersoft.com/2121CST/SPY.GIF recent 2006 vers-Peerless signals -- http://tigersoft.com/NEWPEER/UPD61022.BMP USO-CrudeOil DBO FAS GLD BBH IBB JETS JNUG KOL NUGT OIH PALL RSX RETL SDS AGQ SLV SOXL TAN TECL TLT TMF TNA UGA (gasoline) USO (oil) and China: YINN CHAU Commodities: CANE CORN DBC JJC, NIB, CHOC CORN, CUT (paper) MOO, SOYB WEAT UUP (Dollar) LIT (Lithium) Stocks AAPL ADBE ALXN AMAT AMGN AMD AMZN AXP BA BABA BAC BIDU BLDP CAT CRM CVX CMG DE ENPH FB GILD GOOG GS HD IBM INTU JPM LRCX M (Macy's) MSFT NEM NFLX NKE NVDA PG REGN REV SO SQ QCOM QDEL TSLA TXN XOM V VRTX WFC WMT TOWN ZM New highs and Bullish MAXCPs http://tigersoft.com/MAXCP/10-22/BULLISH.htm Bearish MAXCPs - http://tigersoft.com/MINCP/10-22/BEARISH.htm |
Table 1
10/22/2018 QUICKSILVER on DJI-30 STOCKS.
P21 + ITRS score >+.25 is bullish 3 Bullish (CAT CRM TRV) Bullish CHange
1 Bearish ( IBM )
HIGHEST AI/200 = CRM Second Highest Tied = AAPL then MSFT STOCKS CLOSECHANGE PIVOT-PT 5-dma AROC CL-PWR CANDLE AI/200 IP21 ITRS ------------------------------------------------------------------------------------------------------- ------------------------------------------------------------------------------------------------------- AAPL 115.75 -1.12 120.71 -210.1% ------- RED 156 .043 .011 ---------------------------------------------------------------------------------------------------------- AMGN 227.98 -.99 235.01 -151.3% Bearish RED 129 -.114 -.07 ---------------------------------------------------------------------------------------------------------- AXP 104.79 3.36 104.43 17.4% ------- BLUE 90 .006 .018 ---------------------------------------------------------------------------------------------------------- BA 169.07 5.21 164.24 145.5% Bearish BLUE 33 -.131 -.049 ---------------------------------------------------------------------------------------------------------- CAT 169.66 2.26 165.04 137.9% Bullish BLUE 116 .091 .177 +++ ---------------------------------------------------------------------------------------------------------- CRM 249.67 -4.56 257.72 -157% Bearish RED 191 .029 .283 +++ ---------------------------------------------------------------------------------------------------------- CSCO 38.82 -.24 39.97 -145.4% ------- RED 114 -.029 -.206 ---------------------------------------------------------------------------------------------------------- CVX 73.4 2.53 73.51 -7.6% ------- BLUE 77 -.042 -.204 ---------------------------------------------------------------------------------------------------------- DIS 127.56 .93 127.36 7.9% Bearish BLUE 101 .023 -.045 ---------------------------------------------------------------------------------------------------------- DOW 48.82 .27 49.01 -19.4% Bearish RED 59 -.155 .09 ---------------------------------------------------------------------------------------------------------- GS 205.4 2.49 208.6 -77.6% ------- BLUE 63 -.042 -.045 ---------------------------------------------------------------------------------------------------------- HD 281.16 -3.35 287.54 -111.6% ------- RED 155 -.031 -.014 ---------------------------------------------------------------------------------------------------------- HON 176.85 3.98 172.61 122.5% Bullish BLUE 106 -.026 .092 ---------------------------------------------------------------------------------------------------------- IBM 115.76 .7 124.89 -374.9% Bearish BLUE 111 -.282 -.099 --- ---------------------------------------------------------------------------------------------------------- INTC 53.9 .4 53.85 4.6% Bullish BLUE 88 -.052 .083 ---------------------------------------------------------------------------------------------------------- JNJ 145.08 1.15 147.19 -72.4% ------- BLUE 106 -.088 -.043 ---------------------------------------------------------------------------------------------------------- JPM 102.88 3.51 101.72 57.7% Bullish BLUE 29 .084 -.013 ---------------------------------------------------------------------------------------------------------- KO 50.68 .69 49.99 69% ------- RED 82 .01 .034 ---------------------------------------------------------------------------------------------------------- MCD 229.15 .96 229.64 -10.7% ------- BLUE 131 .002 .099 ---------------------------------------------------------------------------------------------------------- MMM 170.71 1.54 169.08 48% ------- BLUE 91 -.104 .026 ---------------------------------------------------------------------------------------------------------- MRK 79.21 1.14 79.06 9.5% Bearish BLUE 87 -.159 -.055 ---------------------------------------------------------------------------------------------------------- MSFT 214.89 .09 219.66 -110.1% ------- BLUE 155 .034 .014 ---------------------------------------------------------------------------------------------------------- NKE 130.02 .59 129 39.7% Bullish BLUE 125 -.035 .223 ---------------------------------------------------------------------------------------------------------- PG 141.45 -1.8 143.83 -83.1% ------- RED 98 -.01 .031 ---------------------------------------------------------------------------------------------------------- TRV 126.14 1.14 112.64 581% Bullish BLUE 80 .252 .048 +++ ---------------------------------------------------------------------------------------------------------- UNH 325.73 2.94 324.57 17.8% Bullish BLUE 113 .004 -.002 ---------------------------------------------------------------------------------------------------------- V 197.99 -.44 199.55 -39.3% Bearish RED 94 -.142 -.017 ---------------------------------------------------------------------------------------------------------- VZ 57.33 .58 58.16 -72.2% Bearish BLUE 111 -.055 -.035 ---------------------------------------------------------------------------------------------------------- WBA 37.51 .12 37.64 -17.4% ------- ---- 82 -.008 -.116 ---------------------------------------------------------------------------------------------------------- WMT 143.55 -.85 144.53 -34% ------- RED 128 -.071 .076 |
Table 2 QUICKSILVER on ETFS - 10/20/20
               Bullish = 0
               Bearish = 1  OIH
ITRS + IP21>.25 is considered "Bullish"
ETF CLOSE CHANGE PIVOT-PT 5-dma AROC CL-PWR CANDLE IP21 ITRS --------------------------------------------------------------------------------------------- --------------------------------------------------------------------------------------------- DIA 283.65 1.68 285.97 -24.5% ------- BLUE-.027 ---- --------------------------------------------------------------------------------------------- SPY 344.61 1.88 347.29 -41.9% ------- BLUE-.057 .008 --------------------------------------------------------------------------------------------- QQQ 284.18 -.01 288.51 -103.4% ------- RED .016 .032 --------------------------------------------------------------------------------------------- MDY 365.2 6.06 364.01 3.5% Bullish BLUE .121 .01 --------------------------------------------------------------------------------------------- IWM 162.13 2.75 162.35 -19.2% ------- BLUE .121 .016 --------------------------------------------------------------------------------------------- FAS 39.22 1.89 38.23 146.4% ------- BLUE .005 -.001 --------------------------------------------------------------------------------------------- SOXL 294.87 1.03 306.07 -258.5% ------- RED .053 .139 --------------------------------------------------------------------------------------------- TECL 317.82 -4.39 338.84 -357.9% ------- RED .021 .064 --------------------------------------------------------------------------------------------- IBB 136.15 1.96 139.71 -111.3% Bearish BLUE .055 .005 --------------------------------------------------------------------------------------------- GLD 178.83 -1.77 178.3 -2.5% Bearish ---- .073 -.014 --------------------------------------------------------------------------------------------- OIH 101.38 2.38 97.1 -48.4% ------- BLUE .006 -.298 --------------------------------------------------------------------------------------------- |
Table 3 Count of Stocks in Key Directories
20201022
-------------------------------
NEWHIGHS 121
NEWLOWS 66
MAXCP 16
MINCP 42
TTTNH 24
TTTNL 30
FASTUP 83
FASTDOWN 77
CPCROSSA 261
CPCROSSD 17
BIGVOLUP 5
BIGVODN 9
ACCUMVER 146
HIGHIP21 9
HIUPPCT 43
VHIP21 123
LOWACCUM 200
REDSELL 97
AUGSELS7 117
TRAPDOOR 9
|
Table 4 RANKING OF KEY DIRECTORIES BASED PCT.OF STOCKS ABOVE 65-DMA
10/22/20
Bullish = 35
Bearish = 11
---------------------------------------------------------------------------------------
Directory Current day-1 day-2 day-3 day-4 day-5
----------------------------------------------------------------------------------------
JETS .928 .714 .785 .714 .642 .571
SOLAR .909 .909 .909 .909 .909 .909
TRANSP .9 .8 .8 .8 .75 .8
UTILITY .868 .736 .789 .815 .789 .815
AUTO .82 .82 .794 .717 .769 .82
CHEM .812 .77 .75 .77 .812 .791
REGBANKS .807 .692 .615 .5 .692 .615
INFRA .8 .771 .714 .714 .742 .714
DJI-13 .769 .615 .692 .692 .692 .692
SEMI .769 .721 .769 .75 .74 .769
GREEN .761 .761 .809 .761 .809 .809
COMPUTER .75 .7 .75 .8 .7 .7
ELECTRON .748 .7 .734 .721 .721 .734
INDEXES .734 .723 .717 .706 .723 .723
RETAIL .734 .673 .673 .673 .755 .775
NIFTY .733 .755 .822 .777 .777 .777
FINANCE .719 .621 .597 .573 .585 .56
DOWJONES .7 .6 .633 .633 .666 .666
INDMATER .689 .662 .662 .635 .675 .675
NASD-100 .68 .67 .72 .7 .78 .78
SP500 .661 .621 .636 .623 .686 .695
CHINA .64 .6 .6 .6 .66 .56
SOFTWARE .633 .633 .616 .6 .666 .7
RUS-1000 .632 .593 .608 .575 .646 .664
COPPER .625 .625 .5 .5 .5 .5
ETFS .625 .589 .589 .535 .517 .517
HOSPITAL .619 .619 .619 .666 .619 .666
SP-100 .593 .527 .56 .56 .637 .626
FIDSTKS .588 .542 .582 .571 .628 .628
COMODITY .585 .585 .585 .585 .56 .585
INSURANC .576 .576 .461 .307 .461 .461
BIGBANKS .571 .428 .571 .571 .571 .571
GAMING .571 .523 .476 .523 .523 .523
FOOD .547 .566 .584 .566 .547 .584
GUNS .533 .533 .6 .6 .6 .733
================================================================================================
BIOTECH .481 .417 .475 .494 .55 .537
HOMEBLDG .47 .705 .823 .823 .823 .823
BEVERAGE .428 .357 .428 .357 .571 .5
COAL .428 .285 .285 .285 .285 .285
REIT .361 .297 .312 .241 .333 .397
HACKERS .35 .35 .3 .3 .45 .55
EDU .333 .333 .333 .333 .333 .333
MILITARY .321 .214 .285 .321 .321 .321
OILGAS .261 .23 .246 .246 .253 .301
GOLD .163 .204 .204 .142 .204 .244
BONDFUND .138 .168 .168 .118 .118 .128
|
=======================================================================
10/21/2020 "Big
Money" is selling more and more hastily. Our "IPA" Indiator
is in a state of collapse. The FED's support for the market is again
being strained. The Closing Powers are falling. Stay hedged.
Study the earlier cases when our IPA diverged so much from a
still rising DJIA.
We are told that the market is falling back because Nancy Pelosi
refuses to accept a relief bailout package of $1.8 trillion instead of
$2.4 trillion. She's not talking much about what's the difference. This
may well be a big mistake on her part. A lot of people are desperate
due to no fault of their own. They need help now. As a career politican
who is now worth in excess of $100 million, her political games rankle.
This is a long-festering issue for a lot of working people.. Trump should
point this out, in my opnion, in the debate tomorrow. Perhaps, another reason
the market is going down is because bullish Democrats are very nervous that
an over-confident Biden will make a poor showing and his lead in
the polls will drop. Whatever, lies behind the market's decline, we
now see falling Closing Powers, "big money selling" and a weakening
65-dma that may not be able to act as support, unless Pelosi reverses
herself. A decline of 4% -5% more to the horizontal support and the 3.5%
lower band is looking increasingly likely. It remains a good time to be hedged.
It can't be good that there are so few bullish MAXCPs now.
| DIA - If 281 is broken below, there may be
some support at the still rising 65-dma, but better horizontal support for the trading range will be 268-270. The broken uptrendline and all those red candle-sticks sure make this look like a double-top in DIA and the DJIA. The earlier head/shoulders adds to the dangers.  |
QQQ Closing Power is falling. IP21 is negative. A well-tested minor downtrend is in place. If openings turn weak, look for QQQ to break its rising 65-dma and have to test 262-264.  |
Stay hedged. This remains a good time to be short some of the bearish
MINCPs while we hold our high Accumulation longs. Most likely, the
false breakout by TAN and today's weakness in the previously very
strong solar stocks owe to new fears about Biden's campaign and simple
profit-taking. No matter who is President in 2021-2025, solar power is
certain to be a big growth field in the years to come. Hold TAN.
Bearish "Big Money" as represented
by our Accumulation Index (IP21)
and the steeply decliing IPA (Cumulative IP21) is a distinct problem
for the market. On the one hand,
market tops in this a Presidential Election
Year are usually postponed until November because of partisan buying
and the FED, which is constantly reminding us that they will support the
market with an infinite amount of liquidity infusions for years to come
but on the other hand, our IP21 "Big Money" and "Insiders" indicator
refuses to turn positive and the cumulative version of this concept, IPA,
keeps sinking to new lows desite the DJI rally.
|
Immediately Below is our QE-Infinity DJI 2020 chart along with IPA. Below we added a new Sell S12 to our QE-Infinity option using Peerless when the DJI reaches the 3.5%-4.0% band and also shows a negative IP21 and a negative V-I. It is more bearish that S12 signal is occurring in with a weakening 65-dma and falling Closing Powers. Unless the bullish seasonality kicks in and Nancy Pelosi changes her mind, the DJI could very well drop down to the 26000 support. In a trading range, the weakening 65-dma is less likely to bring a recovery than a successful test of good horizontal. Naturally, I like the idea of bringing all the versions of Peerless back into harmony. The 2006 version did give a Sell S12. The 2020 version without QE-Infinity remains on a Sell. And if we add the Sell S12 to ehe QE Infiinity version, then all 3 versions of Peerless are on Sells.   Important. Compare the very weak IPA now with some other earlier cases of comparably weak IPAs when the DJI was rising. These IPA divergences from rising prices are usually quite bearish once key support is broken in the DJI or evem when a a price uptrend is finally broken.
|
|
1929 top |
|
1960 Top |
|
1966 Top |
|
2000 Top |

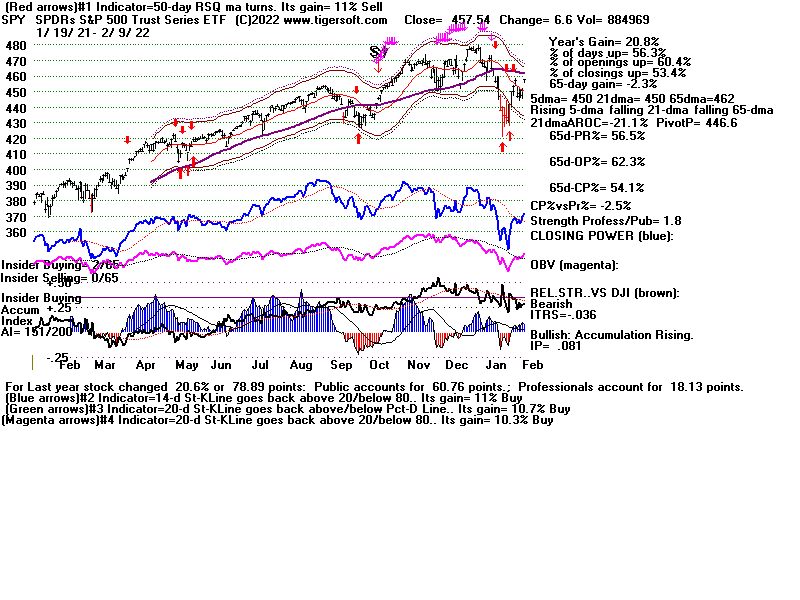
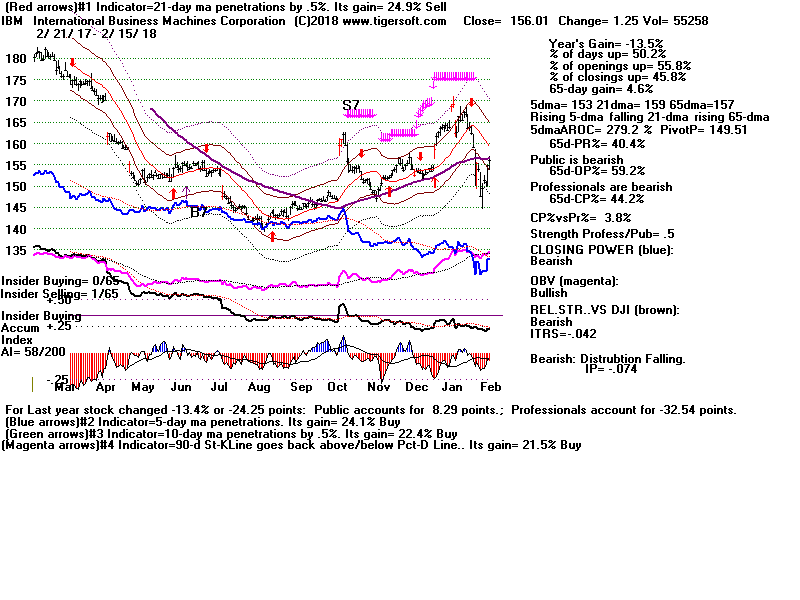
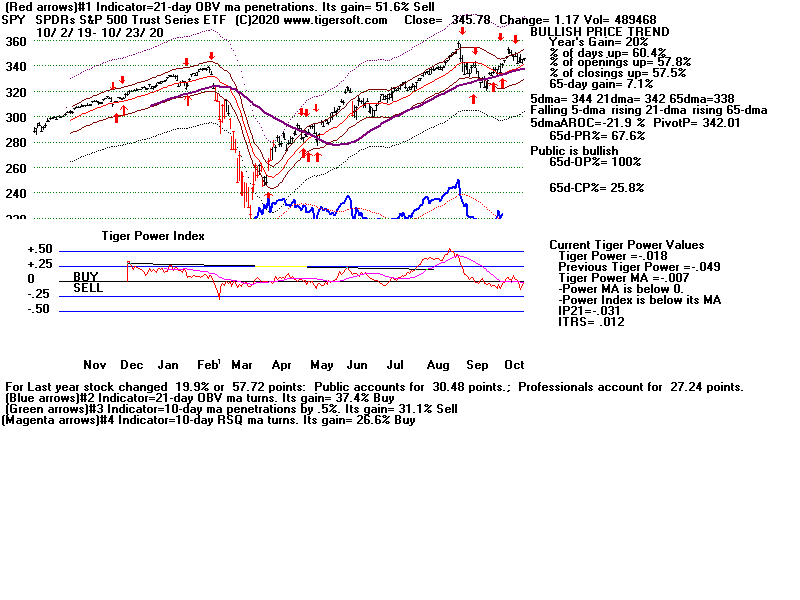
|
Charts 10/21/2020 (Click on Underlined link.) 2020 PEERLESS DJI, Signals, Indicators Daily DJI Volume 10-DayUp/Down Vol Stoch-20 Inverted Traders Index Graph of Pct of All Stocks above 65-dma Cum. Inverted Traders Index NASDAQ S&P OEX NYSE COMPQX DJI-15 DJI-20 DJI-30 DIA QQQ MDY IWM TNA Short-Term Rates DOLLAR-UUP SPY http://tigersoft.com/2121CST/SPY.GIF recent 2006 vers-Peerless signals -- http://tigersoft.com/NEWPEER/UPD61021.BMP USO-CrudeOil DBO FAS GLD BBH IBB JETS JNUG KOL NUGT OIH PALL RSX RETL SDS AGQ SLV SOXL TAN TECL TLT TMF TNA UGA (gasoline) USO (oil) and China: YINN CHAU Commodities: CANE CORN DBC JJC, NIB, CHOC CORN, CUT (paper) MOO, SOYB WEAT UUP (Dollar) LIT (Lithium) Stocks AAPL ADBE ALXN AMAT AMGN AMD AMZN AXP BA BABA BAC BIDU BLDP CAT CRM CVX CMG DE ENPH FB GILD GOOG GS HD IBM INTU JPM LRCX M (Macy's) MSFT NEM NFLX NKE NVDA PG REGN REV SO SQ QCOM QDEL TSLA TXN XOM V VRTX WFC WMT TOWN ZM New highs and Bullish MAXCPs http://tigersoft.com/MAXCP/10-21/BULLISH.htm Bearish MAXCPs - http://tigersoft.com/MINCP/10-21/BEARISH.htm |
Table 1
10/21/2018 QUICKSILVER on DJI-30 STOCKS.
P21 + ITRS score >+.25 is bullish
1 Bullish (CRM)
5 Bearish (BA, CSCO, CVX, IBM, MRK )
HIGHEST AI/200 = CRM Second Highest Tied = AAPL and MSFT STOCKS CLOSECHANGE PIVOT-PT 5-dma AROC CL-PWR CANDLE AI/200 IP21 ITRS ------------------------------------------------------------------------------------------------------- ------------------------------------------------------------------------------------------------------- AAPL 116.87 -.64 121.19 -181.7% Bullish BLUE 156 .008 .051 ---------------------------------------------------------------------------------------------------------- AMGN 228.97 -2.13 237.65 -185.4% Bearish RED 130 -.141 -.041 ---------------------------------------------------------------------------------------------------------- AXP 101.43 -1.71 104.81 -162.6% Bearish RED 90 -.11 -.035 ---------------------------------------------------------------------------------------------------------- BA 163.86 -3.38 163.24 18.7% Bearish RED 33 -.188 -.108 --- ---------------------------------------------------------------------------------------------------------- CAT 167.4 -1.59 163.61 113.6% Bullish RED 116 .03 .157 ---------------------------------------------------------------------------------------------------------- CRM 254.23 -1.74 261.83 -147.4% Bearish RED 191 -.036 .307 +++ ---------------------------------------------------------------------------------------------------------- CSCO 39.06 -.14 39.89 -104.5% Bearish RED 115 -.098 -.19 --- ---------------------------------------------------------------------------------------------------------- CVX 70.87 -.81 72.95 -143.5% Bearish RED 77 -.146 -.226 --- ---------------------------------------------------------------------------------------------------------- DIS 126.63 1.68 126.59 1.6% Bearish BLUE 100 -.029 -.047 ---------------------------------------------------------------------------------------------------------- DOW 48.55 -.79 48.83 -28.5% Bearish RED 59 -.196 .074 ---------------------------------------------------------------------------------------------------------- GS 202.91 -5.12 211.23 -200% Bearish RED 63 -.099 -.056 ---------------------------------------------------------------------------------------------------------- HD 284.51 -1.53 287.09 -45% Bearish RED 156 -.045 .018 ---------------------------------------------------------------------------------------------------------- HON 172.87 -.39 173.47 -17.3% ------- BLUE 107 -.091 .061 ---------------------------------------------------------------------------------------------------------- IBM 115.06 -2.31 125.94 -439% Bearish RED 111 -.363 -.109 --- ---------------------------------------------------------------------------------------------------------- INTC 53.5 .07 53.55 -4.6% Bullish BLUE 89 -.123 .093 ---------------------------------------------------------------------------------------------------------- JNJ 143.93 -.62 148.1 -142.4% Bearish RED 107 -.161 -.038 ---------------------------------------------------------------------------------------------------------- JPM 99.37 -1 100.22 -42.2% ------- RED 28 -.01 -.06 ---------------------------------------------------------------------------------------------------------- KO 49.99 -.26 50.12 -13% ------- ---- 81 -.031 .026 ---------------------------------------------------------------------------------------------------------- MCD 228.19 .74 227.62 12.5% ------- BLUE 131 -.071 .096 ---------------------------------------------------------------------------------------------------------- MMM 169.17 -1.78 168.4 22.7% ------- RED 92 -.182 .018 ---------------------------------------------------------------------------------------------------------- MRK 78.07 -.2 80.51 -153.9% Bearish RED 87 -.216 -.052 --- ---------------------------------------------------------------------------------------------------------- MSFT 214.8 .15 220.86 -139.1% ------- BLUE 155 -.031 .039 ---------------------------------------------------------------------------------------------------------- NKE 129.43 .94 127.66 69.1% ------- BLUE 126 -.104 .214 ---------------------------------------------------------------------------------------------------------- PG 143.25 .77 144.04 -27.6% ------- BLUE 98 -.033 .058 ---------------------------------------------------------------------------------------------------------- TRV 125 6.89 112.03 570.9% Bullish BLUE 80 .112 .025 ---------------------------------------------------------------------------------------------------------- UNH 322.79 -.62 321.85 14.5% Bullish RED 113 -.061 .006 ---------------------------------------------------------------------------------------------------------- V 198.43 .73 202.2 -94.6% Bearish BLUE 95 -.178 -.014 ---------------------------------------------------------------------------------------------------------- VZ 56.75 -.5 58.43 -145.2% Bearish RED 111 -.12 -.047 ---------------------------------------------------------------------------------------------------------- WBA 37.39 -.1 35.91 199.5% ------- BLUE 82 -.07 -.124 ---------------------------------------------------------------------------------------------------------- WMT 144.4 .5 143.94 16% ------- BLUE 128 -.114 .092 |
     Table 2   QUICKSILVER on ETFS - 10/20/20
               Bullish = 0
               Bearish = 1  OIH
ITRS + IP21>.25 is considered "Bullish"
ETF CLOSE CHANGE PIVOT-PT 5-dma AROC CL-PWR CANDLE IP21 ITRS --------------------------------------------------------------------------------------------- --------------------------------------------------------------------------------------------- DIA 281.97 -.98 285.04 -55.6% Bearish RED -.103 ---- --------------------------------------------------------------------------------------------- SPY 342.73 -.65 347.5 -75.2% Bearish RED -.134 .013 --------------------------------------------------------------------------------------------- QQQ 284.19 -.22 290.1 -136.7% Bearish RED -.035 .054 --------------------------------------------------------------------------------------------- MDY 359.14 -2.36 364.95 -32.3% ------- RED .024 -.005 --------------------------------------------------------------------------------------------- IWM 159.38 -1.38 162.75 -53% ------- RED .015 -.001 --------------------------------------------------------------------------------------------- FAS 37.33 -.18 38.12 10.7% Bearish RED -.081 -.049 --------------------------------------------------------------------------------------------- SOXL 293.84 -6.34 310.5 -312.4% ------- RED 0 .246 --------------------------------------------------------------------------------------------- TECL 322.21 -.98 341.38 -361.4% Bearish BLUE-.045 .152 --------------------------------------------------------------------------------------------- IBB 134.19 -2.34 139.21 -297% Bearish RED -.027 0 --------------------------------------------------------------------------------------------- GLD 180.6 1.35 178.92 65.2% Bearish BLUE-.021 -.014 --------------------------------------------------------------------------------------------- OIH 99 -1.26 102.34 -107.5% Bearish RED -.126 -.314 Bearish --------------------------------------------------------------------------------------------- |
   Table 3 Count of Stocks in Key Directories
            20201021
-------------------------------
NEWHIGHS       133
NEWLOWS        63
MAXCP          10
MINCP          97  Bearish
TTTNH          20
TTTNL          34
FASTUP         66
FASTDOWN       80
CPCROSSA       64
CPCROSSD       88
BIGVOLUP       4
BIGVODN        13
ACCUMVER       146
HIGHIP21       5
HIUPPCT        38
REDSELL        90
AUGSELS7       105
TRAPDOOR       9
|
 Table 4   RANKING OF KEY DIRECTORIES BASED PCT.OF STOCKS ABOVE 65-DMA
              10/21/20
 Bullish = 34
 Bearish = 12
---------------------------------------------------------------------------------------
Directory     Current       day-1         day-2         day-3         day-4         day-5
----------------------------------------------------------------------------------------
SOLAR          .909          .909          .909          .909          .909          .909
AUTO           .82           .794          .717          .769          .82           .769
TRANSP         .8            .8            .8            .75           .8            .8
INFRA          .771          .714          .714          .742          .742          .771
CHEM           .77           .75           .77           .812          .791          .729
GREEN          .761          .809          .761          .809          .809          .857
NIFTY          .755          .822          .777          .777          .777          .844
UTILITY        .736          .789          .815          .789          .815          .789
INDEXES        .723          .717          .706          .723          .728          .751
SEMI           .721          .769          .75           .74           .769          .74
JETS           .714          .785          .714          .642          .571          .642
HOMEBLDG       .705          .823          .823          .823          .823          .823
COMPUTER       .7            .75           .8            .7            .7            .75
ELECTRON       .7            .734          .721          .721          .734          .727
REGBANKS       .692          .615          .5            .692          .615          .346
RETAIL         .673          .673          .673          .755          .775          .714
NASD-100       .67           .72           .7            .78           .78           .84
INDMATER       .653          .653          .626          .666          .68           .64
SOFTWARE       .633          .633          .6            .666          .683          .666
COPPER         .625          .5            .5            .5            .5            .625
FINANCE        .621          .597          .573          .585          .56           .487
SP500          .621          .638          .623          .686          .693          .691
HOSPITAL       .619          .619          .666          .666          .666          .666
DJI-13         .615          .692          .692          .692          .692          .692
CHINA          .6            .6            .6            .66           .56           .62
DOWJONES       .6            .633          .633          .666          .666          .7
RUS-1000       .593          .61           .575          .646          .66           .643
ETFS           .589          .589          .535          .517          .517          .625
COMODITY       .585          .585          .585          .56           .609          .609
INSURANC       .576          .461          .307          .461          .461          .346
FOOD           .557          .576          .557          .538          .596          .596
FIDSTKS        .542          .582          .571          .628          .634          .651
GUNS           .533          .6            .6            .6            .666          .666
SP-100         .527          .56           .56           .637          .637          .659
===============================================================================================
GAMING         .523          .476          .523          .523          .523          .619
BIGBANKS       .428          .571          .571          .571          .571          .571
BIOTECH        .417          .475          .497          .55           .537          .553
BEVERAGE       .357          .428          .357          .571          .5            .714
HACKERS        .35           .35           .3            .45           .55           .55
EDU            .333          .333          .333          .333          .333          .333
REIT           .297          .312          .241          .333          .382          .354
COAL           .285          .285          .285          .285          .428          .428
OILGAS         .23           .246          .238          .253          .293          .269
MILITARY       .214          .285          .321          .321          .285          .25
GOLD .204 .204 .142 .204 .265 .326 BONDFUND .168 .168 .118 .118 .128 .207 |
=====================================================================
10/20/2020 QE-Infininity
and the Bullish partisans continue to hold the market up.
But weak closings are becoming a problem.
Hedging with the bullish MAXCPs and bearish MINCPs
is still recommended.
The Solar Energy stocks and TAN, their ETF, are resuming their own
bull market. More biotechs are appearing among the MINCPS. China's
BABA continues to look good.
TAN - Opens higher 64.3% of the time. |
BABA Opens up 63.8% of the time. |
QE-Infinity Software Coming Soon.
| Ever since the FED has generously provided Wall Street an
unlimited amount of buying of their corporate bonds, all dips have been buying opportunities. The amount of money the FED has put into the bond market and therefore the stock market is un-matched in history. History guides us only to the extent that we look at the DJI since April. But this is still helpful, so long as the FED does not change its mind. When they do, expect to see much weakened breadth, steeply falling Opening and Closing Power and head/shoulders top formations. That is what happened in 1930 and 1932 when the FED changed their minds because they feared inflation.  |
I think we have to assume, till proven otherwise, that all dips to the
DJI's 3.5% will likely be supported over-poweringly by the FED. Rallies
to the 3.5% upper band that are not confirmed by the breadth indicators,
P-I and the A/D Line will likely bring declines back to the lower
band. I have created a new set of Peerless B2s and S2s under the
pull-down menu "QE-INFINITY" for the present market. It will be
posted on the ESP Page tomorrow.
The QE-Infinity signals only have this year since April to guide us. So, we
must appreciate their limitations. For exmple, two weeks ago the DJI
closed 3.7% over the 21-dma with the IP21 negative and the P-I well
above +200. Should this be a Sell S2 using the QE-Infinity program?
I have chosen "no" as the answer because of the bullish seasonality at
this time of year in Presidential Elections and because of the special
bullishness of the FED's QE-Infinity. But, it is possible this was a
minor top, especially if Congess cannot agree on a relief payment to those
out of work, rent money and food.
Also making the market tricky is the war going on between Opening
and Closing Power. The former is rising and the latter is weakening.
The DJI seems stuck in its narrow range. So, this is a good time to
buy the strongest AI/200 stocks and ETFs and short OIX and big
oils like Exxon and big banks.
Peerless signals on DJIA without QE-Infinity - Watch A/D Line uptrend. |
| DIA - Will CLosing Power start falling and will that cause Opening Power
to turn down? That is a possibility..  |
SPY |
QQQ |
 Table 1
             10/20/2018   QUICKSILVER on DJI-30 STOCKS.
P21 + ITRS score >+.25 is bullish
             2  Bullish  (CAT CRM)
             2  Bearish ( CVX IBM)
HIGHEST AI/200 = CRM Second Highest Tied = AAPL and MSFT STOCKS CLOSECHANGE PIVOT-PT 5-dma AROC CL-PWR CANDLE AI/200 IP21 ITRS ------------------------------------------------------------------------------------------------------- ------------------------------------------------------------------------------------------------------- AAPL 117.51 1.53 121.1 -150.1% ------- BLUE 156 .053 .025 ---------------------------------------------------------------------------------------------------------- AMGN 231.1 .39 239.34 -174.8% Bearish ---- 131 -.101 -.047 ---------------------------------------------------------------------------------------------------------- AXP 103.14 .67 105.01 -89.6% ------- BLUE 91 -.061 -.002 ---------------------------------------------------------------------------------------------------------- BA 167.24 .13 162.14 154.7% Bearish RED 33 -.173 -.085 --- ---------------------------------------------------------------------------------------------------------- CAT 168.99 1.46 162.12 207.7% Bullish BLUE 116 .088 .173 +++ ---------------------------------------------------------------------------------------------------------- CRM 255.97 .96 266.83 -208.9% Bearish RED 192 .001 .281 +++ ---------------------------------------------------------------------------------------------------------- CSCO 39.2 -.1 39.81 -76.6% Bearish RED 116 -.052 -.196 ---------------------------------------------------------------------------------------------------------- CVX 71.68 .4 73.4 -118.1% Bearish RED 77 -.15 -.218 --- ---------------------------------------------------------------------------------------------------------- DIS 124.95 .72 128.96 -158.1% Bearish BLUE 100 -.017 -.047 ---------------------------------------------------------------------------------------------------------- DOW 49.34 .5 47.88 149.7% Bearish ---- 59 -.133 .084 ---------------------------------------------------------------------------------------------------------- GS 208.03 2.34 210.81 -66.7% Bearish BLUE 63 -.076 -.024 ---------------------------------------------------------------------------------------------------------- HD 286.04 2.31 290.36 -75.2% Bearish BLUE 157 .017 .024 ---------------------------------------------------------------------------------------------------------- HON 173.26 1.67 171.55 49.5% ------- BLUE 108 -.025 .069 ---------------------------------------------------------------------------------------------------------- IBM 117.37 -8.15 125.1 -308% Bearish RED 111 -.318 -.094 --- ---------------------------------------------------------------------------------------------------------- INTC 53.43 -1.15 53.83 -37% ------- RED 90 -.114 .068 ---------------------------------------------------------------------------------------------------------- JNJ 144.55 .23 148.36 -129.4% Bearish RED 108 -.138 -.041 ---------------------------------------------------------------------------------------------------------- JPM 100.37 .57 100.78 -20.3% ------- BLUE 28 -.003 -.02 ---------------------------------------------------------------------------------------------------------- KO 50.25 .63 50.22 3% ------- BLUE 81 -.005 .036 ---------------------------------------------------------------------------------------------------------- MCD 227.45 1.45 227.35 2.2% ------- BLUE 132 -.038 .097 ---------------------------------------------------------------------------------------------------------- MMM 170.95 1.4 166.63 127.9% ------- BLUE 93 -.136 .042 ---------------------------------------------------------------------------------------------------------- MRK 78.27 -.4 80.71 -153% Bearish RED 87 -.165 -.05 ---------------------------------------------------------------------------------------------------------- MSFT 214.65 .43 222.86 -187.1% ------- RED 156 .018 .013 ---------------------------------------------------------------------------------------------------------- NKE 128.49 1.06 129.2 -27.7% Bullish BLUE 127 -.045 .202 ---------------------------------------------------------------------------------------------------------- PG 142.48 .57 144.21 -60.2% ------- RED 98 -.016 .045 ---------------------------------------------------------------------------------------------------------- TRV 118.11 6.27 112.89 231.9% ------- BLUE 80 .008 -.026 ---------------------------------------------------------------------------------------------------------- UNH 323.41 -.81 331.42 -122.7% Bullish RED 114 -.069 -.004 ---------------------------------------------------------------------------------------------------------- V 197.7 .73 204.32 -165% Bearish BLUE 96 -.103 -.013 ---------------------------------------------------------------------------------------------------------- VZ 57.25 -.05 59.36 -181.1% Bearish RED 112 -.076 -.047 ---------------------------------------------------------------------------------------------------------- WBA 37.49 .52 36.18 177.9% ------- BLUE 82 -.063 -.143 ---------------------------------------------------------------------------------------------------------- WMT 143.9 .95 146.23 -80.6% ------- RED 128 -.066 .074 |
Table 2 QUICKSILVER on ETFS - 10/20/20 Bullish = 1 SOXL
Bearish = 1 OIH
ITRS + IP21>.25 is considered "Bullish"
ETF CLOSE CHANGE PIVOT-PT 5-dma AROC CL-PWR CANDLE IP21 ITRS --------------------------------------------------------------------------------------------- --------------------------------------------------------------------------------------------- DIA 282.95 .92 285.13 -66.5% ------- RED -.024 ---- --------------------------------------------------------------------------------------------- SPY 343.38 1.37 347.93 -97.3% ------- ---- -.067 .006 --------------------------------------------------------------------------------------------- QQQ 284.41 .61 292.06 -174.4% Bearish RED .021 .035 --------------------------------------------------------------------------------------------- MDY 361.5 1.68 361.48 -24.7% ------- RED .082 .001 --------------------------------------------------------------------------------------------- IWM 160.76 .35 161.09 -59.9% ------- RED .077 .002 --------------------------------------------------------------------------------------------- FAS 37.51 .92 37.25 -118% Bearish BLUE -.079 -.034 --------------------------------------------------------------------------------------------- SOXL 300.18 -.96 312.97 -287.8% ------- RED .064 .23 Bullish --------------------------------------------------------------------------------------------- TECL 323.19 2.94 346.35 -426.6% Bearish RED .011 .09 --------------------------------------------------------------------------------------------- IBB 136.53 -.9 142.45 -277.7% Bearish RED .078 -.005 --------------------------------------------------------------------------------------------- GLD 179.25 .86 178.27 42.9% Bearish BLUE -.026 -.075 --------------------------------------------------------------------------------------------- OIH 100.26 3.27 101.14 33.2% Bearish BLUE -.115 -.302 Bearish --------------------------------------------------------------------------------------------- GASL 3440 285 3685 -325.1% ------- RED -.021 .096 --------------------------------------------------------------------------------------------- |
  Table 3  Count of Stocks in Key Directories
           20201020
-------------------------------
NEWHIGHS       148
NEWLOWS        45
MAXCP          22
MINCP          61   Bearish plurality
TTTNH          24
TTTNL          33
FASTUP         61
FASTDOWN       77
CPCROSSA       59
CPCROSSD       62
BIGVOLUP       3
BIGVODN        5
ACCUMVER       146
HIGHIP21       5
HIUPPCT        47
REDSELL        86
AUGSELS7       74
TRAPDOOR       8
|
Table 4 RANKING OF KEY DIRECTORIES BASED PCT.OF STOCKS ABOVE 65-DMA
10/20/20
Bullish = 33
Bearish = 12
---------------------------------------------------------------------------------------
Directory Current day-1 day-2 day-3 day-4 day-5
----------------------------------------------------------------------------------------
SOLAR .909 .909 .909 .909 .909 .909
HOMEBLDG .823 .823 .823 .823 .823 .823
NIFTY .822 .777 .777 .777 .822 .844
GREEN .809 .761 .809 .809 .857 .857
TRANSP .8 .8 .75 .8 .8 .8
AUTO .794 .717 .769 .82 .769 .794
UTILITY .789 .815 .789 .815 .815 .789
JETS .785 .714 .642 .571 .642 .714
SEMI .769 .75 .74 .769 .75 .788
CHEM .75 .77 .812 .791 .729 .77
COMPUTER .75 .8 .7 .7 .75 .75
ELECTRON .734 .721 .721 .734 .734 .741
NASD-100 .72 .7 .78 .78 .81 .87
INDEXES .717 .706 .723 .728 .751 .745
INFRA .714 .714 .742 .742 .771 .742
DJI-13 .692 .692 .692 .692 .692 .692
RETAIL .673 .673 .755 .775 .714 .714
INDMATER .653 .626 .666 .68 .626 .653
SP500 .638 .626 .686 .693 .686 .716
DOWJONES .633 .633 .666 .666 .7 .733
SOFTWARE .633 .616 .666 .683 .65 .633
HOSPITAL .619 .666 .666 .714 .714 .666
REGBANKS .615 .5 .692 .615 .346 .538
RUS-1000 .61 .576 .646 .66 .641 .671
CHINA .6 .6 .66 .56 .62 .58
GUNS .6 .6 .6 .666 .666 .666
FINANCE .597 .573 .585 .56 .487 .597
ETFS .589 .535 .517 .517 .625 .607
COMODITY .585 .585 .56 .609 .609 .585
FIDSTKS .582 .571 .628 .634 .64 .685
FOOD .576 .557 .538 .596 .596 .576
BIGBANKS .571 .571 .571 .571 .571 .714
SP-100 .56 .56 .637 .637 .659 .692
========================================================================================
COPPER .5 .5 .5 .5 .625 .5
========================================================================================
GAMING .476 .523 .523 .523 .619 .666
BIOTECH .475 .497 .553 .537 .542 .585
INSURANC .461 .307 .461 .461 .346 .461
BEVERAGE .428 .357 .571 .5 .714 .714
HACKERS .35 .35 .45 .55 .55 .5
EDU .333 .333 .333 .333 .333 .333
REIT .312 .241 .333 .382 .368 .432
COAL .285 .285 .285 .428 .428 .571
MILITARY .285 .321 .321 .285 .25 .214
OILGAS .246 .238 .246 .293 .269 .285
GOLD .204 .142 .204 .265 .326 .285
BONDFUND .168 .118 .118 .128 .207 .287
|
=========================================================================
10/19/2020 Tuesday's
trading will be a good test for how much support there is
for the market. The bull market depends upon the support given it
by the FED and occasionally by the relief packages of Congress. Now
it looks like there will be no Congressional relief package for a while.
News of that lost the DJI 600 points from Monday's opening and caused
Closing Power trend-breaks and a very big red candle-sticks on the key indexes'
charts. The bullish camp needs to see a "blue" candle-stick day, i.e. a
close above
what looks like will be a higher opening on Tuesday. Another "red"
candle-stick
day will be bearish. Tomorrow (Tuesday) will show us just how much support
there is for the market courtesy of QE-Infinity and partisan buying.
With the DJI up +200 after its big decline at the close Monday, I am
reminded of the Presidential Election Year 2000. One could make very
good money day after day buying exactly at the close and selling soon
after the NYSE opening. Let's hope that 2021 does not behave like 2001.
There is a big difference between then and now, fortunately. 53.4% of the Closings
for the last 12 months have been above the openings. At the end of the year 2000,
that number was just above 48%. (One warning: do not employ this tactic of
buying on a very weak closing once key supports have been broken. At that point,
both openings and the next day's opening will probably be down. )
DJI - Peerless 2020 version. |
DIA- Openings are much stronger than closings. So beware of
another badly faded market. |
SP-500 is near its highs and above its rising 65-dma. It shows no
head/shoulders top. |
NASDAQ - Bullishly near its highs and above its rising 65-dma. It
shows no head/shoulders top. QQQ; We have to be on watch for another badly faded opening and then a violation of the 65-dma. If QQQ can avoid that, look for a rally back up to its resistance-line shown below. 
|
My belief is that the support from QE-Infinity and the partisans who
want to dump Trump as President will still control the market and
permit a November new high, as is customary in Presidential Election
years. After that, the FED will have fulfilled its political commitment to
prop the DJI up during the Presidential campaign and then there is apt to be
lots of second thoughts about what a Biden and Democrat victory may do
to perturb Wall Street.
For now, I would remain hedged. Despite its vacillations, the DJI is little
changed from two months ago. Meanwhile our hedging has worked out.
Big oil (like XOM) and big bank stocks (like WFC) continue to hover just
above or at new lows, while at the same time, the high Accumulation growth
stocks/ETFs (like CRM, BABA, ARCW) and bullish MAXCPs deserve
to be held long.
New ideas: TAN seems ready for a fresh, new breakout. Solar is
ranked #1 in Table 4. Watch NVDA to see if can coming bounding back
after today's decline. That would be a bullish sign.
|
Charts 10/19/2020 (Click on Underlined link.) 2020 PEERLESS DJI, Signals, Indicators Daily DJI Volume 10-DayUp/Down Vol Stoch-20 Inverted Traders Index Graph of Pct of All Stocks above 65-dma Cum. Inverted Traders Index NASDAQ S&P OEX NYSE COMPQX DJI-15 DJI-20 DJI-30 DIA QQQ MDY IWM TNA Short-Term Rates DOLLAR-UUP SPY http://tigersoft.com/2121CST/SPY.GIF recent 2006 vers-Peerless signals -- http://tigersoft.com/NEWPEER/UPD6119.BMP USO-CrudeOil DBO FAS GLD BBH IBB JETS JNUG KOL NUGT OIH PALL RSX RETL SDS AGQ SLV SOXL TECL TLT TMF TNA UGA (gasoline) USO (oil) and China: YINN CHAU Commodities: CANE CORN DBC JJC, NIB, CHOC CORN, CUT (paper) MOO, SOYB WEAT UUP (Dollar) LIT (Lithium) Stocks AAPL ADBE ALXN AMAT AMGN AMD AMZN AXP BA BABA BAC BIDU BLDP CAT CRM CVX CMG DE ENPH FB GILD GOOG GS HD IBM INTU JPM LRCX M (Macy's) MSFT NEM NFLX NKE NVDA PG REGN REV SO SQ QCOM QDEL TSLA TXN XOM V VRTX WFC WMT TOWN ZM New highs and Bullish MAXCPs http://tigersoft.com/MAXCP/10-19/BULLISH.htm Bearish MAXCPs - http://tigersoft.com/MINCP/10-19/BEARISH.htm |
 Table 1
             10/19/2018   QUICKSILVER on DJI-30 STOCKS.
P21 + ITRS score >+.25 is bullish
             2  Bullish  (CAT CRM)
             2  Bearish (  CVX WBA)
HIGHEST AI/200 = CRM Second Highest Tied = AAPL and MSFT STOCKS CLOSECHANGE PIVOT-PT 5-dma AROC CL-PWR CANDLE AI/200 IP21 ITRS ------------------------------------------------------------------------------------------------------- ------------------------------------------------------------------------------------------------------- AAPL 115.98 -3.04 124.4 -347.1% ------- RED 156 .109 .017 ---------------------------------------------------------------------------------------------------------- AMGN 230.71 -5.01 239.51 -185.3% Bearish RED 132 -.093 -.068 ---------------------------------------------------------------------------------------------------------- AXP 102.47 -2.44 106.61 -196.9% Bearish RED 92 -.045 .006 ---------------------------------------------------------------------------------------------------------- BA 167.11 -.24 167.35 -7.3% Bearish RED 33 -.165 -.044 ---------------------------------------------------------------------------------------------------------- CAT 167.53 -1.22 162.61 149.6% Bullish RED 116 .071 .215 +++ ---------------------------------------------------------------------------------------------------------- CRM 255.01 -3.54 267.07 -229.8% Bearish RED 192 .059 .241 +++ ---------------------------------------------------------------------------------------------------------- CSCO 39.3 -.86 40.36 -132.4% Bearish RED 117 -.046 -.198 ---------------------------------------------------------------------------------------------------------- CVX 71.28 -1.61 74.51 -219.9% Bearish RED 77 -.103 -.206 --- ---------------------------------------------------------------------------------------------------------- DIS 124.23 -2.58 124.97 -29.1% Bearish RED 100 -.019 -.071 ---------------------------------------------------------------------------------------------------------- DOW 48.84 -.46 48.58 26.7% Bearish RED 59 -.13 .119 ---------------------------------------------------------------------------------------------------------- GS 205.69 -.52 214.12 -200.5% ------- RED 64 .007 -.039 ----------------------------------------------------------------------------------------- ----------------- HD 283.73 -3.93 286.91 -55.2% Bearish RED 157 .076 .018 ---------------------------------------------------------------------------------------------------------- HON 171.59 -3.27 175.36 -108.6% ------- RED 109 -.021 .079 ---------------------------------------------------------------------------------------------------------- IBM 125.52 -.41 127.21 -67.2% Bearish RED 111 -.2 -.023 ---------------------------------------------------------------------------------------------------------- INTC 54.58 .42 53.88 65% Bullish BLUE 91 -.024 .109 ---------------------------------------------------------------------------------------------------------- JNJ 144.32 -3.78 151.84 -252.8% Bearish RED 109 -.127 -.056 ---------------------------------------------------------------------------------------------------------- JPM 99.8 -1.71 102.44 -130.3% ------- RED 28 .046 -.023 ---------------------------------------------------------------------------------------------------------- KO 49.62 -.41 51.09 -146.2% Bearish RED 82 -.029 .011 ---------------------------------------------------------------------------------------------------------- MCD 226 -3.37 226.11 -2.4% ------- RED 133 -.006 .078 ---------------------------------------------------------------------------------------------------------- MMM 169.55 -1.42 168.65 26.7% Bearish RED 94 -.156 .044 ---------------------------------------------------------------------------------------------------------- MRK 78.67 -1.16 80.36 -105.5% Bearish RED 88 -.151 -.056 ---------------------------------------------------------------------------------------------------------- MSFT 214.22 -5.44 221.4 -162.5% ------- RED 156 .091 -.019 ---------------------------------------------------------------------------------------------------------- NKE 127.43 -.57 129.46 -78.9% Bullish RED 128 -.018 .224 ---------------------------------------------------------------------------------------------------------- PG 141.91 -2.48 144.49 -89.5% ------- RED 98 .052 .036 ---------------------------------------------------------------------------------------------------------- TRV 111.84 -1.48 116.54 -207.1% ------- RED 80 -.029 -.074 ---------------------------------------------------------------------------------------------------------- UNH 324.22 -5.68 329.97 -87.8% Bullish RED 115 .015 -.004 ---------------------------------------------------------------------------------------------------------- V 196.97 -3.29 206.4 -232.8% Bearish RED 97 -.095 -.024 ---------------------------------------------------------------------------------------------------------- VZ 57.3 -.75 59.55 -191.6% Bearish RED 113 -.075 -.048 ---------------------------------------------------------------------------------------------------------- WBA 36.97 -.44 36.93 5.4% Bearish RED 82 -.121 -.137 --- ---------------------------------------------------------------------------------------------------------- WMT 142.95 -1.76 144.25 -44.9% ------- RED 128 .038 .073 |
Table 2 QUICKSILVER on ETFS - 10/16/20 Bullish = 1 SOXL
Bearish = 1 OIH
ITRS + IP21>.25 is considered "Bullish"
ETF      CLOSE    CHANGE     PIVOT-PT    5-dma AROC  CL-PWR     CANDLE  IP21   ITRS
---------------------------------------------------------------------------------------------
---------------------------------------------------------------------------------------------
DIA       285.97    .93      288.46        .7%       Bullish      RED  .09   0
---------------------------------------------------------------------------------------------
SPY       347.29   -.21      352.43        6.3%      Bullish      RED  .037  -.005
---------------------------------------------------------------------------------------------
QQQ       288.51   -1.59     294.53        48%       Bullish      RED  .104   .006
---------------------------------------------------------------------------------------------
MDY       364.01   -.94      366.13        2.5%      Bullish      RED  .144  -.001
---------------------------------------------------------------------------------------------
IWM       162.35   -.4       163.79       -10.8%     Bullish      RED  .108   .012
---------------------------------------------------------------------------------------------
FAS       38.23    .11       40.55        -126.6%    Bearish      RED -.015  -.002
---------------------------------------------------------------------------------------------
SOXL      306.07   -4.43     318.39        14.9%     Bullish      RED  .147   .186 +++
---------------------------------------------------------------------------------------------
TECL      338.84   -2.54     358.71        99.5%     Bullish      RED  .112   .055
---------------------------------------------------------------------------------------------
IBB       139.71    .5       143.65       -99%       -------      BLUE .17   -.022
---------------------------------------------------------------------------------------------
GLD       178.3   -.62       180.56       -77.5%     Bearish      RED  .029  -.124
---------------------------------------------------------------------------------------------
OIH       97.1   -5.24       102.4        -280.8%    Bearish      RED -.146  -.318 ---
---------------------------------------------------------------------------------------------                      QUICKSILVER on ETFS - 10/19/20
ETF CLOSE CHANGE PIVOT-PT 5-dma AROC CL-PWR CANDLE IP21 ITRS --------------------------------------------------------------------------------------------- DIA 282.03 -3.94 286.74 -112.3% ------- RED .07 0 --------------------------------------------------------------------------------------------- BA 167.11 -.24 162.14 -7.3% Bearish RED -.165 -.044 --------------------------------------------------------------------------------------------- SPY 342.01 -5.28 350.13 -149.3% ------- RED .023 -.005 --------------------------------------------------------------------------------------------- QQQ 283.8 -4.71 294.52 -183.8% ------- RED .089 .018 --------------------------------------------------------------------------------------------- MDY 359.82 -4.19 363.29 -86.7% ------- RED .134 -.008 --------------------------------------------------------------------------------------------- IWM 160.41 -1.94 162.7 -104% ------- RED .081 0 --------------------------------------------------------------------------------------------- FAS 36.59 -1.64 38.4 -514.2% Bearish RED -.03 -.066 --------------------------------------------------------------------------------------------- RETL 269.05 -11.25 283.96 -132.5% ------- RED .093 .121 --------------------------------------------------------------------------------------------- SOXL 301.14 -4.93 318.01 -275.4% ------- RED .144 .225 --------------------------------------------------------------------------------------------- TECL 320.25 -18.59 352.18 -553.4% ------- RED .1 .059 --------------------------------------------------------------------------------------------- IBB 137.43 -2.28 144.34 -219.2% Bearish RED .093 -.018 --------------------------------------------------------------------------------------------- GLD 178.39 .09 177.72 -60.7% Bearish RED .01 -.092 --------------------------------------------------------------------------------------------- OIL 178.39 .09 177.72 -60.7% Bullish RED -.032 22.727 --------------------------------------------------------------------------------------------- OIH 96.99 -.11 99.6 -269.1% Bearish RED -.155 -.305 --------------------------------------------------------------------------------------------- GASL 3440 285 3685 -325.1% ------- RED -.021 .086 --------------------------------------------------------------------------------------------- UGA 3440 285 3685 -325.1% ------- RED .197 170.032 --------------------------------------------------------------------------------------------- UUP 25.98 -.06 26.26 -53.5% ------- -----.019 -.048 --------------------------------------------------------------------------------------------- IEF 25.98 -.06 26.26 -53.5% Bullish -----.025 -.814 --------------------------------------------------------------------------------------------- CORN 25.98 -.06 26.26 -53.5% ------- ---- .051 1.045 --------------------------------------------------------------------------------------------- WEAT 25.98 -.06 26.26 -53.5% ------- ---- .047 3.671 --------------------------------------------------------------------------------------------- YINN 25.98 -.06 26.26 -53.5% ------- -----.007 .567 --------------------------------------------------------------------------------------------- RSX 20.7 -.03 21.04 -131.1% Bearish RED .038 -.107 |
Table 3    Count of Stocks in Key Directories
           20201019
-------------------------------
NEWHIGHS       207
NEWLOWS        53
MAXCP          19
MINCP          70
TTTNH          19
TTTNL          59
FASTUP         59
FASTDOWN       77
CPCROSSA       14
CPCROSSD       268
BIGVOLUP       1
BIGVODN        6
ACCUMVER       142
HIGHIP21       10
HIUPPCT        39
REDSELL        73
AUGSELS7       40
TRAPDOOR       8
|
Table 4 RANKING OF KEY DIRECTORIES BASED PCT.OF STOCKS ABOVE 65-DMA
              10/19/20
     Bullish = 33
     Bearish = 11
---------------------------------------------------------------------------------------
Directory     Current       day-1         day-2         day-3         day-4         day-5
----------------------------------------------------------------------------------------
ALL            .53           .58
-----------------------------------------------------------------------------------------
SOLAR          .909          .909          .909          .909          .909          .909
HOMEBLDG       .823          .823          .823          .823          .823          .941
UTILITY        .815          .789          .815          .815          .789          .789
COMPUTER       .8            .7            .7            .75           .75           .75
TRANSP         .8            .75           .8            .8            .8            .85
NIFTY          .777          .777          .777          .822          .844          .844
CHEM           .77           .812          .791          .729          .77           .75
GREEN          .761          .809          .809          .857          .857          .809
SEMI           .75           .74           .769          .75           .788          .788
ELECTRON       .721          .721          .734          .734          .741          .775
AUTO           .717          .769          .82           .769          .794          .743
INFRA          .714          .742          .742          .771          .742          .742
JETS           .714          .642          .571          .642          .714          .714
INDEXES        .706          .723          .728          .751          .751          .774
NASD-100       .7            .78           .78           .81           .87           .87
DJI-13         .692          .692          .692          .692          .692          .846
RETAIL         .673          .755          .775          .714          .714          .734
HOSPITAL       .666          .666          .714          .761          .666          .666
DOWJONES       .633          .666          .666          .7            .733          .766
INDMATER       .626          .666          .68           .626          .653          .666
SP500          .626          .689          .693          .686          .718          .771
SOFTWARE       .616          .683          .683          .65           .65           .683
CHINA          .6            .66           .56           .62           .58           .62
GUNS           .6            .6            .666          .666          .666          .733
COMODITY       .585          .56           .609          .609          .585          .56
RUS-1000       .576          .648          .66           .641          .677          .734
FINANCE        .573          .585          .56           .487          .597          .768
BIGBANKS       .571          .571          .571          .571          .714          .857
FIDSTKS        .571          .628          .634          .64           .685          .731
SP-100         .56           .637          .637          .659          .692          .747
FOOD           .557          .538          .596          .596          .576          .557
ETFS           .535          .517          .517          .625          .607          .714
GAMING         .523          .523          .523          .619          .666          .571
------------------------------------------------------------------------------------------------
COPPER         .5            .5            .5            .625          .5            .5
REGBANKS       .5            .692          .615          .346          .538          .73
------------------------------------------------------------------------------------------------
BIOTECH        .497          .553          .54           .542          .588          .553
BEVERAGE       .357          .571          .5            .714          .714          .785
HACKERS        .35           .5            .55           .55           .55           .5
EDU            .333          .333          .333          .333          .333          .333
MILITARY       .321          .321          .285          .25           .214          .357
INSURANC .307 .461 .461 .346 .461 .73 COAL .285 .285 .428 .428 .571 .571 REIT .241 .333 .382 .368 .439 .595 OILGAS .238 .246 .285 .269 .285 .277 GOLD .142 .204 .265 .326 .285 .346 BONDFUND .118 .118 .128 .207 .297 .277 |
=======================================================================
10/16/2020 Hedge by
owning the highest Accumulation Bullish Stocks and
stay short some of most bearish MINCPs, especially the weakest big
oils and big banks. Since April, this has been a more profitable strategy
than trading the DJI in its short-term fluctuations.
The only Peerless signals I would trust at this time are classic Sell S9s,
not S9-Vs. Sell S12s followed by a completed head/shoulders and
a weakening A/D Line will also be dangerously bearish if the FED does not
immediately send out accomodative signals to Wall Street. The most recent
example of this was Powell's telling us the QE-Infinity would last for years!
A quick DJI reversal then back above its 65-dma is bullish.
Seasonality remains bullish. The DJI rises on average +1.2% over the next
two week and shows the probability of an advance of 61.5% by just before the
election in Presidential Election years. We are in the period in election year
Octobers when political partisans usually sweep the market upwards
to new highs, but then most often there is a November peak..
Use the standard Peerless charts discriminatingly.
|
The DJI is most likely to retreat from above its 3.5% band when the NYSE
A/D Line fails to confirm a new high. Watch breadth now on the current rally.
The NYSE A/D is lagging.
DJI and A/D Line - A/D Line should top out when FED changes its
mind about QE-Infinity. |
| DIA - Closing Power is flat,
but Opening Power keeps advancing as DJI opens higher 57.4% of the time this past year. Closings are up 54% of time. Pink candle-sticks show closings below opening. After an advance, the change of color is short-term bearish.. - CandleStick show a nice upward price-channel now and resistance at 290..  |
The study of history lets us see some of its parallels but also see
what either has no parallel or, as they say, is "off the charts". The
FED's QE-Infinity is not entirely off the charts, but there is nothing
even close when measured.
See https://en.wikipedia.org/wiki/Quantitative_easing
Pity the market, when the FED changes its mind. 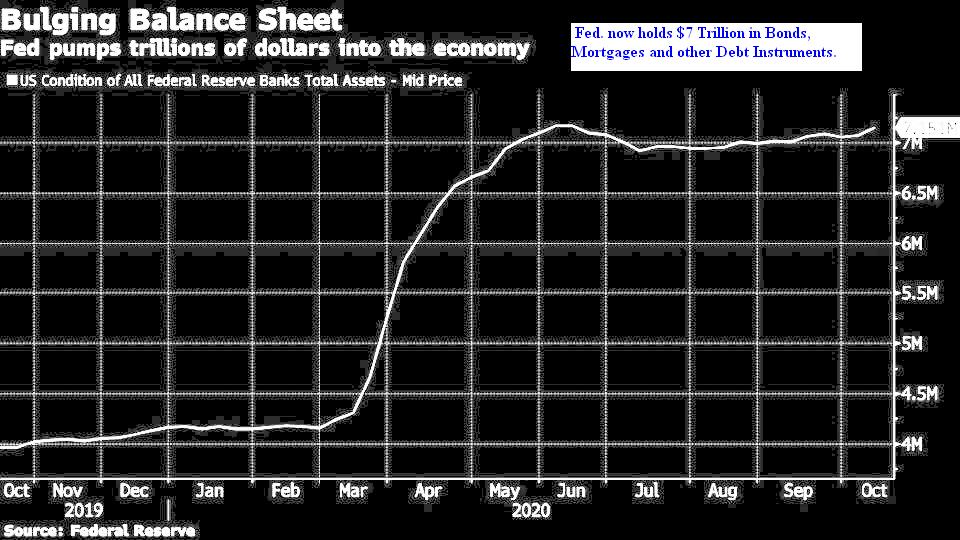 |
Semi-Conductors
With the FED standing ready to support the market, more speculative
growth stocks are especially favored, especially those involved in the new
home-working, home-entertaining and on-line home-ordering Covid-19 world.
That is why we have found lots of bullish MAXCPs that are far outpacing the
DJIA.
Semi-conductors offer unusual growth potential, but very little downside
so long as QE-Infinity continues. We see them near the top of Table 4, which
shows the percent of stocks in specifiic groups above their 65-dma.
NVDA is the highest AI/200 stock among semi-conductors. It is rising at
a rate of more than 200%/yr. 58% of its daily trading brings a gain.
Amazingly, declines like now to the upper band have generally been very good
times to buy. It shows a mini- H/S pattern. Let's see if this weak explodes
that pattern. I suspect it will.
 |
Watch also TAN. We took profits in it but it looks like it is preparing for
a flag-pattern breakout. These bring quick profits to nimble traders who
jump aboard when a new high is made.
TAN - Flag Pattern Breakout would be bullish. |
Chinese stocks are rising because of the country's long period of high growth
rate. Commuinism and consumerism apparently are quite compatible.
Asian markets favor China because of the risks in America from all
the political uncertainties and political divisions. Internet BABA is our favorite
here. While it may seem over-bought, the Chinese markets sometimes
go very hyperbolic. This could be the start of one of those times. The
internals are bullish enough.
BABA - high AI/200 and steadily advancing. |
CRM is our "Tahiti" DJI-30 stock. Each downtrend-break should
launch another advance.
CRM - "Tahiti"
DJI-30 stock - Buying dips to 21dma usually works well with these stocks. |
|
Charts 10/16/2020 (Click on Underlined link.) 2020 PEERLESS DJI, Signals, Indicators Daily DJI Volume 10-DayUp/Down Vol Stoch-20 Inverted Traders Index Graph of Pct of All Stocks above 65-dma Cum. Inverted Traders Index NASDAQ S&P OEX NYSE COMPQX DJI-15 DJI-20 DJI-30 DIA QQQ MDY IWM TNA Short-Term Rates DOLLAR-UUP SPY http://tigersoft.com/2121CST/SPY.GIF recent 2006 vers-Peerless signals -- http://tigersoft.com/NEWPEER/UPD6116.BMP USO-CrudeOil DBO FAS GLD BBH IBB JETS JNUG KOL NUGT OIH PALL RSX RETL SDS AGQ SLV SOXL TECL TLT TMF TNA UGA (gasoline) USO (oil) and China: YINN CHAU Commodities: CANE CORN DBC JJC, NIB, CHOC CORN, CUT (paper) MOO, SOYB WEAT UUP (Dollar) LIT (Lithium) Stocks AAPL ADBE ALXN AMAT AMGN AMD AMZN AXP BA BABA BAC BIDU BLDP CAT CRM CVX CMG DE ENPH FB GILD GOOG GS HD IBM INTU JPM LRCX M (Macy's) MSFT NEM NFLX NKE NVDA PG REGN REV SO SQ QCOM QDEL TSLA TXN XOM V VRTX WFC WMT TOWN ZM New highs and Bullish MAXCPs http://tigersoft.com/MAXCP/10-16/BULLISH.htm Bearish MAXCPs - http://tigersoft.com/MINCP/10-16/BEARISH.htm |
 Table 1
             10/16/2018   QUICKSILVER on DJI-30 STOCKS.
P21 + ITRS score >+.25 is bullish
             1  Bullish  (CRM)
             3  Bearish ( BA CVX IBM)
HIGHEST AI/200 = CRM Second Highest Tied = AAPL and MSFT STOCKS CLOSECHANGE PIVOT-PT 5-dma AROC CL-PWR CANDLE AI/200 IP21 ITRS ------------------------------------------------------------------------------------------------------- ------------------------------------------------------------------------------------------------------- AAPL 119.02 -1.69 116.97 84.8% Bullish RED 156 .074 .001 ---------------------------------------------------------------------------------------------------------- AMGN 235.72 .71 236.7 -20.6% Bearish BLUE 133 -.003 -.068 ---------------------------------------------------------------------------------------------------------- AXP 104.91 .48 106.34 -67.8% ------- RED 93 -.082 .05 ---------------------------------------------------------------------------------------------------------- BA 167.35 3.11 167.33 .6% Bearish RED 33 -.187 -.072 --- ---------------------------------------------------------------------------------------------------------- CAT 168.75 3.71 158.94 301.9% Bullish BLUE 116 .025 .212 ---------------------------------------------------------------------------------------------------------- CRM 258.55 .83 265.98 -140.8% Bearish RED 192 .077 .2 +++ ---------------------------------------------------------------------------------------------------------- CSCO 40.16 .19 39.85 38.8% Bearish BLUE 118 -.046 -.203 ---------------------------------------------------------------------------------------------------------- CVX 72.89 -.62 74 -75.3% Bearish RED 77 -.079 -.211 --- ---------------------------------------------------------------------------------------------------------- DIS 126.81 -.55 124.98 72.3% Bearish RED 100 -.025 -.075 ---------------------------------------------------------------------------------------------------------- DOW 49.3 .29 49.36 -6.2% ------- RED 59 -.149 .128 ---------------------------------------------------------------------------------------------------------- GS 206.21 -2.39 207.54 -31.6% ------- RED 64 .04 -.034 ---------------------------------------------------------------------------------------------------------- HD 287.66 .12 285.92 30.3% Bullish RED 157 .103 .024 ---------------------------------------------------------------------------------------------------------- HON 174.86 2.25 174.38 13.8% Bullish BLUE 109 -.016 .102 ---------------------------------------------------------------------------------------------------------- IBM 125.93 1.04 127.79 -73.7% Bearish BLUE 111 -.209 -.046 --- ---------------------------------------------------------------------------------------------------------- INTC 54.16 .31 52.82 125% Bullish BLUE 92 .023 .071 ---------------------------------------------------------------------------------------------------------- JNJ 148.1 .91 150.97 -96.1% ------- BLUE 110 -.014 -.04 ---------------------------------------------------------------------------------------------------------- JPM 101.51 -.21 101.2 15.3% Bullish BLUE 27 .064 0 ---------------------------------------------------------------------------------------------------------- KO 50.03 .04 50.81 -77.3% ------- ---- 83 -.044 .01 ---------------------------------------------------------------------------------------------------------- MCD 229.37 -.27 224.83 100% Bullish RED 134 -.045 .085 ---------------------------------------------------------------------------------------------------------- MMM 170.97 1.89 169.3 49.6% Bearish BLUE 95 -.208 .052 ---------------------------------------------------------------------------------------------------------- MRK 79.83 .77 80.36 -33% Bearish BLUE 89 -.096 -.059 ---------------------------------------------------------------------------------------------------------- MSFT 219.66 0 215.81 87.5% Bullish RED 156 .136 -.029 ---------------------------------------------------------------------------------------------------------- NKE 128 -1 130.98 -115.3% Bullish RED 129 -.06 .23 ---------------------------------------------------------------------------------------------------------- PG 144.39 .56 142.92 51.1% Bullish BLUE 97 .11 .044 ---------------------------------------------------------------------------------------------------------- TRV 113.32 .68 115.83 -110.1% ------- BLUE 81 -.046 -.048 ---------------------------------------------------------------------------------------------------------- UNH 329.9 5.33 327.84 31.5% Bullish BLUE 114 .053 .006 ---------------------------------------------------------------------------------------------------------- V 200.26 .71 206.64 -156.5% Bearish BLUE 98 -.087 -.037 ---------------------------------------------------------------------------------------------------------- VZ 58.05 -.11 59.33 -108.5% Bearish ---- 114 -.075 -.04 ---------------------------------------------------------------------------------------------------------- WBA 37.41 -.23 36.34 146.2% Bearish RED 82 -.073 -.129 ---------------------------------------------------------------------------------------------------------- WMT 144.71 .18 142.78 66.9% Bullish RED 127 -.004 .075 |
Table 2 QUICKSILVER on ETFS - 10/16/20 Bullish = 1 SOXL
Bearish = 1 OIH
ITRS + IP21>.25 is considered "Bullish"
ETF CLOSE CHANGE PIVOT-PT 5-dma AROC CL-PWR CANDLE IP21 ITRS --------------------------------------------------------------------------------------------- --------------------------------------------------------------------------------------------- DIA 285.97 .93 288.46 .7% Bullish RED .09 0 --------------------------------------------------------------------------------------------- SPY 347.29 -.21 352.43 6.3% Bullish RED .037 -.005 --------------------------------------------------------------------------------------------- QQQ 288.51 -1.59 294.53 48% Bullish RED .104 .006 --------------------------------------------------------------------------------------------- MDY 364.01 -.94 366.13 2.5% Bullish RED .144 -.001 --------------------------------------------------------------------------------------------- IWM 162.35 -.4 163.79 -10.8% Bullish RED .108 .012 --------------------------------------------------------------------------------------------- FAS 38.23 .11 40.55 -126.6% Bearish RED -.015 -.002 --------------------------------------------------------------------------------------------- SOXL 306.07 -4.43 318.39 14.9% Bullish RED .147 .186 +++ --------------------------------------------------------------------------------------------- TECL 338.84 -2.54 358.71 99.5% Bullish RED .112 .055 --------------------------------------------------------------------------------------------- IBB 139.71 .5 143.65 -99% ------- BLUE .17 -.022 --------------------------------------------------------------------------------------------- GLD 178.3 -.62 180.56 -77.5% Bearish RED .029 -.124 --------------------------------------------------------------------------------------------- OIH 97.1 -5.24 102.4 -280.8% Bearish RED -.146 -.318 --- --------------------------------------------------------------------------------------------- |
Table 3 Count of Stocks in Key Directories
20201016
-------------------------------
NEWHIGHS 238
NEWLOWS 31
MAXCP 41
MINCP 15
TTTNH 33
TTTNL 17
FASTUP 59
FASTDOWN 59
CPCROSSA 22
CPCROSSD 148
BIGVOLUP 4
BIGVODN 3
ACCUMVER 141
HIGHIP21 11
HIUPPCT 40
REDSELL 71
AUGSELS7 43
TRAPDOOR 10
|
 Table 4   RANKING OF KEY DIRECTORIES BASED PCT.OF STOCKS ABOVE 65-DMA
              10/16/20
Bullish = 36 Bearish = 8 --------------------------------------------------------------------------------------- Directory Current day-1 day-2 day-3 day-4 day-5 ---------------------------------------------------------------------------------------- SOLAR .909 .909 .909 .909 .909 1 HOMEBLDG .823 .823 .823 .823 .941 .941 CHEM .812 .791 .729 .77 .75 .75 GREEN .809 .809 .857 .857 .809 .904 UTILITY .789 .815 .815 .789 .789 .789 NASD-100 .78 .78 .81 .87 .87 .79 NIFTY .777 .777 .822 .844 .844 .777 AUTO .769 .82 .769 .794 .743 .769 RETAIL .755 .775 .714 .714 .714 .693 TRANSP .75 .8 .8 .8 .85 .95 INFRA .742 .742 .771 .742 .742 .771 SEMI .74 .769 .75 .788 .788 .798 ELECTRON .726 .739 .732 .746 .773 .78 INDEXES .723 .728 .751 .751 .774 .751 COMPUTER .7 .7 .75 .75 .75 .75 DJI-13 .692 .692 .692 .692 .846 .846 REGBANKS .692 .615 .346 .538 .73 .653 SP500 .689 .695 .686 .718 .766 .737 SOFTWARE .683 .7 .65 .65 .683 .583 DOWJONES .666 .666 .7 .733 .766 .766 HOSPITAL .666 .714 .761 .714 .714 .714 INDMATER .666 .68 .626 .653 .666 .666 CHINA .66 .56 .62 .58 .62 .6 RUS-1000 .648 .662 .641 .677 .731 .701 JETS .642 .571 .642 .714 .714 .928 SP-100 .637 .637 .659 .692 .747 .703 FIDSTKS .628 .634 .64 .685 .731 .691 GUNS .6 .666 .666 .666 .733 .733 FINANCE .585 .56 .487 .597 .768 .646 BEVERAGE .571 .5 .714 .714 .785 .857 BIGBANKS .571 .571 .571 .714 .857 .714 COMODITY .56 .609 .609 .585 .634 .682 BIOTECH .553 .54 .545 .588 .55 .561 FOOD .538 .596 .596 .576 .615 .653 GAMING .523 .523 .619 .666 .523 .523 ETFS .517 .517 .625 .607 .714 .732 --------------------------------------------------------------------------------------------- COPPER .5 .5 .625 .5 .5 .625 HACKERS .5 .6 .55 .55 .5 .35 --------------------------------------------------------------------------------------------- INSURANC .461 .461 .346 .461 .73 .615 EDU .333 .333 .333 .333 .333 .333 REIT .333 .382 .368 .439 .617 .531 MILITARY .321 .285 .25 .214 .357 .321 COAL .285 .428 .428 .571 .571 .714 OILGAS .244 .283 .259 .283 .275 .299 GOLD .204 .265 .326 .285 .408 .448 BONDFUND .118 .128 .207 .297 .287 .287 |
========================================================================
10/15/2020 A little rally now
lies ahead. Hopes of a political agreement
are playing out now. But the short-term is difficult to predict, except
that a November top is historically the most probable outcome given
that it is a Presidential Election Year. And even then, if I'm right about how
bullish QE-Infinity is, the next top will not produce more than a
9% decline, just like the worst seen already since April.
Technically, until we see some marked beadth divergences or a dramatic
break in the rising NYSE A/D Line, a November or perhaps a December
top is much, much more likely than an October top. Remember
to follow the NYSE A/D Line very closely now. It is our best
technical gauge of the FED's intentions.
DJI and A/D Line ---- Watch now for new highs unconfirmed by NYSE A/D
Line. |
Expect the NASDAQ to outperform the DJIA. Positive
"NASDJI" predicts that. |
Political Games
Wall Street is waiting for a new government relief bill to find
agreement among the Democrats and Republicans in Congress.
There are 8 million more "poor" Americans, says the NY Times.
McConnell says he will not put up for vote a $1.8 relief package
and Pelosi demands $2.2 trillion. To many this seems a "childish"
game of chicken played out before millions who are going huingry.
Today, the President says "think big". That is partly what lifted the
market and spurred a steady rally back to zero change from a -300
point down Futures.
The market, as they say, is now fully "event
driven". Without stimulus
it looks very vulnerable. We are at war with a dangerous virus, but
General Chaos seems in charge. What do Professionals on Wall Street
think of the messy political divide. Even they are confused. The
Closing Powers turned up a good ways today and the candle-stick
charts changed from red to blue. But one day is not enough.
Staying hedged at this point does not seem to be a bad idea. A portfolio
long the highest Accumulation techs and short the weakest big oil and big
bank MINCPs is my recommendation. A 5% correction is still possible
if the divisions on Capital Hill freeze over in the case of a Relief package.
Taking politicians at their word is always unwise. But, my guess is that
at the last moment, in two weeks, both sides will agree on $1.8 - $2. trillion.
Peerless DJIA and Cumulative Inverted MKDS (1/TRIN) and
Pct of Stocks over 65-dma.   |
Peerless did become a little more optimistic today. Our Accumulation Index
turned positive and the ratio of Up Volume to Down Volume is again
higher than the ratio of NYSE advances to declines. That's not much
to go on, I know. But perhaps, Big Money, will not be selling so heavily
for a while and the the DJI can get past 29000. Waiting and hedging seems
best.
DIA |
SPY |
QQQ |
|
Charts 10/15/2020 (Click on Underlined link.) 2020 PEERLESS DJI, Signals, Indicators Daily DJI Volume 10-DayUp/Down Vol Stoch-20 Inverted Traders Index Graph of Pct of All Stocks above 65-dma Cum. Inverted Traders Index NASDAQ S&P OEX NYSE COMPQX DJI-15 DJI-20 DJI-30 DIA QQQ MDY IWM TNA Short-Term Rates DOLLAR-UUP SPY http://tigersoft.com/2121CST/SPY.GIF recent 2006 vers-Peerless signals -- http://tigersoft.com/NEWPEER/UPD6115.BMP USO-CrudeOil DBO FAS GLD BBH IBB JETS JNUG KOL NUGT OIH PALL RSX RETL SDS AGQ SLV SOXL TECL TLT TMF TNA UGA (gasoline) USO (oil) and China: YINN CHAU Commodities: CANE CORN DBC JJC, NIB, CHOC CORN, CUT (paper) MOO, SOYB WEAT UUP (Dollar) LIT (Lithium) Stocks AAPL ADBE ALXN AMAT AMGN AMD AMZN AXP BA BABA BAC BIDU BLDP CAT CRM CVX CMG DE ENPH FB GILD GOOG GS HD IBM INTU JPM LRCX M (Macy's) MSFT NEM NFLX NKE NVDA PG REGN REV SO SQ QCOM QDEL TSLA TXN XOM V VRTX WFC WMT TOWN ZM New highs and Bullish MAXCPs http://tigersoft.com/MAXCP/10-15/BULLISH.htm Bearish MAXCPs - http://tigersoft.com/MINCP/10-15/BEARISH.htm |
 Table 1
             10/15/2018   QUICKSILVER on DJI-30 STOCKS.
P21 + ITRS score >+.25 is bullish
             1  Bullish  (CRM)
             1  Bearish ( IBM)
HIGHEST AI/200 = CRM Second Highest Tied = AAPL and MSFT STOCKS CLOSECHANGE PIVOT-PT 5-dma AROC CL-PWR CANDLE AI/200 IP21 ITRS ------------------------------------------------------------------------------------------------------- ------------------------------------------------------------------------------------------------------- AAPL 120.71 -.48 114.97 239.7% Bullish BLUE 156 .098 .049 ---------------------------------------------------------------------------------------------------------- AMGN 235.01 -2.64 240.09 -106.4% Bearish RED 134 .03 -.075 ---------------------------------------------------------------------------------------------------------- AXP 104.43 -.38 106.06 -77.1% ------- BLUE 94 -.068 .047 ---------------------------------------------------------------------------------------------------------- BA 164.24 1 168 -113.5% Bearish BLUE 33 -.099 -.106 ---------------------------------------------------------------------------------------------------------- CAT 165.04 1.43 156.66 260.6% Bullish BLUE 116 .04 .175 ---------------------------------------------------------------------------------------------------------- CRM 257.72 -4.11 260.22 -47.3% Bearish RED 192 .098 .224 +++ Bullish ---------------------------------------------------------------------------------------------------------- CSCO 39.97 .08 39.79 22.5% ------- BLUE 119 -.033 -.203 ---------------------------------------------------------------------------------------------------------- CVX 73.51 .56 75.22 -115.5% Bearish BLUE 77 -.029 -.205 ---------------------------------------------------------------------------------------------------------- DIS 127.36 .77 123.09 169.8% Bearish BLUE 100 -.009 -.05 ---------------------------------------------------------------------------------------------------------- DOW 49.01 .18 49.38 -37.9% ------- BLUE 59 -.084 .119 ---------------------------------------------------------------------------------------------------------- GS 208.6 -2.63 207.98 14.7% ------- RED 63 .029 -.028 ---------------------------------------------------------------------------------------------------------- HD 287.54 .45 284.52 52.6% Bullish BLUE 157 .146 .027 ---------------------------------------------------------------------------------------------------------- HON 172.61 -.86 173.78 -33.7% ------- BLUE 109 0 .097 ---------------------------------------------------------------------------------------------------------- IBM 124.89 -1.05 131.49 -258.8% Bearish BLUE 111 -.213 -.052 --- ---------------------------------------------------------------------------------------------------------- INTC 53.85 .3 53.37 44.9% Bullish BLUE 92 .074 .053 ---------------------------------------------------------------------------------------------------------- JNJ 147.19 -.91 148.89 -56.8% Bearish RED 111 -.03 -.056 ---------------------------------------------------------------------------------------------------------- JPM 101.72 1.5 101.78 -3% ------- BLUE 27 .066 -.002 ---------------------------------------------------------------------------------------------------------- KO 49.99 -.13 50.46 -46.5% ------- BLUE 84 .007 .011 ---------------------------------------------------------------------------------------------------------- MCD 229.64 2.02 225.8 84.8% Bullish BLUE 135 .005 .105 ---------------------------------------------------------------------------------------------------------- MMM 169.08 .68 167.71 40.7% ------- BLUE 96 -.175 .04 ---------------------------------------------------------------------------------------------------------- MRK 79.06 -1.45 80.48 -88.2% Bearish RED 90 -.069 -.08 ---------------------------------------------------------------------------------------------------------- MSFT 219.66 -1.2 210.58 208% Bullish BLUE 156 .185 -.016 ---------------------------------------------------------------------------------------------------------- NKE 129 1.34 129.71 -27.4% Bullish BLUE 130 -.062 .23 ---------------------------------------------------------------------------------------------------------- PG 143.83 -.21 141.65 76% Bullish BLUE 97 .164 .03 ---------------------------------------------------------------------------------------------------------- TRV 112.64 .61 115.62 -130% ------- BLUE 82 -.05 -.069 ---------------------------------------------------------------------------------------------------------- UNH 324.57 2.72 322.41 33.1% Bullish BLUE 113 .037 -.009 ---------------------------------------------------------------------------------------------------------- V 199.55 -2.65 202.98 -83.9% Bearish RED 99 -.022 -.03 ---------------------------------------------------------------------------------------------------------- VZ 58.16 -.27 59.19 -87% Bearish ---- 115 -.033 -.037 ---------------------------------------------------------------------------------------------------------- WBA 37.64 1.73 37.07 78.1% ------- BLUE 82 -.028 -.126 ---------------------------------------------------------------------------------------------------------- WMT 144.53 .59 141.36 110.3% Bullish BLUE 127 .039 .065 |
Table 2 QUICKSILVER on ETFS - 10/15/20 Bullish = 1 SOXL
Bearish = 1 OIH
ITRS + IP21>.25 is considered "Bullish"
ETF CLOSE CHANGE PIVOT-PT 5-dma AROC CL-PWR CANDLE IP21 ITRS --------------------------------------------------------------------------------------------- --------------------------------------------------------------------------------------------- DIA 285.04 -.09 285.93 13.1% ------- BLUE .133 0 --------------------------------------------------------------------------------------------- SPY 347.5 -.43 346.85 53.4% ------- BLUE .103 -.002 --------------------------------------------------------------------------------------------- QQQ 290.1 -1.96 285.71 150% Bullish BLUE .126 .022 --------------------------------------------------------------------------------------------- MDY 364.95 3.47 363.83 28.5% Bullish BLUE .203 -.006 --------------------------------------------------------------------------------------------- IWM 162.75 1.66 162.7 27.4% Bullish BLUE .156 .01 --------------------------------------------------------------------------------------------- FAS 38.12 .87 39.21 -128.5% Bearish BLUE-.001 -.003 --------------------------------------------------------------------------------------------- SOXL 310.5 -2.47 305.14 333% Bullish BLUE .201 .195 Bulliah --------------------------------------------------------------------------------------------- TECL 341.38 -4.97 331.95 360.1% Bullish BLUE .16 .109 Bullish --------------------------------------------------------------------------------------------- IBB 139.21 -3.24 142.53 -75.9% ------- RED .23 -.034 --------------------------------------------------------------------------------------------- GLD 178.92 .65 181.08 29.9% Bearish BLUE .095 -.113 --------------------------------------------------------------------------------------------- OIH 102.34 1.2 102.81 -103.4% Bearish BLUE-.067 -.302 Bearish --------------------------------------------------------------------------------------------- |
 Table 3    Count of Stocks in Key Directories
            20201015
-------------------------------
NEWHIGHS       136
NEWLOWS        52
MAXCP          53
MINCP          11
TTTNH          17
TTTNL          27
FASTUP         56
FASTDOWN       52
CPCROSSA       180
CPCROSSD       28
BIGVOLUP       2
BIGVODN        5
ACCUMVER       141
REDSELL        69
AUGSELS7       37
TRAPDOOR       10
|
RANKING OF KEY DIRECTORIES BASED PCT.OF STOCKS ABOVE 65-DMA 10/15/20 --------------------------------------------------------------------------------------- Directory Current day-1 day-2 day-3 day-4 day-5 ---------------------------------------------------------------------------------------- SOLAR .909 .909 .909 .909 1 .909 HOMEBLDG .823 .823 .823 .941 .941 .941 AUTO .82 .769 .794 .743 .769 .769 UTILITY .815 .815 .789 .789 .789 .789 GREEN .809 .857 .857 .809 .904 .809 TRANSP .8 .8 .8 .85 .95 .95 CHEM .791 .729 .77 .75 .75 .75 NASD-100 .78 .81 .87 .87 .78 .72 NIFTY .777 .822 .844 .844 .777 .733 RETAIL .775 .714 .714 .714 .693 .714 SEMI .769 .75 .788 .788 .798 .692 INFRA .742 .771 .742 .742 .771 .742 ELECTRON .734 .734 .741 .775 .782 .721 INDEXES .728 .751 .751 .774 .751 .757 HOSPITAL .714 .761 .714 .761 .714 .809 COMPUTER .7 .75 .75 .75 .75 .7 SOFTWARE .7 .666 .65 .683 .6 .55 SP500 .695 .689 .718 .766 .735 .724 DJI-13 .692 .692 .692 .846 .846 .846 INDMATER .68 .626 .653 .666 .666 .666 DOWJONES .666 .7 .733 .766 .766 .766 GUNS .666 .666 .666 .733 .733 .666 RUS-1000 .662 .642 .677 .731 .699 .699 SP-100 .637 .659 .692 .747 .703 .703 FIDSTKS .634 .64 .685 .731 .685 .668 REGBANKS .615 .346 .538 .73 .653 .73 COMODITY .609 .609 .585 .634 .682 .658 FOOD .603 .603 .584 .622 .679 .66 HACKERS .6 .6 .55 .5 .4 .3 BIGBANKS .571 .571 .714 .857 .714 .714 JETS .571 .642 .714 .714 .928 .857 CHINA .56 .62 .58 .62 .6 .54 FINANCE .56 .487 .597 .768 .658 .743 BIOTECH .54 .545 .59 .55 .556 .55 GAMING .523 .619 .666 .523 .523 .476 ETFS .517 .625 .607 .714 .75 .66 BEVERAGE .5 .714 .714 .785 .857 .785 COPPER .5 .625 .5 .5 .625 .5 INSURANC .461 .346 .461 .73 .615 .576 COAL .428 .428 .571 .571 .714 .714 REIT .382 .368 .439 .617 .531 .631 EDU .333 .333 .333 .333 .333 .333 MILITARY .285 .25 .214 .357 .321 .392 OILGAS .285 .261 .277 .277 .301 .293 GOLD .265 .326 .285 .408 .469 .163 BONDFUND .13 .21 .29 .28 .29 .26 |
=====================================================================
10/14/2020 If the Closing Power
uptrends for the key ETFs were broken, I suggested
a 5% DJI decline would then seem likely. That is what seems to now
have started. I would think the DJI's 65-dma will act as support.
But
the weakness in the Big Banks is of concern. See their compsite chart
just below.
I've suggested using either hedging or trading the Closing Power trends.
Our Power Ranked MAXCPs and MINCPs have made us money long and
short, respectively, at the same time. Why change?

Trust the Professionals.
Use our Closing Power with Candle-Sticks.
| DIA Many times a Closing Power trend-break following a CP
non-confirmation of a minor new highs brings a sell-off. That is what just happened. Note that DIA did reach or tag the resistance at 290, but could go no higher. 276 is where the red 65-dma now crosses. Profitably trading this long and short takes close attention to these details. I want to keep posting these candle-stick charts with notes.  |
SPY |
QQQ |
NASDAQ (COMPQX)) |
I've suggested either hedging high Accumulation stocks and ETFs by
shorting weak MINCPs or else short-term trading ETFs in the direction
of their Closing Powers. I've warned that traders have to be nimble and
draw their trendlines carefully. I've suggested using our candle-stick
charts because they blow up the screen so we can see the value of these
trendlines. Tiger also gives you way to see by how much lower a close
would have to be to break a Closing Power uptrend. (Put a chart of the
screen and use the commands "LINES" + "EXPLODE SELECTED
AREA"
+ "LINES" + "DRAW CLOSING POWER AND SHOW TREND-LINE
CALCULATIONS".) I've put traders on notice to use weak closing below
a much higher openng to go short an over-extended stock or big ETFs.
This technique overcomes the problem of a
very weak openng the next day.
That is what we see now. Shorting at the openng tomorrow will be problematic,
it seems because the DJI looks like it may open 300 points lower because a
stimulus
package may not be forthcoming before the Election. If we grow to trust the
professionals, we can be short going into a very weak opening. That gives
us a big advantage.
Bank of America (BAC) |
Citigroup (C) |
Wells Fargo (WFC) |
The key ETFs' Closing Power uptrends were violated today.
This sets most likely sets up a 5% decline in DIA. A much bigger decline
seems unlikely given the FED's QE-Infinity and the tendency for
bigger declines to wait until a November top in a Presidential
Election year. But I have also suggested shorting C (Citigroup) and
WFC (Wells Fargo) as a hedge. Add BAC to that list. Their weakness
today was considerable and this is worrisome in that turns downward by the big
banks do tend to coincide with market tops and significant declines.
The DJI's upper 3.8% band is again a barrier. .Just as the DJI previously
topped out on 9/22/2020 after the DJI ran up
to the 3.8% upper band,
so it did on October 12th.
DJIA and Peerless - version 2020 |
When we compare the Peerless key values on both days, we see signs
that the FED has become more active, but Big Money (represented
by the IP21) has become a lot more nervous. It has fallen from a
healthy positive number to a negative number.
Tops
9/2/2020 10/12/2000
----------------------------------------------------------------
DJIA
29100.5
28837.52
LA/MA
1.038
1.038 (much less price strength)
AROC
.969
.503 (much less price
strength)
PI
+163
+297 (PI rose).
PI (i)-PI(i-1) +4
+37
IP21
.108
-.02 (Big Money is more
scared.)
VI
-23
-52 Down volume is
rising.
OBVPct
.316
.157 Volume is waning.
|
Charts 10/14/2020 (Click on Underlined link.) 2020 PEERLESS DJI, Signals, Indicators Daily DJI Volume 10-DayUp/Down Vol Stoch-20 Inverted Traders Index Graph of Pct of All Stocks above 65-dma Cum. Inverted Traders Index NASDAQ S&P OEX NYSE COMPQX DJI-15 DJI-20 DJI-30 DIA QQQ MDY IWM TNA Short-Term Rates DOLLAR-UUP SPY http://tigersoft.com/2121CST/SPY.GIF recent 2006 vers-Peerless signals -- http://tigersoft.com/NEWPEER/UPD6114.BMP USO-CrudeOil DBO FAS GLD BBH IBB JETS JNUG KOL NUGT OIH PALL RSX RETL SDS AGQ SLV SOXL TECL TLT TMF TNA UGA (gasoline) USO (oil) and China: YINN CHAU Commodities: CANE CORN DBC JJC, NIB, CHOC CORN, CUT (paper) MOO, SOYB WEAT UUP (Dollar) LIT (Lithium) Stocks AAPL ADBE ALXN AMAT AMGN AMD AMZN AXP BA BABA BAC BIDU BLDP CAT CRM CVX CMG DE ENPH FB GILD GOOG GS HD IBM INTU JPM LRCX M (Macy's) MSFT NEM NFLX NKE NVDA PG REGN REV SO SQ QCOM QDEL TSLA TXN XOM V VRTX WFC WMT TOWN ZM New highs and Bullish MAXCPs http://tigersoft.com/MAXCP/10-14/BULLISH.htm Bearish MAXCPs - http://tigersoft.com/MINCP/10-14/BEARISH.htm |
 Table 1
             10/14/2018   QUICKSILVER on DJI-30 STOCKS.
P21 + ITRS score >+.25 is bullish
             1  Bullish  (CRM)
             3  Bearish (CSCO, CVX, IBM)
HIGHEST AI/200 = CRM Second Highest Tied = AAPL and MSFT STOCKS CLOSECHANGE PIVOT-PT 5-dma AROC CL-PWR CANDLE AI/200 IP21 ITRS ------------------------------------------------------------------------------------------------------- ------------------------------------------------------------------------------------------------------- AAPL 121.19 .09 115.08 257.8% Bullish BLUE 156 .028 .043 ---------------------------------------------------------------------------------------------------------- AMGN 237.65 -1.69 257.67 -412.5% Bearish RED 134 .003 -.087 ---------------------------------------------------------------------------------------------------------- AXP 104.81 -.2 103.38 67.8% Bearish RED 95 -.087 .062 ---------------------------------------------------------------------------------------------------------- BA 163.24 1.1 164.61 -41.3% Bearish BLUE 33 -.104 -.073 ---------------------------------------------------------------------------------------------------------- CAT 163.61 1.49 154.77 278% Bullish BLUE 116 .031 .182 ---------------------------------------------------------------------------------------------------------- CRM 261.83 -5 259.98 35% Bearish RED 192 .046 .238 +++ ---------------------------------------------------------------------------------------------------------- CSCO 39.89 .08 39.4 61.5% Bearish ---- 119 -.106 -.225 --- ---------------------------------------------------------------------------------------------------------- CVX 72.95 -.45 73.78 -55.9% ------- RED 77 -.035 -.219 --- ---------------------------------------------------------------------------------------------------------- DIS 126.59 -2.37 122.91 147.2% Bearish RED 100 -.061 .017 ---------------------------------------------------------------------------------------------------------- DOW 48.83 .95 48.3 54.4% Bearish BLUE 60 -.148 .119 ---------------------------------------------------------------------------------------------------------- GS 211.23 .42 203.6 182.7% ------- RED 62 .031 -.015 ---------------------------------------------------------------------------------------------------------- HD 287.09 -3.27 282.79 75.1% ------- RED 156 .1 .009 ---------------------------------------------------------------------------------------------------------- HON 173.47 1.92 171.55 55.4% ------- BLUE 109 -.016 .115 ---------------------------------------------------------------------------------------------------------- IBM 125.94 .84 124.07 73.5% Bearish BLUE 111 -.23 -.061 --- ---------------------------------------------------------------------------------------------------------- INTC 53.55 -.28 52.67 82.5% ------- RED 92 .021 .028 ---------------------------------------------------------------------------------------------------------- JNJ 148.1 -.26 147.88 7.4% Bearish RED 112 -.064 -.056 ---------------------------------------------------------------------------------------------------------- JPM 100.22 -.56 99.73 24.2% ------- RED 26 .01 -.013 ---------------------------------------------------------------------------------------------------------- KO 50.12 -.1 49.56 55.5% Bearish BLUE 84 -.06 .011 ---------------------------------------------------------------------------------------------------------- MCD 227.62 .27 226.48 25.2% Bullish RED 135 -.009 .079 ---------------------------------------------------------------------------------------------------------- MMM 168.4 1.77 166.49 56.9% Bearish BLUE 97 -.188 .051 ---------------------------------------------------------------------------------------------------------- MRK 80.51 -.2 80.04 29.2% Bearish RED 91 -.022 -.076 ---------------------------------------------------------------------------------------------------------- MSFT 220.86 -2 209.83 255.2% Bullish RED 156 .122 -.027 ---------------------------------------------------------------------------------------------------------- NKE 127.66 -1.54 130.06 -92.4% ------- RED 131 -.1 .249 ---------------------------------------------------------------------------------------------------------- PG 144.04 -.17 140.7 117% Bullish ---- 97 .106 .014 ---------------------------------------------------------------------------------------------------------- TRV 112.03 -.86 113.8 -77% ------- RED 83 -.089 -.072 ---------------------------------------------------------------------------------------------------------- UNH 321.85 -9.57 323.17 -20.2% Bullish BLUE 112 -.045 -.005 ---------------------------------------------------------------------------------------------------------- V 202.2 -2.12 202.47 -6.6% Bearish RED 100 -.032 -.011 ---------------------------------------------------------------------------------------------------------- VZ 58.43 -.93 59.61 -99.3% Bearish RED 116 -.093 -.053 ---------------------------------------------------------------------------------------------------------- WBA 35.91 -.27 36.49 -79.2% ------- RED 82 -.061 -.185 ---------------------------------------------------------------------------------------------------------- WMT 143.94 -2.29 140.89 106.6% Bullish RED 126 -.018 .031 |
Table 2 QUICKSILVER on ETFS - 10/14/20 Bullish = 1 SOXL
Bearish = 1 OIH
ITRS + IP21>.25 is considered "Bullish"
ETF CLOSE CHANGE PIVOT-PT 5-dma AROC CL-PWR CANDLE IP21 ITRS --------------------------------------------------------------------------------------------- --------------------------------------------------------------------------------------------- DIA 285.13 -1.61 284.29 38.7% ------- RED .065 ----- --------------------------------------------------------------------------------------------- SPY 347.93 -2.2 343.78 103.4% ------- RED .027 -.008 --------------------------------------------------------------------------------------------- QQQ 292.06 -2.46 281.41 211.3% ------- RED .062 .018 --------------------------------------------------------------------------------------------- MDY 361.48 -1.81 362.88 32.9% Bullish RED .138 -.016 --------------------------------------------------------------------------------------------- IWM 161.09 -1.61 161.86 32.4% ------- RED .108 .006 --------------------------------------------------------------------------------------------- FAS 37.25 -1.15 39.12 -37.2% Bearish RED -.049 -.001 --------------------------------------------------------------------------------------------- SOXL 312.97 -5.04 289.93 542% Bullish RED .15 .188 ++++ --------------------------------------------------------------------------------------------- TECL 346.35 -5.83 316.81 512.3% Bullish RED .078 .121 --------------------------------------------------------------------------------------------- IBB 142.45 -1.89 141.38 51.2% ------- RED .192 -.028 --------------------------------------------------------------------------------------------- GLD 178.27 .55 177.85 29.3% Bearish RED .052 -.122 --------------------------------------------------------------------------------------------- OIH 101.14 1.54 104.45 72.7% Bearish BLUE-.091 -.297 ---- --------------------------------------------------------------------------------------------- |
 Table 3   Count of Stocks in Key Directories
               20201014
-------------------------------
NEWHIGHS       242
NEWLOWS        37
MAXCP          23
MINCP          46
TTTNH          17
TTTNL          27
FASTUP         88
FASTDOWN       32
CPCROSSA       36
CPCROSSD       151
BIGVOLUP       2
BIGVODN        8
HIUPPCT        43
REDSELL        74
AUGSELS7       61
TRAPDOOR       9
|
Table 4     RANKING OF KEY DIRECTORIES BASED PCT.OF STOCKS ABOVE 65-DMA
              10/14/20
  Bullish = 36
  Bearish = 10
---------------------------------------------------------------------------------------
Directory     Current       day-1         day-2         day-3         day-4         day-5
----------------------------------------------------------------------------------------
SOLAR          .909          .909          .909          1             .909          .909
GREEN          .857          .857          .809          .904          .809          .761
HOMEBLDG       .823          .823          .941          .941          .941          .882
NIFTY          .822          .844          .844          .777          .733          .644
UTILITY        .815          .789          .789          .789          .789          .657
NASD-100       .81           .87           .87           .78           .72           .67
TRANSP         .8            .8            .85           .95           .95           .8
INFRA          .771          .742          .742          .771          .742          .742
AUTO           .769          .794          .743          .769          .769          .769
HOSPITAL       .761          .714          .761          .761          .809          .714
INDEXES        .751          .751          .774          .751          .751          .757
COMPUTER       .75           .75           .75           .75           .7            .65
SEMI           .75           .788          .788          .798          .692          .586
ELECTRON       .734          .741          .775          .782          .721          .612
CHEM           .729          .77           .75           .75           .75           .708
BEVERAGE       .714          .714          .785          .857          .785          .571
RETAIL         .714          .714          .714          .693          .714          .673
DOWJONES       .7            .733          .766          .766          .766          .7
DJI-13         .692          .692          .846          .846          .846          .769
SP500          .689          .72           .766          .735          .722          .661
GUNS           .666          .666          .733          .733          .666          .666
SOFTWARE       .666          .666          .683          .6            .55           .516
SP-100         .659          .692          .747          .703          .703          .626
JETS           .642          .714          .714          .928          .857          .642
RUS-1000       .642          .678          .731          .699          .699          .643
FIDSTKS        .64           .685          .731          .685          .668          .594
INDMATER       .626          .653          .666          .666          .666          .613
COPPER         .625          .5            .5            .625          .5            .5
ETFS           .625          .607          .714          .75           .66           .517
CHINA          .62           .58           .62           .6            .52           .5
GAMING         .619          .666          .523          .523          .476          .523
COMODITY       .609          .585          .634          .682          .634          .634
FOOD           .603          .584          .622          .679          .641          .622
HACKERS        .6            .6            .5            .4            .3            .25
BIGBANKS       .571          .714          .857          .714          .714          .571
BIOTECH        .545          .59           .553          .556          .545          .524
============================================================================================
FINANCE        .487          .597          .768          .658          .743          .621
COAL           .428          .571          .571          .714          .714          .714
REIT           .368          .439          .617          .531          .631          .46
INSURANC       .346          .461          .73           .615          .615          .5
REGBANKS       .346          .538          .73           .653          .73           .615
EDU .333 .333 .333 .333 .333 .333 GOLD .326 .285 .408 .469 .163 .122 OILGAS .261 .277 .269 .301 .285 .23 MILITARY .25 .214 .357 .321 .392 .214 BONDFUND .207 .297 .287 .297 .267 .207 |
========================================================================
10/13/2020 With the DJI near 29000, the
risks of another 5% retreat become
greater. We can either be hedged or play the very short terms trends
with the key ETFs candle-stick charts. The hedging takes a lot
less efort and is nicely profitable. It fits the times, as the Covid-19
is forcing a new life-style on many us, new technolgies to accomodate that,
an extremely accomodative FED and a Presidential Election that will
likely change energy companies favored by the Government.
I like to start with the Peerless chart and the version-2020 signals,
even though the Sell signals have for the most part been discounted
because 2020 has been so different from the past.
DJIA  |
DIA |
NASDAQ |
QQQ |
QE-Infinity is Exceptionally Bullish
Over and over since 1921, a cut in interest rates and an injection of
FED funds into the market by their buying rather than selling bonds
has sent the market up a long ways. Most of us are familiar with how
effective a change in monetary policy was in August 1982 or in March
2009. But let me show you its same super-bullish effect as the Election
approached in 1924, or in mid 1927, and for several months after the
Crash of 1929 and at the bottom in 1932. Few things have such a
bullish effect on the market. Since the disappearance of Labor as a factor,
only a big cut in corporate taxes has even remotely the same bullish effect.
This year the FED has not only lowered rates to nearly 0% and injected
vastly more funds (trillions and trillions of dollars more than in 2008-2009),
they are now saying this will continue for two or three more years.
This is unprecedented. Over and over since the end of March I have said
this is super bullish even in this economic situation. The Peerless Sells were
meant for more normal markets. This market is therefore vastly different.
Market timing must be aware of market history. My new books will show
this. I'm working on them as fast as I can. But they cover all the history
since 1885. That's a lot of years, events and charts to write up.
1924-1925 |
1927-1928 |
1930-1931 |
1932-1933 |
But there are still quick pullbacks. Other than a regular Sell S9 (based
on a negative non-confirmation by the P-Indicator), we probably should
either be hedged (long the most bullish MAXCPs and short the most
bearish MINCPs OR else watch the overbought markets like now (with
the DJI 3.3% over the 21-day ma and near its old highs) for signs of a
reversal from our Closing Power and Candle-Stick charts. For the later,
a likely reversal is at hand if the day's close is 1% below the opening
for that day. That is likely to bring a break in the Closing Power uptrend
and then the price uptrend. We probably can see this best with the
candle-stick charts.
If you are nervous, short more oils and CitiGroup (C) or WellsFargo (WFC).
But hold long the highest power-ranked stocks I mentioned and BABA.
See these below.
See how different the internals are for the
most bullish and most bearish stocks.


|
Charts 10/13/2020 (Click on Underlined link.) 2020 PEERLESS DJI, Signals, Indicators Daily DJI Volume 10-DayUp/Down Vol Stoch-20 Inverted Traders Index Graph of Pct of All Stocks above 65-dma Cum. Inverted Traders Index NASDAQ S&P OEX NYSE COMPQX DJI-15 DJI-20 DJI-30 DIA QQQ MDY IWM TNA Short-Term Rates DOLLAR-UUP SPY http://tigersoft.com/2121CST/SPY.GIF recent 2006 vers-Peerless signals -- http://tigersoft.com/NEWPEER/UPD6113.BMP USO-CrudeOil DBO FAS GLD BBH IBB JETS JNUG KOL NUGT OIH PALL RSX RETL SDS AGQ SLV SOXL TECL TLT TMF TNA UGA (gasoline) USO (oil) and China: YINN CHAU Commodities: CANE CORN DBC JJC, NIB, CHOC CORN, CUT (paper) MOO, SOYB WEAT UUP (Dollar) LIT (Lithium) Stocks AAPL ADBE ALXN AMAT AMGN AMD AMZN AXP BA BABA BAC BIDU BLDP CAT CRM CVX CMG DE ENPH FB GILD GOOG GS HD IBM INTU JPM LRCX M (Macy's) MSFT NEM NFLX NKE NVDA PG REGN REV SO SQ QCOM QDEL TSLA TXN XOM V VRTX WFC WMT TOWN ZM New highs and Bullish MAXCPs http://tigersoft.com/MAXCP/10-13/BULLISH.htm Bearish MAXCPs - http://tigersoft.com/MINCP/10-13/BEARISH.htm |
 Table 1
             10/13/2018   QUICKSILVER on DJI-30 STOCKS.
P21 + ITRS score >+.25 is bullish
             1  Bullish  (CRM)
             2  Bearish (CSCO, IBM)
HIGHEST AI/200 = CRM Second Highest Tied = AAPL and MSFT STOCKS CLOSECHANGE PIVOT-PT 5-dma AROC CL-PWR CANDLE AI/200 IP21 ITRS ------------------------------------------------------------------------------------------------------- ------------------------------------------------------------------------------------------------------- AAPL 121.1 -3.3 113.16 339.6% Bullish RED 156 .018 .037 ---------------------------------------------------------------------------------------------------------- AMGN 239.34 -.17 252.69 -272.1% Bearish RED 134 .001 -.107 ---------------------------------------------------------------------------------------------------------- AXP 105.01 -1.6 101.76 155% Bearish RED 96 -.077 .048 ---------------------------------------------------------------------------------------------------------- BA 162.14 -5.21 159.54 78.6% Bearish RED 33 -.121 -.076 ---------------------------------------------------------------------------------------------------------- CAT 162.12 -.49 151.53 337.5% Bullish BLUE 116 -.025 .155 ---------------------------------------------------------------------------------------------------------- CRM 266.83 -.24 250.14 320.1% Bullish BLUE 192 .105 .238 +++ ---------------------------------------------------------------------------------------------------------- CSCO 39.81 -.55 38.57 156.6% Bearish RED 119 -.087 -.231 --- ---------------------------------------------------------------------------------------------------------- CVX 73.4 -1.11 72.3 74.4% Bearish RED 77 -.039 -.21 ---------------------------------------------------------------------------------------------------------- DIS 128.96 3.99 120.93 325.4% Bearish RED 100 -.065 .033 ---------------------------------------------------------------------------------------------------------- DOW 47.88 -.7 47.88 0% Bearish RED 60 -.187 .119 ---------------------------------------------------------------------------------------------------------- GS 210.81 -3.31 201.09 234.9% ------- RED 61 .039 -.018 ---------------------------------------------------------------------------------------------------------- HD 290.36 3.45 276.47 245.1% Bullish BLUE 155 .135 .016 ---------------------------------------------------------------------------------------------------------- HON 171.55 -3.81 166.89 135.2% ------- RED 109 -.027 .08 ---------------------------------------------------------------------------------------------------------- IBM 125.1 -2.11 121.97 123.7% Bearish RED 111 -.247 -.069 --- ---------------------------------------------------------------------------------------------------------- INTC 53.83 -.05 51.37 232.9% ------- RED 91 .037 .039 ---------------------------------------------------------------------------------------------------------- JNJ 148.36 -3.48 146.26 70.4% Bearish RED 113 -.076 -.068 ---------------------------------------------------------------------------------------------------------- JPM 100.78 -1.66 98.02 137.1% Bearish RED 25 -.008 -.026 ---------------------------------------------------------------------------------------------------------- KO 50.22 -.87 48.94 127.6% Bearish RED 85 -.074 .01 ---------------------------------------------------------------------------------------------------------- MCD 227.35 1.24 224.09 72.3% Bullish BLUE 136 .009 .094 ---------------------------------------------------------------------------------------------------------- MMM 166.63 -2.02 162.23 131.8% Bearish RED 98 -.225 .033 ---------------------------------------------------------------------------------------------------------- MRK 80.71 .35 79.63 67.4% Bearish BLUE 92 -.039 -.097 ---------------------------------------------------------------------------------------------------------- MSFT 222.86 1.46 205.91 398.4% Bullish BLUE 156 .144 -.046 ---------------------------------------------------------------------------------------------------------- NKE 129.2 -.26 127.65 59.8% Bullish BLUE 132 -.117 .239 ---------------------------------------------------------------------------------------------------------- PG 144.21 -.28 139.61 162.1% Bullish BLUE 97 .086 .023 ---------------------------------------------------------------------------------------------------------- TRV 112.89 -3.65 111.53 59.3% Bearish RED 84 -.088 -.088 ---------------------------------------------------------------------------------------------------------- UNH 331.42 1.45 314.45 262.2% Bullish BLUE 112 -.008 .017 ---------------------------------------------------------------------------------------------------------- V 204.32 -2.08 200.45 95% Bearish BLUE 101 -.044 -.004 ---------------------------------------------------------------------------------------------------------- VZ 59.36 -.19 59.46 -8.4% Bearish RED 117 -.042 -.038 ---------------------------------------------------------------------------------------------------------- WBA 36.18 -.75 35.95 31.5% ------- RED 82 -.03 -.194 ---------------------------------------------------------------------------------------------------------- WMT 146.23 1.98 140.63 197.2% Bullish BLUE 126 -.01 .056 |
Table 2 QUICKSILVER on ETFS - 10/13/20 Bullish = 1 SOXL
Bearish = 1 OIH
ITRS + IP21>.25 is considered "Bullish"
ETF CLOSE CHANGE PIVOT-PT 5-dma AROC CL-PWR CANDLE IP21 ITRS --------------------------------------------------------------------------------------------- --------------------------------------------------------------------------------------------- DIA 286.74 -1.72 282.92 158.9% ------- RED .069 0 --------------------------------------------------------------------------------------------- SPY 350.13 -2.3 340.76 221.1% ------- RED .049 -.01 --------------------------------------------------------------------------------------------- QQQ 294.52 -.01 279.92 341.6% Bullish RED .095 .018 --------------------------------------------------------------------------------------------- MDY 363.29 -2.84 359.09 143.5% Bullish RED .158 -.018 --------------------------------------------------------------------------------------------- IWM 162.7 -1.09 160.04 188.8% ------- BLUE .127 .011 --------------------------------------------------------------------------------------------- FAS 38.4 -2.15 37.54 338.2% Bearish RED -.04 .017 --------------------------------------------------------------------------------------------- SOXL 318.01 -.38 280.2 921.7% Bullish RED .16 .25 Bullish --------------------------------------------------------------------------------------------- TECL 352.18 -6.53 312.09 865.4% Bullish RED .087 .139 --------------------------------------------------------------------------------------------- IBB 144.34 .69 140.99 228.6% ------- BLUE .216 -.033 --------------------------------------------------------------------------------------------- GLD 177.72 -2.84 177.22 11.7% ------- RED .082 -.118 --------------------------------------------------------------------------------------------- OIH 99.6 -2.8 99.66 47.2% Bearish RED -.077 -.299 Bearish --------------------------------------------------------------------------------------------- GASL 3440 285 3685 -325.1% ------- RED -.021 .038 --------------------------------------------------------------------------------------------- |
Table 3    Count of Stocks in Key Directories
           20201013
-------------------------------
NEWHIGHS       252
NEWLOWS        37  growing
MAXCP          42
MINCP          42
TTTNH          19
TTTNL          46
FASTUP         147
FASTDOWN       32
CPCROSSA       37
CPCROSSD       149
BIGVOLUP       1
BIGVODN        3
ACCUMVER       137
HIGHIP21       14
HIUPPCT        47
VHIP21         116
AUGSELS7       67
TRAPDOOR       10
|
 Table 4  RANKING OF KEY DIRECTORIES BASED PCT.OF STOCKS ABOVE 65-DMA
              10/13/20
 Bullish = 38
 Bearish = 7
---------------------------------------------------------------------------------------
Directory     Current       day-1         day-2         day-3         day-4         day-5
----------------------------------------------------------------------------------------
SOLAR          .909          .909          1             .909          .909          .909
NASD-100       .87           .87           .78           .72           .68           .52
GREEN          .857          .809          .904          .809          .761          .714
NIFTY          .844          .844          .777          .733          .666          .511
HOMEBLDG       .823          .941          .941          .941          .882          .882
TRANSP         .8            .85           .95           .95           .8            .7
AUTO           .794          .743          .769          .769          .769          .641
UTILITY        .789          .789          .789          .789          .657          .631
SEMI           .788          .788          .798          .692          .586          .49
CHEM           .77           .75           .75           .75           .708          .645
INDEXES        .751          .774          .751          .751          .762          .689
COMPUTER       .75           .75           .75           .7            .65           .55
INFRA          .742          .742          .771          .742          .742          .6
ELECTRON       .741          .775          .782          .721          .612          .517
DOWJONES       .733          .766          .766          .766          .7            .566
SP500          .72           .768          .735          .722          .665          .567
BEVERAGE       .714          .785          .857          .785          .571          .428
BIGBANKS       .714          .857          .714          .714          .571          .142
HOSPITAL       .714          .761          .761          .857          .714          .523
JETS           .714          .714          .928          .857          .642          .5
RETAIL         .714          .714          .693          .714          .673          .612
DJI-13         .692          .846          .846          .846          .769          .615
SP-100         .692          .747          .703          .703          .637          .505
FIDSTKS        .685          .731          .685          .668          .594          .491
RUS-1000       .678          .733          .699          .699          .646          .558
GAMING         .666          .523          .523          .476          .523          .428
GUNS           .666          .733          .733          .666          .666          .733
SOFTWARE       .666          .7            .6            .55           .533          .466
INDMATER       .653          .666          .666          .666          .626          .533
ETFS           .607          .714          .75           .66           .517          .428
HACKERS        .6            .55           .4            .3            .3            .1
FINANCE        .597          .768          .658          .743          .621          .439
BIOTECH        .59           .553          .558          .545          .521          .441
COMODITY       .585          .634          .682          .634          .634          .414
FOOD           .584          .622          .679          .641          .622          .49
CHINA          .58           .62           .6            .52           .5            .52
COAL           .571          .571          .714          .714          .714          .571
REGBANKS       .538          .73           .653          .73           .615          .5
============================================================================================
COPPER         .5            .5            .625          .5            .5            .25
============================================================================================
INSURANC       .461          .73           .615          .615          .5            .384
REIT           .435          .614          .535          .635          .471          .514
EDU            .333          .333          .333          .333          .333          .333
BONDFUND       .297          .287          .297          .267          .207          .178
GOLD           .285          .408          .469          .163          .142          .102
OILGAS         .277          .269          .293          .285          .23           .19
MILITARY       .214          .357          .321          .392          .25           .214
|
See www.tigersoft.com/1919H/OLDINDEX.htm for earlier hotlines...