Earlier Hotlines
www.tigersoft.com/19HLK5/INDEX.htm
www.tigersoft.com/44UHL/INDEX.htm
www.tigersoft.com/NHLP/INDEX.htm
www.tigersoft.com/7LHL/INDEX.htm
www.tigersoft.com/NHL718/INDEX.htm
www.tigersoft.com/21MAY18/INDEX.htm
www.tigersoft.com/55HEP/INDEX.htm
www.tigersoft.com/44H4L/INDEX2.htm
Earlier still: Go here...
HELP
A Guide
To Profitably Using The Tiger Nightly HOTLINE
Introduction to Tiger/Peerless Buys and
Sells.
Peerless Buy and
Sell Signals: 1928-2016
Individual Peerless signals explained:
http://tigersoftware.com/PeerlessStudies/Signals-Res/index.htm
http://www.tigersoft.com/PeerInst-2012-2013/
Explanation of each Peerless signal. http://www.tigersoft.com/PeerInst-2012-2013/
Different Types of
TigerSoft/Peerless CHARTS, Signals and Indicators
-----> More HELP LINKS
Documentation for
TigerSoft Automatic and Optimized Signals.
How reliable support is the
DJI's rising 200-day ma?
SPY Charts since
1994: Advisory Closing Power S7s, Accum. Index, 65-dma, Optimized Signals.
^^^^^^^^^^^^^^^^^^^^^^^^^^^^^^^^^^^^^^^^^^^^^^^^
1/19/2016 ---> Corrections,Deeper
Declines and Bear Markets since 1945.
1/21/2016
---> High
Velocity Declines since 1929
2/12/2016 ---> Presidential
Elections Years and Bullish IP21 Positive Non-Confirmations at Lower Band.
2/12/2016 ---> OBV NNCs on DJI's Rally to
2.7% Upper Band when DJI's 65-dma is falling.
11/6/2016 --->
Killer Short Selling
Techniques: ===> Order Here ($42.50)
It's As Easy as 1,2,3
TigerSoft "Combination" Short-Selling... Easy as 1-2-3 Short Sales
Earlier Q-Answers
QuickSilver Documentation (1/11/2016)
Our Different
Signals
Better understand the difference between
Peerless DJI-based signals,
the one-year optimized red Signals and the fixed signals based
on technical developments.
Introduction to Tiger/Peerless Buys and Sells.
Different Types of
TigerSoft/Peerless CHARTS, Signals and Indicators
New TigerPeerless Installation and
Basic Uses' Instruction
See the re-written materials on TigerSoft Buys and Sells.
Study- Trading SPY
WITHOUT Peerless - Some Guidelines.
When completed this will be a new Tiger Trading E-Book.
Study- Examples of
"Hands above the Head" top patterns.
Study- 9/3/2017 TigerSoft (not
Peerless) charts of Major Tops as they occurred.
===> Please report any broken or out-of-date links. william_schmidt@hotmail.com
--->>> Order New E-Book: "New Tiger Tahiti
System's Stocks: 2000-2018", $50.00
> When to
start avoiding the long side altogether because of Peerless signals.
> When to
start buying Tahiti stocks after the start of a Bear Market.
> When to
avoid a weaker high AI/200 stock and use the second choice.
> When to exit
Tahiti stocks before the normal 21-month holding period is over.
> The special
benefits of working with major Tahiti tech stocks.
> Watch for Head/Shoulders tops with these stocks.
> Using the
90-day Stochastic to time the purchase of Safer Tahiti Stocks
> The Tahiti
Tech System's track record using these rules matches closely the 24%/year gain that
the
blue chip Tahiti system did between 1970 and 2000.
> Tiger Software 858-273-5900 PO Box 22784 San
Diego, CA 92192 Email william_schmidt@hotmail.com
====================================================================
====================================================================
3/12/2019 The Buy B4 and the V-formation
are still in place. But the DJI is being
held back by Boeing and by the technical problems created by its
potential head and shoulders pattern. A closing by the DJI below the
H/S would have to be judged a Sell S10. But that could also bring a
nullifying Buy B9 since the P-I would likely be positive a the lower
band.... The DJI will be doing well just to rally given Boeing's situation
and the uncertainties that introduces. Each 10 points that Boeing falls
drops the DJI by 70.
Fortunately, the V-formation and the January Buy B4 argue for a move
to 27000. Signals on the DJI chart are shown just below. It does show a
potential H/S. But understand that very often a bearish-looking head/shoulders
pattern becomes short-term bullish when prices go above the apex of the right
shoulders. (Presumably, it is at this point that shorts become very nervous.)
The NYSE A/D Line remains bullish and 87% of all the trading instruments
we follow are above their 65-dma. Seasonality is bullish and so are most stocks.
Assuming the DJI can stay above 25000, it will next challenge
26100 and when that is conquered, we will see a move to 27000.
If the FED cooperates and BA is exonerated, we should see an
exciting move past 27000 to 30000.
Right now, there is still a certain amount of caution. But I take it as a
good sign about interest rates that the DJI-Untilities Index has just made a new
12-month high and the interest rates on 10-year bonds have just made a
new low.


I would prefer to stay long the tech ETFs, SOXL or TECL. They will
hold up better than the DJI. So should IWM. Each of these shows a
rising Closing Power.
It is very rare for the DJI to lead the rest of the market lower. There
are only a handful of cases, most notably 1977 and 2001. Much
more likely would for Peerless to give a Buy B9 based on positive
breadth (P-I) as the DJI tags the lower band. But US intervention
in Venezuela could create a whote batch of new uncertainties that would
likely hold back the market in what should be a normally bullish period of time.
SPY - 281-282 is important overhead resistance.

IWM - working on surpassing its 21-dma

SOXL- Very close to breaking downtrend
and bullishly destroying a potential H/S/

TECL - Big Move up Today

|
Charts 3/12/2019 2018 PEERLESS DJI, Signals, Indicators Daily DJI Volume 10-DayUp/Down Vol Hourly DJIA A/D Line for All Stocks Inverted Traders Index NASDAQ S&P OEX NYSE COMPQX DJI-15 DJI-20 DJI-30 DIA SPY QQQ MDY IWM TNA Short-Term Rates USO-CrudeOil DBO FAS GLD BBH IBB JETS JNUG KOL NUGT OIH OIL RSX RETL SDS AGQ SLV SOXL TECL TLT TMF TNA UGA (gasoline) XIV YINN Commodities: CANE CORN DBC JJC, NIB, CHOC CORN, CUT (paper) MOO, SOYB WEAT UUP (Dollar) LIT (Lithium) AAPL ADBE ALXN AMAT AMGN AMD AMZN BA BABA BAC BIDU CAT CVX DE FB GOOG GS HD IBM INTU JPM M (Macy's) MSFT NFLX NVDA QCOM TSLA TXN XOM WMT CMG , LRCX, SWKS, MDGL SPPI WATT SQ TOWN 3/12/19 (Click on Underlined link.) Bullish MAXCPs - http://tigersoft.com/MAXCPS/Mar-12/BULLISH.htm Bearish MAXCPs - http://tigersoft.com/MINCPs/Mar-12/BEARISH.htm |
Table 1 QUICKSILVER on ETFS - 3/12/19 ETF CLOSE CHANGE PIVOT-PT 5-dma AROC CL-PWR CANDLE IP21 ITRS --------------------------------------------------------------------------------------------- DIA 255.86 -.9 256.87 -45.5% Bullish RED .138 ------ --------------------------------------------------------------------------------------------- BA 375.41 -24.6 424.46 -651.4% Bullish RED .158 .077 --------------------------------------------------------------------------------------------- SPY 279.49 1.05 277.33 8.5% Bullish BLUE .154 .02 --------------------------------------------------------------------------------------------- QQQ 175.69 .96 173.56 32.9% Bullish BLUE .179 .042 --------------------------------------------------------------------------------------------- MDY 344.2 .49 343.07 -51.8% Bullish BLUE .175 .042 --------------------------------------------------------------------------------------------- IWM 154.37 .08 153.02 -55.8% Bullish ---- .18 .059 --------------------------------------------------------------------------------------------- FAS 62.44 .62 61.33 -3.3% Bullish BLUE .09 .321 --------------------------------------------------------------------------------------------- SOXL 127.5 1.47 121.98 -30.7% ------- BLUE .058 .486 --------------------------------------------------------------------------------------------- TECL 126.46 2.07 120.31 172.7% Bullish BLUE .185 .408 --------------------------------------------------------------------------------------------- IBB 111.84 .91 109.87 -71.6% Bullish BLUE .086 .069 --------------------------------------------------------------------------------------------- GLD 122.98 .74 121.61 51.6% Bearish BLUE .006 -.086 --------------------------------------------------------------------------------------------- OIH 16.8 .27 16.78 -159.3% ------- BLUE -.022 .094 --------------------------------------------------------------------------------------------- GASL 7.03 .46 7.12 -463.1% ------- BLUE .017 .203 --------------------------------------------------------------------------------------------- RSX 20.56 .07 20.62 -17.1% ------- ---- -.165 .005 |
| Table 2
Count of Stocks in Key Directories 2019-03-12 ------------------------------- NEWHIGHS 195 Bullish NEWLOWS 12 MAXCP 53 MINCP 6 TTTNH 16 TTTNL 11 FASTUP 50 FASTDOWN 90 CPCROSSA 107 CPCROSSD 42 BIGVOLUP 5 BIGVODN 8 ACCUMVER 24 HIGHIP21 8 HIUPPCT 11 VHIP21 31 LOWACCUM 152 REDSELL 32 AUGSELS7 17 TRAPDOOR 20 |
 Table 3
      RANKING OF KEY DIRECTORIES BASED PCT.OF STOCKS ABOVE 65-DMA
              3/12/19
      Bullish 43
      Bearish  1
---------------------------------------------------------------------------------------
Directory     Current       day-1         day-2         day-3         day-4         day-5
----------------------------------------------------------------------------------------
BIGBANKS       1             1             .857          .857          1             1
BONDFUND       .98           .99           .99           .98           .971          .971
UTILITY        .975          .95           .95           .9            .925          .95
HOMEBLDG       .941          .941          .941          .941          .823          .941
REGBANKS       .928          .928          .857          .821          .892          1
DJI-13         .923          .923          .846          .923          .923          .923
SOLAR          .882          .941          .882          .823          .882          .882
ETFS           .879          .879          .672          .706          .827          .896
NIFTY          .877          .877          .824          .824          .877          .877
DOWJONES       .866          .866          .833          .866          .8            .833
FINANCE        .855          .844          .788          .755          .855          .877
FIDSTKS        .854          .827          .783          .8            .816          .837
SP-100         .838          .827          .741          .784          .795          .838
SEMI           .836          .862          .793          .801          .853          .87
SP500          .836          .824          .775          .793          .81           .844
GREEN          .826          .826          .826          .826          .826          .826
NASD-100       .82           .79           .75           .75           .81           .82
HACKERS        .818          .818          .772          .772          .772          .818
REIT           .812          .765          .704          .684          .738          .785
ELECTRON       .808          .814          .771          .771          .808          .839
INFRA          .805          .777          .75           .75           .75           .861
INSURANC       .8            .8            .733          .7            .766          .766
CHEM           .796          .814          .777          .814          .814          .796
RUS-1000       .792          .78           .727          .747          .767          .811
GOLD           .784          .705          .745          .568          .588          .803
INDEXES        .768          .758          .725          .725          .747          .784
CHINA          .762          .796          .694          .762          .864          .847
SOFTWARE       .761          .809          .73           .698          .73           .746
MILITARY       .75           .718          .718          .718          .75           .781
TRANSP         .75           .7            .55           .6            .7            .75
INDMATER       .746          .721          .721          .734          .734          .848
BIG17          .717          .673          .652          .652          .63           .695
RETAIL         .716          .716          .679          .698          .716          .754
OILGAS         .687          .624          .56           .638          .638          .73
BIOTECH        .685          .666          .605          .608          .605          .695
COMPUTER       .681          .727          .681          .727          .772          .772
EDU            .666          .666          .666          .666          .833          .833
GUNS           .647          .647          .647          .647          .647          .764
AUTO           .641          .615          .538          .589          .641          .692
COAL           .571          .428          .428          .428          .428          .428
COMODITY       .56           .536          .512          .487          .56           .609
BEVERAGE       .555          .666          .555          .555          .611          .722
FOOD           .527          .472          .472          .418          .49           .527
==============================================================================================
GAMING         .5            .583          .5            .5            .625          .625
JETS           .5            .5            .3            .3            .4            .4
==============================================================================================
HOSPITAL       .416          .375          .375          .333          .375          .5
|
====================================================================
3/11/2019 The Buy B4 and the V-formation
still rule our market. The first
shallow 3% decline in a V-formation has three times before been followed
by an upside breakout which leads to new 12-month highs. A continued
rally now would destroy an appearance of a possible bearish head/shoulders
pattern now in DIA and SOXL. Following my suggestions of last night,
traders should have retaken long positions in IWM and SOXL. TECL
also looks quite bullish. I would stay away from DIA for now. Boeing's
bearish news is apparently not over and Day-traders will be whipping it
around wildly for now.

The emotional stock selling induced by Friday's weak Jobs' report and the
Boeing jet crash on Sunday in Ethiopia seems to have left shares in much
stronger hands, namely those Professionals who sense the extra power of
the stock market in the third year of a Presidential Election.
Of interest, for
us was how the decline from the DJI's February peak to yesterday's low closely
matched the 3% to 3.5% declines after each of the three previous V-formation
bottoms after a larger decline of 18% or more in the DJI. We can these three
cases below: 1942, 1949 and 1971. In each case, the first decline in the
fast-up rallies of these earlier cases of V-formations was between 3% and 3.5%.
There buyers were eagerly waiting to buy on the first pull-back and the turn
upwards sent the DJI quickly much higher. We should
expect that now.
1941-1942

1949

1971-1972

Buy IWM,
SOXL and TECL.

The high volume ETFs in Table 1 had their Closing
Power downtrends broken
today. This shows Professionals are done with the downside for now and are
aggressively buying again. Last night, I suggested that this action should get
us
to purchase the ETFs with the highest IP21 and the highest ITRS in Table 1.
Using Sunday night's Hotline that would have meant buying MDY or IWM and
SOXL. Using the Table 1 tonight, that would mean buying SOXL and TECL.
If you are using TigerSoft charts, you should have taken the positions in IWM
and SOXL when you saw intra-day the clear breaks in the Closing Power
downtrends. This is much preferable to waiting to buy the next day. Below
are the enlarged CP charts of IWM, SOXL and TECL.


|
Charts 3/11/2019 2018 PEERLESS DJI, Signals, Indicators Daily DJI Volume 10-DayUp/Down Vol Hourly DJIA A/D Line for All Stocks Inverted Traders Index NASDAQ S&P OEX NYSE COMPQX DJI-15 DJI-20 DJI-30 DIA SPY QQQ MDY IWM TNA Short-Term Rates USO-CrudeOil DBO FAS GLD BBH IBB JETS JNUG KOL NUGT OIH OIL RSX RETL SDS AGQ SLV SOXL TECL TLT TMF TNA UGA (gasoline) XIV YINN Commodities: CANE CORN DBC JJC, NIB, CHOC CORN, CUT (paper) MOO, SOYB WEAT UUP (Dollar) LIT (Lithium) AAPL ADBE ALXN AMAT AMGN AMD AMZN BA BABA BAC BIDU CAT CVX DE FB GOOG GS HD IBM INTU JPM M (Macy's) MSFT NFLX NVDA QCOM TSLA TXN XOM WMT CMG , LRCX, SWKS, MDGL SPPI WATT SQ TOWN 3/11/19 (Click on Underlined link.) Bullish MAXCPs - http://tigersoft.com/MAXCPS/Mar-11/BULLISH.htm Bearish MAXCPs - http://tigersoft.com/MINCPs/Mar-11/BEARISH.htm |
Table 1 QUICKSILVER on ETFS - 3/11/19 ETF CLOSE CHANGE PIVOT-PT 5-dma AROC CL-PWR CANDLE IP21 ITRS
---------------------------------------------------------------------------------------------
DIA 256.76 2.05 258.19 -29.6% Bullish BLUE .223 -----
---------------------------------------------------------------------------------------------
BA 400.01 -22.53 430.12 -383.1% Bullish BLUE .359 .152
---------------------------------------------------------------------------------------------
SPY 278.44 3.98 279.02 -17.3% Bullish BLUE .196 .008
---------------------------------------------------------------------------------------------
QQQ 174.73 3.56 174.55 9% Bullish BLUE .207 .023
---------------------------------------------------------------------------------------------
MDY 343.71 4.49 347.75 -80.1% Bullish BLUE .196 .031
---------------------------------------------------------------------------------------------
IWM 154.29 2.65 156.08 -81.9% Bullish BLUE .214 .047
---------------------------------------------------------------------------------------------
FAS 61.82 2.08 62.48 -84.9% Bullish BLUE .141 .327
---------------------------------------------------------------------------------------------
RETL 30.02 1.51 31.23 -80% ------- BLUE .157 .193
---------------------------------------------------------------------------------------------
SOXL 126.03 8.39 128.25 -165.6% Bullish BLUE .082 .481
^^^^^
---------------------------------------------------------------------------------------------
TECL 124.39 7.62 122.31 36.3% Bullish BLUE .232 .408
^^^^
---------------------------------------------------------------------------------------------
IBB 110.93 2.32 113.42 -138.7% Bullish BLUE .121 .047
---------------------------------------------------------------------------------------------
GLD 122.24 -.6 121.72 27.9% Bearish RED -.018 -.101
---------------------------------------------------------------------------------------------
OIH 16.53 .46 17.33 -282.3% Bearish BLUE -.041 .044
---------------------------------------------------------------------------------------------
RSX 20.49 .32 20.63 -2.4% ------- BLUE -.155 -.035
|
Table 2    Count of Stocks in Key Directories
           2019-03-11
-------------------------------
NEWHIGHS       166  Bullish 10x new lows.
NEWLOWS        14
MAXCP          49   Rising quickly.
MINCP          6
TTTNH          21
TTTNL          18
FASTUP         57
FASTDOWN       119
CPCROSSA       361  Bullish Ratio of 10x.
CPCROSSD       35
BIGVOLUP       8
BIGVODN        9
ACCUMVER       30
HIGHIP21       13
HIUPPCT        11
VHIP21         30
LOWACCUM       151
REDSELL        40
AUGSELS7       15
TRAPDOOR       24
|
Table 3   RANKING OF KEY DIRECTORIES BASED PCT.OF STOCKS ABOVE 65-DMA
              3/11/19
          Bullish = 42
          Bearish = 3
---------------------------------------------------------------------------------------
Directory     Current       day-1         day-2         day-3         day-4         day-5
----------------------------------------------------------------------------------------
BIGBANKS       1             .857          .857          1             1             1
BONDFUND       .99           .99           .98           .971          .971          .971
UTILITY        .95           .95           .9            .925          .925          .925
HOMEBLDG       .941          .941          .941          .823          .941          .941
SOLAR          .941          .882          .823          .882          .882          .882
REGBANKS       .928          .857          .821          .892          1             1
DJI-13         .923          .846          .923          .923          .923          .923
ETFS           .879          .672          .706          .827          .896          .896
NIFTY          .877          .824          .824          .877          .877          .859
DOWJONES       .866          .833          .866          .8            .833          .833
SEMI           .862          .793          .801          .853          .87           .896
FINANCE        .844          .788          .755          .855          .877          .888
FIDSTKS        .827          .783          .8            .816          .827          .832
SP-100         .827          .741          .784          .795          .827          .827
GREEN          .826          .826          .826          .826          .826          .869
SP500          .824          .775          .793          .81           .84           .846
HACKERS        .818          .772          .772          .772          .772          .818
CHEM           .814          .777          .814          .814          .814          .796
ELECTRON       .814          .771          .771          .808          .839          .864
SOFTWARE       .809          .73           .698          .73           .761          .809
INSURANC       .8            .733          .7            .766          .766          .766
CHINA          .796          .694          .762          .864          .847          .847
NASD-100       .79           .75           .75           .81           .82           .82
RUS-1000       .78           .727          .745          .769          .811          .816
INFRA          .777          .75           .75           .75           .861          .861
REIT           .765          .704          .684          .738          .785          .798
INDEXES        .763          .725          .725          .747          .784          .79
COMPUTER       .727          .681          .727          .772          .772          .772
INDMATER       .721          .721          .734          .734          .848          .848
MILITARY       .718          .718          .718          .75           .781          .781
RETAIL         .716          .679          .698          .716          .754          .754
GOLD           .705          .745          .568          .588          .803          .803
TRANSP         .7            .55           .6            .7            .7            .75
BIG17          .673          .652          .652          .63           .695          .695
BEVERAGE       .666          .555          .555          .611          .722          .722
EDU            .666          .666          .666          .833          .833          .666
BIOTECH        .664          .605          .608          .605          .685          .706
GUNS           .647          .647          .647          .647          .764          .764
OILGAS         .624          .56           .638          .638          .716          .751
AUTO           .615          .538          .589          .641          .692          .692
GAMING         .583          .5            .5            .625          .625          .666
COMODITY       .536          .512          .487          .56           .56           .585
=============================================================================================
JETS           .5            .3            .3            .4            .4            .4
=============================================================================================
FOOD           .472          .472          .418          .49           .49           .509
COAL           .428          .428          .428          .428          .428          .428
HOSPITAL       .375          .375          .333          .375          .458          .5
|
======================================================================
3/8/2019 Use any early weakness on
Monday to cover the short sales in FAS and SOXL.
When
their short-term Closing Power downtrends are broken, we will
consider
buying the highest ranked ETFs in Table 1, based on IP21 and ITRS.
There
should be very good support for the DJI between 24500 and 25000.
As
the P-I and IP21 are both positive, a 1.5% decline will probably bring
a
bullish Buy B9.

Boeing's stock is down 9% at this writing. By itself, a drop in a single DJI
stock of 52 points would make the DJI fall by more than 319 points. But
the DJI is down "only" 170 right now. So clearly, the rest of the DJI
stocks
are being bought by contrarians on this news that a second Boeing 737-max
has crashed shortly after take-off in Addis Ababa. The experts have hardly
begun to investigate and already these Boeing jets are being grounded and the
worst-case scenarios for BA's stock are being discussed. But what if the plane
went down because of terrorism? The US and Ethiopia are allies in a very active
and bloody campaign against Somalia. BA would go right back up. We
will watch BA's Closing Power downtrend and probably buy it when its CP
downtrend
ends. This worked very well in British Petroleum's case in 2010 after its big and
totally unexpected oil spill in the Gulf of Mexico.
Watch BA's Closing Power.

When BP's Closing Power's downtrend ended,
it again should have been bought back in 2010.

------------------------------------------------ Sources
---------------------------------------------
https://www.nytimes.com/2019/03/10/business/boeing-737-max.html?emc=edit_th_190311&nl=todaysheadlines&nlid=582238940311
www.africanews.com/.../ethiopia-air-force-bombards-al-shabaab-in-somalia-two-leade...
U.S.
Airstrikes Kill Hundreds in Somalia as Shadowy Conflict Ramps Up
--------------------------------------------------------------------------------------------------------
I take the operative Peerless signal to still be the January B4. Ordinarily,
this signal leads us to expect a move up by more than 10%. So, unless the
unexpected happens, the DJI should reach 27800. Peerless emphasizes
seasonality, the Federal Reserve and politics. Usually, because of politics,
the third year of a Presidential Election is nearly 3x more bullish more than
the year of the Election or the first year afterwards, or the second year
afterwards. Trump's contentious relationship with Congressional Democrats
could bring a decline. But Senate Republicans are not ready to vote
for impeachment and Bill Cinton's impeachment in 1999 did not stop
the DJI from rallying in a strong market when short-term interest rates were
falling.
So, I've suggested the FED is the most important element in the picture now.
Since Fed Chairman says short-term rates are, in effect, frozen, that he not worried
about an economic slow-down and that the Fed will only make decisions based
on what the economic data show, I would think the Buy B4 will produce signifiantly
higher prices.
A decline by SPY to 268 could set up
a new H/S pattern. The best support
here should be at 265.

We have just seen a "straight-up" advance of nearly 20% in a V-formation.
Such price action in 1942, 1949 and 1971-2 always brought new highs after
a 20% decline, I think we have to remain bullish. But seasonality needs to
be allowed to play out without bearish exogenous influences intruding.
The appearance of a quick head and shoulders pattern in the DJI is a warning
that the market has had to quickly adjust to some new unexpected bearish
non-economic and exogenous news. When past head/shoulders formations
have quickly appeared in the past - in under 15 days - most often they bring a
DJI
decline to the 65-dma. That is what seems most likely here. Keep in mind
that the rapid advance has left many traders and investors on the sideline
waiting for a pull-back to take their positions. In addition, any DJI close
near the 65-dma will almost certainly bring new Peerless Buys.
See the charts of all the DJI's H/S patterns since 1915 here.
http://tigersoft.com/H-S/H-S.htm
The Dollar remains very strong. One would think this that would give
the FED some room to lower interest rates if the economy weakens or
stocks go down.
|
Charts 3/8/2019 2018 PEERLESS DJI, Signals, Indicators Daily DJI Volume 10-DayUp/Down Vol Hourly DJIA A/D Line for All Stocks Inverted Traders Index NASDAQ S&P OEX NYSE COMPQX DJI-15 DJI-20 DJI-30 DIA SPY QQQ MDY IWM TNA Short-Term Rates USO-CrudeOil DBO FAS GLD BBH IBB JETS JNUG KOL NUGT OIH OIL RSX RETL SDS AGQ SLV SOXL TECL TLT TMF TNA UGA (gasoline) XIV YINN Commodities: CANE CORN DBC JJC, NIB, CHOC CORN, CUT (paper) MOO, SOYB WEAT UUP (Dollar) LIT (Lithium) AAPL ADBE ALXN AMAT AMGN AMD AMZN BA BABA BAC BIDU CAT CVX DE FB GOOG GS HD IBM INTU JPM M (Macy's) MSFT NFLX NVDA QCOM TSLA TXN XOM WMT CMG , LRCX, SWKS, MDGL SPPI WATT SQ TOWN 3/8/19 (Click on Underlined link.) Bullish MAXCPs - http://tigersoft.com/MAXCPS/Mar-8/BULLISH.htm Bearish MAXCPs - http://tigersoft.com/MINCPs/Mar-8/BEARISH.htm |
Table 1 QUICKSILVER on ETFS - 3/8/19 ETF CLOSE CHANGE PIVOT-PT 5-dma AROC CL-PWR CANDLE IP21 ITRS
---------------------------------------------------------------------------------------------
DIA 254.71 -.1 258.28 -110.8% Bullish BLUE .161 -----
---------------------------------------------------------------------------------------------
BA 422.54 -.02 432.69 -210.2% Bullish BLUE .094 .269
---------------------------------------------------------------------------------------------
SPY 274.46 -.55 279.4 -107.1% Bullish BLUE .164 .003
---------------------------------------------------------------------------------------------
QQQ 171.17 -.26 174.42 -92.7% Bullish BLUE .159 .025
---------------------------------------------------------------------------------------------
MDY 339.22 -.97 349.22 -168% ------- BLUE .171 .023
^^^^
---------------------------------------------------------------------------------------------
IWM 151.64 -.04 156.81 -212.7% Bullish BLUE .171 .037
^^^^
---------------------------------------------------------------------------------------------
FAS 59.74 -.04 62.86 -328% Bullish BLUE .138 .423
---------------------------------------------------------------------------------------------
SOXL 117.64 -.19 130.11 -493.9% ------- BLUE .027 .586
^^^^^
---------------------------------------------------------------------------------------------
TECL 116.77 -.15 123.52 -330.3% Bullish BLUE .165 .525
---------------------------------------------------------------------------------------------
IBB 108.61 -.53 114.01 -289.4% ------- BLUE .041 .044
---------------------------------------------------------------------------------------------
GLD 122.84 1.33 121.56 39.5% Bearish BLUE-.013 -.144
---------------------------------------------------------------------------------------------
OIH 16.07 -.4 17.48 -394.8% Bearish --- -.086 .039
---------------------------------------------------------------------------------------------
GASL 6.31 -.57 7.83 -882.3% ------- RED -.097 .303
---------------------------------------------------------------------------------------------
RSX 20.17 -.14 20.5 -65.9% ------- --- -.188 -.074
|
Table 2   Count of Stocks in Key Directories
          20190308
-------------------------------
NEWHIGHS       94
NEWLOWS        36
MAXCP          22
MINCP          17
TTTNH          6
TTTNL          55
FASTUP         42
FASTDOWN       206
CPCROSSA       187
CPCROSSD       33
BIGVOLUP       6
BIGVODN        16
ACCUMVER       46
HIGHIP21       15
HIUPPCT        10
VHIP21         31
LOWACCUM       152
REDSELL        41
AUGSELS7       17
TRAPDOOR       25
|
Table 3  RANKING OF KEY DIRECTORIES BASED PCT.OF STOCKS ABOVE 65-DMA
               3/8/19
 Bullish = 41
 Bearish = 4
---------------------------------------------------------------------------------------
Directory     Current       day-1         day-2         day-3         day-4         day-5
----------------------------------------------------------------------------------------
BONDFUND       .99           .98           .971          .971          .971          .952
UTILITY        .95           .9            .925          .925          .925          .925
HOMEBLDG       .941          .941          .823          .941          .941          .882
SOLAR          .882          .823          .882          .882          .882          .882
BIGBANKS       .857          .857          1             1             1             1
REGBANKS       .857          .821          .892          1             1             1
DJI-13         .846          .923          .923          .923          .846          .923
DOWJONES       .833          .866          .8            .833          .8            .866
GREEN          .826          .826          .826          .826          .869          .826
NIFTY          .824          .824          .877          .877          .859          .912
SEMI           .793          .801          .853          .87           .896          .862
FINANCE        .788          .755          .855          .877          .888          .888
FIDSTKS        .783          .8            .816          .827          .821          .854
CHEM           .777          .814          .814          .814          .814          .833
SP500          .775          .793          .81           .84           .844          .869
HACKERS        .772          .772          .772          .772          .818          .863
ELECTRON       .771          .771          .808          .839          .864          .851
INFRA          .75           .75           .75           .861          .861          .861
NASD-100       .75           .75           .81           .82           .81           .83
GOLD           .745          .568          .588          .803          .803          .823
SP-100         .741          .784          .795          .827          .817          .881
INSURANC       .733          .7            .766          .766          .8            .866
SOFTWARE       .73           .698          .73           .761          .809          .873
RUS-1000       .727          .745          .767          .812          .815          .834
INDEXES        .724          .729          .751          .789          .8            .821
INDMATER       .721          .734          .734          .848          .848          .822
MILITARY       .718          .718          .75           .781          .781          .812
REIT           .704          .684          .738          .785          .791          .778
CHINA          .694          .762          .864          .847          .83           .813
COMPUTER       .681          .727          .772          .772          .772          .772
RETAIL         .679          .698          .716          .754          .754          .754
ETFS           .672          .706          .827          .896          .896          .913
EDU            .666          .666          .833          .833          .666          .833
BIG17          .652          .652          .63           .695          .695          .695
GUNS           .647          .647          .647          .764          .764          .882
BIOTECH        .603          .608          .605          .685          .703          .716
OILGAS         .56           .638          .638          .716          .751          .751
BEVERAGE       .555          .555          .611          .722          .722          .722
TRANSP         .55           .6            .7            .7            .75           .8
AUTO           .538          .589          .641          .692          .666          .794
COMODITY       .512          .487          .56           .56           .536          .585
GAMING         .5            .5            .625          .625          .666          .666
===============================================================================================
FOOD           .464          .41           .482          .482          .464          .517
COAL           .428          .428          .428          .428          .428          .714
HOSPITAL       .375          .333          .375          .458          .5            .583
JETS           .3            .3            .4            .4            .4            .5
|
====================================================================
3/7/2019 The Dollar surged to a new
high. One would think this that would give
the FED some room to lower interest rates if the decline consinues.
But the experience of March 2002 warns that lowering rates may not be
enough if the Corruption circles around the President tighten and involve
more of his close associates. ( More about this on Sunday night.) A head/
shoulders pattern then brought on a bear market decline. The previous
bottom was after 9/11 and the rally had V-bottom characteristics like now.|
Look for a DJI decline to the 65-dma. At that
point, we may get a new
Peerless Buy and the Closing Powers may break their downtrends. Meanwhile
avoid most of the ETFs and stay short FAS and SOXL.
Small (under 6 weeks in length) head and shoulders patterns like we
now see in most of the indexes and general market ETFs are reliably
bearish. I have counted 54 such DJI mini-H/S patterns since 1915. I count
only 6 failures. This means that they are almost 90% reliable in bringing
significant declines that short sellers can take advantage of.
Look back at the 5 cases in Marches. We do see 2 failures, but both were in
World War II. More important, 2 of the 3 successfully bearish March H/S patterns
featured corruption among the then President's close associates, Harding in 1923 and
Bush Jr. with Ken Lay of Enron in 2002. Below are the 5 DJI short-term H/S
patterns in March. It would seem that these patterns should be judged as special
Sell S5s, at least for trading purposes now and at least until the Closing Powers
break their down trends.
DJI-now

Past March Mini-Head/Shoulders
Cabinet Corruption and Rising Interest Rates |
War Year(Not very relevant) |
War Year(Not very relevant) |
|
Corruption and Falling Interest Rates Follows speculative stock bubble.  |
Peerless Sell at top. P-I and IP21 divergence. |
FAS, SPY, IWM and SOXL
 |
 |
 |

|
Charts 3/7/2019 2018 PEERLESS DJI, Signals, Indicators Daily DJI Volume 10-DayUp/Down Vol Hourly DJIA A/D Line for All Stocks Inverted Traders Index NASDAQ S&P OEX NYSE COMPQX DJI-15 DJI-20 DJI-30 DIA SPY QQQ MDY IWM TNA Short-Term Rates USO-CrudeOil DBO FAS GLD BBH IBB JETS JNUG KOL NUGT OIH OIL RSX RETL SDS AGQ SLV SOXL TECL TLT TMF TNA UGA (gasoline) XIV YINN Commodities: CANE CORN DBC JJC, NIB, CHOC CORN, CUT (paper) MOO, SOYB WEAT UUP (Dollar) LIT (Lithium) AAPL ADBE ALXN AMAT AMGN AMD AMZN BA BABA BAC BIDU CAT CVX DE FB GOOG GS HD IBM INTU JPM M (Macy's) MSFT NFLX NVDA QCOM TSLA TXN XOM WMT CMG , LRCX, SWKS, MDGL SPPI WATT SQ TOWN 3/7/19 (Click on Underlined link.) Bullish MAXCPs - http://tigersoft.com/MAXCPS/Mar-7/BULLISH.htm Bearish MAXCPs - http://tigersoft.com/MINCPs/Mar-7/BEARISH.htm |
Table 1 QUICKSILVER on ETFS - 3/7/19 ETF CLOSE CHANGE PIVOT-PT 5-dma AROC CL-PWR CANDLE IP21 ITRS --------------------------------------------------------------------------------------------- DIA 254.81 -2.06 260.42 -86.4% ------- RED .111 ---- --------------------------------------------------------------------------------------------- BA 422.56 -1.9 440.62 -200.7% ------- RED .08 .25 --------------------------------------------------------------------------------------------- SPY 275.01 -2.32 280.42 -65.8% ------- RED .128 .005 --------------------------------------------------------------------------------------------- QQQ 171.43 -2.13 174.39 -50.6% ------- RED .102 .025 --------------------------------------------------------------------------------------------- MDY 340.19 -2.88 350.85 -115.4% ------- RED .137 .024 --------------------------------------------------------------------------------------------- IWM 151.68 -1.34 158.24 -163.3% ------- RED .145 .044 --------------------------------------------------------------------------------------------- FAS 59.78 -1.55 63.81 -252.8% ------- RED .086 .338 --------------------------------------------------------------------------------------------- RETL 29.21 -1.33 32.37 -410.8% Bearish RED .148 .356 --------------------------------------------------------------------------------------------- SOXL 117.83 -4.15 130.05 -349.6% ------- RED .004 .467 --------------------------------------------------------------------------------------------- TECL 116.92 -3.39 124.8 -227.4% Bullish RED .138 .426 --------------------------------------------------------------------------------------------- IBB 109.14 -.73 115.11 -159.2% ------- RED -.002 .064 --------------------------------------------------------------------------------------------- GLD 121.51 -.1 121.88 -101.5% Bearish BLUE-.104 -.114 --------------------------------------------------------------------------------------------- OIH 16.47 -.31 17.42 -182.9% Bearish RED -.096 .07 --------------------------------------------------------------------------------------------- RSX 20.31 -.31 20.44 -26.8% ------- RED -.239 -.046 |
  Table 2  Count of Stocks in Key Directories
          20190307
-------------------------------
NEWHIGHS       86
NEWLOWS        28
MAXCP          9
MINCP          29   Bearish
TTTNH          7
TTTNL          73
FASTUP         49
FASTDOWN       142  Bearish
CPCROSSA       65
CPCROSSD       54
BIGVOLUP       6
BIGVODN        14
ACCUMVER       44
HIGHIP21       16
HIUPPCT        9
VHIP21         30
LOWACCUM       156
REDSELL        44
AUGSELS7       27
TRAPDOOR       23
|
Table 3 RANKING OF KEY DIRECTORIES BASED PCT.OF STOCKS ABOVE 65-DMA
Bullish 40
Bearish = 5
3/7/19
---------------------------------------------------------------------------------------
Directory Current day-1 day-2 day-3 day-4 day-5
----------------------------------------------------------------------------------------
BONDFUND .98 .971 .971 .971 .961 .971
HOMEBLDG .941 .823 .941 .941 .882 .941
DJI-13 .923 .923 .923 .846 .923 .923
UTILITY .9 .925 .925 .925 .925 .925
DOWJONES .866 .8 .833 .8 .866 .866
BIGBANKS .857 1 1 1 1 1
GREEN .826 .826 .826 .869 .826 .782
NIFTY .824 .877 .877 .859 .912 .894
REGBANKS .821 .892 1 1 1 1
CHEM .814 .814 .814 .814 .851 .814
SEMI .801 .853 .87 .896 .862 .862
FIDSTKS .8 .816 .827 .821 .854 .848
SP500 .787 .803 .833 .839 .859 .851
SP-100 .784 .795 .827 .817 .87 .86
SOLAR .777 .833 .833 .833 .833 .833
HACKERS .772 .772 .772 .818 .863 .772
ELECTRON .771 .808 .839 .864 .851 .845
CHINA .762 .864 .847 .83 .813 .83
FINANCE .755 .855 .877 .888 .888 .922
INFRA .75 .75 .861 .861 .861 .888
NASD-100 .75 .81 .82 .81 .83 .81
RUS-1000 .745 .767 .811 .816 .832 .824
INDMATER .734 .734 .848 .848 .81 .835
COMPUTER .727 .772 .772 .772 .772 .772
INDEXES .725 .747 .784 .795 .817 .801
MILITARY .718 .75 .781 .781 .812 .843
SOFTWARE .707 .738 .769 .815 .876 .83
ETFS .706 .827 .896 .896 .913 .913
INSURANC .7 .766 .766 .8 .833 .8
RETAIL .698 .716 .754 .754 .754 .754
EDU .666 .833 .833 .666 .833 .833
REIT .666 .718 .764 .771 .764 .79
BIG17 .652 .63 .695 .695 .695 .673
GUNS .647 .647 .764 .764 .882 .823
OILGAS .62 .62 .693 .726 .7 .673
BIOTECH .605 .605 .685 .703 .714 .679
TRANSP .6 .7 .7 .75 .8 .75
AUTO .589 .641 .692 .666 .794 .82
GOLD .568 .588 .803 .803 .823 .862
BEVERAGE .555 .611 .722 .722 .722 .722
GAMING .5 .625 .625 .666 .666 .666
-----------------------------------------------------------------------------------------
COMODITY .487 .56 .56 .536 .585 .707
COAL .428 .428 .428 .428 .571 .571
FOOD .41 .482 .482 .464 .535 .642
HOSPITAL .333 .375 .458 .5 .583 .458
JETS .3 .4 .4 .4 .5 .6
|
====================================================================
3/6/2019 The
head/shoulders top in April 2010 brought on a 13.5% decline
fueled by rapid-fire use of leveraged negative ETFs. We cannot
rule out the same thing happening here. I've suggested shorting FAS.
I would add SOXL to that list and sell long ETFs if the DJI closes
below 25500 and SOXL is comparably weak tomorrow.
IWM's unusual weakness today makes it too risky to hold. Note
its H/S
and falling Closing Power. Something has happened this week that is
spooking the markets. It may be the evidence of Trump's personal check
to Cohen last April while he was President is a "smoking gun". Or it
may be Trump's jacking up the value of one of his residential West
Chester properties by $200 million in seeking a loan from Deutsche Bank
is "criminal fraud". But it may also may the FED has decided to risk a
big sell-off and is hurredly selling off financial assets from their $4 trillion reserves.
Whatever it is, the H/S patterns have appeared very quickly. This is the
way the market quickly makes its own bearish adjustments. It is not a
good sign.
2009-2010 DJI Chart

Breadth worsened a lot today. There were
1421 more down than
up today compared to yesterday's 142 more down. Now the DJI
and most of the other key ETFs and Indexes are close to breaking
the necklines in their head and shoulders. This would give us a TigerSoft
Sell S5
and very likely bring the DJI and the other ETFs down to
their
65-dma. Since, we still do not have a Peerless Sell, there should then
be a good rebound. The TigerSoft S5 shows a break in a short-term
support using the Tiger charting programs. There is exactly similar Sell
for the more intermediate-term Peerless. However, the Peerless chart of
the DJI back in March 2010 would show a Tiger S5 if one was requested
using
A close below 25550 would break the
current DJI's H/S pattern and call for
a decline to 65-dma at 24600. It would
be a TigerSoft S5. That is not a Peerless
Sell. So, we would still have to expect
a good recovery when the Closing Powers
turn back upwards.
Current DJIA Charts
![]()


At this point, traders should do more reducing of their long
positions.
Until the Closing Powers hook back up, early rallies will probably fail.
The House Democrats have uncovered some more incriminating evidence
against the President. But my research suggests, the rally will not
be over until April, at the earliest, and only after there is another rally, probably
to 26800. More important than the Democrats' challenges to Trump
are what the Federal Reserve and Chairman Powell decide about raising
or lowering short-term interest rates. The Federal Funds rate is back to its high
of 2.4% and the Dollar was unchanged today.
Traders should short SOXL if it breaks its recent price
uptrend-line
and DJI decisively breaks its own neckline.

|
Charts 3/6/2019 2018 PEERLESS DJI, Signals, Indicators Daily DJI Volume 10-DayUp/Down Vol Hourly DJIA A/D Line for All Stocks Inverted Traders Index NASDAQ S&P OEX NYSE COMPQX DJI-15 DJI-20 DJI-30 DIA SPY QQQ MDY IWM TNA Short-Term Rates USO-CrudeOil DBO FAS GLD BBH IBB JETS JNUG KOL NUGT OIH OIL RSX RETL SDS AGQ SLV SOXL TECL TLT TMF TNA UGA (gasoline) XIV YINN Commodities: CANE CORN DBC JJC, NIB, CHOC CORN, CUT (paper) MOO, SOYB WEAT UUP (Dollar) LIT (Lithium) AAPL ADBE ALXN AMAT AMGN AMD AMZN BA BABA BAC BIDU CAT CVX DE FB GOOG GS HD IBM INTU JPM M (Macy's) MSFT NFLX NVDA QCOM TSLA TXN XOM WMT CMG , LRCX, SWKS, MDGL SPPI WATT SQ TOWN 3/6/19 (Click on Underlined link.) Bullish MAXCPs - http://tigersoft.com/MAXCPS/Mar-6/BULLISH.htm Bearish MAXCPs - http://tigersoft.com/MINCPs/Mar-6/BEARISH.htm |
Table 1 QUICKSILVER on ETFS - 3/5/19 ETF CLOSE CHANGE PIVOT-PT 5-dma AROC CL-PWR CANDLE IP21 ITRS --------------------------------------------------------------------------------------------- DIA 256.87 -1.32 259.28 -57.9% ------- RED .153 ----- --------------------------------------------------------------------------------------------- BA 424.46 -5.66 439.96 -126% ------- RED .173 .234 --------------------------------------------------------------------------------------------- SPY 277.33 -1.69 278.68 -33.5% ------- RED .181 0 --------------------------------------------------------------------------------------------- QQQ 173.56 -.99 173.19 -.9% Bullish RED .172 .017 --------------------------------------------------------------------------------------------- MDY 343.07 -4.68 348.22 -94.1% ------- RED .184 .021 --------------------------------------------------------------------------------------------- IWM 153.02 -3.06 156.78 -136.9% ------- RED .206 .039 --------------------------------------------------------------------------------------------- FAS 61.33 -1.15 62.95 -130.9% Bearish RED .148 .3 --------------------------------------------------------------------------------------------- RETL 30.54 -.69 31.78 -256.3% Bearish RED .184 .296 --------------------------------------------------------------------------------------------- SOXL 121.98 -6.27 126.74 -173.4% Bearish RED .019 .462 --------------------------------------------------------------------------------------------- TECL 120.31 -2 122.5 -131.8% Bullish RED .186 .332 --------------------------------------------------------------------------------------------- IBB 109.87 -3.55 112.74 -187.5% Bearish RED -.014 .04 --------------------------------------------------------------------------------------------- GLD 121.61 -.11 123.99 -125.4% Bearish BLUE -.103 -.102 --------------------------------------------------------------------------------------------- OIH 16.78 -.55 17.1 -161.5% Bearish RED -.038 .084 -------------------------------------------------------------------------------------------- GASL 7.12 -.55 7.17 -106.5% Bearish RED -.094 .206 --------------------------------------------------------------------------------------------- RSX 20.62 -.01 20.42 7.3% Bearish RED -.187 -.036 |
 Table 2  Count of Stocks in Key Directories
          2019 03-06
-------------------------------
NEWHIGHS       54
NEWLOWS        27
MAXCP          9
MINCP          22  Bearish
TTTNH          4
TTTNL          51
FASTUP         38
FASTDOWN       135
CPCROSSA       27
CPCROSSD       155 Bearish
BIGVOLUP       3
BIGVODN        12
ACCUMVER       55
HIGHIP21       12
HIUPPCT        9
VHIP21         28
LOWACCUM       158
REDSELL        45
AUGSELS7       36
TRAPDOOR       24
|
 Table 3
              RANKING OF KEY DIRECTORIES BASED PCT.OF STOCKS ABOVE 65-DMA
              3/6/19
 Bullish = 41
 Bearish = 4
---------------------------------------------------------------------------------------
Directory     Current       day-1         day-2         day-3         day-4         day-5
----------------------------------------------------------------------------------------
BIGBANKS       1             1             1             1             1             1
BONDFUND       .971          .971          .971          .961          .971          .98
UTILITY        .925          .925          .925          .925          .925          .925
DJI-13         .923          .923          .846          .923          .923          .923
REGBANKS       .892          1             1             1             1             1
SOLAR          .882          .882          .882          .882          .882          .941
NIFTY          .877          .877          .859          .912          .894          .894
CHINA          .864          .847          .83           .813          .83           .813
FINANCE        .855          .877          .888          .888          .922          .9
SEMI           .853          .87           .896          .862          .862          .862
EDU            .833          .833          .666          .833          .833          .833
ETFS           .827          .896          .896          .913          .913          .931
GREEN          .826          .826          .869          .826          .782          .869
HOMEBLDG       .823          .941          .941          .882          .941          .941
FIDSTKS        .81           .821          .816          .854          .848          .87
NASD-100       .81           .82           .81           .83           .81           .83
ELECTRON       .808          .839          .864          .851          .845          .851
SP500          .808          .838          .842          .865          .855          .867
DOWJONES       .8            .833          .8            .866          .866          .9
CHEM           .796          .796          .796          .851          .833          .87
SP-100         .795          .827          .817          .87           .86           .881
COMPUTER       .772          .772          .772          .772          .772          .818
HACKERS        .772          .772          .818          .863          .772          .818
INSURANC       .766          .766          .8            .833          .8            .833
RUS-1000       .766          .81           .814          .833          .825          .832
INDEXES        .752          .784          .795          .817          .801          .811
INFRA          .75           .861          .861          .861          .888          .888
MILITARY       .75           .781          .781          .812          .843          .812
REIT           .738          .785          .791          .785          .812          .818
INDMATER       .734          .848          .848          .81           .835          .898
SOFTWARE       .73           .761          .809          .873          .825          .825
RETAIL         .716          .754          .754          .754          .754          .735
TRANSP         .7            .7            .75           .8            .75           .75
GUNS           .647          .764          .764          .882          .823          .882
AUTO           .641          .692          .666          .794          .82           .794
OILGAS         .638          .716          .751          .723          .687          .73
BIG17          .63           .695          .695          .695          .652          .695
GAMING         .625          .625          .666          .666          .666          .75
BEVERAGE       .611          .722          .722          .722          .722          .666
BIOTECH        .603          .685          .703          .714          .671          .701
GOLD           .588          .803          .803          .823          .862          .882
COMODITY       .56           .56           .536          .585          .707          .731
================================================================================================
FOOD           .482          .482          .464          .535          .642          .66
COAL           .428          .428          .428          .571          .571          .571
JETS           .4            .4            .4            .5            .6            .6
HOSPITAL       .375          .458          .5            .583          .458          .458
|
====================================================================
3/5/2019 Short-term traders should
be a little guarded in here, but the Peerless
Buy B4 still stands and the seasonality is still quite bullish. Traders should
considering selling short FAS. See below how successful the optimized
red Tiger signals have been. Conveniently, one can cover if the flat
resistance just overhead is violated.

I believe the Federal Reserve "holds the cards" when it somes to the
market now. Not the Democrats in the House, not Muller and not
Bloomberg news.

I do not trust Fed Chairman Powell. He seems erratic and inexperienced
in dealing with the divergent pressures upon him, namely stock traders,
bond traders, the New York Banks, regional banks, Congress and the
President. Right now, the short-term rates' chart (above) shows a yield that is
back
up to its high of 2.4% even though the Dollar is very strong. I would take a
breakout in this day-to-day measure of the Federal Funds rate as
troubling. Perhaps. the "gentleman" (Trump's term for Powell) is selling
a lot more US Treasuries' debt instruments than has been publicly acknowledged.
Bloomerg's website is lopsidedly bearish in its stories this
morning. Let's
see if the DJI can shrug off this slant.
1)Trump Pushes for China Deal in Hope of Fueling
Market Rally
2)Trump Presides Over $100 Billion Jump in
Trade Gap
3) Wall Street Regulators Could
Take a Fresh Look at Bonuses
4) Trump’s Big Tax Cuts Did Little to Boost
Economic Growth
5) A $1 Trillion Rally Is Rewarded
With Billions of ETF Outflows
6) It's Payback Time for Stocks as
Balance-Sheet-Be-Damned Ends
7) John Bolton Shows the Dangers
of a Weak President
8) Health-Insurance Stocks Have
Been Selling Off on Fears of ‘Medicare for All’
9) White House Warns Carmakers on
Emissions in Tense Call
(I admit I do not study Bloomberg every night. Maybe,
some of you know
if such a bearish line-up of stories is unusual. Perhaps, he is just feeling
unusually
"irked" tonight because he had to bow out of his bid to be President.) .
A DIA decline below 255 would complete
a bear-looking head/shoulders pattern that
"bears" some similarities to the one completed
in early 2010 that set off a "flash crash" of 10%
in the DJI. The event that triggered the decline
was the very big oil spill in the Gulf of Mexico
by a British Petroleum deep-water oil drilling rig.

In any case, the breaks in the Closing Power uptrends for the
DJI, SPY, MDY,
IWM and the NASDAQ warn us to expect more of a pull-back. But without
clear-cut head and shoulders patterns (like last Fall or in 2010), or much
poorer daily breadth than we have seen so far on this retreat, or much heavier
down-volume and/or a Peerless Sell signal, the decline now will probably be
shallow and probably not take the DJI more than a percent below its 21-dma or
not more than 3.5% down from the peaks of this recovery rally.
Traders looking for a way to hedge might short
FAS. Note the success this past year with its red
(optimized Stochastic-20) sells. But cover quickly
is prices close above 66.

Appreciate, too, that the current decline could end quite
quickly as soon as the
Closing Powers turn sharply, showing that Professionals have again started to
buy again.
At most, I would think any deeper decline would be stopped by the good support
expected at the DJI's rising 65-dma.
Things could change. So we muct watch the daily breadth, the color of our
Tiger candle-stick charts, what Closing Powers are doing, the slope of the
DJI's Accumulation Index and P-Indicator. And we must be alert for head/
shoulders patterns quick developing, since they show the arrival of previously
unexpected bearish news that Wall Street has not anticipated.


|
Charts 3/5/2019 2018 PEERLESS DJI, Signals, Indicators Daily DJI Volume 10-DayUp/Down Vol Hourly DJIA A/D Line for All Stocks Inverted Traders Index NASDAQ S&P OEX NYSE COMPQX DJI-15 DJI-20 DJI-30 DIA SPY QQQ MDY IWM TNA Short-Term Rates USO-CrudeOil DBO FAS GLD BBH IBB JETS JNUG KOL NUGT OIH OIL RSX RETL SDS AGQ SLV SOXL TECL TLT TMF TNA UGA (gasoline) XIV YINN Commodities: CANE CORN DBC JJC, NIB, CHOC CORN, CUT (paper) MOO, SOYB WEAT UUP (Dollar) LIT (Lithium) AAPL ADBE ALXN AMAT AMGN AMD AMZN BA BABA BAC BIDU CAT CVX DE FB GOOG GS HD IBM INTU JPM M (Macy's) MSFT NFLX NVDA QCOM TSLA TXN XOM WMT CMG , LRCX, SWKS, MDGL SPPI WATT SQ TOWN 3/5/19 (Click on Underlined link.) Bullish MAXCPs - http://tigersoft.com/MAXCPS/Mar-5/BULLISH.htm Bearish MAXCPs - http://tigersoft.com/MINCPs/Mar-5/BEARISH.htm |
Table 1 QUICKSILVER on ETFS - 3/5/19 ETF CLOSE CHANGE PIVOT-PT 5-dma AROC CL-PWR CANDLE IP21 ITRS
---------------------------------------------------------------------------------------------
DIA 258.19 -.09 259.87 -45.2% ------- ---- .22 -----
---------------------------------------------------------------------------------------------
BA 430.12 -2.57 435.44 38.5% Bullish RED .248 .24
---------------------------------------------------------------------------------------------
SPY 279.02 -.38 279.2 -5.4% ------- RED .252 .004
---------------------------------------------------------------------------------------------
QQQ 174.55 .13 173.59 24.4% ------- ---- .246 .023
---------------------------------------------------------------------------------------------
MDY 347.75 -1.47 349.64 -21.6% Bullish RED .25 .037
---------------------------------------------------------------------------------------------
IWM 156.08 -.73 157.32 -32.4% Bullish RED .33 .059
^^^^^
---------------------------------------------------------------------------------------------
FAS 62.48 -.38 62.98 -8.7% ------- RED .21 .294
---------------------------------------------------------------------------------------------
RETL 31.23 .73 32.16 14.2% Bearish BLUE .211 .261
---------------------------------------------------------------------------------------------
SOXL 128.25 -1.86 126.43 -109% ------- RED .099 .517
^^^^^
---------------------------------------------------------------------------------------------
TECL 122.31 -1.21 123.56 -64.3% ------- RED .244 .291
---------------------------------------------------------------------------------------------
IBB 113.42 -.59 114.14 40.5% Bullish RED .127 .073
---------------------------------------------------------------------------------------------
GLD 121.72 .16 124.69 -156.2% Bearish BLUE-.144 -.07
---------------------------------------------------------------------------------------------
OIH 17.33 -.15 17.34 23.1% ------- RED .057 .068
---------------------------------------------------------------------------------------------
GASL 7.67 -.16 7.28 235.1% Bearish RED -.013 .172
---------------------------------------------------------------------------------------------
RSX 20.63 .13 20.59 -31.6% Bearish BLUE-.162 -.069
|
Table 2    Count of Stocks in Key Directories
           2019 03-05
-------------------------------
NEWHIGHS       84
NEWLOWS        17
MAXCP          10
MINCP          13  Bearish
TTTNH          6
TTTNL          26
FASTUP         69
FASTDOWN       98
CPCROSSA       78
CPCROSSD       34
BIGVOLUP       4
BIGVODN        12
ACCUMVER       46
HIGHIP21       30
HIUPPCT        10
VHIP21         27
LOWACCUM       156
REDSELL        44
AUGSELS7       30
TRAPDOOR       24
|
 Table 1
        RANKING OF KEY DIRECTORIES BASED PCT.OF STOCKS ABOVE 65-DMA
               3/5/19
        Bullish = 42
        Bearish= 4
---------------------------------------------------------------------------------------
Directory     Current       day-1         day-2         day-3         day-4         day-5
----------------------------------------------------------------------------------------
BIGBANKS       1             1             1             1             1             1
REGBANKS       1             1             1             1             1             1
BONDFUND       .971          .971          .961          .971          .98           .98
HOMEBLDG       .941          .941          .882          .941          .941          .941
UTILITY        .925          .925          .925          .925          .925          .925
DJI-13         .923          .846          .923          .923          .923          1
ETFS           .896          .896          .913          .913          .931          .931
SOLAR          .882          .882          .882          .882          .941          .882
FINANCE        .877          .888          .888          .922          .9            .9
NIFTY          .877          .859          .912          .894          .894          .894
SEMI           .87           .896          .862          .862          .862          .887
INFRA          .861          .861          .861          .888          .888          .888
INDMATER       .848          .848          .81           .835          .898          .898
CHINA          .847          .83           .813          .83           .813          .813
ELECTRON       .839          .864          .851          .845          .851          .87
SP500          .838          .842          .865          .855          .865          .869
DOWJONES       .833          .8            .866          .866          .866          .933
^^^^^^^^
EDU            .833          .666          .833          .833          .833          .666
SP-100         .827          .817          .87           .86           .87           .881
GREEN          .826          .869          .826          .782          .869          .826
FIDSTKS        .821          .816          .854          .848          .87           .87
NASD-100       .82           .81           .83           .81           .83           .82
RUS-1000       .81           .814          .832          .827          .832          .824
GOLD           .803          .803          .823          .862          .882          .921
CHEM           .796          .796          .851          .833          .888          .888
REIT           .785          .791          .785          .812          .812          .838
INDEXES        .784          .795          .817          .801          .811          .833
MILITARY       .781          .781          .812          .843          .843          .843
COMPUTER       .772          .772          .772          .772          .818          .909
HACKERS        .772          .818          .863          .772          .818          .818
INSURANC       .766          .8            .833          .8            .833          .8
GUNS           .764          .764          .882          .823          .882          .823
SOFTWARE       .761          .809          .873          .825          .825          .841
RETAIL         .754          .754          .754          .754          .735          .698
BEVERAGE       .722          .722          .722          .722          .666          .666
OILGAS         .716          .751          .723          .687          .723          .716
TRANSP         .7            .75           .8            .75           .75           .75
BIG17          .695          .695          .695          .652          .673          .673
AUTO           .692          .666          .794          .82           .794          .82
BIOTECH        .682          .703          .714          .671          .695          .669
GAMING         .625          .666          .666          .666          .75           .791
COMODITY       .56           .536          .585          .707          .731          .707
============================================================================================
FOOD           .482          .464          .535          .642          .66           .642
HOSPITAL       .458          .5            .583          .458          .458          .5
COAL           .428          .428          .571          .571          .571          .571
JETS           .4            .4            .5            .6            .6            .6
|
========================================================================
3/4/2019 The January Peerless B4
signal tells us the 200-point decline today is not
the start of a big drop. But other considerations suggest the DJI is in short-term
trouble. Most important, DIA's Closing Power uptrend has been broken and
it could be forming a mini bearish head/shoulders pattern like it did last Fall and
in February 2010. A decline to 24500 seems likely if the DJI's neckline
at 25500 is broken after a brief one or two day rally from here. Otherwise,
weakness tomorrow should only mean a decline to 25000.

Recall the DJI's H/S 2010 occurrence. That was when the unexpected
British Petroleum oil spill in the Gulf of Mexico caused a quick mini-head/shoulders in
the DJIA and SP-500. See further below.. When these patterns were completed
with
the DJI and SP-500 closing below their necklines, a "flash crash"
followed. It
was blamed on faulty trading orders and computerized trading. But cynics believed
that the real reason was how hedge funds quickly played the short side with
leveraged trading vehicles on down-ticks.
See below how the Hourly DJI shows increasing down-hour volume.
A head/shoulders pattern in it has already been completed.

We are getting to the point where we can not trust strong openings.
That is the message from the break in the CP uptrend and the
bearish "red popcicle" on the SPY candle-stick chart.

A few other bearish signs did appear today. Mighty Boeing broke its very
steep uptrendline. It less steep rising trends are all intact. High priced
United
Health Care lost 10-points as the cost of healthcare seems now to be the second
biggest item that almost all the Democrats are talking about. (The President,
of course, is their #1 target.) JET, the airlines's ETF has completed a bearish
looking head and shoulders pattern.
I am also concerned that the number of our MINCPs (Closing Power
new lows) and MAXCP (Closing Power new highs) is now tied and the
ratio of new highs to new lows has fallen below 10:1. See Table 2.
Fortunately, NYSE Breadth is usually the most important internal strength
indicator and the NYSE A/D Line remains in its very steep uptrend. Despite
the DJI's big decline today, there were only 334 more down than up. This
reflects, I think, the unlikelihood of any rise in interest rates soon, though
Fed Chairman continues to want to continue to slowly unload the trillions of
debt instruments, some toxic and some not, that it carries on its books.
But there was no good reasons in the news for today's decline. That is usually not
a good sign.
I now see potential mini-head and shoulders patterns in the
DJI, SP-500, MDY
and IWM. These can be surprisingly bearish, considering their small size, but
usually Peerless gives a Sell, like it did this past fall, When breadth is good and
the IP21 is still positive, such small H/S patterns are seldom significant. But
there
is one exception. That was in February 2010. See in the DJIA charts, Peerless
and TigerSoft, how the bearish potency of the head/shoulders back then produced
a very swift 10% meltdown. This means we must watch prices
now very closely
and reduce holdings quickly in trading accounts if the DJI's price pattern takes on
more similarities with a classic head/shoulders pattern with a flat neckline. After
a long rally, hedge funds must be expected to swiftly sell stocks and very aggressively
buy all sorts of leveraged short ETFs and other bearish instruments.
Use the Lesson of 2010's Head/shoulders
|
TOP
|
TOP |

|
Charts 3/4/2019 2018 PEERLESS DJI, Signals, Indicators Daily DJI Volume 10-DayUp/Down Vol Hourly DJIA A/D Line for All Stocks Inverted Traders Index NASDAQ S&P OEX NYSE COMPQX DJI-15 DJI-20 DJI-30 DIA SPY QQQ MDY IWM TNA Short-Term Rates USO-CrudeOil DBO FAS GLD BBH IBB JETS JNUG KOL NUGT OIH OIL RSX RETL SDS AGQ SLV SOXL TECL TLT TMF TNA UGA (gasoline) XIV YINN Commodities: CANE CORN DBC JJC, NIB, CHOC CORN, CUT (paper) MOO, SOYB WEAT UUP (Dollar) LIT (Lithium) AAPL ADBE ALXN AMAT AMGN AMD AMZN BA BABA BAC BIDU CAT CVX DE FB GOOG GS HD IBM INTU JPM M (Macy's) MSFT NFLX NVDA QCOM TSLA TXN XOM WMT CMG , LRCX, SWKS, MDGL SPPI WATT SQ TOWN 3/4/19 (Click on Underlined link.) Bullish MAXCPs - http://tigersoft.com/MAXCPS/Mar-4/BULLISH.htm Bearish MAXCPs - http://tigersoft.com/MINCPs/Mar-4/BEARISH.htm |
Table 1 QUICKSILVER on ETFS - 3/4/19 ETF CLOSE CHANGE PIVOT-PT 5-dma AROC CL-PWR CANDLE IP21 ITRS --------------------------------------------------------------------------------------------- DIA 258.28 -2.14 260.54 -50.2% Bullish RED .194 ==== --------------------------------------------------------------------------------------------- BA 432.69 -7.93 426.77 67.1% Bullish RED .235 .231 --------------------------------------------------------------------------------------------- SPY 279.4 -1.02 279.32 -2.1% Bullish RED .244 .007 --------------------------------------------------------------------------------------------- QQQ 174.42 .03 173.7 25.9% Bullish RED .211 .013 --------------------------------------------------------------------------------------------- MDY 349.22 -1.63 349.26 -43% Bullish RED .301 .041 --------------------------------------------------------------------------------------------- IWM 156.81 -1.43 157.1 -43.8% Bullish RED .368 .058 --------------------------------------------------------------------------------------------- FAS 62.86 -.95 62.59 .8% Bullish RED .211 .269 --------------------------------------------------------------------------------------------- RETL 30.5 -1.87 31.14 -3.2% ------- RED .198 .189 --------------------------------------------------------------------------------------------- SOXL 130.11 .06 131.06 -143.5% Bullish RED .125 .35 --------------------------------------------------------------------------------------------- TECL 123.52 -1.28 123.9 13.8% Bullish RED .246 .241 --------------------------------------------------------------------------------------------- IBB 114.01 -1.1 112.5 46.3% Bullish RED .206 .072 --------------------------------------------------------------------------------------------- GLD 121.56 -.32 125.58 -153.3% Bearish ----- .224 -.059 --------------------------------------------------------------------------------------------- OIH 17.48 .06 17.25 11.6% ------- RED .073 .062 --------------------------------------------------------------------------------------------- RSX 20.5 .06 20.76 -58.3% Bearish RED -.211 -.059 |
 Table 2   Count of Stocks in Key Directories
           20190304
-------------------------------
NEWHIGHS       98
NEWLOWS        16
MAXCP          14   Professionals have stopped most aggressive buying.
MINCP          14
TTTNH          10
TTTNL          42
FASTUP         307
FASTDOWN       233
CPCROSSA       497
CPCROSSD       462
BIGVOLUP       3
BIGVODN        12
ACCUMVER       63
HIGHIP21       36
HIUPPCT        10
VHIP21         27
LOWACCUM       161
REDSELL        56
AUGSELS7       27
TRAPDOOR       23
|
Table 3
 RANKING OF KEY DIRECTORIES BASED PCT.OF STOCKS ABOVE 65-DMA
 Bullish = 43
 Bearish = 3
              3/4/19
---------------------------------------------------------------------------------------
Directory     Current       day-1         day-2         day-3         day-4         day-5
----------------------------------------------------------------------------------------
BIGBANKS       1             1             1             1             1             1
REGBANKS       1             1             1             1             1             1
BONDFUND       .971          .961          .971          .98           .98           .98
HOMEBLDG       .941          .882          .941          .941          .941          .941
UTILITY        .925          .925          .925          .925          .925          .925
ETFS           .896          .913          .913          .931          .931          .948
SEMI           .896          .862          .862          .862          .887          .896
FINANCE        .888          .888          .922          .9            .9            .9
SOLAR          .882          .882          .882          .941          .882          .882
GREEN          .869          .826          .782          .869          .826          .869
ELECTRON       .864          .851          .845          .851          .87           .876
INFRA          .861          .861          .888          .888          .888          .888
NIFTY          .859          .912          .894          .894          .894          .894
INDMATER       .848          .81           .835          .898          .898          .911
DJI-13         .846          .923          .923          .923          1             1
SP500          .842          .865          .855          .865          .869          .873
CHINA          .83           .813          .83           .813          .813          .83
HACKERS        .818          .863          .772          .818          .818          .818
SP-100         .817          .87           .86           .87           .881          .892
FIDSTKS        .816          .854          .848          .87           .87           .881
RUS-1000 .814 .832 .825 .833 .824 .84 NASD-100 .81 .83 .81 .83 .82 .84 SOFTWARE .809 .873 .825 .825 .841 .857 GOLD .803 .823 .862 .882 .921 .921 DOWJONES .8 .866 .866 .866 .933 .933 INSURANC .8 .833 .8 .833 .8 .9 CHEM .796 .851 .833 .888 .907 .87 INDEXES .795 .817 .801 .811 .833 .822 REIT .791 .785 .812 .812 .832 .859 MILITARY .781 .812 .843 .843 .843 .906 COMPUTER .772 .772 .772 .818 .909 .909 GUNS .764 .882 .823 .882 .823 .882 RETAIL .754 .754 .754 .735 .698 .679 TRANSP .75 .8 .75 .75 .75 .8 OILGAS .748 .72 .685 .72 .706 .741 BEVERAGE .722 .722 .722 .666 .666 .666 BIOTECH .701 .714 .671 .695 .669 .679 BIG17 .695 .695 .652 .673 .673 .717 AUTO .666 .794 .82 .794 .82 .794 EDU .666 .833 .833 .833 .666 .833 GAMING .666 .666 .666 .75 .791 .833 COMODITY .536 .585 .707 .731 .707 .731 HOSPITAL .5 .583 .458 .458 .5 .541 ===================================================================================================== FOOD .464 .535 .642 .66 .642 .66 COAL .428 .571 .571 .571 .571 .428 JETS .4 .5 .6 .6 .6 .7 |
====================================================================
3/1/2019 The January Peerless
B4 signal is still far from playing itself out. See
below how the DJI's "straight-up" V-advance is now challenging its
resistance just overhead. The DJI still needs to breakout past 26371
and the SP-500 needs to overcome its flat resistance at 2814. I consider
the Russell-2000 ETF, IWM, to be currently showing the strongest combined
internal among the ETFs shown in Table 1 below. Usually flat resistance
levels are overcome.


Though it is slipping for the DJIA, the IP21s are still quite
high for the ETFs
we track in Table 1. Boeing, the leader in the DJIA made another new
high. There are no very weak groups of stocks in Table 3. None have
have a majority of their stocks below their 65-dma. Most have a big
majority above it, and so should expect strong support were there to be
a wave of profit-taking. The ratio of new highs to new lows in Table 2
remains more than 10:1.
But, as I must, I keep looking for impending problems.
The only thing I
noticed tonight is that a few of the South American bank stocks show
head/shoulders patterns, something which no doubt stems from the stronger
Dollar. (See the Bearish MINCPs.)
I 've looked in vain for signs of impending tops, such as
head and shoulders
patterns, in individual DJI and SP-500 stocks. The major ETFs'
Closing Powers are rising. 80% of all 5000+ stocks and ETFs we
track are above their 65-dma. Many of the exceptions are negative
ETFs.
There is another sign of trouble that I cannot find.
This is failed breakouts
above well-tested flat resistance levels. These are the indivdual stocks
that usually do best in strongly uptrending markets. In particular, watch
CDNA, ABT and FE in the Bullish MAXCPs. Breakouts by them that
now fail would be unexpected and a sign of impending trouble for the
market as a whole.
The Dollar was strong and jumped back above its 65-dma.
In fact,
it was so strong that it worries President Trump about US exports.
But its strength would seem to make the DOVISH case that there should
be room for a cut in very short-term rates. And this could coincide
with a very bullish advance by the DJI to new highs. That would also life
take IWM and the other major ETFs very nicely.
We've taken trading profits in SOXL because its steep Closing Power
uptrend has been broken. Let's see if it can get past its well-tested
falling resistance line. Semi-conductors are usually seen as leaders of
the general market.

|
Charts 3/1/2019 2018 PEERLESS DJI, Signals, Indicators Daily DJI Volume 10-DayUp/Down Vol Hourly DJIA A/D Line for All Stocks Inverted Traders Index NASDAQ S&P OEX NYSE COMPQX DJI-15 DJI-20 DJI-30 DIA SPY QQQ MDY IWM TNA Short-Term Rates USO-CrudeOil DBO FAS GLD BBH IBB JETS JNUG KOL NUGT OIH OIL RSX RETL SDS AGQ SLV SOXL TECL TLT TMF TNA UGA (gasoline) XIV YINN Commodities: CANE CORN DBC JJC, NIB, CHOC CORN, CUT (paper) MOO, SOYB WEAT UUP (Dollar) LIT (Lithium) AAPL ADBE ALXN AMAT AMGN AMD AMZN BA BABA BAC BIDU CAT CVX DE FB GOOG GS HD IBM INTU JPM M (Macy's) MSFT NFLX NVDA QCOM TSLA TXN XOM WMT CMG , LRCX, SWKS, MDGL SPPI WATT SQ TOWN 3/1/19 (Click on Underlined link.) Bullish MAXCPs - http://tigersoft.com/MAXCPS/Mar-1/BULLISH.htm Bearish MAXCPs - http://tigersoft.com/MINCPs/Mar-1/BEARISH.htm |
Table 1 QUICKSILVER on ETFS - 3/3/19 ETF CLOSE CHANGE PIVOT-PT 5-dma AROC CL-PWR CANDLE IP21 ITRS
---------------------------------------------------------------------------------------------
DIA 260.42 1.14 260.89 4.8% Bullish RED .265 -----
---------------------------------------------------------------------------------------------
BA 440.62 .66 426.87 192.4% Bullish RED .255 .292
---------------------------------------------------------------------------------------------
SPY 280.42 1.74 279.52 22.9% ------- ---- .287 -.003
---------------------------------------------------------------------------------------------
QQQ 174.39 1.2 173.52 43.3% Bullish ---- .221 .006
---------------------------------------------------------------------------------------------
MDY 350.85 2.63 352.23 -20.1% Bullish BLUE .331 .033
---------------------------------------------------------------------------------------------
IWM 158.24 1.46 158.19 2.9% Bullish BLUE .428 .053
^^^^^
---------------------------------------------------------------------------------------------
FAS 63.81 .86 62.85 95.5% ------- RED .248 .268
---------------------------------------------------------------------------------------------
RETL 32.37 .59 30.52 341.7% Bullish RED .272 .278
---------------------------------------------------------------------------------------------
SOXL 130.05 3.31 133.83 -19.3% Bullish RED .121 .393
---------------------------------------------------------------------------------------------
TECL 124.8 2.3 123.18 142.4% Bullish RED .25 .272
---------------------------------------------------------------------------------------------
IBB 115.11 2.37 112.96 195.4% Bullish BLUE .281 .047
---------------------------------------------------------------------------------------------
GLD 121.88 -2.11 125.37 -144.8% Bearish RED -.268 -.067
---------------------------------------------------------------------------------------------
OIH 17.42 .32 17.44 34.7% ------- BLUE .047 .022
---------------------------------------------------------------------------------------------
GASL 7.62 .45 7.71 33.7% Bearish BLUE-.102 .038
---------------------------------------------------------------------------------------------
RSX 20.44 .02 20.74 -70.2% Bearish RED -.154 -.086
|
Table 2   Count of Stocks in Key Directories
          2019-0301
-------------------------------
NEWHIGHS       186  Bullish
NEWLOWS        11
MAXCP          49
MINCP          14
TTTNH          33
TTTNL          29
FASTUP         295
FASTDOWN       193
CPCROSSA       450
CPCROSSD       384
BIGVOLUP       6
BIGVODN        13
ACCUMVER       85
HIGHIP21       47
HIUPPCT        10
VHIP21         29
LOWACCUM       157
REDSELL        54
AUGSELS7       23
TRAPDOOR       24
|
Table 3
  RANKING OF KEY DIRECTORIES BASED PCT.OF STOCKS ABOVE 65-DMA
              3/1/19
  No groups are considered Bearish
---------------------------------------------------------------------------------------
Directory     Current       day-1         day-2         day-3         day-4         day-5
----------------------------------------------------------------------------------------
BIGBANKS       1             1             1             1             1             .857
REGBANKS       1             1             1             1             1             1
BONDFUND       .961          .971          .98           .98           .98           .99
UTILITY        .925          .925          .925          .925          .925          .925
DJI-13         .923          .923          .923          1             1             1
ETFS           .913          .913          .931          .931          .948          .931
NIFTY          .912          .894          .894          .894          .894          .894
FINANCE        .888          .922          .9            .9            .877          .866
GUNS           .882          .823          .882          .823          .882          .941
HOMEBLDG       .882          .941          .941          .941          .941          .941
SOLAR          .882          .882          .941          .882          .882          .941
SOFTWARE       .873          .825          .825          .841          .857          .841
SP-100         .87           .86           .87           .881          .892          .881
DOWJONES       .866          .866          .866          .933          .933          .933
SP500          .865          .855          .865          .869          .873          .869
HACKERS        .863          .772          .818          .818          .818          .818
SEMI           .862          .862          .862          .887          .896          .887
INFRA          .861          .888          .888          .888          .888          .861
FIDSTKS        .854          .848          .87           .87           .881          .875
CHEM           .851          .833          .888          .907          .888          .87
ELECTRON       .851          .845          .851          .87           .876          .87
EDU            .833          .833          .833          .666          .833          .833
INSURANC       .833          .8            .833          .8            .9            .933
RUS-1000       .832          .825          .832          .825          .841          .834
NASD-100       .83           .81           .83           .82           .84           .83
GREEN          .826          .782          .869          .826          .869          .913
GOLD           .823          .862          .882          .921          .921          .941
INDEXES        .822          .801          .811          .833          .822          .817
CHINA          .813          .83           .813          .813          .83           .83
MILITARY       .812          .843          .843          .843          .906          .906
INDMATER       .81           .835          .898          .898          .911          .924
TRANSP         .8            .75           .75           .75           .8            .8
AUTO           .794          .82           .794          .82           .794          .897
REIT           .785          .812          .812          .832          .859          .899
COMPUTER       .772          .772          .818          .909          .909          .909
RETAIL         .754          .754          .735          .698          .679          .679
BEVERAGE       .722          .722          .666          .666          .666          .666
OILGAS         .715          .68           .715          .701          .729          .715
BIOTECH        .712          .672          .696          .67           .678          .649
BIG17          .695          .652          .673          .673          .717          .652
GAMING         .666          .666          .75           .791          .833          .833
COMODITY       .585          .707          .731          .707          .731          .78
HOSPITAL       .583          .458          .458          .5            .541          .583
COAL           .571          .571          .571          .571          .428          .428
FOOD           .535          .642          .66           .642          .66           .714
JETS           .5            .6            .6            .6            .7            .7
|
====================================================================
2/28/2019 The DJI's uptrend was not
violated despite news which weakens the
President and might at another time cause some serious profit-taking.
Michael Cohen's testimony and the unexpected failure of the US-NK
de-nuclearization talks hardly hurt the market, at all. Now overnight
another rally is developing. The January Buy B4, the V-formation
and the nearly 20% "straight-up" rally will soon take out the over-head
resistance levels shown below for all the major Indexes. This should start
them rushing upwards back to their highs of last September-October.
See if the resistance levels just overhead for
these indexes and ETFs can be broken. That
would show that the next target is their 12 month highs,
in my judgment.
DJIA |
SP-500 |
NASDAQ |
IWM |
UTILITIES |
Bullish seasonality continues for March. A 2.1% DJI gain is
the average and a DJI rise should be expected 75% of the time
.
in the 3rd year of the 4-year Presidential cycle, using the period
from 1967 to 2015 for our data base. In these year, the next two
months' average gain is +4.2% and the next three month's average
gain is +6%. Six months from now the DJI should be +11% higher
if this history of the 3rd year of the 4-year Presidential cycle
repeats.
I mentioned last night how all the usual warnings of a big decline were absent.
And even on today's decline the number of new highs was still 10 times
the number of new lows.
The durability and resiliance of our rally must be driving the bears crazy.
But the trend is our friend. What we know that they do not seem to
appreciate is how bullish the third year in the four-year Presidential cycle
can be as the politicians in Congress and the FED strive especially hard
to boost the stock market and the economy this year. The Peerless
program makes special allowances for this. It is much harder to get
a Peerless Sell in March and April in the third year of the Presidential
cycle. See this in the data below. As long as the P-I and IP21 remain
so positive, we should be very safe still buying.
Of the 22 3rd Years since 1931, when was the first Peerless
Sell?:
Number of Cases
February 1
March
2 (1931 and 1935)
April
3 (1951, 1967 and, 1979)
May
4 (1971, 1991, 2011 and 2015)
June
3 (1943, 1975 and 1999)
July
4 (1955, 1959, 1983 and 2007)
After July 4
(1935, 1963, 1995, 2003
1st Peerless Sells after January
in Third Year of 4-Year Pres. Cycle:
(1931, 1935, 1939...2011, 2015)
1931 03-20
Sell S12
Short Sale Gain = .223 No paper Loss.
1935 no Sell until 0909 Sell
S2 Short Sale Gain = .033 Paper Loss= .012
9/18 peak
1939 03-07 Sell S12
Short Sale
Gain = .17 Paper Loss= -.019 3/10
1943 06-02 Sell
S8
Short Sale Gain = .075 Paper Loss= -.024 7/14
1947 02-10 Sell
S3
Short Sale Gain = .077 No Paper Loss
1951 04-30 Sell S9
Short
Sale Gain = .058 Paper Loss = -.0154 5/3
1955 07-27 Sell
S8
Short Sale Gain = .042 No Paper Loss
1959 07-01 Sell S9
Short
Sale Gain = .019 No Paper Loss
1963 No Sells
1967 04-19 Sell
S12 Short Sale
LOSS=.001
1971 05-06 Sell
S19 Short Sale
Gain = .093 No Paper Loss
1975 06-23 Sell S18
Short Sale
Gain = .054 Paper Loss = -.0196 7/15
1979 04-06 Sell S12
Short Sale
Gain = 057 Paper Loss = -.0034 4/10
1983 07-26 Sell S9
Short Sale Gain = .065 No Paper Loss.
1987 04-06 Sell S9
Short Sale Gain = .051 No Paper Loss.
1991 05-31 Sell S3
Short Sale Gain = .038 No Paper Loss.
1995 No Sells
1999 06-30 Sell S9
Short Sale Gain = .029 Paper Loss= -.0217 7/16
2003 No Sells
2007 07-13 Sell S9
Short Sale Gain = .044 Paper Loss= -.0066 7/19
2011 05-02 Sell S8
Short Sale Gain= .051 No Paper Loss
2015 05-19 Sell S12
Short Sale
Gain= .144 No Paper Loss.
|
Charts 2/28/2019 2018 PEERLESS DJI, Signals, Indicators Daily DJI Volume 10-DayUp/Down Vol Hourly DJIA A/D Line for All Stocks Inverted Traders Index NASDAQ S&P OEX NYSE COMPQX DJI-15 DJI-20 DJI-30 DIA SPY QQQ MDY IWM TNA Short-Term Rates USO-CrudeOil DBO FAS GLD BBH IBB JETS JNUG KOL NUGT OIH OIL RSX RETL SDS AGQ SLV SOXL TECL TLT TMF TNA UGA (gasoline) XIV YINN Commodities: CANE CORN DBC JJC, NIB, CHOC CORN, CUT (paper) MOO, SOYB WEAT UUP (Dollar) LIT (Lithium) AAPL ADBE ALXN AMAT AMGN AMD AMZN BA BABA BAC BIDU CAT CVX DE FB GOOG GS HD IBM INTU JPM M (Macy's) MSFT NFLX NVDA QCOM TSLA TXN XOM WMT CMG , LRCX, SWKS, MDGL SPPI WATT SQ TOWN 2/28/19 (Click on Underlined link.) Bullish MAXCPs - http://tigersoft.com/MAXCPS/Feb-28/BULLISH.htm Bearish MAXCPs - http://tigersoft.com/MINCPs/Feb-28/BEARISH.htm |
Table 1 QUICKSILVER on ETFS - 2/28/19 ETF CLOSE CHANGE PIVOT-PT 5-dma AROC CL-PWR CANDLE IP21 ITRS
---------------------------------------------------------------------------------------------
DIA 259.28 -.59 260.17 14.4% ------- RED .295 ------
---------------------------------------------------------------------------------------------
BA 439.96 4.52 424.05 262.6% Bullish BLUE .313 .306
---------------------------------------------------------------------------------------------
SPY 278.68 -.52 279.14 22.6% ------- RED .289 -.004
---------------------------------------------------------------------------------------------
QQQ 173.19 -.4 172.89 45.4% ------- BLUE .227 .001
---------------------------------------------------------------------------------------------
MDY 348.22 -1.42 352.26 -19.8% ------- RED .337 .027
---------------------------------------------------------------------------------------------
IWM 156.78 -.54 158.15 -.3% Bullish RED .416 .041
++++
---------------------------------------------------------------------------------------------
FAS 62.95 -.03 62.61 60.7% ------- BLUE .262 .207
---------------------------------------------------------------------------------------------
SOXL 126.74 .31 130.55 5.4% ------- BLUE .143 .328
---------------------------------------------------------------------------------------------
TECL 122.5 -1.06 121.3 225.4% ------- BLUE .28 .19
---------------------------------------------------------------------------------------------
IBB 112.74 -1.4 110.71 160.4% Bullish RED .272 .032
---------------------------------------------------------------------------------------------
OIH 17.1 -.24 17.3 -89.3% ------- RED .04 .018
---------------------------------------------------------------------------------------------
RSX 20.42 -.17 20.73 -29% Bearish RED -.075 -.065
|
 Table 2   Count of Stocks in Key Directories
           2019-02-28
-------------------------------
NEWHIGHS       123  Bullish
NEWLOWS        12
MAXCP          51
MINCP          11
TTTNH          33
TTTNL          22
FASTUP         697
FASTDOWN       432
CPCROSSA       381
CPCROSSD       331
BIGVOLUP       4
BIGVODN        19
ACCUMVER       84
HIGHIP21       52
HIUPPCT        9
VHIP21         25
LOWACCUM       161
REDSELL        54
AUGSELS7       12
TRAPDOOR       24
|
 Table 3  RANKING OF KEY DIRECTORIES BASED PCT.OF STOCKS ABOVE 65-DMA
              2/28/19
 All but one are Bullish
---------------------------------------------------------------------------------------
Directory     Current       day-1         day-2         day-3         day-4         day-5
----------------------------------------------------------------------------------------
BIGBANKS       1             1             1             1             .714          1
REGBANKS       1             1             1             1             1             1
BONDFUND       .971          .98           .98           .98           .99           .99
HOMEBLDG       .941          .941          .941          .941          .941          .941
UTILITY        .925          .925          .925          .925          .925          .95
DJI-13         .923          .923          1             1             1             1
FINANCE        .922          .9            .9            .877          .855          .866
ETFS           .913          .931          .931          .948          .931          .931
NIFTY          .894          .894          .894          .894          .894          .894
INFRA          .888          .888          .888          .888          .888          .861
DOWJONES       .866          .866          .933          .933          .933          .866
GOLD           .862          .882          .921          .921          .941          .98
SEMI           .862          .862          .887          .896          .887          .905
SP-100         .86           .87           .881          .892          .86           .87
SP500          .851          .863          .867          .871          .863          .865
FIDSTKS        .849          .87           .87           .881          .876          .865
ELECTRON       .845          .851          .87           .876          .876          .876
MILITARY       .843          .843          .843          .906          .906          .843
INDMATER       .835          .898          .898          .911          .911          .898
CHEM           .833          .888          .907          .888          .907          .907
EDU            .833          .833          .666          .833          .833          .833
SOLAR          .833          .888          .833          .833          .888          .888
CHINA          .83           .813          .813          .83           .83           .779
SOFTWARE       .83           .83           .846          .861          .846          .83
RUS-1000       .825          .832          .824          .842          .834          .823
GUNS           .823          .882          .823          .882          .941          .823
AUTO           .82           .794          .82           .794          .897          .846
NASD-100       .81           .83           .82           .84           .83           .85
INDEXES        .801          .811          .833          .822          .817          .822
INSURANC       .8            .833          .8            .9            .933          .933
REIT           .79           .79           .81           .836          .875          .823
GREEN          .782          .869          .826          .869          .913          .869
COMPUTER       .772          .818          .909          .909          .909          .818
HACKERS        .772          .818          .818          .818          .818          .727
RETAIL         .754          .735          .698          .679          .679          .641
TRANSP         .75           .75           .75           .8            .8            .8
BEVERAGE       .722          .666          .666          .666          .666          .722
COMODITY       .707          .731          .707          .731          .78           .756
BIOTECH        .67           .696          .67           .678          .656          .622
GAMING         .666          .75           .791          .833          .833          .75
OILGAS         .666          .7            .686          .713          .68           .686
BIG17          .652          .673          .673          .717          .652          .565
FOOD           .642          .66           .642          .66           .714          .678
JETS           .6            .6            .6            .7            .7            .7
COAL           .571          .571          .571          .428          .428          .571
============================================================================================
HOSPITAL       .458          .458          .5            .541          .583          .583
|
====================================================================
2/27/2019 A minor 3% to 3.5%
decline seems to be shaping up. But so
far, the steep uptrend of prices and the A/D Line are still in tact.
The break-off in talks to de-nuclearize North Korea and the skirmishes
between India and Pakistan have boosted the Big Mitary stock sector
and especially Boeing, which has so much influence on the DJI-30's
movements.
Every point that BA rises lifts the
DJI-30 by 6.8 points. BA alone
lifted the DJI by 59 points today.

Right now the DJI is pulling back. A 3% to 3.5%
decline from the
recovery high is expected, based on the pattern shown by the
three previous V-formations. That would suggest a downside target
now of 25100-25200.


Interestingly though, the DJI has rallied up 20% from its December 24th low.
In the earlier V-bottom cases, the DJI could rally only 15% to a peak before
starting its first 3% decline and close below its 21-dma. One could argue,
therefore, that the DJI is stronger this time.
Past V-Bottoms from DJI lows
down at least 18% from a high.
Bottom Pct Up to Peak
Size of Decline
before first decline
below 21-dma
----------------------------------------------------
April 1942 15%
3.5%
June 1949
14%
3.0%
Nov 1971 15%
3.0%
Feb 2019
19+%
>
If we were about to experience a bigger decline,
there are a number of
conditions I would expect to be present, but are missing now.
The most notable would be a Peerless Sell signal, a lagging A/D Line,
much lower IP21 readings, more sector weakness in Table 3, weakness
in the Big Banks and many lots more signs of price tops, namely head
and shoulders patterns with red Distribution on the right shoulders.
.
But if we can have V-bottoms, I guess we can have V-tops, too. So,
lets see if the DJI breaks its uptrendline, the ETF's Closing Powers
uptrendlines are broken and volume, which has been low, starts picking
up on any decline. For now, avoid SOXL and leveraged ETFs.

Will Dollar Be Hurt by Trump's Political Weakness?
Michael Cohen's testimony will hurt Trump a little, but he
seems safely in
office until 2021. And more important than inpeachments, I've previously
argued is the trend of interest rates, which I do not expect to turn back up.
Republicans did not break ranks today in the hearings today. This means
that House Democrats will almost certainly be stymied; most, if not all of their
their initiatives will not get enough Senate Republican votes or to over-ride
Trump vetoes. However, we may see lower openings for a while and,
internationally, the Dollar may slip back because Cohen's revellations will
make it easier for some other nations' leaders to adopt less cooperative stances
towards the Administration's policies. The sudden end of Trump's talk with
North Korea may be a result of Trump's weakened condition. So, the
Dollar could be hurt and this will affect the FED and interest rates. In other
words, now we can't completely dismiss the consequences of Cohen's
testimony or even the Muller Report when that comes out. I would expect
weaker weaker openings for a while. Because Accumulation readings are
high, any slippage in prices should be gradual.

|
Charts 2/27/2019 2018 PEERLESS DJI, Signals, Indicators Daily DJI Volume 10-DayUp/Down Vol Hourly DJIA A/D Line for All Stocks Inverted Traders Index NASDAQ S&P OEX NYSE COMPQX DJI-15 DJI-20 DJI-30 DIA SPY QQQ MDY IWM TNA Short-Term Rates USO-CrudeOil DBO FAS GLD BBH IBB JETS JNUG KOL NUGT OIH OIL RSX RETL SDS AGQ SLV SOXL TECL TLT TMF TNA UGA (gasoline) XIV YINN Commodities: CANE CORN DBC JJC, NIB, CHOC CORN, CUT (paper) MOO, SOYB WEAT UUP (Dollar) LIT (Lithium) AAPL ADBE ALXN AMAT AMGN AMD AMZN BA BABA BAC BIDU CAT CVX DE FB GOOG GS HD IBM INTU JPM M (Macy's) MSFT NFLX NVDA QCOM TSLA TXN XOM WMT CMG , LRCX, SWKS, MDGL SPPI WATT SQ TOWN 2/27/19 (Click on Underlined link.) Bullish MAXCPs - http://tigersoft.com/MAXCPS/Feb-27/BULLISH.htm Bearish MAXCPs - http://tigersoft.com/MINCPs/Feb-27/BEARISH.htm |
Table 1 QUICKSILVER on ETFS - 2/27/19 ETF CLOSE CHANGE PIVOT-PT 5-dma AROC CL-PWR CANDLE IP21 ITRS
---------------------------------------------------------------------------------------------
DIA 259.87 -.67 258.53 7.1% Bullish ---- .319 ----
---------------------------------------------------------------------------------------------
BA 435.44 8.67 417.58 164% Bullish BLUE .299 .283
---------------------------------------------------------------------------------------------
SPY 279.2 -.12 277.42 14.2% ------- BLUE .301 -.003
---------------------------------------------------------------------------------------------
QQQ 173.59 -.11 171.62 38.8% ------- BLUE .206 -.004
---------------------------------------------------------------------------------------------
MDY 349.64 .38 349.61 -16.4% Bullish BLUE .353 .035
---------------------------------------------------------------------------------------------
IWM 157.32 .22 156.79 -2.2% Bullish BLUE .424 .047
++++
---------------------------------------------------------------------------------------------
FAS 62.98 .39 62.19 4.8% ------- BLUE .281 .189
---------------------------------------------------------------------------------------------
SOXL 126.43 -4.63 126.6 -115.9% ------- RED .095 .284
---------------------------------------------------------------------------------------------
TECL 123.56 -.34 117.01 283.2% Bullish BLUE .255 .125
---------------------------------------------------------------------------------------------
IBB 114.14 1.64 109.15 136.6% Bullish BLUE .296 .043
---------------------------------------------------------------------------------------------
GLD 124.69 -.89 125.05 -71.3% Bearish RED -.032 .006
---------------------------------------------------------------------------------------------
OIH 17.34 .09 17.41 -157.5% ------- ---- 0 .007
---------------------------------------------------------------------------------------------
RSX 20.59 -.17 20.54 -31.4% ------- RED -.005 -.053
|
 Table 2   Count of Stocks in Key Directories
          20190227
-------------------------------
NEWHIGHS       141  Bullish ratio
NEWLOWS        10
MAXCP          39
MINCP          8
TTTNH          24
TTTNL          19
FASTUP         244
FASTDOWN       145
CPCROSSA       309
CPCROSSD       276
BIGVOLUP       7
BIGVODN        16
ACCUMVER       76
HIGHIP21       70
HIUPPCT        7
VHIP21         28
LOWACCUM       151
REDSELL        53
AUGSELS7       17
TRAPDOOR       23
|
 TABLE 3   RANKING OF KEY DIRECTORIES BASED PCT.OF STOCKS ABOVE 65-DMA
             2/27/19
---------------------------------------------------------------------------------------
Directory     Current       day-1         day-2         day-3         day-4         day-5
----------------------------------------------------------------------------------------
BIGBANKS       1             1             1             .714          1             1
REGBANKS       1             1             1             1             1             1
BONDFUND       .98           .98           .98           .99           .99           .99
HOMEBLDG       .941          .941          .941          .941          .941          .941
SOLAR          .941          .882          .882          .941          .941          1
ETFS           .931          .931          .948          .931          .931          .931
UTILITY        .925          .925          .925          .925          .95           .925
DJI-13         .923          1             1             1             1             .923
FINANCE        .9            .9            .877          .855          .866          .866
INDMATER       .898          .898          .911          .911          .886          .898
NIFTY          .894          .894          .894          .894          .894          .877
CHEM           .888          .907          .888          .907          .925          .888
INFRA          .888          .888          .888          .888          .861          .888
GOLD           .882          .921          .921          .941          .98           .96
GUNS           .882          .823          .882          .941          .823          .882
FIDSTKS        .87           .87           .881          .875          .859          .87
SP-100         .87           .881          .892          .86           .86           .881
GREEN          .869          .826          .869          .913          .826          .869
DOWJONES       .866          .933          .933          .933          .866          .833
SP500          .865          .869          .873          .865          .863          .873
SEMI           .862          .887          .896          .887          .896          .913
ELECTRON       .851          .87           .876          .876          .87           .876
MILITARY       .843          .843          .906          .906          .843          .843
EDU            .833          .666          .833          .833          .833          .666
INSURANC       .833          .8            .9            .933          .933          .966
RUS-1000       .832          .824          .841          .836          .821          .845
NASD-100       .83           .82           .84           .83           .85           .84
SOFTWARE       .825          .841          .857          .841          .825          .841
COMPUTER       .818          .909          .909          .909          .818          .818
HACKERS        .818          .818          .818          .818          .727          .772
CHINA          .813          .813          .83           .83           .779          .762
REIT           .812          .832          .859          .899          .845          .852
INDEXES        .811          .833          .822          .817          .822          .822
AUTO           .794          .82           .794          .897          .846          .846
GAMING         .75           .791          .833          .833          .75           .791
TRANSP         .75           .75           .8            .8            .8            .8
RETAIL         .735          .698          .679          .679          .641          .698
COMODITY       .731          .707          .731          .78           .756          .731
OILGAS         .715          .701          .729          .694          .687          .763
BIOTECH        .694          .671          .678          .655          .623          .634
BIG17          .673          .673          .717          .652          .565          .586
BEVERAGE       .666          .666          .666          .666          .722          .666
FOOD           .66           .642          .66           .714          .678          .66
JETS           .6            .6            .7            .7            .7            .7
COAL           .571          .571          .428          .428          .571          .571
--------------------------------------------------------------------------------------------
HOSPITAL       .458          .5            .541          .583          .583          .583
|
====================================================================
2/26/2019 A retreat is shaping up
as the President's lawyer, Michael Cohen, testifies
in public Congressional testimony today. He will say Trump is a "liar" and
a "con-man". "So what?" his supporters will say.
"How can we trust the
assertions of a convicted liar?". Most of us are getting quite accustomed to
all this ugly banter. It's drama, to be sure. But will it offer anything new?
Unless there are new revelations, it's doubtful if it will cause a serious
decline. I would suggest we watch instead what happens to the Dollar.
It dropped below its 65-dma today. The Dollar, of course, is still up
a lot. So, at this stage, the weakness is just something to note and watch.
More important for the stock market, I've said, is what the FOMC will
do about interest rates. I've asserted that politics will be the determining
factor now because this is the normally bullish 3rd year in the four-year cycle.
It's
as though someone in the FED power structure took my suggestion.
None other than Janet Yellen set forth a "trial balloon" in which she
argued that
the FED should now be considering lowering rates.
https://www.marketwatch.com/story/yellen-says-next-fed-move-could-be-an-interest-rate-cut-2019-02-06
That would boost the DJI and could - if the 1927 scenario were to play
out - lead to a wild market take-off to the upside if the DJI can breakout
past 28,000.
Right now a shallow drop to 25500 could be
developing. That would be
perfectly normal for a DJI in a "V-formation" that is still going to bring a
nominal closing high.
If the A/D Line breaks its steep uptrend line, one
would think there ought to be a DJI decline to its
rising 21-day ma. That should be good support
given the upward momentum and how high the current
IP21 is.

When the market behaves contrary to what our intuitive sense
tells us it
should is often very significant. So, if despite Michael Cohen's testimony
the market rises or does not decline very much, I think our upside expectation
of at least a 10% advance from when our Buy B4 signal occurred (24364)
will look solid.
Watch the Closing Power uptrends for DIA, SPY, QQQ
and IWM.
A weak opening is shaping up. It will be fascinating to see how more
of a decline then occurs. The Closing Powers for these ETF are still
well above their rising 21-dma and have not even broken their steep
up-trendlines.
 |
 |
 |
 |
|
Charts 2/26/2019 2018 PEERLESS DJI, Signals, Indicators Daily DJI Volume 10-DayUp/Down Vol Hourly DJIA A/D Line for All Stocks Inverted Traders Index NASDAQ S&P OEX NYSE COMPQX DJI-15 DJI-20 DJI-30 DIA SPY QQQ MDY IWM TNA Short-Term Rates USO-CrudeOil DBO FAS GLD BBH IBB JETS JNUG KOL NUGT OIH OIL RSX RETL SDS AGQ SLV SOXL TECL TLT TMF TNA UGA (gasoline) XIV YINN Commodities: CANE CORN DBC JJC, NIB, CHOC CORN, CUT (paper) MOO, SOYB WEAT UUP (Dollar) LIT (Lithium) AAPL ADBE ALXN AMAT AMGN AMD AMZN BA BABA BAC BIDU CAT CVX DE FB GOOG GS HD IBM INTU JPM M (Macy's) MSFT NFLX NVDA QCOM TSLA TXN XOM WMT CMG , LRCX, SWKS, MDGL SPPI WATT SQ TOWN 2/26/19 (Click on Underlined link.) Bullish MAXCPs - http://tigersoft.com/MAXCPS/Feb-26/BULLISH.htm Bearish MAXCPs - http://tigersoft.com/MINCPs/Feb-26/BEARISH.htm |
Table 1 QUICKSILVER on ETFS - 2/26/19 ETF CLOSE CHANGE PIVOT-PT 5-dma AROC CL-PWR CANDLE IP21 ITRS
---------------------------------------------------------------------------------------------
DIA 260.54 -.35 259.5 33.3% ------- BLUE .346 ------
---------------------------------------------------------------------------------------------
BA 426.77 -.1 421.55 124.7% Bullish BLUE .293 .247
---------------------------------------------------------------------------------------------
SPY 279.32 -.2 278.41 26.4% ------- BLUE .323 -.007
---------------------------------------------------------------------------------------------
QQQ 173.7 .18 172.25 41.2% ------- BLUE .226 -.007
---------------------------------------------------------------------------------------------
MDY 349.26 -2.97 350.79 1.3% ------- RED .361 .018
---------------------------------------------------------------------------------------------
IWM 157.1 -1.09 157.39 14.3% Bullish RED .412 .025
^^^
---------------------------------------------------------------------------------------------
FAS 62.59 -.26 62.92 8% ------- BLUE .292 .164
---------------------------------------------------------------------------------------------
RETL 31.14 .62 31.38 -21.2% ------- BLUE .302 .037
---------------------------------------------------------------------------------------------
SOXL 131.06 -2.77 129.45 196.5% ------- RED .107 .313
^^^^^^ ??????? ^^^^
---------------------------------------------------------------------------------------------
TECL 123.9 .72 116.74 311.5% Bullish BLUE .265 .129
---------------------------------------------------------------------------------------------
IBB 112.5 -.46 111.1 49.5% ------- RED .236 .007
---------------------------------------------------------------------------------------------
GLD 125.58 .21 126.48 -44.5% Bearish BLUE .035 .007
---------------------------------------------------------------------------------------------
OIH 17.25 -.19 17.89 -128.2% ------- RED .039 -.019
---------------------------------------------------------------------------------------------
RSX 20.76 .02 20.72 53.3% ------- BLUE .019 -.042
|
  Table 2  Count of Stocks in Key Directories
           2019-02-26
-------------------------------
NEWHIGHS       109
NEWLOWS        7
MAXCP          31
MINCP          4
TTTNH          30
TTTNL          11
FASTUP         218
FASTDOWN       307
CPCROSSA       227
CPCROSSD       241
BIGVOLUP       6
BIGVODN        17
ACCUMVER       75
HIGHIP21       57
HIUPPCT        7
VHIP21         23
LOWACCUM       154
REDSELL        53
AUGSELS7       18
TRAPDOOR       21
|
 Table 3   RANKING OF KEY DIRECTORIES BASED PCT.OF STOCKS ABOVE 65-DMA
              2/26/19
 None of the groups here show a majority of their stocks below their 65-dma
---------------------------------------------------------------------------------------
Directory     Current       day-1         day-2         day-3         day-4         day-5
----------------------------------------------------------------------------------------
BIGBANKS       1             1             .714          1             1             1
DJI-13         1             1             1             1             .923          .923
REGBANKS       1             1             1             1             1             1
BONDFUND       .98           .98           .99           .99           .99           .98
HOMEBLDG       .941          .941          .941          .941          .941          .941
DOWJONES       .933          .933          .933          .866          .833          .8
ETFS           .931          .948          .931          .931          .931          .931
UTILITY        .925          .925          .925          .95           .925          .925
GOLD           .921          .921          .941          .98           .96           .98
COMPUTER       .909          .909          .909          .818          .818          .818
CHEM           .907          .888          .907          .925          .907          .851
FINANCE        .9            .877          .855          .866          .866          .877
INDMATER       .898          .911          .911          .886          .898          .848
NIFTY          .894          .894          .894          .894          .877          .894
INFRA          .888          .888          .888          .861          .861          .888
SEMI           .887          .896          .887          .896          .905          .896
SP-100         .881          .892          .86           .86           .87           .86
ELECTRON       .87           .876          .876          .87           .87           .864
FIDSTKS        .87           .881          .875          .859          .859          .875
SP500          .867          .871          .863          .861          .867          .873
SOFTWARE       .846          .861          .846          .83           .846          .876
MILITARY       .843          .906          .906          .843          .843          .843
INDEXES        .833          .822          .817          .822          .822          .822
SOLAR          .833          .833          .888          .888          .944          .944
REIT           .832          .859          .899          .845          .838          .872
GREEN          .826          .869          .913          .826          .869          .913
RUS-1000       .824          .841          .834          .823          .84           .85
GUNS           .823          .882          .941          .823          .882          .882
AUTO           .82           .794          .897          .846          .846          .794
NASD-100       .82           .84           .83           .85           .84           .86
HACKERS        .818          .818          .818          .727          .772          .772
CHINA          .816          .833          .833          .783          .766          .783
INSURANC       .8            .9            .933          .933          .966          .966
GAMING         .791          .833          .833          .75           .791          .833
TRANSP         .75           .8            .8            .8            .75           .9
COMODITY       .707          .731          .78           .756          .731          .707
OILGAS         .701          .729          .694          .687          .75           .784
RETAIL         .698          .679          .679          .641          .698          .66
BIG17          .673          .717          .652          .565          .586          .586
BIOTECH        .668          .678          .657          .621          .631          .631
BEVERAGE       .666          .666          .666          .722          .666          .666
EDU            .666          .833          .833          .833          .666          .666
FOOD           .642          .66           .714          .678          .66           .642
JETS           .6            .7            .7            .7            .6            .9
COAL           .571          .428          .428          .571          .571          .571
HOSPITAL       .5            .541          .583          .583          .583          .541
|
====================================================================
2/25/2019 The Buy B4 rally coninued today
and the DJI is now almost 20%
above its "V" bottom. Still, the DJI lost 145 points from the high
point of the day. So, perhaps there will be a small retreat as the
market sees how Donald Trump's ex-lawyer and "fixer", Michael
Cohen answers questions Tuesday, Wednesday (publicly) and Thursday
before Congress. Another concern Wall Street should have is how
polished and energetic Bernie Sanders looked at a CNN town hall
meeting tonight.


How the market reacts to news that seems bearish to casual obervers
is very important. If the DJI and the broader indexes can brush off
whatever Michael Cohen has to say, it will be bullish and the third-year
rally should make another run, though it would be nice to see higher
trading volume to confirm any move higher.
IWM's components seem bullish when aggregated, but
well-tested resistance has been reached.

The Price and Closing Power uptrends are all still intact, but the SP-500,
OEX, IWM and NYSE simultaneously reached horizontal resistance
levels that are well-tested, as shown below. A pullback would be normal.
And, in fact, there were 34 more down than up on the NYSE despite the
DJI's 60-point gain.
Bullishly, the NYSE A/D Line has been leading the DJI higher for weeks.
With the Dollar still above its 65-dma, I doubt if the "hawkish" minority
in the FOMC will get much hearing. Any decline should be shallow. 83%
of all 5000+ stocks and ETS we track are above the usually good support
of their 65-dma.
|
Charts 2/25/2019 2018 PEERLESS DJI, Signals, Indicators Daily DJI Volume 10-DayUp/Down Vol Hourly DJIA A/D Line for All Stocks Inverted Traders Index NASDAQ S&P OEX NYSE COMPQX DJI-15 DJI-20 DJI-30 DIA SPY QQQ MDY IWM TNA Short-Term Rates USO-CrudeOil DBO FAS GLD BBH IBB JETS JNUG KOL NUGT OIH OIL RSX RETL SDS AGQ SLV SOXL TECL TLT TMF TNA UGA (gasoline) XIV YINN Commodities: CANE CORN DBC JJC, NIB, CHOC CORN, CUT (paper) MOO, SOYB WEAT UUP (Dollar) LIT (Lithium) AAPL ADBE ALXN AMAT AMGN AMD AMZN BA BABA BAC BIDU CAT CVX DE FB GOOG GS HD IBM INTU JPM M (Macy's) MSFT NFLX NVDA QCOM TSLA TXN XOM WMT CMG , LRCX, SWKS, MDGL SPPI WATT SQ TOWN 2/25/19 (Click on Underlined link.) Bullish MAXCPs - http://tigersoft.com/MAXCPS/Feb-25/BULLISH.htm Bearish MAXCPs - http://tigersoft.com/MINCPs/Feb-25/BEARISH.htm |
Resistance Reached... Watch how it is
handled in the next few days.


Table 1   QUICKSILVER on ETFS - 2/25/19

ETF       CLOSE   CHANGE     PIVOT-PT  5-dma AROC   CL-PWR      CANDLE IP21  ITRS
---------------------------------------------------------------------------------------------
DIA       260.89    .72      258.81        43.2%    -------      RED  .328   -----
---------------------------------------------------------------------------------------------
BA        426.87    2.82     416.26        106.1%   Bullish      RED  .295   .257
---------------------------------------------------------------------------------------------
SPY       279.52    .38      277.85        38.7%    -------      RED  .353  -.01
---------------------------------------------------------------------------------------------
QQQ       173.52    .63      172.28        45.9%    -------      RED  .236  -.008
---------------------------------------------------------------------------------------------
MDY       352.23   -.03      349.17        47.7%    Bullish      RED  .446   .027
---------------------------------------------------------------------------------------------
IWM       158.19    .04      156.65        62.7%    Bullish      RED  .475   .035
                                                                      highest
---------------------------------------------------------------------------------------------
FAS       62.85    .24       62.49         51.2%    -------      RED  .297   .164
---------------------------------------------------------------------------------------------
RETL      30.52    .28       31.27        -39.1%    -------      RED  .317   .033
---------------------------------------------------------------------------------------------
SOXL      133.83    3.28     125.98        274.9%   -------      RED  .169   .396
                                                                             highest
---------------------------------------------------------------------------------------------
TECL      123.18    1.88     116.49        295.6%   Bullish      RED  .282   .141
                                           highest
---------------------------------------------------------------------------------------------
IBB       112.96    2.25     111.4         41.5%    -------      BLUE .293   .016
---------------------------------------------------------------------------------------------
GLD       125.37   -.13      126.7         22.7%    Bearish      RED  .065  -.002
---------------------------------------------------------------------------------------------
OIH       17.44    .14       17.7         -34.1%    -------      BLUE .111   .005
---------------------------------------------------------------------------------------------
RSX       20.74    .01       20.54         65.5%    -------      ---- .033  -.046
|
 Table 2   Count of Stocks in Key Directories
           2019-02-25
-------------------------------
NEWHIGHS       170   Bullish
NEWLOWS        7
MAXCP          25
MINCP          5
TTTNH          27
TTTNL          11
FASTUP         189
FASTDOWN       133
CPCROSSA       191
CPCROSSD       165
BIGVOLUP       8
BIGVODN        8
ACCUMVER       65
HIGHIP21       62
HIUPPCT        7
VHIP21         23
LOWACCUM       164
REDSELL        50
AUGSELS7       14
TRAPDOOR       17
|
Table 3    RANKING OF KEY DIRECTORIES BASED PCT.OF STOCKS ABOVE 65-DMA
              2/25/19
---------------------------------------------------------------------------------------
Directory     Current       day-1         day-2         day-3         day-4         day-5
----------------------------------------------------------------------------------------
BIGBANKS       1             .714          1             1             1             .857
DJI-13         1             1             1             .923          .923          .923
REGBANKS       1             1             1             1             1             1
BONDFUND       .98           .99           .99           .99           .98           .99
ETFS           .948          .931          .931          .931          .931          .913
HOMEBLDG       .941          .941          .941          .941          .941          .882
DOWJONES       .933          .933          .866          .833          .8            .8
UTILITY        .925          .925          .95           .925          .925          .95
GOLD           .921          .941          .98           .96           .98           .862
INDMATER       .911          .911          .886          .898          .848          .873
COMPUTER       .909          .909          .818          .818          .818          .772
MILITARY       .906          .906          .843          .843          .843          .906
INSURANC       .9            .933          .933          .966          .966          .9
SEMI           .896          .887          .896          .905          .896          .887
NIFTY          .894          .894          .894          .877          .894          .894
SP-100         .892          .86           .86           .87           .86           .849
CHEM           .888          .907          .925          .907          .87           .851
INFRA          .888          .888          .861          .861          .888          .805
GUNS           .882          .941          .823          .882          .882          .882
SOLAR          .882          .941          .941          1             1             .941
FIDSTKS        .881          .875          .859          .859          .87           .875
FINANCE        .877          .855          .866          .866          .877          .888
ELECTRON       .876          .876          .87           .87           .864          .845
SP500          .873          .865          .863          .869          .869          .861
GREEN          .869          .913          .826          .869          .913          .869
REIT           .859          .899          .845          .838          .872          .859
SOFTWARE       .857          .841          .825          .841          .873          .873
RUS-1000       .841          .834          .821          .841          .845          .837
NASD-100       .84           .83           .85           .84           .85           .86
CHINA          .833          .833          .783          .766          .783          .733
EDU            .833          .833          .833          .666          .666          .666
GAMING         .833          .833          .75           .791          .833          .791
INDEXES        .822          .817          .822          .822          .822          .806
HACKERS        .818          .818          .727          .772          .772          .772
TRANSP         .8            .8            .8            .75           .85           .85
AUTO           .794          .897          .846          .846          .794          .743
COMODITY       .731          .78           .756          .731          .707          .707
OILGAS         .729          .694          .687          .75           .756          .729
BIG17          .717          .652          .565          .586          .565          .608
JETS           .7            .7            .7            .6            .8            .9
RETAIL         .679          .679          .641          .698          .66           .66
BIOTECH        .676          .657          .623          .628          .628          .652
BEVERAGE       .666          .666          .722          .666          .666          .666
FOOD           .66           .714          .678          .66           .642          .642
HOSPITAL       .541          .583          .583          .583          .541          .625
---------------------------------------------------------------------------------------------------
COAL           .428          .428          .571          .571          .428          .571
|
====================================================================
2/22/2019 The Buy B4 continues to rule.
The uptrend lines, the NYSE A/D Line and
Price- and Closing Power- uptrends for the DJI, SP-500, NYSE, OEX,
NASDAQ, QQQ, TECL, SOXL and IWM are all rising. Rising still is
the percentage of all the stocks we follow that are above their 65-dma.
The DJI is up almost 20% in a straight-up advance since the December 24th
bottom and still the Hourly DJI's DISI is rising. BA is rocketing up in all-time
high territory. As long as it advances like this is will be hard for the DJI to
decline. The Dollar remains in an uptrend, too. So, it's most unlikely that
the FED will have to resort to higher interest rates. Meanwhile, the political
pressures are making for another very bullish 3rd year in the four-year
Presidential cycle. History says that interest rates outweight even concerns
about what is in the Muller Report. And interest rates are very bullish.

How long can this advance continue? Is too late to
buy? The answers
are "much higher" and "no". Buy
IWM. V-bottoms and January breadth
-surge Buys like we have working for us now ought to be expected to take
the DJI to new highs. But it is also true that with V-Bottoms there is usually
a shallow pull-back and regrouping before the new high is making. So, perhaps, it's
not a bad idea for short-term traders to take some profits in the leveraged
ETFs like SOXL. They may even want to do this before the steep uptrends
are broken to avoid a "rush the exits". That's what I suggested on Friday
morning last week.
I believe that smaller stocks will start to do much better as
confidence
increases from the steady rise in stocks. That should mean IWM, the
Russell-2000 ETF, is safe to buy even now.

|
Charts 2/22/2019 2018 PEERLESS DJI, Signals, Indicators Daily DJI Volume 10-DayUp/Down Vol Hourly DJIA A/D Line for All Stocks Inverted Traders Index NASDAQ S&P OEX NYSE COMPQX DJI-15 DJI-20 DJI-30 DIA SPY QQQ MDY IWM TNA Short-Term Rates USO-CrudeOil DBO FAS GLD BBH IBB JETS JNUG KOL NUGT OIH OIL RSX RETL SDS AGQ SLV SOXL TECL TLT TMF TNA UGA (gasoline) XIV YINN Commodities: CANE CORN DBC JJC, NIB, CHOC CORN, CUT (paper) MOO, SOYB WEAT UUP (Dollar) LIT (Lithium) AAPL ADBE ALXN AMAT AMGN AMD AMZN BA BABA BAC BIDU CAT CVX DE FB GOOG GS HD IBM INTU JPM M (Macy's) MSFT NFLX NVDA QCOM TSLA TXN XOM WMT CMG , LRCX, SWKS, MDGL SPPI WATT SQ TOWN 2/22/19 (Click on Underlined link.) Bullish MAXCPs - http://tigersoft.com/MAXCPS/Feb-22/BULLISH.htm Bearish MAXCPs - http://tigersoft.com/MINCPs/Feb-22/BEARISH.htm |
Follow Interest Rates, not 'Fake News"
Wouldn't it be something if the President is absolved by
Muller's final
report? The way the market is rising, we might think that may be what
lies ahead. Or it might be that the FED may actually be planning to lower
rates if Inflation is low and the Dollar starts making more new highs. I
would suggest what the FED does in the way of interest rates is much
more important than Muller's Report. The 1927 experience suggests
that the FED might even be induced to lower rates just as the DJI makes new
all-time highs. If it were to do this later this year for unspoken political
reasons, the DJI could be going to 30000 and smaller stocks should
really surge.
Politics is by nature money-driven in America. So is
the stock market.
Voters are not much surprised when a scandal surfaces in Washington.
They almost expect it. So just as long as the Muller Report does
not produce such glaring miscondust that it brings impeachment, the market
should go higher. But even impeachment is not as important to most voters
as their jobs and their retirement accounts. I show below why I think that
the stock market is more influenced by interest rates than even the
probabilities of impeachment.
---------------------------------------------------------------------------------------------------
DJI-1998-1999
The House vote to impeach Clinton did not prevent the stock market from rising
in 1999. Falling interest rates were more important.
Clinton was impeached on December 19, 1998,
by the House of
Representatives on grounds of perjury to a grand jury (by a 228–206 vote)
and obstruction of justice (by a 221–212 vote). He was acquitted
by the Senate on February 12, 1999.

Mo/Year 1 Mo Libor
Prime Rates
11/98 5.136
5.229%
7.75%
12/98 5.052
5.529%
7.75%
1/1999 4.991% 4.979%
7.75%
2/1999 4.940% 4.940%
7.75%
3/1999 4.889% 4.945%
7.75%
4/1999 4.832% 4.921%
7.75%
5/1999 4.783% 4.914%
7.75%
( https://www.firstrepublic.com/finmkts/historical-interest-rates
)
------------------------------------ 1974
---------------------------------------------------
Secondly, Nixon's resignation only added bearish fuel to a
market that was
already declining as a result of the Fed's raising rates, oil shortages and Inflation.

Federal Funds Rate:
1974-02-01 8.97%
1974-03-01 9.35%
1974-04-01 10.51%
1974-05-01 11.31%
1974-06-01 11.93%
1974-07-01 12.92%
1974-08-01 12.01%
1974-09-01 11.34%
1974-10-01 10.06%
------------------------------------ 1923
---------------------------------------------------
Thirdly, the Teapot Dome scandal in the Harding Adminstration brought
some additional selling of stocks in 1923, but the evidence back then shows
that it was probably the FED's raising interest rates that first caused the
market's sell-off in 1923. The Teapot Dome produced criminal convictions
against Harding's Secretary of the Interior, but the President himself was
not considered guilty of any crimes because he did not personally receive
any of the bribe money oil companies used to obtain the very profitable
Navy oil leases in Wyoming.

(I am working on a lengthy history of the
influences in the stock market since 1915
and also a year-by-year technical study of the
charts for these years. The second should
be done in April. I expect it to be
available as a printed book or as an E-book. Stay tuned.)
Table 1 QUICKSILVER on ETFS - 2/22/19 ETF CLOSE CHANGE PIVOT-PT 5-dma AROC CL-PWR CANDLE IP21 ITRS --------------------------------------------------------------------------------------------- DIA 260.17 1.64 258.65 97% Bullish BLUE .384 ----- --------------------------------------------------------------------------------------------- BA 424.05 6.47 417.97 170.8% Bullish BLUE .307 .236 --------------------------------------------------------------------------------------------- SPY 279.14 1.72 277.37 85.9% ------- BLUE .409 -.006 --------------------------------------------------------------------------------------------- QQQ 172.89 1.27 171.94 48.6% Bullish BLUE .311 -.003 --------------------------------------------------------------------------------------------- MDY 352.26 2.65 348.89 109.6% Bullish BLUE .49 .029 --------------------------------------------------------------------------------------------- IWM 158.15 1.36 156.22 140.2% Bullish BLUE .538 .038 --------------------------------------------------------------------------------------------- FAS 62.61 .42 62.21 253% ------- BLUE .35 .141 --------------------------------------------------------------------------------------------- RETL 30.24 .37 30.76 93.2% ------- BLUE .368 .013 --------------------------------------------------------------------------------------------- SOXL 130.55 3.95 126.8 227.7% Bullish BLUE .293 .39 --------------------------------------------------------------------------------------------- TECL 121.3 4.29 116.23 331% Bullish BLUE .34 .131 --------------------------------------------------------------------------------------------- IBB 110.71 1.56 112.04 22.1% ------- BLUE .278 .003 --------------------------------------------------------------------------------------------- GLD 125.5 .45 124.8 57.4% ------- ---- .073 .003 --------------------------------------------------------------------------------------------- OIH 17.3 -.11 17.56 45.6% ------- RED .113 -.012 --------------------------------------------------------------------------------------------- RSX 20.73 .19 20.47 99.9% ------- BLUE .075 -.045 |
 |
 Table 2   Count of Stocks in Key Directories
           2019-02-22
-------------------------------
NEWHIGHS       263  Bullish
NEWLOWS        11
MAXCP          78
MINCP          7
TTTNH          38
TTTNL          16
FASTUP         150
FASTDOWN       63
CPCROSSA       144
CPCROSSD       108
BIGVOLUP       8
BIGVODN        13
ACCUMVER       41
HIGHIP21       104
HIUPPCT        7
VHIP21         23
LOWACCUM       153
REDSELL        46
AUGSELS7       14
TRAPDOOR       17
|
 Table 3  RANKING OF KEY DIRECTORIES BASED PCT.OF STOCKS ABOVE 65-DMA
              2/22/19
 Bullish=45  Bearish=1
---------------------------------------------------------------------------------------
Directory     Current       day-1         day-2         day-3         day-4         day-5
----------------------------------------------------------------------------------------
DJI-13         1             1             .923          .923          .923          .846
REGBANKS       1             1             1             1             1             .964
BONDFUND       .99           .99           .99           .98           .99           .99
GOLD           .941          .98           .96           .98           .862          .882
GUNS           .941          .823          .882          .882          .882          .823
HOMEBLDG       .941          .941          .941          .941          .882          .882
SOLAR          .941          .941          1             1             .941          .882
DOWJONES       .933          .866          .833          .8            .8            .7
INSURANC       .933          .933          .966          .966          .9            .766
ETFS           .931          .931          .931          .931          .913          .844
UTILITY        .925          .95           .925          .925          .95           .9
GREEN          .913          .826          .869          .913          .869          .739
INDMATER       .911          .886          .898          .848          .873          .822
COMPUTER       .909          .818          .818          .818          .772          .818
CHEM           .907          .925          .907          .87           .87           .777
MILITARY       .906          .843          .843          .843          .906          .843
REIT           .899          .845          .838          .872          .859          .852
AUTO           .897          .846          .846          .794          .743          .615
NIFTY          .894          .894          .877          .894          .894          .929
INFRA          .888          .861          .861          .888          .805          .805
SEMI           .887          .896          .905          .896          .887          .87
ELECTRON       .876          .87           .87           .864          .845          .833
FIDSTKS        .875          .859          .859          .87           .864          .794
SP500          .865          .863          .869          .869          .857          .808
SP-100         .86           .86           .87           .86           .849          .72
FINANCE        .855          .866          .866          .877          .888          .822
SOFTWARE       .841          .825          .841          .873          .873          .873
RUS-1000       .836          .823          .841          .846          .837          .792
CHINA          .833          .783          .766          .783          .733          .8
EDU            .833          .833          .666          .666          .666          .666
GAMING         .833          .75           .791          .833          .75           .75
NASD-100       .83           .85           .84           .85           .86           .85
INDEXES        .822          .822          .822          .822          .806          .79
HACKERS        .818          .727          .772          .772          .772          .772
TRANSP         .8            .8            .75           .85           .8            .8
COMODITY       .78           .756          .731          .707          .682          .536
BIGBANKS       .714          1             1             1             .857          .571
FOOD           .714          .678          .66           .642          .625          .5
JETS           .7            .7            .6            .8            .8            .8
OILGAS         .694          .687          .75           .756          .722          .631
RETAIL         .679          .641          .698          .66           .66           .641
BEVERAGE       .666          .722          .666          .666          .666          .611
BIOTECH        .657          .623          .631          .628          .652          .613
BIG17          .652          .565          .586          .565          .586          .543
HOSPITAL       .583          .583          .583          .541          .625          .541
--------------------------------------------------------------------------------------------------
COAL           .428          .571          .571          .428          .428          .428
|
====================================================================
2/21/2019
The Buy B4 is still operative. This means we have to expect the
DJI will probably reach 27000 in the next two months. But first,
there may have to be a retreat by the DJI to a point below the 21-day
ma. I take 25600 to be where the DJI's steep uptrendline now crosses.
DJI's V-formation will likely keep the
market rising until a new high is made. But
in all three earlier "V" bottoms (1942, 1949
aand 1971-1972), the steep uptrend-line from the
bottom was broken and prices had to re-group below the
21-dma for a month before going to new highs.
These charts were shown a few days ago.


Everyone knows the slogan "the trend is our friend." Right now the
the DJI's price uptrend crosses at about 25600. Just about every
short-term trader is now watching this level on the DJI and comparable
levels for the SP-500 and the NASDAQ. As a result, if their uptrendlines
are broken, there will surely be a flood of short-term selling. That's the
reason last night I suggested that short-term traders who look only a week
ahead should probably do some profit-taking if the market closed lower today. |
(Why? Because round numbers like 26000 usually act as resistance, because
volume is not rising as we might hope or expect if the overhead resistance
is to be eaten up and also because before trading started on Thursday
morning the DJI was up more than 100). Something is spooking the markets
a bit. It may be that refund checks are much smaller than expected.
 |
 |
We have been long SOXL since it moved about its inverted head and
shoulders neckline. I think it's probably a good time to take profits in
it. For one thing, AMAT now is developing a head/shoulders pattern.
For another, NVDA just can't see to get any traction. And thirdly, Qualcomm
is again showing heavt distribution. SOXL and semi-conductors have
generally traded very well with the Sell and Buy signals from Peerless.
I was asked to give some guidance on options' trading from a new customer.
See the simple rules I set out at www.tigersoft.com/PHILL/INDEX.htm
 |
|
Charts 2/21/2019 2018 PEERLESS DJI, Signals, Indicators Daily DJI Volume 10-DayUp/Down Vol Hourly DJIA A/D Line for All Stocks Inverted Traders Index NASDAQ S&P OEX NYSE COMPQX DJI-15 DJI-20 DJI-30 DIA SPY QQQ MDY IWM TNA Short-Term Rates USO-CrudeOil DBO FAS GLD BBH IBB JETS JNUG KOL NUGT OIH OIL RSX RETL SDS AGQ SLV SOXL TECL TLT TMF TNA UGA (gasoline) XIV YINN Commodities: CANE CORN DBC JJC, NIB, CHOC CORN, CUT (paper) MOO, SOYB WEAT UUP (Dollar) LIT (Lithium) AAPL ADBE ALXN AMAT AMGN AMD AMZN BA BABA BAC BIDU CAT CVX DE FB GOOG GS HD IBM INTU JPM M (Macy's) MSFT NFLX NVDA QCOM TSLA TXN XOM WMT CMG , LRCX, SWKS, MDGL SPPI WATT SQ TOWN 2/21/19 (Click on Underlined link.) Bullish MAXCPs - http://tigersoft.com/MAXCPS/Feb-21/BULLISH.htm Bearish MAXCPs - http://tigersoft.com/MINCPs/Feb-21/BEARISH.htm |
Table 1 QUICKSILVER on ETFS - 2/21/19 ETF CLOSE CHANGE PIVOT-PT 5-dma AROC CL-PWR CANDLE IP21 ITRS --------------------------------------------------------------------------------------------- DIA 258.53 -.97 255.16 53% Bullish RED .37 ---- --------------------------------------------------------------------------------------------- BA 417.58 -3.97 409.82 84.3% Bullish RED .285 .234 --------------------------------------------------------------------------------------------- SPY 277.42 -.99 274.38 43.9% ------- RED .388 -.006 --------------------------------------------------------------------------------------------- QQQ 171.62 -.63 171.22 17.8% Bullish RED .281 .005 --------------------------------------------------------------------------------------------- MDY 349.61 -1.18 344.62 68.7% Bullish RED .457 .019 --------------------------------------------------------------------------------------------- IWM 156.79 -.6 153.77 108.4% Bullish RED .488 .03 --------------------------------------------------------------------------------------------- FAS 62.19 -.73 59.48 114.5% ------- RED .364 .105 --------------------------------------------------------------------------------------------- RETL 29.87 -1.51 29.67 0% ------- RED .342 .019 --------------------------------------------------------------------------------------------- SOXL 126.6 -2.85 124.78 110.6% Bullish RED .241 .411 --------------------------------------------------------------------------------------------- TECL 117.01 .27 113.62 164% Bullish BLUE .309 .144 --------------------------------------------------------------------------------------------- IBB 109.15 -1.95 110.22 -27.1% ------- RED .231 -.005 --------------------------------------------------------------------------------------------- GLD 125.05 -1.43 124.06 67.2% ------- RED .1 .001 --------------------------------------------------------------------------------------------- RSX 20.54 -.18 20.32 90.5% ------- RED .117 -.066 |
Table 2    Count of Stocks in Key Directories
           2019-02-21
-------------------------------
NEWHIGHS       156
NEWLOWS        4
MAXCP          55
MINCP          4
TTTNH          23
TTTNL          11
FASTUP         94
FASTDOWN       44
CPCROSSA       46
CPCROSSD       80
BIGVOLUP       5
BIGVODN        10
ACCUMVER       52
HIGHIP21       75
HIUPPCT        5
VHIP21         23
LOWACCUM       160
REDSELL        44
AUGSELS7       9
TRAPDOOR       17
|
 Table 3 RANKING OF KEY DIRECTORIES BASED PCT.OF STOCKS ABOVE 65-DMA
              2/21/19
All 46 are Bullish.
---------------------------------------------------------------------------------------
Directory     Current       day-1         day-2         day-3         day-4         day-5
----------------------------------------------------------------------------------------
BIGBANKS       1             1             1             .857          .571          .571
DJI-13         1             .923          .923          .923          .846          .846
REGBANKS       1             1             1             1             .964          1
BONDFUND       .99           .99           .98           .99           .99           .99
GOLD           .98           .96           .98           .86           .88           .9
UTILITY        .95           .925          .925          .95           .9            .875
HOMEBLDG       .941          .941          .941          .882          .882          .823
SOLAR          .941          1             1             .941          .882          .823
INSURANC       .933          .966          .966          .9            .766          .833
ETFS           .931          .931          .931          .913          .844          .862
CHEM           .925          .907          .87           .87           .777          .796
SEMI           .896          .905          .896          .887          .87           .853
NIFTY          .894          .877          .894          .894          .929          .894
INDMATER       .884          .897          .846          .871          .82           .858
ELECTRON       .87           .87           .864          .845          .827          .814
DOWJONES       .866          .833          .8            .8            .7            .733
FINANCE        .866          .866          .877          .888          .822          .844
SP500          .863          .869          .869          .857          .804          .824
INFRA          .861          .861          .888          .805          .805          .777
SP-100         .86           .87           .86           .849          .72           .763
FIDSTKS        .859          .859          .87           .864          .794          .81
NASD-100       .85           .84           .85           .86           .85           .85
AUTO           .846          .846          .794          .743          .615          .641
REIT           .845          .838          .872          .859          .838          .879
MILITARY       .843          .843          .843          .906          .843          .843
EDU            .833          .666          .666          .666          .5            .5
GREEN          .826          .869          .913          .869          .739          .782
SOFTWARE       .825          .841          .873          .873          .873          .873
GUNS           .823          .882          .882          .882          .823          .823
RUS-1000       .823          .841          .846          .837          .788          .8
INDEXES        .822          .822          .822          .806          .79           .79
COMPUTER       .818          .818          .818          .772          .818          .863
TRANSP         .8            .75           .85           .8            .8            .8
CHINA          .783          .766          .783          .733          .8            .816
COMODITY       .761          .738          .714          .69           .547          .619
GAMING         .75           .791          .833          .75           .75           .708
HACKERS        .727          .772          .772          .772          .772          .772
BEVERAGE       .722          .666          .666          .666          .611          .722
JETS           .7            .6            .8            .8            .8            .8
OILGAS         .687          .75           .756          .722          .625          .597
FOOD           .684          .666          .649          .631          .508          .614
RETAIL         .641          .698          .66           .66           .641          .641
BIOTECH        .621          .631          .628          .652          .605          .623
HOSPITAL       .583          .583          .541          .625          .541          .625
COAL           .571          .571          .428          .428          .428          .285
BIG17          .565          .586          .565          .586          .543          .543
|
====================================================================
2/20/2019 The
Trend is Our Friend. There are no groups that
show a majority of their stocks are now below the support
of their 65-dma. Any retreat should be shallow.
The Trend is Our Friend.

The Buy B4 still rules. But we've come a long way and
often round numbers bring small pull-backs. I mentioned
the lagging OBV. My research shows that these do not
bring significant declines to the 3% lower band or lower
when they occur in February. (Only about 12% of the time).

DJ-30's Closing Power cannot easily be broken
by a one-day decline. But a very weak Opening
would probably start some Public selling.

So far, the Closing Powers for the 50+ key ETFs and
stocks I post here are all rising. ADBE is the lone exception.
But very few are very far above their Closing Power uptrend-lines.
So, a big weakness after an opening could change that any
day. And short-term traders should probably do some profit-taking
on such weakness.
The underpinnings of the market still look very good. See
Tables 1-3 below. The leaders are still in sweeping uptrends.


|
Charts 2/20/2019 2018 PEERLESS DJI, Signals, Indicators Daily DJI Volume 10-DayUp/Down Vol Hourly DJIA A/D Line for All Stocks Inverted Traders Index NASDAQ S&P OEX NYSE COMPQX DJI-15 DJI-20 DJI-30 DIA SPY QQQ MDY IWM TNA Short-Term Rates USO-CrudeOil DBO FAS GLD BBH IBB JETS JNUG KOL NUGT OIH OIL RSX RETL SDS AGQ SLV SOXL TECL TLT TMF TNA UGA (gasoline) XIV YINN Commodities: CANE CORN DBC JJC, NIB, CHOC CORN, CUT (paper) MOO, SOYB WEAT UUP (Dollar) LIT (Lithium) AAPL ADBE ALXN AMAT AMGN AMD AMZN BA BABA BAC BIDU CAT CVX DE FB GOOG GS HD IBM INTU JPM M (Macy's) MSFT NFLX NVDA QCOM TSLA TXN XOM WMT CMG , LRCX, SWKS, MDGL SPPI WATT SQ TOWN 2/20/19 (Click on Underlined link.) Bullish MAXCPs - http://tigersoft.com/MAXCPS/Feb-20/BULLISH.htm Bearish MAXCPs - http://tigersoft.com/MINCPs/Feb-20/BEARISH.htm |
Table 1 QUICKSILVER on ETFS - 2/20/19 ETF CLOSE CHANGE PIVOT-PT 5-dma AROC CL-PWR CANDLE IP21 ITRS --------------------------------------------------------------------------------------------- DIA 259.5 .69 255.8 96.8% Bullish BLUE .35 ------ --------------------------------------------------------------------------------------------- BA 421.55 5.29 410.58 131.1% Bullish BLUE .282 .231 --------------------------------------------------------------------------------------------- SPY 278.41 .56 274.99 78.2% ------- BLUE .362 -.007 --------------------------------------------------------------------------------------------- QQQ 172.25 -.03 171.01 39.7% Bullish RED .237 -.007 --------------------------------------------------------------------------------------------- MDY 350.79 1.62 344.83 113.3% Bullish BLUE .429 .019 --------------------------------------------------------------------------------------------- IWM 157.39 .74 153.42 142.3% Bullish BLUE .452 .03 --------------------------------------------------------------------------------------------- FAS 62.92 .43 60.78 231.9% ------- BLUE .336 .072 --------------------------------------------------------------------------------------------- RETL 31.38 .11 29.87 252.6% ------- RED .347 -.037 --------------------------------------------------------------------------------------------- SOXL 129.45 3.47 123.81 268.8% Bullish BLUE .229 .295 --------------------------------------------------------------------------------------------- TECL 116.74 .25 113.23 170.8% Bullish RED .27 .033 --------------------------------------------------------------------------------------------- IBB 111.1 -.3 109.75 76% Bullish RED .221 0 --------------------------------------------------------------------------------------------- GLD 126.48 -.22 123.37 105.2% ------- RED .189 .041 --------------------------------------------------------------------------------------------- RSX 20.72 .18 20.17 -36.6% ------- ---- .108 -.04 |
Table 2 Count of Stocks in Key Directories
20190220
-------------------------------
NEWHIGHS 164
NEWLOWS 7
MAXCP 45
MINCP 5
TTTNH 34
TTTNL 12
FASTUP 117
FASTDOWN 45
CPCROSSA 51
CPCROSSD 52
BIGVOLUP 4
BIGVODN 21
ACCUMVER 60
HIGHIP21 75
HIUPPCT 6
VHIP21 23
LOWACCUM 178
REDSELL 46
AUGSELS7 10
TRAPDOOR 16
|
Table 3 RANKING OF KEY DIRECTORIES BASED PCT.OF STOCKS ABOVE 65-DMA
2/20/19
---------------------------------------------------------------------------------------
Directory Current day-1 day-2 day-3 day-4 day-5
----------------------------------------------------------------------------------------
BIGBANKS 1 1 .857 .571 .571 .571
REGBANKS 1 1 1 .964 1 .928
SOLAR 1 1 .941 .882 .823 .764
BONDFUND .99 .98 .99 .99 .99 .99
INSURANC .966 .966 .9 .766 .833 .8
GOLD .96 .98 .86 .88 .9 .96
HOMEBLDG .941 .941 .882 .882 .823 .823
ETFS .931 .931 .913 .844 .862 .896
UTILITY .925 .925 .95 .9 .875 .9
DJI-13 .923 .923 .923 .846 .846 .846
CHEM .907 .87 .87 .777 .796 .777
SEMI .905 .896 .887 .87 .844 .827
INDMATER .897 .846 .871 .82 .858 .833
GUNS .882 .882 .882 .823 .823 .823
NIFTY .877 .894 .894 .929 .894 .842
ELECTRON .87 .864 .845 .827 .808 .802
SP-100 .87 .86 .849 .72 .752 .688
GREEN .869 .913 .869 .739 .782 .695
SP500 .869 .869 .857 .802 .812 .786
FINANCE .866 .877 .888 .822 .833 .822
INFRA .861 .888 .805 .805 .75 .777
FIDSTKS .859 .87 .864 .794 .805 .789
AUTO .846 .794 .743 .615 .641 .666
MILITARY .843 .843 .906 .843 .843 .843
RUS-1000 .841 .846 .837 .788 .79 .772
SOFTWARE .841 .873 .873 .873 .873 .857
NASD-100 .84 .85 .86 .85 .85 .83
REIT .838 .872 .859 .838 .879 .885
DOWJONES .833 .8 .8 .7 .733 .733
INDEXES .822 .822 .806 .79 .79 .768
COMPUTER .818 .818 .772 .818 .863 .863
GAMING .791 .833 .75 .75 .666 .625
HACKERS .772 .772 .772 .772 .772 .772
CHINA .766 .783 .733 .8 .816 .8
OILGAS .751 .758 .724 .62 .579 .475
TRANSP .75 .85 .8 .8 .8 .8
COMODITY .738 .714 .69 .547 .619 .571
RETAIL .698 .66 .66 .641 .641 .603
BEVERAGE .666 .666 .666 .611 .722 .777
EDU .666 .666 .666 .5 .5 .5
FOOD .666 .649 .631 .508 .614 .561
BIOTECH .628 .628 .652 .605 .618 .61
JETS .6 .8 .8 .8 .8 .8
BIG17 .586 .565 .586 .543 .521 .521
HOSPITAL .583 .541 .625 .541 .625 .583
COAL .571 .428 .428 .428 .285 .285
|
.
====================================================================
2/19/2019 Stick with the Buy B4. Buy some Gold stocks...
The Peerless Buy B4 is now bullishly accompanied by a
NYSE A/D Line that is making new all-time highs.
With the DJI still three percent below its peak (26838.39), more
upside potential seems likely. Its IP21 is still a healthy +.19
even though its OBV (Volume) is no longer confirming. But
what the DJI is lacking in interest, the NASDAQ is still getting an
ample supply of. The NASDAQ's OBV Line is running
upwards into new high territory even though it is still 7%
below its September peak of last year. The NASDAQ and the
Russell-2000, which is more than 8% below its peak, have
more room to advance, assuming all these reach there
old highs, courtesy of the Federal Reserve's change in monetary
policy since December 24th.


Immediately ahead, the market's behavior depends on tomorrow's
release of the "Minutes" from January's FOMC meeting. Expect
a dovish tilt from Powell regarding short-term rates and verbage
to the effect that Inflation must be carefully watched for. When
did the FED ever say anything else regarding inflation. This is
certainly what the Gold "Bugs" are looking forward to. Gold
stocks were very strong today. The Dollar is just above its
flat 65-dma. See how it behaves tomorrow.
See http://tigersoft.com/MAXCPS/Feb-19/BULLISH.htm
The gold stocks' upward momentum stems from being out of favor
for a long time and now from the FED's easy money stance since
last Christmas. There are a number of bullish looking Gold stocks
among the MAXCPs tonight. Let's see if GLD can complete
its potentially very bullish inverted head/shoulders pattern on
its weekly chart.

GOLD seems to be forming a very bullish inverted
head/shoulders
pattern on its weekly chart.

|
Charts 2/19/2019 2018 PEERLESS DJI, Signals, Indicators Daily DJI Volume 10-DayUp/Down Vol Hourly DJIA A/D Line for All Stocks Inverted Traders Index NASDAQ S&P OEX NYSE COMPQX DJI-15 DJI-20 DJI-30 DIA SPY QQQ MDY IWM TNA Short-Term Rates USO-CrudeOil DBO FAS GLD BBH IBB JETS JNUG KOL NUGT OIH OIL RSX RETL SDS AGQ SLV SOXL TECL TLT TMF TNA UGA (gasoline) XIV YINN Commodities: CANE CORN DBC JJC, NIB, CHOC CORN, CUT (paper) MOO, SOYB WEAT UUP (Dollar) LIT (Lithium) AAPL ADBE ALXN AMAT AMGN AMD AMZN BA BABA BAC BIDU CAT CVX DE FB GOOG GS HD IBM INTU JPM M (Macy's) MSFT NFLX NVDA QCOM TSLA TXN XOM WMT CMG , LRCX, SWKS, MDGL SPPI WATT SQ TOWN 2/19/19 (Click on Underlined link.) Bullish MAXCPs - http://tigersoft.com/MAXCPS/Feb-19/BULLISH.htm Bearish MAXCPs - http://tigersoft.com/MINCPs/Feb-19/BEARISH.htm |
Table 1 QUICKSILVER on ETFS - 2/19/19 ETF CLOSE CHANGE PIVOT-PT 5-dma AROC CL-PWR CANDLE IP21 ITRS --------------------------------------------------------------------------------------------- DIA 258.81 .16 254.53 154.3% Bullish BLUE .369 --------- --------------------------------------------------------------------------------------------- BA 416.26 -1.71 410.72 149.9% Bullish RED .25 .183 --------------------------------------------------------------------------------------------- SPY 277.85 .48 274.1 131.8% ------- BLUE .389 -.004 --------------------------------------------------------------------------------------------- QQQ 172.28 .34 170.89 113.7% ------- BLUE .25 .007 --------------------------------------------------------------------------------------------- MDY 349.17 .28 342.95 140.5% Bullish BLUE .436 .016 --------------------------------------------------------------------------------------------- IWM 156.65 .43 152.99 180.8% Bullish BLUE .439 .03 --------------------------------------------------------------------------------------------- FAS 62.49 .28 60.09 340.6% ------- BLUE .364 .061 --------------------------------------------------------------------------------------------- RETL 31.27 .51 29.85 486.4% ------- BLUE .367 -.05 --------------------------------------------------------------------------------------------- SOXL 125.98 -.82 122.74 428.6% ------- BLUE .251 .244 strongest --------------------------------------------------------------------------------------------- TECL 116.49 .26 112.83 356.6% ------- BLUE .309 .044 --------------------------------------------------------------------------------------------- IBB 111.4 -.64 109.42 139.1% Bullish RED .264 .012 --------------------------------------------------------------------------------------------- RSX 20.54 .07 20.87 -53.6% ------- BLUE .123 -.034 --------------------------------------------------------------------------------------------- GLD 126.7 +1.9 123.86 +125.1% Bullish Blue .162 .05 |
Table 2   Count of Stocks in Key Directories
          2019-02-19
-------------------------------
NEWHIGHS       184   Bullish Ratio
NEWLOWS        5
MAXCP          44
MINCP          3     Very low
TTTNH          38
TTTNL          11
FASTUP         136
FASTDOWN       29
CPCROSSA       81
CPCROSSD       44
BIGVOLUP       6
BIGVODN        10
ACCUMVER       72
HIGHIP21       73
HIUPPCT        6
VHIP21         27
LOWACCUM       173
REDSELL        50
AUGSELS7       10
TRAPDOOR       17
|
Table 3   RANKING OF KEY DIRECTORIES BASED PCT.OF STOCKS ABOVE 65-DMA
              2/19/19
---------------------------------------------------------------------------------------
Directory     Current       day-1         day-2         day-3         day-4         day-5
----------------------------------------------------------------------------------------
BIGBANKS       1             .857          .571          .571          .571          .571
REGBANKS       1             1             .964          1             .928          .857
BONDFUND       .98           .99           .99           .99           .99           .98
GOLD           .98           .86           .88           .9            .96           .96
INSURANC       .966          .9            .766          .833          .8            .833
SOLAR          .944          .888          .833          .777          .722          .722
HOMEBLDG       .941          .882          .882          .823          .823          .823
ETFS           .931          .913          .844          .862          .896          .827
UTILITY        .925          .95           .9            .875          .9            .9
DJI-13         .923          .923          .846          .846          .846          .769
GREEN          .913          .869          .739          .782          .695          .652
SEMI           .896          .887          .87           .844          .818          .775
NIFTY          .894          .894          .929          .894          .842          .807
INFRA          .888          .805          .805          .75           .777          .722
GUNS           .882          .882          .823          .823          .823          .882
FINANCE        .877          .888          .822          .833          .822          .811
SOFTWARE       .873          .873          .873          .873          .857          .841
REIT           .872          .859          .838          .879          .885          .912
CHEM           .87           .87           .777          .796          .796          .74
FIDSTKS        .87           .864          .794          .805          .783          .751
SP500          .869          .857          .802          .812          .784          .751
ELECTRON       .864          .845          .827          .808          .796          .746
SP-100         .86           .849          .72           .752          .688          .634
NASD-100       .85           .86           .85           .85           .83           .78
TRANSP         .85           .8            .8            .8            .8            .8
INDMATER       .846          .871          .82           .858          .82           .782
RUS-1000       .846          .837          .788          .79           .77           .736
MILITARY       .843          .906          .843          .843          .843          .812
GAMING         .833          .75           .75           .666          .625          .625
INDEXES        .822          .806          .79           .79           .768          .725
COMPUTER       .818          .772          .818          .863          .863          .863
DOWJONES       .8            .8            .7            .733          .733          .666
JETS           .8            .8            .8            .8            .8            .7
AUTO           .794          .743          .615          .641          .666          .589
CHINA          .783          .733          .8            .816          .8            .75
HACKERS        .772          .772          .772          .772          .772          .772
OILGAS         .758          .724          .62           .579          .462          .406
COMODITY       .714          .69           .547          .619          .571          .476
BEVERAGE       .666          .666          .611          .722          .777          .666
EDU            .666          .666          .5            .5            .5            .5
RETAIL         .66           .66           .641          .641          .584          .509
FOOD           .649          .631          .508          .614          .543          .421
BIOTECH        .626          .652          .605          .618          .602          .565
BIG17          .565          .586          .543          .521          .521          .456
HOSPITAL       .541          .625          .541          .625          .583          .541
----------------------------------------------------------------------------------------------------
COAL           .428          .428          .428          .285          .285          .142
|
====================================================================
2/15/2019
The Peerless Buy B4 is pointing the way for DJI to make
it back above 26000 and most likely to 27000. See how the
NYSE A/D Line made a new high ahead of the DJI. This
signals that traders do not expect the FED to do anything
"untoward". Similarly, our current Accumulation Index
jumped back above its 21-day ma on Friday. 80% of all the
stocks and ETFs we track are now above their 65-dma. This
is a very broad advance.
When we look back to 1967 to see how the DJI did after February
18th in years before the Presidential Election, we see that bullish
optimism seems reasonable. Typically, the DJI gains 11% over
the next 130 trading days and rises 80% of the time. And even over
just the next month, the DJI averages a 2.1% gain and advances
75% of the time.
How can the FED justify a rate hike soon? With the CPI rising at
a 12-mo. rate under 2%, more than 300,000 jobs created last month
and the Dollar strong, the FED would seem to be in a difficult
position justifying more rate hikes for a while. Most likely,
Powell has learned his lesson from his December mistake, when he
had to go running to earlier Fed Chairmen for help and then had to
completely reverse his position.
V-Formations are rare.
But they do bring new highs.
See the DJI charts of 1941-1942, 1949-1950
and 1971-1972 in the Hotline of 2/14/19.
Still, all is notg perfect. Volume could certainly be higher. Usually
more volume is needed to eat up over-head supplies of stock. The
DJI's OBV Line failed to confirm last week's rally. The DJI's
OBVPCT is only +.107. If it drops much more on a new high, it will
look bearish. But there is no Peerless Sell signal based on this.
I will post more on the significance of such OBV non-confirmations
like this later this week.


The DJI-30's most heavily weighted component, Boeing,
rose another 8 Friday, making its broadening pattern's
action look like a runaway rocket with no evident
resistance overhead and a new price target of over
$500/share based on the width of its pattern at the time of its
breakout on Friday. This alone would lift the DJI-30 by
700 points. Let's see if its volume picks up this week
and confirms the breakout.


The broader market was also boosted Friday by IWM's
advance on rising volume. I rate it as now the strongest major
market ETF in Table 1.
Biotechs and IBB made a recovery breakout, but not
on rising volume. Watch this week to see if this matters.


Even so, higher prices are coming, it certainly seems,
if for no other reason than it's become very difficult to
find any attractive short sales.
|
Charts 2/15/2019 2018 PEERLESS DJI, Signals, Indicators Daily DJI Volume 10-DayUp/Down Vol Hourly DJIA A/D Line for All Stocks Inverted Traders Index NASDAQ S&P OEX NYSE COMPQX DJI-15 DJI-20 DJI-30 DIA SPY QQQ MDY IWM TNA Short-Term Rates USO-CrudeOil DBO FAS GLD BBH IBB JETS JNUG KOL NUGT OIH OIL RSX RETL SDS AGQ SLV SOXL TECL TLT TMF TNA UGA (gasoline) XIV YINN Commodities: CANE CORN DBC JJC, NIB, CHOC CORN, CUT (paper) MOO, SOYB WEAT UUP (Dollar) LIT (Lithium) AAPL ADBE ALXN AMAT AMGN AMD AMZN BA BABA BAC BIDU CAT CVX DE FB GOOG GS HD IBM INTU JPM M (Macy's) MSFT NFLX NVDA QCOM TSLA TXN XOM WMT CMG , LRCX, SWKS, MDGL SPPI WATT SQ TOWN 2/15/19 (Click on Underlined link.) Bullish MAXCPs - http://tigersoft.com/MAXCPS/Feb-15/BULLISH.htm Bearish MAXCPs - http://tigersoft.com/MINCPs/Feb-15/BEARISH.htm |
Table 1 QUICKSILVER on ETFS - 2/15/19 ETF CLOSE CHANGE PIVOT-PT 5-dma AROC CL-PWR CANDLE IP21 ITRS --------------------------------------------------------------------------------------------- DIA 258.65 3.49 250.94 144.5% Bullish BLUE .383 ---- --------------------------------------------------------------------------------------------- BA 417.97 8.15 403.95 160.1% Bullish BLUE .259 .161 --------------------------------------------------------------------------------------------- SPY 277.37 2.99 270.62 126.4% ------- BLUE .399 -.007 --------------------------------------------------------------------------------------------- QQQ 171.94 .72 168.4 99.4% ------- RED .263 -.002 --------------------------------------------------------------------------------------------- MDY 348.89 4.27 339.5 167.9% Bullish BLUE .447 .011 --------------------------------------------------------------------------------------------- IWM 156.22 2.45 151.1 209.2% Bullish BLUE .446 .014 strong --------------------------------------------------------------------------------------------- FAS 62.21 2.73 58.39 365.8% Bullish BLUE .372 -.033 --------------------------------------------------------------------------------------------- SOXL 126.8 2.02 115.46 539.9% ------- RED .286 .098 --------------------------------------------------------------------------------------------- TECL 116.23 2.61 108.44 344.5% ------- BLUE .32 -.05 --------------------------------------------------------------------------------------------- IBB 112.04 1.82 108.34 194.3% Bullish BLUE .301 .016 --------------------------------------------------------------------------------------------- GLD 124.8 .74 123.6 23.8% ------- BLUE .117 .072 --------------------------------------------------------------------------------------------- RSX 20.47 .15 20.76 -70.5% ------- ---- .125 -.029 |
Table 2   Count of Stocks in Key Directories
          2019-02-15
-------------------------------
NEWHIGHS       201 Bullish Ratio
NEWLOWS        4
MAXCP          39
MINCP          2   Very low...
TTTNH          25
TTTNL          12
FASTUP         129
FASTDOWN       29
CPCROSSA       120
CPCROSSD       42
BIGVOLUP       5
BIGVODN        4
ACCUMVER       67
HIGHIP21       86
HIUPPCT        6
VHIP21         21
LOWACCUM       170
REDSELL        50
AUGSELS7       9
TRAPDOOR       17
|
 Table 3
RANKING OF KEY DIRECTORIES BASED PCT.OF STOCKS ABOVE 65-DMA
              2/15/19
Bullish = 45
Bearish = 1
---------------------------------------------------------------------------------------
Directory     Current       day-1         day-2         day-3         day-4         day-5
----------------------------------------------------------------------------------------
REGBANKS       1             .964          1             .928          .857          .821
BONDFUND       .99           .99           .99           .99           .98           .98
UTILITY        .95           .9            .875          .9            .9            .95
DJI-13         .923          .846          .846          .846          .769          .846
ETFS           .913          .844          .862          .896          .827          .827
MILITARY       .906          .843          .843          .843          .812          .812
INSURANC       .9            .766          .833          .8            .833          .833
NIFTY          .894          .929          .894          .842          .789          .807
FINANCE        .888          .822          .833          .822          .811          .777
SOLAR          .888          .833          .777          .722          .722          .777
SEMI           .887          .87           .844          .818          .775          .801
GUNS           .882          .823          .823          .823          .882          .764
HOMEBLDG       .882          .882          .823          .823          .823          .823
SOFTWARE       .873          .873          .873          .857          .825          .841
INDMATER       .871          .82           .858          .82           .782          .756
CHEM           .87           .777          .796          .796          .759          .666
GREEN          .869          .739          .782          .695          .652          .695
FIDSTKS        .865          .795          .806          .784          .747          .758
GOLD           .86           .88           .9            .96           .96           .96
NASD-100       .86           .85           .85           .83           .77           .79
REIT           .859          .838          .879          .885          .906          .906
BIGBANKS       .857          .571          .571          .571          .571          .428
SP500          .857          .802          .812          .784          .749          .745
SP-100         .849          .72           .752          .688          .623          .623
ELECTRON       .845          .827          .808          .796          .746          .759
RUS-1000       .837          .788          .79           .77           .734          .718
INDEXES        .806          .79           .79           .768          .725          .709
INFRA          .805          .805          .75           .777          .722          .694
DOWJONES       .8            .7            .733          .733          .633          .666
JETS           .8            .8            .8            .8            .7            .8
TRANSP         .8            .8            .8            .8            .8            .75
COMPUTER       .772          .818          .863          .863          .863          .863
HACKERS        .772          .772          .772          .772          .772          .772
GAMING         .75           .75           .666          .625          .625          .583
AUTO           .743          .615          .641          .666          .589          .512
CHINA          .733          .8            .816          .8            .733          .683
OILGAS         .722          .618          .576          .458          .395          .368
COMODITY       .69           .547          .619          .571          .476          .547
BEVERAGE       .666          .611          .722          .777          .666          .833
EDU            .666          .5            .5            .5            .5            .5
RETAIL         .66           .641          .641          .584          .509          .49
BIOTECH        .65           .605          .618          .602          .56           .542
FOOD           .642          .517          .625          .553          .428          .535
HOSPITAL       .625          .541          .625          .583          .541          .5
BIG17          .586          .543          .521          .521          .456          .391
====================================================================
COAL           .428          .428          .285          .285          .142          .142
|
====================================================================
2/14/2019
Stick with the Peerless Buy B4.
Today saw some technical damage to the market.
Our IP21 (Current Accumulation Index) for the DJI,
the NASDAQ, NYSE, SP-500 and OEX has dropped below
its 21-day ma. This also happened with the charts for SPY
and QQQ. It did not occur for DIA, MDY, IWM and SOXL.
Some of the IP21 down-slopes are gathering speed.
This shows there is still resistance overhead. But gradually,
it is being eaten up.

The good news today was that this is still an Interest-Rate
driven stock market and we did not get a Sell S4,
based on the DJI's IP21 dropping below its 21-dma. This
is because S4s can only occur in the second half of
the
year in the third year of the 4-year Presidential Election cycle.
This is not an arbitrary rule. It has been tested all the
way back to 1929. 9 of the 35 Sell S4s took place in
this year before a Presidential Election. So, an S4 can occur.
So can February
Sell S4s, but always in other years in
the four year cycle (2/9/89, 2/3/94 and 2/7/97)
Besides the decline in the IP21, we are also seeing weakness
in our other oscillators, notably the P-Indicator and V-I. But
the P-I is still a very positive +534 and the AD-Line remains
in a steep uptrend. Today, there were 221 more up than down
on the NYSE despite the DJI's 104 point loss. As
long as
the A/D Line is in a steep uptrend, I think we can safely
trust the Federal Reserve not to de-rail the recovery back
to the old highs.
When we look back at the three clearest cases where the DJI formed
a V-Bottom, like now, after a decline of 16% or more, we
see that it will take more to bring a DJI drop to the lower band
than simply having the IP21 and the P-I fall below their 21-day
moving averages. Declines in these circumstances were limited
and did not usually reach the lower band. Important tops took
glaring non-confirmations and major Sells.
1941-1942 |
 |
 |
|
Charts 2/14/2019 2018 PEERLESS DJI, Signals, Indicators Daily DJI Volume 10-DayUp/Down Vol Hourly DJIA A/D Line for All Stocks Inverted Traders Index NASDAQ S&P OEX NYSE COMPQX DJI-15 DJI-20 DJI-30 DIA SPY QQQ MDY IWM TNA Short-Term Rates USO-CrudeOil DBO FAS GLD BBH IBB JETS JNUG KOL NUGT OIH OIL RSX RETL SDS AGQ SLV SOXL TECL TLT TMF TNA UGA (gasoline) XIV YINN Commodities: CANE CORN DBC JJC, NIB, CHOC CORN, CUT (paper) MOO, SOYB WEAT UUP (Dollar) LIT (Lithium) AAPL ADBE ALXN AMAT AMGN AMD AMZN BA BABA BAC BIDU CAT CVX DE FB GOOG GS HD IBM INTU JPM M (Macy's) MSFT NFLX NVDA QCOM TSLA TXN XOM WMT CMG , LRCX, SWKS, MDGL SPPI WATT SQ TOWN 2/14/19 (Click on Underlined link.) Bullish MAXCPs - http://tigersoft.com/MAXCPS/Feb-14/BULLISH.htm Bearish MAXCPs - http://tigersoft.com/MINCPs/Feb-14/BEARISH.htm |
My job here is to predict the stock market. What Trump
is now doing by declaring a State of Emergency will not
help it.
Trump's Border Wall Emergency seems to be weakening
the major Indexes' internals, even though this should come
as no surprise, as should the political consequences. Trump
has telegraphed his punches at every turn. And still we
have a January Buy B4. But can a bullish year-before-the
Presidential Election scenario still play out? His border
wall and his declaration of a state of emmergency do not
have Congressional or popular approval. A Constitutional
challenge will surely be made. If a Presidential Emergency
over anything can simply be declared at the Presidents will,
what would happen if the next President decides to declare
a State of Emergency over gun violence, climate change,
taxation or some other matter that is highly contentious?
The "checks and balances" in the US Constitution were clearly,
specifically and explicitly designed to prevent this.
Even a Conservative Supreme Court will say "No", is my guess
to setting up a "king". All the heat and hostility over this
will not help the market. Stocks would be much better served
by follow-up on a different campaign pledge, namely, the
re-building of our entire Infrasructure. But now Border Wall
politics and partisan in-fighting will take precedence. It seems
like another big distraction from real issues.
Table 1 QUICKSILVER on ETFS - 2/14/19 ETF CLOSE CHANGE PIVOT-PT 5-dma AROC CL-PWR CANDLE IP21 ITRS --------------------------------------------------------------------------------------------- DIA 255.16 -.64 251.32 64.5% Bullish BLUE .321 ---- --------------------------------------------------------------------------------------------- BA 409.82 -.76 404.91 57.1% Bullish BLUE .201 .183 --------------------------------------------------------------------------------------------- SPY 274.38 -.61 270.47 77.9% Bullish BLUE .33 -.003 --------------------------------------------------------------------------------------------- QQQ 171.22 .21 168.56 88.2% Bullish BLUE .215 .012 --------------------------------------------------------------------------------------------- MDY 344.62 -.21 337.41 102.2% Bullish BLUE .421 .007 --------------------------------------------------------------------------------------------- IWM 153.77 .35 149.85 134.7% Bullish BLUE .393 .009 --------------------------------------------------------------------------------------------- FAS 59.48 -1.3 57.87 105% Bullish RED .34 -.052 --------------------------------------------------------------------------------------------- RETL 29.67 -.2 27.9 195.4% ------- BLUE .29 -.139 --------------------------------------------------------------------------------------------- SOXL 124.78 .97 113.83 444% Bullish BLUE .248 .169 --------------------------------------------------------------------------------------------- TECL 113.62 .39 108.56 310.5% Bullish BLUE .249 -.01 --------------------------------------------------------------------------------------------- IBB 110.22 .47 107.8 142.4% Bullish BLUE .208 .012 --------------------------------------------------------------------------------------------- GLD 124.06 .69 124.21 12.9% ------- BLUE .092 .075 --------------------------------------------------------------------------------------------- OIH 17.14 .09 16.49 116% ------- BLUE .124 -.051 --------------------------------------------------------------------------------------------- RSX 20.32 .15 20.76 -132.9% ------- BLUE .114 -.005 |
Table 2    Count of Stocks in Key Directories
           2019-02-14
-------------------------------
NEWHIGHS       90   Bullish 10+:1
NEWLOWS        7
MAXCP          41
MINCP          4    very low
TTTNH          31
TTTNL          15
FASTUP         82
FASTDOWN       35
CPCROSSA       118
CPCROSSD       36
BIGVOLUP       4
BIGVODN        17
ACCUMVER       72
HIGHIP21       60
HIUPPCT        6
VHIP21         21
LOWACCUM       174
REDSELL        52
AUGSELS7       7
TRAPDOOR       16
|
Table 3      RANKING OF KEY DIRECTORIES BASED PCT.OF STOCKS ABOVE 65-DMA
               2/14/19
Bullish 43
Bearish 1
---------------------------------------------------------------------------------------
Directory     Current       day-1         day-2         day-3         day-4         day-5
----------------------------------------------------------------------------------------
BONDFUND       .99           .99           .99           .98           .98           .98
REGBANKS       .964          1             .928          .857          .821          .785
NIFTY          .929          .894          .842          .789          .807          .824
UTILITY        .9            .875          .9            .9            .95           .925
HOMEBLDG       .882          .823          .823          .823          .823          .823
GOLD           .88           .9            .96           .96           .96           .96
SOFTWARE       .873          .873          .857          .825          .841          .841
SEMI           .87           .844          .818          .775          .793          .81
NASD-100       .85           .85           .83           .77           .78           .79
DJI-13         .846          .846          .846          .769          .846          .846
ETFS           .844          .862          .896          .827          .81           .862
MILITARY       .843          .843          .843          .812          .812          .781
REIT           .838          .879          .885          .906          .899          .906
SOLAR          .833          .777          .722          .722          .777          .833
ELECTRON       .827          .808          .796          .746          .753          .759
GUNS           .823          .823          .823          .882          .764          .705
FINANCE        .822          .833          .822          .811          .777          .788
INDMATER       .82           .858          .82           .782          .743          .782
COMPUTER       .818          .863          .863          .863          .818          .818
INFRA          .805          .75           .777          .722          .694          .722
SP500          .801          .811          .783          .748          .74           .751
CHINA          .8            .816          .8            .733          .683          .683
JETS           .8            .8            .8            .7            .8            .8
TRANSP         .8            .8            .8            .8            .75           .75
FIDSTKS        .795          .806          .784          .747          .752          .758
INDEXES        .79           .79           .768          .725          .704          .715
RUS-1000       .788          .79           .77           .734          .712          .732
CHEM           .777          .796          .796          .759          .685          .685
HACKERS        .772          .772          .772          .772          .772          .772
INSURANC       .766          .833          .8            .833          .8            .833
GAMING         .75           .666          .625          .625          .583          .583
GREEN          .739          .782          .695          .652          .695          .695
SP-100         .72           .752          .688          .623          .612          .655
DOWJONES       .7            .733          .733          .633          .666          .7
RETAIL         .641          .641          .584          .509          .49           .547
OILGAS         .629          .587          .468          .405          .377          .377
AUTO           .615          .641          .666          .589          .512          .589
BEVERAGE       .611          .722          .777          .666          .666          .777
BIOTECH        .602          .618          .602          .56           .536          .528
BIGBANKS       .571          .571          .571          .571          .428          .571
COMODITY       .547          .619          .571          .476          .547          .595
HOSPITAL       .541          .625          .583          .541          .5            .583
FOOD           .517          .625          .553          .428          .5            .517
---------------------------------------------------------------------------------------------
EDU            .5            .5            .5            .5            .5            .5
COAL           .428          .285          .285          .142          .142          .285
|
HISTORY - Churning Tops - 1931 |
====================================================================
2/13/2019 The January B4
signal remains in effect. The DJI added
118. There were 872 more up than down. It was another
positive day. The Labor Department's news was that
the CPI rose only 1.6%. In addition, the Dollar rose handily.
One would think that the FED has even less reason to raise
interest rates and could even lower them.
The Tiger S/R Indicator is not showing any spikes of churning
yet on our key general market charts. See the first chart below,
the NASDAQ's. I will start posting the DJI's S/R charts
year by year so that we can get used to them and learn how
best to use them. See the "HISTORY" chart below.
So far, it looks like we will see the DJI reach 27800 and match
the size advance that Janaury B4s ordinarily achieve. But
this is the third year in the four year Presidential cycle.
They average 15% gains, so even bigger gains may follow.
No Churning yet.

The lower rates are bringing back confidence and buyers into
the mid-caps (MDY) and the Russell-2000. See the chart further below.
They are coming up to where resistance should become evident,
but both Closing and Opening Powers are rising and the level of
Accumulation is exceptionally high. I am a little concerned that
more volume is not coming back into SPY and the other ETFs as
they rally. But that also shows sellers are scarce and buyers are not
used to chasing prices up this far without encountering all the shares
that they want to buy. Their S/R Indicators have not reached levels
that should concern us.


|
HISTORY - 1930 S/R Signals Top. Let's do this year by year and see what we can learn about this indicator. There is no other study available. Last night the 1929 top was signalled in the same way.  |
|
Charts 2/13/2019 2018 PEERLESS DJI, Signals, Indicators Daily DJI Volume 10-DayUp/Down Vol Hourly DJIA A/D Line for All Stocks Inverted Traders Index NASDAQ S&P OEX NYSE COMPQX DJI-15 DJI-20 DJI-30 DIA SPY QQQ MDY IWM TNA Short-Term Rates USO-CrudeOil DBO FAS GLD BBH IBB JETS JNUG KOL NUGT OIH OIL RSX RETL SDS AGQ SLV SOXL TECL TLT TMF TNA UGA (gasoline) XIV YINN Commodities: CANE CORN DBC JJC, NIB, CHOC CORN, CUT (paper) MOO, SOYB WEAT UUP (Dollar) LIT (Lithium) AAPL ADBE ALXN AMAT AMGN AMD AMZN BA BABA BAC BIDU CAT CVX DE FB GOOG GS HD IBM INTU JPM M (Macy's) MSFT NFLX NVDA QCOM TSLA TXN XOM WMT CMG , LRCX, SWKS, MDGL SPPI WATT SQ TOWN 2/13/19 (Click on Underlined link.) Bullish MAXCPs - http://tigersoft.com/MAXCPS/Feb-13/BULLISH.htm Bearish MAXCPs - http://tigersoft.com/MINCPs/Feb-13/BEARISH.htm |
Table 1 QUICKSILVER on ETFS - 2/13/19 ETF CLOSE CHANGE PIVOT-PT 5-dma AROC CL-PWR CANDLE IP21 ITRS --------------------------------------------------------------------------------------------- DIA 255.8 1.27 251.9 38.2% Bullish BLUE .342 0 --------------------------------------------------------------------------------------------- BA 410.58 -.14 405.17 -6.5% Bullish RED .222 .19 --------------------------------------------------------------------------------------------- SPY 274.99 .89 270.14 41.4% Bullish RED .361 -.005 --------------------------------------------------------------------------------------------- QQQ 171.01 .12 168.23 14.5% Bullish RED .241 .008 --------------------------------------------------------------------------------------------- MDY 344.83 1.88 337.66 83.2% Bullish BLUE .449 .004 --------------------------------------------------------------------------------------------- IWM 153.42 .43 149.69 82.5% Bullish ---- .414 .002 --------------------------------------------------------------------------------------------- FAS 60.78 .69 58.24 134.4% Bullish RED .389 -.019 --------------------------------------------------------------------------------------------- RETL 29.87 .02 28.54 132.1% ------- RED .279 -.142 --------------------------------------------------------------------------------------------- SOXL 123.81 1.07 114.3 56.5% ------- RED .22 .197 (high) --------------------------------------------------------------------------------------------- TECL 113.23 .4 106.79 78.9% Bullish RED .268 .005 --------------------------------------------------------------------------------------------- IBB 109.75 .33 107.13 -6% Bullish BLUE .228 .012 --------------------------------------------------------------------------------------------- GLD 123.37 -.49 123.74 -2.8% ------- RED .054 .057 --------------------------------------------------------------------------------------------- OIH 17.05 .03 16.75 -118.4% ------- ---- .113 -.089 --------------------------------------------------------------------------------------------- RSX 20.17 -.7 20.87 -203.8% ------- RED .089 -.042 |
Table 2    Count of Stocks in Key Directories
           2019-02-13
-------------------------------
NEWHIGHS       111  Bullish Ratio to new lows.
NEWLOWS        5
MAXCP          30
MINCP          4    Very low
TTTNH          25
TTTNL          10
FASTUP         59
FASTDOWN       48
CPCROSSA       80
CPCROSSD       59
BIGVOLUP       5
BIGVODN        14
ACCUMVER       71
HIGHIP21       82
HIUPPCT        6
VHIP21         25
LOWACCUM       173
REDSELL        52
AUGSELS7       8
TRAPDOOR       17
|
Table 3  RANKING OF KEY DIRECTORIES BASED PCT.OF STOCKS ABOVE 65-DMA
           2/13/19
Bullish =45
Bearish = 1 (Coal)
---------------------------------------------------------------------------------------
Directory     Current       day-1         day-2         day-3         day-4         day-5
----------------------------------------------------------------------------------------
REGBANKS       1             .928          .857          .821          .785          .821
BONDFUND       .99           .99           .98           .98           .98           .98
GOLD           .9            .96           .96           .96           .96           .96
NIFTY          .894          .842          .789          .807          .824          .859
REIT           .879          .885          .906          .899          .906          .899
UTILITY        .875          .9            .9            .95           .95           .8
SOFTWARE       .873          .857          .825          .841          .841          .841
COMPUTER       .863          .863          .863          .818          .818          .772
ETFS           .862          .896          .827          .81           .862          .913
INDMATER       .858          .82           .782          .743          .782          .807
NASD-100       .85           .83           .77           .78           .8            .83
DJI-13         .846          .846          .769          .846          .846          .846
SEMI           .844          .818          .775          .793          .801          .862
MILITARY       .843          .843          .812          .812          .781          .812
FINANCE        .833          .822          .811          .777          .788          .788
INSURANC       .833          .8            .833          .8            .833          .733
GUNS           .823          .823          .882          .764          .705          .705
HOMEBLDG       .823          .823          .823          .823          .823          .823
CHINA          .816          .8            .733          .683          .7            .75
SP500          .811          .783          .748          .74           .746          .779
ELECTRON       .808          .796          .746          .753          .753          .814
FIDSTKS        .806          .784          .747          .752          .752          .768
JETS           .8            .8            .7            .8            .8            .8
TRANSP         .8            .8            .8            .75           .75           .75
CHEM           .796          .796          .759          .685          .703          .722
INDEXES        .79           .768          .725          .704          .698          .768
RUS-1000       .79           .77           .734          .712          .731          .765
GREEN          .782          .695          .652          .695          .695          .695
SOLAR          .777          .722          .722          .777          .833          .777
HACKERS        .772          .772          .772          .772          .772          .818
SP-100         .752          .688          .623          .612          .655          .72
INFRA          .75           .777          .722          .694          .722          .777
DOWJONES       .733          .733          .633          .666          .666          .7
BEVERAGE       .722          .777          .666          .666          .777          .833
GAMING         .666          .625          .625          .583          .583          .625
AUTO           .641          .666          .589          .512          .589          .641
RETAIL         .641          .584          .509          .49           .528          .547
FOOD           .625          .553          .428          .5            .464          .696
HOSPITAL       .625          .583          .541          .5            .583          .583
COMODITY       .619          .571          .476          .547          .523          .738
BIOTECH        .615          .602          .56           .536          .526          .589
OILGAS         .583          .465          .402          .375          .361          .548
BIGBANKS       .571          .571          .571          .428          .571          .571
BIG17          .521          .521          .456          .391          .391          .478
----------------------------------------------------------------------------------------------
EDU            .5            .5            .5            .5            .5            .5
----------------------------------------------------------------------------------------------
COAL           .285          .285          .142          .142          .142          .428
|
====================================================================
2/12/2019 If typical, the January Buy B4 should give us a rally to new
highs near 27000. The megaphone pattern in the DJI will end finally
with an upside breakout past 25500. Bullishly, the DJI does not want even
to decline back to its 21-da ma even though it is now up nearly 17%
from its low on December 24th. Keep in mind that this is the bullish
third year in the Presidential cycle. That cycle is explained by the
fact that politicians want to do all they can to boost the economy before
a Presidential Election. Since politics and political posturing is as
important now as ever before, the odds are good that the market
will go substantially higher, barring a criminal indictment of those
in the White House now.

The rally back to the resistance at 25500 looks good. The NYSE ADL
made a recovery high. The DJI's current Accumulation (IP21) remains very
positive (+.217). There was no "SR spike" showing the bearish churning
that comes just before many signficant declines. Table 1 (just below)
shows all the key major market ETFs have "bullish" Closing Power
trends, "Blue" candlesticks and IP21s well above .20. All but QQQ
now having rising 5-day moving averages. Impressively, 75% of all
the stocks and ETFs that we follow are above their key 65-day ma.

SOXL remains my favorite sector fund, having been one of the first to
complete and inverted head and shoulders and still showing a high ITRS value
AND high IP21 value. The downtrend at 140 probably will be a good target
for longs.

Table 1 QUICKSILVER on ETFS - 2/12/19 ETF CLOSE CHANGE PIVOT-PT 5-dma AROC CL-PWR CANDLE IP21 ITRS --------------------------------------------------------------------------------------------- DIA 254.53 3.59 253.87 11.3% Bullish BLUE .356 ----- --------------------------------------------------------------------------------------------- BA 410.72 6.77 411.11 6.6% Bullish BLUE .222 .229 --------------------------------------------------------------------------------------------- SPY 274.1 3.48 272.74 18.4% Bullish BLUE .377 -.004 --------------------------------------------------------------------------------------------- QQQ 170.89 2.49 170.52 -4.1% Bullish BLUE .264 .01 --------------------------------------------------------------------------------------------- MDY 342.95 3.45 339.18 50.5% Bullish BLUE .386 .004 --------------------------------------------------------------------------------------------- IWM 152.99 1.89 150.93 62.1% Bullish BLUE .339 .002 --------------------------------------------------------------------------------------------- FAS 60.09 1.7 59.2 28.1% Bullish BLUE .439 -.046 --------------------------------------------------------------------------------------------- SOXL 122.74 7.28 122.48 404.3% Bullish BLUE .233 .164 --------------------------------------------------------------------------------------------- TECL 112.83 4.39 111.5 109% Bullish BLUE .314 -.02 --------------------------------------------------------------------------------------------- IBB 109.42 1.08 109.88 -29.5% Bullish BLUE .19 .015 --------------------------------------------------------------------------------------------- GLD 123.86 .26 123.44 -17% ------- RED .105 .071 --------------------------------------------------------------------------------------------- OIH 17.02 .26 17.45 -129.5% ------- ---- .137 -.086 --------------------------------------------------------------------------------------------- RSX 20.87 .11 21.02 -112.2% ------- RED .19 .002 |
We saw a broad advance again today. There were
three times as many
advancers today. IWM (Russell-2000) is now slightly outperforming the
the DJI over the last 50-trading days. But what I liked the most was
the very high IP21 levels in a number of turn-awound situations. This
is not a rally made up of mostly high-priced and heavily weighted Boeing,
defensive Utilities, Reits and Bonds and a handful of new highs.

Look at how high is the levels of Accumulation in some of the turn-around
sectors and their stocks, notably
CUT (Timber), HD,
FAS (financials), GS and WFC,
DBO and OIL,
as well as MMM and RETL.
Even IBM rates a mention.
|
H I S T O R Y See how well a Support/Resistance Spike Called Final Top in 1929  |
|
Charts 2/12/2019 2018 PEERLESS DJI, Signals, Indicators Daily DJI Volume 10-DayUp/Down Vol Hourly DJIA A/D Line for All Stocks Inverted Traders Index NASDAQ S&P OEX NYSE COMPQX DJI-15 DJI-20 DJI-30 DIA SPY QQQ MDY IWM TNA Short-Term Rates USO-CrudeOil DBO FAS GLD BBH IBB JETS JNUG KOL NUGT OIH OIL RSX RETL SDS AGQ SLV SOXL TECL TLT TMF TNA UGA (gasoline) XIV YINN Commodities: CANE CORN DBC JJC, NIB, CHOC CORN, CUT (paper) MOO, SOYB WEAT UUP (Dollar) LIT (Lithium) AAPL ADBE ALXN AMAT AMGN AMD AMZN BA BABA BAC BIDU CAT CVX DE FB GOOG GS HD IBM INTU JPM M (Macy's) MSFT NFLX NVDA QCOM TSLA TXN XOM WMT CMG , LRCX, SWKS, MDGL SPPI WATT SQ TOWN 2/12/19 (Click on Underlined link.) Bullish MAXCPs - http://tigersoft.com/MAXCPS/Feb-12/BULLISH.htm Bearish MAXCPs - http://tigersoft.com/MINCPs/Feb-12/BEARISH.htm |
 Table 2
          Count of Stocks in Key Directories
          2019-02-12
-------------------------------
NEWHIGHS       140  Bullish Ratio
NEWLOWS        4
MAXCP          38
MINCP          3    Very low...
TTTNH          31
TTTNL          16
FASTUP         60
FASTDOWN       57
CPCROSSA       126
CPCROSSD       38
BIGVOLUP       1
BIGVODN        12
ACCUMVER       77
HIGHIP21       78
HIUPPCT        6
VHIP21         22
LOWACCUM       182
REDSELL        52
AUGSELS7       7
TRAPDOOR       17
|
 Table 3
          RANKING OF KEY DIRECTORIES BASED PCT.OF STOCKS ABOVE 65-DMA
               2/12/19
Bullish = 44
Bearish =  2
---------------------------------------------------------------------------------------
Directory     Current       day-1         day-2         day-3         day-4         day-5
----------------------------------------------------------------------------------------
BONDFUND       .99           .98           .98           .98           .98           .99
GOLD           .96           .96           .96           .96           .96           .96
REGBANKS       .928          .857          .821          .785          .821          .75
UTILITY        .9            .9            .95           .95           .8            .825
-------------------------------------------------------------------------------------------
ETFS           .896          .827          .81           .862          .913          .913
REIT           .885          .906          .899          .906          .899          .932
COMPUTER       .863          .863          .818          .818          .772          .818
SOFTWARE       .857          .825          .841          .841          .841          .873
DJI-13         .846          .769          .846          .846          .846          .846
^^^^^^
MILITARY       .843          .812          .812          .781          .812          .812
NIFTY          .842          .789          .807          .824          .859          .894
NASD-100       .83           .77           .78           .8            .83           .84
^^^^^^^^
GUNS           .823          .882          .764          .705          .647          .705
HOMEBLDG       .823          .823          .823          .823          .823          .882
FINANCE        .822          .811          .777          .788          .788          .755
INDMATER       .82           .782          .743          .782          .807          .846
SEMICONDUCT.   .818          .775          .793          .801          .853          .81
CHINA          .8            .733          .683          .7            .75           .783
INSURANC       .8            .833          .8            .833          .733          .766
JETS           .8            .7            .8            .8            .8            .8
TRANSP         .8            .8            .75           .75           .75           .75
---------------------------------------------------------------------------------------------
CHEM           .796          .759          .685          .703          .74           .777
ELECTRON       .796          .746          .753          .753          .808          .777
FIDSTKS        .784          .747          .752          .752          .768          .774
SP500          .783          .748          .74           .746          .773          .795
^^^^^
BEVERAGE       .777          .666          .666          .777          .777          .722
INFRA          .777          .722          .694          .722          .777          .805
HACKERS        .772          .772          .772          .772          .818          .818
RUS-1000       .77           .734          .712          .731          .762          .787
INDEXES        .768          .725          .704          .698          .768          .806
DOWJONES       .733          .633          .666          .666          .7            .733
^^^^^^^^
PIPELINE       .727          .59           .59           .636          .772          .818
SOLAR          .722          .722          .777          .833          .777          .777
GREEN          .695          .652          .695          .695          .695          .695
SP-100         .688          .623          .612          .655          .72           .72
AUTO           .666          .589          .512          .589          .641          .641
GAMING         .625          .625          .583          .583          .625          .75
BIOTECH        .6            .56           .536          .526          .586          .56
RETAIL         .584          .509          .49           .528          .528          .547
HOSPITAL       .583          .541          .5            .583          .541          .583
BIGBANKS       .571          .571          .428          .571          .571          .571
COMODITY       .571          .476          .547          .523          .714          .761
FOOD           .543          .421          .491          .456          .649          .701
=============================================================================================
EDU            .5            .5            .5            .5            .5            .5
=============================================================================================
OILGAS         .462          .4            .372          .358          .531          .551
COAL           .285          .142          .142          .142          .428          .571
|
====================================================================
2/11/2019 The Buy B4 suggests the DJI will move above the set of
highs near 25500 amd 26000. But there is still resistance overhead and that
must be overcome. We are in a bullish seasonal period, as politicians
look ahead to next year's Election. So interest rates may even go
down a bit. Look at how strong the Dollar is; this gives more latitude
to the FED. New infrastructure spending seems a good possibility. too.
Slowly but surely, I believe, the DJI will eat up the resistance just
overhead. That low interest rates are expected to continue, today the
broader NYSE and IWM rose. In addition, there were almost twice as
many stocks rising as falling on the NYSE (1934 to 1017).
The DJI remains in a "straight-up" advance, having
not closed back below its 21-day ma since its rally's start
on December 26th. The A/D Line is uptrending and the
Accumulation Index is very strong. 25500 is the current
resistance and 24500 is the current best support.


|
Charts 2/11/2019 2018 PEERLESS DJI, Signals, Indicators Daily DJI Volume 10-DayUp/Down Vol Hourly DJIA A/D Line for All Stocks Inverted Traders Index NASDAQ S&P OEX NYSE COMPQX DJI-15 DJI-20 DJI-30 DIA SPY QQQ MDY IWM TNA Short-Term Rates USO-CrudeOil DBO FAS GLD BBH IBB JETS JNUG KOL NUGT OIH OIL RSX RETL SDS AGQ SLV SOXL TECL TLT TMF TNA UGA (gasoline) XIV YINN Commodities: CANE CORN DBC JJC, NIB, CHOC CORN, CUT (paper) MOO, SOYB WEAT UUP (Dollar) LIT (Lithium) AAPL ADBE ALXN AMAT AMGN AMD AMZN BA BABA BAC BIDU CAT CVX DE FB GOOG GS HD IBM INTU JPM M (Macy's) MSFT NFLX NVDA QCOM TSLA TXN XOM WMT CMG , LRCX, SWKS, MDGL SPPI WATT SQ TOWN 2/11/19 (Click on Underlined link.) Bullish MAXCPs - http://tigersoft.com/MAXCPS/Feb-11/BULLISH.htm Bearish MAXCPs - http://tigersoft.com/MINCPs/Feb-11/BEARISH.htm |
Closing Power and Accumulation Remain Bullish
Volume could rise a little more, but the "bullish" Closing Power trends
and IP21 levels above (+.20) for DIA, BA, SPY, QQQ, MDY, IWM,
FAS, SOXL and TEXL shown below in Table 1 are mostly rising and
quite positive.
The fastest advancers (highest ITRS) over the last 50 trading days
are Boeing, the most heavily weighted DJI-30 stock, and SOXL, the
most volatile of the 3x-leveraged ETFs. Professionals remain confident
and, interestingly, they are according higher internal strength to IWM
(IP21 = +.332 and ITRS = +.003) than to QQQ (+.262 and +.016,
respectively). These Professionals expect the market to keep moving
up to a point where secondary stocks attract significant buying from
the broader public. At least, that is the hypothesis I suggest.
It's true that the big banks (FAS... ITRS=-.031) and SPY (ITRS -.06)
have been holding back, but they show the highest Accumulation
(IP21= +.467 and +.392) and should be given more time. The same
can be said for DIA based on its IP21 reading now of +.358.
Table 1 QUICKSILVER on ETFS - 2/11/19 ETF CLOSE CHANGE PIVOT-PT 5-dma AROC CL-PWR CANDLE IP21 ITRS --------------------------------------------------------------------------------------------- DIA 250.94 -.38 253.96 -27.3% Bullish RED .358 0 --------------------------------------------------------------------------------------------- BA 403.95 -.96 410.18 85.7% Bullish RED .213 .256 --------------------------------------------------------------------------------------------- SPY 270.62 .15 273.1 -24.7% Bullish RED .392 -.006 --------------------------------------------------------------------------------------------- QQQ 168.4 -.16 171.03 -33.3% Bullish RED .262 .016 --------------------------------------------------------------------------------------------- MDY 339.5 2.09 339.53 19.8% Bullish BLUE .396 .002 --------------------------------------------------------------------------------------------- IWM 151.1 1.25 151.12 4.7% Bullish BLUE .332 .003 --------------------------------------------------------------------------------------------- FAS 58.39 .52 59.76 -102.7% Bullish BLUE .467 -.031 --------------------------------------------------------------------------------------------- SOXL 115.46 1.63 113.37 158.5% Bullish RED .218 .159 --------------------------------------------------------------------------------------------- TECL 108.44 -.12 110.45 32.1% Bullish RED .311 .028 --------------------------------------------------------------------------------------------- IBB 108.34 .54 110.06 -87.1% Bullish BLUE .192 .021 --------------------------------------------------------------------------------------------- GLD 123.6 -.61 124.28 -14.5% ------- BLUE .083 .061 --------------------------------------------------------------------------------------------- UUP(Dollar)25.82 .1 25.53 70.3% Bullish ---- .055 -.02 --------------------------------------------------------------------------------------------- RSX 20.76 0 21.34 -95.1% Bullish ---- .219 .009 |
It is bullish that the number of new highs is slowly expanding and the
number of new lows is quite. Notice this and the bullish ratio of MAXCPs
to MINCPS in Table 2 below.
 Table 2   Count of Stocks in Key Directories
          20190211
-------------------------------
NEWHIGHS       132  Bullish Ratio
NEWLOWS        5
MAXCP          47
MINCP          5    Very low.
TTTNH          28
TTTNL          18
FASTUP         51
FASTDOWN       81
CPCROSSA       169
CPCROSSD       52
BIGVOLUP       3
BIGVODN        12
ACCUMVER       56
HIGHIP21       85
HIUPPCT        6
VHIP21         24
LOWACCUM       187
REDSELL        51
AUGSELS7       7
TRAPDOOR       17
|
And in Table 3, see how few stock groups show a majority of their shares
below the 65-dma, just of 46. Meanwhile, in the key
groups, DJI-13
(the highest priced DJIA stocks) and SP-500, we see 76.9% % and
74.9% of their stocks remain above the support of their 65-dma. This
means that there should be a considerable cushion for the DJI if trade-talks
with China were to break off. We will also be watching to see if the
defensive groups (Bond Funds, REITS and Utilities) stay at the top of
Table 3. This can be interpreted as a sign that interest rates may be
going lower. The three groups would be much less appealing if there
was to be another rise in rates. Their position shows caution not over-
speculation dominates Wall Street. That is a bullish sign for now. A
top is probably not at hand.
Table 3 RANKING OF KEY DIRECTORIES BASED PCT.OF STOCKS ABOVE 65-DMA
              2/11/19
---------------------------------------------------------------------------------------
Directory     Current       day-1         day-2         day-3         day-4         day-5
----------------------------------------------------------------------------------------
BONDFUND       .98           .98           .98           .98           1             1
GOLD           .96           .96           .96           .96           .96           .96
REIT           .906          .899          .906          .899          .919          .899
UTILITY        .9            .95           .95           .8            .825          .825
GUNS           .882          .764          .705          .647          .705          .705
COMPUTER       .863          .818          .818          .772          .818          .818
REGBANKS       .857          .821          .785          .821          .75           .821
INSURANC       .833          .8            .833          .733          .766          .8
ETFS           .827          .81           .862          .913          .913          .896
SOFTWARE       .825          .841          .841          .841          .873          .857
HOMEBLDG       .823          .823          .823          .823          .882          .941
MILITARY       .812          .812          .781          .812          .812          .812
FINANCE        .811          .777          .788          .788          .755          .777
TRANSP         .8            .75           .75           .75           .75           .7
NIFTY          .789          .807          .824          .859          .894          .842
INDMATER       .782          .743          .782          .807          .833          .82
SEMI-CONDUCT.  .775          .793          .801          .853          .801          .801
HACKERS        .772          .772          .772          .818          .818          .818
NASD-100       .77           .78           .8            .83           .83           .83
DJI-13         .769          .846          .846          .846          .846          .846
^^^^^^
CHEM           .759          .685          .703          .74           .777          .74
SP500          .749          .741          .747          .773          .792          .79
^^^^^
FIDSTKS        .747          .752          .752          .768          .774          .801
ELECTRON       .746          .753          .753          .808          .771          .765
RUS-1000       .734          .712          .731          .762          .785          .779
CHINA          .733          .683          .7            .75           .783          .733
INDEXES        .725          .704          .698          .768          .806          .795
INFRA          .722          .694          .722          .777          .805          .805
SOLAR          .722          .777          .833          .777          .777          .777
JETS           .7            .8            .8            .8            .8            .7
BEVERAGE       .666          .666          .777          .777          .722          .777
GREEN          .652          .695          .695          .695          .695          .739
DOWJONES       .633          .666          .666          .7            .733          .7
********
GAMING         .625          .583          .583          .625          .708          .666
SP-100         .623          .612          .655          .72           .709          .731
PIPELINE       .59           .59           .636          .772          .818          .818
AUTO           .589          .512          .589          .641          .615          .692
BIGBANKS       .571          .428          .571          .571          .571          .714
BIOTECH        .557          .536          .526          .586          .557          .592
HOSPITAL       .541          .5            .583          .541          .583          .583
RETAIL         .509          .49           .528          .528          .547          .509
EDU            .5            .5            .5            .5            .5            .5
=============================================================================================
COMODITY       .476          .547          .523          .714          .761          .785
FOOD           .421          .491          .456          .649          .701          .736
OILGAS         .4            .372          .358          .531          .537          .579
COAL           .142          .142          .142          .428          .571          .571
|
====================================================================
2/8/2019 The Buy B4 has not been reversed. The recent two-day decline
has not come close to taking the DJI back to its 21-dma. Now the DJI's
rally seems to be resuming without it even being necssary to test its 65-dma.
The steep, straight up-advance looks like it will continue? And why shouldn't
it? More than 300,000 new jobs were created in each of the last two months
AND the FED is not tightening. In fact, the Federal Funds rate is more than
1.65% below the level, 4%, that had to be reached in the Summer of 1957 to
finally bring about a 20% DJI decline. The parallel with the 1950s is pretty
close, except that Trump is far less popular and far more incautious than the
Republican President Eisenhower.
By mid 1957, when the major top was made, the bull market had been around
for 8 years. Ours is two years older. So, there may be more danger when the
end finally does come. But one should note that, the DJI "only" sold off
20%
in 1957. That was only one perceent more than we exerieced. From there it
based and rallied to a last new high at the start of 1960. All in all, the
1949-1960 bull market survived a year longer than ours has from 2009-2019.


The Growing Wealth Gap is The Biggest Vulnerability
to Republican Control:
The Top One Percent of American Households Own
More Wealth than the Bottom 90 Percent. https://www.washingtonpost.com/news/wonk/wp/2017/12/06/the-richest-1-percent-now-owns-more-of-the-countrys-wealth-than-at-any-time-in-the-past-50-years/?noredirect=on&utm_term=.6962b8b081d3
What The Bull Market Needs...
Many of the Democrats who want to be President in 2020 are fighting a bidding
war to raise taxes. To prevent them being successful given the popularity
of the wealth gap issue, it will really behoove the market to get very strong
again and bring a price breakout above 26000 and then a run far above
27000.
The surest way to fight off anti-wealth Populism is to create a super-strong
economy. This is what President Trump senses and knows. Does the Fed?
Do Republican Congressmen? For the strong economy now to get even
stronger, I would suggest three things are needed to happen soon. Soon-
because this all has to happen before the Summer of 2020.
1) The FED needs soon to lower interest rates, not just keep them where they
are. This was done in 1927 when the DJI made new highs. They only need
to do this for a short period of time. See in the numbers below, how the FED
only needed to drop rates in August 1927 and September 1929. That was all
that was needed to unleash a big speculative bubble for the next two years,
despite occasional tightening. The two 1927 rate drops when the DJI was
also making new all-time highs sent the DJI up from 174 in August 1927 to 381
in September 1929. And of course, back then rates were much lower.
Discount Rate changes:
1927-03-01 4.00
1927-08-01 3.56
1927-09-01 3.50
1928-02-01 3.97
1928-03-01 4.00
1928-05-01 4.23
1928-06-01 4.50
1928-07-01 4.81
1928-08-01 5.00
1929-08-01 5.74
1929-09-01 6.00
2) Republican Congressmen and FOX need to tell the story over and over
again of how lowering the taxes on the wealthy has made the Economy
roar ahead, just as it did in 1926, 1927 and 1928.
3) I would suggest the President needs to stop being stubborn about
his Border Wall. It is not a winning battle. Instead, he needs to challenge
the Democrats to launch a large-scale infrastructure spending program.
He needs to put them in the position of being more concerned about
balancing the budget than rebuilding the country. This, it seems to me,
is the best way for Trump and Republicans to guarantee success in the
2020 Electoral College.
In all this, the stock market needs to stay strong now to keep alive
the theme that America has a wonderfully strong economy and that any
Democrat shift in priorities will endanger the stock market and thereby
hurt the economic boom.
Technically, the still downtrending "Megaphone" in the DJI
will will need to breakout to the upside and Boeing's rising megaphone
pattern will need to see an upside breakout. We will also want to
see the inverted head/shoulders patterns in the SP-500, NYSE, QQQ
and NASDAQ now rally on rising volume.
Then, as the rally gets going, we will need to see IWM and low
priced stocks move up faster and faster. Right now, its volume is
waning and it is stuck at a 50% retracement level. A stronger IWM
(Russell -2000) will show that the broad Public are becoming participants
in the big bull market. It will probably take a DJI move past 27000
to start a move speculative phase.
|
Charts 2/8/2019 2018 PEERLESS DJI, Signals, Indicators Daily DJI Volume 10-DayUp/Down Vol Hourly DJIA A/D Line for All Stocks Inverted Traders Index NASDAQ S&P OEX NYSE COMPQX DJI-15 DJI-20 DJI-30 DIA SPY QQQ MDY IWM TNA Short-Term Rates USO-CrudeOil DBO FAS GLD BBH IBB JETS JNUG KOL NUGT OIH OIL RSX RETL SDS AGQ SLV SOXL TECL TLT TMF TNA UGA (gasoline) XIV YINN Commodities: CANE CORN DBC JJC, NIB, CHOC CORN, CUT (paper) MOO, SOYB WEAT UUP (Dollar) LIT (Lithium) AAPL ADBE ALXN AMAT AMGN AMD AMZN BA BABA BAC BIDU CAT CVX DE FB GOOG GS HD IBM INTU JPM M (Macy's) MSFT NFLX NVDA QCOM TSLA TXN XOM WMT CMG , LRCX, SWKS, MDGL SPPI WATT SQ TOWN 2/8/19 (Click on Underlined link.) Bullish MAXCPs - http://tigersoft.com/MAXCPS/Feb-8/BULLISH.htm Bearish MAXCPs - http://tigersoft.com/MINCPs/Feb-8/BEARISH.htm |
Table 1 QUICKSILVER on ETFS - 2/8/19 ETF CLOSE CHANGE PIVOT-PT 5-dma AROC CL-PWR CANDLE IP21 ITRS --------------------------------------------------------------------------------------------- DIA 251.32 -.58 252.32 16.6% Bullish BLUE .406 0 --------------------------------------------------------------------------------------------- BA 404.91 -.26 397 217.3% Bullish BLUE .273 .26 --------------------------------------------------------------------------------------------- SPY 270.47 .33 271.96 7.5% Bullish BLUE .44 -.009 --------------------------------------------------------------------------------------------- QQQ 168.56 .33 169.53 32.8% Bullish BLUE .316 .015 --------------------------------------------------------------------------------------------- MDY 337.41 -.25 338.16 37.9% Bullish BLUE .398 -.018 --------------------------------------------------------------------------------------------- IWM 149.85 .16 150.96 22.3% Bullish BLUE .341 -.02 --------------------------------------------------------------------------------------------- FAS 57.87 -.37 59.6 -64.3% Bullish BLUE .495 -.041 --------------------------------------------------------------------------------------------- RETL 27.9 -.64 28.81 6.9% ------- RED .411 -.178 --------------------------------------------------------------------------------------------- SOXL 113.83 -.47 111.81 160.8% Bullish BLUE .236 .144 --------------------------------------------------------------------------------------------- TECL 108.56 1.77 107.74 267.5% Bullish BLUE .376 .03 --------------------------------------------------------------------------------------------- IBB 107.8 .67 110.24 -112.8% Bullish BLUE .206 .007 --------------------------------------------------------------------------------------------- GLD 124.21 .47 123.96 -11.7% ------- BLUE .038 .054 --------------------------------------------------------------------------------------------- OIH 16.49 -.26 17.41 -211.5% ------- RED .205 -.13 --------------------------------------------------------------------------------------------- --------------------------------------------------------------------------------------------- RSX 20.76 -.11 21.16 -85.3% Bullish RED .274 .014 |
Table 2   Count of Stocks in Key Directories
          20190208
-------------------------------
NEWHIGHS       109
NEWLOWS        8
MAXCP          65
MINCP          8
TTTNH          22
TTTNL          16
FASTUP         54
FASTDOWN       84
CPCROSSA       77
CPCROSSD       22
BIGVOLUP       7
BIGVODN        12
ACCUMVER       51
HIGHIP21       119
HIUPPCT        8
VHIP21         20
LOWACCUM       193
REDSELL        50
AUGSELS7       7
TRAPDOOR       18
|
Table 3
       RANKING OF KEY DIRECTORIES BASED PCT.OF STOCKS ABOVE 65-DMA
              2/8/19
       Bullish = 39
       Bearish =  5
---------------------------------------------------------------------------------------
Directory     Current       day-1         day-2         day-3         day-4         day-5
----------------------------------------------------------------------------------------
BONDFUND       .98           .98           .98           1             1             1
GOLD           .96           .96           .96           .96           .96           .94
UTILITY        .95           .95           .8            .825          .825          .8
REIT           .899          .906          .899          .919          .892          .852
DJI-13         .846          .846          .846          .846          .769          .769
SOFTWARE       .841          .841          .841          .873          .857          .793
HOMEBLDG       .823          .823          .823          .882          .941          .941
REGBANKS       .821          .785          .821          .75           .785          .607
COMPUTER       .818          .818          .772          .818          .772          .59
MILITARY       .812          .781          .812          .812          .812          .718
ETFS           .81           .862          .913          .913          .896          .879
NIFTY          .807          .824          .859          .894          .824          .771
INSURANC       .8            .833          .733          .766          .8            .733
JETS           .8            .8            .8            .8            .7            .6
SEMI           .793          .801          .853          .801          .801          .81
NASD-100       .78           .8            .83           .83           .82           .78
FINANCE        .777          .788          .788          .755          .777          .733
SOLAR          .777          .833          .777          .777          .777          .777
HACKERS        .772          .772          .818          .818          .818          .818
GUNS           .764          .705          .647          .705          .705          .647
ELECTRON       .753          .753          .808          .771          .765          .753
FIDSTKS        .752          .752          .768          .774          .795          .715
TRANSP         .75           .75           .75           .75           .7            .55
INDMATER       .743          .782          .807          .833          .82           .769
SP500          .741          .747          .773          .792          .786          .745
RUS-1000       .712          .731          .762          .785          .775          .72
INDEXES        .711          .701          .771          .809          .782          .766
GREEN          .695          .695          .695          .695          .739          .695
INFRA          .694          .722          .777          .805          .805          .75
CHEM           .685          .703          .74           .777          .759          .703
CHINA          .683          .7            .75           .783          .733          .766
BEVERAGE       .666          .777          .777          .722          .777          .722
DOWJONES       .666          .666          .7            .733          .666          .633
SP-100         .612          .655          .72           .709          .72           .645
PIPELINE       .59           .636          .772          .818          .818          .818
GAMING         .583          .583          .625          .708          .666          .625
COMODITY       .547          .523          .714          .761          .785          .761
BIOTECH        .534          .526          .586          .557          .589          .539
AUTO           .512          .589          .641          .615          .692          .641
--------------------------------------------------------------------------------------------
EDU            .5            .5            .5            .5            .5            .5
HOSPITAL       .5            .583          .541          .583          .583          .5
--------------------------------------------------------------------------------------------
FOOD           .491          .456          .649          .701          .736          .684
RETAIL         .49           .528          .528          .547          .509          .49
BIGBANKS       .428          .571          .571          .571          .714          .571
OILGAS         .372          .358          .531          .537          .565          .51
COAL           .142          .142          .428          .571          .571          .571
|
====================================================================
2/7/2019
The DJI has rallied up 17% without a decline back
below its 21-dma.
A retreat to the 21-dma or slightly below should not be a problem
for our Buy B4.
Scenario 1
The Buy B4 has not been reversed. However, a decline
now back to the
support of the DJI's 65-dma, which has today turned slightly down,
seems ahead now. The steep NYSE A/D Line and the price-uptrend-lines
for the DJI, NYSE, SP-500 and NASDAQ have been broken. Retreats
back only to the support of the 65-dma and the 21-dma at 24500 are apt
to turn out to be constructive preludes to a rally to 26000 or higher.
After all, 84.6% of the DJI-30 stocks, 82.4% of our "Nifty Tech Stocks",
80.1% of all semi-conductors, 80% of the QQQ stocks and 74.7% of
the SP-500 stocks are above the presumed good support of their 65-dma.
(See Table 3 below).
Scenario 2
Still, it's possible that the DJI's move three days ago above its (red) well-tested
downtrend-line is significantly false and constitutes a final running in of the
shorts up to the day of Trump's State of The Union speech. The market
has taken on a much more defensive tone in the last two trading days, if we judge
by how many Utility stocks and REITs constitute the MAXCPs or how
it is Bonds (98%), Gold (96%) and Utilities (90.6% that are the leading
groups in our ranking of groups with the most stocks above their 65-dma.
Thus, a decline to the DJI's 3.5% lower band could occur if the trade talks
with China break down or the Dollar gives way or the FED is moved to
start raising rates.
"Wealth Tax" Talk Is Scaring The Market
Much more talk of a Wealth Tax by the most Progressive Democrats
could also scare the market a bit, but my understanding is that this would
be ruled by the Supreme Court to be a violation of the Constitutional
provision that forbids seisure of property without "due process". The
fact that it took the 16th Ammendment to establish the right of the
Federal Government to tax INCOME, which is clearly not WEALTH.
So, aanother ammedment to the Constitution would probably be needed.
But listen what Elizabeth Warren, a Harvard-trained lawyer has to say.
(I did not have time to listen to these yet. But will.
Elizabeth Warren's 'wealth tax' faces constitutional questions |
Fox News
Elizabeth Warren's Wealth Tax Is Probably Constitutional -
Bloomberg
How Can We Know Which Scenario Is Likely.
Watch tomorrow: the DJI, the close vs. the opening, the Dollar,
short-term rates, news about the CPI and, of course, news about the trade talks.
There should be very good support at 24500. Watch to see if any of the key
Indexes and general market ETFs break their 65-dma. As long as they hold
above, our longs should be OK. Below that, we will have to hedge. Even then
the DJI's lower band will act as support.
  |
|
Charts 2/7/2019 2018 PEERLESS DJI, Signals, Indicators Daily DJI Volume 10-DayUp/Down Vol Hourly DJIA A/D Line for All Stocks Inverted Traders Index NASDAQ S&P OEX NYSE COMPQX DJI-15 DJI-20 DJI-30 DIA SPY QQQ MDY IWM TNA Short-Term Rates USO-CrudeOil DBO FAS GLD BBH IBB JETS JNUG KOL NUGT OIH OIL RSX RETL SDS AGQ SLV SOXL TECL TLT TMF TNA UGA (gasoline) XIV YINN Commodities: CANE CORN DBC JJC, NIB, CHOC CORN, CUT (paper) MOO, SOYB WEAT UUP (Dollar) LIT (Lithium) AAPL ADBE ALXN AMAT AMGN AMD AMZN BA BABA BAC BIDU CAT CVX DE FB GOOG GS HD IBM INTU JPM M (Macy's) MSFT NFLX NVDA QCOM TSLA TXN XOM WMT CMG , LRCX, SWKS, MDGL SPPI WATT SQ TOWN 2/7/19 (Click on Underlined link.) Bullish MAXCPs - http://tigersoft.com/MAXCPS/Feb-7/BULLISH.htm Bearish MAXCPs - http://tigersoft.com/MINCPs/Feb-7/BEARISH.htm |
Table 1 QUICKSILVER on ETFS - 2/7/19 ETF CLOSE CHANGE PIVOT-PT 5-dma AROC CL-PWR CANDLE IP21 ITRS --------------------------------------------------------------------------------------------- DIA 251.9 -1.97 250.48 35.3% Bullish RED .365 0 --------------------------------------------------------------------------------------------- BA 405.17 -5.94 387.43 245.4% Bullish RED .223 .26 --------------------------------------------------------------------------------------------- SPY 270.14 -2.6 270.06 3.9% Bullish RED .413 -.011 --------------------------------------------------------------------------------------------- QQQ 168.23 -2.29 167.45 2.1% Bullish RED .292 .019 --------------------------------------------------------------------------------------------- MDY 337.66 -1.52 334.85 57.4% Bullish RED .392 -.022 --------------------------------------------------------------------------------------------- IWM 149.69 -1.24 149.18 21% Bullish RED .328 -.025 --------------------------------------------------------------------------------------------- FAS 58.24 -.96 58.63 45.8% Bullish RED .478 .001 --------------------------------------------------------------------------------------------- SOXL 114.3 -8.18 110.15 348.7% Bullish RED .234 .198 --------------------------------------------------------------------------------------------- TECL 106.79 -4.71 102.79 275.1% Bullish RED .335 .065 --------------------------------------------------------------------------------------------- IBB 107.13 -2.75 110.27 -116.3% Bullish RED .164 .001 --------------------------------------------------------------------------------------------- GLD 123.74 .3 124.5 -40.7% Bullish RED .087 .031 --------------------------------------------------------------------------------------------- OIH 16.75 -.7 17.22 -34.7% ------- RED .223 -.117 --------------------------------------------------------------------------------------------- GASL 6.31 -.95 7.89 -947.6% Bearish RED .093 -.41 --------------------------------------------------------------------------------------------- UGA 6.31 -.95 7.89 -947.6% Bullish RED 0 -.759 --------------------------------------------------------------------------------------------- UUP 25.69 .06 25.39 58.9% Bullish -- -.015 -.044 --------------------------------------------------------------------------------------------- RSX 20.87 -.15 21.12 -85% Bullish --- .308 -.017 |
Table 2    Count of Stocks in Key Directories
           2019-02-07
-------------------------------
NEWHIGHS       104
NEWLOWS        11
MAXCP          47
MINCP          8
TTTNH          22
TTTNL          15
FASTUP         48
FASTDOWN       54
CPCROSSA       35
CPCROSSD       87
BIGVOLUP       3
BIGVODN        19
ACCUMVER       57
HIGHIP21       118
HIUPPCT        5
VHIP21         20
LOWACCUM       209
REDSELL        52
AUGSELS7       7
TRAPDOOR       17
|
Table 3       RANKING OF KEY DIRECTORIES BASED PCT.OF STOCKS ABOVE 65-DMA
              2/7/19
Bullish= 44
Bearish = 2
---------------------------------------------------------------------------------------
Directory     Current       day-1         day-2         day-3         day-4         day-5
----------------------------------------------------------------------------------------
BONDFUND       .98           .98           1             1             1             1
GOLD           .96           .96           .96           .96           .94           .96
UTILITY        .95           .8            .825          .825          .825          .825
REIT           .906          .899          .919          .892          .852          .892
ETFS           .862          .913          .913          .896          .879          .913
DJI-13         .846          .846          .846          .769          .769          .692
SOFTWARE       .841          .841          .873          .857          .793          .793
INSURANC       .833          .733          .766          .8            .733          .733
SOLAR          .833          .777          .777          .777          .777          .777
NIFTY          .824          .859          .894          .824          .771          .754
HOMEBLDG       .823          .823          .882          .941          .941          .941
COMPUTER       .818          .772          .818          .772          .59           .636
SEMI           .801          .853          .801          .801          .801          .775
JETS           .8            .8            .8            .7            .7            .6
NASD-100       .8            .83           .83           .82           .78           .76
FINANCE        .788          .788          .755          .777          .733          .677
REGBANKS       .785          .821          .75           .785          .607          .464
INDMATER       .782          .807          .833          .82           .782          .769
MILITARY       .781          .812          .812          .812          .718          .718
BEVERAGE       .777          .777          .722          .777          .722          .666
HACKERS        .772          .818          .818          .818          .818          .772
ELECTRON       .753          .808          .771          .765          .746          .734
FIDSTKS        .752          .768          .774          .795          .715          .698
TRANSP         .75           .75           .75           .7            .6            .5
SP500          .747          .773          .792          .786          .747          .706
RUS-1000       .731          .762          .785          .775          .723          .704
INFRA          .722          .777          .805          .805          .75           .694
GUNS           .705          .647          .705          .705          .647          .588
CHEM           .703          .74           .777          .759          .74           .685
CHINA          .7            .75           .783          .733          .766          .716
INDEXES        .698          .768          .806          .779          .763          .763
GREEN          .695          .695          .695          .739          .695          .695
DOWJONES       .666          .7            .733          .666          .633          .4
SP-100         .655          .72           .709          .72           .645          .58
PIPELINE       .636          .772          .818          .818          .818          .818
AUTO           .589          .641          .615          .692          .641          .692
GAMING         .583          .625          .708          .666          .625          .625
HOSPITAL       .583          .541          .583          .583          .5            .583
BIGBANKS       .571          .571          .571          .714          .571          .571
RETAIL         .528          .528          .547          .509          .471          .509
BIOTECH        .523          .586          .557          .589          .534          .542
COMODITY       .523          .714          .761          .785          .738          .642
============================================================================================
EDU            .5            .5            .5            .5            .5            .5
============================================================================================
FOOD           .456          .649          .701          .736          .649          .578
COAL           .142          .428          .571          .571          .571          .571
|
====================================================================
2/6/2019
The Buy B4 has not been reversed. A typical
January B4 like
we have just seen would take the DJI up 10.6%. That sets up a
target of 26953. At the point, the DJI would be making a nominal
new all-time high closing. Short-term a break below 25289 (hourly)
would likely bring a test of 24600. It should give us a good chance
to buy.

The NYSE A/D Line has, so far, confirmed the entire rally. I take
this as particulary significant. If we go back and look at all the past
serious market tops when a Republican was President, we find that clear-cut
AD/Line non-confirmations (mostly with S9s) occurred before at least
19 such tops since 1929. Only 4 major tops were called by either
a head/shoulders top or weakness from the Accumulation Index.
19 Examples of significant ADL NC Called Tops in Bull Markets
with Repub. Presidents:
March, May and Sept. 1929,
Sept. 1955,
April 1956 and May 1956,
July 1957,
July 1959,
Janaury 1960,
May 1969,
Jan 1973,
April 1981
October 1987
July 1990
July 2007 and October 2007
May 2008
Jan 2018 and Sept-Oct 2018
There are only a few exceptions, i.e. tops where Peerless would
have gotten a Sell Signal based on a head/shoulders pattern or weakness
from the Accumulation Index, which represents Big Money selling rather
than rising interest rate concerns being behind the top. So, the odds
are good that the next top will be caused by the FED again changing
its mind.
Significant Other Tops in Bull Mkts with Repub. Presidents:
1) April 1971 (P-I turned negative for S19 and Head/Shoulders for S10.
2) December 1976 (IP21 fell below its 21-dma for S4)
3) August 1987 (IP21 fell below its 21-dma for S4... before Oct 87 S9)
4) December 2007 (IP21 NNC for S12)

SRs
Another way to spot a top that we do not much talk about is whether
the DJI or SPY or QQQ... show extreme spikes from their Support:Resistance
Indicator. The idea here that after a rally, prices often reach a turning point
and show high volume "churning" and little daily change. So far, our rally
now
has not had such a spike. We want to compare the DIA's "SR Warning"
Indicator
with the spiking done at some previous peaks, for example September last year.
(This indicator is done under IND-3 with a graph on the screen.)


August 1987 DJI top:

|
Charts 2/6/2019 2018 PEERLESS DJI, Signals, Indicators Daily DJI Volume 10-DayUp/Down Vol Hourly DJIA A/D Line for All Stocks Inverted Traders Index NASDAQ S&P OEX NYSE COMPQX DJI-15 DJI-20 DJI-30 DIA SPY QQQ MDY IWM TNA Short-Term Rates USO-CrudeOil DBO FAS GLD BBH IBB JETS JNUG KOL NUGT OIH OIL RSX RETL SDS AGQ SLV SOXL TECL TLT TMF TNA UGA (gasoline) XIV YINN Commodities: CANE CORN DBC JJC, NIB, CHOC CORN, CUT (paper) MOO, SOYB WEAT UUP (Dollar) LIT (Lithium) AAPL ADBE ALXN AMAT AMGN AMD AMZN BA BABA BAC BIDU CAT CVX DE FB GOOG GS HD IBM INTU JPM M (Macy's) MSFT NFLX NVDA QCOM TSLA TXN XOM WMT CMG , LRCX, SWKS, MDGL SPPI WATT SQ TOWN 2/6/19 (Click on Underlined link.) Bullish MAXCPs - http://tigersoft.com/MAXCPS/Feb-6/BULLISH.htm Bearish MAXCPs - http://tigersoft.com/MINCPs/Feb-6/BEARISH.htm |
Table 1 QUICKSILVER on ETFS - 2/6/19 ETF CLOSE CHANGE PIVOT-PT 5-dma AROC CL-PWR CANDLE IP21 ITRS ----------------------------------------------------------------------- DIA 253.87 -.09 250.12 73.4% Bullish BLUE .386 0 --------------------------------------------------------------------------------------------- BA 411.11 .93 385.62 297.1% Bullish RED .28 .258 --------------------------------------------------------------------------------------------- SPY 272.74 -.36 269.93 95.4% Bullish RED .442 -.009 --------------------------------------------------------------------------------------------- QQQ 170.52 -.51 168.16 143.7% Bullish RED .326 .026 --------------------------------------------------------------------------------------------- MDY 339.18 -.35 333.79 98.4% Bullish BLUE .412 -.019 --------------------------------------------------------------------------------------------- IWM 150.93 -.19 149.06 104.6% Bullish RED .373 -.018 --------------------------------------------------------------------------------------------- FAS 59.2 -.56 57.7 123.5% Bullish RED .477 -.006 --------------------------------------------------------------------------------------------- RETL 29.11 -.48 28.54 125.7% Bullish RED .406 -.1 --------------------------------------------------------------------------------------------- SOXL 122.48 9.11 106.43 735.7% Bullish BLUE .251 .285 --------------------------------------------------------------------------------------------- TECL 111.5 1.05 100.92 484% Bullish BLUE .379 .082 --------------------------------------------------------------------------------------------- IBB 109.88 -.18 109.69 76.6% Bullish RED .246 .031 --------------------------------------------------------------------------------------------- GLD 123.44 -.84 124.75 -50.2% Bullish RED .099 .028 --------------------------------------------------------------------------------------------- OIL 123.44 -.84 124.75 -50.2% Bullish RED .025 13.266 --------------------------------------------------------------------------------------------- OIH 17.45 -.01 16.87 101.7% Bullish BLUE .237 -.11 --------------------------------------------------------------------------------------------- GASL 7.26 -.36 7.77 -743.1% Bearish RED .158 -.377 --------------------------------------------------------------------------------------------- UGA 7.26 -.36 7.77 -743.1% Bullish RED .11 -.722 --------------------------------------------------------------------------------------------- UUP 25.63 .1 25.39 57% Bullish BLUE-.014 -.045 --------------------------------------------------------------------------------------------- IEF 25.63 .1 25.39 57% Bearish BLUE-.088 -.789 --------------------------------------------------------------------------------------------- CORN 25.63 .1 25.39 57% Bullish BLUE .044 .554 --------------------------------------------------------------------------------------------- WEAT 25.63 .1 25.39 57% Bullish BLUE .043 3.143 --------------------------------------------------------------------------------------------- YINN 25.63 .1 25.39 57% Bearish BLUE .035 .403 --------------------------------------------------------------------------------------------- RSX 21.02 -.32 21.23 -30.7% Bullish RED .326 -.03 |
Table 2    Count of Stocks in Key Directories
           2019-02-06
-------------------------------
NEWHIGHS       77
NEWLOWS        9
MAXCP          30
MINCP          6
TTTNH          22
TTTNL          15
FASTUP         80
FASTDOWN       38
CPCROSSA       27
CPCROSSD       45
BIGVOLUP       2
BIGVODN        9
ACCUMVER       55
HIGHIP21       125
HIUPPCT        10
VHIP21         20
LOWACCUM       192
REDSELL        54
AUGSELS7       7
TRAPDOOR       18
|
 Table 3 RANKING OF KEY DIRECTORIES BASED PCT.OF STOCKS ABOVE 65-DMA
         2/6/19
 Bullish = 44
 Bearish = 1
---------------------------------------------------------------------------------------
Directory     Current       day-1         day-2         day-3         day-4         day-5
----------------------------------------------------------------------------------------
BONDFUND       .98           1             1             1             1             .99
GOLD           .96           .96           .96           .94           .96           .92
ETFS           .913          .913          .896          .879          .913          .896
REIT           .899          .919          .892          .852          .892          .838
NIFTY          .859          .894          .824          .771          .754          .824
SEMI           .853          .801          .801          .801          .775          .775
DJI-13         .846          .846          .769          .769          .692          .769
SOFTWARE       .841          .873          .857          .793          .793          .777
NASD-100       .83           .83           .82           .78           .76           .77
HOMEBLDG       .823          .882          .941          .941          .941          .882
REGBANKS       .821          .75           .785          .607          .464          .535
HACKERS        .818          .818          .818          .818          .772          .772
MILITARY       .812          .812          .812          .718          .718          .75
ELECTRON       .808          .771          .765          .746          .734          .728
INDMATER       .807          .833          .82           .782          .756          .769
JETS           .8            .8            .7            .7            .6            .8
UTILITY        .8            .825          .825          .825          .825          .7
FINANCE        .788          .755          .777          .733          .688          .755
BEVERAGE       .777          .722          .777          .722          .666          .611
INFRA          .777          .805          .805          .75           .722          .638
SOLAR          .777          .777          .777          .777          .777          .777
INDEXES        .774          .806          .779          .763          .763          .698
SP500          .773          .791          .785          .746          .708          .714
COMPUTER       .772          .818          .772          .59           .636          .545
PIPELINE       .772          .818          .818          .818          .818          .863
FIDSTKS        .768          .774          .795          .715          .698          .715
RUS-1000       .762          .785          .775          .723          .701          .694
CHINA          .75           .783          .733          .766          .716          .683
TRANSP         .75           .75           .7            .6            .5            .55
CHEM           .74           .777          .759          .74           .703          .722
INSURANC       .733          .766          .8            .733          .733          .733
SP-100         .72           .709          .72           .645          .58           .677
COMODITY       .714          .761          .785          .738          .619          .666
DOWJONES       .7            .733          .666          .633          .4            .6
GREEN          .695          .695          .739          .695          .695          .695
FOOD           .649          .701          .736          .649          .561          .596
GUNS           .647          .705          .705          .647          .588          .588
AUTO           .641          .615          .692          .641          .692          .641
GAMING         .625          .708          .666          .625          .625          .666
BIOTECH        .584          .557          .589          .534          .542          .478
BIGBANKS       .571          .571          .714          .571          .571          1
HOSPITAL       .541          .583          .583          .5            .583          .541
OILGAS         .531          .537          .565          .51           .42           .489
RETAIL         .528          .547          .509          .471          .528          .471
===========================================================================================
EDU            .5            .5            .5            .5            .5            .5
===========================================================================================
COAL           .428          .571          .571          .571          .571          .714
|
====================================================================
2/5/2019
Stick with the Uptrend. The
politics of the speeches today will not help much.
What counts is where interest rates are going, or not going.

The January Buy B4 still looks very good. Our
studies of V-bottoms, straight-
up advances by the DJI in January and February after sell-offs of 18% or
more, the bullish history of third years in Presidential Elections and the median
10+% gains of these Buy B4s all suggest the DJI will move past 26000 soon
and challenge the all-time high just above 27000. The very good
Jobs situation
coupled with the prospects of flat interest rates should achieve this unless
something dangerous happens internationally. It's not clear what that would
be. While Gold is rising, Inflation (the year to year change in the CPI) is
well
below 3% and the Dollar is still above its rising 30-week ma.
Boeing is, by far, the most heavily weighted stock in the DJI. It has reached
the resistance line of a broadening price pattern. Any further advance could
send it up even faster. Already, it is up 39% just since December 24th. Just by
itself, BA has lifted the DJI up 781 of the 3618 points (21.6%) it has risen
in the last 28 trading days. We should watch this more closely than any other
stock. Back at the end of 1928 and early 1929, the highest priced DJI-30
stock, RCA, doubled before splitting 5:1. That played a big role in the last
wave of public speculation before the Crash.
It is important that the DJI not stall out here. The rally is gaining momentum
and just acquiring speculative enthusiasm. If the advance can continue just two
more months, the bulls now are going to be very happy.


|
Charts 2/5/2019 2018 PEERLESS DJI, Signals, Indicators Daily DJI Volume 10-DayUp/Down Vol Hourly DJIA A/D Line for All Stocks Inverted Traders Index NASDAQ S&P OEX NYSE COMPQX DJI-15 DJI-20 DJI-30 DIA SPY QQQ MDY IWM TNA Short-Term Rates USO-CrudeOil DBO FAS GLD BBH IBB JETS JNUG KOL NUGT OIH OIL RSX RETL SDS AGQ SLV SOXL TECL TLT TMF TNA UGA (gasoline) XIV YINN Commodities: CANE CORN DBC JJC, NIB, CHOC CORN, CUT (paper) MOO, SOYB WEAT UUP (Dollar) LIT (Lithium) AAPL ADBE ALXN AMAT AMGN AMD AMZN BA BABA BAC BIDU CAT CVX DE FB GOOG GS HD IBM INTU JPM M (Macy's) MSFT NFLX NVDA QCOM TSLA TXN XOM WMT CMG , LRCX, SWKS, MDGL SPPI WATT SQ TOWN 2/5/19 (Click on Underlined link.) Bullish MAXCPs - http://tigersoft.com/MAXCPS/Feb-5/BULLISH.htm Bearish MAXCPs - http://tigersoft.com/MINCPs/Feb-5/BEARISH.htm |
Table 1 QUICKSILVER on ETFS - 2/5/19 Very high IP21s here. Usually, prices go higher. ETF CLOSE CHANGE PIVOT-PT 5-dma AROC CL-PWR CANDLE IP21 ITRS --------------------------------------------------------------------------------------------- DIA 253.96 1.64 250.18 165.2% Bullish BLUE .381 ---- --------------------------------------------------------------------------------------------- BA 410.18 13.18 387.72 588.6% Bullish BLUE .278 .252 --------------------------------------------------------------------------------------------- SPY 273.1 1.14 267.58 180.4% Bullish BLUE .441 -.005 --------------------------------------------------------------------------------------------- QQQ 171.03 1.5 165.68 284.1% Bullish BLUE .345 .036 --------------------------------------------------------------------------------------------- MDY 339.53 1.37 332.57 135.3% Bullish BLUE .414 -.008 --------------------------------------------------------------------------------------------- IWM 151.12 .16 147.8 165.5% Bullish BLUE .388 -.004 --------------------------------------------------------------------------------------------- FAS 59.76 .16 57.75 285.2% Bullish ---- .47 .01 --------------------------------------------------------------------------------------------- SOXL 113.37 1.56 106.35 728% Bullish BLUE .253 .2 --------------------------------------------------------------------------------------------- TECL 110.45 2.71 101.37 866% Bullish BLUE .365 .091 --------------------------------------------------------------------------------------------- IBB 110.06 -.18 108.2 118.6% Bullish BLUE .272 .038 --------------------------------------------------------------------------------------------- GLD 124.28 .32 124.69 12.1% Bullish ---- .128 .036 --------------------------------------------------------------------------------------------- RSX 21.34 .18 21.15 154.2% Bullish BLUE .363 .014 |
 Table 2   Count of Stocks in Key Directories
           2019-02-05
-------------------------------
NEWHIGHS       128
NEWLOWS        3
MAXCP          45
MINCP          2    Extremely low - bullish Professionals.
TTTNH          20
TTTNL          7
FASTUP         121
FASTDOWN       42
CPCROSSA       67
CPCROSSD       29
BIGVOLUP       2
BIGVODN        14
ACCUMVER       37
HIGHIP21       149
HIUPPCT        10
VHIP21         20
LOWACCUM       210
REDSELL        53
AUGSELS7       5
TRAPDOOR       17
|
Table 3   RANKING OF KEY DIRECTORIES BASED PCT.OF STOCKS ABOVE 65-DMA
          2/5/19
Bullish = 46
Bearish = 0
---------------------------------------------------------------------------------------
Directory     Current       day-1         day-2         day-3         day-4         day-5
----------------------------------------------------------------------------------------
BONDFUND       1             1             1             1             .99           1
GOLD           .96           .96           .94           .96           .92           .9
REIT           .919          .892          .852          .892          .832          .791
ETFS (Foreign) .913          .896          .879          .913          .879          .81
NIFTY          .894          .824          .771          .754          .824          .754
HOMEBLDG       .882          .941          .941          .941          .882          .882
SOFTWARE       .873          .857          .793          .793          .777          .746
DJI-13         .846          .769          .769          .692          .769          .615
INDMATER       .833          .82           .782          .756          .769          .692
NASD-100       .83           .82           .78           .76           .77           .67
UTILITY        .825          .825          .825          .825          .7            .675
COMPUTER       .818          .772          .59           .636          .545          .5
HACKERS        .818          .818          .818          .772          .772          .681
PIPELINE       .818          .818          .818          .818          .863          .863
MILITARY       .812          .812          .718          .718          .75           .75
INDEXES        .806          .779          .763          .763          .693          .586
INFRA          .805          .805          .75           .722          .666          .666
SEMI           .801          .801          .801          .775          .775          .715
JETS           .8            .7            .7            .6            .8            .7
SP500          .792          .786          .747          .708          .714          .637
RUS-1000       .785          .775          .723          .701          .694          .62
CHINA          .783          .733          .766          .716          .683          .583
CHEM           .777          .759          .74           .703          .74           .666
SOLAR          .777          .777          .777          .777          .777          .666
FIDSTKS        .774          .795          .715          .698          .715          .596
ELECTRON       .771          .765          .746          .734          .728          .697
INSURANC       .766          .8            .733          .733          .733          .633
COMODITY       .761          .785          .738          .619          .642          .571
FINANCE        .755          .777          .733          .688          .755          .722
REGBANKS       .75           .785          .607          .464          .535          .607
TRANSP         .75           .7            .6            .5            .55           .5
DOWJONES       .733          .666          .633          .4            .6            .466
BEVERAGE       .722          .777          .722          .666          .611          .666
SP-100         .709          .72           .645          .58           .677          .505
GAMING         .708          .666          .625          .625          .666          .625
GUNS           .705          .705          .647          .588          .588          .647
FOOD           .701          .736          .649          .561          .578          .526
GREEN          .695          .739          .695          .695          .695          .695
AUTO           .615          .692          .641          .692          .666          .641
HOSPITAL       .583          .583          .5            .583          .541          .416
BIGBANKS       .571          .714          .571          .571          1             .714
COAL           .571          .571          .571          .571          .714          .428
BIOTECH        .555          .589          .534          .542          .471          .447
RETAIL         .547          .509          .471          .528          .471          .471
OILGAS         .537          .565          .51           .42           .468          .337
EDU            .5            .5            .5            .5            .5            .5
|
====================================================================
2/4/2019 The
Peerless Buy B4 lifted nearly the entire market up
another day. Not only were there again 1000 more NYSE advancers
than decliners, but: 1) all our key internal strength indicators shown in the
DJI chart moved up again, 2) as did the Closing Powers for the key ETFs,
3) 73% of all 6000 stocks, indexes and ETFs are now above their 65-dma
and 4) not one of the 46 groupings of stocks we follow each night in Table 3
show a majority of their stocks below the 65-dma. As a result, we see
the DJI is breaking its last well-tested price-downtrendline; this should
set up an advance to 26000 and then the resistance around the all-time
high of 26828.39.
The market is setting up for a very good year before the
Presidential
Election. Since 1915, these have averaged rises of more than 15%,
nearly three times what other years average. The Fed Chairman's
new-found dovishness is part of the process or system that brings about
such good gains in this the third year of the four-year cycle. You will
be told that Profits are what drives the market now and you will be told
that the FED is scrupulously apolitical. "Don't you believe it!"
There
is far too much at stake. A booming economy is what Wall Street, Trump
and the FED want.
Powell's Conversion to "Dove" explains the 16%
"straight-up" recovery since December 24th. He
has kindled a growing wave of speculation. And if he
actually were to lower rates when +300,000/mo. new Jobs
are being created, he would throwing gasoline on the fire,
as was done in August 1927 by the Fed. Actually, just by
holding rates steady now at these low levels would be
quite bullish.
Discount Rate
1927-07-01 4.00%
1927-08-01 3.56%
1927-09-01 3.50%
1927-10-01 3.50%
1927-11-01 3.50%
1927-12-01 3.50%
1928-01-01 3.50%

![]()
Consider the Fed Chairman. Powell is a very successful
Washington lawyer, far more than a trained economist..
He did not get a net worth of $100,000,000 in DC
by fighting Republican Presidents and going against
trends. Trump and Wall Street have tamed him,
He may talk of independence, but don't believe him.
(He talks of this too much, as though he wants to convince
himself.)

The DJI's powerful V-formation does have a few precedents.
But except for the V-formation just after 9/11/2001, they
all occurred in much earlier times:
1) May 1942 - after the Battle of Midway.
2) End of 1949 - after Berlin Blockade had ended and Red Scare's Success
3) End of 1971 - Nixon's going off Gold Standard in August 1971 helped
stocks, as FDR's similar action in March 1932.
The Fed Funds rate was quickly lowered, too.
FED FUNDS RATE
1971-09-01 5.55
1971-10-01 5.20
1971-11-01 4.91
1971-12-01 4.14
1972-01-01 3.50
1972-02-01 3.29
1972-03-01 3.83
Three Earlier V-Bottoms
|
|
|
|
Charts 2/4/2019 2018 PEERLESS DJI, Signals, Indicators Daily DJI Volume 10-DayUp/Down Vol Hourly DJIA A/D Line for All Stocks Inverted Traders Index NASDAQ S&P OEX NYSE COMPQX DJI-15 DJI-20 DJI-30 DIA SPY QQQ MDY IWM TNA Short-Term Rates USO-CrudeOil DBO FAS GLD BBH IBB JETS JNUG KOL NUGT OIH OIL RSX RETL SDS AGQ SLV SOXL TECL TLT TMF TNA UGA (gasoline) XIV YINN Commodities: CANE CORN DBC JJC, NIB, CHOC CORN, CUT (paper) MOO, SOYB WEAT UUP (Dollar) LIT (Lithium) AAPL ADBE ALXN AMAT AMGN AMD AMZN BA BABA BAC BIDU CAT CVX DE FB GOOG GS HD IBM INTU JPM M (Macy's) MSFT NFLX NVDA QCOM TSLA TXN XOM WMT CMG , LRCX, SWKS, MDGL SPPI WATT SQ TOWN 2/4/19 (Click on Underlined link.) Bullish MAXCPs - http://tigersoft.com/MAXCPS/Feb-4/BULLISH.htm Bearish MAXCPs - http://tigersoft.com/MINCPs/Feb-4/BEARISH.htm |
Table 1 QUICKSILVER on ETFS - 2/4/19 ETF CLOSE CHANGE PIVOT-PT 5-dma AROC CL-PWR CANDLE IP21 ITRS --------------------------------------------------------------------------------------------- DIA 252.32 1.84 245.71 145.4% Bullish BLUE .396 ----- --------------------------------------------------------------------------------------------- BA 397 9.57 364.91 450.5% Bullish BLUE .252 .227 --------------------------------------------------------------------------------------------- SPY 271.96 1.9 263.41 153.6% Bullish BLUE .46 .001 --------------------------------------------------------------------------------------------- QQQ 169.53 2.08 161.57 194.3% Bullish BLUE .362 .036 --------------------------------------------------------------------------------------------- MDY 338.16 3.31 330.49 115.7% Bullish BLUE .419 -.001 --------------------------------------------------------------------------------------------- IWM 150.96 1.78 146.2 149.2% Bullish BLUE .422 .004 --------------------------------------------------------------------------------------------- FAS 59.6 .97 56.45 236.6% Bullish BLUE .477 -.022 --------------------------------------------------------------------------------------------- SOXL 111.81 1.66 97.86 455.5% Bullish BLUE .282 .218 --------------------------------------------------------------------------------------------- TECL 107.74 4.95 92.93 601.9% Bullish BLUE .399 .022 --------------------------------------------------------------------------------------------- IBB 110.24 -.03 107.47 137.2% Bullish RED .332 .063 --------------------------------------------------------------------------------------------- GLD 123.96 -.54 123.98 27% Bullish ---- .162 .062 --------------------------------------------------------------------------------------------- RSX 21.16 .04 20.69 140.8% Bullish ---- .408 -.004 |
Table 2    Count of Stocks in Key Directories
           2019-02-04
-------------------------------
NEWHIGHS       122
NEWLOWS        7
MAXCP          44
MINCP          1
TTTNH          24
TTTNL          7
FASTUP         97
FASTDOWN       31
CPCROSSA       107
CPCROSSD       8
BIGVOLUP       3
BIGVODN        4
ACCUMVER       42
HIGHIP21       147
HIUPPCT        6
VHIP21         18
LOWACCUM       210
REDSELL        53
AUGSELS7       7
TRAPDOOR       18
|
Table 3  RANKING OF KEY DIRECTORIES BASED PCT.OF STOCKS ABOVE 65-DMA
         2/4/19
 Bullish = 46
 Bearish = 0
---------------------------------------------------------------------------------------
Directory     Current       day-1         day-2         day-3         day-4         day-5
----------------------------------------------------------------------------------------
BONDFUND       1             1             1             .99           1             .99
GOLD           .96           .94           .96           .92           .9            .86
HOMEBLDG       .941          .941          .941          .882          .882          .764
ETFS           .896          .879          .913          .879          .81           .827
REIT           .892          .852          .892          .832          .798          .778
SOFTWARE       .857          .793          .793          .777          .746          .777
UTILITY        .825          .825          .825          .7            .675          .575
NIFTY          .824          .771          .754          .824          .754          .789
INDMATER       .82           .782          .756          .769          .705          .666
NASD-100       .82           .78           .76           .77           .67           .68
HACKERS        .818          .818          .772          .772          .681          .772
PIPELINE       .818          .818          .818          .863          .863          .818
MILITARY       .812          .718          .718          .75           .75           .625
INFRA          .805          .75           .722          .666          .666          .694
SEMI           .801          .801          .775          .775          .715          .767
INSURANC       .8            .733          .733          .733          .633          .666
FIDSTKS        .795          .715          .698          .715          .596          .591
SP500          .786          .747          .708          .714          .637          .608
COMODITY       .785          .738          .619          .642          .595          .547
REGBANKS       .785          .607          .464          .535          .642          .642
INDEXES        .779          .763          .763          .693          .591          .58
BEVERAGE       .777          .722          .666          .611          .666          .666
FINANCE        .777          .733          .688          .755          .722          .777
SOLAR          .777          .777          .777          .777          .666          .666
RUS-1000       .775          .723          .701          .694          .623          .61
COMPUTER       .772          .59           .636          .545          .5            .5
DJI-13         .769          .769          .692          .769          .615          .538
ELECTRON       .765          .746          .734          .728          .697          .716
CHEM           .759          .74           .703          .74           .703          .629
GREEN          .739          .695          .695          .695          .695          .695
FOOD           .736          .649          .561          .578          .543          .543
CHINA          .733          .766          .716          .683          .583          .633
SP-100         .72           .645          .58           .677          .505          .473
BIGBANKS       .714          .571          .571          1             .714          .714
GUNS           .705          .647          .588          .588          .647          .588
JETS           .7            .7            .6            .8            .7            .7
TRANSP         .7            .6            .5            .55           .5            .45
AUTO           .692          .641          .692          .666          .615          .641
DOWJONES       .666          .633          .4            .6            .466          .4
GAMING         .666          .625          .625          .666          .625          .708
BIOTECH        .586          .534          .542          .471          .444          .418
HOSPITAL       .583          .5            .583          .541          .416          .458
COAL           .571          .571          .571          .714          .428          .428
OILGAS         .565          .51           .42           .468          .337          .289
RETAIL         .509          .471          .528          .471          .471          .547
=============================================================================================
EDU            .5            .5            .5            .5            .333          .5
|
====================================================================
2/1/2019 The Buy B4 here, which is caused by intensely positive
breadth in January, has brought a median gain of +10.6 in 11 earlier
occurrences. If that size gain were to repeat here, we would soon see the DJI
reach 26953. It would be making a nominal new all-time high closing.
But should we be chasing the
DJI now and SPY and QQQ?
For one thing,
the Opening and Closing Powers are both rising. This means that there
is a strong tendency for these ETFs to open higher and the close still higher
than their opening. In other words, a sustained rally is usual. For another,
the number of new lows has greatly shrunk, as have the number of attractive
shorts amonth the bearish MINCPs. Thirdly, only Retailers as a group show
a majority of their stocks below the 65-dma. And fourthly, less than 30% of all
stocks and ETFs are below their 65-dma.
In addition, new research tonight now shows that straight-up recoveries after
the DJI has first fallen 18% or more, like we saw between October and
December, are apt to keep rising and not drop below their rising 21-dma
until the internal strength indicators turn negative or there some kind
of automatic Peerless Sell.
 |
 |
 |
New Research on Straight-Up
DJI Advances.
To date the DJI has risen 15% from its last low of December 24th
without pulling back and closing below its rising 21-dma. This is highly unusual,
but it has precedents and they may be studied for clues about what will happen
in our current case. Time permitted only studying the cases from 1929-1937
and from 1990-2018.
The first conclusion is that rallies of 15% "straight-up" (without a decline
below the 21-dma) are most common after the DJI has fallen 18% or more,
like the present case in which the DJI fell 18.6% from its October highs.
Secondly, the biggest straight-up gains occurred in these cases and where the
internal strength indicators were very positive and there were no Peerless Sell
Signals. These are shown in blue.
75% straight-up advance
6/12/1933
21% straight up advance
3/6/1991
22% straight up advance. 11/23/1998
30% straight up advance. 5/8/2009
An additional rally would
seem to be very likely from these cases as the straight-
up advance so far is only about 15%.
A Sample of DJI Straight-Up Advances of More than 14%
2/25/1929 22% advance. Multiple negative non-confirmations
with DJI 4.4% above 21-dma. P
=-2, IP21=-.02 V=-298. S9 and S12.
------------------------------------------------------------------------------------------
7/8/1929 18% advance. la/ma=1.072 P=+10, IP21=.013, V=-145.
Bear Mkt 9/6/1932 95%
advance. la/ma=1.090 P=+130, IP21=0, V=+492. S12
-----------------------------------------------------------------------------------------
Bear Mkt
6/12/1933 75% advance. la/ma=1.112
P=+208, IP21=.177,
V=+877. No Sell (S12) until soon reached a point up 90% from its low.
-----------------------------------------------------------------------------------------
5/27/1935
24% advance. la/ma=1.030 P=+69, IP21=.065, V=74.
No Sell and DJI kept rising after brief decline below 21-dma..
-----------------------------------------------------------------------------------------
9/11/1935 21% advance. la/ma=1.042 P=+44, IP21=.080, V=-19.
No Sell and DJI kept rising after brief decline below 21-dma. S2.
Decline to lower band.
------------------------------------------------------------------------------------------
11/18/1936
16% advance. la/ma=1.041 P=+70, IP21=.052, V=+95
No Sell. Decline to lower band.
-------------------------------------------------------------------------------------------
8/13/1937 15% advance. la/ma=1.024 P=-2, IP21=.042, V=-43
Sell s4, S8, S9. 40% bear mkt immediately followed.
==================================================
Bear
Mkt 3/6/1991 21%
advance. la/ma=1.029 P=263 IP21=.102
No Sell. DJI fell back 4% and then rose to new highs.
--------------------------------------------------------------------------------------------
7/31/1997
29% advance. la/ma=1.207
P=314. IP21=.117, V=+32
No Sell. DJI fell to lower band as soon as its closings' uptrendline
was broken.
--------------------------------------------------------------------------------------------
20%
Decline 11/23/1998 22% advance. la/ma=1.062 P=+258,
IP21=.078,
V=+52 No Sell. DJI fell to lower band and rebounded strongly..
-------------------------------------------------------------------------------------------
5/13/1999
15% advance. la/ma=1.028
P=+320, IP21=.07,
V=+35 No Sell. DJI fell to lower band.
-------------------------------------------------------------------------------------------
12/31/1999 14.8% advance.
la/ma=1.021 P=-130,
IP21=-.068,
V=-58 S9, S12. DJI fell 4%, rebounded to new high and
then dropped 17%,
-------------------------------------------------------------------------------------------
Bear Mkt 5/21/2001 20%
advance. la/ma=1.041 P=+410, IP21=.151, V=78.
Sell S4. DJI dropped 27.5% in four
months.
-------------------------------------------------------------------------------------------
Bear Mkt
5/8/2009 30% advance.
la/ma=1.053 P=+675, IP21=.077, V=219.
No Sell. DJI rose another 5%.
-------------------------------------------------------------------------------------------
4/19/2016 15.5% advance. la/ma=1.02
P=+317, IP21=.086, V=+17
Sell S2 DJI fell back to lower band.
---------------------------------------------------------------------------------------------
1/29/2018 14.2% advance. la/ma=1.04
P=+232, IP21=.169,
V=+44 Sell S9* DJI fell back 11%.
---------------------------------------------------------------------------------------------
Current Case:
18% Decline
2/1/2019 15% advance.
la/ma=1.034 P=+726, IP21=.202,
V=+141 No Sell. outcome?
==========================================================================
|
Charts 2/1/2019 2018 PEERLESS DJI, Signals, Indicators Daily DJI Volume 10-DayUp/Down Vol Hourly DJIA A/D Line for All Stocks Inverted Traders Index NASDAQ S&P OEX NYSE COMPQX DJI-15 DJI-20 DJI-30 DIA SPY QQQ MDY IWM TNA Short-Term Rates USO-CrudeOil DBO FAS GLD BBH IBB JETS JNUG KOL NUGT OIH OIL RSX RETL SDS AGQ SLV SOXL TECL TLT TMF TNA UGA (gasoline) XIV YINN Commodities: CANE CORN DBC JJC, NIB, CHOC CORN, CUT (paper) MOO, SOYB WEAT UUP (Dollar) LIT (Lithium) AAPL ADBE ALXN AMAT AMGN AMD AMZN BA BABA BAC BIDU CAT CVX DE FB GOOG GS HD IBM INTU JPM M (Macy's) MSFT NFLX NVDA QCOM TSLA TXN XOM WMT CMG , LRCX, SWKS, MDGL SPPI WATT SQ TOWN 2/1/19 (Click on Underlined link.) Bullish MAXCPs - http://tigersoft.com/MAXCPS/Feb-1/BULLISH.htm Bearish MAXCPs - http://tigersoft.com/MINCPs/Feb-1/BEARISH.htm |
Table 1 QUICKSILVER on ETFS - 2/1/19 ETF CLOSE CHANGE PIVOT-PT 5-dma AROC CL-PWR CANDLE IP21 ITRS --------------------------------------------------------------------------------------------- DIA 250.48 .36 245.1 62.4% Bullish RED .277 ---- --------------------------------------------------------------------------------------------- BA 387.43 1.81 362.97 311.3% Bullish BLUE .16 .167 --------------------------------------------------------------------------------------------- SPY 270.06 .13 263.76 80.4% Bullish RED .354 .001 --------------------------------------------------------------------------------------------- QQQ 167.45 -.71 163.11 69.8% Bullish BLUE .245 .014 --------------------------------------------------------------------------------------------- MDY 334.85 1.06 330.47 58.2% Bullish ---- .324 0 --------------------------------------------------------------------------------------------- IWM 149.18 .12 146.55 62.4% Bullish RED .341 -.004 --------------------------------------------------------------------------------------------- FAS 58.63 .93 56.88 132.9% Bullish BLUE .365 -.032 --------------------------------------------------------------------------------------------- RETL 27.86 -.68 29.31 -283.3% Bullish RED .372 -.19 --------------------------------------------------------------------------------------------- SOXL 110.15 3.72 102.28 58.9% Bullish BLUE .165 .083 --------------------------------------------------------------------------------------------- TECL 102.79 1.87 95.85 142.5% Bullish BLUE .237 -.114 --------------------------------------------------------------------------------------------- IBB 110.27 .58 107.26 38.3% Bullish BLUE .214 .064 --------------------------------------------------------------------------------------------- GLD 124.5 -.25 123.29 66.2% Bullish RED .243 .091 --------------------------------------------------------------------------------------------- OIH 17.22 .35 16.78 5.9% Bullish BLUE .285 -.094 --------------------------------------------------------------------------------------------- RSX 21.12 -.11 20.57 91% Bullish ---- .423 .019 |
Table 2    Count of Stocks in Key Directories
           2019-02-01
-------------------------------
NEWHIGHS       89
NEWLOWS        11
MAXCP          25
MINCP          4
TTTNH          20
TTTNL          9
FASTUP         79
FASTDOWN       37
CPCROSSA       62
CPCROSSD       24
BIGVOLUP       4
BIGVODN        14
ACCUMVER       91
HIGHIP21       78
HIUPPCT        6
VHIP21         17
LOWACCUM       223
REDSELL        56
AUGSELS7       4
TRAPDOOR       17
|
Table 3   RANKING OF KEY DIRECTORIES BASED PCT.OF STOCKS ABOVE 65-DMA
          2/1/19
Bullish=42
Bearish= 1 Retail
---------------------------------------------------------------------------------------
Directory     Current       day-1         day-2         day-3         day-4         day-5
----------------------------------------------------------------------------------------
BONDFUND       1             1             .99           1             .99           .99
HOMEBLDG       .941          .941          .882          .882          .764          .764
GOLD           .94           .96           .92           .9            .86           .86
ETFS           .879          .913          .879          .81           .827          .862
REIT           .83           .869          .81           .777          .751          .699
UTILITY        .825          .825          .7            .675          .6            .65
HACKERS        .818          .772          .772          .681          .772          .772
PIPELINE       .818          .818          .863          .863          .818          .863
SEMI           .801          .775          .775          .715          .767          .784
SOFTWARE       .793          .793          .777          .746          .793          .809
INDMATER       .782          .756          .769          .705          .666          .679
NASD-100       .78           .76           .77           .67           .68           .71
SOLAR          .777          .777          .777          .666          .666          .722
NIFTY          .771          .754          .824          .754          .789          .807
DJI-13         .769          .692          .769          .615          .538          .692
CHINA          .766          .716          .683          .583          .633          .633
INDEXES        .763          .763          .693          .591          .559          .634
INFRA          .75           .722          .666          .666          .694          .666
SP500          .747          .708          .714          .637          .604          .651
ELECTRON       .746          .734          .728          .697          .716          .728
CHEM           .74           .703          .74           .703          .648          .592
COMODITY       .738          .619          .642          .595          .547          .571
FINANCE        .733          .688          .755          .722          .755          .811
INSURANC       .733          .733          .733          .633          .666          .666
RUS-1000       .726          .704          .696          .624          .609          .642
BEVERAGE       .722          .666          .611          .666          .666          .666
MILITARY       .718          .718          .75           .75           .593          .625
FIDSTKS        .715          .698          .715          .596          .591          .645
JETS           .7            .6            .8            .7            .7            .5
GREEN          .695          .695          .695          .695          .695          .695
FOOD           .649          .561          .578          .543          .543          .526
GUNS           .647          .588          .588          .647          .588          .588
SP-100         .645          .58           .677          .505          .462          .569
AUTO           .641          .692          .666          .615          .666          .692
DOWJONES       .633          .4            .6            .466          .4            .533
GAMING         .625          .625          .666          .625          .708          .708
REGBANKS       .607          .464          .535          .642          .642          .714
TRANSP         .6            .5            .55           .5            .45           .4
COMPUTER       .59           .636          .545          .5            .5            .5
BIGBANKS       .571          .571          1             .714          .571          .857
COAL           .571          .571          .714          .428          .428          .428
BIOTECH        .531          .542          .471          .444          .413          .465
------------------------------------------------------------------------------------------------
EDU            .5            .5            .5            .333          .5            .5
HOSPITAL       .5            .583          .541          .416          .458          .541
OILGAS         .5            .413          .46           .333          .28           .38
------------------------------------------------------------------------------------------------
RETAIL         .471          .528          .471          .471          .547          .49
|
====================================================================
1/31/2019 The superb January breadth and
intense Accumulation
have brought a special Buy B4. As the average past gain with these
January intense-accumulation B4s is more than +16% and their median
gain is more than +10%, a typical takeoff in the present cricumstances
should take the DJI back to at least 26740, based on adding 10%
to 24370 (the DJI's level at the time of the Buy B4 on 1/17). This would
amount
a rise back to a point just 88 points shy of the DJI peak on 10/3/2018,
26828.39.
We will closely watch the NYSE volume. It should rise now as the DJI
advances. I would expect breadth to remain strong. Today there were 1104
more up than down on the NYSE and NYSE volume rose from 839,863,015
shares to 1,383,877,519. The rise in NYSE trading volume was matched
elsewhere. See...
http://www.wsj.com/mdc/public/page/2_3021-tradingdiary2.html
| 1,383,877,519 | 839,863,015 |
The completed inverted completed head and shoulders pattern in the
DJIA, NASDAQ, SPY and QQQ set up targets that should yield prices
reaching new highs based on height of the previous pattern added to
the point of breakout.
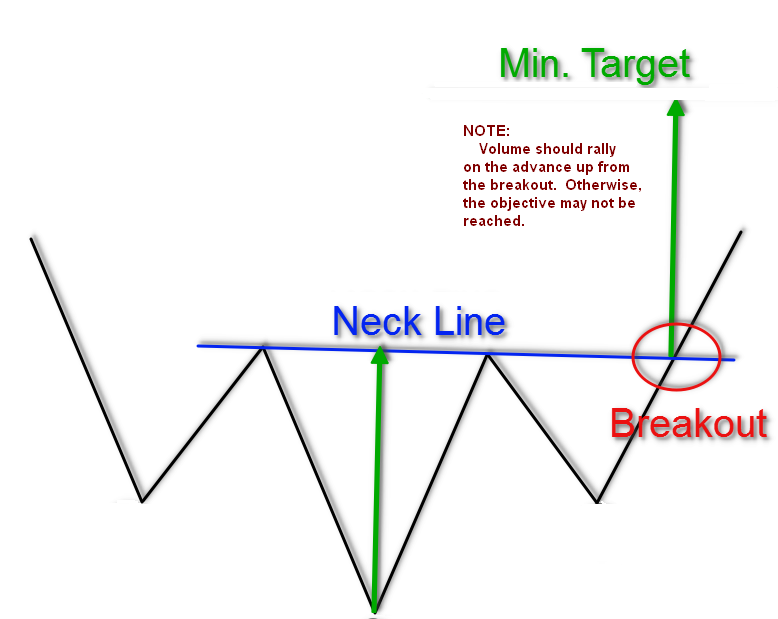

 |
 |
 |
 |
|
Charts 1/31/2019 2018 PEERLESS DJI, Signals, Indicators Daily DJI Volume 10-DayUp/Down Vol Hourly DJIA A/D Line for All Stocks Inverted Traders Index NASDAQ S&P OEX NYSE COMPQX DJI-15 DJI-20 DJI-30 DIA SPY QQQ MDY IWM TNA Short-Term Rates USO-CrudeOil DBO FAS GLD BBH IBB JETS JNUG KOL NUGT OIH OIL RSX RETL SDS AGQ SLV SOXL TECL TLT TMF TNA UGA (gasoline) XIV YINN Commodities: CANE CORN DBC JJC, NIB, CHOC CORN, CUT (paper) MOO, SOYB WEAT UUP (Dollar) LIT (Lithium) AAPL ADBE ALXN AMAT AMGN AMD AMZN BA BABA BAC BIDU CAT CVX DE FB GOOG GS HD IBM INTU JPM M (Macy's) MSFT NFLX NVDA QCOM TSLA TXN XOM WMT CMG , LRCX, SWKS, MDGL SPPI WATT SQ TOWN 1/31/19 (Click on Underlined link.) Bullish MAXCPs - http://tigersoft.com/MAXCPS/Jan-31/BULLISH.htm Bearish MAXCPs - http://tigersoft.com/MINCPs/Jan-31/BEARISH.htm |
Table 1 QUICKSILVER on ETFS - 1/31/19 ETF CLOSE CHANGE PIVOT-PT 5-dma AROC CL-PWR CANDLE IP21 ITRS --------------------------------------------------------------------------------------------- DIA 250.12 -.06 247.39 94.2% Bullish BLUE .329 ---- --------------------------------------------------------------------------------------------- BA 385.62 -2.1 364.2 372% Bullish RED .216 .141 --------------------------------------------------------------------------------------------- SPY 269.93 2.35 265.78 120.5% Bullish BLUE .391 .001 --------------------------------------------------------------------------------------------- QQQ 168.16 2.48 165.15 151.5% Bullish BLUE .293 .013 --------------------------------------------------------------------------------------------- MDY 333.79 1.22 330.99 98.2% Bullish BLUE .341 -.005 --------------------------------------------------------------------------------------------- IWM 149.06 1.26 147.34 122.4% Bullish BLUE .37 -.004 --------------------------------------------------------------------------------------------- FAS 57.7 -.05 57.11 195.6% Bullish BLUE .388 -.045 --------------------------------------------------------------------------------------------- RETL 28.54 .15 29.49 62.7% Bullish BLUE .402 -.206 --------------------------------------------------------------------------------------------- SOXL 106.43 .08 108.92 195.5% Bullish BLUE .175 .008 --------------------------------------------------------------------------------------------- TECL 100.92 -.45 99.99 257.7% Bullish BLUE .256 -.135 --------------------------------------------------------------------------------------------- IBB 109.69 1.49 109.44 87.9% Bullish BLUE .217 .065 --------------------------------------------------------------------------------------------- GLD 124.75 .06 122.86 148.6% Bullish RED .286 .099 --------------------------------------------------------------------------------------------- OIH 16.87 -.23 17.2 59.2% Bullish RED .315 -.108 --------------------------------------------------------------------------------------------- GASL 7.77 -.67 8.04 119.8% ------- RED .354 -.335 --------------------------------------------------------------------------------------------- RSX 21.23 .08 20.74 137.3% Bullish BLUE .463 .019 |
Table 3   Count of Stocks in Key Directories
          2019-01-31
-------------------------------
NEWHIGHS       129
NEWLOWS        7
MAXCP          48
MINCP          3
TTTNH          36
TTTNL          11
FASTUP         129
FASTDOWN       38
CPCROSSA       114
CPCROSSD       6
BIGVOLUP       5
BIGVODN        9
ACCUMVER       83
HIGHIP21       100
HIUPPCT        6
VHIP21         16
LOWACCUM       242
REDSELL        58
AUGSELS7       1
TRAPDOOR       17
|
RANKING OF KEY DIRECTORIES BASED PCT.OF STOCKS ABOVE 65-DMA 1/31/19 --------------------------------------------------------------------------------------- Directory Current day-1 day-2 day-3 day-4 day-5 ---------------------------------------------------------------------------------------- BONDFUND 1 .99 1 .99 .99 .98 GOLD .96 .92 .9 .86 .86 .7 HOMEBLDG .941 .882 .882 .764 .823 .764 ETFS .913 .879 .81 .827 .862 .741 REIT .892 .832 .798 .771 .718 .637 UTILITY .825 .7 .675 .6 .65 .8 PIPELINE .818 .863 .863 .818 .772 .772 SOFTWARE .793 .777 .746 .793 .809 .746 SOLAR .777 .777 .666 .666 .722 .722 SEMI .775 .775 .715 .767 .775 .689 HACKERS .772 .772 .681 .772 .772 .636 NASD-100 .76 .77 .67 .68 .71 .65 INDEXES .758 .693 .591 .559 .629 .521 INDMATER .756 .769 .705 .666 .692 .525 NIFTY .754 .824 .754 .789 .807 .754 ELECTRON .734 .728 .697 .716 .728 .66 INSURANC .733 .733 .633 .666 .666 .7 INFRA .722 .666 .666 .694 .694 .527 MILITARY .718 .75 .75 .593 .625 .593 CHINA .716 .683 .583 .633 .633 .583 SP500 .708 .714 .637 .604 .649 .556 CHEM .703 .74 .703 .648 .629 .462 RUS-1000 .701 .694 .623 .609 .641 .552 FIDSTKS .698 .715 .596 .591 .645 .575 GREEN .695 .695 .695 .695 .695 .652 AUTO .692 .666 .615 .666 .692 .589 DJI-13 .692 .769 .615 .538 .692 .615 FINANCE .688 .755 .722 .755 .822 .733 BEVERAGE .666 .611 .666 .666 .666 .666 COMPUTER .636 .545 .5 .5 .5 .409 GAMING .625 .666 .625 .708 .708 .666 COMODITY .619 .642 .595 .547 .571 .547 JETS .6 .8 .7 .7 .5 .6 GUNS .588 .588 .647 .588 .588 .47 HOSPITAL .583 .541 .416 .458 .541 .5 SP-100 .58 .677 .505 .462 .569 .505 BIGBANKS .571 1 .714 .571 .857 .571 COAL .571 .714 .428 .428 .428 .285 FOOD .561 .578 .543 .543 .526 .543 BIOTECH .539 .471 .444 .413 .463 .431 RETAIL .528 .471 .471 .547 .509 .433 EDU .5 .5 .333 .5 .5 .5 TRANSP .5 .55 .5 .45 .35 .4 REGBANKS .464 .535 .642 .642 .678 .607 OILGAS .417 .465 .335 .28 .349 .26 DOWJONES .4 .6 .466 .4 .533 .533 BIG17 .391 .347 .282 .347 .369 .326 |
====================================================================
1/30/2019
The DJI's
65-dma finally turned up today. That
clinches the January "intense Breadth" Buy B4. The average
gain after one of these is +16.5%
at the time of the next Peerless
Sell signal. The median gain is +10.6%.
The DJI has done what it was supposed to. Now only the OEX still
shows a falling 65-dma.
Another technical feature of the market is the DJI's remarkably high
current Accumulation (IP21). A few days ago it reached +.266.
We can also use this indicator to get a sense of the potential
power of the move ahead. Since 1950, there have been five other
occurrences in January and February when the IP21 rose above
+.25. They are shown below. They sure may the market look
like it has experienced a very good Janaury take-off.
2/21/1986 .292 DJI rose until early July.
2/6/1991 .293 DJI rose until June 3.
2/6/1996 .254 DJI rose until May 3
1/20/2012 .252 DJI rose until April 3.
1/22/2013 .263 DJI rose until May 28.
But we can't sit back and relax. If the A/D Line and the
IP21 break their 21-day moving averages, the odds of a
retreat by the DJI to the lower band would be high. The
drop by the IP21 back below its 21-day ma would likely
bring a Peerless S4.
That we should not relax is also show by the fact that
at the end of World War II, there were three cases when
a very high IP21 in January and February brought a
6% to 10% sell-off in the DJI.
As long as the FED does not reverse course and start
talking about raising short term rates of quickening the
pace at which it sells off its "toxic assets", I would think
the DJI should now be able to advance to 26000 without
to much difficulty.
https://www.nytimes.com/2019/01/30/us/politics/fed-interest-rate.html?emc=edit_th_190131&nl=todaysheadlines&nlid=582238940131
 |
|
Charts 1/30/2019 2018 PEERLESS DJI, Signals, Indicators Daily DJI Volume 10-DayUp/Down Vol Hourly DJIA A/D Line for All Stocks Inverted Traders Index NASDAQ S&P OEX NYSE COMPQX DJI-15 DJI-20 DJI-30 DIA SPY QQQ MDY IWM TNA Short-Term Rates USO-CrudeOil DBO FAS GLD BBH IBB JETS JNUG KOL NUGT OIH OIL RSX RETL SDS AGQ SLV SOXL TECL TLT TMF TNA UGA (gasoline) XIV YINN Commodities: CANE CORN DBC JJC, NIB, CHOC CORN, CUT (paper) MOO, SOYB WEAT UUP (Dollar) LIT (Lithium) AAPL ADBE ALXN AMAT AMGN AMD AMZN BA BABA BAC BIDU CAT CVX DE FB GOOG GS HD IBM INTU JPM M (Macy's) MSFT NFLX NVDA QCOM TSLA TXN XOM WMT CMG , LRCX, SWKS, MDGL SPPI WATT SQ TOWN 1/30/19 (Click on Underlined link.) Bullish MAXCPs - http://tigersoft.com/MAXCPS/Jan-30/BULLISH.htm Bearish MAXCPs - http://tigersoft.com/MINCPs/Jan-30/BEARISH.htm |
Table 1 QUICKSILVER on ETFS - 1/30/19 ETF CLOSE CHANGE PIVOT-PT 5-dma AROC CL-PWR CANDLE IP21 ITRS --------------------------------------------------------------------------------------------- DIA 250.18 4.47 245.47 90.7% Bullish BLUE .34 ----- --------------------------------------------------------------------------------------------- BA 387.72 22.81 358.27 402.3% Bullish BLUE .245 .128 --------------------------------------------------------------------------------------------- SPY 267.58 4.17 263.55 79% Bullish BLUE .405 -.007 --------------------------------------------------------------------------------------------- QQQ 165.68 4.11 163.2 108.3% Bullish BLUE .296 .006 --------------------------------------------------------------------------------------------- MDY 332.57 2.08 327.3 112.7% Bullish BLUE .407 -.006 --------------------------------------------------------------------------------------------- IWM 147.8 1.6 145.47 109.6% Bullish BLUE .379 -.008 --------------------------------------------------------------------------------------------- FAS 57.75 1.3 55.48 244.7% Bullish BLUE .401 -.023 --------------------------------------------------------------------------------------------- RETL 28.39 .3 28.18 89.2% Bullish RED .398 -.237 --------------------------------------------------------------------------------------------- SOXL 106.35 8.49 102.38 948.1% Bullish BLUE .176 .099 --------------------------------------------------------------------------------------------- TECL 101.37 8.44 95.91 412% Bullish BLUE .282 -.077 --------------------------------------------------------------------------------------------- IBB 108.2 .73 107.79 18.1% Bullish BLUE .191 .065 --------------------------------------------------------------------------------------------- GLD 124.69 .71 121.09 139.2% Bullish BLUE .361 .091 --------------------------------------------------------------------------------------------- OIH 17.1 .36 16.67 217.9% Bullish BLUE .34 -.09 --------------------------------------------------------------------------------------------- GASL 8.44 .56 7.58 686.7% ------- BLUE .395 -.272 --------------------------------------------------------------------------------------------- UGA 8.44 .56 7.58 686.7% ------- BLUE .376 -.672 --------------------------------------------------------------------------------------------- RSX 21.15 .46 20.66 128.3% Bullish BLUE .415 .026 |
 Table 3:   Count of Stocks in Key Directories
            2019-01-30
-------------------------------
NEWHIGHS       94
NEWLOWS        7
MAXCP          30
MINCP          4
TTTNH          16
TTTNL          16
FASTUP         110
FASTDOWN       44
CPCROSSA       115
CPCROSSD       9
BIGVOLUP       4
BIGVODN        15
ACCUMVER       60
HIGHIP21       95
HIUPPCT        6
VHIP21         15
LOWACCUM       232
REDSELL        60
AUGSELS7       5
TRAPDOOR       16
|
 Table 3   RANKING OF KEY DIRECTORIES BASED PCT.OF STOCKS ABOVE 65-DMA
              1/30/19
 Bullish = 42
 Bearish = 4
---------------------------------------------------------------------------------------
Directory     Current       day-1         day-2         day-3         day-4         day-5
----------------------------------------------------------------------------------------
BIGBANKS       1             .714          .571          .857          .571          .571
BONDFUND       .99           1             .99           .99           .98           .98
GOLD           .92           .9            .86           .86           .7            .66
HOMEBLDG       .882          .882          .764          .823          .764          .647
ETFS           .879          .81           .827          .862          .724          .689
PIPELINE       .863          .863          .818          .772          .772          .772
REIT           .832          .798          .771          .718          .637          .597
NIFTY          .824          .754          .789          .807          .736          .578
JETS           .8            .7            .7            .5            .6            .4
SOFTWARE       .777          .746          .793          .809          .746          .73
SOLAR          .777          .666          .666          .722          .722          .611
_____
SEMI           .775          .715          .767          .775          .681          .508
HACKERS        .772          .681          .772          .772          .636          .545
NASD-100       .77           .67           .68           .71           .63           .6
DJI-13         .769          .615          .538          .692          .615          .538
INDMATER       .769          .705          .666          .692          .525          .474
FINANCE        .755          .722          .755          .822          .722          .644
MILITARY       .75           .75           .593          .625          .562          .343
CHEM           .74           .703          .648          .629          .462          .388
INSURANC       .733          .633          .666          .666          .7            .766
ELECTRON       .728          .697          .716          .728          .66           .5
FIDSTKS        .715          .596          .591          .645          .564          .543
COAL           .714          .428          .428          .428          .285          .285
SP500          .714          .637          .604          .649          .547          .525
UTILITY        .7            .675          .6            .65           .8            .7
GREEN          .695          .695          .695          .695          .652          .695
RUS-1000       .694          .623          .609          .641          .547          .514
INDEXES        .688          .591          .559          .629          .505          .403
CHINA          .683          .583          .633          .633          .6            .533
SP-100         .677          .505          .462          .569          .505          .548
AUTO           .666          .615          .666          .692          .564          .641
GAMING         .666          .625          .708          .708          .666          .666
INFRA          .666          .666          .694          .694          .527          .416
COMODITY       .642          .595          .547          .571          .523          .452
BEVERAGE       .611          .666          .666          .666          .666          .722
DOWJONES       .6            .466          .4            .533          .533          .6
________
GUNS           .588          .647          .588          .588          .47           .411
FOOD           .578          .543          .543          .526          .526          .473
TRANSP         .55           .5            .45           .35           .4            .25
COMPUTER       .545          .5            .5            .5            .409          .363
HOSPITAL       .541          .416          .458          .541          .5            .5
REGBANKS       .535          .642          .642          .678          .607          .678
===========================================================================================
EDU            .5            .333          .5            .5            .5            .333
===========================================================================================
RETAIL         .471          .471          .547          .509          .415          .433
BIOTECH        .468          .444          .413          .463          .407          .402
OILGAS         .465          .335          .28           .349          .26           .239
BIG17          .347          .282          .347          .369          .326          .369
|
====================================================================
====================================================================
1/29/2019
The operative
Peerless signal is an "unclinched" Buy B4.
The Buy B4 refers to the intense bulge in positive breadth
in January. Its track record is quite bullish and solid.
But the still falling 65-day
ma makes this case different than
past cases of this signal and shows that there is still resistance
overhead. It is in this sense, that the Buy B4 is not clinched.

Until the DJI gets above 25000, the recovery will be less than
50% from what was lost between early October and December
24th AND so cannot be quite trusted, especially as we see
that the NASDAQ, SP-500, QQQ and IWM are not decisively
above their own falling 65-d mvg.averages.
So, hedging with some our Bearish MINCPs seems reasonable,
especially since I don't think we can quite trust Fed Chairman
Powell's new found "dovishness". Note that he will be holding
another Press Conference tomorrow. This one will be without the
help of ex-Chairmen Yellen and Bernanke. The last one where
Powell was alone was in December. It brought a particularly
sharp sell-off in the DJIA.
On January 18th I wrote the following:
"Still, staying short now does not seem
reasonable. I suspect that there are
lots of buyers who "want in" for a January rally. So, Buy DIA on
weakness
on a successful test of the 65-dma. Hold long IBB and some of the bullish
MAXCP semi-conductors and biotechs. There have been 11 of these
January Breadth surges once the IP21 was positive. All proved profitable.
But, a warning is still necessary. None of these Buy B4s occurred with the
DJI still more than 2 percent below its close 65-days earlier.
"History of new January "intensely
positive Breadth" Buy B4s
Gain<1>
65-day Pct Change at time of B4
(A positive number here means the
65-dma is rising)
<1> At time of next Peerless sell.
-----------------------------------------
1/16/34 +.071 .046
1/14/36 +.068 .124
1/9/51 +.064 .063
1/22/54 +.414 .068
1/24/58 +.442 .065
But first DJI did drop from 451 to 437.
1/20/67 +.032 .087
1/18/71 +.106 .111
1/15/75 +.324
-.008
1/6/76 +.133 .118
1/13/85 +.015 .043
1/23/87 +.145 .151
--------------------------------
Avg = +16.5% Median = 10.6%
1/17/2019
?
-.039
Gold and Reits were strong today, as expected. I think that bodes
well for the FED's not raising rates for a few months. That should
allow the DJI to rise to 25000, pause and then go still higher once the
key indexes, shown below, get decisively above their RISING
65-dma.
 |
 |
 |
 |
|
Charts 1/29/2019 2018 PEERLESS DJI, Signals, Indicators Daily DJI Volume 10-DayUp/Down Vol Hourly DJIA A/D Line for All Stocks Inverted Traders Index NASDAQ S&P OEX NYSE COMPQX DJI-15 DJI-20 DJI-30 DIA SPY QQQ MDY IWM TNA Short-Term Rates USO-CrudeOil DBO FAS GLD BBH IBB JETS JNUG KOL NUGT OIH OIL RSX RETL SDS AGQ SLV SOXL TECL TLT TMF TNA UGA (gasoline) XIV YINN Commodities: CANE CORN DBC JJC, NIB, CHOC CORN, CUT (paper) MOO, SOYB WEAT UUP (Dollar) LIT (Lithium) AAPL ADBE ALXN AMAT AMGN AMD AMZN BA BABA BAC BIDU CAT CVX DE FB GOOG GS HD IBM INTU JPM M (Macy's) MSFT NFLX NVDA QCOM TSLA TXN XOM WMT CMG , LRCX, SWKS, MDGL SPPI WATT SQ TOWN 1/29/19 (Click on Underlined link.) Bullish MAXCPs - http://tigersoft.com/MAXCPS/Jan-29/BULLISH.htm Bearish MAXCPs - http://tigersoft.com/MINCPs/Jan-29/BEARISH.htm |
Table 1 QUICKSILVER on ETFS - 1/29/19 ETF CLOSE CHANGE PIVOT-PT 5-dma AROC CL-PWR CANDLE IP21 ITRS --------------------------------------------------------------------------------------------- DIA 245.71 .61 245.72 34.8% Bullish BLUE .256 ----- --------------------------------------------------------------------------------------------- BA 364.91 1.94 358.61 97.3% Bullish BLUE .2 .073 --------------------------------------------------------------------------------------------- SPY 263.41 -.35 263.41 10.4% Bullish RED .335 -.003 --------------------------------------------------------------------------------------------- QQQ 161.57 -1.54 162.15 -11.3% Bullish RED .228 0 --------------------------------------------------------------------------------------------- MDY 330.49 .02 325.16 73.3% Bullish RED .329 .008 --------------------------------------------------------------------------------------------- IWM 146.2 -.35 144.6 41.2% Bullish RED .326 0 --------------------------------------------------------------------------------------------- FAS 56.45 -.43 55 141.4% Bullish RED .342 -.048 --------------------------------------------------------------------------------------------- RETL 28.09 -1.22 27.88 52.6% Bullish RED .371 -.25 --------------------------------------------------------------------------------------------- SOXL 97.86 -4.42 87.43 437% Bullish RED .126 .049 --------------------------------------------------------------------------------------------- TECL 92.93 -2.92 93.49 23% Bullish RED .207 -.159 --------------------------------------------------------------------------------------------- IBB 107.47 .21 107.81 -57.8% Bullish BLUE .117 .062 --------------------------------------------------------------------------------------------- GLD 123.98 .69 121.28 103.7% Bullish BLUE .375 .119 --------------------------------------------------------------------------------------------- OIH 16.74 -.04 16.37 17.9% Bullish RED .299 -.078 --------------------------------------------------------------------------------------------- RSX 20.69 .12 20.62 102.1% Bullish BLUE .379 .051 |
 Table 2   Count of Stocks in Key Directories
           2019-01-29
-------------------------------
NEWHIGHS       73
NEWLOWS        6
MAXCP          13
MINCP          3
TTTNH          11
TTTNL          16
FASTUP         77
FASTDOWN       61
CPCROSSA       55
CPCROSSD       17
BIGVOLUP       3
BIGVODN        9
ACCUMVER       89
HIGHIP21       47
HIUPPCT        6
VHIP21         15
LOWACCUM       219
REDSELL        63
AUGSELS7       7
TRAPDOOR       15
|
 Table 3  RANKING OF KEY DIRECTORIES BASED PCT.OF STOCKS ABOVE 65-DMA
          1/29/19
 Bullish = 37
 Bearish = 8
---------------------------------------------------------------------------------------
Directory     Current       day-1         day-2         day-3         day-4         day-5
----------------------------------------------------------------------------------------
BONDFUND       1             .99           .99           .98           .98           .98
GOLD           .9            .86           .86           .7            .66           .66
HOMEBLDG       .882          .764          .823          .764          .647          .705
PIPELINE       .863          .818          .772          .772          .772          .727
ETFS           .81           .827          .862          .724          .689          .62
REIT           .798          .771          .718          .637          .597          .577
NIFTY          .754          .789          .807          .736          .578          .578
MILITARY       .75           .593          .625          .562          .343          .343
SOFTWARE       .746          .793          .809          .746          .714          .73
FINANCE        .722          .755          .822          .722          .633          .655
SEMI           .715          .767          .775          .681          .508          .525
BIGBANKS       .714          .571          .857          .571          .571          .571
INDMATER       .705          .666          .692          .525          .448          .538
CHEM           .703          .648          .629          .462          .351          .555
JETS           .7            .7            .5            .6            .4            .6
ELECTRON       .697          .716          .728          .66           .493          .518
GREEN          .695          .695          .695          .652          .695          .695
HACKERS        .681          .772          .772          .636          .545          .545
UTILITY        .675          .6            .65           .8            .7            .575
NASD-100       .67           .68           .71           .63           .59           .58
BEVERAGE       .666          .666          .666          .666          .722          .611
INFRA          .666          .694          .694          .527          .416          .555
SOLAR          .666          .666          .722          .722          .611          .555
GUNS           .647          .588          .588          .47           .411          .47
REGBANKS       .642          .642          .678          .607          .678          .714
SP500          .637          .604          .649          .547          .517          .527
INSURANC       .633          .666          .666          .7            .766          .6
GAMING         .625          .708          .708          .666          .666          .666
RUS-1000       .623          .609          .641          .547          .509          .529
AUTO           .615          .666          .692          .564          .641          .692
DJI-13         .615          .538          .692          .615          .538          .538
FIDSTKS        .596          .591          .645          .564          .537          .51
COMODITY       .595          .547          .571          .523          .428          .428
INDEXES        .591          .559          .629          .505          .392          .413
CHINA          .583          .633          .633          .6            .533          .5
FOOD           .543          .543          .526          .526          .456          .456
SP-100         .505          .462          .569          .505          .548          .473
============================================================================================
COMPUTER       .5            .5            .5            .409          .363          .318
TRANSP         .5            .45           .35           .4            .2            .35
============================================================================================
RETAIL         .471          .547          .509          .415          .433          .433
DOWJONES       .466          .4            .533          .533          .6            .466
BIOTECH        .442          .413          .463          .407          .394          .413
COAL           .428          .428          .428          .285          .285          .285
HOSPITAL       .416          .458          .541          .5            .458          .416
OILGAS .335 .28 .349 .26 .226 .239 EDU .333 .5 .5 .5 .333 .333 BIG17 .282 .347 .369 .326 .369 .391 |
====================================================================
====================================================================
1/28/2019
Today's decline seems like another
short-lived Monday sell-off
in that breadth was very good. There were only 277 more
NYSE decliners than advancer and much of the DJI's 200-point
sell-off owed to Caterpillar's 12 1/2 point loss. Big buyers
would not let the DJI stay down at its lows. REITs and BONDs
were strong today, showing optimism that Fed Chairman Powell
will not suddenly turn hawkish when he holds a new conference
on Wednesday. Gold will benefit from any "dovish" statements
coming out of the FED.
REITS are defensive, but they also rise when
their yields look attractive because their rates are
expected to remain competitive.

Gold stocks do tend
to rise when there are growing
inflationary signs which the FED will usually try to stamp
out. And that will usually eventually bring a stock market decline.
For that reason, a breakout now by Gold should not be
considered bullish.

We are in a "holding pattern". The DJI's 65-dma has not turned
|
up yet and there still is considerable resistance up to 25000.
I've suggested patient hedging in here with some bearish MINCPs
shorts while holding long some of the strongest semi-coinductors
and other MAXCPs. SOXL should still be held, despite today's
decline. It is more than 8 points over its 65-dma and in that is "
stronger than the DJI, the SPY and QQQ which are sitting almost
exactly on their 65-dma, waiting to decide which way to move.
Seasonality, good breadth, high Accumulation and rising
Closing Powers make me think the intensely positive January
Buy B4 will win out. But traders are worried that any ill-chosen
words by Powell may cause another sell-off. Moreover, resistance
will likely be heavy until the DJI can get past 25000.
|
Charts 1/28/2019 2018 PEERLESS DJI, Signals, Indicators Daily DJI Volume 10-DayUp/Down Vol Hourly DJIA A/D Line for All Stocks Inverted Traders Index NASDAQ S&P OEX NYSE COMPQX DJI-15 DJI-20 DJI-30 DIA SPY QQQ MDY IWM TNA Short-Term Rates USO-CrudeOil DBO FAS GLD BBH IBB JETS JNUG KOL NUGT OIH OIL RSX RETL SDS AGQ SLV SOXL TECL TLT TMF TNA UGA (gasoline) XIV YINN Commodities: CANE CORN DBC JJC, NIB, CHOC CORN, CUT (paper) MOO, SOYB WEAT UUP (Dollar) LIT (Lithium) AAPL ADBE ALXN AMAT AMGN AMD AMZN BA BABA BAC BIDU CAT CVX DE FB GOOG GS HD IBM INTU JPM M (Macy's) MSFT NFLX NVDA QCOM TSLA TXN XOM WMT CMG , LRCX, SWKS, MDGL SPPI WATT SQ TOWN 1/28/19 (Click on Underlined link.) Bullish MAXCPs - http://tigersoft.com/MAXCPS/Jan-28/BULLISH.htm Bearish MAXCPs - http://tigersoft.com/MINCPs/Jan-28/BEARISH.htm |
Table 1 QUICKSILVER on ETFS - 1/28/19 ETF CLOSE CHANGE PIVOT-PT 5-dma AROC CL-PWR CANDLE IP21 ITRS --------------------------------------------------------------------------------------------- DIA 245.1 -2.29 244 -39.6% Bullish BLUE .324 ----- --------------------------------------------------------------------------------------------- BA 362.97 -1.23 357.9 -24.4% Bullish BLUE .256 .053 --------------------------------------------------------------------------------------------- SPY 263.76 -2.02 262.86 -51.1% Bullish BLUE .4 .004 --------------------------------------------------------------------------------------------- QQQ 163.11 -2.04 161.94 -65.4% Bullish BLUE .31 .017 --------------------------------------------------------------------------------------------- MDY 330.47 -.52 325.68 -4.9% Bullish BLUE .424 .015 --------------------------------------------------------------------------------------------- IWM 146.55 -.79 145 -26.7% Bullish BLUE .39 .006 --------------------------------------------------------------------------------------------- FAS 56.88 -.23 54.87 35.9% Bullish BLUE .399 -.025 --------------------------------------------------------------------------------------------- RETL 29.31 -.18 27.79 -123.8% Bullish ---- .424 -.216 --------------------------------------------------------------------------------------------- SOXL 102.28 -6.64 89.29 246.6% Bullish BLUE .183 .141 --------------------------------------------------------------------------------------------- TECL 95.85 -4.14 92.49 -86.6% Bullish BLUE .293 -.124 --------------------------------------------------------------------------------------------- IBB 107.26 -2.18 108.72 -147.5% Bullish RED .163 .063 --------------------------------------------------------------------------------------------- GLD 123.29 .43 121.45 93.4% Bullish BLUE .329 .121 --------------------------------------------------------------------------------------------- OIH 16.78 -.42 16.68 -136.6% Bullish ---- .377 -.107 --------------------------------------------------------------------------------------------- RSX 20.57 -.17 20.27 14.6% Bullish ---- .404 .046 |
Table 2    Count of Stocks in Key Directories
           2019-01-28
-------------------------------
NEWHIGHS       68
NEWLOWS        6
MAXCP          16
MINCP          7
TTTNH          14
TTTNL          17
FASTUP         52
FASTDOWN       118
CPCROSSA       60
CPCROSSD       13
BIGVOLUP       1
BIGVODN        10
ACCUMVER       42
HIGHIP21       102
HIUPPCT        8
VHIP21         16
LOWACCUM       234
REDSELL        60
AUGSELS7       3
TRAPDOOR       15
|
 Table 3 RANKING OF KEY DIRECTORIES BASED PCT.OF STOCKS ABOVE 65-DMA
              1/28/19
 Bullish = 38
 Bearish = 7
---------------------------------------------------------------------------------------
Directory     Current       day-1         day-2         day-3         day-4         day-5
----------------------------------------------------------------------------------------
BONDFUND       .99           .99           .98           .98           .98           .99
GOLD           .86           .86           .7            .66           .64           .64
ETFS           .827          .862          .724          .689          .603          .793
SOFTWARE       .8            .815          .753          .723          .723          .769
NIFTY          .789          .807          .736          .578          .561          .684
PIPELINE       .782          .739          .739          .739          .695          .739
HACKERS        .772          .772          .636          .545          .545          .681
REIT           .771          .718          .637          .597          .577          .63
SEMI           .767          .775          .681          .508          .517          .655
HOMEBLDG       .764          .823          .764          .647          .705          .882
FINANCE        .755          .822          .722          .633          .633          .711
ELECTRON       .716          .728          .66           .493          .506          .641
GAMING         .708          .708          .666          .666          .666          .666
JETS           .7            .5            .6            .4            .6            .7
GREEN          .695          .695          .652          .695          .695          .695
INFRA          .694          .694          .527          .416          .555          .694
NASD-100       .68           .71           .63           .59           .58           .66
AUTO           .666          .692          .564          .641          .692          .692
BEVERAGE       .666          .666          .666          .722          .555          .611
INDMATER       .666          .692          .525          .448          .525          .679
INSURANC       .666          .666          .7            .766          .633          .766
SOLAR          .666          .722          .722          .611          .555          .611
CHEM           .648          .629          .462          .351          .537          .685
REGBANKS       .642          .678          .607          .678          .678          .75
CHINA          .633          .633          .6            .533          .5            .65
RUS-1000       .609          .641          .547          .509          .522          .63
SP500          .606          .65           .55           .52           .524          .636
UTILITY        .6            .65           .8            .7            .575          .575
MILITARY       .593          .625          .562          .343          .312          .468
FIDSTKS        .591          .645          .564          .537          .5            .661
GUNS           .588          .588          .47           .411          .47           .705
BIGBANKS       .571          .857          .571          .571          .571          .857
INDEXES        .559          .629          .505          .392          .408          .586
COMODITY       .547          .571          .523          .428          .428          .595
RETAIL         .547          .509          .415          .433          .433          .509
FOOD           .543          .526          .526          .456          .456          .561
DJI-13         .538          .692          .615          .538          .538          .769
================================================================================================= COMPUTER .5 .5 .409 .363 .318 .409 EDU .5 .5 .5 .333 .333 .333 ================================================================================================= SP-100 .462 .569 .505 .548 .473 .58 HOSPITAL .458 .541 .5 .458 .416 .458 TRANSP .45 .35 .4 .2 .35 .55 COAL .428 .428 .285 .285 .285 .285 BIOTECH .41 .463 .407 .394 .402 .494 DOWJONES .4 .533 .533 .6 .466 .633 BIG17 .347 .369 .326 .369 .391 .456 OILGAS .28 .349 .26 .226 .232 .383 |
====================================================================
====================================================================
1/25/2019 Breadth is very good, the Closing Powers are well above
their rising 21-day moving averages and a healthy 62%
of all stocks and ETFs are now above their 65-dma. But because
the DJI's 65-dma has not yet turned up, there is still overhead
resistance and I cannot consider our new January "breadth-thrust"
Buy B4 to be clinched. More zig-zagging up to 25000 seems
likely. If the DJI can get past 25000, we ought to see 26000 rather
quickly.
It's Monday, so we should not be surprised if the DJI falls back
for a day or two. Since last October 1st, the first trading day
of the week has fallen back 9 of 17 times and produced
on average dropped the DJI by 86 DJI points. Six of the nine
declining days producing drops of between 245 and 653
points. So, it can be a little scary.
The DJI has, so far, regained 59.6% of what it lost between
early October and December 24th. A typical 61.8% Fibonnacci
retracement should get the DJI back to 25000. As you can
see below in the weekly DJI chart, 25000, besides being a
round number-psychological barrier, is also where the
falling 52-week crosses and could turn into an apex of a right
shoulder in the DJI's weekly chart.
But interest rates remain low, about a full percent below
where big trouble (a 20% DJI decline) began in 1957, when
rates were also coming off a series of years at very low
levels. I would say that each market era seems to have one
major focal point more than others. Ours, right now, seems to
be the rising Federal Funds' rate. Fed Chairman Powell will
hold another press conference on Wednesday. Is he up to
the job? Will he scare investors as he did back in early
December? Or will he go out of his way to allay fears?
We should watch the Bank Stocks, short-term rates and
the Closing Powers early this week. NYSE breadth, which
often closely reflects interest rates' expectations was very good
last Wednesday and Thursday, +1041 and +1583 more
up than down. The breakouts by semi-conductors last week
are also a very good sign.
But is Powell to be trusted? Let's stick with some of shorts
among the MINCPs for now and stay long SOXL, IBB and
some of strongest MAXCPs.
If he speaks carefully and circumspectly on Wednesday,
the market should also go higher based on this being the third
year in the four-year Presidential cycle. Since 1967, these
third years (1967, 1971, 1975, 1979, etc...) have seen the DJI
rise 81.3% of the time over the next three months, making
an average gain of 6%.


 |
 |
 |
|
Charts 1/25/2019 2018 PEERLESS DJI, Signals, Indicators Daily DJI Volume 10-DayUp/Down Vol Hourly DJIA A/D Line for All Stocks Inverted Traders Index NASDAQ S&P OEX NYSE COMPQX DJI-15 DJI-20 DJI-30 DIA SPY QQQ MDY IWM TNA Short-Term Rates USO-CrudeOil DBO FAS GLD BBH IBB JETS JNUG KOL NUGT OIH OIL RSX RETL SDS AGQ SLV SOXL TECL TLT TMF TNA UGA (gasoline) XIV YINN Commodities: CANE CORN DBC JJC, NIB, CHOC CORN, CUT (paper) MOO, SOYB WEAT UUP (Dollar) LIT (Lithium) AAPL ADBE ALXN AMAT AMGN AMD AMZN BA BABA BAC BIDU CAT CVX DE FB GOOG GS HD IBM INTU JPM M (Macy's) MSFT NFLX NVDA QCOM TSLA TXN XOM WMT CMG , LRCX, SWKS, MDGL SPPI WATT SQ TOWN 1/25/19 (Click on Underlined link.) Bullish MAXCPs - http://tigersoft.com/MAXCPS/Jan-25/BULLISH.htm Bearish MAXCPs - http://tigersoft.com/MINCPs/Jan-25/BEARISH.htm |
Table 1 QUICKSILVER on ETFS - 1/25/19 ETF CLOSE CHANGE PIVOT-PT 5-dma AROC CL-PWR CANDLE IP21 ITRS --------------------------------------------------------------------------------------------- DIA 247.39 1.92 247.05 73.2% Bullish ---- .368 ----- --------------------------------------------------------------------------------------------- BA 364.2 5.93 364.73 71% Bullish BLUE .276 .035 --------------------------------------------------------------------------------------------- SPY 265.78 2.23 266.46 53.4% Bullish BLUE .437 .006 --------------------------------------------------------------------------------------------- QQQ 165.15 1.95 165.25 46.6% Bullish BLUE .349 .012 --------------------------------------------------------------------------------------------- MDY 330.99 3.69 330.79 70.2% Bullish BLUE .438 .014 --------------------------------------------------------------------------------------------- IWM 147.34 1.87 147.33 51.8% Bullish BLUE .424 .005 --------------------------------------------------------------------------------------------- FAS 57.11 1.63 56.48 265.4% Bullish BLUE .449 -.057 --------------------------------------------------------------------------------------------- SOXL 108.92 6.54 97.49 945.3% Bullish BLUE .215 .072 --------------------------------------------------------------------------------------------- TECL 99.99 4.08 97.51 352.2% Bullish BLUE .354 -.168 --------------------------------------------------------------------------------------------- IBB 109.44 1.65 110.47 -16.1% Bullish BLUE .241 .065 --------------------------------------------------------------------------------------------- GLD 122.86 1.77 121.02 30.9% Bullish BLUE .209 .122 --------------------------------------------------------------------------------------------- OIH 17.2 .53 17.24 194.6% Bullish BLUE .413 -.106 --------------------------------------------------------------------------------------------- RSX 20.74 .08 20.51 97.7% Bullish BLUE .424 .055 |
Table 2    Count of Stocks in Key Directories
           2019-01-25
-------------------------------
NEWHIGHS       77
NEWLOWS        1
MAXCP          18
MINCP          3
TTTNH          17
TTTNL          13
FASTUP         64
FASTDOWN       60
CPCROSSA       67
CPCROSSD       9
BIGVOLUP       6
BIGVODN        9
ACCUMVER       20
HIGHIP21       79
HIUPPCT        8
VHIP21         15
LOWACCUM       247
REDSELL        53
AUGSELS7       2
TRAPDOOR       15
|
 Table 3  RANKING OF KEY DIRECTORIES BASED PCT.OF STOCKS ABOVE 65-DMA
          1/25/19
 Bullish=39
 Bearish=5
---------------------------------------------------------------------------------------
Directory     Current       day-1         day-2         day-3         day-4         day-5
----------------------------------------------------------------------------------------
BONDFUND       .99           .98           .98           .98           .99           .98
ETFS           .862          .724          .689          .603          .793          .672
GOLD           .86           .7            .66           .64           .62           .72
BIGBANKS       .857          .571          .571          .571          .857          .571
HOMEBLDG       .823          .764          .647          .705          .882          .705
FINANCE        .822          .722          .633          .633          .7            .6
SOFTWARE       .809          .746          .714          .714          .761          .714
NIFTY          .807          .736          .578          .561          .666          .578
SEMI           .775          .681          .508          .517          .637          .525
HACKERS        .772          .636          .545          .545          .636          .545
PIPELINE .739 .739 .739 .695 .739 .782 ELECTRON .728 .66 .493 .506 .629 .543 SOLAR .722 .722 .611 .555 .611 .611 REIT .718 .637 .597 .577 .624 .624 NASD-100 .71 .63 .59 .58 .64 .56 GAMING .708 .666 .666 .666 .666 .666 GREEN .695 .652 .695 .695 .695 .695 INFRA .694 .527 .416 .555 .666 .555 AUTO .692 .564 .641 .692 .692 .666 DJI-13 .692 .615 .538 .538 .769 .384 INDMATER .692 .525 .448 .525 .653 .525 REGBANKS .678 .607 .678 .678 .75 .607 BEVERAGE .666 .666 .722 .555 .555 .555 INSURANC .666 .7 .766 .633 .766 .633 UTILITY .65 .8 .7 .575 .575 .575 SP500 .649 .547 .517 .521 .629 .484 FIDSTKS .645 .564 .537 .5 .661 .489 RUS-1000 .641 .547 .509 .522 .621 .507 CHINA .633 .6 .533 .5 .65 .55 CHEM .629 .462 .351 .537 .648 .481 INDEXES .629 .505 .392 .408 .575 .424 MILITARY .625 .562 .343 .312 .437 .343 GUNS .588 .47 .411 .47 .647 .588 COMODITY .571 .523 .428 .428 .595 .404 SP-100 .569 .505 .548 .473 .58 .473 HOSPITAL .541 .5 .458 .416 .458 .5 DOWJONES .533 .533 .6 .466 .633 .4 FOOD .526 .526 .456 .456 .561 .421 RETAIL .509 .415 .433 .433 .49 .377 ================================================================================================ COMPUTER .5 .409 .363 .318 .409 .318 EDU .5 .5 .333 .333 .333 .333 JETS .5 .6 .4 .6 .7 .7 ================================================================================================ BIOTECH .46 .407 .394 .402 .476 .434 COAL .428 .285 .285 .285 .285 .285 BIG17 .369 .326 .369 .391 .434 .456 TRANSP .35 .4 .2 .35 .5 .3 OILGAS .349 .26 .226 .232 .376 .28 |
====================================================================
1/24/2019
Clearly,
the FED, the White House and Wall Street all
want lower interest rates and rising stock prices. The
DJI has been the leader, but an actual lowering of rates
will probably excite lots of other sectors. The bulls appear
to be in control. As stocks get past the resistance of their
65-dma, they should rally increasingly easily. 75% of our
stock-groups in Table 3 below show a majority of their
stocks are now above their 65-dma. This is quite a turn-around.
Breadth today was again the bullish technical tip-off today.
There were 1041 more up than down today on the NYSE.
I interpret this to be an interest rally rally. They can easily
last four or five months, perhaps longer.
The January "breadth thrust" Buy B4 looks better and
better. All the Peerless daily key internal strength indicators
are not only positive, but making yearly highs. In addition,
the DJI's Hourly DISI-OBV Line is also making new highs.
25000 is the next target. But this action's upward momentum
is striking. It forces all those who want a dip to buy to come
back in at higher and higher prices.
As we are starting, the normally bullish year before the
Presidential Election and the FED is becoming quite |
accomodative, I would buy SOXL aggressively. Semi-conductors
as a group seem to be taking off and SOXL has just completed
a bullish Inverted Head and Shoulders pattern.


It is difficult to exaggerate the close connivance between the
Federal Reserve and Wall Street. That is why we watch the
A/D Line and our CLosing Power trends so closely. Today
the reason for the rally since December 26th became a lot
clearer as short-term interest rates were dropped sharply by
the FED. (I think I can show this weekend that the FED seems
often to do this at the start of the third year in the Presidential
cycle.)
Look below. Any additional decline will break the rates' chart
support, shown below. This will probably be a big boost for stocks.
None more so than the volatile semi-consuctors and the
big banks that have just raised their own rates on their
consumers' credit card and so are now doing very well,
especially in their long trading accounts, thanks to the way they
and the FED have successfully coordinated the rally. There
is no point in being stubborn here. The Buy B4 seems to
have properly noted the continuance of the rally past the
resistance at the 65-dma.

Volatile Semi-Conductors as a group responded most
favorably today to the big drop in rates. Their action has
to be bullishly construed both for themselves and the market
as a whole. .

|
Charts 1/24/2019 2018 PEERLESS DJI, Signals, Indicators Daily DJI Volume 10-DayUp/Down Vol Hourly DJIA A/D Line for All Stocks Inverted Traders Index NASDAQ S&P OEX NYSE COMPQX DJI-15 DJI-20 DJI-30 DIA SPY QQQ MDY IWM TNA Short-Term Rates USO-CrudeOil DBO FAS GLD BBH IBB JETS JNUG KOL NUGT OIH OIL RSX RETL SDS AGQ SLV SOXL TECL TLT TMF TNA UGA (gasoline) XIV YINN Commodities: CANE CORN DBC JJC, NIB, CHOC CORN, CUT (paper) MOO, SOYB WEAT UUP (Dollar) LIT (Lithium) AAPL ADBE ALXN AMAT AMGN AMD AMZN BA BABA BAC BIDU CAT CVX DE FB GOOG GS HD IBM INTU JPM M (Macy's) MSFT NFLX NVDA QCOM TSLA TXN XOM WMT CMG , LRCX, SWKS, MDGL SPPI WATT SQ TOWN 1/24/19 (Click on Underlined link.) Bullish MAXCPs - http://tigersoft.com/MAXCPS/Jan-24/BULLISH.htm Bearish MAXCPs - http://tigersoft.com/MINCPs/Jan-24/BEARISH.htm |
Table 1 QUICKSILVER on ETFS - 1/24/19 ETF CLOSE CHANGE PIVOT-PT 5-dma AROC CL-PWR CANDLE IP21 ITRS --------------------------------------------------------------------------------------------- DIA 245.47 -.25 243.8 73.8% Bullish ---- .306 ---- --------------------------------------------------------------------------------------------- BA 358.27 -.34 359.09 86.6% Bullish RED .225 .03 --------------------------------------------------------------------------------------------- SPY 263.55 .14 262.96 48.8% Bullish BLUE .351 .003 --------------------------------------------------------------------------------------------- QQQ 163.2 1.05 163.63 26.1% Bullish BLUE .284 -.001 --------------------------------------------------------------------------------------------- MDY 327.3 2.14 326.4 63.5% Bullish BLUE .375 .008 --------------------------------------------------------------------------------------------- IWM 145.47 .87 145.83 32.7% Bullish BLUE .351 -.01 --------------------------------------------------------------------------------------------- FAS 55.48 .48 54.18 195.3% Bullish BLUE .353 -.089 --------------------------------------------------------------------------------------------- RETL 28.18 .3 28.52 49.3% Bullish BLUE .443 -.28 --------------------------------------------------------------------------------------------- SOXL 102.38 14.95 91.23 782.6% Bullish BLUE .141 -.029 --------------------------------------------------------------------------------------------- TECL 95.91 2.42 93.33 237% Bullish BLUE .275 -.222 --------------------------------------------------------------------------------------------- IBB 107.79 -.02 109.79 -39.4% Bullish BLUE .18 .042 --------------------------------------------------------------------------------------------- GLD 121.09 -.19 122.11 -48.5% Bullish RED .189 .109 --------------------------------------------------------------------------------------------- OIH 16.67 .3 16.55 84.1% Bullish BLUE .358 -.13 --------------------------------------------------------------------------------------------- RSX 20.66 .04 20.34 107.9% Bullish BLUE .377 .044 |
 Table 2   Count of Stocks in Key Directories
           2019-01-24
-------------------------------
NEWHIGHS       51
NEWLOWS        7
MAXCP          15
MINCP          4
TTTNH          17
TTTNL          14
FASTUP         40
FASTDOWN       95
CPCROSSA       64
CPCROSSD       10
BIGVOLUP       3
BIGVODN        14
ACCUMVER       15
HIGHIP21       79
HIUPPCT        7
VHIP21         16
LOWACCUM       246
REDSELL        66
AUGSELS7       2
TRAPDOOR       15
|
Table 3       RANKING OF KEY DIRECTORIES BASED PCT.OF STOCKS ABOVE 65-DMA
              1/24/19
  Bullish = 36
  Bearish = 9
---------------------------------------------------------------------------------------
Directory     Current       day-1         day-2         day-3         day-4         day-5
----------------------------------------------------------------------------------------
BONDFUND       .98           .98           .98           .99           .98           .98
UTILITY        .8            .7            .575          .575          .575          .5
HOMEBLDG       .764          .647          .705          .882          .705          .705
SOFTWARE       .753          .723          .723          .769          .723          .646
PIPELINE       .739          .739          .695          .739          .695          .695
NIFTY          .736          .578          .561          .666          .578          .526
ETFS           .724          .689          .603          .793          .655          .62
FINANCE        .722          .633          .633          .7            .588          .533
SOLAR          .722          .611          .555          .611          .611          .555
GOLD           .7            .66           .64           .62           .72           .7
INSURANC       .7            .766          .633          .766          .633          .666
SEMI           .686          .513          .521          .643          .521          .469
BEVERAGE       .666          .722          .555          .555          .555          .444
GAMING         .666          .666          .666          .666          .666          .625
ELECTRON       .66           .493          .506          .629          .537          .487
GREEN          .652          .695          .695          .695          .695          .608
REIT           .637          .597          .577          .624          .617          .563
HACKERS        .636          .545          .545          .636          .545          .5
NASD-100       .63           .59           .58           .64           .56           .5
DJI-13         .615          .538          .538          .769          .384          .461
REGBANKS       .607          .678          .678          .75           .607          .607
CHINA          .6            .533          .5            .65           .55           .533
JETS           .6            .4            .6            .7            .7            .5
BIGBANKS       .571          .571          .571          .857          .571          .714
AUTO           .564          .641          .692          .692          .692          .666
FIDSTKS        .564          .537          .5            .661          .483          .419
MILITARY       .562          .343          .312          .437          .406          .281
SP500          .55           .52           .524          .63           .483          .401
RUS-1000       .547          .509          .522          .621          .501          .424
DOWJONES       .533          .6            .466          .633          .4            .366
INFRA          .527          .416          .555          .666          .583          .416
FOOD           .526          .456          .456          .561          .421          .35
INDMATER       .525          .448          .525          .653          .512          .397
COMODITY       .523          .428          .428          .595          .404          .357
INDEXES        .505          .392          .408          .575          .424          .295
SP-100         .505          .548          .473          .58           .473          .419
==========================================================================================
EDU            .5            .333          .333          .333          .333          .333
HOSPITAL       .5            .458          .416          .458          .5            .416
==========================================================================================
GUNS           .47           .411          .47           .647          .647          .47
RETAIL         .415          .433          .433          .49           .377          .358
COMPUTER       .409          .363          .318          .409          .318          .318
BIOTECH        .405          .394          .402          .476          .423          .402
TRANSP         .4            .2            .35           .5            .3            .2
BIG17          .326          .369          .391          .434          .456          .391
COAL           .285          .285          .285          .285          .285          .142
OILGAS         .26           .226          .232          .376          .267          .219
CHEM           0             0             0             0             0             0
|
====================================================================
1/23/2019
The DJI succeeded in getting back above its key
65-dma by 88 points. The margin was slim and the
65-dma is still falling. But the result was the same.
In the last 50 years, second DJI rises back above
its falling 65-dma when the DJI had not dropped more than
20% from its highs and was not rallying from a bear market
low have usually meant rallies back up to the DJI's recent
old highs. A zig-zagging upwards is likely.
The new January Buy B4 will probably work out. But to
be clinched, we will need to see the DJI's 65-dma pct change
show a positive slope. Our chart shows its 65-day ma is
still falling. This means there is still resistance overhead.
But another decline from here on very weak breadth would
force Professionals to again try to prop the market up
near 24000. That would use up some of their ammunition
and possibly mean another decline back to the DJI's 21-dma.

We must watch the NYSE A/D
Line. It should turn back
up tomorrow At the close today, there were 53 more NYSE decliners
than advances. The makes the rally looks rigged as just 3
DJI-30 stocks, IBM, UTX and PG accounted for more
than 140 of the DJI's 175-point gain. But a rigged market
is probably exactly what we should expect. It shows that
Professionals want to support the market and keep it rising.
It shows that they expect plenty of help in this to come from |
the FED and the White House. As long as the DJI stays
in its uptrend, things are "normal". The DJI is the leader and
the FED does not have any new plans to raise rates.
At this point, only the NYSE, IBB and GLD are also
above their 65-dma. So, there is room for improvement
elsewhere. And it should be forthcoming soon. The SP-500
is still very slightly, just 5-points, below its still falling 65-dma.
The NASDAQ remains 23-points below its own 65-dma. The
OEX is 6-points below. IWM is just 0.4 points below. QQQ
is just .85 below while OIL is is 2.5 below. If these other
indexes can do what the DJI did today, the rally will look
appealing.
The DJIA is being used to march the Indexes up towards.
It seems drawn now back to 25000. By most of our measures, the
DJI versus the 21-dma, the Stochastics 14 and 20, MACD,
CCI and RSI, the DJI is already overbought and showing
early signs of topping out. The NYSE A/D Line's steep uptrend
has been slightly violated as have most of the steep Closing
Powers. So, another shallow pullback after 25000 is reached
would not be surprising. A zig-zag path upwards with the rising 2.5%
upper band acting as support would be in keeping with the
apparently now active Buy B4.
Considering all this, I would prefer to be hedged with a few
shorts from our Bearish MINCPs and long some of the Bullish
MAXCPs. I keep posting the chart of LOCO, El Pollo Loco
holdings. Its price is still only 40% of what is was 4 1/2 years
ago. Its chicken is tasty and Pollo Loco has a lot of customer loyalty.
Customers have not failed to not that none of its customers
have eaten bad food as they have frequently at Chipotle, where
prices are much higher.
With the DJI-30 back above its 65-dma and acting as the leader,
the likelihood now is we will see 25000 soon. At that point, the
65-dma will be bullishly rising. Meanwhile with the short-term
fed-funds' rates still only 2.5%, stock prices should be advancing.
Just when the Government shut down comes to an end and Trump
has reached a Trade Deal with China, we will be hearing about
how bullishly the DJI has behaved in before a Presidential Election
since 1915.
 |
 |
|
Charts 1/23/2019 2018 PEERLESS DJI, Signals, Indicators Daily DJI Volume 10-DayUp/Down Vol Hourly DJIA A/D Line for All Stocks Inverted Traders Index NASDAQ S&P OEX NYSE COMPQX DJI-15 DJI-20 DJI-30 DIA SPY QQQ MDY IWM TNA Short-Term Rates USO-CrudeOil DBO FAS GLD BBH IBB JETS JNUG KOL NUGT OIH OIL RSX RETL SDS AGQ SLV SOXL TECL TLT TMF TNA UGA (gasoline) XIV YINN Commodities: CANE CORN DBC JJC, NIB, CHOC CORN, CUT (paper) MOO, SOYB WEAT UUP (Dollar) LIT (Lithium) AAPL ADBE ALXN AMAT AMGN AMD AMZN BA BABA BAC BIDU CAT CVX DE FB GOOG GS HD IBM INTU JPM M (Macy's) MSFT NFLX NVDA QCOM TSLA TXN XOM WMT CMG , LRCX, SWKS, MDGL SPPI WATT SQ TOWN 1/23/19 (Click on Underlined link.) Bullish MAXCPs - http://tigersoft.com/MAXCPS/Jan-23/BULLISH.htm Bearish MAXCPs - http://tigersoft.com/MINCPs/Jan-23/BEARISH.htm |
Table 1 QUICKSILVER on ETFS - 1/23/19 ETF CLOSE CHANGE PIVOT-PT 5-dma AROC CL-PWR CANDLE IP21 ITRS --------------------------------------------------------------------------------------------- DIA 245.72 1.72 241.86 104.3% Bullish RED .195 ----- --------------------------------------------------------------------------------------------- BA 358.61 .71 352.06 89.2% Bullish RED .149 .025 --------------------------------------------------------------------------------------------- SPY 263.41 .55 260.98 58.2% Bullish RED .232 -.001 --------------------------------------------------------------------------------------------- QQQ 162.15 .21 162.35 -7.1% Bullish RED .15 -.015 --------------------------------------------------------------------------------------------- MDY 325.16 -.52 323.16 64.7% Bullish RED .309 -.004 --------------------------------------------------------------------------------------------- IWM 144.6 -.4 144.52 39.6% Bullish RED .229 -.02 --------------------------------------------------------------------------------------------- FAS 55 .13 53.34 381.8% Bullish RED .261 -.092 --------------------------------------------------------------------------------------------- RETL 27.88 .09 27.9 26.4% Bullish RED .39 -.267 --------------------------------------------------------------------------------------------- SOXL 87.43 -1.86 88.18 -162.1% Bullish RED .022 -.173 --------------------------------------------------------------------------------------------- TECL 93.49 1.00 91.47 116.4% Bullish ---- .167 -.244 --------------------------------------------------------------------------------------------- IBB 107.81 -.91 108.65 -65.4% Bullish RED .095 .032 --------------------------------------------------------------------------------------------- GLD 121.28 -.17 122.27 -24.6% Bullish BLUE .154 .107 --------------------------------------------------------------------------------------------- RSX 20.62 .35 20.22 140.5% Bullish ---- .311 .018 |
Table 2    Count of Stocks in Key Directories
           2019-01/23
-------------------------------
NEWHIGHS       39
NEWLOWS        12
MAXCP          19
MINCP          7
TTTNH          10
TTTNL          16
FASTUP         37
FASTDOWN       100
CPCROSSA       46
CPCROSSD       21
BIGVOLUP       3
BIGVODN        10
ACCUMVER       4
HIGHIP21       13
HIUPPCT        7
VHIP21         13
LOWACCUM       263
REDSELL        93
AUGSELS7       5
TRAPDOOR       16
|
 Table 3
           RANKING OF KEY DIRECTORIES BASED PCT.OF STOCKS ABOVE 65-DMA
           1/23/19
 Bullish = 28
 Bearish = 19
---------------------------------------------------------------------------------------
Directory     Current       day-1         day-2         day-3         day-4         day-5
----------------------------------------------------------------------------------------
BONDFUND       .98           .98           .99           .98           .98           .971
INSURANC       .766          .633          .766          .633          .666          .433
PIPELINE       .739          .695          .739          .695          .695          .695
SOFTWARE       .723          .723          .769          .723          .63           .646
BEVERAGE       .722          .555          .555          .555          .444          .555
UTILITY        .7            .575          .575          .575          .525          .425
GREEN          .695          .695          .695          .695          .608          .521
ETFS           .689          .603          .793          .655          .62           .517
REGBANKS       .678          .678          .75           .607          .607          .285
GAMING         .666          .666          .666          .666          .625          .666
GOLD .66 .64 .62 .72 .7 .76 HOMEBLDG .647 .705 .882 .705 .705 .823 AUTO .641 .692 .692 .692 .666 .641 FINANCE .633 .633 .7 .588 .533 .377 SOLAR .611 .555 .611 .611 .555 .555 DOWJONES .6 .466 .633 .4 .433 .366 REIT .597 .577 .624 .617 .563 .436 NASD-100 .59 .58 .64 .56 .51 .52 NIFTY .578 .561 .666 .578 .526 .543 BIGBANKS .571 .571 .857 .571 .714 .285 SP-100 .548 .473 .58 .473 .451 .419 HACKERS .545 .545 .636 .545 .5 .636 DJI-13 .538 .538 .769 .384 .538 .384 FIDSTKS .537 .5 .661 .483 .43 .403 CHINA .533 .5 .65 .55 .533 .433 SP500 .52 .524 .63 .483 .413 .381 RUS-1000 .509 .522 .621 .501 .428 .392 SEMI .508 .517 .637 .517 .465 .448 ================================================================================================ ELECTRON .493 .506 .629 .537 .487 .456 HOSPITAL .458 .416 .458 .5 .416 .333 FOOD .456 .456 .561 .421 .333 .333 INDMATER .448 .525 .653 .512 .397 .358 RETAIL .433 .433 .49 .377 .358 .358 COMODITY .428 .428 .595 .404 .333 .333 INFRA .416 .555 .666 .583 .388 .444 GUNS .411 .47 .647 .647 .47 .411 JETS .4 .6 .7 .7 .5 .4 BIOTECH .392 .402 .476 .423 .405 .389 INDEXES .392 .408 .575 .424 .29 .258 BIG17 .369 .391 .434 .456 .391 .434 COMPUTER .363 .318 .409 .318 .318 .318 CHEM .351 .537 .648 .462 .333 .314 MILITARY .343 .312 .437 .406 .281 .25 EDU .333 .333 .333 .333 .333 .333 COAL .285 .285 .285 .285 .142 .142 OILGAS .226 .232 .376 .267 .205 .198 TRANSP .2 .35 .5 .3 .2 .15 |
====================================================================
1/22/2019
The
DJIA today fell back below its falling 65-dma.
With overhead supply not yet eaten up, look for a searching
for support unless there is some very good news from
the Trade Talks with China or the FED has another "dovish"
speaker to draw upon to lift stock prices.
The DJIA is
presently 3.8% above its 21-dma. A pullback to its
21-dma would seem likely. Watch to see if the Closing Powers
for DIA, SPY, QQQ and IWM break more clearly their uptrends.
This might seriously undermine the confidence in the rally
and make the last three weeks look artificial and manipulated.
On the other hand, a spirited recovery would make believers of many
of those who doubt that the FED can launch a complete recovery
in stock prices without actually lowering short-term rates..

We need more proof that the DJI is in a
V-bottom formation. The
most bullish thing it could do now would be to rise right back above its
falling 65-dma, on good breadth,
rising volume and with the day's
closing being substantially back above the opening.
At a minimum, the Bulls will need to see the DJI get right back
above its falling 65-dma. That is about 100 points above today's close.
It will also help us a lot for the 65-dma to turns up. Right now, the DJI
is 5.4% below its level of 65 days ago. This shows that significant over-head
resistance still lurks above. You will recall that the negative value for the DJI's
65-day up percentage posed a remaining problem for the new, January B4
based on superb breadth.
How much technical damage is caused by the DJI's dropping back
below its falling 65-dma and still closing in over-bought status, a
full +3.8% over its 21-dma? This is most unusual. But its not
as bearish
as I, for one, thought last night. This techical juxtaposition occurred five
times
in the 1930s and always had a bearish outcome, with the DJI always falling to the
lower band, at least. It occurred once in World War II and was not significant.
Since then, the outcomes have been very mixed. But it does appear that
in an on-going bull market, where the DJI is not down more than 20% from
its high, the bull market is more likely to resume once the 65-dma is finally
surpassed after some inconclusive advances AND in a bear market, the
decline is more likely to worsen without another upside breach.
What Happened when DJI dropped back below
its falling 65-dma after 1945 and was more than 1.75%
over the 21-dma?
la/ma 65d pct change
12/14/1971 1.026 -.06
DJI then rallied until May
6/14/1974 1.02
-.055
Bear Market
Deepened badly.
11/141977 1.027 -.038
Bear Market
fell another 10%.
5/8/1980 1.024
-.071
Bull Market
continued.
7/9/1982 1.019
-.017
Bear Market
- DJI fell to LB
4/24/1997 1.025
-.014
Bull Market
continued.
11/24/1997 1.023
-.016
DJI
retested lower band.
11/7/2001 1.023
-.091
DJI rallied
for three more months.
8/23/2002 1.025
-.127
Bear Market
continued.
3/28/2003 1.022
-.041
New bull
market starting.
5/25/2005 1.019
-.031
DJI to
lower band
3/27/2009 1.081 (high) -.088
New bull market.
6/20/2012 1.026
-.032
DJI
fell to 1.75% lower band.
10/14/2015 1.021
-.063
DJI rose 6% and then fell 13%.
1/22/2019 1.038 -.054
????????????????
------------------------------------------------------------------------
Watch Closing Powers and Volume Very Closely
I counted 9 or 101 important stocks
and ETFs whose steep Closing Power
uptrends were violated: AAPL, AMZN, BIDU, COMPQX, NFLX,
REGN as well as IBB, SOXL and IWM.
DIA and SPY still showing uptrending losing Powers. Watch them
tomorrow, as their steep uptrends may be violated.
It is bearish that TQQQ, SOXL and IBB showed rising daily volume
today, on a down-day.
 |
 |
 |
 |
 |
 |
|
Charts 1/22/2019 2018 PEERLESS DJI, Signals, Indicators Daily DJI Volume 10-DayUp/Down Vol Hourly DJIA A/D Line for All Stocks Inverted Traders Index NASDAQ S&P OEX NYSE COMPQX DJI-15 DJI-20 DJI-30 DIA SPY QQQ MDY IWM TNA Short-Term Rates USO-CrudeOil DBO FAS GLD BBH IBB JETS JNUG KOL NUGT OIH OIL RSX RETL SDS AGQ SLV SOXL TECL TLT TMF TNA UGA (gasoline) XIV YINN Commodities: CANE CORN DBC JJC, NIB, CHOC CORN, CUT (paper) MOO, SOYB WEAT UUP (Dollar) LIT (Lithium) AAPL ADBE ALXN AMAT AMGN AMD AMZN BA BABA BAC BIDU CAT CVX DE FB GOOG GS HD IBM INTU JPM M (Macy's) MSFT NFLX NVDA QCOM TSLA TXN XOM WMT CMG , LRCX, SWKS, MDGL SPPI WATT SQ TOWN 1/22/19 (Click on Underlined link.) - Bullish MAXCPs - http://tigersoft.com/MAXCPS/Jan-22/BULLISH.htm Bearish MAXCPs - http://tigersoft.com/MINCPs/Jan-22/BEARISH.htm |
Table 1 QUICKSILVER on ETFS - 1/22/19 ETF CLOSE CHANGE PIVOT-PT 5-dma AROC CL-PWR CANDLE IP21 ITRS --------------------------------------------------------------------------------------------- DIA 244 -3.05 240.64 104.3% Bullish RED .131 ----- --------------------------------------------------------------------------------------------- BA 357.9 -6.83 352.24 106% Bullish RED .123 .024 --------------------------------------------------------------------------------------------- SPY 262.86 -3.6 260.35 104.3% Bullish RED .184 .003 --------------------------------------------------------------------------------------------- QQQ 161.94 -3.31 162.38 82.1% Bullish RED .114 -.001 --------------------------------------------------------------------------------------------- MDY 325.68 -5.11 320.95 103.4% Bullish RED .285 -.002 --------------------------------------------------------------------------------------------- IWM 145 -2.33 143.45 95% Bullish RED .199 -.015 --------------------------------------------------------------------------------------------- FAS 54.87 -1.61 50.88 491.4% Bullish RED .218 -.069 --------------------------------------------------------------------------------------------- RETL 27.79 -2.23 27.73 61.8% Bullish RED .381 -.264 --------------------------------------------------------------------------------------------- SOXL 89.29 -8.2 90.39 -27.9% Bullish RED .016 -.143 --------------------------------------------------------------------------------------------- TECL 92.49 -5.02 91.32 270.5% Bullish RED .136 -.207 --------------------------------------------------------------------------------------------- IBB 108.72 -1.75 109.24 71.1% Bullish RED .073 .05 --------------------------------------------------------------------------------------------- GLD 121.45 .43 121.88 -26.3% Bullish BLUE .143 .094 --------------------------------------------------------------------------------------------- RSX 20.27 -.24 20.05 86.6% Bullish ---- .298 -.001 |
Table 2   Count of Stocks in Key Directories
          2019-01-22
-------------------------------
NEWHIGHS       27
NEWLOWS        17
MAXCP          9
MINCP          7
TTTNH          9
TTTNL          7
FASTUP         35
FASTDOWN       72
CPCROSSA       19
CPCROSSD       71
BIGVOLUP       3
BIGVODN        13
ACCUMVER       3
HIGHIP21       8
HIUPPCT        4
VHIP21         13
LOWACCUM       295
REDSELL        114
AUGSELS7       8
TRAPDOOR       16
|
 Table 3      RANKING OF KEY DIRECTORIES BASED PCT.OF STOCKS ABOVE 65-DMA
              1/22/19
 Bullish = 28
 Bearish = 16
---------------------------------------------------------------------------------------
Directory     Current       day-1         day-2         day-3         day-4         day-5
----------------------------------------------------------------------------------------
BONDFUND       .98           .99           .98           .98           .971          .971
SOFTWARE       .723          .769          .723          .63           .646          .461
HOMEBLDG       .705          .882          .705          .705          .823          .823
GREEN          .695          .695          .695          .608          .521          .478
PIPELINE       .695          .739          .695          .695          .695          .565
AUTO           .692          .692          .692          .666          .615          .641
REGBANKS       .678          .75           .607          .607          .285          .214
GAMING         .666          .666          .666          .625          .666          .625
GOLD           .64           .62           .72           .7            .76           .84
FINANCE        .633          .7            .588          .533          .377          .3
INSURANC .633 .766 .633 .666 .433 .3 ETFS .603 .793 .655 .62 .517 .396 JETS .6 .7 .7 .5 .4 .4 NASD-100 .58 .64 .56 .51 .52 .42 REIT .577 .624 .617 .563 .456 .355 UTILITY .575 .575 .575 .525 .45 .325 BIGBANKS .571 .857 .571 .714 .285 .142 NIFTY .561 .666 .578 .526 .543 .438 BEVERAGE .555 .555 .555 .444 .5 .444 INFRA .555 .666 .583 .388 .444 .444 SOLAR .555 .611 .611 .555 .555 .555 HACKERS .545 .636 .545 .5 .636 .454 DJI-13 .538 .769 .384 .538 .384 .307 CHEM .537 .648 .462 .333 .314 .351 INDMATER .525 .653 .512 .397 .358 .397 SP500 .524 .63 .483 .413 .387 .307 RUS-1000 .522 .623 .501 .427 .394 .332 SEMI .517 .637 .517 .465 .448 .422 ELECTRON .506 .629 .537 .487 .45 .407 =========================================================================================== CHINA .5 .65 .55 .533 .416 .316 FIDSTKS .5 .661 .483 .43 .403 .327 =========================================================================================== SP-100 .473 .58 .473 .451 .43 .311 GUNS .47 .647 .647 .47 .411 .411 DOWJONES .466 .633 .4 .433 .4 .3 FOOD .456 .561 .421 .333 .333 .421 RETAIL .442 .5 .384 .365 .365 .25 COMODITY .428 .595 .404 .333 .333 .428 HOSPITAL .416 .458 .5 .416 .333 .208 INDEXES .408 .575 .424 .29 .252 .215 BIOTECH .4 .476 .423 .405 .384 .328 BIG17 .391 .434 .456 .391 .434 .413 TRANSP .35 .5 .3 .2 .15 .2 EDU .333 .333 .333 .333 .333 .333 COMPUTER .318 .409 .318 .318 .318 .136 MILITARY .312 .437 .406 .281 .218 .218 COAL .285 .285 .285 .142 .142 .142 OILGAS .232 .376 .267 .205 .191 .191 |
====================================================================
====================================================================
1/18/2019
Another early-in-the-week retreat is shaping
up.
Will the DJI's 65-dma at 24400 be successfully tested?
If this really
is a "V-Bottom", we will not have to wait long for the rally to resume
from today's early 150-point weakness. But, if the decline continues,
then look for a DJI decline all the way back to 23600 where the 21-day
ma will be by the end of the week.
The DJI closed above its falling 65-dma on Friday and for the second day,
our IP21 was positive. A "V" formation is forming in the DJI now
because of the FED's talk about not raising rates for months does have
historical precedent wherein a 10% to 19%+% DJI decline is completely
reversed It is a rare phenomenon. I can find only three cases. (Usually there
is a bottom made up of multiple tests of the lows.)
The good news for market now is that interest rates remain well under 3%,
as does the CPI's annual growth. Joblessness apart from Federal workers
remains very low. And with the Budget stalemate, the FED is not apt to risk
raising rates. Powell seems to have gotten his fingers burned and seems
unwilling to run the risks again of raising rates and seeing the DJI quickly
sell-off in the aftermath. Nor is there likely to be any big political changes
or threats to Wall Street's dominance, such is the balance of power in
Washington.
Tuesday morning, the DJI is set to open down more than 150. Will this
lead to a bigger decline? Recently, every such decline has quickly been
reversed back upwards. So, as long as Professionals keep buying heavily
at the close, thereby shoring up the market after any early weakness, I think
we have to expect the DJI to move all the way back to 27000, making a
nominal closing high. See the key ETFs' steeply rising Closing Powers below.
It's tempting to attribute these late buying surges to manipulation, but I would
suggest it also represents lot of instutional money being forced to buy at the
close because their bids underneath the market are not being met. That the
DIA, SPY, QQQ and IWM all are moving up in tandem is bullish, in my
opinion.
A new Buy B4 has been constructed, as described for the last two days.
But a DJI pullback to the 65-dma, 180 points lower, is shaping up for
Tuesday morning. If that test of 24400 is successful, then look for the rally
to resume strongly. These breadth-based January Buy B4s have proven to
be quite bullish. If the DJI drops back below 25400, then the V-Bottom's
validity will be in question. Unlike all the earlier January Breadth-Based B4s,
the DJI is still more than 2.2% below where it was 65-days ago. With the
65-dma still falling, this means there is still some resistance overhead.
Still, staying short now does not seem reasonable. I suspect that there are
lots of buyers who "want in" for a January rally. So, Buy DIA on
weakness
on a successful test of the 65-dma. Hold long IBB and some of the bullish
MAXCP semi-conductors and biotechs. There have been 11 of these
January Breadth surges once the IP21 was positive. All proved profitable.
But, a warning is still necessary. None of these Buy B4s occurred with the
DJI still more than 2 percent below its close 65-days earlier.
Gain 65-day Pct Change
-----------------------------------------
1/16/34 +.071 .046
1/14/36 +.068 .124
1/9/51 +.064 .063
1/22/54 BIG .068
1/24/58 BIG .065
But first DJI did drop from 451 to 437.
1/20/67 +.032 .087
1/18/71 +.106 .111
1/15/75 +.324 -.008
1/6/76 +.133 .118
1/13/85 +.015 .043
1/23/87 +.145 .151
1/17/2019 ? -.039
 |
  |
  |
V-Formations in DJIA after
10%-19% corrections.
In the three cases below, the P-I and
IP21 made new highs when DJI closed
above the 21-day ma below. That is not true yet now in 2019.
Also, there were
no Sells on the way up. So, given all the Sell S9s now and how
far along the DJI
is in the present bull market, we should still be careful. The
V-formation may fail.
But traders should stay long and avoid the short side for now.
 |
 |
 |
|
Charts 1/18/2019 2018 PEERLESS DJI, Signals, Indicators Daily DJI Volume 10-DayUp/Down Vol Hourly DJIA A/D Line for All Stocks Inverted Traders Index NASDAQ S&P OEX NYSE COMPQX DJI-15 DJI-20 DJI-30 DIA SPY QQQ MDY IWM TNA Short-Term Rates USO-CrudeOil DBO FAS GLD BBH IBB JETS JNUG KOL NUGT OIH OIL RSX RETL SDS AGQ SLV SOXL TECL TLT TMF TNA UGA (gasoline) XIV YINN Commodities: CANE CORN DBC JJC, NIB, CHOC CORN, CUT (paper) MOO, SOYB WEAT UUP (Dollar) LIT (Lithium) AAPL ADBE ALXN AMAT AMGN AMD AMZN BA BABA BAC BIDU CAT CVX DE FB GOOG GS HD IBM INTU JPM M (Macy's) MSFT NFLX NVDA QCOM TSLA TXN XOM WMT CMG , LRCX, SWKS, MDGL SPPI WATT SQ TOWN 1/18/19 (Click on Underlined link.) - Bullish MAXCPs - http://tigersoft.com/MAXCPS/Jan-18/BULLISH.htm Bearish MAXCPs - http://tigersoft.com/MINCPs/Jan-18/BEARISH.htm |
Table 1 QUICKSILVER on ETFS - 1/18/19 ETF CLOSE CHANGE PIVOT-PT 5-dma AROC CL-PWR CANDLE IP21 ITRA --------------------------------------------------------------------------------------------- DIA 247.05 3.25 238.94 148.7% Bullish BLUE .074 ------ --------------------------------------------------------------------------------------------- BA 364.73 5.64 350.36 167.4% Bullish BLUE .102 .037 --------------------------------------------------------------------------------------------- SPY 266.46 3.5 257.4 143.8% Bullish BLUE .136 .004 --------------------------------------------------------------------------------------------- QQQ 165.25 1.62 159.27 141% Bullish BLUE .085 .007 --------------------------------------------------------------------------------------------- MDY 330.79 4.39 318.98 155.7% Bullish BLUE .25 0 --------------------------------------------------------------------------------------------- IWM 147.33 1.5 142.25 126.8% Bullish BLUE .153 -.013 --------------------------------------------------------------------------------------------- FAS 56.48 2.3 49.67 703.4% Bullish BLUE .188 -.047 --------------------------------------------------------------------------------------------- RETL 30.02 1.5 27.44 341.8% Bullish BLUE .368 -.223 --------------------------------------------------------------------------------------------- SOXL 97.49 6.26 89.8 177.9% Bullish BLUE-.031 -.055 --------------------------------------------------------------------------------------------- TECL 97.51 4.18 87.5 416.7% Bullish BLUE .106 -.172 --------------------------------------------------------------------------------------------- IBB 110.47 .68 107.17 67.1% Bullish BLUE .055 .052 --------------------------------------------------------------------------------------------- GLD 121.02 -1.09 122.09 -32% ------- RED .048 .069 --------------------------------------------------------------------------------------------- RSX 20.51 .17 19.92 111.8% Bullish BLUE .238 -.014 |
Table 2    Count of Stocks in Key Directories
           2019-01-18
-------------------------------
NEWHIGHS       56
NEWLOWS        7
MAXCP          14
MINCP          3
TTTNH          20
TTTNL          6
FASTUP         76
FASTDOWN       57
CPCROSSA       12
CPCROSSD       30
BIGVOLUP       2
BIGVODN        8
ACCUMVER       5
HIGHIP21       7
HIUPPCT        6
VHIP21         12
LOWACCUM       296
REDSELL        145
AUGSELS7       9
TRAPDOOR       17
|
Table 2        RANKING OF KEY DIRECTORIES BASED PCT.OF STOCKS ABOVE 65-DMA
              1/18/19
Bullish = 37
Bearish =  9
---------------------------------------------------------------------------------------
Directory     Current       day-1         day-2         day-3         day-4         day-5
----------------------------------------------------------------------------------------
BONDFUND       .99           .98           .98           .971          .971          .98
HOMEBLDG       .882          .705          .705          .823          .823          .823
BIGBANKS       .857          .571          .714          .285          .142          .142
ETFS           .793          .655          .62           .517          .396          .568
DJI-13         .769          .384          .538          .384          .307          .307
SOFTWARE       .769          .723          .63           .646          .461          .553
INSURANC       .766          .633          .666          .433          .3            .333
REGBANKS       .75           .607          .607          .285          .214          .214
PIPELINE       .739          .695          .695          .695          .565          .652
FINANCE        .7            .588          .533          .377          .3            .311
JETS .7 .7 .5 .4 .4 .6 GREEN .695 .695 .608 .521 .478 .521 AUTO .692 .692 .666 .615 .641 .615 GAMING .666 .666 .625 .666 .583 .666 INFRA .666 .583 .388 .444 .416 .472 NIFTY .666 .578 .526 .543 .438 .543 FIDSTKS .661 .483 .43 .403 .327 .376 INDMATER .653 .512 .397 .358 .384 .41 CHINA .65 .55 .533 .416 .3 .483 CHEM .648 .462 .333 .314 .351 .351 GUNS .647 .647 .47 .411 .411 .411 NASD-100 .64 .56 .51 .52 .41 .51 SEMI .637 .517 .465 .448 .431 .508 HACKERS .636 .545 .5 .636 .454 .545 DOWJONES .633 .4 .433 .4 .3 .333 SP500 .63 .483 .413 .387 .303 .347 ELECTRON .629 .537 .487 .45 .413 .5 REIT .624 .617 .563 .456 .348 .409 RUS-1000 .621 .501 .428 .396 .331 .367 GOLD .62 .72 .7 .76 .84 .88 SOLAR .611 .611 .555 .555 .555 .611 COMODITY .595 .404 .333 .333 .428 .428 SP-100 .58 .473 .451 .43 .301 .376 UTILITY .575 .575 .525 .45 .325 .45 INDEXES .569 .424 .29 .252 .215 .263 FOOD .561 .421 .333 .333 .421 .421 BEVERAGE .555 .555 .444 .5 .444 .555 ============================================================================================ TRANSP .5 .3 .2 .15 .2 .25 ============================================================================================ RETAIL .49 .377 .358 .358 .245 .301 BIOTECH .473 .423 .405 .384 .331 .378 HOSPITAL .458 .5 .416 .333 .208 .291 MILITARY .437 .406 .281 .218 .218 .25 BIG17 .434 .456 .391 .434 .413 .478 COMPUTER .409 .318 .318 .318 .136 .181 OILGAS .376 .267 .205 .191 .184 .184 EDU .333 .333 .333 .333 .333 .333 COAL .285 .285 .142 .142 .142 .142 |
=====================================================================
1/17/2019 Today our Accumulation Index (IP21) turned positive and the A/D Line
and Closing Power yet rose again. The P-I is making a 12-month
high. If the DJI, SP-500 and the NASDAQ can next surpass and stay
above their 65-dma resistance as easily as they risen this far, it will be
hard to argue that we are not seeing a January take-off.
(See the discussion of our Hotline on 1/28/2013.
http://www.tigersoft.com/xxxindex.htm
)


The 65-dma is often a significant barrier for the DJI
when it is falling
like now. If the DJI does close above 24600, I think we have to assume
still higher prices lie ahead, especially if the Closing Powers keep
uptrending.
A January breadth take-off is very bullish. Some may not believe that
the political news can support this conclusion. The thing to realize is that the
stock market is paying attention to the prospects of an interest rate freeze
more than anything to else, even more than to the political dangers for Trump
if it turns out that he instructed his personal lawyer to lie to Congress about his
bargaining with Putin for rights to build a new Trump tower in Moscow,
even more than the polls showing the President is mostly being blamed
for the Government shut-down and even more than the harm the shut-down
will likely cause the Economy if it continues.
New Breadth-Based Buy B4
Last night, I reported on the bullish trading results
obtained by
buying in January when the real 15-day NYSE A/D differential,
adjusted by the number of stocks traded, reached the levels it
obtained yesteray. But I also pointed out that in all these previous
cases, the IP21 was positive. Well, today the IP21 has turned
positive. Only a close above the 65-dma is missing to meet these
minumum January breadth take-off values.
The results from this system are much more bullish in Janaury than
in any month. See the 11 cases below since 1929. Note that all the
key indicators shown below must be positive and the DJI should not be
more than 7.5% above the 21-dma. I think we also have to require
the DJI to be above the resistance of its 65-dma.
1/14/1931 85.4
--->72.4
la/ma=1.099
aroc=1.262 P=35 (+28) IP21=.058 OP=.159 65d-pct change=-.193
New B4 will eliminate this case.
#1 1/16/1934 103.4 --->110.7 on
2/15/1934
la/ma=1.049
aroc=1.786 P=174 (+32) IP21=.108 OP=.419 65d-pct change= .431
#2 1/14/1936 146.3 --->161.9 on
4/6/1936
la/ma=1.024
aroc= .417 P=83 (+14) IP21=.067 OP=.192 65d-pct change= .124
#3 1/9/1951 243.5 ---> 263.1 on
5/3/1951 (Also the year before Pres. Elect.)
la/ma=1.043
aroc=.901 P=175 (+28) IP21=.173 OP=.315 65d-pct change=.063
#4 1/22/1954
289.7 ---> Powerful Bull Mkt follows.
la/ma=1.022
aroc=.282 P=186 (+21) IP21=.112 OP=.169 65d-pct change=.068
#5 1/24/1958 450.7 ---> 436.9 on 2/25/58. Bull Mkt
follows.
la/ma=1.019 aroc=.583 P=234(+18)
IP21=.023 OP=.061 65d-pct change=.065
Biggest paper loss was here = 3.5%
#6 1/20/1967 847.16 ---> Powerful Bull
Mkt follows.
la/ma=1.022
aroc=.282 P=186 (+21) IP21=.112 OP=.169 65d-pct change=.068
#7 1/18/1971 847.82 --->
Powerful Bull Mkt follows.
la/ma=1.022
aroc=.282 P=186 (+21) IP21=.112 OP=.169 65d-pct change=.068
#8 1/20/1975 647.45 ---> Powerful Bull
Mkt follows.
la/ma=1.030 aroc= .835 P=262 (-13) IP21=.056 OP=
.348 65d-pct change=.008
#9 1/6/1976 890.82 ---> 1009.21 on 3/24/1976
la/ma=1.053 aroc=.871 P=251 (+50) IP21=.169 OP= .578
65d-pct change=.118
#10 1/28/1985 1277.83 ---> 1553.1 on 12/16/1985
la/ma=1.041 aroc=.732 P=347 (+281) IP21=.094 OP= .023 65d-pct
change=.043
#11 1/22/1987 2145.25 ---> 2405.54 4/6/1987 and then to 2720 in August.
la/ma=1.072 aroc= 1.310 P=255 (+55) IP21=.196 OP=.280
65d-pct change=.607
---------------------------------------------------------------------------------
Some of you are interest in the actual code used to generate
this new
type of January take-off Buy B4.
Sy$ = "DATA" or an earlier data file
f3$ = "c:\peerless\" & sy$ & ".txt"
nozz=zero
addenom = zero
On Error GoTo 40024
Open f3$ For Input As #1
40019 Input #1, a$ '- mo
Input #1, a$ '-da
Input #1, a$ '-yr
Input #1, a$ 'hi
Input #1, a$ 'lo
Input #1, a$ 'la
Input #1, advv
Input #1, decc
Input #1, a$ 'lo
Input #1, a$ 'la
addenom = advv + decc
nozz = nozz + 1
GoTo 40019
40024 Resume 40025
40025 Close : On Error GoTo 0
addivisor = addenom / nozz
If nozz = 0 Then Stop
For I = 21 To rn
chanad = adl(I) - adl(I - 16)
chanad = chanad / addivisor '(normalized by factoring # stks traded.)
If chanad > 1080 Then pi = I: BUYB4arrows (pi)
11109 Next I
--------------------------------------------------------------------------
SP-500 and NASDAQ (COMPQX)
|
Charts 1/17/2019 2018 PEERLESS DJI, Signals, Indicators Daily DJI Volume 10-DayUp/Down Vol Hourly DJIA A/D Line for All Stocks Inverted Traders Index NASDAQ S&P OEX NYSE COMPQX DJI-15 DJI-20 DJI-30 DIA SPY QQQ MDY IWM TNA Short-Term Rates USO-CrudeOil DBO FAS GLD BBH IBB JETS JNUG KOL NUGT OIH OIL RSX RETL SDS AGQ SLV SOXL TECL TLT TMF TNA UGA (gasoline) XIV YINN Commodities: CANE CORN DBC JJC, NIB, CHOC CORN, CUT (paper) MOO, SOYB WEAT UUP (Dollar) LIT (Lithium) AAPL ADBE ALXN AMAT AMGN AMD AMZN BA BABA BAC BIDU CAT CVX DE FB GOOG GS HD IBM INTU JPM M (Macy's) MSFT NFLX NVDA QCOM TSLA TXN XOM WMT CMG , LRCX, SWKS, MDGL SPPI WATT SQ TOWN 1/17/19 (Click on Underlined link.) - Bullish MAXCPs - http://tigersoft.com/MAXCPS/Jan-17/BULLISH.htm Bearish MAXCPs - http://tigersoft.com/MINCPs/Jan-17/BEARISH.htm |
Table 1 QUICKSILVER on ETFS - 1/17/19 ETF CLOSE CHANGE PIVOT-PT 5-dma AROC CL-PWR CANDLE IP21 ITRS --------------------------------------------------------------------------------------------- DIA 243.8 1.94 239.88 79.1% Bullish BLUE .034 ------ --------------------------------------------------------------------------------------------- BA 359.09 7.03 352.9 92% Bullish BLUE .099 .038 --------------------------------------------------------------------------------------------- SPY 262.96 1.98 258.98 78.7% Bullish BLUE .092 .001 --------------------------------------------------------------------------------------------- QQQ 163.63 1.28 160.69 72.9% Bullish BLUE .069 ------- --------------------------------------------------------------------------------------------- MDY 326.4 3.24 320.76 90.1% Bullish BLUE .2 -.003 --------------------------------------------------------------------------------------------- IWM 145.83 1.31 143.68 76.3% Bullish BLUE .097 -.019 --------------------------------------------------------------------------------------------- FAS 54.18 .84 49.24 501.5% Bullish BLUE .135 -.048 --------------------------------------------------------------------------------------------- SOXL 91.23 3.05 94.26 -25.9% Bullish BLUE-.075 -.131 --------------------------------------------------------------------------------------------- TECL 93.33 1.86 89.95 163.7% Bullish BLUE .079 -.203 --------------------------------------------------------------------------------------------- IBB 109.79 1.14 109.01 41% Bullish BLUE-.008 .05 --------------------------------------------------------------------------------------------- RSX 20.34 .12 20.06 42.3% Bullish BLUE .189 -.003 |
Table 2   Count of Stocks in Key Directories
          2019-01-17
-------------------------------
NEWHIGHS       50
NEWLOWS        8
MAXCP          17
MINCP          6
TTTNH          22
TTTNL          5
FASTUP         58
FASTDOWN       64
CPCROSSA       17
CPCROSSD       19
BIGVOLUP       2
BIGVODN        12
ACCUMVER       5
HIGHIP21       6
HIUPPCT        5
VHIP21         12
LOWACCUM       289
REDSELL        193
AUGSELS7       10
TRAPDOOR       17
|
 Table 3   RANKING OF KEY DIRECTORIES BASED PCT.OF STOCKS ABOVE 65-DMA
              1/17/19
 Bullish - 28
 Bearish = 18
---------------------------------------------------------------------------------------
Directory     Current       day-1         day-2         day-3         day-4         day-5
----------------------------------------------------------------------------------------
BONDFUND       .98           .98           .971          .971          .98           .971
SOFTWARE       .723          .63           .646          .461          .538          .523
GOLD           .72           .7            .76           .84           .86           .84
HOMEBLDG       .705          .705          .823          .823          .823          .823
JETS           .7            .5            .4            .4            .6            .3
GREEN          .695          .608          .521          .478          .478          .521
PIPELINE       .695          .695          .695          .565          .652          .652
AUTO           .692          .666          .615          .641          .589          .641
GAMING         .666          .625          .666          .583          .666          .625
ETFS           .655          .62           .517          .396          .551          .586
GUNS .647 .47 .411 .411 .411 .352 INSURANC .633 .666 .433 .3 .333 .3 REIT .617 .563 .456 .348 .395 .355 SOLAR .611 .555 .555 .555 .611 .611 REGBANKS .607 .607 .285 .214 .214 .214 FINANCE .588 .533 .377 .3 .277 .222 INFRA .583 .388 .444 .416 .472 .5 NIFTY .578 .526 .543 .438 .526 .561 UTILITY .575 .525 .45 .325 .45 .475 BIGBANKS .571 .714 .285 .142 .142 .142 NASD-100 .56 .51 .52 .41 .5 .51 BEVERAGE .555 .444 .5 .444 .5 .444 CHINA .55 .533 .416 .3 .45 .416 HACKERS .545 .5 .636 .454 .545 .545 ELECTRON .537 .487 .45 .413 .493 .5 SEMI .517 .465 .448 .431 .5 .491 INDMATER .512 .397 .358 .384 .41 .435 RUS-1000 .501 .428 .396 .331 .361 .339 N=28 ============================================================================================= HOSPITAL .5 .416 .333 .208 .291 .25 ============================================================================================= FIDSTKS .483 .43 .403 .327 .365 .392 SP500 .483 .413 .387 .303 .339 .329 SP-100 .473 .451 .43 .301 .344 .333 CHEM .462 .333 .314 .351 .351 .351 BIG17 .456 .391 .434 .413 .456 .478 INDEXES .424 .29 .252 .215 .252 .268 BIOTECH .421 .405 .384 .331 .376 .378 FOOD .421 .333 .333 .421 .421 .315 MILITARY .406 .281 .218 .218 .218 .218 COMODITY .404 .333 .333 .428 .428 .333 DOWJONES .4 .433 .4 .3 .333 .333 DJI-13 .384 .538 .384 .307 .307 .307 RETAIL .377 .358 .358 .245 .301 .32 EDU .333 .333 .333 .333 .333 .333 COMPUTER .318 .318 .318 .136 .181 .181 TRANSP .3 .2 .15 .2 .25 .05 COAL .285 .142 .142 .142 .142 .142 OILGAS .267 .205 .191 .184 .178 .184 |
====================================================================
1/16/2019 Yesterday Peerless produced a second Sell S12 in five days. This is
based on the IP21 (current Accumulation Index) being below zero as
DJI rises towards upper band. Note that it is now 3.6% over the
21-dma and the IP21 is still below zero, standing at -.039. Big money
is using the rally to the 24000 resistance to sell. The news is full of
reasons to scare folks into selling, but Professionals are very buying
on all weakness. The reason is clear: the Fed is just not likely to be
raising its rates soon.
New research tonight shows how bullish in January the excellent
breadth is. Unfortunately, none of the January take-offs on superb
breadth showed negative Accumulation. More on this tomorrow night.
I was asked about the significance of a second S12 in five trading days.
This is a rare event, but it did happen on three separate occasions in the
1970s, in August 1971 (when Nixon removed Gold as backing the Dollar
and institutued Price and Wage controls for a few months), in August
1972 and at the end of 1973. In the first case, the DJI fell 8%. In the
second two cases, the DJI fell back only to the lower band. What's
important is that in all three cases, the DJI rallied 3% higher before
declining. That may mean we will see a 3% paper loss here before
the DJI pulls back.
I was also asked about the paper losses with Sell S12s, generally speaking.
From 1929-1965, there were 50 Sell S12s. 15 of them produced
a paper loss of more than 2.8%. Between 1966 and 2018, there were
55 Sell S12s and 16 showed a paper loss of more than 2.8%. So, about
30% of the time there is a significant paper loss. That would amount to
680 points now.
I have been asked why we have not had a Buy B4 signal, which is
based on a big improvement in the P-Indicator or the Accumulation
Index. The answers here are that the negative IP21 and V-I prevent a
Buy B4.
But there is no mistaking the excellent breadth since December 26.
I wrote a program to test what happened in the past when the daily
difference between NYSE advances and declines for the last 15 trading days,
adjusted by the number of advances and declines is as good in our case now.
There were 18 earlier cases. All but a handful led to big advances in the market.
But none of them, not one, showed a negative IP21 as we see now. I will
post these cases since 1965 tomorrow night. I should add that there were only
three losses: 10/4/1973, 11/28/78 and 10/27/2011. Bulls will note, too, that
there were six big successes for this Bullish Breadth would-be signal
in January: 1/20/67, 1/18/71, 1/16/75, 1/6/1976, 1/24/1985 and 1/22/1987.
At this stage, in our market, I would still weight more heavily the negative
IP21. But, considering the rising Closing Powers, I would prefer to be
hedged if short DIA. If DIA does get back above its 65-dma, I would cover it.


|
Charts 1/16/2019 2018 PEERLESS DJI, Signals, Indicators Daily DJI Volume 10-DayUp/Down Vol Hourly DJIA A/D Line for All Stocks Inverted Traders Index NASDAQ S&P OEX NYSE COMPQX DJI-15 DJI-20 DJI-30 DIA SPY QQQ MDY IWM TNA Short-Term Rates USO-CrudeOil DBO FAS GLD BBH IBB JETS JNUG KOL NUGT OIH OIL RSX RETL SDS AGQ SLV SOXL TECL TLT TMF TNA UGA (gasoline) XIV YINN Commodities: CANE CORN DBC JJC, NIB, CHOC CORN, CUT (paper) MOO, SOYB WEAT UUP (Dollar) LIT (Lithium) AAPL ADBE ALXN AMAT AMGN AMD AMZN BA BABA BAC BIDU CAT CVX DE FB GOOG GS HD IBM INTU JPM M (Macy's) MSFT NFLX NVDA QCOM TSLA TXN XOM WMT CMG , LRCX, SWKS, MDGL SPPI WATT SQ TOWN 1/16/19 (Click on Underlined link.) - Bullish MAXCPs - http://tigersoft.com/MAXCPS/Jan-16/BULLISH.htm Bearish MAXCPs - http://tigersoft.com/MINCPs/Jan-16/BEARISH.htm |
Table 1 QUICKSILVER on ETFS - 1/16/19 ETF CLOSE CHANGE PIVOT-PT 5-dma AROC CL-PWR CANDLE IP21 ITRS --------------------------------------------------------------------------------------------- DIA 241.86 1.22 240 61.3% Bullish BLUE -.012 ---- --------------------------------------------------------------------------------------------- BA 352.06 -.18 352.61 117.4% Bullish RED .049 .016 --------------------------------------------------------------------------------------------- SPY 260.98 .63 258.88 58.2% Bullish BLUE .046 .001 --------------------------------------------------------------------------------------------- QQQ 162.35 -.03 161.28 47.5% Bullish RED .022 -.01 --------------------------------------------------------------------------------------------- MDY 323.16 2.21 320.62 79.7% Bullish BLUE .125 .001 --------------------------------------------------------------------------------------------- IWM 144.52 1.07 143.64 56.6% Bullish BLUE .048 -.012 --------------------------------------------------------------------------------------------- FAS 53.34 2.46 49.12 489.1% Bullish BLUE .088 -.059 --------------------------------------------------------------------------------------------- SOXL 88.18 -2.21 91.7 -55.5% Bullish RED -.134 -.182 --------------------------------------------------------------------------------------------- TECL 91.47 .15 90.38 126.6% Bullish RED .043 -.249 --------------------------------------------------------------------------------------------- IBB 108.65 -.59 108.9 53.1% Bullish RED -.038 .052 --------------------------------------------------------------------------------------------- GLD 122.27 .39 121.59 -1.6% Bullish BLUE .129 .095 --------------------------------------------------------------------------------------------- RSX 20.22 .17 20.17 39.9% Bullish BLUE .136 .004 Table 2 Count of Stocks in Key Directories
2019-01-16
-------------------------------
NEWHIGHS 41
NEWLOWS 7
MAXCP 10
MINCP 6
TTTNH 10
TTTNL 6
FASTUP 50
FASTDOWN 68
CPCROSSA 12
CPCROSSD 50
BIGVOLUP 4
BIGVODN 15
ACCUMVER 6
HIGHIP21 4
HIUPPCT 5
VHIP21 11
LOWACCUM 294 Still, lots of Big Money selling.
REDSELL 250
AUGSELS7 13
TRAPDOOR 16
|
Table 3  RANKING OF KEY DIRECTORIES BASED PCT.OF STOCKS ABOVE 65-DMA
              1/16/19
 Bullish = 20
 Bearish = 25
---------------------------------------------------------------------------------------
Directory     Current       day-1         day-2         day-3         day-4         day-5
----------------------------------------------------------------------------------------
BONDFUND       .98           .971          .971          .98           .971          .971
BIGBANKS       .714          .285          .142          .142          .142          .142
HOMEBLDG       .705          .823          .823          .823          .823          .705
GOLD           .7            .76           .84           .86           .84           .88
PIPELINE       .695          .695          .565          .652          .652          .652
AUTO           .666          .615          .641          .589          .615          .589
INSURANC       .666          .433          .3            .333          .3            .2
SOFTWARE       .63           .646          .461          .538          .507          .461
GAMING         .625          .666          .583          .666          .625          .625
ETFS           .62           .517          .396          .551          .568          .534
GREEN .608 .521 .478 .478 .521 .304 REGBANKS .607 .285 .214 .214 .214 .178 REIT .563 .456 .348 .395 .348 .288 SOLAR .555 .555 .555 .611 .611 .611 DJI-13 .538 .384 .307 .307 .307 .307 CHINA .533 .416 .3 .45 .416 .466
FINANCE .533 .377 .3 .277 .222 .2
NIFTY .526 .543 .438 .526 .543 .491
UTILITY .525 .45 .325 .45 .475 .325
NASD-100 .51 .52 .41 .5 .49 .44
********
==========================================================================================
HACKERS .5 .636 .454 .545 .545 .545
JETS .5 .4 .4 .6 .3 .2
==========================================================================================
ELECTRON .487 .45 .413 .493 .493 .425
GUNS .47 .411 .411 .411 .352 .352
SEMI .465 .448 .431 .5 .491 .439
SP-100 .451 .43 .301 .344 .333 .301
BEVERAGE .444 .5 .444 .5 .444 .333
DOWJONES .433 .4 .3 .333 .333 .333
^^^^^
FIDSTKS .43 .403 .327 .365 .381 .317
RUS-1000 .428 .396 .331 .361 .334 .29
HOSPITAL .416 .333 .208 .291 .25 .333
SP500 .413 .387 .303 .339 .327 .269
=====
BIOTECH .402 .384 .331 .376 .378 .342
INDMATER .397 .358 .384 .41 .435 .371
BIG17 .391 .434 .413 .456 .478 .456
INFRA .388 .444 .416 .472 .5 .472
RETAIL .358 .358 .245 .301 .301 .396
CHEM .333 .314 .351 .351 .351 .296
COMODITY .333 .333 .428 .428 .357 .476
EDU .333 .333 .333 .333 .333 .333
FOOD .333 .333 .421 .421 .333 .473
COMPUTER .318 .318 .136 .181 .181 .181
INDEXES .29 .252 .215 .252 .268 .225
MILITARY .281 .218 .218 .218 .218 .187
OILGAS .205 .191 .184 .178 .178 .136
TRANSP .2 .15 .2 .25 .05 .05
COAL .142 .142 .142 .142 .142 .142
|
====================================================================
1/15/2019 Peerless produced a second Sell S12 today. The necessary five days
has elapsed since the first S12 of the series. But the DJI rose slightly
past the flat 24000 resistance. The DJI is being boosted by a growing
belief that the FED will not be raising interest rates anytime soon
given the hit that the US economy will take from the Budget impasse.
Wall Street, no doubt, liked today's decision by DC Federal District Judge
Richard Leon.
https://en.wikipedia.org/wiki/Richard_J._Leon
https://www.washingtonpost.com/nation/2019/01/15/essence-involuntary-servitude-federal-unions-sue-trump-administration-get-paid-shutdown-work/?noredirect=on&utm_term=.01130e1b8c56
He threw out government workers' law suits asserting that
they
could not be made to work without being paid. The Judge asserted
that the safety consequences of their not working were far too serious to allow.
Today, the British Parliament may well pass a vote 'no confidence' on the
May Government. This will up-end Brexit and which party will next govern
England. This will probably cause a down-opening on Wall Street. But,
weak openings have recently been regularly reversed. This is normally
bullish for US stocks. I would stay short DIA but consider going long IBB
as a hedge.
 |
 |
 |
Sell S12, a remant. a relic of the past?
versus FED's New-Found Dovishness
For us, the problem is now whether to trust the normally
reliable January S12
or to wait until Professionals show some signs of net-selling. Almost every daily
weakness at the beginning of the last 14 trading days (since December 26th) has
been followed by a much higher closing. Such patterns are bullish as long
they last. This we see in the steeply rising Closing Powers and the many blue
candle-sticks on the major market ETFs. A higher opening followed by a
much lower close would break this pattern and foretell a market decline.
That these upward reversals are being driven by the Feds' 180
degree
reversal soon after Dec. 24th where they went from being proudly "hawkish" to
pre-dominately "dovish" is also strongly suggested by the dramatic reversal of
the NYSE Adv-Decline Line, which usually mirrows the outlook for interest
rates.
FIRST-OUT-OF-GATE
With the DJI above the flat 24000 resistance, we can consider
the
DJI making a short-term breakout that will likely have follow-through
until Professionals change their mind and the Closing Power uptrends
are broken. I would suggest hedging the DIA
short by buying IBB,
which represents NASDAQ biotechs. If 2019 were to turn out to
be very good year, we should consider buying the stocks that rush out of
the gate first after about three weeks.
Biotechs often rally past the day the DJI tops out. And at this point
many of their leaders are outperforming the DJI's 10% gain in the last
14 trading days.
14-Day Pct Gain, since 12-24-2018
=========================
TNA
+45% (3x leveraged Russ-2000)
IBB
+21%
BA in DIA-30 +19% (strongest DOW stock here.)
AXSM
+269%
INSM
+101%
LOXO
+80%
SNDX
+76%
PTLA
+57%
CELG
+49%
BIIB
+21%
VRTX
+20%
 |
 |
 |
|
Charts 1/15/2019 2018 PEERLESS DJI, Signals, Indicators Daily DJI Volume 10-DayUp/Down Vol Hourly DJIA A/D Line for All Stocks Inverted Traders Index NASDAQ S&P OEX NYSE COMPQX DJI-15 DJI-20 DJI-30 DIA SPY QQQ MDY IWM TNA Short-Term Rates USO-CrudeOil DBO FAS GLD BBH IBB JETS JNUG KOL NUGT OIH OIL RSX RETL SDS AGQ SLV SOXL TECL TLT TMF TNA UGA (gasoline) XIV YINN Commodities: CANE CORN DBC JJC, NIB, CHOC CORN, CUT (paper) MOO, SOYB WEAT UUP (Dollar) LIT (Lithium) AAPL ADBE ALXN AMAT AMGN AMD AMZN BA BABA BAC BIDU CAT CVX DE FB GOOG GS HD IBM INTU JPM M (Macy's) MSFT NFLX NVDA QCOM TSLA TXN XOM WMT CMG , LRCX, SWKS, MDGL SPPI WATT SQ TOWN 1/15/19 (Click on Underlined link.) - Bullish MAXCPs - http://tigersoft.com/MAXCPS/Jan-15/BULLISH.htm Bearish MAXCPs - http://tigersoft.com/MINCPs/Jan-15/BEARISH.htm |
Table 1 QUICKSILVER on ETFS - 1/15/19 ETF CLOSE CHANGE PIVOT-PT 5-dma AROC CL-PWR CANDLE IP21 ITRS --------------------------------------------------------------------------------------------- DIA 240.64 1.7 238.92 56.9% Bullish BLUE -.042 ----- --------------------------------------------------------------------------------------------- BA 352.24 1.88 343.83 168.2% Bullish BLUE .061 .035 --------------------------------------------------------------------------------------------- SPY 260.35 2.95 257.97 69.4% Bullish BLUE .032 .004 --------------------------------------------------------------------------------------------- QQQ 162.38 3.11 160.82 89.2% Bullish BLUE .013 -.002 --------------------------------------------------------------------------------------------- MDY 320.95 1.97 318.06 94.1% Bullish BLUE .07 .008 --------------------------------------------------------------------------------------------- IWM 143.45 1.2 142.9 60.2% Bullish BLUE .022 -.002 --------------------------------------------------------------------------------------------- FAS 50.88 1.21 48.5 322.4% Bullish BLUE .051 -.089 --------------------------------------------------------------------------------------------- RETL 27.73 .29 29.18 -131.3% Bullish BLUE .299 -.207 --------------------------------------------------------------------------------------------- SOXL 90.39 .59 89.19 424.4% Bullish ---- -.135 -.059 --------------------------------------------------------------------------------------------- TECL 91.32 3.82 89.2 294.5% ------- BLUE .039 -.229 --------------------------------------------------------------------------------------------- IBB 109.24 2.07 107.5 115.4% Bullish BLUE -.026 .092 --------------------------------------------------------------------------------------------- GLD 121.88 -.21 122.31 14.4% Bullish RED .134 .1 --------------------------------------------------------------------------------------------- RSX 20.05 .13 20.06 62.5% Bullish BLUE .11 .006 |
Table 2    Count of Stocks in Key Directories
          2019-01-15
-------------------------------
NEWHIGHS       42
NEWLOWS        7
MAXCP          15
MINCP          3
TTTNH          13
TTTNL          4
FASTUP         74
FASTDOWN       64
CPCROSSA       15
CPCROSSD       29
BIGVOLUP       8
BIGVODN        8
ACCUMVER       5
HIGHIP21       7
HIUPPCT        4
VHIP21         11
LOWACCUM       280
REDSELL        282
AUGSELS7       13
TRAPDOOR       18
|
Table 3RANKING OF KEY DIRECTORIES BASED PCT.OF STOCKS ABOVE 65-DMA 1/15/19 --------------------------------------------------------------------------------------- Directory Current day-1 day-2 day-3 day-4 day-5 ---------------------------------------------------------------------------------------- BONDFUND .971 .971 .98 .971 .971 .971 HOMEBLDG .823 .823 .823 .823 .705 .705 GOLD .76 .84 .86 .84 .88 .88 PIPELINE .695 .565 .652 .652 .652 .652 GAMING .666 .583 .666 .625 .625 .541 SOFTWARE .646 .461 .538 .507 .461 .461 HACKERS .636 .454 .545 .545 .545 .545 AUTO .615 .641 .589 .615 .589 .461 SOLAR .555 .555 .611 .611 .611 .444 NIFTY .543 .438 .526 .543 .491 .368 GREEN .521 .478 .478 .521 .304 .304 NASD-100 .52 .41 .5 .49 .44 .36 ETFS .517 .396 .551 .568 .517 .344 BEVERAGE .5 .444 .5 .444 .333 .333 REIT .456 .348 .395 .348 .288 .261 ELECTRON .45 .413 .493 .493 .425 .32 UTILITY .45 .325 .45 .475 .35 .45 SEMI .448 .431 .5 .491 .439 .327 INFRA .444 .416 .472 .5 .472 .277 BIG17 .434 .413 .456 .478 .434 .434 INSURANC .433 .3 .333 .3 .2 .2 SP-100 .43 .301 .344 .333 .301 .258 CHINA .416 .3 .45 .416 .466 .233 GUNS .411 .411 .411 .352 .352 .352 FIDSTKS .403 .327 .365 .381 .317 .295 DOWJONES .4 .3 .333 .333 .333 .266 JETS .4 .4 .6 .3 .2 .2 RUS-1000 .396 .331 .361 .334 .286 .249 SP500 .387 .303 .339 .327 .267 .228 DJI-13 .384 .307 .307 .307 .307 .23 BIOTECH .381 .331 .376 .378 .339 .31 FINANCE .377 .3 .277 .222 .188 .166 INDMATER .358 .384 .41 .435 .371 .32 RETAIL .358 .245 .301 .301 .396 .283 COMODITY .333 .428 .428 .357 .476 .476 EDU .333 .333 .333 .333 .333 .333 FOOD .333 .421 .421 .333 .473 .456 HOSPITAL .333 .208 .291 .25 .333 .25 COMPUTER .318 .136 .181 .181 .181 .136 CHEM .314 .351 .351 .351 .296 .296 BIGBANKS .285 .142 .142 .142 .142 .142 REGBANKS .285 .214 .214 .214 .178 .178 INDEXES .252 .215 .252 .268 .225 .209 MILITARY .218 .218 .218 .218 .187 .187 OILGAS .191 .184 .178 .178 .13 .143 TRANSP .15 .2 .25 .05 .05 0 COAL .142 .142 .142 .142 .142 .142 |
=================================================================
1/14/2019 The operative Peerless signal is a Sell S12. A retreat to the
DJI's lower band would be in keeping with the S12's excellent
January track record.

But it's also clear that the FED would like to lift the DJI some more,
quite possibly all the way back to 27000. A consortium representing
the White House, the Fed and Wall Street Big Banks appears to be
seeking this. As proof, today, one the FOMC "doves" suggested that
now there might only need to be one US rate hike in 2019.
Still, the Accumulation remains quite negative. This shows that Big Money
is selling into this DJI rally back to 24000 and the resistance there.
Fears that the President's shut-down will have serious consequences
for the Economy, the Nation and the Republican Party may lie behind
this big money distribution. Of course, since the DJI has now rallied
exactly 10% up off its low, traders like us are to taker profits, too.
From Bloomberg: In a Month You’ll Wish the
Shutdown Were Only as Bad as Today
For now, we should see that our Closing Powers are still
rising for the main
ETFs and our Candle-Stick charts remain blue. After the sweep upwards,
candle-sticks turning from blue to green would be expected to bring a short-term
decline. Once again, today's closing was above the day's opening. This
kept the TigerSoft ETF candle-sticks blue and still short-term bullish.
The prospect of a longer freeze in rate hikes has a tendency
to help
small companies more than big ones. See below that IWM alone among
the major ETFs has not generated an optimized TigerSoft sell.
DIA |
SPY |
QQQ |
SOXL |
IWM |
|
Charts 1/14/2019 2018 PEERLESS DJI, Signals, Indicators Daily DJI Volume 10-DayUp/Down Vol Hourly DJIA A/D Line for All Stocks Inverted Traders Index NASDAQ S&P OEX NYSE COMPQX DJI-15 DJI-20 DJI-30 DIA SPY QQQ MDY IWM TNA Short-Term Rates USO-CrudeOil DBO FAS GLD BBH IBB JETS JNUG KOL NUGT OIH OIL RSX RETL SDS AGQ SLV SOXL TECL TLT TMF TNA UGA (gasoline) XIV YINN Commodities: CANE CORN DBC JJC, NIB, CHOC CORN, CUT (paper) MOO, SOYB WEAT UUP (Dollar) LIT (Lithium) AAPL ADBE ALXN AMAT AMGN AMD AMZN BA BABA BAC BIDU CAT CVX DE FB GOOG GS HD IBM INTU JPM M (Macy's) MSFT NFLX NVDA QCOM TSLA TXN XOM WMT CMG , LRCX, SWKS, MDGL SPPI WATT SQ TOWN 1/14/2019 (Click on Underlined link.) - Bullish MAXCPs - http://tigersoft.com/MAXCPS/Jan-14/BULLISH.htm Bearish MAXCPs - http://tigersoft.com/MINCPs/Jan-14/BEARISH.htm |
Table 1 QUICKSILVER on ETFS - 1/14/19 ETF CLOSE CHANGE PIVOT-PT 5-dma AROC CL-PWR CANDLE IP21 ITRS --------------------------------------------------------------------------------------------- DIA 238.94 -.94 237.92 75.1% ------- BLUE -.066 ----- --------------------------------------------------------------------------------------------- BA 350.36 -2.54 340.53 323.8% Bullish BLUE .031 .041 --------------------------------------------------------------------------------------------- SPY 257.4 -1.58 256.77 58.7% ------- BLUE .004 .001 --------------------------------------------------------------------------------------------- QQQ 159.27 -1.42 159.52 36.9% ------- ---- -.019 -.001 --------------------------------------------------------------------------------------------- MDY 318.98 -1.78 314.95 145.5% Bullish BLUE .013 .003 --------------------------------------------------------------------------------------------- IWM 142.25 -1.43 141.73 93.5% ------- RED -.032 -.011 --------------------------------------------------------------------------------------------- FAS 49.67 .43 47.73 276.3% Bullish BLUE .003 -.081 --------------------------------------------------------------------------------------------- RETL 25.24 -.84 28.11 -449.2% Bearish RED .042 -.368 --------------------------------------------------------------------------------------------- SOXL 89.8 -4.46 82.79 323.5% Bullish RED -.138 -.035 --------------------------------------------------------------------------------------------- TECL 87.5 -2.45 86.1 207.6% ------- BLUE .016 -.212 --------------------------------------------------------------------------------------------- IBB 107.17 -1.84 106.75 54.8% ------- RED -.068 .073 --------------------------------------------------------------------------------------------- GLD 122.09 .29 121.53 9.4% ------- RED .157 .094 --------------------------------------------------------------------------------------------- RSX 20.23 -.32 20.36 -117.3% ------- RED -.012 -.022 |
Table 2    Count of Stocks in Key Directories
          2019=01=14
-------------------------------
NEWHIGHS       32
NEWLOWS        6
MAXCP          6
MINCP          4
TTTNH          14
TTTNL          12
FASTUP         71
FASTDOWN       54
CPCROSSA       9
CPCROSSD       64
BIGVOLUP       4
BIGVODN        10
ACCUMVER       6
HIGHIP21       2
HIUPPCT        4
VHIP21         11
LOWACCUM       286
REDSELL        309
AUGSELS7       12
TRAPDOOR       17
|
Table 3 RANKING OF KEY DIRECTORIES BASED PCT.OF STOCKS ABOVE 65-DMA 1/14/19 Bullish 7 Bearish 40 --------------------------------------------------------------------------------------- Directory Current day-1 day-2 day-3 day-4 day-5 ---------------------------------------------------------------------------------------- BONDFUND .971 .98 .971 .971 .961 .933 GOLD .84 .86 .84 .88 .88 .86 HOMEBLDG .823 .823 .823 .705 .705 .647 AUTO .641 .589 .615 .589 .461 .384 GAMING .583 .666 .625 .625 .541 .458 PIPELINE .583 .666 .666 .666 .666 .416 SOLAR .555 .611 .611 .611 .444 .5 ============================================================================================= GREEN .478 .478 .521 .304 .304 .173 SOFTWARE .461 .538 .507 .461 .461 .307 HACKERS .454 .545 .545 .545 .5 .363 BEVERAGE .444 .5 .444 .333 .333 .277 NIFTY .438 .526 .543 .491 .368 .315 SEMI .431 .5 .491 .439 .327 .31 COMODITY .428 .428 .357 .476 .476 .452 FOOD .421 .421 .333 .473 .456 .438 INFRA .416 .472 .5 .472 .277 .194 BIG17 .413 .456 .478 .434 .434 .413 ELECTRON .413 .493 .493 .425 .314 .283 GUNS .411 .411 .352 .352 .352 .352 NASD-100 .41 .5 .49 .44 .35 .33 JETS .4 .6 .3 .2 .2 .2 ETFS .396 .551 .568 .517 .327 .275 INDMATER .384 .41 .435 .371 .32 .32 CHEM .351 .351 .351 .296 .296 .24 REIT .348 .395 .348 .288 .261 .154 EDU .333 .333 .333 .333 .333 .333 RUS-1000 .331 .361 .334 .286 .246 .174 BIOTECH .328 .376 .378 .339 .305 .276 FIDSTKS .327 .365 .381 .317 .295 .209 UTILITY .325 .45 .475 .35 .45 .25 DJI-13 .307 .307 .307 .307 .23 .076 SP500 .303 .339 .327 .267 .224 .148 SP-100 .301 .344 .333 .301 .258 .15 CHINA .3 .45 .416 .466 .233 .216 DOWJONES .3 .333 .333 .333 .266 .166 FINANCE .3 .277 .222 .188 .166 .133 INSURANC .3 .333 .3 .2 .2 .166 RETAIL .245 .301 .301 .396 .264 .15 MILITARY .218 .218 .218 .187 .187 .125 REGBANKS .214 .214 .214 .178 .178 .107 INDEXES .209 .252 .268 .225 .204 .198 HOSPITAL .208 .291 .25 .333 .208 .125 TRANSP .2 .25 .05 .05 0 0 OILGAS .19 .183 .183 .136 .149 .108 BIGBANKS .142 .142 .142 .142 .142 0 COAL .142 .142 .142 .142 .142 .142 COMPUTER .136 .181 .181 .181 .136 .09 |
====================================================================
1/11/2019 The Hourly DJIA has
reached the round-number 24000 Thursday
and failed to get past it again on Friday. It looks like it will break its
uptrend on Monday. The reason we can guess is because more and
more Republicans see Trump's hold-out for his wall has too high a political
price now that the Federal Goverment has gone un-funded a record time.
This is probably signifcant for Wall Street despite the Fed's change of
heart about interest rates in 2019. I would guess this is why Big Money
selling remains so heavy and why Peerless has given a Sell S12.
January Sell S12s are particularly reliable, even when breadth is strong
and the P-Indicator is positive. Our Sell S12 shows particularly heavy
current red Distribution. I think we should believe it and sell Short DIA
and take profits in SOXL and NVDA.
Another reason to be bearish is the number of major ETFs and
DJIA-30
stocks whose Tiger charts have produced optimized
red Sells. These are the
signals TigerSoft automatically posts after calculating "in a blink" the returns
of 60 different trading systems. The red signals are the best system's Buy
and Sell signals.
Optimized Red Sell Signals (!! = new)
close System
IP21
gain for
last year
DIA!! 239.88 66%
-.094
BA 352.9
68.1% +.01
CAT 132.1 106.3%
-.159
DIS 112.65
21.9% -.079
GS 176.93
68.1% -.048
IBM 121.46 31.4%
-.107
INTC!! 48.93 53.4%
-.134
MMM!! 192.21 68.3% -.145
NKE 76.04
64.4% -.076
QQQ!! 160.69 47.0%
-.052
SOXL!! 94.26 603.7%
-.146
TRV!! 120.47 52.9%
-.161
The main hope for the Bullish is the Treasury-White
House-Wall Street
consortium that want the market to go back up to its Summer highs through
a halt in rises of interest rates. The DJI is now down over 150. If it can be
turned up from its opening Monday and close above the opening, then the
Closing Power will rise tomorrow. This may allow the DJI to go up slightly more.
But the past January S12s seldom bring sizeable paper losses and I doubt if
the DJI can retrace more than 50% of what it lost without a pullback.
Hourly DJIA is fighting to get
past 24000 resistance and still staying in an uptrend. |
DJIA and PEERLESS SIGNALS
S12 vs steeply rising NYSE ADL. |
DIA and Automatic TIGER SIGNALS  WEEKLY DJIA shows Resistance may be at 25000 and then 27250  |
SPY - Exploded chart |
 |
 |
 |
|
Charts 1/11/2019 2018 PEERLESS DJI, Signals, Indicators Daily DJI Volume 10-DayUp/Down Vol Hourly DJIA A/D Line for All Stocks Inverted Traders Index NASDAQ S&P OEX NYSE COMPQX DJI-15 DJI-20 DJI-30 DIA SPY QQQ MDY IWM TNA Short-Term Rates USO-CrudeOil DBO FAS GLD BBH IBB JETS JNUG KOL NUGT OIH OIL RSX RETL SDS AGQ SLV SOXL TECL TLT TMF TNA UGA (gasoline) XIV YINN Commodities: CANE CORN DBC JJC, NIB, CHOC CORN, CUT (paper) MOO, SOYB WEAT UUP (Dollar) LIT (Lithium) AAPL ADBE ALXN AMAT AMGN AMD AMZN BA BABA BAC BIDU CAT CVX DE FB GOOG GS HD IBM INTU JPM M (Macy's) MSFT NFLX NVDA QCOM TSLA TXN XOM WMT CMG , LRCX, SWKS, MDGL SPPI WATT SQ TOWN 1/11/2019 (Click on Underlined link.) - Bullish MAXCPs - http://tigersoft.com/MAXCPS/Jan-11/BULLISH.htm Bearish MAXCPs - http://tigersoft.com/MINCPs/Jan-11/BEARISH.htm |
Table 1 QUICKSILVER on ETFS - 1/11/19 ETF CLOSE CHANGE PIVOT-PT 5-dma AROC CL-PWR CANDLE IP21 ITRS --------------------------------------------------------------------------------------------- DIA 239.88 -.12 235.36 118% ------- BLUE -.094 0 --------------------------------------------------------------------------------------------- BA 352.9 .29 328.11 381.5% Bullish BLUE .01 .07 --------------------------------------------------------------------------------------------- SPY 258.98 .1 254.38 128.7% ------- BLUE -.026 0 --------------------------------------------------------------------------------------------- QQQ 160.69 -.59 158.09 140.1% ------- BLUE -.052 .003 --------------------------------------------------------------------------------------------- MDY 320.76 .14 309.76 229.5% ------- BLUE -.005 .005 --------------------------------------------------------------------------------------------- IWM 143.68 .04 139.59 230.1% Bullish BLUE -.041 -.002 --------------------------------------------------------------------------------------------- FAS 49.24 .12 47 309% Bullish BLUE -.046 -.075 --------------------------------------------------------------------------------------------- RETL 28.11 .44 27.69 519% Bullish BLUE .255 -.186 --------------------------------------------------------------------------------------------- SOXL 94.26 2.56 84.08 868.5% Bullish BLUE -.146 .111 --------------------------------------------------------------------------------------------- TECL 89.95 -.43 83.85 477.7% ------- BLUE -.012 -.188 --------------------------------------------------------------------------------------------- IBB 109.01 .11 105.99 303.7% Bullish BLUE -.047 .081 --------------------------------------------------------------------------------------------- GLD 121.8 .21 121.86 14.8% Bullish BLUE .155 .066 --------------------------------------------------------------------------------------------- RSX 20.06 -.11 19.72 88% Bullish ---- .129 .01
|
 Table 2   Count of Stocks in Key Directories
           20190=01=11
-------------------------------
NEWHIGHS       39
NEWLOWS        3
MAXCP          8
MINCP          2
TTTNH          10
TTTNL          7
FASTUP         147
FASTDOWN       31
CPCROSSA       10
CPCROSSD       27
BIGVOLUP       4
BIGVODN        11
ACCUMVER       6
HIGHIP21       2
HIUPPCT        5
VHIP21         11
LOWACCUM       295
REDSELL        338
AUGSELS7       10
TRAPDOOR       17
|
Table 3 RANKING OF KEY DIRECTORIES BASED PCT.OF STOCKS ABOVE 65-DMA
               1/11/19
 Bullish = 12
 Bearish = 32
---------------------------------------------------------------------------------------
Directory     Current       day-1         day-2         day-3         day-4         day-5
----------------------------------------------------------------------------------------
BONDFUND       .98           .971          .971          .961          .933          .895
GOLD           .86           .84           .88           .88           .86           .88
HOMEBLDG       .823          .823          .705          .705          .588          .47
GAMING         .666          .625          .625          .541          .458          .375
PIPELINE       .666          .666          .666          .666          .416          .333
SOLAR .611 .611 .611 .444 .5 .388 JETS .6 .3 .2 .2 .2 .1 AUTO .589 .615 .589 .461 .384 .256 ETFS .551 .568 .517 .327 .241 .206 HACKERS .545 .545 .545 .5 .363 .181 SOFTWARE .538 .507 .461 .461 .292 .215 NIFTY .526 .543 .491 .368 .298 .192 ========================================================================================= BEVERAGE .5 .444 .333 .333 .333 .222 NASD-100 .5 .49 .44 .35 .32 .26 SEMI .5 .491 .439 .327 .31 .215 ========================================================================================= ELECTRON .493 .493 .425 .314 .283 .185 GREEN .478 .521 .304 .304 .173 .217 INFRA .472 .5 .472 .277 .194 .138 BIG17 .456 .478 .434 .434 .413 .195 CHINA .45 .416 .466 .233 .216 .2 UTILITY .45 .475 .35 .45 .25 .275 COMODITY .428 .357 .476 .476 .452 .428 FOOD .428 .339 .482 .464 .446 .428 GUNS .411 .352 .352 .352 .352 .235 INDMATER .41 .435 .371 .32 .32 .269 REIT .395 .348 .288 .261 .154 .134 BIOTECH .373 .378 .339 .305 .273 .207 FIDSTKS .365 .381 .317 .295 .209 .177 RUS-1000 .361 .334 .286 .246 .17 .134 CHEM .351 .351 .296 .296 .24 .185 SP-100 .344 .333 .301 .258 .15 .129 SP500 .339 .327 .267 .224 .144 .118 DOWJONES .333 .333 .333 .266 .166 .166 EDU .333 .333 .333 .333 .333 .5 INSURANC .333 .3 .2 .2 .166 .2 DJI-13 .307 .307 .307 .23 .076 .076 RETAIL .301 .301 .396 .264 .15 .15 HOSPITAL .291 .25 .333 .208 .125 .125 FINANCE .277 .222 .188 .166 .133 .133 TRANSP .25 .05 .05 0 0 0 INDEXES .248 .264 .221 .2 .2 .156 MILITARY .218 .218 .187 .187 .125 .093 REGBANKS .214 .214 .178 .178 .107 .107 OILGAS .183 .183 .136 .149 .108 .081 COMPUTER .181 .181 .181 .136 .09 .09 BIGBANKS .142 .142 .142 .142 0 0 COAL .142 .142 .142 .142 .142 .142 |
====================================================================
1/10/2019 The Peerless Sell S12 signal
tells us that the DJI is likely to
reverse in the next week and probably retest 23000 and
probably 22000. Note that the current IP21 (Accum. Index)|
was stands at a very negative (-.152) with the DJI at the
upper 2.4% upper band. This is a much bigger divergence
than in any of the 16 earlier S12s, all of which worked out
profitably.
It's true the NYSE A/D Line is still in an uptrend and the P-Indicator
has turned positive. Perhaps, sellers are waiting for the DJI to
make a 50% recovery before reversing. With the FOMC postponing
another rate hike until May, at the earliest, we probably should
wait for the steep NYSE A/D Line to break its downtrend.
None of the 16 earlier January S12s occurred, as now, when the
FOMC had just reversed itself so dramatically.


IMPORTANT
Compare the current Janaury S12 with
the 16 earlier examples of these S12s.
In none of these past cases did the FED reverse
itself and suddenly become so dovish. So,
waiting for the A/D Line to breaks its uptrend
now may cost us a few points, but it will show
that the boost given by the FED is probably exhausted.
| 1940
lowest IP21 in these earlier cases.  |
1949
50% retracement |
| 1960
Look at how very negaive the V-I was. (This had to be estimated.)  |
| 1966
Big Money knew that LBJ's war in Vietnam was bringing Inflation and the FED would be raising interest rates very soon.  |
Interest Rates were rising. |
| 1973
Partisan buying climaxed and interest rates were rising.  |
| 1974
DJI could not get back above its falling 65-dma.  |
1981
Interest rates were very high and rising. |
| 1982
Bear Market variety. DJI reverses at 65-dma.
|
| 1983
S12 stops a DJI breakout into all-time high territory, normally a most bullish time.  |
| 1984
Volcker starts to raise rates again, despite serious economic weakness in Mid-West, Texas and Oklahoma.  |
| 2000
Greenspan decides to "take the punch-bowl" away from the speculative party.  |
| 2001
Supreme Court accords Presidency to Bush and S12 still drops the DJI to the lower band. The P-Indicator was wuite positive.  |
| 2003
S12 works out at 3.1% upper band even though IP21 is positive.  |
| 2009
Bear Market variety. IP21 is positive but DJI is at 3.7% upper band.  |
|
Charts 1/10/2019 2018 PEERLESS DJI, Signals, Indicators Daily DJI Volume 10-DayUp/Down Vol Hourly DJIA A/D Line for All Stocks Inverted Traders Index NASDAQ S&P OEX NYSE COMPQX DJI-15 DJI-20 DJI-30 DIA SPY QQQ MDY IWM TNA Short-Term Rates USO-CrudeOil DBO FAS GLD BBH IBB JETS JNUG KOL NUGT OIH OIL RSX RETL SDS AGQ SLV SOXL TECL TLT TMF TNA UGA (gasoline) XIV YINN Commodities: CANE CORN DBC JJC, NIB, CHOC CORN, CUT (paper) MOO, SOYB WEAT UUP (Dollar) LIT (Lithium) AAPL ADBE ALXN AMAT AMGN AMD AMZN BA BABA BAC BIDU CAT CVX DE FB GOOG GS HD IBM INTU JPM M (Macy's) MSFT NFLX NVDA QCOM TSLA TXN XOM WMT CMG , LRCX, SWKS, MDGL SPPI WATT SQ TOWN 1/10/2019 (Click on Underlined link.) - Bullish MAXCPs - http://tigersoft.com/MAXCPS/Jan-10/BULLISH.htm Bearish MAXCPs - http://tigersoft.com/MINCPs/Jan-10/BEARISH.htm |
Table 1 QUICKSILVER on ETFS - 1/10/19 ETF CLOSE CHANGE PIVOT-PT 5-dma AROC CL-PWR CANDLE IP21 ITRS --------------------------------------------------------------------------------------------- DIA 240 1.08 234.28 283% ------- BLUE -.124 ------ --------------------------------------------------------------------------------------------- BA 352.61 8.78 327.08 631.8% ------- BLUE -.03 .008 --------------------------------------------------------------------------------------------- SPY 258.88 .91 252.39 289.8% ------- BLUE -.064 .002 --------------------------------------------------------------------------------------------- QQQ 161.28 .46 156.23 365.2% ------- BLUE -.073 -.006 --------------------------------------------------------------------------------------------- MDY 320.62 2.56 306.35 388% ------- BLUE -.051 .008 --------------------------------------------------------------------------------------------- IWM 143.64 .74 137.19 410.5% ------- BLUE -.076 0 --------------------------------------------------------------------------------------------- FAS 49.12 .62 46.29 716.6% ------- BLUE -.094 -.06 --------------------------------------------------------------------------------------------- RETL 27.67 -1.51 25.24 827.6% ------- BLUE .244 -.178 --------------------------------------------------------------------------------------------- SOXL 91.7 2.51 79.42 1316.5% ------- BLUE -.192 .058 --------------------------------------------------------------------------------------------- TECL 90.38 1.18 81.71 1080.8% ------- BLUE -.038 -.216 --------------------------------------------------------------------------------------------- IBB 108.9 1.4 102.55 540.9% ------- BLUE -.072 .078 --------------------------------------------------------------------------------------------- GLD 121.59 -.72 121.44 -34.5% Bullish RED .159 .068 --------------------------------------------------------------------------------------------- RSX 20.17 .11 19.71 279.6% Bullish BLUE .109 .021 |
 Table 2
 Count of Stocks in Key Directories
          2019-01-10
-------------------------------
NEWHIGHS       45
NEWLOWS        8
MAXCP          8
MINCP          4
TTTNH          14
TTTNL          8
FASTUP         381  Swingtraders remain bullish
FASTDOWN       27
CPCROSSA       9
CPCROSSD       41
BIGVOLUP       2
BIGVODN        8
ACCUMVER       2
HIGHIP21       3
HIUPPCT        5
VHIP21         13
LOWACCUM       307
REDSELL        362
AUGSELS7       7
TRAPDOOR       19
|
 Table 3
 RANKING OF KEY DIRECTORIES BASED PCT.OF STOCKS ABOVE 65-DMA
             1/10/19
 Bullish = 12
 Bearish = 34
---------------------------------------------------------------------------------------
Directory     Current       day-1         day-2         day-3         day-4         day-5
----------------------------------------------------------------------------------------
BONDFUND       .971          .971          .961          .933          .876          .904
GOLD           .84           .88           .88           .86           .88           .84
HOMEBLDG       .823          .705          .705          .588          .47           .294
PIPELINE       .666          .666          .666          .416          .333          .166
GAMING         .625          .625          .541          .458          .375          .208
AUTO           .615          .589          .461          .384          .256          .128
SOLAR          .611          .611          .444          .5            .388          .166
ETFS           .568          .517          .327          .241          .206          .12
HACKERS        .545          .545          .5            .363          .181          .09
NIFTY          .543          .491          .368          .298          .192          .052
GREEN .521 .304 .304 .173 .217 .086 SOFTWARE .507 .461 .461 .292 .215 .123 ============================================================================================= INFRA .5 .472 .277 .194 .138 0 ============================================================================================= ELECTRON .493 .425 .314 .283 .185 .098 SEMI .491 .439 .327 .31 .215 .112 NASD-100 .49 .44 .35 .32 .25 .09 BIG17 .478 .434 .434 .413 .195 .152 UTILITY .475 .35 .45 .25 .275 .2 BEVERAGE .444 .333 .333 .333 .222 .111 INDMATER .435 .371 .32 .32 .269 .166 CHINA .416 .466 .233 .216 .2 .066 FIDSTKS .381 .317 .295 .209 .177 .059 BIOTECH .376 .339 .305 .273 .202 .128 COMODITY .357 .476 .476 .452 .428 .428 GUNS .352 .352 .352 .352 .235 .058 CHEM .351 .296 .296 .24 .185 .129 REIT .348 .288 .261 .154 .127 .073 RUS-1000 .334 .286 .246 .17 .135 .067 DOWJONES .333 .333 .266 .166 .166 .033 ^^^^^^^^ EDU .333 .333 .333 .333 .5 .333 FOOD .333 .473 .456 .438 .421 .421 SP-100 .333 .301 .258 .15 .129 .021 SP500 .327 .267 .224 .144 .12 .05 DJI-13 .307 .307 .23 .076 .076 0 RETAIL .301 .396 .264 .15 .15 .094 INSURANC .3 .2 .2 .166 .2 .133 JETS .3 .2 .2 .2 .1 .1 INDEXES .264 .221 .2 .2 .172 .178 HOSPITAL .25 .333 .208 .125 .125 .083 FINANCE .222 .188 .166 .133 .133 .1 REGBANKS .214 .178 .178 .107 .107 .035 MILITARY .193 .161 .161 .096 .064 .064 OILGAS .183 .136 .149 .108 .074 .034 COMPUTER .181 .181 .136 .09 .09 .045 BIGBANKS .142 .142 .142 0 0 0 COAL .142 .142 .142 .142 .142 .142 TRANSP .05 .05 0 0 0 0 |

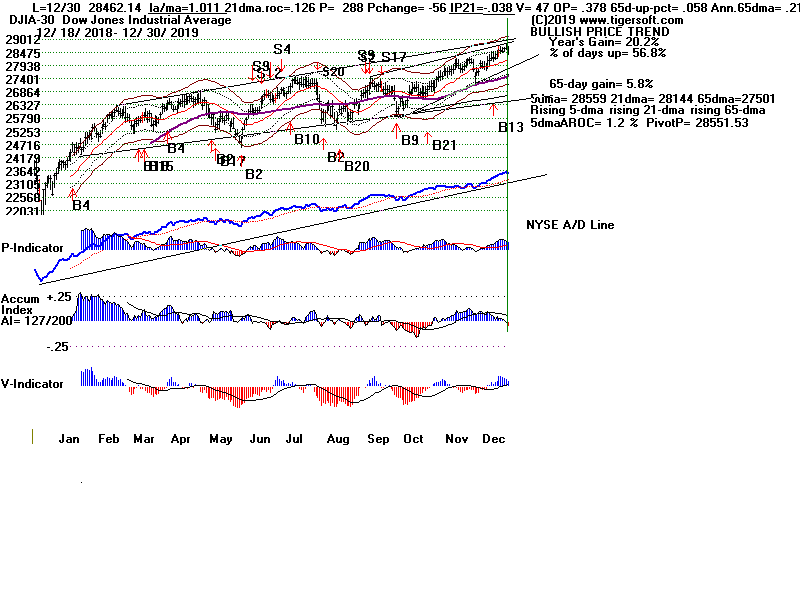
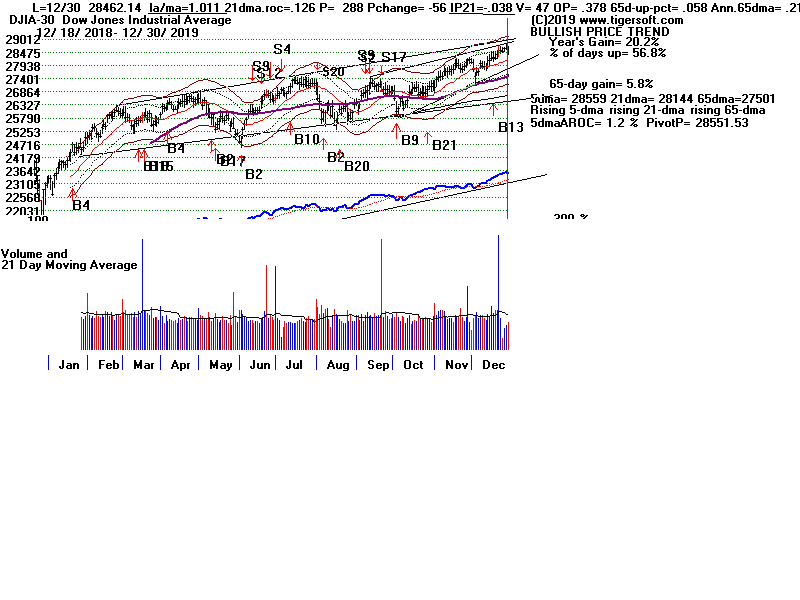
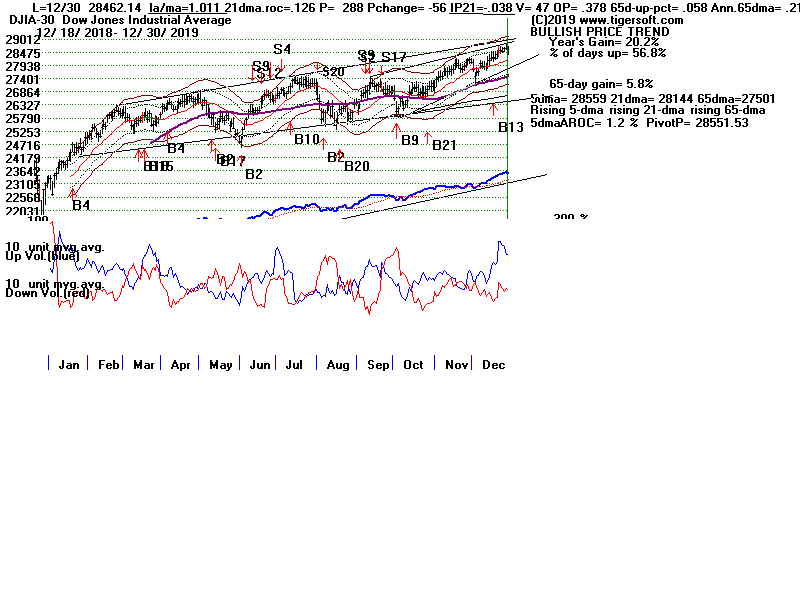
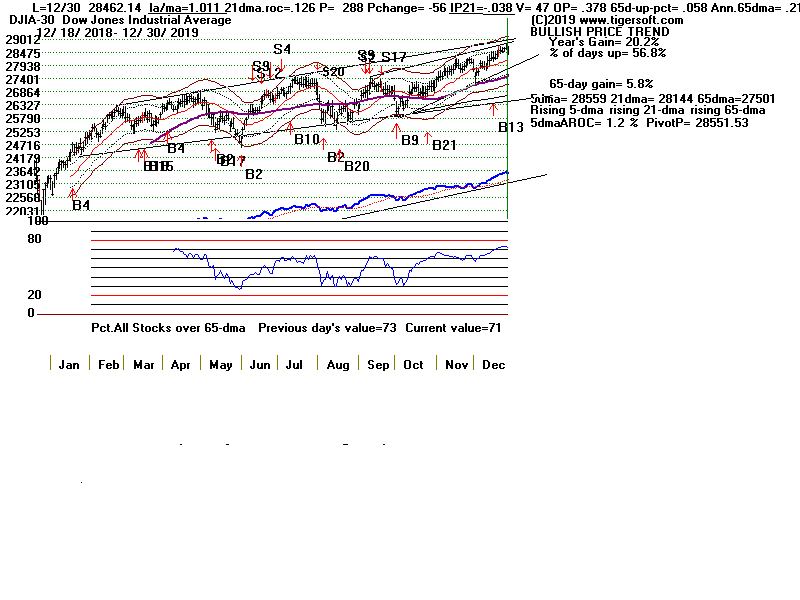
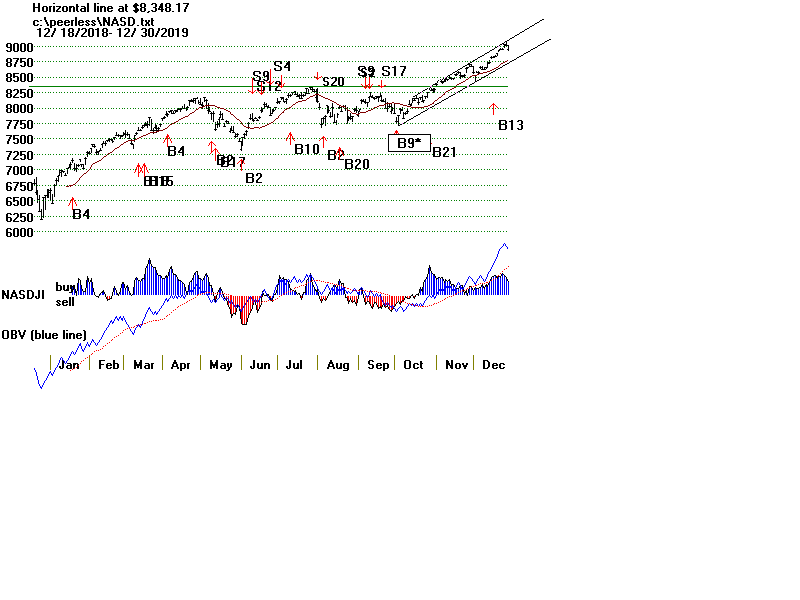
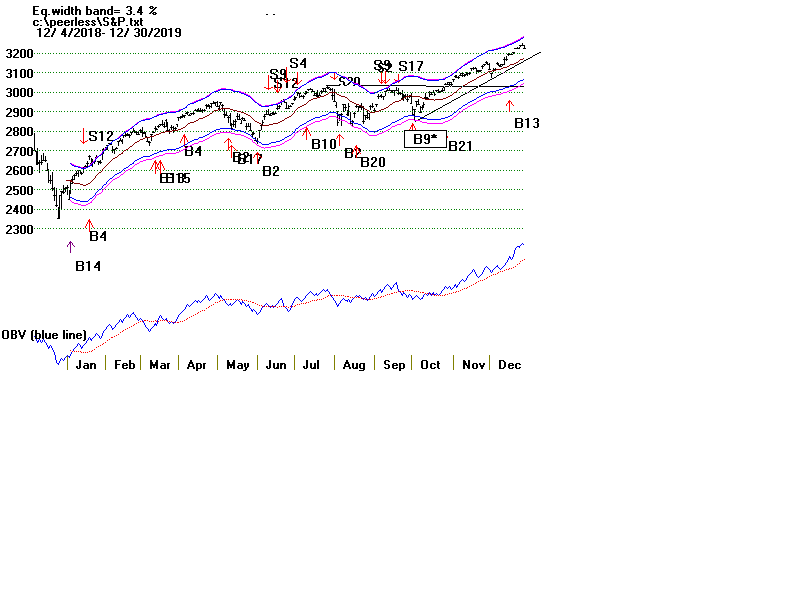
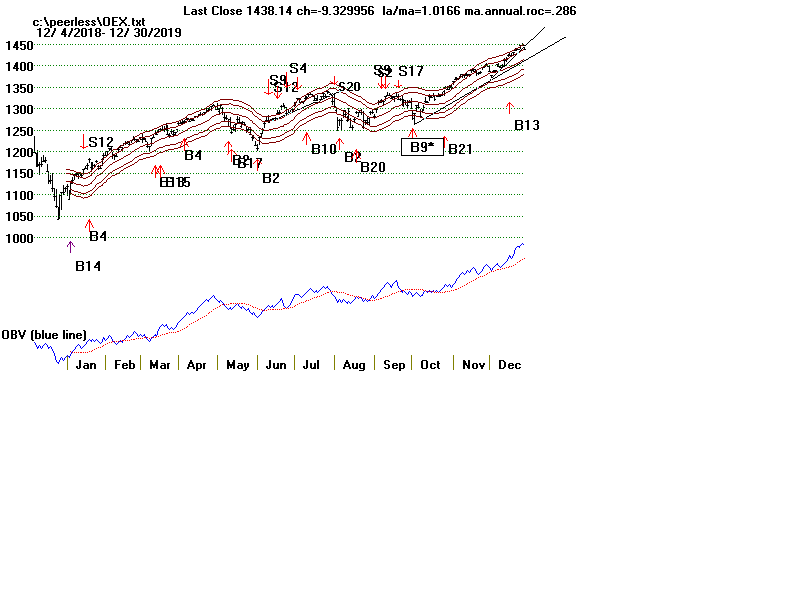
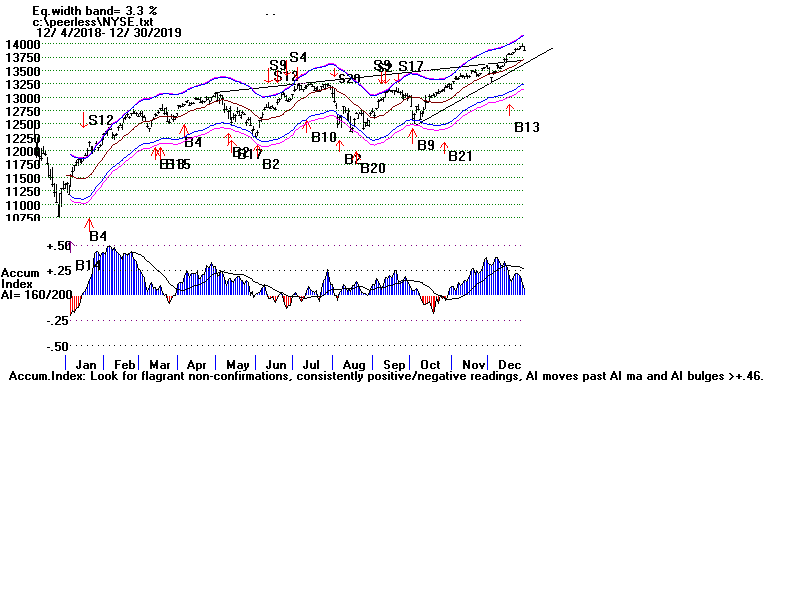
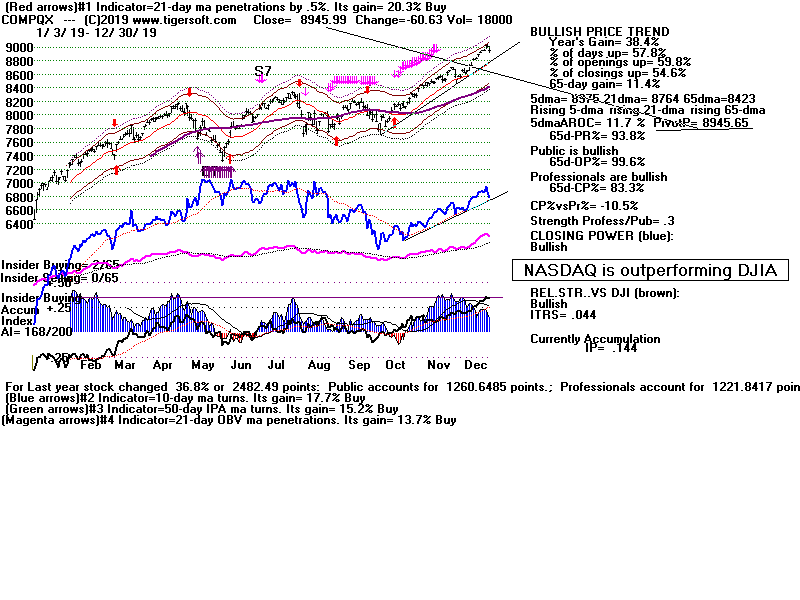
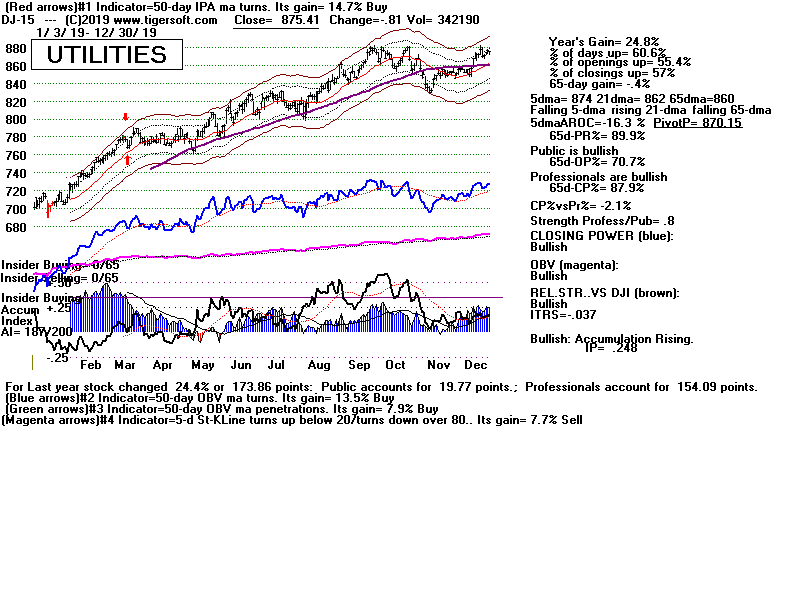
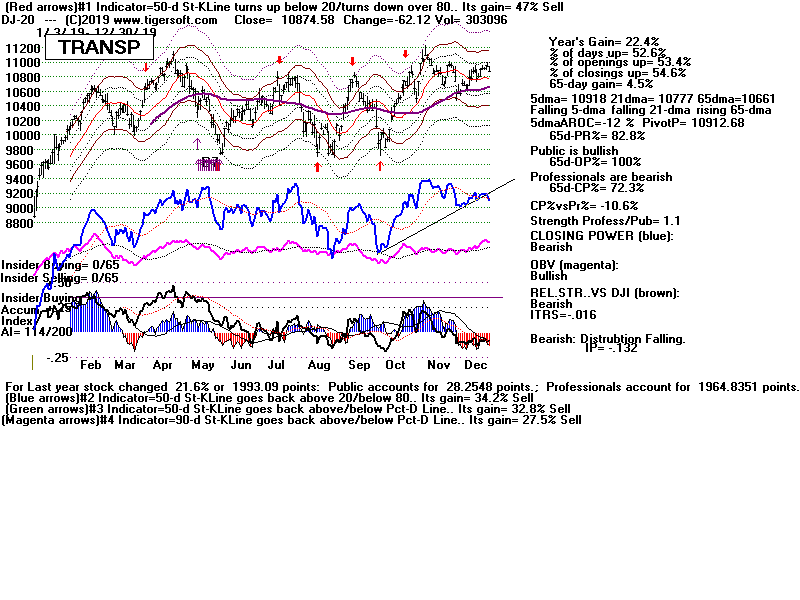
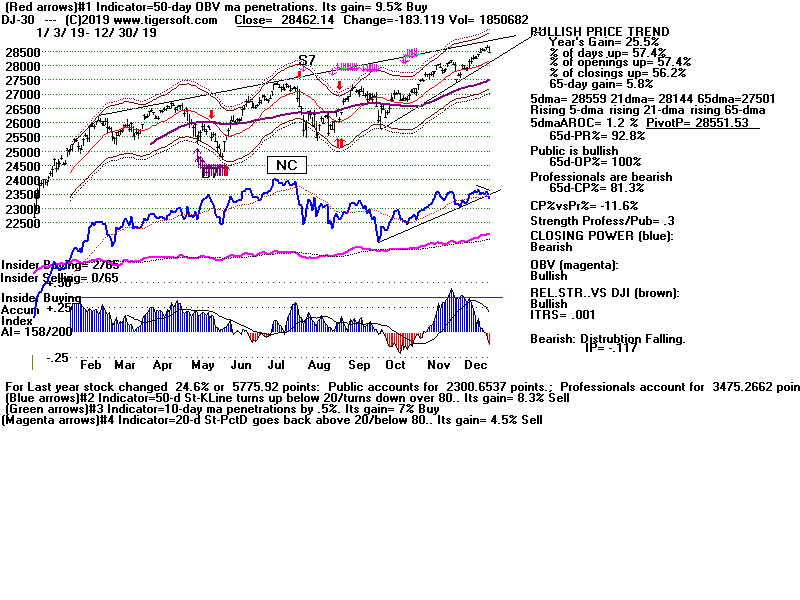
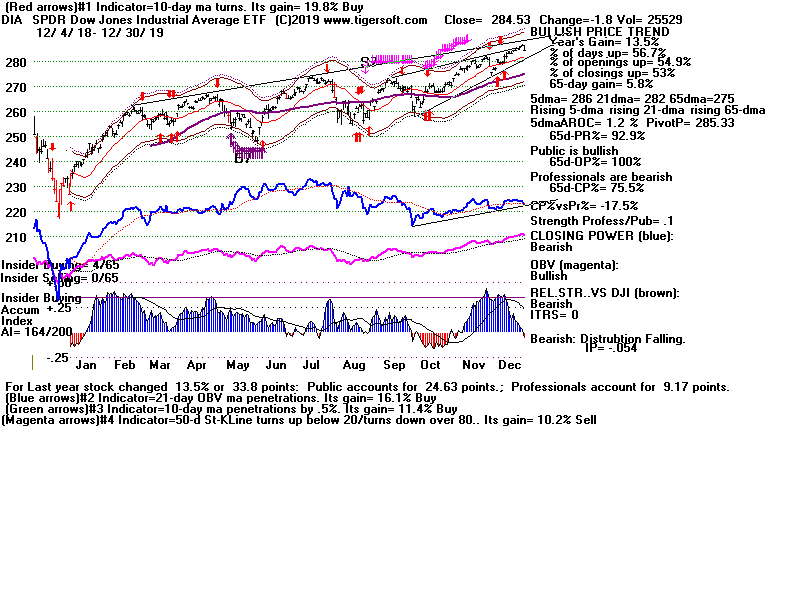
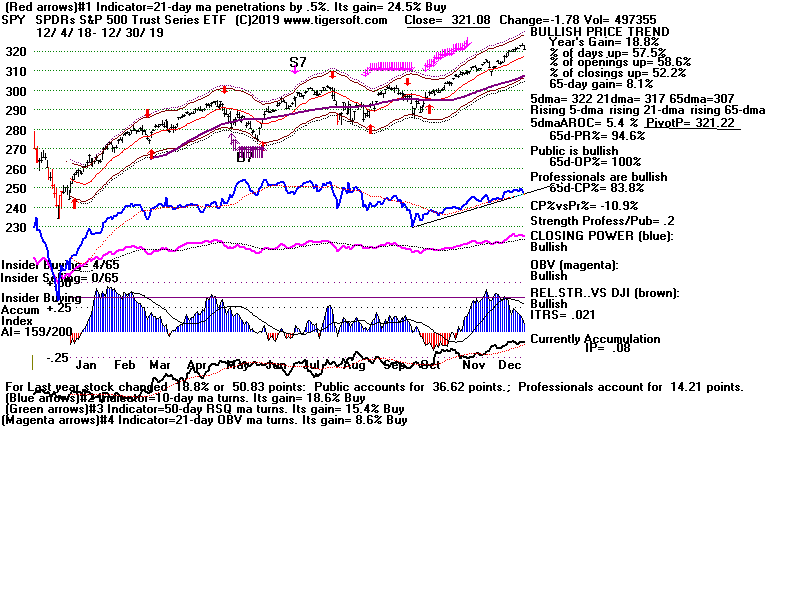
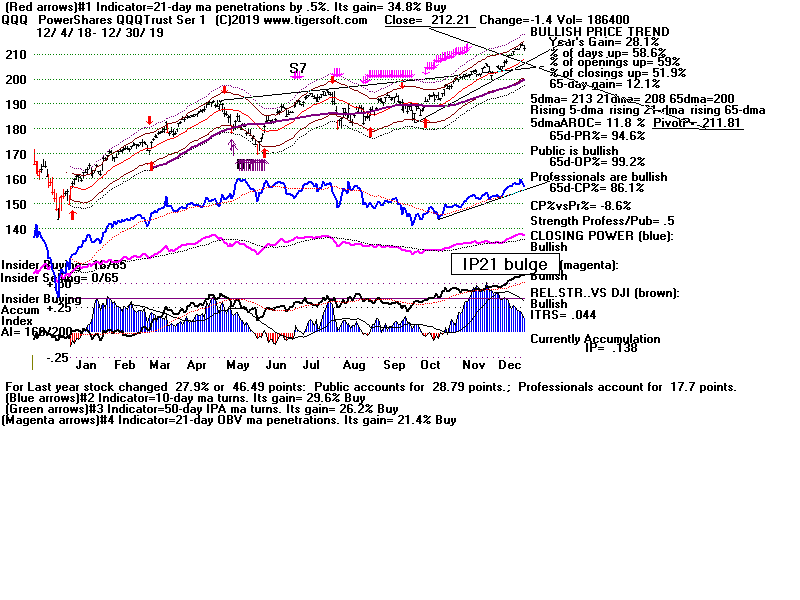
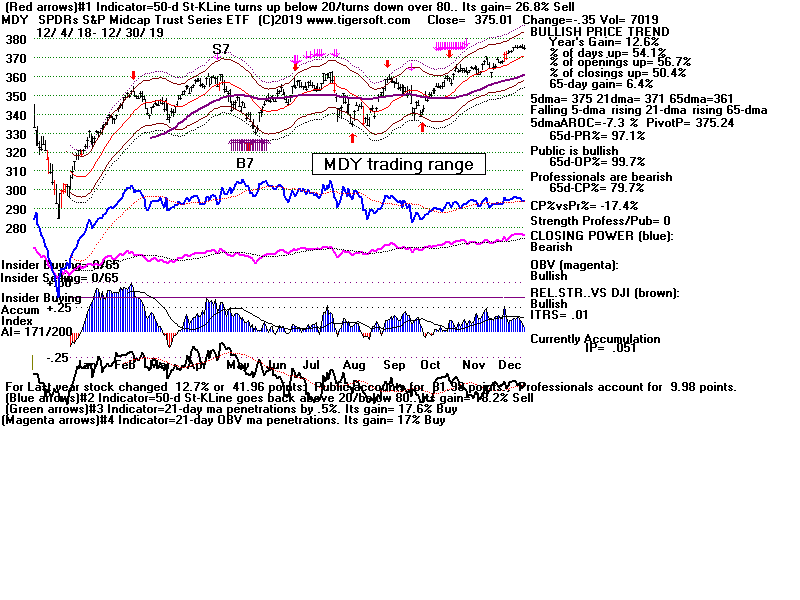
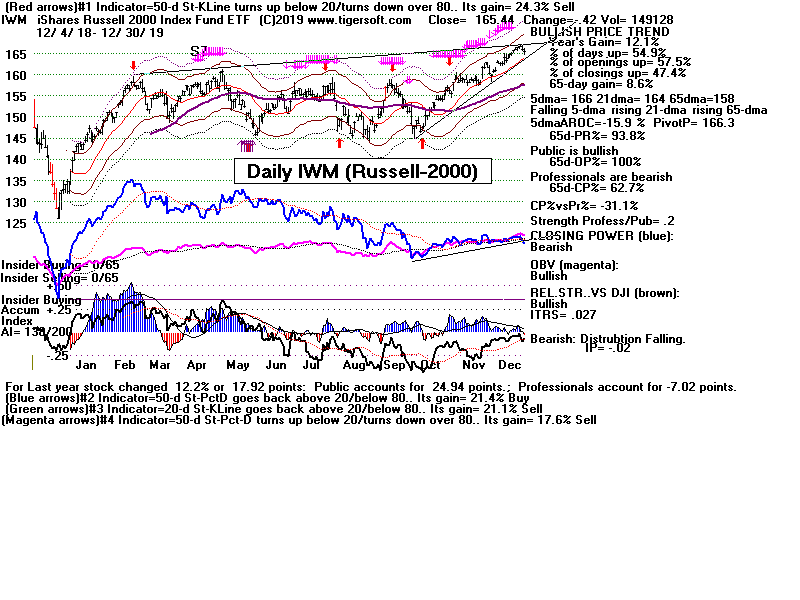
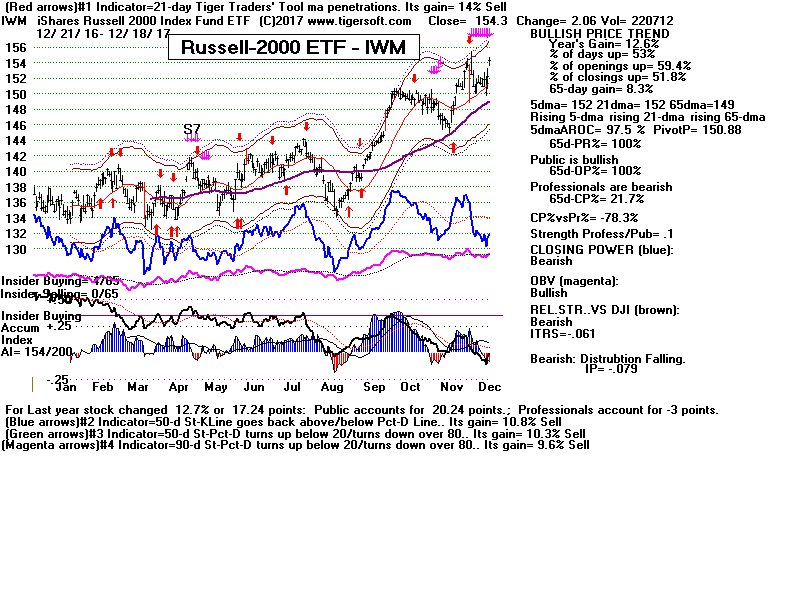
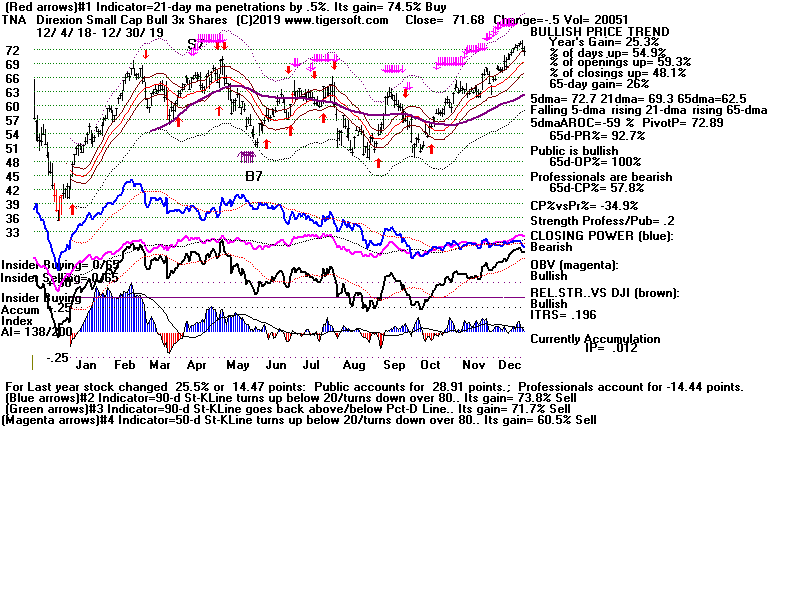
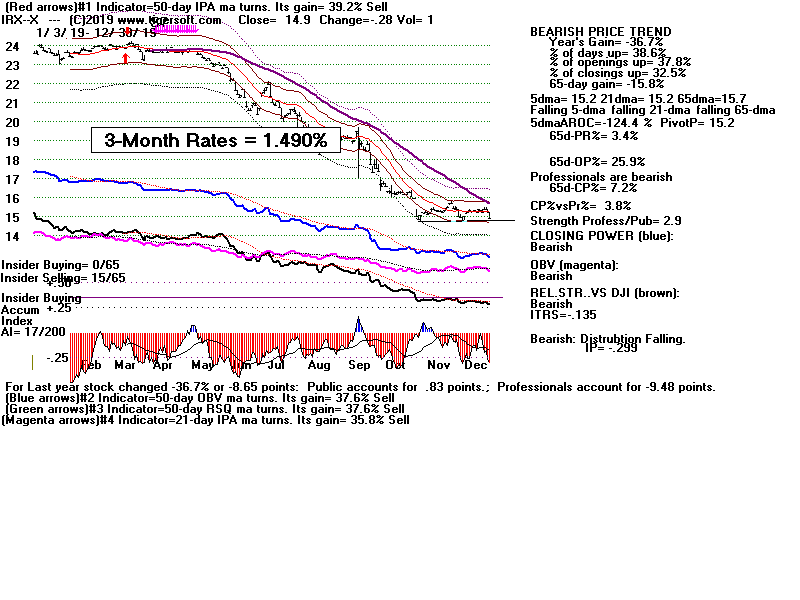
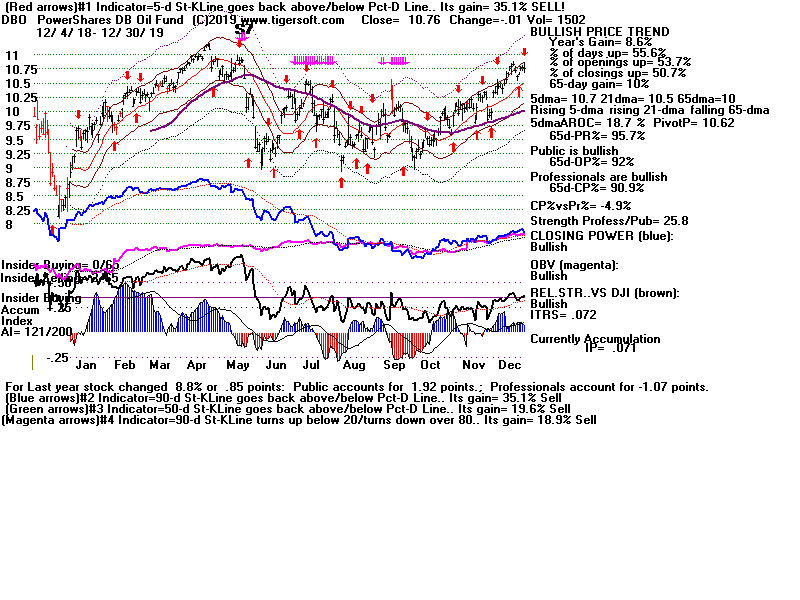
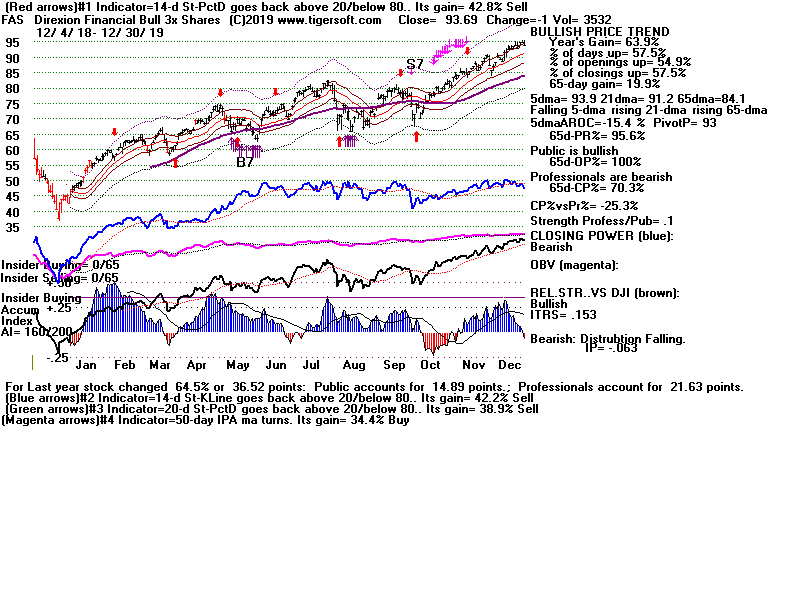
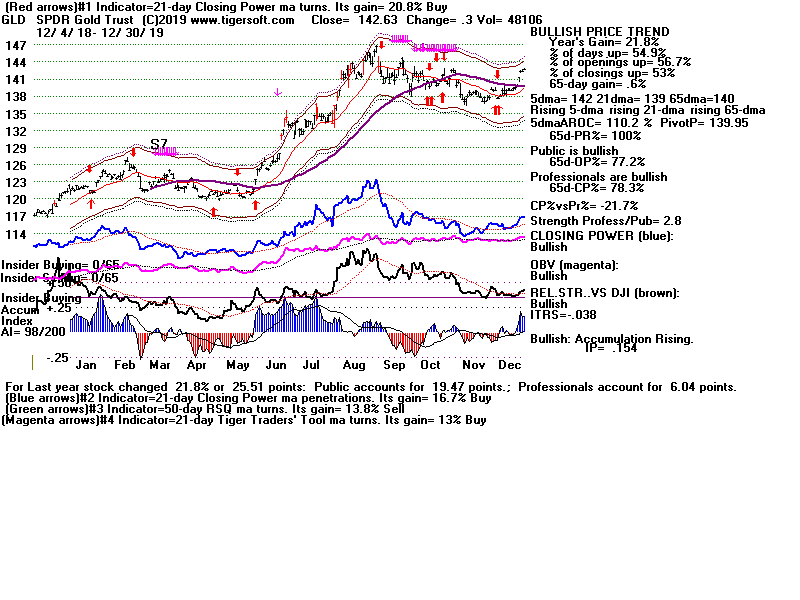
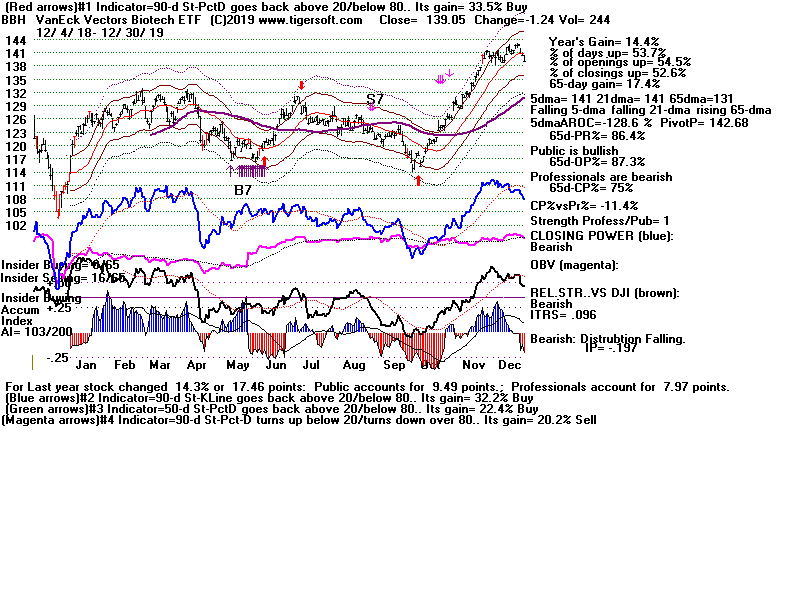
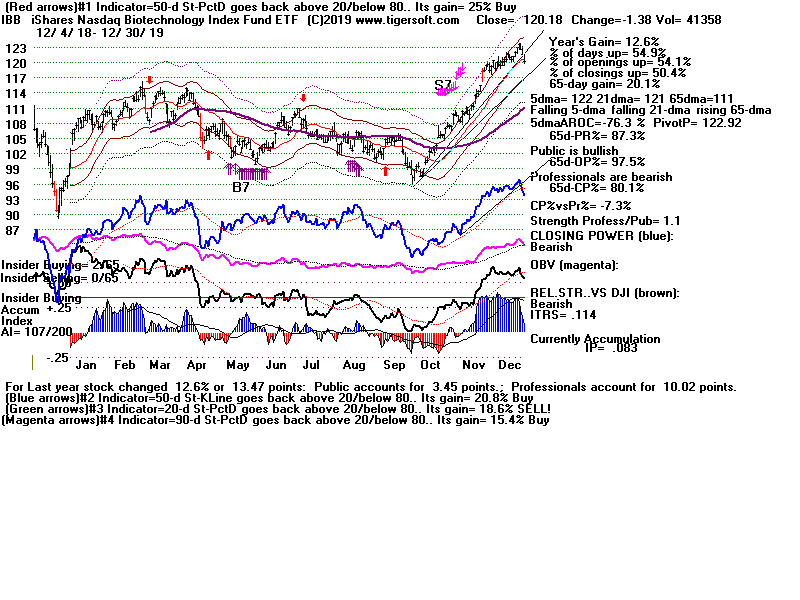
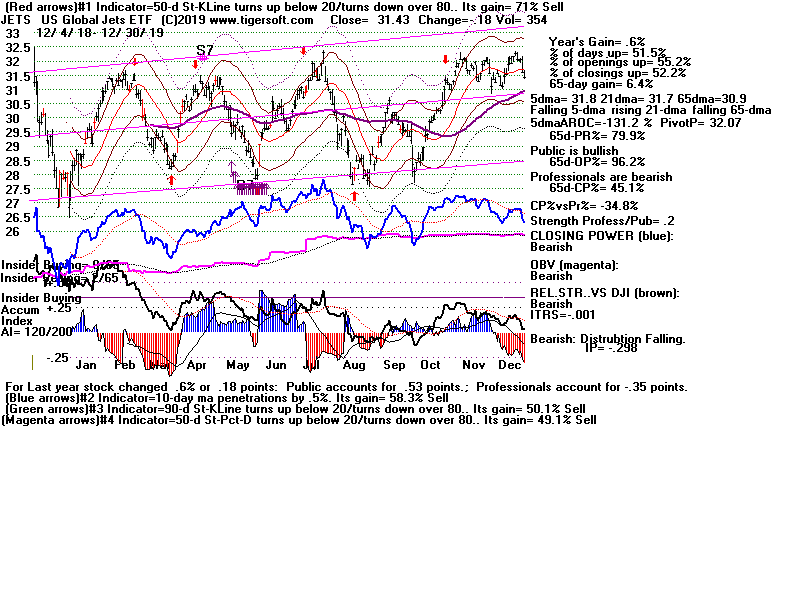
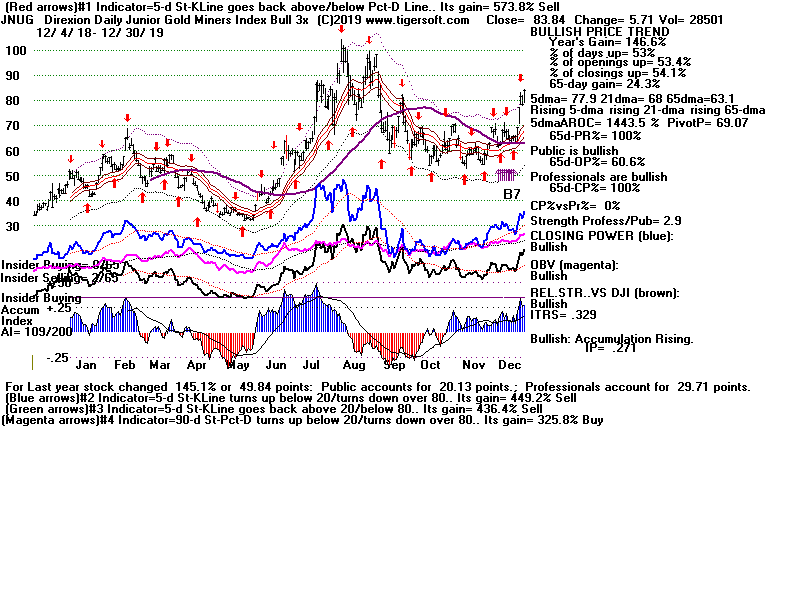
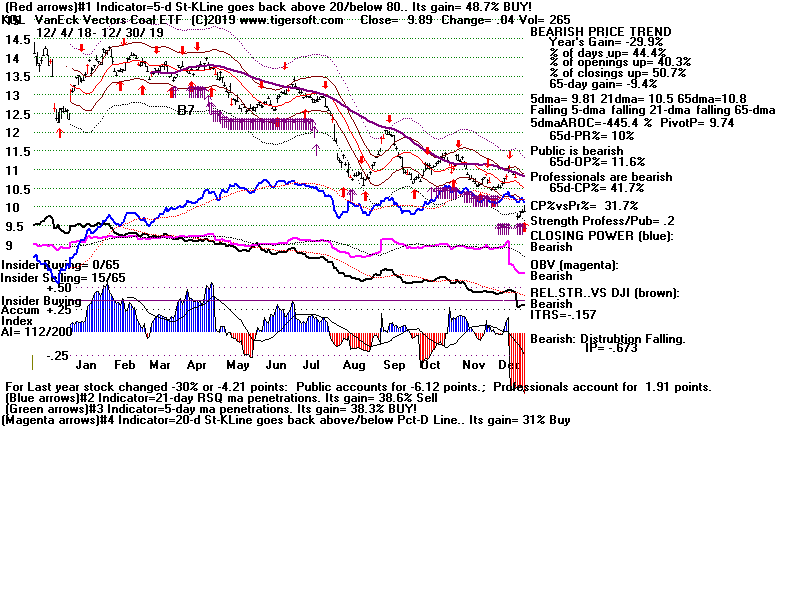
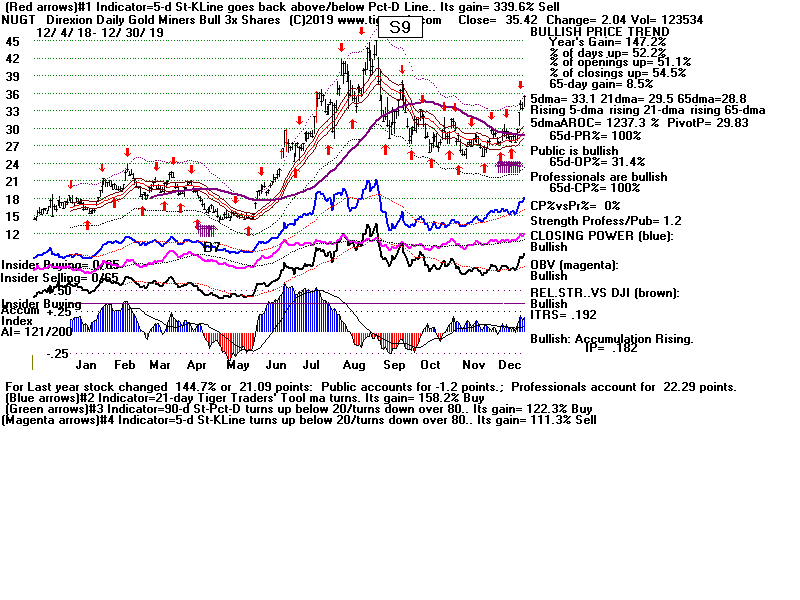
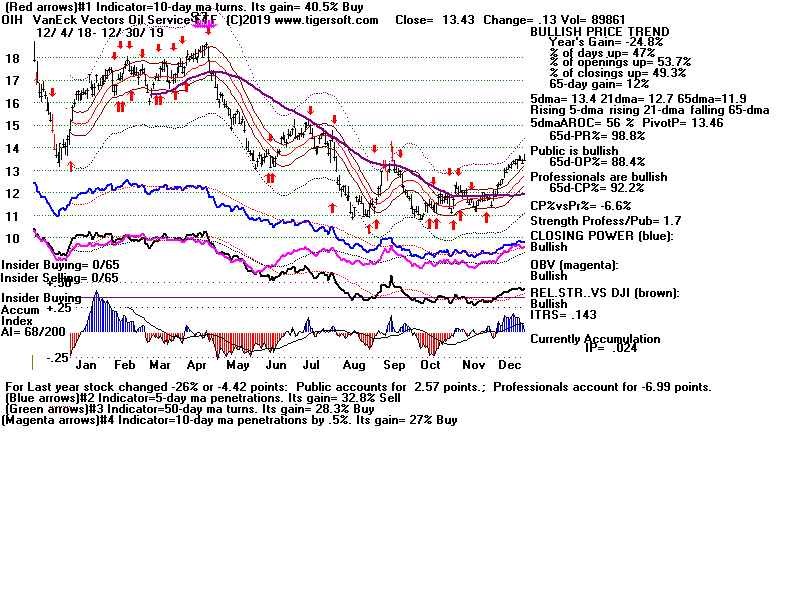
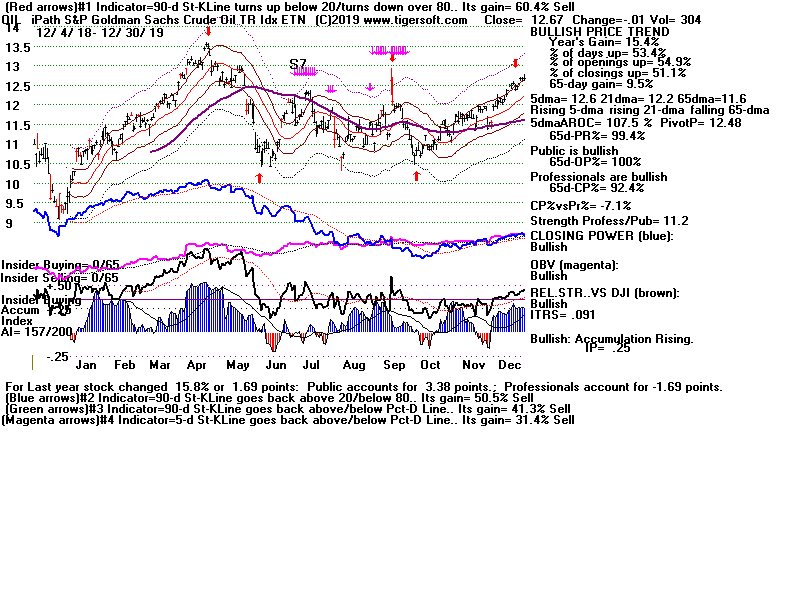
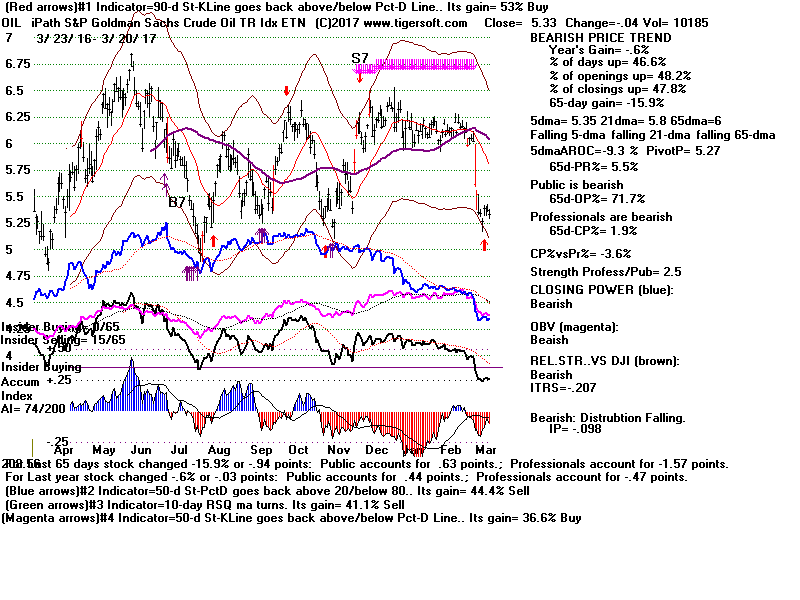
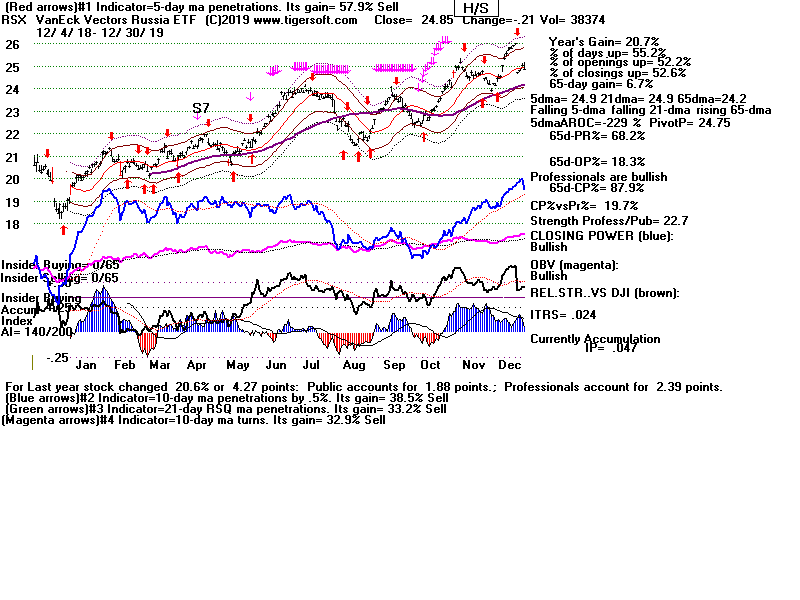
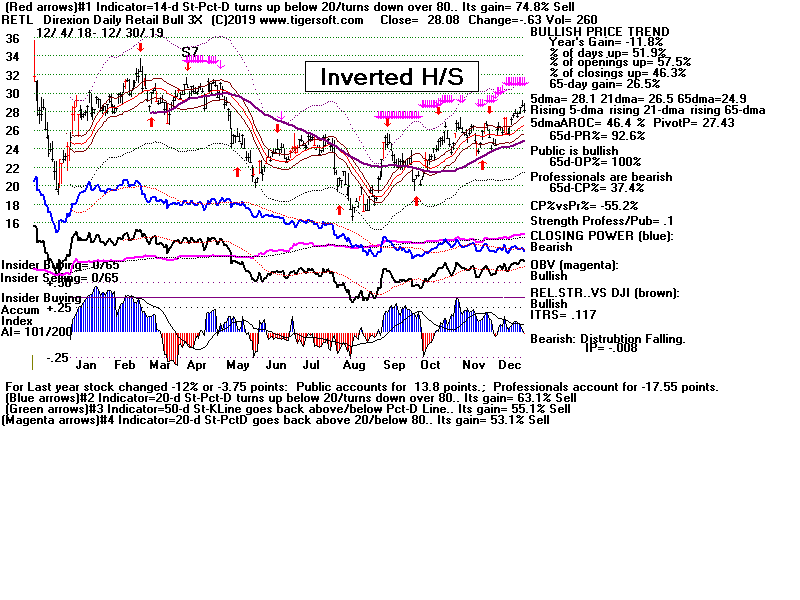
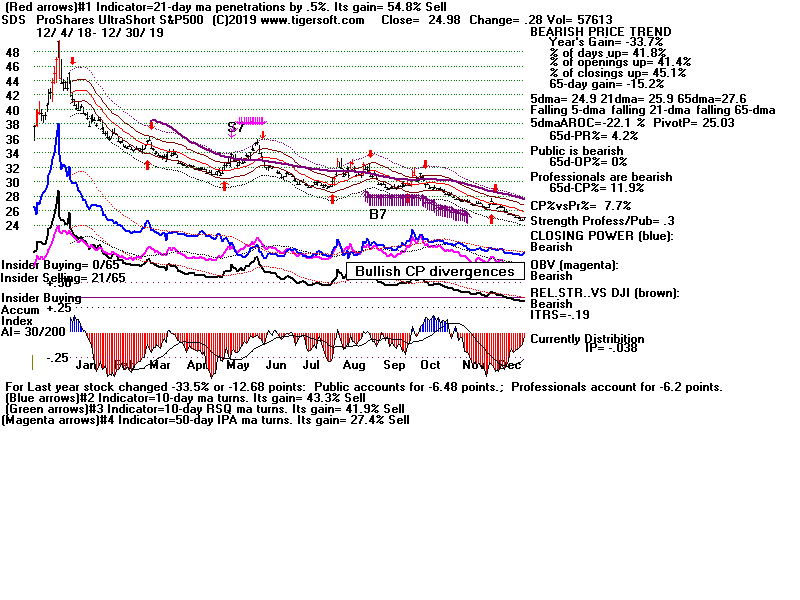
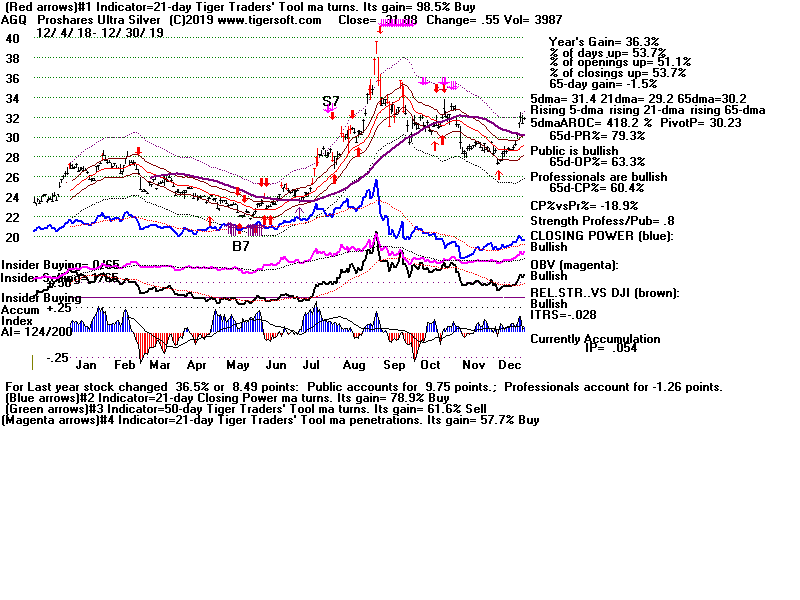
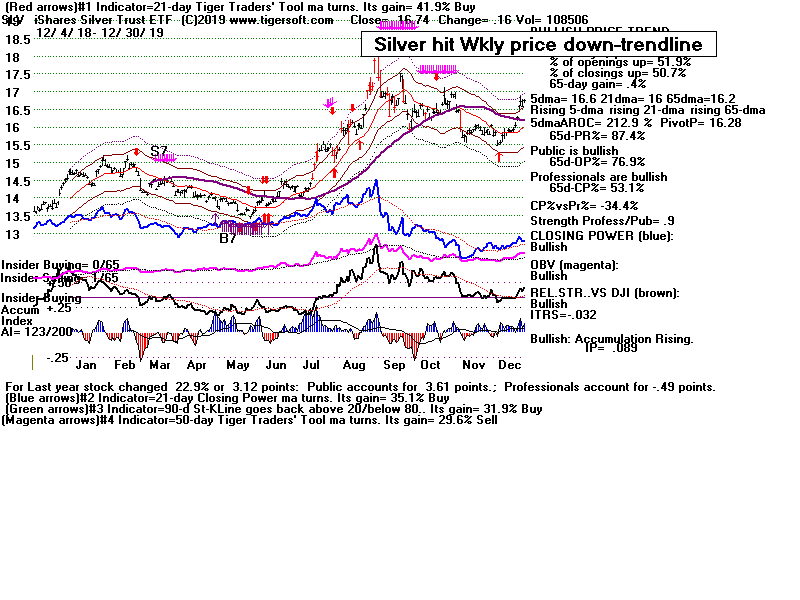
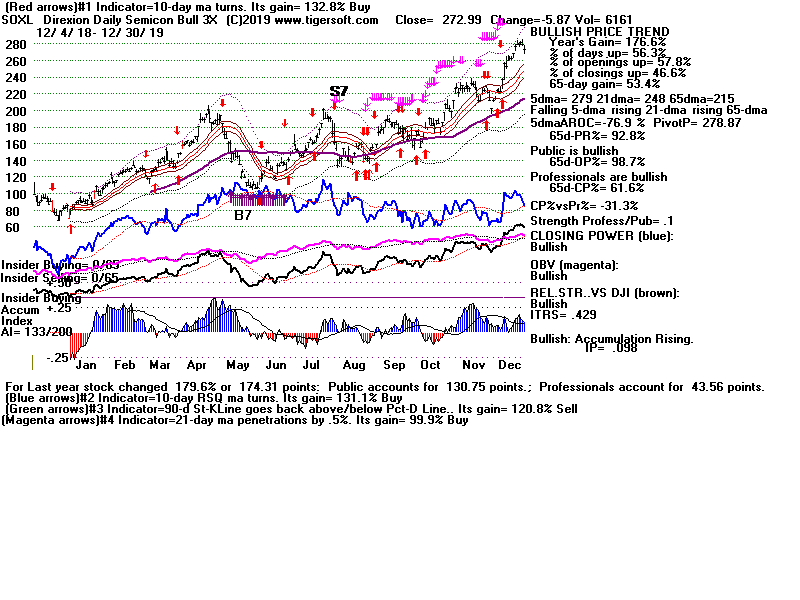
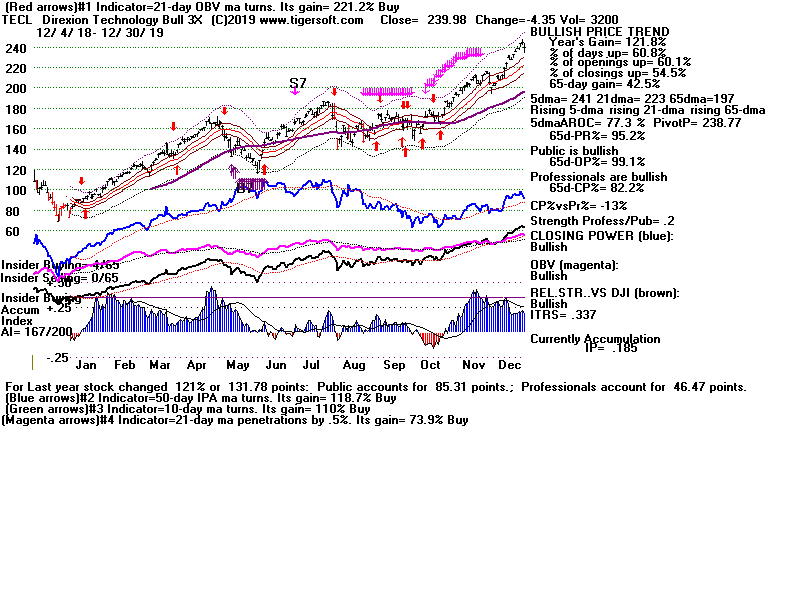
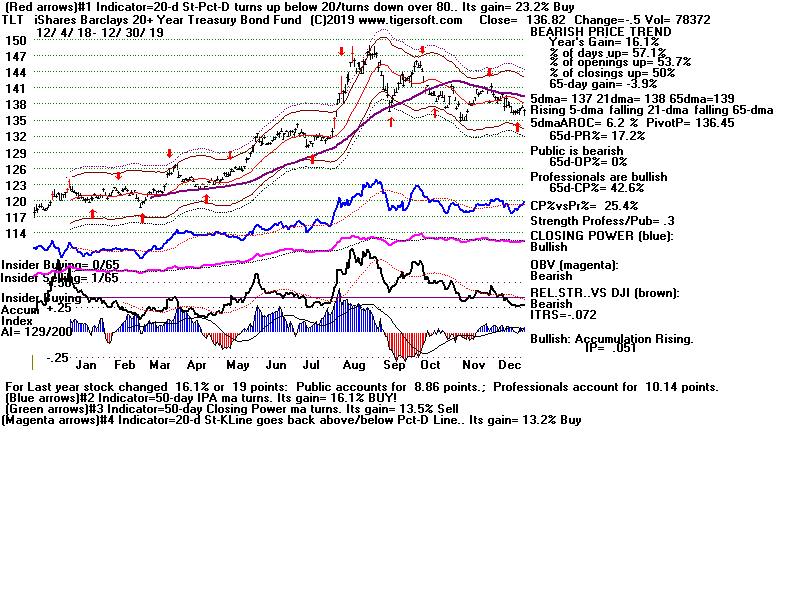
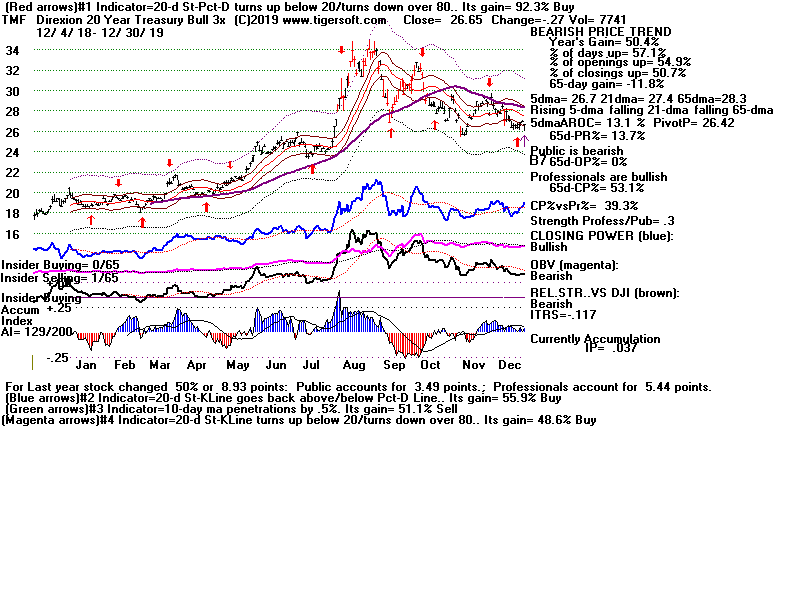
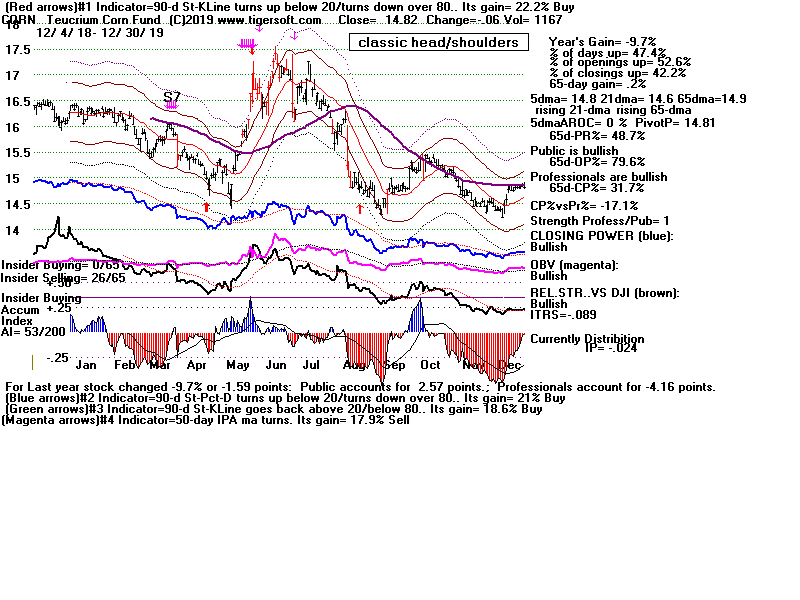
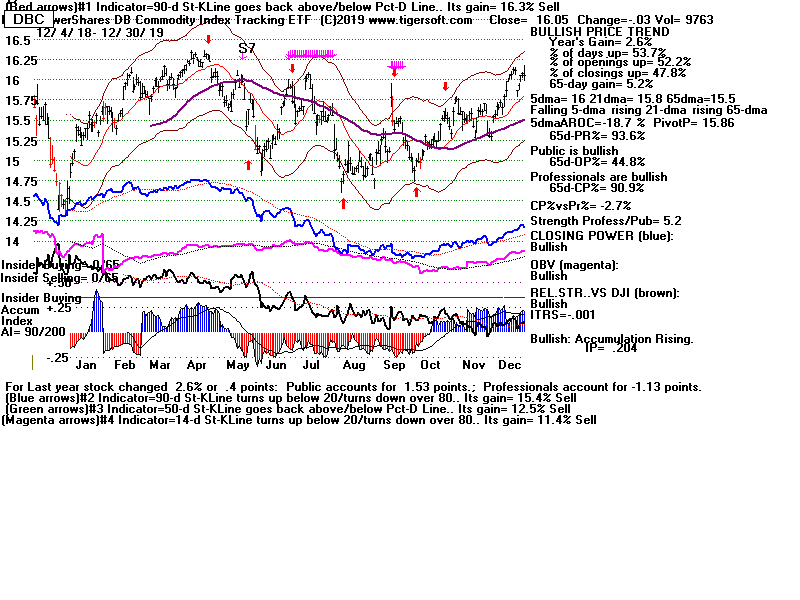
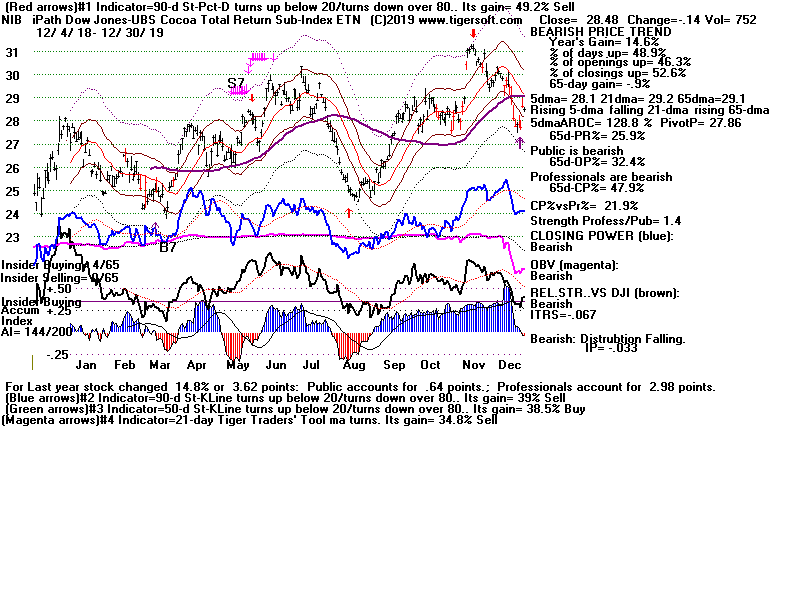
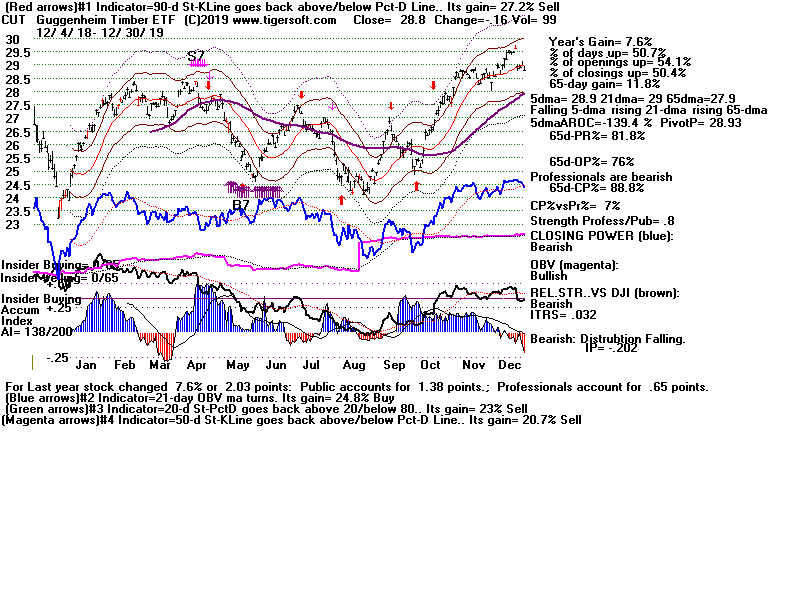
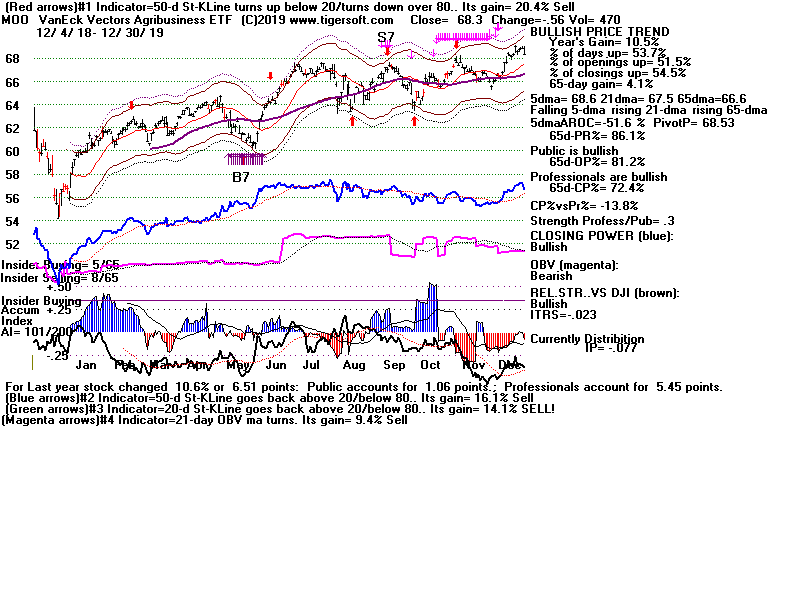
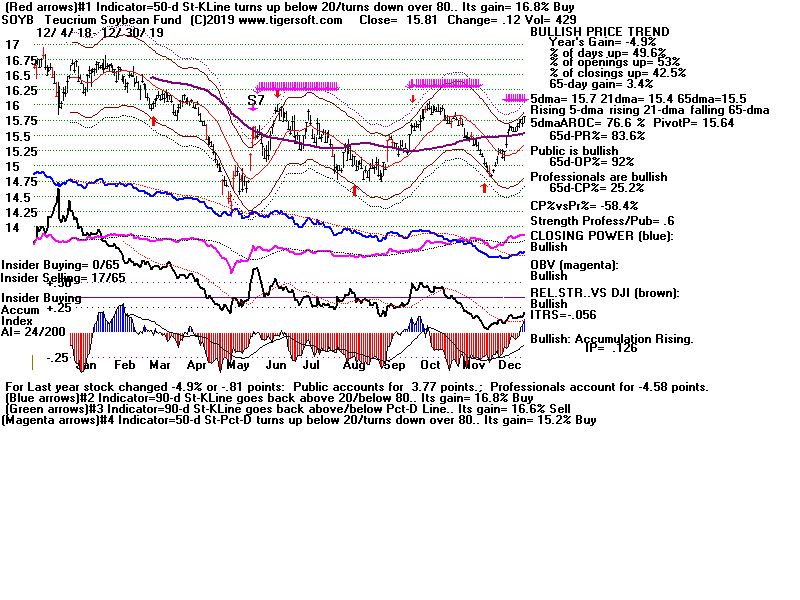
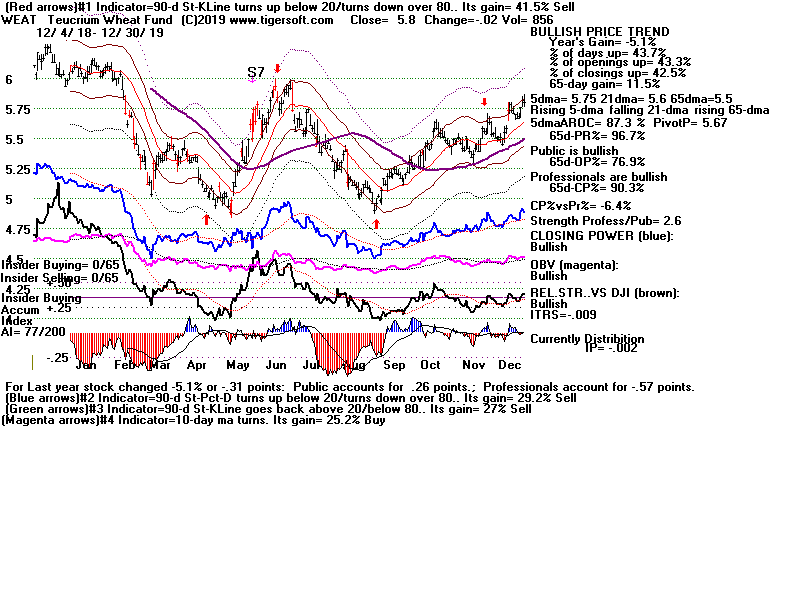
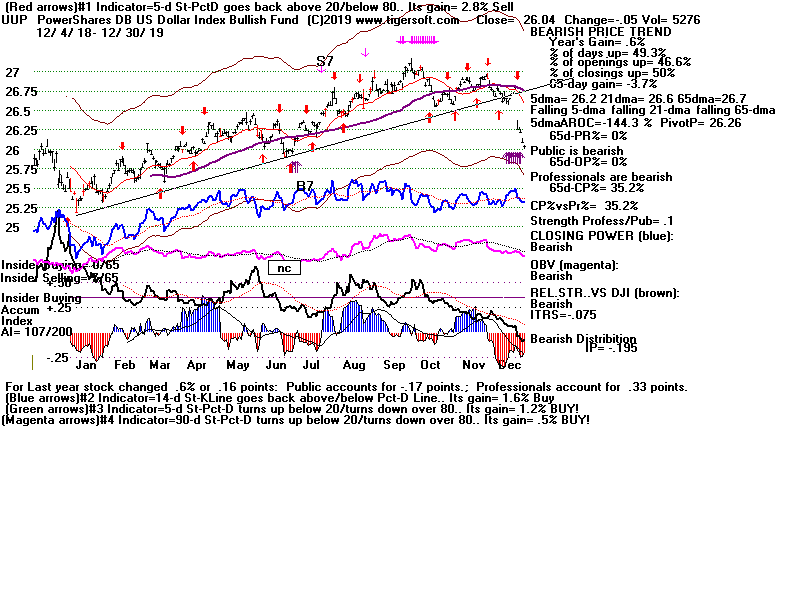
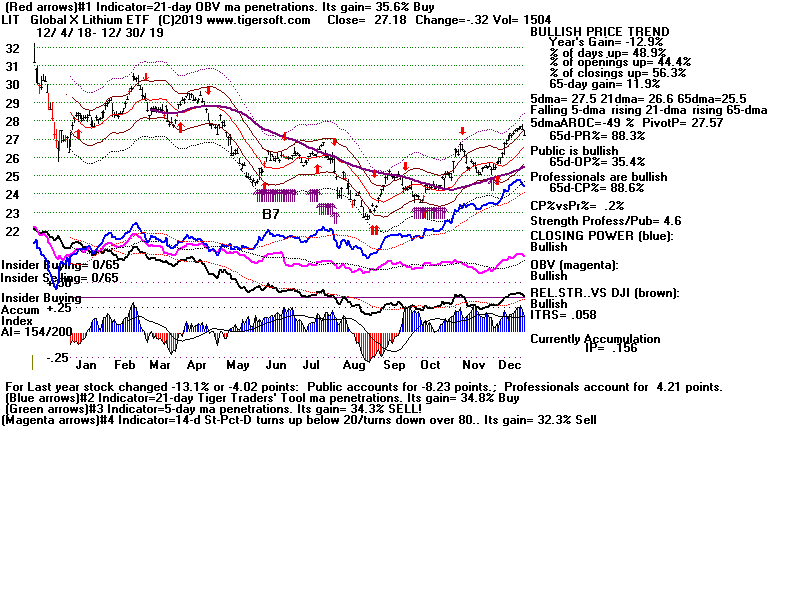
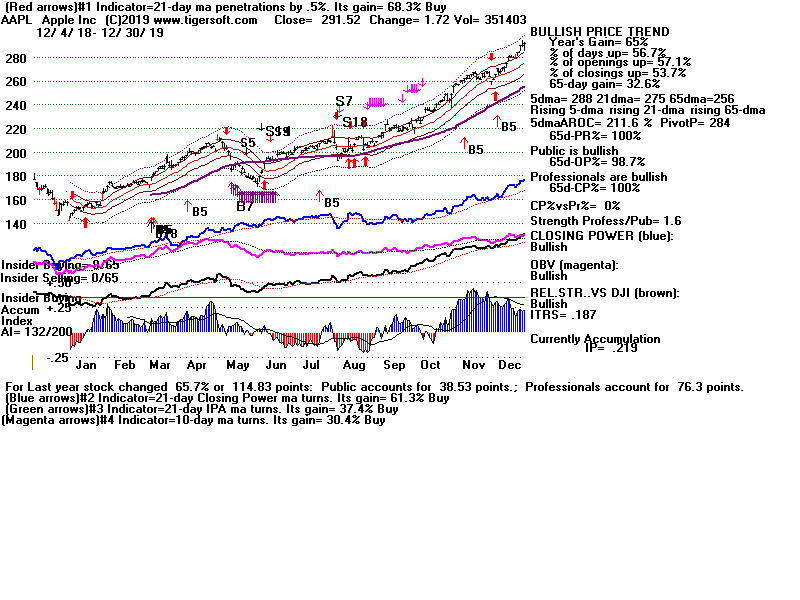
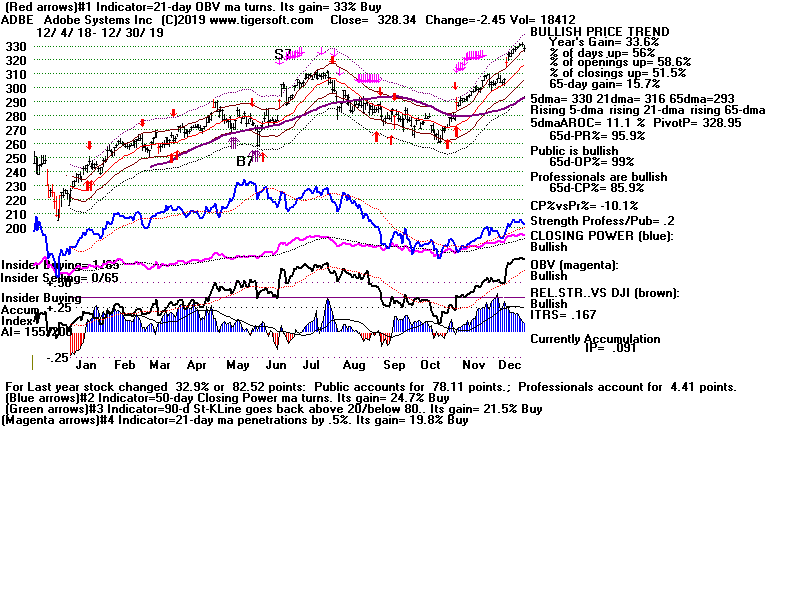
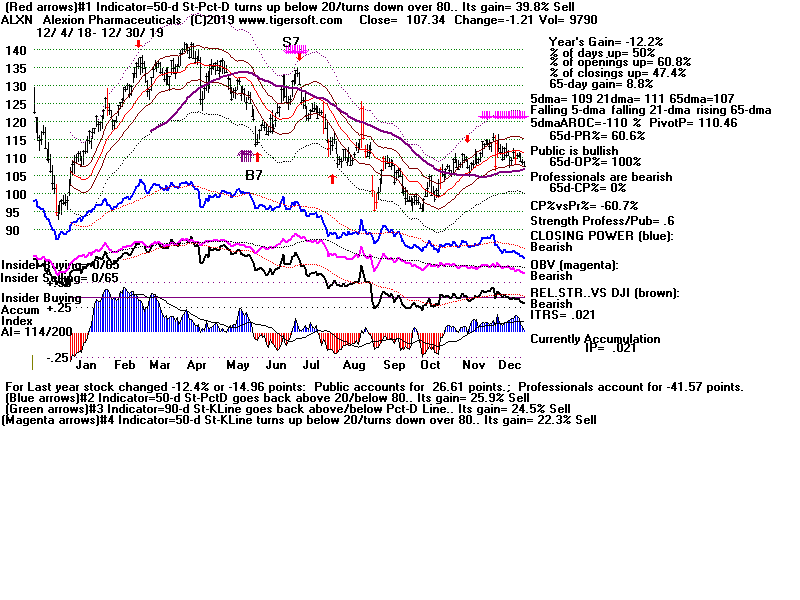
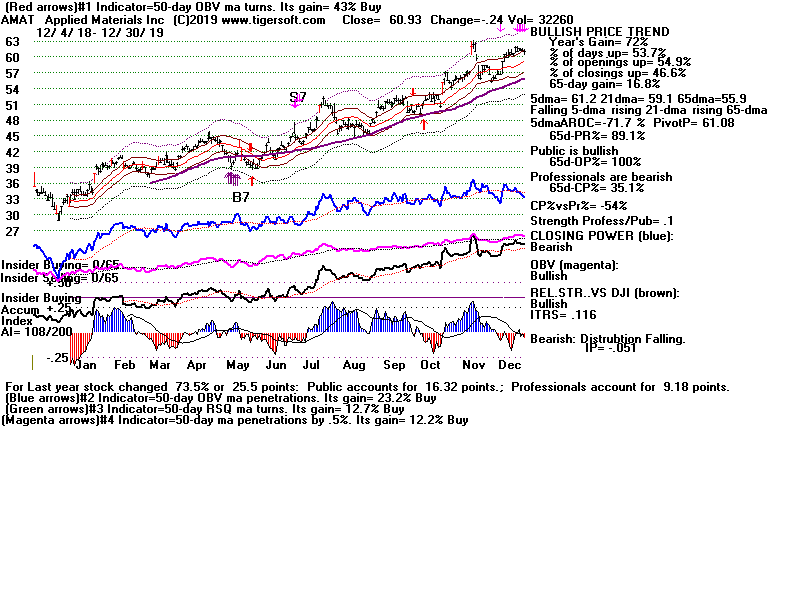
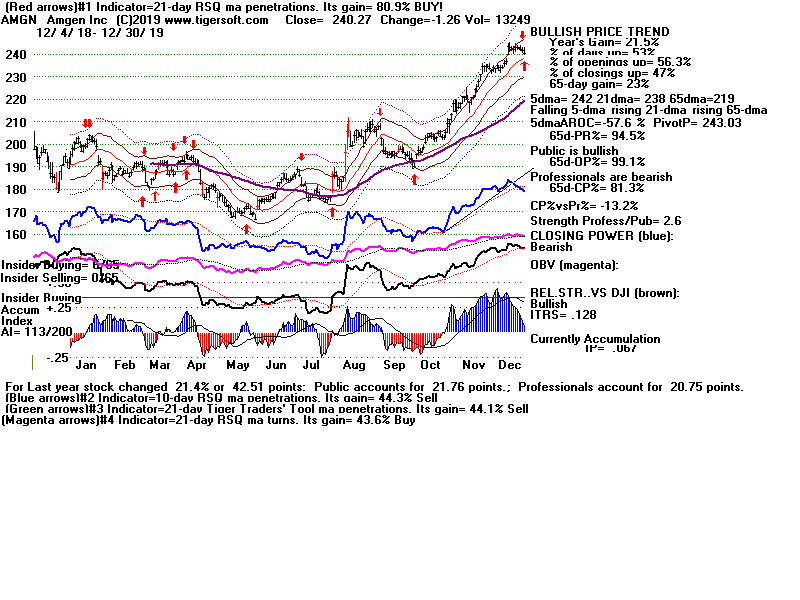
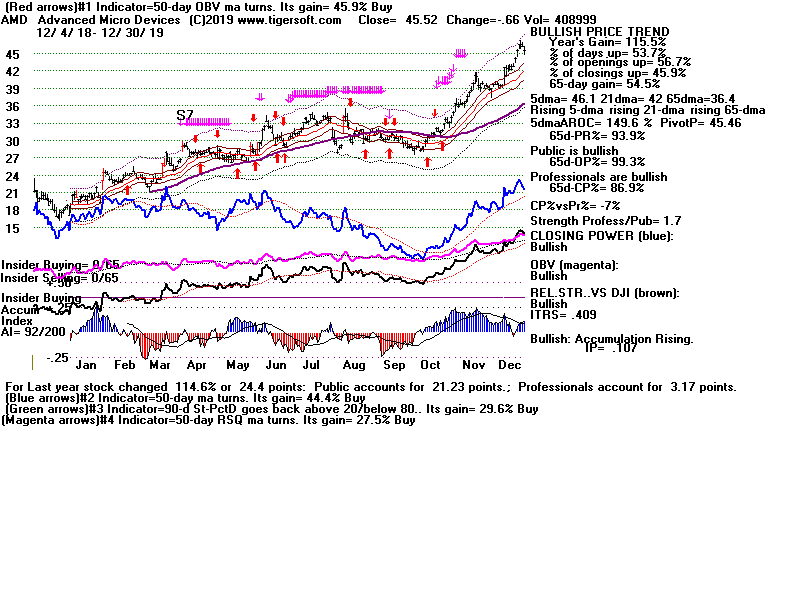
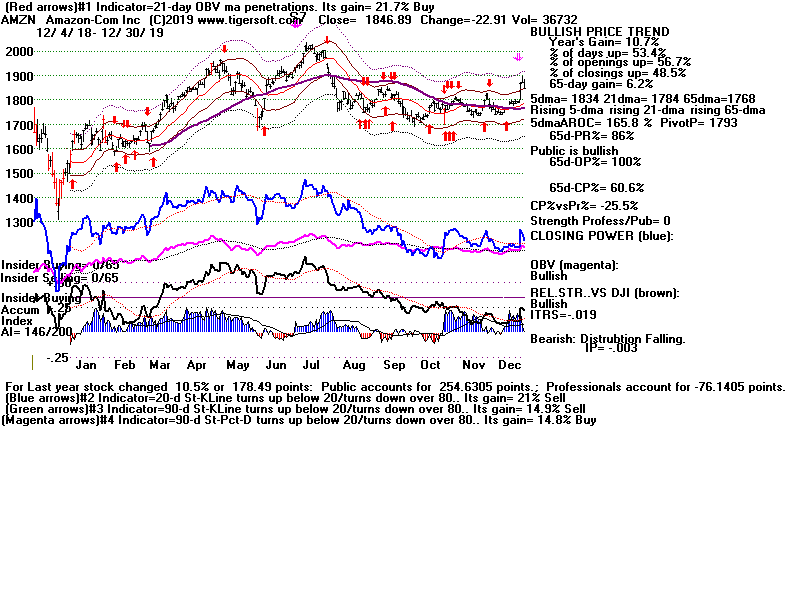
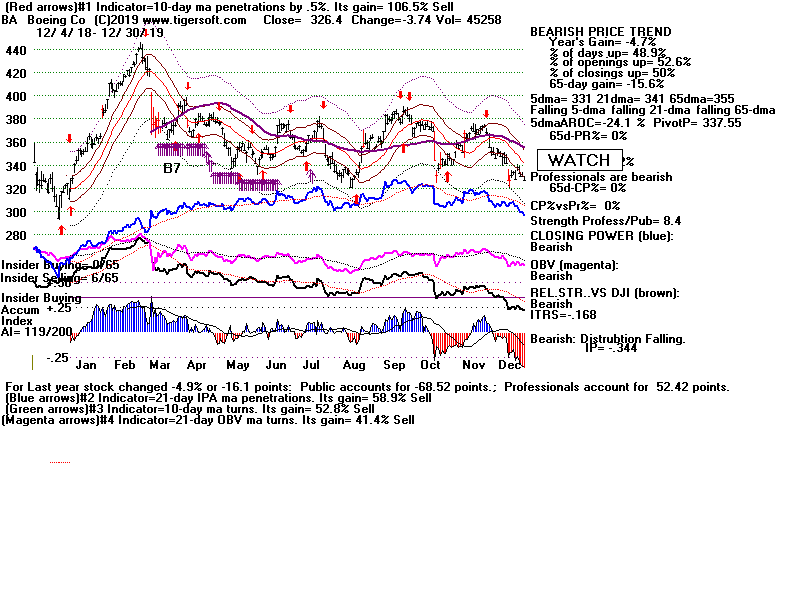
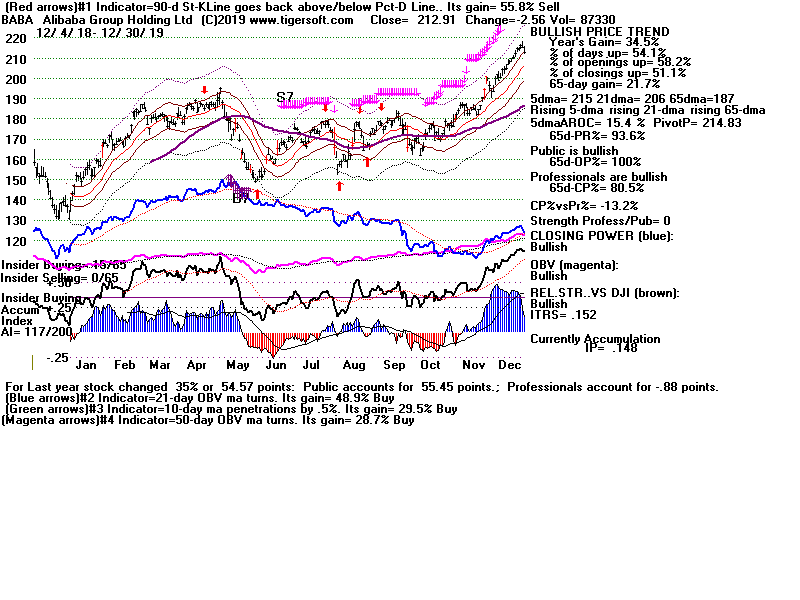
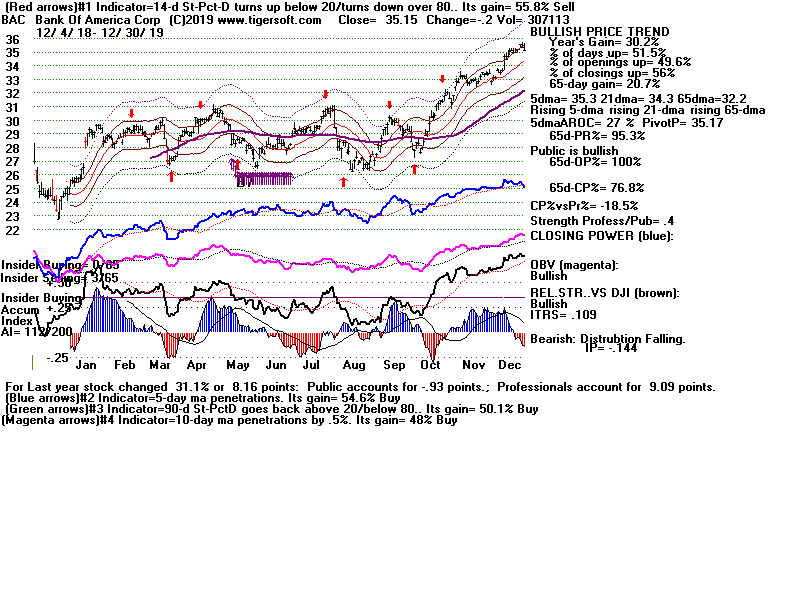
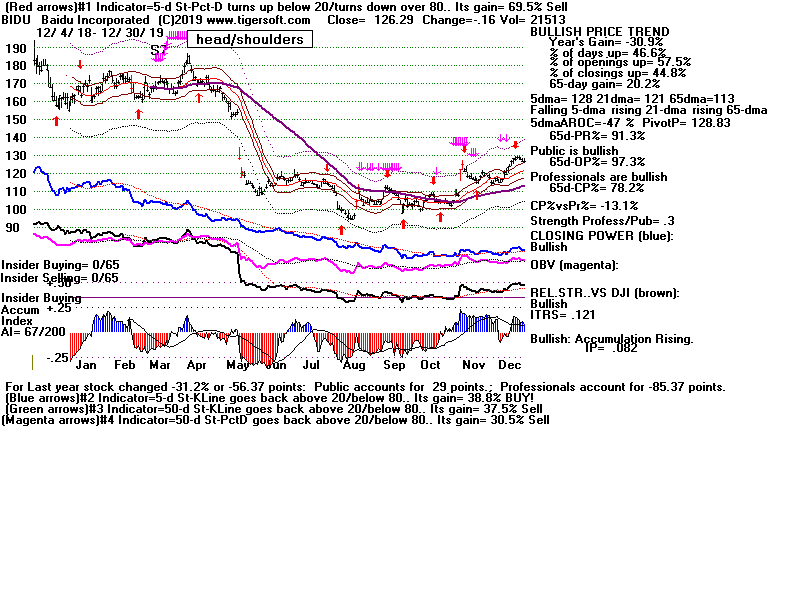
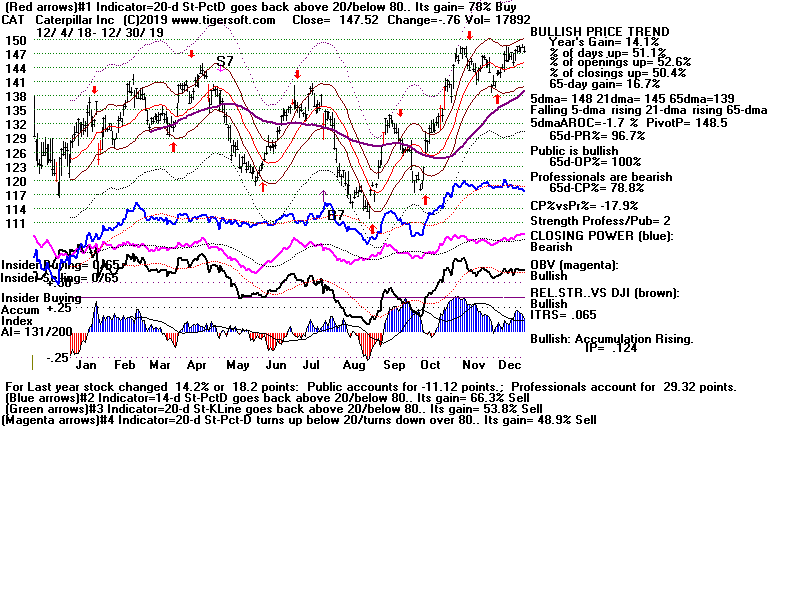
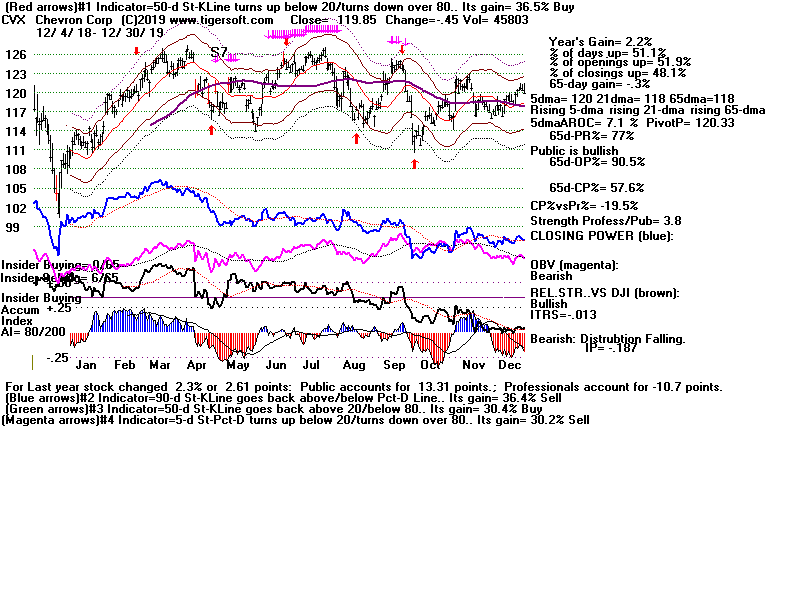
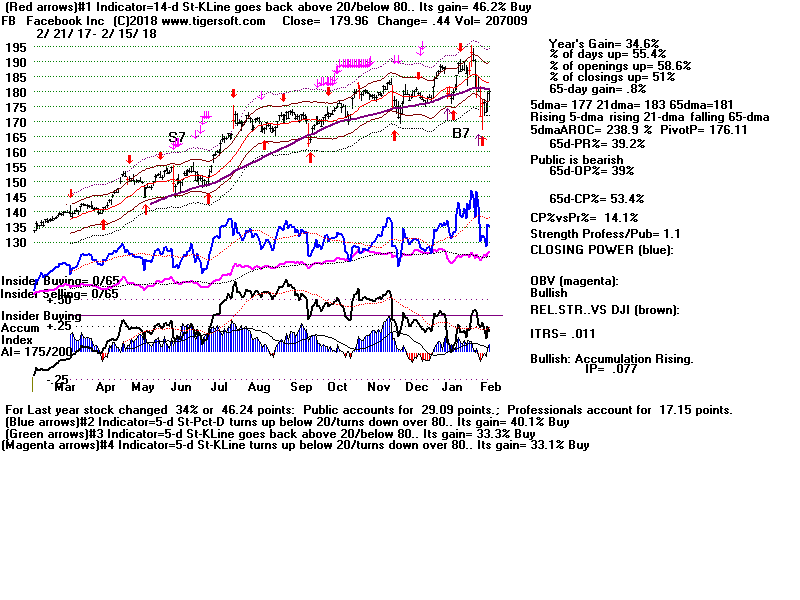
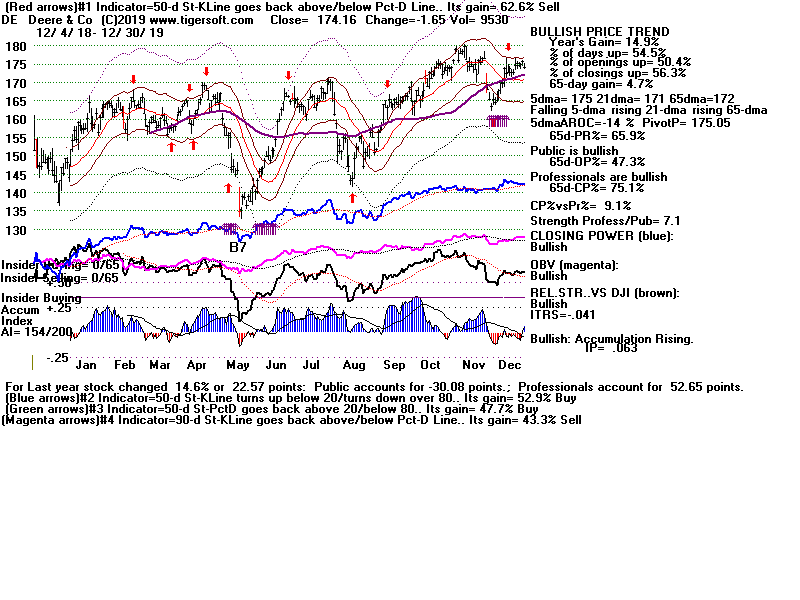
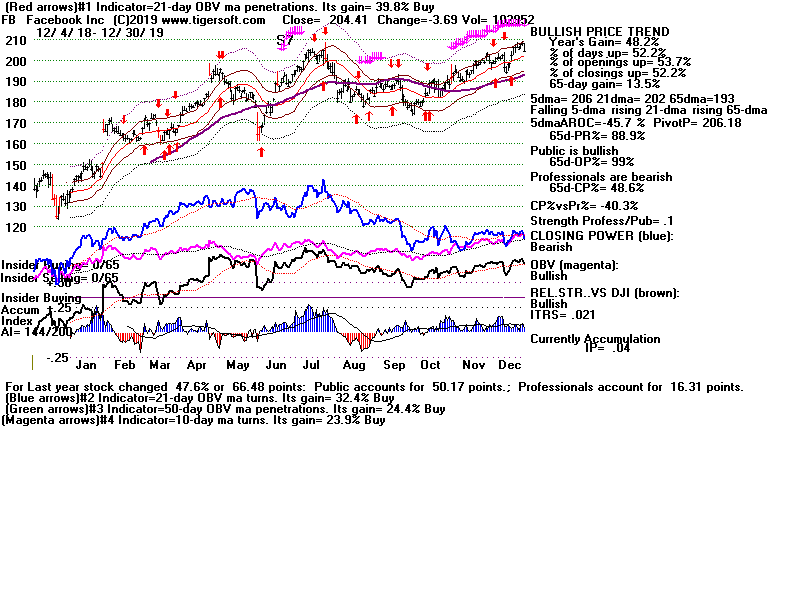
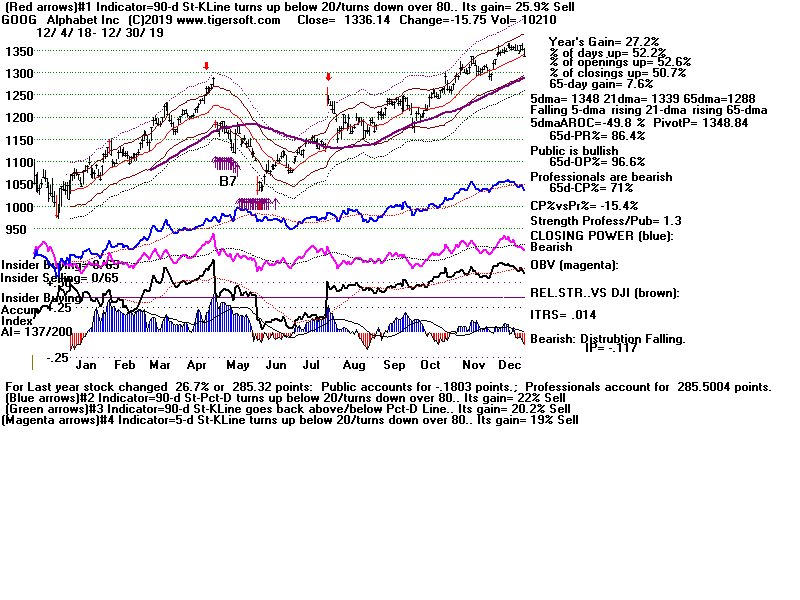
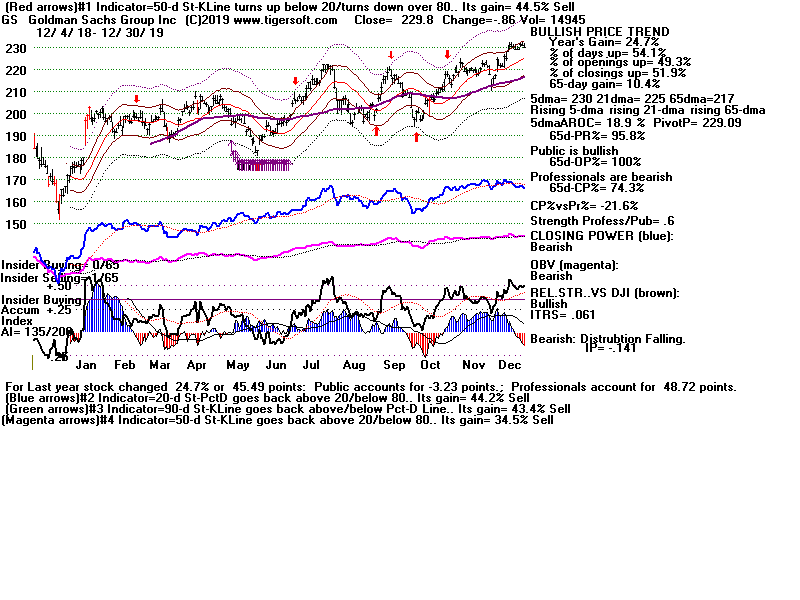
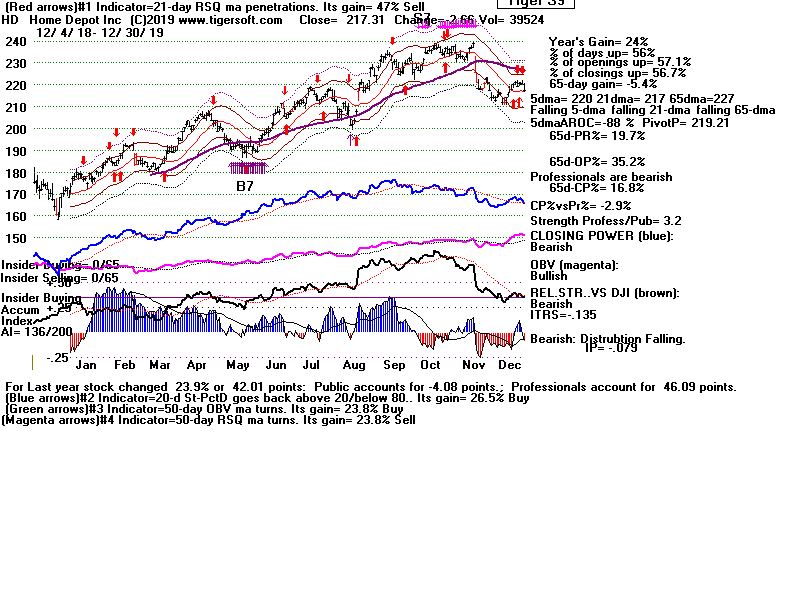
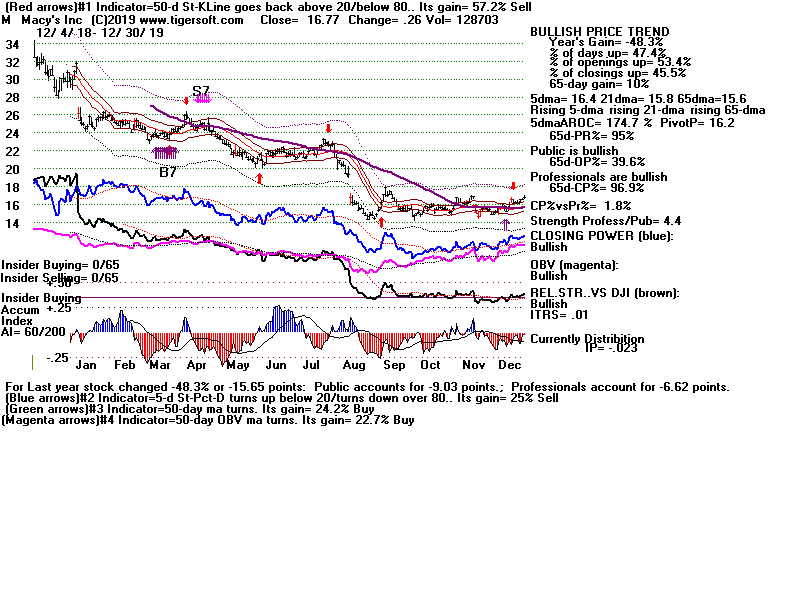
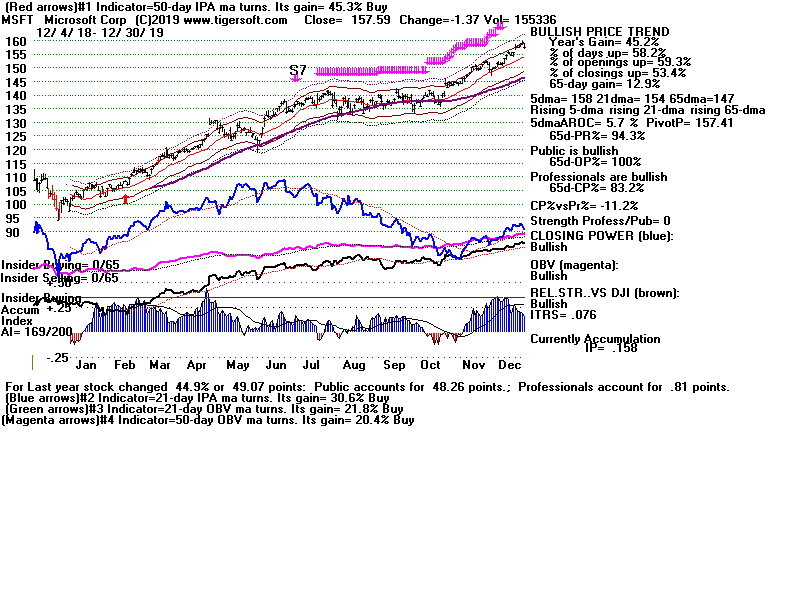
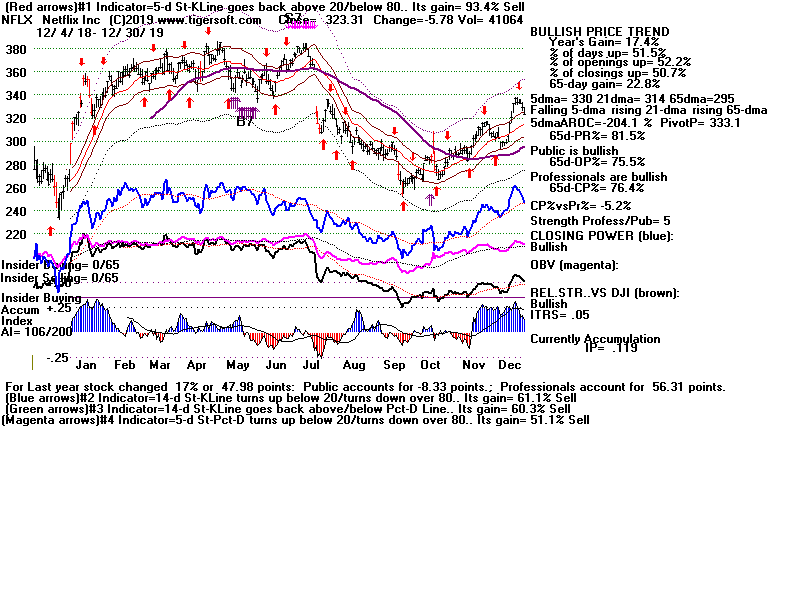
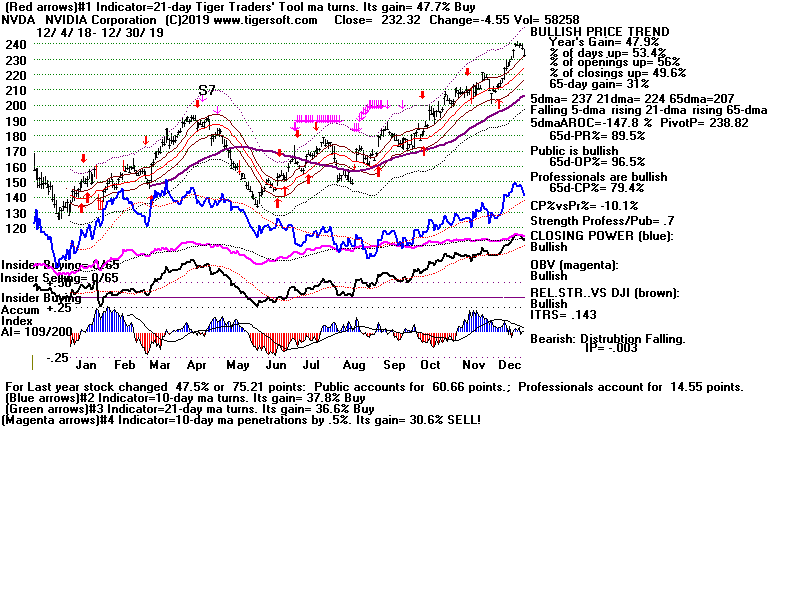
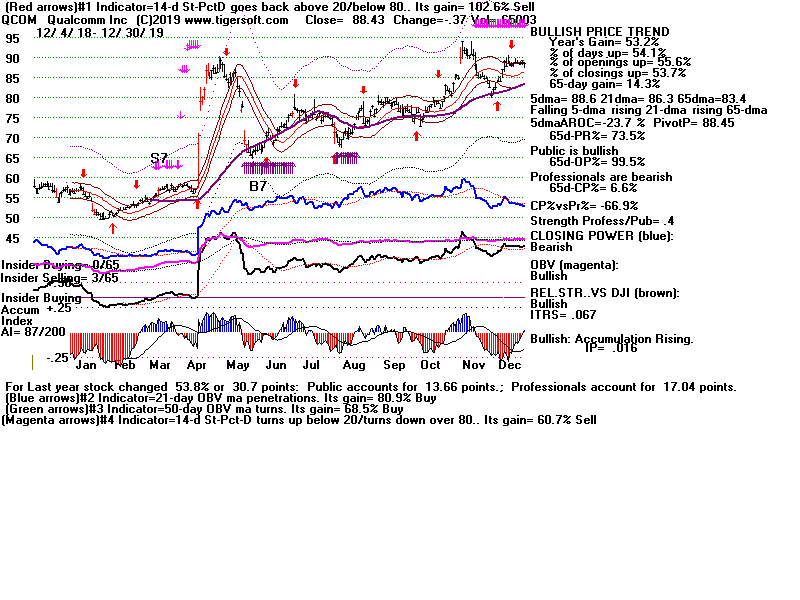
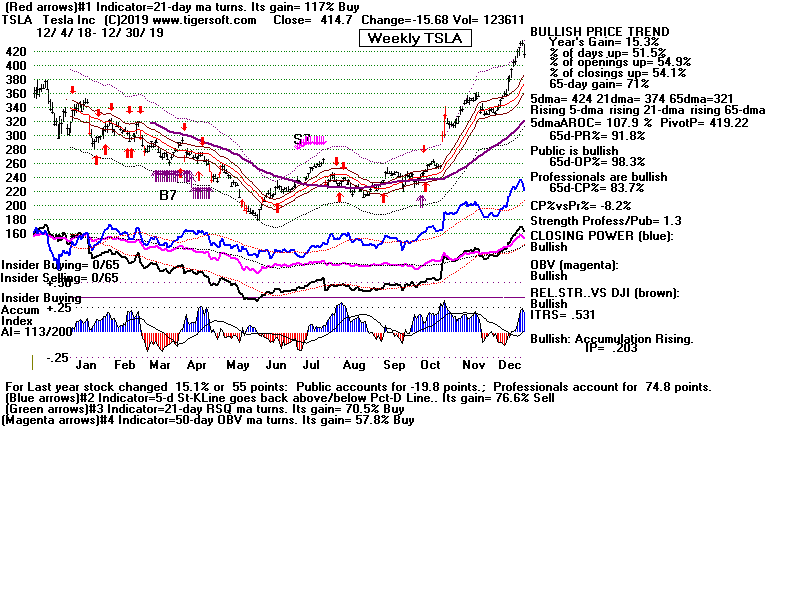
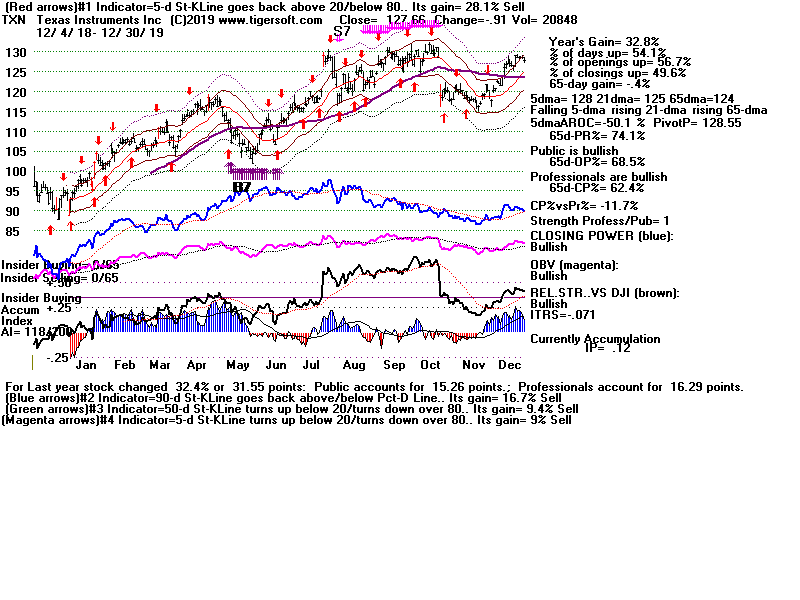
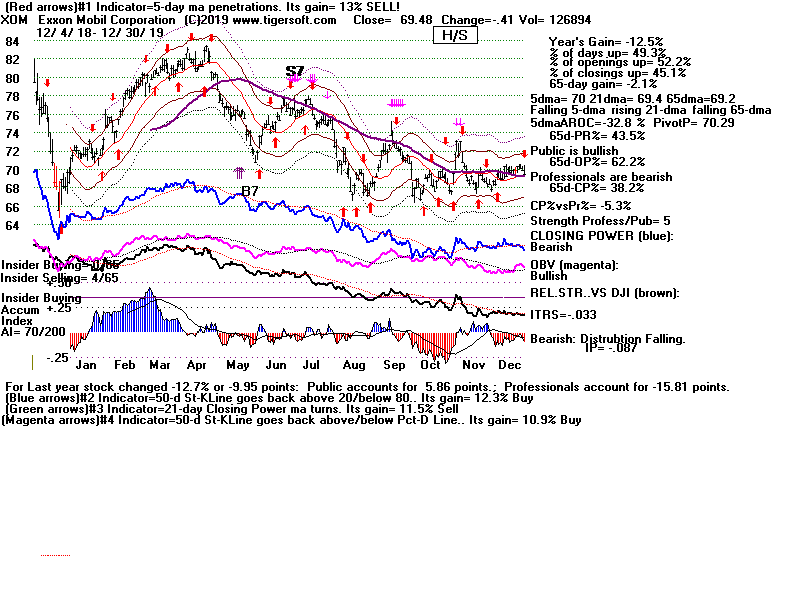
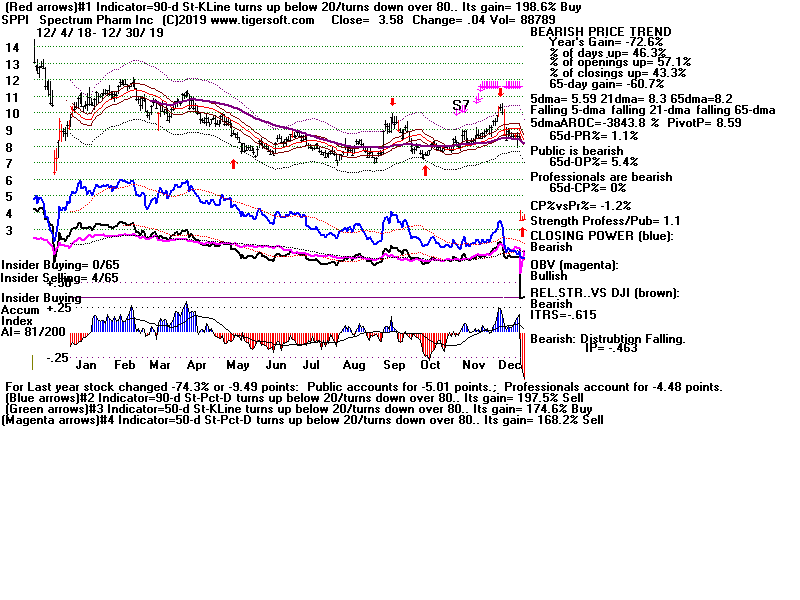
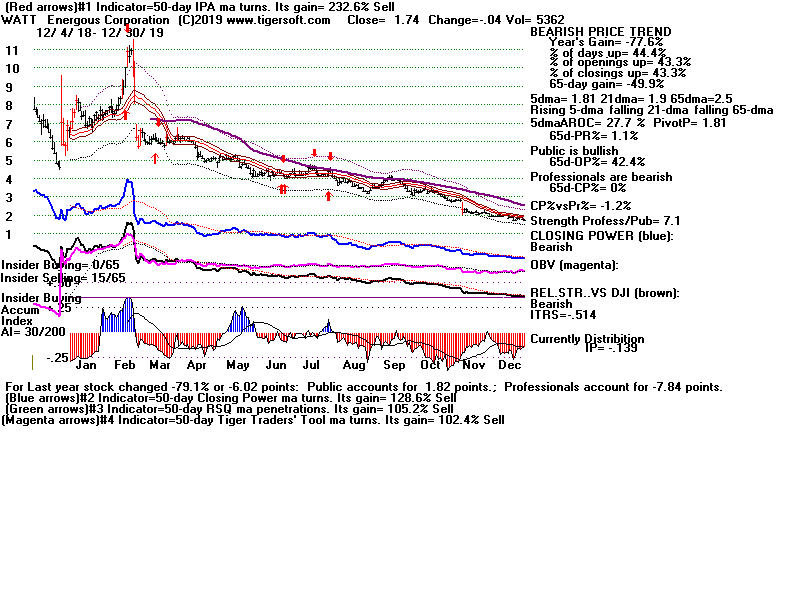
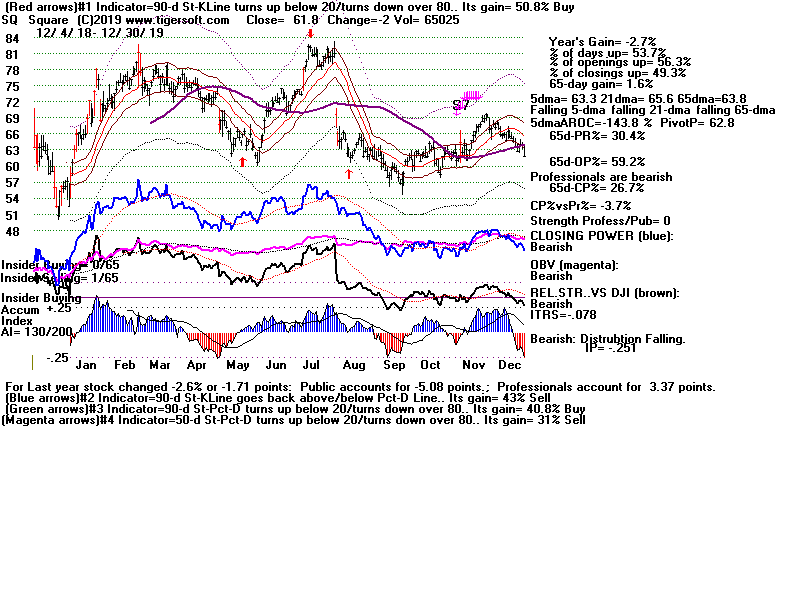
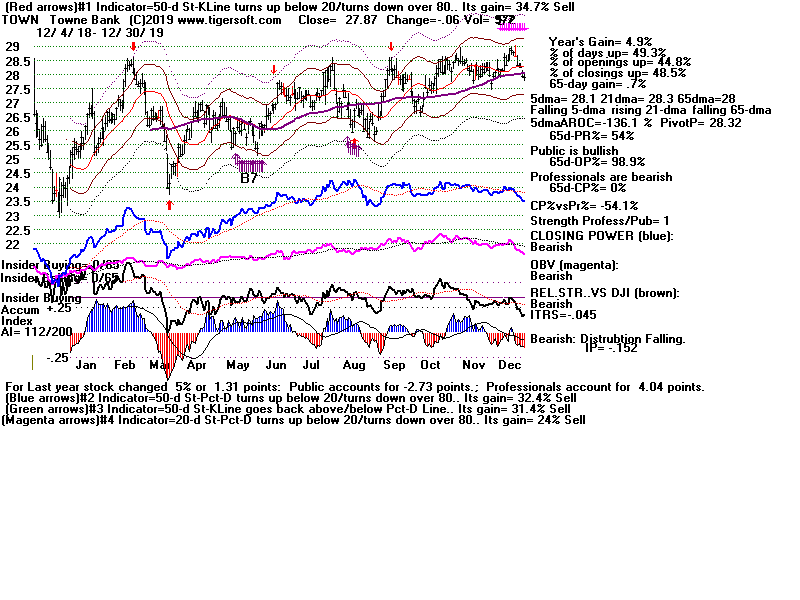
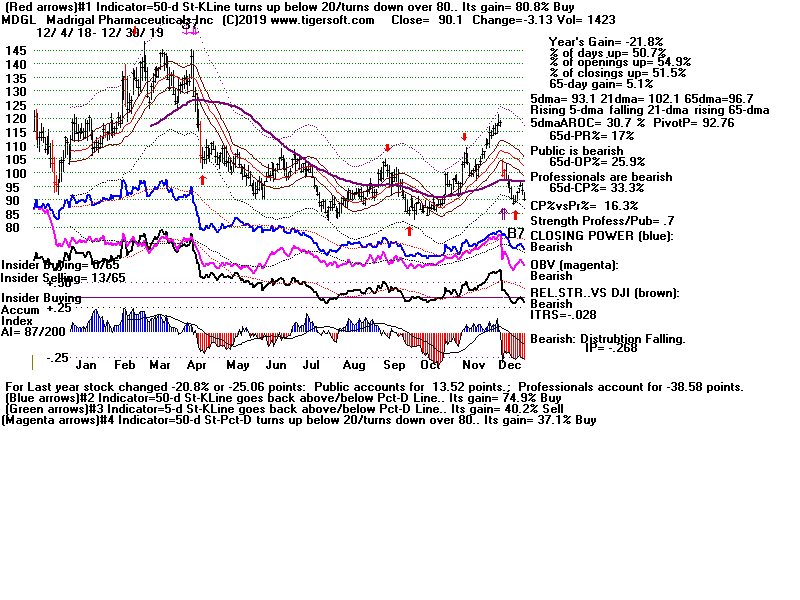
====================================================================
====================================================================
====================================================================
1/09/2019 A Peerless Sell S12 signal
today was given today. DJI Resistance
seems likely to be very intense from here up to 24300, where
the point of 50% retracement is. So, upside potential is quite
limited. At the same time, there is much more downside potential
if the DJI simply re-tests its December lows. The problem for
the market now technically is that we have a series of lower
and lower tops. So, if 21000 does not hold, it will seem like a
bear market has started.


Fortunately, for the market, Fed Chairman Powell has probably
learned not to 'rock the Equities' boat' and the FOMC now
says that they will not be raising rates until May and only twice
in 2019. That may limit the size of the Sell S12 decline.
Some of you may want to wait for the NYSE A/D Line to break
its uptrend before selling out long ETF positions. But can we
trust Powell's new-found dovishness. What if he changes his
mind again, perhaps because the Dollar weakens significantly.
I would suggest that without more signs of inflation, the FED
has no business raising rates, at all. Certainly, there are many who
do not trust the Jobs' numbers and would rather emphasize
the likelihood of an international economic slow-down.
Looking back again at the January S12s since 1928, we see
they are very reliable and the significant (>3%) paper losses or
draw-downs are infrequent. A re-test of the December lows,
or at least 22000 seems likely next. The negative Accumulation
Indexes are warning us that Big Money does not believe the
current rally will continue much higher. I would trust their bearishness
and expect the rising Closing Power uptrends tobe broken and expect
to see a number of optimized red Stochastic-14 Sells even if the
A/D Line uptrend is not quickly broken.
|
Independent January Sell S12s since 1928 Date Peerless Gain Paper Loss --------------------------------------------------- 1/10/1941 +.103 (+10.3%) perfect Sell signal 1/6/1949 +.083 -.0061 (-0.61%) 1/24/1949 +.086 none 1/8/1960 +.107 none 1/6/1966 +.213 -.009 1/8/1968 +.086 perfect 1/11/1973 +.108 none 1/2/1974 +.046 -.029 1/2/1981 +.042 -.038 1/29/1982 +.069 none 1/6/1983 +.038 -.020 1/5/1984 +.108 -.003 1/11/2000 +.130 -.018 1/4/2001 +.129 -.068 1/6/2003 +.137 -.008 1/6/2009 +.087 none ------------------------------------------ Mean=+9.5% Avg=+9.8% Avg= -0.5% |
The A/D Line has been strong since December 26, as we would
expect when the FED seems more "dovish". But S12s, which
are based on heavy red Distribution by Big Money, clearly can
over-ride rising briefly A/D Lines. That is why there are so
many January S12s without a nearby S9 (which is breadth-related).
What could be behind the decline? Powell has shown he can
waffle. Now the Dollar is starting to fall. We may get to a point
where international investors will buy Chinese 10-year bonds
rather than US Treasuries...especially, if the US seems unable
to govern itself and seems more and more unstable.

I believe that the DJI will decline next if it appears that Trump's
quick walk-out today from talks with Democrats to end the 15-day
government shut down is not soon reversed with renewed and fruitful
negotiations. The constitutional implications of a longer-term
Budget stalemate and government shut-down should not be dismissed.
On the one hand, no government means no regulation for Wall Street.
On the other hand, a prolonged political stalemate creates
increasing uncertainty, not to mention that it will probably hurt
Republicans and the President more than it hurts the Democrats.
"The truth is that all men having power
ought to be mistrusted.."
(James Madison)
The Founding Fathers built the Constitution on the basis of
compromise, checks and balances, not Presidents running things
by emergency decrees and ultimatums. 2011 taught us that Federal
Governmennt credit-worthiness counts for something: Wall Street
needs foreigners to have faith in the foundations and stability of
American Government. A long shut-down will shake that. So far,
the 10-year rate of US Treasuries is lower than the Chinese. But
a weak Dollar could change that and require much higher Treasury
rates to be internationally competitive. That would spell big trouble
for the stock market here.
|
Charts 1/9/2019 2018 PEERLESS DJI, Signals, Indicators Daily DJI Volume 10-DayUp/Down Vol Hourly DJIA A/D Line for All Stocks Inverted Traders Index NASDAQ S&P OEX NYSE COMPQX DJI-15 DJI-20 DJI-30 DIA SPY QQQ MDY IWM TNA Short-Term Rates USO-CrudeOil DBO FAS GLD BBH IBB JETS JNUG KOL NUGT OIH OIL RSX RETL SDS AGQ SLV SOXL TECL TLT TMF TNA UGA (gasoline) XIV YINN Commodities: CANE CORN DBC JJC, NIB, CHOC CORN, CUT (paper) MOO, SOYB WEAT UUP (Dollar) LIT (Lithium) AAPL ADBE ALXN AMAT AMGN AMD AMZN BA BABA BAC BIDU CAT CVX DE FB GOOG GS HD IBM INTU JPM M (Macy's) MSFT NFLX NVDA QCOM TSLA TXN XOM WMT CMG , LRCX, SWKS, MDGL SPPI WATT SQ TOWN 1/9/2019 (Click on Underlined link.) - Bullish MAXCPs - http://tigersoft.com/MAXCPS/Jan-09/BULLISH.htm Bearish MAXCPs - http://tigersoft.com/MINCPs/Jan-09/BEARISH.htm |
Table 1 QUICKSILVER on ETFS - 1/8/19 ETF CLOSE CHANGE PIVOT-PT 5-dma AROC CL-PWR CANDLE IP21 ITRS --------------------------------------------------------------------------------------------- DIA 238.92 1 226.72 119% ------- ---- -.109 ----- --------------------------------------------------------------------------------------------- BA 343.83 3.3 310.9 307% ------- BLUE -.041 -.011 --------------------------------------------------------------------------------------------- SPY 257.97 1.2 244.21 154.8% ------- BLUE -.057 -.001 --------------------------------------------------------------------------------------------- QQQ 160.82 1.3 149.82 190.7% ------- BLUE -.062 -.016 --------------------------------------------------------------------------------------------- MDY 318.06 3.11 296.63 269.2% ------- BLUE -.071 .006 --------------------------------------------------------------------------------------------- IWM 142.9 1.17 132.25 300.5% ------- BLUE -.089 .002 --------------------------------------------------------------------------------------------- FAS 48.5 .77 42.47 388.5% Bearish BLUE -.096 -.1 --------------------------------------------------------------------------------------------- RETL 29.18 .71 23.24 956.2% ------- BLUE .184 -.157 --------------------------------------------------------------------------------------------- SOXL 89.19 6.4 70.33 227.5% ------- BLUE -.197 -.007 --------------------------------------------------------------------------------------------- TECL 89.2 3.1 72.51 254.8% ------- BLUE -.034 -.253 --------------------------------------------------------------------------------------------- IBB 107.5 .75 97.64 489.8% ------- BLUE -.085 .077 --------------------------------------------------------------------------------------------- GLD 122.31 .78 122.43 40.3% Bullish BLUE .186 .094 --------------------------------------------------------------------------------------------- RSX 20.06 .26 19.07 264.6% Bullish BLUE .048 .014 |
Table 2
    Count of Stocks in Key Directories
          2019-01-09
-------------------------------
NEWHIGHS       41
NEWLOWS        4
MAXCP          4
MINCP          3
TTTNH          11
TTTNL          10
FASTUP         323  Swing traders are bullish.
FASTDOWN       28
CPCROSSA       21
CPCROSSD       69
BIGVOLUP       4
BIGVODN        11
ACCUMVER       3
HIGHIP21       1
HIUPPCT        4
VHIP21         12
LOWACCUM       315  Big Money continues Selling.
REDSELL        382
AUGSELS7       9
TRAPDOOR       23
|
 Table 3
         RANKING OF KEY DIRECTORIES BASED PCT.OF STOCKS ABOVE 65-DMA
              1/9/19
 Bullish = 9
 Bearish = 38
---------------------------------------------------------------------------------------
Directory     Current       day-1         day-2         day-3         day-4         day-5
----------------------------------------------------------------------------------------
BONDFUND       .971          .961          .933          .876          .904          .857
GOLD           .88           .88           .86           .88           .84           .82
HOMEBLDG       .705          .705          .588          .47           .294          .294
PIPELINE       .666          .666          .416          .333          .166          .166
GAMING         .625          .541          .458          .375          .208          .25
SOLAR          .611          .444          .5            .388          .166          .111
AUTO           .589          .461          .384          .256          .128          .102
HACKERS        .545          .5            .363          .181          .09           .227
ETFS           .517          .327          .241          .206          .12           .137
==========================================================================================
NIFTY          .491          .368          .298          .192          .052          .14
COMODITY       .476          .476          .452          .428          .428          .38
FOOD           .473          .456          .438          .421          .421          .35
INFRA          .472          .277          .194          .138          0             .055
CHINA          .466          .233          .216          .2            .066          .15
SOFTWARE       .461          .461          .292          .215          .123          .2
NASD-100       .44           .35           .32           .25           .09           .13
^^^^^^^^
SEMI           .439          .327          .31           .215          .112          .232
BIG17          .434          .434          .413          .195          .152          .173
ELECTRON       .425          .314          .283          .185          .098          .209
RETAIL         .396          .264          .15           .15           .094          .094
INDMATER       .371          .32           .32           .269          .166          .217
GUNS           .352          .352          .352          .235          .058          .058
UTILITY        .35           .45           .25           .275          .2            .2
BIOTECH        .336          .305          .273          .202          .128          .157
BEVERAGE       .333          .333          .333          .222          .111          .111
DOWJONES       .333          .266          .166          .166          .066          .1
^^^^^^^^
EDU            .333          .333          .333          .5            .333          .333
HOSPITAL       .333          .208          .125          .125          .083          .041
FIDSTKS        .317          .295          .209          .177          .059          .075
DJI-13         .307          .23           .076          .076          0             0
GREEN          .304          .304          .173          .217          .086          .086
SP-100         .301          .258          .15           .129          .032          .075
CHEM           .296          .296          .24           .185          .129          .166
REIT           .288          .261          .154          .127          .073          .04
RUS-1000       .286          .246          .17           .135          .068          .083
SP500          .267          .224          .144          .12           .052          .076
^^^^^
INDEXES        .221          .2            .2            .172          .178          .172
INSURANC       .2            .2            .166          .2            .133          .133
JETS           .2            .2            .2            .1            .1            .1
FINANCE        .188          .166          .133          .133          .1            .088
MILITARY       .187          .187          .125          .093          .093          .093
COMPUTER       .181          .136          .09           .09           .045          .045
REGBANKS       .178          .178          .107          .107          .035          .035
BIGBANKS       .142          .142          0             0             0             0
COAL           .142          .142          .142          .142          .142          .142
OILGAS         .136          .149          .108          .074          .034          .054
TRANSP         .05           0             0             0             0             0
|
====================================================================
1/8/2019 No
Peerless Sell S12 signal today. But it will not take much more
of an up-move to bring this about. A DJI close above 23800 will produce a
Sell S12 even if breadth is as good as today and the P-Indicator thereby
turns positive. Note below that January Sell S12s have been quite reliably
bearish even when they occur alone with the no accompanying or nearby
Sell S9. Independent S12s are numerous and their paper losses are normally
small. Still in that event, let's wait for NYSE
decliners to be greater than
advancers before acting on a Sell S12. Such weakness
will also turn down
the Stochastic-14s and give Red optimized Sells on many of the major market
ETFs. (See the charts of DIA and QQQ below).
Independent January Sell S12s since 1928
Date Peerless Gain
Paper Loss
---------------------------------------------------
1/10/1941 +.103 (+10.3%) perfect Sell signal
1/6/1949 +.083
-.0061 (-0.61%)
1/24/1949 +.086
none
1/8/1960 +.107
none
1/6/1966 +.213
-.0088
1/8/1968 +.086
perfect
1/11/1973 +.108
none
1/2/1974 +.046
-.029
1/2/1981 +.042
-.038
1/29/1982 +.069
none
1/6/1983 +.038
-.020
1/5/1984 +.108
-.003
1/11/2000 +.130
-.0184
1/4/2001 +.129
-.068
1/6/2002 +.137
-.0078
1/6/2009 +.087
none
Still, we should probably wait for a negative breadth day to
clinch a Sell S12
in here, since the market is making a major readjustment. Again, there
were more than 2300 NYSE advancers. Understand that the upwards reversal
since Christmas is not just a Santa Claus rally. It has also occurred because Fed
Chairman has seemingly reversed himself about the need to raise interest
rates later this year. Short-term rates did make a new high today. But
the
market is hearing what it wants to hear and now believes that Powell will be
very circumspect about what he next says. This is very important for the
market.
The ups and downs of interest rates have historically played a particularly important
role in the intermediate-term swings of the market. Simply a long pause now
before raising the Federal Funds rates above 2.5% will help a lot of the stocks
that were December casualties to Powell's careless talk about raising rates and
selling off the Fed's trillions in 'toxic assets' and mortgages.


Charts 1/8/2019 2018 PEERLESS DJI, Signals, Indicators Daily DJI Volume 10-DayUp/Down Vol Hourly DJIA A/D Line for All Stocks Inverted Traders Index NASDAQ S&P OEX NYSE COMPQX DJI-15 DJI-20 DJI-30 DIA SPY QQQ MDY IWM TNA Short-Term Rates USO-CrudeOil DBO FAS GLD BBH IBB JETS JNUG KOL NUGT OIH OIL RSX RETL SDS AGQ SLV SOXL TECL TLT TMF TNA UGA (gasoline) XIV YINN Commodities: CANE CORN DBC JJC, NIB, CHOC CORN, CUT (paper) MOO, SOYB WEAT UUP (Dollar) LIT (Lithium) AAPL ADBE ALXN AMAT AMGN AMD AMZN BA BABA BAC BIDU CAT CVX DE FB GOOG GS HD IBM INTU JPM M (Macy's) MSFT NFLX NVDA QCOM TSLA TXN XOM WMT CMG , LRCX, SWKS, MDGL SPPI WATT SQ TOWN 1/8/2019 (Click on Underlined link.) - Bullish MAXCPs - http://tigersoft.com/MAXCPS/Jan-08/BULLISH.htm Bearish MAXCPs - http://tigersoft.com/MINCPs/Jan-08/BEARISH.htm |
Table 1 QUICKSILVER on ETFS - 1/8/19 ETF CLOSE CHANGE PIVOT-PT 5-dma AROC CL-PWR CANDLE IP21 ITRS --------------------------------------------------------------------------------------------- DIA 237.92 2.56 233.36 101.5% ------- RED -.142 ----- --------------------------------------------------------------------------------------------- BA 340.53 12.42 323.81 279.6% ------- BLUE -.077 -.008 --------------------------------------------------------------------------------------------- SPY 256.77 2.39 250.18 136.9% ------- RED -.104 -.001 --------------------------------------------------------------------------------------------- QQQ 159.52 1.43 154.88 170.1% ------- RED -.116 -.004 --------------------------------------------------------------------------------------------- MDY 314.95 5.19 301.59 202.4% ------- BLUE -.109 -.001 --------------------------------------------------------------------------------------------- IWM 141.73 2.14 134.66 288.9% ------- BLUE -.13 .003 --------------------------------------------------------------------------------------------- FAS 47.73 .73 44.95 328.2% Bearish RED -.134 -.082 --------------------------------------------------------------------------------------------- RETL 28.47 .78 24.25 1072.1% ------- RED .151 -.145 --------------------------------------------------------------------------------------------- SOXL 82.79 -1.29 85.53 -32.9% ------- RED -.266 -.027 --------------------------------------------------------------------------------------------- TECL 86.1 2.25 85.03 67.4% ------- RED -.079 -.224 --------------------------------------------------------------------------------------------- IBB 106.75 .76 97.5 515.9% ------- RED -.112 .07 --------------------------------------------------------------------------------------------- GLD 121.53 -.33 121.33 11.5% Bullish BLUE .167 .073 --------------------------------------------------------------------------------------------- RSX 19.8 .08 19.03 272.6% Bullish BLUE -.024 .002 |
 Table 2   Count of Stocks in Key Directories
           2019-01-08
-------------------------------
NEWHIGHS       36
NEWLOWS        5
MAXCP          4
MINCP          6
TTTNH          11
TTTNL          21
FASTUP         350 Swing traders are bullish
FASTDOWN       28
CPCROSSA       10
CPCROSSD       80
BIGVOLUP       4
BIGVODN        14
ACCUMVER       4
HIGHIP21       1
HIUPPCT        4
VHIP21         11
LOWACCUM       326 Lots of Big Money sellers still
REDSELL        403
AUGSELS7       15
TRAPDOOR       23
|
 Table RANKING OF KEY DIRECTORIES BASED PCT.OF STOCKS ABOVE 65-DMA
              1/8/19
 Bullish = 5
 Bearish = 41
---------------------------------------------------------------------------------------
Directory     Current       day-1         day-2         day-3         day-4         day-5
----------------------------------------------------------------------------------------
BONDFUND       .961          .933          .876          .904          .847          .523
GOLD           .88           .86           .88           .84           .82           .74
HOMEBLDG       .705          .588          .47           .294          .294          .176
PIPELINE       .666          .416          .333          .166          .166          .166
GAMING         .541          .458          .375          .208          .25           .25
===========================================================================================
HACKERS        .5            .363          .181          .09           .227          .272
===========================================================================================
COMODITY       .476          .452          .428          .428          .38           .357
AUTO           .461          .384          .256          .128          .102          .128
SOFTWARE       .461          .292          .215          .123          .2            .184
FOOD           .456          .438          .421          .421          .35           .333
UTILITY        .45           .25           .275          .2            .2            .35
SOLAR          .444          .5            .388          .166          .111          .055
BIG17          .434          .413          .195          .152          .173          .173
NIFTY          .368          .298          .192          .052          .14           .175
GUNS           .352          .352          .235          .058          .058          .117
NASD-100       .35           .32           .25           .09           .13           .17
BEVERAGE       .333          .333          .222          .111          .111          .166
EDU            .333          .333          .5            .333          .333          .333
ETFS           .327          .241          .206          .12           .137          .068
SEMI           .327          .31           .215          .112          .224          .172
INDMATER       .32           .32           .269          .166          .217          .192
ELECTRON       .314          .283          .185          .098          .203          .166
GREEN          .304          .173          .217          .086          .086          .086
BIOTECH        .302          .273          .202          .128          .152          .144
CHEM           .296          .24           .185          .129          .166          .148
FIDSTKS        .295          .209          .177          .059          .075          .107
INFRA          .277          .194          .138          0             .055          .055
DOWJONES       .266          .166          .166          .066          .1            .133
^^^^^^^^       ^^^^
RETAIL         .264          .15           .15           .094          .075          .094
REIT           .261          .154          .127          .073          .04           .073
SP-100         .258          .15           .129          .032          .075          .107
RUS-1000       .246          .17           .135          .068          .083          .112
CHINA          .233          .216          .2            .066          .15           .183
DJI-13         .23           .076          .076          0             0             .076
SP500          .224          .144          .12           .052          .076          .104
HOSPITAL       .208          .125          .125          .083          .041          .041
INDEXES        .204          .204          .177          .182          .177          .188
INSURANC       .2            .166          .2            .133          .133          .166
JETS           .2            .2            .1            .1            .1            .1
MILITARY       .187          .125          .093          .093          .093          .093
REGBANKS       .178          .107          .107          .035          .035          .035
FINANCE        .166          .133          .133          .1            .088          .088
OILGAS         .149          .108          .074          .034          .047          .047
BIGBANKS       .142          0             0             0             0             0
COAL           .142          .142          .142          .142          .142          .142
COMPUTER       .136          .09           .09           .045          .045          .045
TRANSP         0             0             0             0             0             0
|
====================================================================
1/7/2019 No
Peerless Sell signal so far. But my testing of hypothetical DJI
numbers shows that a close above 23875 (corrected) would bring a Sell S12.
The S12 is based on a negative Accum Index as the DJI approaches
upper band. That is now only 320 points higher. Such a move would
also move the DJI's short-term stochastic (14-day) above the 80-level
where an optimized red Sell will appear on the DJIA and DIA on the
next decline. Note also that a sell here would also be consistent with:
1) the failure of volume to rise on the rally;
2) the bearish rising wedge patterns that we now see in
the key ETFs;
3) the mostly still falling Closing Powers 21-day moving averages;
4) the fact that more than 75% of all the stocks we
follow are well below their 65-dma resistance levels;
5) how the "Santa Claus" rally commonly tops out in the second
weak of January.
24000-24300 Looks like firm DJIA resistance.
The Accum. Index remains quite negative, though
the P-I and ADL are improving rapidly.


But let's not anticipate the Sell S12, breadth has become very good.
Some of you may prefer to not rush to sell until the rising NYSE A/D
Line breaks its uptrend. If we do get a Sell S12, we will look back
at January S12s and also the S12 cases where the P-Indicator was rising
quite fast.
Breadth has been very bullish since word got out that Powell was turning
"dovish" and not in a rush to raise interest rates or sell large quantities
of 'toxic assets' and mortgages it has been holding since 2008-2009.
Good NYSE breadth is exactly what we would expect in this environment.
Look below at the daily NYSE Advances and Declines since December 26th.
The P-I (21-dma of adv-declines) now stands at -206. Because of the
way the P-I is calculated, just a flat breadth day tomorrow will lift the P-I
by +70 tomorrow and three more flat breadth days after that will turn
the P-Indicator positive and make an S9 very unlikely.
Adv. Dec.
12/26/18 2646
383
12/27/18 1619 1396
12/28/18 1935 1069
12/31/18 2153 868
1/2/19 2111 909
1/3/19 1272
1742
1/4/19 2732 276
1/7/19 2371
650
---------------------------
Numbers next being dropped of in creation of P-I
(the 21-dma of NYSE Advances minus Declines)
12/4 498
2543
12/6 1166
1845
12/7 932
2042
12/8 975
2024
Another element in the market now is still the
absence of leadership.
But that may be changing. Housing and Solar Energy stocks have
have improved their ranking in Table 3 below. This is the result
of lower interest rates. Bullishly, the biotech ETFs, BBH and IBB,
today got back above their falling 65-dma as has high flier, NFLX.
Watch AMZN tomorrow to see how it handles the falling 65-dma
it has almost reached. The very negative Accumulation Index readings
with these issues warns us that there is still lots of overhead resistance.


|
Charts 1/7/2019 2018 PEERLESS DJI, Signals, Indicators Daily DJI Volume 10-DayUp/Down Vol Hourly DJIA A/D Line for All Stocks Inverted Traders Index NASDAQ S&P OEX NYSE COMPQX DJI-15 DJI-20 DJI-30 DIA SPY QQQ MDY IWM TNA Short-Term Rates USO-CrudeOil DBO FAS GLD BBH IBB JETS JNUG KOL NUGT OIH OIL RSX RETL SDS AGQ SLV SOXL TECL TLT TMF TNA UGA (gasoline) XIV YINN Commodities: CANE CORN DBC JJC, NIB, CHOC CORN, CUT (paper) MOO, SOYB WEAT UUP (Dollar) LIT (Lithium) AAPL ADBE ALXN AMAT AMGN AMD AMZN BA BABA BAC BIDU CAT CVX DE FB GOOG GS HD IBM INTU JPM M (Macy's) MSFT NFLX NVDA QCOM TSLA TXN XOM WMT CMG , LRCX, SWKS, MDGL SPPI WATT SQ TOWN 1/7/2019 (Click on Underlined link.) - Bullish MAXCPs - http://tigersoft.com/MAXCPS/Jan-07/BULLISH.htm Bearish MAXCPs - http://tigersoft.com/MINCPs/Jan-07/BEARISH.htm |
Table 1 QUICKSILVER on ETFS - 1/7/19 ETF CLOSE CHANGE PIVOT-PT 5-dma AROC CL-PWR CANDLE IP21 ITRS --------------------------------------------------------------------------------------------- DIA 235.36 1.08 233.2 105.4% Bearish BLUE -.098 ----- --------------------------------------------------------------------------------------------- BA 328.11 1.03 322.5 183.2% ------- RED -.035 .002 --------------------------------------------------------------------------------------------- SPY 254.38 1.99 249.92 133.2% ------- BLUE -.062 -.005 --------------------------------------------------------------------------------------------- QQQ 158.09 1.86 154.26 166.6% ------- BLUE -.086 -.023 --------------------------------------------------------------------------------------------- MDY 309.76 3.41 302.67 172.6% Bearish BLUE -.091 -.012 --------------------------------------------------------------------------------------------- IWM 139.59 2.4 133.9 250.8% ------- BLUE -.109 -.015 --------------------------------------------------------------------------------------------- FAS 47 .71 44.77 374.7% Bearish BLUE -.093 -.119 --------------------------------------------------------------------------------------------- RETL 27.69 2.45 23.17 1016.8% ------- BLUE .127 -.176 --------------------------------------------------------------------------------------------- SOXL 84.08 4.66 83.32 144.2% ------- BLUE -.2 -.168 --------------------------------------------------------------------------------------------- TECL 83.85 2.14 85 71.3% ------- BLUE -.042 -.306 --------------------------------------------------------------------------------------------- IBB 105.99 3.44 96.43 570.1% ------- BLUE -.093 .036 --------------------------------------------------------------------------------------------- GLD 121.86 .42 121.25 32.9% Bullish RED .132 .112 --------------------------------------------------------------------------------------------- RSX 19.72 .01 18.75 254.4% Bullish BLUE .002 .022 |
 Table 2   Count of Stocks in Key Directories
           2019-01-07
-------------------------------
NEWHIGHS       27
NEWLOWS        7
MAXCP          8
MINCP          5
TTTNH          18
TTTNL          12
FASTUP         339   Swing Traders are bullish.
FASTDOWN       17
CPCROSSA       20
CPCROSSD       43
BIGVOLUP       5
BIGVODN        1
ACCUMVER       3
HIGHIP21       2
HIUPPCT        4
VHIP21         13
LOWACCUM       338   Still heavy big money selling.
REDSELL        398   Still heavy big money selling.
AUGSELS7       12
TRAPDOOR       5
|
 Table 3
             RANKING OF KEY DIRECTORIES BASED PCT.OF STOCKS ABOVE 65-DMA
              1/7/19
 Homebuilding is enjoying a surge.
---------------------------------------------------------------------------------------
Directory     Current       day-1         day-2         day-3         day-4         day-5
----------------------------------------------------------------------------------------
BONDFUND       .933          .876          .904          .847          .523          .39
GOLD           .86           .88           .84           .82           .74           .62
HOMEBLDG       .588          .47           .294          .294          .176          .176
==========================================================================================
SOLAR          .5            .388          .166          .111          .055          .055
==========================================================================================
GAMING         .458          .375          .208          .25           .25           .25
COMODITY       .452          .428          .428          .38           .357          .357
FOOD           .438          .421          .421          .35           .333          .333
PIPELINE       .416          .333          .166          .166          .166          .166
BIG17          .413          .195          .152          .173          .173          .152
AUTO           .384          .256          .128          .102          .128          .102
HACKERS        .363          .181          .09           .227          .272          .227
GUNS           .352          .235          .058          .058          .117          .058
BEVERAGE       .333          .222          .111          .111          .166          .166
EDU            .333          .5            .333          .333          .333          .166
INDMATER       .32           .269          .166          .217          .192          .153
NASD-100       .32           .25           .09           .13           .17           .12
SEMI           .31           .215          .112          .224          .172          .163
NIFTY          .298          .192          .052          .14           .175          .14
SOFTWARE       .292          .215          .123          .2            .184          .138
ELECTRON       .283          .185          .098          .203          .166          .154
BIOTECH        .271          .202          .128          .152          .142          .118
UTILITY        .25           .275          .2            .2            .35           .3
ETFS           .241          .206          .12           .137          .068          .086
CHEM           .24           .185          .129          .166          .148          .148
CHINA          .216          .2            .066          .15           .183          .166
FIDSTKS        .209          .177          .059          .075          .107          .086
INDEXES        .208          .181          .187          .181          .192          .187
JETS           .2            .1            .1            .1            .1            0
INFRA          .194          .138          0             .055          .055          .027
GREEN          .173          .217          .086          .086          .086          .086
RUS-1000       .17           .135          .068          .083          .112          .09
DOWJONES       .166          .166          .066          .1            .133          .066
INSURANC       .166          .2            .133          .133          .166          .166
REIT           .154          .127          .073          .04           .073          .067
RETAIL         .15           .15           .094          .075          .094          .075
SP-100         .15           .129          .032          .075          .107          .075
SP500          .144          .12           .052          .076          .106          .086
COAL           .142          .142          .142          .142          .142          .142
FINANCE        .133          .133          .1            .088          .088          .1
HOSPITAL       .125          .125          .083          .041          .041          .041
MILITARY       .125          .093          .093          .093          .093          .093
OILGAS         .108          .074          .034          .047          .047          .04
REGBANKS       .107          .107          .035          .035          .035          .035
COMPUTER       .09           .09           .045          .045          .045          .045
DJI-13         .076          .076          0             0             .076          0
BIGBANKS       0             0             0             0             0             0
TRANSP         0             0             0             0             0             0
|
====================================================================
1/4/2019 Appearing
with Bernanke and Yellen, Fed Chairman Powell
reversed himself about the need for higher interest rates.
That coupled with a superb December Jobs' number, +313.000
and the market roared upwards. There were nearly 10x more
stocks rising than falling on the NYSE. This generated the
second Peerless Buy B14 since Christmas. Santa Claus was
was late this year, but not without his bounty for Wall Street.
Powell has shown he can be pressured by Wall Street and the
Equities' markets' traders. This has to be a bullish sign. The
"January effect" which boost prices for a week or two this month
'should' lead to higher prices. So hold some of the semi-conductors
long. Meanwhile, the bearish MINCPs still greatly outnumber
the MAXCPs, so do some hedging here.
Less than 17% of the DJI-30 and SP-500 stocks are above their
key 65-dma. This means lots of overhead resistance exists even|
among leaders. It will be tricky for DJI to rally up close enough
to upper 2.3% band to get a new Peerless Sell. Watch with interest
how the manipulators solve this problem. They, the Fed and
the White House desperately do not want another market sell-off.
Peerless is telling us that the DJI-30 will manage to work higher.
24000 -24366 looms as the likely resistance now,
assuming 23000-support hold up now.


Buy B14s have become much more common in the last ten
years, as computerized trading has become so dominant.
Their median gais in only 2% and when paired in close proximity
they produced gains of less than 2%. Below are the Buy B14s
since 2007.
Date DJI
Gain Paper Loss
-------------------------------------------------------------------
20070829 B14 13289.29 .040 13113.3
-.0132 9/17
20070918 B14 13739.39 .006
none
Major market top in October.
20071128 B14 13289.45 .025
none
20080318 B14 12392.66 .013 12099.6 -.0236 3/19
New Bull Market starts in 2009
20090312 B14 7170.06 .186
none
20090715 B14 8616.21 .192
none
20091109 B14 10226.94 .004
none
20100527 B14 10258.99
.015 9816.49 -.0431 6/7
20100602 B14 10249.54 .016 9816.49 -.0422 6/7
(Paired)
20100610 B14 10172.53 .023
none
20100707 B14 10018.28 .052
none
20100901 B14 10269.47 .247
none
20110815 B14 11482.9 .007
10817.6 -.0579 8/19
20110829 B14 11539.25 .002
none
(Paired)
20111010 B14 11433.18 .058 11257.5 -.0153 11/23
20111027 B14 12208.55 -.009 11257.5 -.0778
11/23
20111128 B14 11523.01 .05
none
20120727 B14 13075.66 .038
none
20121231 B14 13104.14 .158
none
20150827 B14 16654.77 .064 16001.8 -.0392 9/28
20160708 B14 18146.74 .010 18034.7 -.0061 9/14
-----------------------------------------------------------------
Avg. = 5.9%
,
So, we cannot rely on a new bull market upswing based
on the
Buy B14 in itself. The DIA, SPY, IWM, QQQ and SOXL are
now moving up into much heavier resistance. Higher volume
will be needed to take price through the resistance.
DIA |
SPY |
IWM |
QQQ |
SOXL |
A Little More Headroom Now.
Since the DJI is now 0.8% below its 21-dma, Peerless will not
easily give a Sell S9 (assuming negative P-I) or a Sell S12
(assuming negative Accum.Index-IP21) until the DJI rises to
a point 2.3% above the 21-dma, about 800 points higher.
The key ETFs Closing Powers jumped a lot on
Friday. But they have
only reached their falling 21-day mvg. averages. More good news -
about trade negotiations with China and regarding the long government
shut-down will be needed to power the DJI back above 24000. With
the 23300 resistance having been taken out on the recovery, I would
24000 to be the new heaviest point of resistance.
|
Charts 1/4/2019 2018 PEERLESS DJI, Signals, Indicators Daily DJI Volume 10-DayUp/Down Vol Hourly DJIA A/D Line for All Stocks Inverted Traders Index NASDAQ S&P OEX NYSE COMPQX DJI-15 DJI-20 DJI-30 DIA SPY QQQ MDY IWM TNA Short-Term Rates USO-CrudeOil DBO FAS GLD BBH IBB JETS JNUG KOL NUGT OIH OIL RSX RETL SDS AGQ SLV SOXL TECL TLT TMF TNA UGA (gasoline) XIV YINN Commodities: CANE CORN DBC JJC, NIB, CHOC CORN, CUT (paper) MOO, SOYB WEAT UUP (Dollar) LIT (Lithium) AAPL ADBE ALXN AMAT AMGN AMD AMZN BA BABA BAC BIDU CAT CVX DE FB GOOG GS HD IBM INTU JPM M (Macy's) MSFT NFLX NVDA QCOM TSLA TXN XOM WMT CMG , LRCX, SWKS, MDGL SPPI WATT SQ TOWN 1/4/2019 (Click on Underlined link.) - Bullish MAXCPs - http://tigersoft.com/MAXCPS/Jan-04/BULLISH.htm Bearish MAXCPs - http://tigersoft.com/MINCPs/Jan-04/BEARISH.htm |
Table 1   QUICKSILVER on ETFS - 1/4/19

 DIA looks stronger than any of the major ETFs below, except GLD.
 The DJI remains the leader.  This is defensive.  It makes market look vulnerable.
ETF CLOSE CHANGE PIVOT-PT 5-dma AROC CL-PWR CANDLE IP21 ITRS --------------------------------------------------------------------------------------------- DIA 234.28 7.56 230.48 65.4% Bearish BLUE -.137 ---- --------------------------------------------------------------------------------------------- BA 327.08 16.18 316.38 156.2% ------- BLUE -.095 -.007 Most important stock in DJIA-30. --------------------------------------------------------------------------------------------- SPY 252.39 8.18 247.75 87.1% Bearish BLUE -.119 -.008 --------------------------------------------------------------------------------------------- QQQ 156.23 6.41 152.97 103.9% ------- BLUE -.143 -.028 --------------------------------------------------------------------------------------------- MDY 306.35 9.72 299.36 109.5% Bearish BLUE -.142 -.022 --------------------------------------------------------------------------------------------- IWM 137.19 4.94 132.86 176.8% Bearish BLUE -.183 -.029 --------------------------------------------------------------------------------------------- FAS 46.29 3.82 43.67 291.5% Bearish BLUE -.131 -.135 --------------------------------------------------------------------------------------------- RETL 25.24 2 22.86 623.5% Bearish BLUE -.072 -.229 --------------------------------------------------------------------------------------------- SOXL 79.42 9.09 81.77 -41.1% Bearish BLUE -.265 -.213 --------------------------------------------------------------------------------------------- TECL 81.71 9.2 82.69 -108.9% Bearish BLUE -.082 -.319 --------------------------------------------------------------------------------------------- IBB 102.55 4.91 94.84 383.6% ------- BLUE -.146 .01 --------------------------------------------------------------------------------------------- GLD 121.44 -.99 121.06 35.9% Bullish BLUE .13 .124 --------------------------------------------------------------------------------------------- RSX 19.71 .64 18.75 321.5% ------- BLUE -.056 .026 |
 Table 2   Count of Stocks in Key Directories
           2019-01-04
-------------------------------
NEWHIGHS       21
NEWLOWS        1
MAXCP          6
MINCP          2
TTTNH          9
TTTNL          5
FASTUP         215   Swing traders are bullish
FASTDOWN       16
CPCROSSA       30
CPCROSSD       20
BIGVOLUP       5
BIGVODN        5
ACCUMVER       3
HIGHIP21       3
HIUPPCT        4
VHIP21         14
LOWACCUM       325
REDSELL        421
AUGSELS7       28
TRAPDOOR       19
|
| Table 3 Only Gold and Bonds show most of their individual stocks or funds are above the key support of 65-dma. This means there is much overhead resistance. Home-builders have jumped upwards RANKING OF KEY DIRECTORIES BASED PCT.OF STOCKS ABOVE 65-DMA
1/4/19
---------------------------------------------------------------------------------------
Directory Current day-1 day-2 day-3 day-4 day-5
----------------------------------------------------------------------------------------
GOLD .88 .84 .82 .74 .62 .68
BONDFUND .876 .904 .847 .523 .39 .314
=============================================================================================
EDU .5 .333 .333 .333 .166 .333
=============================================================================================
HOMEBLDG .47 .294 .294 .176 .176 .176
COMODITY .428 .428 .38 .357 .357 .357
FOOD .421 .421 .35 .333 .333 .333
SOLAR .388 .166 .111 .055 .055 .111
GAMING .375 .208 .25 .25 .25 .25
PIPELINE .333 .166 .166 .166 .208 .125
UTILITY .275 .2 .2 .35 .3 .4
INDMATER .269 .166 .217 .192 .153 .179
AUTO .256 .128 .102 .128 .102 .102
NASD-100 .25 .09 .13 .17 .12 .12
^^^^^^^^
GUNS .235 .058 .058 .117 .058 .117
BEVERAGE .222 .111 .111 .166 .166 .111
GREEN .217 .086 .086 .086 .086 .086
SEMI .215 .112 .224 .172 .155 .129
SOFTWARE .215 .123 .2 .184 .138 .123
ETFS .206 .12 .137 .068 .068 .086
BIOTECH .2 .128 .152 .142 .113 .1
CHINA .2 .066 .15 .183 .166 .15
INSURANC .2 .133 .133 .166 .166 .166
BIG17 .195 .152 .173 .173 .152 .13
NIFTY .192 .052 .14 .175 .14 .105
CHEM .185 .129 .166 .148 .148 .129
ELECTRON .185 .098 .203 .166 .148 .117
HACKERS .181 .09 .227 .272 .227 .181
INDEXES .181 .187 .181 .192 .187 .197
FIDSTKS .177 .059 .075 .107 .086 .091
DOWJONES .166 .066 .1 .133 .066 .066
^^^^^^^^
RETAIL .15 .094 .075 .094 .075 .075
COAL .142 .142 .142 .142 .142 .142
INFRA .138 0 .055 .055 .027 .055
RUS-1000 .135 .068 .083 .112 .09 .094
FINANCE .133 .1 .088 .088 .1 .088
SP-100 .129 .032 .075 .107 .075 .086
REIT .127 .073 .04 .073 .067 .087
HOSPITAL .125 .083 .041 .041 .041 .041
SP500 .12 .052 .076 .106 .086 .098
^^^^^
REGBANKS .107 .035 .035 .035 .035 .035
JETS .1 .1 .1 .1 0 0
MILITARY .093 .093 .093 .093 .093 .093
COMPUTER .09 .045 .045 .045 .045 .045
DJI-13 .076 0 0 .076 0 0
OILGAS .074 .034 .047 .047 .04 .04
BIGBANKS 0 0 0 0 0 0
TRANSP 0 0 0 0 0 0
|
============================================================= ========
1/3/2019 Friday
afternoon, Fed Chairman Powell will be taking the
highly unusual step of having a public discussion with ex-FED Chairs.
Bernanke and Yellen. Clearly, he wants their support to shore up
financial confidence. The last time he spoke, the DJI fell 500 just
while he was talking. Is this a sign of weakness? Does he want their
approval? The market's initial reaction is favorable in that he is,
at least, showing he is sensitive to what stock traders think and
wants to be associated with his predecessors' low-interest rate
policies. So, is he thereby changing his mind and becoming more
"dovish"? The close tomorrow will take on new meaning. Stay tuned.
Powell will do well if he can avoid saying anything untoward and
the market stays on an even keel while he speaks. That will bring
us to next week, when the government shut-down will be front and
center for Wall Street to consider.
Will the 23300-23400 resistance stands firm? Today's down volume
was heavier than yesterday's up volume. The steep Closing Power
uptrend-lines were broken. It is not clear that Professionals will
remain bullish and move up prices above 23300. The 21-day moving
averages of Closing Power are all falling for the key major market
ETFs. About 85% of all equities are below their 65-dma. It will take
a lot of new buying to move most stocks significantly higher.


But for the time being, Stocks still look oversold, given how far down they
are from the 65-dma and given that December-January rebounds usually
last a little longer.
We do show Peerless B6s and a Buy B14. If Peerless is correct, the
rally will continue a little longer. But it may have to do that while
dangerously relying mostly on manipulated higher openings. There were
many more Bearish MINCPs than Bullish MAXCPs tonight. So,
I would stay hedged by being short some of the bearish MINCPs.
Hold SOXL and NVDA long out of respect to Peerless unless they
make new lows. I would prefer to buy DIA, the leader among the
ETFs on weakness near 22000, so that there is some upside
potential.


MONTHLY JOBS NUMBERS
|
https://data.bls.gov/timeseries/CES0000000001?output_view=net_1mth
Friday looks like a higher opening. A lot depends upon the December
Jobs' numbers which will be reported an hour before the NY opening.
Other evidence of a world-wide economic slow down is hard to miss.
How much will it impact the US and the FED?
Apple's predcition of a slowdown in its sales is one warning. Another
is the way Bonds are now rising. The wealthy who are the biggest
buyers of bonds, by far, are clearly avoiding equities in favor of
bonds. They fear a recession. That is the essence of all the talk about
an "inverted yield curve".
Tomorrow, the Jobs numbers come out. Anything above 200,000 will
probably come as a bullish surprise and boost stock prices short-term,
But traders might then have second thoughts, as it would give
give Powell and the FOMC hawks more reason to tighten.
A weak number, 120,000 to 160,000 would confirm the expectation
that a recession is nearing and a bear market may be unavoidable,
no matter what the FED does.
Most likely, we will see a number between 160,000 and 200,000.
That will be more neutral. It is what the market expects. It is
built into stock prices already. In my opinion, such a number
will give another two weeks to the rally.
|
Charts 1/3/2019 2018 PEERLESS DJI, Signals, Indicators Daily DJI Volume 10-DayUp/Down Vol Hourly DJIA A/D Line for All Stocks Inverted Traders Index NASDAQ S&P OEX NYSE COMPQX DJI-15 DJI-20 DJI-30 DIA SPY QQQ MDY IWM TNA Short-Term Rates USO-CrudeOil DBO FAS GLD BBH IBB JETS JNUG KOL NUGT OIH OIL RSX RETL SDS AGQ SLV SOXL TECL TLT TMF TNA UGA (gasoline) XIV YINN Commodities: CANE CORN DBC JJC, NIB, CHOC CORN, CUT (paper) MOO, SOYB WEAT UUP (Dollar) LIT (Lithium) AAPL ADBE ALXN AMAT AMGN AMD AMZN BA BABA BAC BIDU CAT CVX DE FB GOOG GS HD IBM INTU JPM M (Macy's) MSFT NFLX NVDA QCOM TSLA TXN XOM WMT CMG , LRCX, SWKS, MDGL SPPI WATT SQ TOWN 1/3/2019 (Click on Underlined link.) - Bullish MAXCPs - http://tigersoft.com/MAXCPS/Jan-03/BULLISH.htm Bearish MAXCPs - http://tigersoft.com/MINCPs/Jan-03/BEARISH.htm |
Table 1 QUICKSILVER on ETFS - 1/3/19 Lots more rising 5-dma. Only GLD has been stronger than DJI over the last 50 trading days. ETF CLOSE CHANGE PIVOT-PT 5-dma AROC CL-PWR CANDLE IP21 ITRS --------------------------------------------------------------------------------------------- DIA 226.72 -6.64 231.26 -43% Bearish RED -.165 ---- --------------------------------------------------------------------------------------------- BA 310.9 -12.91 317.14 -47.5% Bearish RED -.155 -.019 --------------------------------------------------------------------------------------------- SPY 244.21 -5.97 248.07 -39.7% Bearish RED -.143 -.007 --------------------------------------------------------------------------------------------- QQQ 149.82 -5.06 153.05 -86% Bearish RED -.162 -.026 --------------------------------------------------------------------------------------------- MDY 296.63 -4.96 299.78 -23.3% Bearish RED -.157 -.021 --------------------------------------------------------------------------------------------- IWM 132.25 -2.41 132.48 12% Bearish RED -.202 -.029 --------------------------------------------------------------------------------------------- FAS 42.47 -2.48 43.73 -20.5% Bearish RED -.175 -.198 --------------------------------------------------------------------------------------------- RETL 23.24 -1.01 22.35 93.1% Bearish RED -.016 -.227 --------------------------------------------------------------------------------------------- SOXL 70.33 -15.2 80.08 -505.7% Bearish RED -.291 -.248 --------------------------------------------------------------------------------------------- TECL 72.51 -12.52 83.49 -523.4% Bearish RED -.105 -.34 --------------------------------------------------------------------------------------------- IBB 97.64 .14 95.16 147.8% Bearish RED -.195 -.014 --------------------------------------------------------------------------------------------- GLD 122.43 1.1 120.57 114.7% Bullish BLUE .07 .164 --------------------------------------------------------------------------------------------- RSX 19.07 .04 18.5 61.3% ------- -----.103 .022 |
 Table 2
   Count of Stocks in Key Directories
          2019-01/03
-------------------------------
NEWHIGHS       22
NEWLOWS        50
MAXCP          11
MINCP          6
TTTNH          12
TTTNL          41
FASTUP         76
FASTDOWN       33
CPCROSSA       27
CPCROSSD       241
BIGVOLUP       3
BIGVODN        7
ACCUMVER       3
HIGHIP21       3
HIUPPCT        2
VHIP21         13
LOWACCUM       315
REDSELL        421
AUGSELS7       26
TRAPDOOR       20
|
 Table 3
              RANKING OF KEY DIRECTORIES BASED PCT.OF STOCKS ABOVE 65-DMA
              1/3/19
 Rush into Bonds and Gold. Not much else.
---------------------------------------------------------------------------------------
Directory     Current       day-1         day-2         day-3         day-4         day-5
----------------------------------------------------------------------------------------
BONDFUND       .904          .847          .523          .39           .295          .314
GOLD           .84           .82           .74           .62           .68           .6
============================================================================================
COMODITY       .428          .38           .357          .357          .357          .357
FOOD           .421          .35           .333          .333          .333          .333
EDU            .333          .333          .333          .166          .333          .333
HOMEBLDG       .294          .294          .176          .176          .176          .176
GAMING         .208          .25           .25           .25           .25           .208
UTILITY        .2            .2            .35           .3            .4            .225
INDEXES        .187          .181          .192          .187          .197          .187
INDMATER       .166          .217          .192          .153          .179          .153
PIPELINE       .166          .166          .166          .208          .166          .125
SOLAR          .166          .111          .055          .055          .055          .055
BIG17          .152          .173          .173          .152          .13           .108
COAL           .142          .142          .142          .142          .142          .142
INSURANC       .133          .133          .166          .166          .166          .1
CHEM           .129          .166          .148          .148          .129          .111
AUTO           .128          .102          .128          .102          .102          .102
BIOTECH        .126          .152          .142          .113          .097          .107
SOFTWARE       .123          .2            .184          .138          .123          .076
ETFS           .12           .137          .068          .068          .086          .103
SEMI           .119          .23           .179          .162          .128          .102
BEVERAGE       .111          .111          .166          .166          .111          .055
FINANCE        .1            .088          .088          .1            .088          .066
JETS           .1            .1            .1            0             0             0
ELECTRON       .098          .203          .166          .148          .111          .098
RETAIL         .094          .075          .094          .075          .075          .075
MILITARY       .093          .093          .093          .093          .093          .093
HACKERS        .09           .227          .272          .227          .181          .09
NASD-100       .09           .13           .17           .12           .12           .11
GREEN          .086          .086          .086          .086          .086          .086
HOSPITAL       .083          .041          .041          .041          .041          .041
REIT           .073          .04           .073          .067          .093          .093
RUS-1000       .068          .083          .112          .09           .095          .07
CHINA          .066          .15           .183          .166          .15           .15
DOWJONES       .066          .1            .133          .066          .066          .066
FIDSTKS        .059          .075          .107          .086          .091          .075
GUNS           .058          .058          .117          .058          .117          0
NIFTY          .052          .14           .175          .14           .105          .122
SP500          .052          .076          .106          .086          .098          .062
COMPUTER       .045          .045          .045          .045          .045          .045
REGBANKS       .035          .035          .035          .035          .035          .035
OILGAS         .034          .047          .047          .04           .04           .04
SP-100         .032          .075          .107          .075          .086          .053
BIGBANKS       0             0             0             0             0             0
DJI-13         0             0             .076          0             0             0
INFRA          0             .055          .055          .027          .027          .055
TRANSP         0             0             0             0             0             0
|
====================================================================
1/2/2019 Short-term,
the Closing Powers for DIA, SPY, QQQ, IWM
and SOXL are rising. So are the 5-day moving averages.
This means Professionals are still lifting prices up from weak
openings, like we are apt to see again tomorrow. APPL's
disappointing predictions are pointing to weak opening
of about 300 points. But a DIA close more than 2.10 points below
its opening tomorrow will cause a break in its CP uptrend.
Similarly, a close by SPY of more than 3 points below its opening
will break its uptrend. For QQQ, the amount is .47. Given
the current failure to get past the resistance just overhead,
a DJI decline of 1000 or more points could quickly follow
the disappearance of Professional support for the market.


The rising Closing Power can continue for a while. Enjoy it,
but be prepared for when this cushion of support disappears.
When Professionals shift again to become net sellers, our key
ETFs' Closing Power uptrend-lines will be violated and we could
will then see a retest of 22000 by the DJI.
The most important technical characteristic of the market
now is the the serious December breakdown below the well-tested
support at 23300. That was the key support level for most of
2018. It held firmly on several separate tests. Having been
decisively broken, it now now acts as resistance as the DJI rallies
back to it. This is a classic tenet of technical analysis.
And, if the DJI should somehow spike up to 24000, Peerless
will almost certainly give another Sell.

Broken Support becomes Resistance.
When the NYSE minor A/D Line uptrend-line
is broken, expect a bigger decline to follow. See this
in the 1974 DJI chart.
The chart below from 1973-1974 shows how dangerous the market
will become if the NYSE A/D Line soon breaks its uptrend. That
would probably mean that the FED has again decided to raise
interest rates. Already the FED's decision to raise rates in December
has caused Big Banks to raise the interest rates on their credit cards.
(Such rate hikes are quickly passed on to consumers, with a predictably
deleterious effect. JPM now charges 17 3/4% interest on credit card
debt for good customers. Heaven help those with mediocre credit.
Only state usury laws act as ceilings here. "The current
highest credit
card interest rate is 36%. That’s on the new First Premier Credit Card.
The next highest credit card interest rate seems to be 29.99%, charged by the
Total Visa Credit Card and the First Access Visa. These rates are very high
when you consider that the average interest rate is only around 19%."
(https://wallethub.com/answers/highest-credit-card-interest-rate-2140660307/
)

Such broken support can be overcome. But we need to see
advancing volume that compares favorably to the volume on
the decline when it was broken. So far, such volume is not present.
This was again true today.
But for now, we do see a rising NYSE A/D Line and rising Closing Power
uptrend. So, the effort to overcome the broken-support turned into
resistance is not over.
83% of all stocks are below their 65-dma.
The end of tax-loss selling should help many
stocks for two weeks, or so.
It would be bullish if we saw other sectors, ETFs or Indexes
besides Gold and Bonds acting in a leadership role. But the
DJIA is still the sole leader now. From Table 1 below, we see that
besides GLD, all the other ETFs have negative ITRS readings.
What's worse? Only three of the DJI-30 stocks (INTC, MRK
and PG) are above their key 65-dma. So, it will be difficult for the
DJI to rally very far even if it gets past 23300.
And that is exactly what our market history shows. We may see
a one or two week January rally, but overwhelming when
the DJI falls more than 4% in December, it beomes very bearish
once the January rally is over.
|
What Happened When DJI fell more than 4% in December? December Year DJI's behavior Pct. Decline ---------------------------------------------------------------------------------------- -11.2% 1916 105.9 to 94.0. Then rallied only to 95.70 on 1/10. It then fell to new lows. -5.3% 1920 76.00 to 72.00. Then rallied to 76.80 on 1/19. But Bear Market then resumed. -9.0% 1930 180.9 to 164.6. Then rallied to 171.9 on 1/7. But Bear Market resumed. -17.0% 1931 93.9 to 77.9. Then rallied to 85.9 on 1/15. But Bear Market resumed. -4.1% 1941 114.7 to 111.0. Then rallied to 114.2 on 1/5. But Bear Market resumed. -4.2% 1968 985.08 to 943.75. No rally until 2/26 bottom at 905.7 Bear market resumed in June. -6.2% 2002 8896.09 to 8341.63. Then rallied to 8842.61 on 1/14. But Bear Market resumed. |
|
Charts 1/2/2019 2018 PEERLESS DJI, Signals, Indicators Daily DJI Volume 10-DayUp/Down Vol Hourly DJIA A/D Line for All Stocks Inverted Traders Index NASDAQ S&P OEX NYSE COMPQX DJI-15 DJI-20 DJI-30 DIA SPY QQQ MDY IWM TNA Short-Term Rates USO-CrudeOil DBO FAS GLD BBH IBB JETS JNUG KOL NUGT OIH OIL RSX RETL SDS AGQ SLV SOXL TECL TLT TMF TNA UGA (gasoline) XIV YINN Commodities: CANE CORN DBC JJC, NIB, CHOC CORN, CUT (paper) MOO, SOYB WEAT UUP (Dollar) LIT (Lithium) AAPL ADBE ALXN AMAT AMGN AMD AMZN BA BABA BAC BIDU CAT CVX DE FB GOOG GS HD IBM INTU JPM M (Macy's) MSFT NFLX NVDA QCOM TSLA TXN XOM WMT CMG , LRCX, SWKS, MDGL SPPI WATT SQ TOWN 1/2/2019 (Click on Underlined link.) - Bullish MAXCPs - http://tigersoft.com/MAXCPS/Jan-02/BULLISH.htm Bearish MAXCPs - http://tigersoft.com/MINCPs/Jan-02/BEARISH.htm |
Table 1 QUICKSILVER on ETFS - 1/2/19 Lots more rising 5-dma. But Only GLD has been stronger than DJI over the last 50 trading days. ETF CLOSE CHANGE PIVOT-PT 5-dma AROC CL-PWR CANDLE IP21 ITRS --------------------------------------------------------------------------------------------- DIA 233.36 .16 228.71 334.1% Bearish BLUE -.111 ----- --------------------------------------------------------------------------------------------- SPY 250.18 .26 246.18 322.9% Bearish BLUE -.095 -.015 --------------------------------------------------------------------------------------------- QQQ 154.88 .62 152.46 376.2% Bearish BLUE -.105 -.026 --------------------------------------------------------------------------------------------- MDY 301.59 -1.08 298.03 280% Bearish BLUE -.109 -.041 --------------------------------------------------------------------------------------------- IWM 134.66 .76 131.93 334.1% Bearish BLUE -.162 -.051 --------------------------------------------------------------------------------------------- FAS 44.95 .18 42.65 871.1% Bearish BLUE -.129 -.179 --------------------------------------------------------------------------------------------- RETL 24.25 1.08 22.81 1091.7% Bearish BLUE .013 -.256 --------------------------------------------------------------------------------------------- SOXL 85.53 2.21 78.61 1180.1% ------- BLUE -.205 -.174 --------------------------------------------------------------------------------------------- TECL 85.03 .03 81.25 1000.9% ------- BLUE -.025 -.274 --------------------------------------------------------------------------------------------- IBB 97.5 1.07 94.81 418.9% ------- BLUE -.1 -.057 --------------------------------------------------------------------------------------------- GLD 121.33 .08 119.66 54.4% ------- ---- .026 .127 --------------------------------------------------------------------------------------------- RSX 19.03 .28 18.84 158.1% ------- BLUE -.151 -.009 |
Table 2    Count of Stocks in Key Directories
           2019-01/02
-------------------------------
NEWHIGHS       23
NEWLOWS        7
MAXCP          10  Professionals are waiting.
MINCP          2
TTTNH          10
TTTNL          72
FASTUP         287  Bullish Swing Traders
FASTDOWN       32
CPCROSSA       62
CPCROSSD       20
BIGVOLUP       9
BIGVODN        7
ACCUMVER       3
HIGHIP21       3
HIUPPCT        4
VHIP21         13
LOWACCUM       316
REDSELL        419  Still lots of Big Money Distribution.
AUGSELS7       24
TRAPDOOR       21
|
 Table 3   RANKING OF KEY DIRECTORIES BASED PCT.OF STOCKS ABOVE 65-DMA
              1/2/19
 Bullish = 2   Bearish 45
-----------------------= ----------------------------------------------------------------
Directory     Current       day-1         day-2         day-3         day-4         day-5
----------------------------------------------------------------------------------------
BONDFUND       .847          .523          .39           .295          .304          .371
GOLD           .82           .74           .62           .68           .6            .64
===========================================================================================
COMODITY       .38           .357          .357          .357          .357          .38
FOOD           .35           .333          .333          .333          .333          .35
EDU            .333          .333          .166          .333          .333          .333
HOMEBLDG       .294          .176          .176          .176          .176          0
GAMING         .25           .25           .25           .25           .208          .166
SEMI           .23           .179          .162          .128          .102          .059
HACKERS        .227          .272          .227          .181          .09           .045
INDMATER       .217          .192          .153          .179          .153          .115
ELECTRON       .203          .166          .148          .111          .098          .067
SOFTWARE       .2            .184          .138          .123          .076          .061
UTILITY        .2            .35           .3            .4            .25           .175
INDEXES        .181          .192          .187          .197          .187          .197
BIG17          .173          .173          .152          .13           .108          .086
CHEM           .166          .148          .148          .129          .111          .111
PIPELINE       .166          .166          .208          .166          .125          .125
BIOTECH        .15           .142          .113          .097          .105          .06
CHINA          .15           .183          .166          .15           .15           .116
COAL           .142          .142          .142          .142          .142          .142
NIFTY          .14           .175          .14           .105          .122          .035
ETFS           .137          .068          .068          .086          .103          .086
INSURANC       .133          .166          .166          .166          .1            .1
NASD-100       .13           .17           .12           .12           .11           .03
               ^^^^^
BEVERAGE       .111          .166          .166          .111          .055          .055
SOLAR          .111          .055          .055          .055          .055          0
AUTO           .102          .128          .102          .102          .102          .076
DOWJONES       .1            .133          .066          .066          .066          0
               ^^^^^
JETS           .1            .1            0             0             0             0
MILITARY       .093          .093          .093          .093          .093          .093
FINANCE        .088          .088          .1            .088          .066          .055
GREEN          .086          .086          .086          .086          .086          .043
RUS-1000       .083          .112          .09           .095          .072          .024
SP500          .076          .106          .086          .098          .064          .016
               ^^^^^
FIDSTKS        .075          .107          .086          .091          .075          .01
RETAIL         .075          .094          .075          .075          .075          0
SP-100         .075          .107          .075          .086          .053          0
GUNS           .058          .117          .058          .117          0             0
INFRA          .055          .055          .027          .027          .055          0
OILGAS         .047          .047          .04           .04           .04           .02
COMPUTER       .045          .045          .045          .045          .045          .045
HOSPITAL       .041          .041          .041          .041          .041          .041
REIT           .04           .073          .066          .093          .093          .013
REGBANKS       .035          .035          .035          .035          .035          .035
BIGBANKS       0             0             0             0             0             0
DJI-13         0             .076          0             0             0             0
TRANSP         0             0             0             0             0             0
|
====================================================================
12/31/2018
The easy part of the over-sold
Santa Claus mini-rally
is appears to be over. The DJI has failed to get past its recent
point of breakdown at 23200-23300. Now it may have to fall back
to 22000 or even make a margin low closing before starting another
rally. Volume was not high enough to allow the DJI to move higher.
The Closing Powers failed to rise any further. See this in the
"exploded" charts for DIA, SPY, QQQ and IWM below. Watch
tomorrow to see if the Closing Powers can hold up after a weak
opening.. That will be important for the bulls.
The Buy B14 with a ratio of 28:1 has only occurred 4x in
December or with the DJI below the 2.5% band. Three times
a good rally followed, but the August 2011 case required six more
weeks of basing before a lasting rally developed.
Given the weakness this morning, where the DJI is down over-night
by 350, more base-building definitely seems in order. But
even that may be too optimistic.
December sell-offs of more than 4%, like we just saw this
past
year, have invariably been associated with on-going bear markets.
Let's do some hedging with the Bearish MINCPs. Significantly,
no stocks qualify as Bullish MAXCPs again tonight. I suggested
tech stocks might rebound in the new year. Not yet!. Work with
close stops with longs using their Closing Power uptrends or their
5-day moving averages' pivot-points.
The DJI fell in December 2018, from 25538 to 23327, or 8.7%.
In the past when Decembers brought declines of more than 5%,
the new year sometimes brought a small relief rally. But when it
does not, you have situations like 1968 and 2007 (only a 2%
December decline) where prices fall significantly in January. The
bigger problem is how bearish they make the longer term outlook.
More and more traders probably realize this and they may not
even wait for a rally to sell.
What Happened When DJI fell more
than 4% in December?
December Year
DJI's behavior
Pct. Decline
----------------------------------------------------------------------------------------
-11.2% 1916
105.9 to 94.0. Then rallied only to 95.70 on 1/10.
It then fell to new lows.
-5.3% 1920
76.00 to 72.00. Then rallied
to 76.80 on 1/19.
But Bear Market then resumed.
-9.0% 1930
180.9 to 164.6. Then rallied to
171.9 on 1/7.
But Bear Market resumed.
-17.0% 1931
93.9 to 77.9. Then rallied to 85.9
on 1/15.
But Bear Market resumed.
-4.1% 1941
114.7 to 111.0. Then rallied
to 114.2 on 1/5.
But Bear Market resumed.
-4.2% 1968
985.08 to 943.75. No rally until 2/26 bottom at 905.7
Bear market resumed in June.
-6.2% 2002
8896.09 to 8341.63. Then rallied to
8842.61 on 1/14.
But Bear Market resumed.
32300 Is Current Resistance.

Exploded Charts
Note minor uptrends that will broken this morning,
the low volume (therefore weak) rallies on the 31st
and the failure of Closing Powers to rally on the 31st.
More basing, at a minimum, seems necessary.
 |
 |
 |
 |
2019 - Looking Ahead.
Traders are waiting to see what happens now that we
are entering the New Year. With tax-loss selling
over, can the market rally? Or will the new year bring
more profit-taking. Uncertainties weigh on traders'
minds. Bloomberg is scaring us about China slowing
down. But I thought Trump said that a US-China deal
was looking good... Will House Democrats choose to
work with President Trump? Will Republicans? Romney
is looking ahead to 2020. Will the gathering overseas'
recessionary clouds darken? Will the FED back
away from its plans to sell off chunks of its trillions in
"troubled assets". Will it make its plans clearly and publicly,
as Greenspan and Bernanke did. Does the FED stands ready
to provide whatever liquidity is needed to back up Wall Street
and Big Banks? Populists may not like the idea, but that was
their orignial purpose, though they often forget. So far, no
such guarantees have been made.
From the way the Big Bank stocks are behaving, I would suggest
that most of these Big Bank stocks, and all around the world, too,
are quite worried every bit as much now as they fretted and
fidgeted in January 2008, a mere ten months before the disaster
of Lehman Brothers.
The big question now is if the markets can even
build a base that allows the indexes and key stocks to
get back to their now rapidly falling 65-dma. Foreign
stocks, big banks, big tech stocks and housing stocks
are all weak. There is no leadership. From Table 3 below
we see that 85% of all stocks and ETFs are below their
65-dma. Only Gold stocks and bonds show a majority of their
group above their individual 65-dm averages. All the other
groups have well over 64% of their stocks above the 65-dma.
Peerless may be eventually right about its B6-B14, but I would
prefer to be hedged right now. This is a nine-year old bull market,
short sales can be easily executed on downticks and there have
never been more exotic negative ETFs for hedge funds to pile
into every time a serious market decline develops.
|
Charts 12/31/2018 2018 PEERLESS DJI, Signals, Indicators Daily DJI Volume 10-DayUp/Down Vol Hourly DJIA A/D Line for All Stocks Inverted Traders Index NASDAQ S&P OEX NYSE COMPQX DJI-15 DJI-20 DJI-30 DIA SPY QQQ MDY IWM TNA Short-Term Rates USO-CrudeOil DBO FAS GLD BBH IBB JETS JNUG KOL NUGT OIH OIL RSX RETL SDS AGQ SLV SOXL TECL TLT TMF TNA UGA (gasoline) XIV YINN Commodities: CANE CORN DBC JJC, NIB, CHOC CORN, CUT (paper) MOO, SOYB WEAT UUP (Dollar) LIT (Lithium) AAPL ADBE ALXN AMAT AMGN AMD AMZN BA BABA BAC BIDU CAT CVX DE FB GOOG GS HD IBM INTU JPM M (Macy's) MSFT NFLX NVDA QCOM TSLA TXN XOM WMT CMG , LRCX, SWKS, MDGL SPPI WATT SQ TOWN 12/31/2018 (Click on Underlined link.) - Bullish MAXCPs - http://tigersoft.com/MAXCPS/Dec-28/BULLISH.htm (None on the 31st) Bearish MAXCPs - http://tigersoft.com/MINCPs/Dec-31/BEARISH.htm |
Table 1 QUICKSILVER on ETFS - 12/31/18 Lots more rising 5-dma. Only GLD has been stronger than DJI over the last 50 trading days. ETF CLOSE CHANGE PIVOT-PT 5-dma AROC CL-PWR CANDLE IP21 ITRS --------------------------------------------------------------------------------------------- DIA 233.2 2.72 218.1 201.1% Bearish BLUE -.139 ---- --------------------------------------------------------------------------------------------- SPY 249.92 2.17 234.34 189.4% Bearish BLUE -.121 -.016 --------------------------------------------------------------------------------------------- QQQ 154.26 1.29 143.5 223.1% Bearish RED -.129 -.037 --------------------------------------------------------------------------------------------- MDY 302.67 3.31 284.96 165.9% Bearish BLUE -.13 -.038 --------------------------------------------------------------------------------------------- IWM 133.9 1.04 125.88 212.2% Bearish BLUE -.187 -.06 --------------------------------------------------------------------------------------------- FAS 44.77 1.1 37.55 508.1% Bearish BLUE -.168 -.198 --------------------------------------------------------------------------------------------- RETL 23.17 .31 19.42 841% Bearish RED -.051 -.308 --------------------------------------------------------------------------------------------- SOXL 83.32 1.55 67.08 647% Bearish RED -.244 -.235 --------------------------------------------------------------------------------------------- TECL 85 2.31 68.96 650.5% Bearish BLUE -.051 -.301 --------------------------------------------------------------------------------------------- IBB 96.43 1.59 89.61 299.3% Bearish BLUE -.123 -.067 --------------------------------------------------------------------------------------------- GLD 121.25 .19 120.02 105.4% ------- BLUE .009 .14 strongest --------------------------------------------------------------------------------------------- OIH 14.03 -.09 13.32 137.2% Bearish RED -.315 -.327 --------------------------------------------------------------------------------------------- RSX 18.75 0 18.44 34.9% Bearish RED -.192 -.033 |
Table 2 Count of Stocks in Key Directories
2018-12/31
-------------------------------
NEWHIGHS 20
NEWLOWS 19
MAXCP 7
MINCP 13
TTTNH 12
TTTNL 122
FASTUP 127
FASTDOWN 77
CPCROSSA 35
CPCROSSD 54
BIGVOLUP 11
BIGVODN 13
ACCUMVER 4
HIGHIP21 2
HIUPPCT 4
VHIP21 13
LOWACCUM 323
REDSELL 412
AUGSELS7 18
TRAPDOOR 20
|
Table 3
RANKING OF KEY DIRECTORIES BASED PCT.OF STOCKS ABOVE 65-DMA
12/31/18
Bullish = 2
Bearish - 45
--------------------------------------------------------------------------------------- Directory Current day-1 day-2 day-3 day-4 day-5 ---------------------------------------------------------------------------------------- GOLD .74 .62 .68 .6 .64 .54 BONDFUND .523 .39 .295 .304 .352 .314 ========================================================================================== COMODITY .357 .357 .357 .357 .38 .357 UTILITY .35 .3 .4 .25 .175 .575 FOOD .339 .339 .339 .339 .357 .339 EDU .333 .166 .333 .333 .333 .166 HACKERS .272 .227 .181 .09 .045 .045 GAMING .25 .25 .25 .208 .166 .166 INDMATER .192 .153 .179 .153 .115 .102 INDEXES .192 .187 .197 .187 .197 .187 SOFTWARE .184 .138 .123 .076 .061 .076 CHINA .183 .166 .15 .15 .116 .083 SEMI .179 .162 .128 .102 .059 .068 HOMEBLDG .176 .176 .176 .176 0 .117 NIFTY .175 .14 .105 .122 .035 .052 BIG17 .173 .152 .13 .108 .086 .065 NASD-100 .17 .12 .12 .11 .03 .04 BEVERAGE .166 .166 .111 .055 .055 .055 ELECTRON .166 .148 .111 .098 .067 .067 INSURANC .166 .166 .166 .1 .1 .1 PIPELINE .166 .208 .166 .125 .125 .208 CHEM .148 .148 .129 .111 .111 .092 COAL .142 .142 .142 .142 .142 .142 BIOTECH .139 .113 .097 .105 .06 .065 DOWJONES .133 .066 .066 .066 0 .033 AUTO .128 .102 .102 .102 .076 .076 GUNS .117 .058 .117 0 0 0 RUS-1000 .112 .09 .095 .072 .024 .072 FIDSTKS .107 .086 .091 .075 .01 .037 SP-100 .107 .075 .086 .053 0 .021 SP500 .106 .086 .098 .064 .016 .076 JETS .1 0 0 0 0 0 RETAIL .094 .075 .075 .075 0 0 MILITARY .093 .093 .093 .093 .093 .093 FINANCE .088 .1 .088 .066 .055 .066 GREEN .086 .086 .086 .086 .043 .043 DJI-13 .076 0 0 0 0 0 REIT .071 .065 .091 .091 .013 .143 ETFS .068 .068 .086 .103 .086 .086 INFRA .055 .027 .027 .055 0 0 SOLAR .055 .055 .055 .055 0 0 OILGAS .046 .04 .04 .04 .02 .02 COMPUTER .045 .045 .045 .045 .045 .045 HOSPITAL .041 .041 .041 .041 .041 .041 REGBANKS .035 .035 .035 .035 .035 .035 BIGBANKS 0 0 0 0 0 0 TRANSP 0 0 0 0 0 0 |
====================================================================
12/28/2018
The operative Peerless Buy B14
should be capable of
lifting the DJI another week or two, as happened in 1980-1981
for example. But after that, the fact that so many stocks are below
their 65-dma should stall the rally unless there is a great January
volume surge. For now, as long as the Closing Powers for
DIA, SPY and QQQ do not start new downtrends or are turned
back down from their 21-dma Closing Power downtrends, look
for higher prices.
There were no MAXCPs tonight. So, I have posted some of
NASD-100 stocks that look relatively bullish. When the tax-loss
selling comes off as the new year starts, I would expect many of
the beat-down tech stocks to enjoy a 10%-15% January rise from
here. NVDA and SOXL are my favorites.
As always, cover short sales when their Closing Power downtrends
are broken. This approach relies upon what we believe is the
superior knowledge Professionals have about these stocks,
especially if the CP trend-changes are confirmed by rapid changes
in current Accumulation. A reminder: even in the 2008 bear market,
covering short sales when their CP downtrends were broken worked
very well.
Peerless Chart and Signals


Buy B14s with Up Vol: Down Vol greater than 28:1
either in December or when DJI was below lower 3.5% band.
la/ma
Subsequent DJI action
1 3/10/2009
.952
New Bull Market STARTED
after 18 months of bear market.
2 8/9/2011
.924
DJI fell from 11239 to 10720,
then rose to 11406 and
then fell to 10818.
These zig-zags continued 6 more weeks. .
3 12/20/2011
1.022 DJI rose from 12104 to 13233 on 3/16/12
4 12/31/2012
.997
DJI
rose from 13104 to 15388 on 5/21/14
12/26/2018 .985.
How To Deal with Volatility
Watch the Closing Powers now. Having just come off a bottom
and not set in place a secondary bottom for purposes of building
a Closing Power uptrend, I would build a Closing Power uptrend that
is rising at about a 45-degrees angle.
Lots of traders were surprised by the size of the two day's rally
in the DJI after Christmas Day. Let me suggest some ways of
coping with the market when it is "oversold" or "overbought"
and we know there may be a reversal but Peerless has not signalled
it yet.
1) Use the Hourly chart of whatever you are trading. We use the
Hourly DJI here. Note where the trendline crosses and do not be
afraid to use it. On the Hotline for December 24th, shown just below,
I showed where the key trendline crosses, way down at 22200.
2) Use the Exploded charts (the last choice under "Lines" when
you have a chart on the screen), Explode the last 40 trading days
or so. Select from upper left "Draw Closing Power Trendline
and Show Stats". Note the last row of numbers on the screen. They
will tell you exactly how much the stock or the ETF you are drawing
will have to move up or down from the opening to break the
Closing Power diagonal line you have drawn. Below are the Diagonal
Line and statistics for DIA, as of 12/24/2018.
On the 26th, DIA opened at 219.18. For someone using this chart,
that meant that the Closing Power downtrend for the 26th would
be broken on any close more than 5.8 above that day's opening.
Traders who anticipated the next day's Closing Power chart would have
be buyers as soon as it appeared DIA would close above 244.99.
EXPLODED DIA CHART for 12/24/2018.

Exploded Charts of SPY, QQQ and IWM now.
 |
 |
 |
|
Charts 12/28/2018 2018 PEERLESS DJI, Signals, Indicators Daily DJI Volume 10-DayUp/Down Vol Hourly DJIA A/D Line for All Stocks Inverted Traders Index NASDAQ S&P OEX NYSE COMPQX DJI-15 DJI-20 DJI-30 DIA SPY QQQ MDY IWM TNA Short-Term Rates USO-CrudeOil DBO FAS GLD BBH IBB JETS JNUG KOL NUGT OIH OIL RSX RETL SDS AGQ SLV SOXL TECL TLT TMF TNA UGA (gasoline) XIV YINN Commodities: CANE CORN DBC JJC, NIB, CHOC CORN, CUT (paper) MOO, SOYB WEAT UUP (Dollar) LIT (Lithium) AAPL ADBE ALXN AMAT AMGN AMD AMZN BA BABA BAC BIDU CAT CVX DE FB GOOG GS HD IBM INTU JPM M (Macy's) MSFT NFLX NVDA QCOM TSLA TXN XOM WMT CMG , LRCX, SWKS, MDGL SPPI WATT SQ TOWN 12/28/2018 (Click on Underlined link.) - Bullish MAXCPs - http://tigersoft.com/MAXCPS/Dec-28/BULLISH.htm Bearish MAXCPs - http://tigersoft.com/MINCPS/Dec-28/BEARISH.htm |
Table 1 QUICKSILVER on ETFS - 12/28/18 Lots more rising 5-dma. Only GLD has been stronger than DJI over the last 50 trading days. ETF CLOSE CHANGE PIVOT-PT 5-dma AROC CL-PWR CANDLE IP21 ITRS --------------------------------------------------------------------------------------------- --------------------------------------------------------------------------------------------- DIA 230.48 -.78 224.09 35.1% Bearish RED -.137 ------ --------------------------------------------------------------------------------------------- SPY 247.75 -.32 240.7 11.9% Bearish RED -.117 -.01 --------------------------------------------------------------------------------------------- QQQ 152.97 -.08 147.57 22.7% Bearish RED -.092 -.03 --------------------------------------------------------------------------------------------- MDY 299.36 -.42 292.88 -14.2% Bearish RED -.192 -.036 --------------------------------------------------------------------------------------------- IWM 132.86 .38 128.37 41.1% Bearish BLUE -.187 -.056 --------------------------------------------------------------------------------------------- FAS 43.67 -.06 40.54 67.4% Bearish RED -.177 -.19 --------------------------------------------------------------------------------------------- RETL 22.86 .51 19.57 312.2% Bearish RED .053 -.325 --------------------------------------------------------------------------------------------- SOXL 81.77 1.69 73.46 317.6% Bearish ---- -.214 -.242 --------------------------------------------------------------------------------------------- TECL 82.69 -.8 74.82 -1.9% Bearish RED -.04 -.312 --------------------------------------------------------------------------------------------- IBB 94.84 -.32 90.86 15.1% Bearish RED -.113 -.067 --------------------------------------------------------------------------------------------- GLD 121.06 .49 118.72 76.1% Bearish BLUE -.028 .152 --------------------------------------------------------------------------------------------- OIH 14.12 .12 13.65 76% Bearish ---- -.288 -.318 --------------------------------------------------------------------------------------------- RSX 18.75 .25 18.62 -64.2% Bearish BLUE -.16 -.022 |
Table 2 Count of Stocks in Key Directories
20181228
-------------------------------
NEWHIGHS 17
NEWLOWS 10
MAXCP 2
MINCP 5
TTTNH 7
TTTNL 83
FASTUP 53
FASTDOWN 118
CPCROSSA 48
CPCROSSD 43
BIGVOLUP 9
BIGVODN 15
ACCUMVER 5
HIGHIP21 1
HIUPPCT 3
VHIP21 12
LOWACCUM 321
REDSELL 414
AUGSELS7 12
TRAPDOOR 20
|
Table 3RANKING OF KEY DIRECTORIES BASED PCT.OF STOCKS ABOVE 65-DMA 12/28/18 Bullish = 1 Bearish = 46 --------------------------------------------------------------------------------------- Directory Current day-1 day-2 day-3 day-4 day-5 ---------------------------------------------------------------------------------------- GOLD .62 .68 .6 .64 .54 .56 ========================================================================================== BONDFUND .39 .295 .304 .352 .314 .266 COMODITY .357 .357 .357 .38 .357 .404 FOOD .339 .339 .339 .357 .339 .41 UTILITY .3 .4 .25 .175 .575 .7 GAMING .25 .25 .208 .166 .166 .125 HACKERS .227 .181 .09 .045 .045 .045 PIPELINE .208 .166 .125 .125 .208 .208 INDEXES .187 .197 .187 .197 .187 .219 HOMEBLDG .176 .176 .176 0 .117 .352 BEVERAGE .166 .111 .055 .055 .055 .222 CHINA .166 .15 .15 .116 .083 .166 EDU .166 .333 .333 .333 .166 .333 INSURANC .166 .166 .1 .1 .1 .1 SEMI .162 .128 .102 .059 .068 .102 INDMATER .153 .179 .153 .115 .102 .102 BIG17 .152 .13 .108 .086 .065 .108 CHEM .148 .129 .111 .111 .092 .092 ELECTRON .148 .111 .098 .067 .067 .08 COAL .142 .142 .142 .142 .142 .142 NIFTY .14 .105 .122 .035 .052 .087 SOFTWARE .138 .123 .076 .061 .076 .092 NASD-100 .12 .12 .11 .03 .04 .07 BIOTECH .11 .097 .105 .06 .065 .081 AUTO .102 .102 .102 .076 .076 .076 FINANCE .1 .088 .066 .055 .066 .077 MILITARY .093 .093 .093 .093 .093 .093 RUS-1000 .09 .095 .072 .024 .069 .09 FIDSTKS .086 .091 .075 .01 .037 .069 GREEN .086 .086 .086 .043 .043 .13 SP500 .086 .098 .064 .016 .074 .102 RETAIL .075 .075 .075 0 0 0 SP-100 .075 .086 .053 0 .021 .043 ETFS .068 .086 .103 .086 .086 .086 DOWJONES .066 .066 .066 0 .033 .033 REIT .066 .092 .092 .013 .139 .172 GUNS .058 .117 0 0 0 0 SOLAR .055 .055 .055 0 0 .166 COMPUTER .045 .045 .045 .045 .045 .045 HOSPITAL .041 .041 .041 .041 .041 .041 OILGAS .04 .04 .04 .02 .02 .02 REGBANKS .035 .035 .035 .035 .035 .035 INFRA .027 .027 .055 0 0 0 BIGBANKS 0 0 0 0 0 0 DJI-13 0 0 0 0 0 0 JETS 0 0 0 0 0 .1 TRANSP 0 0 0 0 0 0 |
====================================================================
12/27/2018
Consider the operative Peerless signal to be a
revised Buy B14.

Let's not be stubbornly bearish. I would now
accept yesterday's Buy B6,
even though the DJI rose 5% on the day of the signal. As long as the blue
Closing Powers are rising, the markets will almost certainly rise, especially
at this time of year.
Typically, Closing Powers, having broken their
steep downtrends, will soon rise to their falling 21-dma.
At that point, we see how strong are the Professionals'
bullish convictions.

I looked back at back at what happens when the ratio of Up Volume to
Down Volume was as high as it was yesterday, about 28:1. Of particular,
interest is what happens when the DJI was below the normal
3.5% lower band or it was December. Those cases would seem
to be best matches for how the market looked yesterday when
the B6 was given. Note that we only look back to 1965, since
the NYSE did not report this data before that. Except for the first
2011 case, such Up Volume versus Down Volume would have
been a good time to buy. A Buy B14 showing reflecting this study
will be added to Peerless this weekend.
Cases of Up Vol: Down Vol >28:1
with la/ma< .965 (lower band) or
in December.
la/ma Subsequent DJI action
1 3/10/2009
.952
New Bull Market STARTED.
2 8/9/2011
.924
DJI fell from 11239 to 10720,
then rose to 11406 and
then fell to 10818.
These zig-zags continued 6 more weeks. .
3 12/20/2011
1.022 DJI rose from 12104 to 13233
on 3/16/12
4 12/31/2012
.997
DJI rose from 13104 to 15388 on 5/21/14
12/26/2018 .985.
Three of the four cases above, which will reflect a
revised Buy B14,
worked out very well. In the fourth, a big decline did not follow; only eight
weeks
of backing and filling before much higher prices followed. That suggests a
75% probability of a good rally ahead and a 25% chance that more
basing and filling will be needed. As such, this Buy B14* will be put into
the next version of Peerless. It will be show under the "Experimental"
category..
Trust That Professionals Know Something Very Bullish
Perhaps, word has leaked out the FOMC does not want to be publicly
challenged by the President. Perhaps, the computerized traders are
all using the same rules reflecting "oversold markets", the 20%-down support
and December-January bullishness. Or perhaps, as in the 1957, the DJI
will not tag the 20%-down-from-the peak level until Short-Term interest
rates reach 3.5%.
A post-Christmas rally by SPY back to its broken-support at 260
seems likely. Watch the blue Closing Power. Its turning down near
260 will likely mark the end of this advance.

Whatever lies behind the rally, it's clear that Professionals
are clearly
running the show, especially in the last hour of NY trading. So, with the steep
Closing Power downtrends having been violated, the Pros are bullish for
now, and we should follow their lead. The FED will not be raising rates
again for months. If the DJI can get past the 23300
resistance, it should
move up into mid-January. The bullish action will likely be focused on
the DIA and SOXL. I like the action in SOXL. Alone among the major
ETFs shown in Table 1, below, its 5-day ma is rising.


|
Charts 12/27/2018 2018 PEERLESS DJI, Signals, Indicators Daily DJI Volume 10-DayUp/Down Vol Hourly DJIA A/D Line for All Stocks Inverted Traders Index NASDAQ S&P OEX NYSE COMPQX DJI-15 DJI-20 DJI-30 DIA SPY QQQ MDY IWM TNA Short-Term Rates Signals: 2006 Peerless (1965-2006 based) 2017 Peerless (1928-2017, not completed) USO-CrudeOil DBO FAS GLD BBH IBB JETS JNUG KOL NUGT OIH OIL RSX RETL SDS AGQ SLV SOXL TECL TLT TMF TNA UGA (gasoline) XIV YINN Commodities: CANE CORN DBC JJC, NIB, CHOC CORN, CUT (paper) MOO, SOYB WEAT UUP (Dollar) LIT (Lithium) AAPL ADBE ALXN AMAT AMGN AMD AMZN BA BABA BAC BIDU CAT CVX DE FB GOOG GS HD IBM INTU JPM M (Macy's) MSFT NFLX NVDA QCOM TSLA TXN XOM WMT CMG , LRCX, SWKS, MDGL SPPI WATT SQ TOWN 12/27/2018 (Click on Underlined link.) - Bullish MAXCPs - http://tigersoft.com/MAXCPZ/Dec-27/BULLISH.htm Bearish MAXCPs - http://tigersoft.com/MINCPZ/Dec-27/BEARISH.htm |
Table 1 QUICKSILVER on ETFS - 12/26/18 Only GLD and SOXL have rising 5-dma. Only GLD has been stronger than DJI over the last 50 trading days. ETF CLOSE CHANGE PIVOT-PT 5-dma AROC CL-PWR CANDLE IP21 ITRS
---------------------------------------------------------------------------------------------
---------------------------------------------------------------------------------------------
DIA 231.26 2.55 228.89 -47.7% Bearish BLUE-.089 ----
---------------------------------------------------------------------------------------------
SPY 248.07 1.89 247.17 -65.4% Bearish BLUE-.073 -.012
---------------------------------------------------------------------------------------------
QQQ 153.05 .59 152.29 -49.3% Bearish BLUE-.058 -.028
---------------------------------------------------------------------------------------------
MDY 299.78 1.75 300.2 -73.3% Bearish BLUE-.183 -.039
---------------------------------------------------------------------------------------------
IWM 132.48 .55 131.79 -58.3% Bearish BLUE-.195 -.057
---------------------------------------------------------------------------------------------
FAS 43.73 1.08 43.11 -109.1% Bearish BLUE-.143 -.173
---------------------------------------------------------------------------------------------
RETL 22.35 -.46 21.54 -115.4% Bearish RED .092 -.333
---------------------------------------------------------------------------------------------
SOXL 80.08 1.47 76.99 71.3% Bearish BLUE-.196 -.216
^^^^^
---------------------------------------------------------------------------------------------
TECL 83.49 2.24 82.72 -254.9% Bearish BLUE-.006 -.276
---------------------------------------------------------------------------------------------
IBB 95.16 .35 94.56 -56.3% Bearish BLUE-.064 -.052
---------------------------------------------------------------------------------------------
GLD 120.57 .91 119.24 131.9% ------- -----.073 .123
---------------------------------------------------------------------------------------------
OIH 14 -.17 13.91 -272.2% Bearish BLUE-.302 -.342
---------------------------------------------------------------------------------------------
RSX 18.5 -.34 18.99 -366.6% Bearish -----.16 -.038
|
Table 2
Count of Stocks in Key Directories
2018-12/27
-------------------------------
NEWHIGHS 19
NEWLOWS 17
MAXCP 2
MINCP 8
TTTNH 9
TTTNL 98
FASTUP 24
FASTDOWN 278
CPCROSSA 85
CPCROSSD 12
BIGVOLUP 2
BIGVODN 24
ACCUMVER 6
HIGHIP21 1
HIUPPCT 2
VHIP21 13
LOWACCUM 319
REDSELL 415
AUGSELS7 13
TRAPDOOR 20
|
Table 3
RANKING OF KEY DIRECTORIES BASED PCT.OF STOCKS ABOVE 65-DMA
12/27/18
Bullish = 1 Bearish = 46
---------------------------------------------------------------------------------------
Directory Current day-1 day-2 day-3 day-4 day-5
----------------------------------------------------------------------------------------
GOLD .68 .6 .64 .54 .56 .5
UTILITY .4 .25 .175 .575 .7 .625
COMODITY .357 .357 .38 .357 .404 .428
FOOD .339 .339 .357 .339 .41 .428
EDU .333 .333 .333 .166 .333 .333
BONDFUND .295 .304 .352 .314 .257 .419
GAMING .25 .208 .166 .166 .125 .125
INDEXES .197 .187 .197 .187 .219 .192
HACKERS .181 .09 .045 .045 .045 .045
HOMEBLDG .176 .176 0 .117 .294 .294
INDMATER .166 .141 .102 .089 .089 .089
INSURANC .166 .1 .1 .1 .1 .166
PIPELINE .166 .125 .125 .208 .208 .25
CHINA .15 .15 .116 .083 .166 .15
COAL .142 .142 .142 .142 .142 .142
BIG17 .13 .108 .086 .065 .108 .173
CHEM .129 .111 .111 .092 .092 .092
SEMI .128 .102 .059 .068 .102 .119
SOFTWARE .123 .076 .061 .076 .076 .092
NASD-100 .12 .11 .03 .04 .07 .09
GUNS .117 0 0 0 0 0
BEVERAGE .111 .055 .055 .055 .222 .222
ELECTRON .111 .098 .067 .067 .08 .092
NIFTY .105 .122 .035 .052 .087 .105
AUTO .102 .102 .076 .076 .076 .128
SP500 .098 .064 .016 .074 .102 .132
RUS-1000 .095 .072 .024 .069 .087 .114
BIOTECH .094 .105 .06 .065 .076 .094
MILITARY .093 .093 .093 .093 .093 .125
REIT .092 .092 .013 .139 .172 .192
FIDSTKS .091 .075 .01 .037 .069 .096
FINANCE .088 .066 .055 .066 .077 .077
ETFS .086 .103 .086 .086 .086 .12
GREEN .086 .086 .043 .043 .13 .13
SP-100 .086 .053 0 .021 .043 .086
RETAIL .075 .075 0 0 0 .018
DOWJONES .066 .066 0 .033 .033 .133
SOLAR .055 .055 0 0 .166 .222
COMPUTER .045 .045 .045 .045 .045 .045
HOSPITAL .041 .041 .041 .041 .041 .041
OILGAS .04 .04 .02 .02 .02 .027
REGBANKS .035 .035 .035 .035 .035 .035
INFRA .027 .055 0 0 0 0
BIGBANKS 0 0 0 0 0 0
DJI-13 0 0 0 0 0 .076
JETS 0 0 0 0 .1 .1
TRANSP 0 0 0 0 0 0
|
====================================================================
12/26/2018
Wow! I knew there might be a bounce. But nearly
5% in one day.
President Trump speaks and investors really listen. The ratio of NYSE
advancers to decliners was 6.9:1 and the ratio of NYSE Up Volume to
Down Volume was 28:1. Bulls will hope that is the start of a new leg up
in the long 2009-2018 bull market. Years before the Presidential Election
since 1915 have usually been very good to investors.
But we need more
evidence of a turn-around here, I would suggest.
On Christmas, the President took Fed Chrmn Powell off the
hook. Trump's
Chief of Economic Advisors said Powell would not be fired. In effect, the
President switched over the holiday and now says he will respect the independence
of the FED. This is exactly what Wall Street wanted to hear. Their chief
institutional
benefactor is safe.
But this also means that the FED may feel freer to raise rates. Short-
term rates made a new high today and the Dollar was very strong. So, the
original concern that Trump had about raising rates and hurting the
market still stands. Traders are having second thoughts now.
Technicaly, to become bullish we need to see a deeper
decline or a
much better bottom, one with un-confirmed lows, or we need to see the
23300-23400 support-turned-into-resistance overcome. Do not trust
today's Buy B6. Stay short. What would we buy using Tiger's trading
rules?
Past DJI Advances like Today.
Since almost all the DJI daily gains of nearly 5% occurred in
on-going
bear markets, the past results may not be relevant. But about half of these
big rallies were quickly reversed by sizeable declines and only about half
saw rallies to the upper band. As the DJI is not coming out of a bear market
and has not fall the requisite 20% from its highs, these statistics are probably
not relevant.
At a minimum, more follow-through is certainly needed to
convince me
to be bullish. The only leadership we can see now in Table 3 is Gold.
90% of all stocks are still below their 65-dma. True, some of the
steep Closing Powers were slightly penetrated today. This may allow
the market to make a better base after a limited decline. But we need
some more evidence to become bullish, despite today's Buy B6. None of
our Buy B6s ever took place following so much apparent strength. I would
cancel the B6 today for this reason.
As I write this, the DJI futures are down
350. Of course, that may change.
But they may get worse. In that case, we would be seeing a very rare, and a
two-day-reversal-down phenomenon. These mark serious bear markets.
Let's just hold our short positions a little longer.
What about Peerless? Some have asked why the current
version of Peerless
did not give a Buy B16 on the 24th, as some versions before 2018 did..
The answer is that current version of Peerless denied us that because of the
multiple S9s, the broken support-levels, AROC being below -1.0 and the
IP21 (Current Accum.) being below -.19 on the 24th. These are all reasons
to be cautious now.
Today, Peerless gave a Buy B6. The size of the rally
today did not play
a role in the signal. If I were writing the software today, I would not
allow
any Buy B6 signal after such an advance unless trading volume was
extraordinarily high, thereby confirming the strength. Without higher volume,
I would note that it will be hard for the DJI to eat up the over-head resistance at
23300-23400.
The Buy B6 is simply a late "Santa Claus" rally. A rally until January
always
seems to follow. Let's see if a better base can be built.
Environ.
Date
la/ma AROC P-I
IP21 V-I OPct 65ch
65-dma-aroc
Correction 12/26/2018 .945 -.69 -487
-.15 -333 -.157 -.145 -.590
Here are the past cases:
Environ.
Date
la/ma AROC P-I
IP21 V-I OPct 65ch
65-dma-aroc
Bear Mkt 12/26/1931 .935 -1.667 -132 -.11 -596
-.143 -.277 -1.27
161.2 (-4.0) DJI rose to 171.9 on 1/7/1931 and then fell back to 161.5 on 1/19.
Sell S2 given reversing the B6 at the upper band.
Correction 12/20/1934 .98 -.035 +6 -.057
-35 +.082 +.147 +.51
99.6 (-0.2) DJI rose to 105.9 on 1/7/1935 and then fell back to 100.5 on 1/15
Bear Mkt 12/28/1966 .984 -.187 +3 -.013 +1
-.09 -.004 -.02
789 (-3) DJI fell slightly for 2 days and then rose to
861 on 2/8/1967
Bull Mkt 12/31/1986 .985 -.103 -179 +.072 -16 -.199 +.08
+.28
1896 - DJI took off to the upside until April, reaching 2405.54.
There were many additional Buy signals on the rally.
Bear Mkt 12/24/2002 .980 -.492 +21 -.028 -184
-.279 .073 .26
8448 - DJI rose to upper band (8786) on 1/13/203 and resumed bear mkt.
  |
 |
  |
 |
|
Charts 12/26/2018 PEERLESS DJI, Signals, Indicators Daily DJI Volume 10-DayUp/Down Vol Hourly DJIA A/D Line for All Stocks Inverted Traders Index NASDAQ S&P OEX NYSE COMPQX DJI-15 DJI-20 DJI-30 DIA SPY QQQ MDY IWM TNA Short-Term Rates USO-CrudeOil DBO FAS GLD BBH IBB JETS JNUG KOL NUGT OIH OIL RSX RETL SDS AGQ SLV SOXL TECL TLT TMF TNA UGA (gasoline) XIV YINN Commodities: CANE CORN DBC JJC, NIB, CHOC CORN, CUT (paper) MOO, SOYB WEAT UUP (Dollar) LIT (Lithium) AAPL ADBE ALXN AMAT AMGN AMD AMZN BA BABA BAC BIDU CAT CVX DE FB GOOG GS HD IBM INTU JPM M (Macy's) MSFT NFLX NVDA QCOM TSLA TXN XOM WMT CMG , LRCX, SWKS, MDGL SPPI WATT SQ TOWN 12/26/2018 (Click on Underlined link.) - Bullish MAXCPs - http://tigersoft.com/MAXCPZ/Dec-26/BULLISH.htm Bearish MAXCPs - http://tigersoft.com/MINCPZ/Dec-26/BEARISH.htm |
Table 1 QUICKSILVER on ETFS - 12/26/18 Only GLD has a rising 5-dma and has been stronger than DJI over the last 50 trading days. ETF CLOSE CHANGE PIVOT-PT 5-dma AROC CL-PWR CANDLE IP21 ITRS --------------------------------------------------------------------------------------------- --------------------------------------------------------------------------------------------- DIA 228.71 10.61 233.42 -189.4% Bearish BLUE -.132 --- --------------------------------------------------------------------------------------------- SPY 246.18 11.84 251.26 -181.1% Bearish BLUE -.113 -.011 --------------------------------------------------------------------------------------------- QQQ 152.46 8.96 154.53 -197% Bearish BLUE -.091 -.028 --------------------------------------------------------------------------------------------- MDY 298.03 13.07 304.12 -189.7% Bearish BLUE -.305 -.027 --------------------------------------------------------------------------------------------- IWM 131.93 6.05 134 -187.2% Bearish BLUE -.252 -.044 --------------------------------------------------------------------------------------------- FAS 42.65 5.1 44.64 -433.6% Bearish BLUE -.196 -.187 --------------------------------------------------------------------------------------------- RETL 22.81 3.39 22.84 -249.4% Bearish BLUE .074 -.301 --------------------------------------------------------------------------------------------- SOXL 78.61 11.53 79.01 -764.3% Bearish BLUE -.202 -.234 --------------------------------------------------------------------------------------------- TECL 81.25 12.29 87.52 -715.7% Bearish BLUE -.039 -.31 --------------------------------------------------------------------------------------------- IBB 94.81 5.2 96.21 -186.3% Bearish BLUE -.12 -.051 --------------------------------------------------------------------------------------------- GLD 119.66 -.36 117.43 63.6% Bearish RED -.093 .136 --------------------------------------------------------------------------------------------- OIH 14.17 .85 14.76 -363.5% Bearish BLUE -.376 -.318 --------------------------------------------------------------------------------------------- RSX 18.84 .4 19.89 -281.7% Bearish BLUE -.183 -.013 |
Table 2
Count of Stocks in Key Directories
2018-12/26
-------------------------------
NEWHIGHS 35
NEWLOWS 4
MAXCP 2
MINCP 8
TTTNH 3
TTTNL 50
FASTUP 21
FASTDOWN 319
CPCROSSA 84
CPCROSSD 21
BIGVOLUP 6
BIGVODN 8
ACCUMVER 4
HIGHIP21 3
HIUPPCT 1
VHIP21 14
LOWACCUM 311
REDSELL 417
AUGSELS7 15
TRAPDOOR 21
|
Table 3
RANKING OF KEY DIRECTORIES BASED PCT.OF STOCKS ABOVE 65-DMA
12/26/18
Bullish 1
Bearish = 46
---------------------------------------------------------------------------------------
Directory Current day-1 day-2 day-3 day-4 day-5
----------------------------------------------------------------------------------------
GOLD .6 .64 .54 .56 .5 .64
COMODITY .357 .38 .357 .404 .428 .452
FOOD .339 .357 .339 .41 .428 .464
EDU .333 .333 .166 .333 .333 .333
BONDFUND .304 .352 .314 .257 .39 .314
UTILITY .25 .175 .575 .7 .625 .65
GAMING .208 .166 .166 .125 .125 .125
INDEXES .187 .197 .187 .219 .187 .203
HOMEBLDG .176 0 .117 .294 .294 .294
INDMATER .153 .115 .102 .102 .102 .128
CHINA .15 .116 .083 .166 .15 .166
COAL .142 .142 .142 .142 .142 .142
PIPELINE .125 .125 .208 .208 .25 .208
NIFTY .122 .035 .052 .087 .105 .192
CHEM .111 .111 .092 .092 .092 .092
NASD-100 .11 .03 .04 .07 .09 .14
BIG17 .108 .086 .065 .108 .173 .173
ETFS .103 .086 .086 .086 .12 .137
AUTO .102 .076 .076 .076 .128 .153
BIOTECH .102 .06 .065 .076 .094 .113
SEMI .102 .059 .068 .102 .119 .213
INSURANC .1 .1 .1 .1 .166 .133
ELECTRON .098 .067 .067 .08 .092 .166
MILITARY .093 .093 .093 .093 .125 .125
REIT .092 .013 .139 .172 .192 .218
HACKERS .09 .045 .045 .045 .045 .09
GREEN .086 .043 .043 .13 .13 .13
SOFTWARE .076 .061 .076 .076 .092 .092
FIDSTKS .075 .01 .037 .069 .096 .112
RETAIL .075 0 0 0 .018 .037
RUS-1000 .072 .024 .069 .087 .113 .131
DOWJONES .066 0 .033 .033 .133 .166
FINANCE .066 .055 .066 .077 .077 .077
SP500 .064 .016 .074 .102 .132 .156
BEVERAGE .055 .055 .055 .222 .222 .222
INFRA .055 0 0 0 0 .055
SOLAR .055 0 0 .166 .222 .222
SP-100 .053 0 .021 .043 .086 .107
COMPUTER .045 .045 .045 .045 .045 .09
HOSPITAL .041 .041 .041 .041 .041 .083
OILGAS .04 .02 .02 .02 .027 .034
REGBANKS .035 .035 .035 .035 .035 .035
BIGBANKS 0 0 0 0 0 0
DJI-13 0 0 0 0 .076 .076
GUNS 0 0 0 0 0 .058
JETS 0 0 0 .1 .1 .1
TRANSP 0 0 0 0 0 0
|
====================================================================
12/24/2018
Watch the Big Banks's stocks now. They are the leaders going
down. Their insiders
know best what is driving the market now. FAZ is a leveraged ETF short.
Watch how much the trading volume is rising in the leveraged short ETFs, like
FAZ or the entire group of finance stocks.
Don't trust an early rally. Too many have failed and don't trust that a DJI
bottom will be made at 21000, 20% down from the highs.
Stay short lots of the bearish MINCPs and IWM.


The extreme speed of this decline to the 20%-down-from-the
peak level
has only a handful of past parallels since 1945. The charts for 1962, 1987
and 2008 show us that a rapid 20% down-from-the-peak decline does not
necessarily reach support there even though in 2015, 1957 and 1946,
bottoms were made at this point. Most recently, the DJI bottomed exactly
after it made a "hypothetical" low 20% down. The October 1957 bottom was made
19% down from its July peak.
The news now is very different. In 1946, there were a perfect
head/shoulders
pattern and series of labor strikes to explain the decline. When they ended, the
market bottomed. In early 1962, a massive head and shoulders was
completed.
In this year, JFK directly challenged Wall Street when he sought to control steel
prices as Truman had done in the Korean War. But in June 1962, he offered a
truce and a tax cut to big business. Note that the Cuban missile crisis had more
effect on the market in the second half.
There's more to the current decline than meets the eye. The decline is being
led now
by
Big Banks. The Insiders at these banks know why their stocks are collapsing.
That
is why Trump's Treasury Secretary phoned them all two days ago. But the Big
Banks
are not talking, at least not publicly. It could be that the world's economy is
in
dire financial trouble and lots and lots of bank loans may fail. But since the stock
market decline is also affecting regional US banks almost as badly, I think that the
world's economy cannot be blamed especially. Something else is playing out.
Here's my guess.
#1. The FED is correctly seen as creating another bear market, just
as they did with higher
interest rates in the bear markets of 1919-1920, 1929-1932, 1937, 1957, 1959-1960,
1966,
1968-1970, 1973-1974, 1981-1982, 1983-84 (a correction), 1987, 2000-2002.
#2
The continuing decline has a lot to do with the President's challenge
of
the Federal Reserve. The Big Banks have always been protected by the Fed.
If
the FED's power and autonomy were actually to be taken away, the Big Banks
would
lose their most important political benefactor.
#3
What makes the situation most dangerous now is how
much more damage
the
leveraged short-sellers can do to the stock market by instantly selling short
a
myriad of leveraged ETFs on down-ticks. The Big Banks know this better than
anyone. This is the system that they created to make money in the bull
market. But
nothing now prevents it from being used to profit from an out-of-control decline.

  |
|
Charts 12/24/2018 PEERLESS DJI, Signals, Indicators Daily DJI Volume 10-DayUp/Down Vol Hourly DJIA A/D Line for All Stocks Inverted Traders Index NASDAQ S&P OEX NYSE COMPQX DJI-15 DJI-20 DJI-30 DIA SPY QQQ MDY IWM TNA Short-Term Rates USO-CrudeOil DBO FAS GLD BBH IBB JETS JNUG KOL NUGT OIH OIL RSX RETL SDS AGQ SLV SOXL TECL TLT TMF TNA UGA (gasoline) XIV YINN Commodities: CANE CORN DBC JJC, NIB, CHOC CORN, CUT (paper) MOO, SOYB WEAT UUP (Dollar) LIT (Lithium) AAPL ADBE ALXN AMAT AMGN AMD AMZN BA BABA BAC BIDU CAT CVX DE FB GOOG GS HD IBM INTU JPM M (Macy's) MSFT NFLX NVDA QCOM TSLA TXN XOM WMT CMG , LRCX, SWKS, MDGL SPPI WATT SQ TOWN 12/24/2018 (Click on Underlined link.) - Bullish MAXCPs - http://tigersoft.com/MAXCPZ/Dec-24/BULLISH.htm Bearish MAXCPs - http://tigersoft.com/MINCPZ/Dec-24/BEARISH.htm |
 |
  |
Table 1 QUICKSILVER on ETFS - 12/25/18 ETF CLOSE CHANGE PIVOT-PT 5-dma AROC CL-PWR CANDLE IP21 ITRS --------------------------------------------------------------------------------------------- --------------------------------------------------------------------------------------------- DIA 218.1 -5.99 237.36 -395% Bearish RED -.231 ---- --------------------------------------------------------------------------------------------- SPY 234.34 -6.36 255.08 -420.5% Bearish RED -.208 -.01 --------------------------------------------------------------------------------------------- QQQ 143.5 -4.07 158.42 -452.1% Bearish RED -.183 -.025 --------------------------------------------------------------------------------------------- MDY 284.96 -7.92 309.35 -403% Bearish RED -.36 -.032 --------------------------------------------------------------------------------------------- IWM 125.88 -2.49 136.85 -416.9% Bearish RED -.325 -.052 --------------------------------------------------------------------------------------------- FAS 37.55 -2.99 46.33 -1023.8% Bearish RED -.331 -.231 --------------------------------------------------------------------------------------------- RETL 19.42 -.15 23.88 -907.5% Bearish BLUE -.021 -.337 --------------------------------------------------------------------------------------------- SOXL 67.08 -6.38 90.44 -1223.9% Bearish RED -.265 -.269 --------------------------------------------------------------------------------------------- TECL 68.96 -5.86 92.9 -1275.7% Bearish RED -.153 -.321 --------------------------------------------------------------------------------------------- IBB 89.61 -1.25 98.31 -553.9% Bearish RED -.2 -.05 --------------------------------------------------------------------------------------------- GLD 120.02 1.3 118.15 90.9% ------- BLUE -.024 .165 --------------------------------------------------------------------------------------------- RSX 18.44 -.18 19.92 -430.6% Bearish RED -.242 .023 |
Table 2
Count of Stocks in Key Directories
2018-12/24
-------------------------------
NEWHIGHS 35
NEWLOWS 639 Very bearish >20:1 ratio vs newhighs
MAXCP 18
MINCP 522 Very bearish
TTTNH 18
TTTNL 318 Very bearish
FASTUP 21
FASTDOWN 836 Very bearish
CPCROSSA 35 Some Professional nibbling
CPCROSSD 29
BIGVOLUP 13
BIGVODN 16
LOWACCUM 224
REDSELL 417
AUGSELS7 18
TRAPDOOR 20
|
Table 3
RANKING OF KEY DIRECTORIES BASED PCT.OF STOCKS ABOVE 65-DMA
12/24/18
---------------------------------------------------------------------------------------
Directory Current day-1 day-2 day-3 day-4 day-5
----------------------------------------------------------------------------------------
GOLD .64 .54 .56 .5 .64 .54
================================================================================================
COMODITY .38 .357 .404 .428 .452 .452
BONDFUND .352 .314 .257 .39 .314 .314
FOOD .35 .333 .403 .421 .456 .456
EDU .333 .166 .333 .333 .333 .333
INDEXES .197 .187 .219 .187 .203 .197
UTILITY .175 .575 .7 .625 .675 .725
Big Drop
GAMING .166 .166 .125 .125 .125 .166
COAL .142 .142 .142 .142 .142 .142
PIPELINE .125 .208 .208 .25 .208 .25
CHINA .116 .083 .166 .15 .166 .15
INDMATER .115 .102 .102 .102 .128 .115
CHEM .111 .092 .092 .092 .092 .111
INSURANC .1 .1 .1 .166 .133 .166
MILITARY .093 .093 .093 .125 .125 .125
BIG17 .086 .065 .108 .173 .173 .152
ETFS .086 .086 .086 .12 .12 .12
AUTO .076 .076 .076 .128 .153 .128
ELECTRON .067 .067 .08 .092 .16 .135
SOFTWARE .061 .076 .076 .092 .092 .107
SEMI .059 .068 .102 .119 .205 .188
BIOTECH .057 .065 .076 .094 .113 .134
BEVERAGE .055 .055 .222 .222 .222 .222
FINANCE .055 .066 .077 .077 .077 .066
COMPUTER .045 .045 .045 .045 .09 .045
HACKERS .045 .045 .045 .045 .09 .09
GREEN .043 .043 .13 .13 .13 .13
HOSPITAL .041 .041 .041 .041 .083 .083
NIFTY .035 .052 .087 .105 .192 .14
REGBANKS .035 .035 .035 .035 .035 .035
NASD-100 .03 .04 .07 .09 .13 .13
RUS-1000 .024 .069 .087 .113 .13 .127
OILGAS .02 .02 .02 .027 .034 .034
SP500 .016 .074 .102 .132 .154 .15
^^^^^
REIT .013 .139 .172 .192 .218 .205
FIDSTKS .01 .037 .069 .096 .112 .107
BIGBANKS 0 0 0 0 0 0
DJI-13 0 0 0 .076 .076 .076
DOWJONES 0 .033 .033 .133 .166 .166
^^^^^^^^
GUNS 0 0 0 0 .058 0
HOMEBLDG 0 .117 .294 .294 .294 .294
INFRA 0 0 0 0 .055 0
JETS 0 0 .1 .1 .1 .1
RETAIL 0 0 0 .018 .037 .018
SOLAR 0 0 .166 .222 .222 .277
SP-100 0 .021 .043 .086 .107 .107
TRANSP 0 0 0 0 0 0
|
====================================================================
12/21/2018
"Rudolph, Rudolph...Where Is Santa
Claus?"
Apparently the multitude of Sell S9s this past year has finally taken its toll
on
the bulls. They cannot even hold the DJI above what should have been
good
support levels. See in our DJI chart below how quickly the 24000 and
23400
support levels have given way. Apparently, the market is really scared
that
what the FED hath given the Big Banks and the stock market after the 2008
financial collapse, it now is willing to take away.
Should We Trust Powell and The Fed? That Is The
Problem now.
Have
economic conditions really improved enough to allow the FED to
tighten money supply and dispose of all the mortgages and debt instruments
it
bought from distressed banks seven or eight years ago? President Trump, the
Conservative Populist, fears that Fed Chairman Powell will bring down the
market like a "house of cards". And he may be right. Like most
institutions
that
are insulated from criticism and accountability, the FED has regularly erred
but
always without any apology. Because they are so powerful, the Public
hardly ever hears how frequently that they have turned perfectly good and
sound
economies and bull markets into bear markets and recessions, or worse.
It's
all the more remarkable that they get away doing this despite their original
charter's calling on them, first and foremost, to prevent panics and depressions,
like
the one in 1907-1908, that caused Congress to create the Federal Reserve
in
the first place.


Watch to see if the DJI's 21-dma AROC momentum downtrend (above)
can be
violated so that a "Santa Claus" rally can start. (More information on AROC
is
shown below.)
Big Banks are they key now. Their people, on the inside,
will know
first
if the FED intends to reverse course and save the market from disaster
and
"backup" the market makers and banks in their hour of need like
Greenspan and Bernanke did repeatedly. As of
Friday, the big banks showed
no
sign of reversing on Friday. But a Christmas rally of a week should
probably be expected. Watch the Bank stocks'
Closing Power downtrends.
They
need to be broken for us to read into their action something less
"harkish"
coming from the FED. And it will have to come from Chairman Powell, I think,
not
one of his minions.
Note that we will need to see here something more than just a
higher opening.
Too
many of these have failed recently. We need to see a close much higher
than
the opening. That will show us that Professionals are buying again. If that
does
occur, traders should buy DIA for a quick bounce back to 232 but hold
all
our Bearish MINCPs short..


In most normal markets, the DJI rises nearly two thirds of
the time over
the
next two weeks. The percentage is even higher when momentum has
taken
the DJI below 4% to 5% below its 21-dma at this time of the year.
But
this is no normal market. The DJI is now 8% below its 21-dma.
This
is further down from this 21-dma than at the short-term bottom in 1929
when
the DJI was down "only" 6.7% below the ma just before it turned up.
And
in the terrible December of 1931, the DJI only reached bottom when
it
has fallen on Dec. 17th to a point 16.7% below the 21-dma.
The DJI has gone from making new highs in early October to making new lows
last
week. This is unique. The closest parallel I can find was the DJI in 1916.
It
fell 18% from if November peak to its December 22nd low, 7.4% below the
lower
band. Then it rallied 10% to January 16th, at which point it peaked
and
11% more to a temporary February bottom. Partisans had celebrated
the
re-election of Woodrow Wilson who had campaigned on the slogan,
"He Kept Us Out of War". But soon after he was elected, rumors spread
that
Germany would resume its unrestricted submarine warfare and Britain
might
soon not be able to pay back its war loans to JP Morgan and other
big
banks. See how even in these dire circumstances the DJI did rally 10%
from
a bottom just before Christmas. Then the DJI gave way and fell a full
20%
from its highs before attempting another rally at the time of Wilson's
declaration of war.
Closest Parallel - Dec. 1916

Watch AROC
For Tiger traders, the rate of descent can be usefully measured by
calculating
the
daily pct change of the 21-day-ma and multiplying it by 250. We call
this
the "Annualized Rate of Change", or AROC. When we look back at
past
Decembers when the AROC below -.80 about this time in December,
we
always see Santa Claus rallies, with one exception. The exception was
in
1931. The weakness here reflected numerous bank failures, which the
FED
only made worse by boosting the Discount Rate from 1.5% to 3%
between September and December 1931. That is hardly what the Fed plans
to do
so quickly.

AROC DJI
12/21/2018 -.982
22445 8% below 21-dma.
(It is not clear what is so bad that is causing this big a decline.
My best guess is that big investors are locking in profits all at
once now that 23300 support has been broken. If that is
correct, then we should see a rebound to 23300. But if
a bigger disaster lies ahead, then we are in Big Trouble.
In any case, watch the Big Banks and the Closing Powers.)
12/29/1929
-.694 DJI rallied from 5% lower band for rest of year.
12/23/1930 -1.854 DJI rallied from 6.7% lower band to
upper band.
12/22/1931 -2.419 DJI
fell from 79.6 to 71.2 and then
rallied above upper band (85.4)
12/22/1932 -1.319 DJI
rallied from (56.6) 4.5% lower band to above UB (63.8) (1/11)
12/24/1941 -1.083 DJI rallied from 106.7 - 4.4% lower band
to upper band (114.2)
(1/5)
(Right after Pearl Harbor!)
12/15/1981 -.871 DJI rallied from 911.6 (5.5%
lower band) to above UB (1005)
1/6)
(Interest rates going above 20%/yr)
|
Charts 12/21/2018 PEERLESS DJI, Signals, Indicators Daily DJI Volume 10-DayUp/Down Vol Hourly DJIA A/D Line for All Stocks Inverted Traders Index NASDAQ S&P OEX NYSE COMPQX DJI-15 DJI-20 DJI-30 DIA SPY QQQ MDY IWM TNA Short-Term Rates USO-CrudeOil DBO FAS GLD BBH IBB JETS JNUG KOL NUGT OIH OIL RSX RETL SDS AGQ SLV SOXL TECL TLT TMF TNA UGA (gasoline) XIV YINN Commodities: CANE CORN DBC JJC, NIB, CHOC CORN, CUT (paper) MOO, SOYB WEAT UUP (Dollar) LIT (Lithium) AAPL ADBE ALXN AMAT AMGN AMD AMZN BA BABA BAC BIDU CAT CVX DE FB GOOG GS HD IBM INTU JPM M (Macy's) MSFT NFLX NVDA QCOM TSLA TXN XOM WMT CMG , LRCX, SWKS, MDGL SPPI WATT SQ TOWN 12/21/2018 (Click on Underlined link.) - Bullish MAXCPs - http://tigersoft.com/MAXCPZ/Dec-21/BULLISH.htm Bearish MAXCPs - http://tigersoft.com/MINCPZ/Dec-21/BEARISH.htm |
Table 1 QUICKSILVER on ETFS - 12/20/18 ETF CLOSE CHANGE PIVOT-PT 5-dma AROC CL-PWR CANDLE IP21 ITRS
---------------------------------------------------------------------------------------------
---------------------------------------------------------------------------------------------
DIA 228.89 -4.53 241.42 -363.6% Bearish RED -.167 0
---------------------------------------------------------------------------------------------
SPY 247.17 -4.09 260.47 -353.4% Bearish RED -.138 -.006
---------------------------------------------------------------------------------------------
QQQ 152.29 -2.24 161.08 -402% Bearish RED -.073 -.018
---------------------------------------------------------------------------------------------
MDY 300.2 -3.92 316.27 -327.9% Bearish RED -.301 -.023
---------------------------------------------------------------------------------------------
IWM 131.79 -2.21 140.61 -397.1% Bearish RED -.249 -.049
---------------------------------------------------------------------------------------------
FAS 43.11 -1.53 49.16 -791% Bearish RED -.229 -.251
---------------------------------------------------------------------------------------------
RETL 21.54 -1.3 25.24 -934.2% Bearish RED -.018 -.332
---------------------------------------------------------------------------------------------
SOXL 76.99 -2.02 90.39 -987.5% Bearish RED -.179 -.285
---------------------------------------------------------------------------------------------
TECL 82.72 -4.8 96.93 -1160% Bearish RED -.031 -.322
---------------------------------------------------------------------------------------------
IBB 94.56 -1.65 101.93 -466% Bearish RED -.094 -.045
---------------------------------------------------------------------------------------------
GLD 119.24 1.81 117.06 72.7% Bearish BLUE-.065 .193
---------------------------------------------------------------------------------------------
OIL 119.24 1.81 117.06 72.7% Bullish BLUE-.023 9.316
---------------------------------------------------------------------------------------------
OIH 13.91 -.85 15.66 -781% Bearish RED -.413 -.332
---------------------------------------------------------------------------------------------
RSX 18.99 -.9 20.23 -387.3% Bearish ---- -.229 .029
QUICKSILVER on ETFS - 12/21/18
ETF CLOSE CHANGE PIVOT-PT 5-dma AROC CL-PWR CANDLE IP21 ITRS --------------------------------------------------------------------------------------------- DIA 224.09 -4.8 236.43 -367.9% Bearish RED -.215 0 --------------------------------------------------------------------------------------------- COMPQX 224.09 -4.8 236.43 -367.9% Bullish RED -.178 -.845 --------------------------------------------------------------------------------------------- SPY 240.7 -6.47 255.36 -389.4% Bearish RED -.186 -.01 --------------------------------------------------------------------------------------------- QQQ 147.57 -4.72 157.43 -430.9% Bearish RED -.15 -.016 --------------------------------------------------------------------------------------------- MDY 292.88 -7.32 309.4 -379.9% Bearish RED -.321 -.031 --------------------------------------------------------------------------------------------- IWM 128.37 -3.42 137.02 -449.8% Bearish RED -.283 -.055 --------------------------------------------------------------------------------------------- FAS 40.54 -2.57 46.61 -937.6% Bearish RED -.277 -.24 --------------------------------------------------------------------------------------------- RETL 19.57 -1.97 23.46 -1212% Bearish RED -.013 -.352 --------------------------------------------------------------------------------------------- SOXL 73.46 -3.53 87 -998.6% Bearish RED -.255 -.236 --------------------------------------------------------------------------------------------- TECL 74.82 -7.9 90.84 -1225.9% Bearish RED -.12 -.304 --------------------------------------------------------------------------------------------- IBB 90.86 -3.7 100.25 -563.3% Bearish RED -.177 -.059 --------------------------------------------------------------------------------------------- GLD 118.72 -.52 117.87 70.4% Bearish RED -.104 .177 --------------------------------------------------------------------------------------------- OIL 118.72 -.52 117.87 70.4% Bullish RED -.073 9.342 --------------------------------------------------------------------------------------------- OIH 13.65 -.26 15.51 -669.6% Bearish RED -.419 -.324 --------------------------------------------------------------------------------------------- GASL 5 -.36 6.69 -1881.1% Bearish RED -.362 -.632 --------------------------------------------------------------------------------------------- UGA 5 -.36 6.69 -1881.1% Bullish RED -.387 -.705 --------------------------------------------------------------------------------------------- UUP 25.94 .17 25.97 -19.3% Bullish BLUE .116 .147 --------------------------------------------------------------------------------------------- IEF 25.94 .17 25.97 -19.3% ------- BLUE .03 -.616 --------------------------------------------------------------------------------------------- CORN 25.94 .17 25.97 -19.3% Bullish BLUE .08 .703 --------------------------------------------------------------------------------------------- WEAT 25.94 .17 25.97 -19.3% Bullish BLUE .069 3.295 --------------------------------------------------------------------------------------------- YINN 25.94 .17 25.97 -19.3% ------- BLUE .003 .398 --------------------------------------------------------------------------------------------- RSX 18.62 -.37 20.12 -406% Bearish RED -.205 .03 |
Table 2 Count of Stocks in Key Directories
2018-12/21
-------------------------------
NEWHIGHS 32
NEWLOWS 939 Very bearish
MAXCP 24
MINCP 993 Very bearish
TTTNH 23
TTTNL 558 Very bearish
FASTUP 27
FASTDOWN 292 Bearish
CPCROSSA 34
CPCROSSD 39
BIGVOLUP 13
BIGVODN 132
ACCUMVER 8
HIGHIP21 4
HIUPPCT 1
VHIP21 17
LOWACCUM 366
REDSELL 404
AUGSELS7 18
TRAPDOOR 20
|
Table 3
RANKING OF KEY DIRECTORIES BASED PCT.OF STOCKS ABOVE 65-DMA
12/21/18
Bearish = 45
Bullish = 2
---------------------------------------------------------------------------------------
Directory Current day-1 day-2 day-3 day-4 day-5
----------------------------------------------------------------------------------------
UTILITY .575 .7 .625 .675 .75 .875
GOLD .54 .56 .5 .64 .54 .48
N=2
===========================================================================================
COMODITY .357 .404 .428 .452 .452 .428
FOOD .333 .403 .421 .456 .473 .473
BONDFUND .314 .257 .39 .314 .314 .542
PIPELINE .208 .208 .25 .208 .25 .291
INDEXES .187 .219 .187 .203 .192 .181
EDU .166 .333 .333 .333 .333 .333
GAMING .166 .125 .125 .125 .166 .166
COAL .142 .142 .142 .142 .142 .142
REIT .139 .172 .192 .218 .205 .47
HOMEBLDG .117 .294 .294 .294 .294 .294
INDMATER .102 .102 .102 .128 .115 .128
INSURANC .1 .1 .166 .133 .166 .2
MILITARY .093 .093 .125 .125 .125 .125
CHEM .092 .092 .092 .092 .092 .111
ETFS .086 .086 .12 .12 .12 .155
CHINA .083 .166 .15 .166 .15 .216
AUTO .076 .076 .128 .153 .128 .179
SOFTWARE .076 .076 .092 .092 .107 .276
SP500 .074 .102 .132 .154 .154 .224
RUS-1000 .069 .087 .113 .13 .129 .203
SEMI .068 .102 .119 .205 .17 .23
ELECTRON .067 .08 .092 .16 .129 .172
FINANCE .066 .077 .077 .077 .066 .1
BIG17 .065 .108 .173 .173 .152 .217
BIOTECH .063 .076 .094 .113 .134 .168
BEVERAGE .055 .222 .222 .222 .222 .277
NIFTY .052 .087 .105 .192 .14 .192
COMPUTER .045 .045 .045 .09 .045 .181
HACKERS .045 .045 .045 .09 .09 .363
GREEN .043 .13 .13 .13 .13 .173
HOSPITAL .041 .041 .041 .083 .083 .25
NASD-100 .04 .07 .09 .13 .13 .22
FIDSTKS .037 .069 .096 .112 .107 .172
REGBANKS .035 .035 .035 .035 .035 0
DOWJONES .033 .033 .133 .166 .166 .233
SP-100 .021 .043 .086 .107 .107 .182
OILGAS .02 .02 .027 .034 .034 .034
BIGBANKS 0 0 0 0 0 0
DJI-13 0 0 .076 .076 .076 .076
GUNS 0 0 0 .058 0 .117
INFRA 0 0 0 .055 0 .027
JETS 0 .1 .1 .1 .1 .2
RETAIL 0 0 .018 .037 .018 .056
SOLAR 0 .166 .222 .222 .277 .333
TRANSP 0 0 0 0 0 0
|
====================================================================
12/20/2018
Where Is Santa Claus?
The way the
DJI keeps knifing below support levels despite the
normal
bullishness of December is a dire warning that the market looks
very
dangerous. Even a brief Santa Claus Rally may be asking too much in
this
market. In many ways, the technicals looks more dangerous
than they
did at the end of 2007. Powell's FED is not "Hellicopter" Ben Barnanke's.
It is not
even Greenspan's, which always stood ready to shore up the stock
market
whenever it crashed. The technical condition now is much worse
than it
2000 or 2007, I would suggest. Look at all the Sell S9s. This is more
reminiscent
of 1929!

The Nifty
Tech stocks in 2018 had long and steep advances much like the
computer,
internet and biotechs did between 1995 and 2000. The Big Banks
stocks of
2018 look like they did in late 2007. But unlike in 2000 or 2007,
now we see
extremely weak oil and gas stocks. Today, oil stocks and
just about
every other sector, except Utilities and Gold stocks, shows heavy
red
Distibution, Closing Powers that are falling to new lows and a large plurality of
its
component stocks below their 65-dma. See Table 3. What group of stocks
could we
even make a good case for buying? All the Bullish MAXCPs now are
bearish
(negative) ETFs.


So stay
short a large assortment of our Bearish MINCPs. Shorting small caps
and IWM is
probably still preferable to shorting DIA. There may not even be
a Santa
Clause rally. Wouldn't that be something? Think of all the traders who
have bought
major market EFTs expecting a rally. They are increasingly trapped
and growing
eager to get out on any rally. Meanwhile, long-term investors are
locking in
profits now that the various indexes are all making 12-month lows.


No Buy B13 (Santa Claus Rally)
We have to
take the operative Peerless signal now to be a Sell S10. When we
look back
at market history we find just four cases of the DJI making a 12-month
low
on/after December 17th, as the DJI did today. These were all in existing bear
markets, so
perhaps the fact that they each did experience a Santa Claus rally
is not
relevant.
.
Dec. Bottom Subsequent Peak And Then:
Bear Market
12/19/1917 DJI - 65.90 1/2/1918 76.70 DJI rose to 82.10 on 2/19
(World War I was about to involve the US.)
Bear Market
12/21/1920 DJI - 66.80 1/20/1920 76.10 DJI fell to 63.90 on 8/21/21.
(Very tight money. JP Morgan bombed.)
Bear Market
12/17/1931 DJI - 73.80 1/14/1932 85.4 DJI fell to 41 in July 1932
(Sharply Increasing interest rates to protect Dollar despite deepening Depression)
Bear Market
12/23/1941 DJI - 106.3 1/5/1942 114.2 DJI fell to 92.9 on 4/28/1942
(Aftermath of Pearl Harbor and US entry into World War II.)
|
Charts 12/20/2018 PEERLESS DJI, Signals, Indicators Daily DJI Volume 10-DayUp/Down Vol Hourly DJIA A/D Line for All Stocks Inverted Traders Index NASDAQ S&P OEX NYSE COMPQX DJI-15 DJI-20 DJI-30 DIA SPY QQQ MDY IWM TNA Short-Term Rates USO-CrudeOil DBO FAS GLD BBH IBB JETS JNUG KOL NUGT OIH OIL RSX RETL SDS AGQ SLV SOXL TECL TLT TMF TNA UGA (gasoline) XIV YINN Commodities: CANE CORN DBC JJC, NIB, CHOC CORN, CUT (paper) MOO, SOYB WEAT UUP (Dollar) LIT (Lithium) AAPL ADBE ALXN AMAT AMGN AMD AMZN BA BABA BAC BIDU CAT CVX DE FB GOOG GS HD IBM INTU JPM M (Macy's) MSFT NFLX NVDA QCOM TSLA TXN XOM WMT CMG , LRCX, SWKS, MDGL SPPI WATT SQ TOWN 12/20/2018 (Click on Underlined link.) - Bullish MAXCPs - http://tigersoft.com/MAXCPZ/Dec-20/BULLISH.htm Bearish MAXCPs - http://tigersoft.com/MINCPZ/Dec-20/BEARISH.htm |
Table 1 QUICKSILVER on ETFS - 12/20/18 ETF CLOSE CHANGE PIVOT-PT 5-dma AROC CL-PWR CANDLE IP21 ITRS --------------------------------------------------------------------------------------------- --------------------------------------------------------------------------------------------- DIA 228.89 -4.53 241.42 -363.6% Bearish RED -.167 0 --------------------------------------------------------------------------------------------- SPY 247.17 -4.09 260.47 -353.4% Bearish RED -.138 -.006 --------------------------------------------------------------------------------------------- QQQ 152.29 -2.24 161.08 -402% Bearish RED -.073 -.018 --------------------------------------------------------------------------------------------- MDY 300.2 -3.92 316.27 -327.9% Bearish RED -.301 -.023 --------------------------------------------------------------------------------------------- IWM 131.79 -2.21 140.61 -397.1% Bearish RED -.249 -.049 --------------------------------------------------------------------------------------------- FAS 43.11 -1.53 49.16 -791% Bearish RED -.229 -.251 --------------------------------------------------------------------------------------------- RETL 21.54 -1.3 25.24 -934.2% Bearish RED -.018 -.332 --------------------------------------------------------------------------------------------- SOXL 76.99 -2.02 90.39 -987.5% Bearish RED -.179 -.285 --------------------------------------------------------------------------------------------- TECL 82.72 -4.8 96.93 -1160% Bearish RED -.031 -.322 --------------------------------------------------------------------------------------------- IBB 94.56 -1.65 101.93 -466% Bearish RED -.094 -.045 --------------------------------------------------------------------------------------------- GLD 119.24 1.81 117.06 72.7% Bearish BLUE-.065 .193 --------------------------------------------------------------------------------------------- OIL 119.24 1.81 117.06 72.7% Bullish BLUE-.023 9.316 --------------------------------------------------------------------------------------------- OIH 13.91 -.85 15.66 -781% Bearish RED -.413 -.332 --------------------------------------------------------------------------------------------- RSX 18.99 -.9 20.23 -387.3% Bearish ---- -.229 .029 |
Table 2 Count of Stocks in Key Directories
2018-12/20
-------------------------------
NEWHIGHS 35
NEWLOWS 742 Very bearish
MAXCP 16
MINCP 712 Very bearish
TTTNH 22
TTTNL 527 Very bearish
FASTUP 30
FASTDOWN 643 Very bearish
CPCROSSA 43
CPCROSSD 76
BIGVOLUP 7
BIGVODN 113
ACCUMVER 7
HIGHIP21 3
HIUPPCT 2
VHIP21 17
LOWACCUM 313
REDSELL 370
AUGSELS7 20
TRAPDOOR 19
|
Table 3: RANKING OF KEY DIRECTORIES BASED PCT.OF STOCKS ABOVE 65-DMA
12/20/18
Bullish = 2 Bearish = 45
---------------------------------------------------------------------------------------
Directory Current day-1 day-2 day-3 day-4 day-5
----------------------------------------------------------------------------------------
UTILITY .7 .625 .675 .75 .875 .85
GOLD .56 .5 .64 .54 .48 .56
===========================================================================================
COMODITY .404 .428 .452 .452 .452 .5
FOOD .403 .421 .456 .473 .491 .543
EDU .333 .333 .333 .333 .333 .166
HOMEBLDG .294 .294 .294 .294 .294 .294
BONDFUND .257 .39 .314 .314 .514 .619
BEVERAGE .222 .222 .222 .222 .277 .333
INDEXES .219 .187 .203 .192 .181 .203
PIPELINE .192 .23 .192 .23 .269 .269
REIT .172 .192 .218 .205 .463 .45
CHINA .166 .15 .166 .15 .216 .35
SOLAR .166 .222 .222 .277 .333 .444
COAL .142 .142 .142 .142 .142 .142
GREEN .13 .13 .13 .13 .173 .26
GAMING .125 .125 .125 .166 .166 .166
BIG17 .108 .173 .173 .152 .217 .239
INDMATER .102 .102 .128 .115 .128 .179
SEMI .102 .119 .205 .17 .222 .256
SP500 .102 .132 .154 .154 .224 .291
INSURANC .1 .166 .133 .166 .2 .233
JETS .1 .1 .1 .1 .2 .2
MILITARY .093 .125 .125 .125 .125 .156
CHEM .092 .092 .092 .092 .111 .129
NIFTY .087 .105 .192 .14 .192 .28
RUS-1000 .087 .113 .13 .129 .202 .252
ETFS .086 .12 .12 .12 .155 .293
ELECTRON .08 .092 .16 .129 .172 .209
FINANCE .077 .077 .077 .066 .1 .111
AUTO .076 .128 .153 .128 .179 .179
SOFTWARE .076 .092 .092 .107 .276 .276
BIOTECH .073 .094 .113 .134 .168 .197
NASD-100 .07 .09 .13 .13 .22 .29
FIDSTKS .069 .096 .112 .107 .166 .225
COMPUTER .045 .045 .09 .045 .181 .272
HACKERS .045 .045 .09 .09 .363 .409
SP-100 .043 .086 .107 .107 .182 .247
HOSPITAL .041 .041 .083 .083 .25 .291
REGBANKS .035 .035 .035 .035 0 .071
DOWJONES .033 .133 .166 .166 .233 .4
OILGAS .02 .027 .033 .033 .033 .06
BIGBANKS 0 0 0 0 0 0
DJI-13 0 .076 .076 .076 .076 .23
GUNS 0 0 .058 0 .058 .117
INFRA 0 0 .055 0 .027 .083
RETAIL 0 .018 .037 .018 .056 .094
TRANSP 0 0 0 0 0 0
|
======================================================================
12/19/2018 Most Likely - Any Rally from Here Will Be Quite Limited.
The
DJI has now fallen to the 23200-23350 support, which is down 13.5%
from
its high this year. We did get a new Buy B13 today. But any further decline
would
not only be a Sell S10 violation of well-tested support, it would also drop
the
DJI below the maximum (13.5%) retreat in a "normal" correction and likely
bring
a decline to 21450, the point at which the DJI is down 20% from its highs.
Anything worse than that would be defined as a "bear market".
The dangers then would be very real. I fear that a DJI
decline now below 23000
would
set off a stream of computerized Sell programs using leveraged
ETFs
and we would be down to 20000-21000 in no time.
I've been suggesting hedging out of an excessive confidence in
Santa Claus
and
Fed Chairman Powell. If you still own DIA, plan to sell it if the DJI rallies
back
to 24000 or if 23000 is violated. Hold all the bearish MINCPs short until
the
end of the year or until their Closing Powers break their downtrends.
Hold
off on buying for now because of the new Buy B13 - Santa Claus rally
signal. The DJI needs to get back within its normal 3.5% bands to show us
the
current decline is over.


Why I do not trust the new Buy B13
The
Feds did raise rates, as most experts expected. So, one could hope that
having fulfilled their expectations, Professionals are now ready to buy again.
After
all, the market usually rises this time of the year. And Peerless did give
a Buy
B13 today, even though:
1) the DJI closed way below the normal 3.5% band that usually
acts as support,
2) there was a Sell S9 eleven trading days ago,
3) all our tools, indicators and reports here range from bearish
to very bearish AND
3) clear 12-month new lows were made today by the SP-500, NASDAQ,
QQQ, IWM, SOXL, BBH, OIH, Crude Oil....

My own thinking is that it's very risky to buy DIA here. All these
negatives,
especially
the rapidness of the declines in the major markets' ETFs' Closing
Power and
Day Traders Tools' are shouting out "Be Careful".
In
addition, given the Sell S9 and the market's rapid decline, I would rather not
show a
Peerless Buy B13 or B6 until the DJI closes back above 3.5% lower band.
I will
change the software to effect these rules this weekend.
|
Charts 12/19/2018 PEERLESS DJI, Signals, Indicators Daily DJI Volume 10-DayUp/Down Vol Hourly DJIA A/D Line for All Stocks Inverted Traders Index NASDAQ S&P OEX NYSE COMPQX DJI-15 DJI-20 DJI-30 DIA SPY QQQ MDY IWM TNA Short-Term Rates USO-CrudeOil DBO FAS GLD BBH IBB JETS JNUG KOL NUGT OIH OIL RSX RETL SDS AGQ SLV SOXL TECL TLT TMF TNA UGA (gasoline) XIV YINN Commodities: CANE CORN DBC JJC, NIB, CHOC CORN, CUT (paper) MOO, SOYB WEAT UUP (Dollar) LIT (Lithium) AAPL ADBE ALXN AMAT AMGN AMD AMZN BA BABA BAC BIDU CAT CVX DE FB GOOG GS HD IBM INTU JPM M (Macy's) MSFT NFLX NVDA QCOM TSLA TXN XOM WMT CMG , LRCX, SWKS, MDGL SPPI WATT SQ TOWN 12/19/2018 (Click on Underlined link.) - Bullish MAXCPs - http://tigersoft.com/MAXCPZ/Dec-19/BULLISH.htm Bearish MAXCPs - http://tigersoft.com/MINCPZ/Dec-19/BEARISH.htm |
The
Economy's Real Boss was never elected.
No wonder, he does not believe in politics
or political accountability.

There's a new sherriff in town.
I was
struck today by how "strong" Fed Chairman Powell thinks the economy
is now and
how insignifiant he thinks the stock market is as a predictor of where
the Economy
is headed. When I next talk to him, I will point out that the Rich
have never
had a higher proportion of the Nation's Wealth than now. Even more so than
in 1929.
So the national economy is more dependent than ever on the confidence
the Rich
have in the stock market. Surely, if their stocks go down, they lose confidence
and the
national economy will suffer. At least, that's what I think. I think President
Trump and I
are on the same page here. A rising stock market lifts "all boats",
but a
falling stock market will probably swamp those in row-boats and canoes.
Did you
notice how Powell would not look at the ticker tape as he was talking
this
afternoon. So, he seemed not to notice how fast the stock market was falling
while he
spoke. 500 points by my reckoning.
But,
perhaps, the FOMC really does know what they are doing. That the economy really
IS still
quite strong. That November's Job numbers were a just false "blip".
After all,
Labor
demands are getting uppity. Real wages might actually start to rise soon. We
can't
have
"rising expectations". And of course, the world Economy needs a very
strong
Dollar to
sustain it. So, we should consider the dramatic fall in Oil prices and Federal
Express
today as temporary "blips", too, not as sure signs of a global slow-down. And
perhaps, a
bear market in stocks will not deprive the Rich - who own most shares - of
enough
wealth to cause them to "drop the ball" when it comes to Consumer Spending.
Or perhaps,
the DJI will bravely now go right back up and that will breathe confidence
in all the
other stocks and sectors now making new lows.
Let's all
just be "sheeple" and assume that Powell, who is personally worth $100,000,000,
knows what
it is best for the rest of us.
OK.
But why, if Powell is so smart, are so many Big Banks' stocks making yearly new
lows, just
as they did in late 2007, before the financial panic and crashed economy?
CitiGroup in Dec 2007
just as a long and deep bear mkt was starting.
The
2007 chart below looks a lot like CitiGroup's
current chart.


Table 1 QUICKSILVER on ETFS - 12/19/18 ETF CLOSE CHANGE PIVOT-PT 5-dma AROC CL-PWR CANDLE IP21 ITRS --------------------------------------------------------------------------------------------- --------------------------------------------------------------------------------------------- DIA 233.42 -3.94 246.27 -258% Bearish RED -.158 ----- --------------------------------------------------------------------------------------------- SPY 251.26 -3.82 265.37 -272.7% Bearish RED -.145 -.008 --------------------------------------------------------------------------------------------- QQQ 154.53 -3.89 165.1 -325.9% Bearish RED -.094 -.018 --------------------------------------------------------------------------------------------- MDY 304.12 -5.23 320.66 -315.6% Bearish RED -.321 -.032 --------------------------------------------------------------------------------------------- IWM 134 -2.85 142.77 -385.3% Bearish RED -.267 -.053 --------------------------------------------------------------------------------------------- FAS 44.64 -1.69 50.62 -669.4% Bearish RED -.213 -.249 --------------------------------------------------------------------------------------------- RETL 22.84 -1.04 26.08 -1094% Bearish RED -.061 -.318 --------------------------------------------------------------------------------------------- SOXL 79.01 -11.43 94.42 -899.5% Bearish RED -.206 -.286 --------------------------------------------------------------------------------------------- TECL 87.52 -5.38 104.66 -855.8% Bearish RED -.065 -.3 --------------------------------------------------------------------------------------------- IBB 96.21 -2.1 103.89 -454.5% Bearish RED -.083 -.049 --------------------------------------------------------------------------------------------- GLD 117.43 -.72 117.53 -15.3% Bearish RED -.07 .162 --------------------------------------------------------------------------------------------- RSX 19.89 -.03 20.55 -128.4% Bearish RED -.228 .055 |
Table 2 Count of Stocks in Key Directories
2018-12/19
-------------------------------
NEWHIGHS 32
NEWLOWS 594 Bearish
MAXCP 18
MINCP 644 Very bearish >20:1 MINCPS
TTTNH 19
TTTNL 389 Very bearish >20:1 TTTNLS
FASTUP 25
FASTDOWN 599 Very Bearish >20:1 FASTUPs
CPCROSSA 23
CPCROSSD 57
BIGVOLUP 5
BIGVODN 44
ACCUMVER 8
HIGHIP21 3
HIUPPCT 3
VHIP21 17
LOWACCUM 302
REDSELL 356
AUGSELS7 23
TRAPDOOR 17
|
Table 3: RANKING OF KEY DIRECTORIES BASED PCT.OF STOCKS ABOVE 65-DMA
12/19/18
45 Bearish. Only Utilities are Bullish
---------------------------------------------------------------------------------------
Directory Current day-1 day-2 day-3 day-4 day-5
----------------------------------------------------------------------------------------
UTILITY .625 .675 .75 .875 .85 .85
==========================================================================================
GOLD .5 .64 .54 .48 .56 .52
==========================================================================================
COMODITY .428 .452 .452 .452 .523 .5
FOOD .421 .456 .473 .491 .561 .526
BONDFUND .39 .314 .314 .514 .609 .771
EDU .333 .333 .333 .333 .166 .333
HOMEBLDG .294 .294 .294 .294 .294 .352
PIPELINE .23 .192 .23 .269 .269 .23
BEVERAGE .222 .222 .222 .277 .388 .388
SOLAR .222 .222 .277 .333 .444 .444
REIT .192 .218 .205 .463 .443 .397
INDEXES .187 .203 .192 .181 .203 .213
BIG17 .173 .173 .152 .217 .217 .304
INSURANC .166 .133 .166 .2 .233 .266
CHINA .15 .166 .15 .216 .333 .3
COAL .142 .142 .142 .142 .142 .142
DOWJONES .133 .166 .166 .233 .4 .4
SP500 .132 .154 .154 .224 .289 .307
GREEN .13 .13 .13 .173 .26 .217
AUTO .128 .153 .128 .179 .179 .205
GAMING .125 .125 .166 .166 .166 .25
MILITARY .125 .125 .125 .125 .156 .218
ETFS .12 .12 .12 .155 .293 .206
SEMI .119 .205 .17 .222 .256 .282
RUS-1000 .113 .13 .129 .202 .251 .272
NIFTY .105 .192 .14 .192 .28 .263
INDMATER .102 .128 .115 .128 .179 .153
JETS .1 .1 .1 .2 .2 .6
FIDSTKS .096 .112 .107 .166 .22 .263
BIOTECH .092 .113 .134 .168 .194 .231
CHEM .092 .092 .092 .111 .129 .129
ELECTRON .092 .16 .129 .172 .209 .203
SOFTWARE .092 .092 .107 .276 .276 .246
NASD-100 .09 .13 .13 .22 .29 .33
SP-100 .086 .107 .107 .182 .247 .258
FINANCE .077 .077 .066 .1 .111 .133
DJI-13 .076 .076 .076 .076 .23 .23
COMPUTER .045 .09 .045 .181 .272 .272
HACKERS .045 .09 .09 .363 .409 .454
HOSPITAL .041 .083 .083 .25 .291 .333
REGBANKS .035 .035 .035 0 .071 .142
OILGAS .027 .033 .033 .033 .06 .054
RETAIL .018 .037 .018 .056 .094 .15
BIGBANKS 0 0 0 0 0 0
GUNS 0 .058 0 .058 .117 .176
INFRA 0 .055 0 .027 .083 .027
TRANSP 0 0 0 0 0 .15
|
====================================================================
12/18/2018 Hold DIA and SPY long and some of our many Bearish
MINCPs
short. I believe the DJI will move back above 24000 if the
FOMC does
not raise rates tomorrow. If they do raise
rates, I would think
the DJI
will drop to 23200, where it really needs to hold ... but probably will not.
The broad
stock market fell again today. There were 266
more
down than up on the NYSE. Only 20 stocks made new highs on the
NYHSE
and NASDAQ while 1415 made new lows. The Biotech ETFs
(BBH
and IWM) broke their year-long support. Crude Oil plunged to
12-month lows. Look at Table 1-3 below. By any measure, Professionals
remain very bearish and there is massive overhead resistance for most stocks.
Once
again most of our bearish MINCPs fell. Until the end of the year,
these
very weak stocks will remain under heavy tax loss selling pressure.
This
has the look and feel of a bear market.
But all this may give the FED reason not to add to stock market
miseries
and
instead not raise interest rates tomorrow. Moreover, as bad as the
general market looks, it is "over-sold" and usually there is some kind of rally
just
before and after Christmas. That is why I suggesting holding DIA and
SPY
if you are also short some of our bearish MINCPs.


Today, the DJIA did what it is supposed to. It held above its 23200-23500
support. True, it could not get back above the broken support at 24000 that
now acts
as
resistance. But the DJI's positive action today and now over-night offers
the
bulls reasonable hope that the Fed will not raise short-term rates tomorrow
afternoon and the 23500 support will hold for the rest of the year. It's risky,
but
we can hope that the FED's Open Market Committee appreciate just how
much
technical damage they could do to the market at this time by raising
rates.
So,
for us, a move back above 24000 would have effect of nullifying the
judged Sell S10 I mentioned yesterday and re-instating the Buy B6. However,
note
that a recovery above the 3.5% lower band will not bring a Buy B13,
but
it could bring another Buy B6 soon.
If
you are long DIA appreciate the following:
The risk:reward ratio is favorable to traders who
buy
DIA near support only if they are prepared to
quickly sell out if the year-long support (23200-23500) is violated.
Why I Think The Fed Will Not Raise Rates Tomorrow.
#1 Today, Oil fell sharply. Higher interest rates now will
unduly hurt the already
suffering
oil and gas producing sections of America. A month ago, Powell
made a trip
to Texas to show he was cognizant of how this part of the country
was already
hurting despite "full employment" elsewhere. He seemed to be
acknowledging the undue harm done them repeatedly in the 1980s by Paul
Volcker's
obsessive drive to kill inflation using extremely high interest rates.
#2
The NASDAQ and the SP-500 are hanging by a thread. They are just above
their
12-month support levels. If they break down now in December, a normally
bullish
month, they will likely behave much worse next year. One would think
that the
FED will appreciate how precarious the stock market is. In fact, it may
already be
too late to save them.

Remember December 1968 and 2007.
Only if you are hedged with Bearish MINCPs as a hedge, would I stay long
DIA
and hope that the
FED's inaction tomorrow will bring a blue-chip rally that may
last until early
January. This could bring a typical Santa Claus rally that lasts two
weeks, even
though we will probably not get a Peerless Buy B13 even if the DJI
quickly rises
back above 24000 and the lower 3.5% band. Our December 3rd
Sell S9 prevents
in our software a Buy B13 for the next three weeks in December.
This rule was put
into place primarily because of the December 2007 decline. The
older 2006
version of Peerless would have dangerously generated a Buy B13 in
mid December
2007, at what then proved to be the worse possible time. The DJI
was just
beginning to drop down more than 10% from its highs and begin its deep
2007-2009 bear
market. As is true now, Financials were then particularly weak.
 |
 |
|
Charts 12/18/2018 PEERLESS DJI, Signals, Indicators Daily DJI Volume 10-DayUp/Down Vol Hourly DJIA A/D Line for All Stocks Inverted Traders Index NASDAQ S&P OEX NYSE COMPQX DJI-15 DJI-20 DJI-30 DIA SPY QQQ MDY IWM TNA Short-Term Rates USO-CrudeOil DBO FAS GLD BBH IBB JETS JNUG KOL NUGT OIH OIL RSX RETL SDS AGQ SLV SOXL TECL TLT TMF TNA UGA (gasoline) XIV YINN Commodities: CANE CORN DBC JJC, NIB, CHOC CORN, CUT (paper) MOO, SOYB WEAT UUP (Dollar) LIT (Lithium) AAPL ADBE ALXN AMAT AMGN AMD AMZN BA BABA BAC BIDU CAT CVX DE FB GOOG GS HD IBM INTU JPM M (Macy's) MSFT NFLX NVDA QCOM TSLA TXN XOM WMT CMG , LRCX, SWKS, MDGL SPPI WATT SQ TOWN 12/18/2018 (Click on Underlined link.) - Bullish MAXCPs - http://tigersoft.com/MAXCPZ/Dec-18/BULLISH.htm Bearish MAXCPs - http://tigersoft.com/MINCPZ/Dec-18/BEARISH.htm |
Table 1 QUICKSILVER on ETFS - 12/18/18 ETF CLOSE CHANGE PIVOT-PT 5-dma AROC CL-PWR CANDLE IP21 ITRS --------------------------------------------------------------------------------------------- --------------------------------------------------------------------------------------------- DIA 237.36 .93 245.88 -141.4% Bearish RED -.082 --- --------------------------------------------------------------------------------------------- SPY 255.08 -.28 265.46 -172.6% Bearish RED -.074 -.012 --------------------------------------------------------------------------------------------- QQQ 158.42 .99 165.05 -159.7% Bearish RED -.033 -.019 --------------------------------------------------------------------------------------------- MDY 309.35 -.05 324.06 -192.8% Bearish RED -.271 -.034 --------------------------------------------------------------------------------------------- IWM 136.85 -.17 144.82 -232.8% Bearish RED -.175 -.054 --------------------------------------------------------------------------------------------- FAS 46.33 -.28 51.17 -471.7% Bearish RED -.162 -.237 --------------------------------------------------------------------------------------------- RETL 23.88 .42 28.4 -731.5% Bearish RED .015 -.305 --------------------------------------------------------------------------------------------- SOXL 90.44 3.44 95.48 -54% Bearish BLUE-.109 -.24 --------------------------------------------------------------------------------------------- TECL 92.9 2.06 104.28 -448.3% Bearish RED -.011 -.302 --------------------------------------------------------------------------------------------- IBB 98.31 -1.94 105.48 -284.1% Bearish RED -.002 -.054 --------------------------------------------------------------------------------------------- GLD 118.15 .28 117.79 25.9% Bullish BLUE .008 .14 --------------------------------------------------------------------------------------------- RSX 19.92 -.2 20.41 -91% Bearish RED -.142 .042 |
Table 2 Count of Stocks in Key Directories
2018-12/18
-------------------------------
NEWHIGHS 25
NEWLOWS 390 Bearish
MAXCP 17
MINCP 498 Professionals: Very Bearish
TTTNH 28
TTTNL 353 Day Traders: Very Bearish
FASTUP 26
FASTDOWN 331 Swing Traders: Very Bearish
CPCROSSA 22
CPCROSSD 31
BIGVOLUP 5
BIGVODN 30
ACCUMVER 5
HIGHIP21 4
HIUPPCT 5
VHIP21 17
LOWACCUM 294
REDSELL 350
AUGSELS7 14
TRAPDOOR 20
|
Table 3: RANKING OF KEY DIRECTORIES BASED PCT.OF STOCKS ABOVE 65-DMA
12/18/18
Bullish = 2
Bearish 43
---------------------------------------------------------------------------------------
Directory Current day-1 day-2 day-3 day-4 day-5
----------------------------------------------------------------------------------------
UTILITY .675 .75 .875 .85 .85 .825
GOLD .64 .54 .48 .56 .52 .48
=============================================================================================
FOOD .456 .473 .491 .561 .526 .526
COMODITY .452 .452 .452 .523 .5 .5
EDU .333 .333 .333 .166 .333 .333
BONDFUND .314 .314 .514 .609 .761 .78
HOMEBLDG .294 .294 .294 .294 .352 .294
BEVERAGE .222 .222 .277 .388 .388 .333
SOLAR .222 .277 .333 .444 .444 .333
REIT .218 .205 .463 .443 .397 .523
INDEXES .208 .192 .181 .203 .213 .203
SEMI .205 .17 .222 .256 .282 .196
NIFTY .192 .14 .192 .28 .263 .245
PIPELINE .192 .23 .269 .269 .23 .192
BIG17 .173 .152 .217 .217 .304 .195
CHINA .166 .15 .216 .333 .3 .166
DOWJONES .166 .166 .233 .4 .4 .366
^^^^^^^^
ELECTRON .16 .129 .172 .209 .203 .148
SP500 .154 .154 .224 .289 .307 .273
^^^^^
AUTO .153 .128 .179 .179 .205 .179
COAL .142 .142 .142 .142 .142 .142
INSURANC .133 .166 .2 .233 .266 .266
GREEN .13 .13 .173 .26 .217 .217
NASD-100 .13 .13 .22 .29 .33 .26
^^^^^^^^
RUS-1000 .13 .129 .202 .251 .272 .237
INDMATER .128 .115 .128 .179 .166 .141
GAMING .125 .166 .166 .166 .25 .166
MILITARY .125 .125 .125 .156 .218 .156
ETFS .12 .12 .155 .293 .206 .103
FIDSTKS .112 .107 .166 .22 .263 .215
BIOTECH .11 .134 .168 .194 .228 .197
SP-100 .107 .107 .182 .247 .258 .247
^^^^^^
JETS .1 .1 .2 .2 .6 .4
CHEM .092 .092 .111 .129 .148 .111
SOFTWARE .092 .107 .276 .276 .246 .215
COMPUTER .09 .045 .181 .272 .272 .227
HACKERS .09 .09 .363 .409 .454 .363
HOSPITAL .083 .083 .25 .291 .333 .291
FINANCE .077 .066 .1 .111 .133 .111
DJI-13 .076 .076 .076 .23 .23 .23
GUNS .058 0 .058 .117 .176 .117
INFRA .055 0 .027 .083 .027 0
RETAIL .037 .018 .056 .094 .15 .113
REGBANKS .035 .035 0 .071 .142 .035
OILGAS .033 .033 .033 .06 .047 .04
BIGBANKS 0 0 0 0 0 0
TRANSP 0 0 0 0 .15 .05
|
====================================================================
12/17/2018 The DJI failed to hold above its 4x tested horizontal support
at
approximately 24000. I would judge this a Sell S10 and expect the DJI now to
have
to test the 23200-23500 support more fully unless
word leaks out from the
FOMC
which meets today and Wednesday that they will not be raising short-term
rates
as is expected. In that event, we may still see a quick Santa Claus rally.
Most likely 24000 will act as resistance now unless the FED does
not raise rates.
But a
quick recovery right back above 24000 would be bullish. That would be
in
keeping with a Buy B13 rally. And a close back above the lower 3.5% band
would
likely yield a Buy B13 tomorrow or Wednesday. Today there was no Buy B13.
Unfortunately, the overall market is very weak. And if we look at the DJI's trading
in
mid-December, especially before World War II, we find quite a few cases where
the
DJI falls a long way below the 3.5% lower band before rallying. This explains
why
the Buy B13 nearly always occurs only when the DJI closes above the 4% lower
band
and why it did not occur today, 4.9% down from the 21-dma. (There are a few
exceptions, but breadth needs to be better. The NYSE A/D Line now is much weaker
than
the DJI.)
The chart below shows that 23200 is the key support for the DJI.
A close below
23000
would likely drop the quick to 21000 and the 20% down-from-the-peak
boundary that divides a deep correction from a bear market. I am
still surprised that
the
FED's FOMC members would needlessly risk starting a bear market that
could
easily get out of control. But when you look back at all the mistakes they made
for
example between 1927 and 1932 and in 1937, one should not be surprised. Afterall,
they
have a long history of tightenng credit and causing recessions despite their mandate
to do
otherwise. (There is a well-researched book on this topic, "Secrets of
the Temple".
https://www.amazon.com/Secrets-Temple-Federal-Reserve-Country/dp/0671675567
)
There are two bullish key values in the DJI chart. The IP21 (Accum. Index)
is still positive. This means Big Money has not yet turned net bearish. As
a result, volume is not at climactic levels and the OP (OBVPct) is only slightly negative.
But the most important indicators, those that measure Breadth, the P-I and
A/D-Line are clearly bearish. Lots of stocks are falling because their economic
outlook is darkening in good measure because of the expectations of rising
interest rates. Note that momentum (AROC) is now below -.70. This is the
annualized slope of the 21-dma. Below -.70 makes it harder for the DJI to find
get past the resistance now posed by the violated 3.5% lower band. Instead, a
rally now back to 24000 will face a lot more resistance.
![]()

Years when December's Bullishness disappointed bulls badly
and The Santa Claus Rally came only after a deeper decline
than we have so far seen:
12/22/1916 DJI
bottomed 7.4% below the 21-dma and then rallied for two weeks.
12/19/1917 DJI
bottomed 6.9% below the 21-dma and then rallied for two weeks.
Late 12/26/1918
DJI bottomed 2.3% below the 21-dma and than rallied a week.
12/21/1917 DJI
bottomed 9.9% below the 21-dma and then rallied a week.
12/20/1929 DJI
bottomed 6.7% below the 21-dma and then rallied 4 months.
12/17/1931 DJI
bottomed briefly 16.7% below the 21-dma and then rallied only a day.
12/28/1937 DJI
bottomed 5.6% below the 21-dma and then rallied two weeks.
12/11/1980 DJI
bottomed 6.4% below the 21-dma and then rallied two weeks.
Stay Hedged. Our Bearish MINCPs are
Recommended.
Significantly, the Tiger programs can only find short-TFS to play
on the long side tonight using our MAXCP screening. Meanwhile,
many of the Bearish MINCPS look like outstanding classic short
sales.
If you bought DIA or
SPY at the opening today as I suggested, you are only down 1%
and presumably you are
short a number of the Bearish MINCPs that were very weak
again today and may not
be able to rally much until their tax selling ends December 31st.
In this case, let's see
if the DJI can try to start a recovery, a la "Santa Claus". But
if you are not hedged
in this way, then I would sell DIA and SPY because of the
judged Sell S10 close
by the DJI below well-tested horizontal support at 24000
and I would wait for a
successful test of the 23200-23500 support and decision
by the FED not to cut
rates Wednesday afternoon.
Today's weakness saw
6.5 times more stocks falling than rising on the NYSE.
There were only 5 new
highs. But Up Volume was still 148 million shares. A final
capitulation by longs
on this decline should see higher down volume. On the other hand,
if SPY, COMPQX
(NASDAQ), BBH-IBB and SOXL can hold here for a few days
without making 12-month
lows, that will probably show traders enough proof that
there is still good
support to give us a two-week rally. So watch these indexes and ETFS
tomorrow. Bulls
will also want to see a strong closing in DIA and SPY tomorrow or
Wednesday. This
will be evidence that the Fed will not be raising rates. As I showed
yesterday, that usually
is what helps a Santa Claus and January rally most.
 |
 |
 |
 |
|
Charts 12/17/2018 PEERLESS DJI, Signals, Indicators Daily DJI Volume 10-DayUp/Down Vol Hourly DJIA A/D Line for All Stocks Inverted Traders Index NASDAQ S&P OEX NYSE COMPQX DJI-15 DJI-20 DJI-30 DIA SPY QQQ MDY IWM TNA Short-Term Rates USO-CrudeOil DBO FAS GLD BBH IBB JETS JNUG KOL NUGT OIH OIL RSX RETL SDS AGQ SLV SOXL TECL TLT TMF TNA UGA (gasoline) XIV YINN Commodities: CANE CORN DBC JJC, NIB, CHOC CORN, CUT (paper) MOO, SOYB WEAT UUP (Dollar) LIT (Lithium) AAPL ADBE ALXN AMAT AMGN AMD AMZN BA BABA BAC BIDU CAT CVX DE FB GOOG GS HD IBM INTU JPM M (Macy's) MSFT NFLX NVDA QCOM TSLA TXN XOM WMT CMG , LRCX, SWKS, MDGL SPPI WATT SQ TOWN 12/17/2018 (Click on Underlined link.) - Bullish MAXCPs - http://tigersoft.com/MAXCPZ/Dec-17/BULLISH.htm Bearish MAXCPs - http://tigersoft.com/MINCPZ/Dec-17/BEARISH.htm |
Table 1 QUICKSILVER on ETFS - 12/17/18 ETF CLOSE CHANGE PIVOT-PT 5-dma AROC CL-PWR CANDLE IP21 ITRS --------------------------------------------------------------------------------------------- --------------------------------------------------------------------------------------------- DIA 236.43 -4.99 244.23 -169.3% Bearish RED -.035 ---- --------------------------------------------------------------------------------------------- SPY 255.36 -5.11 264.13 -165% Bearish RED -.013 -.006 --------------------------------------------------------------------------------------------- QQQ 157.43 -3.65 163.61 -172.4% Bearish RED .021 -.025 --------------------------------------------------------------------------------------------- MDY 309.4 -6.87 321.63 -205.9% Bearish RED -.21 -.03 --------------------------------------------------------------------------------------------- IWM 137.02 -3.59 143.45 -230% Bearish RED -.092 -.051 --------------------------------------------------------------------------------------------- FAS 46.61 -2.55 51.02 -531.5% Bearish RED -.086 -.232 --------------------------------------------------------------------------------------------- RETL 23.46 -1.78 27.71 -857.7% Bearish RED .067 -.317 --------------------------------------------------------------------------------------------- SOXL 87 -3.39 91.43 -153.8% ------- RED -.045 -.3 --------------------------------------------------------------------------------------------- TECL 90.84 -6.09 101.84 -525.8% Bearish RED .03 -.328 --------------------------------------------------------------------------------------------- IBB 100.25 -1.68 104.17 -171.9% ------- RED .079 -.038 --------------------------------------------------------------------------------------------- GLD 117.87 .81 117.54 8.1% ------- BLUE-.028 .151 --------------------------------------------------------------------------------------------- RSX 20.12 -.11 20.29 -58.9% Bearish RED -.069 .073 |
Table 2
Count of Stocks in Key Directories
2018-12/17
-------------------------------
NEWHIGHS 27
NEWLOWS 526 Very Bearish
MAXCP 18
MINCP 541 Very Bearish
TTTNH 27
TTTNL 371 Bearish
FASTUP 22
FASTDOWN 294 Bearish
CPCROSSA 23
CPCROSSD 109 Bearish
BIGVOLUP 2
BIGVODN 46
ACCUMVER 7
HIGHIP21 4
HIUPPCT 4
VHIP21 17
LOWACCUM 295
REDSELL 346
AUGSELS7 15
TRAPDOOR 19
|
Table 3 RANKING OF KEY DIRECTORIES BASED PCT.OF STOCKS ABOVE 65-DMA
12/17/18
Bullish = 2
Bearish = 45
---------------------------------------------------------------------------------------
Directory Current day-1 day-2 day-3 day-4 day-5
----------------------------------------------------------------------------------------
UTILITY .75 .875 .85 .85 .85 .85
GOLD .54 .48 .56 .52 .46 .42
=================================================================================================
FOOD .464 .482 .553 .517 .517 .482
COMODITY .452 .452 .523 .5 .5 .452
EDU .333 .333 .166 .333 .333 .333
BONDFUND .314 .514 .609 .761 .78 .838
HOMEBLDG .294 .294 .294 .352 .294 .235
SOLAR .277 .333 .444 .444 .333 .333
PIPELINE .23 .269 .269 .23 .192 .192
BEVERAGE .222 .277 .388 .388 .333 .388
REIT .205 .463 .443 .397 .523 .483
INDEXES .192 .181 .203 .213 .203 .219
SEMI .17 .222 .256 .282 .196 .179
DOWJONES .166 .233 .4 .4 .366 .333
^^^^^^^^
GAMING .166 .166 .166 .25 .166 .166
INSURANC .166 .2 .233 .266 .266 .3
SP500 .154 .224 .289 .307 .275 .267
^^^^^
BIG17 .152 .217 .217 .304 .195 .173
CHINA .15 .216 .333 .3 .183 .2
COAL .142 .142 .142 .142 .142 .142
NIFTY .14 .192 .28 .263 .245 .228
BIOTECH .131 .168 .194 .228 .194 .184
GREEN .13 .173 .26 .217 .217 .173
NASD-100 .13 .22 .29 .33 .26 .24
^^^^^^^^
ELECTRON .129 .172 .209 .203 .148 .135
RUS-1000 .129 .202 .251 .272 .237 .219
AUTO .128 .179 .179 .205 .179 .128
MILITARY .125 .125 .156 .218 .156 .125
ETFS .12 .155 .293 .206 .103 .086
INDMATER .115 .128 .179 .166 .141 .141
FIDSTKS .107 .166 .22 .263 .22 .215
SOFTWARE .107 .276 .276 .246 .2 .184
SP-100 .107 .182 .247 .258 .247 .215
JETS .1 .2 .2 .6 .4 .4
CHEM .092 .111 .129 .148 .111 .111
HACKERS .09 .363 .409 .454 .363 .363
HOSPITAL .083 .25 .291 .333 .291 .291
DJI-13 .076 .076 .23 .23 .23 .153
FINANCE .066 .1 .111 .133 .111 .111
COMPUTER .045 .181 .272 .272 .227 .227
REGBANKS .035 0 .071 .142 .035 .071
OILGAS .033 .033 .06 .047 .04 .04
RETAIL .018 .056 .094 .15 .113 .113
BIGBANKS 0 0 0 0 0 0
GUNS 0 .058 .117 .176 .117 .117
INFRA 0 .027 .083 .027 0 0
TRANSP 0 0 0 .15 .05 .05
|
====================================================================
12/14/2018 The DJI is testing
its 24000 support at its lower 3.5%
band.
Our OBVPct, Accumulation Index and our P-Indicator did not
confirm the
DJI's closing low on Friday. And, most important, we are entering the
bullish
season period from December 17th to early January over which
the DJI
rallies 75% of the time. So, we should buy DIA and SPY.
But let's
hold off on doing more than that until we see a Buy B13 (Santa Claus buy).
There is
still a good chance of the DJI dropping down to 23200 if the FED
continues
with its plans to raise rates at the FOMC meeting on Wednesday
this week.
Watch the DJI Stocks showing head/shoulders Tops now.
Any rally
likely now will probably limited to the DIA, SPY, QQQ, TECL and SOXL.
By most
measures and Tables 1-3 below, we have a very ugly market in all but a handful
of stocks
and the technicals are worsening. The Russell-2000, the MDY Mid-caps
and Rails
made new-low breakdowns at the end of the week. Even the ETFs we would
like to
buy, such as DIA, SPY and QQQ, have their Closing Powers making new lows
ahead of
prices. It seems that only Utilities and a few very defensive blue chips
in the DJI,
like KO, PG and Verizon are still attracting enough buyers to look outright
bullish.
In fact, the number of strong-looking blue-chips in the DJI is shrinking. JNJ
had been
one of the bullish "hold-outs". But Friday, it lost 14.84 on huge volume.
Will the
seven DJI-30 stocks now showing bearish head/shoulders patterns, AXP,
DIS, MCD,
PFE, UNH, WBA and WMT suffer the same fate soon? Watch them
this week.
Their breakdowns would pose a real problem for a stock market
that
depends more than ever on the DJIA to maintain appearances that all is still fine.
 |
 |
 |

|
The FED Is in Control. The Market Awaits
Its Decision about Short-Term Rates on Wednesday.
Despite
Friday's Buy B6, there may be more market weakness. Be especially
wary of
opening strength that fades away. The Closing Powers for the key ETFs
are all
falling, as are the Tiger Day Traders' Tools. What we need to see
to become
bullish for the next two week is closing strength after early weakness.
And even if
the DJI makes such a reversal upwards, to be buyers in preparation
for a Santa
Claus rally, I think we should also require similar reversals in the tech
sector,
notably QQQ, TECL and SOXL.
There is
risk now of a DJI penetration of the flat support at 24000 and a decline
to the
"final" support at 23200. The FED more than the President controls what
will happen
next. It appears the FED will stick to its plans to raise short-term rates
this month.
There is no need to raise rates. The Dollar is strong. Inflation is
stuck just
above 2%. There are lots of signs that big banks are worried about
a global
economic slow-down and the vast amount of indebtedness. But the
FED often
listens listens too much to bond-salesmen and forgets too often how
easily it
can cause bear markets by raising rates too quickly. Over and over, history
shows how
the rising of short-term interest rates cause turn a bull market into
a bear
market. It would be a mistake to think that this Federal Reserve is any
different
or any smarter. In particular, the 1980 experience with a hawkish
FED warns
us that even though it's now December, the DJI could drop below the
7% lower
band before recovering.
Peerless
did give another Buy B6 on Friday. That gives encouragement to the
bulls.
The B6 was always eventually profitable. But we should be careful.
The Buy
B2-B6 of a week ago was considered cancelled because of how fast
the DJI had
fallen from the upper 3.3% band to the lower 3% band after a Sell S9.
I think
that this special bearishness (which I called an "experimental S13 in the Hotline
and in the
current Peerless version now available on the ESP Page) ") is probably
used up and
we should be buying for a Santa Claus rally. But I would rather see
a Buy B13
Santa Claus signal and act on that.
Peerless Buy B6
Let's look
at the Buy B6 more closely. As you can see it has always proved
to have
been profitable. But, there have only been five past cases. This is
because the
only drops to the lower band in Decembers that produce Buy B6s
are those
that only occur in mid-term Presidential Years. A second concern
is that all
but one, the 1986 case, took place in bear markets. Since our DJIA now
is only
down 10% from its highs, only the1986 case might be considered a
good
parallel. But is it? After December 1st, 1986 the FED began lowering
interest
rates. It is raising them in steps now even when there is no need that
I can see
and that could prove dangerous to the bulls.
Fed Funds Rate
1986-12-01 6.91
1987-01-01 6.43
1987-02-01 6.10
1987-03-01 6.13
The next thing to
note is that all but one of the past B6s occurred after December 25th.
Finally, only one
of the past B6s called the December bottom perfectly.
Past Peerless B6s
Date Gain
Paper Loss
12-26-1930 +.059 -.0062
bottom was on 12/29
12-02-1966 +.124 -.0036
bottom was on 12/30
12-28-1966 +.125 -.0035
bottom was on 12/30
12-31-1986 +.269
zero
12-26-2002 +.040 -.0152
Buying the DJI at the Lower 3% Band in December
Is Nearly Always Profitable for Traders. But sometimes,
the DJI drops another 2%-3% before making a good recovery.
When the DJI closes below the lower 3.0% band in Decembers
since 1940
in bear markets, it
invariable experiences a Santa Claus bounce with the DJI
rallying
until the following year. This was true in all eight cases. But in five
of these
cases the DJI fell below the 4% lower band and twice reached the 7%
lower
band.
Of
more interest for us are five cases where the DJI closed below the 3% band
in bull markets. These are
cases of 1975, 1980, 1982, 1998 and 2014.
In
1975, 1982 and 1998 short-term interest rates were falling and the DJI
did
not fall further and quickly rebounded until the second week of January,
at
least. But when interest rates were flat, the December 2014 case, the
DJI
rallied only until the day after Christmas. When interest rates were on
the
rise in December and at very high levels, too, the DJI did not bottom
until
it closed 7.4% below the 21-dma. This was the December 1980 case.
But
then the DJI did zoom back up above the upper band. As you can
see
below, the DJI did nominally break below its horizontal support in
December 1980, but then it quickly reversed back upwards. What makes
this
instance especially interesting, is that there was also a Sell S9 before the
DJI's
decline. That is like now. But unlike now, there was also a bearish
head/shoulders top.
Date
LA/MA
Outcome
---------------------------------------------------------------------------------------------
12/22/1941 .946 (5.4% LB)
From 106.3, the DJI then rose back to 114.2 on 1/5/1942
Bear Mkt Environm.
and then resumed bear market.
12/17/1957 .966 (3.4% LB)
From 425.7, the DJI quickly bottomed and rose back to 458.7
Bear Mkt Environm.
on 2/4/1958 before falling back below 21-dma.
12/17/1969 .961 (3.9% LB) From 769.93, the DJI rose back to 811.31 on
1/5/1970
Bear Mkt Environm.
and then resumed bear market.
12/13/1973 .958 (4.2% LB) From 800.43, the DJI rose back to 880.69 on
1/3/1974
Bear Mkt Environm
before re-testing 800 support again.
12/6/1974 .923 (7.7% LB) From
577.60, the DJI rose back to 786.53 on 3/17/1975
Bear Mkt Environm
before falling back below its rising 21-dma.
12/4/1987 .929 (7.1% LB) From
1766.74, the DJI rose back to 2037.80 on 1/6/1988
Bear Mkt Environm
before falling back below its rising 21-dma.
12/27/2003 .968 (3.2% LB) From 8303.78, the DJI rose back to 8740.59 on
1/7/2003
Bear Mkt Environm
before resuming bear market.
12/1/2008 .945 (5.5% LB) From
8149.09, the DJI rose back to 9034.69 on 1/2/2009
Bear Mkt Environm
before resuming bear market.
Bull Market Closings below 3% Lower Band.
#1 12/5/1975 .969 (3.1% LB)
From 818.8, the DJI shot upwards as interest rates were lowered.
Bull Market Environm
The DJI rose
to 975.28 on 1/30/1976 before falling back
briefly below its 21-dma
Fed. Funds Rate:
1975-10-01 5.82
1975-11-01 5.22 down
1975-12-01 5.20 down
1976-01-01 4.87 down
1976-02-01 4.77 down
1976-03-01 4.84 up
1976-04-01 4.82 down
1976-05-01 5.29 up
https://fred.stlouisfed.org/data/FEDFUNDS.txt
#2 12/11/1980 .936
(7.4% LB) From 908.45, the DJI quickly rose back to a nominal new high
Bull Market Environm
at 1004.69 on 1/6/1981. It then fell back to lower band.
Short-term rates were rising to very lofty heights at this time.
Fed. Funds Rate:
1980-10-01 12.81
1980-11-01 15.85 Up
1980-12-01 18.90 Up
1981-01-01 19.08 Up
1981-02-01 15.93 Down
1981-03-01 14.70 Down
1981-04-01 15.72 Up
1981-05-01 18.52 Up
1981-06-01 19.10 Up
#3 12/16/1982 .970
(3.0% LB) From 990.25, the DJI quickly rose back to 1083.61 on 1/12/1983
Bull Market Environm
before pulling back to its lower band.
Short-term rates were falling from their extreme highs.
Fed. Funds Rate:
1982-10-01 9.71
1982-11-01 9.20
1982-12-01 8.95
1983-01-01 8.68
1983-02-01 8.51
1983-03-01 8.77
#4 12/14/1998 .960 (4.0%
LB) From 8695, the DJI quickly rose back to 9643 on 1/8/1999
Bull Market Environm
before pulling back to its lower band.
Short-term rates were falling.
Fed. Funds Rate:
1998-10-01 5.07 1998-11-01 4.83 Down 1998-12-01 4.68 Down 1999-01-01 4.63 Down 1999-02-01 4.76 Up 1999-03-01 4.81 Up 1999-04-01 4.74 Down 1999-05-01 4.74 Down
#5 12/16/2014 .965 (3.5%
LB) From 17069, the DJI quickly rose back to 18053 on 12/26/2014
Bull Market Environm
before pulling back to its lower band.
Short-term rates were flat.
Fed. Funds Rate:
2014-11-01 0.09 2014-12-01 0.12 Up 2015-01-01 0.11 Down 2015-02-01 0.11 2015-03-01 0.11 2015-04-01 0.12 Up 2015-05-01 0.12 Up
|
Charts 12/14/2018 PEERLESS DJI, Signals, Indicators Daily DJI Volume 10-DayUp/Down Vol Hourly DJIA A/D Line for All Stocks Inverted Traders Index NASDAQ S&P OEX NYSE COMPQX DJI-15 DJI-20 DJI-30 DIA SPY QQQ MDY IWM TNA Short-Term Rates USO-CrudeOil DBO FAS GLD BBH IBB JETS JNUG KOL NUGT OIH OIL RSX RETL SDS AGQ SLV SOXL TECL TLT TMF TNA UGA (gasoline) XIV YINN Commodities: CANE CORN DBC JJC, NIB, CHOC CORN, CUT (paper) MOO, SOYB WEAT UUP (Dollar) LIT (Lithium) AAPL ADBE ALXN AMAT AMGN AMD AMZN BA BABA BAC BIDU CAT CVX DE FB GOOG GS HD IBM INTU JPM M (Macy's) MSFT NFLX NVDA QCOM TSLA TXN XOM WMT CMG , LRCX, SWKS, MDGL SPPI WATT SQ TOWN 12/14/2018 (Click on Underlined link.) - Bullish MAXCPs - http://tigersoft.com/MAXCPZ/Dec-14/BULLISH.htm Bearish MAXCPs - http://tigersoft.com/MINCPZ/Dec-14/BEARISH.htm |
Table 1 QUICKSILVER on ETFS - 12/14/18 ETF CLOSE CHANGE PIVOT-PT 5-dma AROC CL-PWR CANDLE IP21 ITRS --------------------------------------------------------------------------------------------- --------------------------------------------------------------------------------------------- DIA 241.42 -4.85 244.71 -59% Bearish RED -.028 ----- --------------------------------------------------------------------------------------------- SPY 260.47 -4.9 264.07 -58.6% Bearish RED -.004 -.008 --------------------------------------------------------------------------------------------- QQQ 161.08 -4.02 163.07 -9.2% Bearish RED .017 -.035 --------------------------------------------------------------------------------------------- MDY 316.27 -4.39 322.62 -128.1% Bearish RED -.173 -.033 --------------------------------------------------------------------------------------------- IWM 140.61 -2.16 143.6 -118.6% Bearish RED -.075 -.054 --------------------------------------------------------------------------------------------- FAS 49.16 -1.46 52.01 -417.2% Bearish RED -.062 -.209 --------------------------------------------------------------------------------------------- RETL 25.24 -.84 28.11 -449.2% Bearish RED .042 -.308 --------------------------------------------------------------------------------------------- SOXL 90.39 -4.03 89.84 229.6% ------- RED -.021 -.323 --------------------------------------------------------------------------------------------- TECL 96.93 -7.73 101.55 -17.7% Bearish RED .045 -.335 --------------------------------------------------------------------------------------------- IBB 101.93 -1.96 103.82 -82.1% Bearish RED .049 -.06 --------------------------------------------------------------------------------------------- GLD 117.06 -.47 117.68 -43.7% ------- BLUE-.015 .131 --------------------------------------------------------------------------------------------- RSX 20.23 -.32 20.36 -117.3% Bearish RED -.012 .037 |
Table 2
Count of Stocks in Key Directories
2018-12/14
-------------------------------
NEWHIGHS 32
NEWLOWS 331 Bearish >10:1 ratio
MAXCP 14 MINCP 344 Bearish >10:1 ratio TTTNH 21 TTTNL 206 FASTUP 23 FASTDOWN 224 Bearish >10:1 ratio CPCROSSA 36 CPCROSSD 39 Subtle shift to bullish side by some Pros? BIGVOLUP 1 BIGVODN 21 ACCUMVER 10 HIGHIP21 5 HIUPPCT 6 VHIP21 18 LOWACCUM 256 REDSELL 332 AUGSELS7 23 TRAPDOOR 20 |
Table 3
RANKING OF KEY DIRECTORIES BASED PCT.OF STOCKS ABOVE 65-DMA
12/14/18
---------------------------------------------------------------------------------------
Directory Current day-1 day-2 day-3 day-4 day-5
----------------------------------------------------------------------------------------
UTILITY .875 .85 .85 .85 .85 .85
BONDFUND .514 .609 .761 .78 .828 .8
==============================================================================================
FOOD .491 .561 .526 .526 .491 .561
GOLD .48 .56 .52 .46 .42 .52
REIT .463 .443 .397 .523 .476 .576
COMODITY .452 .523 .5 .5 .452 .547
HACKERS .363 .409 .454 .363 .363 .272
EDU .333 .166 .333 .333 .333 .333
SOLAR .333 .444 .444 .333 .333 .444
HOMEBLDG .294 .294 .352 .294 .235 .411
BEVERAGE .277 .388 .388 .333 .388 .388
SOFTWARE .276 .276 .246 .2 .184 .184
PIPELINE .269 .269 .23 .192 .192 .192
HOSPITAL .25 .291 .333 .291 .291 .333
DOWJONES .233 .4 .4 .366 .333 .3
^^^^^^^^
SP500 .224 .289 .307 .275 .265 .259
^^^^^
SEMI .222 .256 .282 .196 .179 .153
NASD-100 .22 .29 .33 .26 .24 .19
^^^^^^^^
BIG17 .217 .217 .304 .195 .173 .152
CHINA .216 .333 .3 .183 .2 .2
RUS-1000 .202 .251 .272 .237 .219 .233
INSURANC .2 .233 .266 .266 .3 .3
JETS .2 .2 .6 .4 .4 .5
NIFTY .192 .28 .263 .245 .228 .157
SP-100 .182 .247 .258 .247 .215 .193
COMPUTER .181 .272 .272 .227 .227 .181
INDEXES .181 .203 .213 .203 .219 .24
AUTO .179 .179 .205 .179 .128 .153
GREEN .173 .26 .217 .217 .173 .217
ELECTRON .172 .209 .203 .148 .129 .141
FIDSTKS .166 .22 .263 .22 .215 .204
GAMING .166 .166 .25 .166 .166 .166
BIOTECH .165 .194 .228 .194 .184 .189
ETFS .155 .293 .206 .103 .086 .12
COAL .142 .142 .142 .142 .142 .142
INDMATER .128 .179 .166 .141 .141 .153
MILITARY .125 .156 .218 .156 .125 .125
CHEM .111 .129 .148 .111 .111 .129
FINANCE .1 .111 .133 .111 .111 .111
DJI-13 .076 .23 .23 .23 .153 .23
GUNS .058 .117 .176 .117 .117 0
RETAIL .056 .094 .15 .113 .113 .113
OILGAS .033 .06 .047 .04 .04 .054
INFRA .027 .083 .027 0 0 0
BIGBANKS 0 0 0 0 0 0
REGBANKS 0 .071 .142 .035 .071 .142
TRANSP 0 0 .15 .05 .05 .05
|
====================================================================
12/13/2018
Peerless still shows the operative signal
to be a Sell S9, based
on the speed of the DJI's decline recently from the 3% upper
band to the 3% lower band. Internals are still weakening. Big
Banks are breaking down just as they did in 2007. Closing
Powers are leading prices to new lows just as they did in 2000.
Stay short some of the many, many Bearish MINCPs and
wait for a successful test of 24000 to buy. December 17th
will likely give us a Peerless Santa Claus B13.


Another DJI test of 24000 is shaping up. Very likely, we
will get a Buy B13 on Monday. This is the Santa Claus rally
Buy signal. One would think that buying on the DJI's test
of 24000 would make sense. But let's not get too enthusiastic
yet. It is mostly defensive stocks, like utilities, PG and MCD,
which are holding up. Breadth today was poor. So, perhaps,
the Fed will not throw a life raft out to the market in December.
That is also the message given by today's weakness in Retailers.
Very disconcerting is the way Professionals, if we judge from
the many Closing Power new lows ahead of price in leading ETFs,
are giving ample warning that pessimism, political uncertainty and
tax loss selling abound. When the openings are down, there is
the conserable danger that Professional selling will add still more
pressure to the downside. In that case, the flat support at 24000
may give way, despite December's usual bullishness. If that happens,
a lot of seasonal traders will be trapped and in big trouble.
Transports have made a new low today
and broken key support.

So, our timing for buying in here must be very good and our trading
goals should probably limited by the falling 21-day moving averages
unless there is a dramatic improvement in breadth. Still, the odds
are so good for some kind of a two-week rally from the December
17th close, I think we have to be buyers of QQQ or TQQQ, TECL
and SOXL on Monday as long as the DJI does not close more than
marginally below the support at 24000. But note, too, that a drop below
23900 could easily bring a decline to 23200-23500. Such is the
effect, at the very least, of leveraged short major market ETFs.
Since 1965 if we had bought the DJI on the close of
December 17th,
the historical odds of the DJI being higher are 75% after the next ten
trading days. That is the basis of the Peerless Buy B13 that will then
appear.
 |
 |
|
Charts 12/13/2018 PEERLESS DJI, Signals, Indicators Daily DJI Volume 10-DayUp/Down Vol Hourly DJIA A/D Line for All Stocks Inverted Traders Index NASDAQ S&P OEX NYSE COMPQX DJI-15 DJI-20 DJI-30 DIA SPY QQQ MDY IWM TNA Short-Term Rates USO-CrudeOil DBO FAS GLD BBH IBB JETS JNUG KOL NUGT OIH OIL RSX RETL SDS AGQ SLV SOXL TECL TLT TMF TNA UGA (gasoline) XIV YINN Commodities: CANE CORN DBC JJC, NIB, CHOC CORN, CUT (paper) MOO, SOYB WEAT UUP (Dollar) LIT (Lithium) AAPL ADBE ALXN AMAT AMGN AMD AMZN BA BABA BAC BIDU CAT CVX DE FB GOOG GS HD IBM INTU JPM M (Macy's) MSFT NFLX NVDA QCOM TSLA TXN XOM WMT CMG , LRCX, SWKS, MDGL SPPI WATT SQ TOWN 12/13/2018 (Click on Underlined link.) - Bullish MAXCPs - http://tigersoft.com/MAXCPZ/Dec-13/BULLISH.htm Bearish MAXCPs - http://tigersoft.com/MINCPZ/Dec-13/BEARISH.htm |
Table 1 QUICKSILVER on ETFS - 12/13/18 ETF CLOSE CHANGE PIVOT-PT 5-dma AROC CL-PWR CANDLE IP21 ITRS --------------------------------------------------------------------------------------------- --------------------------------------------------------------------------------------------- DIA 246.27 .39 244.31 -70.2% Bearish RED -.002 ---- --------------------------------------------------------------------------------------------- SPY 265.37 -.09 263.57 -84.2% Bearish RED .003 -.01 --------------------------------------------------------------------------------------------- QQQ 165.1 .05 161.38 -54.6% Bearish RED .013 -.032 --------------------------------------------------------------------------------------------- MDY 320.66 -3.4 324.54 -166.7% Bearish RED -.141 -.037 --------------------------------------------------------------------------------------------- IWM 142.77 -2.05 144.02 -153.2% Bearish RED -.073 -.053 --------------------------------------------------------------------------------------------- FAS 50.62 -.55 53.47 -570.3% Bearish RED -.04 -.197 --------------------------------------------------------------------------------------------- RETL 26.08 -2.32 27.72 -911.1% Bearish RED .057 -.305 --------------------------------------------------------------------------------------------- SOXL 94.42 -1.06 86.19 -143.5% ------- RED -.005 -.316 --------------------------------------------------------------------------------------------- TECL 104.66 .38 97.29 -204.8% Bearish RED .062 -.303 --------------------------------------------------------------------------------------------- IBB 103.89 -1.59 103.64 -142.7% Bearish RED .046 -.057 --------------------------------------------------------------------------------------------- RSX 20.55 .14 20.71 -43.9% Bearish BLUE-.021 .037 |
Table 2 Count of Stocks in Key Directories
20181213
-------------------------------
NEWHIGHS 52
NEWLOWS 204 Bearish
MAXCP 16
MINCP 355 Bearish
TTTNH 20
TTTNL 273 Bearish
FASTUP 21
FASTDOWN 208 Bearish
CPCROSSA 34
CPCROSSD 81 Bearish
BIGVOLUP 1
BIGVODN 17
ACCUMVER 12
HIGHIP21 5
HIUPPCT 6
VHIP21 19
LOWACCUM 259
REDSELL 323
AUGSELS7 22
TRAPDOOR 20
|
Table 3
RANKING OF KEY DIRECTORIES BASED PCT.OF STOCKS ABOVE 65-DMA
12/13/18
Bullish = 5
Bearish = 41
---------------------------------------------------------------------------------------
Directory Current day-1 day-2 day-3 day-4 day-5
----------------------------------------------------------------------------------------
UTILITY .85 .85 .85 .85 .85 .85
BONDFUND .609 .761 .78 .828 .79 .771
FOOD .561 .526 .526 .491 .561 .456
GOLD .56 .52 .46 .42 .52 .42
COMODITY .523 .5 .5 .452 .547 .452
=============================================================================================
SOLAR .444 .444 .333 .333 .444 .555
REIT .443 .397 .523 .476 .576 .629
HACKERS .409 .454 .363 .363 .272 .363
DOWJONES .4 .4 .366 .333 .3 .433
^^^^^^^^
BEVERAGE .388 .388 .333 .388 .388 .388
CHINA .333 .3 .183 .2 .2 .35
HOMEBLDG .294 .352 .294 .235 .352 .352
ETFS .293 .206 .103 .086 .12 .327
HOSPITAL .291 .333 .291 .291 .333 .375
NASD-100 .29 .33 .26 .24 .18 .38
^^^^^^^^
SP500 .289 .307 .275 .265 .257 .357
^^^^^
NIFTY .28 .263 .245 .228 .157 .245
SOFTWARE .276 .246 .2 .184 .184 .261
COMPUTER .272 .272 .227 .227 .181 .272
PIPELINE .269 .23 .192 .192 .192 .269
GREEN .26 .217 .217 .173 .26 .26
SEMI .256 .282 .196 .179 .153 .256
RUS-1000 .251 .272 .237 .219 .232 .325
^^^^^^^^
SP-100 .247 .258 .247 .215 .193 .301
^^^^^^
INSURANC .233 .266 .266 .3 .3 .366
DJI-13 .23 .23 .23 .153 .23 .23
FIDSTKS .22 .263 .22 .215 .193 .306
BIG17 .217 .304 .195 .173 .152 .173
ELECTRON .209 .203 .148 .129 .141 .228
INDEXES .203 .213 .203 .219 .24 .262
JETS .2 .6 .4 .4 .5 .8
BIOTECH .192 .228 .194 .184 .186 .228
AUTO .179 .205 .179 .128 .153 .256
INDMATER .179 .166 .141 .141 .153 .179
EDU .166 .333 .333 .333 .333 .5
GAMING .166 .25 .166 .166 .166 .291
MILITARY .156 .218 .156 .125 .125 .125
COAL .142 .142 .142 .142 .142 .142
CHEM .129 .148 .111 .111 .129 .185
GUNS .117 .176 .117 .117 0 0
FINANCE .111 .133 .111 .111 .111 .155
RETAIL .094 .15 .113 .113 .113 .264
INFRA .083 .027 0 0 0 .083
REGBANKS .071 .142 .035 .071 .142 .107
OILGAS .06 .047 .04 .04 .054 .06
BIGBANKS 0 0 0 0 0 0
^^^^^^^^
TRANSP 0 .15 .05 .05 .05 .25
|
====================================================================
12/12/2018
We will likely get a Buy B2 on the
next test of lower 3%-3.5% band.
Today's last two-hour weakness may spill over to tomorrow.
That may provide us a good opportunity for traders to take long positions
again in TQQQ, TECL and SOXL. Presently, it is the higher
openings that are holding up the market. This is very reminiscent
of 2000 before support gave way and the bear market started
for the DJIA and the leaders in the NASDAQ and Biotech of
that era.
As the DJI has held above its support for about a week,
it is looks more and more like we should now accept
new buys at the lower-band/support. The problem remains
that there are many more attractive BEARISH MINCP
short sales than appealing BULLISH MAXCPs and
many of the key ETFs show not just falling Closing Powers,
but also Closing Powers making new lows. That poses
a danger for them and the market. Fortunately, from December
17th to December, the odds heavily favor a Santa Claus rally.


For now hold some Bearish MINCPs short and, if you
are a short-term trader, hold long the following ETFs.
Note that if you followed our advise here, traders should
have sold TECL, TQQQ and SOXL today near their
highs when they reached their falling 21-dma. At this
point, I would sell NVDA. It is acting strongly enough.
Perhaps, we can buy TECL, TQQQ and SOXL again if
they re-test their supports or if Peerless gives a new Buy signal.
The Leading ETFs
Price
21-dma Closing Power Status Red System's
Year Profitab.
------------------------------------------------------------------------------
DIA
245.88 +1.65
250 Bearish - 12
mo low 14-day Stoch Buy +59.3%
Today's high = 248.76 So, 21-dma not reached to sell.
TECL
104.28 +2.44
108 Bearish - 12
mo low 14-day Stoch Buy +144.0%
Today's high = 109. So, yesterday's 21-dma
(109) was reached to sell.
TQQQ
46.39 +.38
47.1 Bearish - 12
mo low 14-day Stoch Buy +156.5%
Today's high = 48.53. So, yesterday's 21-dma
(47.44) was reached to sell.
SOXL
95.48 +4.05
97.5 Bearish
14-day Stoch Buy +558.3%
Today's high = 99.41. So, yesterday's 21-dma
(98.1) was reached to sell.
NVDA
148.9 +.71 162
Bearish
14-day Stoch Buy +55.0%
Today's high = 152.78 So, 21-dma not reached to sell.
 |
 |
 |
|
Charts 12/12/2018 PEERLESS DJI, Signals, Indicators Daily DJI Volume 10-DayUp/Down Vol Hourly DJIA A/D Line for All Stocks Inverted Traders Index NASDAQ S&P OEX NYSE COMPQX DJI-15 DJI-20 DJI-30 DIA SPY QQQ MDY IWM TNA Short-Term Rates USO-CrudeOil DBO FAS GLD BBH IBB JETS JNUG KOL NUGT OIH OIL RSX RETL SDS AGQ SLV SOXL TECL TLT TMF TNA UGA (gasoline) XIV YINN Commodities: CANE CORN DBC JJC, NIB, CHOC CORN, CUT (paper) MOO, SOYB WEAT UUP (Dollar) LIT (Lithium) AAPL ADBE ALXN AMAT AMGN AMD AMZN BA BABA BAC BIDU CAT CVX DE FB GOOG GS HD IBM INTU JPM M (Macy's) MSFT NFLX NVDA QCOM TSLA TXN XOM WMT CMG , LRCX, SWKS, MDGL SPPI WATT SQ TOWN 12/12/2018 (Click on Underlined link.) - Bullish MAXCPs - http://tigersoft.com/MAXCPZ/Dec-12/BULLISH.htm Bearish MAXCPs - http://tigersoft.com/MINCPZ/Dec-12/BEARISH.htm |
Table 1 QUICKSILVER on ETFS - 12/12/18 ETF CLOSE CHANGE PIVOT-PT 5-dma AROC CL-PWR CANDLE IP21 ITRS --------------------------------------------------------------------------------------------- DIA 245.88 1.65 249.72 -98.3% Bearish RED -.071 ----- --------------------------------------------------------------------------------------------- SPY 265.46 1.33 269.84 -89.9% Bearish RED -.019 -.012 --------------------------------------------------------------------------------------------- QQQ 165.05 1.44 166.89 -20.4% Bearish RED -.025 -.035 --------------------------------------------------------------------------------------------- MDY 324.06 2.43 331.49 -137.6% Bearish RED -.116 -.033 --------------------------------------------------------------------------------------------- IWM 144.82 1.37 147.2 -93% Bearish RED -.073 -.051 --------------------------------------------------------------------------------------------- FAS 51.17 .15 56.65 -554.9% Bearish RED -.049 -.195 --------------------------------------------------------------------------------------------- RETL 28.4 .69 31.3 -584.6% Bearish RED .089 -.314 --------------------------------------------------------------------------------------------- SOXL 95.48 4.05 97.06 -172.7% Bearish RED -.015 -.309 --------------------------------------------------------------------------------------------- TECL 104.28 2.44 108.87 -189.3% Bearish RED .031 -.307 --------------------------------------------------------------------------------------------- IBB 105.48 1.31 106.88 -58.5% Bearish BLUE .025 -.051 --------------------------------------------------------------------------------------------- RSX 20.41 .12 20.73 -41.4% Bearish BLUE-.065 .011 |
Table 2
Count of Stocks in Key Directories
2018-12/12
-------------------------------
NEWHIGHS 40
NEWLOWS 74 Bearish
MAXCP 13
MINCP 300 Very bearish ratio
TTTNH 18
TTTNL 189 Very bearish ratio
FASTUP 28
FASTDOWN 505 Very bearish ratio
CPCROSSA 57
CPCROSSD 223 Bearish ratio
BIGVOLUP 3
BIGVODN 10
ACCUMVER 13
HIGHIP21 9
HIUPPCT 6
VHIP21 19
LOWACCUM 268
REDSELL 311
AUGSELS7 15
TRAPDOOR 23
|
Table 3
RANKING OF KEY DIRECTORIES BASED PCT.OF STOCKS ABOVE 65-DMA
12/12/18
Bullish = 5 Bearish = 41 --------------------------------------------------------------------------------------- Directory Current day-1 day-2 day-3 day-4 day-5 ---------------------------------------------------------------------------------------- UTILITY .85 .85 .85 .85 .85 .85 BONDFUND .761 .78 .828 .79 .761 .742 JETS .6 .4 .4 .5 .8 .9 FOOD .526 .526 .491 .561 .456 .491 GOLD .52 .46 .42 .52 .42 .42 =========================================================================================== COMODITY .5 .5 .452 .547 .452 .476 =========================================================================================== HACKERS .454 .363 .363 .272 .363 .318 SOLAR .444 .333 .333 .444 .555 .5 DOWJONES .4 .366 .333 .3 .433 .4 ^^^^^^^ REIT .397 .523 .476 .576 .622 .43 BEVERAGE .388 .333 .388 .388 .388 .388 HOMEBLDG .352 .294 .235 .352 .352 .294 EDU .333 .333 .333 .333 .5 .5 HOSPITAL .333 .291 .291 .333 .375 .458 NASD-100 .33 .26 .24 .18 .37 .34 ^^^^^^^^ SP500 .307 .275 .265 .257 .355 .357 BIG17 .304 .195 .173 .152 .173 .239 CHINA .3 .183 .2 .2 .333 .466 SEMI .282 .196 .179 .153 .247 .273 COMPUTER .272 .227 .227 .181 .272 .272 RUS-1000 .272 .237 .219 .232 .325 .326 INSURANC .266 .266 .3 .3 .366 .4 FIDSTKS .263 .22 .215 .193 .301 .29 NIFTY .263 .245 .228 .157 .245 .263 SP-100 .258 .247 .215 .193 .301 .279 ^^^^^^ GAMING .25 .166 .166 .166 .291 .25 SOFTWARE .246 .2 .184 .184 .261 .261 DJI-13 .23 .23 .153 .23 .23 .23 PIPELINE .23 .192 .192 .192 .269 .23 BIOTECH .226 .194 .184 .186 .226 .228 MILITARY .218 .156 .125 .125 .125 .156 GREEN .217 .217 .173 .26 .26 .347 INDEXES .213 .203 .219 .24 .262 .315 ETFS .206 .103 .086 .12 .293 .362 AUTO .205 .179 .128 .153 .256 .307 ELECTRON .203 .148 .129 .141 .222 .259 GUNS .176 .117 .117 0 0 0 INDMATER .166 .141 .141 .153 .179 .243 RETAIL .15 .113 .113 .113 .264 .245 TRANSP .15 .05 .05 .05 .25 .3 CHEM .148 .111 .111 .129 .185 .24 COAL .142 .142 .142 .142 .142 .142 REGBANKS .142 .035 .071 .142 .107 .178 FINANCE .133 .111 .111 .111 .144 .133 OILGAS .046 .04 .04 .053 .06 .073 INFRA .027 0 0 0 .083 .083 BIGBANKS 0 0 0 0 0 0 |
====================================================================
12/11/2018
Be careful. Traders should be very selective. I've suggested
buying DIA, TECL, TQQQ, SOXL and NVDA because of
their Stochastic-based RED Buy signals. Accept short-term
gains in these. Their falling 21-dma may be a better place
to take profits in them than waiting for a reversing Red Sell.
Their price-trends are all down, thus limiting how far they may be
be able to rally. Another thing to notice is that of the 100 individual
stocks that make up the QQQ, only 36 are now on Buys. A lot
depends on the most heavily weighted QQQ stocks, namely
AAPL, AMZN, and these are still on Red Sells. So, the upside
potential appears limited even if we succeed in buying near the
lows of the day, near the closes.
The Leading ETFs
Price
21-dma Closing Power Status Red System's Year Profitab.
------------------------------------------------------------------------------
DIA
244.83 -.48
250
Bearish - 12 mo low 14-day Stoch
Buy +58.3%
TECL
101.84 +.29
109 Bearish
14-day Stoch Buy +138.3%
TQQQ
45.25 +.38
47.4 Bearish
14-day Stoch Buy +150.2%
SOXL
91.43 +1.59
98.1 Bearish
14-day Stoch Buy +511.2%
NVDA
148.9 -3.67 165
Bearish
14-day Stoch Buy +55.7%
The Internediate-term outlook is more guarded, at least
until we get a Santa Claus Buy signal sometime next week,
about the same time the FOMC makes its decision about
interest rates and Trump makes his decision about his border
wall's special importance.
For now, I take the current Peerless signal to be a
Sell S9, not the
Buy B2 and B6 lower band buys. The high speed of the
DJI's recent decline from the upper 3% band to the 3% lower
band following a Sell S9 should, I think, keep intermediate-term
traders away from quickly buying at the lower band in the first half
of December for at least four reasons.
Only 20% of the A-Z stocks and ETFs are
above their 65-dma and that proportion worsened today.

First, even the DJI could still break support. That
would
likely bring a real rush to sell. Secondly, all market
rallies recently have had the bad habit of quickly failing after
positive openings. Today was such a case. The DJI lost more
than 250 points from its early strength. This is why our
Closing Powers and Tiger Day Traders' Tools are still in
steep downtrends. Thirdly, 80% of all stocks and ETFs are
below their 65-dma. So, there is a massive amount of resistance
overhead. And, fourthly, year-end tax loss selling is likely
to put heavy pressure on the stocks that are close to their
lows, even right to the end of the year. This will hurt IWM,
MDY and most small caps.
There are very few attractive bullish MAXCPs, especially
if we eliminate the riskier smaller stocks. The leaders now
are UTILITIES. The market cannot get much more defensive
than these stocks. Hold the Bearish MINCPs short. Most of
them keep falling even when the DJI does rise.
 |
 |
 |
|
Charts 12/10/2018 PEERLESS DJI, Signals, Indicators Daily DJI Volume 10-DayUp/Down Vol Hourly DJIA A/D Line for All Stocks Inverted Traders Index NASDAQ S&P OEX NYSE COMPQX DJI-15 DJI-20 DJI-30 DIA SPY QQQ MDY IWM TNA Short-Term Rates USO-CrudeOil DBO FAS GLD BBH IBB JETS JNUG KOL NUGT OIH OIL RSX RETL SDS AGQ SLV SOXL TECL TLT TMF TNA UGA (gasoline) XIV YINN Commodities: CANE CORN DBC JJC, NIB, CHOC CORN, CUT (paper) MOO, SOYB WEAT UUP (Dollar) LIT (Lithium) AAPL ADBE ALXN AMAT AMGN AMD AMZN BA BABA BAC BIDU CAT CVX DE FB GOOG GS HD IBM INTU JPM M (Macy's) MSFT NFLX NVDA QCOM TSLA TXN XOM WMT CMG , LRCX, SWKS, MDGL SPPI WATT SQ TOWN 12/11/2018 (Click on Underlined link.) - Bullish MAXCPs - http://tigersoft.com/MAXCPZ/Dec-11/BULLISH.htm Bearish MAXCPs - http://tigersoft.com/MINCPZ/Dec-11/BEARISH.htm |
Table 1 QUICKSILVER on ETFS - 12/11/18 ETF CLOSE CHANGE PIVOT-PT 5-dma AROC CL-PWR CANDLE IP21 ITRS --------------------------------------------------------------------------------------------- --------------------------------------------------------------------------------------------- DIA 244.23 -.48 250.73 -290.4% Bearish RED -.048 ---- --------------------------------------------------------------------------------------------- SPY 264.13 .06 270.25 -281.5% Bearish RED .018 -.015 --------------------------------------------------------------------------------------------- QQQ 163.61 .54 165.72 -262.8% Bearish RED .006 -.043 --------------------------------------------------------------------------------------------- MDY 321.63 -.99 333.05 -356.5% Bearish RED -.071 -.048 --------------------------------------------------------------------------------------------- IWM 143.45 -.15 147.52 -360.9% Bearish RED -.03 -.073 --------------------------------------------------------------------------------------------- FAS 51.02 -.99 57.17 -1174.9% Bearish RED .003 -.198 --------------------------------------------------------------------------------------------- RETL 27.71 -.4 31.83 -1302.3% Bearish RED .072 -.344 --------------------------------------------------------------------------------------------- SOXL 91.43 1.59 98.68 -1236.4% Bearish RED .005 -.332 --------------------------------------------------------------------------------------------- TECL 101.84 .29 108.2 -955.7% Bearish RED .068 -.315 --------------------------------------------------------------------------------------------- IBB 104.17 .35 106.71 -290.7% ------- RED .023 -.069 --------------------------------------------------------------------------------------------- GLD 117.54 -.14 117.12 48.2% Bearish RED -.053 .119 --------------------------------------------------------------------------------------------- RSX 20.29 -.07 20.58 -190.9% Bearish RED -.095 .017 |
Table 2 Count of Stocks in Key Directories
2018-12/11
-------------------------------
NEWHIGHS 52
NEWLOWS 257 Bearish
MAXCP 17
MINCP 373 Bearish
TTTNH 25
TTTNL 370 Bearish
FASTUP 58
FASTDOWN 398 Bearish
CPCROSSA 21
CPCROSSD 145 Bearish
BIGVOLUP 3
BIGVODN 16
ACCUMVER 17
HIGHIP21 32
HIUPPCT 6
VHIP21 19
LOWACCUM 271
REDSELL 299
AUGSELS7 15
TRAPDOOR 29
|
Table 3
RANKING OF KEY DIRECTORIES BASED PCT.OF STOCKS ABOVE 65-DMA
12/11/18
Bullish = 4
Bearish = 42
---------------------------------------------------------------------------------------
Directory Current day-1 day-2 day-3 day-4 day-5
----------------------------------------------------------------------------------------
UTILITY .85 .85 .85 .85 .85 .85
BONDFUND .78 .828 .79 .761 .733 .6
FOOD .526 .491 .561 .456 .508 .526
REIT .523 .476 .576 .622 .43 .629
============================================================================================
COMODITY .5 .452 .547 .452 .476 .476
============================================================================================
GOLD .46 .42 .52 .42 .42 .4
JETS .4 .4 .5 .8 .9 1
DOWJONES .366 .333 .3 .433 .4 .733
HACKERS .363 .363 .272 .363 .318 .545
BEVERAGE .333 .388 .388 .388 .388 .5
EDU .333 .333 .333 .5 .5 .833
SOLAR .333 .333 .444 .555 .5 .777
HOMEBLDG .294 .235 .352 .352 .294 .411
HOSPITAL .291 .291 .333 .375 .458 .541
SP500 .275 .265 .257 .355 .357 .548
INSURANC .266 .3 .3 .366 .4 .5
NASD-100 .26 .24 .18 .37 .34 .6
SP-100 .247 .215 .193 .301 .279 .526
NIFTY .245 .228 .157 .245 .263 .508
RUS-1000 .237 .219 .232 .325 .325 .503
DJI-13 .23 .153 .23 .23 .23 .615
COMPUTER .227 .227 .181 .272 .272 .363
FIDSTKS .22 .215 .193 .301 .29 .521
GREEN .217 .173 .26 .26 .347 .521
INDEXES .203 .219 .24 .262 .299 .326
SOFTWARE .2 .184 .184 .261 .261 .353
SEMI .196 .179 .153 .247 .273 .478
BIG17 .195 .173 .152 .173 .217 .304
BIOTECH .192 .184 .186 .226 .228 .326
PIPELINE .192 .192 .192 .269 .23 .384
CHINA .183 .2 .2 .333 .45 .583
AUTO .179 .128 .153 .256 .307 .461
GAMING .166 .166 .166 .291 .25 .375
MILITARY .156 .125 .125 .125 .156 .281
ELECTRON .148 .129 .141 .222 .259 .407
COAL .142 .142 .142 .142 .142 .142
INDMATER .141 .141 .153 .179 .23 .307
GUNS .117 .117 0 0 0 .411
RETAIL .113 .113 .113 .264 .245 .396
CHEM .111 .111 .129 .185 .24 .351
FINANCE .111 .111 .111 .144 .133 .322
ETFS .103 .086 .12 .293 .362 .534
TRANSP .05 .05 .05 .25 .3 .55
OILGAS .04 .04 .053 .06 .073 .114
REGBANKS .035 .071 .142 .107 .178 .428
BIGBANKS 0 0 0 0 0 .285
INFRA 0 0 0 .083 .083 .25
|
====================================================================
12/10/2018
A bounce by the major market indexes now
will try and lift some
the biggest capitalization stocks up from the floor. It may be
important that we did not get a trading Buy 'b' signals. Though
deeply oversold, the 6-day Tiger Inverted Traders Index has
not yet turned up. The good news
is that the DJI did hold today
and we are only a week away from a Peerless Santa Claus Buy B13
that ordinarily brings a rally to year-end. DIA, SOXL, TECL, TQQQ
and NVDA all gave red Buy signals. These make good trades
so often that they have to be recommended here for Tiger users.
As I write this, the DJI has turned around in overnight
trading.
Most likely, the FOMC has leaked its intention not to raise rates.
We'll see.


Bullishly, the key Indexes, DJIA, SP-500, QQQ and NASDAQ did not
close at new lows but instead reversed after steep early losses.
The strength today was important. This shows that the Accumulators
(who I call 'big money') are still buyers. This was not true in the
tests of the lower band that I mentioned yesterday that gave way
and turned into massacres following Sell S9s and swift tests of
the 65-dma. So, traders should probably be buyers again.
But rather than consider the Peerless B2 and B6 safely
active, I suggest
using the Stochastic Red Buy signals that popped up today. That
has the effect of letting us know that this is a short-term traders'
buying opportunity and reminds us that if the DJI does break below
today's lows, the markets could quickly become very bearish. If the
FED goes ahead with its plans to raise short-term rates by 1/4% on
Wednesday, there may be more trouble for the market.
Note the Red Stochastic Buy Signals Today.
in DIA, SOXL, TECL, NVDA and TQQQ
Traders using Tiger should take advantage of
these buy signals. They are safe to use so long as the
indexes stay in their broad trading ranges.
 |
 |
 |
 |
 |
|
Charts 12/10/2018 PEERLESS DJI, Signals, Indicators Daily DJI Volume 10-DayUp/Down Vol Hourly DJIA A/D Line for All Stocks Inverted Traders Index NASDAQ S&P OEX NYSE COMPQX DJI-15 DJI-20 DJI-30 DIA SPY QQQ MDY IWM TNA Short-Term Rates USO-CrudeOil DBO FAS GLD BBH IBB JETS JNUG KOL NUGT OIH OIL RSX RETL SDS AGQ SLV SOXL TECL TLT TMF TNA UGA (gasoline) XIV YINN Commodities: CANE CORN DBC JJC, NIB, CHOC CORN, CUT (paper) MOO, SOYB WEAT UUP (Dollar) LIT (Lithium) AAPL ADBE ALXN AMAT AMGN AMD AMZN BA BABA BAC BIDU CAT CVX DE FB GOOG GS HD IBM INTU JPM M (Macy's) MSFT NFLX NVDA QCOM TSLA TXN XOM WMT CMG , LRCX, SWKS, MDGL SPPI WATT SQ TOWN 12/10/2018 (Click on Underlined link.) Bullish MAXCPs - http://tigersoft.com/MAXCPZ/Dec-10/BULLISH.htm Bearish MAXCPs - http://tigersoft.com/MINCPZ/Dec-10/BEARISH.htm |
Table 1 QUICKSILVER on ETFS - 12/10/18 ETF CLOSE CHANGE PIVOT-PT 5-dma AROC CL-PWR CANDLE IP21 ITRS --------------------------------------------------------------------------------------------- --------------------------------------------------------------------------------------------- DIA 244.71 .4 258.73 -214.5% Bearish BLUE -.02 ----- --------------------------------------------------------------------------------------------- SPY 264.07 .5 279.3 -213.1% Bearish BLUE .046 -.018 --------------------------------------------------------------------------------------------- QQQ 163.07 1.69 172.33 -188.5% Bearish BLUE .016 -.049 --------------------------------------------------------------------------------------------- MDY 322.62 -1.92 345.26 -299.9% Bearish RED -.029 -.045 --------------------------------------------------------------------------------------------- IWM 143.6 -.42 154.08 -302.5% Bearish RED -.008 -.071 --------------------------------------------------------------------------------------------- FAS 52.01 -1.46 64.35 -919.4% Bearish RED .074 -.196 --------------------------------------------------------------------------------------------- RETL 28.11 .39 35.77 -993% Bearish RED .121 -.343 --------------------------------------------------------------------------------------------- SOXL 89.84 3.65 115.53 -845.1% ------- BLUE .062 -.334 --------------------------------------------------------------------------------------------- TECL 101.55 4.26 122.42 -605.9% Bearish BLUE .1 -.312 --------------------------------------------------------------------------------------------- IBB 103.82 .18 110.35 -246% Bearish BLUE .012 -.074 --------------------------------------------------------------------------------------------- RSX 20.36 -.35 21.08 -21.7% Bearish RED -.11 .017 |
Table 2
Count of Stocks in Key Directories
20181210
(Do not compare the numbers with past numbers.
We are now using additional volume criteria.
Instead compare the ratios of opposites, like MAXCP vs MINCP.)
-------------------------------
NEWHIGHS 39
NEWLOWS 295 Bearish
MAXCP 22
MINCP 303 Bearish
TTTNH 56
TTTNL 415 Bearish
FASTUP 58
FASTDOWN 682 Bearish
CPCROSSA 36
CPCROSSD 82 Bearish
BIGVOLUP 2
BIGVODN 15
ACCUMVER 14
HIGHIP21 38
HIUPPCT 6
VHIP21 19
LOWACCUM 275
REDSELL 292
AUGSELS7 15
TRAPDOOR 37
|
Table 3
RANKING OF KEY DIRECTORIES BASED PCT.OF STOCKS ABOVE 65-DMA
12/10/18
Bullish = 2
Bearish = 45
---------------------------------------------------------------------------------------
Directory Current day-1 day-2 day-3 day-4 day-5
----------------------------------------------------------------------------------------
UTILITY .85 .85 .85 .85 .85 .875
BONDFUND .828 .79 .761 .733 .59 .447
==============================================================================================
FOOD .491 .561 .456 .508 .526 .368
REIT .476 .576 .622 .43 .622 .549
COMODITY .452 .547 .452 .476 .476 .309
GOLD .42 .52 .42 .42 .4 .34
JETS .4 .5 .8 .9 1 1
BEVERAGE .388 .388 .388 .388 .5 .388
HACKERS .363 .272 .363 .318 .545 .454
DOWJONES .333 .3 .433 .4 .733 .633
EDU .333 .333 .5 .5 .833 .666
SOLAR .333 .444 .555 .5 .722 .611
INSURANC .3 .3 .366 .4 .5 .5
HOSPITAL .291 .333 .375 .458 .541 .5
SP500 .265 .257 .355 .357 .546 .487
NASD-100 .24 .18 .37 .34 .6 .53
HOMEBLDG .235 .352 .352 .294 .411 .352
NIFTY .228 .157 .245 .263 .508 .35
COMPUTER .227 .181 .272 .272 .363 .363
INDEXES .219 .24 .262 .299 .31 .267
RUS-1000 .219 .232 .325 .325 .496 .441
FIDSTKS .215 .193 .301 .29 .521 .462
SP-100 .215 .193 .301 .279 .526 .462
CHINA .2 .2 .333 .45 .55 .35
PIPELINE .192 .192 .269 .23 .384 .192
SOFTWARE .184 .184 .261 .261 .338 .292
BIOTECH .181 .186 .226 .228 .323 .284
SEMI .179 .153 .247 .273 .461 .367
BIG17 .173 .152 .173 .217 .304 .195
GREEN .173 .26 .26 .347 .521 .434
GAMING .166 .166 .291 .25 .375 .333
DJI-13 .153 .23 .23 .23 .615 .461
COAL .142 .142 .142 .142 .142 .142
INDMATER .141 .153 .179 .23 .307 .205
ELECTRON .129 .141 .222 .259 .395 .32
AUTO .128 .153 .256 .307 .461 .435
MILITARY .125 .125 .125 .156 .281 .187
GUNS .117 0 0 0 .411 .176
RETAIL .113 .113 .264 .245 .377 .339
CHEM .111 .129 .185 .24 .351 .296
FINANCE .111 .111 .144 .133 .3 .277
ETFS .086 .12 .293 .362 .534 .327
REGBANKS .071 .142 .107 .178 .392 .464
TRANSP .05 .05 .25 .3 .5 .5
OILGAS .04 .053 .06 .073 .107 .093
BIGBANKS 0 0 0 0 .285 .285
INFRA 0 0 .083 .083 .25 .222
|
====================================================================
12/7/2018 Consider
the Sell S9* to still be operating. It is not safe to
buy at the lower band when the DJI falls so fast from the
upper band to the lower band, when there are so few equities
above the 65-dma, when the key ETFs' Closing Powers are all falling,
when the Hourly DJIA is downtrending, when the optimized
red Short signals are still on Sell and when the DJI's flat support
at 24000-24200 seems to beckon for a breakdown. The
market is nervous for many reasons. Not mentioned much
here is the rebellion in France against the status quo which
is seen as being maintained by a Government that listens
only to the rich and powerful, not working people. The "Yellow
Jackets" have wide support; this rebellion will not be over soon
and it may spread elsewhere.
( https://www.youtube.com/watch?v=ZC0rczrqn5s
)
The DJI's "knifing down" from tagging the 3.3% upper band
four trading days ago and reaching the 3% lower band on Friday
should scare us, especially if we take the previous Sell signal
be an S9. This is not much different than what we see in the
sell-offs in October 1973 (after Nixon's "Saturday Night Massacre",
October 1978, October 1979 and October 1987. Can we trust
that December's usual bullish seasonality will save us now?
The increasing likelihood of a December rate hike and also
a gathering movement among Democrats to impeach Trump is
clearly frightening traders. That is why I believe prices have fallen so
fast this past week.
I do not want to add the 'S13' into the software,
but I do want to nullify Buys at the lower band now
in the software until we see signs that there will be
more than a brief bounce.

At the very least, in my opinion, we should consider a new Sell S13
to be rendered by the rapid decline of the DJI from the upper band
to the upper band. This should nullify the Buy B2 and Buy B5 that
also appeared on Friday. Two contradictory signals have that
effect in Peerless.
This S13 history should get us to do more selling. There may not be
much of a recovery for a while. And we should do more
shorting if the DJI closes decisively below 24000. That is the well-tested
and round-number horizontal support. A close below 24000 will
probably bring a Sell S10.
Nor should we put too much faith in the currently still positive IP21.
That represents "big-money" accumulation. In this situation,
big money buying is very often premature and not something traders
can count on to turn the market up much. While it's true positive IP21
and a rising IPA line at the lower band may forestall a deep bear market
and a DJI decline of more than 20% from its highs, traders can not accord
a Buy signal to a positive non-confirmation by our IP21 at the DJI's lower
band. There are too many cases to detail them. Suffice it to just list
the many cases where buying at the lower band because the IP21 (AI)
was positive would not have worked out well for a trader. This
is why there is no Buy signal for this combination (a lower band
tagging with the IP21 positive or even>+.05).
12/8/1931 DJI fell from 176.1 to 157.5 on 12/16/1931
9/22/1933 DJI fell from 99.1 to 88.4 on 10/19/1933
10/28/1937 DJI fell from 135.2 to 113.6 on 11/24/1937
11/16/1937 DJI fell from 127.9 to 113.6 on 11/29/1937
12/15/1941 DJI fell from 111.2 to 106.7 on 12/24/1941
2/9/1946 DJI fell from 196.1 to 186.00 on 2/26/1946
10/7/? DJI fell from 458.2 to 438.6 on 10/11/?
11/19/1991 DJI fell from 2939.57 to 2863.82 12/10/1991
9/22/2008 DJI fell from 11015.69 to 8451.19 10/10/2008
12/7/2018 ?
We are in dangerous times according to the market. That is
why it is falling for fast. We see this first when we realize that
most of the past cases of this "knifing down" from tagging the
upper band to the lower band occurred in the 1930s. This,|
too, was a dangerous time. Comparble knifing-down S13s
have only occured nine times since 1928
11/18/1932 DJI 101.7 to 73.8 12/17/1932
3/14/1932 81.1 to 44.7 5/3/1932
9/13/1932 69.9 to 58.5 10/10/1032
11/23/1932 59.5 to only 55.9 on 12/2/1932
7/20/1933 96.3 to only 88.7 on 7/21/1933
9/21/1933 97.6 to 84.4 on 10/19/1933
4/17/2000 10582.51 to 11124.82 on 4/25 and then down
NA 10/13/1989 2569.26 to 2761.09 on 12/3/1989
(Not applicable: Most of the drop to the decline
occurred in one big day.
This is not so with the other cases.)
NA 10/1/1998 7632.53. Then up.
(Not applicable: DJI has already fallen 20% in ten weeks.
This is not true here.)
Sell S9s and "Near" S13s are extremely
dangerous.
If we look back at Sell S9s that quickly (in four or five
trading days) bring DJI declines to the lower 3%-3.5%
band, we see that bigger declines regularly followed.
The first one to study is the October 1973 occurrence.
This was only two weeks after Nixon's "Saturday Night
Massacre" when he fired two Attorney Generals before
he could find one who would fire the Special Prosecutor
looking into the White House connction to the
Watergate Burglary. The DJI sliced right through the
lower band and fell 20% from its October peak. 
.
Three more "quick S13" knife-downs to the lower band
occurred when interest rates were raised faster than
traders expected or liked: 1978, 1979 and 1987.


|
Charts 12/7/2018 PEERLESS DJI, Signals, Indicators Daily DJI Volume 10-DayUp/Down Vol Hourly DJIA A/D Line for All Stocks Inverted Traders Index NASDAQ S&P OEX NYSE COMPQX DJI-15 DJI-20 DJI-30 DIA SPY QQQ MDY IWM TNA Short-Term Rates USO-CrudeOil DBO FAS GLD BBH IBB JETS JNUG KOL NUGT OIH OIL RSX RETL SDS AGQ SLV SOXL TECL TLT TMF TNA UGA (gasoline) XIV YINN Commodities: CANE CORN DBC JJC, NIB, CHOC CORN, CUT (paper) MOO, SOYB WEAT UUP (Dollar) LIT (Lithium) AAPL ADBE ALXN AMAT AMGN AMD AMZN BA BABA BAC BIDU CAT CVX DE FB GOOG GS HD IBM INTU JPM M (Macy's) MSFT NFLX NVDA QCOM TSLA TXN XOM WMT CMG , LRCX, SWKS, MDGL SPPI WATT SQ TOWN 12/7/2018 (Click on Underlined link.) Bullish MAXCPs - http://tigersoft.com/MAXCPZ/Dec-07/BULLISH.htm Bearish MAXCPs - http://tigersoft.com/MINCPZ/Dec-07/BEARISH.htm |
Table 1 QUICKSILVER on ETFS - 12/07/18 ETF CLOSE CHANGE PIVOT-PT 5-dma AROC CL-PWR CANDLE IP21 ITRS --------------------------------------------------------------------------------------------- --------------------------------------------------------------------------------------------- DIA 244.31 -5.41 255.51 -182.9% Bearish RED -.023 ---- --------------------------------------------------------------------------------------------- SPY 263.57 -6.27 275.65 -190.1% Bearish RED .046 -.017 --------------------------------------------------------------------------------------------- QQQ 161.38 -5.51 169.37 -200.9% Bearish RED .02 -.05 --------------------------------------------------------------------------------------------- MDY 324.54 -6.95 342.74 -233.9% Bearish RED -.007 -.039 --------------------------------------------------------------------------------------------- IWM 144.02 -3.18 152.62 -259.2% Bearish RED .016 -.069 --------------------------------------------------------------------------------------------- FAS 53.47 -3.18 62.84 -656.4% Bearish RED .087 -.179 --------------------------------------------------------------------------------------------- SOXL 86.19 -10.87 106.89 -791% Bearish RED .059 -.351 --------------------------------------------------------------------------------------------- TECL 97.29 -11.58 114.92 -634.6% Bearish RED .088 -.327 --------------------------------------------------------------------------------------------- IBB 103.64 -3.24 109.1 -178.1% Bearish RED .032 -.067 --------------------------------------------------------------------------------------------- GLD 118.09 .95 115.54 101% Bearish BLUE -.067 .118 --------------------------------------------------------------------------------------------- RSX 20.71 -.02 20.45 -36.2% Bearish RED -.077 .053 |
Table 3 Count of Stocks in Key Directories
2018-12/07
-------------------------------
NEWHIGHS 41
NEWLOWS 454 Bearish
MAXCP 32
MINCP 528 Bearish
TTTNH 50
TTTNL 567 Bearish
FASTUP 61
FASTDOWN 481 Bearish
CPCROSSA 45
CPCROSSD 358 Bearish
BIGVOLUP 2
BIGVODN 12
LOWACCUM 518 Bearish
REDSELL 281
AUGSELS7 10
TRAPDOOR 39
|
Table 3| RANKING OF KEY DIRECTORIES BASED PCT.OF STOCKS ABOVE 65-DMA Bullish = 6
Bearish = 40
12/7/18
---------------------------------------------------------------------------------------
Directory Current day-1 day-2 day-3 day-4 day-5
----------------------------------------------------------------------------------------
UTILITY .85 .85 .85 .85 .875 .775
BONDFUND .79 .761 .733 .59 .409 .361
Bonds are favored for safety and because higher rates are expected.
REIT .576 .622 .43 .622 .549 .49
FOOD .561 .456 .508 .526 .403 .315
COMODITY .547 .452 .476 .476 .357 .309
GOLD .52 .42 .42 .4 .34 .34
N=6
=============================================================================================
JETS .5 .8 .9 1 1 .9
=============================================================================================
SOLAR .444 .555 .5 .722 .611 .666
BEVERAGE .388 .388 .388 .5 .388 .444
HOMEBLDG .352 .352 .294 .411 .352 .411
EDU .333 .5 .5 .833 .666 .666
HOSPITAL .333 .375 .458 .541 .458 .458
DOWJONES .3 .433 .4 .733 .6 .6
INSURANC .3 .366 .4 .5 .5 .466
HACKERS .272 .363 .318 .545 .454 .363
GREEN .26 .26 .347 .521 .434 .478
SP500 .257 .355 .357 .546 .485 .439
INDEXES .24 .262 .299 .31 .256 .267
RUS-1000 .232 .325 .325 .496 .44 .4
DJI-13 .23 .23 .23 .615 .461 .461
CHINA .2 .333 .45 .55 .35 .3
FIDSTKS .193 .301 .29 .521 .456 .387
SP-100 .193 .301 .279 .526 .451 .397
PIPELINE .192 .269 .23 .384 .192 .23
BIOTECH .184 .226 .228 .323 .281 .26
SOFTWARE .184 .261 .261 .338 .292 .246
COMPUTER .181 .272 .272 .363 .363 .318
NASD-100 .18 .37 .34 .6 .53 .47
GAMING .166 .291 .25 .375 .333 .375
NIFTY .157 .245 .263 .508 .35 .315
AUTO .153 .256 .307 .461 .435 .435
INDMATER .153 .179 .23 .307 .205 .217
SEMI .153 .247 .273 .461 .358 .324
BIG17 .152 .173 .217 .304 .195 .195
COAL .142 .142 .142 .142 .142 .142
REGBANKS .142 .107 .178 .392 .464 .392
ELECTRON .141 .222 .259 .395 .314 .296
CHEM .129 .185 .24 .351 .296 .296
MILITARY .125 .125 .156 .281 .187 .156
ETFS .12 .293 .362 .534 .31 .344
RETAIL .115 .269 .25 .384 .346 .346
FINANCE .111 .144 .133 .3 .266 .222
OILGAS .053 .06 .073 .107 .093 .093
TRANSP .05 .25 .3 .5 .5 .4
BIGBANKS 0 0 0 .285 .142 .142
GUNS 0 0 0 .411 .176 .117
INFRA 0 .083 .083 .25 .222 .194
|
====================================================================
12/6/2018
The
DJI's test of 24300 seems to have held. A little more
probing of the support seems likely, but the market should
rally back above 25000 again. The Accumulation Index for
the DJI now is well above +.10. In December that means
the lower band should hold even with the P-Indicator too
negative to bring another Buy B9. After December 16th,
Peerless will very probably give a Buy B13 (Santa Claus
rally signal). I think it is a bullish sign that the NASDAQ
and QQQ outperformed the DJI today. It shows all the
fears of a December rate hike and a renewed trade war
with China will not prevent speculators from buying on
the current decline in the bullish month of December.

How much higher the DJI will soon go again will depend
on which side the FOMC comes down on:
Hawkish (Williams - NY Fed Governor -
Bonds are #1 ---> December rate hike)
(1968-1969)
or
Dovish (Powell - Fed Chairman -
Stocks matter ---> a rate hike pause)
(1976-1977)
This, in turn, will be affected by the Jobs numbers
that come out before the opening today and what the Department
of Labor says about workers' pay. The truth is this is often what
the FED most often looks at most closely. Rising real wages
are dangerously "inflationary" in the parlance of most FOMC
participants.
Since we did not get a new Buy signal today because the DJI
closed too far up off the lows, I would still plan to reduce some
of our long positions on the next rally. The odds of
the DJI
breaking below the 24000 round number support seem low.
The current IP21 value is too high. If we do get a new Buy signal,
we will add to our existing long positions. Hold the bearish MINCP
short sale positions. Tax loss selling should not relent for them
until the new year.
"Dove" FOMC member Brainard will be speaking this morning at
9:30 AM
EST. ( https://www.federalreserve.gov/newsevents/calendar.htm
)
We will consult this schedule of speeches and the chart below
to occasionally get an insight into what will move the market. Williams'
predictably Hawkish speech shows the value of this.
 https://www.itcmarkets.com/hawk-dove-cheat-sheet/ |
DJI is oversold but has not yet given a small "b" Buy signal.


QQQ us now outperforming the DJIA. This is short-term bullish.
It shows speculators are not being scared away by market's gyrations.

We still retain a 50% position in SOXL. Plan to
sell it between 107 and 110.

|
Charts 12/6/2018 PEERLESS DJI, Signals, Indicators Daily DJI Volume 10-DayUp/Down Vol Hourly DJIA A/D Line for All Stocks Inverted Traders Index NASDAQ S&P OEX NYSE COMPQX DJI-15 DJI-20 DJI-30 DIA SPY QQQ MDY IWM TNA Short-Term Rates USO-CrudeOil DBO FAS GLD BBH IBB JETS JNUG KOL NUGT OIH OIL RSX RETL SDS AGQ SLV SOXL TECL TLT TMF TNA UGA (gasoline) XIV YINN Commodities: CANE CORN DBC JJC, NIB, CHOC CORN, CUT (paper) MOO, SOYB WEAT UUP (Dollar) LIT (Lithium) AAPL ADBE ALXN AMAT AMGN AMD AMZN BA BABA BAC BIDU CAT CVX DE FB GOOG GS HD IBM INTU JPM M (Macy's) MSFT NFLX NVDA QCOM TSLA TXN XOM WMT CMG , LRCX, SWKS, MDGL SPPI WATT SQ TOWN 12/6/2018 (Click on Underlined link.) Bullish MAXCPs - http://tigersoft.com/MAXCPZ/Dec-06/BULLISH.htm Bearish MAXCPs - http://tigersoft.com/MINCPZ/Dec-06/BEARISH.htm |
Table 1 QUICKSILVER on ETFS -
12/06/18ETF CLOSE CHANGE PIVOT-PT 5-dma AROC CL-PWR CANDLE IP21 ITRS --------------------------------------------------------------------------------------------- DIA 249.72 -1.01 253.59 -80.9% ------- BLUE .037 ------ --------------------------------------------------------------------------------------------- SPY 269.84 -.41 273.98 -86.3% Bullish BLUE .127 -.015 --------------------------------------------------------------------------------------------- QQQ 166.89 1.17 168.15 -53.6% Bullish BLUE .085 -.037 --------------------------------------------------------------------------------------------- MDY 331.49 -1.56 340.38 -134.8% ------- BLUE .086 -.046 --------------------------------------------------------------------------------------------- IWM 147.2 -.32 151.83 -166.2% ------- BLUE .074 -.078 --------------------------------------------------------------------------------------------- FAS 56.65 -.52 61.41 -496.7% ------- BLUE .169 -.178 --------------------------------------------------------------------------------------------- RETL 31.3 -.53 34.48 -560.4% Bearish BLUE .200 -.284 --------------------------------------------------------------------------------------------- SOXL 97.06 -1.62 102.67 -383.3% ------- BLUE .138 -.314 --------------------------------------------------------------------------------------------- TECL 108.87 .67 111.66 -260% ------- BLUE .167 -.282 --------------------------------------------------------------------------------------------- IBB 106.88 .17 107.49 -30.5% Bullish BLUE .068 -.054 --------------------------------------------------------------------------------------------- GLD 117.14 .02 115.74 75.8% Bearish RED -.112 .087 --------------------------------------------------------------------------------------------- RSX 20.73 .15 20.86 -12% Bearish BLUE -.034 .021
|
Table 2
Count of Stocks in Key Directories
2018-12/06
-------------------------------
NEWHIGHS 66
NEWLOWS 298 Bearish
MAXCP 60
MINCP 209 Bearish
TTTNH 59
TTTNL 382 Bearish
FASTUP 66
FASTDOWN 318 Bearish
CPCROSSA 341 Bullish
CPCROSSD 50
BIGVOLUP 2
BIGVODN 26 Bearish
ACCUMVER 10
HIGHIP21 54
HIUPPCT 8
VHIP21 20
LOWACCUM 535 Big Money Distribution
REDSELL 269
AUGSELS7 15
TRAPDOOR 35
|
Table 3
RANKING OF KEY DIRECTORIES BASED PCT.OF STOCKS ABOVE 65-DMA
Bullish = 41
Bearish = 5
12/6/18
---------------------------------------------------------------------------------------
Directory Current day-1 day-2 day-3 day-4 day-5
----------------------------------------------------------------------------------------
UTILITY .85 .85 .85 .875 .775 .825
JETS .8 .9 1 1 .9 .9
BONDFUND .761 .733 .59 .409 .352 .18
REIT .622 .43 .622 .549 .483 .476
SOLAR .555 .5 .722 .611 .611 .722
N=5
=============================================================================================
EDU .5 .5 .833 .666 .666 .666
=============================================================================================
FOOD .456 .508 .526 .403 .35 .35
COMODITY .452 .476 .476 .357 .333 .309
DOWJONES .433 .4 .733 .6 .6 .6
GOLD .42 .42 .4 .34 .34 .38
BEVERAGE .388 .388 .5 .388 .444 .444
HOSPITAL .375 .458 .541 .458 .458 .333
NASD-100 .37 .34 .6 .53 .45 .52
INSURANC .366 .4 .5 .5 .466 .4
HACKERS .363 .318 .545 .454 .363 .363
SP500 .355 .357 .546 .485 .431 .457
HOMEBLDG .352 .294 .411 .352 .411 .47
CHINA .333 .45 .55 .35 .283 .333
RUS-1000 .325 .325 .496 .44 .397 .412
FIDSTKS .301 .29 .521 .456 .381 .403
SP-100 .301 .279 .526 .451 .397 .419
ETFS .293 .362 .534 .31 .344 .362
GAMING .291 .25 .375 .333 .375 .375
COMPUTER .272 .272 .363 .363 .318 .363
PIPELINE .269 .23 .384 .192 .23 .192
RETAIL .264 .245 .377 .339 .339 .301
INDEXES .262 .299 .31 .256 .272 .251
SOFTWARE .261 .261 .338 .292 .246 .23
GREEN .26 .347 .521 .434 .478 .391
AUTO .256 .307 .461 .435 .435 .435
TRANSP .25 .3 .5 .5 .4 .45
SEMI .247 .273 .461 .358 .307 .367
NIFTY .245 .263 .508 .35 .298 .35
DJI-13 .23 .23 .615 .461 .461 .461
BIOTECH .223 .228 .323 .281 .257 .26
ELECTRON .222 .259 .395 .314 .283 .327
CHEM .185 .24 .351 .296 .296 .277
INDMATER .179 .23 .307 .205 .217 .23
BIG17 .173 .217 .304 .195 .195 .217
FINANCE .144 .133 .3 .266 .211 .222
COAL .142 .142 .142 .142 .142 .142
MILITARY .125 .156 .281 .187 .156 .218
REGBANKS .107 .178 .392 .464 .392 .428
INFRA .083 .083 .25 .222 .194 .194
OILGAS .06 .073 .107 .093 .093 .1
BIGBANKS 0 0 .285 .142 .142 .285
GUNS 0 0 .411 .176 .117 .117
N=41
|
====================================================================
12/4/2018
Blame the FED. They are divided and fighting among themselves.
The market does not like the prospects now of a December hike
in interest rates. That I suggest is the real fundamental reason why
the market suddenly turned so weak on Tuesday. It was not
Trump's talk of tariffs, which is just his normal style of negotating
with a heavy hand.
Our technicals did reach over-bought on the 3rd and there was
a tell-tale deterioration in the P-Indicator of breadth. I noted that
we came within just 38 points then of a Sell S9. Upon doing more
research since, I take the operative Peerless signal now to be a Sell S9.
(This is discussed below. The change does not affect our past signals.)
Wednesday's 800 point decline is quite worrisome. There was
a Professionals' panic and an absence of bids. Such a reversal alone
probably calls for a re-test of DJIA 24300-24600, following the
principle that the market, like a ping-pong ball, moves quickly back
and forth between support and resistance when it is locked in a
well-defined trading range.

What To Do? The
S9 means we want more short positions
than long positions. I would use the next DJI rally to make
such adjustments unless Peerless first gives us a new Buy signal.
The DJI will most likely again find support at 24300-24400. But
it is not clear if Peerless will bring a new Buy there.
Watch Breadth and SPY's Closing Power Now
What happens next depends most on what the Federal
Reserve chooses to do. There are two
scenarios. The
FOMC members appear divided among themselves. If breadth
stays very negative I would bet that rates are going up soon
and the market will have trouble holding up even in the normally
bullish month of December. This the bearish 1968-1969
scenario.
. But if there is a "pause", then we
will see a Buy B9 soon, breadth
will start to improve a lot and the DJI will shoot up past the 65-dma
resistance. The 1975-1976 scenario would then apply.
| Usually short-term rates (Federal Funds Rates) must be above
3.3% before a bear market can follow. That was true in the period 1954-1957. But a rapid rise in rates lower than 3.3% can also cause a terrible bear market. (This is most clear in 1931). If you study the data linked to here, I think you will see how frequently abrupt increases in rates being DJI sell-offs. This is certainly one of the themes in the Peerless book I am writing. |
RECENT monthly Fed Funds rates: ( https://fred.stlouisfed.org/data/FEDFUNDS.txt ) 2017-10-01 1.15 2017-11-01 1.16 2017-12-01 1.30 2018-01-01 1.41 2018-02-01 1.42 2018-03-01 1.51 2018-04-01 1.69 2018-05-01 1.70 2018-06-01 1.82 2018-07-01 1.91 2018-08-01 1.91 Pause set off Aug. rally. 2018-09-01 1.95 2018-10-01 2.19 2018-11-01 2.20 |
Watch (1) NYSE daily breadth and (2) the Closing Power of SPY.
(1) Wednesday's breadth was miserable. There were 2543 decliners on NYSE.
 (2) Watch the Closing Power of SPY. Inside information from the FED
will leak out. As long as the Closing Power is falling on heavy volume,
the word must be that the FOMC will raise rates in December.
(2) Watch the Closing Power of SPY. Inside information from the FED
will leak out. As long as the Closing Power is falling on heavy volume,
the word must be that the FOMC will raise rates in December.
 The Ugly Details
Wednesday's decline was very broad. Down volume was 14x
Up-Volume on the NYSE. The 65-dma has turned back the DJI
and SP-500. The NASDAQ could not even reach it. Trump's
statement that he a "tariff-man" is blamed for the decline, but
I would suggest the decline deepened right after NY Fed Governor
Williams, one of the "hawks" in the FOMB on Tuesday rejected
the idea of a pause in interest rate hikes. Seven times in his
speech, he desribed the US Economy as strong. "The U.S. economy
will stay strong in 2019 and inflation will tick up above 2%...Given this
outlook of strong growth, strong labor market and inflation near our
goal and taking account all the various risks around the outlook, I do
expect further gradual increases in interest rates will best sponsor a
sustained economic expansion.”
https://www.marketwatch.com/story/feds-williams-strong-outlook-for-2019-calls-for-continued-interest-rate-hikes-2018-12-04
Williams' statement is significantly different statement than Fed Chairman
Powell's last week which suggested a December pause because
the near-term goals of the Fed had almost been achieved.
A known Fed "hawk" (meaning he listens to bond traders closely),
Fed Gov. Williams left out of his talk mention of the great dangers of
a bear market occurring if rates are lifted too sharply when
Unemployment drops below 4%. That is what happened in 1969,
2000 and 2007. See the Market Watch chart on the link above.
TWO SCENARIOS:
Bearish 1968-1969 and Bullish 1975-1976
BEARISH SCENARIO:
The DJI's swift sell-off in early December 1968 broke the DJI's
65-dma and the NYSE A/D Line uptrend. There was one more
rally in the Spring of 1969, but the weak ADL showed traders
it would fail badly. There followed a very big decline. The DJI
fell 34% from its December high in May 1970. See here how
the rapidly (each month) rising Federal Funds rate killed the bull
market of 1966-1968.
Fed Funds Rate:
The Ugly Details
Wednesday's decline was very broad. Down volume was 14x
Up-Volume on the NYSE. The 65-dma has turned back the DJI
and SP-500. The NASDAQ could not even reach it. Trump's
statement that he a "tariff-man" is blamed for the decline, but
I would suggest the decline deepened right after NY Fed Governor
Williams, one of the "hawks" in the FOMB on Tuesday rejected
the idea of a pause in interest rate hikes. Seven times in his
speech, he desribed the US Economy as strong. "The U.S. economy
will stay strong in 2019 and inflation will tick up above 2%...Given this
outlook of strong growth, strong labor market and inflation near our
goal and taking account all the various risks around the outlook, I do
expect further gradual increases in interest rates will best sponsor a
sustained economic expansion.”
https://www.marketwatch.com/story/feds-williams-strong-outlook-for-2019-calls-for-continued-interest-rate-hikes-2018-12-04
Williams' statement is significantly different statement than Fed Chairman
Powell's last week which suggested a December pause because
the near-term goals of the Fed had almost been achieved.
A known Fed "hawk" (meaning he listens to bond traders closely),
Fed Gov. Williams left out of his talk mention of the great dangers of
a bear market occurring if rates are lifted too sharply when
Unemployment drops below 4%. That is what happened in 1969,
2000 and 2007. See the Market Watch chart on the link above.
TWO SCENARIOS:
Bearish 1968-1969 and Bullish 1975-1976
BEARISH SCENARIO:
The DJI's swift sell-off in early December 1968 broke the DJI's
65-dma and the NYSE A/D Line uptrend. There was one more
rally in the Spring of 1969, but the weak ADL showed traders
it would fail badly. There followed a very big decline. The DJI
fell 34% from its December high in May 1970. See here how
the rapidly (each month) rising Federal Funds rate killed the bull
market of 1966-1968.
Fed Funds Rate:
1968-11-01 5.82
1968-12-01 6.02 Up
1969-01-01 6.30 Up
1969-02-01 6.61 Up
1969-03-01 6.79 Up
1969-04-01 7.41 Up
1969-05-01 8.67 Up
1969-06-01 8.90 up
 BULLISH SCENARIO:
It remains to be seen if the FED lifts rates this fast.
There is a bullish alternative scenario. This would call
for the DJI to fall to the lower 3.5% band with the
P-Indicator still positive. This would generate a Buy B9.
If the DJI then quickly rallies up above the 65-dma,
there could be a January take-off. This is what happened
in 1975-1976. In this case, short-term rates quickly fell
from December to February the next year.
Fed Funds Rate:
BULLISH SCENARIO:
It remains to be seen if the FED lifts rates this fast.
There is a bullish alternative scenario. This would call
for the DJI to fall to the lower 3.5% band with the
P-Indicator still positive. This would generate a Buy B9.
If the DJI then quickly rallies up above the 65-dma,
there could be a January take-off. This is what happened
in 1975-1976. In this case, short-term rates quickly fell
from December to February the next year.
Fed Funds Rate:
1975-11-01 5.22
1975-12-01 5.20 Down
1976-01-01 4.87 Down - Big Drop
1976-02-01 4.77 Down

New Peerless S9*
We will have to change the Peerless software so that it will give the
particular Sell S9* that failed to deploy Tuesday only because the DJI
closed 38 points too low. The difference was 0.147%. My solution
is to lower the parameter for la/ma (DJI close/21-dma) to 1.022
from 1.024 when the DJI's hypothetical high/21-dma is 1.03
in December and the P-I is quite low in relation to the DJI's reaching
the upper band and the V-I is negative. I will post the
changed
Peerless on the ESP Page this weekend.
|
Charts 12/4/2018 PEERLESS DJI, Signals, Indicators Daily DJI Volume 10-DayUp/Down Vol Hourly DJIA A/D Line for All Stocks Inverted Traders Index NASDAQ S&P OEX NYSE COMPQX DJI-15 DJI-20 DJI-30 DIA SPY QQQ MDY IWM TNA Short-Term Rates USO-CrudeOil DBO FAS GLD BBH IBB JETS JNUG KOL NUGT OIH OIL RSX RETL SDS AGQ SLV SOXL TECL TLT TMF TNA UGA (gasoline) XIV YINN Commodities: CANE CORN DBC JJC, NIB, CHOC CORN, CUT (paper) MOO, SOYB WEAT UUP (Dollar) LIT (Lithium) AAPL ADBE ALXN AMAT AMGN AMD AMZN BA BABA BAC BIDU CAT CVX DE FB GOOG GS HD IBM INTU JPM M (Macy's) MSFT NFLX NVDA QCOM TSLA TXN XOM WMT CMG , LRCX, SWKS, MDGL SPPI WATT SQ TOWN 12/4/2018 (Click on Underlined link.) Bullish MAXCPs - http://tigersoft.com/MAXCPZ/Dec-04/BULLISH.htm Bearish MAXCPs - http://tigersoft.com/MINCPZ/Dec-04/BEARISH.htm |
Table 1 QUICKSILVER on ETFS - 12/4/18 ETF CLOSE CHANGE PIVOT-PT 5-dma AROC CL-PWR CANDLE IP21 ITRS --------------------------------------------------------------------------------------------- DIA 250.73 -8 253.84 63.6% Bearish RED -.022 ---- --------------------------------------------------------------------------------------------- SPY 270.25 -9.05 274.58 33.7% Bearish RED .059 -.016 --------------------------------------------------------------------------------------------- QQQ 165.72 -6.61 168.7 67.7% Bearish RED .041 -.043 --------------------------------------------------------------------------------------------- MDY 333.05 -12.21 340.67 -14.4% ------- RED .044 -.044 --------------------------------------------------------------------------------------------- IWM 147.52 -6.56 152.24 -34.6% Bearish RED .006 -.076 --------------------------------------------------------------------------------------------- FAS 57.17 -7.18 62.78 -178.6% Bearish RED .093 -.177 --------------------------------------------------------------------------------------------- RETL 31.83 -3.94 35.15 -225% Bearish RED .201 -.278 --------------------------------------------------------------------------------------------- SOXL 98.68 -16.85 105.17 12.8% ------- RED .077 -.339 --------------------------------------------------------------------------------------------- TECL 108.2 -14.22 114.82 180.5% Bearish RED .103 -.289 --------------------------------------------------------------------------------------------- IBB 106.71 -3.64 107.54 93.2% Bearish RED .012 -.055 --------------------------------------------------------------------------------------------- GLD 117.12 .71 115.38 93.9% Bearish RED -.105 .088 --------------------------------------------------------------------------------------------- RSX 20.58 -.5 20.78 70.1% Bearish RED -.047 .02 |
Table 2 Count of Stocks in Key Directories
2018-12/04
-------------------------------
NEWHIGHS 36
NEWLOWS 249 Bearish
MAXCP 29
MINCP 448 Professionals: Bearish
TTTNH 40
TTTNL 441 Day Traders: Bearish
FASTUP 99
FASTDOWN 144 Swing traders: Bearish
CPCROSSA 25
CPCROSSD 781 Big Shift to bearishness by Professionals
BIGVOLUP 1
BIGVODN 12
ACCUMVER 9
HIGHIP21 48
HIUPPCT 8
VHIP21 20
LOWACCUM 543 Big Money Heavy Selling continues
REDSELL 274
AUGSELS7 19
TRAPDOOR 41
|
Table 3 RANKING OF KEY DIRECTORIES BASED PCT.OF STOCKS ABOVE 65-DMA
12/4/18
Bullish = 3
Bearish = 41
---------------------------------------------------------------------------------------
Directory Current day-1 day-2 day-3 day-4 day-5
----------------------------------------------------------------------------------------
JETS .9 1 1 .9 .9 .9
UTILITY .85 .85 .875 .775 .825 .85
BONDFUND .733 .59 .409 .352 .171 .123
============================================================================================
EDU .5 .833 .666 .666 .666 .5
FOOD .5 .517 .392 .339 .339 .303
SOLAR .5 .722 .611 .611 .722 .555
============================================================================================
COMODITY .476 .476 .357 .333 .309 .285
HOSPITAL .458 .541 .458 .458 .333 .333
CHINA .45 .55 .35 .283 .333 .25
REIT .43 .622 .549 .483 .476 .41
GOLD .42 .4 .34 .34 .38 .3
DOWJONES .4 .733 .6 .6 .6 .4
INSURANC .4 .5 .5 .466 .4 .266
BEVERAGE .388 .5 .388 .444 .444 .388
ETFS .362 .534 .31 .344 .327 .12
SP500 .357 .546 .485 .431 .449 .343
GREEN .347 .521 .434 .478 .391 .304
NASD-100 .34 .6 .53 .45 .51 .33
RUS-1000 .325 .496 .44 .397 .409 .309
HACKERS .318 .545 .454 .363 .363 .272
AUTO .307 .461 .435 .435 .435 .41
TRANSP .3 .5 .5 .4 .4 .35
INDEXES .299 .31 .256 .272 .251 .229
HOMEBLDG .294 .411 .352 .411 .47 .294
FIDSTKS .29 .521 .456 .381 .397 .279
SP-100 .279 .526 .451 .397 .408 .279
SEMI .273 .461 .358 .307 .35 .239
COMPUTER .272 .363 .363 .318 .363 .227
NIFTY .263 .508 .35 .298 .333 .21
SOFTWARE .261 .338 .292 .246 .23 .153
ELECTRON .259 .395 .314 .283 .308 .191
GAMING .25 .375 .333 .375 .375 .208
RETAIL .245 .377 .339 .339 .301 .245
CHEM .24 .351 .296 .296 .277 .185
DJI-13 .23 .615 .461 .461 .461 .307
INDMATER .23 .307 .205 .217 .23 .166
PIPELINE .23 .384 .192 .23 .192 .192
BIOTECH .226 .323 .281 .257 .26 .184
BIG17 .217 .304 .195 .195 .217 .152
REGBANKS .178 .392 .464 .392 .428 .285
MILITARY .156 .281 .187 .156 .218 .156
COAL .142 .142 .142 .142 .142 .142
FINANCE .133 .3 .266 .211 .222 .144
INFRA .083 .25 .222 .194 .194 .138
OILGAS .073 .107 .093 .093 .1 .08
BIGBANKS 0 .285 .142 .142 .285 0
GUNS 0 .411 .176 .117 .117 0
|