Earlier Hotlines
www.tigersoft.com/44UHL/INDEX.htm
www.tigersoft.com/NHLP/INDEX.htm
www.tigersoft.com/7LHL/INDEX.htm
www.tigersoft.com/NHL718/INDEX.htm
www.tigersoft.com/21MAY18/INDEX.htm
www.tigersoft.com/55HEP/INDEX.htm
www.tigersoft.com/44H4L/INDEX2.htm
Earlier still: Go here...
HELP
A Guide
To Profitably Using The Tiger Nightly HOTLINE
Introduction to Tiger/Peerless Buys and
Sells.
Peerless Buy and
Sell Signals: 1928-2016
Individual Peerless signals explained:
http://tigersoftware.com/PeerlessStudies/Signals-Res/index.htm
http://www.tigersoft.com/PeerInst-2012-2013/
Explanation of each Peerless signal. http://www.tigersoft.com/PeerInst-2012-2013/
Different Types of
TigerSoft/Peerless CHARTS, Signals and Indicators
-----> More HELP LINKS
Documentation for
TigerSoft Automatic and Optimized Signals.
How reliable support is the
DJI's rising 200-day ma?
SPY Charts since
1994: Advisory Closing Power S7s, Accum. Index, 65-dma, Optimized Signals.
^^^^^^^^^^^^^^^^^^^^^^^^^^^^^^^^^^^^^^^^^^^^^^^^
1/19/2016 ---> Corrections,Deeper
Declines and Bear Markets since 1945.
1/21/2016
---> High
Velocity Declines since 1929
2/12/2016 ---> Presidential
Elections Years and Bullish IP21 Positive Non-Confirmations at Lower Band.
2/12/2016 ---> OBV NNCs on DJI's Rally to
2.7% Upper Band when DJI's 65-dma is falling.
11/6/2016 --->
Killer Short Selling
Techniques: ===> Order Here ($42.50)
It's As Easy as 1,2,3
TigerSoft "Combination" Short-Selling... Easy as 1-2-3 Short Sales
Earlier Q-Answers
QuickSilver Documentation (1/11/2016)
Our Different
Signals
Better understand the difference between
Peerless DJI-based signals,
the one-year optimized red Signals and the fixed signals based
on technical developments.
Introduction to Tiger/Peerless Buys and Sells.
Different Types of
TigerSoft/Peerless CHARTS, Signals and Indicators
New TigerPeerless Installation and
Basic Uses' Instruction
See the re-written materials on TigerSoft Buys and Sells.
Study- Trading SPY
WITHOUT Peerless - Some Guidelines.
When completed this will be a new Tiger Trading E-Book.
Study- Examples of
"Hands above the Head" top patterns.
Study- 9/3/2017 TigerSoft (not
Peerless) charts of Major Tops as they occurred.
===> Please report any broken or out-of-date links. william_schmidt@hotmail.com
--->>> Order New E-Book: "New Tiger Tahiti
System's Stocks: 2000-2018", $50.00
> When to
start avoiding the long side altogether because of Peerless signals.
> When to
start buying Tahiti stocks after the start of a Bear Market.
> When to
avoid a weaker high AI/200 stock and use the second choice.
> When to exit
Tahiti stocks before the normal 21-month holding period is over.
> The special
benefits of working with major Tahiti tech stocks.
> Watch for Head/Shoulders tops with these stocks.
> Using the
90-day Stochastic to time the purchase of Safer Tahiti Stocks
> The Tahiti
Tech System's track record using these rules matches closely the 24%/year gain that
the
blue chip Tahiti system did between 1970 and 2000.
> Tiger Software 858-273-5900 PO Box 22784 San
Diego, CA 92192 Email william_schmidt@hotmail.com
====================================================================
====================================================================
1/23/2019
The DJI succeeded in getting back above its key
65-dma
by 88 points. The margin was slim and the
65-dma
is still falling. But the result was the same.
In
the last 50 years, second DJI rises back above
its
falling 65-dma when the DJI had not dropped more than
20%
from its highs and was not rallying from a bear market
low
have usually meant rallies back up to the DJI's recent
old
highs. A zig-zagging upwards is likely.
The
new January Buy B4 will probably work out. But to
be
clinched, we will need to see the DJI's 65-dma pct change
show
a positive slope. Our chart shows its 65-day ma is
still
falling. This means there is still resistance overhead.
But
another decline from here on very weak breadth would
force
Professionals to again try to prop the market up
near
24000. That would use up some of their ammunition
and
possibly mean another decline back to the DJI's 21-dma.

We must watch the NYSE A/D Line. It
should turn back
up
tomorrow At the close today, there were 53 more NYSE decliners
than
advances. The makes the rally looks rigged as just 3
DJI-30
stocks, IBM, UTX and PG accounted for more
than
140 of the DJI's 175-point gain. But a rigged market
is
probably exactly what we should expect. It shows that
Professionals
want to support the market and keep it rising.
It
shows that they expect plenty of help in this to come from |
the
FED and the White House. As long as the DJI stays
in
its uptrend, things are "normal". The DJI is the leader and
the
FED does not have any new plans to raise rates.
At
this point, only the NYSE, IBB and GLD are also
above
their 65-dma. So, there is room for improvement
elsewhere.
And it should be forthcoming soon. The SP-500
is
still very slightly, just 5-points, below its still falling 65-dma.
The
NASDAQ remains 23-points below its own 65-dma. The
OEX
is 6-points below. IWM is just 0.4 points below. QQQ
is
just .85 below while OIL is is 2.5 below. If these other
indexes
can do what the DJI did today, the rally will look
appealing.
The
DJIA is being used to march the Indexes up towards.
It
seems drawn now back to 25000. By most of our measures, the
DJI
versus the 21-dma, the Stochastics 14 and 20, MACD,
CCI
and RSI, the DJI is already overbought and showing
early
signs of topping out. The NYSE A/D Line's steep uptrend
has
been slightly violated as have most of the steep Closing
Powers.
So, another shallow pullback after 25000 is reached
would
not be surprising. A zig-zag path upwards with the rising 2.5%
upper
band acting as support would be in keeping with the
apparently
now active Buy B4.
Considering
all this, I would prefer to be hedged with a few
shorts
from our Bearish MINCPs and long some of the Bullish
MAXCPs.
I keep posting the chart of LOCO, El Pollo Loco
holdings.
Its price is still only 40% of what is was 4 1/2 years
ago.
Its chicken is tasty and Pollo Loco has a lot of customer loyalty.
Customers
have not failed to not that none of its customers
have
eaten bad food as they have frequently at Chipotle, where
prices
are much higher.
With
the DJI-30 back above its 65-dma and acting as the leader,
the
likelihood now is we will see 25000 soon. At that point, the
65-dma
will be bullishly rising. Meanwhile with the short-term
fed-funds'
rates still only 2.5%, stock prices should be advancing.
Just
when the Government shut down comes to an end and Trump
has
reached a Trade Deal with China, we will be hearing about
how
bullishly the DJI has behaved in before a Presidential Election
since
1915.
 |
 |
 |
|
Charts
1/23/2019 2018 PEERLESS DJI, Signals, Indicators Daily DJI Volume 10-DayUp/Down Vol Hourly DJIA A/D Line for All Stocks Inverted Traders Index NASDAQ S&P OEX NYSE COMPQX DJI-15 DJI-20 DJI-30 DIA SPY QQQ MDY IWM TNA Short-Term Rates USO-CrudeOil DBO FAS GLD BBH IBB JETS JNUG KOL NUGT OIH OIL RSX RETL SDS AGQ SLV SOXL TECL TLT TMF TNA UGA (gasoline) XIV YINN Commodities: CANE CORN DBC JJC, NIB, CHOC CORN, CUT (paper) MOO, SOYB WEAT UUP (Dollar) LIT (Lithium) AAPL ADBE ALXN AMAT AMGN AMD AMZN BA BABA BAC BIDU CAT CVX DE FB GOOG GS HD IBM INTU JPM M (Macy's) MSFT NFLX NVDA QCOM TSLA TXN XOM WMT CMG , LRCX, SWKS, MDGL SPPI WATT SQ TOWN 1/23/19 (Click on Underlined link.) Bullish MAXCPs - http://tigersoft.com/MAXCPS/Jan-23/BULLISH.htm Bearish MAXCPs - http://tigersoft.com/MINCPs/Jan-23/BEARISH.htm |
Table 1 QUICKSILVER on ETFS - 1/23/19 ETF CLOSE CHANGE PIVOT-PT 5-dma AROC CL-PWR CANDLE IP21 ITRS --------------------------------------------------------------------------------------------- DIA 245.72 1.72 241.86 104.3% Bullish RED .195 ----- --------------------------------------------------------------------------------------------- BA 358.61 .71 352.06 89.2% Bullish RED .149 .025 --------------------------------------------------------------------------------------------- SPY 263.41 .55 260.98 58.2% Bullish RED .232 -.001 --------------------------------------------------------------------------------------------- QQQ 162.15 .21 162.35 -7.1% Bullish RED .15 -.015 --------------------------------------------------------------------------------------------- MDY 325.16 -.52 323.16 64.7% Bullish RED .309 -.004 --------------------------------------------------------------------------------------------- IWM 144.6 -.4 144.52 39.6% Bullish RED .229 -.02 --------------------------------------------------------------------------------------------- FAS 55 .13 53.34 381.8% Bullish RED .261 -.092 --------------------------------------------------------------------------------------------- RETL 27.88 .09 27.9 26.4% Bullish RED .39 -.267 --------------------------------------------------------------------------------------------- SOXL 87.43 -1.86 88.18 -162.1% Bullish RED .022 -.173 --------------------------------------------------------------------------------------------- TECL 93.49 1.00 91.47 116.4% Bullish ---- .167 -.244 --------------------------------------------------------------------------------------------- IBB 107.81 -.91 108.65 -65.4% Bullish RED .095 .032 --------------------------------------------------------------------------------------------- GLD 121.28 -.17 122.27 -24.6% Bullish BLUE .154 .107 --------------------------------------------------------------------------------------------- RSX 20.62 .35 20.22 140.5% Bullish ---- .311 .018 |
Table 2    Count of Stocks in Key Directories
           2019-01/23
-------------------------------
NEWHIGHS       39
NEWLOWS        12
MAXCP          19
MINCP          7
TTTNH          10
TTTNL          16
FASTUP         37
FASTDOWN       100
CPCROSSA       46
CPCROSSD       21
BIGVOLUP       3
BIGVODN        10
ACCUMVER       4
HIGHIP21       13
HIUPPCT        7
VHIP21         13
LOWACCUM       263
REDSELL        93
AUGSELS7       5
TRAPDOOR       16
|
 Table 3
           RANKING OF KEY DIRECTORIES BASED PCT.OF STOCKS ABOVE 65-DMA
           1/23/19
 Bullish = 28
 Bearish = 19
---------------------------------------------------------------------------------------
Directory     Current       day-1         day-2         day-3         day-4         day-5
----------------------------------------------------------------------------------------
BONDFUND       .98           .98           .99           .98           .98           .971
INSURANC       .766          .633          .766          .633          .666          .433
PIPELINE       .739          .695          .739          .695          .695          .695
SOFTWARE       .723          .723          .769          .723          .63           .646
BEVERAGE       .722          .555          .555          .555          .444          .555
UTILITY        .7            .575          .575          .575          .525          .425
GREEN          .695          .695          .695          .695          .608          .521
ETFS           .689          .603          .793          .655          .62           .517
REGBANKS       .678          .678          .75           .607          .607          .285
GAMING         .666          .666          .666          .666          .625          .666
GOLD .66 .64 .62 .72 .7 .76 HOMEBLDG .647 .705 .882 .705 .705 .823 AUTO .641 .692 .692 .692 .666 .641 FINANCE .633 .633 .7 .588 .533 .377 SOLAR .611 .555 .611 .611 .555 .555 DOWJONES .6 .466 .633 .4 .433 .366 REIT .597 .577 .624 .617 .563 .436 NASD-100 .59 .58 .64 .56 .51 .52 NIFTY .578 .561 .666 .578 .526 .543 BIGBANKS .571 .571 .857 .571 .714 .285 SP-100 .548 .473 .58 .473 .451 .419 HACKERS .545 .545 .636 .545 .5 .636 DJI-13 .538 .538 .769 .384 .538 .384 FIDSTKS .537 .5 .661 .483 .43 .403 CHINA .533 .5 .65 .55 .533 .433 SP500 .52 .524 .63 .483 .413 .381 RUS-1000 .509 .522 .621 .501 .428 .392 SEMI .508 .517 .637 .517 .465 .448 ================================================================================================ ELECTRON .493 .506 .629 .537 .487 .456 HOSPITAL .458 .416 .458 .5 .416 .333 FOOD .456 .456 .561 .421 .333 .333 INDMATER .448 .525 .653 .512 .397 .358 RETAIL .433 .433 .49 .377 .358 .358 COMODITY .428 .428 .595 .404 .333 .333 INFRA .416 .555 .666 .583 .388 .444 GUNS .411 .47 .647 .647 .47 .411 JETS .4 .6 .7 .7 .5 .4 BIOTECH .392 .402 .476 .423 .405 .389 INDEXES .392 .408 .575 .424 .29 .258 BIG17 .369 .391 .434 .456 .391 .434 COMPUTER .363 .318 .409 .318 .318 .318 CHEM .351 .537 .648 .462 .333 .314 MILITARY .343 .312 .437 .406 .281 .25 EDU .333 .333 .333 .333 .333 .333 COAL .285 .285 .285 .285 .142 .142 OILGAS .226 .232 .376 .267 .205 .198 TRANSP .2 .35 .5 .3 .2 .15 |
====================================================================
1/22/2019
The
DJIA today fell back below its falling 65-dma.
With overhead supply not yet eaten up, look for a searching
for support unless there is some very good news from
the Trade Talks with China or the FED has another "dovish"
speaker to draw upon to lift stock prices.
The DJIA is
presently 3.8% above its 21-dma. A pullback to its
21-dma would seem likely. Watch to see if the Closing Powers
for DIA, SPY, QQQ and IWM break more clearly their uptrends.
This might seriously undermine the confidence in the rally
and make the last three weeks look artificial and manipulated.
On the other hand, a spirited recovery would make believers of many
of those who doubt that the FED can launch a complete recovery
in stock prices without actually lowering short-term rates..

We need more proof that the DJI is in a
V-bottom formation. The
most bullish thing it could do now would be to rise right back above its
falling 65-dma, on good breadth,
rising volume and with the day's
closing being substantially back above the opening.
At a minimum, the Bulls will need to see the DJI get right back
above its falling 65-dma. That is about 100 points above today's close.
It will also help us a lot for the 65-dma to turns up. Right now, the DJI
is 5.4% below its level of 65 days ago. This shows that significant over-head
resistance still lurks above. You will recall that the negative value for the DJI's
65-day up percentage posed a remaining problem for the new, January B4
based on superb breadth.
How much technical damage is caused by the DJI's dropping back
below its falling 65-dma and still closing in over-bought status, a
full +3.8% over its 21-dma? This is most unusual. But its not
as bearish
as I, for one, thought last night. This techical juxtaposition occurred five
times
in the 1930s and always had a bearish outcome, with the DJI always falling to the
lower band, at least. It occurred once in World War II and was not significant.
Since then, the outcomes have been very mixed. But it does appear that
in an on-going bull market, where the DJI is not down more than 20% from
its high, the bull market is more likely to resume once the 65-dma is finally
surpassed after some inconclusive advances AND in a bear market, the
decline is more likely to worsen without another upside breach.
What Happened when DJI dropped back below
its falling 65-dma after 1945 and was more than 1.75%
over the 21-dma?
la/ma 65d pct change
12/14/1971 1.026 -.06
DJI then rallied until May
6/14/1974 1.02
-.055
Bear Market
Deepened badly.
11/141977 1.027 -.038
Bear Market
fell another 10%.
5/8/1980 1.024
-.071
Bull Market
continued.
7/9/1982 1.019
-.017
Bear Market
- DJI fell to LB
4/24/1997 1.025
-.014
Bull Market
continued.
11/24/1997 1.023
-.016
DJI
retested lower band.
11/7/2001 1.023
-.091
DJI rallied
for three more months.
8/23/2002 1.025
-.127
Bear Market
continued.
3/28/2003 1.022
-.041
New bull
market starting.
5/25/2005 1.019
-.031
DJI to
lower band
3/27/2009 1.081 (high) -.088
New bull market.
6/20/2012 1.026
-.032
DJI
fell to 1.75% lower band.
10/14/2015 1.021
-.063
DJI rose 6% and then fell 13%.
1/22/2019 1.038 -.054
????????????????
------------------------------------------------------------------------
Watch Closing Powers and Volume Very Closely
I counted 9 or 101 important stocks
and ETFs whose steep Closing Power
uptrends were violated: AAPL, AMZN, BIDU, COMPQX, NFLX,
REGN as well as IBB, SOXL and IWM.
DIA and SPY still showing uptrending losing Powers. Watch them
tomorrow, as their steep uptrends may be violated.
It is bearish that TQQQ, SOXL and IBB showed rising daily volume
today, on a down-day.
 |
 |
 |
 |
 |
 |
|
Charts 1/22/2019 2018 PEERLESS DJI, Signals, Indicators Daily DJI Volume 10-DayUp/Down Vol Hourly DJIA A/D Line for All Stocks Inverted Traders Index NASDAQ S&P OEX NYSE COMPQX DJI-15 DJI-20 DJI-30 DIA SPY QQQ MDY IWM TNA Short-Term Rates USO-CrudeOil DBO FAS GLD BBH IBB JETS JNUG KOL NUGT OIH OIL RSX RETL SDS AGQ SLV SOXL TECL TLT TMF TNA UGA (gasoline) XIV YINN Commodities: CANE CORN DBC JJC, NIB, CHOC CORN, CUT (paper) MOO, SOYB WEAT UUP (Dollar) LIT (Lithium) AAPL ADBE ALXN AMAT AMGN AMD AMZN BA BABA BAC BIDU CAT CVX DE FB GOOG GS HD IBM INTU JPM M (Macy's) MSFT NFLX NVDA QCOM TSLA TXN XOM WMT CMG , LRCX, SWKS, MDGL SPPI WATT SQ TOWN 1/22/19 (Click on Underlined link.) - Bullish MAXCPs - http://tigersoft.com/MAXCPS/Jan-22/BULLISH.htm Bearish MAXCPs - http://tigersoft.com/MINCPs/Jan-22/BEARISH.htm |
Table 1 QUICKSILVER on ETFS - 1/22/19 ETF CLOSE CHANGE PIVOT-PT 5-dma AROC CL-PWR CANDLE IP21 ITRS --------------------------------------------------------------------------------------------- DIA 244 -3.05 240.64 104.3% Bullish RED .131 ----- --------------------------------------------------------------------------------------------- BA 357.9 -6.83 352.24 106% Bullish RED .123 .024 --------------------------------------------------------------------------------------------- SPY 262.86 -3.6 260.35 104.3% Bullish RED .184 .003 --------------------------------------------------------------------------------------------- QQQ 161.94 -3.31 162.38 82.1% Bullish RED .114 -.001 --------------------------------------------------------------------------------------------- MDY 325.68 -5.11 320.95 103.4% Bullish RED .285 -.002 --------------------------------------------------------------------------------------------- IWM 145 -2.33 143.45 95% Bullish RED .199 -.015 --------------------------------------------------------------------------------------------- FAS 54.87 -1.61 50.88 491.4% Bullish RED .218 -.069 --------------------------------------------------------------------------------------------- RETL 27.79 -2.23 27.73 61.8% Bullish RED .381 -.264 --------------------------------------------------------------------------------------------- SOXL 89.29 -8.2 90.39 -27.9% Bullish RED .016 -.143 --------------------------------------------------------------------------------------------- TECL 92.49 -5.02 91.32 270.5% Bullish RED .136 -.207 --------------------------------------------------------------------------------------------- IBB 108.72 -1.75 109.24 71.1% Bullish RED .073 .05 --------------------------------------------------------------------------------------------- GLD 121.45 .43 121.88 -26.3% Bullish BLUE .143 .094 --------------------------------------------------------------------------------------------- RSX 20.27 -.24 20.05 86.6% Bullish ---- .298 -.001 |
Table 2   Count of Stocks in Key Directories
          2019-01-22
-------------------------------
NEWHIGHS       27
NEWLOWS        17
MAXCP          9
MINCP          7
TTTNH          9
TTTNL          7
FASTUP         35
FASTDOWN       72
CPCROSSA       19
CPCROSSD       71
BIGVOLUP       3
BIGVODN        13
ACCUMVER       3
HIGHIP21       8
HIUPPCT        4
VHIP21         13
LOWACCUM       295
REDSELL        114
AUGSELS7       8
TRAPDOOR       16
|
 Table 3      RANKING OF KEY DIRECTORIES BASED PCT.OF STOCKS ABOVE 65-DMA
              1/22/19
 Bullish = 28
 Bearish = 16
---------------------------------------------------------------------------------------
Directory     Current       day-1         day-2         day-3         day-4         day-5
----------------------------------------------------------------------------------------
BONDFUND       .98           .99           .98           .98           .971          .971
SOFTWARE       .723          .769          .723          .63           .646          .461
HOMEBLDG       .705          .882          .705          .705          .823          .823
GREEN          .695          .695          .695          .608          .521          .478
PIPELINE       .695          .739          .695          .695          .695          .565
AUTO           .692          .692          .692          .666          .615          .641
REGBANKS       .678          .75           .607          .607          .285          .214
GAMING         .666          .666          .666          .625          .666          .625
GOLD           .64           .62           .72           .7            .76           .84
FINANCE        .633          .7            .588          .533          .377          .3
INSURANC .633 .766 .633 .666 .433 .3 ETFS .603 .793 .655 .62 .517 .396 JETS .6 .7 .7 .5 .4 .4 NASD-100 .58 .64 .56 .51 .52 .42 REIT .577 .624 .617 .563 .456 .355 UTILITY .575 .575 .575 .525 .45 .325 BIGBANKS .571 .857 .571 .714 .285 .142 NIFTY .561 .666 .578 .526 .543 .438 BEVERAGE .555 .555 .555 .444 .5 .444 INFRA .555 .666 .583 .388 .444 .444 SOLAR .555 .611 .611 .555 .555 .555 HACKERS .545 .636 .545 .5 .636 .454 DJI-13 .538 .769 .384 .538 .384 .307 CHEM .537 .648 .462 .333 .314 .351 INDMATER .525 .653 .512 .397 .358 .397 SP500 .524 .63 .483 .413 .387 .307 RUS-1000 .522 .623 .501 .427 .394 .332 SEMI .517 .637 .517 .465 .448 .422 ELECTRON .506 .629 .537 .487 .45 .407 =========================================================================================== CHINA .5 .65 .55 .533 .416 .316 FIDSTKS .5 .661 .483 .43 .403 .327 =========================================================================================== SP-100 .473 .58 .473 .451 .43 .311 GUNS .47 .647 .647 .47 .411 .411 DOWJONES .466 .633 .4 .433 .4 .3 FOOD .456 .561 .421 .333 .333 .421 RETAIL .442 .5 .384 .365 .365 .25 COMODITY .428 .595 .404 .333 .333 .428 HOSPITAL .416 .458 .5 .416 .333 .208 INDEXES .408 .575 .424 .29 .252 .215 BIOTECH .4 .476 .423 .405 .384 .328 BIG17 .391 .434 .456 .391 .434 .413 TRANSP .35 .5 .3 .2 .15 .2 EDU .333 .333 .333 .333 .333 .333 COMPUTER .318 .409 .318 .318 .318 .136 MILITARY .312 .437 .406 .281 .218 .218 COAL .285 .285 .285 .142 .142 .142 OILGAS .232 .376 .267 .205 .191 .191 |
====================================================================
====================================================================
1/18/2019
Another early-in-the-week retreat is shaping
up.
Will the DJI's 65-dma at 24400 be successfully tested?
If this really
is a "V-Bottom", we will not have to wait long for the rally to resume
from today's early 150-point weakness. But, if the decline continues,
then look for a DJI decline all the way back to 23600 where the 21-day
ma will be by the end of the week.
The DJI closed above its falling 65-dma on Friday and for the second day,
our IP21 was positive. A "V" formation is forming in the DJI now
because of the FED's talk about not raising rates for months does have
historical precedent wherein a 10% to 19%+% DJI decline is completely
reversed It is a rare phenomenon. I can find only three cases. (Usually there
is a bottom made up of multiple tests of the lows.)
The good news for market now is that interest rates remain well under 3%,
as does the CPI's annual growth. Joblessness apart from Federal workers
remains very low. And with the Budget stalemate, the FED is not apt to risk
raising rates. Powell seems to have gotten his fingers burned and seems
unwilling to run the risks again of raising rates and seeing the DJI quickly
sell-off in the aftermath. Nor is there likely to be any big political changes
or threats to Wall Street's dominance, such is the balance of power in
Washington.
Tuesday morning, the DJI is set to open down more than 150. Will this
lead to a bigger decline? Recently, every such decline has quickly been
reversed back upwards. So, as long as Professionals keep buying heavily
at the close, thereby shoring up the market after any early weakness, I think
we have to expect the DJI to move all the way back to 27000, making a
nominal closing high. See the key ETFs' steeply rising Closing Powers below.
It's tempting to attribute these late buying surges to manipulation, but I would
suggest it also represents lot of instutional money being forced to buy at the
close because their bids underneath the market are not being met. That the
DIA, SPY, QQQ and IWM all are moving up in tandem is bullish, in my
opinion.
A new Buy B4 has been constructed, as described for the last two days.
But a DJI pullback to the 65-dma, 180 points lower, is shaping up for
Tuesday morning. If that test of 24400 is successful, then look for the rally
to resume strongly. These breadth-based January Buy B4s have proven to
be quite bullish. If the DJI drops back below 25400, then the V-Bottom's
validity will be in question. Unlike all the earlier January Breadth-Based B4s,
the DJI is still more than 2.2% below where it was 65-days ago. With the
65-dma still falling, this means there is still some resistance overhead.
Still, staying short now does not seem reasonable. I suspect that there are
lots of buyers who "want in" for a January rally. So, Buy DIA on
weakness
on a successful test of the 65-dma. Hold long IBB and some of the bullish
MAXCP semi-conductors and biotechs. There have been 11 of these
January Breadth surges once the IP21 was positive. All proved profitable.
But, a warning is still necessary. None of these Buy B4s occurred with the
DJI still more than 2 percent below its close 65-days earlier.
Gain 65-day Pct Change
-----------------------------------------
1/16/34 +.071 .046
1/14/36 +.068 .124
1/9/51 +.064 .063
1/22/54 BIG .068
1/24/58 BIG .065
But first DJI did drop from 451 to 437.
1/20/67 +.032 .087
1/18/71 +.106 .111
1/15/75 +.324 -.008
1/6/76 +.133 .118
1/13/85 +.015 .043
1/23/87 +.145 .151
1/17/2019 ? -.039
 |
  |
  |
V-Formations in DJIA after
10%-19% corrections.
In the three cases below, the P-I and
IP21 made new highs when DJI closed
above the 21-day ma below. That is not true yet now in 2019.
Also, there were
no Sells on the way up. So, given all the Sell S9s now and how
far along the DJI
is in the present bull market, we should still be careful. The
V-formation may fail.
But traders should stay long and avoid the short side for now.
 |
 |
 |
|
Charts 1/18/2019 2018 PEERLESS DJI, Signals, Indicators Daily DJI Volume 10-DayUp/Down Vol Hourly DJIA A/D Line for All Stocks Inverted Traders Index NASDAQ S&P OEX NYSE COMPQX DJI-15 DJI-20 DJI-30 DIA SPY QQQ MDY IWM TNA Short-Term Rates USO-CrudeOil DBO FAS GLD BBH IBB JETS JNUG KOL NUGT OIH OIL RSX RETL SDS AGQ SLV SOXL TECL TLT TMF TNA UGA (gasoline) XIV YINN Commodities: CANE CORN DBC JJC, NIB, CHOC CORN, CUT (paper) MOO, SOYB WEAT UUP (Dollar) LIT (Lithium) AAPL ADBE ALXN AMAT AMGN AMD AMZN BA BABA BAC BIDU CAT CVX DE FB GOOG GS HD IBM INTU JPM M (Macy's) MSFT NFLX NVDA QCOM TSLA TXN XOM WMT CMG , LRCX, SWKS, MDGL SPPI WATT SQ TOWN 1/18/19 (Click on Underlined link.) - Bullish MAXCPs - http://tigersoft.com/MAXCPS/Jan-18/BULLISH.htm Bearish MAXCPs - http://tigersoft.com/MINCPs/Jan-18/BEARISH.htm |
Table 1 QUICKSILVER on ETFS - 1/18/19 ETF CLOSE CHANGE PIVOT-PT 5-dma AROC CL-PWR CANDLE IP21 ITRA --------------------------------------------------------------------------------------------- DIA 247.05 3.25 238.94 148.7% Bullish BLUE .074 ------ --------------------------------------------------------------------------------------------- BA 364.73 5.64 350.36 167.4% Bullish BLUE .102 .037 --------------------------------------------------------------------------------------------- SPY 266.46 3.5 257.4 143.8% Bullish BLUE .136 .004 --------------------------------------------------------------------------------------------- QQQ 165.25 1.62 159.27 141% Bullish BLUE .085 .007 --------------------------------------------------------------------------------------------- MDY 330.79 4.39 318.98 155.7% Bullish BLUE .25 0 --------------------------------------------------------------------------------------------- IWM 147.33 1.5 142.25 126.8% Bullish BLUE .153 -.013 --------------------------------------------------------------------------------------------- FAS 56.48 2.3 49.67 703.4% Bullish BLUE .188 -.047 --------------------------------------------------------------------------------------------- RETL 30.02 1.5 27.44 341.8% Bullish BLUE .368 -.223 --------------------------------------------------------------------------------------------- SOXL 97.49 6.26 89.8 177.9% Bullish BLUE-.031 -.055 --------------------------------------------------------------------------------------------- TECL 97.51 4.18 87.5 416.7% Bullish BLUE .106 -.172 --------------------------------------------------------------------------------------------- IBB 110.47 .68 107.17 67.1% Bullish BLUE .055 .052 --------------------------------------------------------------------------------------------- GLD 121.02 -1.09 122.09 -32% ------- RED .048 .069 --------------------------------------------------------------------------------------------- RSX 20.51 .17 19.92 111.8% Bullish BLUE .238 -.014 |
Table 2    Count of Stocks in Key Directories
           2019-01-18
-------------------------------
NEWHIGHS       56
NEWLOWS        7
MAXCP          14
MINCP          3
TTTNH          20
TTTNL          6
FASTUP         76
FASTDOWN       57
CPCROSSA       12
CPCROSSD       30
BIGVOLUP       2
BIGVODN        8
ACCUMVER       5
HIGHIP21       7
HIUPPCT        6
VHIP21         12
LOWACCUM       296
REDSELL        145
AUGSELS7       9
TRAPDOOR       17
|
Table 2        RANKING OF KEY DIRECTORIES BASED PCT.OF STOCKS ABOVE 65-DMA
              1/18/19
Bullish = 37
Bearish =  9
---------------------------------------------------------------------------------------
Directory     Current       day-1         day-2         day-3         day-4         day-5
----------------------------------------------------------------------------------------
BONDFUND       .99           .98           .98           .971          .971          .98
HOMEBLDG       .882          .705          .705          .823          .823          .823
BIGBANKS       .857          .571          .714          .285          .142          .142
ETFS           .793          .655          .62           .517          .396          .568
DJI-13         .769          .384          .538          .384          .307          .307
SOFTWARE       .769          .723          .63           .646          .461          .553
INSURANC       .766          .633          .666          .433          .3            .333
REGBANKS       .75           .607          .607          .285          .214          .214
PIPELINE       .739          .695          .695          .695          .565          .652
FINANCE        .7            .588          .533          .377          .3            .311
JETS .7 .7 .5 .4 .4 .6 GREEN .695 .695 .608 .521 .478 .521 AUTO .692 .692 .666 .615 .641 .615 GAMING .666 .666 .625 .666 .583 .666 INFRA .666 .583 .388 .444 .416 .472 NIFTY .666 .578 .526 .543 .438 .543 FIDSTKS .661 .483 .43 .403 .327 .376 INDMATER .653 .512 .397 .358 .384 .41 CHINA .65 .55 .533 .416 .3 .483 CHEM .648 .462 .333 .314 .351 .351 GUNS .647 .647 .47 .411 .411 .411 NASD-100 .64 .56 .51 .52 .41 .51 SEMI .637 .517 .465 .448 .431 .508 HACKERS .636 .545 .5 .636 .454 .545 DOWJONES .633 .4 .433 .4 .3 .333 SP500 .63 .483 .413 .387 .303 .347 ELECTRON .629 .537 .487 .45 .413 .5 REIT .624 .617 .563 .456 .348 .409 RUS-1000 .621 .501 .428 .396 .331 .367 GOLD .62 .72 .7 .76 .84 .88 SOLAR .611 .611 .555 .555 .555 .611 COMODITY .595 .404 .333 .333 .428 .428 SP-100 .58 .473 .451 .43 .301 .376 UTILITY .575 .575 .525 .45 .325 .45 INDEXES .569 .424 .29 .252 .215 .263 FOOD .561 .421 .333 .333 .421 .421 BEVERAGE .555 .555 .444 .5 .444 .555 ============================================================================================ TRANSP .5 .3 .2 .15 .2 .25 ============================================================================================ RETAIL .49 .377 .358 .358 .245 .301 BIOTECH .473 .423 .405 .384 .331 .378 HOSPITAL .458 .5 .416 .333 .208 .291 MILITARY .437 .406 .281 .218 .218 .25 BIG17 .434 .456 .391 .434 .413 .478 COMPUTER .409 .318 .318 .318 .136 .181 OILGAS .376 .267 .205 .191 .184 .184 EDU .333 .333 .333 .333 .333 .333 COAL .285 .285 .142 .142 .142 .142 |
=====================================================================
1/17/2019 Today our Accumulation Index (IP21) turned positive and the A/D Line
and Closing Power yet rose again. The P-I is making a 12-month
high. If the DJI, SP-500 and the NASDAQ can next surpass and stay
above their 65-dma resistance as easily as they risen this far, it will be
hard to argue that we are not seeing a January take-off.
(See the discussion of our Hotline on 1/28/2013.
http://www.tigersoft.com/xxxindex.htm
)


The 65-dma is often a significant barrier for the DJI
when it is falling
like now. If the DJI does close above 24600, I think we have to assume
still higher prices lie ahead, especially if the Closing Powers keep
uptrending.
A January breadth take-off is very bullish. Some may not believe that
the political news can support this conclusion. The thing to realize is that the
stock market is paying attention to the prospects of an interest rate freeze
more than anything to else, even more than to the political dangers for Trump
if it turns out that he instructed his personal lawyer to lie to Congress about his
bargaining with Putin for rights to build a new Trump tower in Moscow,
even more than the polls showing the President is mostly being blamed
for the Government shut-down and even more than the harm the shut-down
will likely cause the Economy if it continues.
New Breadth-Based Buy B4
Last night, I reported on the bullish trading results
obtained by
buying in January when the real 15-day NYSE A/D differential,
adjusted by the number of stocks traded, reached the levels it
obtained yesteray. But I also pointed out that in all these previous
cases, the IP21 was positive. Well, today the IP21 has turned
positive. Only a close above the 65-dma is missing to meet these
minumum January breadth take-off values.
The results from this system are much more bullish in Janaury than
in any month. See the 11 cases below since 1929. Note that all the
key indicators shown below must be positive and the DJI should not be
more than 7.5% above the 21-dma. I think we also have to require
the DJI to be above the resistance of its 65-dma.
1/14/1931 85.4
--->72.4
la/ma=1.099
aroc=1.262 P=35 (+28) IP21=.058 OP=.159 65d-pct change=-.193
New B4 will eliminate this case.
#1 1/16/1934 103.4 --->110.7 on
2/15/1934
la/ma=1.049
aroc=1.786 P=174 (+32) IP21=.108 OP=.419 65d-pct change= .431
#2 1/14/1936 146.3 --->161.9 on
4/6/1936
la/ma=1.024
aroc= .417 P=83 (+14) IP21=.067 OP=.192 65d-pct change= .124
#3 1/9/1951 243.5 ---> 263.1 on
5/3/1951 (Also the year before Pres. Elect.)
la/ma=1.043
aroc=.901 P=175 (+28) IP21=.173 OP=.315 65d-pct change=.063
#4 1/22/1954
289.7 ---> Powerful Bull Mkt follows.
la/ma=1.022
aroc=.282 P=186 (+21) IP21=.112 OP=.169 65d-pct change=.068
#5 1/24/1958 450.7 ---> 436.9 on 2/25/58. Bull Mkt
follows.
la/ma=1.019 aroc=.583 P=234(+18)
IP21=.023 OP=.061 65d-pct change=.065
Biggest paper loss was here = 3.5%
#6 1/20/1967 847.16 ---> Powerful Bull
Mkt follows.
la/ma=1.022
aroc=.282 P=186 (+21) IP21=.112 OP=.169 65d-pct change=.068
#7 1/18/1971 847.82 --->
Powerful Bull Mkt follows.
la/ma=1.022
aroc=.282 P=186 (+21) IP21=.112 OP=.169 65d-pct change=.068
#8 1/20/1975 647.45 ---> Powerful Bull
Mkt follows.
la/ma=1.030 aroc= .835 P=262 (-13) IP21=.056 OP=
.348 65d-pct change=.008
#9 1/6/1976 890.82 ---> 1009.21 on 3/24/1976
la/ma=1.053 aroc=.871 P=251 (+50) IP21=.169 OP= .578
65d-pct change=.118
#10 1/28/1985 1277.83 ---> 1553.1 on 12/16/1985
la/ma=1.041 aroc=.732 P=347 (+281) IP21=.094 OP= .023 65d-pct
change=.043
#11 1/22/1987 2145.25 ---> 2405.54 4/6/1987 and then to 2720 in August.
la/ma=1.072 aroc= 1.310 P=255 (+55) IP21=.196 OP=.280
65d-pct change=.607
---------------------------------------------------------------------------------
Some of you are interest in the actual code used to generate
this new
type of January take-off Buy B4.
Sy$ = "DATA" or an earlier data file
f3$ = "c:\peerless\" & sy$ & ".txt"
nozz=zero
addenom = zero
On Error GoTo 40024
Open f3$ For Input As #1
40019 Input #1, a$ '- mo
Input #1, a$ '-da
Input #1, a$ '-yr
Input #1, a$ 'hi
Input #1, a$ 'lo
Input #1, a$ 'la
Input #1, advv
Input #1, decc
Input #1, a$ 'lo
Input #1, a$ 'la
addenom = advv + decc
nozz = nozz + 1
GoTo 40019
40024 Resume 40025
40025 Close : On Error GoTo 0
addivisor = addenom / nozz
If nozz = 0 Then Stop
For I = 21 To rn
chanad = adl(I) - adl(I - 16)
chanad = chanad / addivisor '(normalized by factoring # stks traded.)
If chanad > 1080 Then pi = I: BUYB4arrows (pi)
11109 Next I
--------------------------------------------------------------------------
SP-500 and NASDAQ (COMPQX)
|
Charts 1/17/2019 2018 PEERLESS DJI, Signals, Indicators Daily DJI Volume 10-DayUp/Down Vol Hourly DJIA A/D Line for All Stocks Inverted Traders Index NASDAQ S&P OEX NYSE COMPQX DJI-15 DJI-20 DJI-30 DIA SPY QQQ MDY IWM TNA Short-Term Rates USO-CrudeOil DBO FAS GLD BBH IBB JETS JNUG KOL NUGT OIH OIL RSX RETL SDS AGQ SLV SOXL TECL TLT TMF TNA UGA (gasoline) XIV YINN Commodities: CANE CORN DBC JJC, NIB, CHOC CORN, CUT (paper) MOO, SOYB WEAT UUP (Dollar) LIT (Lithium) AAPL ADBE ALXN AMAT AMGN AMD AMZN BA BABA BAC BIDU CAT CVX DE FB GOOG GS HD IBM INTU JPM M (Macy's) MSFT NFLX NVDA QCOM TSLA TXN XOM WMT CMG , LRCX, SWKS, MDGL SPPI WATT SQ TOWN 1/17/19 (Click on Underlined link.) - Bullish MAXCPs - http://tigersoft.com/MAXCPS/Jan-17/BULLISH.htm Bearish MAXCPs - http://tigersoft.com/MINCPs/Jan-17/BEARISH.htm |
Table 1 QUICKSILVER on ETFS - 1/17/19 ETF CLOSE CHANGE PIVOT-PT 5-dma AROC CL-PWR CANDLE IP21 ITRS --------------------------------------------------------------------------------------------- DIA 243.8 1.94 239.88 79.1% Bullish BLUE .034 ------ --------------------------------------------------------------------------------------------- BA 359.09 7.03 352.9 92% Bullish BLUE .099 .038 --------------------------------------------------------------------------------------------- SPY 262.96 1.98 258.98 78.7% Bullish BLUE .092 .001 --------------------------------------------------------------------------------------------- QQQ 163.63 1.28 160.69 72.9% Bullish BLUE .069 ------- --------------------------------------------------------------------------------------------- MDY 326.4 3.24 320.76 90.1% Bullish BLUE .2 -.003 --------------------------------------------------------------------------------------------- IWM 145.83 1.31 143.68 76.3% Bullish BLUE .097 -.019 --------------------------------------------------------------------------------------------- FAS 54.18 .84 49.24 501.5% Bullish BLUE .135 -.048 --------------------------------------------------------------------------------------------- SOXL 91.23 3.05 94.26 -25.9% Bullish BLUE-.075 -.131 --------------------------------------------------------------------------------------------- TECL 93.33 1.86 89.95 163.7% Bullish BLUE .079 -.203 --------------------------------------------------------------------------------------------- IBB 109.79 1.14 109.01 41% Bullish BLUE-.008 .05 --------------------------------------------------------------------------------------------- RSX 20.34 .12 20.06 42.3% Bullish BLUE .189 -.003 |
Table 2   Count of Stocks in Key Directories
          2019-01-17
-------------------------------
NEWHIGHS       50
NEWLOWS        8
MAXCP          17
MINCP          6
TTTNH          22
TTTNL          5
FASTUP         58
FASTDOWN       64
CPCROSSA       17
CPCROSSD       19
BIGVOLUP       2
BIGVODN        12
ACCUMVER       5
HIGHIP21       6
HIUPPCT        5
VHIP21         12
LOWACCUM       289
REDSELL        193
AUGSELS7       10
TRAPDOOR       17
|
 Table 3   RANKING OF KEY DIRECTORIES BASED PCT.OF STOCKS ABOVE 65-DMA
              1/17/19
 Bullish - 28
 Bearish = 18
---------------------------------------------------------------------------------------
Directory     Current       day-1         day-2         day-3         day-4         day-5
----------------------------------------------------------------------------------------
BONDFUND       .98           .98           .971          .971          .98           .971
SOFTWARE       .723          .63           .646          .461          .538          .523
GOLD           .72           .7            .76           .84           .86           .84
HOMEBLDG       .705          .705          .823          .823          .823          .823
JETS           .7            .5            .4            .4            .6            .3
GREEN          .695          .608          .521          .478          .478          .521
PIPELINE       .695          .695          .695          .565          .652          .652
AUTO           .692          .666          .615          .641          .589          .641
GAMING         .666          .625          .666          .583          .666          .625
ETFS           .655          .62           .517          .396          .551          .586
GUNS .647 .47 .411 .411 .411 .352 INSURANC .633 .666 .433 .3 .333 .3 REIT .617 .563 .456 .348 .395 .355 SOLAR .611 .555 .555 .555 .611 .611 REGBANKS .607 .607 .285 .214 .214 .214 FINANCE .588 .533 .377 .3 .277 .222 INFRA .583 .388 .444 .416 .472 .5 NIFTY .578 .526 .543 .438 .526 .561 UTILITY .575 .525 .45 .325 .45 .475 BIGBANKS .571 .714 .285 .142 .142 .142 NASD-100 .56 .51 .52 .41 .5 .51 BEVERAGE .555 .444 .5 .444 .5 .444 CHINA .55 .533 .416 .3 .45 .416 HACKERS .545 .5 .636 .454 .545 .545 ELECTRON .537 .487 .45 .413 .493 .5 SEMI .517 .465 .448 .431 .5 .491 INDMATER .512 .397 .358 .384 .41 .435 RUS-1000 .501 .428 .396 .331 .361 .339 N=28 ============================================================================================= HOSPITAL .5 .416 .333 .208 .291 .25 ============================================================================================= FIDSTKS .483 .43 .403 .327 .365 .392 SP500 .483 .413 .387 .303 .339 .329 SP-100 .473 .451 .43 .301 .344 .333 CHEM .462 .333 .314 .351 .351 .351 BIG17 .456 .391 .434 .413 .456 .478 INDEXES .424 .29 .252 .215 .252 .268 BIOTECH .421 .405 .384 .331 .376 .378 FOOD .421 .333 .333 .421 .421 .315 MILITARY .406 .281 .218 .218 .218 .218 COMODITY .404 .333 .333 .428 .428 .333 DOWJONES .4 .433 .4 .3 .333 .333 DJI-13 .384 .538 .384 .307 .307 .307 RETAIL .377 .358 .358 .245 .301 .32 EDU .333 .333 .333 .333 .333 .333 COMPUTER .318 .318 .318 .136 .181 .181 TRANSP .3 .2 .15 .2 .25 .05 COAL .285 .142 .142 .142 .142 .142 OILGAS .267 .205 .191 .184 .178 .184 |
====================================================================
1/16/2019 Yesterday Peerless produced a second Sell S12 in five days. This is
based on the IP21 (current Accumulation Index) being below zero as
DJI rises towards upper band. Note that it is now 3.6% over the
21-dma and the IP21 is still below zero, standing at -.039. Big money
is using the rally to the 24000 resistance to sell. The news is full of
reasons to scare folks into selling, but Professionals are very buying
on all weakness. The reason is clear: the Fed is just not likely to be
raising its rates soon.
New research tonight shows how bullish in January the excellent
breadth is. Unfortunately, none of the January take-offs on superb
breadth showed negative Accumulation. More on this tomorrow night.
I was asked about the significance of a second S12 in five trading days.
This is a rare event, but it did happen on three separate occasions in the
1970s, in August 1971 (when Nixon removed Gold as backing the Dollar
and institutued Price and Wage controls for a few months), in August
1972 and at the end of 1973. In the first case, the DJI fell 8%. In the
second two cases, the DJI fell back only to the lower band. What's
important is that in all three cases, the DJI rallied 3% higher before
declining. That may mean we will see a 3% paper loss here before
the DJI pulls back.
I was also asked about the paper losses with Sell S12s, generally speaking.
From 1929-1965, there were 50 Sell S12s. 15 of them produced
a paper loss of more than 2.8%. Between 1966 and 2018, there were
55 Sell S12s and 16 showed a paper loss of more than 2.8%. So, about
30% of the time there is a significant paper loss. That would amount to
680 points now.
I have been asked why we have not had a Buy B4 signal, which is
based on a big improvement in the P-Indicator or the Accumulation
Index. The answers here are that the negative IP21 and V-I prevent a
Buy B4.
But there is no mistaking the excellent breadth since December 26.
I wrote a program to test what happened in the past when the daily
difference between NYSE advances and declines for the last 15 trading days,
adjusted by the number of advances and declines is as good in our case now.
There were 18 earlier cases. All but a handful led to big advances in the market.
But none of them, not one, showed a negative IP21 as we see now. I will
post these cases since 1965 tomorrow night. I should add that there were only
three losses: 10/4/1973, 11/28/78 and 10/27/2011. Bulls will note, too, that
there were six big successes for this Bullish Breadth would-be signal
in January: 1/20/67, 1/18/71, 1/16/75, 1/6/1976, 1/24/1985 and 1/22/1987.
At this stage, in our market, I would still weight more heavily the negative
IP21. But, considering the rising Closing Powers, I would prefer to be
hedged if short DIA. If DIA does get back above its 65-dma, I would cover it.


|
Charts 1/16/2019 2018 PEERLESS DJI, Signals, Indicators Daily DJI Volume 10-DayUp/Down Vol Hourly DJIA A/D Line for All Stocks Inverted Traders Index NASDAQ S&P OEX NYSE COMPQX DJI-15 DJI-20 DJI-30 DIA SPY QQQ MDY IWM TNA Short-Term Rates USO-CrudeOil DBO FAS GLD BBH IBB JETS JNUG KOL NUGT OIH OIL RSX RETL SDS AGQ SLV SOXL TECL TLT TMF TNA UGA (gasoline) XIV YINN Commodities: CANE CORN DBC JJC, NIB, CHOC CORN, CUT (paper) MOO, SOYB WEAT UUP (Dollar) LIT (Lithium) AAPL ADBE ALXN AMAT AMGN AMD AMZN BA BABA BAC BIDU CAT CVX DE FB GOOG GS HD IBM INTU JPM M (Macy's) MSFT NFLX NVDA QCOM TSLA TXN XOM WMT CMG , LRCX, SWKS, MDGL SPPI WATT SQ TOWN 1/16/19 (Click on Underlined link.) - Bullish MAXCPs - http://tigersoft.com/MAXCPS/Jan-16/BULLISH.htm Bearish MAXCPs - http://tigersoft.com/MINCPs/Jan-16/BEARISH.htm |
Table 1 QUICKSILVER on ETFS - 1/16/19 ETF CLOSE CHANGE PIVOT-PT 5-dma AROC CL-PWR CANDLE IP21 ITRS --------------------------------------------------------------------------------------------- DIA 241.86 1.22 240 61.3% Bullish BLUE -.012 ---- --------------------------------------------------------------------------------------------- BA 352.06 -.18 352.61 117.4% Bullish RED .049 .016 --------------------------------------------------------------------------------------------- SPY 260.98 .63 258.88 58.2% Bullish BLUE .046 .001 --------------------------------------------------------------------------------------------- QQQ 162.35 -.03 161.28 47.5% Bullish RED .022 -.01 --------------------------------------------------------------------------------------------- MDY 323.16 2.21 320.62 79.7% Bullish BLUE .125 .001 --------------------------------------------------------------------------------------------- IWM 144.52 1.07 143.64 56.6% Bullish BLUE .048 -.012 --------------------------------------------------------------------------------------------- FAS 53.34 2.46 49.12 489.1% Bullish BLUE .088 -.059 --------------------------------------------------------------------------------------------- SOXL 88.18 -2.21 91.7 -55.5% Bullish RED -.134 -.182 --------------------------------------------------------------------------------------------- TECL 91.47 .15 90.38 126.6% Bullish RED .043 -.249 --------------------------------------------------------------------------------------------- IBB 108.65 -.59 108.9 53.1% Bullish RED -.038 .052 --------------------------------------------------------------------------------------------- GLD 122.27 .39 121.59 -1.6% Bullish BLUE .129 .095 --------------------------------------------------------------------------------------------- RSX 20.22 .17 20.17 39.9% Bullish BLUE .136 .004 Table 2 Count of Stocks in Key Directories
2019-01-16
-------------------------------
NEWHIGHS 41
NEWLOWS 7
MAXCP 10
MINCP 6
TTTNH 10
TTTNL 6
FASTUP 50
FASTDOWN 68
CPCROSSA 12
CPCROSSD 50
BIGVOLUP 4
BIGVODN 15
ACCUMVER 6
HIGHIP21 4
HIUPPCT 5
VHIP21 11
LOWACCUM 294 Still, lots of Big Money selling.
REDSELL 250
AUGSELS7 13
TRAPDOOR 16
|
Table 3  RANKING OF KEY DIRECTORIES BASED PCT.OF STOCKS ABOVE 65-DMA
              1/16/19
 Bullish = 20
 Bearish = 25
---------------------------------------------------------------------------------------
Directory     Current       day-1         day-2         day-3         day-4         day-5
----------------------------------------------------------------------------------------
BONDFUND       .98           .971          .971          .98           .971          .971
BIGBANKS       .714          .285          .142          .142          .142          .142
HOMEBLDG       .705          .823          .823          .823          .823          .705
GOLD           .7            .76           .84           .86           .84           .88
PIPELINE       .695          .695          .565          .652          .652          .652
AUTO           .666          .615          .641          .589          .615          .589
INSURANC       .666          .433          .3            .333          .3            .2
SOFTWARE       .63           .646          .461          .538          .507          .461
GAMING         .625          .666          .583          .666          .625          .625
ETFS           .62           .517          .396          .551          .568          .534
GREEN .608 .521 .478 .478 .521 .304 REGBANKS .607 .285 .214 .214 .214 .178 REIT .563 .456 .348 .395 .348 .288 SOLAR .555 .555 .555 .611 .611 .611 DJI-13 .538 .384 .307 .307 .307 .307 CHINA .533 .416 .3 .45 .416 .466
FINANCE .533 .377 .3 .277 .222 .2
NIFTY .526 .543 .438 .526 .543 .491
UTILITY .525 .45 .325 .45 .475 .325
NASD-100 .51 .52 .41 .5 .49 .44
********
==========================================================================================
HACKERS .5 .636 .454 .545 .545 .545
JETS .5 .4 .4 .6 .3 .2
==========================================================================================
ELECTRON .487 .45 .413 .493 .493 .425
GUNS .47 .411 .411 .411 .352 .352
SEMI .465 .448 .431 .5 .491 .439
SP-100 .451 .43 .301 .344 .333 .301
BEVERAGE .444 .5 .444 .5 .444 .333
DOWJONES .433 .4 .3 .333 .333 .333
^^^^^
FIDSTKS .43 .403 .327 .365 .381 .317
RUS-1000 .428 .396 .331 .361 .334 .29
HOSPITAL .416 .333 .208 .291 .25 .333
SP500 .413 .387 .303 .339 .327 .269
=====
BIOTECH .402 .384 .331 .376 .378 .342
INDMATER .397 .358 .384 .41 .435 .371
BIG17 .391 .434 .413 .456 .478 .456
INFRA .388 .444 .416 .472 .5 .472
RETAIL .358 .358 .245 .301 .301 .396
CHEM .333 .314 .351 .351 .351 .296
COMODITY .333 .333 .428 .428 .357 .476
EDU .333 .333 .333 .333 .333 .333
FOOD .333 .333 .421 .421 .333 .473
COMPUTER .318 .318 .136 .181 .181 .181
INDEXES .29 .252 .215 .252 .268 .225
MILITARY .281 .218 .218 .218 .218 .187
OILGAS .205 .191 .184 .178 .178 .136
TRANSP .2 .15 .2 .25 .05 .05
COAL .142 .142 .142 .142 .142 .142
|
====================================================================
1/15/2019 Peerless produced a second Sell S12 today. The necessary five days
has elapsed since the first S12 of the series. But the DJI rose slightly
past the flat 24000 resistance. The DJI is being boosted by a growing
belief that the FED will not be raising interest rates anytime soon
given the hit that the US economy will take from the Budget impasse.
Wall Street, no doubt, liked today's decision by DC Federal District Judge
Richard Leon.
https://en.wikipedia.org/wiki/Richard_J._Leon
https://www.washingtonpost.com/nation/2019/01/15/essence-involuntary-servitude-federal-unions-sue-trump-administration-get-paid-shutdown-work/?noredirect=on&utm_term=.01130e1b8c56
He threw out government workers' law suits asserting that
they
could not be made to work without being paid. The Judge asserted
that the safety consequences of their not working were far too serious to allow.
Today, the British Parliament may well pass a vote 'no confidence' on the
May Government. This will up-end Brexit and which party will next govern
England. This will probably cause a down-opening on Wall Street. But,
weak openings have recently been regularly reversed. This is normally
bullish for US stocks. I would stay short DIA but consider going long IBB
as a hedge.
 |
 |
 |
Sell S12, a remant. a relic of the past?
versus FED's New-Found Dovishness
For us, the problem is now whether to trust the normally
reliable January S12
or to wait until Professionals show some signs of net-selling. Almost every daily
weakness at the beginning of the last 14 trading days (since December 26th) has
been followed by a much higher closing. Such patterns are bullish as long
they last. This we see in the steeply rising Closing Powers and the many blue
candle-sticks on the major market ETFs. A higher opening followed by a
much lower close would break this pattern and foretell a market decline.
That these upward reversals are being driven by the Feds' 180
degree
reversal soon after Dec. 24th where they went from being proudly "hawkish" to
pre-dominately "dovish" is also strongly suggested by the dramatic reversal of
the NYSE Adv-Decline Line, which usually mirrows the outlook for interest
rates.
FIRST-OUT-OF-GATE
With the DJI above the flat 24000 resistance, we can consider
the
DJI making a short-term breakout that will likely have follow-through
until Professionals change their mind and the Closing Power uptrends
are broken. I would suggest hedging the DIA
short by buying IBB,
which represents NASDAQ biotechs. If 2019 were to turn out to
be very good year, we should consider buying the stocks that rush out of
the gate first after about three weeks.
Biotechs often rally past the day the DJI tops out. And at this point
many of their leaders are outperforming the DJI's 10% gain in the last
14 trading days.
14-Day Pct Gain, since 12-24-2018
=========================
TNA
+45% (3x leveraged Russ-2000)
IBB
+21%
BA in DIA-30 +19% (strongest DOW stock here.)
AXSM
+269%
INSM
+101%
LOXO
+80%
SNDX
+76%
PTLA
+57%
CELG
+49%
BIIB
+21%
VRTX
+20%
 |
 |
 |
|
Charts 1/15/2019 2018 PEERLESS DJI, Signals, Indicators Daily DJI Volume 10-DayUp/Down Vol Hourly DJIA A/D Line for All Stocks Inverted Traders Index NASDAQ S&P OEX NYSE COMPQX DJI-15 DJI-20 DJI-30 DIA SPY QQQ MDY IWM TNA Short-Term Rates USO-CrudeOil DBO FAS GLD BBH IBB JETS JNUG KOL NUGT OIH OIL RSX RETL SDS AGQ SLV SOXL TECL TLT TMF TNA UGA (gasoline) XIV YINN Commodities: CANE CORN DBC JJC, NIB, CHOC CORN, CUT (paper) MOO, SOYB WEAT UUP (Dollar) LIT (Lithium) AAPL ADBE ALXN AMAT AMGN AMD AMZN BA BABA BAC BIDU CAT CVX DE FB GOOG GS HD IBM INTU JPM M (Macy's) MSFT NFLX NVDA QCOM TSLA TXN XOM WMT CMG , LRCX, SWKS, MDGL SPPI WATT SQ TOWN 1/15/19 (Click on Underlined link.) - Bullish MAXCPs - http://tigersoft.com/MAXCPS/Jan-15/BULLISH.htm Bearish MAXCPs - http://tigersoft.com/MINCPs/Jan-15/BEARISH.htm |
Table 1 QUICKSILVER on ETFS - 1/15/19 ETF CLOSE CHANGE PIVOT-PT 5-dma AROC CL-PWR CANDLE IP21 ITRS --------------------------------------------------------------------------------------------- DIA 240.64 1.7 238.92 56.9% Bullish BLUE -.042 ----- --------------------------------------------------------------------------------------------- BA 352.24 1.88 343.83 168.2% Bullish BLUE .061 .035 --------------------------------------------------------------------------------------------- SPY 260.35 2.95 257.97 69.4% Bullish BLUE .032 .004 --------------------------------------------------------------------------------------------- QQQ 162.38 3.11 160.82 89.2% Bullish BLUE .013 -.002 --------------------------------------------------------------------------------------------- MDY 320.95 1.97 318.06 94.1% Bullish BLUE .07 .008 --------------------------------------------------------------------------------------------- IWM 143.45 1.2 142.9 60.2% Bullish BLUE .022 -.002 --------------------------------------------------------------------------------------------- FAS 50.88 1.21 48.5 322.4% Bullish BLUE .051 -.089 --------------------------------------------------------------------------------------------- RETL 27.73 .29 29.18 -131.3% Bullish BLUE .299 -.207 --------------------------------------------------------------------------------------------- SOXL 90.39 .59 89.19 424.4% Bullish ---- -.135 -.059 --------------------------------------------------------------------------------------------- TECL 91.32 3.82 89.2 294.5% ------- BLUE .039 -.229 --------------------------------------------------------------------------------------------- IBB 109.24 2.07 107.5 115.4% Bullish BLUE -.026 .092 --------------------------------------------------------------------------------------------- GLD 121.88 -.21 122.31 14.4% Bullish RED .134 .1 --------------------------------------------------------------------------------------------- RSX 20.05 .13 20.06 62.5% Bullish BLUE .11 .006 |
Table 2    Count of Stocks in Key Directories
          2019-01-15
-------------------------------
NEWHIGHS       42
NEWLOWS        7
MAXCP          15
MINCP          3
TTTNH          13
TTTNL          4
FASTUP         74
FASTDOWN       64
CPCROSSA       15
CPCROSSD       29
BIGVOLUP       8
BIGVODN        8
ACCUMVER       5
HIGHIP21       7
HIUPPCT        4
VHIP21         11
LOWACCUM       280
REDSELL        282
AUGSELS7       13
TRAPDOOR       18
|
Table 3RANKING OF KEY DIRECTORIES BASED PCT.OF STOCKS ABOVE 65-DMA 1/15/19 --------------------------------------------------------------------------------------- Directory Current day-1 day-2 day-3 day-4 day-5 ---------------------------------------------------------------------------------------- BONDFUND .971 .971 .98 .971 .971 .971 HOMEBLDG .823 .823 .823 .823 .705 .705 GOLD .76 .84 .86 .84 .88 .88 PIPELINE .695 .565 .652 .652 .652 .652 GAMING .666 .583 .666 .625 .625 .541 SOFTWARE .646 .461 .538 .507 .461 .461 HACKERS .636 .454 .545 .545 .545 .545 AUTO .615 .641 .589 .615 .589 .461 SOLAR .555 .555 .611 .611 .611 .444 NIFTY .543 .438 .526 .543 .491 .368 GREEN .521 .478 .478 .521 .304 .304 NASD-100 .52 .41 .5 .49 .44 .36 ETFS .517 .396 .551 .568 .517 .344 BEVERAGE .5 .444 .5 .444 .333 .333 REIT .456 .348 .395 .348 .288 .261 ELECTRON .45 .413 .493 .493 .425 .32 UTILITY .45 .325 .45 .475 .35 .45 SEMI .448 .431 .5 .491 .439 .327 INFRA .444 .416 .472 .5 .472 .277 BIG17 .434 .413 .456 .478 .434 .434 INSURANC .433 .3 .333 .3 .2 .2 SP-100 .43 .301 .344 .333 .301 .258 CHINA .416 .3 .45 .416 .466 .233 GUNS .411 .411 .411 .352 .352 .352 FIDSTKS .403 .327 .365 .381 .317 .295 DOWJONES .4 .3 .333 .333 .333 .266 JETS .4 .4 .6 .3 .2 .2 RUS-1000 .396 .331 .361 .334 .286 .249 SP500 .387 .303 .339 .327 .267 .228 DJI-13 .384 .307 .307 .307 .307 .23 BIOTECH .381 .331 .376 .378 .339 .31 FINANCE .377 .3 .277 .222 .188 .166 INDMATER .358 .384 .41 .435 .371 .32 RETAIL .358 .245 .301 .301 .396 .283 COMODITY .333 .428 .428 .357 .476 .476 EDU .333 .333 .333 .333 .333 .333 FOOD .333 .421 .421 .333 .473 .456 HOSPITAL .333 .208 .291 .25 .333 .25 COMPUTER .318 .136 .181 .181 .181 .136 CHEM .314 .351 .351 .351 .296 .296 BIGBANKS .285 .142 .142 .142 .142 .142 REGBANKS .285 .214 .214 .214 .178 .178 INDEXES .252 .215 .252 .268 .225 .209 MILITARY .218 .218 .218 .218 .187 .187 OILGAS .191 .184 .178 .178 .13 .143 TRANSP .15 .2 .25 .05 .05 0 COAL .142 .142 .142 .142 .142 .142 |
=================================================================
1/14/2019 The operative Peerless signal is a Sell S12. A retreat to the
DJI's lower band would be in keeping with the S12's excellent
January track record.

But it's also clear that the FED would like to lift the DJI some more,
quite possibly all the way back to 27000. A consortium representing
the White House, the Fed and Wall Street Big Banks appears to be
seeking this. As proof, today, one the FOMC "doves" suggested that
now there might only need to be one US rate hike in 2019.
Still, the Accumulation remains quite negative. This shows that Big Money
is selling into this DJI rally back to 24000 and the resistance there.
Fears that the President's shut-down will have serious consequences
for the Economy, the Nation and the Republican Party may lie behind
this big money distribution. Of course, since the DJI has now rallied
exactly 10% up off its low, traders like us are to taker profits, too.
From Bloomberg: In a Month You’ll Wish the
Shutdown Were Only as Bad as Today
For now, we should see that our Closing Powers are still
rising for the main
ETFs and our Candle-Stick charts remain blue. After the sweep upwards,
candle-sticks turning from blue to green would be expected to bring a short-term
decline. Once again, today's closing was above the day's opening. This
kept the TigerSoft ETF candle-sticks blue and still short-term bullish.
The prospect of a longer freeze in rate hikes has a tendency
to help
small companies more than big ones. See below that IWM alone among
the major ETFs has not generated an optimized TigerSoft sell.
DIA |
SPY |
QQQ |
SOXL |
IWM |
|
Charts 1/14/2019 2018 PEERLESS DJI, Signals, Indicators Daily DJI Volume 10-DayUp/Down Vol Hourly DJIA A/D Line for All Stocks Inverted Traders Index NASDAQ S&P OEX NYSE COMPQX DJI-15 DJI-20 DJI-30 DIA SPY QQQ MDY IWM TNA Short-Term Rates USO-CrudeOil DBO FAS GLD BBH IBB JETS JNUG KOL NUGT OIH OIL RSX RETL SDS AGQ SLV SOXL TECL TLT TMF TNA UGA (gasoline) XIV YINN Commodities: CANE CORN DBC JJC, NIB, CHOC CORN, CUT (paper) MOO, SOYB WEAT UUP (Dollar) LIT (Lithium) AAPL ADBE ALXN AMAT AMGN AMD AMZN BA BABA BAC BIDU CAT CVX DE FB GOOG GS HD IBM INTU JPM M (Macy's) MSFT NFLX NVDA QCOM TSLA TXN XOM WMT CMG , LRCX, SWKS, MDGL SPPI WATT SQ TOWN 1/14/2019 (Click on Underlined link.) - Bullish MAXCPs - http://tigersoft.com/MAXCPS/Jan-14/BULLISH.htm Bearish MAXCPs - http://tigersoft.com/MINCPs/Jan-14/BEARISH.htm |
Table 1 QUICKSILVER on ETFS - 1/14/19 ETF CLOSE CHANGE PIVOT-PT 5-dma AROC CL-PWR CANDLE IP21 ITRS --------------------------------------------------------------------------------------------- DIA 238.94 -.94 237.92 75.1% ------- BLUE -.066 ----- --------------------------------------------------------------------------------------------- BA 350.36 -2.54 340.53 323.8% Bullish BLUE .031 .041 --------------------------------------------------------------------------------------------- SPY 257.4 -1.58 256.77 58.7% ------- BLUE .004 .001 --------------------------------------------------------------------------------------------- QQQ 159.27 -1.42 159.52 36.9% ------- ---- -.019 -.001 --------------------------------------------------------------------------------------------- MDY 318.98 -1.78 314.95 145.5% Bullish BLUE .013 .003 --------------------------------------------------------------------------------------------- IWM 142.25 -1.43 141.73 93.5% ------- RED -.032 -.011 --------------------------------------------------------------------------------------------- FAS 49.67 .43 47.73 276.3% Bullish BLUE .003 -.081 --------------------------------------------------------------------------------------------- RETL 25.24 -.84 28.11 -449.2% Bearish RED .042 -.368 --------------------------------------------------------------------------------------------- SOXL 89.8 -4.46 82.79 323.5% Bullish RED -.138 -.035 --------------------------------------------------------------------------------------------- TECL 87.5 -2.45 86.1 207.6% ------- BLUE .016 -.212 --------------------------------------------------------------------------------------------- IBB 107.17 -1.84 106.75 54.8% ------- RED -.068 .073 --------------------------------------------------------------------------------------------- GLD 122.09 .29 121.53 9.4% ------- RED .157 .094 --------------------------------------------------------------------------------------------- RSX 20.23 -.32 20.36 -117.3% ------- RED -.012 -.022 |
Table 2    Count of Stocks in Key Directories
          2019=01=14
-------------------------------
NEWHIGHS       32
NEWLOWS        6
MAXCP          6
MINCP          4
TTTNH          14
TTTNL          12
FASTUP         71
FASTDOWN       54
CPCROSSA       9
CPCROSSD       64
BIGVOLUP       4
BIGVODN        10
ACCUMVER       6
HIGHIP21       2
HIUPPCT        4
VHIP21         11
LOWACCUM       286
REDSELL        309
AUGSELS7       12
TRAPDOOR       17
|
Table 3 RANKING OF KEY DIRECTORIES BASED PCT.OF STOCKS ABOVE 65-DMA 1/14/19 Bullish 7 Bearish 40 --------------------------------------------------------------------------------------- Directory Current day-1 day-2 day-3 day-4 day-5 ---------------------------------------------------------------------------------------- BONDFUND .971 .98 .971 .971 .961 .933 GOLD .84 .86 .84 .88 .88 .86 HOMEBLDG .823 .823 .823 .705 .705 .647 AUTO .641 .589 .615 .589 .461 .384 GAMING .583 .666 .625 .625 .541 .458 PIPELINE .583 .666 .666 .666 .666 .416 SOLAR .555 .611 .611 .611 .444 .5 ============================================================================================= GREEN .478 .478 .521 .304 .304 .173 SOFTWARE .461 .538 .507 .461 .461 .307 HACKERS .454 .545 .545 .545 .5 .363 BEVERAGE .444 .5 .444 .333 .333 .277 NIFTY .438 .526 .543 .491 .368 .315 SEMI .431 .5 .491 .439 .327 .31 COMODITY .428 .428 .357 .476 .476 .452 FOOD .421 .421 .333 .473 .456 .438 INFRA .416 .472 .5 .472 .277 .194 BIG17 .413 .456 .478 .434 .434 .413 ELECTRON .413 .493 .493 .425 .314 .283 GUNS .411 .411 .352 .352 .352 .352 NASD-100 .41 .5 .49 .44 .35 .33 JETS .4 .6 .3 .2 .2 .2 ETFS .396 .551 .568 .517 .327 .275 INDMATER .384 .41 .435 .371 .32 .32 CHEM .351 .351 .351 .296 .296 .24 REIT .348 .395 .348 .288 .261 .154 EDU .333 .333 .333 .333 .333 .333 RUS-1000 .331 .361 .334 .286 .246 .174 BIOTECH .328 .376 .378 .339 .305 .276 FIDSTKS .327 .365 .381 .317 .295 .209 UTILITY .325 .45 .475 .35 .45 .25 DJI-13 .307 .307 .307 .307 .23 .076 SP500 .303 .339 .327 .267 .224 .148 SP-100 .301 .344 .333 .301 .258 .15 CHINA .3 .45 .416 .466 .233 .216 DOWJONES .3 .333 .333 .333 .266 .166 FINANCE .3 .277 .222 .188 .166 .133 INSURANC .3 .333 .3 .2 .2 .166 RETAIL .245 .301 .301 .396 .264 .15 MILITARY .218 .218 .218 .187 .187 .125 REGBANKS .214 .214 .214 .178 .178 .107 INDEXES .209 .252 .268 .225 .204 .198 HOSPITAL .208 .291 .25 .333 .208 .125 TRANSP .2 .25 .05 .05 0 0 OILGAS .19 .183 .183 .136 .149 .108 BIGBANKS .142 .142 .142 .142 .142 0 COAL .142 .142 .142 .142 .142 .142 COMPUTER .136 .181 .181 .181 .136 .09 |
====================================================================
1/11/2019 The Hourly DJIA has
reached the round-number 24000 Thursday
and failed to get past it again on Friday. It looks like it will break its
uptrend on Monday. The reason we can guess is because more and
more Republicans see Trump's hold-out for his wall has too high a political
price now that the Federal Goverment has gone un-funded a record time.
This is probably signifcant for Wall Street despite the Fed's change of
heart about interest rates in 2019. I would guess this is why Big Money
selling remains so heavy and why Peerless has given a Sell S12.
January Sell S12s are particularly reliable, even when breadth is strong
and the P-Indicator is positive. Our Sell S12 shows particularly heavy
current red Distribution. I think we should believe it and sell Short DIA
and take profits in SOXL and NVDA.
Another reason to be bearish is the number of major ETFs and
DJIA-30
stocks whose Tiger charts have produced optimized
red Sells. These are the
signals TigerSoft automatically posts after calculating "in a blink" the returns
of 60 different trading systems. The red signals are the best system's Buy
and Sell signals.
Optimized Red Sell Signals (!! = new)
close System
IP21
gain for
last year
DIA!! 239.88 66%
-.094
BA 352.9
68.1% +.01
CAT 132.1 106.3%
-.159
DIS 112.65
21.9% -.079
GS 176.93
68.1% -.048
IBM 121.46 31.4%
-.107
INTC!! 48.93 53.4%
-.134
MMM!! 192.21 68.3% -.145
NKE 76.04
64.4% -.076
QQQ!! 160.69 47.0%
-.052
SOXL!! 94.26 603.7%
-.146
TRV!! 120.47 52.9%
-.161
The main hope for the Bullish is the Treasury-White
House-Wall Street
consortium that want the market to go back up to its Summer highs through
a halt in rises of interest rates. The DJI is now down over 150. If it can be
turned up from its opening Monday and close above the opening, then the
Closing Power will rise tomorrow. This may allow the DJI to go up slightly more.
But the past January S12s seldom bring sizeable paper losses and I doubt if
the DJI can retrace more than 50% of what it lost without a pullback.
Hourly DJIA is fighting to get
past 24000 resistance and still staying in an uptrend. |
DJIA and PEERLESS SIGNALS
S12 vs steeply rising NYSE ADL. |
DIA and Automatic TIGER SIGNALS  WEEKLY DJIA shows Resistance may be at 25000 and then 27250  |
SPY - Exploded chart |
 |
 |
 |
|
Charts 1/11/2019 2018 PEERLESS DJI, Signals, Indicators Daily DJI Volume 10-DayUp/Down Vol Hourly DJIA A/D Line for All Stocks Inverted Traders Index NASDAQ S&P OEX NYSE COMPQX DJI-15 DJI-20 DJI-30 DIA SPY QQQ MDY IWM TNA Short-Term Rates USO-CrudeOil DBO FAS GLD BBH IBB JETS JNUG KOL NUGT OIH OIL RSX RETL SDS AGQ SLV SOXL TECL TLT TMF TNA UGA (gasoline) XIV YINN Commodities: CANE CORN DBC JJC, NIB, CHOC CORN, CUT (paper) MOO, SOYB WEAT UUP (Dollar) LIT (Lithium) AAPL ADBE ALXN AMAT AMGN AMD AMZN BA BABA BAC BIDU CAT CVX DE FB GOOG GS HD IBM INTU JPM M (Macy's) MSFT NFLX NVDA QCOM TSLA TXN XOM WMT CMG , LRCX, SWKS, MDGL SPPI WATT SQ TOWN 1/11/2019 (Click on Underlined link.) - Bullish MAXCPs - http://tigersoft.com/MAXCPS/Jan-11/BULLISH.htm Bearish MAXCPs - http://tigersoft.com/MINCPs/Jan-11/BEARISH.htm |
Table 1 QUICKSILVER on ETFS - 1/11/19 ETF CLOSE CHANGE PIVOT-PT 5-dma AROC CL-PWR CANDLE IP21 ITRS --------------------------------------------------------------------------------------------- DIA 239.88 -.12 235.36 118% ------- BLUE -.094 0 --------------------------------------------------------------------------------------------- BA 352.9 .29 328.11 381.5% Bullish BLUE .01 .07 --------------------------------------------------------------------------------------------- SPY 258.98 .1 254.38 128.7% ------- BLUE -.026 0 --------------------------------------------------------------------------------------------- QQQ 160.69 -.59 158.09 140.1% ------- BLUE -.052 .003 --------------------------------------------------------------------------------------------- MDY 320.76 .14 309.76 229.5% ------- BLUE -.005 .005 --------------------------------------------------------------------------------------------- IWM 143.68 .04 139.59 230.1% Bullish BLUE -.041 -.002 --------------------------------------------------------------------------------------------- FAS 49.24 .12 47 309% Bullish BLUE -.046 -.075 --------------------------------------------------------------------------------------------- RETL 28.11 .44 27.69 519% Bullish BLUE .255 -.186 --------------------------------------------------------------------------------------------- SOXL 94.26 2.56 84.08 868.5% Bullish BLUE -.146 .111 --------------------------------------------------------------------------------------------- TECL 89.95 -.43 83.85 477.7% ------- BLUE -.012 -.188 --------------------------------------------------------------------------------------------- IBB 109.01 .11 105.99 303.7% Bullish BLUE -.047 .081 --------------------------------------------------------------------------------------------- GLD 121.8 .21 121.86 14.8% Bullish BLUE .155 .066 --------------------------------------------------------------------------------------------- RSX 20.06 -.11 19.72 88% Bullish ---- .129 .01
|
 Table 2   Count of Stocks in Key Directories
           20190=01=11
-------------------------------
NEWHIGHS       39
NEWLOWS        3
MAXCP          8
MINCP          2
TTTNH          10
TTTNL          7
FASTUP         147
FASTDOWN       31
CPCROSSA       10
CPCROSSD       27
BIGVOLUP       4
BIGVODN        11
ACCUMVER       6
HIGHIP21       2
HIUPPCT        5
VHIP21         11
LOWACCUM       295
REDSELL        338
AUGSELS7       10
TRAPDOOR       17
|
Table 3 RANKING OF KEY DIRECTORIES BASED PCT.OF STOCKS ABOVE 65-DMA
               1/11/19
 Bullish = 12
 Bearish = 32
---------------------------------------------------------------------------------------
Directory     Current       day-1         day-2         day-3         day-4         day-5
----------------------------------------------------------------------------------------
BONDFUND       .98           .971          .971          .961          .933          .895
GOLD           .86           .84           .88           .88           .86           .88
HOMEBLDG       .823          .823          .705          .705          .588          .47
GAMING         .666          .625          .625          .541          .458          .375
PIPELINE       .666          .666          .666          .666          .416          .333
SOLAR .611 .611 .611 .444 .5 .388 JETS .6 .3 .2 .2 .2 .1 AUTO .589 .615 .589 .461 .384 .256 ETFS .551 .568 .517 .327 .241 .206 HACKERS .545 .545 .545 .5 .363 .181 SOFTWARE .538 .507 .461 .461 .292 .215 NIFTY .526 .543 .491 .368 .298 .192 ========================================================================================= BEVERAGE .5 .444 .333 .333 .333 .222 NASD-100 .5 .49 .44 .35 .32 .26 SEMI .5 .491 .439 .327 .31 .215 ========================================================================================= ELECTRON .493 .493 .425 .314 .283 .185 GREEN .478 .521 .304 .304 .173 .217 INFRA .472 .5 .472 .277 .194 .138 BIG17 .456 .478 .434 .434 .413 .195 CHINA .45 .416 .466 .233 .216 .2 UTILITY .45 .475 .35 .45 .25 .275 COMODITY .428 .357 .476 .476 .452 .428 FOOD .428 .339 .482 .464 .446 .428 GUNS .411 .352 .352 .352 .352 .235 INDMATER .41 .435 .371 .32 .32 .269 REIT .395 .348 .288 .261 .154 .134 BIOTECH .373 .378 .339 .305 .273 .207 FIDSTKS .365 .381 .317 .295 .209 .177 RUS-1000 .361 .334 .286 .246 .17 .134 CHEM .351 .351 .296 .296 .24 .185 SP-100 .344 .333 .301 .258 .15 .129 SP500 .339 .327 .267 .224 .144 .118 DOWJONES .333 .333 .333 .266 .166 .166 EDU .333 .333 .333 .333 .333 .5 INSURANC .333 .3 .2 .2 .166 .2 DJI-13 .307 .307 .307 .23 .076 .076 RETAIL .301 .301 .396 .264 .15 .15 HOSPITAL .291 .25 .333 .208 .125 .125 FINANCE .277 .222 .188 .166 .133 .133 TRANSP .25 .05 .05 0 0 0 INDEXES .248 .264 .221 .2 .2 .156 MILITARY .218 .218 .187 .187 .125 .093 REGBANKS .214 .214 .178 .178 .107 .107 OILGAS .183 .183 .136 .149 .108 .081 COMPUTER .181 .181 .181 .136 .09 .09 BIGBANKS .142 .142 .142 .142 0 0 COAL .142 .142 .142 .142 .142 .142 |
====================================================================
1/10/2019 The Peerless Sell S12 signal
tells us that the DJI is likely to
reverse in the next week and probably retest 23000 and
probably 22000. Note that the current IP21 (Accum. Index)|
was stands at a very negative (-.152) with the DJI at the
upper 2.4% upper band. This is a much bigger divergence
than in any of the 16 earlier S12s, all of which worked out
profitably.
It's true the NYSE A/D Line is still in an uptrend and the P-Indicator
has turned positive. Perhaps, sellers are waiting for the DJI to
make a 50% recovery before reversing. With the FOMC postponing
another rate hike until May, at the earliest, we probably should
wait for the steep NYSE A/D Line to break its downtrend.
None of the 16 earlier January S12s occurred, as now, when the
FOMC had just reversed itself so dramatically.


IMPORTANT
Compare the current Janaury S12 with
the 16 earlier examples of these S12s.
In none of these past cases did the FED reverse
itself and suddenly become so dovish. So,
waiting for the A/D Line to breaks its uptrend
now may cost us a few points, but it will show
that the boost given by the FED is probably exhausted.
| 1940
lowest IP21 in these earlier cases.  |
1949
50% retracement |
| 1960
Look at how very negaive the V-I was. (This had to be estimated.)  |
| 1966
Big Money knew that LBJ's war in Vietnam was bringing Inflation and the FED would be raising interest rates very soon.  |
Interest Rates were rising. |
| 1973
Partisan buying climaxed and interest rates were rising.  |
| 1974
DJI could not get back above its falling 65-dma.  |
1981
Interest rates were very high and rising. |
| 1982
Bear Market variety. DJI reverses at 65-dma.
|
| 1983
S12 stops a DJI breakout into all-time high territory, normally a most bullish time.  |
| 1984
Volcker starts to raise rates again, despite serious economic weakness in Mid-West, Texas and Oklahoma.  |
| 2000
Greenspan decides to "take the punch-bowl" away from the speculative party.  |
| 2001
Supreme Court accords Presidency to Bush and S12 still drops the DJI to the lower band. The P-Indicator was wuite positive.  |
| 2003
S12 works out at 3.1% upper band even though IP21 is positive.  |
| 2009
Bear Market variety. IP21 is positive but DJI is at 3.7% upper band.  |
|
Charts 1/10/2019 2018 PEERLESS DJI, Signals, Indicators Daily DJI Volume 10-DayUp/Down Vol Hourly DJIA A/D Line for All Stocks Inverted Traders Index NASDAQ S&P OEX NYSE COMPQX DJI-15 DJI-20 DJI-30 DIA SPY QQQ MDY IWM TNA Short-Term Rates USO-CrudeOil DBO FAS GLD BBH IBB JETS JNUG KOL NUGT OIH OIL RSX RETL SDS AGQ SLV SOXL TECL TLT TMF TNA UGA (gasoline) XIV YINN Commodities: CANE CORN DBC JJC, NIB, CHOC CORN, CUT (paper) MOO, SOYB WEAT UUP (Dollar) LIT (Lithium) AAPL ADBE ALXN AMAT AMGN AMD AMZN BA BABA BAC BIDU CAT CVX DE FB GOOG GS HD IBM INTU JPM M (Macy's) MSFT NFLX NVDA QCOM TSLA TXN XOM WMT CMG , LRCX, SWKS, MDGL SPPI WATT SQ TOWN 1/10/2019 (Click on Underlined link.) - Bullish MAXCPs - http://tigersoft.com/MAXCPS/Jan-10/BULLISH.htm Bearish MAXCPs - http://tigersoft.com/MINCPs/Jan-10/BEARISH.htm |
Table 1 QUICKSILVER on ETFS - 1/10/19 ETF CLOSE CHANGE PIVOT-PT 5-dma AROC CL-PWR CANDLE IP21 ITRS --------------------------------------------------------------------------------------------- DIA 240 1.08 234.28 283% ------- BLUE -.124 ------ --------------------------------------------------------------------------------------------- BA 352.61 8.78 327.08 631.8% ------- BLUE -.03 .008 --------------------------------------------------------------------------------------------- SPY 258.88 .91 252.39 289.8% ------- BLUE -.064 .002 --------------------------------------------------------------------------------------------- QQQ 161.28 .46 156.23 365.2% ------- BLUE -.073 -.006 --------------------------------------------------------------------------------------------- MDY 320.62 2.56 306.35 388% ------- BLUE -.051 .008 --------------------------------------------------------------------------------------------- IWM 143.64 .74 137.19 410.5% ------- BLUE -.076 0 --------------------------------------------------------------------------------------------- FAS 49.12 .62 46.29 716.6% ------- BLUE -.094 -.06 --------------------------------------------------------------------------------------------- RETL 27.67 -1.51 25.24 827.6% ------- BLUE .244 -.178 --------------------------------------------------------------------------------------------- SOXL 91.7 2.51 79.42 1316.5% ------- BLUE -.192 .058 --------------------------------------------------------------------------------------------- TECL 90.38 1.18 81.71 1080.8% ------- BLUE -.038 -.216 --------------------------------------------------------------------------------------------- IBB 108.9 1.4 102.55 540.9% ------- BLUE -.072 .078 --------------------------------------------------------------------------------------------- GLD 121.59 -.72 121.44 -34.5% Bullish RED .159 .068 --------------------------------------------------------------------------------------------- RSX 20.17 .11 19.71 279.6% Bullish BLUE .109 .021 |
 Table 2
 Count of Stocks in Key Directories
          2019-01-10
-------------------------------
NEWHIGHS       45
NEWLOWS        8
MAXCP          8
MINCP          4
TTTNH          14
TTTNL          8
FASTUP         381  Swingtraders remain bullish
FASTDOWN       27
CPCROSSA       9
CPCROSSD       41
BIGVOLUP       2
BIGVODN        8
ACCUMVER       2
HIGHIP21       3
HIUPPCT        5
VHIP21         13
LOWACCUM       307
REDSELL        362
AUGSELS7       7
TRAPDOOR       19
|
 Table 3
 RANKING OF KEY DIRECTORIES BASED PCT.OF STOCKS ABOVE 65-DMA
             1/10/19
 Bullish = 12
 Bearish = 34
---------------------------------------------------------------------------------------
Directory     Current       day-1         day-2         day-3         day-4         day-5
----------------------------------------------------------------------------------------
BONDFUND       .971          .971          .961          .933          .876          .904
GOLD           .84           .88           .88           .86           .88           .84
HOMEBLDG       .823          .705          .705          .588          .47           .294
PIPELINE       .666          .666          .666          .416          .333          .166
GAMING         .625          .625          .541          .458          .375          .208
AUTO           .615          .589          .461          .384          .256          .128
SOLAR          .611          .611          .444          .5            .388          .166
ETFS           .568          .517          .327          .241          .206          .12
HACKERS        .545          .545          .5            .363          .181          .09
NIFTY          .543          .491          .368          .298          .192          .052
GREEN .521 .304 .304 .173 .217 .086 SOFTWARE .507 .461 .461 .292 .215 .123 ============================================================================================= INFRA .5 .472 .277 .194 .138 0 ============================================================================================= ELECTRON .493 .425 .314 .283 .185 .098 SEMI .491 .439 .327 .31 .215 .112 NASD-100 .49 .44 .35 .32 .25 .09 BIG17 .478 .434 .434 .413 .195 .152 UTILITY .475 .35 .45 .25 .275 .2 BEVERAGE .444 .333 .333 .333 .222 .111 INDMATER .435 .371 .32 .32 .269 .166 CHINA .416 .466 .233 .216 .2 .066 FIDSTKS .381 .317 .295 .209 .177 .059 BIOTECH .376 .339 .305 .273 .202 .128 COMODITY .357 .476 .476 .452 .428 .428 GUNS .352 .352 .352 .352 .235 .058 CHEM .351 .296 .296 .24 .185 .129 REIT .348 .288 .261 .154 .127 .073 RUS-1000 .334 .286 .246 .17 .135 .067 DOWJONES .333 .333 .266 .166 .166 .033 ^^^^^^^^ EDU .333 .333 .333 .333 .5 .333 FOOD .333 .473 .456 .438 .421 .421 SP-100 .333 .301 .258 .15 .129 .021 SP500 .327 .267 .224 .144 .12 .05 DJI-13 .307 .307 .23 .076 .076 0 RETAIL .301 .396 .264 .15 .15 .094 INSURANC .3 .2 .2 .166 .2 .133 JETS .3 .2 .2 .2 .1 .1 INDEXES .264 .221 .2 .2 .172 .178 HOSPITAL .25 .333 .208 .125 .125 .083 FINANCE .222 .188 .166 .133 .133 .1 REGBANKS .214 .178 .178 .107 .107 .035 MILITARY .193 .161 .161 .096 .064 .064 OILGAS .183 .136 .149 .108 .074 .034 COMPUTER .181 .181 .136 .09 .09 .045 BIGBANKS .142 .142 .142 0 0 0 COAL .142 .142 .142 .142 .142 .142 TRANSP .05 .05 0 0 0 0 |

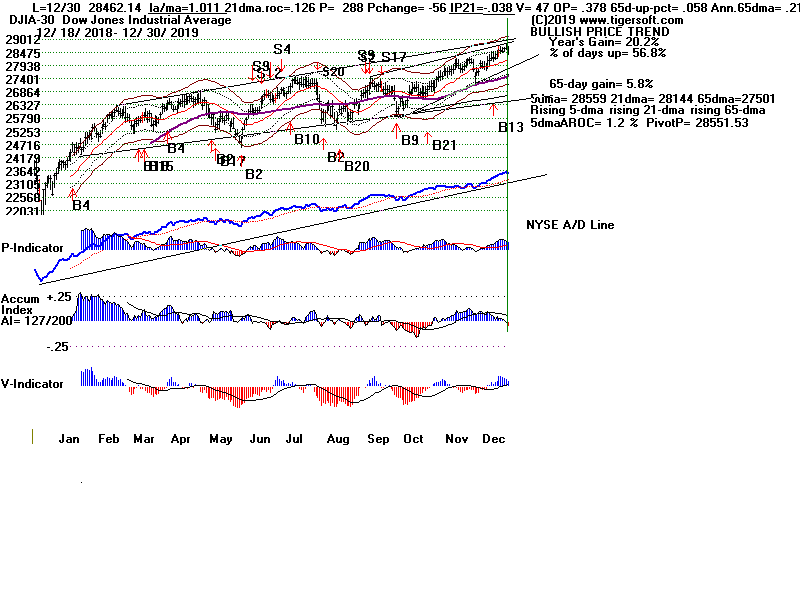
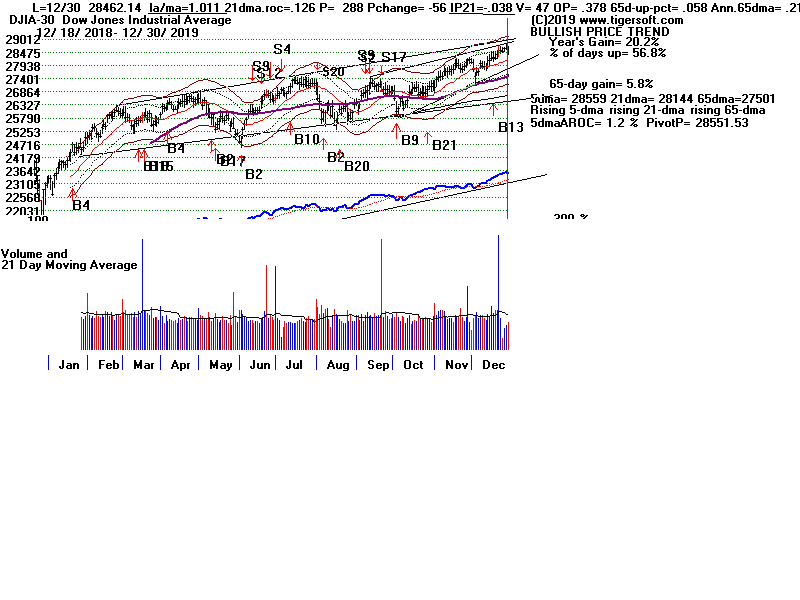
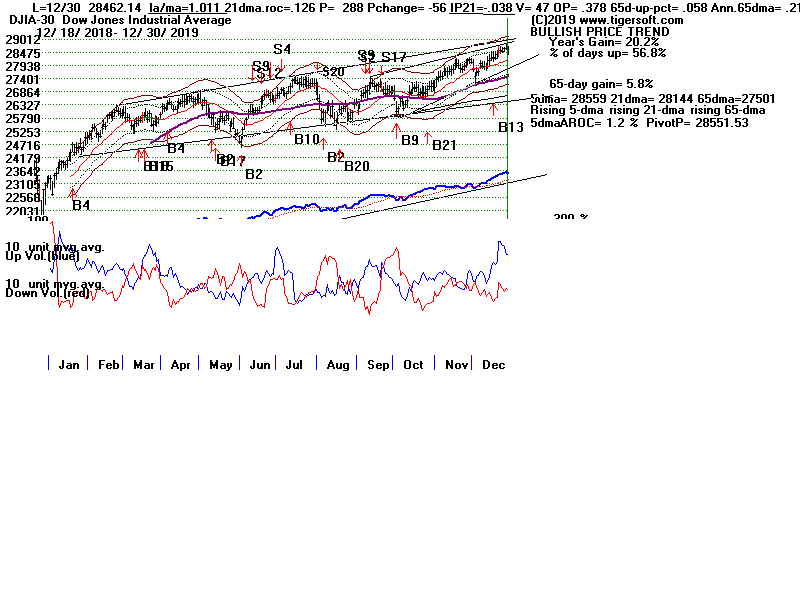
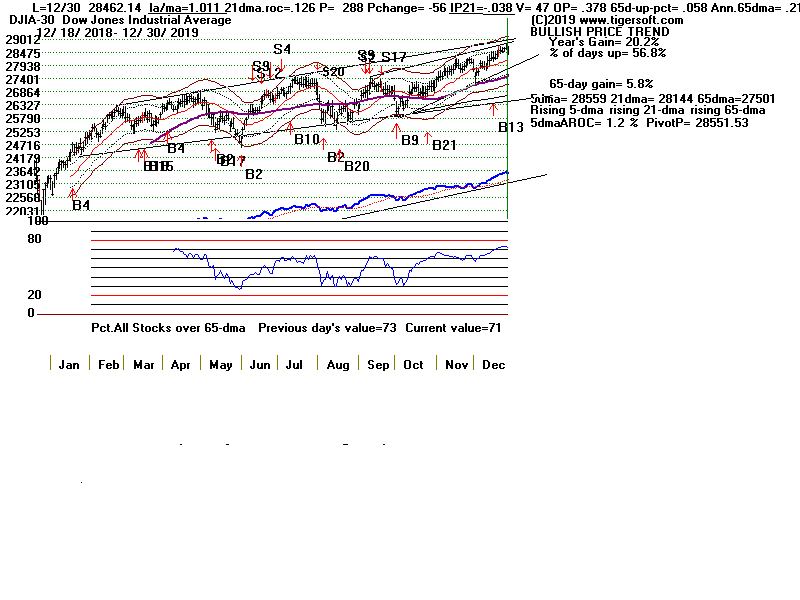
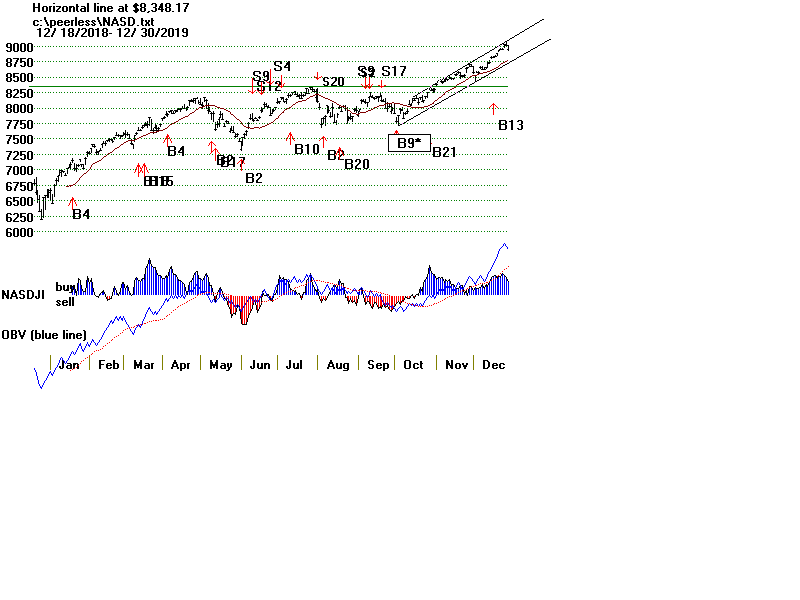
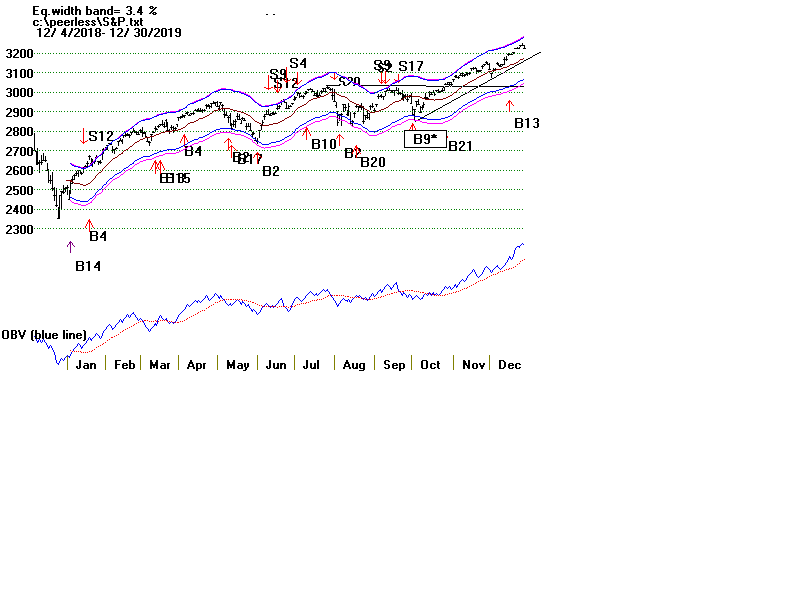
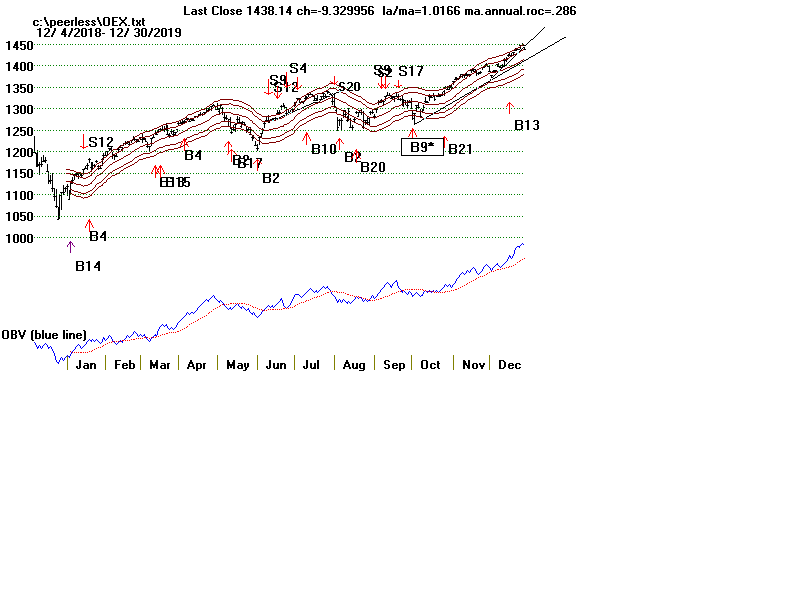
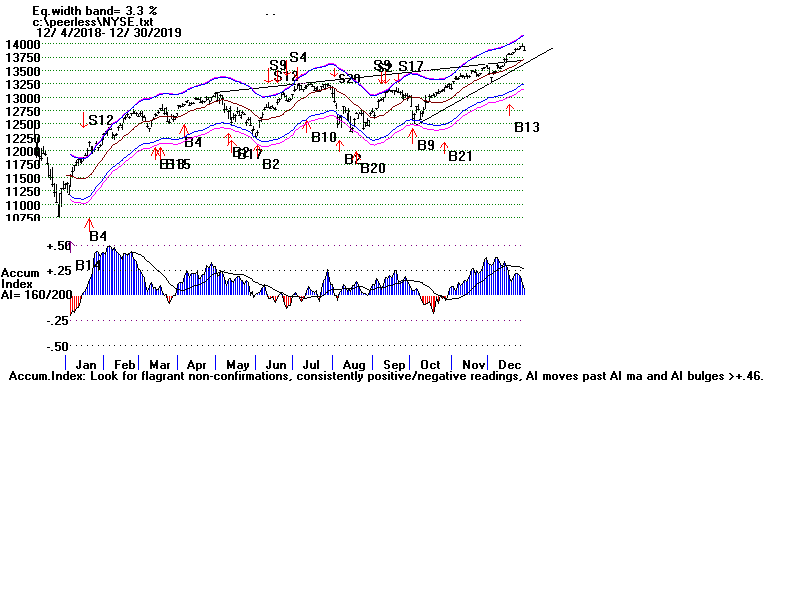
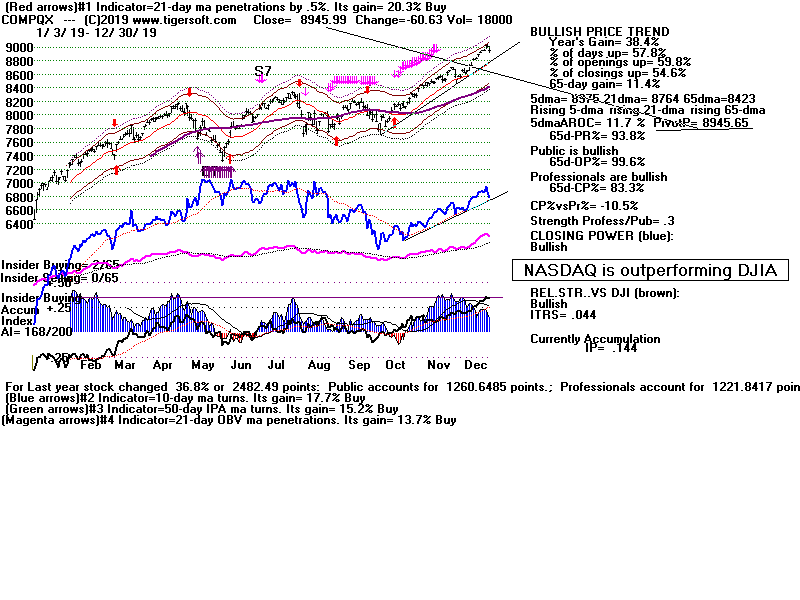
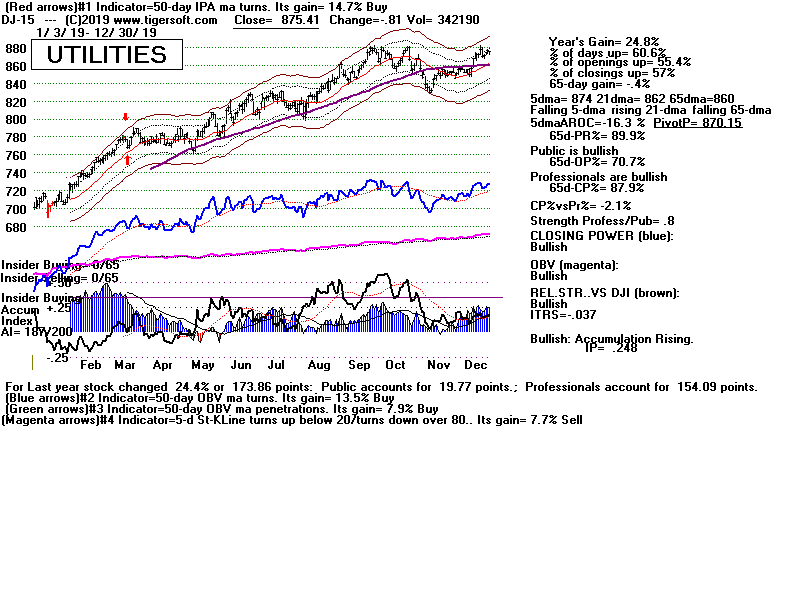
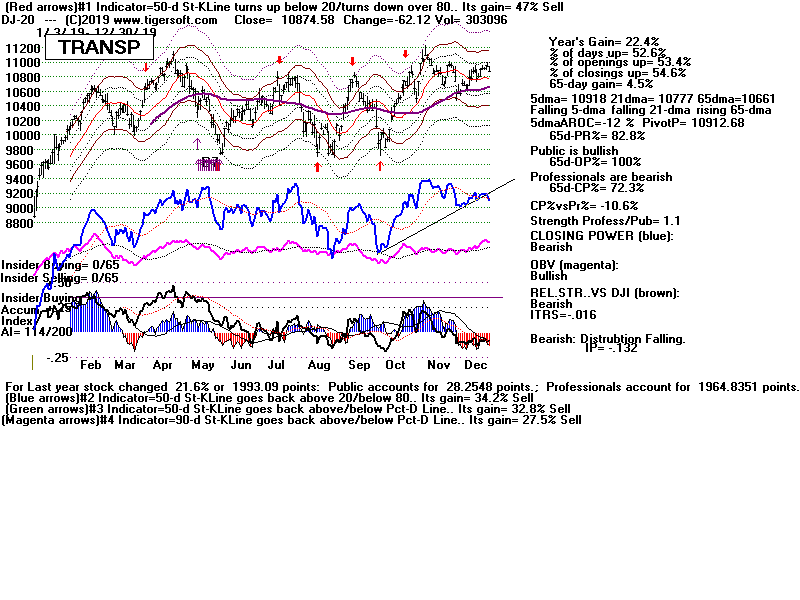
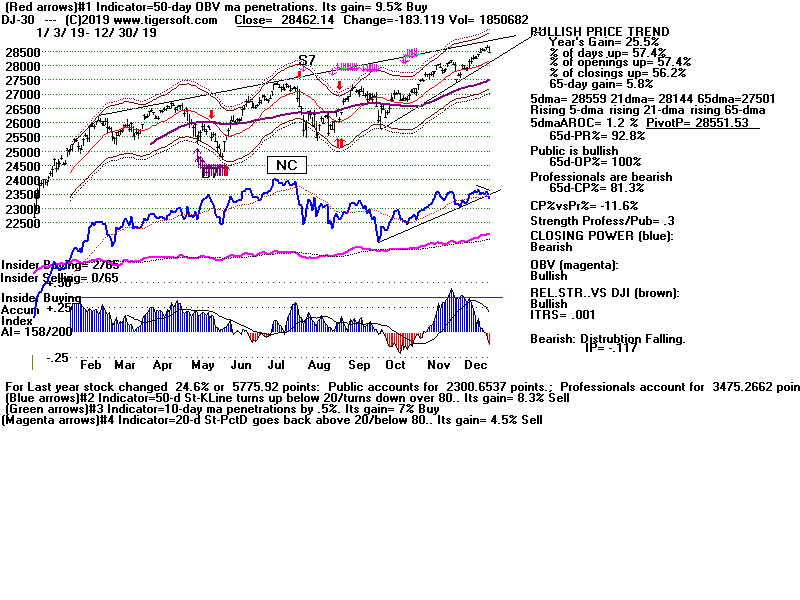
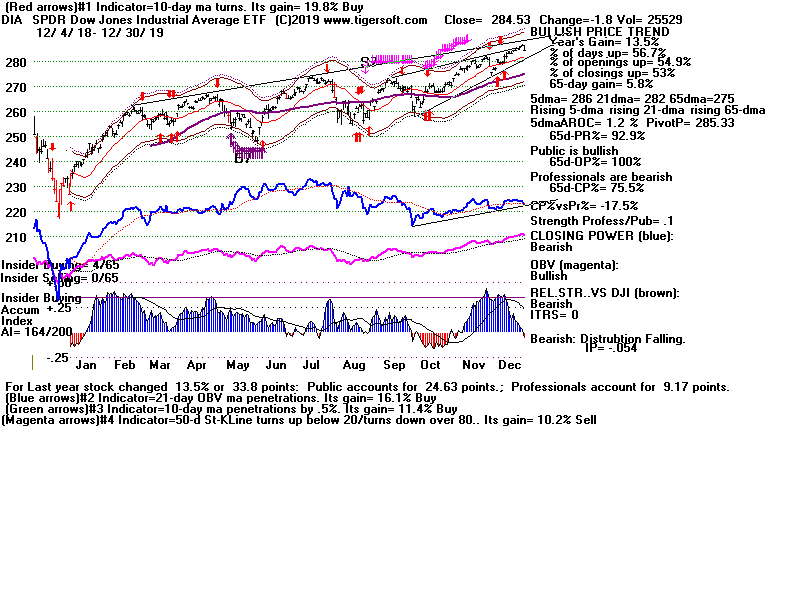
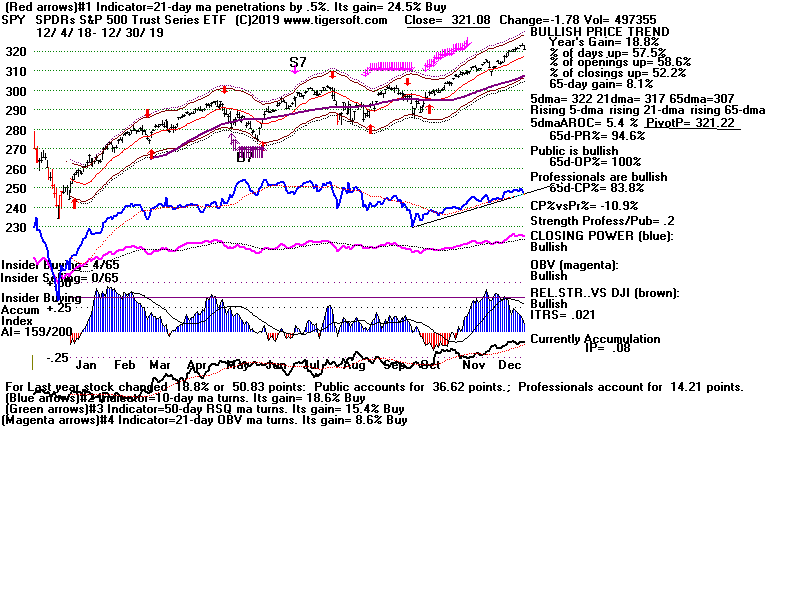
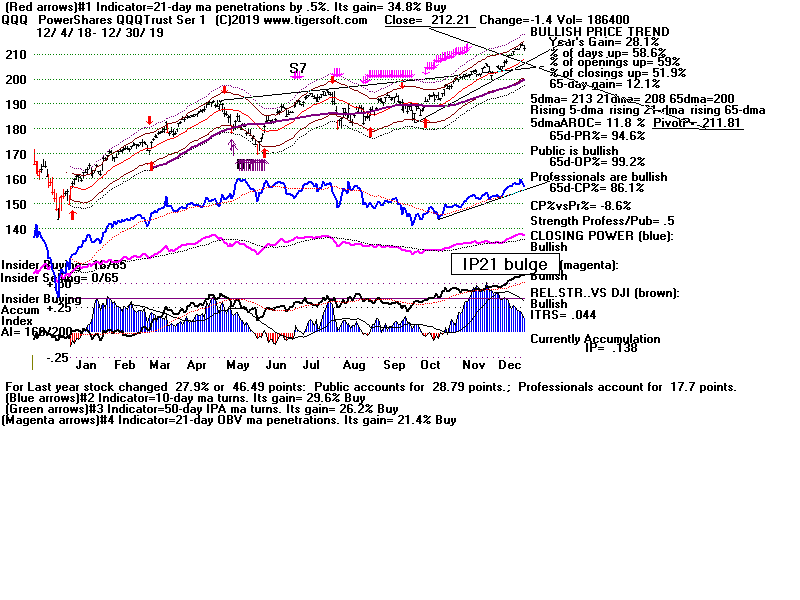
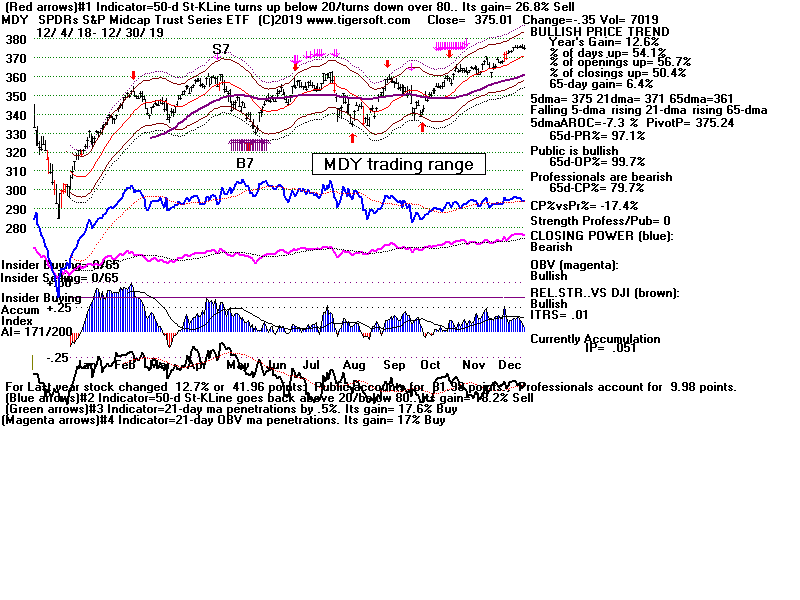
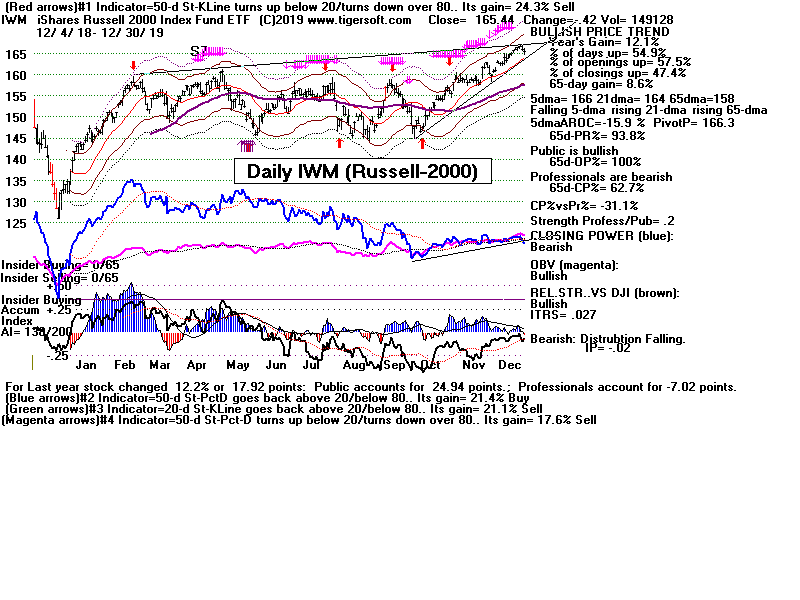
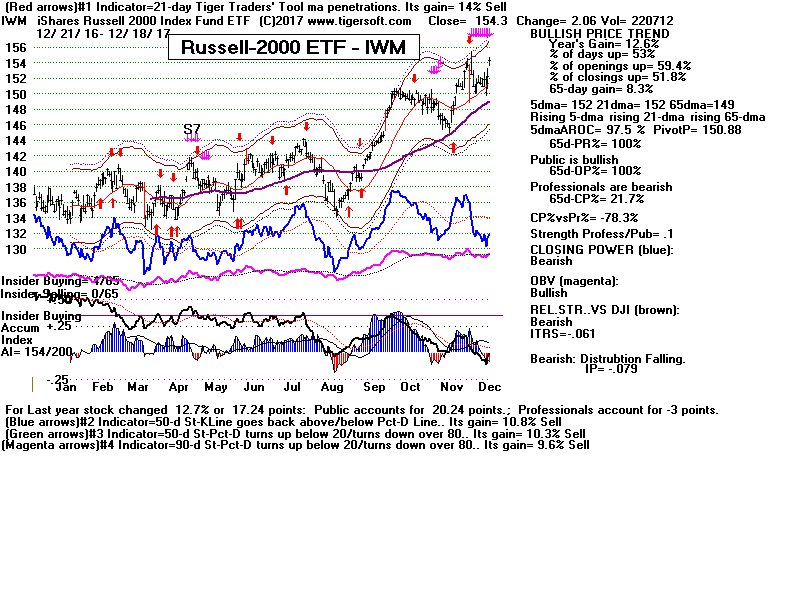
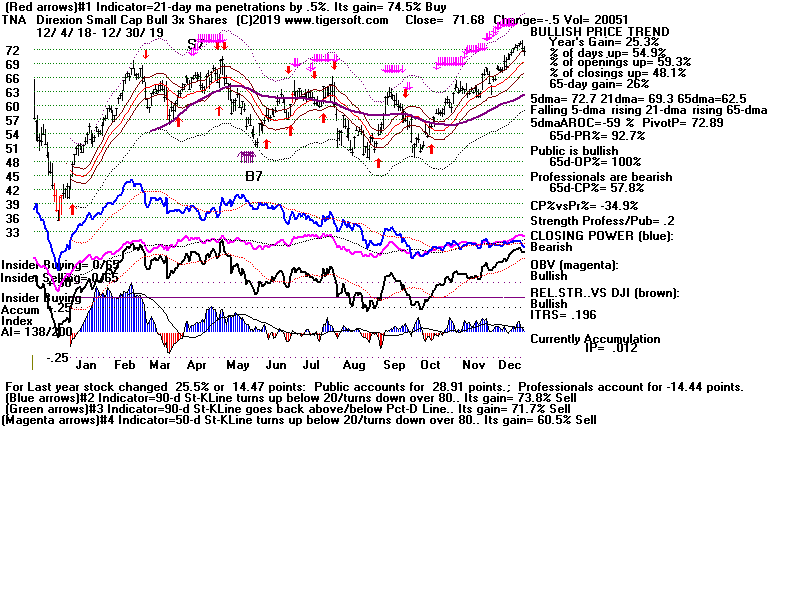
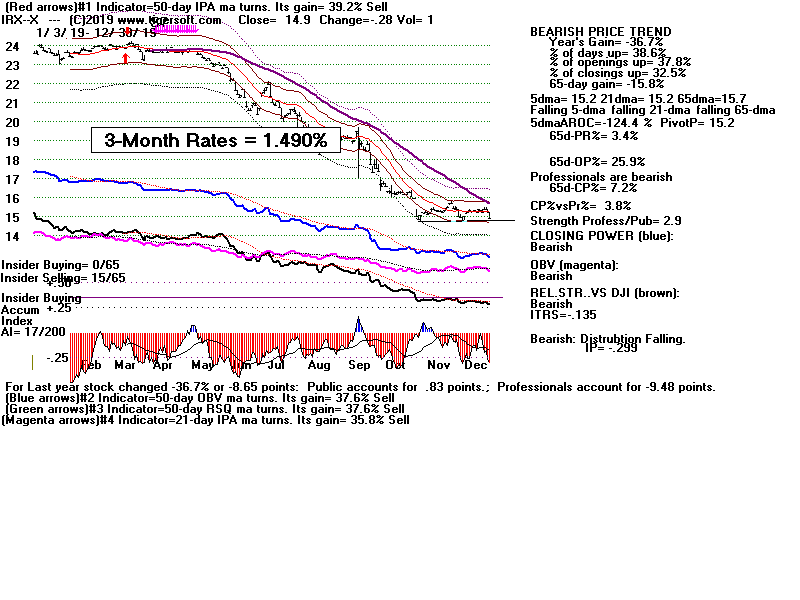
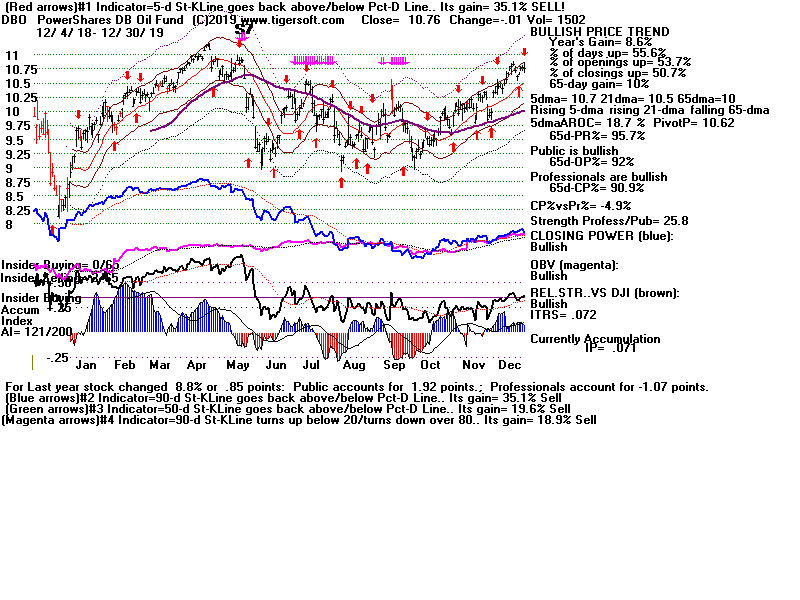
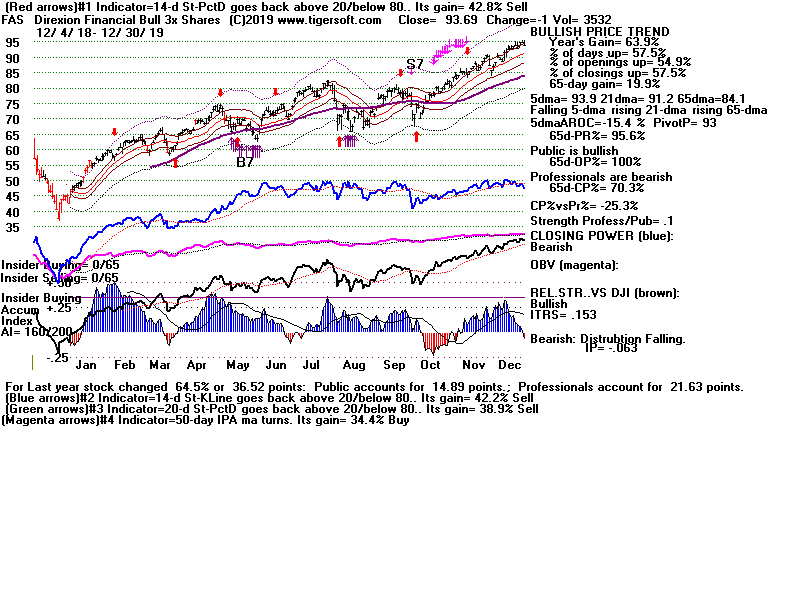
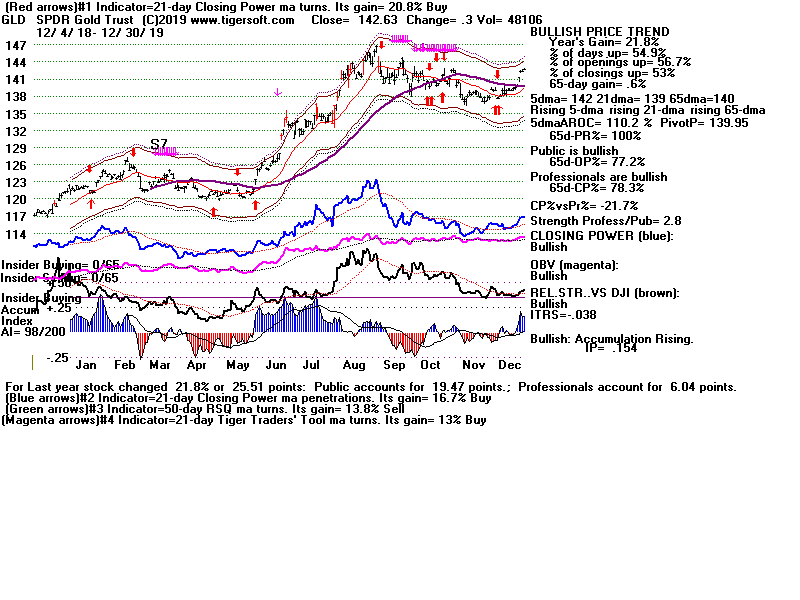
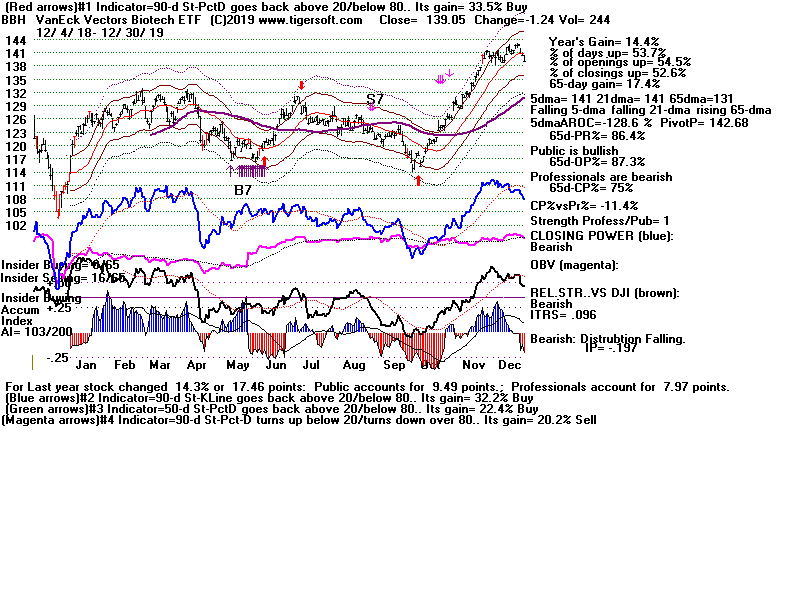
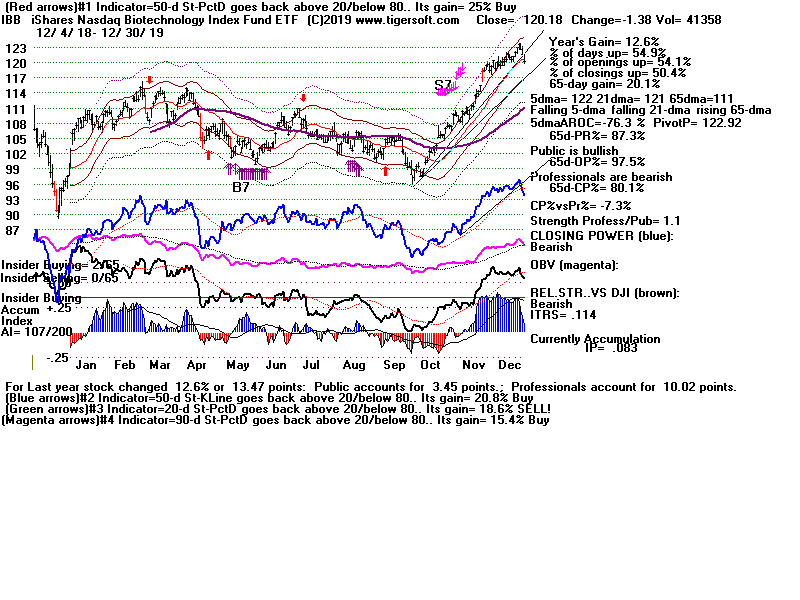
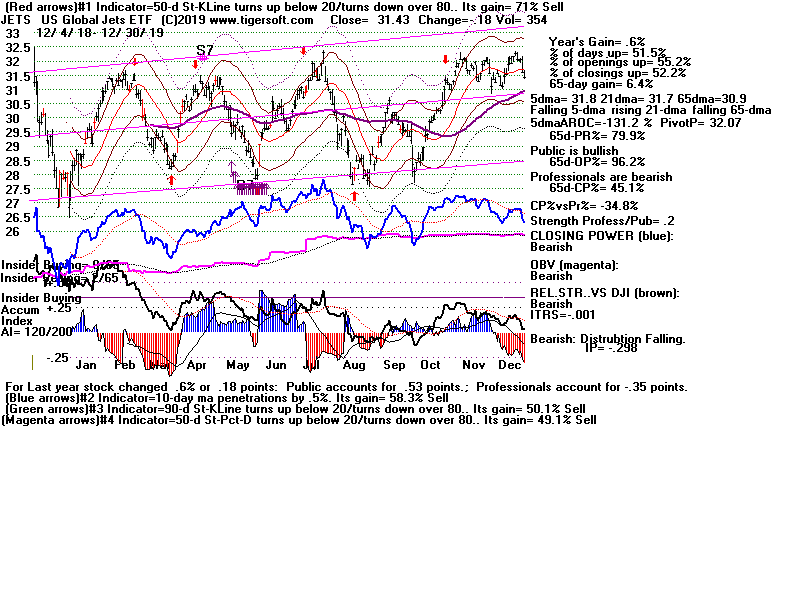
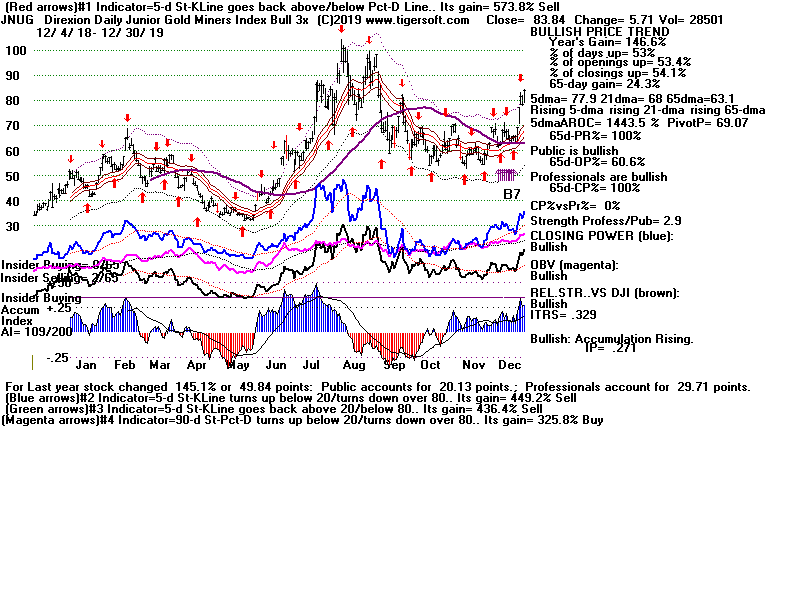
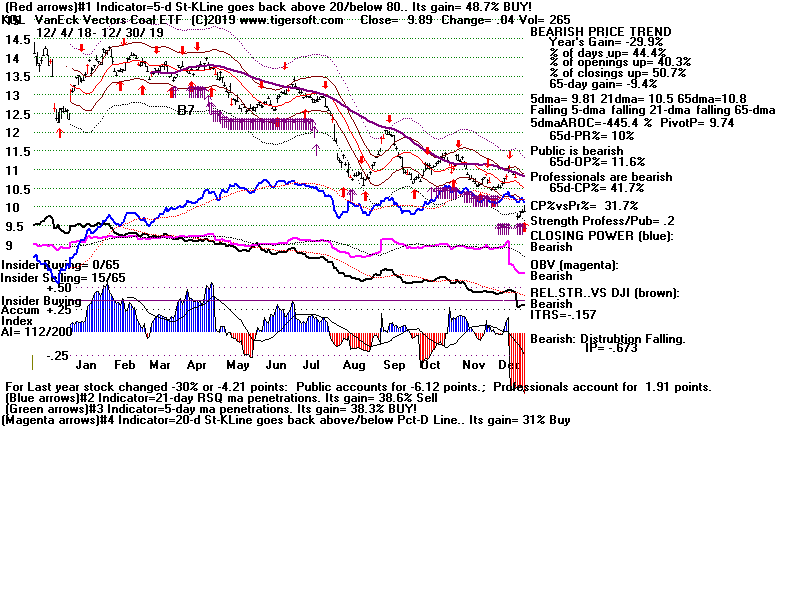
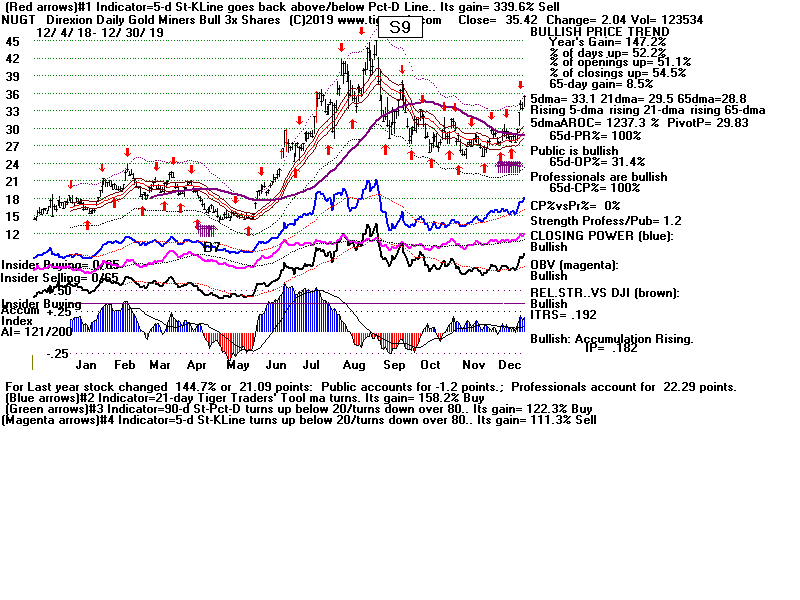
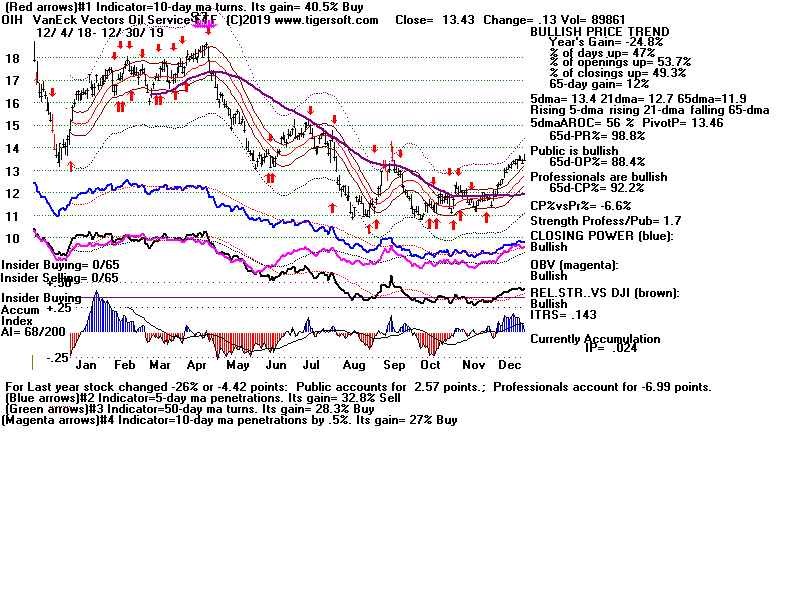
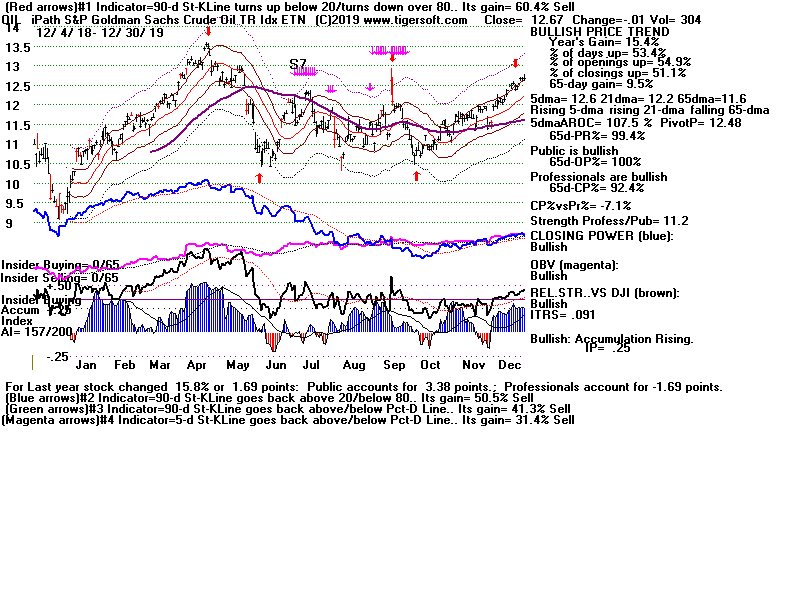
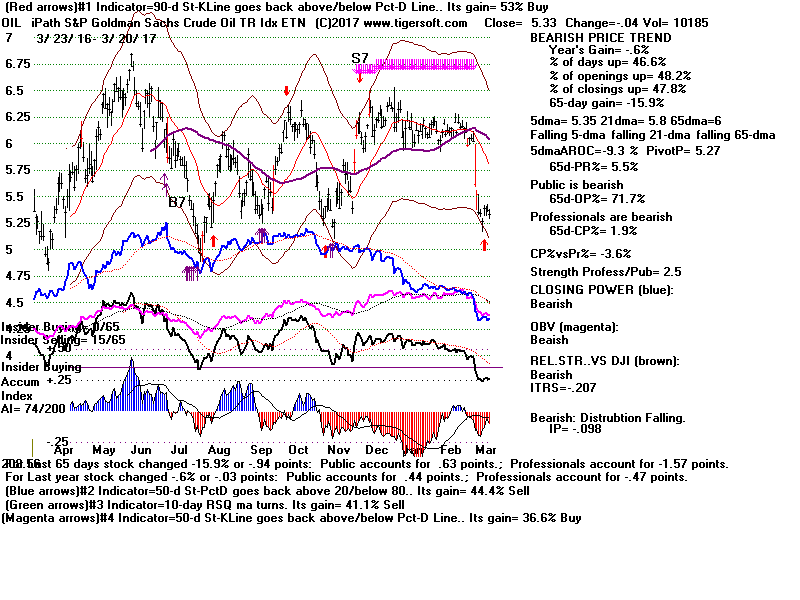
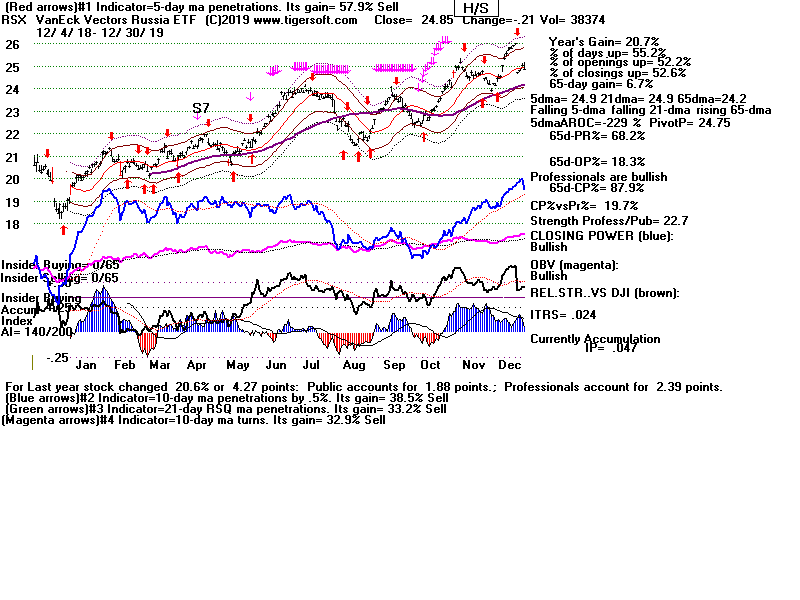
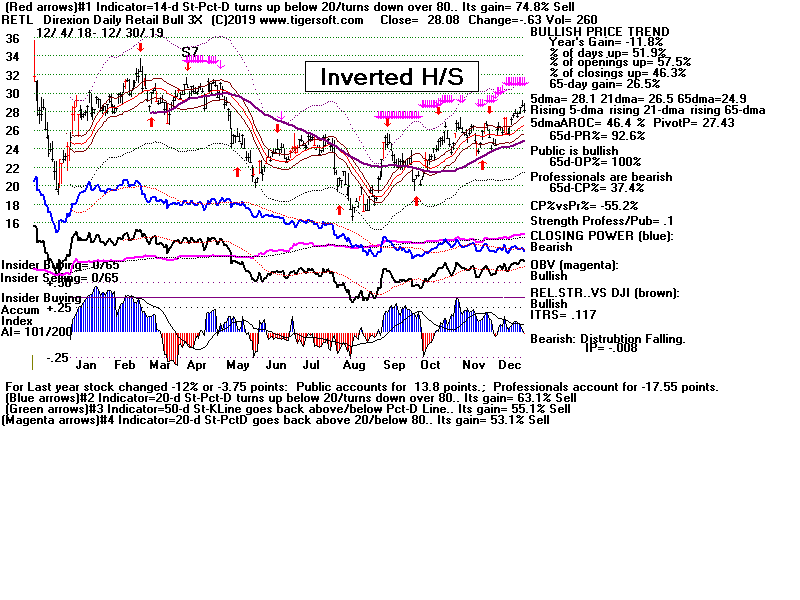
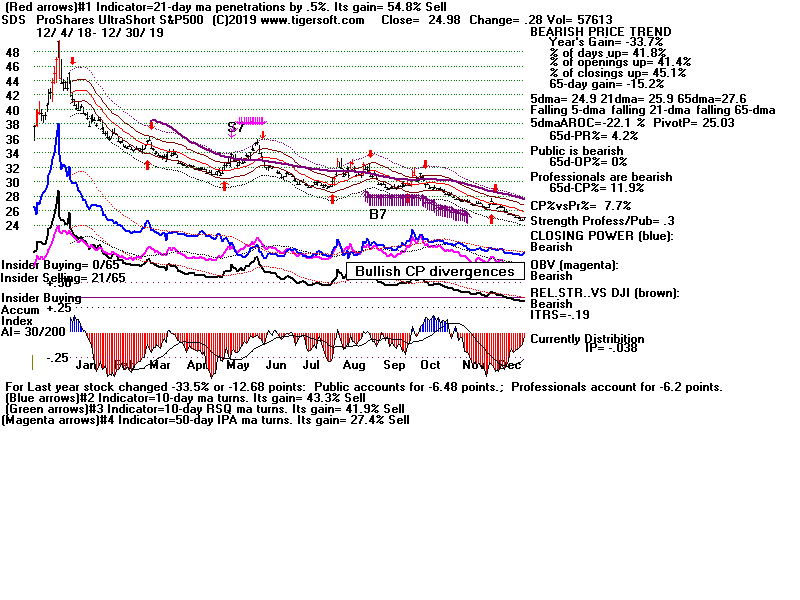
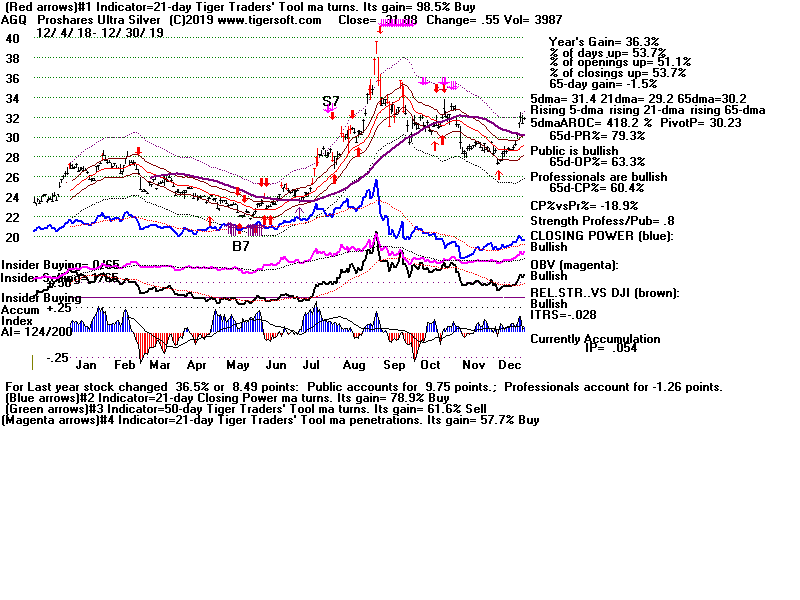
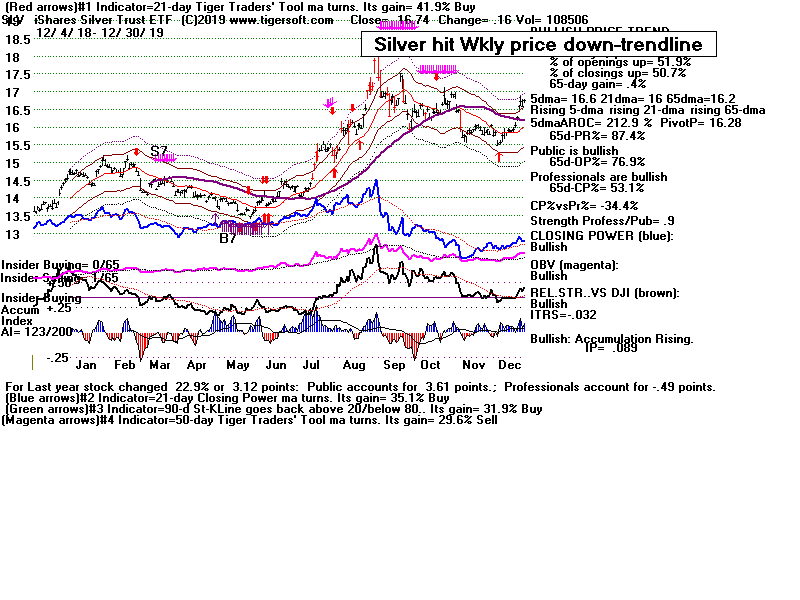
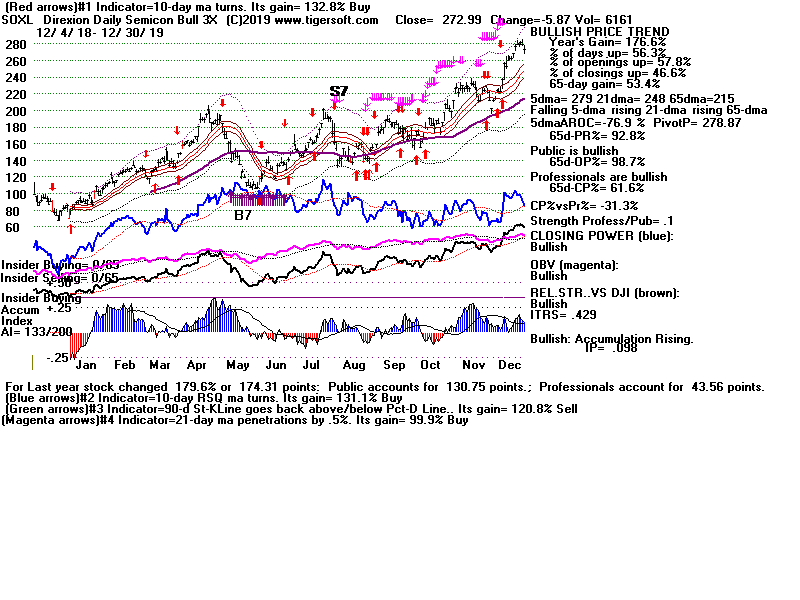
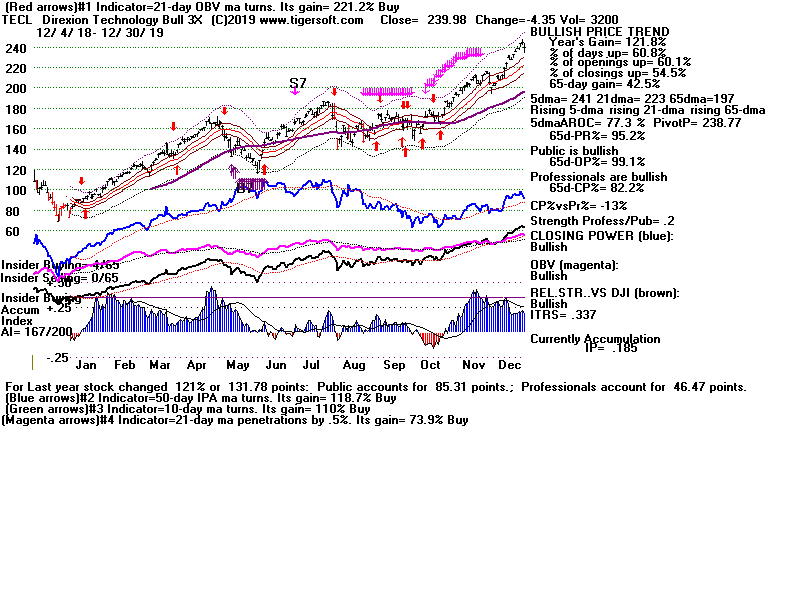
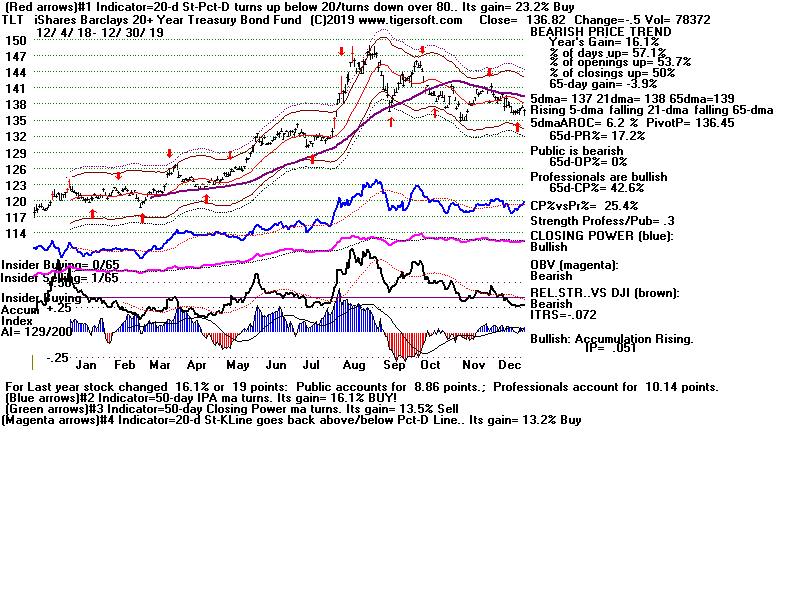
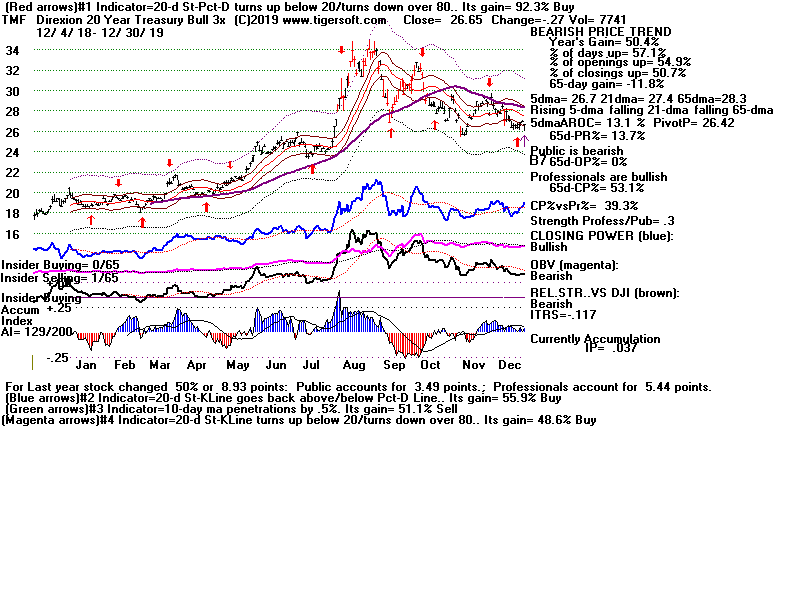
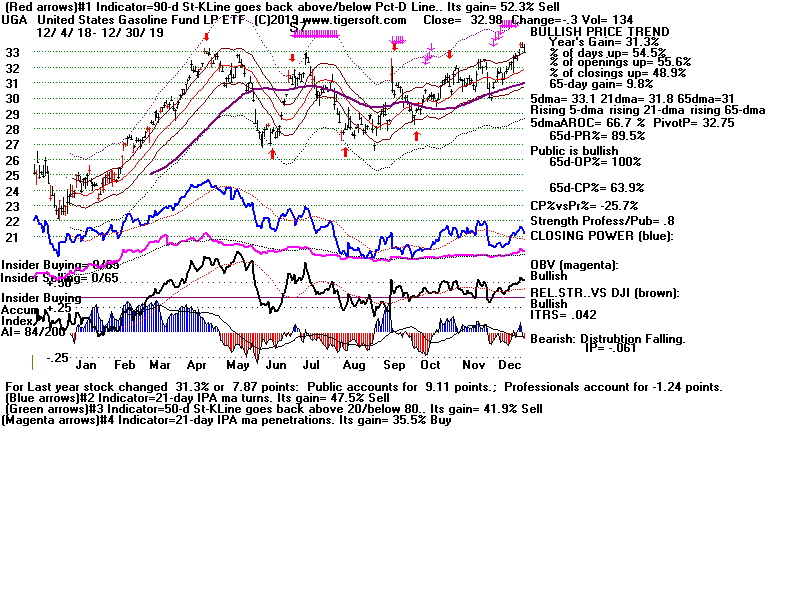
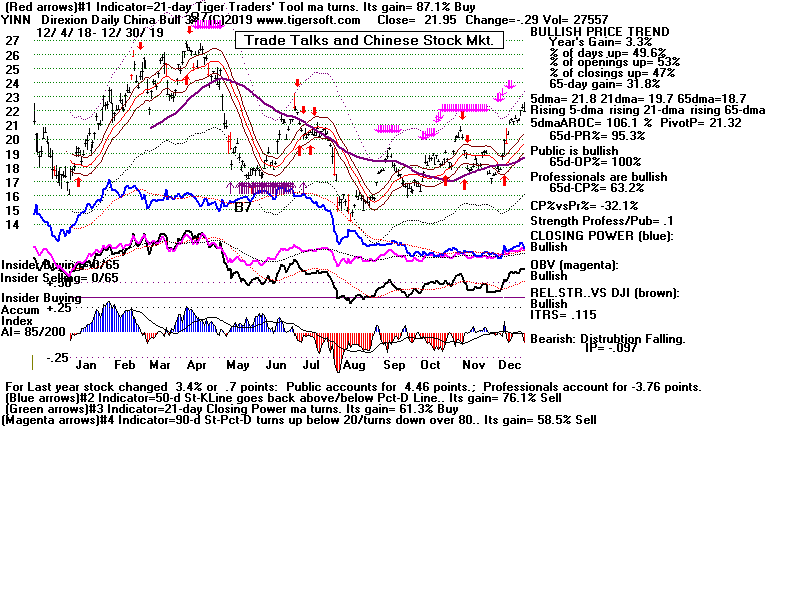
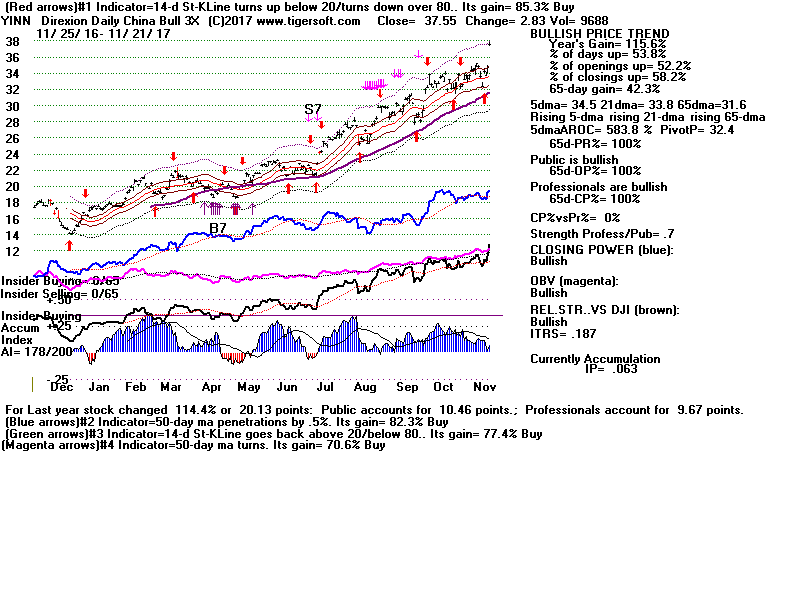
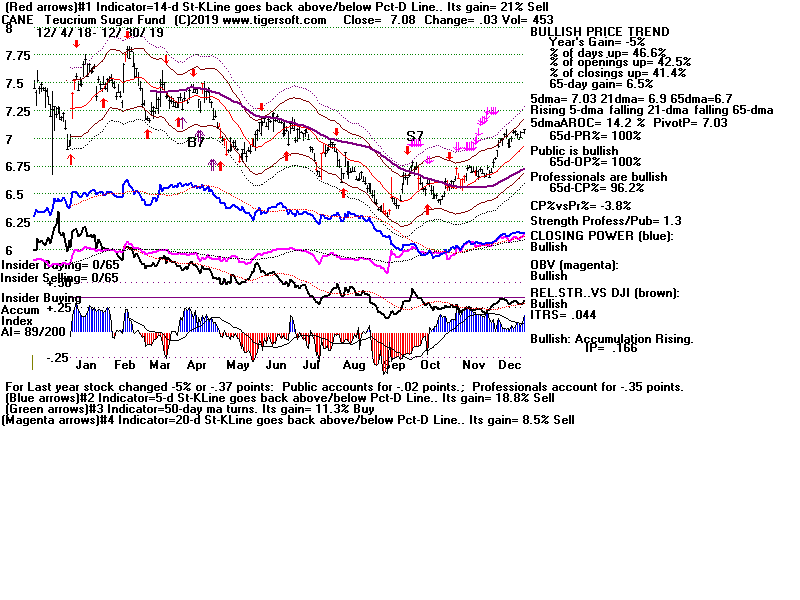
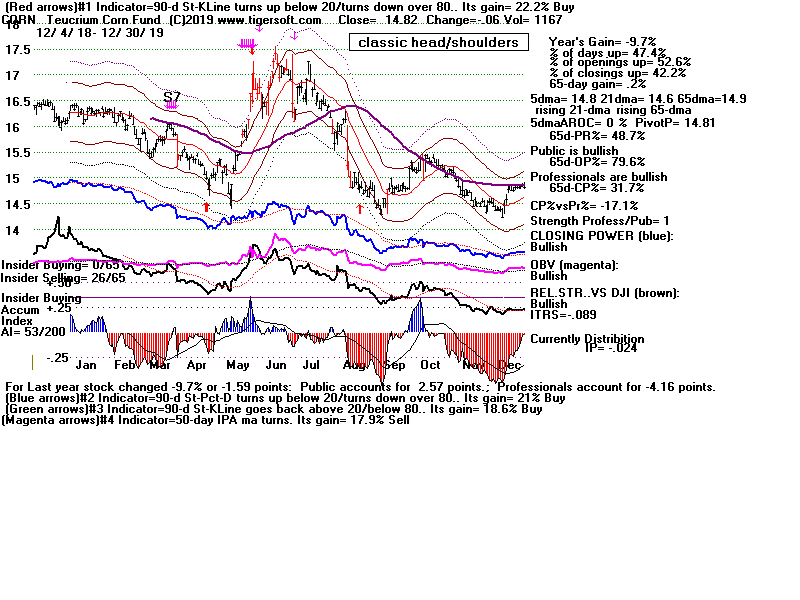
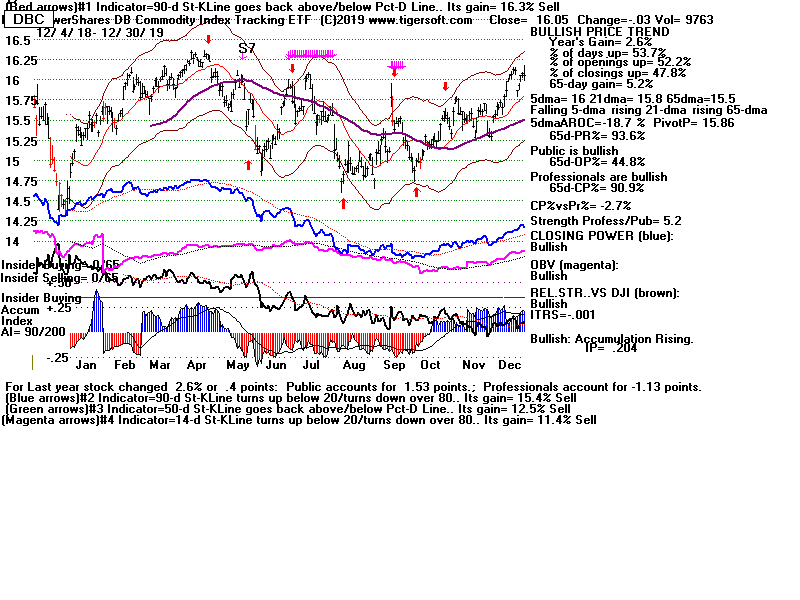
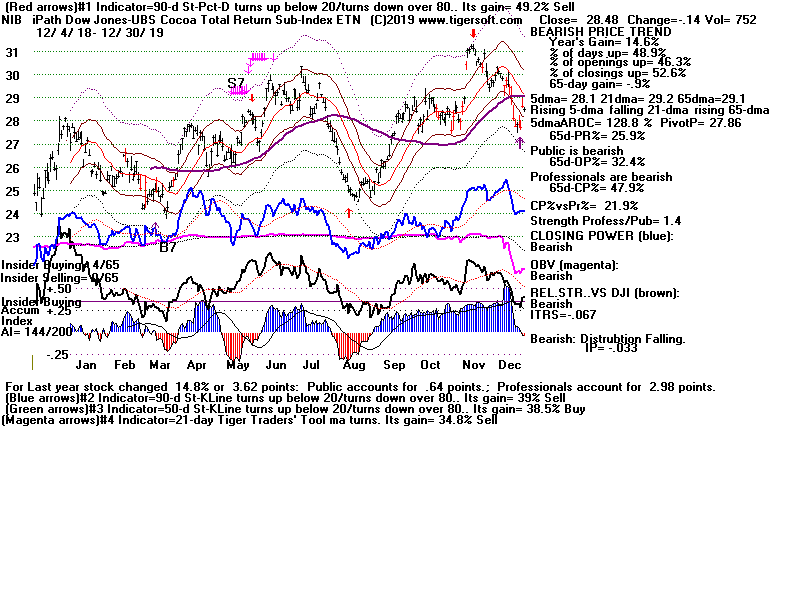
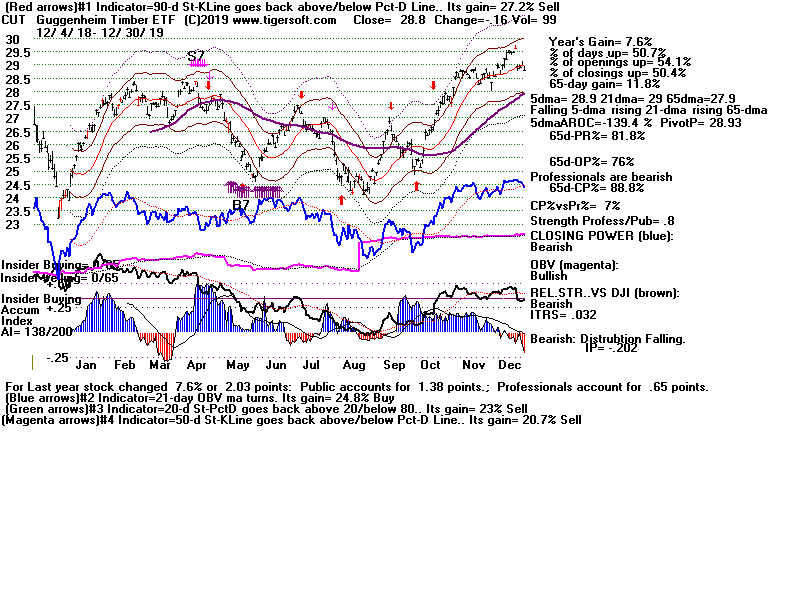
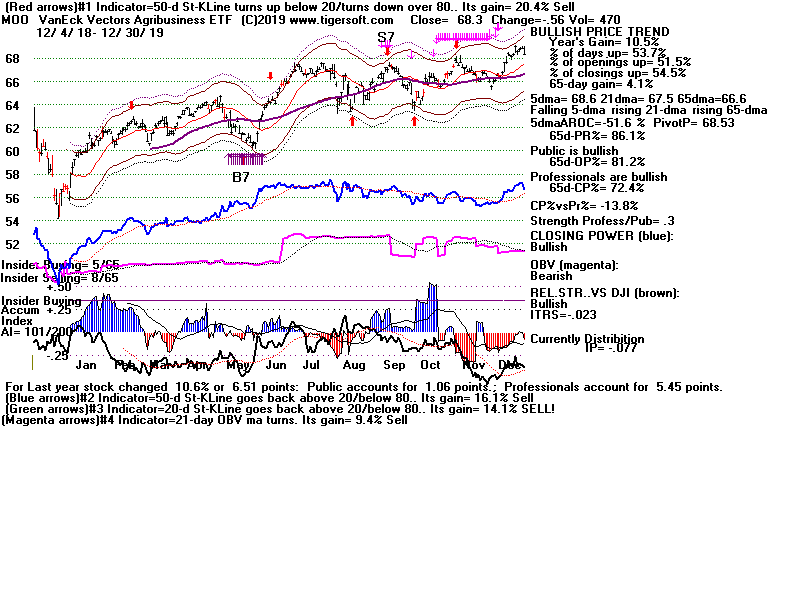
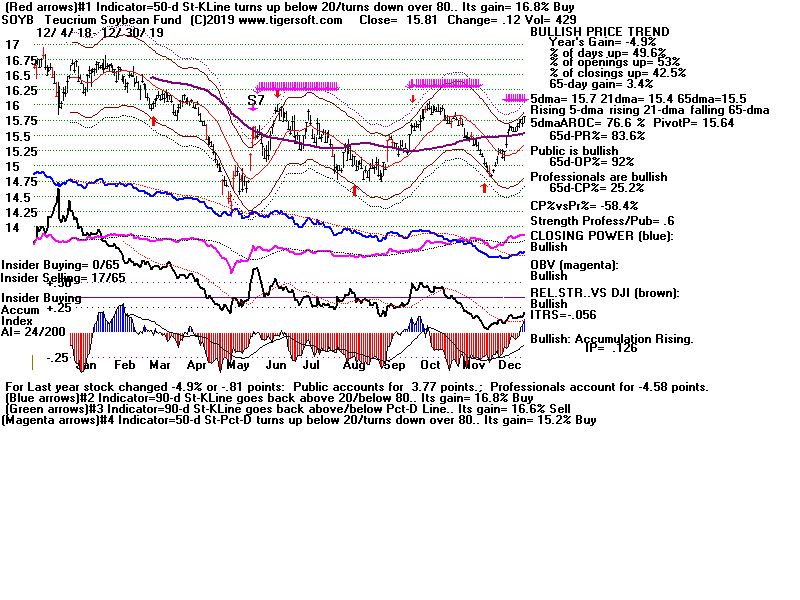
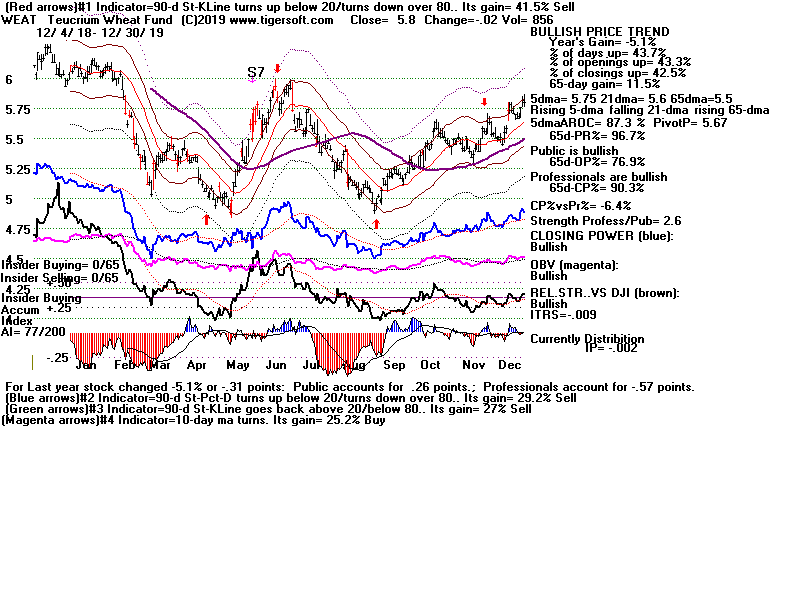
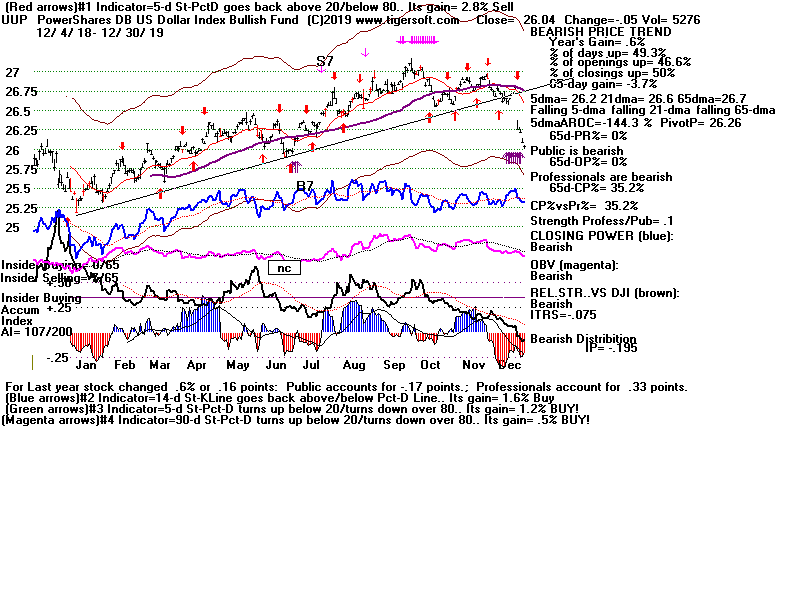
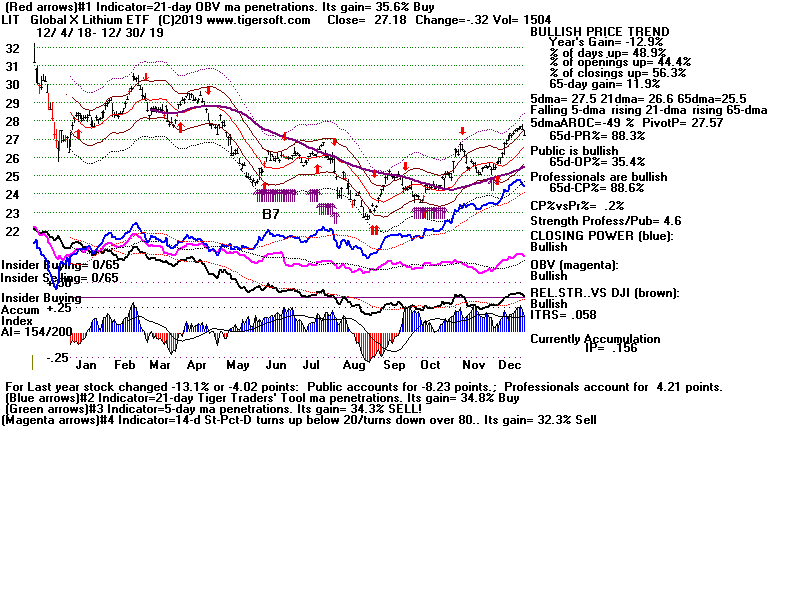
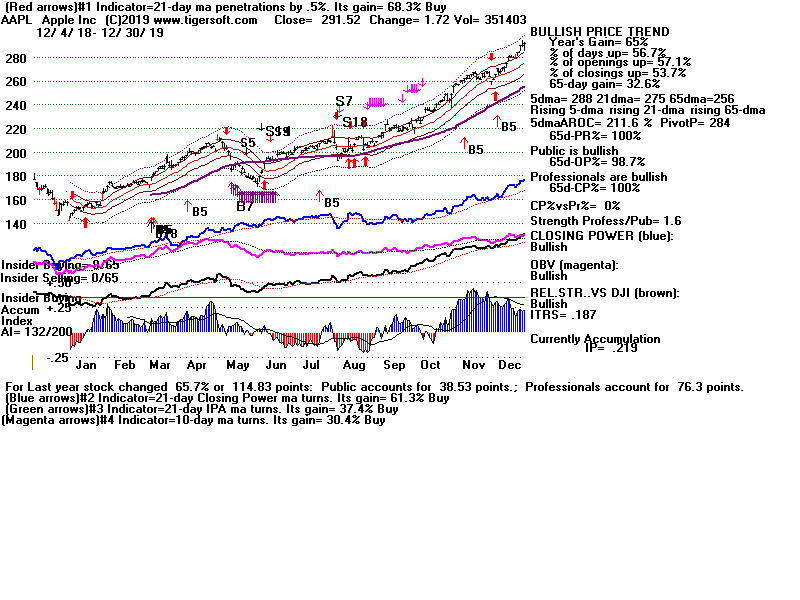
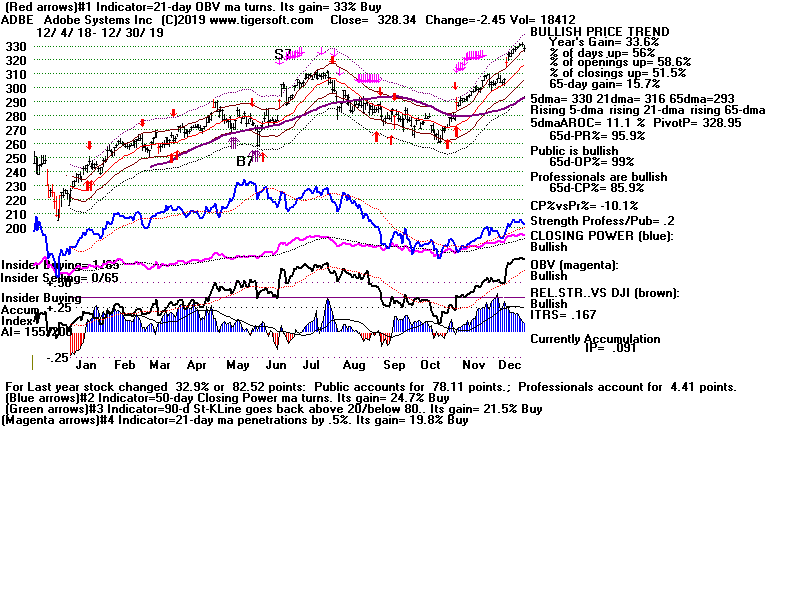
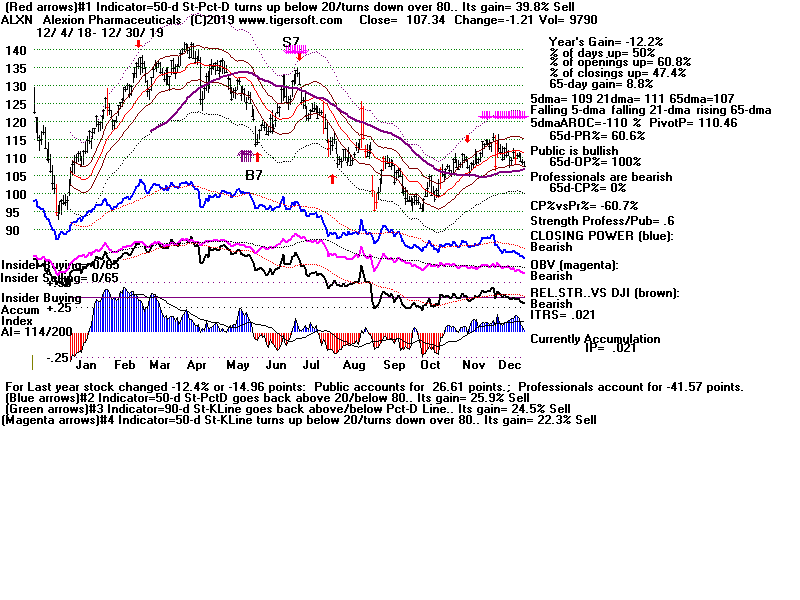
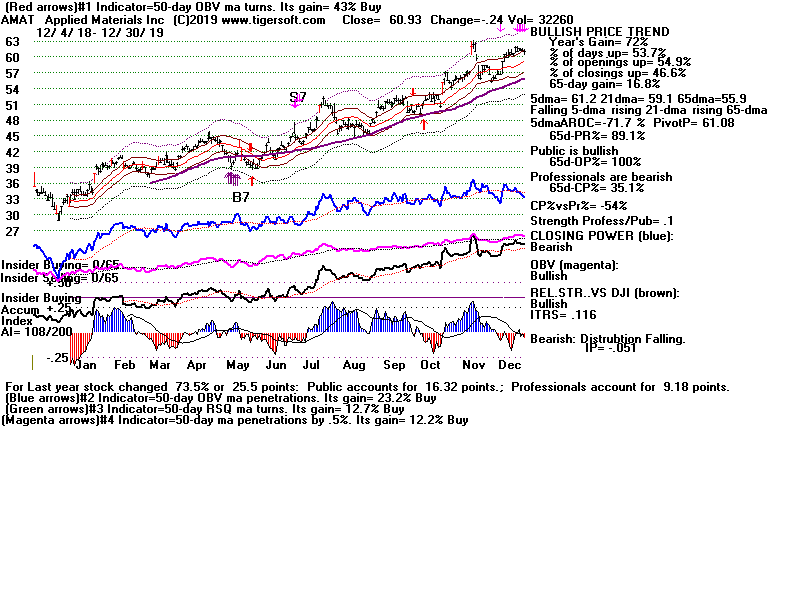
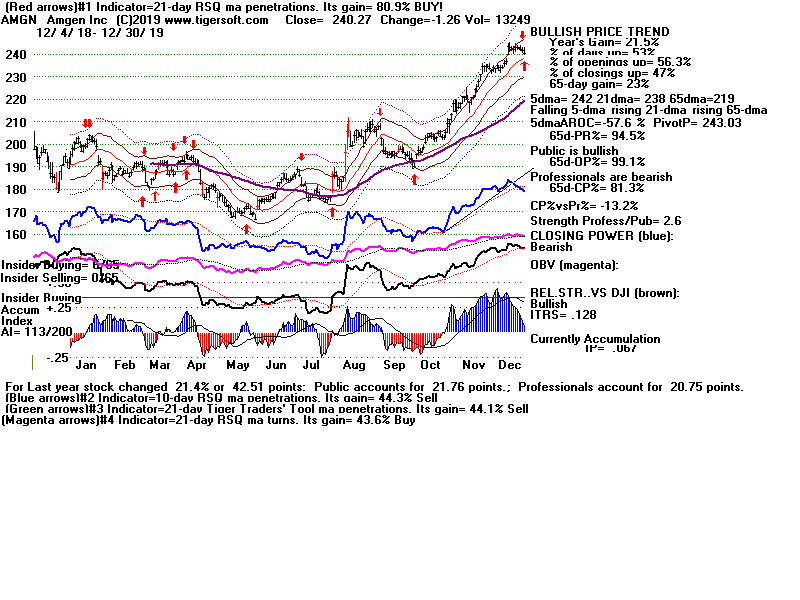
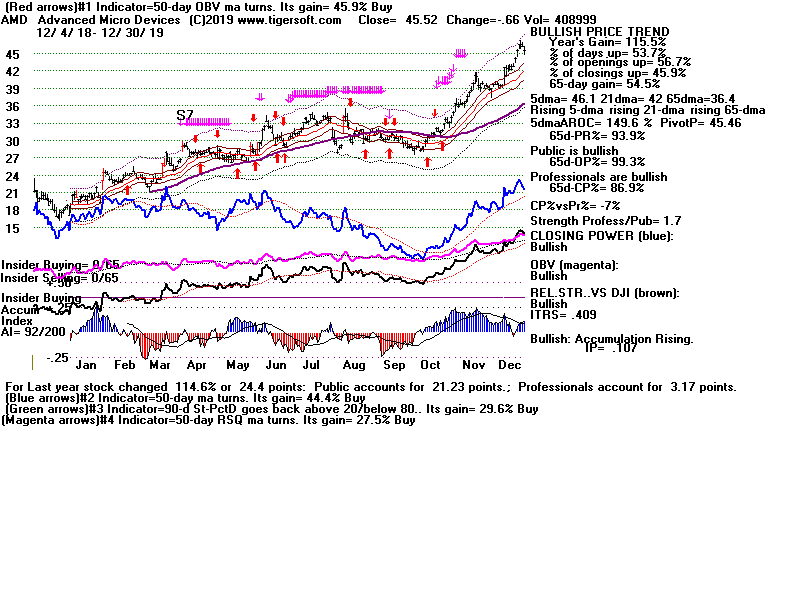
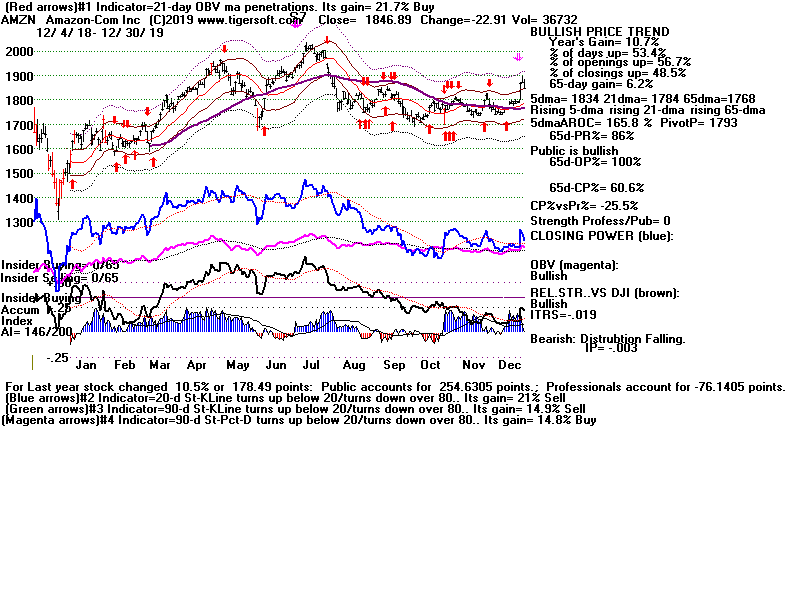
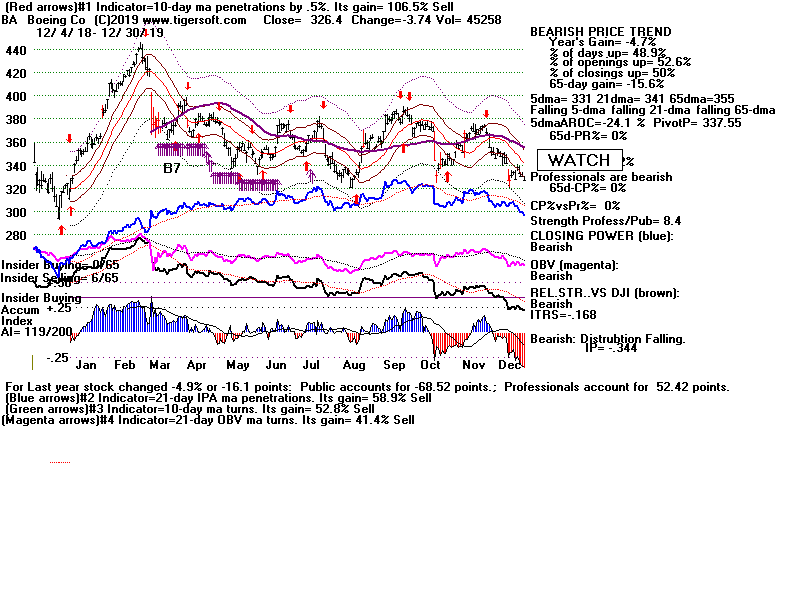
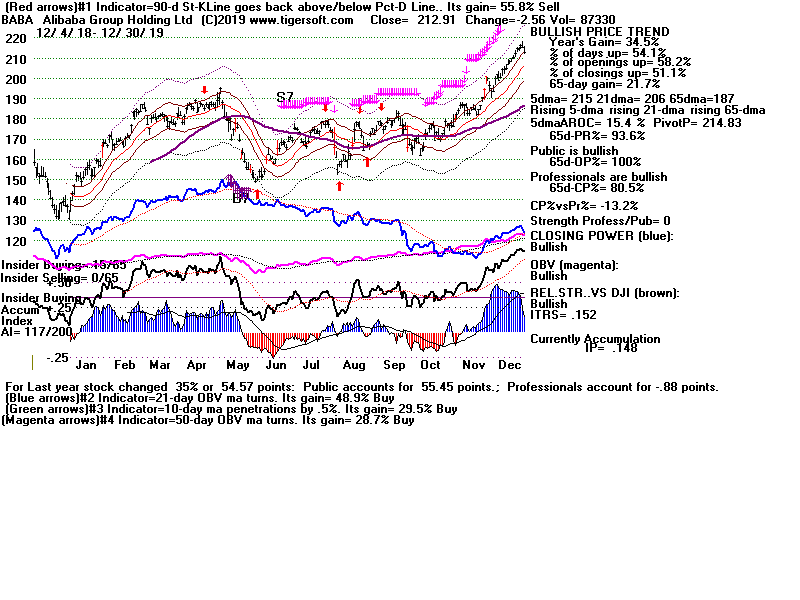
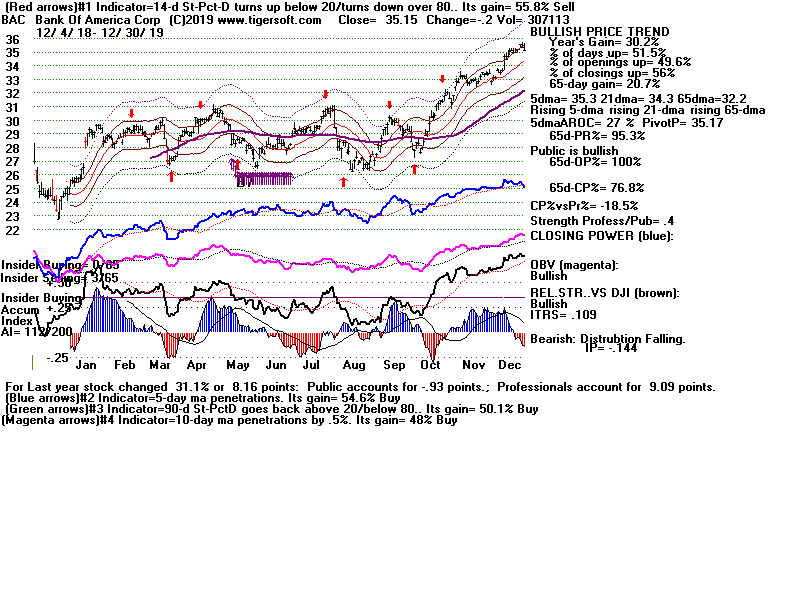
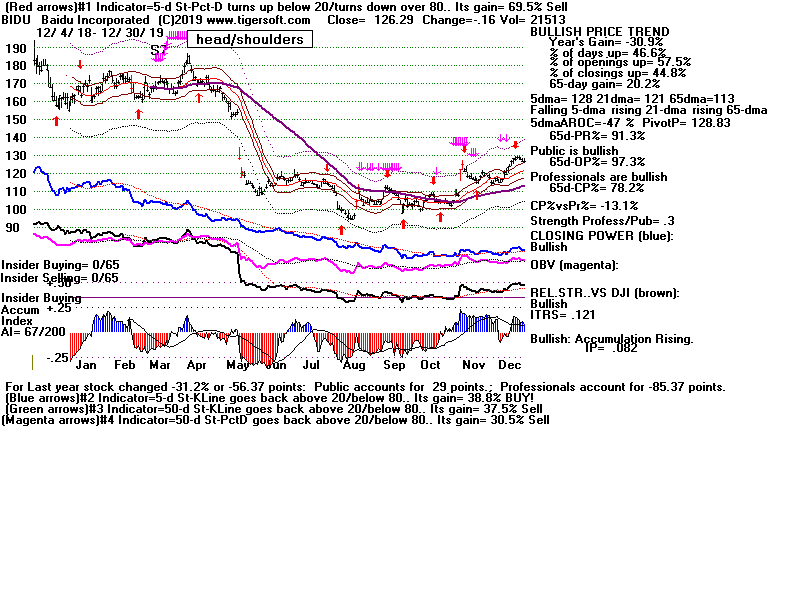
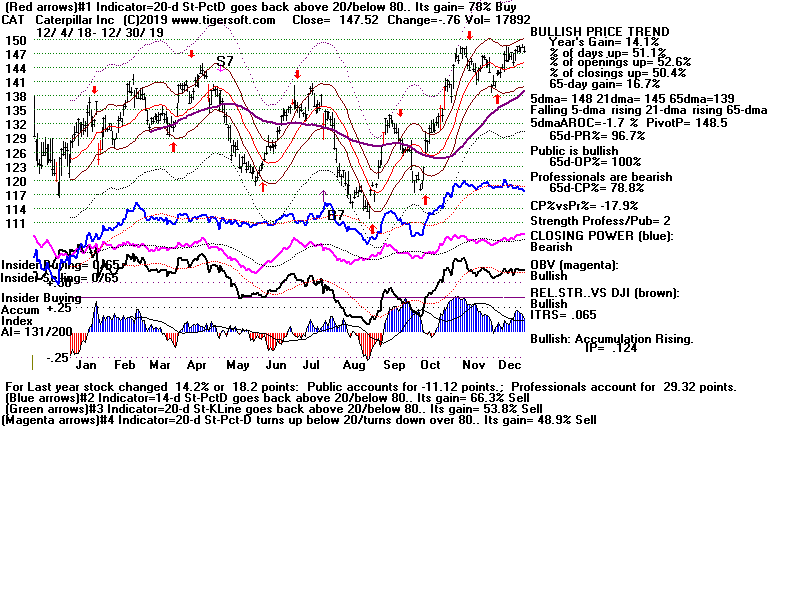
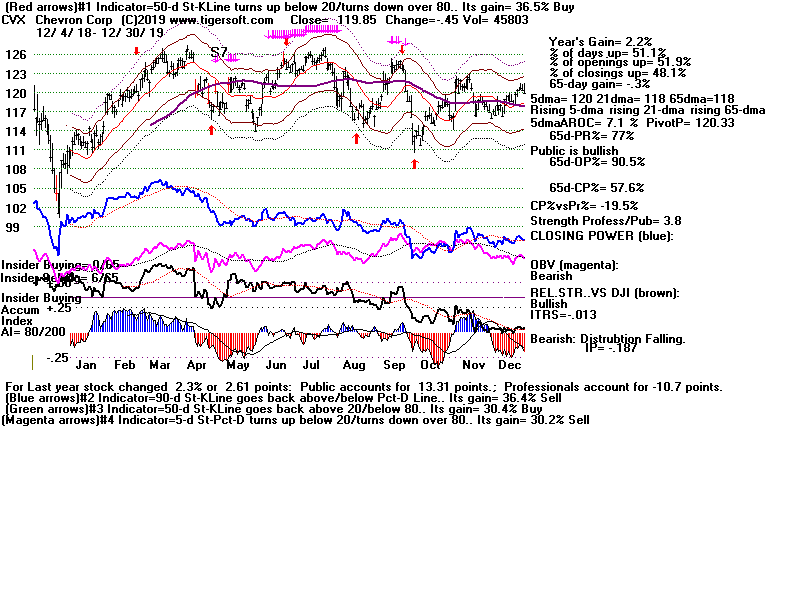
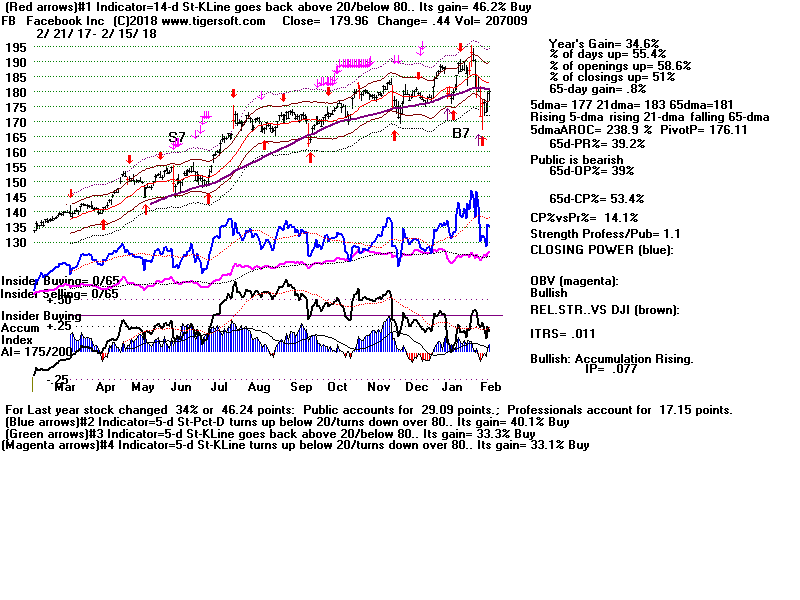
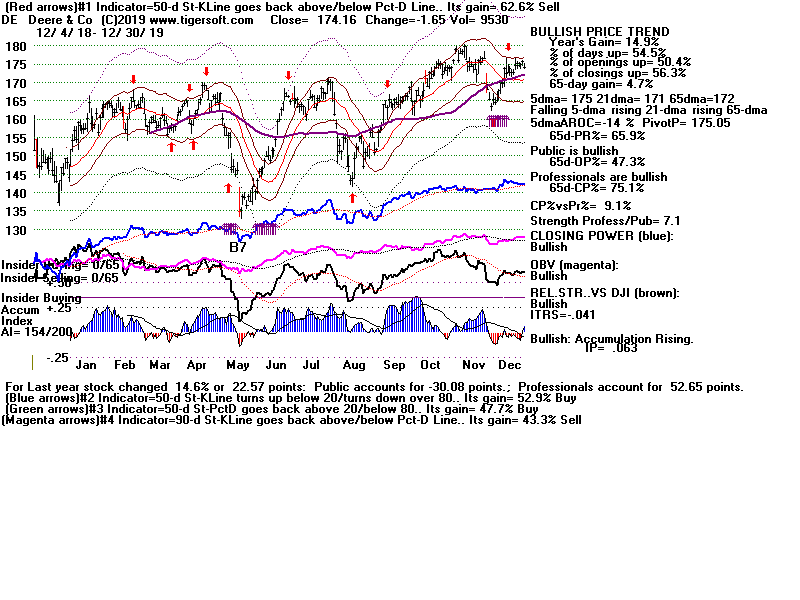
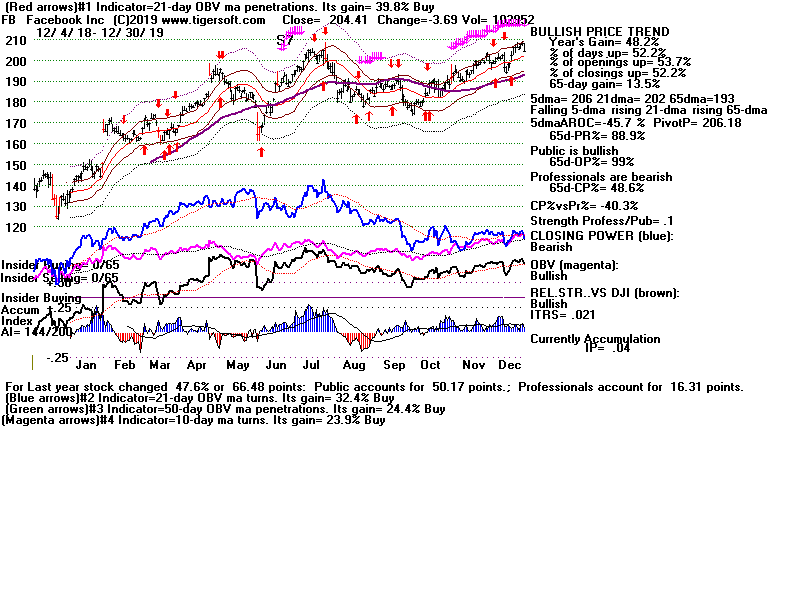
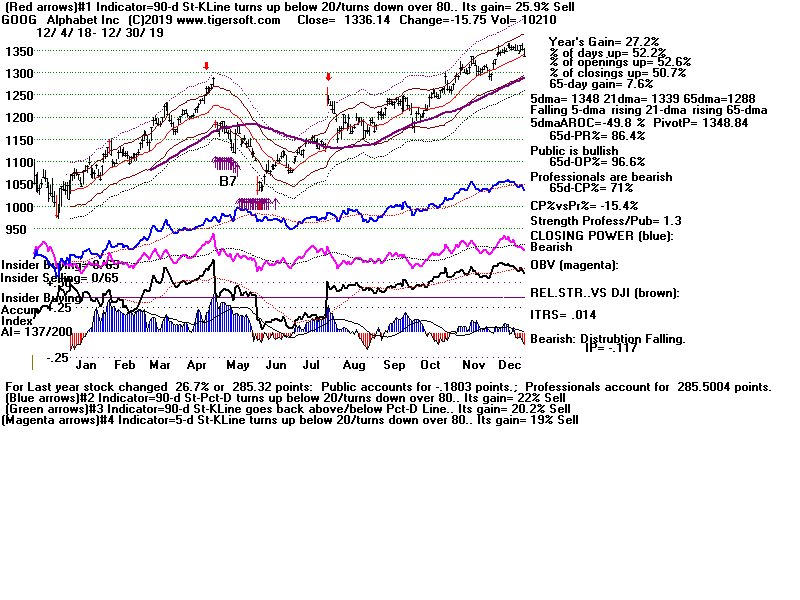
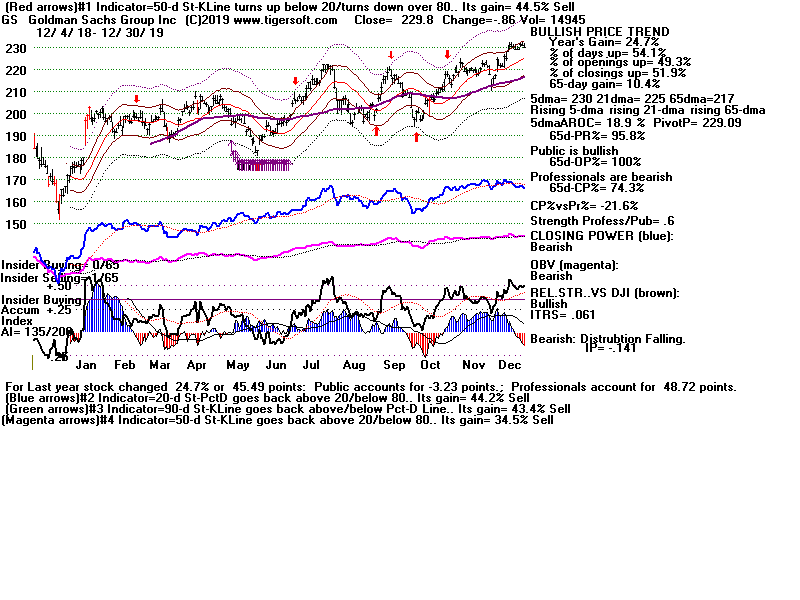
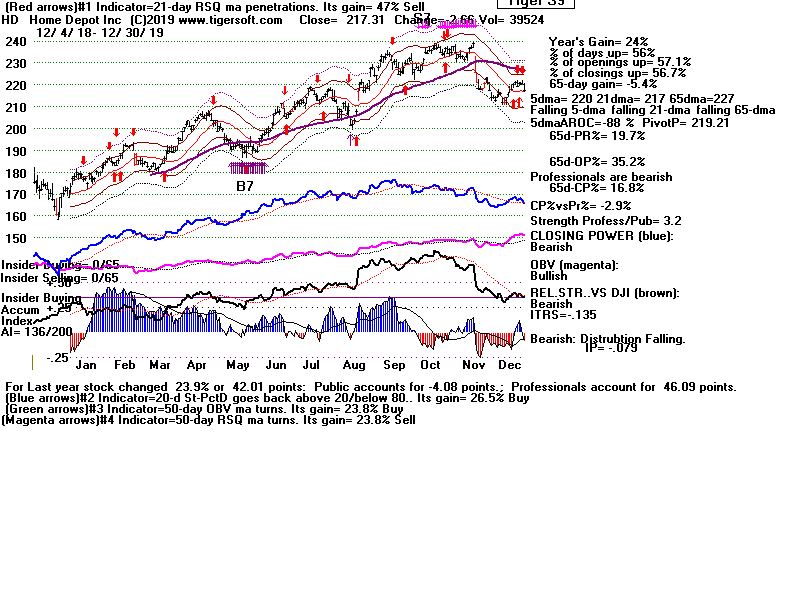
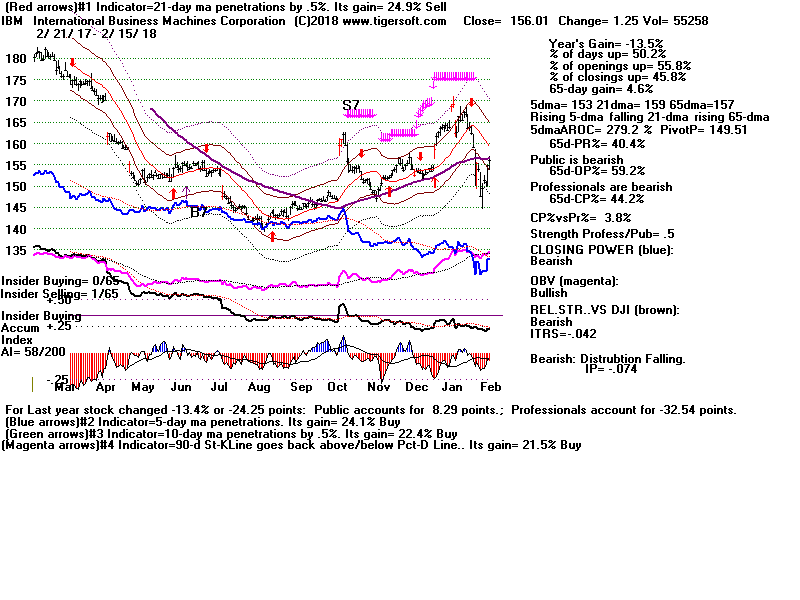
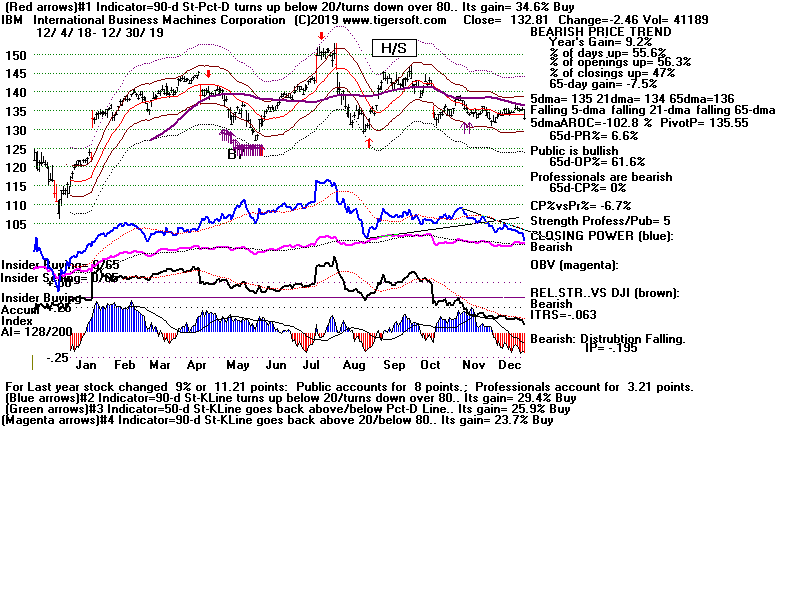
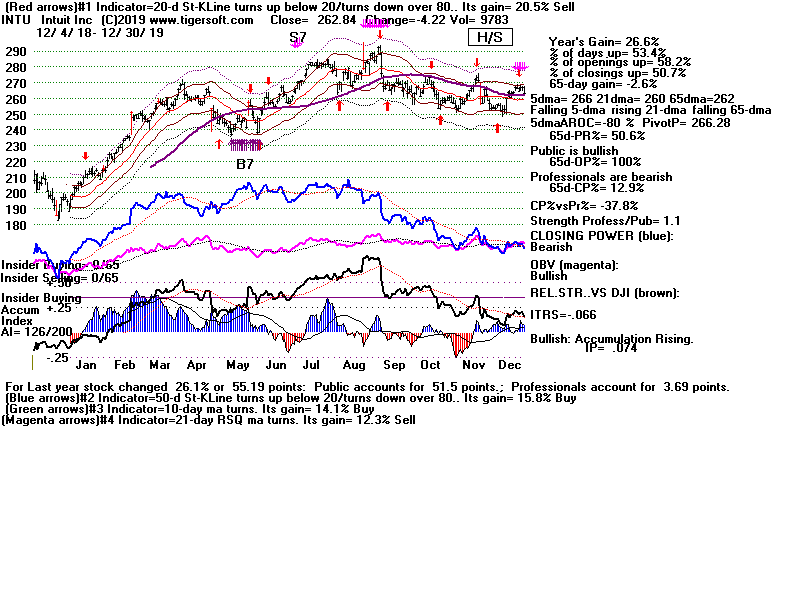
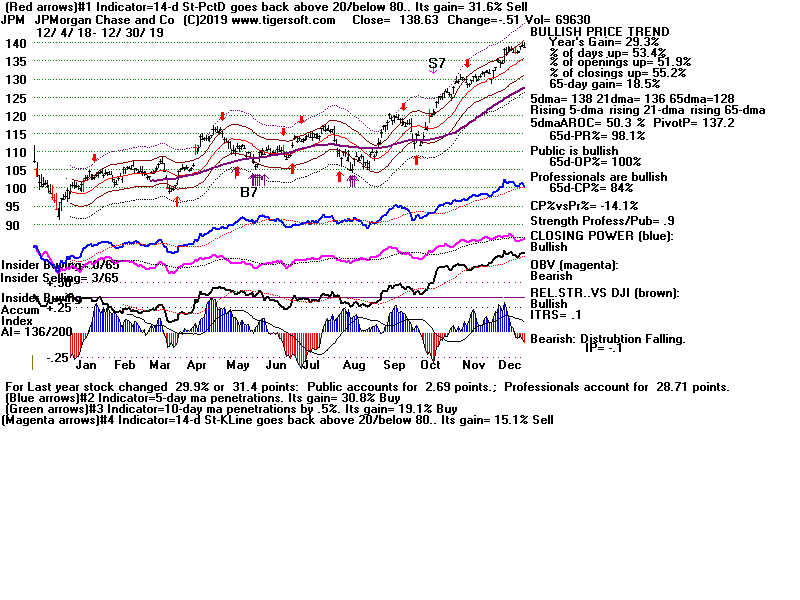
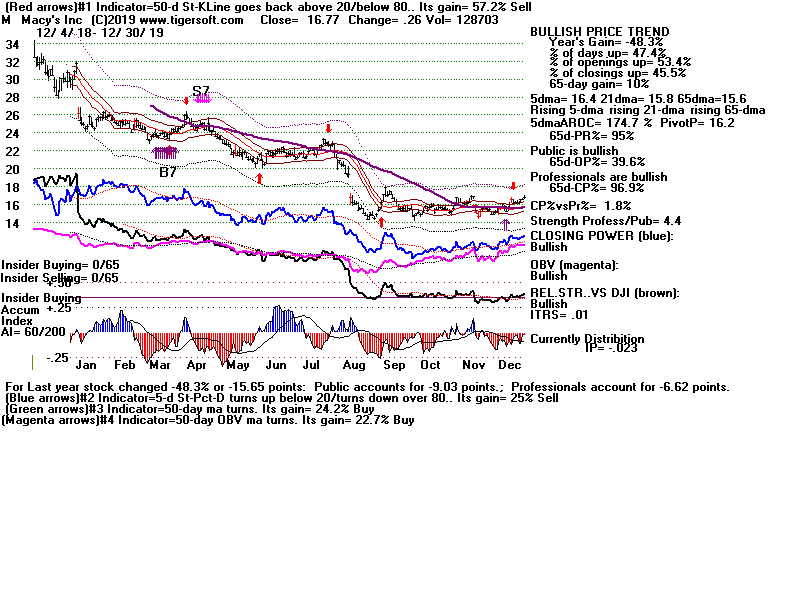
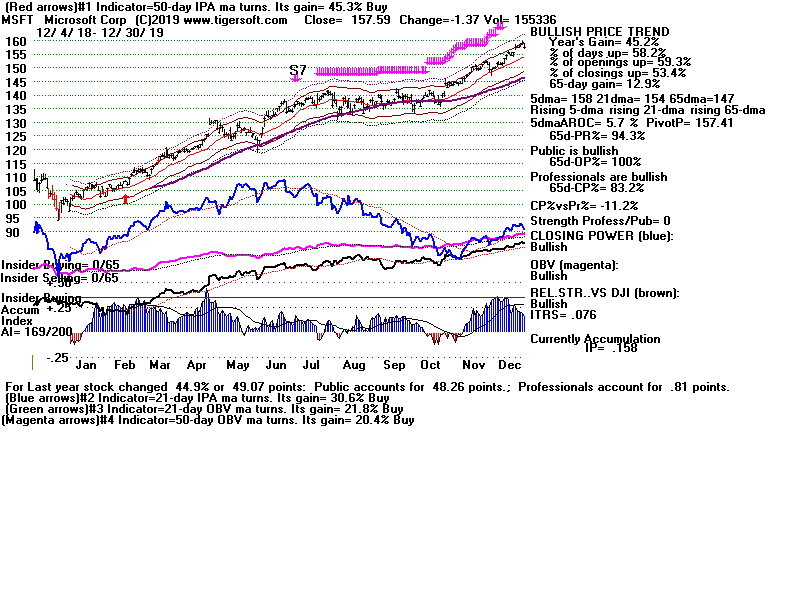
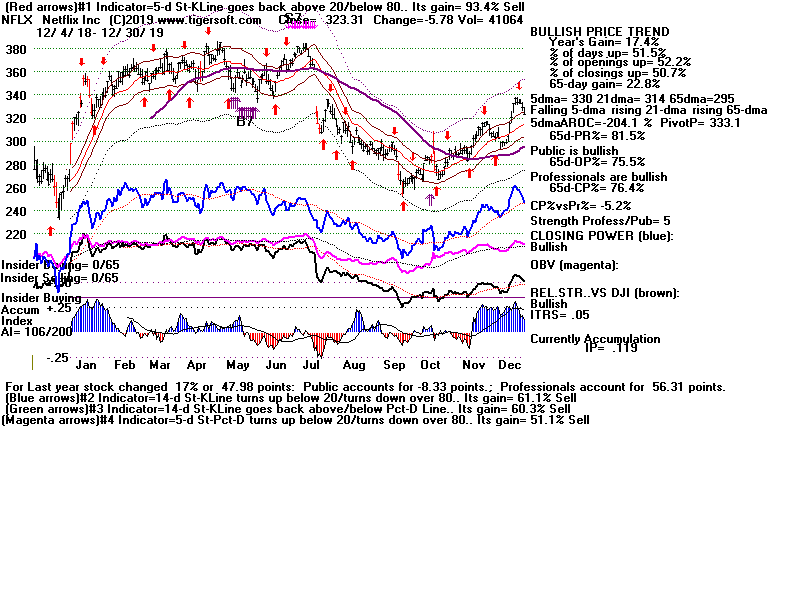
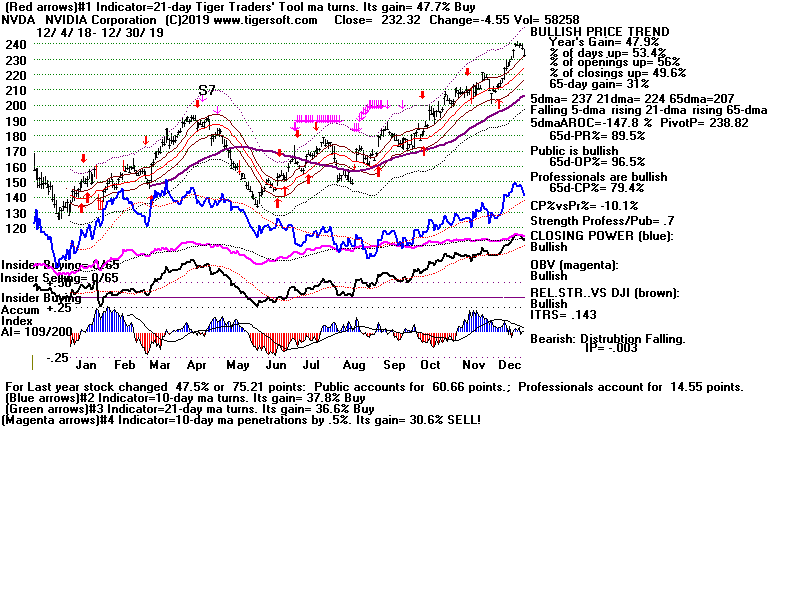
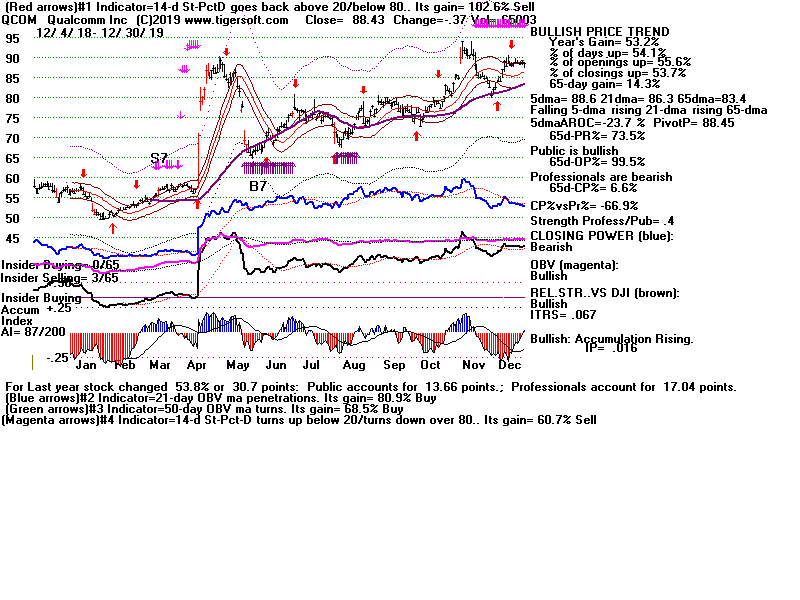
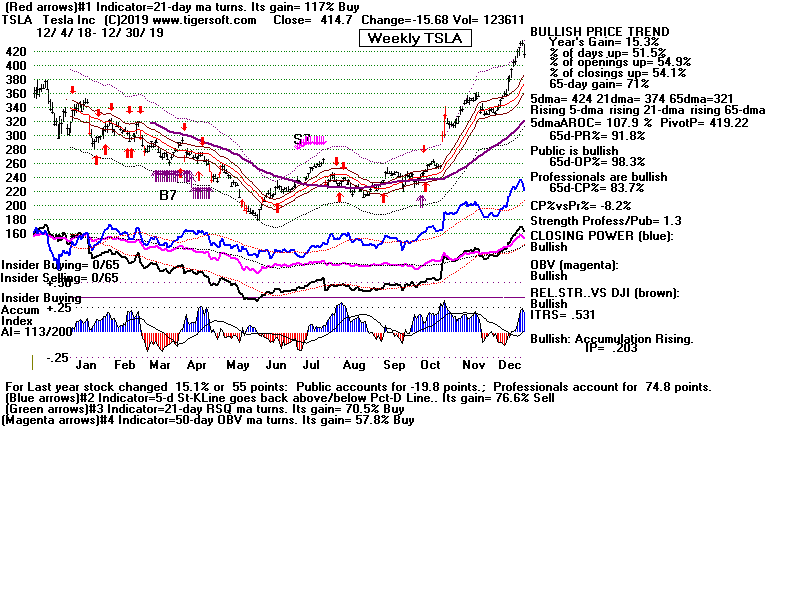
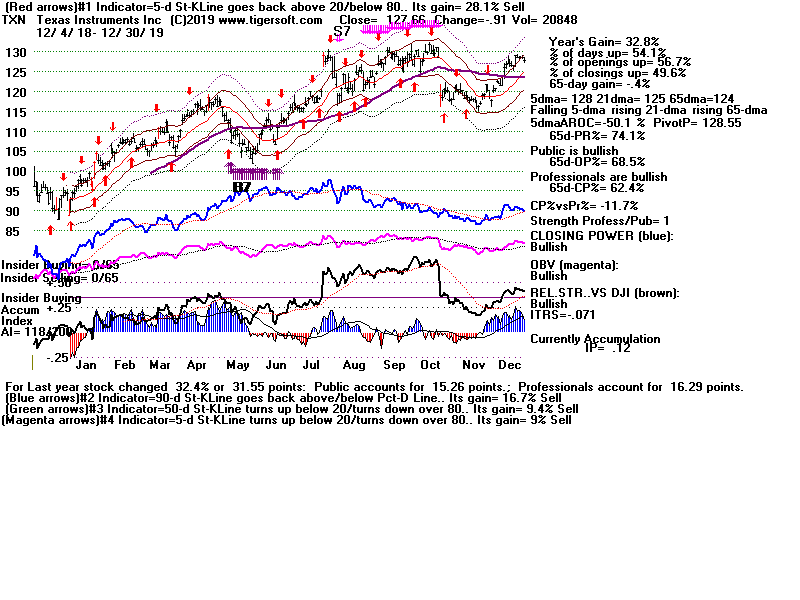
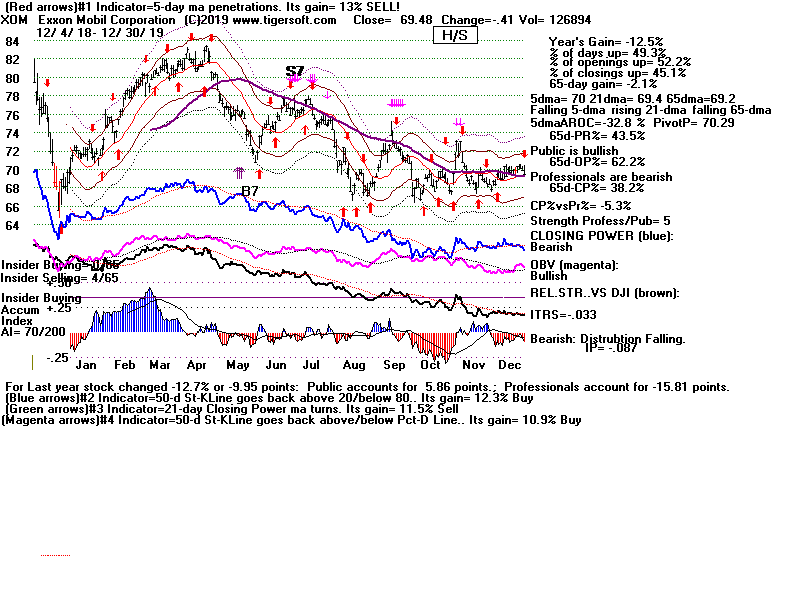
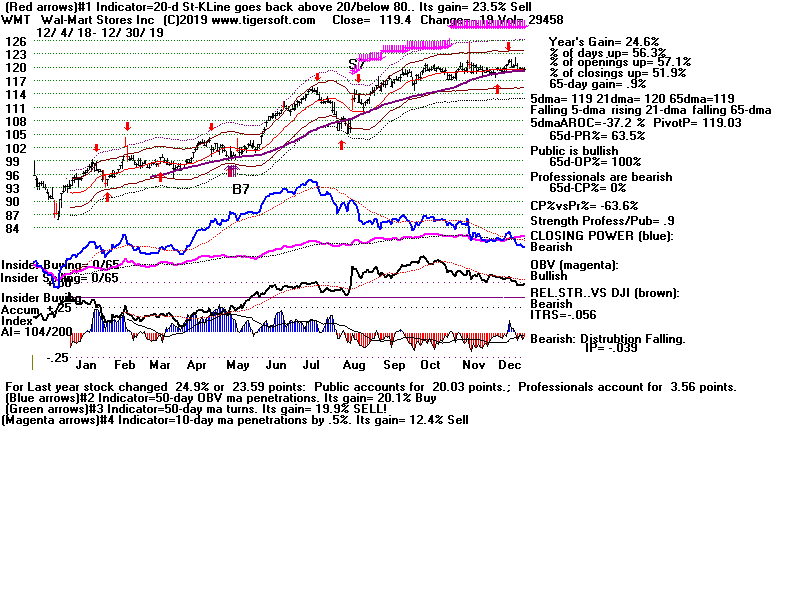
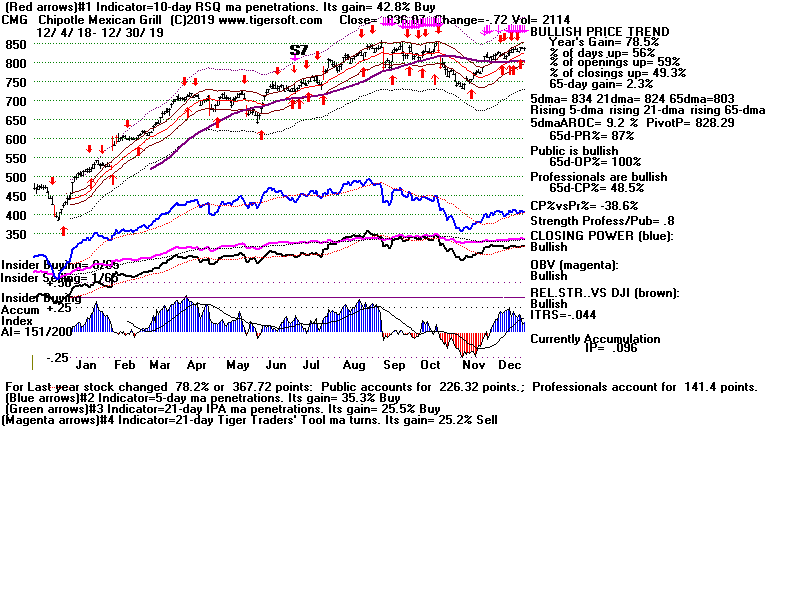
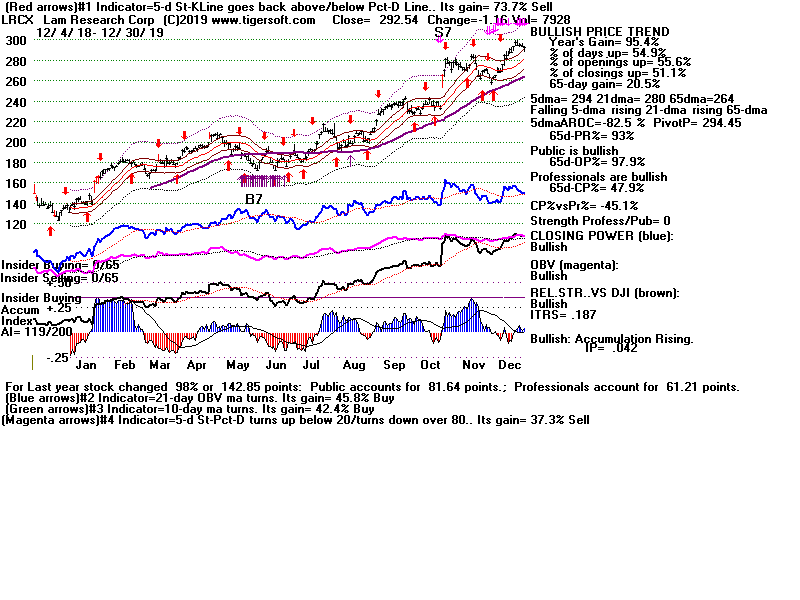
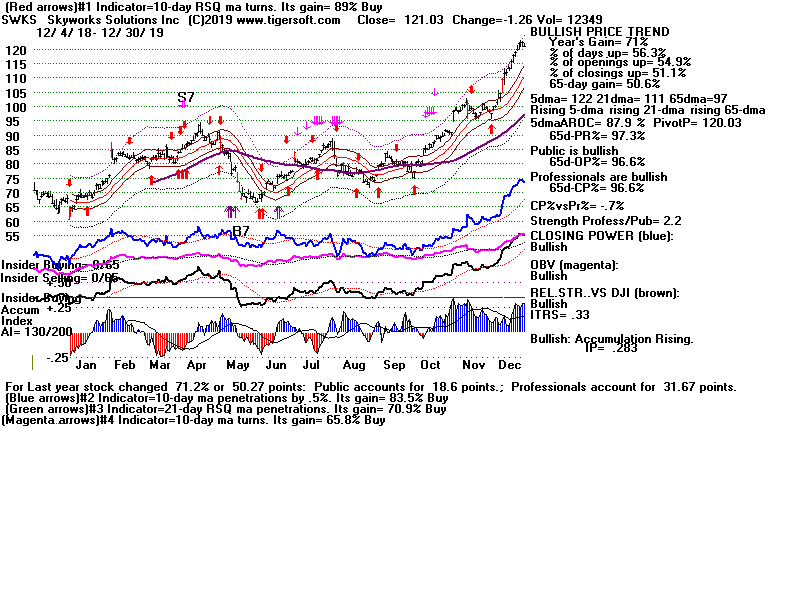
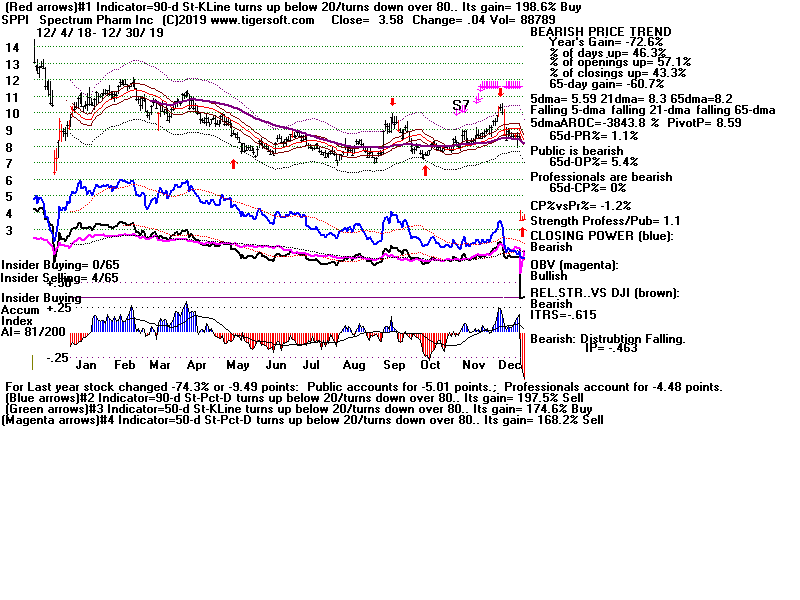
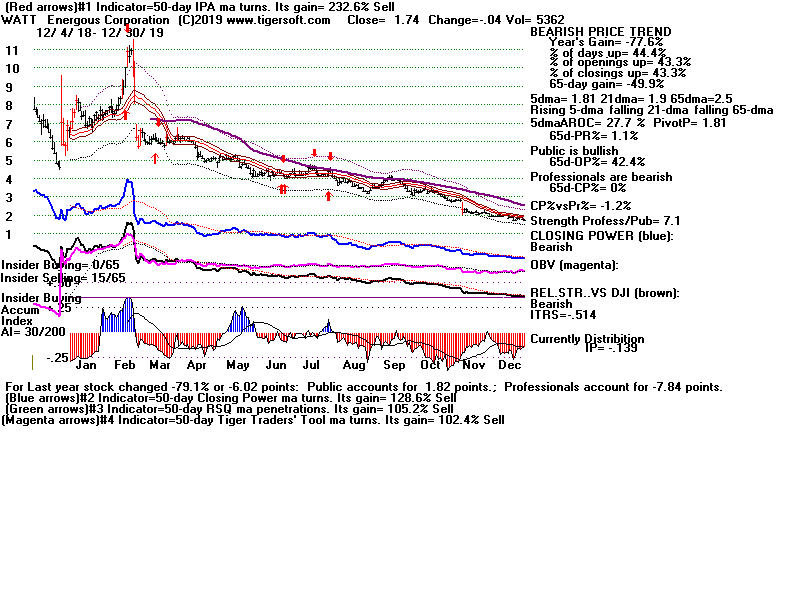
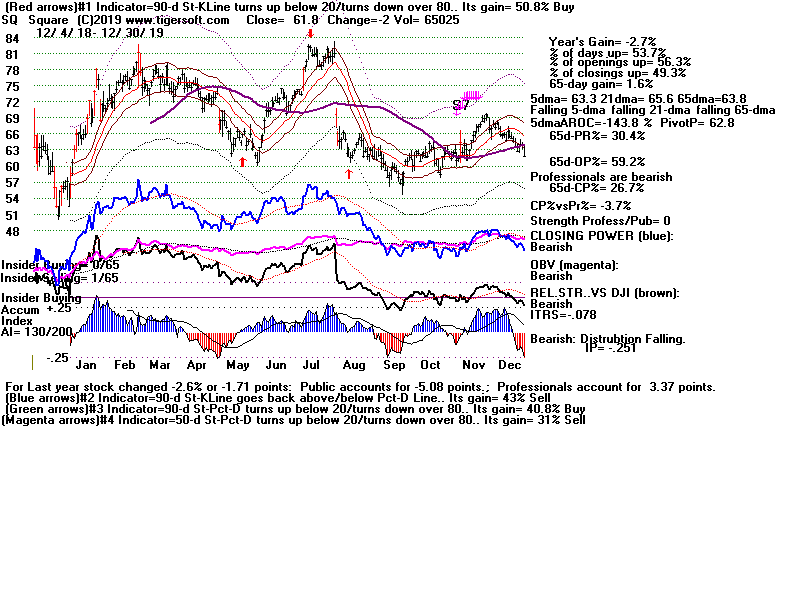
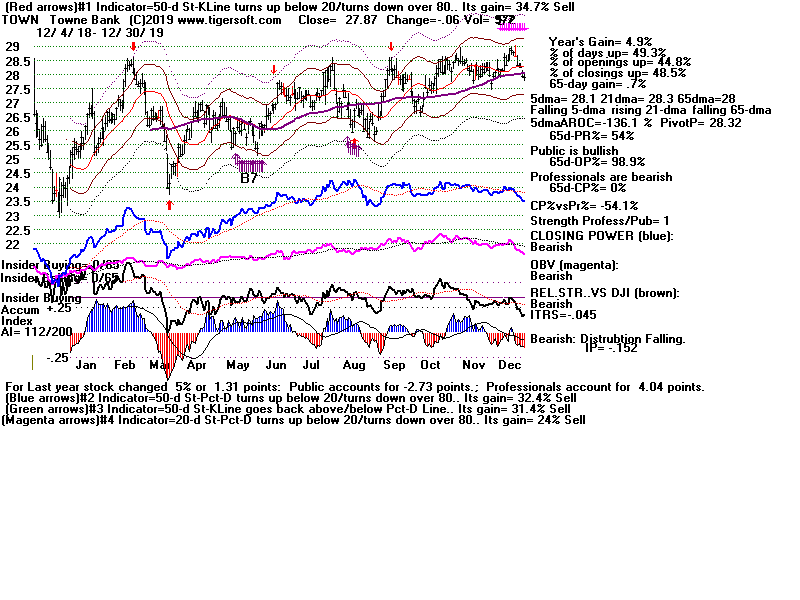
====================================================================
====================================================================
====================================================================
1/09/2019 A Peerless Sell S12 signal
today was given today. DJI Resistance
seems likely to be very intense from here up to 24300, where
the point of 50% retracement is. So, upside potential is quite
limited. At the same time, there is much more downside potential
if the DJI simply re-tests its December lows. The problem for
the market now technically is that we have a series of lower
and lower tops. So, if 21000 does not hold, it will seem like a
bear market has started.


Fortunately, for the market, Fed Chairman Powell has probably
learned not to 'rock the Equities' boat' and the FOMC now
says that they will not be raising rates until May and only twice
in 2019. That may limit the size of the Sell S12 decline.
Some of you may want to wait for the NYSE A/D Line to break
its uptrend before selling out long ETF positions. But can we
trust Powell's new-found dovishness. What if he changes his
mind again, perhaps because the Dollar weakens significantly.
I would suggest that without more signs of inflation, the FED
has no business raising rates, at all. Certainly, there are many who
do not trust the Jobs' numbers and would rather emphasize
the likelihood of an international economic slow-down.
Looking back again at the January S12s since 1928, we see
they are very reliable and the significant (>3%) paper losses or
draw-downs are infrequent. A re-test of the December lows,
or at least 22000 seems likely next. The negative Accumulation
Indexes are warning us that Big Money does not believe the
current rally will continue much higher. I would trust their bearishness
and expect the rising Closing Power uptrends tobe broken and expect
to see a number of optimized red Stochastic-14 Sells even if the
A/D Line uptrend is not quickly broken.
|
Independent January Sell S12s since 1928 Date Peerless Gain Paper Loss --------------------------------------------------- 1/10/1941 +.103 (+10.3%) perfect Sell signal 1/6/1949 +.083 -.0061 (-0.61%) 1/24/1949 +.086 none 1/8/1960 +.107 none 1/6/1966 +.213 -.009 1/8/1968 +.086 perfect 1/11/1973 +.108 none 1/2/1974 +.046 -.029 1/2/1981 +.042 -.038 1/29/1982 +.069 none 1/6/1983 +.038 -.020 1/5/1984 +.108 -.003 1/11/2000 +.130 -.018 1/4/2001 +.129 -.068 1/6/2003 +.137 -.008 1/6/2009 +.087 none ------------------------------------------ Mean=+9.5% Avg=+9.8% Avg= -0.5% |
The A/D Line has been strong since December 26, as we would
expect when the FED seems more "dovish". But S12s, which
are based on heavy red Distribution by Big Money, clearly can
over-ride rising briefly A/D Lines. That is why there are so
many January S12s without a nearby S9 (which is breadth-related).
What could be behind the decline? Powell has shown he can
waffle. Now the Dollar is starting to fall. We may get to a point
where international investors will buy Chinese 10-year bonds
rather than US Treasuries...especially, if the US seems unable
to govern itself and seems more and more unstable.

I believe that the DJI will decline next if it appears that Trump's
quick walk-out today from talks with Democrats to end the 15-day
government shut down is not soon reversed with renewed and fruitful
negotiations. The constitutional implications of a longer-term
Budget stalemate and government shut-down should not be dismissed.
On the one hand, no government means no regulation for Wall Street.
On the other hand, a prolonged political stalemate creates
increasing uncertainty, not to mention that it will probably hurt
Republicans and the President more than it hurts the Democrats.
"The truth is that all men having power
ought to be mistrusted.."
(James Madison)
The Founding Fathers built the Constitution on the basis of
compromise, checks and balances, not Presidents running things
by emergency decrees and ultimatums. 2011 taught us that Federal
Governmennt credit-worthiness counts for something: Wall Street
needs foreigners to have faith in the foundations and stability of
American Government. A long shut-down will shake that. So far,
the 10-year rate of US Treasuries is lower than the Chinese. But
a weak Dollar could change that and require much higher Treasury
rates to be internationally competitive. That would spell big trouble
for the stock market here.
|
Charts 1/9/2019 2018 PEERLESS DJI, Signals, Indicators Daily DJI Volume 10-DayUp/Down Vol Hourly DJIA A/D Line for All Stocks Inverted Traders Index NASDAQ S&P OEX NYSE COMPQX DJI-15 DJI-20 DJI-30 DIA SPY QQQ MDY IWM TNA Short-Term Rates USO-CrudeOil DBO FAS GLD BBH IBB JETS JNUG KOL NUGT OIH OIL RSX RETL SDS AGQ SLV SOXL TECL TLT TMF TNA UGA (gasoline) XIV YINN Commodities: CANE CORN DBC JJC, NIB, CHOC CORN, CUT (paper) MOO, SOYB WEAT UUP (Dollar) LIT (Lithium) AAPL ADBE ALXN AMAT AMGN AMD AMZN BA BABA BAC BIDU CAT CVX DE FB GOOG GS HD IBM INTU JPM M (Macy's) MSFT NFLX NVDA QCOM TSLA TXN XOM WMT CMG , LRCX, SWKS, MDGL SPPI WATT SQ TOWN 1/9/2019 (Click on Underlined link.) - Bullish MAXCPs - http://tigersoft.com/MAXCPS/Jan-09/BULLISH.htm Bearish MAXCPs - http://tigersoft.com/MINCPs/Jan-09/BEARISH.htm |
Table 1 QUICKSILVER on ETFS - 1/8/19 ETF CLOSE CHANGE PIVOT-PT 5-dma AROC CL-PWR CANDLE IP21 ITRS --------------------------------------------------------------------------------------------- DIA 238.92 1 226.72 119% ------- ---- -.109 ----- --------------------------------------------------------------------------------------------- BA 343.83 3.3 310.9 307% ------- BLUE -.041 -.011 --------------------------------------------------------------------------------------------- SPY 257.97 1.2 244.21 154.8% ------- BLUE -.057 -.001 --------------------------------------------------------------------------------------------- QQQ 160.82 1.3 149.82 190.7% ------- BLUE -.062 -.016 --------------------------------------------------------------------------------------------- MDY 318.06 3.11 296.63 269.2% ------- BLUE -.071 .006 --------------------------------------------------------------------------------------------- IWM 142.9 1.17 132.25 300.5% ------- BLUE -.089 .002 --------------------------------------------------------------------------------------------- FAS 48.5 .77 42.47 388.5% Bearish BLUE -.096 -.1 --------------------------------------------------------------------------------------------- RETL 29.18 .71 23.24 956.2% ------- BLUE .184 -.157 --------------------------------------------------------------------------------------------- SOXL 89.19 6.4 70.33 227.5% ------- BLUE -.197 -.007 --------------------------------------------------------------------------------------------- TECL 89.2 3.1 72.51 254.8% ------- BLUE -.034 -.253 --------------------------------------------------------------------------------------------- IBB 107.5 .75 97.64 489.8% ------- BLUE -.085 .077 --------------------------------------------------------------------------------------------- GLD 122.31 .78 122.43 40.3% Bullish BLUE .186 .094 --------------------------------------------------------------------------------------------- RSX 20.06 .26 19.07 264.6% Bullish BLUE .048 .014 |
Table 2
    Count of Stocks in Key Directories
          2019-01-09
-------------------------------
NEWHIGHS       41
NEWLOWS        4
MAXCP          4
MINCP          3
TTTNH          11
TTTNL          10
FASTUP         323  Swing traders are bullish.
FASTDOWN       28
CPCROSSA       21
CPCROSSD       69
BIGVOLUP       4
BIGVODN        11
ACCUMVER       3
HIGHIP21       1
HIUPPCT        4
VHIP21         12
LOWACCUM       315  Big Money continues Selling.
REDSELL        382
AUGSELS7       9
TRAPDOOR       23
|
 Table 3
         RANKING OF KEY DIRECTORIES BASED PCT.OF STOCKS ABOVE 65-DMA
              1/9/19
 Bullish = 9
 Bearish = 38
---------------------------------------------------------------------------------------
Directory     Current       day-1         day-2         day-3         day-4         day-5
----------------------------------------------------------------------------------------
BONDFUND       .971          .961          .933          .876          .904          .857
GOLD           .88           .88           .86           .88           .84           .82
HOMEBLDG       .705          .705          .588          .47           .294          .294
PIPELINE       .666          .666          .416          .333          .166          .166
GAMING         .625          .541          .458          .375          .208          .25
SOLAR          .611          .444          .5            .388          .166          .111
AUTO           .589          .461          .384          .256          .128          .102
HACKERS        .545          .5            .363          .181          .09           .227
ETFS           .517          .327          .241          .206          .12           .137
==========================================================================================
NIFTY          .491          .368          .298          .192          .052          .14
COMODITY       .476          .476          .452          .428          .428          .38
FOOD           .473          .456          .438          .421          .421          .35
INFRA          .472          .277          .194          .138          0             .055
CHINA          .466          .233          .216          .2            .066          .15
SOFTWARE       .461          .461          .292          .215          .123          .2
NASD-100       .44           .35           .32           .25           .09           .13
^^^^^^^^
SEMI           .439          .327          .31           .215          .112          .232
BIG17          .434          .434          .413          .195          .152          .173
ELECTRON       .425          .314          .283          .185          .098          .209
RETAIL         .396          .264          .15           .15           .094          .094
INDMATER       .371          .32           .32           .269          .166          .217
GUNS           .352          .352          .352          .235          .058          .058
UTILITY        .35           .45           .25           .275          .2            .2
BIOTECH        .336          .305          .273          .202          .128          .157
BEVERAGE       .333          .333          .333          .222          .111          .111
DOWJONES       .333          .266          .166          .166          .066          .1
^^^^^^^^
EDU            .333          .333          .333          .5            .333          .333
HOSPITAL       .333          .208          .125          .125          .083          .041
FIDSTKS        .317          .295          .209          .177          .059          .075
DJI-13         .307          .23           .076          .076          0             0
GREEN          .304          .304          .173          .217          .086          .086
SP-100         .301          .258          .15           .129          .032          .075
CHEM           .296          .296          .24           .185          .129          .166
REIT           .288          .261          .154          .127          .073          .04
RUS-1000       .286          .246          .17           .135          .068          .083
SP500          .267          .224          .144          .12           .052          .076
^^^^^
INDEXES        .221          .2            .2            .172          .178          .172
INSURANC       .2            .2            .166          .2            .133          .133
JETS           .2            .2            .2            .1            .1            .1
FINANCE        .188          .166          .133          .133          .1            .088
MILITARY       .187          .187          .125          .093          .093          .093
COMPUTER       .181          .136          .09           .09           .045          .045
REGBANKS       .178          .178          .107          .107          .035          .035
BIGBANKS       .142          .142          0             0             0             0
COAL           .142          .142          .142          .142          .142          .142
OILGAS         .136          .149          .108          .074          .034          .054
TRANSP         .05           0             0             0             0             0
|
====================================================================
1/8/2019 No
Peerless Sell S12 signal today. But it will not take much more
of an up-move to bring this about. A DJI close above 23800 will produce a
Sell S12 even if breadth is as good as today and the P-Indicator thereby
turns positive. Note below that January Sell S12s have been quite reliably
bearish even when they occur alone with the no accompanying or nearby
Sell S9. Independent S12s are numerous and their paper losses are normally
small. Still in that event, let's wait for NYSE
decliners to be greater than
advancers before acting on a Sell S12. Such weakness
will also turn down
the Stochastic-14s and give Red optimized Sells on many of the major market
ETFs. (See the charts of DIA and QQQ below).
Independent January Sell S12s since 1928
Date Peerless Gain
Paper Loss
---------------------------------------------------
1/10/1941 +.103 (+10.3%) perfect Sell signal
1/6/1949 +.083
-.0061 (-0.61%)
1/24/1949 +.086
none
1/8/1960 +.107
none
1/6/1966 +.213
-.0088
1/8/1968 +.086
perfect
1/11/1973 +.108
none
1/2/1974 +.046
-.029
1/2/1981 +.042
-.038
1/29/1982 +.069
none
1/6/1983 +.038
-.020
1/5/1984 +.108
-.003
1/11/2000 +.130
-.0184
1/4/2001 +.129
-.068
1/6/2002 +.137
-.0078
1/6/2009 +.087
none
Still, we should probably wait for a negative breadth day to
clinch a Sell S12
in here, since the market is making a major readjustment. Again, there
were more than 2300 NYSE advancers. Understand that the upwards reversal
since Christmas is not just a Santa Claus rally. It has also occurred because Fed
Chairman has seemingly reversed himself about the need to raise interest
rates later this year. Short-term rates did make a new high today. But
the
market is hearing what it wants to hear and now believes that Powell will be
very circumspect about what he next says. This is very important for the
market.
The ups and downs of interest rates have historically played a particularly important
role in the intermediate-term swings of the market. Simply a long pause now
before raising the Federal Funds rates above 2.5% will help a lot of the stocks
that were December casualties to Powell's careless talk about raising rates and
selling off the Fed's trillions in 'toxic assets' and mortgages.


Charts 1/8/2019 2018 PEERLESS DJI, Signals, Indicators Daily DJI Volume 10-DayUp/Down Vol Hourly DJIA A/D Line for All Stocks Inverted Traders Index NASDAQ S&P OEX NYSE COMPQX DJI-15 DJI-20 DJI-30 DIA SPY QQQ MDY IWM TNA Short-Term Rates USO-CrudeOil DBO FAS GLD BBH IBB JETS JNUG KOL NUGT OIH OIL RSX RETL SDS AGQ SLV SOXL TECL TLT TMF TNA UGA (gasoline) XIV YINN Commodities: CANE CORN DBC JJC, NIB, CHOC CORN, CUT (paper) MOO, SOYB WEAT UUP (Dollar) LIT (Lithium) AAPL ADBE ALXN AMAT AMGN AMD AMZN BA BABA BAC BIDU CAT CVX DE FB GOOG GS HD IBM INTU JPM M (Macy's) MSFT NFLX NVDA QCOM TSLA TXN XOM WMT CMG , LRCX, SWKS, MDGL SPPI WATT SQ TOWN 1/8/2019 (Click on Underlined link.) - Bullish MAXCPs - http://tigersoft.com/MAXCPS/Jan-08/BULLISH.htm Bearish MAXCPs - http://tigersoft.com/MINCPs/Jan-08/BEARISH.htm |
Table 1 QUICKSILVER on ETFS - 1/8/19 ETF CLOSE CHANGE PIVOT-PT 5-dma AROC CL-PWR CANDLE IP21 ITRS --------------------------------------------------------------------------------------------- DIA 237.92 2.56 233.36 101.5% ------- RED -.142 ----- --------------------------------------------------------------------------------------------- BA 340.53 12.42 323.81 279.6% ------- BLUE -.077 -.008 --------------------------------------------------------------------------------------------- SPY 256.77 2.39 250.18 136.9% ------- RED -.104 -.001 --------------------------------------------------------------------------------------------- QQQ 159.52 1.43 154.88 170.1% ------- RED -.116 -.004 --------------------------------------------------------------------------------------------- MDY 314.95 5.19 301.59 202.4% ------- BLUE -.109 -.001 --------------------------------------------------------------------------------------------- IWM 141.73 2.14 134.66 288.9% ------- BLUE -.13 .003 --------------------------------------------------------------------------------------------- FAS 47.73 .73 44.95 328.2% Bearish RED -.134 -.082 --------------------------------------------------------------------------------------------- RETL 28.47 .78 24.25 1072.1% ------- RED .151 -.145 --------------------------------------------------------------------------------------------- SOXL 82.79 -1.29 85.53 -32.9% ------- RED -.266 -.027 --------------------------------------------------------------------------------------------- TECL 86.1 2.25 85.03 67.4% ------- RED -.079 -.224 --------------------------------------------------------------------------------------------- IBB 106.75 .76 97.5 515.9% ------- RED -.112 .07 --------------------------------------------------------------------------------------------- GLD 121.53 -.33 121.33 11.5% Bullish BLUE .167 .073 --------------------------------------------------------------------------------------------- RSX 19.8 .08 19.03 272.6% Bullish BLUE -.024 .002 |
 Table 2   Count of Stocks in Key Directories
           2019-01-08
-------------------------------
NEWHIGHS       36
NEWLOWS        5
MAXCP          4
MINCP          6
TTTNH          11
TTTNL          21
FASTUP         350 Swing traders are bullish
FASTDOWN       28
CPCROSSA       10
CPCROSSD       80
BIGVOLUP       4
BIGVODN        14
ACCUMVER       4
HIGHIP21       1
HIUPPCT        4
VHIP21         11
LOWACCUM       326 Lots of Big Money sellers still
REDSELL        403
AUGSELS7       15
TRAPDOOR       23
|
 Table RANKING OF KEY DIRECTORIES BASED PCT.OF STOCKS ABOVE 65-DMA
              1/8/19
 Bullish = 5
 Bearish = 41
---------------------------------------------------------------------------------------
Directory     Current       day-1         day-2         day-3         day-4         day-5
----------------------------------------------------------------------------------------
BONDFUND       .961          .933          .876          .904          .847          .523
GOLD           .88           .86           .88           .84           .82           .74
HOMEBLDG       .705          .588          .47           .294          .294          .176
PIPELINE       .666          .416          .333          .166          .166          .166
GAMING         .541          .458          .375          .208          .25           .25
===========================================================================================
HACKERS        .5            .363          .181          .09           .227          .272
===========================================================================================
COMODITY       .476          .452          .428          .428          .38           .357
AUTO           .461          .384          .256          .128          .102          .128
SOFTWARE       .461          .292          .215          .123          .2            .184
FOOD           .456          .438          .421          .421          .35           .333
UTILITY        .45           .25           .275          .2            .2            .35
SOLAR          .444          .5            .388          .166          .111          .055
BIG17          .434          .413          .195          .152          .173          .173
NIFTY          .368          .298          .192          .052          .14           .175
GUNS           .352          .352          .235          .058          .058          .117
NASD-100       .35           .32           .25           .09           .13           .17
BEVERAGE       .333          .333          .222          .111          .111          .166
EDU            .333          .333          .5            .333          .333          .333
ETFS           .327          .241          .206          .12           .137          .068
SEMI           .327          .31           .215          .112          .224          .172
INDMATER       .32           .32           .269          .166          .217          .192
ELECTRON       .314          .283          .185          .098          .203          .166
GREEN          .304          .173          .217          .086          .086          .086
BIOTECH        .302          .273          .202          .128          .152          .144
CHEM           .296          .24           .185          .129          .166          .148
FIDSTKS        .295          .209          .177          .059          .075          .107
INFRA          .277          .194          .138          0             .055          .055
DOWJONES       .266          .166          .166          .066          .1            .133
^^^^^^^^       ^^^^
RETAIL         .264          .15           .15           .094          .075          .094
REIT           .261          .154          .127          .073          .04           .073
SP-100         .258          .15           .129          .032          .075          .107
RUS-1000       .246          .17           .135          .068          .083          .112
CHINA          .233          .216          .2            .066          .15           .183
DJI-13         .23           .076          .076          0             0             .076
SP500          .224          .144          .12           .052          .076          .104
HOSPITAL       .208          .125          .125          .083          .041          .041
INDEXES        .204          .204          .177          .182          .177          .188
INSURANC       .2            .166          .2            .133          .133          .166
JETS           .2            .2            .1            .1            .1            .1
MILITARY       .187          .125          .093          .093          .093          .093
REGBANKS       .178          .107          .107          .035          .035          .035
FINANCE        .166          .133          .133          .1            .088          .088
OILGAS         .149          .108          .074          .034          .047          .047
BIGBANKS       .142          0             0             0             0             0
COAL           .142          .142          .142          .142          .142          .142
COMPUTER       .136          .09           .09           .045          .045          .045
TRANSP         0             0             0             0             0             0
|
====================================================================
1/7/2019 No
Peerless Sell signal so far. But my testing of hypothetical DJI
numbers shows that a close above 23875 (corrected) would bring a Sell S12.
The S12 is based on a negative Accum Index as the DJI approaches
upper band. That is now only 320 points higher. Such a move would
also move the DJI's short-term stochastic (14-day) above the 80-level
where an optimized red Sell will appear on the DJIA and DIA on the
next decline. Note also that a sell here would also be consistent with:
1) the failure of volume to rise on the rally;
2) the bearish rising wedge patterns that we now see in
the key ETFs;
3) the mostly still falling Closing Powers 21-day moving averages;
4) the fact that more than 75% of all the stocks we
follow are well below their 65-dma resistance levels;
5) how the "Santa Claus" rally commonly tops out in the second
weak of January.
24000-24300 Looks like firm DJIA resistance.
The Accum. Index remains quite negative, though
the P-I and ADL are improving rapidly.


But let's not anticipate the Sell S12, breadth has become very good.
Some of you may prefer to not rush to sell until the rising NYSE A/D
Line breaks its uptrend. If we do get a Sell S12, we will look back
at January S12s and also the S12 cases where the P-Indicator was rising
quite fast.
Breadth has been very bullish since word got out that Powell was turning
"dovish" and not in a rush to raise interest rates or sell large quantities
of 'toxic assets' and mortgages it has been holding since 2008-2009.
Good NYSE breadth is exactly what we would expect in this environment.
Look below at the daily NYSE Advances and Declines since December 26th.
The P-I (21-dma of adv-declines) now stands at -206. Because of the
way the P-I is calculated, just a flat breadth day tomorrow will lift the P-I
by +70 tomorrow and three more flat breadth days after that will turn
the P-Indicator positive and make an S9 very unlikely.
Adv. Dec.
12/26/18 2646
383
12/27/18 1619 1396
12/28/18 1935 1069
12/31/18 2153 868
1/2/19 2111 909
1/3/19 1272
1742
1/4/19 2732 276
1/7/19 2371
650
---------------------------
Numbers next being dropped of in creation of P-I
(the 21-dma of NYSE Advances minus Declines)
12/4 498
2543
12/6 1166
1845
12/7 932
2042
12/8 975
2024
Another element in the market now is still the
absence of leadership.
But that may be changing. Housing and Solar Energy stocks have
have improved their ranking in Table 3 below. This is the result
of lower interest rates. Bullishly, the biotech ETFs, BBH and IBB,
today got back above their falling 65-dma as has high flier, NFLX.
Watch AMZN tomorrow to see how it handles the falling 65-dma
it has almost reached. The very negative Accumulation Index readings
with these issues warns us that there is still lots of overhead resistance.


|
Charts 1/7/2019 2018 PEERLESS DJI, Signals, Indicators Daily DJI Volume 10-DayUp/Down Vol Hourly DJIA A/D Line for All Stocks Inverted Traders Index NASDAQ S&P OEX NYSE COMPQX DJI-15 DJI-20 DJI-30 DIA SPY QQQ MDY IWM TNA Short-Term Rates USO-CrudeOil DBO FAS GLD BBH IBB JETS JNUG KOL NUGT OIH OIL RSX RETL SDS AGQ SLV SOXL TECL TLT TMF TNA UGA (gasoline) XIV YINN Commodities: CANE CORN DBC JJC, NIB, CHOC CORN, CUT (paper) MOO, SOYB WEAT UUP (Dollar) LIT (Lithium) AAPL ADBE ALXN AMAT AMGN AMD AMZN BA BABA BAC BIDU CAT CVX DE FB GOOG GS HD IBM INTU JPM M (Macy's) MSFT NFLX NVDA QCOM TSLA TXN XOM WMT CMG , LRCX, SWKS, MDGL SPPI WATT SQ TOWN 1/7/2019 (Click on Underlined link.) - Bullish MAXCPs - http://tigersoft.com/MAXCPS/Jan-07/BULLISH.htm Bearish MAXCPs - http://tigersoft.com/MINCPs/Jan-07/BEARISH.htm |
Table 1 QUICKSILVER on ETFS - 1/7/19 ETF CLOSE CHANGE PIVOT-PT 5-dma AROC CL-PWR CANDLE IP21 ITRS --------------------------------------------------------------------------------------------- DIA 235.36 1.08 233.2 105.4% Bearish BLUE -.098 ----- --------------------------------------------------------------------------------------------- BA 328.11 1.03 322.5 183.2% ------- RED -.035 .002 --------------------------------------------------------------------------------------------- SPY 254.38 1.99 249.92 133.2% ------- BLUE -.062 -.005 --------------------------------------------------------------------------------------------- QQQ 158.09 1.86 154.26 166.6% ------- BLUE -.086 -.023 --------------------------------------------------------------------------------------------- MDY 309.76 3.41 302.67 172.6% Bearish BLUE -.091 -.012 --------------------------------------------------------------------------------------------- IWM 139.59 2.4 133.9 250.8% ------- BLUE -.109 -.015 --------------------------------------------------------------------------------------------- FAS 47 .71 44.77 374.7% Bearish BLUE -.093 -.119 --------------------------------------------------------------------------------------------- RETL 27.69 2.45 23.17 1016.8% ------- BLUE .127 -.176 --------------------------------------------------------------------------------------------- SOXL 84.08 4.66 83.32 144.2% ------- BLUE -.2 -.168 --------------------------------------------------------------------------------------------- TECL 83.85 2.14 85 71.3% ------- BLUE -.042 -.306 --------------------------------------------------------------------------------------------- IBB 105.99 3.44 96.43 570.1% ------- BLUE -.093 .036 --------------------------------------------------------------------------------------------- GLD 121.86 .42 121.25 32.9% Bullish RED .132 .112 --------------------------------------------------------------------------------------------- RSX 19.72 .01 18.75 254.4% Bullish BLUE .002 .022 |
 Table 2   Count of Stocks in Key Directories
           2019-01-07
-------------------------------
NEWHIGHS       27
NEWLOWS        7
MAXCP          8
MINCP          5
TTTNH          18
TTTNL          12
FASTUP         339   Swing Traders are bullish.
FASTDOWN       17
CPCROSSA       20
CPCROSSD       43
BIGVOLUP       5
BIGVODN        1
ACCUMVER       3
HIGHIP21       2
HIUPPCT        4
VHIP21         13
LOWACCUM       338   Still heavy big money selling.
REDSELL        398   Still heavy big money selling.
AUGSELS7       12
TRAPDOOR       5
|
 Table 3
             RANKING OF KEY DIRECTORIES BASED PCT.OF STOCKS ABOVE 65-DMA
              1/7/19
 Homebuilding is enjoying a surge.
---------------------------------------------------------------------------------------
Directory     Current       day-1         day-2         day-3         day-4         day-5
----------------------------------------------------------------------------------------
BONDFUND       .933          .876          .904          .847          .523          .39
GOLD           .86           .88           .84           .82           .74           .62
HOMEBLDG       .588          .47           .294          .294          .176          .176
==========================================================================================
SOLAR          .5            .388          .166          .111          .055          .055
==========================================================================================
GAMING         .458          .375          .208          .25           .25           .25
COMODITY       .452          .428          .428          .38           .357          .357
FOOD           .438          .421          .421          .35           .333          .333
PIPELINE       .416          .333          .166          .166          .166          .166
BIG17          .413          .195          .152          .173          .173          .152
AUTO           .384          .256          .128          .102          .128          .102
HACKERS        .363          .181          .09           .227          .272          .227
GUNS           .352          .235          .058          .058          .117          .058
BEVERAGE       .333          .222          .111          .111          .166          .166
EDU            .333          .5            .333          .333          .333          .166
INDMATER       .32           .269          .166          .217          .192          .153
NASD-100       .32           .25           .09           .13           .17           .12
SEMI           .31           .215          .112          .224          .172          .163
NIFTY          .298          .192          .052          .14           .175          .14
SOFTWARE       .292          .215          .123          .2            .184          .138
ELECTRON       .283          .185          .098          .203          .166          .154
BIOTECH        .271          .202          .128          .152          .142          .118
UTILITY        .25           .275          .2            .2            .35           .3
ETFS           .241          .206          .12           .137          .068          .086
CHEM           .24           .185          .129          .166          .148          .148
CHINA          .216          .2            .066          .15           .183          .166
FIDSTKS        .209          .177          .059          .075          .107          .086
INDEXES        .208          .181          .187          .181          .192          .187
JETS           .2            .1            .1            .1            .1            0
INFRA          .194          .138          0             .055          .055          .027
GREEN          .173          .217          .086          .086          .086          .086
RUS-1000       .17           .135          .068          .083          .112          .09
DOWJONES       .166          .166          .066          .1            .133          .066
INSURANC       .166          .2            .133          .133          .166          .166
REIT           .154          .127          .073          .04           .073          .067
RETAIL         .15           .15           .094          .075          .094          .075
SP-100         .15           .129          .032          .075          .107          .075
SP500          .144          .12           .052          .076          .106          .086
COAL           .142          .142          .142          .142          .142          .142
FINANCE        .133          .133          .1            .088          .088          .1
HOSPITAL       .125          .125          .083          .041          .041          .041
MILITARY       .125          .093          .093          .093          .093          .093
OILGAS         .108          .074          .034          .047          .047          .04
REGBANKS       .107          .107          .035          .035          .035          .035
COMPUTER       .09           .09           .045          .045          .045          .045
DJI-13         .076          .076          0             0             .076          0
BIGBANKS       0             0             0             0             0             0
TRANSP         0             0             0             0             0             0
|
====================================================================
1/4/2019 Appearing
with Bernanke and Yellen, Fed Chairman Powell
reversed himself about the need for higher interest rates.
That coupled with a superb December Jobs' number, +313.000
and the market roared upwards. There were nearly 10x more
stocks rising than falling on the NYSE. This generated the
second Peerless Buy B14 since Christmas. Santa Claus was
was late this year, but not without his bounty for Wall Street.
Powell has shown he can be pressured by Wall Street and the
Equities' markets' traders. This has to be a bullish sign. The
"January effect" which boost prices for a week or two this month
'should' lead to higher prices. So hold some of the semi-conductors
long. Meanwhile, the bearish MINCPs still greatly outnumber
the MAXCPs, so do some hedging here.
Less than 17% of the DJI-30 and SP-500 stocks are above their
key 65-dma. This means lots of overhead resistance exists even|
among leaders. It will be tricky for DJI to rally up close enough
to upper 2.3% band to get a new Peerless Sell. Watch with interest
how the manipulators solve this problem. They, the Fed and
the White House desperately do not want another market sell-off.
Peerless is telling us that the DJI-30 will manage to work higher.
24000 -24366 looms as the likely resistance now,
assuming 23000-support hold up now.


Buy B14s have become much more common in the last ten
years, as computerized trading has become so dominant.
Their median gais in only 2% and when paired in close proximity
they produced gains of less than 2%. Below are the Buy B14s
since 2007.
Date DJI
Gain Paper Loss
-------------------------------------------------------------------
20070829 B14 13289.29 .040 13113.3
-.0132 9/17
20070918 B14 13739.39 .006
none
Major market top in October.
20071128 B14 13289.45 .025
none
20080318 B14 12392.66 .013 12099.6 -.0236 3/19
New Bull Market starts in 2009
20090312 B14 7170.06 .186
none
20090715 B14 8616.21 .192
none
20091109 B14 10226.94 .004
none
20100527 B14 10258.99
.015 9816.49 -.0431 6/7
20100602 B14 10249.54 .016 9816.49 -.0422 6/7
(Paired)
20100610 B14 10172.53 .023
none
20100707 B14 10018.28 .052
none
20100901 B14 10269.47 .247
none
20110815 B14 11482.9 .007
10817.6 -.0579 8/19
20110829 B14 11539.25 .002
none
(Paired)
20111010 B14 11433.18 .058 11257.5 -.0153 11/23
20111027 B14 12208.55 -.009 11257.5 -.0778
11/23
20111128 B14 11523.01 .05
none
20120727 B14 13075.66 .038
none
20121231 B14 13104.14 .158
none
20150827 B14 16654.77 .064 16001.8 -.0392 9/28
20160708 B14 18146.74 .010 18034.7 -.0061 9/14
-----------------------------------------------------------------
Avg. = 5.9%
,
So, we cannot rely on a new bull market upswing based
on the
Buy B14 in itself. The DIA, SPY, IWM, QQQ and SOXL are
now moving up into much heavier resistance. Higher volume
will be needed to take price through the resistance.
DIA |
SPY |
IWM |
QQQ |
SOXL |
A Little More Headroom Now.
Since the DJI is now 0.8% below its 21-dma, Peerless will not
easily give a Sell S9 (assuming negative P-I) or a Sell S12
(assuming negative Accum.Index-IP21) until the DJI rises to
a point 2.3% above the 21-dma, about 800 points higher.
The key ETFs Closing Powers jumped a lot on
Friday. But they have
only reached their falling 21-day mvg. averages. More good news -
about trade negotiations with China and regarding the long government
shut-down will be needed to power the DJI back above 24000. With
the 23300 resistance having been taken out on the recovery, I would
24000 to be the new heaviest point of resistance.
|
Charts 1/4/2019 2018 PEERLESS DJI, Signals, Indicators Daily DJI Volume 10-DayUp/Down Vol Hourly DJIA A/D Line for All Stocks Inverted Traders Index NASDAQ S&P OEX NYSE COMPQX DJI-15 DJI-20 DJI-30 DIA SPY QQQ MDY IWM TNA Short-Term Rates USO-CrudeOil DBO FAS GLD BBH IBB JETS JNUG KOL NUGT OIH OIL RSX RETL SDS AGQ SLV SOXL TECL TLT TMF TNA UGA (gasoline) XIV YINN Commodities: CANE CORN DBC JJC, NIB, CHOC CORN, CUT (paper) MOO, SOYB WEAT UUP (Dollar) LIT (Lithium) AAPL ADBE ALXN AMAT AMGN AMD AMZN BA BABA BAC BIDU CAT CVX DE FB GOOG GS HD IBM INTU JPM M (Macy's) MSFT NFLX NVDA QCOM TSLA TXN XOM WMT CMG , LRCX, SWKS, MDGL SPPI WATT SQ TOWN 1/4/2019 (Click on Underlined link.) - Bullish MAXCPs - http://tigersoft.com/MAXCPS/Jan-04/BULLISH.htm Bearish MAXCPs - http://tigersoft.com/MINCPs/Jan-04/BEARISH.htm |
Table 1   QUICKSILVER on ETFS - 1/4/19

 DIA looks stronger than any of the major ETFs below, except GLD.
 The DJI remains the leader.  This is defensive.  It makes market look vulnerable.
ETF CLOSE CHANGE PIVOT-PT 5-dma AROC CL-PWR CANDLE IP21 ITRS --------------------------------------------------------------------------------------------- DIA 234.28 7.56 230.48 65.4% Bearish BLUE -.137 ---- --------------------------------------------------------------------------------------------- BA 327.08 16.18 316.38 156.2% ------- BLUE -.095 -.007 Most important stock in DJIA-30. --------------------------------------------------------------------------------------------- SPY 252.39 8.18 247.75 87.1% Bearish BLUE -.119 -.008 --------------------------------------------------------------------------------------------- QQQ 156.23 6.41 152.97 103.9% ------- BLUE -.143 -.028 --------------------------------------------------------------------------------------------- MDY 306.35 9.72 299.36 109.5% Bearish BLUE -.142 -.022 --------------------------------------------------------------------------------------------- IWM 137.19 4.94 132.86 176.8% Bearish BLUE -.183 -.029 --------------------------------------------------------------------------------------------- FAS 46.29 3.82 43.67 291.5% Bearish BLUE -.131 -.135 --------------------------------------------------------------------------------------------- RETL 25.24 2 22.86 623.5% Bearish BLUE -.072 -.229 --------------------------------------------------------------------------------------------- SOXL 79.42 9.09 81.77 -41.1% Bearish BLUE -.265 -.213 --------------------------------------------------------------------------------------------- TECL 81.71 9.2 82.69 -108.9% Bearish BLUE -.082 -.319 --------------------------------------------------------------------------------------------- IBB 102.55 4.91 94.84 383.6% ------- BLUE -.146 .01 --------------------------------------------------------------------------------------------- GLD 121.44 -.99 121.06 35.9% Bullish BLUE .13 .124 --------------------------------------------------------------------------------------------- RSX 19.71 .64 18.75 321.5% ------- BLUE -.056 .026 |
 Table 2   Count of Stocks in Key Directories
           2019-01-04
-------------------------------
NEWHIGHS       21
NEWLOWS        1
MAXCP          6
MINCP          2
TTTNH          9
TTTNL          5
FASTUP         215   Swing traders are bullish
FASTDOWN       16
CPCROSSA       30
CPCROSSD       20
BIGVOLUP       5
BIGVODN        5
ACCUMVER       3
HIGHIP21       3
HIUPPCT        4
VHIP21         14
LOWACCUM       325
REDSELL        421
AUGSELS7       28
TRAPDOOR       19
|
| Table 3 Only Gold and Bonds show most of their individual stocks or funds are above the key support of 65-dma. This means there is much overhead resistance. Home-builders have jumped upwards RANKING OF KEY DIRECTORIES BASED PCT.OF STOCKS ABOVE 65-DMA
1/4/19
---------------------------------------------------------------------------------------
Directory Current day-1 day-2 day-3 day-4 day-5
----------------------------------------------------------------------------------------
GOLD .88 .84 .82 .74 .62 .68
BONDFUND .876 .904 .847 .523 .39 .314
=============================================================================================
EDU .5 .333 .333 .333 .166 .333
=============================================================================================
HOMEBLDG .47 .294 .294 .176 .176 .176
COMODITY .428 .428 .38 .357 .357 .357
FOOD .421 .421 .35 .333 .333 .333
SOLAR .388 .166 .111 .055 .055 .111
GAMING .375 .208 .25 .25 .25 .25
PIPELINE .333 .166 .166 .166 .208 .125
UTILITY .275 .2 .2 .35 .3 .4
INDMATER .269 .166 .217 .192 .153 .179
AUTO .256 .128 .102 .128 .102 .102
NASD-100 .25 .09 .13 .17 .12 .12
^^^^^^^^
GUNS .235 .058 .058 .117 .058 .117
BEVERAGE .222 .111 .111 .166 .166 .111
GREEN .217 .086 .086 .086 .086 .086
SEMI .215 .112 .224 .172 .155 .129
SOFTWARE .215 .123 .2 .184 .138 .123
ETFS .206 .12 .137 .068 .068 .086
BIOTECH .2 .128 .152 .142 .113 .1
CHINA .2 .066 .15 .183 .166 .15
INSURANC .2 .133 .133 .166 .166 .166
BIG17 .195 .152 .173 .173 .152 .13
NIFTY .192 .052 .14 .175 .14 .105
CHEM .185 .129 .166 .148 .148 .129
ELECTRON .185 .098 .203 .166 .148 .117
HACKERS .181 .09 .227 .272 .227 .181
INDEXES .181 .187 .181 .192 .187 .197
FIDSTKS .177 .059 .075 .107 .086 .091
DOWJONES .166 .066 .1 .133 .066 .066
^^^^^^^^
RETAIL .15 .094 .075 .094 .075 .075
COAL .142 .142 .142 .142 .142 .142
INFRA .138 0 .055 .055 .027 .055
RUS-1000 .135 .068 .083 .112 .09 .094
FINANCE .133 .1 .088 .088 .1 .088
SP-100 .129 .032 .075 .107 .075 .086
REIT .127 .073 .04 .073 .067 .087
HOSPITAL .125 .083 .041 .041 .041 .041
SP500 .12 .052 .076 .106 .086 .098
^^^^^
REGBANKS .107 .035 .035 .035 .035 .035
JETS .1 .1 .1 .1 0 0
MILITARY .093 .093 .093 .093 .093 .093
COMPUTER .09 .045 .045 .045 .045 .045
DJI-13 .076 0 0 .076 0 0
OILGAS .074 .034 .047 .047 .04 .04
BIGBANKS 0 0 0 0 0 0
TRANSP 0 0 0 0 0 0
|
============================================================= ========
1/3/2019 Friday
afternoon, Fed Chairman Powell will be taking the
highly unusual step of having a public discussion with ex-FED Chairs.
Bernanke and Yellen. Clearly, he wants their support to shore up
financial confidence. The last time he spoke, the DJI fell 500 just
while he was talking. Is this a sign of weakness? Does he want their
approval? The market's initial reaction is favorable in that he is,
at least, showing he is sensitive to what stock traders think and
wants to be associated with his predecessors' low-interest rate
policies. So, is he thereby changing his mind and becoming more
"dovish"? The close tomorrow will take on new meaning. Stay tuned.
Powell will do well if he can avoid saying anything untoward and
the market stays on an even keel while he speaks. That will bring
us to next week, when the government shut-down will be front and
center for Wall Street to consider.
Will the 23300-23400 resistance stands firm? Today's down volume
was heavier than yesterday's up volume. The steep Closing Power
uptrend-lines were broken. It is not clear that Professionals will
remain bullish and move up prices above 23300. The 21-day moving
averages of Closing Power are all falling for the key major market
ETFs. About 85% of all equities are below their 65-dma. It will take
a lot of new buying to move most stocks significantly higher.


But for the time being, Stocks still look oversold, given how far down they
are from the 65-dma and given that December-January rebounds usually
last a little longer.
We do show Peerless B6s and a Buy B14. If Peerless is correct, the
rally will continue a little longer. But it may have to do that while
dangerously relying mostly on manipulated higher openings. There were
many more Bearish MINCPs than Bullish MAXCPs tonight. So,
I would stay hedged by being short some of the bearish MINCPs.
Hold SOXL and NVDA long out of respect to Peerless unless they
make new lows. I would prefer to buy DIA, the leader among the
ETFs on weakness near 22000, so that there is some upside
potential.


MONTHLY JOBS NUMBERS
|
https://data.bls.gov/timeseries/CES0000000001?output_view=net_1mth
Friday looks like a higher opening. A lot depends upon the December
Jobs' numbers which will be reported an hour before the NY opening.
Other evidence of a world-wide economic slow down is hard to miss.
How much will it impact the US and the FED?
Apple's predcition of a slowdown in its sales is one warning. Another
is the way Bonds are now rising. The wealthy who are the biggest
buyers of bonds, by far, are clearly avoiding equities in favor of
bonds. They fear a recession. That is the essence of all the talk about
an "inverted yield curve".
Tomorrow, the Jobs numbers come out. Anything above 200,000 will
probably come as a bullish surprise and boost stock prices short-term,
But traders might then have second thoughts, as it would give
give Powell and the FOMC hawks more reason to tighten.
A weak number, 120,000 to 160,000 would confirm the expectation
that a recession is nearing and a bear market may be unavoidable,
no matter what the FED does.
Most likely, we will see a number between 160,000 and 200,000.
That will be more neutral. It is what the market expects. It is
built into stock prices already. In my opinion, such a number
will give another two weeks to the rally.
|
Charts 1/3/2019 2018 PEERLESS DJI, Signals, Indicators Daily DJI Volume 10-DayUp/Down Vol Hourly DJIA A/D Line for All Stocks Inverted Traders Index NASDAQ S&P OEX NYSE COMPQX DJI-15 DJI-20 DJI-30 DIA SPY QQQ MDY IWM TNA Short-Term Rates USO-CrudeOil DBO FAS GLD BBH IBB JETS JNUG KOL NUGT OIH OIL RSX RETL SDS AGQ SLV SOXL TECL TLT TMF TNA UGA (gasoline) XIV YINN Commodities: CANE CORN DBC JJC, NIB, CHOC CORN, CUT (paper) MOO, SOYB WEAT UUP (Dollar) LIT (Lithium) AAPL ADBE ALXN AMAT AMGN AMD AMZN BA BABA BAC BIDU CAT CVX DE FB GOOG GS HD IBM INTU JPM M (Macy's) MSFT NFLX NVDA QCOM TSLA TXN XOM WMT CMG , LRCX, SWKS, MDGL SPPI WATT SQ TOWN 1/3/2019 (Click on Underlined link.) - Bullish MAXCPs - http://tigersoft.com/MAXCPS/Jan-03/BULLISH.htm Bearish MAXCPs - http://tigersoft.com/MINCPs/Jan-03/BEARISH.htm |
Table 1 QUICKSILVER on ETFS - 1/3/19 Lots more rising 5-dma. Only GLD has been stronger than DJI over the last 50 trading days. ETF CLOSE CHANGE PIVOT-PT 5-dma AROC CL-PWR CANDLE IP21 ITRS --------------------------------------------------------------------------------------------- DIA 226.72 -6.64 231.26 -43% Bearish RED -.165 ---- --------------------------------------------------------------------------------------------- BA 310.9 -12.91 317.14 -47.5% Bearish RED -.155 -.019 --------------------------------------------------------------------------------------------- SPY 244.21 -5.97 248.07 -39.7% Bearish RED -.143 -.007 --------------------------------------------------------------------------------------------- QQQ 149.82 -5.06 153.05 -86% Bearish RED -.162 -.026 --------------------------------------------------------------------------------------------- MDY 296.63 -4.96 299.78 -23.3% Bearish RED -.157 -.021 --------------------------------------------------------------------------------------------- IWM 132.25 -2.41 132.48 12% Bearish RED -.202 -.029 --------------------------------------------------------------------------------------------- FAS 42.47 -2.48 43.73 -20.5% Bearish RED -.175 -.198 --------------------------------------------------------------------------------------------- RETL 23.24 -1.01 22.35 93.1% Bearish RED -.016 -.227 --------------------------------------------------------------------------------------------- SOXL 70.33 -15.2 80.08 -505.7% Bearish RED -.291 -.248 --------------------------------------------------------------------------------------------- TECL 72.51 -12.52 83.49 -523.4% Bearish RED -.105 -.34 --------------------------------------------------------------------------------------------- IBB 97.64 .14 95.16 147.8% Bearish RED -.195 -.014 --------------------------------------------------------------------------------------------- GLD 122.43 1.1 120.57 114.7% Bullish BLUE .07 .164 --------------------------------------------------------------------------------------------- RSX 19.07 .04 18.5 61.3% ------- -----.103 .022 |
 Table 2
   Count of Stocks in Key Directories
          2019-01/03
-------------------------------
NEWHIGHS       22
NEWLOWS        50
MAXCP          11
MINCP          6
TTTNH          12
TTTNL          41
FASTUP         76
FASTDOWN       33
CPCROSSA       27
CPCROSSD       241
BIGVOLUP       3
BIGVODN        7
ACCUMVER       3
HIGHIP21       3
HIUPPCT        2
VHIP21         13
LOWACCUM       315
REDSELL        421
AUGSELS7       26
TRAPDOOR       20
|
 Table 3
              RANKING OF KEY DIRECTORIES BASED PCT.OF STOCKS ABOVE 65-DMA
              1/3/19
 Rush into Bonds and Gold. Not much else.
---------------------------------------------------------------------------------------
Directory     Current       day-1         day-2         day-3         day-4         day-5
----------------------------------------------------------------------------------------
BONDFUND       .904          .847          .523          .39           .295          .314
GOLD           .84           .82           .74           .62           .68           .6
============================================================================================
COMODITY       .428          .38           .357          .357          .357          .357
FOOD           .421          .35           .333          .333          .333          .333
EDU            .333          .333          .333          .166          .333          .333
HOMEBLDG       .294          .294          .176          .176          .176          .176
GAMING         .208          .25           .25           .25           .25           .208
UTILITY        .2            .2            .35           .3            .4            .225
INDEXES        .187          .181          .192          .187          .197          .187
INDMATER       .166          .217          .192          .153          .179          .153
PIPELINE       .166          .166          .166          .208          .166          .125
SOLAR          .166          .111          .055          .055          .055          .055
BIG17          .152          .173          .173          .152          .13           .108
COAL           .142          .142          .142          .142          .142          .142
INSURANC       .133          .133          .166          .166          .166          .1
CHEM           .129          .166          .148          .148          .129          .111
AUTO           .128          .102          .128          .102          .102          .102
BIOTECH        .126          .152          .142          .113          .097          .107
SOFTWARE       .123          .2            .184          .138          .123          .076
ETFS           .12           .137          .068          .068          .086          .103
SEMI           .119          .23           .179          .162          .128          .102
BEVERAGE       .111          .111          .166          .166          .111          .055
FINANCE        .1            .088          .088          .1            .088          .066
JETS           .1            .1            .1            0             0             0
ELECTRON       .098          .203          .166          .148          .111          .098
RETAIL         .094          .075          .094          .075          .075          .075
MILITARY       .093          .093          .093          .093          .093          .093
HACKERS        .09           .227          .272          .227          .181          .09
NASD-100       .09           .13           .17           .12           .12           .11
GREEN          .086          .086          .086          .086          .086          .086
HOSPITAL       .083          .041          .041          .041          .041          .041
REIT           .073          .04           .073          .067          .093          .093
RUS-1000       .068          .083          .112          .09           .095          .07
CHINA          .066          .15           .183          .166          .15           .15
DOWJONES       .066          .1            .133          .066          .066          .066
FIDSTKS        .059          .075          .107          .086          .091          .075
GUNS           .058          .058          .117          .058          .117          0
NIFTY          .052          .14           .175          .14           .105          .122
SP500          .052          .076          .106          .086          .098          .062
COMPUTER       .045          .045          .045          .045          .045          .045
REGBANKS       .035          .035          .035          .035          .035          .035
OILGAS         .034          .047          .047          .04           .04           .04
SP-100         .032          .075          .107          .075          .086          .053
BIGBANKS       0             0             0             0             0             0
DJI-13         0             0             .076          0             0             0
INFRA          0             .055          .055          .027          .027          .055
TRANSP         0             0             0             0             0             0
|
====================================================================
1/2/2019 Short-term,
the Closing Powers for DIA, SPY, QQQ, IWM
and SOXL are rising. So are the 5-day moving averages.
This means Professionals are still lifting prices up from weak
openings, like we are apt to see again tomorrow. APPL's
disappointing predictions are pointing to weak opening
of about 300 points. But a DIA close more than 2.10 points below
its opening tomorrow will cause a break in its CP uptrend.
Similarly, a close by SPY of more than 3 points below its opening
will break its uptrend. For QQQ, the amount is .47. Given
the current failure to get past the resistance just overhead,
a DJI decline of 1000 or more points could quickly follow
the disappearance of Professional support for the market.


The rising Closing Power can continue for a while. Enjoy it,
but be prepared for when this cushion of support disappears.
When Professionals shift again to become net sellers, our key
ETFs' Closing Power uptrend-lines will be violated and we could
will then see a retest of 22000 by the DJI.
The most important technical characteristic of the market
now is the the serious December breakdown below the well-tested
support at 23300. That was the key support level for most of
2018. It held firmly on several separate tests. Having been
decisively broken, it now now acts as resistance as the DJI rallies
back to it. This is a classic tenet of technical analysis.
And, if the DJI should somehow spike up to 24000, Peerless
will almost certainly give another Sell.

Broken Support becomes Resistance.
When the NYSE minor A/D Line uptrend-line
is broken, expect a bigger decline to follow. See this
in the 1974 DJI chart.
The chart below from 1973-1974 shows how dangerous the market
will become if the NYSE A/D Line soon breaks its uptrend. That
would probably mean that the FED has again decided to raise
interest rates. Already the FED's decision to raise rates in December
has caused Big Banks to raise the interest rates on their credit cards.
(Such rate hikes are quickly passed on to consumers, with a predictably
deleterious effect. JPM now charges 17 3/4% interest on credit card
debt for good customers. Heaven help those with mediocre credit.
Only state usury laws act as ceilings here. "The current
highest credit
card interest rate is 36%. That’s on the new First Premier Credit Card.
The next highest credit card interest rate seems to be 29.99%, charged by the
Total Visa Credit Card and the First Access Visa. These rates are very high
when you consider that the average interest rate is only around 19%."
(https://wallethub.com/answers/highest-credit-card-interest-rate-2140660307/
)
Such broken support can be overcome. But we need to see
advancing volume that compares favorably to the volume on
the decline when it was broken. So far, such volume is not present.
This was again true today.
But for now, we do see a rising NYSE A/D Line and rising Closing Power
uptrend. So, the effort to overcome the broken-support turned into
resistance is not over.
83% of all stocks are below their 65-dma.
The end of tax-loss selling should help many
stocks for two weeks, or so.
It would be bullish if we saw other sectors, ETFs or Indexes
besides Gold and Bonds acting in a leadership role. But the
DJIA is still the sole leader now. From Table 1 below, we see that
besides GLD, all the other ETFs have negative ITRS readings.
What's worse? Only three of the DJI-30 stocks (INTC, MRK
and PG) are above their key 65-dma. So, it will be difficult for the
DJI to rally very far even if it gets past 23300.
And that is exactly what our market history shows. We may see
a one or two week January rally, but overwhelming when
the DJI falls more than 4% in December, it beomes very bearish
once the January rally is over.
|
What Happened When DJI fell more than 4% in December? December Year DJI's behavior Pct. Decline ---------------------------------------------------------------------------------------- -11.2% 1916 105.9 to 94.0. Then rallied only to 95.70 on 1/10. It then fell to new lows. -5.3% 1920 76.00 to 72.00. Then rallied to 76.80 on 1/19. But Bear Market then resumed. -9.0% 1930 180.9 to 164.6. Then rallied to 171.9 on 1/7. But Bear Market resumed. -17.0% 1931 93.9 to 77.9. Then rallied to 85.9 on 1/15. But Bear Market resumed. -4.1% 1941 114.7 to 111.0. Then rallied to 114.2 on 1/5. But Bear Market resumed. -4.2% 1968 985.08 to 943.75. No rally until 2/26 bottom at 905.7 Bear market resumed in June. -6.2% 2002 8896.09 to 8341.63. Then rallied to 8842.61 on 1/14. But Bear Market resumed. |
|
Charts 1/2/2019 2018 PEERLESS DJI, Signals, Indicators Daily DJI Volume 10-DayUp/Down Vol Hourly DJIA A/D Line for All Stocks Inverted Traders Index NASDAQ S&P OEX NYSE COMPQX DJI-15 DJI-20 DJI-30 DIA SPY QQQ MDY IWM TNA Short-Term Rates USO-CrudeOil DBO FAS GLD BBH IBB JETS JNUG KOL NUGT OIH OIL RSX RETL SDS AGQ SLV SOXL TECL TLT TMF TNA UGA (gasoline) XIV YINN Commodities: CANE CORN DBC JJC, NIB, CHOC CORN, CUT (paper) MOO, SOYB WEAT UUP (Dollar) LIT (Lithium) AAPL ADBE ALXN AMAT AMGN AMD AMZN BA BABA BAC BIDU CAT CVX DE FB GOOG GS HD IBM INTU JPM M (Macy's) MSFT NFLX NVDA QCOM TSLA TXN XOM WMT CMG , LRCX, SWKS, MDGL SPPI WATT SQ TOWN 1/2/2019 (Click on Underlined link.) - Bullish MAXCPs - http://tigersoft.com/MAXCPS/Jan-02/BULLISH.htm Bearish MAXCPs - http://tigersoft.com/MINCPs/Jan-02/BEARISH.htm |
Table 1 QUICKSILVER on ETFS - 1/2/19 Lots more rising 5-dma. But Only GLD has been stronger than DJI over the last 50 trading days. ETF CLOSE CHANGE PIVOT-PT 5-dma AROC CL-PWR CANDLE IP21 ITRS --------------------------------------------------------------------------------------------- DIA 233.36 .16 228.71 334.1% Bearish BLUE -.111 ----- --------------------------------------------------------------------------------------------- SPY 250.18 .26 246.18 322.9% Bearish BLUE -.095 -.015 --------------------------------------------------------------------------------------------- QQQ 154.88 .62 152.46 376.2% Bearish BLUE -.105 -.026 --------------------------------------------------------------------------------------------- MDY 301.59 -1.08 298.03 280% Bearish BLUE -.109 -.041 --------------------------------------------------------------------------------------------- IWM 134.66 .76 131.93 334.1% Bearish BLUE -.162 -.051 --------------------------------------------------------------------------------------------- FAS 44.95 .18 42.65 871.1% Bearish BLUE -.129 -.179 --------------------------------------------------------------------------------------------- RETL 24.25 1.08 22.81 1091.7% Bearish BLUE .013 -.256 --------------------------------------------------------------------------------------------- SOXL 85.53 2.21 78.61 1180.1% ------- BLUE -.205 -.174 --------------------------------------------------------------------------------------------- TECL 85.03 .03 81.25 1000.9% ------- BLUE -.025 -.274 --------------------------------------------------------------------------------------------- IBB 97.5 1.07 94.81 418.9% ------- BLUE -.1 -.057 --------------------------------------------------------------------------------------------- GLD 121.33 .08 119.66 54.4% ------- ---- .026 .127 --------------------------------------------------------------------------------------------- RSX 19.03 .28 18.84 158.1% ------- BLUE -.151 -.009 |
Table 2    Count of Stocks in Key Directories
           2019-01/02
-------------------------------
NEWHIGHS       23
NEWLOWS        7
MAXCP          10  Professionals are waiting.
MINCP          2
TTTNH          10
TTTNL          72
FASTUP         287  Bullish Swing Traders
FASTDOWN       32
CPCROSSA       62
CPCROSSD       20
BIGVOLUP       9
BIGVODN        7
ACCUMVER       3
HIGHIP21       3
HIUPPCT        4
VHIP21         13
LOWACCUM       316
REDSELL        419  Still lots of Big Money Distribution.
AUGSELS7       24
TRAPDOOR       21
|
 Table 3   RANKING OF KEY DIRECTORIES BASED PCT.OF STOCKS ABOVE 65-DMA
              1/2/19
 Bullish = 2   Bearish 45
-----------------------= ----------------------------------------------------------------
Directory     Current       day-1         day-2         day-3         day-4         day-5
----------------------------------------------------------------------------------------
BONDFUND       .847          .523          .39           .295          .304          .371
GOLD           .82           .74           .62           .68           .6            .64
===========================================================================================
COMODITY       .38           .357          .357          .357          .357          .38
FOOD           .35           .333          .333          .333          .333          .35
EDU            .333          .333          .166          .333          .333          .333
HOMEBLDG       .294          .176          .176          .176          .176          0
GAMING         .25           .25           .25           .25           .208          .166
SEMI           .23           .179          .162          .128          .102          .059
HACKERS        .227          .272          .227          .181          .09           .045
INDMATER       .217          .192          .153          .179          .153          .115
ELECTRON       .203          .166          .148          .111          .098          .067
SOFTWARE       .2            .184          .138          .123          .076          .061
UTILITY        .2            .35           .3            .4            .25           .175
INDEXES        .181          .192          .187          .197          .187          .197
BIG17          .173          .173          .152          .13           .108          .086
CHEM           .166          .148          .148          .129          .111          .111
PIPELINE       .166          .166          .208          .166          .125          .125
BIOTECH        .15           .142          .113          .097          .105          .06
CHINA          .15           .183          .166          .15           .15           .116
COAL           .142          .142          .142          .142          .142          .142
NIFTY          .14           .175          .14           .105          .122          .035
ETFS           .137          .068          .068          .086          .103          .086
INSURANC       .133          .166          .166          .166          .1            .1
NASD-100       .13           .17           .12           .12           .11           .03
               ^^^^^
BEVERAGE       .111          .166          .166          .111          .055          .055
SOLAR          .111          .055          .055          .055          .055          0
AUTO           .102          .128          .102          .102          .102          .076
DOWJONES       .1            .133          .066          .066          .066          0
               ^^^^^
JETS           .1            .1            0             0             0             0
MILITARY       .093          .093          .093          .093          .093          .093
FINANCE        .088          .088          .1            .088          .066          .055
GREEN          .086          .086          .086          .086          .086          .043
RUS-1000       .083          .112          .09           .095          .072          .024
SP500          .076          .106          .086          .098          .064          .016
               ^^^^^
FIDSTKS        .075          .107          .086          .091          .075          .01
RETAIL         .075          .094          .075          .075          .075          0
SP-100         .075          .107          .075          .086          .053          0
GUNS           .058          .117          .058          .117          0             0
INFRA          .055          .055          .027          .027          .055          0
OILGAS         .047          .047          .04           .04           .04           .02
COMPUTER       .045          .045          .045          .045          .045          .045
HOSPITAL       .041          .041          .041          .041          .041          .041
REIT           .04           .073          .066          .093          .093          .013
REGBANKS       .035          .035          .035          .035          .035          .035
BIGBANKS       0             0             0             0             0             0
DJI-13         0             .076          0             0             0             0
TRANSP         0             0             0             0             0             0
|
====================================================================
12/31/2018
The easy part of the over-sold
Santa Claus mini-rally
is appears to be over. The DJI has failed to get past its recent
point of breakdown at 23200-23300. Now it may have to fall back
to 22000 or even make a margin low closing before starting another
rally. Volume was not high enough to allow the DJI to move higher.
The Closing Powers failed to rise any further. See this in the
"exploded" charts for DIA, SPY, QQQ and IWM below. Watch
tomorrow to see if the Closing Powers can hold up after a weak
opening.. That will be important for the bulls.
The Buy B14 with a ratio of 28:1 has only occurred 4x in
December or with the DJI below the 2.5% band. Three times
a good rally followed, but the August 2011 case required six more
weeks of basing before a lasting rally developed.
Given the weakness this morning, where the DJI is down over-night
by 350, more base-building definitely seems in order. But
even that may be too optimistic.
December sell-offs of more than 4%, like we just saw this
past
year, have invariably been associated with on-going bear markets.
Let's do some hedging with the Bearish MINCPs. Significantly,
no stocks qualify as Bullish MAXCPs again tonight. I suggested
tech stocks might rebound in the new year. Not yet!. Work with
close stops with longs using their Closing Power uptrends or their
5-day moving averages' pivot-points.
The DJI fell in December 2018, from 25538 to 23327, or 8.7%.
In the past when Decembers brought declines of more than 5%,
the new year sometimes brought a small relief rally. But when it
does not, you have situations like 1968 and 2007 (only a 2%
December decline) where prices fall significantly in January. The
bigger problem is how bearish they make the longer term outlook.
More and more traders probably realize this and they may not
even wait for a rally to sell.
What Happened When DJI fell more
than 4% in December?
December Year
DJI's behavior
Pct. Decline
----------------------------------------------------------------------------------------
-11.2% 1916
105.9 to 94.0. Then rallied only to 95.70 on 1/10.
It then fell to new lows.
-5.3% 1920
76.00 to 72.00. Then rallied
to 76.80 on 1/19.
But Bear Market then resumed.
-9.0% 1930
180.9 to 164.6. Then rallied to
171.9 on 1/7.
But Bear Market resumed.
-17.0% 1931
93.9 to 77.9. Then rallied to 85.9
on 1/15.
But Bear Market resumed.
-4.1% 1941
114.7 to 111.0. Then rallied
to 114.2 on 1/5.
But Bear Market resumed.
-4.2% 1968
985.08 to 943.75. No rally until 2/26 bottom at 905.7
Bear market resumed in June.
-6.2% 2002
8896.09 to 8341.63. Then rallied to
8842.61 on 1/14.
But Bear Market resumed.
32300 Is Current Resistance.

Exploded Charts
Note minor uptrends that will broken this morning,
the low volume (therefore weak) rallies on the 31st
and the failure of Closing Powers to rally on the 31st.
More basing, at a minimum, seems necessary.
 |
 |
 |
 |
2019 - Looking Ahead.
Traders are waiting to see what happens now that we
are entering the New Year. With tax-loss selling
over, can the market rally? Or will the new year bring
more profit-taking. Uncertainties weigh on traders'
minds. Bloomberg is scaring us about China slowing
down. But I thought Trump said that a US-China deal
was looking good... Will House Democrats choose to
work with President Trump? Will Republicans? Romney
is looking ahead to 2020. Will the gathering overseas'
recessionary clouds darken? Will the FED back
away from its plans to sell off chunks of its trillions in
"troubled assets". Will it make its plans clearly and publicly,
as Greenspan and Bernanke did. Does the FED stands ready
to provide whatever liquidity is needed to back up Wall Street
and Big Banks? Populists may not like the idea, but that was
their orignial purpose, though they often forget. So far, no
such guarantees have been made.
From the way the Big Bank stocks are behaving, I would suggest
that most of these Big Bank stocks, and all around the world, too,
are quite worried every bit as much now as they fretted and
fidgeted in January 2008, a mere ten months before the disaster
of Lehman Brothers.
The big question now is if the markets can even
build a base that allows the indexes and key stocks to
get back to their now rapidly falling 65-dma. Foreign
stocks, big banks, big tech stocks and housing stocks
are all weak. There is no leadership. From Table 3 below
we see that 85% of all stocks and ETFs are below their
65-dma. Only Gold stocks and bonds show a majority of their
group above their individual 65-dm averages. All the other
groups have well over 64% of their stocks above the 65-dma.
Peerless may be eventually right about its B6-B14, but I would
prefer to be hedged right now. This is a nine-year old bull market,
short sales can be easily executed on downticks and there have
never been more exotic negative ETFs for hedge funds to pile
into every time a serious market decline develops.
|
Charts 12/31/2018 2018 PEERLESS DJI, Signals, Indicators Daily DJI Volume 10-DayUp/Down Vol Hourly DJIA A/D Line for All Stocks Inverted Traders Index NASDAQ S&P OEX NYSE COMPQX DJI-15 DJI-20 DJI-30 DIA SPY QQQ MDY IWM TNA Short-Term Rates USO-CrudeOil DBO FAS GLD BBH IBB JETS JNUG KOL NUGT OIH OIL RSX RETL SDS AGQ SLV SOXL TECL TLT TMF TNA UGA (gasoline) XIV YINN Commodities: CANE CORN DBC JJC, NIB, CHOC CORN, CUT (paper) MOO, SOYB WEAT UUP (Dollar) LIT (Lithium) AAPL ADBE ALXN AMAT AMGN AMD AMZN BA BABA BAC BIDU CAT CVX DE FB GOOG GS HD IBM INTU JPM M (Macy's) MSFT NFLX NVDA QCOM TSLA TXN XOM WMT CMG , LRCX, SWKS, MDGL SPPI WATT SQ TOWN 12/31/2018 (Click on Underlined link.) - Bullish MAXCPs - http://tigersoft.com/MAXCPS/Dec-28/BULLISH.htm (None on the 31st) Bearish MAXCPs - http://tigersoft.com/MINCPs/Dec-31/BEARISH.htm |
Table 1 QUICKSILVER on ETFS - 12/31/18 Lots more rising 5-dma. Only GLD has been stronger than DJI over the last 50 trading days. ETF CLOSE CHANGE PIVOT-PT 5-dma AROC CL-PWR CANDLE IP21 ITRS --------------------------------------------------------------------------------------------- DIA 233.2 2.72 218.1 201.1% Bearish BLUE -.139 ---- --------------------------------------------------------------------------------------------- SPY 249.92 2.17 234.34 189.4% Bearish BLUE -.121 -.016 --------------------------------------------------------------------------------------------- QQQ 154.26 1.29 143.5 223.1% Bearish RED -.129 -.037 --------------------------------------------------------------------------------------------- MDY 302.67 3.31 284.96 165.9% Bearish BLUE -.13 -.038 --------------------------------------------------------------------------------------------- IWM 133.9 1.04 125.88 212.2% Bearish BLUE -.187 -.06 --------------------------------------------------------------------------------------------- FAS 44.77 1.1 37.55 508.1% Bearish BLUE -.168 -.198 --------------------------------------------------------------------------------------------- RETL 23.17 .31 19.42 841% Bearish RED -.051 -.308 --------------------------------------------------------------------------------------------- SOXL 83.32 1.55 67.08 647% Bearish RED -.244 -.235 --------------------------------------------------------------------------------------------- TECL 85 2.31 68.96 650.5% Bearish BLUE -.051 -.301 --------------------------------------------------------------------------------------------- IBB 96.43 1.59 89.61 299.3% Bearish BLUE -.123 -.067 --------------------------------------------------------------------------------------------- GLD 121.25 .19 120.02 105.4% ------- BLUE .009 .14 strongest --------------------------------------------------------------------------------------------- OIH 14.03 -.09 13.32 137.2% Bearish RED -.315 -.327 --------------------------------------------------------------------------------------------- RSX 18.75 0 18.44 34.9% Bearish RED -.192 -.033 |
 Table 2   Count of Stocks in Key Directories
           2018-12/31
-------------------------------
NEWHIGHS       20
NEWLOWS        19
MAXCP          7
MINCP          13
TTTNH          12
TTTNL          122
FASTUP         127
FASTDOWN       77
CPCROSSA       35
CPCROSSD       54
BIGVOLUP       11
BIGVODN        13
ACCUMVER       4
HIGHIP21       2
HIUPPCT        4
VHIP21         13
LOWACCUM       323
REDSELL        412
AUGSELS7       18
TRAPDOOR       20
|
Table 3
         RANKING OF KEY DIRECTORIES BASED PCT.OF STOCKS ABOVE 65-DMA
         12/31/18
 Bullish = 2
 Bearish - 45
--------------------------------------------------------------------------------------- Directory Current day-1 day-2 day-3 day-4 day-5 ---------------------------------------------------------------------------------------- GOLD .74 .62 .68 .6 .64 .54 BONDFUND .523 .39 .295 .304 .352 .314 ========================================================================================== COMODITY .357 .357 .357 .357 .38 .357 UTILITY .35 .3 .4 .25 .175 .575 FOOD .339 .339 .339 .339 .357 .339 EDU .333 .166 .333 .333 .333 .166 HACKERS .272 .227 .181 .09 .045 .045 GAMING .25 .25 .25 .208 .166 .166 INDMATER .192 .153 .179 .153 .115 .102 INDEXES .192 .187 .197 .187 .197 .187 SOFTWARE .184 .138 .123 .076 .061 .076 CHINA .183 .166 .15 .15 .116 .083 SEMI .179 .162 .128 .102 .059 .068 HOMEBLDG .176 .176 .176 .176 0 .117 NIFTY .175 .14 .105 .122 .035 .052 BIG17 .173 .152 .13 .108 .086 .065 NASD-100 .17 .12 .12 .11 .03 .04 BEVERAGE .166 .166 .111 .055 .055 .055 ELECTRON .166 .148 .111 .098 .067 .067 INSURANC .166 .166 .166 .1 .1 .1 PIPELINE .166 .208 .166 .125 .125 .208 CHEM .148 .148 .129 .111 .111 .092 COAL .142 .142 .142 .142 .142 .142 BIOTECH .139 .113 .097 .105 .06 .065 DOWJONES .133 .066 .066 .066 0 .033 AUTO .128 .102 .102 .102 .076 .076 GUNS .117 .058 .117 0 0 0 RUS-1000 .112 .09 .095 .072 .024 .072 FIDSTKS .107 .086 .091 .075 .01 .037 SP-100 .107 .075 .086 .053 0 .021 SP500 .106 .086 .098 .064 .016 .076 JETS .1 0 0 0 0 0 RETAIL .094 .075 .075 .075 0 0 MILITARY .093 .093 .093 .093 .093 .093 FINANCE .088 .1 .088 .066 .055 .066 GREEN .086 .086 .086 .086 .043 .043 DJI-13 .076 0 0 0 0 0 REIT .071 .065 .091 .091 .013 .143 ETFS .068 .068 .086 .103 .086 .086 INFRA .055 .027 .027 .055 0 0 SOLAR .055 .055 .055 .055 0 0 OILGAS .046 .04 .04 .04 .02 .02 COMPUTER .045 .045 .045 .045 .045 .045 HOSPITAL .041 .041 .041 .041 .041 .041 REGBANKS .035 .035 .035 .035 .035 .035 BIGBANKS 0 0 0 0 0 0 TRANSP 0 0 0 0 0 0 |
====================================================================
12/28/2018
The operative Peerless Buy B14
should be capable of
lifting the DJI another week or two, as happened in 1980-1981
for example. But after that, the fact that so many stocks are below
their 65-dma should stall the rally unless there is a great January
volume surge. For now, as long as the Closing Powers for
DIA, SPY and QQQ do not start new downtrends or are turned
back down from their 21-dma Closing Power downtrends, look
for higher prices.
There were no MAXCPs tonight. So, I have posted some of
NASD-100 stocks that look relatively bullish. When the tax-loss
selling comes off as the new year starts, I would expect many of
the beat-down tech stocks to enjoy a 10%-15% January rise from
here. NVDA and SOXL are my favorites.
As always, cover short sales when their Closing Power downtrends
are broken. This approach relies upon what we believe is the
superior knowledge Professionals have about these stocks,
especially if the CP trend-changes are confirmed by rapid changes
in current Accumulation. A reminder: even in the 2008 bear market,
covering short sales when their CP downtrends were broken worked
very well.
Peerless Chart and Signals


Buy B14s with Up Vol: Down Vol greater than 28:1
either in December or when DJI was below lower 3.5% band.
la/ma
Subsequent DJI action
1 3/10/2009
.952
New Bull Market STARTED
after 18 months of bear market.
2 8/9/2011
.924
DJI fell from 11239 to 10720,
then rose to 11406 and
then fell to 10818.
These zig-zags continued 6 more weeks. .
3 12/20/2011
1.022 DJI rose from 12104 to 13233 on 3/16/12
4 12/31/2012
.997
DJI
rose from 13104 to 15388 on 5/21/14
12/26/2018 .985.
How To Deal with Volatility
Watch the Closing Powers now. Having just come off a bottom
and not set in place a secondary bottom for purposes of building
a Closing Power uptrend, I would build a Closing Power uptrend that
is rising at about a 45-degrees angle.
Lots of traders were surprised by the size of the two day's rally
in the DJI after Christmas Day. Let me suggest some ways of
coping with the market when it is "oversold" or "overbought"
and we know there may be a reversal but Peerless has not signalled
it yet.
1) Use the Hourly chart of whatever you are trading. We use the
Hourly DJI here. Note where the trendline crosses and do not be
afraid to use it. On the Hotline for December 24th, shown just below,
I showed where the key trendline crosses, way down at 22200.
2) Use the Exploded charts (the last choice under "Lines" when
you have a chart on the screen), Explode the last 40 trading days
or so. Select from upper left "Draw Closing Power Trendline
and Show Stats". Note the last row of numbers on the screen. They
will tell you exactly how much the stock or the ETF you are drawing
will have to move up or down from the opening to break the
Closing Power diagonal line you have drawn. Below are the Diagonal
Line and statistics for DIA, as of 12/24/2018.
On the 26th, DIA opened at 219.18. For someone using this chart,
that meant that the Closing Power downtrend for the 26th would
be broken on any close more than 5.8 above that day's opening.
Traders who anticipated the next day's Closing Power chart would have
be buyers as soon as it appeared DIA would close above 244.99.
EXPLODED DIA CHART for 12/24/2018.

Exploded Charts of SPY, QQQ and IWM now.
 |
 |
 |
|
Charts 12/28/2018 2018 PEERLESS DJI, Signals, Indicators Daily DJI Volume 10-DayUp/Down Vol Hourly DJIA A/D Line for All Stocks Inverted Traders Index NASDAQ S&P OEX NYSE COMPQX DJI-15 DJI-20 DJI-30 DIA SPY QQQ MDY IWM TNA Short-Term Rates USO-CrudeOil DBO FAS GLD BBH IBB JETS JNUG KOL NUGT OIH OIL RSX RETL SDS AGQ SLV SOXL TECL TLT TMF TNA UGA (gasoline) XIV YINN Commodities: CANE CORN DBC JJC, NIB, CHOC CORN, CUT (paper) MOO, SOYB WEAT UUP (Dollar) LIT (Lithium) AAPL ADBE ALXN AMAT AMGN AMD AMZN BA BABA BAC BIDU CAT CVX DE FB GOOG GS HD IBM INTU JPM M (Macy's) MSFT NFLX NVDA QCOM TSLA TXN XOM WMT CMG , LRCX, SWKS, MDGL SPPI WATT SQ TOWN 12/28/2018 (Click on Underlined link.) - Bullish MAXCPs - http://tigersoft.com/MAXCPS/Dec-28/BULLISH.htm Bearish MAXCPs - http://tigersoft.com/MINCPS/Dec-28/BEARISH.htm |
Table 1 QUICKSILVER on ETFS - 12/28/18 Lots more rising 5-dma. Only GLD has been stronger than DJI over the last 50 trading days. ETF CLOSE CHANGE PIVOT-PT 5-dma AROC CL-PWR CANDLE IP21 ITRS --------------------------------------------------------------------------------------------- --------------------------------------------------------------------------------------------- DIA 230.48 -.78 224.09 35.1% Bearish RED -.137 ------ --------------------------------------------------------------------------------------------- SPY 247.75 -.32 240.7 11.9% Bearish RED -.117 -.01 --------------------------------------------------------------------------------------------- QQQ 152.97 -.08 147.57 22.7% Bearish RED -.092 -.03 --------------------------------------------------------------------------------------------- MDY 299.36 -.42 292.88 -14.2% Bearish RED -.192 -.036 --------------------------------------------------------------------------------------------- IWM 132.86 .38 128.37 41.1% Bearish BLUE -.187 -.056 --------------------------------------------------------------------------------------------- FAS 43.67 -.06 40.54 67.4% Bearish RED -.177 -.19 --------------------------------------------------------------------------------------------- RETL 22.86 .51 19.57 312.2% Bearish RED .053 -.325 --------------------------------------------------------------------------------------------- SOXL 81.77 1.69 73.46 317.6% Bearish ---- -.214 -.242 --------------------------------------------------------------------------------------------- TECL 82.69 -.8 74.82 -1.9% Bearish RED -.04 -.312 --------------------------------------------------------------------------------------------- IBB 94.84 -.32 90.86 15.1% Bearish RED -.113 -.067 --------------------------------------------------------------------------------------------- GLD 121.06 .49 118.72 76.1% Bearish BLUE -.028 .152 --------------------------------------------------------------------------------------------- OIH 14.12 .12 13.65 76% Bearish ---- -.288 -.318 --------------------------------------------------------------------------------------------- RSX 18.75 .25 18.62 -64.2% Bearish BLUE -.16 -.022 |
Table 2    Count of Stocks in Key Directories
           20181228
-------------------------------
NEWHIGHS       17
NEWLOWS        10
MAXCP          2
MINCP          5
TTTNH          7
TTTNL          83
FASTUP         53
FASTDOWN       118
CPCROSSA       48
CPCROSSD       43
BIGVOLUP       9
BIGVODN        15
ACCUMVER       5
HIGHIP21       1
HIUPPCT        3
VHIP21         12
LOWACCUM       321
REDSELL        414
AUGSELS7       12
TRAPDOOR       20
|
Table 3RANKING OF KEY DIRECTORIES BASED PCT.OF STOCKS ABOVE 65-DMA 12/28/18 Bullish = 1 Bearish = 46 --------------------------------------------------------------------------------------- Directory Current day-1 day-2 day-3 day-4 day-5 ---------------------------------------------------------------------------------------- GOLD .62 .68 .6 .64 .54 .56 ========================================================================================== BONDFUND .39 .295 .304 .352 .314 .266 COMODITY .357 .357 .357 .38 .357 .404 FOOD .339 .339 .339 .357 .339 .41 UTILITY .3 .4 .25 .175 .575 .7 GAMING .25 .25 .208 .166 .166 .125 HACKERS .227 .181 .09 .045 .045 .045 PIPELINE .208 .166 .125 .125 .208 .208 INDEXES .187 .197 .187 .197 .187 .219 HOMEBLDG .176 .176 .176 0 .117 .352 BEVERAGE .166 .111 .055 .055 .055 .222 CHINA .166 .15 .15 .116 .083 .166 EDU .166 .333 .333 .333 .166 .333 INSURANC .166 .166 .1 .1 .1 .1 SEMI .162 .128 .102 .059 .068 .102 INDMATER .153 .179 .153 .115 .102 .102 BIG17 .152 .13 .108 .086 .065 .108 CHEM .148 .129 .111 .111 .092 .092 ELECTRON .148 .111 .098 .067 .067 .08 COAL .142 .142 .142 .142 .142 .142 NIFTY .14 .105 .122 .035 .052 .087 SOFTWARE .138 .123 .076 .061 .076 .092 NASD-100 .12 .12 .11 .03 .04 .07 BIOTECH .11 .097 .105 .06 .065 .081 AUTO .102 .102 .102 .076 .076 .076 FINANCE .1 .088 .066 .055 .066 .077 MILITARY .093 .093 .093 .093 .093 .093 RUS-1000 .09 .095 .072 .024 .069 .09 FIDSTKS .086 .091 .075 .01 .037 .069 GREEN .086 .086 .086 .043 .043 .13 SP500 .086 .098 .064 .016 .074 .102 RETAIL .075 .075 .075 0 0 0 SP-100 .075 .086 .053 0 .021 .043 ETFS .068 .086 .103 .086 .086 .086 DOWJONES .066 .066 .066 0 .033 .033 REIT .066 .092 .092 .013 .139 .172 GUNS .058 .117 0 0 0 0 SOLAR .055 .055 .055 0 0 .166 COMPUTER .045 .045 .045 .045 .045 .045 HOSPITAL .041 .041 .041 .041 .041 .041 OILGAS .04 .04 .04 .02 .02 .02 REGBANKS .035 .035 .035 .035 .035 .035 INFRA .027 .027 .055 0 0 0 BIGBANKS 0 0 0 0 0 0 DJI-13 0 0 0 0 0 0 JETS 0 0 0 0 0 .1 TRANSP 0 0 0 0 0 0 |
====================================================================
12/27/2018
Consider the operative Peerless signal to be a
revised Buy B14.

Let's not be stubbornly bearish. I would now
accept yesterday's Buy B6,
even though the DJI rose 5% on the day of the signal. As long as the blue
Closing Powers are rising, the markets will almost certainly rise, especially
at this time of year.
Typically, Closing Powers, having broken their
steep downtrends, will soon rise to their falling 21-dma.
At that point, we see how strong are the Professionals'
bullish convictions.

I looked back at back at what happens when the ratio of Up Volume to
Down Volume was as high as it was yesterday, about 28:1. Of particular,
interest is what happens when the DJI was below the normal
3.5% lower band or it was December. Those cases would seem
to be best matches for how the market looked yesterday when
the B6 was given. Note that we only look back to 1965, since
the NYSE did not report this data before that. Except for the first
2011 case, such Up Volume versus Down Volume would have
been a good time to buy. A Buy B14 showing reflecting this study
will be added to Peerless this weekend.
Cases of Up Vol: Down Vol >28:1
with la/ma< .965 (lower band) or
in December.
la/ma Subsequent DJI action
1 3/10/2009
.952
New Bull Market STARTED.
2 8/9/2011
.924
DJI fell from 11239 to 10720,
then rose to 11406 and
then fell to 10818.
These zig-zags continued 6 more weeks. .
3 12/20/2011
1.022 DJI rose from 12104 to 13233
on 3/16/12
4 12/31/2012
.997
DJI rose from 13104 to 15388 on 5/21/14
12/26/2018 .985.
Three of the four cases above, which will reflect a
revised Buy B14,
worked out very well. In the fourth, a big decline did not follow; only eight
weeks
of backing and filling before much higher prices followed. That suggests a
75% probability of a good rally ahead and a 25% chance that more
basing and filling will be needed. As such, this Buy B14* will be put into
the next version of Peerless. It will be show under the "Experimental"
category..
Trust That Professionals Know Something Very Bullish
Perhaps, word has leaked out the FOMC does not want to be publicly
challenged by the President. Perhaps, the computerized traders are
all using the same rules reflecting "oversold markets", the 20%-down support
and December-January bullishness. Or perhaps, as in the 1957, the DJI
will not tag the 20%-down-from-the peak level until Short-Term interest
rates reach 3.5%.
A post-Christmas rally by SPY back to its broken-support at 260
seems likely. Watch the blue Closing Power. Its turning down near
260 will likely mark the end of this advance.

Whatever lies behind the rally, it's clear that Professionals
are clearly
running the show, especially in the last hour of NY trading. So, with the steep
Closing Power downtrends having been violated, the Pros are bullish for
now, and we should follow their lead. The FED will not be raising rates
again for months. If the DJI can get past the 23300
resistance, it should
move up into mid-January. The bullish action will likely be focused on
the DIA and SOXL. I like the action in SOXL. Alone among the major
ETFs shown in Table 1, below, its 5-day ma is rising.


|
Charts 12/27/2018 2018 PEERLESS DJI, Signals, Indicators Daily DJI Volume 10-DayUp/Down Vol Hourly DJIA A/D Line for All Stocks Inverted Traders Index NASDAQ S&P OEX NYSE COMPQX DJI-15 DJI-20 DJI-30 DIA SPY QQQ MDY IWM TNA Short-Term Rates Signals: 2006 Peerless (1965-2006 based) 2017 Peerless (1928-2017, not completed) USO-CrudeOil DBO FAS GLD BBH IBB JETS JNUG KOL NUGT OIH OIL RSX RETL SDS AGQ SLV SOXL TECL TLT TMF TNA UGA (gasoline) XIV YINN Commodities: CANE CORN DBC JJC, NIB, CHOC CORN, CUT (paper) MOO, SOYB WEAT UUP (Dollar) LIT (Lithium) AAPL ADBE ALXN AMAT AMGN AMD AMZN BA BABA BAC BIDU CAT CVX DE FB GOOG GS HD IBM INTU JPM M (Macy's) MSFT NFLX NVDA QCOM TSLA TXN XOM WMT CMG , LRCX, SWKS, MDGL SPPI WATT SQ TOWN 12/27/2018 (Click on Underlined link.) - Bullish MAXCPs - http://tigersoft.com/MAXCPZ/Dec-27/BULLISH.htm Bearish MAXCPs - http://tigersoft.com/MINCPZ/Dec-27/BEARISH.htm |
Table 1 QUICKSILVER on ETFS - 12/26/18 Only GLD and SOXL have rising 5-dma. Only GLD has been stronger than DJI over the last 50 trading days. ETF CLOSE CHANGE PIVOT-PT 5-dma AROC CL-PWR CANDLE IP21 ITRS
---------------------------------------------------------------------------------------------
---------------------------------------------------------------------------------------------
DIA 231.26 2.55 228.89 -47.7% Bearish BLUE-.089 ----
---------------------------------------------------------------------------------------------
SPY 248.07 1.89 247.17 -65.4% Bearish BLUE-.073 -.012
---------------------------------------------------------------------------------------------
QQQ 153.05 .59 152.29 -49.3% Bearish BLUE-.058 -.028
---------------------------------------------------------------------------------------------
MDY 299.78 1.75 300.2 -73.3% Bearish BLUE-.183 -.039
---------------------------------------------------------------------------------------------
IWM 132.48 .55 131.79 -58.3% Bearish BLUE-.195 -.057
---------------------------------------------------------------------------------------------
FAS 43.73 1.08 43.11 -109.1% Bearish BLUE-.143 -.173
---------------------------------------------------------------------------------------------
RETL 22.35 -.46 21.54 -115.4% Bearish RED .092 -.333
---------------------------------------------------------------------------------------------
SOXL 80.08 1.47 76.99 71.3% Bearish BLUE-.196 -.216
^^^^^
---------------------------------------------------------------------------------------------
TECL 83.49 2.24 82.72 -254.9% Bearish BLUE-.006 -.276
---------------------------------------------------------------------------------------------
IBB 95.16 .35 94.56 -56.3% Bearish BLUE-.064 -.052
---------------------------------------------------------------------------------------------
GLD 120.57 .91 119.24 131.9% ------- -----.073 .123
---------------------------------------------------------------------------------------------
OIH 14 -.17 13.91 -272.2% Bearish BLUE-.302 -.342
---------------------------------------------------------------------------------------------
RSX 18.5 -.34 18.99 -366.6% Bearish -----.16 -.038
|
 Table 2
          Count of Stocks in Key Directories
          2018-12/27
-------------------------------
NEWHIGHS       19
NEWLOWS        17
MAXCP          2
MINCP          8
TTTNH          9
TTTNL          98
FASTUP         24
FASTDOWN       278
CPCROSSA       85
CPCROSSD       12
BIGVOLUP       2
BIGVODN        24
ACCUMVER       6
HIGHIP21       1
HIUPPCT        2
VHIP21         13
LOWACCUM       319
REDSELL        415
AUGSELS7       13
TRAPDOOR       20
|
 Table 3
             RANKING OF KEY DIRECTORIES BASED PCT.OF STOCKS ABOVE 65-DMA
             12/27/18
 Bullish = 1  Bearish = 46
---------------------------------------------------------------------------------------
Directory     Current       day-1         day-2         day-3         day-4         day-5
----------------------------------------------------------------------------------------
GOLD           .68           .6            .64           .54           .56           .5
UTILITY        .4            .25           .175          .575          .7            .625
COMODITY       .357          .357          .38           .357          .404          .428
FOOD           .339          .339          .357          .339          .41           .428
EDU            .333          .333          .333          .166          .333          .333
BONDFUND       .295          .304          .352          .314          .257          .419
GAMING         .25           .208          .166          .166          .125          .125
INDEXES        .197          .187          .197          .187          .219          .192
HACKERS        .181          .09           .045          .045          .045          .045
HOMEBLDG       .176          .176          0             .117          .294          .294
INDMATER       .166          .141          .102          .089          .089          .089
INSURANC       .166          .1            .1            .1            .1            .166
PIPELINE       .166          .125          .125          .208          .208          .25
CHINA          .15           .15           .116          .083          .166          .15
COAL           .142          .142          .142          .142          .142          .142
BIG17          .13           .108          .086          .065          .108          .173
CHEM           .129          .111          .111          .092          .092          .092
SEMI           .128          .102          .059          .068          .102          .119
SOFTWARE       .123          .076          .061          .076          .076          .092
NASD-100       .12           .11           .03           .04           .07           .09
GUNS           .117          0             0             0             0             0
BEVERAGE       .111          .055          .055          .055          .222          .222
ELECTRON       .111          .098          .067          .067          .08           .092
NIFTY          .105          .122          .035          .052          .087          .105
AUTO           .102          .102          .076          .076          .076          .128
SP500          .098          .064          .016          .074          .102          .132
RUS-1000       .095          .072          .024          .069          .087          .114
BIOTECH        .094          .105          .06           .065          .076          .094
MILITARY       .093          .093          .093          .093          .093          .125
REIT           .092          .092          .013          .139          .172          .192
FIDSTKS        .091          .075          .01           .037          .069          .096
FINANCE        .088          .066          .055          .066          .077          .077
ETFS           .086          .103          .086          .086          .086          .12
GREEN          .086          .086          .043          .043          .13           .13
SP-100         .086          .053          0             .021          .043          .086
RETAIL         .075          .075          0             0             0             .018
DOWJONES       .066          .066          0             .033          .033          .133
SOLAR          .055          .055          0             0             .166          .222
COMPUTER       .045          .045          .045          .045          .045          .045
HOSPITAL       .041          .041          .041          .041          .041          .041
OILGAS         .04           .04           .02           .02           .02           .027
REGBANKS       .035          .035          .035          .035          .035          .035
INFRA          .027          .055          0             0             0             0
BIGBANKS       0             0             0             0             0             0
DJI-13         0             0             0             0             0             .076
JETS           0             0             0             0             .1            .1
TRANSP         0             0             0             0             0             0
|
====================================================================
12/26/2018
Wow! I knew there might be a bounce. But nearly
5% in one day.
President Trump speaks and investors really listen. The ratio of NYSE
advancers to decliners was 6.9:1 and the ratio of NYSE Up Volume to
Down Volume was 28:1. Bulls will hope that is the start of a new leg up
in the long 2009-2018 bull market. Years before the Presidential Election
since 1915 have usually been very good to investors.
But we need more
evidence of a turn-around here, I would suggest.
On Christmas, the President took Fed Chrmn Powell off the
hook. Trump's
Chief of Economic Advisors said Powell would not be fired. In effect, the
President switched over the holiday and now says he will respect the independence
of the FED. This is exactly what Wall Street wanted to hear. Their chief
institutional
benefactor is safe.
But this also means that the FED may feel freer to raise rates. Short-
term rates made a new high today and the Dollar was very strong. So, the
original concern that Trump had about raising rates and hurting the
market still stands. Traders are having second thoughts now.
Technicaly, to become bullish we need to see a deeper
decline or a
much better bottom, one with un-confirmed lows, or we need to see the
23300-23400 support-turned-into-resistance overcome. Do not trust
today's Buy B6. Stay short. What would we buy using Tiger's trading
rules?
Past DJI Advances like Today.
Since almost all the DJI daily gains of nearly 5% occurred in
on-going
bear markets, the past results may not be relevant. But about half of these
big rallies were quickly reversed by sizeable declines and only about half
saw rallies to the upper band. As the DJI is not coming out of a bear market
and has not fall the requisite 20% from its highs, these statistics are probably
not relevant.
At a minimum, more follow-through is certainly needed to
convince me
to be bullish. The only leadership we can see now in Table 3 is Gold.
90% of all stocks are still below their 65-dma. True, some of the
steep Closing Powers were slightly penetrated today. This may allow
the market to make a better base after a limited decline. But we need
some more evidence to become bullish, despite today's Buy B6. None of
our Buy B6s ever took place following so much apparent strength. I would
cancel the B6 today for this reason.
As I write this, the DJI futures are down
350. Of course, that may change.
But they may get worse. In that case, we would be seeing a very rare, and a
two-day-reversal-down phenomenon. These mark serious bear markets.
Let's just hold our short positions a little longer.
What about Peerless? Some have asked why the current
version of Peerless
did not give a Buy B16 on the 24th, as some versions before 2018 did..
The answer is that current version of Peerless denied us that because of the
multiple S9s, the broken support-levels, AROC being below -1.0 and the
IP21 (Current Accum.) being below -.19 on the 24th. These are all reasons
to be cautious now.
Today, Peerless gave a Buy B6. The size of the rally
today did not play
a role in the signal. If I were writing the software today, I would not
allow
any Buy B6 signal after such an advance unless trading volume was
extraordinarily high, thereby confirming the strength. Without higher volume,
I would note that it will be hard for the DJI to eat up the over-head resistance at
23300-23400.
The Buy B6 is simply a late "Santa Claus" rally. A rally until January
always
seems to follow. Let's see if a better base can be built.
Environ.
Date
la/ma AROC P-I
IP21 V-I OPct 65ch
65-dma-aroc
Correction 12/26/2018 .945 -.69 -487
-.15 -333 -.157 -.145 -.590
Here are the past cases:
Environ.
Date
la/ma AROC P-I
IP21 V-I OPct 65ch
65-dma-aroc
Bear Mkt 12/26/1931 .935 -1.667 -132 -.11 -596
-.143 -.277 -1.27
161.2 (-4.0) DJI rose to 171.9 on 1/7/1931 and then fell back to 161.5 on 1/19.
Sell S2 given reversing the B6 at the upper band.
Correction 12/20/1934 .98 -.035 +6 -.057
-35 +.082 +.147 +.51
99.6 (-0.2) DJI rose to 105.9 on 1/7/1935 and then fell back to 100.5 on 1/15
Bear Mkt 12/28/1966 .984 -.187 +3 -.013 +1
-.09 -.004 -.02
789 (-3) DJI fell slightly for 2 days and then rose to
861 on 2/8/1967
Bull Mkt 12/31/1986 .985 -.103 -179 +.072 -16 -.199 +.08
+.28
1896 - DJI took off to the upside until April, reaching 2405.54.
There were many additional Buy signals on the rally.
Bear Mkt 12/24/2002 .980 -.492 +21 -.028 -184
-.279 .073 .26
8448 - DJI rose to upper band (8786) on 1/13/203 and resumed bear mkt.
  |
 |
  |
 |
|
Charts 12/26/2018 PEERLESS DJI, Signals, Indicators Daily DJI Volume 10-DayUp/Down Vol Hourly DJIA A/D Line for All Stocks Inverted Traders Index NASDAQ S&P OEX NYSE COMPQX DJI-15 DJI-20 DJI-30 DIA SPY QQQ MDY IWM TNA Short-Term Rates USO-CrudeOil DBO FAS GLD BBH IBB JETS JNUG KOL NUGT OIH OIL RSX RETL SDS AGQ SLV SOXL TECL TLT TMF TNA UGA (gasoline) XIV YINN Commodities: CANE CORN DBC JJC, NIB, CHOC CORN, CUT (paper) MOO, SOYB WEAT UUP (Dollar) LIT (Lithium) AAPL ADBE ALXN AMAT AMGN AMD AMZN BA BABA BAC BIDU CAT CVX DE FB GOOG GS HD IBM INTU JPM M (Macy's) MSFT NFLX NVDA QCOM TSLA TXN XOM WMT CMG , LRCX, SWKS, MDGL SPPI WATT SQ TOWN 12/26/2018 (Click on Underlined link.) - Bullish MAXCPs - http://tigersoft.com/MAXCPZ/Dec-26/BULLISH.htm Bearish MAXCPs - http://tigersoft.com/MINCPZ/Dec-26/BEARISH.htm |
Table 1 QUICKSILVER on ETFS - 12/26/18 Only GLD has a rising 5-dma and has been stronger than DJI over the last 50 trading days. ETF CLOSE CHANGE PIVOT-PT 5-dma AROC CL-PWR CANDLE IP21 ITRS --------------------------------------------------------------------------------------------- --------------------------------------------------------------------------------------------- DIA 228.71 10.61 233.42 -189.4% Bearish BLUE -.132 --- --------------------------------------------------------------------------------------------- SPY 246.18 11.84 251.26 -181.1% Bearish BLUE -.113 -.011 --------------------------------------------------------------------------------------------- QQQ 152.46 8.96 154.53 -197% Bearish BLUE -.091 -.028 --------------------------------------------------------------------------------------------- MDY 298.03 13.07 304.12 -189.7% Bearish BLUE -.305 -.027 --------------------------------------------------------------------------------------------- IWM 131.93 6.05 134 -187.2% Bearish BLUE -.252 -.044 --------------------------------------------------------------------------------------------- FAS 42.65 5.1 44.64 -433.6% Bearish BLUE -.196 -.187 --------------------------------------------------------------------------------------------- RETL 22.81 3.39 22.84 -249.4% Bearish BLUE .074 -.301 --------------------------------------------------------------------------------------------- SOXL 78.61 11.53 79.01 -764.3% Bearish BLUE -.202 -.234 --------------------------------------------------------------------------------------------- TECL 81.25 12.29 87.52 -715.7% Bearish BLUE -.039 -.31 --------------------------------------------------------------------------------------------- IBB 94.81 5.2 96.21 -186.3% Bearish BLUE -.12 -.051 --------------------------------------------------------------------------------------------- GLD 119.66 -.36 117.43 63.6% Bearish RED -.093 .136 --------------------------------------------------------------------------------------------- OIH 14.17 .85 14.76 -363.5% Bearish BLUE -.376 -.318 --------------------------------------------------------------------------------------------- RSX 18.84 .4 19.89 -281.7% Bearish BLUE -.183 -.013 |
Table 2
    Count of Stocks in Key Directories
          2018-12/26
-------------------------------
NEWHIGHS       35
NEWLOWS        4
MAXCP          2
MINCP          8
TTTNH          3
TTTNL          50
FASTUP         21
FASTDOWN       319
CPCROSSA       84
CPCROSSD       21
BIGVOLUP       6
BIGVODN        8
ACCUMVER       4
HIGHIP21       3
HIUPPCT        1
VHIP21         14
LOWACCUM       311
REDSELL        417
AUGSELS7       15
TRAPDOOR       21
|
Table 3
 RANKING OF KEY DIRECTORIES BASED PCT.OF STOCKS ABOVE 65-DMA
              12/26/18
 Bullish 1
 Bearish = 46
---------------------------------------------------------------------------------------
Directory     Current       day-1         day-2         day-3         day-4         day-5
----------------------------------------------------------------------------------------
GOLD           .6            .64           .54           .56           .5            .64
COMODITY       .357          .38           .357          .404          .428          .452
FOOD           .339          .357          .339          .41           .428          .464
EDU            .333          .333          .166          .333          .333          .333
BONDFUND       .304          .352          .314          .257          .39           .314
UTILITY        .25           .175          .575          .7            .625          .65
GAMING         .208          .166          .166          .125          .125          .125
INDEXES        .187          .197          .187          .219          .187          .203
HOMEBLDG       .176          0             .117          .294          .294          .294
INDMATER       .153          .115          .102          .102          .102          .128
CHINA          .15           .116          .083          .166          .15           .166
COAL           .142          .142          .142          .142          .142          .142
PIPELINE       .125          .125          .208          .208          .25           .208
NIFTY          .122          .035          .052          .087          .105          .192
CHEM           .111          .111          .092          .092          .092          .092
NASD-100       .11           .03           .04           .07           .09           .14
BIG17          .108          .086          .065          .108          .173          .173
ETFS           .103          .086          .086          .086          .12           .137
AUTO           .102          .076          .076          .076          .128          .153
BIOTECH        .102          .06           .065          .076          .094          .113
SEMI           .102          .059          .068          .102          .119          .213
INSURANC       .1            .1            .1            .1            .166          .133
ELECTRON       .098          .067          .067          .08           .092          .166
MILITARY       .093          .093          .093          .093          .125          .125
REIT           .092          .013          .139          .172          .192          .218
HACKERS        .09           .045          .045          .045          .045          .09
GREEN          .086          .043          .043          .13           .13           .13
SOFTWARE       .076          .061          .076          .076          .092          .092
FIDSTKS        .075          .01           .037          .069          .096          .112
RETAIL         .075          0             0             0             .018          .037
RUS-1000       .072          .024          .069          .087          .113          .131
DOWJONES       .066          0             .033          .033          .133          .166
FINANCE        .066          .055          .066          .077          .077          .077
SP500          .064          .016          .074          .102          .132          .156
BEVERAGE       .055          .055          .055          .222          .222          .222
INFRA          .055          0             0             0             0             .055
SOLAR          .055          0             0             .166          .222          .222
SP-100         .053          0             .021          .043          .086          .107
COMPUTER       .045          .045          .045          .045          .045          .09
HOSPITAL       .041          .041          .041          .041          .041          .083
OILGAS         .04           .02           .02           .02           .027          .034
REGBANKS       .035          .035          .035          .035          .035          .035
BIGBANKS       0             0             0             0             0             0
DJI-13         0             0             0             0             .076          .076
GUNS           0             0             0             0             0             .058
JETS           0             0             0             .1            .1            .1
TRANSP         0             0             0             0             0             0
|
====================================================================
12/24/2018
Watch the Big Banks's stocks now. They are the leaders going
down. Their insiders
know best what is driving the market now. FAZ is a leveraged ETF short.
Watch how much the trading volume is rising in the leveraged short ETFs, like
FAZ or the entire group of finance stocks.
Don't trust an early rally. Too many have failed and don't trust that a DJI
bottom will be made at 21000, 20% down from the highs.
Stay short lots of the bearish MINCPs and IWM.


The extreme speed of this decline to the 20%-down-from-the
peak level
has only a handful of past parallels since 1945. The charts for 1962, 1987
and 2008 show us that a rapid 20% down-from-the-peak decline does not
necessarily reach support there even though in 2015, 1957 and 1946,
bottoms were made at this point. Most recently, the DJI bottomed exactly
after it made a "hypothetical" low 20% down. The October 1957 bottom was made
19% down from its July peak.
The news now is very different. In 1946, there were a perfect
head/shoulders
pattern and series of labor strikes to explain the decline. When they ended, the
market bottomed. In early 1962, a massive head and shoulders was
completed.
In this year, JFK directly challenged Wall Street when he sought to control steel
prices as Truman had done in the Korean War. But in June 1962, he offered a
truce and a tax cut to big business. Note that the Cuban missile crisis had more
effect on the market in the second half.
There's more to the current decline than meets the eye. The decline is being
led now
by
Big Banks. The Insiders at these banks know why their stocks are collapsing.
That
is why Trump's Treasury Secretary phoned them all two days ago. But the Big
Banks
are not talking, at least not publicly. It could be that the world's economy is
in
dire financial trouble and lots and lots of bank loans may fail. But since the stock
market decline is also affecting regional US banks almost as badly, I think that the
world's economy cannot be blamed especially. Something else is playing out.
Here's my guess.
#1. The FED is correctly seen as creating another bear market, just
as they did with higher
interest rates in the bear markets of 1919-1920, 1929-1932, 1937, 1957, 1959-1960,
1966,
1968-1970, 1973-1974, 1981-1982, 1983-84 (a correction), 1987, 2000-2002.
#2
The continuing decline has a lot to do with the President's challenge
of
the Federal Reserve. The Big Banks have always been protected by the Fed.
If
the FED's power and autonomy were actually to be taken away, the Big Banks
would
lose their most important political benefactor.
#3
What makes the situation most dangerous now is how
much more damage
the
leveraged short-sellers can do to the stock market by instantly selling short
a
myriad of leveraged ETFs on down-ticks. The Big Banks know this better than
anyone. This is the system that they created to make money in the bull
market. But
nothing now prevents it from being used to profit from an out-of-control decline.

  |
|
Charts 12/24/2018 PEERLESS DJI, Signals, Indicators Daily DJI Volume 10-DayUp/Down Vol Hourly DJIA A/D Line for All Stocks Inverted Traders Index NASDAQ S&P OEX NYSE COMPQX DJI-15 DJI-20 DJI-30 DIA SPY QQQ MDY IWM TNA Short-Term Rates USO-CrudeOil DBO FAS GLD BBH IBB JETS JNUG KOL NUGT OIH OIL RSX RETL SDS AGQ SLV SOXL TECL TLT TMF TNA UGA (gasoline) XIV YINN Commodities: CANE CORN DBC JJC, NIB, CHOC CORN, CUT (paper) MOO, SOYB WEAT UUP (Dollar) LIT (Lithium) AAPL ADBE ALXN AMAT AMGN AMD AMZN BA BABA BAC BIDU CAT CVX DE FB GOOG GS HD IBM INTU JPM M (Macy's) MSFT NFLX NVDA QCOM TSLA TXN XOM WMT CMG , LRCX, SWKS, MDGL SPPI WATT SQ TOWN 12/24/2018 (Click on Underlined link.) - Bullish MAXCPs - http://tigersoft.com/MAXCPZ/Dec-24/BULLISH.htm Bearish MAXCPs - http://tigersoft.com/MINCPZ/Dec-24/BEARISH.htm |
 |
  |
Table 1 QUICKSILVER on ETFS - 12/25/18 ETF CLOSE CHANGE PIVOT-PT 5-dma AROC CL-PWR CANDLE IP21 ITRS --------------------------------------------------------------------------------------------- --------------------------------------------------------------------------------------------- DIA 218.1 -5.99 237.36 -395% Bearish RED -.231 ---- --------------------------------------------------------------------------------------------- SPY 234.34 -6.36 255.08 -420.5% Bearish RED -.208 -.01 --------------------------------------------------------------------------------------------- QQQ 143.5 -4.07 158.42 -452.1% Bearish RED -.183 -.025 --------------------------------------------------------------------------------------------- MDY 284.96 -7.92 309.35 -403% Bearish RED -.36 -.032 --------------------------------------------------------------------------------------------- IWM 125.88 -2.49 136.85 -416.9% Bearish RED -.325 -.052 --------------------------------------------------------------------------------------------- FAS 37.55 -2.99 46.33 -1023.8% Bearish RED -.331 -.231 --------------------------------------------------------------------------------------------- RETL 19.42 -.15 23.88 -907.5% Bearish BLUE -.021 -.337 --------------------------------------------------------------------------------------------- SOXL 67.08 -6.38 90.44 -1223.9% Bearish RED -.265 -.269 --------------------------------------------------------------------------------------------- TECL 68.96 -5.86 92.9 -1275.7% Bearish RED -.153 -.321 --------------------------------------------------------------------------------------------- IBB 89.61 -1.25 98.31 -553.9% Bearish RED -.2 -.05 --------------------------------------------------------------------------------------------- GLD 120.02 1.3 118.15 90.9% ------- BLUE -.024 .165 --------------------------------------------------------------------------------------------- RSX 18.44 -.18 19.92 -430.6% Bearish RED -.242 .023 |
Table 2
    Count of Stocks in Key Directories
          2018-12/24
-------------------------------
NEWHIGHS       35
NEWLOWS        639  Very bearish >20:1 ratio vs newhighs
MAXCP          18
MINCP          522  Very bearish
TTTNH          18
TTTNL          318  Very bearish
FASTUP         21
FASTDOWN       836  Very bearish
CPCROSSA       35   Some Professional nibbling
CPCROSSD       29
BIGVOLUP       13
BIGVODN        16
LOWACCUM       224
REDSELL        417
AUGSELS7       18
TRAPDOOR       20
|
 Table 3
              RANKING OF KEY DIRECTORIES BASED PCT.OF STOCKS ABOVE 65-DMA
              12/24/18
---------------------------------------------------------------------------------------
Directory     Current       day-1         day-2         day-3         day-4         day-5
----------------------------------------------------------------------------------------
GOLD           .64           .54           .56           .5            .64           .54
================================================================================================
COMODITY       .38           .357          .404          .428          .452          .452
BONDFUND       .352          .314          .257          .39           .314          .314
FOOD           .35           .333          .403          .421          .456          .456
EDU            .333          .166          .333          .333          .333          .333
INDEXES        .197          .187          .219          .187          .203          .197
UTILITY        .175          .575          .7            .625          .675          .725
              Big Drop
GAMING         .166          .166          .125          .125          .125          .166
COAL           .142          .142          .142          .142          .142          .142
PIPELINE       .125          .208          .208          .25           .208          .25
CHINA          .116          .083          .166          .15           .166          .15
INDMATER       .115          .102          .102          .102          .128          .115
CHEM           .111          .092          .092          .092          .092          .111
INSURANC       .1            .1            .1            .166          .133          .166
MILITARY       .093          .093          .093          .125          .125          .125
BIG17          .086          .065          .108          .173          .173          .152
ETFS           .086          .086          .086          .12           .12           .12
AUTO           .076          .076          .076          .128          .153          .128
ELECTRON       .067          .067          .08           .092          .16           .135
SOFTWARE       .061          .076          .076          .092          .092          .107
SEMI           .059          .068          .102          .119          .205          .188
BIOTECH        .057          .065          .076          .094          .113          .134
BEVERAGE       .055          .055          .222          .222          .222          .222
FINANCE        .055          .066          .077          .077          .077          .066
COMPUTER       .045          .045          .045          .045          .09           .045
HACKERS        .045          .045          .045          .045          .09           .09
GREEN          .043          .043          .13           .13           .13           .13
HOSPITAL       .041          .041          .041          .041          .083          .083
NIFTY          .035          .052          .087          .105          .192          .14
REGBANKS       .035          .035          .035          .035          .035          .035
NASD-100       .03           .04           .07           .09           .13           .13
RUS-1000       .024          .069          .087          .113          .13           .127
OILGAS         .02           .02           .02           .027          .034          .034
SP500          .016          .074          .102          .132          .154          .15
^^^^^
REIT           .013          .139          .172          .192          .218          .205
FIDSTKS        .01           .037          .069          .096          .112          .107
BIGBANKS       0             0             0             0             0             0
DJI-13         0             0             0             .076          .076          .076
DOWJONES       0             .033          .033          .133          .166          .166
^^^^^^^^
GUNS           0             0             0             0             .058          0
HOMEBLDG       0             .117          .294          .294          .294          .294
INFRA          0             0             0             0             .055          0
JETS           0             0             .1            .1            .1            .1
RETAIL         0             0             0             .018          .037          .018
SOLAR          0             0             .166          .222          .222          .277
SP-100         0             .021          .043          .086          .107          .107
TRANSP         0             0             0             0             0             0
|
====================================================================
12/21/2018
"Rudolph, Rudolph...Where Is Santa
Claus?"
Apparently the multitude of Sell S9s this past year has finally taken its toll
on
the bulls. They cannot even hold the DJI above what should have been
good
support levels. See in our DJI chart below how quickly the 24000 and
23400
support levels have given way. Apparently, the market is really scared
that
what the FED hath given the Big Banks and the stock market after the 2008
financial collapse, it now is willing to take away.
Should We Trust Powell and The Fed? That Is The
Problem now.
Have
economic conditions really improved enough to allow the FED to
tighten money supply and dispose of all the mortgages and debt instruments
it
bought from distressed banks seven or eight years ago? President Trump, the
Conservative Populist, fears that Fed Chairman Powell will bring down the
market like a "house of cards". And he may be right. Like most
institutions
that
are insulated from criticism and accountability, the FED has regularly erred
but
always without any apology. Because they are so powerful, the Public
hardly ever hears how frequently that they have turned perfectly good and
sound
economies and bull markets into bear markets and recessions, or worse.
It's
all the more remarkable that they get away doing this despite their original
charter's calling on them, first and foremost, to prevent panics and depressions,
like
the one in 1907-1908, that caused Congress to create the Federal Reserve
in
the first place.


Watch to see if the DJI's 21-dma AROC momentum downtrend (above)
can be
violated so that a "Santa Claus" rally can start. (More information on AROC
is
shown below.)
Big Banks are they key now. Their people, on the inside,
will know
first
if the FED intends to reverse course and save the market from disaster
and
"backup" the market makers and banks in their hour of need like
Greenspan and Bernanke did repeatedly. As of
Friday, the big banks showed
no
sign of reversing on Friday. But a Christmas rally of a week should
probably be expected. Watch the Bank stocks'
Closing Power downtrends.
They
need to be broken for us to read into their action something less
"harkish"
coming from the FED. And it will have to come from Chairman Powell, I think,
not
one of his minions.
Note that we will need to see here something more than just a
higher opening.
Too
many of these have failed recently. We need to see a close much higher
than
the opening. That will show us that Professionals are buying again. If that
does
occur, traders should buy DIA for a quick bounce back to 232 but hold
all
our Bearish MINCPs short..


In most normal markets, the DJI rises nearly two thirds of
the time over
the
next two weeks. The percentage is even higher when momentum has
taken
the DJI below 4% to 5% below its 21-dma at this time of the year.
But
this is no normal market. The DJI is now 8% below its 21-dma.
This
is further down from this 21-dma than at the short-term bottom in 1929
when
the DJI was down "only" 6.7% below the ma just before it turned up.
And
in the terrible December of 1931, the DJI only reached bottom when
it
has fallen on Dec. 17th to a point 16.7% below the 21-dma.
The DJI has gone from making new highs in early October to making new lows
last
week. This is unique. The closest parallel I can find was the DJI in 1916.
It
fell 18% from if November peak to its December 22nd low, 7.4% below the
lower
band. Then it rallied 10% to January 16th, at which point it peaked
and
11% more to a temporary February bottom. Partisans had celebrated
the
re-election of Woodrow Wilson who had campaigned on the slogan,
"He Kept Us Out of War". But soon after he was elected, rumors spread
that
Germany would resume its unrestricted submarine warfare and Britain
might
soon not be able to pay back its war loans to JP Morgan and other
big
banks. See how even in these dire circumstances the DJI did rally 10%
from
a bottom just before Christmas. Then the DJI gave way and fell a full
20%
from its highs before attempting another rally at the time of Wilson's
declaration of war.
Closest Parallel - Dec. 1916

Watch AROC
For Tiger traders, the rate of descent can be usefully measured by
calculating
the
daily pct change of the 21-day-ma and multiplying it by 250. We call
this
the "Annualized Rate of Change", or AROC. When we look back at
past
Decembers when the AROC below -.80 about this time in December,
we
always see Santa Claus rallies, with one exception. The exception was
in
1931. The weakness here reflected numerous bank failures, which the
FED
only made worse by boosting the Discount Rate from 1.5% to 3%
between September and December 1931. That is hardly what the Fed plans
to do
so quickly.

AROC DJI
12/21/2018 -.982
22445 8% below 21-dma.
(It is not clear what is so bad that is causing this big a decline.
My best guess is that big investors are locking in profits all at
once now that 23300 support has been broken. If that is
correct, then we should see a rebound to 23300. But if
a bigger disaster lies ahead, then we are in Big Trouble.
In any case, watch the Big Banks and the Closing Powers.)
12/29/1929
-.694 DJI rallied from 5% lower band for rest of year.
12/23/1930 -1.854 DJI rallied from 6.7% lower band to
upper band.
12/22/1931 -2.419 DJI
fell from 79.6 to 71.2 and then
rallied above upper band (85.4)
12/22/1932 -1.319 DJI
rallied from (56.6) 4.5% lower band to above UB (63.8) (1/11)
12/24/1941 -1.083 DJI rallied from 106.7 - 4.4% lower band
to upper band (114.2)
(1/5)
(Right after Pearl Harbor!)
12/15/1981 -.871 DJI rallied from 911.6 (5.5%
lower band) to above UB (1005)
1/6)
(Interest rates going above 20%/yr)
|
Charts 12/21/2018 PEERLESS DJI, Signals, Indicators Daily DJI Volume 10-DayUp/Down Vol Hourly DJIA A/D Line for All Stocks Inverted Traders Index NASDAQ S&P OEX NYSE COMPQX DJI-15 DJI-20 DJI-30 DIA SPY QQQ MDY IWM TNA Short-Term Rates USO-CrudeOil DBO FAS GLD BBH IBB JETS JNUG KOL NUGT OIH OIL RSX RETL SDS AGQ SLV SOXL TECL TLT TMF TNA UGA (gasoline) XIV YINN Commodities: CANE CORN DBC JJC, NIB, CHOC CORN, CUT (paper) MOO, SOYB WEAT UUP (Dollar) LIT (Lithium) AAPL ADBE ALXN AMAT AMGN AMD AMZN BA BABA BAC BIDU CAT CVX DE FB GOOG GS HD IBM INTU JPM M (Macy's) MSFT NFLX NVDA QCOM TSLA TXN XOM WMT CMG , LRCX, SWKS, MDGL SPPI WATT SQ TOWN 12/21/2018 (Click on Underlined link.) - Bullish MAXCPs - http://tigersoft.com/MAXCPZ/Dec-21/BULLISH.htm Bearish MAXCPs - http://tigersoft.com/MINCPZ/Dec-21/BEARISH.htm |
Table 1 QUICKSILVER on ETFS - 12/20/18 ETF CLOSE CHANGE PIVOT-PT 5-dma AROC CL-PWR CANDLE IP21 ITRS
---------------------------------------------------------------------------------------------
---------------------------------------------------------------------------------------------
DIA 228.89 -4.53 241.42 -363.6% Bearish RED -.167 0
---------------------------------------------------------------------------------------------
SPY 247.17 -4.09 260.47 -353.4% Bearish RED -.138 -.006
---------------------------------------------------------------------------------------------
QQQ 152.29 -2.24 161.08 -402% Bearish RED -.073 -.018
---------------------------------------------------------------------------------------------
MDY 300.2 -3.92 316.27 -327.9% Bearish RED -.301 -.023
---------------------------------------------------------------------------------------------
IWM 131.79 -2.21 140.61 -397.1% Bearish RED -.249 -.049
---------------------------------------------------------------------------------------------
FAS 43.11 -1.53 49.16 -791% Bearish RED -.229 -.251
---------------------------------------------------------------------------------------------
RETL 21.54 -1.3 25.24 -934.2% Bearish RED -.018 -.332
---------------------------------------------------------------------------------------------
SOXL 76.99 -2.02 90.39 -987.5% Bearish RED -.179 -.285
---------------------------------------------------------------------------------------------
TECL 82.72 -4.8 96.93 -1160% Bearish RED -.031 -.322
---------------------------------------------------------------------------------------------
IBB 94.56 -1.65 101.93 -466% Bearish RED -.094 -.045
---------------------------------------------------------------------------------------------
GLD 119.24 1.81 117.06 72.7% Bearish BLUE-.065 .193
---------------------------------------------------------------------------------------------
OIL 119.24 1.81 117.06 72.7% Bullish BLUE-.023 9.316
---------------------------------------------------------------------------------------------
OIH 13.91 -.85 15.66 -781% Bearish RED -.413 -.332
---------------------------------------------------------------------------------------------
RSX 18.99 -.9 20.23 -387.3% Bearish ---- -.229 .029
QUICKSILVER on ETFS - 12/21/18
ETF CLOSE CHANGE PIVOT-PT 5-dma AROC CL-PWR CANDLE IP21 ITRS --------------------------------------------------------------------------------------------- DIA 224.09 -4.8 236.43 -367.9% Bearish RED -.215 0 --------------------------------------------------------------------------------------------- COMPQX 224.09 -4.8 236.43 -367.9% Bullish RED -.178 -.845 --------------------------------------------------------------------------------------------- SPY 240.7 -6.47 255.36 -389.4% Bearish RED -.186 -.01 --------------------------------------------------------------------------------------------- QQQ 147.57 -4.72 157.43 -430.9% Bearish RED -.15 -.016 --------------------------------------------------------------------------------------------- MDY 292.88 -7.32 309.4 -379.9% Bearish RED -.321 -.031 --------------------------------------------------------------------------------------------- IWM 128.37 -3.42 137.02 -449.8% Bearish RED -.283 -.055 --------------------------------------------------------------------------------------------- FAS 40.54 -2.57 46.61 -937.6% Bearish RED -.277 -.24 --------------------------------------------------------------------------------------------- RETL 19.57 -1.97 23.46 -1212% Bearish RED -.013 -.352 --------------------------------------------------------------------------------------------- SOXL 73.46 -3.53 87 -998.6% Bearish RED -.255 -.236 --------------------------------------------------------------------------------------------- TECL 74.82 -7.9 90.84 -1225.9% Bearish RED -.12 -.304 --------------------------------------------------------------------------------------------- IBB 90.86 -3.7 100.25 -563.3% Bearish RED -.177 -.059 --------------------------------------------------------------------------------------------- GLD 118.72 -.52 117.87 70.4% Bearish RED -.104 .177 --------------------------------------------------------------------------------------------- OIL 118.72 -.52 117.87 70.4% Bullish RED -.073 9.342 --------------------------------------------------------------------------------------------- OIH 13.65 -.26 15.51 -669.6% Bearish RED -.419 -.324 --------------------------------------------------------------------------------------------- GASL 5 -.36 6.69 -1881.1% Bearish RED -.362 -.632 --------------------------------------------------------------------------------------------- UGA 5 -.36 6.69 -1881.1% Bullish RED -.387 -.705 --------------------------------------------------------------------------------------------- UUP 25.94 .17 25.97 -19.3% Bullish BLUE .116 .147 --------------------------------------------------------------------------------------------- IEF 25.94 .17 25.97 -19.3% ------- BLUE .03 -.616 --------------------------------------------------------------------------------------------- CORN 25.94 .17 25.97 -19.3% Bullish BLUE .08 .703 --------------------------------------------------------------------------------------------- WEAT 25.94 .17 25.97 -19.3% Bullish BLUE .069 3.295 --------------------------------------------------------------------------------------------- YINN 25.94 .17 25.97 -19.3% ------- BLUE .003 .398 --------------------------------------------------------------------------------------------- RSX 18.62 -.37 20.12 -406% Bearish RED -.205 .03 |
Table 2    Count of Stocks in Key Directories
           2018-12/21
-------------------------------
NEWHIGHS       32
NEWLOWS        939  Very bearish
MAXCP          24
MINCP          993  Very bearish
TTTNH          23
TTTNL          558  Very bearish
FASTUP         27
FASTDOWN       292  Bearish
CPCROSSA       34
CPCROSSD       39
BIGVOLUP       13
BIGVODN        132
ACCUMVER       8
HIGHIP21       4
HIUPPCT        1
VHIP21         17
LOWACCUM       366
REDSELL        404
AUGSELS7       18
TRAPDOOR       20
|
 Table 3
            RANKING OF KEY DIRECTORIES BASED PCT.OF STOCKS ABOVE 65-DMA
              12/21/18
 Bearish = 45
 Bullish = 2
---------------------------------------------------------------------------------------
Directory     Current       day-1         day-2         day-3         day-4         day-5
----------------------------------------------------------------------------------------
UTILITY        .575          .7            .625          .675          .75           .875
GOLD           .54           .56           .5            .64           .54           .48
N=2
===========================================================================================
COMODITY       .357          .404          .428          .452          .452          .428
FOOD           .333          .403          .421          .456          .473          .473
BONDFUND       .314          .257          .39           .314          .314          .542
PIPELINE       .208          .208          .25           .208          .25           .291
INDEXES        .187          .219          .187          .203          .192          .181
EDU            .166          .333          .333          .333          .333          .333
GAMING         .166          .125          .125          .125          .166          .166
COAL           .142          .142          .142          .142          .142          .142
REIT           .139          .172          .192          .218          .205          .47
HOMEBLDG       .117          .294          .294          .294          .294          .294
INDMATER       .102          .102          .102          .128          .115          .128
INSURANC       .1            .1            .166          .133          .166          .2
MILITARY       .093          .093          .125          .125          .125          .125
CHEM           .092          .092          .092          .092          .092          .111
ETFS           .086          .086          .12           .12           .12           .155
CHINA          .083          .166          .15           .166          .15           .216
AUTO           .076          .076          .128          .153          .128          .179
SOFTWARE       .076          .076          .092          .092          .107          .276
SP500          .074          .102          .132          .154          .154          .224
RUS-1000       .069          .087          .113          .13           .129          .203
SEMI           .068          .102          .119          .205          .17           .23
ELECTRON       .067          .08           .092          .16           .129          .172
FINANCE        .066          .077          .077          .077          .066          .1
BIG17          .065          .108          .173          .173          .152          .217
BIOTECH        .063          .076          .094          .113          .134          .168
BEVERAGE       .055          .222          .222          .222          .222          .277
NIFTY          .052          .087          .105          .192          .14           .192
COMPUTER       .045          .045          .045          .09           .045          .181
HACKERS        .045          .045          .045          .09           .09           .363
GREEN          .043          .13           .13           .13           .13           .173
HOSPITAL       .041          .041          .041          .083          .083          .25
NASD-100       .04           .07           .09           .13           .13           .22
FIDSTKS        .037          .069          .096          .112          .107          .172
REGBANKS       .035          .035          .035          .035          .035          0
DOWJONES       .033          .033          .133          .166          .166          .233
SP-100         .021          .043          .086          .107          .107          .182
OILGAS         .02           .02           .027          .034          .034          .034
BIGBANKS       0             0             0             0             0             0
DJI-13         0             0             .076          .076          .076          .076
GUNS           0             0             0             .058          0             .117
INFRA          0             0             0             .055          0             .027
JETS           0             .1            .1            .1            .1            .2
RETAIL         0             0             .018          .037          .018          .056
SOLAR          0             .166          .222          .222          .277          .333
TRANSP         0             0             0             0             0             0
|
====================================================================
12/20/2018
Where Is Santa Claus?
The way the
DJI keeps knifing below support levels despite the
normal
bullishness of December is a dire warning that the market looks
very
dangerous. Even a brief Santa Claus Rally may be asking too much in
this
market. In many ways, the technicals looks more dangerous
than they
did at the end of 2007. Powell's FED is not "Hellicopter" Ben Barnanke's.
It is not
even Greenspan's, which always stood ready to shore up the stock
market
whenever it crashed. The technical condition now is much worse
than it
2000 or 2007, I would suggest. Look at all the Sell S9s. This is more
reminiscent
of 1929!

The Nifty
Tech stocks in 2018 had long and steep advances much like the
computer,
internet and biotechs did between 1995 and 2000. The Big Banks
stocks of
2018 look like they did in late 2007. But unlike in 2000 or 2007,
now we see
extremely weak oil and gas stocks. Today, oil stocks and
just about
every other sector, except Utilities and Gold stocks, shows heavy
red
Distibution, Closing Powers that are falling to new lows and a large plurality of
its
component stocks below their 65-dma. See Table 3. What group of stocks
could we
even make a good case for buying? All the Bullish MAXCPs now are
bearish
(negative) ETFs.


So stay
short a large assortment of our Bearish MINCPs. Shorting small caps
and IWM is
probably still preferable to shorting DIA. There may not even be
a Santa
Clause rally. Wouldn't that be something? Think of all the traders who
have bought
major market EFTs expecting a rally. They are increasingly trapped
and growing
eager to get out on any rally. Meanwhile, long-term investors are
locking in
profits now that the various indexes are all making 12-month lows.


No Buy B13 (Santa Claus Rally)
We have to
take the operative Peerless signal now to be a Sell S10. When we
look back
at market history we find just four cases of the DJI making a 12-month
low
on/after December 17th, as the DJI did today. These were all in existing bear
markets, so
perhaps the fact that they each did experience a Santa Claus rally
is not
relevant.
.
Dec. Bottom Subsequent Peak And Then:
Bear Market
12/19/1917 DJI - 65.90 1/2/1918 76.70 DJI rose to 82.10 on 2/19
(World War I was about to involve the US.)
Bear Market
12/21/1920 DJI - 66.80 1/20/1920 76.10 DJI fell to 63.90 on 8/21/21.
(Very tight money. JP Morgan bombed.)
Bear Market
12/17/1931 DJI - 73.80 1/14/1932 85.4 DJI fell to 41 in July 1932
(Sharply Increasing interest rates to protect Dollar despite deepening Depression)
Bear Market
12/23/1941 DJI - 106.3 1/5/1942 114.2 DJI fell to 92.9 on 4/28/1942
(Aftermath of Pearl Harbor and US entry into World War II.)
|
Charts 12/20/2018 PEERLESS DJI, Signals, Indicators Daily DJI Volume 10-DayUp/Down Vol Hourly DJIA A/D Line for All Stocks Inverted Traders Index NASDAQ S&P OEX NYSE COMPQX DJI-15 DJI-20 DJI-30 DIA SPY QQQ MDY IWM TNA Short-Term Rates USO-CrudeOil DBO FAS GLD BBH IBB JETS JNUG KOL NUGT OIH OIL RSX RETL SDS AGQ SLV SOXL TECL TLT TMF TNA UGA (gasoline) XIV YINN Commodities: CANE CORN DBC JJC, NIB, CHOC CORN, CUT (paper) MOO, SOYB WEAT UUP (Dollar) LIT (Lithium) AAPL ADBE ALXN AMAT AMGN AMD AMZN BA BABA BAC BIDU CAT CVX DE FB GOOG GS HD IBM INTU JPM M (Macy's) MSFT NFLX NVDA QCOM TSLA TXN XOM WMT CMG , LRCX, SWKS, MDGL SPPI WATT SQ TOWN 12/20/2018 (Click on Underlined link.) - Bullish MAXCPs - http://tigersoft.com/MAXCPZ/Dec-20/BULLISH.htm Bearish MAXCPs - http://tigersoft.com/MINCPZ/Dec-20/BEARISH.htm |
Table 1 QUICKSILVER on ETFS - 12/20/18 ETF CLOSE CHANGE PIVOT-PT 5-dma AROC CL-PWR CANDLE IP21 ITRS --------------------------------------------------------------------------------------------- --------------------------------------------------------------------------------------------- DIA 228.89 -4.53 241.42 -363.6% Bearish RED -.167 0 --------------------------------------------------------------------------------------------- SPY 247.17 -4.09 260.47 -353.4% Bearish RED -.138 -.006 --------------------------------------------------------------------------------------------- QQQ 152.29 -2.24 161.08 -402% Bearish RED -.073 -.018 --------------------------------------------------------------------------------------------- MDY 300.2 -3.92 316.27 -327.9% Bearish RED -.301 -.023 --------------------------------------------------------------------------------------------- IWM 131.79 -2.21 140.61 -397.1% Bearish RED -.249 -.049 --------------------------------------------------------------------------------------------- FAS 43.11 -1.53 49.16 -791% Bearish RED -.229 -.251 --------------------------------------------------------------------------------------------- RETL 21.54 -1.3 25.24 -934.2% Bearish RED -.018 -.332 --------------------------------------------------------------------------------------------- SOXL 76.99 -2.02 90.39 -987.5% Bearish RED -.179 -.285 --------------------------------------------------------------------------------------------- TECL 82.72 -4.8 96.93 -1160% Bearish RED -.031 -.322 --------------------------------------------------------------------------------------------- IBB 94.56 -1.65 101.93 -466% Bearish RED -.094 -.045 --------------------------------------------------------------------------------------------- GLD 119.24 1.81 117.06 72.7% Bearish BLUE-.065 .193 --------------------------------------------------------------------------------------------- OIL 119.24 1.81 117.06 72.7% Bullish BLUE-.023 9.316 --------------------------------------------------------------------------------------------- OIH 13.91 -.85 15.66 -781% Bearish RED -.413 -.332 --------------------------------------------------------------------------------------------- RSX 18.99 -.9 20.23 -387.3% Bearish ---- -.229 .029 |
 Table 2   Count of Stocks in Key Directories
           2018-12/20
-------------------------------
NEWHIGHS       35
NEWLOWS        742 Very bearish
MAXCP          16
MINCP          712 Very bearish
TTTNH          22
TTTNL          527 Very bearish
FASTUP         30
FASTDOWN       643 Very bearish
CPCROSSA       43
CPCROSSD       76
BIGVOLUP       7
BIGVODN        113
ACCUMVER       7
HIGHIP21       3
HIUPPCT        2
VHIP21         17
LOWACCUM       313
REDSELL        370
AUGSELS7       20
TRAPDOOR       19
|
Table 3:  RANKING OF KEY DIRECTORIES BASED PCT.OF STOCKS ABOVE 65-DMA
          12/20/18
Bullish = 2   Bearish = 45
---------------------------------------------------------------------------------------
Directory     Current       day-1         day-2         day-3         day-4         day-5
----------------------------------------------------------------------------------------
UTILITY        .7            .625          .675          .75           .875          .85
GOLD           .56           .5            .64           .54           .48           .56
===========================================================================================
COMODITY       .404          .428          .452          .452          .452          .5
FOOD           .403          .421          .456          .473          .491          .543
EDU            .333          .333          .333          .333          .333          .166
HOMEBLDG       .294          .294          .294          .294          .294          .294
BONDFUND       .257          .39           .314          .314          .514          .619
BEVERAGE       .222          .222          .222          .222          .277          .333
INDEXES        .219          .187          .203          .192          .181          .203
PIPELINE       .192          .23           .192          .23           .269          .269
REIT           .172          .192          .218          .205          .463          .45
CHINA          .166          .15           .166          .15           .216          .35
SOLAR          .166          .222          .222          .277          .333          .444
COAL           .142          .142          .142          .142          .142          .142
GREEN          .13           .13           .13           .13           .173          .26
GAMING         .125          .125          .125          .166          .166          .166
BIG17          .108          .173          .173          .152          .217          .239
INDMATER       .102          .102          .128          .115          .128          .179
SEMI           .102          .119          .205          .17           .222          .256
SP500          .102          .132          .154          .154          .224          .291
INSURANC       .1            .166          .133          .166          .2            .233
JETS           .1            .1            .1            .1            .2            .2
MILITARY       .093          .125          .125          .125          .125          .156
CHEM           .092          .092          .092          .092          .111          .129
NIFTY          .087          .105          .192          .14           .192          .28
RUS-1000       .087          .113          .13           .129          .202          .252
ETFS           .086          .12           .12           .12           .155          .293
ELECTRON       .08           .092          .16           .129          .172          .209
FINANCE        .077          .077          .077          .066          .1            .111
AUTO           .076          .128          .153          .128          .179          .179
SOFTWARE       .076          .092          .092          .107          .276          .276
BIOTECH        .073          .094          .113          .134          .168          .197
NASD-100       .07           .09           .13           .13           .22           .29
FIDSTKS        .069          .096          .112          .107          .166          .225
COMPUTER       .045          .045          .09           .045          .181          .272
HACKERS        .045          .045          .09           .09           .363          .409
SP-100         .043          .086          .107          .107          .182          .247
HOSPITAL       .041          .041          .083          .083          .25           .291
REGBANKS       .035          .035          .035          .035          0             .071
DOWJONES       .033          .133          .166          .166          .233          .4
OILGAS         .02           .027          .033          .033          .033          .06
BIGBANKS       0             0             0             0             0             0
DJI-13         0             .076          .076          .076          .076          .23
GUNS           0             0             .058          0             .058          .117
INFRA          0             0             .055          0             .027          .083
RETAIL         0             .018          .037          .018          .056          .094
TRANSP         0             0             0             0             0             0
|
======================================================================
12/19/2018
Most Likely - Any Rally from Here Will Be Quite Limited.The DJI has now fallen to the 23200-23350 support, which is down 13.5%
from its high this year. We did get a new Buy B13 today. But any further decline
would not only be a Sell S10 violation of well-tested support, it would also drop
the DJI below the maximum (13.5%) retreat in a "normal" correction and likely
bring a decline to 21450, the point at which the DJI is down 20% from its highs.
Anything worse than that would be defined as a "bear market".
The dangers then would be very real. I fear that a DJI decline now below 23000
would set off a stream of computerized Sell programs using leveraged
ETFs and we would be down to 20000-21000 in no time.
I've been suggesting hedging out of an excessive confidence in Santa Claus
and Fed Chairman Powell. If you still own DIA, plan to sell it if the DJI rallies
back to 24000 or if 23000 is violated. Hold all the bearish MINCPs short until
the end of the year or until their Closing Powers break their downtrends.
Hold off on buying for now because of the new Buy B13 - Santa Claus rally
signal. The DJI needs to get back within its normal 3.5% bands to show us
the current decline is over.


Why I do not trust the new Buy B13
The Feds did raise rates, as most experts expected. So, one could hope that
having fulfilled their expectations, Professionals are now ready to buy again.
After all, the market usually rises this time of the year. And Peerless did give
a Buy B13 today, even though:
1) the DJI closed way below the normal 3.5% band that usually
acts as support,
2) there was a Sell S9 eleven trading days ago,
3) all our tools, indicators and reports here range from bearish
to very bearish AND
3) clear 12-month new lows were made today by the SP-500, NASDAQ,
QQQ, IWM, SOXL, BBH, OIH, Crude Oil....

My own thinking is that it's very risky to buy DIA here. All these negatives,
especially the rapidness of the declines in the major markets' ETFs' Closing
Power and Day Traders Tools' are shouting out "Be Careful".
In addition, given the Sell S9 and the market's rapid decline, I would rather not
show a Peerless Buy B13 or B6 until the DJI closes back above 3.5% lower band.
I will change the software to effect these rules this weekend.
|
Charts 12/19/2018 PEERLESS DJI, Signals, Indicators Daily DJI Volume 10-DayUp/Down Vol Hourly DJIA A/D Line for All Stocks Inverted Traders Index NASDAQ S&P OEX NYSE COMPQX DJI-15 DJI-20 DJI-30 DIA SPY QQQ MDY IWM TNA Short-Term Rates USO-CrudeOil DBO FAS GLD BBH IBB JETS JNUG KOL NUGT OIH OIL RSX RETL SDS AGQ SLV SOXL TECL TLT TMF TNA UGA (gasoline) XIV YINN Commodities: CANE CORN DBC JJC, NIB, CHOC CORN, CUT (paper) MOO, SOYB WEAT UUP (Dollar) LIT (Lithium) AAPL ADBE ALXN AMAT AMGN AMD AMZN BA BABA BAC BIDU CAT CVX DE FB GOOG GS HD IBM INTU JPM M (Macy's) MSFT NFLX NVDA QCOM TSLA TXN XOM WMT CMG , LRCX, SWKS, MDGL SPPI WATT SQ TOWN 12/19/2018 (Click on Underlined link.) - Bullish MAXCPs - http://tigersoft.com/MAXCPZ/Dec-19/BULLISH.htm Bearish MAXCPs - http://tigersoft.com/MINCPZ/Dec-19/BEARISH.htm |
The
Economy's Real Boss was never elected.
No wonder, he does not believe in politics
or political accountability.

There's a new sherriff in town.
I was
struck today by how "strong" Fed Chairman Powell thinks the economy
is now and
how insignifiant he thinks the stock market is as a predictor of where
the Economy
is headed. When I next talk to him, I will point out that the Rich
have never
had a higher proportion of the Nation's Wealth than now. Even more so than
in 1929.
So the national economy is more dependent than ever on the confidence
the Rich
have in the stock market. Surely, if their stocks go down, they lose confidence
and the
national economy will suffer. At least, that's what I think. I think President
Trump and I
are on the same page here. A rising stock market lifts "all boats",
but a
falling stock market will probably swamp those in row-boats and canoes.
Did you
notice how Powell would not look at the ticker tape as he was talking
this
afternoon. So, he seemed not to notice how fast the stock market was falling
while he
spoke. 500 points by my reckoning.
But,
perhaps, the FOMC really does know what they are doing. That the economy really
IS still
quite strong. That November's Job numbers were a just false "blip".
After all,
Labor
demands are getting uppity. Real wages might actually start to rise soon. We
can't
have
"rising expectations". And of course, the world Economy needs a very
strong
Dollar to
sustain it. So, we should consider the dramatic fall in Oil prices and Federal
Express
today as temporary "blips", too, not as sure signs of a global slow-down. And
perhaps, a
bear market in stocks will not deprive the Rich - who own most shares - of
enough
wealth to cause them to "drop the ball" when it comes to Consumer Spending.
Or perhaps,
the DJI will bravely now go right back up and that will breathe confidence
in all the
other stocks and sectors now making new lows.
Let's all
just be "sheeple" and assume that Powell, who is personally worth $100,000,000,
knows what
it is best for the rest of us.
OK.
But why, if Powell is so smart, are so many Big Banks' stocks making yearly new
lows, just
as they did in late 2007, before the financial panic and crashed economy?
CitiGroup in Dec 2007
just as a long and deep bear mkt was starting.
The
2007 chart below looks a lot like CitiGroup's
current chart.


Table 1 QUICKSILVER on ETFS - 12/19/18 ETF CLOSE CHANGE PIVOT-PT 5-dma AROC CL-PWR CANDLE IP21 ITRS --------------------------------------------------------------------------------------------- --------------------------------------------------------------------------------------------- DIA 233.42 -3.94 246.27 -258% Bearish RED -.158 ----- --------------------------------------------------------------------------------------------- SPY 251.26 -3.82 265.37 -272.7% Bearish RED -.145 -.008 --------------------------------------------------------------------------------------------- QQQ 154.53 -3.89 165.1 -325.9% Bearish RED -.094 -.018 --------------------------------------------------------------------------------------------- MDY 304.12 -5.23 320.66 -315.6% Bearish RED -.321 -.032 --------------------------------------------------------------------------------------------- IWM 134 -2.85 142.77 -385.3% Bearish RED -.267 -.053 --------------------------------------------------------------------------------------------- FAS 44.64 -1.69 50.62 -669.4% Bearish RED -.213 -.249 --------------------------------------------------------------------------------------------- RETL 22.84 -1.04 26.08 -1094% Bearish RED -.061 -.318 --------------------------------------------------------------------------------------------- SOXL 79.01 -11.43 94.42 -899.5% Bearish RED -.206 -.286 --------------------------------------------------------------------------------------------- TECL 87.52 -5.38 104.66 -855.8% Bearish RED -.065 -.3 --------------------------------------------------------------------------------------------- IBB 96.21 -2.1 103.89 -454.5% Bearish RED -.083 -.049 --------------------------------------------------------------------------------------------- GLD 117.43 -.72 117.53 -15.3% Bearish RED -.07 .162 --------------------------------------------------------------------------------------------- RSX 19.89 -.03 20.55 -128.4% Bearish RED -.228 .055 |
 Table 2   Count of Stocks in Key Directories
           2018-12/19
-------------------------------
NEWHIGHS       32
NEWLOWS        594  Bearish
MAXCP          18
MINCP          644  Very bearish >20:1 MINCPS
TTTNH          19
TTTNL          389  Very bearish >20:1 TTTNLS
FASTUP         25
FASTDOWN       599  Very Bearish >20:1 FASTUPs
CPCROSSA       23
CPCROSSD       57
BIGVOLUP       5
BIGVODN        44
ACCUMVER       8
HIGHIP21       3
HIUPPCT        3
VHIP21         17
LOWACCUM       302
REDSELL        356
AUGSELS7       23
TRAPDOOR       17
|
 Table 3: RANKING OF KEY DIRECTORIES BASED PCT.OF STOCKS ABOVE 65-DMA
          12/19/18
 45 Bearish.  Only Utilities are Bullish
---------------------------------------------------------------------------------------
Directory     Current       day-1         day-2         day-3         day-4         day-5
----------------------------------------------------------------------------------------
UTILITY        .625          .675          .75           .875          .85           .85
==========================================================================================
GOLD           .5            .64           .54           .48           .56           .52
==========================================================================================
COMODITY       .428          .452          .452          .452          .523          .5
FOOD           .421          .456          .473          .491          .561          .526
BONDFUND       .39           .314          .314          .514          .609          .771
EDU            .333          .333          .333          .333          .166          .333
HOMEBLDG       .294          .294          .294          .294          .294          .352
PIPELINE       .23           .192          .23           .269          .269          .23
BEVERAGE       .222          .222          .222          .277          .388          .388
SOLAR          .222          .222          .277          .333          .444          .444
REIT           .192          .218          .205          .463          .443          .397
INDEXES        .187          .203          .192          .181          .203          .213
BIG17          .173          .173          .152          .217          .217          .304
INSURANC       .166          .133          .166          .2            .233          .266
CHINA          .15           .166          .15           .216          .333          .3
COAL           .142          .142          .142          .142          .142          .142
DOWJONES       .133          .166          .166          .233          .4            .4
SP500          .132          .154          .154          .224          .289          .307
GREEN          .13           .13           .13           .173          .26           .217
AUTO           .128          .153          .128          .179          .179          .205
GAMING         .125          .125          .166          .166          .166          .25
MILITARY       .125          .125          .125          .125          .156          .218
ETFS           .12           .12           .12           .155          .293          .206
SEMI           .119          .205          .17           .222          .256          .282
RUS-1000       .113          .13           .129          .202          .251          .272
NIFTY          .105          .192          .14           .192          .28           .263
INDMATER       .102          .128          .115          .128          .179          .153
JETS           .1            .1            .1            .2            .2            .6
FIDSTKS        .096          .112          .107          .166          .22           .263
BIOTECH        .092          .113          .134          .168          .194          .231
CHEM           .092          .092          .092          .111          .129          .129
ELECTRON       .092          .16           .129          .172          .209          .203
SOFTWARE       .092          .092          .107          .276          .276          .246
NASD-100       .09           .13           .13           .22           .29           .33
SP-100         .086          .107          .107          .182          .247          .258
FINANCE        .077          .077          .066          .1            .111          .133
DJI-13         .076          .076          .076          .076          .23           .23
COMPUTER       .045          .09           .045          .181          .272          .272
HACKERS        .045          .09           .09           .363          .409          .454
HOSPITAL       .041          .083          .083          .25           .291          .333
REGBANKS       .035          .035          .035          0             .071          .142
OILGAS         .027          .033          .033          .033          .06           .054
RETAIL         .018          .037          .018          .056          .094          .15
BIGBANKS       0             0             0             0             0             0
GUNS           0             .058          0             .058          .117          .176
INFRA          0             .055          0             .027          .083          .027
TRANSP         0             0             0             0             0             .15
|
====================================================================
12/18/2018 Hold DIA and SPY long and some of our many Bearish
MINCPs
short. I believe the DJI will move back above 24000 if the
FOMC does
not raise rates tomorrow. If they do raise
rates, I would think
the DJI
will drop to 23200, where it really needs to hold ... but probably will not.
The broad
stock market fell again today. There were 266
more
down than up on the NYSE. Only 20 stocks made new highs on the
NYHSE
and NASDAQ while 1415 made new lows. The Biotech ETFs
(BBH
and IWM) broke their year-long support. Crude Oil plunged to
12-month lows. Look at Table 1-3 below. By any measure, Professionals
remain very bearish and there is massive overhead resistance for most stocks.
Once
again most of our bearish MINCPs fell. Until the end of the year,
these
very weak stocks will remain under heavy tax loss selling pressure.
This
has the look and feel of a bear market.
But all this may give the FED reason not to add to stock market
miseries
and
instead not raise interest rates tomorrow. Moreover, as bad as the
general market looks, it is "over-sold" and usually there is some kind of rally
just
before and after Christmas. That is why I suggesting holding DIA and
SPY
if you are also short some of our bearish MINCPs.


Today, the DJIA did what it is supposed to. It held above its 23200-23500
support. True, it could not get back above the broken support at 24000 that
now acts
as
resistance. But the DJI's positive action today and now over-night offers
the
bulls reasonable hope that the Fed will not raise short-term rates tomorrow
afternoon and the 23500 support will hold for the rest of the year. It's risky,
but
we can hope that the FED's Open Market Committee appreciate just how
much
technical damage they could do to the market at this time by raising
rates.
So,
for us, a move back above 24000 would have effect of nullifying the
judged Sell S10 I mentioned yesterday and re-instating the Buy B6. However,
note
that a recovery above the 3.5% lower band will not bring a Buy B13,
but
it could bring another Buy B6 soon.
If
you are long DIA appreciate the following:
The risk:reward ratio is favorable to traders who
buy
DIA near support only if they are prepared to
quickly sell out if the year-long support (23200-23500) is violated.
Why I Think The Fed Will Not Raise Rates Tomorrow.
#1 Today, Oil fell sharply. Higher interest rates now will
unduly hurt the already
suffering
oil and gas producing sections of America. A month ago, Powell
made a trip
to Texas to show he was cognizant of how this part of the country
was already
hurting despite "full employment" elsewhere. He seemed to be
acknowledging the undue harm done them repeatedly in the 1980s by Paul
Volcker's
obsessive drive to kill inflation using extremely high interest rates.
#2
The NASDAQ and the SP-500 are hanging by a thread. They are just above
their
12-month support levels. If they break down now in December, a normally
bullish
month, they will likely behave much worse next year. One would think
that the
FED will appreciate how precarious the stock market is. In fact, it may
already be
too late to save them.

Remember December 1968 and 2007.
Only if you are hedged with Bearish MINCPs as a hedge, would I stay long
DIA
and hope that the
FED's inaction tomorrow will bring a blue-chip rally that may
last until early
January. This could bring a typical Santa Claus rally that lasts two
weeks, even
though we will probably not get a Peerless Buy B13 even if the DJI
quickly rises
back above 24000 and the lower 3.5% band. Our December 3rd
Sell S9 prevents
in our software a Buy B13 for the next three weeks in December.
This rule was put
into place primarily because of the December 2007 decline. The
older 2006
version of Peerless would have dangerously generated a Buy B13 in
mid December
2007, at what then proved to be the worse possible time. The DJI
was just
beginning to drop down more than 10% from its highs and begin its deep
2007-2009 bear
market. As is true now, Financials were then particularly weak.
 |
 |
|
Charts 12/18/2018 PEERLESS DJI, Signals, Indicators Daily DJI Volume 10-DayUp/Down Vol Hourly DJIA A/D Line for All Stocks Inverted Traders Index NASDAQ S&P OEX NYSE COMPQX DJI-15 DJI-20 DJI-30 DIA SPY QQQ MDY IWM TNA Short-Term Rates USO-CrudeOil DBO FAS GLD BBH IBB JETS JNUG KOL NUGT OIH OIL RSX RETL SDS AGQ SLV SOXL TECL TLT TMF TNA UGA (gasoline) XIV YINN Commodities: CANE CORN DBC JJC, NIB, CHOC CORN, CUT (paper) MOO, SOYB WEAT UUP (Dollar) LIT (Lithium) AAPL ADBE ALXN AMAT AMGN AMD AMZN BA BABA BAC BIDU CAT CVX DE FB GOOG GS HD IBM INTU JPM M (Macy's) MSFT NFLX NVDA QCOM TSLA TXN XOM WMT CMG , LRCX, SWKS, MDGL SPPI WATT SQ TOWN 12/18/2018 (Click on Underlined link.) - Bullish MAXCPs - http://tigersoft.com/MAXCPZ/Dec-18/BULLISH.htm Bearish MAXCPs - http://tigersoft.com/MINCPZ/Dec-18/BEARISH.htm |
Table 1 QUICKSILVER on ETFS - 12/18/18 ETF CLOSE CHANGE PIVOT-PT 5-dma AROC CL-PWR CANDLE IP21 ITRS --------------------------------------------------------------------------------------------- --------------------------------------------------------------------------------------------- DIA 237.36 .93 245.88 -141.4% Bearish RED -.082 --- --------------------------------------------------------------------------------------------- SPY 255.08 -.28 265.46 -172.6% Bearish RED -.074 -.012 --------------------------------------------------------------------------------------------- QQQ 158.42 .99 165.05 -159.7% Bearish RED -.033 -.019 --------------------------------------------------------------------------------------------- MDY 309.35 -.05 324.06 -192.8% Bearish RED -.271 -.034 --------------------------------------------------------------------------------------------- IWM 136.85 -.17 144.82 -232.8% Bearish RED -.175 -.054 --------------------------------------------------------------------------------------------- FAS 46.33 -.28 51.17 -471.7% Bearish RED -.162 -.237 --------------------------------------------------------------------------------------------- RETL 23.88 .42 28.4 -731.5% Bearish RED .015 -.305 --------------------------------------------------------------------------------------------- SOXL 90.44 3.44 95.48 -54% Bearish BLUE-.109 -.24 --------------------------------------------------------------------------------------------- TECL 92.9 2.06 104.28 -448.3% Bearish RED -.011 -.302 --------------------------------------------------------------------------------------------- IBB 98.31 -1.94 105.48 -284.1% Bearish RED -.002 -.054 --------------------------------------------------------------------------------------------- GLD 118.15 .28 117.79 25.9% Bullish BLUE .008 .14 --------------------------------------------------------------------------------------------- RSX 19.92 -.2 20.41 -91% Bearish RED -.142 .042 |
 Table 2   Count of Stocks in Key Directories
           2018-12/18
-------------------------------
NEWHIGHS       25
NEWLOWS        390  Bearish
MAXCP          17
MINCP          498  Professionals: Very Bearish
TTTNH          28
TTTNL          353  Day Traders: Very Bearish
FASTUP         26
FASTDOWN       331  Swing Traders: Very Bearish
CPCROSSA       22
CPCROSSD       31
BIGVOLUP       5
BIGVODN        30
ACCUMVER       5
HIGHIP21       4
HIUPPCT        5
VHIP21         17
LOWACCUM       294
REDSELL        350
AUGSELS7       14
TRAPDOOR       20
|
 Table 3: RANKING OF KEY DIRECTORIES BASED PCT.OF STOCKS ABOVE 65-DMA
          12/18/18
 Bullish = 2
 Bearish 43
---------------------------------------------------------------------------------------
Directory     Current       day-1         day-2         day-3         day-4         day-5
----------------------------------------------------------------------------------------
UTILITY        .675          .75           .875          .85           .85           .825
GOLD           .64           .54           .48           .56           .52           .48
=============================================================================================
FOOD           .456          .473          .491          .561          .526          .526
COMODITY       .452          .452          .452          .523          .5            .5
EDU            .333          .333          .333          .166          .333          .333
BONDFUND       .314          .314          .514          .609          .761          .78
HOMEBLDG       .294          .294          .294          .294          .352          .294
BEVERAGE       .222          .222          .277          .388          .388          .333
SOLAR          .222          .277          .333          .444          .444          .333
REIT           .218          .205          .463          .443          .397          .523
INDEXES        .208          .192          .181          .203          .213          .203
SEMI           .205          .17           .222          .256          .282          .196
NIFTY          .192          .14           .192          .28           .263          .245
PIPELINE       .192          .23           .269          .269          .23           .192
BIG17          .173          .152          .217          .217          .304          .195
CHINA          .166          .15           .216          .333          .3            .166
DOWJONES       .166          .166          .233          .4            .4            .366
^^^^^^^^
ELECTRON       .16           .129          .172          .209          .203          .148
SP500          .154          .154          .224          .289          .307          .273
^^^^^
AUTO           .153          .128          .179          .179          .205          .179
COAL           .142          .142          .142          .142          .142          .142
INSURANC       .133          .166          .2            .233          .266          .266
GREEN          .13           .13           .173          .26           .217          .217
NASD-100       .13           .13           .22           .29           .33           .26
^^^^^^^^
RUS-1000       .13           .129          .202          .251          .272          .237
INDMATER       .128          .115          .128          .179          .166          .141
GAMING         .125          .166          .166          .166          .25           .166
MILITARY       .125          .125          .125          .156          .218          .156
ETFS           .12           .12           .155          .293          .206          .103
FIDSTKS        .112          .107          .166          .22           .263          .215
BIOTECH        .11           .134          .168          .194          .228          .197
SP-100         .107          .107          .182          .247          .258          .247
^^^^^^
JETS           .1            .1            .2            .2            .6            .4
CHEM           .092          .092          .111          .129          .148          .111
SOFTWARE       .092          .107          .276          .276          .246          .215
COMPUTER       .09           .045          .181          .272          .272          .227
HACKERS        .09           .09           .363          .409          .454          .363
HOSPITAL       .083          .083          .25           .291          .333          .291
FINANCE        .077          .066          .1            .111          .133          .111
DJI-13         .076          .076          .076          .23           .23           .23
GUNS           .058          0             .058          .117          .176          .117
INFRA          .055          0             .027          .083          .027          0
RETAIL         .037          .018          .056          .094          .15           .113
REGBANKS       .035          .035          0             .071          .142          .035
OILGAS         .033          .033          .033          .06           .047          .04
BIGBANKS       0             0             0             0             0             0
TRANSP         0             0             0             0             .15           .05
|
====================================================================
12/17/2018 The DJI failed to hold above its 4x tested horizontal support
at
approximately 24000. I would judge this a Sell S10 and expect the DJI now to
have
to test the 23200-23500 support more fully unless
word leaks out from the
FOMC
which meets today and Wednesday that they will not be raising short-term
rates
as is expected. In that event, we may still see a quick Santa Claus rally.
Most likely 24000 will act as resistance now unless the FED does
not raise rates.
But a
quick recovery right back above 24000 would be bullish. That would be
in
keeping with a Buy B13 rally. And a close back above the lower 3.5% band
would
likely yield a Buy B13 tomorrow or Wednesday. Today there was no Buy B13.
Unfortunately, the overall market is very weak. And if we look at the DJI's trading
in
mid-December, especially before World War II, we find quite a few cases where
the
DJI falls a long way below the 3.5% lower band before rallying. This explains
why
the Buy B13 nearly always occurs only when the DJI closes above the 4% lower
band
and why it did not occur today, 4.9% down from the 21-dma. (There are a few
exceptions, but breadth needs to be better. The NYSE A/D Line now is much weaker
than
the DJI.)
The chart below shows that 23200 is the key support for the DJI.
A close below
23000
would likely drop the quick to 21000 and the 20% down-from-the-peak
boundary that divides a deep correction from a bear market. I am
still surprised that
the
FED's FOMC members would needlessly risk starting a bear market that
could
easily get out of control. But when you look back at all the mistakes they made
for
example between 1927 and 1932 and in 1937, one should not be surprised. Afterall,
they
have a long history of tightenng credit and causing recessions despite their mandate
to do
otherwise. (There is a well-researched book on this topic, "Secrets of
the Temple".
https://www.amazon.com/Secrets-Temple-Federal-Reserve-Country/dp/0671675567
)
There are two bullish key values in the DJI chart. The IP21 (Accum. Index)
is still positive. This means Big Money has not yet turned net bearish. As
a result, volume is not at climactic levels and the OP (OBVPct) is only slightly negative.
But the most important indicators, those that measure Breadth, the P-I and
A/D-Line are clearly bearish. Lots of stocks are falling because their economic
outlook is darkening in good measure because of the expectations of rising
interest rates. Note that momentum (AROC) is now below -.70. This is the
annualized slope of the 21-dma. Below -.70 makes it harder for the DJI to find
get past the resistance now posed by the violated 3.5% lower band. Instead, a
rally now back to 24000 will face a lot more resistance.
![]()

Years when December's Bullishness disappointed bulls badly
and The Santa Claus Rally came only after a deeper decline
than we have so far seen:
12/22/1916 DJI
bottomed 7.4% below the 21-dma and then rallied for two weeks.
12/19/1917 DJI
bottomed 6.9% below the 21-dma and then rallied for two weeks.
Late 12/26/1918
DJI bottomed 2.3% below the 21-dma and than rallied a week.
12/21/1917 DJI
bottomed 9.9% below the 21-dma and then rallied a week.
12/20/1929 DJI
bottomed 6.7% below the 21-dma and then rallied 4 months.
12/17/1931 DJI
bottomed briefly 16.7% below the 21-dma and then rallied only a day.
12/28/1937 DJI
bottomed 5.6% below the 21-dma and then rallied two weeks.
12/11/1980 DJI
bottomed 6.4% below the 21-dma and then rallied two weeks.
Stay Hedged. Our Bearish MINCPs are
Recommended.
Significantly, the Tiger programs can only find short-TFS to play
on the long side tonight using our MAXCP screening. Meanwhile,
many of the Bearish MINCPS look like outstanding classic short
sales.
If you bought DIA or
SPY at the opening today as I suggested, you are only down 1%
and presumably you are
short a number of the Bearish MINCPs that were very weak
again today and may not
be able to rally much until their tax selling ends December 31st.
In this case, let's see
if the DJI can try to start a recovery, a la "Santa Claus". But
if you are not hedged
in this way, then I would sell DIA and SPY because of the
judged Sell S10 close
by the DJI below well-tested horizontal support at 24000
and I would wait for a
successful test of the 23200-23500 support and decision
by the FED not to cut
rates Wednesday afternoon.
Today's weakness saw
6.5 times more stocks falling than rising on the NYSE.
There were only 5 new
highs. But Up Volume was still 148 million shares. A final
capitulation by longs
on this decline should see higher down volume. On the other hand,
if SPY, COMPQX
(NASDAQ), BBH-IBB and SOXL can hold here for a few days
without making 12-month
lows, that will probably show traders enough proof that
there is still good
support to give us a two-week rally. So watch these indexes and ETFS
tomorrow. Bulls
will also want to see a strong closing in DIA and SPY tomorrow or
Wednesday. This
will be evidence that the Fed will not be raising rates. As I showed
yesterday, that usually
is what helps a Santa Claus and January rally most.
 |
 |
 |
 |
|
Charts 12/17/2018 PEERLESS DJI, Signals, Indicators Daily DJI Volume 10-DayUp/Down Vol Hourly DJIA A/D Line for All Stocks Inverted Traders Index NASDAQ S&P OEX NYSE COMPQX DJI-15 DJI-20 DJI-30 DIA SPY QQQ MDY IWM TNA Short-Term Rates USO-CrudeOil DBO FAS GLD BBH IBB JETS JNUG KOL NUGT OIH OIL RSX RETL SDS AGQ SLV SOXL TECL TLT TMF TNA UGA (gasoline) XIV YINN Commodities: CANE CORN DBC JJC, NIB, CHOC CORN, CUT (paper) MOO, SOYB WEAT UUP (Dollar) LIT (Lithium) AAPL ADBE ALXN AMAT AMGN AMD AMZN BA BABA BAC BIDU CAT CVX DE FB GOOG GS HD IBM INTU JPM M (Macy's) MSFT NFLX NVDA QCOM TSLA TXN XOM WMT CMG , LRCX, SWKS, MDGL SPPI WATT SQ TOWN 12/17/2018 (Click on Underlined link.) - Bullish MAXCPs - http://tigersoft.com/MAXCPZ/Dec-17/BULLISH.htm Bearish MAXCPs - http://tigersoft.com/MINCPZ/Dec-17/BEARISH.htm |
Table 1 QUICKSILVER on ETFS - 12/17/18 ETF CLOSE CHANGE PIVOT-PT 5-dma AROC CL-PWR CANDLE IP21 ITRS --------------------------------------------------------------------------------------------- --------------------------------------------------------------------------------------------- DIA 236.43 -4.99 244.23 -169.3% Bearish RED -.035 ---- --------------------------------------------------------------------------------------------- SPY 255.36 -5.11 264.13 -165% Bearish RED -.013 -.006 --------------------------------------------------------------------------------------------- QQQ 157.43 -3.65 163.61 -172.4% Bearish RED .021 -.025 --------------------------------------------------------------------------------------------- MDY 309.4 -6.87 321.63 -205.9% Bearish RED -.21 -.03 --------------------------------------------------------------------------------------------- IWM 137.02 -3.59 143.45 -230% Bearish RED -.092 -.051 --------------------------------------------------------------------------------------------- FAS 46.61 -2.55 51.02 -531.5% Bearish RED -.086 -.232 --------------------------------------------------------------------------------------------- RETL 23.46 -1.78 27.71 -857.7% Bearish RED .067 -.317 --------------------------------------------------------------------------------------------- SOXL 87 -3.39 91.43 -153.8% ------- RED -.045 -.3 --------------------------------------------------------------------------------------------- TECL 90.84 -6.09 101.84 -525.8% Bearish RED .03 -.328 --------------------------------------------------------------------------------------------- IBB 100.25 -1.68 104.17 -171.9% ------- RED .079 -.038 --------------------------------------------------------------------------------------------- GLD 117.87 .81 117.54 8.1% ------- BLUE-.028 .151 --------------------------------------------------------------------------------------------- RSX 20.12 -.11 20.29 -58.9% Bearish RED -.069 .073 |
 Table 2
          Count of Stocks in Key Directories
          2018-12/17
-------------------------------
NEWHIGHS       27
NEWLOWS        526   Very Bearish
MAXCP          18
MINCP          541   Very Bearish
TTTNH          27
TTTNL          371   Bearish
FASTUP         22
FASTDOWN       294   Bearish
CPCROSSA       23
CPCROSSD       109   Bearish
BIGVOLUP       2
BIGVODN        46
ACCUMVER       7
HIGHIP21       4
HIUPPCT        4
VHIP21         17
LOWACCUM       295
REDSELL        346
AUGSELS7       15
TRAPDOOR       19
|
 Table 3   RANKING OF KEY DIRECTORIES BASED PCT.OF STOCKS ABOVE 65-DMA
           12/17/18
 Bullish = 2
 Bearish = 45
---------------------------------------------------------------------------------------
Directory     Current       day-1         day-2         day-3         day-4         day-5
----------------------------------------------------------------------------------------
UTILITY        .75           .875          .85           .85           .85           .85
GOLD           .54           .48           .56           .52           .46           .42
=================================================================================================
FOOD           .464          .482          .553          .517          .517          .482
COMODITY       .452          .452          .523          .5            .5            .452
EDU            .333          .333          .166          .333          .333          .333
BONDFUND       .314          .514          .609          .761          .78           .838
HOMEBLDG       .294          .294          .294          .352          .294          .235
SOLAR          .277          .333          .444          .444          .333          .333
PIPELINE       .23           .269          .269          .23           .192          .192
BEVERAGE       .222          .277          .388          .388          .333          .388
REIT           .205          .463          .443          .397          .523          .483
INDEXES        .192          .181          .203          .213          .203          .219
SEMI           .17           .222          .256          .282          .196          .179
DOWJONES       .166          .233          .4            .4            .366          .333
^^^^^^^^
GAMING         .166          .166          .166          .25           .166          .166
INSURANC       .166          .2            .233          .266          .266          .3
SP500          .154          .224          .289          .307          .275          .267
^^^^^
BIG17          .152          .217          .217          .304          .195          .173
CHINA          .15           .216          .333          .3            .183          .2
COAL           .142          .142          .142          .142          .142          .142
NIFTY          .14           .192          .28           .263          .245          .228
BIOTECH        .131          .168          .194          .228          .194          .184
GREEN          .13           .173          .26           .217          .217          .173
NASD-100       .13           .22           .29           .33           .26           .24
^^^^^^^^
ELECTRON       .129          .172          .209          .203          .148          .135
RUS-1000       .129          .202          .251          .272          .237          .219
AUTO           .128          .179          .179          .205          .179          .128
MILITARY       .125          .125          .156          .218          .156          .125
ETFS           .12           .155          .293          .206          .103          .086
INDMATER       .115          .128          .179          .166          .141          .141
FIDSTKS        .107          .166          .22           .263          .22           .215
SOFTWARE       .107          .276          .276          .246          .2            .184
SP-100         .107          .182          .247          .258          .247          .215
JETS           .1            .2            .2            .6            .4            .4
CHEM           .092          .111          .129          .148          .111          .111
HACKERS        .09           .363          .409          .454          .363          .363
HOSPITAL       .083          .25           .291          .333          .291          .291
DJI-13         .076          .076          .23           .23           .23           .153
FINANCE        .066          .1            .111          .133          .111          .111
COMPUTER       .045          .181          .272          .272          .227          .227
REGBANKS       .035          0             .071          .142          .035          .071
OILGAS         .033          .033          .06           .047          .04           .04
RETAIL         .018          .056          .094          .15           .113          .113
BIGBANKS       0             0             0             0             0             0
GUNS           0             .058          .117          .176          .117          .117
INFRA          0             .027          .083          .027          0             0
TRANSP         0             0             0             .15           .05           .05
|
====================================================================
12/14/2018 The DJI is testing
its 24000 support at its lower 3.5%
band.
Our OBVPct, Accumulation Index and our P-Indicator did not
confirm the
DJI's closing low on Friday. And, most important, we are entering the
bullish
season period from December 17th to early January over which
the DJI
rallies 75% of the time. So, we should buy DIA and SPY.
But let's
hold off on doing more than that until we see a Buy B13 (Santa Claus buy).
There is
still a good chance of the DJI dropping down to 23200 if the FED
continues
with its plans to raise rates at the FOMC meeting on Wednesday
this week.
Watch the DJI Stocks showing head/shoulders Tops now.
Any rally
likely now will probably limited to the DIA, SPY, QQQ, TECL and SOXL.
By most
measures and Tables 1-3 below, we have a very ugly market in all but a handful
of stocks
and the technicals are worsening. The Russell-2000, the MDY Mid-caps
and Rails
made new-low breakdowns at the end of the week. Even the ETFs we would
like to
buy, such as DIA, SPY and QQQ, have their Closing Powers making new lows
ahead of
prices. It seems that only Utilities and a few very defensive blue chips
in the DJI,
like KO, PG and Verizon are still attracting enough buyers to look outright
bullish.
In fact, the number of strong-looking blue-chips in the DJI is shrinking. JNJ
had been
one of the bullish "hold-outs". But Friday, it lost 14.84 on huge volume.
Will the
seven DJI-30 stocks now showing bearish head/shoulders patterns, AXP,
DIS, MCD,
PFE, UNH, WBA and WMT suffer the same fate soon? Watch them
this week.
Their breakdowns would pose a real problem for a stock market
that
depends more than ever on the DJIA to maintain appearances that all is still fine.
 |
 |
 |

|
The FED Is in Control. The Market Awaits
Its Decision about Short-Term Rates on Wednesday.
Despite
Friday's Buy B6, there may be more market weakness. Be especially
wary of
opening strength that fades away. The Closing Powers for the key ETFs
are all
falling, as are the Tiger Day Traders' Tools. What we need to see
to become
bullish for the next two week is closing strength after early weakness.
And even if
the DJI makes such a reversal upwards, to be buyers in preparation
for a Santa
Claus rally, I think we should also require similar reversals in the tech
sector,
notably QQQ, TECL and SOXL.
There is
risk now of a DJI penetration of the flat support at 24000 and a decline
to the
"final" support at 23200. The FED more than the President controls what
will happen
next. It appears the FED will stick to its plans to raise short-term rates
this month.
There is no need to raise rates. The Dollar is strong. Inflation is
stuck just
above 2%. There are lots of signs that big banks are worried about
a global
economic slow-down and the vast amount of indebtedness. But the
FED often
listens listens too much to bond-salesmen and forgets too often how
easily it
can cause bear markets by raising rates too quickly. Over and over, history
shows how
the rising of short-term interest rates cause turn a bull market into
a bear
market. It would be a mistake to think that this Federal Reserve is any
different
or any smarter. In particular, the 1980 experience with a hawkish
FED warns
us that even though it's now December, the DJI could drop below the
7% lower
band before recovering.
Peerless
did give another Buy B6 on Friday. That gives encouragement to the
bulls.
The B6 was always eventually profitable. But we should be careful.
The Buy
B2-B6 of a week ago was considered cancelled because of how fast
the DJI had
fallen from the upper 3.3% band to the lower 3% band after a Sell S9.
I think
that this special bearishness (which I called an "experimental S13 in the Hotline
and in the
current Peerless version now available on the ESP Page) ") is probably
used up and
we should be buying for a Santa Claus rally. But I would rather see
a Buy B13
Santa Claus signal and act on that.
Peerless Buy B6
Let's look
at the Buy B6 more closely. As you can see it has always proved
to have
been profitable. But, there have only been five past cases. This is
because the
only drops to the lower band in Decembers that produce Buy B6s
are those
that only occur in mid-term Presidential Years. A second concern
is that all
but one, the 1986 case, took place in bear markets. Since our DJIA now
is only
down 10% from its highs, only the1986 case might be considered a
good
parallel. But is it? After December 1st, 1986 the FED began lowering
interest
rates. It is raising them in steps now even when there is no need that
I can see
and that could prove dangerous to the bulls.
Fed Funds Rate
1986-12-01 6.91
1987-01-01 6.43
1987-02-01 6.10
1987-03-01 6.13
The next thing to
note is that all but one of the past B6s occurred after December 25th.
Finally, only one
of the past B6s called the December bottom perfectly.
Past Peerless B6s
Date Gain
Paper Loss
12-26-1930 +.059 -.0062
bottom was on 12/29
12-02-1966 +.124 -.0036
bottom was on 12/30
12-28-1966 +.125 -.0035
bottom was on 12/30
12-31-1986 +.269
zero
12-26-2002 +.040 -.0152
Buying the DJI at the Lower 3% Band in December
Is Nearly Always Profitable for Traders. But sometimes,
the DJI drops another 2%-3% before making a good recovery.
When the DJI closes below the lower 3.0% band in Decembers
since 1940
in bear markets, it
invariable experiences a Santa Claus bounce with the DJI
rallying
until the following year. This was true in all eight cases. But in five
of these
cases the DJI fell below the 4% lower band and twice reached the 7%
lower
band.
Of
more interest for us are five cases where the DJI closed below the 3% band
in bull markets. These are
cases of 1975, 1980, 1982, 1998 and 2014.
In
1975, 1982 and 1998 short-term interest rates were falling and the DJI
did
not fall further and quickly rebounded until the second week of January,
at
least. But when interest rates were flat, the December 2014 case, the
DJI
rallied only until the day after Christmas. When interest rates were on
the
rise in December and at very high levels, too, the DJI did not bottom
until
it closed 7.4% below the 21-dma. This was the December 1980 case.
But
then the DJI did zoom back up above the upper band. As you can
see
below, the DJI did nominally break below its horizontal support in
December 1980, but then it quickly reversed back upwards. What makes
this
instance especially interesting, is that there was also a Sell S9 before the
DJI's
decline. That is like now. But unlike now, there was also a bearish
head/shoulders top.
Date
LA/MA
Outcome
---------------------------------------------------------------------------------------------
12/22/1941 .946 (5.4% LB)
From 106.3, the DJI then rose back to 114.2 on 1/5/1942
Bear Mkt Environm.
and then resumed bear market.
12/17/1957 .966 (3.4% LB)
From 425.7, the DJI quickly bottomed and rose back to 458.7
Bear Mkt Environm.
on 2/4/1958 before falling back below 21-dma.
12/17/1969 .961 (3.9% LB) From 769.93, the DJI rose back to 811.31 on
1/5/1970
Bear Mkt Environm.
and then resumed bear market.
12/13/1973 .958 (4.2% LB) From 800.43, the DJI rose back to 880.69 on
1/3/1974
Bear Mkt Environm
before re-testing 800 support again.
12/6/1974 .923 (7.7% LB) From
577.60, the DJI rose back to 786.53 on 3/17/1975
Bear Mkt Environm
before falling back below its rising 21-dma.
12/4/1987 .929 (7.1% LB) From
1766.74, the DJI rose back to 2037.80 on 1/6/1988
Bear Mkt Environm
before falling back below its rising 21-dma.
12/27/2003 .968 (3.2% LB) From 8303.78, the DJI rose back to 8740.59 on
1/7/2003
Bear Mkt Environm
before resuming bear market.
12/1/2008 .945 (5.5% LB) From
8149.09, the DJI rose back to 9034.69 on 1/2/2009
Bear Mkt Environm
before resuming bear market.
Bull Market Closings below 3% Lower Band.
#1 12/5/1975 .969 (3.1% LB)
From 818.8, the DJI shot upwards as interest rates were lowered.
Bull Market Environm
The DJI rose
to 975.28 on 1/30/1976 before falling back
briefly below its 21-dma
Fed. Funds Rate:
1975-10-01 5.82
1975-11-01 5.22 down
1975-12-01 5.20 down
1976-01-01 4.87 down
1976-02-01 4.77 down
1976-03-01 4.84 up
1976-04-01 4.82 down
1976-05-01 5.29 up
https://fred.stlouisfed.org/data/FEDFUNDS.txt
#2 12/11/1980 .936
(7.4% LB) From 908.45, the DJI quickly rose back to a nominal new high
Bull Market Environm
at 1004.69 on 1/6/1981. It then fell back to lower band.
Short-term rates were rising to very lofty heights at this time.
Fed. Funds Rate:
1980-10-01 12.81
1980-11-01 15.85 Up
1980-12-01 18.90 Up
1981-01-01 19.08 Up
1981-02-01 15.93 Down
1981-03-01 14.70 Down
1981-04-01 15.72 Up
1981-05-01 18.52 Up
1981-06-01 19.10 Up
#3 12/16/1982 .970
(3.0% LB) From 990.25, the DJI quickly rose back to 1083.61 on 1/12/1983
Bull Market Environm
before pulling back to its lower band.
Short-term rates were falling from their extreme highs.
Fed. Funds Rate:
1982-10-01 9.71
1982-11-01 9.20
1982-12-01 8.95
1983-01-01 8.68
1983-02-01 8.51
1983-03-01 8.77
#4 12/14/1998 .960 (4.0%
LB) From 8695, the DJI quickly rose back to 9643 on 1/8/1999
Bull Market Environm
before pulling back to its lower band.
Short-term rates were falling.
Fed. Funds Rate:
1998-10-01   5.07
1998-11-01   4.83 Down
1998-12-01   4.68 Down
1999-01-01   4.63 Down
1999-02-01   4.76 Up
1999-03-01   4.81 Up
1999-04-01   4.74 Down
1999-05-01   4.74 Down
#5 12/16/2014 .965 (3.5%
LB) From 17069, the DJI quickly rose back to 18053 on 12/26/2014
Bull Market Environm
before pulling back to its lower band.
Short-term rates were flat.
Fed. Funds Rate:
2014-11-01   0.09
2014-12-01   0.12 Up
2015-01-01   0.11 Down
2015-02-01   0.11
2015-03-01   0.11
2015-04-01   0.12 Up
2015-05-01   0.12 Up
|
Charts 12/14/2018 PEERLESS DJI, Signals, Indicators Daily DJI Volume 10-DayUp/Down Vol Hourly DJIA A/D Line for All Stocks Inverted Traders Index NASDAQ S&P OEX NYSE COMPQX DJI-15 DJI-20 DJI-30 DIA SPY QQQ MDY IWM TNA Short-Term Rates USO-CrudeOil DBO FAS GLD BBH IBB JETS JNUG KOL NUGT OIH OIL RSX RETL SDS AGQ SLV SOXL TECL TLT TMF TNA UGA (gasoline) XIV YINN Commodities: CANE CORN DBC JJC, NIB, CHOC CORN, CUT (paper) MOO, SOYB WEAT UUP (Dollar) LIT (Lithium) AAPL ADBE ALXN AMAT AMGN AMD AMZN BA BABA BAC BIDU CAT CVX DE FB GOOG GS HD IBM INTU JPM M (Macy's) MSFT NFLX NVDA QCOM TSLA TXN XOM WMT CMG , LRCX, SWKS, MDGL SPPI WATT SQ TOWN 12/14/2018 (Click on Underlined link.) - Bullish MAXCPs - http://tigersoft.com/MAXCPZ/Dec-14/BULLISH.htm Bearish MAXCPs - http://tigersoft.com/MINCPZ/Dec-14/BEARISH.htm |
Table 1 QUICKSILVER on ETFS - 12/14/18 ETF CLOSE CHANGE PIVOT-PT 5-dma AROC CL-PWR CANDLE IP21 ITRS --------------------------------------------------------------------------------------------- --------------------------------------------------------------------------------------------- DIA 241.42 -4.85 244.71 -59% Bearish RED -.028 ----- --------------------------------------------------------------------------------------------- SPY 260.47 -4.9 264.07 -58.6% Bearish RED -.004 -.008 --------------------------------------------------------------------------------------------- QQQ 161.08 -4.02 163.07 -9.2% Bearish RED .017 -.035 --------------------------------------------------------------------------------------------- MDY 316.27 -4.39 322.62 -128.1% Bearish RED -.173 -.033 --------------------------------------------------------------------------------------------- IWM 140.61 -2.16 143.6 -118.6% Bearish RED -.075 -.054 --------------------------------------------------------------------------------------------- FAS 49.16 -1.46 52.01 -417.2% Bearish RED -.062 -.209 --------------------------------------------------------------------------------------------- RETL 25.24 -.84 28.11 -449.2% Bearish RED .042 -.308 --------------------------------------------------------------------------------------------- SOXL 90.39 -4.03 89.84 229.6% ------- RED -.021 -.323 --------------------------------------------------------------------------------------------- TECL 96.93 -7.73 101.55 -17.7% Bearish RED .045 -.335 --------------------------------------------------------------------------------------------- IBB 101.93 -1.96 103.82 -82.1% Bearish RED .049 -.06 --------------------------------------------------------------------------------------------- GLD 117.06 -.47 117.68 -43.7% ------- BLUE-.015 .131 --------------------------------------------------------------------------------------------- RSX 20.23 -.32 20.36 -117.3% Bearish RED -.012 .037 |
 Table 2
          Count of Stocks in Key Directories
          2018-12/14
-------------------------------
NEWHIGHS       32
NEWLOWS        331  Bearish >10:1 ratio
MAXCP          14
MINCP          344  Bearish >10:1 ratio
TTTNH 21 TTTNL 206 FASTUP 23 FASTDOWN 224 Bearish >10:1 ratio CPCROSSA 36 CPCROSSD 39 Subtle shift to bullish side by some Pros? BIGVOLUP 1 BIGVODN 21 ACCUMVER 10 HIGHIP21 5 HIUPPCT 6 VHIP21 18 LOWACCUM 256 REDSELL 332 AUGSELS7 23 TRAPDOOR 20 |
 Table 3
          RANKING OF KEY DIRECTORIES BASED PCT.OF STOCKS ABOVE 65-DMA
              12/14/18
---------------------------------------------------------------------------------------
Directory     Current       day-1         day-2         day-3         day-4         day-5
----------------------------------------------------------------------------------------
UTILITY        .875          .85           .85           .85           .85           .85
BONDFUND       .514          .609          .761          .78           .828          .8
==============================================================================================
FOOD           .491          .561          .526          .526          .491          .561
GOLD           .48           .56           .52           .46           .42           .52
REIT           .463          .443          .397          .523          .476          .576
COMODITY       .452          .523          .5            .5            .452          .547
HACKERS        .363          .409          .454          .363          .363          .272
EDU            .333          .166          .333          .333          .333          .333
SOLAR          .333          .444          .444          .333          .333          .444
HOMEBLDG       .294          .294          .352          .294          .235          .411
BEVERAGE       .277          .388          .388          .333          .388          .388
SOFTWARE       .276          .276          .246          .2            .184          .184
PIPELINE       .269          .269          .23           .192          .192          .192
HOSPITAL       .25           .291          .333          .291          .291          .333
DOWJONES       .233          .4            .4            .366          .333          .3
^^^^^^^^
SP500          .224          .289          .307          .275          .265          .259
^^^^^
SEMI           .222          .256          .282          .196          .179          .153
NASD-100       .22           .29           .33           .26           .24           .19
^^^^^^^^
BIG17          .217          .217          .304          .195          .173          .152
CHINA          .216          .333          .3            .183          .2            .2
RUS-1000       .202          .251          .272          .237          .219          .233
INSURANC       .2            .233          .266          .266          .3            .3
JETS           .2            .2            .6            .4            .4            .5
NIFTY          .192          .28           .263          .245          .228          .157
SP-100         .182          .247          .258          .247          .215          .193
COMPUTER       .181          .272          .272          .227          .227          .181
INDEXES        .181          .203          .213          .203          .219          .24
AUTO           .179          .179          .205          .179          .128          .153
GREEN          .173          .26           .217          .217          .173          .217
ELECTRON       .172          .209          .203          .148          .129          .141
FIDSTKS        .166          .22           .263          .22           .215          .204
GAMING         .166          .166          .25           .166          .166          .166
BIOTECH        .165          .194          .228          .194          .184          .189
ETFS           .155          .293          .206          .103          .086          .12
COAL           .142          .142          .142          .142          .142          .142
INDMATER       .128          .179          .166          .141          .141          .153
MILITARY       .125          .156          .218          .156          .125          .125
CHEM           .111          .129          .148          .111          .111          .129
FINANCE        .1            .111          .133          .111          .111          .111
DJI-13         .076          .23           .23           .23           .153          .23
GUNS           .058          .117          .176          .117          .117          0
RETAIL         .056          .094          .15           .113          .113          .113
OILGAS         .033          .06           .047          .04           .04           .054
INFRA          .027          .083          .027          0             0             0
BIGBANKS       0             0             0             0             0             0
REGBANKS       0             .071          .142          .035          .071          .142
TRANSP         0             0             .15           .05           .05           .05
|
====================================================================
12/13/2018
Peerless still shows the operative signal
to be a Sell S9, based
on the speed of the DJI's decline recently from the 3% upper
band to the 3% lower band. Internals are still weakening. Big
Banks are breaking down just as they did in 2007. Closing
Powers are leading prices to new lows just as they did in 2000.
Stay short some of the many, many Bearish MINCPs and
wait for a successful test of 24000 to buy. December 17th
will likely give us a Peerless Santa Claus B13.


Another DJI test of 24000 is shaping up. Very likely, we
will get a Buy B13 on Monday. This is the Santa Claus rally
Buy signal. One would think that buying on the DJI's test
of 24000 would make sense. But let's not get too enthusiastic
yet. It is mostly defensive stocks, like utilities, PG and MCD,
which are holding up. Breadth today was poor. So, perhaps,
the Fed will not throw a life raft out to the market in December.
That is also the message given by today's weakness in Retailers.
Very disconcerting is the way Professionals, if we judge from
the many Closing Power new lows ahead of price in leading ETFs,
are giving ample warning that pessimism, political uncertainty and
tax loss selling abound. When the openings are down, there is
the conserable danger that Professional selling will add still more
pressure to the downside. In that case, the flat support at 24000
may give way, despite December's usual bullishness. If that happens,
a lot of seasonal traders will be trapped and in big trouble.
Transports have made a new low today
and broken key support.

So, our timing for buying in here must be very good and our trading
goals should probably limited by the falling 21-day moving averages
unless there is a dramatic improvement in breadth. Still, the odds
are so good for some kind of a two-week rally from the December
17th close, I think we have to be buyers of QQQ or TQQQ, TECL
and SOXL on Monday as long as the DJI does not close more than
marginally below the support at 24000. But note, too, that a drop below
23900 could easily bring a decline to 23200-23500. Such is the
effect, at the very least, of leveraged short major market ETFs.
Since 1965 if we had bought the DJI on the close of
December 17th,
the historical odds of the DJI being higher are 75% after the next ten
trading days. That is the basis of the Peerless Buy B13 that will then
appear.
 |
 |
|
Charts 12/13/2018 PEERLESS DJI, Signals, Indicators Daily DJI Volume 10-DayUp/Down Vol Hourly DJIA A/D Line for All Stocks Inverted Traders Index NASDAQ S&P OEX NYSE COMPQX DJI-15 DJI-20 DJI-30 DIA SPY QQQ MDY IWM TNA Short-Term Rates USO-CrudeOil DBO FAS GLD BBH IBB JETS JNUG KOL NUGT OIH OIL RSX RETL SDS AGQ SLV SOXL TECL TLT TMF TNA UGA (gasoline) XIV YINN Commodities: CANE CORN DBC JJC, NIB, CHOC CORN, CUT (paper) MOO, SOYB WEAT UUP (Dollar) LIT (Lithium) AAPL ADBE ALXN AMAT AMGN AMD AMZN BA BABA BAC BIDU CAT CVX DE FB GOOG GS HD IBM INTU JPM M (Macy's) MSFT NFLX NVDA QCOM TSLA TXN XOM WMT CMG , LRCX, SWKS, MDGL SPPI WATT SQ TOWN 12/13/2018 (Click on Underlined link.) - Bullish MAXCPs - http://tigersoft.com/MAXCPZ/Dec-13/BULLISH.htm Bearish MAXCPs - http://tigersoft.com/MINCPZ/Dec-13/BEARISH.htm |
Table 1 QUICKSILVER on ETFS - 12/13/18 ETF CLOSE CHANGE PIVOT-PT 5-dma AROC CL-PWR CANDLE IP21 ITRS --------------------------------------------------------------------------------------------- --------------------------------------------------------------------------------------------- DIA 246.27 .39 244.31 -70.2% Bearish RED -.002 ---- --------------------------------------------------------------------------------------------- SPY 265.37 -.09 263.57 -84.2% Bearish RED .003 -.01 --------------------------------------------------------------------------------------------- QQQ 165.1 .05 161.38 -54.6% Bearish RED .013 -.032 --------------------------------------------------------------------------------------------- MDY 320.66 -3.4 324.54 -166.7% Bearish RED -.141 -.037 --------------------------------------------------------------------------------------------- IWM 142.77 -2.05 144.02 -153.2% Bearish RED -.073 -.053 --------------------------------------------------------------------------------------------- FAS 50.62 -.55 53.47 -570.3% Bearish RED -.04 -.197 --------------------------------------------------------------------------------------------- RETL 26.08 -2.32 27.72 -911.1% Bearish RED .057 -.305 --------------------------------------------------------------------------------------------- SOXL 94.42 -1.06 86.19 -143.5% ------- RED -.005 -.316 --------------------------------------------------------------------------------------------- TECL 104.66 .38 97.29 -204.8% Bearish RED .062 -.303 --------------------------------------------------------------------------------------------- IBB 103.89 -1.59 103.64 -142.7% Bearish RED .046 -.057 --------------------------------------------------------------------------------------------- RSX 20.55 .14 20.71 -43.9% Bearish BLUE-.021 .037 |
 Table 2   Count of Stocks in Key Directories
           20181213
-------------------------------
NEWHIGHS       52
NEWLOWS        204  Bearish
MAXCP          16
MINCP          355  Bearish
TTTNH          20
TTTNL          273  Bearish
FASTUP         21
FASTDOWN       208  Bearish
CPCROSSA       34
CPCROSSD       81   Bearish
BIGVOLUP       1
BIGVODN        17
ACCUMVER       12
HIGHIP21       5
HIUPPCT        6
VHIP21         19
LOWACCUM       259
REDSELL        323
AUGSELS7       22
TRAPDOOR       20
|
 Table 3
 RANKING OF KEY DIRECTORIES BASED PCT.OF STOCKS ABOVE 65-DMA
            12/13/18
 Bullish = 5
 Bearish = 41
---------------------------------------------------------------------------------------
Directory     Current       day-1         day-2         day-3         day-4         day-5
----------------------------------------------------------------------------------------
UTILITY        .85           .85           .85           .85           .85           .85
BONDFUND       .609          .761          .78           .828          .79           .771
FOOD           .561          .526          .526          .491          .561          .456
GOLD           .56           .52           .46           .42           .52           .42
COMODITY       .523          .5            .5            .452          .547          .452
=============================================================================================
SOLAR          .444          .444          .333          .333          .444          .555
REIT           .443          .397          .523          .476          .576          .629
HACKERS        .409          .454          .363          .363          .272          .363
DOWJONES       .4            .4            .366          .333          .3            .433
^^^^^^^^
BEVERAGE       .388          .388          .333          .388          .388          .388
CHINA          .333          .3            .183          .2            .2            .35
HOMEBLDG       .294          .352          .294          .235          .352          .352
ETFS           .293          .206          .103          .086          .12           .327
HOSPITAL       .291          .333          .291          .291          .333          .375
NASD-100       .29           .33           .26           .24           .18           .38
^^^^^^^^
SP500          .289          .307          .275          .265          .257          .357
^^^^^
NIFTY          .28           .263          .245          .228          .157          .245
SOFTWARE       .276          .246          .2            .184          .184          .261
COMPUTER       .272          .272          .227          .227          .181          .272
PIPELINE       .269          .23           .192          .192          .192          .269
GREEN          .26           .217          .217          .173          .26           .26
SEMI           .256          .282          .196          .179          .153          .256
RUS-1000       .251          .272          .237          .219          .232          .325
^^^^^^^^
SP-100         .247          .258          .247          .215          .193          .301
^^^^^^
INSURANC       .233          .266          .266          .3            .3            .366
DJI-13         .23           .23           .23           .153          .23           .23
FIDSTKS        .22           .263          .22           .215          .193          .306
BIG17          .217          .304          .195          .173          .152          .173
ELECTRON       .209          .203          .148          .129          .141          .228
INDEXES        .203          .213          .203          .219          .24           .262
JETS           .2            .6            .4            .4            .5            .8
BIOTECH        .192          .228          .194          .184          .186          .228
AUTO           .179          .205          .179          .128          .153          .256
INDMATER       .179          .166          .141          .141          .153          .179
EDU            .166          .333          .333          .333          .333          .5
GAMING         .166          .25           .166          .166          .166          .291
MILITARY       .156          .218          .156          .125          .125          .125
COAL           .142          .142          .142          .142          .142          .142
CHEM           .129          .148          .111          .111          .129          .185
GUNS           .117          .176          .117          .117          0             0
FINANCE        .111          .133          .111          .111          .111          .155
RETAIL         .094          .15           .113          .113          .113          .264
INFRA          .083          .027          0             0             0             .083
REGBANKS       .071          .142          .035          .071          .142          .107
OILGAS         .06           .047          .04           .04           .054          .06
BIGBANKS       0             0             0             0             0             0
^^^^^^^^
TRANSP         0             .15           .05           .05           .05           .25
|
====================================================================
12/12/2018
We will likely get a Buy B2 on the
next test of lower 3%-3.5% band.
Today's last two-hour weakness may spill over to tomorrow.
That may provide us a good opportunity for traders to take long positions
again in TQQQ, TECL and SOXL. Presently, it is the higher
openings that are holding up the market. This is very reminiscent
of 2000 before support gave way and the bear market started
for the DJIA and the leaders in the NASDAQ and Biotech of
that era.
As the DJI has held above its support for about a week,
it is looks more and more like we should now accept
new buys at the lower-band/support. The problem remains
that there are many more attractive BEARISH MINCP
short sales than appealing BULLISH MAXCPs and
many of the key ETFs show not just falling Closing Powers,
but also Closing Powers making new lows. That poses
a danger for them and the market. Fortunately, from December
17th to December, the odds heavily favor a Santa Claus rally.


For now hold some Bearish MINCPs short and, if you
are a short-term trader, hold long the following ETFs.
Note that if you followed our advise here, traders should
have sold TECL, TQQQ and SOXL today near their
highs when they reached their falling 21-dma. At this
point, I would sell NVDA. It is acting strongly enough.
Perhaps, we can buy TECL, TQQQ and SOXL again if
they re-test their supports or if Peerless gives a new Buy signal.
The Leading ETFs
Price
21-dma Closing Power Status Red System's
Year Profitab.
------------------------------------------------------------------------------
DIA
245.88 +1.65
250 Bearish - 12
mo low 14-day Stoch Buy +59.3%
Today's high = 248.76 So, 21-dma not reached to sell.
TECL
104.28 +2.44
108 Bearish - 12
mo low 14-day Stoch Buy +144.0%
Today's high = 109. So, yesterday's 21-dma
(109) was reached to sell.
TQQQ
46.39 +.38
47.1 Bearish - 12
mo low 14-day Stoch Buy +156.5%
Today's high = 48.53. So, yesterday's 21-dma
(47.44) was reached to sell.
SOXL
95.48 +4.05
97.5 Bearish
14-day Stoch Buy +558.3%
Today's high = 99.41. So, yesterday's 21-dma
(98.1) was reached to sell.
NVDA
148.9 +.71 162
Bearish
14-day Stoch Buy +55.0%
Today's high = 152.78 So, 21-dma not reached to sell.
 |
 |
 |
|
Charts 12/12/2018 PEERLESS DJI, Signals, Indicators Daily DJI Volume 10-DayUp/Down Vol Hourly DJIA A/D Line for All Stocks Inverted Traders Index NASDAQ S&P OEX NYSE COMPQX DJI-15 DJI-20 DJI-30 DIA SPY QQQ MDY IWM TNA Short-Term Rates USO-CrudeOil DBO FAS GLD BBH IBB JETS JNUG KOL NUGT OIH OIL RSX RETL SDS AGQ SLV SOXL TECL TLT TMF TNA UGA (gasoline) XIV YINN Commodities: CANE CORN DBC JJC, NIB, CHOC CORN, CUT (paper) MOO, SOYB WEAT UUP (Dollar) LIT (Lithium) AAPL ADBE ALXN AMAT AMGN AMD AMZN BA BABA BAC BIDU CAT CVX DE FB GOOG GS HD IBM INTU JPM M (Macy's) MSFT NFLX NVDA QCOM TSLA TXN XOM WMT CMG , LRCX, SWKS, MDGL SPPI WATT SQ TOWN 12/12/2018 (Click on Underlined link.) - Bullish MAXCPs - http://tigersoft.com/MAXCPZ/Dec-12/BULLISH.htm Bearish MAXCPs - http://tigersoft.com/MINCPZ/Dec-12/BEARISH.htm |
Table 1 QUICKSILVER on ETFS - 12/12/18 ETF CLOSE CHANGE PIVOT-PT 5-dma AROC CL-PWR CANDLE IP21 ITRS --------------------------------------------------------------------------------------------- DIA 245.88 1.65 249.72 -98.3% Bearish RED -.071 ----- --------------------------------------------------------------------------------------------- SPY 265.46 1.33 269.84 -89.9% Bearish RED -.019 -.012 --------------------------------------------------------------------------------------------- QQQ 165.05 1.44 166.89 -20.4% Bearish RED -.025 -.035 --------------------------------------------------------------------------------------------- MDY 324.06 2.43 331.49 -137.6% Bearish RED -.116 -.033 --------------------------------------------------------------------------------------------- IWM 144.82 1.37 147.2 -93% Bearish RED -.073 -.051 --------------------------------------------------------------------------------------------- FAS 51.17 .15 56.65 -554.9% Bearish RED -.049 -.195 --------------------------------------------------------------------------------------------- RETL 28.4 .69 31.3 -584.6% Bearish RED .089 -.314 --------------------------------------------------------------------------------------------- SOXL 95.48 4.05 97.06 -172.7% Bearish RED -.015 -.309 --------------------------------------------------------------------------------------------- TECL 104.28 2.44 108.87 -189.3% Bearish RED .031 -.307 --------------------------------------------------------------------------------------------- IBB 105.48 1.31 106.88 -58.5% Bearish BLUE .025 -.051 --------------------------------------------------------------------------------------------- RSX 20.41 .12 20.73 -41.4% Bearish BLUE-.065 .011 |
 Table 2
   Count of Stocks in Key Directories
          2018-12/12
-------------------------------
NEWHIGHS       40
NEWLOWS        74  Bearish
MAXCP          13
MINCP          300 Very bearish ratio
TTTNH          18
TTTNL          189 Very bearish ratio
FASTUP         28
FASTDOWN       505 Very bearish ratio
CPCROSSA       57
CPCROSSD       223 Bearish ratio
BIGVOLUP       3
BIGVODN        10
ACCUMVER       13
HIGHIP21       9
HIUPPCT        6
VHIP21         19
LOWACCUM       268
REDSELL        311
AUGSELS7       15
TRAPDOOR       23
|
Table 3
      RANKING OF KEY DIRECTORIES BASED PCT.OF STOCKS ABOVE 65-DMA
             12/12/18
Bullish = 5 Bearish = 41 --------------------------------------------------------------------------------------- Directory Current day-1 day-2 day-3 day-4 day-5 ---------------------------------------------------------------------------------------- UTILITY .85 .85 .85 .85 .85 .85 BONDFUND .761 .78 .828 .79 .761 .742 JETS .6 .4 .4 .5 .8 .9 FOOD .526 .526 .491 .561 .456 .491 GOLD .52 .46 .42 .52 .42 .42 =========================================================================================== COMODITY .5 .5 .452 .547 .452 .476 =========================================================================================== HACKERS .454 .363 .363 .272 .363 .318 SOLAR .444 .333 .333 .444 .555 .5 DOWJONES .4 .366 .333 .3 .433 .4 ^^^^^^^ REIT .397 .523 .476 .576 .622 .43 BEVERAGE .388 .333 .388 .388 .388 .388 HOMEBLDG .352 .294 .235 .352 .352 .294 EDU .333 .333 .333 .333 .5 .5 HOSPITAL .333 .291 .291 .333 .375 .458 NASD-100 .33 .26 .24 .18 .37 .34 ^^^^^^^^ SP500 .307 .275 .265 .257 .355 .357 BIG17 .304 .195 .173 .152 .173 .239 CHINA .3 .183 .2 .2 .333 .466 SEMI .282 .196 .179 .153 .247 .273 COMPUTER .272 .227 .227 .181 .272 .272 RUS-1000 .272 .237 .219 .232 .325 .326 INSURANC .266 .266 .3 .3 .366 .4 FIDSTKS .263 .22 .215 .193 .301 .29 NIFTY .263 .245 .228 .157 .245 .263 SP-100 .258 .247 .215 .193 .301 .279 ^^^^^^ GAMING .25 .166 .166 .166 .291 .25 SOFTWARE .246 .2 .184 .184 .261 .261 DJI-13 .23 .23 .153 .23 .23 .23 PIPELINE .23 .192 .192 .192 .269 .23 BIOTECH .226 .194 .184 .186 .226 .228 MILITARY .218 .156 .125 .125 .125 .156 GREEN .217 .217 .173 .26 .26 .347 INDEXES .213 .203 .219 .24 .262 .315 ETFS .206 .103 .086 .12 .293 .362 AUTO .205 .179 .128 .153 .256 .307 ELECTRON .203 .148 .129 .141 .222 .259 GUNS .176 .117 .117 0 0 0 INDMATER .166 .141 .141 .153 .179 .243 RETAIL .15 .113 .113 .113 .264 .245 TRANSP .15 .05 .05 .05 .25 .3 CHEM .148 .111 .111 .129 .185 .24 COAL .142 .142 .142 .142 .142 .142 REGBANKS .142 .035 .071 .142 .107 .178 FINANCE .133 .111 .111 .111 .144 .133 OILGAS .046 .04 .04 .053 .06 .073 INFRA .027 0 0 0 .083 .083 BIGBANKS 0 0 0 0 0 0 |
====================================================================
12/11/2018
Be careful. Traders should be very selective. I've suggested
buying DIA, TECL, TQQQ, SOXL and NVDA because of
their Stochastic-based RED Buy signals. Accept short-term
gains in these. Their falling 21-dma may be a better place
to take profits in them than waiting for a reversing Red Sell.
Their price-trends are all down, thus limiting how far they may be
be able to rally. Another thing to notice is that of the 100 individual
stocks that make up the QQQ, only 36 are now on Buys. A lot
depends on the most heavily weighted QQQ stocks, namely
AAPL, AMZN, and these are still on Red Sells. So, the upside
potential appears limited even if we succeed in buying near the
lows of the day, near the closes.
The Leading ETFs
Price
21-dma Closing Power Status Red System's Year Profitab.
------------------------------------------------------------------------------
DIA
244.83 -.48
250
Bearish - 12 mo low 14-day Stoch
Buy +58.3%
TECL
101.84 +.29
109 Bearish
14-day Stoch Buy +138.3%
TQQQ
45.25 +.38
47.4 Bearish
14-day Stoch Buy +150.2%
SOXL
91.43 +1.59
98.1 Bearish
14-day Stoch Buy +511.2%
NVDA
148.9 -3.67 165
Bearish
14-day Stoch Buy +55.7%
The Internediate-term outlook is more guarded, at least
until we get a Santa Claus Buy signal sometime next week,
about the same time the FOMC makes its decision about
interest rates and Trump makes his decision about his border
wall's special importance.
For now, I take the current Peerless signal to be a
Sell S9, not the
Buy B2 and B6 lower band buys. The high speed of the
DJI's recent decline from the upper 3% band to the 3% lower
band following a Sell S9 should, I think, keep intermediate-term
traders away from quickly buying at the lower band in the first half
of December for at least four reasons.
Only 20% of the A-Z stocks and ETFs are
above their 65-dma and that proportion worsened today.

First, even the DJI could still break support. That
would
likely bring a real rush to sell. Secondly, all market
rallies recently have had the bad habit of quickly failing after
positive openings. Today was such a case. The DJI lost more
than 250 points from its early strength. This is why our
Closing Powers and Tiger Day Traders' Tools are still in
steep downtrends. Thirdly, 80% of all stocks and ETFs are
below their 65-dma. So, there is a massive amount of resistance
overhead. And, fourthly, year-end tax loss selling is likely
to put heavy pressure on the stocks that are close to their
lows, even right to the end of the year. This will hurt IWM,
MDY and most small caps.
There are very few attractive bullish MAXCPs, especially
if we eliminate the riskier smaller stocks. The leaders now
are UTILITIES. The market cannot get much more defensive
than these stocks. Hold the Bearish MINCPs short. Most of
them keep falling even when the DJI does rise.
 |
 |
 |
|
Charts 12/10/2018 PEERLESS DJI, Signals, Indicators Daily DJI Volume 10-DayUp/Down Vol Hourly DJIA A/D Line for All Stocks Inverted Traders Index NASDAQ S&P OEX NYSE COMPQX DJI-15 DJI-20 DJI-30 DIA SPY QQQ MDY IWM TNA Short-Term Rates USO-CrudeOil DBO FAS GLD BBH IBB JETS JNUG KOL NUGT OIH OIL RSX RETL SDS AGQ SLV SOXL TECL TLT TMF TNA UGA (gasoline) XIV YINN Commodities: CANE CORN DBC JJC, NIB, CHOC CORN, CUT (paper) MOO, SOYB WEAT UUP (Dollar) LIT (Lithium) AAPL ADBE ALXN AMAT AMGN AMD AMZN BA BABA BAC BIDU CAT CVX DE FB GOOG GS HD IBM INTU JPM M (Macy's) MSFT NFLX NVDA QCOM TSLA TXN XOM WMT CMG , LRCX, SWKS, MDGL SPPI WATT SQ TOWN 12/11/2018 (Click on Underlined link.) - Bullish MAXCPs - http://tigersoft.com/MAXCPZ/Dec-11/BULLISH.htm Bearish MAXCPs - http://tigersoft.com/MINCPZ/Dec-11/BEARISH.htm |
Table 1 QUICKSILVER on ETFS - 12/11/18 ETF CLOSE CHANGE PIVOT-PT 5-dma AROC CL-PWR CANDLE IP21 ITRS --------------------------------------------------------------------------------------------- --------------------------------------------------------------------------------------------- DIA 244.23 -.48 250.73 -290.4% Bearish RED -.048 ---- --------------------------------------------------------------------------------------------- SPY 264.13 .06 270.25 -281.5% Bearish RED .018 -.015 --------------------------------------------------------------------------------------------- QQQ 163.61 .54 165.72 -262.8% Bearish RED .006 -.043 --------------------------------------------------------------------------------------------- MDY 321.63 -.99 333.05 -356.5% Bearish RED -.071 -.048 --------------------------------------------------------------------------------------------- IWM 143.45 -.15 147.52 -360.9% Bearish RED -.03 -.073 --------------------------------------------------------------------------------------------- FAS 51.02 -.99 57.17 -1174.9% Bearish RED .003 -.198 --------------------------------------------------------------------------------------------- RETL 27.71 -.4 31.83 -1302.3% Bearish RED .072 -.344 --------------------------------------------------------------------------------------------- SOXL 91.43 1.59 98.68 -1236.4% Bearish RED .005 -.332 --------------------------------------------------------------------------------------------- TECL 101.84 .29 108.2 -955.7% Bearish RED .068 -.315 --------------------------------------------------------------------------------------------- IBB 104.17 .35 106.71 -290.7% ------- RED .023 -.069 --------------------------------------------------------------------------------------------- GLD 117.54 -.14 117.12 48.2% Bearish RED -.053 .119 --------------------------------------------------------------------------------------------- RSX 20.29 -.07 20.58 -190.9% Bearish RED -.095 .017 |
  Table 2  Count of Stocks in Key Directories
           2018-12/11
-------------------------------
NEWHIGHS       52
NEWLOWS        257  Bearish
MAXCP          17
MINCP          373  Bearish
TTTNH          25
TTTNL          370  Bearish
FASTUP         58
FASTDOWN       398  Bearish
CPCROSSA       21
CPCROSSD       145  Bearish
BIGVOLUP       3
BIGVODN        16
ACCUMVER       17
HIGHIP21       32
HIUPPCT        6
VHIP21         19
LOWACCUM       271
REDSELL        299
AUGSELS7       15
TRAPDOOR       29
|
 Table 3
              RANKING OF KEY DIRECTORIES BASED PCT.OF STOCKS ABOVE 65-DMA
              12/11/18
 Bullish = 4
 Bearish = 42
---------------------------------------------------------------------------------------
Directory     Current       day-1         day-2         day-3         day-4         day-5
----------------------------------------------------------------------------------------
UTILITY        .85           .85           .85           .85           .85           .85
BONDFUND       .78           .828          .79           .761          .733          .6
FOOD           .526          .491          .561          .456          .508          .526
REIT           .523          .476          .576          .622          .43           .629
============================================================================================
COMODITY       .5            .452          .547          .452          .476          .476
============================================================================================
GOLD           .46           .42           .52           .42           .42           .4
JETS           .4            .4            .5            .8            .9            1
DOWJONES       .366          .333          .3            .433          .4            .733
HACKERS        .363          .363          .272          .363          .318          .545
BEVERAGE       .333          .388          .388          .388          .388          .5
EDU            .333          .333          .333          .5            .5            .833
SOLAR          .333          .333          .444          .555          .5            .777
HOMEBLDG       .294          .235          .352          .352          .294          .411
HOSPITAL       .291          .291          .333          .375          .458          .541
SP500          .275          .265          .257          .355          .357          .548
INSURANC       .266          .3            .3            .366          .4            .5
NASD-100       .26           .24           .18           .37           .34           .6
SP-100         .247          .215          .193          .301          .279          .526
NIFTY          .245          .228          .157          .245          .263          .508
RUS-1000       .237          .219          .232          .325          .325          .503
DJI-13         .23           .153          .23           .23           .23           .615
COMPUTER       .227          .227          .181          .272          .272          .363
FIDSTKS        .22           .215          .193          .301          .29           .521
GREEN          .217          .173          .26           .26           .347          .521
INDEXES        .203          .219          .24           .262          .299          .326
SOFTWARE       .2            .184          .184          .261          .261          .353
SEMI           .196          .179          .153          .247          .273          .478
BIG17          .195          .173          .152          .173          .217          .304
BIOTECH        .192          .184          .186          .226          .228          .326
PIPELINE       .192          .192          .192          .269          .23           .384
CHINA          .183          .2            .2            .333          .45           .583
AUTO           .179          .128          .153          .256          .307          .461
GAMING         .166          .166          .166          .291          .25           .375
MILITARY       .156          .125          .125          .125          .156          .281
ELECTRON       .148          .129          .141          .222          .259          .407
COAL           .142          .142          .142          .142          .142          .142
INDMATER       .141          .141          .153          .179          .23           .307
GUNS           .117          .117          0             0             0             .411
RETAIL         .113          .113          .113          .264          .245          .396
CHEM           .111          .111          .129          .185          .24           .351
FINANCE        .111          .111          .111          .144          .133          .322
ETFS           .103          .086          .12           .293          .362          .534
TRANSP         .05           .05           .05           .25           .3            .55
OILGAS         .04           .04           .053          .06           .073          .114
REGBANKS       .035          .071          .142          .107          .178          .428
BIGBANKS       0             0             0             0             0             .285
INFRA          0             0             0             .083          .083          .25
|
====================================================================
12/10/2018
A bounce by the major market indexes now
will try and lift some
the biggest capitalization stocks up from the floor. It may be
important that we did not get a trading Buy 'b' signals. Though
deeply oversold, the 6-day Tiger Inverted Traders Index has
not yet turned up. The good news
is that the DJI did hold today
and we are only a week away from a Peerless Santa Claus Buy B13
that ordinarily brings a rally to year-end. DIA, SOXL, TECL, TQQQ
and NVDA all gave red Buy signals. These make good trades
so often that they have to be recommended here for Tiger users.
As I write this, the DJI has turned around in overnight
trading.
Most likely, the FOMC has leaked its intention not to raise rates.
We'll see.


Bullishly, the key Indexes, DJIA, SP-500, QQQ and NASDAQ did not
close at new lows but instead reversed after steep early losses.
The strength today was important. This shows that the Accumulators
(who I call 'big money') are still buyers. This was not true in the
tests of the lower band that I mentioned yesterday that gave way
and turned into massacres following Sell S9s and swift tests of
the 65-dma. So, traders should probably be buyers again.
But rather than consider the Peerless B2 and B6 safely
active, I suggest
using the Stochastic Red Buy signals that popped up today. That
has the effect of letting us know that this is a short-term traders'
buying opportunity and reminds us that if the DJI does break below
today's lows, the markets could quickly become very bearish. If the
FED goes ahead with its plans to raise short-term rates by 1/4% on
Wednesday, there may be more trouble for the market.
Note the Red Stochastic Buy Signals Today.
in DIA, SOXL, TECL, NVDA and TQQQ
Traders using Tiger should take advantage of
these buy signals. They are safe to use so long as the
indexes stay in their broad trading ranges.
 |
 |
 |
 |
 |
|
Charts 12/10/2018 PEERLESS DJI, Signals, Indicators Daily DJI Volume 10-DayUp/Down Vol Hourly DJIA A/D Line for All Stocks Inverted Traders Index NASDAQ S&P OEX NYSE COMPQX DJI-15 DJI-20 DJI-30 DIA SPY QQQ MDY IWM TNA Short-Term Rates USO-CrudeOil DBO FAS GLD BBH IBB JETS JNUG KOL NUGT OIH OIL RSX RETL SDS AGQ SLV SOXL TECL TLT TMF TNA UGA (gasoline) XIV YINN Commodities: CANE CORN DBC JJC, NIB, CHOC CORN, CUT (paper) MOO, SOYB WEAT UUP (Dollar) LIT (Lithium) AAPL ADBE ALXN AMAT AMGN AMD AMZN BA BABA BAC BIDU CAT CVX DE FB GOOG GS HD IBM INTU JPM M (Macy's) MSFT NFLX NVDA QCOM TSLA TXN XOM WMT CMG , LRCX, SWKS, MDGL SPPI WATT SQ TOWN 12/10/2018 (Click on Underlined link.) Bullish MAXCPs - http://tigersoft.com/MAXCPZ/Dec-10/BULLISH.htm Bearish MAXCPs - http://tigersoft.com/MINCPZ/Dec-10/BEARISH.htm |
Table 1 QUICKSILVER on ETFS - 12/10/18 ETF CLOSE CHANGE PIVOT-PT 5-dma AROC CL-PWR CANDLE IP21 ITRS --------------------------------------------------------------------------------------------- --------------------------------------------------------------------------------------------- DIA 244.71 .4 258.73 -214.5% Bearish BLUE -.02 ----- --------------------------------------------------------------------------------------------- SPY 264.07 .5 279.3 -213.1% Bearish BLUE .046 -.018 --------------------------------------------------------------------------------------------- QQQ 163.07 1.69 172.33 -188.5% Bearish BLUE .016 -.049 --------------------------------------------------------------------------------------------- MDY 322.62 -1.92 345.26 -299.9% Bearish RED -.029 -.045 --------------------------------------------------------------------------------------------- IWM 143.6 -.42 154.08 -302.5% Bearish RED -.008 -.071 --------------------------------------------------------------------------------------------- FAS 52.01 -1.46 64.35 -919.4% Bearish RED .074 -.196 --------------------------------------------------------------------------------------------- RETL 28.11 .39 35.77 -993% Bearish RED .121 -.343 --------------------------------------------------------------------------------------------- SOXL 89.84 3.65 115.53 -845.1% ------- BLUE .062 -.334 --------------------------------------------------------------------------------------------- TECL 101.55 4.26 122.42 -605.9% Bearish BLUE .1 -.312 --------------------------------------------------------------------------------------------- IBB 103.82 .18 110.35 -246% Bearish BLUE .012 -.074 --------------------------------------------------------------------------------------------- RSX 20.36 -.35 21.08 -21.7% Bearish RED -.11 .017 |
Table 2
          Count of Stocks in Key Directories
          20181210
   (Do not compare the numbers with past numbers.
   We are now using additional volume criteria.
   Instead compare the ratios of opposites, like MAXCP vs MINCP.)
-------------------------------
NEWHIGHS       39
NEWLOWS        295    Bearish
MAXCP          22
MINCP          303    Bearish
TTTNH          56
TTTNL          415    Bearish
FASTUP         58
FASTDOWN       682    Bearish
CPCROSSA       36
CPCROSSD       82     Bearish
BIGVOLUP       2
BIGVODN        15
ACCUMVER       14
HIGHIP21       38
HIUPPCT        6
VHIP21         19
LOWACCUM       275
REDSELL        292
AUGSELS7       15
TRAPDOOR       37
|
 Table  3
      RANKING OF KEY DIRECTORIES BASED PCT.OF STOCKS ABOVE 65-DMA
              12/10/18
      Bullish = 2
      Bearish = 45
---------------------------------------------------------------------------------------
Directory     Current       day-1         day-2         day-3         day-4         day-5
----------------------------------------------------------------------------------------
UTILITY        .85           .85           .85           .85           .85           .875
BONDFUND       .828          .79           .761          .733          .59           .447
==============================================================================================
FOOD           .491          .561          .456          .508          .526          .368
REIT           .476          .576          .622          .43           .622          .549
COMODITY       .452          .547          .452          .476          .476          .309
GOLD           .42           .52           .42           .42           .4            .34
JETS           .4            .5            .8            .9            1             1
BEVERAGE       .388          .388          .388          .388          .5            .388
HACKERS        .363          .272          .363          .318          .545          .454
DOWJONES       .333          .3            .433          .4            .733          .633
EDU            .333          .333          .5            .5            .833          .666
SOLAR          .333          .444          .555          .5            .722          .611
INSURANC       .3            .3            .366          .4            .5            .5
HOSPITAL       .291          .333          .375          .458          .541          .5
SP500          .265          .257          .355          .357          .546          .487
NASD-100       .24           .18           .37           .34           .6            .53
HOMEBLDG       .235          .352          .352          .294          .411          .352
NIFTY          .228          .157          .245          .263          .508          .35
COMPUTER       .227          .181          .272          .272          .363          .363
INDEXES        .219          .24           .262          .299          .31           .267
RUS-1000       .219          .232          .325          .325          .496          .441
FIDSTKS        .215          .193          .301          .29           .521          .462
SP-100         .215          .193          .301          .279          .526          .462
CHINA          .2            .2            .333          .45           .55           .35
PIPELINE       .192          .192          .269          .23           .384          .192
SOFTWARE       .184          .184          .261          .261          .338          .292
BIOTECH        .181          .186          .226          .228          .323          .284
SEMI           .179          .153          .247          .273          .461          .367
BIG17          .173          .152          .173          .217          .304          .195
GREEN          .173          .26           .26           .347          .521          .434
GAMING         .166          .166          .291          .25           .375          .333
DJI-13         .153          .23           .23           .23           .615          .461
COAL           .142          .142          .142          .142          .142          .142
INDMATER       .141          .153          .179          .23           .307          .205
ELECTRON       .129          .141          .222          .259          .395          .32
AUTO           .128          .153          .256          .307          .461          .435
MILITARY       .125          .125          .125          .156          .281          .187
GUNS           .117          0             0             0             .411          .176
RETAIL         .113          .113          .264          .245          .377          .339
CHEM           .111          .129          .185          .24           .351          .296
FINANCE        .111          .111          .144          .133          .3            .277
ETFS           .086          .12           .293          .362          .534          .327
REGBANKS       .071          .142          .107          .178          .392          .464
TRANSP         .05           .05           .25           .3            .5            .5
OILGAS         .04           .053          .06           .073          .107          .093
BIGBANKS       0             0             0             0             .285          .285
INFRA          0             0             .083          .083          .25           .222
|
====================================================================
12/7/2018 Consider
the Sell S9* to still be operating. It is not safe to
buy at the lower band when the DJI falls so fast from the
upper band to the lower band, when there are so few equities
above the 65-dma, when the key ETFs' Closing Powers are all falling,
when the Hourly DJIA is downtrending, when the optimized
red Short signals are still on Sell and when the DJI's flat support
at 24000-24200 seems to beckon for a breakdown. The
market is nervous for many reasons. Not mentioned much
here is the rebellion in France against the status quo which
is seen as being maintained by a Government that listens
only to the rich and powerful, not working people. The "Yellow
Jackets" have wide support; this rebellion will not be over soon
and it may spread elsewhere.
( https://www.youtube.com/watch?v=ZC0rczrqn5s
)
The DJI's "knifing down" from tagging the 3.3% upper band
four trading days ago and reaching the 3% lower band on Friday
should scare us, especially if we take the previous Sell signal
be an S9. This is not much different than what we see in the
sell-offs in October 1973 (after Nixon's "Saturday Night Massacre",
October 1978, October 1979 and October 1987. Can we trust
that December's usual bullish seasonality will save us now?
The increasing likelihood of a December rate hike and also
a gathering movement among Democrats to impeach Trump is
clearly frightening traders. That is why I believe prices have fallen so
fast this past week.
I do not want to add the 'S13' into the software,
but I do want to nullify Buys at the lower band now
in the software until we see signs that there will be
more than a brief bounce.

At the very least, in my opinion, we should consider a new Sell S13
to be rendered by the rapid decline of the DJI from the upper band
to the upper band. This should nullify the Buy B2 and Buy B5 that
also appeared on Friday. Two contradictory signals have that
effect in Peerless.
This S13 history should get us to do more selling. There may not be
much of a recovery for a while. And we should do more
shorting if the DJI closes decisively below 24000. That is the well-tested
and round-number horizontal support. A close below 24000 will
probably bring a Sell S10.
Nor should we put too much faith in the currently still positive IP21.
That represents "big-money" accumulation. In this situation,
big money buying is very often premature and not something traders
can count on to turn the market up much. While it's true positive IP21
and a rising IPA line at the lower band may forestall a deep bear market
and a DJI decline of more than 20% from its highs, traders can not accord
a Buy signal to a positive non-confirmation by our IP21 at the DJI's lower
band. There are too many cases to detail them. Suffice it to just list
the many cases where buying at the lower band because the IP21 (AI)
was positive would not have worked out well for a trader. This
is why there is no Buy signal for this combination (a lower band
tagging with the IP21 positive or even>+.05).
12/8/1931 DJI fell from 176.1 to 157.5 on 12/16/1931
9/22/1933 DJI fell from 99.1 to 88.4 on 10/19/1933
10/28/1937 DJI fell from 135.2 to 113.6 on 11/24/1937
11/16/1937 DJI fell from 127.9 to 113.6 on 11/29/1937
12/15/1941 DJI fell from 111.2 to 106.7 on 12/24/1941
2/9/1946 DJI fell from 196.1 to 186.00 on 2/26/1946
10/7/? DJI fell from 458.2 to 438.6 on 10/11/?
11/19/1991 DJI fell from 2939.57 to 2863.82 12/10/1991
9/22/2008 DJI fell from 11015.69 to 8451.19 10/10/2008
12/7/2018 ?
We are in dangerous times according to the market. That is
why it is falling for fast. We see this first when we realize that
most of the past cases of this "knifing down" from tagging the
upper band to the lower band occurred in the 1930s. This,|
too, was a dangerous time. Comparble knifing-down S13s
have only occured nine times since 1928
11/18/1932 DJI 101.7 to 73.8 12/17/1932
3/14/1932 81.1 to 44.7 5/3/1932
9/13/1932 69.9 to 58.5 10/10/1032
11/23/1932 59.5 to only 55.9 on 12/2/1932
7/20/1933 96.3 to only 88.7 on 7/21/1933
9/21/1933 97.6 to 84.4 on 10/19/1933
4/17/2000 10582.51 to 11124.82 on 4/25 and then down
NA 10/13/1989 2569.26 to 2761.09 on 12/3/1989
(Not applicable: Most of the drop to the decline
occurred in one big day.
This is not so with the other cases.)
NA 10/1/1998 7632.53. Then up.
(Not applicable: DJI has already fallen 20% in ten weeks.
This is not true here.)
Sell S9s and "Near" S13s are extremely
dangerous.
If we look back at Sell S9s that quickly (in four or five
trading days) bring DJI declines to the lower 3%-3.5%
band, we see that bigger declines regularly followed.
The first one to study is the October 1973 occurrence.
This was only two weeks after Nixon's "Saturday Night
Massacre" when he fired two Attorney Generals before
he could find one who would fire the Special Prosecutor
looking into the White House connction to the
Watergate Burglary. The DJI sliced right through the
lower band and fell 20% from its October peak. 
.
Three more "quick S13" knife-downs to the lower band
occurred when interest rates were raised faster than
traders expected or liked: 1978, 1979 and 1987.


|
Charts 12/7/2018 PEERLESS DJI, Signals, Indicators Daily DJI Volume 10-DayUp/Down Vol Hourly DJIA A/D Line for All Stocks Inverted Traders Index NASDAQ S&P OEX NYSE COMPQX DJI-15 DJI-20 DJI-30 DIA SPY QQQ MDY IWM TNA Short-Term Rates USO-CrudeOil DBO FAS GLD BBH IBB JETS JNUG KOL NUGT OIH OIL RSX RETL SDS AGQ SLV SOXL TECL TLT TMF TNA UGA (gasoline) XIV YINN Commodities: CANE CORN DBC JJC, NIB, CHOC CORN, CUT (paper) MOO, SOYB WEAT UUP (Dollar) LIT (Lithium) AAPL ADBE ALXN AMAT AMGN AMD AMZN BA BABA BAC BIDU CAT CVX DE FB GOOG GS HD IBM INTU JPM M (Macy's) MSFT NFLX NVDA QCOM TSLA TXN XOM WMT CMG , LRCX, SWKS, MDGL SPPI WATT SQ TOWN 12/7/2018 (Click on Underlined link.) Bullish MAXCPs - http://tigersoft.com/MAXCPZ/Dec-07/BULLISH.htm Bearish MAXCPs - http://tigersoft.com/MINCPZ/Dec-07/BEARISH.htm |
Table 1 QUICKSILVER on ETFS - 12/07/18 ETF CLOSE CHANGE PIVOT-PT 5-dma AROC CL-PWR CANDLE IP21 ITRS --------------------------------------------------------------------------------------------- --------------------------------------------------------------------------------------------- DIA 244.31 -5.41 255.51 -182.9% Bearish RED -.023 ---- --------------------------------------------------------------------------------------------- SPY 263.57 -6.27 275.65 -190.1% Bearish RED .046 -.017 --------------------------------------------------------------------------------------------- QQQ 161.38 -5.51 169.37 -200.9% Bearish RED .02 -.05 --------------------------------------------------------------------------------------------- MDY 324.54 -6.95 342.74 -233.9% Bearish RED -.007 -.039 --------------------------------------------------------------------------------------------- IWM 144.02 -3.18 152.62 -259.2% Bearish RED .016 -.069 --------------------------------------------------------------------------------------------- FAS 53.47 -3.18 62.84 -656.4% Bearish RED .087 -.179 --------------------------------------------------------------------------------------------- SOXL 86.19 -10.87 106.89 -791% Bearish RED .059 -.351 --------------------------------------------------------------------------------------------- TECL 97.29 -11.58 114.92 -634.6% Bearish RED .088 -.327 --------------------------------------------------------------------------------------------- IBB 103.64 -3.24 109.1 -178.1% Bearish RED .032 -.067 --------------------------------------------------------------------------------------------- GLD 118.09 .95 115.54 101% Bearish BLUE -.067 .118 --------------------------------------------------------------------------------------------- RSX 20.71 -.02 20.45 -36.2% Bearish RED -.077 .053 |
Table 3    Count of Stocks in Key Directories
           2018-12/07
-------------------------------
NEWHIGHS       41
NEWLOWS        454  Bearish
MAXCP          32
MINCP          528  Bearish
TTTNH          50
TTTNL          567  Bearish
FASTUP         61
FASTDOWN       481  Bearish
CPCROSSA       45
CPCROSSD       358  Bearish
BIGVOLUP       2
BIGVODN        12
LOWACCUM       518  Bearish
REDSELL        281
AUGSELS7       10
TRAPDOOR       39
|
 Table 3|
 RANKING OF KEY DIRECTORIES BASED PCT.OF STOCKS ABOVE 65-DMA
Bullish = 6
Bearish = 40
12/7/18
---------------------------------------------------------------------------------------
Directory Current day-1 day-2 day-3 day-4 day-5
----------------------------------------------------------------------------------------
UTILITY .85 .85 .85 .85 .875 .775
BONDFUND .79 .761 .733 .59 .409 .361
Bonds are favored for safety and because higher rates are expected.
REIT .576 .622 .43 .622 .549 .49
FOOD .561 .456 .508 .526 .403 .315
COMODITY .547 .452 .476 .476 .357 .309
GOLD .52 .42 .42 .4 .34 .34
N=6
=============================================================================================
JETS .5 .8 .9 1 1 .9
=============================================================================================
SOLAR .444 .555 .5 .722 .611 .666
BEVERAGE .388 .388 .388 .5 .388 .444
HOMEBLDG .352 .352 .294 .411 .352 .411
EDU .333 .5 .5 .833 .666 .666
HOSPITAL .333 .375 .458 .541 .458 .458
DOWJONES .3 .433 .4 .733 .6 .6
INSURANC .3 .366 .4 .5 .5 .466
HACKERS .272 .363 .318 .545 .454 .363
GREEN .26 .26 .347 .521 .434 .478
SP500 .257 .355 .357 .546 .485 .439
INDEXES .24 .262 .299 .31 .256 .267
RUS-1000 .232 .325 .325 .496 .44 .4
DJI-13 .23 .23 .23 .615 .461 .461
CHINA .2 .333 .45 .55 .35 .3
FIDSTKS .193 .301 .29 .521 .456 .387
SP-100 .193 .301 .279 .526 .451 .397
PIPELINE .192 .269 .23 .384 .192 .23
BIOTECH .184 .226 .228 .323 .281 .26
SOFTWARE .184 .261 .261 .338 .292 .246
COMPUTER .181 .272 .272 .363 .363 .318
NASD-100 .18 .37 .34 .6 .53 .47
GAMING .166 .291 .25 .375 .333 .375
NIFTY .157 .245 .263 .508 .35 .315
AUTO .153 .256 .307 .461 .435 .435
INDMATER .153 .179 .23 .307 .205 .217
SEMI .153 .247 .273 .461 .358 .324
BIG17 .152 .173 .217 .304 .195 .195
COAL .142 .142 .142 .142 .142 .142
REGBANKS .142 .107 .178 .392 .464 .392
ELECTRON .141 .222 .259 .395 .314 .296
CHEM .129 .185 .24 .351 .296 .296
MILITARY .125 .125 .156 .281 .187 .156
ETFS .12 .293 .362 .534 .31 .344
RETAIL .115 .269 .25 .384 .346 .346
FINANCE .111 .144 .133 .3 .266 .222
OILGAS .053 .06 .073 .107 .093 .093
TRANSP .05 .25 .3 .5 .5 .4
BIGBANKS 0 0 0 .285 .142 .142
GUNS 0 0 0 .411 .176 .117
INFRA 0 .083 .083 .25 .222 .194
|
====================================================================
12/6/2018
The
DJI's test of 24300 seems to have held. A little more
probing of the support seems likely, but the market should
rally back above 25000 again. The Accumulation Index for
the DJI now is well above +.10. In December that means
the lower band should hold even with the P-Indicator too
negative to bring another Buy B9. After December 16th,
Peerless will very probably give a Buy B13 (Santa Claus
rally signal). I think it is a bullish sign that the NASDAQ
and QQQ outperformed the DJI today. It shows all the
fears of a December rate hike and a renewed trade war
with China will not prevent speculators from buying on
the current decline in the bullish month of December.

How much higher the DJI will soon go again will depend
on which side the FOMC comes down on:
Hawkish (Williams - NY Fed Governor -
Bonds are #1 ---> December rate hike)
(1968-1969)
or
Dovish (Powell - Fed Chairman -
Stocks matter ---> a rate hike pause)
(1976-1977)
This, in turn, will be affected by the Jobs numbers
that come out before the opening today and what the Department
of Labor says about workers' pay. The truth is this is often what
the FED most often looks at most closely. Rising real wages
are dangerously "inflationary" in the parlance of most FOMC
participants.
Since we did not get a new Buy signal today because the DJI
closed too far up off the lows, I would still plan to reduce some
of our long positions on the next rally. The odds of
the DJI
breaking below the 24000 round number support seem low.
The current IP21 value is too high. If we do get a new Buy signal,
we will add to our existing long positions. Hold the bearish MINCP
short sale positions. Tax loss selling should not relent for them
until the new year.
"Dove" FOMC member Brainard will be speaking this morning at
9:30 AM
EST. ( https://www.federalreserve.gov/newsevents/calendar.htm
)
We will consult this schedule of speeches and the chart below
to occasionally get an insight into what will move the market. Williams'
predictably Hawkish speech shows the value of this.
 https://www.itcmarkets.com/hawk-dove-cheat-sheet/ |
DJI is oversold but has not yet given a small "b" Buy signal.


QQQ us now outperforming the DJIA. This is short-term bullish.
It shows speculators are not being scared away by market's gyrations.

We still retain a 50% position in SOXL. Plan to
sell it between 107 and 110.

|
Charts 12/6/2018 PEERLESS DJI, Signals, Indicators Daily DJI Volume 10-DayUp/Down Vol Hourly DJIA A/D Line for All Stocks Inverted Traders Index NASDAQ S&P OEX NYSE COMPQX DJI-15 DJI-20 DJI-30 DIA SPY QQQ MDY IWM TNA Short-Term Rates USO-CrudeOil DBO FAS GLD BBH IBB JETS JNUG KOL NUGT OIH OIL RSX RETL SDS AGQ SLV SOXL TECL TLT TMF TNA UGA (gasoline) XIV YINN Commodities: CANE CORN DBC JJC, NIB, CHOC CORN, CUT (paper) MOO, SOYB WEAT UUP (Dollar) LIT (Lithium) AAPL ADBE ALXN AMAT AMGN AMD AMZN BA BABA BAC BIDU CAT CVX DE FB GOOG GS HD IBM INTU JPM M (Macy's) MSFT NFLX NVDA QCOM TSLA TXN XOM WMT CMG , LRCX, SWKS, MDGL SPPI WATT SQ TOWN 12/6/2018 (Click on Underlined link.) Bullish MAXCPs - http://tigersoft.com/MAXCPZ/Dec-06/BULLISH.htm Bearish MAXCPs - http://tigersoft.com/MINCPZ/Dec-06/BEARISH.htm |
Table 1 QUICKSILVER on ETFS -
12/06/18ETF CLOSE CHANGE PIVOT-PT 5-dma AROC CL-PWR CANDLE IP21 ITRS --------------------------------------------------------------------------------------------- DIA 249.72 -1.01 253.59 -80.9% ------- BLUE .037 ------ --------------------------------------------------------------------------------------------- SPY 269.84 -.41 273.98 -86.3% Bullish BLUE .127 -.015 --------------------------------------------------------------------------------------------- QQQ 166.89 1.17 168.15 -53.6% Bullish BLUE .085 -.037 --------------------------------------------------------------------------------------------- MDY 331.49 -1.56 340.38 -134.8% ------- BLUE .086 -.046 --------------------------------------------------------------------------------------------- IWM 147.2 -.32 151.83 -166.2% ------- BLUE .074 -.078 --------------------------------------------------------------------------------------------- FAS 56.65 -.52 61.41 -496.7% ------- BLUE .169 -.178 --------------------------------------------------------------------------------------------- RETL 31.3 -.53 34.48 -560.4% Bearish BLUE .200 -.284 --------------------------------------------------------------------------------------------- SOXL 97.06 -1.62 102.67 -383.3% ------- BLUE .138 -.314 --------------------------------------------------------------------------------------------- TECL 108.87 .67 111.66 -260% ------- BLUE .167 -.282 --------------------------------------------------------------------------------------------- IBB 106.88 .17 107.49 -30.5% Bullish BLUE .068 -.054 --------------------------------------------------------------------------------------------- GLD 117.14 .02 115.74 75.8% Bearish RED -.112 .087 --------------------------------------------------------------------------------------------- RSX 20.73 .15 20.86 -12% Bearish BLUE -.034 .021
|
 Table 2
   Count of Stocks in Key Directories
          2018-12/06
-------------------------------
NEWHIGHS       66
NEWLOWS        298  Bearish
MAXCP          60
MINCP          209  Bearish
TTTNH          59
TTTNL          382  Bearish
FASTUP         66
FASTDOWN       318  Bearish
CPCROSSA       341  Bullish
CPCROSSD       50
BIGVOLUP       2
BIGVODN        26   Bearish
ACCUMVER       10
HIGHIP21       54
HIUPPCT        8
VHIP21         20
LOWACCUM       535  Big Money Distribution
REDSELL        269
AUGSELS7       15
TRAPDOOR       35
|
 Table 3
 RANKING OF KEY DIRECTORIES BASED PCT.OF STOCKS ABOVE 65-DMA
 Bullish = 41
 Bearish = 5
               12/6/18
---------------------------------------------------------------------------------------
Directory     Current       day-1         day-2         day-3         day-4         day-5
----------------------------------------------------------------------------------------
UTILITY        .85           .85           .85           .875          .775          .825
JETS           .8            .9            1             1             .9            .9
BONDFUND       .761          .733          .59           .409          .352          .18
REIT           .622          .43           .622          .549          .483          .476
SOLAR          .555          .5            .722          .611          .611          .722
N=5
=============================================================================================
EDU            .5            .5            .833          .666          .666          .666
=============================================================================================
FOOD           .456          .508          .526          .403          .35           .35
COMODITY       .452          .476          .476          .357          .333          .309
DOWJONES       .433          .4            .733          .6            .6            .6
GOLD           .42           .42           .4            .34           .34           .38
BEVERAGE       .388          .388          .5            .388          .444          .444
HOSPITAL       .375          .458          .541          .458          .458          .333
NASD-100       .37           .34           .6            .53           .45           .52
INSURANC       .366          .4            .5            .5            .466          .4
HACKERS        .363          .318          .545          .454          .363          .363
SP500          .355          .357          .546          .485          .431          .457
HOMEBLDG       .352          .294          .411          .352          .411          .47
CHINA          .333          .45           .55           .35           .283          .333
RUS-1000       .325          .325          .496          .44           .397          .412
FIDSTKS        .301          .29           .521          .456          .381          .403
SP-100         .301          .279          .526          .451          .397          .419
ETFS           .293          .362          .534          .31           .344          .362
GAMING         .291          .25           .375          .333          .375          .375
COMPUTER       .272          .272          .363          .363          .318          .363
PIPELINE       .269          .23           .384          .192          .23           .192
RETAIL         .264          .245          .377          .339          .339          .301
INDEXES        .262          .299          .31           .256          .272          .251
SOFTWARE       .261          .261          .338          .292          .246          .23
GREEN          .26           .347          .521          .434          .478          .391
AUTO           .256          .307          .461          .435          .435          .435
TRANSP         .25           .3            .5            .5            .4            .45
SEMI           .247          .273          .461          .358          .307          .367
NIFTY          .245          .263          .508          .35           .298          .35
DJI-13         .23           .23           .615          .461          .461          .461
BIOTECH        .223          .228          .323          .281          .257          .26
ELECTRON       .222          .259          .395          .314          .283          .327
CHEM           .185          .24           .351          .296          .296          .277
INDMATER       .179          .23           .307          .205          .217          .23
BIG17          .173          .217          .304          .195          .195          .217
FINANCE        .144          .133          .3            .266          .211          .222
COAL           .142          .142          .142          .142          .142          .142
MILITARY       .125          .156          .281          .187          .156          .218
REGBANKS       .107          .178          .392          .464          .392          .428
INFRA          .083          .083          .25           .222          .194          .194
OILGAS         .06           .073          .107          .093          .093          .1
BIGBANKS       0             0             .285          .142          .142          .285
GUNS           0             0             .411          .176          .117          .117
N=41
|
====================================================================
12/4/2018
Blame the FED. They are divided and fighting among themselves.
The market does not like the prospects now of a December hike
in interest rates. That I suggest is the real fundamental reason why
the market suddenly turned so weak on Tuesday. It was not
Trump's talk of tariffs, which is just his normal style of negotating
with a heavy hand.
Our technicals did reach over-bought on the 3rd and there was
a tell-tale deterioration in the P-Indicator of breadth. I noted that
we came within just 38 points then of a Sell S9. Upon doing more
research since, I take the operative Peerless signal now to be a Sell S9.
(This is discussed below. The change does not affect our past signals.)
Wednesday's 800 point decline is quite worrisome. There was
a Professionals' panic and an absence of bids. Such a reversal alone
probably calls for a re-test of DJIA 24300-24600, following the
principle that the market, like a ping-pong ball, moves quickly back
and forth between support and resistance when it is locked in a
well-defined trading range.

What To Do? The
S9 means we want more short positions
than long positions. I would use the next DJI rally to make
such adjustments unless Peerless first gives us a new Buy signal.
The DJI will most likely again find support at 24300-24400. But
it is not clear if Peerless will bring a new Buy there.
Watch Breadth and SPY's Closing Power Now
What happens next depends most on what the Federal
Reserve chooses to do. There are two
scenarios. The
FOMC members appear divided among themselves. If breadth
stays very negative I would bet that rates are going up soon
and the market will have trouble holding up even in the normally
bullish month of December. This the bearish 1968-1969
scenario.
. But if there is a "pause", then we
will see a Buy B9 soon, breadth
will start to improve a lot and the DJI will shoot up past the 65-dma
resistance. The 1975-1976 scenario would then apply.
| Usually short-term rates (Federal Funds Rates) must be above
3.3% before a bear market can follow. That was true in the period 1954-1957. But a rapid rise in rates lower than 3.3% can also cause a terrible bear market. (This is most clear in 1931). If you study the data linked to here, I think you will see how frequently abrupt increases in rates being DJI sell-offs. This is certainly one of the themes in the Peerless book I am writing. |
RECENT monthly Fed Funds rates: ( https://fred.stlouisfed.org/data/FEDFUNDS.txt ) 2017-10-01 1.15 2017-11-01 1.16 2017-12-01 1.30 2018-01-01 1.41 2018-02-01 1.42 2018-03-01 1.51 2018-04-01 1.69 2018-05-01 1.70 2018-06-01 1.82 2018-07-01 1.91 2018-08-01 1.91 Pause set off Aug. rally. 2018-09-01 1.95 2018-10-01 2.19 2018-11-01 2.20 |
Watch (1) NYSE daily breadth and (2) the Closing Power of SPY.
(1) Wednesday's breadth was miserable. There were 2543 decliners on NYSE.
 (2) Watch the Closing Power of SPY. Inside information from the FED
will leak out. As long as the Closing Power is falling on heavy volume,
the word must be that the FOMC will raise rates in December.
(2) Watch the Closing Power of SPY. Inside information from the FED
will leak out. As long as the Closing Power is falling on heavy volume,
the word must be that the FOMC will raise rates in December.
 The Ugly Details
Wednesday's decline was very broad. Down volume was 14x
Up-Volume on the NYSE. The 65-dma has turned back the DJI
and SP-500. The NASDAQ could not even reach it. Trump's
statement that he a "tariff-man" is blamed for the decline, but
I would suggest the decline deepened right after NY Fed Governor
Williams, one of the "hawks" in the FOMB on Tuesday rejected
the idea of a pause in interest rate hikes. Seven times in his
speech, he desribed the US Economy as strong. "The U.S. economy
will stay strong in 2019 and inflation will tick up above 2%...Given this
outlook of strong growth, strong labor market and inflation near our
goal and taking account all the various risks around the outlook, I do
expect further gradual increases in interest rates will best sponsor a
sustained economic expansion.”
https://www.marketwatch.com/story/feds-williams-strong-outlook-for-2019-calls-for-continued-interest-rate-hikes-2018-12-04
Williams' statement is significantly different statement than Fed Chairman
Powell's last week which suggested a December pause because
the near-term goals of the Fed had almost been achieved.
A known Fed "hawk" (meaning he listens to bond traders closely),
Fed Gov. Williams left out of his talk mention of the great dangers of
a bear market occurring if rates are lifted too sharply when
Unemployment drops below 4%. That is what happened in 1969,
2000 and 2007. See the Market Watch chart on the link above.
TWO SCENARIOS:
Bearish 1968-1969 and Bullish 1975-1976
BEARISH SCENARIO:
The DJI's swift sell-off in early December 1968 broke the DJI's
65-dma and the NYSE A/D Line uptrend. There was one more
rally in the Spring of 1969, but the weak ADL showed traders
it would fail badly. There followed a very big decline. The DJI
fell 34% from its December high in May 1970. See here how
the rapidly (each month) rising Federal Funds rate killed the bull
market of 1966-1968.
Fed Funds Rate:
The Ugly Details
Wednesday's decline was very broad. Down volume was 14x
Up-Volume on the NYSE. The 65-dma has turned back the DJI
and SP-500. The NASDAQ could not even reach it. Trump's
statement that he a "tariff-man" is blamed for the decline, but
I would suggest the decline deepened right after NY Fed Governor
Williams, one of the "hawks" in the FOMB on Tuesday rejected
the idea of a pause in interest rate hikes. Seven times in his
speech, he desribed the US Economy as strong. "The U.S. economy
will stay strong in 2019 and inflation will tick up above 2%...Given this
outlook of strong growth, strong labor market and inflation near our
goal and taking account all the various risks around the outlook, I do
expect further gradual increases in interest rates will best sponsor a
sustained economic expansion.”
https://www.marketwatch.com/story/feds-williams-strong-outlook-for-2019-calls-for-continued-interest-rate-hikes-2018-12-04
Williams' statement is significantly different statement than Fed Chairman
Powell's last week which suggested a December pause because
the near-term goals of the Fed had almost been achieved.
A known Fed "hawk" (meaning he listens to bond traders closely),
Fed Gov. Williams left out of his talk mention of the great dangers of
a bear market occurring if rates are lifted too sharply when
Unemployment drops below 4%. That is what happened in 1969,
2000 and 2007. See the Market Watch chart on the link above.
TWO SCENARIOS:
Bearish 1968-1969 and Bullish 1975-1976
BEARISH SCENARIO:
The DJI's swift sell-off in early December 1968 broke the DJI's
65-dma and the NYSE A/D Line uptrend. There was one more
rally in the Spring of 1969, but the weak ADL showed traders
it would fail badly. There followed a very big decline. The DJI
fell 34% from its December high in May 1970. See here how
the rapidly (each month) rising Federal Funds rate killed the bull
market of 1966-1968.
Fed Funds Rate:
                         1968-11-01   5.82
                         1968-12-01   6.02  Up
                         1969-01-01   6.30  Up
                         1969-02-01   6.61  Up
                         1969-03-01   6.79  Up
                         1969-04-01   7.41  Up
                         1969-05-01   8.67  Up
                         1969-06-01   8.90  up


                                             BULLISH SCENARIO:

                              It remains to be seen if the FED lifts rates this fast.
                             There is a bullish alternative scenario.  This would call
                              for the DJI to fall to the lower 3.5% band with the
                              P-Indicator still positive.  This would generate a Buy B9.
                              If the DJI then quickly rallies up above the 65-dma,
                              there could be a January take-off.  This is what happened
                              in 1975-1976. In this case, short-term rates quickly fell
                              from December to February the next year.

                     Fed Funds Rate:
BULLISH SCENARIO:
It remains to be seen if the FED lifts rates this fast.
There is a bullish alternative scenario. This would call
for the DJI to fall to the lower 3.5% band with the
P-Indicator still positive. This would generate a Buy B9.
If the DJI then quickly rallies up above the 65-dma,
there could be a January take-off. This is what happened
in 1975-1976. In this case, short-term rates quickly fell
from December to February the next year.
Fed Funds Rate:
                     1975-11-01   5.22
                     1975-12-01   5.20 Down
                     1976-01-01   4.87 Down - Big Drop
                     1976-02-01   4.77 Down

New Peerless S9*
We will have to change the Peerless software so that it will give the
particular Sell S9* that failed to deploy Tuesday only because the DJI
closed 38 points too low. The difference was 0.147%. My solution
is to lower the parameter for la/ma (DJI close/21-dma) to 1.022
from 1.024 when the DJI's hypothetical high/21-dma is 1.03
in December and the P-I is quite low in relation to the DJI's reaching
the upper band and the V-I is negative. I will post the
changed
Peerless on the ESP Page this weekend.
|
Charts 12/4/2018 PEERLESS DJI, Signals, Indicators Daily DJI Volume 10-DayUp/Down Vol Hourly DJIA A/D Line for All Stocks Inverted Traders Index NASDAQ S&P OEX NYSE COMPQX DJI-15 DJI-20 DJI-30 DIA SPY QQQ MDY IWM TNA Short-Term Rates USO-CrudeOil DBO FAS GLD BBH IBB JETS JNUG KOL NUGT OIH OIL RSX RETL SDS AGQ SLV SOXL TECL TLT TMF TNA UGA (gasoline) XIV YINN Commodities: CANE CORN DBC JJC, NIB, CHOC CORN, CUT (paper) MOO, SOYB WEAT UUP (Dollar) LIT (Lithium) AAPL ADBE ALXN AMAT AMGN AMD AMZN BA BABA BAC BIDU CAT CVX DE FB GOOG GS HD IBM INTU JPM M (Macy's) MSFT NFLX NVDA QCOM TSLA TXN XOM WMT CMG , LRCX, SWKS, MDGL SPPI WATT SQ TOWN 12/4/2018 (Click on Underlined link.) Bullish MAXCPs - http://tigersoft.com/MAXCPZ/Dec-04/BULLISH.htm Bearish MAXCPs - http://tigersoft.com/MINCPZ/Dec-04/BEARISH.htm |
Table 1 QUICKSILVER on ETFS - 12/4/18 ETF CLOSE CHANGE PIVOT-PT 5-dma AROC CL-PWR CANDLE IP21 ITRS --------------------------------------------------------------------------------------------- DIA 250.73 -8 253.84 63.6% Bearish RED -.022 ---- --------------------------------------------------------------------------------------------- SPY 270.25 -9.05 274.58 33.7% Bearish RED .059 -.016 --------------------------------------------------------------------------------------------- QQQ 165.72 -6.61 168.7 67.7% Bearish RED .041 -.043 --------------------------------------------------------------------------------------------- MDY 333.05 -12.21 340.67 -14.4% ------- RED .044 -.044 --------------------------------------------------------------------------------------------- IWM 147.52 -6.56 152.24 -34.6% Bearish RED .006 -.076 --------------------------------------------------------------------------------------------- FAS 57.17 -7.18 62.78 -178.6% Bearish RED .093 -.177 --------------------------------------------------------------------------------------------- RETL 31.83 -3.94 35.15 -225% Bearish RED .201 -.278 --------------------------------------------------------------------------------------------- SOXL 98.68 -16.85 105.17 12.8% ------- RED .077 -.339 --------------------------------------------------------------------------------------------- TECL 108.2 -14.22 114.82 180.5% Bearish RED .103 -.289 --------------------------------------------------------------------------------------------- IBB 106.71 -3.64 107.54 93.2% Bearish RED .012 -.055 --------------------------------------------------------------------------------------------- GLD 117.12 .71 115.38 93.9% Bearish RED -.105 .088 --------------------------------------------------------------------------------------------- RSX 20.58 -.5 20.78 70.1% Bearish RED -.047 .02 |
  Table 2   Count of Stocks in Key Directories
            2018-12/04
-------------------------------
NEWHIGHS       36
NEWLOWS        249  Bearish
MAXCP          29
MINCP         448   Professionals: Bearish
TTTNH          40
TTTNL          441  Day Traders: Bearish
FASTUP         99
FASTDOWN       144  Swing traders: Bearish
CPCROSSA       25
CPCROSSD       781  Big Shift to bearishness by Professionals
BIGVOLUP       1
BIGVODN        12
ACCUMVER       9
HIGHIP21       48
HIUPPCT        8
VHIP21         20
LOWACCUM       543  Big Money Heavy Selling continues
REDSELL        274
AUGSELS7       19
TRAPDOOR       41
|
Table 3 RANKING OF KEY DIRECTORIES BASED PCT.OF STOCKS ABOVE 65-DMA
12/4/18
Bullish = 3
Bearish = 41
---------------------------------------------------------------------------------------
Directory Current day-1 day-2 day-3 day-4 day-5
----------------------------------------------------------------------------------------
JETS .9 1 1 .9 .9 .9
UTILITY .85 .85 .875 .775 .825 .85
BONDFUND .733 .59 .409 .352 .171 .123
============================================================================================
EDU .5 .833 .666 .666 .666 .5
FOOD .5 .517 .392 .339 .339 .303
SOLAR .5 .722 .611 .611 .722 .555
============================================================================================
COMODITY .476 .476 .357 .333 .309 .285
HOSPITAL .458 .541 .458 .458 .333 .333
CHINA .45 .55 .35 .283 .333 .25
REIT .43 .622 .549 .483 .476 .41
GOLD .42 .4 .34 .34 .38 .3
DOWJONES .4 .733 .6 .6 .6 .4
INSURANC .4 .5 .5 .466 .4 .266
BEVERAGE .388 .5 .388 .444 .444 .388
ETFS .362 .534 .31 .344 .327 .12
SP500 .357 .546 .485 .431 .449 .343
GREEN .347 .521 .434 .478 .391 .304
NASD-100 .34 .6 .53 .45 .51 .33
RUS-1000 .325 .496 .44 .397 .409 .309
HACKERS .318 .545 .454 .363 .363 .272
AUTO .307 .461 .435 .435 .435 .41
TRANSP .3 .5 .5 .4 .4 .35
INDEXES .299 .31 .256 .272 .251 .229
HOMEBLDG .294 .411 .352 .411 .47 .294
FIDSTKS .29 .521 .456 .381 .397 .279
SP-100 .279 .526 .451 .397 .408 .279
SEMI .273 .461 .358 .307 .35 .239
COMPUTER .272 .363 .363 .318 .363 .227
NIFTY .263 .508 .35 .298 .333 .21
SOFTWARE .261 .338 .292 .246 .23 .153
ELECTRON .259 .395 .314 .283 .308 .191
GAMING .25 .375 .333 .375 .375 .208
RETAIL .245 .377 .339 .339 .301 .245
CHEM .24 .351 .296 .296 .277 .185
DJI-13 .23 .615 .461 .461 .461 .307
INDMATER .23 .307 .205 .217 .23 .166
PIPELINE .23 .384 .192 .23 .192 .192
BIOTECH .226 .323 .281 .257 .26 .184
BIG17 .217 .304 .195 .195 .217 .152
REGBANKS .178 .392 .464 .392 .428 .285
MILITARY .156 .281 .187 .156 .218 .156
COAL .142 .142 .142 .142 .142 .142
FINANCE .133 .3 .266 .211 .222 .144
INFRA .083 .25 .222 .194 .194 .138
OILGAS .073 .107 .093 .093 .1 .08
BIGBANKS 0 .285 .142 .142 .285 0
GUNS 0 .411 .176 .117 .117 0
|
====================================================================
12/3/2018
The DJI came
within 38 points of giving a reversing Sell S9
today. A close that much higher would have produced a Sell S9
even though the P-Indicator is somewhat positive. Note also
that the rally has taken the key indexes up to points now 50%
or more up from their recent bottoms back to their September highs.
In addition, the Stochastic-14 K-Line for our SOXL has turned
down from above 80. The success this past year for this red-automatic
system has been extraordinary, +412%! I would not argue with it.
So even, without a Peerless sell signal, it would be understandable if
our traders took profits in 50% of their positions in it tomorrow.
The other half we will sell when Peerless gives a Sell on the DJIA.

It is now essential that breadth stay very positive, namely
that there are 2000 NYSE Advancers. This will suggest
that the FED will not be raising interest rates.

SPY has reached the keen resistance of its 65-dma. Traders
may want to sell some of this. But Peerless has not given a Sell.
I think that there is a very good chance we will see SPY breakout
past its 280-282 resistance this month and make a new high
above 295.


QQQ and TQQQ have not yet given a Stochastic Red Sell.
Hold them a day
longer at least.

The market might rally more now if the FED decides not to
raise the Federal Funds rate in December. There is a very good
chance, in my opinion, that they will not raise rates again this
month.. Our chart (shown) below of short-term interest rates
has just broken an 11-month uptrend.

And our TigerSoft chart of the Bond Funds has just risen above
its purple 65-dma.
My conclusion: the way the DJI is streaking higher, I believe
bond traders at the Big Banks and others have inside information
from the Fed that rates will not go up in December. If true, this
would almost certainly take the DJI higher. So, except for 1/2 of
our SOXL position, I conclude, we should wait a little longer to sell.

|
Charts 12/3/2018 PEERLESS DJI, Signals, Indicators Daily DJI Volume 10-DayUp/Down Vol Hourly DJIA A/D Line for All Stocks Inverted Traders Index NASDAQ S&P OEX NYSE COMPQX DJI-15 DJI-20 DJI-30 DIA SPY QQQ MDY IWM TNA Short-Term Rates USO-CrudeOil DBO FAS GLD BBH IBB JETS JNUG KOL NUGT OIH OIL RSX RETL SDS AGQ SLV SOXL TECL TLT TMF TNA UGA (gasoline) XIV YINN Commodities: CANE CORN DBC JJC, NIB, CHOC CORN, CUT (paper) MOO, SOYB WEAT UUP (Dollar) LIT (Lithium) AAPL ADBE ALXN AMAT AMGN AMD AMZN BA BABA BAC BIDU CAT CVX DE FB GOOG GS HD IBM INTU JPM M (Macy's) MSFT NFLX NVDA QCOM TSLA TXN XOM WMT CMG , LRCX, SWKS, MDGL SPPI WATT SQ TOWN 12/3/2018 (Click on Underlined link.) Bullish MAXCPs - http://tigersoft.com/MAXCPZ/Dec-03/BULLISH.htm Bearish MAXCPs - http://tigersoft.com/MINCPZ/Dec-03/BEARISH.htm |
Table 1 QUICKSILVER on ETFS - 12/3/18 ETF CLOSE CHANGE PIVOT-PT 5-dma AROC CL-PWR CANDLE IP21 ITRS --------------------------------------------------------------------------------------------- DIA 258.73 3.22 247.5 245.5% Bullish RED .011 ---- --------------------------------------------------------------------------------------------- SPY 279.3 3.65 268.4 216.9% Bullish RED .13 -.012 --------------------------------------------------------------------------------------------- QQQ 172.33 2.96 163.44 283.5% ------- RED .068 -.031 --------------------------------------------------------------------------------------------- MDY 345.26 2.52 334.03 125.3% Bullish RED .13 -.038 --------------------------------------------------------------------------------------------- IWM 154.08 1.46 148.57 141.4% Bullish RED .108 -.064 --------------------------------------------------------------------------------------------- FAS 64.35 1.51 59.39 426.3% Bullish RED .173 -.132 --------------------------------------------------------------------------------------------- SOXL 115.53 8.64 98.41 868.5% Bullish RED .135 -.252 --------------------------------------------------------------------------------------------- TECL 122.42 7.5 104.1 866.3% ------- RED .138 -.219 --------------------------------------------------------------------------------------------- IBB 110.35 1.25 104.7 252% Bullish RED .032 -.038 --------------------------------------------------------------------------------------------- GLD 116.41 .87 114.95 33.3% Bearish RED -.103 .057 --------------------------------------------------------------------------------------------- RSX 21.08 .63 20.29 246.5% Bearish ---- .034 .03 |
Table 2    Count of Stocks in Key Directories
           20181203
-------------------------------
NEWHIGHS       137  Bullish
NEWLOWS        31
MAXCP          67
MINCP          77   Bearish
TTTNH          53
TTTNL          110  Bearish
FASTUP         235  Bullish
FASTDOWN       102
CPCROSSA       57
CPCROSSD       138  Bearish
BIGVOLUP       1
BIGVODN        9
ACCUMVER       5
HIGHIP21       54
HIUPPCT        9
VHIP21         20
LOWACCUM       532 Bearish
REDSELL        283
AUGSELS7       18
TRAPDOOR       43
|
 Table 3   RANKING OF KEY DIRECTORIES BASED PCT.OF STOCKS ABOVE 65-DMA
              12/3/18
 Bullish =19
 Bearish =26
---------------------------------------------------------------------------------------
Directory     Current       day-1         day-2         day-3         day-4         day-5
----------------------------------------------------------------------------------------
JETS           1             1             .9            .9            .8            .9
UTILITY        .85           .875          .775          .825          .85           .8
EDU            .833          .666          .666          .666          .5            .5
DOWJONES       .733          .6            .6            .6            .4            .366
^^^^^^^^
SOLAR          .722          .611          .611          .722          .555          .555
^^^^^
REIT           .618          .546          .48           .473          .407          .421
DJI-13         .615          .461          .461          .461          .307          .307
^^^^^^
NASD-100       .6            .53           .45           .51           .33           .3
^^^^^^^^
BONDFUND       .59           .409          .352          .171          .123          .095
^^^^^^^^
CHINA          .55           .35           .283          .333          .25           .25
SP500          .546          .485          .431          .449          .345          .337
^^^^^
HACKERS        .545          .454          .363          .363          .272          .272
HOSPITAL       .541          .458          .458          .333          .333          .333
ETFS           .534          .31           .344          .327          .12           .103
SP-100         .526          .451          .397          .408          .279          .247
^^^^^^
FIDSTKS        .521          .456          .381          .397          .279          .274
GREEN          .521          .434          .478          .391          .347          .304
FOOD           .509          .381          .327          .327          .29           .29
NIFTY          .508          .35           .298          .333          .21           .192
================================================================================================
BEVERAGE       .5            .388          .444          .444          .388          .388
INSURANC       .5            .5            .466          .4            .266          .333
TRANSP         .5            .5            .4            .4            .3            .35
================================================================================================
RUS-1000       .496          .44           .397          .409          .31           .318
COMODITY       .476          .357          .333          .309          .285          .285
AUTO           .461          .435          .435          .435          .41           .41
SEMI           .461          .358          .307          .35           .239          .247
GUNS           .411          .176          .117          .117          0             0
HOMEBLDG       .411          .352          .411          .47           .294          .352
GOLD           .4            .34           .34           .38           .3            .36
ELECTRON       .395          .314          .283          .308          .191          .191
REGBANKS       .392          .464          .392          .428          .285          .357
PIPELINE       .384          .192          .23           .192          .192          .192
RETAIL         .377          .339          .339          .301          .245          .226
GAMING         .375          .333          .375          .375          .208          .25
COMPUTER       .363          .363          .318          .363          .227          .181
CHEM           .351          .296          .296          .277          .185          .222
SOFTWARE       .338          .292          .246          .23           .153          .184
BIOTECH        .321          .281          .257          .26           .186          .186
INDEXES        .31           .256          .272          .251          .229          .213
INDMATER       .307          .205          .217          .23           .166          .205
BIG17          .304          .195          .195          .217          .152          .152
FINANCE        .3            .266          .211          .222          .144          .188
BIGBANKS       .285          .142          .142          .285          0             0
MILITARY       .281          .187          .156          .218          .156          .187
INFRA          .25           .222          .194          .194          .138          .194
COAL           .142          .142          .142          .142          .142          .142
OILGAS         .107          .093          .093          .1            .08           .08
|
====================================================================
11/30/2018
Peerless remains on Buys.
The Closing Powers and 5-day
moving averages are rising. It looks like the DJI will power
right past the 65-day ma barrier tomorrow. Hold the longs,
notably DIA, SOXL and NVDA. I would not try to anticipate
a reversal back downward. This December could be superb
if the FED does not raise rates.


"I'd rather be lucky than smart". Have you heard that before?
That's the way I feel with our Buy B9 and Buy B3 telling us
to get long for this nice December rally. But, of course, we turned bullish
when we saw that Professionals had become net buyers at the lower
band. We suspect a lot of them probably had inside information
from the FED and the President's inner circle. So maybe luck
was not really involved, at all.
The Market Wants To Believe!
That Is All That Matters for Now.
Wedneday the market seized on Fed Chairman Powell's three
words of encouragement about interest rates ('just below neutral')
and sent the DJI up 600 points. This weekend, traders heard that
there will be a "trade war truce" until March 1st and they are sending
the DJI up +500 even before trading has started today.
The market wants to believe in positive outcomes - at this juncture.
It wants to believe the bull market will surge to new highs. And it may
be right if the FED is accommodative. If breadth is very good
tomorrow, we will avoid a Peerless Sell S9 at the upper band.
Then the odds are that the market will be allowed to sustain its bullish
sentiments until next Year.
But it also may be the bulls are over-reaching a bit. It may
be the FED will raise interest rates in December and it may also be
that the intellectual property differences alone in trade talks
will ultimately prevent a peaceful outcome to the now suspended trade
war with China.
Illusions Can Propel The Stock Market up for
Months.
But in the meantime, the market wants to believe. It wants
to believe now just like it wanted to believe in 1964 and 1965
that LBJ could have both Guns (the War in Vietnam) and
Butter (his Great Society programs) and so drove the market
and the DJI (led by high priced IBM (>$350/share) up and up,
only stopping when rising interest rates pierced the bubble
of illusion at the start of 1966. Another example: the market
in 1968 wanted to believe that Richard Nixon truly did have
a "secret peace plan" to end the quagmire war in Vietnam.
Once again, the reality of sharply higher interest rates (which were
not raised until the November 1968 Election 1968 was safely past)
ended the traders' illusion. Then the market began the nightmarish
decline of 1968-1970.

|
Charts 11/30/2018 PEERLESS DJI, Signals, Indicators Daily DJI Volume 10-DayUp/Down Vol Hourly DJIA A/D Line for All Stocks Inverted Traders Index NASDAQ S&P OEX NYSE COMPQX DJI-15 DJI-20 DJI-30 DIA SPY QQQ MDY IWM TNA Short-Term Rates USO-CrudeOil DBO FAS GLD BBH IBB JETS JNUG KOL NUGT OIH OIL RSX RETL SDS AGQ SLV SOXL TECL TLT TMF TNA UGA (gasoline) XIV YINN Commodities: CANE CORN DBC JJC, NIB, CHOC CORN, CUT (paper) MOO, SOYB WEAT UUP (Dollar) LIT (Lithium) AAPL ADBE ALXN AMAT AMGN AMD AMZN BA BABA BAC BIDU CAT CVX DE FB GOOG GS HD IBM INTU JPM M (Macy's) MSFT NFLX NVDA QCOM TSLA TXN XOM WMT CMG , LRCX, SWKS, MDGL SPPI WATT SQ TOWN 11/30/2018 (Click on Underlined link.) Bullish MAXCPs - http://tigersoft.com/MAXCPZ/Nov-30/BULLISH.htm Bearish MAXCPs - http://tigersoft.com/MINCPZ/Nov-30/BEARISH.htm |
Table 1 QUICKSILVER on ETFS - 11/30/18 ETF CLOSE CHANGE PIVOT-PT 5-dma AROC CL-PWR CANDLE IP21 ITRS --------------------------------------------------------------------------------------------- DIA 255.51 1.92 246.39 255.2% Bullish BLUE .04 ----- --------------------------------------------------------------------------------------------- SPY 275.65 1.67 267.5 230% Bullish BLUE .161 -.018 --------------------------------------------------------------------------------------------- QQQ 169.37 1.22 162.89 308.9% Bullish BLUE .088 -.04 --------------------------------------------------------------------------------------------- MDY 342.74 2.36 336.77 152.3% Bullish BLUE .19 -.038 --------------------------------------------------------------------------------------------- IWM 152.62 .79 149.81 157.6% Bullish BLUE .124 -.065 --------------------------------------------------------------------------------------------- FAS 62.84 1.43 59.14 563% Bullish BLUE .206 -.146 --------------------------------------------------------------------------------------------- SOXL 106.89 4.22 97.78 721.9% Bullish BLUE .19 -.299 --------------------------------------------------------------------------------------------- TECL 114.92 3.26 103.4 852% Bullish BLUE .155 -.26 --------------------------------------------------------------------------------------------- IBB 109.1 1.61 104.97 278.9% Bullish BLUE .098 -.042 --------------------------------------------------------------------------------------------- GLD 115.54 -.2 115.64 -10% Bearish BLUE -.076 .054 --------------------------------------------------------------------------------------------- RSX 25.92 .1 25.92 9.7% ------- ---- -.286 .252 --------------------------------------------------------------------------------------------- |
 Table 2
 Count of Stocks in Key Directories
          2018-11/30
-------------------------------
NEWHIGHS       109  Bullish
NEWLOWS        67
MAXCP          87   Bullish - Professionals
MINCP          51
TTTNH          107  Bullish - Day Traders
TTTNL          81
FASTUP         200  Bullish - Swing Traders
FASTDOWN       125
CPCROSSA       104  Bullish - nervous Professionals
CPCROSSD       46
BIGVOLUP       2
BIGVODN        18   Dumping continues.
ACCUMVER       8
HIGHIP21       59
HIUPPCT        9
VHIP21         19
LOWACCUM       517  Big Money Selling remains very high
REDSELL        272
AUGSELS7       9
TRAPDOOR       45
|
 Table 3
 RANKING OF KEY DIRECTORIES BASED PCT.OF STOCKS ABOVE 65-DMA
              11/30/18
 Bearish = 38
 Bullish = 7
---------------------------------------------------------------------------------------
Directory     Current       day-1         day-2         day-3         day-4         day-5
----------------------------------------------------------------------------------------
JETS           1             .9            .9            .8            .9            .8
UTILITY        .875          .775          .825          .85           .825          .675
EDU            .666          .666          .666          .5            .5            .5
SOLAR          .611          .611          .722          .555          .555          .277
DOWJONES       .6            .6            .6            .4            .366          .233
REIT           .546          .48           .473          .407          .421          .414
NASD-100       .53           .45           .51           .33           .3            .21
N= 7
===========================================================================================
INSURANC       .5            .466          .4            .266          .333          .2
TRANSP         .5            .4            .4            .3            .35           .35
===========================================================================================
SP500          .485          .431          .449          .345          .335          .275
REGBANKS       .464          .392          .428          .285          .357          .25
DJI-13         .461          .461          .461          .307          .307          .153
HOSPITAL       .458          .458          .333          .333          .333          .333
FIDSTKS        .456          .381          .397          .279          .274          .193
HACKERS        .454          .363          .363          .272          .272          .181
SP-100         .451          .397          .408          .279          .247          .193
RUS-1000       .44           .397          .409          .31           .316          .263
AUTO           .435          .435          .435          .41           .41           .333
GREEN          .434          .478          .391          .347          .304          .304
BONDFUND       .409          .352          .171          .123          .095          .066
FOOD           .392          .339          .339          .303          .303          .321
BEVERAGE       .388          .444          .444          .388          .388          .444
COMPUTER       .363          .318          .363          .227          .181          .136
SEMI           .358          .307          .35           .239          .247          .17
COMODITY       .357          .333          .309          .285          .285          .285
HOMEBLDG       .352          .411          .47           .294          .294          .294
CHINA          .35           .283          .333          .25           .25           .166
NIFTY          .35           .298          .333          .21           .192          .105
GOLD           .34           .34           .38           .3            .36           .4
RETAIL         .339          .339          .301          .245          .226          .188
GAMING         .333          .375          .375          .208          .208          .208
ELECTRON       .314          .283          .308          .191          .191          .148
ETFS           .31           .344          .327          .12           .12           .086
CHEM           .296          .296          .277          .185          .222          .222
SOFTWARE       .292          .246          .23           .153          .184          .153
BIOTECH        .278          .257          .26           .186          .189          .184
FINANCE        .266          .211          .222          .144          .188          .133
INDEXES        .251          .272          .251          .229          .213          .219
INFRA          .222          .194          .194          .138          .194          .111
INDMATER       .205          .217          .23           .166          .205          .205
BIG17          .195          .195          .217          .152          .152          .13
PIPELINE       .192          .23           .192          .192          .192          .076
MILITARY       .187          .156          .218          .156          .187          .156
GUNS           .176          .117          .117          0             0             0
BIGBANKS       .142          .142          .285          0             0             0
COAL           .142          .142          .142          .142          .142          .142
OILGAS         .093          .093          .1            .08           .08           .08
Bearish N= 38
|
====================================================================
11/29/2018
More profit-taking probably lies
ahead. But after that is over,
the DJI should be able to rebound back to the 65-dma. Hold DIA,
SOXL and some of the strongest solar energy MAXCPs. I would
hold NVDA for more of a recovery, too.
The weak opening tomorrow is probably "normal" profit-taking.
The advance Wednesday looks "over-done" and "artificial".
More basing is needed. Despite the Peerless Buy signals, the
NYSE A/D Line is still below its down-trendline going back to
this Summer. That needs to be broken so that the market can be
freed to more easily advance. The extent of the DJI's decline
today was somewhat concealed by Boeing's 9 point advance.
Even so, short-term traders should, I think, abide by the rising Closing
Power 21-dma trends and the rising 5-day ma trends for all the
major market ETFs and Indexes. Opening weakness may be followed
by strength at the closing.
 |
 |
 |
The longer-term bearish clouds have not lifted. More than
500 stocks show heavy big Money Distrubtion. More than 77% of
all common stocks and bullish ETFs are below their 65-dma.
But 63% of the DJI-30 stocks are now above their 65-dma and
Boeing, which is by far the most heavily weighted DJI-30 stock
is roaring back upwards. So, the DJI will likely play its usual role late
in a bull market of trying to lead the market up and maintain the
appearance to the Public that all is well. We should be OK until
January.
Seasonality: the next week's trading has since 1965 seen the DJI rise
only 44% of the time. It is the two week period after December 17th,
that typically turns most bullish with the blue chip average rising more
than 75% of the time and averaging a 2% gain.
All in all, it must be considered bullish that the DJIA jumped up over
600 points on Wednesday at what was a rather vague and weak
indication that FED would slow down its rate hiking schedule. The
FED as we all know can make or break markets. Like a lot of people,
FED Chairman Powell chose not to immediately respond to criticism
from the President Trump or the likes ex-Chairman Yellen a month ago
who warned emphatically about the dangers to the market and the
world economy of the existence of so much Debt.
(Worth reading: Yellen:
$20 trillion national debt 'should keep people
awake
at night' )
I think another overlooked reason for the rally is the election of
Nancy Pelosi to be the Democrats' House Speaker in 2019.
Republicans say they don't much like her. That just legitimizes her
with her own base. Truth is she is not a populist who would do much
to raise taxes on the rich or on corporations, nor is she someone who
shows any interest in reducing military spending or foreign wars.
She is officially against pursuing impeachment. Moreover, we also
never hear her take up the call for Medicare for all. She also avoids,
like Hillary and Bill Clinton, the subject of the big banks being too big
to fail or even the subject of Bank Regulation. Like FDR in the 1930s,
she incurs lots of Republican hostility, but it's clear from what
she does not say that she intends to maintain the very system that has
benefitted Wall Street more than any other sector since 1982. Her
leftist critics call her a "Corporatist Democrat". To her way of thinking,
she is pursuing policies just to the left of the Republican Party because
there is no real alternative for most voters left of center. Pelosi
does what she does because she is a practical politician. Hers is the
safest way for the Democrats to hold political power in an age of big
campaign contributions when polls show that Trump Republicans are
more and more seen as not doing much to actually help the working class
Americans that won him office in 2016.
( https://www.nbcnews.com/politics/first-read/poll-economic-satisfaction-under-trump-isn-t-helping-his-party-n880721
)
|
Charts 11/29/2018 PEERLESS DJI, Signals, Indicators Daily DJI Volume 10-DayUp/Down Vol Hourly DJIA A/D Line for All Stocks Inverted Traders Index NASDAQ S&P OEX NYSE COMPQX DJI-15 DJI-20 DJI-30 DIA SPY QQQ MDY IWM TNA Short-Term Rates USO-CrudeOil DBO FAS GLD BBH IBB JETS JNUG KOL NUGT OIH OIL RSX RETL SDS AGQ SLV SOXL TECL TMF TNA UGA (gasoline) XIV YINN Commodities: CANE CORN DBC JJC, NIB, CHOC CORN, CUT (paper) MOO, SOYB WEAT UUP (Dollar) LIT (Lithium) AAPL ADBE ALXN AMAT AMGN AMD AMZN BA BABA BAC BIDU CAT CVX DE FB GOOG GS HD IBM INTU JPM M (Macy's) MSFT NFLX NVDA QCOM TSLA TXN XOM WMT CMG , LRCX, SWKS, MDGL SPPI WATT SQ TOWN 11/29/2018 (Click on Underlined link.) Bullish MAXCPs - http://tigersoft.com/MAXCPZ/Nov-29/BULLISH.htm Bearish MAXCPs - http://tigersoft.com/MINCPZ/Nov-29/BEARISH.htm |
Table 1 QUICKSILVER on ETFS - 11/29/18 ETF CLOSE CHANGE PIVOT-PT 5-dma AROC CL-PWR CANDLE IP21 ITRS --------------------------------------------------------------------------------------------- DIA 253.59 -.25 242.81 180.9% Bullish ---- -.01 ---- --------------------------------------------------------------------------------------------- SPY 273.98 -.6 263.25 167.3% Bullish BLUE .091 -.018 --------------------------------------------------------------------------------------------- QQQ 168.15 -.55 159.21 238.8% Bullish BLUE .056 -.039 --------------------------------------------------------------------------------------------- MDY 340.38 -.29 332.48 110% Bullish BLUE .017 -.04 --------------------------------------------------------------------------------------------- IWM 151.83 -.41 147.89 127.3% Bullish BLUE .006 -.064 --------------------------------------------------------------------------------------------- FAS 61.41 -1.37 56.11 340.9% Bullish RED .138 -.146 --------------------------------------------------------------------------------------------- SOXL 102.67 -2.5 92.55 518% Bullish RED .157 -.306 --------------------------------------------------------------------------------------------- TECL 111.66 -3.16 96.83 582.2% Bullish RED .112 -.259 --------------------------------------------------------------------------------------------- IBB 107.49 -.05 103.21 224.1% ------- BLUE .025 -.045 --------------------------------------------------------------------------------------------- GLD 115.74 .36 115.77 -5.2% Bearish RED -.045 .057 --------------------------------------------------------------------------------------------- RSX 20.86 .08 20.45 0% ------- RED .113 .041 |
Table 2    Count of Stocks in Key Directories
           2018-11/29
-------------------------------
NEWHIGHS       66  Bullish
NEWLOWS        49
MAXCP          60  Bullish
MINCP          49
TTTNH          87  Bullish
TTTNL          59
FASTUP         174  Bullish
FASTDOWN       108
CPCROSSA       62
CPCROSSD       77  Mild Weakening
BIGVOLUP       3
BIGVODN        10  Dumping Continues
ACCUMVER       7
HIGHIP21       14  Very little Big Money Accumulation.
HIUPPCT        7
VHIP21         19
LOWACCUM       504  Dangerously high continuation distribition by Big Money.
REDSELL        314
AUGSELS7       9
TRAPDOOR       45   Sudden plunges show why Big Money selling.
|
RANKING OF KEY DIRECTORIES BASED PCT.OF STOCKS ABOVE 65-DMA 11/29/18 --------------------------------------------------------------------------------------- Directory Current day-1 day-2 day-3 day-4 day-5 ---------------------------------------------------------------------------------------- JETS .9 .9 .8 .9 .8 .5 UTILITY .775 .825 .85 .825 .675 .7 EDU .666 .666 .5 .5 .5 .5 SOLAR .611 .722 .555 .555 .277 .277 DOWJONES .6 .6 .4 .366 .233 .3 REIT .48 .473 .407 .421 .407 .407 GREEN .478 .391 .347 .304 .304 .347 INSURANC .466 .4 .266 .333 .233 .233 DJI-13 .461 .461 .307 .307 .153 .153 HOSPITAL .458 .333 .333 .333 .333 .291 NASD-100 .45 .51 .33 .3 .21 .21 BEVERAGE .444 .444 .388 .388 .444 .388 AUTO .435 .435 .41 .41 .333 .333 SP500 .431 .449 .345 .335 .273 .275 HOMEBLDG .411 .47 .294 .294 .294 .235 TRANSP .4 .4 .3 .35 .35 .25 RUS-1000 .397 .409 .31 .316 .263 .251 SP-100 .397 .408 .279 .247 .193 .215 REGBANKS .392 .428 .285 .357 .25 .285 FIDSTKS .381 .397 .279 .274 .198 .188 GAMING .375 .375 .208 .208 .208 .208 HACKERS .363 .363 .272 .272 .181 .181 BONDFUND .352 .171 .123 .095 .047 .028 ETFS .344 .327 .12 .12 .086 .137 GOLD .34 .38 .3 .36 .38 .5 FOOD .339 .339 .303 .303 .321 .428 RETAIL .339 .301 .245 .226 .188 .15 COMODITY .333 .309 .285 .285 .285 .404 COMPUTER .318 .363 .227 .181 .136 .136 SEMI .307 .35 .239 .247 .17 .188 NIFTY .298 .333 .21 .192 .105 .14 CHEM .296 .277 .185 .222 .222 .222 CHINA .283 .333 .25 .25 .183 .216 ELECTRON .283 .308 .191 .191 .148 .154 INDEXES .272 .251 .229 .213 .219 .213 BIOTECH .257 .263 .186 .189 .184 .168 SOFTWARE .246 .23 .153 .184 .153 .138 PIPELINE .23 .192 .192 .192 .076 .23 INDMATER .217 .23 .166 .205 .205 .243 FINANCE .211 .222 .144 .188 .133 .166 BIG17 .195 .217 .152 .152 .13 .108 INFRA .194 .194 .138 .194 .111 .166 MILITARY .156 .218 .156 .187 .156 .093 BIGBANKS .142 .285 0 0 0 0 COAL .142 .142 .142 .142 .142 .142 GUNS .117 .117 0 0 0 0 OILGAS .093 .1 .08 .08 .08 .1 |
====================================================================
11/28/2018
The operative Peerless Buy B2-B3-B9
tells us to expect the
DJI to reach its falling 65-dma again and thereby rally back
about half way back to its September peak. But first, we
need another pullback to digest today's big advance.
The good news is that the key ETFs' Closing Power downtrends
have been broken and their 5-day moving averages are rising.
The Hourly DJI is now in an uptrend. Usually once a bottom has
been found, the market, the stock, the ETF or the commodity
all will rise until well-established resistance is reached. I take the
DJI's falling 65-dma to be the most likely spot where sell orders
will be concentrated into resistance.
But another pullback seems likely. It's true that Breadth was
very good. Advancers were greater than 2400 on the NYSE today.
Numerous dividend and bond funds joined the rally in over-sold
tech stocks. But the last time, NYSE breadth was this good was in the
middle of October just before another sell-off.
My guess is that there were too many over-eager buyers today. The
DJI rose way too much. Traders will certainly have second thoughts
and doubts about it. Many will see the weakness that is developing
overnight as proof that today's huge gain was a suckers' rally, a "rigged
bear market relief rally". Such cynics will point out that NYSE volume
today was again below its 21-dma. They will contend that word must
have gotten out in advance that Fed Chief Powerll would verbally relent
just a little on his march to raise interest rates to "neutral", whatever that
is. So, when he did make his speech, market makers rapidly lifted prices
to generate hopes in the more naive bulls and weaker shorts so they
would buy the same shares that these same market makers had
bought a few days earlier just above DJI 24000 knowing that there would
be a bounce and what would cause it. "You cannot be too cynical
when it comes to Wall Street". That is what I have learned, too.
So maybe there will now be another minor retreat. But
Peerless remains on three reliable Buy signals and Decembers
are very bullish. Hold all our longs and still hold some Bearish
MINCPs as long as their Closing Powers remain below their
21-dma.


|
Charts 11/28/2018 PEERLESS DJI, Signals, Indicators Daily DJI Volume 10-DayUp/Down Vol Hourly DJIA A/D Line for All Stocks Inverted Traders Index NASDAQ S&P OEX NYSE COMPQX DJI-15 DJI-20 DJI-30 DIA SPY QQQ MDY IWM TNA Short-Term Rates USO-CrudeOil DBO FAS GLD BBH IBB JETS JNUG KOL NUGT OIH OIL RSX RETL SDS AGQ SLV SOXL TECL TMF TNA UGA (gasoline) XIV YINN Commodities: CANE CORN DBC JJC, NIB, CHOC CORN, CUT (paper) MOO, SOYB WEAT UUP (Dollar) LIT (Lithium) AAPL ADBE ALXN AMAT AMGN AMD AMZN BA BABA BAC BIDU CAT CVX DE FB GOOG GS HD IBM INTU JPM M (Macy's) MSFT NFLX NVDA QCOM TSLA TXN XOM WMT CMG , LRCX, SWKS, MDGL SPPI WATT SQ TOWN 11/27/2018 (Click on Underlined link.) Bullish MAXCPs - http://tigersoft.com/MAXCPZ/Nov-28/BULLISH.htm Bearish MAXCPs - http://tigersoft.com/MINCPZ/Nov-28/BEARISH.htm |
Table 1 QUICKSILVER on ETFS - 11/28/18 ETF CLOSE CHANGE PIVOT-PT 5-dma AROC CL-PWR CANDLE IP21 ITRS --------------------------------------------------------------------------------------------- DIA 253.84 6.34 244.65 190.5% Bullish BLUE .047 ----- --------------------------------------------------------------------------------------------- SPY 274.58 6.18 265.02 196.9% Bullish BLUE .151 -.022 --------------------------------------------------------------------------------------------- QQQ 168.7 5.26 160.37 296.2% Bullish BLUE .121 -.043 --------------------------------------------------------------------------------------------- MDY 340.67 6.64 333 169.6% Bullish BLUE .097 -.048 --------------------------------------------------------------------------------------------- IWM 152.24 3.67 148.03 211.1% Bullish BLUE .056 -.071 --------------------------------------------------------------------------------------------- FAS 62.78 3.39 57.39 502.6% Bullish BLUE .19 -.115 --------------------------------------------------------------------------------------------- SOXL 105.17 6.76 92.59 722.8% Bullish BLUE .233 -.292 --------------------------------------------------------------------------------------------- TECL 114.82 10.72 99.58 848.6% Bullish BLUE .157 -.25 --------------------------------------------------------------------------------------------- IBB 107.54 2.84 102.8 258.8% Bullish BLUE .05 -.05 --------------------------------------------------------------------------------------------- GLD 115.38 .43 115.86 -12.5% ------- BLUE-.037 .052 --------------------------------------------------------------------------------------------- OIL 115.38 .43 115.86 -12.5% Bullish BLUE-.093 7.756 --------------------------------------------------------------------------------------------- RSX 20.78 .49 20.86 122.6% ------- BLUE .174 .041 |
Table 2 Count of Stocks in Key Directories 2018-11/28 ------------------------------- NEWHIGHS 84 Bullish NEWLOWS 40 MAXCP 69 Bullish MINCP 56 TTTNH 98 B ullish TTTNL 71 FASTUP 290 Bullish FASTDOWN 85 CPCROSSA 444 Bullish CPCROSSD 22 BIGVOLUP 3 BIGVODN 7 ACCUMVER 7 HIGHIP21 61 HIUPPCT 6 VHIP21 19 LOWACCUM 533 Heavy big money distribution. REDSELL 303 AUGSELS7 10 TRAPDOOR 45 |
TABLE 3   RANKING OF KEY DIRECTORIES BASED PCT.OF STOCKS ABOVE 65-DMA
             11/28/18
Bullish = 6
Bearish = 41
---------------------------------------------------------------------------------------
Directory     Current       day-1         day-2         day-3         day-4         day-5
----------------------------------------------------------------------------------------
JETS           .9            .8            .9            .8            .5            .4
UTILITY        .825          .85           .825          .675          .7            .75
SOLAR          .722          .555          .555          .277          .277          .277
EDU            .666          .5            .5            .5            .5            .5
DOWJONES       .6            .4            .366          .233          .3            .3
NASD-100       .51           .33           .3            .21           .2            .18
N=6
============================================================================================
REIT           .473          .407          .421          .407          .407          .401
HOMEBLDG       .47           .294          .294          .294          .235          .235
DJI-13         .461          .307          .307          .153          .153          .153
SP500          .449          .345          .335          .273          .275          .259
BEVERAGE       .444          .388          .388          .444          .388          .333
AUTO           .435          .41           .41           .333          .307          .205
REGBANKS       .428          .285          .357          .25           .285          .285
RUS-1000       .409          .31           .316          .263          .251          .233
SP-100         .408          .279          .247          .193          .215          .215
INSURANC       .4            .266          .333          .233          .233          .233
TRANSP         .4            .3            .35           .35           .25           .15
FIDSTKS        .397          .279          .274          .198          .188          .182
GREEN          .391          .347          .304          .304          .347          .26
GOLD           .38           .3            .36           .38           .5            .4
GAMING         .375          .208          .208          .208          .208          .208
COMPUTER       .363          .227          .181          .136          .136          .136
HACKERS        .363          .272          .272          .181          .181          .181
SEMI           .35           .239          .247          .17           .179          .153
FOOD           .339          .303          .303          .321          .428          .357
CHINA          .333          .25           .25           .183          .2            .2
HOSPITAL       .333          .333          .333          .333          .333          .291
NIFTY          .333          .21           .192          .105          .122          .122
ETFS           .327          .12           .12           .086          .137          .086
COMODITY       .309          .285          .285          .285          .404          .333
ELECTRON       .308          .191          .191          .148          .148          .117
RETAIL         .301          .245          .226          .188          .15           .075
BIGBANKS       .285          0             0             0             0             0
CHEM           .277          .185          .222          .222          .222          .166
BIOTECH        .26           .186          .189          .184          .168          .142
INDEXES        .251          .229          .213          .219          .219          .229
INDMATER       .23           .166          .205          .205          .243          .205
SOFTWARE       .23           .153          .184          .153          .138          .107
FINANCE        .222          .144          .188          .133          .155          .155
MILITARY       .218          .156          .187          .156          .093          .093
BIG17          .217          .152          .152          .13           .108          .086
INFRA          .194          .138          .194          .111          .166          .083
PIPELINE       .192          .192          .192          .076          .23           .115
BONDFUND       .171          .123          .095          .047          .028          .057
COAL           .142          .142          .142          .142          .142          .142
GUNS           .117          0             0             0             0             .058
OILGAS         .1            .08           .08           .08           .1            .08
N= 41
|
===================================================================
11/27/2018
The operative Peerless
Buy B2-B3-B9 tells us to expect the
DJI to reach its falling 65-dma again and thereby rally back about half
way back to its September peak. I am much more optimistic
about this happening in a month or six weeks than in two weeks.
After Christmas we should see good retail sales numbers and
the market experiences a Santa Claus rally almost 90% of
the time. So, let's look bullishly ahead.
I would look for more weather extremes. This is will drive home
the message that our climate IS changing for the worse and Solar
Energy will be an indispensable part of how we meet our future
energy needs. Solar stocks are emerging now as the most bullish
group technically. We do not want to wait to invest in them. See
the Bullish MAXCPs tonight.
Expect the Hourly Breakout to continue.


But we do need to see the NYSE A/D Line and the Closing
Powers of the major market ETFs break their downtrend-lines.
Perhaps, if someone in the FED would mutter something,
anything, sounding "dovish" soon, that would be a big boost.
They all seemed programmed quite hawkishly. But, it is bullish
that the near-term Hourly DJI's downtrend-line has been broken.
That is something to build on!
A rally higher now will have to work harder. There remains much overhead
supply of stock overhead. 42 of the 47 groupings of stocks
we follow still show 60% of their stocks below the 65-dma.
The task of over-coming this over-head tresistance will be difficult
so long as NYSE Volume remains low and below its 21-dma.
NYSE Volume remains low.

But we do have our Peerless Buy signals. That
helps. We know
the job of the DJI is to stabilize the market and help lead it back upwards
after a sell-off. That task will be much each easier in the second
half of December. What will happen over the next two weeks?
Another retreat for a few days, even a re-test the lower band, cannot be
ruled out. Since 1965, the DJI has risen only 44% of the time in the five
trading days following November 27th.


I think we will do fine
if we hold DIA, SOXL, NVDA and some
of the bullish solar stocks in tonight's MAXCPs. I would still stay
short MINCP stocks whose Closing Powers still show declining
trends. They are apt to be under heavy tax-loss
selling right up
the end of the year. Big Money is acting as a heavy seller in more
than 500 stocks, judging by the count of stocks in our "LOWACCUM"
category. (See Table 2). This is a count of stocks with an AI/200 score
of less than 70, exactly the type we like to short.)


|
Charts 11/27/2018 PEERLESS DJI, Signals, Indicators Daily DJI Volume 10-DayUp/Down Vol Hourly DJIA A/D Line for All Stocks Inverted Traders Index NASDAQ S&P OEX NYSE COMPQX DJI-15 DJI-20 DJI-30 DIA SPY QQQ MDY IWM TNA Short-Term Rates USO-CrudeOil DBO FAS GLD BBH IBB JETS JNUG KOL NUGT OIH OIL RSX RETL SDS AGQ SLV SOXL TECL TMF TNA UGA (gasoline) XIV YINN Commodities: CANE CORN DBC JJC, NIB, CHOC CORN, CUT (paper) MOO, SOYB WEAT UUP (Dollar) LIT (Lithium) AAPL ADBE ALXN AMAT AMGN AMD AMZN BA BABA BAC BIDU CAT CVX DE FB GOOG GS HD IBM INTU JPM M (Macy's) MSFT NFLX NVDA QCOM TSLA TXN XOM WMT CMG , LRCX, SWKS, MDGL SPPI WATT SQ TOWN 11/27/2018 (Click on Underlined link.) Bullish MAXCPs - http://tigersoft.com/MAXCPZ/Nov-27/BULLISH.htm Bearish MAXCPs - http://tigersoft.com/MINCPZ/Nov-27/BEARISH.htm |
Table 1 QUICKSILVER on ETFS - 11/27/18 ETF CLOSE CHANGE PIVOT-PT 5-dma AROC CL-PWR CANDLE IP21 ITRS --------------------------------------------------------------------------------------------- --------------------------------------------------------------------------------------------- DIA 247.5 1.11 244.5 -48% Bearish BLUE-.023 ---- --------------------------------------------------------------------------------------------- SPY 268.4 .9 264.12 -13.2% ------- BLUE .073 -.021 --------------------------------------------------------------------------------------------- QQQ 163.44 .55 159.16 42.9% ------- BLUE .031 -.047 --------------------------------------------------------------------------------------------- MDY 334.03 -2.74 329.37 -16.2% Bullish RED .029 -.045 --------------------------------------------------------------------------------------------- IWM 148.57 -1.24 145.99 -9.8% ------- RED -.027 -.072 --------------------------------------------------------------------------------------------- FAS 59.39 .25 56.97 -81.1% Bullish BLUE .113 -.136 --------------------------------------------------------------------------------------------- RETL 33.39 .26 29.49 85.6% Bearish BLUE .18 -.252 --------------------------------------------------------------------------------------------- SOXL 98.41 .63 91.5 394.2% Bullish BLUE .171 -.301 --------------------------------------------------------------------------------------------- TECL 104.1 .7 97.79 -15.9% ------- BLUE .061 -.288 --------------------------------------------------------------------------------------------- IBB 104.7 -.27 102.18 92.1% Bearish BLUE 0 -.047 --------------------------------------------------------------------------------------------- RSX 20.29 .22 20.28 -182.6% Bearish ---- .125 .051 |
  Table 2   Count of Stocks in Key Directories
          2018-11/27
-------------------------------
NEWHIGHS       40
NEWLOWS        159  Bearish.
MAXCP          31
MINCP          178  Bearish
TTTNH          56
TTTNL          104  Bearish
FASTUP         76
FASTDOWN       179  Bearish
CPCROSSA       94   Professionals still switching to bullish camp.
CPCROSSD       82
BIGVOLUP       3
BIGVODN        14
ACCUMVER       6
HIGHIP21       37
HIUPPCT        5
VHIP21         20
LOWACCUM       519  Lots of stocks are experiencing Big Money dumping.
REDSELL        340
AUGSELS7       12
TRAPDOOR       48
|
Table 3 RANKING OF KEY DIRECTORIES BASED PCT.OF STOCKS ABOVE 65-DMA 11/27/18 Bullish = 3 Solar stands out here. Bearish = 43 --------------------------------------------------------------------------------------- Directory Current day-1 day-2 day-3 day-4 day-5 ---------------------------------------------------------------------------------------- UTILITY .85 .825 .675 .7 .725 .8 JETS .8 .9 .8 .5 .4 .4 SOLAR .555 .555 .277 .277 .277 .388 ============================================================================================= EDU .5 .5 .5 .5 .5 .5 ============================================================================================= AUTO .41 .41 .333 .307 .205 .256 REIT .407 .421 .407 .407 .401 .434 DOWJONES .4 .366 .233 .3 .3 .5 BEVERAGE .388 .388 .444 .388 .333 .5 GREEN .347 .304 .304 .347 .26 .391 SP500 .345 .335 .273 .275 .255 .333 HOSPITAL .333 .333 .333 .333 .291 .333 NASD-100 .33 .3 .21 .2 .18 .25 RUS-1000 .31 .316 .263 .251 .229 .291 DJI-13 .307 .307 .153 .153 .153 .461 FOOD .303 .303 .321 .428 .357 .428 GOLD .3 .36 .38 .5 .4 .4 TRANSP .3 .35 .35 .25 .15 .3 HOMEBLDG .294 .294 .294 .235 .176 .117 COMODITY .285 .285 .285 .404 .333 .428 REGBANKS .285 .357 .25 .285 .285 .285 FIDSTKS .279 .274 .198 .188 .182 .263 SP-100 .279 .247 .193 .215 .215 .311 HACKERS .272 .272 .181 .181 .181 .181 INSURANC .266 .333 .233 .233 .233 .233 CHINA .25 .25 .183 .2 .2 .166 RETAIL .245 .226 .188 .15 .075 .207 SEMI .239 .247 .17 .179 .153 .162 INDEXES .229 .213 .219 .219 .229 .251 COMPUTER .227 .181 .136 .136 .136 .136 NIFTY .21 .192 .105 .122 .122 .14 GAMING .208 .208 .208 .208 .208 .25 PIPELINE .192 .192 .076 .23 .115 .192 ELECTRON .191 .191 .148 .148 .117 .135 CHEM .185 .222 .222 .222 .166 .24 BIOTECH .184 .189 .184 .168 .142 .157 INDMATER .166 .205 .205 .243 .205 .307 MILITARY .161 .193 .161 .096 .064 .161 SOFTWARE .153 .184 .153 .138 .123 .169 BIG17 .152 .152 .13 .108 .086 .108 FINANCE .144 .188 .133 .155 .133 .177 COAL .142 .142 .142 .142 .142 .285 INFRA .138 .194 .111 .166 .083 .25 BONDFUND .123 .095 .047 .028 .057 .066 ETFS .12 .12 .086 .137 .086 .172 OILGAS .08 .08 .08 .1 .08 .134 BIGBANKS 0 0 0 0 0 0 GUNS 0 0 0 0 0 .117 |
====================================================================
11/26/2018
The operative Peerless signals, Buy B2, B3 and
B9, suggest
the DJI will likely go back to its 65-dma and the
SP-500 will recover at least one half of what it has lost
since its September peak. Buy more of DIA and SOXL
if the NYSE A/D Line and the Closing Powers' downtrend-
lines are broken for DIA and SPY. Semi-conductors and
solar energy shares look they will continue to rally. That will
undoubtedly lift NVDA, which should be bought again.
 |
 |
 |
Expect A December.
The DJI may even go back to its highs as the bullish December
seasonality starts to take hold of the market's psychology.
And it might go higher than the 65-dma if the Buy B3's November
bullishness is matched here. Making this more credible is the
strength now shown by the volatile Semi-Conductors and
way all of our Peerless internal strength indicators are
improving.
November B3s since 1929
November B3s since 1929
19431115      B3        131.6      .246       129.6    -.0151    11/30
19481124      B3        173.4      .039       171.2    -.0126    11/30
19711111      B3        814.91     .177       797.97   -.0207    11/23
19781113      B3        792.01     .106       785.26   -.0085    11/14
19941123      B3       3674.63     .510                none
20071119      B3       12958.44    .051       12743.4  -.0165    11/26
                       Mean Gain = +14.1%      Median Paper Loss= 1.4%
The FED Very Likely Controls The Market's
Destiny
The DJI should certainly rally back to its 65-dma if
the FED decides against a boost in interest rates in December.
As long as our blue Closing Powers are rising, that is
considered a possibility by Professionals, I would judge.
One might think that the odds of the hawks drive for higher
and more normal interest rates could be slowed down a bit,
especially after GM's surprise announcement today that it will lay off
15000 workers and close 3 assembly plants in the Mid-West.
After all, official inflation is still below 3% (CPI pct. change
over 12 months) and the Dollar is very strong.
One might also think that the FED might delay in raising rates
because of the weakness in new home sales and because
the World Economy is slowing down. But the foreign ETFs
we track, especially those in Latin America, fell today sharply|
today as the DJI surged higher. The Dollar's uptrend not
only hurts American exports, it also presents may borrowers
in developing countries with a more and more impossible
task of ever paying back their loans denominated in Dollars.
But so far, there is no evidence that I can see, that the
FED's
hawks are relenting. Bonds were weak today and the number
of NYSE advancing stocks was only 1900 - not nearly what
one would expect if the FED's "doves" might be victorious
at the next FOMC meeting.
So, unless you believe that Trump's trade war with China
is going to be toned down, it looks like a rally by the DJI
only to the falling 65-dma is likely. After that, there will|
probably have to be another decline even though it will
then be December.
Traders may want to buy NVDA for rally back up to 180.

|
Charts 11/26/2018 PEERLESS DJI, Signals, Indicators Daily DJI Volume 10-DayUp/Down Vol Hourly DJIA A/D Line for All Stocks Inverted Traders Index NASDAQ S&P OEX NYSE COMPQX DJI-15 DJI-20 DJI-30 DIA SPY QQQ MDY IWM TNA Short-Term Rates USO-CrudeOil DBO FAS GLD BBH IBB JETS JNUG KOL NUGT OIH OIL RSX RETL SDS AGQ SLV SOXL TECL TMF TNA UGA (gasoline) XIV YINN Commodities: CANE CORN DBC JJC, NIB, CHOC CORN, CUT (paper) MOO, SOYB WEAT UUP (Dollar) LIT (Lithium) AAPL ADBE ALXN AMAT AMGN AMD AMZN BA BABA BAC BIDU CAT CVX DE FB GOOG GS HD IBM INTU JPM M (Macy's) MSFT NFLX NVDA QCOM TSLA TXN XOM WMT CMG , LRCX, SWKS, MDGL SPPI WATT SQ TOWN 11/26/2018 (Click on Underlined link.) Bullish MAXCPs - http://tigersoft.com/MAXCPZ/Nov-26/BULLISH.htm Bearish MAXCPs - http://tigersoft.com/MINCPZ/Nov-26/BEARISH.htm |
Table 1 QUICKSILVER on ETFS - 11/26/18 ETF CLOSE CHANGE PIVOT-PT 5-dma AROC CL-PWR CANDLE IP21 ITRS
---------------------------------------------------------------------------------------------
---------------------------------------------------------------------------------------------
DIA 246.39 3.58 249.86 -155% Bearish BLUE -.054 ----
---------------------------------------------------------------------------------------------
SPY 267.5 4.25 269.1 -116.6% ------- BLUE .009 -.021
---------------------------------------------------------------------------------------------
QQQ 162.89 3.68 162.06 -142.6% Bearish BLUE -.004 -.055
---------------------------------------------------------------------------------------------
MDY 336.77 4.29 335.11 -44.9% Bullish BLUE .047 -.039
---------------------------------------------------------------------------------------------
IWM 149.81 1.92 148.86 -71.7% Bearish BLUE .006 -.067
---------------------------------------------------------------------------------------------
FAS 59.14 3.03 60.33 -199.3% ------- BLUE .077 -.141
---------------------------------------------------------------------------------------------
RETL 33.13 1.83 32.85 -292.8% Bearish BLUE .159 -.273
---------------------------------------------------------------------------------------------
SOXL 97.78 5.23 91.07 -280.4% Bullish BLUE .155 -.326
---------------------------------------------------------------------------------------------
TECL 103.4 6.57 104.42 -703.7% Bearish BLUE .02 -.31
---------------------------------------------------------------------------------------------
IBB 104.97 1.76 102.8 -3.9% ------- BLUE -.006 -.05
---------------------------------------------------------------------------------------------
RSX 20.07 -.38 21.04 -226.7% Bearish BLU E .135 .054
|
Table 2    Count of Stocks in Key Directories
           2018-11/26
-------------------------------
NEWHIGHS       29
NEWLOWS        67
MAXCP          24
MINCP          122
TTTNH          48
TTTNL          80
FASTUP         59
FASTDOWN       190
CPCROSSA       139  Professionals' ranks are growing.
CPCROSSD       60
BIGVOLUP       2
BIGVODN        11
ACCUMVER       7
HIGHIP21       37
HIUPPCT        5
VHIP21         19
LOWACCUM       519  Lots of Big Money Distribution
REDSELL        327
AUGSELS7       11
TRAPDOOR       48
|
Table 3RANKING OF KEY DIRECTORIES BASED PCT.OF STOCKS ABOVE 65-DMA 11/26/18 Bullish = 3 Bearish = 43 --------------------------------------------------------------------------------------- Directory Current day-1 day-2 day-3 day-4 day-5 ---------------------------------------------------------------------------------------- JETS .9 .8 .5 .4 .4 .5 UTILITY .825 .675 .7 .725 .8 .75 SOLAR .555 .277 .277 .277 .388 .388 =============================================================================================== EDU .5 .5 .5 .5 .5 .5 =============================================================================================== REIT .421 .407 .407 .401 .427 .427 AUTO .41 .333 .307 .205 .256 .256 BEVERAGE .388 .444 .388 .333 .5 .444 DOWJONES .366 .233 .3 .3 .5 .533 GOLD .36 .38 .5 .4 .4 .44 REGBANKS .357 .25 .285 .285 .285 .285 TRANSP .35 .35 .25 .15 .25 .3 SP500 .335 .273 .275 .255 .329 .373 HOSPITAL .333 .333 .333 .291 .333 .333 INSURANC .333 .233 .233 .233 .266 .233 RUS-1000 .316 .263 .251 .229 .29 .334 DJI-13 .307 .153 .153 .153 .461 .461 GREEN .304 .304 .347 .26 .391 .391 FOOD .303 .321 .428 .357 .428 .5 NASD-100 .3 .21 .2 .18 .25 .31 HOMEBLDG .294 .294 .235 .176 .117 .176 COMODITY .285 .285 .404 .333 .428 .476 FIDSTKS .274 .198 .188 .182 .263 .29 HACKERS .272 .181 .181 .181 .181 .318 CHINA .25 .183 .2 .2 .166 .333 SEMI .247 .17 .179 .153 .162 .23 SP-100 .247 .193 .215 .215 .311 .333 RETAIL .23 .192 .153 .076 .192 .25 CHEM .222 .222 .222 .166 .24 .296 INDEXES .213 .219 .219 .229 .251 .278 GAMING .208 .208 .208 .208 .25 .291 INDMATER .205 .205 .243 .205 .307 .346 INFRA .194 .111 .166 .083 .222 .305 NIFTY .192 .105 .122 .122 .14 .21 PIPELINE .192 .076 .23 .115 .153 .115 ELECTRON .191 .148 .148 .117 .135 .185 FINANCE .188 .133 .155 .133 .177 .188 MILITARY .187 .156 .093 .062 .156 .187 BIOTECH .186 .184 .168 .142 .163 .197 SOFTWARE .184 .153 .138 .123 .169 .246 COMPUTER .181 .136 .136 .136 .136 .318 BIG17 .152 .13 .108 .086 .108 .152 COAL .142 .142 .142 .142 .285 .285 ETFS .12 .086 .137 .086 .172 .224 BONDFUND .095 .047 .028 .057 .066 .066 OILGAS .08 .08 .1 .08 .134 .12 BIGBANKS 0 0 0 0 0 0 GUNS 0 0 0 0 .117 .294 |
====================================================================
11/23/2018
Combined B9-B3
Peerless Buy Signals appeared
on Friday's Close. Buy DIA and SOXL. If semi-conductors
do lead the expected recovery, that would be very bullish for the
overall market. Professionals are net long SOXL and it shows
positive big-money Accumulation now.
Rumors of the FED not raising rates in December and Trump
reaching a deal with China are sending the DJI up a lot this
morning. If they are true, expect the DJI to go right back to 27000.
The Fed's legal responsibility is to maximize full employment,
prevent inflation and avert a financial collapse. Inflation still is
under control. I suspect this morning's advance owes to
a decision not to raise rates in December. If this is so, we
should very good breadth tomorrow.
We've seen numerous false rallies at the openings. But with the
DJI having closed at the 3.5% lower band, we should not be
picky or fussy. Buying at or near the opening even with it up
a lot seems necessary to take at least on half of your trading positions.
Wait until the close to take the second half.
Peerless is determined to get us to commit to the long
side. Friday's limited trading brought a combined Buy
B9 and Buy B3 to supplement Tuesday's Buy B2. The
Buy B2 told us that the DJI's lower 3.5% band below
the 21-dma was almost tagged. The Buy B9 tells us that
the lower band was tagged with the P-Indicator (the 21-
dma of NYSE advances minus declines) was positive.
In other words, the DJI has dropped inordinately compared
the typical stock on the NYSE. The Buy B3 appeared
because the DJI's is very oversold in the sense that
the DJI is at its lower band but the Stochastic 20 Pct-D has
not made a 30-trading day low.

Friday's Buy B3 has a particularly bull track record and
often comes at very good trading points. We can see below
that the median gain for a November B3, and there have
been six of them since 1929, is +14.1%. The median
Buy B9 gain is a more modest +5.3%, but its average
gain is twice that. See Table A and B).
If we put all the first November Election Year B3s and B9s together,
of which there are seven, we then get a median November
gain of 5.7% and a median paper loss of 0.85%. See Table D.
The ratio of the median gain to the median loss makes a long
commitment now in DIA seem reasonable, despite the DJI's
recent weakness.
The most the DJI may still fall would seem to be 2.7% based
on the biggest paper loss for a Buy B9 or a Buy B3. A more
typical 1% paper loss in here would drop the DJI to about
23800, thereby playing out the bearishness of the head/shoulders
pattern that was quickly created last week.
It's worth noting that the older 2006 version of Peerless also
a Buy B17 on Friday. Its median gains and paper losses
are somewhat bigger. See Table C. The current version of
Peerless does not show a Buy B17. But since the B17 is
based on improving internals, especially IP21, and the
key internal strength indicators are all improving, we should
factor this signal in now, I believe.

These new signals appeared in quick abundance, stacked on
another in November 1948, when the DJI quickly fell 10%
because of the Dmeocrat Truman's susprise victory over
the Republican Dewey for the Presidency. The Democrats
winning the House in 2018 did not come as much of a surprise.
So, a repeat of the November-December 1948 weak response
to the Buys just now is not expected. But it does show that
a multiplicity of Buy signals in a short period of time does
act to hold up prices even when the political news seems
unfavorable to Wall Street. Usually a quick multiplicity of Buy
signals is setting the stage for a very good advance, but that
was not the case in late 1948.
Buy DIA - Red 14-day Stochastic Buys have
a very good track record.

Buy SOXL - Red Stochastic Buys have had
a magnificent track record for the last year.

So, hedging still with some short Bearish MINCPs as long as their
Closing Powers are falling seems advisable. But Buy DIA and
SOXL now and some of the Bullish MAXCPs. At this point, I would
consider buying volatile stocks that show a positive IP21
above +.15 and have just had automatic (optimized) Red Buy signals
appear on their charts. Semi-Conductors are the stocks I would
focus on for trading long.
                                    November B9s since 1929

                                         DJI               Gain                          Biggest Paper Loss
19431108      B9        131.7      .245       129.6    -.0159    11/30
  (19431116   B9        131.2      .250       129.6    -.0121    11/30)
  (19431126   B9        131.3      .249       129.6    -.0129    11/30)
19481115      B9        176        .024       171.2    -.0272    11/30
19581125      B9        540.5      .203                none
19821124      B9       1000.00     .057                none
20001124      B9       10470.23    .042     10318.9    -.0144    12/20
20111121      B9       11547.31    .048     11257.5    -.025     11/23

              N=6      Mean Gain =  4.5%     Median Paper Loss= 1.5%
======================================================================================

Table B               November B3s since 1929
November B3s since 1929
19431115      B3        131.6      .246       129.6    -.0151    11/30
19481124      B3        173.4      .039       171.2    -.0126    11/30
19711111      B3        814.91     .177       797.97   -.0207    11/23
19781113      B3        792.01     .106       785.26   -.0085    11/14
19941123      B3       3674.63     .510                none
20071119      B3       12958.44    .051       12743.4  -.0165    11/26
                       Mean Gain = +14.1%      Median Paper Loss= 1.4%
=====================================================================================
Table C
                      November B17s since 1929
                (Based on 2006 Peerless B17's appearance now.)
November B17s since 1929  (Based on 2006 Peerless B17 occurrences.)
19481108      B17       178.2      .011       171.2    -.0392    11/30
19481117      B17       176.1      .023       171.2    -.0278    11/30
19671113      B17       859.74     .057                none
19711126      B17       816.59     .175                none
19791107      B17       796.67     .086                none
19861119      B17      1826.63     .317                none
19881111      B17      2065.97     .124        2038.58 -.0132        11/16
                       Mean Gain = 8.6%      Avg. Paper Loss= 1.0%
=========================================================================

Table D
                      Election Year B9 and B3s
19481115      B9        176        .024       171.2    -.0272    11/30
19481124      B3        173.4      .039       171.2    -.0126    11/30
19581125      B9        540.5      .203                none
19781113      B3        792.01     .106       785.26   -.0085    11/14
19821124      B9       1000.00     .057                none
19941123      B3       3674.63     .510                none
20001124      B9       10470.23    .042     10318.9    -.0144    12/20
                       Mean Gain = 5.7%      Mean Paper Loss= 0.85%
=========================================================================
|
|
Charts 11/23/2018 PEERLESS DJI, Signals, Indicators Daily DJI Volume 10-DayUp/Down Vol Hourly DJIA A/D Line for All Stocks Inverted Traders Index NASDAQ S&P OEX NYSE COMPQX DJI-15 DJI-20 DJI-30 DIA SPY QQQ MDY IWM TNA Short-Term Rates USO-CrudeOil DBO FAS GLD BBH IBB JETS JNUG KOL NUGT OIH OIL RSX RETL SDS AGQ SLV SOXL TECL TMF TNA UGA (gasoline) XIV YINN Commodities: CANE CORN DBC JJC, NIB, CHOC CORN, CUT (paper) MOO, SOYB WEAT UUP (Dollar) LIT (Lithium) AAPL ADBE ALXN AMAT AMGN AMD AMZN BA BABA BAC BIDU CAT CVX DE FB GOOG GS HD IBM INTU JPM M (Macy's) MSFT NFLX NVDA QCOM TSLA TXN XOM WMT CMG , LRCX, SWKS, MDGL SPPI WATT SQ TOWN 11/23/2018 (Click on Underlined link.) Bullish MAXCPs - http://tigersoft.com/MAXCPZ/Nov-23/BULLISH.htm Bearish MAXCPs - http://tigersoft.com/MINCPZ/Nov-23/BEARISH.htm |
Table 1 QUICKSILVER on ETFS - 11/23/18 ETF CLOSE CHANGE PIVOT-PT 5-dma AROC CL-PWR CANDLE IP21 ITRS --------------------------------------------------------------------------------------------- --------------------------------------------------------------------------------------------- DIA 242.81 -1.84 254.05 -208.8% Bearish RED -.046 ---- --------------------------------------------------------------------------------------------- SPY 263.25 -1.77 273.73 -181.6% Bearish BLUE .004 -.022 --------------------------------------------------------------------------------------------- QQQ 159.21 -1.16 167.5 -271.7% Bearish BLUE .003 -.065 --------------------------------------------------------------------------------------------- MDY 332.48 -.52 339.77 -105.6% Bullish BLUE .061 -.034 --------------------------------------------------------------------------------------------- IWM 147.89 -.14 151.94 -123.6% ------- BLUE .034 -.061 --------------------------------------------------------------------------------------------- FAS 56.11 -1.28 61.47 -427.1% Bearish RED .066 -.161 --------------------------------------------------------------------------------------------- SOXL 92.55 -.04 103.06 -738.5% Bullish BLUE .136 -.327 --------------------------------------------------------------------------------------------- TECL 96.83 -2.75 117.94 -1001.2% Bearish BLUE-.001 -.338 --------------------------------------------------------------------------------------------- IBB 103.21 .41 105.05 -45.5% ------- BLUE .033 -.056 --------------------------------------------------------------------------------------------- RSX 20.45 -.41 21.01 -153.4% Bearish RED .136 .097 |
Table 2
    Count of Stocks in Key Directories
          2018-11-23
-------------------------------
NEWHIGHS       21
NEWLOWS        126  Bearish
MAXCP          21
MINCP          95   Bearish
TTTNH          54   Day Traders are now net bullish.
TTTNL          48
FASTUP         67
FASTDOWN       226  Bearish
CPCROSSA       111  Bullish change of thinking by Professionals
CPCROSSD       22
BIGVOLUP       1
BIGVODN        4
ACCUMVER       8
HIGHIP21       29
HIUPPCT        5
VHIP21         20
LOWACCUM       430   Still very high
REDSELL        323   Still very high
AUGSELS7       10
TRAPDOOR       50
|
Table 3
          RANKING OF KEY DIRECTORIES BASED PCT.OF STOCKS ABOVE 65-DMA
              11/23/18
Bullish =2
Bearish = 44
---------------------------------------------------------------------------------------
Directory     Current       day-1         day-2         day-3         day-4         day-5
----------------------------------------------------------------------------------------
JETS           .8            .5            .4            .4            .5            .6
UTILITY        .675          .7            .725          .8            .75           .725
===========================================================================================
EDU            .5            .5            .5            .5            .5            .5
===========================================================================================
BEVERAGE       .444          .388          .333          .5            .444          .388
REIT           .407          .407          .401          .427          .414          .355
GOLD           .38           .5            .4            .4            .44           .36
TRANSP         .35           .25           .15           .25           .3            .3
AUTO           .333          .307          .205          .256          .256          .307
HOSPITAL       .333          .333          .291          .333          .333          .375
FOOD           .321          .428          .357          .428          .464          .339
GREEN          .304          .347          .26           .391          .391          .391
HOMEBLDG       .294          .235          .176          .117          .176          .176
COMODITY       .285          .404          .333          .428          .476          .333
SOLAR          .277          .277          .277          .388          .388          .333
SP500          .273          .275          .255          .329          .369          .357
RUS-1000       .263          .251          .229          .29           .334          .321
REGBANKS       .25           .285          .285          .285          .285          .285
DOWJONES       .233          .3            .3            .5            .533          .433
INSURANC       .233          .233          .233          .266          .3            .233
INDEXES        .224          .219          .229          .251          .278          .256
CHEM           .222          .222          .166          .24           .296          .259
NASD-100       .21           .2            .18           .25           .3            .33
GAMING         .208          .208          .208          .25           .291          .291
INDMATER       .205          .243          .205          .307          .346          .282
FIDSTKS        .198          .188          .182          .263          .29           .268
SP-100         .193          .215          .215          .311          .333          .301
RETAIL         .188          .15           .075          .188          .245          .283
CHINA          .183          .2            .2            .166          .333          .266
BIOTECH        .181          .168          .142          .163          .205          .178
HACKERS        .181          .181          .181          .181          .272          .318
SEMI           .17           .179          .153          .162          .23           .239
MILITARY       .156          .093          .062          .156          .187          .187
DJI-13         .153          .153          .153          .461          .461          .23
SOFTWARE       .153          .138          .123          .169          .23           .23
ELECTRON       .148          .148          .117          .135          .179          .179
COAL           .142          .142          .142          .285          .285          .285
COMPUTER       .136          .136          .136          .136          .318          .318
FINANCE        .133          .155          .133          .177          .188          .166
BIG17          .13           .108          .086          .108          .152          .108
INFRA          .111          .166          .083          .222          .305          .305
NIFTY          .105          .122          .122          .14           .192          .175
ETFS           .086          .137          .086          .172          .224          .155
OILGAS         .08           .1            .08           .134          .12           .114
PIPELINE       .076          .23           .115          .153          .115          .076
BONDFUND       .047          .028          .057          .066          .057          .047
BIGBANKS       0             0             0             0             0             0
GUNS           0             0             0             .117          .294          .294
|
====================================================================
11/21/2018 It's getting very difficult to find technically attractive stocks
to buy. ones which are above their 65-dma, show high
Accumulation and whose Closing Powers are even close
to their yearly highs. I believe that we should try not to
force bullishness on a weakened stock market by
over-stating the importance of the Peerless Buy B2, our
weakest buy signal. It will likely turn out that December
will be a better time to buy.
And what does the DJI's new, quick head and shoulder pattern
say?
For me the conclusion I must reach is delay acting
any further on
the Buy B2, and for now stay short our recent Bearish MINCPs.
Tricky markets like this are dangerous. This is a longer hotline
than usual. There is a lot to consider.

Why Is The DJI Going Down?
Is the Fed moving ahead with plans to raise interest rates in
December even as the world's economy stalls? Has President
Trump's combative streak become a liability to Wall Street?
What can a Democratic House really do? Will there be a
stalemate in Congress over raising the Debt limit? Will there be any
impact on the Dollar, the stock market and corporate profits
if the much of the rest of the World believes the US has lost its claim of a
moral high ground by having its President threaten refugees with
bullets and then cover up for the Saudi Premier's role in brutally
murdering a critic. The stock market is signalling problems ahead.
While there should be a bounce soon, there is no guarantee.
Hold our Bearish MINCP shorts longer. Tax loss selling should be
very pronounced this year. Let's also hold off on additional buying.
It's not at all clear what we can safely buy, quite frankly. We
will even consider adding to our shorts if the key ETFs break down
below the lows they made earlier in the year. The Russell-2000
is an example to be considered.
TNA must hold above 55.

The Buy B2 Should Work out, but maybe
not until we go 2%-3% lower on DJIA.
The DJI's decline has come close to the lower 3.5% band. This
gave us a Buy B2 on Tuesday's close. It was not repeated
Wednesday. The July 2006 version of Peerless did not give
any Buy B2. It tended to avoid B2s after any S9s. But our
1928-2018 version of Peerless, which we now use, did give a Buy B2.
Having twice as much data to work with, the newer Peerless
is more month-specific. In certain months, declines to the lower band
cannot be trusted to bring a bounce; but in other months a recovery
usually occurs.
Looking back over all the data in this newer way, we find that Buy B2s
have a good track record even when there has been a recent Sell S9,
though it remains true that we have had only one November S9-B2. That
was in 1980, and it was not reversed until December 10th. It is this
case which was the basis for my somewhat cautionary note Tuesday
night.
But see tonight in the table below that only 5 of the 16 currently
calculated (31%) S9-B2s brought ANY paper loss. The largest loss
was the most recent case, in 2011. The paper loss here was 2.1%.
Such a paper loss now would take the DJI down to about 23900.
The way the DJI refused to bounce on the normally bullish day
before Thanksgiving has to be disconcerting. And as I write this,
the DJI is now down 110. The day after Thanksgiving "should" be
an up-day!
The Hourly DJI's recent head/shoulders pattern
does suggest a
decline to 23750 based on the height of its recent head/shoulders
(circled in pink). Unfortunately for
bulls, we can also make out a
quick head/shoulders pattern in DIA and SPY, too. Further weakness
seems unavoidable.
Right now, all the Tables and indicators
suggest caution. The DJI-30
is not acting as a leader. Or if it is leading at all, it may be leading lower.
|
Cases when a Buy B2 followed a Sell S9 within a month. Sell S9 Buy B9 Outcome for DJIA from B9 ------------------------------------------------------------------- 2/1/1929 2/15/1929 +.057 No paper loss 5/7/1929 5/29/1919 +.069 No paper loss 4/17/1930 5/7/1930 +.043 No paper loss 8/10/1936 8/21/1936 +.178 No paper loss 4/30/1938 5/2/1938 +.071 No paper loss 7/27/1955 8/9/1955 +.046 No paper loss 10/14/1960 10/25/1960 +.239 No paper loss 6/17/1970 7/7/1970 +.063 No paper loss 7/23/1970 8/13/1970 +.325 No paper loss 4/12/1970 5/2/1972 +.032 Paper loss=.011 10/16/1980 10/27/1980 +.059 Paper loss=.008 11/14/1980 12/10/1980 +.062 Paper loss=.008 12/7/1982 12/15/1982 +.079 No paper loss 7/26/1983 8/8/1983 +.097 No paper loss 7/9/1999 7/30/1999 +.043 Paper loss=.001 8/9/2010 8/27/2010 +.262 No paper loss 5/3/2011 6/3/2011 +.022 Paper loss=.021 ------------------------------------------------------------------ 11/7/2018 11/20/2018 ? |
 |
What To Do?
What do we do? Cover some short sales on additional weakness.
As for buying, that is a problem. What is there to buy, except for a
small bounce? November Buy B2s show a median gain of only 6%.
With the upside limited, we should be careful and probably consider any
purchases here to be simple trades. From Table 3, we can see that only
Utilities show a majority of their component-stocks are above their
65-day ma resistance levels. A lot of technical damage has been done.
Ordinarily, I would recommend DIA since all the other major market
ETFs (SPY, QQQ, IWM, MDY, TECL, SOXL, IBB) have negative
ITRS readings, meaning that they are down more than the DJI
over the last 50 trading days. See Table 1 below.
DIA or SPY will probably work out as a long, especially if you wait to buy
the second half of a position in it until its Closing Power downtrend is broken.
Professionals need to show that they have stopped selling and a ready to
propel prices higher. Their becoming new buyers again might also mean that
the Fed hawks will relent in December.
 |
 |
What Looks Good? Not
Much.
For now DIA has a big problem now. Whereas in the bull market,
the highest priced DJIA-30 stocks (BA, GS, MMM, HD, United Health
Care) gave big boosts by their inordinate indivudual advances from time
time, now all the highest priced individual DJI stocks are acting much more
weakly than the Index itself. And they may get even weaker.
Goldman Sachs looks terrible technically. (It shows Low AI/200,
negative IP21 and falling Closing Power which is weaker than its price
action and negativeRelative strength). BA, the highest priced
stock in the DJI. is hovering just above the key 20%-down-from-its
peak and therefore seems very vulnerable. The second highest priced
DJIA-30 stock (United Health Care) is under heavy Professional selling
pressure. Its Closing Power is making new lows far ahead of prices.
Its enrollments for senior health care must not look good. Making DIA
all the more problematic is that its most defensive components, except
for MCD, namely KO, PFE, MRK and PG are now being sold by
profit-takers who are grabbing anything they can get from the market.
So, I would now wait for its Closing Power to be violated to buy DIA
the second half of a DIA position for this Buy B2.
I would avoid IWM and QQQ because of their relative weakness
versus the DJI. IWM is vulnerably perched just above its yearly lows.
A Few Techs May Bounce in December
The market is clearly on the defensive. The NASDAQ's NASDJI
indicator is negative. Many of the leading tech giants' stocks are down
more than 20% from their highs, thus putting them in so-called "bear
market" territory. The current inhabitants of this bearish realm were the
biggest leaders of the 2009-2018 bull market. There are a few that
are not down 20% from their highs. They are the ones I would favor
now because of the Buy B2. But I would also sell them quickly if they
rally 10% or fall below the 20%-down-from-peak level.
Pct below Year's High
-----------------------
AAPL -24%
ADBE - 18%
AMAT - 43%
AMZN - 25%
BA - 19%
BIDU -25%
FB - 38%
GOOG - 18%
MSFT - 11%
NFLX - 37%
NVDA - 50%

|
Charts 11/21/2018 PEERLESS DJI, Signals, Indicators Daily DJI Volume 10-DayUp/Down Vol Hourly DJIA A/D Line for All Stocks Inverted Traders Index NASDAQ S&P OEX NYSE COMPQX DJI-15 DJI-20 DJI-30 DIA SPY QQQ MDY IWM TNA Short-Term Rates USO-CrudeOil DBO FAS GLD BBH IBB JETS JNUG KOL NUGT OIH OIL RSX RETL SDS AGQ SLV SOXL TECL TMF TNA UGA (gasoline) XIV YINN Commodities: CANE CORN DBC JJC, NIB, CHOC CORN, CUT (paper) MOO, SOYB WEAT UUP (Dollar) LIT (Lithium) AAPL ADBE ALXN AMAT AMGN AMD AMZN BA BABA BAC BIDU CAT CVX DE FB GOOG GS HD IBM INTU JPM M (Macy's) MSFT NFLX NVDA QCOM TSLA TXN XOM WMT CMG , LRCX, SWKS, MDGL SPPI WATT SQ TOWN 11/21/2018 (Click on Underlined link.) Bullish MAXCPs - http://tigersoft.com/MAXCPZ/Nov-21/BULLISH.htm Bearish MAXCPs - http://tigersoft.com/MINCPZ/Nov-21/BEARISH.htm |
Table 1 QUICKSILVER on ETFS - 11/21/18 ETF CLOSE CHANGE PIVOT-PT 5-dma AROC CL-PWR CANDLE IP21 ITRS --------------------------------------------------------------------------------------------- --------------------------------------------------------------------------------------------- DIA 244.65 .15 253.22 -124.9% Bearish RED -.089 ---- --------------------------------------------------------------------------------------------- SPY 265.02 .9 273.02 -95.9% Bearish RED -.044 -.023 --------------------------------------------------------------------------------------------- QQQ 160.37 1.21 168.09 -146.9% Bearish RED -.047 -.062 --------------------------------------------------------------------------------------------- MDY 333 3.63 339.56 -36.3% ------- BLUE -.003 -.043 --------------------------------------------------------------------------------------------- IWM 148.03 2.04 151.58 -47.5% Bearish BLUE -.037 -.072 --------------------------------------------------------------------------------------------- FAS 57.39 .42 61.19 -160.4% Bearish RED .024 -.156 --------------------------------------------------------------------------------------------- SOXL 92.59 1.09 106.88 -228.3% Bullish RED .035 -.318 --------------------------------------------------------------------------------------------- TECL 99.58 1.79 118.38 -482.5% Bearish RED -.055 -.314 --------------------------------------------------------------------------------------------- IBB 102.8 .62 104.15 42.6% Bearish ---- -.081 -.065 --------------------------------------------------------------------------------------------- GLD 115.86 .19 114.77 52.9% ------- RED -.019 .075 --------------------------------------------------------------------------------------------- RSX 20.86 .58 21.09 45.6% Bearish BLUE .083 .115 |
 Table 2   Count of Stocks in Key Directories
          2018-11-21
-------------------------------
NEWHIGHS       21
NEWLOWS        100  Bearish
MAXCP          16
MINCP          147  Bearish
TTTNH          39
TTTNL          106  Bearish
FASTUP         85
FASTDOWN       178  Bearish
CPCROSSA       71   Professionals did turn more positive than negative.
CPCROSSD       42
BIGVOLUP       1
BIGVODN        5
ACCUMVER       7
LOWACCUM       524  Heavy Big Money Selling.
REDSELL        317  Heavy Big Money Selling.
TRAPDOOR       51   Dumping continues.
|
Table 3 RANKING OF KEY DIRECTORIES BASED PCT.OF STOCKS ABOVE 65-DMA Bearish = 42
Bullish = 1
11/21/18
---------------------------------------------------------------------------------------
Directory Current day-1 day-2 day-3 day-4 day-5
----------------------------------------------------------------------------------------
UTILITY .7 .725 .8 .75 .725 .775
===============================================================================================
EDU .5 .5 .5 .5 .5 .5
GOLD .5 .4 .4 .44 .36 .26
JETS .5 .4 .4 .5 .6 .6
===============================================================================================
FOOD .428 .357 .428 .464 .339 .339
REIT .407 .401 .427 .414 .355 .407
COMODITY .404 .333 .428 .476 .333 .357
BEVERAGE .388 .333 .5 .444 .388 .388
GREEN .347 .26 .391 .391 .391 .304
HOSPITAL .333 .291 .333 .333 .375 .416
AUTO .307 .205 .256 .256 .307 .282
DOWJONES .3 .3 .5 .533 .433 .366
^^^^^^^^
REGBANKS .285 .285 .285 .285 .285 .214
SOLAR .277 .277 .388 .388 .333 .222
SP500 .275 .255 .329 .369 .357 .315
^^^^^
RUS-1000 .251 .229 .29 .334 .32 .274
^^^^^^^^
TRANSP .25 .15 .25 .3 .3 .25
INDMATER .243 .205 .307 .346 .282 .217
HOMEBLDG .235 .176 .117 .176 .176 .117
INSURANC .233 .233 .266 .3 .233 .166
PIPELINE .23 .115 .153 .115 .076 .115
CHEM .222 .166 .24 .296 .259 .222
SP-100 .215 .215 .311 .333 .301 .29
^^^^^^
INDEXES .213 .229 .251 .278 .256 .235
GAMING .208 .208 .25 .291 .291 .291
CHINA .2 .2 .166 .333 .266 .183
NASD-100 .2 .18 .25 .3 .33 .26
^^^^^^^^
FIDSTKS .188 .182 .263 .29 .268 .241
HACKERS .181 .181 .181 .272 .318 .272
SEMI .179 .153 .162 .23 .239 .162
INFRA .166 .083 .222 .305 .305 .194
BIOTECH .165 .142 .163 .205 .178 .136
FINANCE .155 .133 .177 .188 .166 .144
DJI-13 .153 .153 .461 .461 .23 .153
^^^^^^
RETAIL .15 .075 .188 .245 .283 .339
ELECTRON .148 .117 .135 .179 .179 .111
COAL .142 .142 .285 .285 .285 .285
SOFTWARE .138 .123 .169 .23 .23 .184
ETFS .137 .086 .172 .224 .172 .12
COMPUTER .136 .136 .136 .318 .318 .181
NIFTY .122 .122 .14 .192 .175 .14
BIG17 .108 .086 .108 .152 .108 .086
OILGAS .1 .08 .134 .12 .107 .1
MILITARY .093 .062 .156 .187 .187 .156
BONDFUND .028 .057 .066 .057 .047 .047
BIGBANKS 0 0 0 0 0 0
GUNS 0 0 .117 .294 .294 .235
|
====================================================================
11/20/2018 Today produced a reversing Peerless Buy B2. These are
based on DJI declines very close to the lower band in certain
months, but especially November and December. A
rally
back to the upper band would seem the most likely
scenario in December. Defensive blue chips rather than
tech stocks will probably continue to be favored. See below how
far into negative territory the relative strength "NASDJI"
indicator is on our NASDAQ chart.

All the past November B2s occurred in Bull Markets.
Past November Buy B2s alway signalled profitable buy-points,
though most often they do show small paper losses
before the DJI rallies to the upper band or higher. The
median
gain is onlyabout 6% and the median loss is about 1.1%.
However, since none of the earlier November Buy B2s reversed
a Sell S9, I would have to suspect we will see somewhat lower
prices next week, after the Thanksgiving bounce. The good
news is that our most important internal strength oscillattors
(P-I, IP21, Obv-Pct and V-I) are each higher now than the last
time the DJI was at this level and the current Accumulation
Index is actually positive.
Below is a list of all the first November Buy B2s going
back to 1929. (I say "first" because sometimes there were
two or more B2s before the DJI rallied.) Note, too, this list
excludes five instances where there was also a coinciding
Buy B9, based on the P-Indicator being positive at the lower
band. There was no coincident B9 here but the P-Indicator today
was clearly negative.
First November B2s (tagging the lower
DJI
Gain when Biggest Paper Loss
Reversed
11/29/1938 +.05
(5%) none
la/ma= .968 aroc= -.414 P= -65 (+19) IP21= -.058 VI=
-158 OBVPct= -.014 65dpch= + .023
----------------------------------------------------------------------------------
11/27/1940
+.017
-.011 (12/23/1940)
la/ma= .969 aroc= -.142 P= -29 (-16) IP21= -.088 VI=
-57 OBVPct= -.005 65dpch= +.026
----------------------------------------------------------------------------------
11/6/1950
+.058
-.023 (11/30/1950)
la/ma= .974 aroc= -.385 P= -4 (+32) IP21= +.025 VI=
-105 OBVPct= +.110 65dpch= +.053
----------------------------------------------------------------------------------
11/20/1956
+.048
-.007 (11/28/1956)
la/ma= .970 aroc= -.393 P= -84 (-23) IP21= -.135 VI=
-290 OBVPct= -.317 65dpch= -.089
----------------------------------------------------------------------------------
11/10/1976
+.065
none
la/ma= .976 aroc= -.211 P= -39(+32) IP21= +.058
VI= -2 OBVPct= -.066 65dpch= -.061
----------------------------------------------------------------------------------
11/16/1984
+.086
-.013
la/ma= .976 aroc= -.366P= -33(-67) IP21= -.071
VI= -6 OBVPct= -.147 65dpch= -.010
----------------------------------------------------------------------------------
11/11/1988
+.124
-.015
la/ma= .963 aroc= -.367P= -133(-50) IP21= .025
VI= -15 OBVPct= -.053 65dpch= +.013
----------------------------------------------------------------------------------
11/12/2012
+.184
-.015
la/ma= .972 aroc= -.477P= -48(+26) IP21=- .152
VI= -106 OBVPct= +.030 65dpch= -.028
----------------------------------------------------------------------------------
Average Gain = +8.1% Median Gain = +6.1% Avg. Paper
Loss = 1.1%
11/20/2018
+.184
-.015
la/ma= .970 aroc= -.401 P= -164(-75) IP21=+.04
VI= -129 OBVPct= +.01 65dpch= -.20
|
Charts 11/20/2018 PEERLESS DJI, Signals, Indicators Daily DJI Volume 10-DayUp/Down Vol Hourly DJIA A/D Line for All Stocks Inverted Traders Index NASDAQ S&P OEX NYSE COMPQX DJI-15 DJI-20 DJI-30 DIA SPY QQQ MDY IWM TNA Short-Term Rates USO-CrudeOil DBO FAS GLD BBH IBB JETS JNUG KOL NUGT OIH OIL RSX RETL SDS AGQ SLV SOXL TECL TMF TNA UGA (gasoline) XIV YINN Commodities: CANE CORN DBC JJC, NIB, CHOC CORN, CUT (paper) MOO, SOYB WEAT UUP (Dollar) LIT (Lithium) AAPL ADBE ALXN AMAT AMGN AMD AMZN BA BABA BAC BIDU CAT CVX DE FB GOOG GS HD IBM INTU JPM M (Macy's) MSFT NFLX NVDA QCOM TSLA TXN XOM WMT CMG , LRCX, SWKS, MDGL SPPI WATT SQ TOWN 11/20/2018 (Click on Underlined link.) Bullish MAXCPs - http://tigersoft.com/MAXCPZ/Nov-20/BULLISH.htm Bearish MAXCPs - http://tigersoft.com/MINCPZ/Nov-20/BEARISH.htm |
=====================================================================
11/19/2018
Stay Mostly Short.
Let's see if BA and AAPL join AMZN in the
20%-down-from-the-high club. Because of their weight in the Indexes
everyone watches, as long as these three show a falling Closing Power,
there seems little point in calling a bottom even though a bounce around
Thanksgiving usually takes place.
The 11/7/2018 extreme Sell S9 (three negative NNs at the DJI's
upper band, a nearly negative IP21 and an AROC value less
than .28) have been seen only three previous times since 1965.
That is the year when we start getting accurate NYSE up volume
and down volume numbers. These S9s occurred in August 1971,
November 1980 and December 2008. The average subsequent
DJI decline was more than 10%. The November 1980 case did
require a head/shoulders pattern before declining, but it paid no
attention to the normally bullish seasonality around Thanksgiving.
24400
is the present location of DJI's 3.5% lower band
and
marks a 10% decline from peak.


|
Charts 11/19/2018 with Closing Powers, for the most past. PEERLESS DJI, Signals, Indicators Daily DJI Volume 10-DayUp/Down Vol Hourly DJIA A/D Line for All Stocks Inverted Traders Index NASDAQ S&P OEX NYSE COMPQX DJI-15 DJI-20 DJI-30 DIA SPY QQQ MDY IWM TNA Short-Term Rates USO-CrudeOil DBO FAS GLD BBH IBB JETS JNUG KOL NUGT OIH OIL RSX RETL SDS AGQ SLV SOXL TECL TMF TNA UGA (gasoline) XIV YINN Commodities: CANE CORN DBC JJC, NIB, CHOC CORN, CUT (paper) MOO, SOYB WEAT UUP (Dollar) LIT (Lithium) AAPL ADBE ALXN AMAT AMGN AMD AMZN BA BABA BAC BIDU CAT CVX DE FB GOOG GS HD IBM INTU JPM M (Macy's) MSFT NFLX NVDA QCOM TSLA TXN XOM WMT CMG , LRCX, SWKS, MDGL SPPI WATT SQ TOWN 11/19/2018 (Click on Underlined link.) Bullish MAXCPs - http://tigersoft.com/MAXCPZ/Nov-19/BULLISH.htm Bearish MAXCPs - http://tigersoft.com/MINCPZ/Nov-19/BEARISH.htm |
As long as the key key ETFs Closing Powers and the NYSE
ADL are falling, we should let the decline play itself out. Most
likely, we will see a weak Buy B2 at the 3.5% lower band at
about 24400. But let's just wait and see what happens there. A
typical 10% decline from the most recent Sell S9 would, in fact,
take the DJI down to 23600.
It may prove helpful for the bulls that the high priced
DJI and NASDAQ stocks are now being sold off badly. This
shows fear has finally reached the blue chips and what have
long been considered the safest growth stocks. This someimes
occurs in the late stages of a bull market. But my guess is
the Fear out there can get worse, possibly much worse, if
the biggest bank stock of all - JP Morgan - finally goes down
and especially if the DJI breaks its lows of February and March.
BA, AAPL and AMZN


The 23200 support is probably the most important level
to watch. Bear markets all show Sell S9s and/or Sell S12s.
Many show a falling NYSE A/D Line and most show
one or more head/shoulders patterns. But all break decisively
below earlier support levels typically 10% to 13.5% below
their peaks and then begin to plunge.
But can a bear market start when Unemployment is below 4%?
That is the question raised but not answered in a NY Times article
tonight?
https://www.nytimes.com/2018/11/19/business/tech-stocks-markets-slump.html?emc=edit_th_181120&nl=todaysheadlines&nlid=582238941120
This seem contradiction is also what fools the general
public.
The answer is that very low levels of unemployment
are
actually dangerous for the market. They always seem to
bring higher wages, inflation, raises in interest rates,
over-speculation and eventual supply bottlenecks. Occasionally,
levels below 4% delay in bringing a decline, as happened
between 1943-1946, 1951-1956, 1966-1968, 1998-1999,
but they all eventually brought bear markets. We see this
looking at the unemployment numbers in the many of the
years of a market top before a bear market.
Low Unemployment Bear Market
1919 3%
1919-1921
1929 3%
1929-1932
1946 3.9%
1946-1947
1957 3.7%
1957-1958
1968 3.4%
1969-1970
2000 3.7%
2000-2003
Table 1 QUICKSILVER on ETFS - 11/19/18 ETF CLOSE CHANGE PIVOT-PT 5-dma AROC CL-PWR CANDLE IP21 ITRS --------------------------------------------------------------------------------------------- --------------------------------------------------------------------------------------------- DIA 249.86 -4.19 253.06 -86.1% Bearish RED -.01 ------ --------------------------------------------------------------------------------------------- SPY 269.1 -4.63 272.06 -63.7% Bearish RED .028 -.031 --------------------------------------------------------------------------------------------- QQQ 162.06 -5.44 166.47 -128.1% Bearish RED -.004 -.073 --------------------------------------------------------------------------------------------- MDY 335.11 -4.66 337.48 -34.9% ------- RED .028 -.06 --------------------------------------------------------------------------------------------- IWM 148.86 -3.08 150.55 -71.9% Bearish RED -.002 -.093 --------------------------------------------------------------------------------------------- FAS 60.33 -1.14 61.19 -20.6% ------- RED .066 -.147 --------------------------------------------------------------------------------------------- SOXL 91.07 -11.99 95.94 -73.2% Bullish RED .093 -.392 --------------------------------------------------------------------------------------------- TECL 104.42 -13.52 114.46 -420.8% Bearish RED .007 -.299 --------------------------------------------------------------------------------------------- IBB 102.8 -2.25 104.03 -79.4% Bearish RED -.078 -.093 --------------------------------------------------------------------------------------------- GLD 115.67 .05 113.7 87.8% Bearish BLUE -.016 .057 --------------------------------------------------------------------------------------------- |
Table 2   Count of Stocks in Key Directories
          2018-11/19
-------------------------------
NEWHIGHS       48
NEWLOWS        209
MAXCP          24
MINCP          309
TTTNH          38
TTTNL          317
FASTUP         80
FASTDOWN       279
CPCROSSA       27
CPCROSSD       321
BIGVOLUP       2
BIGVODN        9
ACCUMVER       9
LOWACCUM       528
REDSELL        313
AUGSELS7       41
TRAPDOOR       51
|
 Table 3   RANKING OF KEY DIRECTORIES BASED PCT.OF STOCKS ABOVE 65-DMA
           11/19/18
Bearish = 42 Bullish = 1 --------------------------------------------------------------------------------------- Directory Current day-1 day-2 day-3 day-4 day-5 ---------------------------------------------------------------------------------------- UTILITY .8 .75 .725 .775 .8 .8 =========================================================================================== BEVERAGE .5 .444 .388 .388 .388 .444 DOWJONES .5 .533 .433 .366 .433 .433 EDU .5 .5 .5 .5 .666 .833 =========================================================================================== DJI-13 .461 .461 .23 .153 .23 .23 COMODITY .428 .476 .333 .357 .261 .309 FOOD .428 .464 .339 .357 .25 .321 REIT .427 .414 .355 .401 .414 .427 GOLD .4 .44 .36 .26 .18 .18 JETS .4 .5 .6 .6 .6 .4 GREEN .391 .391 .391 .304 .304 .26 SOLAR .388 .388 .333 .222 .166 .166 HOSPITAL .333 .333 .375 .416 .416 .416 SP500 .329 .369 .357 .315 .361 .355 SP-100 .311 .333 .301 .29 .333 .311 INDMATER .307 .346 .282 .23 .256 .269 RUS-1000 .29 .334 .32 .277 .32 .314 COAL .285 .285 .285 .285 .571 .428 REGBANKS .285 .285 .285 .214 .25 .178 INSURANC .266 .3 .233 .2 .233 .233 FIDSTKS .263 .29 .268 .236 .258 .241 AUTO .256 .256 .307 .282 .256 .23 INDEXES .251 .278 .256 .235 .229 .235 GAMING .25 .291 .291 .291 .25 .25 NASD-100 .25 .3 .33 .25 .27 .27 TRANSP .25 .3 .3 .25 .2 .2 CHEM .24 .296 .259 .222 .203 .185 INFRA .222 .305 .305 .222 .222 .194 RETAIL .188 .245 .283 .32 .433 .452 HACKERS .181 .272 .318 .272 .272 .272 FINANCE .177 .188 .166 .144 .155 .111 ETFS .172 .224 .172 .12 .103 .086 SOFTWARE .169 .23 .23 .184 .215 .23 CHINA .166 .333 .266 .183 .166 .15 SEMI .162 .23 .239 .162 .153 .136 BIOTECH .16 .205 .178 .144 .176 .186 MILITARY .156 .187 .187 .156 .218 .25 PIPELINE .153 .115 .076 .115 .076 .076 NIFTY .14 .192 .175 .14 .157 .157 COMPUTER .136 .318 .318 .181 .272 .272 ELECTRON .135 .179 .179 .111 .111 .111 OILGAS .134 .12 .107 .1 .107 .107 GUNS .117 .294 .294 .235 .294 .235 HOMEBLDG .117 .176 .176 .117 .117 .117 BIG17 .108 .152 .108 .086 .195 .195 BONDFUND .066 .057 .047 .047 .066 .057 BIGBANKS 0 0 0 0 .142 0 |
====================================================================
11/16/2018 I take the 11/7/2018 Sell S9 to still be guiding us.
To turn seasonally bullish short-term now, we will need to see
a breaking of the major ETFs falling Closing Powers' downtrend-lines
and the NYSE A/D Line downtrend. Traders are, of course,
looking for a seasonal bounce.
Given the overall bearishness of Sell S9s, I think we have to hold off
most buying here until there is either more weakness or until these
CP and ADL down-trend-liness are violated. And if these downtrends
are broken, I would simply be inclined to buy more of our Bullish
MAXCP stocks rather major market ETFs. A rally this week would
be in keeping with recoveries in the market just before Thanksgiving.
But a rally on rising volume and improving breadth may also show that the
Fed is becoming more "dovish" because fears that a world-wide
economic slow-down is developing. But twice before, November Sell S9s
denied any Thanksgiving bounce. (1931 and 1980) Remember, too, that
the four previous "extreme" Sell S9s each brought a decline of 10% or
more in the DJI.
 |
 |
 |
The Tiger 6-day Inverted Traders Index (above) has turned up. (Use the Older
2006 Peerless to produce this chart using DJIA data + Signals(1) +
Inverted Traders' Index - small 'b' signals.) For short-term
traders this is clearly a helpful tool. But my research suggests
limiting most buying after a Buy 'b' to situations where the Inverted
Traders Index turns up from below 0 and the DJI is then not much
above the 21-day ma. The 2% band then becomes the target.
I will put the parameters shown above in the 11/18/2018 version
of Peerless on the ESP page Monday. And I will start providing links
here to this chart each night. But know its limitations.
The Buy 'b' also works best when a support level is being tested or the
DJI has at least tagged the lower 2% band recently. Unfortunately,
it does not tell us how far the bounce will go and it is not entirely
trustworthy soon after a Sell S9, Sell S12 or a completed head/shoulders
pattern.. But it does give notice of a very short-term bounce.
Bullishly, DIA's candle-stick chart now shows two consecutive Blue days.
This means that the DJI has closed considerably above its openings
Thursday and Friday. My own study of DIA, SPY and QQQ candle-sticks
suggests that buying is more reliably done after three
straight blue days
if an upside resistance level was soon about to be overcome. Neither
condition applies here. So, I would have to believe we need other evidence
to be very bullish..
 |
Too Many Bears?
There is a lot of well-advertised bearisness now. Goldman Sachs,
JP Morgan and UBS have taken to issue public warnings about
the very limited upside potential they see now for equities. Still, the
DJI holds up. In fact, we know from past experience that it usually
takes many months for an important top formation to be completed
by the blue-chip DIA. Thus, more upside action is quite possible.
But most likely, the DJI will be forming some kind of head/shoulders
pattern near where it is now. I have mentioned that such formations
were necessary after the similar extreme-divergences of August 1971
and November 1980 before the DJI could make its big decline..
FED Hawks May Relent
My suspicion here is that Professionals in the US are turning
somewhat bullish for the Holiday Season because they sense that
the Fed will not be raising rates in December. The swift decline in
Oil Prices (above) shows declining world demand. A world-wide economic
slowdown developing. That and tighter money is what is worry
the big brokerages now. Surely, one hopes, the FED knows from
history the risks of abruptly raising interest rates when economies
are already weakening. But maybe they have no other way, they think,
of protecting the Dollar against increasing efforts of many countries to
break away from it.
But looking six weeks ahead, a break in the NYSE Adv-Decline
downtrend now should be taken as good reason for accepting this
dovish expectation about the Fed.
Another point: when Peerless has not given a good reversing Buy signal
and the 2%-3.5% lower band has been tested between October and
November, we might want to consider a break in a well-tested ADL
downtrend to be judged a Buy B6. This was one of the Buy signals in
the original Peerless manual from 1981. And as I showed a few nights
ago, Peerless does not alway give a timely buy signal in October or
November, but using a break in the ADL downtrend serves us well.
A/D Trend-Breaks Are Very Useful
for when Peerless Gives no Buy Signal

For Now Trust The "Extreme" Sell S9
I take the current Peerless signal to be the Sell S9 that occurred
the day after the Election (11/7/2018) because the DJI closed 3.6%
over the 21-day ma and three of our key indicators were negative
and the IP21 was less than +.01. Sell S9s in November are
unusual. There have been only 4 prior to our case on 11/7/2018.
In two cases, the DJI fell on average 7.8% and completelt ignored the
frequent bullishness around Thanksgiving. The third case, 2009,
was in a fresh new bull market, so the DJI waited until the new year
to decline. The fourth instance was exceptional, too. It
owed to the generally unexpected victory of the Republican
Trump as President. So, upon further consideration, I conclude
that the 1980 case shown below is the best parallel, though it
is also flawed, since the head/shoulders top in late November
at Thanksgiving then owed to the Fed Chairman Volcker's loud
insistence that the prime rate then might have to go to 20% to cool off
the red hot commodities based inflation. Back then inflation was
much higher and was partly a result of heightened oil/gold/silver
speculation. In our world, now, rates and inflation are much lower.
November Sell S9s since 1929
and covered on next Peerless Buy
DJIA
Gain if Paper Loss
Short Subsequent DJI High
--------------------------------------------------------------
19321114 S9 65.6
.084
none
Bear Market variant. DJI fell to 56.4 on 11/30, just after Thanksgiving.)
19801114 S9 986.35 .053
1000.17 -.014
11/20
DJI fell to 908.4 on 12/10, soon after Thanksgiving.)
20091113 S9 10270.47 -.020
10471.5 -.0195
12/01
DJI did fall to 9908.39 on 2/8/2009, early in the next year.
20161109 S9 18589.69 -.029
19121.6 -.0286
11/29
DJI rallied strongly when Trump elected.
-------------------------------------------------------------------
20181107 S9 25080.50
|
Charts 11/16/2018 with Closing Powers, for the most past. PEERLESS DJI, Signals, Indicators Daily DJI Volume 10-DayUp/Down Vol Hourly DJIA A/D Line for All Stocks NASDAQ S&P OEX NYSE COMPQX DJI-15 DJI-20 DJI-30 DIA SPY QQQ MDY IWM TNA Short-Term Rates USO-CrudeOil DBO FAS GLD BBH IBB JETS JNUG KOL NUGT OIH OIL RSX RETL SDS AGQ SLV SOXL TECL TMF TNA UGA (gasoline) XIV YINN Commodities: CANE CORN DBC JJC, NIB, CHOC CORN, CUT (paper) MOO, SOYB WEAT UUP (Dollar) LIT (Lithium) AAPL ADBE ALXN AMAT AMGN AMD AMZN BA BABA BAC BIDU CAT CVX DE FB GOOG GS HD IBM INTU JPM M (Macy's) MSFT NFLX NVDA QCOM TSLA TXN XOM WMT CMG , LRCX, SWKS, MDGL SPPI WATT SQ TOWN 11/16/2018 (Click on Underlined link.) Bullish MAXCPs - http://tigersoft.com/MAXCPZ/Nov-16/BULLISH.htm Bearish MAXCPs - http://tigersoft.com/MINCPZ/Nov-16/BEARISH.htm |
Table 1 QUICKSILVER on ETFS - 11/16/18 ETF CLOSE CHANGE PIVOT-PT 5-dma AROC CL-PWR CANDLE IP21 ITRS --------------------------------------------------------------------------------------------- --------------------------------------------------------------------------------------------- DIA 254.05 .83 254.22 -118.8% Bearish BLUE -.003 ---- --------------------------------------------------------------------------------------------- SPY 273.73 .71 272.57 -73.8% ------- BLUE .02 -.027 --------------------------------------------------------------------------------------------- QQQ 167.5 -.59 166.33 -120% ------- BLUE -.005 -.054 --------------------------------------------------------------------------------------------- MDY 339.77 .21 337.47 -45.6% ------- BLUE .025 -.059 --------------------------------------------------------------------------------------------- IWM 151.94 .36 151.03 -70.7% Bearish BLUE -.014 -.088 --------------------------------------------------------------------------------------------- FAS 61.47 .28 60.58 -193.6% ------- BLUE .064 -.143 --------------------------------------------------------------------------------------------- SOXL 103.06 -3.82 92.52 -170.9% Bullish BLUE .1 -.309 --------------------------------------------------------------------------------------------- TECL 117.94 -.44 114.1 -418.5% ------- BLUE .043 -.22 --------------------------------------------------------------------------------------------- IBB 105.05 .9 104.45 -128.3% Bearish BLUE -.091 -.087 --------------------------------------------------------------------------------------------- RSX 21.01 -.08 20.36 97.1% Bearish ---- .07 .117 |
 Table 2   Count of Stocks in Key Directories
           2018-11-16
-------------------------------
NEWHIGHS       65
NEWLOWS        110
MAXCP          36
MINCP          115
TTTNH          60
TTTNL          143
FASTUP         70
FASTDOWN       309
CPCROSSA       107
CPCROSSD       50
BIGVOLUP       2
BIGVODN        15
LOWACCUM       515
REDSELL        311
AUGSELS7       40
TRAPDOOR       51
|
Table 3   RANKING OF KEY DIRECTORIES BASED PCT.OF STOCKS ABOVE 65-DMA
          11/16/18
 Bullish = 2
 Bearish = 43
---------------------------------------------------------------------------------------
Directory     Current       day-1         day-2         day-3         day-4         day-5
----------------------------------------------------------------------------------------
UTILITY        .75           .725          .775          .8            .8            .775
DOWJONES       .533          .433          .366          .433          .4            .6
============================================================================================
EDU            .5            .5            .5            .666          .833          .833
JETS           .5            .6            .6            .6            .4            .5
============================================================================================
COMODITY       .476          .333          .357          .261          .309          .5
FOOD           .464          .339          .357          .25           .321          .464
DJI-13         .461          .23           .153          .23           .23           .461
BEVERAGE       .444          .388          .388          .388          .444          .5
GOLD           .44           .36           .26           .18           .18           .36
REIT           .414          .355          .401          .414          .427          .434
GREEN          .391          .391          .304          .304          .26           .347
SOLAR          .388          .333          .222          .166          .166          .222
SP500          .369          .357          .315          .361          .353          .435
INDMATER       .346          .282          .23           .256          .269          .333
RUS-1000       .334          .32           .277          .32           .313          .389
CHINA          .333          .266          .183          .166          .15           .183
HOSPITAL       .333          .375          .416          .416          .416          .416
SP-100         .333          .301          .29           .333          .301          .387
COMPUTER       .318          .318          .181          .272          .272          .454
INFRA          .305          .305          .222          .222          .194          .222
INSURANC       .3            .233          .2            .233          .233          .333
NASD-100       .3            .33           .25           .27           .26           .37
TRANSP         .3            .3            .25           .2            .2            .25
CHEM           .296          .259          .222          .203          .185          .259
GUNS           .294          .294          .235          .294          .294          .294
GAMING         .291          .291          .291          .25           .25           .25
FIDSTKS        .29           .268          .236          .258          .241          .344
COAL           .285          .285          .285          .571          .428          .571
REGBANKS       .285          .285          .214          .25           .178          .214
INDEXES        .278          .256          .235          .229          .235          .278
HACKERS        .272          .318          .272          .272          .272          .409
AUTO           .256          .307          .282          .256          .23           .205
RETAIL         .245          .283          .32           .433          .452          .471
SEMI           .239          .239          .162          .153          .128          .196
SOFTWARE       .23           .23           .184          .215          .23           .323
ETFS           .224          .172          .12           .103          .086          .155
BIOTECH        .202          .178          .144          .176          .186          .268
NIFTY          .192          .175          .14           .157          .14           .28
FINANCE        .188          .166          .144          .155          .111          .166
MILITARY       .187          .187          .156          .218          .25           .375
ELECTRON       .179          .179          .111          .111          .104          .191
HOMEBLDG       .176          .176          .117          .117          .117          .117
BIG17          .152          .108          .086          .195          .195          .239
OILGAS         .12           .107          .1            .107          .107          .114
PIPELINE       .115          .076          .115          .076          .076          .115
BONDFUND       .057          .047          .047          .066          .057          .019
BIGBANKS       0             0             0             .142          0             0
|
====================================================================
11/15/2018 Today seems to have been a One-Day "Flash in the pan".
I would look for a successful test of 24400 and the lower 3.5% band
because of Thanksgiving's bullishness.
After four straight down days, the market was due for an up-day.
But the operative Peerless signal is considered to be the "quintuple
bearish divergence" Sell S9 of November
7th. The three earlier
examples of this signal each produced a decline of more than 10%,
though in two cases (August 1971 and December 2008), the DJI did need
to first complete a head/shoulders pattern before declining.
The bullish seasonality around Thanksgiving and Christmas should boost
the DJI soon and prevent an all-out rupture of the lower 3.5% band.
But if the seasonality does not bring support and December brings
a decline as it did in 1968 and 2007, then I would expect next year
to be quite ugly, despite the general tendency since 1915 of DJI
to rally strongly in the third year in the 4-year Presidential cycle.
(Note that if we look back before 1915, we then see that this 3rd year
being bullish is not an iron-clad guarantee! 1907 was deadly and
1911 was down. And of course, 1987 and 2007 were very bad
after August.)

The 400-point DJI intra-day reversal and rally today saw only 422
more up than down on the NYSE. So, the ADL is still falling. The
major market ETFs' Closing Powers are all still in downtrends. Table
3 actually shows some deterioration, as only two groups (Jets and
Utilities) show a majority of their stocks above their 65-dma.
Volume was too low to be convincing and there's little assurance
that the DJI and the rest of the markets will not fall after their openings.
The declining Closing Powers suggest the weakness will
re-occur
tomorrow and Monday. Then the bullishness of the few days before
Thanksiving week should bring another recovery. At least, that
has been the DJI's pattern since 1965, during which time it rose
just 38.5% of the time in the two trading days after November 15th
but ended up being higher 55.8% of the time in two weeks.
I have suggested we should be looking for a bottom between
the
2.5% and 3.5% lower band in here. A Buy B2 seems likely if
the DJI does decline this much. And then I would expect the
TigerSoft Closing Power and the TigerSoft Day Traders Tool
downtrends will likely be broken in time for a typical December
rally or perhaps only long enough to form a bearish head/shoulders
pattern in the DJI. The ETFs' Closing Power charts are linked to
just below. Study also the key ETFs' Day Traders Tool charts
shown further below tonight. The Traders Tool trend-breaks
have offered us excellent notices of impending price-trend changes.
|
Charts 11/15/2018 with Closing Powers, for the most past. PEERLESS DJI, Signals, Indicators Daily DJI Volume 10-DayUp/Down Vol Hourly DJIA A/D Line for All Stocks NASDAQ S&P OEX NYSE COMPQX DJI-15 DJI-20 DJI-30 DIA SPY QQQ MDY IWM TNA Short-Term Rates USO-CrudeOil DBO FAS GLD BBH IBB JETS JNUG KOL NUGT OIH OIL RSX RETL SDS AGQ SLV SOXL TECL TMF TNA UGA (gasoline) XIV YINN Commodities: CANE CORN DBC JJC, NIB, CHOC CORN, CUT (paper) MOO, SOYB WEAT UUP (Dollar) LIT (Lithium) AAPL ADBE ALXN AMAT AMGN AMD AMZN BA BABA BAC BIDU CAT CVX DE FB GOOG GS HD IBM INTU JPM M (Macy's) MSFT NFLX NVDA QCOM TSLA TXN XOM WMT CMG , LRCX, SWKS, MDGL SPPI WATT SQ TOWN 11/15/2018 (Click on Underlined link.) Bullish MAXCPs - http://tigersoft.com/MAXCPZ/Nov-15/BULLISH.htm Bearish MAXCPs - http://tigersoft.com/MINCPZ/Nov-15/BEARISH.htm |
| ETFs' Charts showing Tiger Day Traders Tools. All are currently Declining DIA. This tells us to expect more weakness than strength after the opening.  |
SPY |
QQQ |
IWM |
Table 1-3
Table 1 QUICKSILVER on ETFS - 11/15/18 ETF CLOSE CHANGE PIVOT-PT 5-dma AROC CL-PWR CANDLE IP21 ITRS --------------------------------------------------------------------------------------------- --------------------------------------------------------------------------------------------- DIA 253.22 2.31 260.09 -173.4% Bearish BLUE-.052 ----- --------------------------------------------------------------------------------------------- SPY 273.02 2.82 277.76 -136.2% Bearish BLUE-.025 -.025 --------------------------------------------------------------------------------------------- QQQ 168.09 2.89 171.52 -188.7% ------- BLUE-.056 -.048 --------------------------------------------------------------------------------------------- MDY 339.56 4.12 342.86 -102.2% ------- BLUE-.018 -.056 --------------------------------------------------------------------------------------------- IWM 151.58 2.13 154.08 -177.5% Bearish BLUE-.082 -.084 --------------------------------------------------------------------------------------------- FAS 61.19 1.88 63.84 -341.5% ------- BLUE .028 -.15 --------------------------------------------------------------------------------------------- RSX 21.09 .42 20.61 2.4% Bearish BLUE-.026 .111 |
Table 2   Count of Stocks in Key Directories
          2018-11-15
-------------------------------
NEWHIGHS       50   NYSE & NASDAQ NHs = 41
NEWLOWS        101  NYSE & NASDAQ NLs = 441
MAXCP          23
MINCP          119  Professionals remain bearish
TTTNH          30
TTTNL          127  Day Traders remain bearish
FASTUP         53
FASTDOWN       472  Bearish Swing Traders predominate
CPCROSSA       135
CPCROSSD       39
BIGVOLUP       2
BIGVODN        12   Big Sellers predominate
ACCUMVER       4
LOWACCUM       524  Lots of big sellers.
TRAPDOOR       51
|
Table 3  RANKING OF KEY DIRECTORIES BASED PCT.OF STOCKS ABOVE 65-DMA
                              11/15/18
Bearish = 44 ... Much technical damage and overhead resistance. Bullish = 2 --------------------------------------------------------------------------------------- Directory Current day-1 day-2 day-3 day-4 day-5 ---------------------------------------------------------------------------------------- UTILITY .725 .775 .8 .8 .775 .75 JETS .6 .6 .6 .4 .5 .6 ============================================================================================ EDU .5 .5 .666 .833 .833 .833 ============================================================================================ DOWJONES .433 .366 .433 .4 .6 .666 GREEN .391 .304 .304 .26 .347 .347 BEVERAGE .388 .388 .388 .444 .5 .5 HOSPITAL .375 .416 .416 .416 .416 .583 GOLD .36 .26 .18 .18 .36 .42 SP500 .357 .315 .361 .353 .435 .471 REIT .355 .401 .414 .427 .434 .407 FOOD .339 .357 .25 .321 .446 .464 SOLAR .333 .222 .166 .166 .222 .222 NASD-100 .33 .25 .27 .26 .37 .42 RUS-1000 .32 .277 .32 .313 .388 .412 COMPUTER .318 .181 .272 .272 .454 .545 HACKERS .318 .272 .272 .272 .409 .5 COMODITY .317 .341 .243 .292 .487 .463 AUTO .307 .282 .256 .23 .205 .307 INFRA .305 .222 .222 .194 .222 .361 SP-100 .301 .29 .333 .301 .387 .419 TRANSP .3 .25 .2 .2 .25 .3 GUNS .294 .235 .294 .294 .294 .352 GAMING .291 .291 .25 .25 .25 .333 COAL .285 .285 .571 .428 .571 .571 REGBANKS .285 .214 .25 .178 .214 .214 RETAIL .283 .32 .433 .452 .471 .528 INDMATER .282 .23 .256 .269 .333 .371 FIDSTKS .268 .236 .258 .241 .344 .365 CHINA .266 .183 .166 .15 .166 .15 CHEM .259 .222 .203 .185 .259 .277 INDEXES .256 .235 .229 .235 .278 .304 SEMI .239 .162 .153 .128 .196 .222 INSURANC .233 .2 .233 .233 .333 .466 DJI-13 .23 .153 .23 .23 .461 .538 SOFTWARE .23 .184 .215 .23 .323 .307 MILITARY .187 .156 .218 .25 .375 .343 ELECTRON .179 .111 .111 .104 .191 .246 BIOTECH .176 .144 .176 .186 .265 .326 HOMEBLDG .176 .117 .117 .117 .117 .176 NIFTY .175 .14 .157 .14 .28 .28 ETFS .172 .12 .103 .086 .155 .172 FINANCE .166 .144 .155 .111 .155 .255 BIG17 .108 .086 .195 .195 .239 .26 OILGAS .107 .1 .107 .107 .114 .147 PIPELINE .076 .115 .076 .076 .115 .153 BONDFUND .047 .047 .066 .057 .019 0 BIGBANKS 0 0 .142 0 0 .285 |
====================================================================
11/14/2018 The market looks bad. We should consider the current Peerless Signal
to be a Sell S9. The DJI's 3.5% lower band is still our target. But once
again an early rally of more than 150 points failed. This is becoming
a pattern. It is very discouraging to the longs and it is meant to be!
Look at all the bearish signs.
Table 1 below shows only the DJI is trying to hold up. The other
indexes and major market ETFs are much weaker.
Table 2 shows that all the non-public trading groups we watch are quite
bearish. Note the high number of LOWACCUM stocks. This
shows Big-Money selling. This is becoming a real problem for
liquidity. Very important is the statistic about Closing Power new lows.
More than 500 were present today. And that included DIA, SPY,
IWM, QQQ and TECL despite their prices not being at new lows, yet!
Our Closing Power book emphasizes the bearishness of such action.

Closing Power New Lows: DIA, SPY and TECL

Table 3 shows that 44 of the 47 stock groups we follow have the
majority of their stocks below their 65 dma.
Each day, there is bad news on a new front. PG&E will likely be sued
for lots of money because of the northern California wild fire. There
already was mounting evidence that Pacific Gas & Electric's power lines
had started the majority of fires in California in the last few years, even
before the recent fire that has probably killed more than a 100 people
in Paradise, what used to be a small town up in the foothills above Sacramento.
SDGE's lobbying for the last two years for protection from such
law suits just increases their apparent culpability. We will be watching
PGE's downtrending Closing Power in the day's ahead. Traders
who sold short British Petroleum after its Gulf Oil explosion in 2010
did well not covering until its Closing Power downtrend was violated.
(Tomorrow in the Bearish MINCPs' Section, I will show these charts).
It is quite bearish that Aggressive professional traders cannot find many
stocks to buy. We see this in the way they are piling into natural gas
futures. See BOIL and UNG among the Bullish MAXCPs. And they
are heavy buyers of the short-ETFs in the SP-500 (like SPXS and SDS)
and the Russell-2000 (like RWM, SRTY and TWM). See below how
RWM's head/shoulder potential top pattern is being destroyed by prices
rising above its potential right shoulder apex that is symmetrical with
the left shoulder apex. RWM looks like it will rally significantly higher
before it reverses when its Closing Power uptrend is violated. This is
another bearish sign for the general market.

I had thought that seasonality and the Republican control of the
Senate would bolster the market more. But the technicals are
just too weak. Since our traders have probably already sold DIA
and FAS already, the effect of the signal-change now is mostly to tell
us to wait for a new Peerless Buy signal to buy DIA again rather than
buying automatically near the lower band or if the DIA's Closing
Power is broken.
I asked myself which is more important: the many Peerless
bearish divergences OR the lack
of big declines in November
and the quick recoveries in December. To answer that I
considered what happened in the last third of the year when there
is a "quintuple severe NC - bearish
divergence" at the
DJI's upper 3% band.
Specifically, what should we do when the DJI tags the full upper band
and not only is the (1) P-Indicator negative, but so is the (2) V-Indicator, the
(3) OBV-Pct, the (4) IP21 is nearly negative (less than .01)
AND the
21-day m.a.'s rate of change annualized ((5) ANNroc) is less than .28
(hardly turned up despite the DJI's rally) and the DJI is not
down more than 3% below where it was 65-days ago (so we eliminate
cases where the DJI is already in a bear market.).
The outcomes of the DJI in the past when these conditions
were all present is clearly quite bearish.
1) 8/16/1971 - The DJI formed a bearish head/shoulders
and fell 11% to a bottom on 11/23/1971, just before Thanksgiving.
2) 10/10/1978 - The DJI immeidately fell 11% and did not bottom
out until 12/18/1978.
3) 12/6/2007 - The DJI quickly formed a rare December
head/shoulders pattern and fell 13.5% until a temporary bottom
was reached on 3/10/2008 in what was to become a 50%-down
14-month bear market.
Stay short a lot more stocks than you are
long. Take the
current Peerless signal to be a reliable Sell S9. Buy RWM.
|
Charts 11/14/2018 PEERLESS DJI, Signals, Indicators Daily DJI Volume 10-DayUp/Down Vol Hourly DJIA A/D Line for All Stocks NASDAQ S&P OEX NYSE COMPQX DJI-15 DJI-20 DJI-30 DIA SPY QQQ MDY IWM TNA Short-Term Rates USO-CrudeOil DBO FAS GLD BBH IBB JETS JNUG KOL NUGT OIH OIL RSX RETL SDS AGQ SLV SOXL TECL TMF TNA UGA (gasoline) XIV YINN Commodities: CANE CORN DBC JJC, NIB, CHOC CORN, CUT (paper) MOO, SOYB WEAT UUP (Dollar) LIT (Lithium) AAPL ADBE ALXN AMAT AMGN AMD AMZN BA BABA BAC BIDU CAT CVX DE FB GOOG GS HD IBM INTU JPM M (Macy's) MSFT NFLX NVDA QCOM TSLA TXN XOM WMT CMG , LRCX, SWKS, MDGL SPPI WATT SQ TOWN 11/14/2018 (Click on Underlined link.) Bullish MAXCPs - http://tigersoft.com/MAXCPZ/Nov-14/BULLISH.htm Bearish MAXCPs - http://tigersoft.com/MINCPZ/Nov-14/BEARISH.htm |
Table 1 QUICKSILVER on ETFS - 11/14/18 ETF CLOSE CHANGE PIVOT-PT 5-dma AROC CL-PWR CANDLE IP21 ITRS --------------------------------------------------------------------------------------------- --------------------------------------------------------------------------------------------- DIA 250.91 -2.15 262.1 -210.5% Bearish RED -.064 ----- --------------------------------------------------------------------------------------------- SPY 270.2 -1.86 280.5 -195.3% Bearish RED -.043 -.03 --------------------------------------------------------------------------------------------- QQQ 165.2 -1.27 174.46 -303.7% Bearish RED -.082 -.065 --------------------------------------------------------------------------------------------- MDY 335.44 -2.04 346.51 -181.2% Bearish RED -.019 -.062 --------------------------------------------------------------------------------------------- IWM 149.45 -1.1 156.99 -258.4% Bearish RED -.087 -.095 --------------------------------------------------------------------------------------------- FAS 59.31 -1.88 65.43 -444.7% Bearish RED -.006 -.171 --------------------------------------------------------------------------------------------- SOXL 97.06 1.12 112.76 -823.8% ------- RED -.01 -.392 --------------------------------------------------------------------------------------------- TECL 110.17 -4.29 134.22 -979.7% Bearish RED -.031 -.278 --------------------------------------------------------------------------------------------- IBB 101.92 -2.11 110.17 -423.8% Bearish RED -.142 -.12 --------------------------------------------------------------------------------------------- RSX 20.67 .43 21.08 -214.3% Bearish BLUE-.07 .088 |
Table 2 Count of Stocks in Key Directories
2018-11-14
-------------------------------
NEWHIGHS 25
NEWLOWS 159 Bearish
MAXCP 26
MINCP 659 Professionals are very bearish.
TTTNH 58
TTTNL 604 Day Traders are very Bearish.
FASTUP 80
FASTDOWN 699 Swing traders are preponderately bearish.
CPCROSSA 32
CPCROSSD 264
BIGVOLUP 2
BIGVODN 21 Much heavy dumping!
ACCUMVER 4
LOWACCUM 512 Heavy big-money distribution.
TRAPDOOR 48 Liquidity problems are growing.
|
Table 3 RANKING OF KEY DIRECTORIES BASED PCT.OF STOCKS ABOVE 65-DMA
11/14/18
Bearish = 44
Bullish = 3
---------------------------------------------------------------------------------------
Directory Current day-1 day-2 day-3 day-4 day-5
----------------------------------------------------------------------------------------
UTILITY .775 .8 .8 .775 .75 .8
JETS .6 .6 .4 .5 .6 .7
EDU .5 .666 .833 .833 .833 .833
============================================================================================
HOSPITAL .416 .416 .416 .416 .541 .541
REIT .401 .414 .427 .434 .407 .394
BEVERAGE .388 .388 .444 .5 .5 .555
DOWJONES .366 .433 .4 .6 .666 .7
^^^^^^^^
FOOD .357 .25 .321 .446 .464 .589
COMODITY .341 .243 .292 .487 .463 .585
RETAIL .32 .433 .452 .471 .509 .528
SP500 .315 .361 .353 .435 .473 .473
^^^^^
GREEN .304 .304 .26 .347 .347 .304
GAMING .291 .25 .25 .25 .291 .333
SP-100 .29 .333 .301 .387 .43 .408
^^^^^^
COAL .285 .571 .428 .571 .571 .428
AUTO .282 .256 .23 .205 .282 .282
RUS-1000 .277 .32 .313 .388 .414 .42
^^^^^^^^
HACKERS .272 .272 .272 .409 .5 .454
GOLD .26 .18 .18 .36 .42 .48
NASD-100 .25 .27 .26 .37 .42 .44
^^^^^^^^
TRANSP .25 .2 .2 .25 .3 .4
FIDSTKS .236 .258 .241 .344 .37 .403
GUNS .235 .294 .294 .294 .352 .352
INDEXES .232 .232 .237 .281 .318 .324
INDMATER .23 .256 .269 .333 .371 .384
CHEM .222 .203 .185 .259 .277 .277
INFRA .222 .222 .194 .222 .361 .388
SOLAR .222 .166 .166 .222 .222 .333
REGBANKS .214 .25 .178 .214 .214 .178
INSURANC .2 .233 .233 .333 .466 .4
CHINA .186 .169 .152 .169 .152 .305
SOFTWARE .184 .215 .23 .323 .307 .292
COMPUTER .181 .272 .272 .454 .545 .454
SEMI .162 .153 .128 .196 .222 .205
MILITARY .156 .218 .25 .375 .343 .343
DJI-13 .153 .23 .23 .461 .538 .538
^^^^^^
FINANCE .144 .155 .111 .155 .266 .211
BIOTECH .142 .176 .186 .265 .331 .342
NIFTY .14 .157 .14 .28 .28 .263
ETFS .12 .103 .086 .155 .172 .241
HOMEBLDG .117 .117 .117 .117 .176 .235
PIPELINE .115 .076 .076 .115 .115 .115
ELECTRON .111 .111 .104 .191 .246 .234
OILGAS .1 .107 .107 .114 .147 .201
BIG17 .086 .195 .195 .239 .26 .369
BONDFUND .047 .066 .057 .019 0 0
BIGBANKS 0 .142 0 0 .285 .142
|
====================================================================
11/13/2018 The Closing Powers are still falling and the major market
ETFs' inverted head and shoulders patterns (namely SPY,
QQQ, OEX, MDY and also the NASDAQ) have
not shown reversals from their right shoulder low-points.
Let's watch the bearish SP-500 ETF SDS, shown below, to see how
its potential Head/Shoulders pattern plays out.
| SDS (Short on SPY) shows a potential head/shoulders pattern. Watch
to see if it can surpass the apex of its right shoulder. That would be very bullish for SDS and bearish for SPY and the general market. Bulls on the general market will want to see SDS's H/S pattern play out bearishly for this reverse ETF.  |
 |
Stay short more Bearish MINCPs than you are long
among the Bullish MAXCPs. Let's wait before buying
DIA or FAS again.
Without another Peerless Buy, most likely the DJI will next
fall to between its 2% and its 3.5% lower band. There
have been a number of declines this deep since 1945
even when Peerless gave no Sell. And think about this: a
decline that deep (to the lower band) could perhaps more easily
occur here since we saw a quadruple negative
non-confirmation
on 11/7/2018 AND the IP21 was
just barely positive as
the DJI closed at the full 3.5% upper band.
.
The key values then were
la/ma = 1.036
AROC = -.118
PI = -53 (+31 daily change)
IP21 = .004
VI = 103
OBVPct = -.036
65-day rate of change = .021
Key values like this can be very bearish. The cases that
proved to be the most bearish were on 10/5/1979 and
12/6/2007. See their charts below. But these same parameters
can prove highly misleading when the market keeps rallying,
as it did just after Trump was elected President. See these
charts below.
Quadruple NNC - 1979 |
Quadruple NNC - 2007 |
Failed Quadruple Sell S9/S12 in November - Trump's Suprise victory. |
DJI's Lower Band Should Hold
Since Novembers and early December very seldom
bring DJI declines below the lower band and these end
quickly with dramatic reversals back up, I think we have
to expect the DJI to go back up if its does fall to the lower
band. Three cases
illustrate what typically happens when
the DJI does decline below the lower band. The DJI then reverses
itself in late November and December. The first was right after the
JFK assassination in 1963. The DJI immediately rebounded.
The the second was when interest rates were going sky high
in late 1980 and the DJI fell to the lower 6.4% band before rallying
right back up to a new high three weeks later. The third occurred
on11/16/1988 with the DJI very briefly falling to the 4.5%
lower band and then quickly zooming back up at the end
of the year.

|
Charts 11/13/2018 PEERLESS DJI, Signals, Indicators Daily DJI Volume 10-DayUp/Down Vol Hourly DJIA A/D Line for All Stocks NASDAQ S&P OEX NYSE COMPQX DJI-15 DJI-20 DJI-30 DIA SPY QQQ MDY IWM TNA Short-Term Rates USO-CrudeOil DBO FAS GLD BBH IBB JETS JNUG KOL NUGT OIH OIL RSX RETL SDS AGQ SLV SOXL TECL TMF TNA UGA (gasoline) XIV YINN Commodities: CANE CORN DBC JJC, NIB, CHOC CORN, CUT (paper) MOO, SOYB WEAT UUP (Dollar) LIT (Lithium) AAPL ADBE ALXN AMAT AMGN AMD AMZN BA BABA BAC BIDU CAT CVX DE FB GOOG GS HD IBM INTU JPM M (Macy's) MSFT NFLX NVDA QCOM TSLA TXN XOM WMT CMG , LRCX, SWKS, MDGL SPPI WATT SQ TOWN 11/13/2018 (Click on Underlined link.) Bullish MAXCPs - http://tigersoft.com/MAXCPZ/Nov-13/BULLISH.htm Bearish MAXCPs - http://tigersoft.com/MINCPZ/Nov-13/BEARISH.htm |
Table 1 QUICKSILVER on ETFS - 11/13/18 ETF CLOSE CHANGE PIVOT-PT 5-dma AROC CL-PWR CANDLE IP21 ITRS --------------------------------------------------------------------------------------------- --------------------------------------------------------------------------------------------- DIA 253.06 -1.16 261.78 -61.2% Bearish RED .016 ----- --------------------------------------------------------------------------------------------- SPY 272.06 -.51 281.01 -55.2% Bearish RED .017 -.036 --------------------------------------------------------------------------------------------- QQQ 166.47 .14 175.58 -109.8% Bearish RED -.017 -.079 --------------------------------------------------------------------------------------------- MDY 337.48 .01 347.85 -76.3% Bearish RED .041 -.066 --------------------------------------------------------------------------------------------- IWM 150.55 -.48 157.41 -132.1% Bearish RED -.008 -.1 --------------------------------------------------------------------------------------------- FAS 61.19 .61 64.93 -71% Bearish BLUE .048 -.164 --------------------------------------------------------------------------------------------- SOXL 95.94 3.42 114.26 -669.4% ------- BLUE .03 -.416 --------------------------------------------------------------------------------------------- TECL 114.46 .36 134.67 -376.9% Bearish RED .034 -.289 --------------------------------------------------------------------------------------------- IBB 104.03 -.42 111.03 -206.2% Bearish RED -.068 -.115 --------------------------------------------------------------------------------------------- GLD 113.7 .04 116.03 -101.6% Bearish ---- -.163 .032 --------------------------------------------------------------------------------------------- RSX 20.24 -.12 21.56 -255% Bearish RED -.049 .056 |
Table 2 Count of Stocks in Key Directories
2018-11-13
-------------------------------
NEWHIGHS 44
NEWLOWS 155 Bearish
MAXCP 20
MINCP 379 Very Bearish - Professionals overwhelmingly bearish
TTTNH 47
TTTNL 275 Bearish - Day Traders
FASTUP 84
FASTDOWN 493 Bearish - Swing traders
CPCROSSA 49
CPCROSSD 78
BIGVOLUP 3
BIGVODN 16
LOWACCUM 494 Big Money - heavy selling.
REDSELL 271
AUGSELS7 27
TRAPDOOR 47
|
Table 3 RANKING OF KEY DIRECTORIES BASED PCT.OF STOCKS ABOVE 65-DMA
11/13/18
Bullish = 4
Bearish = 43
---------------------------------------------------------------------------------------
Directory Current day-1 day-2 day-3 day-4 day-5
----------------------------------------------------------------------------------------
UTILITY .8 .8 .775 .75 .8 .6
EDU .666 .833 .833 .833 .833 .666
JETS .6 .4 .5 .6 .7 .3
COAL .571 .428 .571 .571 .428 .571
=============================================================================================
DOWJONES .433 .4 .6 .666 .7 .5
RETAIL .433 .452 .471 .509 .509 .415
HOSPITAL .416 .416 .416 .541 .541 .541
REIT .414 .427 .434 .407 .394 .309
BEVERAGE .388 .444 .5 .5 .555 .5
SP500 .361 .353 .435 .473 .469 .355
SP-100 .333 .301 .387 .43 .408 .344
RUS-1000 .32 .313 .388 .414 .418 .314
GREEN .304 .26 .347 .347 .304 .26
GUNS .294 .294 .294 .352 .352 .176
COMPUTER .272 .272 .454 .545 .454 .363
HACKERS .272 .272 .409 .5 .454 .363
NASD-100 .27 .26 .37 .42 .43 .32
FIDSTKS .258 .241 .344 .37 .403 .258
AUTO .256 .23 .205 .282 .282 .256
INDMATER .256 .269 .333 .371 .384 .358
FOOD .25 .321 .446 .464 .553 .482
GAMING .25 .25 .25 .291 .333 .208
REGBANKS .25 .178 .214 .214 .178 .107
COMODITY .243 .292 .487 .463 .56 .463
INSURANC .233 .233 .333 .466 .4 .3
DJI-13 .23 .23 .461 .538 .538 .307
INDEXES .229 .235 .278 .315 .32 .283
INFRA .222 .194 .222 .361 .388 .333
MILITARY .218 .25 .375 .343 .343 .281
SOFTWARE .215 .23 .323 .307 .276 .2
CHEM .203 .185 .259 .277 .277 .203
TRANSP .2 .2 .25 .3 .35 .15
BIG17 .195 .195 .239 .26 .391 .217
GOLD .18 .18 .36 .42 .42 .5
BIOTECH .173 .186 .265 .331 .35 .263
CHINA .166 .15 .166 .15 .283 .166
SOLAR .166 .166 .222 .222 .333 .277
NIFTY .157 .14 .28 .28 .263 .192
FINANCE .155 .111 .155 .266 .211 .144
SEMI .153 .128 .196 .222 .205 .188
BIGBANKS .142 0 0 .285 .142 0
HOMEBLDG .117 .117 .117 .176 .235 .176
ELECTRON .111 .104 .191 .246 .234 .185
OILGAS .107 .107 .114 .147 .201 .161
ETFS .103 .086 .155 .172 .241 .155
PIPELINE .076 .076 .115 .115 .115 .115
BONDFUND .066 .057 .019 0 0 0
|
===========================================================================
11/12/2018
Peerless remained on a Buy despite
the multiple negative
non-confirmations at the DJI's 3.6% upper band. Perhaps,
that will turn out to be a mistake. But traders were recently
advised two or three times to lock in profits on DIA and FAS
in expectation of the DJI falling back to its rising 21-day ma.
I just did not expect this to happen in just one day. But now
we will get to see if the DJI will do what I suggested it might,
namely, find support at its rising 21-day ma, where it is now,
And will the NASDAQ, QQQ and SPY construct bullish
inverted head and shoulders patterns? (See their charts below
the hotline's text tonight.).
First, let's consider the main reason given for the big DJI decline.
According to Bloomberg, the declined mostly owed to news
that Goldman Sachs used bribes to get business in Malaysia.
https://www.bloomberg.com/news/articles/2018-11-12/goldman-shares-tumble-to-2016-levels-as-1mdb-pressure-mounts?srnd=premium
This "ugly" truth about GS may have surprised some of the
Public, but seasoned and cycnical traders on Wall Street
mostly consider it just the cost of doing business there. So,
now we are seeing another turn-around Tuesday in progress.
The big question is will tonight's +120 point recovery
continue.
Today's breadth was not nearly so bearish as a 600-point DJI
decline might usually warrant. In addition, there were 119
new highs on the NYSE and NASDAQ. This number
is a lot more bullish than we would expect if a new bear market
was about to be starting. And some of the Bullish MAXCPs
are starting to look good enough to buy.
But the Professionals, Day-Traders and Swing Traders are all
preponderately bearish. See Table 2. In addition, the major market
ETFs' Closing Powers all display the word "bearish" on their charts and
now have declining CP trendlines. Moreover, Table 3 shows that
about 80% of all common stocks are below the resistance
of their 65-dma. So, the DJI will be asked to do the "heavy-lifting"
once again. But that won't be easy with high-priced GS under a
cloud. And look at the completed head/shoulders pattern shown
by AAPL. Let's wait and see if Warren Buffet buys more AAPL
just before AAPL announces another big buy-back. I doubt if
the DJI can make a sustained advance so long as within the DJI-30,
it is mostly defensive stocks like MRK, PFE, MCD and PG that
show price and IP21 strength.
For now, let's stay short more MINCPs than MAXCPs. That is
stance of our Stocks' Hotline. I also would prefer to wait to buy DIA
at its lower 3% band or after I see its Closing Power downtrend broken.

 |
 |
 |
 |
|
Charts 11/12/2018 PEERLESS DJI, Signals, Indicators Daily DJI Volume 10-DayUp/Down Vol Hourly DJIA A/D Line for All Stocks NASDAQ S&P OEX NYSE COMPQX DJI-15 DJI-20 DJI-30 DIA SPY QQQ MDY IWM TNA Short-Term Rates USO-CrudeOil DBO FAS GLD BBH IBB JETS JNUG KOL NUGT OIH OIL RSX RETL SDS AGQ SLV SOXL TECL TMF TNA UGA (gasoline) XIV YINN Commodities: CANE CORN DBC JJC, NIB, CHOC CORN, CUT (paper) MOO, SOYB WEAT UUP (Dollar) LIT (Lithium) AAPL ADBE ALXN AMAT AMGN AMD AMZN BA BABA BAC BIDU CAT CVX DE FB GOOG GS HD IBM INTU JPM M (Macy's) MSFT NFLX NVDA QCOM TSLA TXN XOM WMT CMG , LRCX, SWKS, MDGL SPPI WATT SQ TOWN 11/12/2018 (Click on Underlined link.) Bullish MAXCPs - http://tigersoft.com/MAXCPZ/Nov-12/BULLISH.htm Bearish MAXCPs - http://tigersoft.com/MINCPZ/Nov-12/BEARISH.htm |
Table 1 QUICKSILVER on ETFS - 11/12/18 All major market US ETFs are under-performing DJIA. ETF CLOSE CHANGE PIVOT-PT 5-dma AROC CL-PWR CANDLE IP21 ITRS --------------------------------------------------------------------------------------------- --------------------------------------------------------------------------------------------- DIA 254.22 -5.87 256.23 -5% Bearish RED -.014 ------ --------------------------------------------------------------------------------------------- SPY 272.57 -5.19 275.12 -14.8% Bearish RED .003 -.039 --------------------------------------------------------------------------------------------- QQQ 166.33 -5.19 170.24 -76.4% Bearish RED -.006 -.087 --------------------------------------------------------------------------------------------- MDY 337.47 -5.39 342.72 -47.8% Bearish RED .056 -.072 --------------------------------------------------------------------------------------------- IWM 151.03 -3.05 154.64 -91.7% Bearish RED .027 -.105 --------------------------------------------------------------------------------------------- FAS 60.58 -3.26 62.09 -46.5% ------- RED .026 -.168 --------------------------------------------------------------------------------------------- SOXL 92.52 -13.95 110.3 -632.5% ------- RED .035 -.428 --------------------------------------------------------------------------------------------- TECL 114.1 -13.63 124.03 -307.3% Bearish RED .027 -.303 --------------------------------------------------------------------------------------------- RSX 20.36 -.25 21.31 -254.7% Bearish RED -.03 .038 |
Table 2 Count of Stocks in Key Directories
2018-11-12
Professionals, Dat Traders and Swing-Traders are all bearish.
-------------------------------
NEWHIGHS 56
NEWLOWS 167 Bearish
MAXCP 25
MINCP 393 Very Bearish
TTTNH 49
TTTNL 477 Bearish
FASTUP 117
FASTDOWN 425 Bearish
CPCROSSA 44
CPCROSSD 376
BIGVOLUP 1
BIGVODN 9
TRAPDOOR 46
|
Table 3
RANKING OF KEY DIRECTORIES BASED PCT.OF STOCKS ABOVE 65-DMA
11/12/18
Bearish = 45
Bullish = 2
---------------------------------------------------------------------------------------
Directory Current day-1 day-2 day-3 day-4 day-5
----------------------------------------------------------------------------------------
EDU .833 .833 .833 .833 .666 .666
UTILITY .8 .775 .75 .8 .6 .575
==========================================================================================
RETAIL .452 .471 .509 .509 .396 .339
BEVERAGE .444 .5 .5 .555 .5 .388
COAL .428 .571 .571 .428 .571 .571
REIT .427 .434 .407 .394 .302 .25
HOSPITAL .416 .416 .541 .541 .541 .541
DOWJONES .4 .6 .666 .7 .5 .433
JETS .4 .5 .6 .7 .3 .3
SP500 .353 .435 .473 .469 .353 .291
FOOD .321 .446 .464 .553 .482 .571
RUS-1000 .313 .388 .414 .418 .314 .263
SP-100 .301 .387 .43 .408 .344 .322
GUNS .294 .294 .352 .352 .176 .117
COMODITY .292 .487 .463 .56 .463 .56
COMPUTER .272 .454 .545 .454 .363 .318
HACKERS .272 .409 .5 .454 .363 .318
INDMATER .269 .333 .371 .384 .358 .333
GREEN .26 .347 .347 .304 .26 .217
NASD-100 .26 .37 .42 .43 .31 .26
GAMING .25 .25 .291 .333 .25 .291
MILITARY .25 .375 .343 .343 .281 .125
FIDSTKS .241 .344 .37 .403 .252 .225
INDEXES .235 .278 .315 .32 .283 .283
INSURANC .233 .333 .466 .4 .3 .3
AUTO .23 .205 .282 .282 .256 .23
DJI-13 .23 .461 .538 .538 .307 .307
SOFTWARE .23 .323 .307 .276 .2 .169
TRANSP .2 .25 .3 .35 .15 .1
BIG17 .195 .239 .26 .391 .217 .195
INFRA .194 .222 .361 .388 .305 .166
CHEM .185 .259 .277 .277 .203 .203
BIOTECH .184 .265 .331 .35 .263 .255
GOLD .18 .36 .42 .42 .5 .56
REGBANKS .178 .214 .214 .178 .107 .142
SOLAR .166 .222 .222 .333 .277 .222
CHINA .15 .166 .15 .283 .183 .15
NIFTY .14 .28 .28 .263 .192 .157
SEMI .128 .196 .222 .205 .188 .17
HOMEBLDG .117 .117 .176 .235 .176 .117
FINANCE .111 .155 .266 .211 .144 .1
OILGAS .107 .114 .147 .201 .167 .167
ELECTRON .104 .191 .246 .234 .185 .166
ETFS .086 .155 .172 .241 .155 .137
PIPELINE .076 .115 .115 .115 .115 .076
BONDFUND .057 .019 0 0 0 0
BIGBANKS 0 0 .285 .142 0 0
|
====================================================================
11/9/2018
Remembering Armistice Day
On the Eleventh hour of the Eleventh day of the Eleventh
month
a hundred years ago, an armistice was signed near Paris ending
the horrific World War I in which 16 million people were killed. This
war which no one predicted in 1913 was said to be the war to end
all wars. But soon it caused the bloody civil war in Russia and
sewed the seeds for the even more horrible Second World war
from 1939-1945 in which 80 million people died directly as a result.
Our leaders, and we, too, should study this history, so that we do not
go down the same path again with even more deadly weapons of mass
destruction. Communism is gone, but the Cold War has not ended.
Nor has the Arms' Race. Nor has our economic dependence on military
spending. Today should be a somber day. It used to be known as
"Armistice Day". I like that term. It reminds us of 1918 and makes
us think a little about history whether we are inclined to or not.
Peerless also tells us that history matters. In recent
hotlines
I have explained why Novembers in the second-year of
the four year
Presidential cycle do not ordinarily bring Sell S9s even when internals
are weak at the upper band. Elections often bring on extremes of
partisian optimism. And not without good reason. "Elections have
consequences" or as humorist Will Rogers was wont to say:
"We have the best Congress that money can buy". But this does
not mean there will not be a November decline for the next two weeks.
Just because Peerless does not give a Sell signal does not mean
there can not be a decline to the lower band in this year in a bull market.
Below see what happened since WWII in bull market years in the Novembers
in the second year in the Presidential 4-year cycle, like now. In fact, there
have been no fewer than six such declines to the lower band without
a Peerless Sell.
November Declines To Lower Band
even though there is no Peerless Sell
in Bull Markets after Mid-Term Elections.
Signal
------- Peak ---------- Decline to Lower Band
date DJI
date
DJI
None 11/24/1950
235.5
12/4/1950 222.3
-----------------------------------------------------------------
None
DJI advanced strongly
in Nov and Dec.
despite PI-NNC at UB on 11/5/1954
-----------------------------------------------------------------
None
11/17/1958 567.4
11/25/1958
540.5 (2.3% LB)
-----------------------------------------------------------------
None
11/10/1982 1044.52 12/15/1982
990.49 (LB)
-----------------------------------------------------------------
None
11/4/1986 1899.88
11/18/1986 1819.81
A small H/S was completed here.
-----------------------------------------------------------------
earlier S9 DJI declined until 11/22/1994 at
LB
-----------------------------------------------------------------
None
11/23/1998
9374.27 12/14/1998 8695.61
A H/S was completed here.
-----------------------------------------------------------------
None
2006. DJI rose in Nov and Dec. No decline
to lower band.
-----------------------------------------------------------------
None 11/5/2010
11444.
11/30/2010 10006
The pullback that started on Friday is at an
important short-term
juncture. More weakness Monday after the opening could well
break the still rising Closing Powers. It could break the Hourly
DJI's uptrend. Nor should we be surprised by additional weakness:
(1) The DJI is still 2.5% over its 21-dma. (2) Last Wedneday's trading gaps
probably need to be closed. (3) Volume was not high enough on the
post-election rally to eat up the large amount of stock available over-head
given the preponderance of stocks below their 65-dma. (4) Too much
aggressive buying is being concentrated in the DJI. All the other key
ETFs and INDEX are weaker. See Tables 1 and 3. (5) It's hard to imagine
the DJI surging to new highs led mainly by its defensive and lower-priced
components, MCD, PG, PFE and MRK. Only UNH of the DJI's $200+
stocks is making new highs.
The other nagging problem now for us being bullish is the absence of
attractive Bullish MAXCPs. There are many more Bearish MINCPs.
And the Bearish MINCPs look much more bearish than the Bullish
MAXCPs look bullish.
With the political news taking a back-seat now, the News on the inflation front
will get attention. Last week, the Producer Price Index rose .6% from
September to October. If this continues, the larger CPI will probably be
rising much faster than 3% on a yearly basis. At that rate, the FED will likely
speed up its so far leisurely pace of rate hikes.
So hold some Bearish MINCPs short and consider taking some profits
in DIA and FAS despite the absence of a Peerless sell.


|
Charts 11/09/2018 PEERLESS DJI, Signals, Indicators Daily DJI Volume 10-DayUp/Down Vol Hourly DJIA A/D Line for All Stocks NASDAQ S&P OEX NYSE COMPQX DJI-15 DJI-20 DJI-30 DIA SPY QQQ MDY IWM TNA Short-Term Rates USO-CrudeOil DBO FAS GLD BBH IBB JETS JNUG KOL NUGT OIH OIL RSX RETL SDS AGQ SLV SOXL TECL TMF TNA UGA (gasoline) XIV YINN Commodities: CANE CORN DBC JJC, NIB, CHOC CORN, CUT (paper) MOO, SOYB WEAT UUP (Dollar) LIT (Lithium) AAPL ADBE ALXN AMAT AMGN AMD AMZN BA BABA BAC BIDU CAT CVX DE FB GOOG GS HD IBM INTU JPM M (Macy's) MSFT NFLX NVDA QCOM TSLA TXN XOM WMT CMG , LRCX, SWKS, MDGL SPPI WATT SQ TOWN 11/9/2018 (Click on Underlined link.) Bullish MAXCPs - http://tigersoft.com/MAXCPZ/Nov-09/BULLISH.htm Bearish MAXCPs - http://tigersoft.com/MINCPZ/Nov-09/BEARISH.htm |
Table 1 QUICKSILVER on ETFS - 11/09/18 ETF CLOSE CHANGE PIVOT-PT 5-dma AROC CL-PWR CANDLE IP21 ITRS --------------------------------------------------------------------------------------------- --------------------------------------------------------------------------------------------- DIA 260.09 -2.01 254.48 148.2% ------- RED .087 ----- --------------------------------------------------------------------------------------------- SPY 277.76 -2.74 273.39 106.2% ------- RED .069 -.044 --------------------------------------------------------------------------------------------- QQQ 171.52 -2.94 168.96 62.3% ------- RED .08 -.08 --------------------------------------------------------------------------------------------- MDY 342.86 -3.65 340.76 55% ------- RED .08 -.078 --------------------------------------------------------------------------------------------- IWM 154.08 -2.91 153.88 2.6% Bearish RED .047 -.106 --------------------------------------------------------------------------------------------- FAS 63.84 -1.59 61.17 384.6% ------- RED .055 -.146 --------------------------------------------------------------------------------------------- RETL 40.27 -2.64 40.13 77% Bearish RED .258 -.176 --------------------------------------------------------------------------------------------- SOXL 106.47 -6.29 106.44 -125.7% ------- RED .073 -.356 --------------------------------------------------------------------------------------------- TECL 127.73 -6.49 122 212.2% ------- RED .124 -.243 --------------------------------------------------------------------------------------------- IBB 107.73 -2.44 108.03 -16.9% Bearish RED .011 -.117 --------------------------------------------------------------------------------------------- GLD 114.48 -1.3 116.37 -93.4% Bearish RED -.208 .007 --------------------------------------------------------------------------------------------- RSX 20.61 -.47 21.44 -119.7% Bearish RED .075 .045 |
Table 2 Count of Stocks in Key Directories
2018-11- 09
-------------------------------
NEWHIGHS 78 All NYSE&NASD=156
NEWLOWS 90 All NYSE&NASD=187
MAXCP 35
MINCP 153 Bearish
TTTNH 48
TTTNL 226 Bearish
FASTUP 148
FASTDOWN 274 Swing Traders now Bearish
CPCROSSA 51
CPCROSSD 204 Bearish
BIGVOLUP 1
BIGVODN 23 Bearish
TRAPDOOR 48
|
Table 3
RANKING OF KEY DIRECTORIES BASED PCT.OF STOCKS ABOVE 65-DMA
11/9/18
Bearish = 40
Bullish = 4
---------------------------------------------------------------------------------------
Directory Current day-1 day-2 day-3 day-4 day-5
----------------------------------------------------------------------------------------
EDU .833 .833 .833 .666 .666 .5
UTILITY .775 .75 .8 .6 .575 .325
DOWJONES .6 .666 .7 .5 .433 .466
COAL .571 .571 .428 .571 .571 .571
===========================================================================================
BEVERAGE .5 .5 .555 .5 .388 .222
COMODITY .5 .476 .571 .476 .547 .571
JETS .5 .6 .7 .3 .3 .5
===========================================================================================
RETAIL .471 .509 .509 .396 .339 .339
DJI-13 .461 .538 .538 .307 .307 .307
FOOD .456 .473 .561 .491 .543 .578
COMPUTER .454 .545 .454 .363 .318 .318
SP500 .435 .473 .469 .353 .291 .242
REIT .431 .405 .392 .3 .241 .183
HOSPITAL .416 .541 .541 .541 .541 .5
HACKERS .409 .5 .454 .363 .318 .318
RUS-1000 .388 .414 .418 .314 .263 .224
SP-100 .387 .43 .408 .344 .322 .258
MILITARY .375 .343 .343 .281 .125 .156
NASD-100 .37 .42 .43 .31 .26 .23
GOLD .36 .42 .42 .5 .56 .56
GREEN .347 .347 .304 .26 .217 .26
FIDSTKS .344 .37 .403 .252 .231 .204
INDMATER .333 .371 .384 .358 .32 .32
INSURANC .333 .466 .4 .3 .3 .2
SOFTWARE .323 .307 .276 .2 .169 .184
GUNS .294 .352 .352 .176 .117 .176
INDEXES .283 .315 .32 .283 .283 .219
NIFTY .28 .28 .263 .192 .157 .157
BIOTECH .265 .329 .337 .265 .268 .278
CHEM .259 .277 .277 .203 .203 .203
GAMING .25 .291 .333 .25 .291 .416
TRANSP .25 .3 .35 .15 .1 .1
BIG17 .239 .26 .391 .217 .217 .217
INFRA .222 .361 .388 .305 .166 .166
SOLAR .222 .222 .333 .277 .222 .333
REGBANKS .214 .214 .178 .107 .142 .071
AUTO .205 .282 .282 .256 .23 .23
SEMI .196 .222 .205 .188 .17 .179
ELECTRON .191 .246 .234 .185 .166 .185
CHINA .166 .15 .283 .183 .15 .2
ETFS .155 .172 .241 .155 .137 .12
FINANCE .155 .266 .211 .144 .111 .155
HOMEBLDG .117 .176 .235 .176 .117 0
PIPELINE .115 .115 .115 .115 .076 .038
OILGAS .114 .147 .201 .167 .167 .127
BONDFUND .019 0 0 0 0 0
BIGBANKS 0 .285 .142 0 0 .142
|
====================================================================
11/8/2018
It looks like we will
now see some profit-taking. It's over-due.
Perhaps, the DJI's strength, such as it is, has been designed just to
turn folks' attention away from the considerable weakness in the stock market.
Cynics might argue that the DJI's strength is no longer needed, now
that the Election is over, so, a bigger decline will now follow. That
is not what I expect.
I believe that is being too cynical. The DJI could pull back 800-900
points now and still not violate its 21-day ma, a level that should act as
good support. The operative Peerless signal remains the Buy B5. Without a
a new Peerless Sell, it is likely that any pullback will be limited
and followed by another advance that challenges the year's highs.
The study I did tonight warns us that yesterday's negative key
values in November do not reliably bring a decline to the lower band
despite the DJI having reached the upper 3.5% band.
The DJI's short-term indicators are all rising. The quick inverted
head/shoulders pattern it completed with Wednesday's big 2%+
rally actually sets up a new high above 27200 as the minimum target.
so long as 25200 holds on the next decline.

The major reason, I think, for the strength now is the usual
November-December bullish seasonality and the victory of the
Republicans in getting control of the Senate. Their majority
there could easily last to 2022 by my reckoning. With Trump as
President, corporate interests should be quite safe unless the FED
decides to keep raising rates very sharply. The market may even
enjoy another big leg up next year, if the 1986-1987 scenario
repeats and honors the tradition since 1915 of giving the third
year in the Presidential 4-year cycle average gains almost 3x those
of other years.
A little history may help here. The last time the Dems controlled the
House and the Repubs controlled the Senate was under Republican Reagan
from 1981 to 1989. (This was the only such division of US political
power going back to the XIXth Century.). The point, of course, is that
the 1980s were very good years for the stock market under Reagan
once the Fed stopped raising interest rates to ridiculous levels.
The DJI rose from 787 in August 1982 to 2169 by the end of 1988.
(The Prime Rate was lifted to 20.5% on May 22nd, 1981. That
did cause a 15-month bear market back then. Fortunately, the
Prime Rate is "only" 5.25% now.)
The chart below shows the ascendancy of the Republicans
to control of the Senate as Dems held a majority in
House. November 1980 did bring an S9-sell-off but first
the DJI formed a quick head/shoulders pattern in the week
before Thanksgiving. The DJI then rose to new highs. Only
when Fed Chairman raised rates over 20% did the second
half of 1981 turn into a bear market.
DJI 1980-1981

Once again, the DJI is doing the heavy-lifting for the indexes. Per se,
I am not worried by that. There is ample precedent for that maintaining
a bull market. But it is why I suggested buying DIA and FAS instead
of the NASDAQ, QQQ, SPY or IWM. Let's keep an eye on the DIA's
uptrending short-term indicators, especially its 5-day ma and Closing Power.
Only when these break their uptrends, will the odds then favor a DJI
retreat the support of its 21-dma.
Buy some of the BULLISH MAXCPs, but don't be surprised if the
BEARISH MINCPs remain weak all the way to the end of the year.
| New Research
Cases between 1929 where a November S9 would have occurred if we simply look for the basic negative non-confirmations that were present Wednesday. Only four of the nine would have been points where clearly successful short sales could have been initiated. In two more more cases, there would have been a paper loss bigger than the biggest gain. And in 3 instances, very big losses would have followed. The risks of Selling here using would appear to be at least here as the rewards. Successful 11/7/1932 TestS9 at DJI 64.6. DJI did rally to 68.0, but then fell to 56.4 on 11/30. ---------------------------------------------------------------- Unsuccessful 11/8/1934 TestS9 at 95.5. DJI rose to 102 on 12/7, and then finally fell to 95.3 on 12/20 ---------------------------------------------------------------- Successful 11/12/1936 TestS9 at 183.2. DJI fell to 175.9 on 12/21 ---------------------------------------------------------------- Bad 11/4/1954 TestS9 at 367. DJI then rose to 404.4 at end of year. ---------------------------------------------------------------- Successful 11/13/1980 TestS9 at 982.42 DJI rose to 991.04, but then fell to 908.45 in early Dec. ---------------------------------------------------------------- Unsuccessful 11/20/1997 TestS9 at 7826.61 DJI rose to 8149.13, and then finally fell to 7660.13 ---------------------------------------------------------------- Bad 11/5/1999 TestS9 at 10706.48 DJI rose to 11484.66 but then fell only to 10957.96 ---------------------------------------------------------------- Successful 11/3/2008 TestS9 at 9319.83 DJI fell sharply to 7552.29 in deep bear market. ---------------------------------------------------------------- Bad 11.9/2016 TestS9 at 18589.67 DJI rose sharply in aftermath of Trump election, reaching 19974.62 on 12/20. Code Used For I = 50 To rn ' rn = last record. If MO(I) <> 11 Then 10000 If la(I) / ma(I) < 1.024 Then 10000 ' DJI must be more than 2.4% over 21dma If p(I) > 0 Then 10000 ' PI must be below zero. If NEWIPXXX(I) > .01 Then 10000 ' VI must be below zero. If V21(I) > 0 Then 10000 ' VI must be below zero. pi = I: ms(I) = 9: sells9arrows (pi) ' place test new S9 signal on chart 10000 Next I |
|
Charts 11/08/2018 PEERLESS DJI, Signals, Indicators Daily DJI Volume 10-DayUp/Down Vol Hourly DJIA A/D Line for All Stocks NASDAQ S&P OEX NYSE COMPQX DJI-15 DJI-20 DJI-30 DIA SPY QQQ MDY IWM TNA Short-Term Rates USO-CrudeOil DBO FAS GLD BBH IBB JETS JNUG KOL NUGT OIH OIL RSX RETL SDS AGQ SLV SOXL TECL TMF TNA UGA (gasoline) XIV YINN Commodities: CANE CORN DBC JJC, NIB, CHOC CORN, CUT (paper) MOO, SOYB WEAT UUP (Dollar) LIT (Lithium) AAPL ADBE ALXN AMAT AMGN AMD AMZN BA BABA BAC BIDU CAT CVX DE FB GOOG GS HD IBM INTU JPM M (Macy's) MSFT NFLX NVDA QCOM TSLA TXN XOM WMT CMG , LRCX, SWKS, MDGL SPPI WATT SQ TOWN 11/8/2018 (Click on Underlined link.) Bullish MAXCPs - http://tigersoft.com/MAXCPZ/Nov-08/BULLISH.htm Bearish MAXCPs - http://tigersoft.com/MINCPZ/Nov-08/BEARISH.htm |
Table 1 QUICKSILVER on ETFS - 11/08/18 ETF CLOSE CHANGE PIVOT-PT 5-dma AROC CL-PWR CANDLE IP21 ITRS --------------------------------------------------------------------------------------------- --------------------------------------------------------------------------------------------- DIA 262.1 .32 252.46 163.6% ------- BLUE .009 ----- --------------------------------------------------------------------------------------------- SPY 280.5 -.51 271.89 127.1% ------- BLUE .007 -.041 --------------------------------------------------------------------------------------------- QQQ 174.46 -1.12 169.38 70.1% ------- RED .048 -.069 --------------------------------------------------------------------------------------------- MDY 346.51 -1.34 339.08 113.9% ------- RED -.018 -.075 --------------------------------------------------------------------------------------------- IWM 156.99 -.42 154 113.1% Bearish BLUE-.046 -.093 --------------------------------------------------------------------------------------------- FAS 65.43 .5 59.03 473.4% ------- BLUE-.009 -.143 --------------------------------------------------------------------------------------------- RSX 21.08 -.48 21.12 -11.7% ------- RED .109 .039 |
Table 2 Count of Stocks in Key Directories
20181108
-------------------------------
NEWHIGHS 119
NEWLOWS 63
MAXCP 50
MINCP 153
TTTNH 68
TTTNL 190
FASTUP 250
FASTDOWN 186
CPCROSSA 41
CPCROSSD 164
BIGVOLUP 3
BIGVODN 19
ACCUMVER 2
HIGHIP21 23
HIUPPCT 11
VHIP21 22
LOWACCUM 502
REDSELL 286
AUGSELS7 18
TRAPDOOR 47
|
Table 3
RANKING OF KEY DIRECTORIES BASED PCT.OF STOCKS ABOVE 65-DMA
11/8/18
Bullish = 9 Bearish = 36 --------------------------------------------------------------------------------------- Directory Current day-1 day-2 day-3 day-4 day-5 ---------------------------------------------------------------------------------------- EDU .833 .833 .666 .666 .5 .5 UTILITY .75 .8 .6 .575 .375 .45 DOWJONES .666 .7 .5 .433 .466 .433 JETS .6 .7 .3 .3 .5 .2 COAL .571 .428 .571 .571 .571 .571 COMPUTER .545 .454 .363 .318 .318 .318 HOSPITAL .541 .541 .541 .541 .5 .416 DJI-13 .538 .538 .307 .307 .307 .307 RETAIL .509 .509 .396 .339 .339 .245 ================================================================================================ BEVERAGE .5 .555 .5 .388 .222 .333 HACKERS .5 .454 .363 .318 .318 .318 ================================================================================================ COMODITY .476 .571 .476 .547 .571 .476 SP500 .473 .469 .353 .291 .251 .263 INSURANC .466 .4 .3 .3 .2 .266 FOOD .464 .553 .482 .535 .571 .482 SP-100 .43 .408 .344 .322 .258 .258 GOLD .42 .42 .5 .56 .56 .56 NASD-100 .42 .43 .31 .26 .23 .27 RUS-1000 .414 .418 .314 .263 .23 .23 REIT .405 .392 .3 .241 .183 .189 INDMATER .371 .384 .358 .32 .307 .282 FIDSTKS .37 .403 .252 .231 .204 .215 INFRA .361 .388 .305 .166 .166 .138 GUNS .352 .352 .176 .117 .176 .176 GREEN .347 .304 .26 .217 .26 .26 MILITARY .343 .343 .281 .125 .187 .218 BIOTECH .327 .337 .265 .268 .276 .246 INDEXES .315 .32 .283 .283 .219 .24 SOFTWARE .307 .276 .2 .169 .184 .2 TRANSP .3 .35 .15 .1 .1 .1 GAMING .291 .333 .25 .291 .416 .291 BIGBANKS .285 .142 0 0 .142 0 AUTO .282 .282 .256 .23 .23 .205 NIFTY .28 .263 .192 .157 .157 .21 CHEM .277 .277 .203 .203 .203 .166 FINANCE .266 .211 .144 .111 .133 .122 BIG17 .26 .391 .217 .217 .217 .195 ELECTRON .246 .234 .185 .166 .185 .185 SEMI .222 .205 .188 .17 .179 .179 SOLAR .222 .333 .277 .222 .333 .222 REGBANKS .214 .178 .107 .142 .107 .071 HOMEBLDG .176 .235 .176 .117 0 0 ETFS .172 .241 .155 .137 .12 .12 CHINA .15 .283 .183 .15 .166 .116 OILGAS .147 .201 .167 .167 .127 .134 PIPELINE .115 .115 .115 .076 .038 .076 BONDFUND 0 0 0 0 0 .009 |
====================================================================
11/7/2018
The operative Peerless
signal remains the Buy B5. Frankly,
I was surprised that Peerless did not give a new Sell. The DJI did
reach its last internal resistance-line before making it back to its
12-month high. No sell Peerless signal occurred today despite the
negative P-I with the DJI at the 3.6% upper band because of the big
jump (+2%) in the DJI today, because Novembers often bring partisan
rallies after an Election is over and because the DJI appears to be in a broad
trading range now, having easily sliced through its 200-day and now
its 65-dma.
Even without a Peerless Sell, a retreat back to 25200-25500 would
seem likely. Traders will be sorely tempted to do some profit-taking,
believing that bullish partisans have over-reacted.
Know that a pullback and pause next will probably end up being
constructive since Peerless did not give a Sell and the bullish seasonality
will kick in soon.
The DJI is overbought (ma/ma = 1.036) and all our internal
strength indicators are seriously lagging. A pullback to the
DJI's 21-day would take the DJI down almost 1000 points.
After that, we should enjoy the bullish seasonality of the end of
November and most of December. So, a new DJI attack on
26400-26800 then seems likely. And if 1986-1987 repeats,
the first half of 2019 could be quite bullish.


It may well orove best to not try to call a top here. As long as the Closing
Powers on the charts of the key ETFs are rising, the various indexes and ETFs
will go higher.
NASDAQ now shows rising 5-dma and a rising Closing Power trend. |
| QQQ - Closing Power and 5-dma are in uptrends. The falling 65-dma
is a problem, however, as is the falling RSQ (Relative Strength Quotient).  |
SP-500  |
|
Charts 11/07/2018 PEERLESS DJI, Signals, Indicators Daily DJI Volume 10-DayUp/Down Vol Hourly DJIA A/D Line for All Stocks NASDAQ S&P OEX NYSE COMPQX DJI-15 DJI-20 DJI-30 DIA SPY QQQ MDY IWM TNA Short-Term Rates USO-CrudeOil DBO FAS GLD BBH IBB JETS JNUG KOL NUGT OIH OIL RSX RETL SDS AGQ SLV SOXL TECL TMF TNA UGA (gasoline) XIV YINN Commodities: CANE CORN DBC JJC, NIB, CHOC CORN, CUT (paper) MOO, SOYB WEAT UUP (Dollar) LIT (Lithium) AAPL ADBE ALXN AMAT AMGN AMD AMZN BA BABA BAC BIDU CAT CVX DE FB GOOG GS HD IBM INTU JPM M (Macy's) MSFT NFLX NVDA QCOM TSLA TXN XOM WMT CMG , LRCX, SWKS, MDGL SPPI WATT SQ TOWN 11/7/2018 (Click on Underlined link.) Bullish MAXCPs - http://tigersoft.com/MAXCPZ/Nov-07/BULLISH.htm Bearish MAXCPs - http://tigersoft.com/MINCPZ/Nov-07/BEARISH.htm |
Table 1 QUICKSILVER on ETFS - 11/07/18 ETF CLOSE CHANGE PIVOT-PT 5-dma AROC CL-PWR CANDLE IP21 ITRS --------------------------------------------------------------------------------------------- --------------------------------------------------------------------------------------------- DIA 261.78 5.55 253.73 208.8% ------- BLUE -.077 ---- --------------------------------------------------------------------------------------------- SPY 281.01 5.89 273.51 190.2% ------- BLUE -.067 -.035 --------------------------------------------------------------------------------------------- QQQ 175.58 5.34 172.06 169.3% ------- BLUE -.017 -.053 --------------------------------------------------------------------------------------------- MDY 347.85 5.13 338.72 231.8% ------- BLUE -.059 -.07 --------------------------------------------------------------------------------------------- IWM 157.41 2.77 153.49 240.8% Bearish BLUE -.101 -.089 --------------------------------------------------------------------------------------------- FAS 64.93 2.84 59.62 530.9% ------- BLUE -.081 -.147 --------------------------------------------------------------------------------------------- SOXL 114.26 3.96 114.38 634.1% ------- RED -.054 -.327 --------------------------------------------------------------------------------------------- TECL 134.67 10.64 129.96 375.2% ------- BLUE -.004 -.19 --------------------------------------------------------------------------------------------- RSX 21.56 .25 21.13 179.6% ------- ---- .086 .078 |
Table 2 Count of Stocks in Key Directories
2018-11-07
-------------------------------
NEWHIGHS 143 NYSE and NASDAQ totals
NEWLOWS 129
MAXCP 55
MINCP 95 Professionals still net bearish.
TTTNH 69
TTTNL 133 Day Traders remain bearish.
FASTUP 497 Swing Traders are very bullish.
FASTDOWN 134
CPCROSSA 41
CPCROSSD 60
BIGVOLUP 6
BIGVODN 16
TRAPDOOR 41
|
Table 3 RANKING OF KEY DIRECTORIES BASED PCT.OF STOCKS ABOVE 65-DMA
11/7/18
Bearish = 38
Bullish = 9
---------------------------------------------------------------------------------------
Directory Current day-1 day-2 day-3 day-4 day-5
----------------------------------------------------------------------------------------
EDU .833 .666 .666 .5 .5 .5
UTILITY .8 .6 .575 .375 .45 .55
DOWJONES .7 .5 .433 .466 .433 .366
JETS .7 .3 .3 .5 .2 0
COMODITY .571 .476 .547 .571 .476 .357
FOOD .561 .491 .543 .578 .491 .385
BEVERAGE .555 .5 .388 .222 .333 .388 HOSPITAL .541 .541 .541 .5 .416 .208 DJI-13 .538 .307 .307 .307 .307 .153 RETAIL .509 .396 .339 .339 .264 .207 ============================================================================================ SP500 .469 .353 .291 .251 .261 .228 COMPUTER .454 .363 .318 .318 .318 .272 HACKERS .454 .363 .318 .318 .318 .227 NASD-100 .43 .31 .26 .23 .26 .2 COAL .428 .571 .571 .571 .571 .571 GOLD .42 .5 .56 .56 .56 .3 RUS-1000 .418 .314 .263 .23 .232 .193 SP-100 .408 .344 .322 .258 .247 .258 FIDSTKS .403 .252 .231 .204 .215 .177 INSURANC .4 .3 .3 .2 .266 .233 REIT .394 .302 .243 .184 .197 .171 BIG17 .391 .217 .217 .217 .195 .086 INFRA .388 .305 .166 .166 .138 .111 INDMATER .384 .358 .32 .307 .282 .179 GUNS .352 .176 .117 .176 .176 .176 TRANSP .35 .15 .1 .1 .1 0 MILITARY .343 .281 .125 .187 .218 .125 BIOTECH .335 .265 .268 .276 .249 .158 GAMING .333 .25 .291 .416 .333 .25 SOLAR .333 .277 .222 .333 .222 .166 INDEXES .318 .286 .286 .221 .237 .2 GREEN .304 .26 .217 .26 .26 .173 CHINA .283 .183 .15 .166 .116 .066 AUTO .282 .256 .23 .23 .205 .179 CHEM .277 .203 .203 .203 .166 .129 SOFTWARE .276 .2 .169 .184 .2 .184 NIFTY .263 .192 .157 .157 .21 .14 ETFS .241 .155 .137 .12 .12 .103 HOMEBLDG .235 .176 .117 0 0 0 ELECTRON .234 .185 .166 .185 .185 .111 FINANCE .211 .144 .111 .133 .122 .111 SEMI .205 .188 .17 .179 .17 .102 OILGAS .201 .167 .167 .127 .134 .067 REGBANKS .178 .107 .142 .107 .071 .035 BIGBANKS .142 0 0 .142 0 0 PIPELINE .115 .115 .076 .038 .076 .115 BONDFUND 0 0 0 0 .009 .009 |
====================================================================
11/6/2018 With the Election over and Congress again politically stalemated,
Wall Street can focus on economic growth, corporate profits and
what the Fed intends to do. The only questions for me is will President
Trump pull some surprises regarding trade talks with China and
nuclear arms talks with Russia.
And will new Peerless signals keep working satisfactorily? Because
of the bullish seasonality of November and December, I would want
them to be supported by signs that Professionals are also expecting
what Peerless signals to us. This we can judge from Closing Power
trend-breaks on DIA, SPY, QQQ and IWM or MDY.
26000 poses Strong Resistance for DJI.
But DIA's Closing Power is zig-zagging higher.
This convienently gives us a nice CP uptrend
to play and watch closely.


For the present, Peerless is on a Buy B5 and the key ETFs are
zig-zagging
higher. However, a Sell S9 and a Sell S12 may occur if the DJI closes
near 26000. This is where its 2.5% upper band is. It is also just above
the DJI's 65-dma. Presently both P-Indicator and IP21 are still negative.
This will have to be repaired before there can be swubstantially higher
prices. Similarly, Volume does not appear high enough to propel the DJI
up much more, though partisan enthusiam does sometime get carried away
at this time of the year.
But don't be in a hurry to sell now. What seems important to note here
is that November Sells are rare in bull markets and have in each case
been somewhat premature.
See below how few cases there have been of Novermber
sells in bull markets
since 1928 and seel also how each suffered a paper loss ranging between
0.9% and 4.0%. Moreover, only once in the 6 cases was the resulting gain
from a DJI sell-off over 3.2%. In addition, in two instances a November
Peerless sell in a bull market would have been reversed at a loss.
November Peerless Sells in Bull Markets: 1928-2017
Gain Subseq. Peak Paper Loss
19331117 S12 98.1
.009 102.0
-.0397 12/11
19801114 S9 986.35 .071
1000.17
-.014
11/20
19831122 S4 1275.81
.031 1287.30
-.009
11/29
20091113 S9 10270.47 -.020 10471.5
-.0195
12/01
20161109 S9 18589.69 -.029 19121.6
-.0286
11/29
20161110 S12 18807.88 -.017 19121.6
-.0166
11/29
All this should make us be in no hurry to sell even
if we do get a new
Peerless Sell. We should at least wait for the S9 to be clinched by
a negative breadth day and I would want the incipient Closing Power
uptrends to be violated, too. Most
likely, we will see some constructive
basing rather than another big decline.
Traders may soon be talking about two new things. Will the Democrats
partner with Trump to bring on a massive Public Works program? And
will there be a new push to expanding public Medicare. This might
explain why United Health in the DJI-30 shows such a weak Closing Power.
I noticedalso that the Dollar has formed a mini-head/shoulders top. Does this
mean that Professionals expect a much bigger Federal Deficit in the
years ahead? Watch the Dollar and Gold, too.
DIA and DJI remain the strongest ETF and Index. The
NASDAQ
is much weaker. Its ITRS and RELDJI relative strength
indicators are negative. Its Closing Power needs to start zig-zagging up
more convincingly. As I showed last night, the 1986-1987 DJI-NASDAQ
chart shows us that the NASDAQ may be in the doldrums until January,
when it may suddenly wake up and take off along with the DJI.
SPY seems headed for 280.

Watch TECL to see if tech stocks can do better.

Watch UNH.

|
Charts 11/06/2018 PEERLESS DJI, Signals, Indicators Daily DJI Volume 10-DayUp/Down Vol Hourly DJIA A/D Line for All Stocks NASDAQ S&P OEX NYSE COMPQX DJI-15 DJI-20 DJI-30 DIA SPY QQQ MDY IWM TNA Short-Term Rates USO-CrudeOil DBO FAS GLD BBH IBB JETS JNUG KOL NUGT OIH OIL RSX RETL SDS AGQ SLV SOXL TECL TMF TNA UGA (gasoline) XIV YINN Commodities: CANE CORN DBC JJC, NIB, CHOC CORN, CUT (paper) MOO, SOYB WEAT UUP (Dollar) LIT (Lithium) AAPL ADBE ALXN AMAT AMGN AMD AMZN BA BABA BAC BIDU CAT CVX DE FB GOOG GS HD IBM INTU JPM M (Macy's) MSFT NFLX NVDA QCOM TSLA TXN XOM WMT CMG , LRCX, SWKS, MDGL SPPI WATT SQ TOWN 11/6/2018 (Click on Underlined link.) Bullish MAXCPs - http://tigersoft.com/MAXCPZ/Nov-06/BULLISH.htm Bearish MAXCPs - http://tigersoft.com/MINCPZ/Nov-06/BEARISH.htm |
Table 1 QUICKSILVER on ETFS - 11/06/18 ETF CLOSE CHANGE PIVOT-PT 5-dma AROC CL-PWR CANDLE IP21 ITRS --------------------------------------------------------------------------------------------- --------------------------------------------------------------------------------------------- DIA 256.23 1.75 251.19 149.3% Bearish BLUE -.108 ---- --------------------------------------------------------------------------------------------- SPY 275.12 1.73 270.63 135.4% Bearish BLUE -.111 -.034 --------------------------------------------------------------------------------------------- QQQ 170.24 1.28 169.82 127.6% Bearish BLUE -.053 -.06 --------------------------------------------------------------------------------------------- MDY 342.72 1.96 332.15 174.1% Bearish BLUE -.096 -.063 --------------------------------------------------------------------------------------------- IWM 154.64 .76 150.03 161.3% Bearish BLUE -.155 -.083 --------------------------------------------------------------------------------------------- FAS 62.09 .92 58.55 478.3% Bearish BLUE -.123 -.161 --------------------------------------------------------------------------------------------- SOXL 110.3 3.86 100.54 627.8% ------- BLUE -.076 -.321 --------------------------------------------------------------------------------------------- TECL 124.03 2.03 125.31 287.9% Bearish BLUE -.044 -.231 --------------------------------------------------------------------------------------------- RSX 21.31 -.13 20.8 178.5% ------- RED .089 .08 |
TABLE 2
Count of Stocks in Key Directories
2018-11-06
-------------------------------
NEWHIGHS 96
NEWLOWS 148
MAXCP 39
MINCP 94 falling.
TTTNH 54
TTTNL 122 Day Traders, do not trust the rally.
FASTUP 470 Swing Traders are quite bullish,
FASTDOWN 105
CPCROSSA 45
CPCROSSD 64
BIGVOLUP 4
BIGVODN 18
TRAPDOOR 33
|
| Table 3 RANKING OF KEY DIRECTORIES BASED PCT.OF STOCKS ABOVE 65-DMA Bearish = 41 Bullish = 4 11/6/18 --------------------------------------------------------------------------------------- Directory Current day-1 day-2 day-3 day-4 day-5 ---------------------------------------------------------------------------------------- EDU .666 .666 .5 .5 .5 .333 UTILITY .6 .575 .375 .45 .55 .65 COAL .571 .571 .571 .571 .571 .285 HOSPITAL .541 .541 .5 .416 .208 .291 ============================================================================================ BEVERAGE .5 .388 .222 .333 .388 .333 DOWJONES .5 .433 .466 .433 .4 .366 GOLD .5 .56 .56 .56 .3 .36 ============================================================================================ FOOD .491 .543 .578 .491 .385 .403 COMODITY .476 .547 .571 .476 .357 .357 RETAIL .396 .339 .339 .264 .226 .32 COMPUTER .363 .318 .318 .318 .318 .136 HACKERS .363 .318 .318 .318 .272 .181 INDMATER .358 .32 .307 .282 .179 .141 SP500 .353 .291 .251 .261 .236 .23 SP-100 .344 .322 .258 .247 .268 .247 RUS-1000 .314 .263 .23 .232 .2 .189 NASD-100 .31 .26 .23 .26 .21 .16 DJI-13 .307 .307 .307 .307 .23 .153 INFRA .305 .166 .166 .138 .111 .083 INSURANC .3 .3 .2 .266 .233 .233 JETS .3 .3 .5 .2 .1 .1 REIT .3 .241 .183 .196 .169 .228 INDEXES .288 .283 .219 .235 .197 .203 MILITARY .281 .125 .187 .218 .125 .093 SOLAR .277 .222 .333 .222 .166 .055 BIOTECH .265 .268 .276 .249 .158 .136 GREEN .26 .217 .26 .26 .173 .086 AUTO .256 .23 .23 .205 .179 .153 FIDSTKS .252 .231 .204 .215 .188 .15 GAMING .25 .291 .416 .333 .25 .208 BIG17 .217 .217 .217 .195 .086 .043 CHEM .203 .203 .203 .166 .129 .111 SOFTWARE .2 .169 .184 .2 .2 .123 NIFTY .192 .157 .157 .21 .175 .087 SEMI .188 .17 .179 .17 .102 .076 ELECTRON .185 .166 .185 .185 .111 .067 CHINA .183 .15 .166 .116 .066 .066 GUNS .176 .117 .176 .176 .176 .117 HOMEBLDG .176 .117 0 0 0 .058 OILGAS .166 .166 .126 .133 .066 .053 ETFS .155 .137 .12 .12 .103 .103 TRANSP .15 .1 .1 .1 .05 .05 FINANCE .144 .111 .133 .122 .122 .1 PIPELINE .115 .076 .038 .076 .115 .076 REGBANKS .107 .142 .107 .071 .035 .071 BIGBANKS 0 0 .142 0 0 0 BONDFUND 0 0 0 .009 .009 0 |
====================================================================
11/5/2018 The operative Peerless Buy B5 tells us now to expect the DJI to
go a little higher. The DJI is much the strongest Index. So being long
DIA and FAS would seem to be the best vehicles to play now
But overhead, the DJI faces keen resistance at its 2% upper band,
only about 1.5% or about 275 points higher. With the upper
2% band falling and both the P-Indicator and the V-Indicator
negative and not likely soon to turn positive, a rally above 25800
is likely to bring a reversing Sell S9 and Sell S12. The DJI may
not even rally this far. An advance to 25800 will come up against
the flat 65-dma. The next few days will likely by governed by the
Election results.
The DJI is considerably stronger than the NASDAQ, QQQ,
SPY, MDY and IWM. We can see this from the falling Relative Strength
Quotients in these other charts, shown below, and we can see in Table 1 how
these other ETFs' show negative ITRS reading. (Their 50-day pct change
less the DJI's 50-day pct change is negative.) Fortunately, there is ample
historical precedent for the DJI acting as leader for a while, even
through the end of the year. For example, compare the DJI's 1986
strength with the lagging NASDAQ and A/D Line then. This did not
prevent 1987 from starting off very bullishly. 1987 like 2019 will
be the year before a Presidential Election, which is usually quite
bullish. Of course, this could lead to a bigger sell-off in the
second half of 2019.
DJI and NASDAQ: 1986-1987

Let's await the Elections' results and not try to anticipate
them.
Professionals have been covering short sales and turned the Closing
Powers up. But as you can see below, the Closing Power 21-day
moving averages are still falling for DIA, SPY, QQQ, MDY and IWM.
The most constructive thing these indexes and ETFs could do now
would be to have their Closing Powers (based on closes above their
openings) to start zig-zagging upwards. Stay long a few of the
Bullish MAXCPs, DIA and FAS for now, but avoid most tech stocks.
  |
 |
Charts 11/05/2018 PEERLESS DJI, Signals, Indicators Daily DJI Volume 10-DayUp/Down Vol Hourly DJIA A/D Line for All Stocks NASDAQ S&P OEX NYSE COMPQX DJI-15 DJI-20 DJI-30 DIA SPY QQQ MDY IWM TNA Short-Term Rates USO-CrudeOil DBO FAS GLD BBH IBB JETS JNUG KOL NUGT OIH OIL RSX RETL SDS AGQ SLV SOXL TECL TMF TNA UGA (gasoline) XIV YINN Commodities: CANE CORN DBC JJC, NIB, CHOC CORN, CUT (paper) MOO, SOYB WEAT UUP (Dollar) LIT (Lithium) AAPL ADBE ALXN AMAT AMGN AMD AMZN BA BABA BAC BIDU CAT CVX DE FB GOOG GS HD IBM INTU JPM M (Macy's) MSFT NFLX NVDA QCOM TSLA TXN XOM WMT CMG , LRCX, SWKS, MDGL SPPI WATT SQ TOWN 11/5/2018 (Click on Underlined link.) Bullish MAXCPs - http://tigersoft.com/MAXCPZ/Nov-05/BULLISH.htm Bearish MAXCPs - http://tigersoft.com/MINCPZ/Nov-05/BEARISH.htm |
 |
 |
Table 1 QUICKSILVER on ETFS - 11/05/18
DIA continues to outperform all major market ETFs in US. (ITRS<0)
ETF CLOSE CHANGE PIVOT-PT 5-dma AROC CL-PWR CANDLE IP21 ITRS --------------------------------------------------------------------------------------------- --------------------------------------------------------------------------------------------- DIA 254.48 2.02 248.7 200.1% Bearish BLUE -.085 ---- --------------------------------------------------------------------------------------------- SPY 273.39 1.5 267.77 176.8% Bearish BLUE -.106 -.036 --------------------------------------------------------------------------------------------- QQQ 168.96 -.42 165.92 170.5% Bearish RED -.051 -.061 --------------------------------------------------------------------------------------------- MDY 340.76 1.68 331.01 232.3% Bearish BLUE -.115 -.067 --------------------------------------------------------------------------------------------- IWM 153.88 -.12 149.73 239.1% Bearish RED -.151 -.09 --------------------------------------------------------------------------------------------- FAS 61.17 2.14 56.45 592% Bearish BLUE -.123 -.154 --------------------------------------------------------------------------------------------- RETL 40.13 .49 38.56 634.3% Bearish BLUE .071 -.188 --------------------------------------------------------------------------------------------- SOXL 106.44 -2.81 97.05 991.6% ------- RED -.096 -.318 --------------------------------------------------------------------------------------------- TECL 122 -.32 116.93 355.8% Bearish ---- -.047 -.226 --------------------------------------------------------------------------------------------- IBB 108.03 -.07 103.63 257.4% Bearish RED -.11 -.067 --------------------------------------------------------------------------------------------- GLD 116.37 -.28 115.8 2.6% Bullish BLUE .035 .032 --------------------------------------------------------------------------------------------- RSX 21.44 .32 20.56 291.3% Bullish BLUE .122 .089 |
Table 2 Count of Stocks in Key Directories
2018-11-05
-------------------------------
NEWHIGHS 69 NYSE & NASDAQ count
NEWLOWS 113 NYSE & NASDAQ count
MAXCP 31
MINCP 133 Bearish
TTTNH 40
TTTNL 170 Day Traders are bearish.
FASTUP 616 Swing Traders are bullish.
FASTDOWN 106
CPCROSSA 60
CPCROSSD 103
BIGVOLUP 6
BIGVODN 9
TRAPDOOR 32
|
Table 3
RANKING OF KEY DIRECTORIES BASED PCT.OF STOCKS ABOVE 65-DMA
11/5/18
Bullish = 7
Bearish = 37
---------------------------------------------------------------------------------------
Directory Current day-1 day-2 day-3 day-4 day-5
----------------------------------------------------------------------------------------
EDU .666 .5 .5 .5 .333 .166
UTILITY .575 .375 .45 .55 .675 .675
COAL .571 .571 .571 .571 .285 .285
GOLD .56 .56 .56 .3 .36 .36
COMODITY .547 .571 .476 .357 .357 .38
FOOD .543 .578 .491 .385 .385 .421
HOSPITAL .541 .5 .416 .208 .291 .125
N= 7
===========================================================================================
DOWJONES .433 .466 .433 .4 .366 .3
BEVERAGE .388 .222 .333 .388 .333 .277
RETAIL .339 .339 .264 .226 .32 .188
SP-100 .322 .258 .247 .268 .247 .193
INDMATER .32 .307 .282 .179 .141 .128
COMPUTER .318 .318 .318 .318 .136 .09
HACKERS .318 .318 .318 .272 .227 .136
DJI-13 .307 .307 .307 .23 .153 .153
INSURANC .3 .2 .266 .233 .233 .166
JETS .3 .5 .2 .1 .1 0
GAMING .291 .416 .333 .25 .208 .125
SP500 .291 .251 .261 .236 .23 .172
INDEXES .283 .219 .235 .197 .197 .208
BIOTECH .268 .276 .249 .158 .136 .126
RUS-1000 .263 .23 .232 .2 .189 .14
NASD-100 .26 .23 .26 .21 .16 .12
REIT .241 .183 .196 .169 .235 .163
FIDSTKS .231 .204 .215 .188 .155 .129
AUTO .23 .23 .205 .179 .153 .102
SOLAR .222 .333 .222 .166 .055 0
BIG17 .217 .217 .195 .086 .043 .065
GREEN .217 .26 .26 .173 .086 .086
CHEM .203 .203 .166 .129 .111 .092
SEMI .17 .179 .17 .102 .076 .042
SOFTWARE .169 .184 .2 .2 .123 .092
ELECTRON .166 .185 .185 .111 .074 .055
INFRA .166 .166 .138 .111 .083 .055
OILGAS .166 .126 .133 .066 .053 .046
NIFTY .157 .157 .21 .175 .087 .07
CHINA .15 .166 .116 .066 .066 .066
REGBANKS .142 .107 .071 .035 .071 .035
ETFS .137 .12 .12 .103 .103 .068
MILITARY .125 .187 .218 .125 .093 .093
GUNS .117 .176 .176 .176 .117 .117
HOMEBLDG .117 0 0 0 .058 0
FINANCE .111 .133 .122 .122 .1 .088
TRANSP .1 .1 .1 .05 .05 0
PIPELINE .076 .038 .076 .115 .076 .076
BIGBANKS 0 .142 0 0 0 0
BONDFUND 0 0 .009 .009 0 0
|
====================================================================
11/2/2018 I take the Peerless B5 to be operating now. But the DJI needs
to not close
below 24850. That would restore a potential H/S
pattern in the DJI and DIA and be bearish. And we do need to see
the major ETFs' Closing Powers to start to zig-zag upwards.
Tuesday's Election is worrisome. Once it is past, the market may
surprise folks by rallying, provided the Democrats do not get a
"sweeping victory".
The excellent Jobs numbers on Friday raised expectations for a
rate hike. Friday's reversal owes, in part, to the contradictory
interpretations that can be made of such enduring economic strength.
The ramification of it will continue for some time. The Jobs' Report
should help Republicans on Tuesday. A better indicator of the effect
of good economic news on the stock market was, perhaps, the Russell-2000's
advance despite the declines elsewhere. It is important technically that
IWM's year-long support does not break down in here.
For several months, the DJI has been doing its best to hold up the market.
But AAPL's weakness Friday worries me: the DJI's role as "leader" and
"sustainer of confidence" could be ending. Fortunately, AAPL is
still well above the support of its rising 65-dma. But volume was very
high Friday on the reversal downwards. Traders are properly quite
nervous before Tuesday's election. Professionals remain heavy net sellers.
But shorts are clearly taking profits now. They usually cover like this
when they sense a rally is
coming.
Bonds weakened with the Excellent Jobs' Report.
Though, DIA, SPY and QQQ sold off, IWM's response
was much more bullish.
For traders, it is vital now that the DJI not
fall back below the neckline in its
developing head and shoulders pattern. As long as the DJI stays above
24850, where its neckline is, I would consider the operative Peerless signal
to be a Buy B5. The median gain for a Buy B5 is above 9% on
the DJI. But
there have been two fairly large paper losses in the earlier 15 B5 cases.
One occurred in the aftermath of Truman's surprise victory over Dewey in
November 1948. It was 2.8%. Here that would take the DJI down to 24350.
If the Democrats take over the House as a result of Tuesday's election, such
a decline would seem likely. The other big decline (-4.3%) after a Buy B5
took place following President Eisenhower's heart attack in 1955.
(I am working hard to get the new Peerless DJI chart-book, 1915-2108
done soon. Stay tuned. It will be a wonderful reference book for traders.)


The multitude of head/shoulders top patterns among the key general market
indexes and ETFs is certainly a warning that the DJI and the other indexes
may go lower again. Though the Closing Power downtrend-lines for the
key ETFs have been broken, they are still below their falling CP 21-day moving
averages. Closing Power uptrend-lines need better definition than are
now seen. They need to start zig-zagging up!
|
Charts 11/02/2018 PEERLESS DJI, Signals, Indicators Daily DJI Volume 10-DayUp/Down Vol Hourly DJIA A/D Line for All Stocks NASDAQ S&P OEX NYSE COMPQX DJI-15 DJI-20 DJI-30 DIA SPY QQQ MDY IWM TNA Short-Term Rates USO-CrudeOil DBO FAS GLD BBH IBB JETS JNUG KOL NUGT OIH OIL RSX RETL SDS AGQ SLV SOXL TECL TMF TNA UGA (gasoline) XIV YINN Commodities: CANE JJC, NIB, CHOC CORN, CUT (paper) WEAT UUP (Dollar) LIT (Lithium) AAPL ADBE ALXN AMAT AMGN AMD AMZN BA BABA BAC BIDU CAT CVX DE FB GOOG GS HD IBM INTU JPM M (Macy's) MSFT NFLX NVDA QCOM TSLA TXN XOM WMT CMG , LRCX, SWKS, MDGL SPPI WATT SQ TOWN 11/2/2018 (Click on Underlined link.) Bullish MAXCPs - http://tigersoft.com/MAXCPZ/Nov-02/BULLISH.htm Bearish MAXCPs - http://tigersoft.com/MINCPZ/Nov-02/BEARISH.htm |
Note that October often marks the end to stock market sell-offs. Once the Election
is over, I would think the market will turn its attention to the economy's strength,
renewed trade talks between China and the US and the bullish year-end seasonality.


Make no mistake about it, 80%+ of all equities' stocks are below their
65-dma. This represents serious technical damage. Rallies in these stocks
will face stiff overhead resistance, especially if tax-loss selling picks up.
Fortunately,
since 1915, the year before a Presidential Election, averages a gain that is nearly
three times the size of the other years' average gains.
Our Stocks' Hotline's short sales all have broken their CP down-trends.
Short sellers must be expecting a good rally. Stay short a few of the
the current MINCPs and go long HCKT (22.32), LOCO (15.42),
ENSG (45.98), HLIT (6.16) and NTWK (9.69), the current bullish
MAXCPs.
.


Table 1 QUICKSILVER on ETFS - 11/02/18 ETF CLOSE CHANGE PIVOT-PT 5-dma AROC CL-PWR CANDLE IP21 ITRS --------------------------------------------------------------------------------------------- --------------------------------------------------------------------------------------------- DIA 252.46 -1.27 244.47 119.1% Bearish RED -.106 ---- --------------------------------------------------------------------------------------------- SPY 271.89 -1.62 263.86 122.3% Bearish RED -.124 -.033 --------------------------------------------------------------------------------------------- QQQ 169.38 -2.68 163.23 81.2% Bearish RED -.071 -.047 --------------------------------------------------------------------------------------------- MDY 339.08 .36 325.28 188.2% Bearish RED -.141 -.066 --------------------------------------------------------------------------------------------- IWM 154 .51 146.67 218.1% Bearish RED -.162 -.082 --------------------------------------------------------------------------------------------- FAS 59.03 -.59 54.35 463.3% Bearish RED -.154 -.17 --------------------------------------------------------------------------------------------- RETL 39.64 .88 35.33 659.1% Bearish BLUE .022 -.221 --------------------------------------------------------------------------------------------- SOXL 109.25 -5.13 86.31 1042.7% ------- RED -.137 -.268 --------------------------------------------------------------------------------------------- TECL 122.32 -7.64 113.35 126.1% Bearish RED -.073 -.199 --------------------------------------------------------------------------------------------- IBB 108.1 .03 102.61 215% Bearish RED -.123 -.063 --------------------------------------------------------------------------------------------- GLD 116.65 .02 116.31 -5.2% Bullish ---- .04 .055 --------------------------------------------------------------------------------------------- RSX 21.12 -.01 20.23 201.4% Bullish ---- .115 .104 |
Table 2
Count of Stocks in Key Directories
2018-11-02
-------------------------------
NEWHIGHS 47
NEWLOWS 97 Bearish
MAXCP 29
MINCP 218 Bearish Professional
TTTNH 39
TTTNL 202 Bearish Day Traders dominate
FASTUP 487 Swing Traders are bullish
FASTDOWN 100
CPCROSSA 33
CPCROSSD 167 Bearish
BIGVOLUP 5
BIGVODN 21
TRAPDOOR 31
|
Table 3
RANKING OF KEY DIRECTORIES BASED PCT.OF STOCKS ABOVE 65-DMA
11/2/18
Bearish = 40
Much technical damage done when equity groups show majority of their stocks
are below 65-dma, which will then act as resistance on next rally or two.
Bullish = 4
---------------------------------------------------------------------------------------
Directory Current day-1 day-2 day-3 day-4 day-5
----------------------------------------------------------------------------------------
COAL .571 .571 .571 .285 .285 .285
COMODITY .571 .476 .357 .357 .357 .523
FOOD .571 .482 .375 .375 .375 .517
GOLD .56 .56 .3 .36 .34 .38
N=4
=============================================================================================
EDU .5 .5 .5 .333 .166 .5
HOSPITAL .5 .416 .208 .291 .125 .083
JETS .5 .2 .1 .1 0 0
DOWJONES .466 .433 .4 .366 .3 .266
GAMING .416 .333 .25 .208 .125 .125
UTILITY .375 .45 .55 .675 .675 .5
RETAIL .339 .264 .226 .32 .188 .15
SOLAR .333 .222 .166 .055 0 .055
COMPUTER .318 .318 .318 .136 .09 .09
HACKERS .318 .318 .272 .227 .136 .181
DJI-13 .307 .307 .23 .153 .153 .23
INDMATER .307 .282 .179 .141 .128 .153
BIOTECH .276 .249 .158 .136 .126 .136
GREEN .26 .26 .173 .086 .086 .043
SP-100 .258 .247 .268 .247 .193 .129
SP500 .251 .261 .236 .23 .172 .136
AUTO .23 .205 .179 .153 .102 .102
NASD-100 .23 .26 .21 .16 .12 .09
RUS-1000 .23 .232 .2 .189 .14 .123
BEVERAGE .222 .333 .388 .333 .277 .111
INDEXES .219 .235 .197 .197 .208 .213
BIG17 .217 .195 .086 .043 .065 .108
FIDSTKS .204 .215 .188 .155 .129 .086
CHEM .203 .166 .129 .111 .092 .092
INSURANC .2 .266 .233 .233 .166 .133
MILITARY .187 .218 .125 .093 .093 .125
ELECTRON .185 .185 .111 .074 .055 .049
SOFTWARE .184 .2 .2 .123 .092 .076
REIT .183 .196 .169 .235 .163 .13
SEMI .179 .17 .102 .076 .042 .042
GUNS .176 .176 .176 .117 .117 .117
CHINA .166 .116 .066 .066 .066 .083
INFRA .166 .138 .111 .083 .055 .083
NIFTY .157 .21 .175 .087 .07 .07
BIGBANKS .142 0 0 0 0 0
FINANCE .133 .122 .122 .1 .088 .088
OILGAS .126 .133 .066 .053 .046 .06
ETFS .12 .12 .103 .103 .068 .086
REGBANKS .107 .071 .035 .071 .035 .035
TRANSP .1 .1 .05 .05 0 0
PIPELINE .038 .076 .115 .076 .076 .076
BONDFUND 0 .009 .009 0 0 0
HOMEBLDG 0 0 0 .058 0 0
|
====================================================================
11/1/2018 The Peerless Buy B5 has been reinstated because of the failure
of the DJI's head and shoulder' pattern to keep the DJI below its
neckline as should be expected when an S10 reverses a Peerless
buy signal. The DJI has now closed just under
its falling 21-dma.
A rally of 2.4%, about 600 points higher, will probably produce
a new Sell S9 since the P-Indicator is now -324 and a new Sell S12
since the IP21 (current Accumulation) is -.054 and may not easily
turn positive.

|
Charts 11/01/2018 PEERLESS DJI, Signals, Indicators Daily DJI Volume 10-DayUp/Down Vol Hourly DJIA A/D Line for All Stocks NASDAQ S&P OEX NYSE COMPQX DJI-15 DJI-20 DJI-30 DIA SPY QQQ MDY IWM TNA Short-Term Rates USO-CrudeOil DBO FAS GLD BBH IBB JETS JNUG KOL NUGT OIH OIL RSX RETL SDS AGQ SLV SOXL TECL TMF TNA UGA (gasoline) XIV YINN Commodities: CANE JJC, NIB, CHOC CORN, CUT (paper) WEAT UUP (Dollar) LIT (Lithium) AAPL ADBE ALXN AMAT AMGN AMD AMZN BA BABA BAC BIDU CAT CVX DE FB GOOG GS HD IBM INTU JPM M (Macy's) MSFT NFLX NVDA QCOM TSLA TXN XOM WMT CMG , LRCX, SWKS, MDGL SPPI WATT SQ TOWN 11/01/2018 (Click on Underlined link.) Bullish MAXCPs - http://tigersoft.com/MAXCPZ/Nov-01/BULLISH.htm Bearish MAXCPs - http://tigersoft.com/MINCPZ/Nov-01/BEARISH.htm |
The rally in the DJI is quite steep. It has taken bears
by surprise.
It appears to be based on President Trump's sudden willingness to
reconsider his trade war with China. Watching our Closing
Power in DIA for a downtrend-break has tipped us off that some sort
of surprise like this was up.
Note DIA's bullish break in CP down-trendline. SPY's
followed a day later. DIA is leader now.


I suspect the market is right to rally now. I doubt if the Republicans
will lose control of the House in next Tuesday's Election. In addition,
we are now entering a much more bullish seasonal period. Since 1965,
the DJI has risen 60% of the time over the next two months and
averaged a 1% gain. By comparison, the
previous two months since
1965 typically lost 1% and rose just 55% of the time.
There is ample precedent for the DJI quickly leading a reversal
back upwards and the NYSE A/D Line playing "catch-up". The
most recent example of this is the March rally earlier year. Note
also how the DJI led the rest of the market back upwards in the
Fall of 1989 after a similar combination of signals, a Sell S9 and then
a Buy B5.

If you do not like chasing the rally and buying DIA for what appears
to be only a small gain, I can certainly understand. Consider buying
instead the highest AI/200 stocks and those that look most bullish
among our Bullish MAXCPs. As for our short sales, I would recommend
covering any of them if their Closing Power downtrend-lines are violated.
High AI/200 Stocks Now.
 |
 |
 |
 |
Table 1 QUICKSILVER on ETFS - 11/01/18 ETF CLOSE CHANGE PIVOT-PT 5-dma AROC CL-PWR CANDLE IP21 ITRS --------------------------------------------------------------------------------------------- --------------------------------------------------------------------------------------------- DIA 253.73 2.54 246.53 79.8% Bearish BLUE -.09 ----- --------------------------------------------------------------------------------------------- SPY 273.51 2.88 265.33 64.1% Bearish BLUE -.116 -.031 --------------------------------------------------------------------------------------------- QQQ 172.06 2.24 166.66 29.9% Bearish BLUE -.068 -.036 --------------------------------------------------------------------------------------------- MDY 338.72 6.57 326.63 127.8% Bearish BLUE -.157 -.072 --------------------------------------------------------------------------------------------- IWM 153.49 3.46 147.48 147.4% Bearish BLUE -.192 -.09 --------------------------------------------------------------------------------------------- FAS 59.62 1.07 53.79 265.4% Bearish BLUE -.144 -.172 --------------------------------------------------------------------------------------------- SOXL 114.38 13.84 88.93 1095.3% ------- BLUE -.138 -.235 --------------------------------------------------------------------------------------------- TECL 129.96 4.65 119.27 133% Bearish BLUE -.072 -.147 --------------------------------------------------------------------------------------------- IBB 108.07 4 103.61 196.9% Bearish BLUE -.132 -.071 --------------------------------------------------------------------------------------------- GLD 116.63 1.48 116.77 9.9% ------- BLUE .03 .043 --------------------------------------------------------------------------------------------- RSX 21.13 .33 20.29 112.1% ------- BLUE .016 .084 |
Table 2 Count of Stocks in Key Directories
20181101
-------------------------------
NEWHIGHS 40
NEWLOWS 60 rapidly falling
MAXCP 27
MINCP 87 rapid decline
TTTNH 47
TTTNL 93
FASTUP 380 swing traders are now bullish
FASTDOWN 126
CPCROSSA 74
CPCROSSD 41
BIGVOLUP 3
BIGVODN 16
TRAPDOOR 25
|
Table 3 RANKING OF KEY DIRECTORIES BASED PCT.OF STOCKS ABOVE 65-DMA
11/1/18
Bullish = 3
Bearish = 44
---------------------------------------------------------------------------------------
Directory Current day-1 day-2 day-3 day-4 day-5
----------------------------------------------------------------------------------------
COAL .571 .571 .285 .285 .285 0
GOLD .56 .3 .36 .34 .36 .4
EDU .5 .5 .333 .166 .5 .166
===========================================================================================
FOOD .482 .375 .375 .375 .517 .446
COMODITY .476 .357 .357 .357 .523 .428
UTILITY .45 .55 .675 .675 .5 .7
DOWJONES .433 .4 .366 .3 .3 .433
HOSPITAL .416 .208 .291 .125 .083 .125
BEVERAGE .333 .388 .333 .277 .055 .166
GAMING .333 .25 .208 .125 .125 .125
COMPUTER .318 .318 .136 .09 .09 .136
HACKERS .318 .272 .227 .136 .181 .181
DJI-13 .307 .23 .153 .153 .23 .384
INDMATER .282 .179 .141 .128 .141 .166
INSURANC .266 .233 .233 .166 .133 .1
RETAIL .264 .226 .32 .188 .15 .15
SP500 .261 .236 .23 .172 .14 .196
GREEN .26 .173 .086 .086 .043 .043
NASD-100 .26 .21 .16 .12 .09 .14
BIOTECH .249 .158 .136 .126 .139 .142
SP-100 .247 .268 .247 .193 .15 .225
RUS-1000 .232 .2 .189 .14 .126 .157
INDEXES .229 .197 .197 .208 .208 .213
SOLAR .222 .166 .055 0 .055 .055
MILITARY .218 .125 .093 .093 .125 .125
FIDSTKS .215 .188 .155 .129 .091 .161
NIFTY .21 .175 .087 .07 .07 .07
AUTO .205 .179 .153 .102 .102 .051
JETS .2 .1 .1 0 0 .1
SOFTWARE .2 .2 .123 .092 .076 .107
REIT .196 .169 .235 .163 .13 .228
BIG17 .195 .086 .043 .065 .108 .108
ELECTRON .185 .111 .074 .055 .049 .055
GUNS .176 .176 .117 .117 .117 .117
SEMI .17 .102 .076 .042 .042 .042
CHEM .166 .129 .111 .092 .092 .092
INFRA .138 .111 .083 .055 .083 .083
OILGAS .133 .066 .053 .046 .06 .08
FINANCE .122 .122 .1 .088 .088 .088
ETFS .12 .103 .103 .068 .086 .103
CHINA .116 .066 .066 .066 .083 .1
TRANSP .1 .05 .05 0 0 .05
PIPELINE .076 .115 .076 .076 .076 .115
REGBANKS .071 .035 .071 .035 .035 .035
BONDFUND .009 .009 0 0 0 0
BIGBANKS 0 0 0 0 0 0
HOMEBLDG 0 0 .058 0 0 0
|
====================================================================
10/31/2018 Reinstate the Peerless Buy B5. The DJI's head and Shoulders'
pattern is failing.
The DJI has clearly closed above its neckline (24900).
This should
not normally happen with a valid shead/shoulders Sell S10.
It did not happen in either of the cases where a Sell S10 reversed
an existing Peerless Buy. So, sticking with the Sell S10 at this point
has no good historical basis. Therefore, I think we have to consider the
Sell S10 frozen and suspended unless the DJI unexpectedly and quickly
falls right back below 25000. A narrow DJI-led rally back to the
upper band seems the most likely scenario now. November is a
much more bullish month than September and October are, And
December is very reliably bullish.

.
By this interpretation, we are now back on our previous Buy
B5
as the active Peerless signal.
Still higher DJI prices are likely now. See how below how the DJI's
and DIA's Closing Power downtrends were violated today This should
be bullish short-term, since any additional rise will lift the DJI above
its 200-day ma, where it closed today. Notice, too, how the 5-day
moving averages for DIA, SPY, QQQ and IWM turned up today,
Our QuickSilver strategy recommends that active short-term traders use
this event to cover short position ma when a stock or ETF has swung
wildly down. QuickSilver does frequently lead Closing Power trend-
breaks, but not always.
Clearly, the DJI is trying to lead the other indexes back
up. The SPY,
QQQ and and IWM did see their 5-day ma turn upward. To be more
convincing, we will need to see a strong close by these other ETFs
and a clear break in their Closing Power downtrends.
For now, I would respect the power (and advance intelligence)
of
whoever or whatever it is that is lifting the DJI up at the opening from
its recent lows.
Individual stocks are another matter. Breadth is still bearish. The
NYSE A/D Line is still in a downtrend. There were many more new
lows than new highs. And a number of the Bearish MINCP stocks
shown tonight fell a long way today after breaking their recent support-levels
and H/S necklines. This is apt to remain a very polarized stock market!
| Closing
Power has broken its downtrend. Neckline has been surpassed. 5-dma is rising and all four Optimized Best signals are on Buys.  |
| QQQ's Closing Power is still in downtrend but 5-dma is now rising. Optimized best Tiger system (small red arrows) is on a Sell QQQ is still below its 200.day ma. QQQ's 5-day ma is rising.  |
SPY's Closing Power is still falling but 5-dma is now rising. |
IWM's Closing Power is still falling but 5-dma is now rising. |
|
Charts 10/31/2018 PEERLESS DJI, Signals, Indicators Daily DJI Volume 10-DayUp/Down Vol Hourly DJIA A/D Line for All Stocks NASDAQ S&P OEX NYSE COMPQX DJI-15 DJI-20 DJI-30 DIA SPY QQQ MDY IWM TNA Short-Term Rates USO-CrudeOil DBO FAS GLD BBH IBB JETS JNUG KOL NUGT OIH OIL RSX RETL SDS AGQ SLV SOXL TECL TMF TNA UGA (gasoline) XIV YINN Commodities: CANE JJC, NIB, CHOC CORN, CUT (paper) WEAT UUP (Dollar) LIT (Lithium) AAPL ADBE ALXN AMAT AMGN AMD AMZN BA BABA BAC BIDU CAT CVX DE FB GOOG GS HD IBM INTU JPM M (Macy's) MSFT NFLX NVDA QCOM TSLA TXN XOM WMT CMG , LRCX, SWKS, MDGL SPPI WATT SQ TOWN 10/31/2018 (Click on Underlined link.) Bullish MAXCPs - http://tigersoft.com/MAXCPZ/Oct-31/BULLISH.htm Bearish MAXCPs - http://tigersoft.com/MINCPZ/Oct-31/BEARISH.htm |
Table 1 QUICKSILVER on ETFS - 10/31/2018 ETF CLOSE CHANGE PIVOT-PT 5-dma AROC CL-PWR CANDLE IP21 ITRS --------------------------------------------------------------------------------------------- --------------------------------------------------------------------------------------------- DIA 251.19 2.49 249.77 112.3% Bearish BLUE -.133 ----- --------------------------------------------------------------------------------------------- SPY 270.63 2.86 270.08 99.6% Bearish RED -.159 -.028 --------------------------------------------------------------------------------------------- QQQ 169.82 3.9 171.06 134.6% Bearish BLUE -.105 -.032 --------------------------------------------------------------------------------------------- MDY 332.15 1.14 330.31 101.9% Bearish RED -.216 -.077 --------------------------------------------------------------------------------------------- IWM 150.03 .3 149.11 138% Bearish RED -.213 -.095 --------------------------------------------------------------------------------------------- FAS 58.55 2.1 56.65 429.9% Bearish BLUE -.181 -.178 --------------------------------------------------------------------------------------------- SOXL 100.54 3.49 93.93 693% Bearish RED -.19 -.304 --------------------------------------------------------------------------------------------- RSX 20.8 .24 20.67 95.4% Bearish BLUE -.059 .063 |
Table 2
Count of Stocks in Key Directories
2018-10/31
-------------------------------
NEWHIGHS 24
NEWLOWS 139
MAXCP 23
MINCP 240 Bearish
TTTNH 34
TTTNL 175
FASTUP 472 very high
FASTDOWN 1000 limit reached
CPCROSSA 27
CPCROSSD 134
BIGVOLUP 7
BIGVODN 22
ACCUMVER 2
HIGHIP21 14
HIUPPCT 9
VHIP21 23
LOWACCUM 461
REDSELL 561
AUGSELS7 29
TRAPDOOR 23
|
Table 3
RANKING OF KEY DIRECTORIES BASED PCT.OF STOCKS ABOVE 65-DMA
10/31/18
Bulish = 2
Bearish = 44
---------------------------------------------------------------------------------------
Directory Current day-1 day-2 day-3 day-4 day-5
----------------------------------------------------------------------------------------
COAL .571 .285 .285 .285 0 0
UTILITY .55 .675 .675 .5 .7 .75
============================================================================================
EDU .5 .333 .166 .5 .166 .166
============================================================================================
DOWJONES .4 .366 .3 .3 .433 .266
BEVERAGE .388 .333 .277 .055 .166 .222
FOOD .375 .375 .375 .517 .446 .464
COMODITY .357 .357 .357 .523 .428 .452
COMPUTER .318 .136 .09 .09 .136 .09
GOLD .3 .36 .34 .36 .4 .52
HACKERS .272 .227 .136 .181 .181 .181
SP-100 .268 .247 .193 .15 .236 .15
GAMING .25 .208 .125 .125 .125 .041
SP500 .236 .23 .172 .14 .2 .144
INSURANC .233 .233 .166 .133 .1 .1
DJI-13 .23 .153 .153 .23 .384 .153
RETAIL .226 .32 .188 .15 .169 .132
NASD-100 .21 .16 .12 .09 .14 .08
HOSPITAL .208 .291 .125 .083 .125 .083
RUS-1000 .2 .189 .14 .126 .16 .126
SOFTWARE .2 .123 .092 .076 .107 .107
INDEXES .197 .197 .208 .208 .213 .235
FIDSTKS .188 .155 .129 .091 .166 .102
AUTO .179 .153 .102 .102 .051 .025
INDMATER .179 .141 .128 .141 .153 .153
GUNS .176 .117 .117 .117 .117 .117
NIFTY .175 .087 .07 .07 .07 0
GREEN .173 .086 .086 .043 .086 .086
REIT .169 .235 .163 .13 .228 .13
SOLAR .166 .055 0 .055 .055 .055
BIOTECH .158 .136 .126 .139 .136 .115
CHEM .129 .111 .092 .092 .111 .092
MILITARY .125 .093 .093 .125 .093 .031
FINANCE .122 .1 .088 .088 .088 .066
PIPELINE .115 .076 .076 .076 .115 .153
ELECTRON .111 .074 .055 .049 .055 .043
INFRA .111 .083 .055 .083 .083 .055
ETFS .103 .103 .068 .086 .103 .068
SEMI .102 .076 .042 .042 .042 .034
JETS .1 .1 0 0 .1 0
BIG17 .086 .043 .065 .108 .108 .065
CHINA .066 .066 .066 .083 .1 .1
OILGAS .066 .053 .046 .06 .08 .053
TRANSP .05 .05 0 0 .05 0
REGBANKS .035 .071 .035 .035 .035 .035
BONDFUND .009 0 0 0 0 0
BIGBANKS 0 0 0 0 0 0
HOMEBLDG 0 .058 0 0 0 0
|