 TIGER
HOTLINE
TIGER
HOTLINE 
william_schmidt@hotmail.com
HOTLINES from 1/30/2012 to 3/22/2012
 A Guide To Profitably Using The
Tiger Nightly HOTLINE
A Guide To Profitably Using The
Tiger Nightly HOTLINE TIGER
HOTLINE
william_schmidt@hotmail.com
HOTLINES from 1/30/2012 to
3/22/2012
A Guide To Profitably Using The
Tiger Nightly HOTLINE
TigerSoft and
Peerless Daily Hotline
(C)
1985-2012 William Schmidt, Ph.D. www.tigersoft.com
All rights
strictly reserved.
|
NOTES: ---> To renew this Hotline, order here $350 (check) - $360(Visa/MC)  IMPORTANT - The server
that hosts this site is now sometimes IMPORTANT - The server
that hosts this site is now sometimes slow or unavailable briefly as I post updates. It may be necessary in an emmergency to use the other web-page at tigersoftware.com If that happens, I will post the Tiger Data on www.tigersoftware.com/92-12HL/index.html instead of here. Notice the difference is only a matter of adding "soft" to "tigersoft". It will be there only if I have problem here. |
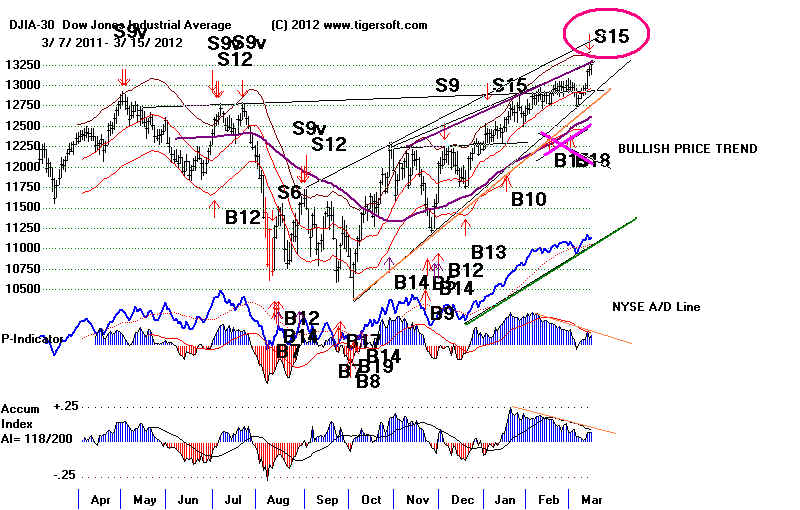
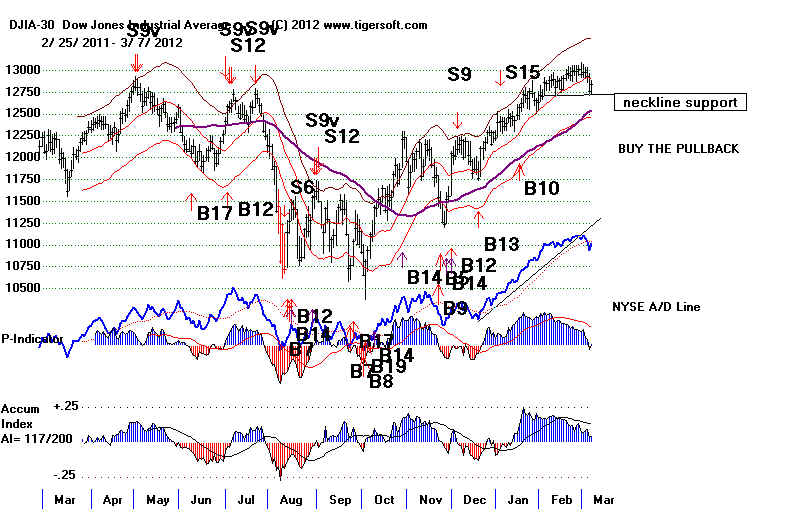
3/22/2011
Hotline Peerless Sell S15 and Sell S1 Still Operate.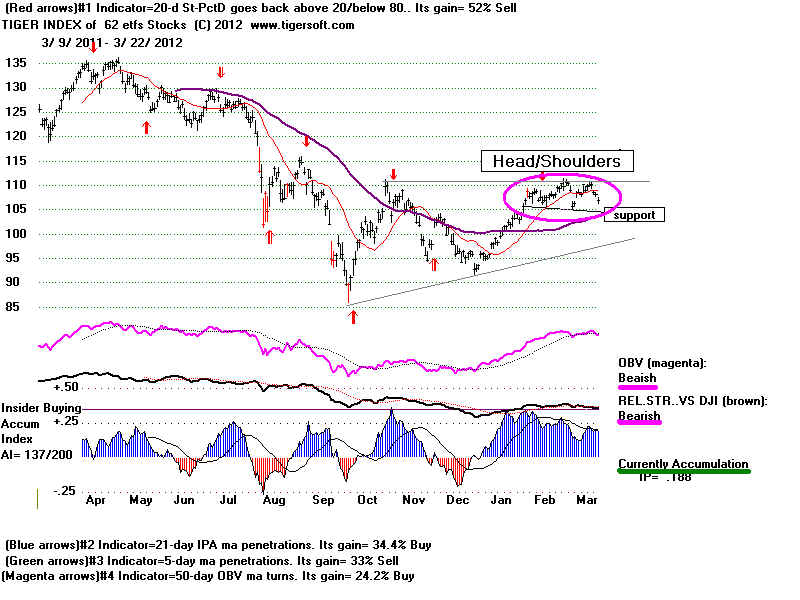
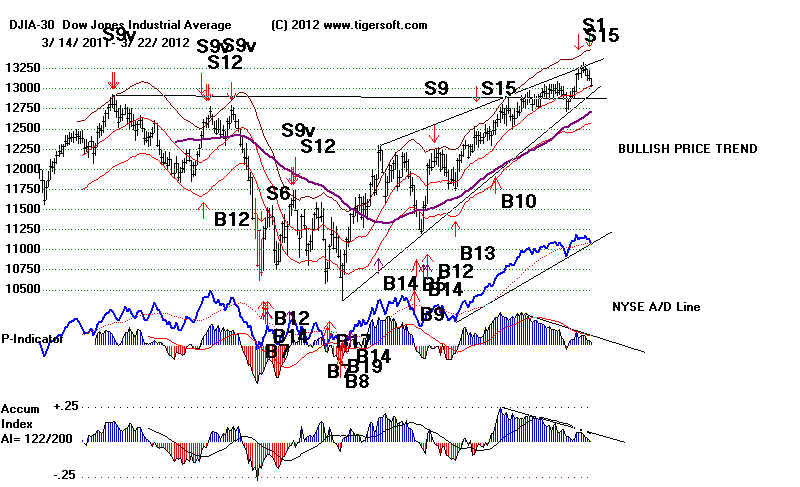  |
Watch CAT to see if it penetrates its H/S Patern's Neckline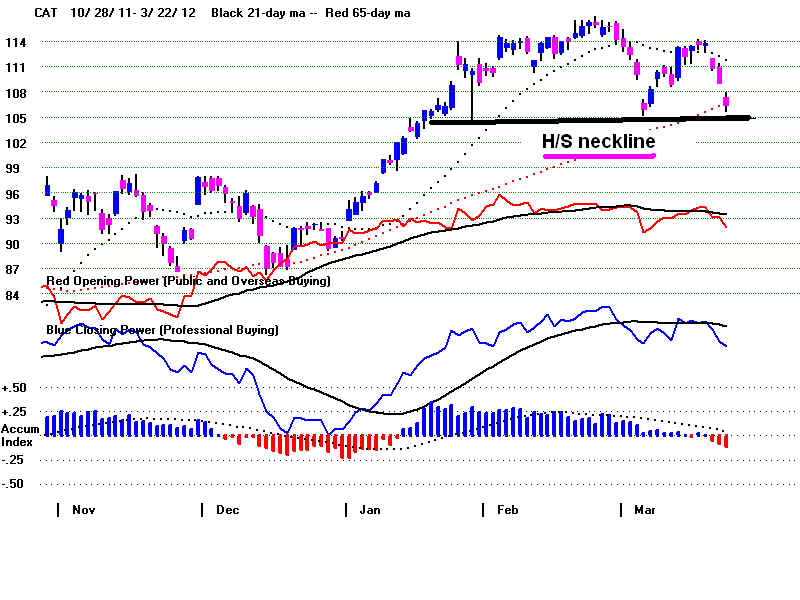 |
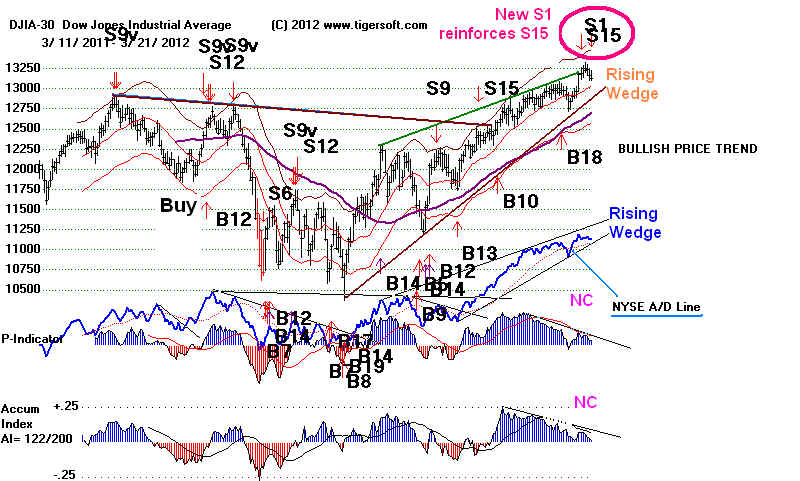
 |
DJI 13046 la/ma = 1.001 21dmaROC=.098
P=60 P-Ch= -38 IP21=.002 (low) V= -32 OP= .002
BREADTH
STATISTICS: Advance=
786 Declines=2231 UpVol =119.38 DownVol= 637.87
Key Stocks: AAPL and 4 highest priced DJI
stocks: IBM, CAT,
CVX, MCD and XOM
.
--->
181 (+4) MAXCP stocks Bullish MAXCP Stocks Bullish.
---> 52 (+7 ) MINCP stocks Bearish MINCP
Stocks
MAXCP stocks are those showing Tiger Closing Power making new
highs.
This suggests heavy Professional Buying. Applying the Tiger Power Ranker's
"bullish" to the MAXCP stocks find those with heavy insider buying and
institutional accumulation. Bearish MINCP stocks show the opposite.
---> 27(-30) new
highs on NASDAQ. 15 (+5) new lows on NASDAQ Bullish.
---> 20(-11 ) new
highs NYSE 10 (+1) new lows on NYSE
3/21/2012 Consider Low Priced
High Accummulation speculations in
the third wave
general market advance since 2009. Trade these with the trend of the 21-day ma of
Closing Power
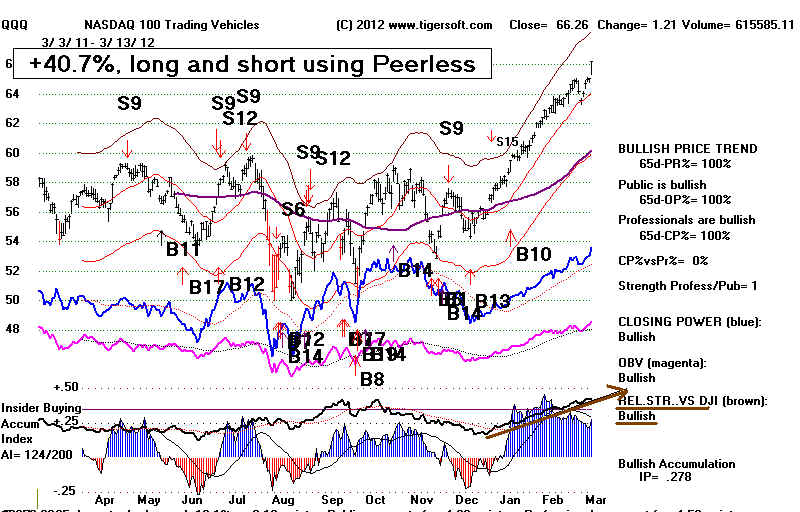
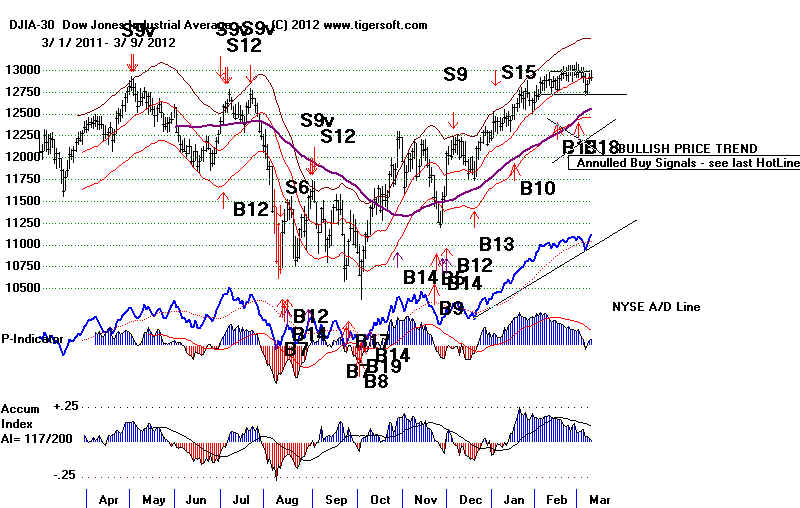
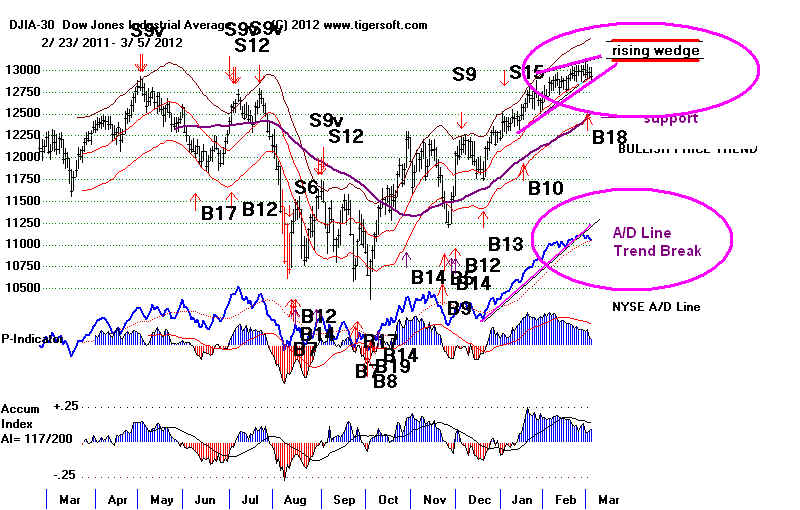
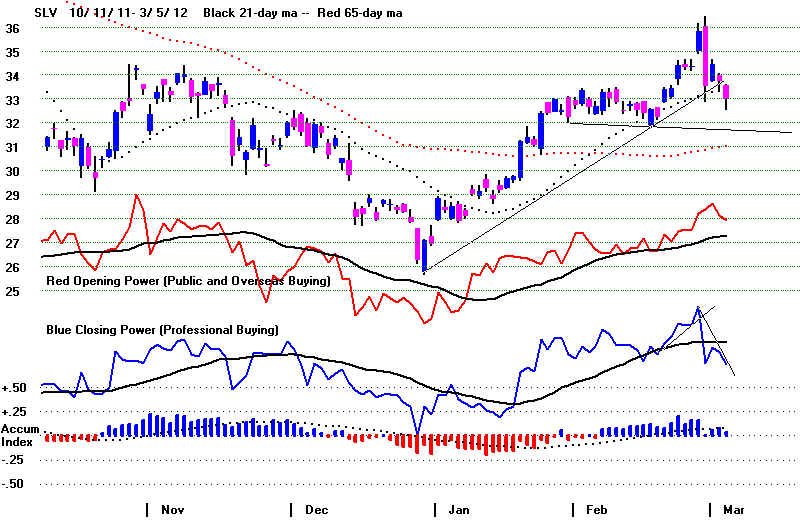
3/22/2012 KEY CHARTS OF INDUSTRY INDICES
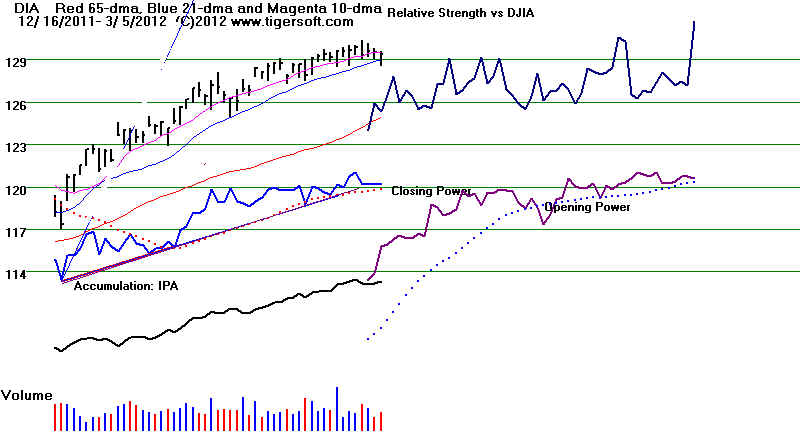
DIA SPY
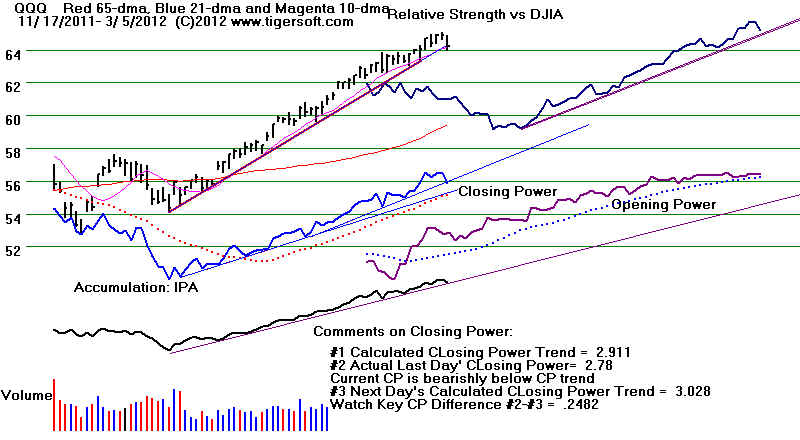
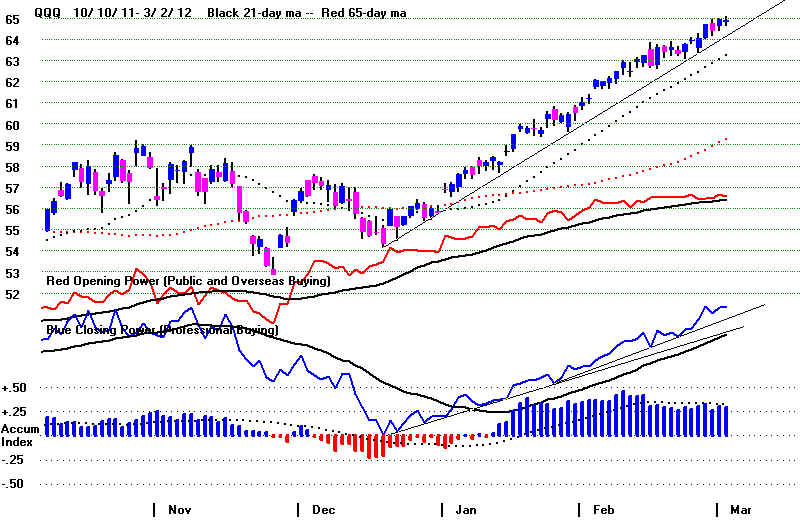
QQQ
DJIA-Peerless
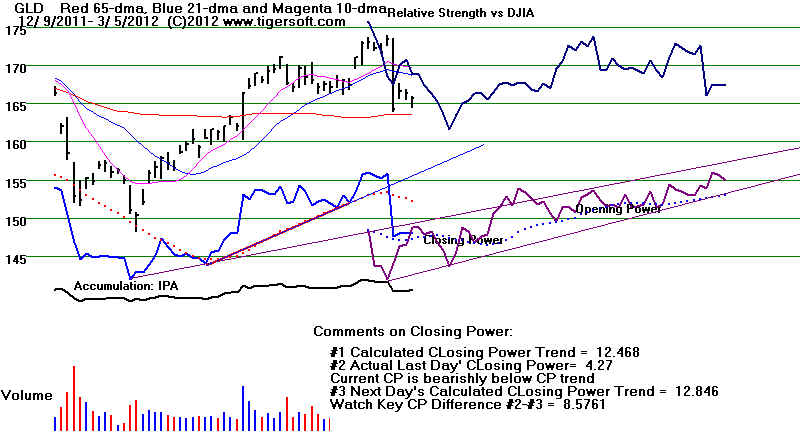
TigerDJI TigerSPY TigerQQQ GLD SLV Crude Oil
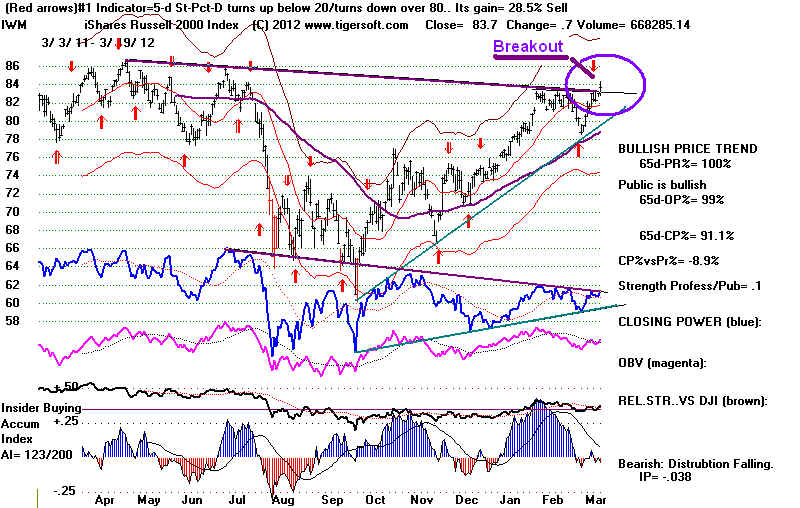
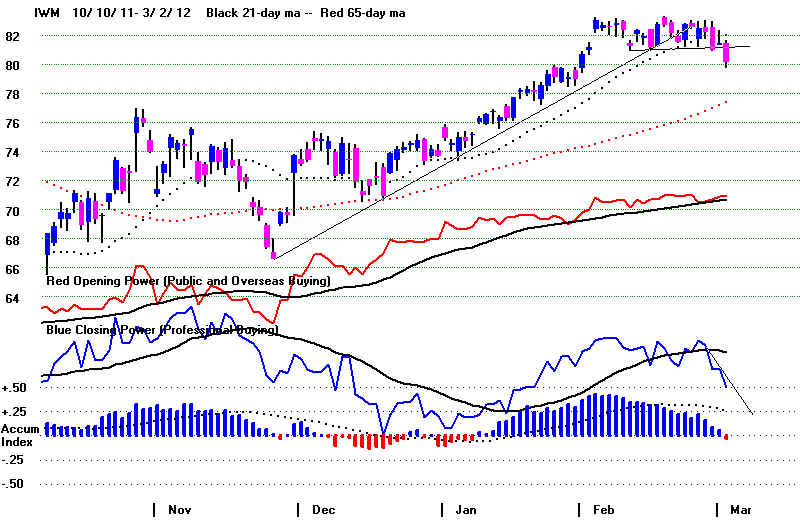
IWM-Russell-2000
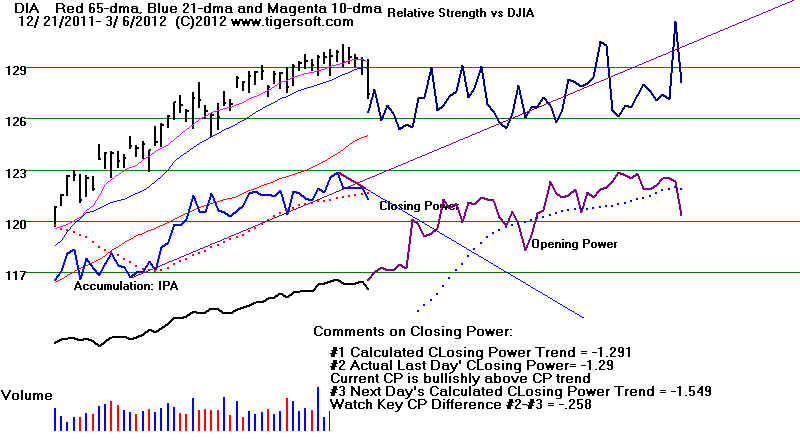
DIA' s CP
is uptrending It
would take a close of more than 0.31
below the opening to break the
longer term CP uptrend. The Opening Power
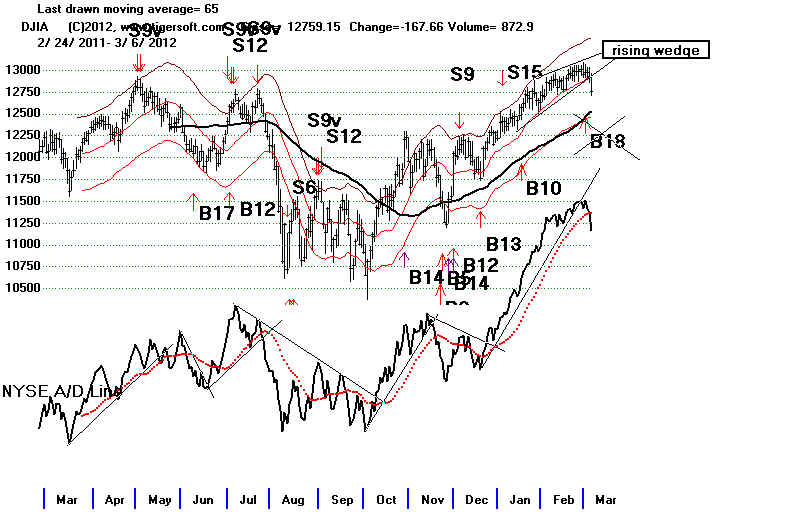
is flat. The DJI is caught
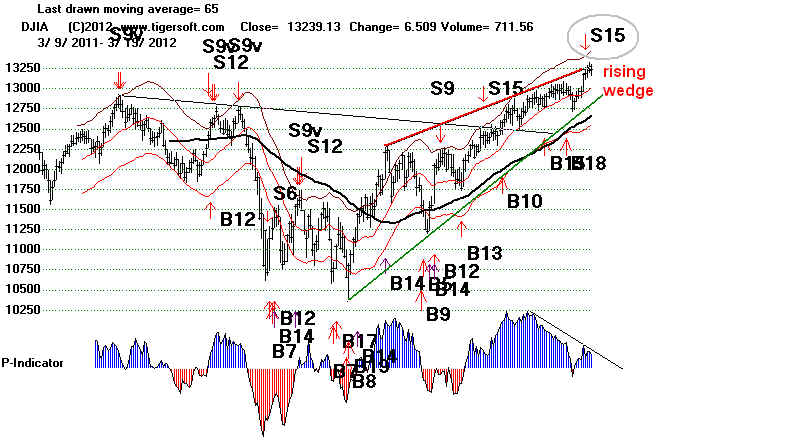
in another rising wedge
price pattern. These usually bring a downaisde break. .
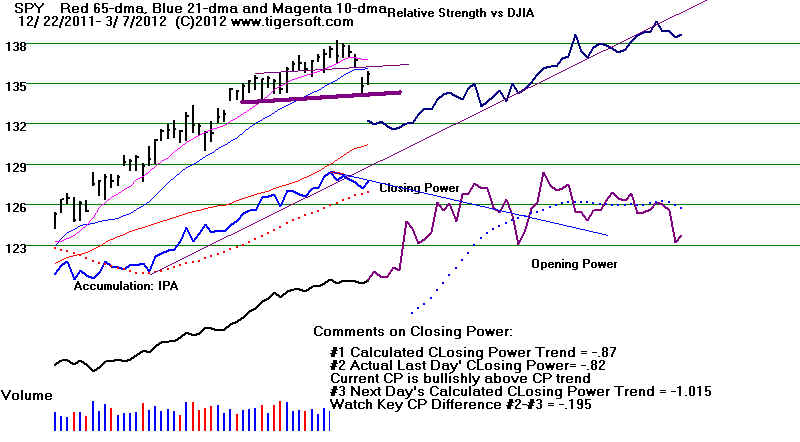
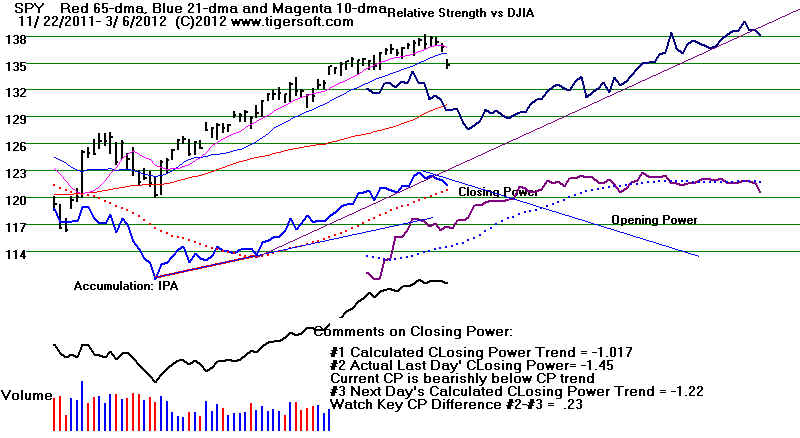
SPY's
CP's is uptrending. It would take a close of more than 0.21 below the
opening to break
the steeper CP uptrend. Opening
Power is back below its rising ma.
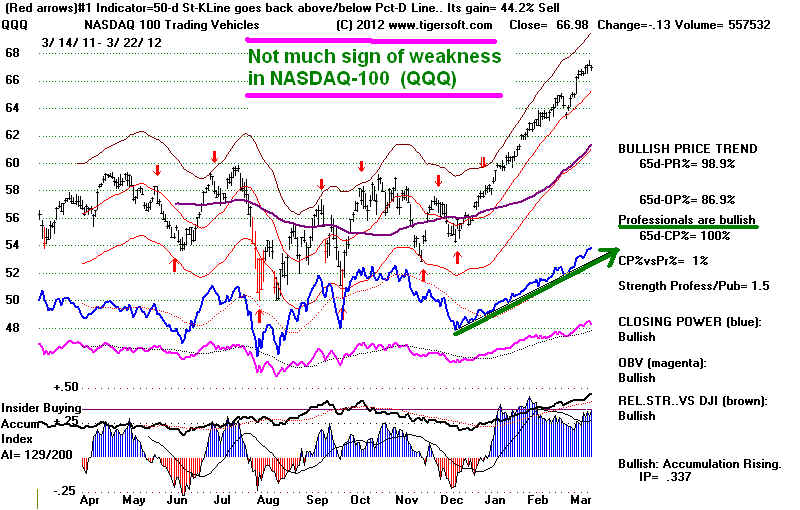
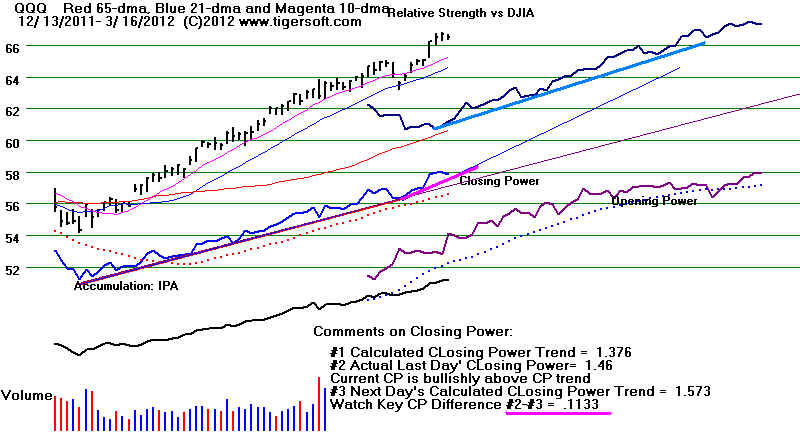
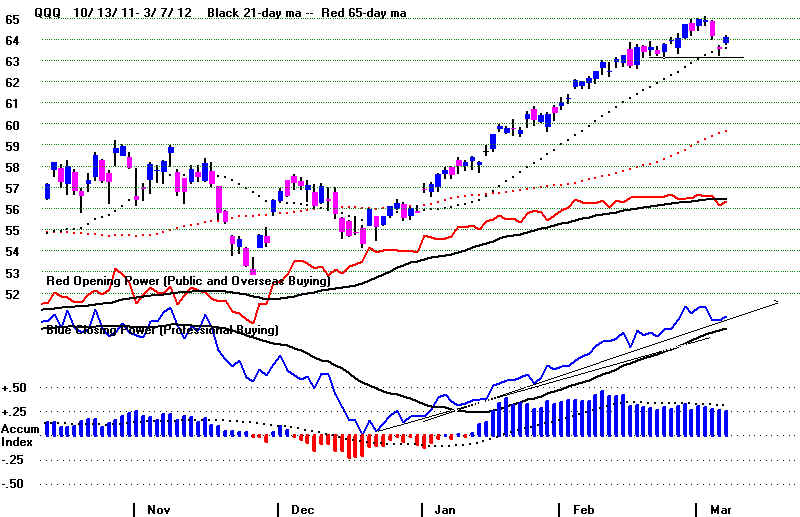
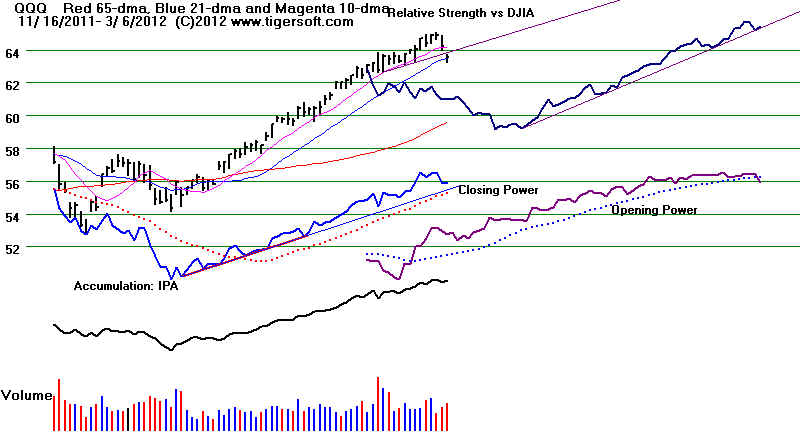
QQQ's CP is
uptrending. QQQ is much stronger than the DJI.
It will take a close of more than 0.11 BELOW the Opening to break the STEEPER CP UP-trendline.
Opening Power is uptrending. BOTH
Opening Power and Closing Power are RISING.
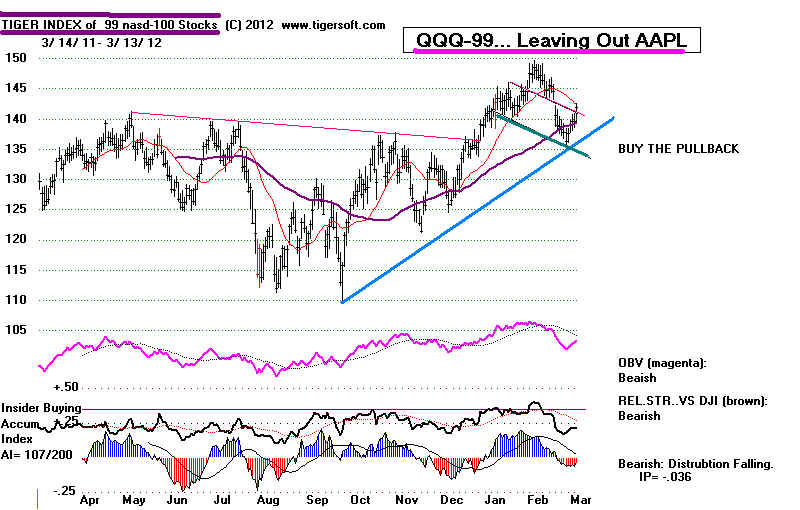
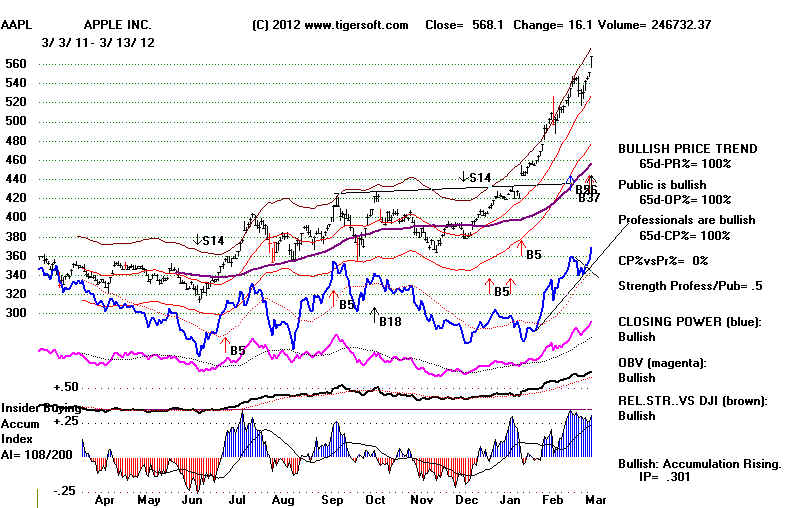
The QQQ is being boosted considerably by AAPL's
powerful advance.
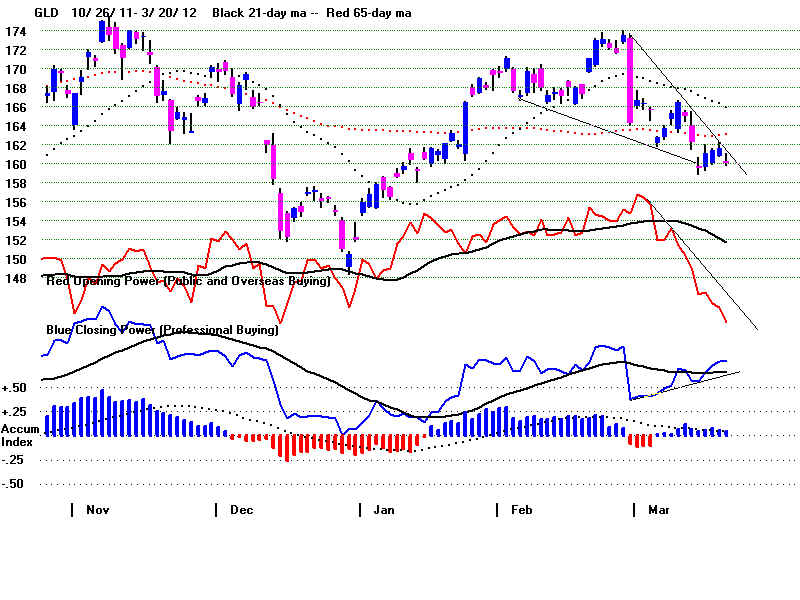
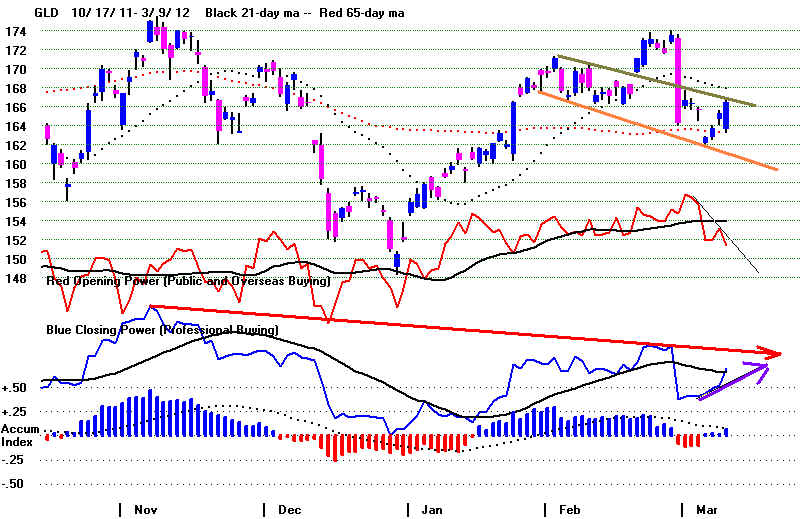
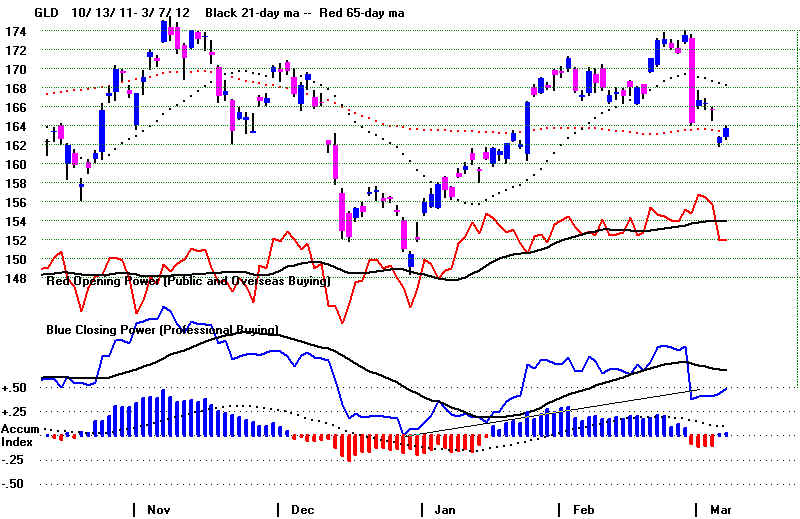
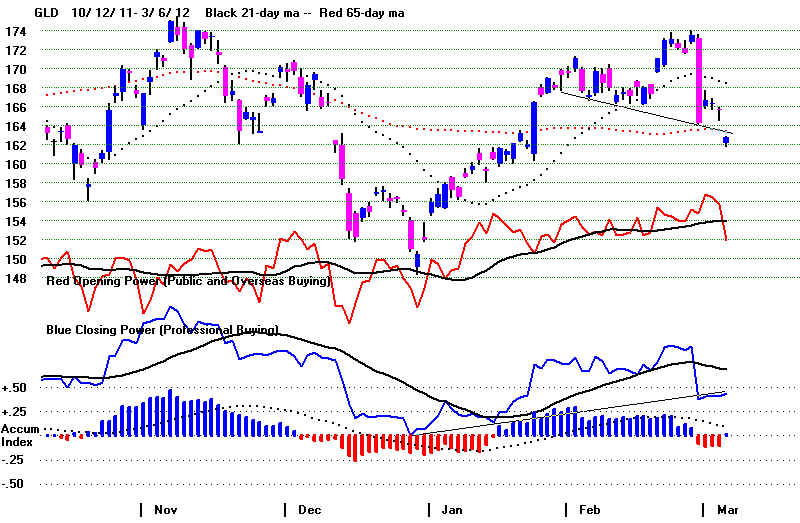
GLD's CP is above its
rising CP uptrend The less steep CP uptrendline is far below the current CP
. Its
Opening Power is falling. Note the bearish
head/shoulder price pattern, the price
downtrendline and the bullish Closing Power divergence Buy B7s.

===================================================================================
OLDER HOTLINES
===================================================================================
3/21/2011
Hotline
The DJI's weakness
brought a Peerless Sell S1. This occurs because the Stochastic-Pct-D
falls below 80 with accompanying internal weakness. This
signal can only take place in a
Presidential Election year. There have been 26 Sell S1s since
1928. 23 of the 26 would have
brought gains to the short seller who covered at the next
Peerless Buy signal. The average
gain was only +3.4%. See http://tigersoft.com/PeerInst-2012/-Sell-S1.htm
Below is the only Sell S1 in March.
3/11/1988
Gain = +2.8%
DJI
la/ms AnnROC P
IP21 Opct
2034.98 1.0
.428 160
.094 -.052
The DJI rallied to 2090
before falling to the lower band
and a Buy signal. 3% Paper Loss
With the NYSE
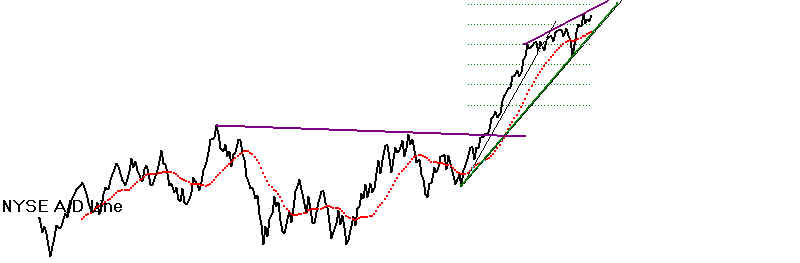
A/D Line still rising and the Closing Powers in uptrends, the market
still has a chance to rally again. A break in the rising
Closing Powers of IBM and AAPL
would certainly hurt the still strong tech sector. I
would stay hedged now. But
the new Peerless Sell signal and the negative V-Indicator
probably justifies shorting
DIA now. We
will probably get a new Buy signal at the rising 65-day around 13000. But that
cannot be assumed. If the DJI were to knife through it,
there would then be no Buy there.
The DJI's rising wedge pattern is bearish. So is the
head/shoulders in CAT, a leading
high priced DJI stock. Bearish head/shoulders patterns are
developing in EWZ
(Brazil ETF), FXI (China), Latin America (ILF), Instead of shortng DIA, these ETFs
might work out better because their chart patterns are also
bearish.
DJI 13125 la/ma = 1.008 21dmaROC=.145
P=97 P-Ch= -1 IP21=.011 (low) V= -19 OP= .004
BREADTH
STATISTICS:
Advance= 1492 Declines=1519 UpVol = 312.88 DownVol= 388.89
Key Stocks: AAPL and 4 highest priced DJI
stocks: IBM, CAT,
CVX, MCD and XOM
Watch CAT to see if
it completes its developing head/shoulders. 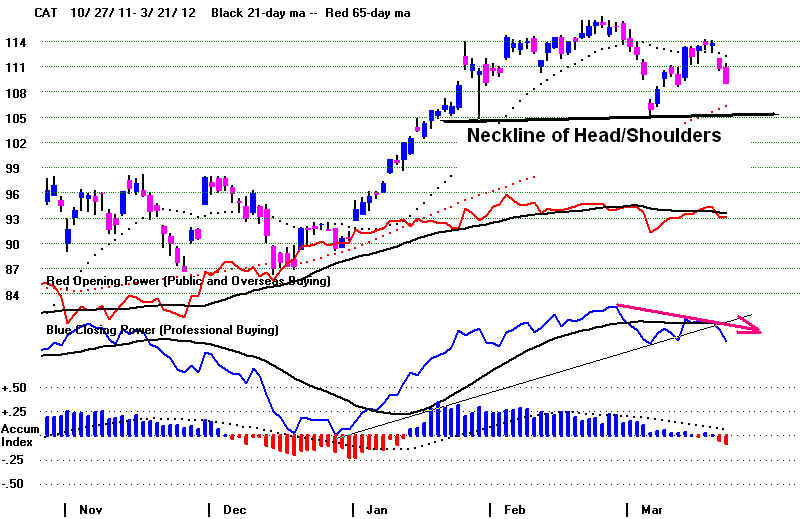
--->
177 (-38) MAXCP stocks
Bullish MAXCP Stocks Bullish.
---> 45 (+8 ) MINCP stocks Bearish MINCP
Stocks
MAXCP stocks are those showing Tiger Closing Power making new
highs.
This suggests heavy Professional Buying. Applying the Tiger Power Ranker's
"bullish" to the MAXCP stocks find those with heavy insider buying and
institutional accumulation. Bearish MINCP stocks show the opposite.
---> 57
new
highs on NASDAQ. 10 (-1) new lows on NASDAQ Bullish.
---> 31(+17 ) new
highs NYSE 9(+1) new lows on NYSE
3/21/2012 Consider Low Priced
High Accummulation speculations in
the third wave
general market advance since 2009. Trade these with the trend of the 21-day ma of
Closing Power
3/21/2012 KEY CHARTS OF INDUSTRY INDICES
DIA SPY
QQQ
DJIA-Peerless
TigerDJI TigerSPY TigerQQQ GLD SLV Crude Oil
IWM-Russell-2000
DIA' s CP
is uptrending It
would take a close of more than 0.68
below the opening to break the
longer term CP uptrend. The Opening Power
is flat. The DJI is caught
in another rising wedge
price pattern. These usually bring a downaisde break. .
SPY's
CP's is uptrending. It would take a close of more than 1.48 below the opening
to break
the longer term CP uptrend. Opening
Power is back below its rising ma.
QQQ's CP is
uptrending. QQQ is much stronger than the DJI.
It will take a close of more than 0.10 BELOW the Opening to break the STEEPER CP UP-trendline.
Opening Power is uptrending. BOTH
Opening Power and Closing Power are RISING.
The QQQ is being boosted considerably by AAPL's
powerful advance.
GLD's CP is above its
rising CP uptrend The less steep CP uptrendline is far below the current CP
. Its
Opening Power is falling. Note the bearish
head/shoulder price pattern and price
downtrendline.
===================================================================================
OLDER HOTLINES
===================================================================================
3/20/2011
DJI 13170 -69 la/ma = 1.012 21dmaROC=.202 P=98
P-Ch= -73 IP21=.026 (low) V= -15
OP= .088
BREADTH
STATISTICS:
Advance= 1000 Declines=2031 UpVol = 240.86 DownVol= 460.0
Key Stocks: AAPL and 4 highest priced DJI
stocks: IBM, CAT,
CVX, MCD and XOM
Hotline
Sell S15 -> DJI Sell Off to Lower
Band?
Russell-2000- IWM Flat-Topped Breakout
False?
AAPL's rocket keeps boosting the NASDAQ and QQQ.
There
have been 14 reversing S15s like the current signal. They averaged drops of 7.3%
in the DJI at the time of the
next reversing Peerless Buy. If a cluster of new major Sells
were to follow, such as S9s
or S12s, it would make the present Sell S15 more bearish.
Note that reversing S15s in a Presidential Election year averaged
only declines
of 3.3% at the time of the
next Peeless Buy. There were 6 cases.
All occurred between
January and April 14th, This
suggests that any DJI decline to the rising 65-day ma will
likely find very good support
and a new Buy from Peerless.
I
continue to think that secondary stocks showing high levels of Accumulation and
rising Closing Powers will do well
at this time. The rise in interest rates from such a
low level will have little effect
on them, unlike bonds. This is the third leg up since
the bottom in March 2009.
Such "legs" tend of bring big gains in many of the more
speculative and lower priced
stocks. Our Stocks' Hotline, accordingly, is hedged
and not short any of the major
market ETFs yet.
The recovery in Housing Stocks
is certainly bullish. So is the decline in Gold.
If inflation is seen as less of a
problem and there is an economic recovery, Gold
will drop much more. A
recovering economy, like in 1995-1996, would leave Gold
and SIlver far behind. My
sense is that they have made their moves and, for now,
they are not as attractive as low
priced stock special situations. .
With the NYSE A/D Line and ETFs' CLosing Powers still rising it is
probably rash to call a top
just now in the general market.
Sell S15s by themselves can be a 1% to 5% premature. An
additional Peerless Sell signal based on
greater Accum. Index and P-Indicator divergences
(i.e. S12s and S9s) are sometimes needed.
I pointed this out a few days ago. Below are the
cases where the S15s were premature and
there was sometimes a paper loss because the DJI
did not reverse until there were other
Peerless Sell signals. The biggest such loss was
back in 1936, 5.1%, also early in a
Presidential Election year and at a time of recovery
from a Depression and extemely high
unemployment.
As our Sell S15 here occurred with the
DJI at 13194, we could assume that there is
a slight possibility of the DJI rallying
another 5% more before turning down. That would
mean it would reach 13750.
Much more commonly, there is little additional rally by the
DJI after a Sell S15, but it does take a
week or so for the market to turn down. The
V-Indicator has moved into more deeply
negative territory. This is associated with a DJI
which will not make much more of an
advance. We should, though, keep watching the
highest priced DJI-30 stocks for clues.
CAT seems to be forming a bearish H/S pattern.
Only IBM has made a sustained price
breakout on this advance.
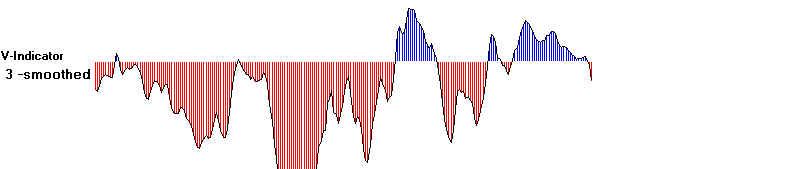
See how V-Indicator has turned more deeply negative.
Reversing S15s, Paper Losses,
Subsequent Peerless Sells and Only Then a DJI Decline/
^ = Reversing Sell.
S15s
Next Reversing Sell Signal
Date
DJI
la/ma ann
roc. P-I P-ch AI V-I
OPct Date
DJI Gain
Signal
------------------------------------------------------------------------------------------------------------------------
^2/18/36 153.4
1.029 .608 57
17 .016 -28 .18
5/5/36
148.6 +3.1.%
B2
This was first of a cluster of Peerless Sells. DJI rallied to
160.90 on 4/7/1936 before falling below lower band and reaching 143.70 on
4/29/1936. Paper loss = 7.9/153.4 =
5.1%
V-Indicator went more deeply negative on the rally.
^2/10/37
189.4 1.019
.391 -10
12 .034 -202 .116
2/10/37 189.4 +12.6% B8
This was first of a cluster of Peerless Sells. DJI rallied
to 194.40 on 3/10/1937 before falling below lower band and reaching 143.70 on
4/29/1936. Paper loss = 5/189.4 = 2.6%
V-Indicator went more deeply negative on the rally.
^4/6/72 959.44
1.02 .159
-70 15 .036
-1
.086 7/18/72
911.72 +5.0% B2
An Sell S9 occurred a week later. After S9, the DJI fell
immediately to the lower band. .
Paper loss = 0
The V-Indicatator turned positive for only one day and then fell more
deeply negative,
^1/5/1973 1047.49
1.023 .238
-77 -7 .039
-2 .053 2/26/73 953.79 + 8.9%
B16
A Sell S9 quickly followed. The DJI then started a, 23
month long bear market.
Paper loss = 0
The V-Indicator went more deeply negative
^1/2/90
2810.15 1.028 .453
50 30
.108 -1
.02 1/22/90 2600.45
+7.5% B5
DJI fell immediately below to the lower band. An S4 occurred the
next day.
Paper loss = 0
The V-Indicator turned more deeply negative.
See the definition and
research on this B15 signal.
--->
215 (-1) MAXCP stocks Bullish MAXCP Stocks Bullish.
---> 37 (-21 ) MINCP stocks Bearish MINCP
Stocks
MAXCP stocks are those showing Tiger Closing Power making new
highs.
This suggests heavy Professional Buying. Applying the Tiger Power Ranker's
"bullish" to the MAXCP stocks find those with heavy insider buying and
institutional accumulation. Bearish MINCP stocks show the opposite.
---> 33 (-74) new
highs on NASDAQ. 11 (+1) new lows on NASDAQ Bullish.
---> 14(-41 ) new
highs NYSE 8(+4) new lows on NYSE
3/20/2012 Consider Low Priced
High Accummulation speculations in
the third wave
general market advance since 2009. Trade these with the trend of the 21-day ma of
Closing Power
3/20/2012 KEY CHARTS OF INDUSTRY INDICES
DIA SPY
QQQ
DJIA-Peerless
TigerDJI TigerSPY TigerQQQ GLD SLV Crude Oil
IWM-Russell-2000
DIA' s CP is uptrending It would
take a close of more than 1.57 below the opening to break the
longer term CP uptrend. The Opening Power
is flat. The DJI is caught
in another rising wedge
price pattern. These usually bring a downaisde break. .
SPY's CP's is uptrending.
It would take a close of more than 0.57 below the
opening to break
the steeper
CP uptrend. Opening Power is back below its rising ma. Accumulation is at a level
high enough to
indicate good support.
QQQ's CP is uptrending. QQQ
is much stronger than the DJI.
It will
take a close of more than 0.21 BELOW the Opening to break the STEEPER CP
UP-trendline.
Opening
Power is uptrending. BOTH Opening Power and Closing Power are RISING.
The QQQ is being
boosted considerably by AAPL's powerful advance.
GLD's CP is above its
rising CP uptrend The less steep CP uptrendline is far below the current CP
. Its Opening Power is falling.
Note the bearish head/shoulder price pattern and price
downtrendline.
=====================================================================================
OLDER HOTLINES
=====================================================================================
3/19/2011 Hotline
Sell S15 DJI Sell Off to Lower Band?
Russell-2000- IWM Flat-Topped
Breakout?
AAPL's rocket is boosting the NASDAQ.
But IBM was down today, Down Volume was high
and IWM sold off from its highs. Stay hedged.
DJI
13239+7 la/ma = 1.018 21dmaROC=.307 P=170 P-Ch= -35
IP21=.033 (low) V= -2
OP= .189
BREADTH STATISTICS: Advance= 1907 Declines=1109 UpVol = 391.99 DownVol= 319.57
--->
216 (+55) MAXCP stocks Bullish MAXCP Stocks Bullish.
---> 58 (+24 ) MINCP stocks Bearish MINCP
Stocks
MAXCP stocks are those showing Tiger Closing Power making new
highs.
This suggests heavy Professional Buying. Applying the Tiger Power Ranker's
"bullish" to the MAXCP stocks find those with heavy insider buying and
institutional accumulation. Bearish MINCP stocks show the opposite.
---> 105 (+32)
new
highs on NASDAQ. 10 (-1) new lows on NASDAQ Bullish.
---> 55(+19 ) new
highs NYSE 4(-2) new lows on NYSE
3/19/2012 Consider Low Priced
High Accummulation speculations in
the third wave
general market advance since 2009. Trade these with the trend of the 21-day ma of
Closing Power
3/19/2012 KEY CHARTS OF INDUSTRY INDICES
DIA SPY
QQQ
DJIA-Peerless
TigerDJI TigerSPY TigerQQQ GLD SLV Crude Oil
IWM-Russell-2000
HOTLINE See below that the Russell-2000
ETF (IWM) has moved above
its resistance line. At this time, too, the NYSE A/D
Line and Closing
Powers for the major market ETFs are all rising. It
is also hard now to
find good short sales among the bearish MINCP stocks.
That puts
the bearish Sell S15 in a largely isolated technical
position, except that
bonds and utilities have weakened as interest
rates have risen
from their extremely low levels. Our stocks'
Hotline is hedged,
as we wait for either a more decisive breakout or a market
pullback.
Sell S15 -
research on this signal and charts of earlier cases
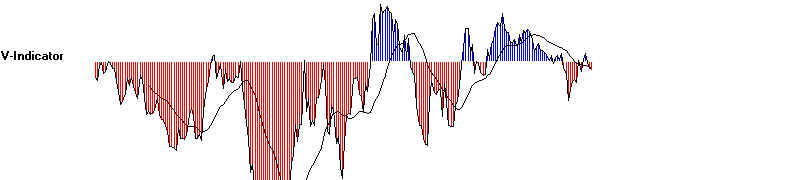
"The V-Indicator Should Not Turn Positive
for More Than A Few Days"
======================================================================================
OLDER HOTLINES
======================================================================================
3/16/2011 Hotline
What's Next?
Sell S15 DJI Sell Off to Lower Band?
Russell-2000- IWM Flat-Topped Breakout?
Selective Mild Decline in Bonds and Dividend Stocks
on NYSE?
All of the above?
3/16/2011 DJI
13293 -20 la/ma = 1.019 21dmaROC=.415 P=205 P-Ch= 8
IP21=.055 V=19 OP= .189
BREADTH STATISTICS: Advance= 1391 Declines=1657 UpVol = 897.44 DownVol= 728.06
--->
161 (+30) MAXCP stocks Bullish MAXCP Stocks Bullish.
---> 34 (+6 ) MINCP stocks Bearish MINCP
Stocks
MAXCP stocks are those showing Tiger Closing Power making new
highs.
This suggests heavy Professional Buying. Applying the Tiger Power Ranker's
"bullish" to the MAXCP stocks find those with heavy insider buying and
institutional accumulation. Bearish MINCP stocks show the opposite.
---> 72 (+7)
new
highs on NASDAQ. 11 (+8) new lows on NASDAQ Bullish.
---> 36(-54 ) new
highs NYSE 6(+2) new lows on NYSE
3/16/2012 Consider Low Priced
High Accummulation speculations in
the third wave
general market advance since 2009. Trade these with the trend of the 21-day ma of
Closing Power
3/16/2012
KEY CHARTS OF INDISTRY INDICES
DIA SPY
QQQ
DJIA-Peerless
TigerDJI TigerSPY TigerQQQ GLD SLV Crude Oil
IWM-Russell-2000
HOTLINE
Sell S15 -
research on this signal and charts of earlier cases
"The V-Indicator Should Not Turn Positive
for More Than A Few Days"
"Usually after an S15, the
V-Indicator stays negative and falls more deeply so
after the Sell S15. See the tables
and charts at the bottom of this
page. The V-Indicator
can sometimes turn positive for a
few days. When it turns positive for a week,
as in 1992 and 2008, if there is no
Peerless Buy signal, consider the DJI decline delayed
and about to start in earnest as
soon as the V-Indicator turns negative again. On the
other hand, if it turns positive
and keeps rising for more than a week, I would suggest
doubting the Sell S15 and waiting
for new signal. This occurred in January 2012 and
may be occurring again in March
2012."
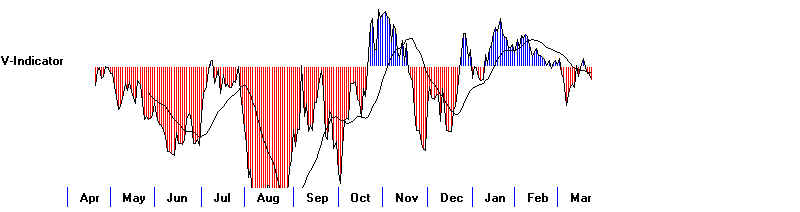
V-Indicator has just turned positive.
I have not yet suggested selling
short any of the major market ETFs.
The rising Closing Powers and
rising NYSE A/D Line leave the Sell S15
"unclinched". The
now positive and rising V-Indicator is a warning, too.
DJI is up 23% since its October
low. The momentum and
internal strength indicators have
been weakening, but they are
not yet negative. The recent
bulges of Accumulation suggest the ETFs
are in strong hands. So,
any decline will find good support at the
rising 65-day ma. APPL's
weakness on a Friday is not a good
indication it has peaked.
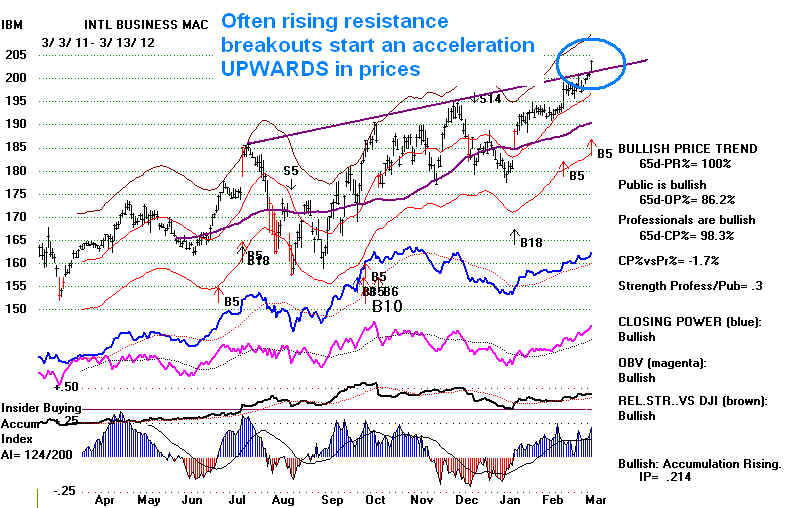
Meanwhile, IBM is advancing steadily
and the oil stocks in the DJI-30
(XOM and CVX) may still make
breakouts above their well-tested
flat resistance. It is from secondary
stocks that I would expect the
biggest move if IWM breaks out above 84.
The current advance represents the
3rd wave up since the bottom in March 2009.
This often send a lot of hot money
into the "cats and dogs", low priced
and technology stocks. 1968
and 1999-2000 are the two best examples.
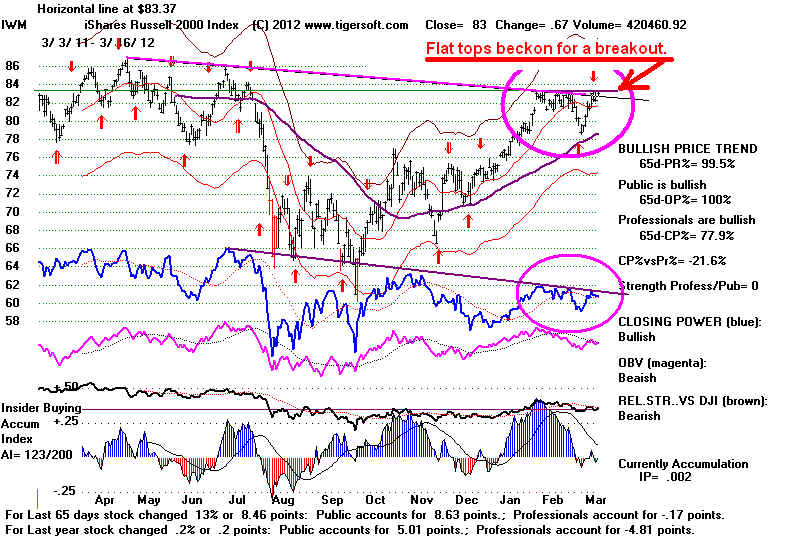
Watch closely IWM, the Russell-2000. It closed at
83. It will not take much of an advance to
bring a flat-topped breakout.
These breakouts are usually reliable, because the selling has been
done too simply and lazily done.
If there is a breakout, everyone sees the breakout. A diagonal
trane-break is harder to see.
Be very careful with any short sales that get past their 21-day ma if
this breakout takes place.
They are apt to rally 10% higher, at least. I would suggest putting
asside the Sell S15 for the time
being if there is such a closing breakout if you are trading secondary
stocks. I would expect
Professionals to jump aboard and bring a much higher closing. That would
mean breakout also in the long
Closing Power resistance lines. This has not happened yet.
But it looks like it will, despite
the frequency with which March brings tops in the DJI in a Presidential
Election year.
It is the dividend paying stocks
that are in most trrouble right now, as interest rates rise.
See how weak the Utilities and
Bonds have been.
March Tops
have been much more frequent than March Advances in a Presidential Election Year
since 1916. In this period,
there have been only 6 advances by the DJI in March in a Presidential
Election year. By contrast,
in 16 instances since 1916 the DJI or the A/D Line peaked or fell in
March. In 6 of these it fell
below the lower band.
March
and DJI:1886-2012
UP DOWN
-------------------------------------------------------------------------------
1888
down
1892
DJI peak on 3/4/1892
1896
DJI peak on 3/4/1896
1900 up
down first half of month.
1904 up
down first half of month.
1908 up
1912 up
-------------------------------------------------------------------------------
1916
DJI peak and decline to LB
(lower band)
1920
DJI decline and decline
below LB and bear market.
1924 -
DJI peak and decline to LB
1928 - up
1932 -
down steeply and DJI fall far beloe lower band.
1936 -
DJI peak - 3/6/36...decline to
LB and back up
1940 - flat
1944
DJI peak 3/13/1944...decline to
LB
1948 - up
1952 -
DJI peak 3/31/1951 top
...decline to LB
1956 -
3/23/ A/D top. DJI peaked
4/9 and fell below LB.
1960 -
3/24/ A/D top. DJI peaked
4/16 and fell below LB.
1964 - up (4/6
peak in A/D Line. DJI peaked on 5/8 and almost to LB
1968 - up
1972 -
3/6 peak in A/D Line.
DJI peaked on 4/17 and fell to LB
1976 -
DJI - 3/24 peak. DJI fell
to lower band.
1980 -
breakdown below H/D neckine and decline below LB
1984 -
DJI 3/16 peak - DJI fell to LB
1988 -
DJI 3/17 peak - DJI fell to LB.
1992 -
DJI 3/4/ peak - DJI fell nearly
to LB
1996 -
DJI 3/18 peak - DJI fell to LB
2004 - up
2008 - up
2012
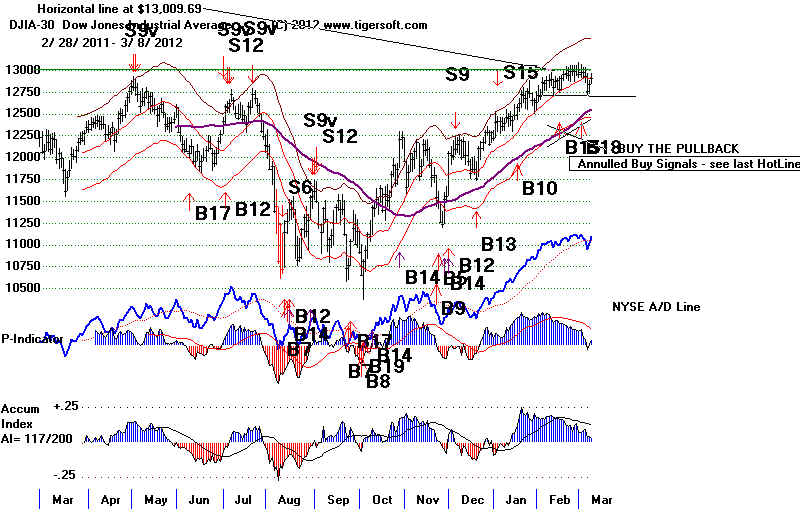
KEY
ETFS - 3/15/2012
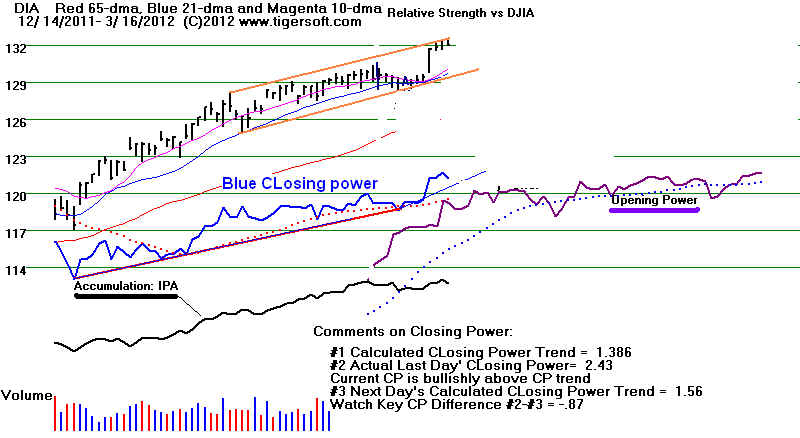
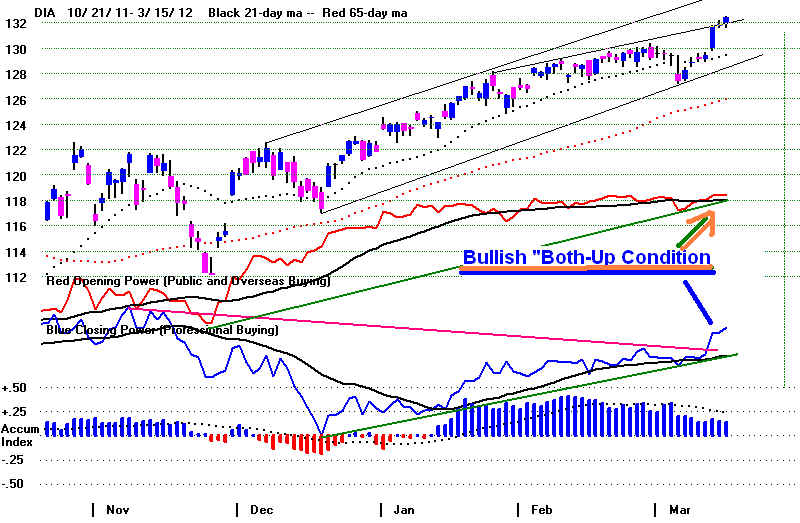
DIA' s CP and Opening Power are Both uptrending
BOTH RISING.
Any close of more than 0 below
the opening will break the steeper CP uptrend.
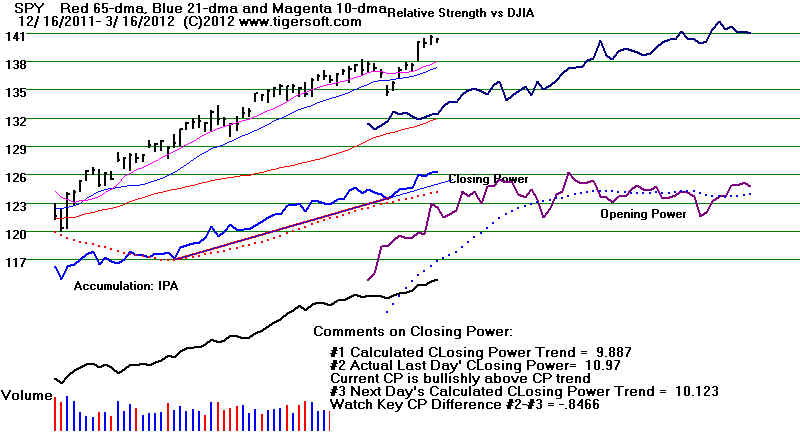
SPY's CP's is uptrending.
It would take a close of more than 0.47 below the
opening to bring
a break in the less steep CP uptrend. Opening Power is back above its rising
ma. BOTH RISING.
QQQ's Steeper CP is uptrending. QQQ
is much stronger than the DJI.
It will take a close of more than 0.12
BELOW the Opening to break the
STEEPERCP UP-trendline.
Opening Power is uptrending. BOTH RISING.
GLD's CP broke its steeper
rising CP uptrend The less steep CP uptrendline is far below
Its Opening Power is falling.
BOTH RISING. A clos emore than
1.48 below the Opening will
break
the newest CP uptrendline. Note the bearish head/shoulder price pattern
 ================================================================
OLDER HOTLINES
================================================================
3/15/2012
DJI= 13253 la/ma = 1.022
21dmaROC= +.344 P=+196
(+67) IP21=.071
V= +5 OP= .235
New: 5 Highest Priced DJI Stocks have the most weight in DJI-30 we track/trade with
Peerless
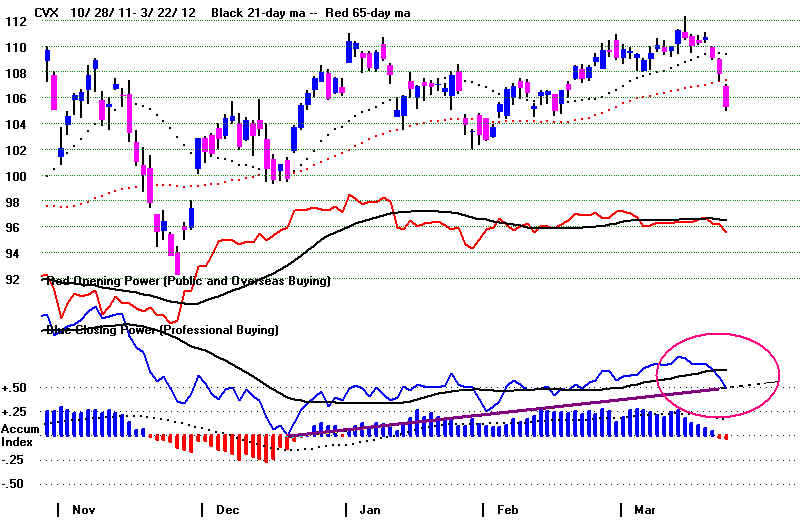
IBM running CAT potential H/S CVX
failed at 111 resistance
XOM potential H/S MCD below 65-dma
plus AAPL running
but -4 today.
BREADTH
New Highs New Lows
NASDAQ 73
13
bullish
plurality
NYSE
70
5 bullish plurality
MAXCP Stocks = 206 (-17)
MINCP Stocks =94 (+6) Bullish pluralitu
of MAXCP>MINCP
3/15/2012 Consider
buying Bullish MAXCPs on confirmed price breakouts and CP
hooks back up
3/15/2012 Consider
shorting Bearish MINCPS as hedges
when CP makes new lows ahead of price
and breaks CP support. Coal stocks are showing unusual weakness.
3/15/2012 Consider Low Priced
High Accummulation speculations in
the third wave
general market advance since 2009. Trade these with the trend of the 21-day ma of
Closing Power
as much as possible Selling 50% when one has a 50% profit is suggested as good
money
management with very low-priced stocks.
 HOTLINE - "Beware
the Ides of March"
HOTLINE - "Beware
the Ides of March"
I like the
quote below from Shakespeare about Caesars who would be dictators.
"CAESAR: Let me have men about me that are fat,
Sleek-headed (i.e. bald) men, and such as sleep a-nights.
Yond Cassicus has a lean and hungry look;
He thinks too much: such men are dangerous".
( Julius Caesar Act
1, scene 2, 190–195 )
Stay Hedged with some shorts among the Bearish MINCP stocks.
I would not yet go short any of the major market ETFs.
The internal strength indicators are falling, but are still not
negative. At 2.2% over the 21-day ma, the DJI is about 1%
below "over-bought" status. I would think that is the upside
potential right now, though that could change if IBM accelerates upwards.
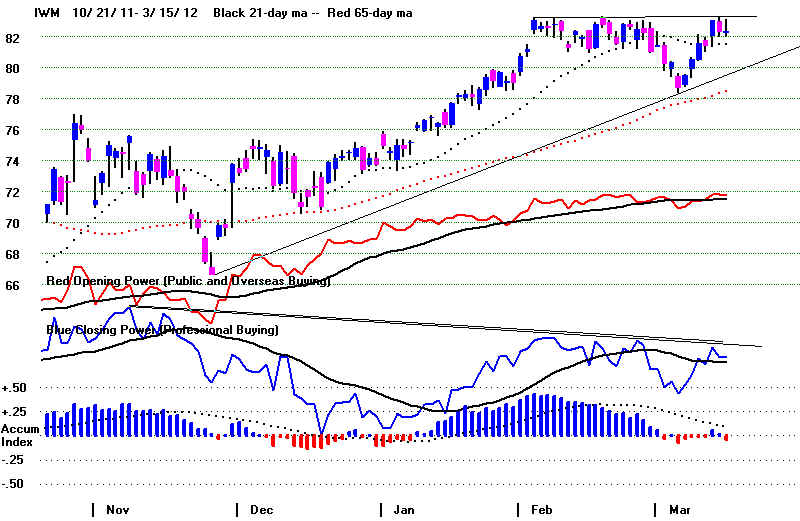
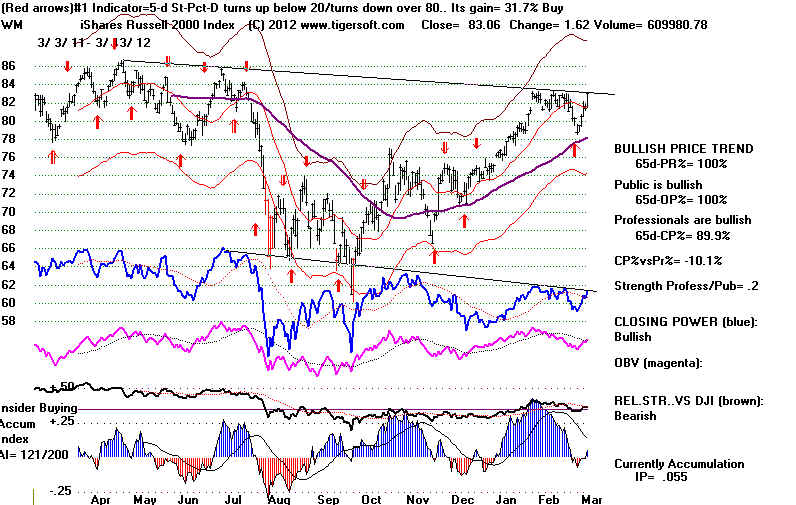
Watch IWM (Russell-2000 ETF).
A breakout in IWM could force us to reconsider
many of our recent short sales. Breakouts above
well-tested flat resistance lines are reliably bullish
if the Accumulation Index is positive and the CLosing
Power confirms the new high. Presently IWM's Accum. Index
is negative and its CP is lagging prices.
NEW SELL S15 from PEERLESS Yesterday
See the newly updated definition
and research on this signal.
There have been 14 reversing S15s like the current signal.
They
averaged gains of 7.3%. A cluster of major Sells which might follow,
including
S9s and S12s would make the Sell S15 more bearish.
Note that reversing S15s in a Presidential Election year averaged only gains
of 3.3%.
There were 6 cases. All occurred between January and April 14th,
This
suggests that a DJI decline to the rising 65-day ma would likely find
very good
support and probably a new Buy from Peerless.
Closing Power and A/D Lines Have Not Clinched This Sell Signal.
Though Apple was down today, IBM moved
higher. I have suggested
buying IBM or buying calls in it, because of its breakout above
a
well-tested, rising resistance line.
Bearishly, we still have not seen the broader
market, as measured by the
Russell-2000, IWM, make a new
high to match the DIA, SPY and QQQ's.
The fact that the ETFs' Opening and Closing Powers show Both-Up trajectories
invites caution about shorting prematurely. Certainly, a breakout by
IWM
above its flat resistance would be very bullish short-term for less
seasoned and lower priced stocks.
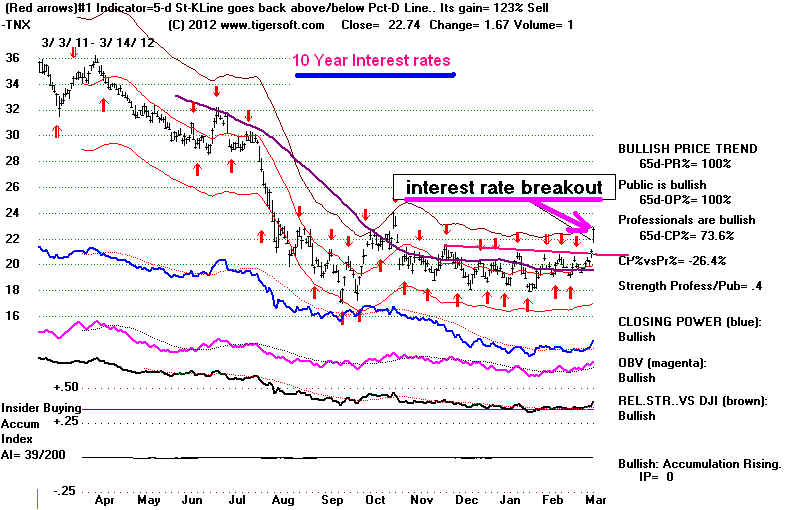
Rising Interest Rates.
The most likely cause for the next intermediate decline is rising interest rates.
See the sharp drop below the 65-day ma by 20-year notes.
By itself, a drop below 20-year bonds below its 65-dma has produced a mix
of gains and losses since 2000. At times, the selling in bonds reflects the lure
of stocks over bonds, as business conditions improve. In our case, that is
a factor, but the bigger element is a nuanced tightening by the Fed with
Paul Volcker giving new expression of fears withing the Fed of inflation
and a speculative bubble in stocks.
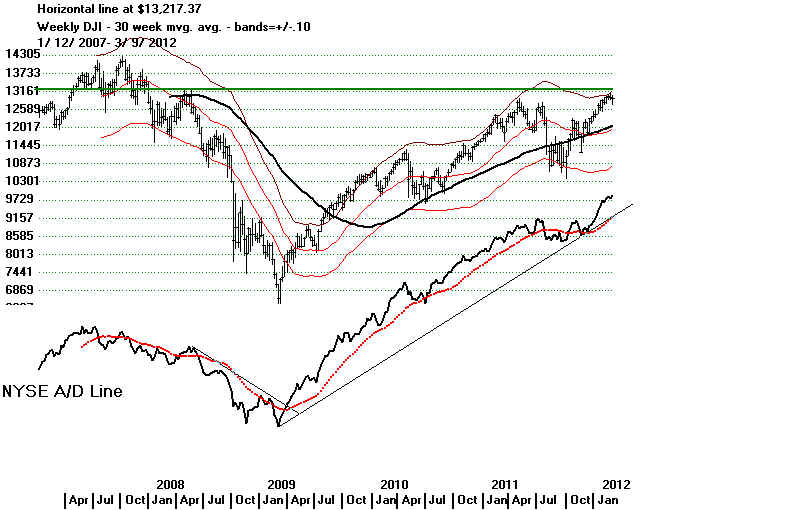
| What Happens to the DIA when 20 Year Treasury
Bonds (TLT) Drop Sharply below Their 65-dma? Answer: The DIA was just as likely to rally as fall! Compare the present TLT (because of penetration downward of 65-dma) with past cases of it breaking 65-dma AND see what happens to DIA ...Red means DIA fell and short sales on DIA would have been profitable. 7 cases. ... Green means DIA rose and short sales would have NOT been profitable. 7 cases.. 10/14/2010 - DIA rallied from 111.07 to 114.54 on 11/6/2010 11/3/2009 - DIA rallied from 104.65 to 111.21 on 11/16/2009 4/17/2008 - DIA fell from126.70 to 109.30 on 7/15/2008 (-2% paper loss) 7/26/2007 - DIA fell from 134.71 to 129.15 on 8/16/2007 (no paper loss) 7/20/2006 - DIA rallied from 109.42 to 123.36 on 11/16/2006 12/23/2005 - DIA fell from 108.75 to 106.95 on 12/30/2005 (no paper loss) 8/30/2005 - DIA rallied from 104.00 to 106.81on 9/12/2005 4/18/2005 - DIA rallied from 100.55 to 105.78 on 6/16/2005 7/2/3004 - DIA fell from 103.30 to 99.72 on 8/5/2004 (no paper loss) 9/26/2003 - DIA rallied from 83.30 to 98.22 on 10/15/2003 5/7/2003 - DIA went sidewise for 7 days and rallied from 85.86 to93.50 on 6/16/2003 5/31/2002 - DIA fell from 99.25 to 77.17 on 7/23/2002 (no paper loss) 7/19/2001 - DIA fell from 106.40 to 83.65 on 9/20/2001 (no paper loss) 6/2/2000 - DIA fell from 107.51 to 104.00 on 6/22/2000 (no paper loss) |
Bond funds and utililities have been the main casualty, so far of the Sell S12.
Bonds tend to move all together, at once, as they adjust to interest rate changes.
Utilities' yields relative to bonds are a key element in their investment appeal.
There usually is a lag of a few weeks between
rising rates, as expressed
in Discount Rate and Overnight Fed Funds' Rates and a market sell-off.
The Overnikght Fed Funds' rates are still so
low, it is hard to see their rise
as being significant in supressing bank speculations in equities.
Read TigerSoft
Blog 8/18/2007: Federal Reserve Discount
Rate Changes
and Stock Price
Movements: 1955-2008
=====================================================================================
OLDER HOTLINES
=====================================================================================
3/14/2012
DJI= 13194
+16 la/ma = 1.019 21dmaROC= +.295 P=+129 (-148) IP21=.069 V=-24 OP= .23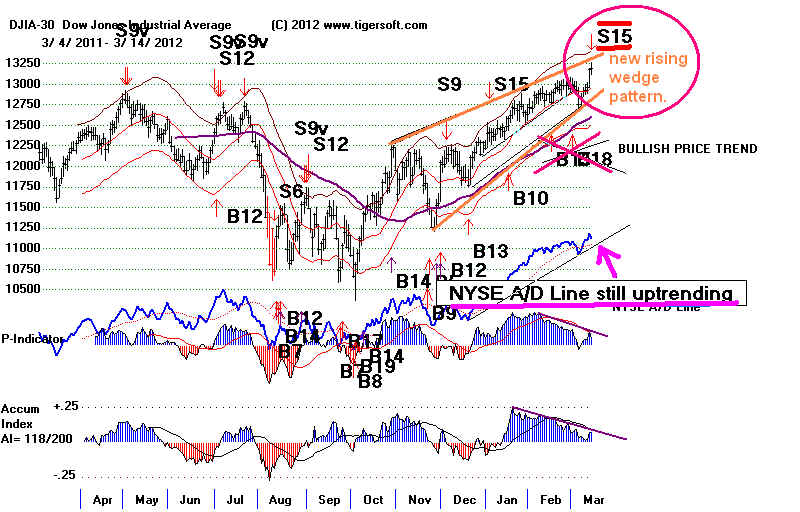
DIA SPY QQQ DJIA-Peerless TigerDJI TigerSPY TigerQQQ
GLD SLV
Crude Oil
IWM-Russell-2000
STATUSES of
CLOSING POWERs of ETFs
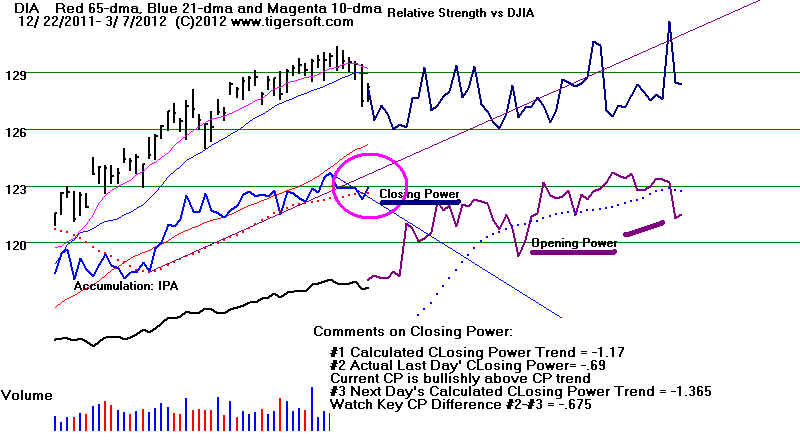
DIA' s CP is rising
and above its 21-DMA. Breakout
Opening Power above its rising 21-dma. This is Bullish
BOTH UP condition.
Only a close of more than 1.82 below the Opening would break the CP uptrendline.
SPY's main CP is rising
and above its rising 21-DMA. Breakout. It would
take a
Close of more than 1.36 belowthe Opening to break the CP uptrendline.
Opening Power is above its 21-dma. This is Bullish BOTH
UP condition.


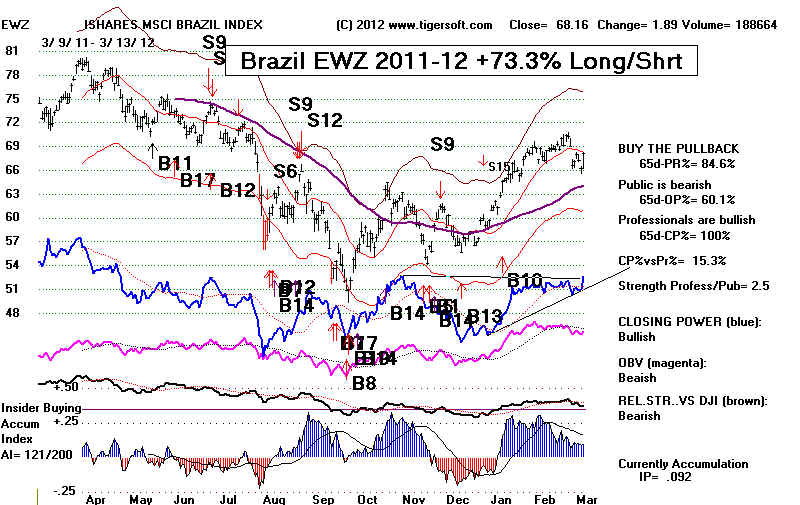
Colossal Annual Gains
Trading EWZ (ETF for Brazil - NYSE) from 2001-2012
Simply Super-imposing Automatic Peerless Buys and Sells on EWZ
"Long and Short" "Long"
Short
2001
+78.6%
+31.5% +35.8%
2002
+62.1%
+8.1% +50.0%
2003
+122.8%
+124.9% -0.9%
2004
+87.2%
+63.5% +14.5%
2005
+45.6%
+45.6%
no trades
2006
+133.7%
+74.3% +34.1%
2007
+141.1%
+119.8%
+12.5%
2008
+155.3%
+18.8% +115.0%
2009
+110.2%
+108.8% +1.0%
2010
+29.3%
+18.5% +9.2%
2011
+87.2%
+24.3% +50.6%
2011-2012
+73.7%
+32.8% +30.5%

3/9/2012 HOTLINE
DJI= 12922 +14
la/ma = 1.001 21dmaROC= +.035 P=+124 (+34) IP21=.014 V= -43 OP= .133
Peerless Remains on a Buy despite
Rising Wedge. Now
the DJI's head/shoulders pattern is
a visible threat to the
rally. People still remember
the quick H/S shoulders pattern
in early 2010 that dropped the DJI
quickly back 13.5%. The
price pattern then looks like what
is emerging now. The A/D
Line was weaker then. Our
current P-Indicator and Accum. Index,
however, are weaker than back when
the 2010 right shoulder
was formed.
The Completed DJI 2010
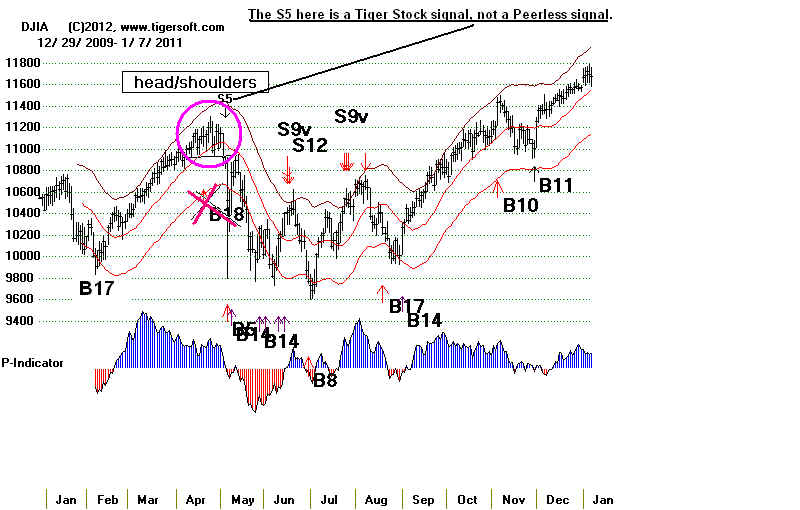
Head/Shoulders Pattern led to 13.5% Decline
So the DJI really needs to keep advancing. A reversal now
would
defintely keep alive the Bears'
hopes of a Head/Shoulders pattern
being completed.
The DJI does look like it will open lower. But the bulls have
not
been overcome. Breadth was
excellent on the rally and the major
market ETFs' Closing Powers are
Rising.
The A/D Line has bullishly made
another 12-month high.
But the P-Indicator and
Accumulation Index below on the
Peerless chart show considerable
deterioration. The
DJI has reached the apex of a right
shoulder in what could
become a head/shoulders pattern.
Chartists often go short here.
My expecation is that the pattern
will not be completed with
a drop below the neckline at 12750.
Usually, the A/D Line does
not make a new high on the making
of a valid DJI head/shoulders
pattern.
The foreign news is bearish.
A lower opening is to be expected.
Afghan civilian deaths could delay
strategic pact with U.S.
China sacrifices growth to satiate
inflation dragon
Greek debt swap could be short-lived
reprieve
France's Sarkozy defies Europe with
protectionist push
The US news is mixed. Housing stocks are quite
strong now. See
the Tiger Index of Housing Stocks. The Dollar's strength helps the
FED keep interest rates low.
But a decline
in oil prices will hurt
two of the highest priced DJI
components. The perpetual Crude Oil
chart shows considerable
Professional selling. I take it as a bullish
sign for the economic
recovery that Gold itself could be forming a
down-sloping head/shoulders
pattern. Gold's is strong when Inflation
and Fear are rising.
Economic recoveries as in the mid 1980s and
from 1995-1999 hurt Gold.
The DJI futures at this
writing are down 24. One could short some
of the bearish MINCP stocks
as a hedge against weakness. Our Stocks'
Hotline has simple stopped
buying for a day or two to see what happens
next.
Historically, from 1965-2011, the DHI rallies 63% of the time
over the next week and
58.7% of the time over the next two weeks.
BREADTH
New Highs New Lows
NASDAQ 66
8 bullish plurality
NYSE
86
2 bullish
plurality
MAXCP Stocks = 189 (+59) MINCP Stocks = 35
(-35) Bullish plurality of 60.
3/9/2012 Consider
buying Bullish
MAXCPs on confirmed
price breakouts and CP hooks back up
3/9/2012 Consider
shorting Bearish MINCPS as hedges
when CP makes new lows ahead of price
and breaks CP support. Coal stocks are showing unusual weakness.
3/9/2012 Consider Low Priced
High Accummulation speculations in
the third wave
general market advance since 2009. Trade these with the trend of the 21-day ma of
Closing Power
as much as possible Selling 50% when one has a 50% profit is suggested as good
money
management with very low-priced stocks.
3/9/2012 KEY CHARTS OF INDUSTRY INDICES
DIA SPY QQQ DJIA-Peerless TigerDJI TigerSPY TigerQQQ
GLD SLV
Crude Oil
IWM-Russell-2000
DIA' s CP broke its steep downtrend-line and got back above
its 21-DMA.
Opening Power is at its 21-dma. Watch for a
head/shoulders pattern
which peaks at 129 on the current rally and then turns down.
SPY's main CP's is
rising-line and is above its rising 21-DMA. It would
take a
Close 0.49 below the Opening to break the new, steeper CP uptrendline.
Opening Power is below its 21-dma. The 138 resistance of the SPY has now been
tagged,
QQQ's more gradual CP has
held. The QQQ CP is above its rising 21-dma.
Opening Power is below its 21-dma. The QQQ has
reached the resistance of its highs of last week.
A Close 0.17 below the Opening would break the new, steeper CP uptrendline.
GLD's CP is caught in a
triangle with converging uptrend and downtrendlines.
Its Opening Power is bearishly below
its 21-dma. It must resolve its head/shoulder pattern
SLV must also resolve its head/shoulder pattern soon.

====================================================================================
OLDER HOTLINES
====================================================================================
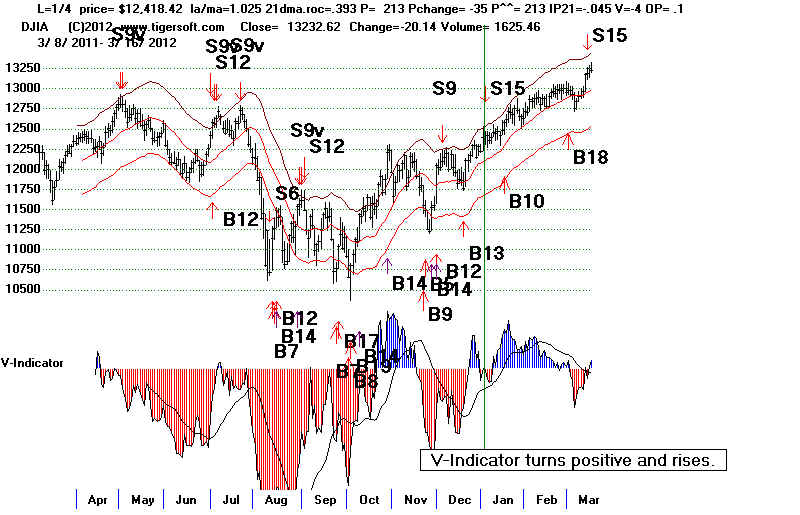
3/8/2012 HOTLINE
DJI= 12910 la/ma = 1.00 21dmaROC= +.027 P=+89 (+65) IP21=.030 V= -48 OP= .134
Peerless Remains on a Buy despite
Rising Wedge.
DJI Needs to Keep Advancing.
A Reversal Now Would
Keep Alive The Bears' Hopes of A
Head/Shoulders Pattern.
Breadth was good. Closing
Powers are Rising.
BREADTH
New Highs New Lows
NASDAQ 50
8 bullish plurality
NYSE
62
3 bullish
plurality
MAXCP Stocks = 130 (+48) MINCP Stocks = 70
(-15) Bullish plurality of 60.
3/8/2012 Consider
buying Bullish
MAXCPs on confirmed
price breakouts and CP hooks back up
3/8/2012 Consider
shorting Bearish MINCPS as hedges
when CP makes new lows ahead of price
and breaks CP support. Coal stocks are showing unusual weakness.
3/8/2012 Consider Low Priced
High Accummulation speculations in
the third wave
general market advance since 2009. Trade these with the trend of the 21-day ma of
Closing Power
as much as possible Selling 50% when one has a 50% profit is suggested as good
money
management with very low-priced stocks.
3/8/2012 KEY CHARTS OF INDUSTRY INDICES
DIA SPY QQQ DJIA-Peerless TigerDJI TigerSPY TigerQQQ
GLD SLV
Crude Oil
IWM-Russell-2000
DIA' s CP broke its steep downtrend-line and got back above its
21-DMA.
Opening Power is below its 21-dma. Watch for a
head/shoulders pattern
which peaks at 129 on the current rally and then turns down.
Has Rising Wedge Pattern Played Itself Out in A
One Day Decline?
Peerless Has Not Given A New Sell Signal.

"The
Esperanto Award": Peerless as Candidate for the New Universal
Language of Trading.
Yesterday's comments apply:
Note that there is still a chance that the DJI will roll over again and
complete a bearish
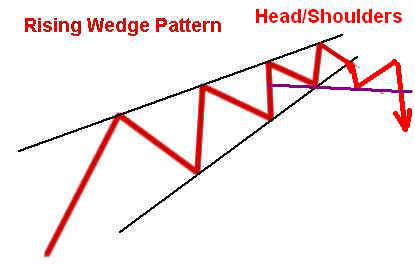
Head/Shoulders pattern, perhaps like it did in April 2010. DJI Rising
Wedge patterns often turn into head/shoulders patterns. The result,
then, is
more likely to be a decline below the lower band. On the other
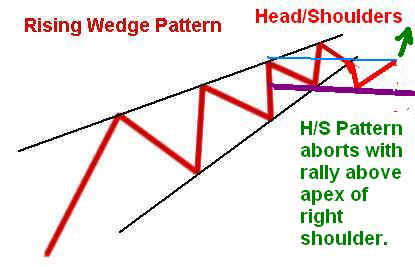
hand, a move above
the apex of a potential right shoulder would bullishly abort the
bearish H/D pattern.
See how this happened in May 2003
with a very bullish outcome.
There are other
scenarios. But these two stand out as the most likely given the
reveral-rally). It can happen that the DJI will quickly get past
the apex of the right shoulder
in a potential H/S pattern. This nearly always forces shorts to cover
and sends up
prices up quickly. In our case now, a DJI close above 13000 would
likely have this effect.
If this IS to be a valid rising wedge breakdown, the DJI should not be
able to get
past the point of breakdown, about 12980. Because Peerless is
still on a Buy
and the A/D Line is strong, I would emphasize the long side.
We covered most of our
short sales, including the coal and solar energy stocks. They did
not rally today.
The shorts are not giving up! We can retake them if the
head/shoulders pattern is
not aborted by this rally.
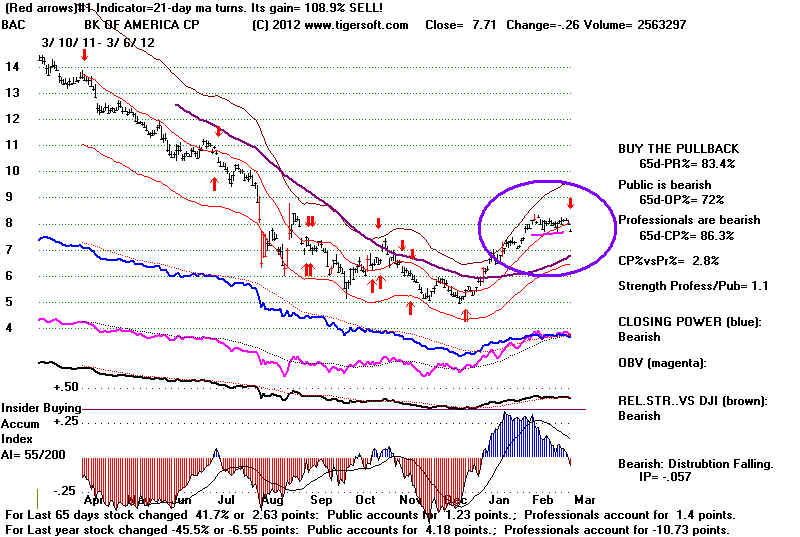
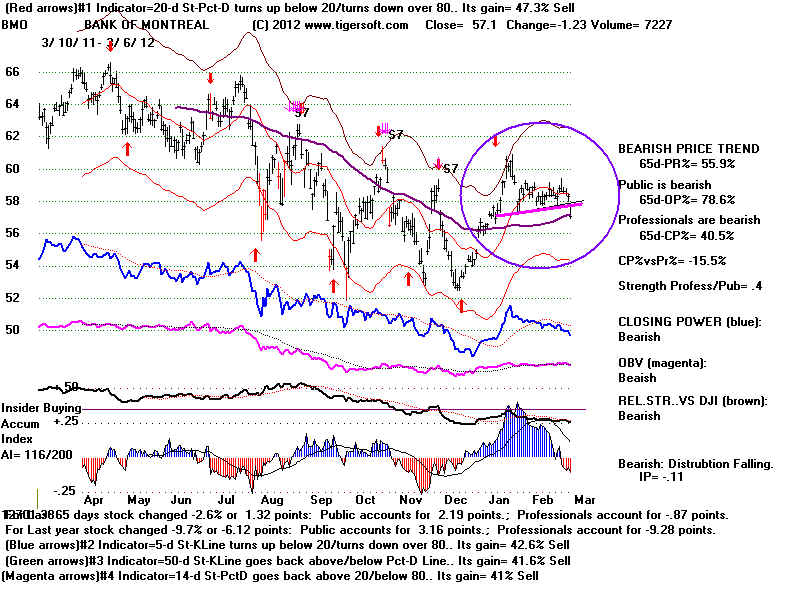
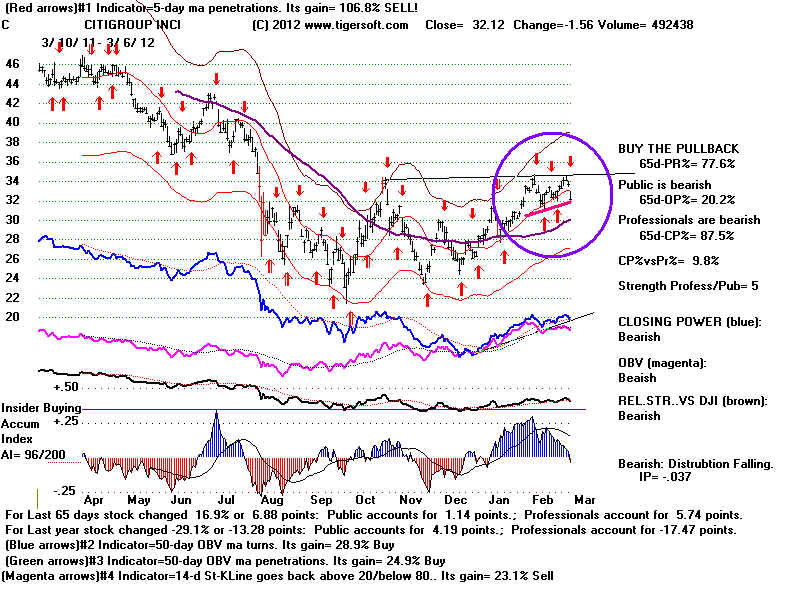
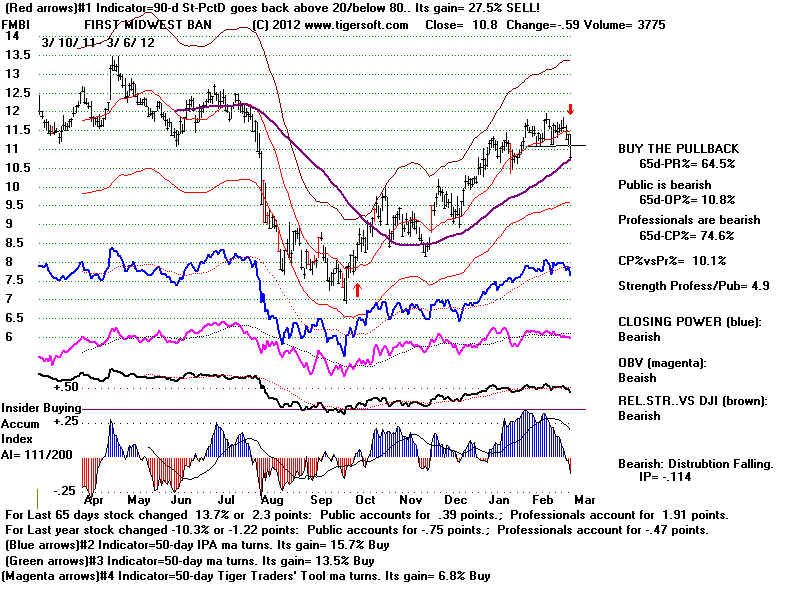
Watch the bank stocks as a group.

Foreign ETFs Performance in 2012
96% of foreign ETFs are above their 65-day ma. This ranks
their stocks now #1 among
the 28 industry groups I regulalry
track here.
.
In the second column below, you can
compare the results of trading the Peerless reversing
Buys and Sell signals with the
various NON-US ETFs and DIA, SPY, QQQ and IWM.
Instead of buying DIA when Peerless
gives a reversing Buy, consider a set of the best
performing that also trade well
with Peerless. TRE-Russia and RSX stand out. here.
I have no custiomers in Russia
presently. So this is a virgin field for us "tigers".
Note that the Peerless performance here
does not include the excellent Buy B13 on
December 17th which we suggested using on
the Hotline. That would have added
+11% to the DJI's results and on average,
at least, as much to the others. Here we
are assuming positions are being taken at
the opening the day after the signal, that
$10,000 is the original investment, with
all proceeds reinvested in longs and shorts, too.
$40 per round trip is allowed for
commissions, too. This is realistic.
Because of the success of Peerless
over time with so many countries, I have translated
the story of Peerless into Russian,
German, French (France and Belgium), Spanish
(Spain as well as Mexico), Italian
and Portuguese (Brazil as well as Portugal). I used
a machine translator. If you
speak these languanges, have a look and feel free to
make suggestions. I would
also be interested in helping. for a small fee, other website
owners into doing what I have done.
![]()
C:\etfs       Days back= 46
----------- RANKED BY 2012 PERFORMANCE --------------------------------------------
                     12/30/2011 - 3/8/2012
Rank Peerless Symbol        Name                        Price          Pct.Gain
     Pct Gain
---- -------- ---------------------------------       ----------    ------------
 1   +12.0%   TGA           TRANSGLOBE ENERGY            11.76         48%
 2   +89.2%   TRF           TEMPLETON RUSSIA FUND        17.39         27%
 3   +100.0%  CEE           CENTRAL EUROPEAN EQUITY FUND 35.2
 4    +32.0%  INP           PACIFIC-ASIA ex Japan        57.65         23%
 5   +104.7%  RSX           MKT VCTR RUSSIA S            32.65         22%
 6    +40.4%  SGF           SINGAPORE FUND               13.33         22%
 7     +3.3%  TF            THAI CAPITAL FUND            10.44         21%
 8    +85.4%  HAO           CLAYMORE/ALPHASHA            23.33         20%
 9    +22.7%  IIF           MS INDIA INVESTMT FUND       16.82         20%
 10   +66.9%  GF            NEW GERMANY FUND             14.59         19%
 11   +23.5%  IFN           INDIA FUND     22.71         19%           3.3%
 12   +64.3%  EWG           ISHARES MSCI GERMANY INDEX   22.87         18%
 13   +60.4%  EWZ           ISHARES MSCI BRAZIL INDEX    68.02         18%
 14   +45.6%  JFC           J FLEMING CHINA REGION FUND  13.03
 15   +32.5%  TWN           TAIWAN FUND                  17.12         18%
 16   +32.9%  EWS           ISHAR SINGAPORE INDEX        12.76         17%
 17   +48.3%   CH           CHILE FUND                   17.47         16%
 18   +20.7%  CAF           MORGAN STANLEY CHINA         22.27         15%
 19   +48.9%  ECH           ISHARES MSCI CHILE           66.66         15%
 20   +57.4%  EEM           ISHARES MSCI EMERGING MKTS   43.81         15%
 21   +34.0%  EWH           ISHARES MSCI HONG KONG INDEX 17.86         15%
 22   +42.1%  EWT           ISHARES MSCI TAIWAN INDEX    13.48         15%
 23   +48.9%  GCH           GREATER CHINA FUND           11.59         15%
 24   +60.6%  VWO           Vanguard Emerging Markets    44.2          15%
 ---- +23.9%  QQQ           ETF for NASDAQ-100           64.75         15%
 25   +43.1%  EWD           ISHARES MSCI SWEDEN INDEX    28.77         14%
 26   +66.5%  EWO           ISHARES MSCI AUSTRIA INDEX   16.27         14%
 27   +98.0%  EWY           ISHARES MSCI SO KOREA INDEX  59.71         14%
 28   +44.9%  GMF           ST SP EM AS PACIFIC E        75.7          14%
 29   +49.9%  GXC           STRK SPDR S&P CH             71.16         14%
 30   +30.9%  IXN           ISHARES S&P GLOBAL TECHN.    67.45         14%
 31   +68.8%  EWI           ISHARES MSCI ITALY INDEX     13.6          13%
 32   +75.1%  EWQ           IShares MSCI France          22.25         13%
 33   +55.0%  ILF           ISHARES S&P LATIN AMERICA 40 48.16         13%
 34   +35.5%  JEQ           JAPAN EQUITY FUND            5.65          13%
 35   +37.7%  PGJ            Gldn Dragon  USX China      22.22         13%
 36   +42.4%  EWK           ISHARES MSCI BELGIUM INDEX   11.9          12%
 37   +55.4%  EWW           ISHARES MSCI MEXICO          60.25         12%
 38   +29.1%  MXF           MEXICO FUND                  24.57         12%
 39   +59.8%  CHN           CHINA FUND                   22.94         11%
 40   +70.0%  FEZ           FRESCO DOW JONES EURO 50     32.88         11%
 41   +48.2%  FXI           iShares FTSE/Xinhua China 25 38.81         11%
 42   +56.9%  GRR           ASIA TIGERS FUNDS            13.43         11%
 43   +30.4%  ITF           ISHARES S&P-TOPIX 150 INDEX  43.06         11%
 44   +25.2%  EWJ           ISHARES MSCI JAPAN INDEX     10.03         10%
 45   +54.8%  EWM           ISHARES MSCI MALAYSIA        14.76         10%
 46   +48.4%  IEV           ISHARES S&P EUROPE 350 FUND  37.25         10%
 47   +55.9%  VGK           Vanguard European Stock      45.92         10%
 48   +37.9%  VPL           Vanguard Pacific Stock       52.61         10%
 --   +33.1%  SPY           ETF for SP-500              137.04          9%
 --   +51.4%  IWM           ETF for Russell-2000         80.51          9%
 50   +63.4%  EWA           ISHARES MSCI AUSTRALIA       23.2           8%
 51   +23.2%  EWL           ISHARES MSCI SWITZERLAND     24.56          8%
 52   +34.1%  IF            INDONESIA FUND               12.74          8%
 53   +21.0%  JOF           JAPAN OTC EQUITY FUND         7.78          8%
 54   +31.9%  EWC           ISHARES MSCI CANADA INDEX    28.48          7%
 55   +37.0%  EWU           ISHARES MSCI UK INDEX        17.32          7%
 56   +44.2%  KEF           KOREA EQUITY FUND             9.72          7%
 --   +32.5%  DIA           DJI-30 ETF                  128.91          5%
 57   +39.5%  IDX           Vectors INDONESIA            29.18          2%
 58   +57.9%  EWP           ISHARES MSCI SPAIN INDEX     30.4           0%              59           IXP           ISHARES S&P GLOBAL TELECOMM  56.14          0%
|
====================================================================================
OLDER HOTLINES
====================================================================================
3/7/2012 HOTLINE
BREADTH
New Highs New Lows
NASDAQ 20
14 bullish plurality
NYSE
31
6 bullish
plurality
MAXCP Stocks = 82 (+36) MINCP Stocks = 85
(-37) BEARISH MINCP PLURALITY = only 3
3/7/2012 Consider
buying Bullish
MAXCPs on confirmed
price breakouts and CP hooks back up
3/7/2012 Consider
shorting Bearish MINCPS as hedges
when CP makes new lows ahead of price
and breaks CP support. Coal stocks are showing unusual weakness.
3/7/2012 Consider Low Priced High Accummulation speculations in the
third wave advance.
Trade
these with the trend of the 21-day ma of Closing Power as much as possible
3/7/2012 KEY CHARTS OF INDUSTRY INDICES
DIA SPY QQQ DJIA-Peerless TigerDJI TigerSPY TigerQQQ
GLD SLV
Crude Oil
IWM-Russell-2000
Has
Rising Wedge Pattern Played Itself Out in One Day?.
Peerless Has Not Given A New Sell Signal.
Our Stocks Hotline Will
Reduce Short Sales Tommorw.
Most were weaker today, but DJI Futures
are Up +86
Tiger's Closing
Powers moved up nicely today and broke the CP downtrends in
for DIA and SPY.
Note that there is still a chance that the DJI will roll over again and
complete a bearish
Head/Shoulders pattern, perhaps like it did in April 2010. DJI Rising
Wedge patterns often turn into head/shoulders patterns. The
result, then, is more likely to be a decline below the lower band. On
the
other hand, a move above the apex of a potential right shoulder would
bullishly abort the bearish H/D pattern. See how this happened in May 2003 with
a very bullish outcome. There are other scenarios.
But these two stand out
as the most likely given the reveral-rally today. It can
happen that the DJI will
quickly get past the apex of the right shoulder in a potential H/S
pattern. This
nearly always forces shorts to cover and sends up prices up quickly.
In our case now,
a DJI close above 13000 would likely have this effect.
If this IS to be a valid rising wedge breakdown, the DJI should not be
able to get
past the point of breakdown, about 12980. Because Peerless is
still on a Buy
and the A/D Line is strong, I would cover most of the short sales used
for hedging.
We can retake them if the head/shoulders pattern is not aborted by this
rally.
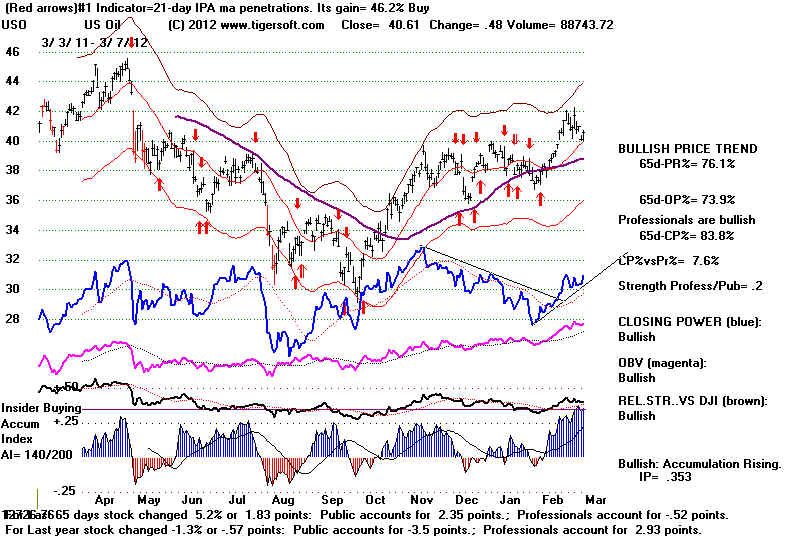
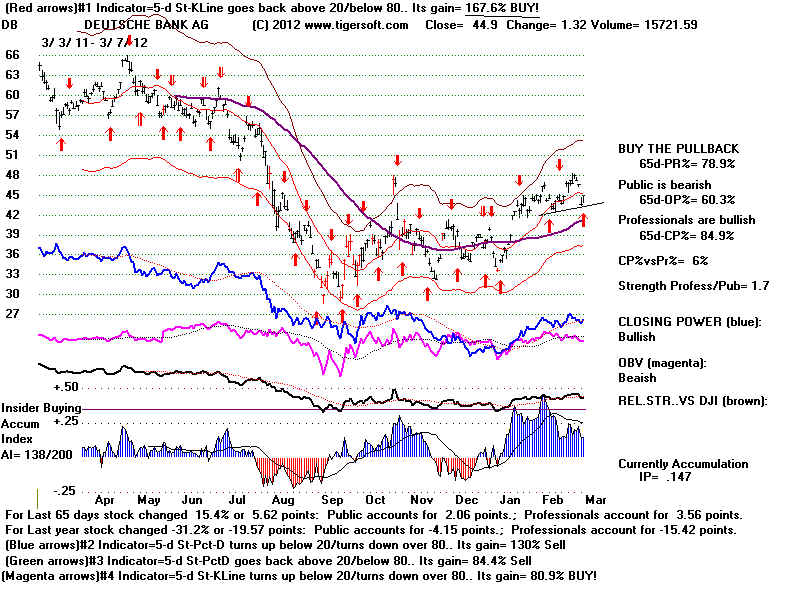
Watch the bank stocks as a group. See the charts of Wells Fargo
and Deutsche
Banks at the bottom of this Hotline. They reversed upwards today
and show
Red short-term Buys. Buys and Sells from DB's 5-day stochastic would
have
gained a trader +167.6% for the last year. Clearly professionals are
whipping the
stock up and dwon to serve their own trading purposes. This
pattern is more likely
to continue than end.
Will DJI Turn Down at 12950?
Or Surpass 13000?
Bearish Scenario
Bullish Scenario
Rising Wedge Patterns That
Morphed into Head/Shoulders Patterns
March 2012 No Peerless Automatic Sell Outcome?
April 2010 No Peerless Automatic Sell except H/S Bear Market continued.
August 2008 Peerless Sell.
Extreme Bear Market followed.
May 2008 Peerless Sell. Extreme
Bear Market followed.
May 2006 Peerless Sell.
6% decline from peak to lower band
August 2002 Peerless Sell.
Bear Market continued.
May 1999 No Peerless Automatic Sell except H/S. 2-week decline to lower band
July 1977 Peerless Sell.
Bear Market continued.
Sept 1971 13.2% decline followed. DJI
fell below lower band.
Jan 1959 No Peerless Automatic Sell except H/S 2-week decline to lower band
Aug 1932 Peerless Sell.
Extreme Bear Market followed.
May 1930 Peerless Sell.
Extreme Bear Market followed.
Unless the DJI repeats what happened in
April-May 2010, a completed head/shoulders
here should be expected only to bring a
quick test of the lower band.
.
BREADTH
New Highs New Lows
NASDAQ 20
14 bullish plurality
NYSE
31
6 bullish
plurality
MAXCP Stocks = 82 (+36) MINCP Stocks = 85
(-37) BEARISH MINCP PLURALITY = only 3
3/8/2012 Consider
buying Bullish
MAXCPs on confirmed
price breakouts and CP hooks back up
3/8/2012 Consider
shorting Bearish MINCPS as hedges
when CP makes new lows ahead of price
and breaks CP support. Coal stocks are showing unusual weakness.
3/8/2012 Consider Low Priced High Accummulation speculations in the
third wave advance.
Trade
these with the trend of the 21-day ma of Closing Power as much as possible
3/7/2012 KEY CHARTS OF INDUSTRY INDICES
DIA SPY QQQ DJIA-Peerless TigerDJI TigerSPY TigerQQQ
GLD SLV
Crude Oil
IWM-Russell-2000
DIA' s CP broke its steep downtrend-line and got back above
its 21-DMA.
Opening Power is below its 21-dma. Watch for a
head/shoulders pattern
which peaks at 129 on the current rally and then turns down.
SPY's main CP's
slightly broke its steep downtrend-line and is above its rising 21-DMA.
Opening Power is below its 21-dma. Watch for a
head/shoulders pattern
which peaks at 137 on the current rally and then turns down.
QQQ's more gradual CP has
held. The QQQ CP is still above its rising 21-dma.
Opening Power is below its 21-dma. A further QQQ 1 point rhigher close would bullishly
destroy any
potential H/S top here.
GLD's CP sharp
trend-break has not yet based. The less steep CP uptrendline was also violated.
Its Opening Power is bearishly below
its 21-dma
SILVER - BOTH DOWN BEARISH
condition. Now testing Support at 31.70-32.
CRUDE OIL - USO is recovering from its rising 21-day ma with a CP uptrend
in place
and showing high Accumulation. The corresponding Crude Perpetual Contract chart -
CL1600 is
much weaker. It would be more bullish if they were in synch.
TWO KEY BANK STOCKS
 |
 |
-------------------------------------------------------------------------------------------------------------------------------------------------------
OLDER HOTLINES
-------------------------------------------------------------------------------------------------------------------------------------------------------
3/6/2012 HOTLINE
Rising Wedge Pattern Must Play Out.
But Peerless Has Not Given A New Sell Signal.
So, Watch for A Reversal Back Upwards Using Tiger's Closing Powers.
Stay Hedged f\or Now with Some Short Sales from Bearish MINCP
DJI and Peerless Signals. Notice that the recent
B15 and B18 have
been removed. These are not to be trusted when Peerless is
already
on a Buy, especially in a Presidential Election year from February to
September. See: Revisions to Peerless Buy B15s
and Buy B18s 3/7/2012


As I have said before in this Hotline,
the recent Buy B15s and B18s are not significant. They are there
in case Peerless had not
already turned bullish. I will re-work the software to only show them if Peerless
is on a Sell when they occur.
(This black Comment added Tuesday morning)
DJI= 12759 la/ma = 0.988 21dmaROC= -.095 P= -89 (-204) IP21=.037 V= -92 OP= .049
3/6/2012 KEY CHARTS OF INDUSTRY INDICES
DIA SPY QQQ DJIA-Peerless TigerDJI TigerSPY TigerQQQ
GLD SLV
Crude Oil
IWM-Russell-2000
----------------------------------------------------------------------------------------------------------------------------------------------------------------
BREADTH
MAXCP Stocks =46 (-31) MINCP Stocks = 122 (+28) BEARISH
MINCP PLURALITY =76
Consider buying Bullish MAXCPs on breakouts and CP hooks back up
Consider shorting Bearish MINCPS
as hedges when CP makes new lows ahead of price
and breaks CP support. Coal stocks are showing unusual weakness.
Consider Low Priced High Accummulation speculations in
the third wave advance.
Trade
these with the trend of the 21-day ma of Closing Power as much as possible
 Bearish Ttianic Effect
= New Lows outnumbering new highs with the DJI
Bearish Ttianic Effect
= New Lows outnumbering new highs with the DJI
only a week away from its high, I remember reading about this in Barrons 20 years
ago, Stocks/Commodities
article.
New Highs New Lows
NASDAQ 12
28
bearish plurality
NYSE
12
15
bearish plurality
DIA' s CP broke its rising uptrend-line and
its 21-DMA. Opening Power is also below
its
21-dma. This is the BOTH DOWN BEARISH condition. A Close by DIA 0.25 above its
Opening would break the CP downtrend-line.
SPY's main CP's has been violated but its CP is still above its
rising 21-dma.
SPY's Opening Power is below its
21-dma. A Close by SPY 0.24 above its
Opening would break the CP downtrend-line.
QQQ's Steeper CP
has been violated. The QQQ CP is still above its rising 21-dma.
Opening Power is below its
21-dma.
GLD's
CP sharp trend-break has not yet based. The less steep CP uptrendline was
also violated.
Its Opening Power is bearishly below
its 21-dma
SILVER
- BOTH DOWN BEARISH condition. Now testing Support at
31.70-32.
3/6/2012 HOTLINE - Because of the typical bearishness of the rising
wedge pattern in the
DJI, I suggested Sunday night that
it was "Time To Do Some Hedging by Short Selling some of the Bearish
MINCPs, to Sell Major Market
ETFs and to Profit-Taking in over-extended stocks." Our Stocks' Hotline
went more short than long on Monday
morning. The downside target now is 12500, where the support
from the rising 65-day ma and lower
band converge.
But since we have no new Peerless
Sell, other than the low volatility/rising wedge pattern, I would think
the DJI will to turn around and
make more new highs. It will probably do so ahead of the A/D Line after the
Closing Power downtrends for DIA
and SPY are broken. We will watch DIA, SPY and QQQ charts closely
for this. The weakness is
most apparent in Industrial Materials, Gold Stocks, Utilities,
Coal Stocks (ACI, JRCC, BTU) AND Europe where the EFFs for Russia, Germany, Italy, France,
Austria,
Spain and Sweden each fell more
than 5%, ostensibly because of the bankers' concerns that they might default
on their own debt but actually
because of the deepening recession there caused by the austerity measures
taken by the governments at the
bankers' behest. Inflation is not the problem, though that is what bankers
will always tell you. Rather,
it is chronic, high and growing unemployment. Sadly, the 1930s did not teach
Europeans that economics is too
important to be left to bankers. History clearly shows that
government austerity measures in an era of high
unemployment led directly to the Great Depression.
Below the DJI charts are some
weak-looking banks with head and shoulders patterns. If they break or
are below their 65-dma and show
negative red Distribution and a falling Closing Power weaker than
their price action (S7s), I would
think they would make good short sales, provided one covers if the
Closing Power breaks its downtrend.
Banks with Head and Shoulders Patterns.
=====================================================================================
OLDER HOTLINES
=====================================================================================
3/5/2012 HOTLINE
Because of Rising
Wedge, We Are More Short than Long
DJI= 12926.01 la/ma = 1.001 21dmaROC=.204
P= 118 -49 IP21=.094 V= -26 OP= .152
3/5/2012 KEY CHARTS OF INDUSTRY INDICES
DIA SPY QQQ DJIA-Peerless TigerDJI TigerSPY TigerQQQ
GLD
SLV
Crude Oil
IWM-Russell-2000
Rising Wedge Patterns are reliably bearish DJIA
patterns.
----------------------------------------------------------------------------------------------------------------------------------------------------------------
BREADTH
MAXCP Stocks =77 -20 MINCP Stocks = 94 +4 BEARISH
Consider buying Bullish MAXCPs on breakouts and CP hooks back up
Consider shorting Bearish MINCPS as hedges when CP makes new lows ahead of price
and breaks CP support. Coal stocks are showing unusual weakness.
Consider Low Priced High Accummulation speculations in
the third wave advance.
Trade
these with the trend of the 21-day ma of Closing Power as much as possible
New Highs New Lows
NASDAQ 31
16
bullish plurality
NYSE
38
16
bullish plurality
DIA' s CP is just
above its rising 21-DMA. The Closing Power uptrend has been
violated, but has not turned down. It is at the support of its rising 21-dma.
Opening Power is flat and just above its 21-dma.
SPY's main CP's has been violated
CPis still above its rising 21-dma.
SPY's Opening Power has turned
flat and is below its 21-dma
.

QQQ's Main CP was slightly
violated today. The QQQ CP is still above its rising 21-dma.
The QQQ Opening Power is slightly above
its MA.
GLD's CP sharp trend-break
has not yet based. The less steep CP uptrendline was also violated.
Its Opening Power is still rising.
SILVER - Note the bearish "red popcicle" CP is falling but Opening Power
is rising.
Support appears to be at 32..
3/5/2012 HOTLINE - Because of the typical bearishness of the rising wedge pattern in
the
DJI, I suggested Sunday night that
it was "Time To Do Some Hedging by Short Selling some of the Bearish
MINCPs, to Sell Major Market
ETFs and to Profit-Taking in over-extended stocks." Our Stocks' Hotline
went more short than long on Monday
morning. That is looking like a good move. The DJI Futures
are down 102, at this writing.
Particularly weak are the several coal stocks mentioned Sunday night
here in the Bearish MINCP page.
The Giant (Apple) is Falling and
the Beanstock Is Coming
Down

We need to see if APPL's decline
today continues or IBM's rally goes higher. Both are leaders. A break
in the A/D Line in March after a
rally usually causes breadth to weaken for a month, or a little more.
The DJI's CP has slightly broken,
and closed below, the uptrend-line. It would be surprising if the DJI did not
next test the 65-day ma at
12550. A decline to that point will provide a good re-entry point for traders
wanting to buy DIA.
Though secondary stocks are apt to
weaken for a month, or so, I would recommend considering
buying some very low-priced stock
special situations that show heavy (very positive) Accumulation
and are acting well. I gave a
list of five stocks to my mechanic Sunday.
I will update their progress
for a while. The plan is to
allow the stocks to show why they were under so much insider buying.
I believe that 2012 will be a
generally good year for these stocks. The year could produce the
third leg up since March 2009.
These produce much more speculation in low priced stocks. My sense
is that the "Obama-Fed-Wall
Street Junta" will not allow the stock market to go down more than 7%
from any high this year, in order
to continue the political-financial status quo.
That does not mean that there will not be some swings down. Breaks in the A/D Line
in March
without multiple major Peerless
Sell S9s typically drop the NYSE A/D Line only for a month if there
has been an A/D rally.
Below are the cases since 1933. There
were 24 March A/D Line
trend-breaks. In 8 cases the
A/D Line quickly turned up; in 5 , it turned up 5 times in Aprill.
So, in 2/3 of the cases, the A/D
Line does not fall for more than 8 weeks.
A/D
Line Trend-Breaks February and April since 1934
A/D Line Peak Next Subsequent Bottom
1934
April
July
1936
March
April
1937
February
June
1939
March
April
1940
April
May
1944
March
April
1946 April
November
1947 April
May
1950
February
April
1951 February
June
1952 March
May
1953
March
June
1954
April
resumed advance
1955
March
March resumed advance
1956 March
May
1958
March
advance
quickly resumed
1959
March
June - DJI kept rising
throughout this period.
1963 February
March - 12 day decline
only.
1964 April
June
1965
March
advance
quickly resumed until May and mighty but minature H/S top..
1967 March
advance
quickly resumed until May
1971
February
advance quickly resumed until April
1972
March
October
1974 March
October
1975
March
advance quickly resumed until July
1976 February June
1979
April
May
1980
February March
1983
March
advance quickly resumed
1986
April
May
1987 March
May
1988 March
May
1989
February
March
1991 April
June
1992
February
April
1993
March
Advance
quickly resumed
1995
March
Advance
immediately resumed
1996
March
Advance
immediately resumed
1997
March
April
1998
April
October
2001 February March
2004
March
May
2005 March
April
2006
April
June
2010 April
July
2011 March
Advance
immediately resumed
To be continued tomorrow.
=====================================================================================
OLDER HOTLINES
=====================================================================================
3/2/2012
DJI= 12977.57 la/ma = 1.006 21dmaROC=.241
P= 1660 -144 IP21=.089 V= -16 OP= .148
3/2/2012
KEY CHARTS OF INDUSTRY INDICES
DIA SPY
QQQ DJIA-Peerless TigerDJI TigerSPY TigerQQQ
GLD
SLV
Crude Oil
IWM-Russell-2000
MAXCP
Stocks = 97 MINCP Stocks = 90 Still a bullish plurality, but BEARISH
considering where DJI is.
Consider buying Bullish MAXCPs on breakouts and
CP hooks back up
Consider shorting Bearish MINCPS as hedges when CP
makes new lows ahead of price
and breaks CP support. Coal stocks are showing unusual weakness.
New Highs New Lows
NASDAQ 37
16
bullish plurality
NYSE
48
16
bullish plurality
3/2/2012 HOTLINE - Time To Do Some Hedging by Short Selling some of the Bearish
MINCPs,
to Sell Major Market ETFs and
Profit-Taking in over-extended stocks.
Peerless BUY B10. But Rising Wedge
Patterns in DJI bring DJI decline
at least to the
lower band 85% of the time since
1928. Low Volatility after a Rally and NYSE A/D Line
uptrend Break are undeniably
Bearish. I can not help wondering how much the market
is being held up by the strength in
computer stocks like IBM and MSFT as well as APPL.
If they started to show weakness,
along with Banks and Home Building stocks which have
been strong this year, what would
hold the market up? Wouldn't the rising wedge pattern
then have to breakdown. In
that case, a decline to the DJI's lower band would seem highly
likely, given the history of these
things. It occurs to me that Wall Street wants to hold
the market up until Facebook is
offered the public. A successful offering of it will bring
its underwriters millions.
After a Peerless Sell signal these
rising wedge patterns are reliably very bearish. If
you have any doubts, see the one in
1930 that started the three year bear market and
Great Depression.
Fortunately, without a Peerless Sell signal they are much more benign.
I have numbered the cases below.
There were 14 instances of a rising wedge breakdown
without a Peerless Sell.
A decline to the lower band followed by a recovery occurred
in 6 cases (43 %). There were
also 6cases when the DJI went down less than 2% more
and then rallied. In 2
cases, the most recent, the DJI fell below the lower band. But this was
only after a bearish head/shoulders
pattern also appeared.
I think from this we have to
conclude that there is not much chance of a deep sell-off.
And the DJI is as likely to rally
as go to the lower band. There are no cases where March
breakdowns from rising wedge
patterns broke below the lower band.
Bull Market Rising Wedge Patterns: 1929-2012
Breakdown
DJI
Peerless
Outcome
Date
Level Signals
March
2012
1 April 2010
11000 no Sells but H/S Decline
quickly to 9800
2 Jan 2010
10500 no Sells since 11/09
Decline quickly to 9800
May 2009
12700 Sell S9/S15
Decline quickly to 10900 in 6 weeks.
Oct 2007
13800 Sell S2/S4
Decline quickly to 12800 in 4 weeks.
May 2006
11100 Sell S9/S9V
Decline quickly to 10700 in 3 weeks.
3 May 1999
10750 no
Sells
Decline quickly to 10500
- only to lower band.
4 Dec 1998
9000 no Sells
Decline quickly to 8700
- only to lower band
Dec 1992
3350 Sell S9/S15
Decline quickly to 3150 -
below lower band
5 Jan 1991
2600 no Sells
Decline quickly to 2480
- only to lower band
Dec 1992
3350 Sell S9/S15
Decline quickly to 3150 -
below lower band
Dec 1987
2550 Sell S9/S15
Decline quickly to 1750 -
below lower band
6 March 1987
2300 no
Sells
This was bottom and DJI rallied.
Dec 1992
3350 Sell S9/S15
Decline quickly to 3150 -
below lower band
June 1986
1860 Sell S9/S5
Decline quickly to 1770 in 2 weeks.
7 Aug 1985
1330
Simulataneous Buy B11
Decline only to
1300 and then rally.
Jan 1984
1245
Sell S4/S12
Decline quickly to 11400 in 3 weeks.
July
1975
860
Sell S8
Decline quickly to 790 in 4 weeks.
8 Dec 1973
1020 no Sells
DJI rallied to 1050 and S9 and then started bear market.
Sept
1971
900 Sell S9v/S9.S2
Decline quickly to 900 in 10 weeks.
Feb 1969
935 Sell S8
Decline quickly to 800 - lowerband
9 Jan 1963
675 Simulataneous Buy B11 Decline quickly to 660 - lowerband
10 Jan 1959
590 no Sells
Decline quickly to 575 - lowerband
11 June 1954
320 no Sells
DJI rallied strongly from 320
12 June 1952
278 Simulataneous Buy B11 Decline
quickly to 262 - near lowerband
13 Jan 1950
195 no Sells
DJI rallied strongly from 195
May 1945
164 Sell
S9v/SS
DJI went sidewise. 2 months later rallied strongly.
14 March 1945
157 no Sells
Decline quickly to 153 - lowerband
Oct 1940
132 Sell
S4
DJI rallied to 138 and
then fell below lower band.
Aug 1937
186
Sell S9
Decline quickly to 115 in 3 months.
Apr 1930
284
Sell S9
Decline quickly to 215 in 6 months.
The break in the A/D Line uptrend is
expected to bring weakness to secondary stocks.
The A/D Line should be weak
for a month or so, if history repeats the most frequent pattern
after March A/D Line in the
past. (This was discussed a week or so ago in our Hotline.
Friday, despite the DJI being
down 3, there were 1021 more down than up on the NYSE,
only the Russell 2000 fell
1.5% and broke down below its recent support. The read
bearish "popcicle"
candlestick of two days ago was correct.
The QQQ chart's uptrend reminds be of Jack's beanstock. If APPL were to
start falling, the
whole thing would come down. We shoud watch APPL, IBM,
Finance and Housing
Stocks for signs of weakness.
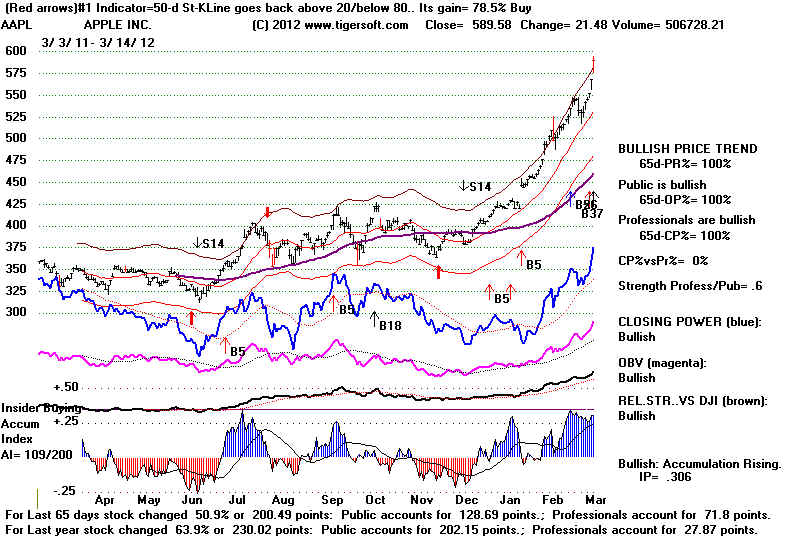
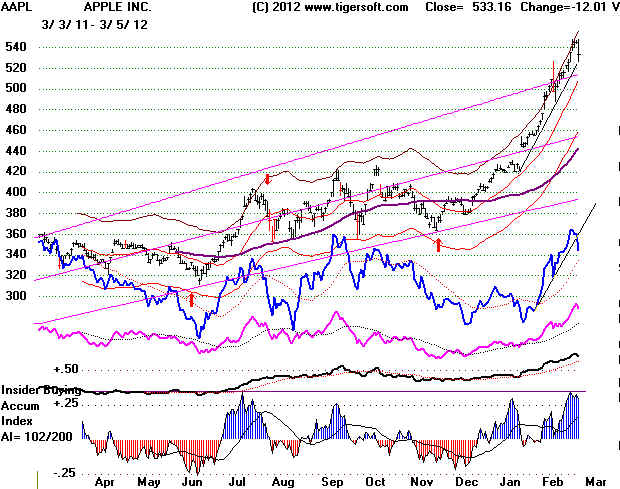
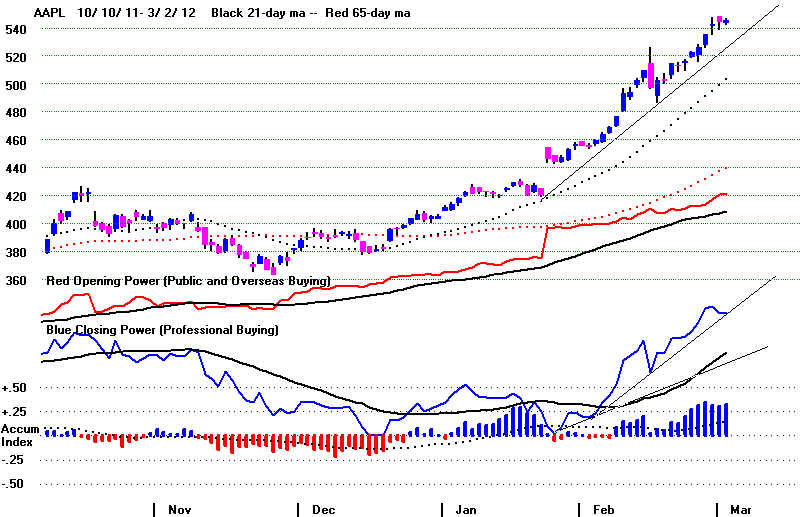
AAPL
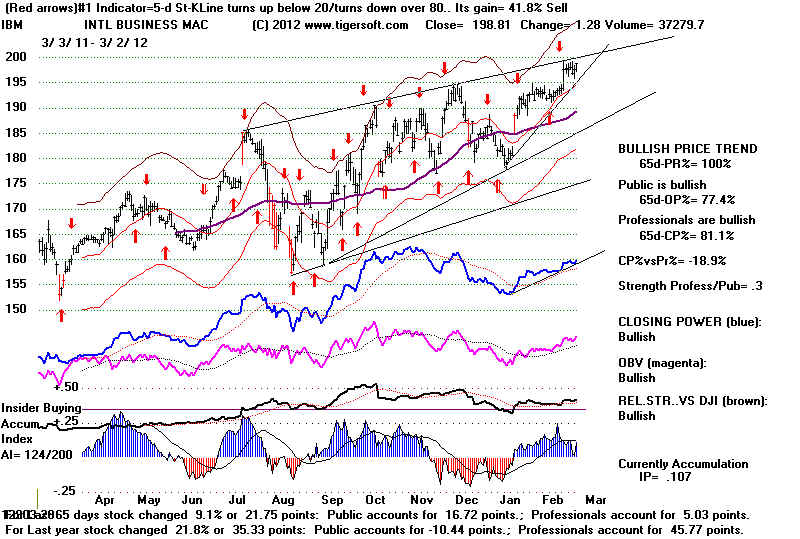
IBM
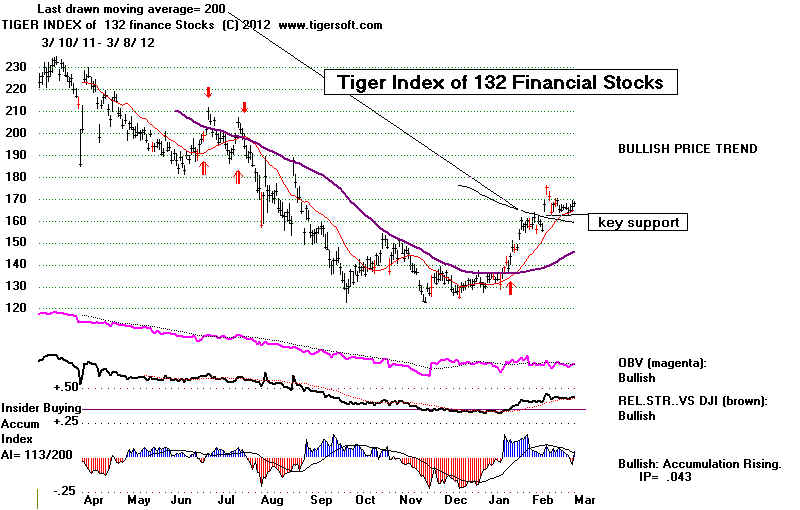
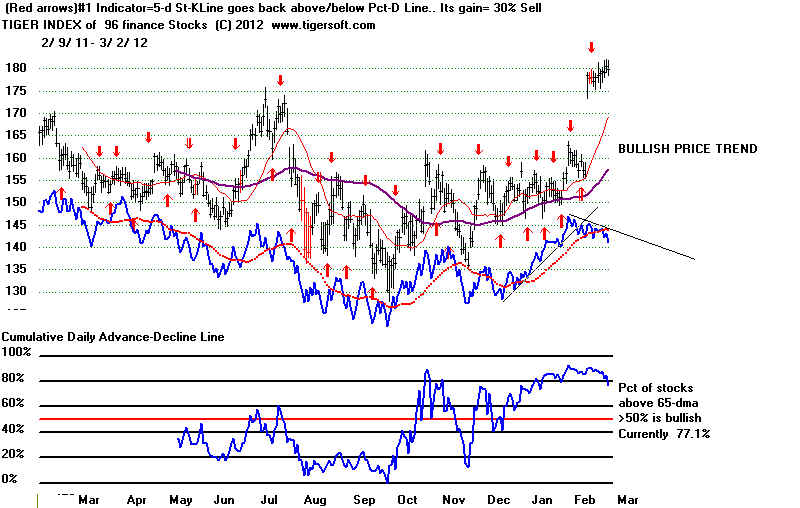
TIGER INDEX of FINANCE STOCKS
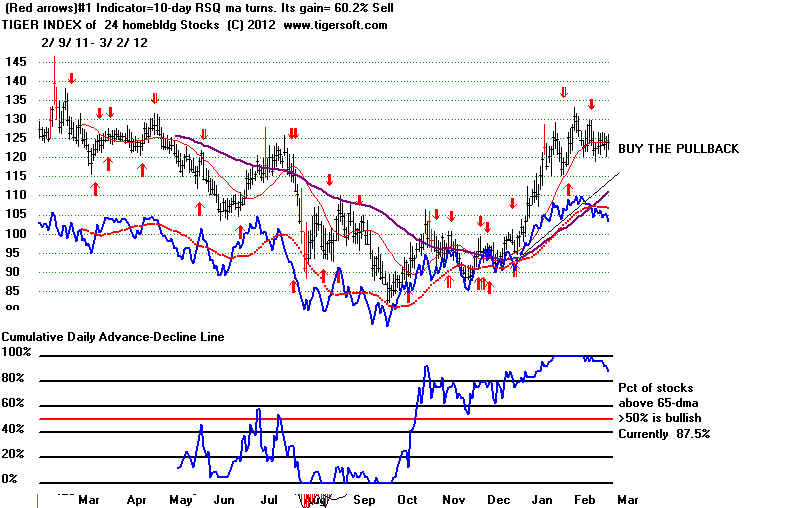
TIGER INDEX of HOMEBUILDING STOCKS
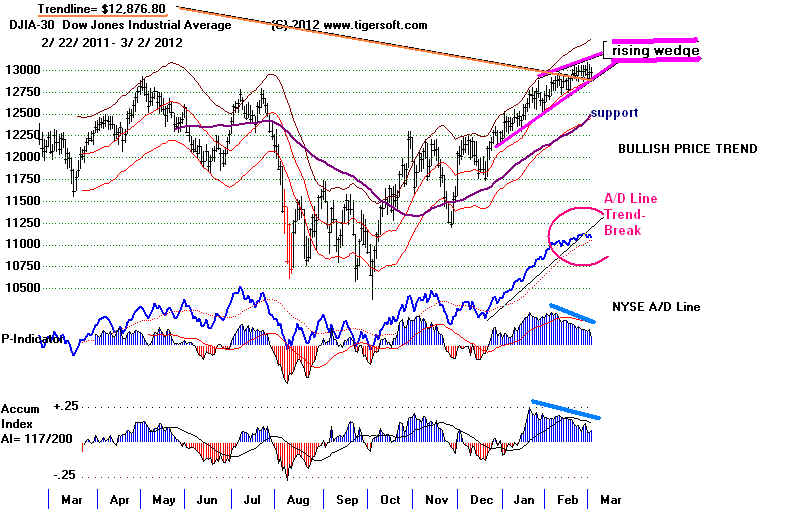
DJIA, Peerless Signals and Rising Wedge Pattern.
===================================================================================
OLDER HOTLINES
===================================================================================
3/1/2012
DJI= 12952.07 la/ma = 1.006 21dmaROC=.276
P= 283 -9 IP21=.069 V= +6
OP= .121
BUY B10 reinforced by Buy B18.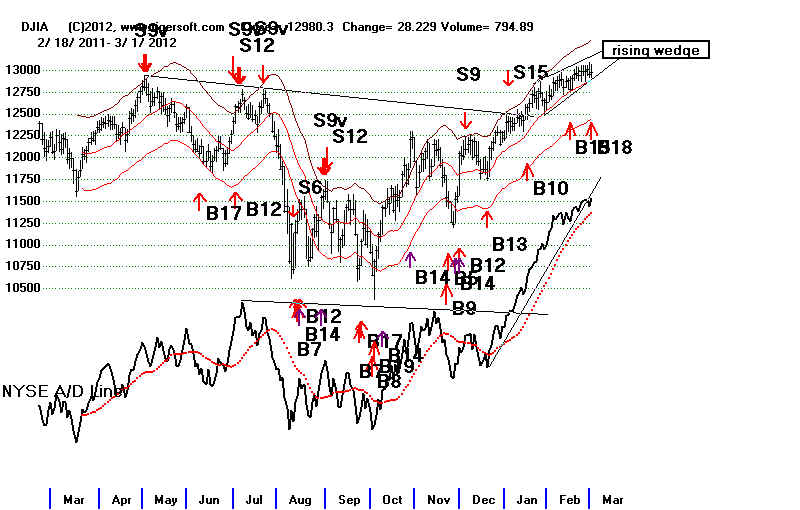
HOTLINE The BUY B10 Still operates, but
the very steep A/D Line uptrend was violated
yesterday, By itself, this is not reliably very bearish for the DJI in the first
half of a Presidential
Election year. But LOW VOLATILITY AFTER A BIG RALLY is. It is a 70% reliable
warning of a reversal
later in two to three weeks. For now the upwards momentum is bullish. That is
the meaning of
the B15 and B18. (The earlier Buy B15 which just appeared belatedly comes about
because of a small
Peerless program change just made and possibly because some earlier data was corrected
today
in a minor way.)
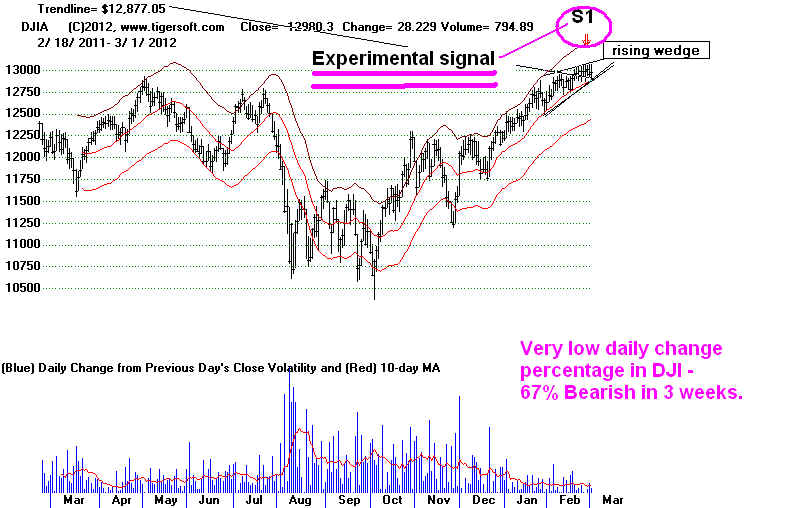
Results of Low Volality such as just Seen
in February and March since 1931
Yesterday, I reported that the DJI had closed 5 times within 0.075% of the day before's
close -
a very small daily change - over the previous 15 trading days. Below is the record
of what
has happened when this occurs after a DJI rally. In the charts linked to here, the
low volatility
signals are labelled S1s. This has occurred 11 times since 1928. In 3 cases
(27.3% of the time)
this would have given a very bad sell signal. In 8 cases (72.7% of the time), the
DJI was at or
within 3 weeks of peaking and about to decline to near the lower band, at least. My
impression
of this experimental signal is that when it works well as a Sell, the DJI still usually
must
have a final rally to the upper band. See the two
cases in 1994, for example.
Feb 1950 Bad - DJI rose for 4 more months.
March 1952 DJI peaked a
weak later and fell to almost to lower
band and support.
March
1953 - DJI fell below lower
band after 5 days more rallying.
Feb 1964 Bad DJI rose for 6 more months.
March 1964 Bad DJI rose for 6 more months.
March 1971 DJI peaked 3 weaks later
and fell below lower band.
March 1988 DJI fell to lower band (perfect sell)
March 1992 DJI fell nearly to lower band
March 2004 - DJI peaked 1 weak
later and fell below lower band.
Feb 2007 - DJI fell to lower band after peaking 2 weeks later. .
Feb 2011 - DJI peaked
1 weak later and fell below lower band.
Today's Buy B18 is not meant to time new Buys. Rather within
Peerless, it is to guarantee that
Peerless has switched to a Buy signal when momentum is very strong. Actually, B18s since 2010
have been better at calling tops.
But going back to 1928, they are reliably profitable.
B18 11/3/2003 9850.46 Reversed
Sell...> rally to 10737.7 (gain
of +8.9%)
B18 1/2/04
10409.85 ...> .> rally to 10737.7 (gain of +3.1%)
B18 12/1/04
10590.22 ...> .> rally to 10854.54 (gain of +5.9%)
B18 8/1/05
10623.15 ...>.. .> fell to
10216.59 before rallying.
B18 1/27/06
10409.85 ...> .> rally to 11577.74 (gain of +6.1%)
B18 4/4/06
11203.85 ...> .> rally to 11577.74 (gain of +3.3%)
B18 10/5/06
11866.69 ...> .> rally to 12398.01 (gain of +6.1%)
B18 12/4/06
12283.85 ...> .> rally to 12398.01 (gain of +3.3%)
B18 5/18/07
13556.53 ...> .> rally to 12398.01 (gain of +3.1%)
B18 4/21/2010 11124.92...>H/S
Stop...> decline to low of 9816 (below lower band)
B18 2/17/2011 12318.14...>decline to low of 11613.30 (to lower band)
The key ETF's Closing Powers are each still in uptrends.
---> 123 (+23) MAXCP stocks Bullish MAXCP Stocks
Still Bullish.
3 (+1 ) SUPER2011 Stocks making New Highs: ISRG +9.71
ULTA 85.31 +2.07
---> 75 (-6) MINCP stocks Bearish MINCP Stocks
MAXCP stocks are those showing Tiger Closing Power
making new highs.
This suggests heavy Professional Buying. Applying the Tiger Power Ranker's
"bullish" to the MAXCP stocks find those with heavy insider buying and
institutional accumulation. Bearish MINCP stocks show the opposite.
---> 42
new
highs on NASDAQ. 7 new lows on NASDAQ Bullish.
--->
87 new
highs NYSE 5 new lows on NYSE Bullish.
3/1/2012 KEY CHARTS OF INDUSTRY INDICES
DIA SPY
QQQ DJIA-Peerless TigerDJI TigerSPY TigerQQQ
GLD
SLV
Crude Oil IWM-Russell-2000
3/1/2012
DIA' s CP is just at
its rising 21-DMA.
Any close more than 0.33 below the opening will break the main CP uptrendline.
Opening Power is flat.
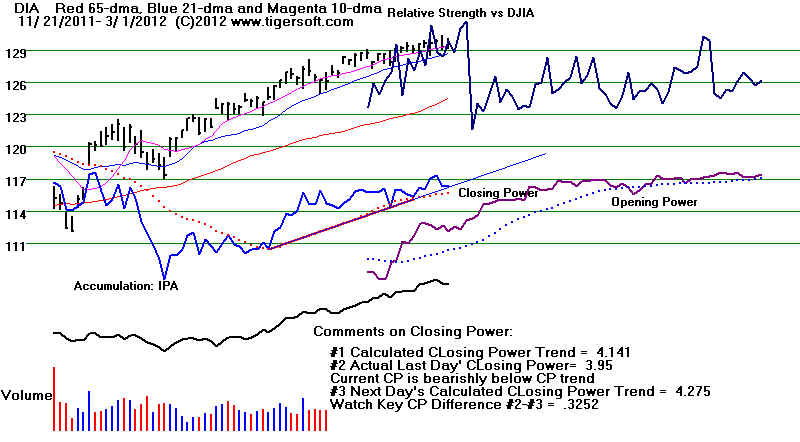
SPY's main CP's is uptrending.
It would take a close of more than 0.07 below the opening to
break the steeper CP uptrend. SPY's Opening Power has turned flat.
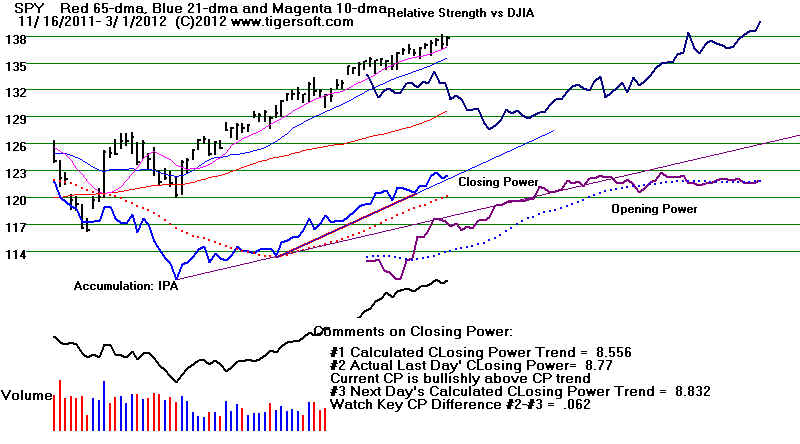
QQQ's Main CP is uptrending. QQQ
was until a week ago much stronger than the DJI.
It will take a close of more than 0.50
BELOW the Opening to break the basic CP
UP-trendline.
Opening Power has turned flat.
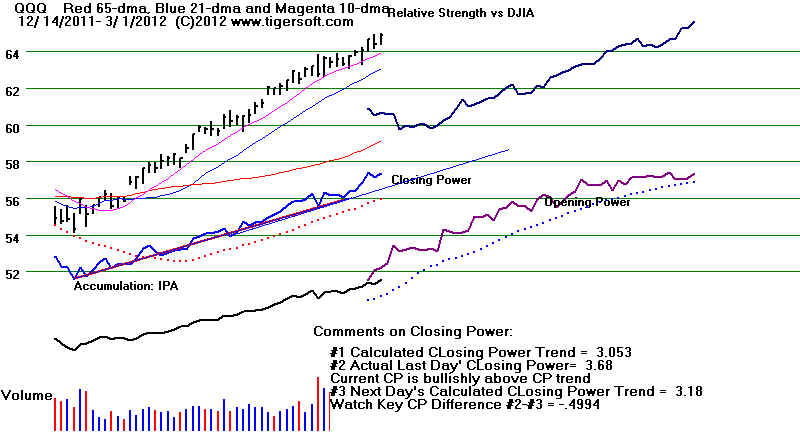
GLD's CP rising CP uptrend has
been violated Opening Power is
rising. Look
for support
at the rising blue 65-day ma.
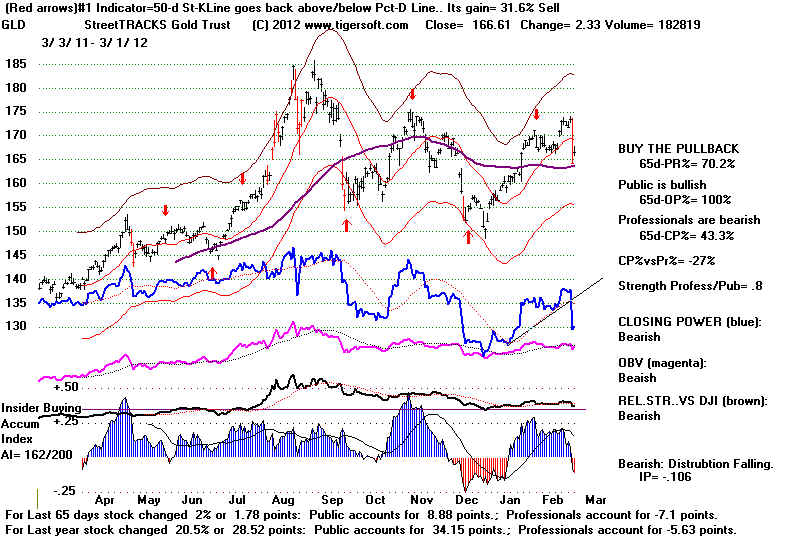
SILVER broke its CP uptrend but its Opening Power is
still rising.
It should find support now at its rising blue 21-day ma.
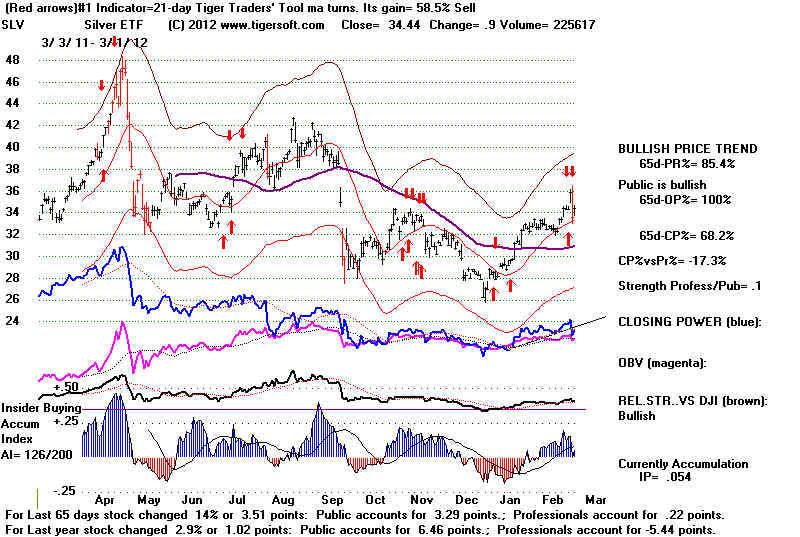
=====================================================================================
OLDER HOTLINES
=====================================================================================
2/29/2012
DJI= 12592 la/ma = 1.006 21dmaROC=.276 P= 293 -9
IP21=.068 V= +4
OP= .134
HOTLINE Buy B10 Still operates. Our Stocks' Hotline is not
selling anything.
Note
that a violation of the rising wedge's support line (12860) is not apt to bring a
decline of more than 4% and only a test of the rising 65-day ma. A steep A/D
Line
uptrend-break, such as we saw today, in a Presidential Election year seldom drops the
DJI
as much as 4%. 1944 was the last time this happened.
Tomorrow, I will be doing a new study that historically examines the significance
of
the recent very low DJI volatility where the DJI day-to-day changes are under 0.1%
as
many as 6 days in the last 20 trading days, as we have just
seen.
The headlines
explaining the $100 decline in Gold attribute it to Bernanke's testimony
today which did not suggest any new inflationary steps. Gold's decline was the
biggest in
the last 3 years. 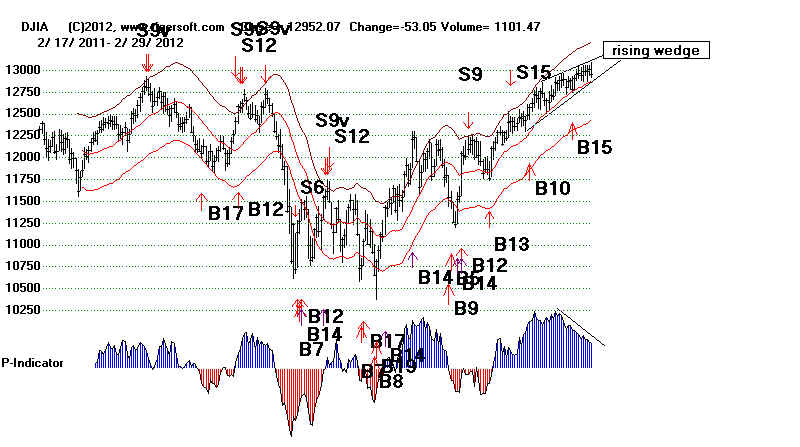

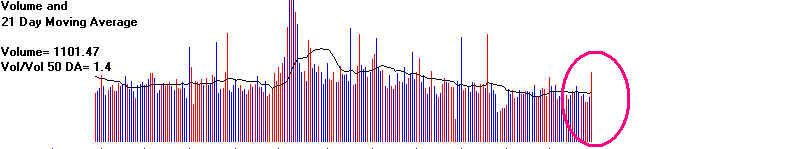
Huge one-day sell-off like we saw in Gold today are not usually bearish for equities.
Gold is usually a haven for the fearful. When the economy gets into a very positive
mode,
as it did in 1995-1996, gold is not a good investment. Very high interest rates are
also
gold's enemy.
Has Bernanke signalled that he will actually be tightening interest rates? In
the second chart
below, you can see that the rise in the 10-year rates looks like an innocent adjustment in
its 3 month trading range. I know of nothing to shake my conviction that the
Obama-Fed-
Wall Street Junta/Syndricate/Clique (Call it what you like.) will NOT allow interest rates
to rise
before the Presidential Election in November. That doe snot mean that some of the
more
aggressive hedge funds might now want to test the power and resolve of Bernanke & Co.
They might try a quick bear raid using high speed computerized sell orders as occurred on
May 6th, 2011. The difference now is that we do not have an environmental crisis
like the
Gulf spill in 2011 and if Israel was about to attack Iran, gold would be rising, not
falling.
Moreover, falling Gold prices help the Dollar and a stornger Dollar gives the Fed more
wiggle-room to keep rates low. Bernanke may, in fact, feel that there is enough of a
recovery
to back away from additional "quantitative easing" now. Home Depot's rally
today shows
there is a recovery of sorts taking place in construction. But it's very weak.
There are not US
enough jobs. That provides Bernanke the excuse or rationale to keep rates low.
And if
rates stay low, there will be more speculation in stocks this year, not a big sell-off.
MWW (Monster.com)
is testing its 12 month lows now. Interesting discussion of Monster.

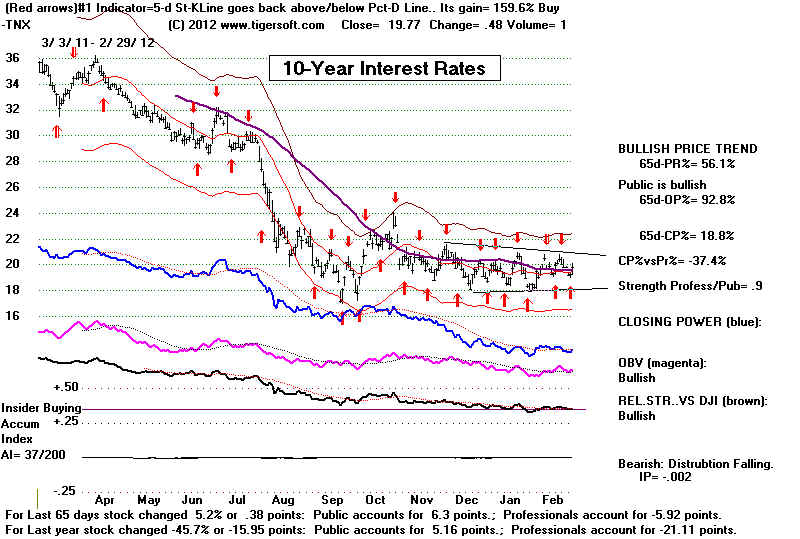
BUY B10 Still operates, but LOW
VOLATILITY AFTER A BIG RALLY IS OFTEN BEARISH.
The low volatility invites public inattention and carelessness.
Low volatility is also associated with tops.
See Bearish Low Volatility on >10% Rally. But no Sell S8,
Bearish Rising Wedge - These are rare in DJI.
Many recent nearly zero daily DJI changes in DJI this year.
1/5/12 -2.72/12418.42
2/2/12 -11.05/12716.46 - 0.087% change
2/8/12 +5.75/12878.20
2/9/12 +6.51/12883.95
2/14/12 +4.24/12874.04
2/24/12 -1.74/12984.69
2/27/12 -1.44/12982.95
I can not recall seeing 6 days in a month when the DJI changed
less than 0.1% from the previos days.
The daily DJI change was less than 0.05% 5 times since 2/8/12
Consider the very low daily change in DJI at some previous very significant tops:
9/11/1978 no daily change 9/12/1978 -1.34 daily change
10/3/1979 .17/885.32 change
10/1/87 - 2639.18, 10/2/87- 2640.94, 10/5/87-2640.99
Tomorrow I will check out the desirability of a new Sell signal based on so many days
in the last 21 where the daily percent change is less than 0.1% or so many in the last 15
days when the daily percent change is less than 0.05%.
Other Technicals:
Jump in Down Volume Today. Bearish
13000 Barrier Still Not overcome by Peerless Buy B10.
> Steep A/D Line was broken today. (See below) Bearish
This is associated with a 4% DJI decline in 30% of such cases.
It is more likely to mean the A/D Line starts to fall for a month.
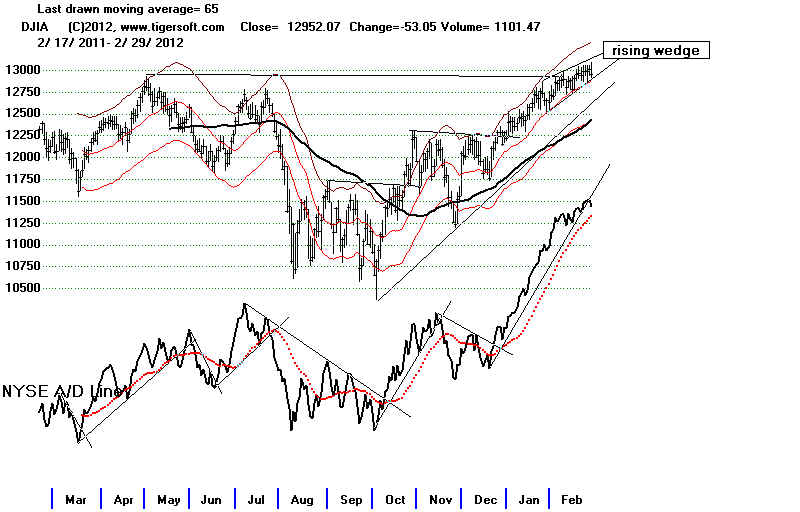
A/D Line has been much stronger than DJI = This is Bullish.
Closing Powers for ETFs are all rising = Bullish: DIA,
CP New Highs outnumber CP New Lows = Bullish
High Priced DJI Stocks: Dull: IBM -1.25
CAT -1.55 XOM -.64 CVX -.49 MCD -.50
High Capitalization NASDAQ: AAPL + 9.65
BREADTH STATISTICS: Advance=1040
Declines=2006 UpVol = 320.52 DownVol= 780.95
ratio1= 0.518
ratio2 = 0.410 Bearishly below Ratio1.
---> 100 (-94) MAXCP stocks Bullish MAXCP Stocks
Still Bullish.
2 (0 ) SUPER2011 Stocks making New Highs: JAZZ +.89
---> 81 (+43) MINCP stocks Bearish MINCP Stocks
MAXCP stocks are those showing Tiger Closing Power
making new highs.
This suggests heavy Professional Buying. Applying the Tiger Power Ranker's
"bullish" to the MAXCP stocks find those with heavy insider buying and
institutional accumulation. Bearish MINCP stocks show the opposite.
---> 25
new
highs on NASDAQ. 18 new lows on NASDAQ Bullish.
--->
62 new
highs NYSE 8 new lows on NYSE Bullish.
2/28/2012 KEY CHARTS OF INDISTRY INDICES Not
yet ready for tonight
DIA SPY
QQQ
DJIA-Peerless
TigerDJI TigerSPY TigerQQQ
GLD
SLV
Crude Oil IWM-Russell-2000
DIA' s CP is just at
its rising 21-DMA.
Any close more than 0.20 below the opening will break the main CP uptrendline.
Opening Power is flat.
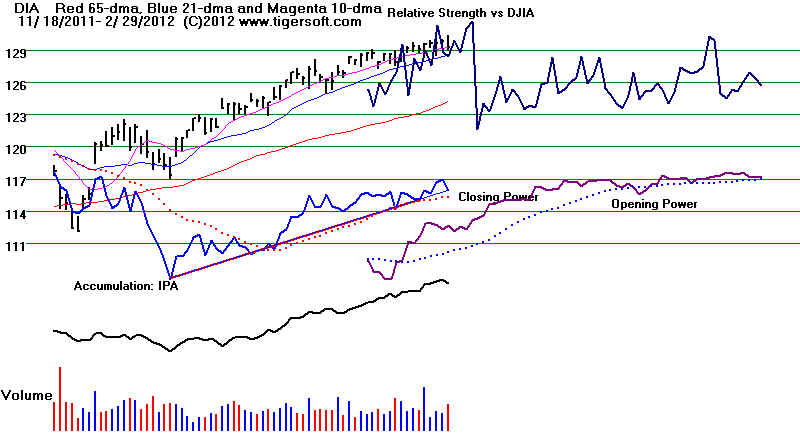
SPY's main CP's is uptrending.
It would take a close of more than 0.30 below the opening to
break the steeper CP uptrend. SPY'd Opening Power has turned flat.
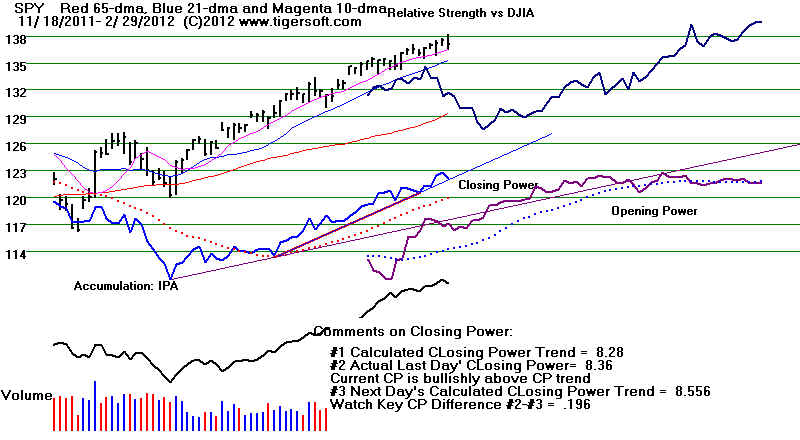
QQQ's Main CP is uptrending. QQQ
was until a week ago much stronger than the DJI.
It will take a close of more than 1.00
BELOW the Opening to break the basic CP
UP-trendline.
Opening Power has turned flat.
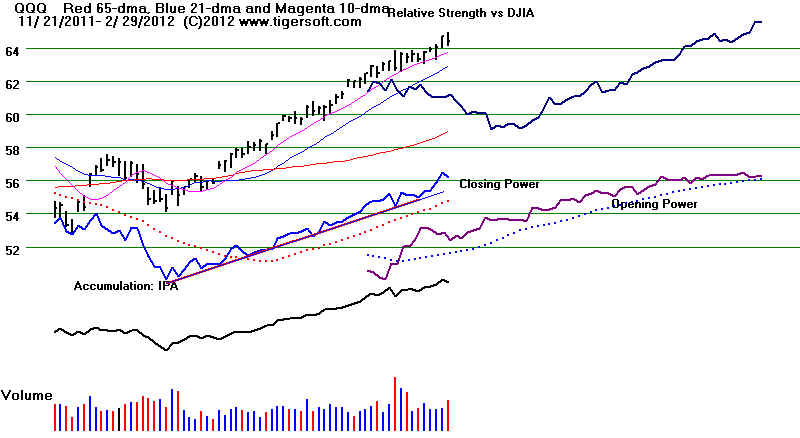
GLD's CP rising CP uptrend has
been violated Opening Power is
rising.
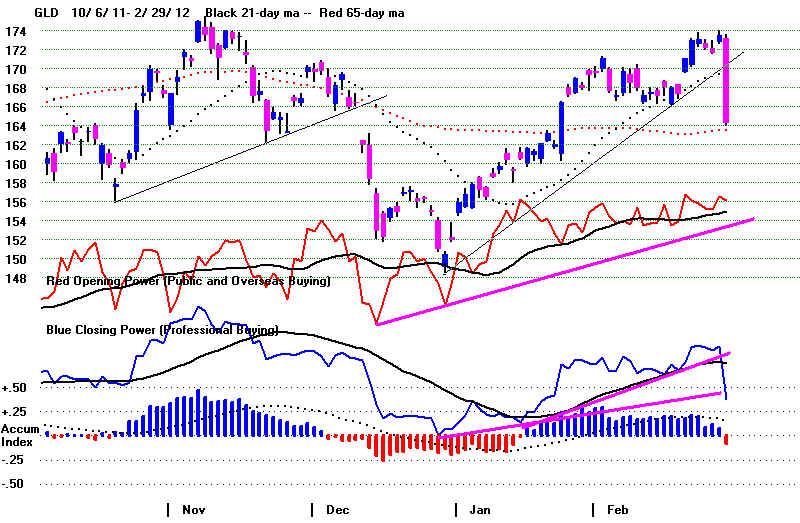
SILVER broke its CP uptrend but its Opening Power is still rising.
It should find support now at its rising blue 21-day ma.
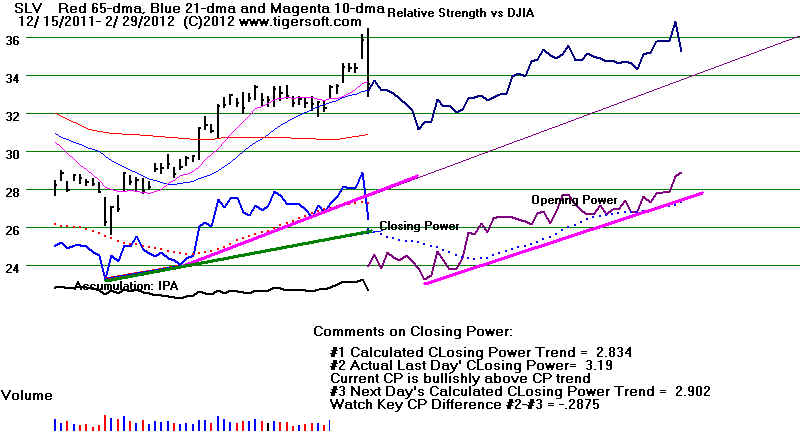
=====================================================================================
OLDER HOTLINES
=====================================================================================
2/28/2012
DJI= 13005 +24 la/ma = 1.011 21dmaROC=.319 P= 302 -38 IP21=.134 V=
+12 OP= .16
13000 Has Been Reached with Peerless Buy B10. Hold Current Positions
SPY is now making 12 months highs, along with DIA and QQQ.
A/D Line is uptrending and strong than the DJI = Bullish.
Closing Powers for ETFs are all rising = Bullish.
CP New Highs outnumber CP New Lows = Bullish
High Priced DJI Stocks: Dull: IBM +.45 CAT +.13 XOM -.09 CVX
-.02 MCD -.58
High Capitalization NASDAQ: AAPL + 9.65
Special Report
Tonight: Low Priced Stock Speculation - Turn-Around Insider Buying.
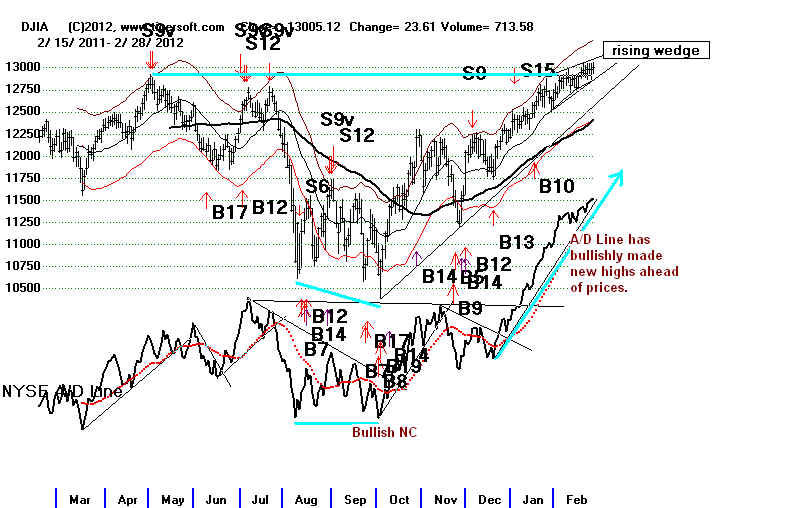
BREADTH STATISTICS: Advance=1524
Declines=1450 UpVol = 389.93 DownVol= 323.65
ratio1= 1.05
ratio2 = 1.20 Bullishly higher than Ratio1.
---> 198 (-4) MAXCP stocks Bullish MAXCP
Stocks Bullish.
2 (0 ) SUPER2011 Stocks making New Highs: Dominoes Pizza
38.82 +5.28
---> 38 (+3) MINCP stocks Bearish MINCP Stocks
MAXCP stocks are those showing Tiger Closing Power
making new highs.
This suggests heavy Professional Buying. Applying the Tiger Power Ranker's
"bullish" to the MAXCP stocks find those with heavy insider buying and
institutional accumulation. Bearish MINCP stocks show the opposite.
---> 38
new
highs on NASDAQ. 6 new lows on NASDAQ Bullish.
--->
86 (+6 ) new
highs NYSE 5 (+2) new lows on NYSE
2/28/2012 KEY CHARTS OF INDISTRY INDICES
DIA SPY
QQQ
DJIA-Peerless
TigerDJI TigerSPY TigerQQQ
GLD
SLV
Crude Oil IWM-Russell-2000
DIA' s CP is above
its rising 21-DMA.
A close more than 0.70 below the opening will break the main CP uptrendline.
Opening Power is rising.
SPY's main CP's is uptrending.
It would take a close of more than 0.64 below the opening to
break the steeper CP uptrend. SPY has made a nominal new 12-month high.
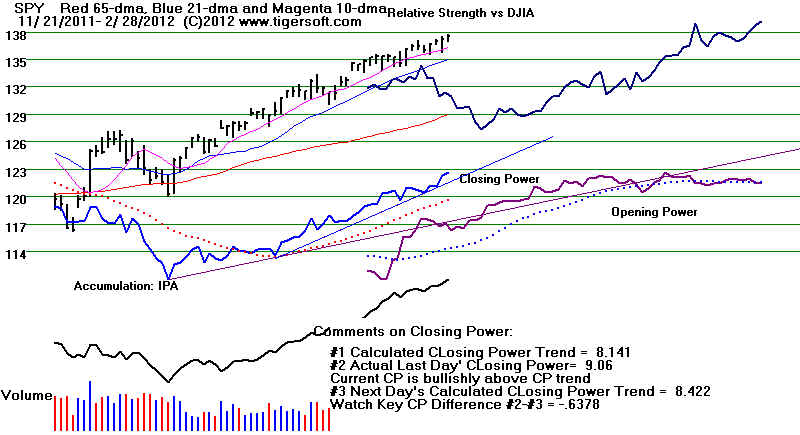
QQQ's Main CP is uptrending. QQQ
was until a week ago much stronger than the DJI.
It will take a close of more than 0.70
BELOW the Opening to break the steep CP
UP-trendline.
Opening Power is uptrending. BOTH RISING.
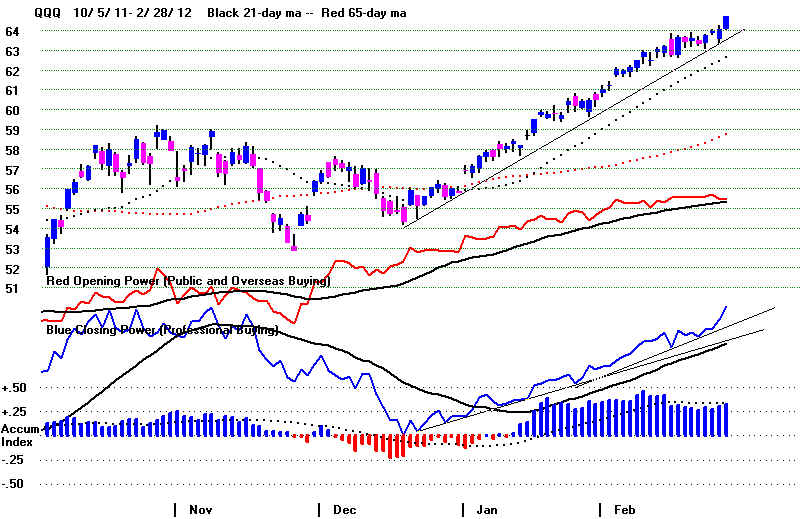
GLD's CP restored its steeper
rising CP uptrend The less steep CP uptrendline is far below
Its Opening Power is rising. It will
take a close of more than 0.88
BELOW the Opening
to break the steeper CP UP-trendline. Opening Power is rising.
SILVER - Note the completed inverted head and shoulders pattern.
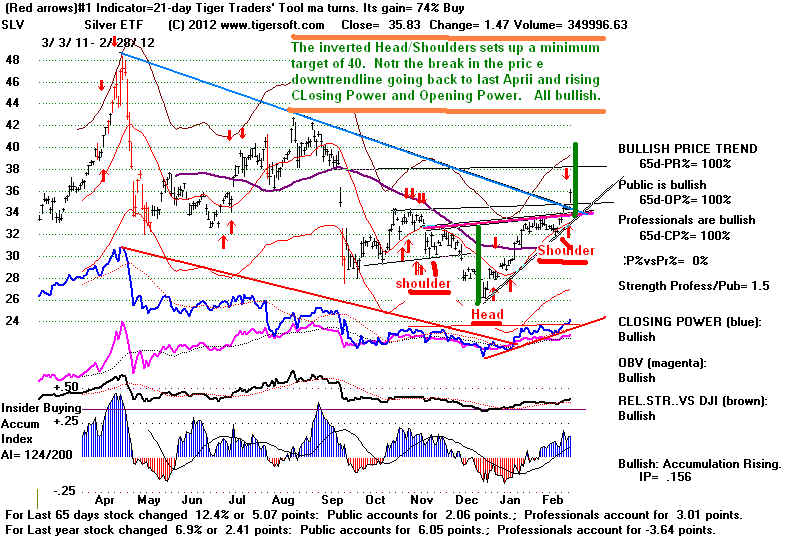
Hotline
The
Peerless Buy B10 Gives Rise to Rebounding Low-Priced
Stocks Showing Bulges
of Accumulation That Signify Insider Buying.
Usually,
breakouts to new highs offer the best trades. This is not so after a
year of decline.
At the end of last year many low priced stocks had been declining
for nearly 12
months. Here are some Selection and Buying Rules to use
with them.
When these
(1) break their price and CP downtrend-lines and
(2) have their purple 65-day ma turn up, they are set to make very good rebounds, especially
in cases showing
(3) very high Accumulation (insider buying bulges) and
(4) price breakouts
above flat tops on red high volume.
(5) Look for major Buy signals, B10, B12, B20
and B24.
(6) Buy either on the price breakout or on pullbacks to support like rising 65-dma
as soon as
Closing Power hooks back up.
I wrote a program
to find stocks between 50 cents and
$4.00 that have shown
Accumulation (IP21) bulges above +.50 in
the last 3 months. The data for
all these
stocks will be
posted regularly only our Tiger Data page starting tomorrow.
Look for "LOWPBULG.exe".
Let me show you
some of the successes (big advances in this group) to give a
better idea of
the technical characteristics to look for. Then I will show some
of the best
prospects now. Last we want to see some additional rules applied.
Successes: More than one breakout and 2 or more legs up.
These are also
candidates for Buying.
CCRT - Compucredit - B24, B20, B24
COCO - Corinthian College B12
CRIS - Curis - B24, B12, N24, B20 - but now CP is below its 21-day ma
FCAL - First Calif. B24, B20, B12 - Strong!
INOD - Innodata - This is a better example of buying
a new 12-mo high.
This shows stair-step advance (breakout followed by breakout).
IPAS -
B20, B24
JMBA - Jamba Juices - B20, B24
LOV - Spark Networks - B12, B24, B24
MEG (see below) - Media General - B24, B12, B24 - Looks very good.
MNTG - MTR Gaming - B20, B24, B12 - powerful 12 mo today.
OPWV - Openwave - B10, B24, B12, B20, B24
RGEN - Repligen - B10, B24
RTK - Rentech - B10, B20, B24
SNTS - Santarus - B20, B12
THLD - Threshold Pharm - B10-B12-B20 all on same day, B24.
ULGX - Urologics - B24, B20-B12
WOLF - Great Wolf Resort - B12, B10, B20, B24
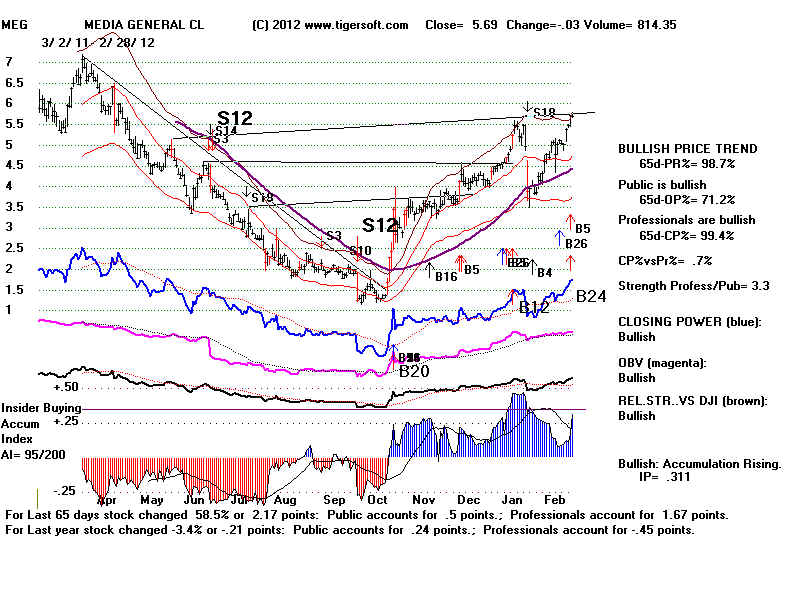
Power Ranking
Simply
looking at the top power-ranked of this universe of low priced, high Accumulation
Insider-Buying stocks usually does a decent job of screening. The top Power-Ranked
stocks with
positive current Accumulation above their 65-dma are:
LOV ULGX
RTK OPWV DRJ CCRT
DUSA
| LOV 4.74 Spark Networks, Inc. Internet services. 8383 Wilshire Boulevard Suite 800 Beverly Hills, CA 90211 http://www.spark.net 144 employees 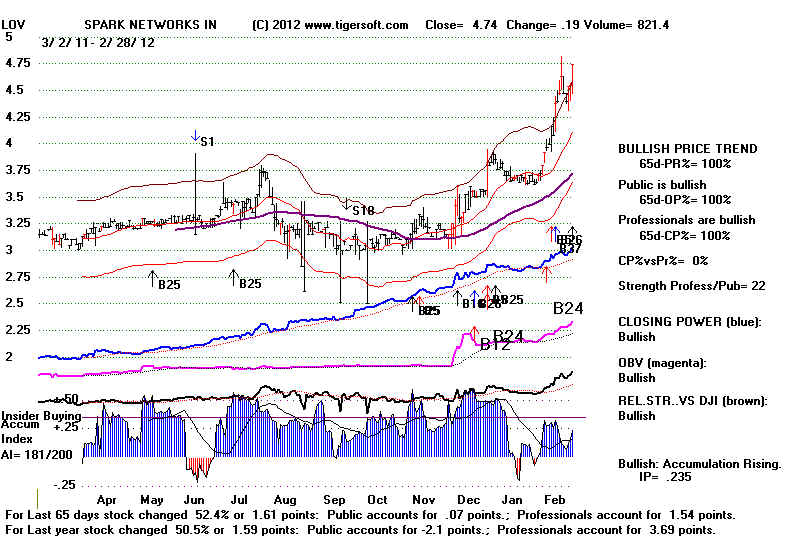 |
| ULGX 1.50 Urologix, Inc. Medical Appliances 14405 21st Avenue North Suite 110 Minneapolis, MN 55447 http://www.urologix.com 88 employees 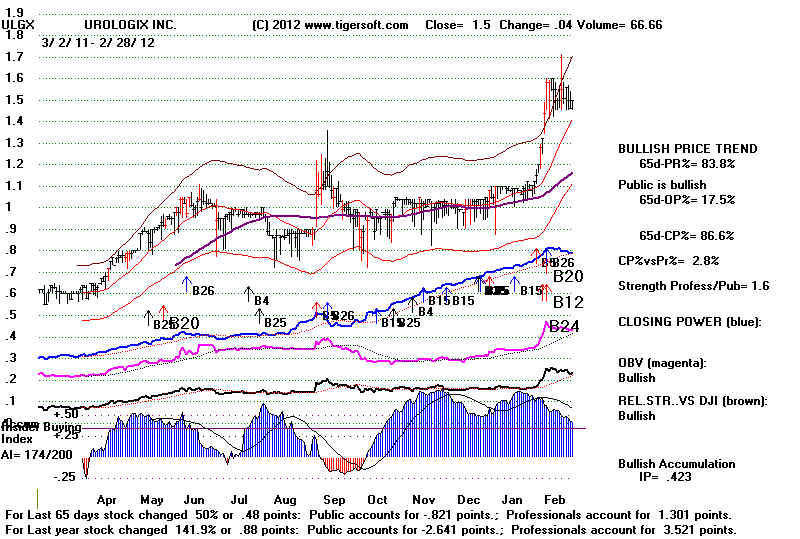 |
| RTK 1.87 Rentech, Inc. Agricultural Chemicals 10877 Wilshire Boulevard Suite 600 Los Angeles, CA 90024 http://www.rentechinc.com 266 employees 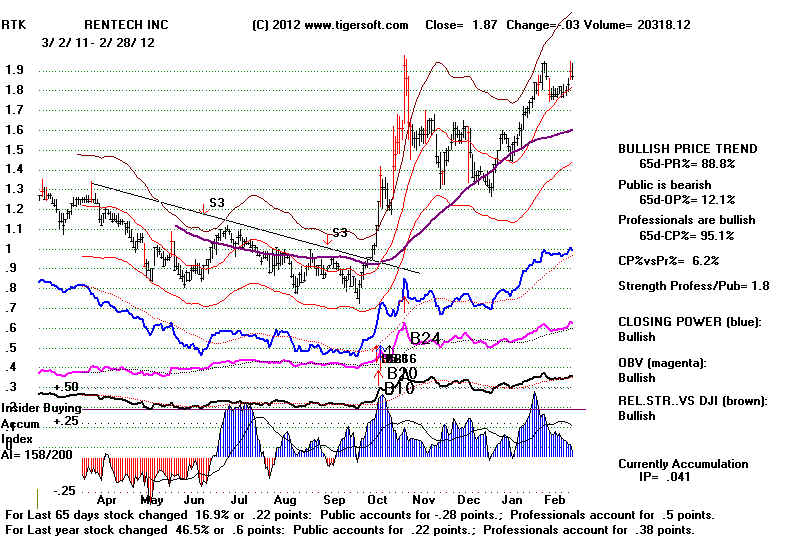 |
| OPWV 2.55 Openwave Systems Inc. mediation and messaging software 2100 Seaport Boulevard Redwood City, CA 94063 http://www.openwave.com 536 employees 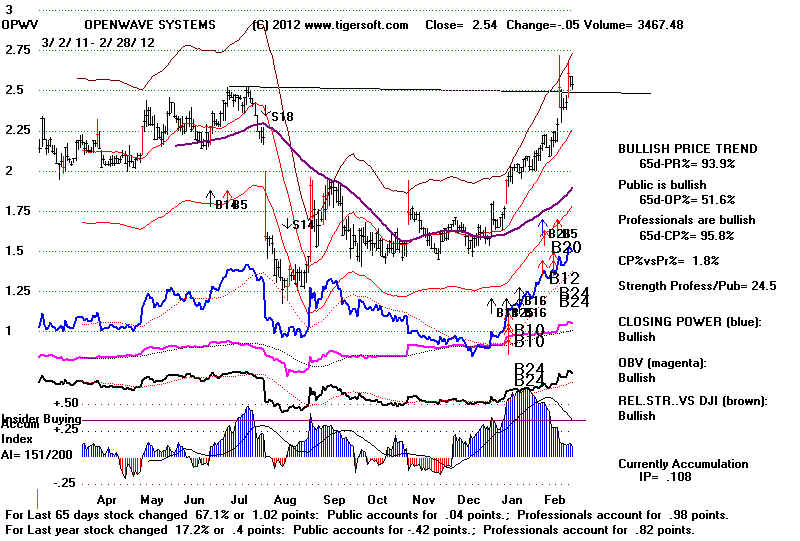 |
| DRJ 2.70 Dreams Inc. 2 South University Drive Suite 325 Plantation, FL 33324 http://www.dreamscorp.com 406 employees Manufacturing, distributing, retailing, and selling sports licensed products, memorabilia, and acrylic display cases through various channels, including Internet, brick and mortar, catalogue, kiosks, and trade shows in North America. 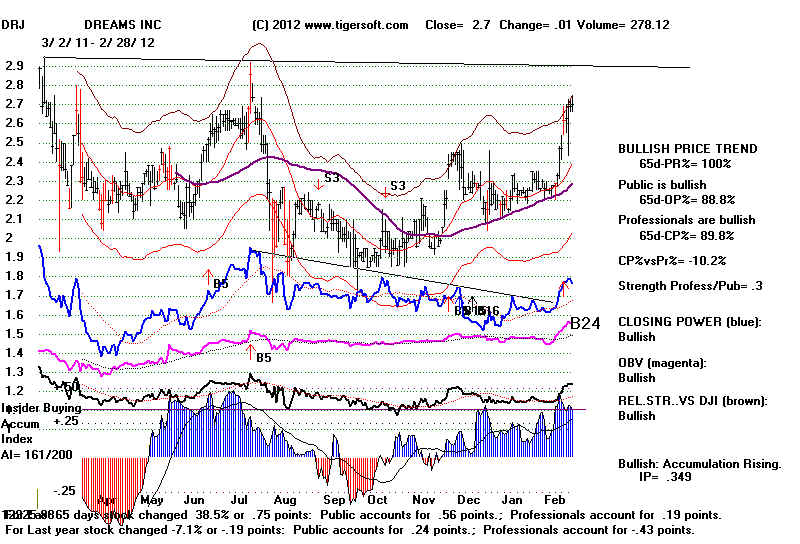 |
| CCRT 4.95 CompuCredit Holdings Corp. Credit Services Five Concourse Parkway Suite 400 Atlanta, GA 30328 http://www.compucredit.com 1,623 employees 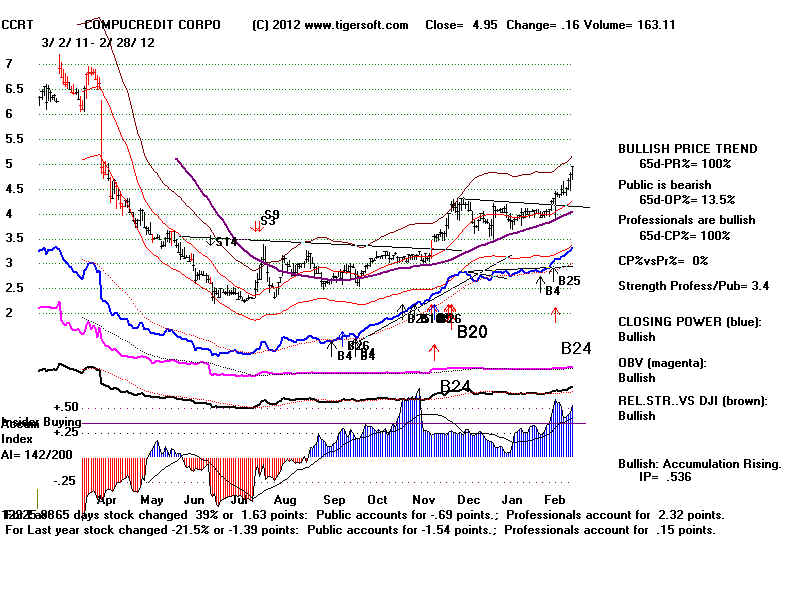 |
| DUSA 4.94 DUSA Pharmaceuticals Inc. Dermatology company 25 Upton Drive Wilmington, MA 01887 : http://www.dusapharma.com 93 employees 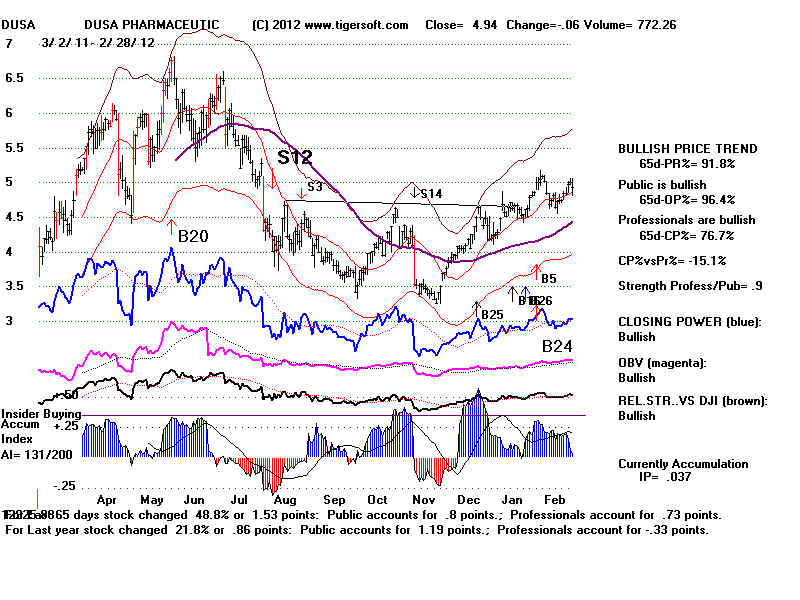 |
Additional Candidates for Purchase:
The more Blue Accumulation, the better.
3 or more major
Buys on any one day is very bullish.
Negative Accum cancels a Buy.
Blue Closing
Power should be rising and above its 21-day ma. EDGW
ALU Alcatel Lucent - B20
ARRY Array Pharm - B10, B20
AVNR - Avanir Pharm - B10, B12, B20, B24
BKMU - Bank Mutual - B10, B12, B20, B24
BPZ - BPZ Resources (natl. gas) B10
BXC - Bluelinx Holdings B10, B24 (red high volume is missing)
BXC - Bluegreen B24
CCRT - Compucredit - B24, B20, B24
CGA - China Green Agric. B20
- Looks very good. Breakout above 4.74
would start another leg up.
CT - Capital Trust - B24, B20
DCA - Div Cap Realty Trust - B24
DRJ - Dreams - B24
DRL - Doral Finan. - B20, B24 (red high volume is missing)
DUSA - Dusa Pharm - B24 - (red high volume is missing)
DYAX - Dyax - B24 - (red high volume is missing)
ES - Energy Solutions - B10, B24, B20 - Looks very good.
HOVNP - Hovanian Enterp - B20, B12, B24 - IP21
now = .466
ISLE - B10. (red high volume is missing)
JRJC - China Finance - B24, B20 - Looks very good.
MLNK - Moduslink - B20
RAD - Rite Aid - B24
RDNT - Radnet - B10, B20 (red high volume is missing)
SBCF - Seacoast Banking - B24
SLP - Simulations - B24
VSCP - Virtualscopics - B10-B12-B20-B24 all on same day!
Further Refining
the Insider-Bulge-Rebounder Trading Strategy:
ACTS, AWC, BAMM,
CMLS, DAIO, DRAD
>All these
show the need to see prices surpass the rising 65-dma.
High Accumulation
and a Bullish Closing Power divergence is not enough.
Insiders are not
always right. Some CEOs make really dumb decisions.
|
> A major
Tiger Buy is needed.
ASTC, ATRM, AUO, CALI, DDE, DHF, ORCC, SNAK.
====================================================================================
OLDER HOTLINES
====================================================================================
2/27/2012
DJI= 12982 -1 la/ma = 1.011 21dmaROC=.229
P= 340 +15 IP21=.118 V= +9
OP= .064
BREADTH STATISTICS: Advance=1626
Declines=1361 UpVol = 323.58 DownVol= 305.29
ratio= 1.19
ratio = 1.06 (exactly same as last night.)
---> 202 (+52) MAXCP stocks Bullish MAXCP
Stocks Bullish.
2 (-1 ) SUPER2011 Stocks making New Highs: TGE 10,59
+1.46
---> 35 (-2) MINCP stocks Bearish
MINCP Stocks
MAXCP stocks are those showing Tiger Closing Power
making new highs.
This suggests heavy Professional Buying. Applying the Tiger Power Ranker's
"bullish" to the MAXCP stocks find those with heavy insider buying and
institutional accumulation. Bearish MINCP stocks show the opposite.
---> 55 (+3)
new
highs on NASDAQ. 12 (+5) new lows on NASDAQ Bullish.
--->
80 (-16 ) new
highs NYSE 3 (+3) new lows on NYSE
2/27/2012 KEY CHARTS OF INDISTRY INDICES
DIA SPY
QQQ
DJIA-Peerless
TigerDJI TigerSPY TigerQQQ
GLD
SLV
Crude Oil IWM-Russell-2000
DIA' s CP is above
its rising 21-DMA.
A close more than 0.60 below the opening will break the steeper CP uptrendline.
Opening Power is rising.
SPY's main CP's is uptrending.
It would take a close of more than 0.56 below the opening to
break the steeper CP uptrend.
QQQ's Main CP is uptrending. QQQ
was until a week ago much stronger than the DJI.
It will take a close of more than 0.70
BELOW the Opening to break the steep CP
UP-trendline.
Opening Power is uptrending. BOTH RISING.
GLD's CP restored its steeper
rising CP uptrend The less steep CP uptrendline is far below
Its Opening Power is rising. It will
take a close of more than 1.08
BELOW the Opening
to break the steeper CP UP-trendline. Opening Power is rising.
Hotline
The Peerless Buy B10 and a New "NIFTY FIFTY" have
emerged.
The Peerless Buy still operates. While we
trust Peerless, it is clear that the DJI is struggling
to make any more
gains and even keep from falling.
 The DJI just would not stay down today.
It was like a balloon
under water today. The early reversal
did not, however,
mean it could make much
upside progress. In the DJI's prices we now see a "rising wedge
pattern".
This often leads to a bearish reversal down. It gives a name to the
loss
of momentum, volatility
and volume we are seeing.
For now, we are
operating under a Peerless Buy and the A/D Line and Closing Powers
are in uptrends.
Many more stocks are being bought by Professionals than sold short
if we notice the very
positive ratio of Closing Power new highs to CP new lows. But at
some time, perhaps next
month, the rising A/D Line uptrend will be broken and we
will start to see
breadth deterioration, possibly like in 1972. (See the 71-72 and 72 charts
below.) This A/D
Line uptrend-break may not bring a Peerless Sell immediately. It
will take more time for
the P-Indicator to turn negative when the DJI rallies to
the upper band.
In this scenario, the DJI will probably soon afterward enter
a long and flat trading
range like in 1972 or 1976. Only next year, 2013, will there be a
serious decline,
barring a wider Israeli-Iranian conflict this year. This is the dominant
historical pattern for
a Presidential Election year.
The rising wedge shows
the difficulty of keeping a rally alive with just low interest rates
when oil is over $100
and there is a distinctly inadequate growth in good-paying
domestic jobs.
See below how poorly Monster.com Jobs is performing. It threatens to make
a new low and looks
like a good short sale to hedge with.
Crude Oil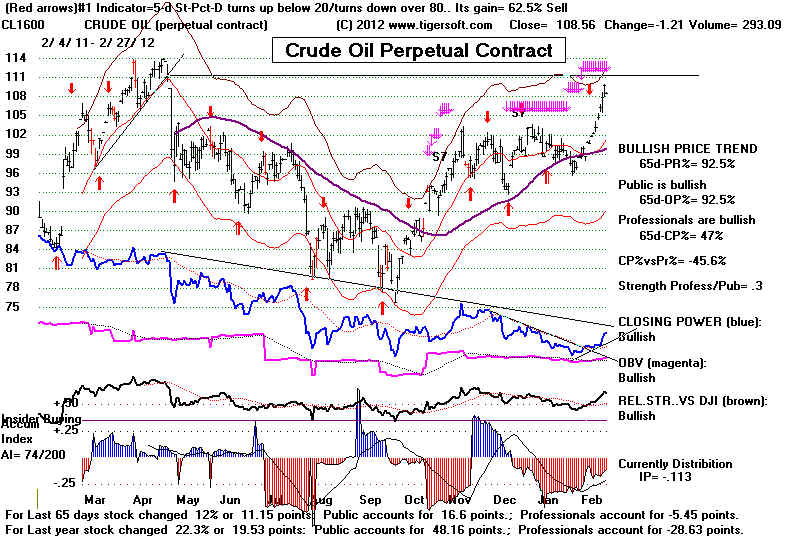 |
Monster.Com Jobs
Monster®
- Official Site - Search Jobs |
In this environment,
traders will keep pushing up the strongest stocks, apart from dividend
plays and bonds, ultil
we are ultimately left with only a small clique of "nifty fifty" stocks
much like was seen in
1972, also a Presidential Election year when the President pressured
his the Federal Reserve
Chairman to keep interest rates low, just as is happening now.
Some of Today's Nifty Fifty (Only 17 here)
When only a
handful of high priced stocks get most of investors' new money, we will have
to be very
concerned. That is not true yet. But AAPL''s huge rise does distort and
exaggerate
the advance in the NASDAQ and QQQ. A market which is left with only
a
nifty-fifty group of high priced stocks to lift it, is like a game of musical chairs.
When the
momentum players
jump ship, only the nimblest will go unscathed. This was true in
1972 (which was
followed by the long1973-1974 bear market) and in early 2000 (which
was followed by
the long 2000-2003 bear market).
We should, I
think start watching the high priced leaders in the market now. As long
as they are in
price uptrends and their Closing Powers are rising, we should be confident.
Traders can buy
these super high-priced stocks using Closing Power hooks back upwards
after tests of
support or on confirmed price breakouts. See REGN below. Options players
should consider
these stocks, especially.
But when these
stocks start to break down, we will have to quickly do some selling and
hedging by
shorting "bearish MINCP" stocks.
IP21
Tiger Technicals
------------------------------------------------------------------------------------------------
AAPL 525.76
+3.35
.307 Both CP and Opening Power
Rising
ATRI
209.18 -1.31
-.42 Serious breakout failure.
Two week drop from 260 to 210.
BIIB (Biogen)
116.4
Head/Shoulders top with neckline now at
115.
CAT 115.63 -.37
.198 CP above rising ma.
CMG (Chipotle) 388,89 +1.47
.198 CP above rising ma.
EQIX (Equinox)
139.29 +0.50 .35 CP above rising ma.
GWW (Grainger) 210.18 +2.89 .253 CP above rising ma.
IBM 197.53 -.23
.121 CP above rising ma.
ISRG 514.23 +1.47
.306 Both CP and Opening
Power Rising
MA (Master Card) 421.4 +5.79
.382 Both CP and Opening Power Rising
NVO (Novo Nordisk) 142.19 -1.25 .257 Both CP and Opening Power Rising
PCLN (PriceLine) 591.54 +1.13
.175 Both CP and Opening
Power Rising
Price breakout past 560 7x tested resistance last week.
REGN (Regeneron)
105.94 +2.72 .249 Both CP and Opening Power Rising
RL (Ralph Lauren)
174.86 +1.14 -.077 Both CP and Opening Power Rising
TNH (Tierra Nitr)
222.68 +2.77 .08 Both CP and Opening Power Rising
V (Visa)
118.86 -.68
.11 Both CP
and Opening Power Rising
VFC 148.09
.112 CP above rising ma.
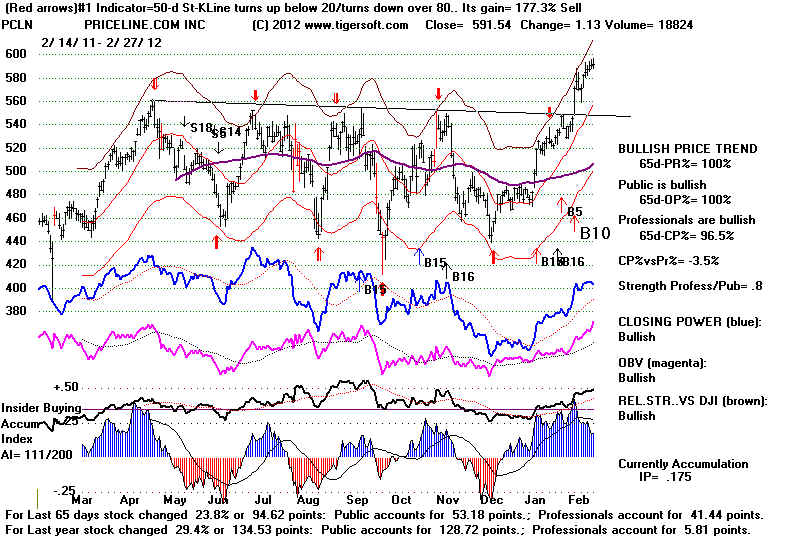 |
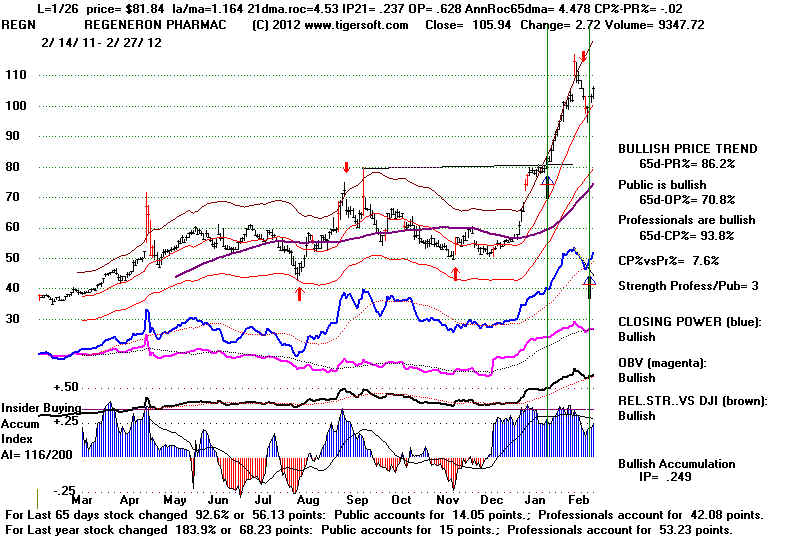 |
 Fed.
Chairman Arthur Burns and Nixon, 1972 Fed.
Chairman Arthur Burns and Nixon, 1972Quoted from http://www.tigersoft.com/tiger-blogs/8-18-2003/index.htm "1969-1972 The Fed decided to drop the stock market very early in the new Republican President's tenure. It raised the Discount rate from 5.25% to 6.0% by April 4th, 1969. And the stock market fell sharply. (See Peerless charts of DJI below). The DJI fell from 970 in May 1969 to 540 in May 1970. Articles have appeared in Barron's suggesting the utility of watching for three successive Discount Rate/Fed Funds Rate hikes before selling out and three successive Discount Rate/Fed Funds Rate declines before buying. Multiple Peerless major Sell signals work better, especially after only two Discount Rate Hikes or Declines. Thus, Peerless gave many major Buy signals from May 1970 to the end of the year. The Fed showed it wanted the stock market to rise by lowering the Discount Rate fives times between November 1970 and February 1971. The DJI responded by roaring ahead, setting up the Republican Richard Nixon with a strong market going into the 1972 Presidential Election. When Nixon's 1971 New Economic Plan made investors fear that wages, prices and possibly incomes might be controlled, the stock market fell sharply. Nixon privately demanded the Fed cut interest rates and Burns stop stressing "fears of inflation" in his appearances before Congress. Adding to his pressure on the Fed, Nixon even let it be known that he was considering backing legislation which would expand the number of Fed Governors. This would let him "pack" the Fed with supporters who would back his more expansionist policies. He even spread a rumor that Burns wanted a $20,000 raise. Not surprisingly, the FED succumbed to this pressure. Burns had been Fed Chairman little more than a year. So, he accomodated the President. He cut the Discount Rate in November and December of 1971. That quickly had the desired effect and sent the market up sharply from a 790 low to 960 in the summer of 1972, the Presidential Election year. Nixon got what he wanted and was re-elected by a wide margin in November 1972. My conclusions are supported here by conservative writer Bruce Bartlett. "The inflation of the 1970s came about primarily because Fed Chairman Arthur Burns gunned the money supply to get Richard Nixon re-elected in 1972." " http://72.14.253.104/search?q=cache:b2UpTlb83fIJ:www.heartland.org/Article.cfm%3FartId%3D15468+Carter+%22tight+money%22+Volcker&hl=en&ct=clnk&cd=2&gl=us&client=firefox-a See discussion between Nixon and Burns on Nixon Tapes. http://cba.unomaha.edu/faculty/mwohar/web/links/Donestic_Money_papers/Abrams_jep-v20n42006.pdf
|
====================================================================================
OLDER HOTLINES
====================================================================================
2/24/2012
DJI= 12983 -2 la/ma = 1.012 21dmaROC=.21 P= 325 -64 IP21=.082 V=
-5 OP= .046 (low)
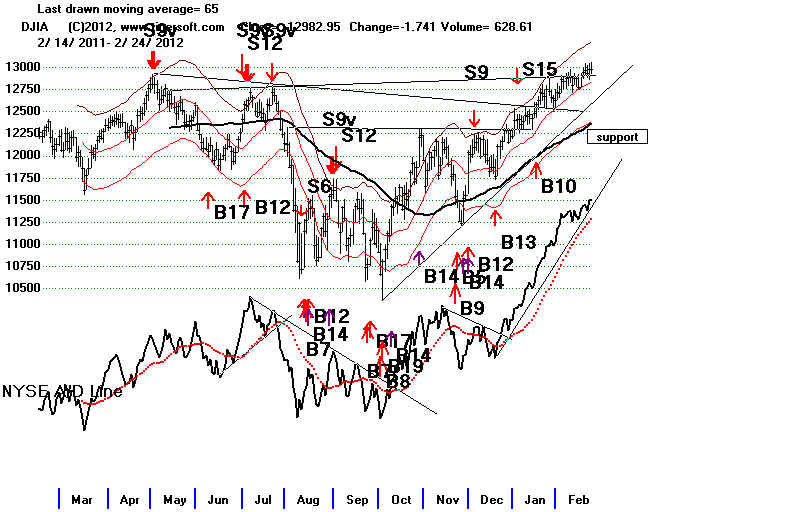
BREADTH STATISTICS: Advance=1648
Declines=1386 UpVol = 322.77 DownVol= 305.84
ratio= 1.19
ratio = 1.06
New ALL TIME
HIGHS (ATH) Bullish ATHIGHS
Stocks
--->
150 (+12) MAXCP stocks Bullish MAXCP Stocks Bullish.
3 (0 ) SUPER2011 Stocks making New Highs: LQDT +.76
---> 37 (-1) MINCP stocks Bearish MINCP
Stocks
MAXCP stocks are those showing Tiger Closing Power
making new highs.
This suggests heavy Professional Buying. Applying the Tiger Power Ranker's
"bullish" to the MAXCP stocks find those with heavy insider buying and
institutional accumulation. Bearish MINCP stocks show the opposite.
---> 52 (-14)
new
highs on NASDAQ. 6 (-1) new lows on NASDAQ Bullish.
--->
96 (+3 ) new
highs NYSE 0 (-1) new lows on NYSE
2/24/2012 KEY CHARTS OF INDISTRY INDICES
DIA SPY
QQQ
DJIA-Peerless
TigerDJI TigerSPY TigerQQQ
GLD SLV
Crude Oil IWM-Russell-2000
DIA' s CP is above
its rising 21-DMA.
A close more than 0.20 below the opening will break the stee[er CP uptrendline.
Opening Power is rising.
SPY's main CP's is uptrending.
It would take a close of more than 0.15 below the opening to
break the steeper CP uptrend.
QQQ's Main CP is uptrending. QQQ
was until a week ago much stronger than the DJI.
It will take a close of more than 0.11
BELOW the Opening to break the steep CP
UP-trendline.
Opening Power is uptrending. BOTH RISING.
GLD's CP restored its steeper
rising CP uptrend The less steep CP uptrendline is far below
Its Opening Power is rising. It will take a close of more than 1.90 BELOW the Opening
to break the steeper CP UP-trendline. Opening Power is rising.
Hotline
The
Peerless Buy B10 still operates but the DJI is struggling
to get past the
psychological resistance between 12900 and the round number 13000.
While breadth (the
rising A/D Line and ratio of new highs to new lows) is bullish, volume
has been low, leaving a
supply of over-hanging stock that has not been removed from
the price ceiling.
We see this also in the highest priced DJI-30 stocks which one might
expect to lead any
charge higher. (See all the charts below of IBM, CAT, MCD, CVX and
XOM.) The OBV
Lines are clearly lagging prices. If the DJI cannot go up, at some point
it must decline and
test support before advancing again. Without a Peerless Sell, any
such decline will most
likely start at the very good support at the rising 65-day ma,
now at 12350.
This means we might see a 4% DJI decline if the NYSE A/D Line uptrend
and the Closing Powers
for DIA, SPY and QQQ break their uptrends. But for now, they are
rising and the DJI
rises 58% of the time in the week after February 26th and 67% of
the time in the two
weeks that follow.
The Dollar
shows a potential head and shoulders pattern developing. Weakness could
develop here in the next
month that would challenge the FED's policy of low interest rates.
But the bigger threat to the
recovery which the stock market is anticipating by rallying is
rising oil prices, especially
if there are hostilities with Iran and Persian Gulf oil supplies
are cut off. Our Tiger
chart of Crude Oil (Perpetual contract - CL1600) shows prices have
broken above a lengthy
inverted head/shoulders pattern. While this is bullish, the blue CL1600
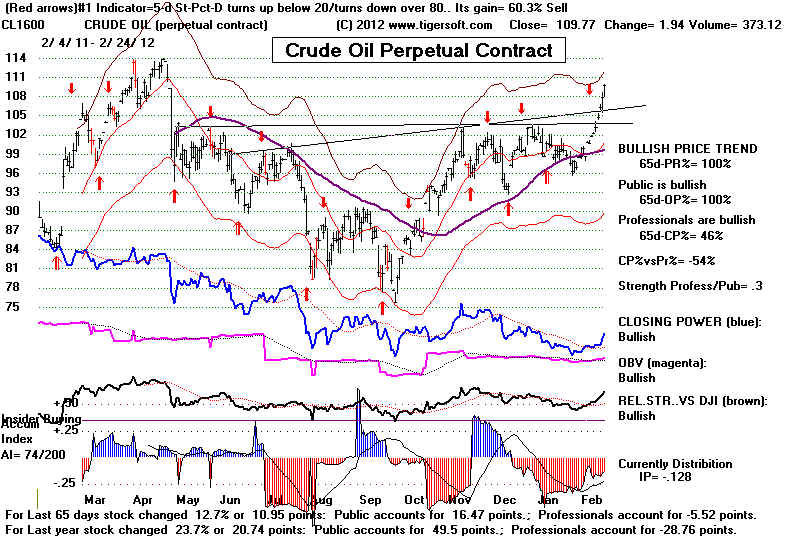
Tiger Closing Power is weak
and is lagging prices badly. This shows that the European
buying is not yet matched by
NY Professional buying. Similarly, the negative Accumulation
readings now indicate heavy
institutional selling on this rally. These internals warn that
the biggest players are not
yet betting on much higher oil prices. So, I have to conclude
that we should be patient
with our longs and focus on the best performing, high Accumulation
stocks making Closing Power
new highs or all-time price highs.
See Bullish All Time HIGHS
Stocks Bullish MAXCP Stocks
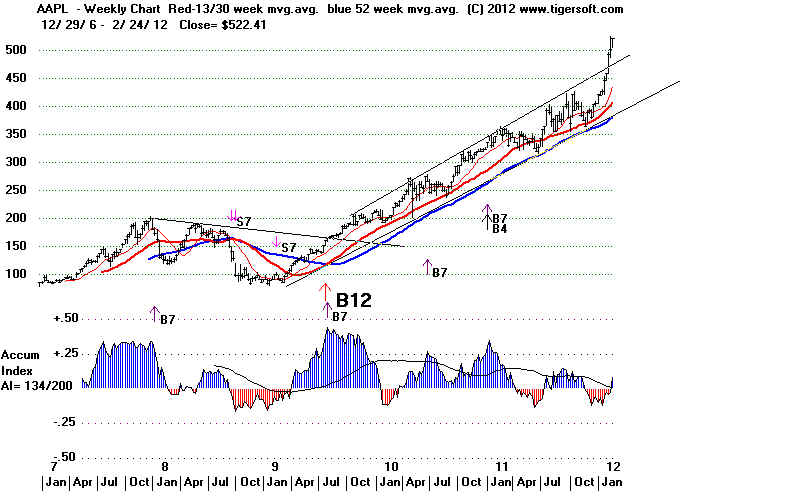
NASDAQ and QQQ weakness in the next few weeks might stem from any
long over-due
profit-taking in APPLE's
stock. An exceptional amount of the gains in these two indexes
owe to AAPL's high
capitalization and big gains. The Tiger Weekly chart shows a weak
Accumulation Index.
Institutional profit-taking could put the stock in the weaker hands
of the public, many of whom
probably could be induced to sell by a sharp correction.
Market makers and hedge funds
know this and may attempt such a sell-off "play" in the
near-term, though for now the
Closing Power is rising. (See the daily chart of AAPL.)
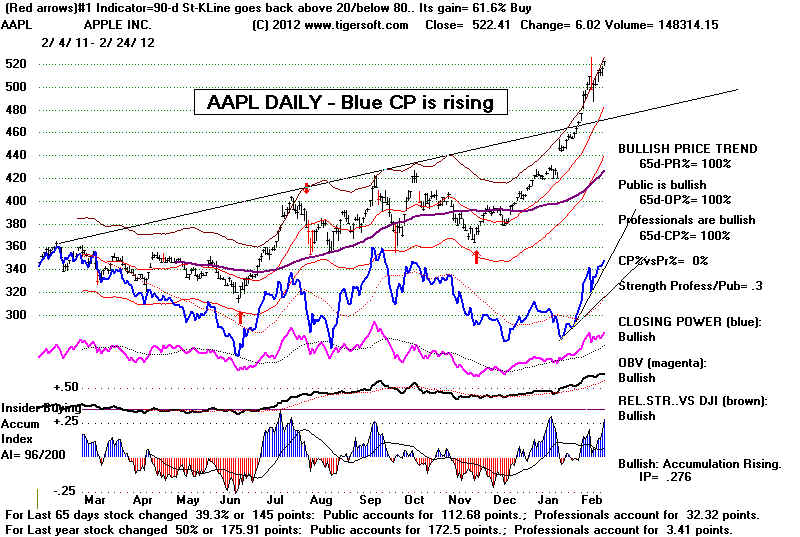
While I would like to see US
investors plow their funds into American investments
i have to report that
research I did this weekend shows that the Peerless buy and
sell signals work very well
with the biggest German and Russian stocks.
Germany's DB's Trading Gain =
+116.%/last 12 mo.
Long and Short using next day's openings following a Peerless signal.
http://tigersoft.com/GERMANY/index.html
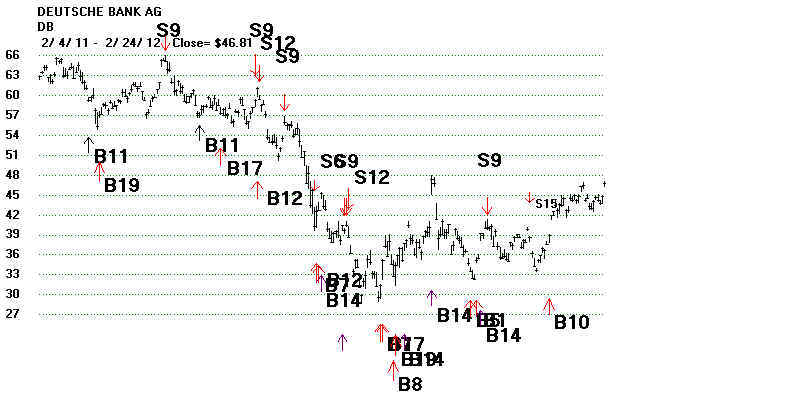
RUSSIA's
OGZPY, the Gazprom ADR. Trading on the long side
(Buying and
Selling) using the Peerless signals would have gained the trader +69.5%.
Also
Selling Short on the Peerless Sells and Covering the Shorts on the Peerless Buys
would have
gained the trader +178%
http://tigersoft.com/RUSSIA/default.htm
=====================================================================================
OLDER HOTLINES
=====================================================================================
2/23/2012
DJI= 12985 +46 la/ma = 1.013 21dmaROC=.287 P=
389 +51 IP21=.121 V=14 OP= .127
BREADTH STATISTICS: Advance= 2183
Declines= 856 UpVol = 531.6 DownVol= 225.2
ratio= 2.55
ratio = 2.36 Upside Volume lags.
New 59 ALL TIME HIGHS (ATH) Bullish ATHIGHS Stocks
--->
138 (+61) MAXCP stocks Bullish MAXCP Stocks Bullish.
3 (+1 ) SUPER2011 Stocks making New Highs: ALXN +2.45
---> 38 (-26) MINCP stocks Bearish
MINCP Stocks
MAXCP stocks are those showing Tiger Closing Power
making new highs.
This suggests heavy Professional Buying. Applying the Tiger Power Ranker's
"bullish" to the MAXCP stocks find those with heavy insider buying and
institutional accumulation. Bearish MINCP stocks show the opposite.
---> 64 (+39)
new
highs on NASDAQ. 7 (-6) new lows on NASDAQ Bullish.
--->
93 (+52 ) new
highs NYSE 0 (-1) new lows on NYSE
2/23/2012 KEY CHARTS OF INDISTRY INDICES
DIA SPY
QQQ
DJIA-Peerless
TigerDJI TigerSPY TigerQQQ
GLD SLV
Crude Oil IWM-Russell-2000
DIA' s CP is above
its rising 21-DMA.
A close more than 0.91 below the opening will break the main CP uptrendline.
Opening Power is rising.
SPY's main CP's is uptrending.
It would take a close of more than 0.14 below the opening to
break the steep CP uptrend.
QQQ's Main CP is uptrending. QQQ
was until a week ago much stronger than the DJI.
It will take a close of more than 0.25
BELOW the Opening to break the main CP
UP-trendline.
Opening Power is uptrending. BOTH RISING.
GLD's CP restored its steeper
rising CP uptrend The less steep CP uptrendline is far below
Its Opening Power is rising.
Opening Power is
rising.
Hotline
The
Peerless Buy B10 still operates. The Big Guns (IBM and APPLE)
are making runs
into all-time highs. With the Divisor of the Dow now 0.13, any 3 point
advance in the
DJI lifts it 23 points. Now if Chevron, now at 108.35, can get past
111, the DJI
could easily surpass 13000. With the A/D Line and Closing Powers rising,
we should
remain bullish, I believe.
This is a
market where high performance hedge funds rush into the best performing
stocks. Stocks making all-time highs, generally, can make runs most easily
because it is not clear where to sell. Everyone has a profit. No one is trying
to get
out
even. Sell orders cannot easily be bunched to turn back a rally. Accordingly,
I
will start posting the most "bullish" (as ranked by Tiger's Power Ranker) of
these
stocks. The most bullish show heavy Accumulation and are usually more
tightly held. Buy them on breakouts and when their CLosing Power hooks back
up
after minor sell-offs. Bullish ATHIGHS
Stocks Our advantages ares that we can
hold
them comfortably as long as their CLosing Power is rising and so long as Peerless
does
not give a Sell.
====================================================================================
OLDER HOTLINES
====================================================================================
2/22/2011
Hotline
The Peerless Buy B10 still operates. The NYSE A/D Line
uptrend is still intact.
If it is broken,
it will likely turn downwards for a month, but the DJI is 4x more
likely not to
decline as much as 4 pct. or just continue to rally until there is a Peerless Sell.
This is the
conclusion reached in last night's Hotline for A/D Line trendbreaks from
February to April
in a Presidential Election year from 1945 to 2011.
Interest rates turned down again today. Low interest
rates are likely to be maintained
as long as
possible by the FED to keep the recovery going. Do not underestimate the
determination of the Obama-Wall Street-Fed "Financial Junta" to keep the stock
market rising
so that
there will be no change in ruling elites that could upset the status quo in November 2012.
As we used
to hear throughout the 1970s and 1980s, "Do not fight the
Fed.".
Most likely
the DJI will get past 13000, though a 2% pullback is quite possible. As it
does so,
fewer and fewer stocks will advance. Those that do will get undo attention
from the
high-performance crowd. We will see more very steep advances in indeividual
stocks
showing high Accumulation that are making Closing Power new highs. The high
Accumulation suggests insider and institutional buying and
tight holding for a year. The
Closing
Power new highs show Wall Street Professional buying. The combination is very
bullish.
These are
our Bullish MAXCP stocks. If you want to hedge,
sell short some of the stocks
showing the
opposite conditions, the Bearish MINCP stocks that we
post most nights here.
The
year-end and year-beginning short covering is just about over. So, the bearish MINCP
stocks will start to show more sustained weakness again. Of course, waiting for a
Peerless
Sell
at this time of the year is our preferred strategy.
18 of
the 77 Bullish MAXCP stocks have risen more than 5% over the last five days.
CAB
(+18%), ASPS (+17%), DWCH(+13%),
CLR (+12%) and OYOG(+12%)
are
the
biggest winners here. CAB has just made a flat topped breakout above 34 on a
gap,
red high volume and IP21 readings above .35. These usually go much higher.
ASPS showed several red-high volume, gapped flat top
breakouts plus bulges of very
high
Accumulation. These should be bought on breakouts or on pullbacks to support when
their
Closing Power hooks back up. As long as the CLosing Power is in an uptrend, they can
be
held comfortably for higher prices. See also today's biggest gainers: TGE and DWCH
for
what they can show us about the preconditions for rallies and because they may go
much
higher.
Bullish for
the overall market, the Closing Powers for the key ETFs are still in uptrends. too.
See DIA, SPY and QQQ.
If there
were going to be a significant (more than 4%) decline I would expect to see
more
completed head/shoulders formations whose stocks show current Accum. Index (IP21)
readings
below 0. We should watch such emmerging patterns among SP-500 stocks.
Each
would
need to close below its neckline to complete the pattern.
Stock 2/22/2012 Close
Neckline
IP21
----------------------------------------------------------------------
A
42.72 +11 41.70
.15
AA
10.38 -,03 10.00
.029
ADP
53.81 -.05 53.50
-.249
AEP
39.84 -.04 39.00
-.076
AMGN 66.69
66.50 .135
BXP
101.76 -1.58 102
.097 CP is
weak - Boston Properties
====> CAG
26.11
26.52 -.075 At rising 65-dna support.
CLX
67.51
67.0
.002
FLSR
40.45 -1.93 38.5
-.178
HAS
34.52 -1.32 34.5
.002
HST
15.76 -.17 16.00
.045 completed H/S
JEC
44.76 -.86 44.
.109
DJI= 12939 -27 la/ma = 1.01 21dmaROC=.214 P=
338 -56 IP21=.117 V=+3 OP= .047 (low)
BREADTH STATISTICS:
Advance= 1192 Declines= 1857 UpVol = 244.0 DownVol= 476.7
ratio=
0.642
ratio =0.512 BEARISH DOWN VOL EXCESS
DJI - BUY B10 St10 Still Operates
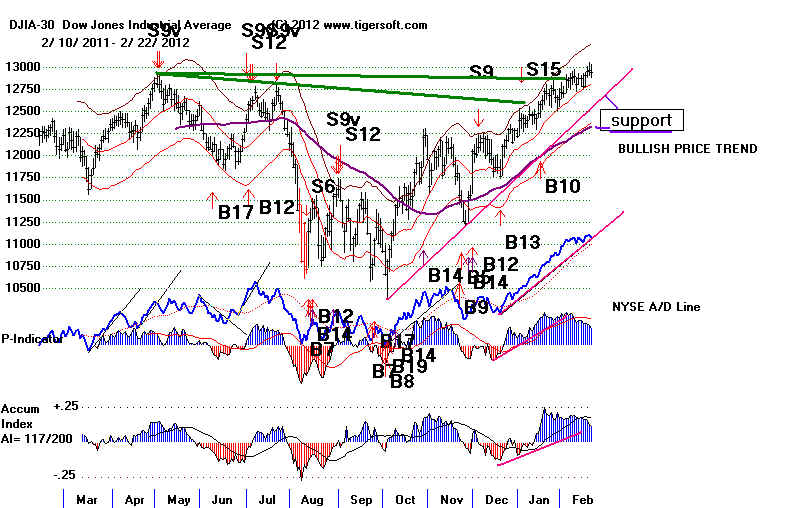
--->
77 (-4) MAXCP stocks Bullish MAXCP Stocks Bullish.
2 (+1 ) SUPER2011 Stocks making New Highs:
---> 64 (+23) MINCP stocks Bearish MINCP
Stocks
MAXCP stocks are those showing Tiger Closing Power
making new highs.
This suggests heavy Professional Buying. Applying the Tiger Power Ranker's
"bullish" to the MAXCP stocks find those with heavy insider buying and
institutional accumulation. Bearish MINCP stocks show the opposite.
---> 25 (-12)
new
highs on NASDAQ. 13 (+5) new lows on NASDAQ Bullish.
--->
41 (-33 ) new
highs NYSE 1 (....) new lows on NYSE
2/22/2012 KEY CHARTS OF INDISTRY INDICES
DIA SPY
QQQ
DJIA-Peerless
TigerDJI TigerSPY TigerQQQ
GLD SLV
Crude Oil IWM-Russell-2000
DIA' s CP is above
its rising 21-DMA.
A close more than 0.45 below the opening will break the main CP uptrendline.
SPY's main CP's is uptrending.
It would take a close of more than 2.99 below the opening to
break the main CP uptrend. The steep CP uptrend was slightly violated
today,
QQQ's Main CP is uptrending. QQQ
was until a week ago much stronger than the DJI.
It will take a close of more than 0.36
BELOW the Opening to break the main CP
UP-trendline.
Opening Power is uptrending. BOTH RISING.
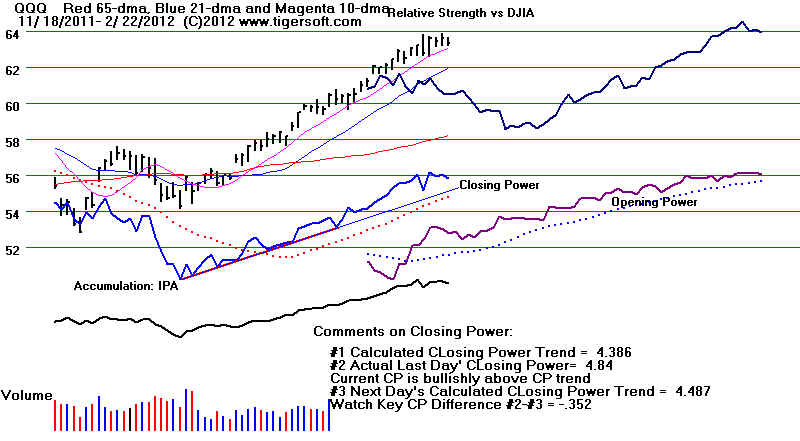
GLD's CP restored its
steeper rising CP uptrend
It will take a close of more than 2.70
BELOW the Opening to break this CP
UP-trendline.
The less st/ep CP uptrendline is far below. Its Opening Power
is rising.
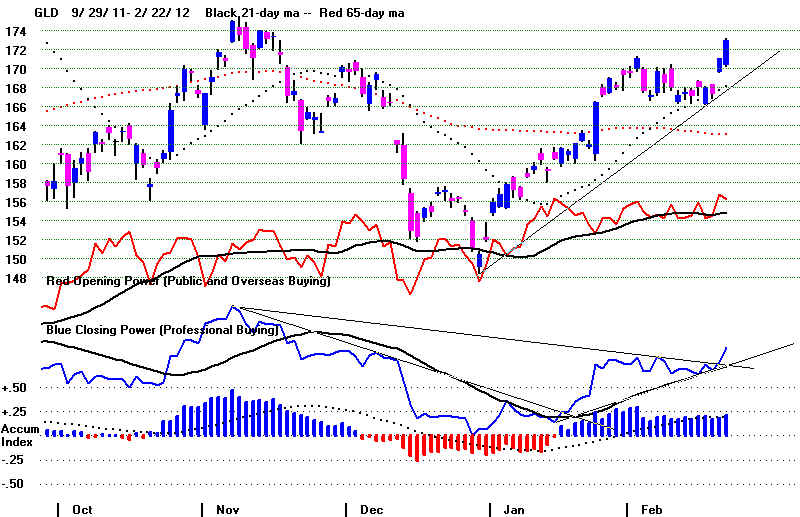
=====================================================================================
Older Hotmail
=====================================================================================
2/21/2011
DJI= 12966 +16 la/ma = 1.013 21dmaROC=.228 P=
393 -24 IP21=.122 V=17 OP= .047 (low)
BREADTH STATISTICS: Advance= 1514
Declines= 1527 UpVol = 402.7 DownVol= 386.9
ratio= 0.991
ratio =1.041
YAHOO OVERSEAS MARKETS 3 1/2 hours before opening in NYC
- 
http://finance.yahoo.com/
--->
81 (-60) MAXCP stocks Bullish MAXCP Stocks Bullish.
1 (+1 ) SUPER2011 Stocks making New Highs:
---> 41 (+21) MINCP stocks Bearish MINCP/Sell S7 Stocks
MAXCP stocks are those showing Tiger Closing Power
making new highs.
This suggests heavy Professional Buying. Applying the Tiger Power Ranker's
"bullish" to the MAXCP stocks find those with heavy insider buying and
institutional accumulation. Bearish MINCP stocks show the opposite.
---> 37 (-31)
new
highs on NASDAQ. 8 (-2) new lows on NASDAQ Bullish.
--->
74 (-6 ) new
highs NYSE 1(-3) new lows on NYSE
2/21/2012 KEY CHARTS OF INDISTRY INDICES
DIA SPY
QQQ
DJIA-Peerless
TigerDJI TigerSPY TigerQQQ
GLD SLV
Crude Oil IWM-Russell-2000
DIA' s CP recovered
bullishly from its rising 21-DMA.
A close more than 026 below the opening will break the main CP uptrendline.
SPY's CP's is uptrending.
It would take a close of more than .05 below the opening to
break the main CP uptrend.
QQQ's Steeper CP is uptrending. QQQ
is much stronger than the DJI.
It will take a close of more than 0.30
BELOW the Opening to break the long
short-term CP UP-trendline.
Opening Power is uptrending. BOTH RISING.
GLD's CP restored its
steeper rising CP uptrend The less steep CP uptrendline is far below
Its Opening Power is rising.
Hotline
The Peerless Buy B10 still operates. A
failure to get past 13000
and a break in
the A/D Line uptrend could bring a small pull-back. Of some concern would
be a further DJI
advance with the NYSE failing to make any more new high. Potential
head/shoulder
patterns are appearing in the Tiger Indexes of REITs, INDUSTRIAL MATERIALs
and COMPUTERs. Watch to see if these break their neclines.
REITs INDEX
The 90-day
Stochastic Sell has been a reliable Sell, producing a +114.4% gain since last July.
Gains of
more than 100% with a Stochastic deserve attention. And with the trading
range still
viable and extant, this could well bring a tradeable decline. Is this a sign
that
short-term interest rates may be going up?
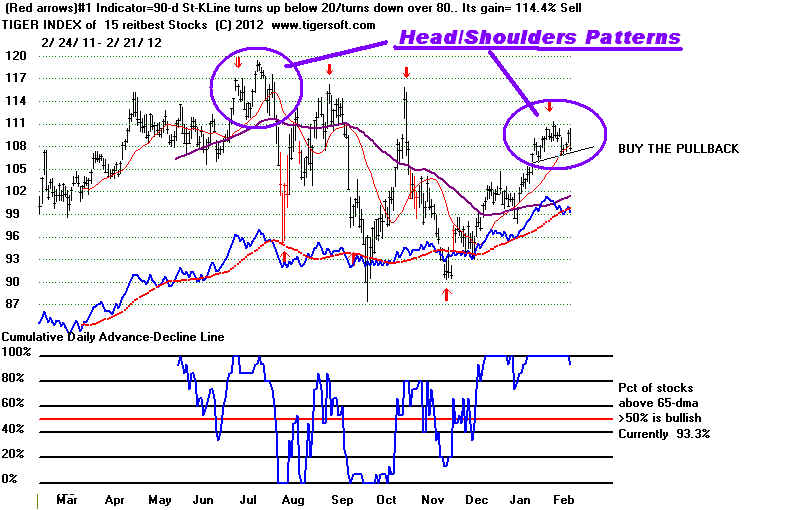
Stocks in SP-500 That Could Break Their
H/S Necklines and Complete Bearish Head/Shoulders Patterns..
(A-N examined only)
Stock Close
Neckline
----------------------------------------------------
A
42.61 41.70
AA
10.41 10.00
AEP
39.86 38.74
AMGN 66.69
66.50
BXP
103.34 102.00
CLX
67.7 67
HST
15.93 16.00
completed but IP21=.103
JEC
45.62 44.
Stocks in SP-500 Making False Breakouts
GPC
63.81 - 1.77
Another concern
now might be the dropping back below its 21-day ma by our Accumulation Index.
Later in the year
and after a 10% DJI rally such as we have seen, this can bring a major
Peerless Sell S4.
But it is not reliable now. If Sell S4s were allowed in February, March and
April of a
Presidential Election Year when the AI breaks below its 21-dma, their track record
since 1944 would
show only three cases in 16 occurrences where the DJI fell more than 3.%.
Losses
predominated.
The Dropping below its 21-day ma by the Accum. Index
Is Not A Good Sell.
2/2/1944 137.10 decline only to 134.20
2/24/1944 136.60 B10 would have brought a loss 1.5% on
3/8/1944
3/23/1944 138.90 decline to 135.00 on 4/24/1944 but no Buy there, so big
loss.
2/13/1952 266.20 +3.7% decline to 256.40 on 5/1/1944
and B2.
3/5/1952 264.70 +3.1% decline to 256.40 on
5/1/1944 and B2.
4/5/1956 516.6 7.5% decline to 477.70 on
5/29/1944 and B2.
2/5/1964 783.00 big loss -7.5%
3/9/1964 807.70 big loss -4.2%
2/15/1972 914.51 loss -2.3%
3/9/1972 942.81 3% paper loss, gain =
+0.8%
2/4/`976 975.62 5% paper loss declined to
966.76 B2 on
3/18/1976 979.76 3% paper loss declined to 966.76 B2 on
3/11/1988 2034.98 gain - 2.8%
2/16/1992 big loss
2/21/1996 gain = +0.5%
4/1/1996 gain =
+2.7% .
Clearly the DJI
is having trouble movng past the resistance at the round number 13000 just
as the SPY has
reached the resistance of its 12 month high. But in 1976, it took 11
separate assaults
on 1000 before the DJI gave up and declined 8%. Repeated DJI failures
to get past a
round number in an election year can themselves eventually cause a reversal,
but normally such
reversals require Peerless Sells, or take place later in the year, as was seen
in July and
September 1976.
The A/D Line did
not confirm today's DJI high, nor did the NASDAQ, which was made
weak because many
of the biotechs lost ground in the aftermath of news that the success
of the GILD
clinical trials for its hepatatitis drug was premature and much exaggerated.
See BBH (Biotech
Index) below.
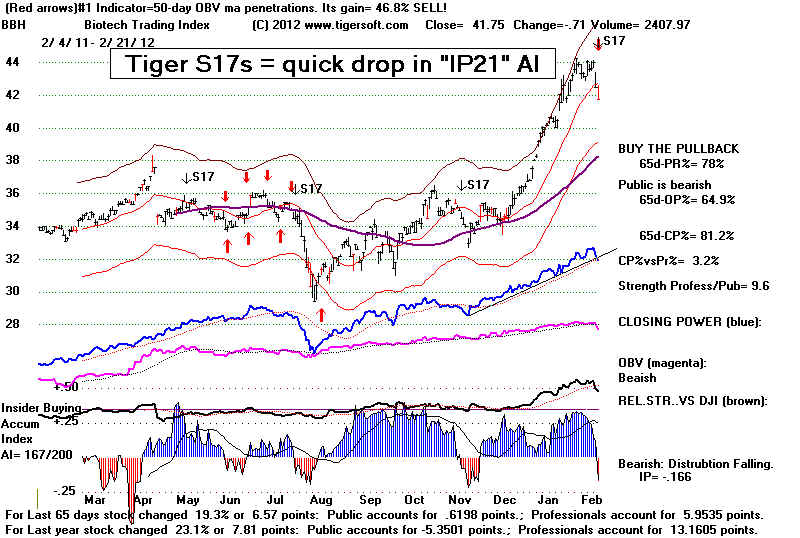
Conclusion
Without a Peerless
Sell, we cannot predict much of a decline by the DJI even when the
A/D Line uptrend
breaks. Secondary stocks and dividend paying stocks, however, might well
weaken more after such
a break. At this time, 10-year interest rates are
threatening to move up
out of their trading
range. At the same time, the Dollar may complete a
bearish head and
shoulders pattern while
Gold and Crude Oil are
approcaching breakout points.
Since 1944, a
clear break in the steep NYSE A/D-Line uptrend by itself without a Peerless
Sell. produced a
DJI decline of 4% or more in a Presidential Election year only once
A shallow further
DJI dip or a strong advance was 4x times more likely. However, a
break in the A/D
Line did turn the A/D Line down for a month or more in all cases.
A/D Line Trend Subsequent
A/D Line
Break
Low
------------------------------------------------------------------------------------------
3/23/1944 138.90 135.10 Peerless buys
there. A/D Lined turned down
and later up with DJI.
3/23/1964 844.2 800.30 earlier Peerless Buys. A/D
Line peaked in April
and fell until early June.
3/10/1972 939.87 No DJI
decline
A/D Line peaked and declined
until October.
2/26/1976 978.83 No DJI
decline
A/D Line peaked and declined
until early June.
(earlier S1 3/24/1988 2024 1988.06
low...B9/B17
A/D Line peaked and declined
until late May.)
2/24/1992 3282
3224.96
A/D Line peaked and declined
until early April.
(earlier S9 3/3/2008 12239 11740
A/D Line declined until early March. )
====================================================================================
OLDER HOTLINE
====================================================================================
2/17/2011
Hotline The Peerless Buy B10
properly anticipated the DJI's
Friday breakout close above 12900. The round number 13000 will offer resistance now.
With the NYSE being closed today, world markets advanced enough to put DJI futures
just below 13000. As long as the A/D Line keep rising, we have to let the markets
advance.
News would seem bullish for bank stocks: Deal reached on Greek bailout package
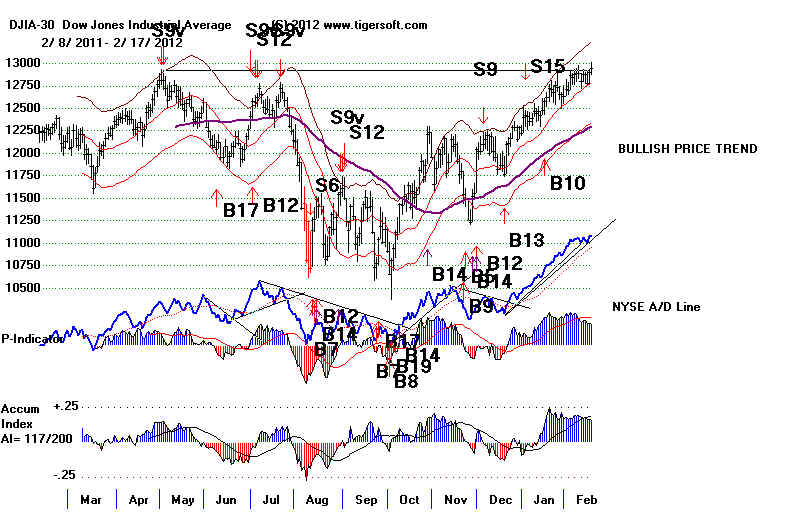
Biotech Shake-Up
Gilead Science's big drop Friday (14%) was based on their report of a post-6-week
resurgence
of the hepatitis virus in a high percentage of stage-2 trial patients treated with their
anti-hepatis drug,
GS-7977 was recently acquired through their $11 billion purchase of Pharmasset, which
claimed
a nearly 100% success rate in very limited size, shorter-term trials.
All this raises lots of questions which will make an interesting drama? Most
immediately, what
will the insttitutions like Fidelity Biotech do, with all their shares? What will
the Professionals do?
The only significant sign of institutional selling before Friday was the drop by the Tiger
Accumulation
Index below its 21-day ma? Is drug development too big a gamble for most investors?
Will the GILD drug create a more resistant strain of hepatitis if used? Will it be
effective in
a cocktail with other anti-drug treatments? Which drugs will be in that cocktail?
Will there
now be more interest in all the other possible anti-hepatitis drugs>
How did Pharmasset schnooker the over-paid Gilead Sciences brass who paid so much for
the VRUS stock? Did the GILD R&D Chief not mislead investors by saying on
February 2nd
that most patients who rebound after treatment do so in the first four weeks?
And within GILD, will there be accountability for this apparently huge blunder?
James Cornelius
has been CEO for GILD less than six months and is scheduled will receive $25.18 million this year.
One worrisome sign, that may help us elsewhere, he has an MBA, not a science degree.
GILD's
evident mistake reminds me of Bristol Meyers buyng out of 20% of Imclone in 2001 at $72
just 12
months before that stock plunged to $6 when the FDA tossed out its application to get
Erbitux
approved for colon cancer. Remembering BMY and Imclone, there is no way I
would not hold
GILD until much better news comes out on this drug. |
The only warning before the GILD decline were the current Accum.
Index
dropping below its 21-day ma. and the 20-day Pct-D sell. These would ordinarily
only bring a decline to its 21-day ma. The report clearly took both Professionals
and Institutions by surprise. 7.3% of FBIOX's holding are in GILD.
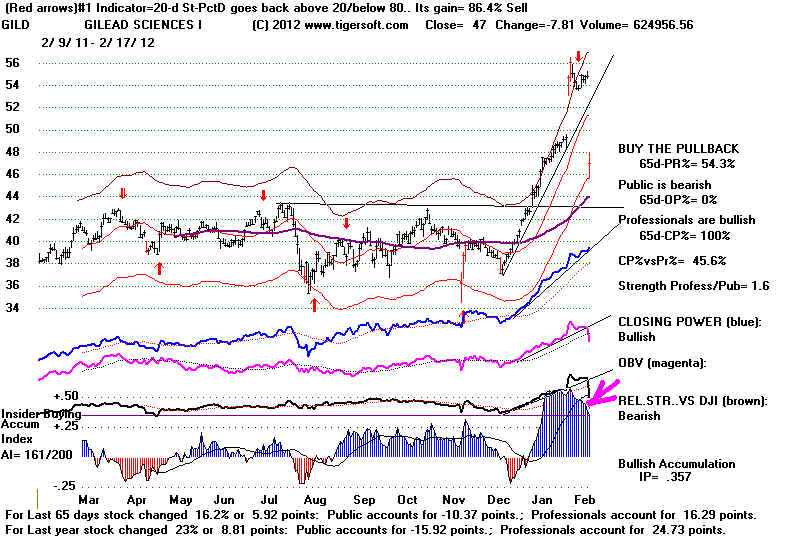

Did this man just destroy $11 billion for GDT? Will he be
fired? Paid any less?
OTHER HEPATITIS FIGHTING BIOTECHS
GILD's over-reaching has opened up for grabs the $20+Billion world market for a new
hepatitis treatment beyond Interferon. There are 130-170 million people workdwide
who have hepatitis. Let's look see what Friday's bad trial results mean for other
biotechs
working on drugs to fight the world-wode scourge of hepatitis. Big drug companies
will
probably make a play for ownership of ACHN and IDIX. We should buy these I think.
| VRTX - Vertex - FDA Approved Incivek
- Bad side effects for 12 weeks. 90% survival rate.. Incevik will start drying up as a significant source of income to Vertx within 14-18 months. VRTX's stock is at the heavy resistance zone between its 149-day (30-week ma) and 200-day ma. 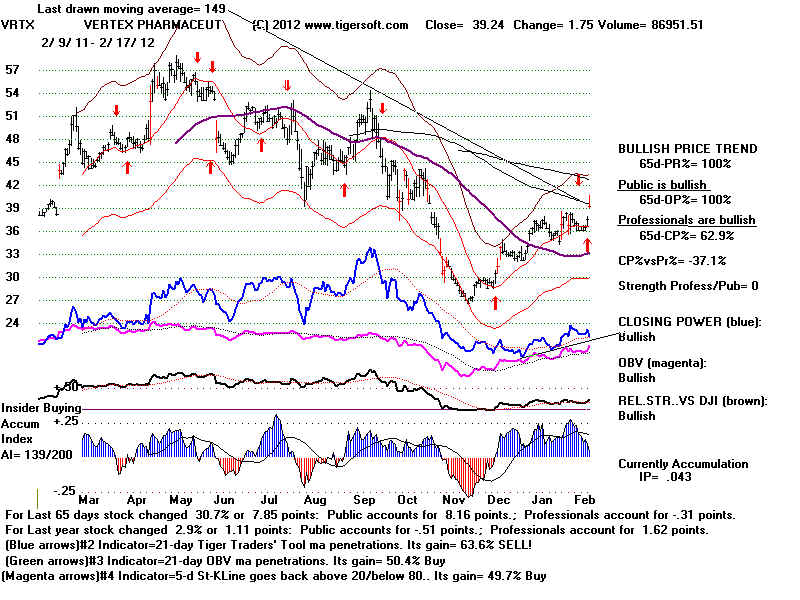 |
| Achillion Pharmaceuticals Inc. (ACHN)
ACHN - 1625 Acquisition target? Achillion, based in New Haven, Connecticut, rose 26 percent to $11.04 for its biggest increase since December Achillion's lead HCV drug candidate belongs to a class of drugs known as protease inhibitors. 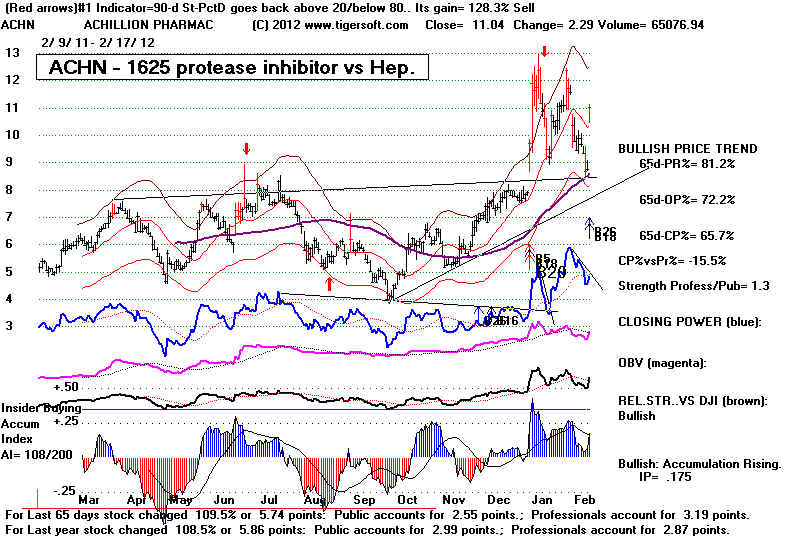 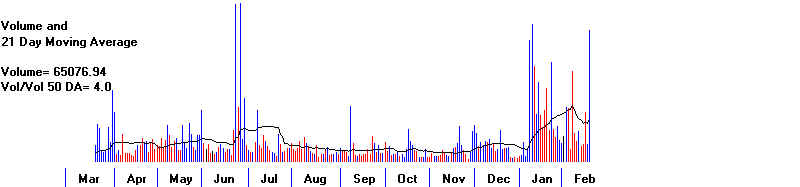 |
| Idenix Pharmaceuticals Inc. (IDIX) Idenix,
in Cambridge, Massachusetts, increased 3.9 percent to $11.91 Working on a nucleotide HCV drug candidate. "Idenix's lead product for treating hepatitis C, IDX184, is a pan-genotypic oral nucleotide polymerase inhibitor. The partial clinical hold that was placed on IDX184 was lifted by the Food & Drug Administration on Feb. 3. The hold was put in place in September 2010 because of three cases of elevated liver function tests. Now that the hold has been lifted, Idenix's 12-week phase IIb study looking at IDX184 with pegylated interferon and ribavirin is allowed to continue. " Source. "IDX184 has exhibited a high barrier to resistance and broad genotypic coverage in in vitro studies, has demonstrated potent antiviral activity, and was generally safe and well tolerated in a Phase IIa 14-day study. This clinical trial evaluated IDX184 in combination with pegylated interferon (PegIFN) and ribavirin (RBV) in treatment-naïve HCV genotype 1-infected patients. In July 2011, the Company initiated enrollment of treatment-naïve genotype 1 HCV-infected patients into a randomized, double-blind, parallel group phase IIb clinical trial of IDX184. The study features two treatment arms, either 50 mg or 100 mg of IDX184 administered once-daily for 12 weeks, each arm in combination with pegylated interferon and ribavirin (PegIFN/RBV). Study objectives include safety and tolerability, and antiviral activity endpoints. Source. My guess is that when you pair this with a potent PI or NS5A inhibitor that you will get great cure rates. The most important thing nucs bring to the table is their high barrier to resistance. Without that you can have a very potent drug but get high relapse rates. If any other company wants to have a prayer of being competitive with GILD or BMY they better have a nuc. Source. The first 31 patients have completed 28 days of treatment, and the interim data have shown favorable safety and antiviral activity. 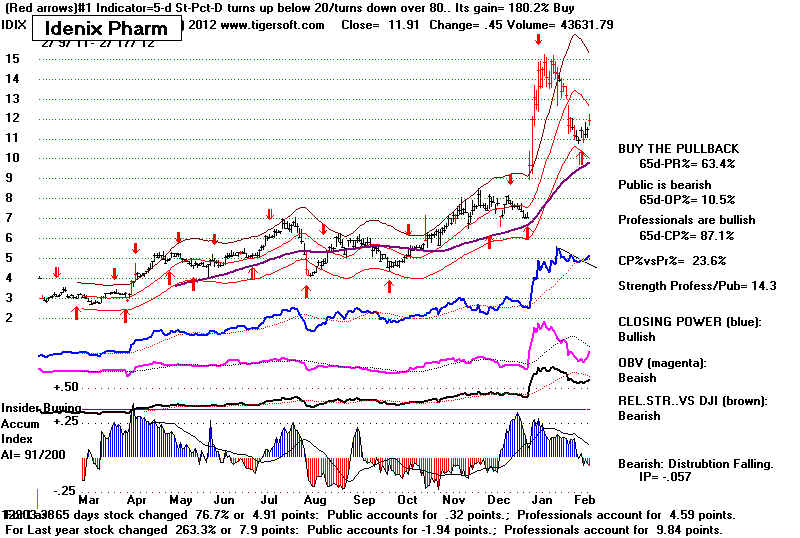 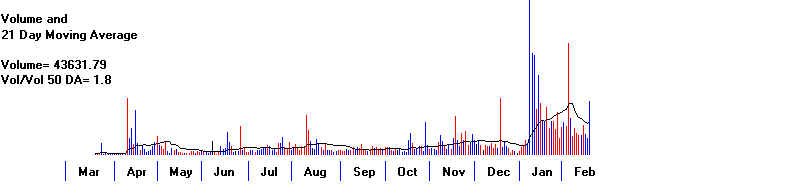 |
| Bristol-Myers Squibb Co. (BMY) spent $2.5 billion
buying Inhibitex Inc just after GILD bought out
Phamasset. Note the bulges of insider buying in INHX in October. This commonly occurs in Buy Outs. See more on Tiger's Accumulation and Biotech Buy Outs. http://www.tigersoftware.com/Biotechs/index.html 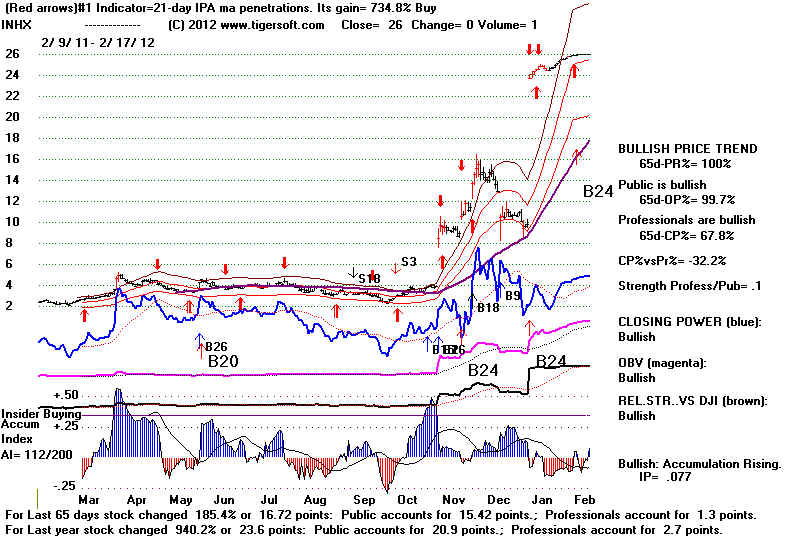 |
| Roche Holding AG bought experimental hepatitis C drugmaker Anadys Pharmaceuticals in November for about $230 million. |
Sangamo BioSciences, Inc. (SGMO)
|
2/17/2011 DJI=
12950 la/ma =
1.013 21dmaROC=.304 P=417 -22
IP21=.156 V=21 OP= .053 (low)
BREADTH STATISTICS: Advance= 1758
Declines= 1277 UpVol = 493 DownVol= 392
ratio= 1.38
ratio =1.26
--->
141 (-35) MAXCP stocks Bullish MAXCP Stocks Bullish.
0 (-1 ) SUPER2011 Stocks making New Highs:
---> 20 (-13) MINCP stocks Bearish MINCP/Sell
S7 Stocks
MAXCP stocks are those showing Tiger Closing Power making new
highs.
This suggests heavy Professional Buying. Applying the Tiger Power Ranker's
"bullish" to the MAXCP stocks find those with heavy insider buying and
institutional accumulation. Bearish MINCP stocks show the opposite.
---> 68 (+3)
new
highs on NASDAQ. 10 (+5) new lows on NASDAQ Bullish.
---> 80 (-10
) new
highs NYSE 1(-3) new lows on NYSE
2/17/2012 KEY CHARTS OF INDISTRY INDICES
DIA SPY
QQQ
DJIA-Peerless
TigerDJI TigerSPY TigerQQQ GLD SLV Crude Oil
IWM-Russell-2000
DIA' s CP recovered
bullishly from its rising 21-DMA.
A close more than 0.65 below the opening will break the main CP uptrendline.
SPY's CP's is uptrending.
It would take a close of more than 052 below the opening to
break the main CP uptrend.
QQQ's Steeper CP is uptrending. QQQ
is much stronger than the DJI.
It will take a close of more than 0.67
BELOW the Opening to break the long
short-term CP UP-trendline.
Opening Power is uptrending. BOTH RISING.
GLD's CP broke its steeper
rising CP uptrend The less steep CP uptrendline is far below
Its Opening Power is rising.
=====================================================================================
OLDER HOTLINES
=====================================================================================
2/16/2011
Hotline
Peerless Buy
B10 still operates. The reversal
back upwards today despite the A/D Line breaks
most likely puts the DJI in the group of cases I showed last
night where there was no Peerless Sell and the
DJI rose despite the break in the steep A/D line break in
February or March..These cases all saw bullish
market outcomes. Only in 3 of these 10 earlier cases did
the DJI not rally more than 8%. . However,
there were only 2 cases where this happened in a Presidential
Election year: 1972 and 1976. In these years
the subsequent gains were only 3% and 8%.
To get the DJI to breakout above the 12900 resistance and the 13000
round number psychological resistance
we will need to see some exceptioal strength in the higher priced
DJI-30 stocks. In each of these stocks,
however, the volume as measured by OBV is lagging. That
suggests to me that speculative money will keep
going into the strongest stocks, many of which are in the QQQ.
There are 6 stocks in the QQQ which are
up more that 30% in the last 65 trading days. Our bullish MAXCP
stocks keep doing very well.
Hold them except where their Closing Powers break longer-term uptrends.
Today bank stocks did
well on hopes of a deal between European bankers and Greece. Cash
loan stocks surged, too.
Traders can profitably use the candle-stick charts, too, and may want
to take profits where bearish
red reversals ("red popcicles") appear. Keep in mind our very bullish MAXCP stocks may not reverse
very much on a one-day, minor red-distribution candle-stick. These work much better on average
stocks. (I will be posting the
new CandleStick Program-Peerless on the Elite Page this weekend.
It now has the Buy B13 Santa Claus Buys. If you want it and do
not have a subscription to the Elite Page,
I must charge $75. Please read the scaling instructions.
The Explode and CandleStock charts can be
resized by you to fit your monitor and resolution settings.)
High
Priced DJI Stocks
CAT, now 113.96, need to surpass its resistance at 116.28.
CVX. now 106.52. needs to get past 111.
IBM, now 193.02, needs to breakput past 195.
MCD, now 99.26, needs to overcome the resistance at 102.10
Biggest
Gainers in QQQ-100
GMCR 69.05 +57% IP21=.10
MU 8.46 +55% IP21= .05
STX 27.18 +51% IP21=.21 28.87 was 2007 high
NFLX 121.91 +38% IP21= -.07
GILD 54.81 +33% IP21=.39 2008 high was 57.65
AAPL 502.21 +30% IP21=.06 making new highs and above top of its weekly price
channel.
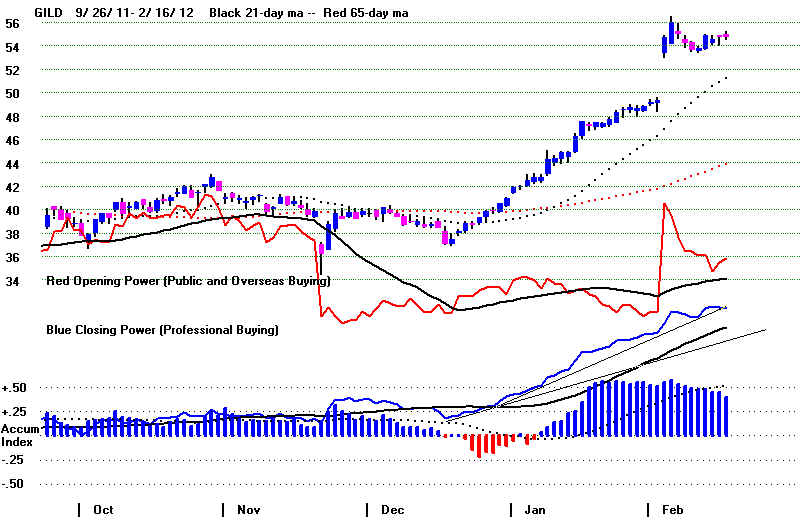
            Outcomes of A/D Line Uptrend Breaks from
                    after February, 1945-2011,
              Where the DJI Kept rallying

  Early Year A/DLine Break                 Low CLose
         with DJI at/over
         21-dma (Feb-May)
---------------------------------------------------------------
1)  2/16/1950  201.70   No Sell  DJI rallied 10% higher.
2)  2/16/1954  289.69   No Sell  DJI kept rising after right shoulder of H/S broken.
3)  3/15/1961  662.90   No Sell  DJI kept rallying 8%
4)  2/11/1972  917.59   No Sell Kept rising 8%
5)  2/24/1975  736.94   No Sell kept rising 20% more.
6)  3/3/1976   978.83   No Sell kept rising 3% but A/D Line started to deteriorate.
7)  3/28/1983 1133.32   No Sell kept rising 10%
8)  2/23/1987 2216.54   No Sell rallied 7%
9)  2/27/1995 3988.57   No Sell kept rallying 15%
10) 4/6/2006  11216.50  no Sell kept rallying 6% to top with Sell S9
|
2/16/2011 DJI=
12904 la/ma =
1.01 21dmaROC=.303 P=438 -12
IP21=.164 V=28 OP= .048 (low)
BREADTH STATISTICS: Advance= 2308 Declines= 779 UpVol = 679.25 DownVol= 112.8
ratio= 2.96
ratio = 6.02
--->
176 (+89) MAXCP stocks Bullish MAXCP Stocks Bullish.
1 (-1 ) SUPER2011 Stocks making New Highs:
---> 33 (-34 ) MINCP stocks Bearish MINCP Stocks
MAXCP stocks are those showing Tiger Closing Power making new
highs.
This suggests heavy Professional Buying. Applying the Tiger Power Ranker's
"bullish" to the MAXCP stocks find those with heavy insider buying and
institutional accumulation. Bearish MINCP stocks show the opposite.
---> 68 (+3)
new
highs on NASDAQ. 10 (+5) new lows on NASDAQ Bullish.
---> 80 (-10
) new
highs NYSE 1(-3) new lows on NYSE
2/16/2012 KEY CHARTS OF INDISTRY INDICES
DIA SPY
QQQ
DJIA-Peerless
TigerDJI TigerSPY TigerQQQ GLD SLV Crude Oil
IWM-Russell-2000
DIA' s CP recovered
bullishly from its rising 21-DMA. The Opening Power is above its rising
MA.
A close more than 1.18 below the opening will break the gradual CP uptrendline.
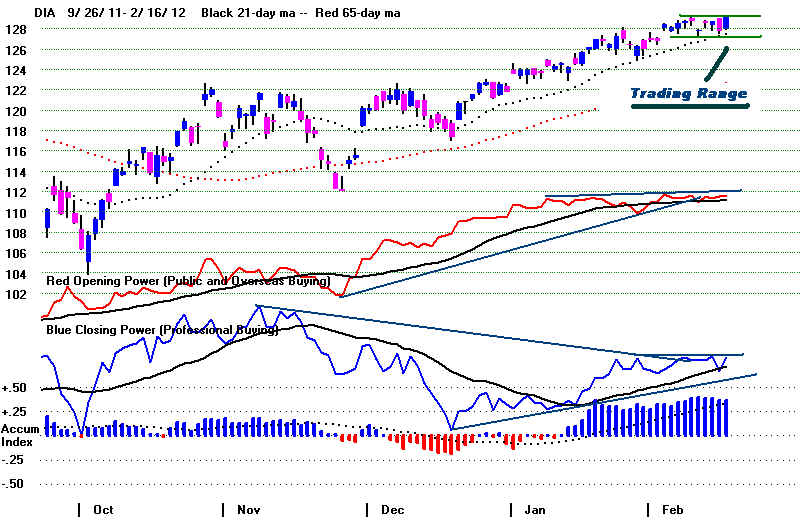
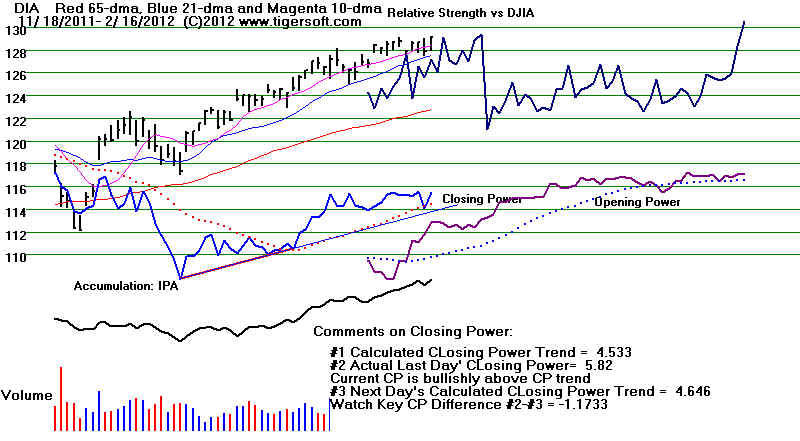
======================================================================================
SPY's CP uptrendline was restored.
It will take a close of more than 0.98 BELOW the Opening
to break the newCP UP-trendline. Yesterday's red popcicle was wrapped up in a
bullish "blue blanket".
A breakout to new highs would be bullish. But resistance remains from last April highs up
to 137.30,
+1.26 higher. The SPY is lagging the DJI and the QQQ. There is still overhead
resistance. This
seen most clearly on our Tiger Index of SP-500 Stocks. But, there these stocks' A/D
Line scored
a bullish recovery new high today.
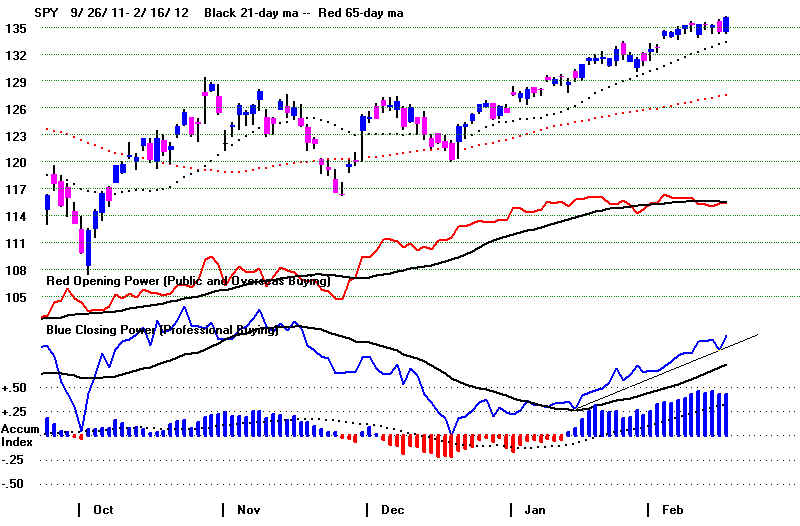
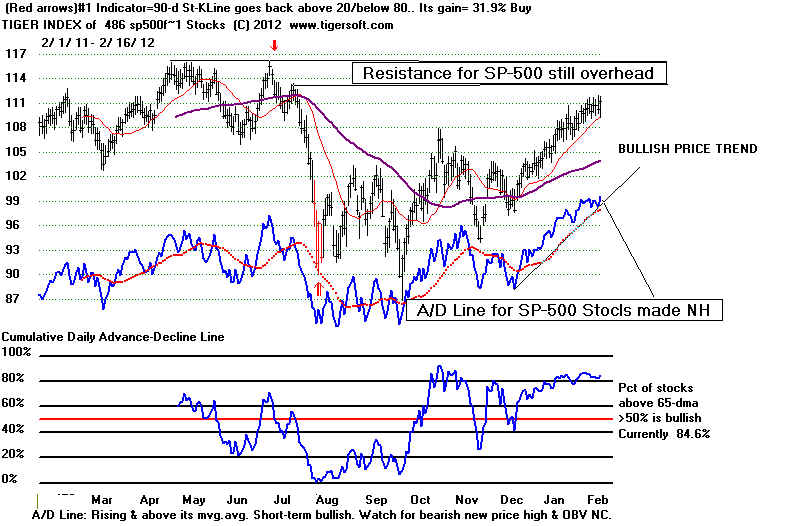
=================================================================================================
QQQ's Steeper CP is uptrending. QQQ
is much stronger than the DJI.
It will take a close of more than 0.23
BELOW the Opening to break the long
short-term CP UP-trendline.
Opening Power is uptrending. BOTH RISING. Yesterday's "encompassing red upside-down
popcicle on its TigerSoft candle-stick chart was replaced by a bigger "bullish blue
blanket."
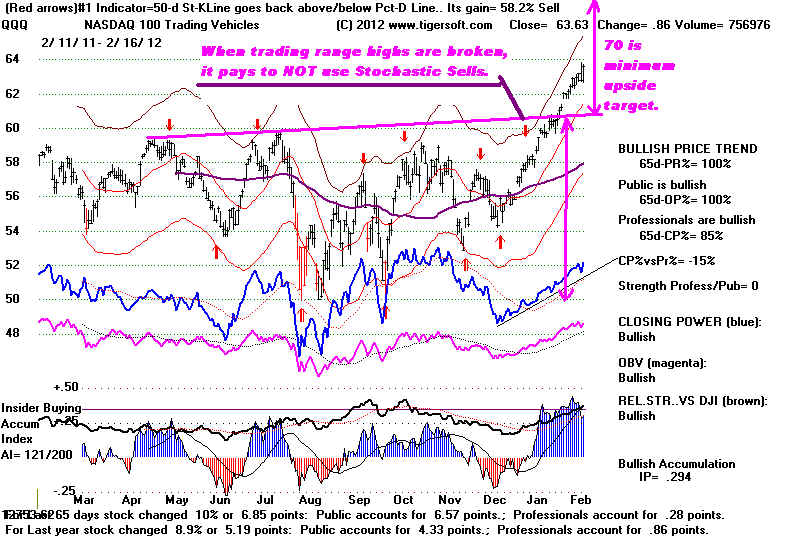
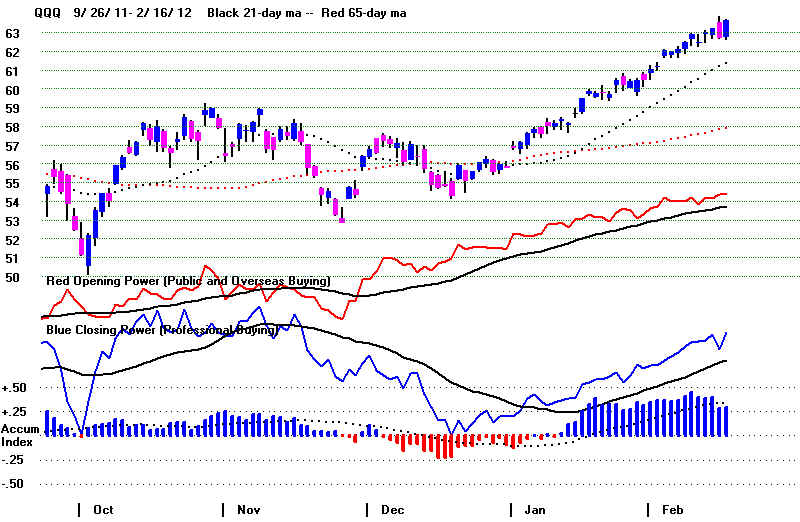
GLD's CP's slower rising CP has not been violated.
Its Opening Power broke its rising 21-dma.
The CLosing Power bullishly turned up from its rising 21-day ma. It needs to break
out above its
recent peaks to complete the reversal upwards.
=======================================================================================
Older Hotlines
=====================================================================================
2/15/2011 Hotline
Peerless Buy B10 still operates, but DJI is
clearly having trouble getting
past
resistance at 12900. The NYSE A/D Line was broken today. Without
an
accompanying Sell, any decline is apt to be shallow. The Closing Power
uptrend for
DIA was violated after failing to make a new 12-month high of
its own.
CP trend-breaks after a NC are more bearish, though the CP may
still find
support at its rising 21-day ma.
With the
15th of the month, seasonality has turned bearish. Since 1965, the
DJI only
rallies 38.8% of the time over the next week and 42.2% over the
next two
weeks. Thereafter, it turns quite bullish.
Take a few
profits, if a stock breaks its CP uptrend, but mostly hold long positions.
Professionals are still much more bullish than bearish, judging from the far greater
number of
stocks whose CLosing Power is near its 12-month highs than lows.
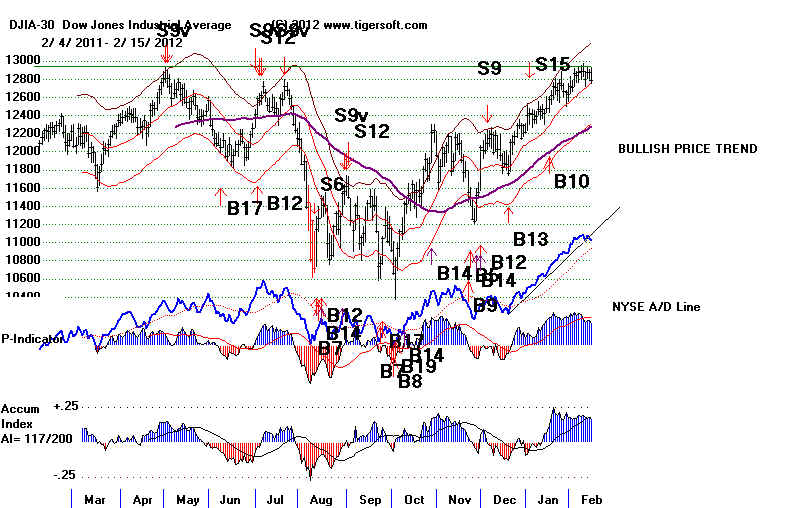
Based on
the market history since 1945, the odds are only 10% that there will be a
decline of
45%-8%. The odds are 25% that the DJI will very soon rally without much
more
decline. The odds are also 25% that the DJI will drop between 2% and 4% next.
Most
likely, we will see a DJI decline of 0.1% ro 4%. The development of a
head/shoulders
would add
the downside projection.
I
did a study of breaks in the NYSE A/D Line uptrend after January in the first quarter
for the
period 1945-2010. We are particulalry interested in what happened in those 30
cases when
there was no Peerless Sell. I have shown in red the instances
where there was a
trend-break
in the rising A/D Line uptrend without a Peerless Sell like now and the
DJI fell
more than 4%. Those in blue shows these cases where the
subsequent decline
took the
DJI down 0%-4%. And those in green brought a loss
because there was no
significant
decline.
Here are the outcomes where there was not Peerless Sell:
>7% decline = 1 case 1997 (7.7% decline after head/shoulders)
4%-5% decline = 2 cases
3%-4% decline = 6 cases
2%-3% decline = 4 cases
0%-2% decline = 7 cases
DJI did not decline = 10 cases
-----------------------------------------------------------
N = 30
  Outcomes of A/D Line Uptrend Breaks from after February, 1945-2011
  Early Year A/DLine Break                 Low CLose
         with DJI at/over
         21-dma (Feb-May)
---------------------------------------------------------------
2/5/1946   206.6    Sell S9/S8          2/26/1946 186.0    B17
4/24/1946  206.10   No Sell         5/6/1946  200.7    No Buy
                    2.6% decline
2/16/1950  201.70   No Sell  DJI rallied 10% higher.                    .
2/15/1951  253.60   No Sell         3/14/1951 243.90   Buy B11
                    3.8% decline
2/5/1953   286.20   Sell S8         6/8/1953  267.90   no Buy
2/16/1954  289.69   No Sell  DJI kept rising after right shoulder of H/S broken.
3/8/1955   409.10   No Sell         3/14/1955 391.40   Buy B19
                    4.1% decline
3/20/1956  512.60   Sell S2 at top 2 wks later. 5/28/1956  468.80
                    4.3% decline
2/6/1958   453.10   No Sell         2/25/1958 436.90   no Buy
                    3.6% decline
3/6/1959   609.50   No Sell         3/31/1959 601.70 and then up 10%
3/15/1961  662.90   No Sell  DJI kept rallying 8%
2/5/1963   681.30   No Sell         3/1/1963  659.70  and then rally 8%
                    3.1% decline
3/24/1964  811.40   No Sell 3% higher 6/8/1964 800.30  Buy B11 a little early
3/17/1965  899.40   No Sell         3/29/65   887.80  Buy B11
2/16/1967  851.66   No Sell         2/27/1967 836.64  No Buy
2/19/1971  878.56   No Sell         2/22/1971 868.98 No Buy
2/11/1972  917.59   No Sell Kept rising 8%
2/24/1975  736.94   No Sell kept rising 20% more.
3/3/1976   978.83   No Sell kept rising 3% but A/D Line started to deteriorate.
2/13/1980  903.84   Sell S9         3/27/1980  759.80
3/28/1983 1133.32   No Sell kept rising 10%
2/19/1985 1280.59   No Sell         5/2/1985  1242.27
                    3.0% decline.
3/25/1986 1778.50   No Sell rallied 3% and then 4/7/1986  1735.51
                    2.4% decline
2/23/1987 2216.54   No Sell rallied 7%
2/10/1989 2286.07   No Sell         2/27/1989  2250.36  Buy B18
                    2.0% decline
3/12/1991 2922.52   No Sell         3/22/1991  2858.91
                    2.9% decline
2/14/1992 3245.97   No Sell         4/2/1992   3191.35 Buy B11
3/19/1993 3478.58   No Sell         4/2/1993   3370.81 Buy B11
                    3.1% decline
2/27/1995 3988.57   No Sell kept rallying 15%
2/28/1996 5506.21   Sell S1         5/7/1996   5420.95 Buy B2
2/28/1997 6877.74   No Sell         4/11/1997  6391.68 Buy B17
                    7.1% decline
4/8/1998  8891.48   Sell S15 at top 2 wks later 6/16/98  8665.29
2/8/2001 10880.55   earlier S12     3/23/2001  9504.78
3/20/2002 10501.57  earlier S9      4/29/2002  9819.87
3/11/2004 10128.38  earlier S9/S15  3/24/2004  10048.23
3/10/2005 10851.51  earlier S15     4/20/2005  10012.36
4/6/2006  11216.50  no Sell kept rallying 6% to top with Sell S9
3/10/2011 11984.61  No Sell         3/16/2011  11613.30 Buy B19
                    3.1% decline
|
. 2/15/2011 DJI= 12781 la/ma = 1.002 21dmaROC=.279 P=449 -55 IP21=.167 V=28 OP= .048 (low)
BREADTH STATISTICS: Advance= 1295 Declines=1743 UpVol = 281.61 DownVol= 514.35
ratio= .743
ratio = .548
--->
87 (-44) MAXCP stocks Bullish MAXCP Stocks Bullish.
2 (-4 ) SUPER2011 Stocks making New Highs:
These include RPTP amd REGN 102.69
+2.35 See Bullish MAXCP
Stocks
---> 67 (+39 ) MINCP stocks Bearish MINCP Stocks
MAXCP stocks are those showing Tiger Closing Power making new
highs.
This suggests heavy Professional Buying. Applying the Tiger Power Ranker's
"bullish" to the MAXCP stocks find those with heavy insider buying and
institutional accumulation. Bearish MINCP stocks show the opposite.
---> 65 (+7)
new
highs on NASDAQ. 5 (+3) new lows on NASDAQ Bullish.
---> 90 (+5 ) new
highs NYSE 4(+4) new lows on NYSE
2/15/2012 KEY CHARTS OF INDISTRY INDICES
DIA SPY
QQQ
DJIA-Peerless
TigerDJI TigerSPY TigerQQQ GLD SLV Crude Oil
IWM-Russell-2000
DIA' s CP broke its
Uptrendline after failing to confirm its recent run. The CP is at its
rising 21-DMA. The Opening Power is above its rising MA. A close more
than 0.26
below the opening will break the gradual CP uptrendline. DIA shows a bearish red popcicle
on its TigerSoft candle-stick chart
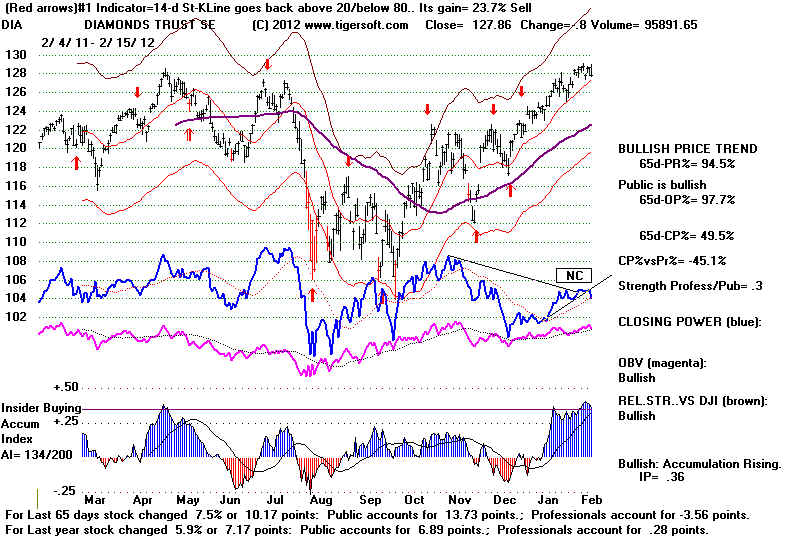 |
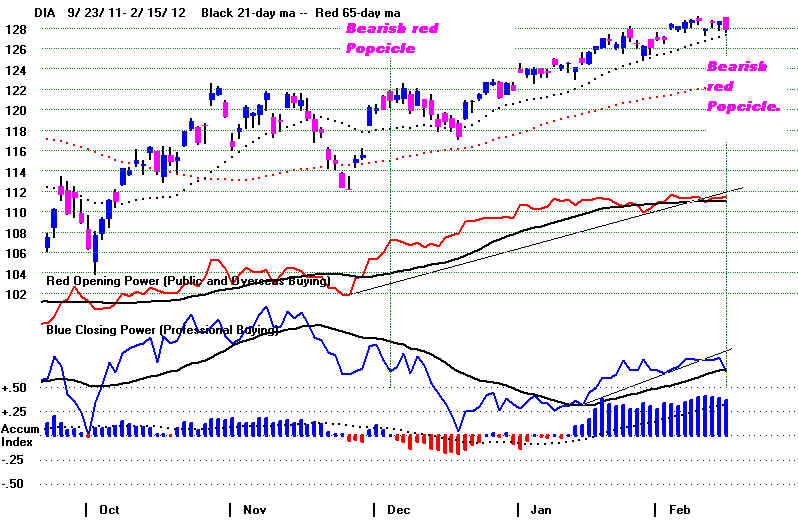 |
SPY's CP uptrendline was very
slightly broken. Opening Power is below its ma.
SPY CandleStick Chart has turned red (bearish).
QQQ's Steeper CP is uptrending. QQQ
is much stronger than the DJI.
It will take a close of more than 0.23
BELOW the Opening to break the long
short-term CP UP-trendline.
Opening Power is uptrending. BOTH RISING. QQQ bearishly shows an encompassing red upside-down
popcicle on its TigerSoft candle-stick chart
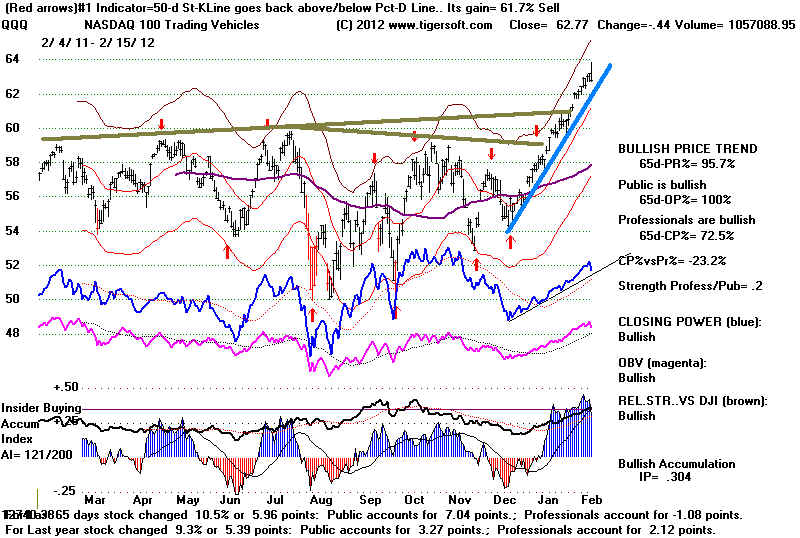 |
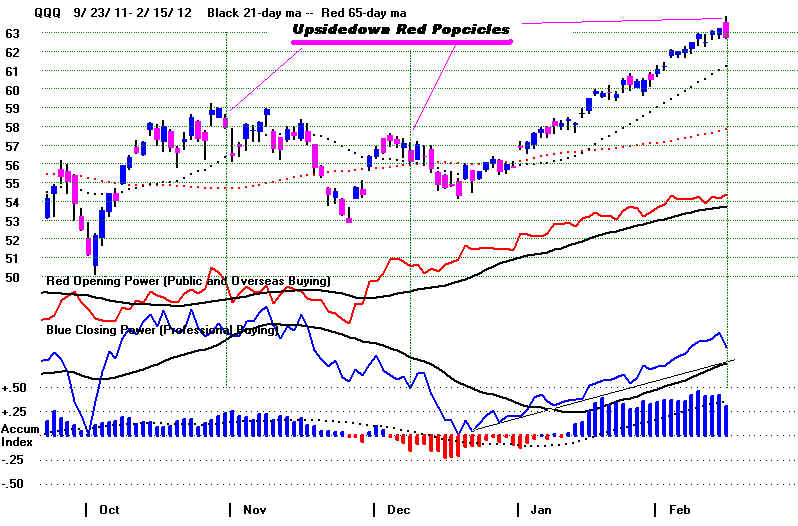 |
GLD's CP is short-term
falling. The less steep rising CP trendline is far below
Its Opening Power is rising.
GLD bearishly shows a red upside-down
popcicle
on its TigerSoft candle-stick chart.
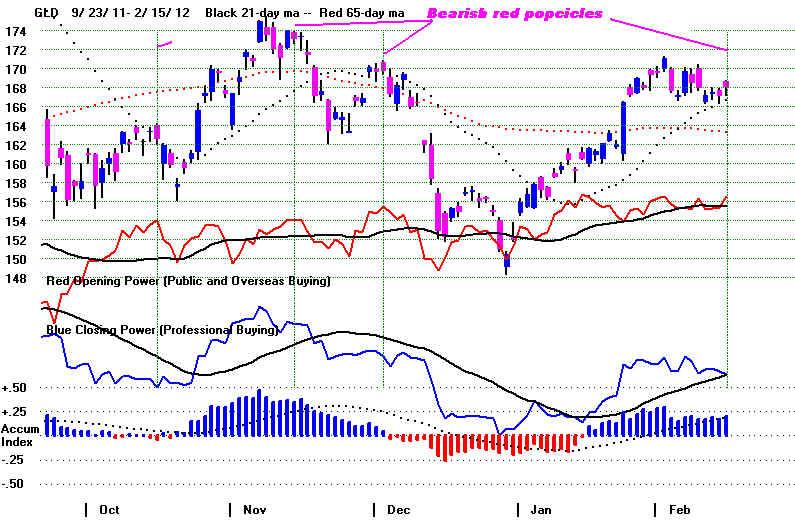
--------------------------------------------------------------------------------------------------------------------------------------------------------
Older Hotlines
--------------------------------------------------------------------------------------------------------------------------------------------------------
10/14/2012
Hotline
The Buy B10 still operates.
The DJI's overhead resistance at 12900 still has
not been overcome. The NASDAQ and QQQ are running upwards much more freely.
New buying should go into these stocks primarily. The NYSE A/D Line is
still uptrending. Higher prices are probable. Even a slight break in the NYSE
A/D Line
would probably not change this situation.
Please note
My hotmail account was down for the last 6 hours and now eeems to be working again.
If you do not get an email response within 12 hours, email me at
wm_tigersoft@yahoo.com
2/14/2011 BREADTH STATISTICS:
151 MAXCP stocks Bullish MAXCP Stocks Bullish.
SUPER2011 Stocks making New Highs
52 MINCP stocks Bearish MINCP Stocks
MAXCP stocks are those showing
Tiger Closing Power making new highs.
This suggests heavy Professional Buying. Applying the Tiger Power Ranker's
"bullish" to the MAXCP stocks find those with heavy insider buying and
institutional accumulation. Bearish MINCP stocks show the opposite.
47 new highs on NASDAQ. 8 new lows on NASDAQ Bullish.
43 new
highs NYSE 1 new lows on NYSE
Bullish.
2/14/2012 GRAPHS ===> See Key Peerless TigerSoft
Index Charts: Industry Groups and ETFs
DIA SPY QQQ DJIA-Peerless TigerDJI TigerSPY
TigerQQQ
GLD
SLV Crude
Oil
2/14/2012 ===> Closing
Power (CP) Status Report: KEY ETF CHARTS:
Opening Power are rising, as are CLosing Powers. This is
bullish
until one of them violates its 21-day ma.
DIA' s
Slower CP is uptrending But steeper CP uptrend was violated.
A close 1.52 BELOW
its opening would break the steeper rising CP uptrend.
Opening Power is above its 21-day ma.
SPY's Shallow CP's
is uptrending.
A close 0.15 BELOW its opening would break the shallow CP uptrend.
Opening Power fell below its 21-day ma.
QQQ's Steeper CP is uptrending.
It will take a close of more than 1.06
BELOW the Opening to break the steeper
short-term CP UP-trendline.
Its Opening Power is rising.
GLD's CP's slower rising CP has not been violated.
Its Opening Power is at its rising 21-dma.
====================================================================================
OLDER HOTLINES
====================================================================================
2/9/2011 Hotline
Peerless is still on a Buy B10.
With no Peerless Sell signal we should not expect a decline of more than 4%.
2/9/2011 DJI
12890
la/ma = 1.016 21dmaROC=.402 P=543 P-Ch= -77
IP21=.193 V=53 OP= .056 (low)
BREADTH STATISTICS: Advance= 1532 Declines=1513 UpVol = 401.88 DownVol= 346.79
--->
131 (-36) MAXCP stocks Bullish MAXCP Stocks
Bullish.
6 (+0 ) SUPER2011 Stocks making New Highs:
These include RPTP amd REGN 102.69
+2.35 See Bullish MAXCP
Stocks
---> 28 (+3 ) MINCP stocks Bearish MINCP Stocks
MAXCP stocks are those showing Tiger Closing Power making new
highs.
This suggests heavy Professional Buying. Applying the Tiger Power Ranker's
"bullish" to the MAXCP stocks find those with heavy insider buying and
institutional accumulation. Bearish MINCP stocks show the opposite.
---> 65 (+7)
new
highs on NASDAQ. 5 (+3) new lows on NASDAQ Bullish.
---> 90 (+5 ) new
highs NYSE 4(+4) new lows on NYSE
2/9/2012 KEY CHARTS OF INDISTRY INDICES
DIA SPY
QQQ
DJIA-Peerless
TigerDJI TigerSPY TigerQQQ GLD SLV Crude Oil
IWM-Russell-2000
DIA' s CP and Opening Power are Both uptrending
BOTH RISING.
Any close of more than 0 below
the opening will break the steeper CP uptrend.
SPY's CP's is uptrending.
It would take a close of more than 2.83 below the
opening to bring
a break in the less steep CP uptrend. Opening Power is back above its rising
ma. BOTH RISING.
QQQ's Steeper CP is uptrending. QQQ
is much stronger than the DJI.
It will take a close of more than 0.78
BELOW the Opening to break the long
short-term CP UP-trendline.
Opening Power is uptrending. BOTH RISING.
GLD's CP broke its steeper
rising CP uptrend The less steep CP uptrendline is far below
Its Opening Power is rising.
BOTH RISING.
=====================================================================================
DRAFTING MATERIALS
Disregard
=====================================================================================
------/2011 Hotline
Peerless The CLosing
Powers
2/ /2011 DJI
12890
la/ma = 1.016 21dmaROC=.402 P=543 P-Ch= -77
IP21=.193 V=53 OP= .056 (low)
BREADTH STATISTICS: Advance= 1532 Declines=1513 UpVol = 401.88 DownVol= 346.79
--->
131 (-36) MAXCP stocks Bullish MAXCP Stocks
Bullish.
6 (+0 ) SUPER2011 Stocks making New Highs:
These include RPTP amd REGN 102.69
+2.35 See Bullish MAXCP
Stocks
---> 28 (+3 ) MINCP stocks Bearish MINCP Stocks
MAXCP stocks are those showing Tiger Closing Power making new
highs.
This suggests heavy Professional Buying. Applying the Tiger Power Ranker's
"bullish" to the MAXCP stocks find those with heavy insider buying and
institutional accumulation. Bearish MINCP stocks show the opposite.
---> 65 (+7)
new
highs on NASDAQ. 5 (+3) new lows on NASDAQ Bullish.
---> 90 (+5 ) new
highs NYSE 4(+4) new lows on NYSE
2/ /2012 KEY CHARTS OF INDISTRY INDICES
DIA SPY
QQQ
DJIA-Peerless
TigerDJI TigerSPY TigerQQQ GLD SLV Crude Oil
IWM-Russell-2000
DIA' s CP and Opening Power are Both uptrending
BOTH RISING.
Any close of more than 0 below
the opening will break the steeper CP uptrend.
SPY's CP's is uptrending.
It would take a close of more than 2.83 below the
opening to bring
a break in the less steep CP uptrend. Opening Power is back above its rising
ma. BOTH RISING.
QQQ's Steeper CP is uptrending. QQQ
is much stronger than the DJI.
It will take a close of more than 0.78
BELOW the Opening to break the long
short-term CP UP-trendline.
Opening Power is uptrending. BOTH RISING.
GLD's CP broke its steeper
rising CP uptrend The less steep CP uptrendline is far below
Its Opening Power is rising.
BOTH RISING.
===================================================================================
OLDER HOTLINES|
===================================================================================
2/13/2011 DJI
12874 +73
la/ma = 1.012 21dmaROC=.378 P=499 P-Ch=+45
IP21=.171 V=35 OP= .48 (low)
BREADTH STATISTICS:
Advance= 2368 Declines= 720
UpVol = 520
DownVol=155
A/D Ratio 3.3 UV/DV Ratio = 3.4 Down Volume
--->
141
(+10) MAXCP stocks Bullish MAXCP Stocks Bullish.
10 (+6 )
SUPER2011 Stocks making New Highs:
These include ABMD, AKRX, ALXN. ISRG (perfect flag)
LQDT, PCYC +2.22. REGN +12.57
---> 41 (+1 ) MINCP stocks Bearish MINCP Stocks
MAXCP stocks are those showing Tiger Closing Power making new
highs.
This suggests heavy Professional Buying. Applying the Tiger Power Ranker's
"bullish" to the MAXCP stocks find those with heavy insider buying and
institutional accumulation. Bearish MINCP stocks show the opposite.
---> 66 (+14)
new
highs on NASDAQ. 9 (-3) new lows on NASDAQ Bullish.
---> 92(+5 ) new
highs NYSE 0(-6) new lows on NYSE
2/10/2012 KEY CHARTS OF INDUSTRY INDICES
DIA SPY
QQQ
DJIA-Peerless
TigerDJI TigerSPY TigerQQQ
GLD SLV Crude Oil
IWM-Russell-2000
DIA' shallower CP Power is rising.
The steeper CP uptrendline was slightly violated.
The
Opening Power irebounded up from its rising 21-day ma. .
SPY's CP's is uptrending.
It would take a close of more than .68
below the opening to bring
a break in the less steep CP uptrend.
The Opening Power fell back above its
rising 21-dma.
QQQ's Steeper CP is uptrending. QQQ
is much stronger than the DJI.
It will take a close of more than 0.89
BELOW the Opening to break the long
short-term CP UP-trendline.
Opening Power is uptrending. BOTH RISING.
GLD's CP broke its steeper rising
CP uptrend The less steep CP uptrendline is far below
Its Opening Power is at its 21-day ma
2/13/2012
Peerless remains on a Buy B10.
There is still some resistance at 12950 to eat up.
The NASDAQ and QQQ are the
strongest and are making new highs. The Biotechs are
particularly powerful. The width of
the previous trading range added onto the point of
breakout is a reliable way to get
a MINIMUM upside target. Prices for the QQQ
and BIOTECHS should move higher.
This market is one that definitely is favoring the
highest performing stocks. This
often happens in the third wave up. It can last many months.
I am reminded of 1967-1968 and 1998-1999.
The tactic of using breaks in the up trend of the Closing Power
as a place to sell and take profits makes
these periods much safer than they will seem to non-Tiger
users. Realize that the Fed has
brought this period of speculation to pass by telling investors
that there will be low interest rates for
nearly two more years. See the way the best performing
2011 stocks and High Price stocks over
$110 are running up. Before this move is over, I expect|
Low Priced stocks to become the center of
speculation. A low-priced "Cats and Dogs" stock
market will represent the climax and
culmination of increasing speculation that will end with
involvement by the general public.
This is how we know the end will be near.
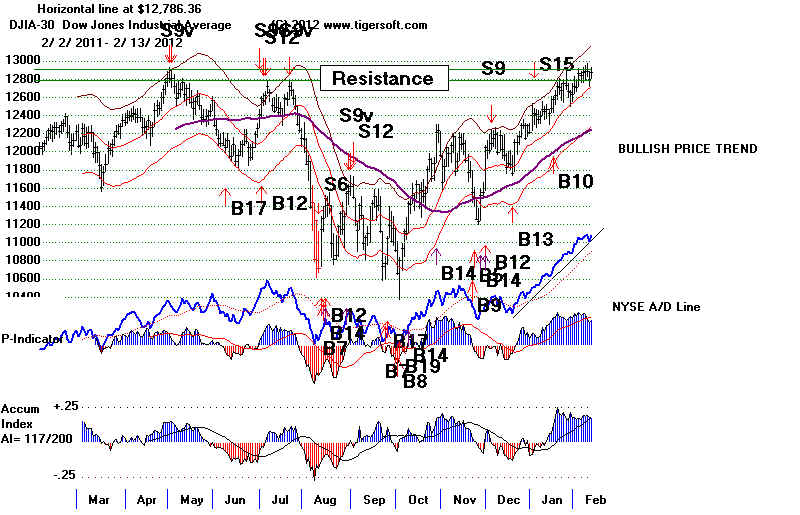
QQQ - Both Public and Professionals are Bullish. 69 is minimum upside
target.
QQQ SHOULD GO HIGHER
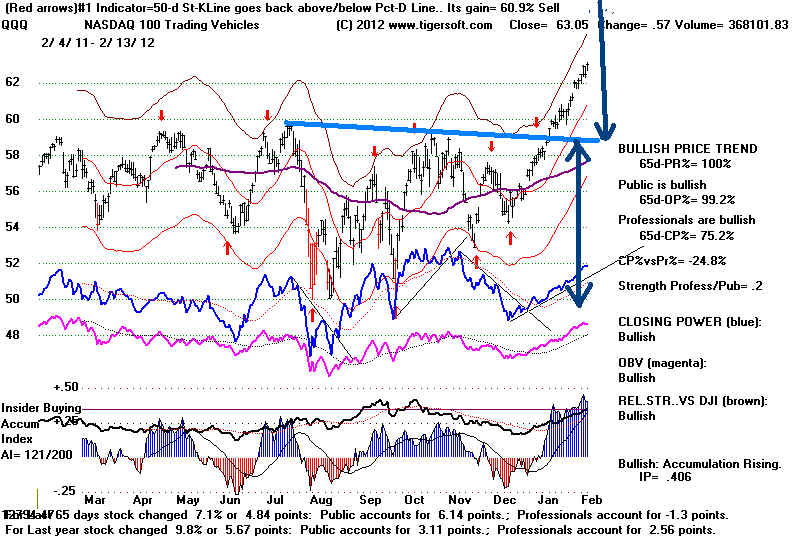
BIOTECHS SHOULD GO HIGHER
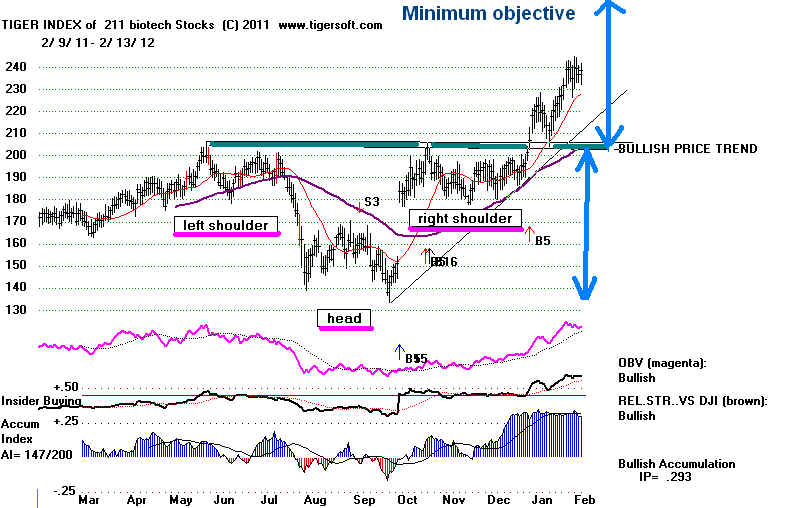
Tiger Index of Stocks over $110
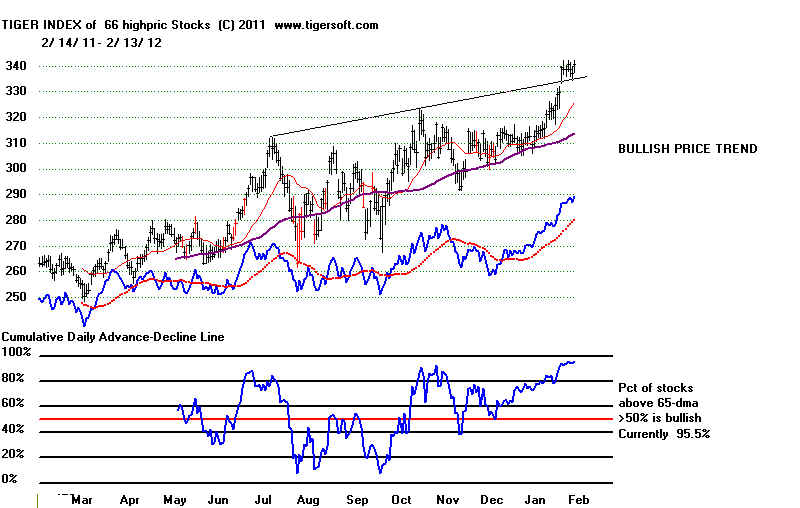
=====================================================================================
OLDER HOTLINES
=====================================================================================
2/10/2011 Hotline
12900 Resistance Turns Back DJI
DIA's CP and A/D Line Uptrends were slightly violated today
Greece Burns and Yet The DJI Rallies before
Monday's Opening.
Peerless is still on a Buy B10.
The DJI closed 40 points up off its lows.
This may
prevent a follow-through of Friday's decline. Without a Peerless
Sell
signal, any decline from here is apt to be shallow.
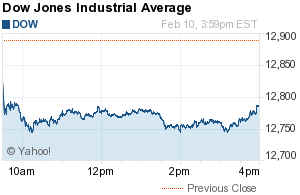
DOES THE
MARKET REALLY THINK A GREEK DEFAULT
WILL BE AVOIDED?
The steep
NYSE A/D Line uptrend was only slightly broken today. A clearer break is required.
Friday's
weakness tagged the 21-day ma. That the DJI turned up so
quickly will worry the
shorts on
Monday. They will be made even more anxious if the market rallies next week in spite
of the wild
anti-government and anti-bank demonstrations in many cities in Greece. Though the
Parliamentary vote to accept the austerity measures demanded by the bankers, the riots may
be
spiraling out of control. The violence has spread to most Greek cities including
those
on the
tourist islands of Corfu and Crete. Among the austerity measures was the lowering
of the
minimum wage to 400 Eu/month. The backlash against the austerity measures is so
strong, I
doubt if they can be enforced.
A Greek default seems inevitable. If Greece defaults,
the Italy
and Portugal will become the next stages of this high drama.
The Greek PM said
unless Greece gets a bailout based on austerity, Greece ""would be drawn into
a vortex of
recession, instability, unemployment and protracted misery". Is it not
already
in such a vortex?

Source.
NY Times.
http://www.rawstory.com/rs/2012/02/12/greek-riots-escalate-as-parliament-passes-austerity-pla/
WATCH THE A/D LINE
If the breadth
turns negative after what appears to be a strong opening on Monday or later
in the week, and
the rising A/D Line is more clearly violated, history shows that 60% of the
time when this
happens in the first quarter, the DJI falls no more than 4% without a Peerless
Sell having been
given. The NYSE A/D Line is apt to be weaker and pivot down for 4-10 weeks.
With
no Peerless Sell signal we should not expect a decline of more than 4%.
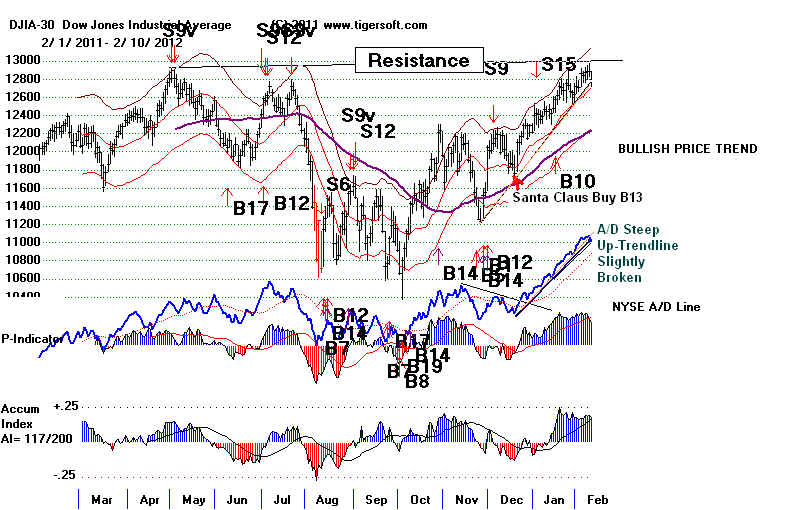
SHORT SELLING
TECHNIQUES TO USE IF
THE A/D LINE
UPTREND IS MORE CLEARLY BROKEN
|
The DJI is up 10%
since just before Christmas. The new year has brought good rallies to
many of last
year's biggest decliners. Some of the rallies have been triggered by tax-based
buying
(short-covering) as the new year begins. This may be temporary. In any
case, the
rallied has
denied us having very many NEW LOWS and MINCP stocks to choose from for
short selling.
What can we do when so many stocks are above their 65-day ma?
Besides using the
"Bearish ranked" MINCP stocks, here are two
other techniques to use to find
suitable
bearish-divergence shorts if you wish to hedge. They may fall back only to their
65-dma.
Or they may break
that support and test their lows. We have to wait and see, all the while
using the
declining Closing Power to tell us when we should cover.
1. Run the
Tiger ranking program against the MINCP stocks (Closing
Power new lows)
and look for the
list of stocks whose current Accumulation Index ("IP21")
has dropped below
the Accum.
Index's 21-day ma (TISI). This is Tiger Analysis
#281 - IP21 crosses back below TISI.
This produces an
interesting short sale candidate, MAKO, whose AI/200 is under
76
2. Run the
Tiger ranking program against the AUGSELS7 stocks
(recent augmented Sell S7s)
and look for the
list of stocks whose current Accumulation Index ("IP21") has dropped below
the Accum.
Index's 21-day ma (TISI). This is Tiger Analysis #281 -
IP21 crosses back below TISI.
This produces
interesting short sale candidates, including TGH,
whose Closing Power has hardly
moved up at all
despite the stock having risen more than 50% from its September low.
CPLP shows a negative IP21 for more of the last 3 months.
Breaks by any of these stocks
of their 65-dma
would likely bring a tetsing of their prices lows. ROL
looks the most bearish,
having broken its
65-day ma and completed a head/shoulders pattern.
MAKO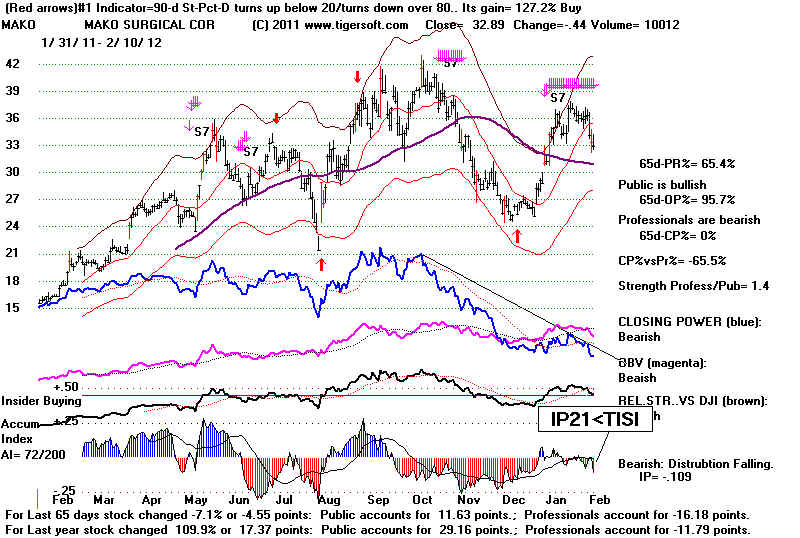 |
ROL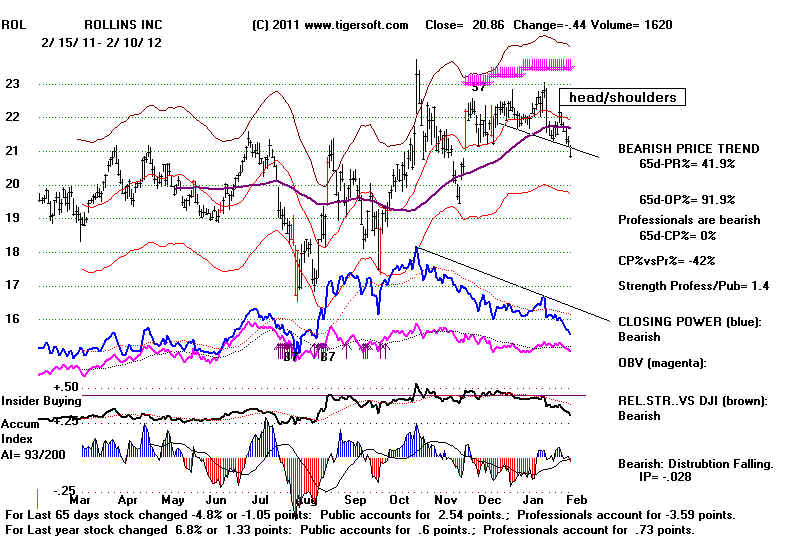 |
CPLP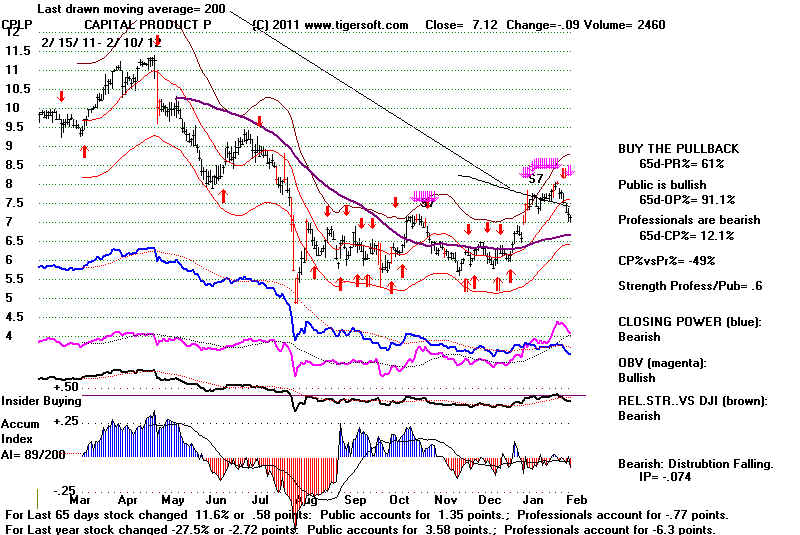 |
2/10/2011 DJI 12801
-89 la/ma = 1.008
21dmaROC=.33 P=453 P-Ch=
-91 IP21=.179 V=25
OP= .053 (low)
BREADTH STATISTICS:
Advance= 762
Declines=2312 UpVol = 146 DownVol= 600
A/D Ratio .33
UV/DV Ratio .24 Down Volume Heavy
--->
131 (0) MAXCP stocks Bullish MAXCP Stocks Bullish.
4 (-2 )
SUPER2011 Stocks making New Highs:
These include ALXN +3.03 amd PCYC +3.44
---> 40 (+12 ) MINCP stocks Bearish MINCP Stocks
MAXCP stocks are those showing Tiger Closing Power making new
highs.
This suggests heavy Professional Buying. Applying the Tiger Power Ranker's
"bullish" to the MAXCP stocks find those with heavy insider buying and
institutional accumulation. Bearish MINCP stocks show the opposite.
---> 52 (-13)
new
highs on NASDAQ. 12 (+7) new lows on NASDAQ Bullish.
---> 87 (-3 ) new
highs NYSE 6(+2) new lows on NYSE
2/10/2012 KEY CHARTS OF INDUSTRY INDICES
DIA SPY
QQQ
DJIA-Peerless
TigerDJI TigerSPY TigerQQQ GLD SLV Crude Oil
IWM-Russell-2000
DIA' shallower CP Power is rising.
The steeper CP uptrendline was slightly violated.
The
Opening Power is sitting on its uptrendline. .
SPY's CP's is uptrending.
It would take a close of more than .05
below the opening to bring
a break in the less steep CP uptrend.
The Opening Power fell back above its
rising 21-dma.
QQQ's Steeper CP is uptrending. QQQ
is much stronger than the DJI.
It will take a close of more than 0.02
BELOW the Opening to break the long
short-term CP UP-trendline.
Opening Power is uptrending. BOTH RISING.
GLD's CP broke its steeper
rising CP uptrend The less steep CP uptrendline is far below
Its Opening Power broke below its
rising 21-day ma
=====================================================================================
OLDER HOTLINES
=====================================================================================
2/9/2011 Hotline
Peerless is still on a Buy B10.
The CLosing Powers are rising, but see how any weakness
from the
DIA's Opening to its CLose will break the DIA's CP steeper uptrend. That may happen
tomorrow
and bring a quick DJI test of its rising 21-day ma 165 points below today's close.
The
resistance at 12900 is still extant, untamed and threatens to bring a pullback soon.
Buy B10s
are based on the theory that a breakout has or soon will overcome
all
near-term resistance. That has been true here for the NASDAQ
and QQQ, but not the DJI
or SP-500. The NASDAQ keep rising, reaping the benefits
of having investors moving
funds
out from the stalled DJI-30 stocks. High priced NASDAQ stocks are doing
especially
well,
suggesting the buying in the NASDAQ is from institutions rather than individuals.
But that
may change if:
1) Shorter-term interest rates rise,
2) the Euro's recovery contines and reduces the
attractiveness of US stocks as a haven
3) Profit-taking is brought about by a break in the steep A/D Line uptrend.
What if the A/D Line Uptrend Is Broken?
Should Friday being a sell-off in which the number of declining NYSE stocks exceeds
advancers
by more than 1350, the current steep A/D Line uptrend will be broken.
If the
steep NYSE A/D Line uptrend is broken, the odds are 8/11 (based on rising first
DJIs in the
first quarter of a Presidential Election Year since 1936 that the DJI will not
fall more
than 4% and then recover and make new highs. See all the
charts of this study.
First Break of A/D Line Uptrend
Brings:
DJI falls to 21-dma: 1936, 1972, 1976, 2004
(4/11)
DJI falls 2% below 21-dma and then rallies: 1944, 1964, 1992, 1996 (4/11)
DJI falls to lower band: 1988
DJI falls slightly below lower band: 1956
DJI falls far below lower band: 1980
Such an A/D Line uptrendbreak is most likely to turn the A/D Line abruptly down
for 4 to 10 weeks.
A/D Line falls quickly to 21-dma and then recovers to make new
highs: 1972
A/D Line enters a zig-zag trading range pattern: 1936, 1996, 2004
A/D Line falls below its 21-dma and falls for one-two months before recovering. 1944,
1956, 1964, 1976, 1988
A/D Line falls far below its 21-dma and falls for two months before recovering: 1980, 1992
The DJI resistance at 12900 is taking on
more significance than many traders may be
willing to tolerate. Tonight, they may well be saying "If the market
cannot make much
of a new high on news of a Greek-European Banker Agreement and news that no
US Banks
executives
will be charged with a crime or the banks even penalized more than a fraction of the
amount
of their year-end bonuses for fraudulent home seizures, what will the market do
if there
is bad news, like war in the Middle East with Iran At this writing, the DJI futures
are down 62.
We have a number of biomedical stocks that have risen quite a bit. I expect
profit-taking to hit
them hardest. Sell some of them tomorrow to be safe unless there is a positive
Opening.
With no Peerless Sell signal we should not expect a decline of more than 4%.
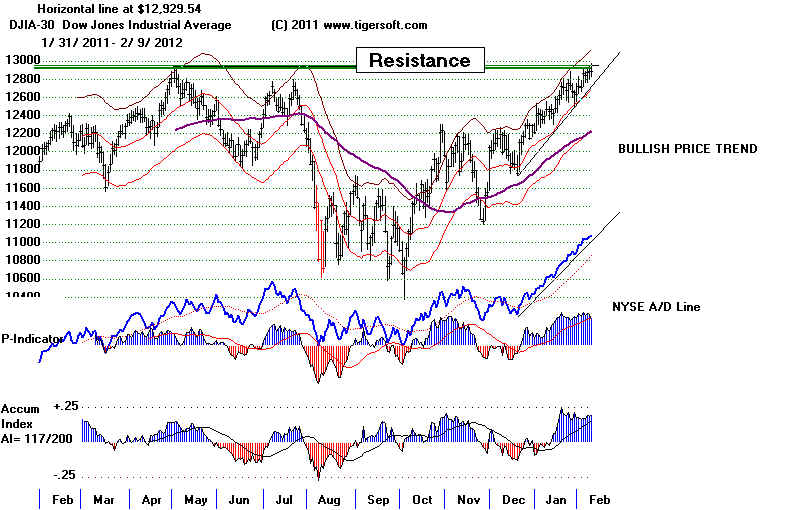
2/9/2011 DJI
12890
la/ma = 1.016 21dmaROC=.402 P=543 P-Ch= -77
IP21=.193 V=53 OP= .056 (low)
BREADTH STATISTICS: Advance= 1532 Declines=1513 UpVol = 401.88 DownVol= 346.79
--->
131 (-36) MAXCP stocks Bullish MAXCP Stocks Bullish.
6 (+0 ) SUPER2011 Stocks making New Highs:
These include RPTP amd REGN 102.69 +2.35 See Bullish MAXCP Stocks
---> 28 (+3 ) MINCP stocks Bearish MINCP Stocks
MAXCP stocks are those showing Tiger Closing Power making new
highs.
This suggests heavy Professional Buying. Applying the Tiger Power Ranker's
"bullish" to the MAXCP stocks find those with heavy insider buying and
institutional accumulation. Bearish MINCP stocks show the opposite.
---> 65 (+7)
new
highs on NASDAQ. 5 (+3) new lows on NASDAQ Bullish.
---> 90 (+5 ) new
highs NYSE 4(+4) new lows on NYSE
2/9/2012 KEY CHARTS OF INDUSTRY INDICES
DIA SPY
QQQ
DJIA-Peerless
TigerDJI TigerSPY TigerQQQ GLD SLV Crude Oil
IWM-Russell-2000
DIA' s CP and Opening Power are Both uptrending
BOTH RISING.
Any close of more than 0 below
the opening will break the steeper CP uptrend.
SPY's CP's is uptrending.
It would take a close of more than 2.83 below the
opening to bring
a break in the less steep CP uptrend. Opening Power is back above its rising
ma. BOTH RISING.
QQQ's Steeper CP is uptrending. QQQ
is much stronger than the DJI.
It will take a close of more than 0.78
BELOW the Opening to break the long
short-term CP UP-trendline.
Opening Power is uptrending. BOTH RISING.
GLD's CP broke its steeper
rising CP uptrend The less steep CP uptrendline is far below
Its Opening Power is rising.
BOTH RISING.
Tiger Index of 65 High Priced Stocks >$112
These are favored by institutions and options traders. Their A/D
Line is uptrending
powerfully. The most Tiger "bullish"
in this group with AI/200>145 or IP21>.39.
Apple's
surge sirely is a big part of the QQQ and NASDAQ strength directly and indirectly.
This
group of stocks' data will be added as a download this weekend.
AI/200 IP21 CP 65-day Pct
V Visa 150
.095 92.2%
SPG (REIT 141 .454
76.3%
TNH (fertilizer) 152 .21 72.3%
NVO
145 .397 100% Novo Nordisk
TDG
152 .14
86.3%
ADS
118 .404 100% Alliance Data
Also CMG 130 .30
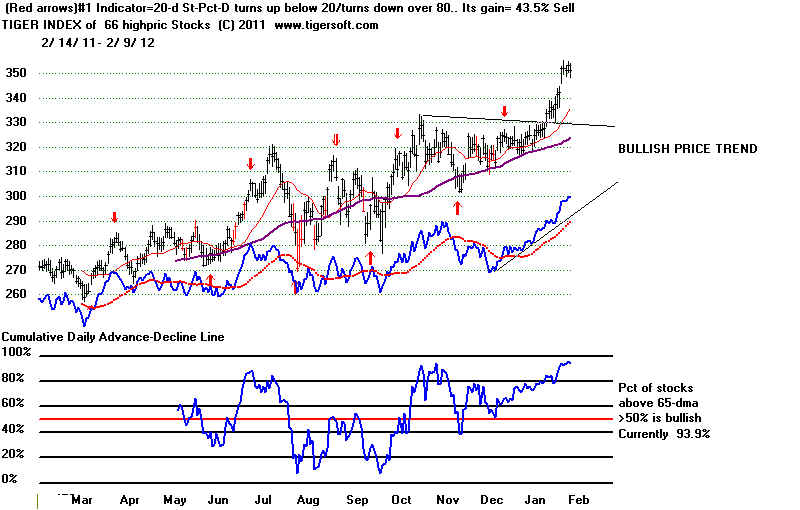
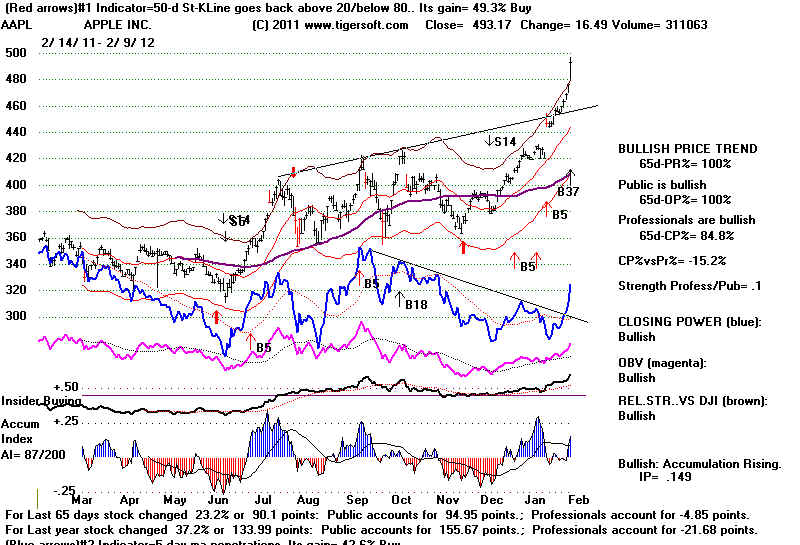
=====================================================================================
OLDER HOTLINES
=====================================================================================
2/8/2011 Hotline
2/8/2011 DJI
12884
la/ma = 1.017 21dmaROC=.463 P= 620 P-Ch= -16 IP21=.19 V=72 OP= .06 (low)
BREADTH STATISTICS: Advance= 1763 Declines=1283 UpVol = 439 DownVol= 308
--->
167 (-7) MAXCP stocks Bullish MAXCP Stocks
Bullish.
6
(+3 ) SUPER2011 Stocks making New
Highs:
These include RPTP amd REGN See Bullish MAXCP Stocks
---> 25 (+5 ) MINCP stocks Bearish MINCP Stocks
MAXCP stocks are those showing Tiger Closing Power making new
highs.
This suggests heavy Professional Buying. Applying the Tiger Power Ranker's
"bullish" to the MAXCP stocks find those with heavy insider buying and
institutional accumulation. Bearish MINCP stocks show the opposite.
---> 58
new
highs on NASDAQ. 2 (-1) new lows on NASDAQ Bullish.
---> 85 (-7 ) new
highs NYSE 0(9) new lows on NYSE
2/8/2012 KEY CHARTS OF INDUSTRY INDICES
DIA SPY
QQQ
DJIA-Peerless
TigerDJI TigerSPY TigerQQQ GLD SLV Crude Oil
IWM-Russell-2000
2/8/2012 - ===> Closing Power (CP) Status Report: KEY ETF CHARTS:
DIA' s CP and Opening Power are Both uptrending
It would take a close of more than .15
below the opening to break the steeper
CP uptrend.
SPY's CP's is uptrending.
It would take a close of more than .36 below the
opening to bring
a break in the steeper CP uptrend. Opening Power is back above its rising ma. BOTH RISING.
QQQ's Steeper CP is uptrending. QQQ
is much stronger than the DJI.
It will take a close of more than 0.78
BELOW the Opening to break the long
short-term CP UP-trendline.
Opening Power is uptrending.
GLD's CP is above steeper
rising CP uptrend
It will take a close of more than 0.46 BELOW the Opening to break the stee[er CP UP-trendline.
Its Opening Power is rising.
Peerless is still on a Buy B10. The DJI needs to close above 12900 for a clear price
breakout.
The key P-Indicator, V-Indicator and Tiger
Accum. Index are too strong to give a sell signal.
But there
is still a significant big cap selling as the DJI reaches for 12900. Many of our
lower
priced stocks showing high Accumulation have come to life, as well as the biotech
group as a
whole. The Fed's determination to prevent another sell-off by working
to lower
longer term interest rates is helping fuel a rebound in
housing and construction.
The Housing
Industry creates many, many jobs. This is a very good economic sign.
Seasonality is still bullish for another week. The DJI has risen 60% of the time
over
the five trading days following February 8th. When an Incumbent Democrat
holds
the Presidency and the market rallies, the first quarter 's rally is more apt to
continue until March or April than end in February, by 3 to 2. Only in one case,
Carter's, did the first quarter decline take the DJI below the lower band. In that
case
we got ample warnings. Both the A/D Line and Tiger Accum. Index clearly
failed to confirm new highs, resulting in multiple Peerless Sells.
Wilson Feb. 11, 1916
96.15
Next Low 90.89 Feb 28, 1916
FDR April 4, 1936
161.89
Next Low 146.20 April 30, 1936
LBJ April 17, 1964
827.33
Next Low 800.31 June 8, 1964
Carter Feb 13, 1980
903.84
Next Low 759.13 April 21, 1964
Clinton March 15, 1996 5693.6
Next Low 5420.95 April 7, 1964
The DJI is
obviously winded and struggling hard to get past the 12900 resistance.
The NASDAQ and QQQ are having a much
easier time because they are capitalization
weighted. High priced ISRG, AAPL, GOOG and AMZN are up between 3% and 5%
for
last week. Remember that when the QQQ last broke out above 60, back in 1999,
it
nearly doubled in 5 months. Its current Accum. Index reading of .419 shows an
institutional rush is on buying these stocks. At least, give speculation a chance to
become more frothy. Taking the 10 point width of the QQQ's trading range last year,
(60 -
high and 50 - low), we can project a minimum upside QQQ target of 70, more than
10%
higher than now. Of course, a lot could change this bullish picture But as
long
as
the Closing Powers for the major ETFs are rising and so is the A/D Line for the NYSE
and
the A/D Line for the QQQ (shown below), Until then, I would just hold most
speculative positions, the only exceptions would be those whose CLosing Powers break
their
steep and long-standing uptrend-lines. Such stocks are likely to
be hit by
enough professional profit-taking to justify selling on the CP uptrend-break.
BEFORE THE DJI CAN FALL MUCH
ANY STOCKS IN IT THAT SHOW HEAD/SHOULDERS PATTERNS
WILL PROBABLY BREAK THEIR CP UPTRENDS.
Watch the DJI stocks that could be forming H/S Patterns. Before a substantial
decline, we often see 6ix or more H/S tops among the DJI-30 stocks. A breaking
of the neckline support would complete these bearish patterns.
Current Price Neckline
BA 75.46 +.26
73.93
AI above rising 21-dma
MCD 100.5 -.86
98
CP weak but AI above rising 21-dma
MRK 38.42 -.21
38
AI and CP below falling 21-dma
TRV 59.85 +.11
57.5
AI above rising 21-dma
On the other hand, if a significant advance were about to take place I would
expect IBM (now at 192.95) to breakout above 195, CAT (now at 114.04) to
make a 12 mo high above 116.7 or CVX (now 106.76) to surpass its 6x tested
flat resistance between 109-111.
The DJI seems stalled a resistance but still finds buyers on any dip. Meanwhile
the NASDAQ gets much of the new speculative money. This situation could last
a while longer.
TIGER STOCK SELECTION TECHNIQUES FOR SPECULATIVE MARKETS
A good way to spot the stocks up the most over a
very short period that also have shown
heavy
Accumulation is to download ELITSTKS. Then after changing the directory to
c:\ELITSTKS run the older ranking program. Peercomm +
Older Charting + Ranking
Results +
User Set Ranking + 1 (for one day pct gain ranking) + 1. The size of the
display may
be too small for some monitor's setting. Sorry. I will fix that soon.
If the
display is large enough, note the best performing stocks whose IP21 is above
+.35.
Today we see ULGX (up 9% and
IP21=.62). I try to include many of these
in the
Bullish MAXCP Group.
---------------------------------------------------------------------------------------------------------------------------------------------------
Older Hotlines
---------------------------------------------------------------------------------------------------------------------------------------------------
2/7/2011 Hotline
Peerless is still on a Buy B10. The DJI needs to close above 12900 for a clear price
breakout.
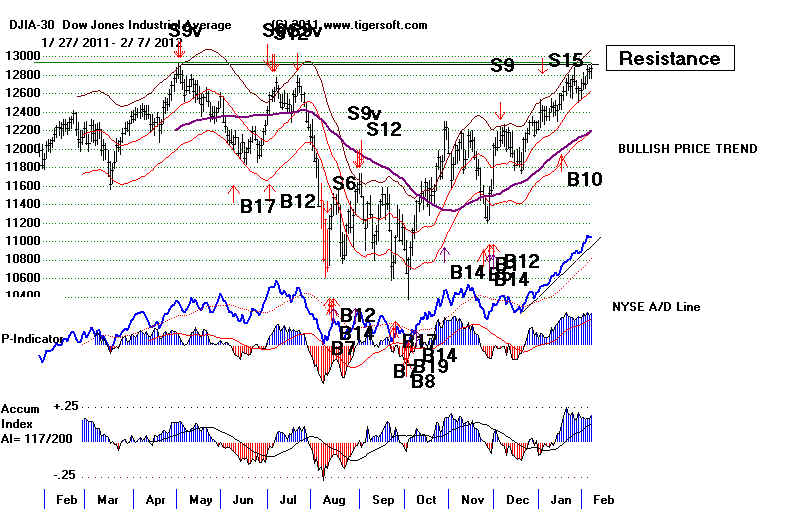
The key
P-Indicator, V-Indicator and Tiger Accum. Index are too strong to give a sell
signal.
But there is
still significant big cap selling as the DJI tages tags the 12900 barrier.
The Peerless
Cumulative MKDS is below its 21-day ma despite the DJI;s price
strength.
Some of the high-cap selling is going right back into buying more speculative
stocks. But
much of it is pulling out and assuming a wait and see stance. My belief is that
A clear breakout
would probably bring a recovery in the Inverted MKDS and a
belated
confirmation. That has happened before. (See the Inverted Traders' Index (MKDS)
in the past.
http://tigersoftware.com/TBlogs-2012/1-30-2012/index.html
)
it is best to
just watch the NYSE A/D Line uptrend. As long as it is rising, just hold
most long
positions. It is certainly a bullish sign that good Short Possibilities
that show CLosing
Power new lows and heavy red Distribution are very hard to find now.
The last
time the Peerless Inverted MKDS lagged a new high by this much was
right
before last years's July-August 16% DJI sell-off. So, do watch the A/D Line
BERNANKE's NUANCES TODAY
Bernanke told
Congress today he believed in last month's formal FED
statement on managing
inflation and
unemployment. He said that he will not seek to encourage inflation, but if inflation
should rise, he
and the FED "may rein it in" more slowly to promote job growth. This did
not
go well with many
Republicans.
"I think this policy runs the great risk of fueling asset
bubbles, destabilizing prices and eventually
eroding the value of the dollar,” said Representative Paul Ryan, the Wisconsin
Republican who
is chairman of the House Budget Committee. “The prospect of all three,” Mr. Ryan
said, “is adding
to uncertainty and holding our economy back.”
Bernanke said joblessness was still far too high. The Fed will keep interest rates
near zero until
late 2014
and would stimulate the economy by buying longer term government securities to make
borrowing
cheaper for businesses and consumers.
I suspect the Republicans are mostly afraid the
Fed-Obama-Wall Street Junta will
succeed in
sparking enough economic recovery to win Obama another term in
office.
It's hard to make a case looking at the Dollar since Obama was in office
that
American Inflation is more deadly to business growth here than is the lack of
consumer
buying power born of 15% unofficial unemployment in the US. I would
add that
Republicans are lucky Obama's apparent economics' ignorance makes him
unable to
answer persuasively Republican talk about Inflation. now.
US DOLLAR 2007-2012
The least-squares line here is falling at a rate approaching zero.
The Dollar was weakest when the stock market collapsed in 2007-2009.
The best way to keep the dollar from collapsing is to prevent another
stock
market collapse, exactly what Bernanke is trying to
do. In the absence of fiscal
stalemate, Bernanke is probably the best hope
in town for a boosted stock market and
some trickle-down for Main Street as higher
stock prices bring more confidence and higher
onsumption..
US DOLLAR
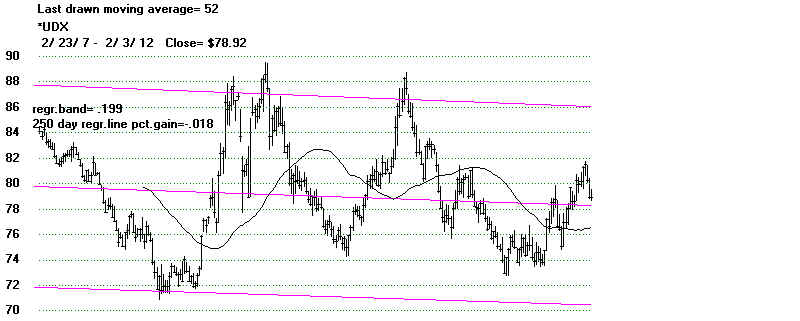
![]()
2/7/2011 DJI
12878 la/ma
= 1.019 21dmaROC=.489 P= 636 P-Ch= +31 IP21=.192
V=76 OP= .057
BREADTH STATISTICS: Advance= 1724 Declines=1302 UpVol = 378 DownVol= 342
--->
174 (+15) MAXCP stocks Bullish MAXCP Stocks
Bullish.
3
(-4 ) SUPER2011 Stocks making New Highs:
---> 20 (-5 ) MINCP stocks Bearish MINCP Stocks
MAXCP stocks are those showing Tiger Closing Power making new
highs.
This suggests heavy Professional Buying. Applying the Tiger Power Ranker's
"bullish" to the MAXCP stocks find those with heavy insider buying and
institutional accumulation. Bearish MINCP stocks show the opposite.
---> 46 (-131) new
highs on NASDAQ. 3 (-4) new lows on NASDAQ Bullish.
---> 92 (-70
) new
highs NYSE 0(-3) new lows on NYSE
2/7/2012 KEY CHARTS OF INDUSTRY INDICES
DIA SPY
QQQ DJIA-Peerless TigerDJI TigerSPY TigerQQQ GLD SLV Crude Oil
IWM-Russell-2000
2/7/2012 - ===> Closing Power (CP) Status Report: KEY ETF CHARTS:
DIA' s CP and Opening Power
are both uptrending
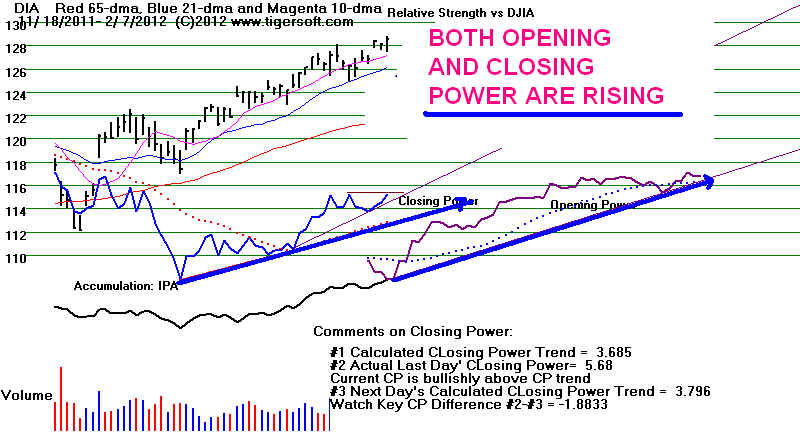
SPY's CP's is uptrending.
It would take a close of more than .36 below the opening
to bring
a break in the CP uptrend. Opening Power is back above its rising ma. BOTH RISING.
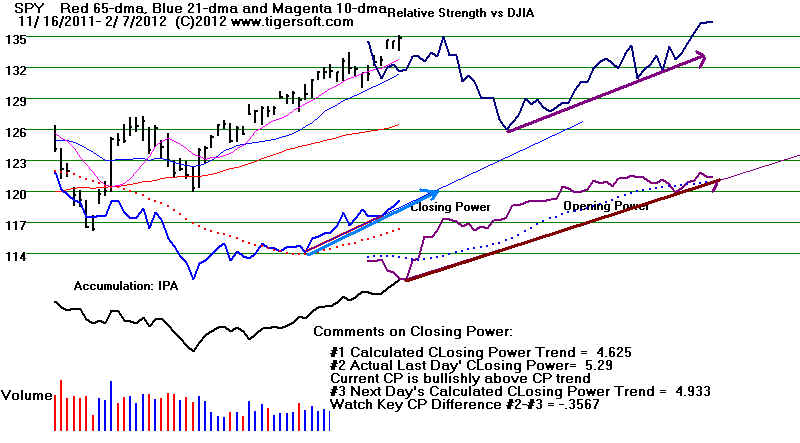
QQQ's Steeper CP is uptrending.
QQQ is much stronger than the DJI.
It will take a close of more than 0.57
BELOW the Opening to break the long
short-term CP UP-trendline.
Opening Power is uptrending.
QQQ's
Bullish BOTHUP CONDITION: Both CP and Opng Power Are Rising.
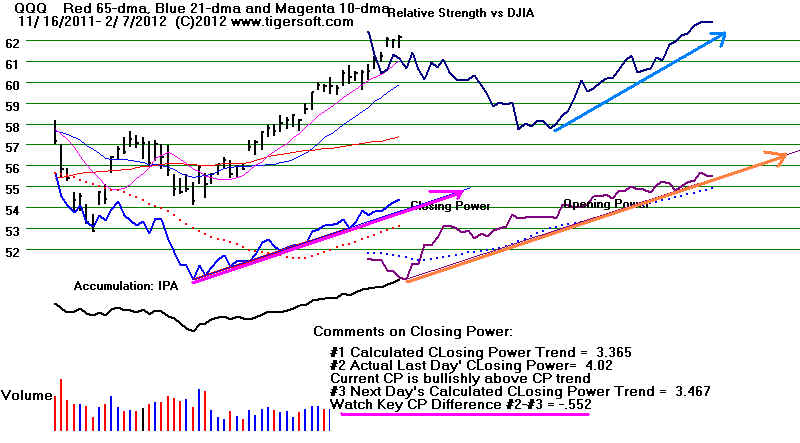
GLD's CP is above gradually
rising CP uptrend
the steeper CP-UP-trendline was broken. Its Opening Power is rising.
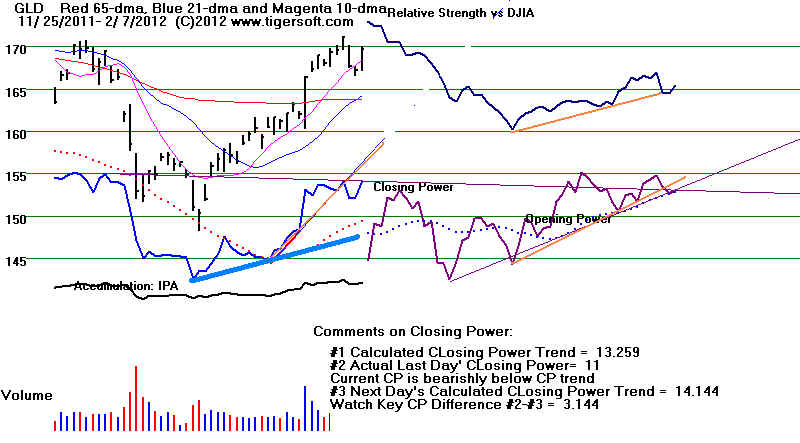
---------------------------------------------------------------------------------------------------------------------------------------------------
Older Hotlines
---------------------------------------------------------------------------------------------------------------------------------------------------
2/6/2011 Hotline
B10 Buy Still. The
highest resistance-line going through the hypothetical highs
of the DJI still has not been breached so far. This is what Peerless
calls a
"breakout". A "confirmed breakout" would require the A/D
Line, P-Indicator
and Accumulation Index to confirm by making 12-month highs, too. Even better
would be if the V-Indicator and Daily Volume would also confirm such a breakout.
If the DJI should close at 12900 or higher and breakout above the highest
ressitance line this week, the A/D Line will likely confirm such a new high. The
P-Indicator is at such a high levels now that any non-confirmation would be minor.
The Accum. Index is slipping back, but it is still above the AI 21-day ma and
more than 2/3 of its recent highs. As such, a new Peerless Sell is not likely
on
strength this week. On weakness, if the NYSE A/D Line should break its uptrend, I
would say, we should take some profits. So, until there is a Peerless Sell or the
A/D Line Uptrend Line is broken, we should just hold most of our long positions.
The strongest of these will continue to advance. Breaks in extended CLosing Power
uptrends are an exception. Taking profits in these, especially if the CP has not
confirmed
the last new high, is
reasonable.
The DJI, QQQ and NASDAQ made new highs
last week. The SP-500 has not yet..
Biotechs are still the strongest
group. Speculation in the NASDAQ is growing.
The last time the NASDAQ was above 2900 was back in the year 2000. In 1999,
just after it broke out over 3000, it ran up 67% to over 5000 in only five months.
Check out some of the most "bullish" biotechs listed below and watch to
see if they can make new all-time highs, as shown below.
DJIA and Peerless Signals
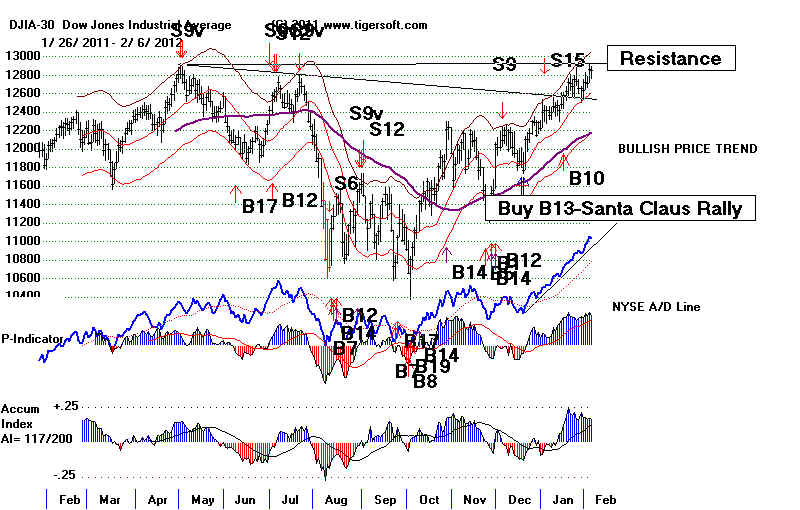
Daily QQQ is running
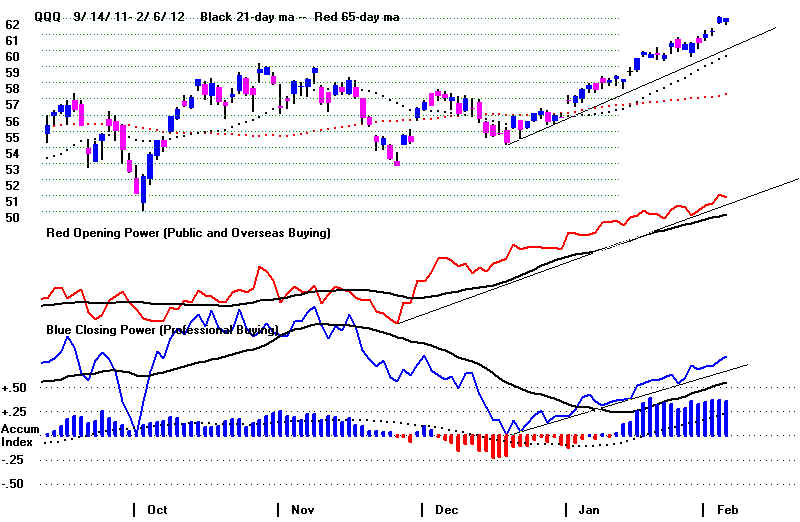
There is very little resistance above 60 on the QQQ
until the 110 high of the year 2000 is reached.
2/6/2011 DJI 12845 la/ma = 1.018 21dmaROC=.406 P= 605 P-Ch= -56 IP21=.163 V=67 OP= -.027
BREADTH STATISTICS:
Advance= 1255
Declines=1788 UpVol = 318 DownVol= 365
--->
159 MAXCP stocks Bullish MAXCP Stocks
Bullish.
7
(-3 ) SUPER2011 Stocks making New Highs:
---> 27 (-5 ) MINCP stocks Bearish
MINCP Stocks
MAXCP stocks are those showing Tiger Closing Power
making new highs.
This suggests heavy Professional Buying. Applying the Tiger Power Ranker's
"bullish" to the MAXCP stocks find those with heavy insider buying and
institutional accumulation. Bearish MINCP stocks show the opposite.
---> 177
new
highs on NASDAQ. 5 (-4) new lows on NASDAQ Bullish.
---> 166 ( ) new
highs NYSE 3(-1) new lows on NYSE
2/6/2012 KEY CHARTS OF INDUSTRY INDICES (Link
restored.)
DIA SPY
QQQ DJIA-Peerless TigerDJI TigerSPY TigerQQQ GLD SLV Crude Oil
IWM-Russell-2000
2/6/2012 - ===> Closing Power (CP) Status Report: KEY ETF CHARTS:
DIA' s Slower CP is
uptrending But steeper CP uptrend has been violated.
Opening Power broke its 21-day ma but is back at its ma
SPY's Shallow CP's is
uptrending. Opening Power broke its 21-day ma but is back above its ma
QQQ's Steeper CP is uptrending.
QQQ is much stronger than the DJI.
It will take a close of more than 0.59 BELOW the Opening to break the steeper short-term
CP UP-trendline.
Opening Power is uptrending.
QQQ's Bullish BOTHUP CONDITION: Both CP and Opng Power Are Rising.
GLD's CP is above gradually
rising CP uptrend
the steeper CP-UP-trendline was broken. Its Opening Power is rising.
STOCK SELECTION
C:\fidelity   Days back= 65
 11/1/2011 - 2/6/2012
Rank          Symbol        Name                         Price      Pct.Gain
---------     -----------------------------------       ----------  ---------
 1            FBIOX         FIDELITY BIOTECHNOLOGY       103.54        30%
 2            FSHOX         FIDELITY CONSTR & HOUSING     39.74        22%
 3            FSCHX         FIDELITY CHEMICALS           110.94        20%
 4            FSRBX         FIDELITY BANKING              17.7         19%
 5            FSCGX         FIDELITY IND. EQUIPMENT       36.21        18%
 6            FSELX         FIDELITY ELECTRONICS          53.08        17%
 7            FIDSX         FIDELITY FINANCIAL SERVICES   57.65        16%
 8            FLVCX         Fidelity Leveraged            28.86        16%
 9            FSLBX         FIDELITY BROKERAGE-INV MGT    47.54        16%
 10           FCYIX         FIDELITY CYCLICAL INDISTRIES  24.62        15%
 11           FSDPX         FIDELITY IND. MATERIALS       70.37        14%
 12           FBMPX         FIDELITY MULTI MEDIA          47.17        13%
 13           FDCPX         FIDELITY COMPUTER             62.22        13%
 14           FSDAX         FIDELITY DEFENSE & AEROSPACE  84.68        13%
 15           FDVLX         Fidelity Invest. Values       70.19        12%
 16           FSESX         FIDELITY ENERGY SERVICES      73.73        12%
 17           FSVLX         FIDELITY HOME FINANCE         12.28        12%
 18           FDLSX         FIDELITY LEISURE             104.59        11%
 19           FBSOX         FIDELITY BUS.SRVCS-OUTSOURC.  23.25        10%
 20           FSAVX         FIDELITY AUTOMOTIVE           37.65        10%
 21           FSHCX         FIDELITY MEDICAL DELIVERY     57.99        10%
 22           FSPCX         FIDELITY INSURANCE            47.77        10%
 23           FNARX         FIDELITY NATURAL RESOURCES    35.38         9%
 24           FPHAX         FIDELITY PHARMACEUTICALS      14.01         9%
 25           FSCPX         FIDELITY CONSUMER INDUST.     25.24         9%
 26           FSDCX         FIDELITY DEVELOP.COMMUNICAT.  24.42         9%
 27           FSENX         FIDELITY ENERGY               54.85         9%
 28           FSRFX         FIDELITY TRANSP.              54.31         9%
 29           FEXPX         FIDELITY EXPORT/MULTINATIONAL 22.15         8%
 30           FSAIX         FIDELITY AIR TRANSPORTATION   38.76         8%
 31           FCNTX         FID. LARGE CAP GROWTH/CONTRA  72.5          7%
 32           FSPTX         FIDELITY TECHNOLOGY           97.05         7%
 33           FSLEX         FIDELITY ENVIRONMENTAL        16.48         6%
 34           FSNGX         FIDELITY NATURAL GAS          32.19         6%
 35           FSMEX         FIDELITY MEDICAL EQUIPM.      27.82         5%
 36           FSTCX         FIDELITY TELECOMMUNICATIONS   44.85         5%
 37           FIGRX         Fidelity Internat. Discovery  29.99         4%
 38           FSPHX         FIDELITY HEALTH CARE         132.88         4%
 39           FDFAX         FIDELITY FOOD & AGRICULTURE   72.6          3%
 40           FSCSX         FIDELITY SOFTWARE-COMP.SYST.  86.44         3%
 41           FWRLX         FIDELITY WIRELESS              7.62         2%
 42           FSCBX         FIDELITY SMALL CAPS           20.46         1%
 43           FSRPX         FIDELITY RETAILING            55.11         1%
 44           FSUTX         FIDELITY UTILITIES GROWTH     51.78        -1%
 45           GLD           StreetTRACKS Gold Trust      167.18        -1%
 46           FSAGX         FIDELITY GOLD                 46.67        -4%
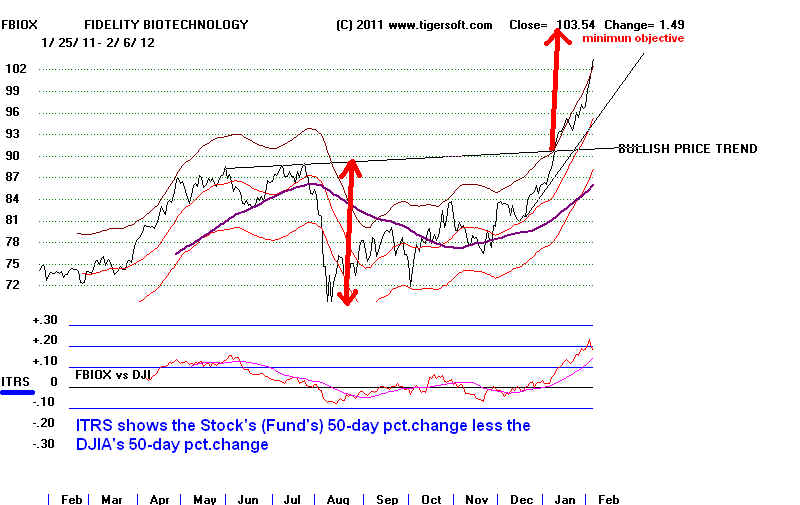
A good strategy is to buy the most "bullish" Power-Ranked biotech. They
normally should have an AI/200 score above 200 and an IP21 (current AI)
over .25. Here are the biotechs that meet these criteria. A stock
running
in all-time highs is more bullish. There are no obvious price resistance levels
to bunch sell orders and get a reversal.
MOST BULLISH BIOTECHS:
AI/200>150. IP21>.25,
Change Vol
AI/200 IP21
NAII
9.21 0
114
173
.489
Closing Power Not New High
Buy 9.55 stop
ELGX 13.16 0 2675
174
.294
CP marginally confirmed NH
BBH 132.66 +1.87 84
168
.331
CP is very strong and made NH
ULGX 1.281 +.08
802
174
.690
CP is running ahead of prices
Contiues to be a BUY.
GILD 56.03 +1.33 178908
152 .574
CP is running ahead of
prices
57.77 is 5 year and all-time high. Getting above
that would be very bullish,
CPHD 44.91 +1.40 6776
160
.268
CP is belatedly
uptrending.
At all-time high.
NAII 9.21
WEEKLY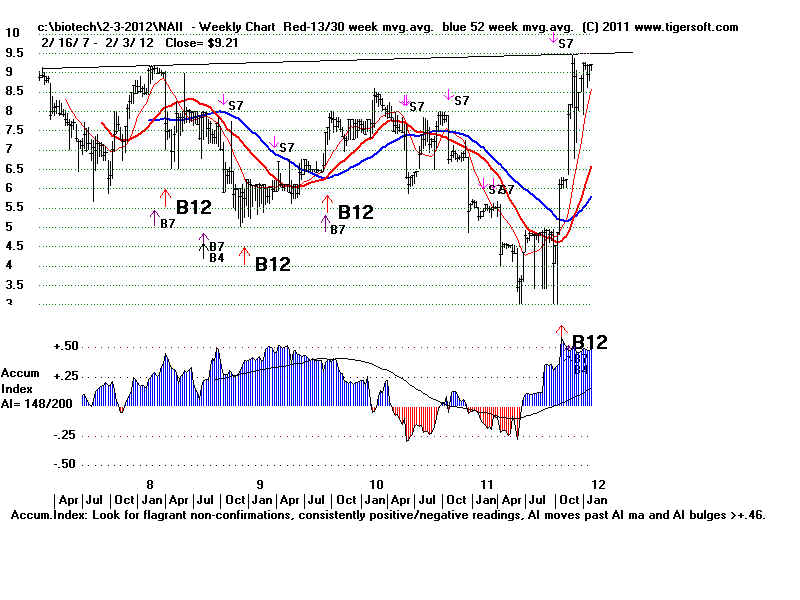 |
ELGX 13.16
WEEKLY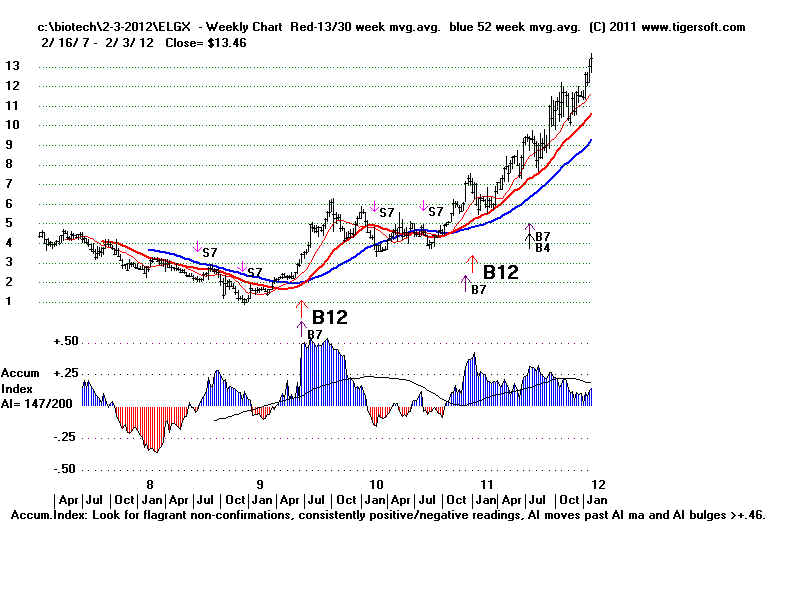 |
ULGX 1.28 WEEKLY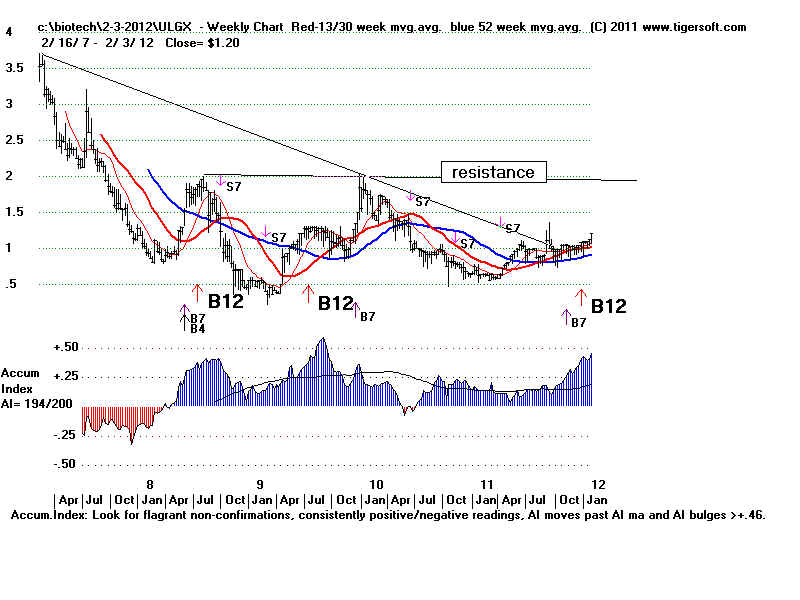 |
GILD 56.03
WEEKLY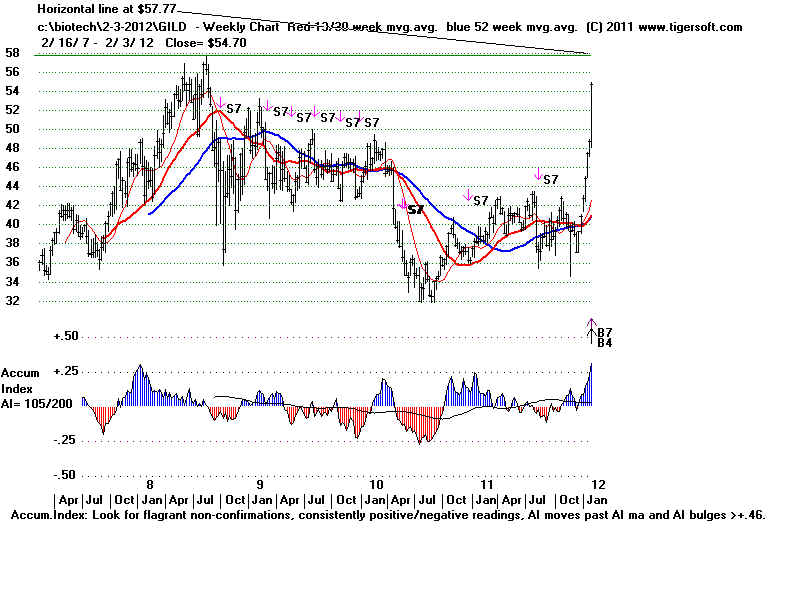 |
CPHD 44.91 WEEKLY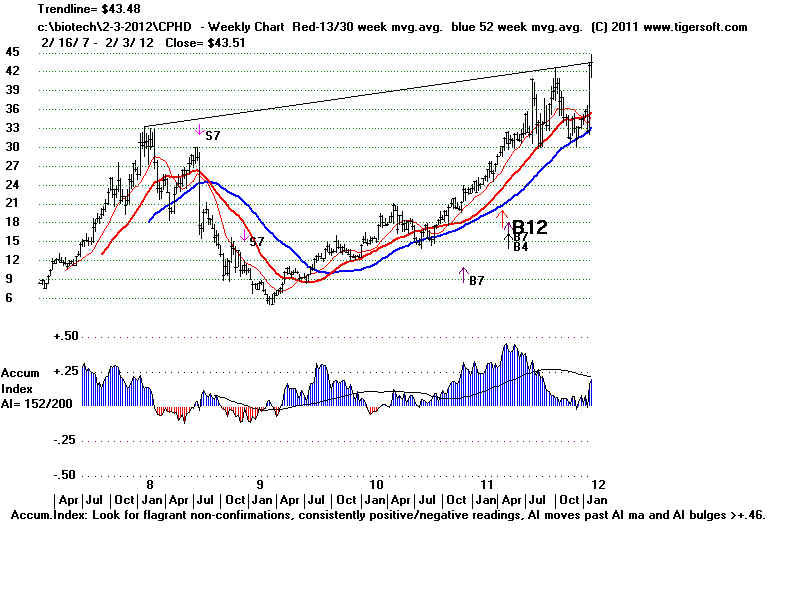 |
---------------------------------------------------------------------------------------------------------------------------------------------------
Older Hotlines
---------------------------------------------------------------------------------------------------------------------------------------------------
2/3/2011 Hotline
B10 Buy Still. When the DJI gains between 1% and 5% in
January of a Presidential
Election year, it rises on average
12% for the next 11 months of
the year. See the 5 cases
below since 1888. This
is consistent with the results for our
January B10s.
The DJI, QQQ and NASDAQ have
just made new highs.
Biotechs are very strong as a
group. The last time
the NASDAQ was above 2900 was
back in the year 2000.
In last 1999, it broke out
over 3000 and ran up 67% to over
5000 in only five months.
Wait for a Peerless Sell, a
head and shoulders pattern
or a break in the steep A/D
Line uptrend to take profits.
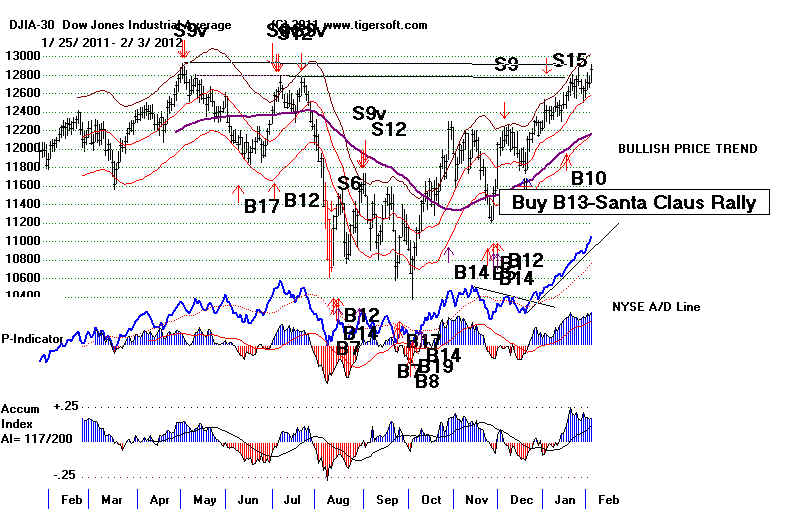
2/3/2011 DJI
12862 la/ma =
1.021 21dmaROC=.42 P= 661 P-Ch= 84 IP21=.173 V=74 OP=
-.033
BREADTH STATISTICS:
Advance= 2386
Declines= 653 UpVol = 773 DownVol= 125
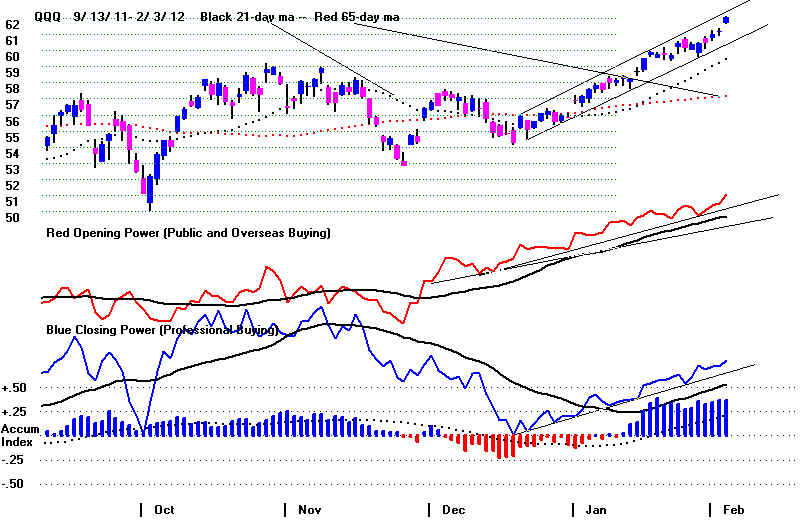
Biotechs are running.
They are the best performing group by a
wide margin. Check out their
stories using Yahoo or Google.. Some are
close to getting FDA approval for one or
even two drugs.
The best way I know to identify
these is by watching the
level of the Accumulation
Index. On the premise that someone
inside always knows and buys first,
rank the Biotech stocks
for IP21. (Peercomm + Analyse +
Peercomm + View + Tiger Spread Sheet
and then click on the top of the
column labeled 'IP21'. We
generally consider those showing IP21
levels above +.37 to
be showing current insider buying.
Stocks over 50 are definitely
more likely to be being bought by
insiders. The charts are shown
further below for two of the best,
GILD and REGN. FBIOX (Fidelity Biotech)
and IBB are two other ways to play this unusual strength.
Highest IP21 Biotechs over $50.
AI/200 IP21 (Current Accum.)
GILD 54.70 151
.55 (very high) 4000 employees http://www.gilead.com
Hepatitis,
HIV
and more - http://finance.yahoo.com/q/pr?s=GILD+Profile
Fidelity owns 4.7% of shares. I suspect that teople who sold
their shares of Pharmasset to GILD for cash, want back in this
play on the world-wide hepatitis market.
2/5/2012 Motley F. There
is no Stopping Gilead Sciences.
REGN 96.86
116 .34 1525 employees
: http://www.regeneron.com
http://finance.yahoo.com/q/pr?s=REGN+Profile
11/16/2011 Regeneron
And Amgen: More Breakthrough Drugs
REGN727 Lowers LDLs by 35%. REGN is a
fully human monoclonial that binds the specifi
protein that manages LDL a primary cause of "cardiac events". http://www.regeneron.com/regn727
"Controlling high cholesterol levels statins have reigned for a very
long time, generating over $30 billion a year, with products like Lipitor and crestor
generating almost ten million a year each. Statins act by blocking HMG-CoA reductase, an
enzyme required for the production of LDL, (the bad cholesterol) in the liver.
Statins side effects could be severe. They can cause muscle damage. Some
physicians believe they are over-prescribed, as 30 million Americans currently take the
cholesterol pills....Regeneron’s/Sanofi’s drug REGN727 is more advanced
than the other drugs. When REGN 727 was given at varying doses in combination
with statins, it reduced LDL levels by a further 30% to more than 65%. The patients have
familial hypercholesterolemia, an inherited condition associated with very high LDL
levels. Regeneron has decided to conduct late Phase trials in the upcoming months. George
Yancopoulos, Regeneron’s chief scientific officer, said in a telephone interview,
“The antibodies are really performing in a very exciting fashion. They seemingly do
an even better job at sweeping the LDL out than existing medicines. It should be a big
commercial opportunity.”
http://investor.regeneron.com/releaseDetail.cfm?releaseid=622543
IBB 120.64
142 .35 - Nasdaq
Biotech
16% of assets in GILD, much more than any other holding.
| Top 10 Holdings (54.82% of Total Assets) |
|---|
|
GILD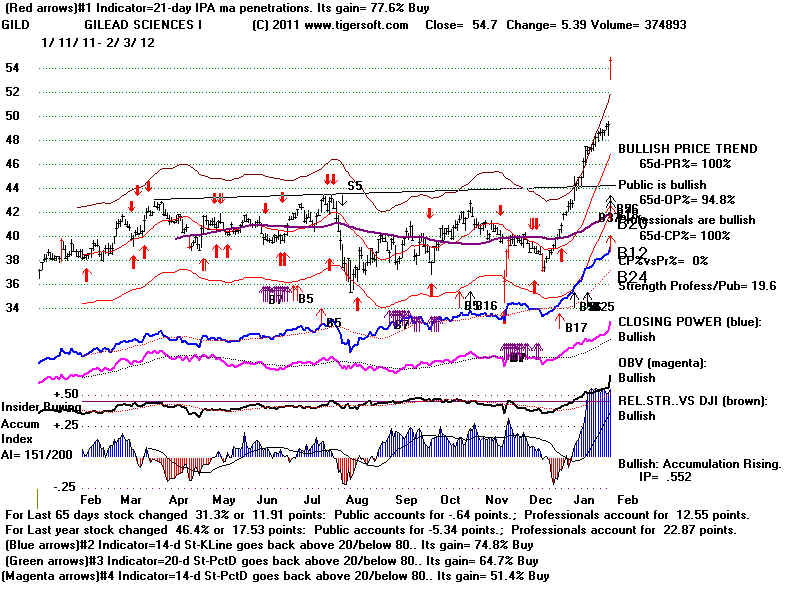 |
REGN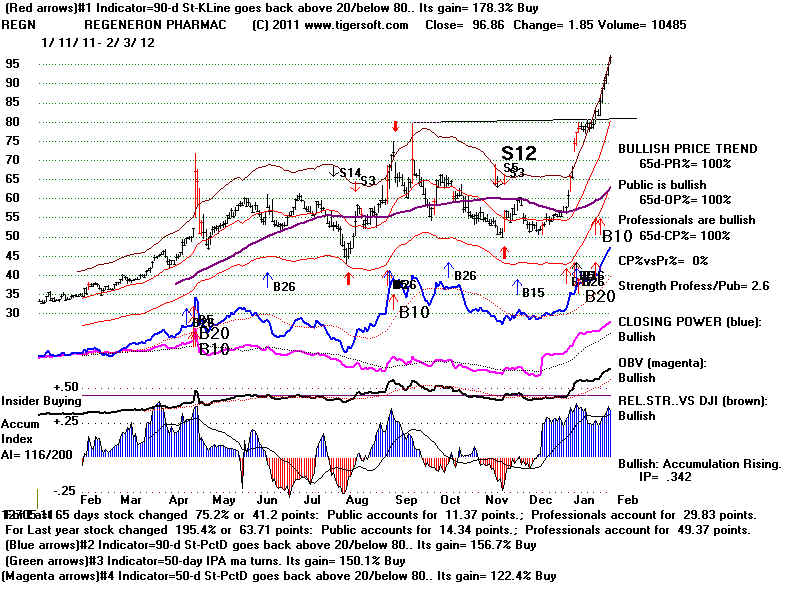 |
IBB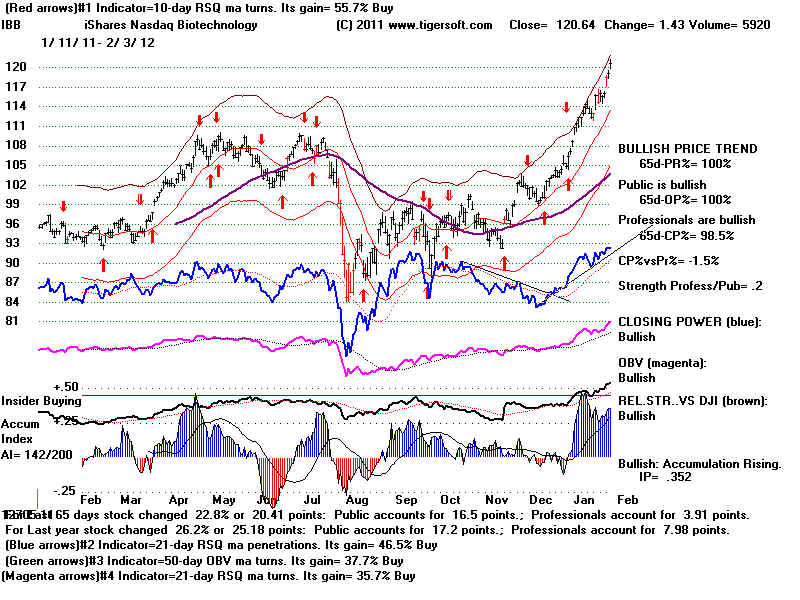 |
|
WHAT IS THE MEANING OF JANUARY's STRENGTH, This Being a Presidential Election (PE) Year. 1888-2008 See also Investors' Daily confusing and tendentious study of only 1936-2008. http://news.investors.com/Article/600150/201202040805/january-stock-market-indicates-obama-loss.htm?src=HPLNews 1. When January in PE Year is up, DJI rises for rest of year in 12 cases and falls 3 2. When January in PE Year is down, DJI rises for rest of year in 7 cases and falls 7 3. Presidential Incumbents won 13 times and lost 6. 4. When DJI is up more than 5% in January of the Presidential Election Year, the Incumbents lost 3x and won just once. 5. When DJI is up moderately, between 1% and 5% in January of the Presidential Election Year, the Incumbents won 4x and lost just once. 6. When DJI is up moderately, between 1% and 5% the DJI rallied more between
10.6%-20.3% in 4 cases and rose 2.4% in one case.
WHAT IS THE MEANING OF JANUARY's STRENGTH
In PRESIDENTIAL ELECTION (PE)YEAR
PEYear Dec-Close Jan-Cl Jan    Dec. Close
                        Gain   of Pres.Election Year
----------------------------------------------------------------------------
1888   82.51     82.66         86.48 Incumbent Cleveland (D) LOST to Harrison (R)
1892   81.59     90.10 +10.4%  87.61 Incumbent Harrison (R) LOST to Cleveland(D)
1896   52.23     54.11 +3.6%   51.33 McKinley (R) beat Bryan (D)
1900   66.08     66.13         70.71 Incumbent McKinley (R) BEAT Bryan (D)
1904   49.11     48.91         69.61 Incumbent Ted Rooselvelt (R) BEAT Parker (D)
1908   58.75     62.70 +6.7%   86.25 Taft (R) beat Bryan (D)
1912   81.68     80.19         87.87 Wilson(D) beat Roosevelt and Taft (R)
1916   95.25     90.58         95.00 Incumbent Wilson(D) BEAT Hughes (R)
1920  107.23    103.82         71.95 Harding(R) beat Cox (D) BEAT Davis(D)
1928  202.40    198.59         300.00 Hoover(R) BEAT Smith (D)
1932   77.90     76.19         59.93 Incumbent Hoover (R) LOST to FDRoosevelt (D)
1936  144.13    149.49 +3.7%   179.90 Incumbent FDRoosevelt (D) BEAT Landon (R)
1940  150.24    145.33         131.13 Incumbent FDRoosevelt (D) BEAT Wilkie (R)
1944  136.20    137.40 +1.0%   151.9  Incumbent FDRoosevelt (D) BEAT Dewey (R)
1948  181.16    175.05         177.30 Incumbent Truman (D) beats Dewey (R)
1952  269.23    270.69         291.90 Eisenhower (R) beats Stephenson (D)
1956  488.40    470.74         499.47 Incumbent Eisenhower (R) BEAT Stephenson (D)
1960  679.36    622.62         615.89 Kennedy (D) beat Nixon(R)
1964  762.95    785.34 +2.9%   874.13 Incumbent Johnson (D) BEAT Goldwater(R)
1968  905.11    855.47 +5.5%   943.75 Nixon(R) beat Humphrey(D)
1972  890.20    902.17 +1.3%   1020   Incumbent Nixon(R) beat McGovern(D)
1976  852.41    975.28 +14.4%  1005   Incumbent Ford LOST to Carter(D)
1980  838.74    881.91 +5.1%   963.99 Incumbent Carter(D) LOST to Reagan (R)
1984  1259      1221           1212   Incumbent Reagan (R) BEAT Mondale(D)
1988  1939      1959   +1.0%   2169   Bush1 beat Dukakis (D)
1992  3169      3223   +1.7%   3301   Incumbent Bush1 LOST to Clinton(D)
1996  5117      5395   +5.4%   6448   Incumbent Clinton(D) BEAT Dole(R) and Perot(I)
2000  11497    10941          10787  Bush2 beat Gore (D)
2004  10454    10488          10783  Incumbent Bush2 beat Kerry
2008  13265    12650          8776   Obama(R) beat McCain(D)
2012  12218    12633  +3.3%
First Month Up - Up for rest of the year (12 cases)
1888, 1900, 1908, 1936, 1952, 1964, 1972, 1976, 1988, 1992, 1996, 2004
First Month Up - Down for rest of the year (3 cases) 1892, 1896, 1980 First Month Down - Down for the rest of the Year (7 cases) 1920, 1932, 1940, 1960, 1984, 2000, 2008 First Month Down - Up for the rest of the Year (7) 1904, 1912, 1916, 1928, 1948, 1956, 1968 What happens to incumbent Presidents running again? Wins 13 Loses 6 When DJI rises in January Incumbent wins (7) Incumbent loses (5) 1900, 1936, 1944, 1964, 1972, 1996, 2004 1888, 1892, 1976, 1980, 1992 When DJI Falls in January Incumbent wins (6) Incumbent loses (1) 1904, 1916, 1940, 1948, 1956, 1984 1932 (1) Big January Gains >5% Incumbents Lose (3) Incumbents Win (1) +10.4% 1892 81.59 90.10 87.61 Incumbent Harrison (R) LOST to Cleveland(D) +14.4% 1976 852.41 975.28 1005 Incumbent Ford LOST to Carter(D) +5.1% 1980 838.74 1221 1212 Incumbent Carter(D) LOST to Reagan (R) +5.4% 1996 5117 5395 6448 Incumbent Clinton(D) BEAT Dole(R) and Perot(I) Moderately Big January Gains >1%<5% Incumbents win 4 Incumbents Lose 1 1936 144.13 149.49 +3.7% 179.90 Incumbent FDRoosevelt (D) BEAT Landon (R) 1944 136.20 137.40 +1.0% 151.9 Incumbent FDRoosevelt (D) BEAT Dewey (R) 1964 762.95 785.34 +2.9% 874.13 Incumbent Johnson (D) BEAT Goldwater(R) 1972 890.20 902.17 +1.3% 1020 Incumbent Nixon(R) beat McGovern(D) 1992 3169 3223 +1.7% 3301 Incumbent Bush1 LOST to Clinton(D) Moderately Big January Gains >1%<5% Feb-Dec Up 5 Feb-Dec Down 0 Feb-Dec Gains +20.3% 1936 144.13 149.49 +3.7% 179.90 Incumbent FDRoosevelt (D) BEAT Landon (R) +10.6% 1944 136.20 137.40 +1.0% 151.9 Incumbent FDRoosevelt (D) BEAT Dewey (R) +12.6% 1964 762.95 785.34 +2.9% 874.13 Incumbent Johnson (D) BEAT Goldwater(R) +12.0% 1972 890.20 902.17 +1.3% 1020 Incumbent Nixon(R) beat McGovern(D) +2.4% 1992 3169 3223 +1.7% 3301 Incumbent Bush1 LOST to Clinton(D) See also Investors' Daily confusing and tendentious study of only 1936-2008. http://news.investors.com/Article/600150/201202040805/january-stock-market-indicates-obama-loss.htm?src=HPLNews |
===============================================================
Older Hotlines
===============================================================
2/2/2012 - ===> Closing Power (CP) Status Report: KEY ETF CHARTS:
DIA' s Slower CP is uptrending But steeper CP uptrend has been violated.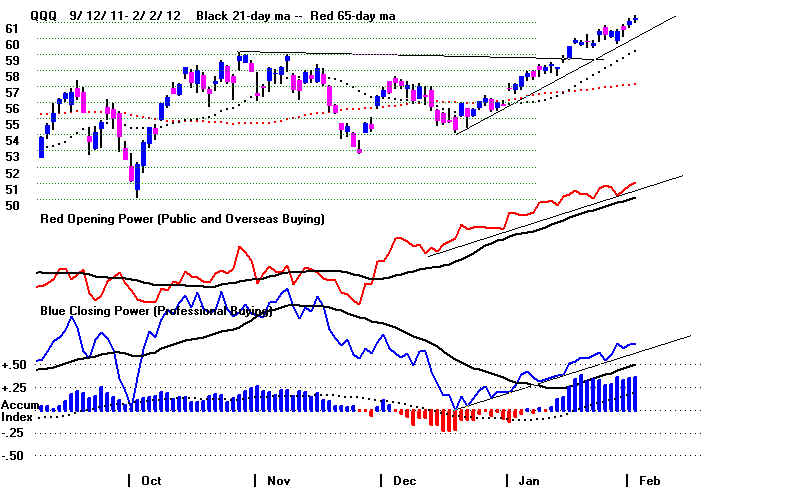
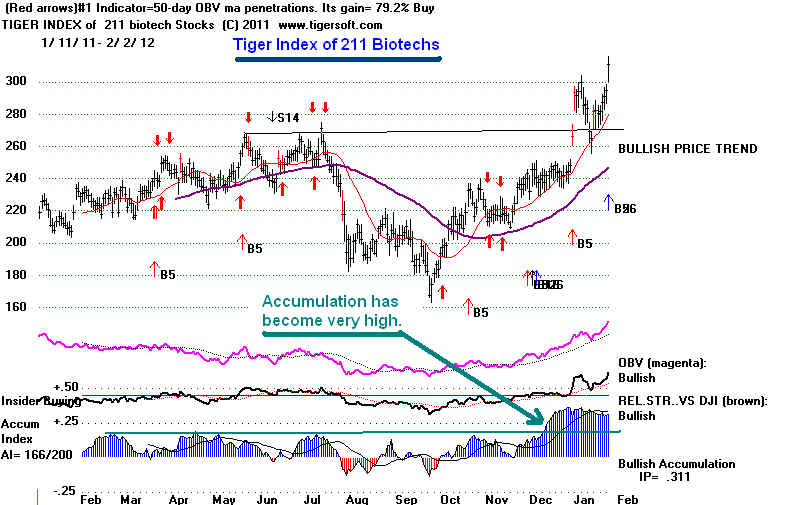
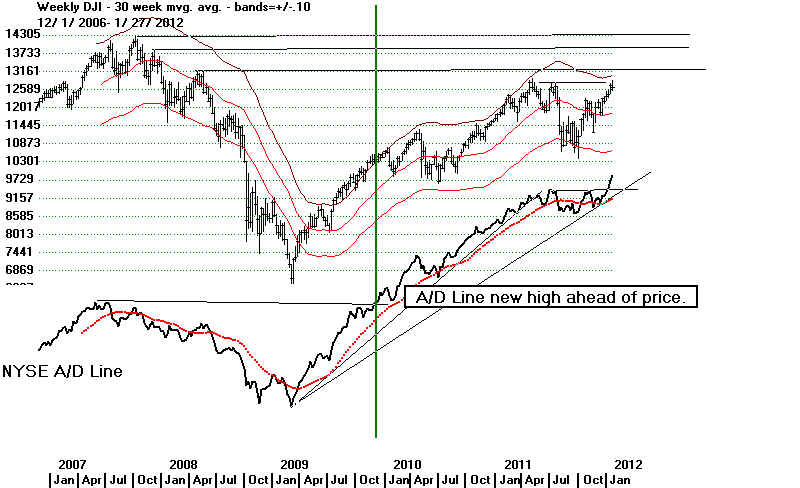
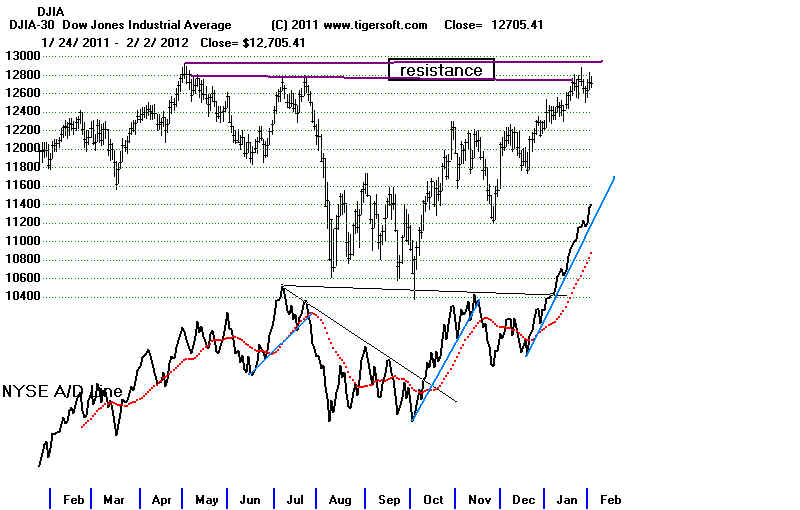
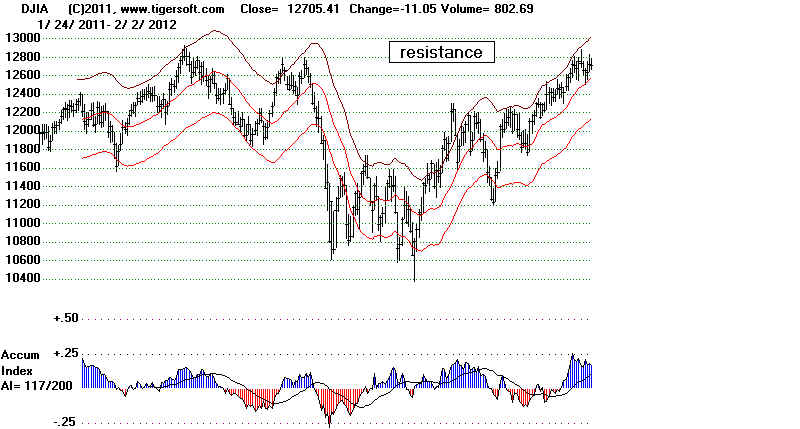
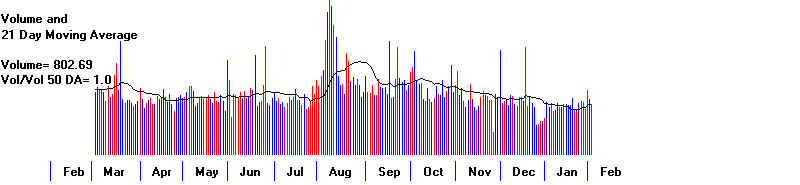
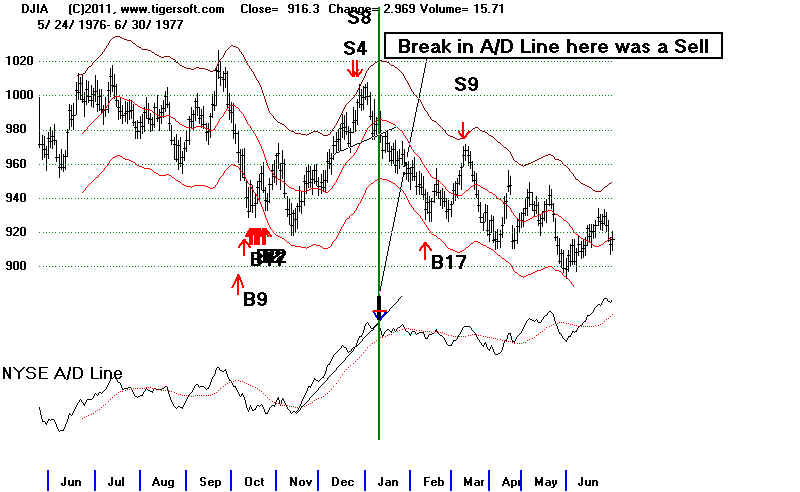
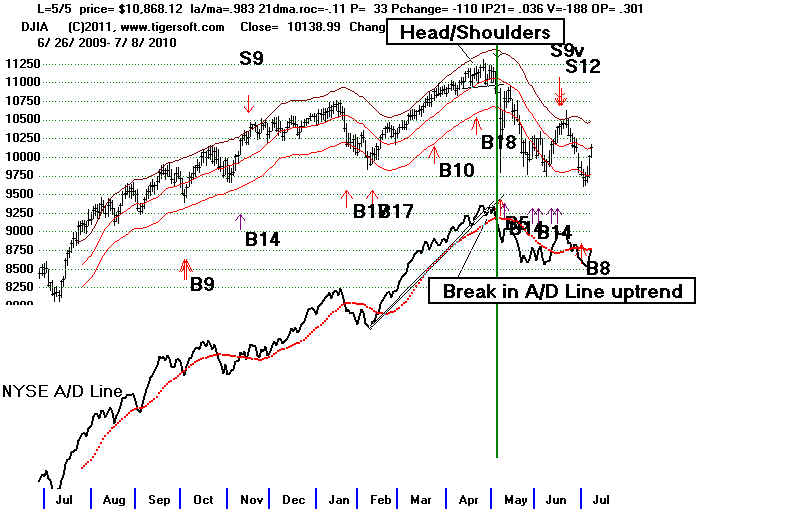
-----------------------------------------------------------------------------------------------------------------------------
OLDER HOTLINES
-----------------------------------------------------------------------------------------------------------------------------
2/1/2011 DJI 12716 +84 la/ma = 1.013 21dmaROC=.474 P= 635
P-Ch-101 IP21=.181 V=65 OP=.054
BREADTH STATISTICS:
Advance=
2524 Declines= 536 UpVol = 747 DownVol= 137
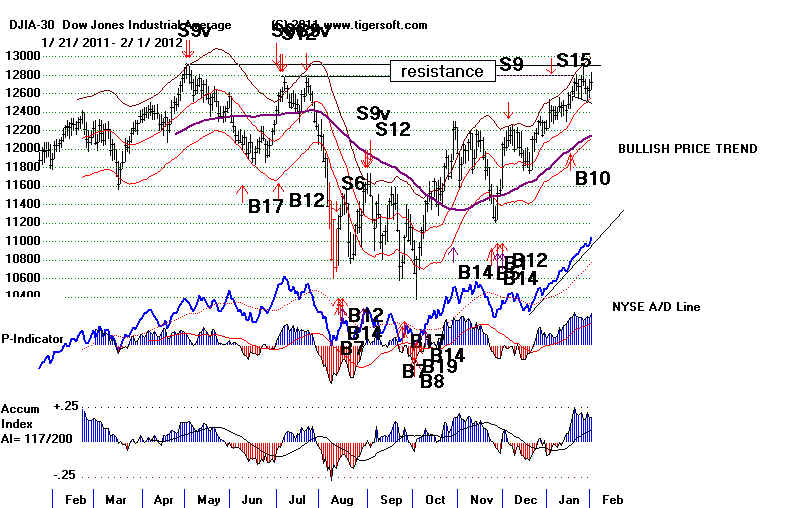
184 (+62) MAXCP stocks Bullish MAXCP Stocks Bullish.
4 ( )
SUPER2011 Stocks
making New Highs:
Includes REGN
92.43 +1.57
32 ( )
MINCP stocks Bearish
MINCP Stocks
MAXCP stocks are those showing
Tiger Closing Power making new highs.
This suggests heavy Professional Buying. Applying the Tiger Power Ranker's
"bullish" to the MAXCP stocks find those with heavy insider buying and
institutional accumulation. Bearish MINCP stocks show the opposite.
95 (+38) new highs on NASDAQ. 7 () new lows on NASDAQ Bullish.
173 (+) new
highs NYSE 8(-3) new lows on NYSE Bullish.
DIA SPY QQQ DJIA-Peerless
TigerDJI TigerSPY
TigerQQQ GLD SLV
Crude Oil
2/1/2012 ===> Closing
Power (CP) Status Report: KEY ETF CHARTS:
Opening Power are rising, as are CLosing Powers. This is
bullish
until one of them violates its 21-day ma.
DIA'
s Slower CP is uptrending But steeper CP uptrend has been violated.
Opening Power broke
its 21-day ma but is back above its ma
SPY's Shallow CP's
is uptrending. Opening Power broke its 21-day ma but is back above
its ma
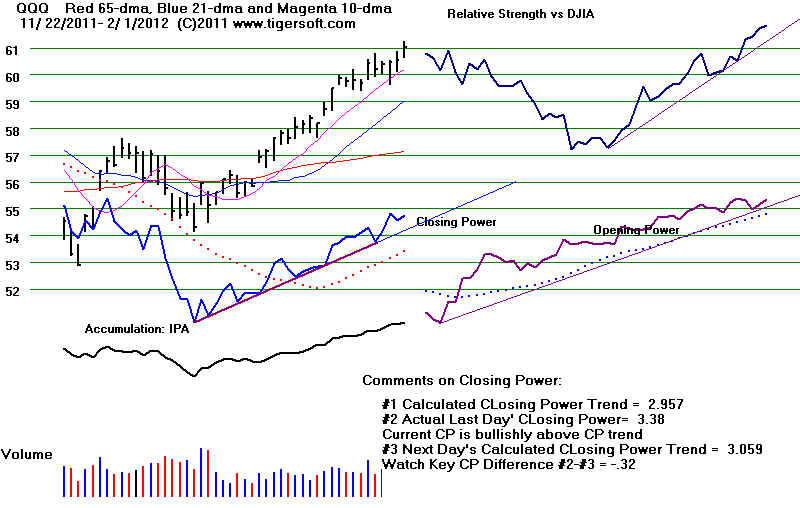
Peerless Remains on a Buy.
Oil and Natural
Gas Stocks are weak.
They would seem to be the best shorts
now. Global warming
data show a worsening trend. This may not
boost Green Stocks as much as
it may make Oil and Gas Stocks
weaken.
BUY B10 and Rising A/D Line Predict Higher Prices. 12900 Remains Our DJI Target.
The QQQ is much stronger than the DJI-30. The NASDAQ is up to
its well-tested resistance.
Speculators are
getting the sense that the FED-Obama-Wall Street financial junta will
not let the
market drop much in this Presideential Election year.
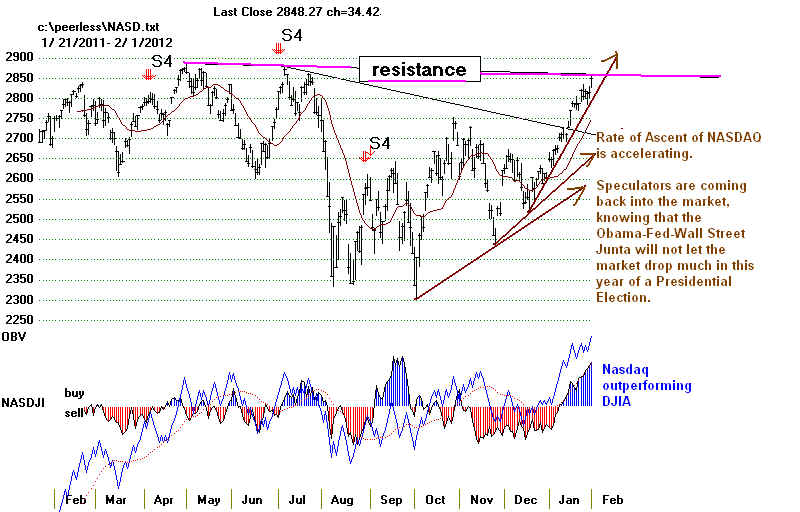
US market
Professionals have driven Crude Oil down so that today it
broke below its 65-dma.
This weakens XOM
and CVX among the higher priced DJI stocks. Natural Gas prices fell again,
as the lower 48
enjoys another very warm winter. Global warming? With the Artic ice cap melting
and oceans losing
oxygen and fish, Futurists like us have to take note. Antartica reports more
sea ice, i.e. ice
chunks that have broken off from the continent. melted iglaciers. Carbon
dioxide
in
the air keeps rising.
Will droughts be
extended in the SouthWest. Will the new summer norm for Phoenix be 120 degrees F.
Southwest
May Get Even Hotter, Drier.
Washington Post
Extreme
droughts: The new normal - Global Warming
The
New Normal?: Average Global Temperatures Continue to Rise
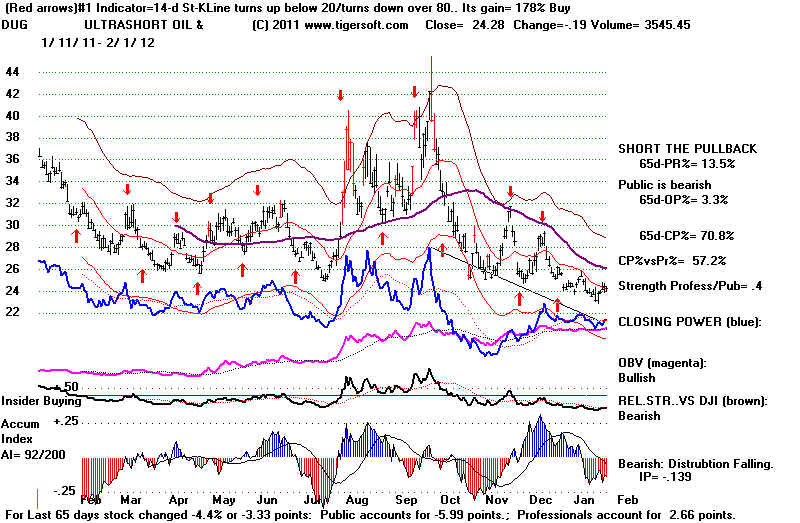
One might think
these dire trends will bring more discussion and awareness in a Presidential Election
year. Our
Green Stocks' Index has gotten back above its 200-day ma, but the A/D Line for this
group has not
broken above last year's downtrend. Scandalous misuse of loan guarantees by
the Obama
Administration's Energy Department still weighs on the group's performance. But
the inevitability
of the use of more solar energy and use of more carbon scrubbers should get us
to look further
into these stocks.
Third
Corrupt Obama Solar Loan–Total known cost over $932 million
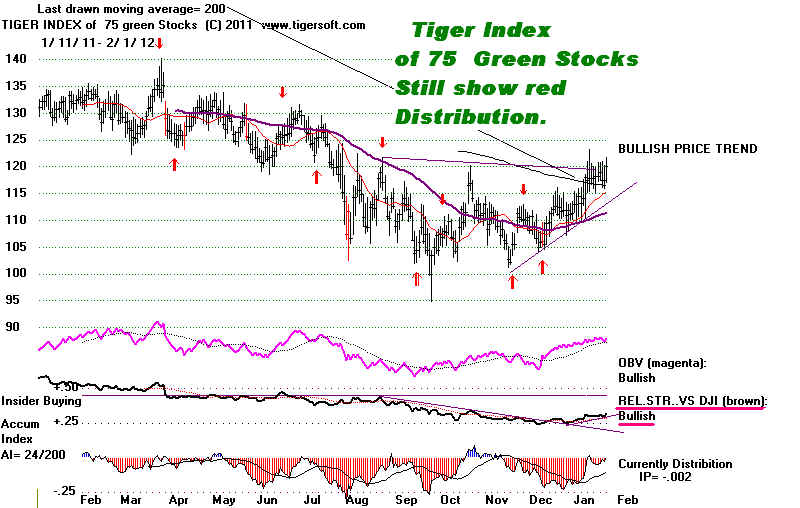
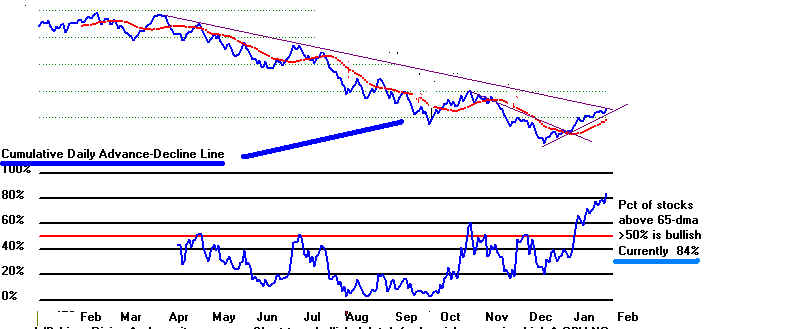
Artic Ice Mass compared to past years "December
2011 compared to past years
Arctic sea ice extent
for December 2011 was the third lowest in the satellite record. The five lowest
December extents in the
satellite record have occurred in the past six years. Including the year 2011,
the linear rate of
decline ice December ice extent over the satellite record is -3.5% per decade."
Antartica Ice Mass "After a
particularly slow ice loss rate at the beginning of the month, Antarctic sea ice
extent was
unusually high through much of December, in particular in the northern Ross Sea and the
eastern
Weddell Sea...Sea ice
for the Antarctic in December 2011 was the fifth-highest for that month in the
satellite record; the
highest December extent occurred in 2007."
Antarctic sea ice data
are available on the Sea Ice Index
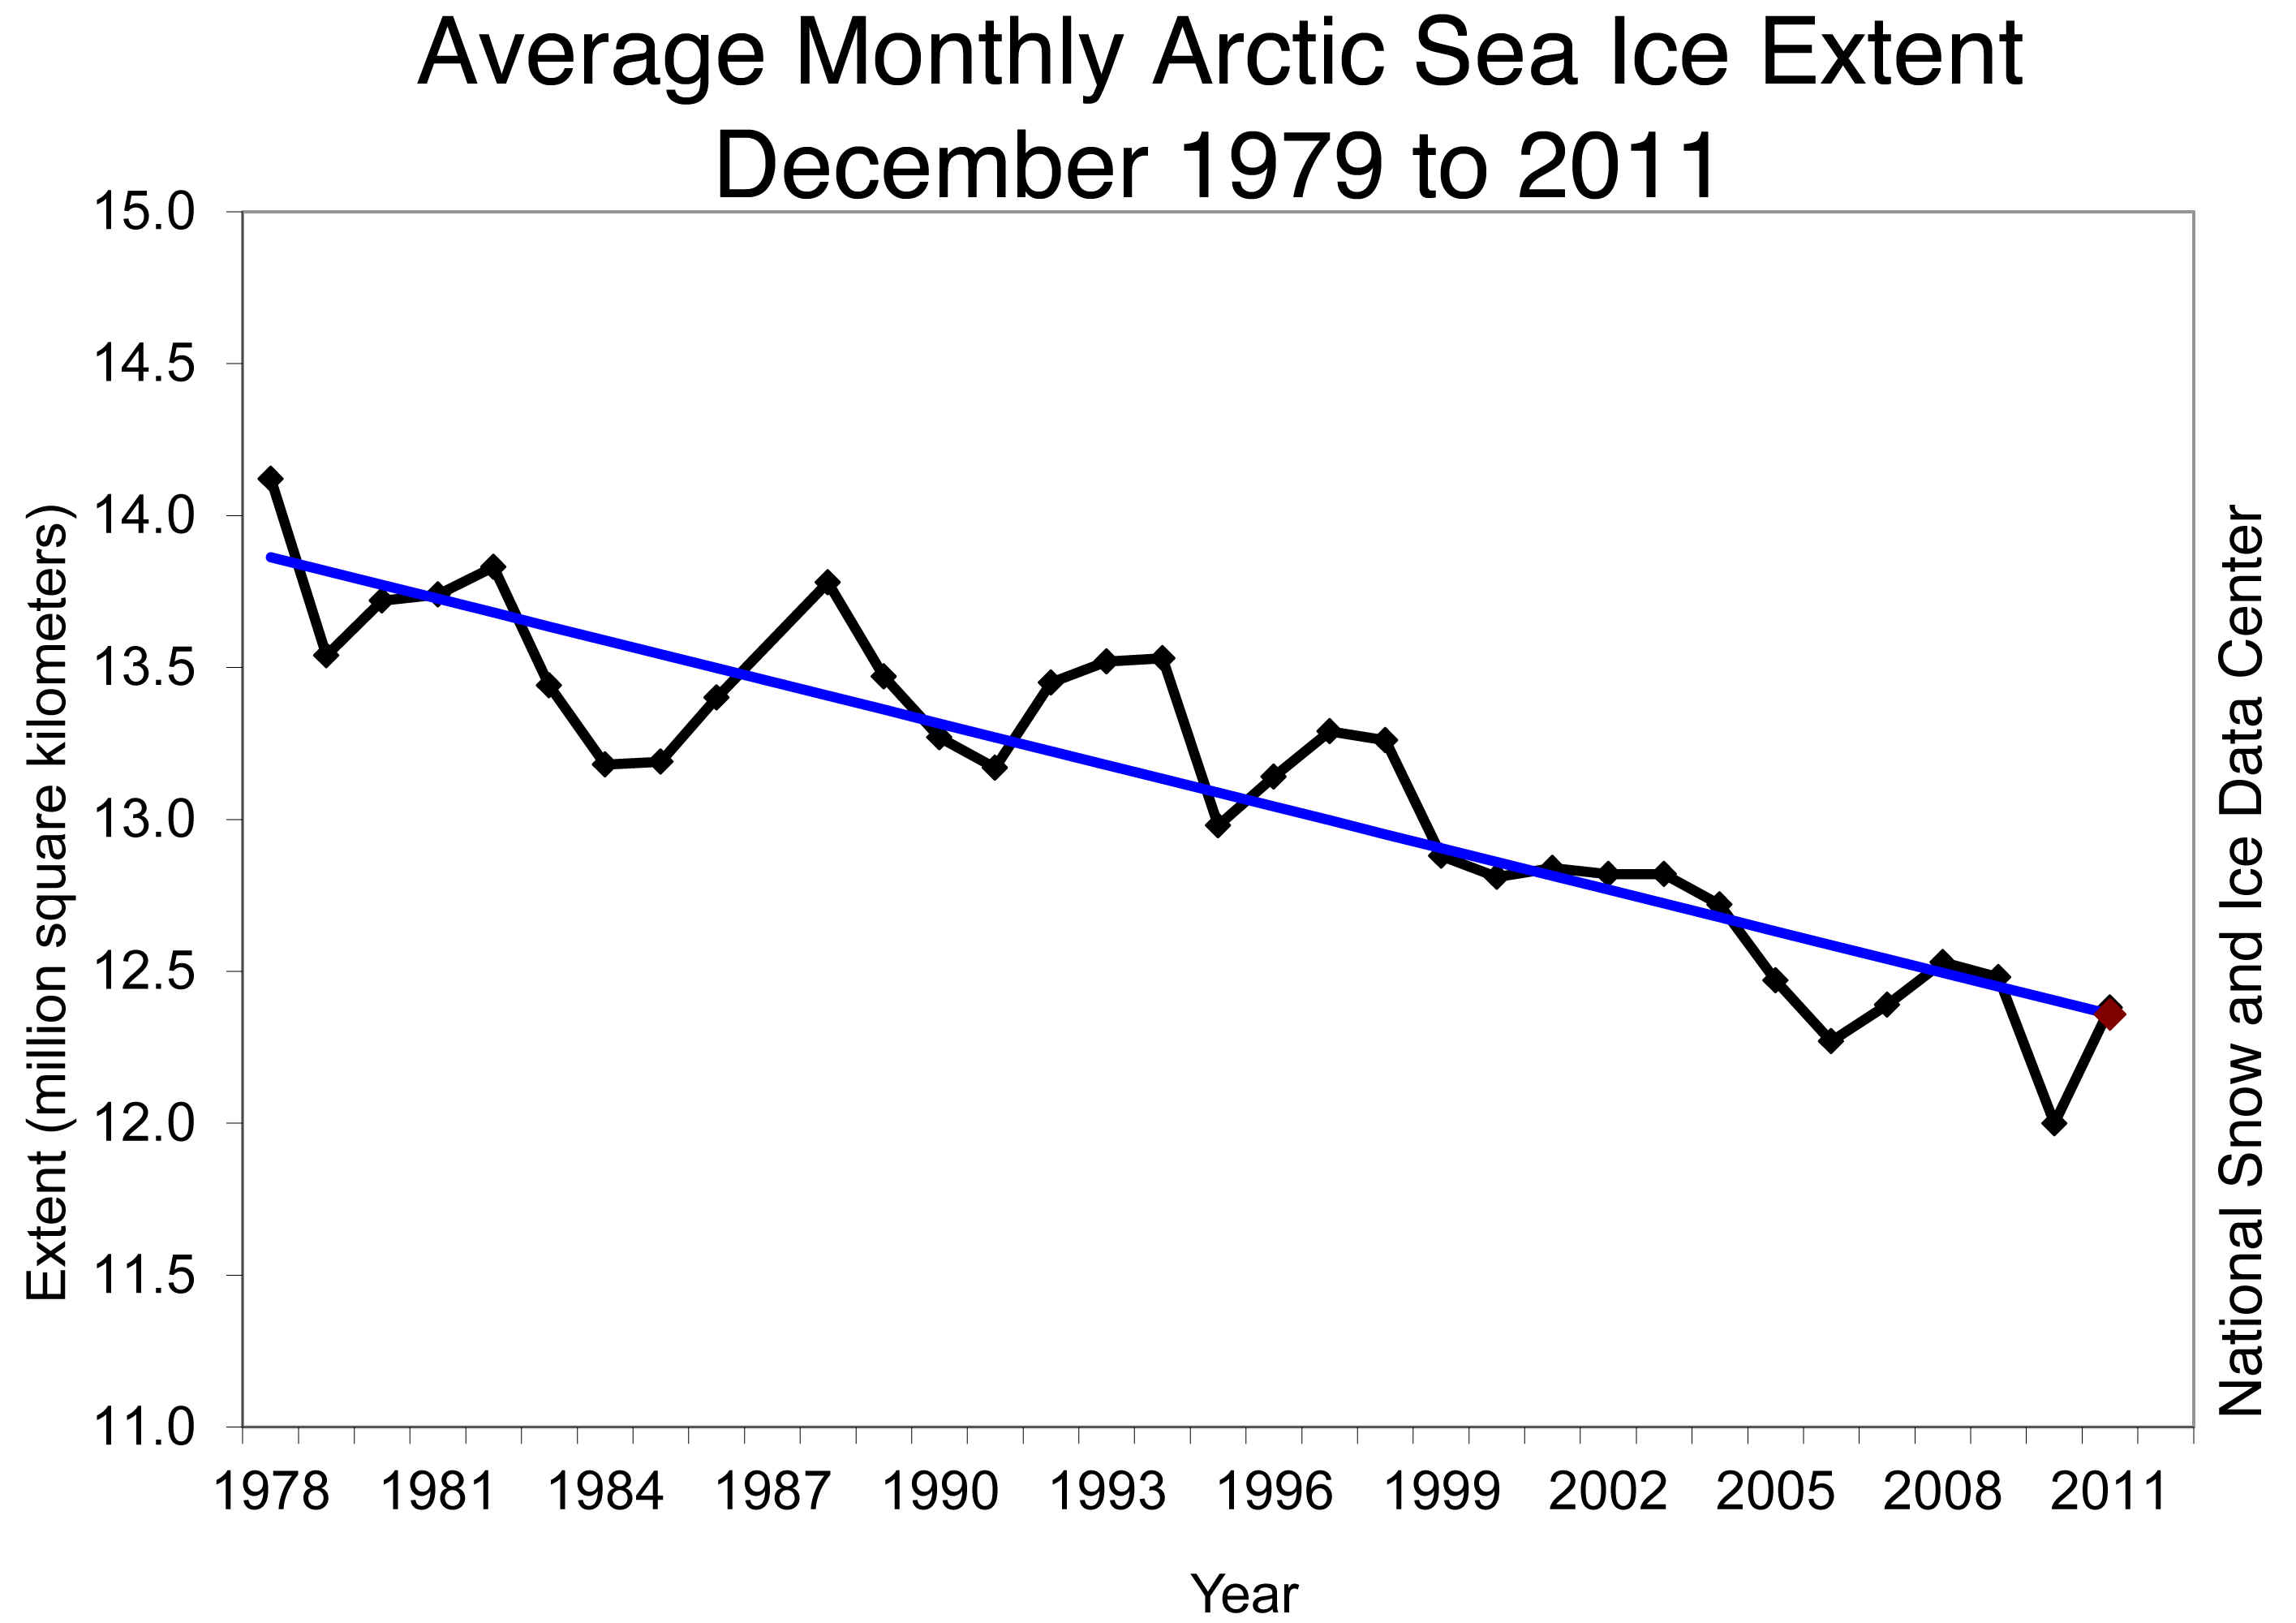
-----------------------------------------------------------------------------------------------------------------------------
OLDER HOTLINES
-----------------------------------------------------------------------------------------------------------------------------
1/31/2011 BREADTH STATISTICS:
DJI 12633 -21
Advance= 1756 Declines= 1247
122 (-53) MAXCP stocks Bullish MAXCP Stocks Bullish.
4 (+1)
SUPER2011 Stocks making New Highs:
Incl REGN 90.86 +1.98, WPRT 41. +3.63 RPTP 7.16 +.19
29 (-5) MINCP stocks
Bearish MINCP Stocks
MAXCP stocks are those showing
Tiger Closing Power making new highs.
This suggests heavy Professional Buying. Applying the Tiger Power Ranker's
"bullish" to the MAXCP stocks find those with heavy insider buying and
institutional accumulation. Bearish MINCP stocks show the opposite.
38 (+7) new highs on NASDAQ. 7 (-3) new lows on NASDAQ Bullish.
106 (+4) new
highs NYSE 11(+5) new lows on NYSE Bullish.
BUY B10 and Rising A/D Line Predict Higher Prices. 12900 Remains Our Target.
The DJI is still
finding support at its rising 21-day ma and turned up at the close so that the DJI's loss
was very minor.
Interest rates are falling. So are oil and gas prices/stocks.
Speculative
high performance
stocks are in favor. As fewer stocks make new highs, the "hot performance
money" is
funnelled into fewer stocks which rise more sharply, especially when they make new
highs and force
some of the shorts to cover.
US market
Professionals expect Crude Oil to break below its 65-dma
if we are to judge from the the
extreme
divergence between rising Openings and Falling Closings. This would
likely drop
XOM and CVX among
the higher priced DJI stocks. Lower oil prices, on the other hand, would
stimulate a
broader recovery.
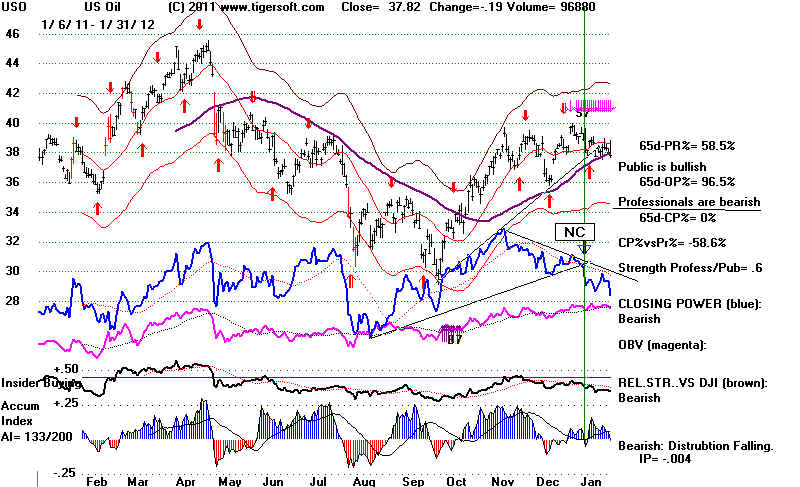
The DIA and SPY
breaking by the Opening Power of its rising 21-day ma is a warning that more weakness
at the openings
could be ahead. The steep uptrends of the DIA and
SPY Closing Powers were also
violated today.
Usually this means a day or two more weakness until the Closing Powers fall back
more nearly to
their rising 21-dma. But as long as the NYSE A/D Line is rising, the
intermediate-term
trend must be
considered a Buy. Breaks in very-over-extended A/D Lines that get far ahead of
the DJI are
bearish and should be treated as judged Sell S6s. (That was the number we originally
used with
Peerless.) See the DJI and A/D Charts for 1967, 2001 and 2002.
As I said last
night:
"The
proportion of NYSE Up Volume to Down Volume is falling behind the ratio of NYSE
advances to
declines. See the last chart for today below. This has to be of concern, but
as long
as such a NC
(non-confirmation) does not occuur on a tagging of the upper 3.5% band and
the NYSE A/D Line
is uptrending, I think we have to trust the Peerless Buy signal. A break
in the
uptrend of what has been a very strong period of Daily and Weekly Advances-Declines
would likely stop
the advances as it did early 1977, 2001 and 2002. For now, let's see if the
DJI can reach the
expected keenest resistance at 12900."
DJI remains on a Buy B10
NYSE A/D Line is uptrending. 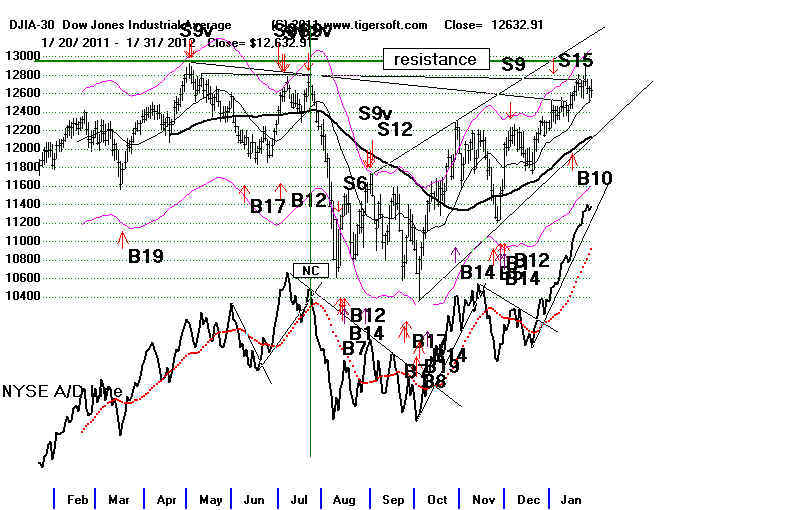
DIA SPY QQQ DJIA-Peerless TigerDJI TigerSPY TigerQQQ GLD SLV Crude Oil
1/31/2012 ===> Closing
Power (CP) Status Report: KEY ETF CHARTS:
Opening Power are rising, as are CLosing Powers. This is
bullish
until one of them violates its 21-day ma.
DIA'
s Slower CP is uptrending But steeper CP uptrend has been violated.
Opening Power broke
its 21-day ma and is below its ma
SPY's Shallow CP's
is uptrending. Opening Power broke its 21-day ma.
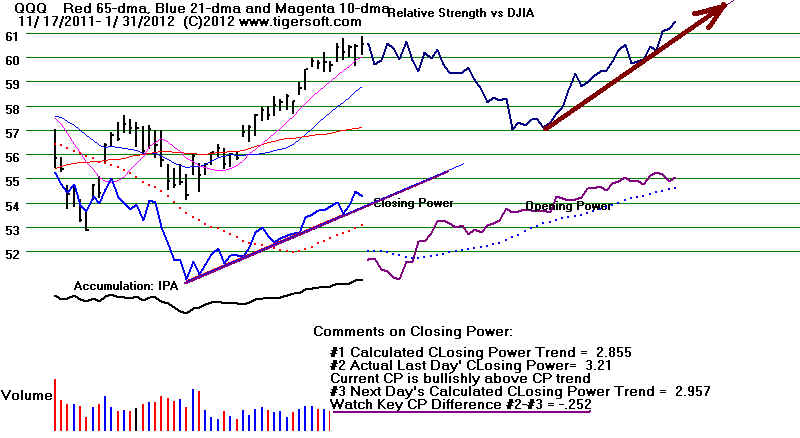
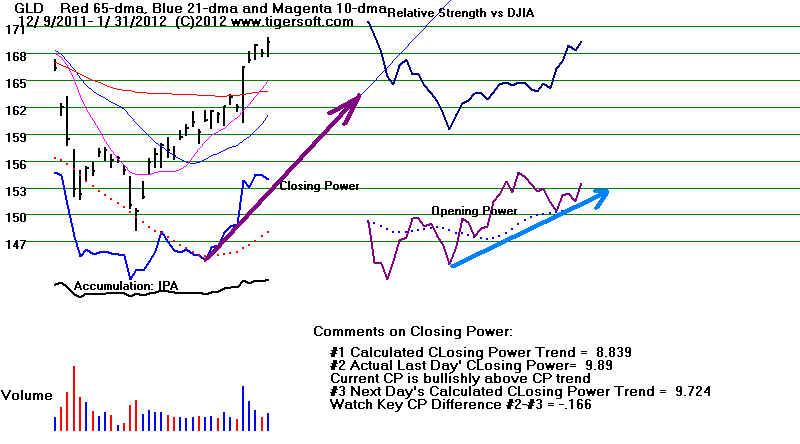
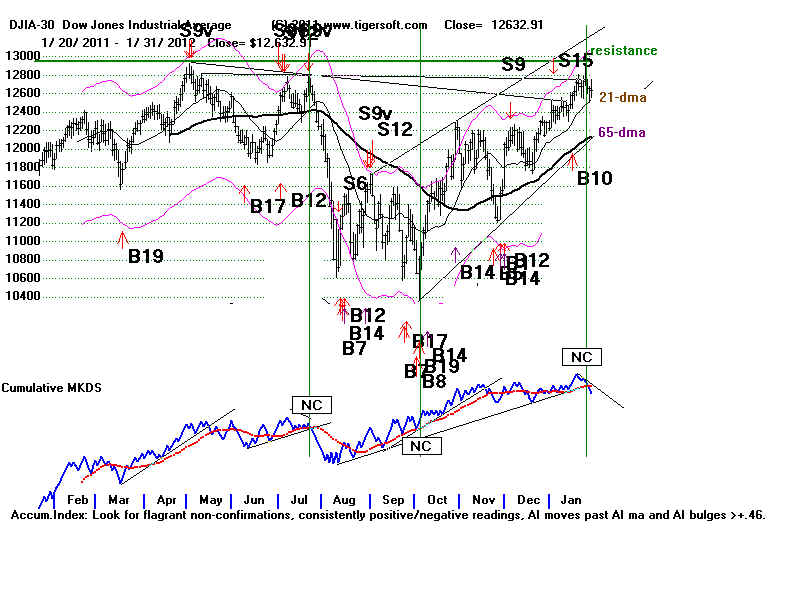
-----------------------------------------------------------------------------------------------------------------------------
OLDER HOTLINES
-----------------------------------------------------------------------------------------------------------------------------
1/30/2011 BREADTH STATISTICS:
DJI 12661 -74
Advance= 1112 Declines= 1904
175 (+32) MAXCP stocks Bullish
MAXCP Stocks Bullish.
3 (-1)
SUPER2011 Stocks making New Highs: Incl REGN 88.88 +3.34
29 (-5) MINCP stocks
Bearish MINCP Stocks
MAXCP stocks are those showing
Tiger Closing Power making new highs.
This suggests heavy Professional Buying. Applying the Tiger Power Ranker's
"bullish" to the MAXCP stocks find those with heavy insider buying and
institutional accumulation. Bearish MINCP stocks show the opposite.
31 (-17) new highs on NASDAQ. 10 (+4) new lows on NASDAQ Bullish.
102 (+1) new
highs NYSE 6 (0) new lows on NYSE Bullish.
1/30/2012 12661 -74
Advance= 1112 Declines= 1904
BUY B10 and
Rising A/D Line Predict Higher Prices. 12900 Remains Our Target.
The DJI found
support at its rising 21-day ma and turned up at the close so that the DJI's loss
was very minor.
I noticed that NYSE new highs rose for the day. Dividend stocks and
speculative high
performance stocks are in favor. The breaking by the Opening Power
of its rising
21-day ma is a warning that more weakness at the openings could be ahead.
But, as long, as
the Closing Power uptrend in intact, we should expect 12900 or more.
And as long as
the NYSE A/D Line is rising, the intermediate-term trend is clearly up.
The proportion of
NYSE Up Volume to Down Volume is falling behind the ratio of NYSE
advances to
declines. See the last chart for today below. This has to be of concern, but
as long
as such a NC
(non-confirmation) does not occuur on a tagging of the upper 3.5% band and
the NYSE A/D Line
is uptrending, I think we have to trust the Peerless Buy signal. A break
in the
uptrend of what has been a very strong period of Daily and Weekly Advances-Declines
would likely stop
the advances as it did early 1977, 2001 and 2002. For now, let's see if the
DJI can reach the
expected keenest resistance at 12900
DJI remains on a Buy B10
NYSE A/D Line is uptrending.
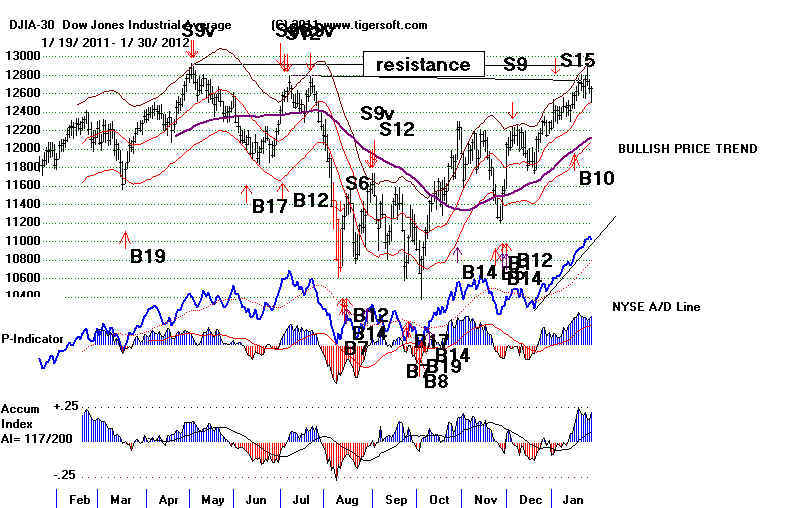
1/30/2012 GRAPHS ===> See Key Peerless TigerSoft
Index Charts: Industry Groups and ETFs
DIA SPY
QQQ DJIA-Peerless TigerDJI TigerSPY
TigerQQQ
GLD
SLV
Crude Oil
1/30/2012 ===> Closing
Power (CP) Status Report: KEY ETF CHARTS:
Opening Power are rising, as are CLosing Powers. This is
bullish
until one of them violates its 21-day ma.
DIA' s Slower CP is
uptrending But steeper CP
uptrend was violated.
A close 0.19 BELOW its opening would break the shallow CP uptrend.
Opening Power broke its 21-day ma.
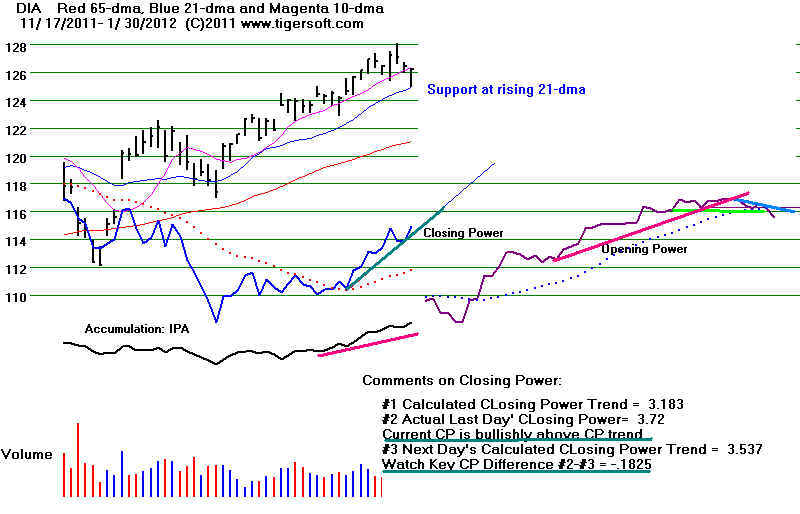
SPY's Shallow CP's is uptrending.
A close 0.31 BELOW
its opening would break the steep CP uptrend.
Opening Power broke its 21-day ma.
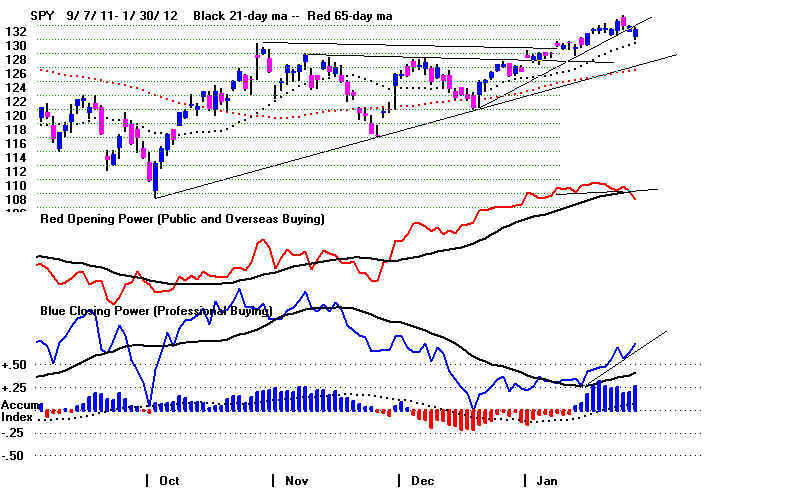
QQQ
's Steeper CP is uptrending.
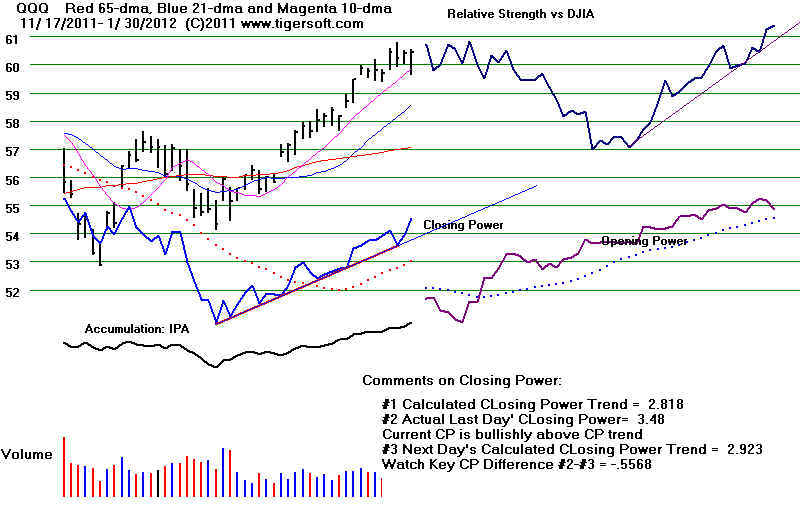
WARNING:
Up Volume is Rising but No Longer in Proportion to the Ratio of NYSE Advances to Declines.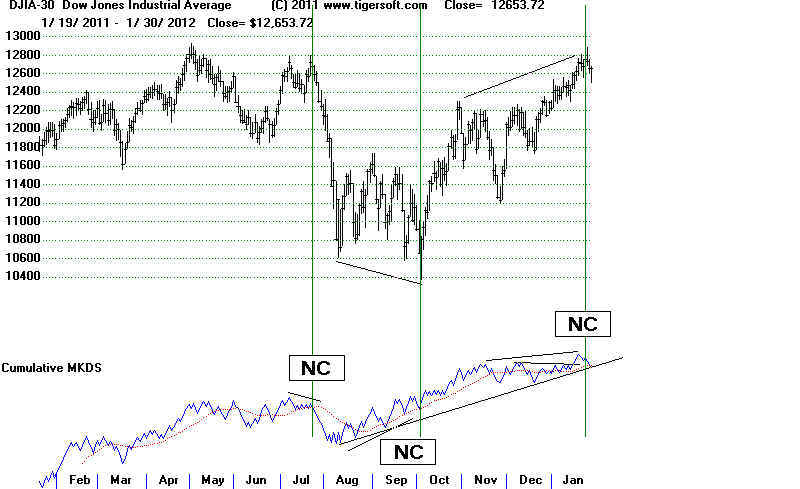
-----------------------------------------------------------------------------------------------------------------------------------------------------
OLDER HOTLINES
-----------------------------------------------------------------------------------------------------------------------------------------------------
1/27/2011 BREADTH STATISTICS:
142 (-37) MAXCP stocks Bullish MAXCP Stocks Bullish.
4 (-2) SUPER2011
Stocks making New Highs
34 (+19)
MINCP stocks Bearish MINCP Stocks
MAXCP stocks are those showing
Tiger Closing Power making new highs.
This suggests heavy Professional Buying. Applying the Tiger Power Ranker's
"bullish" to the MAXCP stocks find those with heavy insider buying and
institutional accumulation. Bearish MINCP stocks show the opposite.
48 (+8) new highs on NASDAQ. 6 (+2) new lows on NASDAQ Bullish.
101 (-28) new
highs NYSE 6 (+2) new lows on NYSE Bullish.
1/27/2012 GRAPHS ===> See Key Peerless TigerSoft
Index Charts: Industry Groups and ETFs
DIA SPY
QQQ DJIA-Peerless TigerDJI TigerSPY
TigerQQQ
GLD
SLV Crude
Oil
1/27/2012 ===> Closing
Power (CP) Status Report: KEY ETF CHARTS:
Opening Power are rising, as are CLosing Powers. This is
bullish
until one of them violates its 21-day ma.
DIA' s
Slower CP is uptrending But steeper CP uptrend was violated.
A close 1.80 BELOW its opening would break the shallow CP uptrend.
Opening Power is at its 21-day ma.
SPY's Shallow CP's
is uptrending.
A close 2.09 BELOW its opening would break the shallow CP uptrend.
Opening Power is at its 21-day ma.
QQQ's Steeper CP is uptrending.
It will take a close of more than 0.20
BELOW the Opening to break the
steeper short-term CP UP-trendline.
Its Opening Power is rising.
GLD's CP is
uptrending.
It would take a close of 2.56 BELOW the Opening to break this CP-UP-trendline.
Its Opening Power is rising.
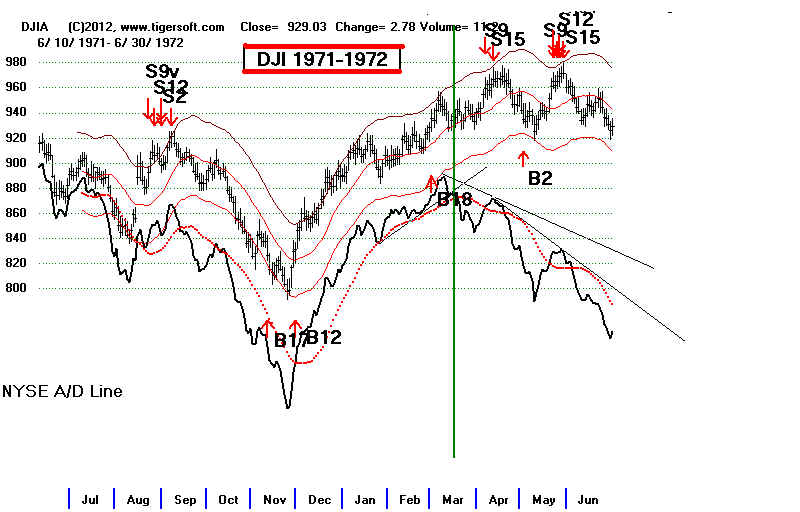
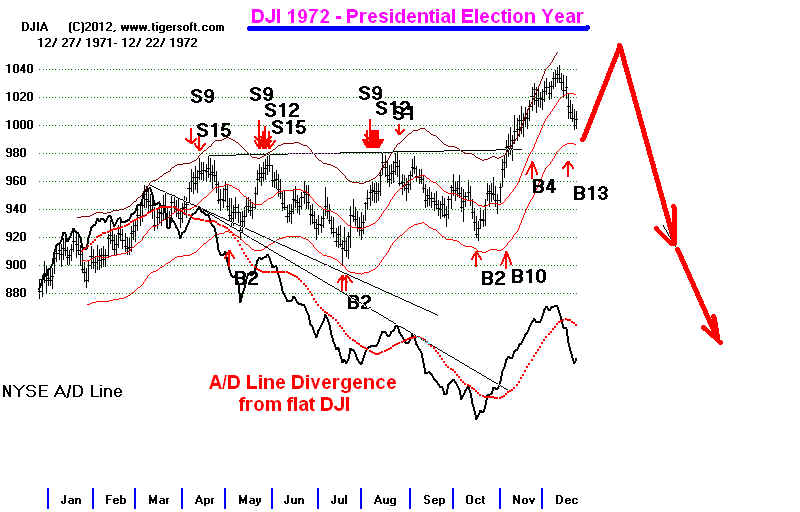

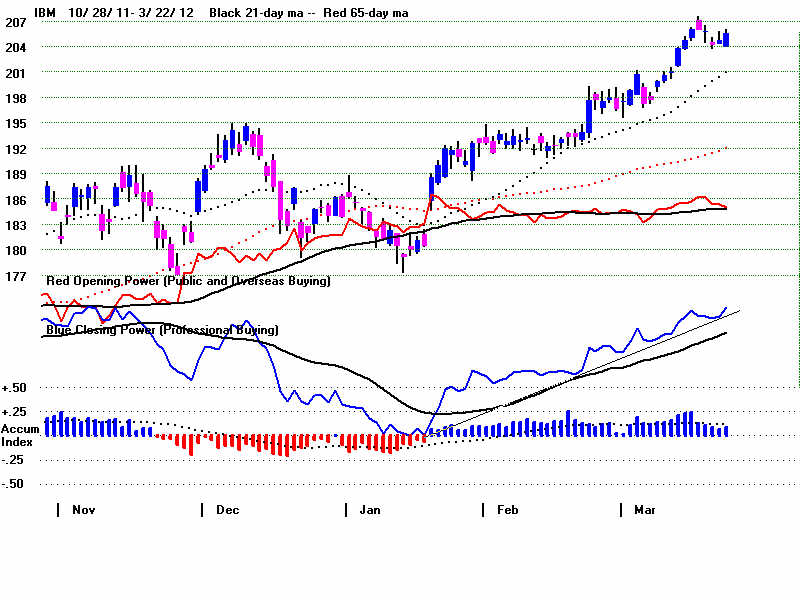
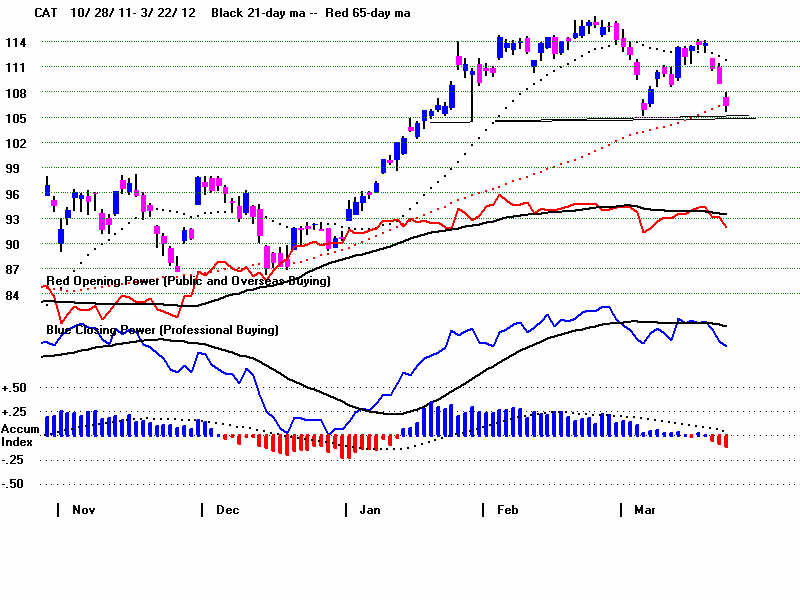
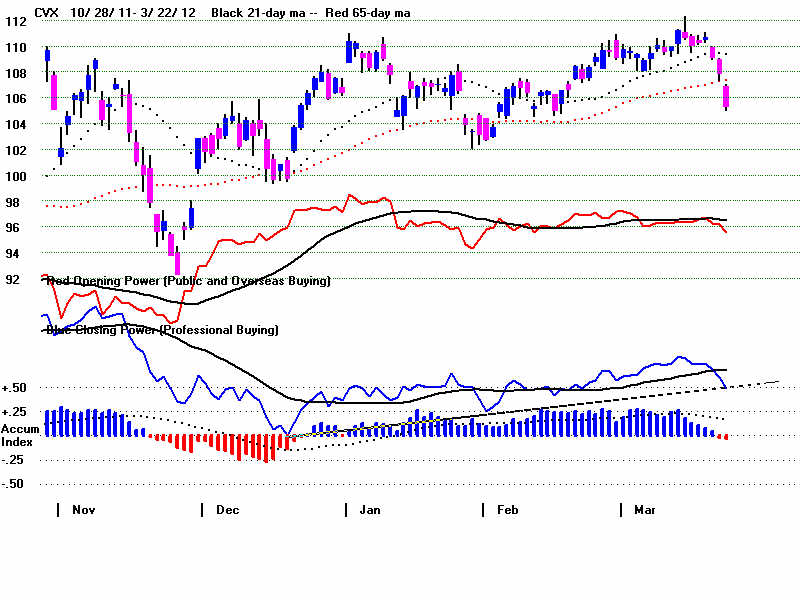
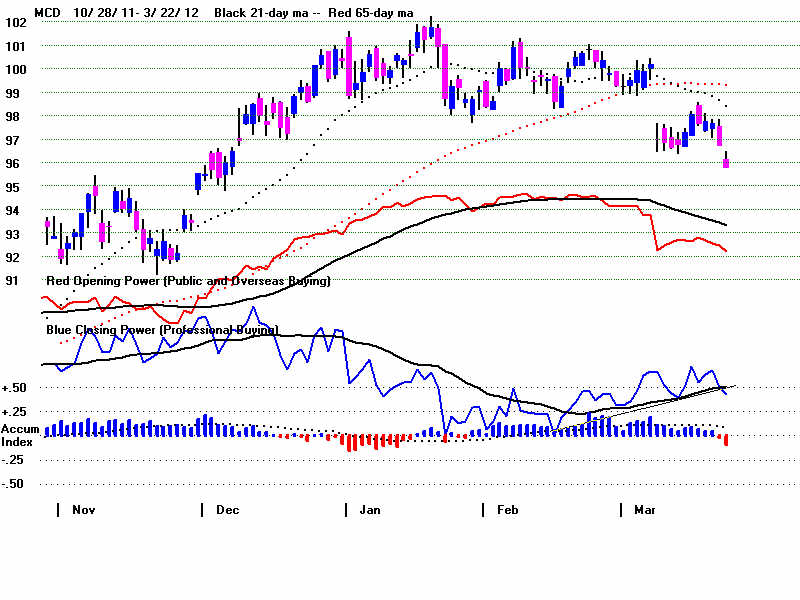
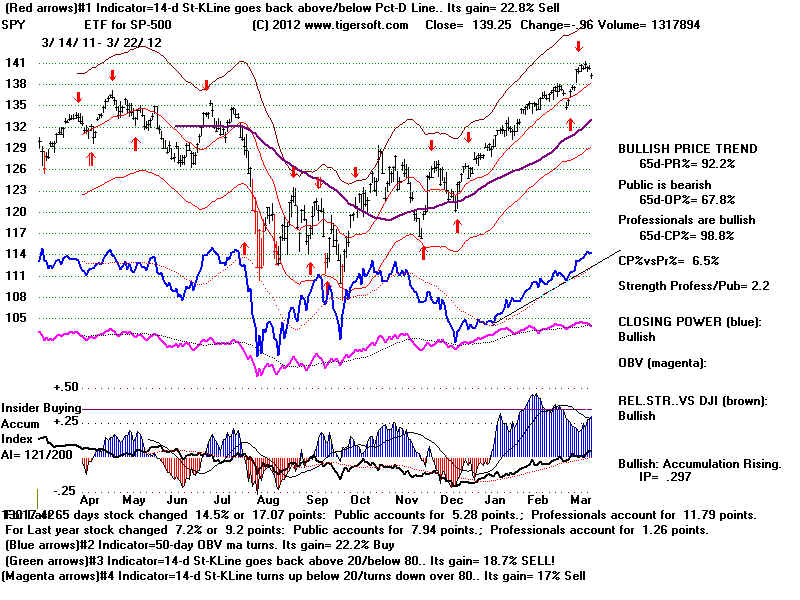
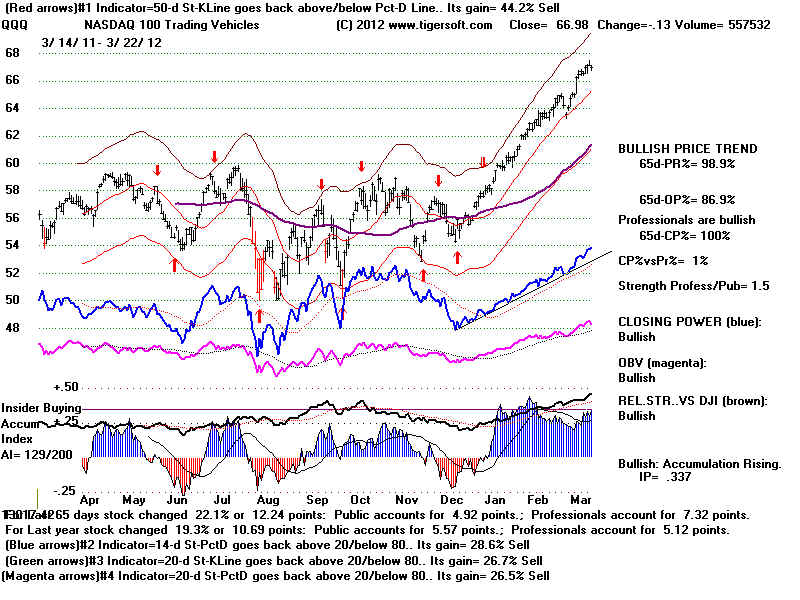
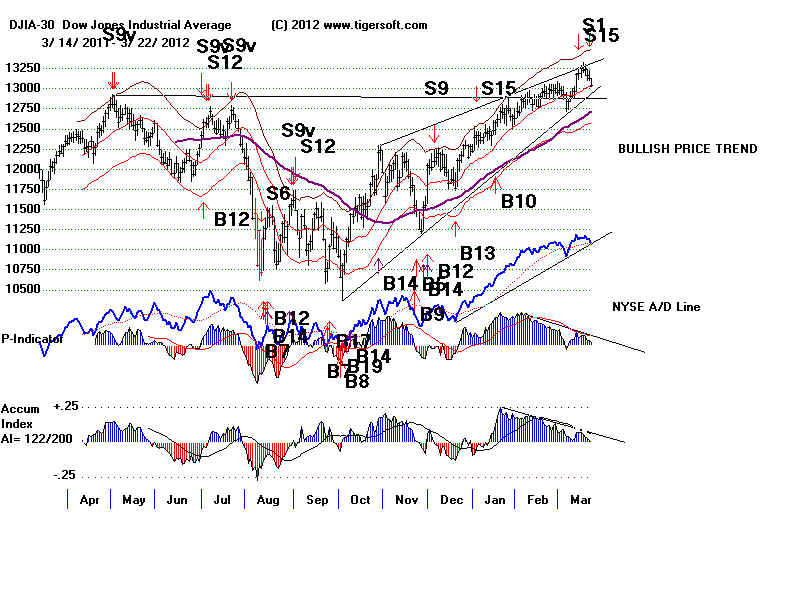
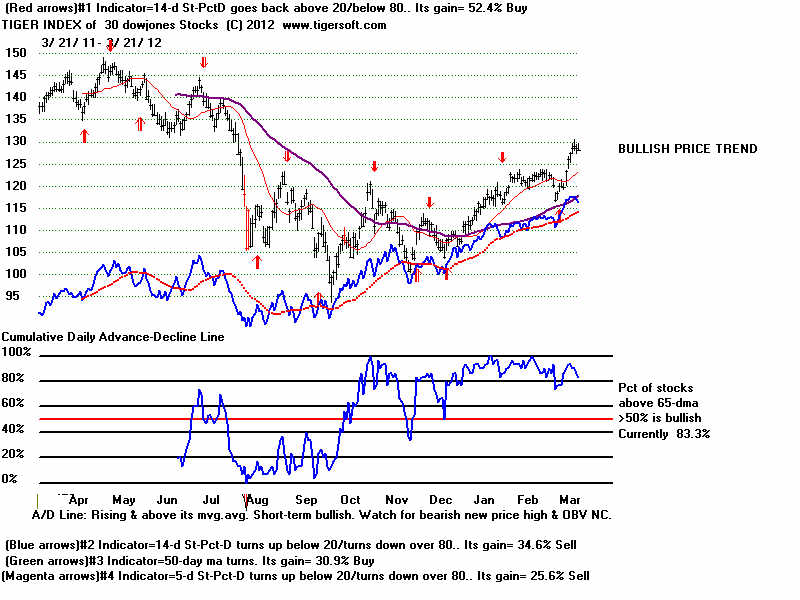
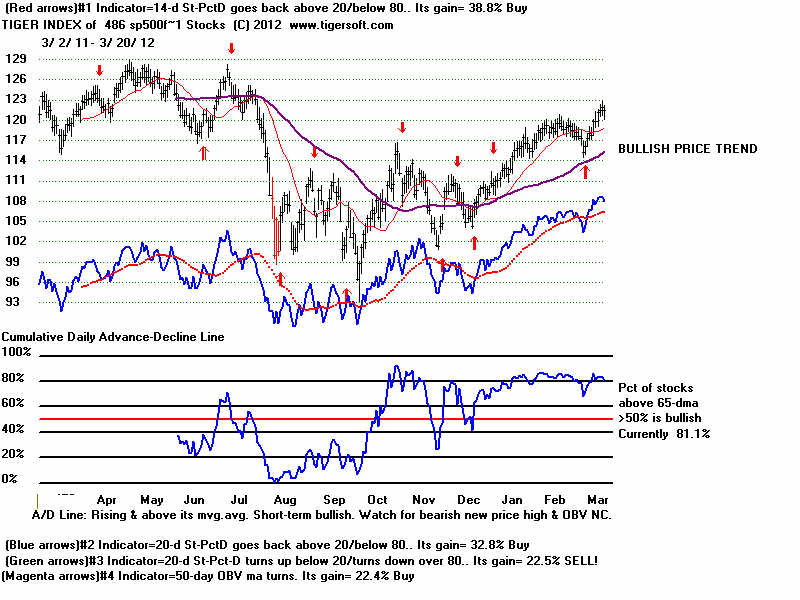
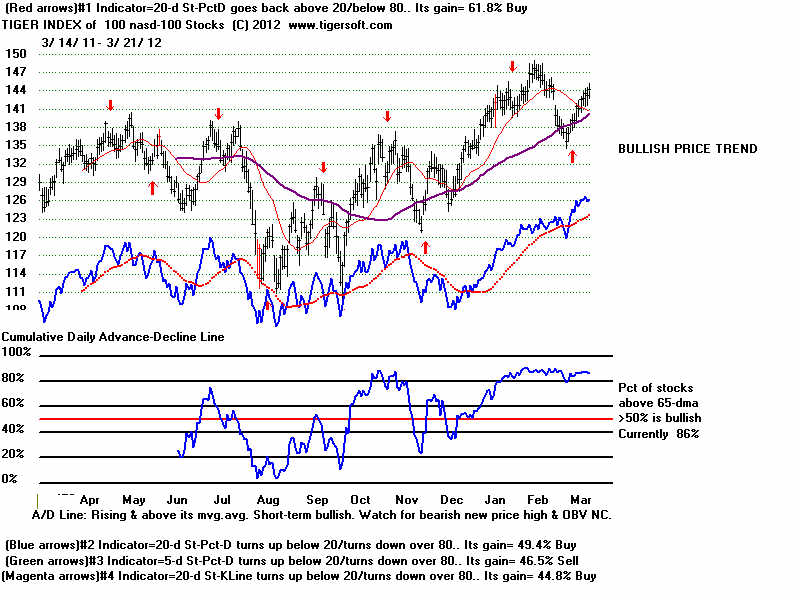
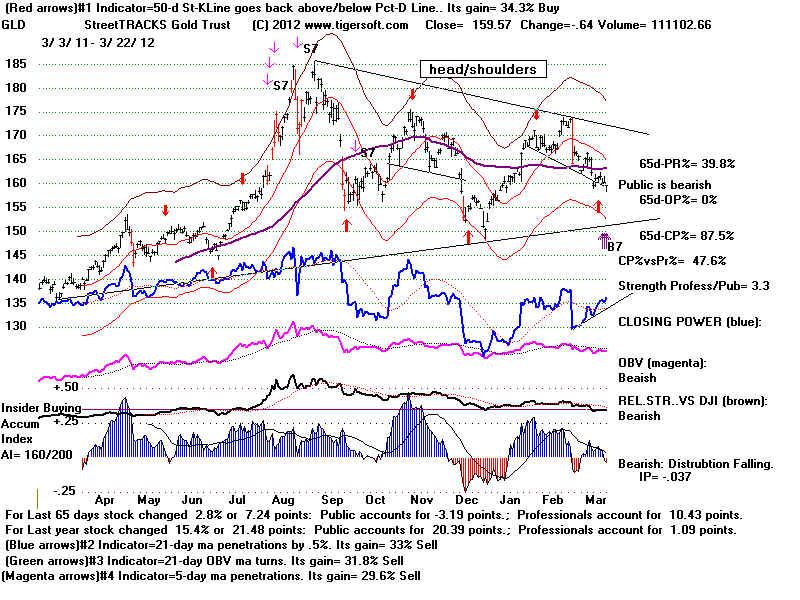
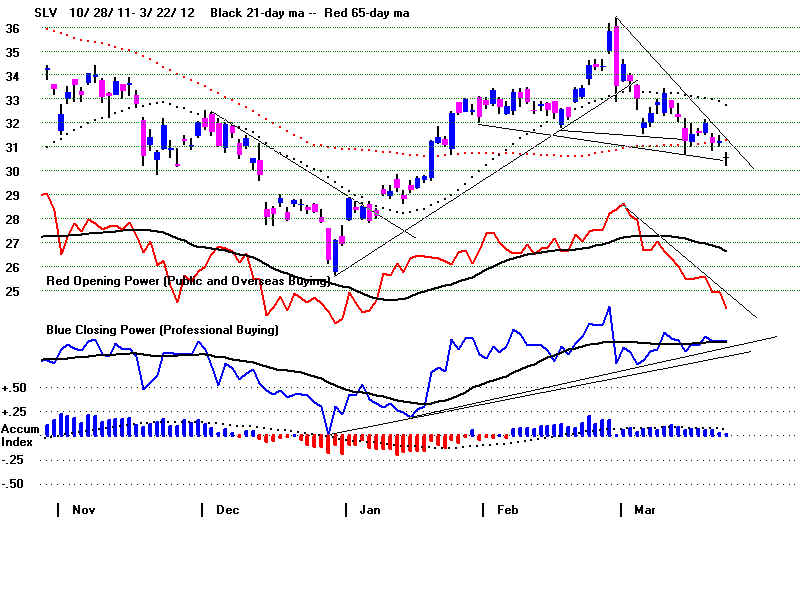
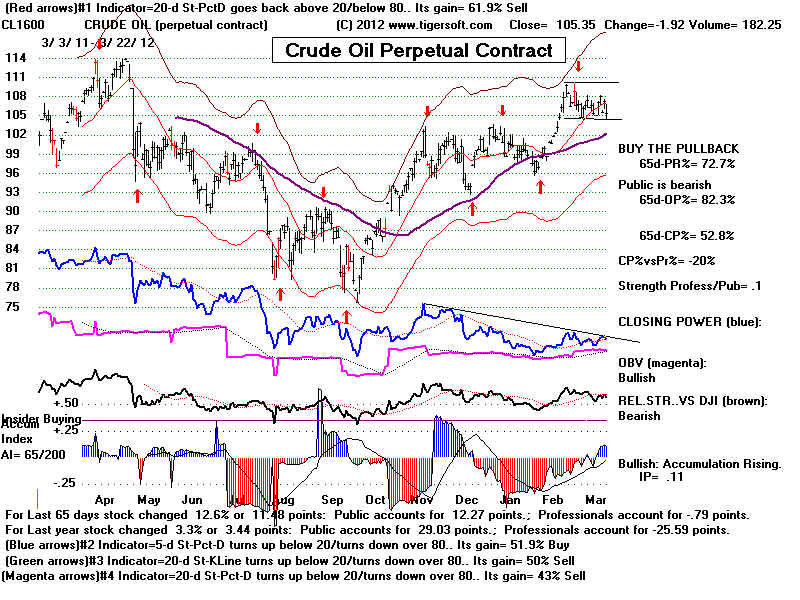
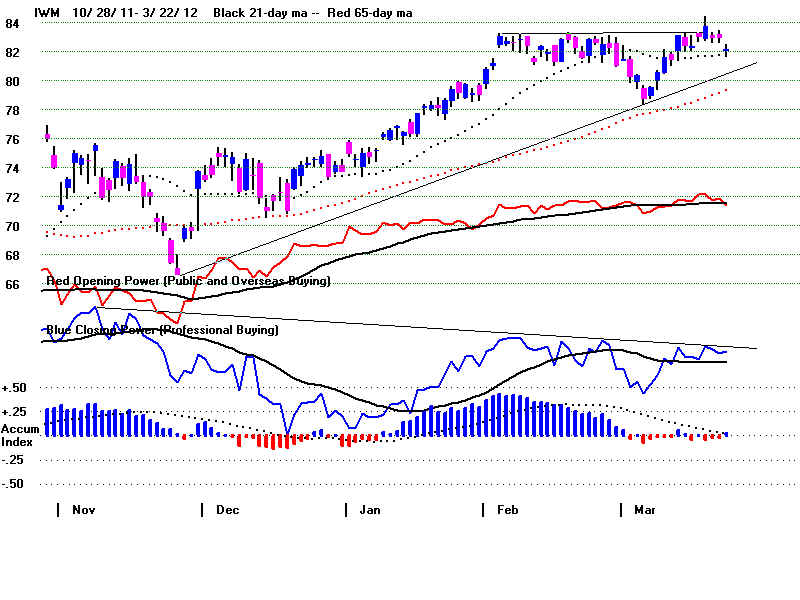
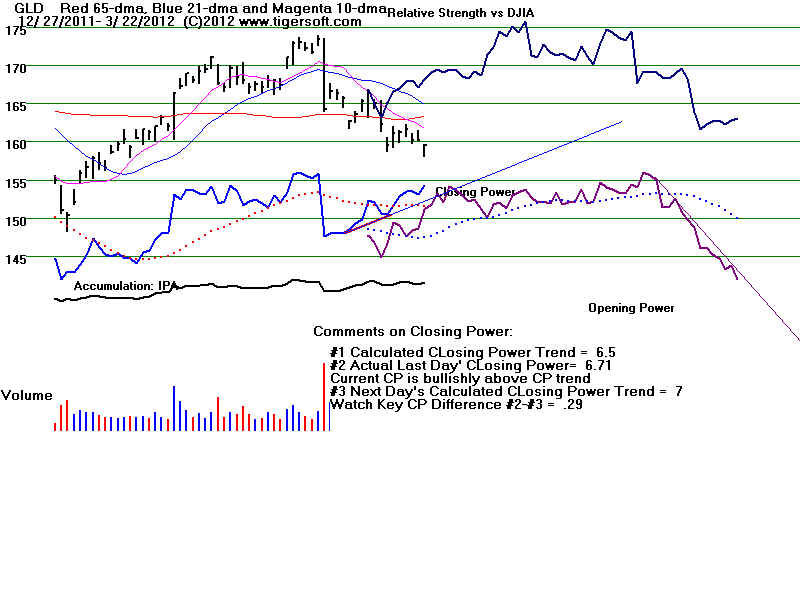
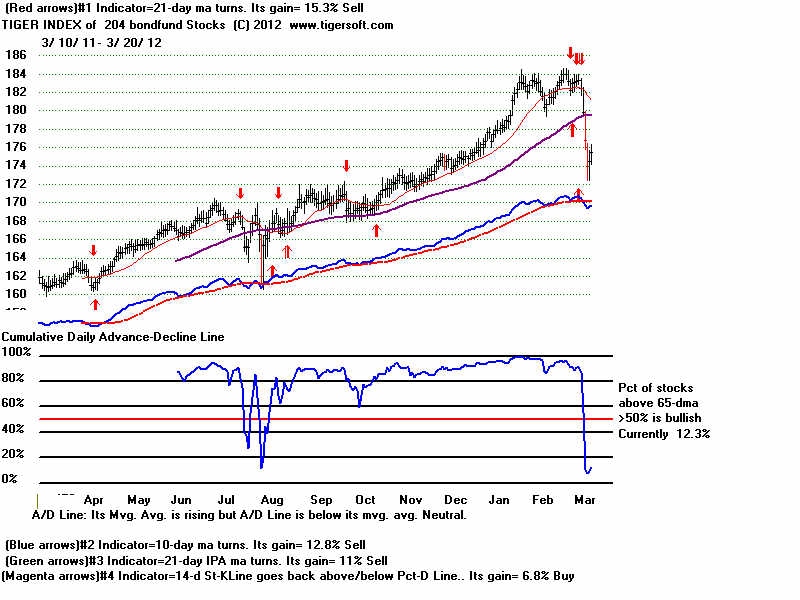
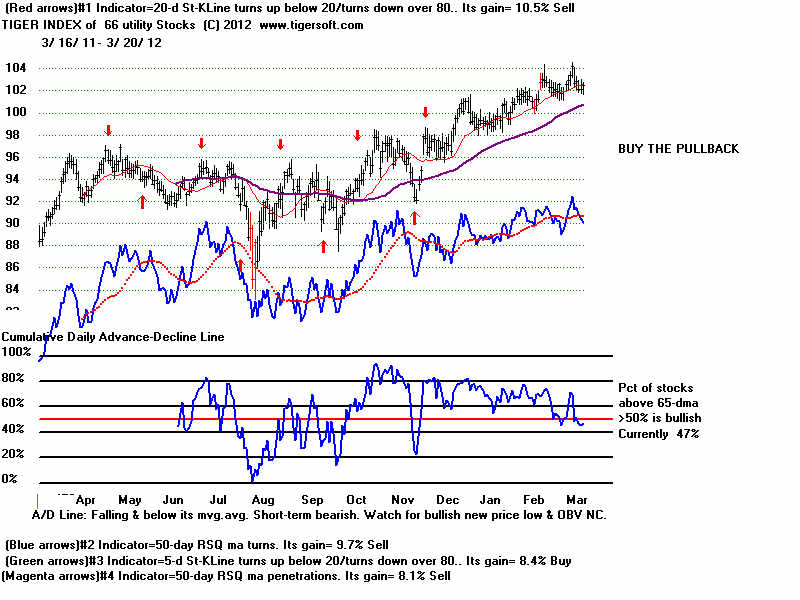
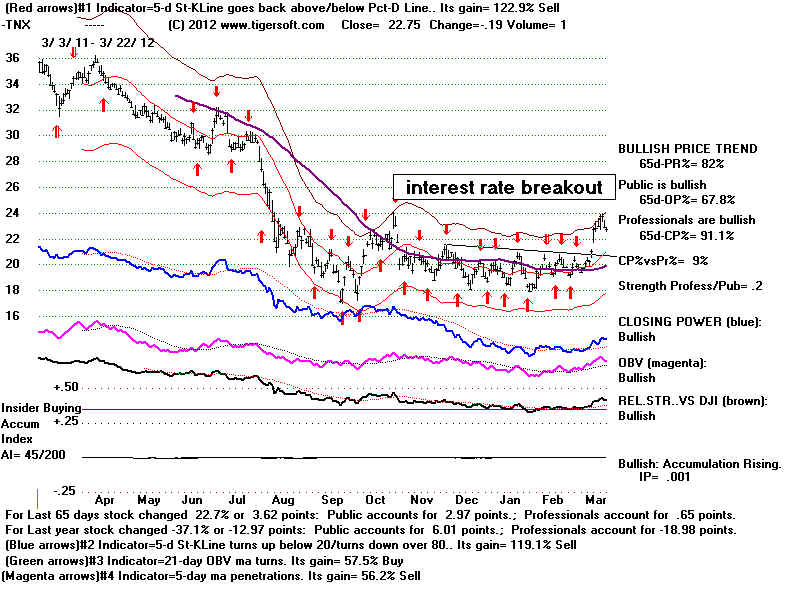
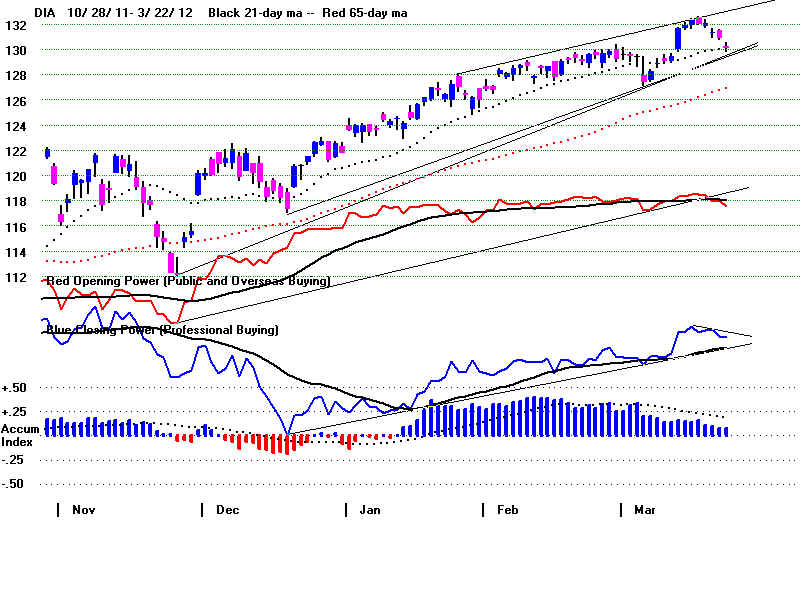
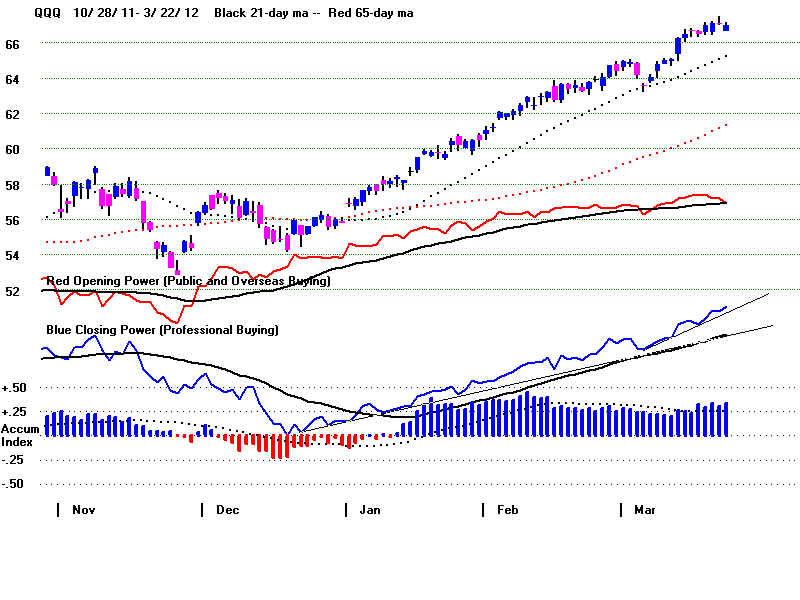
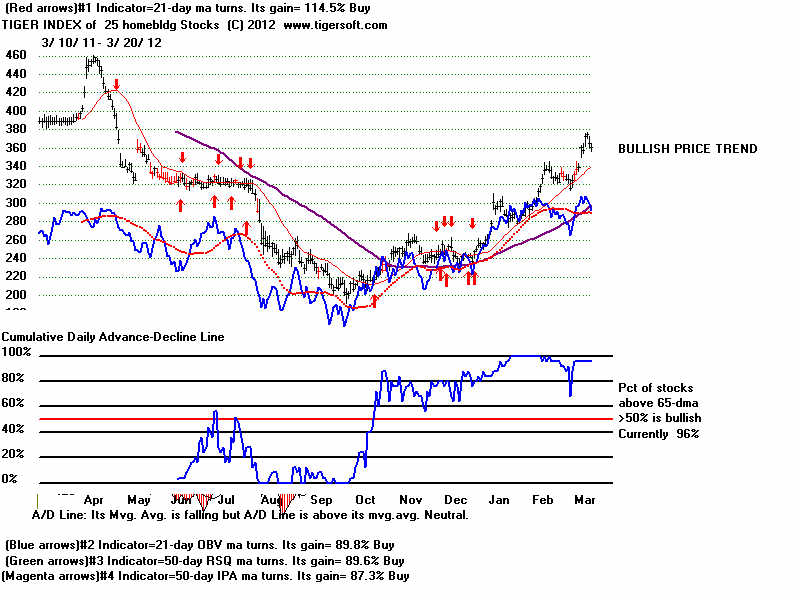
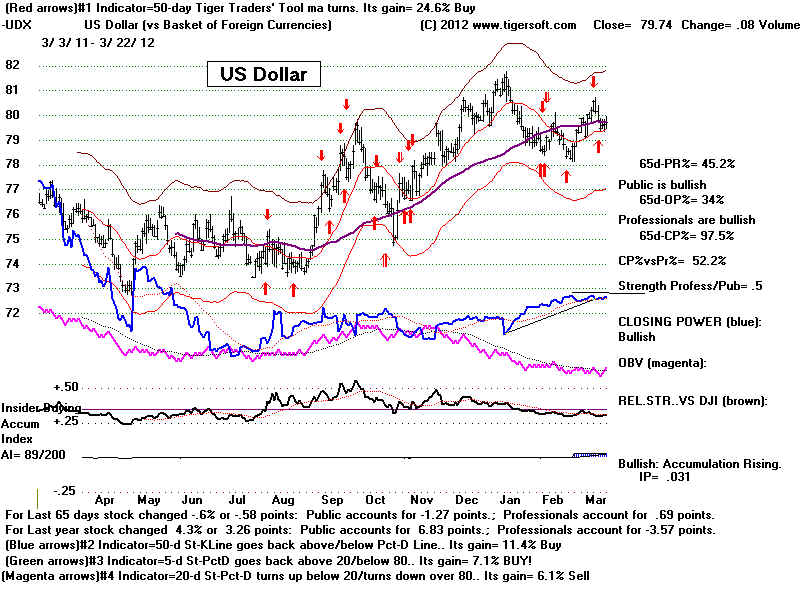
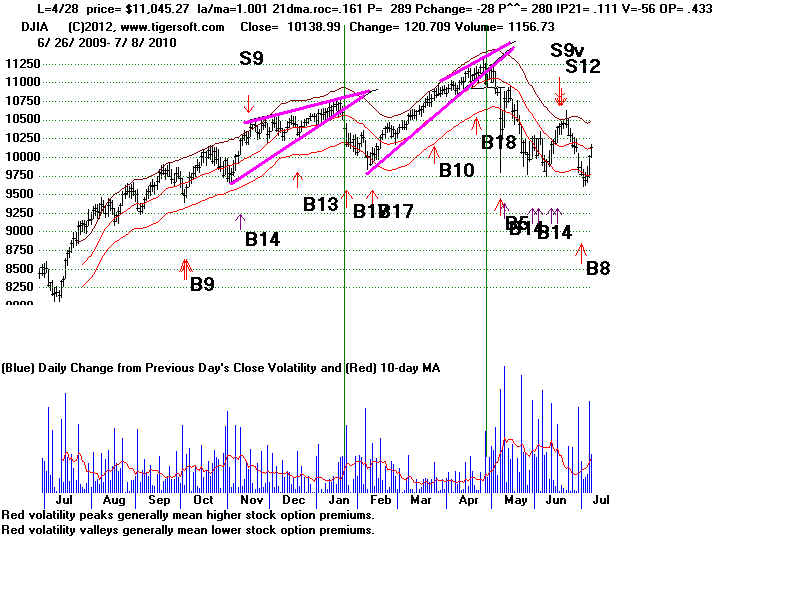
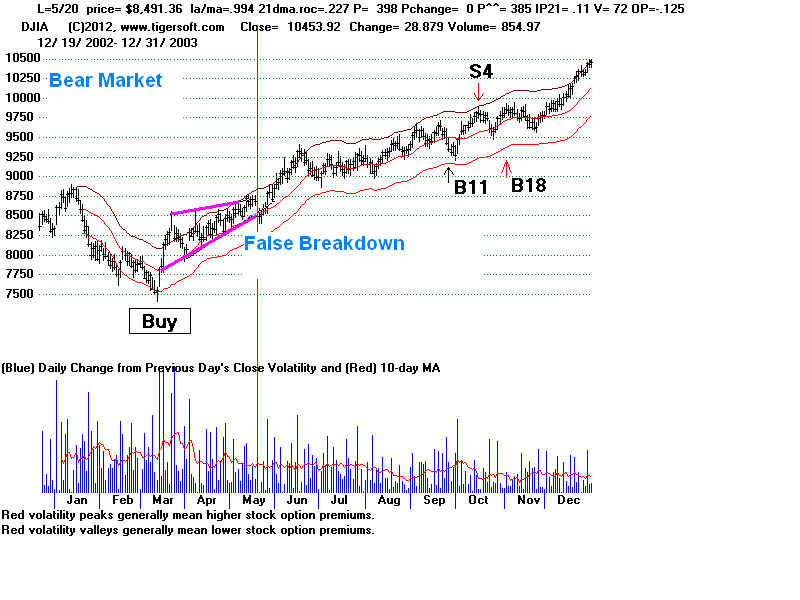
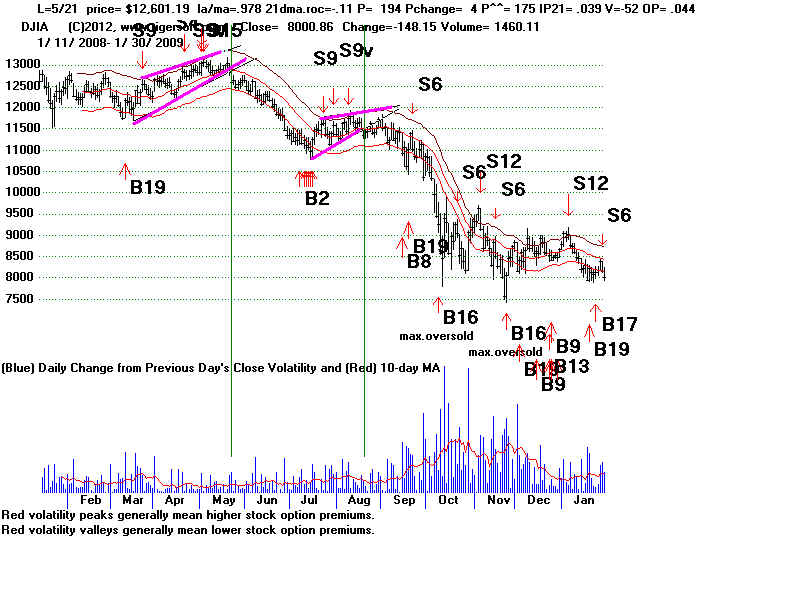
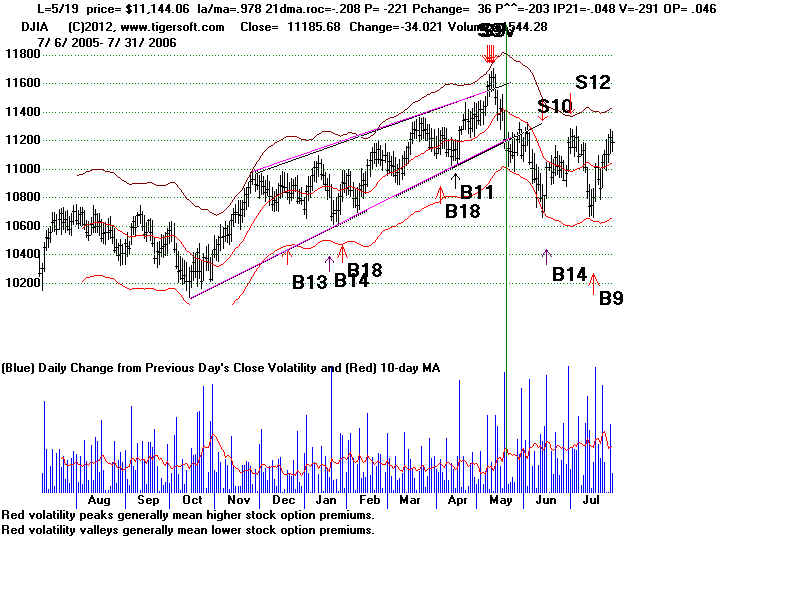
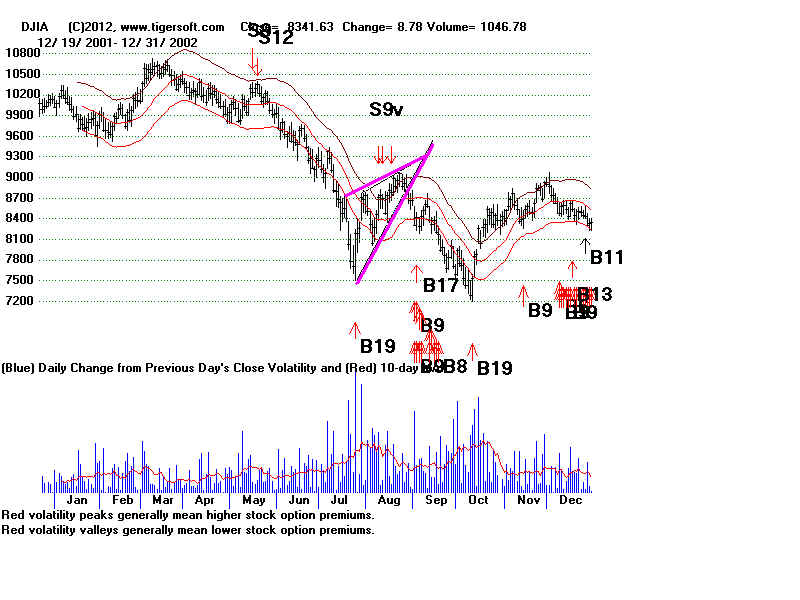
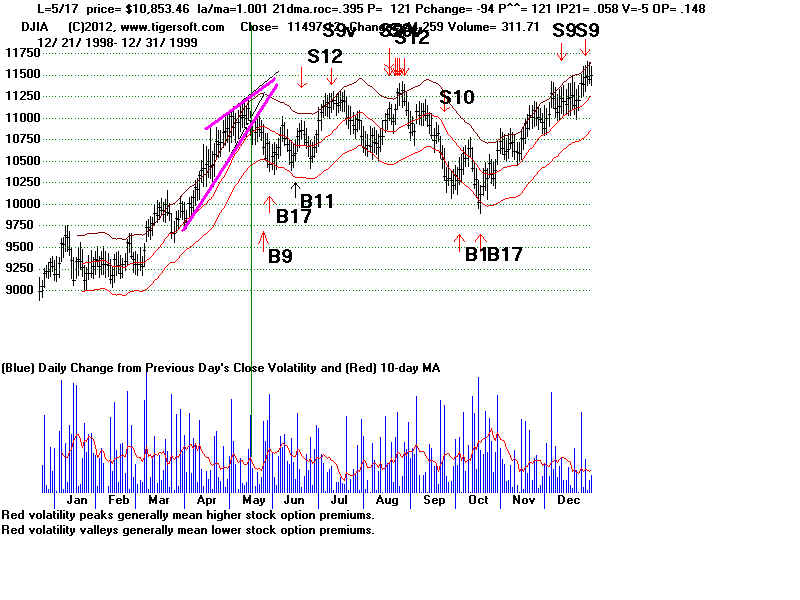
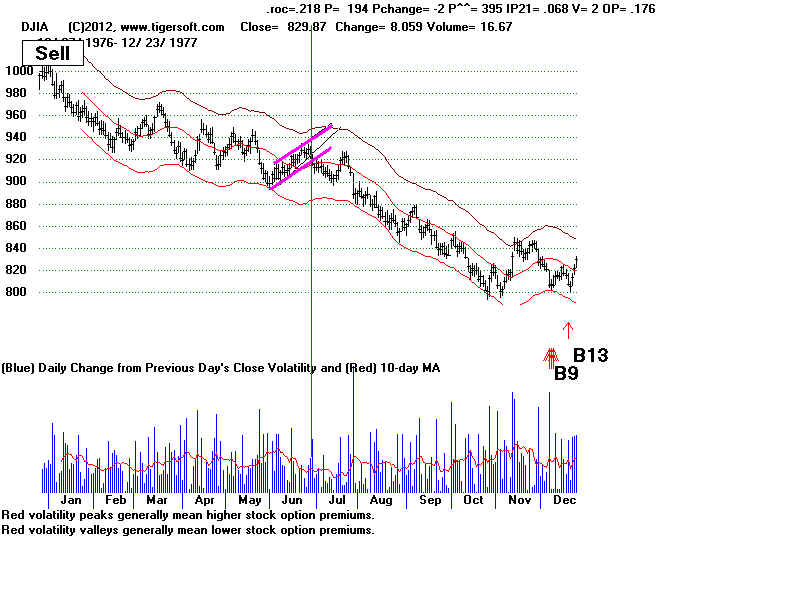
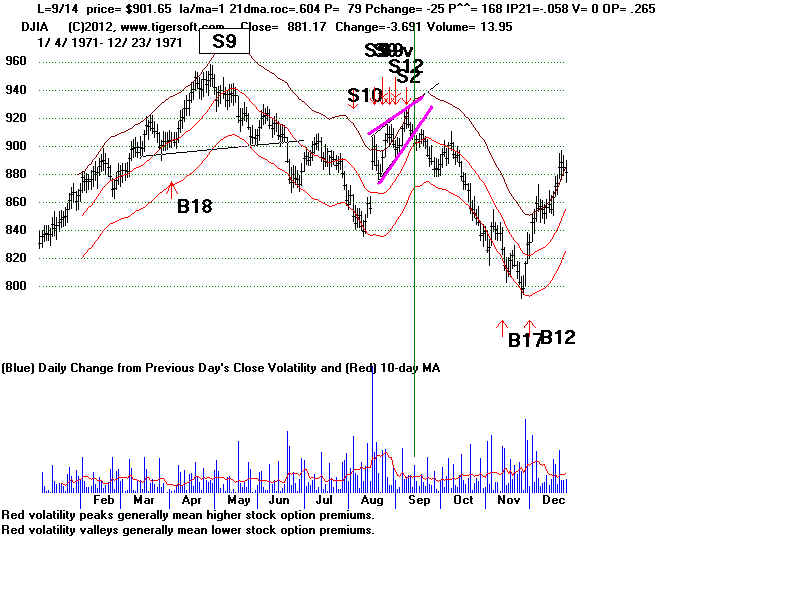
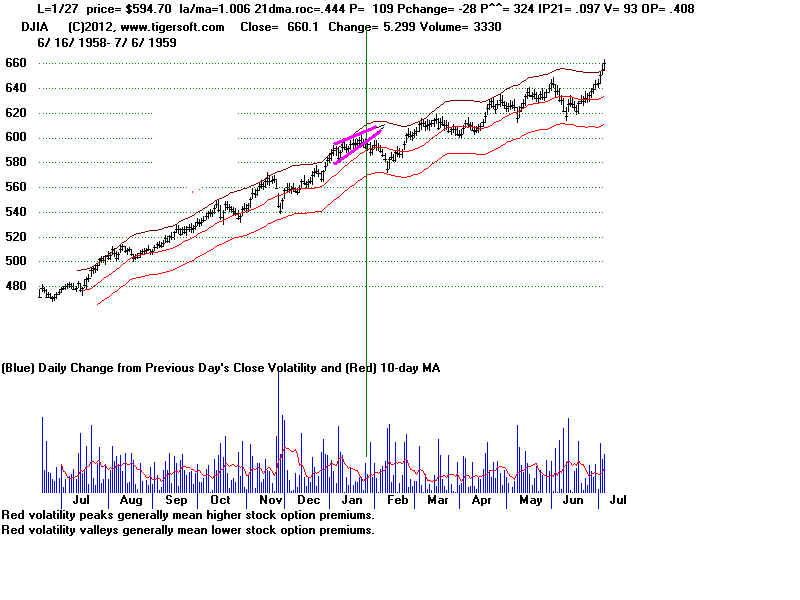
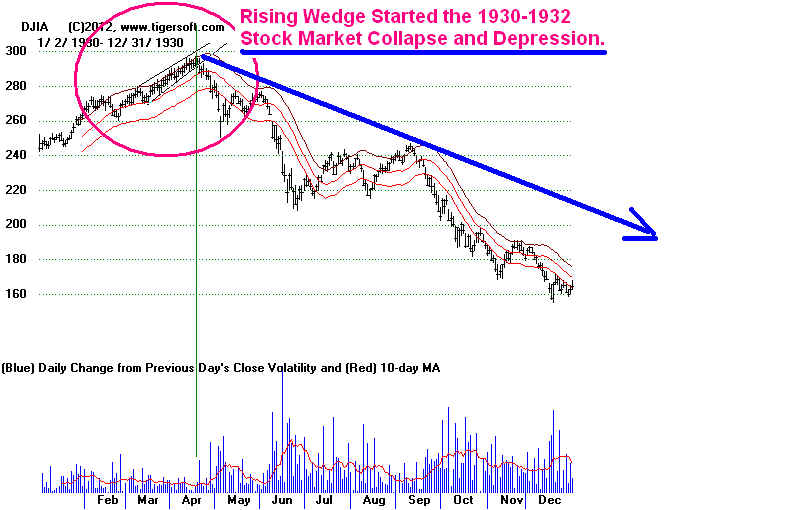
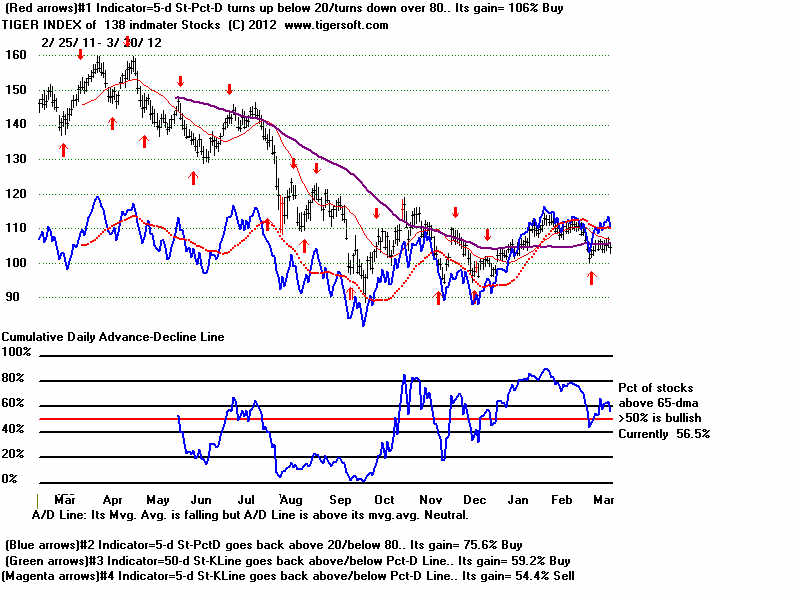
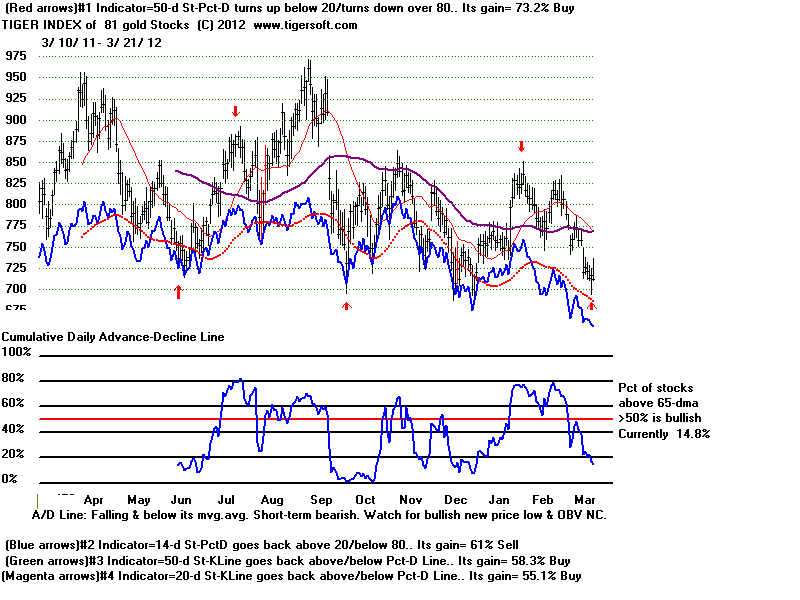
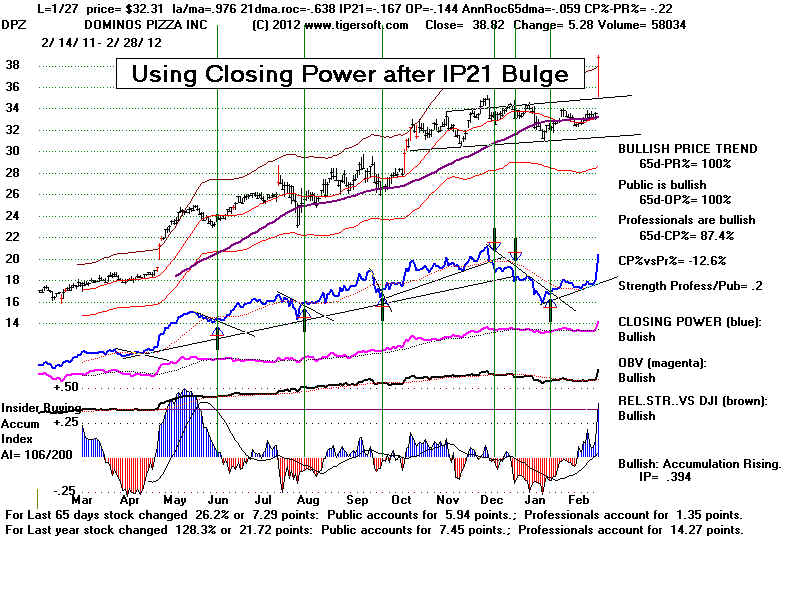
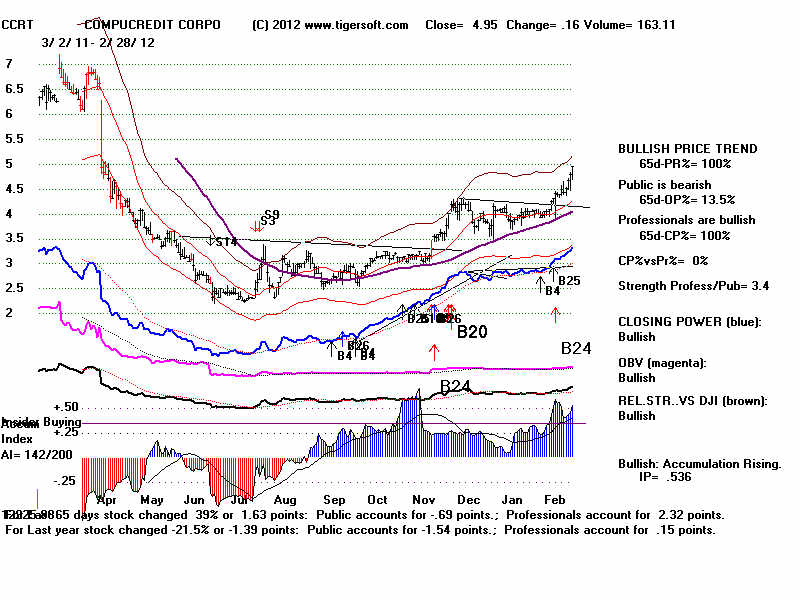
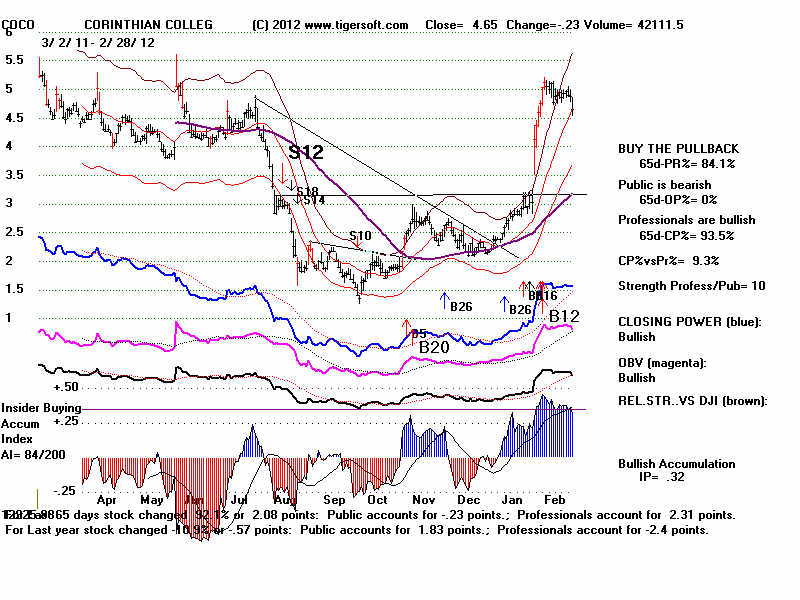
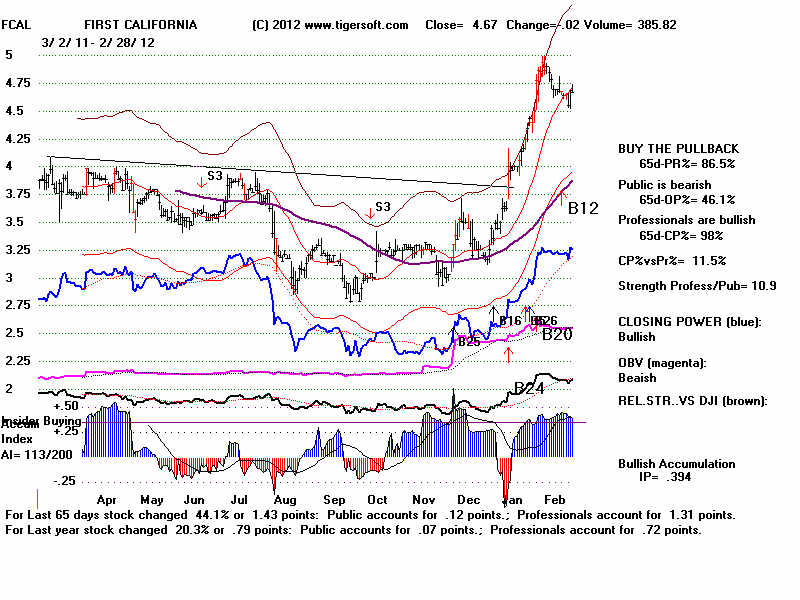
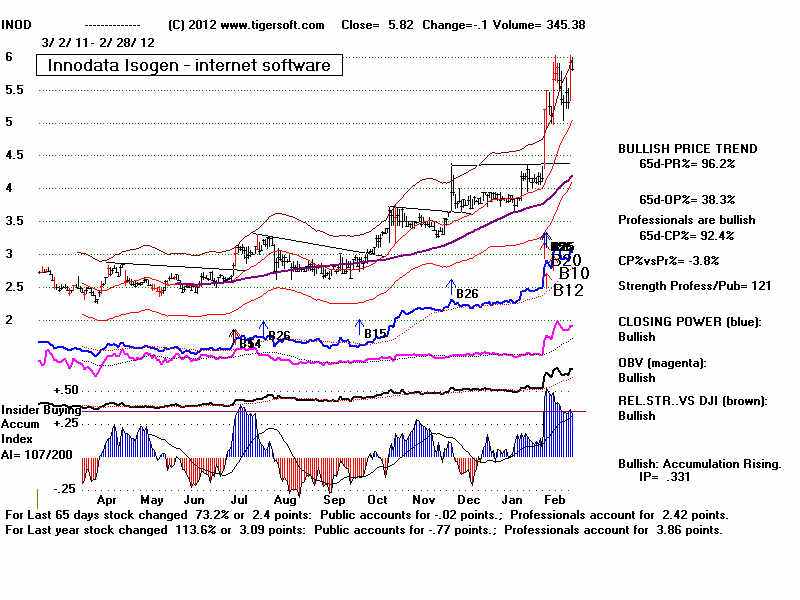
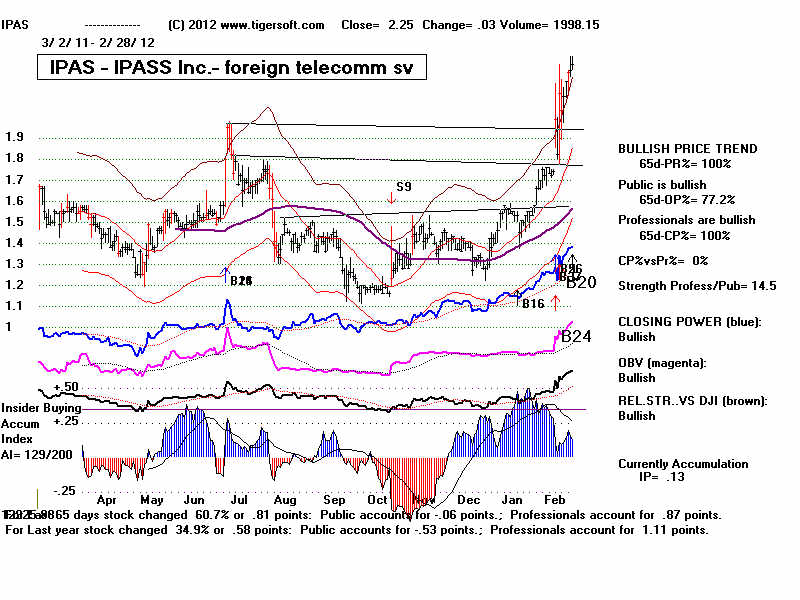
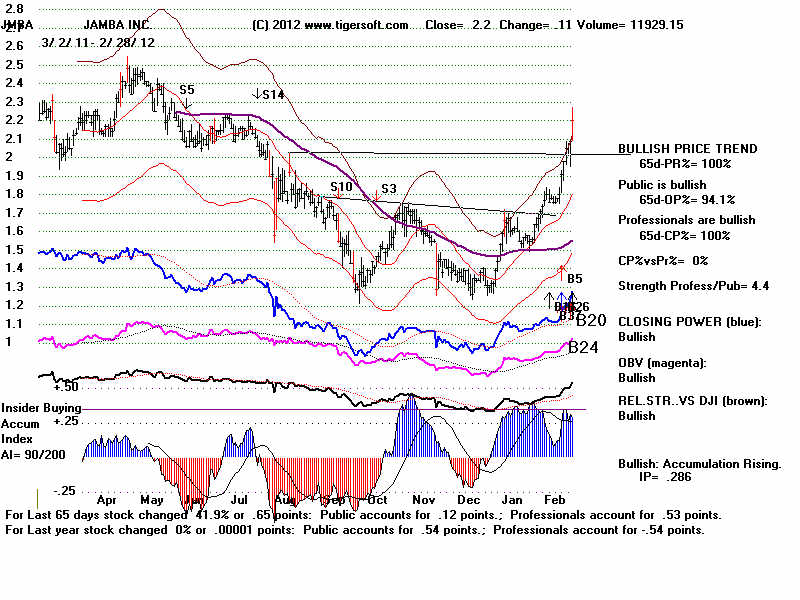
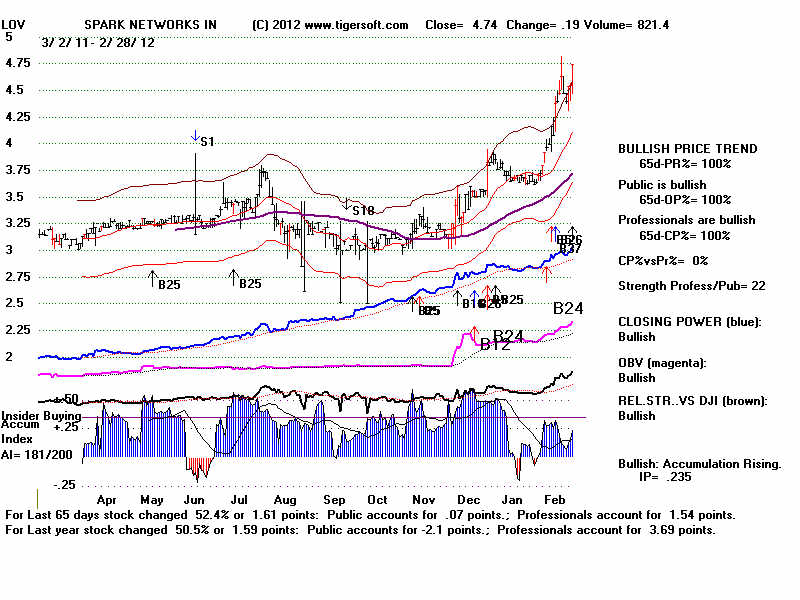
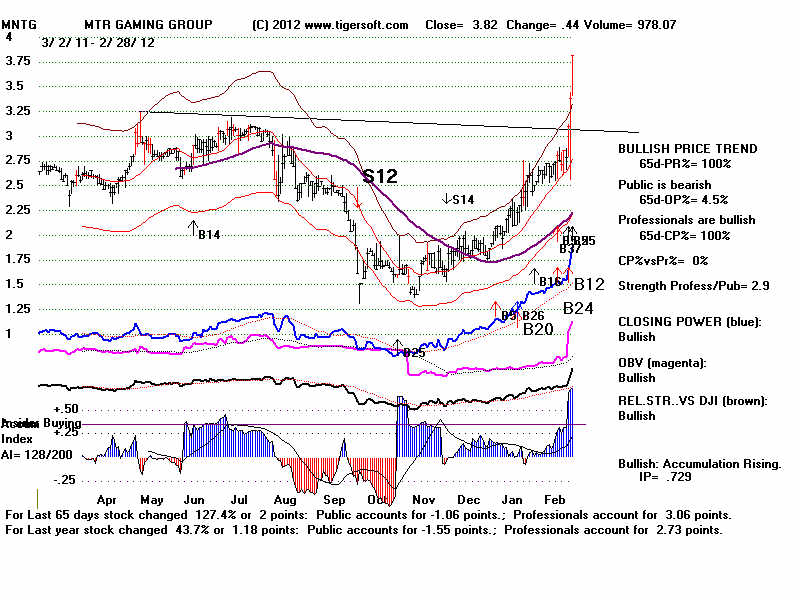
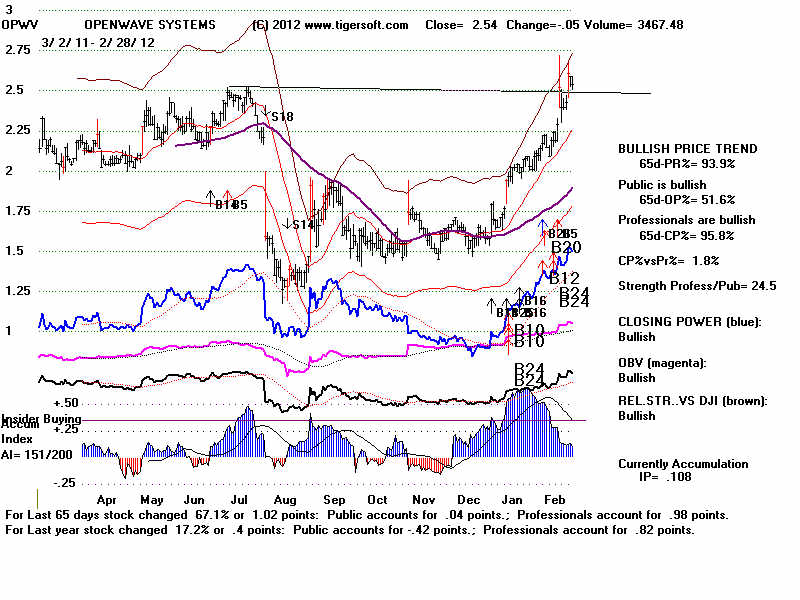
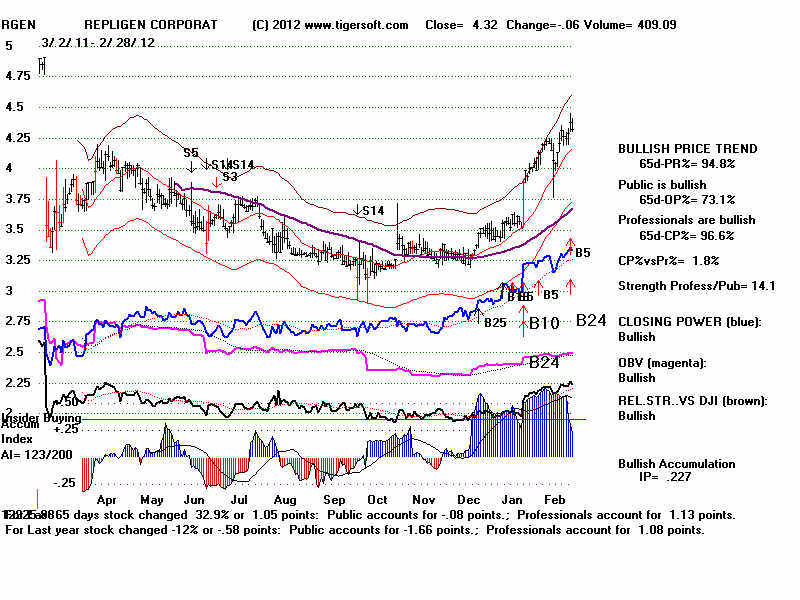
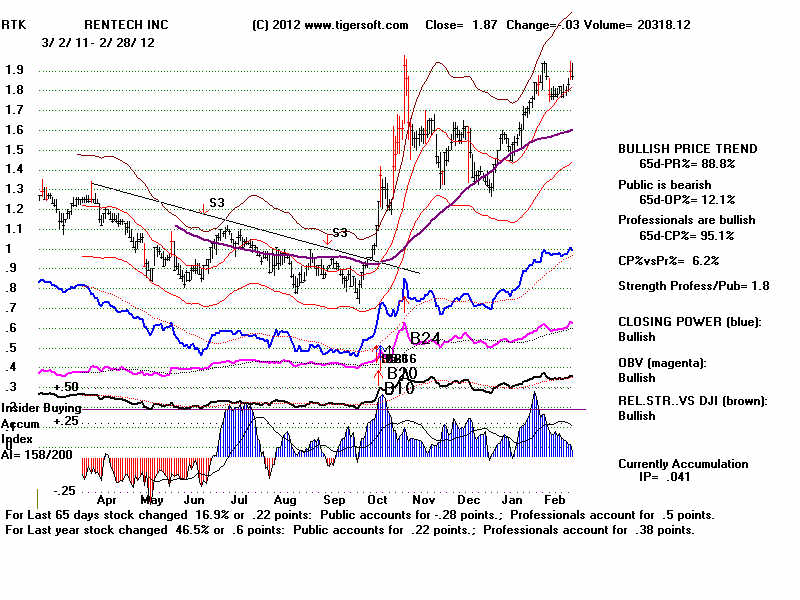
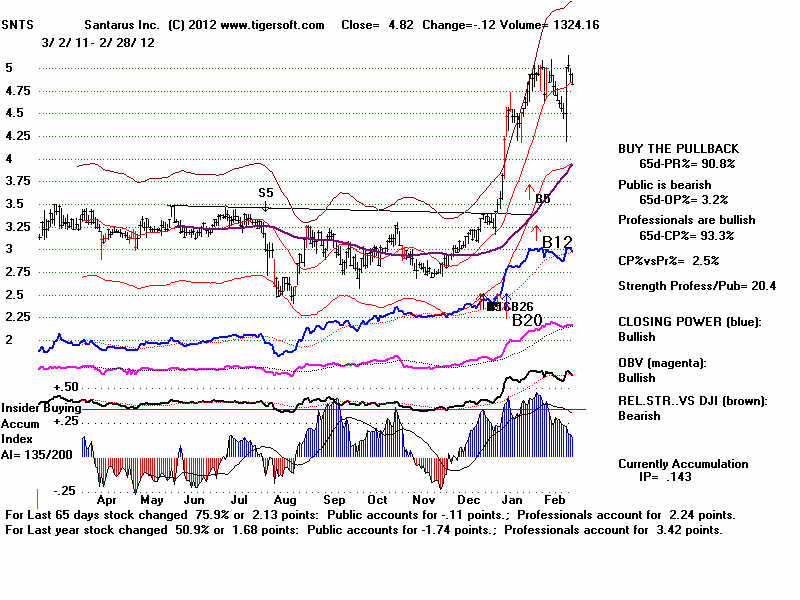
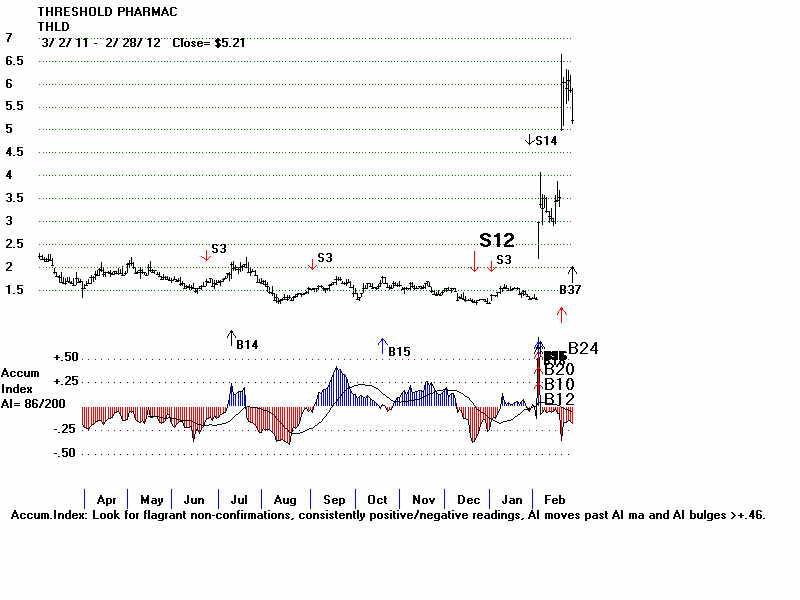
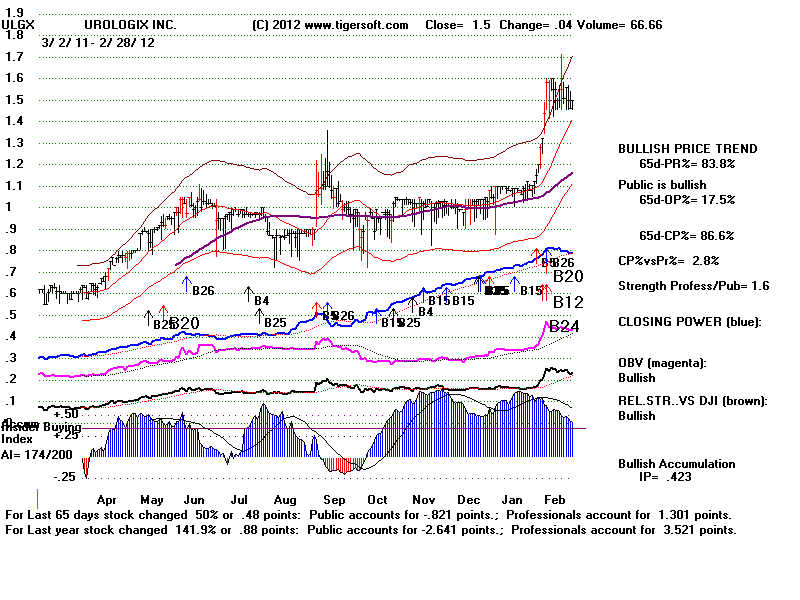
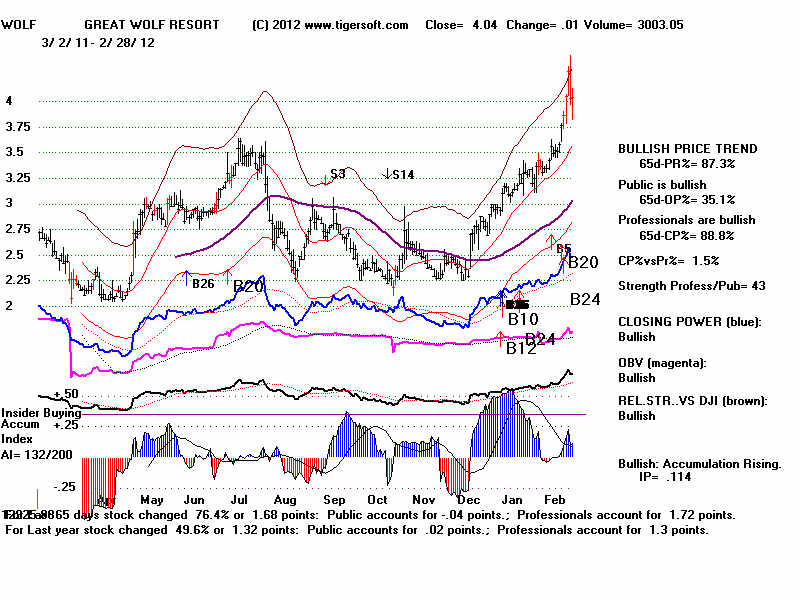
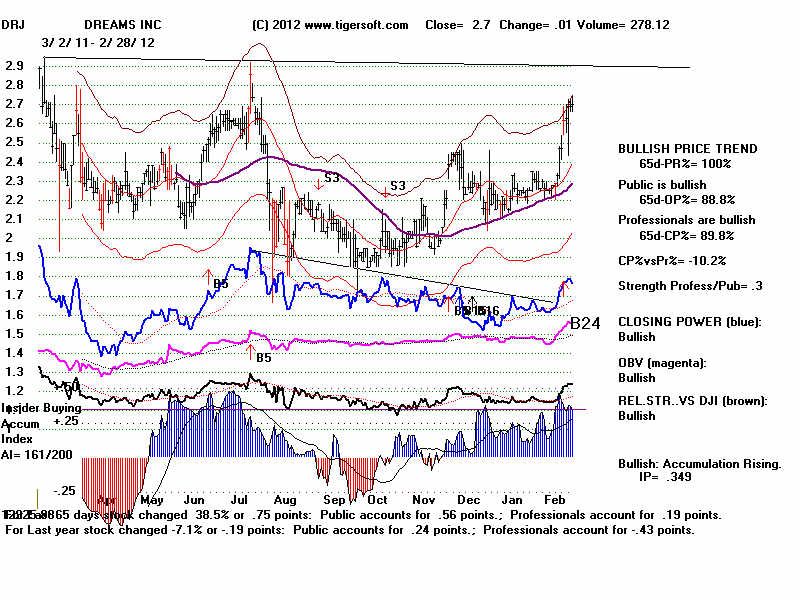
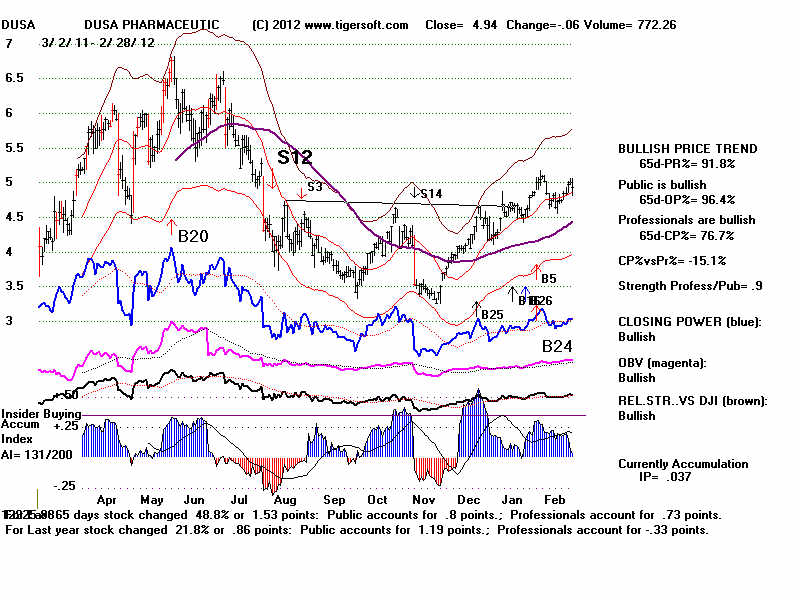
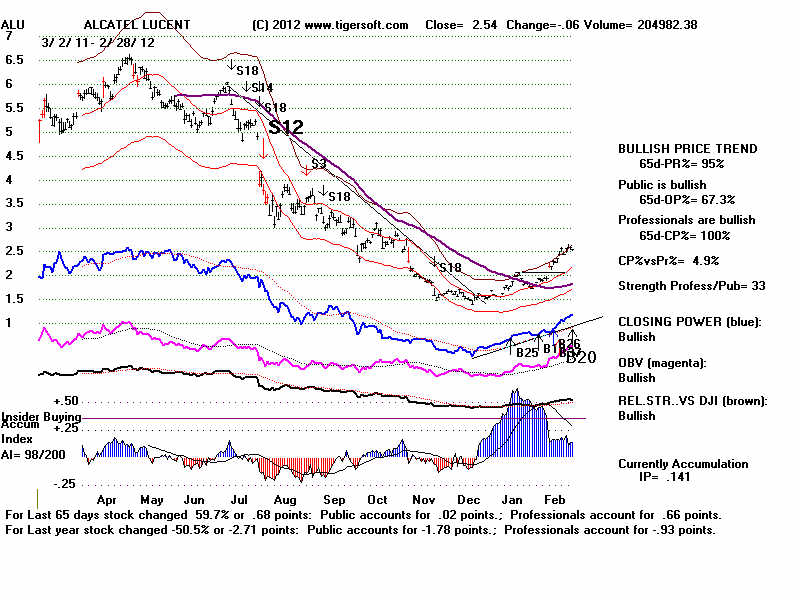
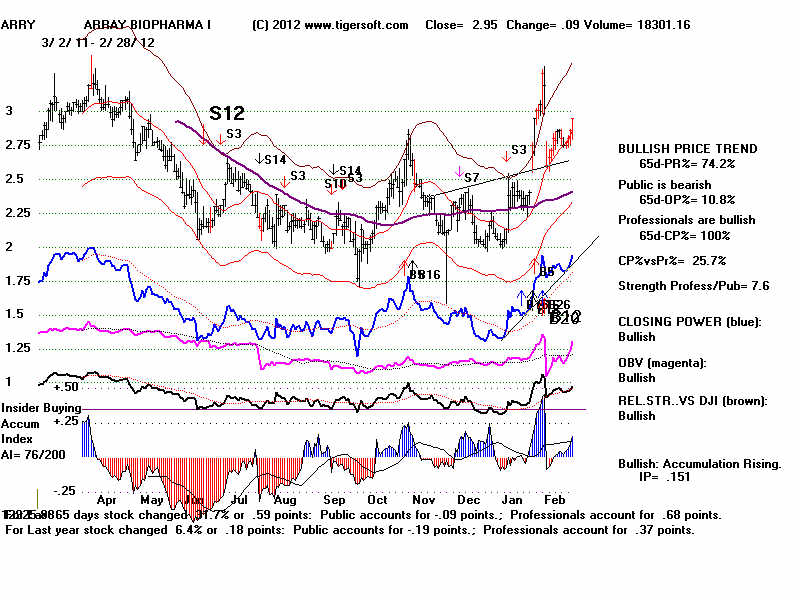
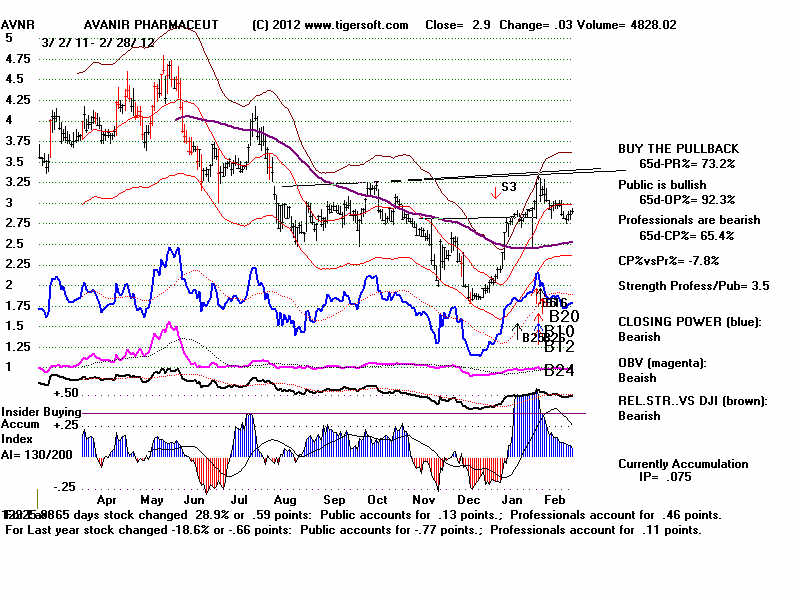
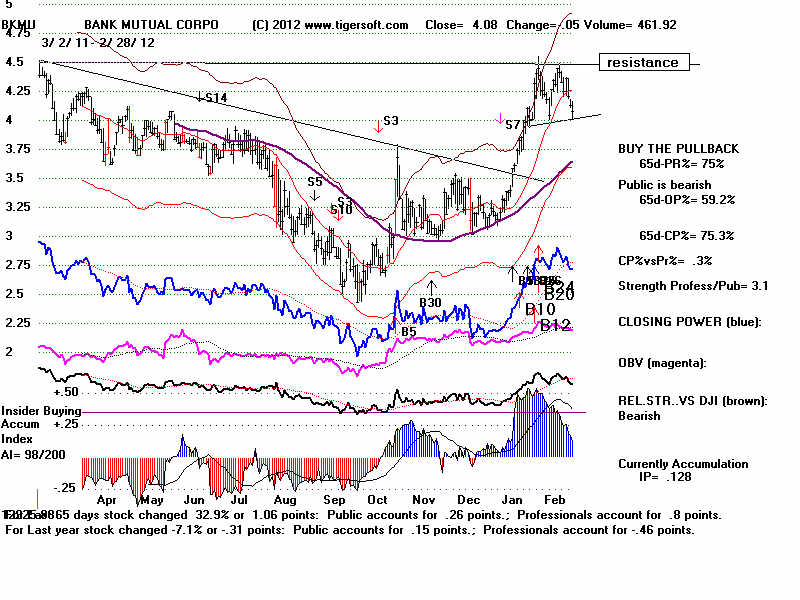
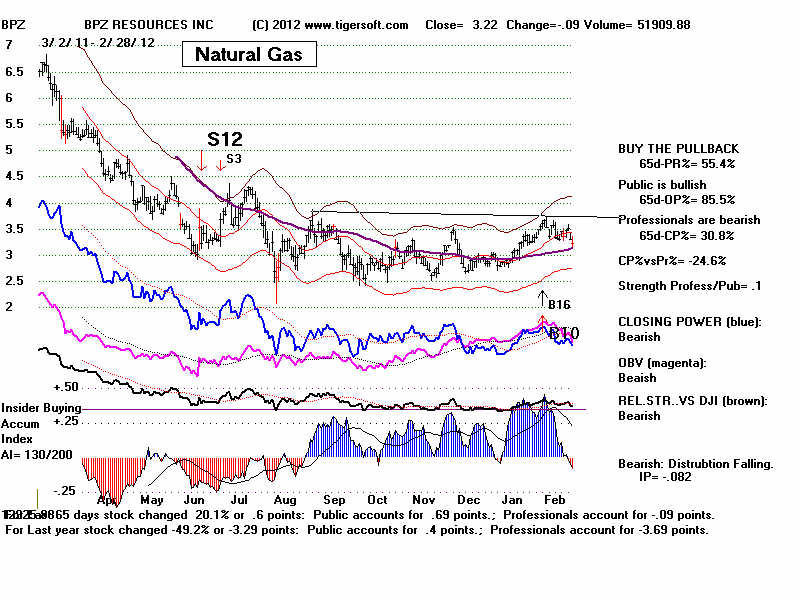
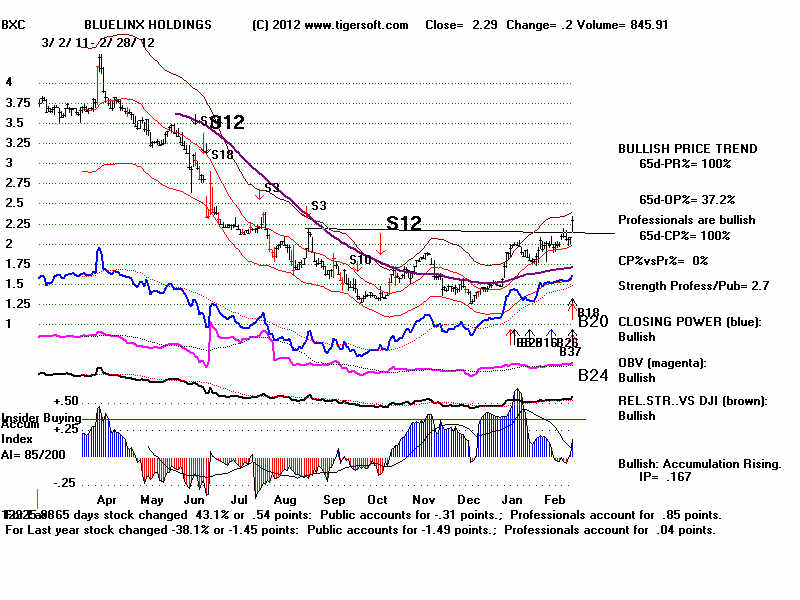
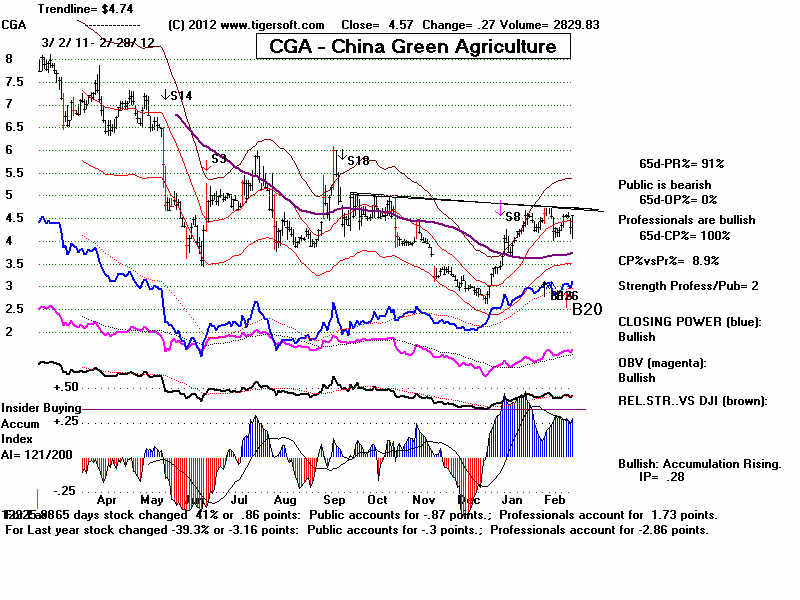
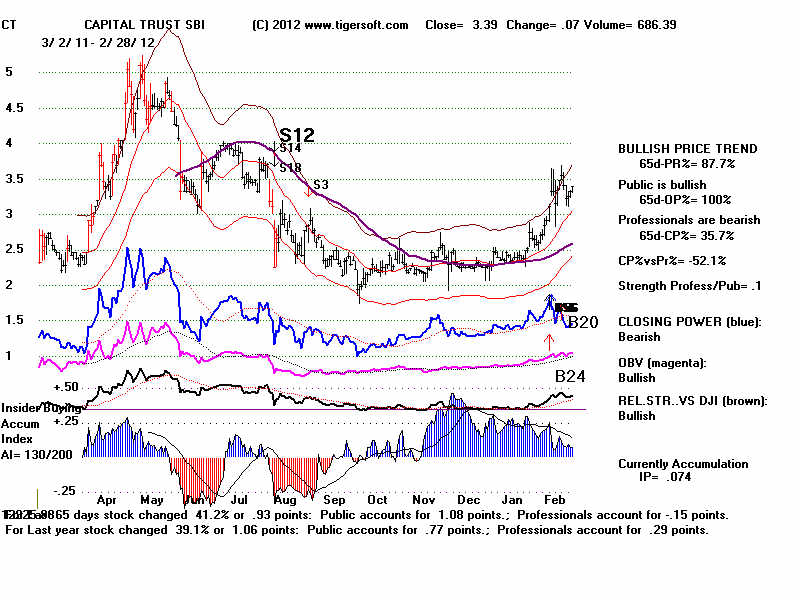
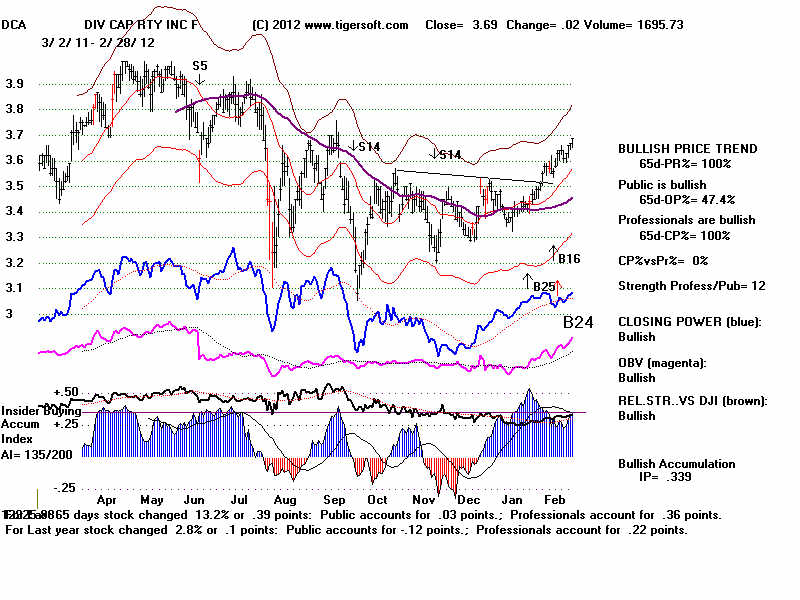
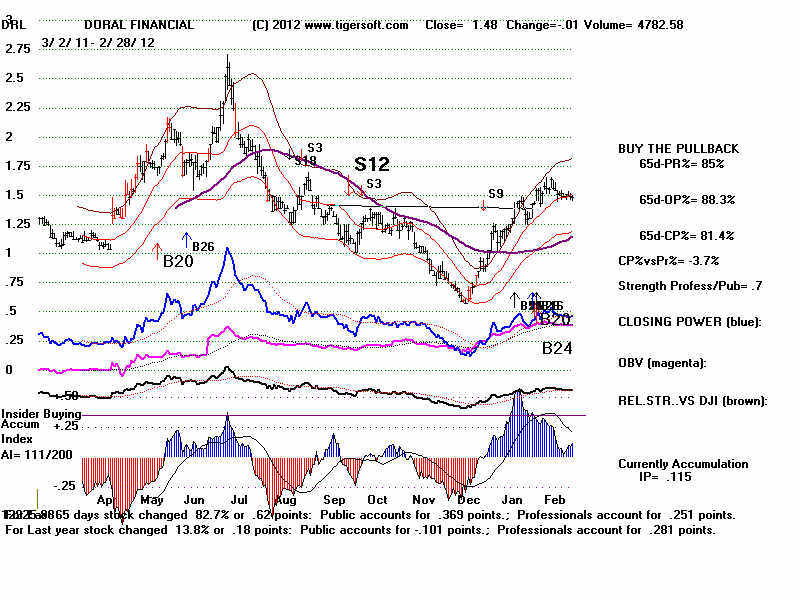
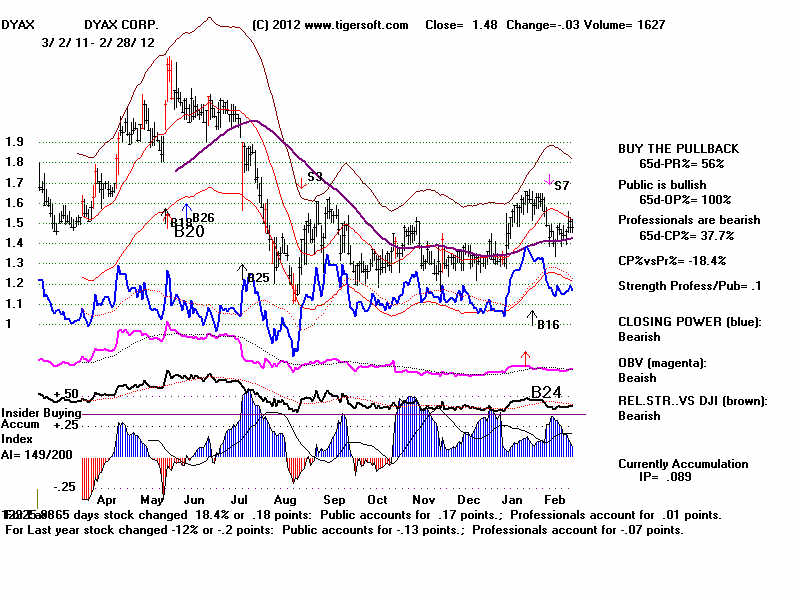
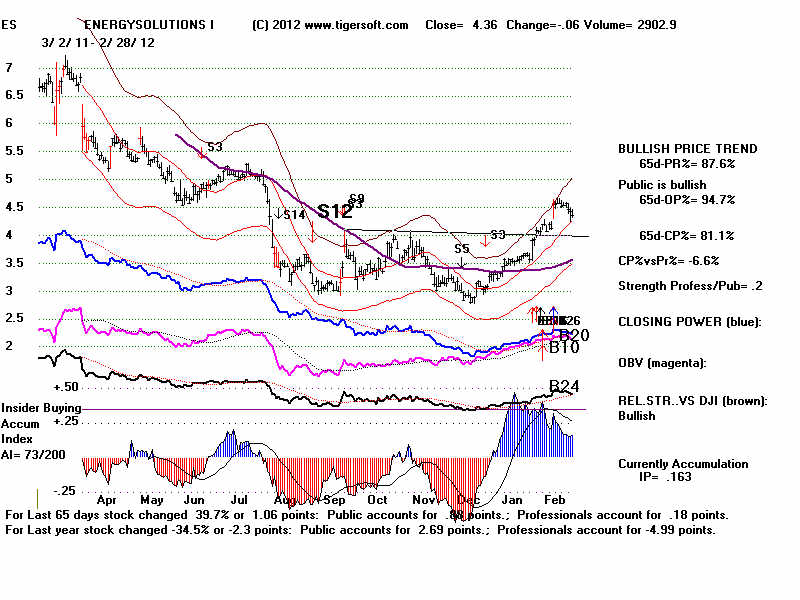
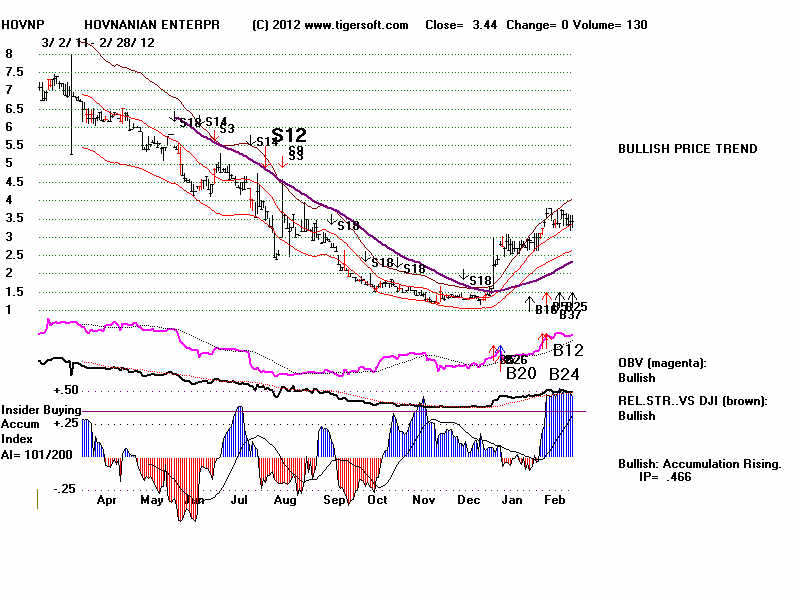
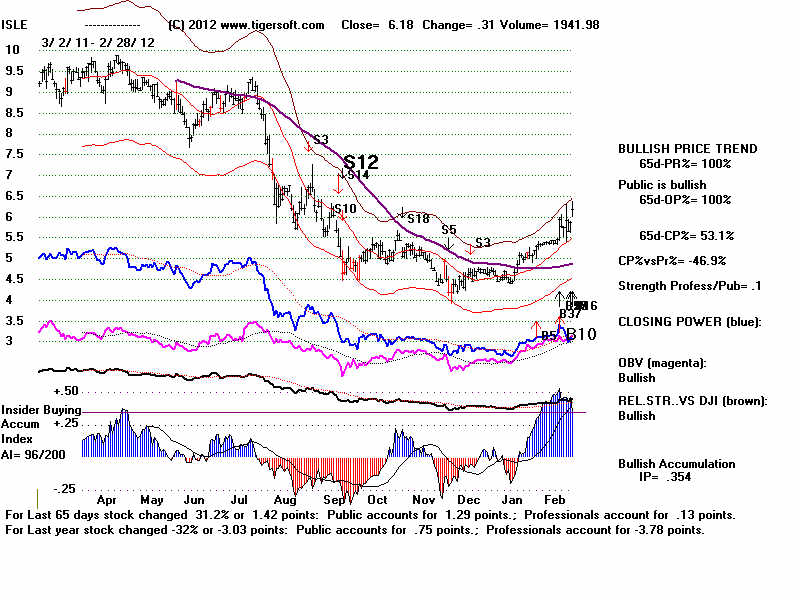
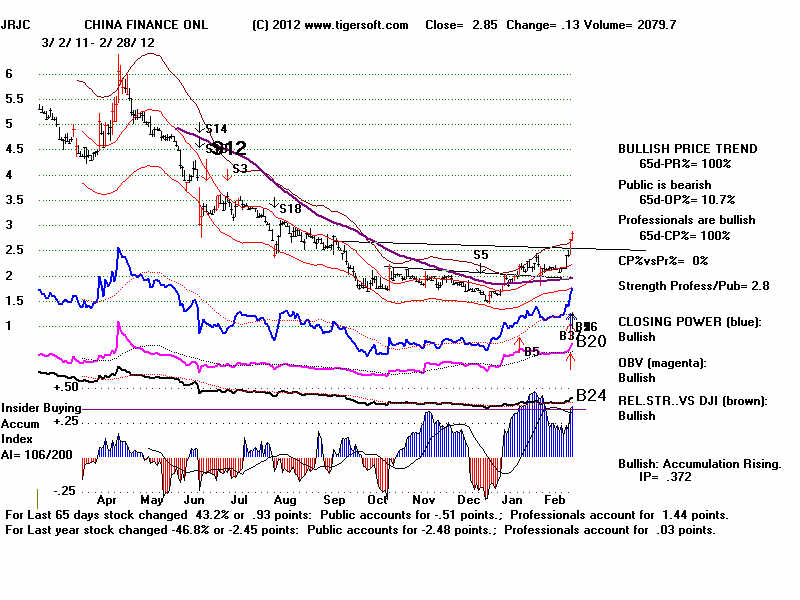
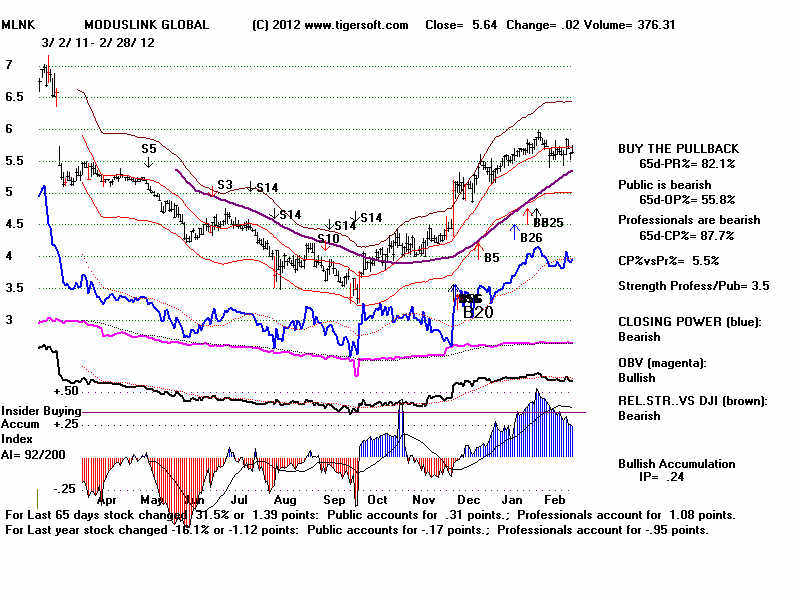
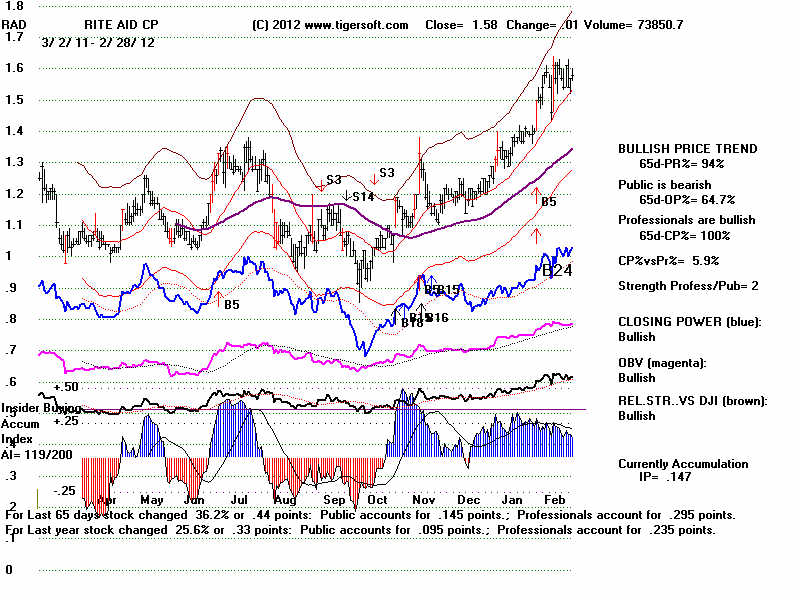
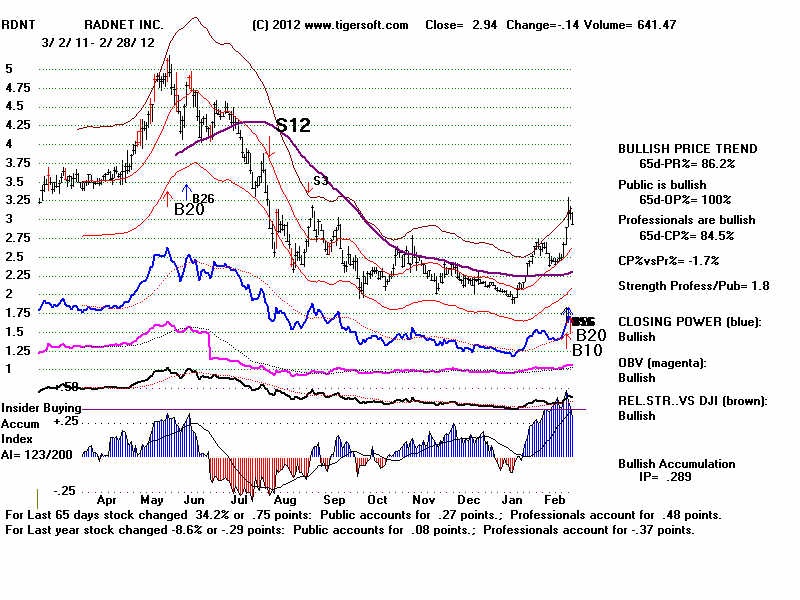
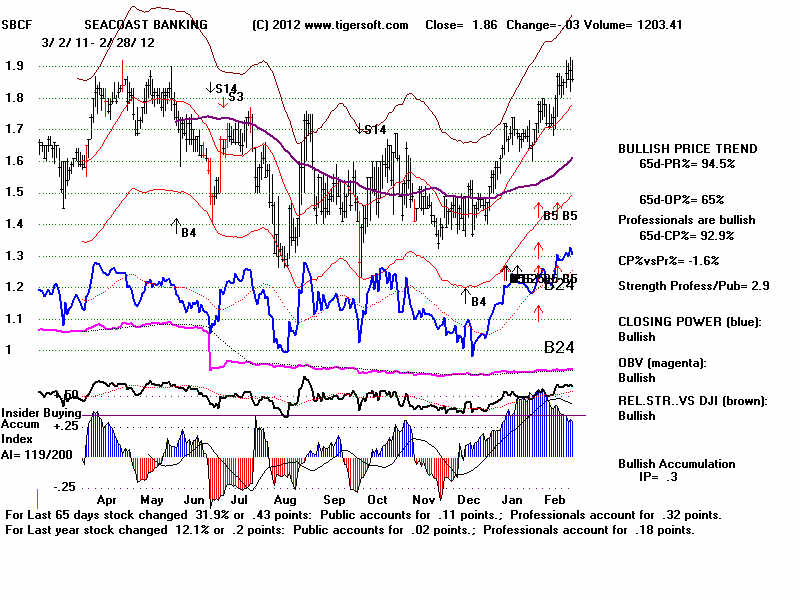
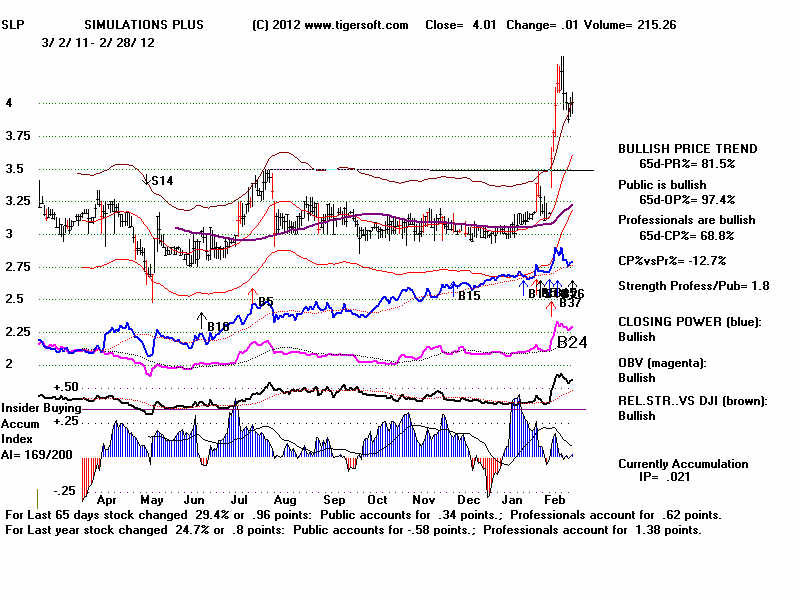
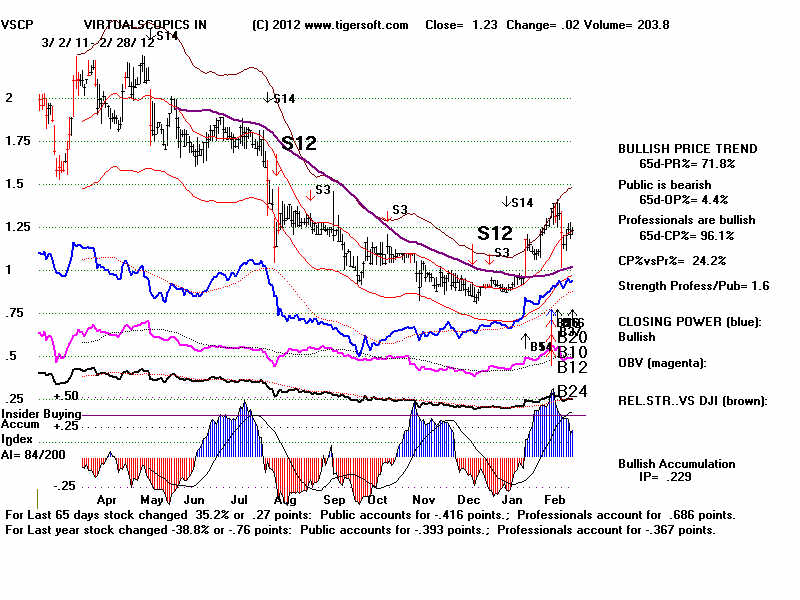
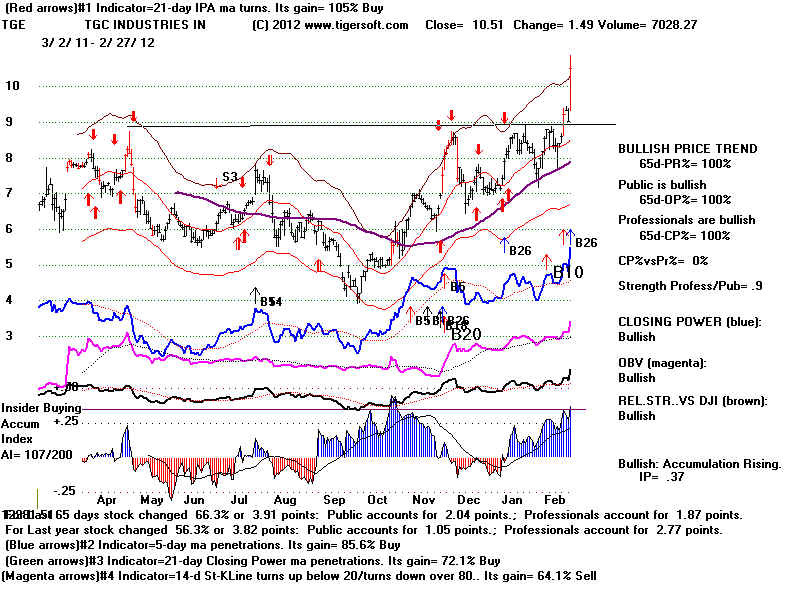
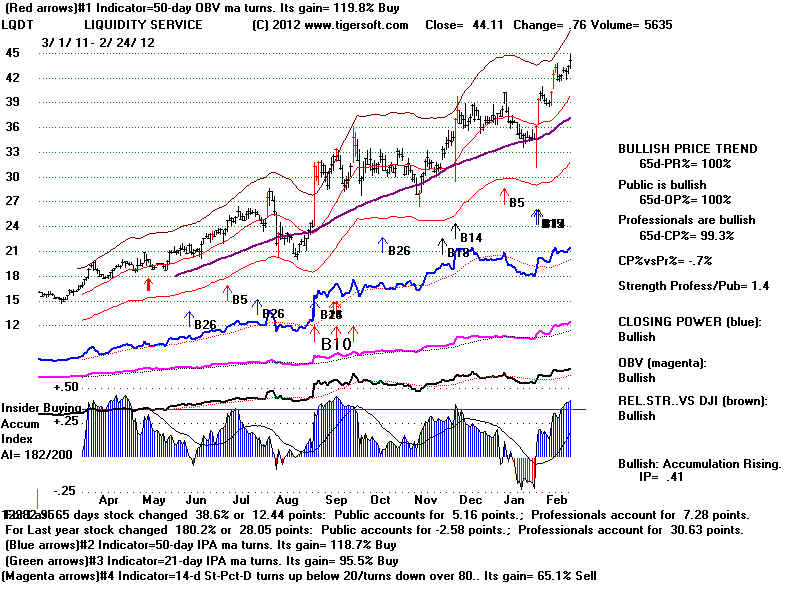
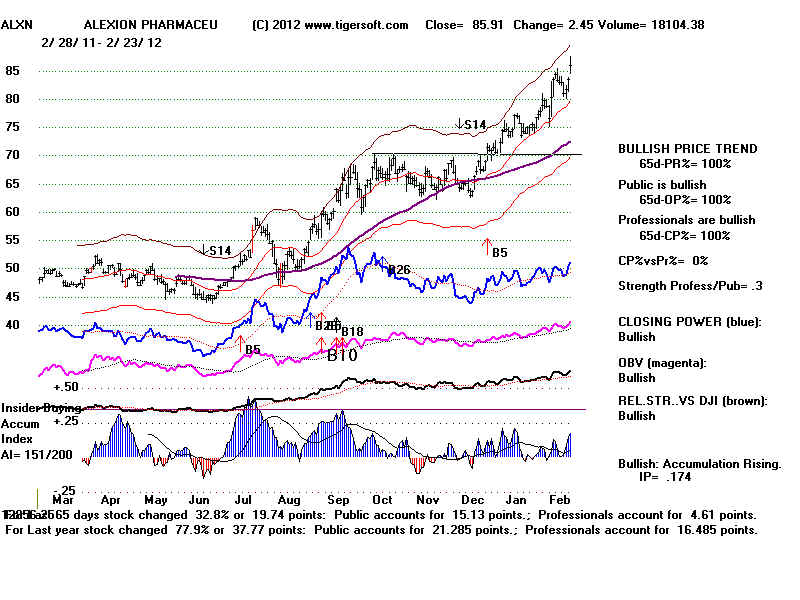
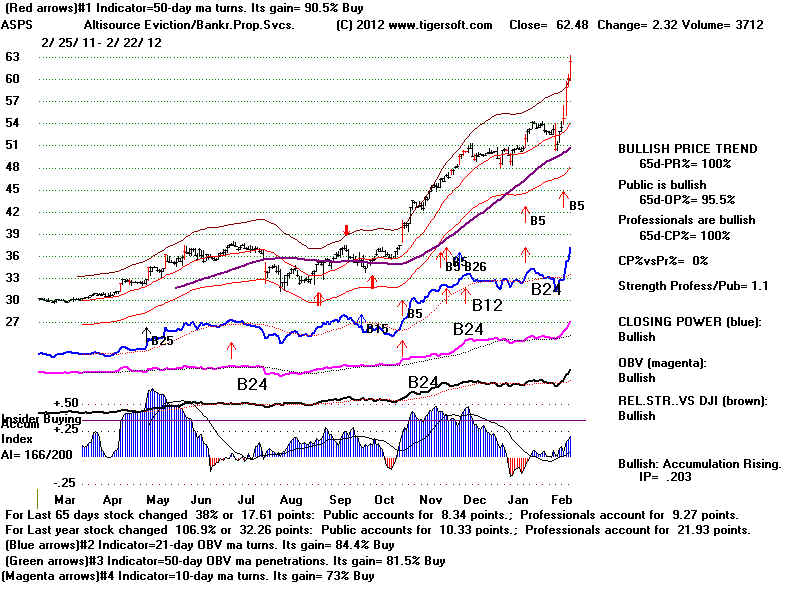
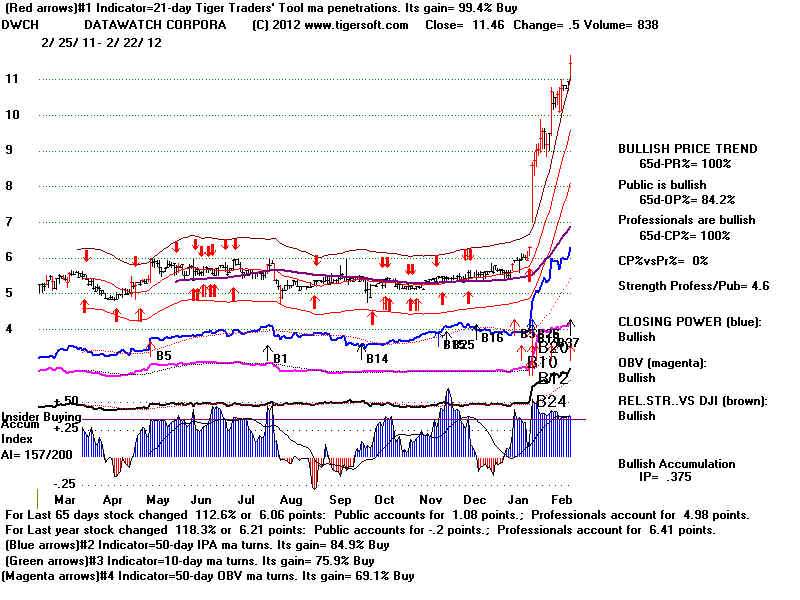
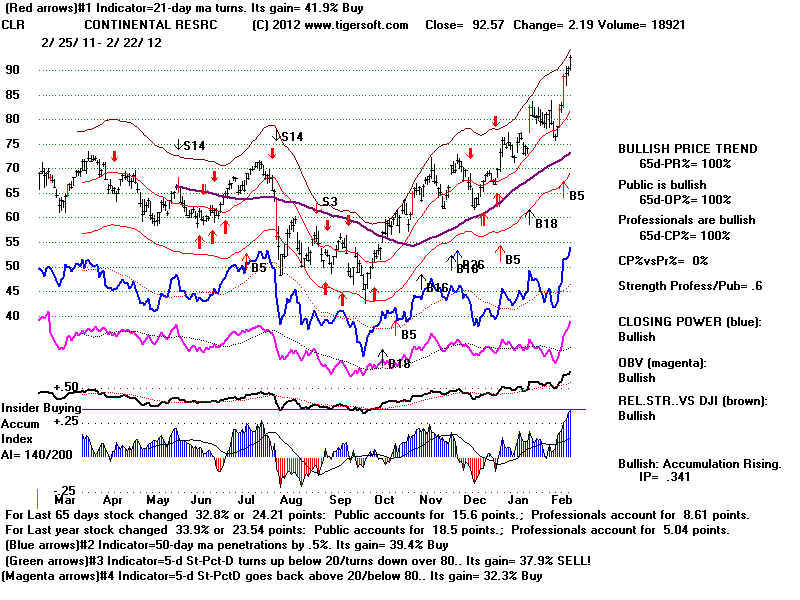
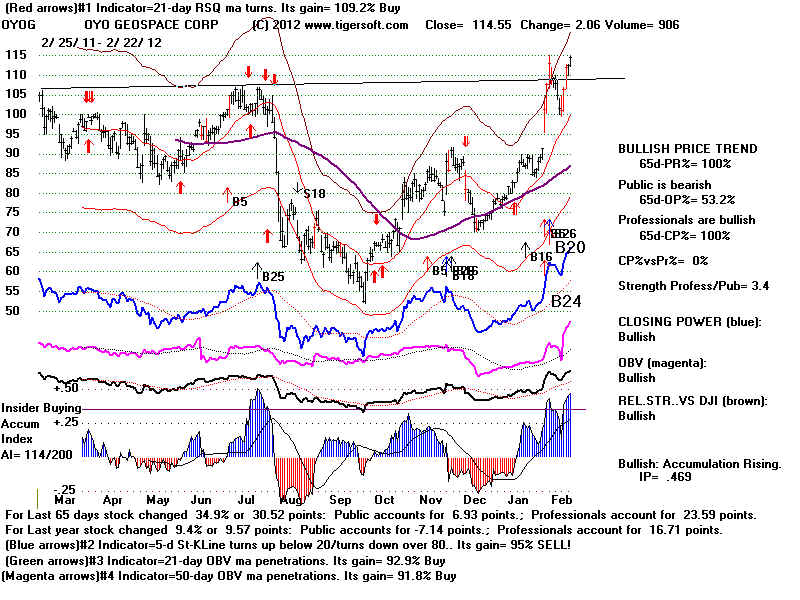
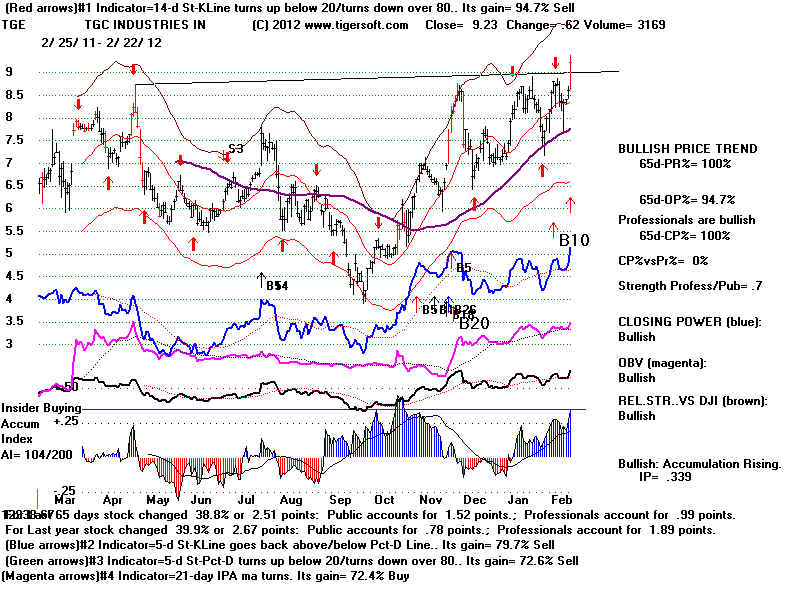
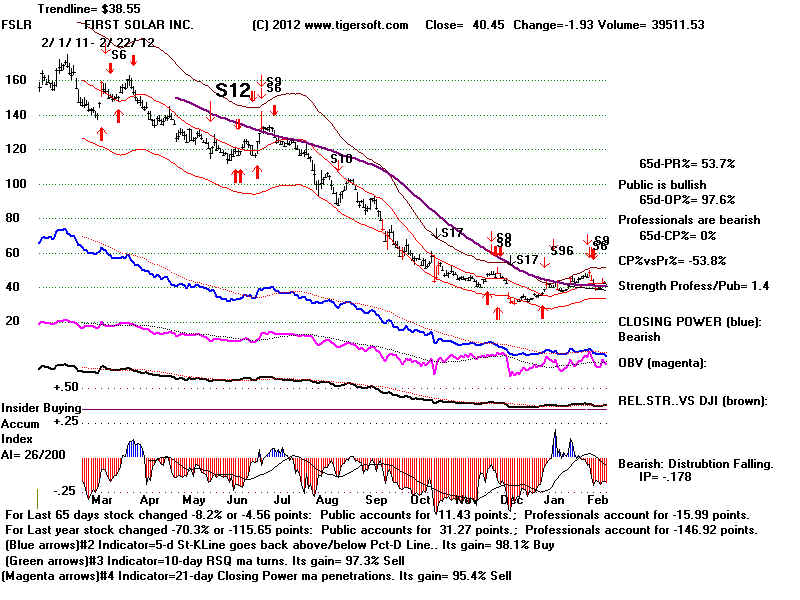
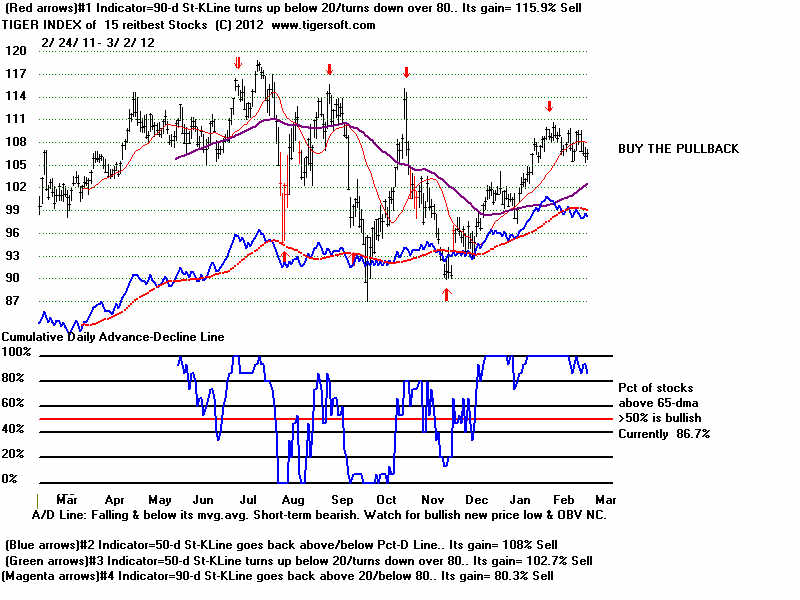
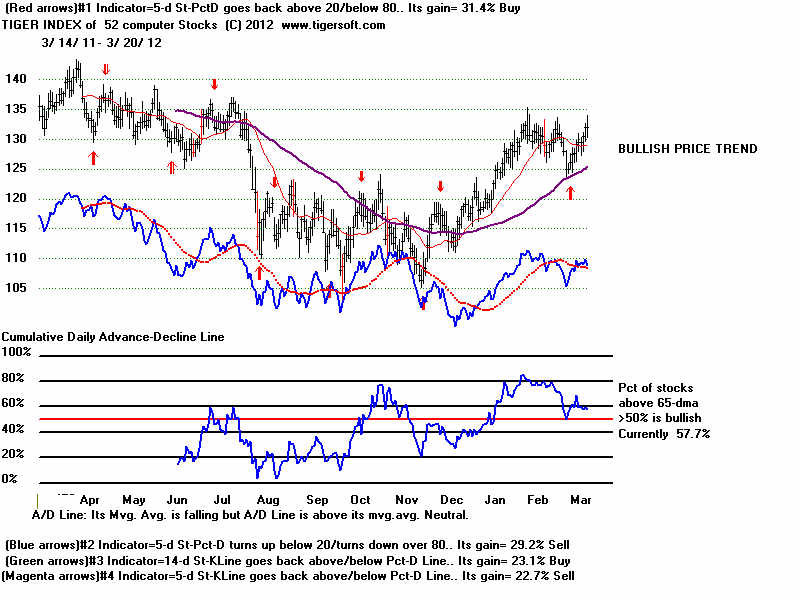
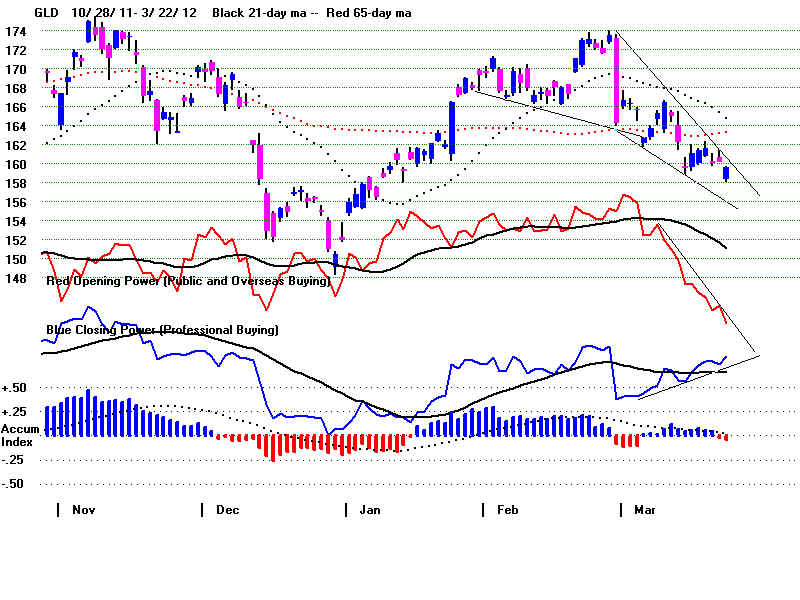
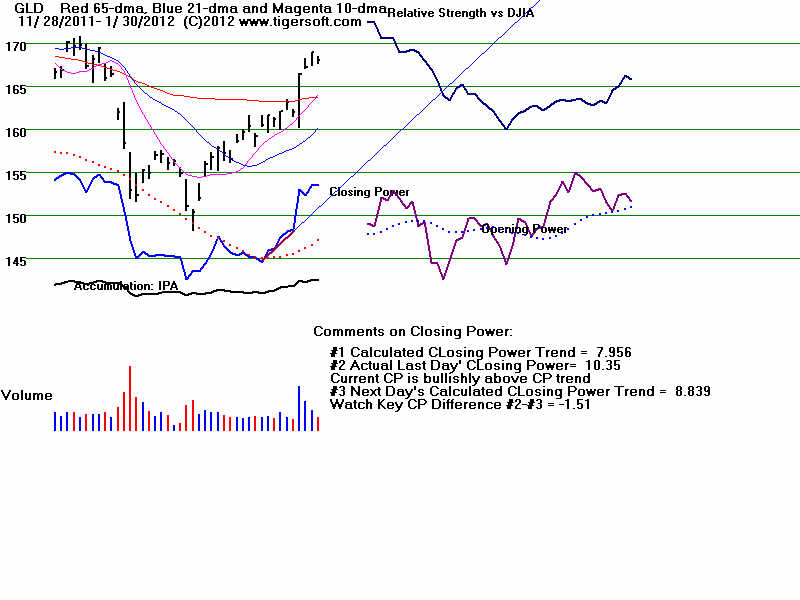
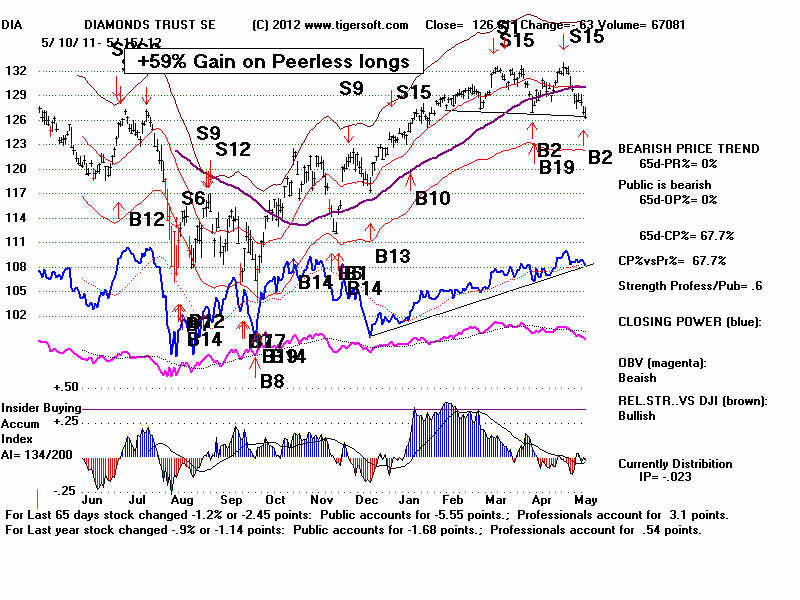
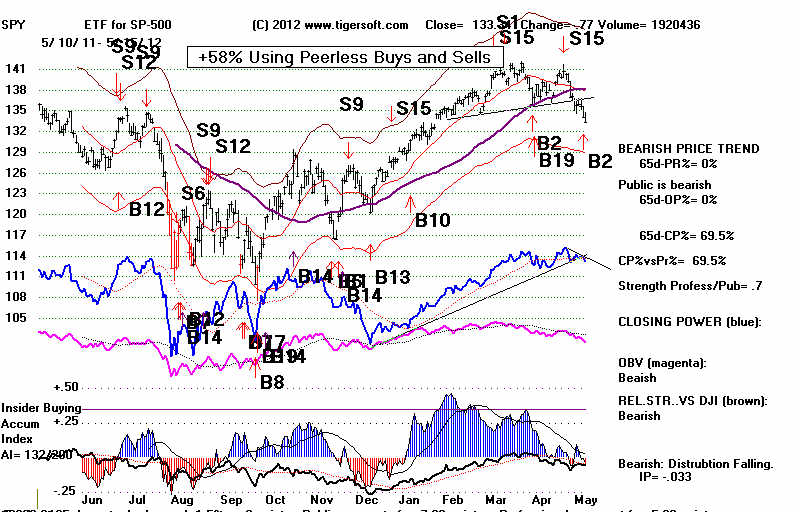
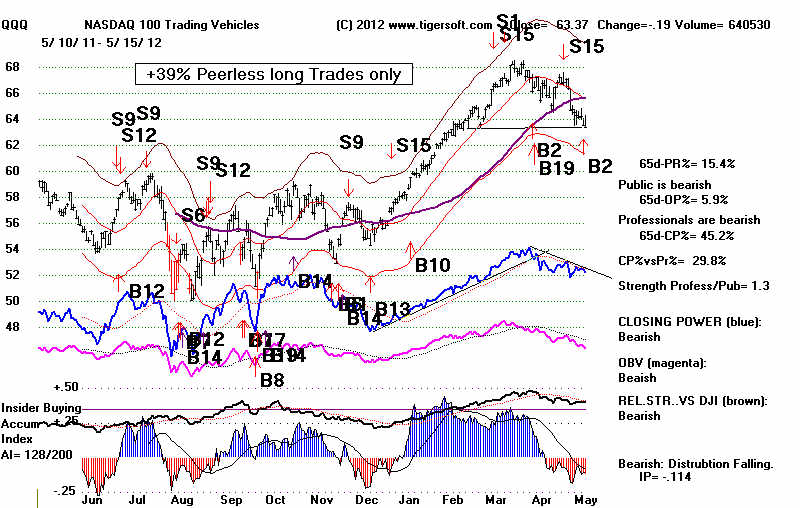
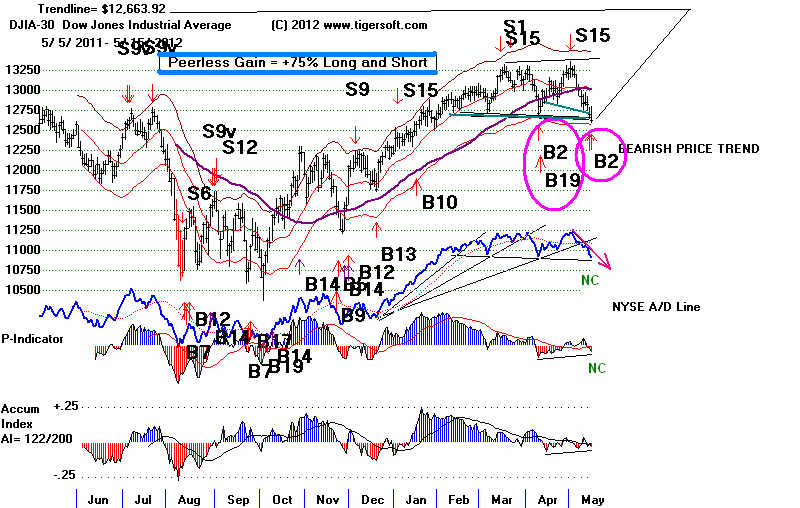
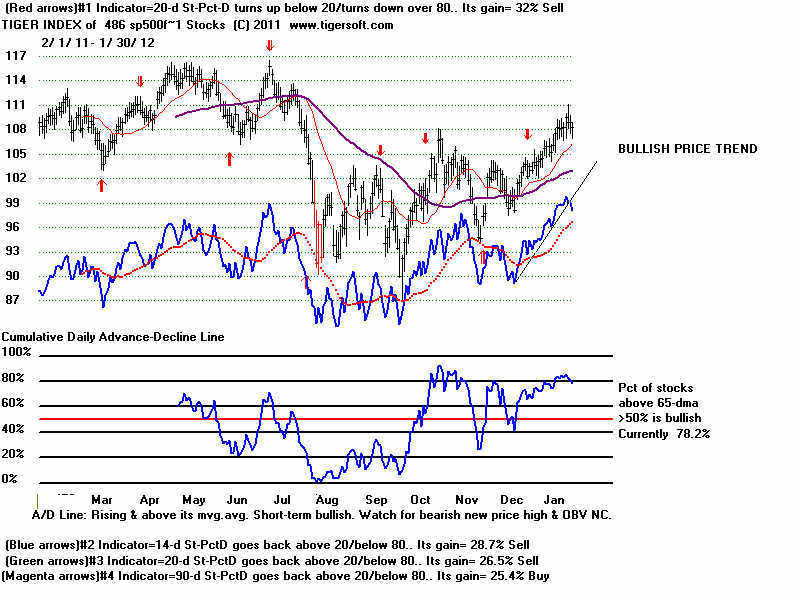
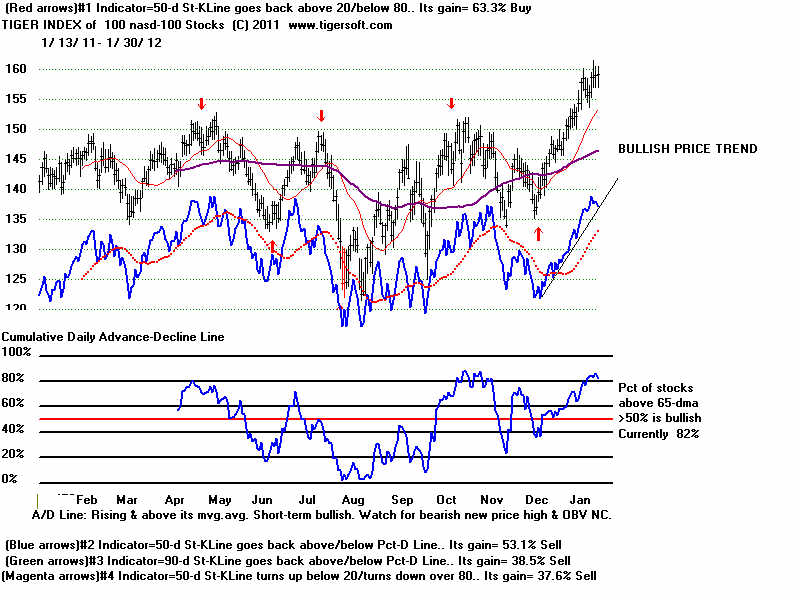
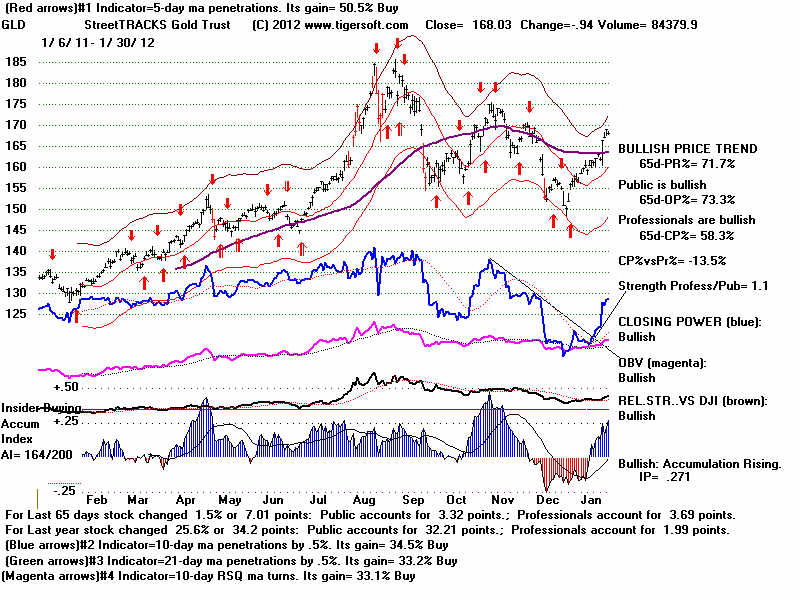
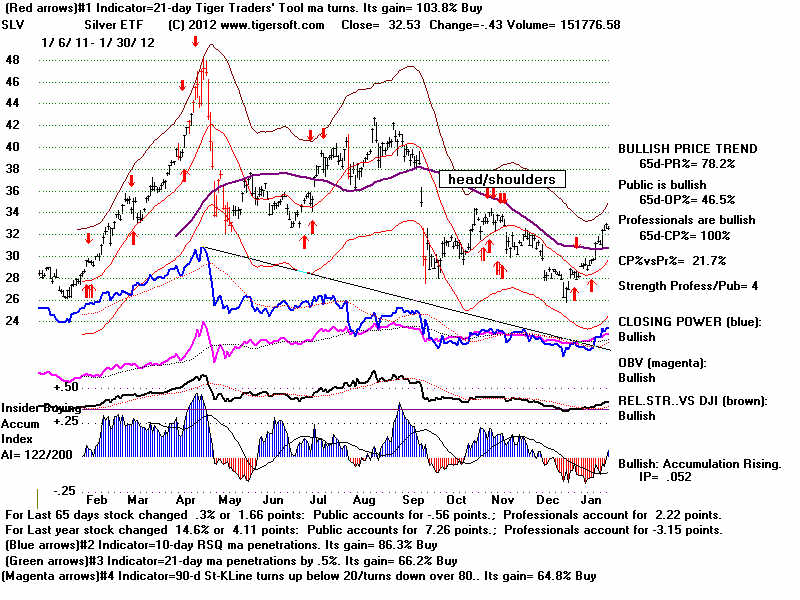
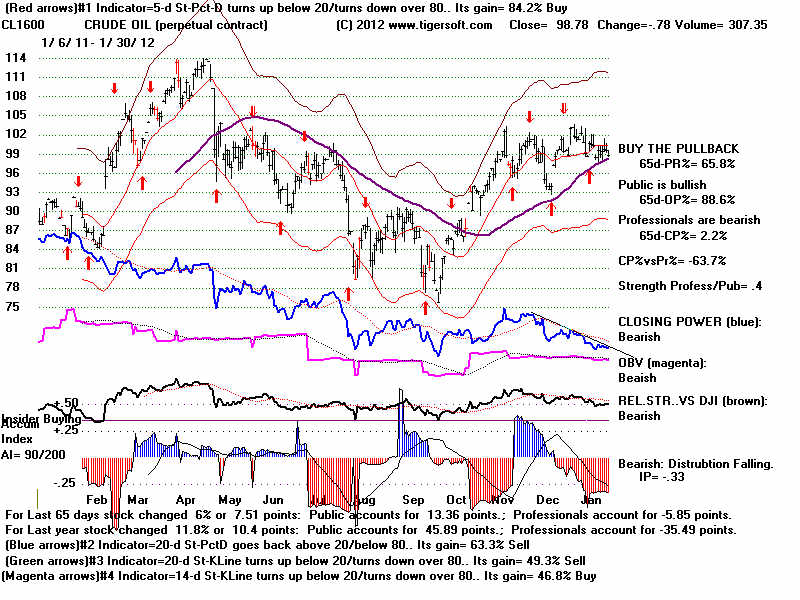
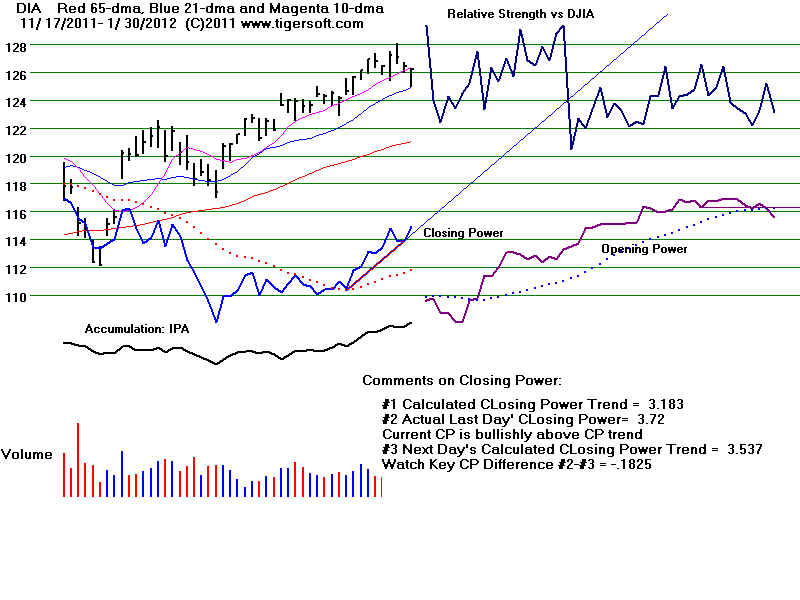
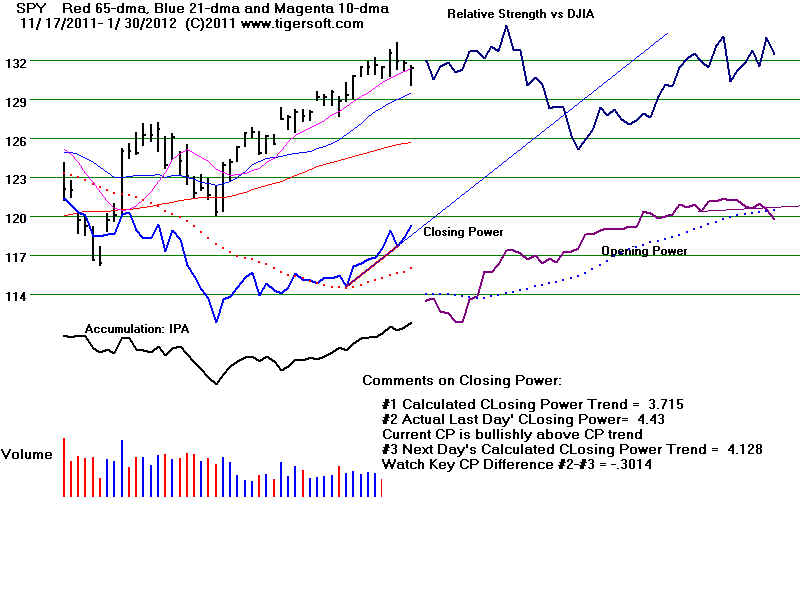
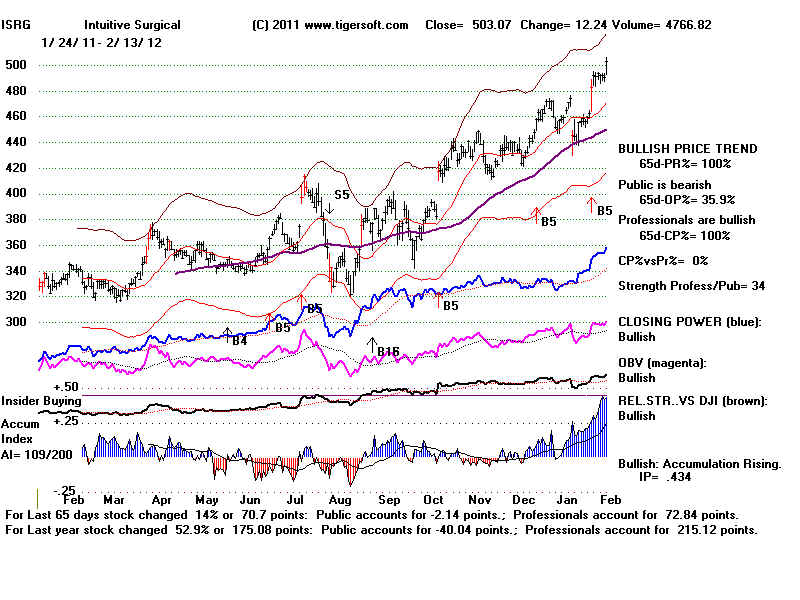
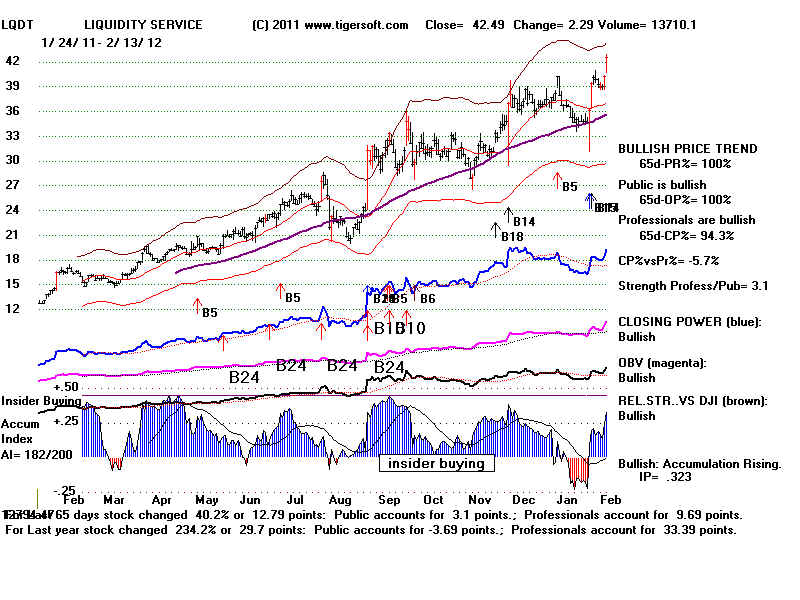
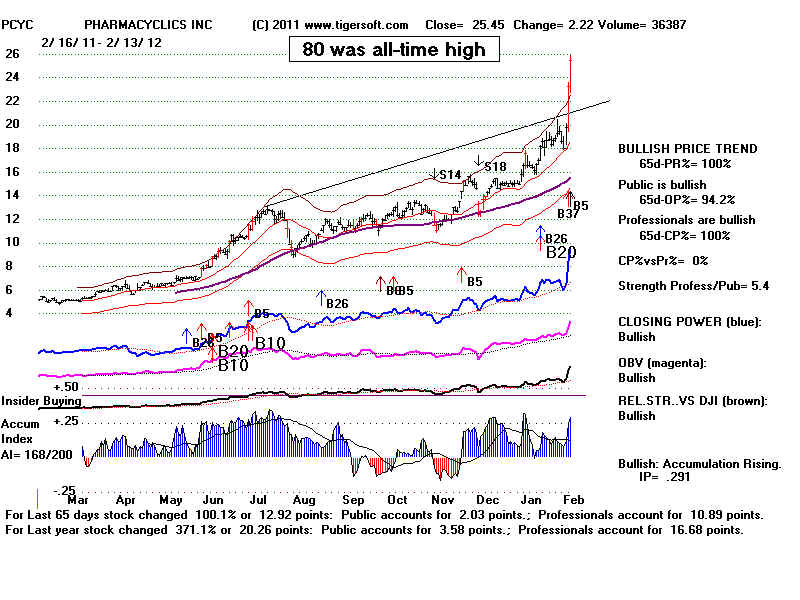
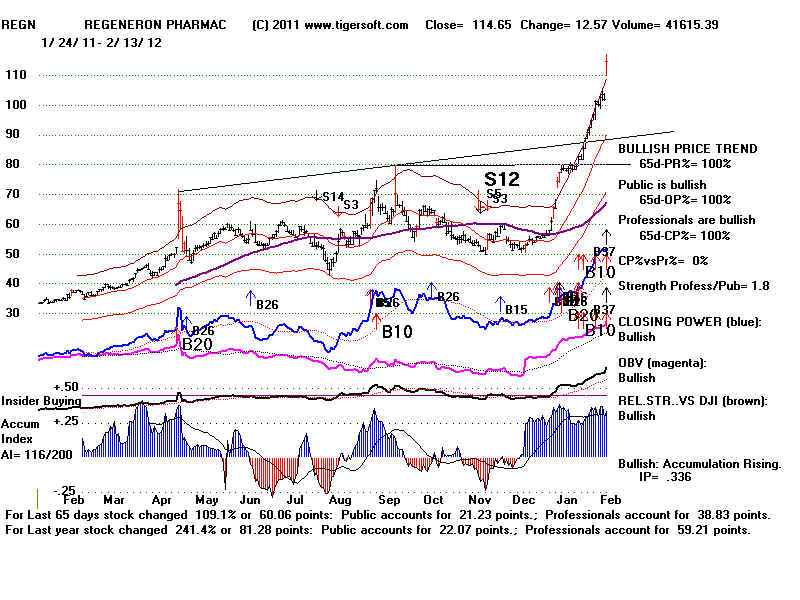
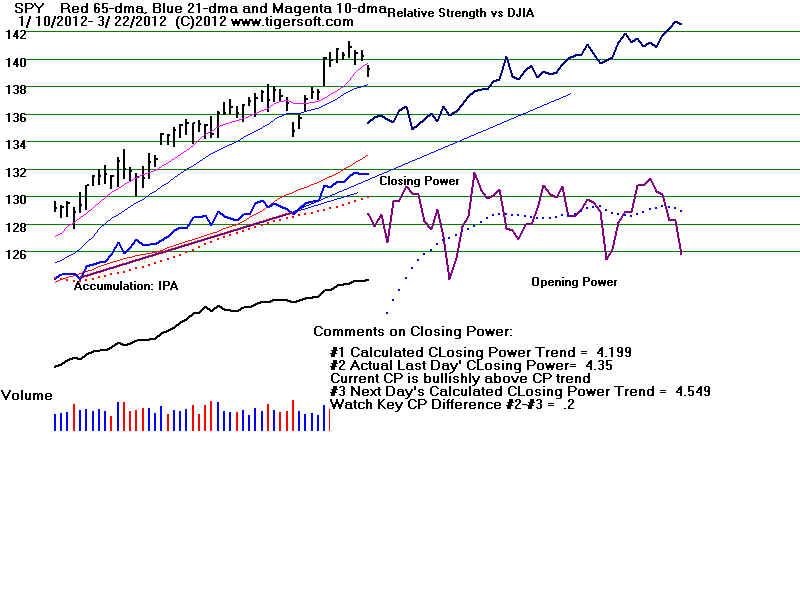
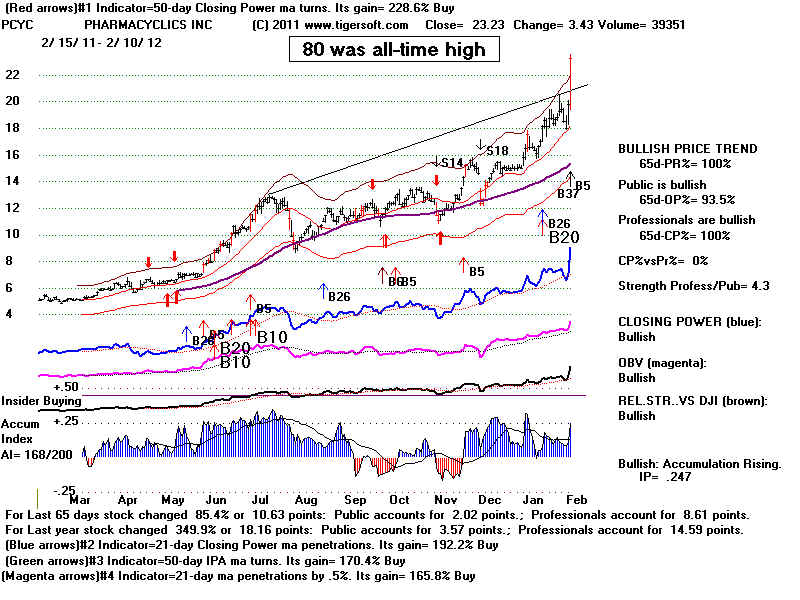
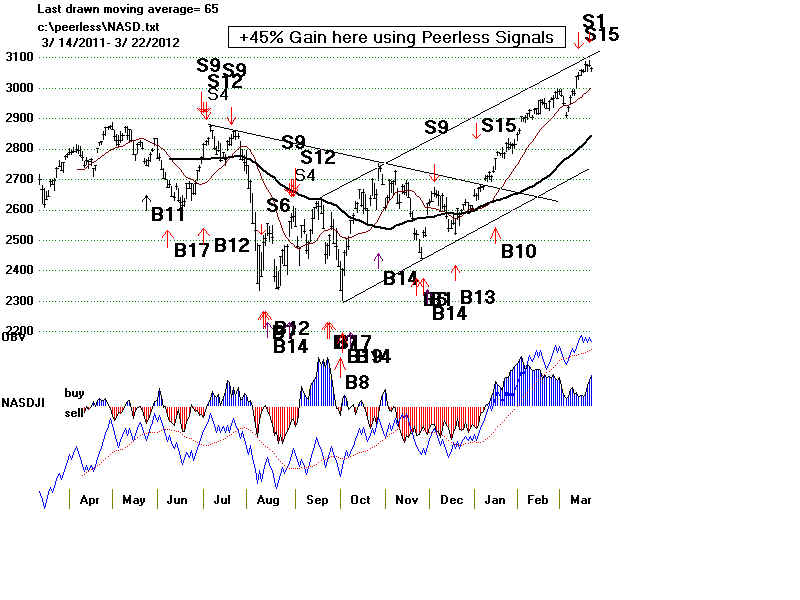
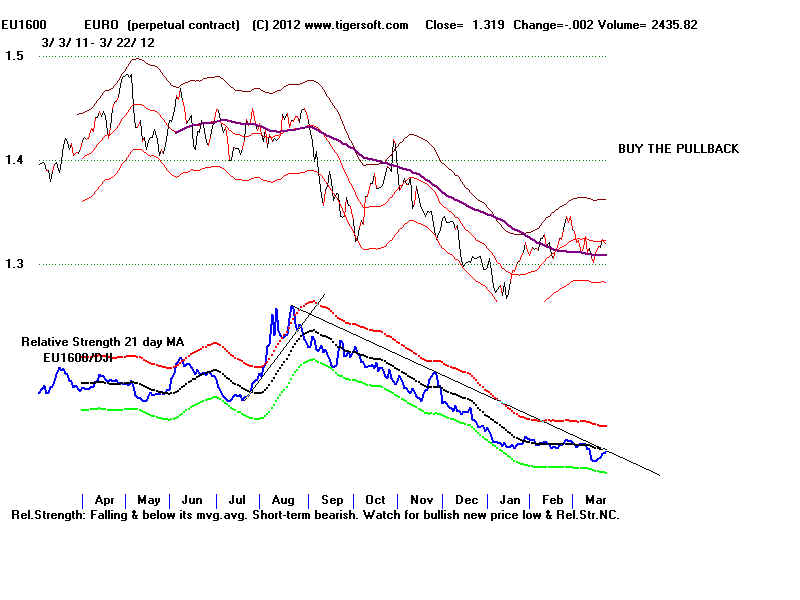
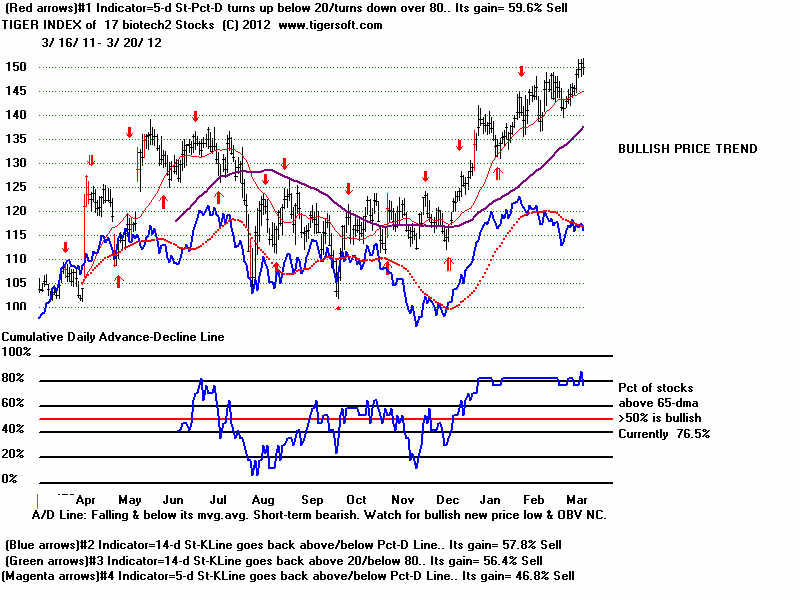
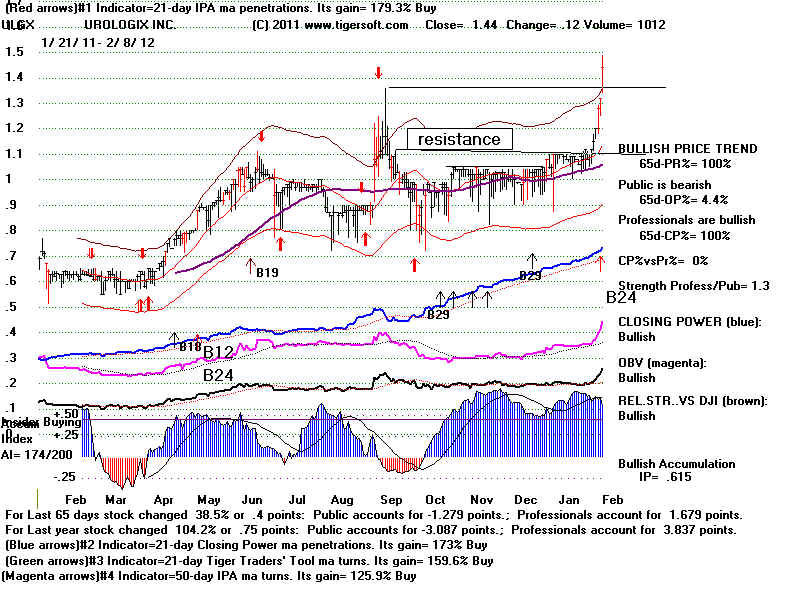
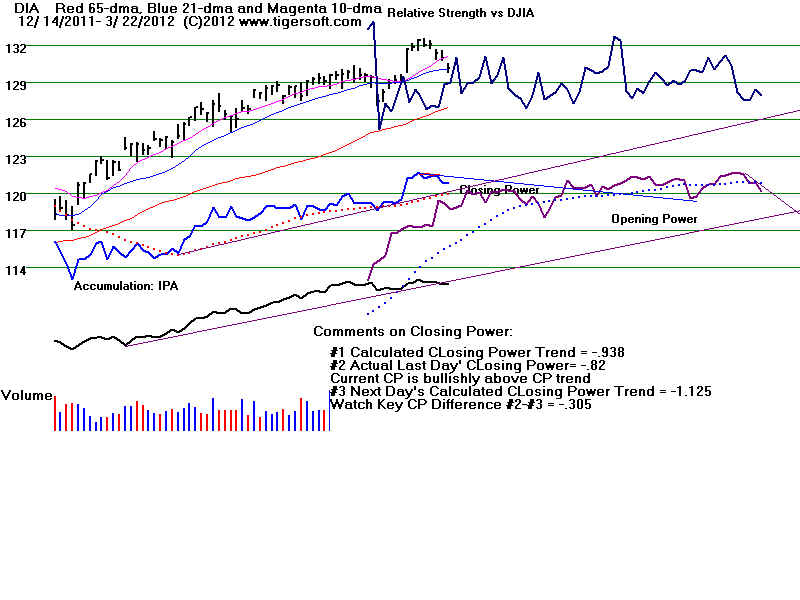
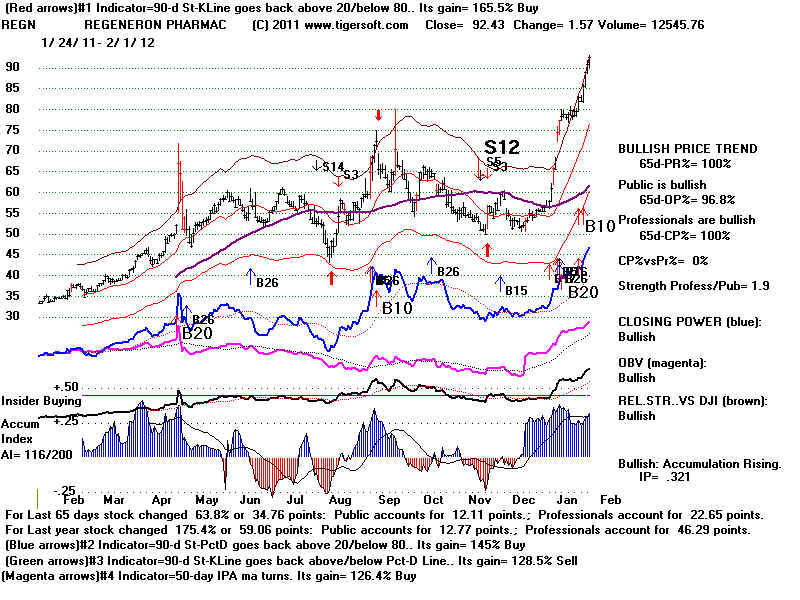
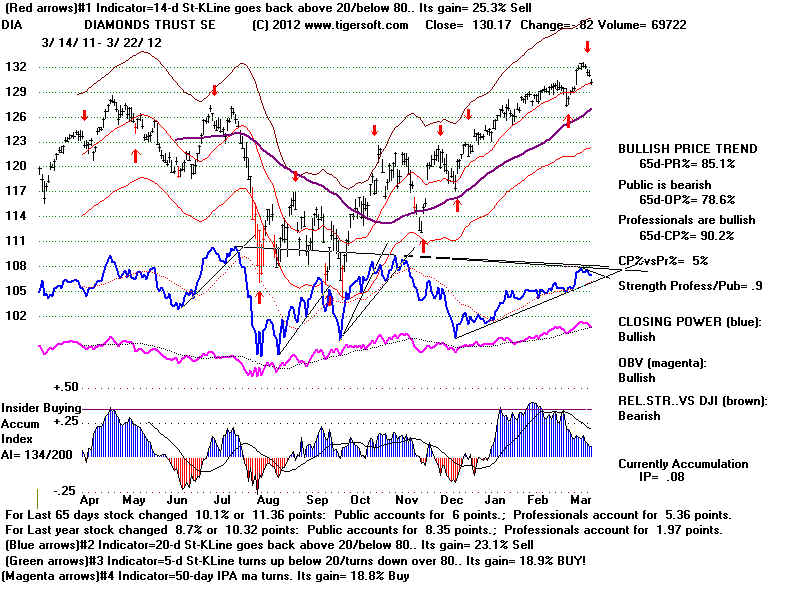
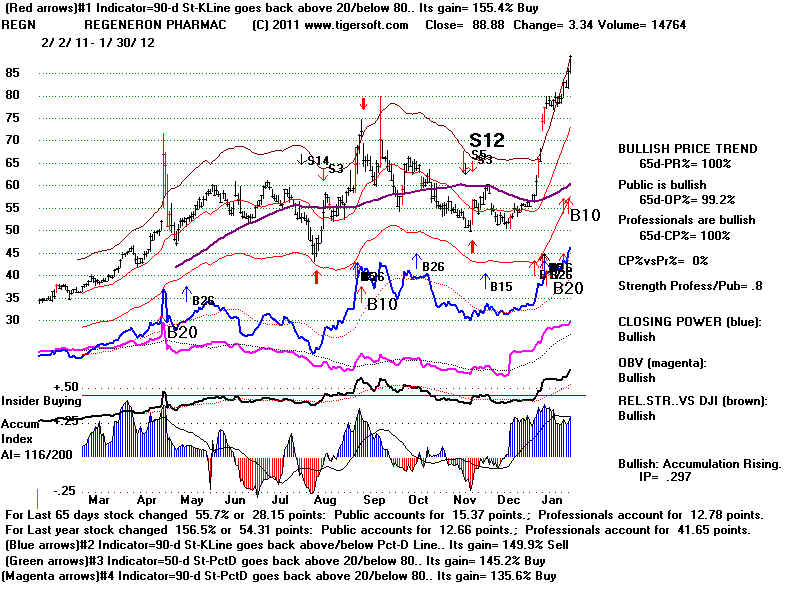