SELL S8s
Low Volatility Peaks When the DJI Is Not at
ALL-Time High
(C) 2/29/2012 www.tigersoft.com
LOW VOLATILITY SELL SIGNAL - Sell "S8"
Sell S8s are based on unusually low volatility
after a 3-month rally of more than 10%
by the
DJIA, provided that index is not in
all-time high territory where the path of least
resistance
is often up. The rate of daily change in closing
prices must have stayed under
its 10-day
ma for 6 straight days. This signal seems to work particularly well after
there has
been a substantial jump up from a bear market low.
There have been 12 such earlier cases when the DJI
was not in all-time high territory.
In 8 cases
the DJI fell more than 8%. There were only 2 cases
where the paper loss
was a
significant 8%.
Here are the cases since 1928 when the DJI was not
in all-time high territory.
DATE What DJI did subsequently
(Key values: last/21-dma, OBVPct., IP21
(Current AI), annualized rate of change of 21-dma)
(1) 8/30/1932 DJI moved up for
a week from 74.30 to 80
and then fell to 58 in 2 months
Key values: la/ma
= 1.098 OBVPct= .246 ip21=.01
roc=3.46
This
was on a recovery from a bear market low.
8% paper loss before a profit.
More
than 20% decline.
(2) 9/29/1932 DJI fell
from 71.50 to 59 in 2 weeks.
Key values: la/ma =.988 OBVPct=-.107
ip21=-.069 roc=.46
This
was just after a recovery from a bear market low.
More
than 15% decline.
(3) 10/31/1932 DJI fell from 61.90 to 58 in a week, rallied to 67 and then fell steadily to 50
4
months later..
Key values: la/ma
=. .97 OBVPct= -.087 ip21=-.139 roc=1.779
This
was just after a recovery from a bear market low.
8% paper loss
before a big profit.
More
than an 18% decline.
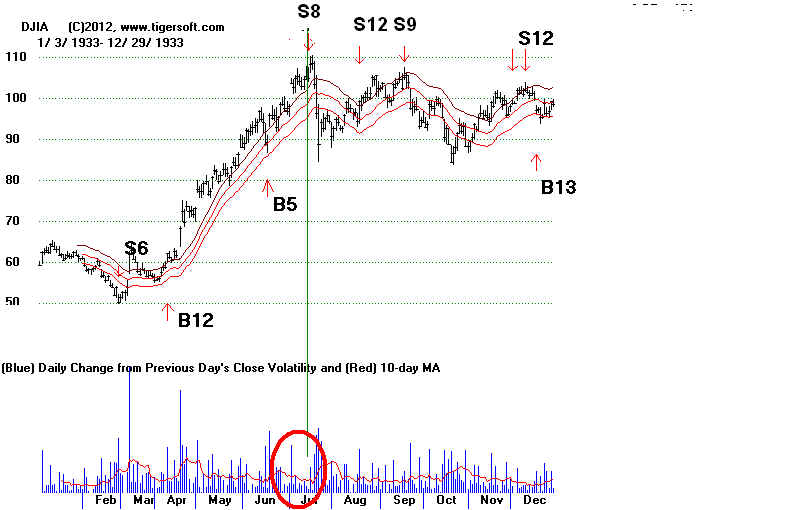
(4) 7/14/1933 DJI rose
from 105 to 109 in 3 days and then fell to 89 a week later.
(See above.)
Key values: la/ma = 1.059 OBVPct= .17 ip21=-.103
roc=1.316
This
was on a recovery from a bear market low.
4% paper loss before a profit.
More
than 15% decline.
(5) 9/17/1935 DJI fell
from 133.10 to 128 in a week and two mo later hit 148.
Key values: la/ma
= 1.027 OBVPct= .316 ip21=.04
roc=506
Only
3% profit before rally.
(6) 3/25/1936 DJI rose
from 157.90 to 162 in a week and fell, a month later hit to
143
Key values: la/ma
= 1.017 OBVPct= .221 ip21=.016
roc=.546|
3% paper loss before a profit.
More
than 8% decline.
(7) 7/31/1939 DJI
fell from 143.30 to 131 in 3 weeks and then rallied to
156 2 weeks later.
Key values: la/ma
= 1.03 OBVPct= .328 ip21 =.099
roc=1.03
This
was on a recovery from a bear market low.
More
than 8% decline.
(8) 9/27/1939 DJI
from 150 went sidewise for 7 months and then fell to 114.
Key values:
la/ma = 1.028 OBVPct= .27 ip21=.068
roc=1.479
More
than 22% decline.
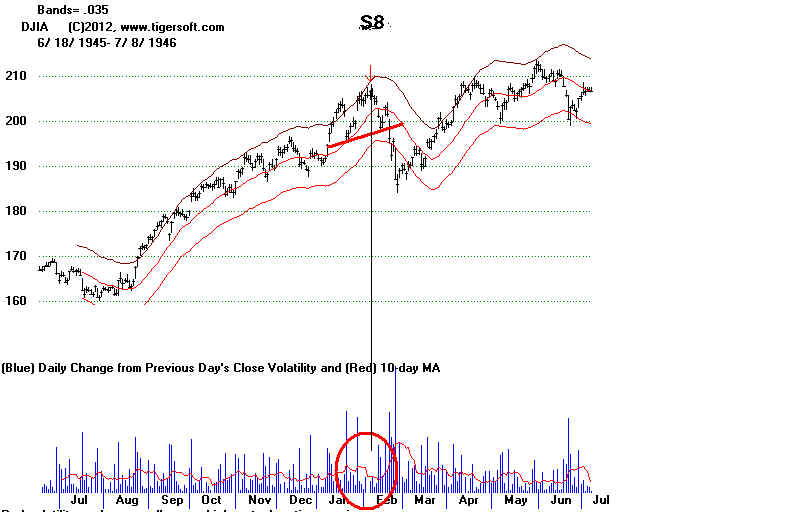
(9) 2/25/1946 DJI
fell from 206.60 to 186 in 2 weeks and 5 weeks after that.
rose to 208
Key values:
la/ma = 1.024 OBVPct= .43 ip21=.268
roc=.877
More
than 9% decline.
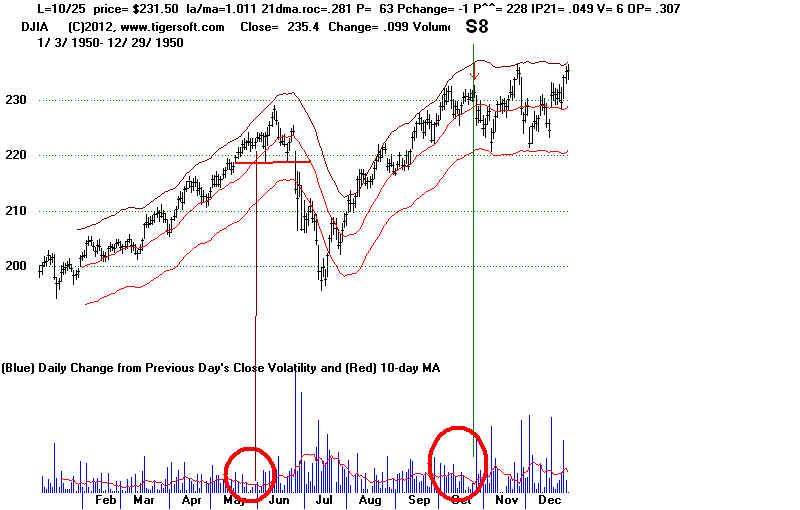
(10) 10/25/1950 DJI fell from 231.50 to LB at 221 in 8 trading days and two weeks later hit 236.
Key values:
la/ma = 1.011 OBVPct= .286 ip21=.049
roc=.281
More
than 5% decline.
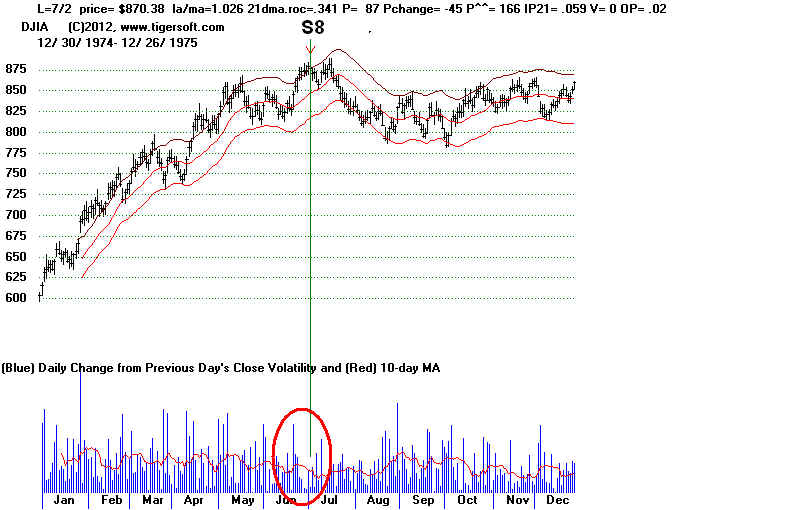
(11) 7/1/1975 DJI fell from
877.42 to 784, 10 weeks later.
Key values:
la/ma = 1.036 OBVPct= .01 ip21=.04
roc=.434
This
marked the recovery high after the 73-74 bear market for 6 months.
More
than 9% decline.
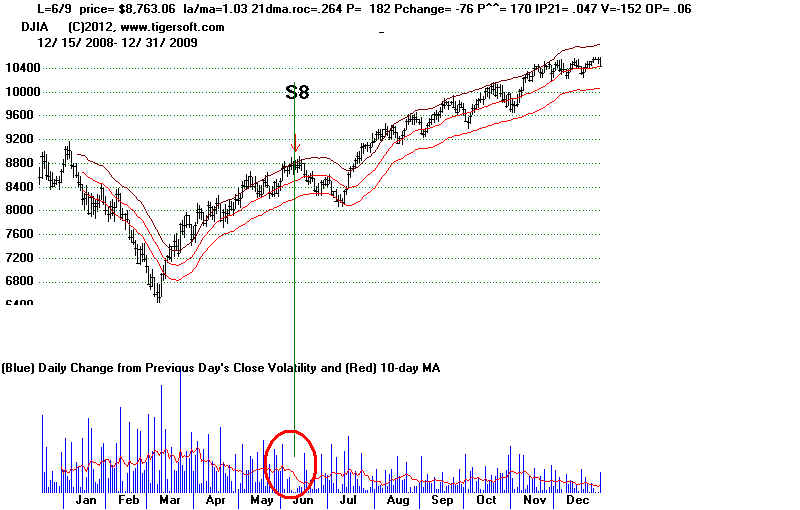
(12) 6/9/2009 No Paper Loss Gain on
Short=+5%
DJI fell from 8763.06 to 8146.52, 4 weeks later. 7% decline to lows
Key values:
la/ma = 1.03 AnnRoc=.264 P=182 IP21=.047 V=-152
OBVPct= .057
Note false head/shoulders and take-off when right shoulder exceeded.
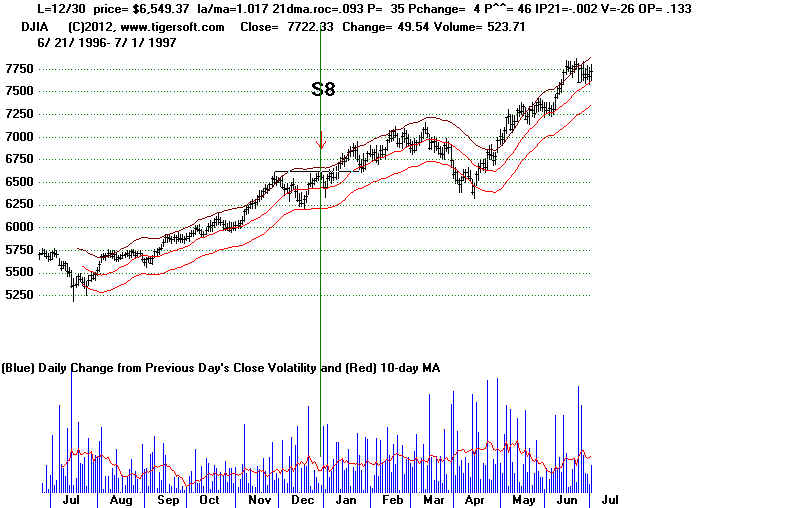
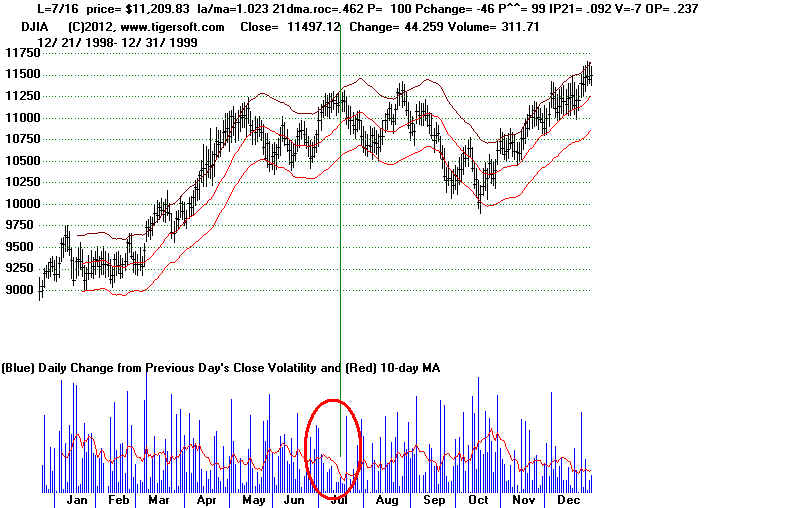
ALL TIME HIGH LOW VOLATILITY
IS
LESS RELIABLY A GOOD SHORT SALE
1996-1997
1998
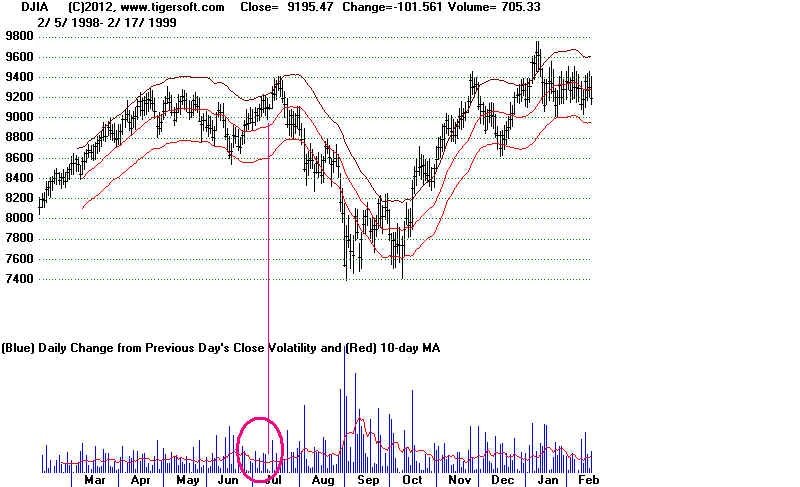
1999
2003-2004
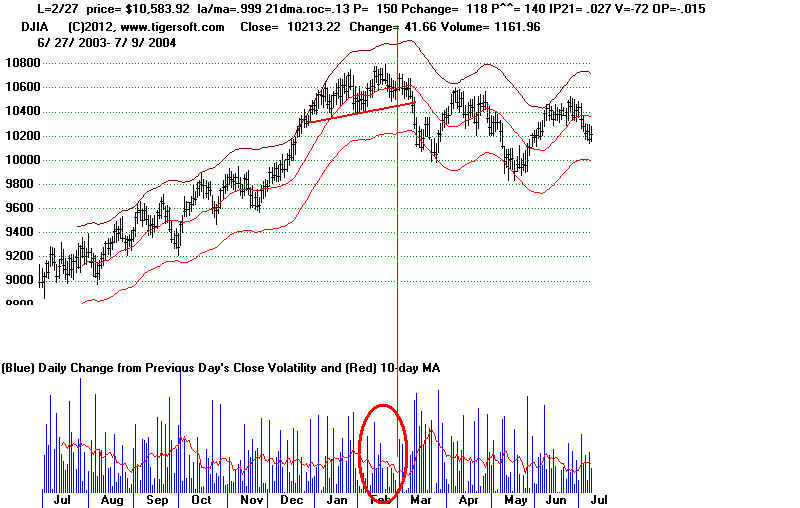
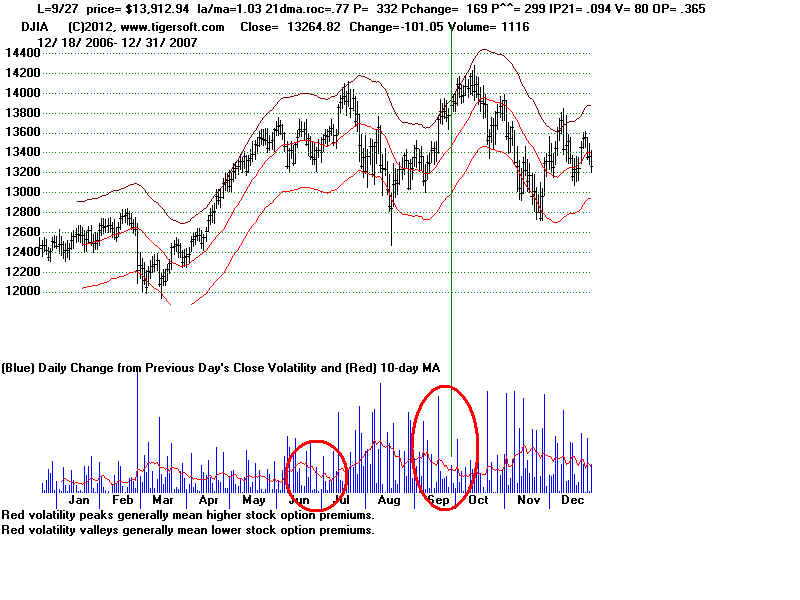
2007