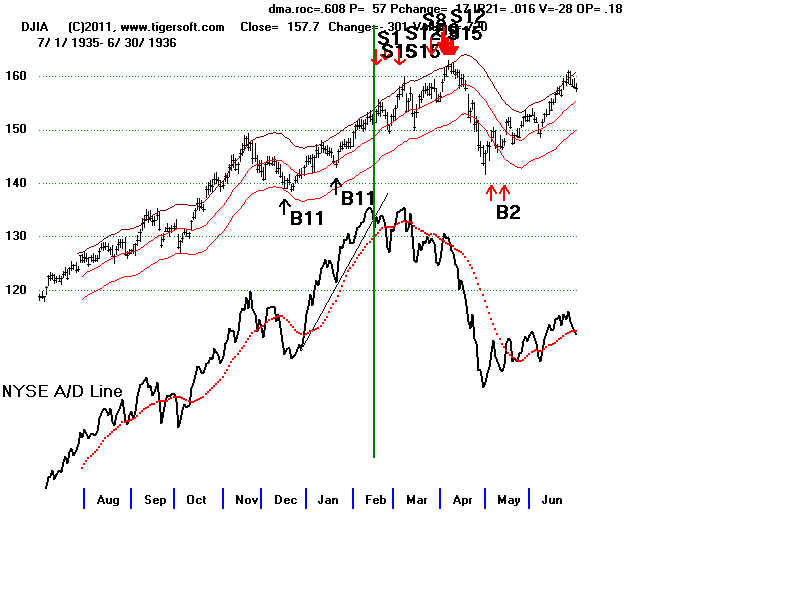
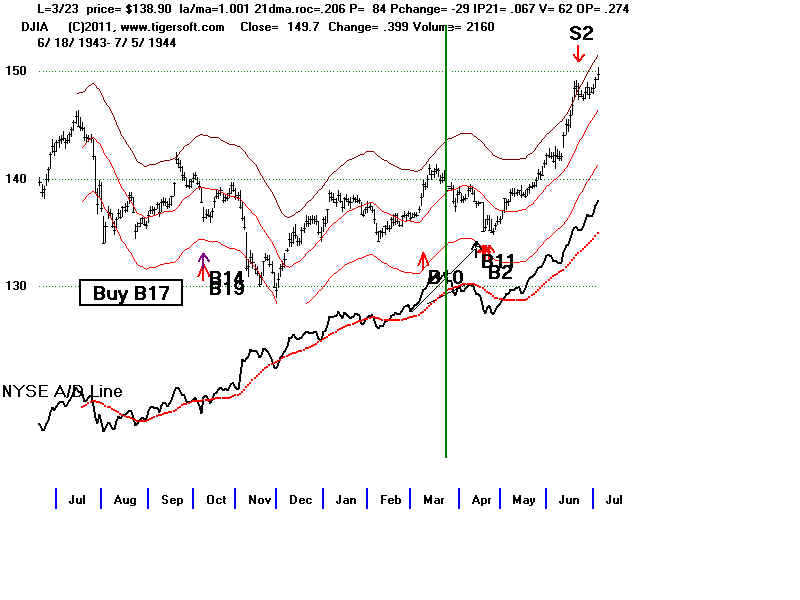
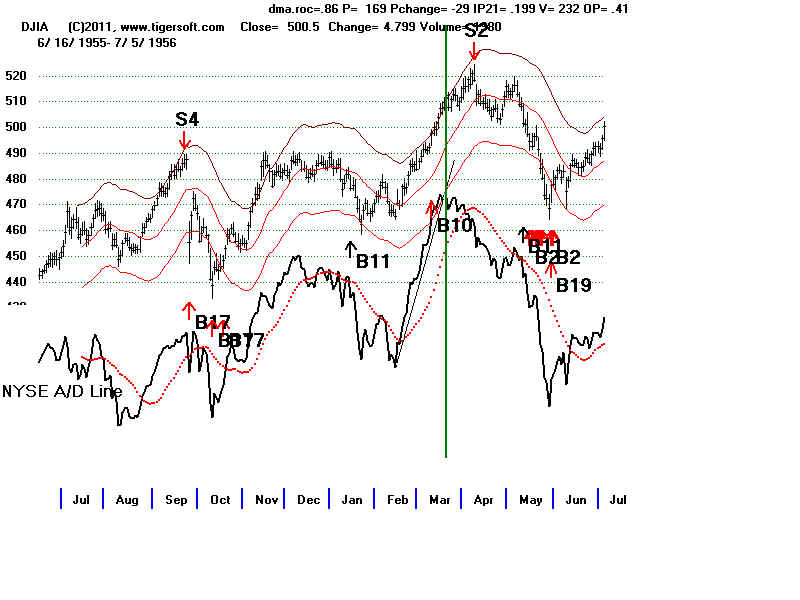
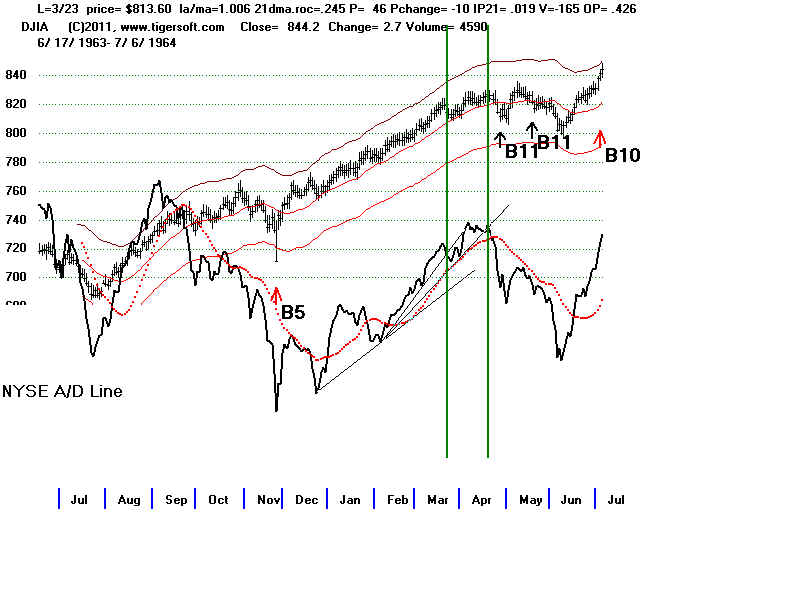
IN FIRST QUARTER OF A PRESIDENTIAL ELECTION
WHEN DJIA IS STRONGLY UP.
1936, 1944, 1956, 1964, 1972, 1976, 1980,
1988, 1992, 1996, 2004
First Break of A/D Line Brings
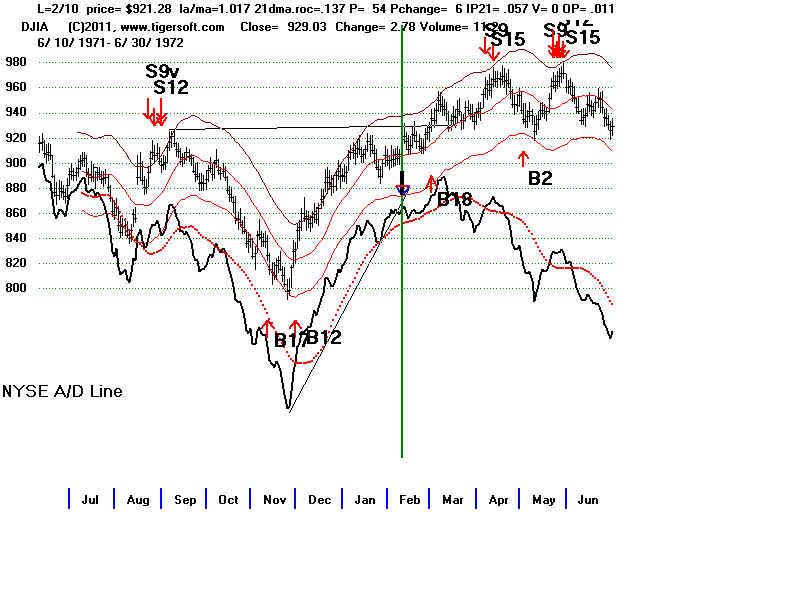
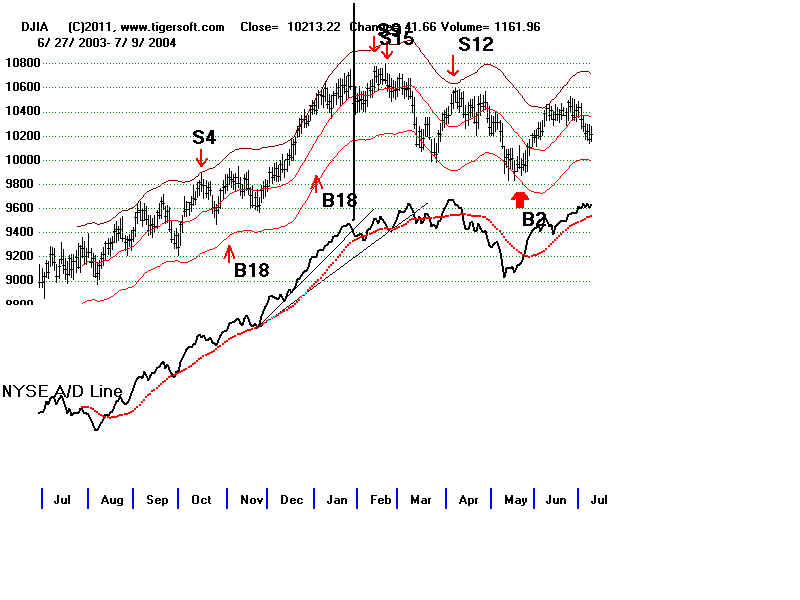
DJI falls to 21-dma: 1936, 1972, 1976, 2004 (4/11)
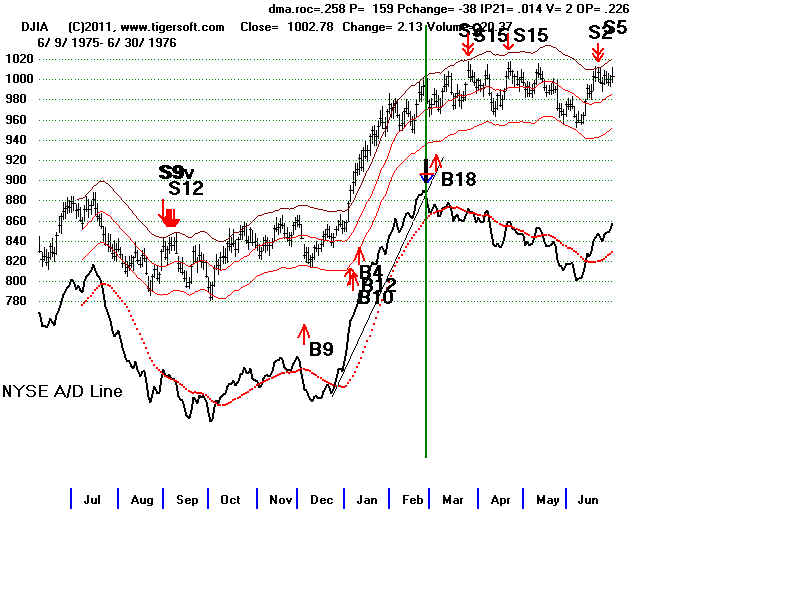
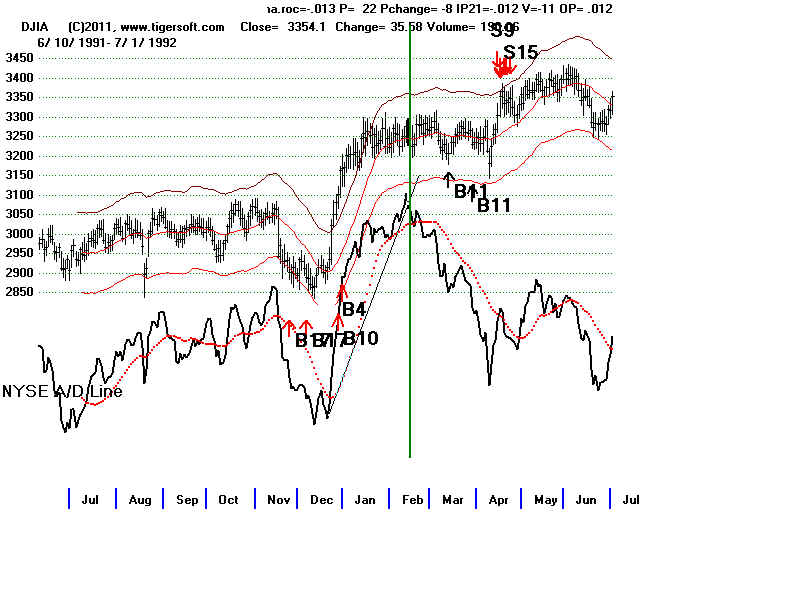
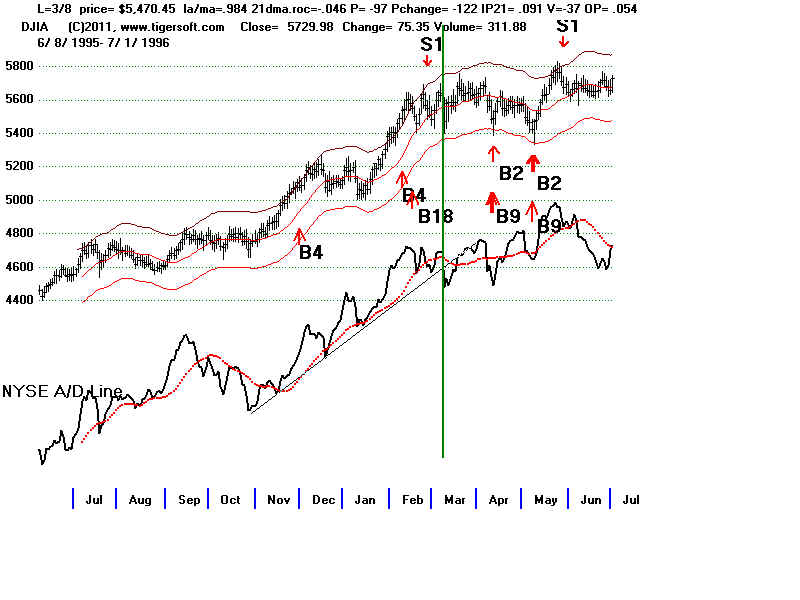
DJI falls 2% below 21-dma and then rallies: 1944, 1964, 1992, 1996 (4/11)
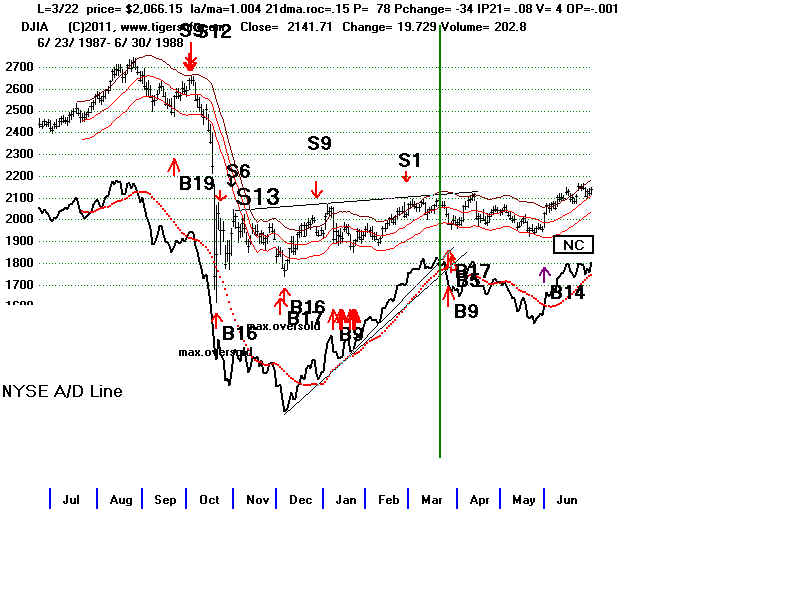
DJI falls to lower band: 1988
DJI falls slightly below lower band: 1956
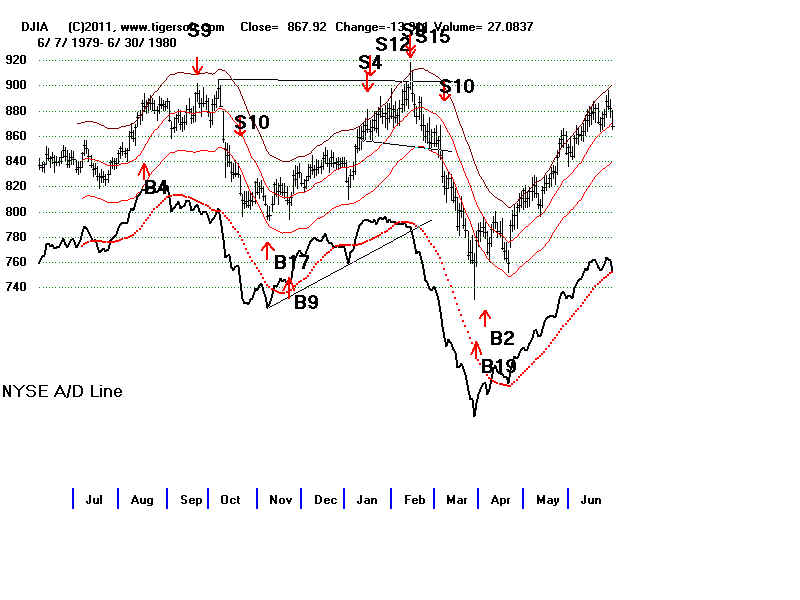
DJI falls far below lower band: 1980
First Break of A/D Line Brings
A/D Line falls quickly to 21-dma
and then recovers to make new highs: 1972
A/D Line enters a zig-zag trading
range pattern: 1936, 1996, 2004
A/D
Line falls below its 21-dma and falls for one-two months before recovering. 1944, 1956,
1964, 1976, 1988
A/D Line falls far below its 21-dma
and falls for two months before recovering: 1980, 1992
In 8 of 11 cases the DJI fell no more
than 4% and in 7 of 11 cases the A/D Line declined for 4 to 10
weeks.