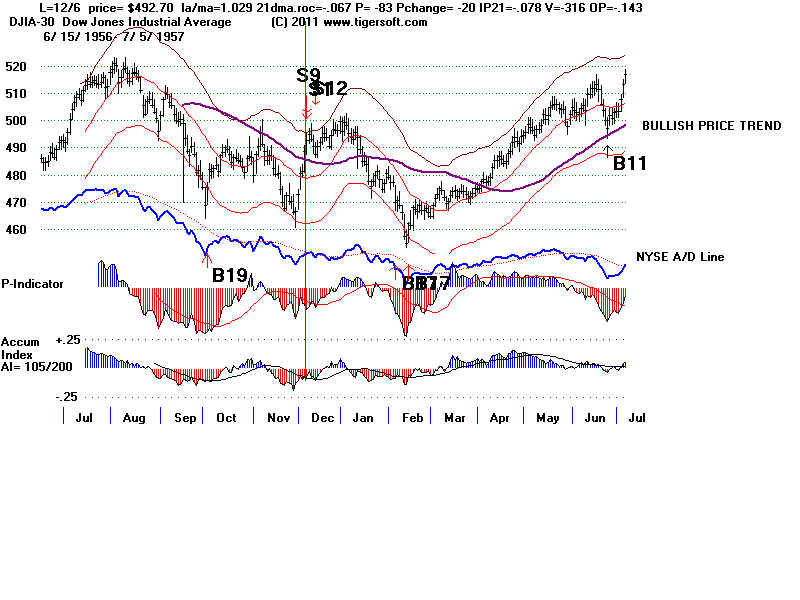
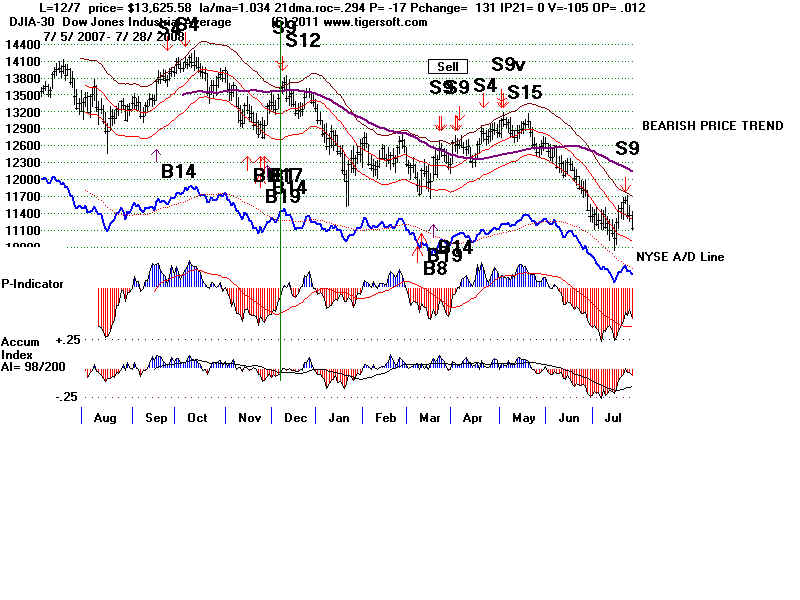
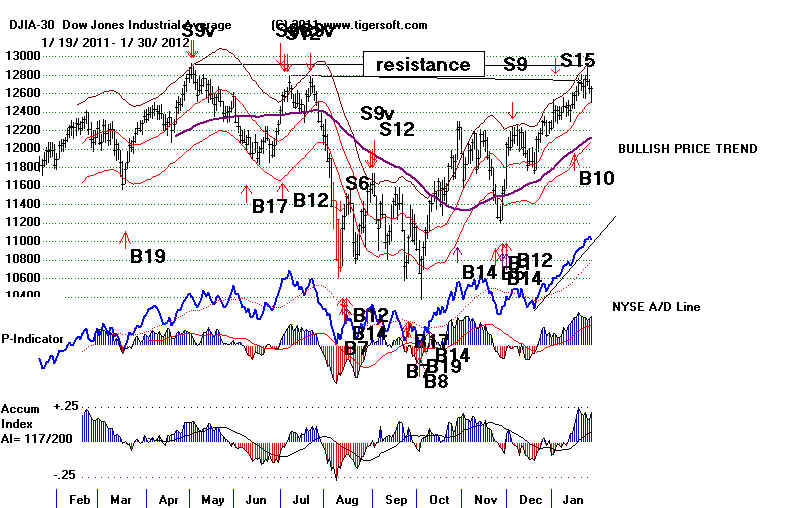
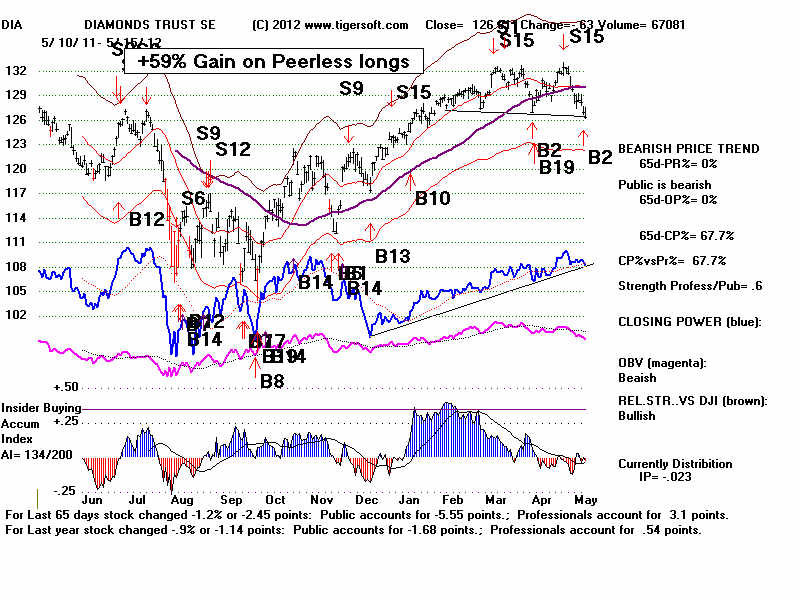
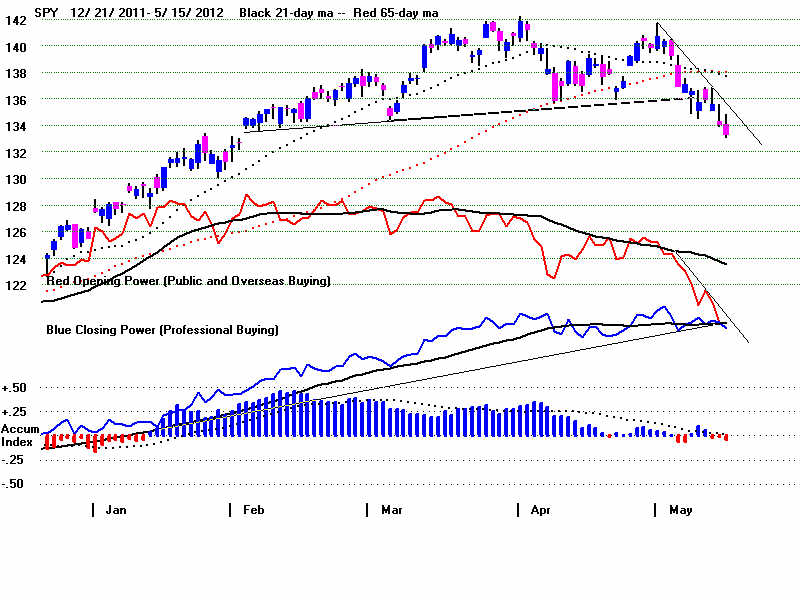
DJIA - PEERLESS - 1/30/2012
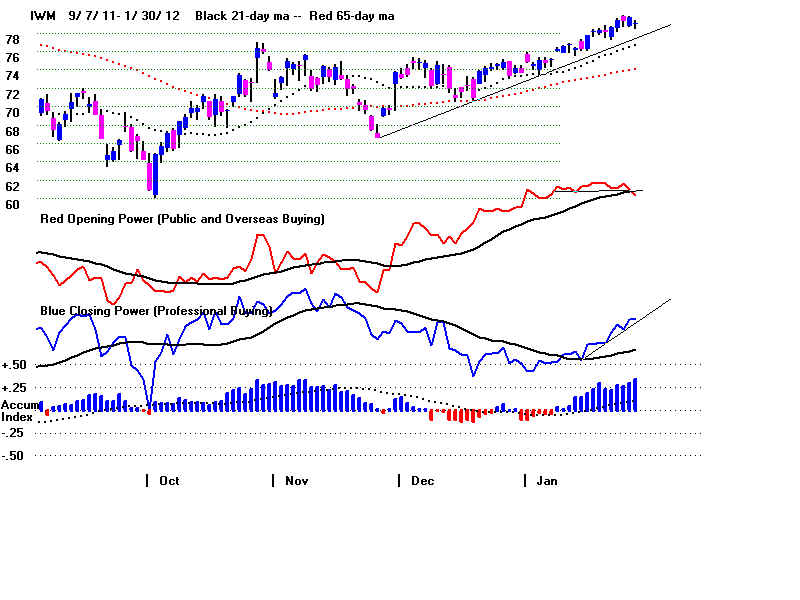
IWM - Candle Stick Chart
======= 1/27/2012 =======
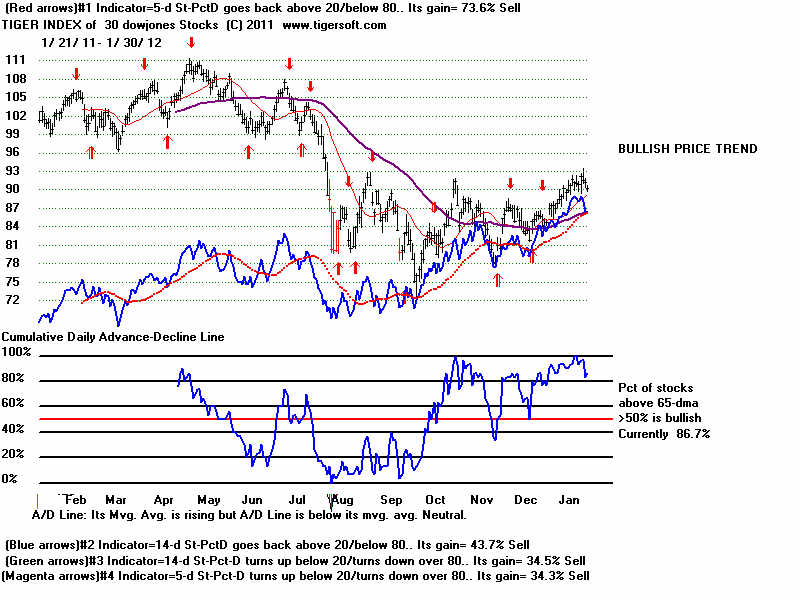
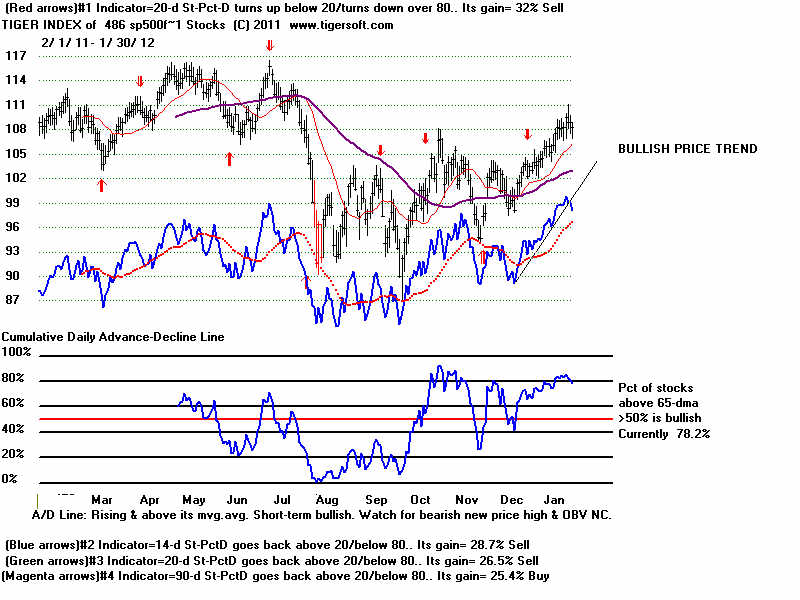
24 groups show >50% over 65-dma
0 groups show <50% over 65dma
Pct of Stocks over 65-dma - 1 Day Change Pct%
1/27/2012 1/25/2012 1/11/2012 1/4//2012 12/22//2011 12/9//2011 12/1//2011
------------------------------------------------------------------------------------------------------------------------------------------------------ -
BestREITs 100% 100% 100% -20% 100% 100% +7% 67% +20% 47% -20%
Homebuilding 100% 100% +4% 83% 79% 83% -5% 79% +22% 75% -4%
Bond Funds 99% +1% 97% +3% 96% +1% 94% 94% +2% 91% +1% 85% -1%
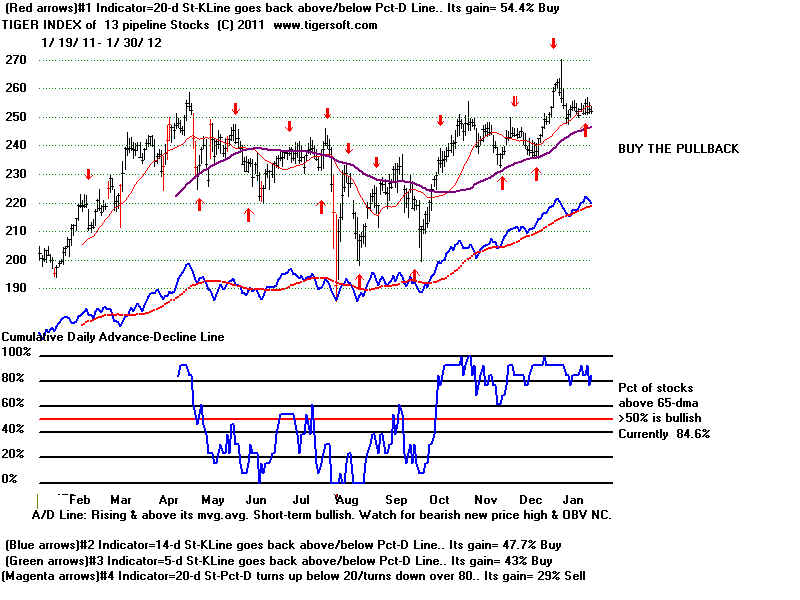
Pipelines 92% -1% 85%
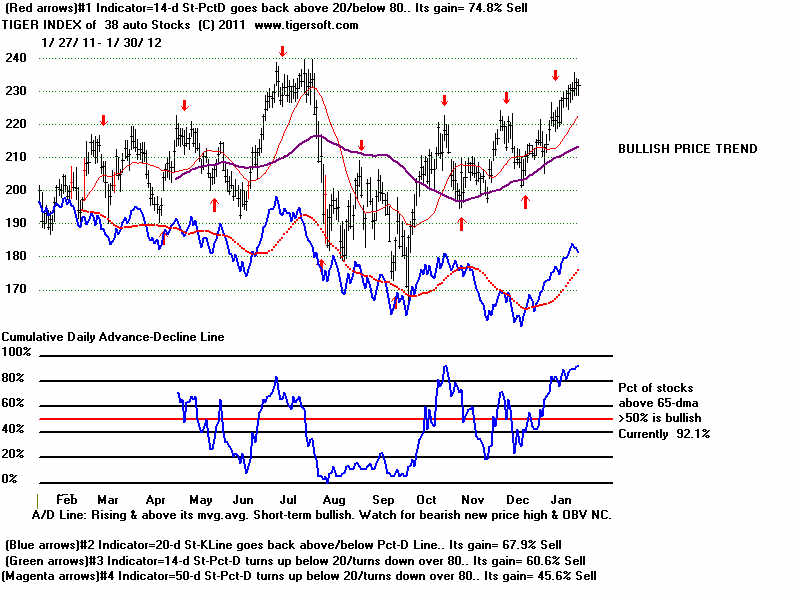
Auto Stocks 92% +2% 90% 82% -2% 53% +8% 47% +7% 70% +20% 45% -8%
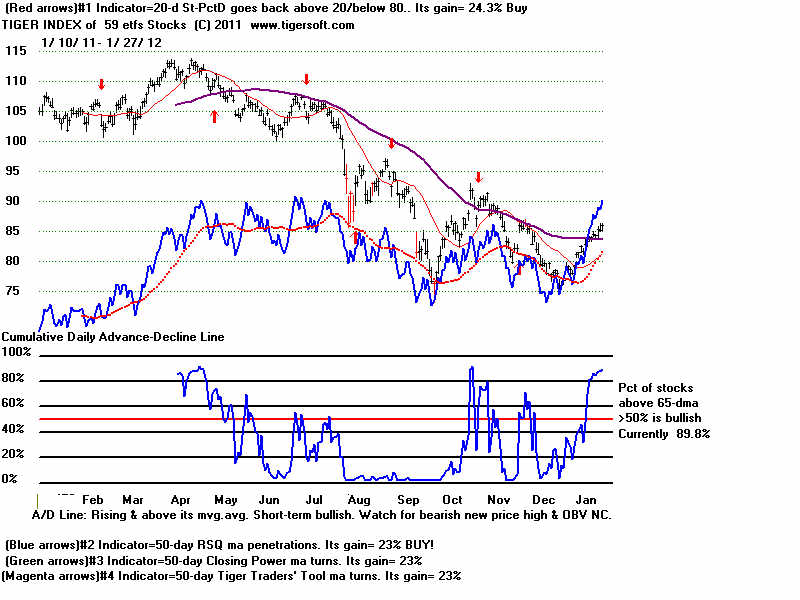
Foreign ETFs 90% +1% 89% +4% 40% +3% 33% +21% 25% +15%
Gaming 86% 93% +7% 86% +7% 71% +7% 50% +7% 52% 64%
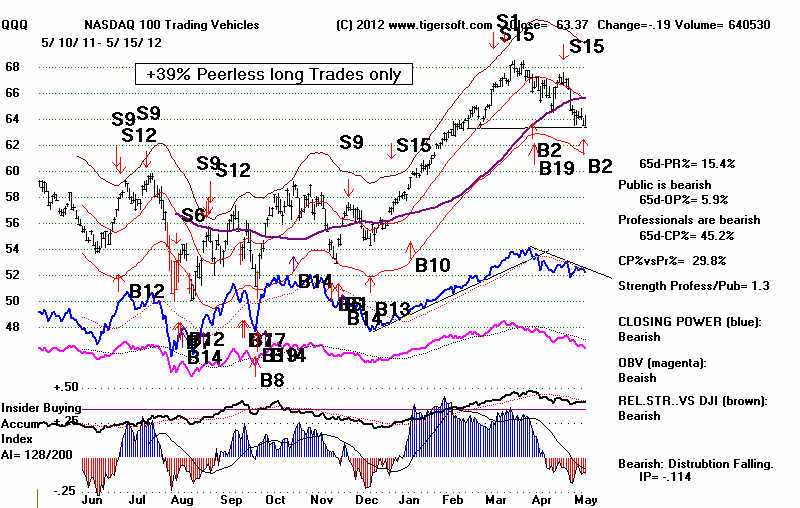
QQQ-100 stocks 86% +3% 84% 72% +3% 58% +8% 54% +2% 68% +10% 71% +3%
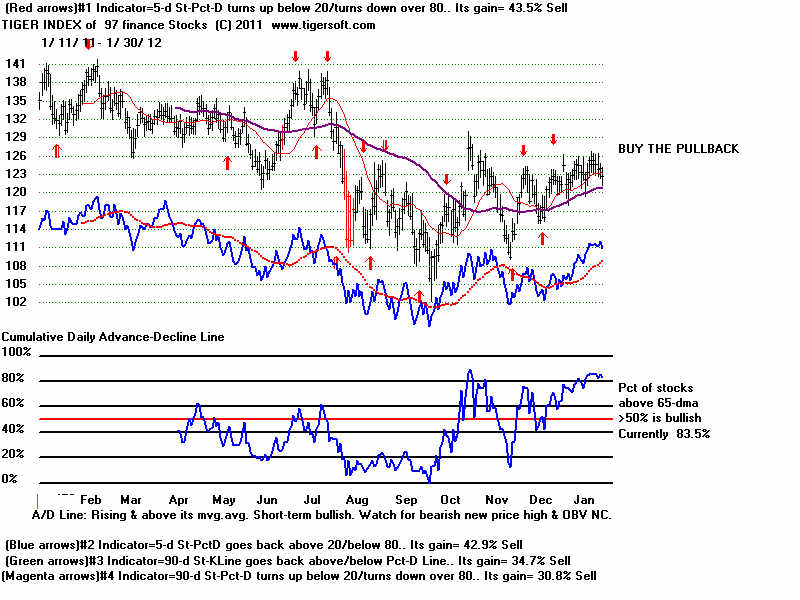
Finance Stocks 86% +3% 87% +1% 79% +-2% 74% +20% 68% +7% 71% +16% 58% -2%
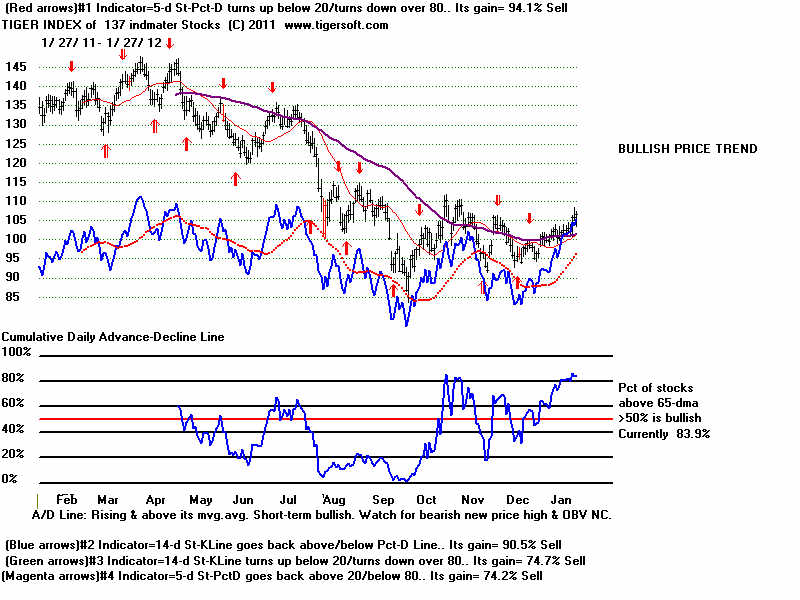
Ind. Materials 84% -2% 86% +6% 74% +5% 65% +18% 56% +3% 63% +9% 63% -5%
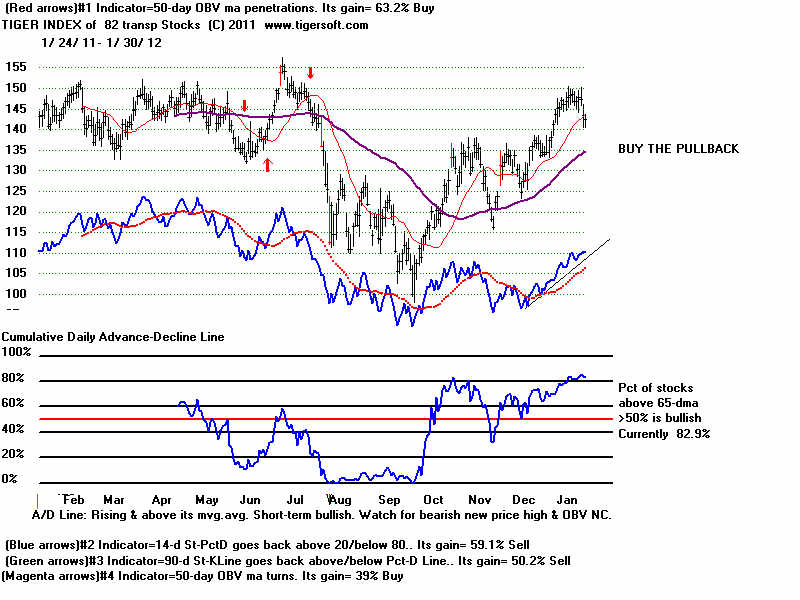
Transport Stock 84% -1% 83% +6% 77% +3% 68% +3% 72% 68% +8% 57% -6%
DJI-30 stocks 83% -14% 93% 94% +1% 93% +13% 80% +3% 87% +4% 80% -3%
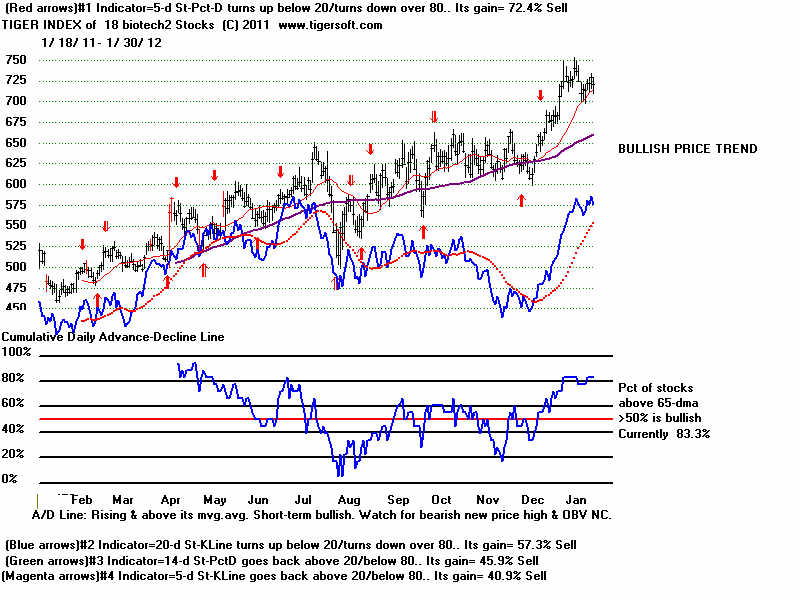
Biotech 18 83% 83% +5% 83% 72% 56% 50% +6 56% +2%
SP-500 stocks 81% -2% 83% 78% -2% 74% +8% 69% +4% 74% +12% 73% -3%
Chem 81% +2% 79% 76%+4% 67% +7% 62% +2% 60% +3% 64% -5%
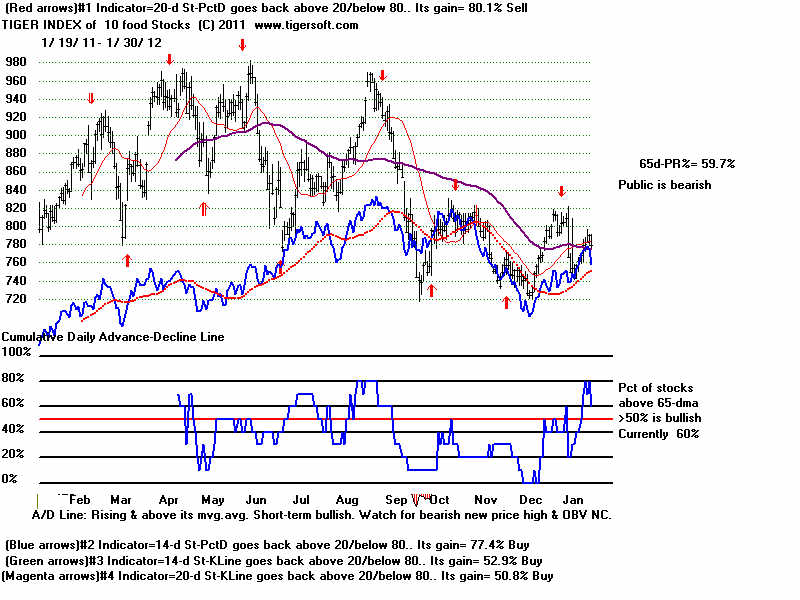
Food Commodi 80% +10% 80% +10% 60% +20% 50% +10% 20% +20% 10% 30%
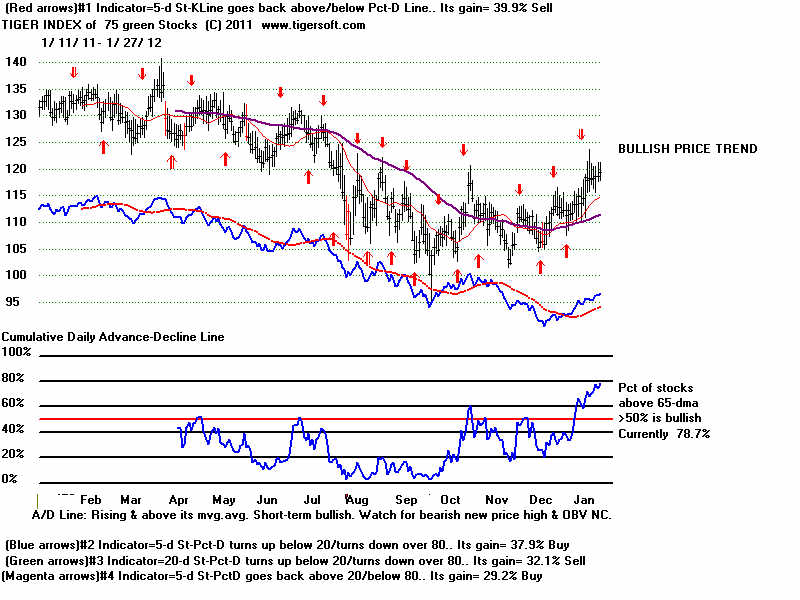
Green Stks 79% +4% 77% +5% 61% +10% 37% +2% 37% +8% 48% +12% 45% -3%
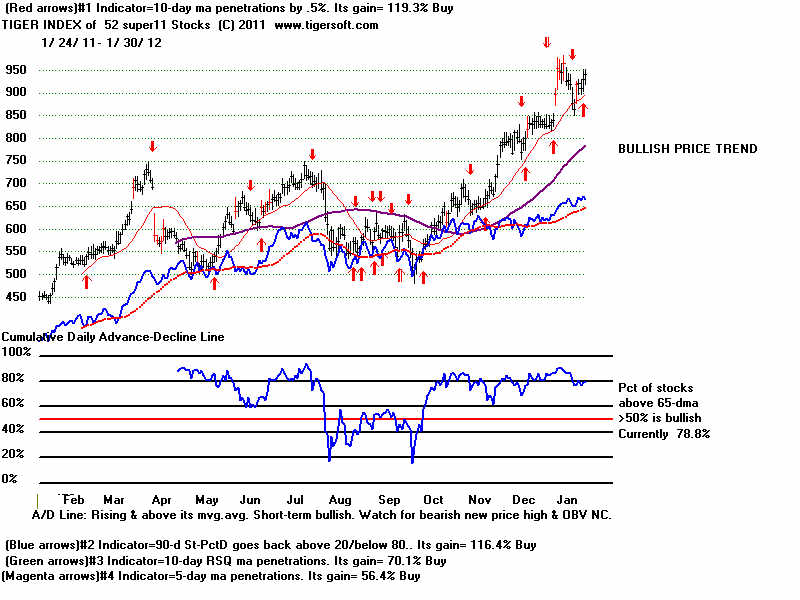
Super 2011 79% +2% 81% 89% +4%
Gold/Silver Stks 77% +4% 63% +20% 30% -3% 24% +9% 16% -1% 45% +9% 44% - -2%
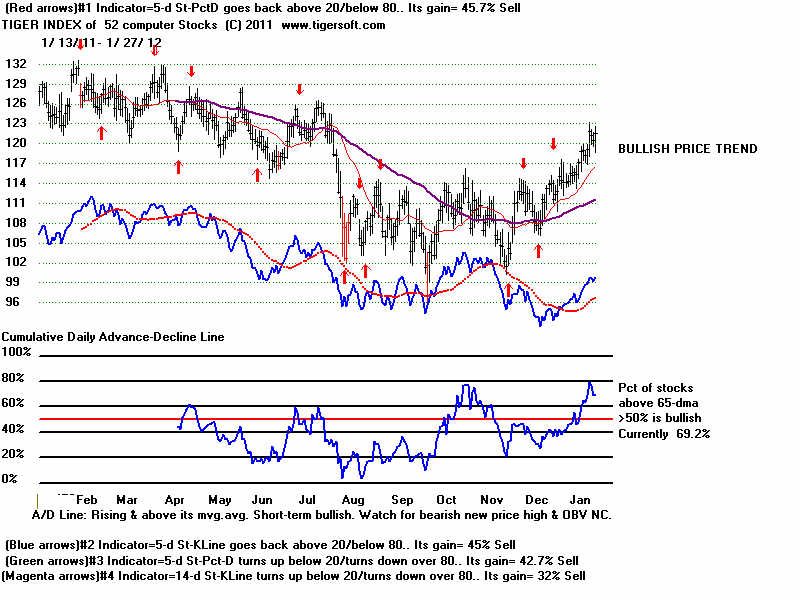
Computer Eq 69% -8% 77% -2% 48% +2% 39% 39% +4% 44% +5% 45% -2%
Utility Stocks 68% -3% 72% +10% 71% -3% 75% -6% 77% +3% 81% +15% 79%
Chinese Stocks 68% -1% 66% 45% +4% 32% +13% 26% +5% 32% 32% -4%
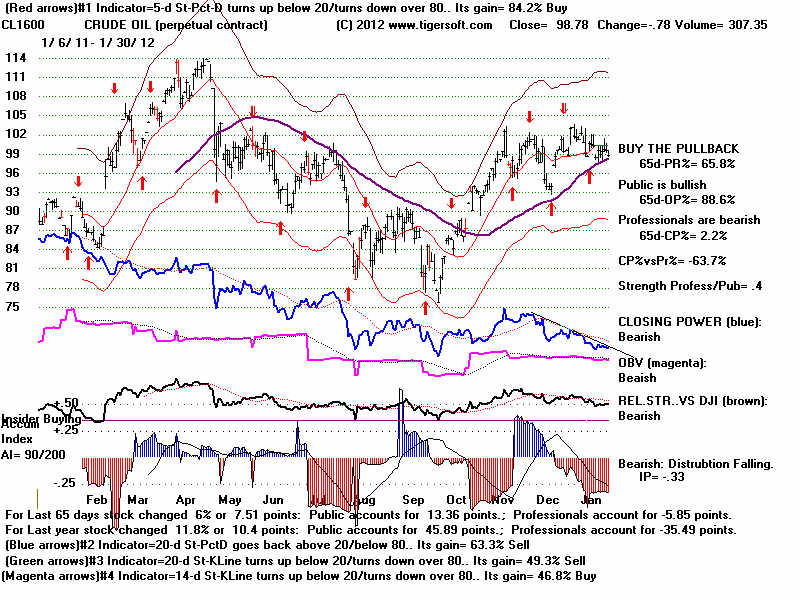
Oil stocks .. 64% -4%
Retails 61% 65% +7% 26% -9% 61% -+4% 52% -4% 52% 43% -1%
DOW STOCKS
SP500 STOCKS
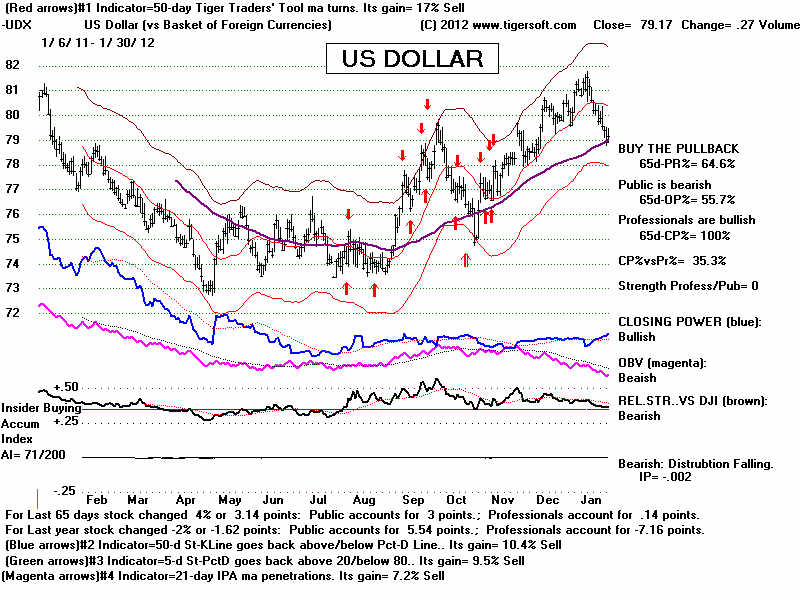
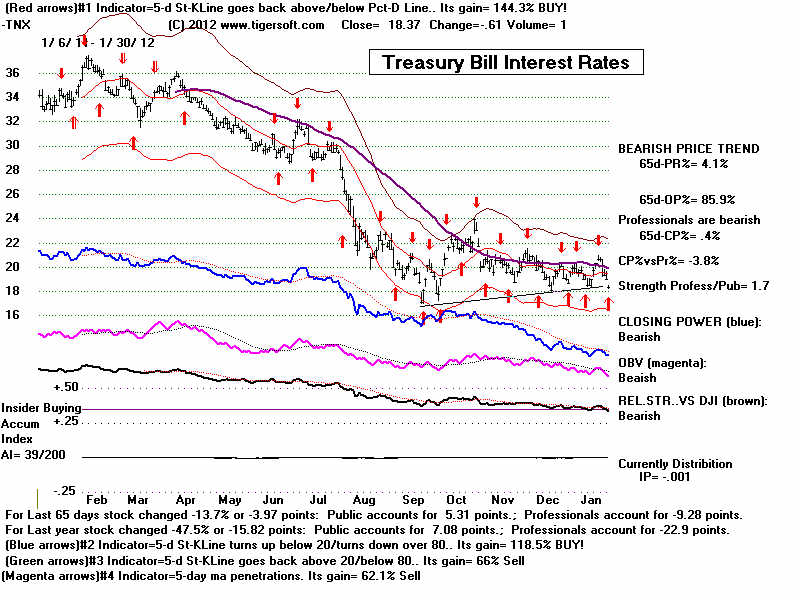
INTEREST RATES
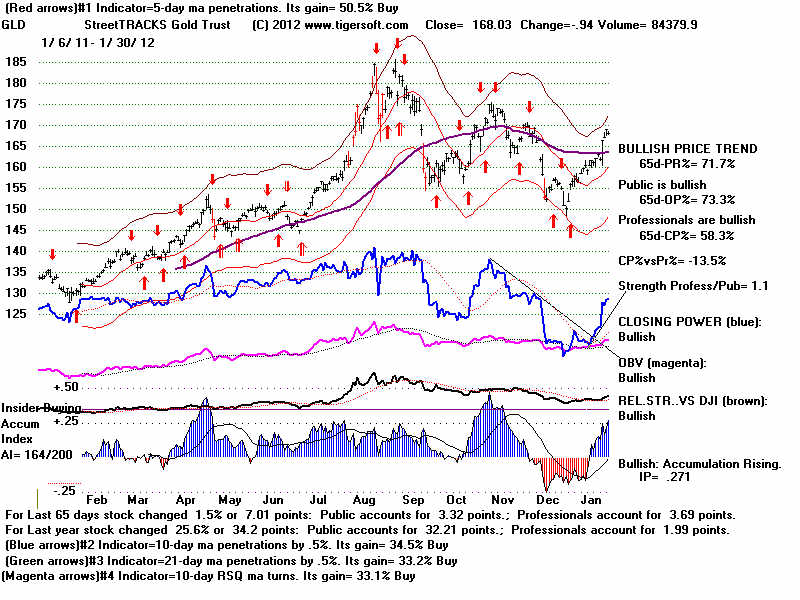
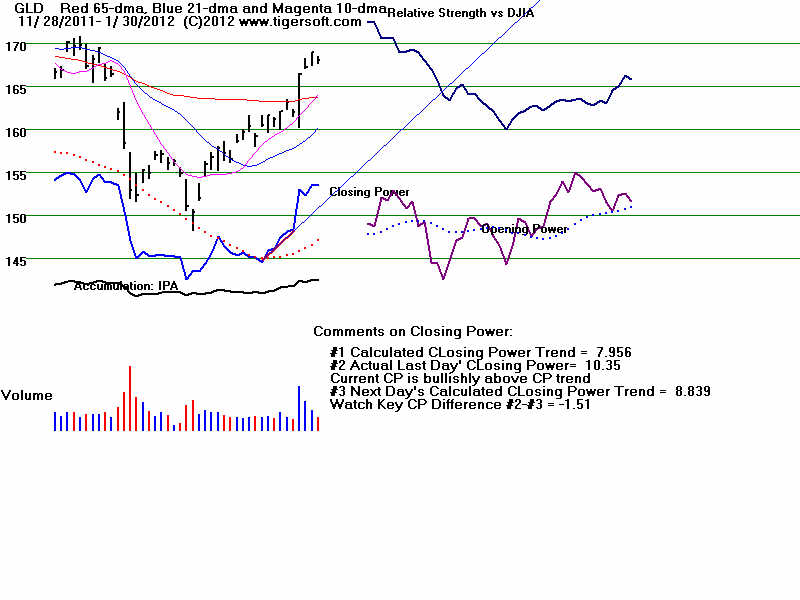
GOLD ETF
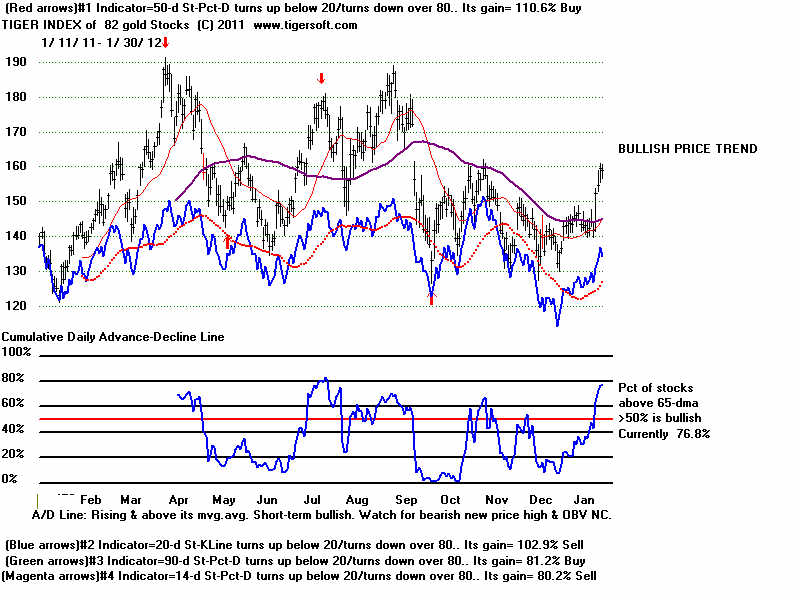
GOLD STOCKS,
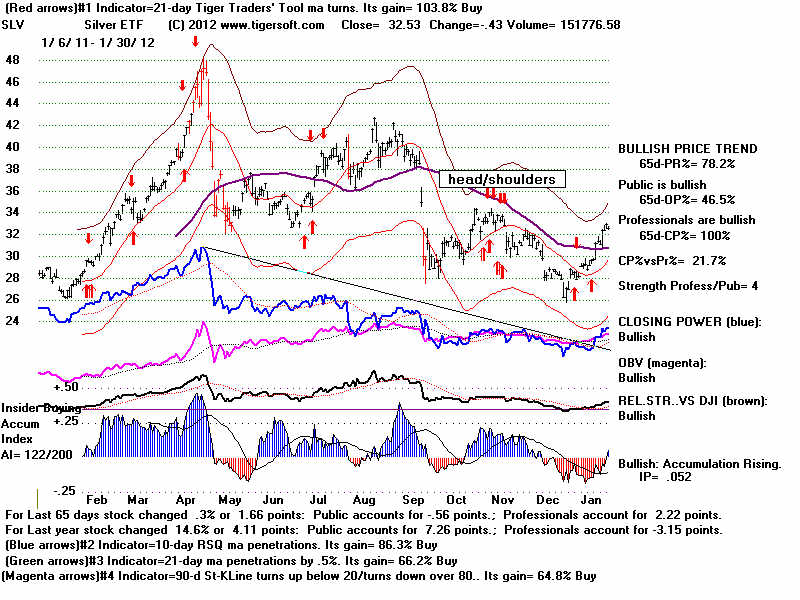
SILVER
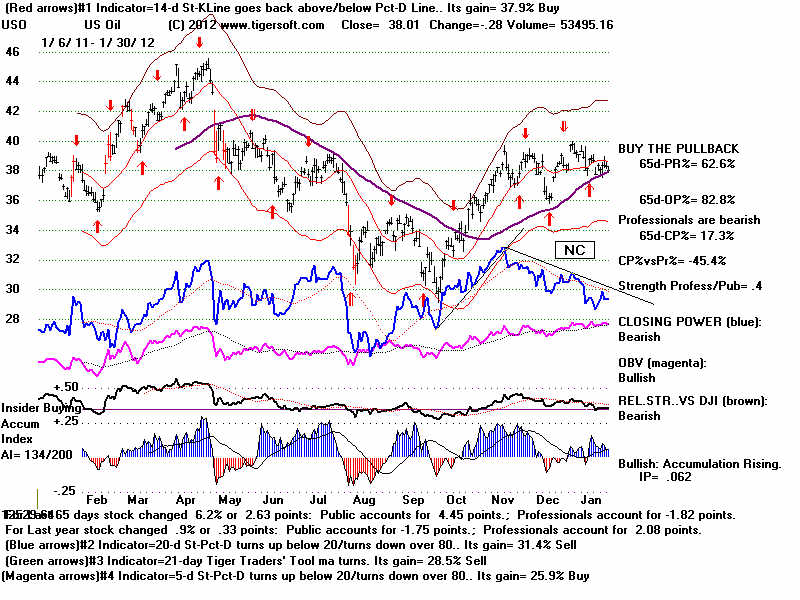
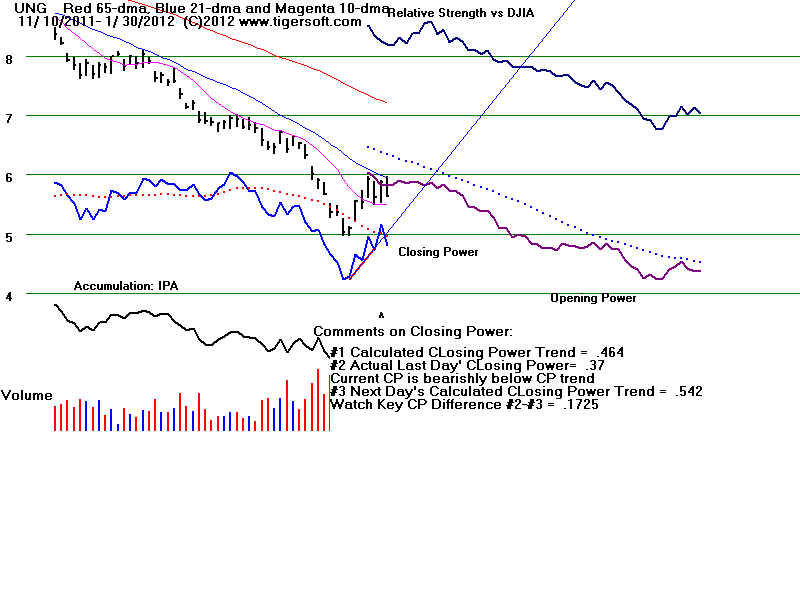
Natural Gas - UNG
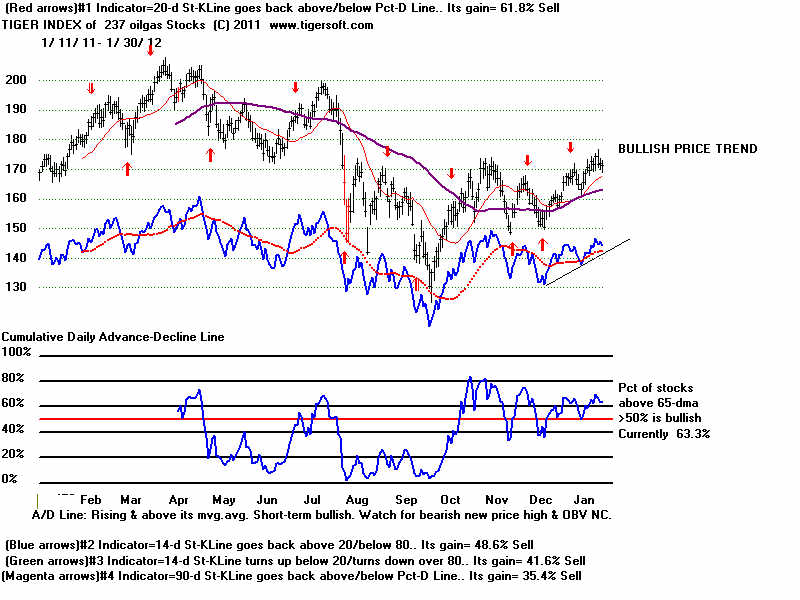
Index of Oil Stocks
NATURAL GAS PIPELINES
BONDS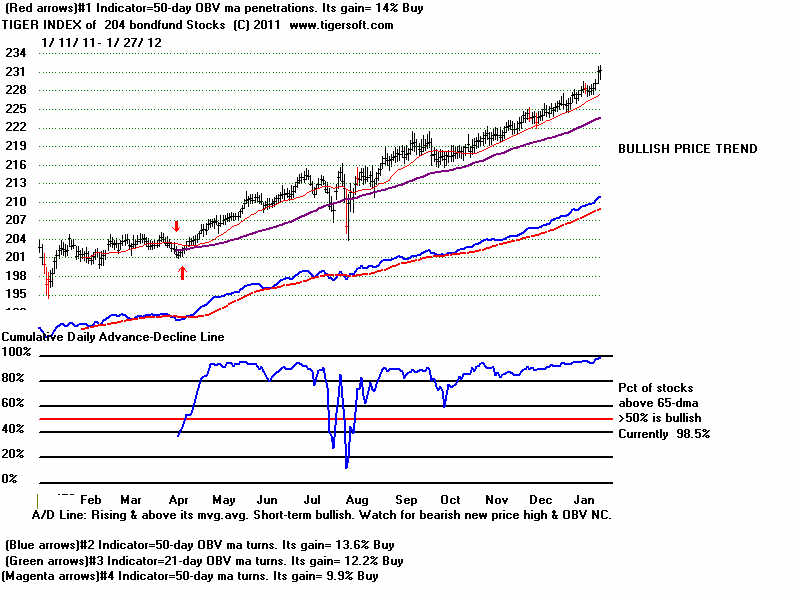 |