Tiger's
Peerless Stock Market Timing: 1915-2013
Full List of Peerless Signals on DJIA 1/1/2014
Example: Peerless
Automatic Buys/Sells Chart, for 12 months ending May 25, 2012

William Schmidt, Ph.D. (Columbia Unversity) Tiger Software
858-273-5900 william_schmidt@hotmail.com
--------- CALLING ALL TOPS --------
You,
too, Can Call The Tops with Peerless
TIP: When you know how to call tops, you also
can tell when the market is safe.
This lets you buy aggressively early in a bull market
and not sell out prematurely.
TIMING IS EVERYTHING IN THE STOCK MARKET.
> Trade with new confidence. Peerless has called
every major top real-time since 1981.
> It calls bottoms, too. Amazingly,
Peerless has averaged more than 20%/ year
using the blue chip Dow Jones
industrial Average.
>
Its automatic Buys and Sells have been
painstakingly back-tested to 1929.
>
Profitably super-impose the Peerless
signals on DIA, SPY, QQQ, IWM, FAS, TNA.
>
When Peerless gives a Buy, go long the
strongest stocks and ETFs with new confidence.
> When
Peerless gives a Sell, sell short the weakest stocks and ETFs.
>
You can run the software yourself or
get a discussion of the signals and the
market each night from our on-line
Hotline.
You
are invited to:
> Discover the technical rules behind the Peerless Automatic Buys and Sell
Signals.
> Study
their individual track record since 1928 and trade them confidently.
> Use our Buy B1....Buy B19 and Sell
S1...S19 signals.
The numbers allow us to distinguish them and study their individual
potency and reliability since 1928.
====================================================================================
Introduction
Many casual writers glibly say market timing cannot be done.
They call it a waste of time and "a fool's
errand". If you're "lucky" to get
out before a big decline, they warn, "you'll surely miss the next bull market."
But just because these nay-sayers cannot do it, does not mean it can't be done.
Our real-time track record is proof of the power of Peerless. I've spent 30
years back-testing, verifying and predicting the stock market. At least,
consider all that my Peerless can teach you. Over and over, the same
type of tops occur. Over and over, the same type of bottoms occur.
Next time you run into one of these nay-dayers, asking them some questions?
1) "How do you prove a negative?"
2) "Are you really familiar with technical analysis?"
3) "How much original historical research have you done?
4) "Have you ever used Peerless Stock Market Timing?"
5) If they're still
snippy, ask them why they persist in helping Wall Street insiders
keep their biggest trading secrets and advantage all to themselves?
Stock market history and our automatic Buys and Sell offer overwhelming evidence
showing how wrong they are. The very Wealth and Power of Wall Street
is contrary proof. Insiders time and manipulate the market all the
time.
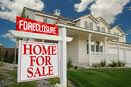
There's so much at stake here, keep an open mind and please read on.
Discover that you do not have to suffer through long bear marets.
Instead make money from them and still buy at the bottom!
Too often buying and holding is very costly. You can easily lose 50% or more
in a market "correction". Anyone who went through a market Crash like 1987
or 1998
or a long bear market like 2000-2003 or 2007-2009 will tell you how much they now wish
they had not listened to a "buy and hold" stock broker.
How Many Times Must
We Prove Peerless Works?
Peerless is proof that the stock market can be timed. In fact, we have been
successfully
timing the market real-time since 1981. We have had subscribers for 30 years.
And
we share the secrets of what we have learned, so that you can back-test the signals
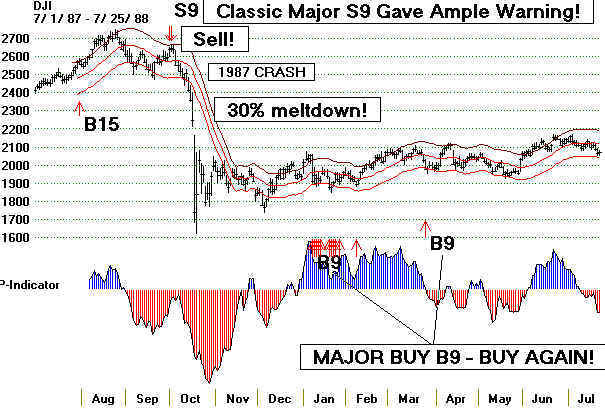
themselves. Take for example our famous Sell S9. Look at what has happened
real-time when a Peerless Sell S9 has occurred. How many subsequent big
declines in the market will it take to convince the doubters?
Recent Famous Sell S9s Subsequent
DJI Decline
----------------------------------------------------------------------------
October 1987 Sell S9 brings 34.1% gain on short sale.
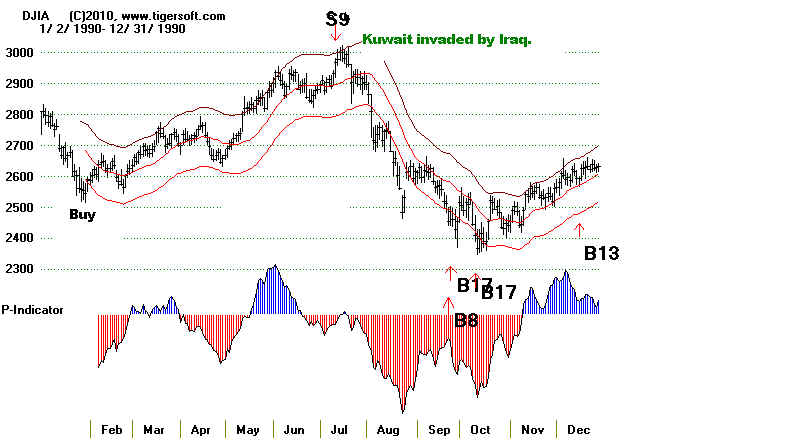
July 1990
Sell S9 brings 16.8% gain on short sale.
July 1998
Sell S9 brings 16.8% gain on short sale.
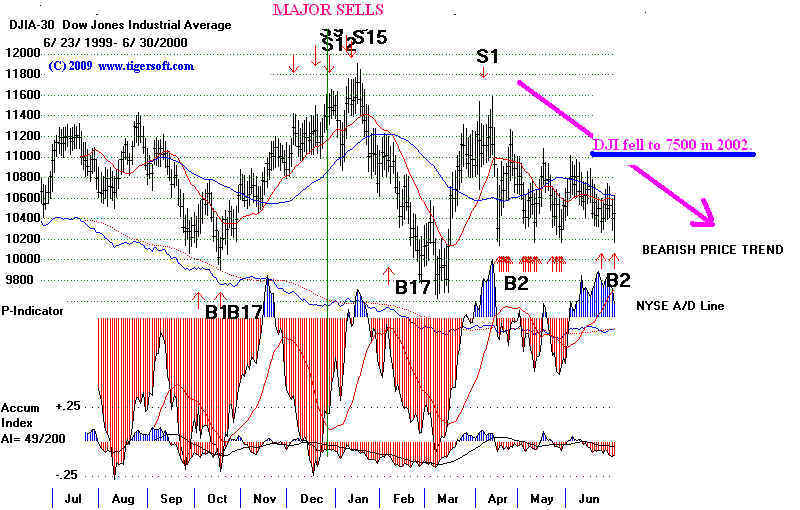
January 2000 Sell S9
brings 12.8% gain on short sale.
February 2001 Sell S9 brings 12.8% gain on short sale.
May 2002
Sell S9 brings 12.8% gain on short sale.
July 2007
Sell S9 brings 4.7% gain on short sale.
December 2007 Sell S9 brings 9.9% gain on short sale.
March 2008
Sell S9 brings 9.3% gain on short sale.
May 2008
Sell S9 brings 9.3% gain on short
sale.
Peerless works because history repeats. Tops are made in a limited number of
of well-defined ways. They show insider Distrbution. They show measurably
foolish over-enthusiasm. And they show too much money is going into too few
stocks at the final top. We mumber the ways the market tops out. Some of
our Sell signals are extraordinarily deadly. Others only call for 5%-8%
intermediate-term
declines. Similarly, market bottoms are also made in a limied number of very
definable ways.
The Sells and Buys are numbered so that we can distinguish them, one from another,
and so that we can study their track record going back to 1928. You will want
to
readily study these signals so that you validate them and see their likely
significance when they occur real-time. Peerless will elevate you to a completely
new level of understanding about the stock market. And it will be much better than
most market Pros have.
====================================================================================
Peerless Shows History Does Repeat.
Very Profitable Applications
Superimposing Peerless Reversing Signals on Various Investments:
30% Annualized
Rate of Return since 1993 Trading SPY (Long and Short)
Long Trades Only, 2%
Slippage/Commissions allowed for each round-trip trade.
SAFER, HIGH Peerless
Investing Returns on SPY, DIA, QQQ and EWC (Canada).
Which Country ETFs
Have Worked Best with Peerless Automatic Buys and Sells since 1996?
$1,000 would have
become $100,000 in 15 years.
Which Sectors Work Best
Trading with Peerless Automatic Buys and Sells?
Peerless Fidelity
Sector Funds' Performance: 1986-2011
FSLBX Gained 26% per
year. $1,000 Becomes $340,000.
Trading Individual SP-500 Stocks
Using Peerless: 1980-2011
One Year of Peerless/Tiger HOTLINE $350
Peerless Stock
Market Timing: 1929-2011 $395.
TigerSoft &
Peerless Stock Market Timing: 1929-2011 $495.
Introduction to Peerless Stock
Market Timing Older Real-Time Track Record:
1981-2009
New Peerless with On-Line Book - Peerless
Stock Market Timing: 1915-2011
---------
CALLING ALL TOPS --------
You,
too, Can Call The Tops with Peerless
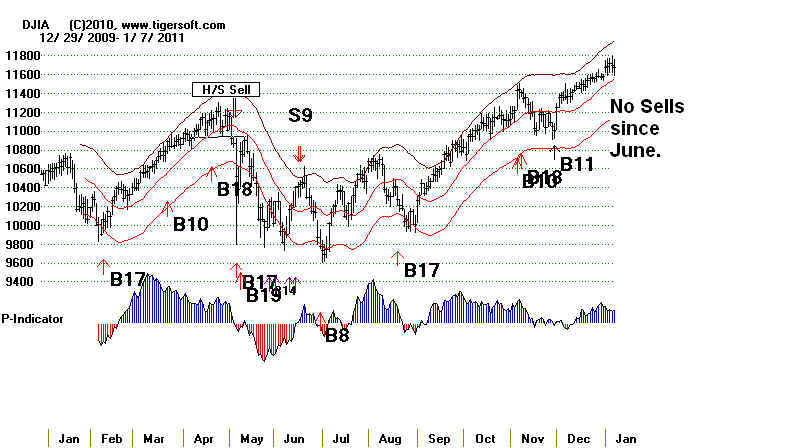
The First Task for A Successful Trader:
Determine How Safe The Market Is.
Most
of your profits will normally be made in rising markets. A reversing Peerless
Buy signal should be your starting
point to buy aggressively. The lastest Peerless
Buy in late June 2010 has now seen
the DJIA rally 25%. Our stocks have done
much better. We bought
aggressively, because we know how reliable Peerless is
at getting out as the market peaks.
Peerless Buys/Sells on DJIA
You do not have to suffer through declines in the
stock market. And you do
not
need to wonder if it's safe buy.
Peerless can show you exactly when to get out
of the market. It has done
that, REAL-TIME, in early 1981, January 1984, October 1987,
July 1990 and at the tops in 1997, 1998,
2000, 2001, 2007, 2008 and 2009.
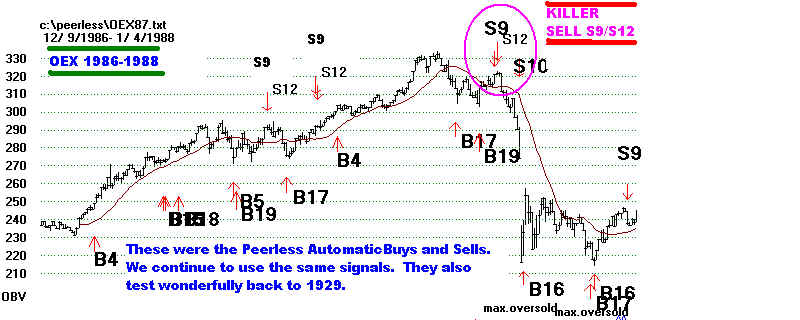
You can actually make a fortune from declining markets.
Our Peerless users made millions in the
1987 Crash. Many bought OEX puts
because of the fourth Sell S9 in early
October 1987. Three weeks later the
options had risen 50-fold. The OEX
fell from 321 on 10/1/87 to 233 on 10/20/87.
The Peerless Sell S9 was classic.
It was unmistakeable. And it was made
more bearish by the fact that there had
been earlier Sells without a market break.
Instead of buying puts, one can now buy
leveraged short sale ETFs on various
indexes.
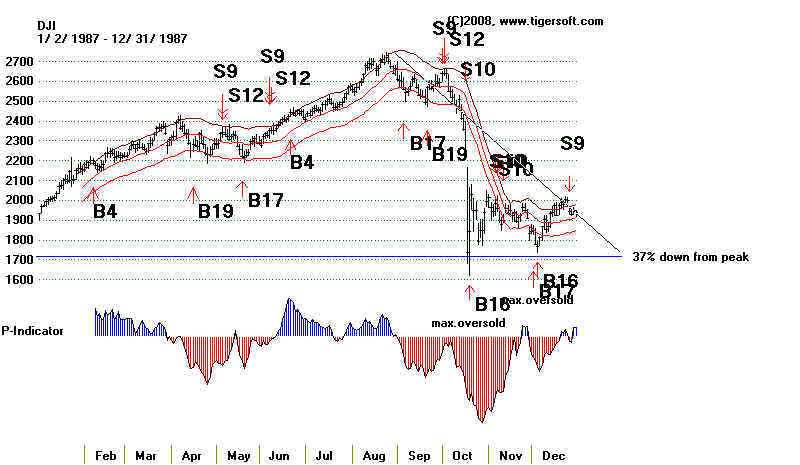
PEERLESS DJIA CHART - OCTOBER 1987 CRASH
PEERLESS SIGNALS ON OEX - OCTOBER 1987 CRASH
Peerless can also show you when it's safe to buy, just as it did real-time August 1982,
July 1984, December 1987, October 1990,
January 1995, October 1997, October 1998
and March 2003 when major Buys occur.
Trade anything with Peerless.
The world markets have never been
so closely
linked as now. That has made our
Peerless Stock Market Timing even more valuable
and necessary for trading and
investing success. The result is that Peerless can be
used not just by traders of general
market ETFs (DIA, SPY and QQQQ and their more
leveraged equivalents), Options'
and S&P Futures' traders, but also investors
in foreign ETFS and certainly most
stocks, too.
http://www.tigersoftware.com/TigerBlogs/June-5-2009/index.html
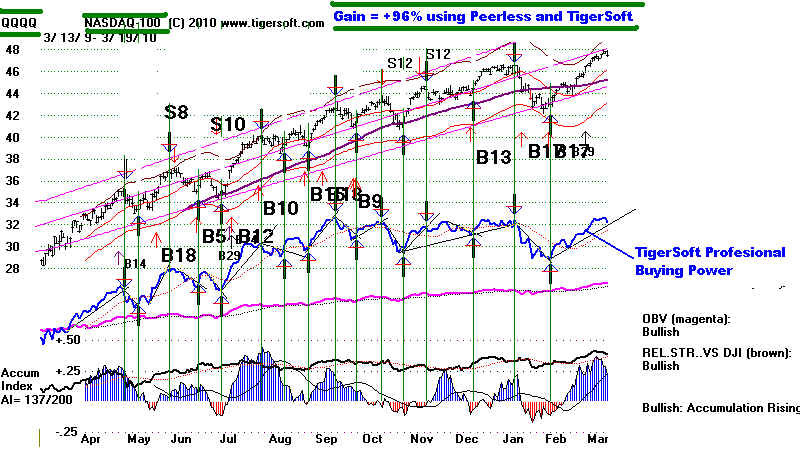
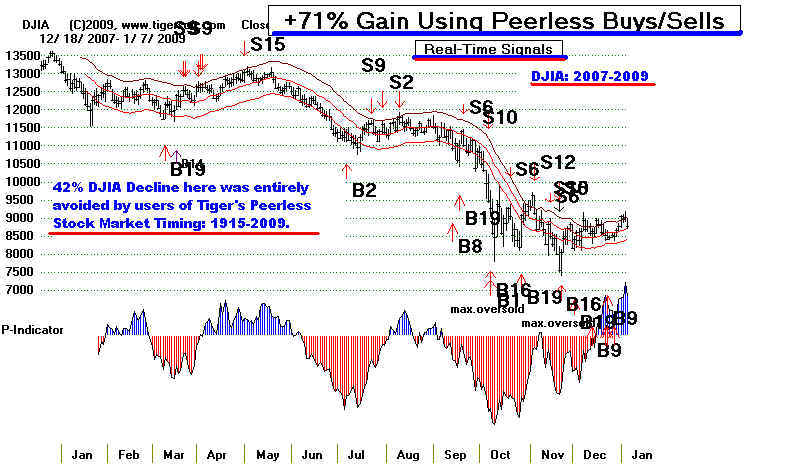
At least, hedge with Peerless. Instead of losing money, in the 2008-2009 market crash,
a Peerless user who traded DIA (the
equivalent of the DJIA) long and short from
April 2008 to March 2009 would have
gained more than +96%, most conservative
calculated. Please note: these were
real-time signals, documented on our Hotline,
so that you get these signals, even if
you did not have Peerless.
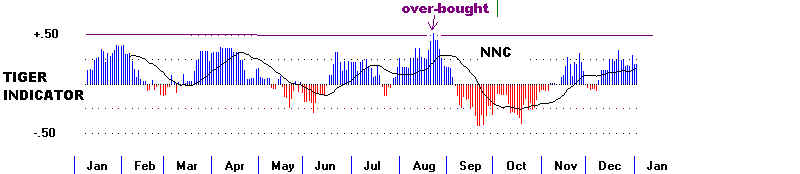
Short-term traders should trade the trend of TigerSoft Professional Buying
Power for the DIA, SPY, QQQQ etc.
primarily in the direction of the operative
Peerless Signal.
http://www.tigersoftware.com/TigerBlogs/August162008/index.html
http://www.tigersoftware.com/TigerBlogs/August162008/qqqq.html
The QQQQ chart below shows both the Peerless
signals and the Professional Buying Power
signals.
The gain for these signals was 92.2%, conservatively calculated, using the next
day's
openings to make the trades and allowing $40 commission for each trade with
the
proceeds from $10,000 fully re-invested. There were 14 winning trades. 3
losing trades.
The biggest
intra-day loss was 5.2%. Trading beat buying and holding by 35.7%.
See also
Trading DIA, SPY and QQQQ
with Peerless Signals
and TigerSoft's Professional
Buying Power Index
See also:
http://www.tigersoft.com/--1--/index.html
http://www.tigersoft.com/majorpeerless.htm
http://www.tigersoft.com/products/peerless.htm
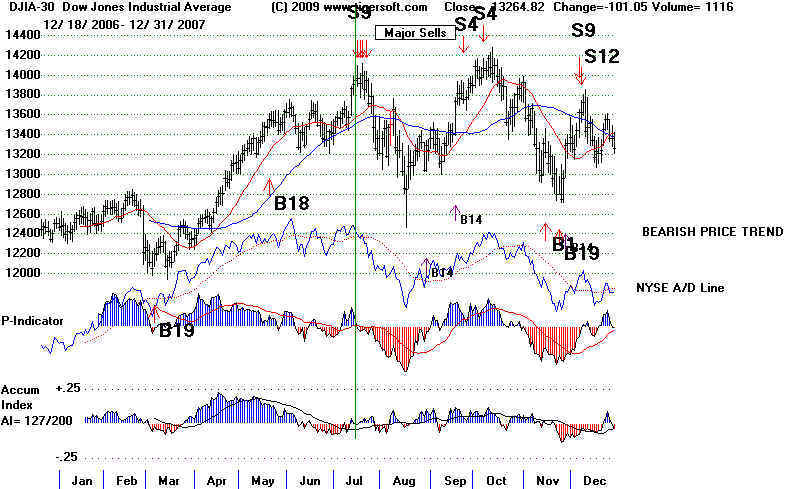
Look at
the real-time track record of Peerless major "Sell S9s" and "Sell S12s" since
1928 in the charts below. When they appear, the
market becomes dangerous.
The more such signals appear, the more dangerous the
market becomes. The
failure of key support following Peerless major Sells
always has brought a bear
market.
Our Peerless Stock Market
Timing: 1915-2011 Will Tell You When The Market Is Safe
and When It Is Dangerous. Look at Its real-time
track record. As the world markets
become more and more integrated, the Peerless
automatic Buys and Sells have proven
themselves universally. Peerless averages 3
reversals per year. The average gain on
the DJI from Buy to Sell produces an average gain of
17%/year. 91% of Peerless signals
have been profitable. We provide all the data
needed. And if you prefer to simply get the
Buys and Sells with explanations and historical
justification, subscribe to our popular
on-Line Nightly Hotline.
Buys and Sells You Can Count On and Understand.
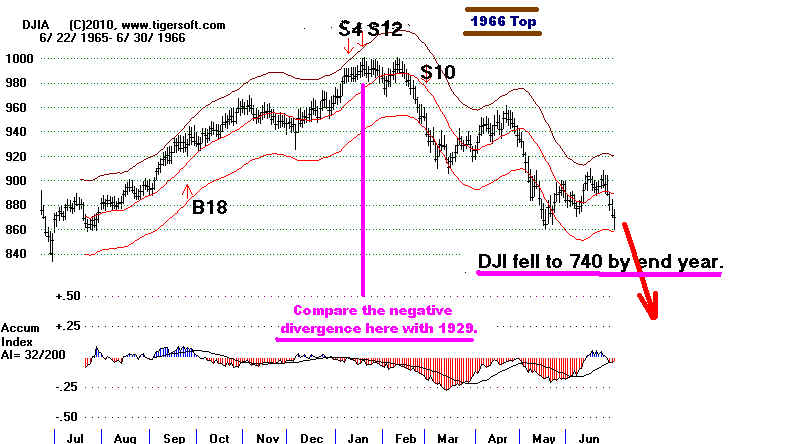
Calling All Tops: 1929, 1937, 1957 1959, 1962, 1966,
1973, 1978, 1979, 1980, 1987, 1990, 1998, 2000 and 2007
Peerless Gain = +96% April
2008-March 2009
Calling All Bottoms: 1933, 1938, 1942, 1949, 1953, 1958, 1961, 1962, 1967, 1970, 1975,
1978,
1980, 1982, 1984, 1988, 1991, 1995, 1998, 2003...
Calling All Tops:
1929, 1937, 1957, 1966, 1973, 1978,
1987, 1990, 2000, 2007, 2008
and others, too.
- Our Famous Warning of June 24, 2007 -
"SELL S9, SELL S12"
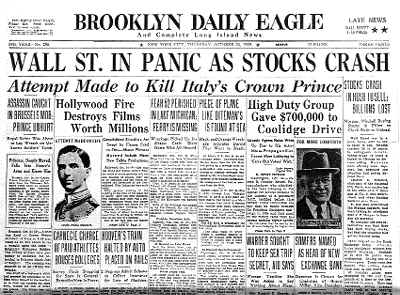
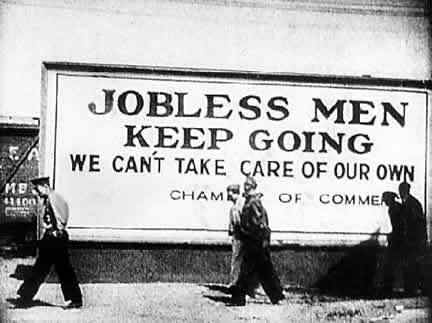
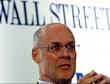
The 1929 Crash: Could It Happen Again? Yes - Absolutely.

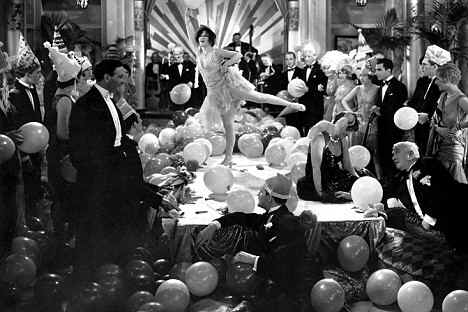
JPMorgan
Twenties
party, as depicted in the 1929 film Gold Diggers Of Broadway
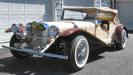
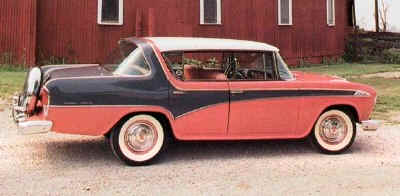
1929 Car
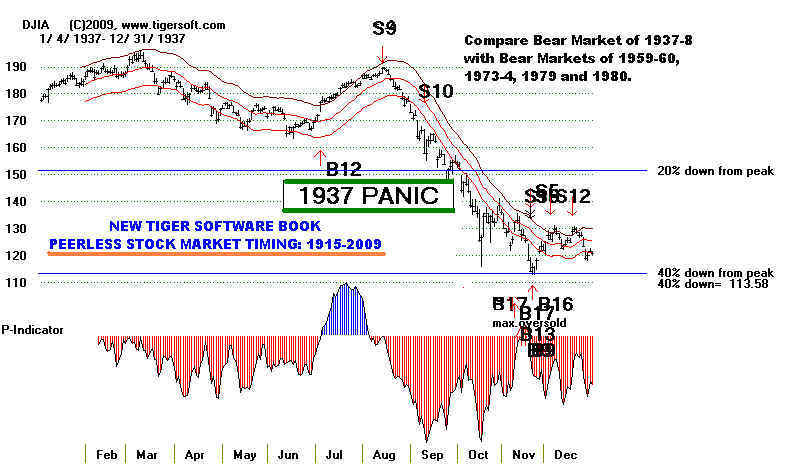
The 1937 Panic:
"SELL S9"

http://www.dailykos.com/story/2009/5/24/727557/-STFU
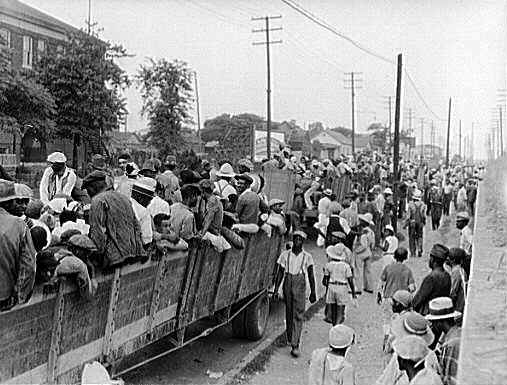
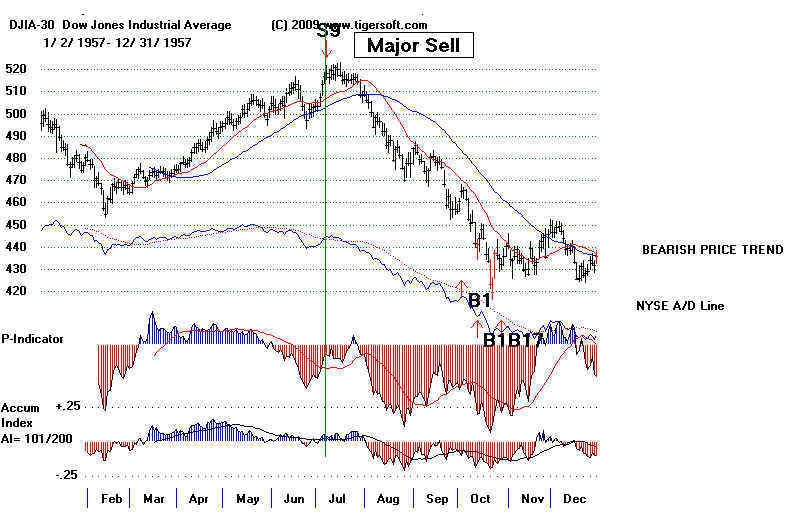
1957 Bear Market:
"SELL S9"
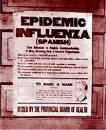
World
Wide Influenza Pandemic of 1957
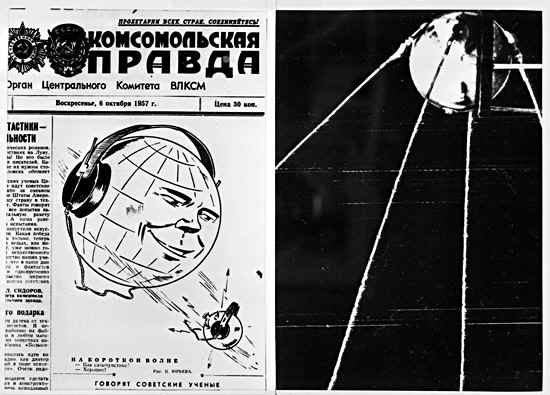
Sputnik
1966 Bear Market:
"SELL S12"


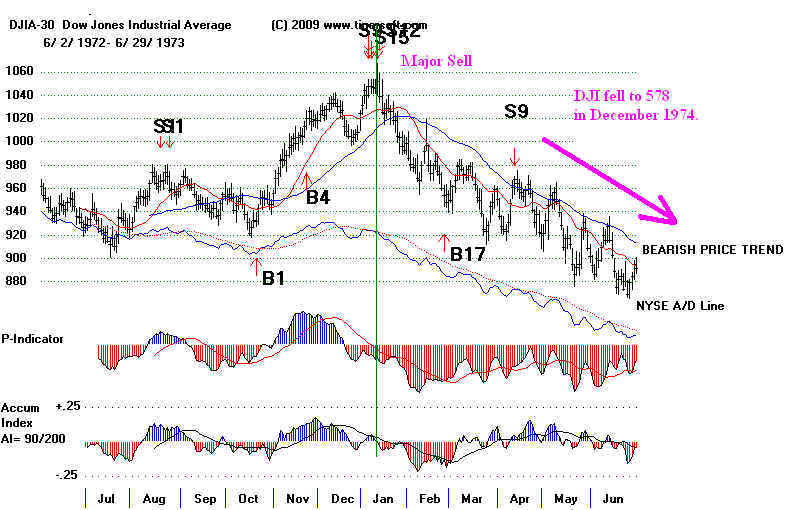
1973 Top to 1973-1974 Bear Market:
"SELL S9 SELL S12"


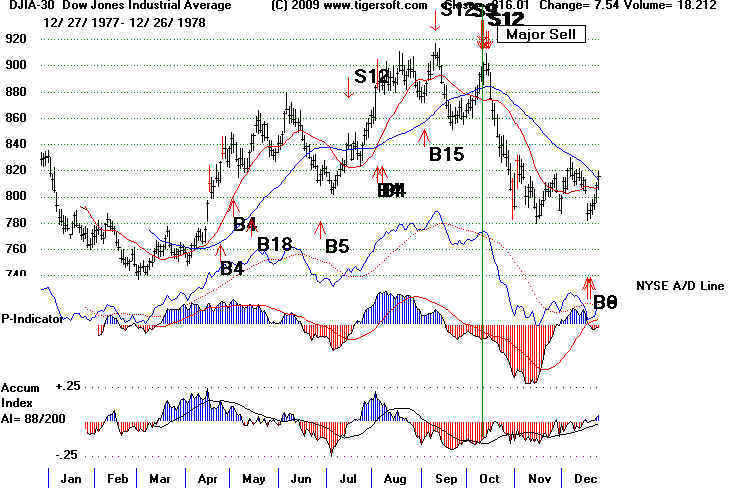
1978 Mini Crash:
"SELL S9 SELL S12"
1987 Crash
"SELL S9"


1990 Bear Market
"SELL S9"


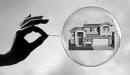
2000-2003 Bear Market
"SELL S9 SELL S12"
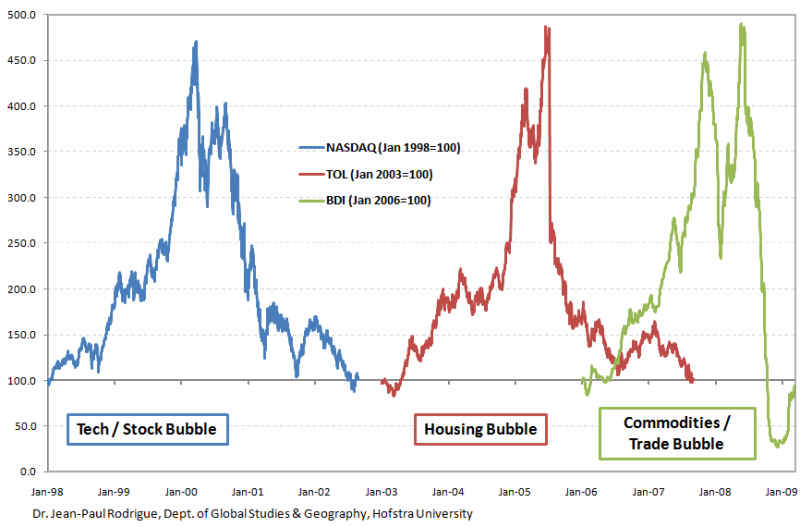
http://people.hofstra.edu/jean-paul_rodrigue/images/blowingbubbles.gif
2007 Top to Bear Market of 2007-2009
"SELL S9"
2008 Continuation Top
"SELL S9"


===============================================================================
ORDER One Year of Peerless/Tiger HOTLINE
$298
--
ORDER
TigerSoft & Peerless Stock Market Timing: 1929-2010 $395.
--
ORDER TigerSoft &
Peerless Stock Market Timing: 1929-2010 $495.