TigerSoft's
Peerless Stock Market Timing 1915-2009:
+96% GAIN: April 2008 - March 2009 Trading Gain DJIA-30 ETFs (DIA and DOG)
(C) 2009 William Schmidt, Ph.D. All rights reserved.
Our Products/Services - Order Forms More Reading To Help You Beat The Pros
TigerSoft Links: See also www.tigersoft.com
Welcome Testimonials What We Offer Insider Trading Predictions Cassandra's Curse About Us
Tiger Blog Tiger's Books on Investing Automatic Buys/Sells on Stocks Explosive Super Stocks
Killer Short Sales Techniques Gold and Silver Stocks Crude Oil Calling All Tops
Longer-Term Investing Blue Chip Stocks Different Trading Applications of TigerSoft

858-273-5900 -- PO Box 9491 -- San Diego, CA 92169 william_schmidt@hotmail.com
Peerless Stock Market Timing: 1915-2009
NOW is the perfect time to start using TigerSoft and Peerless.
Is this the start of a new bull market or a bear market rally?
What signs must we see to call a new Bull Market, based on market
history since 1915?
Thanks for visiting ... Yes, there's a lot to read here. But this site may
well offer the most valuable reading you can do now as an investor.
Using Peerless can make an enormous difference to your retirement.
Correct timing the stock market makes a huge difference to profitable
investing. At the very least, seeing when to get out of the stock market
would have saved many readers a lot of anguish and dimmed retirement
hopes. See if you don't think so.... Thanks for visiting.
By studying the past, very often we can predict the future and understand
the present's potential. Examples. In 1981, I found a pattern in the stock
market's technical data that would have predicted the 1973-1974 bear market
and the 1978, 1979 and 1980 mini-market massacres. Early in October 1987,
the same pattern appeared. Sure enough, the stock market fell 34% in
three weeks. In July 2007, the same bearish pattern appeared. To disregard
this pattern seems highly unwise. As James Bond said, "Once in chance,
twice is coincidence, but thrice is enemy action." (Ian Fleming)
For more details, see: "Calling All Tops": Peerless Stock Market Timing:
Many Stock Market Tops Show The Same Technical Signature: 1929,
1937. 1957, 1959, 1973, 1978, 1979. 1980, 1987, 2000 and 2007.
Automatic Buy and Sell Signals
TigerSoft's Peerless Software produces red arrowed Buy and Sell signals.
They have numbers like "B5" (Buy) and "S9" (Sell) so that you can look
up the technical conditions that generated the Buy or Sell and see its
track record in our on-Line Help Section. When I say "technical" I mean
that the Buys and Sells are generated based on the market's own statistics,
not news or earnings. The DJIA's opening, high, low, close, NYSE advances,
NYSE declines, NYSE Advancing Stocks' volume and NYSE Declining
Stocks's daily volume are the only information the Peerless system uses.
We have derived from this data, a number of original indicators of internal
strength (insider and professional buying) and internal weakness
(insider and professional selling.) We have a series of rules for each signal.
The signals' trading results of each rule since 1928, and sometimes 1915,
have been closely studied. When the market, for example, falls 10% over
the following 3 months on average in, say, 15 cases, we look closely
at the rules for the potential Sell signal. If we can then see a solid
rationale for the re-occurring pattern of behavior following the occurence
of conditions meeting the rule, we make it a Buy or Sell. Come to our
San Diego User group meeting or call us - 858-273-5900, and we will
give you some examples of valid Peerless rules that we use.
New to the stock market?
San Diego Tiger Users meet once a month. Join us. Upon purchase,
we walk you through the installation of our Windows-based software
and give you personalized instruction on using the programs. It takes
about 30 minutes to get operational. We provide all the data you need,
though you can use our Ascii converter if you already have a data feed.
Most important is good stock market timing. Look at the track record
of Peerless Stock Market Timing below.
|
TigerSoft's Peerless Stock Market Timing Software Back-Tested To 1915 Signal Date DJI Gain ------ ----- -------- ---- BUY 4/21/2005 10219 13.2% SELL 5/5/2006 11578 4.9% BUY 6/15/2006 11015 1.2% SELL 6/30/2006 11150 3.1% BUY 7/18/2006 10799 14.8% SELL 1/5/2007 12398 2.3% BUY 3/2/2007 12007 14.4% SELL 7/17/2007 13971 3.3% BUY 8/7/2007 13504 1.9% SELL 9/24/2007 13759 3.9% BUY 11/14/2007 13223 3.0% SELL 12/6/2007 13619 12.6% BEARISH BUY 3/7/2008 11900 5.5% SELL 3/24/2007 12549 13.0% BUY 9/15/2008 10918 0.9% SELL 9/22/2008 11016 16.0% BUY 10/8/2008 9258 0.1% SELL 10/14/2008 9311 2.6% BUY 10/28/2008 9065 0.8% SELL 11/5/2008 9139 12.0% BUY 11/21/2008 8046 1.3% SELL 1/29/2009 8149 Cover 3/9/2009 6547 19.7% BUY 3/10/2009 6926 12.3% as of 3/27/2009 7776 |
TigerSoft's Hotline answers the
most important questions you can ask now. 1. Should we buy, sell or sell short? 2. Are we in a Depression and will the stock market keep falling like it did in 1930, 1931 and 1932? 3. What is the key seasonality factor about to hit the market? 4. What is the safest hedging approach to use right now? 5. What is the single best short-seling technique to use in cave-in markets? 6. What would have been the very best way to have safely recognized all tradeable bottoms in the 1930s. 7. How can one distinguish bear market rallies from the next bull market's start? 8. Is Gold a satisfactory hedge? 9. What steps can the Obama Administration take to turn the stock market up? 10. How you can save a lot of money even if you are unemployed? Order Here - TigerSoft Buys/Sells/Insider Trading Detection Peerless Stock Market Timing (1915-2009) Nightly On-Line Hotline 200 Page Books Killer Short Selling Profits in Any Market: Using Tiger's Accumulation Index To Spot Insider Selling. Tiger-Power-Ranker Everything! $995 One year of all services, data, updates, Hotlines books. Peerless, TigerSoft and Power-Ranker software. |
Downside Volatility Can Be Profitably Tamed.
Use Peerless Stock Market Timing: 1915-2009
Who Let The Dogs Out?
For good or bad, the Bush Securities Exchange Commission permitted a
great
expansion in the number of trading vehicles that can be used to sell short
major
market indexes in a retirement account. Just before the Crash began,
in
June 2007, the Bush SEC also allowed short selling on down-ticks. These
changes have badly served most holders of stocks and Main Street and I have written
many
Blogs and Hotlines comdemning them. See my Blog -
7/18/2008
Wall Street's Dirty Little Secret. It Owns The SEC.
The SEC's Hand
in the 2007-2008 Bear Market
2007-2009 Big Losses, unless You Used
Peerless Stock Market Timing
These SEC changes have added greatly to the stock market's downward volatility.
Because Peerless predicted the declines, the extra volatility has actually helped
TigerSoft's Peerless traders make considerable profits in the extreme weakness
since mid-2007 Folks following Peerless and our Hotline have completely
avoided
the Bear Market because of the real-time Peerless major Sells. Others who did not
heed or did not know of our Peerless Sells on the general market are mostly down
50% or more. As you will see, I tried to warn anyone who visited my site.
I wrote Peerless in 1981 to avoid
exactly what has just happened. It is now
back-tested to 1915. I watch the stock market very closely every day and write
a
nightly on-line Hotline. The few hundred dollars a year I charge for it has saved my
customers millions and millions. As a trained political economist
with years of experience
writing about politics and economics from a populist's perspective, I wanted desperately
to
warn everyday people of the economic dangers I saw lying ahead. Put yourself
in my
position, How would you get the word out? How would you now? I wrote
and I
wrote about the troubles I foresaw. See My
Predictions
June
24, 2007 - The
1929 Crash: Could It Happen Again? Yes- Absolutely.
June
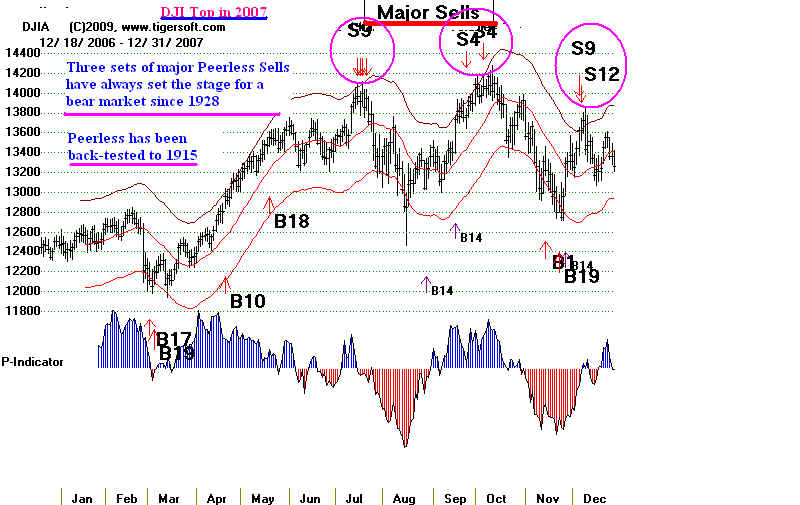
17, 2007 - June 23, 2007 Peerless gave major Sells to our people.
Major Peerless Sells in 2007 Warn of Coming Bear Market
Blogs - July 25, 2007 The Curse of Cassandra:
With Peerless You Will See The Future,
but Your Friends Will Not Believe You.
- August 5, 2007 Don't Be A Deer in The Head
Lights. Timely!
- November 22, 2007 World Bull Market Is
Ending
- November 27, 2007 Chinese Stocks Show As
Much Insider Selling as The DJI Did in 1929!
- May 1, 2008 Overpaid CEOs Are
Destroying Their Companies,
- June 4,
2008 Far
from Over, The Credit Crunch Is Worsening.
- July 16, 2008 Investing in A
Perfect Financial Storm
- September 21, 2008 Wall Street Is
Dangerously Out of Control.
- October 28, 2008 The Biggest US
Stock Market Declines: 1915-2008
For years, I have explained to investors
that "long-term investing" carries enormous
risks. Most people in the stock market with portfolios now down 50% see how
right I was. But Wall Street had for years trained most people to "Buy and
Hold".
So, resistance was hard to overcome. People tend to "freeze with anxiety".
I wrote Don't Be A Deer in The Head
Lights right after the top in 2007. It was
timely!
But only 30 or 40 people bought my software in the Summer of 2007. Will it be
any different now, as we look for a bottom?
Here's how we
advise using Peerless.
Use a reversing Peerless Sell Signal on
the DJI-30 chart to decide when
the market is going to decline. When that happens, buy DOG even in a Retirement
Account to effectively go short the DJIA-30. Oppositely, when there is a
reversing
Peerless Buy signal, buy DIA, the ETF that matches the DJIA. Most everything
moves up and down with the DJIA-30.
Other
hedging vehicles of the major market indices can also be used:
DOG
Short 1.0 x Dow Jones Industrial
Average
DXD ultra
short 2 .0 x DJIA On a 1% market decline, this ETF will be up around 2.0%.
SH Short S&P 500
ProShares (AMEX:
SDS UltraShort 2.5 X S&P 500 ProShares .
PSQ Short NASDAQ-100 ProShares
QID UltraSort 2.0 X
NASDAQ-100 ProShares.
April 2008 - March 2009 Trading Gain on DIA
+96%
Using
Peerless'es Buys and Sells on the DJIA-30 would have gained a trader 113%
applied to
the DIA from April 2008 to March 2009. Here are the trades.
Our
software shows what would have happened starting with $10,000 and taking
each trade
for the last 12 months. Here we assume that each trade has a slippage
(commissions and differences between bid and ask) of $40 with each trade and that
the trades
are taken at the close the day of the signal. Had the trades been taken
at the next
day's opening, as is more likely, the gains would have been +96%. It
should be
noted that our Hotline actually improved on some of these trades, such
as covering
the short sale on DIA on 3/9/2009 at 6547.06, well below the next day's
Buy signal
at 6926.49.
5/1/2008 Sell
Short DIA @ 129.96 using $10,000
9/15/2008 Cover Short DIA and buy DIA @109.8 using account's new
value of $11,551.25
9/22/2008 Sell DIA and Sell Short DIA @ 110.5 using account's new
value of $11624.89
10/8/2008 Cover Short DIA and buy DIA @91.4 using account's new
value of $13634.26
10/14/2008 Sell DIA and Sell Short DIA @ 93.67 using account's new value of
$13972.89
10/28/2008 Cover Short DIA and buy DIA @91.14 using account's new value of
$14350.28
11/5/2008 Sell DIA and Sell Short DIA @ 91.85 using account's new
value of $14462.07
11/21/2008 Cover Short DIA and buy DIA @80.54 using account's new value of
$16242.87
1/29/2009 Sell DIA and Sell Short DIA @ 81.53 using account's new
value of $16442.52
3/10/2009 Cover Short DIA and buy DIA @69.14 using account's new
value of $18941.27
3/27/2009 Sell DIA and Sell Short DIA @ 77.81 using account's new
value of $21316.46
open.....
Peerless Buys and Sells on the chart of the DIA.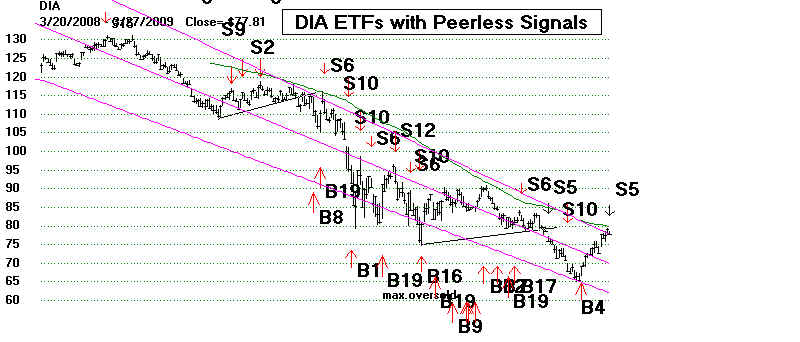

Had these signals been used to trade the SPY for this period at the openings the next day,
the gain would
have been 118.52%. For the QQQQ, the gain would have been 110.45%.
The software
allows one to superimpose the Peerless signals on any other chart. When you
do this, you will
quickly see the enormous value of Peerless.
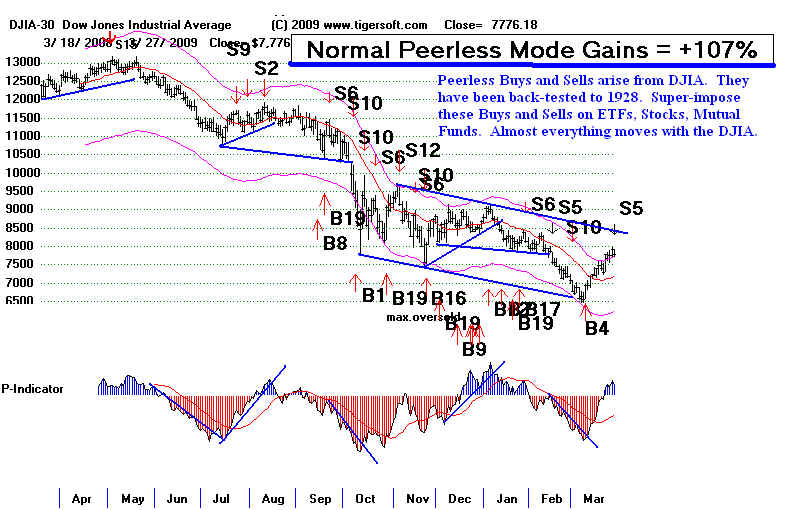
Below is the DJI chart on which the Peerless signals are based.
DJI and Peerless Signals: 2008-2009
More information? Call Us -
858-273-5900
Trade Like A Pro. Then
Profits Are Easy.
Some Basics:
"Tips" Are Unreliable.
"Buy and Hold" Is Proven Deadly..
Greed and Fear Bring Trouble. Be Objective.
Be Self-Reliant....Be Your Own Guru... Use TigerSoft Charts.
Perfection is not possible...Take small losses to avoid bigger ones...
Use The Best Trading Software.
Peerless has been back-tested carefully to 1915.
Always Inspect TigerSoft Charts for Insider Trading.
Buy What Insiders and Professionals Are Buying
Sell What Insiders and Professionals Are Selling Short.
Look for Historical Parallels. Learn from Market History.

It's easy...We can show you how in 30 minutes on your computer.
1. TigerSoft Automatic Buy
and Sells
And much more. All developed by us over
a 28 year period, since 1981. $295 or $49/mo
2. TigerSoft Insights into Key
Insider Trading $298
Use TigerSoft's Unique Tools To Spot Insider Trading
"Accumulation Index" and "Closing Power".
Don't trade without these tools.
Insider Buying
Insider
Selling.
"TigerSoft's
Closing Power is a game-changer"
3. Peerless Stock Market
Timing: 1915-2009 $398
4. Read our TigerBlog and Nightly Hotline ($298/yr).
5. Nightly Data and
Stock Trading Tutorials for TigerSoft
Data Users. $150/year
6. TigerSoft Books:
Explosive Super Stocks
Killer Short Sales in Any Market
Tiger's Tahiti Strategy for
Investing in DJI Blue Chips: 1970-2007
More about How We Can Help You:
Tiger Software's
#1 PEERLESS STOCK MARKET TIMING and TIGERSOFT. $495.00
<<<
Automatic Buy and Sell Signals:
Full History of All Reversing Buys and Sells since 1965
 43 year Track Record .... 28+% per year!
PEERLESS Provides Investors an Average Gain of
28+% per Year
on the DJIA. This is perfect for overall-market timing,
trading mutual funds,
index options and futures.
FACT: "Successful Stock Market
Timing Accounts
for 70% of A Typical Investor's Profits."
Our
Peerless Stocks Market Timing Has been back-tested as far as 1965.
Originally written in 1981, and tested with the Dow Jones Industrial Avg.,
it
has certainly stood the time. Look at the typical annual returns:
Avg.Annual Returns from Peerless Stock Market Timing and TigerSoft
25%-36%
per Year: DJIA
SP-500
NASDAQ
QQQQ
75%,
100+% per Year: Using Options Safer Blue Chips.
FACT: The SP-500 has not had a 10% correction
since January 2003.
This is the longest such period without a correction since 1965.
A correction is Over-Due. The market is now especially vulnerable!
FACT: Study after study shows that
historically most stock market profits
are
made between October lows and the end of April.
Want to read more about Peerless?
See Full Track Record?
Market Timers, See
also TigerSmart nearly 30%/year NASDAQ/QQQQ
Market Timing below.
Learn to compare current market conditions with those in the past.
For example, does the market right now bear the same characteristics of
other Summer
periods before a decline, or before a rally. History does repeat in the stock
market...
SIMPLE BUYING AND HOLDING
IS GETTING RISKIER and RISKIER!
The DJIA has now gone a record 50
months without a 10% correction.
It would be wise to get our Peerless Stock Market Timing to know
when the next correction is about to start. "The higher the diving board,
the bigger the splash!".
The long bull market from 1982 to 2000 is now a part of market history.
Market History shows long bull markets are often followed by 13-17
years of volatile trading markets. The year 2000 saw the
top in a long bull market that started in August 1982.
Despite the strength seen in 2007, as investors enjoy the world-wide bull market,
in the US we will probably see volatile swings up and down, for many years,
without a sustained run to multiple years' new highs.
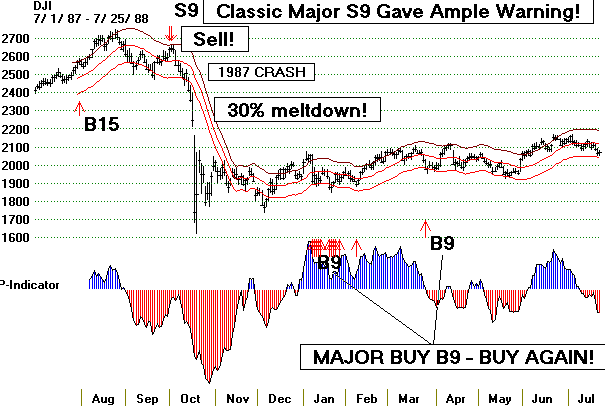
Below, look at how well investors were alerted to the impending
Crash of 1987.
This was done real-time. The Peerless
Stock Market Timing system had been
written six years earlier. Hundreds of investors got out at the top
because
of Peerless. at the time! We teach you how to see these tops coming.
Learn from the past! Don't let the next "BIG ONE" hurt you.
Get Peerless!
Market Timing is Everything.
If you buy at a significant market bottom, you will almost
certainly make money. But if you buy near a major market
top, you will almost certainly lose a lot of money. The importance
of market timing is now the subject of a new book, by our
long-time friend David Rogers:
The 90% Solution,
(John Wiley & Sons, 2006.)
The long bull market from 1982 to 2000 is gone.
Market History for the 20th century shows long bull markets
are followed by 13-17 years of volatile trading markets. The year
2000 saw the top in a long bull market that started in August 1982.
We may well see volatile swings up and down, as
repeatedly occurred between 1966 and 1982 when war,
inflation, higher and higher interest rates and heightened
partisanship, including impeachment reigned supreme....
Review by William Schmidt of Tiger Software
So, don't just buy and hold, hoping for the best!
===> Here's our Special Offer in honor of the
May 10th, 2006 - Perfect Real-Time Major Sell
What are you waiting for? Pick up the phone
order Peerless today. 858-273-5900. We'll give
all the details needed to start trading these signals
right away.
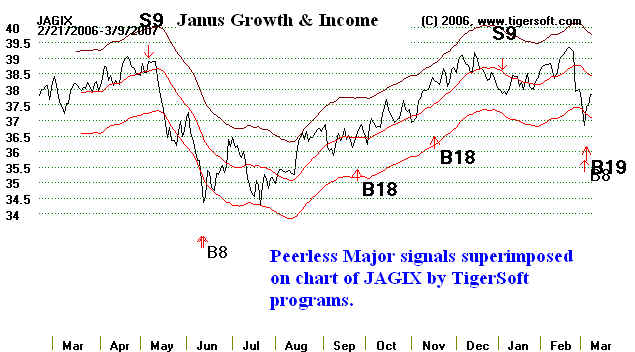
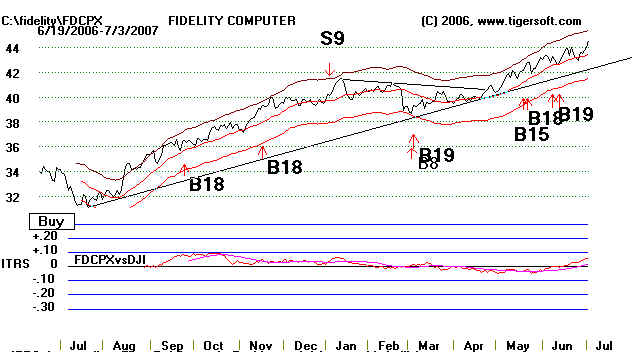
Peerless-Tiger Soft combine to give very profitable signals
on mutual funds like those of Janus and Fidelity funds...
More information.
Recent chart of Janus Fund:
 Here is the recent chart of
 Fidelity's FDCPX - Computer
Select Fund.
..........................................................................................................................................................................
PEERLESS STOCK MARKET TIMING
BUY & SELL SIGNALS
Detailed Track Record
Peerless Gained +28.5% per year from 1965-2007 on DJI-30
LEARN WHEN TO INVEST & WHEN TO WAIT!
BUYING AND SIMPLY BLINDLY HOLDING IS RISKY AND RESULTS
IN DEMONSTRATABLY INFERIOR RESULTS!
Nearly everything goes up when the DJI-30 rises.
And nearly everything falls sharply when the DJI-30 plunges.
So, Peerless will help you no matter what you trade.
Nearly All Stocks
DIAMONDS - DJI-30 Equivalent.
Spiders (SPY)
NASDAQ-100 (QQQQ)
RYDEX Nova and Ursa Funds
Fidelity Select Funds.
Non-ETFs and Overseas Stocks.
Index Options
Index Futures
Use the major reversing Peerless Buys and Sells from charts the DJI-30 and
the NASDAQ. They have been back-tested to 1915. The results here have been
carefully computed for the 42-year period 1965-2007.
Peerless has been bringing big profits to its users since 1981. Its core concepts
and initial signals have remain unchanged. Over the years since 1981, a few more
major Buys and Sells have been added, but only after careful back-testing.
There have been 67 times since 1965 when a long position was taken and 66
occasions when a Peerless user should have gone short the DJI-30 or its equivalent.
RESULTS YOU CAN BACK-TEST YOURSELF
We provide you all the back-data to 1965, so you can readily back-test
and better understand the dependability and power of Peerless.
The Automatic major Buy and Sell Signals for Peerless have averaged
a yearly gain of more than 28% on the DJI since 1965. They give a big boost to
the performance to nearly all portfolios, because of how inter-twined and
inter-dependent global markets now are. The reversing major Peerless
signals are powerful and last long enough to affect nearly all markets.
Which Sectors benefir most from Peerless Stock Market Timing?
Peerless improved the profits of those holding Fidelity Select funds by 11.6% per year
from 2000-2004 . Especially fine results are seen in Technology, Consumer Services,
Cyclical and Banking for the entire period 1987-2005. Anyone owning stocks in these
areas would have been aided enormously by employing the Peerless automatic
Buy and Sell signals.
Make 28.4% per Year on DJI-30 if you are willing to Sell Short
Make nearly 20%/year Buying the DJI-30 and Selling only
Using Peerless would have turned $100 in 1965 into $89,600 in 2007
.This is the equivalent of 17.5 %/year.
By comparison, buying and holding the DJI-30 from 1965 to 2007
would have only increased the value of the original $100 investment to $1437.
61 of the 67 trades (91.0%) would have been profitable.
On average 1.6 trades per year.
Avg. Trade's Gain = +11.2%
The Peerless gains of simply buying and selling on the reversing major Peerless signals
are understated, in that no consideration is given the interest received while in cash.
This would probably have increased the average annual return by more than 2.5%,
making the average annual return 20%. It is assumed that dividends received cancel
out commissions..
83% of the reversing major Peerless Sells brought a decline to at least the
lower band in our charts. And that was in a market environment that rose
from 1000 to 13500. Calling All Tops!
In 50% of the cases of a Peerless major Sell, the DJIA went well below
the lower band and down anywhere from 8% to 33%.
What Value Do You Place on Peace of Mind?
Know when the stock market is safe and know when it is dangerous.
We have spent 25 years researching market history. It repeats and repeats.
Don't resign yourself to a cruel financial fate. You do not have to suffer bear
markets. Sell when Peerless tells you to and use the time until the next Buy
to relax and to prepare for the next Buy signal. You peace of mind and
confidence will soar, along wth your investments.
With Peerless You Can Afford To Be More Aggressive.
Keep in mind the returns below are for conservative Dow Jones Industrial
Average. Because of the added safety our Peerless system offers, you may
well want to be more aggressive.
"Calling
All Tops "
19 Reversing Major PEERLESS SELLS
brought Dow Declines of 6.2% to 34.1%, 1965-2005
Date of Major Reversing Sell
Next Subsequent Reversal to BUY
------------------------------------------------------
-------------------------------------------------------------------------------
1/6/1966 Peerless Major Sell
"S12" 7
months later after 21.3% decline in DJI
9/14/1967 Peerless Major Sell "S12"
4 months later after 6.2%
decline in DJI
1/7/1969 Peerless Major Sell
"S10" 16 months
later after 28.4% decline in DJI
8/17/1971 Peerless Major Sell "S9"
3 months
later after 7.6% decline in DJI
1/3/1973 Peerless Major Sell
"S9"
8
months later after 9.9% decline in DJI
10/26/1973
Peerless Major Sell "S9"
4 months later after 16.1% decline in DJI
4/19/1974 Peerless Major Sell
"S9"
6 months later after 29.8% decline in DJI
5/25/1977 Peerless Major Sell "S10"
7 months later
after 10.7% decline in DJI
10/10/1978 Peerless Major Sell
"S12" 1 month later after
7.2% decline in DJI
9/21/1979 Peerless Major Sell "S9"
2 months
later after 9.7% decline in DJI
1/16/1980 Peerless Major Sell "S12"
2 months later
after 10.1% decline in DJI
2/26/1981 Peerless Major Sell "S12"
7 months later
after 12.9% decline in DJI
Real Time Signals: Peerless Users Saw These
Signals at The Time.
10/1/1987 Peerless Major Sell
"S9"
3 weeks later after 34.1% decline in DJI
1/3/1990 Peerless Major Sell "S9"
3 weeks later after 8.9% decline in DJI
7/13/1990 Peerless Major Sell "S9"
3 months
later after 17.7% decline in DJI
10/1/1997 Peerless Major Sell "S9"
3 weeks
later after 6.5% decline in DJI
4/23/1998 Peerless Major Sell "S9"
5 months
later after 16.5% decline in DJI
1/4/1999 Peerless Major Sell "S9"
32 months
later after 10.3% decline in DJI
5/15/2002 Peerless Major Sell "S12"
3 months later after
20.0% decline in DJI
"Calling All Bottoms, too"
35 Reversing Major PEERLESS Buys
brought Dow Advances of 6.0% to 35.6%, 1965-2005
Date of Major Reversing Buy
Next Subsequent Reversal to Sell
-------------------------------------------------
-------------------------------------------------------------------------------
9/24/1965 Peerless Major
Buy "B18"
4 months later
after 6.0% advance in DJI
11/22/1966 Peerless Major Buy "B9"
4 months later
after 9.4% advance in DJI
5/19/1967 Peerless Major Buy "B9"
4
months later after 6.3% advance in DJI
1/22/1968 Peerless Major Buy "B9"
12 months later after
6.2% advance in DJI
5/27/1970 Peerless Major Buy "B19"
2 months later
after 9.1% advance in DJI
8/11/1970 Peerless Major Buy "B9"
3 months
later after 9.4% advance in DJI
12/15/1970 Peerless Major Buy
"B4" 9
months later after 9.8% advance in DJI
11/30/1971 Peerless Major Buy "B12"
5 months later after 15.4% advance
in DJI
10/7/1974 Peerless Major Buy "B19"
11 months later after 35.6%
advance in DJI
12/4/1975 Peerless Major Buy "B9"
4 months
later after 19.9% advance in DJI
2/23/1978 Peerless Major Buy "B9"
5 months
later after 11.7% advance in DJI
11/1/1978 Peerless Major Buy "B19"
10 months later after 8.0%
advance in DJI
11/21/1979 Peerless Major Buy "B9"
2 months later after 7.2%
advance in DJI
3/28/1980 Peerless Major Buy "B19"
7 months later
after 26.3% advance in DJI
Real Time Signals: Peerless
Users Saw These Signals at The Time.
8/17/1982
Peerless Major Buy "B19" 4
months later after 29.5% advance in DJI
1/24/1983 Peerless Major Buy "B9"
6 months later after
20.7% advance in DJI
1/14/1985 Peerless Major
Buy "B9" 9
months later after 20.7% advance in DJI
11/18/1985 Peerless Major Buy "B4"
3 months later after 10.6% advance
in DJI
2/10/1986 Peerless Major
Buy "B4" 4
months later after 14.6% advance in DJI
9/11/1986 Peerless Major
Buy "B17" 7 months
later after 33.3% advance in DJI
6/22/1987 Peerless Major Buy "B4"
3 months later
after 7.9% advance in DJI
10/19/1987 Peerless
Major Buy "B16" 2 months later
after 18.8% advance in DJI
11/2/1988 Peerless Major
Buy "B15" 2 months
later after 27.7% advance in DJI
1/25/1990 Peerless
Major Buy "B17" 6 months
later after 16.4% advance in DJI
9/24/1990 Peerless
Major Buy "B17" 19 months
later after 16.4% advance in DJI
12/28/1992 Peerless Major Buy "B15"
22 months later after 18.1% advance in DJI.
3/27/1995 Peerless
Major Buy "B15" 8
months later after 17.2% advance in DJI.
9/13/1996 Peerless Major Buy
"B10" 4 months later after
14.8% advance in DJI.
5/5/1997 Peerless Major Buy "B14"
4 months later after 11.1%
advance in DJI.
10/28/97 Peerless
Major Buy "B19"
3 months later after
8.1% advance in DJI.
2/10/98 Peerless
Major Buy "B4"
2 months later after 10.2% advance in DJI.
10/1/98 Peerless
Major Buy "B17"
3 months
later after 20.3% advance in DJI.
9/21/01 Peerless Major
Buy "B16"
3 months
later after 23.8% advance in DJI.
7/24/02 Peerless
Major Buy
"B19" 19
months later after 29.1% advance in DJI.
THE PEERLESS DJI/SP500 SYSTEM OF BUY AND SELL SIGNALS
CAN BE YOURS
TOMMORROW FOR ONLY $495. Order here.
(See also TigerSmart nearly 30%/year
NASDAQ/QQQQ Market Timing below, under #2)
These signals on the DJIA have been
helping investors and traders since 1981!
They have been back-tested to 1965. These signals
gained 28% in 2004.
The yearly average gain is more than 28% on the DJI, sometimes a lot more.
Reduce your risk and trade the DJI and its equivalents. Theoretically, someone
putting $500 into this system in 1965, would now have a nest egg of $3,000,000.
Superimpose these Peerless DJI signals on your SP-500
and OEX charts and
see your money grow. Peerless DJI signals are great for trading Rydex Index
funds that mirror SP-500. Someone
investing $100 into the SP-500 in 1970
would have seen their funds grow to $89,687. The system is simple and
automatic. And there were only an average of 3 trades a year. This improves
an investors'| gains by a factor of 74.6 over buying and holding.
|
You will want to superimpose the Peerless Major Buys and Sells on your stock charts. Most stocks advance when Peerless gives a Buy and most fall when it gives a Sell. Here are current signals on IBM. 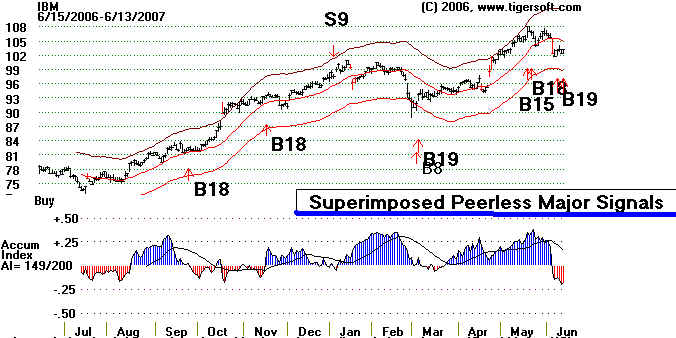 |
Track Record: DJI
1965-2007 Major Signals |