12/28/2008
(C) 2008 www.tigersoft.com William Schmidt, Ph.D.
The simplest approach to making money using TigerSoft is to use
its automatic Buys and Sells. Buy on a fresh automatic TigerSoft
red Buy and Sell on a fresh automatic TigerSoft Sell. The manual that
we provide makes a number of suggestions on how best to use them.
But here are some important considerations for anyone who is freshly
considering adding TigerSoft to their investment and trading arsenal.
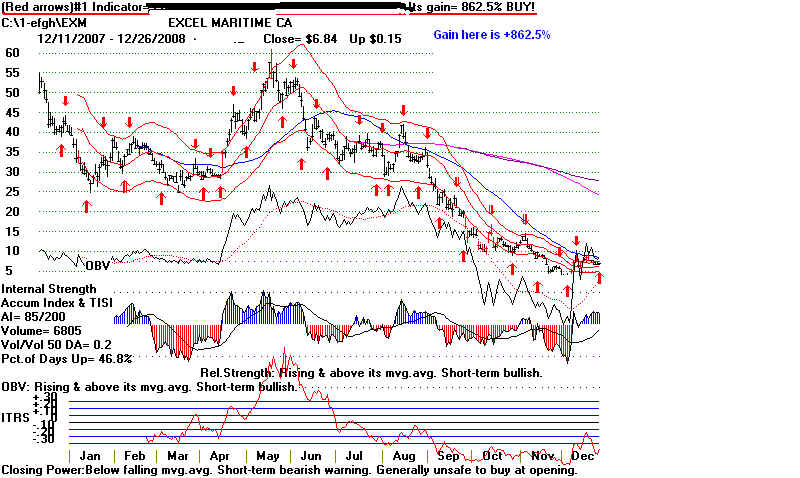
Example: EXM - Excel Maritime
The basic TigerSoft chart also shows 4 moving averages (ma):
red 21-day ma and upper and lower band.
blue 50-day ma
pink 30-week ma
black 200 day ma
black OBV (aggressive buying)
blue and red Accumulation Index
red Intermediate Term Relative Strength.
Chart advises that the short-term expected price direction is up.
new red up Buy arrow.
Short-term relative strength is bullish.
Short-term OBV trend is up.
but last day's volume was only 20% of normal
------------------------------------------------------- EXM --------------------------------------------------
The Best Signals for The Past DO Profitably Predict The Future
We also suggest you look at the 8 month, day-to-day real-time reporting
of Buys and Sells on a silver stock, Silver Standard. The gains using
TigerSoft was about +80%/year annualized and allowing a sizeable amount
for commissions and overnight slippage.
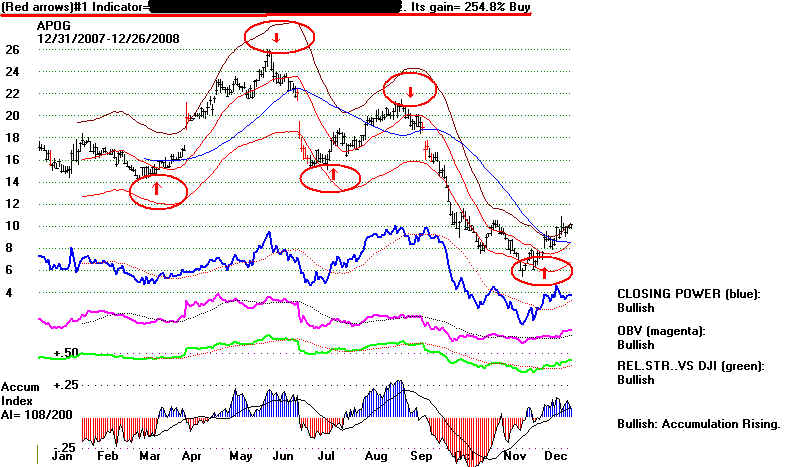
Look at the chart velow of APOG - Apogee Enterprises. It is one of
a great many that might have been used an example. You will find many
more on this page and elsewhere on www.tigersoft.com. In it 4 completed
trades and 1 open trade int he last 12 months would have gained someone
using these signals +254.8% had they started with $10,000 and reinvested
the profits fully woth each trade. This allows $40 per trade for commission and
slippage. It does assune that we take the trade at the close the day of the signal
and that you would have been willing to sell short on a Red Sell, also. The
software lets you change these assumptions. If you were only interested
in Buying and Selling at the next day's opening and did not use short sales,
the profit would have been +86.8%. $10,000 would have become $18,681.
This is not bad in a year when many NASDAQ stocks fell 50%
Our charts show the best trading system's Buys and Sells for the
last year for any stock you wish. In a blink more than 50 different
trading systems are tested and the best four are reported to you.
The top line shows the basis of the signal and the gain. Except for
the example above, we have dropped this top line, because we want
you to need our software to get this information.
The Tiger Power-Ranker gives you a status report on all the stocks
you follow, showing the stock, the best system. the percent gain achieved by
it for the last year and whether the stock is on a Buy, Sell, a new Buy or a new Sell.
It also shows a number of key values, so that you can quickly determine
which of the stocks on a new Buy have the most bullish internals.
Many stocks like those shown below fluctuate extremly regularly and very
proftably according to rules our TigerSoft charts discover for you. The stocks
below gained more than +200% for a trader using the best system for the
last year. Below we show only NYSE and ASE stocks over $10 and beginning
with the letter "A" as of 12/26/2008.
We contend that these stocks are manipulated up and down to suit the
trading purposes of progessionals who are using the same tools we
show you for these stocks when you actually run our programs/ The best
system tends to keep on worling because very few know the basis of the
manipulation of the stock and because the best system is likely to be an
enduring constant, because it is a reflection of the stock's trading personality
and those who trade it. We suggest that professionals who whip the stock up
and down, are using technical tools and trading systems just like ours.
So, our software can show you exactly what progessionals want the stock to
do and you can trade with these professionalsm, instead of fighting them.
Look at the size of these annual gains.
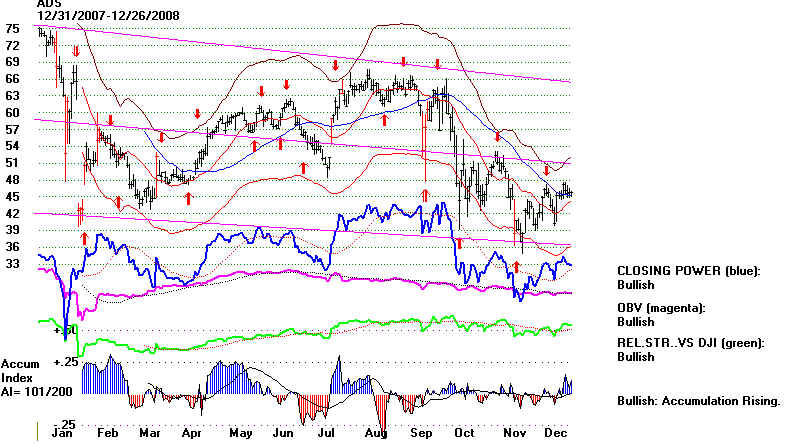
ADS ALLIANCE DATA SYSTEMS. +253%
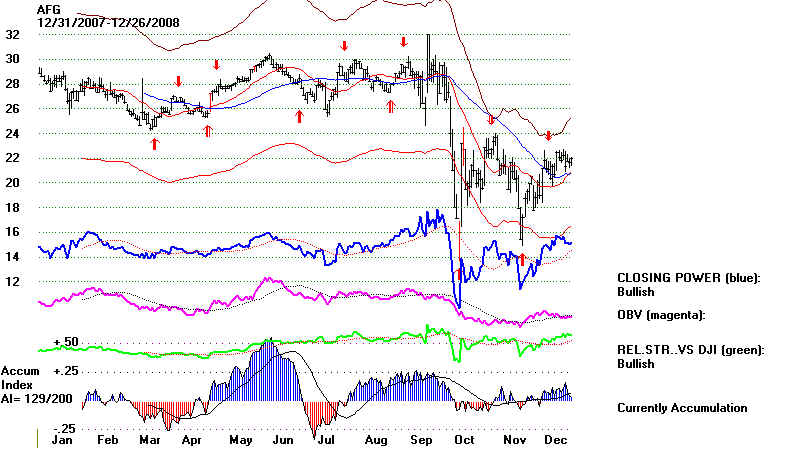
AFG ANERICAN FINANCIAL +262.4%
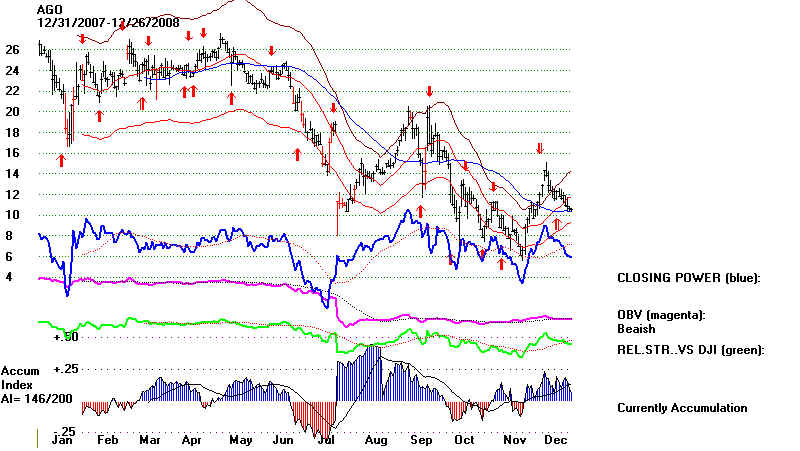
AGO ASSURED GUARANTY +270.7%
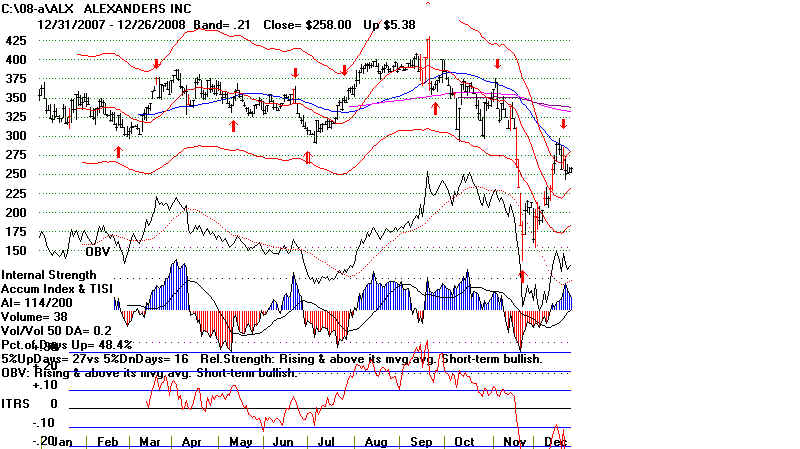
ALX ALEXANDER +224.2%
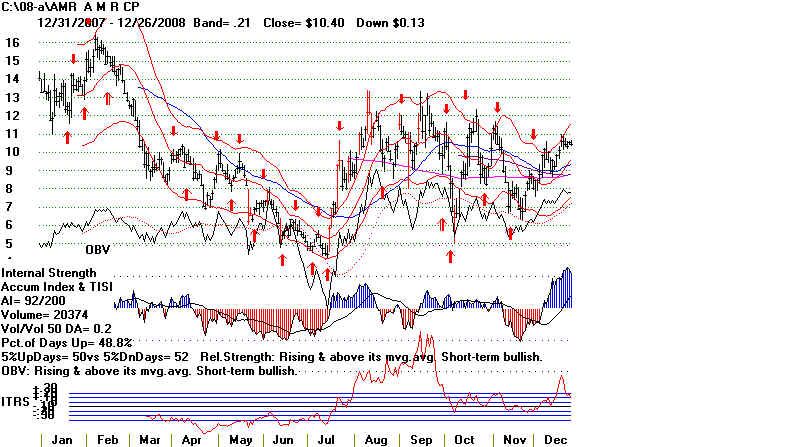
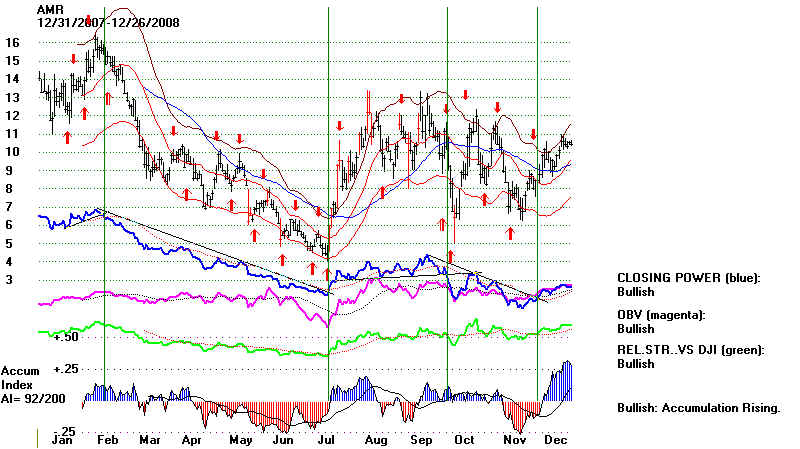
AMR AMERICAN AIRLINES +495.7%
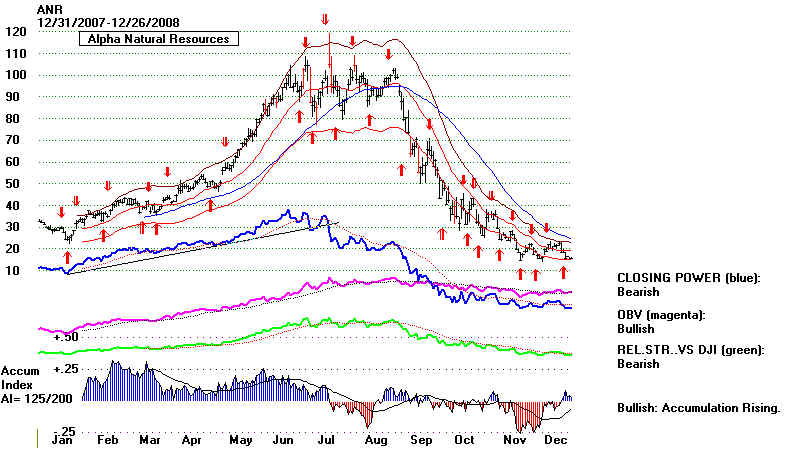
ANR ALPHA NATURAL RESOURCES +240%
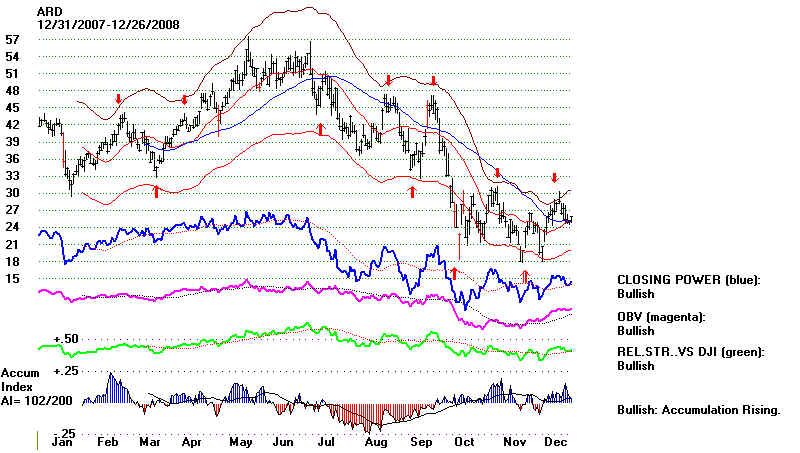
ARD ARENA RESOURCES +246.7%
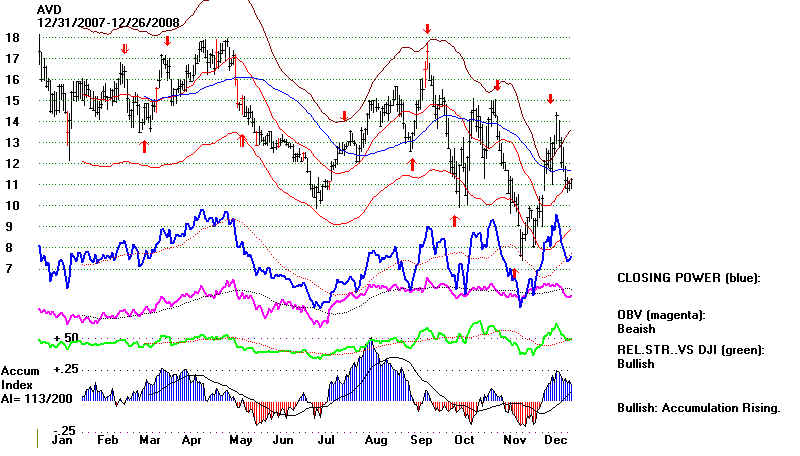
AVD AMERICAN VANGUARD +208.5%
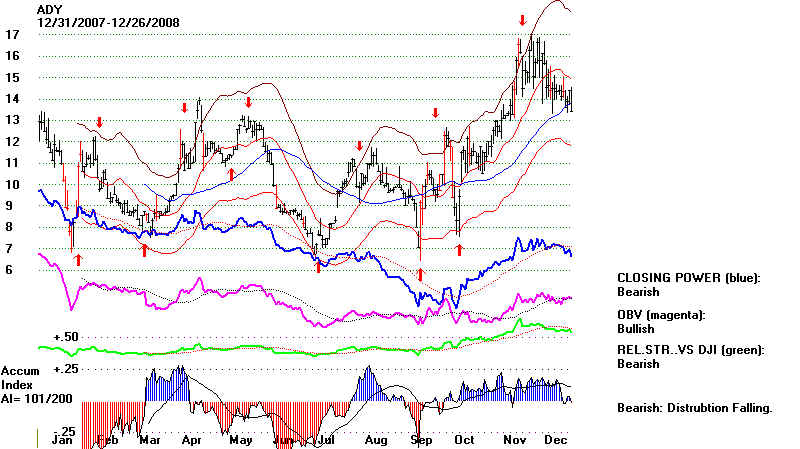
ADY AMERICAN DAIRY 336.7%
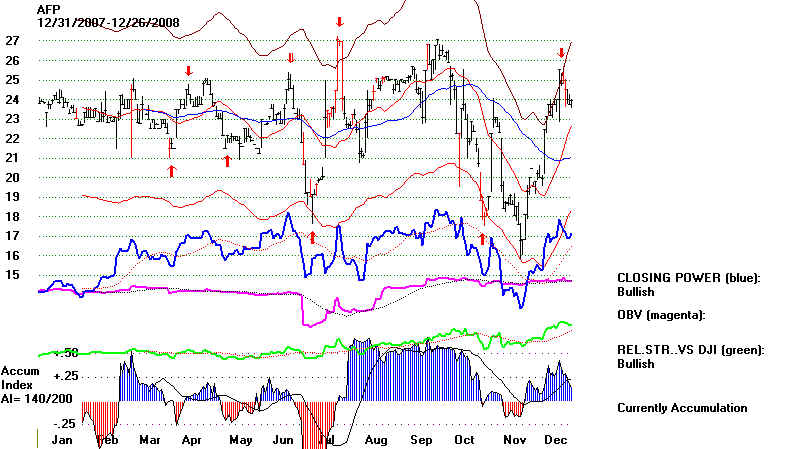
AFP UNITED CAPITAL +337.6%
The best here is AMR - Amercian Airlines. Pilots are well-paid.
Not many of them know how their company's stock is manipulated.
When you get our software, you will know something very valuable
to them. We advise traders to work with stocks like these where
the signals have been expecially profitable. We also try to trade in
the direction of the internal strength indicators. They are all bullish now.
So, we would wait for them to weaken before using the red down-arrows|
to sell short.
Examples
ADS -