
(C) 2015 William Schmidt, Ph.D.
Peerless/TigerSoft Updates
11/5/2015 New Buy B3 based on Stochastic 21 K crossing Pct after Sell S4.
Also Weekly programs and experimental S9. Note 5-day ma data on basic Tiger graph.
You can also flag 5-day ma turns.
--------TigerSoft Updates'
Documentation Page -------
(C) 2015 William Schmidt, Ph.D.
Peerless/TigerSoft Updates
11/5/2015 New Buy B3 based on Stochastic 21 K crossing Pct
after Sell S4.
Also Weekly programs and experimental S9. Note 5-day ma data on basic
Tiger graph.
You can also flag 5-day ma turns.
|
9/20/2015 New WEEKLY PROGRAMS allow you now to get 5-years of data on nearly all stocks, A-Z and those specific categories. A few stocks starting with AU...AZ, CU...CZ and SU...SZ cannot yet be provided due to current limitations on the size of the files that can be transferred. EXPERIMENTAL S9 - Choose Experimental S9 under Signal-1. This allows you to see potential S9s using the day's theoretical high rather the closing price. There is mounting evidence that the upper 3.5% band is no longer being reached regularly. One solution is to produce signals when the DJI's theoretical high "tags" the 3% upper band. One could also use an even narrower upper band. I would suggest that these experimental S9s are much more reliable when the DJI's 65-dma is falling. See the full history of "experimental" Sell S9s that occur when PI<0, IP21<+.02, the DJI's 65-dma is falling and the DJI's theoretical high is more than 3% above the 21-day ma on Sunday's Hotline. |
8/22/2015
QuickSilver Ranking....
Short-term traders of stocks and ETFs will want to run QuickSilver from
the Tiger page (third item
under Run/Setups). When it is
finished,
choose Bullish
or Bearish
from Displays.
All this works with the
stocks/ETFs in the assumed directory that you have selected.
The
Bullish table you
pick will show you the stocks/ETFs that have a quickly
rising 5-day ma AND have
an IP21 > +.20 AND the Bullish BOTH-UP condition,
where both Opening and
Closing Power are rising. Click on the Symbol
and then
click on
Graph to see the chart.
Oppositely, by clicking on Displays
and Bearish,
you will see a table of
fast falling stocks/ETFs with an IP21< -.20 and the
BEARISH BOTH-DOWN
condition where both Opening and Closing Power
will be falling.
Since we mostly play the
trends of the 5-day ma., consider buying
1) on successful tests of the rising 5-day
ma
and then selling at the 5-day ma's 10% upper band,
2) when the close rises above the pivot-point making the 5-dma turn up AND
then sell when the stock closes
below the PIVOT-POINT. which turns down the
5-dma.
The
faster the 5DAROC is rising the more rapidly the stock will
jump up after
a successful test of its 5-dma. However, it may
then run
wildly to the upside and experience a buying climax and
then reverse
sharply down.
Examples:
Directory= C:\LEVERAGE date= 08/21/15 5DAROC Symbol Last 5-dma Pivot Change .................................................................................... IP21 AI/200 OP-PWR CP-PWR PCT-Up Daily Vol. notes ==================================================================================== 1046.6 TECS 45.22 39.47 36.59 4.69 .26 123 Rising Rising .45 bullish --------------------------------------------------------------------------------------------- 1001.5 DPK 32.41 29.08 26.94 2.13 .34 102 Rising Rising .514 vol.fell on up-day --------------------------------------------------------------------------------------------- 788.5 DWTI 199.14 184.78 174 6.6 .32 109 Rising Rising .578 bullish --------------------------------------------------------------------------------------------- 742.9 REW 58.27 52.94 50.63 4.39 .22 52 Rising Rising .41 bullish --------------------------------------------------------------------------------------------- 681.2 BIS 32.75 29.55 27.58 1.9 .26 87 Rising Rising .458 bullish --------------------------------------------------------------------------------------------- 667.6 EFU 42.03 39.06 37.21 2.03 .44 77 Rising Rising .494 bullish --------------------------------------------------------------------------------------------- 628.8 SCO 121.81 115.1 109.32 2.89 .27 127 Rising Rising .582 bullish |
QuickSilver
Programs.
Start this program by using Peercomm + Charts-2015 + Run/Setups (upper
left) + Run QuickSilver... This produces a table like the
one below.
The more items in the directory you have chosen, the more time it takes
for the table to appear. The resulting QuickSilver table ranks all the
stocks
in the chosen directory based on the annualized rate of change of the 5-day ma,
from high to low.
Interpretation: A 5DAROC above 250(%) usually allows a stock/ETF to
rebound up
off its 5-day ma. A 5DAROC below -250(%) usually means a stock/ETF
will continue downward from its 5-day ma. The odds of such
trend-continuations
increase when the IP21 is above +.20 or below -.20 AND both the Opening
and Closing Power are falling. I would also favor on the long side
stocks
with an Up% above 55 (the odds of the stock rising on any given day for
the last year). Similarly, I would favor buying stocks with an AI/200
score
above 147. When selling short, I would favor stocks with an Up% below 50%
and an AI/200 below 70.
The QuickSilver program's table also provides on the first row the current
price,
the level of the 5-day ma and the pivot-point, the price above which the next
day
will produce a rising 5-day ma and below which will produce a falling 5-day ma.
When you play this trend, you thereby know what closing price the next day
will present a short-term 5-day ma trend reversal. Using this along with
Closing
Power trends allows you to play swift short term trend until they end. You
can|
|
thus be more safely aggressive.
With this table displayed, click on any symbol and Graph to see its chart.
LEVERAGED ETFS - 08/03/15
5DAROC        Symbol        Last          5-dma         Pivot         Change        ..............................................................................................
IP21          AI/200        OP-PWR        CP-PWR        PCT-Up   Daily Vol. notes
==============================================================================================
598.8 DYY 4.06 3.68 3.6 .38 -.05 79 ? Rising .357 bullish --------------------------------------------------------------------------------------------- 500.6 DWTI 138.49 122.95 121.1 11.73 .19 103 Rising Rising .558 vol.fell on up-day --------------------------------------------------------------------------------------------- 355.1 DTO 100.1 93.24 92.05 5.85 .23 138 Rising Rising .566 bullish --------------------------------------------------------------------------------------------- 339.7 CURE 42.23 41.91 41.6 -.05 .09 133 Rising Falling .57 vol.fell on down-day --------------------------------------------------------------------------------------------- 330.5 UMX 30.1 28.97 28.21 0 -.33 47 Falling Falling .293 ? --------------------------------------------------------------------------------------------- 327.8 SCO 94.3 86.98 86.18 5.46 .2 127 Rising Rising .566 bullish --------------------------------------------------------------------------------------------- .... --------------------------------------------------------------------------------------------- -351.7 NUGT 3.09 3.36 3.44 -.35 -.26 49 Falling Falling .454 bearish --------------------------------------------------------------------------------------------- -356.3 MIDZ 41.16 41.37 42.74 .4 .26 80 Falling ? .474 bullish --------------------------------------------------------------------------------------------- -532 UWTI 1.36 1.56 1.59 -.14 -.21 56 Falling Falling .434 bearish --------------------------------------------------------------------------------------------- -561.6 GASL 6.42 7.83 8.25 -.93 -.34 53 Falling Falling .402 bearish --------------------------------------------------------------------------------------------- -588.4 VXX 15.78 16.1 16.49 -.24 -.25 34 Falling Falling .414 bearish ---------------------------------------------------------------------------------------------
|
====================================================================================
More PEERLESS UPDATES
- Sell S12***
June 2015 > Peerless now shows two new "red Sell
S12"s. See
earlier track record below
New Peerless Red S12s' Track Record: 1928-2015
This occurs when DJI is above 1% upper band and there have been
50 straight days where the IP21 is below .018
1) Sept 5, 1929 - Crash followed immediately.
2) April 4, 1934 - DJI fell from 103.2 to 91.8 on 6/1/1934 Peerless reversing
Buy.
3) April 2, 1936 - DJI fell 6.2% to next reversing Peerless Buy signal.
4) January 2, 1960 - DJI fell 9.9% to next reversing Peerless Buy signal.
5) April 13, 1965 - Premature but still gained 4.4% at time of next reversing
Peerless Buy signal.
6) April 19, 1965 - Premature but loss at time of next reversing Peerless Buy
signal was only 0.1%.
7) August 2, 1972 - Premature but still gained 2.7% at time of next reversing
Peerless Buy signal.
8) May 19, 2015 - Not closed out yet.
No new red S12 signals allowed in June or from October 15th to December 31st.
No new red S12 signals allowed if DJI closes above 1.034% band.
===================================================================================
Special Situations for Study
===================================================================================

7/24/2015 ECA CX CDI
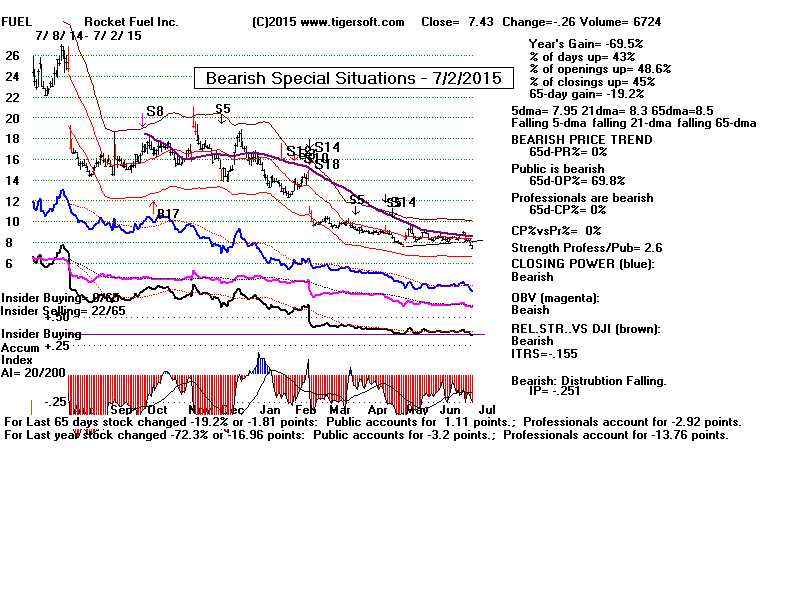
7/2/2015 FUEL -
Bearish
6/26/2015 DDD -
Bearish
-----------------------------------------------------------------------------------------------------
*