TigerSoft and Peerless Daily
Hotline
(C) 1985-2015 William Schmidt,
Ph.D. www.tigersoft.com
All rights
strictly reserved.
Tiger Software
858-273-5900 PO Box 22784 San Diego, CA 92192 Email
william_schmidt@hotmail.com
------------------------------------------------------------------------------------------------------------------
Announcements
-

Tiger/Peerless UPDATE. A new TigerSoft/Peerless update will be released Tuesday.
The new Tiger's update has the new Sell S12. It has the
new QuickSilver table which is produced for any directory's stocks.
It should work well with the stocks in LEVERAGE, HIGHIP21,
MAXCP, MINCP, REDSELL and NEAR65. With this QuickSilver
table displayed, you point the mouse at the symbol and click Graph.
The Peercomm will also allow you to get stock data again from Dial Data.
------------------------------------------------------------------------------------------------------------------
8/3/2014
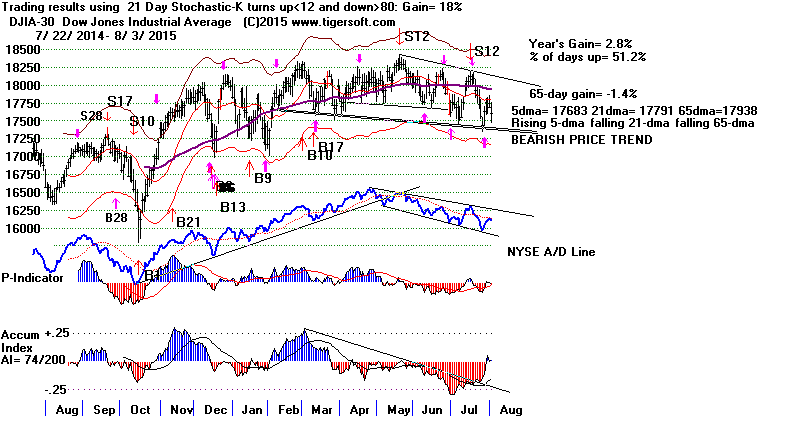
The operative Peerless signal remains a pair of Red Sell 12*s.
The steady Red distribution continues, as does the heavy down-hour
and down-day volume. These warn that any rally is apt to be very limited
and another test of 17500 may not be successful. Hedging with shorts
among our many Bearish MINCP stocks is thus advised. This is a very
difficult market to make money in on the long side, except by using our
short-term QuickSilver approach.
Still, the 17500 support did hold up today. That should increase the
odds of a recovery by the stubbornly bullish DJI back up to its
now falling 65-dma. Not shown here, but important, is the weekly
chart of the DJI. Today's decline exactly stopped at its rising
52-week ma. Also supporting the notion that the general market
should rally is the failure of the QuickSilver approach to give Buys
to any of the most important leveraged short ETFs on the general market.
QuickSilver does says to continue to hold short Oil and Gold Stocks'
leveraged ETFs.
|
Deflation's Dangers
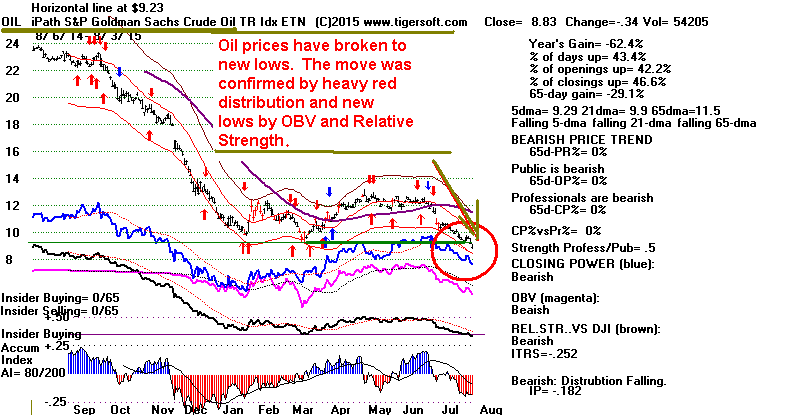
The global economy is weakening dangerously. Crude Oil broke its
flat support today. Its new low was confirmed by heavy Red Distribution
and an OBV new low. The long downtrend in commodities
prices, I have said, results in a much weakened ability to consume
by many "emerging" countries' populations. The ETFs for Latin America,
Mexico and Indonesia look particularly weak. This will gravely impact
America
if the downtrend continues much longer. This is the same type of
Deflationary
commodities' trend that contradicted and ultimately confounded the
the boom and over-production of the late 1920s.

US Corporations needs these overseas markets for their products. The last 30 years'
wholesale export of manufacturing jobs and the resulting stagnation of real
wages in
America can be viewed as a giant wager by American corporations on
internationalism. But now that bet's safety seems dubious. If many
overseas
markets dry up and the US home markets are insufficient to absorb what many
big companies make, lay-offs and much lower corporate profits could
cause a dramatic decline in US share prices. There is nothing the FED
could
do to prevent such a decline, apart from themselves buying up all the
shares being sold, much like China is now attempting to do.
Chinese shares were again sold off today. A failure to hold up at their
year's
lows would signify that the wave of selling is too much even for the Chinese
government and the brokerages it funds. This would be another bearish
sign.
It could cause China to sell US long term government debt issues, which
would drive up US interest rates.
I had hoped we would, at least, see a gold rally today. That did not
occur. And
NUGT, the 3x leverage Gold mining ETF still shows a falling 5-day ma.
It did not close above its pivot point, so it should not have been bought.
This is the cardinal rule in our QuickSilver discipline. That NUGT's
opposite
was a much better Buy today shows that QuickSilver worked exactly
as it was supposed to.
Key Leveraged Short ETFs
Is the market about to collapse? The key short ETFs do not show this.
The QuickSilver approach tells us that ETFs should mainly be bought
on confirmed breakouts or when both their Opening and Closing Power
are rising with an IP21 above +.20 and a 5-day ma that has just turned up
or is rising at a +250% rate. All the key ETFs below show falling 5-day
ma.
None have even a positive IP21. However, the Closing Powers are all
rising except for FAZ.
Leveraged SHORT ETFS on GENERAL MARKET - 08/03/15
5DAROC        Symbol        Last          5-dma         Pivot         Change        ..............................................................................................
IP21          AI/200        OP-PWR        CP-PWR        PCT-Up   Daily Vol. notes
==============================================================================================
-88.1         DXD           21.16         20.95         21.07         .24
-.13          88            Falling       Rising        .446          vol.fell on up-day
---------------------------------------------------------------------------------------------
-134.7        QID           32.16         32.14         32.47         .18
-.1           91            Falling       Rising        .438          bullish
---------------------------------------------------------------------------------------------
-150.5        SDS           20.22         20.14         20.33         .12
-.1           64            Falling       Rising        .47           bullish
---------------------------------------------------------------------------------------------
-205          FAZ           10.37         10.41         10.63         -.01
-.25          51            ?             Falling       .43           bearish
---------------------------------------------------------------------------------------------
-227.6        SPXU          33.09         32.87         33.31         .36
-.09          72            Falling       Rising        .482          bullish
---------------------------------------------------------------------------------------------
-231.3        TZA           10.04         10.07         10.23         .15
-.07          38            ?             Rising        .442          bullish
---------------------------------------------------------------------------------------------
The Most Bullish Leveraged ETFs
LEVERAGED ETFS - 08/03/15
5DAROC        Symbol        Last          5-dma         Pivot         Change        ..............................................................................................
IP21          AI/200        OP-PWR        CP-PWR        PCT-Up   Daily Vol. notes
==============================================================================================
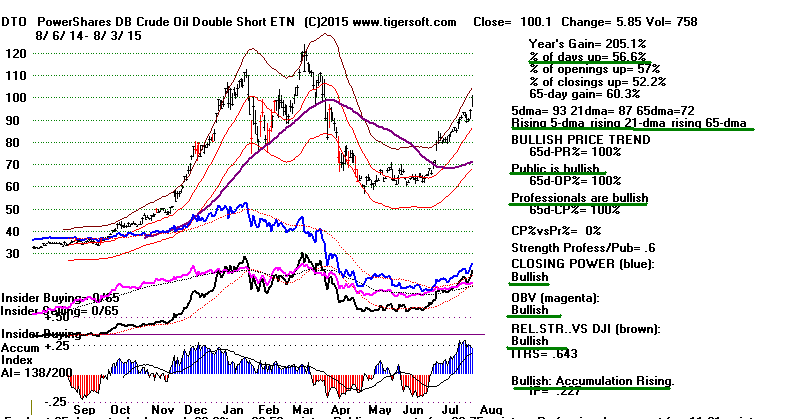
355.1 DTO 100.1 93.24 92.05 5.85
.23 138 Rising Rising .566 bullish
---------------------------------------------------------------------------------------------
327.8 SCO 94.3 86.98 86.18 5.46
.2 127 Rising Rising .566 bullish
---------------------------------------------------------------------------------------------
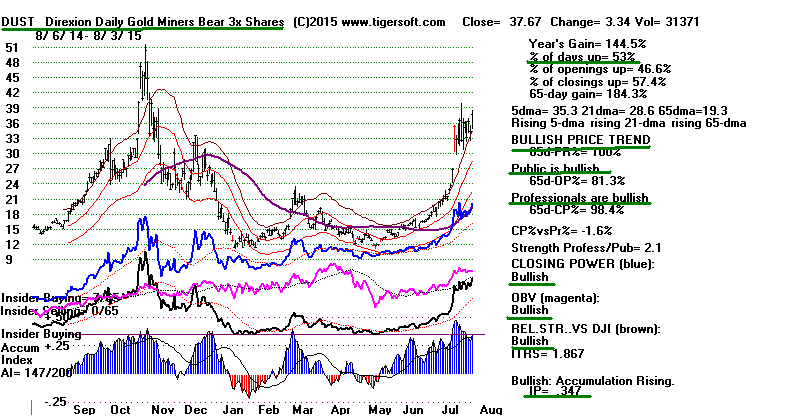 229.9 DUST 37.67 35.33 35.17 3.34
.35 147 Rising Rising .53 bullish
---------------------------------------------------------------------------------------------
227.5 RETL 36.33 36.15 35.02 -.56
.05 110 Rising ? .53 bearish
---------------------------------------------------------------------------------------------
229.9 DUST 37.67 35.33 35.17 3.34
.35 147 Rising Rising .53 bullish
---------------------------------------------------------------------------------------------
227.5 RETL 36.33 36.15 35.02 -.56
.05 110 Rising ? .53 bearish
---------------------------------------------------------------------------------------------
|
The very weak Hourly DJIA's OBV/DISI Line continues.

See
below the continuing downtrend of Closing Power in the DIA.
If this is broken, it would give the DJI a good chance
to rally back up
to the resistance of its falling 65-dma. In a week this
would probably
set up another set of automatic Stochastic red and blue
Sells.
Today's successful test of 175 would seem to make such a
limited, short-term rally more likely. A large head/head and shoulders
pattern seems to be forming. A closing clearly below the green
support-line would be quite bearish.
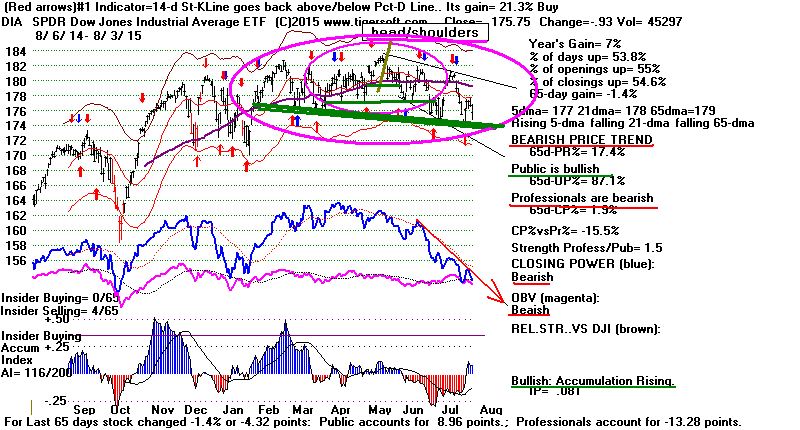
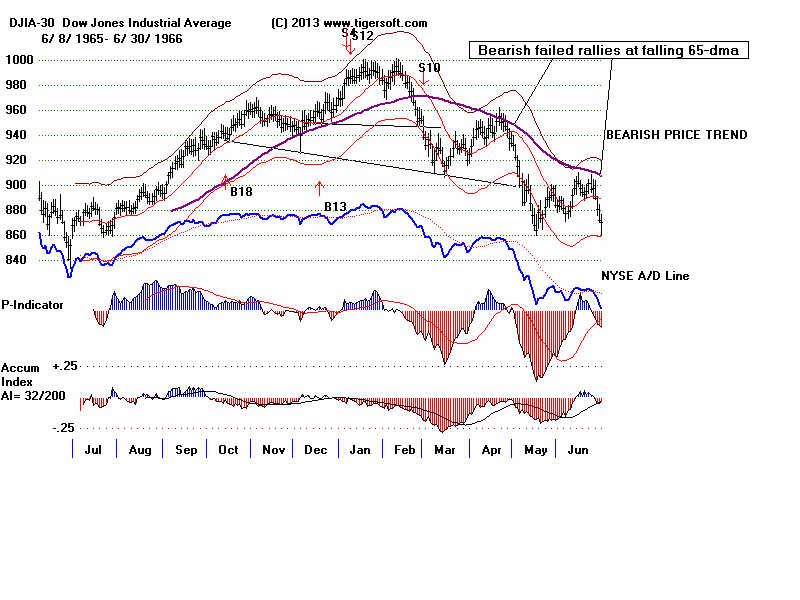
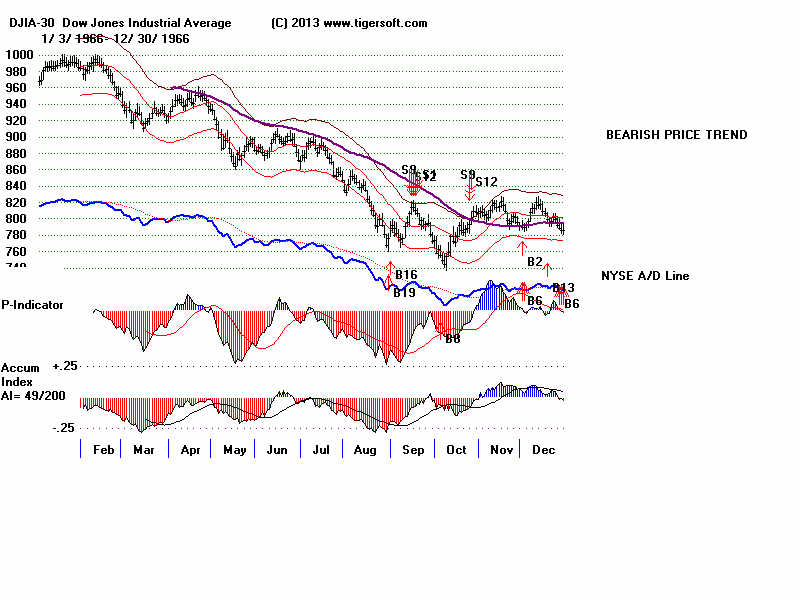
As I said yesterday:
"August, generally speaking, is not great month for the market. But
it is
much better in the third year in the four year Presidential cycle. So,
there should be more of a rally. But let's stick with the Sell S12.
And if the Accumulation Index quickly turns negative again, the DJI will look
much
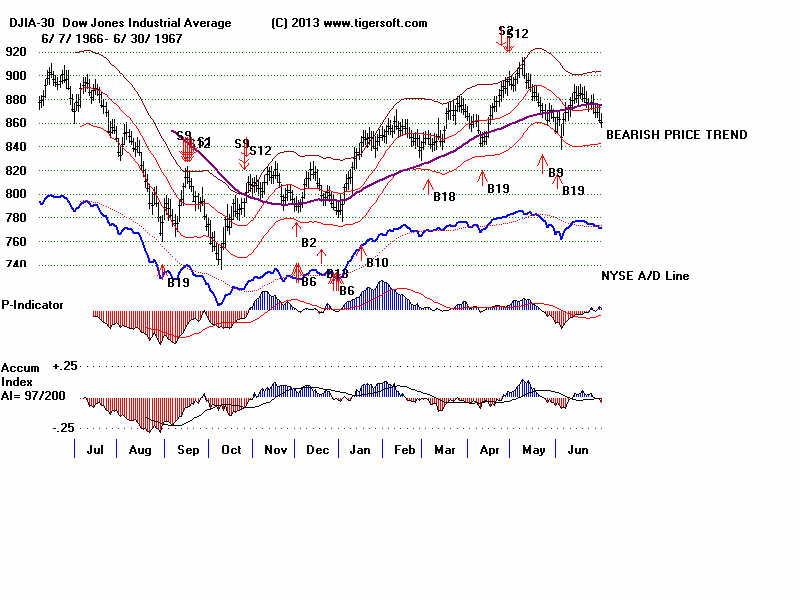
like it did in February 1966 at 790, just before a nine month decline to 750.
At the very least, most we might want to wait to
see the NYSE A/D Line
downtrend be broken to nullify the
Red Sell S12. And even if that happens,
the rally may not take the DJI up past 18200, only 3% higher. That is what
happened a month ago.
I would say that the new "nifty fifty" could do well. QQQ could reach
118 and IBB could get a little past 400."
Short term traders should
consider
buying NUGT when its 5-day ma finally
turns up and it closes above its pivot point, now 3.55.
------------------------
Announcements
--------------------------------
E-Books
1
The On-Line Explosive Stocks
2
The On-Line Killer Short
Sales book
Purchase each all new book by CC for
$42.50 or send a check for $37.50 to me.
I call your
attention now to the many new concepts and
the considerable new research in them:
For example:
1) A very good New Tiger Buy B12 for Low
Priced Stocks
2) After Red high volume reversal days use CP
uptrend-breaks.
3) Buy the stocks the Federal Govt wants you
to buy.
4) 100-Day Power Rankings...
5) Using Closing Power Hooks after Buy B26s
and B20s.
6) How A Stock Reacts to Its Earnings Report
Is Very important.
7) TigerSoft Major Buy Signals' Combinations
Which are most Powerful? Reliable?
8) Augmented Buy B20s' Independent Success
Rate.
9) What factors warn a rising 65-dma will not
hold?
10) The classic cluster of technical
characteristics that commonly appear
in the 23 stocks falling 70% or more in
the deep pullback of 2011.
----------------------------------------------------------------------------------------------------------------------------------------------------------------------------
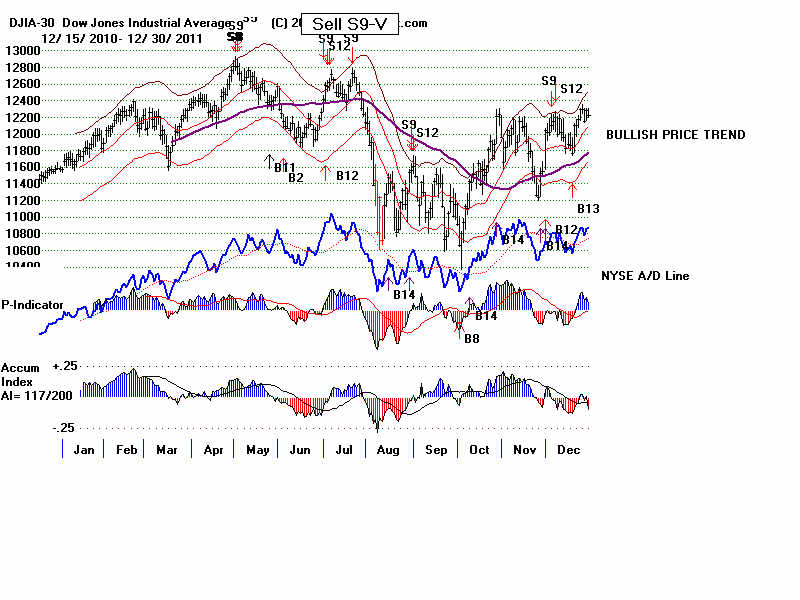
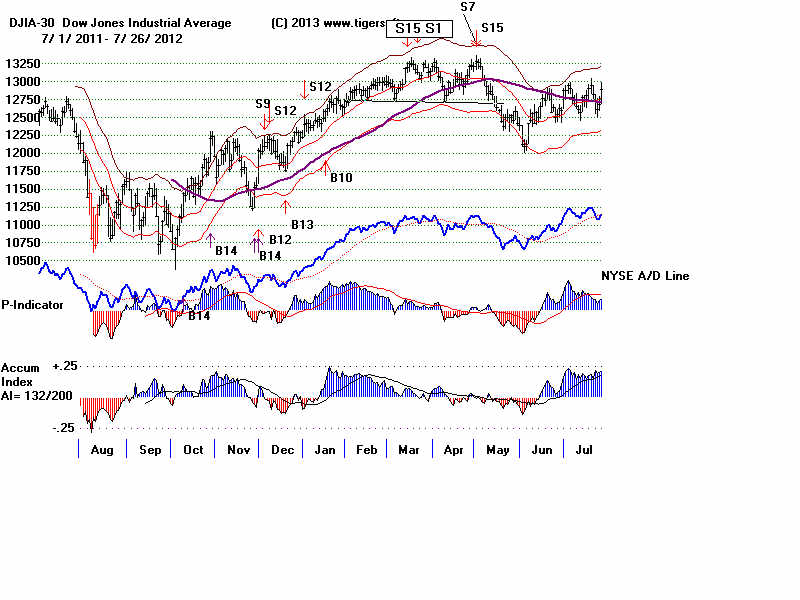
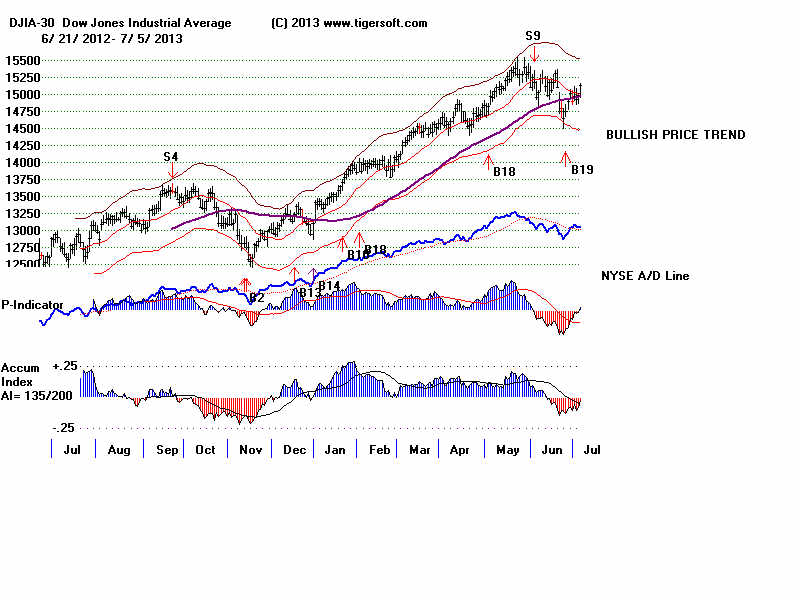
PEERLESS STOCK MARKET TIMING:
A Guide To
Profitably Using The Tiger Nightly HOTLINE
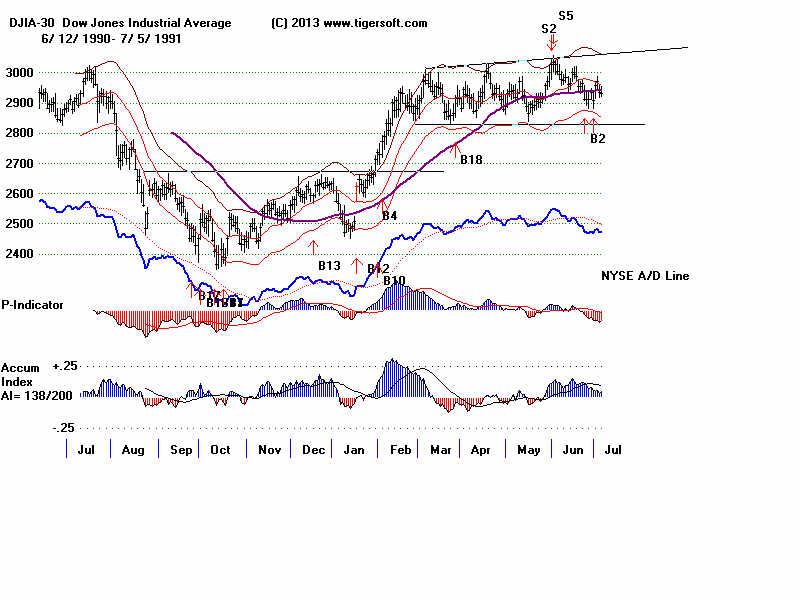
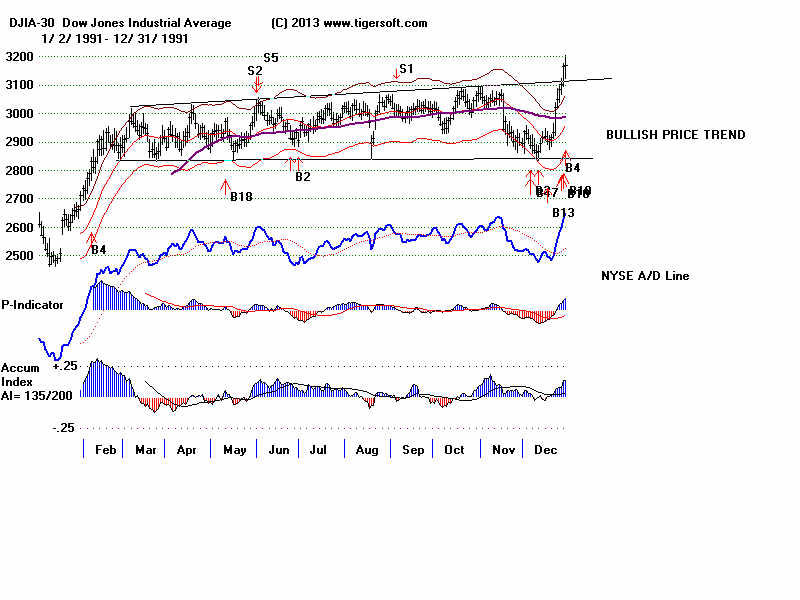
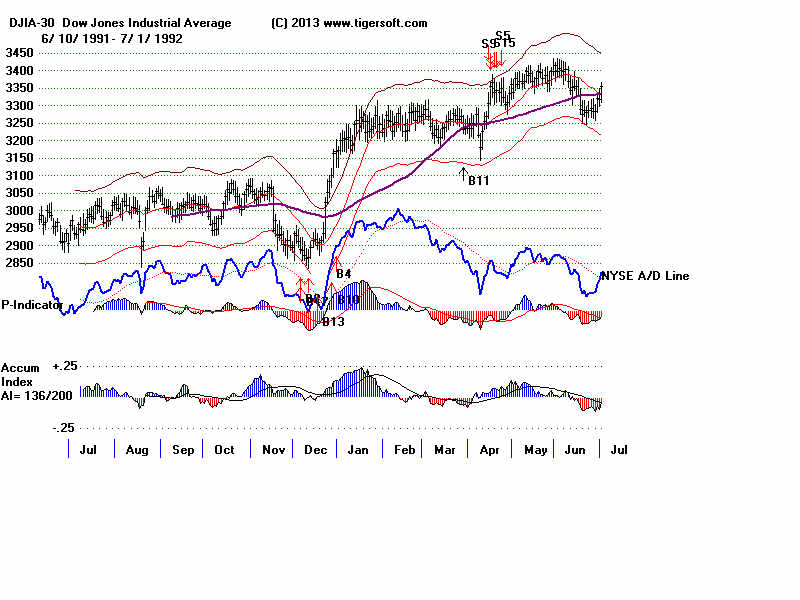
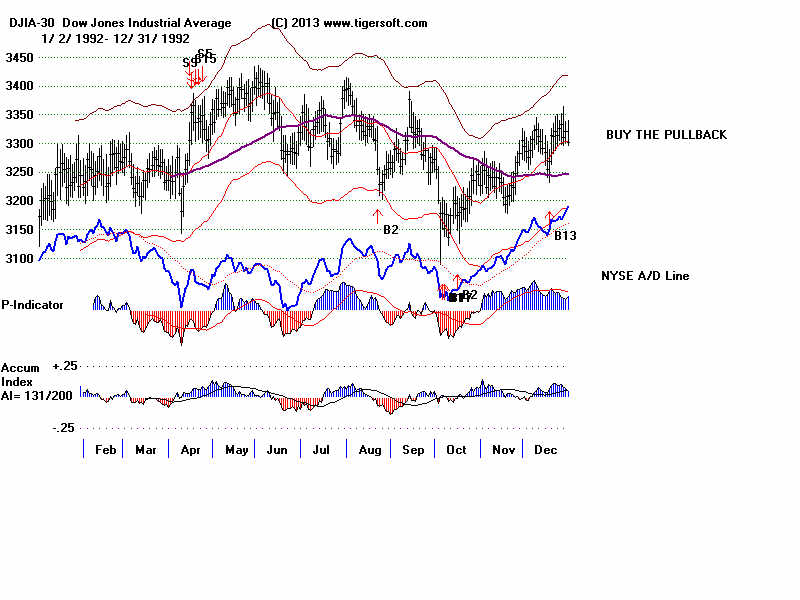
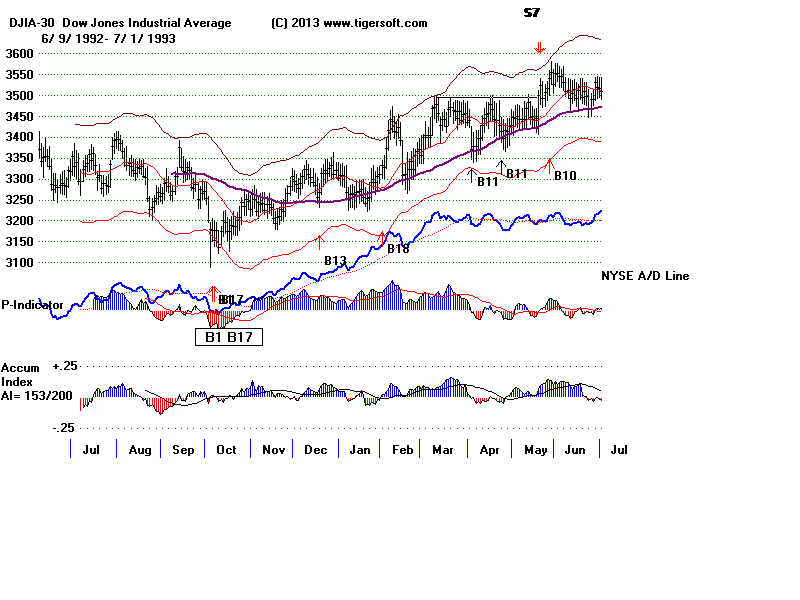
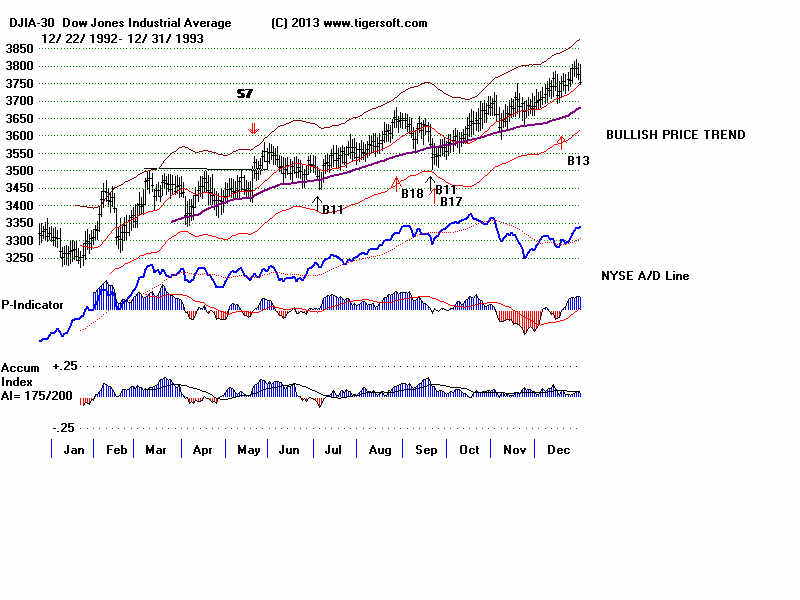
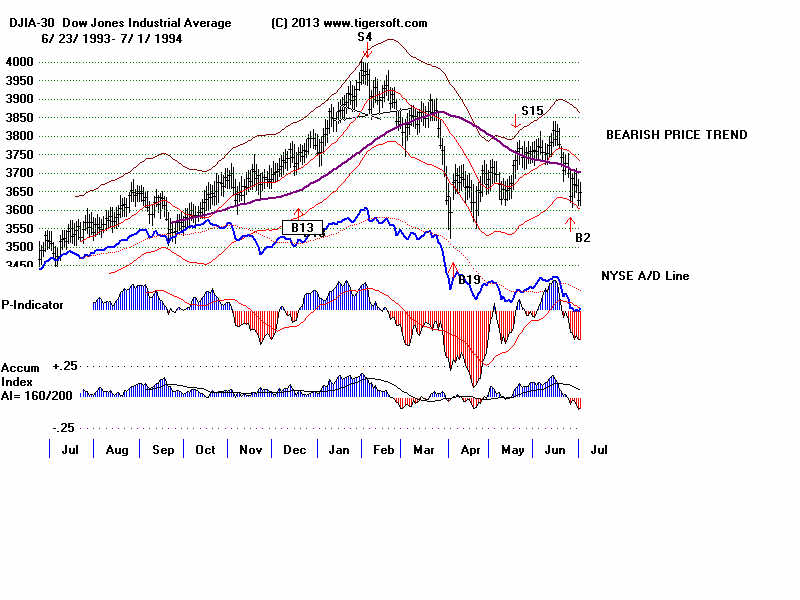
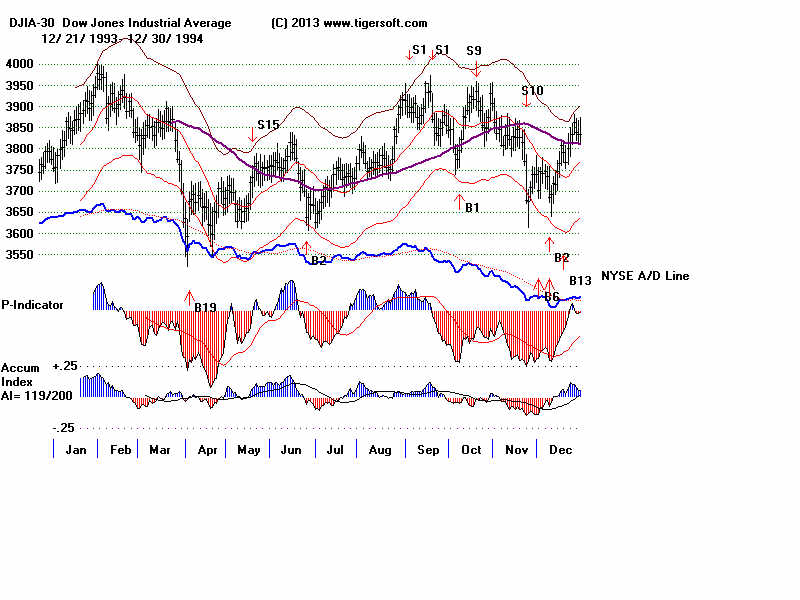
New Peerless Signals and DJI Charts - version 7/4/2013
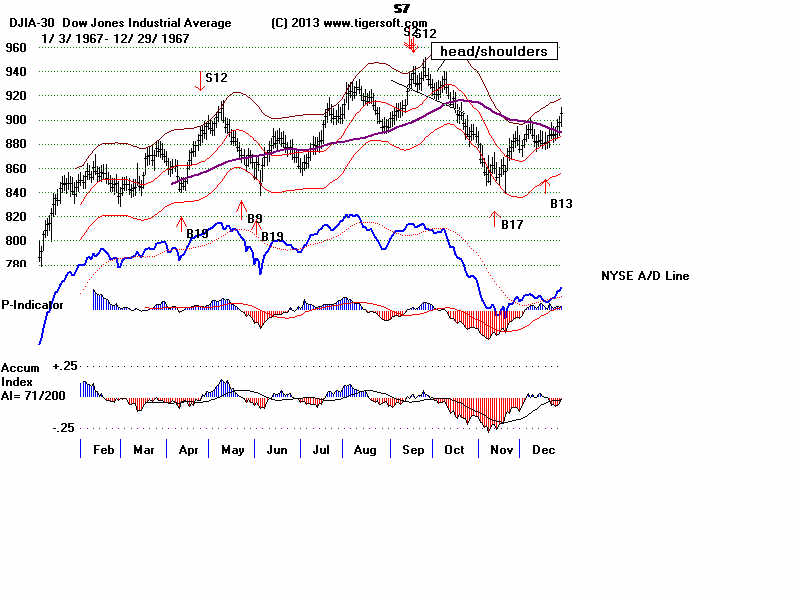
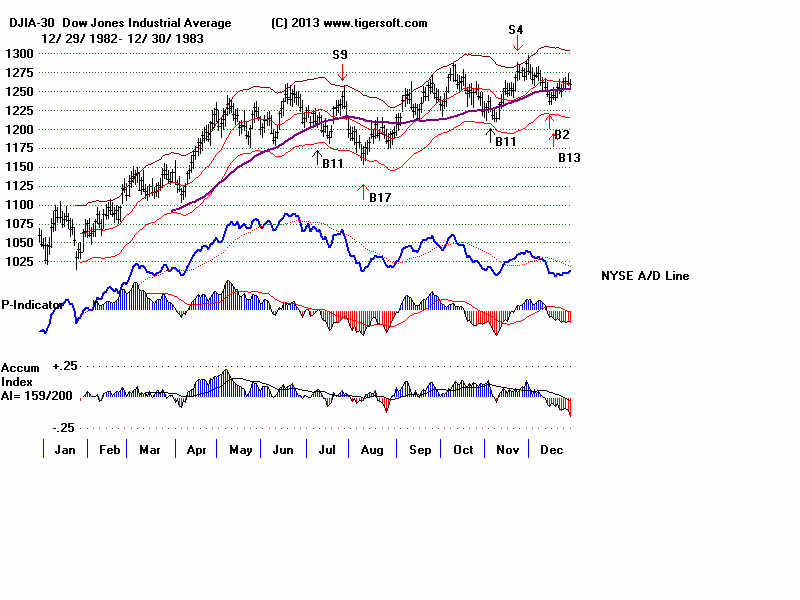
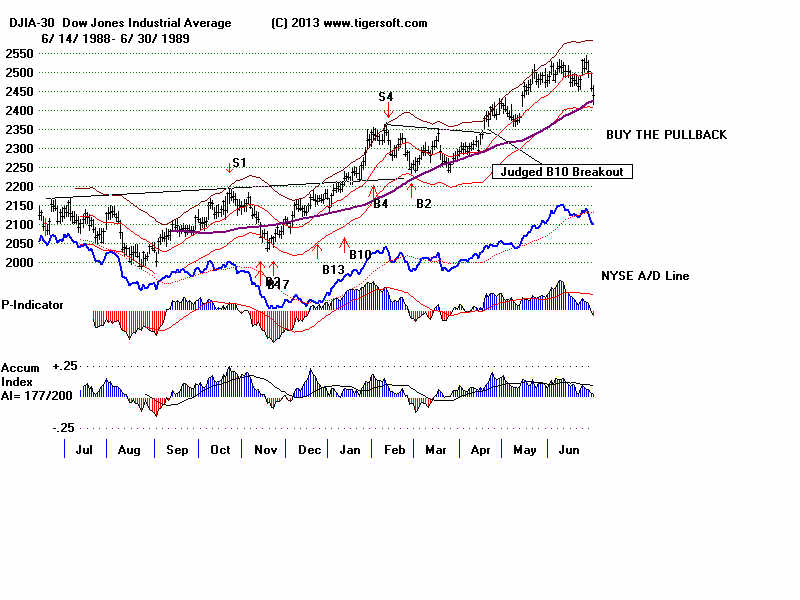
1965
1965-6 1966
1966-7 1967
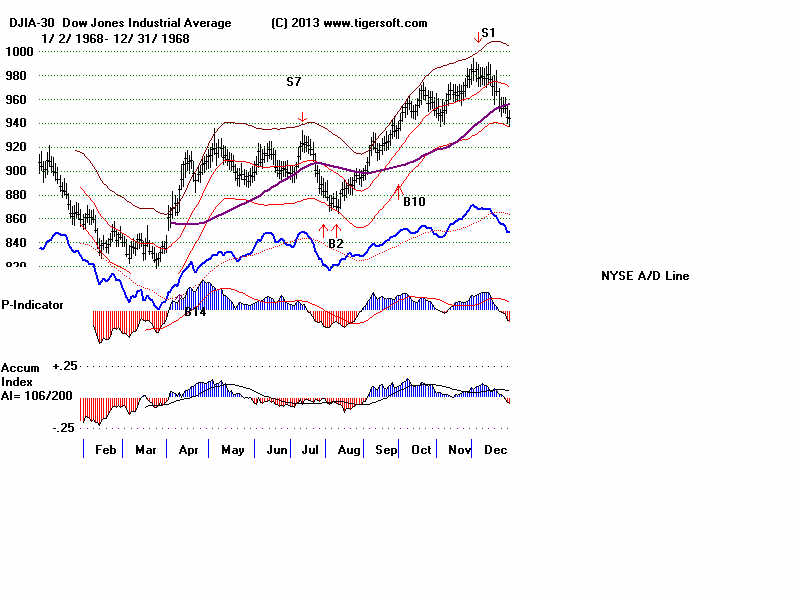
1967-8 1968
1968-9 1969
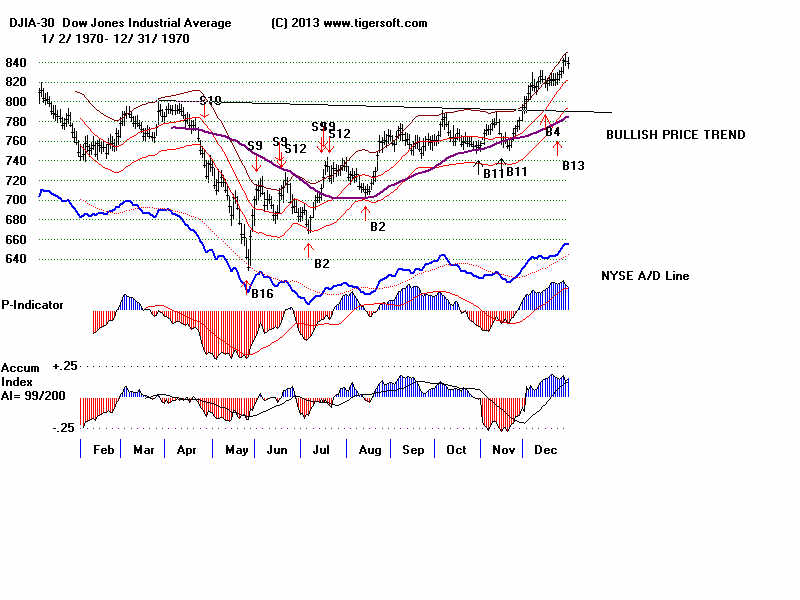
1969-70
1970
1970-1
1971
1971-2 1972
1972-3
1973 1973-4
1974
1974-5 1975
1975-6
1976 1976-7
1977
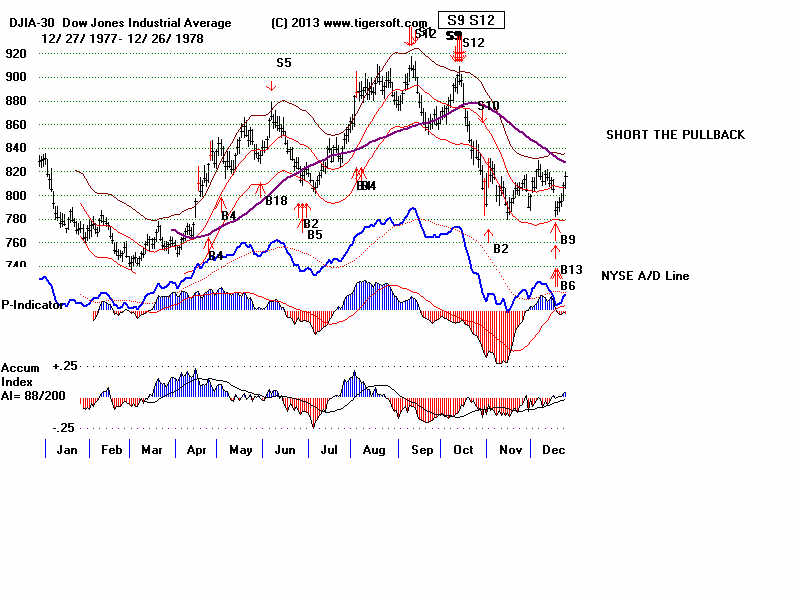
1977-1978
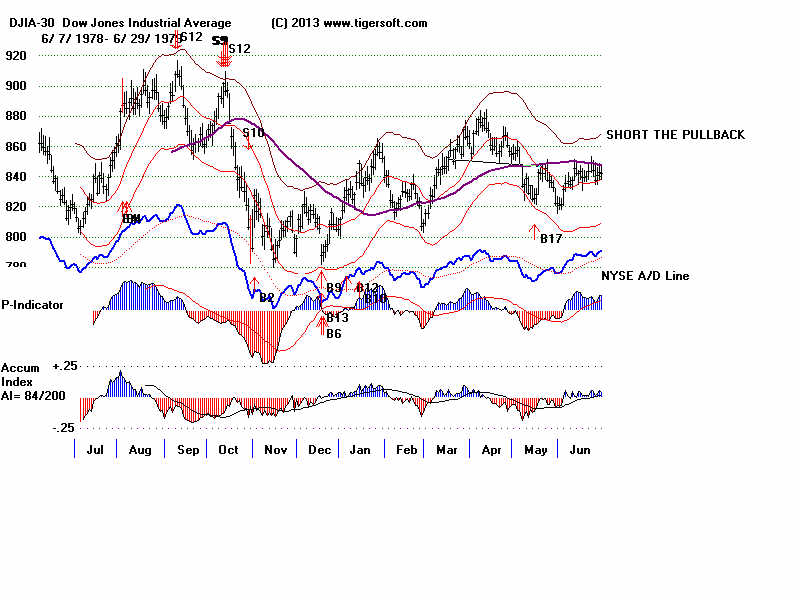
1978
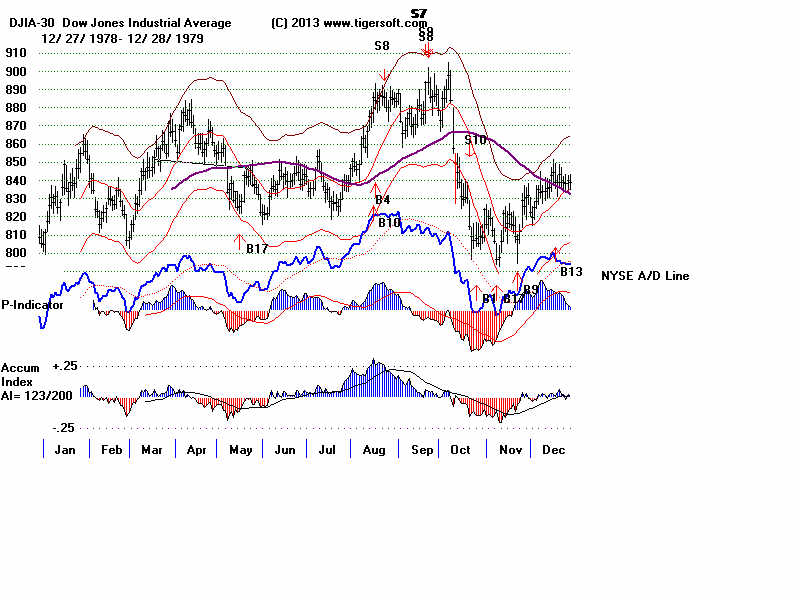
1978-79
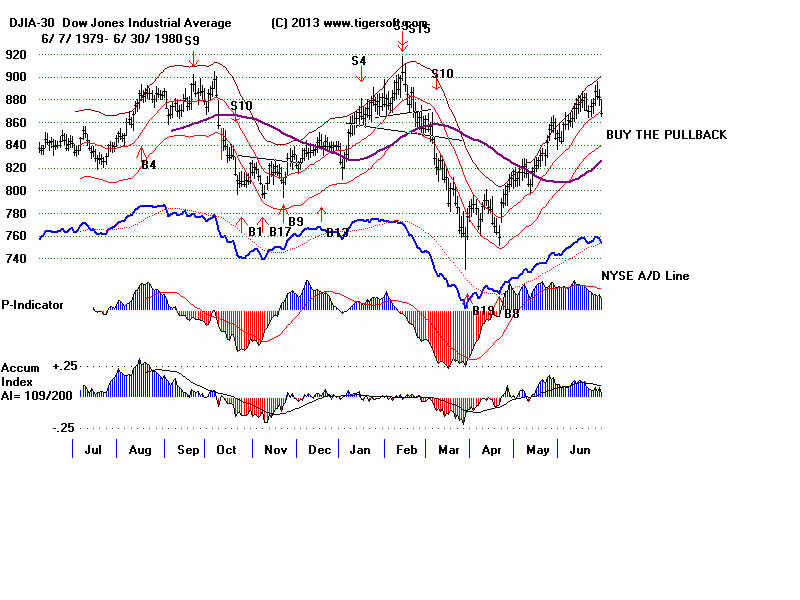
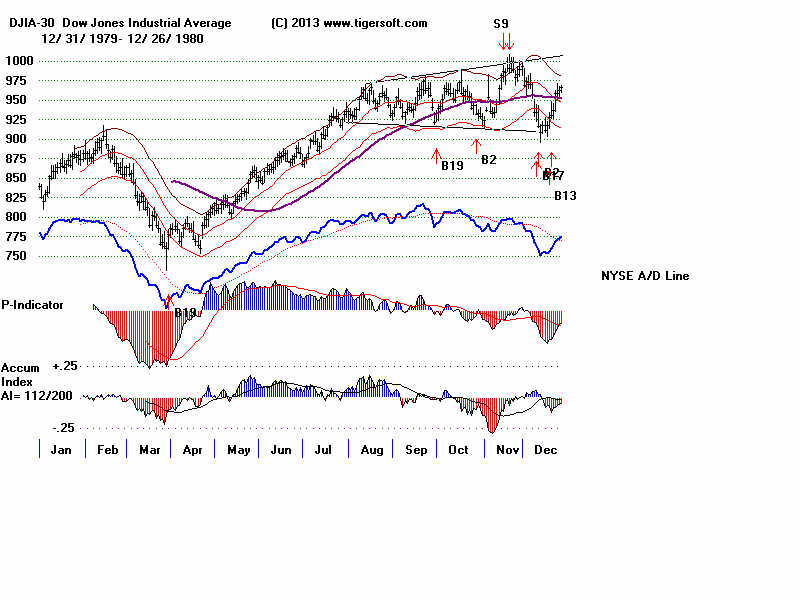
1979 1979-80
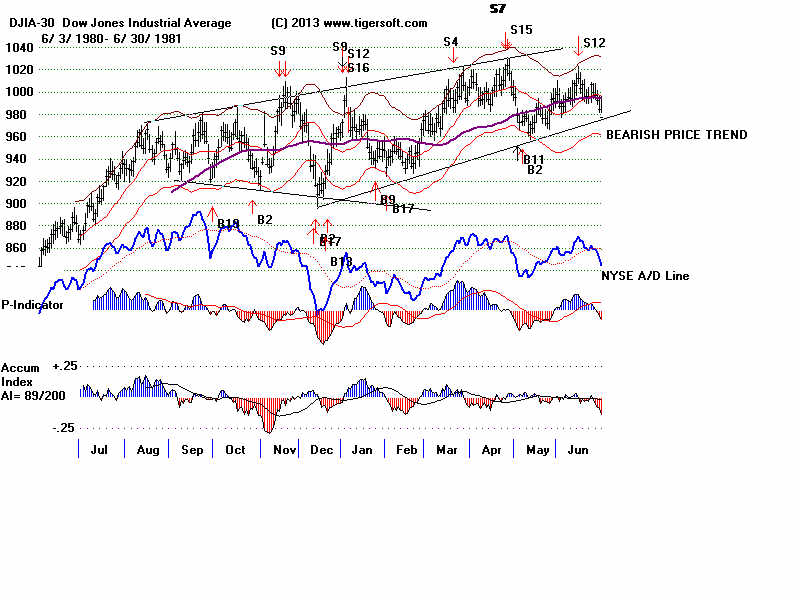
1980 1980-1
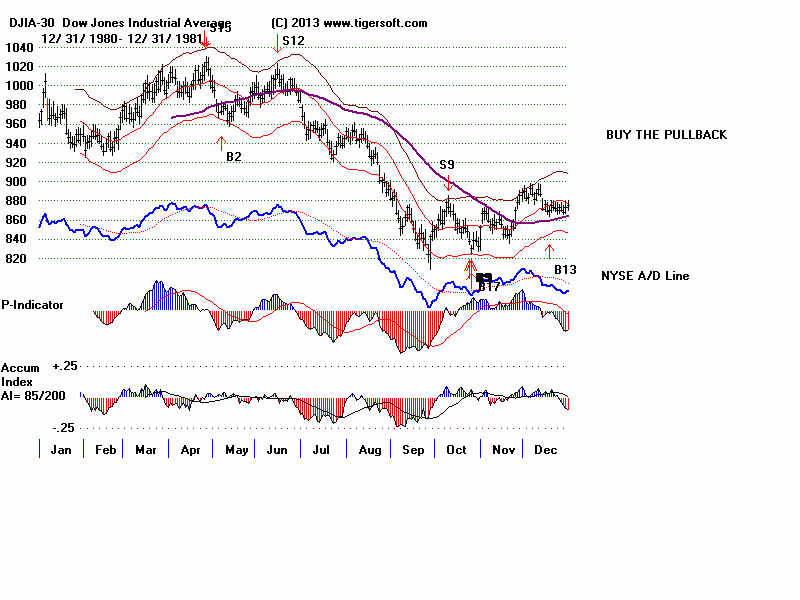
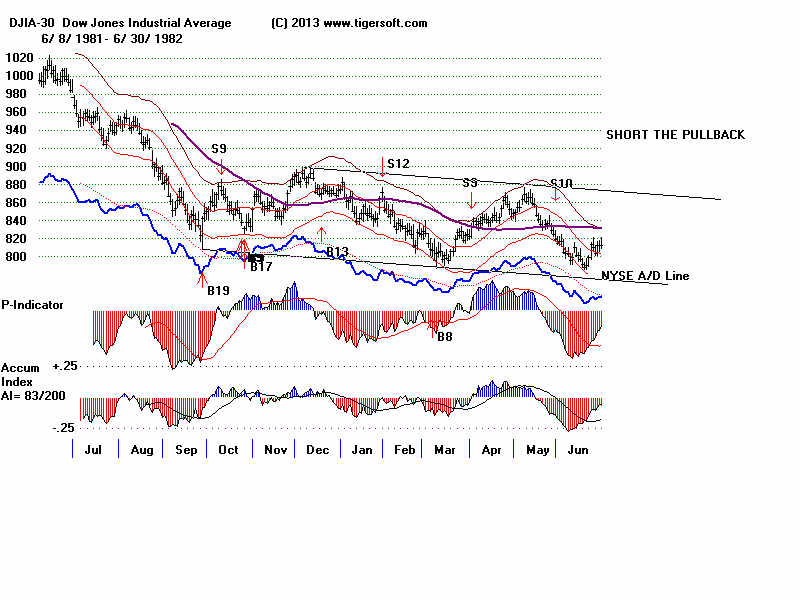
1981 1981-2
1982 1982-1983
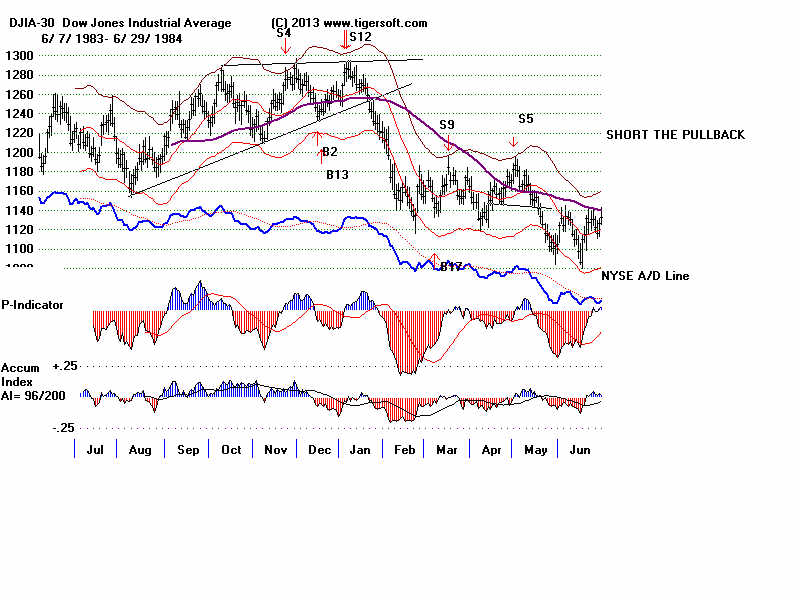
1983 1983-1984
1984
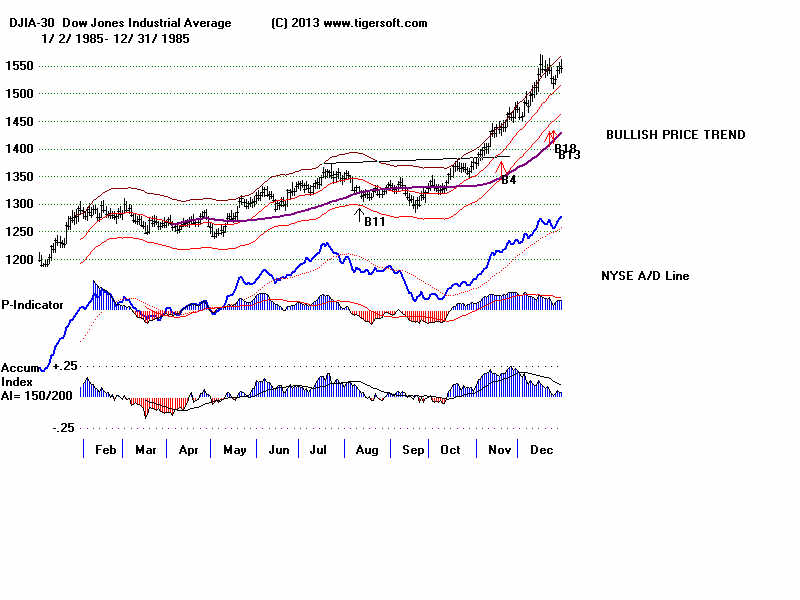
1984-1985
1985
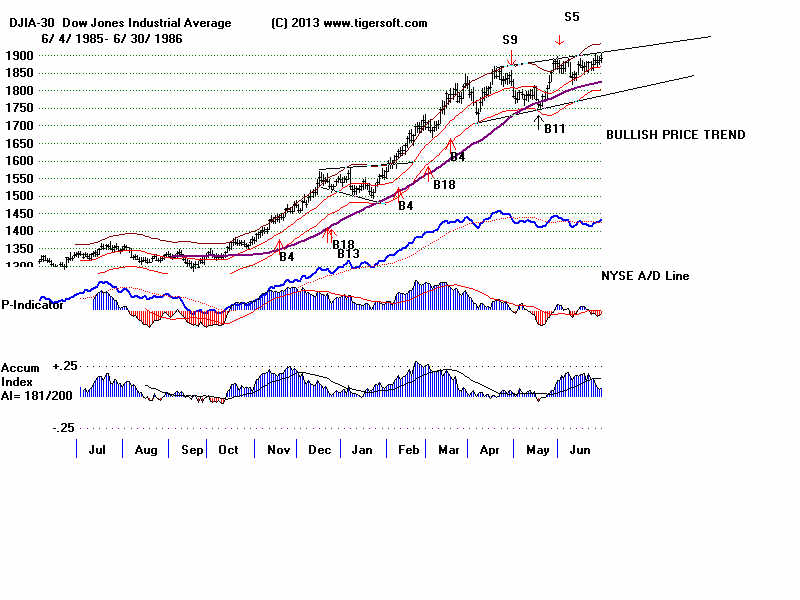
1985-1986
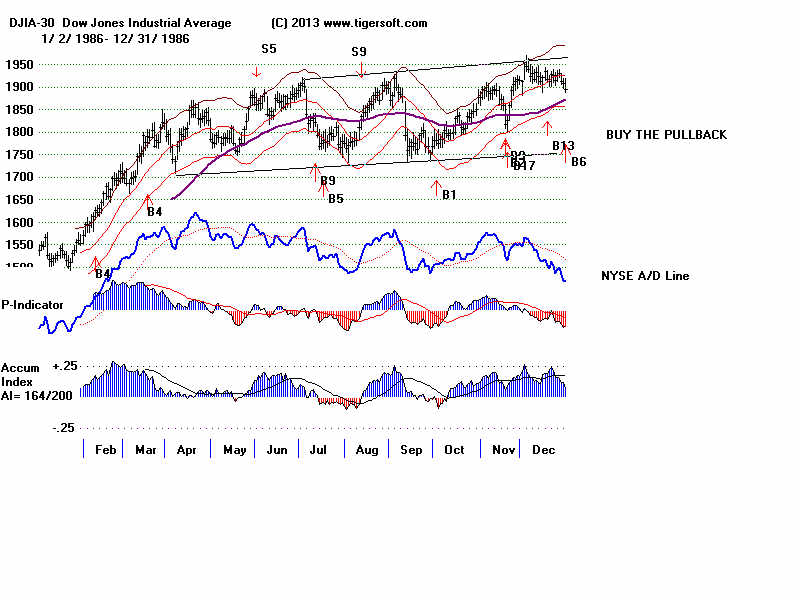
1986 1986-1987
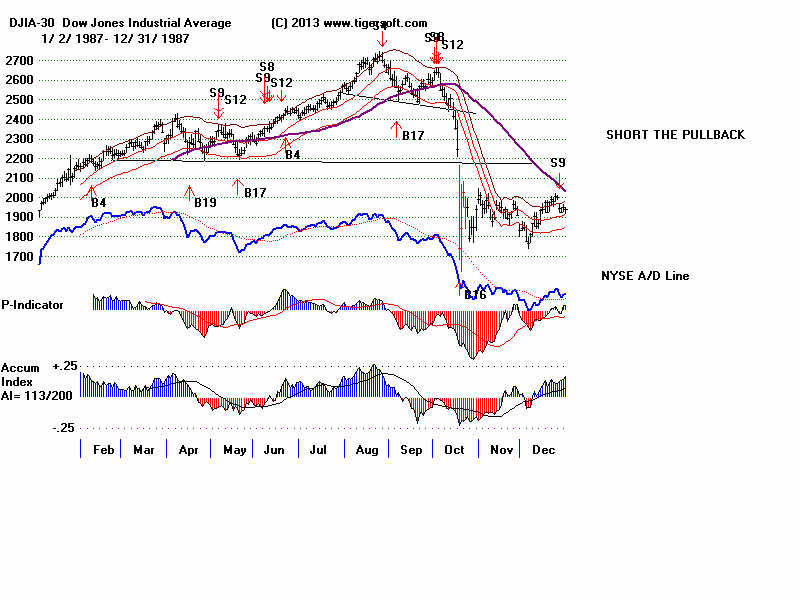
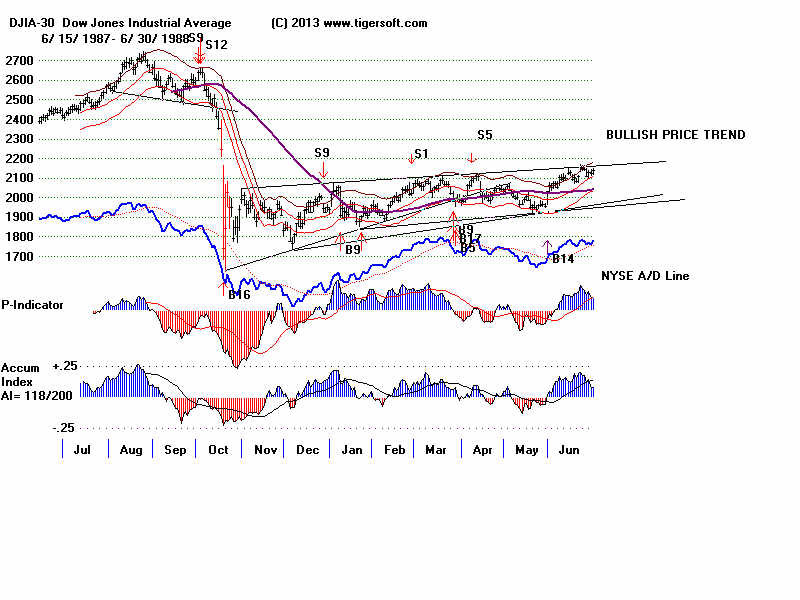
1987 1987-8
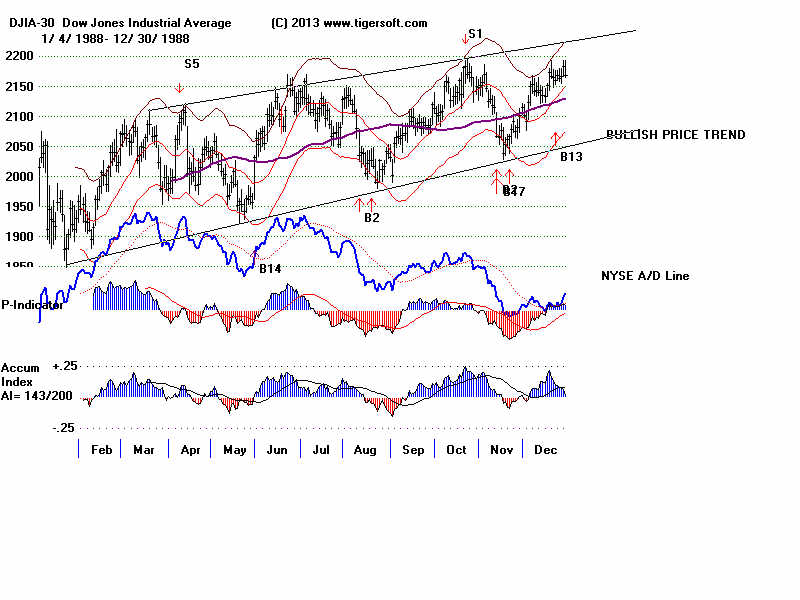
1988
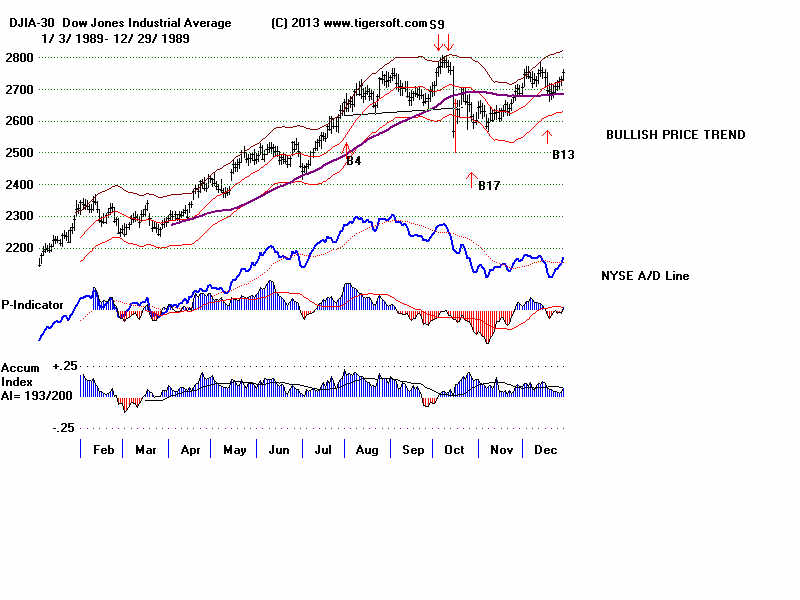
1988-9 1989
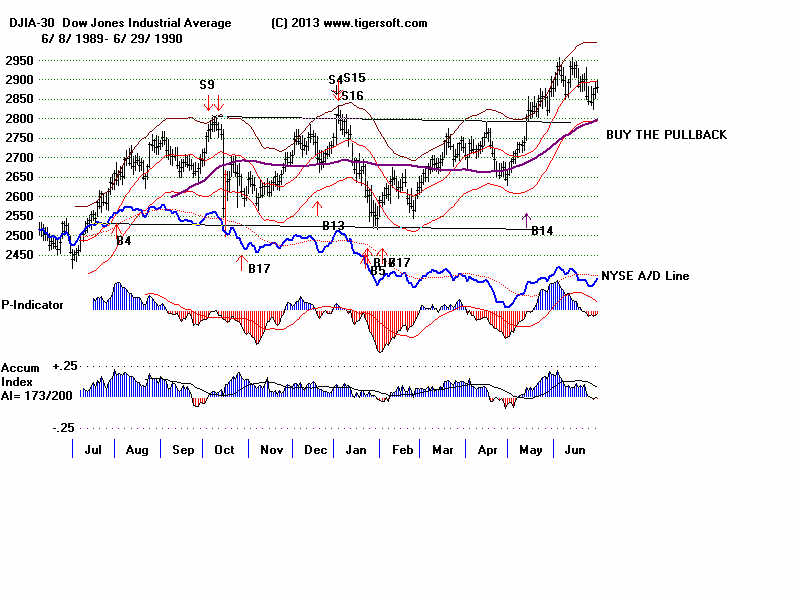
1989-90
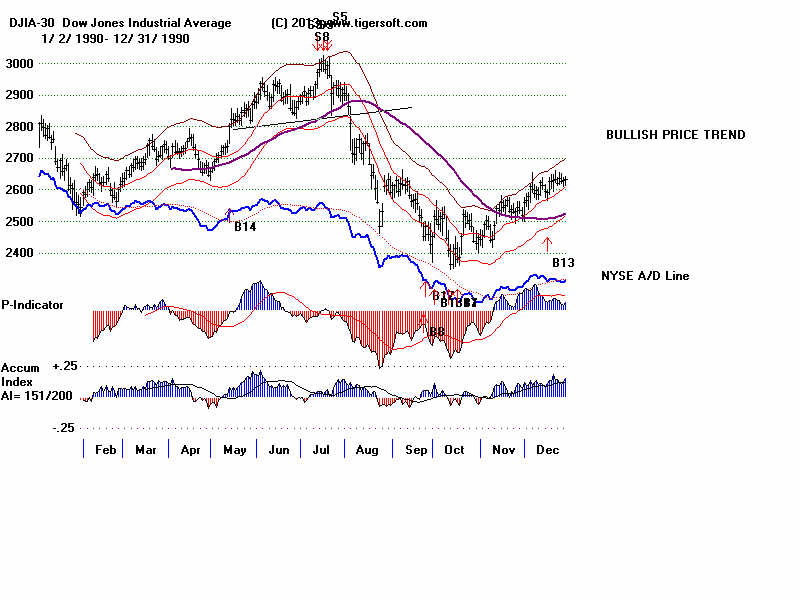
1990
1990-1 1991
1991-2 1992
1992-3 1993
1993-4 1994
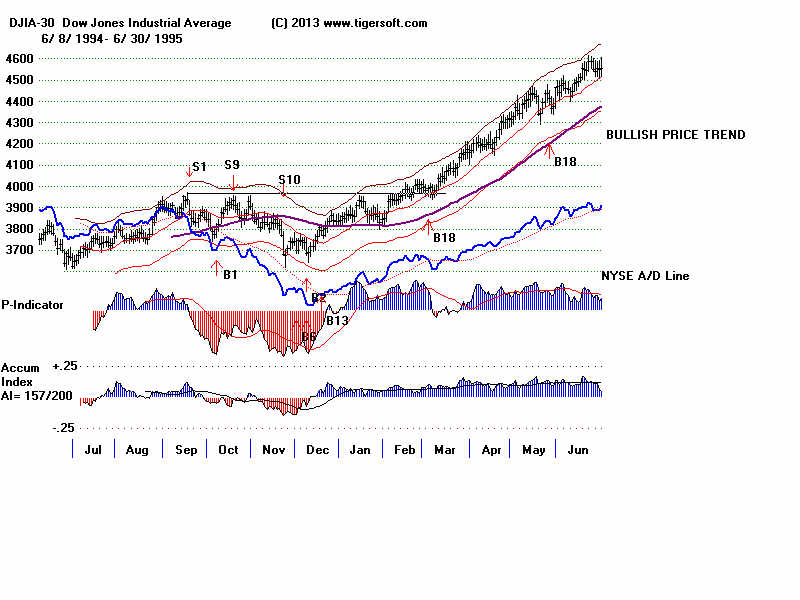
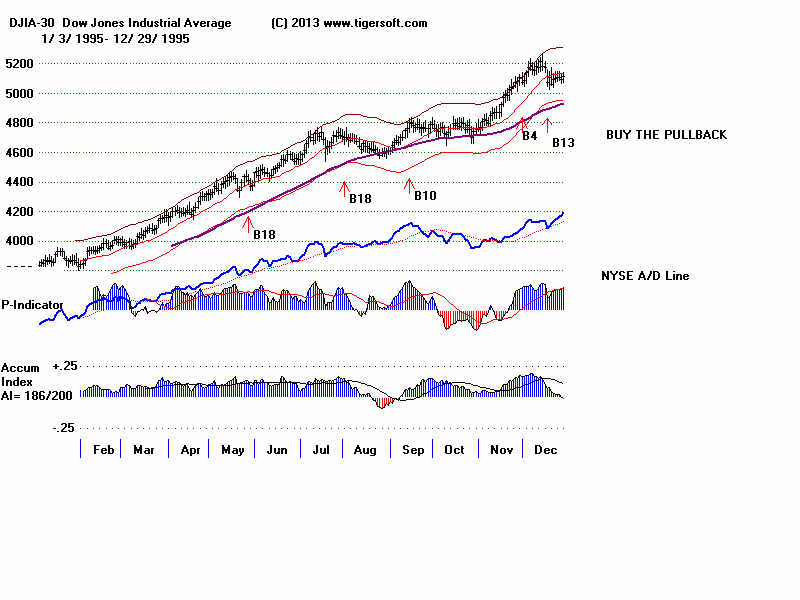
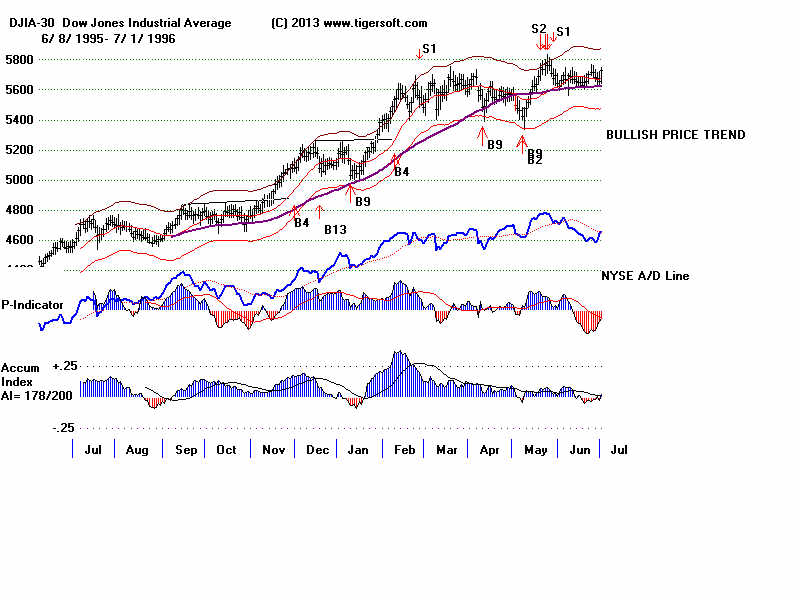
1994-5 1995
1995-1996
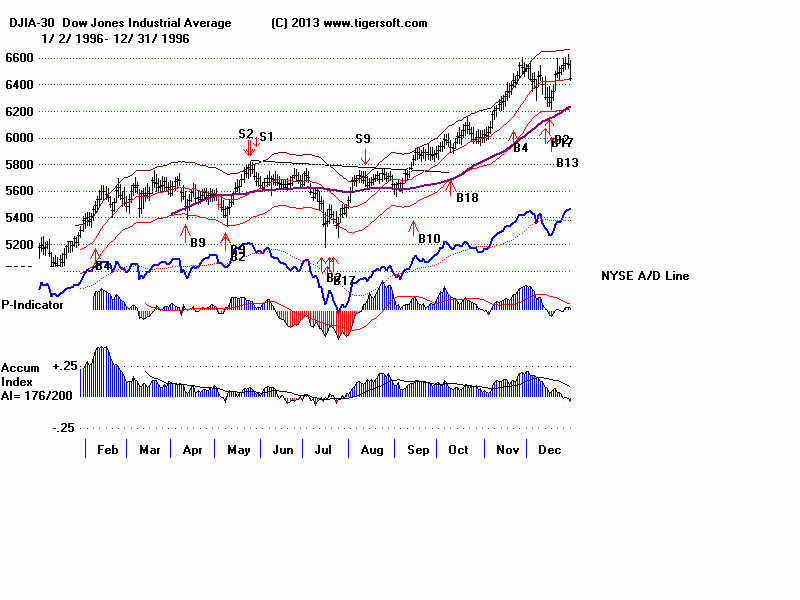
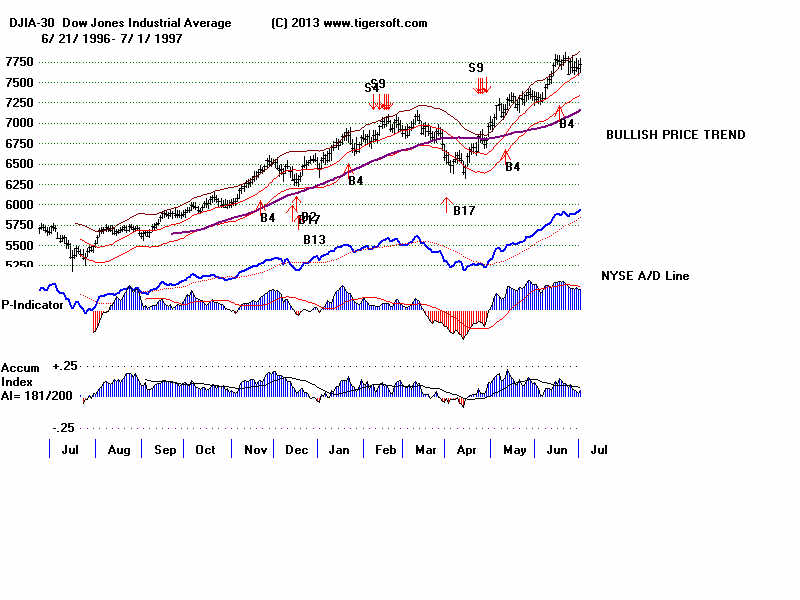
1996
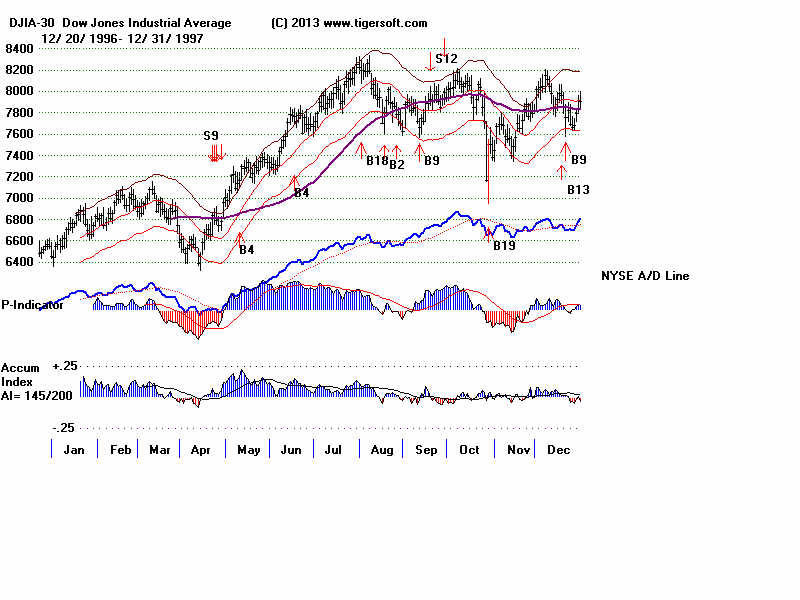
1996-7 1997
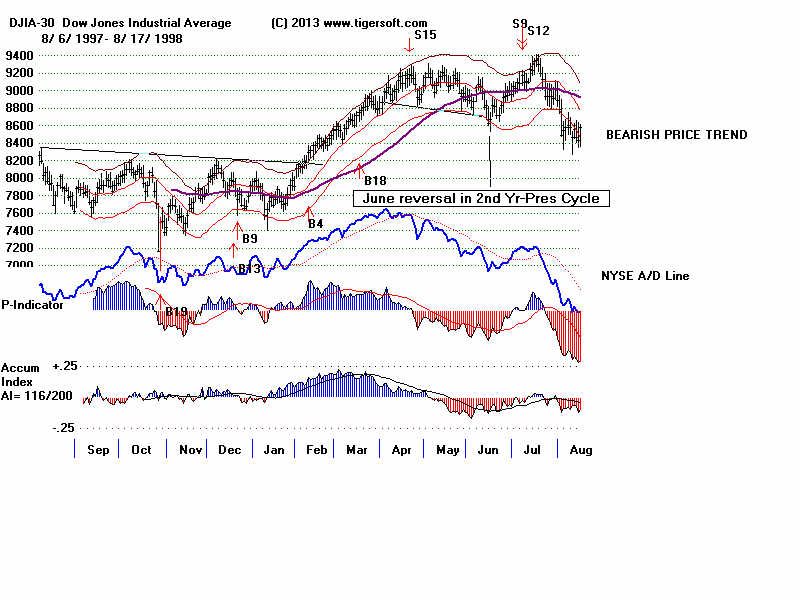
1997-8 1998
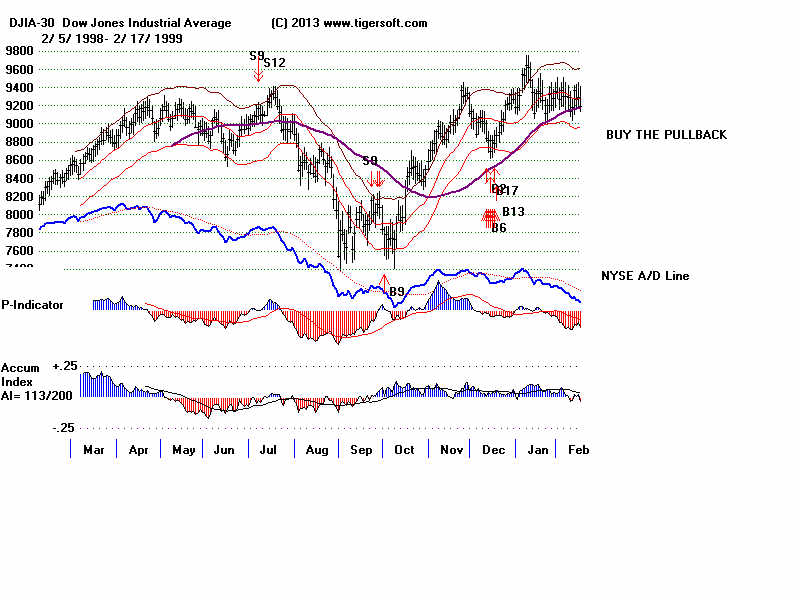
1998-1999 1999
1999-2000 2000
2000-1
2001 2001-2
2002
2002-3 2003
2003-4 2004
2004-5
2005 2005-6
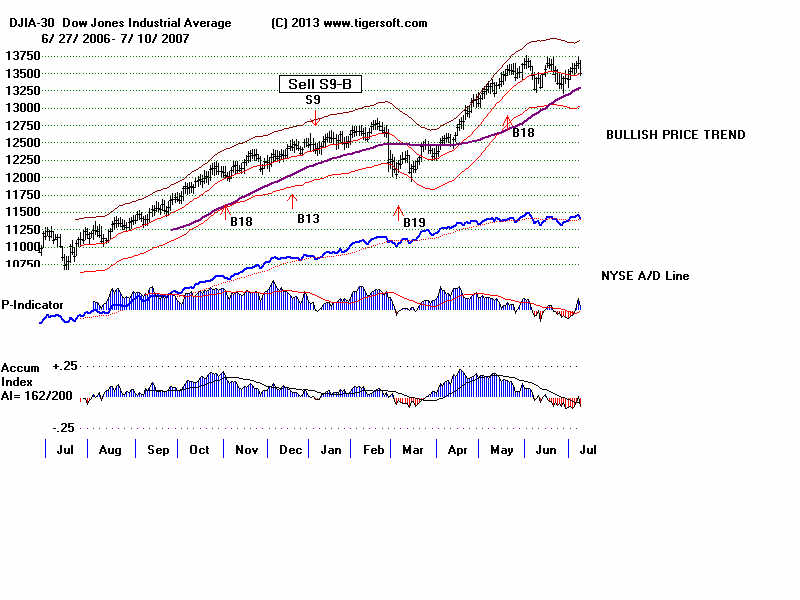
2006 2006-7
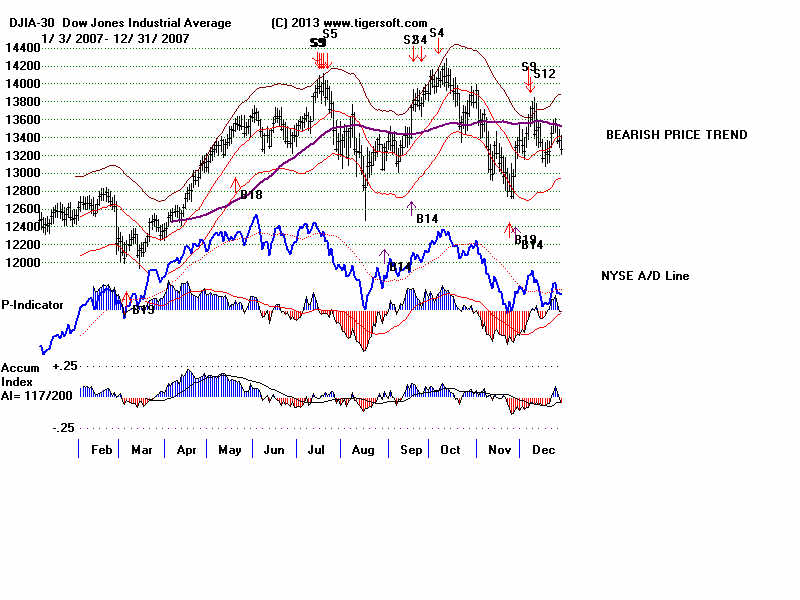
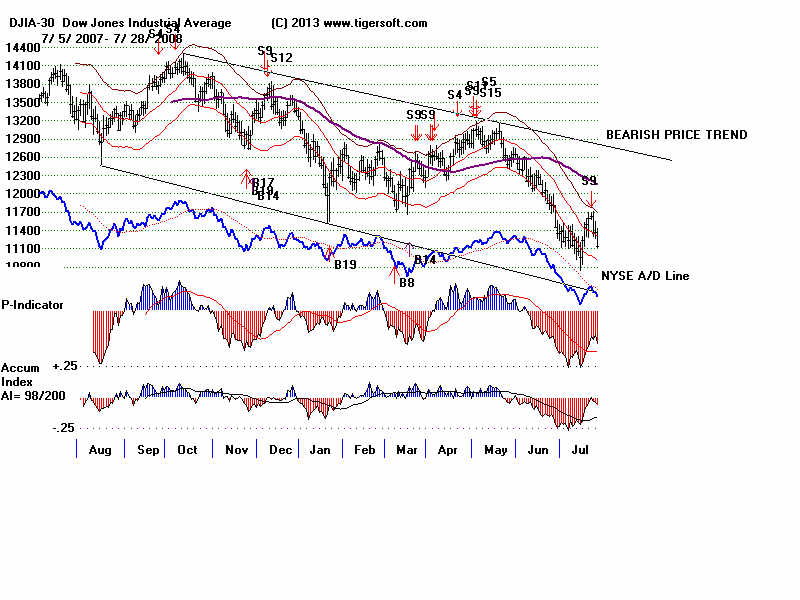
2007 2007-8
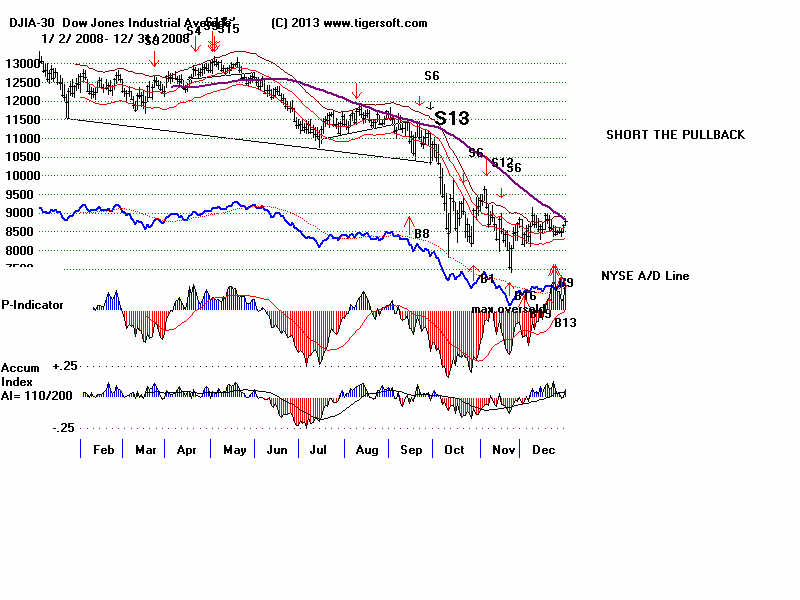
2008 2008-9
2009
2009-10
2010 2010-11
2011 2011-12
2012
2012-2013
2013 2013-4 2014
Introduction to Tiger/Peerless Buys and Sells.
Different Types
of TigerSoft/Peerless CHARTS, Signals and Indicators
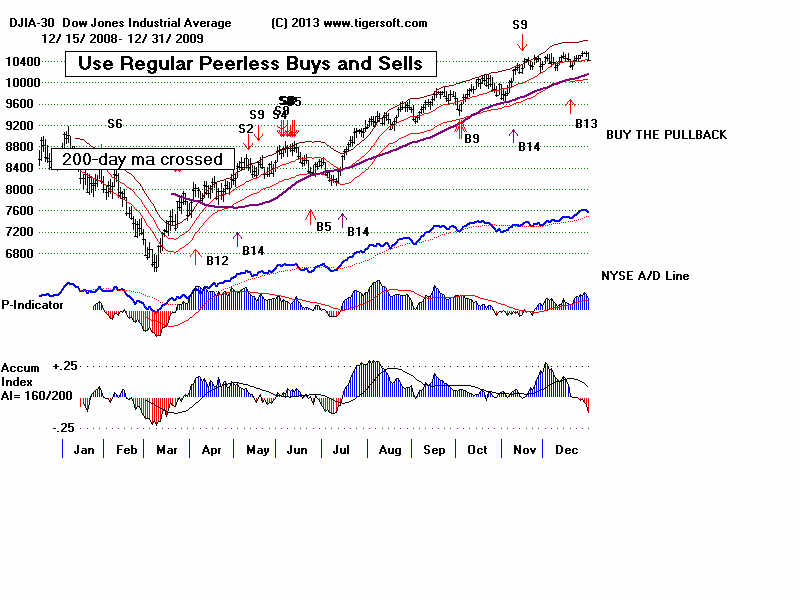
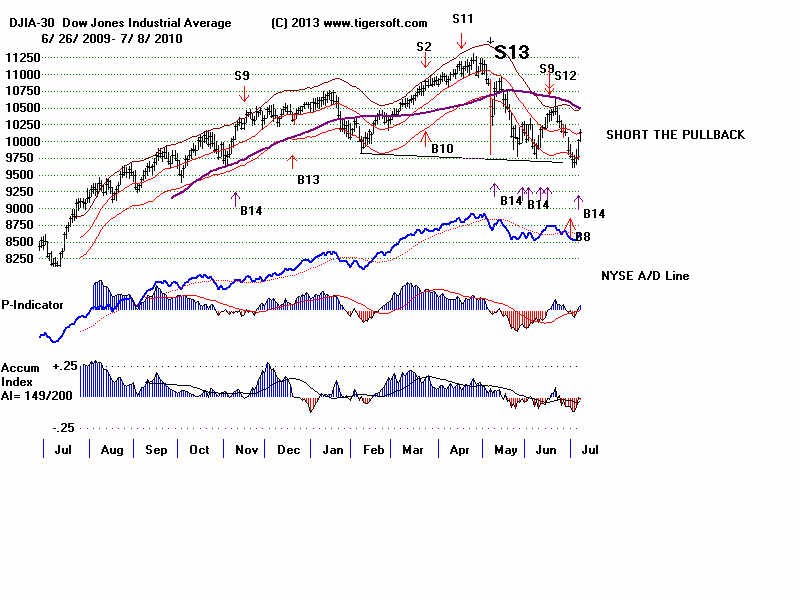
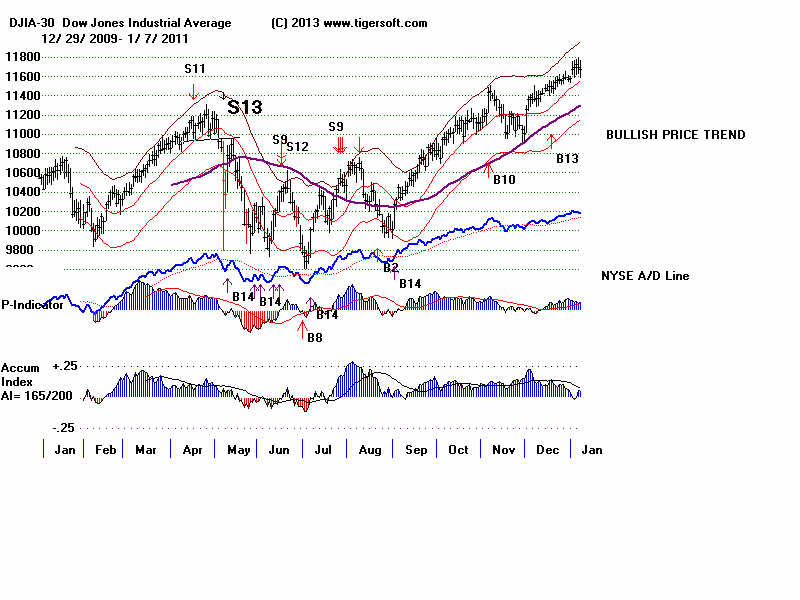
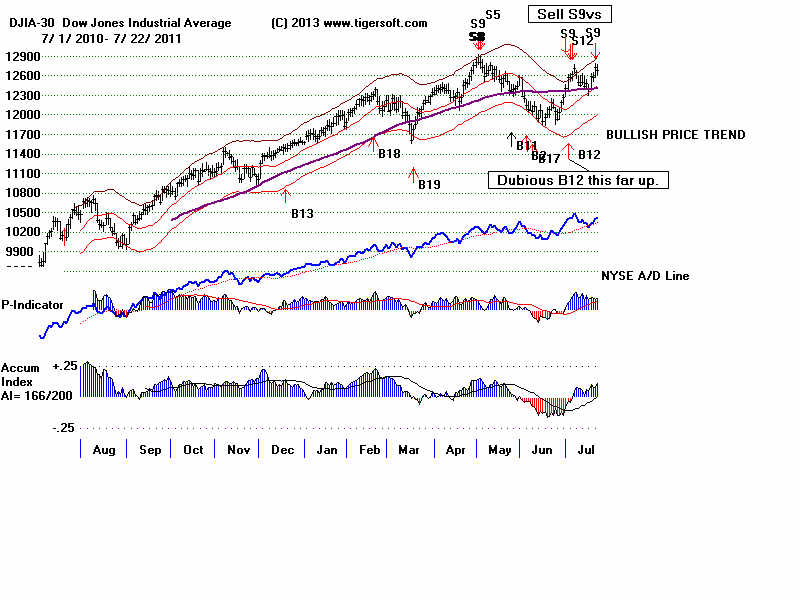
How reliable support is the DJI's rising 200-day ma?
-------------------------------------------------------------------------------------------------------------------
TIGERSOFT SIGNALS AND INDICATORS:
Documentation for TigerSoft
Automatic and Optimized Signals.
SPY Charts since 1994: Advisory Closing Power S7s, Accum. Index, 65-dma,
Optimized Signals.
"The
Jig Is Up": Calling September and October Tops.
A Keynesian's Warning Signs.
NUGT since 2012: A study of Tiger Technicals
Tiger Day
Traders Tool and most active Triple Leveraged ETFs
Advisory Pink Closing Power S7s at ETF at top since 1994
1994
1996
1997
1998
1999
2000 QQQ
SPY
DIA
2002
2007
2008
SPY 2011
2013-2014
Tiger Buy and Sell
Signals: New 2014 Research:
These are randomly chosen
groups.
but clearly we need to back-test them in more years.
You can replicate or do similar studies yourself
for other signals and/or other years.
9/1/2014 -
2014 Tiger
B19s - Steady rallying and no pullbacks below the 21-day ma.
9/2/2014 -
2014 Tiger
B17s on 14As taken alphabetically
9/3/2014 -
2014 Tiger B17s on 60
Biotechs taken alphabetically
9/4/2014 -
2014 Tiger
B18s on all "R" stocks taken alphabetically
* 9/8/2014 -
2014 Tiger
B20s - Conclusion: Use Closing Power trendbreaks in aftermath.
9/8/2014 -
2014 Tiger
B16s - Conclusion: Use mostly when
LA/MA under 1.05.
9/11/2014 -
2014 Tiger
B15s - Conclusion: Certain conditions
improved the results dramatically.
9/12/2014 -
2014 Tiger
B25s - Conclusion: 87.5% success rate
when other internals are positive.
9/15/2014 -
2014 Tiger B25s -
Best conditions for using B25s with somewhat
higher RSX capitalization stocks.
9/16/2014 -
New Tiger
Closing Power Take-Off Buy Signal in 2014: 14s, QQQ, DJI-30 and ETFs
9/17/2014 -
New Tiger
Closing Power Take-Off Buy Signal: 2009A-s
9/18/2014 -
New Tiger
Closing Power Take-Off Buy Signal: 2010A-s
9/21/2014 -
New Tiger
Augmented Sell S8s: DJI-30 - 2014
Requiring S8s to show
Negative CP%-Pr and IP21<+.15 produced a 70% success rate
in a rising market for
DJI-30 stocks and big ETFs.
9/24/2014 -
Tiger Sell
S14s: They make price breakdowns very bearish.
1/15/2015
-
Tiger Day
Traders' Tool Explained.
http://www.tigersoft.com/day-traders/index.html
http://www.tigersoft.com/Indicators/index.htm
http://www.tigersoftware.com/TigerBlogs/Aug-31-2009/index.html
NEW
2/16/2015
1) New -
Tiger Charts showing UP%, Opening-Up%, Closing-Up%
Note differences between bullish
and bearish stocks...
2) New -
UP%,
Opening-Up%, Closing-Up% Rankings of any directory.
3) New -
Display of what happens to a stock after various size openings up or down.
4) New -
6-month charts to better
show volume changes and 5-day ma with bands.
More profitable trading schemes coming...
Targeted Trading Opportunities:The Profits Quickly Add Up,
3/29/2015
Tiger CandleSticks:
IBB: 2001-2015
and
Recent Others.
====================================================================================
Earlier Hotlines
2-7-2014 to 3/19/2014
11-22-2014 to 2-6-2014
http://tigersoftware.com/555HL555/index.htm
10/9/2014 - 11/21/2014
http://tigersoftware.com/9933Hot/
9/2/2014 - 10/8/2014-
http://tigersoftware.com/2233HL/index.html
6/25/2013-9/1/2014
http://tigersoftware.com/112211-H/index.htm
11/22/2013-3/20/2014
http://tigersoft.com/1111-HL/index.html
10/22/2013-11/21/2013
Past
Hotline Predictions
http://tigersoft.com/-HL42013/index.html
http://www.tigersoft.com/-2GBL13HL/index.htm
==============================================================================================================================
 8/3/2015 200+ TigerSoft Charts -