


TigerSoft and Peerless Daily
Hotline
(C)
1985-2013 William Schmidt, Ph.D. www.tigersoft.com
All rights strictly reserved.
Sharing this hotline address with non-subscribers is a violation of our contract with you
and a violation of copyright laws. I work hard for you. Respect that effort!
Important ===> Look for an email sent you giving the
new IP address for our Hotline
This HOTLINE Address will
change Monday night.
If you did not get an email, we may have made a mistake. But it may also
mean that your subscription has expired. To renew please
---> To
renew this Hotline,
order here $350 (check) - $360(Visa/MC)
www.tigersoft.com/-2GBL13HL/index.htm
-----------------------------------------------------------------------------------------------------
For earlier hotlines this year, please go to
http://www.tigersoft.com/-2GBL13HL/index.htm
 A Guide To Profitably Using The
Tiger Nightly HOTLINE
A Guide To Profitably Using The
Tiger Nightly HOTLINE
 Peerless Signals: 1915-2013
=====================================================================================
4/19/2013
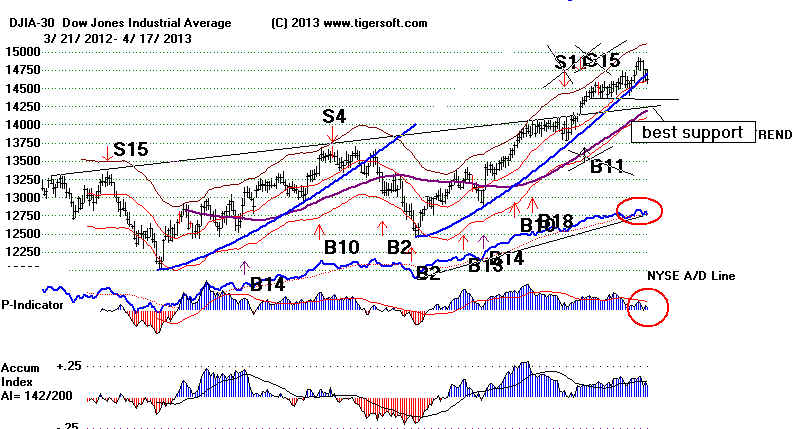
A/D Line Uptrend Is Intact. The Test of It Looks Successful.
Usually, this brings a good recovery. Technically minded Traders will now
be
watching this line even more closely. With such a reference point for selling,
short-term traders are expected to move aggressively into in strong, high Accumulation
stocks.
The problem
for now is that the DJI's current chart pattern could become a problem
and limit
the rally.
The margin
calls in Gold and Silver stocks are probably over for the time-being.
Watch to
see if Professionals switch to the long side with a strong closing.
Gold
futures are up 5%..
We have no
Peerless Sell. But the round number 15000 is likely to be resistance.
The market
is too defensive. It is led by Biotechs, Utilities, Reits and Food Stocks.
Such
leadership often occurs late in a long advance when economic growth conditions are
absent.
(This ascertained by
looking at the most bullish of the high
Accumulation new highs now.)
Perhaps,
the market will enter a narrow trading range like in 1984 and 1991
while the
necessary base is built for further gains. Industry selection will continue
to be very
important.
The
upside would seem to be limited for most stocks. Unless you are willing to sell out
quickly if the new Closing Power uptrends are violated, I would wait for a further
decline
to
buy where there will be more head-room. If there is a rally, I expect to do a lot of
selling
at
15000. As I keep saying, May is more likely to bring a tradable top than April.
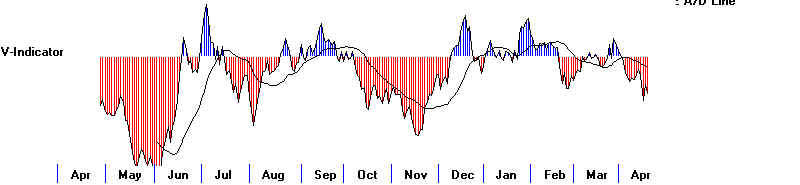
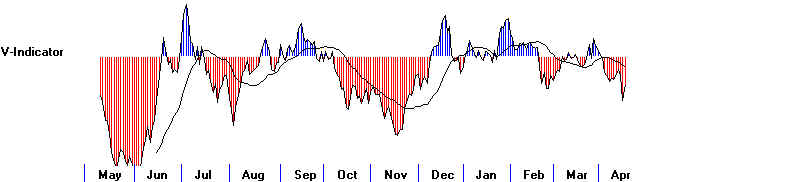
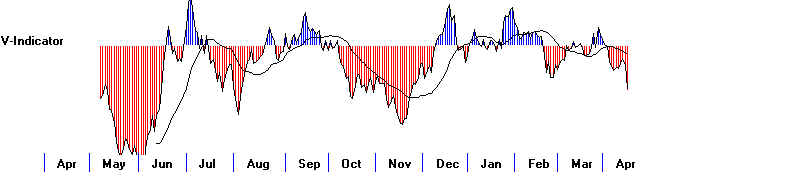
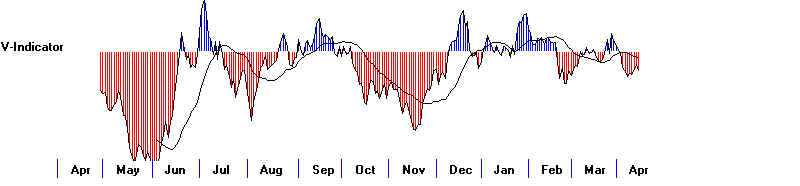
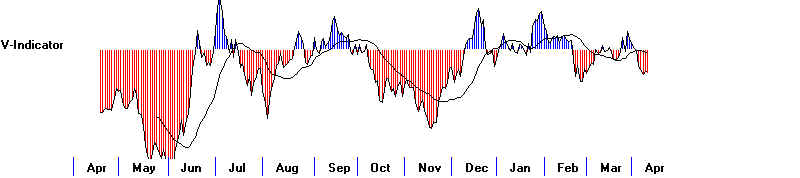
But unless,
the
V-Indicator turns up sharply, we will probably get a Sell S15 or S9V at the upper band
because the V-Indicator is now quite negative.
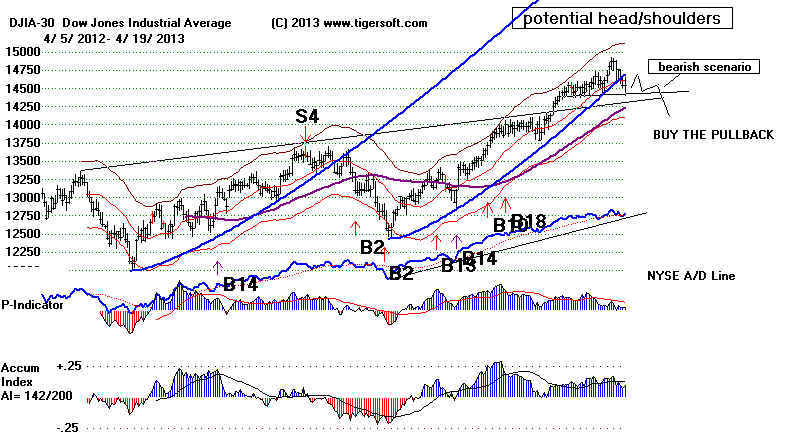
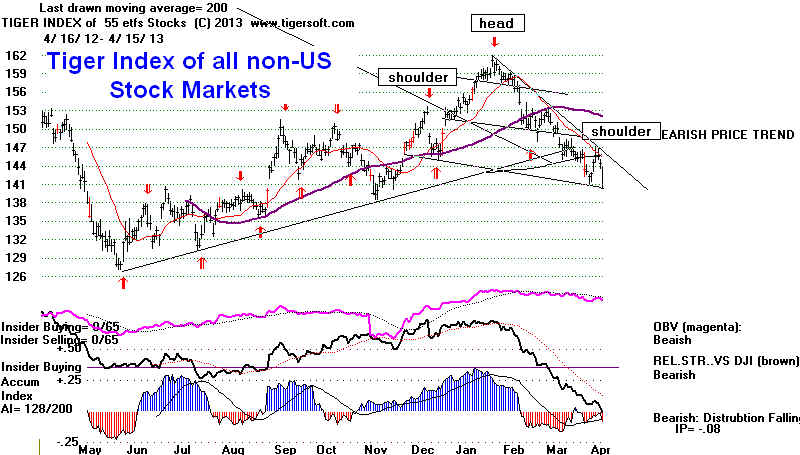
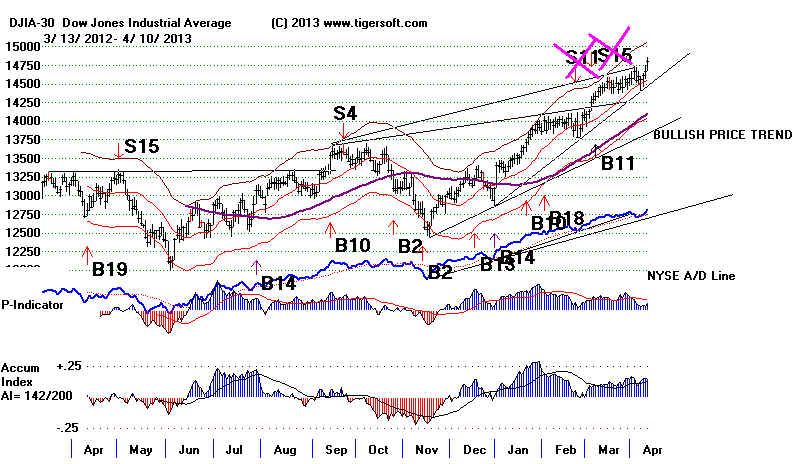
 The DJI's pattern is taking on the appearance of a potential head/shoulders. This
would
make a DJI breaking of the 65-dma more significant. The neckline
support is at 14415, The right shoulder apex resistance must be expected at 14750.
If
the pattern develops symmetrically, and they often do, it may be a month before we
see
whether the DJI can bullishly advance above the apex of the right shoulder or
breakdown. The standard measuring rule for this pattern if it breaks down, would
call for
a
minimum DJI decline to 14000.
That
the DJI helped up so well in the face of drops Friday by MCD (-2) and IBM (-17) of
has
to be seen as bullish short-term. By themselves, they would have put the DJI
down
158, but for strength elsewhere. Medium priced DJI stock with high
Accumulation
did
well. AXP (+2.19), BA (+1.84), HD (1.52), VZ (+1.34), JNJ (1.31), UTX
(1.67)
and
DIS (1.57. Together these rose 11.44. So, the fact that the DJI close +10.37
for
the day is remarkable. IBM's chart pattern shows a lot
more Accumulation
than AAPL did when it began its decline. See how AAPL's
Closing Power was already
falling before it completed a bearish head/shoulders pattern. Analysts apparently
think
much
more highly of IBM now. But this was IBM's
first earnings miss in 8 years. One can
not
help but wonder if there will be other earnings misses soon.
---> 164 MAXCP
stocks Bullish
MAXCP Stocks (4/19/2013) Bullish plurality
---> 94
MINCP stocks Bearish MINCP Stocks
(4/19/2013)
---> 36 New
Highs on NASDAQ 17 new lows. Bullish plurality
---> 117 New Highs on
NYSE 15 new lows. Bullish
plurality
Key Values: DJI
14547 +10
la/ma= 0.995 21dma-roc = 0.029 P=+ 61 Pch= -7
IP21 = +.096
(on 1/30/2013 IP21 was .293) V =
-72 Opct = .013 65
day-pct-up = .069
4/19/2013 ---> To
Key Index and Leading Stock Charts
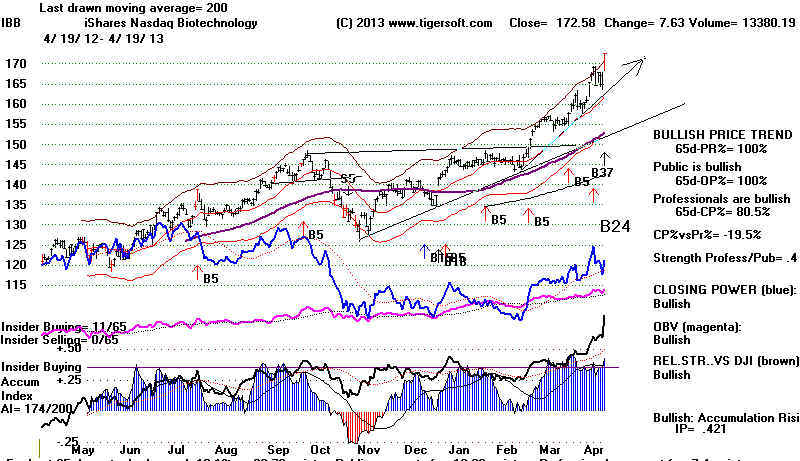
Biotechs Are The Strongest Group
Is it too late to buy some of these rapidly rising high priced Biotechs or FBIOX?
The gain so far this year for FBIOX is like 1991 and 1987. In 1987, Peerless Sell
S9s
turned it down early in the year and it never recovered. In 1991, the DJI was stuck
in a flat trading range from March until December. In that environment and
without
a Sell S9 signal, FBIOX did very well. This suggests as long as Peerless does not
give
a Sell S9, FBIOX will be safe and biotechs should keep rallying. But keep in mind,
biotechs are not impervious to market weakness, once significant market weakness
is perceived to be imminent. They top out late, but they do drop in a bear market.
Right now, confidence is high enough to boost FBIOX and the bigger biotechs. As the
"main game in town now" for speculators, these biotechs are accelerating upwards
in a
way that can be traded short-term on the long side. But such trends bring bigger
declines
eventually. So, use the Closing Powers with them if you choose to chase them.
They'll be
safe until the CP uptrend is violated. Working with the highest AI/200 and positive IP21
stocks in the Biotech directory in uptrends will help. .
AI/200 IP21 Close change
RHHBY 199 .316
61.1 +.02 Running. CP is above its
21-dma.
INFI 178
.216 40.76 +.74
At 65-dma. CP is just below its 21-day ma.
IBB 174
.421 172.58 +7.63 High volume new
high.
CLDX 168 .162
13.03 +.50 Fresh breakout past 5 tops.
TSRO 167 .08
23.99 +.14 Move avove 25.20 would be
breakout.
LGND 163 .212
26.92 +2.52 27.34 is recent high.
ACOR 156 .369
40,44 +1.44 Up 8 points in last week.
REGN 147 .335
212/58 + 5.92 218 is recent high.
Is It Too Late To Buy FBIOX?
Splashy biotech gains often present problems for the market. Over-speculation in
a
small handful of stocks and panicking short covering are not good signs.
VRTX
rose 61% Friday on news of qualified efficacy in
stage 2 trials for its
treatment
of the most common form of cystic fibrosis. I rebuilt the BIOTECHs'
Tiger
data download so that it now has more than 200 biotechs. I eliminated the
specialty chemicals that had somehow populated that directory. VRTX chart.

The
higher priced Biotechs (especially AMGN, BIIB, CELG, GILD, REGN) are
getting much of the "hot", high performance money. The trend is still
up.
Heavy
institutional buying is very apparent. VRTX is 93% owned by institutions,
like
FBIOX. A vicious circle of hyper-speculation is building now. The better
the
Seclect Fidelity Biotech fund, FBIOX, does compared to
other funds, including
the
42 other Fidelity Select funds, the more its managers must keep buying more
of
its top stocks to meet the demands of the new investors that are flooding into it.
And
that just makes their funds' performance do even better and that brings in another
round
of public buying of FBIOX. FBIOX is up 28% so far this year. Its Utility
Fund,
FSUTX, is number 2, up 17%.
The
FED denies that a speculative bubble is being created by its stimulative efforts.
But
bubbles are an integral part of Wall Street and when you tell the world that
there
will not be any surprise increases in interest rates, which is one of the
reasons that speculators might hesitate to chase hot stocks, you get an even
bigger bubble in the top performing stocks.
| Top 10 Holdings of
FBIOX (59.73% of Total Assets) |
|
| Company |
Symbol |
% Assets |
YTD Return % |
| Amgen Inc. |
AMGN |
14.63 |
7.95 |
| Gilead Sciences, Inc. |
GILD |
10.72 |
18.31 |
| Celgene Corporation |
CELG |
7.22 |
34.60 |
| Biogen Idec Inc. |
BIIB |
5.96 |
15.26 |
| Regeneron Pharmaceuticals, Inc. |
REGN |
4.62 |
0.39 |
| Alexion Pharmaceuticals, Inc. |
ALXN |
4.09 |
-7.44 |
| BioMarin Pharmaceutical Inc. |
BMRN |
3.45 |
21.16 |
| Vertex Pharmaceuticals Incorpor |
VRTX |
3.09 |
10.19 |
| ONYX Pharmaceuticals, Inc. |
ONXX |
3.00 |
-0.37 |
| Medivation, Inc. |
MDVN |
2.95 |
-9. |
|
Do Big Gains from January to April 19th for FBIOX
mean strength for the rest of year?
Since
1996, the first 4 months of the year have tended to bring declines not rallies for FBIOX.
So
the FBIOX rally this year is unusual. There are only a few such cases:
2012, 2011, 2010, 2004, 1995, 1991, 1989 and 1987.
Half
the time FBIOX kept advancing. But half the time it fell back, sometimes a
long
ways when it was up between December 31st and April 19th.
This
year so far has seen the biggest percentage gain for FBIOX since
1991 and 1987.
Though 1991 saw FBIOX advance all year, there was a subsidence
from
4/17 (29.12) to 6/27 (25.77) before the advance resumed. In 1987s case,
FBIOX
peaked early in 3/24 two weeks before the first Sell S9 of 1987.
.
Dec 31st
April
19 Peak
Summer low
of year before
Rally continued.
---------------------------------------------------------------------------------------------------------------------[
2013
109.90
142.55
2012
86.19
93.44 116.16
(10/18) rallied from April to October.
2011
72.96
81.98 89.00 (7/22)
69.65 (8/8)
2010
65.49
74.43 75.10
(4/15) 59.53 (7/2)
2009
59.11
54.95 68.31 (9/21)
rallied from March to
September.
2008
66.68
63.48 74.39 (7/29) rallied from March low to Sept.
2007 64.96
66.18 73.44 (10/15)
63.16 (8/1)
2006
62.70
64.02 68.62 (3/2)
57.21 (8/14)
2005
57.65
51.34 63.02 (11/23)
rallied from March to November.
2004
51.48
59.62 62.64 (4/26)
47.35 (8/9)
2003
38.73
40.78 52.20 (9/10)
rallied from February to
September.
2002
65.12
51.74 none
fell steadily to 31.82 on 7/10
2001 86.80
64.56 75.03 (6/5)
51.04 (9/24)
2000
67.13
64.85 102.70 (11/2)
rallied from April to November.
1999
39.77
37.53 68.54 (12/30)
rallied from April to December
1998
31.89
32.51 36.35 (3/19)
27.01 (8/31)
1997
32.51
29.27 39.38 (10/8)
rallied from April to
October
1996
34.83
35.22 36.53 (3/8)
30.65 (7/16)
1995
23.41
26.03 34.83 (12/29)
rallied steadily the whole
year.
1994
28.61
23.26 25.40 (9/16)
22.70 (7/25)
1993
28.41
22.22 28.96 (10/15)
rallied from April to October
1992
36.42
27.34 24.88 (6/8)
went sidewise until October.
1991
19.94
27.92 36.42 (12/31)
rallied from June to December
1990 14.30
15.33
19.53 (7/16) 16.70 (8/23) then )rallied from August to
December
1989 10.10
11.81 15.12 (10/6) rallied steadily until October.
1988 9.70
10.25 10.86 (3/10) 9.48
(11/16)
1987 10.35
13.80 14.76 (3/23) 8.47 (10/27)
=====================================================================================
OLDER HOTLINES
====================================================================================
4/18/2013
Continue Holding
Some Bearish MINCPs Short and
Hold Mostly High Caps Showing High Accumulation.
These we may sell on a rally to 15000. Our "Rule of 7"
is still bullish.
Capture so quickly of Marathon Terrorist Is A Big
Boost for All of US.
A Rally To 15000 Suddenly Seems A Good Possibility.
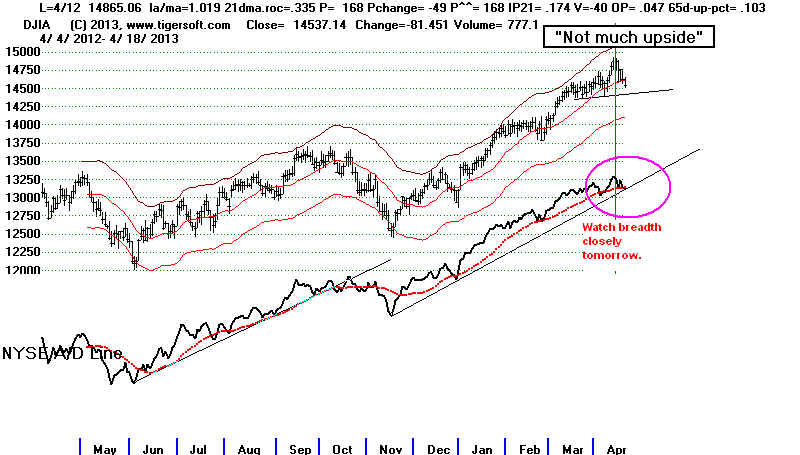
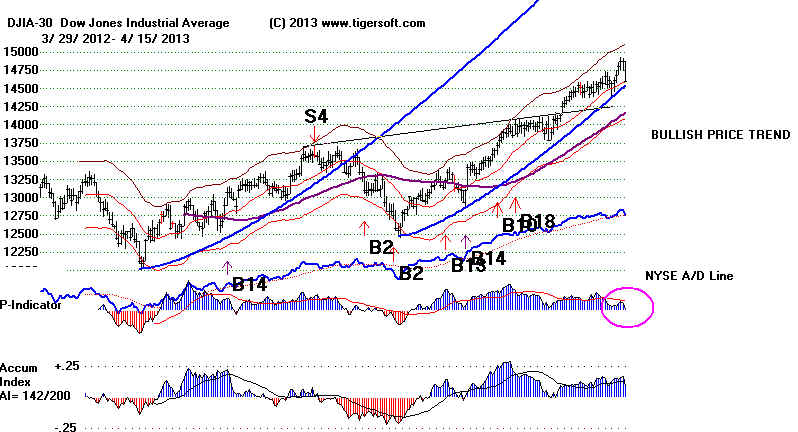
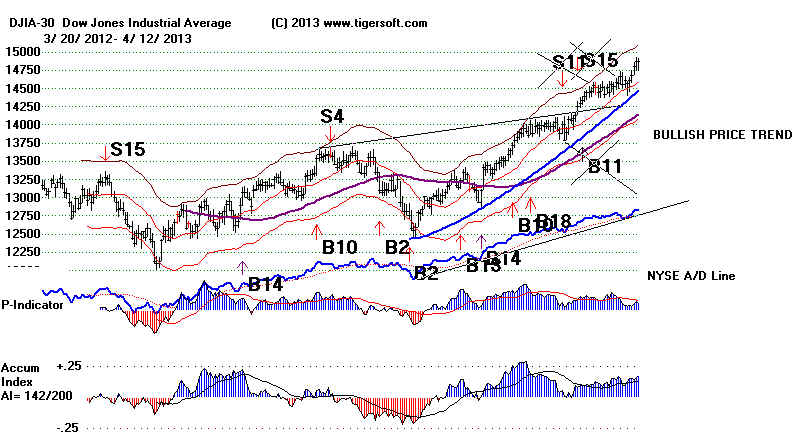
A lot depends on whether early gains are held. The A/D Line
Uptrend May Now Hold.
Key Values: DJI
14547 -81
la/ma= 0.995 21dma-roc = 0.066 P=+ 67 Pch= +5
IP21 = +.076
(on 1/30/2013 IP21 was .293) V =
-75 Opct = -.004 65
day-pct-up = .07
4/18/2013 ---> To Key Index and Leading Stock
Charts
The
Absence of A New Peerless Sell Signal Does Suggest A DJI Rally.
But
there would seem to be much more upside potential buying near 14200.
The
DJI's Accumulation Index remains positive. That should help hold up
the
DJI. But even if it succeeds any rally to 15000 will likely fail. Besides the
psychological
resistance there, the internal strength indicators have slipped a lot. The V-Indicator is
now
-75. In May a rally to the 2.7% upper band (around 15000) will bring a Sell S9V.
We
could even get a Sell S9 signal this month if the P-Indicator is 67 more points lower
on a
rally to a new high.
The
market has narrowed subtly. High caps are trying to hold up. The DJI, OEX and SP-500
are
still above their 65-day ma. But the smaller stocks are weakening
disproportionately.
The
NASDAQ, QQQ, MDY and NYSE broke below their 65-dma today while the IWM
and
Value Line broke below theirs previously. We saw this weakening process mainly in
the
declining tops of the P-Indicator. This was the primary reason we thought doing some
selling at the 1.9% upper band Sunday night was a good idea. There seemed little
upside potential and risk of a decline back to the 65-dma seemed high.
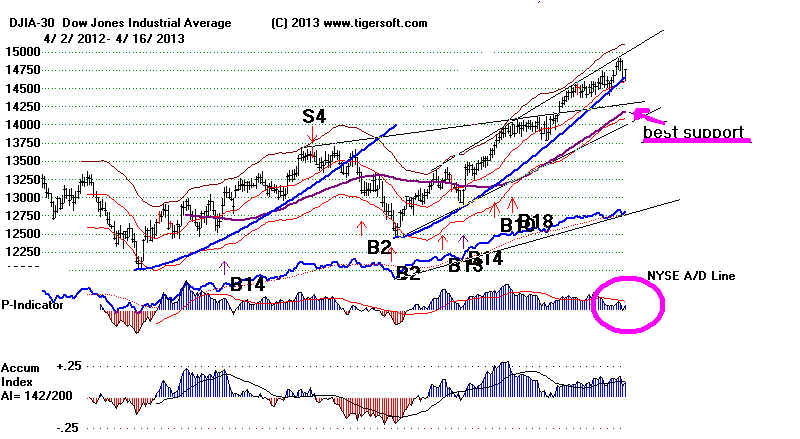
Note
that the NYSE A/D Line did not produce a non-confirmation on the last new high
because of how much the FED's low interest rates are boosting dividend paying NYSE stocks,
REITs, utilities, bond funds, etc. In this environment, we want to make use of
decisive
trend-breaks in the A/D Line. Today, the NYSE A/D Line fell back to its 5-month
uptrend.
A
decisive break would definitely be bearish and invite a lot more selling.
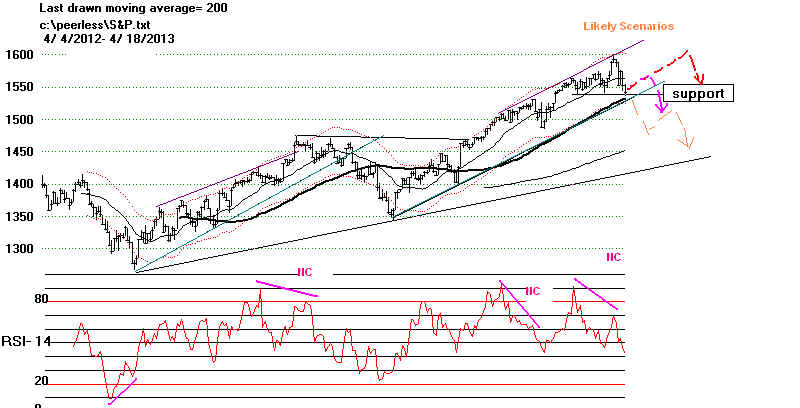
In this
low-interest rate environment after a 10% advance, we should probably start heeding
the RSI and
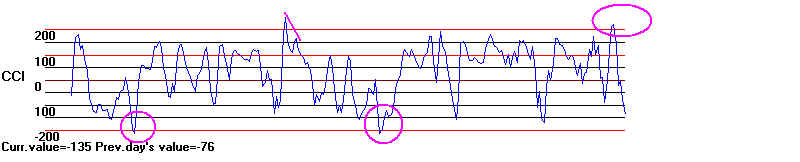
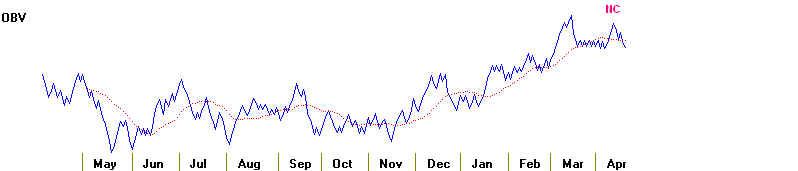
CCI momentum indicators. I wrote a brief electronic book a few years ago
for trading
index options. It emphasized the SP-500's 2.5% band, RSI's NC's, CCI NC's
and CCI
readings over/under 200. If anyone ones to get it, let me know. It's still
$38.50
and if you
give me a few days, I will bring its charts up to date. Below is the CCI
and RSI on
the SP-500. See how large the RSI NC (non-confirmation) was of the
last two
highs. And see how the CCI reversed from above +200. There was a wide
OBV NC at
the top, too.
These are
all bearish signs. The most likely next paths (scenarios) for the SP-500
are shown
in the SP-500 chart below. Note that a weak right-shoulder rally for the next few
trading
days would set up a head/shoulders pattern in the DJI. That might be
more
bearish than a quicker and simpler re-test of the 65-dma.
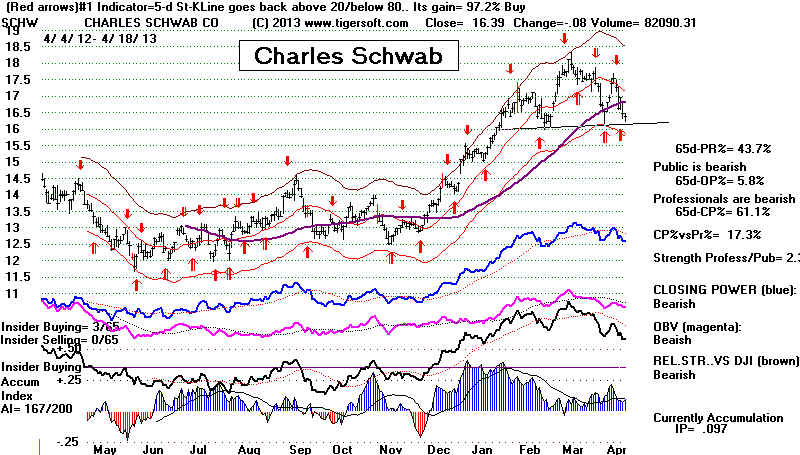
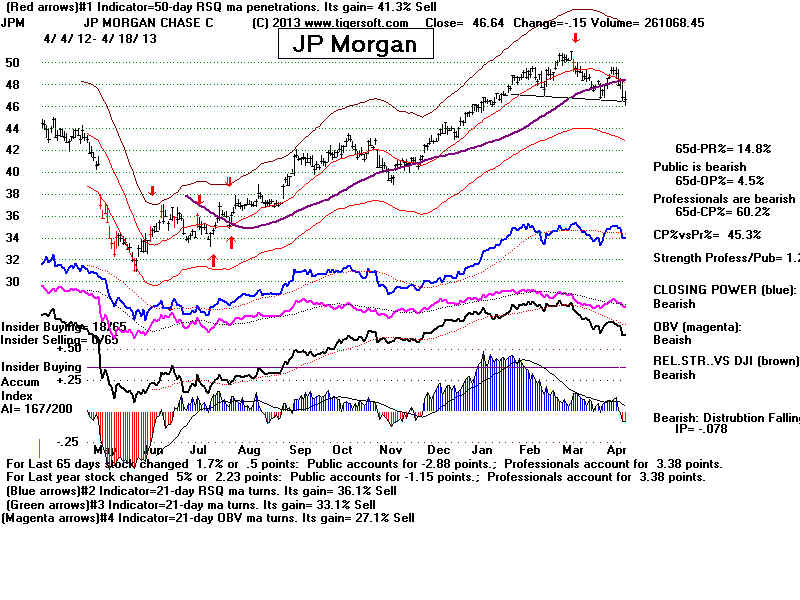
I also
suggest watching key financial stocks like BAC, JPM and SCHW
to see if they
break
support and complete their head/shoulders patterns. SCHW and JPM show
considerable Accumulation and not enough red Distribution to seem bearish
enough to
short. However, a break in their necklines will be bearish, since
the stocks
are also below their 65-dma.
.
---> 65 -20 MAXCP stocks Bullish MAXCP Stocks (4/18/2013)
---> 139 +37 MINCP stocks Bearish MINCP Stocks (4/18/2013) Bearsh
plurality
---> 11 New
Highs on NASDAQ 48 new lows. Bearsh
plurality
---> 25 New Highs on
NYSE 79 new lows. Bearsh
plurality
-------------------------------------------------------------------------------------------------------------------------------------------------------
OLDER HOTLINES
------------------------------------------------------------------------------------------------------------------------------------------------------
4/17/2013
THE ROLLER COASTER VOLATILITY
When confidence starts to crumble,
we have to expect wilder swings. And one of
the ways the market fools people is
to get them thinking that each decline is
a buying opportunity.
So, if the market rallies tomorrow, it will be conditioning
folks to buy on the next dip and
the dip after that. These dips may not bring recoveries
so nicely, especially after the
next Peerless Sell, perhaps in May.
Blame the big boys' computers, too.
Until their trading is regulated or taxed like it is
in Europe, we must expect wilder
and wilder daily volatility, which produces
no trend and where there is no
follow-through the next day. Such computerized trading
accounted for 75% of all trading on
the NYSE two years ago, when the Exchange
stopped reported it, for fear of
self-incrimination. Before 2010, there were very few
cases of mere 2-day whip-saws, up
and down. Before October 1987, there were none
for 50 years.
Here we have just seen 3 whip-saw days in a row. And tomorrow
could be another! The end result, whip-sawing aside, is that the DJI is back at the
support of its rising 21-day ma and
its 21-day ma momentum and IP21 are above .07.
This usually brings a rebound.
See the statistics further below.
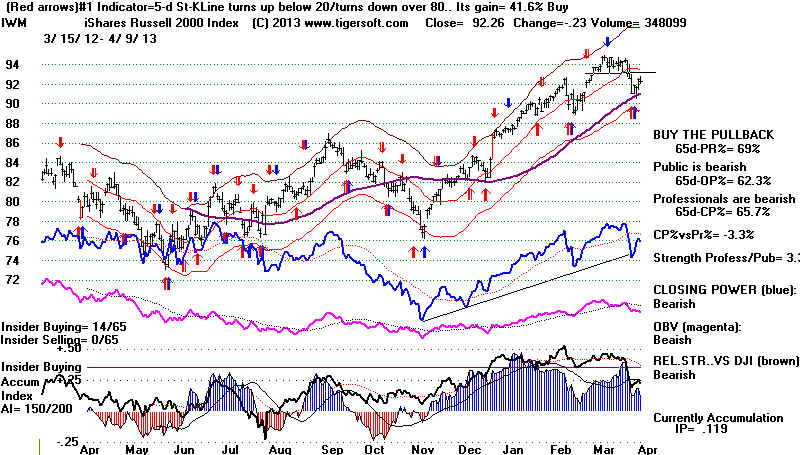
The broad-based Value Line and the Russell-2000 ETF
(IWM) dropped today below
their 65-dma.
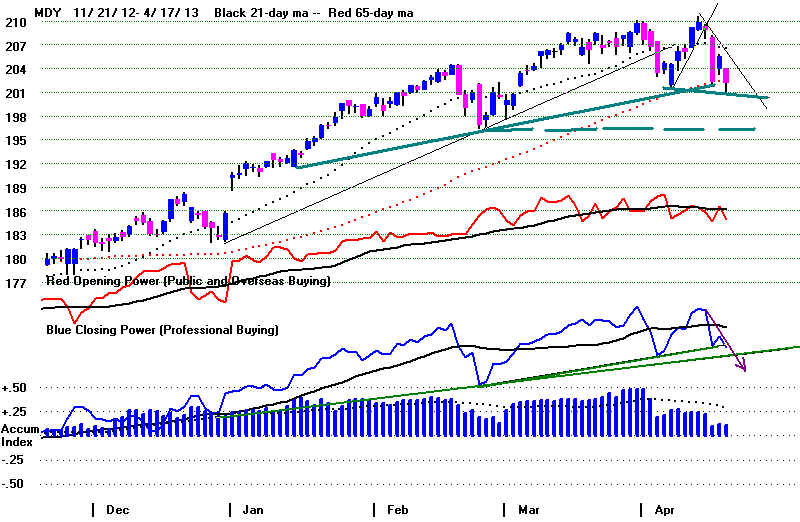
MDY, the ETF for MIDCAPS, closed right on its now flat 65-dma.
Besides, the DJI, watch MDY
tomorrow. Its Closing Power is in a steep short-term decline
which could be broken if the
closing is firm on Thursday..
What To Do.
On strength, consider more
selling of less seasoned stocks if they do not
show an AI/200 score above 175.
Short the stocks breaking below their 65-dma
if they have completed a
head/shoulders pattern and have negative Accumulation
on the right shoulder. Or just
hedge by shorting some of the Bearish MINCP stocks
and hold these short as long as
their Closing Powers are falling.
Completed Head/Shoulders
My concern now is that there are
more and more stocks and Tiger Sector Indexes
that have completed bearish
head/shoulders patterns or could easily break their necklines
in another day or two. AAPL (continuation H/S), Crude Oil,
USB, CMCSA, Computers,
Foreign
ETFs, High Priced Stocks, Home Builders, Ind Materials,
REITS, SEMI-Conductors.
Three particularly scary looking
key stock charts where the head/shoulders has not yet
been completed are JPM, SCHW and TWC. Schwab's neckline is only 26 cents below
today's close and JPM's is .43
lower. A closing below these would make the market look
a lot worse.
Go Away In May, Not April
It is normal for the broader market to start to fall behind the DJI in April even though
the DJI does not top out until May
or June. This is what makes the DJI and the A/D Line
start to diverge in April and then
much more critically in May and June. See the
A/D Line and DJI charts for 1959, 1965, 1972, 1986, 1998 and 2006.
"+ Double .07" (.0655, actually.) Usually Brings DJI
Rally up from 21-dma
The DJI-30 will now try to hold the
market up at its rising 21-day ma, only 11 points below
today's close. Usually if the
annualized rate of change of the DJI (Ann-Roc) is above +.065
and
the current Accum. Index (IP21) is above +.065, and they are
for the time being, the DJI
soon rebounds from the ma or from a
little below it. When one or both are below .065,
there is usually a decline to the
lower band. Below I checked the cases where the ratio
of down volume was more than 6:1
with the DJI just above the 21-day ma. You can
see my rule of
"double-07" has some merit in cases like ours now: 6/21/2012, 11/1/2011
,1/28/2011 and 10/29/2011.
la/ma AnnRoc
P-I P-I Ch
PI^^ IP21
V-I OPct 65-day Pct Ch.
4/17/2013
1.001 .136
61 -50
61 .101 -77
.094 .076
9/25/2012
DJI fell below lower band
1.009 .268
249 -109
249 -.029 -5
.119 .06
6/21/2012 DJI
moved upwards for 3 mo
1.006 .07
218
-96
218
.082
-17 -.04
-.047
11/1/2011 DJI rebounded to upper band.
1.008 1.037
511
17
509
.21
13 .264 -.04
9/2/2011 DJI fell to lower band
1.00 -.152
76 32
76
0.0
-150 .183 -.088
7/18/2011 DJI rose 2% and then collapsed
1.004 .409
272 -88
272
.047
-48 .107 .009
2/22/2011 DJI held up for two weeks and fell to lower band only when internals weakened.
1.007 .335
337 -120
335
.223
-12 .385 .097
3/9/2011 1.001 .05
197
-62
196
.10
-101 .052
.068
1/28/2011 DJI rose from 11824 to 12391 on 2/18
1.004 .241
78 -140
78 .07
-75 .129 .054
10/19/2011 DJI rose to upper band
1.006 .246
144 -185
140 .07
-38 .036 .073
4/16/2010 DJI fell below lower band after testing 21-dma
for 2 weeks.
1.009 .311 185
-151
180 .061 -65
.29 .035
5/4/2010 .988 -.05
142
-181
138 .056 -139
.329 .077
10/26/2010 DJI declined 2% and then rallied 9%.
1.002 .245
95
-62
88
.047
126 -.177
.077
6/15/2009 DJI fell slightly below
lower band .
1.005 .391
229
-166
213 .056 -83
.054 .163
Confidence Erodes Rather Than Collapsing
All At Once.
The way yesterday's rally was
totally snuffed out by today's decline has to
damage traders' confidence.
Whether or not the DJI can hold up, I have suggested selling
and hedging by shorting some
bearish MINCPs.
I think we still have to wait for a
fresh Peerless Sell signal before we may expect the DJI
to crumble badly.
Bigger declines do not usually start until May. A narrow DJI rally to
new highs could easily bring a Sell
signal.
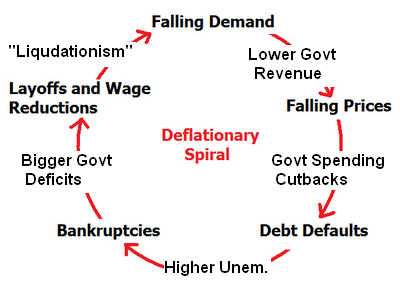
Deflation fears are mounting as
economists and market pundits see rapidly Gold, Silver,
Mining
Stocks and the entire Industrial Materials sector and
Crude Oil are falling.
This is a world-wide phenomenon.
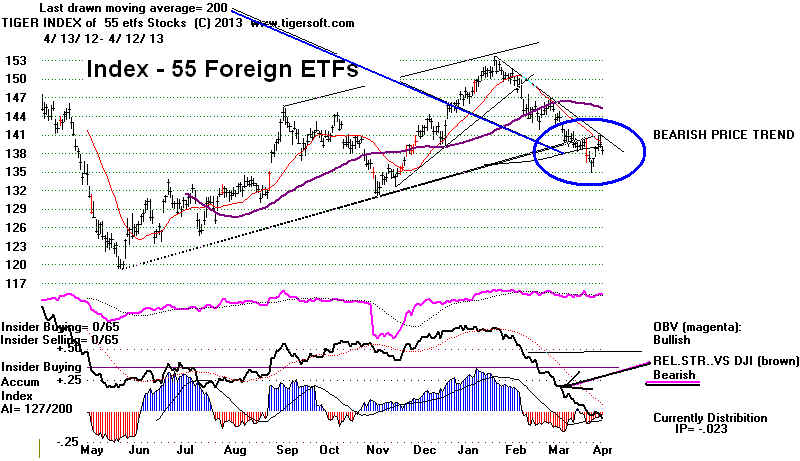
As I feared, overseas ETFs dropped further
below
their 200-day ma. That should
put a limit on how far the DJI can rally. See yesterday's
remarks on the Deflationary Spiral
and how the blue chips ran out of steam in 1930
when they discovered that they
could no longer sell what they had produced.
Key Values: DJI 14619 -138 la/ma= 1.001 21dma-roc = 0.136
P=+ 61 Pch= -50
----------------------------------
IP21 = +.101
(on 1/30/2013 IP21 was .293) V =
-77 Opct = .10
65 day-pct-up = .076
-----------------
4/17/2013 ---> To Key Index and Leading Stock
Charts
---> 85 MAXCP stocks Bullish MAXCP Stocks (4/17/2013)
---> 112 MINCP stocks Bearish MINCP Stocks (4/17/2013) Bearsh
plurality
---> 11 New
Highs on NASDAQ 48 new lows. Bearsh
plurality
---> 25 New Highs on
NYSE 79 new lows. Bearsh
plurality
====================================================================================
OLDER HOTLINES
====================================================================================
4/16/2013
Let's See if We Can't Get A Better Place to
Buy
with A More Head-Room? If 15000 is the resistance,
we should not buy until we can see at least 5% upside potential.
That would mean buying at 14286. That's about where the
65-day ma will be in a week or two. There are also more
non-gold stocks tonight among the Bearish MINCP
stocks
that look like attractive short
sales.
Key
Values: DJI 14757 +158 la/ma= 1.011 21dma-roc = 0.198 P=+110 Pch= +102
IP21 = +.125
(on 1/30/2013 IP21 was .293) V =
-59 Opct = .109
65 day-pct-up = .088
4/16/2013 ---> To
Key Index and Leading Stock Charts
I suggested selling into strength in today's trading because of the market's
weakening internals and the
negative V-Indicator. These would seem to make it
difficult for the market to
escape a Peerless Sell signal on any rally to the
round number resistance at
15000.
I have to quickly add that a big decline is not expected. Without a
new Peerless Sell signal, the
odds favor only a retreat to the 65-day ma, now at 14400.
Dips to the lower band are
usually good buying opportunities in April, May and
late June.
DJIA and Peerless Signals as revised.
More revisions are being made, so there is no
Peerless.exe past the mid-March version.
See www.tigersoft.com/PeerInst-2012
Why No Buy B19?
The
DJI's reversal upwards raises the question "why did Peerless gave no
Buy B19 today. The
ratios of up and down volume yesterday and then today met the
requirements. The
answer is that the DJI closed above the 21-day ma today.
That makes it far less
reliable. But what about April reversals like this?
It is true that April
reversals like we saw today have in 7 of 7 cases brought
rallies of 3% in the DJI, at
least. But that may be because 6 of the 7 April Buy B19-like
reversals since 1945 occurred
with the DJI below the 21-day ma. Closing
below the ma gives the signal
more upside potential See the new
study
of uncontrolled B19-like reversals upwards between March and October.
And there is another problem
with more recent B19s. They are much more
numerous with the advent of
leveraged ETFs and computerized day trading. Two day swings
up and down are much more
common now than they were before 2000. Their intermediate-
term significance is less, as
a result. So, it is important for us to be more discriminating
in those reversals we do
trade on. Being below the 21-day ma seems like a good start.
That the Futures are sharply
down right now despite the big reversal back upwards
today, makes this
refinement seem even more vital. .
Austerity, Deflation,
Liquidationism and Social
Darwinism
No political leader in the US or Europe is talking about the dangers of Deflation.
But there's no shortage of
"liquidationists" That's the problem as I see it.
There is mounting evidence of
world-wide Deflation, I think it will pay to be cautious regarding
how much more the Fed's low
interest rate and QE-3 policies can still boost stocks, especially
when it's very clear that
political elites in Europe and America are way too timid to
challenge exactly the same
financial austerity-orthodoxy that ruled England in the
high unemployment,
"locust" years from 1920 to 1939. (This was the subject of my Ph.D.
dissertation at Columbia.)
The
dismal American economic experience in the
early 1930s and again in
1937-1938 was a close parallel. It's important to appreciate
that years later, both
President Hoover and P.M. Churchill rued as their long career's
biggest political mistake,
the listening to orthodox advise from their big bank advisors,
Andrew Mellon at the US
Treasury and the Bank of England and the
Financial City of London.
Here's
the full quote from President Herbert Hoover on the advice given to him by Mellon:
"...The
“leave it alone liquidationists” headed by [my] Secretary of the Treasury
Mellon,
who felt that government must
keep its hands off and let the slump liquidate itself.
Mr. Mellon had only one
formula: “Liquidate labor, liquidate stocks,
liquidate the farmers,
liquidate real estate.”
He insisted that, when the people get an inflation brainstorm, the only way
to get it out of their blood
is to let it collapse. He held that even a panic was not altogether a bad thing.
He said: “It will purge the
rottenness out of the system. High costs of living and
high living will come
down. People will work harder, live
a more moral life. Values will be adjusted, and enterprising people
will pick up the wrecks from less
competent people”... (Source: U.C.
Berkeley Economist Brad
De Long).
---> 104 MAXCP stocks Bullish MAXCP Stocks (4/16/2013)
---> 112 MINCP stocks Bearish MINCP Stocks (4/16/2013) Bearsh
plurality
--->35 New
Highs on NASDAQ 20 new lows. Bearsh
plurality
---> 60 New Highs on NYSE 23
new lows. Bearsh plurality
=====================================================================================
OLDER HOTLINES
=====================================================================================
4/15/2013
Key Values: DJI
14599.2 -265
la/ma= 1.001 21dma-roc = 0.049 P= +9 Pch= -159
IP21 = +.088
(on 1/30/2013 IP21 was .293) V =
-93 Opct = -.059
65 day-pct-up = .081
No Peerless Sell, but
Take Some Profits On The Next Rally.
A Peerless Sell Signal in May Seems Likely.
There Does Not Seem to Be Much More Upside Right Now.
Gold Stocks Are So Beaten Down, I Would Not Short Them until They Rally.
Deflation Is The Threat Now.
Deflation Is The
Problem
For some time, gold stocks have been on our bearish radar. They have heavily
populated our "BEARISH MINCP" stocks.
Today's drop in gold and silver were
the worst since 1983. And that was not a good time to buy them long-term,
though Gold then rallied back to its falling 65-dma and Silver jumped 30% in 10
weeks.
Historically, Gold's long-term weakness portends one of three possibilities:
(1) a strong economy (as started for example in 1983 and 1995) or
(2) financial confidence (which started in 2011 with QE-II) or
a liquidity trap and World-wide Deflation.
I fear that the movement in the direction of Deflation has reached a point where it
cannot be stopped. Early in 1930, analysts predicted corporate profits would rise
sharply because of the drop in labor and producer prices. They failed to factor in
the drying up of demand. Consumers in the US and in Europe lacked the money and/or
confidence to keep buying what was produced. There was soon a glut of unsold
cars, radios, even grain... and the lay offs and bank failures began.
Half
of the Europe Power Elite still wants to pursue a Hoover-like Austerity now. So,
does
half of the US Congress. There is stalemate. But without Keynesian government
pump priming and massive public infrastructure rebuilding, the joblessness will rise
again.
From 1945 to 1965 there was widespread acceptance of Keynesianism. The Viet Nam
war unleashed deep-rooted inflationary forces and sparked the rise in oil prices.
That changed the consensus in favor of Keynes. Our military misadventures
in Iraq and Afghanistah have had the same effect. Keyesianism has given way to
libertarianism, austerity and now deflation. .
So, once again, as in 1930, there will not be enough global Demand for whatever
big corporations produce. Their profits may hold up for a while because their labor
and commodity prices are falling, but sooner or later, they will be left with big
inventories, and as in 1930, and there will be trouble. The Fed knows this. But
Obama
does not. A majority of Congress does not know this. There's the problem, as I
see it.
Eventually, the over-production will be eaten away. But that will take years.
But there is hope. In the 1930s the Solid South, because of the high unemployment
there,
was 100% behind FDR's public works. In fact, they were more behind them than was FDR
himself. (See Ira Katznelson,
Fear Itself: The New Deal.)
Meanwhile What Is To Be Done?
With the V-Indicator so negative, I do not see how a new high near the 15000
psychological resistance will not bring a Peerless S9v or Sell S15. A sizeable
P-Indicator non-confirmation would likely bring a Sell S7, even if the P-Indicator
is positive. Right now, it stands at an anemic +9. A 2.5% rally from here
could
even bring a Sell S9 this month.
Today it was the DowN Jones Average. Every one of its 30 components declined.
It was the biggest down day in six months. One has to wonder if any of the early
selling
was done by the terrorists themselves, as apparently occurred in the weeks before
the 9/11 attack on New York.
I said Sunday night that the upside seemed limited and I would certainly
approve of anyone taking profits and waiting for a pullback to buy back in.
Since the DJI has fallen to the support of its rising 21-day ma with its IP21 still
quite positive, + .088, a rebound is likely. But the Closing Power uptrends
for DIA, SPY, QQQ, IWM and MDY were very weak today. Professionals
may well use a higher opening to sell into. Watch for a resumption of weakness
tomorrow or the next day. Lightening up somewhat on this technical bounce would seem
reasonable. Note that the momentum of the 21-day ma has lost its strength.
It has fallen
back to +0.049. Below .07 it often does not have enough strength to turn back
upwards
a determined decline.

Sell short some of the Bearish MINCP stocks as
a hedge. Keep in mind that
new lows have suddenly outpaced new highs even though the DJI is only one
trading day from making a new high. This is a bearish "titanic syndrome".
(This seems aptly named. Our financial system rests on a collective disbelief
that it can not sink because the FED will always be able to save it, much like
the technologically new and powerful Titanic was thought to be unsinkable.).
The Insiders' Secret Sell Signal
I mentioned the absolutely flat trading in the DJI from Thursday to Friday. I
said that three such days of essentially zero change in the
DJIA might be a sign hoisted
by the "cognoscenti"
to tell each other that prices were about to drop sharply.
See the discussion on the newly revised Sell S8 page.
As it turns out, two such
days of zero change like we saw between Thursday and Friday are also good sell
points, but not in April. This signal is a perfect,
seven for seven from May to
October. As a Peerless Sell signal in these months, it would reinforce the validity
of other signals. So, I think it should be added. (Cognoscenti is my contribution to
the English language.)
When To Go Away in May
But as a Sell signal now, only two days unchanged cannot be reliably used.
The two April cases ahown below, 2011 and 1989, are warnings it can completely
fail in this month.
Here are the past cases since 1965 when the DJI changed less than 0.035% as on Friday and
the following conditions were also true, as on Friday: 1) The DJI was up more than
4% over
the last 65 trading days; 2) the DJI closed more than 1.7% above its 21-day ma and
3) the V-Indicator was negative.
2-Day Cognoscenti Sell S8s
November-April
May-October
-----------------------------------------------------------------------------------------------------------------------------
4/12/2013
3/19/2013 DJI continued to rally
3/12/2013 DJI continued to rally
1/5/2013 DJI continued to rally
12/21/2012 DJI continued to rally
May 2, 2011 Perfect sell before drop below LB
4/11/2011 DJI continued to rally
2/2/2011 DJI continued to rally
1/25/2011 DJI continued to rally
June 8, 2009 Perfect sell before drop below LB
May 10, 2006 Perfect sell before quick sell-off
1/4/1999 DJI rose and then fell only to lower band.
July 17, 1990 Perfect sell before bear market
4/17/1989 DJI continued to rally
October 5, 1987 Perfect sell before bear market
2/5/1986 DJI continued to rally.
1/9/1984 Excellent Sell before bear market.
11/23/1983 DJI fell to lower band.
September 21, 1979 Perfect sell before mini bear.
May 30, 1972 Perfect sell before quick decline.
12/9/1970 DJI continued to rally.
4/15/2013 ---> To
Key Index and Leading Stock Charts
---> 69 MAXCP stocks Bullish
MAXCP Stocks (4/15/2013) Bearsh plurality
---> 54 +16
MINCP stocks Bearish MINCP Stocks
(4/152013)
--->12 New
Highs on NASDAQ 39 new lows. Bearsh
plurality
--->133 New Highs on NYSE 81
new lows. Bearsh plurality
=====================================================================================
OLDER HOTLINES
=====================================================================================
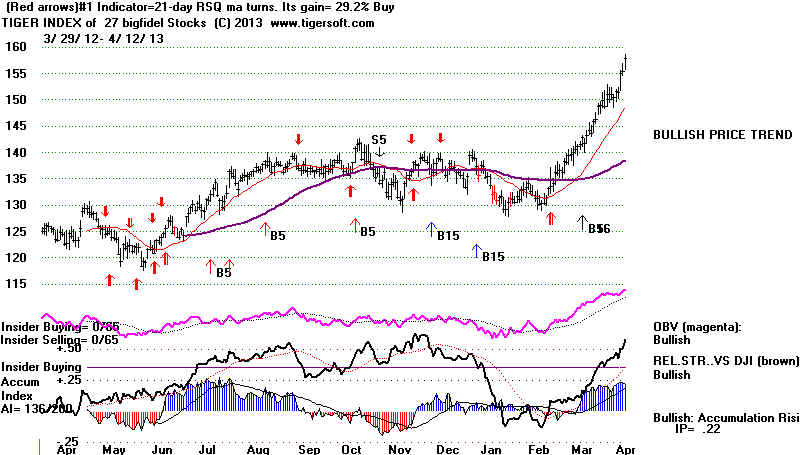
4/12/2013 The advance in the DJI-30
was stopped "cold" on Friday.
It was virtually unchanged for the day. This Is Not A Good Sign. A third
straight day without a .1% change would be bearish, if we judge from
the past tops when this occurred, most notably in early October 1987.
I have been working on an improved Sell S8 based on three straight days
where the DJI moves less than 0.1% after a long advance. The details
appear at the bottom of this hotline. For now, the rally in
high priced, high
caps will probably continue. That should boost DIA and SPY.
Will the DJI reach 12500 so Wall Street can celebrate?
It might be a hollow victory. I don't see how the DJI or SP-500 can rise
another 10% without a pause. The bullish MAXCP
stocks are already
up a long ways already. Mostly the safest, highest priced, institutional favorites
rose Friday. HD, our Tahiti stock, jumped 1.72.
The high-priced Biotech stocks
were the most bullish. AMGN, BIIB and REGN each added 3%. Is
this because
they
hope that the Supreme Court will grant patent rights to the human genome sequence?
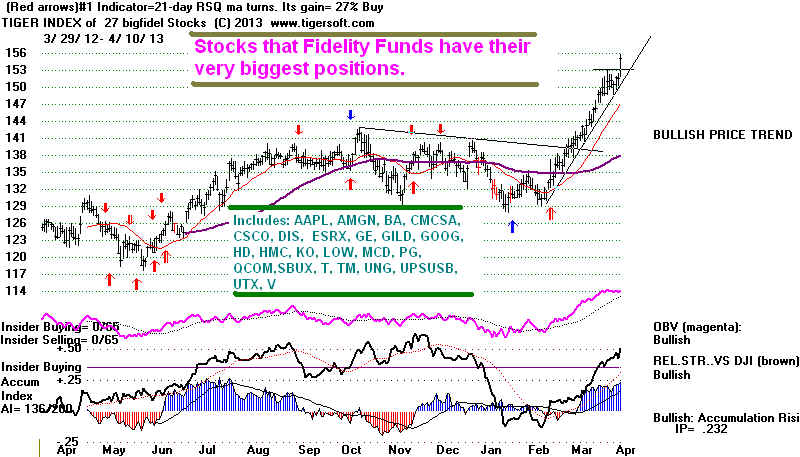
See below how well Fidelity' biggest positions are rising. Clearly, the advance has
become
a defensive and blue-chip rally.
(Factors favoring big companies.)
All this is normal in the late stages of a bull market. It is still bullish for DIA
and SPY.
But what will happen when even blue chips are not considered safe enough to still buy?
A lot depends on the whether Austerity wins out here in America. We have seen
what it did to Europe. Right now, the world' stock markets are stuggling to
stay
above their longer-term 200-day ma. Without a wealthy middle class in the US,
it's not clear who will buy what is made.
I
hope I'm pleasantly surprised by the DJI cracking through 15000.
Certainly, for now,
it's true that the A/D Line and the Closing Power are
rising. Another bullish sign for now,
Non-Confirmations of
new highs by the P-Indicator will not be reliably bearish until May.
See Sell-S5. The most
bullish sign now is that professional shorts are nervous. They
seem to have stopped
shorting stocks on weakness, apart from mining stocks. The result
is we have no new short
sale candidates among the Bearish MINCP Stocks.
But realistically how
much higher can stocks, as a whole, rise in three more weeks?
The P-Indicator is
weakening. We may even see a Sell S9 if the DJI is at the 2.5%
upper band and the
P-Indicator becomes negative. So, I can certainly understand if you
decide to take some profits
at 15000 and choose to wait for a pullback to buy.
2 Straight and 3 Straight Days When The DJI Is Unchanged.
There's another more
pressing, scary development. The DJI was essential unchanged
Friday from Thursday.
Rounded off, it closed at 14865 both days. Is this a secret sign
among professionals
that something significant is about to happen?
Paranoia aside, I
have found that an essentially unchanged DJI for two or three days
is often quite bearish.
Two days in a row with almost no change also can be an
important turning
points, too.
Examples:
2/21/1945
5/31/1946 perfect Sell before 24 % DJI decline.
2/10/1947, 7/16/1947, 4/30/1951, 11/16/1956, 3/16/1956, 11/20/1959, 7/8/1959,
8/8/1961, 10/21/1969 (a month before start of 1968-1970 bear market.
5/20/1972, 10/3/1979, 8/23/1984, 10/5/1989, 1/3/1989, 7/18/90... (to be studied more.)
But by itself, it is
not reliable enough to be a Peerless Sell signal. There are too many cases
where it fails.
Examples:
10/9/1945, 1/31/1946, 3/26/1946, 12/29/1951,
1/5/1951, 5/3/1954, 11/17/1955, 6/20/1955,
1/12/1959, 3/5/1959, 7/21/1967, 12/7/1971, 12/30/1971, 4/16/1975.
More important, a DJI that is unchanged for
three days is actually a very good sell signal.
I
first noticed that unusually low volatility can call a major top back in early October
1987.
Look how how close to
each other the three closings were just before the market fell 30%.
10/1/1987 2639.2
10/2/1987 2640.99 change +.000678
10/5/1987 2640.18 change - .000307
....
10/19/1987 1738.74
The 2007 top also showed a similar pattern:
7/17/2007
13971.55
7/18/2007 13918.22
7/19/2007 14000.41
Revised Sell S8
Three days in a row with such low volatility is unusual. Here
are the
cases going back to 1965 where the daily change is less than 0.1% and
the DJI is in a rising trend, along with the the outcomes. Red indicates a decline.
It seems best to not apply this rule in November, December, January or
February. As developed now, this signal would have been profitable in
11 of 13 cases, assuming that a paper loss of 3.4% would have been used.
This is much better than the current Sell S8 signal. There are more cases here
and this signal does not require the user to eliminate those cases where the
DJI is at an all-time high.
#1
9/28/2012 DJI fell from
13577.96 to 12588.31 on 11/16/2013 no paper loss
#2
5/3/2011 DJI fell from
12807.51 to 11879.27 on 6/15/2011 no
paper loss
#3
6/9/2009 DJI fell
from 8763.06 to 8146.52 on 7/10/2009 no
paper loss
(11/9/2004 DJI rose from 10386.37 to 10827.12 on 12/23/2005 )
(1/7/2004 DJI fell from 10529.03 to
10063.64 on 3/23/2004 2.0% paper loss)
#4
1/13/2003 DJI fell from
8785.98 to 7524.06 on 3/11/2003. no paper
loss
#5
7/28/1997 DJI fell from
8121.11 to 7161.15 on 10/2797 1.6% paper
loss
(2/25/1991 DJI went sidewise for 10 months.)
(The July 1990 top was close to this pattern: 2999.75, 2999.75, 2981.68)
#6
5/16/1990 DJI rose from 2819.68 to 2999.75 before
starting a bear market. 6.4% paper loss
#7
3/2/1988 DJI
fell from 2071.29 to 1941.48 on 5/23/1988. 1.7% paper loss
(2/24/1988 DJI fell from 2039.95 to 1941.48 on
5/23/1988. 3.3% paper loss)
#8
10/5/1987 DJI fell from 2640.18 to 1738.74
on 10/19/2007. no paper loss
#9
6/18/1987 reversed at a small
loss by Buy B4.
(2/5/1987
reversed at a small loss by Buy B4. )
(12/28/1986 reversed at a small loss by Buy B4.)
(12/20/1985 This fails, but Decembers are too bullish a month to use this signal.)
#10
8/22/1979 DJI fell from 885.84 to 796.67 on
11/7/1970. 1.7% paper loss
( 1/23/1967 Late Januaries are too bullish to apply the signal here.)
#11
4/17/1963 DJI fell to 687.8 on 7/23/1963. Paper
loss = 2.2%
#12
9/20/1955 DJI fell from 483.7 to 438.6 on
10/11/1955. Paper loss = 0.8%
#13
5/25/1948 DJI fell from 189.7 to 173.2 on 12/1/1948.
Paper loss = 1.8%

Key Values: DJI 14865 +0 la/ma= 1.019 21dma-roc = 0.335 P= +168 Pch= -49
IP21 = +.174
(on 1/30/2013 IP21 was .293) V =
-40 Opct = ..49
65 day-pct-up = .103
4/12/2013 ---> To Key Index and Leading Stock
Charts
---> 435 MAXCP stocks Bullish MAXCP
Stocks (4/12/2013) Bullish plurality
---> 54 +16
MINCP stocks Bearish MINCP Stocks (4/12/2013)
--->53 New
Highs on NASDAQ 15 new lows. Bullish plurality
--->103 New Highs on NYSE 26
new lows. Bullish plurality

=====================================================================================
OLDER HOTLINES
=====================================================================================
4/11/2013
Any Retreat Should Be Shallow. The Non-Confirmation of
the P-Indicator Is Not A Reliable Sell-S5 Signal in April
The odds favor higher prices by May. This is a run into
all-time high. The path of
least resistance is upwards. Sellers do not know where to bunch their
orders. The DJI, S&P-500, NYSE and now the QQQ have achieved bereakouts
above well-tested flat resistance. This is bullish and it also means support
must now be expected at the point of breakout. True, the round number 15000
could offer some resistance. But the NYSE A/D Line and Closing Powers have
confirmed the new highs. Seasonality now is good. The DJI advances70% of the
time over the next 21 trading days since 1965.
After 1945, market tops at this time in April bring only shallow declines of
4% to 5%
when there was a January take-off.
Here are the January take-offs since 1929:
1929, 1936, 1945, 1950,
1954, 1955, 1956, 1961, 1963, 1964, 1965, 1967, 1971, 1972,
1975, 1976, 1983, 1986, 1987, 1989, 1993, 1995, 1998, 1999, 2006, 2011, 2012
April peaks that bring declines of more than 4% following a January take-off
are not as common as those in May or June. But there are 9 cases. These
tops have occurred when the DJI was a low as 1.7% over the 21-dma while the
adjusted P-Indicator (P^^) was always below +203. We are far enough above the
21-day
ma now to match one of these peaks. But the current P-Indicator is +217 and the
current IP21 is +.16. The latter value is above all but one of the April tops below.
Two technical problems will be important in May. The first is the negative
V-Indicator,
The other is the P-Indicator is less than half what it was on its March peak. This
condition
could bring a Sell S5 from May to July, but not in April
See http://tigersoft.com/PeerInst-2012/-Sell-S5.htm
4/15/1929 Peak before longest,
deepest bear market in US history.
la/ma
21dma-roc P-I
P-I ch.
P^^
IP21
V-I
Opct
65-pct change
1.027 .795
+27
-17 +136
+.097. -175
.607 .149
--------------------------------------------------------------------------------------------------------------------------
4/6/1936 11%
la/ma
21dma-roc P-I
P-I ch.
P^^
IP21
V-I
Opct
65-pct change
1.034 .236
-37
-1
-161 -.152
-249 .074
.107
--------------------------------------------------------------------------------------------------------------------------
4/26/1955 4%
la/ma
21dma-roc P-I
P-I ch.
P^^
IP21
V-I
Opct
65-pct change
1.024 .448
+50
+8 +145
+.052 -75
.306 .081
--------------------------------------------------------------------------------------------------------------------------
4/6/1956
10%
la/ma
21dma-roc P-I
P-I ch.
P^^
IP21
V-I
Opct
65-pct change
1.023 .669
+33
+4 +105
+.15
-98
.524 .071
--------------------------------------------------------------------------------------------------------------------------
4/29/1971
11%
la/ma
21dma-roc P-I
P-I ch.
P^^
IP21
V-I
Opct
65-pct change
1.019 .574
+69
-14 +147
+.084
+1
.403 .085
--------------------------------------------------------------------------------------------------------------------------
4/18/1972 4%
la/ma
21dma-roc P-I
P-I ch.
P^^
IP21
V-I
Opct
65-pct change
1.019 .327
-20
+4
-43 +.054
-1
.147 .064
--------------------------------------------------------------------------------------------------------------------------
4/21/1976 5%
la/ma
21dma-roc P-I
P-I ch.
P^^
IP21
V-I
Opct
65-pct change
1.019 .345
-1
+15
-2 +.038
-1
.07 .067
--------------------------------------------------------------------------------------------------------------------------
4/18/1986 5%
la/ma
21dma-roc P-I
P-I ch.
P^^
IP21
V-I
Opct
65-pct change
1.025 .348
`06
+8 +202
-.001
+2
.137 .168
--------------------------------------------------------------------------------------------------------------------------
4/6/1987
8%
la/ma
21dma-roc P-I
P-I ch.
P^^
IP21
V-I
Opct
65-pct change
1.039 .646
-2
+14
-3 +.187
+8
.524 .197
--------------------------------------------------------------------------------------------------------------------------
Key
Values: DJI 14865 +129 la/ma= 1.021 21dma-roc = 0.34 P= +217 Pch= +58
IP21 = +.15
(on 1/30/2013 IP21 was .293) V =
-27 Opct = .127
65 day-pct-up = .10
4/11/2013 ---> To Key Index and Leading Stock
Charts
---> 463 MAXCP stocks Bullish
MAXCP Stocks (4/11/2013) Bullish plurality
---> 38 +7
MINCP stocks Bearish MINCP Stocks
(4/11/2013)
--->111 New Highs on
NASDAQ 10new lows. Bullish plurality
--->235
New Highs on NYSE 4
new lows. Bullish plurality
====================================================================================
OLDER HOTLINES
====================================================================================
4/10/2013 There Were Good Reasons The Stock Market Was Not
Upset by Last Week's Jobs' Report and North Korean War Talk.
       Key Values: DJI   14802  +129   la/ma= 1.018    21dma-roc = 0.291  P=  158  Pch= +64
            IP21 = +.15    (on 1/30/2013 IP21 was .293)   V = -38  Opct =  .133   65 day-pct-up = .093


      Important:    The 3.8% paper loss on the Sell S15 of March 7th when the DJI was at 14329
                 would now be above the 3.4% stop loss limit suggested for S15s,  as last edited on 3/17/2013.
                 We have already closed out nearly all our short positions on the Tiger Stocks' Hotline and
                 would hold long mostly "bullish: ranked high capitalization stocks showing AI/200 scores
                 above 165.

     4/10/2013  --->  To Key Index and Leading Stock Charts

     ---> 390 +125  MAXCP stocks  Bullish MAXCP Stocks (4/10/2013)  Bullish plurality
     ---> 31 -6     MINCP stocks   Bearish MINCP Stocks  (4/10/2013)

             --->132      New Highs on NASDAQ  8 new lows.    Bullish plurality
     --->216         New Highs on NYSE  3  new lows.    Bullish plurality
Important: The 3.8% paper loss on the Sell S15 of March 7th when the DJI was at 14329
would now be above the 3.4% stop loss limit suggested for S15s, as last edited on 3/17/2013.
We have already closed out nearly all our short positions on the Tiger Stocks' Hotline and
would hold long mostly "bullish: ranked high capitalization stocks showing AI/200 scores
above 165.
4/10/2013 ---> To Key Index and Leading Stock Charts
---> 390 +125 MAXCP stocks Bullish MAXCP Stocks (4/10/2013) Bullish plurality
---> 31 -6 MINCP stocks Bearish MINCP Stocks (4/10/2013)
--->132 New Highs on NASDAQ 8 new lows. Bullish plurality
--->216 New Highs on NYSE 3 new lows. Bullish plurality
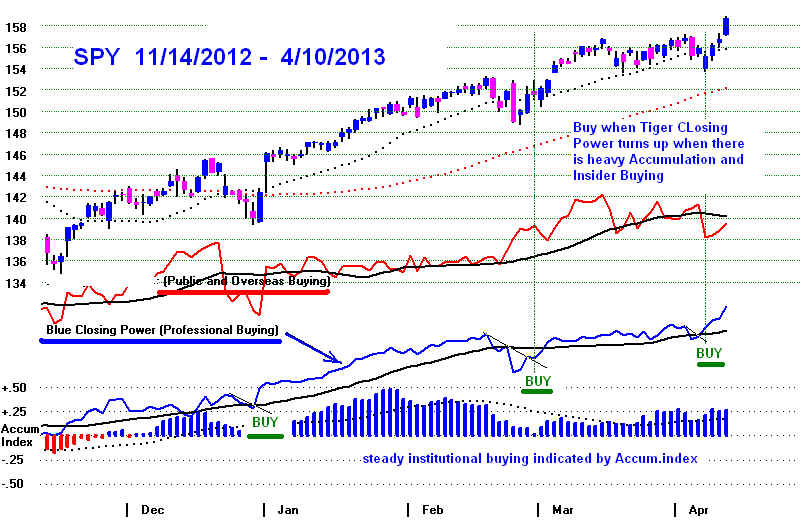
Surprise. Surprise. Big Banks got
the Bullish FED Minutes a day early.
That's why the Closing Power turned up! And they want to privatize
social security! They say they want to police insider trading!
Keep watching Tiger's Closing Power. With it you can trade as an equal.
Professionals Aren't Selling and We Shouldn't Either.
Breadth Expanded Nicely Today. Helped by soaring
high-priced
biotechs, like AMGN and CELG,
the NASDAQ made a new high today, too.
Clearly, the FED wants the Market up on April 15th so that tax payers will have lots of
money to send to Washington.
The high caps that Fidelity has the most confidence in are doing well
as a whole. These are the BIGFIDEL stocks. The "Tahiti" stocks in
this
group can be traded profitably using the Closing Power trends. The highest
AI/200 stocks in this group are:
AI/200 Opening Power Closing Power Price
MACD Signal
-----------------------------------------------------------------------------------------------------------
TM Toyota
174 Up
Up
108.8 Buy
HMC Honda
173
Down
Up
38.96 Buy
HD (Home Depot) 161
Down
Up
71.69 Buy
UTX (United Tech) 155
Up
Up
95.18 Buy
The DJI,
SP-500 and our BIGFIDEL Index accelerated their run in all-time high territory.
What was behind it?
Not so much earnings as the latest FED minutes showing that a
clear majority of
voting FED members are still in the Bernanke camp and do not see a
reduction in the QE-III
strategy for months. Professionals like this.
What's Behind The Rally?
The
Wall-Street-Washington Connection Has Grown Even Closer.
The stock market is up
127% since March 2009. But real, not official, unemployment is
probably 13%.
Most new jobs are low-paying. 14% of all Americans now rely on Food
Stamps.
Millions of young
people have no real way to pay back their expensive college loans.
Health insurance costs
and medical bankruptcies keep making new highs. Yet despite all this,
Obama and his advisers
still believe that creating a Wall Street boom is the best way
to fix what ails Main
Street. Wall Street is very grateful about Obama's loyalty to them
rather than his own
supporters.
Don't be fooled by
Obama being a Democrat. Wall Street has grown to love this man,
even if they dare not
say this in front of wealthy donors to Romney and other Republicans.
From
2009 to 2011, the top 1% got 121% of the entire income growth in the US. The
other
99% saw incomes decline. Obama has rekindled Wall Street's appreciation of
his Presidency by his
budgetary stance this week, It is clearly to the right of President
Nixon, who never
attempted to take away seniors' Social Security or Medicare. It is
to the right of Paul
Ryan's budget. Both Progressives
and many Republicans
expressed "shock"
that Obama would take
away future Social Security and Medicare benefits from seniors.
Defenders, of course,
say that Obama is just being "pragmatic" in the new age of
"austerity",
something which
he has wholly embraced, just when Europe is starting to wake up to how
horrible this policy is when
unemployment is already high.
Progressive critics suggest
that Obama will once again demoralize his base just in time for the
2014 mid-term elections, much as he
did in 2010; that he is a lot more"Ivy League" than
community organizer, way too
academic and hopelessly out of touch with the economics
of the lives of most working and
retired people.
Whatever you think, Wall
Street, I want to emphasize, is extremely happy with his swing
to the right on this and on the
Keystone Pipeline. Rhetoric aside, he is their ally.
He is no FDR. He and
his advisors are "trickle-downers", free marketers
and definitely not fervent
supporters of financial regulation. Real unemployment
is probably more than 13% but Obama and
his advisers still believes that a Wall Street
boom will benefit Main
Street. This has been the hidden message of our rising
Closing Power since March
2009. Now the DJI seems headed for 15000, and all the
splashy headlines it can get, to
draw in more new investors.
Smaller Social Security Payments Would Increase
The Public's Playing of Wall Street
Some take Obama's
betrayal of seniors a step further. Listen
to Bill Black
"The
Grand Betrayal Has Arrived". Is this the start of a new effort to privatize
Social Security?
Wall Street would love that!
Bullish Technicals
Bullish Seasonality,
powerful momentum, steadily positive Accumulation and excellent breadth
have all done in our
Peerless March, volume-based Sell S15. The Hotline and our write-up
on Sell S15s soon
afterwards have tried to prepare readers for this development. The next
version of Peerless
will disallow Sell S15s when
the P-Indicator is above +175 and the 65 day
percent change is above
.0875. The research I am doing now on Sell S1s, S2s, S3s, S4s
and Sell S5 all point to the
importance of not making too much of Sell signals in February,
March or even April
after a January take-off. Most of the time, the first intermediate-term
top comes in May or
early June.
So Many Bearish-Looking Leveraged
Short ETFS
I learned another thing
from the market of the last few weeks: that the appearance among
the Bearish MINCP
stocks of so many leveraged short ETFs must be considered very bearish.
Tonight 7 of the 10
bearish MINCP stocks are leveraged short ETFS:
SKF, SH, SPXU, SRS, DXD, DUG, DOG
Two of the remaining 3
were counter-cyclical ABX ( the world's biggest
gold stock)
and FXY (the ETF for the falling Japanese Yen. So,
Professionals are closing out
many of their shorts,
apart from Gold. Goldman Sachs
predicted further declines
in
gold and silver.
We also see
Professional Short Covering in the rebound from well-tested price support
in the Tiger Index of
the Most Heavily Shorted Stocks.
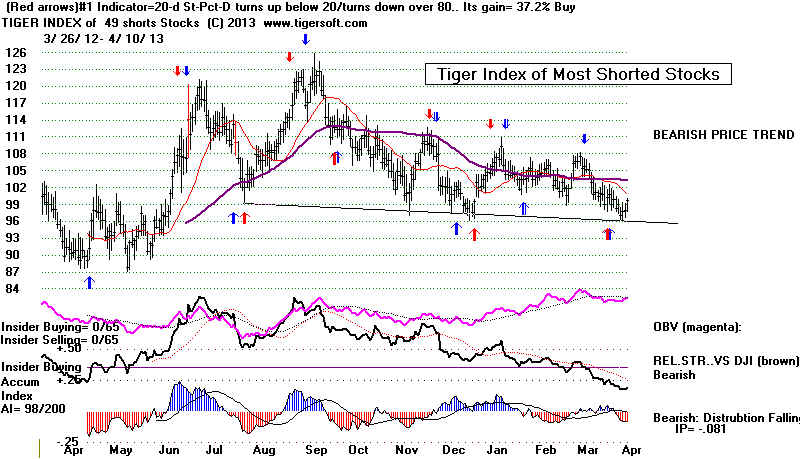
I will start showing
them and report this bullish situation, instead of discarding their charts
as an annoying
interference in my quest for the perfect stock to sell short. Look and
see if you don't agree
that many of the leveraged Short ETFs now come close to our
view of what the ideal
short sale looks like.
====================================================================================
OLDER HOTLINES
====================================================================================
     4/9/2013   Key Values: DJI   14673  +60   la/ma= 1.01    21dma-roc = 0.227  P=  94  Pch= -25
            IP21 = +.157   (on 1/30/2013 IP21 was .293)   V = -49  Opct =  .127   65 day-pct-up = .087

     4/9/2013  --->  To All Key Index and Leading Stock Charts

     ---> 265 -24  MAXCP stocks  Bullish MAXCP Stocks (4/9/2013)  Bullish plurality
     ---> 37 +2     MINCP stocks   Bearish MINCP Stocks  (4/9/2013)

             --->43  -2     New Highs on NASDAQ    13 new lows.    Bullish plurality
     --->90 -50       New Highs on NYSE  5 new lows.    Bullish plurality
4/9/2013 It's
Still Too Early To Sell Out.
Flat top breakouts from patterns like the DJI and SP-500 show
reliably bring runs upward. They are at the top of their patterns.
But watch the P-Indicator now. It has been positive now 91 straight days.
If that positive streak reaches 105, then its turning negative would
bring a Special Peerless Sell S9.
See http://tigersoft.com/PeerInst-2012/SellS9.htm
The P-Indicator is now +94. It fell by 25 today. So, weak breadth
in the next two weeks will make the P-It decline more. It is possible that the
it might be negative when the DJI next closes above the 2.3%
upper band. That would probably bring a Sell S9. The DJI now
stands 1.1% over the 21-dma.
The advance is clearly narrowing. See how the NYSE A/D Line did not confirm
the DJI's nominal new closing high today. The P-Indicator is less than
half its level on the previous peak. At the upper 2.7%-3.5% band this type of
non-confirmation from May to August would likely bring a Sell
S5. But
usually, apart from S9s, we do not see tops this early in the year. See
the evidence I presented recently here about this.
The narrowing of the market may reach the point where the DJI
could soon run up to the 3%-3.5% upper band and still find the P-Indicator
negative or nearly so. That would bring a normal Sell S9. Both
normal and
Special Sell S9s can occur in April. There have been 9 April Sell S9s.
In 4
of these 9 cases, the paper loss was between 3% and 4.9%. So, even
a Sell S9 might not immediately stop the market from rallying. We have
enough cases of April Sell S9s to make it worth while to list and study them.
April Sell S9s
Peerless   Date       DJI   Pct.   Reversing Date       DJI   Pct.
Signal                      Gain   Signal                     Gain
--------------------------------------------------------------------------
Sell S9  4/18/1929   311.9 27.0%  *Buy B16  11/13/1929 198.7  35.1%
4% paper loss  Gain = +2.5%
       LA/MA       ANNROC    P-I     IP21       V-I     Opct
       1.024   -.219   -60     +.01         -710  -.131
------------------------------------------------------------------------
Sell S9  4/11/1934   105.2  4.5%   Buy B9   4/30/1934  100.5  -1.5%
1% paper loss   Gain = +4.5%
                 LA/MA       ANNROC    P-I     IP21       V-I     Opct
                  1.020   +.117   +33     +.016   -17  +.208
------------------------------------------------------------------------
Sell  S9  4/14/50  215.38 -1.6%    Buy B4   8/9/50      216.9   6.2%
4.2% paper loss  Gain = +6.4%
       LA/MA       ANNROC    P-I       IP21       V-I     Opct
        1.026          .443          -28  -43    .022         -189         .404
------------------------------------------------------------------------
Sell S9  4/30/69   950.18  24.4%   Buy B8  1/27/70      763.99  1.8%
1.9% paper loss   Gain = +19.0%

        LA/MA       ANNROC    P-I      IP21       V-I     Opct    65day Pct Change
        1.025             .189           -30  +11    -66             .083           -1           .138
------------------------------------------------------------------------
Sell S9  4/6/72    959.44  2.5%    Buy B2  5/2/72       935.2    3.2%
No Paper Loss   Gain = +5.7%
       LA/MA       ANNROC    P-I     IP21       V-I     Opct
         1.023         .483             -2         .087              0            .237
------------------------------------------------------------------------
Sell S9 4/1/82      833.24  6.7%   Buy B8  8/11/82      777.21   36.0%
3.4% paper loss   Gain = +6.7%
       LA/MA       ANNROC    P-I     IP21       V-I     Opct
             1.026          .265            45        .004               0          .135
------------------------------------------------------------------------
Special Sell S9 4/29/86 (P-I turns negative after being positive 100 days.)
           1825.89  -0.1%  Buy B9  7/9/86       1826.07   0.5%
No Paper Loss  Gain = +3.6%
       LA/MA       ANNROC    P-I     IP21       V-I     Opct
        1.01            .048              -1          .049              -9          .112
------------------------------------------------------------------------
Sell S9 4/6/87      2405.54  7.7%  Buy B17 5/19/87      2221.28    5.9%
No Paper Loss  Gain = +5.2%
       LA/MA       ANNROC     P-I     IP21     V-I     Opct
         1.039           .646              -2        .187           +8          .27
------------------------------------------------------------------------
Sell S9 4/22/97     6833.59  -4.9% Buy B4 5/9/97        7169.53   10.5%
4.9% paper loss   Loss = 4.9%
       LA/MA       ANNROC    P-I     IP21       V-I     Opct
          1.03              .141          + 2        -.025             -17        .058
------------------------------------------------------------------------

                       High Cap Strength
                For now, the Closing Powers for DIA and SPY
                                        are still rising .  The Accumulation levels
                                        with these ETFs suggest there is ample
                                        underlying support tohold the market up,
                                        barring a sudden outbreak of fighting in Korea.
                                        I take the lagging IWN and Value Line to be signs
                                        that public speculation in more unseasoned stocks
                                        has been put in a holding pattern presently.

                                        Dividend-paying high caps are favored even
                                        though many look over-bought. This is now
                                        a defensive rally. Considering CNN's scary war talk
                                        and the weakness in the economy here and overseas,
                                        the DJI's strength keeps surprising the many
                                        pundits who say a Crash is near.
=====================================================================================
OLDER HOTLINES
=====================================================================================
4/8/2013
The A/D Line and Closing Power Uptrends are
bullishly rising.
So is seasonality. Usually intermediate-term declines of more than 5%
do not start until late April at the earliest after a January take-off like
we have just seen. It is normal for the blue chip DJIA to keep making
new highs even after the A/D Line starts to visibly lag. The A/D Line's
non-confirmations seem minor so far. And NYSE breadth was quite good
today.
Another thing: the market seems to be holding well despite a lot of bad
economic news. That is a good sign, too. Here are some stock trading
concepts and specific ideas for this environment.
One of the tricks now is to focus more on the highest Accumulation (AI/200)
institutional favorites as long as their Closing Powers are rising or turn up
after the stocks test price support, preferably the rising 65-day ma. The longer
term positive Accumulation lends hope to the idea that these stocks will
find ready buyers if they should fall back to support.
I applied the Power Ranker to the FIDSTKS (Those that Fidelity Sector funds
have the biggest positions in.) and the best performing sectors now:
Home-Builders, Reits
and now Pipelines.
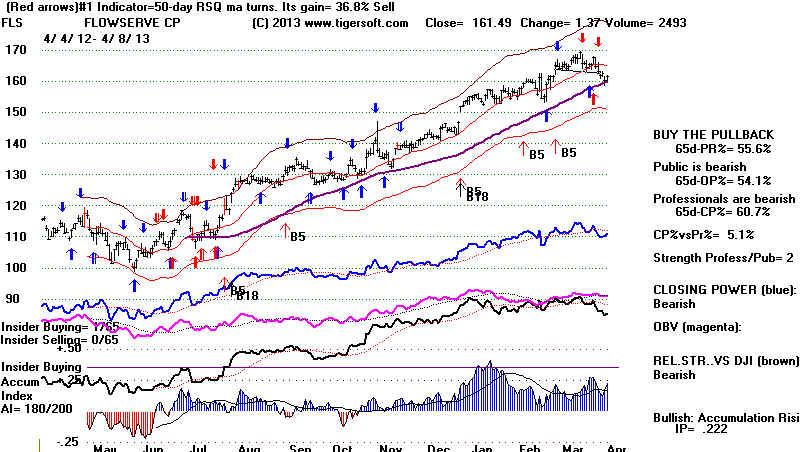
See the stocks I found in this pursuit. As
always, flat topped breakouts in these
stocks make excellent short-term trades. Watch FSP
and COR
in this connection. Two of the high Accumulation stocks that seem to
have successfully tested their 65-day ma are FLS (below) and NBL.
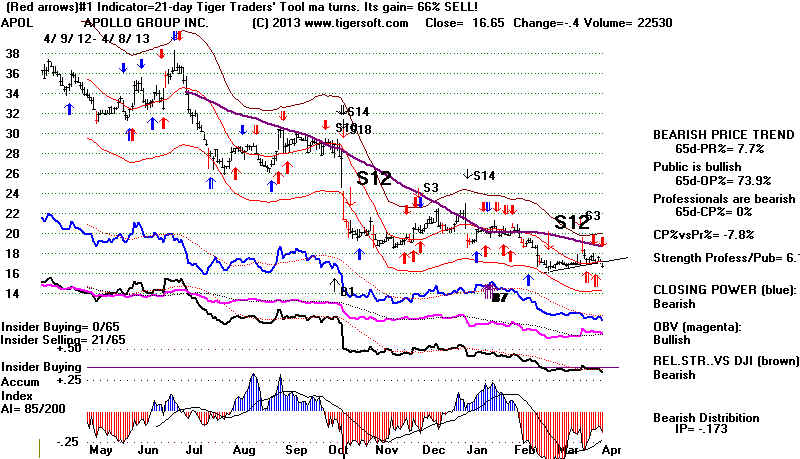
I have been suggesting selling short as hedges the
weakest stocks whose
Closing Powers show Professionals are aggressively selling. Consider
sector weakness, too, when selling short. Private Education and Gold stocks
have been among the weakest sectors for some time. Until their Closing
Powers break their downtrendlines, I would keep shorting them. But at some
point, Professionals will start covering them and we should, too. APOL
look like a good short sale now, having just broken below another minor
support level.
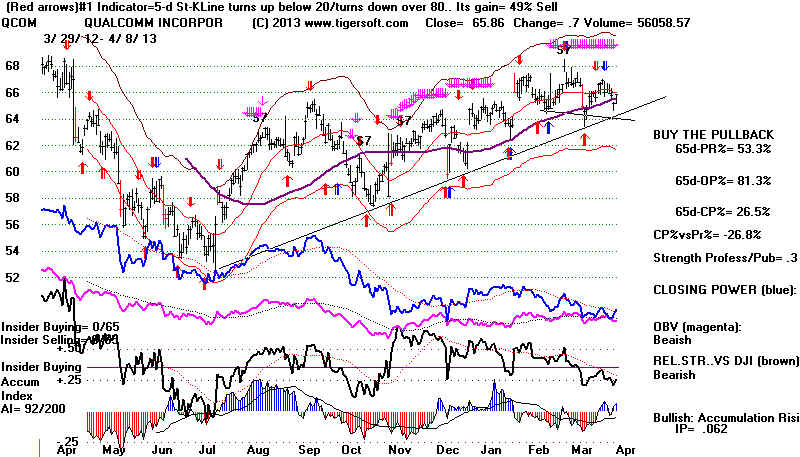
AAPL shows the bad things that can happen when the outlook clouds
up for
a heavy instititional favorite. In this vein, we might want to look at the weakest
stocks in BIGFIDEL, the 27 biggest Fidelity long positions. Right now, except
for AAPL, none are below their 65-day ma support and also show an AI/200
score below 100 and bearish Closing Power Sell S7s divergences from price.
QCOM (below) does show a head/sh0ulders pattern like
AAPL did at the top.
but QCOM's support at 64 recently held. With these Tiger Sell S7 divergence
stocks, we have to wait for a violation of the 65-day ma support to become
bearish enough to actually short them. Often they are heavily shorted already,
so that weakness to price support invites short-covering.
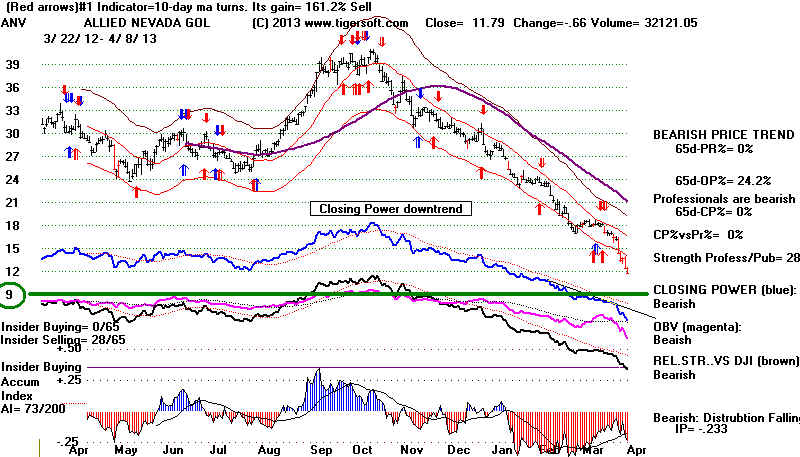
Another trick is to use my "rule
of 10" with stocks that fall steadily for 6
months
and then drop quickly from 14 below 10. This often brings a short-term selling
climax
which then allows a stock bought immediately between 8 and 9 to rally in days back
to 12, for a very nice trading profit. I would not hold the stock long in
expectation
of a bounce, if the stock closes below 7.5. ANV is the stock I'm watching now to
apply my "rule of 10" too. You might recall that I mentioned ANV as the
domestic
gold producer that I would watch for a reversal which would be a sign that other golds
might also be good to buy. Only the first dip to 8-9 should be used for buying.
4/8/2013
Key Values: DJI 14613 +48 la/ma= 1.007 21dma-roc = 0.223 P= 117 Pch= +30
IP21 = +.195 (on 1/30/2013 IP21 was .293) V = -56 Opct = .147 65 day-pct-up = .082
4/8/2013
---> To All Key Index and Leading Stock Charts
---> 289 +91 MAXCP stocks Bullish
MAXCP Stocks (4/5/2013) Bullish plurality
---> 35 +2 MINCP stocks Bearish MINCP Stocks (4/5/2013)
--->45 New Highs on
NASDAQ 14 new lows. Bullish plurality
--->140
New Highs on NYSE 7 new
lows. Bullish plurality
====================================================================================
4/5/2013
Until There Is A New Peerless Sell, Seasonality Argues That
The DJI Will Hold Up and A Bigger Decline Will Be Averted.
That
Would Change if The NYSE A/D Line Uptrend and Closing
Power
Uptrends Are Violated.
4/5/2013 Key Values: DJI 14565 -41
la/ma= 1.004
21dma-roc = 0.221 P= 87 Pch= -24
IP21 = +.131 (on 1/30/2013 IP21 was .293) V = -53 Opct = .136 65 day-pct-up = .10
4/5/2013
---> To All Key Index and Leading Stock Charts
---> 198 +110 MAXCP stocks Bullish
MAXCP Stocks (4/5/2013) Bullish plurality
---> 33 -142 MINCP stocks Bearish MINCP Stocks (4/5/2013)
--->22 +4 New Highs on
NASDAQ 15 new lows. Bullish plurality
--->64 -4
New Highs on NYSE 20 new
lows. Bullish plurality
Is the decline over? Will there be a bigger market decline this month?
The A/D Line NCs show the advance is narrowing. This is normal as the
DJI approaches an intermediate-term top.
The NYSE A/D Line and Closing Power uptrends are still
intact. This is
bullish. If the Openings are not too weak, the markets should rally. SPY's
156-156.5 will be resistance. 153.5 is support.
Peerless is ambivalent, I admit On the hand, it gave a Sell S15 a month
ago.
That signal has not been reversed by a new Peerless Buy signal. And the paper
loss so far is still under 3.5%, the point where the paper loss is bigger than past S15s.
So orthodox Peerless users are happy with the decline and may still expect a test
of 14000, the rising 65-dma or the lower band.
But, as I have emphasized, momentum and breadth were unusually strong when
the signal occurred, thereby casting doubts about the Sell S15. Major Sells
usually must wait until May or later following a January take-off.
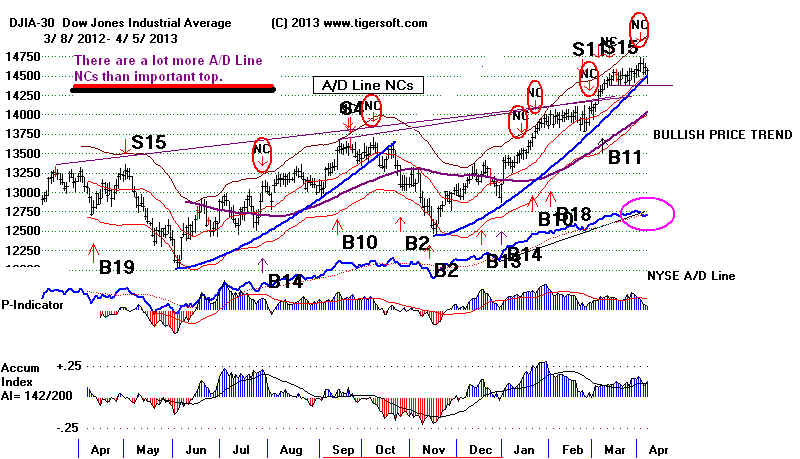
How about the A/D Line Non-Confirmation? Isn 't that bearish? After the Sell
S15,
the DJI rallied to a closing high of 14662 on April 2nd. That DJI closing high was
widely unconfirmed by the other indexes and the NYSE A/D Line. Studying old
charts, I have to conclude that A/D Line NC's by themselves do not reliably produce
a decline to the lower band. This can be shown here.
This weekend I put into the programs a way to show the 40-day A/D NCs. Study them
below.
I suggest that the best way to use the A/D Line NCs for an intermediate-term investor
would be to wait for a Peerless Sell. There are just too many insignificant A/D Line
NCs,
at least, until May. (The next Peerless Update will let you display A/D Line NCs.
I have
recently made a number of improvements to B17s, S1s, S2s, S3s and S4s. More on this
later. )
Looking at the old charts, I would expect the A/D Line to start to lag much more
noticeably
before a major top. This is what happens typically happens after a January take-off
starting
in late April, May or later. There are only 3 exceptions, 1976, 1986, and 1987.
That makes the odds one in eight that there will be a 5% or more decline. (A
5%
drop by the DJI peak would take to about 13800.)
Here are the January take-offs since 1945.:
1945, 1950, 1954, 1955, 1956, 1961, 1963, 1964, 1965, 1967, 1971, 1972, 1975, 1976,
1983, 1986, 1987, 1989, 1993, 1995, 1998, 1999, 2006, 2011, 2012
Late March or early April peaks that bring declines of more than 5% when the the
market has been uptrending are rare.
4/6/1956
10%
3/24/1976
4%
3/27/1986
5%
4/7/1987
8%
Scary Unemployment Numbers
As if US austerity, falling overseas markets, rising imports from Japan and
North Korean threats of war were not enough tests of the stock market,
on Friday the market got a blast of very cold air about the real economy to wake
it up and bring it back for a few hours to, at least, a distant awareness of how
the rest of countryis faring.
The private sector is not creating enough jobs and the government sector is laying
off people. Yet the Unemployment number dropped .1%. Clearly, a lot of people
have given up finding regular work. Yet the stock market recovered from its lows
on Friday. For now, it seems the weak Labor Depratment's Unemployment data
is causing the FED to intensify its QE-III program to keep interest rates low.
See how rapidly the interest rate on the 10-year bonds has dropped in the last two
weeks. The view of many bond investors is that over-bought stocks are unsafe in
a weak economy and that the Fed will not be abandoning its program of buying
long-term mortgages anytime soon.
Falling Non-US Stock Markets
Falling Interest Rates
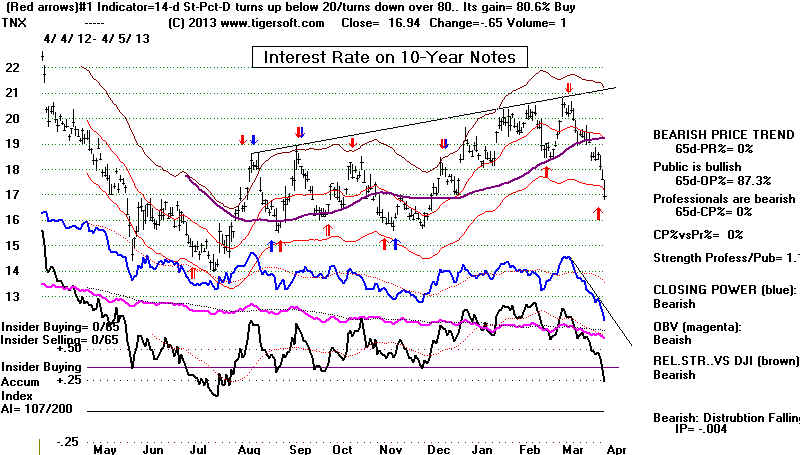
Japanese Yen free-Fall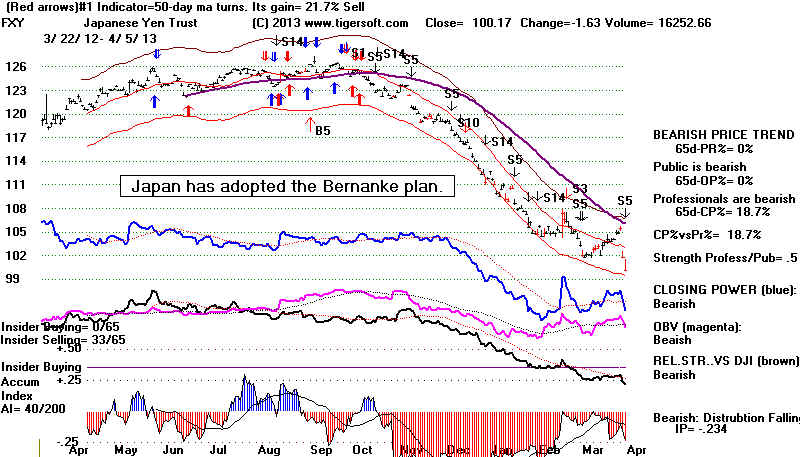
I have doubts that interest rates can stay this low. The Tiger Index of Bond
Fund still show months and months of big money selling,
red Distribution
and a very weak Closing Power.
===================================================================================
OLDER HOTLINES
===================================================================================
4/4/2013
The Bull Market Is Straining To Stay
Up.
Watch how the Stock Market Reacts to the Unemployment
Numbers. Watch not just the changes in the Indexes,
watch:
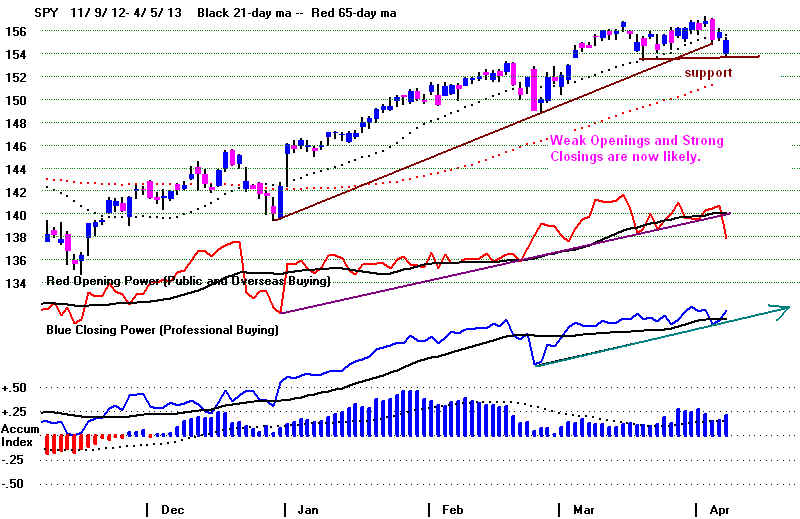
1) The A/D Line,
2) the well-tested Parabolic Uptrendline,
3) SPY's Closing Power uptrendline,
4) NASDAQ New Lows versus New Highs
5) the Peerless key values: P-I, IP21 and the 21-dayma ROC.
4/4/2013 Key Values: DJI 14606 +56 la/ma= 1.008 21dma-roc = 0.290 P= 110 Pch= -34
IP21 = +.11 (on 1/30/2013 IP21 was .293) V = -42 Opct = .23 65 day-pct-up = .114
4/4/2013
---> To All Key Index and Leading Stock Charts
---> 84 MAXCP
stocks Bullish
MAXCP Stocks (4/4/2013)
---> 175 +12 MINCP stocks Bearish MINCP Stocks (4/4/2013) Bearish plurality
--->19 -1 New Highs
on NASDAQ 14 -15 new lows.
Bullish plurality
--->68
New Highs on NYSE 9 new
lows. Bullish plurality
Seasonality and internals argue that the DJI will hold up a
while longer. But the March
Unemployment Level out tomorrow will be politically very important. I have to
say
that I suspect that the market sold off early this week because traders were worried
that unemployment would jump back up. That is what happened last year at this time
and the DJI fell 3% just before the announcement and 3% afterwards.
From an othodox Peerless point of view, I have to note that the Sell S15 at 14254
could stilll be proven correct. In that case, the 2.9% rally subsequent to the
signal
can be considered within "Paper Loss" - tolerance levels for a Sell S15.
Either way,
hedging has been recommended.
It is
quite possible that the US high caps will hold up while other stocks weaken.
Our Index of non-US ETFs is struggling to get back just to its
200-day ma.
The
last few days show a much weaker VLE (Value Line) or IWM (Russell-2000)
than DIA (DJI-30 ETF) or SPY
(SP-500-ETF). This is a clear sign of rapid
breadth deterioration.
US Unemployment Rate

The Unemployment Number Is Very Important
Will It Show Little or No Recovery? Will It Prove Deflation Is
The Real Problem?
The real danger now is not the size of the federal budget deficit.
It is that we are falling into
a
deflationary economic spiral, which is about to be made much worse by Washington's belated
conversion to Hoover-like Austerity Policies. That would be very dangerous.
How ill-advised
Austerity in the 1937 Budget caused the wholly unnecessary
Crash of 1937 should be required
reading for all law-makers and Presidents. Fortunately, breadth and Accumulation levels
now
do not yet look like they did at the top in August 1937.
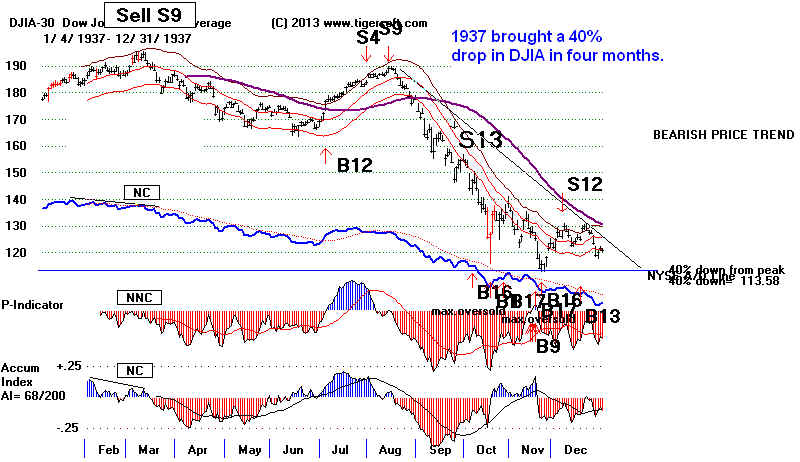
They
call it the "jobs numbers", but that is a mainstream euphemism. It is the
joblessness
that matters. How long must people wait for decent jobs? Tomorrow we are
told the
official rate of unemployment and how many new jobs have been ccreated.
These are the most important grades on the Administration's report card. They
show whether our government is working. They show whether the economic system
is working.
Unemployment numbers are one of a handful statistics that go back to the early
1950s.
It is a number every economist looks at at.
So, tomorrow we learn the offical March 2013 unemployment number comes out. It MUST show
a big drop or the whole premise behind the trillion dollar, Fed's loose-money program will
be
subjected to fierce challenge. People will not be considering what the
Unemployment Rate
would be without QE1, QE2 and QE3. Rather, there will be an outcry among Conservatives
that the Fed is debasing the money supply for no good reason, all the while creating
another
dangerous financial bubble. Progressives will
quickly cry out that the Fed and the President
are enriching Wall Street and making the rich even richer, all the while the average
worker
is forgotten and, more and more, forced to accept paltry
and near-starvation wages. The
dysfunctional result will be more political polorization, more stalemate and more
dangerous
Austerity.
So, a rise in the official level of Unemployment will greatly weaken, I would
predict, the President, his supporters, Wall Street and the Fed. Opposition to
the Fed's policies will quickly intensify. They will be put of the defensive.
Stock
traders may well take profits and wait to see if the Fed is still strong enough
politically
to continue to prop up the rising stock market in hopes that it will, by itself, stimulate
economic growth.
Or perhaps, the stock market will go down even as the Unemployment falls
The
belief here will be that the drop takes us that much closer to the point
where the Fed will no longer see it needs to continue QEIII.
Either way, there are a lot of stocks that have advanced a long
ways. So profit-
taking alone could quickly bring a retreat to the DJI's rising 65-dma and lower
band now at 14000, almost 4% lower. Tonight the "Bullish MAXCPs" only
produced stocks that were very over-extended, with the result that I posted
only high Accumulation new highs.
What To Indicators and Trends To Watch
If two or more of the changed indicator-readings described below occur in the
next few trading days, I would think the odds will shift decisively to a decline
soon afterwards to 14000.
1) A Break in the NYSE A/D Line UpTrend. Here we want
to watch the
"key" A/D Line. See the A/D Line trend-break of last October. It worked
well to clinch the Sell S4. I would think that the similarly sloped "key"
A/D Line
will also be important now.
2) A Break in the Accelerating DJI uptrend. The current blue
parabolic-line
support is well-tested and has the same slope as the one that was well-tested
last October when it was significantly broken.
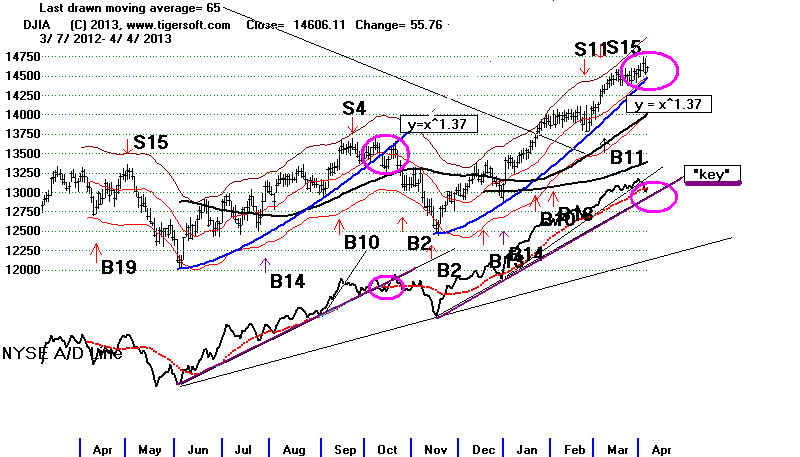
3) A Break in the key Closing Power Uptrendline for SP-500. Again,
I would
look back to the slope of last Summer's uptrend-lines, specifically, last
Summer's CP uptrend's slope.
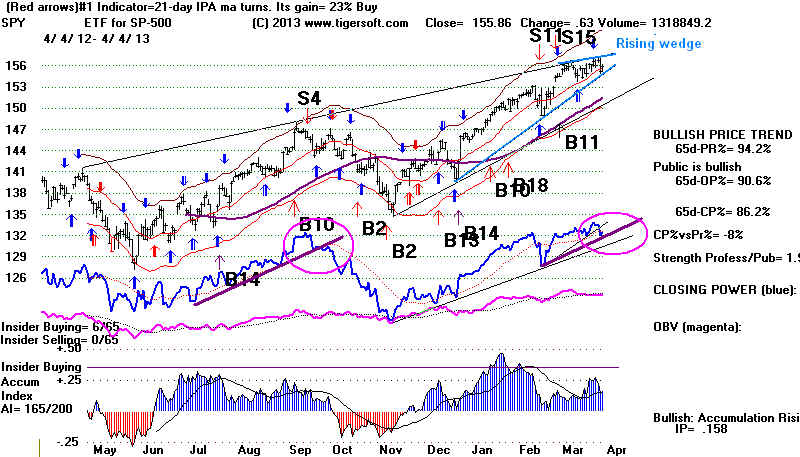
4) New Lows Exceeding New Highs on the NYSE. This has
been called
the Titanic effect. So soon after the DJI makes a new high, it would be bearish.
"The Titanic Syndrome is deceptively simple. Two
statistics, printed daily in the financial press,
tell you whether the iceberg will wreak disaster. You know you are on board the Titanic
when the
DJIA hits an all-time high for the year or rallies 400 points and—within seven
trading days, before
or after this DJIA high—the number of yearly lows on the New York Stock Exchange
Composite
Index (NYSE) exceeds the number of yearly highs. (The NYSE defines yearly as the past 52
weeks.)"
http://store.traders.com/-v06-c11-pattern-pdf.html
I wouild prefer to watch the NASDAQ new high and low numbers, because of
how much the composition of the NYSE has shifted towards dividend vehicles.
Today the number of NASDAQ new highs was only 19, while the number of
NASDAQ new lows was 14.
http://www.nasdaq.com/aspx/52-week-high-low.aspx?exchange=Nasdaq&status=HI#.UV6LUDfiFac
4) And, of course, watch for any new Peerless S9 or S12. The
P-Indicator has fallen all the
way back to +110 and the IP21 is now at +.11. Both are way down from their
peaks much earlier on this rally. If they should approach or fall below 0
on a 2-4% rally, we would probably get a Sell S9 or Sell S12.
But understand, they are still positive. The 21-day mac may not
be broken by
very
much or for very long with the IP21 above +.07 and the rate of change
of
the 21-day ma at +.29. My "rule of .07"
suggests the 21-day ma will hold up
until
one of those key values drops below +.07. That means underlying support
here
looks fairly good for a while. Moreover, a decline to the lower band will almost
certainly produce a new Buy signal and another high-cap rally that would favor the
highest AI/200 stocks in the DJI-30, the SP-500 and in our BIGFIDEL
(the 27 biggest
positions in the Fidelity Select funds. .
====================================================================================
OLDER HOTLINES
====================================================================================
4/3/2013
False Breakouts Are Rare in DJI
"Darvas" Rectangle Patterns
And Aprils Seldom Bring Significant
Market Tops. But we still
should be hedged and watchful about
narrowing market breadth..
Don't ignore our Bearish MINCP stocks for short selling. They
are
making us some nice profits. Notice
that the number of new lows ran
to up to levels today above new highs.
This so soon after the DJI makes a new high
is a warning side. So is the fact
that Professionals are selling more stocks
aggressively than they are buying.
A rebound tomorrow will probably
be sold into by professionals. They have a lot of profits to lock in. They
may be concerned that Friday's March
Unemployment numbers will show the recovery
is waning. Austerity keeps bringing
mainly Deflation, higher Unemployment
and even bigger budget deficits to
Europe. Without a neo-Keynesian counter-attack from
the White House, the Austerity-now crowd
still control the media in America. Because
there are limits to what a loose monetary
policy can do to bring about an economic
recovery from a deep recession, the
disconnect between rising stocks and how well
most Americans are living is apt to reach
a snapping point this Summer. That's also when
market rallies typically turn into sell-offs.
If the divergences and contradictions widen
into September, the eventual decline will be
that much greater.
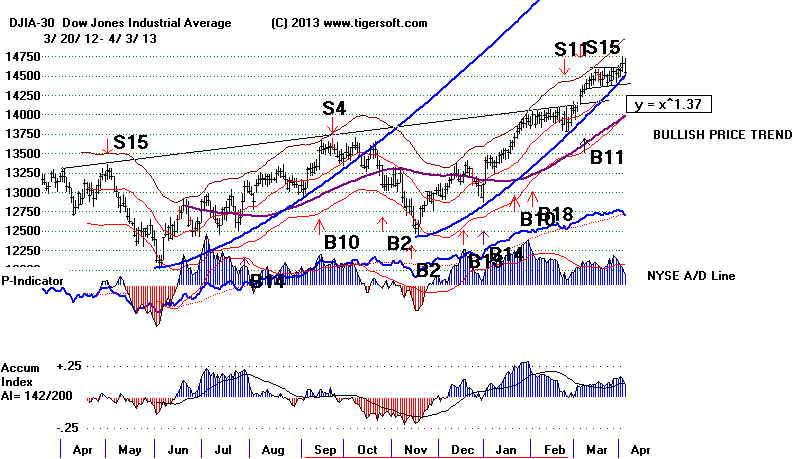
The three day deterioration in breadth we
have just seen is turning down the P-Indicator
and the Accumulation index. They
are still quite positive now, +144 and +.097, but
we must watch them now. A mostly
DJI rally to the upper band could bring a Sell S9 or
a Sell S12. That would not be good.
4/3/2013 Key
Values: DJI 14550 -111 la/ma= 1.005 21dma-roc = 0.348 P= 144 Pch= -101
IP21 = +.097 (on 1/30/2013 IP21 was .293) V = -35 Opct = .232 65 day-pct-up = .099
April Is Not Usually A Month
When The Stock Market Tops Out.
I think we still have to be
optimistic. Upside runs are more than twice as likely after
breakouts as are even shallow pull backs.
See charts at www.tigersoft.com/ron
and
my False DJI Breakouts' study below.
When they do occur, they typically bring a
decline slightly below the 21-day ma
if the DJI drops a second day. Stay
bullish: The high level of Accumulation (IP21) now
argues that any sell-off will be shallow;
Aprils are not usually the months
that bring important declines; there do not appear to be enough head/shoulders
patterns
in key stocks to make the present market look as vulnerable as, say,
last Summer; momentum and breadth (until last
Friday) are usually bullish.
And, as I keep saying, until Gold turns up, we
are probably not at a major top.
There's Cunning in His Madness.
But Probably Not War
Of course, I am assuming that Kim Jong-un is
semi-rational. That's asking a lot of
a 27-year old who is trying to show his
generals that he is worthy of being leader
by accident of birth in purportledly socialist
North Korea. He has only known
privilege, isolation and a father who was
considered a God by many in his country.
How conducive is that to the development of a
healthy concern for life and
the well-being of others? Then there's
the more common bluster and macho
swagger in any young man who is physically
twice as heavy as his peers?
The key question: is he smart enough to
understand that most of his fathers
wild bellicosity was a conscious compensation
for weakness and mostly designed
to win concessions from more cautious and more
temperate Western leaders.
Or will he be more like George Bush Jr,
perhaps, and be driven by a subconscious
urge to prove that he, George Jr, is tougher
and more of a fighter than his father
in the matter of Saddam in Iraq.
Kim Jong Il
"A hedonistic narcissist.
This political personality type is narcissistic and histrionic, with antisocial
tendencies,
but not substantially paranoid or sadistic. Although not as dangerous as the malignant
narcissist,
this subtype offers its own distinctive set of challenges in the international arena.
Hedonistically narcissistic leaders are most notable for their indifferent conscience,
their fraudulence, and their skill in the art of deception. Unlike malignant
narcissists,
they are conflict averse, preferring guile, craft, and cunning rather than force or
confrontation in extracting or extorting from others what they consider their due.
The major policy implications of the study were the following: First, it suggested that no
claim,
concession, or threat by Kim Jong Il could be taken at face value; he was the consummate
con artist.
(Source)

A Study of DJI False Breakouts from One-Month Darvas Rectangle Patterns
False breakouts from the type of pattern we now
see for the DJI are rare. The IP21
on Monday's was much more positive than
in any of the five earlier instances where
a 4-week DJI rectangle pattern failed the
breakout for more then a day or two.
This is a sign of underlying support that is
likely to come in on weakness from
instututional buying. When we consider
all the key values, the case most similar to
our own was in November 1942. If the DJI
acts similarly to then it would fall another 100 points
or so and bottom out just below the 21-day ma.
However, if we consider the A/D Line
non-confirmation as the most salient factor, then
somewhat more weakness might be expected.
But the market does not look at all like it did
in 1929 and this is not January when reversals
downward are likely.
la/ma 21dma-roc P-I
P-ch P**
IP21 V-I Opct 65s-up-pct
4/2/2013
1.014 .472
244 -23 244 .154
-2 .261
.106
A/D Line did not
confirm this new high
One was in January 2011. It brought
a quick 7.5% decline to the 65-dma and just as
quick reversal back upwards. There was
not Peerless Sell. The Accumulation Index
was much lower than now and the DJI much more
often reverses downward in January
than April.
la/ma 21dma-roc P-I
P-ch P**
IP21 V-I Opct 65s-up-pct
1/13/2010 1.015
.237
459
20 446
.022 27 .30
.076
A/D Line did confirm this new high
A second was in July 2007. Here
there was also a Sell S9 and Sell S11.
la/ma 21dma-roc P-I
P-ch P**
IP21 V-I Opct
65s-up-pct
7/12/2007 1.024
.500
283
189 255
.035 25
.092 .094
A/D Line did
not confirm this new high
A third was on 4/21/1959. The DJI
pulled back for one day below its 21-day ma
and then moved 10% higher in July.
The internal strength indicators were much lower
than now.
la/ma 21dma-roc P-I
P-ch P**
IP21 V-I Opct 65s-up-pct
4/21/1959 1.031
.367
-16
-5 -47
.03 -251 .257
.053
A/D Line did not
confirm this new high
A fourth was on 11/9/1942. The DJI
pulled back just below its 21-day ma
and then moved 25% higher by June of
1944. The OPct was much lower then.
But the other internals were similar to
now.
la/ma
la/ma
21dma-roc P-I
P-ch P**
IP21 V-I
Opct 65s-up-pct
11/19/1942 1.024
.563
67
-1 +340 .075
42 -.174
.106
A/D Line did confirm this new high
A fifth was on 8/2/1929. The DJI
pulled back to the low of the rectangle formation
and then ran up 10% to a final top before
the 1929 Crash, The internals were much
weaker than now.
la/ma
la/ma
21dma-roc P-I
P-ch P**
IP21 V-I
Opct 65s-up-pct
8/2/1929 1.024
.384
-32 -4
-138
-.111 -402 +.217 .094
A/D Line did not
confirm this new high
4/3/2013
---> To All Key Index and Leading Stock Charts
---> 60
-119 MAXCP stocks Bullish MAXCP Stocks (4/3/2013)
---> 163 +69
MINCP stocks Bearish MINCP Stocks (4/3/2013) Bearish plurality
--->20 -37 New Highs
on NASDAQ 29 +12 new lows. Bearish plurality
--->23 New Highs on NYSE 35 new
lows. Bearish
plurality
====================================================================================
OLDER HOTLINES
====================================================================================
4/2/2013 The Darvas Breakout
Should Bring Higher Prices in the
DJI despite the non-confirmations.
In the government's new higher payments to
health insurers, we see another example
of the Wall Street - Washington Axis.
It's probably best not to fight them.
While biotechs and health insurers are further
avored, the weakness in Gold and Silver
today
drives home our sense that the Closing
Power downtrends must be broken
before these stocks can be safely bought.
Gold's weakness is important. Gold
is a counter-trend warning device.
As long as Gold is falling, stocks are apt to
rise. And Gold's additional
weakness shows Inflation is not a current problem.
That helps the Bernanke supporters at the
Fed continue QE-III. And Wall Street
will like that.
DJI breakouts like we have just seen
usually bring additional price gains even when
the V-Indicator is negative and the A/D
Line fails to confirm, as now. My sense of these
breakouts is that a pullback only becomes
likely when the 3.5% upper band is
tagged. Patterns like this have
their own over-riding dynamics. See the many examples
of these "Darvas breakouts" in the DJI that I posted
last night.
As breakouts for the DJI go, the new high
today above the recent top of the rectangle program
does leave a lot to be
desired. The NYSE, with its high
concentration of dividend paying
stocks failed to make a new high.
Similar non-confirmations were registered by the
NASDAQ, IWM
(the ETF for the Russell-2000) actually lost -.58) and MDY
(Mid-Caps ETF)
which lost .85. Disturbingly, there
were 103 more decliners on the NYSED today and
NYSE down volume was 15% more than up
volume. Internal weakness may reach the
point where Peerless gives a Sell.
But over and over, it usually takes weeks of divergences
before a big reversal down is seen.
I think the market is also waiting to see what the March
Jobs' data looks like on Friday morning.
The jump by the DJI took place because 8
DJI-30 stocks rose by more than 1% and
United Health Care shot up 4%.
Professionals knew something good was about to
happen. See how the Closing Power
for UNH below jumped upwards late last week. Biotechs
liked this news and rose strongly today,
too. In this connection. Look at AMGN
soar. A
week ago, it announced impressive results
for its new
skin cancer drug. Nearly 15% of
Fidelity Biotech (FBIOX) is AMGN.
That's a very heavy bet on the stock.
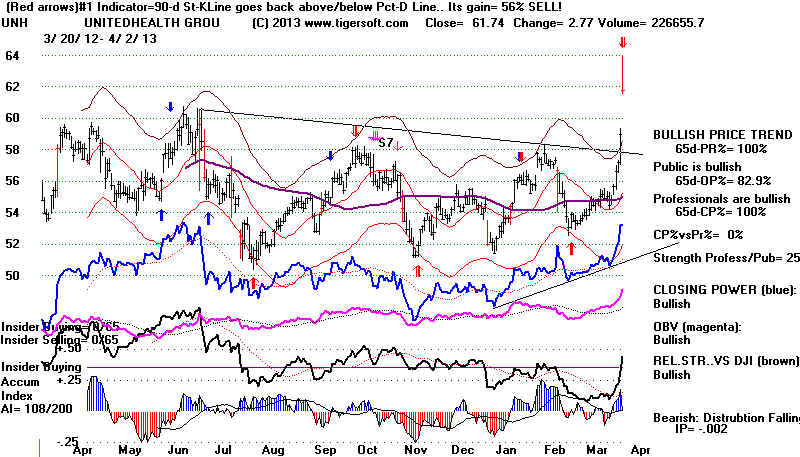
Wall Street Loves Its Special Access To Washington Regulators
and Law-Makers. The Obama-Wall-Street-Federal Reserve Axis
Wants Higher Stock Prices, each for a different reason. This is
a symbiotic system that will not easily breakdown.
The US Government was busy boosting health
insurers today. After the close, the federal agency
that administers Medicare and Medicaid
announced that they will be boosting Medicare Advantage
reimbursement rates, rather than cutting
them as initially proposed. I guess we should not
complain. The US Government has
been making Wall Street winners and losers for years, beginning with
its building of the Erie Canal, giving
massive free land grants to railroads, offering lucrative, cost-
plus arms' contracts, building the
interstate highways, providing the GI Bill to universities via
students, paying for much of the research
that went into computers, mminiature circuits, the
human genome project and the internet.
And lest we forget, it has been enormously helpful to
the housing and construction industries
by allowing mortgage payments to be tax deductible and,
repeatedly guaranteeing big Wall Street
banks and brokerages against failure through low interest
Federal Reserve loans.
IBM will
probably now be strong. It shows very high Accumulation. Institutions
can put a lot of money to work quickly
and relatively safely in IBM. As the highest
priced DJI stock, each 1% gain in it will
add more than 16 points to the DJIA. The height
of IBM's pattern, 183-213, or 30 points
gives us a way to guess where its current breakout
might now go. All by itself, an IBM
move upwards by 30 points will add 230 points to
the DJIA.
4/2/2013 Key Values: DJI 14662 +89
la/ma= 1.04 21dma-roc = 0.472 P= 244 Pch= -23
IP21 = +.154 -.20 (on 1/30/2013 IP21 was .293) V = -2 Opct = .335 65 day-pct-up = .106
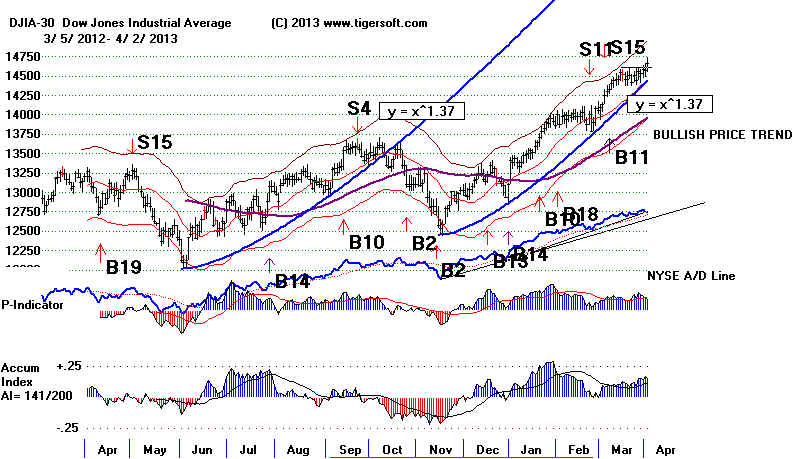
4/2/2013 ---> To
All Key Index and Leading Stock Charts
---> 179
-85 MAXCP stocks Bullish MAXCP Stocks (4/2/2013)
BULLish plurality
---> 94 +44
MINCP stocks Bearish MINCP Stocks (4/2/2013)
--->57 +12 New Highs on NASDAQ 17 - 4 new lows.
BULLish plurality
--->142 +50
New Highs on NYSE 20 new
lows. BULLish
plurality
====================================================================================
OLDER HOTLINES
====================================================================================
4/1/2013
DJI's Rectangle Pattern Remains Bullish. The
Sell S12 Will Be Voided
if the DJI Closes above 14800. The Peerless write-up on Sell S12s explains my
qualms with the current Sell S12. The next version of Peerless will probably have to
make Sell S15s impossible when the P-Indicator is above +175 and the 65-day
rate of change is above 8.8%. It will also eliminate March Sell S11s because those
that do work out are just too weak.
The DJI is
locked in a Darvas box, a flat rectangle.
Usually this pattern
leads to a breakout upwards; The odds of an upwards breakout are about
3:1 with stocks and about 2:1 with the DJIA. Below are the 6 cases where
DJI rectangle box patterns with flat tops bring declines. There were 13 instances
of upside breakouts and significant advances.
Rectangle patterns and reversals down
January 1956 - 2 months and no breakout brought quick decline to lower band.
January 1962 - massive
head/shoulders appeared before significant decline.
July 2007 - 3% rally and then
multiple Peerless Sells before decline below lower band.
Jan 2010 - marginal false breakout and then a decline to the lower band.
April 2012 Multiple
Peerless Sells and then decline below the lower band.
Oct 2012 - Sell S4
and notably weaker second decline brought decline below the lower band.
Rectangle patterns usually take about a month to resolve. Until there is a
clear
breakout above the resistance line through the DJI's hypothetical highs or through its
lows, the movements up and down are not significant from an intermediate-term perspective.
The pattern reflects the close equilibrium between aggressive buyers and sellers, many of
whom use the top of the pattern to sell and the bottom of the pattern to buy.
Below are all the cases I could find of this length pattern
since 1915. 3 of the
13 I could find occurred in April. Only one of the declines occurred in this month.
Most breakouts took place many months before a significant top, one where the DJI
fell more than 10%. The exceptions, in 1929 and 1959 all showed flagrant
breadth
and Accumulation Index divergences. Head and shoulders patterns sometimes
developed
after the breakdown, as in 1962. Breadth and Accumulation Index divergences
usually warned when the patterns were unreliable, as in 1929, 1959 and 2007.
I think we have to optimistic here. Except for the
V-Indicator, all the key internals are quite
positive now. Momentum, which is reflected in the
annualized rate of change in the
DJI and how much the DJI is up from 65 trading days ago, are both strong.
See all the charts here.
Upside flat top Breakouts from rectangles 4-6 weeks long.:
July 1925
April 1927
October 1928
November 1928
August 1929
Nov 1942
May 1943
March 1954
April 1959
April 1983
Feb 1986
Nov 1995
Jan 1996
4/1/2013 Key Values: DJI 14573 -6
la/ma= 1.01 21dma-roc = 0.429 P= 267 Pch= -59
IP21 = +.174 (on 1/30/2013 IP21 was .293) V = +2 Opct = .34 65 day-pct-up = .098
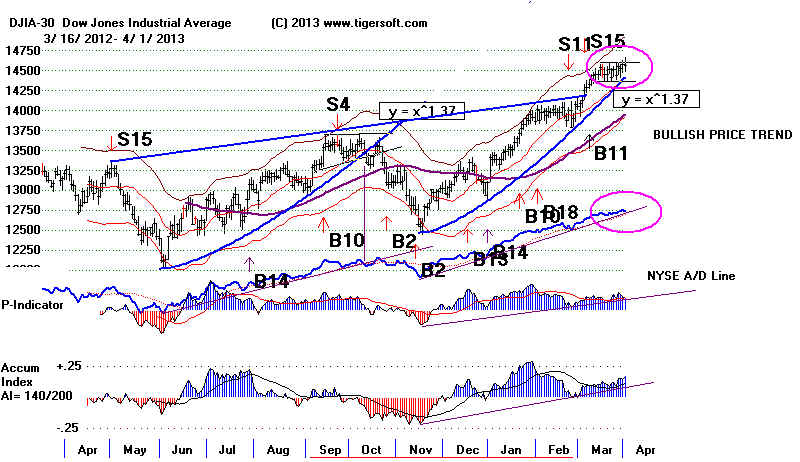
Both the Opening and Closing Power are in rising uptrends. You can see that the
uptrend is
bullishly accelerating. Breakouts above flat tops when the uptrend is
accelerating are often quite exciting. As I mentioned recently, April is usually a
bullish
month for
the DJI. Breadth did deteriorate today. So, we will have
to watch the A/D Line
A/D Line
non-confirmations of new highs near the upper band usually bring reversals down-
wards.
Right now the DJI is only 1% over the 21-day ma. I would be more concerned
about
divergences if this were late April or May. Last week I showed that most sell-offs
do not
start in the first week of April
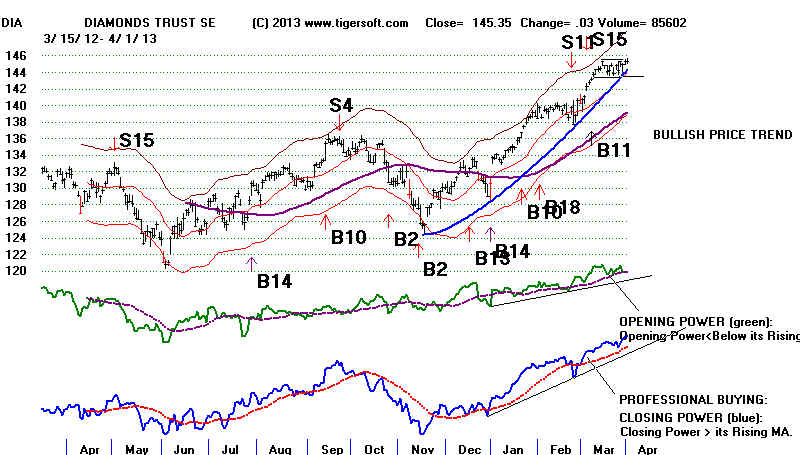
4/1/2013 ---> To
All Key Index and Leading Stock Charts
---> 264 MAXCP stocks Bullish MAXCP
Stocks (4/1/2013) BULLish plurality
---> 50
MINCP stocks Bearish MINCP Stocks (4/1/2013)
--->45 New Highs on NASDAQ 21 new lows.
BULLish plurality
--->92 New Highs on NYSE 17 new
lows. BULLish
plurality
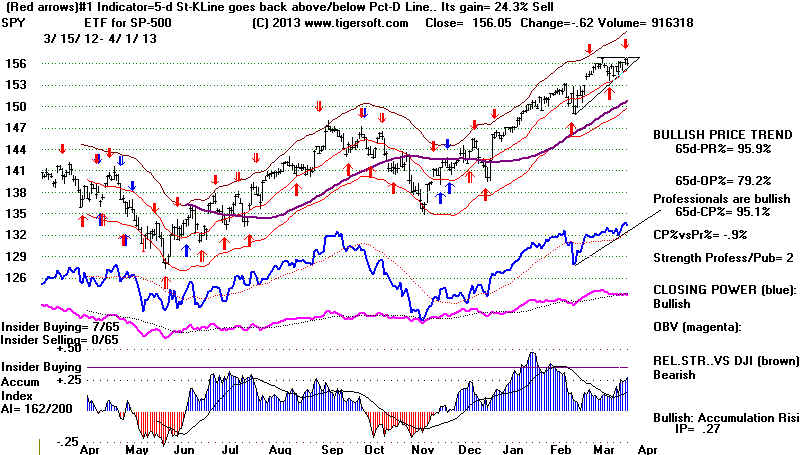
================================================================================
OLDER HOTLINES
================================================================================
3/28/2013 Many, many high Accumulation
breakouts. High P-Indicator readings.
Strongly rising ETF-Closing Powers. Bullish April Seasonality. All-Time High
Momentum.
The
Fed's Pumping Money into Speculation, in hopes some of it will create
more
jobs. Each one of these factors put more pressure on the orthodox Peerless Sell S15.
There
are no cases where the P-Indicator and Accumulation Index remained this
strong after a Peerless S15. That is why we have not gone short any index ETFs.
A
clear DJI closing price breakout into all-time territory past 14800 would cause me
to
set the Sell S15 aside officially and revise Peerless rules to eliminate it when the
P-Indicator is above +175 and the DJI is also up more than 8.5%. A close above
14800
would
bring about a paper loss in the Sell S15 that is higher than past cases
since
1945.
As in
January, we see a great number of stocks now that are making price
new
highs with Accumulation above +.25 (273!) above +.45 (45) above +.50. (19) .
This
shows institutional and insider-informed buying. Such stocks usually are
tightly held, so that they can continue to advance fairly easily.
Window Dressing
Admittedly, some of the buying this past week may have been be end-of-quarter
institutional window-dressing, it's true. Fidelity Sector funds, for example,
show more
and
more concentration in fewer and fewer stocks. 25% of the FBIOX (Biotech)
are
just two stocks, AMGN and GILD.
In their FSHOX (Housing/Construction)
fund,
HS constitutes 21.6% of their fund. And in FSDAX (Military), their UTX
holding is 24.0% of the fund. BA and UTX make up 35%. One has to wonder how
much
of these stocks' rallies this week owes to window-dressing. If they ever decide
to
sell any of these shares, we could see another AAPL. Consider what has happened
to
AAPL. Two weeks ago Market
Watch reported that "Fidelity had trimmed its
Apple
holdings modestly as of January 31, by 200,000 shares...But that still left it
with
14,467,047 shares." AAPL's top late last year was easy to spot. You just
had
to
believe it and not buy it because it looked cheap. The chart below should be
printed out and studied. If another big institutional holding starts to look like
AAPL
did 6 months ago, sell, sell short and buy puts.
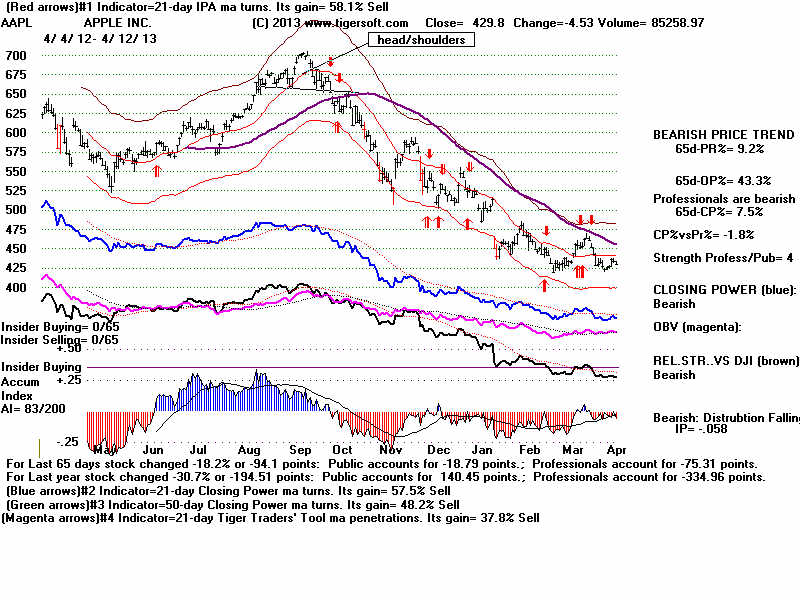
I
think it will be useful to watch closely the Tiger Index of the Stocks that
Fidelity Sector Fund managers have bought most heavily. Each stock in this index
represents
more
than 10% of the holdings of each of these funds. A lot of investors now
are
being attracted to and buy funds like this because of their sterling performance
so
far this year. But if that performance should cool off, new buying will
probably
quickly dry up. Back in 1972, the markets had narrowed much more than
now.
By
the end of that year, mutual funds were putting most of their money into just
the "nifty-fifty". When
that game of musical chairs ended in January 1973, the
DJI
began a deep 40% bear market.
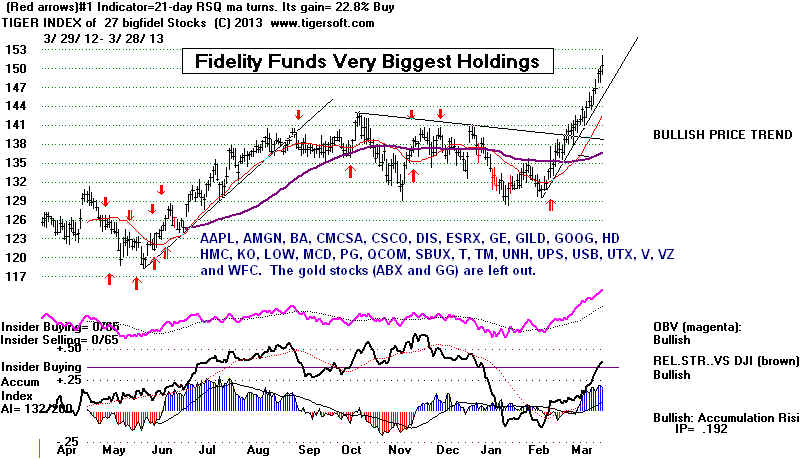
The
DJI still has not broken decisively out of its classic Darvas "box"
formation.
The
psychological forces here are classic. Profit-taking currently is equalizing the
powerful buying signified by the uptrend. Once a clear breakout-advance occurs
and
prices surpass the two-three week highs which have all lined up very closely,
it
will show that the lazy profit-taking at the old highs has been overcome.
Professionals
will
start to buy even more aggressively. And the rising prices will create a powerful
mass
impulse to chase stocks even higher. That, at least, is the theory. And, if
the
underlying economic news gets better, for example, with a very positive Jobs' Report on
Friday, 15000 will be seen.
The
seasonality for April is quite favorable. Since 1965, April has produced a DJI
rally
70.2% of the time. When a Democrat was been in the White House, the DJI
went
up 6 times and declined slightly twice over the next month since 1945 in the
year
after the Presidential Election.
3/31
4/30
Truman '45 154,1
165,4
Truman '49 177.1
174.1
down
JFK
676.6
678.7
LBJ
889.1
922.3
Carter 919.13
926.9
Clinton '93 3435.11 3427.55
down
Clinton '97 6583.48 7008.99
Obama
7608.92
8168.15
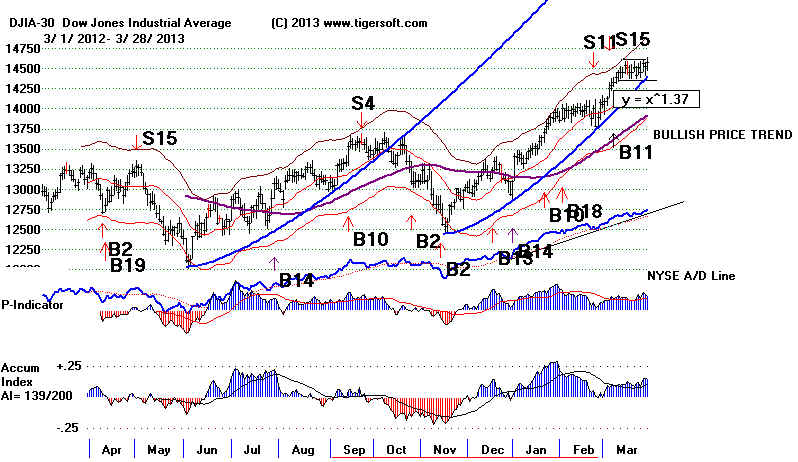
3/28/2013 ---> To All Key Index
and Leading Stock Charts
---> 439 MAXCP stocks Bullish MAXCP
Stocks (3/28/2013) BULLish
plurality
233 of these had IP21s over +.250
---> 50
MINCP stocks Bearish MINCP Stocks (3/28/2013)
--->138 New Highs on NASDAQ 7 new lows.
BULLish plurality
--->265 New Highs on NYSE 3 new
lows. BULLish
plurality
================================================================================
3/27/2013 Peerless still shows a Sell S15.
Should we believe it?
--->
356 MAXCP stocks Bullish
MAXCP Stocks (3/26/2013) BULLish plurality
---> 48
MINCP stocks Bearish MINCP Stocks (3/27/2013)
--->71 New Highs on NASDAQ 11 new lows.
BULLish plurality
--->135 New Highs on NYSE 11
new lows. BULLish
plurality
3/27/2013 Key Values: DJI 14526 -33
la/ma= 1.011 21dma-roc = 0.519 P= 364 Pch= -41
IP21 = +.158 (on 1/30/2013 IP21 was .293) V = +23 Opct = .294 65 day-pct-up = .083
(Note the big improvement in IP21 today from two days ago.)
For now the DJI is locked in a narrow trading range, 14380-14600 and
the bullish
Seasonality before and after Easter Sunday should hold up the market.
But will it
break out. Watch the big bank stocks. They have retreated
and will to
need to turn up vigorously to convince the skeptics.
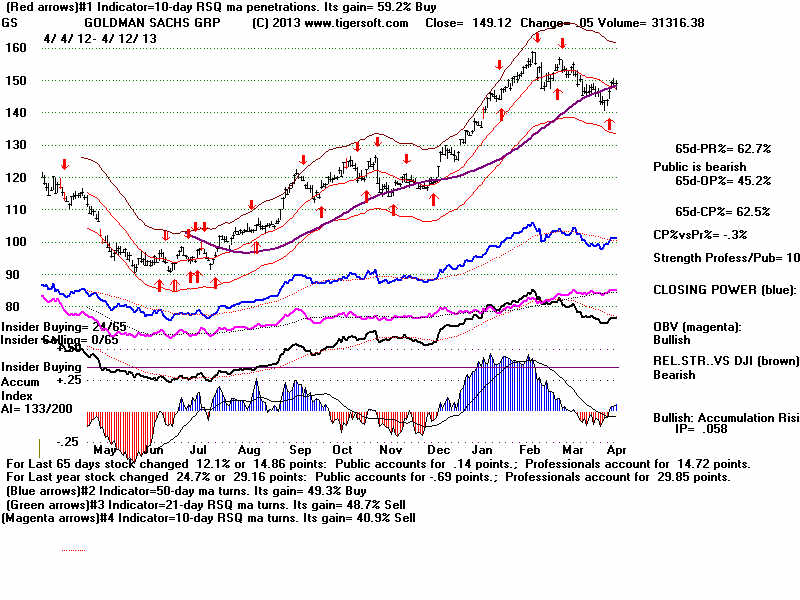
If there is
a decline, the high Accumulation and Closing Power new highs
today in
the DJI make me think that it will be shallow. However,
a break in the rising NYSE A/D Line would make me much more bearish.
A/D Line
trend breaks are especially significant when low interest rates
have been
boosting the market. I showed the Peerless charts for 2001 and
2002 last
week to make this point.
The DJI is now up 20% from May 2012. The Value Line is up more than
30%.
Is this all because of the Fed's pumping money into the banking system?
Or is there
a real recovery going on? Officially unemployment has fallen in
the US from
9% to 7.7%. If the steady improvement of the last year continues,
the stock
market will look pretty smart. If not, the rally will look even more like
an
artificial bubble. The Sell S15 reflects the many doubts in the genuineness
and
sustainability of the economic recovery. It also reflects the dangers of a
US banking
system dependent on Federal Reserve subsidies and made even
more
vulnerable due to its improper leveraging and exposure to EURO losses,
which now
seem to be systemically caused.
Hedging by being long the Bullish MAXCP stocks and short some of
the Bearish
MINCP stocks has been the answer I prefer. Why?
Because
this strategy works profitably in most markets. And also because,
the Sell
S15 signal here is problematic. Peerless Sell S15s would otherwise
and
generally be improved if we disallowed them when the the P-Indicator was
above +175
on the day of the signal and the DJI was up more
than 8.75%
from 65
days before the S15, as occurred here.
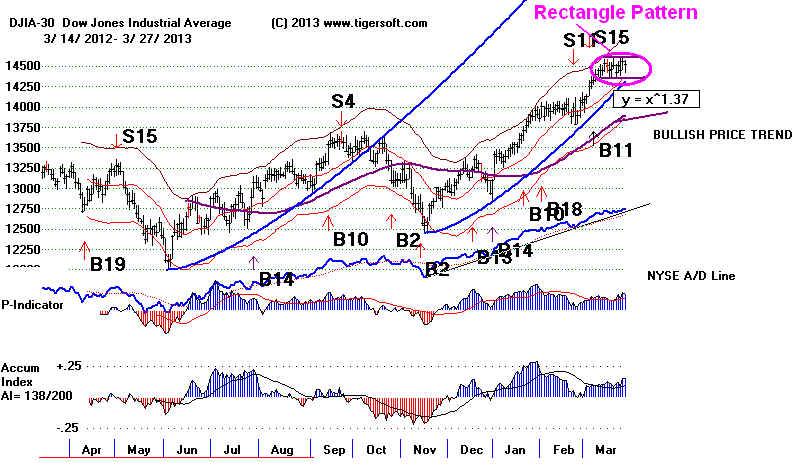
Again the
DJI was unable to make a clear new high and breakout above
its
three-week flag formation. Banks stocks in the US are still pulling
back.
The US big banks here are afraid of still more bad press. Their
exposure to
European government bonds denominated in EUROs
is said to
be extensive.
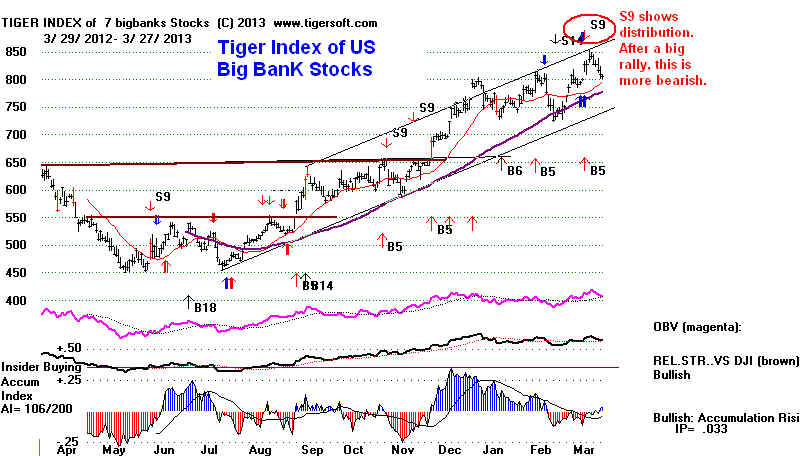
In Europe,
banks must be concerned that that people may now decide
to keeping
their savings under their mattresses, now that bank deposits
can just be
seized whenever the EEC Central Bank demands it of

compliant
national government leaders. Who knows when the EEC
Central
Bank bank will pull another "inside job" and steal depositors' savings
in Italy,
Spain, Portugal or Greece, just as they have did this week in
Cypress with the
approval, it's important to add, of the Cypriot PM.
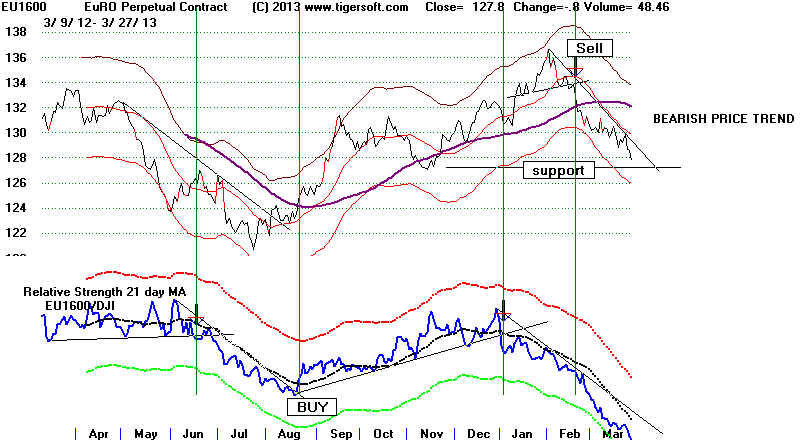
The Euro's
weakness helps the Dollar, though, short-term. And this makes more non-US
hot
money flow into the US stock market and US bonds. But how long
can
this continue? Uusually, the world markets rise and fall together. With much of
Europe in near-Depression, at least when you look at the unemployment rates
in
Spain (26.6%), Italy (11.1) and Greece (26.8%), the upside for
multinational
profits would seem to be limited, unless the economy in the US can show much more
improvement. The unemployment rates for France (10.5%), UK (7.8%) and
Belgium (7.4%) are also not good. Only Netherlands (5.8% and Germany (5.4%)
are
at what Americans call "full employment"
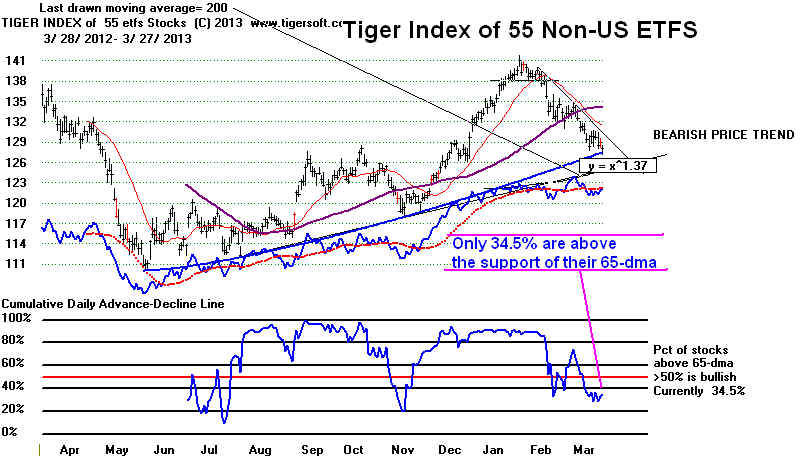
That's why I think the March Jobs' Report, which is due out next Friday, will be
particularly important for the stock market. Last
year the March Jobs' Report
was
"disappointing" and the DJI broke down from its rectangle pattern after
another Peerless Sell S15.
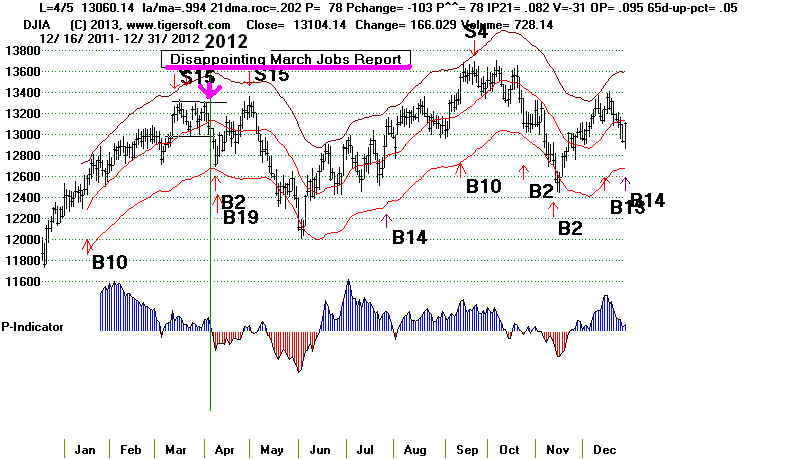
Profit-taking could be a problem now. But the Fed does not want the
market to go down.
The NYSE
A/D Line actually rose today as 10-year rates fell a little. The major ETFs'
Closing
Powers were strong. DIA, SPY, MDY and IWM all had Closing Power new highs.
If there is
a decline, it should be shallow. Look at how steadily positive the Accumulation
Index is.
This represents institutional buying intra-day and on weakness. That is
a big
cushion for the market now. So, any decline should be shallow.
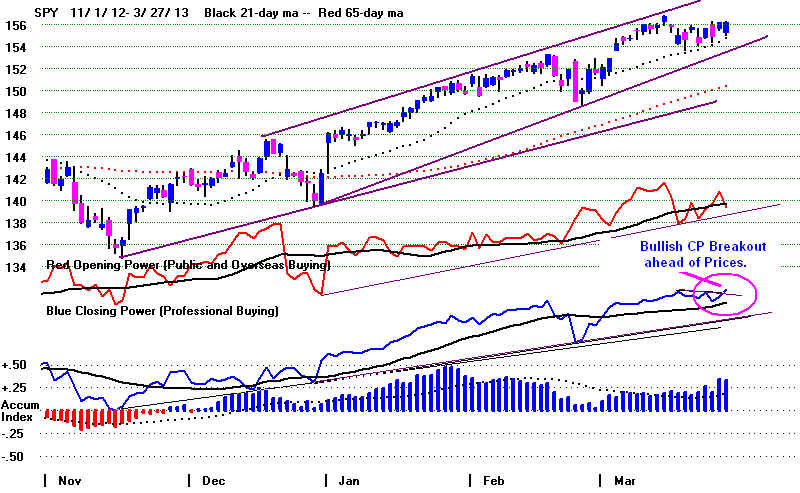
====================================================================================
OLDER HOTLINES
www.tigersoft.com/-2GBL13HL/index.htm
====================================================================================
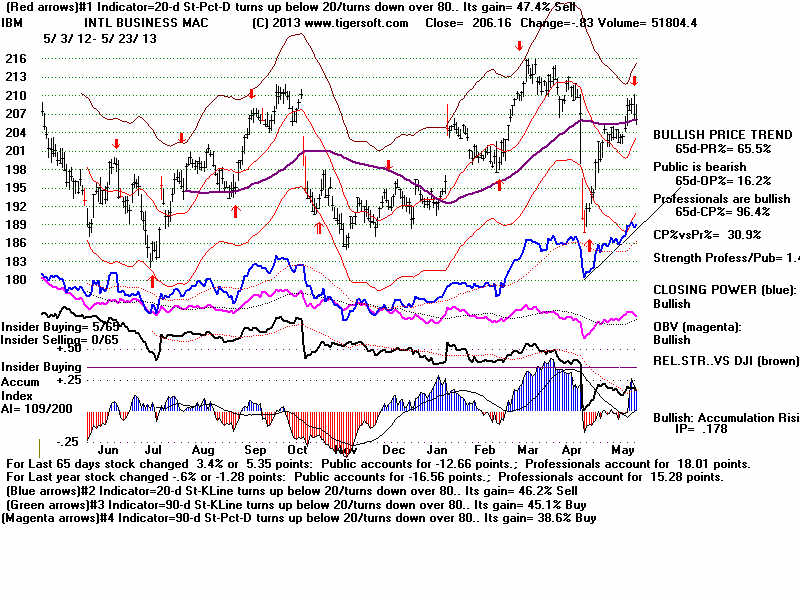
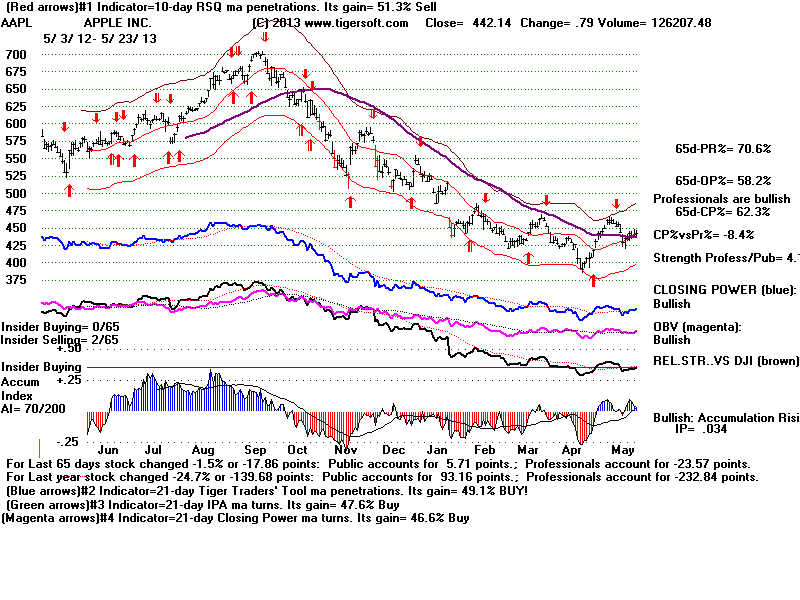
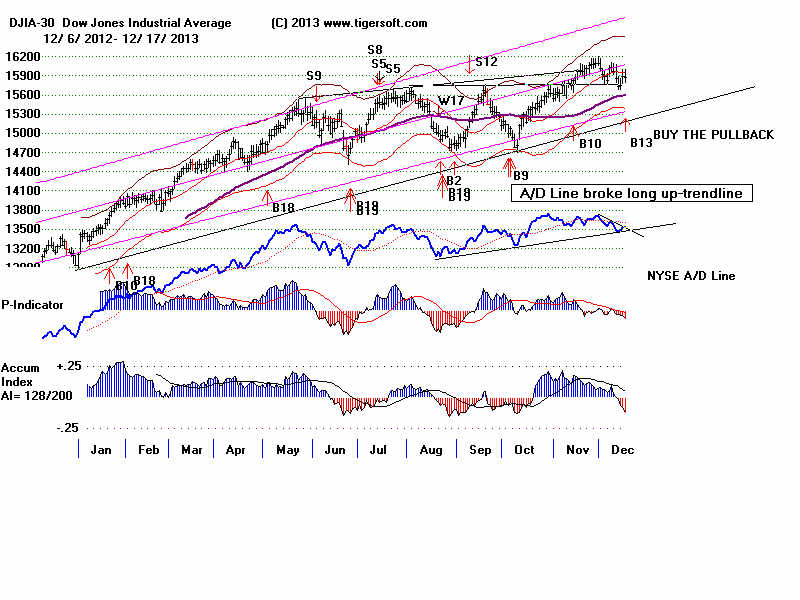
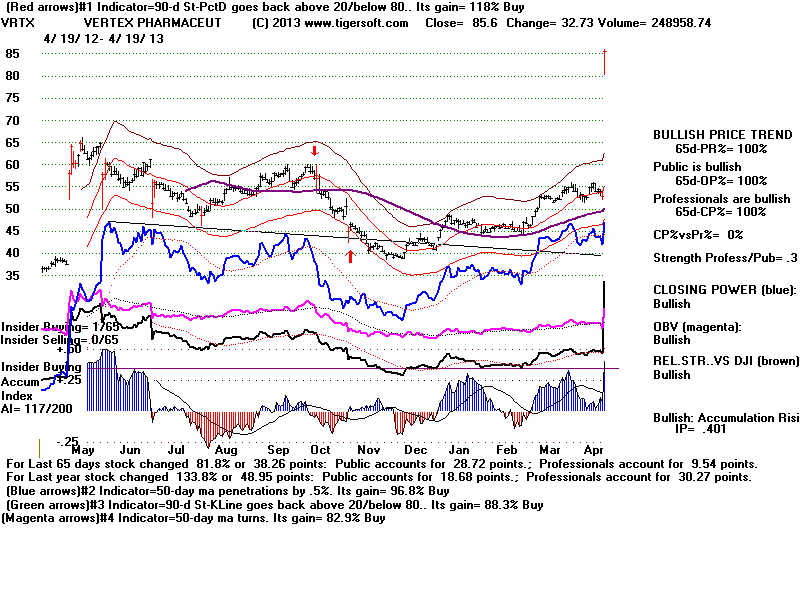
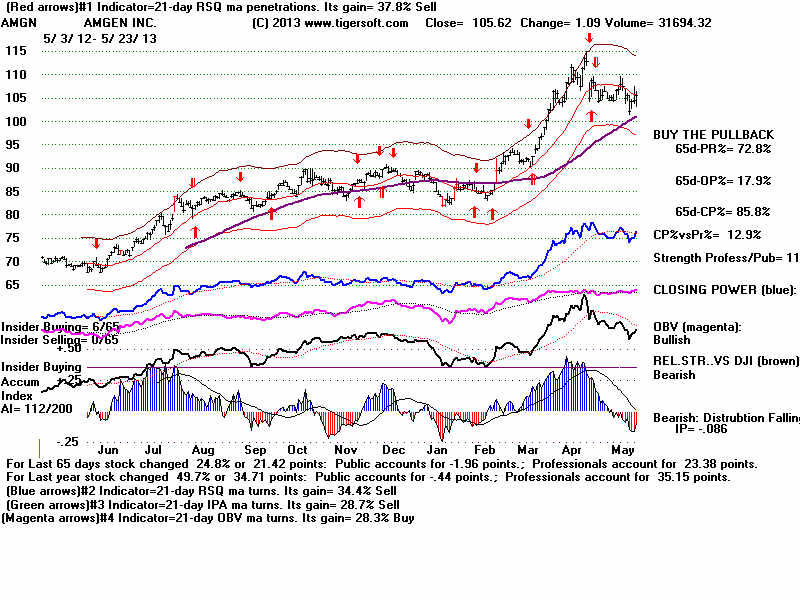
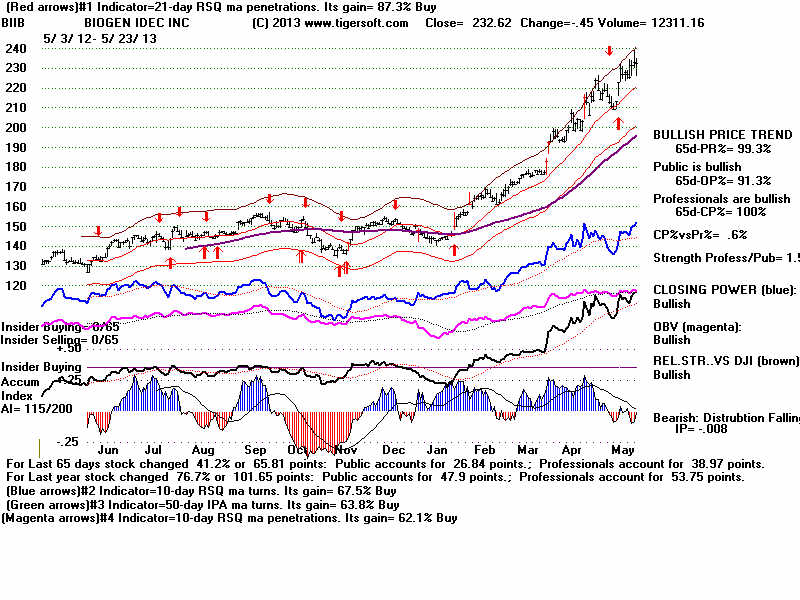
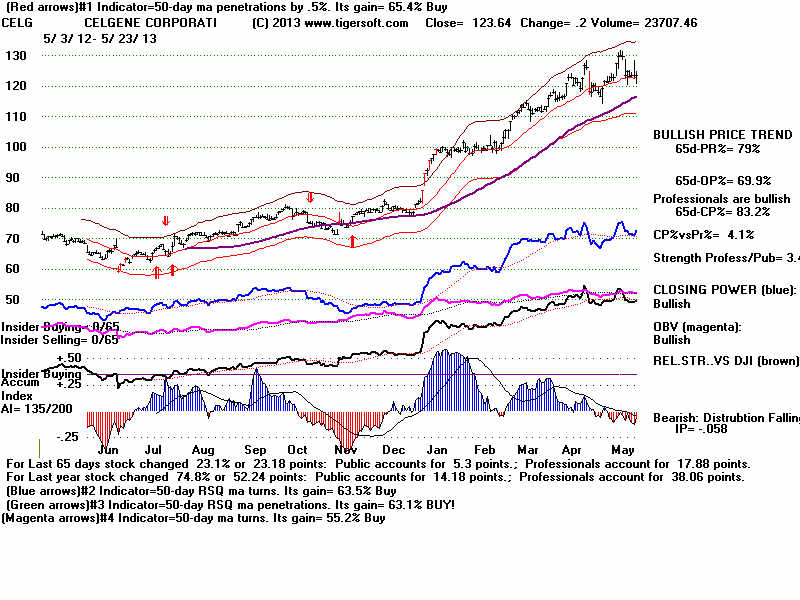
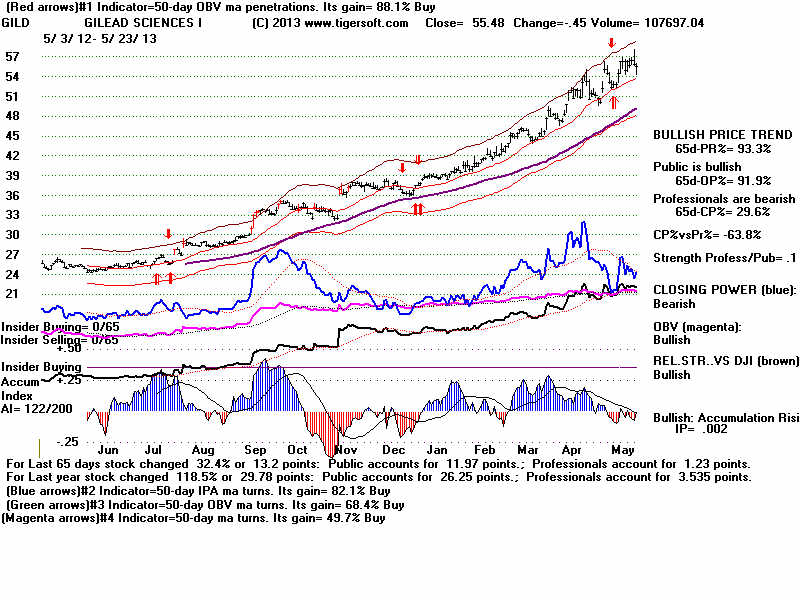
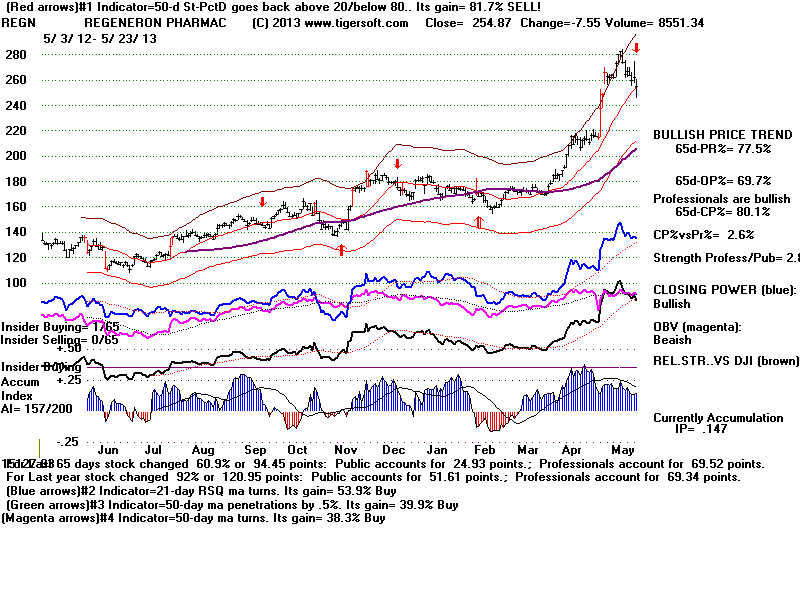
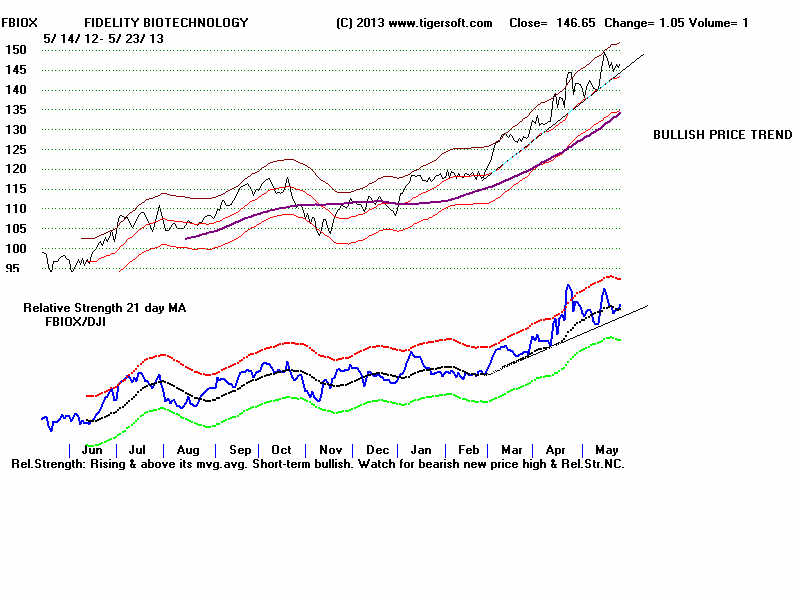
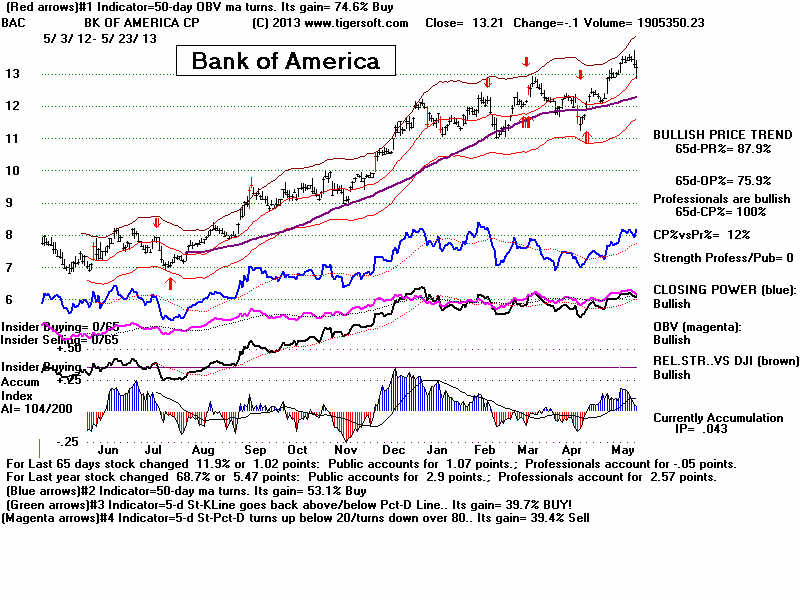
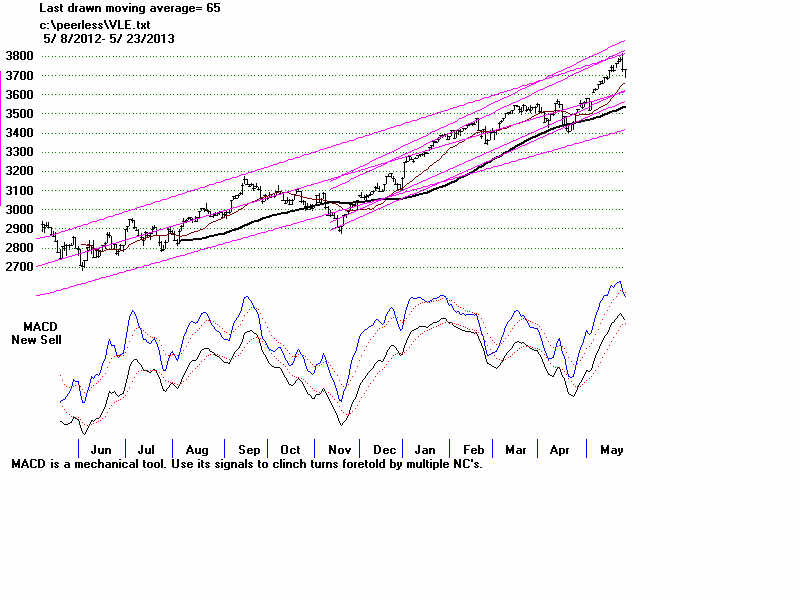
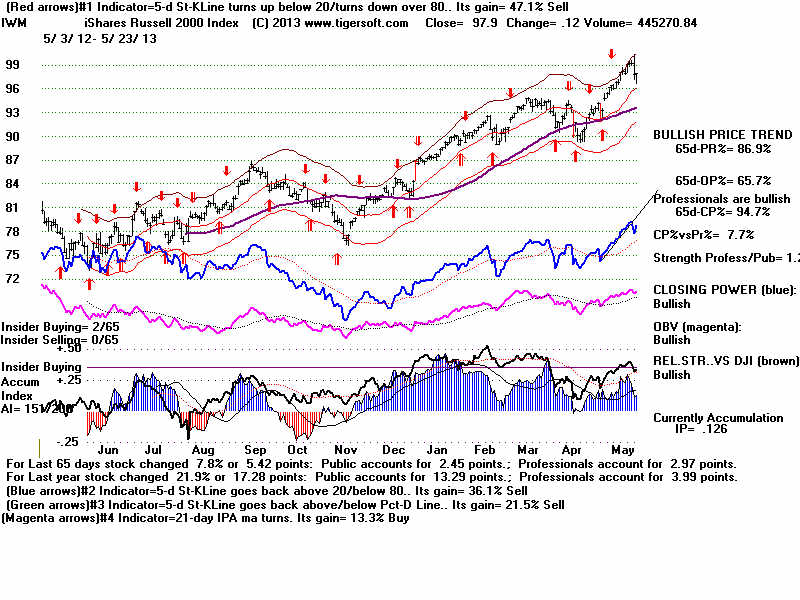
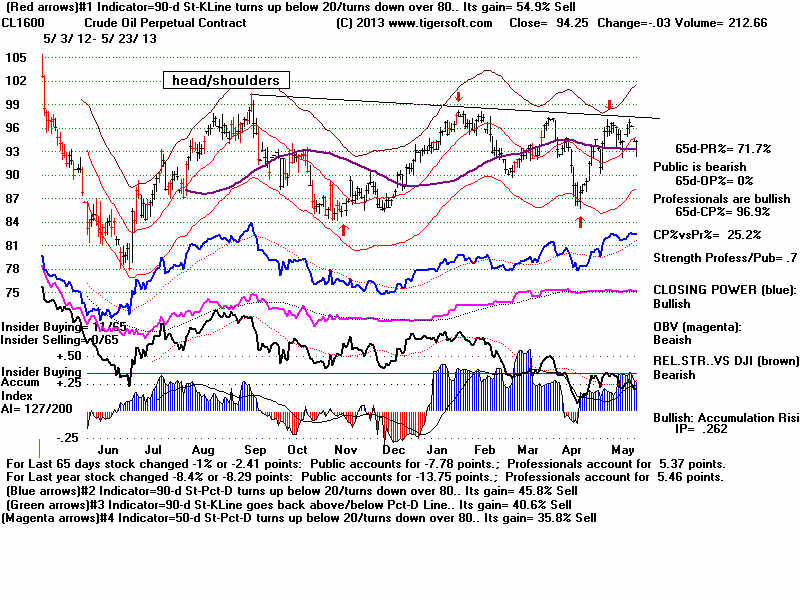
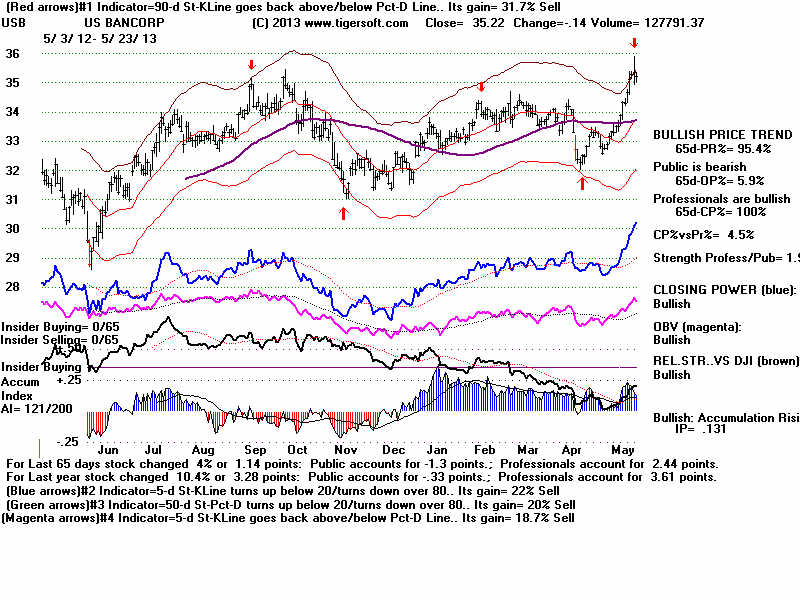
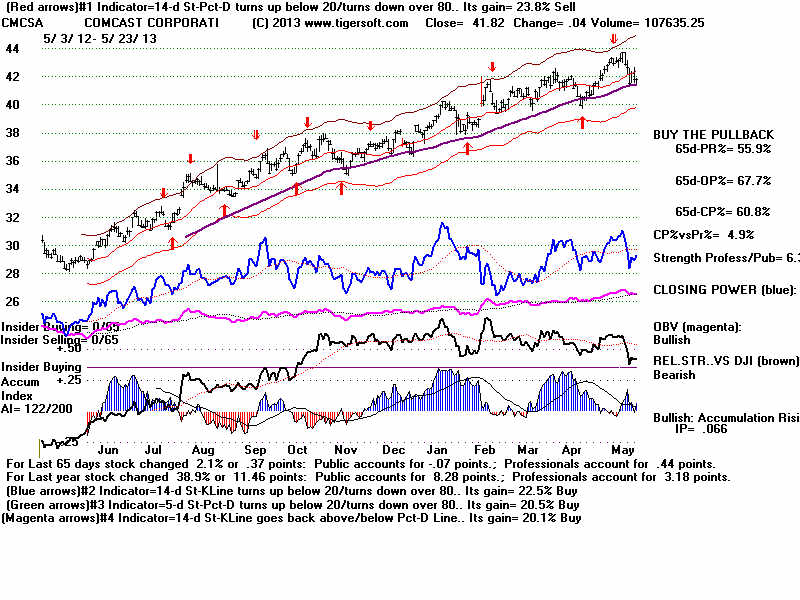
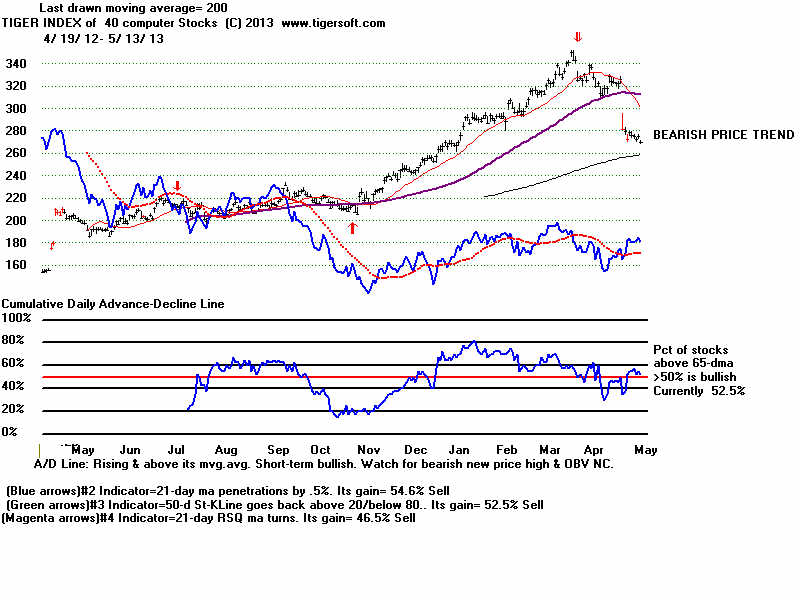
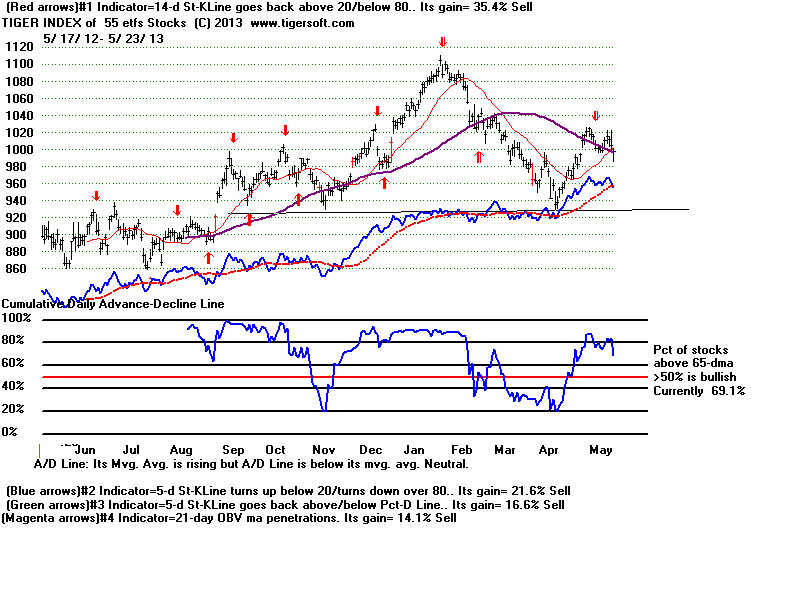
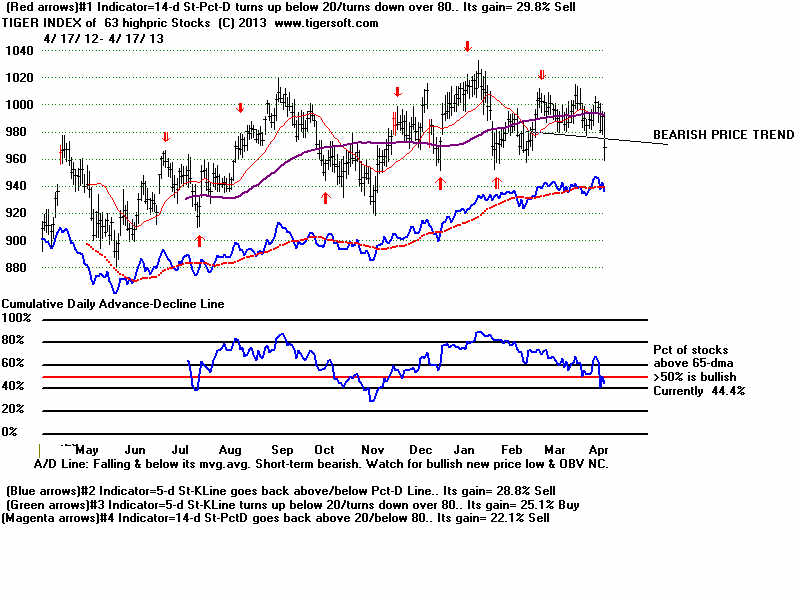
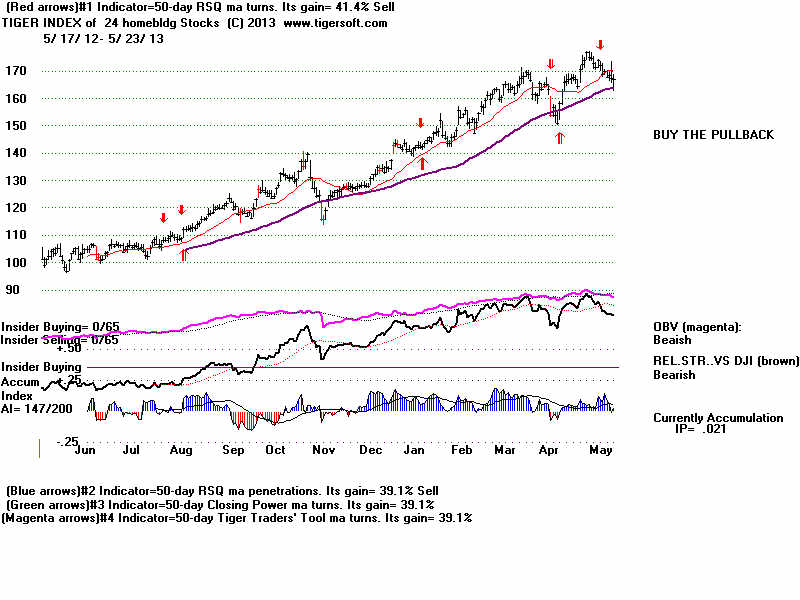
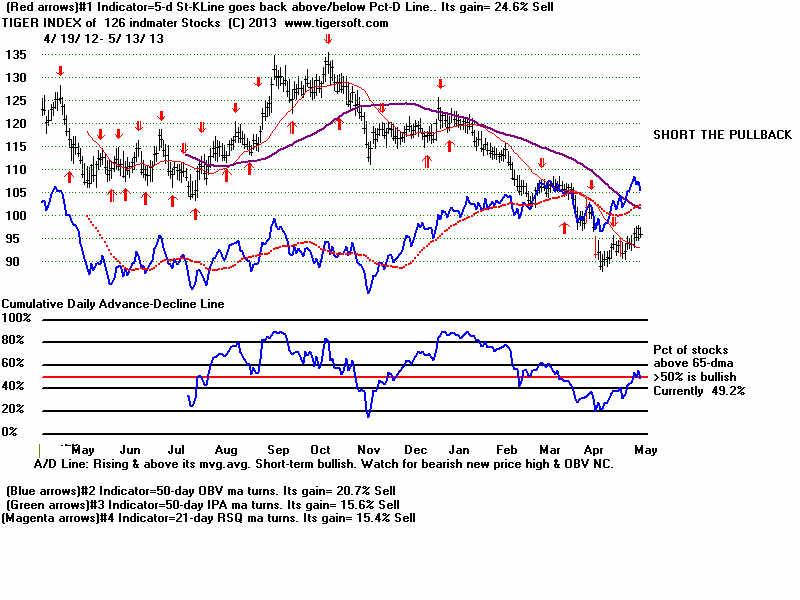
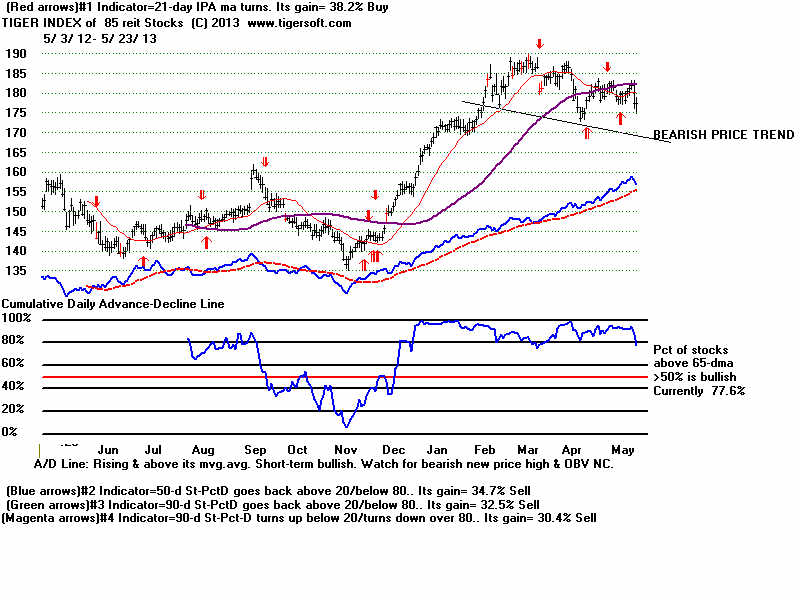
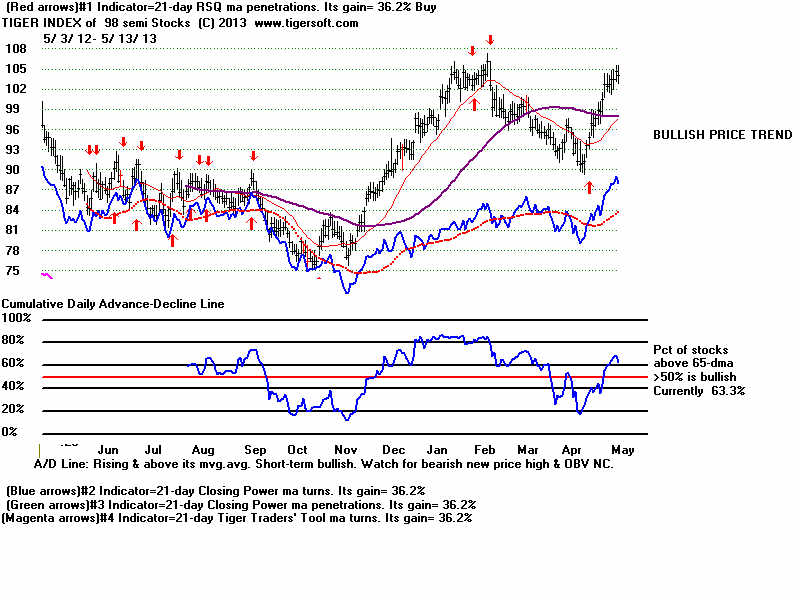
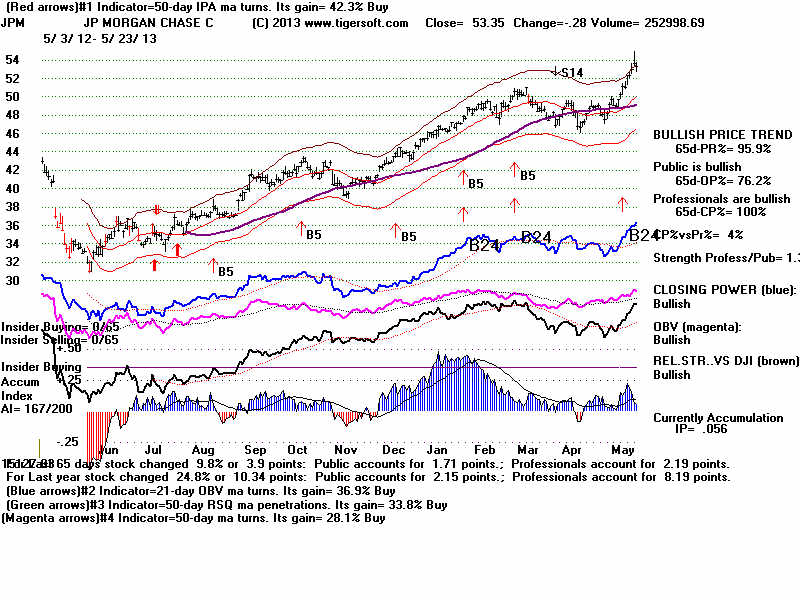
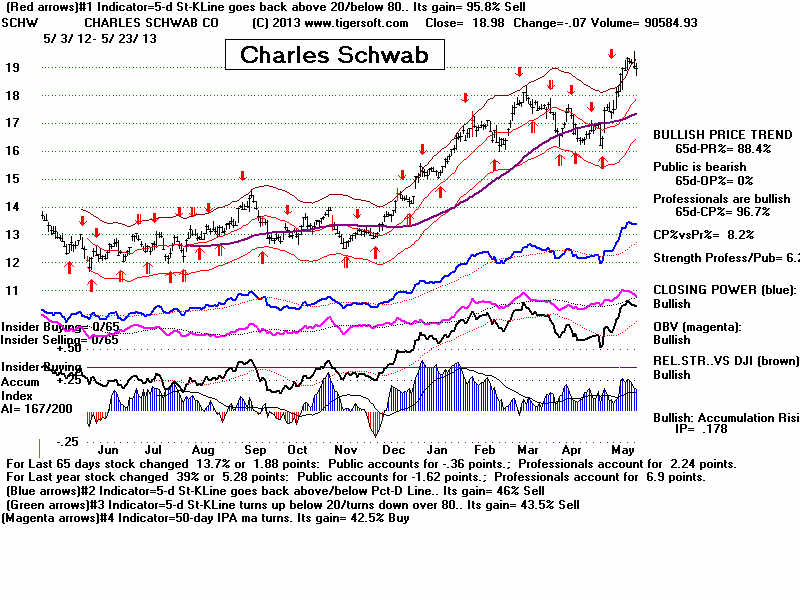
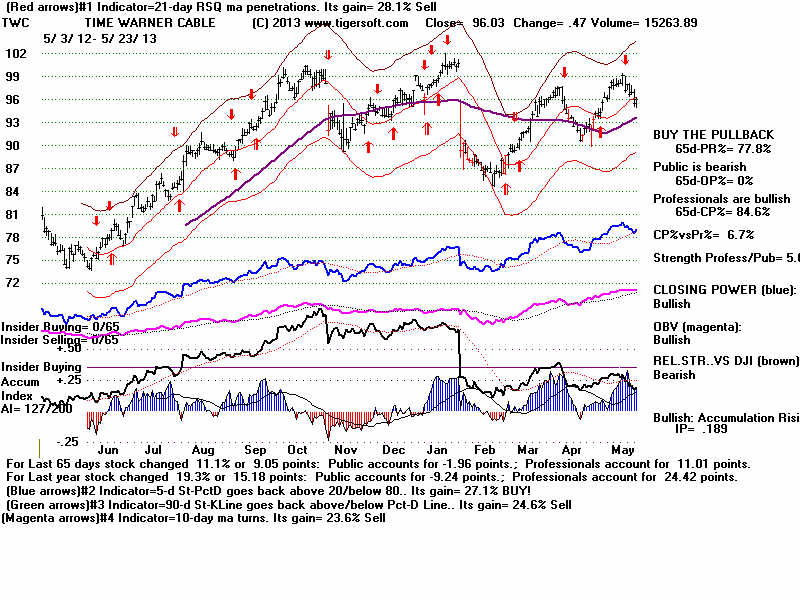
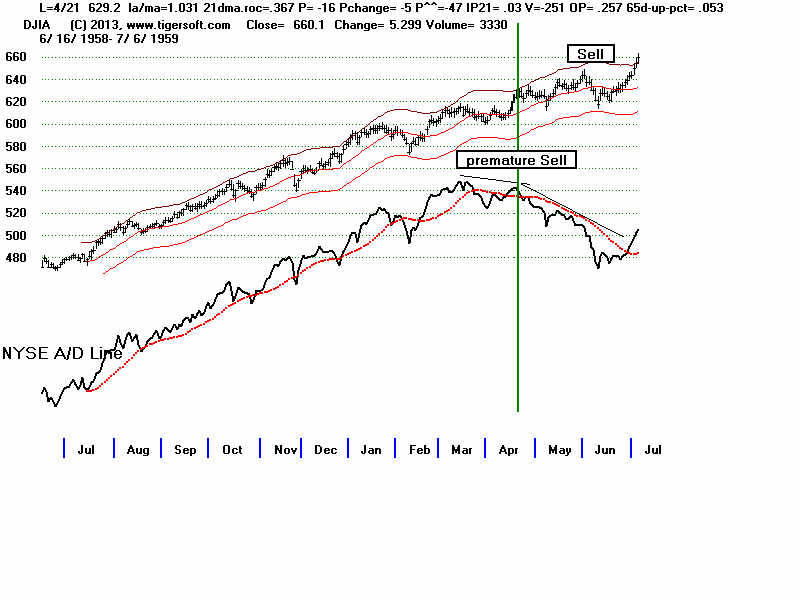
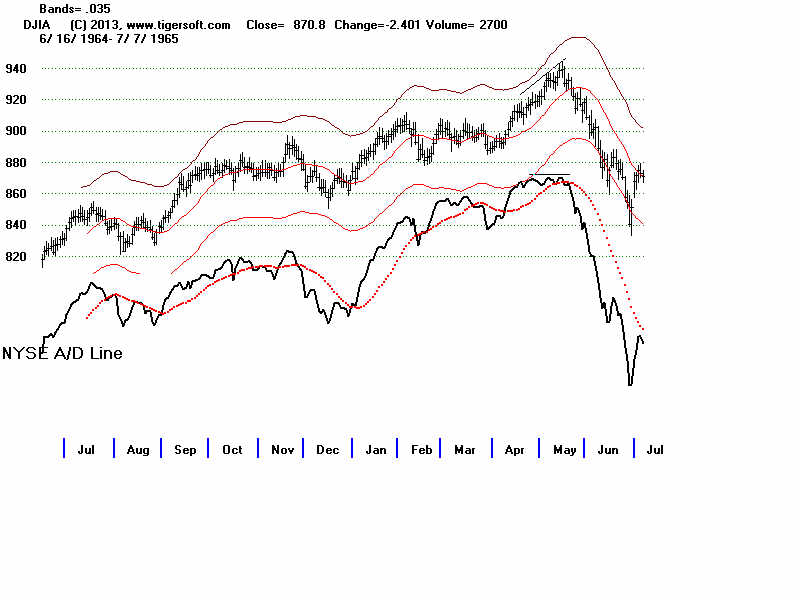
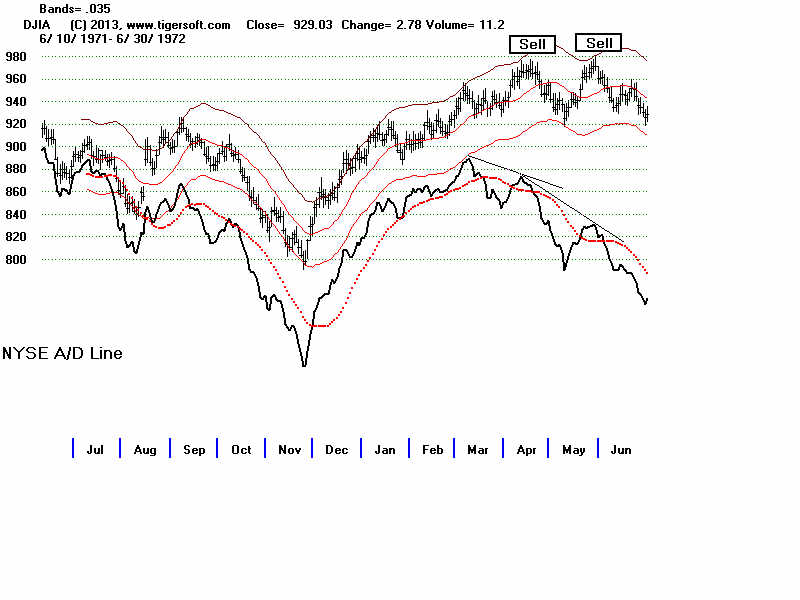
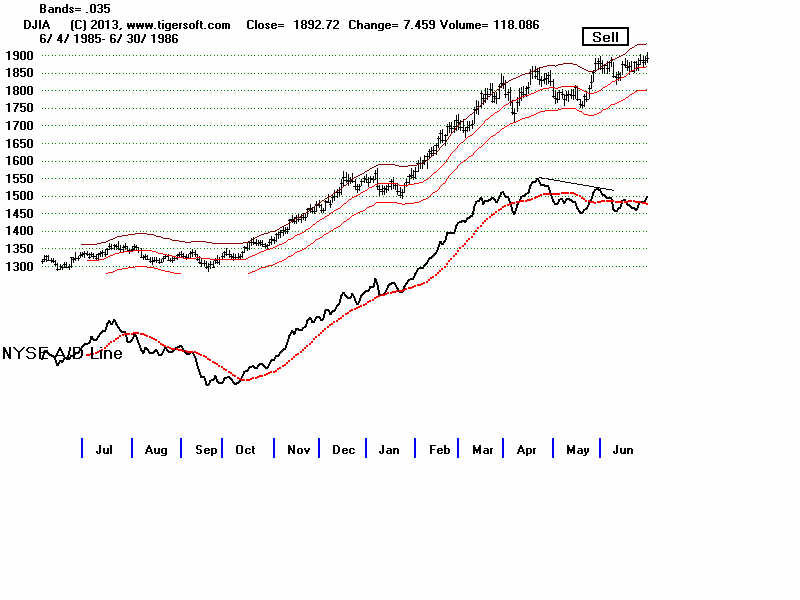
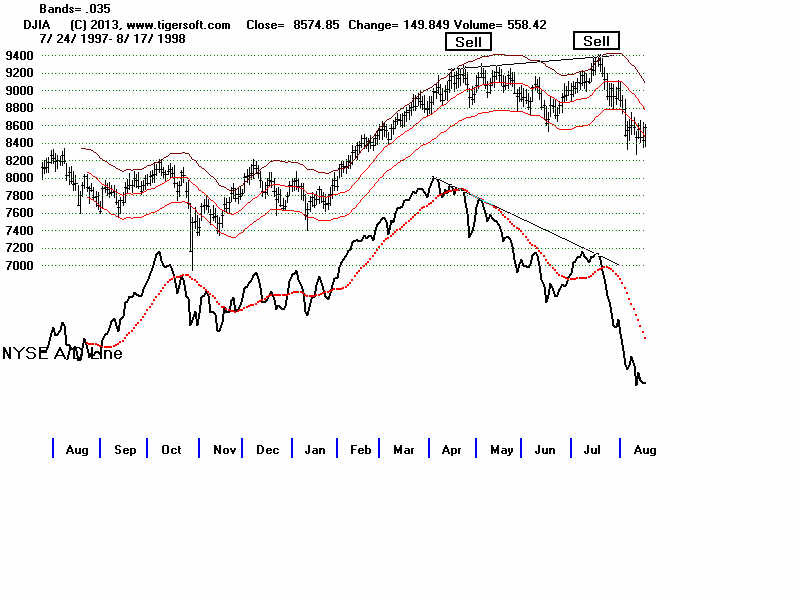
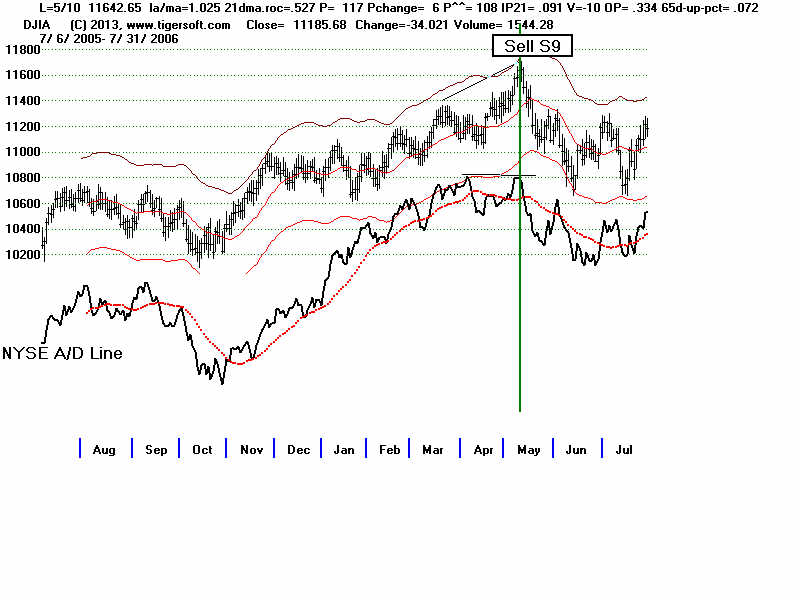
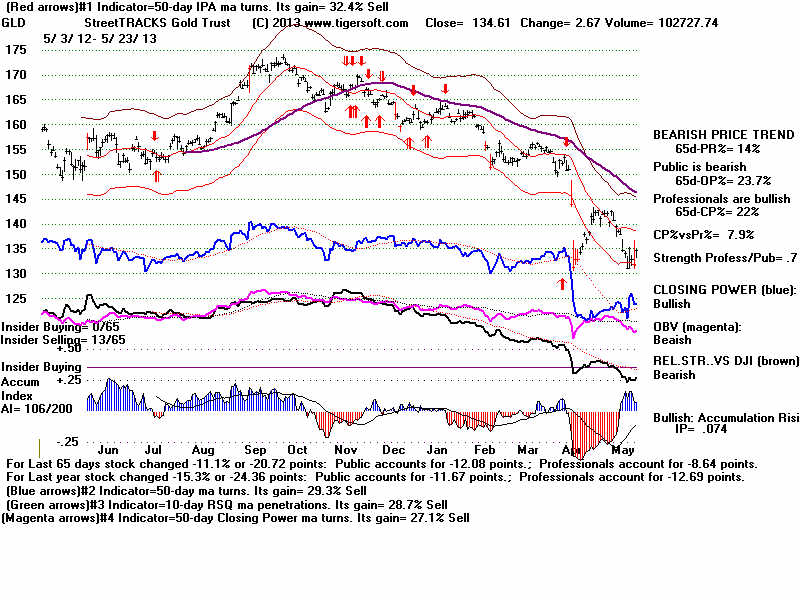
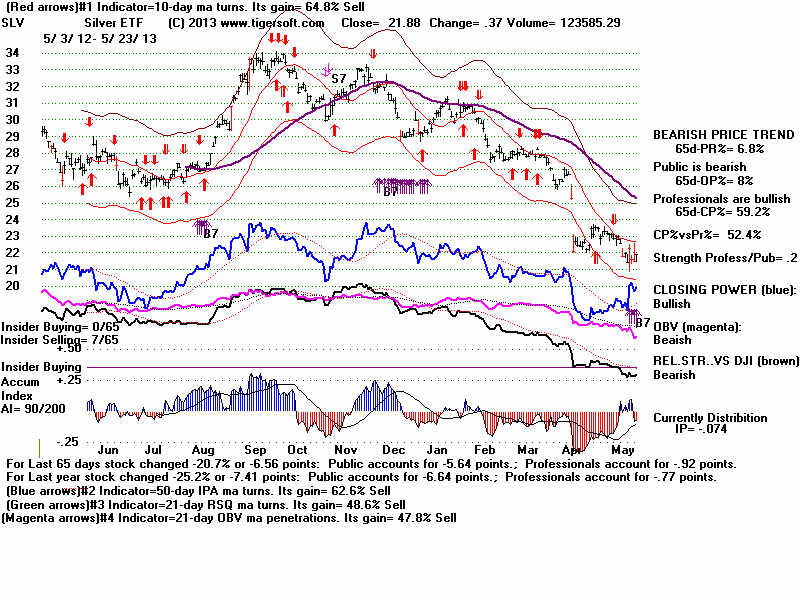
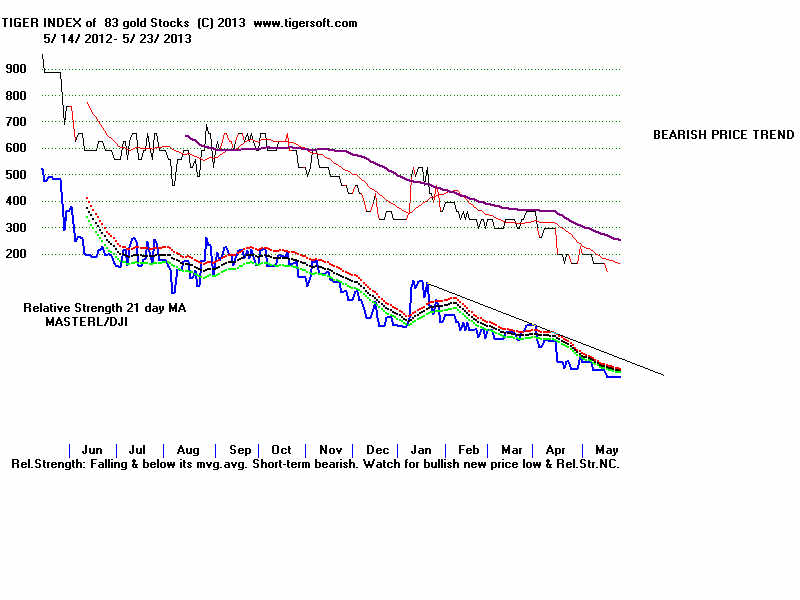
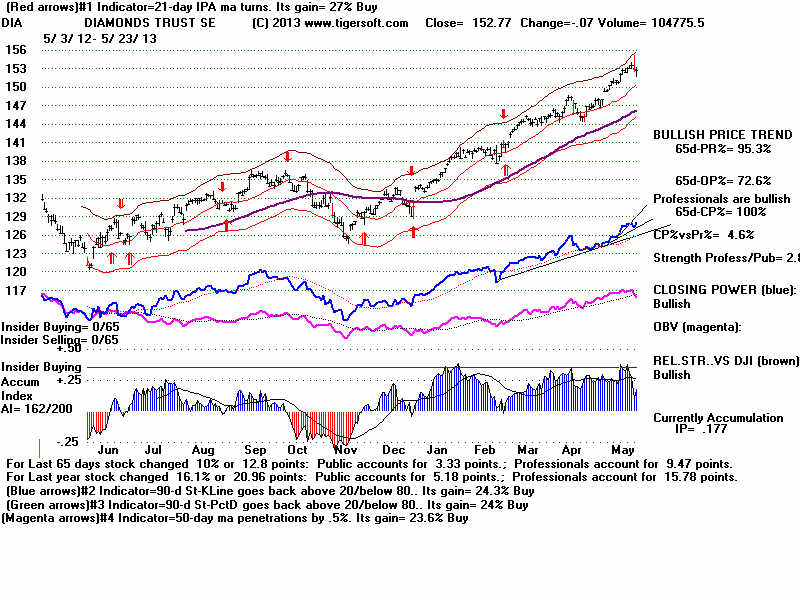
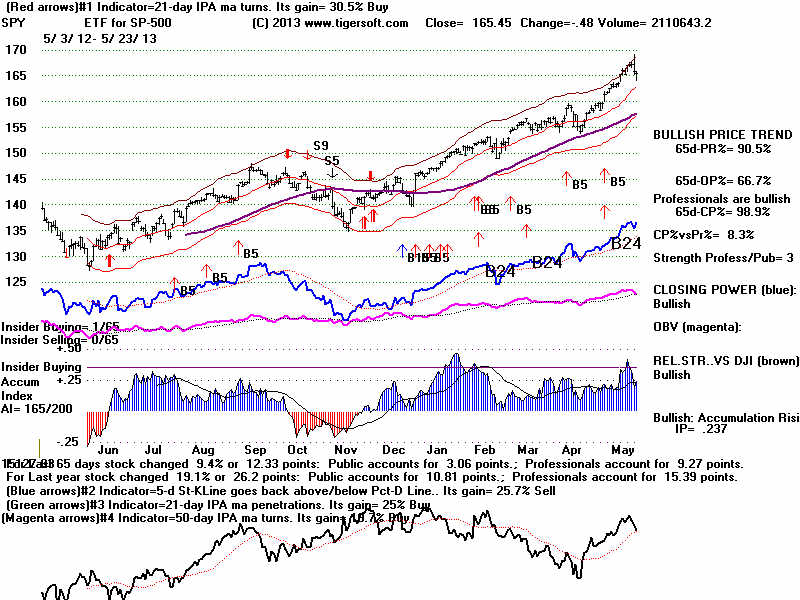
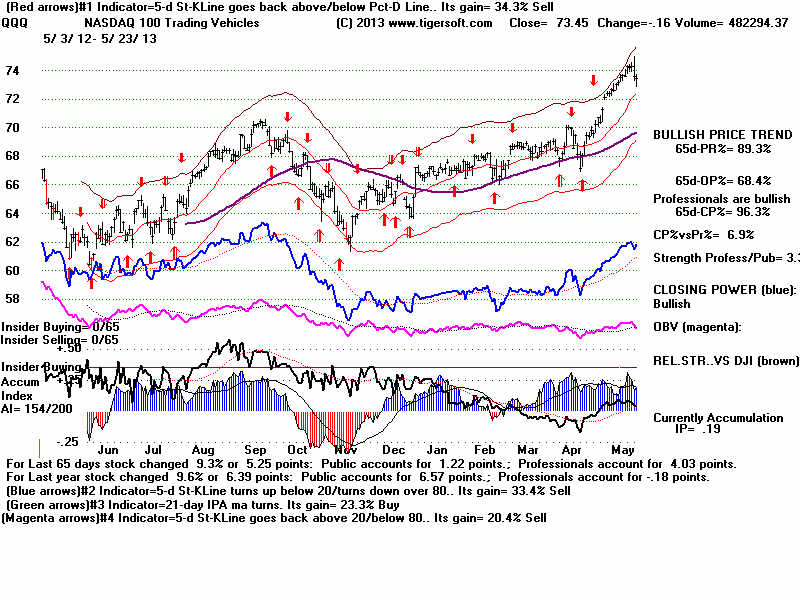
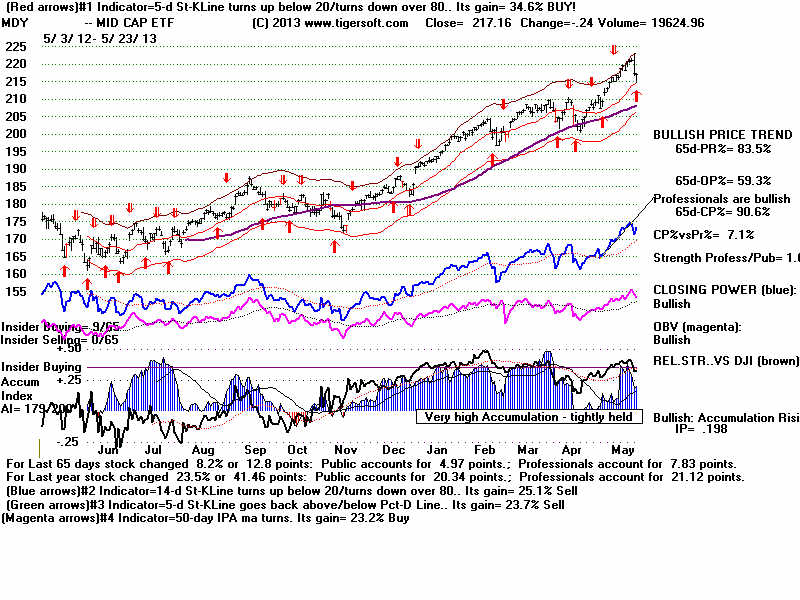
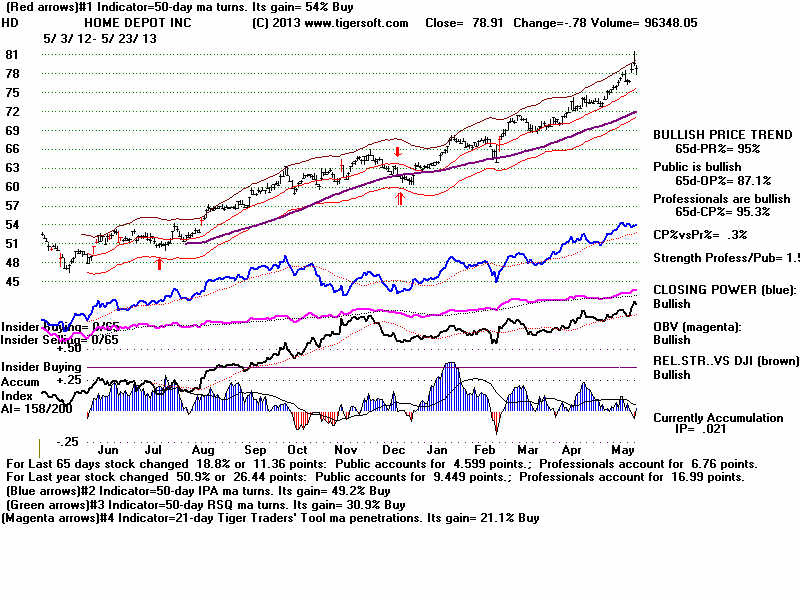
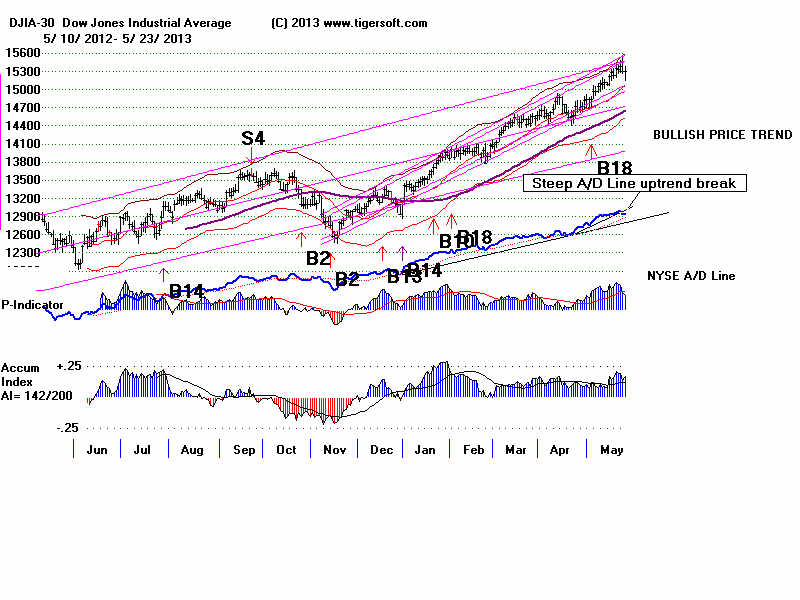
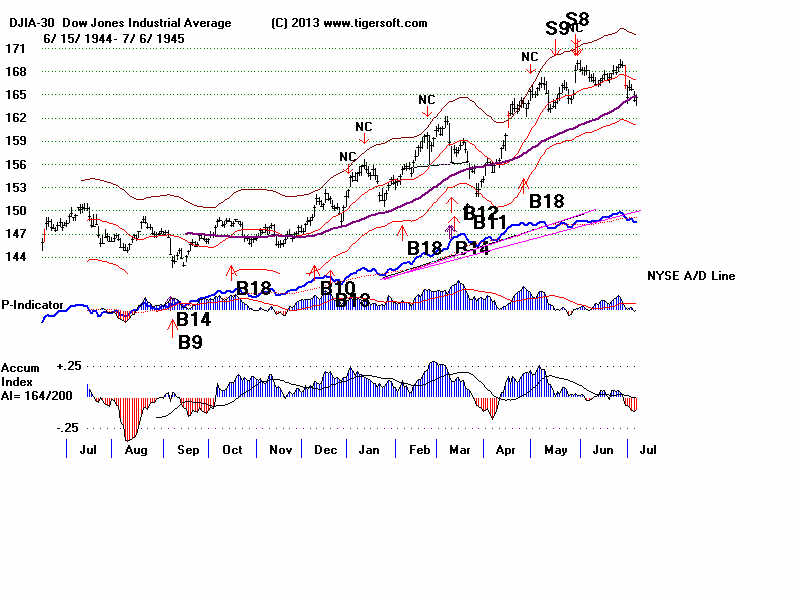
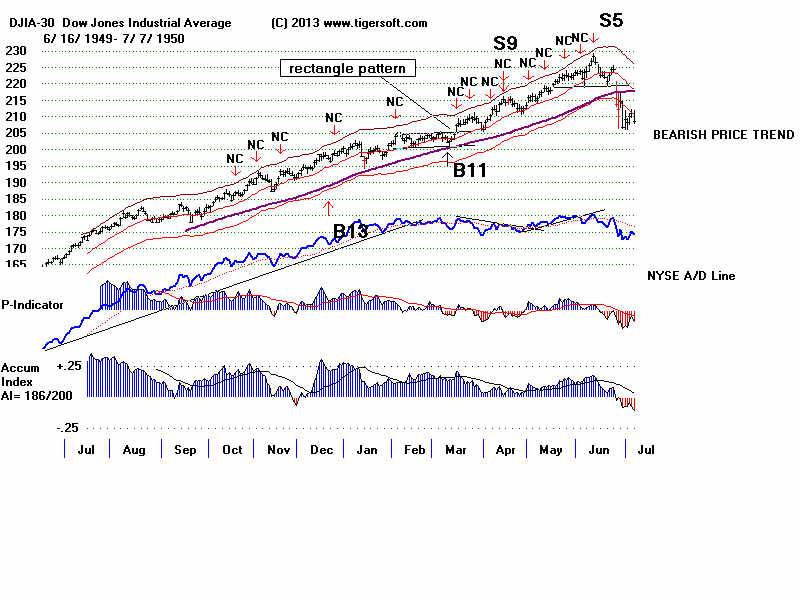
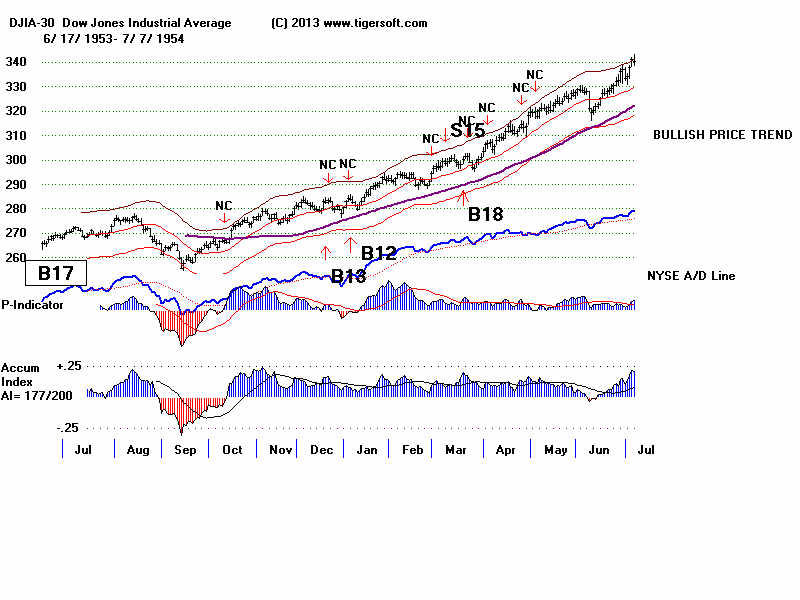
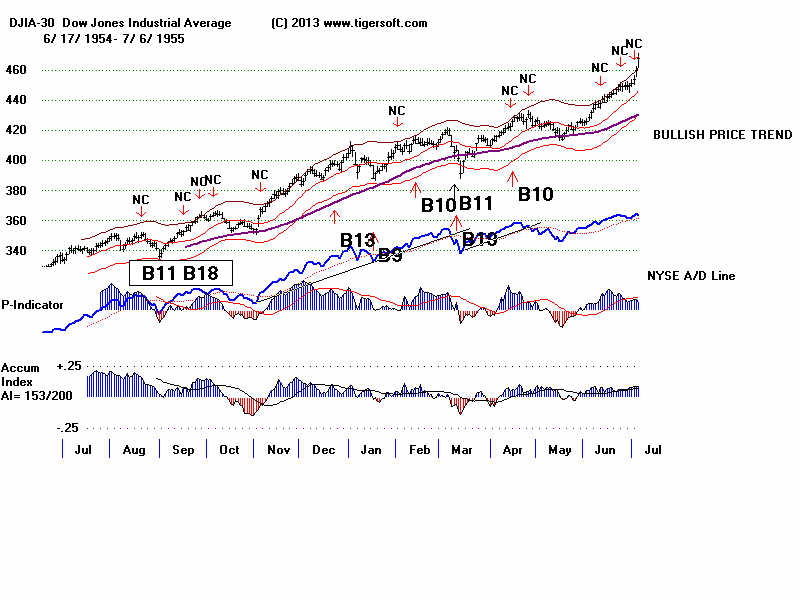
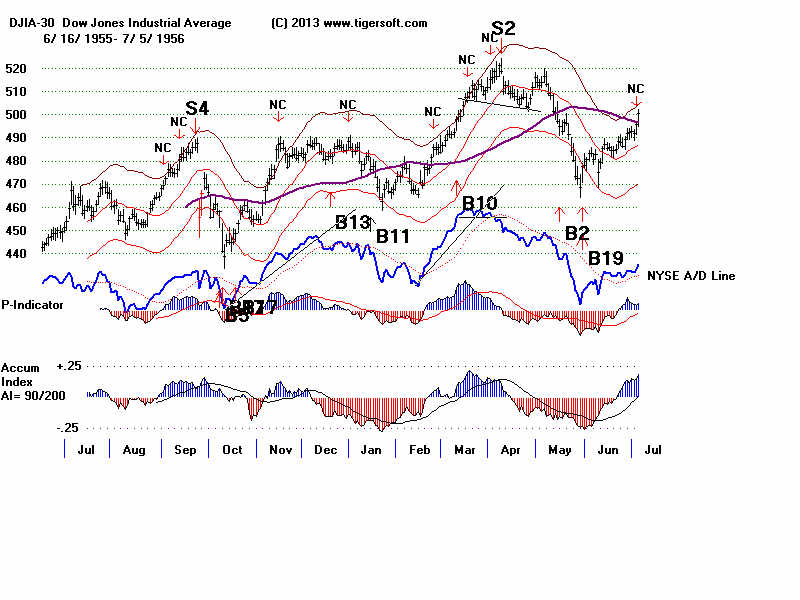
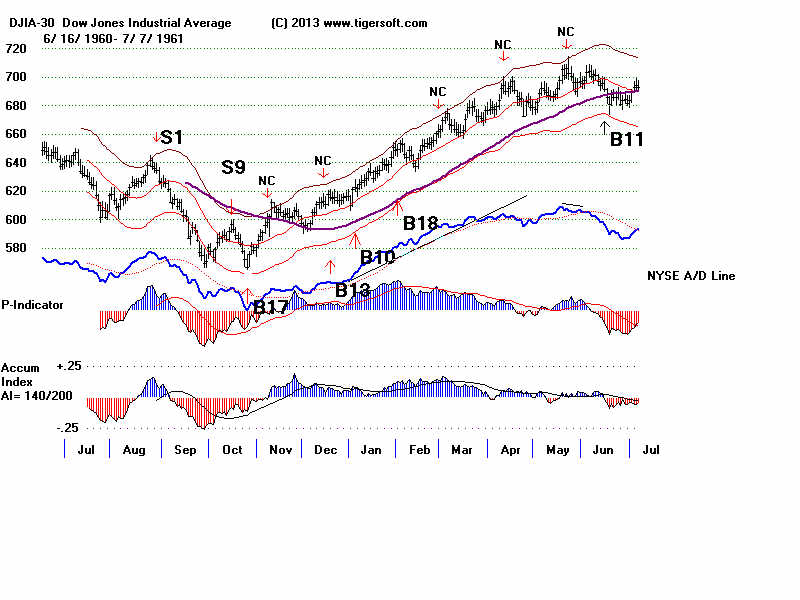
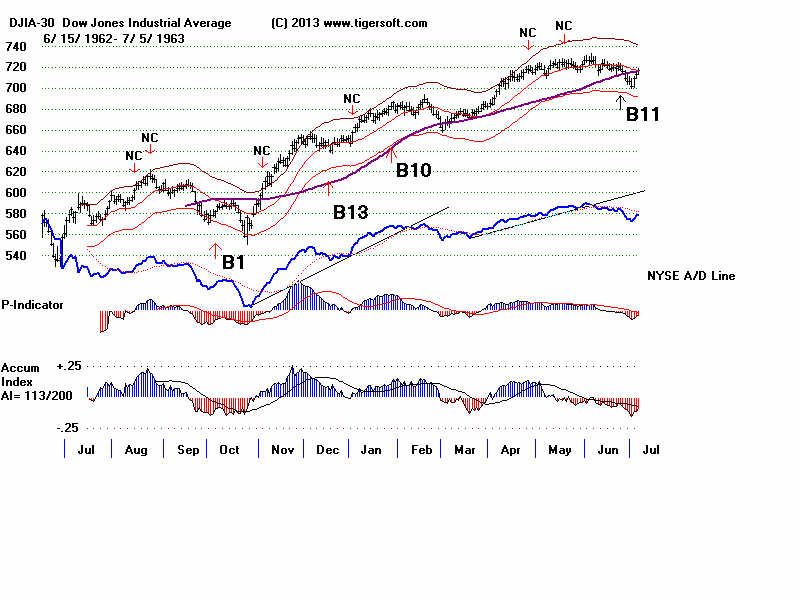
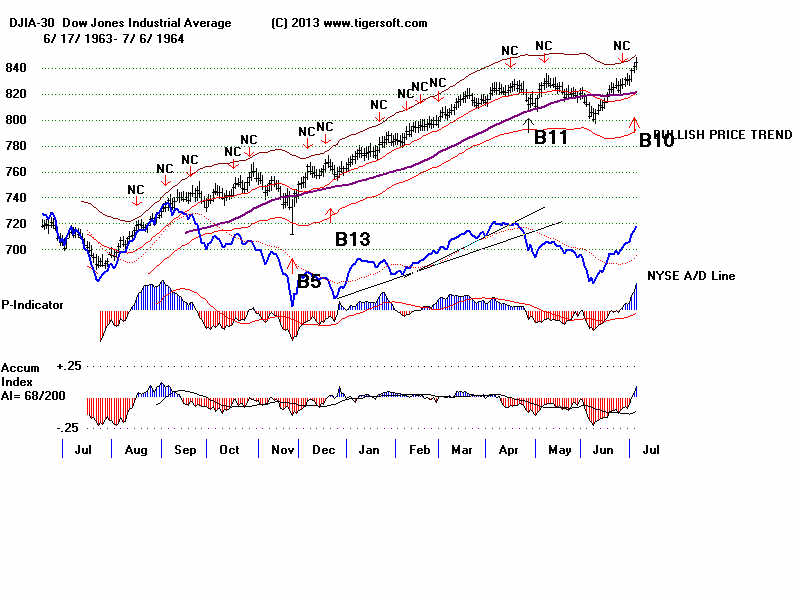
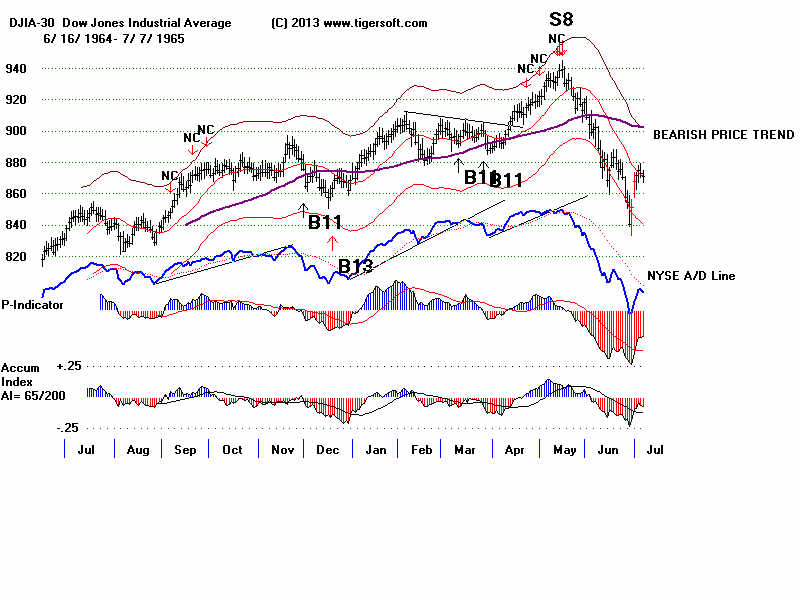
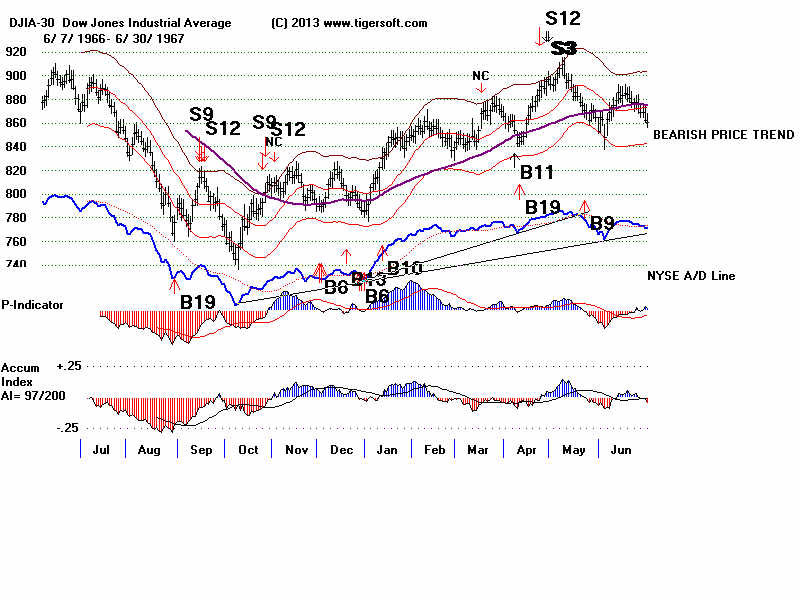
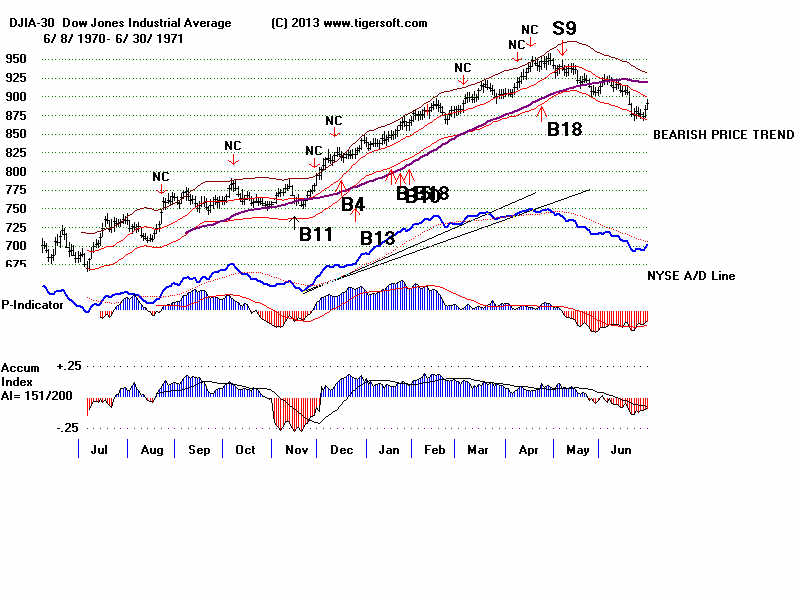
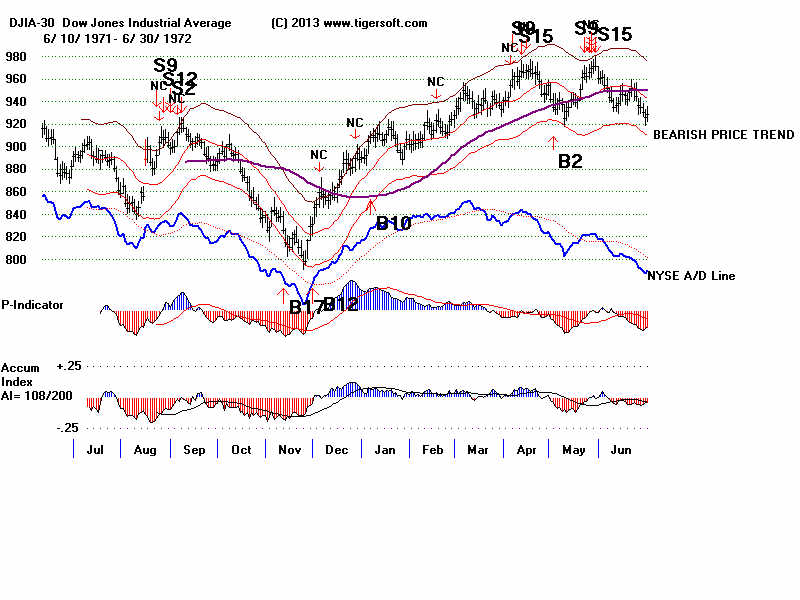
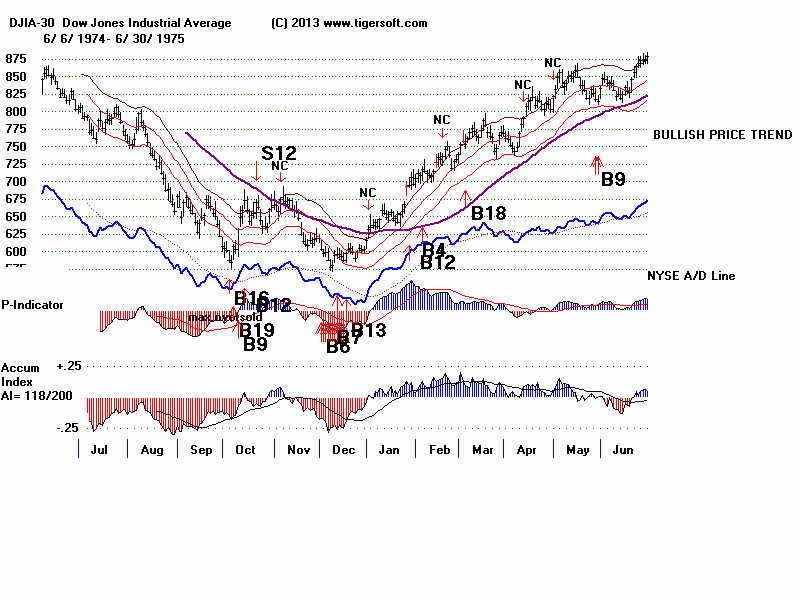
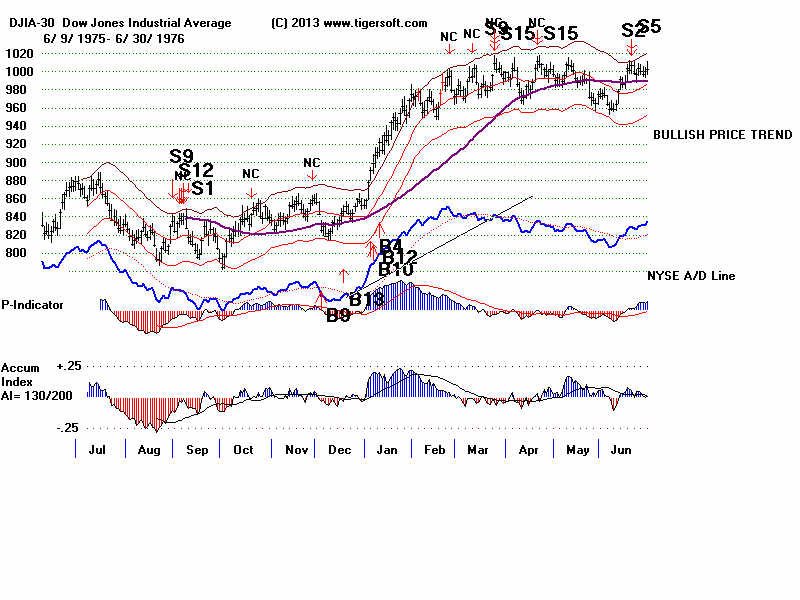
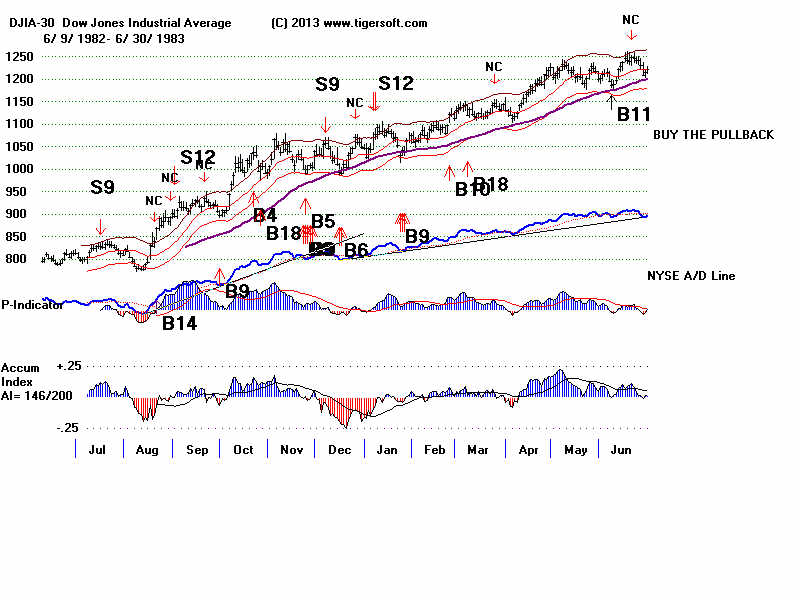
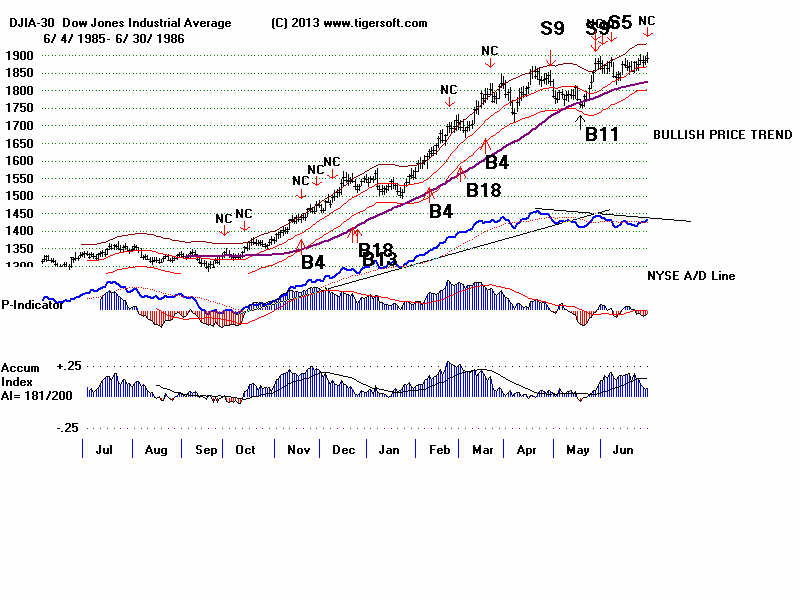
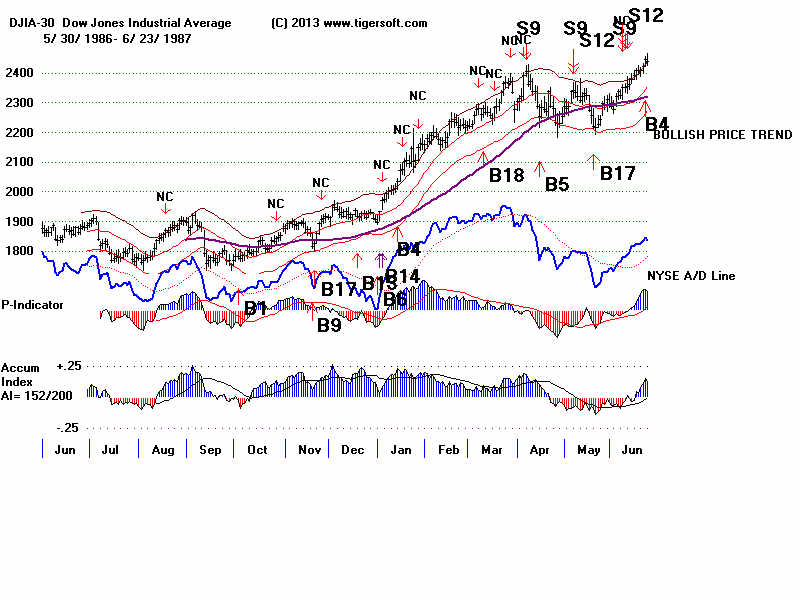
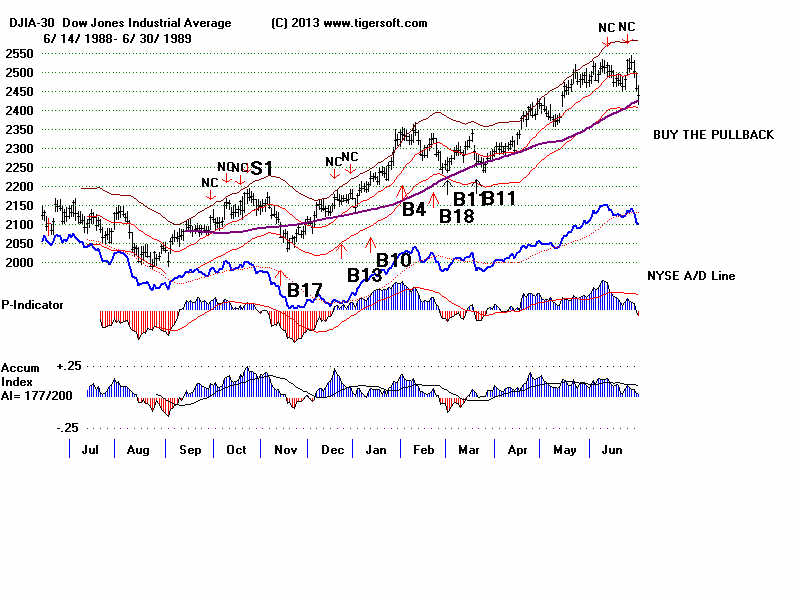
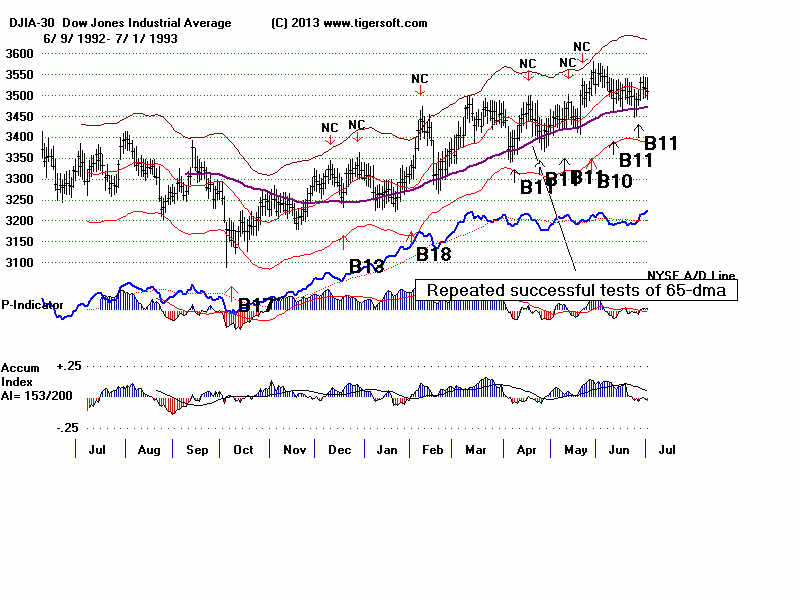
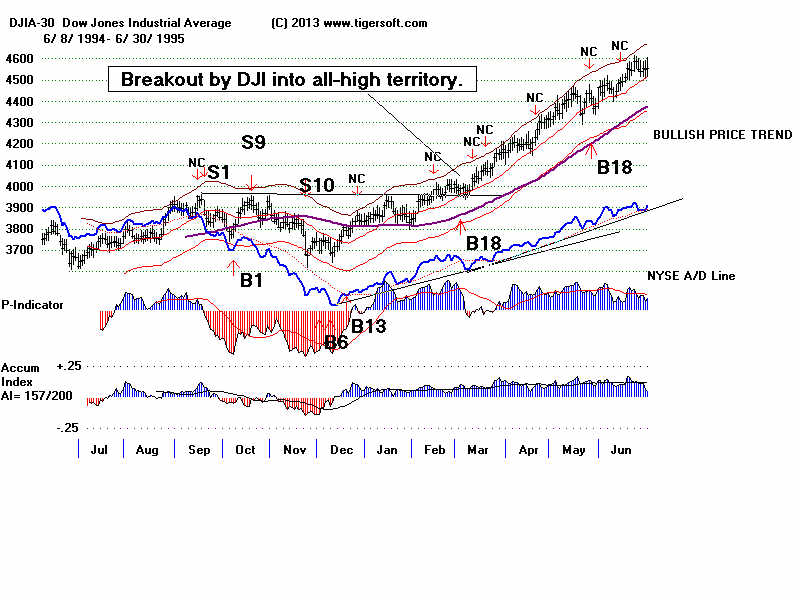
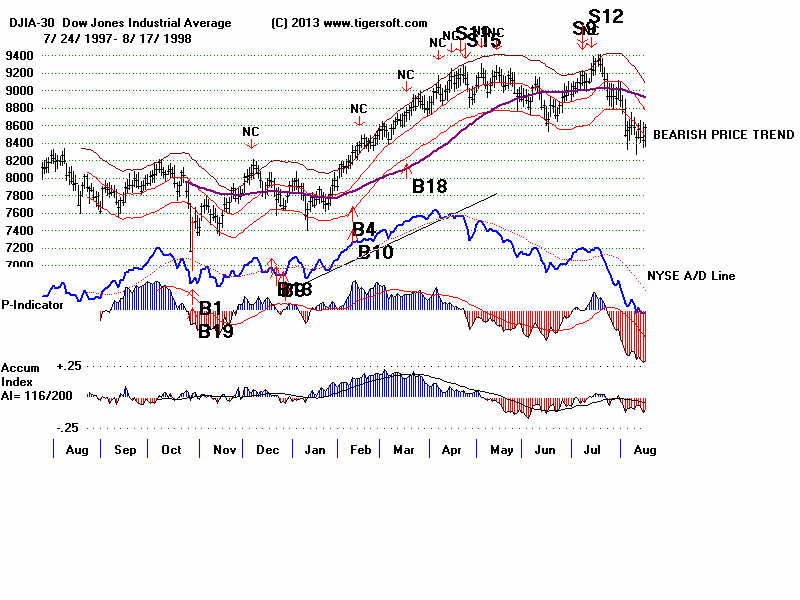
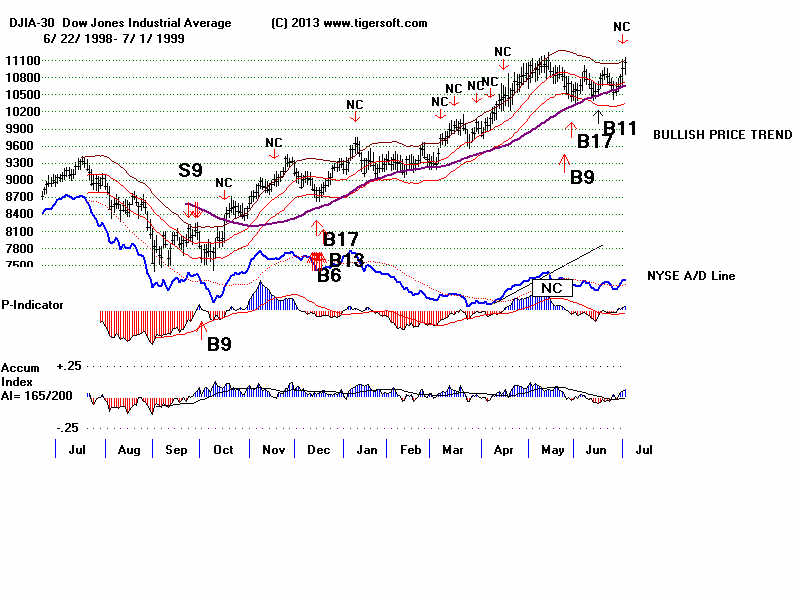
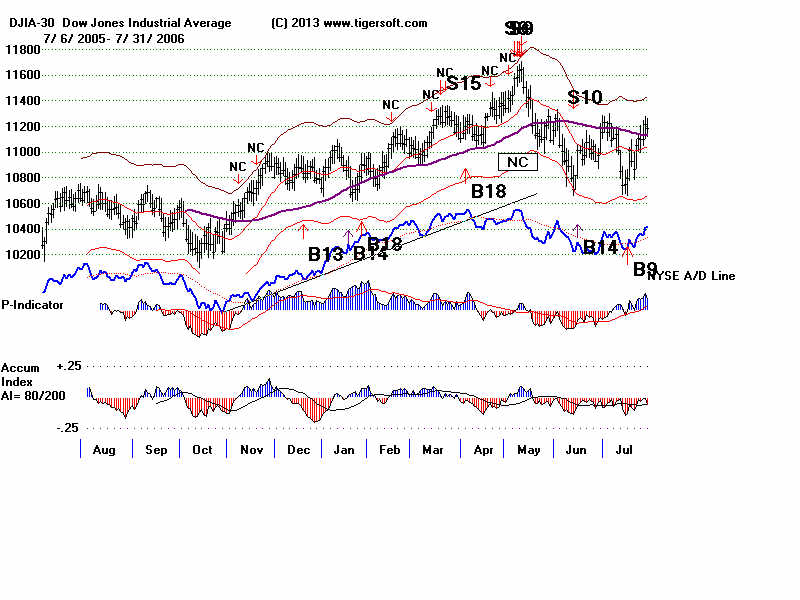
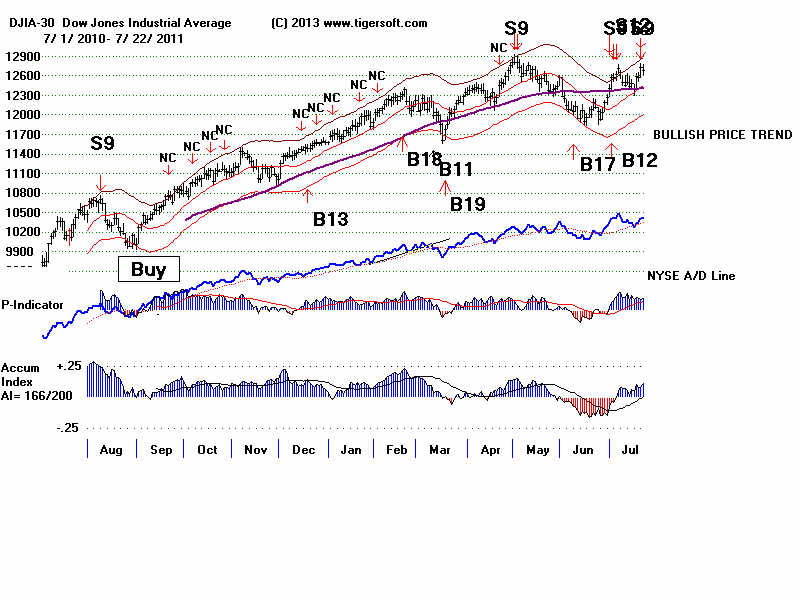
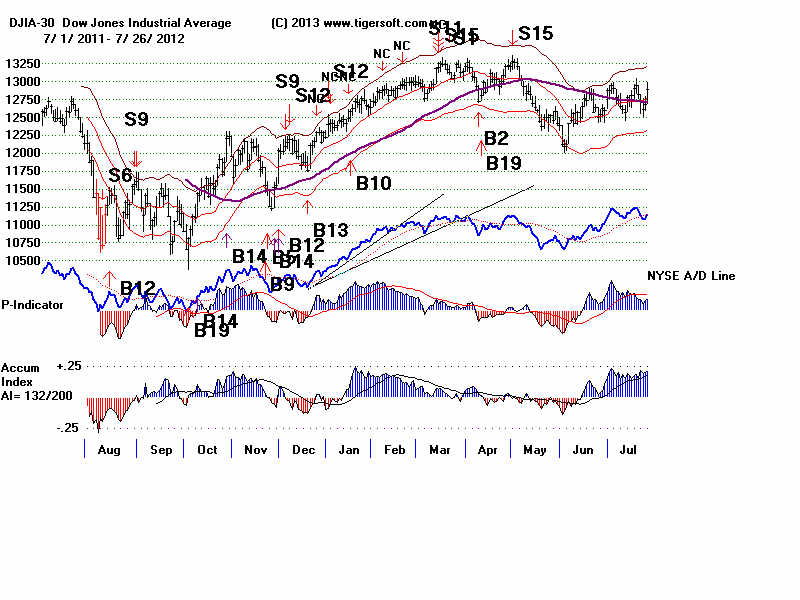
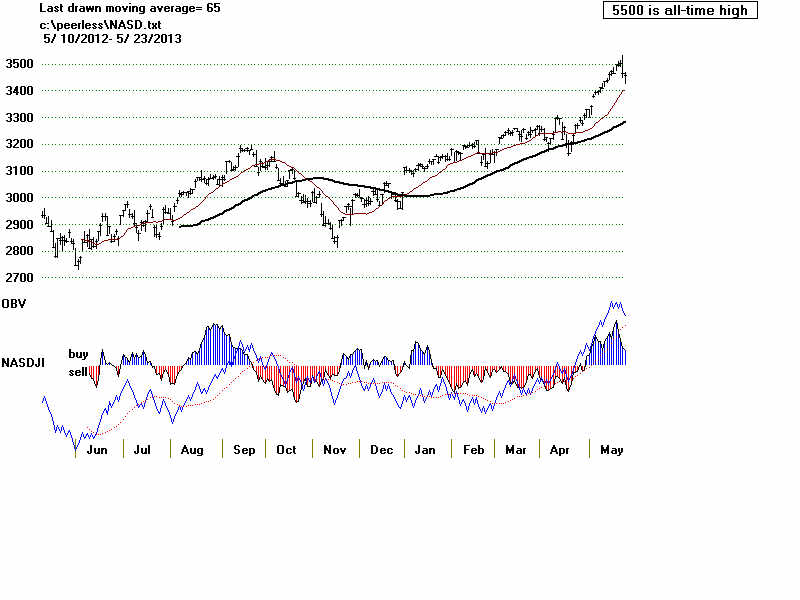
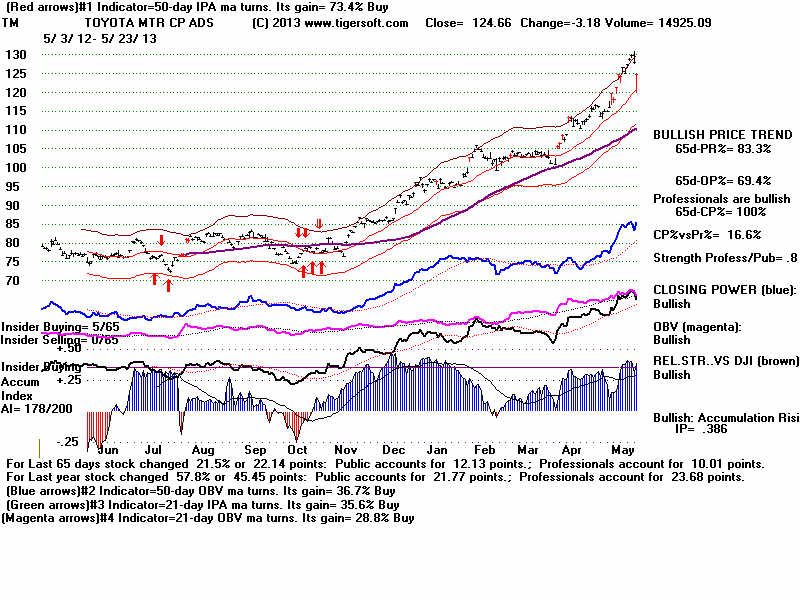
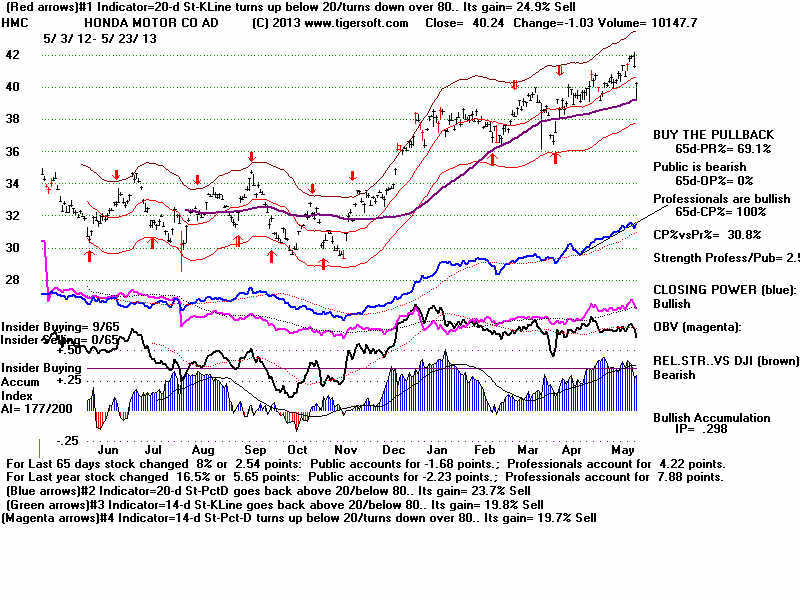
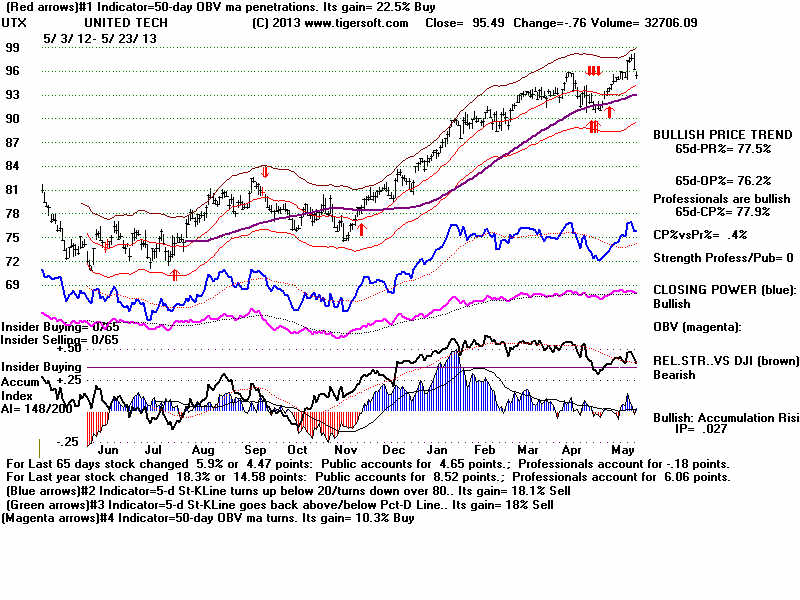
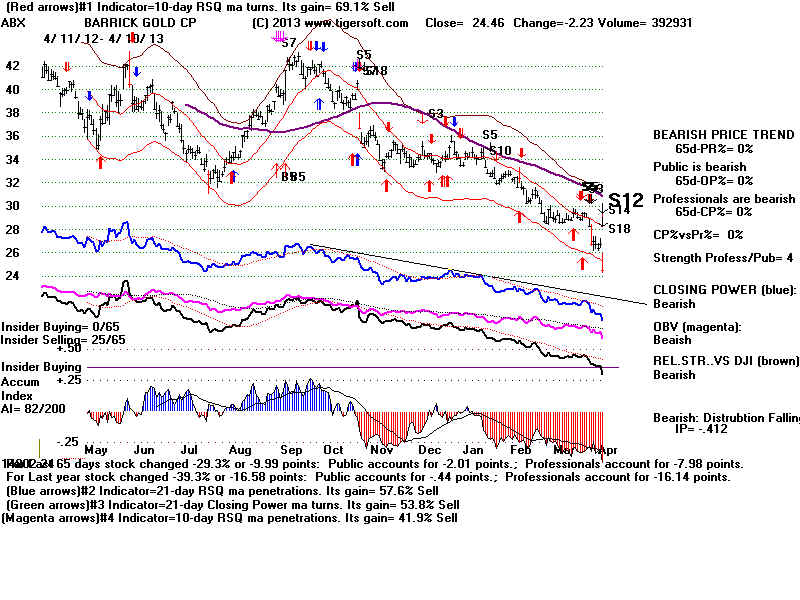
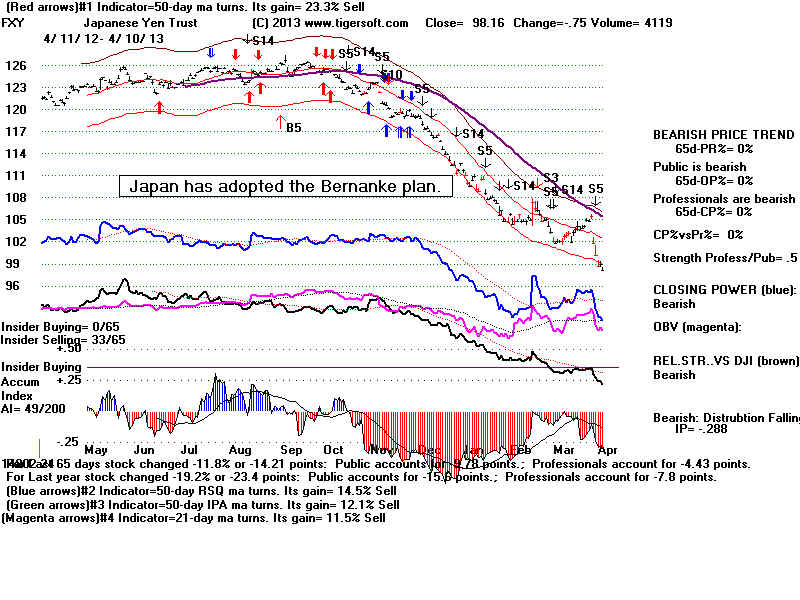
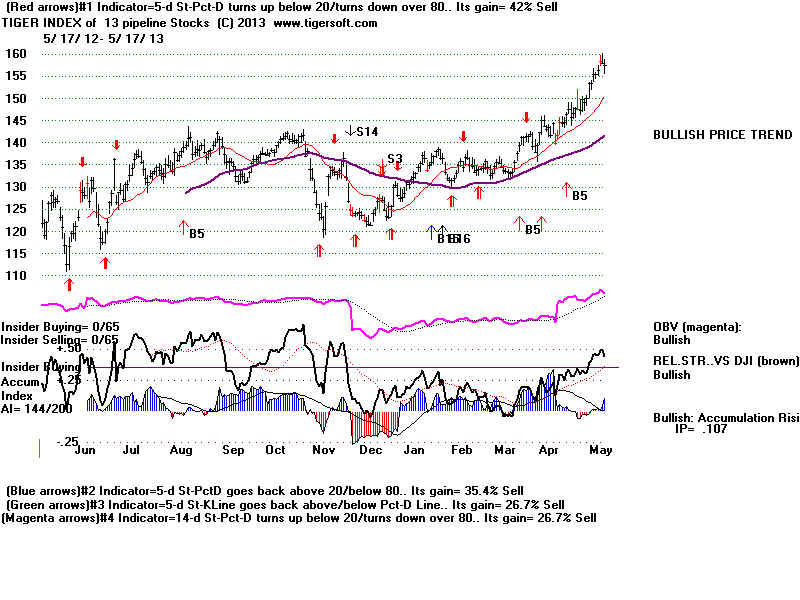
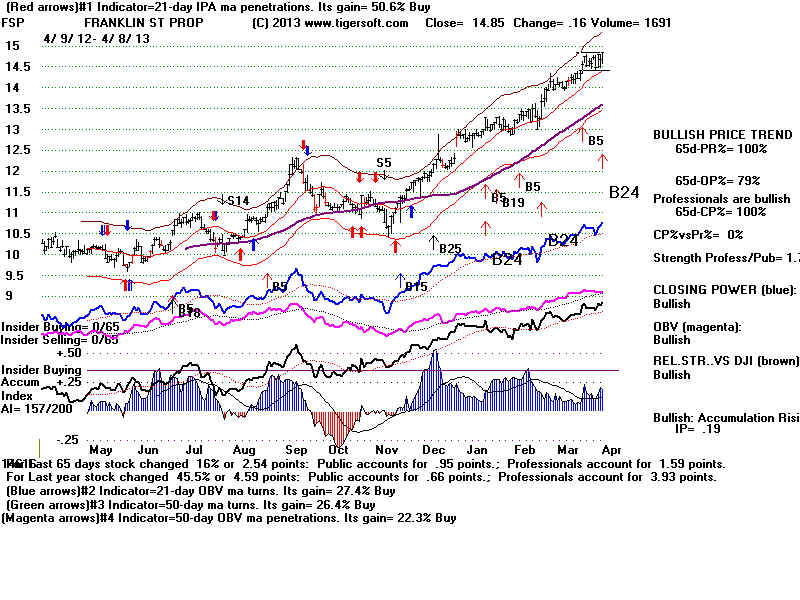
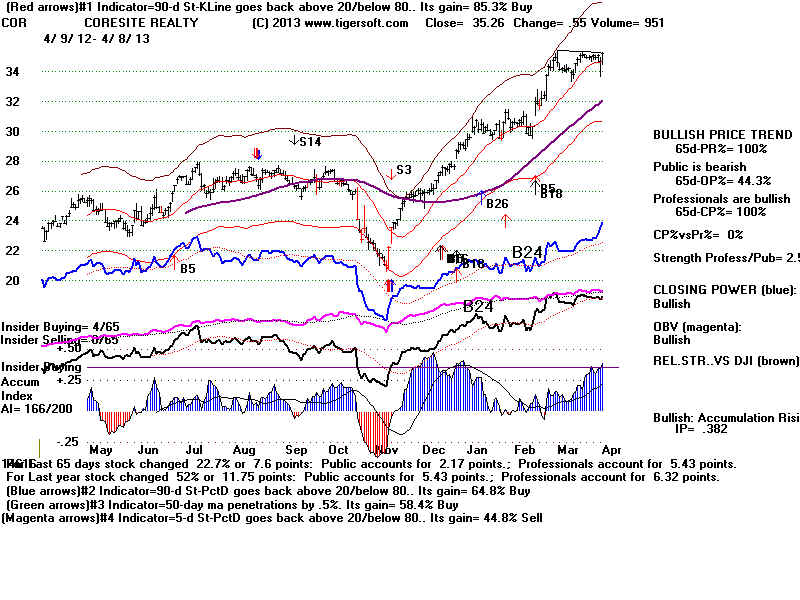
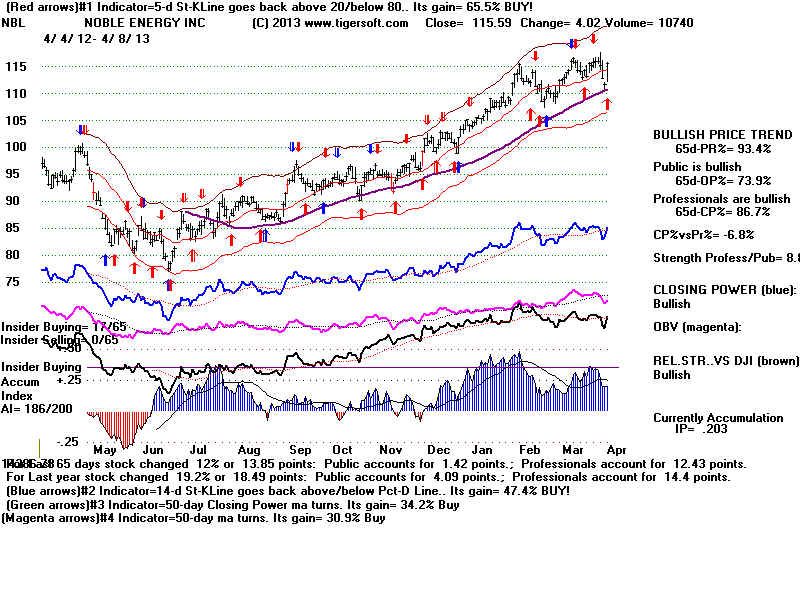
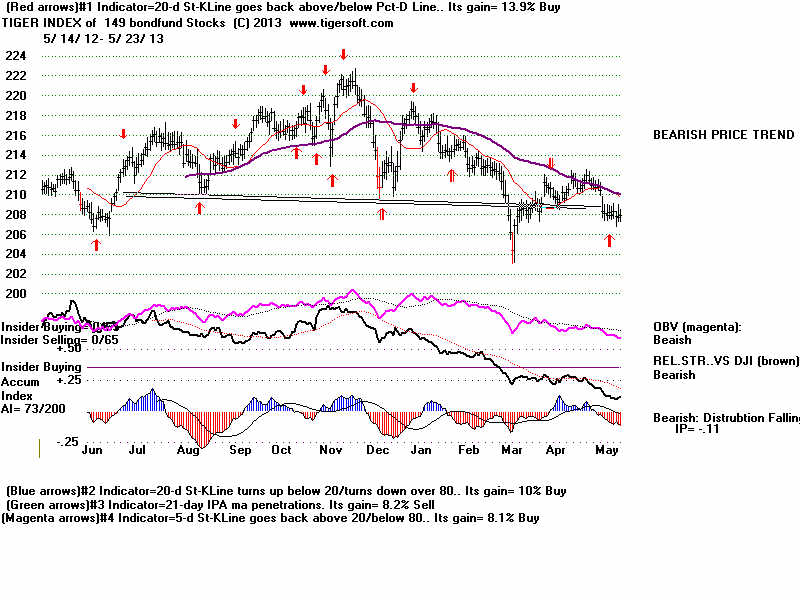
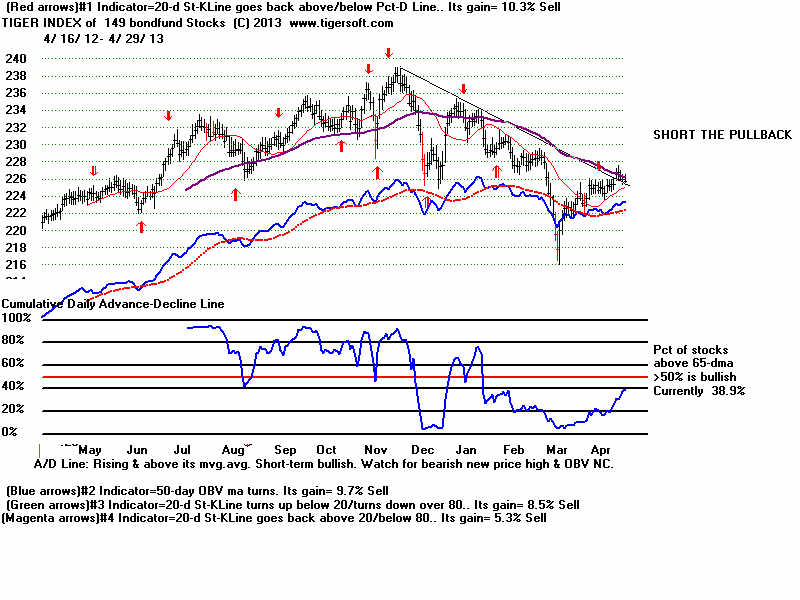
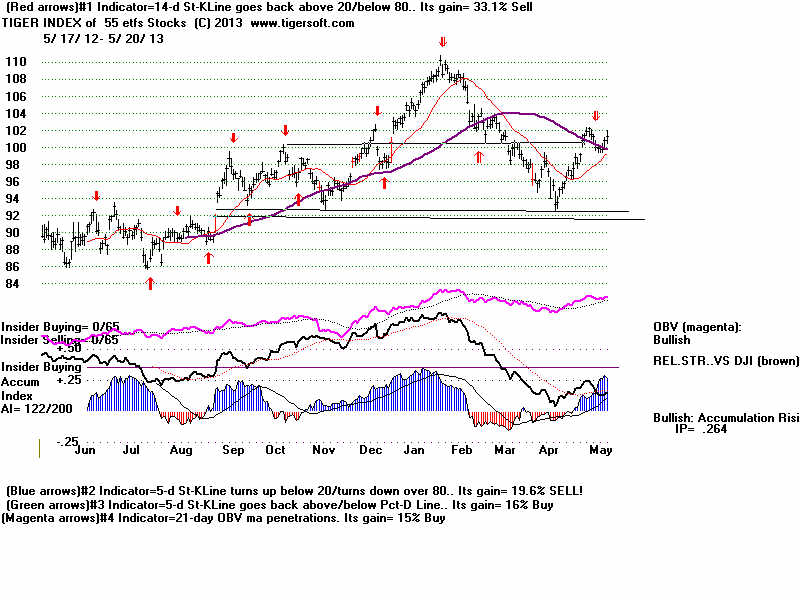
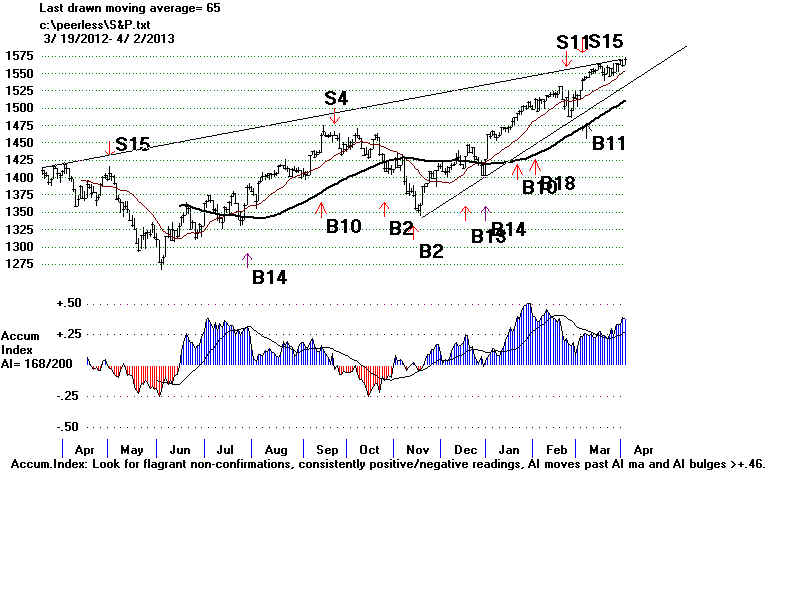
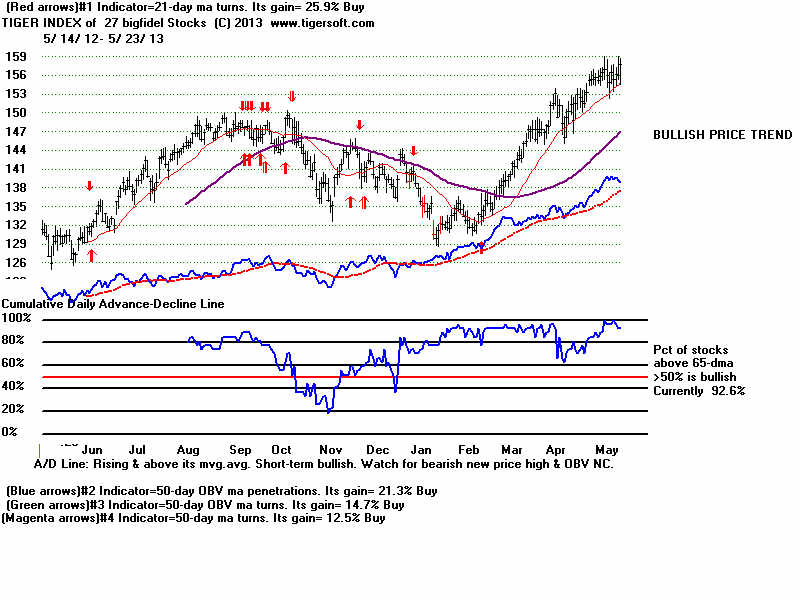
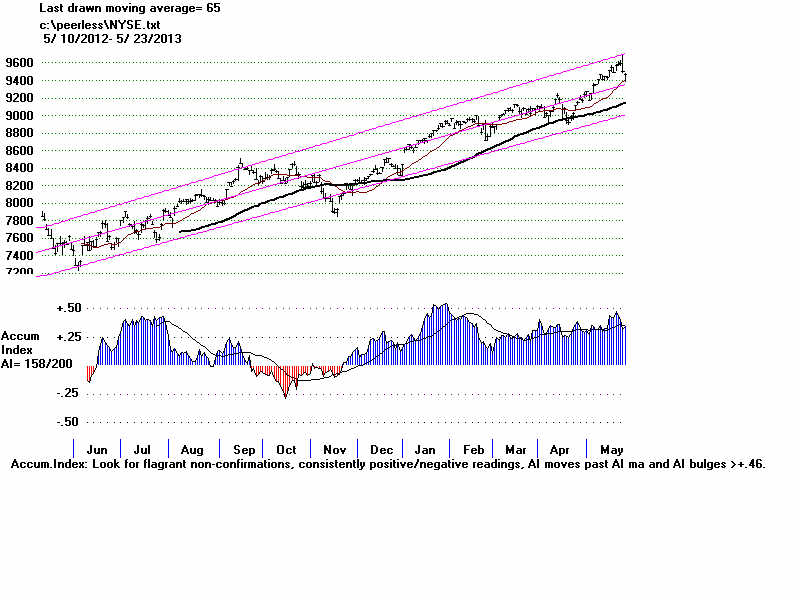
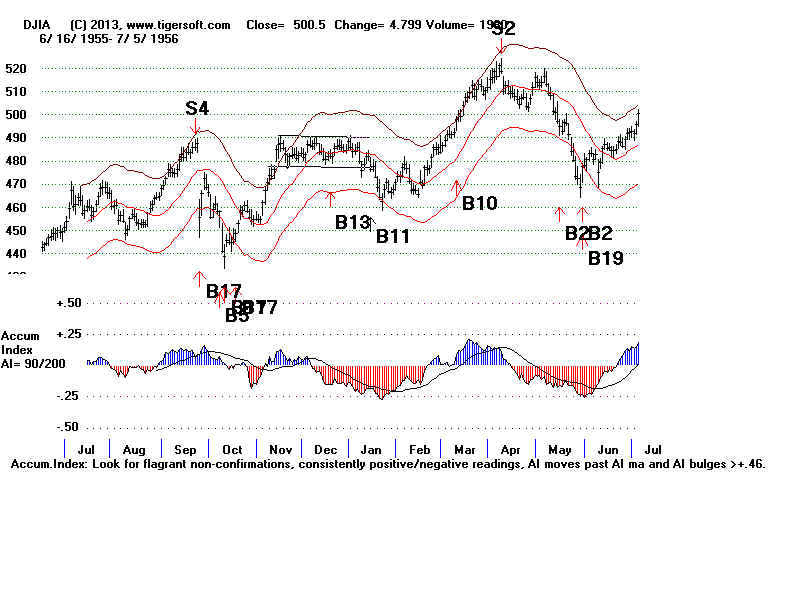
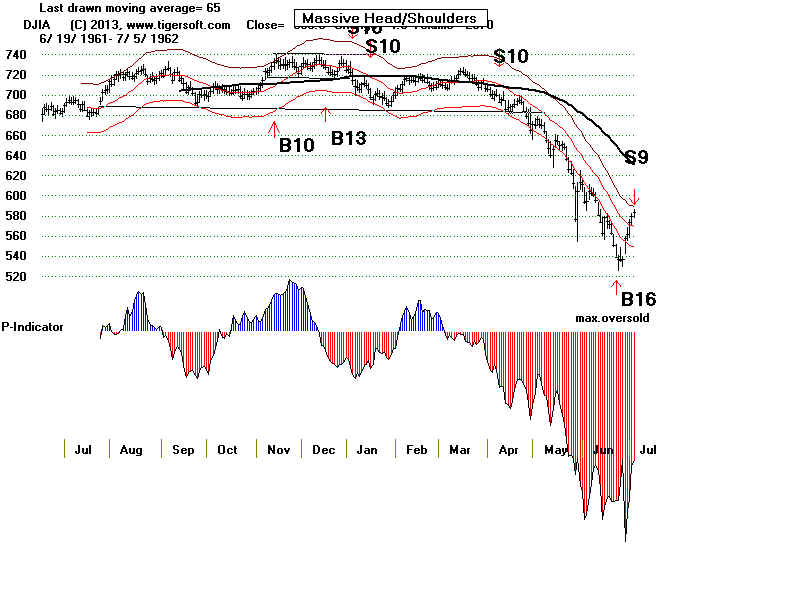
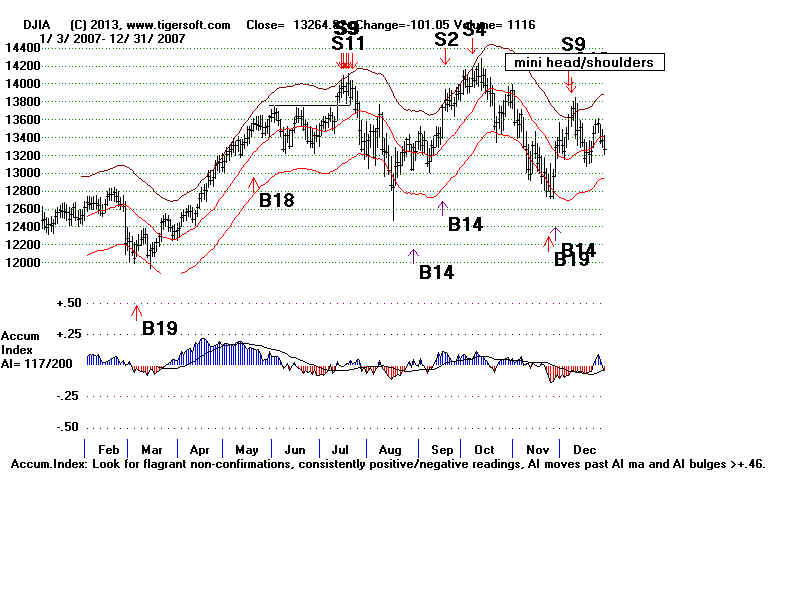
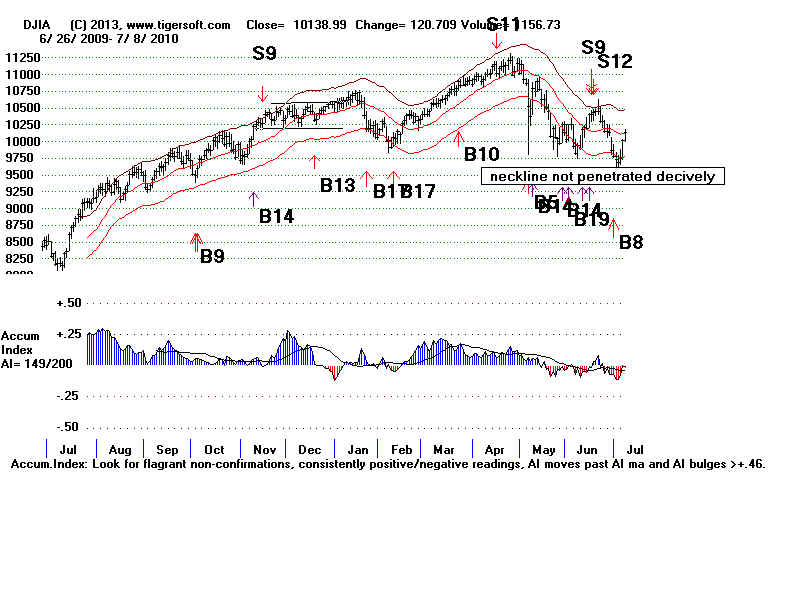
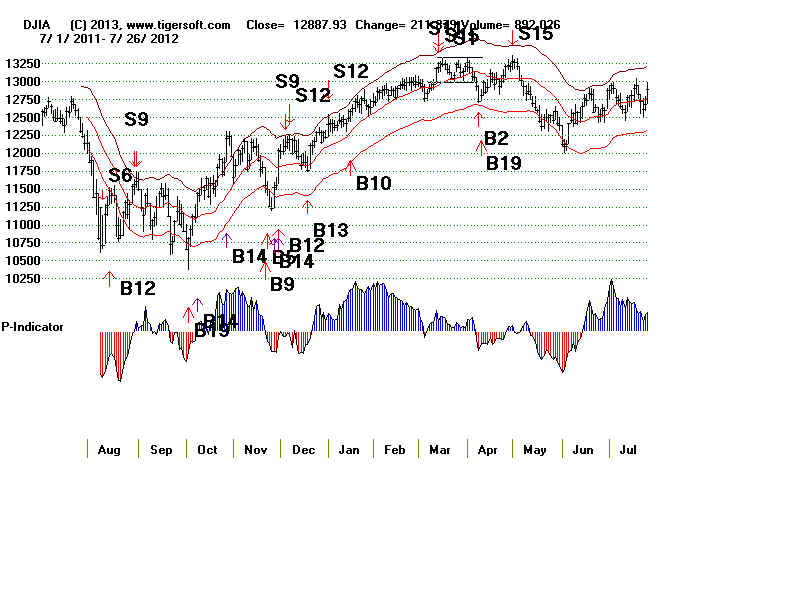
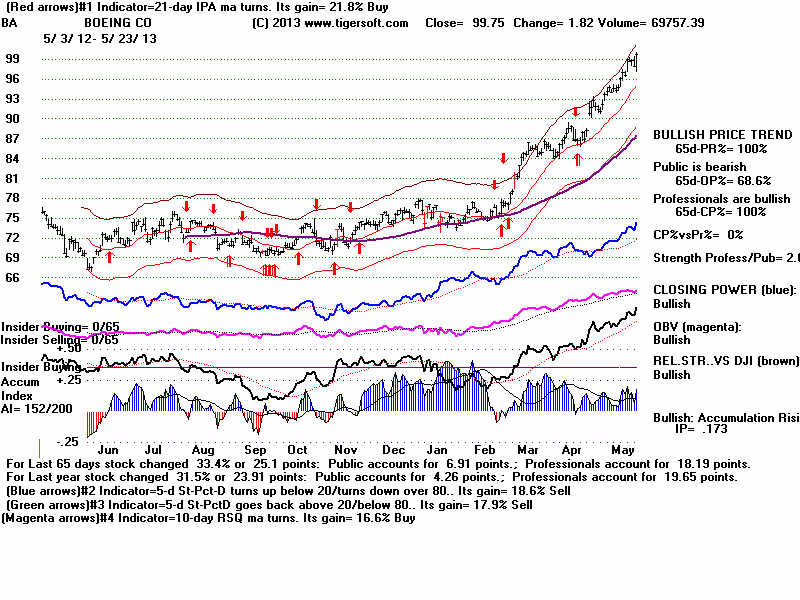