


TigerSoft and Peerless Daily
Hotline
-----------------------------------------------------------------------------------------------------------------------
(C) 1985-2013 William Schmidt, Ph.D. www.tigersoft.com
All
rights strictly reserved.
Tiger Software 858-273-5900
PO Box 22784 San Diego, CA
92192
Email william_schmidt@hotmail.com
----------------------------------------------------------------------------------------------------------------------
 Important - This
site's addres will change Monday night.
Important - This
site's addres will change Monday night.
Look for an email from us giving the new address,
----------------------------------------------------------------------------------------------------------------------
 Shhh.
Sharing this hotline address with non-subscribers is a violation of our contract
Shhh.
Sharing this hotline address with non-subscribers is a violation of our contract
with you and a violation of copyright laws. I work hard for you. Respect that
effort!
---> To
renew this Hotline,
order here $350 (check) - $360(Visa/MC)
www.tigersoft.com/-2GBL13HL/index.htm
-----------------------------------------------------------------------------------------------------
 http://tigersoft.com/-HL42013/index.html
http://www.tigersoft.com/-2GBL13HL/index.htm
http://tigersoft.com/-HL42013/index.html
http://www.tigersoft.com/-2GBL13HL/index.htm
 A Guide To Profitably Using The
Tiger Nightly HOTLINE
A Guide To Profitably Using The
Tiger Nightly HOTLINE
 Peerless Signals: 1915-2013

New Peerless
Signals and DJI Charts - version 7/4/2013
1965 1965-6
1966
1966-7
1967
1967-8
1968
1968-9
1969 1969-70
1970
1970-1 1971
1971-2
1972
1972-3
1973
1973-4
1974
1974-5
1975
1975-6
1976
1976-7
1977 1977-1978
1978 1978-79
1979
1979-80
1980
1980-1
1981
1981-2
1982
1982-1983
1983
1983-1984
1984 1984-1985
1985 1985-1986
1986
1986-1987
1987
1987-8
1988 1988-9
1989
1989-90
1990 1990-1
1991
1991-2
1992
1992-3
1993
1993-4
1994
1994-5
1995
1995-1996
1996
1996-7 1997 1997-8
1998
1998-1999
1999
1999-2000
2000
2000-1
2001
2001-2
2002
2002-3
2003
2003-4
2004
2004-5
2005
2005-6
2006
2006-7
2007
2007-8
2008
2008-9
2009 2009-10
2010
2010-11
2011
2011-12
2012
2012-2013
Background and New Studies
New 9/23/2013
It's Usually Quite Bearish
When The Tiger IPA Makes A New Low ahead of The DJIA.
New 9/16/2013 Trading Low Priced Stocks Using
TigerSoft
New Introduction to
Tiger/Peerless Buys and Sells.
Peerless Charts and Signals
Documentation for TigerSoft
Automatic and Optimized Signals.
------------------------------------------------------------------------------------------------------------------------------------------------------
------------------------------------------------------------------------------------------------------------------------------------------------------
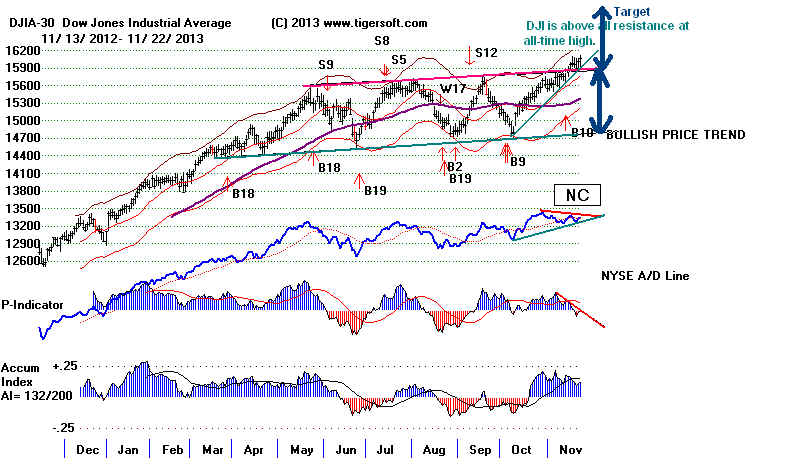
11/22/2013
The Peerless Buy B10 sets
up an average Peerless goal of 16676.
The 1000 points' height
of the previous trading range gives technicians a classic way to
caclulate a minimum DJI upside target now of 16900. More
interesting to watch
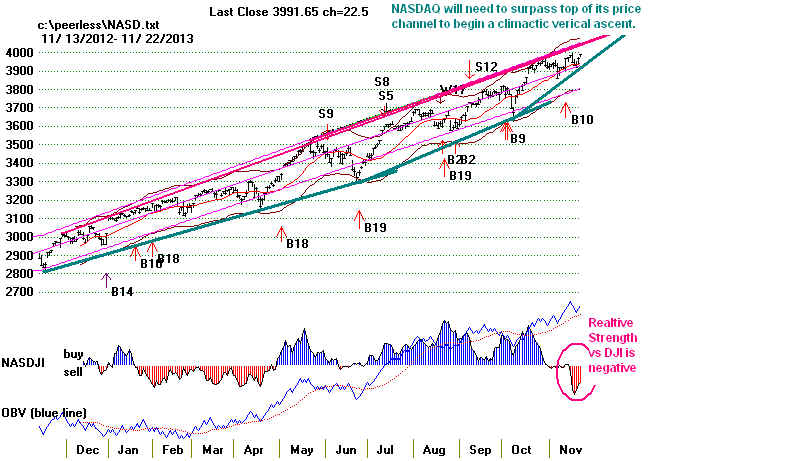
will be the NASDAQ and
QQQ. They may still breakout out above the top of their
well-tested price
channels. This could re-establish the"bubble" 1999-2000 scenario.
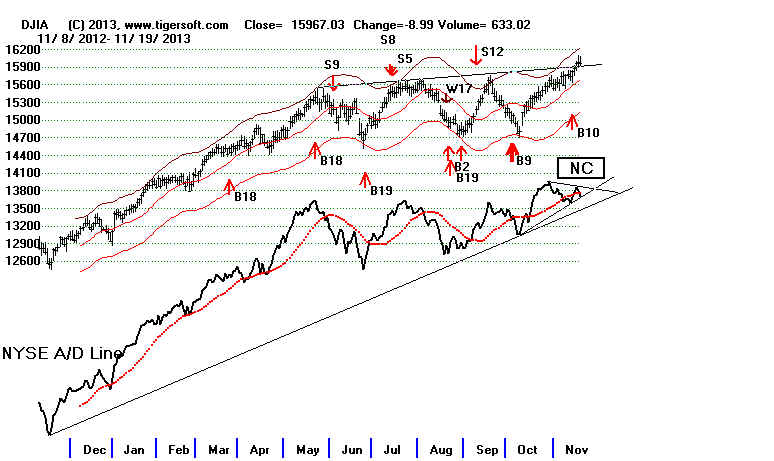
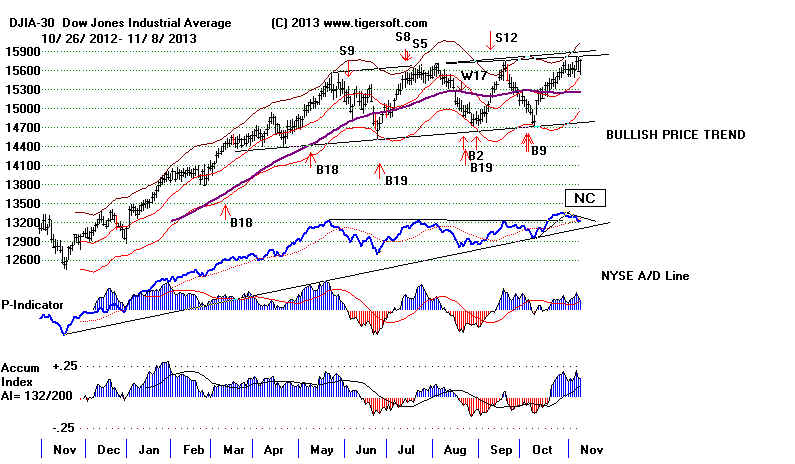
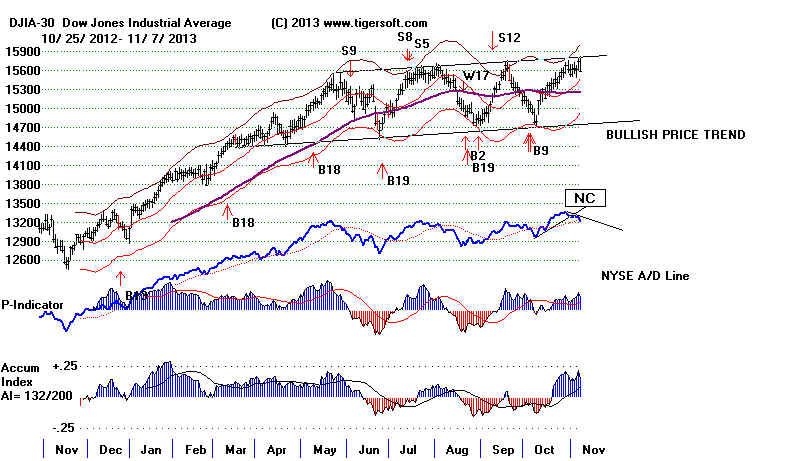
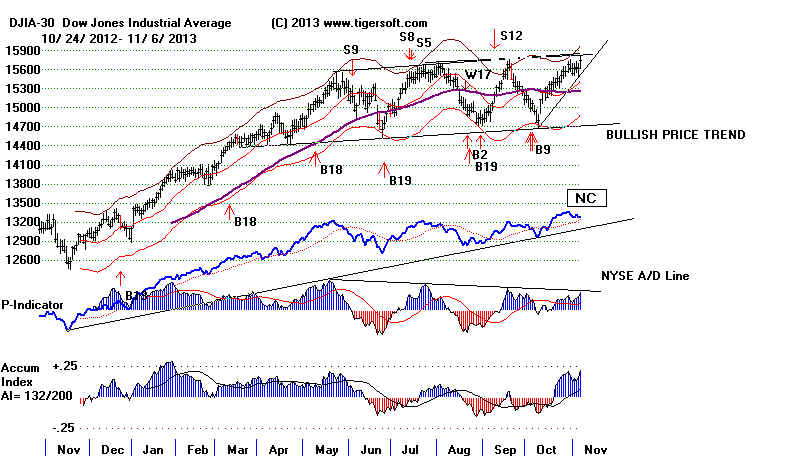
Peerless Signals and DJI
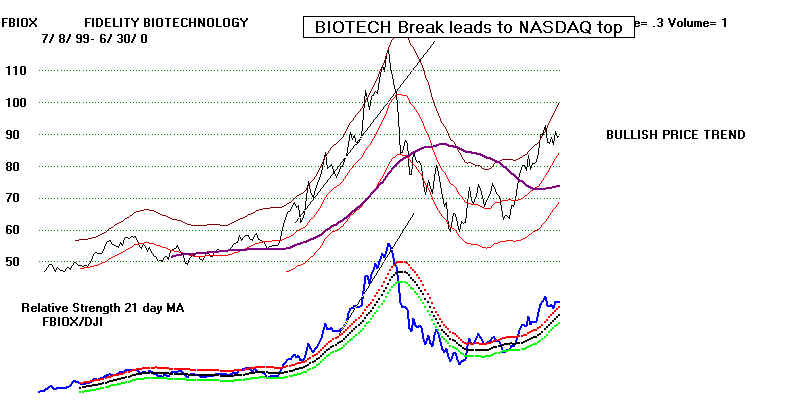
Friday, the
Biotechs broke out above their flat resistance levels. See BBH
and IBB below
NASDAQ IBB Biotech Flat-Topped Breakout
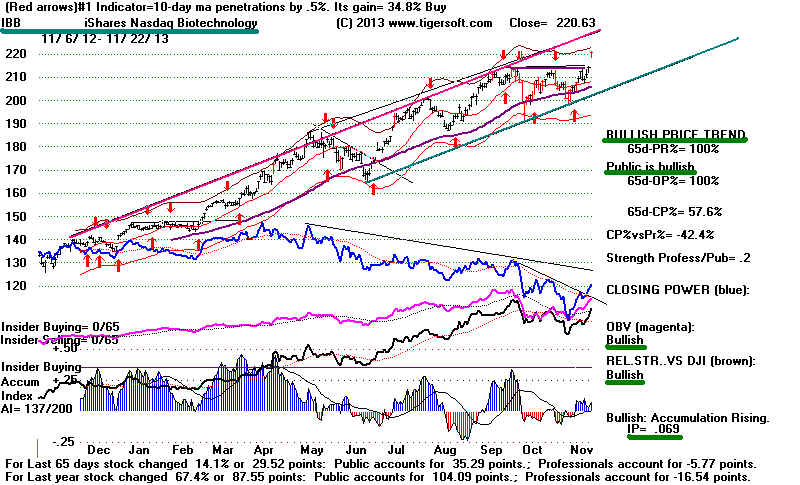
Momentum players
will probably push these higher and that will boost the NASDAQ
and QQQ. It
remains to be seen if the NASDAQ can recapture market leadership
from the DJI.
The TigerSoft RELDJI Indicator is still negative. It measures the
strength of the
NASDAQ versus the DJI. Right now it is quite negative. This
fact argues
against a climactic advance now in the NASDAQ and QQQ, which
is actually
bullish for the present, since very often the market does something
spectacular to
draw in unwary public investors near the end of a long advance.
Peerless Signals and NASDAQ Trendlines
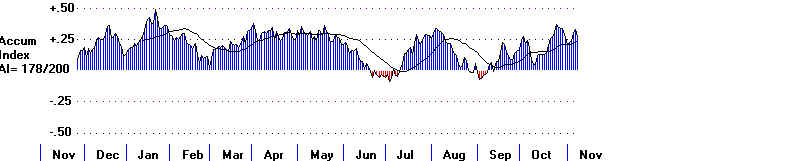
Will There Be A Sell S9?
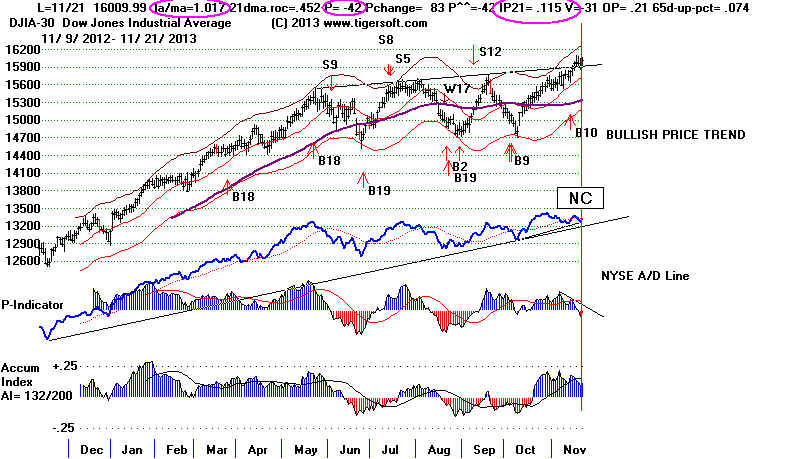
The DJI stands 1.9% over the
21-day ma with the P-Indicator still negative. P-I is
now -32.
Because the Accumulation Index is quite positive (>.10) and it is November,
we won't easily
get a Sell S9 with Peerless as it stands now. Earlier in the year, a Sell S9
would probably
have occurred if the DJI were to reach the 3% upper band. Seasonality
is too bullish
now. The programs have been written tot ake that into account. The DJI
rises 70.2% of
the time over the next month and typically gains 1.8%. With a Democrat
in the White
House going into the year of the mid-term Elections, we do have to be
watchful of a top
between December and February.
I know there are
some bears out there. So, here are the results if one got a Sell S9
in November or
December in the years 1929, 1933, 1937, 1941...2001, 2005, 2009,
2013 when the
DJI, as now, was simply 1.9% or more over the 21-dma with the P-Indicator
negative. In a rising market, all four of the "Sell S9s" based on these
simple parameters
would have
brought losses. In a declining market, the signals did much better, though
in 2 of the 9
cases, they were significantly premature bring paper losses of more than 4%.
Sell S9 based on only
LA/MA >1.018 and P-I<0
la/ma PI
IP21 Gain
-----------------------------------------------------------------------------------------------
bear mkt 12/2/1929 1.024 -62 .002 +3.7%
DJI rallied 3% before falling to lower band.
bear mkt 12/3/1929 1.053 -.9 .049 +6.8%
bear mkt 11/8/1933 1.038 -12 .006 95.5 DJI reached 102 before falling to lower band (95.5) on
12/21/1933
bear mkt 11/24/1933 1.046 -8 -.005 98.1 DJI reached 102 before falling to lower band (95.5) on
12/21/1933
bear mkt 12/3/1937 1.025 -109 -.125 127.6 DJI fell to lower band 118.9 on 12/28/1937
bear mkt 12/8/1937 1.044 -58 -.041
129.8 DJI fell to lower band 118.9 on
12/28/1937
bear mkt 12/26/1973 1.02 -148 -.041 +1.1% DJI rose from 837.36 and reached 855.32 and then fell to 828.46
bear mkt 12/27/1973 1.034 -84 .016 +2.6% DJI rose from 851.01 and reached 855.32 and then fell
to 828.46
bear mkt 11/10/1977 1.023 -2
.128 +3.1% DJI rose from 832.55 and reached 845.89 and then fell to
828.46
11/24/1989 1.019 -28 .046 -.008%
DJI rose from 2676 to 2751 before falling back to a Buy signal.
11/20/1997 1.031 -106 -.014 -1.7% DJI rose from
7827 to 8111 befroe falling to 7660.
11/3/2005 1.019 -101-.03 -2.8%
DJI rallied and broke out...
11/9/2009 1.029 -47 .051. -0.8%
DJI rallied and then gave Buy B13
11/22/2013 ---> To Key Index and
Leading Stock Charts: DJI, SP-500, etc.
---->
288 +164 MAXCP stocks Bullish
MAXCP Stocks (11/22`/2013) Bullish
plurality
---> 68 -22 MINCP stocks
Bearish MINCP Stocks (11/22/2013)
---> 172
New Highs on NASDAQ 14
new lows. Bullish plurality
---> 158 New Highs on NYSE 29 new lows.
Bullish
plurality
DJI
la/ma
annroc P-I
IP21 V-I
Opct 65-day Pct Change
-----------------------------------------------------------------------------------------------------------------------------------
11/7/2013
15594 -153
1.000
.61 +301 .159
+6
.115 007
11/8/2013
15762 +167 1.017 .489 +222 .158
-5 .120
016
11/11/2013
15783 +21 1.016 .419 +159 .139
-13 .115 023
11/12/201
15751 -32
1.013
.344 +97 .109
-28 .035
021
11/13/2013
15822 +71
1.015
.500 +228 .179
+6 .124 024
11/14/2013
15876 +54
1.017
.384 +187 .168
-4
.119
035
11/15/2013
15962 +85
1.021
.450 +136 NC .166
-10 .220 056
11/18/2013
15976 +14
1.020
.439 +38 NC .140
-31 .206 059
11/19/2013
15967 -9 1.018 .437
-11 .126 -36 .206
063
11/20/2013
15901 66
1.012
.329 -126
.102 -57 .117
059
11/21/2013
16010 +109
1.017
.452 -42 NNC .115 -31 .21 074
11/22/2013
16065 +55
1.019
.420 -32 NNC .124
-27 .203 073
************************************************************************************
===================================================================================
OLDER HOTLINES
===================================================================================
11/21/2013
The Peerless Buy B10 sets
up an average Peerless goal of 16676.
The DJI stands
1.7% over the 21-day ma with the P-Indicator still negative. P-I is
now -.42.
Because of November's normally bullish seasonality, it is harder to
produce a Sell
S9, based on the DJI 2.5% over the 21-dma with the P-Indicator
negative.
In part, this is because the program also looks at the level of the Accumulation
Index, which is
now +.115. If you study the S9s (not S9Bs or S9Vs) shown below
since 1928,
you will see all
the cases of S9s where the IP21 was positive. There were no cases where
this was true in
November. There were only 2 instances in December (1987 and 1999).
Both were
ineffectual. So, a positive IP21 mitigates the bearishness of the Sell S9 at
these times.
I think this is generally true, too, But more so at the ned of the year.
As a result, the
Peerless program should probably require the Accumulation Index
(IP21) to be, at
least, below +.065 in November and December. You will remember that
I have suggested
that DJI tests of a rising 21-day ma are more likely to be successful
(and not bring a
bigger decline) if the IP21 is above +.065.
As for the
weakening A/D Line, price momentum like we have seen this year, usually
trumps such
non-confirmations. Tops usually take months to complete. Along with the
B10 breakout and
bullish seasonality, we have compelling reasons to play the market
mostly on the
long side. If you want to hedge, the BEARISH MINCP
stocks will
probably be under
heavy tax-loss selling right until the end of the year, as traders
close out their
losing positions to help balance their big gainers. I would mostly
play the high Accumulation breakouts. These are the stocks the
momentum buyers
keep favoring for
as long as the FED does not make rates move up sharply.
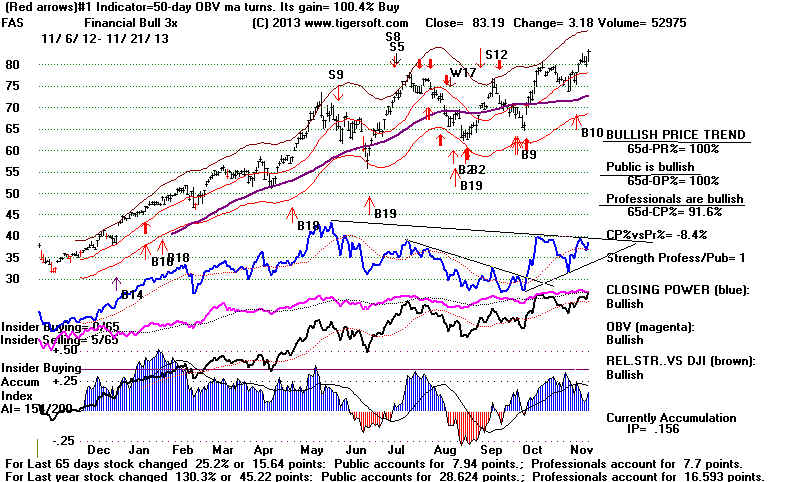
Watch to see if
the IWM, NASDAQ and QQQ can regain the leadership role from the DJI-30.
Today they did
rise more than the DJI on a percentage basis. A biotech breakout by IBB
would certainly
help the NASDAQ. FAS, the leveraged Financials'
ETF, made a new high
today, as did JPM and BAC. If the bank
stocks cannot fall back when JPM is fined
$13 billion,
surely they must rise as Professionals expect much more help from the FED
for them under
the next FED Chairman who is considered even more of a "dove" than
Bernanke. .
S9 Signals with IP21>0 since 1929.
These are not
S9Bs or S9vs.
----------------------------------------------------------------------------------------------------------------
Date
la/ma
P-I IP21 Gain Paper
Loss Comments
----------------------------------------------------------------------------------------------------------------
8/27/1930
1.033 -36 .034 big gain
8/19/1931
1.022 -53 .038 big gain
9/18/1933
1.03 -17 .097 big
gain
4/11/1934
1.032 +33 .016 +4.5%
1%
2/11/1937
1.022 -11 .055 +13.0% 2%
3/3/1937
1.025 -6 .075
+14.2% 0%
9/13/1939
1.095 -43 .138
+3.2% 0% Way above upper band.
^^^^
1/6/1942
1.034 -59 .022
+5.6% 0%
6/2/1942
1.024 22 .12
-3.1% 3.1%
6/7/1943
1.016 -11
.012 1.7% 0%
1/10/1946
1.033 -14 .105 3.4%
3.7%
4/14/1950
1.026 -28 .022 3.5%
4.2%
4/30/1951
1.024 +26 .179 6.4% 1.5%
7/8/1957
1.022 -27 .038
10.3% 0%
8/3/1961
1.032 -8 .017
-1.7% 3%
7/16/1962
1.034 35 .082
1.0% 4%
4/30/1969
1.025 -30 .083 19.0% 1.3%
2/27/1970
1.03 61 .023
8.6% 1.9%
6/17/1990
1.026 -109 .001 5.0% 1.6%
8/17/1971
1.038 -93 .153
8.2% 2.3% head/shoulders
4/12/1972
1.023 -2 .087
5.7% 0%
8/10/1976
1.022 -5 .06
3.3% 1.8%
1/8/1973
1.022 -72 .052
9.0% 0.4%
4/11/1973
1.023 -158 .049
9.6% 0%
9/5/1973
1.016 -79
.013 -4.6% 4.6%
10/26/1973 1.021
-9 .163
20.1% 0% On-going-bear-market.
3/4/1974
1.024 40 .014
3.7% 4.5%
3/5/1977
1.024 26 .06
6.4% 0.3%
9/21/1979
1.017 -69 .049
10.9% 0.7%
10/9/1981
1.024 -12 .066
4.0% 0%
7/12/1982
1.026 -13 .07
5.8% 0.9%
7/26/1983
1.024 -73 .058
5.7% 0%
3/16/1984
1.024 +7 .001
5.7% 0%
5/28/1986
1.047 -19 .052
2.3% 1.6%
4/6/1987
1.039 -2 .187 6.3% 0%
This was 3.9% over 21-dma.
12/28/1987 1.021 -37 .132
1.6% 0%
10/4/1989
1.028 -49 .018
4.8% 0.1%
7/12/1990
1.025 -45 .052
17.4% 1.0%
4/15/1992
1.030 -56 .049
3.0% 1.8%
4/22/1998
1.03 -172 .075
-4.9% 4.9%
9/23/1998
1.026 -201 .018
6.4% 0%
12/10/1999 1.021 -391 .01
-0.3% 0.3%
(2/27/2002
1.027 93(!) .047
19.0% 5.1%
This should only be a Sell S15, not an S9.)
8/8/2002
1.039 -271 .063
4.6% 3.9%
5/5/2006
1.026 -10 .035
4.9% 0.6%
3/24/2008
1.024 -209 .116
9.3% 4.1%
4/2/2008
1.031 -75 .042
9.7% 0%
7/30/2008
1.023 -105 .058
5.8% 1.7%
-------------------------------------------------------------
11/21/2013 ---> To Key Index and Leading Stock Charts: DJI, SP-500, etc.
---->
288 +164 MAXCP stocks Bullish
MAXCP Stocks (11/21/2013) Bullish
plurality
---> 68 -22 MINCP stocks Bearish MINCP Stocks (11/21/2013)
---> 140
New Highs on NASDAQ 16 -3 new lows. Bullish plurality
---> 105 New Highs on NYSE 22 new lows.
Bullish
plurality
DJI
la/ma
annroc P-I
IP21 V-I
Opct 65-day Pct Change
-----------------------------------------------------------------------------------------------------------------------------------
11/7/2013
15594 -153
1.000
.61 +301 .159
+6
.115 007
11/8/2013
15762 +167 1.017 .489 +222 .158
-5 .120
016
11/11/2013
15783 +21 1.016 .419 +159 .139
-13 .115 023
11/12/201
15751 -32
1.013
.344 +97 .109
-28 .035
021
11/13/2013
15822 +71
1.015
.500 +228 .179
+6 .124 024
11/14/2013
15876 +54
1.017
.384 +187 .168
-4
.119
035
11/15/2013
15962 +85
1.021
.450 +136 NC .166
-10 .220 056
11/18/2013
15976 +14
1.020
.439 +38 NC .140
-31 .206 059
11/19/2013
15967 -9 1.018 .437
-11 .126 -36 .206
063
11/20/2013
15901 66
1.012
.329 -126
.102 -57 .117
059
11/21/2013
16010 +109
1.017
.452 -42
.115 -31 .21 074
************************************************************************************
===================================================================================
OLDER HOTLINES
===================================================================================
11/20/2013
The Peerless Buy B10 sets
up an average Peerless goal of 16676.
It's hard to turn
bearish with so much upward momentum, the bullish seasonality now
into December and the
Peerless Buy. But we always have to on guard when the NASDAQ
starts slipping away
from a rising DJI, the NYSE A/D Line fails to confirm the DJI
high
and the P-Indicator turns negative. These warnings could
lead to a Peerless Sell signal
on the next rally.
November S9s are rare. And as I showed two nights ago, they
don't immediately drop
the DJI.
11/20/2013 ---> To Key Index and Leading
Stock Charts: DJI, SP-500, etc.
---->
124 MAXCP stocks Bullish
MAXCP Stocks (11/20/2013) Bullish
plurality
---> 90 MINCP stocks
Bearish MINCP Stocks (11/20/2013)
---> 39
New Highs on NASDAQ 19 +1 new lows. Bullish plurality
---> 19 New Highs on NYSE 47 new lows.
Bearish plurality
DJI
la/ma
annroc P-I
IP21 V-I
Opct 65-day Pct Change
-----------------------------------------------------------------------------------------------------------------------------------
11/7/2013
15594 -153
1.000
.61 +301 .159
+6
.115 007
11/8/2013
15762 +167 1.017 .489 +222 .158
-5 .120
016
11/11/2013
15783 +21 1.016 .419 +159 .139
-13 .115 023
11/12/201
15751 -32
1.013
.344 +97 .109
-28 .035
021
11/13/2013
15822 +71
1.015
.500 +228 .179
+6 .124 024
11/14/2013
15876 +54
1.017
.384 +187 .168
-4
.119
035
11/15/2013
15962 +85
1.021
.450 +136 NC .166
-10 .220 056
11/18/2013
15976 +14
1.020
.439 +38 NC .140
-31 .206 059
11/19/2013
15967 -9 1.018 .437
-11 .126 -36 .206
063
11/20/2013
15901 66
1.012
.329 -126
.102 -57 .117
059
************************************************************************************
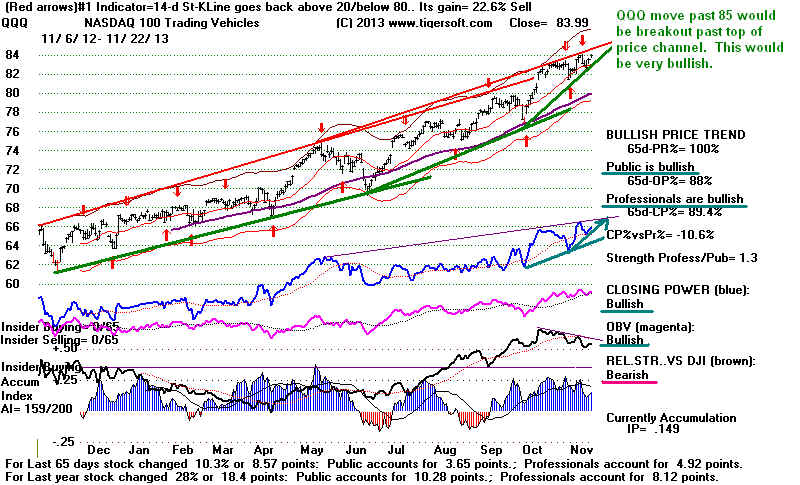
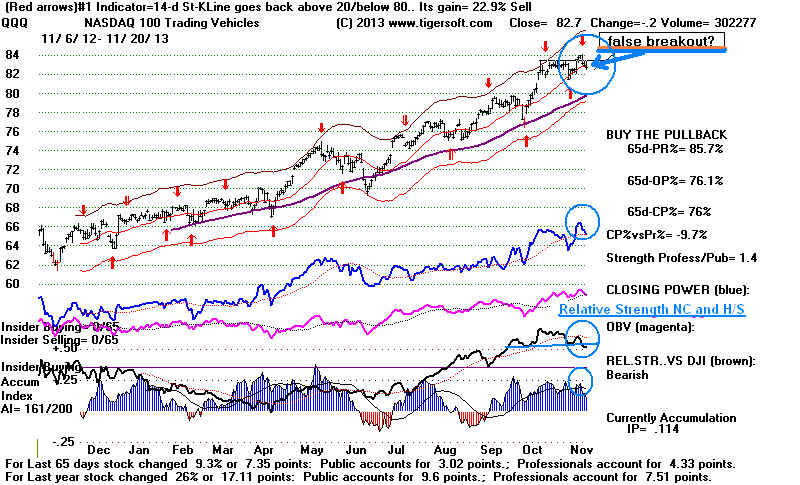
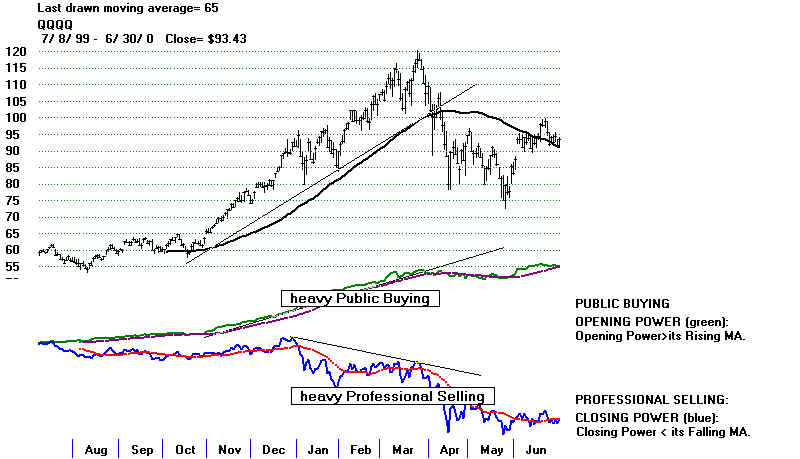
QQQ False Breakouts and RSQ Head/Shoulders
Consider also the just
failed QQQ breakout. Usually Buy B10s and valid breakouts
bring runaway moved.
But new concerns about a Fed which may reduced its QE-III
program has brought on
a round of quick profit-taking. The QQQ's chart shows that
its prices are still
above its rising 21-day. In addition, its Closing Power confirmed the
last high and the
Accumulation Index was quite positive on the last rally. Still, we
should look back at
false breakouts by the QQQ since false breakouts often come
in bunches when the
market is topping out. Notice the date of the Tiger Blog when I wrote
about false breakouts.
Tiger
Blog - FALSE BREAKOUTS: How to Recognize Them and Trade Them
www.tigersoft.com/tiger-blogs/11-15-2007/index.html
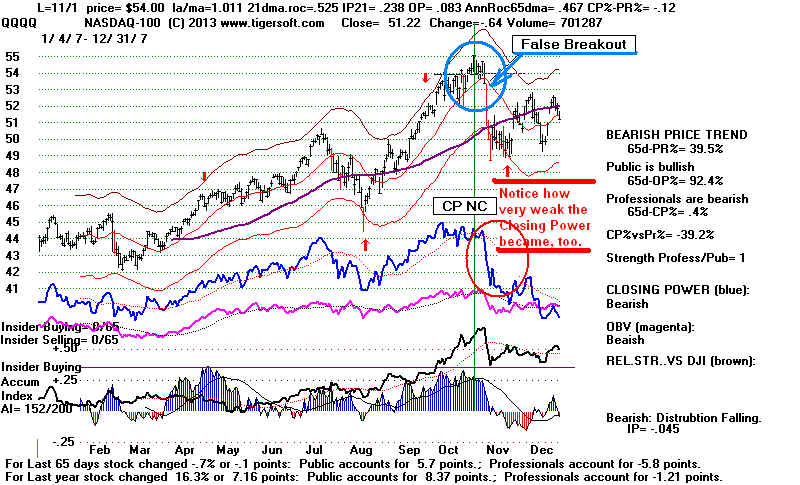
QuickBreakout Failures since 1999.
There is only one case of a quick breakout failure on the QQQ. That was on 11/1/2007,
which proved a very good time to sell. Peerless had already given a Sell S4 signal
on 10/4/2007. The Closing Power turned very weak right after this. This is an
important
bearish sign. An exceptionally weak Closing Power on the QQQ also appeared
from March to April in 2000, in January-Feb 2001, in January-Feb 2002 and in September
2008.
Plunges soon followed. However, in all cases Peerless gave a classic Sell.
==================================================================================
OLDER HOTLINES
==================================================================================
11/19/2013
The Peerless Buy B10 sets
up an average Peerless goal of 16676.
If it's usually true
that when a stock goes up on bad news, it's bullish, how must it
be when the stock rises
after being fined $13 billion. That's the case of JPM now.
Moreover, since bank
stocks's prices usually correlate very well with Peerless
Buys and Sells, such
"bullishness" should be noticed.
The momentum should also keep
the market rising here. More than 72% of the Russell-1000,
QQQ-100, SP-500 and DJI-30
(90%) stocks are above their 65-dma. But breadth has
weakened. Even though
the DJI is 1.8% over the 21-day ma, the P-Indicator has turned
negative. This could
lead to a Sell S9 signal if the DJI should rally. But November S9s
are rare. There was one
on 11/14/1980 with the DJI 4.2% over the 21-day ma and
the P-Indicator at -93.
In this case the DJI fell back to the lower band after forming
a head/shoulders. There
was also one on 11/13/2009 with the DJI 2.7% over the
21-day ma and the P-Indicator
a -110. It ended up losing 0.4% and suffering a
paper loss of 3.2%. The problem with November Sell S9s is that they confront a very
bullish seasonality.
The DJI rallies on average 0.9% over the next 5 trading days
and 1.3% over the next 10
trading days. The odds of it rising over the next two weeks
are 72.3%.
A/D Line NC of New High
A/D Line Uptrend still intact.
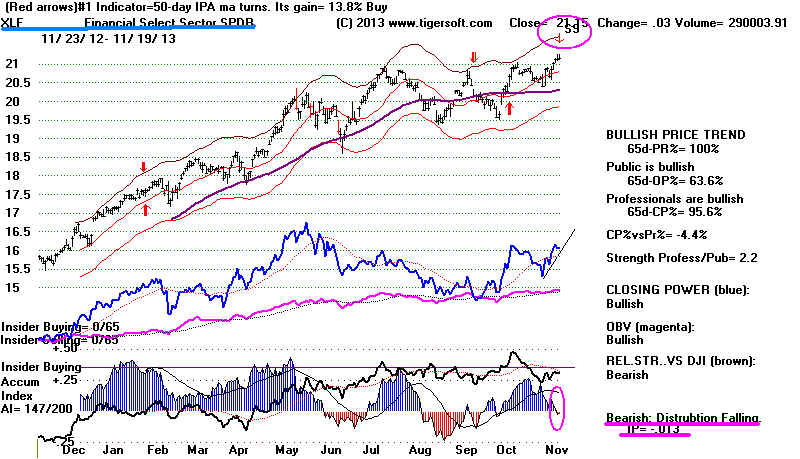
Finding Stocks Under Red Distribution as They Make New Highs
It's true that there is a
certain amount of red distribution now. See the weakest of
these stocks in our Bearish MINCP group again tonight. But distribution is not aggressive
selling. The
distribution can last for some time. We want to start watching the
percentage of new highs each
night that have an IP21 less zero. 31 of the 156 new hiighs
had negative IP21s tonight. (To get these results: Peercomm + Older
Charting + Run/Setups
+ Run New
Analysis/Ranking/Optimization + X(when finished). Then Peercomm + V iew
+ Tiger Spreadsheet.(
Then click top of "IP21 column" to reverse the display order so
it shows the negative IP21
new highs first. But shorts need to find stocks that traded
more than 1000 lots. The best
way to find these is to display the stocks showing new
Tiger Sell S9s. (Use the commands: Peercomm + Daily Stocks + S9 -218
Accum Index
-negative near the upper
band". ) The only Tiger Sell S9 of interest is XLF - the
Financial Select SPDR.
We will only watch it now. Its Closing Power is in an uptrend.
There is not much red
Distribution here.
Will This End The Law Suits against JPM?
Are Other Mortgage Lenders Next? JPM's stock
holders are optimistic. Of course, they know
the FED will "always be there to protect them.
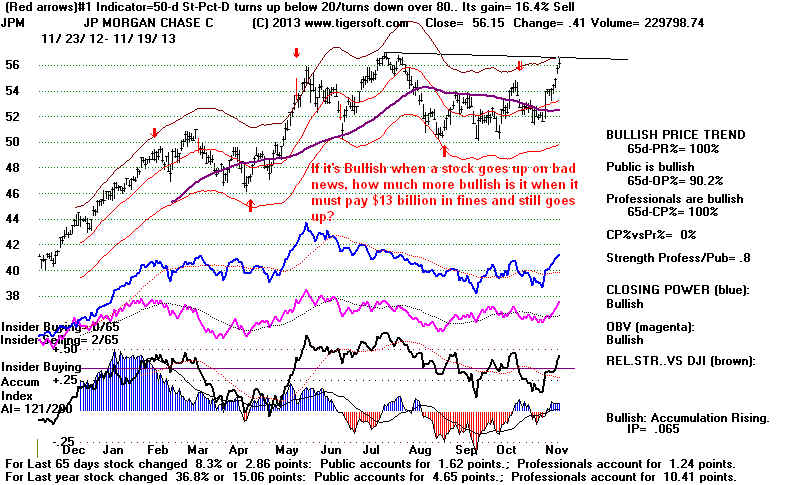
JP Morgan today agreed
to pay $13.0 BILLION in fines to the FEDs for its
fraudulent mortgage
selling of a few years ago. This amounts to 1/2 of the banks
profits in the last
year. $7 billion of the settlement is tax-deductible.
"The breakdown
of the $13 billion settlement with JPMorgan includes a $2 billion fine
to prosecutors in
Sacramento and $4 billion in relief to struggling homeowners in hard-hit areas
like Detroit and
certain neighborhoods in New York. The government earmarked the other $7 billion
as compensation to
federal agencies and state attorneys general across the country, including those
in Illinois, New York
and California.... The Justice Department secured a range of other concessions,
including admitting to
the statement
of facts. JPMorgan also backed down from demands that
prosecutors drop a
related criminal investigation into the bank, and it forfeited the right to try later
to recoup any of the
$13 billion from the Federal
Deposit Insurance Corporation." (NY Times)
11/19/2013 ---> To Key Index and Leading
Stock Charts: DJI, SP-500, etc.
---->
157 MAXCP stocks Bullish
MAXCP Stocks (11/19/2013) Bullish
plurality
---> 74 +19
MINCP stocks Bearish
MINCP Stocks (11/19/2013)
---> 38
New Highs on NASDAQ 18
-2 new lows. Bullish plurality
---> 20 New Highs on NYSE 26 new lows.
Bearish plurality
DJI
la/ma
annroc P-I
IP21 V-I
Opct 65-day Pct Change
-----------------------------------------------------------------------------------------------------------------------------------
11/7/2013
15594 -153
1.000
.61 +301 .159
+6
.115 007
11/8/2013
15762 +167 1.017 .489 +222 .158
-5 .120
016
11/11/2013
15783 +21 1.016 .419 +159 .139
-13 .115 023
11/12/201
15751 -32
1.013
.344 +97 .109
-28 .035
021
11/13/2013
15822 +71
1.015
.500 +228 .179
+6 .124 024
11/14/2013
15876 +54
1.017
.384 +187 .168
-4
.119
035
11/15/2013
15962 +85
1.021
.450 +136 NC .166
-10 .220 056
11/18/2013
15976 +14
1.020
.439 +38 NC .140
-31 .206 059
11/19/2013
15967 -9 1.018 .437
-11 .126 -36 .206
063
********************************************************************************************
=====================================================================================
11/18/2013 Peerless Buy B10 sets
up an average Peerless goal of 16676.
But breadth is lagging. Given the Peerless Buy signal and the momentum
of all the the key indexes and major market ETFs, only a small retreat seems
in the making. Seasonality is bullish for a while longer. The main problem for
the market is political. Having a Democrat in the White House nearly always
set up
an important market top at the end of the year in the year after a Presidential Election
(1933, 1937, 1941, 1946, 1961, 1966, 1993, 1997, 2001, 2010)
There is only one exception to this rule since 1933. We should be alert
to the possibility of a Peerless Sell. The P-Indicator is not very positive anymore
and the DJI is 2% over the 21-day ma.
Democrats Bring Tops between December and February
With a Democrat in the White House, a bearish picture emerges at the end of the
year. Since 1934, a DJI top has always been made, with one
year excepted,
in December in the year after a Presidential Election (12/29/1983, 12/29/1977, 12/5/1997), or
the following January (1938, 1942, 2010) or February (1934, 1946, 1966,
1994 - only 5% drop).
The 1949-1950 was an exception when there was no peak at this time.
NASDAQ Profit-Taking...
Will It Worsen?
The 16000 pschological resistance has started a notable round of red Distribution
among some of the bigger NASDAQ-100 stocks. Most bigger NASDAQ stocks
do look over-extended. They are not close to a base. So, some are ripe for a
pullback. About 12% of the QQQ stocks show
increasing and very steady red Distribution:
AKAM, ALTR, CHKP, CTRX, CTXS, EQIX, FB, FFIV, NFLX, NUAN and SIRI.
In addition, some of the bigger biotech stocks show heavy Professional selling, judging
from the weakness in their blue Closing Powers.
This wave of distribution is mostly on strength. It is not
clear that the selling will
become aggressive or spread to the strongest stocks. The NASDAQ is still in an
accelerating uptrend. It will take a lot of selling to break the back of this
uptrend.
We have no Peerless Sell. Until Peerless gives a major Sell, it's best to expect
the DJI to keep making new highs. But if you
want to hedge, consider some of the
stocks showing very heavy Red Distribution,
Year-end selling in them will probably
continue to depress them.
The key question now is will the NASDAQ keep following the DJI up? If it does not,
we will have a bearish warning. See the NASDAQ's Relative Strength
"NASDJI" Indicator
below. This compares the DJI's momentum to the NASDAQ's. It has turned
decisively
negative as the DJI rallies.
NASDAQ with PEERLESS SIGNALS
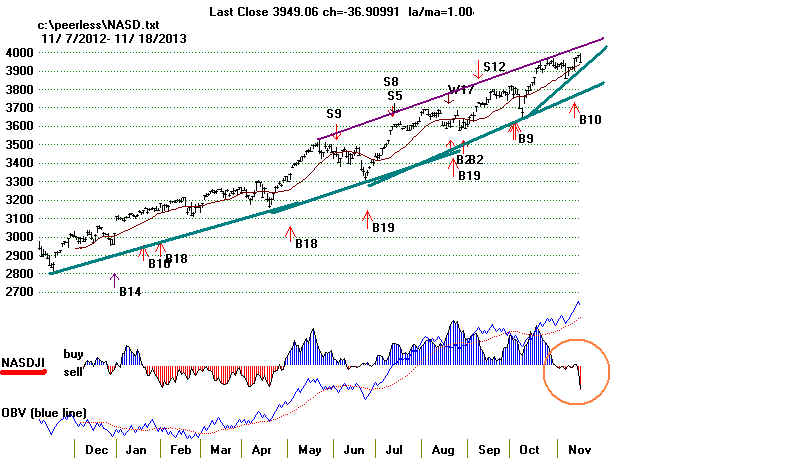
NASDJI Negative Non-Confirmations Usually Lead To DJI
Tops,
but not always immediately. Waiting for the Peerless Sell is Best.
Since 1972, I counted 7 cases where it was clearly bearish when the NASDAQ's
Relative Strength NASDJI Indicator turned negative as the DJI rallied to new highs.
Only in one case, January 1987, did the lagging NASDAQ play "catchup" and take
back
the leadership from the DJI. The divergence now, thus, puts the NASDAQ on notice.
I had hoped we would see a NASDAQ take-off in the next 3 months like occurred
in 1999-2000. But the NASDAQ has turned down and is much weaker than the
DJI. Today the NASDAQ fell 36.90 (-0.93%) while the DJI rose +14 (0.09%).
One day is not especially important, but the current Peerless
"NASDJI" Indicator
has turned quite negative on this rally to new highs by the DJI. This did not occur
in 1999-2000. Just the opposite was seen then. The NASDAQ stayed very positive
throughout the period from November 1999 to March 2000. Some of the more
important market tops saw the NASDJI Indicator turn negative despite the
DJI rally to new highs: namely:
1
1972-January 1973 DJI top - S9/S12,
2
Oct. 1979 - NASDAQ breakout but NASDJI was only slighlty
positive.
3
January 1984 - NASDAQ had been falling for 6 months when DJI
finally topped out.
4
August 1987 - NASDAQ had been negative for 5 months despite
the DJI rally.
5
July 1990 - July DJI top saw NASDJI turn negative at the same
time.
6
February 1994 - NASDJI turned negative just as DJI
topped out.
7
May 2011 - NASDJI turned negative just as DJI reached a peak
from which it fell 15% by Sept.
NASDAQ weakness does not always pave the way to a January market top.
Just the opposite was true in January 1987, when a lagging
NASDAQ suddenly jumped
from 350 to 440 in March. But even in this
case, from March to August 1987, the
NASDJI indicator was below zero. Only in August 1987 did the DJI finally top
out.
But that top led to a 35% plunge in two months. The lengthy period of NASDAQ
weakness vis-a-vis the DJI was a significantly bearish divergence. It is much better
when the DJI and the NASDAQ are moving up together.
11/18/2013 ---> To Key Index and Leading Stock Charts: DJI, SP-500, etc.
---->
285 MAXCP stocks Bullish MAXCP Stocks
(11/18/2013) Bullish plurality
---> 55 +6
MINCP stocks Bearish
MINCP Stocks (11/18/2013)
---> 63
New Highs on NASDAQ
20 new lows. Bullish plurality
---> 79 New Highs on NYSE 13 new lows.
Bullish
plurality
DJI
la/ma
annroc P-I
IP21 V-I
Opct 65-day Pct Change
-----------------------------------------------------------------------------------------------------------------------------------
11/7/2013
15594 -153
1.000
.61 +301 .159
+6
.115 007
11/8/2013
15762 +167 1.017 .489 +222 .158
-5 .120
016
11/11/2013
15783 +21 1.016 .419 +159 .139
-13 .115 023
11/12/201
15751 -32
1.013
.344 +97 .109
-28 .035
021
11/13/2013
15822 +71
1.015
.500 +228 .179
+6 .124 024
11/14/2013
15876 +54
1.017
.384 +187 .168
-4
.119
035
11/15/2013
15962 +85
1.021
.450 +136 NC .166
-10 .220 056
11/18/2013
15976 +14
1.020
.439 +38 NC .140
-31 .206 059
********************************************************************************************
================================================================================
OLDER HOTLINES
================================================================================
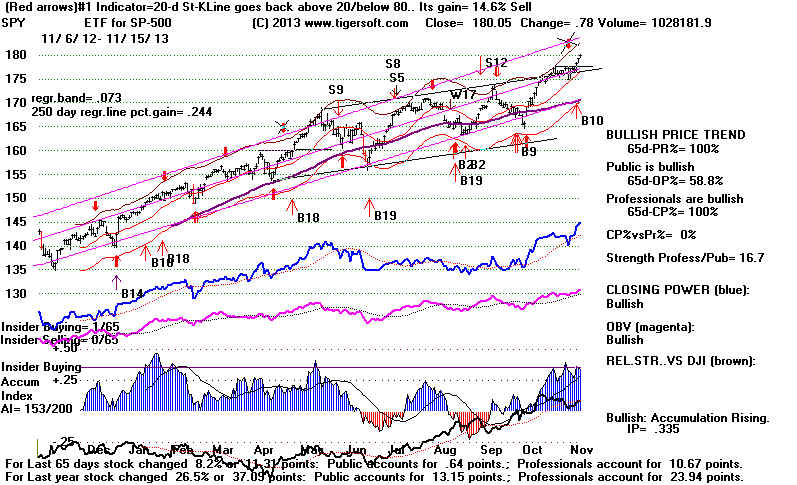
11/15/2013 Peerless Buy B10 sets
up an average Peerless goal of 16676.
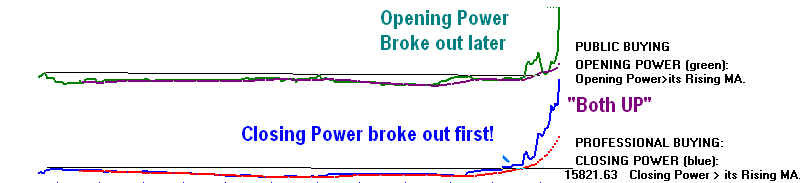
The Opening and Closing Powers are both rising for the key ETFs. This
"both-up" condition often brings the quickest advances. There is some
weakness in the next two or three days if seasonality rules. But two weeks
after November 17th, the DJI is up on average 0.8% and rallies 68.1% of the time
since 1965.
More significantly, near all the BEARISH MINCP stocks
again tonight are
leveraged major market short ETFs. If these were stocks, we would want to
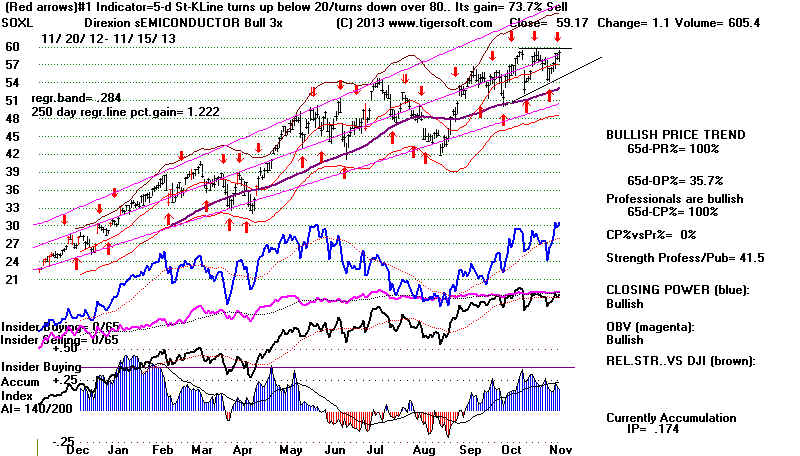
short them aggressively. If the market really is ready to "melt up", I
would
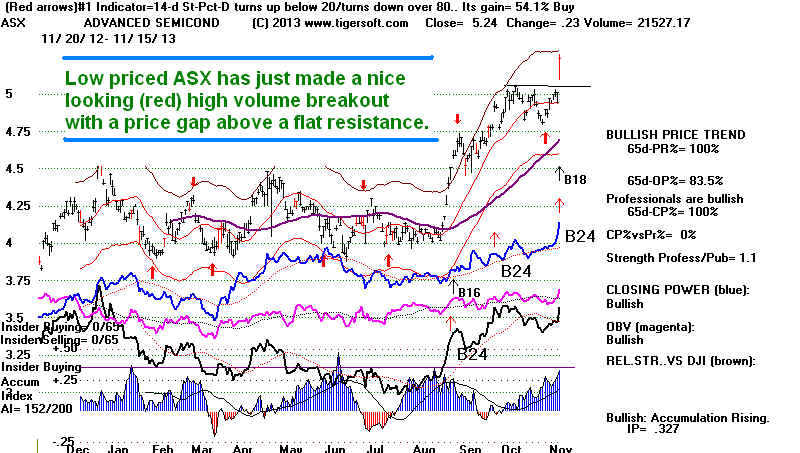
think that the 3x leveraged Semiconductor ETF, SOXL, will
make a good breakout
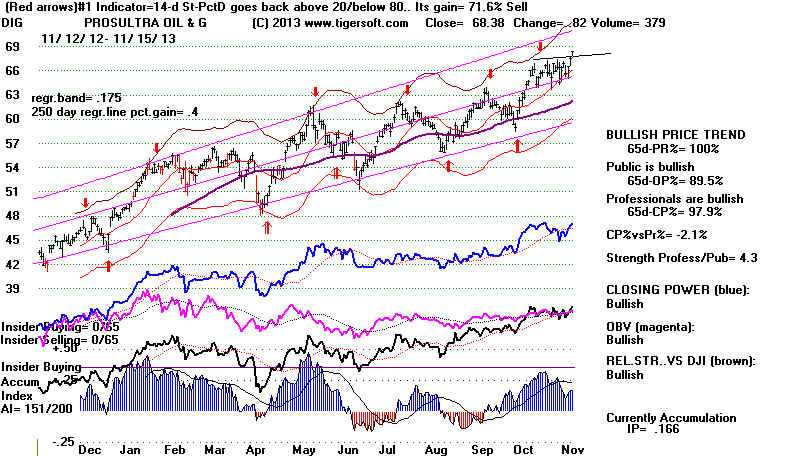
soon. Watch also the Oil ETF, DIG, which did breakout
Friday. The low-priced
ASX in the semi-conductor group looks like a good speculation
now, too.
Charts for these are shown at bottom of tonight's Hotline.
DJI
la/ma annroc P-I
IP21 V-I
Opct 65-day Pct Change
-----------------------------------------------------------------------------------------------------------------------------------
10/29/2013 15680 +111 1.027 .430 +312 .210 +27
.149 01
10/30/2013 15618 -62 1.022 .333 +188 .175
-1 .054
006
10/31/2013 15546 -73 1.016 .321 +175
.13 -18
.038
006
11/1/2013
15615 +70
1.019 .482
+245 .153 +4 .138 - 001
11/4/2013
15639 +24
1.018
.44
+248
.134 +6 .141 - 002
11/5/2013
15618 -20 1.015
.529
+279 .161 +7
.130 - 000
11/6/2013
15747 +129
1.020
.751 +378 .218 +37
.226 014
11/7/2013
15594 -153
1.000
.61 +301 .159
+6
.115 007
11/8/2013
15762 +167 1.017 .489 +222 .158
-5 .120
016
11/11/2013
15783 +21 1.016 .419 +159 .139
-13 .115 023
11/12/201
15751 -32
1.013
.344 +97 .109
-28 .035
021
11/13/2013
15822 +71
1.015
.500 +228 .179
+6 .124 024
11/14/2013
15876 +54
1.017
.384 +187 .168
-4
.119
035
11/15/2013
15962 +85
1.021
.450 +136 NC .166
-10 .220 056
********************************************************************************************
11/15/2013 ---> To Key Index and Leading
Stock Charts: DJI, SP-500, etc.
---->
524 +11 MAXCP stocks
Bullish
MAXCP Stocks (11/15/2013) Bullish
plurality
---> 49 +4
MINCP stocks Bearish
MINCP Stocks (11/15/2013)
---> 105
New Highs on NASDAQ
21 new lows. Bullish plurality
---> 152 New Highs on NYSE 11 new lows.
Bullish
plurality
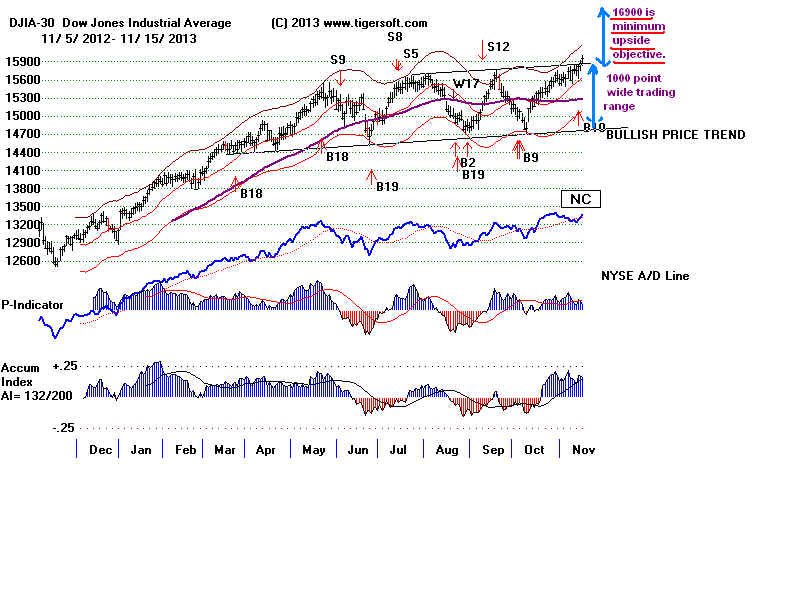
The breakout from the top of
the 1000 point-wide trading range at 15900 sets up a
minimum downside objective of
16900. With the DJI moving in all-time high territory
sellers do not no where to
concentrate their sell orders except at round numbers.
That means 16000 is the
immediate goal. Bullishly, the A/D Line for the DJI
stocks,
the NASDAQ-100 stocks, the SP-500
stocks and Russell-1000 stocks are making
new highs. Let's
let the rising tide and the Peerless Buy B10 do their jobs. Continue
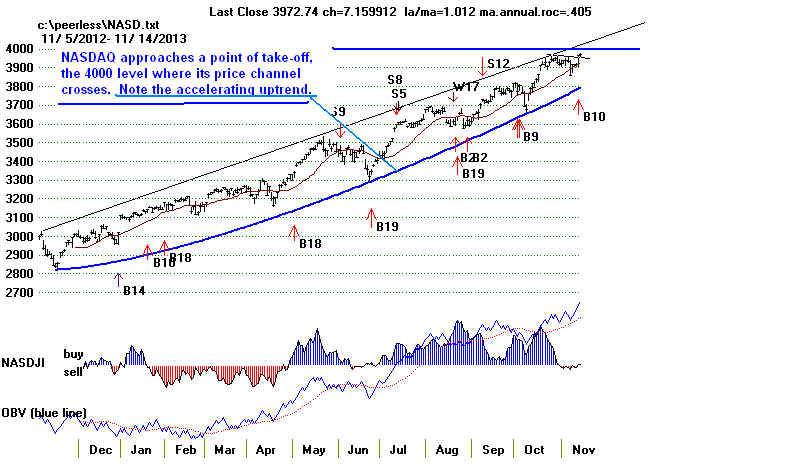
to watch the NASDAQ and QQQ to see if they can
break out past their rising resistance
lines. This could
set up quick, vertical ascents, which may let them reach their March
2000 highs. Back
in the 1999-2000 tech bubble, the last 6 months saw very steep rises.
Back then, Fed Chairman
Greenspan, like Yellen now, did not acknowledge that a
speculative bubble was
developing. Instead of, tightening margin requirements as
the Fed did in the 1968
bubble, he flooded the markets with more liquidity to avert any
possible trouble in the
roll-over to the year 2000. The result was from 11/1/1999 to
2/10/2000, only 14
weeks' time, the NASDAQ jumped from 2968 to 5048 and the
QQQ advanced from 65.41
to 117.56. This represented a rise of more than 65%.
I think the bears
should be worried now and we should let our long profits run.
 |
 |
===================================================================================
OLDER HOTLINES
===================================================================================
Janet Yellen - "There
is no Speculative Bubble"
11/14/2013 The new
Peerless Buy B10 is
apt to bring a rise in the DJI by
1000 points. At least, that is projectione can make from its trading range breakout.
Stay long the major market ETFs making breakouts. They should rally higher
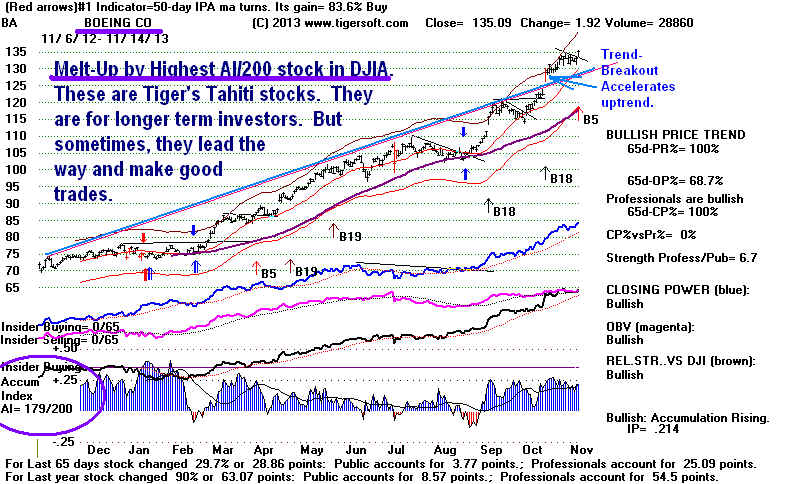
by Thanksgiving. Our highest AI/200 stock in the DJI, Boeing, shows what a
"meltup"
is like. There is now more chance of this than a serious decline. I
would stick
with the very highest Accumulation stocks showing strong Relative Strength and
a rising Closing Power.
 While
Janet Yellen's words could come back to haunt her,
While
Janet Yellen's words could come back to haunt her,
for now, they are very bullish.
The Fed is not going to "taper". It wants higher
stock prices! See the Senate's confirmation hearings' report in NY
Times. She
insisted that Main Street has gained as much from the ripple effects of Fed policies
as Wall Street.
"Lookout above...."
November Peerless B10s in rising markets have been reliable bullish, but not wildly so.
November Buy B10s
The average November Peerless Buy signal is a rising market brings a DJI gain
of 5.4%. Compared to earlier B10s, ours shows a high IP21 and low volume
(V-I and OPct). A 5.4% gain from 15821.63 would put the DJI at 16676.
Date      DJIA    Gain    LA/MA   ROC   P-I P-chan. IP21 V-I  OPCT
--------------------------------------------------------------------
11/28/1952 283.70   +2.9%  1.034  .774  186  13    .19    217  .47
11/3/1972  984.12      +6.4%   1.039 .539  120  55    .083    1   .259
11/21/2005 10820.28  +7.0%  1.026  .685  227  -10   .108   108  .316

11/13/2013        15821.63        1.015  .500  228  +130  .179    6   .124
A more impressive gain main be made by the NASDAQ if the speculative energies
return to levels like this Summer.
The number of stocks making big daily and 10-day gains is not as high as it was this
Summer.
Instead, speculative money is going into a handful of super-performers. This
focusing on
fewer very hot stocks if it continues will be a sign of trouble ahead. As I
showed, when
a Democrat is in the White House the market usually does not make it past mid February
without a significant decline. But, a decline does not look imminent. Instead,
there is
chance of a "MELT-UP". Seasonality, momentum, the Breakout B10 are all
amply bullish
now. There is no hint from Janet Yellen, the heir apparent to Bernanke, that the
FED
will reduce its Quantiative Easing.
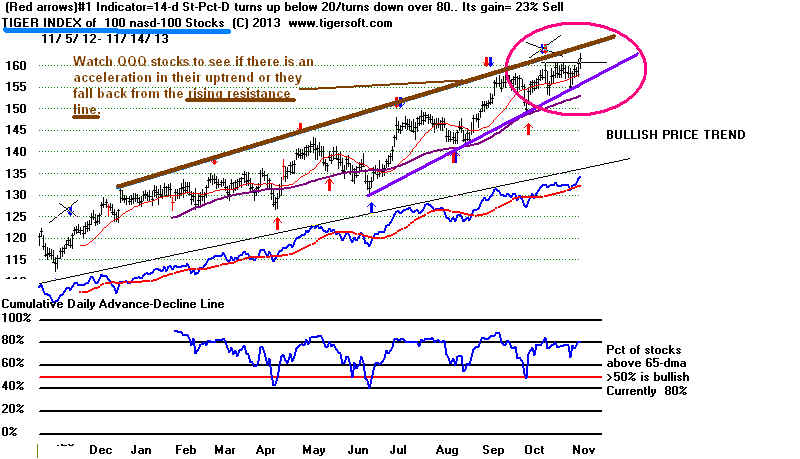
Will The NASDAQ and QQQ Breakout
above the top of their Channel Resistance Lines?
This could start a wild veritical ascent, as
occurred between October 1999 and March 2000.
11/14/2013 ---> To Key Index and Leading
Stock Charts: DJI, SP-500, etc.
---->
513 MAXCP stocks Bullish MAXCP
Stocks (11/14/2013) Bullish
plurality
---> 45 -3
MINCP stocks Bearish
MINCP Stocks (11/14/2013)
---> 102 -4
New Highs on NASDAQ 24
+5 new lows. Bullish plurality
---> 163 New Highs on NYSE 13 -4 new lows.
Bullish
plurality
====================================================================================
OLDER HOTLINES
====================================================================================
If you liked what Ben Bernanke did for you in the
stock market, wait until you meet his friend, Janet Yellen....
11/13/2013 Peerless added a Buy B10 to help
convince us the market will keep rising.
Janet
Yellen's words today that the Fed's job of improving the US economy using
Quantitative Easing has "more work to do" sent the DJI up to another new
all-time
high closing. It marginally surpassed the set of
recent high closings and thereby gave a Buy
B10. We should probably wait for a clearer DJI breakout past the well-tested
resistance
line, before according the breakout "decisive" status. But the internals
are generally positive enough to be optimistic, as is seasonality now. Wall
Street
loves how compliant the Obama Justice Deptartment is. Today they approved
the merger of airlines' giants, American and US Airways. They are also very pleased
that Obama
is doing so much to have international trade agreements be reached in total secrecy.
All the fuss about the Affordable Care Act will probably disappear once the Fed's
websites work. Lana here at Tiger has signed up with a California health insurance
plan
on-line tonight that will bring her much more care with a far lower deductible at very
affordable price.
11/13/2013 ---> To Key Index and Leading
Stock Charts: DJI, SP-500, etc.
I would cover most of the short sales taken to hedge
against a decline down
from resistance. You can see there are very few Bearish
MINCP stocks now.
There are lots of Bullish MAXCP stocks to choose
from. I prefer the ones
that have not advanced more than 10% in their last breakout and show very high
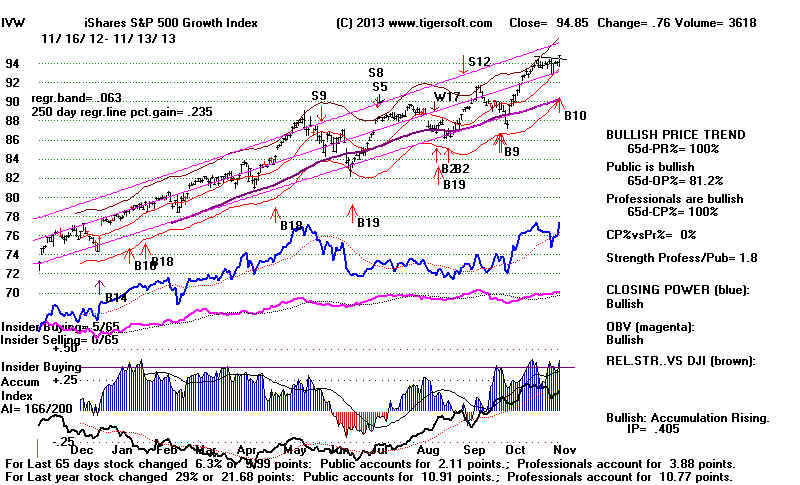
Accumulation. Among the major market ETFs, consider
buying IVW or SPY,
also leveraged TQQQ and MVV. The last two show up when
the Power Ranker is run
against the Leveraged stocks. Avoid the Biotech stocks for now. They
have recently been underperforming.
Promising No "Sneak Attacks", the Fed Guarantees
That There Will Be Many More Speculative Bubble Stocks
The Fed has taken away much of the risk element in the market
by telling us in
advance rates will be kept low for a long time. In other markets in the past, there
was
always the risk that the Fed would suddenly surprise investors by raising the
Fed Funds' Rates or the Discount Rate. This seems not true now. As a result,
speculators are having a great time, reminiscent of 1967-1968, 2009-2010 and
oil stocks briefly in 2008. Before a bear market ruined the excitement and good
times in these memorable periods, Peerless gave multiple Sell Signals, especially
including
Sell S9s. These occurred because the DJI reached the upper band with the
P-Indicator negative. The May-2013 S9 was actually a Sell S9-B, not a regular Sell
S9.
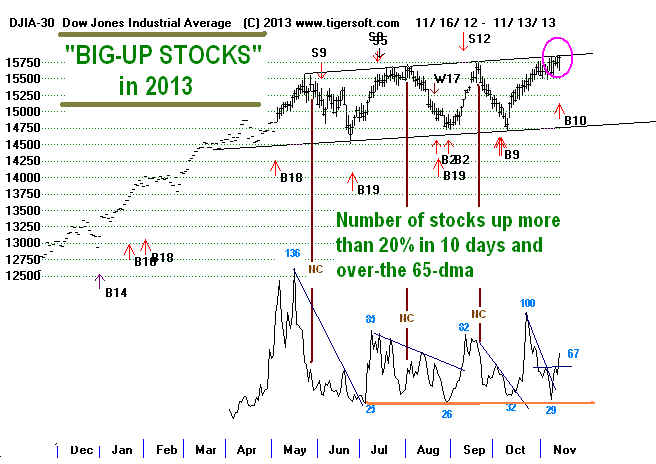
The Number of "Big-Up Stocks" (>20% in 10-trading days, over $5/share)
We will keep watching this chart. It is a measure of
the speculative energy.
Let's watch to see if the number of "big-ups" increases some more because
of the DJI breakout. Right now, this indicator is lagging. I think it will
keep rising.
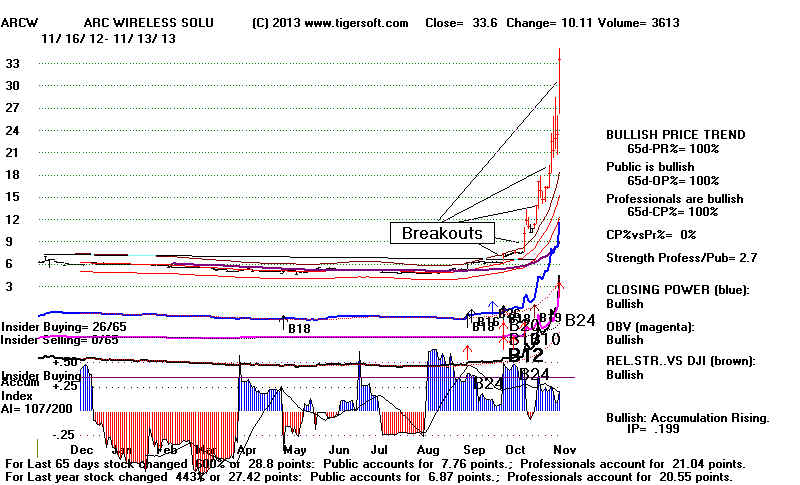
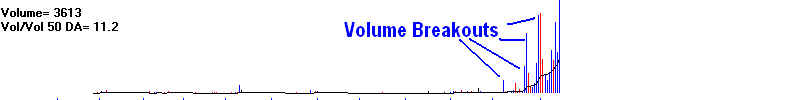
A Perfect Explosive Super Stock
When we look at the Bullish MAXCP stocks, we keep seeing
lots of stocks surging
to new highs that show very high Accumulation, red high volume, Closing Power
and Relative Strength new highs. The best in this market are the ones with good
stories
and new products, like "3-D printing". That's what's behond ARCW.
Print
its chart out below. Put it up where you can see it and be reminded of the
conditions that
come as the stock begins its take-off. Then Google "TigerSoft"
"Explosive Super
Stocks". You'll see ARCW was one in a long line of "explosive super
stocks", as
we define them.

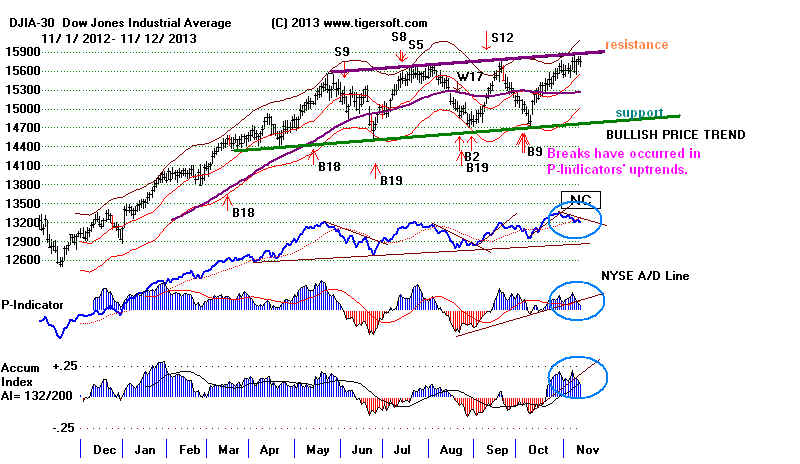
I have to note now that the P-Indicators uptrends have been broken. Additional
weakness would now likely be see in a rise in the 10-year rates,
IBM's falling back from the 65-dma overhead, the QQQ breaking
its new head/shoulders' neckline and IBB (Biotech) turning
back down in accord
with its weak Closing Power.
DJI
la/ma annroc P-I
IP21 V-I
Opct 65-day Pct Change
-----------------------------------------------------------------------------------------------------------------------------------
10/29/2013 15680 +111 1.027 .430 +312 .210 +27
.149 01
10/30/2013 15618 -62 1.022 .333 +188 .175
-1 .054
006
10/31/2013 15546 -73 1.016 .321 +175
.13 -18
.038
006
11/1/2013
15615 +70
1.019 .482
+245 .153 +4 .138 - 001
11/4/2013
15639 +24
1.018
.44
+248
.134 +6 .141 - 002
11/5/2013
15618 -20 1.015
.529
+279 .161 +7
.130 - 000
11/6/2013
15747 +129
1.020
.751 +378 .218 +37
.226 014
11/7/2013
15594 -153
1.000
.61 +301 .159
+6
.115 007
11/8/2013
15762 +167 1.017 .489 +222 .158
-5 .120
016
11/11/2013
15783 +21 1.016 .419 +159 .139
-13 .115 023
11/12/201
15751 -32
1.013
.344 +97 .109
-28 .035
021
11/13/2013
15822 +71
1.015
.500 +228 .179
+6 .124 024
********************************************************************************************
---->
480 MAXCP stocks Bullish MAXCP Stocks
(11/13/2013) Bullish plurality
---> 48 -8
MINCP stocks Bearish MINCP Stocks (11/13/2013)
---> 106
New Highs on NASDAQ
19 new lows. Bullish plurality
---> 126
New Highs on NYSE 17 new lows.
Bullish
plurality
=====================================================================================
OLDER HOTLINES
=====================================================================================
11/12/2013 Peerless remains on a Buy. Fears
of a decrease in the Quantitative Easing
were said to be responsible for today's DJI decline in increased volume. The decline
was minor. So, most fund managers are more afraid to be out of the market than
seriously
think QE will be soon curtailed. They are probably right. Just like the big
banks are
too big to be allowed to fail, so too, at $4 trillion now QE-III is too big to be
allowed to fail.
Some hedging seems advisable. Our Stocks' Hotline has a few
more longs than
shorts now. The shorts will protect us if the DJI does retreat 5%-6% from its
well-tested resistance line.
.
At the same time, look at the Bullish MAXCP stocks to
see continuing evidence
that speculative optimism is alive and well. The number of "big jumpers",
those
up 30% in the last 10 trading days IS falling, though. Tomorrow night, I'll try
to show a yearly chart of this number.
Momentum and seasonality should give the market more upside
time,
as should the positive P-Indicator, V-Indicator and active Buy.
But it is
a warning that the Peerless Indicators' uptrends have been broken.
Sneak Attacks and Market Tops.
The DJI has again failed to get past the well-tested resistance. This is
automatically bearish for traders, because they know that the market must now
go searching for support. We can't let down our guard.
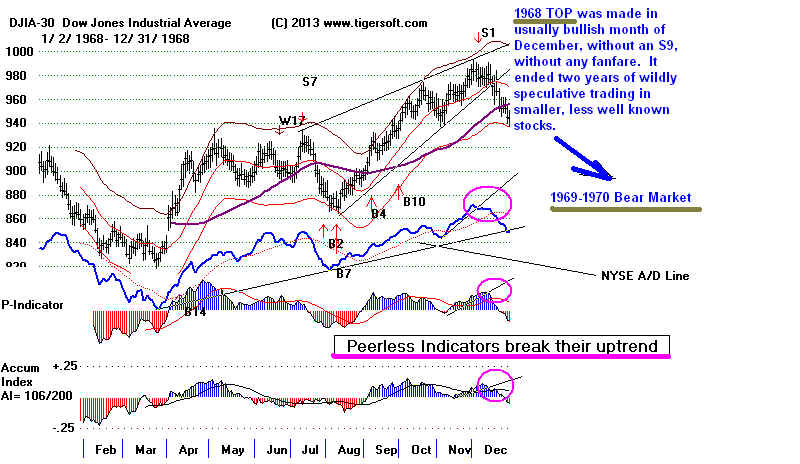
In history, one side's
"sneak" attack is the other side's lack of readiness and failure to allow for
the enemy's treachery and cruelty. Bear market, it is said, come in like a
thief in the night. That was the way the December 1968 top occurred after 2 years
of increasingly wild and wooly over-speculation.
I have to note now that the P-Indicators uptrends have been broken. Additional
weakness would now likely be see in a rise in the 10-year rates,
IBM's falling back from the 65-dma overhead, the QQQ breaking
its new head/shoulders' neckline and IBB (Biotech) turning
back down in accord
with its weak Closing Power.
11/12/2013 ---> To Key Index and Leading
Stock Charts: DJI, SP-500, etc.
DJI
la/ma annroc P-I
IP21 V-I
Opct 65-day Pct Change
-----------------------------------------------------------------------------------------------------------------------------------
10/29/2013 15680 +111 1.027 .430 +312 .210 +27
.149 01
10/30/2013 15618 -62 1.022 .333 +188 .175
-1 .054
006
10/31/2013 15546 -73 1.016 .321 +175
.13 -18
.038
006
11/1/2013
15615 +70
1.019 .482
+245 .153 +4 .138 - 001
11/4/2013
15639 +24
1.018
.44
+248
.134 +6 .141 - 002
11/5/2013
15618 -20 1.015
.529
+279 .161 +7
.130 - 000
11/6/2013
15747 +129
1.020
.751 +378 .218 +37
.226 014
11/7/2013
15594 -153
1.000
.61 +301 .159
+6
.115 007
11/8/2013
15762 +167 1.017 .489 +222 .158
-5 .120
016
11/11/2013
15783 +21 1.016 .419 +159 .139
-13 .115 023
11/12/2013
15751 -32
1.013
.344 +97 .109
-28 .035
021
********************************************************************************************
---->217 -12 MAXCP stocks Bullish MAXCP Stocks (11/12/2013) Bullish plurality
---> 56 -2
MINCP stocks Bearish MINCP Stocks (11/12/2013)
---> 58 (-36)
New Highs on NASDAQ 11
new lows. Bullish plurality
---> 73
New Highs on NYSE 20 new lows.
Bullish
plurality
===================================================================================
OLDER HOTLINES
===================================================================================
11/11/2013 Peerless remains on A Buy. It sure looks the DJI wants
to
breakout. I think the FED will sit on its policy-changing hands this
Christmas
retail season.
The DJI's price pattern is so precise, one has to think that
a clear penetration
of its resistance would be significant for it. With a volume increase, a decisive
DJI breakout close past 15840 should bring a new minimum DJI target of 17,000.
Since the DJI is watched by a lot of people, expect quite a few to be drawn in from
the sidelines. I suspect the speculative energies we are seeing in less
welll-known
stocks will heat up more if the DJI breaks out.
 The Fed Is Still
The Key
The Fed Is Still
The Key
Unfortunately for the bulls, investors are looking ahead into 2014 and
seeing trouble. That's why 10-Year rates are
at the apex of a right shoulder,
thereby poised to go higher, and several housing stocks are now in the Bearish MINCPs,
as is an Emerging markets' bond fund. As a result, the NYSE A/D Line is
lagging
noticeably, though it usually takes a much wider non-confirmation by the A/D Line
of the DJI new highs to stop momentum like we see now. Dissension
within the Fed
is building. The head
of the Fed's whole bond buying program is now talking openly
about
how little the Fed's massive buying of bonds has helped Main Street. I doubt
if he would speak out so publicly if this was not now the accepted wisdom within
the Fed. But as I suggested two weeks ago, there is no easy QE Exit-Plan.
The market
appears hooked on artificial stimulus. The real US economy is widely lagging the
market. So, the Fed needs to support Wall Street stock prices to prevent a
Financial
Collpase-caused deep recession.
"QE" Has Become "too big to fail"!
"Over five years, its bond purchases have come to more than $4 trillion.
Amazingly, in a supposedly free-market nation, QE has become the largest
financial-markets intervention by any government in world history. And the impact?
Even by the Fed's sunniest calculations, aggressive QE over five years has generated
only a few percentage points of U.S. growth....Having racked up hundreds of billions of
dollars in opaque Fed subsidies, U.S. banks have seen their collective stock price triple
since March 2009. The biggest ones have only become more of a cartel:
0.2% of them
now control more than 70% of the U.S. bank assets...As for the rest of America, good luck.
Because QE was relentlessly pumping money into the financial markets during the
past five years, it killed the urgency for Washington to confront a real crisis:
that of a
structurally unsound U.S. economy. Yes, those financial markets have rallied
spectacularly,
breathing much-needed life back into 401(k)s, but for how long? "
( Andrew Huszar -
Head of Fed's Bond Buying Program)
For Now, Momentum Should Rule
and Seasonality is Bullish, too.
The upward trend of the rest of the market is very steadily up. And any
decline, if
it still happens, is likely to be shallow and limited to 5% to 6%. Seasonality is
neutral for
the next week, but the DJI rises 70.2% of the time in the 10 trading days after
November 11th and 80..9% over the next two months. That, at least, is what happened
between 1965 and 2011. The Accumulation Index and P-Indicator on the DJI now
are quite positive. That makes a rare November or December Peerless Sell unlikely. i
Democrats in The
White House Bring Tops At The
Beginning of The Second Year in The Presidential Cycle
But what we have to worry about, I think, is the typical market top and decline
with a Democrat in the White House. See below how often this occurred after 1945
between late December and February in the year of the mid-term Elections.
Feb 1946-March 1946 10% decline - Truman
Feb 1950-March 1951 5% decline - Truman
12/28/1961 was a major top. DJI fell 26% by June.
Kennedy
1/18/1966 top before 9 mo 20% bear market Johnsom
Carter's Presidency was an exception. His first year
was a bear market.
2/1/1994 - top and 10% DJI decline. Clinton.
Earlier sell-off
-/12/5/1997-1/9/1998 DJI 10% decline. Clinton
1/14/2010 - 2/8/2010 7% decline. Obama
Momentum Is Up
The DJI-30 has struggled in isolation to get past its well-tested resistance.
The
NASDAQ, SP-500, the Tiger Index of the Dow-30 stocks themselves,
the Tiger Index of SP-500 stocks and the Tiger Index of the Russell-1000 stocks
are in unusually well-defined up-channels.
Having studied the relationship between the other indexes when the DJI makes
breakouts after the NASDAQ and the SP-500, it's hard to
believe that an official
DJI breakout would do immediate harm to what is already a powerful up-market
that is shared by most sectors. The real risk is that it will speed up a buying
climax,
where the NASDAQ jumps 25% as it did in the October 1999-March 2000 period
and the Fed then decides to start raising rates to prevent a bigger stocks' bubble
not backed up realistically by earnings' potential.
11/11/2013 ---> To Key Index and Leading
Stock Charts: DJI, SP-500, etc.
DJI
la/ma annroc P-I
IP21 V-I
Opct 65-day Pct Change
-----------------------------------------------------------------------------------------------------------------------------------
10/29/2013 15680 +111 1.027 .430 +312 .210 +27
.149 01
10/30/2013 15618 -62 1.022 .333 +188 .175
-1 .054
006
10/31/2013 15546 -73 1.016 .321 +175
.13 -18
.038
006
11/1/2013
15615 +70
1.019 .482
+245 .153 +4 .138 - 001
11/4/2013
15639 +24
1.018
.44
+248
.134 +6 .141 - 002
11/5/2013
15618 -20 1.015
.529
+279 .161 +7
.130 - 000
11/6/2013
15747 +129
1.020
.751 +378 .218 +37
.226 014
11/7/2013
15594 -153
1.000
.61 +301 .159
+6
.115 007
11/8/2013
15762 +167 1.017 .489 +222 .158
-5 .120
016
11/11/2013
15783 +21 1.016 .419 +159 .139
-13 .115 023
********************************************************************************************
---->229 MAXCP stocks Bullish MAXCP Stocks (11/11/2013) Bullish plurality
---> 58
MINCP stocks Bearish MINCP Stocks (11/11/2013)
---> 58 (-36)
New Highs on NASDAQ 11
new lows. Bullish plurality
---> 73
New Highs on NYSE 20 new lows.
Bullish
plurality
********************************************************************************************
=================================================================================
OLDER HOTLINES
=================================================================================
11/8/2013 Peerless Remains on A Buy. Though breadth was somewhat
impaired
because interest rates rose, many of the week's weakest NASDAQ and Biotechs
stocks fought their way back above the 65-dma. IBB's
Closing Power is still in
a falling trend. Even though many high priced biotechs were up, their Closing
Powers are is steep declines, showing continued Professional selling. See their
charts here:
11/8/2013 ---> To Key Index and Leading
Stock Charts: DJI, SP-500, etc.
The DJI is at the top of its trading range. Until it breakouts, there is more
downside
potential than usual when Peerless is on a Buy signal.
2-Day Reversals Up
I examined today the cases since 1980 where the DJI fell 1.75% one day and then
rose by that much the next day with the DJI between 1.5% and 2.5% over the
21-day ma. The first thing that emerges is how many more cases there are in the
last 6 years due to computerized trading. The conclusion I draw from this is that
such reversals are less important. Still, there are two cases where such 2-day
reversals were soon followed by flat-topped breakouts.
la/ma Outcome
--------------------------------------------------------------------------------------------------------
11/8/2013 1.017
12/29/2011 1.018 Breakout
followed with January take-off.
7/22/2010 1.022 DJI
rallied 3% and then droped to lower band.
10/20/2010 1.016 DJI rallied
2.5% and then droped close to lower band.
10/22/2009 1.026 DJI fell 3%
and then rallied.
12/5/2008 1.02 Sidewise for 3
weeks.
4/28/2003 1.022 Up
strongly.
2/5/2001 1.025 DJI fell below lower band.
4/17/1998 1.025 DJI fell lower band.
4/14/1989 1.02 A valid FLAT TOPPED BREAKOUT followed..
6/28/1988 1.015 DJI
declined to lower band.
4/28/1983 1.022 BREAKOUT
followed.
Flat-Topped Breakouts
Momentum, as I keep saying favors an upside breakout by the DJI above the
well-tested 15800 resistance. But when? I
re-did the study of DJI trading ranges,
> 5%-6% DJI pullbacks above flat resistance occured without Sells
in 1984 three times: September, October and November)
and in 1986 (November).
> Novembers brought reversals down, not breakouts, in 1980. However,
1972 did yield a successful November breakout, as Nixon's re-election was
celeberated.
>Breakouts are more common in late December or January. Valid late
December/January flat topped breakouts occurred in 1985, 1987 and 1991.
The breakout in January 2000 was quite false. The Peerless Sells in January
2000 were unmistakably bearish.
>The NYSE A/D Line is lagging the DJI now. Flat topped breakouts can still
work out in these circumstances, but the advances are more likely to be limited
than bring big advances that last more than 3 months.
Flat
Topped DJI Breakouts with Peerless Buys and A/D Line NCs.
DJI Breakout
Result
----------------------------------------------------------------------------
9/26/1968
11 weeks advance
11/14/1972
7 weeks advance
Dec 1986
much higher later in 1986
May 1990
7 weeks advance
9/17/1996
much higher...
11/8/2013 ---> To Key Index and Leading Stock Charts: DJI, SP-500, etc.
Links corrected. Some items added.
DJI
la/ma annroc P-I
IP21 V-I
Opct 65-day Pct Change
-----------------------------------------------------------------------------------------------------------------------------------
10/29/2013 15680 +111 1.027 .430 +312 .210 +27
.149 01
10/30/2013 15618 -62 1.022 .333 +188 .175
-1 .054
006
10/31/2013 15546 -73 1.016 .321 +175
.13 -18
.038
006
11/1/2013
15615 +70
1.019 .482
+245 .153 +4 .138 - 001
11/4/2013
15639 +24
1.018
.44
+248
.134 +6 .141 - 002
11/5/2013
15618 -20 1.015
.529
+279 .161 +7
.130 - 000
11/6/2013
15747 +129
1.020
.751 +378 .218 +37
.226 014
11/7/2013
15594 -153
1.000
.61 +301 .159
+6
.115 007
11/8/2013
15762 +167 1.017 .489 +222 .158
-5 .120
016
********************************************************************************************
---->183 MAXCP stocks Bullish MAXCP Stocks (11/8/2013) Bullish plurality
---> 78
MINCP stocks Bearish MINCP Stocks (11/8/2013)
Low Priced High Accum Stocks (11/8/2013)
---> 94
New Highs on NASDAQ 20 new lows. Bullish plurality
---> 92
New Highs on NYSE 30 new lows.
Bullish
plurality
===================================================================================
OLDER HOTLINES
===================================================================================
11/6/013 Still No Peerless Sell. The
DJI approaches 15800, its pivot point.
If it breaks out above that level, it should boost IWM and the rest of the
market. But if it fails to stay above 17700, a DJI retreat of 5%-6% would
seem to become more probable.
The DJI scored a new all-time high today, but its high has all but tagged
the well-tested resistance-line over-head. Bearishly its move was not confirmed
by the NYSE A/D Line, the NASDAQ, SP-500,
QQQ or IWM. Such
non-confirmations a
re not good. A DJI retreat would probably be healthier than a breakout. Our
IWM long position actually fell today. It should not have done
this. IWM's
a close call, but I think simple prudence requires it to be sold tomorrow if the DJI
cannot stay above 15700. There is the possibility that it will breakout
past 15800...
But a DJI 5% to 6% retreat from the well-tested resistance is also possible, too,
even without a Peerless sell. The 1986-1987
case shows this.
Biotechs are a problem for the market now. In 2000, they peaked 2-3
weeks
before the QQQQ and NASDAQ did. Will that happen again here? Their very
weak Closing Power shows that Professionals are not ruling that out! Sell short IBB
on the strength tomorrow after the DJI's higher opening..
===================================================================================
OLDER HOTLINES
===================================================================================
11/7/013 Still No Peerless Sell. The DJI, however, has fallen back
from the
15800 pivot point. A 5% or 6% decline would be consistent with the dictates
of its well-established trading range. So we have to take some profits and
should do some short-term hedging. I have suggested selling IWM,
which
is still in an uptrend, shorting IBB (Nasdaq biotechs) and
some of our "Piffle"
and bearish MINCP stocks, while we await developments
regarding Fed intentions.
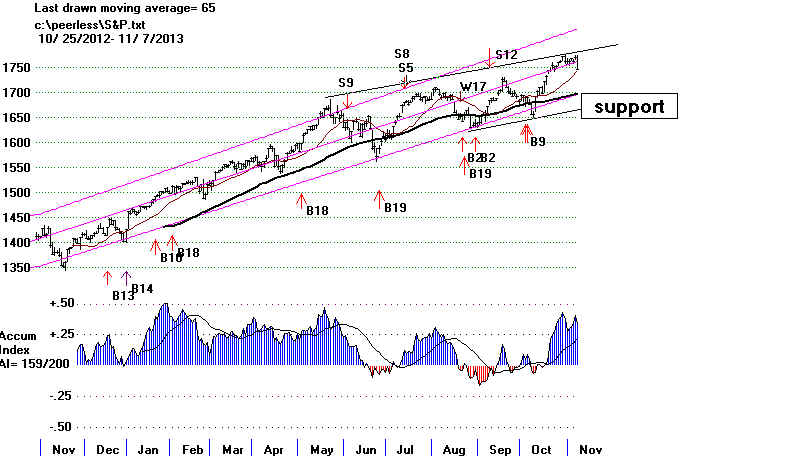
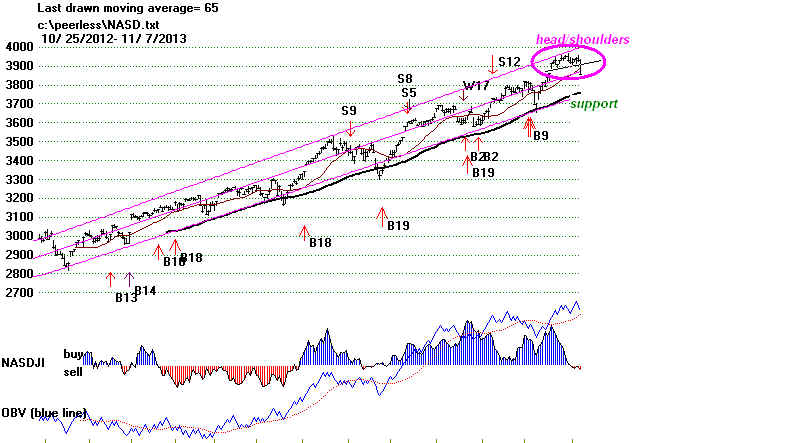
The SP-500 and NASDAQ charts below show high and steady Accumulation. This
means that any decline by them to their uptrends and their rising 65-dma may
good support. But it is no guaranee. The NASDAQ's high
AI/200 score may not forestall
or prevent a year-end decline. Looking back when the AI/200 was consistently positive
and above 150, we still see a 10% retreat by the NASDAQ in 1989, a 30% decline in
mid 1990,a 15% decline in the first half of 1992, a 14% sell-off in the first hald of 1994
and a 18% free-fall in 2010. In these cases, there was either a Peerless Sell or a
completed head/shoulders in the NASDAQ. We have no Peerless Sell, but the NASDAQ
has completed a small head/shoulders pattern. Caution now is warranted.
11/7/2013 ---> To Key Index and Leading
Stock Charts: DJI, SP-500, etc.
Links corrected. Some items added.
DJI
la/ma annroc P-I
IP21 V-I
Opct 65-day Pct Change
-----------------------------------------------------------------------------------------------------------------------------------
10/29/2013 15680 +111 1.027 .430 +312 .210 +27
.149 01
10/30/2013 15618 -62 1.022 .333 +188 .175
-1 .054
006
10/31/2013 15546 -73 1.016 .321 +175
.13 -18
.038
006
11/1/2013
15615 +70
1.019 .482
+245 .153 +4 .138 - 001
11/4/2013
15639 +24
1.018
.44
+248
.134 +6 .141 - 002
11/5/2013
15618 -20 1.015
.529
+279 .161 +7
.130 - 000
11/6/2013
15747 +129
1.020
.751 +378 .218 +37
.226 014
11/7/2013
15594 -153
1.000
.61 +301 .159
+6
.115 007
********************************************************************************************
----> 53 MAXCP stocks Bullish MAXCP Stocks (11/7/2013)
---> 136
MINCP stocks
Bearish MINCP Stocks (11/7/2013) Bearish
plurality
Bearish-Looking
Crazy-Up Stocks. 11/7/2013
---> 28
New Highs on NASDAQ 39 new lows. Bearish plurality
---> 22
New Highs on NYSE 29 new lows.
Bearish plurality
===================================================================================
OLDER HOTLINES
===================================================================================
11/6/013 Still No Peerless Sell. The
DJI approaches 15800, its pivot point.
If it breaks out above that level, it should boost IWM and the rest of the
market. But if it fails to stay above 17700, a DJI retreat of 5%-6% would
seem to become more probable.
The DJI scored a new all-time high today, but its high has all but tagged
the well-tested resistance-line over-head. Bearishly its move was not confirmed
by the NYSE A/D Line, the NASDAQ, SP-500,
QQQ or IWM. Such
non-confirmations a
re not good. A DJI retreat would probably be healthier than a breakout. Our
IWM long position actually fell today. It should not have done
this. IWM's
a close call, but I think simple prudence requires it to be sold tomorrow if the DJI
cannot stay above 15700. There is the possibility that it will breakout
past 15800...
But a DJI 5% to 6% retreat from the well-tested resistance is also possible, too,
even without a Peerless sell. The 1986-1987
case shows this.
Biotechs are a problem for the market now. In 2000, they peaked 2-3
weeks
before the QQQQ and NASDAQ did. Will that happen again here? Their very
weak Closing Power shows that Professionals are not ruling that out! Sell short IBB
on the strength tomorrow after the DJI's higher opening..
11/6/2013 ---> To Key Index and Leading
Stock Charts: DJI, SP-500, etc.
Links corrected. Some items added.
DJI
la/ma annroc P-I
IP21 V-I
Opct 65-day Pct Change
-----------------------------------------------------------------------------------------------------------------------------------
10/29/2013 15680 +111 1.027 .430 +312 .210 +27
.149 01
10/30/2013 15618 -62 1.022 .333 +188 .175
-1 .054
006
10/31/2013 15546 -73 1.016 .321 +175
.13 -18
.038
006
11/1/2013
15615 +70
1.019 .482
+245 .153 +4 .138 - 001
11/4/2013
15639 +24
1.018
.44
+248
.134 +6 .141 - 002
11/5/2013
15618 -20 1.015
.529
+279 .161 +7
.130 - 000
11/6/2013
15747 +129
1.020
.751 +378 .218
+37
.226
014
********************************************************************************************
----> 196 -48 MAXCP stocks Bullish MAXCP Stocks (11/6/2013) Bullish plurality
High
Accumulation Low Priced Stocks 11/5/2013)
---> 71 +12
MINCP stocks
Bearish MINCP Stocks (11/6/2013)
Bearish-Looking
Crazy-Up Stocks. 11/6/2013
---> 57
New Highs on NASDAQ 34new lows. Bullish plurality
---> 65
New Highs on NYSE 13 new lows.
Bullish
plurality
Biotech Weakness Will Hurt NASDAQ
It was the breaking of the biotech bubble in 2000 just as the mapping of the
human genome was accomplished that played a big role in the NASDAQ
collapse. See an article from 2000. QQQQ topped out two weaks later.
It was the way QQQQ' Closing Power fell and fell to new 12 month
lows in 2000 that is the parallel I fear now looking at a number of Biotechs
that are up a long ways.
Biotech
Sell-Off Ignites Rout of Tech Stocks - Los Angeles Times
"Mar 15, 2000 - A vicious morning sell-off
in biotechnology stocks spilled over to other techs"
QQQQ 2000 Top
The research I have presented here suggests that any retreat will
probably
be limited, especially given the DJI's upward momentum. But the weakness
in Biotechs could easily worsen. Sell short IBB with the idea that we may
have to cover it quickly if it aborts its head/shoulders pattern by moving
above its right shoulder. The biggest biotechs are getting too far ahead
of their rank and file brethern. They also are breaking the 65-dma. With
heavy Professional selling (falling Closing Power), we will see how bullish
the broad Public still is. Very often, distribution occurs mostly on the way
down. In other words, prices decline on falling Closing Power even though
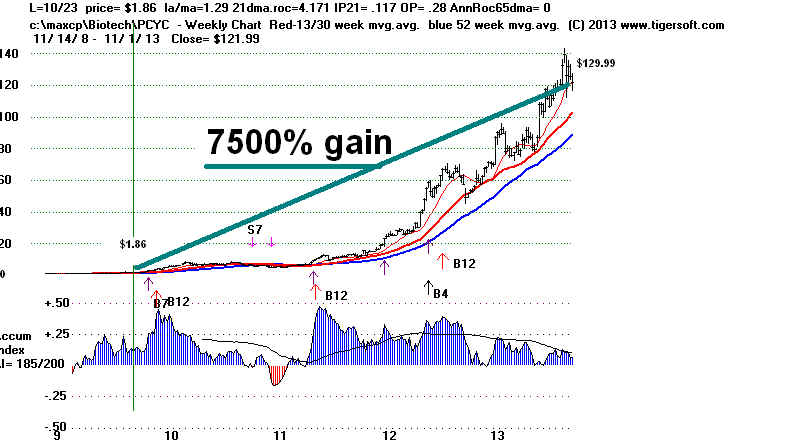
there may be higher Openings. Many have risen a very long ways. PCYC,
for example, has risen more than 75x its level 4 years ago.
I am concerned about the growing weakness in the Biotech group. An awful
lot of profit-taking could occur. With profits so big, there will likely be a lot
of hasty, clumsy dumping as prices drop much further. The leaders are
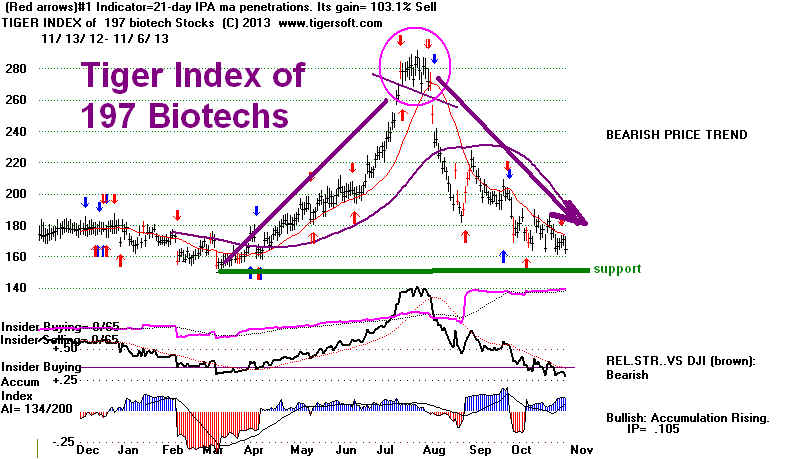
too far ahead of the rank and file, I would say. The Tiger Biotech Index of 197 |
such stocks is looking much, much weaker.
Now the Fidelity Biotech Index (FBIOX ) and IBB (Nasdaq
Biotechs)
have just violated their 65-dma. This will force institutions to either add to
their positions or lighten up. My guess is that they will lighten up.
And if they
start to do that, it may turn into a selling rout.
See how a number of biotechs have already badly fallen through trap-doors:
ARIA, AVEO, BIOF, CCXI, CRIS, GTXI, HWAY, IMGN. A lot more
seem likely.
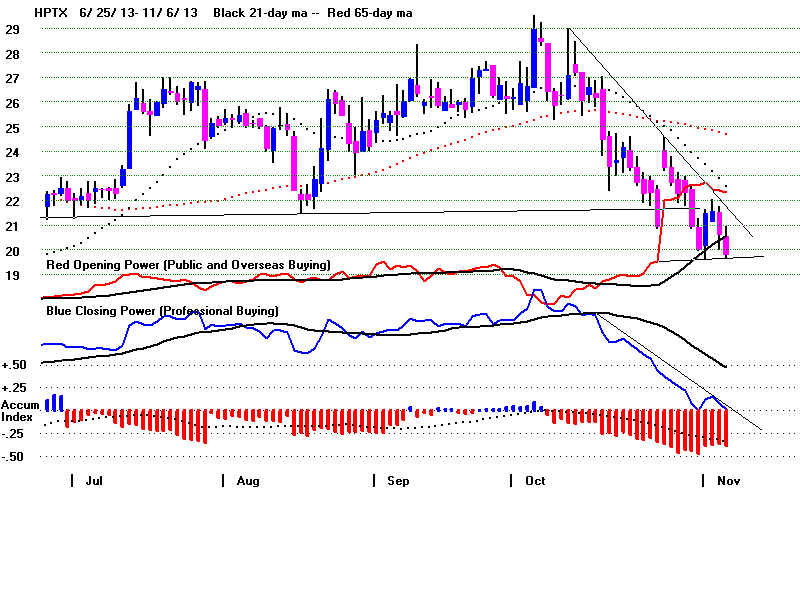
I would sell short IBB. PCYC, RPRX and HPTX should also be considered.
 |
===================================================================================
OLDER HOTLINES
===================================================================================
11/5/013 Still No Peerless Sell. I take the strength in the Futures
(now +77) as a sign
that Wall Street is much relieved that the Republican Tea Party candidate in
Virginia lost and that the "moderate" Republican Christie won handily in New
Jersey.
The Tea Party represents uncontrollable, wild unpredicatability to Wall Street.
Establishment Democrats are much easier to influence and work with.
We are long IWM and did not go short IBB. Because of the DJI's trading range
and the frequent cases where there is a pullback of 5% to 6% from its well-tested
resistance even when there is no Peerless Sell, I have suggested hedging with
some BEARISH MINCP or CRAXY-UP/PIFFLE
stocks.
Many of our high Accumulation BULLISH MAXCPs keep advancing
to new highs.
Now with the DJI futures up so much, it looks like the pivot point of 15831 will be
tested soon. Understand that breakouts into all-time high territory truly terrify
the shorts
because there is often no good technical price level where they can take a stand
against the stampeding bulls. That is why the market may breakout and advance
a quick 5% or 10%, even, in these circumstances.
The closest parallel I can find for the market right now is seen in the
1986
and 1986-1987
charts. If the market were to follow the pattern here, there would be a 6%
retreat in November from 15800 and then a powerful surge early next year.
Another way to look for parallels is to find the cases since 1945 where the upwards
momentum of the DJI (using the annualized rate of change of the Least Squares Line)
and the AI/200 were roughlty similar. Using this approach, we should not expect a
top until January unless Peerless gives a Sell Signal.

I came across an article in Yahoo that reflects my own bullishness. It talked
about
one of my favorite themes: how the stock market can keep rising while Main Street,
employment and wages languish.
http://finance.yahoo.com/news/us-economy-plods-pay-lags-184103537.html
Bears are mostly basing their case now on sentiment indicators showing excessive
bullishness
on the part of individual investors. Many of the individual stock gains
have been "frothy", I agree. Some hedging may be justified, but Peerless
has not
given a Sell and the research tonight would tend to make us think that the next
top may not be until January unless we get a Peerless Sell, a head/shoulders top
or some other clearly bearish development.
Watch the Biotechs tomorrow. If they fail to participate in a strong DJI advance,
it will show the NASDAQ and the QQQ will have to retrace some of their gains
and consolidate before they can hope to repeat the November 1999 to March 2000
climactic advance.
DJI-15800 is where resistance line now crosses.
11/5/2013 ---> To Key Index and Leading
Stock Charts: DJI, SP-500, etc.
Links corrected. Some items added.
DJI
la/ma annroc P-I
IP21 V-I
Opct 65-day Pct Change
-----------------------------------------------------------------------------------------------------------------------------------
10/29/2013 15680 +111 1.027 .430 +312 .210 +27
.149 01
Top?
10/30/2013 15618 -62 1.022 .333 +188 .175
-1 .054
006
10/31/2013 15546 -73 1.016 .321 +175
.13 -18
.038
006
11/1/2013
15615 +70
1.019 .482
+245 .153 +4 .138 - 001
11/4/2013
15639 +24
1.018
.44
+248
.134 +6 .141 - 002
11/5/2013
15618 -20 1.015
.529
+279 .161 +7
.130 - 000
********************************************************************************************
----> 244 MAXCP stocks Bullish MAXCP Stocks (11/5/2013) Bullish plurality
High
Accumulation Low Priced Stocks 11/5/2013)
---> 59
MINCP stocks
Bearish MINCP Stocks (11/5/2013)
Bearish-Looking
Crazy-Up Stocks. 11/5/2013
---> 66
New Highs on NASDAQ 25 new lows. Bullish plurality
---> 58
New Highs on NYSE 14 new lows.
Bullish
plurality
12-Month Momentum and AI/200:
Cases where DJI's Yearly Charts Show a Least Squares
Line with a Rate of Chnage above 18%.
The power of the uptrend in the DJI, SP-500 and NASDAQ suggests we should
let prices run until either there is a Peerless sell signal, a new DJI utterly
not confirmed by the NYSE A/D Line or the Accumulation Index turns negative.
Compare the rate of ascent of the least squares line for the DJI now and
its AI/200 levels with similar strong advance in the past since 1945.
The closest parallels, looking at these two variables, are 1985, 1980, 1975, 1955 and
1945.
In each of these cases, there was a least a 5% decline by January, But only in
1980, did it start before January of the following year.
DJI
2012-2013 .204 132 (relatively low)
2009 .367
160 7% decline in January 2010 No Peerless Sell.
2003 .270
176 10 month peak on 2/20/2004 with Sell S9.
1996 .195
176 peaked in March 1997 after Sell S9 in February.
1995 .330
186 peaked in March after February S1.
1989 .257
193 peaked on 1/3/1990 on multiple Peerless Sells. Fell 10%.
1985
.188 150
After 4% retreat in January DJI soared 25% by April 1986.
1982 .261
105 Choppy 7% bounces up and down at end of year, starting late November.
1980
.203 112
Choppy bounces up and down at end of year, starting late November.
1975
,213 109
January take-off.
1958 .343
183 After 4% Decline from November peak, DJI soared 20% by July 1959.
1955
.234 138
A January 1956 peak produced 5% decline and then 12% rally to April.
1954 .389
178 DJI fell 6% from February peak. Mp {eer;ess Sell.
1945
.214 149
DJI peaked in January 1946 after Sell S9 and fell 10%.
===================================================================================
OLDER HOTLINES
===================================================================================
11/4/013 Still No Peerless Sell. Buy
into a pullback of about 4%. Without
a Peerless Sell, any decline should be limited. Hedging of rthe next two
weeks still seems advisable. Biotechs are looking dangerously over-priced
using out "Crazy-Up-Piffle" rules.
Aggressive traders should Sell short IBB
if it cannot rally tomorrow. Tonight the NY Times has two articles heralding
biotech's successes with cancer and hepatitis. (Click on the titles to see article.)
Hopeful Glimmers in Long War on Cancer
Hepatitis C, a Silent Killer, Meets Its Match
Let's wait to see the articles' impact. FBIOX
and IBB are testing their rising 65-dma
with weak internals. Continuing weakness here would definitely be bearish
for the biotech group. It would also hold the NASDAQ back.
The DJI is now back in the zone of intense profit-taking
between 15600
and 15700. The other averages appear to be following the lead now of the DJI.
You can below that the NASDAQ's relative strength vis-a-vis the DJI has turned
negative. Nasdaq Accumulation remains reassuringly high, but volume has fallen
off somewhat. Despite its jump today, IWM's
Closing Power still needs to get
back above its 21-day ma to appear ready for a run to new highs.
The NASDAQ has been rising at a 32.2% clip this year, using the slope of the
least squares line. Its history suggests that as long as its
Accumulation Index
stays positive, we should trust it upward momentum. (More on this tomorrow
night).
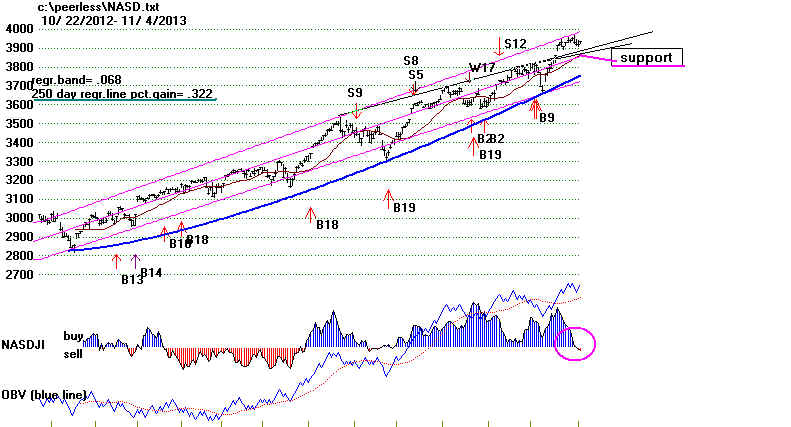
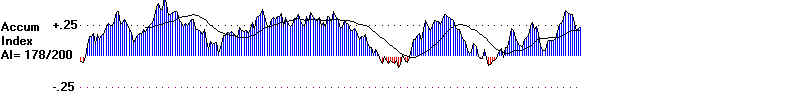
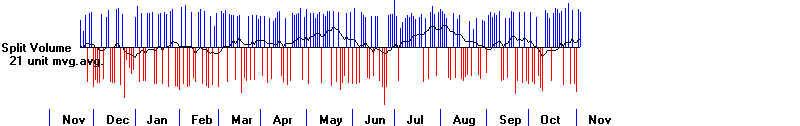
DJI Breakout: What Significance if It Occurs?
At its key pivot point, 15700, the DJI could fall back or it could breakout out.
I have said any retreat should be viewed as a buying opposrtunity because DJI trading
range pullbacks are rarely bearish. (1976 is the exception in 7 cases.)
Since its trading range is almost 1000 points wide, that theoretically could set up
a new minimum upside objective of 16700. However, when one goes back over
Novembers with a Democrat in the White House since 1945 - for any
year in the
Presidential 4-year cycle - we see almost as many false new high moves as valid
breakouts
There were 6 cases of successful November breakouts:
11/28//1952
11/17/1994
11/10/1994
11/16/1995
11/8/1996
11/10/2009
There were 5 cases of failed breakouts which produce a retreat towards
the lower band. Only two of these led quickly to deep declines. Moreoften
the market was ready to rally again after a 4% decline.
11/24/1950 5.5% decline then
rally to new highs
11/15/1961 trading range for 5 weeks, then S16 and bear market.
11/17/1965 4.0% decline then
rally to new highs
11/26/1968 bear market starts in December, Peerless
Sell
11/19/1980 false breakout and 10% decline. Peerless
Sell
11/5/2011 4.5% decline then rally to new highs
I have also said that it seemed to me that the market seems to be shaping up
for a speculative "binge-blow-off" like occured on late 1999. With the
NASDAQ
showing a hyperbolic curve, we want to be on the watch for a NASDAQ breakout
either from a flat topped trading range or above the top of its price channel.
I have suggested that it might run the last 1000 points of its advance to 5200
like the NASDAQ did from November 1999 to March 2000.
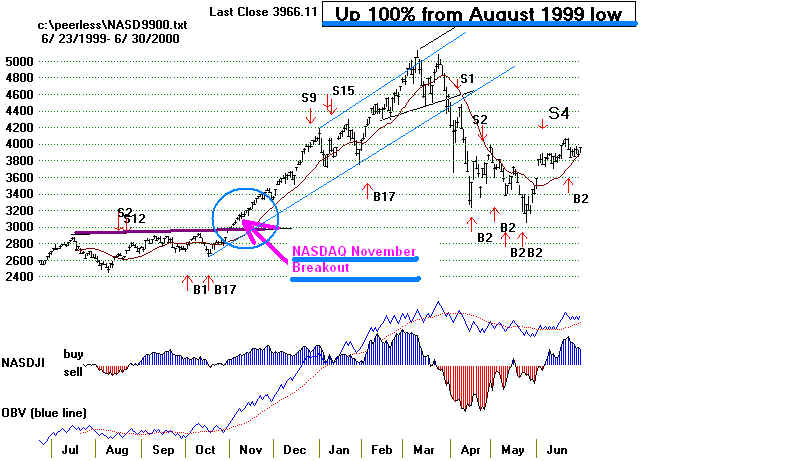
Biotechs Look Vulnerable Now
A NASDAQ advance like the once that we saw in late 1999 now would have
to occur in ways that are hard to imagine. In 1999, internet and biotech stocks
were soaring. The best internet and biotech stocks of our era have already
made very big gains, it would be asking a lot for them to shoot skyward some
more without first pausing for a few months. In addition, the Closing Powers
for
a number fo Biotech stocks now are looking toppy and show downtrends. Small
investors have a lot less money this time around. That reduces the chances
for another 1999-2000 doubling in the NASDAQ. Moreover, I think
professionals mostly DO remember 1999-2000, though the "system" of
performance-based-rewards virutally guarantees that the strongest stocks
will be pushed up again to unreasonable levels.
The Fidelity Biotech Index (FBIOX) is at its uptrendline
and its rising 65-dma.
This is critical nested support. It could turn back upwards. It had done this
before But see now the IP121 and Closing Power weakness in nearly all the
higher priced biotechs:
AEGR 65-dma turned down, IP21<0, CP breakdown.
Red Popsicles and big rolling-pins.
ALXN Double red automatic Sell. 3 straight red popsicles.
AMGN looks OK.
BIIB CP weakness. IP21<0. 5 straight red
popsicles
BMRN CP in steady downtrend. IP21<0
Prices testing August lows.
CELG Mostly red popsciles for last week. Testing
65-dma
GILD Bearish CP head/shoulders. 3 straight red popsicles.
IP21 is still positive.
IBB shows 4 straight red popsicles and negative IP21.
CP making 100-day lows.
PCYC CP is making a 250-day low as stock tests its rising
65-dma. IP21 is still positive.
REGN CP H/S. negative IP21,5 straight red popsicles.
At 65-dma
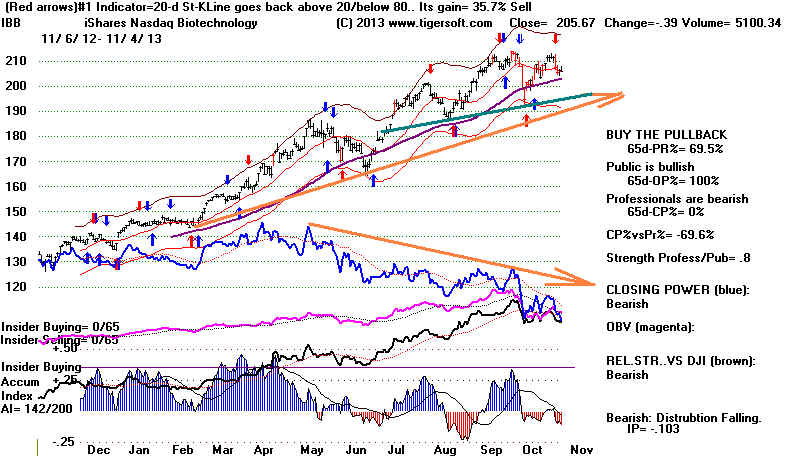
In sum, if there is going to be a breakout now, it will probably be by the DJI
and it could well quickly be followed by a 4%-5.5% pullback. The most bullish
thing the market could do now is to go sidewise and prepare a better launching pad
for higher prices. Since any retreat now should be limited,
let's continue to hold
IWM and some of the very high Accumulation stocks making new
highs and
showing Closing Power strength. See in the Bullish MAXCP stocks, numerous
examples of big movers that not not at all disturbed at the possibility of a DJI
retreat from the its 15600-15700 resistance. Stay hedged and short some of the
Bearish MINCP stocks.
11/4/2013 ---> To Key Index and Leading
Stock Charts: DJI, SP-500, etc.
Links corrected. Some items added.
DJI
la/ma annroc P-I
IP21 V-I
Opct 65-day Pct Change
-----------------------------------------------------------------------------------------------------------------------------------
10/29/2013 15680 +111 1.027 .430 +312 .210 +27
.149 01
Top?
10/30/2013 15618 -62 1.022 .333 +188 .175
-1 .054
006
10/31/2013 15546 -73 1.016 .321 +175
.13 -18
.038
006
11/1/2013
15615 +70
1.019 .482
+245
.153
+4 .138 - 001
11/4/2013
15639 +24
1.018
.44 +248 .134
+6
.141 - 002
********************************************************************************************
----> 244 MAXCP stocks Bullish MAXCP Stocks (11/3/2013) Bullish plurality
High Accumulation
Low Priced Stocks 11/1/2013)
---> 59
MINCP stocks
Bearish MINCP Stocks (11/4/2013)
Bearish-Looking Crazy-Up Stocks. 11/1/2013
---> 71
New Highs on NASDAQ 18new lows. Bullish plurality
---> 94
New Highs on NYSE 10 new lows.
Bullish
pluraliy
===================================================================================
OLDER HOTLINES
===================================================================================
11/1/013 Still No Peerless Sell. The DJI also has not yet tagged
the resistance
line over-head. That gives a little more head-room for it to advance. In
additon,
IWM has retreated back to
the support of its rising 21-day ma and its point of
breakout. Short-term traders should buy it back. I think.
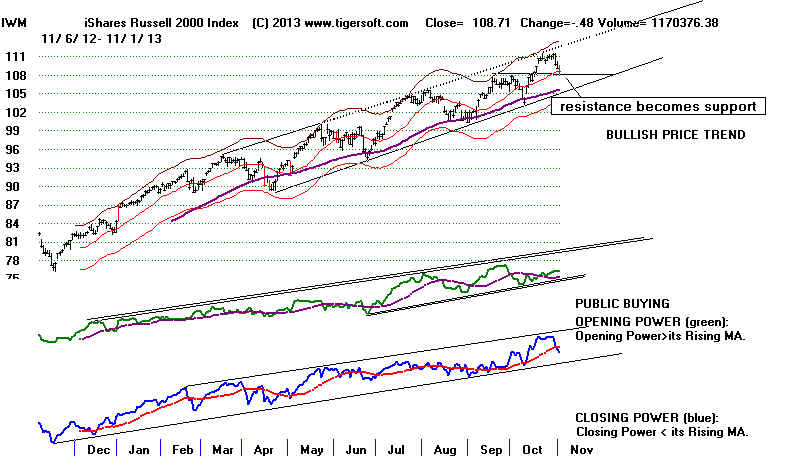
But we also want to be cautious because of the trading range's dynamics.
History shows that the DJI can fall as much as 6% from well-tested ressitance even
without a Peerless Sell signal. Hedging for the next week or two is
recommended.
There are a number of bearish MINCP and Piffle Stocks that look like good short sales.
At the same time, we see many still attractive bullish MAXCP
stocks.
11/1/2013 ---> To Key Index and Leading Stock Charts: DJI, SP-500, etc.
Links corrected. Some items added.
DJI
la/ma annroc P-I
IP21 V-I
Opct 65-day Pct Change
-----------------------------------------------------------------------------------------------------------------------------------
10/29/2013 15680 +111 1.027 .430 +312 .211 +27
.149 01
Top?
10/30/2013 15618 -62 1.022 .333 +188 .171
-9 .04
006
10/31/2013 15546 -73 1.016 .321 +175 .125
-26 .025
006
11/1/2013
15615 +70
1.019 .482
+245
.149
-4
.236 - 001
********************************************************************************************
----> 192 MAXCP stocks Bullish MAXCP Stocks (11/1/2013) Bullish plurality
High
Accumulation Low Priced Stocks 11/1/2013)
---> 51
MINCP stocks
Bearish MINCP Stocks (11/1/2013)
Bearish-Looking Crazy-Up Stocks. 11/1/2013
---> 44
New Highs on NASDAQ 24 new lows. Bullish plurality
---> 48
New Highs on NYSE 11 new lows.
Bullish
pluraliy
Don't get real bearish here. Remember that since 1945,
a Democrat in the
White House has always brought an advance in November and also in December
in the year after a Presidential Election. In additon, these flat trading ranges
have a hefty probability (6 of 7) of bringing significant upside breakouts before
the "big bear" comes. So any dip is a buying ipportunity. This
sanguine view
is also boosted by the continuing weakness of Gold and Silver. This shows
confidence and it shows very little fear of inflation. The falling gold and silver
prices between 1982 and 1999 coincided with the biggest advance in stock
market history. This was particularly true from 1995-1999 when the DJI
rose 150% and internet and biotech stocks bubbled wildly. The FED has said
rates will be kept low for a long time. This is an open invitation to speculators.
The FED has removed the biggest risk they face, an unexpected jump in interest
rates. I would not expect the Fed to do anything in the pre-Chistmas months that
would hurt retail sales.
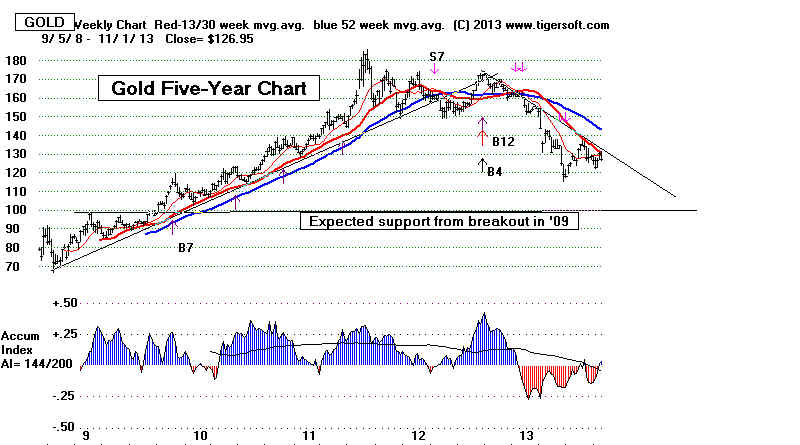
Now we also see Crude Oil turning down, having failed to stay above $100.
This means more money in most average consumers' pockets, which is very good
for the economy. Falling fuel prices are also a very big factor in the booming
transportation stocks, though they do hold back CVX and XOM in the DJIA.
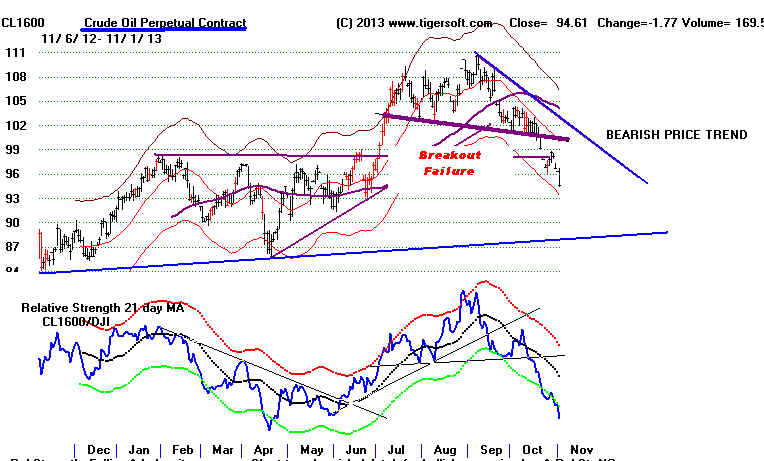
Aerospace and Aitlines stocks are the leaders. BA
is our Tahiti stock
(highest AI/200 in DJI-30). But look at CIR take off, too: see its wall of
steadily positive Accumulation and the price-channel breakout. FSAIX
(Fidelity Aerospace) has been the best performing Fidelity Select fund for the
last month.
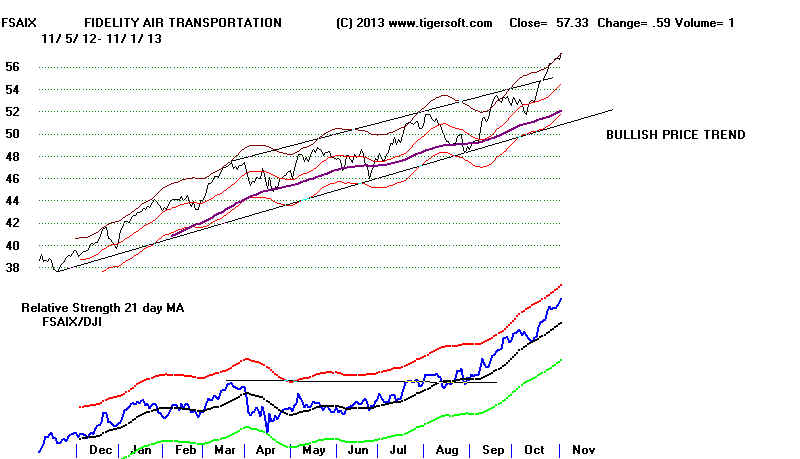
| Top 10 Holdings of FSAIX (66.63% of Total Assets) |
|
| Company |
Symbol |
% Assets |
YTD Return % |
| United Parcel Service, Inc. Com |
UPS |
11.85 |
27.03 |
| Boeing Company (The) Common Sto |
BA |
11.27 |
58.18 |
| Delta Air Lines, Inc. Common St |
DAL |
9.35 |
104.47 |
| FedEx Corporation Common Stock |
FDX |
7.07 |
26.14 |
| Rockwell Collins, Inc. Common S |
COL |
6.14 |
20.59 |
| Ryanair Holdings PLC ADR |
RYAAY.IR |
5.29 |
45.60 |
| Precision Castparts Corporation |
PCP |
4.91 |
22.64 |
| United Continental Holdings |
UAL |
3.74 |
34.22 |
| Textron Inc. Common Stock |
TXT |
3.54 |
12.67 |
| Westjet Airlines Ltd. |
WJAVF.TO |
3.47 |
23.24 |
|
The New Sardine-Liner
Boeing's new Dreamliner is supposed to be a big-fuel saver. But there's another
reason
Boeing is doing so well. All its new places offer much tighter coach seating.
This
forces bigger people to fly first class and allows 15% more fliers to be packed like
sardines into coach. For almost 20 years, the standard setup in the back
of a Boeing 777 was nine seats per row. But now Boeing jets oferf 10-abreast
seating.
The new seats are 16.7" wide. A typical movie theater seat is 21"-22"
wide.
So make some money with BA. You may need to fly first-class this Christmas.
===================================================================================
OLDER HOTLINES
===================================================================================
10/31/013 Still No Peerless Sell. But history does show that the
DJI can retreat 6%
from flat, well-tested resistance without a Peerless Sell. But eventually,
except in 1976, the DJI always achieved a decisive breakout past the well-tested
resistance. So any decline here, should give us another good ETF buying
opportunity.
Novembers have brought advances in 70.2% of the years since 1965.
10/31/2013 ---> To Key Index and Leading
Stock Charts: DJI, SP-500, etc.
Links corrected. Some items added.
DJI
la/ma annroc P-I
IP21 V-I
Opct 65-day Pct Change
-----------------------------------------------------------------------------------------------------------------------------------
10/29/2013 15680 +111 1.027 .430 +312 .211 +27
.149 01 Top
10/30/2013 15618 -62 1.022 .333 +188 .171
-9 .04
006
10/31/2013 15546 -73 1.016 .321 +175 .125
-26 .025
006
********************************************************************************************
----> 203 MAXCP stocks Bullish MAXCP Stocks (10/31/2013) Bullish plurality
High
Accumulation Low Priced Stocks 10/31/2013)
---> 51
MINCP stocks
Bearish MINCP Stocks (10/31/2013)
Bearish-Looking Crazy-Up Stocks. 10/31/2013
---> 54
New Highs on NASDAQ 27 new lows. Bullish plurality
---> 51
New Highs on NYSE 15 new lows.
Bullish
pluraliy
85 5 year highs of 630 weekly charts we follow each
week with Tiger
Presidential Strength and the Market
I mentioned that having a Democrat in the White House has always brought
an advance in the DJI in November and December. The Obama's Administration's
troubles right now with making ready the Federal website for the huge numbers
affected by the Affordable Care Act and right now with the unfocused, rogue
phone-wire-tapping by the NSA on allies hurts American prestige, the President's
political power and forces him to divert attention in ways that are very wasteful.
These things shows significant gaps in Presidential administrative skills.
It creates doubts and fears that there will be more big problems ahead.
The stock market senses this. Its hesitation reflects new undertainties.
The stock market is surprisingly apolitical, in the sense that it usually likes strong
and effective leadership. It certainly can be duped, though, as it celebrated
Nixon's re-election by making a major market top. Generally, it does not
like uncertainty. Strong leadership creates confidence and also tends to
reduce the dangers of unexpected developments blind-siding the market..
One could blame the stock market's troubles in the 1970s on failures of
Presidential leadership. Nixon proved terrible for the market and Carter was just
not just seen as a forceful leader. As a result, it repeatedly tumbled while
he
was President. Oppositely, Reagan and Clinton provded to be just the market
needed. They had their scandals, but these Presdients knew how to put them
behind them.
Obama has peacefully succeeded in the Middle East. He has stood his
ground on shutting down the entire Government. The Affordable Care websites
can be fixed. And clear-cut Presidential guildelines about spying on allies may
now be forthcoming. But right now the market is waiting for renewed signs of
Presidential strength. I think we also have to wait.
Consider doing some short-term hedging by shorting some of the now
more numerous Bearish MINCP stocks and some of the the "Crazy-Up Piffle"
stocks showing "multiple red popsicles", negative Accumulation and
head/shoulders
top patterns.
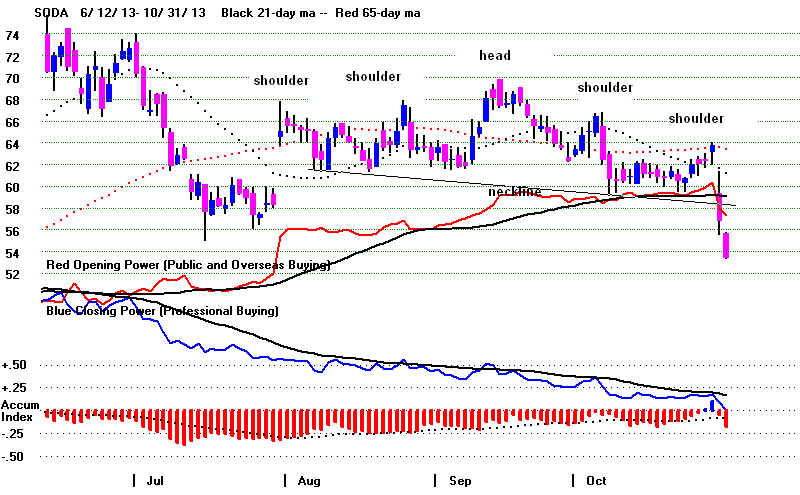
.
At the same time, remaining long high Accumulation stocks in steep uptrends
with rising Closing Power should work out. As expected, there were more
uptrend-channel breakouts. Here is the list of these high Accumulation "bull
shark"
stocks I posted a few days ago.
AI/200 IP21 Price
Price
10/26 10/26 10/26
10/31
------------------------------------------------------------
ACXM 190
.258 32.89
33.23
BA
179 .213 129.02
130.50
BCPC
177
.366 59.13
57.26
BEAV
162
.337 81.18
81.16
CIR
190
.286 64.88
73.77
CW
191
.377 49.9
49.78
EEFT
173
.278 45.32
43.40
KWR
188
.331 80.98
75.91
NEOG
169 .422 70.74
46.22 (3:2)
PRLB
168
.211 88.1
83.86
WST
184
.400 46.28
48.35
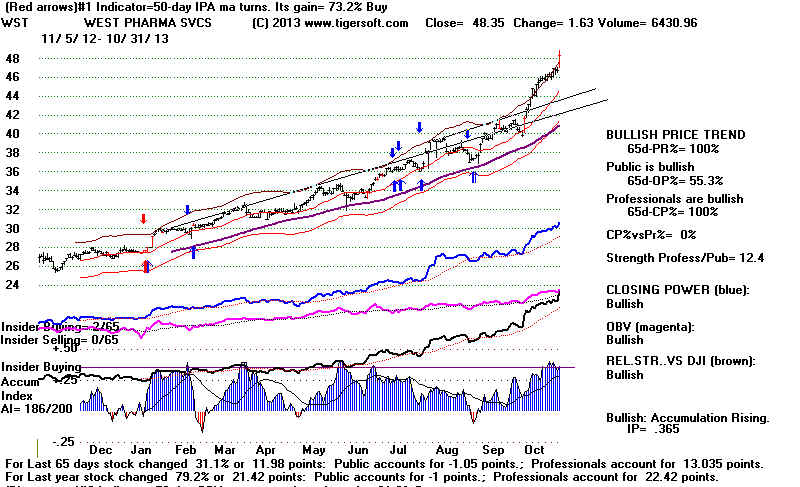
Until there is a retreat or a decisive DJI breakout past the 15700-15800
resistance, I would hold off buying IWM, QQQ, SPY or FAS.
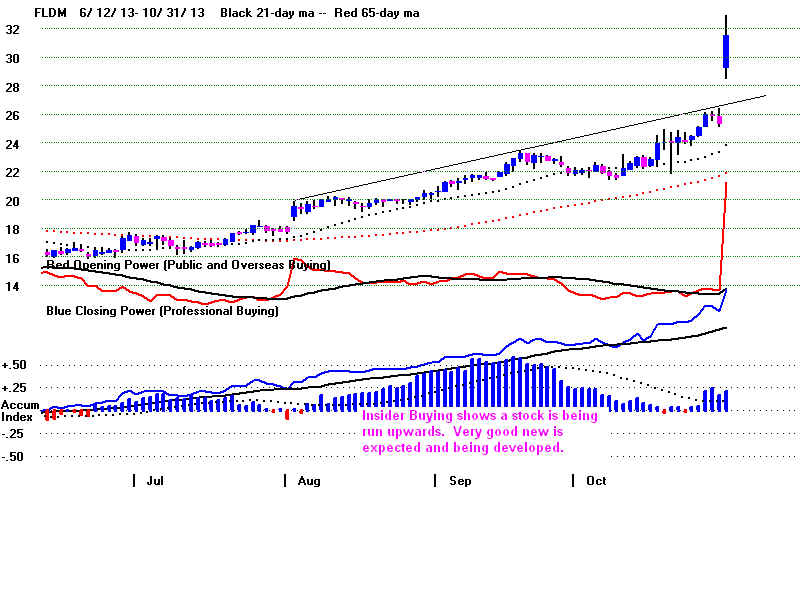
===================================================================================
OLDER HOTLINES
===================================================================================
10/30/013
Summary of Tonights' Hotline:
> A Democrat in The White House was invariably
Bullish in Nov and Dec in years
after a Presidential Election after 1945.
> Flat topped Trading Ranges are Bullish in 7 of 8 cases.
> Institutional Speculation and Bubble-Making lasts longer.
> No Peerless Sell
> Trading Ranges tops can bring 6% DJI declines without a Peerless Sell.
So consider shorting some of the "crazy-up piffle stocks" that meet the
conditions
set out here. Taking profits now in IWM is the probably the safe thing to do.
> When the DJI reaches an expected pivot point, look at the Hourly
DJI's MVM0735.
(See how it changes directions. We first noticed this back in 2000.)
Peerless did not give a sell signal today even as the DJI moved up
close to the 15700
well-tested resistance and then fell back. Bulls will be pleased
that there is only one
instance since 1945 where a trading range minor top turned
into a bear market top.
That was in December 1976. In all the other cases of flat
trading ranges, the DJI
eventually broke out to the upside: 1972, 1980, 1982, 1984,
1986-7 and 1996.
Pullbacks were excellent buying opportunities in these flat trading
ranges. In 1976 it took 7 months of repeated failures by the DJIA to get past 1000
to turn
enough bulls into bears
so that a bear market could follow.
10/30/2013 ---> To Key Index and Leading
Stock Charts: DJI, SP-500, etc.
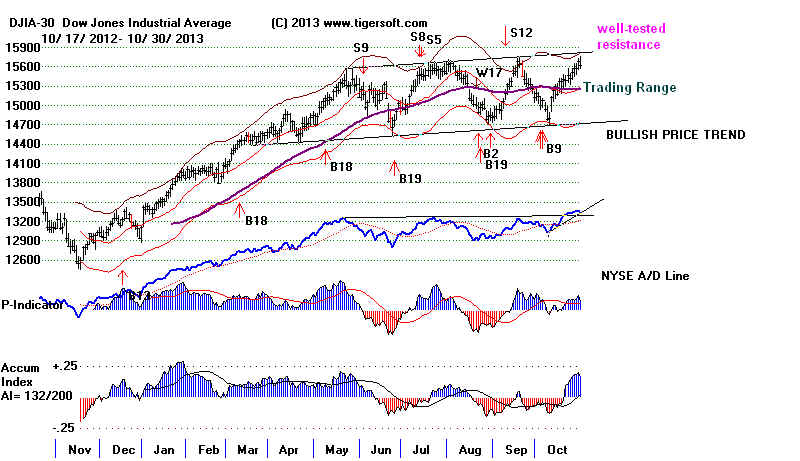
Such well-tested
resistance lines in a trading range does show Professional selling
into strength.
Historically, tops in these patterns without a Peerless Sell do have
the power to reverse
the DJI and produce a 6% decline. But no more than this.
Peerless, of course, is
not perfect. Since 1945, there have been 24 cases
where the
DJI fell 6% to 9% without a sell
signal. 7 of these these failures of omission took place
when the DJI was locked
in a trading range. In 4 of the 7 cases, the trading range was flat.
See the cases of 1980, 1982, 1984 and 1986 From a longer term point of view, these
declines
are almost always
delays in a rising bull market. hey offer another good buying opportunity.
None brought a decline
of more than 6%. Interestingly, they all occurred in even-numbered
years, i.e. when
there was an Election in the US.
As
I see it, the market may not even retreat 6% now. The fact is
that since 1945
when a Democrat was in
the White House, the DJI always rose in November
and always rose more in
December.
DJIA with Democrat in White House
Red shows a down month.
7/3 7/31
8/31 9/31
10/31 11/30 12/30
-------------------------------------------------------------------------------------------------------------------------------
1945
165.7
162.9 174.3 180.1
186.6 191.5 192.9
Celebration- end of WW-II
1949
168.1
175.9 178.7 182.5
189.5 191.6 200.5
very strong rally after June 14th,
1961
689.8
705.3 716.9 701.2 701.1 721.6
731.5 JFK and Camelot enchantment.
1965
875.2
881.7 893.1
930.6 960.8 946.7
969.3 LBJ and war reving up.
1977
912.65
890.07 850.89
847.11 818,35 829.7
831.2 Carter was not a Keynesian
1993 3484
3539 3651
3555 3681 3684
3754 Clinton and Rubin start dereg.
1997
7896
8223 7622 7945
7442
7823 7908 Clinton and
Rubin dereg.
2009
8281
9172 9496
9712 6 9713 10345
10428 Recovery
---------------------------------------------------------------------------------------------------------------------------------
7 up 6 up 5
up 5 up 8 up
8 up
1 down 2 down 3 down 3 down 0 down 0 down
-------------------------------------------------------------------------------------------------------------------------------------------------------
10/30/2013 ---> To Key Index and Leading
Stock Charts: DJI, SP-500, etc.
Links corrected. Some items added.
DJI
la/ma annroc P-I
IP21 V-I
Opct 65-day Pct Change
-----------------------------------------------------------------------------------------------------------------------------------
10/8/2013 14777 -175
.967
-.223
-43
-.116
-115 -.238 -.03
DJI bottom
10/9/2013 14803 +26 .970 -.302
-94
-.129 -129
-.241 -.033
10/10/2013 15126
+323 .992 -.156
-11
-.116 -108 -.234
-.011
10/11/2013 15237
+111 .999 -.156
+121 -.078 -85
-.152 -.015
10/14/2013 15301
+64 1.004 -.058
+100
-.057 -83 -.151 -.011
10/15/2013 15168
-131 .996 -.255
-30 -.078
-109 -.237 -.021
10/16/2013 15374
+206 1.001 -.122 +8
-.047 -99 -.225
-.006
10/17/2013 15372
-2 1.011 -.239 -1
-.051 -105
-.326 -.007
10/18/2013 15400
+28 1.014 -.185
+89
-.021 -83 -.220 -.01
10/21/2013 15392
-7 1.013 -.046 +148 .101 -29 -.147 -.01
10/22/2013 15467
+75
1.018
.052 +238 .117 -6 -.048 -.006
10/23/2013 15413
-54 1.014 .062 +208 .144 -16 -.05 -.01
10/24/2013 15509
+96
1.020
.185 +230
.175 -11
.042 -.003
10/25/2013 15570
+61
1.023
.189 +215
.186 -9
.049 0
10/28/2013 15569
-1 1.022
.243 +250 .187 +1 .042 0
10/29/2013 15680 +111 1.027 .430 +312 .211 +27 .149
01
10/30/2013 15618 -62 1.022 .333 +188 .271
-9 .04 006
********************************************************************************************
----> 203 MAXCP stocks Bullish MAXCP Stocks (10/30/2013) Bullish plurality
---> 51
MINCP stocks
Bearish MINCP Stocks (10/30/2013)
Bearish-Looking Crazy-Up Stocks. 10/30/2013
---> 121
New Highs on NASDAQ 5 new lows. Bullish plurality
---> 48
New Highs on NYSE 8 new lows.
Bullish
pluraliy
85 5 year highs of 630 weekly charts we follow each
week with Tiger
------------------------------------------------------------------------------------------------------------------------------------------------------
The Deep
Impulse to Wildly Speculate Is Not Easily Stopped.
Now It's Big Banks and Funds That Are Doing It.
Such is the need
to competitively perform. JPM's problem with unchecked
leverage is
symptomatic...
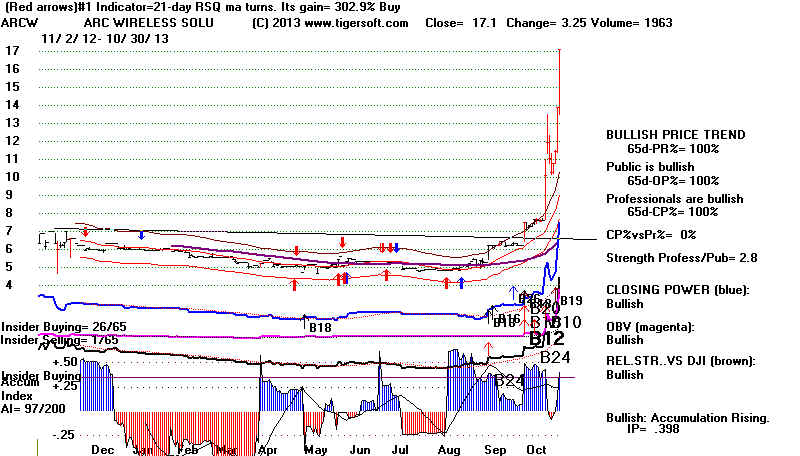
The Speculative Bubble Is Most Likely Far from Over.
Bears will tell you that there is too much "sloppy"
buying of low-priced
stocks. This is a sure sign that we have a stock market "bubble".
They
infer that a Crash is near. (I've noticed that these are also the same people
that are quickest to tell you that the stock market cannot be timed.
Surely, they can't have it both ways.) Still, I wouldn't argue with the
general description that there is a "bubble" and a lot of over-eager
buying now. But we should realize that big institutions and banks
are doing it. It is not the "little guy". Since 2007-2008, there are
not
enough "small investors" to produce a bubble. Examination of the stocks
making new highs and the Bullish MAXCP stocks shows that a
good many
of these have big bulges of very high Accumulation. This is not produced
by the "little guy". It usually shows the stocks are tightly held and
could
easily rise 6 months or a year or more.
My point is that the speculative wave we are seeing is almost
certainly not over.
Unbridled Greed works its way into the fanciest of Wall Street conference
rooms. And, of course, just a little selling in high capitalization/high priced
stocks provides lot of fire-power for thinner stocks, which are not necessarily
even low-priced stocks. I counted 15 stocks up more than 10% today, despite
the DJI sell-off. Interestingly, only one was under $10/share.
Bearish Red Popsicle on Tiger Candle-Sticks of IWM and TNA
The Fed minutes seem slightly more hawkish. They
downplayed the
continuing weakness in the US economy. This gave more of an excuse
for profit-taking in stocks that have advanced a long ways. The Russell-2000
ETF shows a big, engulfing "red Popsicle". It is not clear if the rising
21-day
ma of the Tiger Closing Power can reverse this decline. There will be more
support when prices fall back to the rising 21-day ma.
Taking profits in
IWM tomorrow seems safest. "Red Popsicle"
have also done a good job
for the last 150 days in calling show-term declines in TNA, the leveraged
ETF for low priced stocks.
Crazy-Up Piffle Stocks Worth Shorting
A number of low priced stocks have recently compressed
their own little bull
market advances of 200%-500% in less than than a year. This is typical
in an aging bull market. I have suggested looking for these
"piffle"/"crazy-up"
stocks that show 2 or more "red popsicles" and a negative Accumulation
Index. Let me add to the conditions we want to see to go show that they either
exhibit a bearish head/shoulders patter or an extended, well-tested uptrendline.
I found a number of stocks tonight that that meet all these conditions. Short
them carefully. If they Closing Power turns back up when the stocks reach
support, cover them. Cover them also is the apex of a right shoulder is
breached.
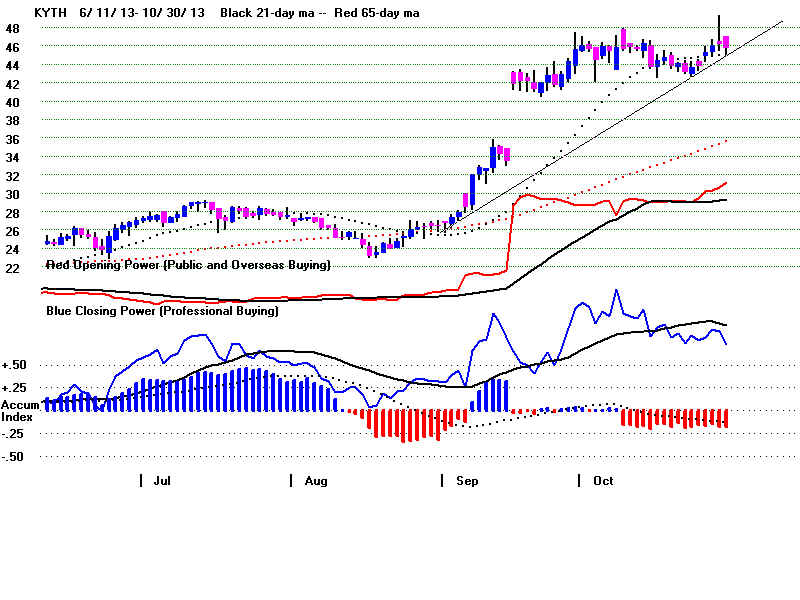
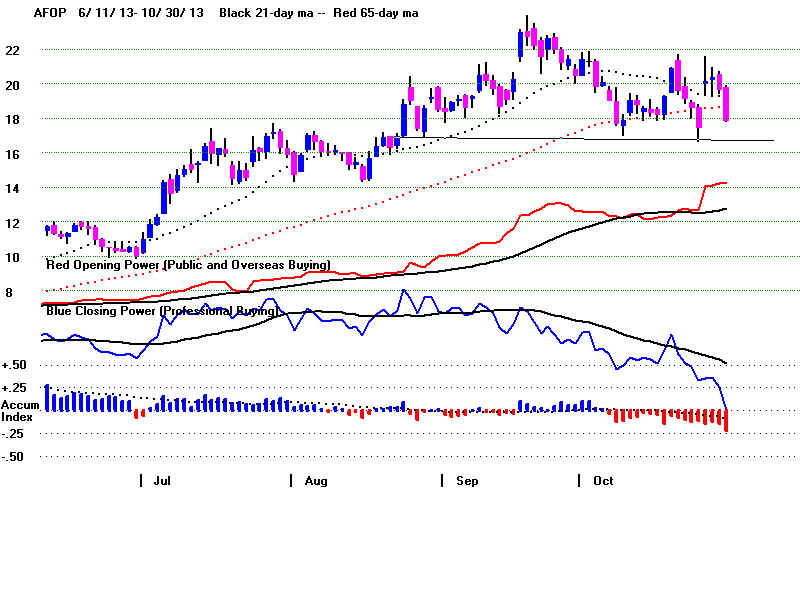
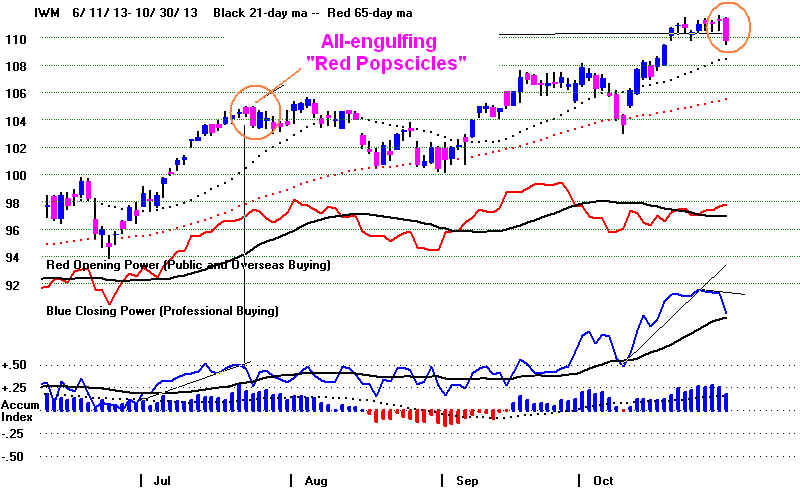
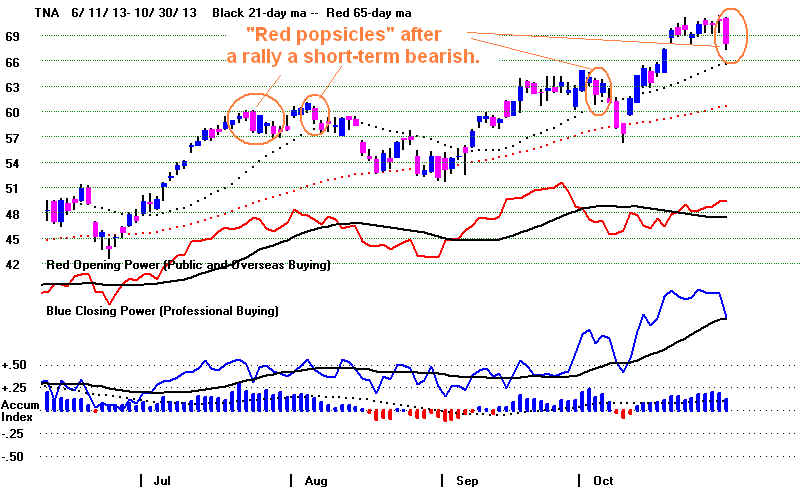
====================================================================================
OLDER HOTLINES
====================================================================================
10/29/013
Peerless still shows an unreversed Buy B9. The
considerable
improvement in the IP21
in the last week may be enough to give|
us the new type of Buy
B4 if the DJI does breakout above 15800
and surpasses the 3.5%
upper band.
For now, the DJI closed
2.7% over its 21-day ma. It is common at reversal points
for the previous high
closing to be marginally surpassed. On 9/18/2013 the DJI closed
at 15676.95.
Today it closed at 14468.93. So, for the next few days it will be important
to watch for signs of a
reversal. A weak closing after a strong opening will be a warning sign.
This would produce a
"red Popsicle" on the Tiger candle-stock charts of DIA, SPY, QQQ
and IWM.
The A/D Line might be very weak despite a DJI advance. The DJI would
probably close above
the 3% upper band. And the Fed might say something
"hawkish".
10/29/2013 ---> To Key Index and Leading Stock Charts: DJI,
SP-500, etc.
IWM, QQQ amd TNA are hesitating at the top of their price channels
waiting
to see what the Fed
Minutes will show later this week and whether the
DJI can breakout past
15800, the top of its current trading range. The 1986 case, which
I keep referring to as
a historical parallel, did not see a late October-early
November breakout.
There was a quick retreat to the lower band instead.
The breakout had to
wait until January 1987. But there are precedents for an
October -November
breakout in the year after a Presidential Election with a
Democrat in the White
House. See the charts below of 1949 and 1965. And
even in 1961, the DJI
did not top out until the end of December.
I take it as a bullish
sign that APPL's retreat today did not upset the NASDAQ or QQQ.
Rather Semi-Conductors,
GOOG, IBM and YHOO put on good shows of strength.
Of course, if AAPL's
weakness continues, it will work against a QQQ breakout.
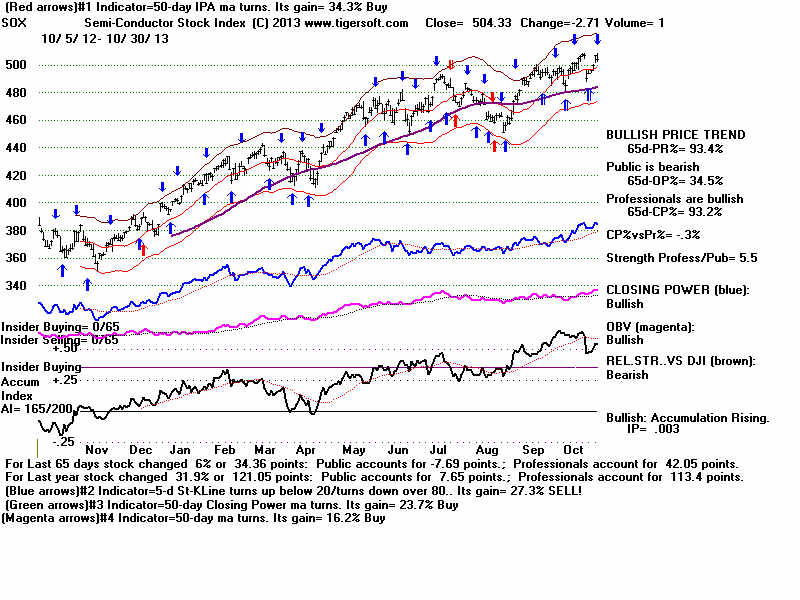
But let's continue to
trust the Peerless Buy signal. There are lots of breakouts
in stocks having an
IP21 way over +.375. This was one of the bullish signs of the January
take-off this year.
I think we could get another big lift-off and run upwards if the DJI can
breakout past 15800.
The NASDAQ's target, I think, is 20% higher.
10/29/2013 ---> To Key Index and Leading
Stock Charts: DJI, SP-500, etc.
Links corrected. Some items added.
DJI
la/ma annroc P-I
IP21 V-I
Opct 65-day Pct Change
-----------------------------------------------------------------------------------------------------------------------------------
10/8/2013 14777 -175
.967
-.223
-43
-.116
-115 -.238 -.03
DJI bottom
10/9/2013 14803 +26 .970 -.302
-94
-.129 -129
-.241 -.033
10/10/2013 15126
+323 .992 -.156
-11
-.116 -108 -.234
-.011
10/11/2013 15237
+111 .999 -.156
+121 -.078 -85
-.152 -.015
10/14/2013 15301
+64 1.004 -.058
+100
-.057 -83 -.151 -.011
10/15/2013 15168
-131 .996 -.255
-30 -.078
-109 -.237 -.021
10/16/2013 15374
+206 1.001 -.122 +8
-.047 -99 -.225
-.006
10/17/2013 15372
-2 1.011 -.239 -1
-.051 -105
-.326 -.007
10/18/2013 15400
+28 1.014 -.185
+89
-.021 -83 -.220 -.01
10/21/2013 15392
-7 1.013 -.046 +148 .101 -29 -.147 -.01
10/22/2013 15467
+75
1.018
.052 +238 .117 -6 -.048 -.006
10/23/2013 15413
-54 1.014 .062 +208 .144 -16 -.05 -.01
10/24/2013 15509
+96
1.020
.185 +230
.175 -11
.042 -.003
10/25/2013 15570
+61
1.023
.189 +215
.186 -9
.049 0
10/28/2013 15569
-1 1.022
.243 +250 .187 +1 .042 0
10/29/2013 15680 +111 1.027 .430 +312 .211 +27 .149
01
********************************************************************************************
----> 442 MAXCP stocks Bullish MAXCP Stocks (10/29/2013) Bullish plurality
---> 28
MINCP stocks
Bearish MINCP Stocks (10/29/2013)
Bearish-Looking Crazy-Up Stocks.
10/29/2013
---> 121
New Highs on NASDAQ 5 new lows. Bullish plurality
---> 145
New Highs on NYSE 3 new lows.
Bullish
pluraliy
85 5 year highs of 630 weekly charts we follow each
week with Tiger
********************************************************************************************I
====================================================================================
OLDER HOTLINES
====================================================================================
10/28/2013
Peerless still shows an unreversed Buy B9. The
DJI closed 2.2%
over its 21-day ma.
I would think it will close 3%-3.5% over the 21-day ma
before it reverses.
But the DJI's
well-tested resistance zone between 15500-15700 has been reached.
Good breadth and high
current Accumulation along with the Buy B9 suggest that there
will be a breakout.
Volume is lagging. It usually takes volume to bring a breakout past
well-tested
resistance. The Hourly DJI clearly shows the lagging
up-hour Volume on the
current rally.
So, there is considerable big-money selling going on here. It remains to
be
seen if the Buy B9 will
bring a breakout.
10/28/2013 ---> To Key Index and Leading
Stock Charts: DJI, SP-500, etc.
Links corrected. Some items added.
I would not try
to stop someone from taking some profits now in IWM and QQQ.
But history shows
that the upper resistance line is usually more closely challenged
| in trading ranges like
this, particularly with a Buy B9 signal operating. The best
examples are in 1986
and in the middle of 1987.
Note that there are many more
Bullish MAXCP stocks than Bearish
MINCP stocks. Also bullish: the
Closing Powers
for the key ETFs have not hooked down. See DIA, SPY, QQQ, IWM.

A Chinese panda bear is stumped.
Pending Big Collapses
A number of
Chinese "bubble" stocks have burst. Some say China is one big "bubble".
That's not my
opinion. But Chinese stocks do offer us volatility and we are very
interested
in identifying what predicts the collapse of a "piffle - crazy-up"
stock.
It seems that the presence of two or three red popsicles in candle-stick
charts that have
advanced 180% or more in 100 days is a good starting point.
Here are more cases of such sell-offs. Tomorrow
night I will post stocks here that meet
these
conditions and are still above their 65-dma. We'll then see how good this screen
for pending
big sell-offs is real-time.
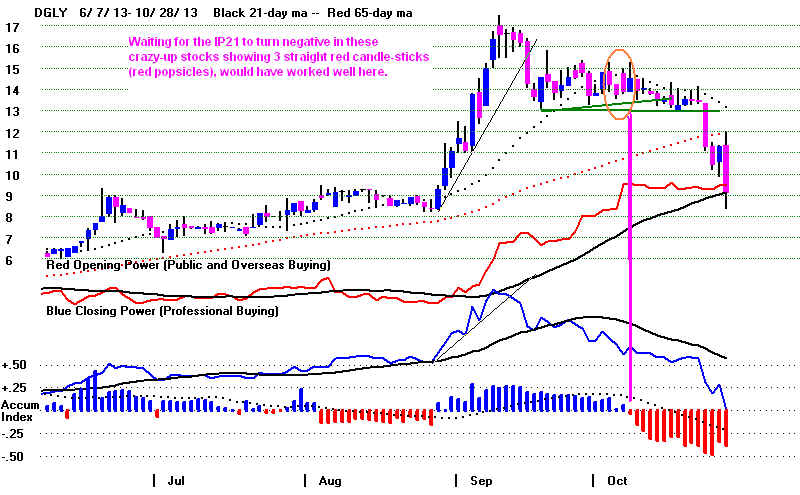 |
DJI
la/ma annroc P-I
IP21 V-I
Opct 65-day Pct Change
-----------------------------------------------------------------------------------------------------------------------------------
10/8/2013 14777 -175
.967
-.223
-43
-.116
-115 -.238 -.03
DJI bottom
10/9/2013 14803 +26 .970 -.302
-94
-.129 -129
-.241 -.033
10/10/2013 15126
+323 .992 -.156
-11
-.116 -108 -.234
-.011
10/11/2013 15237
+111 .999 -.156
+121 -.078 -85
-.152 -.015
10/14/2013 15301
+64 1.004 -.058
+100
-.057 -83 -.151 -.011
10/15/2013 15168
-131 .996 -.255
-30 -.078
-109 -.237 -.021
10/16/2013 15374
+206 1.001 -.122 +8
-.047 -99 -.225
-.006
10/17/2013 15372
-2 1.011 -.239 -1
-.051 -105
-.326 -.007
10/18/2013 15400
+28 1.014 -.185
+89
-.021 -83 -.220 -.01
10/21/2013 15392
-7 1.013 -.046 +148 .101 -29 -.147 -.01
10/22/2013 15467
+75
1.018
.052 +238 .117 -6 -.048 -.006
10/23/2013 15413
-54 1.014 .062 +208 .144 -16 -.05 -.01
10/24/2013 15509
+96
1.020
.185 +230
.175 -11
.042 -.003
10/25/2013 15570
+61
1.023
.189 +215
.186 -9
.049 0
10/28/2013 15569
-1 1.022
.243 +250 .187 +1 .042 0
********************************************************************************************
----> 396 MAXCP stocks Bullish MAXCP Stocks (10/28/2013) Bullish plurality
---> 38
MINCP stocks
Bearish MINCP Stocks (10/28/2013)
Bearish-Looking Crazy-Up Stocks.
10/28/2013
---> 95
New Highs on NASDAQ 4 new lows. Bullish plurality
---> 81
New Highs on NYSE 6 new lows.
Bullish
pluraliy
85 5 year highs of 630 weekly charts we follow each
week with Tiger
********************************************************************************************I
===================================================================================
OLDER HOTLINES
===================================================================================
10/25/2013
Peerless shows an unreversed Buy B9. The A/D Line has
soared to
another new high ahead of the
DJIA. As a result, the DJI could rally and close
at 15700 tomorrow and there
would still be no Sell. This is because Sell S9's based
on a negative V-I indicator
when the DJI tags the upper 3%-4% band are not allowed.
There are too many failures.
The seasonal strength after an October selling climax
especially after Thanksgiving
tends to work against a meaningful decline.
There are many, many more
bullish-looking stocks that bearish-looking stocks.
IWM and QQQ look are
both looking very good.
30%-50% Declines in A Week Are Worth Watching for.
But I was asked to look
a little more into other "crazy-up, piffle" stocks that might
soon collapse as NQ
has. My "Crazy-Up" tonight report shows
very few stocks
look bearish enough to
quickly fall apart. But the rewards are so great, we will
keep watching for them.
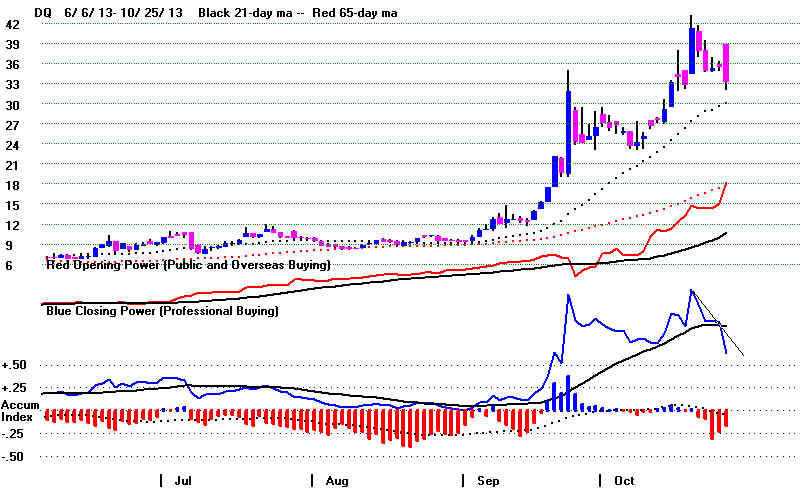
"Bull Shark" Stocks.
I recently built a
directory of all the stocks showing an AI/200 score above 145 and an IP21
above .24. The
most bullish of these are shown in the 7
"Bull Shark" Stocks Page.
Presently, they are
RYJ, PLXT, LYG, CW, UBSH and VB. VB is the Vanguard
Small Caps' ETF.
BA is included as the present "Tahiti stock", the highest AI/200
DJI-30 stock. .
The most bullish
Leveraged ETFs with trading above 800 lots now are:
TNA ex Small Caps,
URTY UltraPro Russell-2000
TQQQ Ultr Pro QQQ - Watch how this hyperbolic trend works.
All dips will probably be very shallow, almost certainly, at least,
until the upper hyperbolic band is reached. And prices may explode
upwards past that.
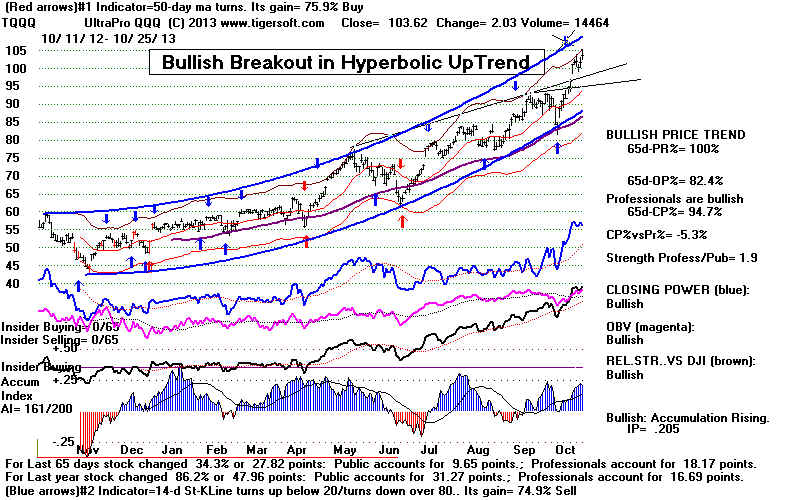
---->
467 MAXCP stocks Bullish MAXCP Stocks
(10/25/2013) Bullish plurality
"Bull Stocks" 10/25/2013
---> 26
MINCP stocks
Bearish MINCP Stocks (10/25/2013)
Bearish-Looking Crazy-Up Stocks. 10/25/2013
---> 100
New Highs on NASDAQ 11 new lows. Bullish plurality
---> 145
New Highs on NYSE 5 new lows.
Bullish
pluraliy
85 5 year highs of 630 weekly charts we follow each
week with Tiger
Even so, we cannot help but
notice the weakness in NYSE volume indicators including
OBV and OPct.
Right now I would dismissed as the result of so much trading now takes
place away from the NYSE.
All things considered, I prefer to trust Peerless
and the absence of a sell
signal. Perhaps, more important, it looks like the NASDAQ is
starting what may be a
hyperbolic take-off.
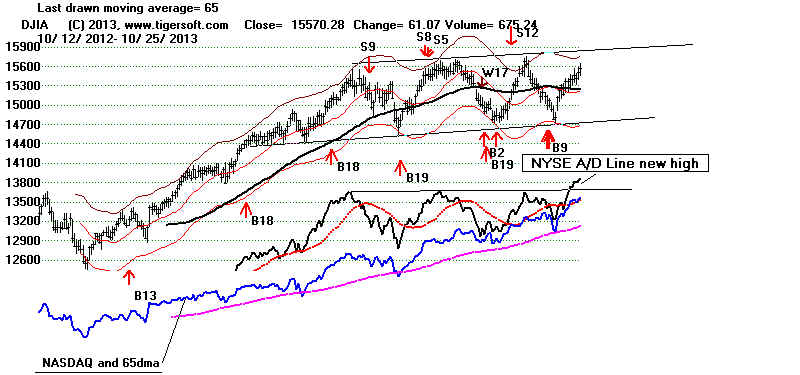
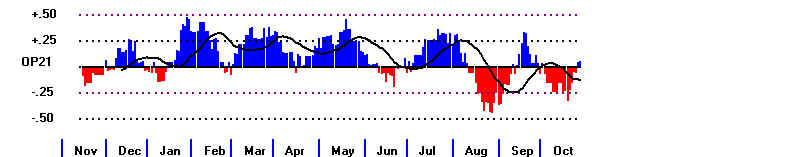
Until the Fed changes its monetary
stance or raises margin requirements (something it
has not done since 1968!),
professionals are bound to push prices higher. The upward |
direction of the US stock
market now results simply from capital seeking the best
apparent way to make a
profit. Main Street business ventures cannot so easily compete
now with Wall Street.
Perhaps, if the special capital gains tax rate for stock transactions
was reduced, it would change
things. But what are the chances of that? Perhaps,
a transaction tax on
computerized bank trading would alter the picture, too. But
neither party can afford to
give up all the campaign contributions they get from Wall Street.
Purely, technically, with
prices at their highs, most investors are way ahead for this year.
Those that sold earlier are
being forced to reconsider as they see prices keep rising
without them.
Some of these are being soothed by what appears to be an endless stream
of articles on Yahoo
predicting a collapse. (See all the articles you get if you google
"Market"
"Collapse"
Yahoo" simultaneously. The biggest fear of these calamity-minded bears
is that the world economy
will lift all boats, including the US economy.
I hold that the stock market
keeps rising precisely because there are so many, very
public bears and nay-sayers.
Their bearishness keeps the "Public" and the "Little Guy"
out of the market.
Only when the "Public" stampedes into the market is a top apt to
be made. In my own
experience, this was certainly true in 1968, 1973, 1987, 2000 and
2008. Look at the
charts of DIA, SPY, QQQ and IWM. The CLosing Powers in each
are rising faster than
Opening Power. Specifically look at DIA and IWM and ask
which is more likely: will
the Public turn bullish again or will the Professionals turn
bearish. Given how many
stocks are making new highs with heavy blue Accumulation,
I would bet that the Public
will turn bullish before the Professionals turn bearish.
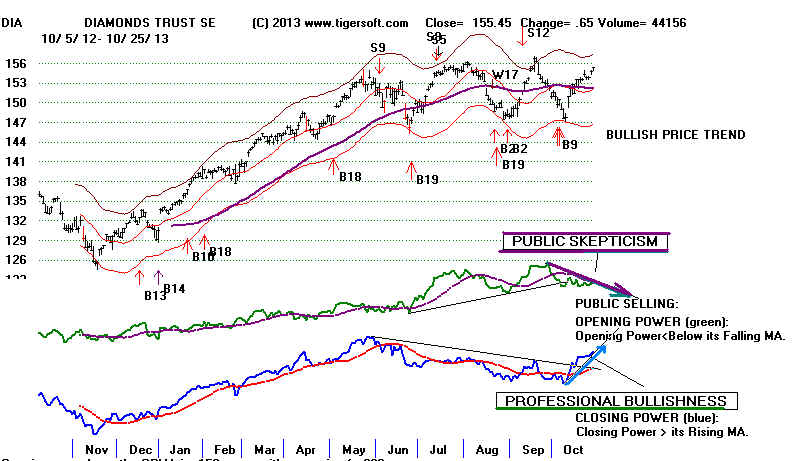 |
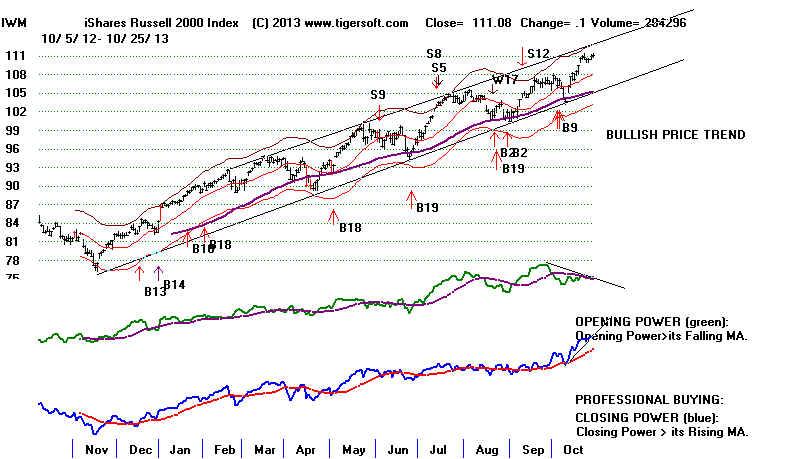 |
10/25/2013 ---> To Key Index and Leading
Stock Charts: DJI, SP-500, etc.
DJI
la/ma annroc P-I
IP21 V-I
Opct 65-day Pct Change
-----------------------------------------------------------------------------------------------------------------------------------
10/8/2013 14777 -175
.967
-.223
-43
-.116
-115 -.238 -.03
DJI bottom
10/9/2013 14803 +26 .970 -.302
-94
-.129 -129
-.241 -.033
10/10/2013 15126
+323 .992 -.156
-11
-.116 -108 -.234
-.011
10/11/2013 15237
+111 .999 -.156
+121 -.078 -85
-.152 -.015
10/14/2013 15301
+64 1.004 -.058
+100
-.057 -83 -.151 -.011
10/15/2013 15168
-131 .996 -.255
-30 -.078
-109 -.237 -.021
10/16/2013 15374
+206 1.001 -.122 +8
-.047 -99 -.225
-.006
10/17/2013 15372
-2 1.011 -.239 -1
-.051 -105
-.326 -.007
10/18/2013 15400
+28 1.014 -.185
+89
-.021 -83 -.220 -.01
10/21/2013 15392
-7 1.013 -.046 +148 .101 -29 -.147 -.01
10/22/2013 15467
+75
1.018
.052 +238 .117 -6 -.048 -.006
10/23/2013 15413
-54 1.014 .062 +208 .144 -16 -.05 -.01
10/24/2013 15509
+96
1.020
.185 +230
.175 -11
.042 -.003
10/25/2013 15570
+61
1.023
.189 +215
.186 -9
.049 0
====================================================================================
OLDER HOTLINES
====================================================================================
10/24/2013 Be Wary
of Over-Extended Stocks Showing Bearish Technicals,
especially ones with "Red Popsicles" when TigerSoft
Candle-Stick Charts are Viewed.
The weak volume indicators (V-I and
OPct) give notice that a breakout past 15750 by
the DJI is not likely. Above 15600,
I would think the downside risk becomes much greater
than the upside potential for DIA and
probably SPY. But we are there yet.
10/24/2013 ---> To Key Index and Leading
Stock Charts: DJI, SP-500, etc.
DJI
la/ma annroc P-I
IP21 V-I
Opct 65-day Pct Change
-----------------------------------------------------------------------------------------------------------------------------------
10/8/2013 14777 -175
.967
-.223
-43 -.116 -115 -.238
-.03
DJI bottom
10/9/2013 14803 +26 .970 -.302
-94
-.129 -129
-.241 -.033
10/10/2013 15126
+323 .992 -.156
-11 -.116 -108 -.234
-.011
10/11/2013 15237
+111 .999 -.156
+121 -.078 -85
-.152 -.015
10/14/2013 15301
+64 1.004 -.058 +100 -.057 -83 -.151
-.011
10/15/2013 15168
-131 .996 -.255
-30 -.078 -109 -.237 -.021
10/16/2013 15374
+206 1.001 -.122
+8
-.047 -99
-.225 -.006
10/17/2013 15372
-2 1.011 -.239
-1 -.051 -105
-.326 -.007
10/18/2013 15400
+28 1.014 -.185 +89 -.021 -83 -.220
-.01
10/21/2013 15392
-7 1.013 -.046 +148 .101 -29 -.147
-.01
10/22/2013 15467
+75
1.018
.052 +238 .117 -6 -.048 -.006
10/23/2013 15413
-54 1.014
.062 +208 .144 -16 -.05
-.01
10/24/2013 15509
+96
1.020
.185 +230
.175
-11 .042 -.003
warning
Buy B9
The DJI is now back above 15500. For some big funds, this
will seem a good place to sell DJI stocks
and DIA. But without a Peerless Sell or the DJI
reaching the well tetested resistance
line that now crosses at 15700, I think that the
odds favor even more of a DJI advance.
The stronger NASDAQ with its accelerating-up
rising support line is apt to go up even
more. It seems headed for 5000, 25% higher. So,
I would just hold IWM and stocks that
have rising Closing Powers.
But the speculative surge is now getting
quite splashy. The market seldom rewards the reckless
chasing of stocks too much above the
points of breakout past well-tested resistance.
We must be alert to signs that the stocks
we own are weakening, possibly dangerously. You know
most of the signs of a top, especially
1) negative non-confirmations (NNC's) of new highs by our Accumulation Index,
2) Closing Power NC's and then CP trend-breaks and
3) Breaks in very over-extended price uptrendlines.
But there are others you want to watch for:
1) Tiger Day's Traders' Tool Divergences and then new lows despite price highs.
2) Larry Williams' Index NNCs.
3) Especially, Red Popsicles using Tiger Candle Stick Charts.
MANY, MANY "CRAZY-UP" STOCKS

My first inclination tonight was is to
point out the large number of stocks that are surpassing their
rising resistance levels as drawn on
arithmetically scaled charts. Then I realized that the
the last time I had this notion was on
August 1st this Summer, exactly at an intermediate-term
top. See http://www.tigersoftware.com/SUPPLEMENTA/Crazyup/index.html
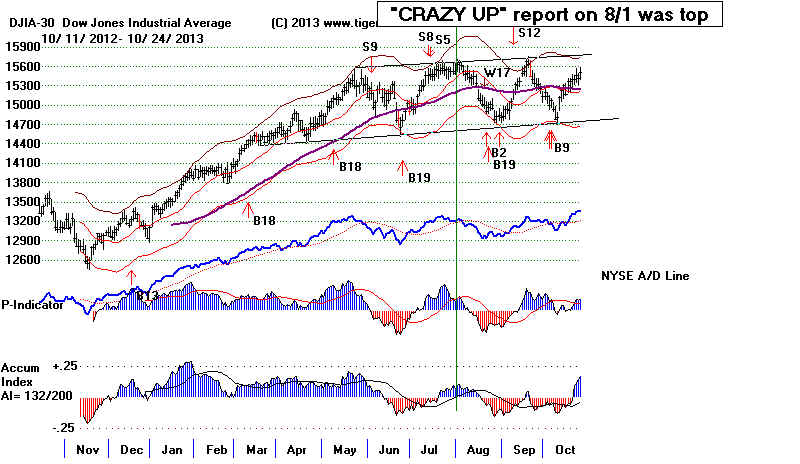
"Crazy
up" stocks, of course, are showing exceptional strength. Their
flashiness makes
them appeal to the public that wants to
buy on dips. Where they have achieved a breakout
past well-tested rising resistance, my
studies show they usually do not retreat much, at least,
until they achieve an additional 15%-30%
rise above the point of breakout. Buying these stocks
may seem risky, but I believe as long as
their internals are positive, they are good bets to keep
advancing provided the Closing Power keeps
rising. They may actually be a lot safer than
new flat topped breakouts which are likely to
suddenly to fall and fail their breakouts if the
market retreats because the DJI falls back from
its upper band. Here are some of the current
"Crazy-Up" stocks showing steadily
high Accumulation. Consider these the most Bullish
MAXCP stocks for today.
High Accumulation - Breakouts
above Rising Resistance.
AI/200 IP21 Price
ACXM 190
.258 32.89
BA
179 .213 129.02
BCPC
177
.366 59.13
BEAV
162
.337 81.18
CIR
190
.286 64.88
CW
191
.377 49.9
EEFT
173
.278 45.32
KWR
188
.331 80.98
NEOG
169 .422 70.74
PRLB
168
.211 88.1
WST
184
.400 46.28
Boeing (BA), our current Tahiti stock - the
highest AI/200 stock in the DJI, is a fine example.
So far, blue bars predominate when one looks at
its Tiger candle-stick chart. Its uptrendlines
for price and Closing Power have not been
violated. Its Accumulation Index is bullishly
still above +.25
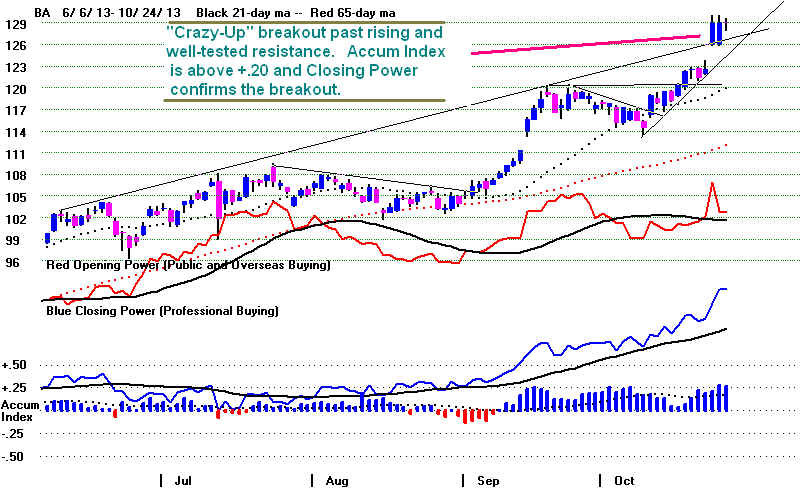
 Red Popsicles: How
"Crazy-Up" Stocks Top Out.
Red Popsicles: How
"Crazy-Up" Stocks Top Out.
Lessons from 1999-2000
Before these high accumulation Crazy-UP
stocks individually top out, I would expect them
to go truly hyperbolic and then show the
signs of a classic reversal following a climactic advance.:
1) a gap up
2) red high volume
3) a strong opening and then a very weak close.
4) viewed by TigerSoft's candle-stock charts, we see:
Red Popsicles in the daily price bars,
Closing Power Non-Confirmations and a breaking of a Closing Power uptrend,
and Red or weakening Accumulation at the bottom.
Tiger candle-stick charts will help here.
You will usually see the red day's bar showing
prices closed at the lows of the day
after a higher opening. Often these are what I call
bearish red popsicles. See some
stock examples from the top in 1999-2000.
Watch for Bearish Signs in Stock Making New Highs.
Avoid These Stocks
Today the bull market came to a sudden and violent end with thesmall Chinese stock NQ.
Study
below all its bearish technical warnings as it made a top. We wouldn't yet
look for stocks that look like this for shorting. The overall market seems
to strong. But no self-respecting Tiger user should ever hold a stock that looks
like this.
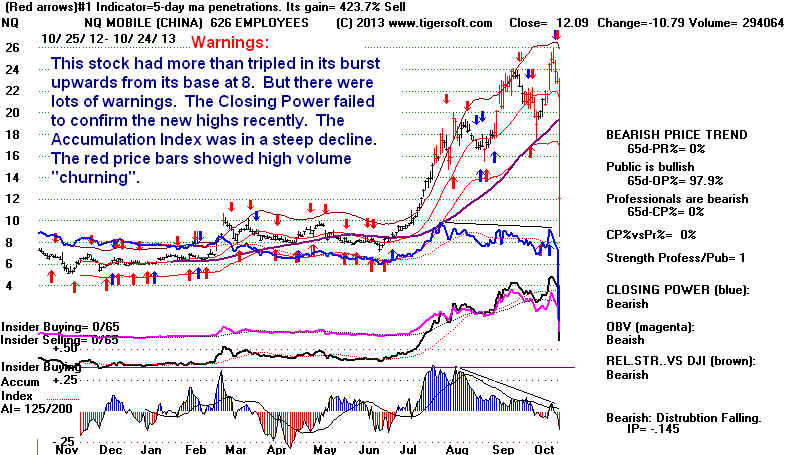

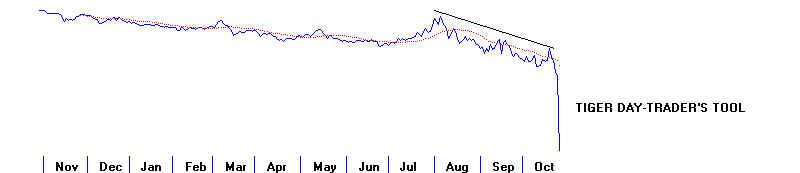
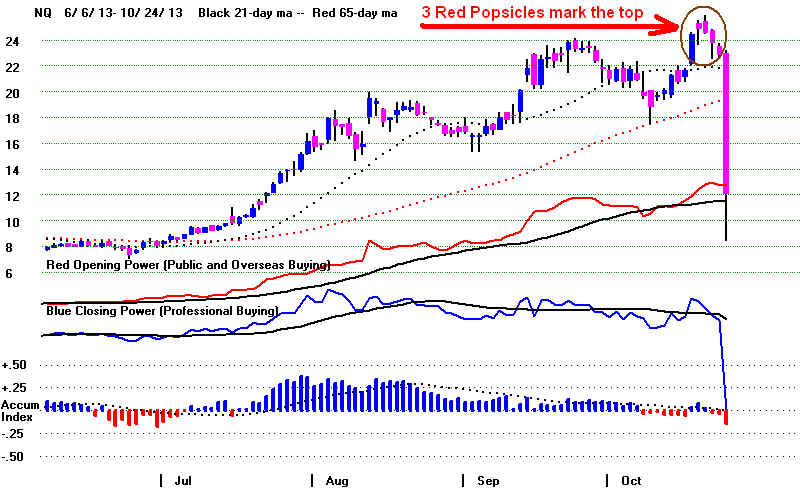
====================================================================================
OLDER HOTLINES
====================================================================================
10/23/2013 Buy B9 We still have
no sell signal. The Futures are up powerfully.
There is a bullish stampede under way. Stay
long IWM and a collection of bullish
MAXCP stocks. Cover the JCP short sale.
We don't want to let a nice profit get away
from us.
The NASDAQ shows a hyperbolic uptrend but has not yet
entered into its vertical
ascent phase. The strength its higher priced
members, PCLN, GOOG, NFLX, REGN,
BIIB and PCYC, each above $120, is unmistakeable.
The Tiger Index of 65 High Priced
stocks is accelerating up. I suspect the NASDAQ
will keep rising until it reaches 5000,
the March 2000 all-time high. That is still
more than 25% higher. So, though the
DJI has not had an 18%+ decline since early 2009 or
55 months ago, I would look for
much higher prices. The DJI may stall out at
its upper 3.5% band at 15700 for a while,
but I think the NASDAQ has too much momentum.
The Fed's Easy Money Policies Are Likely To
Continue
Business is not great. Private job creation is
hardly robust. So, investment
opportunities outside the stock market are muted.
The stock market remains
the premier place to grow one's net worth. The
US economy is still quite
weak. The middle class just doesn't buy as much
as they used to and what they
do buy is usually made overseas. The
weakness of the recovery keeps the demand
for money for business purposes limited. Banks
would prefer not to lend the money.
So, interest rates and oil prices are now falling.
Stock traders like this. Bulls do not
want upside surprises in interest rates. They
want the FED to keep keep pumping money into
the market. Without a big governmental fiscal
stimulus or the putting up protectionist trade
barriers, the FED's lower interest rates are probably
what prevents the American Economy
from slipping into another recession. The Fed
knows its low rates are not bringing a robust
recovery. They know real wages are much lower now
than 10 or 20 years ago for millions
of workers. But what are they to do? Just
let the stock market crash and joblessness
go back above 10%? They appreciate the present
reality, namely if the stock market were
to decline sharply, the spending of the wealthy and
those with IRAs would abuptly be
dramatically reduced. More and more, it is the
Buying by the wealthy that has come to
be the backbone of demand in this economy. The
stock market must keep rising or else!
10/23/2013 ---> To Key Index and Leading
Stock Charts: DJI, SP-500, etc.
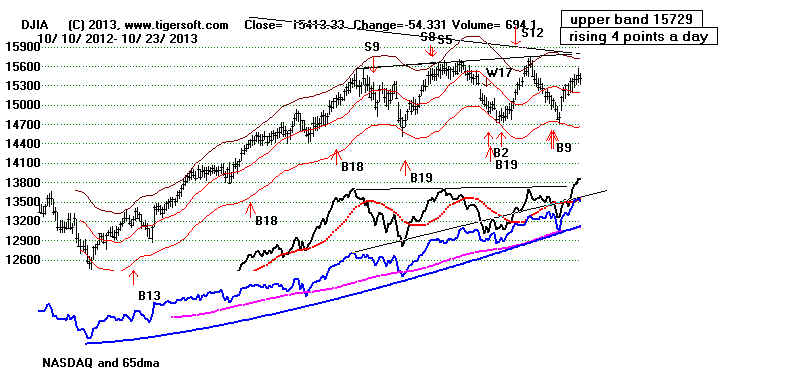

........................................................................................................................................................
10/8/2013 14777 -175
.967 -.223
-43 -.116 -115 -.238
-.03
DJI bottom
10/9/2013 14803 +26 .970 -.302
-94
-.129 -129
-.241 -.033
10/10/2013 15126
+323 .992 -.156
-11 -.116 -108 -.234
-.011
10/11/2013 15237
+111 .999 -.156
+121 -.078 -85
-.152 -.015
10/14/2013 15301
+64 1.004 -.058 +100 -.057 -83 -.151
-.011
10/15/2013 15168
-131 .996 -.255
-30 -.078 -109
-.237 -.021
10/16/2013 15374
+206 1.001 -.122
+8
-.047 -99 -.225 -.006
10/17/2013 15372
-2 1.011 -.239
-1 -.051 -105
-.326 -.007
10/18/2013 15400
+28 1.014 -.185 +89 -.021 -83 -.220
-.01
10/21/2013 15392
-7
1.013
-.046 +148 .101
-29 -.147 -.01
10/22/2013 15467
+75 1.018 .052 +238 .117 -6 -.048 -.006
10/23/2013 15413
-54
1.014
.062 +208
.144
-16 -.05 -.01
volume is weak
---->
501 MAXCP stocks Bullish MAXCP Stocks (10/23/2013) Bullish plurality
Chinese Low-Priced Bullish MAXCP Stocks
---> 18
MINCP stocks
Bearish MINCP Stocks (10/23/2013)
---> 79
New Highs on NASDAQ 11 new lows. Bullish plurality
---> 83
New Highs on NYSE 5 new lows.
Bullish
pluraliy
103 5 year highs of 630 weekly charts we follow each week
with Tiger
====================================================================================
OLDER HOTLINES
====================================================================================
10/22/2013 Buy B9 We still have
no sell signal. However, the DJI is clearly
lagging. I would just avoid it and continue to hold IWM instead
of DIA or SPY. Our bullish MAXCP stocks remain the leaders.
There are not many attractive short sale candidates using our
Bearish flagging MINCPs or NEW LOWs. The DJI has closed
1.8% over the 21-day ma. On its last rally it peaked when it
was 3.5% over the 21-dma. That would suggest the DJI could go
up another 240 points.
Immediately ahead, we are apt to see a small decline. The markets
closed off their highs as the DJI appreached the 15500-15600 resistance.
Since 1965, the DJI has fallen 66% of the time in the 3 trading days
after October 22nd for an average fall of 0l.7%. But the odds of the
DJI being higher jumps to 57.4% if we look two weeks ahead.
10/22/2013 ---> To Key Index and Leading
Stock Charts: DJI, SP-500, etc.
---->
551 MAXCP stocks Bullish
MAXCP Stocks (10/22/2013) Bullish
plurality
---> 26
MINCP stocks Bearish MINCP Stocks (10/22/2013)
---> 153 New Highs on NASDAQ 11 new lows. Bullish plurality
---> 158 New Highs on NYSE 9 new lows.
Bullish
pluraliy
103 5 year highs of 630 weekly charts we follow each week
with Tiger
10/22/2013 ---> To Key Index and Leading Stock Charts: DJI, SP-500, etc.
10/8/2013 14777 -175
.967 -.223
-43 -.116 -115 -.238
-.03
DJI bottom
10/9/2013 14803 +26 .970 -.302
-94
-.129 -129
-.241 -.033
10/10/2013 15126
+323 .992 -.156
-11 -.116 -108 -.234
-.011
10/11/2013 15237
+111 .999 -.156
+121 -.078 -85
-.152 -.015
10/14/2013 15301
+64 1.004 -.058 +100 -.057 -83 -.151
-.011
10/15/2013 15168
-131 .996 -.255
-30 -.078 -109
-.237 -.021
10/16/2013 15374
+206 1.001 -.122
+8
-.047 -99 -.225 -.006
10/17/2013 15372
-2 1.011 -.239
-1 -.051 -105
-.326 -.007
10/18/2013 15400
+28 1.014 -.185 +89 -.021 -83 -.220
-.01
10/21/2013 15392
-7
1.013
-.046 +148 .101
-29 -.147 -.01
10/22/2013 15467
+75 1.018 .052 +238 .117 -6 -.048 -.006
Some Yahoo pundits are saying the DJI's lagging bodes badly
for the market. At this point I think it simply represents portflio shiftng
to more aggressive speculation. This seems reasonable in a world where
traders know the Fed will not dare to raise rates for fear of spooking both
the market and the fragile recovery.
My own research suggests that we should stick with the NASDAQ, QQQ,
IWM, Russell-2000 and the small caps. There are lots of technical reasons:
1) Buy B9s are reliably bullish.
2) The A/D Line keeps soaring to new highs,
3) Our Closing Powers are still in uptrends,
4) There are hundreds of stocks whose Closing Power is making
new highs and also show hefty Accumulation.
5) There are only a handful of Bearish MINCP stocks that show
the reverse.
6) There is precedent for the DJI lagging the NASDAQ.
7) There is precedent for the DJI running to new highs despite
a negative IP65, most notably in 1936, 1963-1966 when a
Democrat
is in the Whote House. Democrats do tend to favor smaller stocks.
The 1999-2000 chart of the DJI and the NASDAQ shows that the NASDAQ
can lead the DJI for 6 months. Myexperience in 1967-1969, suggests
that secondary stocks can come to monopolize much of the trading for
longer than 2 years. Selling on a simple failure of the DJI to make a
new high when the NASDAQ did is not advisable. It would have gotten one
out 5 months early and many points below the final top on the NASDAQ. in March 2000.
At the very least, we should now wait for a Peerless Sell on the DJI or
a break in the accelerating-up NASDAQ uptrendline.
DJI / NASDAQ 1999-2000
Even with a plunging NYSE A/D Line, the NASDAQ still
rose 60% in the last 6 months of its bull market. It rocketed
up from 3000 ro 5000 after breaking out in late October.
That could happen here. Our NYSE A/D Line now is much stronger
the the one in 1999-2000 which plunged even as the NASDAQ
soared.,

See how the Negative IP65 eventually was proven correct. But it
had to stay negative for 6 months before the NASDAQ was
turned down.

Still. we have to be watchful and not dogmatic. The 3-months smoothed
Tiger Accumulation Index (IP65) is bearishly negative and has flattened
out. This is 3 times more likely to bring a DJI retreat than allow
a big surge.
DJI,
NASDAQ, IP65 and A/D Line Now


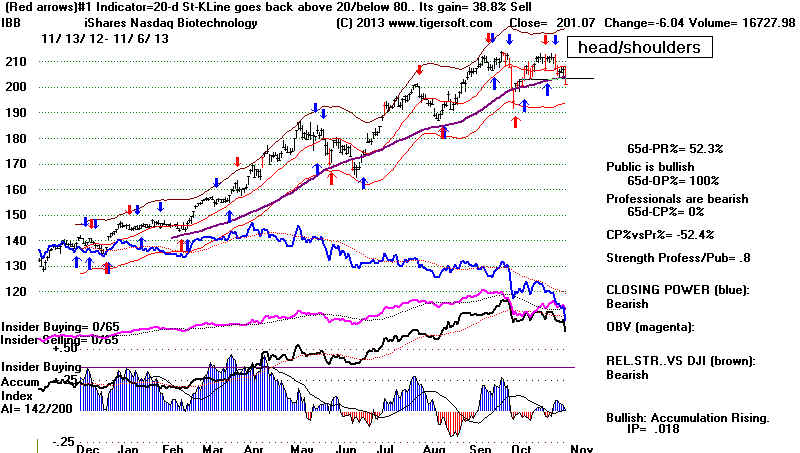
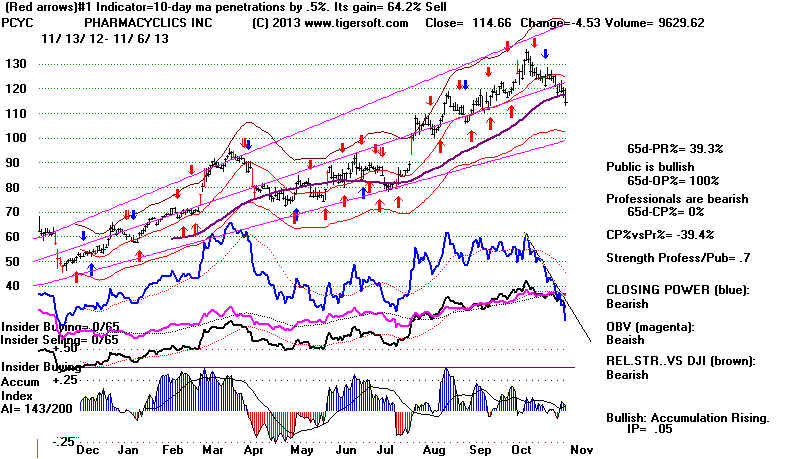
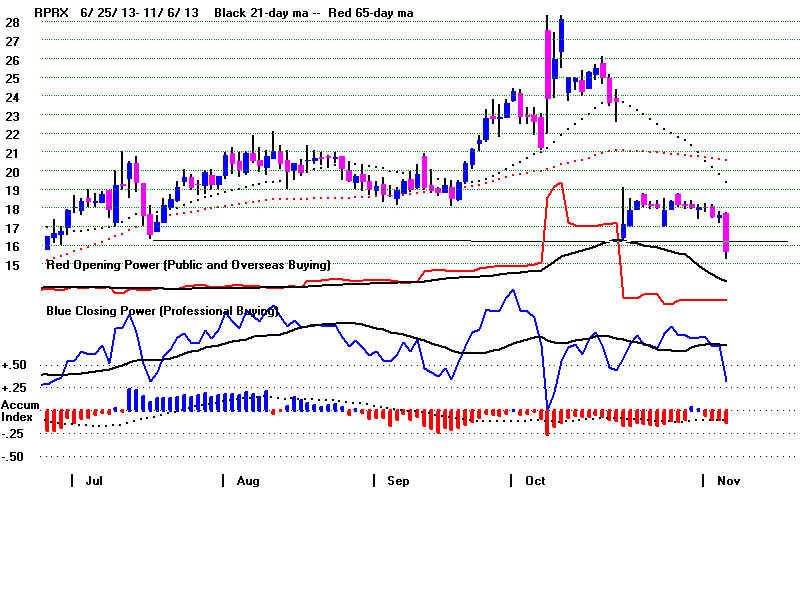


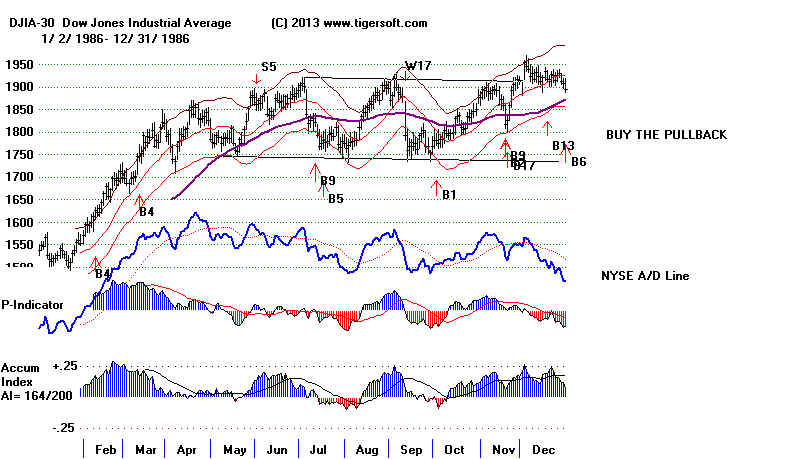
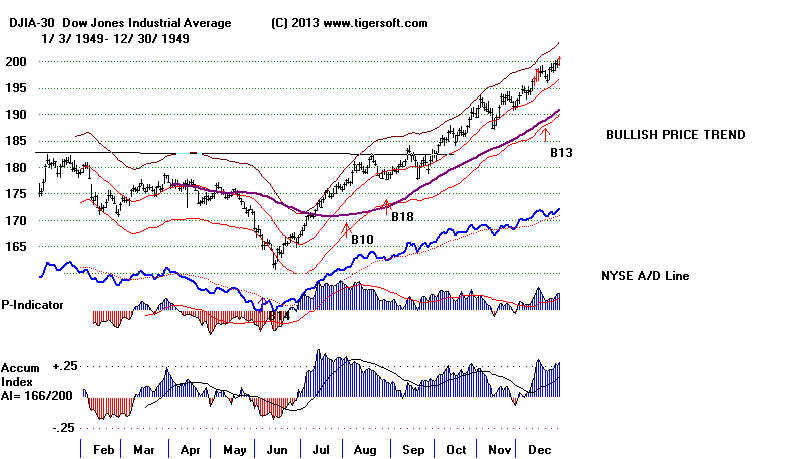
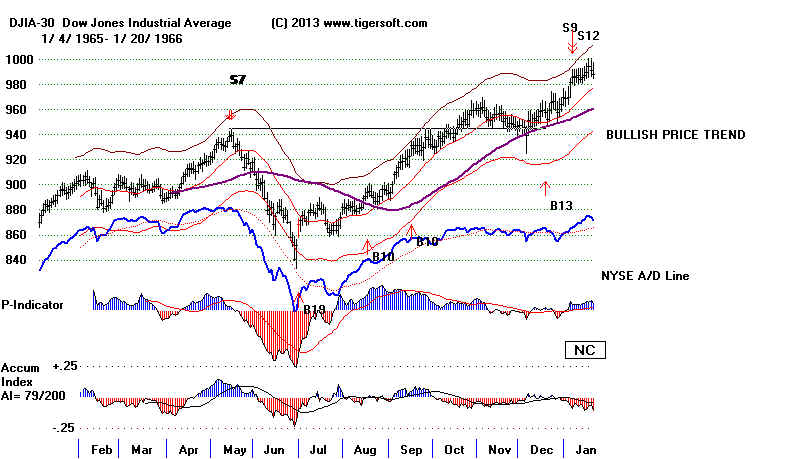
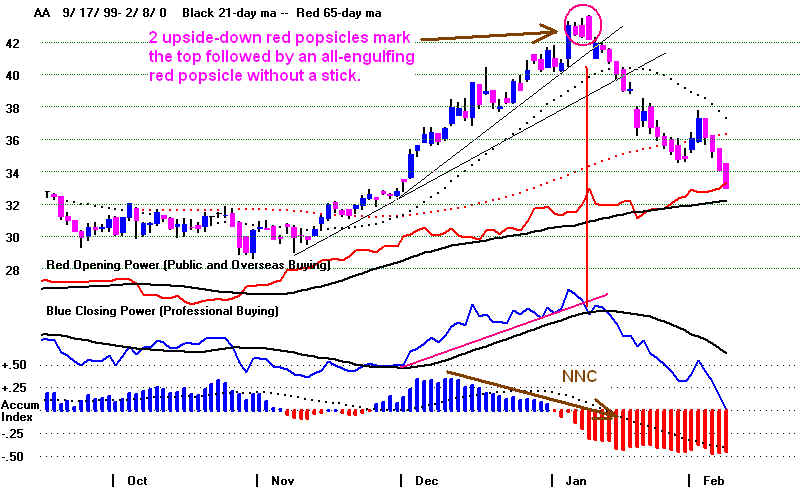
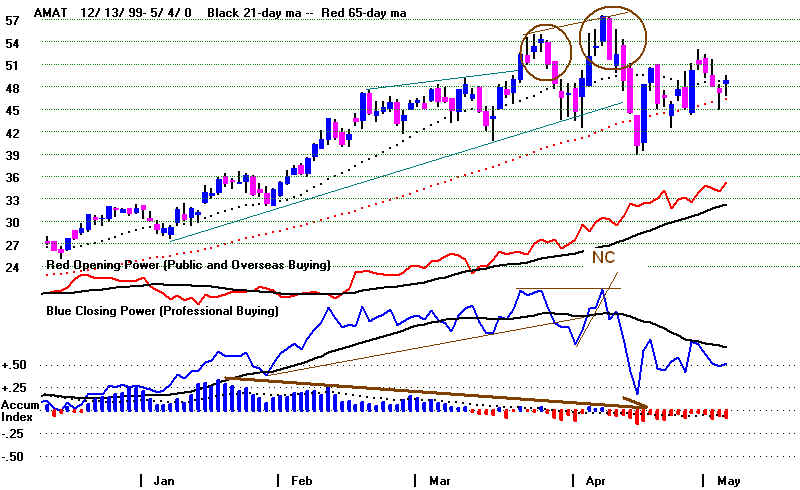
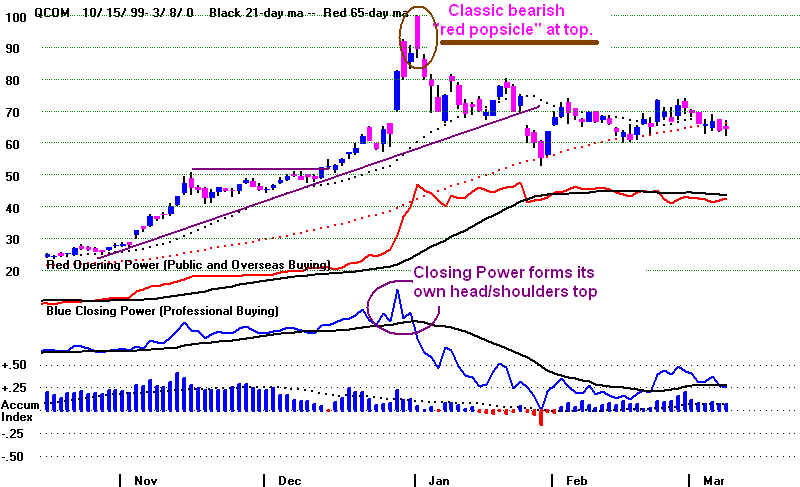
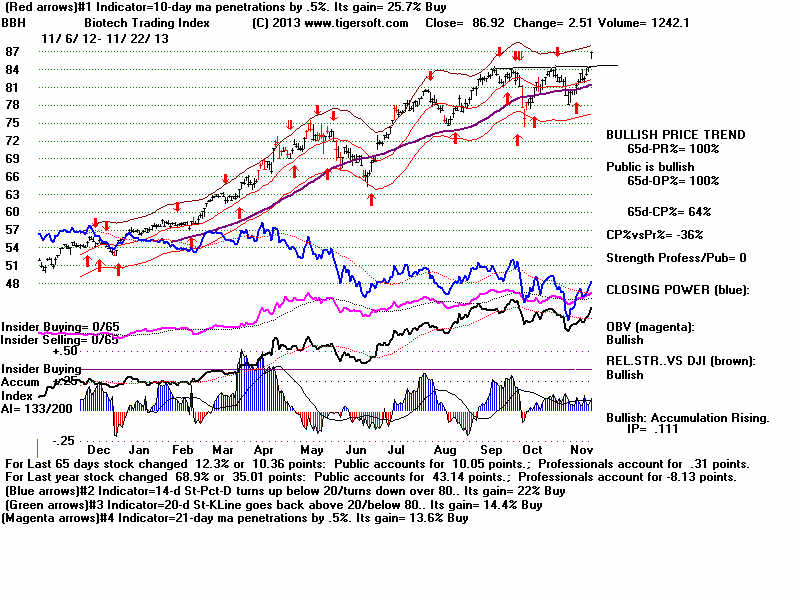
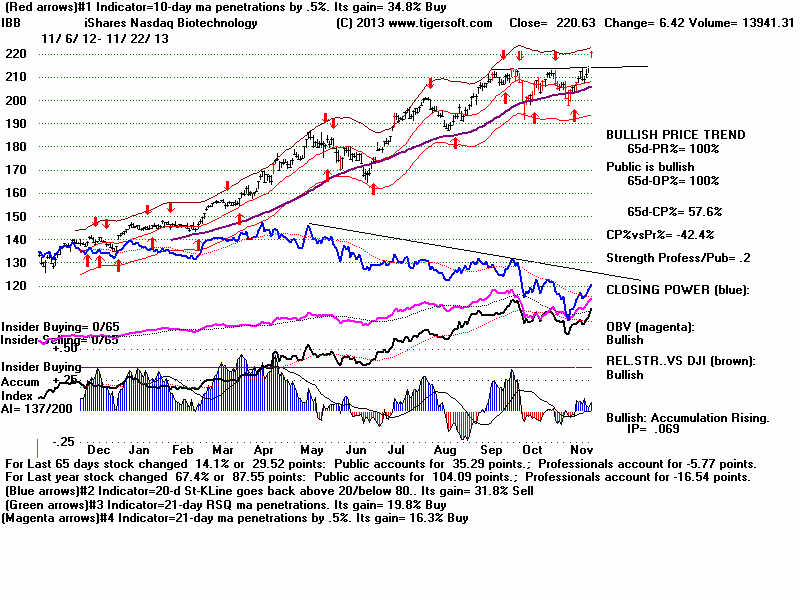
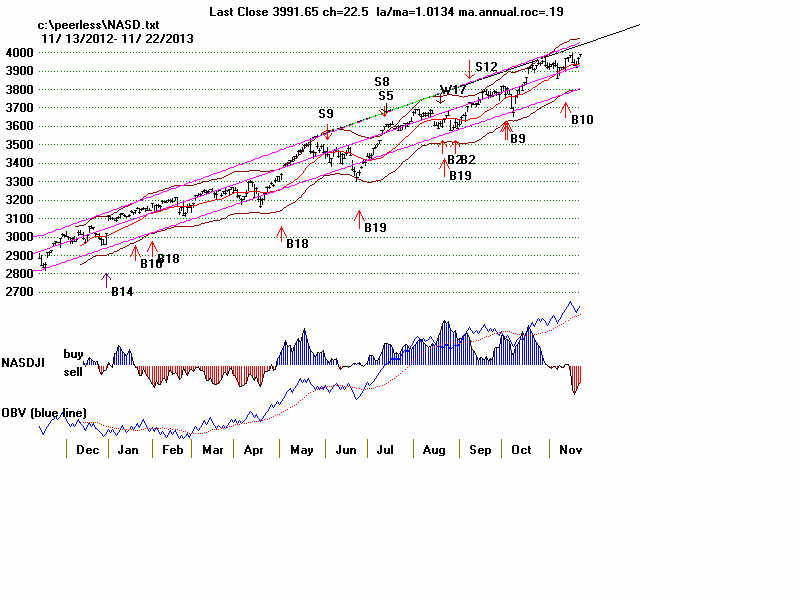
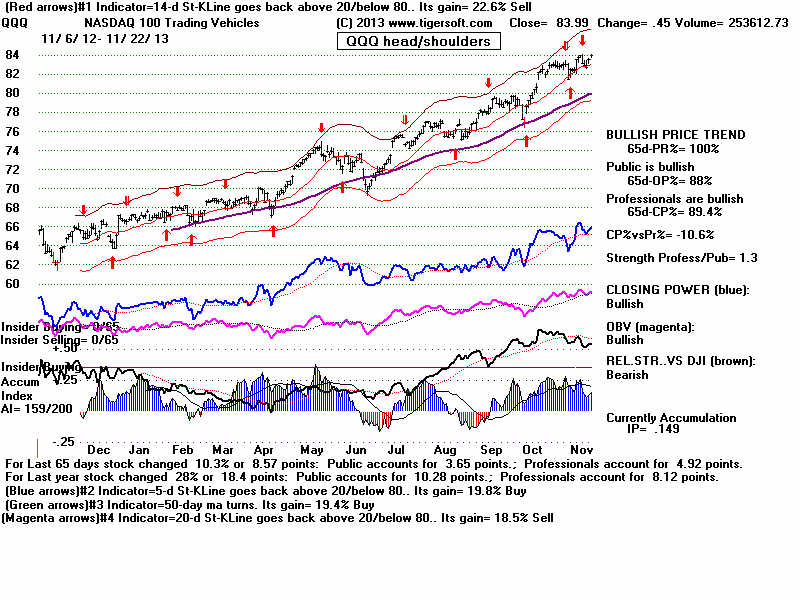
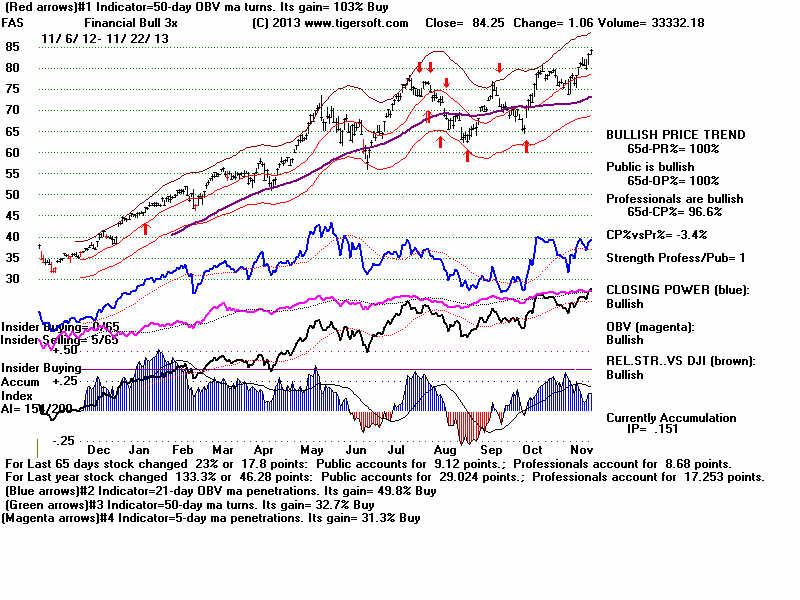
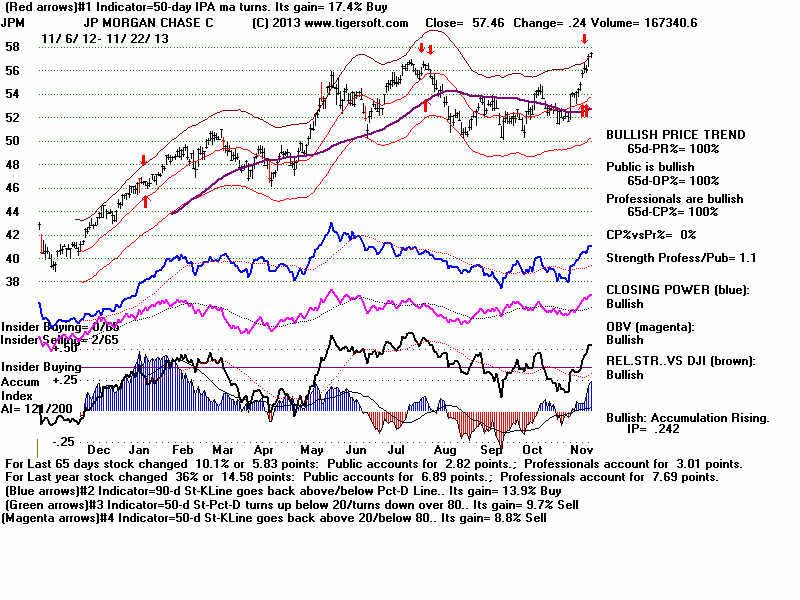
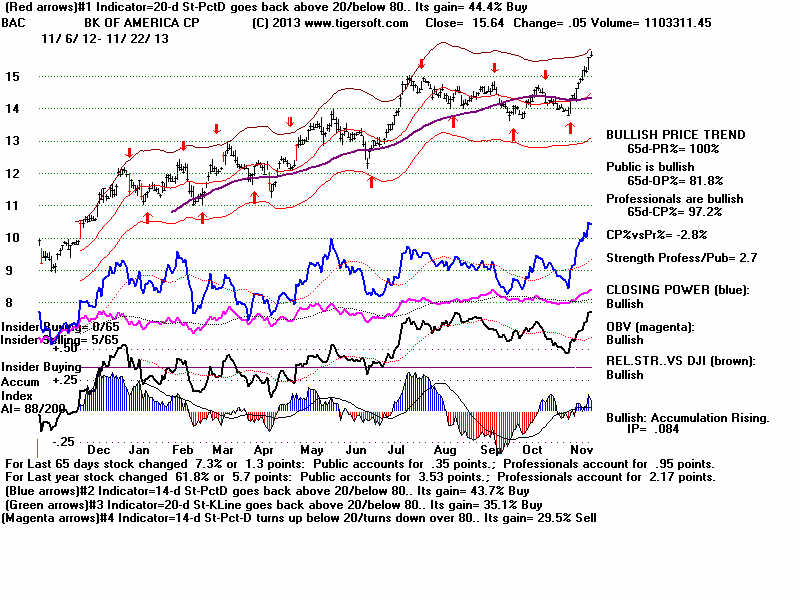
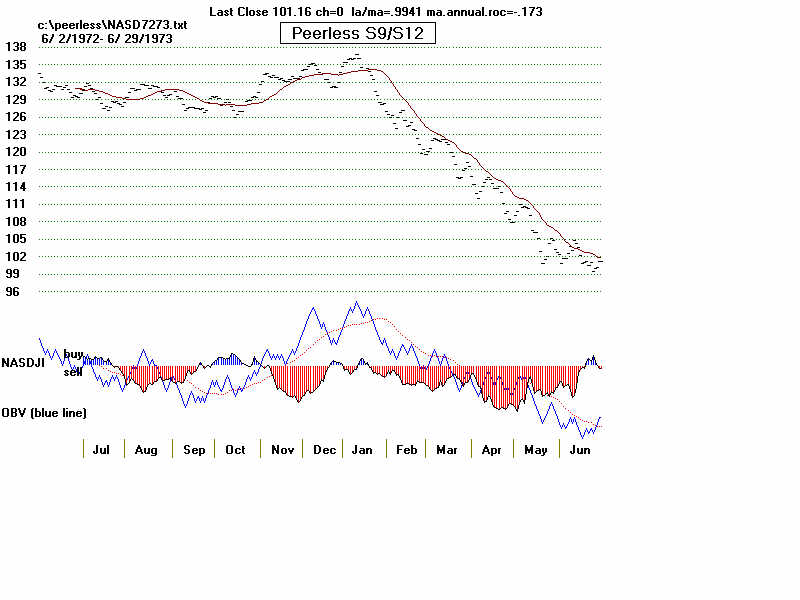
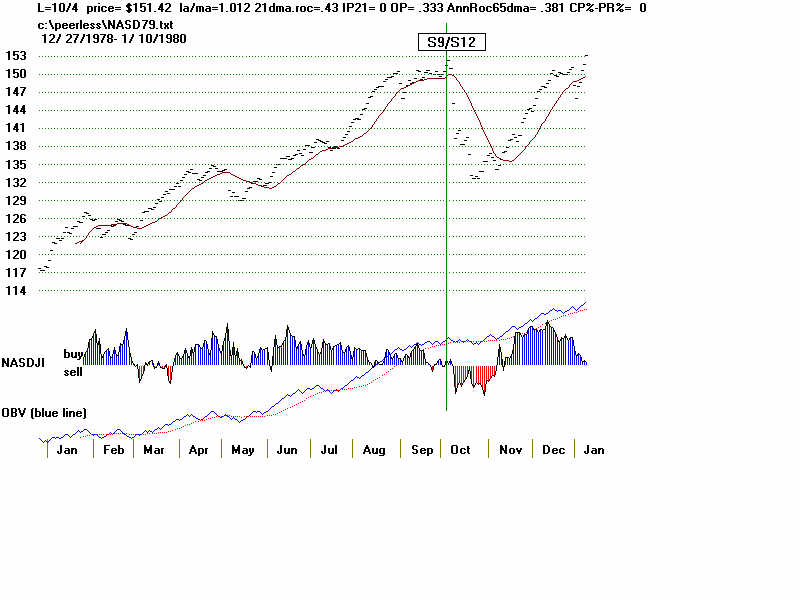
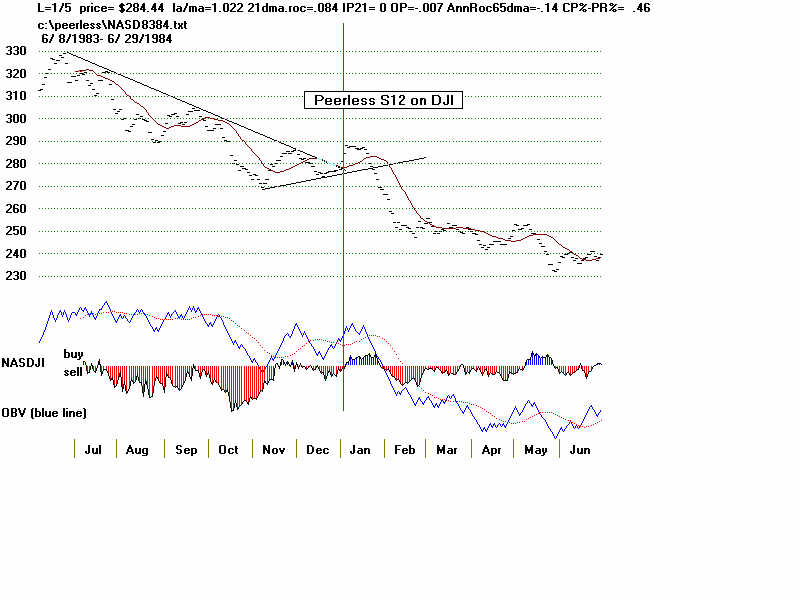
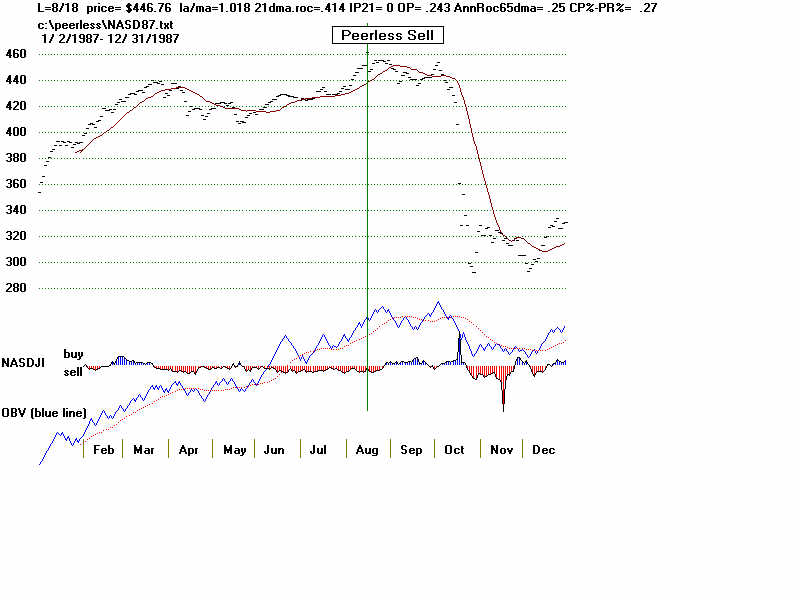
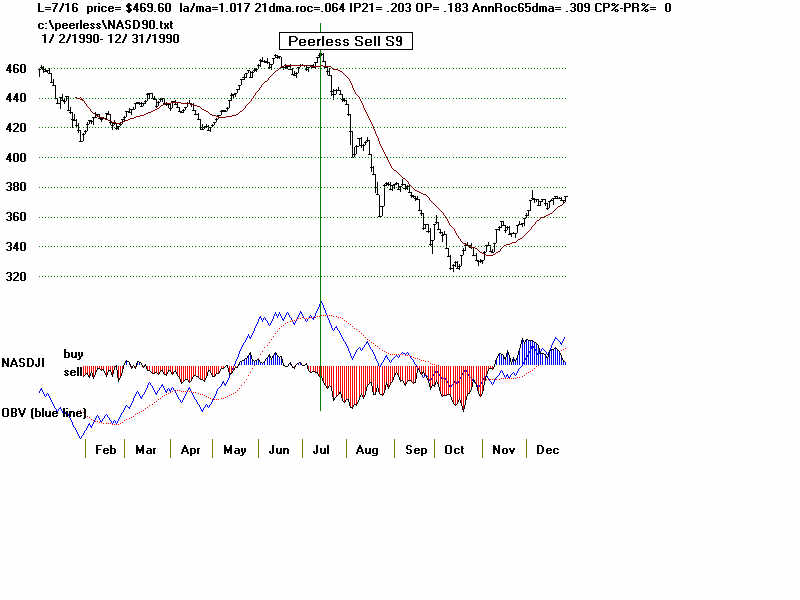
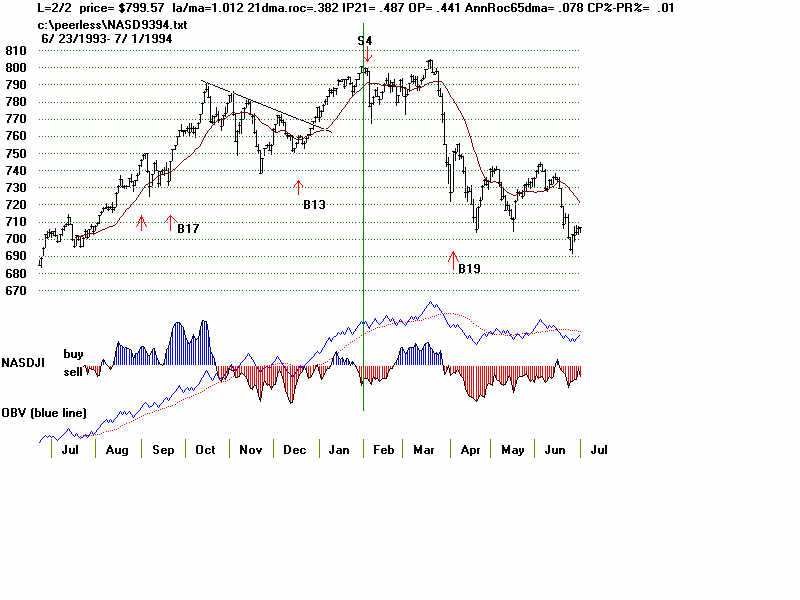
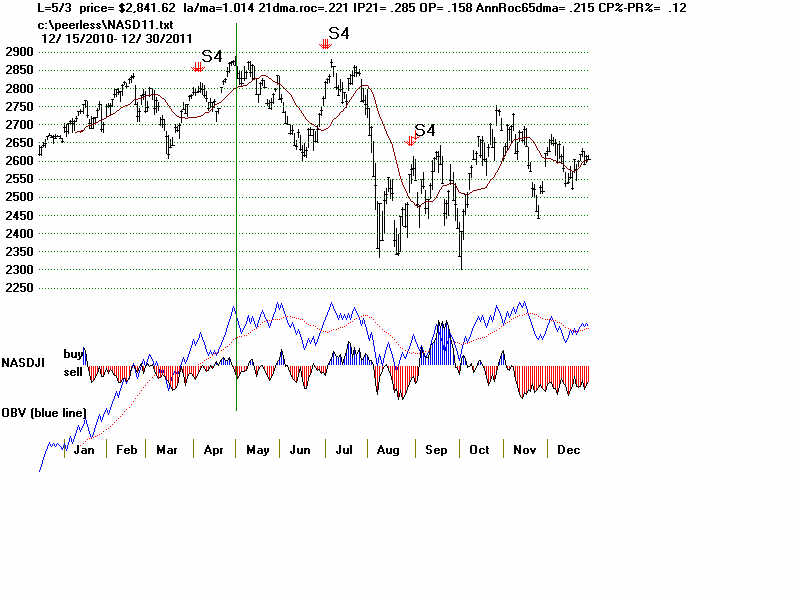
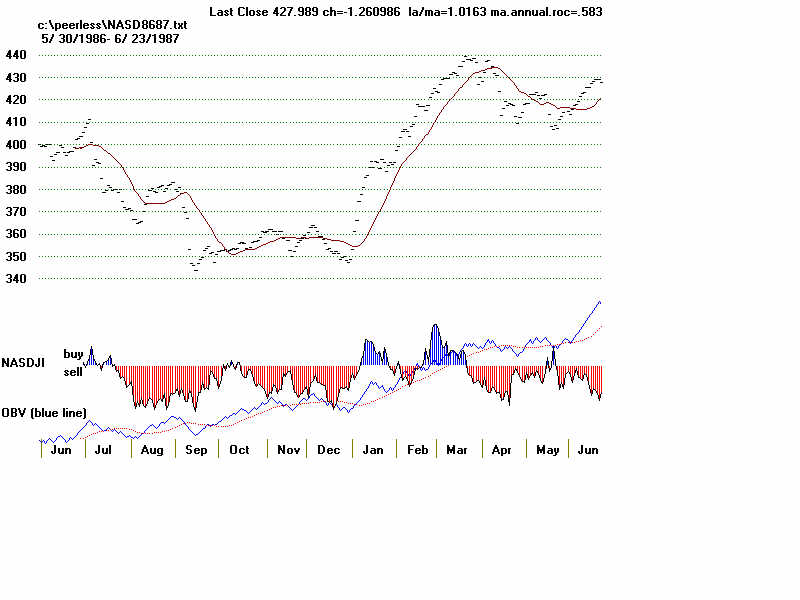
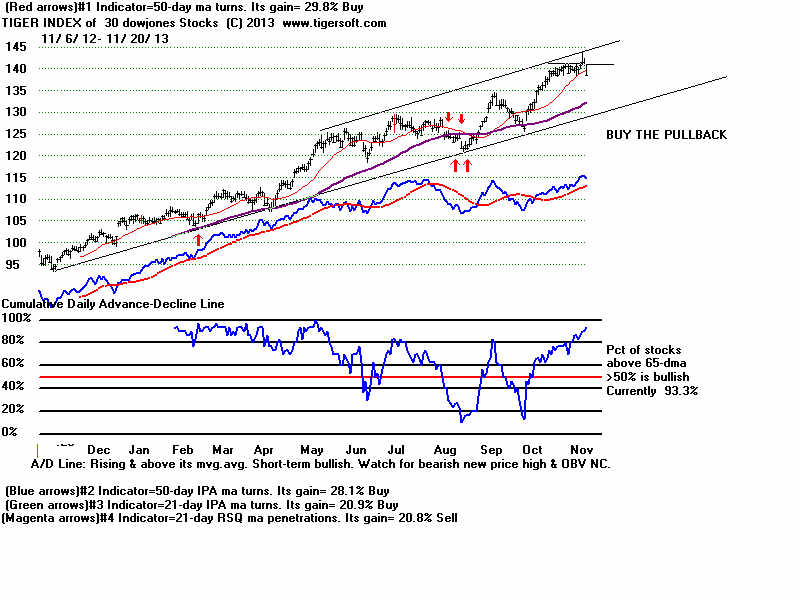
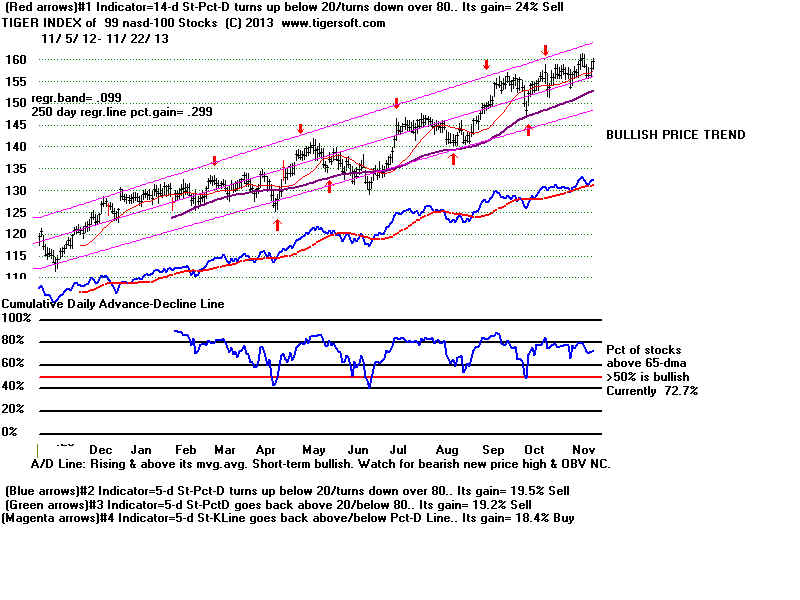
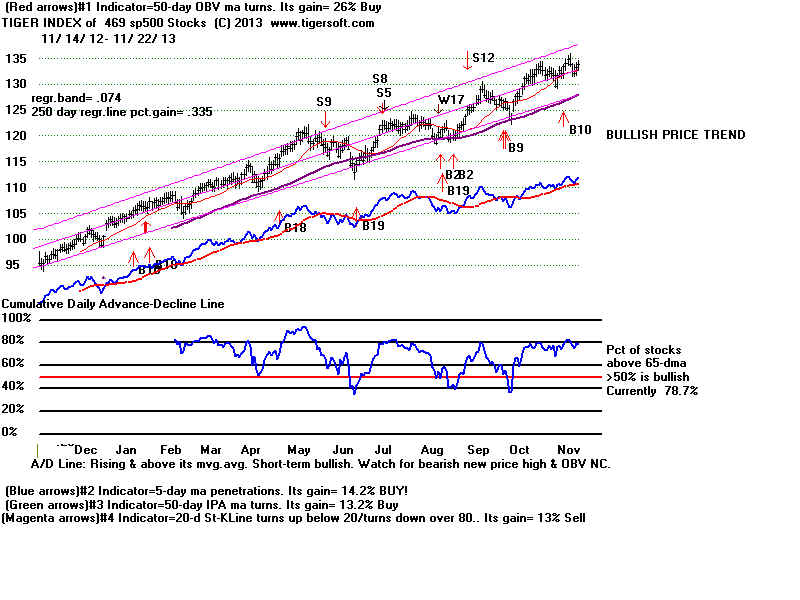
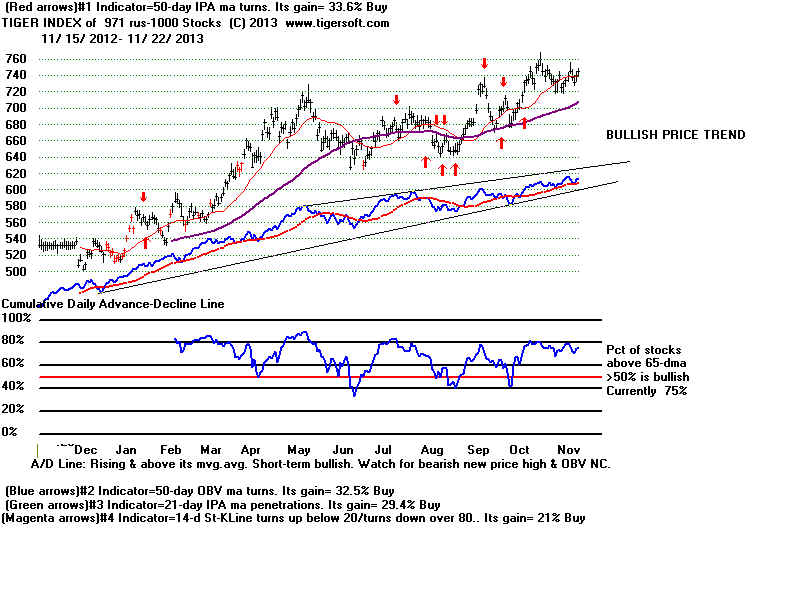
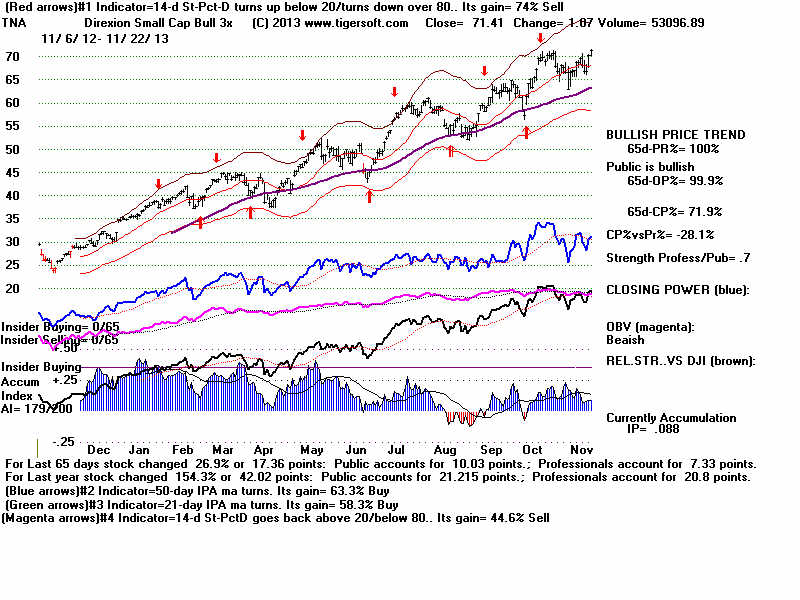
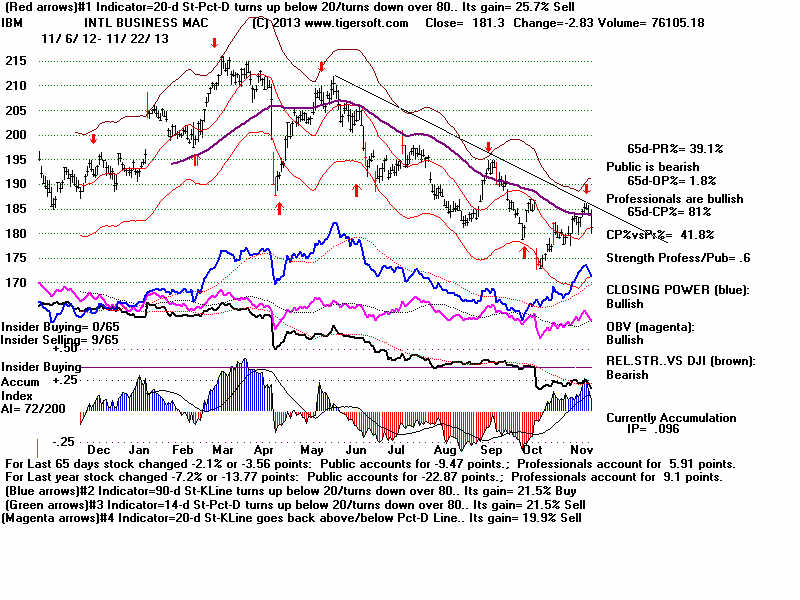
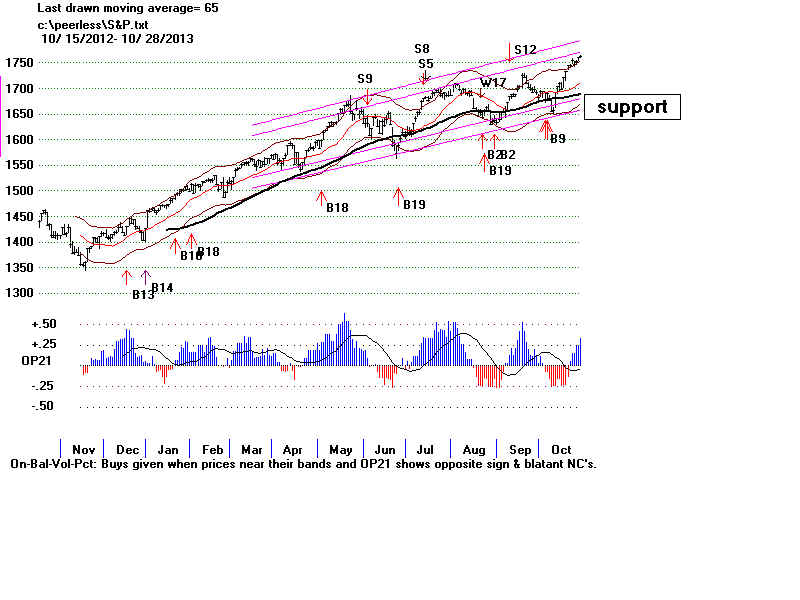
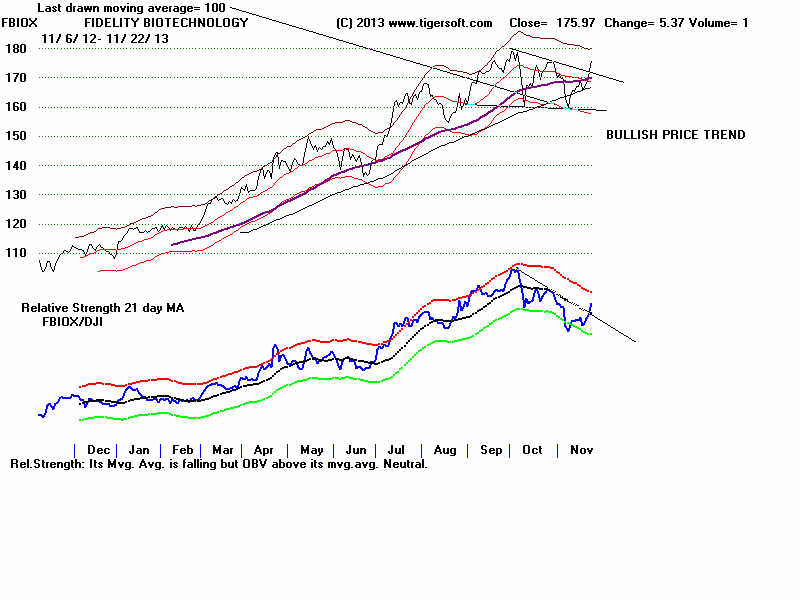
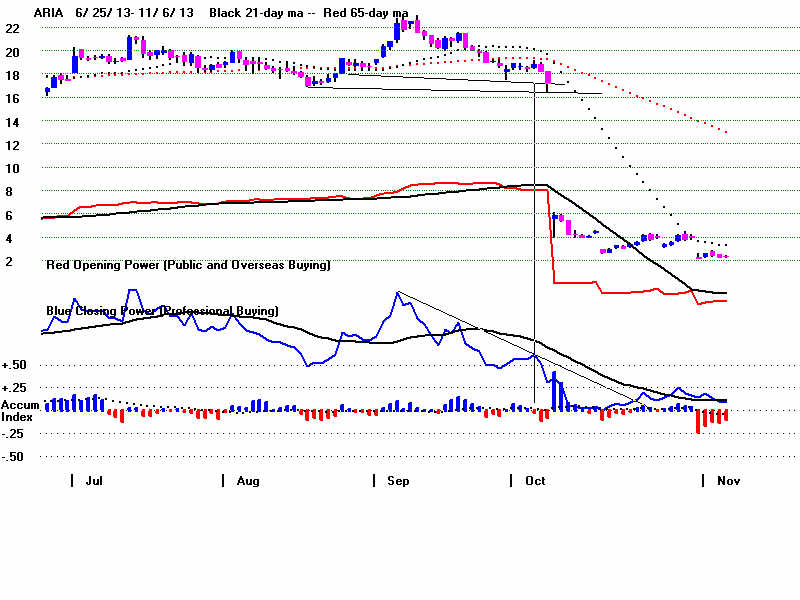
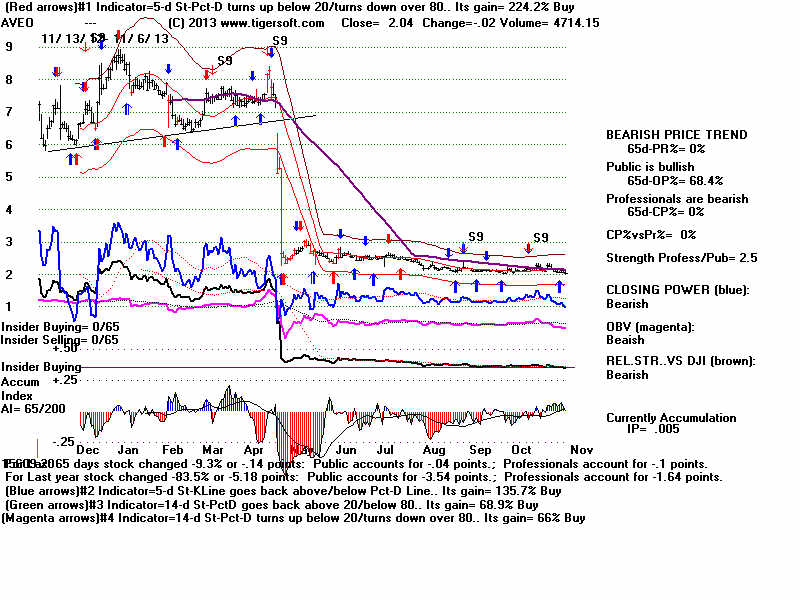
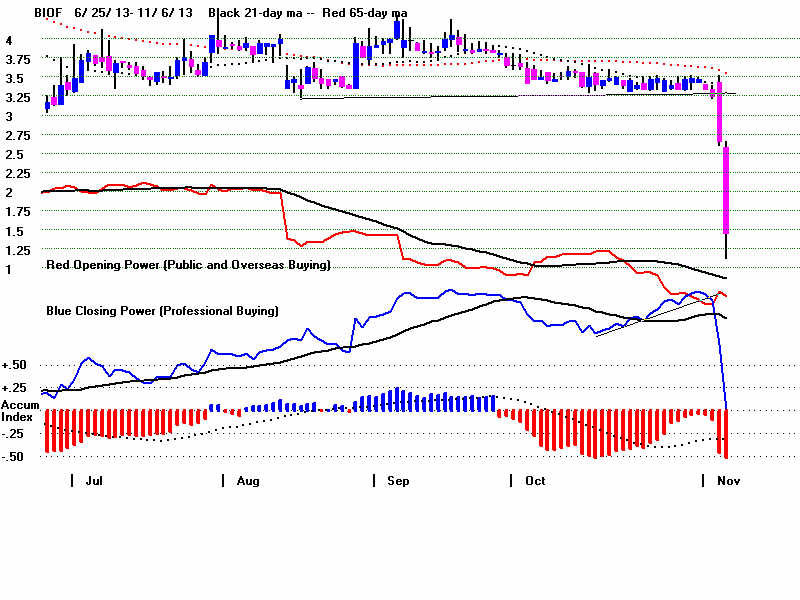
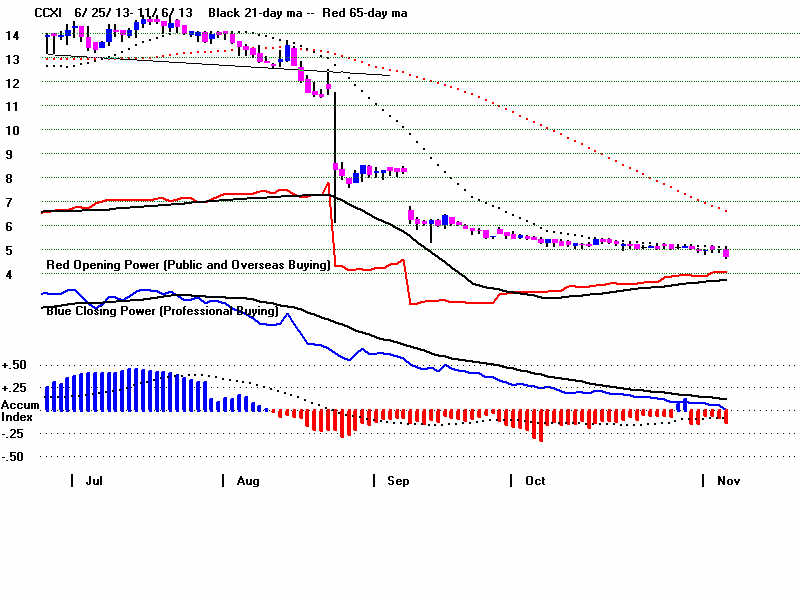
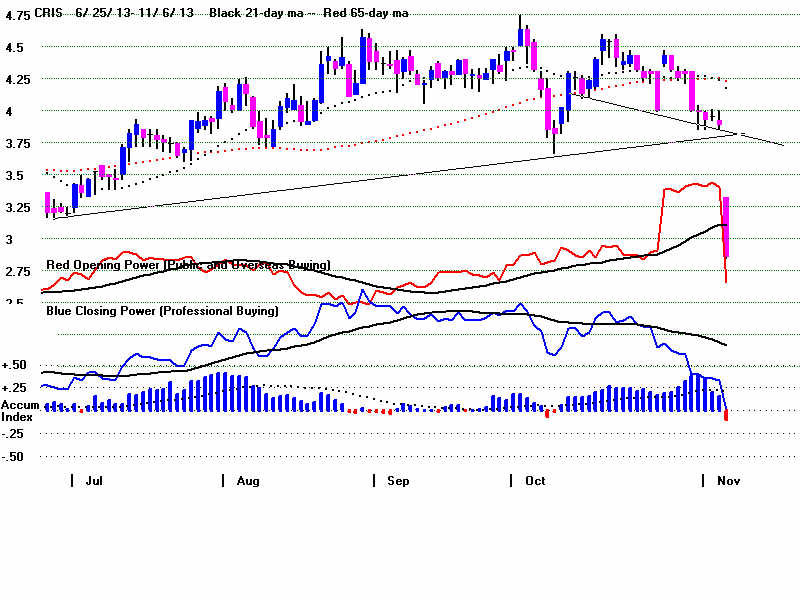
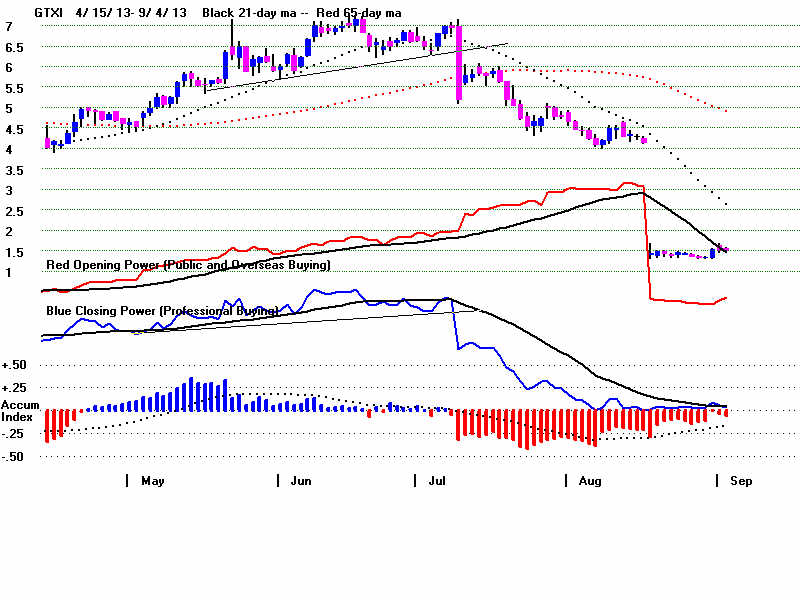
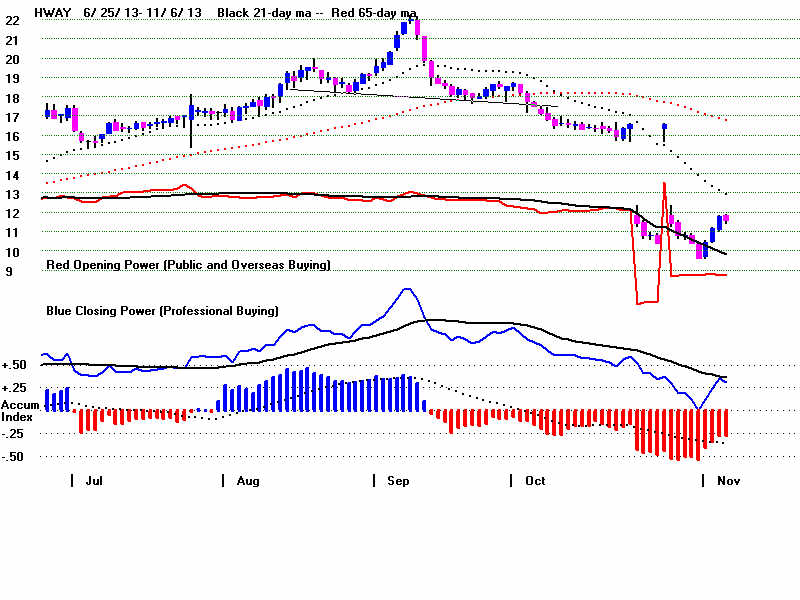
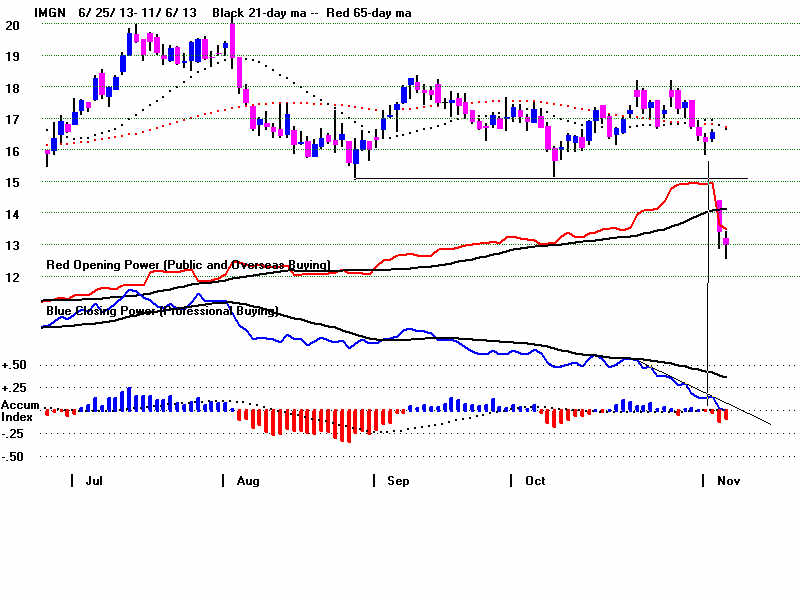
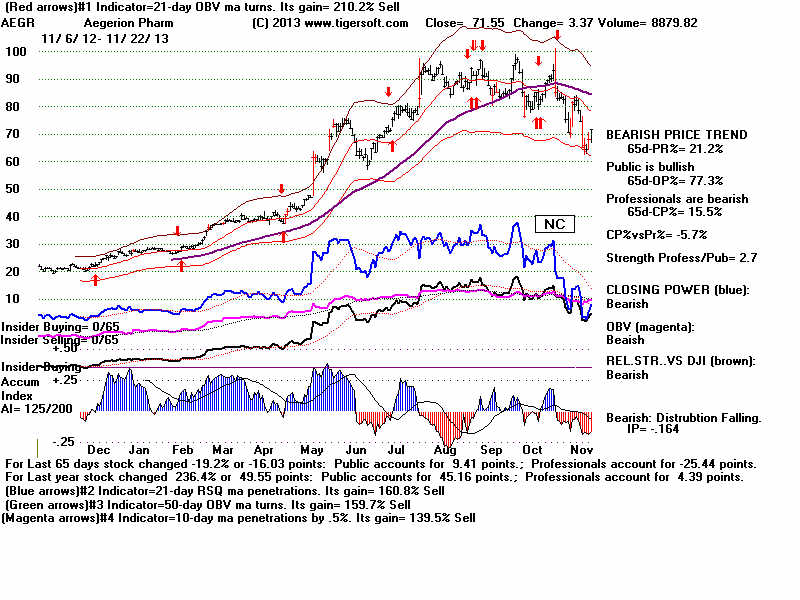
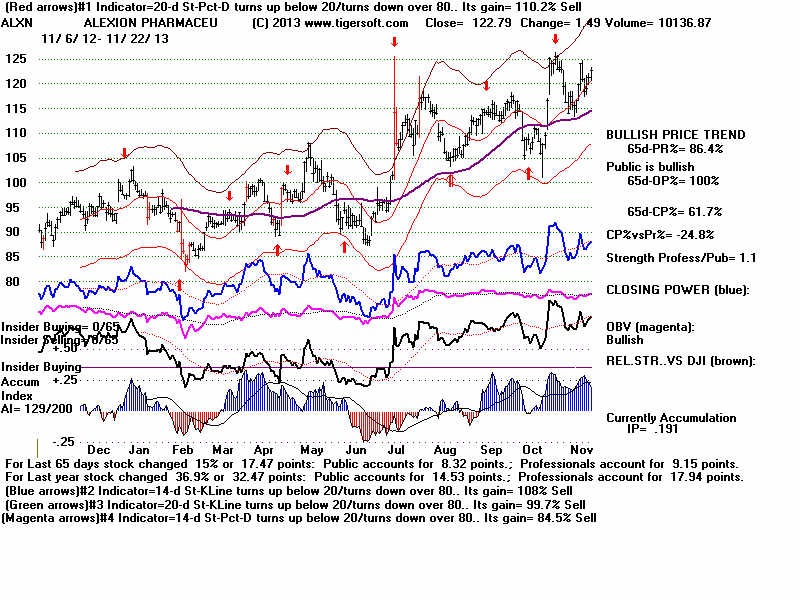
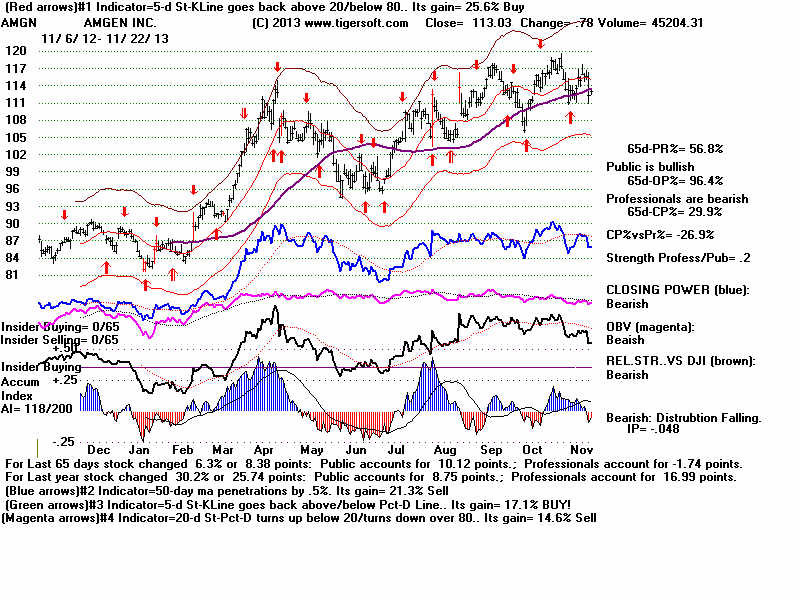
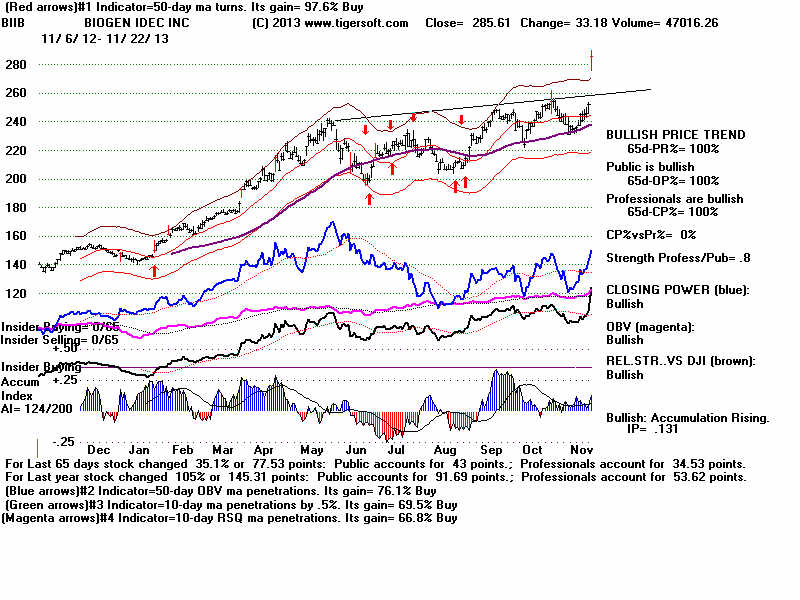
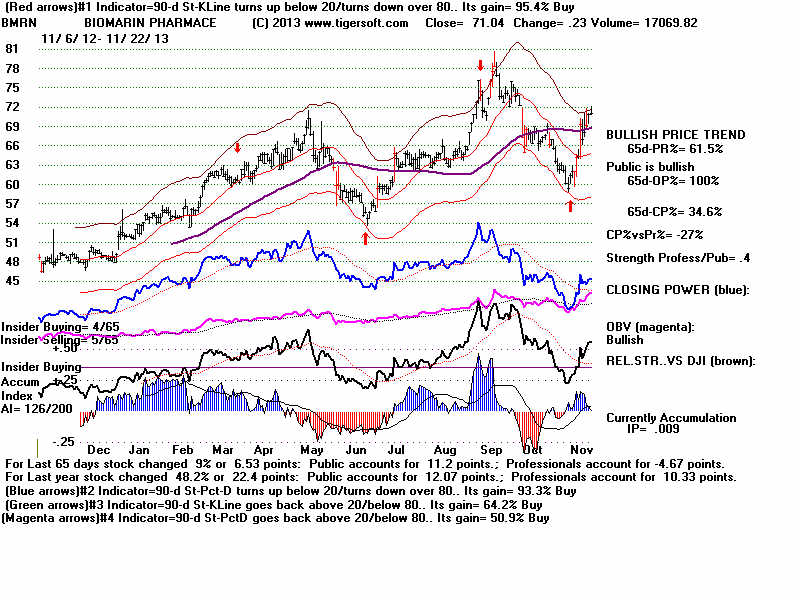
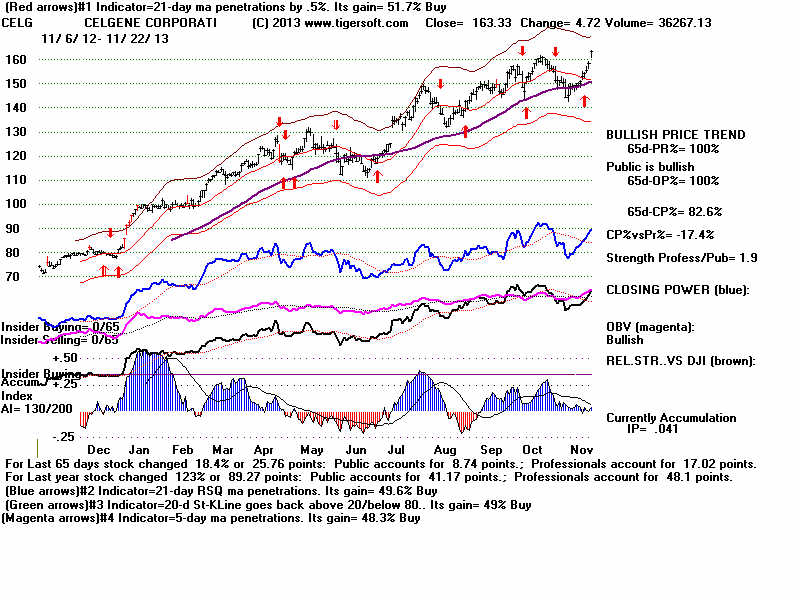
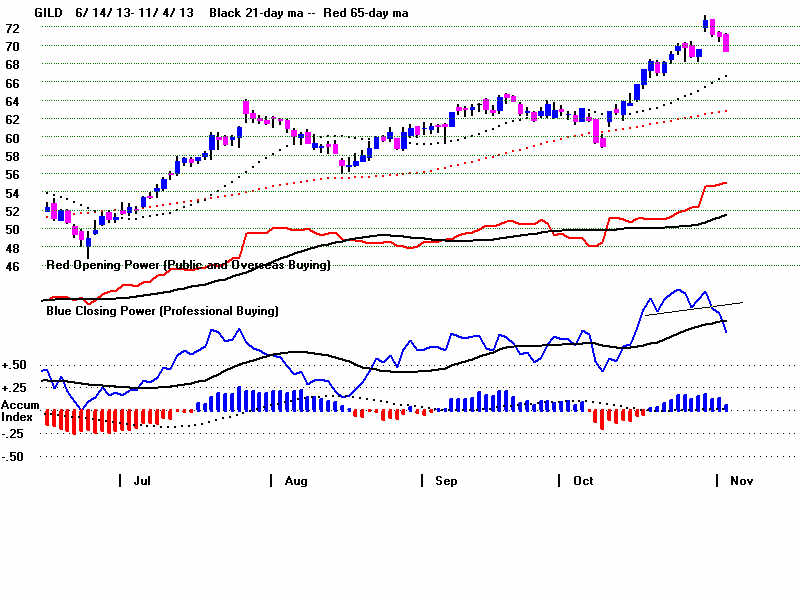
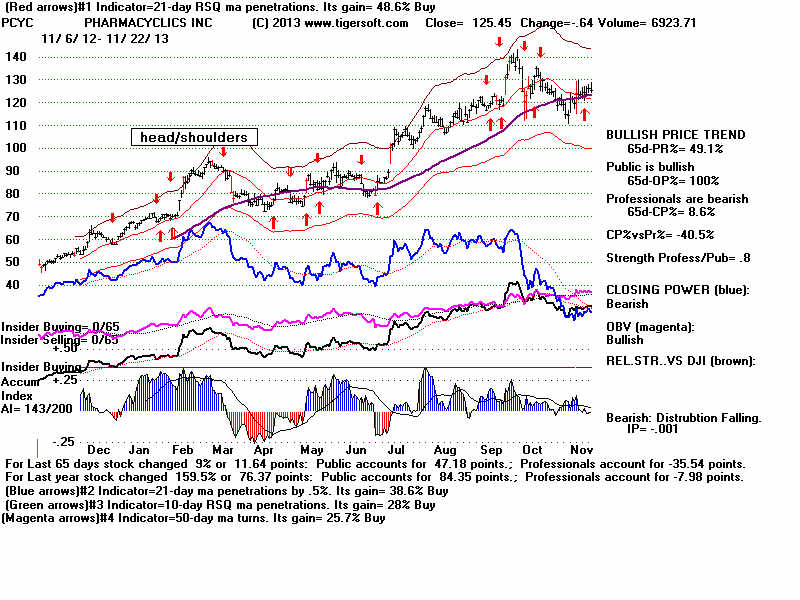
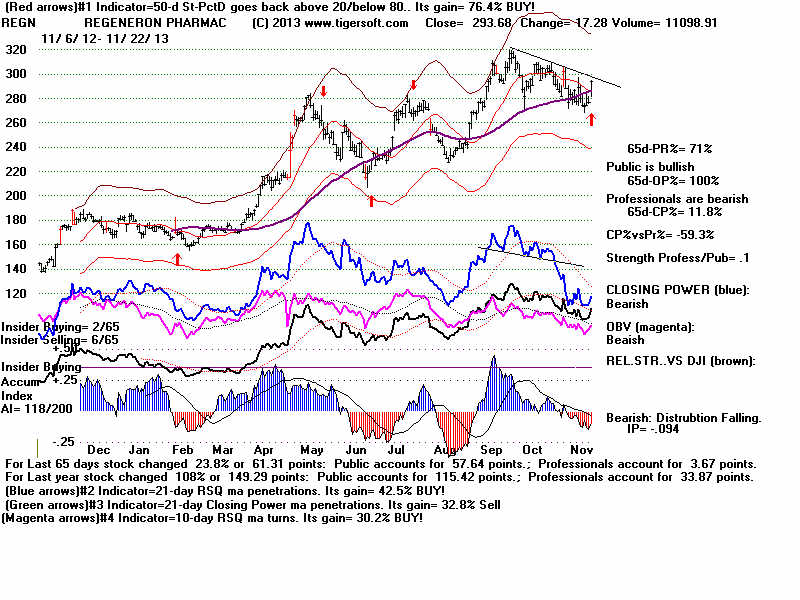
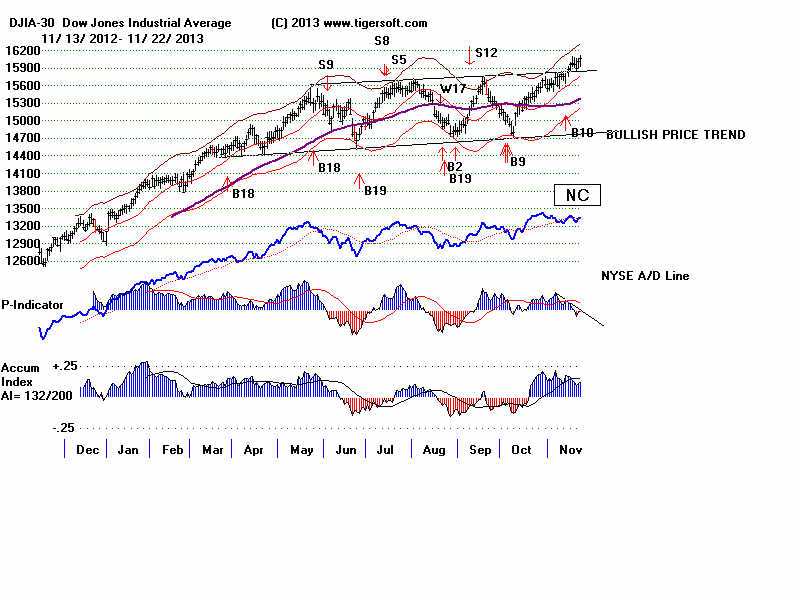
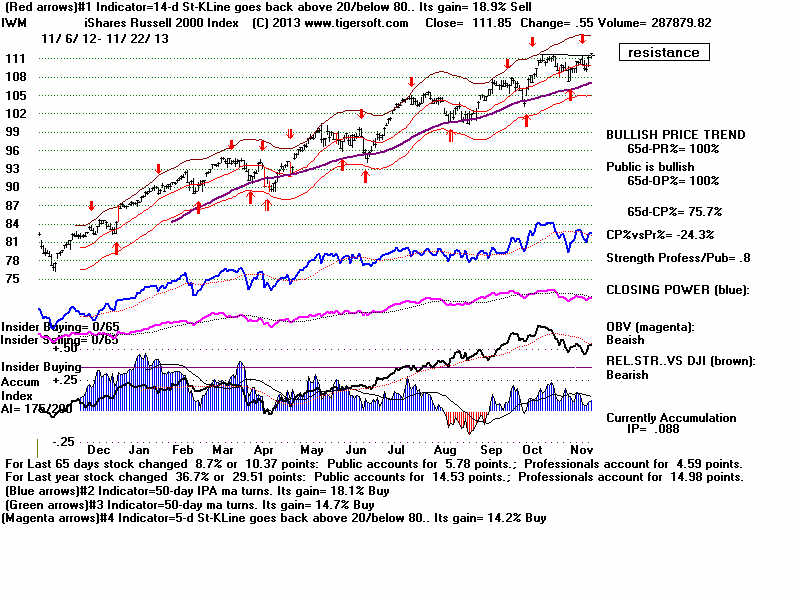
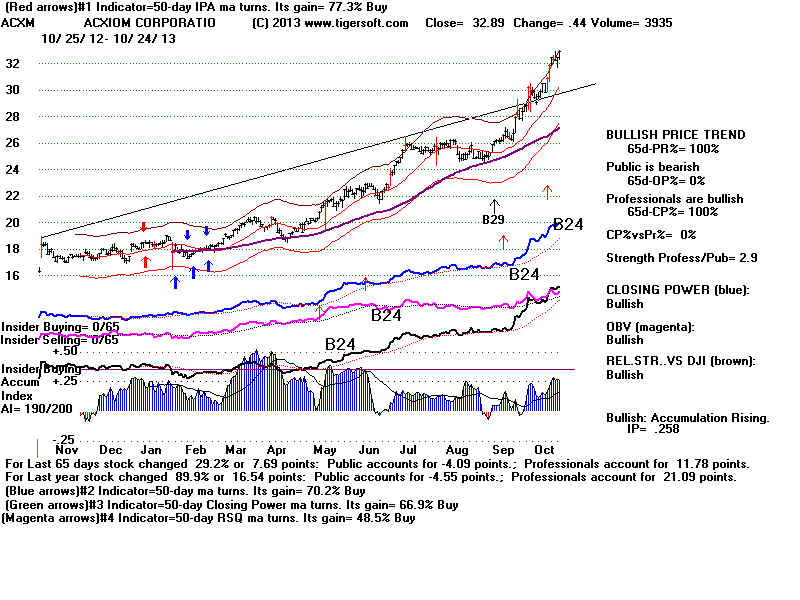
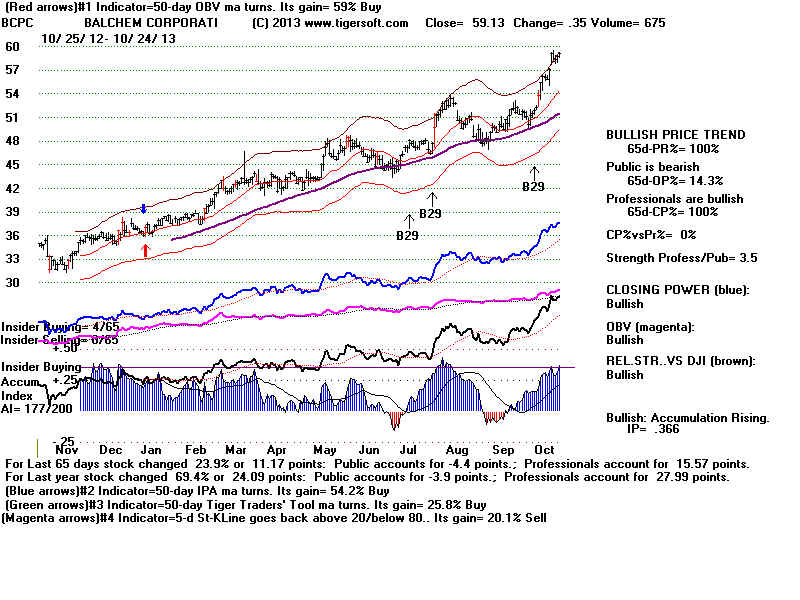
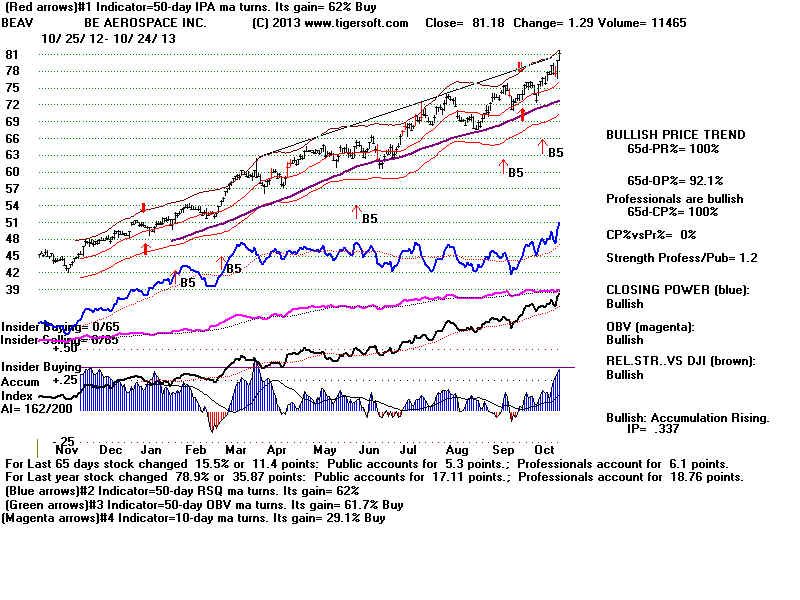
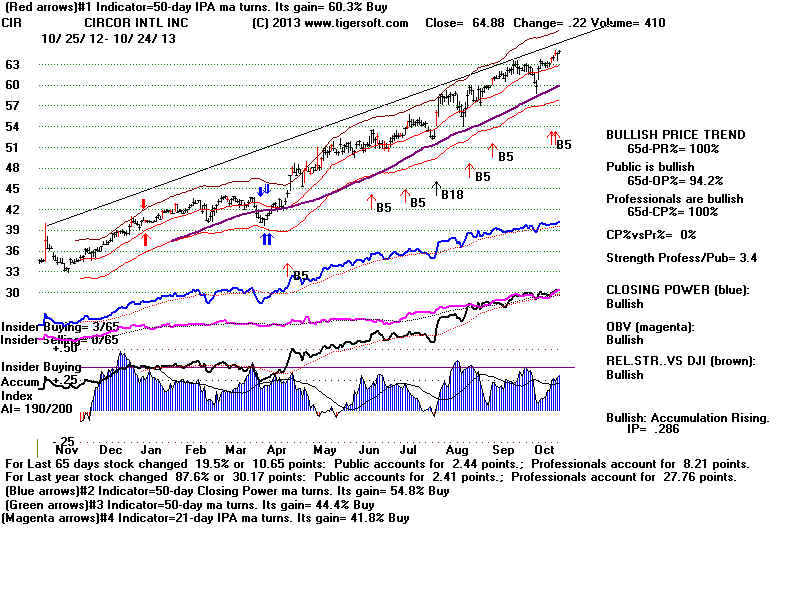
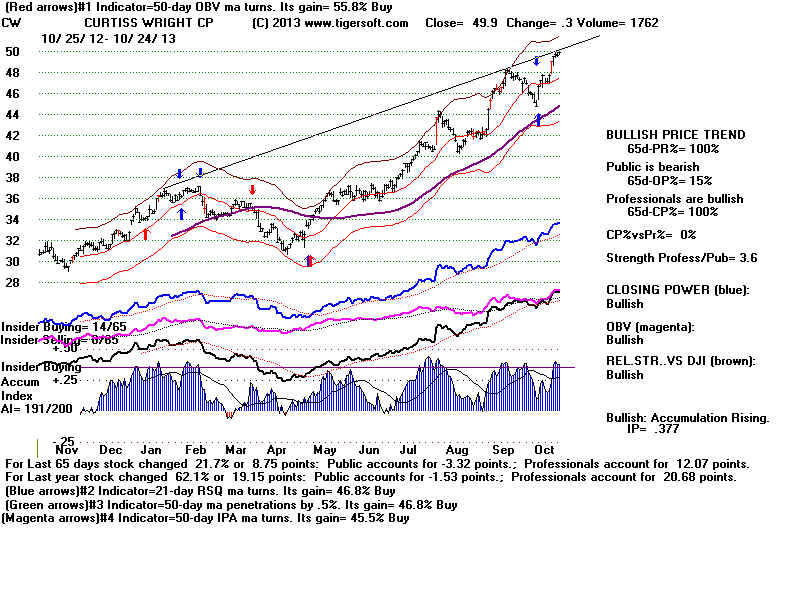
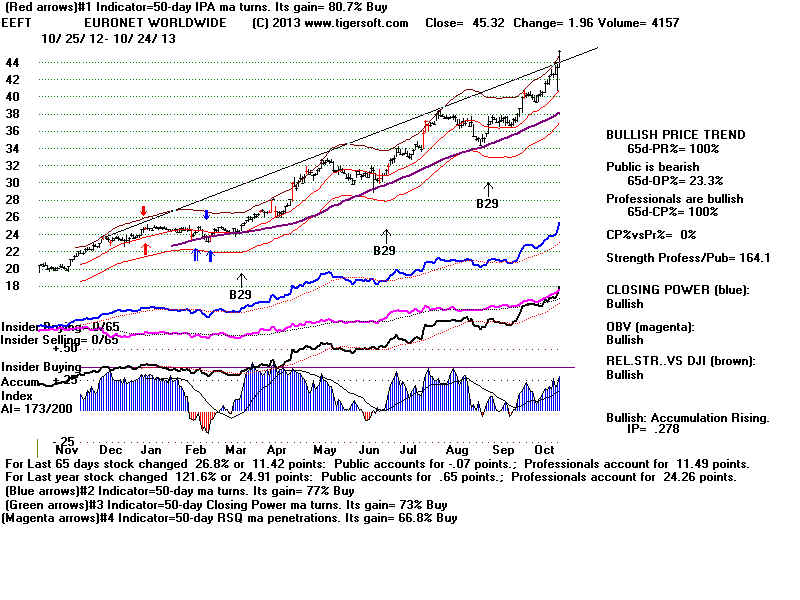
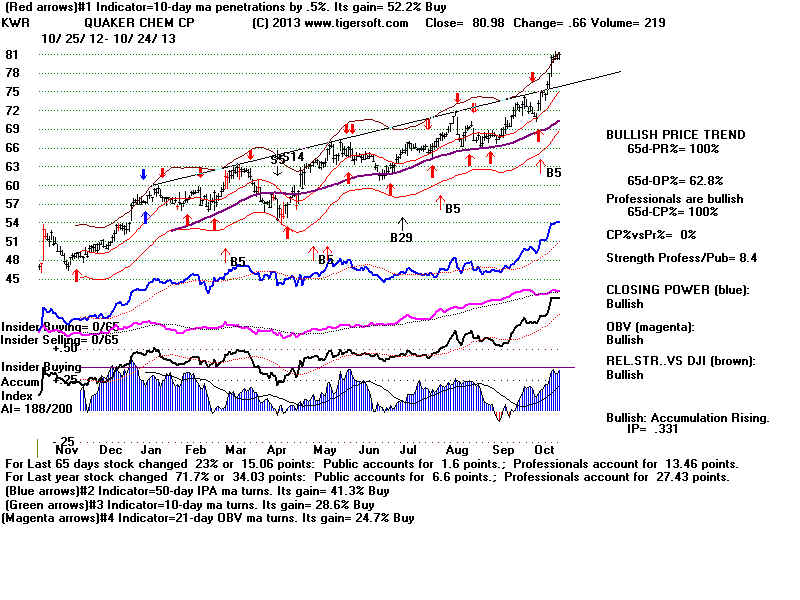
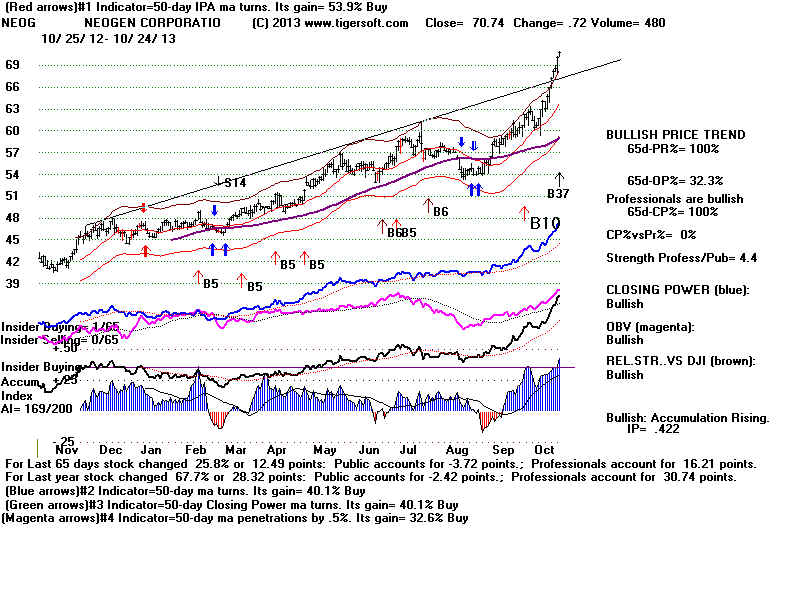
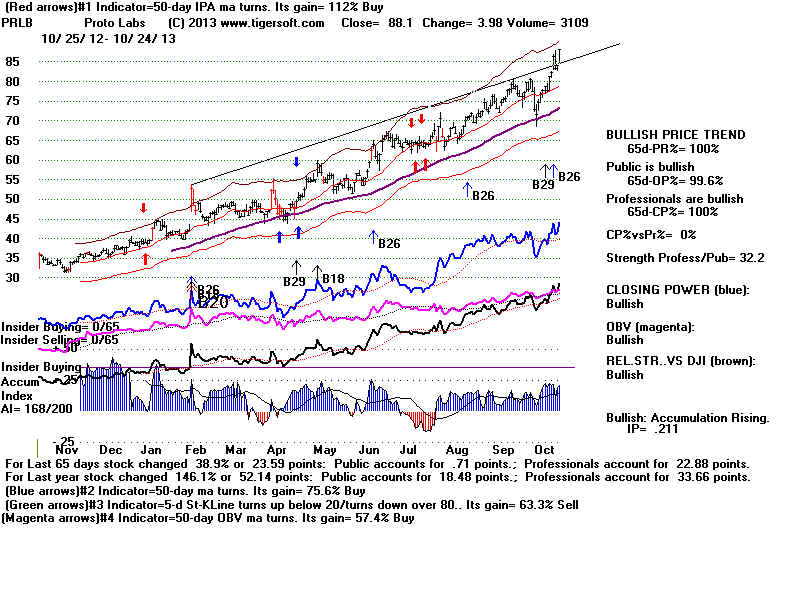
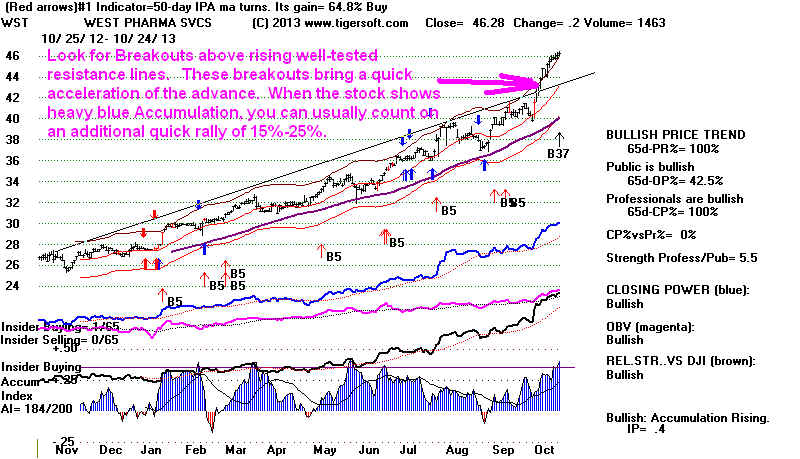
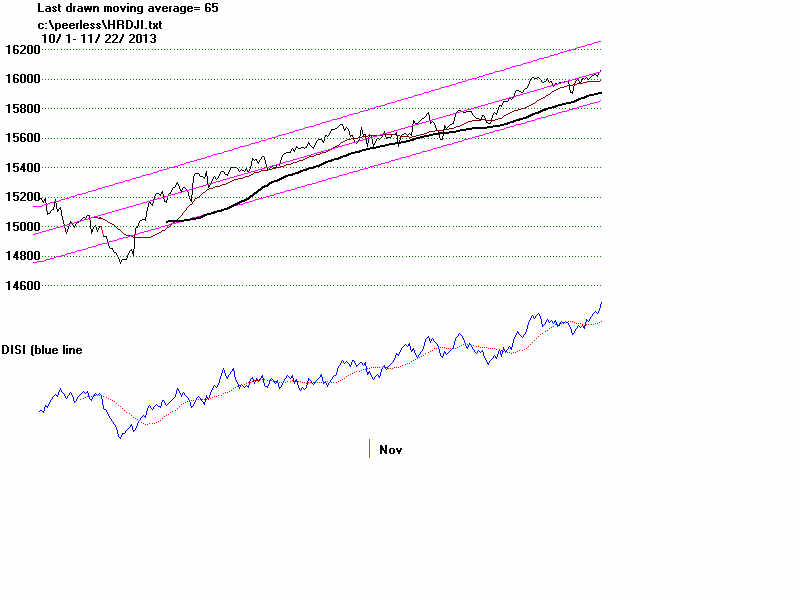
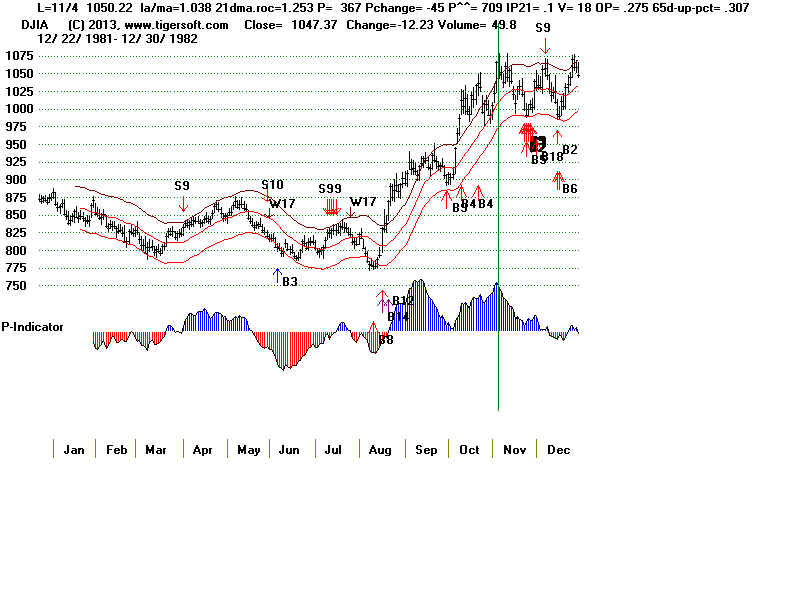
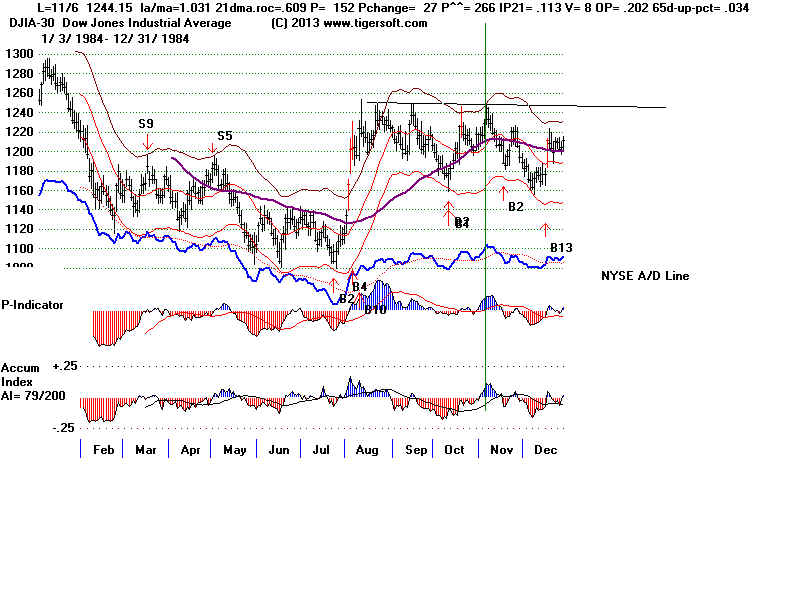
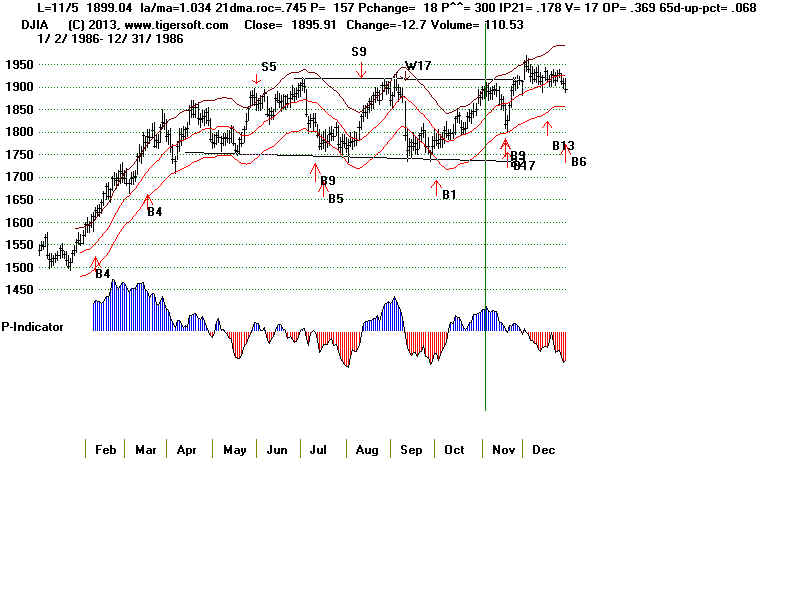
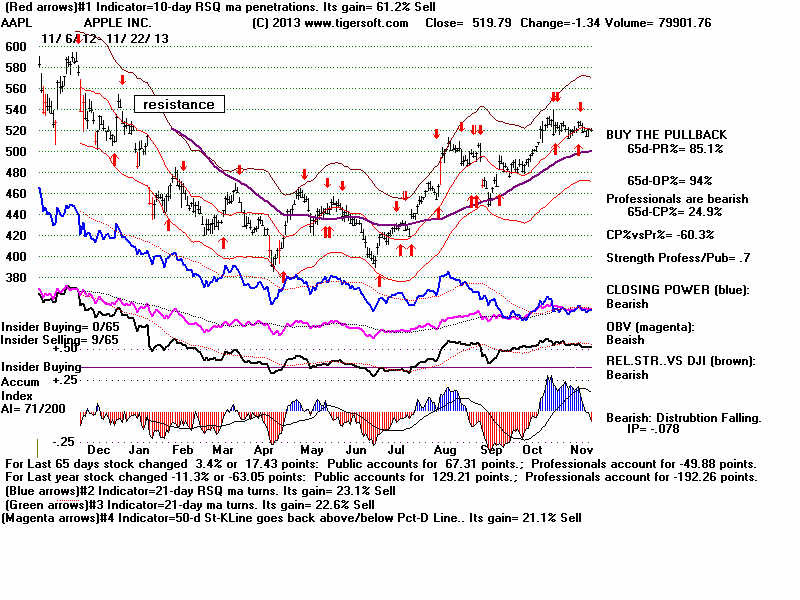
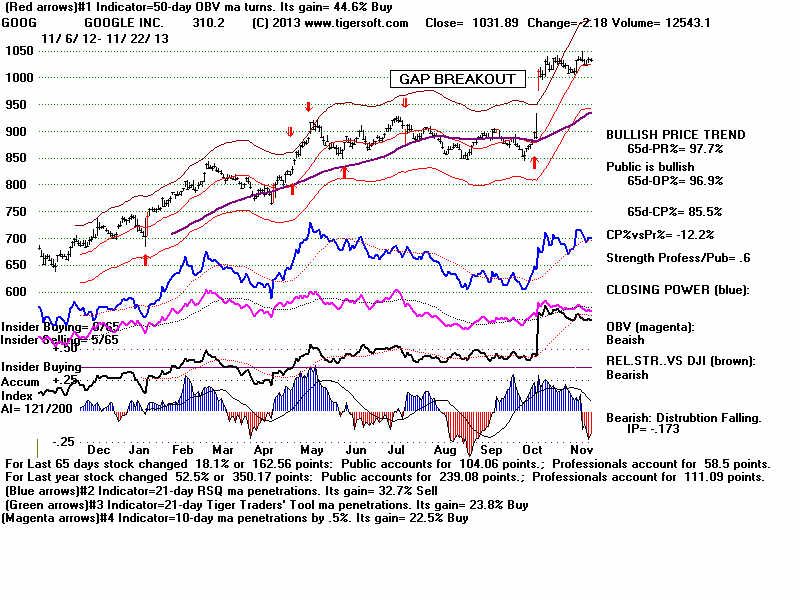
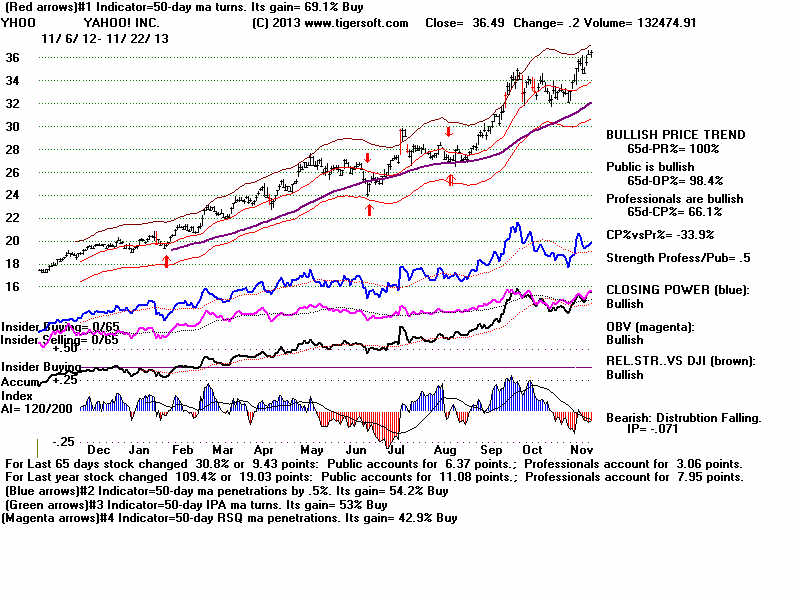
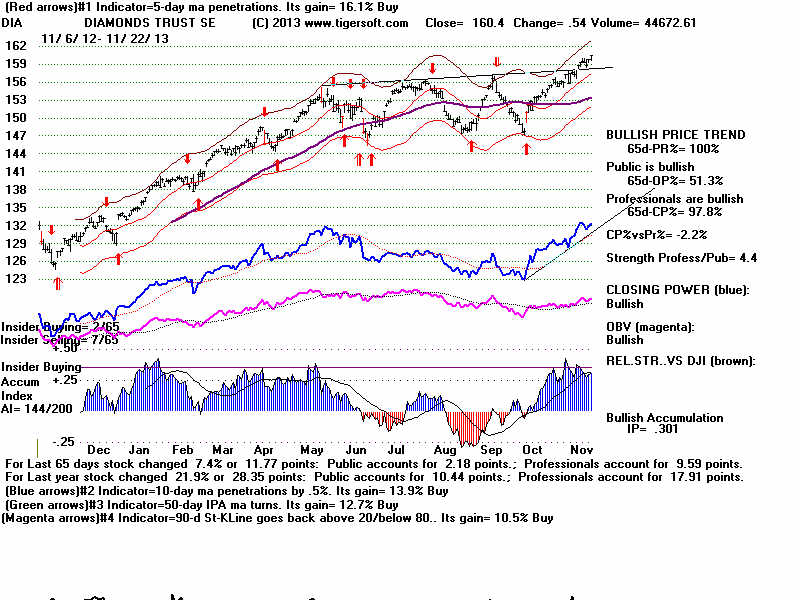