TigerSoft and Peerless Daily
Hotline
(C) 1985-2015 William Schmidt,
Ph.D. www.tigersoft.com
All rights
strictly reserved.
Tiger Software
858-273-5900 PO Box 22784 San Diego, CA 92192 Email
william_schmidt@hotmail.com
------------------------------------------------------------------------------------------------------------------
7/21/2014 Add more short sales
from the Bearish MINCPs and take
profits in stocks breaking their CP uptrends. Also sell
stocks closing clearly below their 65-dma if they also
show negative Accum. Index readings. Hold IBB, however.
The stock market appears quite dangerous, much more so
than I thought last night. I say this because of the new study done
tonight on the cases where the DJI went 4 months in a
row with very heavy and steadily Red Distribution. See the
charts of 1929, 1930, 1937, 1965-1966 and 1974 below
to appreciate this.
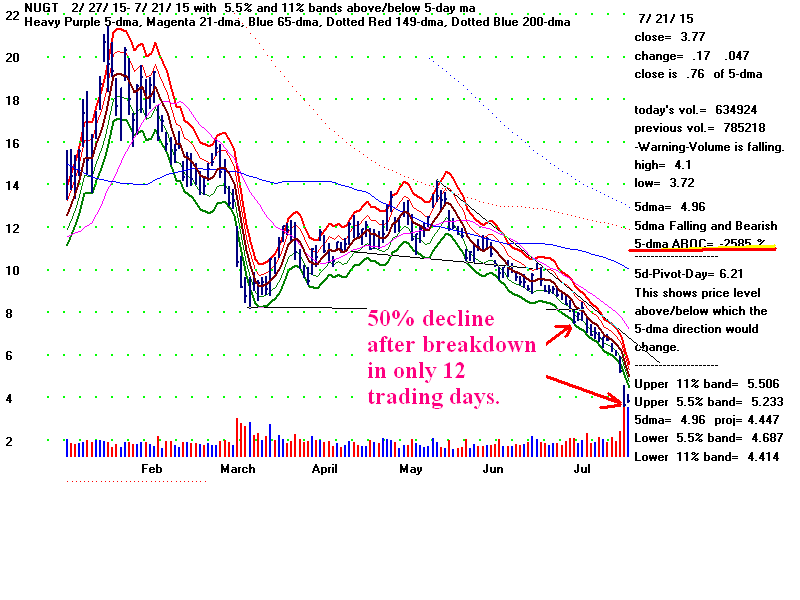
In addition, I am struck by how fast gold and oil stocks and their ETFs are
falling. This not only creates margin calls that affect other stocks'
prices, it also shows an utter absence of liquidity. Look at how
NUGT, the leveraged ETF for gold mining shares has plunged
in the last two weeks. Until a few years ago, Gold was considered
a haven and protection against disasters, bear markets and inflation.
Not any more. I think this is telling us that Deflation is now a very
real threat.
There was no Liquidity for Gold When Key Support Was
Broken.
What Might Happen if the DJI's 17500 Is Violated?
Differences from 1929
More and more, I see similarities with 1929. But I've mentioned
them already and quite a few times, too.
Fortunately, there are three or four differences between now and 1929.
So as not to sound too bearish, let me point out the key differences as
I see them. They should prevent the DJI from plunging more than 15%
in what would be the first correction since 2011.
1) Economists now understand, even if politicians do not,
the principles behind using deliberate deficit spending to create
jobs to prevent a Depression. Moreover, Bernanke has shown
that if you give trillions to the Big Banks, at least, you can get
the stock market to go up;
2) The broad Public is not in this market and Rand Paul regularly
appears on TV warning the Public about how dangerous the stock
market is;
3) The Fed has not yet raised rates to 5% to try to stop stock
speculation, as was done in 1929 and
4) The NYSE Stock Exchange A/D Line is not yet seriously diverging
from prices, as was true in1929.
But a severe correction seems to be shaping up.
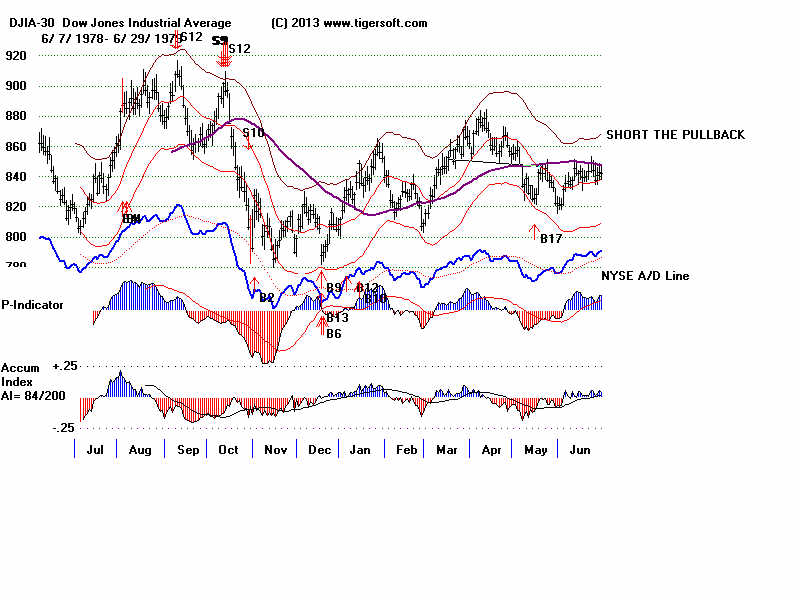
4 Months of Heavy Red Distribution
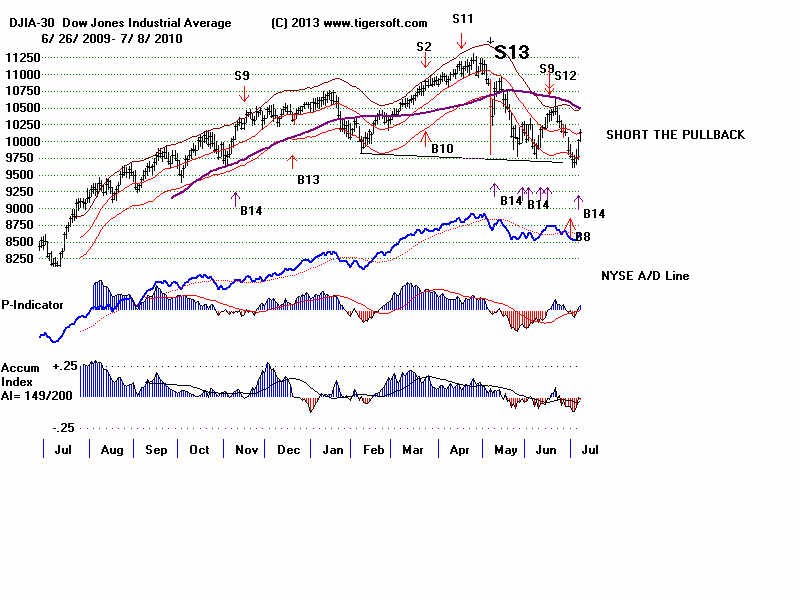
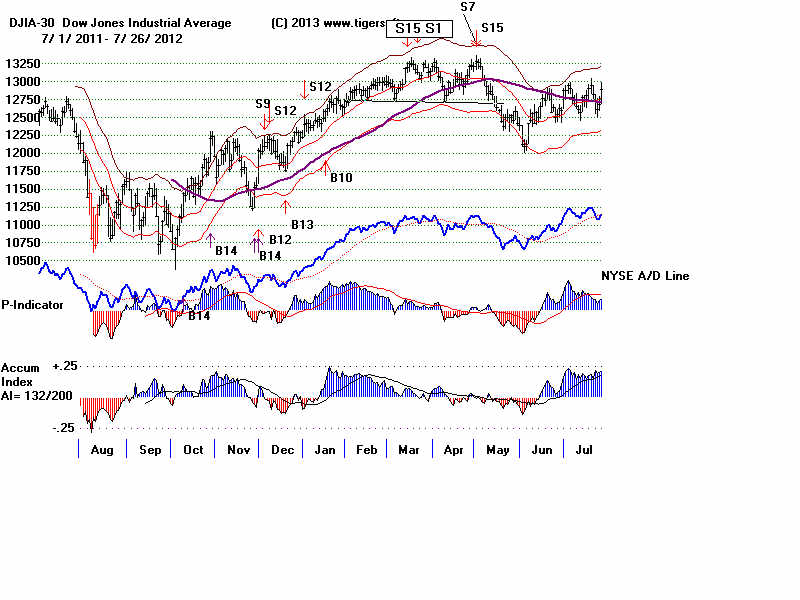
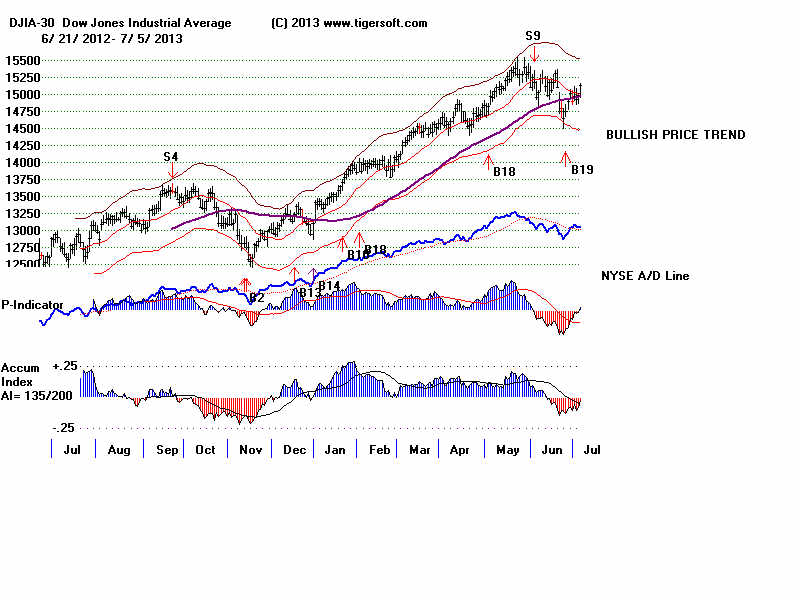
The current Peerless signal is a Red Sell S12 (or Sell S12*).
This is the same signal that occurred two weeks ago. Both
signified that the DJI has reached the +1.1% to +2% band
over 21day ma with Accum negative or nearly so for last
50
trading days.
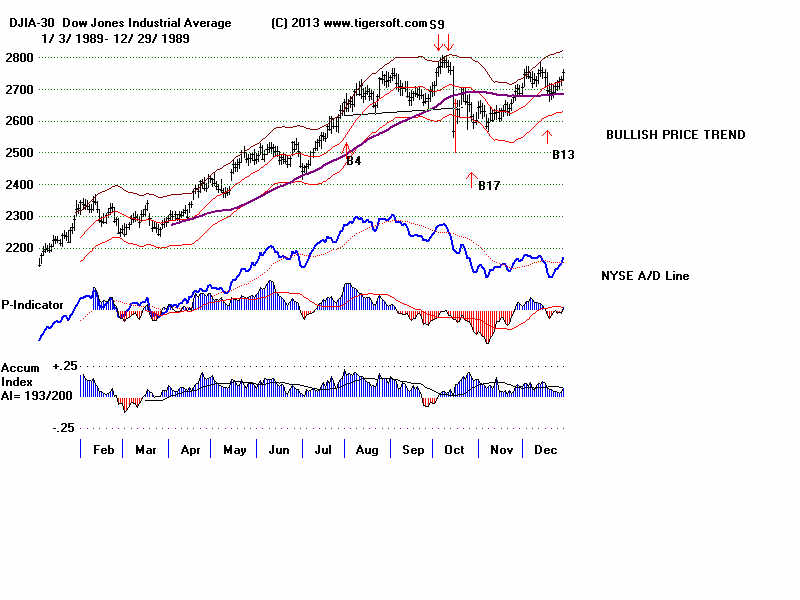
Now the Accumulation Index has been negative or nearly
so
(below +.022) every day since March 25th, or for a
whopping 82 trading days. This has been repeated only
a few times since 1929, the year when the necessary DJI data became
available to compute the Tiger IP21-Accumulation Index.
80 straight Red days has always brought on a severe
sell-off
unless the market was extremely (!) oversold as it was in 1932
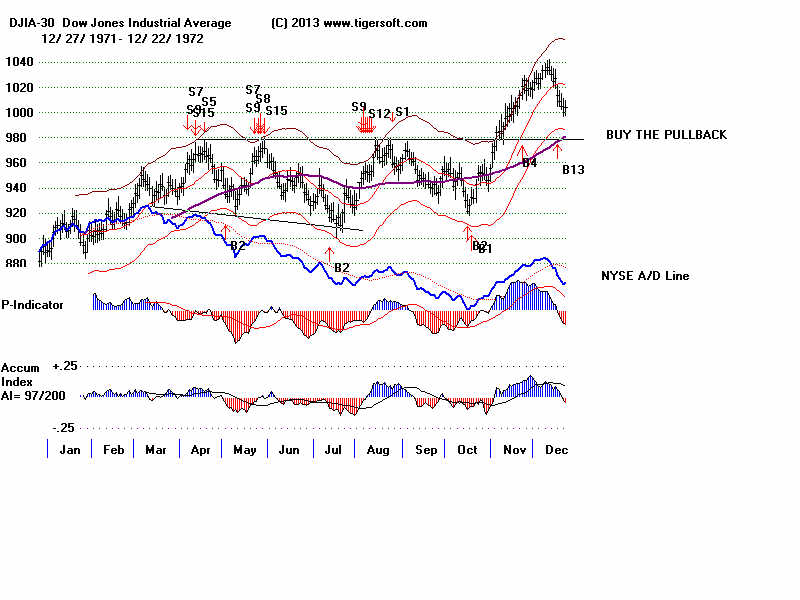
See the cases further below. .
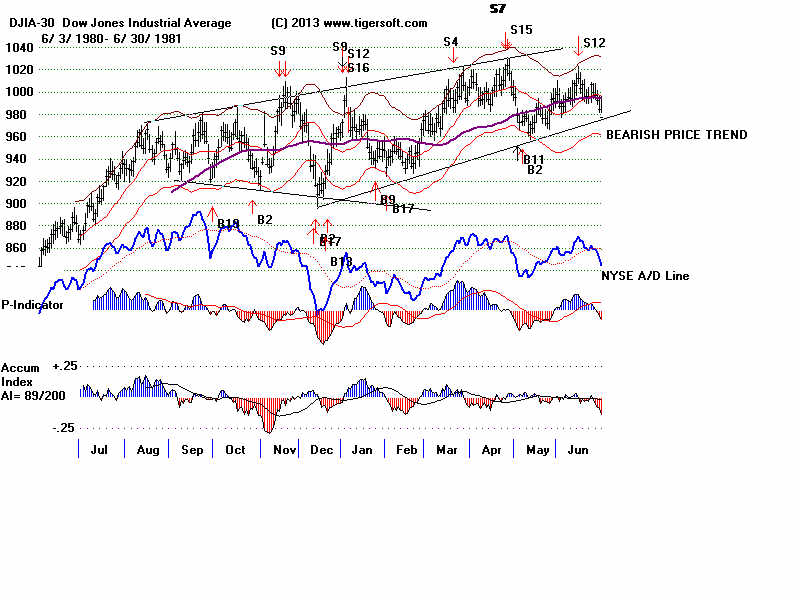
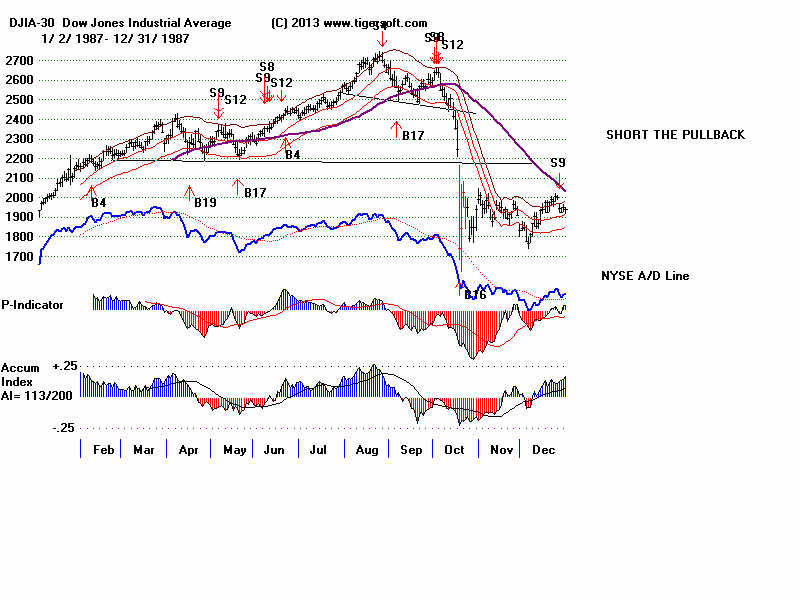
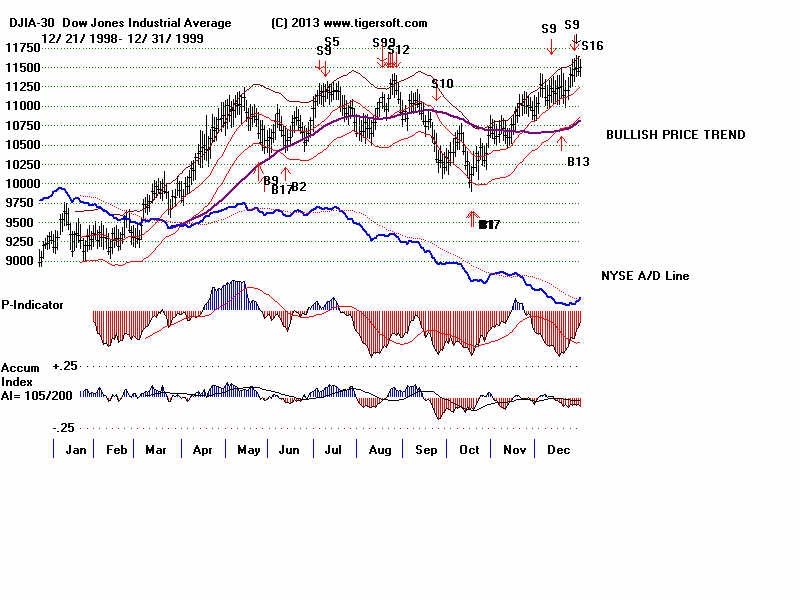
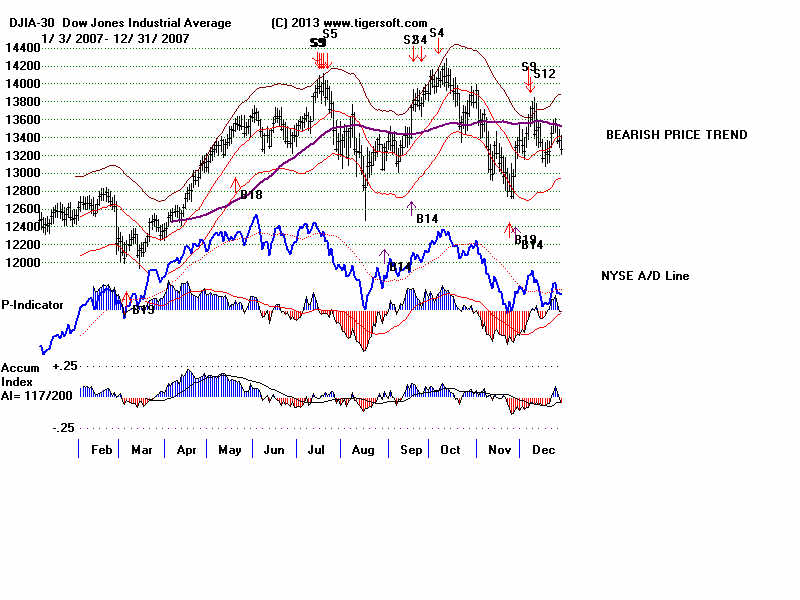
1929: In this year,
there were never 82 straight days when the IP21 was below
+.023 until after the October stock market massacre. But you can see
how long the IP21-Accum. Index was negative for much of the year.
Right at the September top, the IP21 had been negative 50 straight days.
Making the situation more bearish, the NYSE A/D Line (not shown here)
|
had been falling throughout the whole year. In this way, the DJI's new
highs
in August and September made the stock market seem a lot stronger
than it really was.
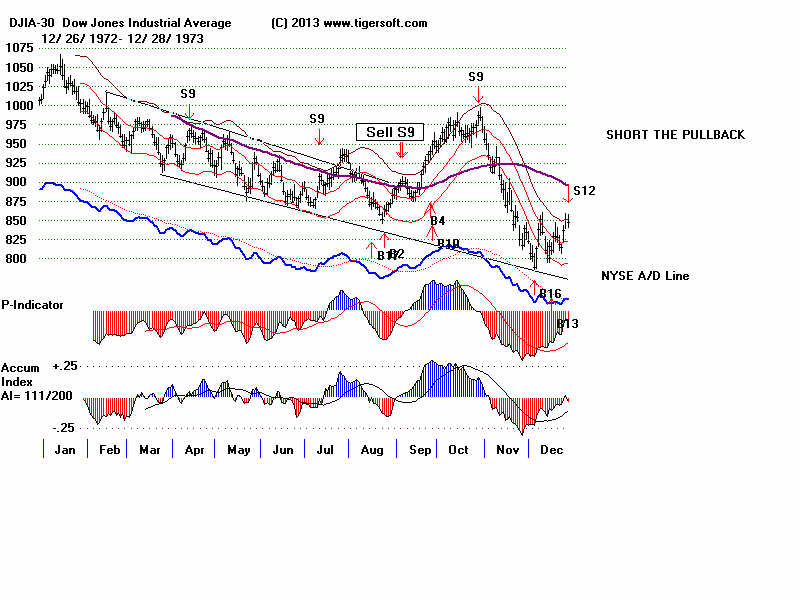
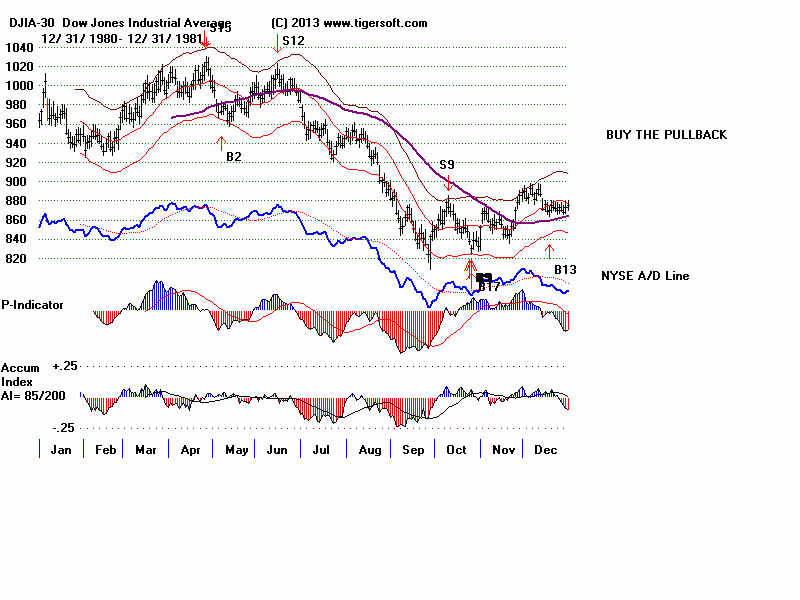
1931 - 4 months of negative IP21
readings set up a renewal of the
on-going bear
market.
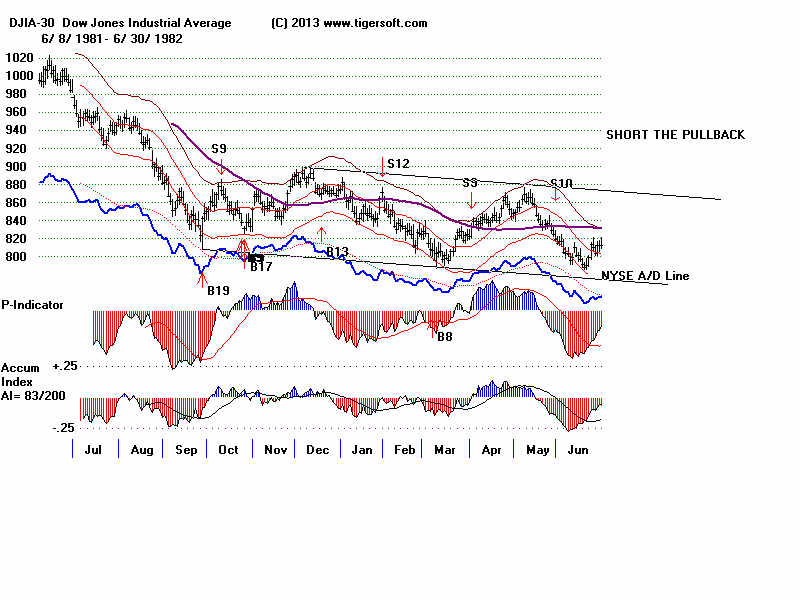
1937; The August peak and
the subsequent 47% sell-off was
forewarned by
months of heavy Red Distribution. Our situation now
is worse, as
there were never 82 straight days in 1937 with the IP21
| always below +.022.
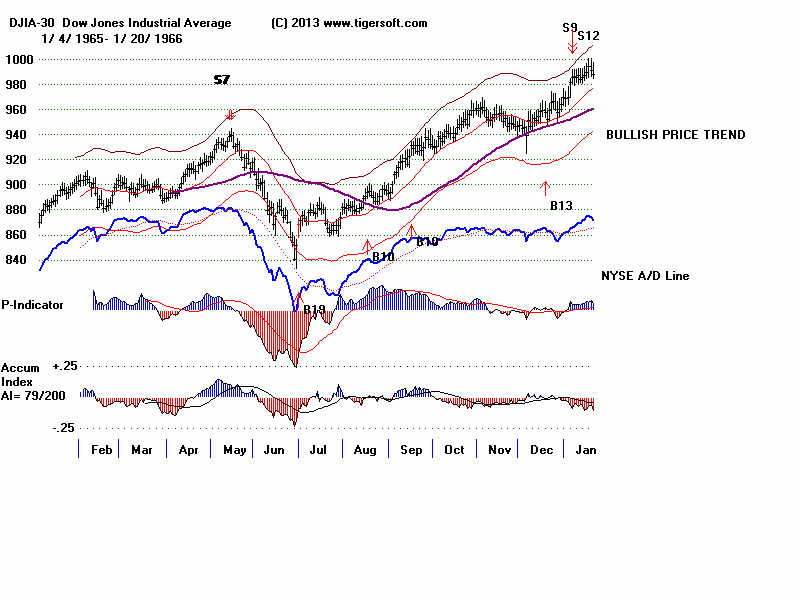
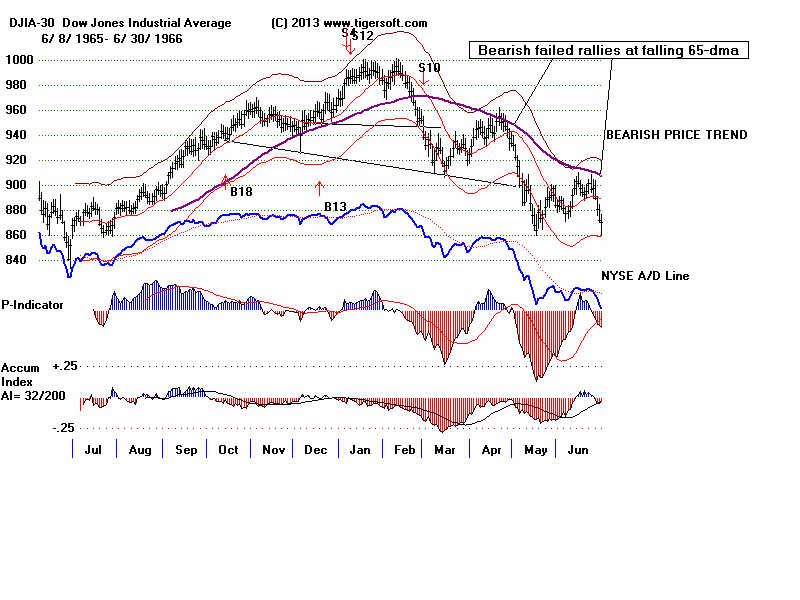
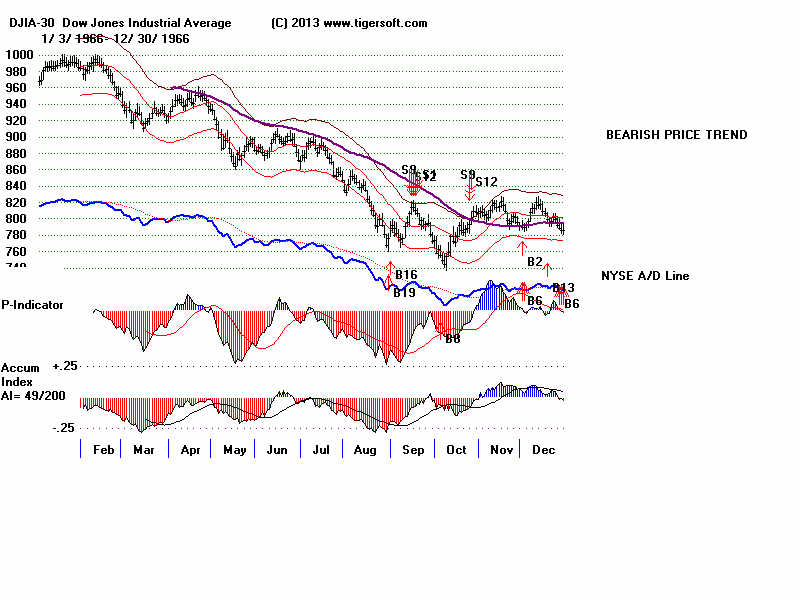
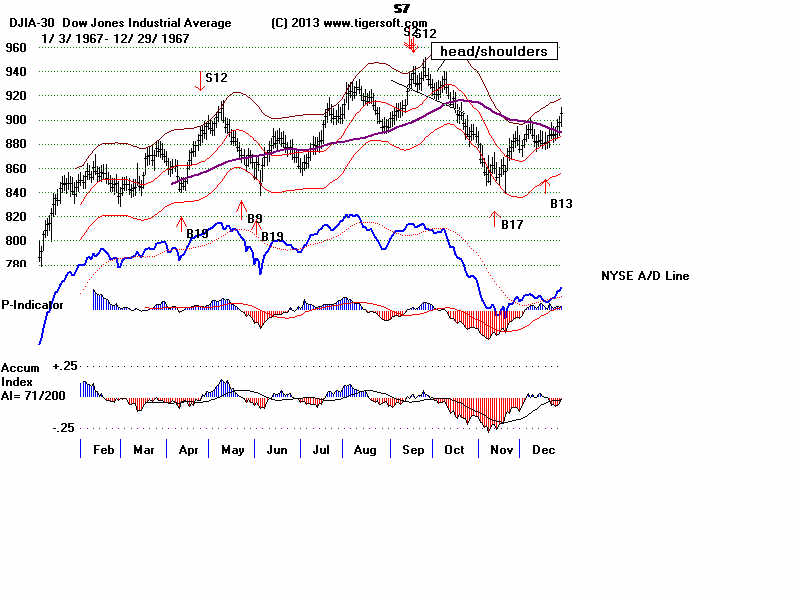
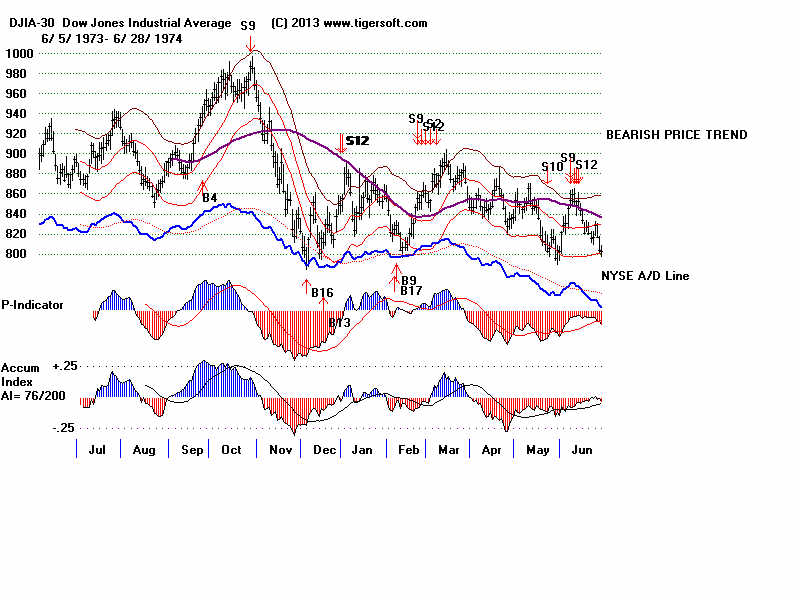
1966: The 9 months' long bear
market in 1966 was first signaled by normal
Sell S12s in
January and February. After the head/shoulders top was completed,
the year
produced a period of 82 straight days with the IP21 under +.022.
The important
thing about the 1966 bear market is that it was only signaled
by S12s.
There were no Peerless S9s based on A/D Line bearish divergences.
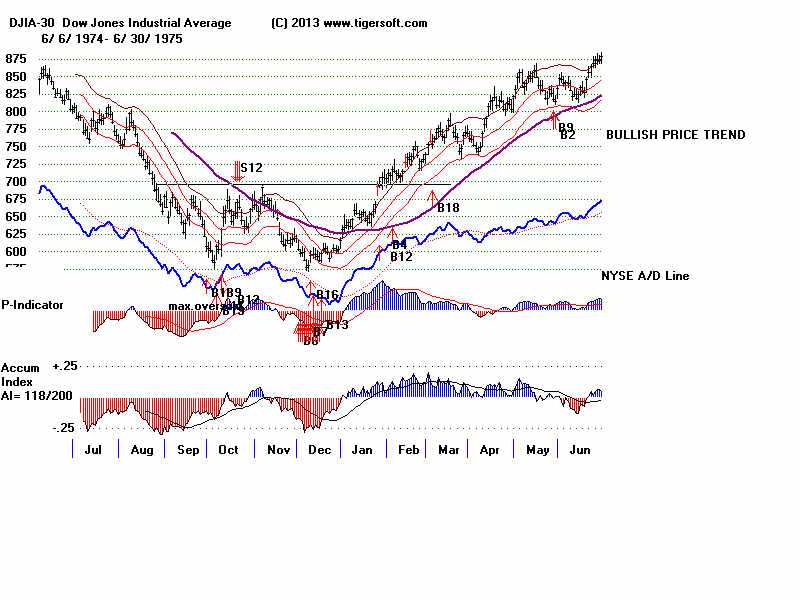
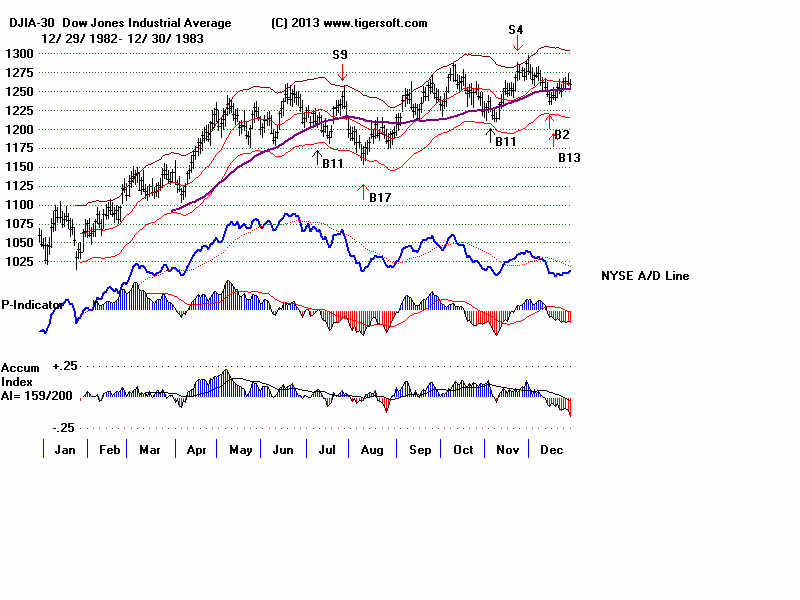
1974 Final capitulation
followed an extended period of Red Distribution.
Conclusion
What the history of 80 straight days of Heavy Red Distribution shows
is that we are in a very dangerous stock market. In fact, these charts
show that 80 days of heavy Red Distribution is a lot more bearish
than I have previously suggested. The 17500 and 17800 support levels
are likely not to hold up. And if the 1966 bear market is revisited, we
will
see that the booming high techs will be overtaken by the bear very
abruptly if the 17500 support fails. I remember seeing charts of lots
of tech stocks for 1966. I got the James Dines P&F charts in the
Summer of 1967 while in London working on my dissertation.)
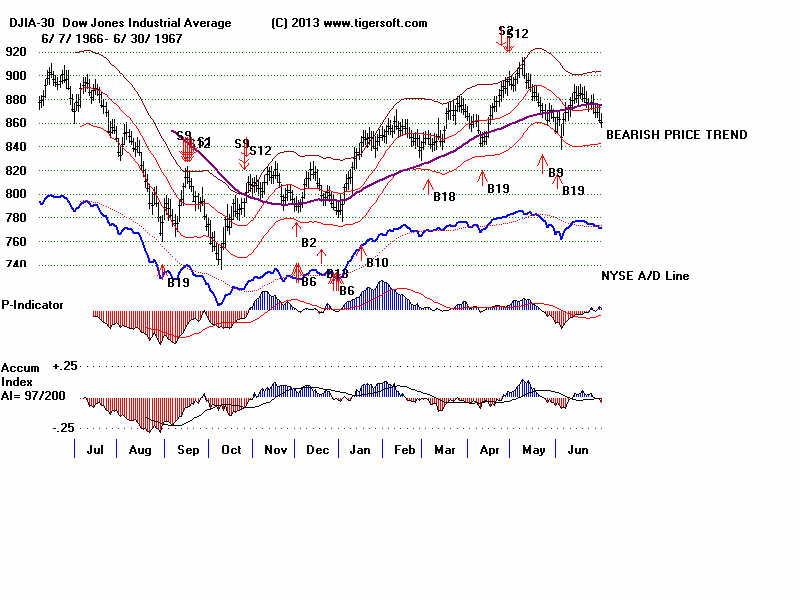
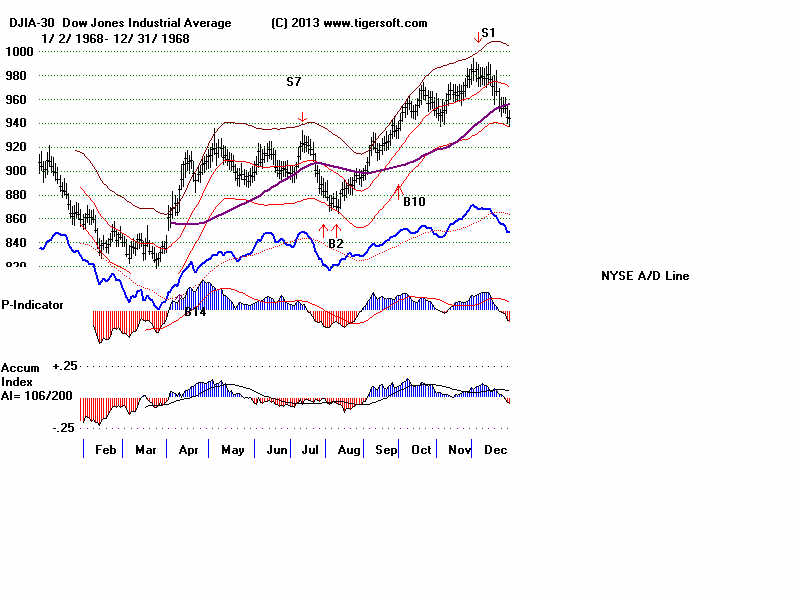
It was only after the DJI's head/shoulder pattern in 1966 was completed
|
that the booming high techs then sold off badly. After the bear
market
was over and in 1967, they came roaring back.
------------------------
Announcements
--------------------------------
E-Books
1
The On-Line Explosive Stocks
2
The On-Line Killer Short
Sales book
Purchase each all new book by CC for
$42.50 or send a check for $37.50 to me.
I call your
attention now to the many new concepts and
the considerable new research in them:
For example:
1) A very good New Tiger Buy B12 for Low
Priced Stocks
2) After Red high volume reversal days use CP
uptrend-breaks.
3) Buy the stocks the Federal Govt wants you
to buy.
4) 100-Day Power Rankings...
5) Using Closing Power Hooks after Buy B26s
and B20s.
6) How A Stock Reacts to Its Earnings Report
Is Very important.
7) TigerSoft Major Buy Signals' Combinations
Which are most Powerful? Reliable?
8) Augmented Buy B20s' Independent Success
Rate.
9) What factors warn a rising 65-dma will not
hold?
10) The classic cluster of technical
characteristics that commonly appear
in the 23 stocks falling 70% or more in
the deep pullback of 2011.
----------------------------------------------------------------------------------------------------------------------------------------------------------------------------
PEERLESS STOCK MARKET TIMING:
A Guide To
Profitably Using The Tiger Nightly HOTLINE
New Peerless Signals and DJI Charts - version 7/4/2013
1965
1965-6 1966
1966-7 1967
1967-8 1968
1968-9 1969
1969-70
1970
1970-1
1971
1971-2 1972
1972-3
1973 1973-4
1974
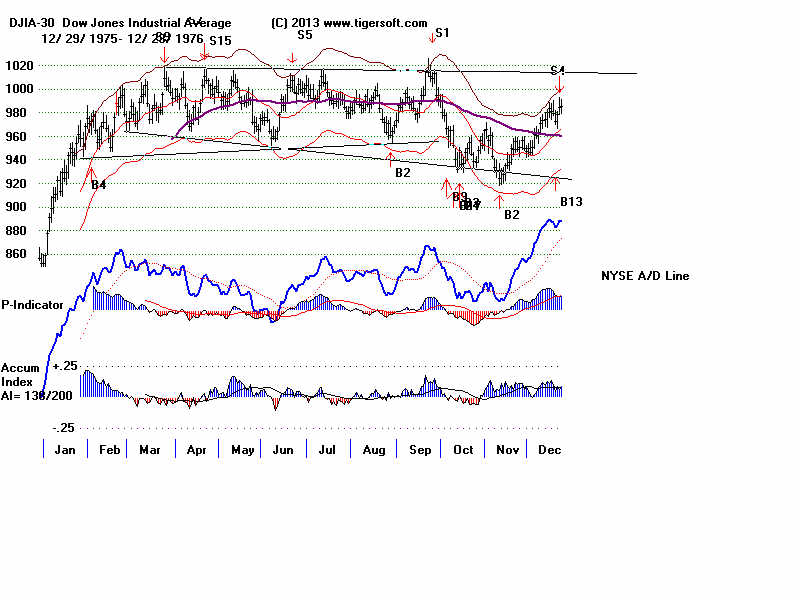
1974-5 1975
1975-6
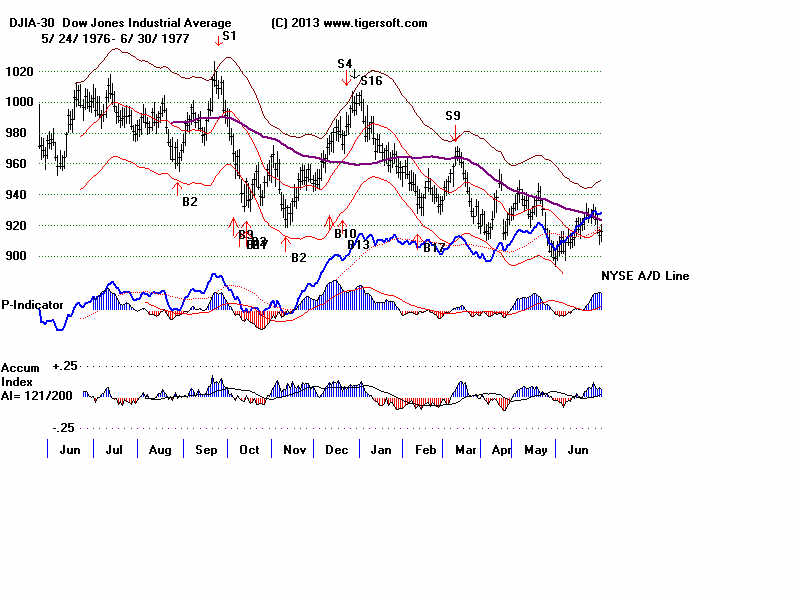
1976 1976-7
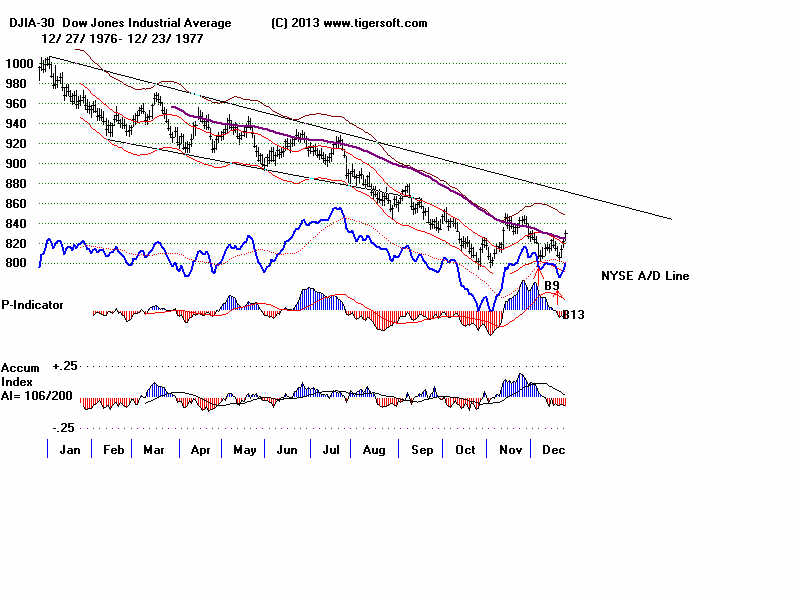
1977
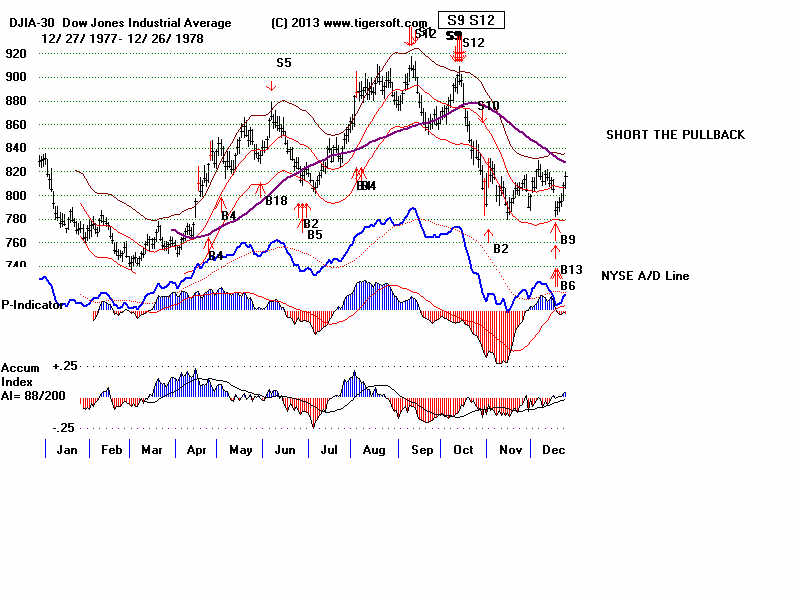
1977-1978
1978
1978-79
1979 1979-80
1980 1980-1
1981 1981-2
1982 1982-1983
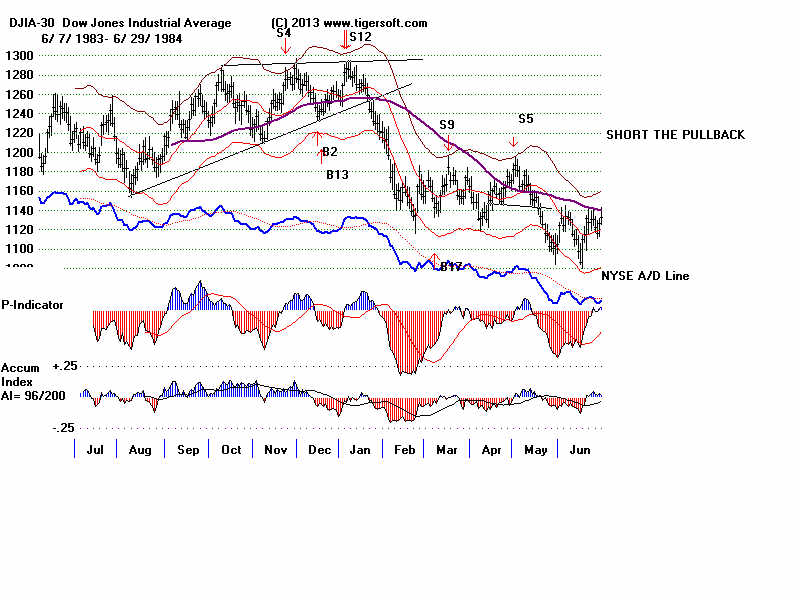
1983 1983-1984
1984
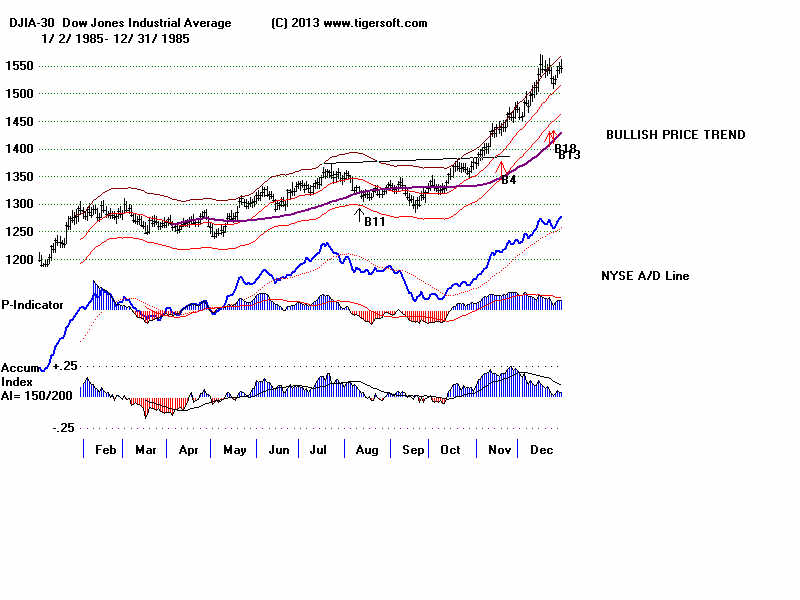
1984-1985
1985
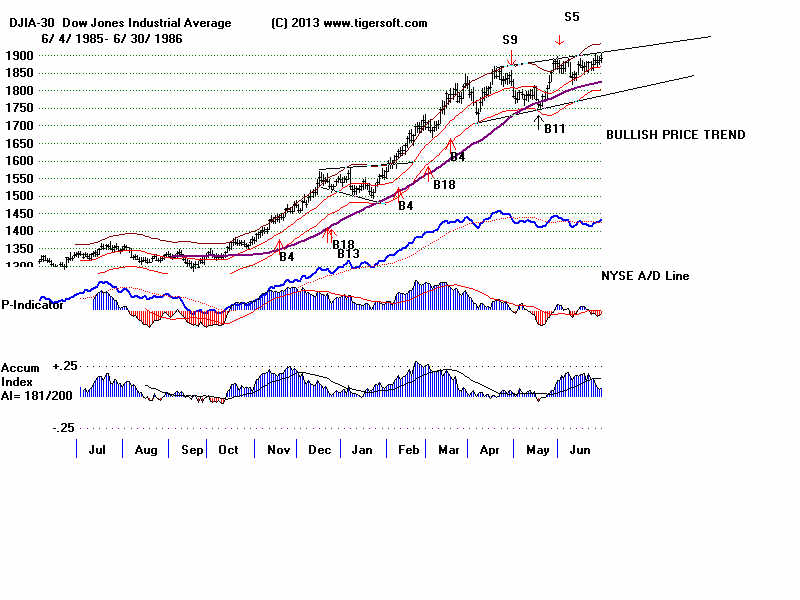
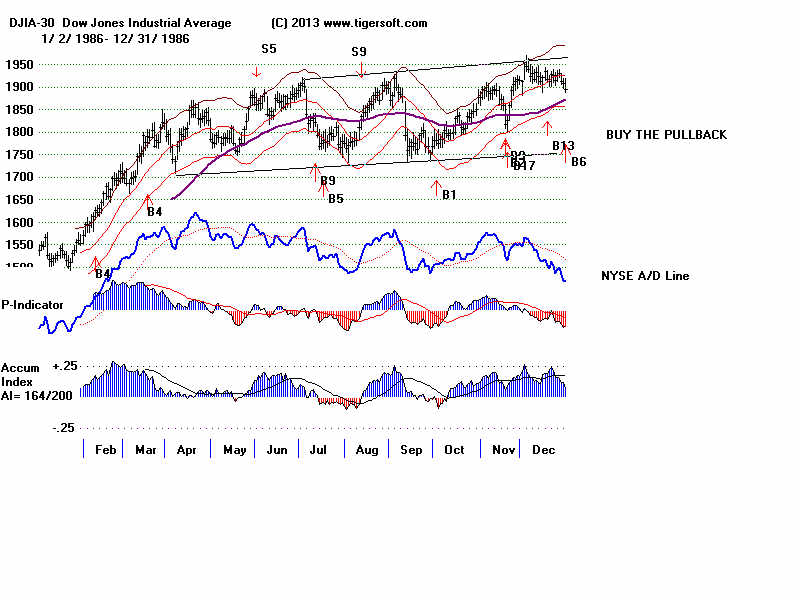
1985-1986
1986 1986-1987
1987 1987-8
1988
1988-9 1989
1989-90
1990
1990-1 1991
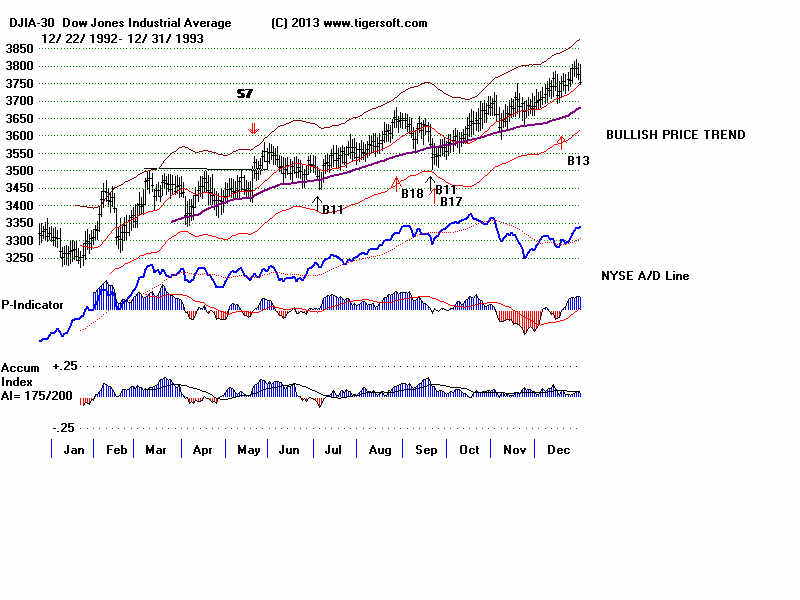
1991-2 1992
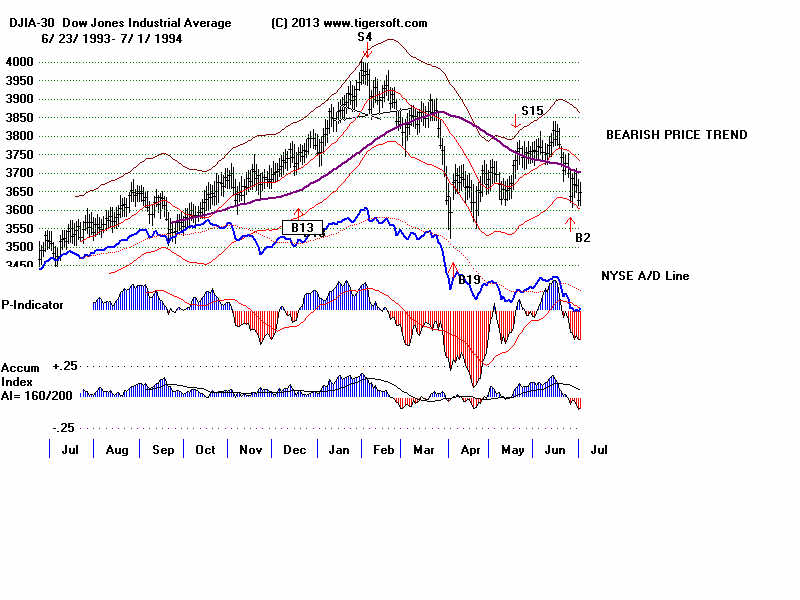
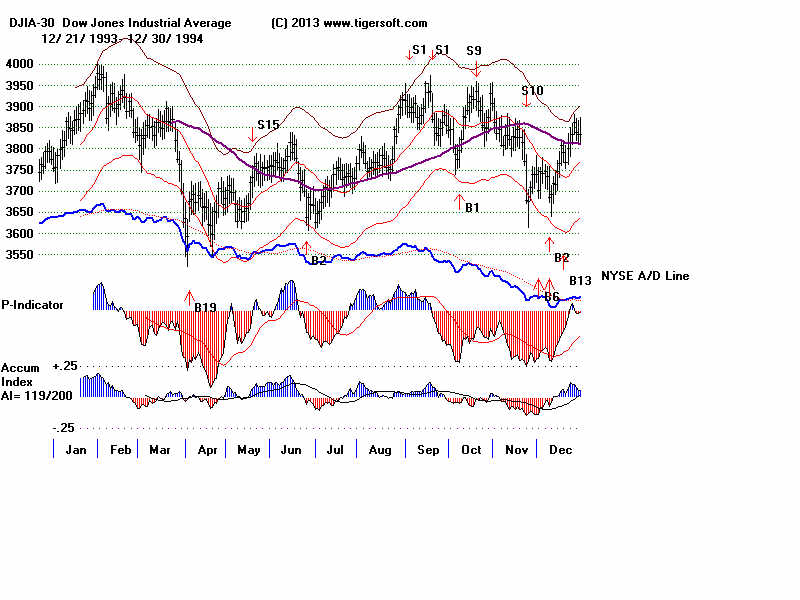
1992-3 1993
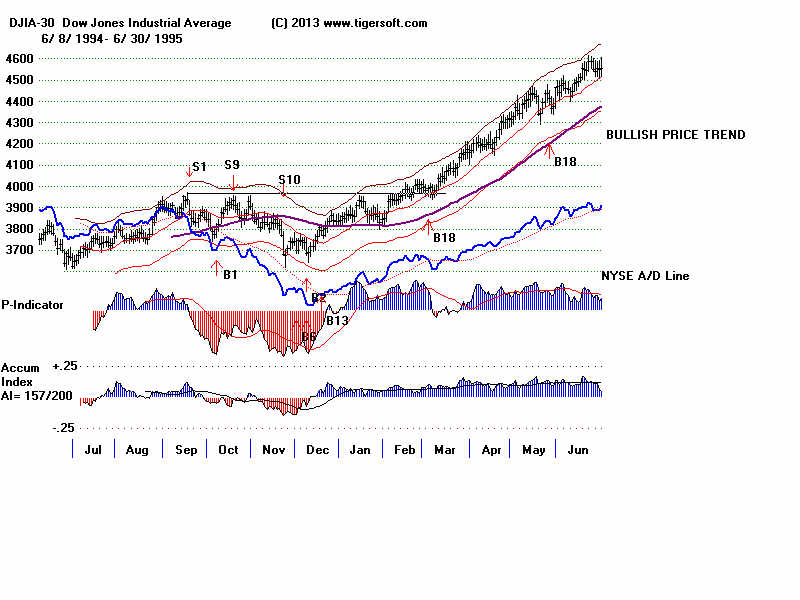
1993-4 1994
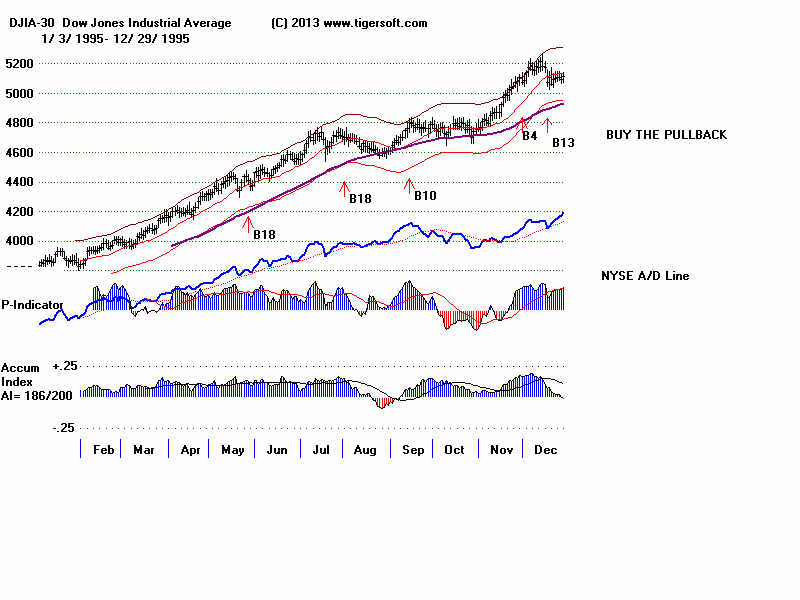
1994-5 1995
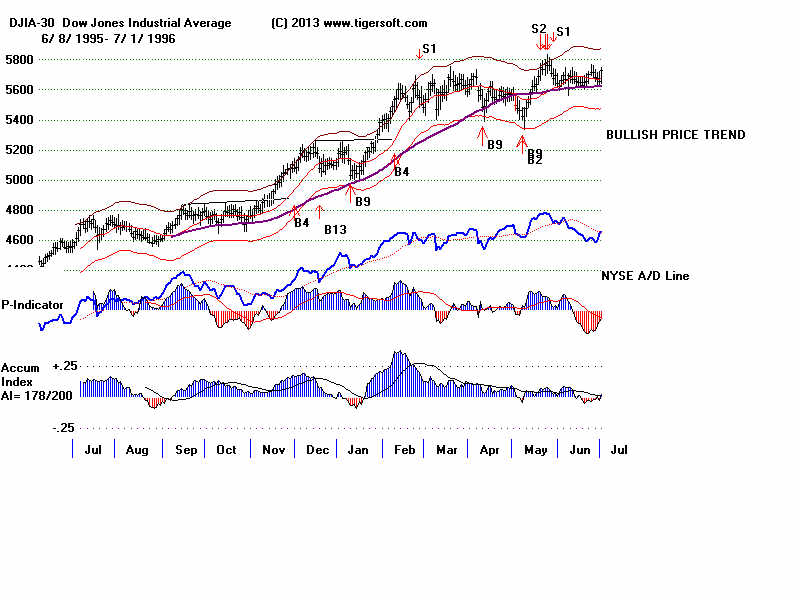
1995-1996
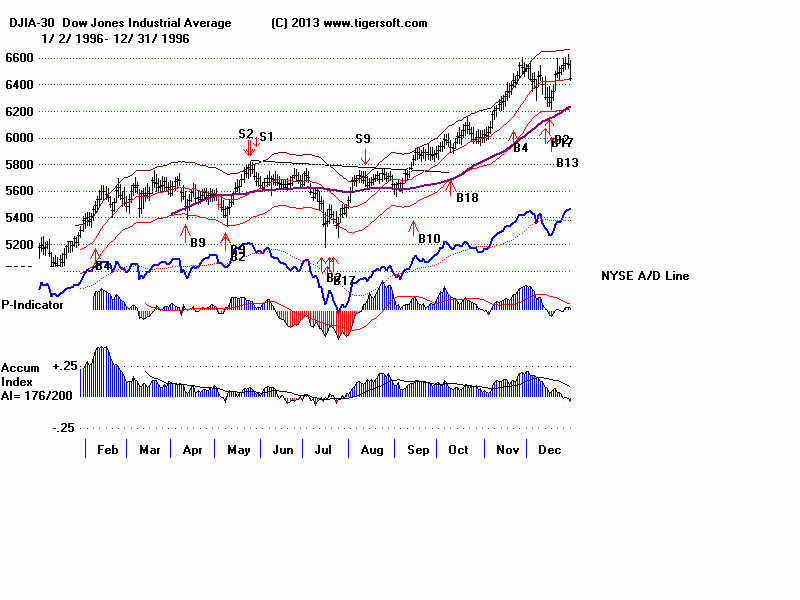
1996
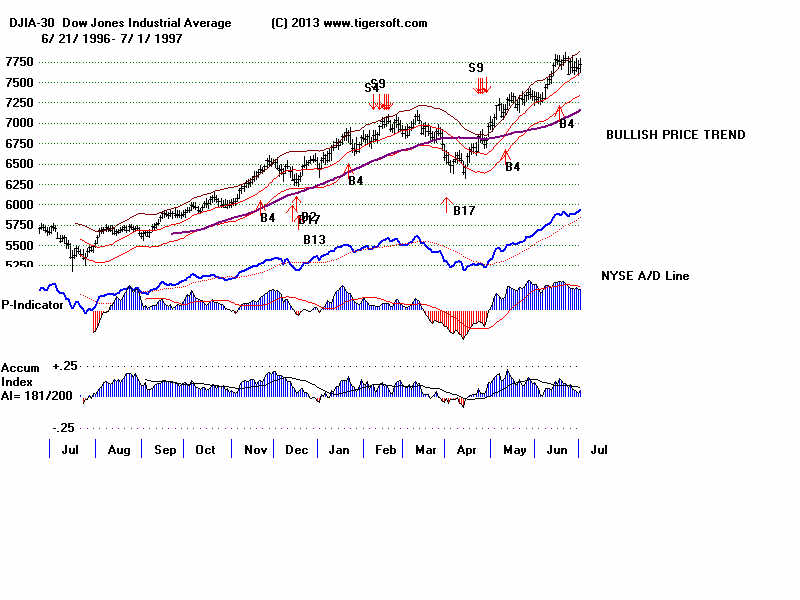
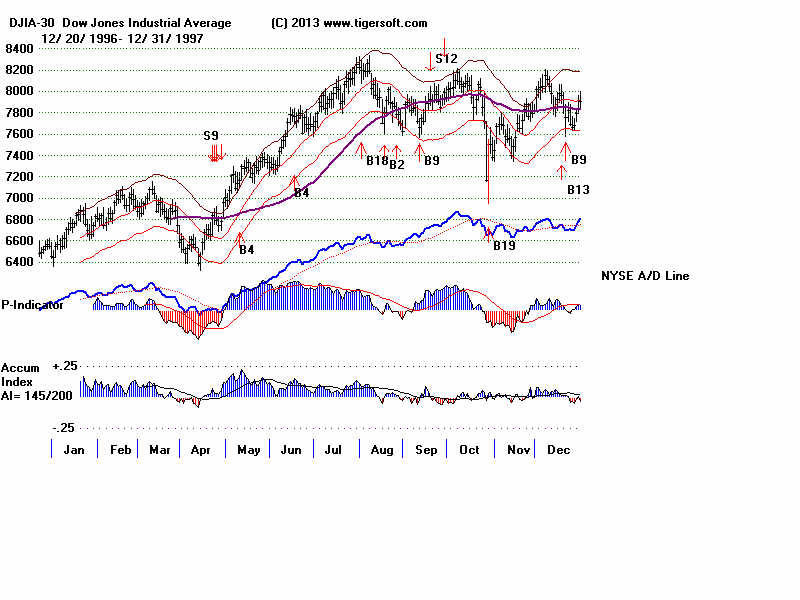
1996-7 1997
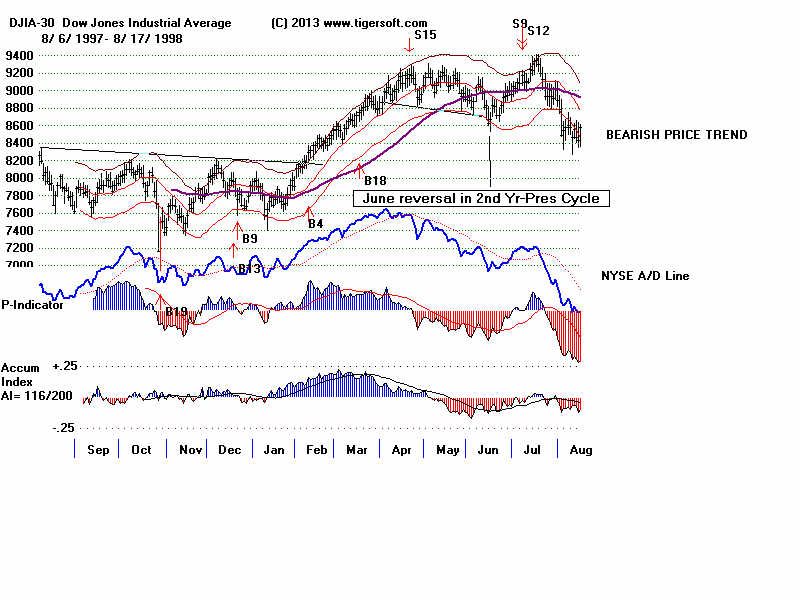
1997-8 1998
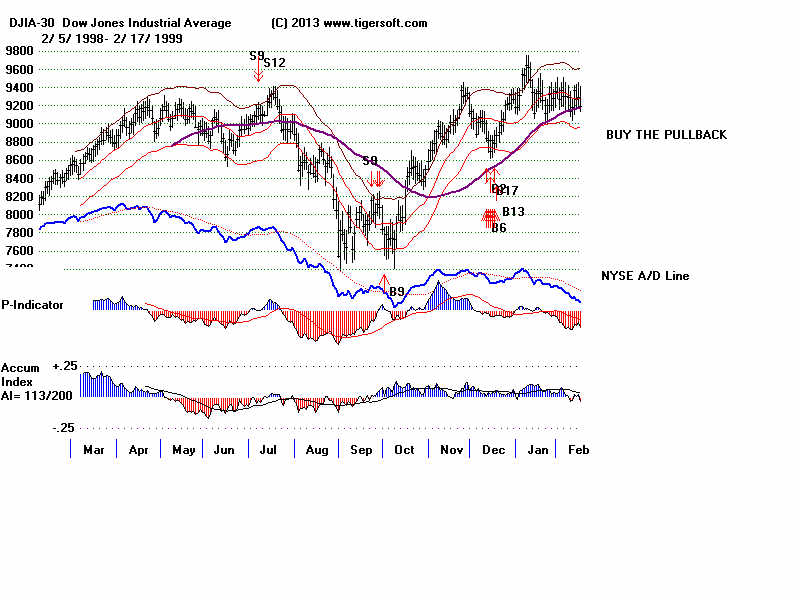
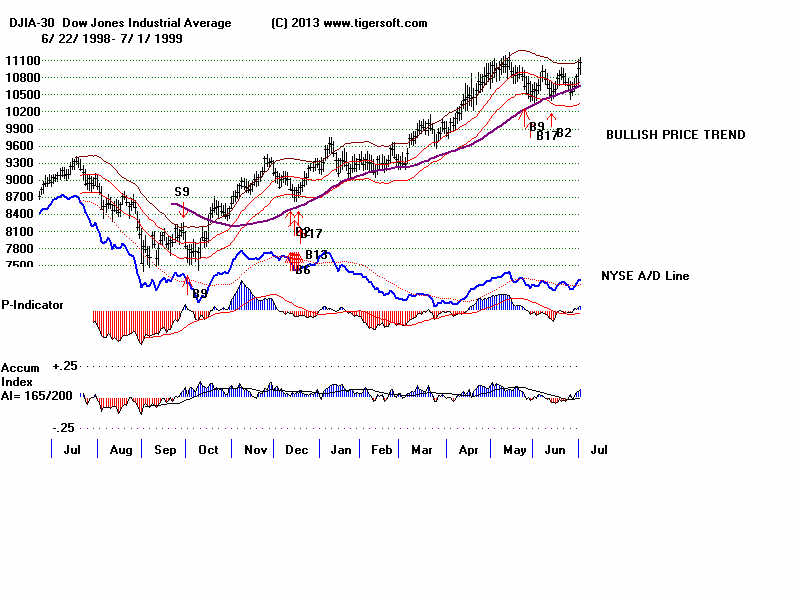
1998-1999 1999
1999-2000 2000
2000-1
2001 2001-2
2002
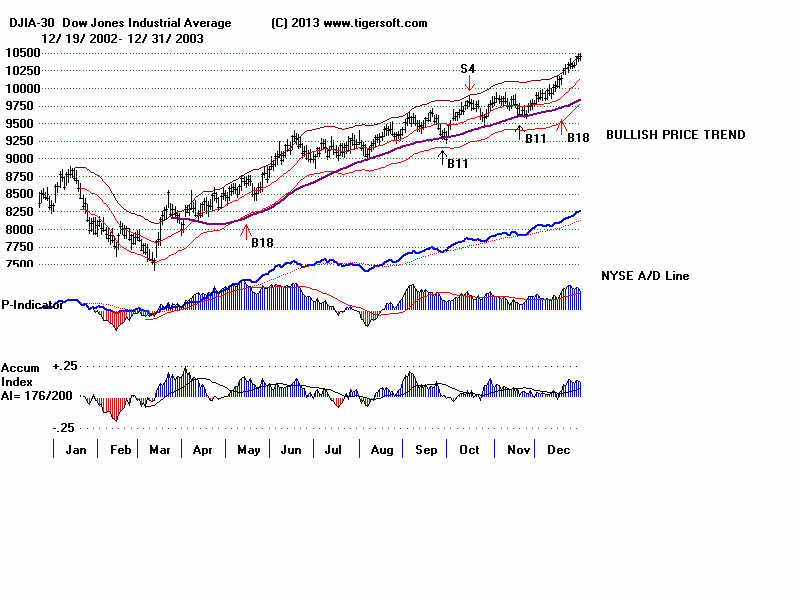
2002-3 2003
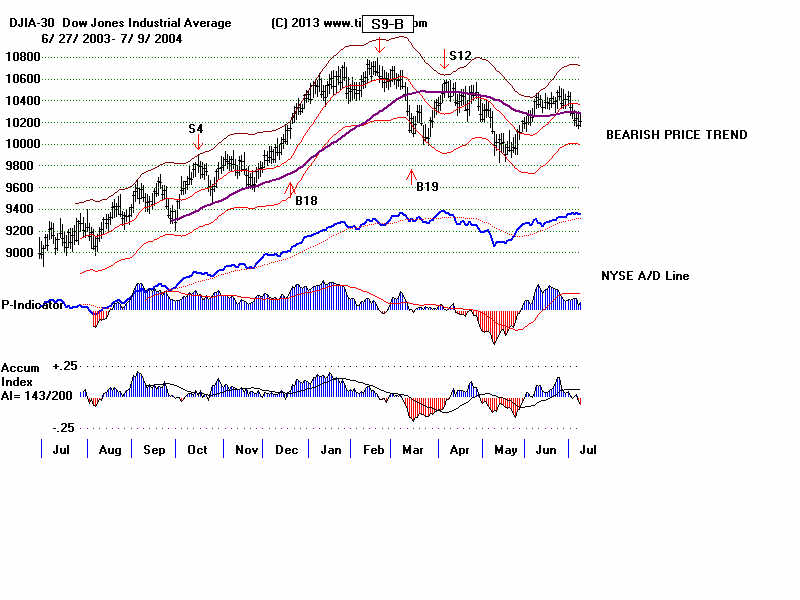
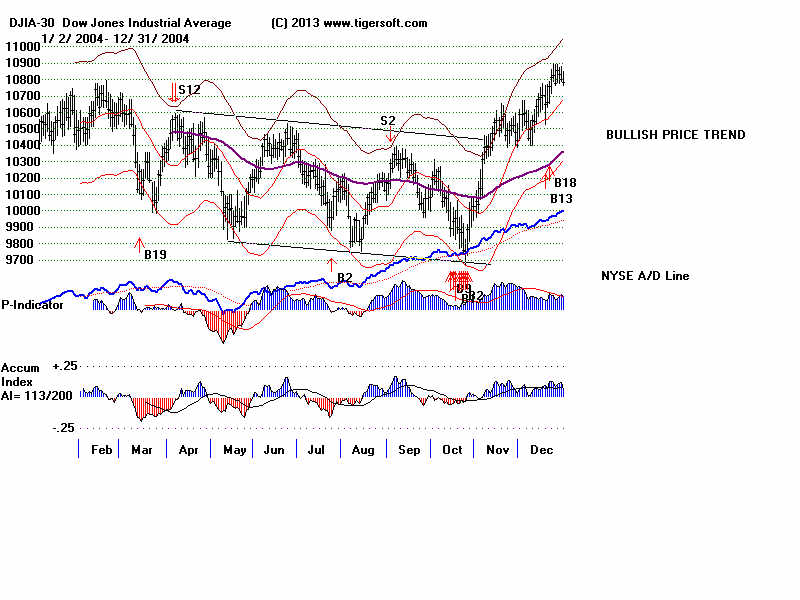
2003-4 2004
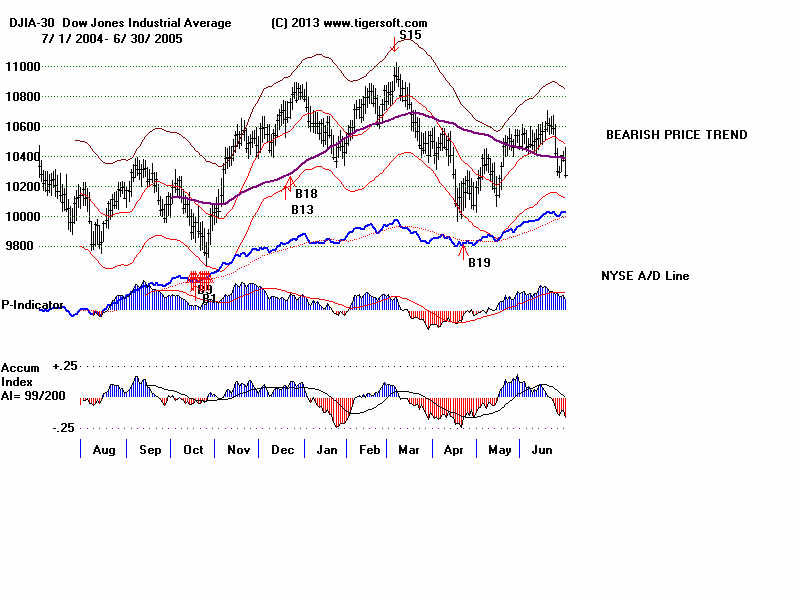
2004-5
2005 2005-6
2006 2006-7
2007 2007-8
2008 2008-9
2009
2009-10
2010 2010-11
2011 2011-12
2012
2012-2013
2013 2013-4 2014
Introduction to Tiger/Peerless Buys and Sells.
Different Types
of TigerSoft/Peerless CHARTS, Signals and Indicators
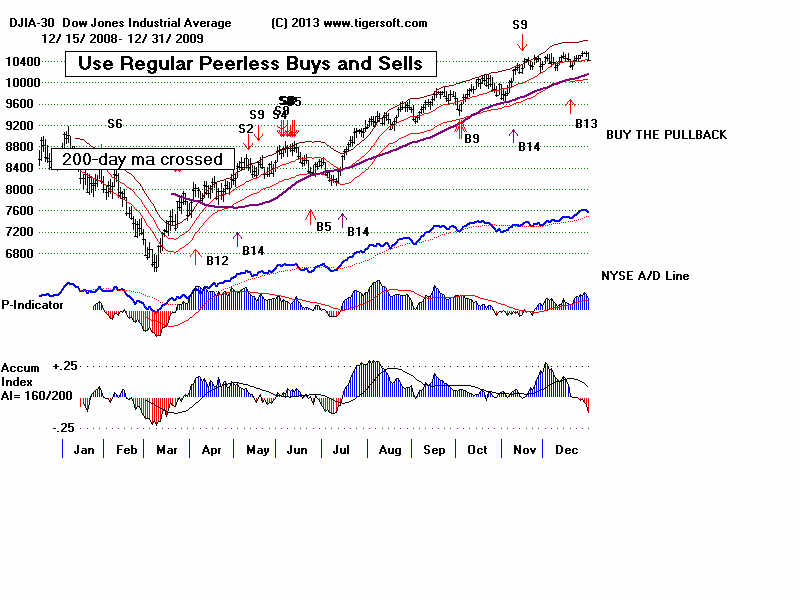
How reliable support is the DJI's rising 200-day ma?
-------------------------------------------------------------------------------------------------------------------
TIGERSOFT SIGNALS AND INDICATORS:
Documentation for TigerSoft
Automatic and Optimized Signals.
SPY Charts since 1994: Advisory Closing Power S7s, Accum. Index, 65-dma,
Optimized Signals.
"The
Jig Is Up": Calling September and October Tops.
A Keynesian's Warning Signs.
NUGT since 2012: A study of Tiger Technicals
Tiger Day
Traders Tool and most active Triple Leveraged ETFs
Advisory Pink Closing Power S7s at ETF at top since 1994
1994
1996
1997
1998
1999
2000 QQQ
SPY
DIA
2002
2007
2008
SPY 2011
2013-2014
Tiger Buy and Sell
Signals: New 2014 Research:
These are randomly chosen
groups.
but clearly we need to back-test them in more years.
You can replicate or do similar studies yourself
for other signals and/or other years.
9/1/2014 -
2014 Tiger
B19s - Steady rallying and no pullbacks below the 21-day ma.
9/2/2014 -
2014 Tiger
B17s on 14As taken alphabetically
9/3/2014 -
2014 Tiger B17s on 60
Biotechs taken alphabetically
9/4/2014 -
2014 Tiger
B18s on all "R" stocks taken alphabetically
* 9/8/2014 -
2014 Tiger
B20s - Conclusion: Use Closing Power trendbreaks in aftermath.
9/8/2014 -
2014 Tiger
B16s - Conclusion: Use mostly when
LA/MA under 1.05.
9/11/2014 -
2014 Tiger
B15s - Conclusion: Certain conditions
improved the results dramatically.
9/12/2014 -
2014 Tiger
B25s - Conclusion: 87.5% success rate
when other internals are positive.
9/15/2014 -
2014 Tiger B25s -
Best conditions for using B25s with somewhat
higher RSX capitalization stocks.
9/16/2014 -
New Tiger
Closing Power Take-Off Buy Signal in 2014: 14s, QQQ, DJI-30 and ETFs
9/17/2014 -
New Tiger
Closing Power Take-Off Buy Signal: 2009A-s
9/18/2014 -
New Tiger
Closing Power Take-Off Buy Signal: 2010A-s
9/21/2014 -
New Tiger
Augmented Sell S8s: DJI-30 - 2014
Requiring S8s to show
Negative CP%-Pr and IP21<+.15 produced a 70% success rate
in a rising market for
DJI-30 stocks and big ETFs.
9/24/2014 -
Tiger Sell
S14s: They make price breakdowns very bearish.
1/15/2015
-
Tiger Day
Traders' Tool Explained.
http://www.tigersoft.com/day-traders/index.html
http://www.tigersoft.com/Indicators/index.htm
http://www.tigersoftware.com/TigerBlogs/Aug-31-2009/index.html
NEW
2/16/2015
1) New -
Tiger Charts showing UP%, Opening-Up%, Closing-Up%
Note differences between bullish
and bearish stocks...
2) New -
UP%,
Opening-Up%, Closing-Up% Rankings of any directory.
3) New -
Display of what happens to a stock after various size openings up or down.
4) New -
6-month charts to better
show volume changes and 5-day ma with bands.
More profitable trading schemes coming...
Targeted Trading Opportunities:The Profits Quickly Add Up,
3/29/2015
Tiger CandleSticks:
IBB: 2001-2015
and
Recent Others.
====================================================================================
Earlier Hotlines
2-7-2014 to 3/19/2014
11-22-2014 to 2-6-2014
http://tigersoftware.com/555HL555/index.htm
10/9/2014 - 11/21/2014
http://tigersoftware.com/9933Hot/
9/2/2014 - 10/8/2014-
http://tigersoftware.com/2233HL/index.html
6/25/2013-9/1/2014
http://tigersoftware.com/112211-H/index.htm
11/22/2013-3/20/2014
http://tigersoft.com/1111-HL/index.html
10/22/2013-11/21/2013
Past
Hotline Predictions
http://tigersoft.com/-HL42013/index.html
http://www.tigersoft.com/-2GBL13HL/index.htm
==============================================================================================================================
 7/21/2015 200+ TigerSoft Charts