 TIGER
HOTLINE
TIGER
HOTLINE 
william_schmidt@hotmail.com
 A
Guide To Profitably Using The Tiger Nightly HOTLINE
A
Guide To Profitably Using The Tiger Nightly HOTLINE
TIGER
HOTLINE
william_schmidt@hotmail.com
A
Guide To Profitably Using The Tiger Nightly HOTLINE
TigerSoft and
Peerless Daily Hotline
(C)
1985-2011 William Schmidt, Ph.D. www.tigersoft.com
All rights
strictly reserved.
IMPORTANT: Please notice The
Hotline's Address will change Monday night.
Subscribers should have gottem an email this weekend giving new address.
If you did not get it, send an email to william_schmidt@hotmail or
Renew the Hotline, order here
350 (check) - 360(Visa/MC)
====================================================================================
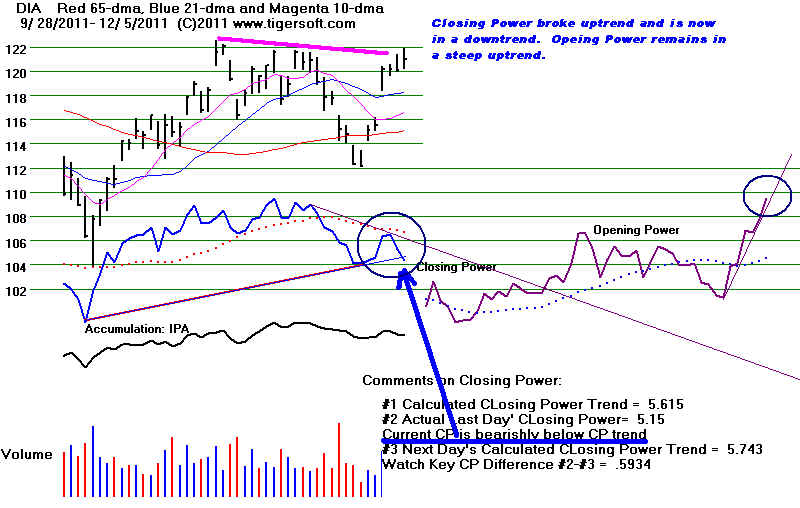
1216/2011 DJI = 11867 =2 la/ma=1 .003 21-dma ROC-
-.039 P= -174 ( +110 ) IP21=
-.116 V=
-104 OP=
-.106
12/16/2011 BREADTH STATISTICS:
37 +4 MAXCP stocks Bullish MAXCP Stocks
312
-18 MINCP stocks Bearish MINCP Stocks Bearish Plurality
MAXCP stocks are those showing
Tiger Closing Power making new highs.
This suggests heavy Professional Buying. Applying the Tiger Power Ranker's
"bullish" to the MAXCP stocks find those with heavy insider buying and
institutional accumulation. Bearish MINCP stocks show the opposite.
Also use the BOTHUPs condition with MAXCPs and BOTHDOWNS MINCPS.
18 new highs on NASDAQ. 77 new lows on NASDAQ BEARISH
33 new
highs NYSE
36- new lows on NYSE BEARISH
12/16//2011 ===> See Key Peerless TigerSoft
Index Charts: Industry Groups and ETFs
Most groups still have a plurality of stocks below their 65-dma. Defensive groups are still favored. BEARISH
DIA SPY QQQ DJIA-Peerless TigerDJI TigerSPY TigerQQQ
GLD SLV Crude
Precious Metal Stocks declining
CP BEARISH
12/16/2001 ===> Closing Power (CP) Status Report: KEY ETF CHARTS:
The ETFs CPs are all in
Down-trends. This is short-term
BEARISH
DIA' s CP iS in a
DOWNtrend
Any close of more than 3.39 ABOVE
the Opening
will break the CP DOWN-trendline. Meanwhile, the CP is now below its
21-dma.
The Opening Power is short-term declining.
SPY's CP is in a DOWNtrend Any close of more than 3.27 ABOVE the Opening
will break the CP DOWN-trendline. Meanwhile, the CP is now below its
21-dma.
The Opening Power is short-term declining.
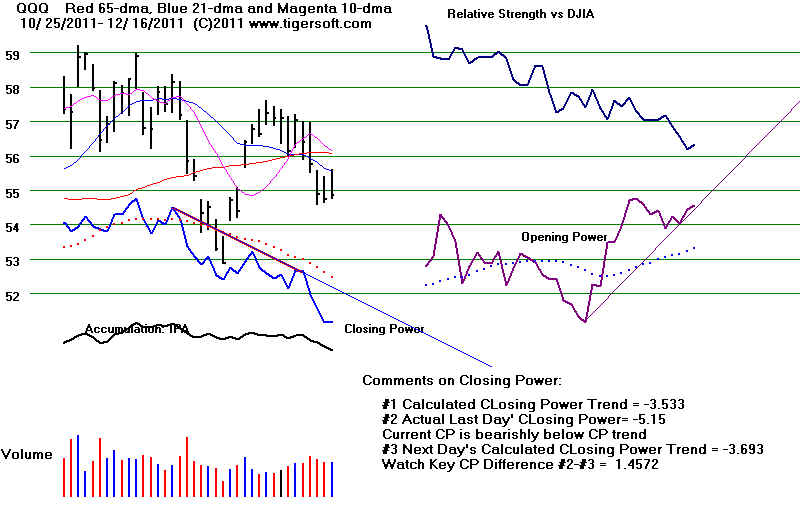
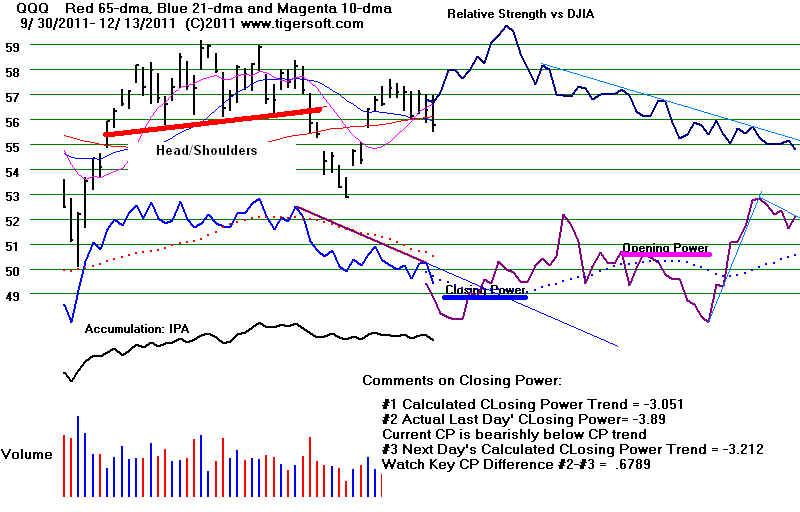
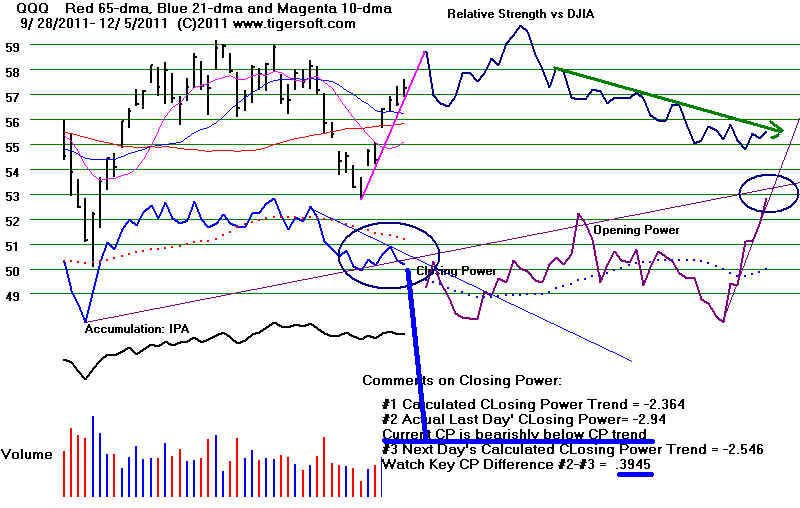
QQQ's CP is in a DOWN-trend Any close of more than 1.46 ABOVE the Opening
GLD's CP is in a DOWN-trendline- Any
close of more than 7.42 ABOVE
the Opening will break the CP DOWN-trendline. The CP is now below its rising
21-dma.
The Opening Power is short-term
risng.
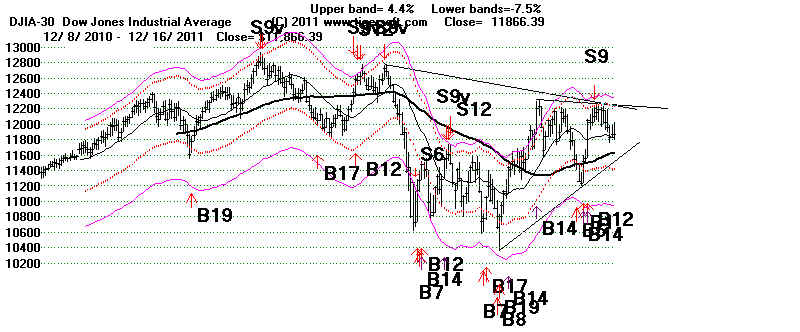
Clinched SELL S9 vs Santa Claus Rally
The futures have turned up at this point and no longer show a
weak opening. Weakness may still
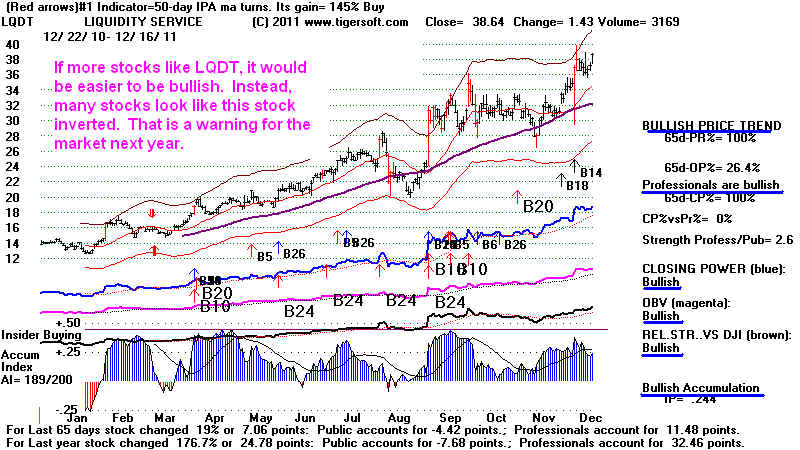
break the recent support at 11760 on the DJI. Not many
stocks look as bullish as LQDT below...
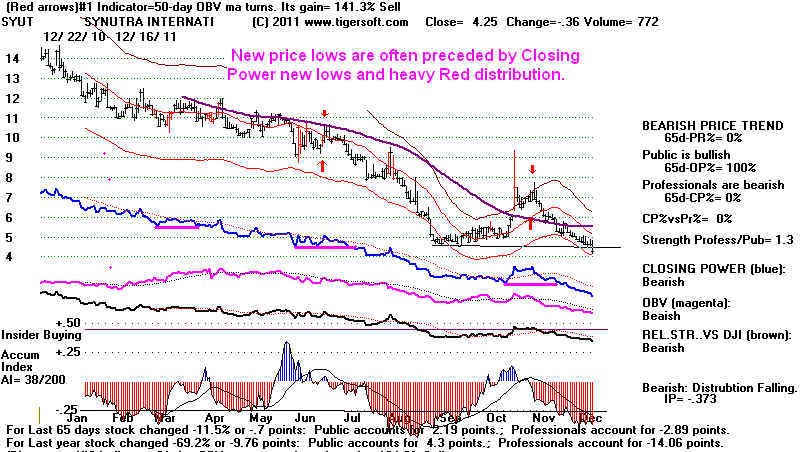
Instead, many MINCP stocks show heavy red distribution and
Closing Power new lows.
That suggests to me the odds are good the DJI will need to test its 10
week price uptrend-line
at 11539 in the next few trading days. I think we have to be
buyers of DIA there because of the bullish
Santa Claus period we are about to enter. On the buy side, I
would stick with defensive stocks or DIA.
If there is no more pullback on Monday, we will
be buyers on Turesday. What could spark a rally?
Successful peace
talks in Aghanistan, for one thing.
Not enough stocks loook like this.
Too many stocks look like this.
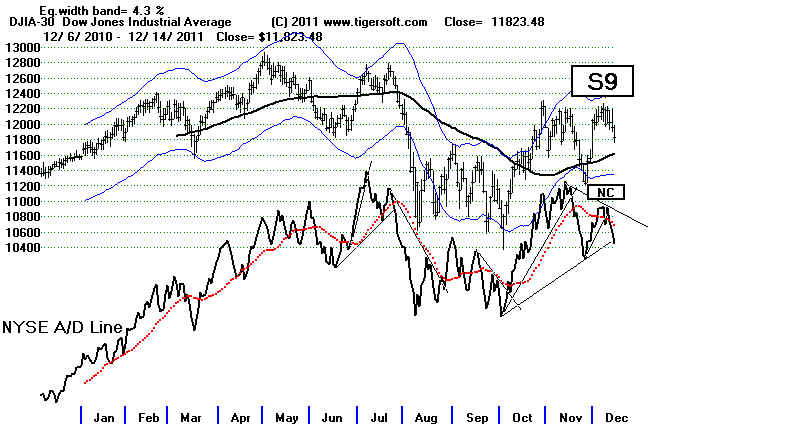
The DJI keeps selling off from its daily highs but refusing to close
below the 21-day ma
Clearly there are buyers who expect a Santa Claus rally. The
problem is the Sell S9
signal will not be satisfied until the lower band is reached. I
have found the best time to
buy based on the Santa Cluas rally's 89% probability of producing a
rally is at the close
of December 17th or the next trading day. Monday will be
the 19th. The avg gain for
the following 10 day is 1.7% going back to 1965. The odds as
better than 3:1 that the
DJI will be higher 10 trading days forward. What do we do?
Our Stocks Hotline is
hedged with 5 long positions and short 7. I think we have to
cover the general market ETF short
sales on Monday or Tuesday because of the 3:1 probability generally of
a rally until after
Christmas. Hopefully, we will see a DJI decline to 11600 to do
that.. That should be a good entry point for
buying DIA. Our Stocks' Hotline is still short more stocks than
we are long. Let's see what
Monday brings. Notice the Hotline will be at a new location
Monday night.
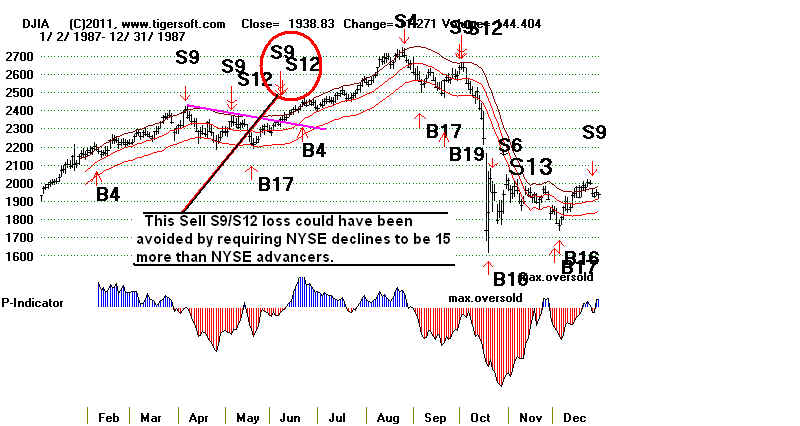
There have been 4 December Sell S9s.
December S9s' Aftermaths
1957 The DJI rallied to 12/31/1957 and then fell below the lower band
1982 The DJI fell immediately from the S9 on 12/7 to the lower band on
12/15/1982 and rallied.
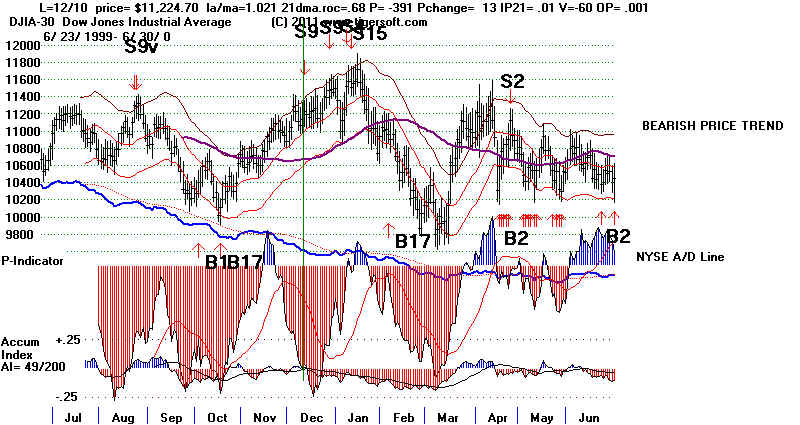
1999 The
DJI fell only to the 21-day ma on 12/17/1999 and then rallied to the upper band
on 12/28/1999 for another Sell S9
and then declined quickly to the lower band on 1/4/2000
before rallying quickly again to
the upper band and beginning a big sell-off.
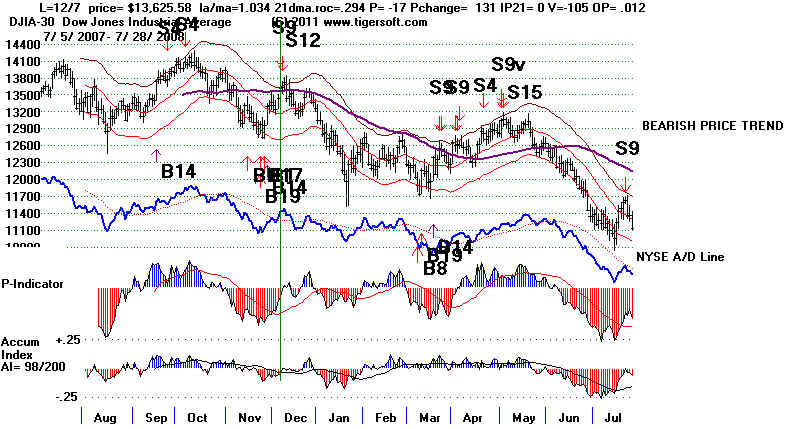
2007 The DJI fell from the
12/7 Sell S9 to just below the 21-day ma on 12/18 and rallied
2.5%
and formed a right shoulder on
12/26 in a head/shoulders pattern. It then sold off sharly, breaking the
lower band on 1/4/2000.

Which Side Will Win? US Professionals or the Overseas Buyers?
The
market now is like a tug of war. The Europeans and the Public are busy
buying over-night and at the opening. But the
NY Professionals and US institutions
are selling the market off during the day. The
Sell S7 below shows this condition.
Usually Professionals win out. But they could
change their mind because of the
seasonality. A strong close would show the
Professionals are betting on a Santa
Claus rally. On the other hand, a very weak
opening would probably mean that
the Europeans have switched to the sell side and the
Santa rally will be postponed.
The SP-500 is trying to hold up at its rising 65-day
ma.
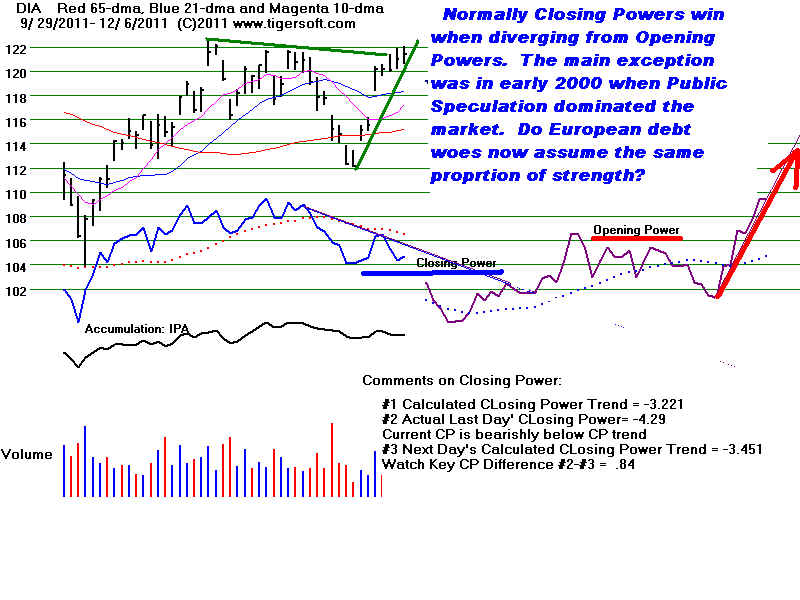
Which side is stronger depends on the circumstances.
though nornally it
is the Closing Power. But it does depend
on the times. Which slide blinks first?.
When there's a lot of Public speculation (as from
1997 to early 2000) or
when Europe is in grave trouble (as now), then
Opening Power is probably
stronger. When the Public is not in the
market and Europe is quiet, Closing Power
is much stronger and its trend will identify the real
price trend. What is important
now is to see that Professionals are not loyal to a rising or a falling market trend.
What differentiates their behavior from the public is
they are pragmatic "survivors", not
ideologues. They switch gears (as to the expected market direction) suddenly and
buy instead of sell because they believe there is
more potential on the upside.
This is apt to happen soon now because of the
exceptionally strong seasonality of the market
these coming two weeks, which they know to accept,
anticipate and not to fight.
at least until early January, when they can better
assess the influx of investment funds
for the new year.
====================================================================================
OLDER HOTLINES
====================================================================================
1215/2011 DJI = 11869 21-dmaRoc= -229
la/ma=1 .003 21-dma ROC- -.257 P= -285 ( =2 ) IP21= -.125 V= -154 OP= - .074
12/15/2011 BREADTH STATISTICS:
33 MAXCP stocks Bullish MAXCP Stocks
330 MINCP stocks Bearish MINCP Stocks Bearish Plurality
MAXCP stocks are those showing
Tiger Closing Power making new highs.
This suggests heavy Professional Buying. Applying the Tiger Power Ranker's
"bullish" to the MAXCP stocks find those with heavy insider buying and
institutional accumulation. Bearish MINCP stocks show the opposite.
Also use the BOTHUPs condition with MAXCPs and BOTHDOWNS MINCPS.
8 new highs on NASDAQ. 57new lows on NASDAQ BEARISH
23 new
highs NYSE
37- new lows on NYSE BEARISH
12/15//2011 ===> See Key Peerless TigerSoft
Index Charts: Industry Groups and ETFs
Most groups still have a plurality of stocks below their 65-dma. Defensive groups are still favored. BEARISH
DIA SPY QQQ DJIA-Peerless TigerDJI TigerSPY TigerQQQ
GLD SLV Crude
Precious Metal Stocks declining
CP BEARISH
12/15/2001 ===> Closing Power (CP) Status Report: KEY ETF CHARTS:
The ETFs CPs are all in
Down-trends. This is short-term
BULLISH
DIA' s CP iS in a
DOWNtrend
Any close of more than 2.70 ABOVE
the Opening
will break the CP DOWN-trendline. Meanwhile, the CP is now below its
21-dma.
The Opening Power is short-term declining.
SPY's CP is in a DOWNtrend Any close of more than 2.93 ABOVE the Opening
will break the CP DOWN-trendline. Meanwhile, the CP is now below its
21-dma.
The Opening Power is short-term declining.
QQQ's CP is in a DOWN-trend Any close of more than 1.61 ABOVE the Opening
GLD's CP is in a DOWN-trendline- Any
close of more than 8.70 ABOVE
the Opening will break the CP DOWN-trendline. The CP is now below its rising
21-dma.
The Opening Power is short-term
risng.
Clinched SELL S9 vs
Santa Claus Rally
There are few good technical signs now, but a Santa Claus Rally is
a very real factor now. See the studies in the last few Hotlines here.
The average gain for the DJI is 1.6% over the next 10 trading days,
going back to 1965. The DJI was up 77.8% of the time.
Saturday will be December 17th, the
day when Peerless
used to give a Santa Claus Buy signal. That signal was
dropped because some of the paper losses were too
great. Still, as you can see from our recent Hotline
studies, this is the time of the year when a rally usually
starts if the DJI is below its 21-day ma. The DJI is now
slightly above that ma. As the 17th falls on a Saturday this year
any additional decline would put the DJI in a zone where
below the 21-day ma, where we should probably do some
covering, including the recommended shorts on DIA, SPY and SDS.
In deference to the Santa Claus rally
traditition and how shallow
declines are from December 15th to December 31s, we will cover
many of our short sales on any further weakness by 1% or if their
CLosing Power downtrends are violated.
Three nights ago I showed the low points of the DJI relative to the 21-day
ma in the second half December. There were 27 cases where the DJI
dipped to or below the 21-day ma in mid to late December after 1940.
Buying 3% or more below the 21-day ma would have been possible in
only 8 cases. Buying 1.5% or more below the 21-dma would have been
possible in 13 cases. Buying 1% or more below the 21-day ma could have
been done in 18 cases. Another way of saying is that waiting for more
than a 2% decline would have worked out well in only 9 times: in 1972, 1975,
1980, 1983, 1991, 1996, 1997, 1998, 2000. That is just once in the last 10
years.
I conclude that we can't count such a deep decline. It will be most consistent
with past dips at this time of year to cover on any 1% weakness or on a close
below the 21-day ma next week.
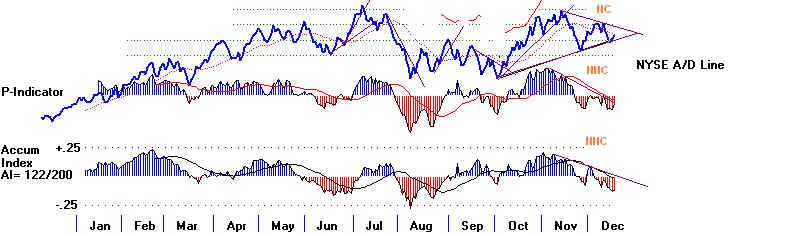
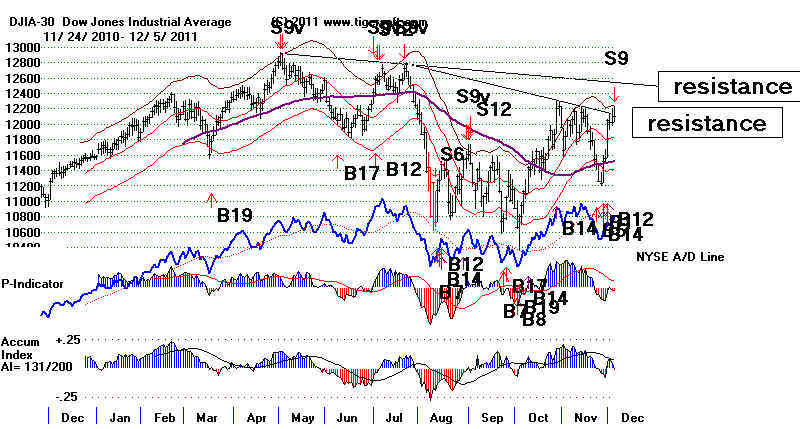
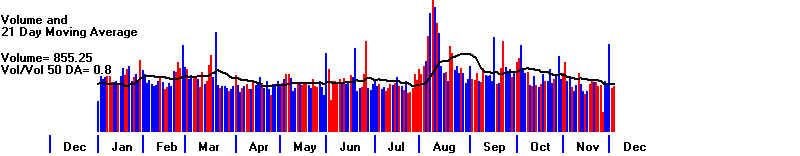
Breadth was good today. There were nearly 800 more up than
down on the NYESE. See the A/D Line chart below.
The A/D Line did turn up in vicinity of its 13-week uptrend.
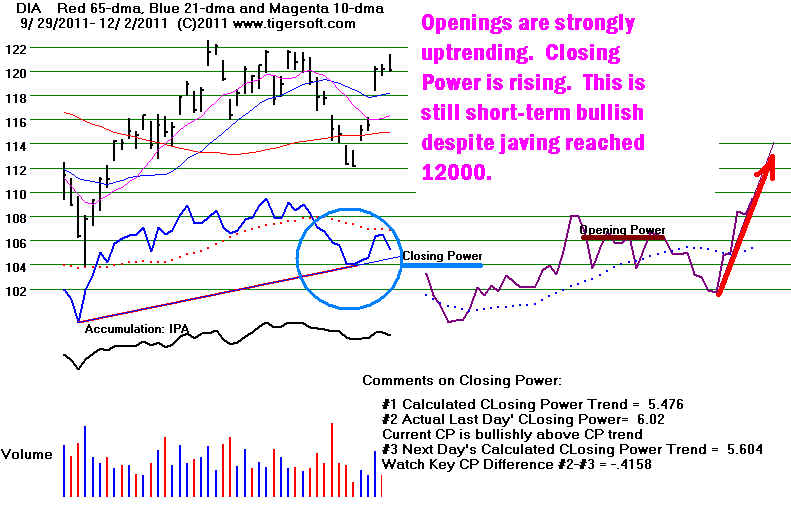
While the Tiger Closing Power remains in a downtrend, it looks
oversold (far below its 21-dma) and the Openings have been up
very strongly. See the second chart below. I would think that Openings
will remain strong as long as the EURO remains quiet. Remember:
politicians usually go away for the next two weeks. That also means
that Congress will likely agree to a compromise to keep the government
running.
DJI
Sell S7
- Professionals are much more bearish than Public and Europeans.
Sell S21
- Both Opening and Closing Power are falling
====================================================================================
OLDER HOTLINE
====================================================================================
1214/2011 DJI = 11823 -131
la/ma= .998 21-dma ROC- -.257 P= -284 ( +11 ) IP21= -.102 V= -155 OP= - .079
Clinched SELL S9 vs
Santa Claus
BREADTH STATISTICS:
39 MAXCP stocks Bullish MAXCP Stocks
296 MINCP stocks Bearish MINCP Stocks Bearish Plurality
MAXCP stocks are those showing
Tiger Closing Power making new highs.
This suggests heavy Professional Buying. Applying the Tiger Power Ranker's
"bullish" to the MAXCP stocks find those with heavy insider buying and
institutional accumulation. Bearish MINCP stocks show the opposite.
Also use the BOTHUPs condition with MAXCPs and BOTHDOWNS MINCPS.
7 new highs on NASDAQ. 83 new lows on NASDAQ BEARISH
22 new
highs NYSE 71- new lows on NYSE
BEARISH
12/14//2011 ===>
See Key Peerless TigerSoft Index Charts: Industry Groups and ETFs
DIA
SPY
QQQ DJIA-Peerless TigerDJI TigerSPY TigerQQQ
GLD SLV Crude
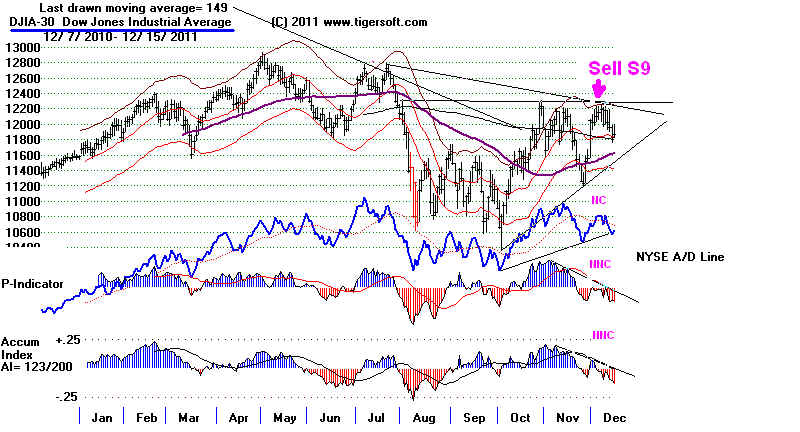
12/14/2011 I see no reason to cover our short
sales yet. ASell S9 usually brings a decline
to the lower band. The A/D Line uptrendline going back to
Septmber was violated today
and the CLosing Powers are declining. The bearish MINCP stocks
have been weak, some
spectacularly. The decline seems likely to tag the price
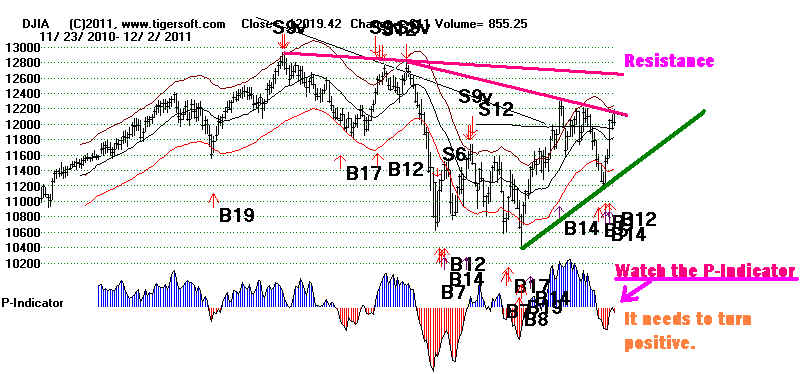
uptrendline that now crosses at 11511.92.
The failure of the DJI to even reach its declining resistance line near
12600 on th elast rally
is bearish until the 11400-11500 is successfully tested. The
P-Indicator and V-Indicator are
clearly negative. The only buy signal we can get on this weakness
is an old, no longer used
Peerless Buy on December 17th. The Santa Claus Buy signal.
This, I should add is less trustworthy
after a Sell S9.
Can Santa Claus be counted on this year?
The B17 takes place on the first such occurrence between December 17th
and December 24th
where the DJI closes below its 21-day ma. (CL/MA <1.0 )
Below are the statistics of Santa Claus B17s. Cases where the DJI is in
a generally uptrending
markets avoid most of the serious losses, but not that of 2007.
If the presence of a recent Sell S9/S12
is factored in, the failed 2007 Santa Claus B17 would be over-ridden.
But using that rule would
mean we get no Buy B17 this year, because of the recent Sell S9.
Date LA/MA
Gain Reversing Signal
12/18/33
.974 12.0% 2/1/34 S4
12/17/34
.993 3.6% 1/2/35 S12
12/17/35
.980 9.1% 2/18/36 S15
12/17/36
.997 4.8% 2/10/27 S15
12/17/40
.993 2.4% 1/10/41 S12
12/17/41
.96 4.1%
1/6/42 S9 Bear market
12/17/45 .991
4.6% 1/10/46 S9
12/17/47 .999
-1.3%
1/14/48 S10 Bear market
12/22/53 .997
7.0% 3/9/54
S15
12/19/55 .997
7.6% 4/9/56
S2 3.9% Paper Loss...DJI fell from
481.80 to 462.40 and then rallied.
12/17/57 .966
29.2% 7/1/59 S12 A
perfect Buy at bottom
12/18/62 .997
-1.8% 1/5/62 S10
12/17/64 .989
8.7% 5/13/65
S8
12/17/68 .997
-3.6%
3/28/69 970.91 Bear market
6.7 % Paper Loss. DJI fell
to 905.77 on 2/26/69 and rallied
12/18/72
.997 3.4%
1/5/73 S15
12/17/73
.997 5.4%
1/2/74 S12
12/17/74
.992 46.9% 7/1/75 S8 Bear market
12/22/75
.998 20.3%
3/24/76 S15
12/19/77 .981
-1.8% 1/7/78 S10
12/17/80
.968 4.8%
1/2/81 S12
12/17/81
.968 -4.3% 4/1/82 S9 Bear market
8.6 % Paper Loss. DJI fell from 870.53 to 795.75
and then rallied.
12/17/82 .968
5.9% 1/6/83 S12
12/19/83
.985 3.4% 1/6/84 S12
12/17/84
.991 55.1% 4/29/86 S9
12/18/86
.999 25.8% 4/6/87 S9
12/18/89 .995
4.2% 1/2/90
S9
12/17/91 .998
13.9% 4/14/92 92
12/18/95 .993
9.3%
2/27/96 S1
12/17/96 .982
8.3% 4/23/97 S9
12/18/97 .98
17.1% 4/21/98 S15 DJI fell from 7846 to 7580 on 1/9/98 and
rallied.
3.3% Paper Loss.
12/17/98 .982
22.3% 6/18/99 S12
12/19/00 .999
1.2%
5/17/01 S4 Bear market? DJI next hit upper band, but no Sell, and
fell from 10584 to 9505 on 3/23/01 and rallied.
10.2% Paper Loss.
12/17/01 .999
2.3%
2/26/02 S9 Bear market 2% Paper Loss.
12/17/02 .985
2.3% 1/6/03
S12 Bear market
12/19/05 .999
6.8%
5/5/01 S9 1.5% Paper Loss.
12/17/07 .991
-4.7%.
3/24/08 S9
DJI fell from 13167.2 to 11740.15 and then rallied.
10.8% Paper Loss.
12/22/08 .992
5.8% 1/6/09
S12 Bear market
12/17/09 .991
1.0%
6/16/10 S12 DJI fell from 10308.26 to 9816.49 and then rallied.
4.7% Paper Loss.
Though this signal usally works out,
there are some very big paper losses. The biggest being
the 10%-11% losses in emerging bear
markets in 2000 and 2007. Where there have been
multiple Sells in a trading range after a
long advance, we have to be a bit leery of Santa Claus
B17s. That would seem to apply to
2011.
=================================================================================
OLDER HOTLINES
=================================================================================
1213/2011 DJI = 11955 -66 la/ma=
1.008 21-dma ROC- -.199 P= -296( -166 ) IP21=
-.094 V=
-152 OP=
- .068
Clinched SELL S9 vs Santa Claus
BREADTH STATISTICS:
33(-44) MAXCP stocks Bullish MAXCP Stocks
239 MINCP stocks Bearish MINCP Stocks Bearish Plurality
MAXCP stocks are those showing
Tiger Closing Power making new highs.
This suggests heavy Professional Buying. Applying the Tiger Power Ranker's
"bullish" to the MAXCP stocks find those with heavy insider buying and
institutional accumulation. Bearish MINCP stocks show the opposite.
Also use the BOTHUPs condition with MAXCPs and BOTHDOWNS MINCPS.
9 new highs on NASDAQ. 56 new lows on NASDAQ BEARISH
19 (-15)
new
highs NYSE 44 (+17) - new lows on NYSE BEARISH
12/13/2001 ===> DAILY Trading 3 Sample Stocks using Closing
Power trend-changes:
This is updated each night for a
while to show new users how one might trade
some volatile precious metals'
stocks simply using Closing Power.
12/13//2011 ===> See Key Peerless TigerSoft
Index Charts: Industry Groups and ETFs
DIA
SPY
QQQ DJIA-Peerless TigerDJI TigerSPY TigerQQQ
GLD SLV Crude
12/12/2001 ===> Closing Power (CP) Status Report: KEY ETF CHARTS:
The ETFs CPs broke their
Down-trends. This is short-term
BULLISH
DIA'CP iS in a
DOWNtrend
Any close of more than 1.54 ABOVE
the Opening
will break the CP DOWN-trendline. Meanwhile, the CP is now below its
21-dma.
The Opening Power is short-term declining.
SPY's CP is in a DOWNtrend Any close of more than 1.65 ABOVE the Opening
will break the CP DOWN-trendline. Meanwhile, the CP is now below its
21-dma.
The Opening Power is short-term declining.
QQQ's CP is in a DOWN-trend Any close of more than 0.68 ABOVE the Opening
Sell S9s in December before 12/20
in Bull Market Environments
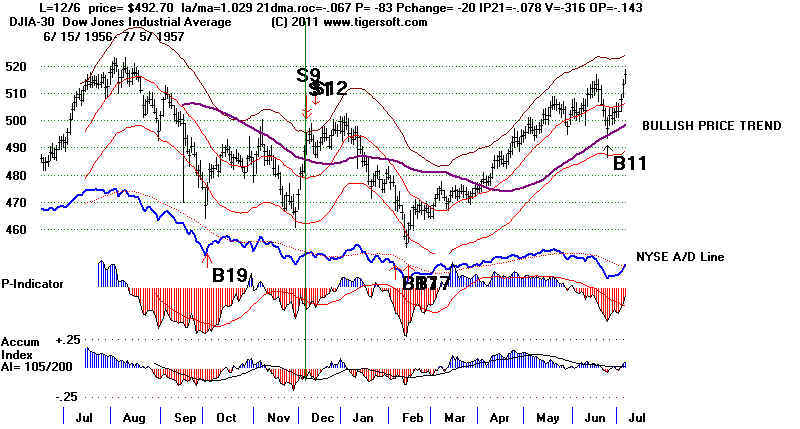
12/6/1956 492.7 +4.6% Reversed: 470.00 2/5/57 B4
LA/MA ANNROC P-I IP21 V-I Opct
1.029 -.067 -83 -.078 -316 .143
1% paper loss. Reversing.
DJI rallied to 496.00 and then fall below lower band in mid january.
1956-1957
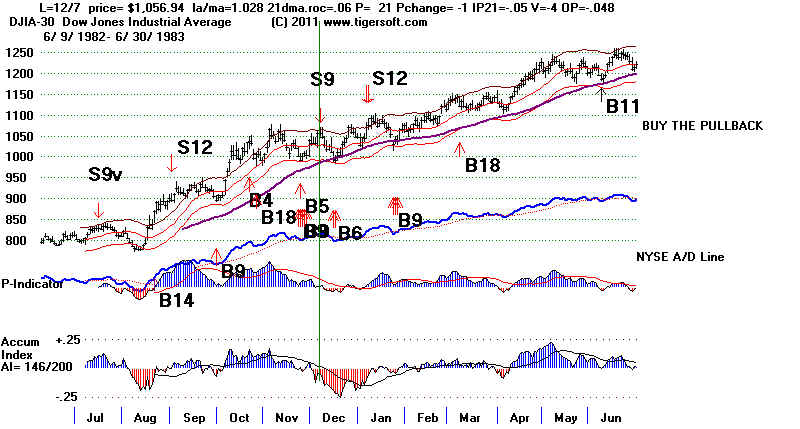
 12/7/1982 1056.94 +6.1% Reversed: 992.64 12/15/82 B6
LA/MA ANNROC P IP21 V-I Opct
1.028 .06 21 -.05 -4 -.048
No paper loss. Reversing.
DJI fell to lower band on 12/15 and reversed on Buy at rising 65-dmA.
1982-1983
12/7/1982 1056.94 +6.1% Reversed: 992.64 12/15/82 B6
LA/MA ANNROC P IP21 V-I Opct
1.028 .06 21 -.05 -4 -.048
No paper loss. Reversing.
DJI fell to lower band on 12/15 and reversed on Buy at rising 65-dmA.
1982-1983
       12/10/1999 11224.70 +2.3%
    LA/MA     ANNROC            P         IP21       V-I         Opct
          1.021        .68                -391      -.01     -60         .001
          2% Paper Loss.  Reversing.
    DJI rose to 11484 on 12/29 and then fell in a week to the lower band.
    There was no Buy signal there.

  1999-2000


      12/7/2007   13625.58   +3.4%  Reversed:   11899.69  3/7/08  B8
     LA/MA        ANNROC          P        IP21      V-I         Opct
     1.034  .294     -17   0  -105  .012
     1% Paper Loss.  Reversing.
     DJI rose one day more by 1% and then fell below the
     on 1/4/2007 lower band. There was no Buy signal there.

  2007-2008
12/7/2007 13625.58 +3.4% Reversed: 11899.69 3/7/08 B8
LA/MA ANNROC P IP21 V-I Opct
1.034 .294 -17 0 -105 .012
1% Paper Loss. Reversing.
DJI rose one day more by 1% and then fell below the
on 1/4/2007 lower band. There was no Buy signal there.
2007-2008
A Big Decline This Month Is NOT Expected.
Big declines below the lower band, another 3% down, very seldom happen
in December
unless there is already a bear market. Declines to or below
the lower 3.5% band
occurred only in 1933, 1980 and 1998. 3 times in 43 bull market
years.
>The Blue data *15 cases) below show the most common occurrence: a decline
around the 20th and before the 25th, below the 21-dma (LA/MA <1.)
and the a January rally to the upper band.
> Bottoms
after December 25th in December are unusual. 6 cases.
> A December
close more than 3.5% below the 21-day ma is most ununusal. (LA/MA<
.965)
Post December 11 Bull Market Bottoms
LA/MA
12/20/1933 .959 shot above upper
band on 1/15/1934
12/20/1934 .980 hit upper band on 1/3/1935
12/16/1935 .968 hit upper band on 1/13/1936
12/21/1938 .972 hit upper band on 1/21/1939
12/21/1939 1.003 hit upper band on 1/3/1940
12/23/1940 .983 peaked 2% over ma on 1/10/1941
12/14/1942 1.006 hit upper band on 12/18/1942 and kept rising...
12/15/1943 1.015 peaked 2% over ma on 1/6/1944
12/27/1944 .993
peaked 2.4% over ma on 1/10/1945
12/21/1945 .986 hit upper band
on 1/10/1946
12/21/1949 1.008 rose steadily for five months.
12/15/1950 .983 hit upper band on 12/29/1951 and kept
rising.
12/26/1951 .998 peaked 2.2% over ma on 1/22/1952
12/29/1953 .99
hit upper 2.5% band on 1/27/1954 and kept rising.
12/15/1954 1.007 hit upper band on 1/3/1959
12/14/1956 .993 only rose to
0.2%% over MA on 1/3/1957
12/12/1958 1.006 hit upper band on 1/5/1959
12/22/1962 .99 only rose to 0.5%% over MA on
12/28/1962
12/24/1963 1.002 rose steadily a long ways...
12/15/1964 .98
rose steadily for 4 months
12/20/1966 1.002 peaked 2.0% over ma on
1/18/1966
12/19/1968 1.00 peaked 1.8% over ma on 1/9/1966 and Sell
S12
12/21/1972 .978 peaked 2.4% over ma on 1/11/1966 and Sells
(12/8/1975) .973 broke out
above upper band on 1/5/1976 and went higher.
(12/11/1980) .936 rebounded to 5.9% above ma on 1/6/1981
12/15/1983 .971 hit upper 5.2% band on
1/10/1984
12/10/1984 .98 rebounded to 4.1% above ma on 1/21/1985
and moved higher.
12/24/1985 1.011 hit upper 2.2% band on 1/7/1986, fell back and
rebounded strongly.
12/31/1986
.985 rose above the upper band on 1/14/1987 and advanced strongly
12/21/1990 .99 Tagged upper band on
1/3/1990 and fell back on Sells.
(12/10/1991) .974 Shot back above upper
band on 12/23/1992 and kept rallying.
12/16/1992 .995 Rallied only to 1% over ma on 12/28/1962 and fell
back 3% before advancing..
12/15/1993
1.003 Rallied until 2/1/1994
(12/8/1994) .980 Rose steadily and kept
rallying.
12/19/1995 .999 Rose to upper band on
1/30/1996 and advanced further.
12/16/1996 .976 Rose past upper band on 1/14/1997
and advanced further.
12/26/1997
.971 Rallied to 1% over MA on 1/5/1998 and fell back in January before advancing.
12/14/1998
.96 Rose past upper band on
1/8/1998 and fell back to regroup.
12/21/1999 1.008 Rallied to upper band on 12/28/1999 and fell back to LB on
1/4/2000
12/20/2000 .975 Rallied to upper band on 1/3/2001
12/7/2004 .994 Rallied to a high 2.1%
over 21-dma and then fell back.
12/29/2005 .996 Rallied to 1.6% over MA on
1/11/2006 and fell back to regroup.
12/17/2009 .991 Rallied to 1.5% over MA on 1/13/2009
and fell back below LB to regroup.
A decline to near the DJI's lower band now would first require
the DJI closing more than
100 points lower to break its 21-dma. The DJI today closed
right at its 200-day ma.
Since that moving avererage is flat, I would not think it will act as
much support.
The NASDAQ is weaker. It broke its rising 65-day ma support
slightly today.
The NASDAQ will need to recover strongly tomorrow to convince bulls
that Santa
will save them from the Grinch S9.
For now, I would be mostly short,
including DIA or SPY, and wait for the key ETFs'
CLosing Powers to break their downtrends to cover in deference to
the seasonal Santa Claus rally,
which sometimes is delayed as late as the 23rd.
DJI for 12/12/2011
The DJI did nearly the worse thing it can do intra-day. It jumped
in the
first 30 monites and sold off considerably in the last two hours.
The
result was that the key ETFs Closing Power all made minor new lows
and set up Closing Power downtrends.
Most pundits blame this decline on Europe and American Bankers'
concerns
that Italy and Greece might not be able to pay back on its bonds,
especially with
Italy's present cost of borrowing now above 6%. Big US
banks have sold
large sums of Credit Default Swaps against this contingency.
Britain
has made matters worse for the banks by refusing to accept the
French-German demand that each EEC member accede to the Big EEC
Bankers effective control of each country's monetary and aggregate
fiscal
policies. The EEC bankers are essentially saying to each
countries'
voters, you can vote Conservative, Catholic or Socialist all you
want,
but we will fix your rate of interests and how much your
government
spends and taxes.
If there is a run on Euro, the consequences, though impossible
to predict
with any precision, might certainly include a freezing up of
credit and trade.
These are deflationary consequences. Gold and Silver declined sharply
today,
as a result. Food commodities
have been showing weakness for months.
Today showed that Bond holders
love deflation and a weak stock market.
There is a bullish aspect to all this, and that is your Dollars
are worth a little
bit more. The Dollar
broke out to the upside today, And interest rates
fell.
Although the FED did not do more at its meeting today to pump more
liquidity
into the market, the strong Dollar gives it more leeway in
the future to do that.
====================================================================================
OLDER HOTLINES
====================================================================================
1212/2011 DJI
= 12021 -163 la/ma= 1.013 21-dma ROC- +.128 P= -130( -141 ) IP21= -.04 V= -97 OP= .022
Clinched SELL S9 but will December bring a
breakout?
BREADTH STATISTICS:
77(+12)
MAXCP stocks Bullish
MAXCP Stocks
64(-43) MINCP stocks Bearish MINCP Stocks Bearish Plurality
MAXCP stocks are those showing
Tiger Closing Power making new highs.
This suggests heavy Professional Buying. Applying the Tiger Power Ranker's
"bullish" to the MAXCP stocks find those with heavy insider buying and
institutional accumulation. Bearish MINCP stocks show the opposite.
Also use the BOTHUPs condition with MAXCPs and BOTHDOWNS MINCPS.
8 new highs on NASDAQ. 31 new lows on NASDAQ BEARISH
34 (+15)
new
highs NYSE 27 (+22) - new lows on NYSE BULLISH
12/12/2001 ===> DAILY Trading 3 Sample Stocks using Closing
Power trend-changes:
NEM's CP is uptrending. SSRI (Silver) and PAAS
(Silver) broke CP downtrends.
This is updated each night for a
while to show new users how one might trade
some volatile precious metals'
stocks simply using Closing Power.
12/12//2011 ===> See Key Peerless TigerSoft
Index Charts: Industry Groups and ETFs
DIA
SPY
QQQ DJIA-Peerless TigerDJI TigerSPY TigerQQQ
GLD SLV Crude
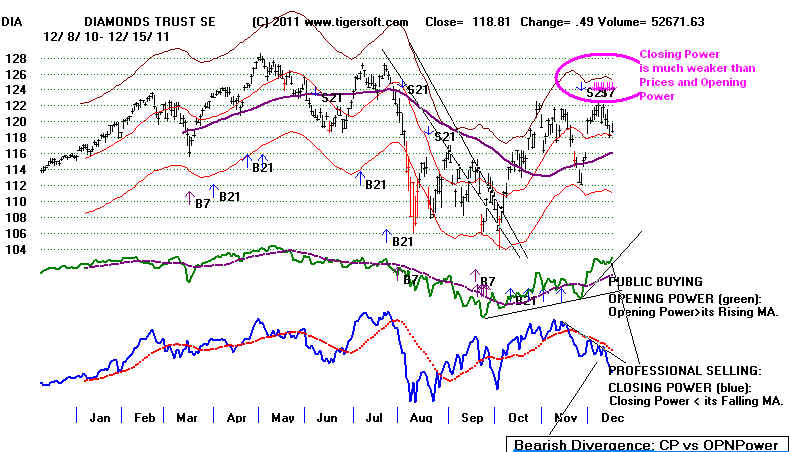
12/12/2001 ===> Closing Power (CP) Status Report: KEY ETF CHARTS:
The ETFs CPs broke their
Down-trends. This is short-term
BULLISH
Opening Powers are rising.
DIA restored its CP
DOWNtrend
But any close of more than 0.31
ABOVE the Opening
will break the CP DOWN-trendline. Meanwhile, the CP is now below its
21-dma.
The Opening Power is short-term declining.
SPY's CP is below its
DOWNtrend-line Any
close of more than 0.13 ABOVE the Opening
will break the CP DOWN-trendline. Meanwhile, the CP is now below its
21-dma.
The Opening Power is short-term declining.
BREADTH STATISTICS:
65(+37)
MAXCP stocks Bullish
MAXCP Stocks
107(-93) MINCP stocks Bearish MINCP Stocks Bearish
Plurality
MAXCP stocks are those showing
Tiger Closing Power making new highs.
This suggests heavy Professional Buying. Applying the Tiger Power Ranker's
"bullish" to the MAXCP stocks find those with heavy insider buying and
institutional accumulation. Bearish MINCP stocks show the opposite.
Also use the BOTHUPs condition with MAXCPs and BOTHDOWNS MINCPS.
25 new highs on NASDAQ. 18 new lows on NASDAQ
BULLISH
19 (-11)
new
highs NYSE 5 - new lows on NYSE BULLISH
12/9/2001 ===> DAILY
Trading 3 Sample Stocks using Closing Power trend-changes:
NEM's CP is uptrending. SSRI (Silver) and PAAS
(Silver) broke CP downtrends.
This is updated each night for a
while to show new users how one might trade
some volatile precious metals'
stocks simply using Closing Power.
12/9//2011 ===> See Key Peerless TigerSoft
Index Charts: Industry Groups and ETFs
DIA
SPY
QQQ DJIA-Peerless TigerDJI TigerSPY TigerQQQ
GLD SLV Crude
12/9/2001 ===>
Closing Power (CP) Status Report: KEY ETF CHARTS:
The ETFs CPs broke their
Down-trends. This is short-term
BULLISH
Opening Powers are rising.
DIA broke CP DOWNtrend But any close of
more than 0.44 BELOW the Opening
will restore the CP DOWN-trendline. Meanwhile, the CP is now below its
21-dma.
The Opening Power is uptrendng.
SPY CP is at its
DOWNtrend-line Any
close of more than 0.46 BELOW the Opening
will restore the CP DOWN-trendline. The CP is now below its rising
21-dma.
Opening Power is in an Uptrend...
 23 NATO fuel tankers set ablaze in Pakistan
 But at least, Obama is not choosing to
escalate this incident into a causus belli. The stock market
is always spooked by a run-up to war. Obama's lack of response may
suggests that he DOES expect to
wind down his war in Afghanistan. This will be tricky.
Will There Be A Repeat of 1973-1974?
The stock market fell 45% in 1973-1974, partly because of the defeat of
the US in Vietnam.
History could repeat. Afghanistan
has cost 1732+ American soldiers'
lives and
$471+
billion, narrowly calculated. Adding in Iraq makes the scale of the war in
Vietnam comparable.
The Obama Administration has made tragic mistakes that even a casual reading
of Afghanistan
history and the failed imperial invasions by the British and Soviets should
have prevented.
Add to that, it's easy to see how much greater the benefits to America would
have been if even half
this money was spent domestically on education, health care, mass transit,
infrastructure repair.
Will Obama be challenged on this? Obama must think Republicans will
not. Hubris alone could
cause Obama to fail terribly, as Nixon did. But we see now also an even
stronger military-industrial
complex, unchecked corporate power and a thoroughly stalemated political
system. It's hard to be
optimistic this December. The Sell S9 will probably be profitable.
Sources: http://www.navytimes.com/news/2011/12/ap-nato-fuel-tankers-set-ablaze-in-pakistan-120811/
http://www.guardian.co.uk/world/2009/oct/18/afghan-war-soviet-invasion-mistakes
http://www.telegraph.co.uk/expat/expatnews/7070390/United-States-must-shift-strategies-in-Afghanistan.html
Afghanistan
Online: The Role of Afghanistan in the fall of the USSR
British
Empire: Forces: Campaigns: Afghanistan 1878 - 1880
Afghanistan
'will collapse into civil war when western troops fall out
http://topics.nytimes.com/top/news/international/countriesandterritories/afghanistan/index.html
================================================================================
12/8/2011 DJI = 11998 -199 la/ma=
1.013 21-dma ROC= - .173 P=
-210 ( -175
) IP21=-.095 V=
-132 OP= .008
Clinched SELL S9
BREADTH
STATISTICS:
28(-25) MAXCP stocks Bullish MAXCP Stocks
200(-133) MINCP stocks Bearish MINCP Stocks Bearish
MAXCP stocks are those showing
Tiger Closing Power making new highs.
This suggests heavy Professional Buying. Applying the Tiger Power Ranker's
"bullish" to the MAXCP stocks find those with heavy insider buying and
institutional accumulation. Bearish MINCP stocks show the opposite.
Also use the BOTHUPs condition with MAXCPs and BOTHDOWNS MINCPS.
3 new highs on NASDAQ. 54 new lows on NASDAQ
BEARISH
30
new
highs NYSE 10 - new lows on NYSE BULLISH
12/8/2001 ===> DAILY
Trading 3 Sample Stocks using Closing Power trend-changes:
NEM's CP is uptrending but , SSRI (Silver) and PAAS
(Silver) are in CP downtrends now.
This is updated each night for a
while to show new users how one might trade
some volatile precious metals'
stocks simply using Closing Power.
12/8//2011 ===> See Key Peerless TigerSoft
Index Charts: Industry Groups and ETFs
DIA
SPY
QQQ DJIA-Peerless TigerDJI TigerSPY TigerQQQ
GLD SLV Crude
12/8/2001 ===>
Closing Power (CP) Status Report: KEY ETF CHARTS:
The ETFs CPs are now in
Down-trends. This is short-term
BEARISH
Opening Powers are rising
steeply. When the Opening Power uptrend is
violated, a retreat should follow.
DIA shows a CP DOWNtrend Any close of more
than 1.13 ABOVE the Opening
will break the CP DOWN-trendline. Meanwhile, the CP is now below its
21-dma.
The steep Opening Power's uptrend has been violated.
SPY shows a CP DOWNtrend- Any close of more than 1.35 ABOVE the Opening
will break the CP DOWN-trendline. The CP is now below its rising
21-dma.
Opening Power broke its steep Uptrend...
| Lesson of the 1930s:
AUSTERITY IS DANGEROUS! Paul De Grauwe - Centre for European Policy Studies Incredibly, the same mistakes are being made today involving some of the same countries as during the Great Depression. This time it is the continental west European countries tied together in the eurozone that have seen their currency, the euro, become strongly overvalued. The two countries that in the 1930s responded to the crisis by devaluing their currencies, the US and the UK, have today also allowed their currencies to depreciate significantly. Since the start of the financial crisis, pound sterling has depreciated against the euro by about 30%. After having strengthened vis-à-vis the euro prior to the banking crisis of October 2008, the dollar depreciated against the euro by close to 20%. Thus, as in the 1930s, the dividing line is the same. The US and the UK have allowed their currencies to depreciate; the continental European countries tied into the euro area have allowed their currency to become significantly overvalued. Even the numbers are of the same order of magnitude. During the1930s, the overvaluation of the gold bloc currencies amounted to 20-30%. Today, the euro is overvalued by similar percentages against the dollar and the pound. So why are the euro area countries employing the same policies as the gold bloc countries did nearly eighty years ago? The answer is economic orthodoxy. In the 1930s it was the orthodoxy inspired by the last vestiges of the gold standard. Today the economic orthodoxy that inspires the ECB is very different, but no less constraining. It is the view that the foreign exchange market is better placed than the central bank to decide the appropriate level of the exchange rate. A central bank should be concerned with keeping inflation low and not with meddling in the foreign exchange market. As a result the ECB has not been willing to gear its monetary policy towards some exchange rate objective. As in the 1930s, the euro area countries will pay a heavy price for this orthodoxy. The price will be a slower and more protracted recovery from the recession. This will also make it more difficult to deal with the internal disequilibria within the eurozone between the deficit and the surplus countries. |
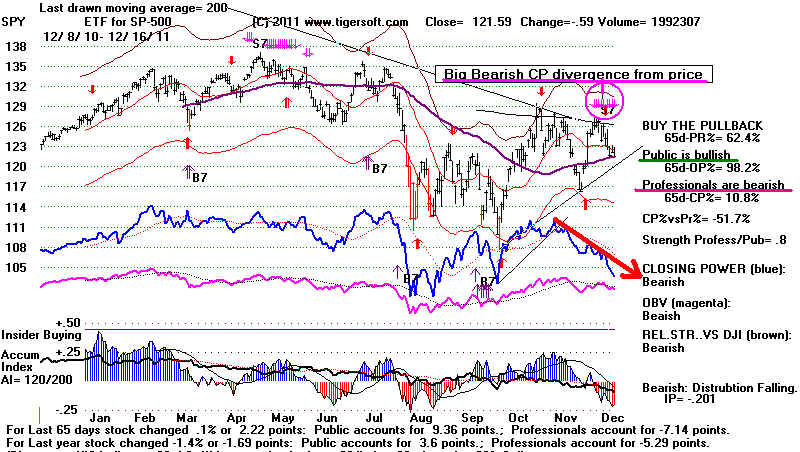
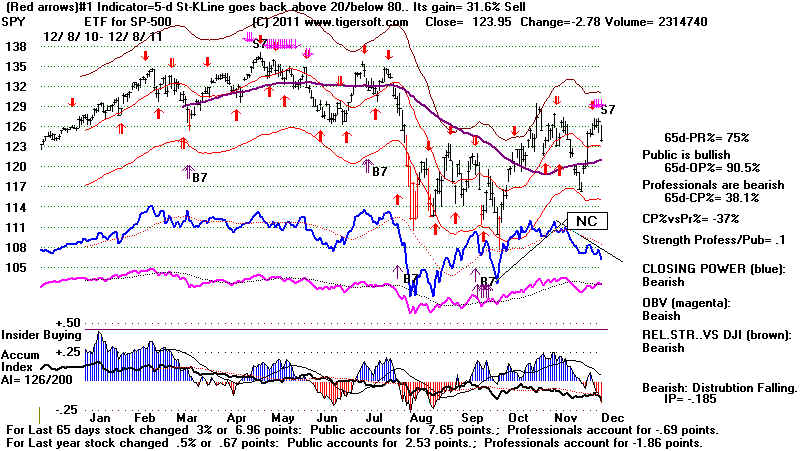
Technicals
The DIA could not
get past 122; it will likely have to test its rising 65-dma support at 115.
Note how the DIA marginally made a new CLosing
high but the Closing Power lagged
considerably and then broke it uptrend.
This is a reliable trading Sell.
SPY's
CLosing Power made a 2 month low far ahead of price. This yields a CLosing Power
Divergence Sell S7. (Signals(3) + Closing
Power Divergence Warnings). SPY should be
shorted.
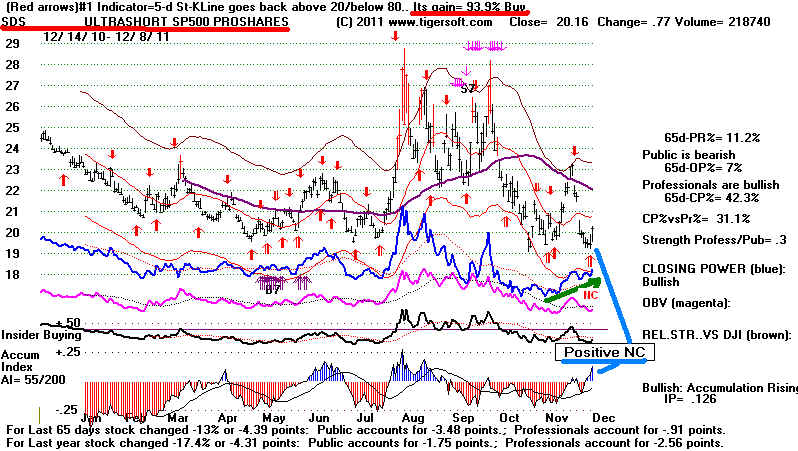
LEVERAGED SHORT SPY - SDS
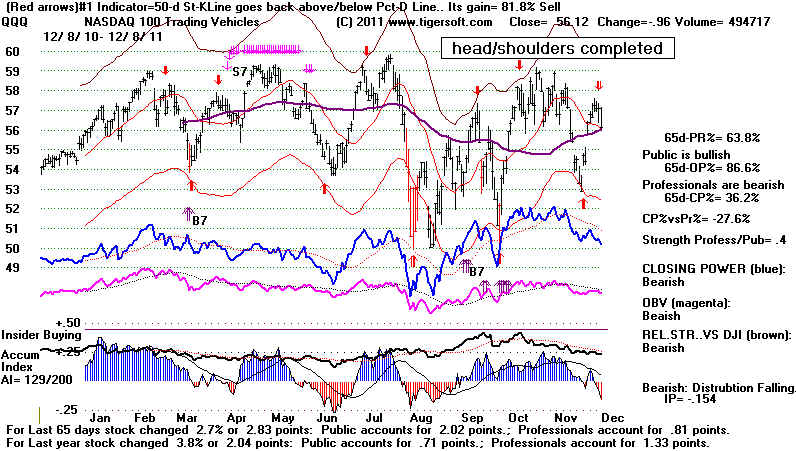
Watch tomorrow to see if QQQ
breaks below the ususal support of its rising 65-dma.
That the optimized best trading system has
gained a whopping 81.% on the QQQ this
year should give us more confidence of a
breakdown.
The Stock Market Does Not Like Uncertainty
Unanswered Questions about the Fate of the Euro:
Will the EURO survive? Goldman says "No". Morgan Stanley
says 20% probability.
Zero Hedge reports 50% chance by end of 2012.
What would be the consequences if it does
collapse? Would
loans dry up 50%? Would we see another liquidity crisis, as in 2008?
How would
that be resolved? What
central bank would guarantee banks or big loans soon again?
Would trade barriers
suddenly go up? Would
inter-nation European commerce dropsharply?
The Wall Street Journal downplays the dangers
now.
"A number of investors and bankers have
indicated that companies are hoarding liquidity and refraining
from making acquisitions to strengthen their
internal financing, rather than turning to banks....
In late November, Lufthansa said it would halt
all non-essential investment for six months to combat rising
financing costs, and on Wednesday Tognum’s
CEO told the Financial Times Deutschland the company
is increasing liquidity and hedging activity as
a preventive measure, to avoid the consequences of a potential
collapse of the euro zone." Source
How will America be
affected? The Dollar would soar? That
would badly hurt American exports.
Will America's biggest banks be hurt badly because
they have sold massive amounts of credit default swaps
on Italian, Greek, Spanish and Portuguese
government bonds.
Clinched SELL S9
Date
DJI on Gain
Adv
Dec
Date
DJI
Adv Dec
Plurality
date of S9
of Clinching:
1. 9/14/1966
806.23 +6.0% 691 467 9/19/1966 810.85
460 677
--------------------------------------------------------------------------------------
2. 10/25/1966 793.09 +0.4% 596 549 11/3/1966 804.34 467 664
-----------------------------------------------------------------------------------
3. 3/28/1969 935.48 +17.8% 804 518 4/1/1969 933.08 638 720
----------------------------------------------------------------------------------
4. 4/30/1969 950.18 +19.0% 942 419 5/7/1969 959.60 587 779
---------------------------------------------------------------------------------
5. 1/5/1970 811.31 +5.8% 1021 426 1/6/1970 803.66 488 890
-----------------------------------------------------------------------------------
6. 6/17/1970 704.68 +5.0% 639 643 6/22/1970 669.36 412 820
----------------------------------------------------------------------------------
7. 6/22/1970 716.11 +6.5% 412 820 6/22/1970 716.11 412 820
---------------------------------------------------------------------------------
8 7/15/1970 711.66 +0.6% 837 412 7/21/70 722.07 398 900
---------------------------------------------------------------------------------
9 7/21/1970 722.07 +2.0% 398 900 7/21/1970 722.07 398 900
--------------------------------------------------------------------------------
10 5/6/1971 937.39 +3.7% 463 947 5/6/1971 937.39 463 947
--------------------------------------------------------------------------------
11 8/23/1971 892.38 +7.4% 917 474 8/30/1971 901.43 494 894
-----------------------------------------------------------------------------
12 4/12/1972 966.96 +5.7% 865 649 4/13/1972 965.53 569 890
--------------------------------------------------------------------------------
13 5/22/1972 965.31 +5.6% 823 644 5/23/1972 962.3 649 762
-------------------------------------------------------------------------------
14 5/30/1972 971.18 +6.1% 636 783 5/30/1972 971.18 636 783
------------------------------------------------------------------------------
15 8/3/1972 947.7 +2.7% 828 586 8/8/1972 952.44 682 746
-----------------------------------------------------------------------------
16 8/10/1972 952.89 +3.3% 783 588 8/15/1972 969.97 783 588
-------------------------------------------------------------------------------
17 1/5/1973 1047.49 +16.5% 745 687 1/8/1973 1047.86 676 771
-------------------------------------------------------------------------------
18 4/11/1973 967.41 +9.6%
4/12/1973 964.03 703 717 -14
4/13/1973 959.36 592 788
---------------------------------------------------------------------------
19 7/11/1973 908.19 +3.7% 1294 224 7/13/1973 895.99 504 881
---------------------------------------------------------------------------
20 9/4/1973 895.39 -5.0% 1010 439
9/10/1973 891.33 574 836
------------------------------------------------------------------------------
21 10/26/1973 987.06 +20.1% 915 532 10/29/73 984.8 655 822
------------------------------------------------------------------------
22 2/22/1974 855.99 +27.3% 988 439 2/28/1974 860.53 658 746
----------------------------------------------------------------------
23 2/28/1974 860.53 +27.7% 658 746 2/28/1974 860.53 658 746
----------------------------------------------------------------------
24 3/4/1974 853.18 +27.1% 706 707 3/7/1974
869.06 521 924
----------------------------------------------------------------------
25 6/6/1974 845.35 +26.4% 1007 386 6/11/1974 852.08 490 905
----------------------------------------------------------------------
26 6/13/1974 852.08 +27.0% 648 671 6/14/1974 843.09 370 953
------------------------------------------------------------------------
27 8/29/1975 835.34 +4.8% 1051 352 9/2/1975 823.69 399 992
------------------------------------------------------------------------
28 9/5/1975 835.97 +4.9% 491 811 9/8/1975
840.11 649 659
9/9/1975 827.75 478 884
-----------------------------------------------------------------------
29 3/24/1976 1009.21 +4.2% 1081 452 3/25/1976 1002.13 514 933
---------------------------------------------------------------------------------
30 3/15/1977 965.01 +6.4% 954 514 3/17/1977 964.84 676 709 -33
3/19/1977 961.02 650 729
------------------------------------------------------------------------------------
31 10/10/1978 891.63 +11.7% 720 752 10/10/1978 891.63 720 752 -32
10/12/1978 896.74 663 811
---------------------------------------------------------------------------------
32 9/21/1979 893.94 +10.9% 529 803 9/21/1979 893.94 529 803
-------------------------------------------------------------------------------------
33 2/13/1980 903.84 +14.0% 799 759 2/14/1980 893.77 415 1104
----------------------------------------------------------------------------------
34 11/14/1980 986.35 +5.3% 869 696 11/17/1980 968.94 638 941
-------------------------------------------------------------------------------------
35 1/2/1981 972.78 +3.5% 1061 495 1/7/1981
980.89 219 1552
-----------------------------------------------------------------------------------
36 10/9/1981 873 +4.0% 783 749
10/13/81 865.58 729 744 -15
10/14/81 850.81 384 1116
----------------------------------------------------------------------------------
37 4/1/1982 833.24 +6.7% 1061 377 4/9/82
842.94 669 767
----------------------------------------------------------------------------
38 7/12/1982 824.87 +5.8% 1061 456 7/13/1982 824.2 664 752
----------------------------------------------------------------------------
39 12/7/1982 1056.94 +6.1% 1017 628 12/8/1982 1047.09 796 826 -30
-----------------------------------------------------------------------------
40 7/26/1983 1243.69 +6.1% 1030 592 7/27/1983 1230.47 477 1189
-------------------------------------------------------------------------------
41 3/16/1984 1184.36 +5.7% 1141 438 3/19/1984 1171.38 394 1215
------------------------------------------------------------------------------- 42
10/ 14/ 1985 1354.73 -6.3% 987 462
10/18/1985
1368.84
740 770 -30
-----------------------------------------------------------------------------
43 4/ 29/ 1986 1825.89
0.0%
499
1153 4/ 29/
1986 1825.89
499 1153
-----------------------------------------------------------------------------
44 8/12/1986 1835.49 +2.3% 1171
494 8/18/1986 1869.42 786
828 -42
-----------------------------------------------------------------------------
45 4/6/1987 2405.54 +7.7%
877 734 4/7/1987 2362.94
527 1121
-----------------------------------------------------------------------------
46 5/6/1987 2342.19 +5.2% 771 798 5/6/1987 2342.19 771 798 -27
-----------------------------------------------------------------------------
Never Clinched.
47 6/8/1987 2351.64 -4.0% BUY B4
6/22/1988
2445.51 907 692
-----------------------------------------------------------------------------
48 10/1/1987 2639.2 +30.2%
1029 526 10/5/1987 2640.18 688
855
-----------------------------------------------------------------------------
49 12/28/1987 1942.97 +1.6% 283
1392 12/28/1987 1942.97
283 1392
-----------------------------------------------------------------------------
50 9/6/1988 2065.26 -0.1% 807 625 9/12/1988 2072.37 606 788
-----------------------------------------------------------------------------
51 10/4/1989 2771.09 +4.8%
831 656 10/10/1989
2785.33
652 831
-----------------------------------------------------------------------------
52 10/11/1989 2773.36 +4.9%
458 1021 10/11/1989 2773.36
458 102
-----------------------------------------------------------------------------
53 7/12/1990 2969.8
+17.4% 973 540 7/17/1990 2999.75 643
877
-----------------------------------------------------------------------------
54 4/15/1992 3353.76 +3.0% 1111 651 4/16/1992 3366.50 805 898
----------------------------------------------------------------------------
55 4/21/1992 3343.25
+2.7% 782 937 4/21/1992 3343.25
782 937
-----------------------------------------------------------------------------
56 10/17/1994 3923.93 +5.5%
1057 1129 10/17/1994 3923.93 1057 1129
-----------------------------------------------------------------------------
57 4/22/1997 6833.59 -4.9% 1536 971 4/23/1997 6812.72
1149 1359
-----------------------------------------------------------------------------
58 7/8/1998
9174.97 +16.8% 1759 1240 7/9/1998 9089.78 1217 1716
-----------------------------------------------------------------------------
59 9/23/1998 8154.41
+6.4% 2377 800 9/24/1998 8001.99 1093 2042
-----------------------------------------------------------------------------
60 8/17/1999 11117.07 +6.4%
1845 1150 8/18/1999 10991.37 1195 1799
-----------------------------------------------------------------------------
61 12/10/1999 11224.70 +2.3%
1554 1482 12/13/1999 11192.59 1230 1847
----------------------------------------------------------------------------
62 12/28/1999 11476.71 +4.5% 1557 1522 1/3/2000 11257.51 1079 2140
---------------------------------------------------------------------------
63 4/11/2001 10013.46 +12.5% 1160 1917 4/11/2001 10013.46 1160 1917
-----------------------------------------------------------------------------
64 10/10/2001 9240.86 -0.2% 2259 876 10/12/2001 9344.16 1275 1996
-----------------------------------------------------------------------------
65 2/26/2002 10115.26 +19.0%
1799 1334 3/12/2002 10632.35 1539 1616
5% higher
-----------------------------------------------------------------------------
66 5/17/2002 10353.08 +20.9%
1735 1424 5/20/2002 10229.50 1197 1942
-----------------------------------------------------------------------------
67 2/20/2004 10619.03 +6.1%
1170 2089 2/20/2004 10619.03 1170 2089
-----------------------------------------------------------------------------
68 5/5/2006 11577.74 +4.9%
2449 853 5/9/2006 11639.77
1639 1683
-----------------------------------------------------------------------------
69 7/17/2007 13971.55 +4.9%
1369 1898 7/17/2007 13971.55
1369 1898
-----------------------------------------------------------------------------
70 12/7/2007 13625.58 +3.4%
1649 1615 12/11/2007 13432.77
534 2759
-----------------------------------------------------------------------------
71 3/24/2008 12548.64 +9.3%
2604 628 3/26/2008 12422.86
1346 1826
-----------------------------------------------------------------------------
72 4/2/2008 12608.92 +9.7% 1859 1236 4/8/2008 12576.44 1325 1816
-----------------------------------------------------------------------------
73 7/23/2008 11632.38
+6.1% 1997 1214 7/24/2008 11349.28
609 2600
-----------------------------------------------------------------------------
74 7/30/2008 11583.69 +5.8%
2112 1065 7/31/2008 11378.02 1206 1960
-----------------------------------------------------------------------------
75 11/13/2009
10270.47 +0.9% 2206 813 11/17/2009 10437.42
1374 1660
-----------------------------------------------------------------------------
76 6/17/2010 10434.17 +6.3%
1525 1545 6/17/2010 10434.17
1525 1545 -20
-----------------------------------------------------------------------------
77 7/26/2010 10542.43 +2.6%
2472 602 7/27/2010 10537.69 1355 1716
-----------------------------------------------------------------------------
78 8/9/2010
10698.75 +4.0% 2215 859 8/10/2010 10644.25 841 2237
-----------------------------------------------------------------------------
79 12/5/2011 12097.83
????
====================================================================================
OLDER HOTLINES
====================================================================================
12/7/1941 - Remember
This Day of Infamy and Terrible Sacrifice
12/7/2011 DJI = 12196 +46 la/ma=
1.029 21-dma ROC= .129 P= -35 ( -6 ) IP21=-.027 V= -
68 OP= .103
SELL S9 versus Santa Claus
A January Top Is Most Likely
The Sell S9 Still Has Not Been Clinched.
The QQQ has been acting much weaker than the
DJI.
The cases of December S9s are too few to be super-confident of the Sell S9 right now..
Decembers tend (2 of 3) to bring support
and make bigger declines wait until the next year.
But 2007 showed we can't count on that.
Breaks in the A/D Line uptrend
and Opening Power uptrend, as well as
"clinching", have not yet occurred.
I suspect another big 8% to 12% decline
will not start in earnest until January.
After the new year starts, be very
careful. With Democrats in the White House,
the stock market most often shows first
quarter weakness.
Though waiting for the clinching (more than 15
down than up on NYSE at the close on the
day of the Sell S9 or on subsequent closes
until there is a reversing Buy) achieves
a higher price only 40% of the time compared to
selling on the S9, it is still possible
now for a price breakout above the flat 11250
resistance to occur. That would send prices
up smartly. Similar breakouts occurred in
June 1987 and February 2002 while S9s were
waiting for clinching. In 1987 prices
went 5% higher. In 2002 they rose 5% higher before
clinching.
Though the Opening Powers broke their steep
uptrends Wednesday, the Closing
Powers for the DIA and SPY rose slightly above
their declining downtrends and appear
to be at key pivot (or inflection) points where
they could spring either way. While we
wait, our Stocks' Hotline has taken twice as many short positions as long
ones among
the extreme and "bullish" CLosing Power
MAXCP and MINCP stocks.
Historically, the DJI tends to turn strongly up near
December 17th, by the end of next week.
It might seem that the Sell S9 is running out of
time. But in 2007, the DJI peaked on December 10th
and quickly formed a head/shooulders pattern in the
rest of December and then sold off badly.
BREADTH
STATISTICS:
53(+15) MAXCP stocks Bullish MAXCP Stocks
67(-60) MINCP stocks Bearish MINCP Stocks Bearish
MAXCP stocks are those showing
Tiger Closing Power making new highs.
This suggests heavy Professional Buying. Applying the Tiger Power Ranker's
"bullish" to the MAXCP stocks find those with heavy insider buying and
institutional accumulation. Bearish MINCP stocks show the opposite.
Also use the BOTHUPs condition with MAXCPs and BOTHDOWNS MINCPS.
13 new highs on NASDAQ. 22 new lows on NASDAQ
BEARISH
52
new
highs NYSE 4 new lows on NYSE BULLISH
12/7//2011 ===> See Key Peerless TigerSoft
Index Charts: Industry Groups and ETFs
DIA
SPY
QQQ DJIA-Peerless TigerDJI TigerSPY TigerQQQ
GLD SLV Crude
12/7/2001 ===> DAILY Trading 3 Sample Stocks using Closing
Power trend-changes:
BREADTH STATISTICS:
12/6/2001 ===> DAILY Trading 3 Sample Stocks using Closing
Power trend-changes:

There is another negative factor. That is the extent to which computerized
trading has produced the rally.
When you look at the SP-500 stock, you see how uniformly high all their tradin volumes
seem to be.
Computers are now tending to rush the stock market up a lot one day and then drive it down
the next.
This weakens the argument that breadth today was so good that we should wait.
All in all, we might want to wait for the Sell S9 to be clinched. But the case for
this is not so clear
or one-sided. Accordingly, we will take five or six Bearish MINCP Stocks short positions tomorrow
and sell most of the long positions in the Bullish MAXCP Stocks we own.
The shadows from
the December 2007 experience are still too dark. It may be that the decline will be
only a short-term
one, perhaps just to the rising 21-day ma of the DJI. But we have CLosing Power on
our side. And that
the CP downtrends now suggest Professionals have turned bearish, as does the relatively
high number
of MINCP stocks and low number of MAXCP stocks. .
BREADTH STATISTICS:
36(-14) MAXCP stocks Bullish MAXCP Stocks
145(+25) MINCP stocks Bearish MINCP Stocks
Bearish
MAXCP stocks are those showing
Tiger Closing Power making new highs.
This suggests heavy Professional Buying. Applying the Tiger Power Ranker's
"bullish" to the MAXCP stocks find those with heavy insider buying and
institutional accumulation. Bearish MINCP stocks show the opposite.
Also use the BOTHUPs condition with MAXCPs and BOTHDOWNS MINCPS.
34 new highs on NASDAQ. 18 new lows on NASDAQ
BULLISH
48 new
highs NYSE 6 new lows on NYSE BULLISH
12/5//2011 ===> See Key Peerless TigerSoft
Index Charts: Industry Groups and ETFs
DIA
SPY QQQ DJIA-Peerless TigerDJI TigerSPY TigerQQQ
GLD
SLV
Crude
12/5/2001 ===> DAILY Trading 3 Sample Stocks using Closing
Power trend-changes:
NEM, SSRI (Silver) and PAAS (Silver) are in CP
downtrends now.
This is updated each night for a
while to show new users how one might trade
some volatile precious metals'
stocks simply using Closing Power.
12/ 5 / 2001 ===>
Closing Power (CP) Status Report: KEY ETF CHARTS:
The ETFs CPs are now in
Down-trends. This is short-term
BEARISH
Opening Powers are rising steeply. When
the Opening Power uptrend is
violated, a retreat should follow.
DIA broke CP UPtrend - Any close of
more than 0.60 ABOVE the Opening
to restore the CP UPtrendline. Meanwhile, the CP is now bwlow its
21-dma
and shows a falling CP trend.
SPY has a CP DOWNtrend- Any close of more than 0.98 ABOVE the Opening
will break the CP DOWNtrendline. The CP is now below its rising 21-dma.
Opening Power is in a steep Uptrend...
QQQ has a CP DOWN-trend Any close of more than 0.40 ABOVE the Opening
will break the CP UPtrendline. The CP is now below its rising 21-dma.
Opening Power is tising steeply.
GLD
has a CP UPtrend - Any close of more than 0.11 BELOW the Opening
will break the CP UPtrendline. The CP is now above its rising
21-dma.
NEW SELL S9 TODAY.
Only 3 December S9s since 1933
Other than the fact that in our cases
the ratio of NYSE advances to declines
is a very positive 3.5 to 1, the key values now fall within the ranges of the
3 earlier December S9s.
S9/S12 12/6/1956 492.7 +4.6% 4700 2/5/57 B4
NYSE advances 524 declines 428
This would have been clinched with NYSE declines being greater than"
advances two trading days later with the DJI at 493.2
LA/MA ANNROC P IP21 V-I Opct
1.029 -.067 -83 -.078 -316 .143 1% paper loss. Reversing.
DJI rallied to 496.00 at end of December and then fall below
the lower band. Santa Claus Rally delayed the decline to the lower band.
--------------------------------------------------------------------------------------------------------------------------------------------------------------------------------------
S7 S9 12/ 28/ 1987 1942.97 +1.6% 1942.97 12/28/87 B9
NYSE advances 283 declines 1392
This would have been clinched with NYSE declines being greater than"
advances the same day.
LA/MA ANNROC P IP21 V-I Opct
1.021 -.025 -37 .132 -8 .157
This was a dubious Sell because of cross-currents from tax loss
selling at the end of the year and because the Accum.Index readings
were a very positive +.132 on this day. The DJI did not peak
until early January.
-------------------------------------------------------------------------------------------------------------------------------------------------------------------------------------
S9 12/ 7/ 2007 13625.58 +12.6% 11899.69 3/7/08 B8
NYSE advances 1649 declines 1615
This would have been clinched with NYSE declines being greater than"
advances the two trading days later with the DJI at 13432.77
LA/MA ANNROC P IP21 V-I Opct
1.034 .295 -15 -.035 -105 .032
DJI fell below the lower band. Santa Claus Rally had little delaying effect
on the decline.
------------------------------------------------------------------------------------------------------------------------------------------------------------------------------------
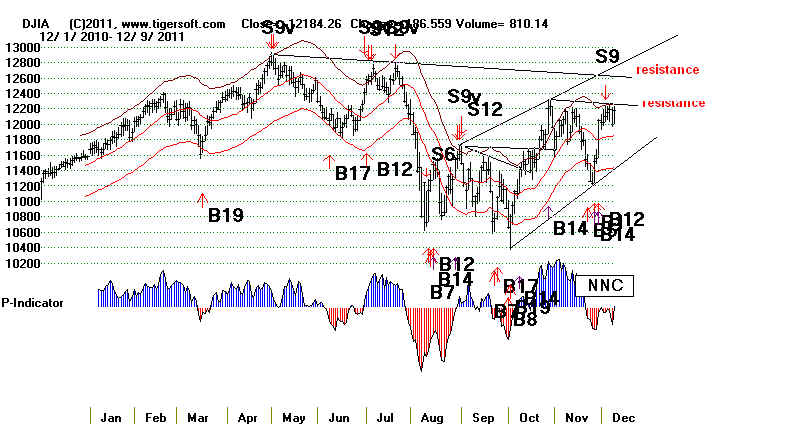
S9 12/ 5/ 2011 12097.83
NYSE advances 2377 declines 685
LA/MA ANNROC P IP21 V-I Opct
1.022 .054 -62 -.006 -77 .006
DJI fell below the lower band. Santa Claus Rally had little delaying effect
on the decline.
===============================================================================
OLDER HOTLINES
===============================================================================
12/2/2011 DJI = 12019 -1 la/ma= 1.016 21-dma
ROC= .185 P= -62 (-65) IP21=+.048 V=
- 74 OP= .014
BREADTH STATISTICS:
50(-37) MAXCP stocks Bullish MAXCP Stocks
NGLS, TMF, PCYS, SPPI,
120(+39) MINCP stocks Bearish
MINCP Stocks Bearish
TBT SYUT AIXG NUVA TZOO NAT GES HSP RWT
FTR SKX
MAXCP stocks are those showing
Tiger Closing Power making new highs.
This suggests heavy Professional Buying. Applying the Tiger Power Ranker's
"bullish" to the MAXCP stocks find those with heavy insider buying and
institutional accumulation. Bearish MINCP stocks show the opposite.
Also use the BOTHUPs condition with MAXCPs and BOTHDOWNS MINCPS.
14 new highs on NASDAQ. 22 new lows on NASDAQ
BEARISH
37 new
highs NYSE 8 new lows on NYSE BULLISH
12/1//2011 ===> See Key Peerless TigerSoft
Index Charts: Industry Groups and ETFs
DIA
SPY QQQ DJIA-Peerless TigerDJI TigerSPY TigerQQQ
GLD
SLV
Crude
12/1/2001 ===> DAILY Trading 3 Sample Stocks using Closing
Power trend-changes:
NEM, SSRI (Silver) and PAAS (Silver) are in CP
downtrends now.
This is updated each night for a
while to show new users how one might trade
some volatile precious metals'
stocks simply using Closing Power.
12/ 1 / 2001 ===>
Closing Power (CP) Status Report: KEY ETF CHARTS:
The ETFs CPs are in
shallow uptrends. This is short-term
slightly BULLISH
DIA has a CP UPtrend - Any close of
more than 1.61 BELOW the Opening
will break the CP UPtrendline. The CP is now above its rising 21-dma.
SPY has a CP UPtrend- Any close of more than 1.16 BELOW the Opening
will break the CP UPtrendline. The CP is now above its rising 21-dma.
QQQ has a CP UPtrend Any close of more than 3.31 BELOW the Opening
will break the CP UPtrendline. The CP is now above its rising 21-dma.
GLD
has a CP UPtrend - Any close of more than 0.11 BELOW the Opening
will break the CP UPtrendline. The CP is now above its rising
21-dma.
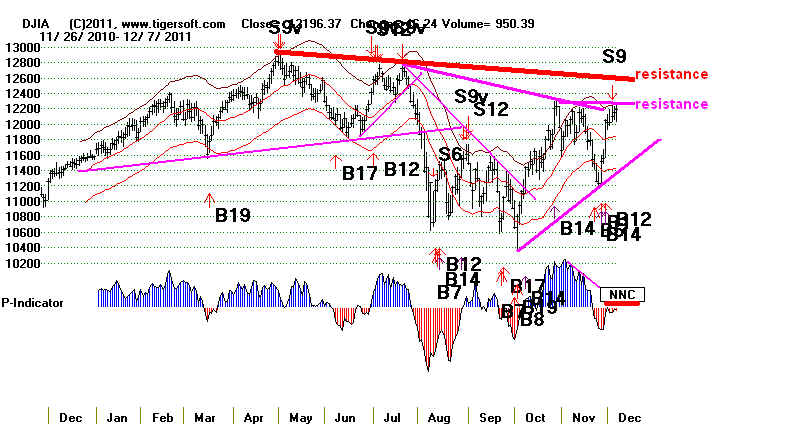
Peerless Multiple Buy
Signals versus 12000-12200 Resistance
December is Reliably Bullish, especially before a Presidential
Year. But first, a pullback seems likely when the CLosing
Power uptrends are broken....
Before the month is out I would expect a challenge of the 12800 high. I do not expect
Obama to do anything to rock the
financial establishment to cause him to be the first
Democrat ever to bring a December marlet
decline in the year before the start of a
Presidential Election year. But
first, there may have to be a retreat when the Closing
Power uptrend (above) is
violated.... The Big Banks and Military stocks have done well
in this rally. Home repairs and
eating inexpensively have helped HD and MCD make
new highs. Seasonality is neutral
for the next two weeks and is then very bullish.
DJIA is at resistance and near the upper band.


The P-Indicator has turned negative
as the DJI approaches the upper band. The
NYSE A/D Line has slipped back from
its falling 21-day ma. The number of stocks
that Professionals are
pushing to new highs has fallen considerably below the
number they are forcing down.
Year-end tax loss selling works against these stocks.
In the chart above, you can see Peerless recently gave a Buy B12. More volume
is
probably needed to get the DJI past the
12000-12000 resistance. But the selling is not
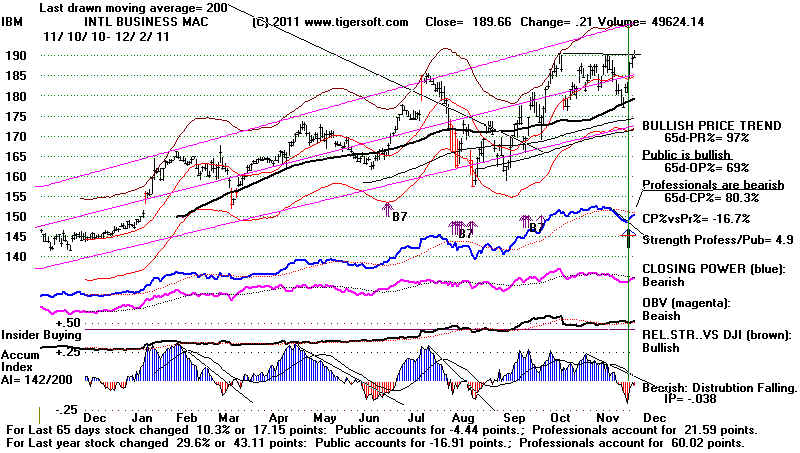
aggressive. Watch IBM. As the
highest priced DJI stock by far, it has much more
power tp move the DJI. Right now ,
at the old highs its Accumulation Index is negative
(showing institutional distribution) and
it shows much more Public than Professional
Buying.
A B12 is at this stage in a 30 month
advance (as opposed to when it is ending a bear market)
considered much less powerful. In
the present case, it is based on only two really good
breadth days. which is something the
ubiquitous computerized buying can easily
produce in an era of Fed guaranteed low
intrest rates. What is less sure is that
this buying will be sufficient to reverse
the many downtrends in non-dovident,
secondary stocks and get the DJI past all
the resistance overhead. Add to that,
B12s have not been very powerful
recently. The Buy B12 does make it harder to get
a Peerless sell signal for the next two
weeks, after which point a bullish Santa
Claus rally usually occurs. We will
tell you if a Sell Signal would be given here if the
B12 is taken out of the picture.
Foreign, Chinese and Financial stocks
have been among the weakest groups until the recent
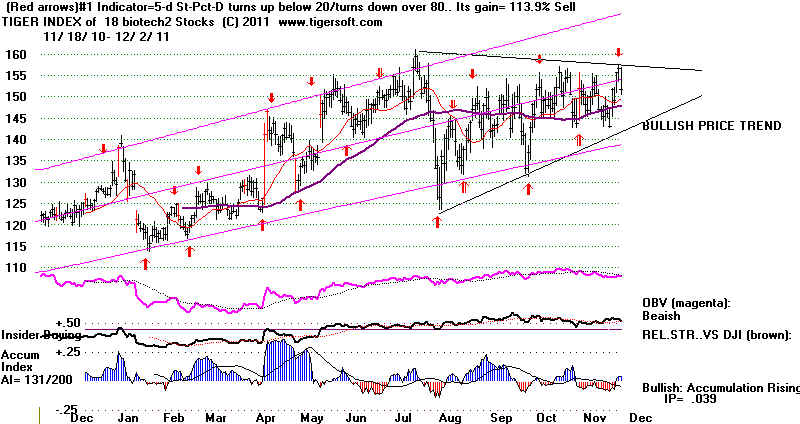
rally. I would still prefer to buy
selected Biotechs because their trend has been up all year.
The 18 stocks that make my BIO2 group
which is charted below are ACOR, ALXN, AMGN, BIIB, CELG,
CPHD, GILD, ILMN, JAZZ, MYL, XVNT,
TEVA, VRTX, CRUS/ I recently added BMRN, ITMN
and REGN because the Fidelity Biotech
Fund (FBIOX) has been positions in them. A
new high in this
group would certainly be bullish.
====================================================================================
OLDER HOTLINES
====================================================================================
12/1/2011 DJI = 12020 la/ma= 1.017 21-dma ROC= .365
P= 2 (+72) IP21=+.093 V= -47 OP= .104
BREADTH STATISTICS:
87(-10) MAXCP stocks Bullish MAXCP Stocks BULLISH
81(-12) MINCP stocks Bearish MINCP Stocks
MAXCP stocks are those showing
Tiger Closing Power making new highs.
This suggests heavy Professional Buying. Applying the Tiger Power Ranker's
"bullish" to the MAXCP stocks find those with heavy insider buying and
institutional accumulation. Bearish MINCP stocks show the opposite.
Also use the BOTHUPs condition with MAXCPs and BOTHDOWNS MINCPS.
14 new highs on NASDAQ. 22 new lows on NASDAQ
BEARISH
37 new
highs NYSE 8 new lows on NYSE BULLISH
12/1//2011 ===> See Key Peerless TigerSoft
Index Charts: Industry Groups and ETFs
DIA
SPY QQQ DJIA-Peerless TigerDJI TigerSPY TigerQQQ
GLD
SLV
Crude
12/1/2001 ===> DAILY Trading 3 Sample Stocks using Closing
Power trend-changes:
NEM, SSRI (Silver) and PAAS (Silver) are in CP
downtrends now.
This is updated each night for a
while to show new users how one might trade
some volatile precious metals'
stocks simply using Closing Power.
12/ 1 / 2001 ===>
Closing Power (CP) Status Report: KEY ETF CHARTS:
The ETFs CPs are in
shallow uptrends. This is short-term
slightly BULLISH
DIA has a CP UPtrend - Any close of
more than 1.61 BELOW the Opening
will break the CP UPtrendline. The CP is now above its rising 21-dma.
SPY has a CP UPtrend- Any close of more than 1.16 BELOW the Opening
will break the CP UPtrendline. The CP is now above its rising 21-dma.
QQQ has a CP UPtrend Any close of more than 3.31 BELOW the Opening
will break the CP UPtrendline. The CP is now above its rising 21-dma.
GLD
has a CP UPtrend - Any close of more than 0.11 BELOW the Opening
will break the CP UPtrendline. The CP is now above its rising
21-dma.
Peerless Show Multiple Buy Signals
in the Bullish Month of December!
Expect a breakout above 12200 and a challenge of the 12800 high.
Do not expect Obama to do anything to
rock the financial establishment.
====================================================================================
12/1/2011
====================================================================================
11/30/2011 DJI = 12045.68 la/ma= 1.02 21-dma ROC=
.091 P= 71 (+201) IP21=+.056 V=
-93 OP= .082
BREADTH STATISTICS:
97(+56) MAXCP stocks Bullish MAXCP Stocks BULLISH
93(-61) MINCP stocks Bearish MINCP Stocks
MAXCP stocks are those showing
Tiger Closing Power making new highs.
This suggests heavy Professional Buying. Applying the Tiger Power Ranker's
"bullish" to the MAXCP stocks find those with heavy insider buying and
institutional accumulation. Bearish MINCP stocks show the opposite.
Also use the BOTHUPs condition with MAXCPs and BOTHDOWNS MINCPS.
38 new highs on NASDAQ. 32 new lows on NASDAQ
BULLISH
52 new
highs NYSE 11 new lows on NYSE BULLISH
11/30/2011 ===> See Key Peerless TigerSoft
Index Charts: Industry Groups and ETFs
DIA
SPY QQQ DJIA-Peerless TigerDJI TigerSPY TigerQQQ
GLD
SLV
Crude
11/30/2001 ===> DAILY Trading 3 Sample Stocks using Closing
Power trend-changes:
NEM is on a New Buy...
SSRI (Silver) and PAAS (Silver) broke their CP downtrends today,
This is updated each night for a
while to show new users how one might trade
some volatile precious metals'
stocks simply using Closing Power.
11/30/2001 ===>
Closing Power (CP) Status Report: KEY ETF CHARTS:
The ETFs CPs are in
shallow uptrends. This is short-term
slightly BULLISH
DIA has a CP UPtrend - Any close of
more than 1.2 BELOW the Opening
will break the CP UPtrendline. The CP is now above its rising 21-dma.
SPY has a CP UPtrend- Any close of more than 1.19 BELOW the Opening
will break the CP UPtrendline. The CP is now above its rising 21-dma.
QQQ has a CP UPtrend Any close of more than 0.55 BELOW the Opening
will break the CP UPtrendline. The CP is now above its rising 21-dma.
GLD
has a CP UPtrend - Any close of more than 0.20 ABOVE the Opening
will break the CP UPtrendline. The CP is now above its rising
21-dma.
Hooray!
I think we still have to believe
the Peerless Buys, the bullish seasonality and the breaks in
the steep Closing Power downtrend,
The DJI's downtrending resistance line is at 12200s.
This is also where the 3.5% upper
band is. Today's volume rose sharply. It will need to stay
high to eat up the overhead supply
of stock up to 12800 on the DJI. But the good news is
breadth was so good it brought a
Buy B12. In on-going bull markets, B12s average aboout
8% gains in the DJI before being
reversed. Here that would mean a run to 13000. Buy B12s
do suppress some Peerless Sell
signals at the upper band for two weeks. So 13000 is a
possibility. Do not
underestimate how many stops the Administration and the Fed will
pull out to ramp the market up
before the 2012 Presidential Election Season begins.
Decembers in the Year were up 69%
of the time since 1966. How strongly up depends in
part on whether it was the Year
just before A Presidential Election Year. As we political
cynics might expect, Decembers in
the year before a Presidential Election rose 20 times
since 1915 and fell only 4 times,
each while a Republican was President. Obama would become
the first Democratic President
since before 1900 to allow the DJI to fall in December if he
did not do all he can to keep the
current rally rising.
December Average
DJI Gain since 1915
Years before
The Presid. Election Year
2.0%
-------------------------------------------------------------------
Mid-Term Year
1.4%
-------------------------------------------------------------------
Year after
The Presidential Year
1.15%
-------------------------------------------------------------------
The Presidential Year
1.0%
-------------------------------------------------------------------
Republicans controlled the
White House in Decembers before a Presidential Election
in the 4 cases when the DJI
declined in the December before a Presidential Election
Year.
December DJI
2007
13371.72 to 13264.82
2003
9782.46 to 10425.04
1991
2894.68 to 3168.83
1987
1833.55 to 1938.83
1983
1276.02 to 1258.64
1975
860.67 to 852.41
1971
831.34 to 890.20
1959
659.10 to 679.30
1955
483.30 to 488.40
1931
93.90 to 77.90
1927
198.20 to 200.70
1923
92.30 to 95.50
Democrats
1999
10877.81 to 11497.12
1995
5074.49 to 5117.12
1979
822.35 to 838.74
1967
875.81 to 905.11
1963
750.50 to 763.00
1951
261.30 to 269.20
1947
179.50 to 181.20
1943
129.60 to 136.20
1939
145.70 to 149.90
1935
142.30 to 144.10
1919
103.70 to 107.20
1915
96.70 to 99.20
.
====================================================================================
OLDER HOTLINES
====================================================================================
11/29/2011 DJI = 11556 +33 la/ma= .979 21-dma ROC= -.68 P= -269 (-11) IP21=-.052 V= -199 OP= -.058
BREADTH STATISTICS:
41 (-1) MAXCP stocks Bullish MAXCP Stocks
158 (-5) MINCP stocks
Bearish MINCP Stocks
BEARISH
MAXCP stocks are those showing
Tiger Closing Power making new highs.
This suggests heavy Professional Buying. Applying the Tiger Power Ranker's
"bullish" to the MAXCP stocks find those with heavy insider buying and
institutional accumulation. Bearish MINCP stocks show the opposite.
Also use the BOTHUPs condition with MAXCPs and BOTHDOWNS MINCPS.
11 new highs on NASDAQ. 41 new lows on NASDAQ
BEARISH
12 new
highs NYSE 22 new lows on NYSE
BEARISH
11/29/2011 ===> See Key Peerless TigerSoft
Index Charts: Industry Groups and ETFs
DIA
SPY QQQ DJIA-Peerless TigerDJI TigerSPY TigerQQQ
GLD
SLV
Crude
11/29/2001 ===> DAILY Trading 3 Sample Stocks using Closing
Power trend-changes:
NEM is on a Sell but is testing its 65-day ma
SSRI (Silver) and PAAS (Silver) broke their CP downtrends today,
This is updated each night for a
while to show new users how one might trade
some volatile precious metals'
stocks simply using Closing Power.
11/29/2001 ===>
Closing Power (CP) Status Report: KEY ETF CHARTS:
The ETFs CPs are in
shallow uptrends. This is short-term
slightly BULLISH
DIA is in an UPtrend - Any close of
more than 2.44 BELOW the Opening
will restore old broken CP UPdowntrendline. The CP is at its rising
21-dma.
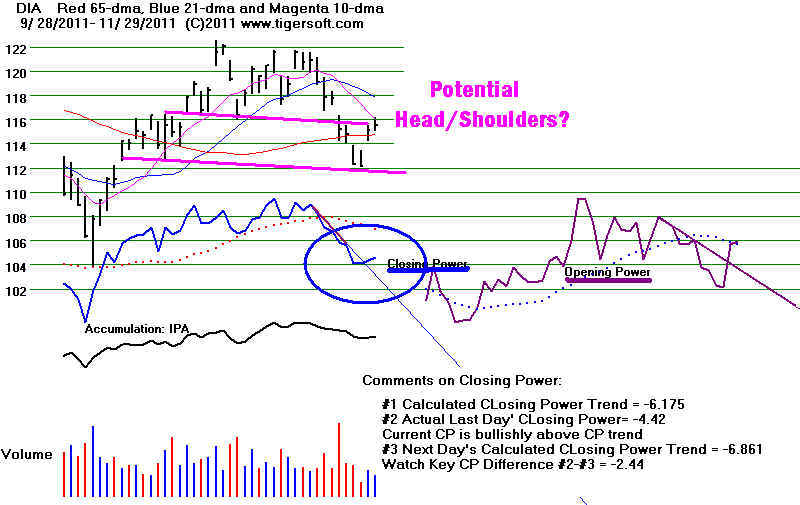 SPY is in an UPtrend- Any close of more than 2.28 BELOW the Opening
will restore the old CP-Downtrendline. The CP is BELOW its
rising 21-dma.
Opening Power is at its 21-day ma
QQQ is in an UPtrend Any close of more than 1.43 BELOW the Opening
will restore the old CP-Downtrendline. The CP is BELOW its
rising 21-dma.
Opening Power is at its 21-day ma
GLD
broke its CP downtrend - It will take a close of 0.52 ABOVE the Opening
to break the CP
downtrendline. The Opening
Power is back above its ma
PEERLESS
BUY B1 YESTERDAY.
I think we have to believe the
Peerless Buys, the bullish seasonality and the breaks in
the steep Closing Power downtrends. With
B1s there is a 40% chance of a new
low about 3% lower than yesterday's
close. Hold current long positions. I would "bank"
on the Fed doing all it can to
protect the big US banks from suffering another financial
collapse. They will do this
behind the scenes as much as possible, to avoid becoming
the center of political contention
in a Presidential Election year. They know that a rising stock market
tends to silence critics.
Accordingly, I still think December may surprise the many bears.
Hedging by shorting BAC, GS and JPM
is suggested if the EURO makes a new closing low below 1.31.
See the chart further below.
The DJI futures are only
down 36 at this writing...

There is more and more evidence
pointing to US big banks' writing enormous sums of
credit default swaps on European
debt. To do this they borrowed hundreds of billions from the
Federal Reserve at an interest rate
just above 0%. The Federal Reserve loaned them these vast
sums with no restrictions, such as
that the money had to be used to make loans in the US
rather than back the EURO.
The Euro seems to me a losing proposition. The poorer regions
need fiscal and monetary
independence, by my reckoning; so that their currency's decline will boost
tourism and their exports, thereby
providing a self-correcting mechanism. The banks who
have loaned them a trillion Euros
cannot stand this idea. So, the taxpayers in northern Europe
and the US are being positioned to
again bail out the big banks. My belief in the inevitability
of the collapse of the current Euro
is held by many others. Predictably, the mainstream media
in the US has close to no clue
about the connection between the Euro's potential collapse and
what it will mean for the US.
11/30/2011 - Euro
collapse looms as bailout plan sinks
Prepare
for riots in euro collapse, Foreign Office warns
French
Bank: Euro Collapse 'Inevitable'
Euro
collapse: Ron Paul's prediction-
Soros:
Euro on Verge of Major Collapse - 'Inevitable'
Roubini: The
Euro Is Doomed.
America is again in danger
because of Wall Street banks. JPMorgan Chase & Co. (JPM)
and Goldman Sachs Group Inc. (GS), are among the
world’s biggest traders of credit default derivatives.
They have disclosed to their
shareholders that they have sold protection on more than $5 trillion of debt
globally. They will not
say how much of that was issued by Greece, Italy, Ireland, Portugal and Spain..
Source.
Weakness in the Euro to the
point of a new low below 1.32 will likely bring another drop
by US banks. At some
point, they could again become insolvent. Even Congress may not dare to
bail them out again.
The bailout will likely come from the Federal Reserve. Nothing prevents this.
And nothing now requires the
Fed to be transparent.
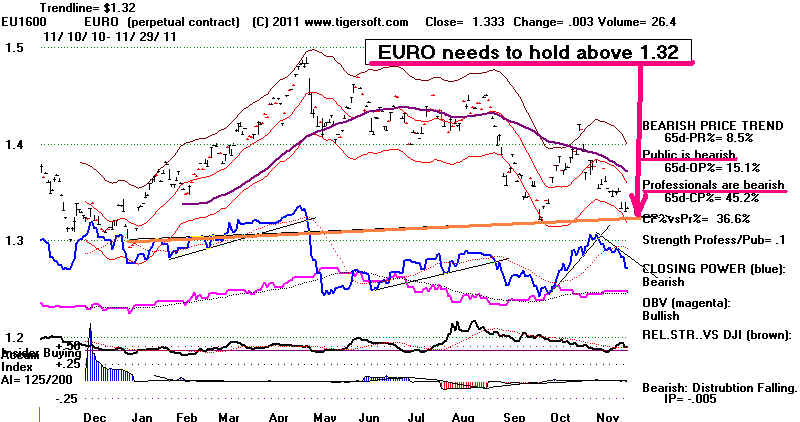 |
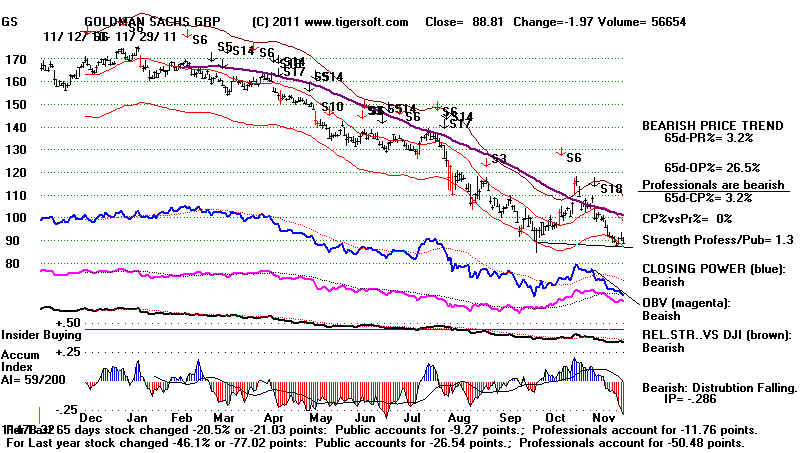 |
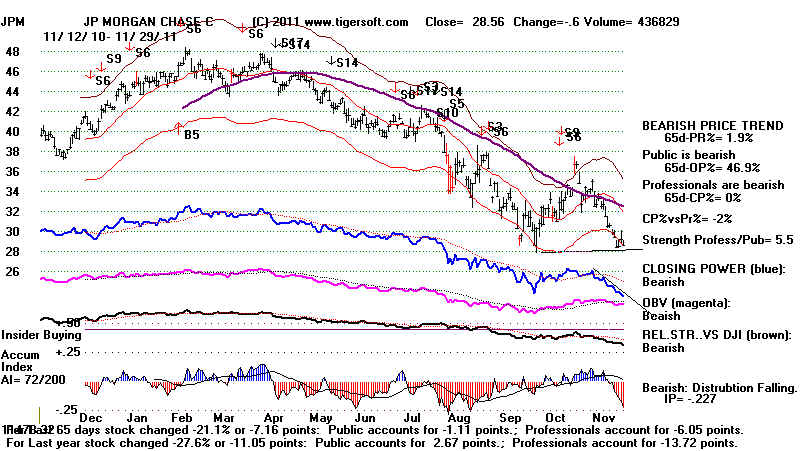 |
2 new Tiger Blogs today. Neither story inspires much public confidence in Wall
Street.
11/29/2011 American
Airlines has just filed for Bankruptcy.
No Tiger trader should
ever have considered buying this stock. It bore all the most bearish signs.
How Former Secretary
Paulson Secretly Aided Some of Wall Street's Biggest Professional Short Sellers
with non-public information in July 2008 about the dire financial condition of Fannie Mae
and Fredie Mac.
Using TigerSoft and Peerless, we saw the resulting Insider Selling and recommended
selling.
The DJI fell 30% in next 4 months.
=================================================================================
OLDER HOTLINES
=================================================================================
11/28/2011 DJI = 11523 +291 la/ma= .974 21-dma ROC= -.688 P= -269 (-11) IP21=-.052 V= -199 OP= -.058
BREADTH STATISTICS:
42 (+26) MAXCP stocks Bullish MAXCP Stocks
163 (+1) MINCP stocks
Bearish MINCP Stocks
BEARISH
MAXCP stocks are those showing
Tiger Closing Power making new highs.
This suggests heavy Professional Buying. Applying the Tiger Power Ranker's
"bullish" to the MAXCP stocks find those with heavy insider buying and
institutional accumulation. Bearish MINCP stocks show the opposite.
Also use the BOTHUPs condition with MAXCPs and BOTHDOWNS MINCPS.
8 new highs on NASDAQ. 28 new lows on NASDAQ
BEARISH
12 new
highs NYSE 14 new lows on NYSE
BEARISH
11/28/2011 ===> See Key Peerless TigerSoft
Index Charts: Industry Groups and ETFs
DIA
SPY QQQ DJIA-Peerless TigerDJI TigerSPY TigerQQQ
GLD
SLV
Crude
11/28/2001 ===>
DAILY Trading 3 Sample Stocks using
Closing Power trend-changes:
NEM is on a Sell but is testing its 65-day ma
SSRI (Silver) and PAAS (Silver) broke their CP downtrends today,
This is updated each night for a
while to show new users how one might trade
some volatile precious metals'
stocks simply using Closing Power.
11/28/2001 ===>
Closing Power (CP) Status Report: KEY ETF CHARTS:
The ETFs CPs are in
uptrends. This is short-term
BULLISH
DIA is in an UPtrend - Any close of
more than 1.53 BELOW the Opening
will to break the new CP UPtrendline. The CP is at its rising 21-dma.
SPY is in an UPtrend- Any close of more than 1.58 BELOW the Opening
will break the new CP-UP-trend. The CP is BELOW its rising
21-dma.
Opening Power still shows a DOWNtrend.
QQQ is in an UPtrend Any close of more than 1.29 BELOW the Opening
will break the new CP-UP-trend. The CP is BELOW its rising
21-dma.
Opening Power still shows a DOWNtrend.
GLD
broke its CP downtrend - It will take a close 0.43 BELOW the Opening
to restore the CP
downtrendline. The Opening
Power is below its ma
start.
PEERLESS GIVES NEW BUY B1 TODAY.
I think we have to believe the Peerless
Buys, the bullish seasonality and the breaks in
the steep Closing Power downtrends.
I would cover remaining short sales and Buy some
ot the bullish or very high Accumulation
MAXCP stocks, DIA might also be bought.
IBM is the highest Power Ranked DJI-30
stock. It is rebounding from its rising
65-day ma. Its CP needs to turn up
to make it a Buy here. That will require a closing
above the opening. I would also buy
GILD if it can break above 40 and its 65-day ma.
GILD is now the owner of the world's most
effective treatment for hepatitis by vittue
of buying out VRUS. the charts of
IBM and GILD ae further below.
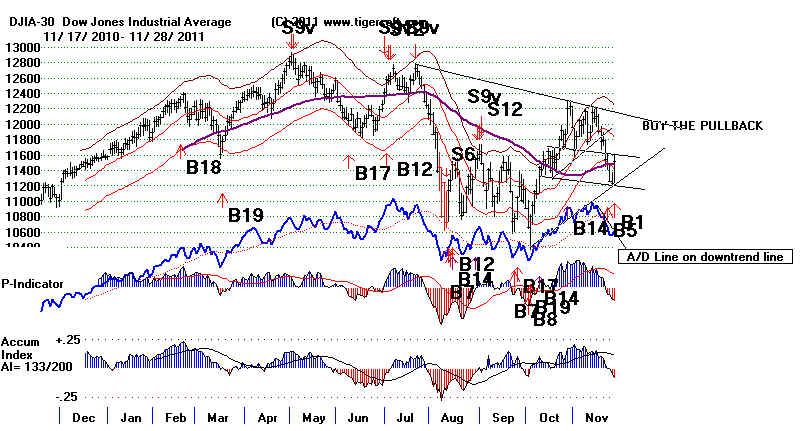
The Futures show the DJI up again today. The Buy
B1 rides
on the bullish seasonality of the end of November that
we have
been talking about here. It occurs on selected
20-day Stochastic
Buys at this time of year. There have only
been five previously.
3 of the 5 brought gains of more than 10%.
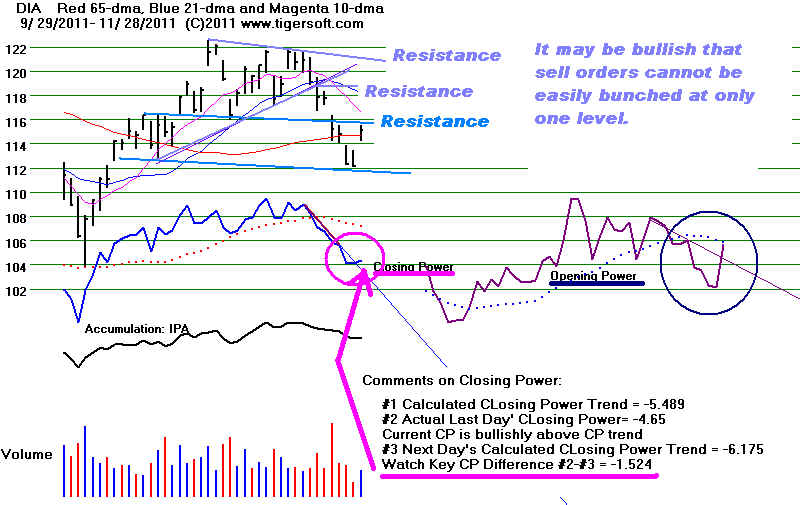
50-Day Stochastic Has Gained 73.6$ on QQQ for
2011
It has been nearly perfect since January. Until it starts
to fail, this system on the QQQ deserves special respect.
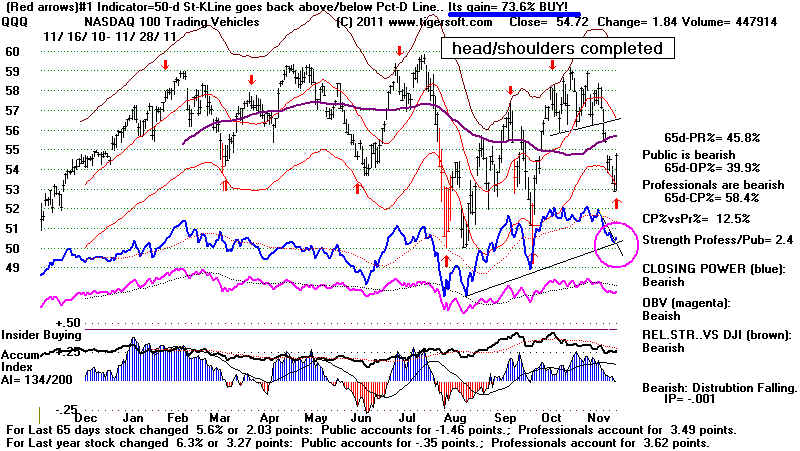
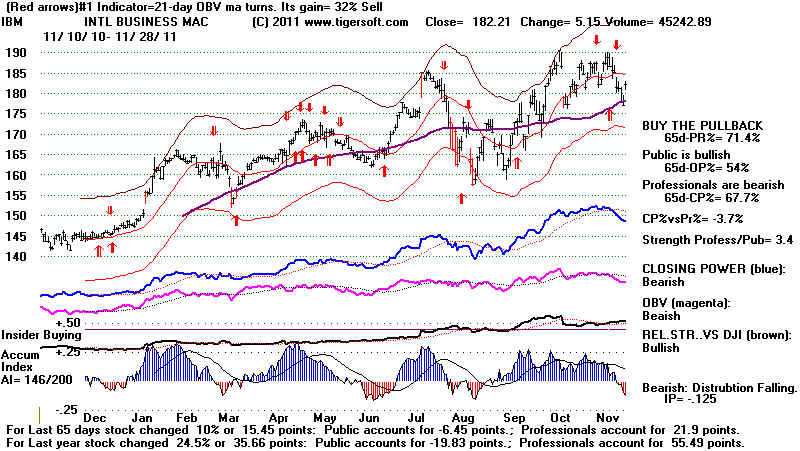
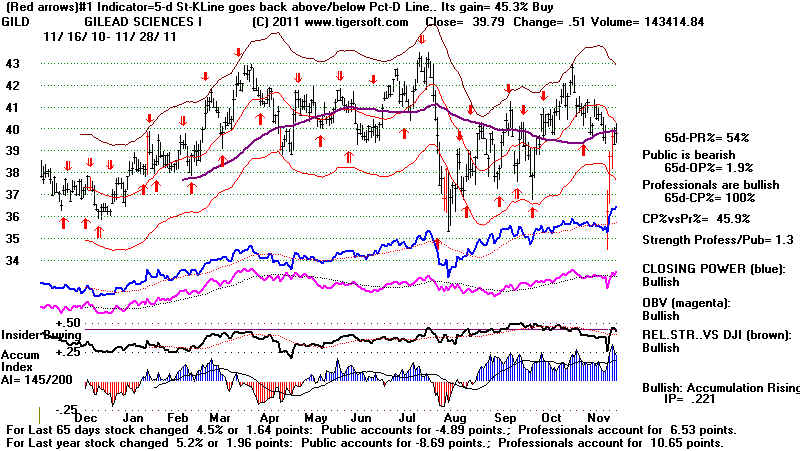
====================================================================================
OLDER HOTLINES
====================================================================================
11/25/2011 DJI = 11232 -26 la/ma= .947 21-dma ROC= -.638 P= -258 (-105) IP21=-.037 V=
-184 OP= -.03
BREADTH STATISTICS:
18 (+2) MAXCP stocks Bullish MAXCP Stocks
162 (+35) MINCP stocks Bearish MINCP Stocks BEARISH
MAXCP stocks are those showing
Tiger Closing Power making new highs.
This suggests heavy Professional Buying. Applying the Tiger Power Ranker's
"bullish" to the MAXCP stocks find those with heavy insider buying and
institutional accumulation. Bearish MINCP stocks show the opposite.
Also use the BOTHUPs condition with MAXCPs and BOTHDOWNS MINCPS.
3 new highs on NASDAQ. 118 new lows on NASDAQ
BEARISH
31 new
highs NYSE 82 new lows on NYSE
BEARISH
11/25/2011 ===> See Key Peerless TigerSoft
Index Charts: Industry Groups and ETFs
DIA
SPY QQQ DJIA-Peerless TigerDJI TigerSPY TigerQQQ
GLD
SLV
Crude
11/25/2001 ===>
DAILY Trading 3 Sample Stocks using
Closing Power trend-changes:
NEM is on a Sell but is testing its 65-day ma
SSRI (Silver) and PAAS (Silver) broke their CP downtrends today,
This is updated each night for a
while to show new users how one might trade
some volatile precious metals'
stocks simply using Closing Power.
11/25/2001 ===>
Closing Power (CP) Status Report: KEY ETF CHARTS:
The CPs are in downtrends
as a result of the CPs minornew low today. This is short-term BEARISH
DIA is in a DOWNtrend - Any close of only 0.10 ABOVE the
Opening
will to break the steeper CP DOWN-trend. The CP is BELOW its rising
21-dma.
Opening Power shows an uptrend that could be broken tomorrow.
SPY is in a DOWNtrend- It will take a close of more than 0.44 ABOVE the
Opening
to break the CP-DOWN-trend. The CP is BELOW its rising
21-dma.
Opening Power shows an uptrend that could be broken tomorrow.
QQQ is in a downtrend
t will take a close of more than 0.36 ABOVE the
Opening
to break the CP-DOWN-trend. The CP is BELOW its rising
21-dma.
Opening Power shows a DOWNtrend.
GLD is in a
downtrend - It will take a close 2.02 ABOVE the Opening
to break the CP
downtrendline. The Opening
Power is below its ma
WEEKLY DJIA: Compare 2007-2008 topping process with 2011.
This year the NYSE A/D Line is much stronger. The 52-week ma is still rising.
This is the time of the year when good rallies often start.
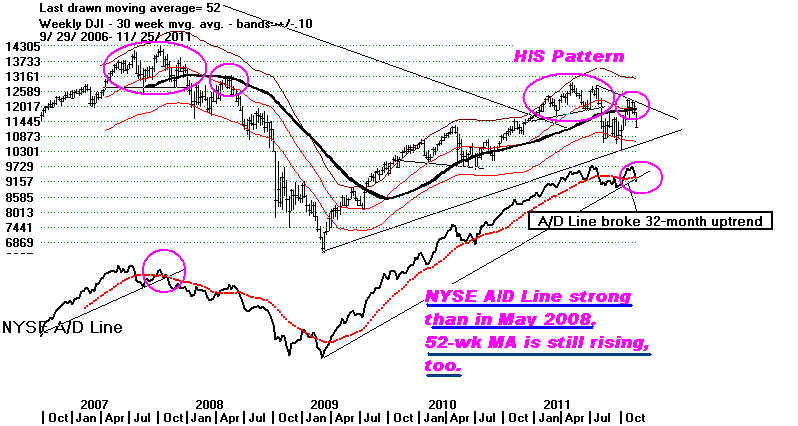
PEERLESS REMAINS ON BUYs.
The Futures show the DJI up 175. That should
easily break the
downtrendline of prices for the
DIA. It also won't take much to
break the Closing Power
downtrends.
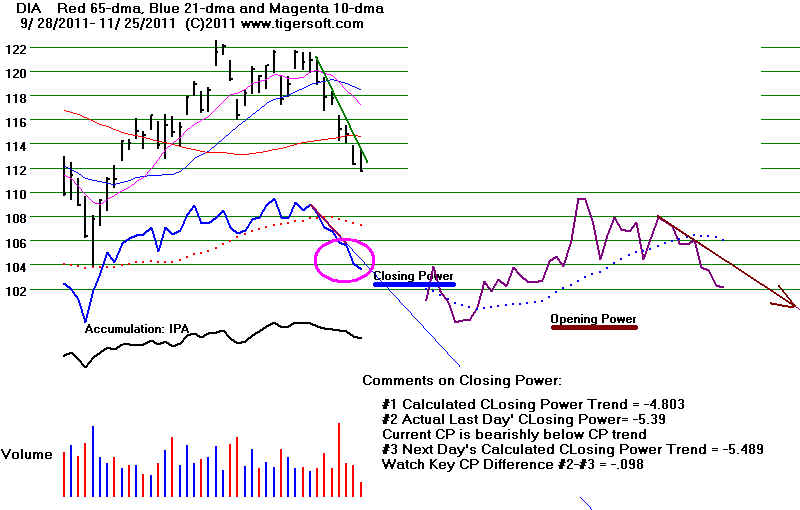
Recent
Buy B5 but
the DJI has broken below the lower band
and the 65-day ma support on the day before and after
Thanksgiving.
A lot of traders, including us, would prefer to just wait for the
market
to stop falling to buy. A breaking of the Closing Power
down-trendlines
should give us a good entry point. If you want to be more
conservative.
wait for now for the NYSE A/D Line to break its trend.
Many
institutions will sit on the sideline now until the DJI gets back
above either its 65-day ma or its 200-day ma. My back-testing
suggests we can be more aggressive. Our Hotline has remained safely
hedged with almost as many bearish MINCP short sales as long
positions. But we should now cover some of these to
lock in nice
profits... Consider buying now stocks with big bulges of
Accumulation,
rising relative strength and Tiger major Buys (B10, B12, B20 and
B24) will get us into stocks that have the highest chance for
big gains when the market does turn up. Study the case of VRUS,
which has just been bought out. Other biotechs may
follow.
See the Bullish MAXCP Stocks for some other ideas. Here are the
charts
of Biotechs showing recent
high Accumulation. When their CLosing
Power downtrends are broken, they should advance nicely.
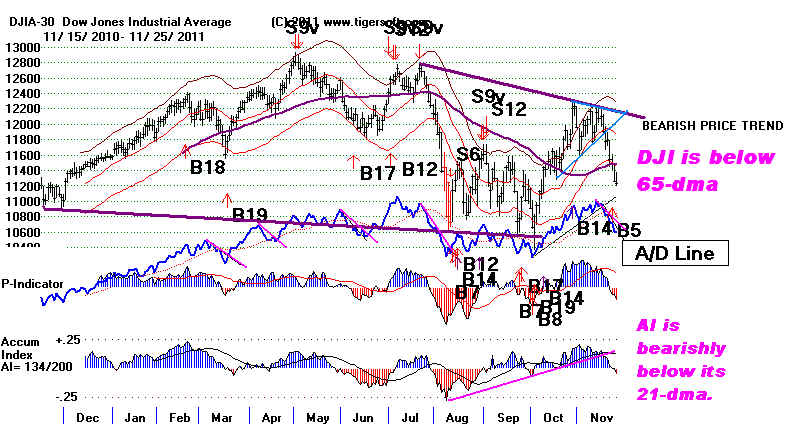
History is Bullish
I tried
to show Thursday that late November and early very December very often
bring very good rallies. In fact,
since the establishment of Thanksgiving on the
fourth Thursday of November in 1939, the DJI
has reversed in 41 of the 72 years
in the last two week of November and the first
week of December. In only 12 cases,
did it keep on declining past December 7th.
the bad news is that so much weakness
as we are now seeing, a DJI drop more than 5%
below the 21-day ma, is associated
with bear markets in the next year.
The breaking of the 65-day with a positive or nearly positive Accumulation
Index,
however, is also a bullish factor. I finished a study this weekend showing that In a
rising market environment since 1929 at this
time of year, having either a P-Indicator
above -64 or the current Accumulation Index
(IP21) above -.034 on the breaking
of the 65-day ma is much more likely to set up
a bottom than bring a further decline.
See http://tigersoft.com/PeerInst/65dma-penet-down-nov.htm
In our case, the IP21 was .001 on the day of
the breakdown. Here are the earlier cases
where the IP21 was between -.034 and +.035 and
the DJI was not in an on-going bear
market.
Date
LA/MA P-I IP21
Drop Subsequently to
low.
11/23/11
.946 -153 .001
?
11/6/1950
.974 -4
.025 Good place to buy
11/4/1983
.976 -180
.018 Good place to buy
11/11/1988
.963 -133 .025 Only 1.7% further decline.
11/15/1991
.967 -20 .027
Only 2.4% further decline.
==================================================================================
OLDER HOTLINES
==================================================================================
11/23/2011 DJI = 11258 la/ma= .946 21-dma
ROC= -.449 P= -153 (-17) IP21=+.001 V= -152 OP= .042
BREADTH STATISTICS:
16 (-29) MAXCP stocks Bullish MAXCP Stocks
127 (-14) MINCP stocks Bearish MINCP Stocks BEARISH
MAXCP stocks are those showing
Tiger Closing Power making new highs.
This suggests heavy Professional Buying. Applying the Tiger Power Ranker's
"bullish" to the MAXCP stocks find those with heavy insider buying and
institutional accumulation. Bearish MINCP stocks show the opposite.
Also use the BOTHUPs condition with MAXCPs and BOTHDOWNS MINCPS.
2 new highs on NASDAQ. 146 new lows on NASDAQ
BEARISH
17 new
highs NYSE 135 new lows on NYSE
BEARISH
11/23/2011 ===> See Key Peerless TigerSoft
Index Charts: Industry Groups and ETFs
DIA
SPY QQQ DJIA-Peerless TigerDJI TigerSPY TigerQQQ
GLD
SLV
Crude
11/23/2001 ===>
DAILY Trading 3 Sample Stocks using
Closing Power trend-changes:
NEM is on a Sell but is testing its 65-day ma
SSRI (Silver) and PAAS (Silver) broke their CP downtrends today,
This is updated each night for a
while to show new users how one might trade
some volatile precious metals'
stocks simply using Closing Power.
11/23/2001 ===>
Closing Power (CP) Status Report: KEY ETF CHARTS:
The CPs are in downtrends
as a result of the CPs minornew low today. This is short-term BEARISH
DIA is in a DOWNtrend - Any close of only 3.59 ABOVE the
Opening
will to break the CP DOWN-trend. The CP is BELOW its rising
21-dma.
Opening Power shows an uptrend that could be broken tomorrow.
SPY is in a DOWNtrend- It will take a close of more than 2.78 ABOVE the Opening
to break the CP-DOWN-trend. The CP is BELOW its rising
21-dma.
Opening Power shows an uptrend that could be broken tomorrow.
QQQ is in a downtrend
t will take a close of more than 2.19 ABOVE the Opening
to break the CP-DOWN-trend. The CP is BELOW its rising
21-dma.
Opening Power shows a DOWNtrend.
GLD is in a
downtrend - It will take a close 2.02 ABOVE the Opening
to break the CP
downtrendline. The Opening
Power is below its ma
H A P P Y T H A N K S G I V
I N G!

PEERLESS REMAINS ON BUYs.
NEW
Buy B5 but
the DJI has broken below the lower band
and the 65-day ma support on the day before
Thanksgiving.
Before
there can be a good rally, the market must stop opening
much lower most mornings. 6 of the last 8 openings have
seen the
DIA open down. This is
European and Asian selling mostly. A world-
wide recession and the floundering of the EURO are the apparent
causes. But there may be more negatives that have not hit
the
news.
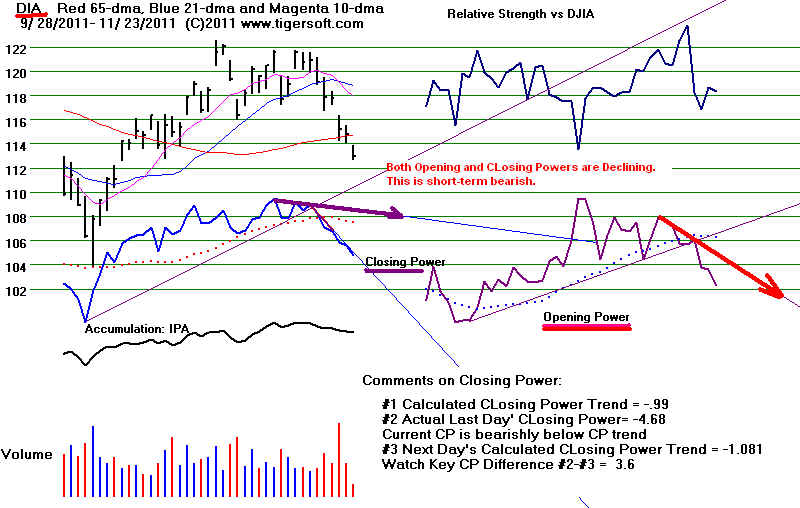
Something is seriously wrong!
(See the mid-day comments for 11/23/2011
below to see some of the worries confounding the market.)
Fortunately, our Accumulation Index is still
positive, using
estimated data.
(Dial Data has not yet given us Tueday's official Up and Down
volume.)
The good
news is that seasonally a market bottom is very often made
in the last two weeks of November and the first week of December.
This took place in 41 of the 72 years cases since 1939. Most of the other
years did not have any pullbacks at this time.
Declines which lasted
longer were very rare. On average, these longer lasting,
deeper
declines occurred only 1/7 of the time. So, the odds favor
a recovery
by December 8th, and most likely much sooner.
The Exceptions: Later Than Early December Bottoms
CL/MA
Aftermath
157.50 12/16/1931 .877
DJI rallied to 194.4 2/24/1931
175.90
12/21/1936 .972 DJI rallied to
194.4 3/10/1937
128.90
12/20/1940 .986 DJI rallied only to
133.60 1/10/1941
106.30
12/23/1942 .948 DJI rallied
briefly to upper band 113.90 1/6/1942
165.70
2/10/1948 .956
DJI did not bottom until 2/10/1949 and then rose sharply.
Truman's re-election and heating up of Cold War...
426.20
12/18/1957 .968 DJI
rallied to 458.70 2/4/1958
857.50
12/15/1964 .980 DJI
rallied to 906.30 2/3/1965
769.93
12/17/1970 .961 DJI
rallied only to 811.31 1/5/1970
908.45
12/11/1980 .936 DJI
rallied only to 992/66 1/5/1981
795.47
3/8/1982 .965
DJI finally rallied past upper band
Sell S9 4/1/1982
2863.82 12/10/1991
.974 DJI rallied steadily...
833.24 Sell S9 4/1/1982
8695.60 12/14/1998
.96 DJI rallied
only to 9643.32 1/8/1999
Late Nov-Early December Bottoms
CL/MA DJI
DJI
Peak in Dec-April
(DJI/21-dma)
11/30/1939
.972 145.70
152.80 1/3/1940 UB but no
sell
11/27/1940
.969 129.80
133.60 1/18/1941 Sell S12 - right
shoulder peak
11/25/1942
.993 114.10
136.00 3/30/1943 - no Sells - DJI
went higher.
11/30/1943
.973 129.60
141.00 3/13/1044 - no Sells -
DJI went higher.
11/16/1944
.991 145.70
161.50 3/6/1945 - no Sells -
DJI went higher.
11/23/1945
.996 187.80
199.20 1/10/1946 Sell S9
11/22/1946
.97 163.60
183.70 2/7/1947 no Sells.,
H/S, 11% decline and new highs.
12/5/1947
.973 176.10
181.20 12/31/1948 no Buys. Completed
H/S 1/13/1948 - 177.50-
11/30/1948
.962 171.20
181.30 1/7/1949 Sell S12
11/30/1949
1.002 191.50
215.30 4/14/1950 Sell S9
12/4/1950
.971 222.30
263.10 5/3/1951 - no Sells
11/23/1951
.986
257.00
274.20 1/28/1951 Sell S1
11/17/1953 .994
273.90 299.50 3/9/1954 Sell S15
11/28/1956
.969 466.10
492.70 12/6/1957 Sell S9. S12
11/25/1958
.977 540.50
643.80 5/29/1959 - no Sells - DJI went
higher.
11/16/1959
.988 634.50
671.2 12/9/1959 - Sell S12
12/2/1960
.991 596.00
702.40 5/22/1961 - no Sells
11/30/1961
.997 721.60
722.50 1/4/1962 Sell S10
11/22/1963
.953 711.50
828.20 5/6/1964 - no Sells - DJI went higher.
12/6/1965
.988 939.53
985.41 1/10/1966 - Sell S4
12/2/1966
.981 789.42
887.53 4/24/1967 Sell S12
11/18/1970
.988 754.27 937.39
5/6/1971 Sell S9
11/23/1971
.966 797.97 959.44
4/6/1972 Sell S15
12/5/1973
.917 788/31 855.32
1/2/1974 Sell S12
12/6/1974
.923
577.60 up sharply 878.99
6/30/1975
12/5/1975 .98 818.80
1009.21 3/24/76 Sell S15
12/7/1977
.972 807.43
794.49 1/7/1978 head/shoulders neckline breakdown Sell S10
11/29/1978
.983 790.11 up
steadily 841.98 6/29/1979
11/23/1982
.967 990.99 1056.94 12/7/1983 Sell
S9
12/7/1984 .971
1163.21 1335.46 up steadily 841.98 6/29/1979
11/18/1986
.975 1817.21 2405.54 Sell S9 4/6/1987
12/4/1987
.929 1766.74 1942.97
Sell S9 12/28/1987
11/16/1988
.955 2038.58 2440.06 no sells by
6/30/1989.
11/17/1992
.989 3193.32 3510.54 no sells
by 7/1/1993.
11/23/1994
.961 3674.63 4556.10 no sells
by 6/30/1995.
12/1/2000
.975 10373.54 10712.91 Sell
S12 12/8/2001
11/20/2003
.987 9619.42 10737.70 Sell S15
2/11/2003
12/7/2004
.994 10440.58 10854.54
Sell S8 12/28/2004
11/26/2007
.958 12743.44 13619.89 Sell S12 12/6/2007
11/20/2008
.867 7552.29 9015.10
Sell S12 1/6/2009
11/30/2010 .983 11006.02
12807.36 Sell S9V 5/2/2011
11/24/2011 .948
???
The bad news is that the DJI is
extraordinarily weak given the bullish
seasonality. The market is warning that there is more bad news coming
this way. A deeper world recession? Bank failures and bailouts? A new
war...
with Iran? Violent repression of 99% protestors? All the above?
The day before Thanksgiving has
been down only 19 of 70 times
since the fourth week of November was made a holiday. The
2.05% decline Wednesday was the biggest decline ever on the
day before Thanksgiving. In each
of the cases where there was
a 1%-2% decline the day before Thanksgiving a very tradeable
bottom was being made to a significant peak in the second week
of January. This seems like a
reasonable scenario now, but I would
stay
short some of the bearish MINCP stocks now until the major market
ETF's Closing Power downtrend-lines are broken above. An opening
down more than 100 will get us to add some additonal shorts to the
Tiger Stocks' Hotline.
MORE THAN 1% DECLINE ON THE DAY BEFORE THANKSGIVING
DJI Chart
Daily Change Nov-Dec
Bottom
----------------------------------------------------------------------------------------------------------------------------------------
11/23/2011 -2.1%
currently 5.2% below 21-dma
129.8 11/27/1940
-1.9% 11/27/1940 129.8 3.1% below 21-dma, 12/10 128.9
1.4% below 21-dma
Next rally brought a Sell S12
(1/10/1941) and a significant H/S Top.
173.4
11/24/1948 -1.6%
11/30/1948 171.20 3.8% below 21-dma
Next rally brought a Sell S12
(1/7/1949) and a significant H/S Top.
189.50 11/22/1945
-1.4% 11/26/1945 188.20 0.3% below 21-dma
Next rally brought a Sell S9
(1/10/1946) and H/S Top.
It is rare for the DJI to fall more than 5% below the 21-day ma in November
or December. In only one of the 11 cases, 1974, did a bear market not
follow in the next year. Next year will take a lot of attention/ Here are the
cases:
DEEP DECLINES MORE THAN 5% BELOW THE 21-DAY MA IN NOV and DEC
1929 11/13/1929 29% below
21-dma
1929 12/20/ 1929 6.7% below 21-dma
1930 11/10/1930 9.1% below 21-dma
1930 12/16/1930 12.3% below 21-dma
1932 12/17/1932 16.3% below 21-dma
1937 11/23/1937 5.6% below 21-dma
1941 12/9/1941 5.6% below 21-dma
1973 12/5/1973 8.3% below 21-dma
1974 12/6/1974 7.7% below 21-dma
1980 12/11/1980 6.4% below 21-dma
2008 11/20/2008 13.3% below 21-dma
DJIA and Peerless Signals
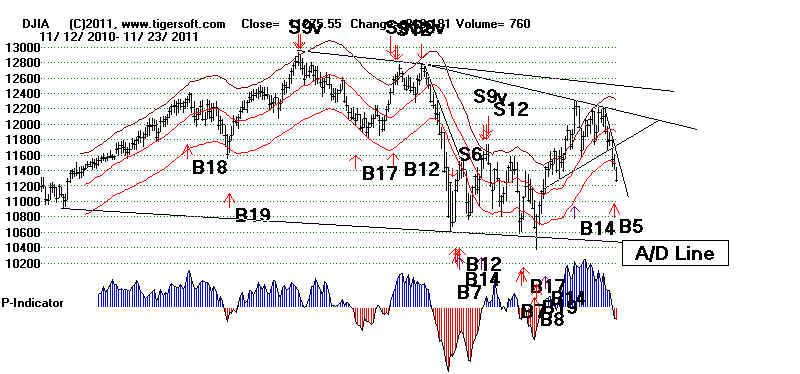

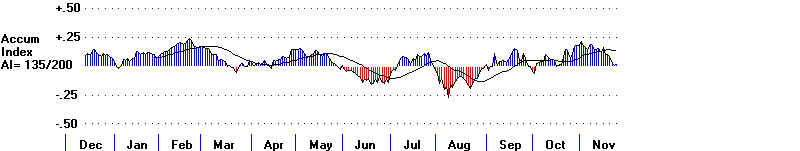
CLOSING POWERS ARE DECLINING
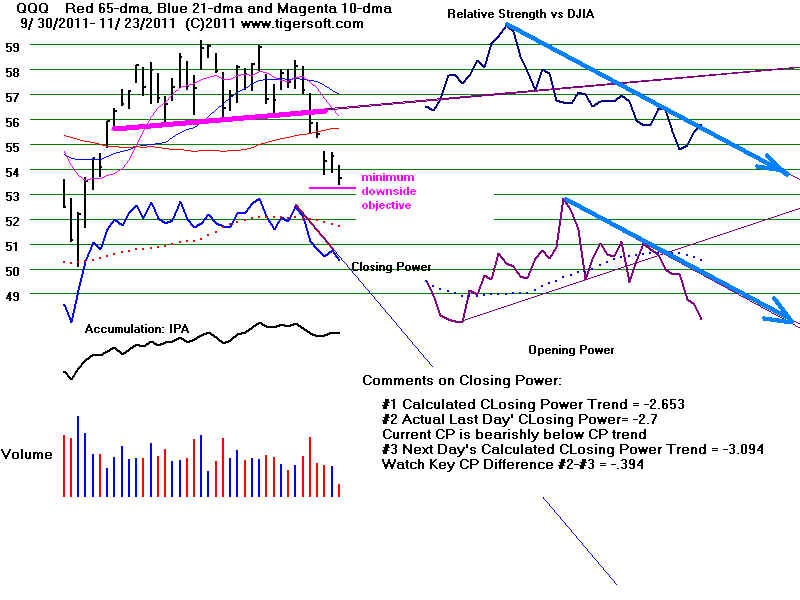
=================================================================================
OLDER HOTLINES
=================================================================================
11/23/2011
Mid-Day Notes on continued decline:
DJI down 198...Our Stocks' Hotline is
still short 5 stocks. We are long 7.
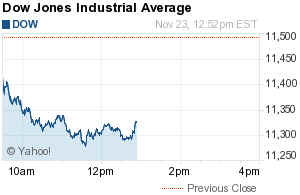
The current Buy B5 does have an average
paper loss of 2%, but it is
reliable, never having failed ultimately. I will consider what
might be a fail-safe here if we see more weakness.
Apparently, just too many worries for the
market today...
"Data showed Chinese manufacturing shrank the most in 32 months in November,
intensifying concerns about a global economic slowdown. U.S. crude oil fell 2.6 percent on
fears of reduced demand from China, the world's No. 2 economy. U.S. data painted a
mixed
picture and showed little reason for optimism. New unemployment benefit claims rose last
week
and consumer spending barely increased in October." Source
 Today's breaking of the 65-dma on a day when there is ordinarily an
up-day is of high concern. The speed downward of the 10-day decline
is also a danger-sign here. The Closing Power's continued falling and the
NASDAQ H/S minimum downside objective being still lower are bearish.
It is never good when both the Opening and CLosing Power are falling, as now...
Not to mention bad policy choices made by European bankers and
their political appointees on behalf of the hundreds of million people
in the name of the Common Market. Europe's austerity-in-a-recession policies
are exactly those pursued in 1930-1931 in the US and Europe.
Or the absurdity of demanding that all European countries have the same
monetary policy. The EURO will have to go sooner or later...
Or the fiscal stalemate in US.
Nouriel
Roubini: Government Gridlock ‘Ensures’ 2012 Recession
"Disastrous"
bond sale shakes confidence in Germany
Add to these concerns, we always have to worry about the Middle East.
I have to wonder if Iran is going to be attacked soon.
-------------------------------------------------------------------------------------------------------------------------------------------------
11/22/2011
DJI = 11494 -54 la/ma=
.965 21-dma ROC= -.419 P= -137(-131) IP21=+.005 V=
-153 OP= .035
BREADTH STATISTICS:
45 (+5)
MAXCP stocks Bullish MAXCP Stocks
113 (-10) MINCP stocks Bearish MINCP Stocks BEARISH
MAXCP stocks are those showing
Tiger Closing Power making new highs.
This suggests heavy Professional Buying. Applying the Tiger Power Ranker's
"bullish" to the MAXCP stocks find those with heavy insider buying and
institutional accumulation. Bearish MINCP stocks show the opposite.
Also use the BOTHUPs condition with MAXCPs and BOTHDOWNS MINCPS.
9 new highs on NASDAQ. 88 new lows on NASDAQ
BEARISH
22 new
highs NYSE 50 new lows on NYSE
BEARISH
11/21/2011 ===> See Key Peerless TigerSoft
Index Charts: Industry Groups and ETFs
DIA
SPY QQQ DJIA-Peerless TigerDJI TigerSPY TigerQQQ
GLD
SLV
Crude
11/22/2001 ===> DAILY Trading 3 Sample Stocks using Closing
Power trend-changes:
NEM is on a Sell but is testing its 65-day ma
SSRI (Silver) and PAAS (Silver) broke their CP downtrends today,
This is updated each night for a
while to show new users how one might trade
some volatile precious metals'
stocks simply using Closing Power.
11/22/2001 ===>
Closing Power (CP) Status Report: KEY ETF CHARTS:
The CPs are in downtrends
as a result of the CPs minornew low today. This is short-term BEARISH
DIA is in a DOWNtrend - Any close of only 1.08 ABOVE the
Opening
will to break the CP DOWN-trend. The CP is BELOW its rising
21-dma.
Opening Power shows an uptrend that could be broken tomorrow.
SPY is in a DOWNtrend- It will take a close of more than 2.25 ABOVE the Opening
to break the CP-DOWN-trend. The CP is BELOW its rising
21-dma.
Opening Power shows an uptrend that could be broken tomorrow.
QQQ is in a downtrend
t will take a close of more than 1.75 ABOVE the Opening
to break the CP-DOWN-trend. The CP is BELOW its rising
21-dma.
Opening Power shows a DOWNtrend.
GLD is in a
downtrend - It will take a close 1.355 ABOVE
the Opening
to break the CP
downtrendline. The Opening
Power is below its ma
HAPPY THANKSGIVING!
 PEERLESS
REMAINS ON BUYs.
PEERLESS
REMAINS ON BUYs.
NEW
BUY B5 but The Futures are down 100 at this writing.
I would cover half of the short sales
taken recently and buy some of the MAXCP
stocks for a seasonal recovery from the
rising 65-day ma tomorrow. If you prefer to wait
for a close above the opening to turn the
Tiger Closing Power UP on a test of the 65-day
ma, that's fine. But remember
that the market usually rallies the day before Thanksgiving.
Since 1966, the DJI has rallied 60% of
the time over the two weeks following November 23rd.
Consider buying some of the very
highest current Accumulation (IP21)
stocks with CLosing Powers making new
highs. Use the CP uptrendline
as your guide when to sell. ASPS,
XRIT 4.67 (IP21=.51 and 5.06 12 mo high).
TDF (Templeton Dragon Fund - 24.86,
IP21=.476), VSNT (11.46, IP21= .538)
Respect the bullishness of multiple separate AI bulges over the last 12
months.
VSNT is worth looking up.
It was a $200 stock in 1996. http://finance.yahoo.com/q/pr?s=VSNT+Profile
http://messages.finance.yahoo.com/Stocks_%28A_to_Z%29/Stocks_V/threadview?m=tm&bn=19612&tid=13807&mid=13807&tof=1&frt=2
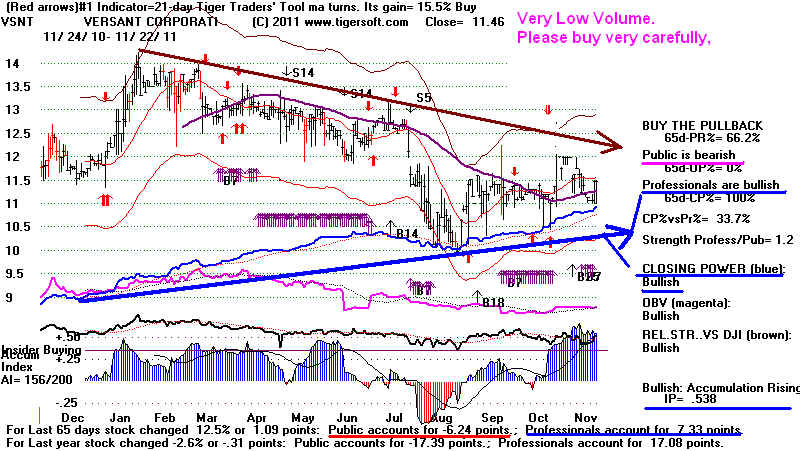
DJI and new Buy B5 from Peerless.
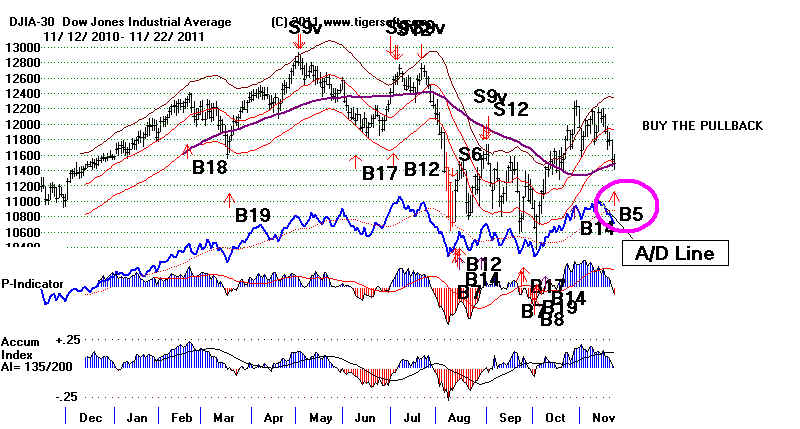
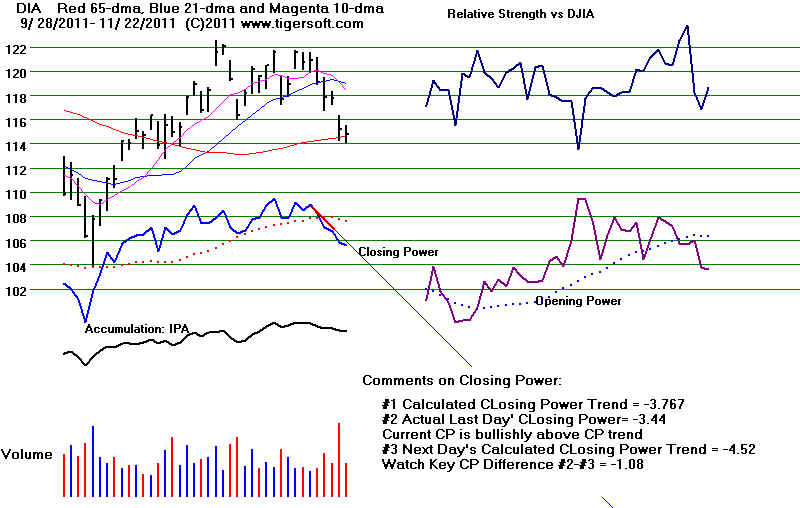
| BUY B5s: 1929-2011 More datails Buy B5 Buy B5s require: A sell-off of 6% to 10% in the last month. Annualized Rate of Change of 21-dma > -.60 DJI must be 3% to 5% below its 21-day ma. la/ma >.95 <.97 OBVPct > -.03 or IP21 > -.03 13 earlier cases. Avg Gain = approx 10% Avg paper Loss= approx 2% Paper Losses in 8 of 13 cases. Paper Losses of more than 4% in 2 of 13 cases. 3 cases of Buy B5s in November: 11/15/1948 176.00 +18.3% 11/22/1963 711.50 + 32.0% JFK assassination 11/23/1982 990.99 + 6.7% 1 12/7/1928 271.10 +17.1% S12 1/31/29 317.5 la/ma ma-roc P-I P-ch IP21 V-I OPct .966 .442 -52 (-40) -.03 -652 0.223 Paper Loss = 3% -------------------------------------------------------------------- 2 2/15/1929 300.4 +3.8% S9 4/19/29 311.9 la/ma ma-roc P-I P-ch IP21 V-I OPct .967 -.088 -91 (-28) -.085 -797 -.03 Paper Loss = 1% -------------------------------------------------------------------- 3 11/15/1948 176.00 +18.3% 215.30 4/14/1950 la/ma ma-roc P-I P-ch IP21 V-I OPct .958 .504 187 .085 285 .006 Paper Loss = 8% -------------------------------------------------------------------- 4 10/7/1955 458.20 +7.2% 3/6/1956 S12 la/ma ma-roc P-I P-ch IP21 V-I OPct .969 -.425 -30 .074 -343 .076 Paper Loss = 4% -------------------------------------------------------------------- 5 11/22/1963 711.50 + 32.0% Sell S8 5/13/1965 5.1% la/ma ma-roc P-I P-ch IP21 V-I OPct .953 -.557 -151 (-40) -.141 -.1021 .007 No Paper Loss -------------------------------------------------------------------- 6 6/27/1978 817.31 + 2.7% 9/11/78 S12 la/ma ma-roc P-I P-ch IP21 V-I OPct .97 -.203 -114 -.11 -1 .069 Paper Loss = 1% -------------------------------------------------------------------- 7 11/23/1982 990.99 + 6.7% 12/7/1982 S9 la/ma ma-roc P-I P-ch IP21 V-I OPct .967 -.048 81 .009 -1 .065 No Paper Loss -------------------------------------------------------------------- 8 7/17/1986 1781.78 + 3.0% 8/12/1986 S9 la/ma ma-roc P-I P-ch IP21 V-I OPct .963 -.539 -83 -.034 -11 .144 No Paper Loss -------------------------------------------------------------------- 9 4/14/1987 2253.98 + 3.9% 5/6/1 987 S12 la/ma ma-roc P-I P-ch IP21 V-I OPct .966 .028 -203 .108 -17 .207 No Paper Loss -------------------------------------------------------------------- 10 3/28/1988 1979.77 + 1.3% 4/14/1988 S1 la/ma ma-roc P-I P-ch IP21 V-I OPct .964 -.252 -35 .08 -6 .005 No Paper Loss -------------------------------------------------------------------- 11 10/16/1989 2657.38 + 5.7% 1/2/1990 S15 la/ma ma-roc P-I P-ch IP21 V-I OPct .98 -.075 -75 .109 -1 .187 Paper Loss = 3% -------------------------------------------------------------------- 12 1/22/1990 2600.45 + 14.2% 2969.8 7/30/1990 S9 la/ma ma-roc P-I P-ch IP21 V-I OPct .954 -.382 -69 .019 -17 .018 Paper Loss = 2% -------------------------------------------------------------------- 13. 6/23/2009 8322.91 + 19.5% 9949.36 10/21/2009 S12 la/ma ma-roc P-I P-ch IP21 V-I OPct .968 .063 36 (-14) .011 -115 .03 Paper Loss = 2.5% ==================================================================== Avg.Gain= 10.5% Avg.paper Loss= 2.0 13. 11/22/2011 11493.73 la/ma ma-roc P-I P-ch IP21 V-I OPct .965 -.419 -137 (-131) .005 -153 .033 |
====================================================================================
OLDER HOTLINE
====================================================================================
11/21/2011
DJI = 11547 -249 la/ma= .967
21-dma ROC= .261 P= -6(-209) IP21=+.025 V=
-106 OP= .122
BREADTH STATISTICS:
40 (-4) MAXCP stocks Bullish MAXCP Stocks
123 (+114) MINCP stocks Bearish MINCP Stocks
BEARISH
MAXCP stocks are those showing
Tiger Closing Power making new highs.
This suggests heavy Professional Buying. Applying the Tiger Power Ranker's
"bullish" to the MAXCP stocks find those with heavy insider buying and
institutional accumulation. Bearish MINCP stocks show the opposite.
Also use the BOTHUPs condition with MAXCPs and BOTHDOWNS MINCPS.
7 new highs on NASDAQ. 90 new lows on NASDAQ
BEARISH
17 new
highs NYSE 63 new lows on NYSE
BEARISH
11/21/2011 ===> See Key Peerless TigerSoft
Index Charts: Industry Groups and ETFs
DIA
SPY QQQ DJIA-Peerless TigerDJI TigerSPY TigerQQQ
GLD
SLV
Crude
11/21/2001 ===> DAILY Trading 3 Sample Stocks using Closing
Power trend-changes:
NEM gave a CP sell today when its CP uptrendline was
broken.
SSRI (Silver) and PAAS (Silver) have already done this,
This is updated each night for a
while to show new users how one might trade
some volatile precious metals'
stocks simply using Closing Power.
11/21/2001 ===>
Closing Power (CP) Status Report: KEY ETF CHARTS:
The CPs are in downtrends
as a result of the CPs minornew low today. This is short-term BEARISH
DIA is in a DOWNtrend - Any close of only 2.73 ABOVE the
Opening
will to break the CP DOWN-trend. The CP is BELOW its rising
21-dma.
Opening Power shows an uptrend that could be broken tomorrow.
SPY is in a DOWNtrend- It will take a close of more than 2.31 ABOVE the Opening
to break the CP-DOWN-trend. The CP is BELOW its rising
21-dma.
Opening Power shows an uptrend that could be broken tomorrow.
QQQ is in a downtrend
t will take a close of more than 2.13
1ABOVE the Opening
to break the CP-DOWN-trend. The CP is BELOW its rising
21-dma.
Opening Power shows a DOWNtrend.
GLD is in a
downtrend - It will take a close 0.49 ABOVE the
Opening
to break the CP
downtrendline. The Opening
Power is below its ma
PEERLESS
REMAINS ON BUYs.
But the QQQ and NASDAQ broke below
their Head/Shoulders
Pattern's
neckline. The NASDAQ has further to decline to
fulfull its minimum downside
objective.
The DJI has now tagged the lower 3.5%
band. There was no Buy B9 today
because
the V-Indicator is
quite negative (-104). Buy
B9s typically occur at the the lower band with
the P-Indicator and
Accumulation Index nearly or actually positive.
(See the History of Buy B9s table at the bottom
of today's hotline.) I
believe it was in 2002
when we decided to add
the additonal requirement that the V-Indicator not be be
below
-70.... If this requirement had not been added, Peerless users might have
been trapped in long
positions in the two months leading up to the sell-off from
the 9/11/2001 terrorist
attacks. The V-Indicator stands now at -104. There are two
cases from October 2004
where a Buy B9 was allowed with this low a reading,
based on the frequency
with which rallies occur from an October low in a Presidential
Election year. In
this case, it took a week of basing at the lower band before the
DJI could reverse and
rise.
In the present case, without a Peerless Sell signal and without a
head/shoulders top
in the DJI, the history
of the 7 NASDAQ completed head/shoulders patterns
back to 1988 tells us
to expect the lower 3.5% band to hold for the DJI. That was true
in all the older
cases. The DJI is there now.
So, there may still be a good recovery
starting tomorrow, if turnaround-Tuesday
and Thanksgiving week
live up to their reputations. If this is to be so, we should
this week see the NYSE
A/D and Closing Powers break their down-trends-lines.
Notice that the DJI is
back to a rising 65-day ma and the QQQ's CLosing
Power has fallen back
to a 2 month uptrendline. Unfortunately, the NASDAQ has
not fallen down as much
as its head/shoulders pattern sets up as a minimum
downside objective.
See its chart further below. The NASDAQ will likely stay weak
a little longer, even
as the DJI recovers...
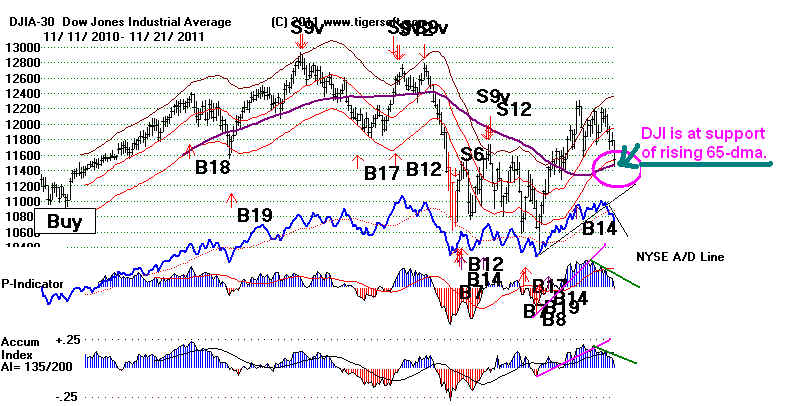
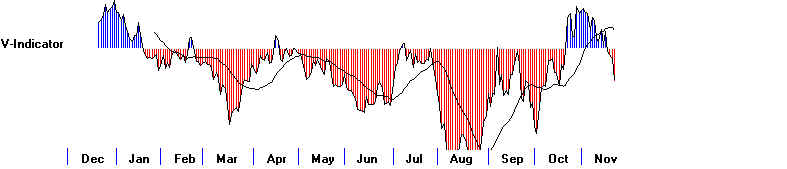
NASDAQ
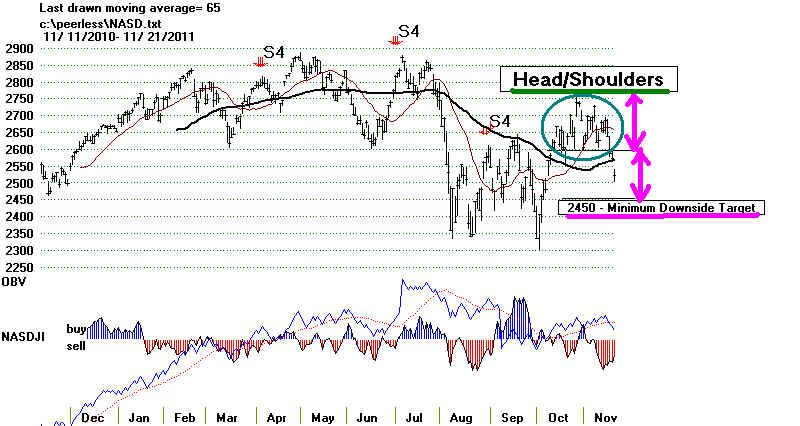
| History of 50 Buy B9s 1928-2011 Note that the V-Indicator can only be estimated before 1966. Most of the B9s occur 2% to 4.5% below the 21-day ma (CL/MA>.955 and <.98) These exceptions are a special case. There are a two cases in 2004 where a Buy B9 occurred in the 4th Quarter with a V-Indicator reading below -100. 45 of the 50 Buy B9s ended up producing a gain. 9 of the 50 had paper losses at least as high as 4%. Column 1 = DJI/21-dma of DJI
2 = P-Indicator
3 - IP21 (current AI)
4 - V-Indicator
5 - gain in DJI if long position closed out at next Peerless Sell
6 - paper loss in DJI
LA/MA  P-I      IP21     V-I        Gain    Paper Loss  Date
.965  52   -.083            1.4%      5%    4/30/1934
.964  21    .006           -1.2%      8%    7/2/1934
.973  32   -.026            5.8%      -     5/31/1935
.975  11    .001          -10.7%      -12%  3/29/1939  Czechosloakia occucpied.
.97  -32   -.024           -7.1%      -14%  2/20/1942  Japanese WWII victories.
.958 158 -.261 12.3% 2% 11/8/1943 .978 81 .044 14.2% - 9/7/1943 .930 -91 .008 14.2% - 2/25/1946 bullish divergences. .975 13 -.017 7.0% 1% 9/20/1948 .984 92 .24 -1.7% 7% 11/3/1948 Truman wins unexpectedly .971 198 .103 23.8% - 12/4/1950 .974 6 -.011 25.2% - 1/7/1955 .978 -8 -.001 6.7% 4% 5/22/1967 .975 -1 -.021 32.5% - 8/13/1970 .977 21 -.029 3.3% 3% 2/7/1974 .999 -27 -.064 6.1% - 10/9/1974 special case .978 69 -.002 0 7.4% - 5/28/1975 .976 -8 -.028 -2 22.3% 1% 12/3/1975 .974 -13 -.001 -1 1.8% 4% 10/5/1976 .971 163 .044 1 1.7% 2% 12/6/1977 .971 -14 -.055 -2 16.8% - 2/28/1978 .975 9 -.007 -2 13.5% - 12/18/1978 .994 77 -.056 0 7.2% - 11/21/1979 RD and triple bottom .973 5 .048 5 8.7% - 1/26/1981 .997 43 .04 0 -0.6% - 10/23/1981 There was a rally to upper band. .977 42 -.063 -2 17.9% 1% 9/30/1982 .975 38 -.006 -3 5.7% - 11/22/1982 .975 38 -.027 1 20.7% - 1/24/1983 .978 -13 .05 -3 8.8% 3% 7/9/1986 .975 18 .061 0 32.1% - 11/18/1986 .975 185 .118 14 5.9% 2% 1/8/1988 .963 3 .071 -3 4.4% 1% 3/25/1988 .963 3 .042 -15 3.4% 1% 4/10/1996 .979 41 -.034 -4 4.7% - 5/7/1996 .979 83 -.013 3.4% - 9/11/1997 .979 83 -.013 -57 18.4% - 12/19/1997 .966 9 .017 -81 42.2% - 10/1/1998 .978 31 .028 -37 1.9% - 5/24/1999 .996 -50 .08 -78 1.9% - 11/13/2000 special case .979 55 .042 -77 2.3% 1% 11/24/2000 A (.929 -181 -.007 -231 ! 18.2% - 3/23/2001 special case) 1.001 83 .192 -94 9.2% - 11/1/2001 ? special case also B17 .956 189 .122 -29 5.6% 13% 9/3/2002 DJI head/shoulders wins out. .996 -99 .089 -73 4.5% 1% 11/13/2002 .981 122 -.004 -92 ! 3.5% 2% 12/9/2002 .97 121 .012 -76 17.8% 9% 1/22/2003 .978 114 -.054 -142 9.7% 1.4%% 10/14/2004
.973 119 -.032 -141 11.3% - 10/25/2004 A
.98 -28 -.124 -200 14.8% - 7/18/2006 special case
.983 403 .067 -45 4.9% - 10/2/2009
.967 -6 .025 -106 ? ? 11/21/2011
|
====================================================================================
OLDER HOTLINES
====================================================================================
11/18/2011
DJI = 11796 +25 la/ma=
.987 21-dma ROC= .254 P= +203 (-9) IP21=+.09 V=
-33 OP= .223
BREADTH STATISTICS:
44 (+6) MAXCP stocks Bullish MAXCP Stocks
109 (+102) MINCP stocks Bearish MINCP Stocks BEARISH
MAXCP stocks are those showing
Tiger Closing Power making new highs.
This suggests heavy Professional Buying. Applying the Tiger Power Ranker's
"bullish" to the MAXCP stocks find those with heavy insider buying and
institutional accumulation. Bearish MINCP stocks show the opposite.
Also use the BOTHUPs condition with MAXCPs and BOTHDOWNS MINCPS.
5 new highs on NASDAQ. 49 new lows on NASDAQ
BEARISH
17 new
highs NYSE 20 new lows on NYSE
BEARISH
11/18/2011 ===> See Key Peerless TigerSoft
Index Charts: Industry Groups and ETFs
DIA
SPY QQQ DJIA-Peerless TigerDJI TigerSPY TigerQQQ
GLD
SLV
Crude
11/18/2001 ===> DAILY Trading 3 Sample Stocks using Closing
Power trend-changes:
NEM gave a CP sell today when its CP uptrendline was
broken.
SSRI (Silver) and PAAS (Silver) have already done this,
This is updated each night for a
while to show new users how one might trade
some volatile precious metals'
stocks simply using Closing Power.
11/21/2001 ===>
Closing Power (CP) Status Report: KEY ETF CHARTS:
The CPs are in downtrends
as a rult of the CPs minot new low today. This is short-term BEARISH
DIA is in a DOWNtrend - Any close of 2.73 ABOVE the
Opening
will to break the CP DOWN-trend. The CP is BELOW its rising
21-dma.
Opening Power uptrend gas been broken.
SPY is in a DOWNtrend- It will take a close of more than 2.31 ABOVE the Opening
to break the CP-DOWN-trend. The CP is BELOW its rising
21-dma.
Opening Power uptrend gas been broken.
QQQ is in a downtrend
t will take a close of more than 2.13 1ABOVE the Opening
to break the CP-DOWN-trend. The CP is BELOW its rising
21-dma.
Opening Power shows a DOWNtrend.
GLD is in a
downtrend - It will take a close 0.49 ABOVE the
Opening
to break its steep CP
downtrendline. The Opening
Power is below its falling ma
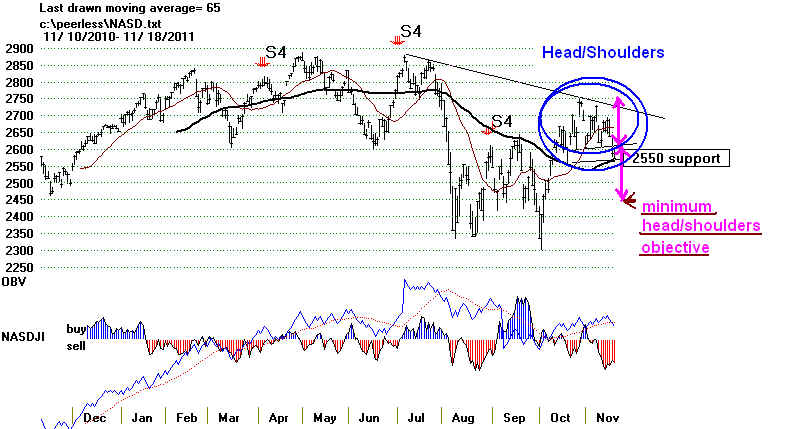
PEERLESS
REMAINS ON BUYs.
But the QQQ and NASDAQ broke below
their Head/Shoulders
Pattern's
neckline. The DJI is
expected to find support at the
lower 3.5% band at
11531, 265 points below today's close.
More stocks look like
good short sales than good purchases
in my weekend's review.
There are twice as many bearish MINCP
stocks as bullish MAXCP
stocks, showing professionals are
more bearish than
bullish. The Closing Power up-trend
breaks have been
replaced with CP downtrends. More weakness
until closer to
Thanksgiving is expected. We are short more stocks
than long now on our
Stocks' Hotline.
The DJI has not formed a
head/shoulders pattern or given a Sell, but the NASDAQ
has completed a
bearish head/shoulders pattern. Since 1989, there have been
8 earlier cases
like this. The NASDAQ fell from 2% to 10% further in the aftermath,
in 7 cases.
In one instance, the H/S breakdown proved false for. The DJI was
another story.
In half the cases, shorting the DJI would have produced a loss.
The gains from
short sales would have been modest, 2% to 5%. In the other cases,
short sales would
have produced losses, most of them substantial. See the details
in Thursday's
hotline.
DJI 11600 appear to be next support,
going down.
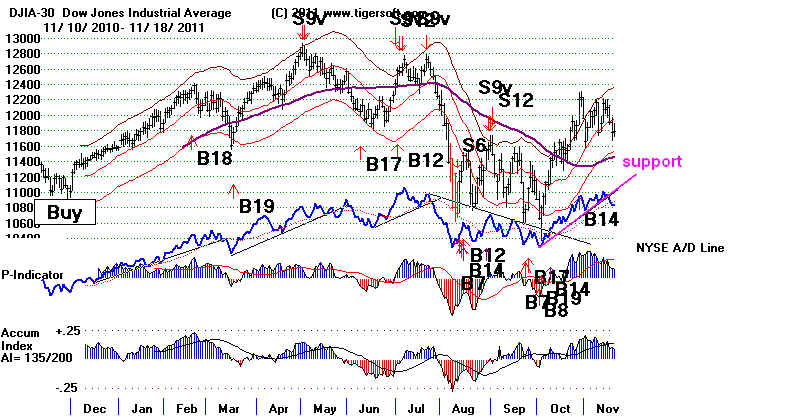
The DJI tends to
find support 2.5% to 3.5% below the lower band. It is now 1.3%
below the 21-day ma (corrected) and shows a very positive current Accumulation
Index
(+.09). I would think any weakness early next week will give us a new
Peerless
Buy and a good chance for a rally later next week, as is the custom
around
Thanksgiving.
====================================================================================
OLDER HOTLINES
====================================================================================
11/17/2011
DJI = 11771 -135 la/ma= .328
21-dma ROC=+0.268 P= +212 (-24) IP21=+.104 V=
-22 OP= .213
BREADTH STATISTICS:
38 (-109) MAXCP stocks Bullish MAXCP
Stocks
97 (+54) MINCP stocks Bearish
MINCP Stocks
BEARISH
MAXCP stocks are those showing
Tiger Closing Power making new highs.
This suggests heavy Professional Buying. Applying the Tiger Power Ranker's
"bullish" to the MAXCP stocks find those with heavy insider buying and
institutional accumulation. Bearish MINCP stocks show the opposite.
Also use the BOTHUPs condition with MAXCPs and BOTHDOWNS MINCPS.
6 new highs on NASDAQ. 50 new lows on NASDAQ
BEARISH
6 new
highs NYSE 38 new lows on NYSE
BEARISH
11/17/2011 ===> See Key Peerless TigerSoft
Index Charts: Industry Groups and ETFs
DIA
SPY QQQ DJIA-Peerless TigerDJI TigerSPY TigerQQQ
GLD
SLV
Crude
11/17/2001 ===> DAILY Trading 3 Sample Stocks using Closing
Power trend-changes:
NEM gave a CP sell today when its CP uptrendline was
broken.
SSRI (Silver) and PAAS (Silver) have already done this,
This is updated each night for a
while to show new users how one might trade
some volatile precious metals'
stocks simply using Closing Power.
11/17/2001 ===>
Closing Power (CP) Status Report: KEY ETF CHARTS:
The CPs are in downtrends
as a rult of the CPs minot new low today. This is short-term BEARISH
DIA is in a DOWNtrend - Any close of only 1.87 ABOVE the
Opening
will to break the CP DOWN-trend. The CP is BELOW its rising
21-dma.
Opening Power shows an uptrend that could be broken tomorrow.
SPY is in a DOWNtrend- It will take a close of more than 1.65 ABOVE the Opening
to break the CP-DOWN-trend. The CP is BELOW its rising
21-dma.
Opening Power shows an uptrend that could be broken tomorrow.
QQQ is in a downtrend
No close can easily reverse the new DOWNTREND.of more than 0.22 ABOVE the Opening
The Opening Power is below its falling ma.
GLD is in a
downtrend - It will take a close 2.11 ABOVE the
Opening
to break the CP
downtrendline. C
The Opening Power is
below itsma
PEERLESS
REMAINS ON BUYs.
But the QQQ and NASDAQ broke below
their Head/Shoulders
Pattern's
neckline. This strongly suggests a testing of the DJI's
lower band. In addition, we saw
today the breaks in the NYSE
A/D Line uptrend and its congruent,
well-tested NYSE price
uptrend. Appreciate the
bearishness in such a pattern, even
without a Peerless Sell signal.
See the discussion of this below
in the last few hotlines.
We can see the track record of
bearish head and shoulders
patterns in the NASDAQ should be
respected. Here are the
cases since May 1988.
Except once in 2010, when a head and shoulders was completed in the NASDAQ
and Peerless
was still on a BUY
signal, the DJI never fell below the lower band. The downside gains
gotten by selling on
the neckline penetration were much greater for the NASDAQ than the DJI.
The declines also
lasted longer for the NASDAQ. It took a while to repair the technical damage
on its charts,
There were 8 cases from 1988 to 2010 where the NASDAQ:completed its
head/shoulders, the DJI
did not and there were no Peerless automatic Sells.
NASDAQ DJI
DECLINE DECLINE
8/10/88
2% 2%
to DJI lower band
3/27/92
10% 1% loss (rally)
2/12/93
6.5% 5%
6/17/94
4.5% 4%
to DJI lower band
10/4/94
3% 3% LOSS (rally)
10/29/96
LOSS
LOSS
2/5/2002
3% 3% LOSS (rally)
8/16/2005
4.7% 3%
to DJI lower band
Stay hedged until Monday when we can assess the fall-out from the
breakdown better and
look
forward to a recovery just before Thanksgiving.
----------------------------------------------------------------------------------------------------------------------------------
1988-1997
Completed NASDAQ
H/S Peerless
Outcome
Signal
-------------------------------------------------------------------------------------------------------------------------------------------
8/10/88 378.51
NASDAQ
2% NASD falls only to 372.96 on 9/1/88
2034.14 DJI Buy B2
2% DJI decline. Peerless gives good
la/ma
- .969 IP21=
+.042
Buy on 8/22 with DJI at 1989.33.
11/7/1988 376.51
NASDAQ
3% NASD falls to 365.07 on 11/21
2124.64 DJI Sell S4
4% DJI decline to 2038 on 11/16.
la/ma
- .987 IP21= +.109
Peerless gives good reversing Buy B17
on 11/14 with DJI at 2067
3/27/1992 604.67 NASDAQ
10% NASD falls to 548.02 on 6/25
3231.44 DJI Buy B11
<1% Loss DJI decline to 3225 on 4/9.
la/ma
- .994 IP21= -.062
Peerless gives good Sell S9 on 4/15
with DJI at 3353.76
2/12/1993 690.54 NASDAQ
6.5% NASD falls to 645.87 on 4/26
3392.43 DJI Buy B18
5% DJI decline to 3225 on 2/19.
la/ma - 1.017 IP21= +.046
Decline stopped half way down to LB
from 21-dma.
6/17/1994 729.35 NASDAQ
4.5% NASD falls to 693.79 on 6/24
3776.78 DJI Buy B19
4% DJI decline to 3624.96 on 6/30.
la/ma
- 1.003 IP21= +.07
Decline stopped at DJI's LB.
10/4/1994 747.30 NASDAQ
3.6% NASD falls to 719.05 on 12/19
There was an intervening rally to 777
on 10/31
3801 DJI Buy B11
There was an intervening rally to S9 at 3917 on
10/18.
la/ma
- .981 IP21= -.047
A 5.7% decline to 3700 on 12/1.
Decline stopped at DJI's LB.
10/29/1996 1203.05
NASDAQ
NASD immediately reversed and rose
above 1300
falls to 719.05 on 12/19
6007 DJI Buy B18
DJI immediately
rallied and rose to 6528.
10/24/1997 1651 NASDAQ
9.1% NASD falls to 1499.53 on 12/24
8060.44 DJI Sell
S12
7.0% DJI decline to 7498 on 10/28
la/ma
- 1.002 IP21=
+.073
Decline stopped below DJI's LB on B1/B7..
5/21/1998 1821 NASDAQ
6.5% NASD falls to 1715.75 on 6/15
9132 DJI Sell
S15
5.5% DJI decline to 8627 on 6/15
la/ma
- 1.005 IP21=
-.116
Decline at DJI's LB - no buy signal.
8/3/1998
1851 NASDAQ
17% NASD falls to 1499.16 on 8/31
8787 DJI Sell
S9/S12
14.2% DJI decline to 7539 on 10/28
la/ma
- .967 IP21= -.048
Decline stopped below DJI's LB on B9.
6/14/2001
2044 NASDAQ
17% NASD falls to 1423.19 on 9/21
10690 DJI Sell S4
22.9% DJI decline to 8235 on 9/21
Decline stopped below DJI's LB on B16.
2/5/2002
1839 NASDAQ
3% NASD falls to 1776. on 2/26
9685
DJI Buy B18
DJI
immediately rallied and rose to 10574
DJI
Decline reversed LB - no new Buy..
8/16/2005
2137 NASDAQ
4.7% NASD falls to 2037. on 10/12
10513
DJI Buy B18
3%
DJI decline to 10217 on 9/21
DJI Decline reversed on tagging of 3% LB
- no new buy.
5/11/2006
2273 NASDAQ
8.8% NASD falls to 2072. on 6/13
11500
DJI Sell S9
6.2% DJI decline to 10786 on 6/13
DJI Decline reversed on tagging of LB - New buy.
7/26/2007
2599 NASDAQ
5.7% NASD falls to 2451 on 8/16
13474
DJI Sell S9
6.2% DJI decline to 12845 on 8/16
DJI Decline reversed below LB - New buy.
5/4/2010 2424
NASDAQ
10.4% NASD falls to 2171 on 6/8
10927
DJI DJI H/S
10.1%% DJI decline to 9816 on 8/16
DJI Declined below LB - New buys.
WORK IN PROGRESS
Key Charts
NYSE A/D Line broken
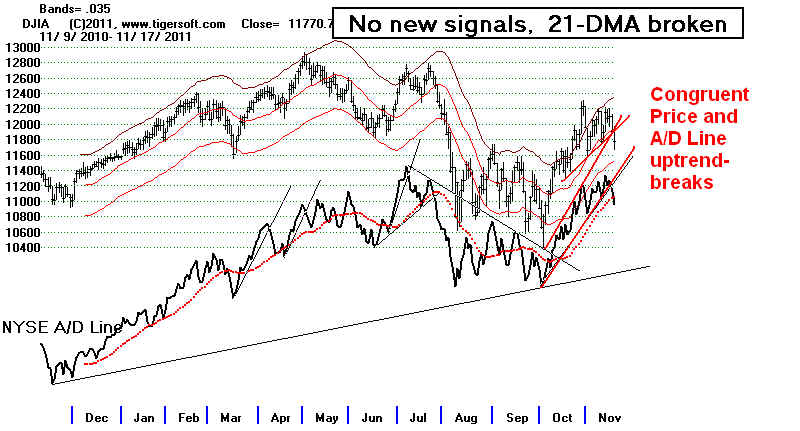
NASD Head/Shoulders Pattern Completed
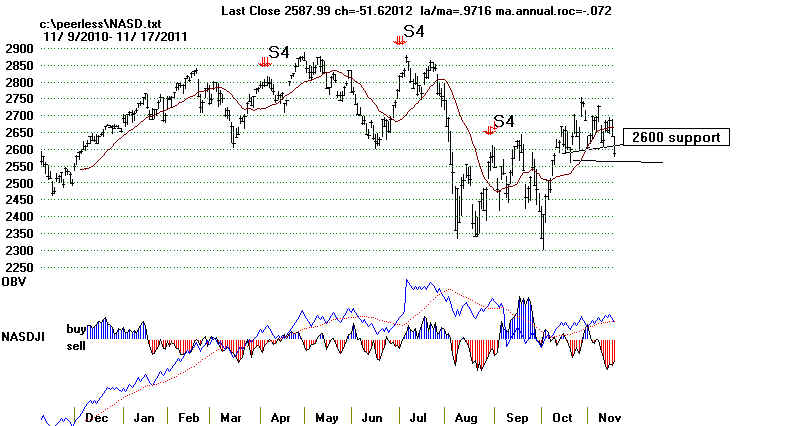
QQQ Head/Shoulders and Broken CP Uptrend
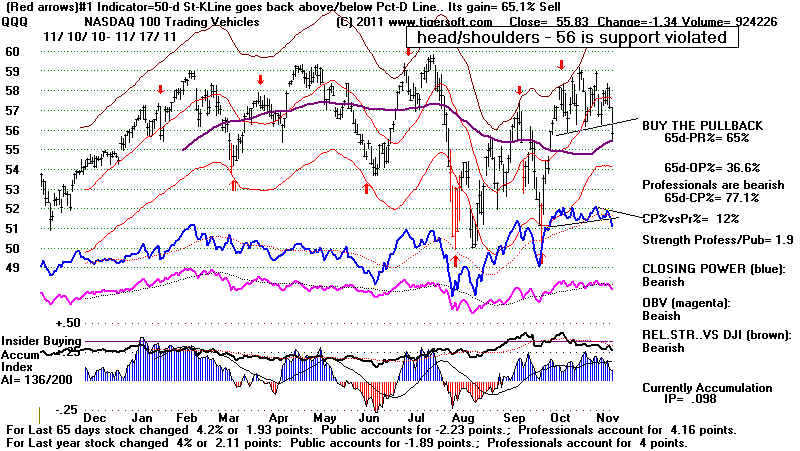
IWM (Russell-2000) Candlestick Chart
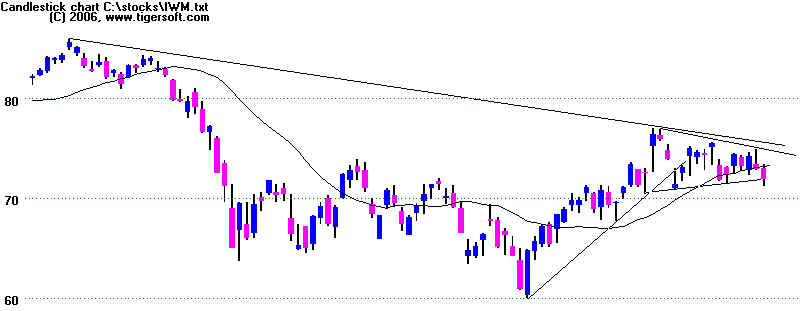
====================================================================================
OLDER HOTLINES
====================================================================================
11/16/2011
DJI = 11906 -191 la/ma= .328
21-dma ROC=+0.328 P= +235 (-176) IP21=+.099 V=
-12 OP= .226
BREADTH
STATISTICS:
147 (-44) MAXCP stocks Bullish MAXCP
Stocks
43 (-1) MINCP stocks Bearish
MINCP Stocks
MAXCP stocks are those showing
Tiger Closing Power making new highs.
This suggests heavy Professional Buying. Applying the Tiger Power Ranker's
"bullish" to the MAXCP stocks find those with heavy insider buying and
institutional accumulation. Bearish MINCP stocks show the opposite.
Also use the BOTHUPs condition with MAXCPs and BOTHDOWNS MINCPS.
10 new highs on NASDAQ. 47 new lows on NASDAQ
12 new
highs NYSE 18 new lows on NYSE
11/16/2011 ===> See Key Peerless TigerSoft
Index Charts: Industry Groups and ETFs
DIA
SPY QQQ DJIA-Peerless TigerDJI TigerSPY TigerQQQ
GLD
SLV
Crude
11/16/2001 ===> DAILY Trading 3 Sample Stocks using Closing
Power trend-changes:
SSRI (Silver) and PAAS (Silver) broke CP
uptrendlines, NEM (Gold) still on Buy.
This is updated each night for a
while to show new users how one might trade
some volatile precious metals'
stocks simply using Closing Power.
11/16/2001 ===>
Closing Power (CP) Status Report: KEY ETF CHARTS:
The DIA's CP and QQQ's CP
broke its CP uptrend.
DIA broke its CP UPtrendline - Any close of
only 1.09 ABOVE the Opening
will restore the new CP-uptrend. The CP is still at its rising
21-dma.
Opening Power shows an uptrend has been restored.
SPY is just above its UPTREDNDLINE- It will take a close of more than 0.61 BELOW the Opening
to break the CP-UP-trend. The CP is at its
21-dma. The Opening Power uptrend has been
restored within a narrowing flat CP triangle..
QQQ broke its CP
Uptrendline Any close of more than 0.22 ABOVE the Opening
to restore the CP-uptrend. The CP is at its flat
21-dma.
The Opening Power uptrend is still extant.
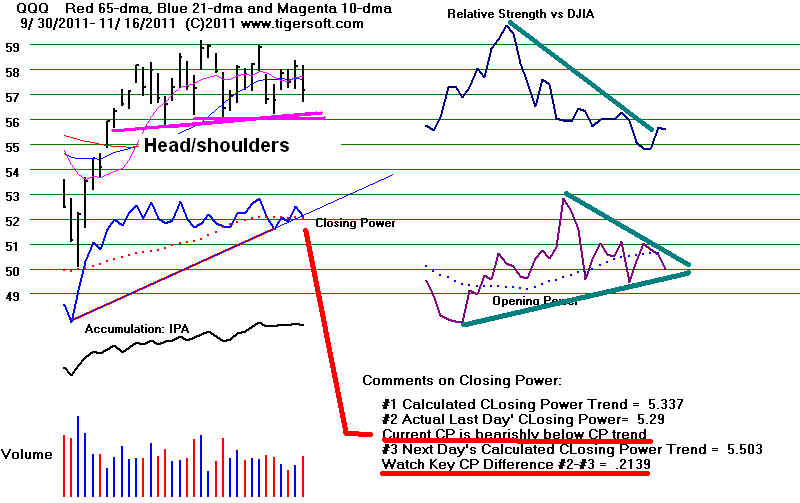
GLD broke its CP Uptrendline - It
will take a close 2.12 ABOVE the Opening
to restore the CP
Uptrendline. CP here is above its MA.
The Opening Power is
above its rising ma
DJI and Peerless Signals -
DJI is at its key 21-dma. A reversal on close will be bullish.
A close below it with weak breadth will be bearish.
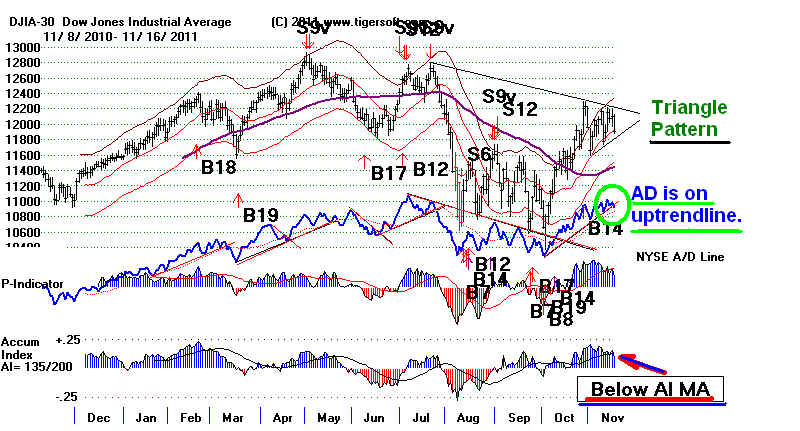
Tomorrow will be important. DJI is at 21-day ma support with very positive
internals.
PEERLESS
REMAINS ON BUYs. The QQQ's Head/Shoulders
Pattern has
lost some symmetry. But a QQQ or NASDAQ close
below below its neckline at 56 would
complete a complex
head/shoulders pattern.
Appreciate the bearishness in such a
pattern, even without
a Peerless Sell signal.
The Closing Powers and the NYSE A/D Line are sitting
on their uptrends. Tomorrow
should be an
important day. It could be a violent day, too. It occurs when protestors
around the world
are preparing their biggest demonstration against the excesses, fraud
and misuse of
political power by the world's Financial Elites. The demonstrators are "mad as
hell" at
apparent police brutality (a NYC
Councilman was knocked to the ground by the
Police
two blocks from the Park Sit-In, bloodied up and held 16 hours in jail without
being
allowed to make a phone call). The demonstrators are growing frustrated because
 NY Mayor Bloomberg one of the richest men in the US),
Congress (most of
whom are millionaires) which now enagage in insider trading
with impunity and
the President (whose candidacy got more money from Goldman Sachs
than anywhere
else) all show no inclination to prosecute Wall Street fraud crimes or
address the
protestors' central demands to level the political play field and provide the
number of jobs
needed to allow Americans a decent life.
___________________________________________________________________________________
"TIp" of the iceberg:
Insider Trading is perfectly legal if you are a Congressmen.
That is not by accident.


Pelosi
Spenser Bachus
Dem Leader
Rep House Fin.Srvcs. Chairman
"While Congressman Bachus was publicly trying to keep the economy from
cratering,
he was privately betting that it would, buying option funds that would go up in value
if the market went down. http://thinkprogress.org/economy/2011/11/14/367446/one-day-after-attending-private-economic-crisis-briefing-gop-financial-services-chairman-bet-on-stocks-tanking/
http://www.onenewspage.com/n/Internet/74mx9y9ga/Outside-the-Box-Congressional-insider-trading-The-story.htm

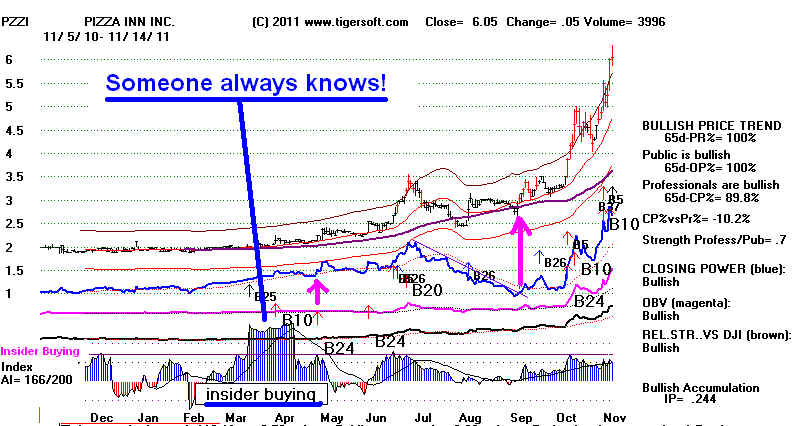
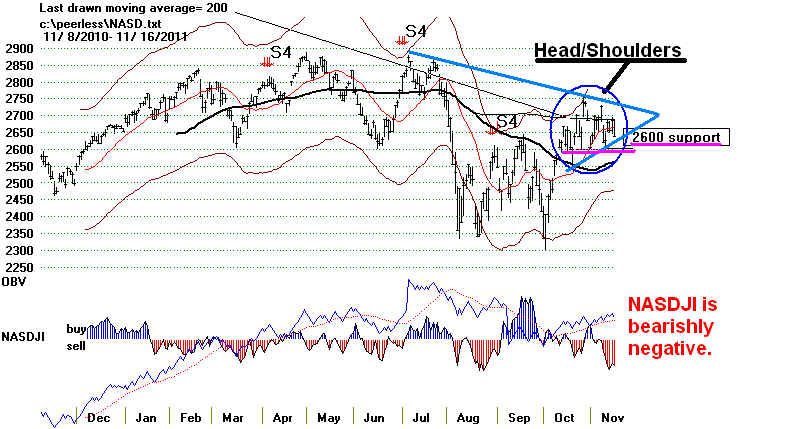
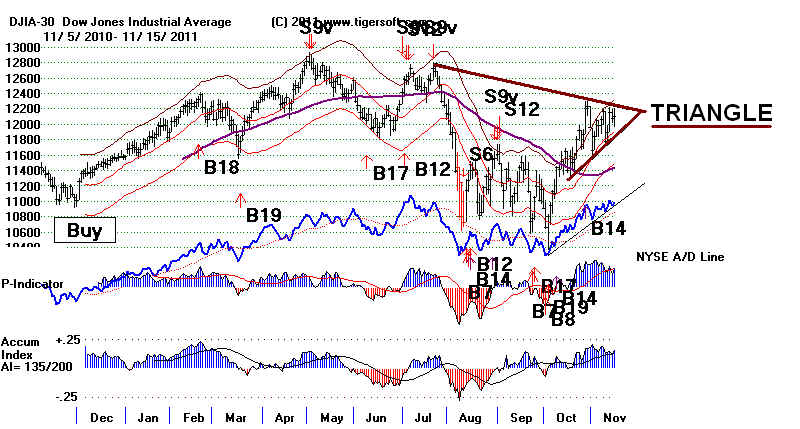
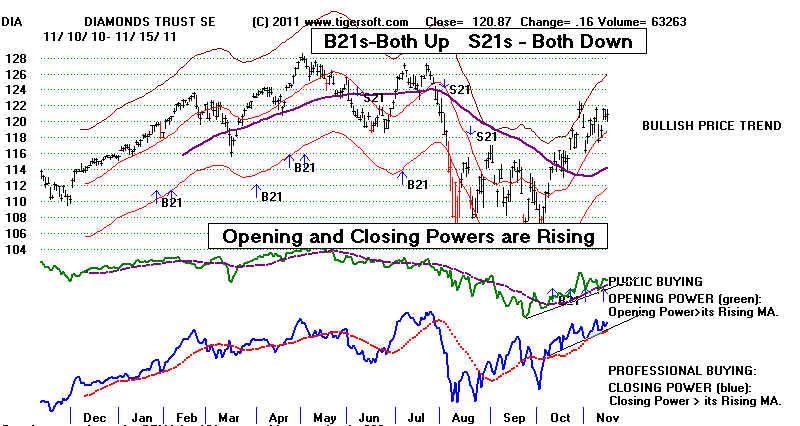
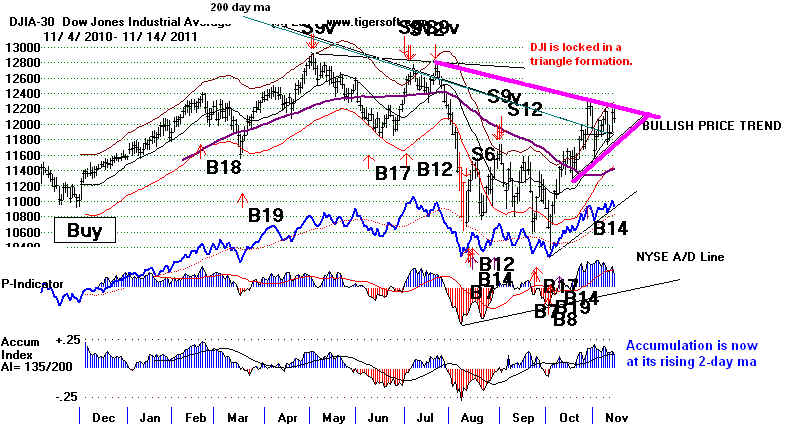
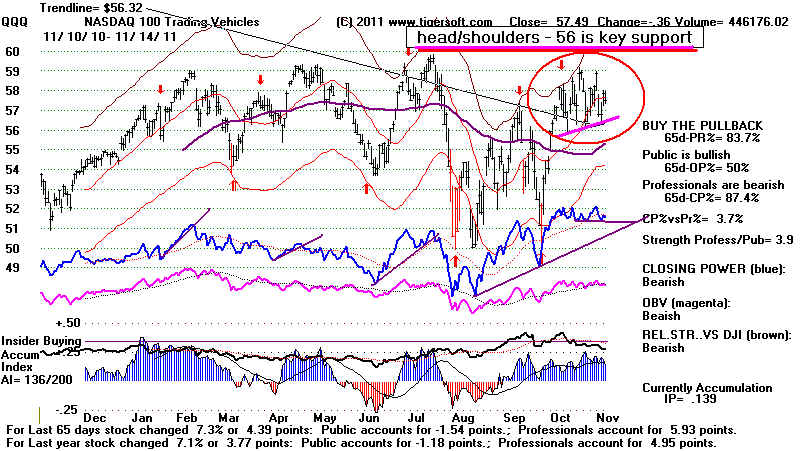
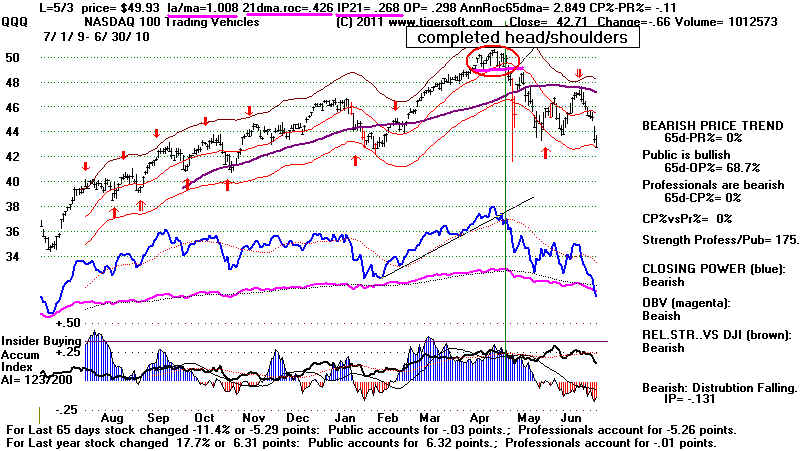
"If We Make It Through November" (A take-off on the Merle Haggard song
written at the bottom of the 1973-1974 bear marker).
If the head/shoulders patterns can be aborted by moves above their
right shoulders' apexes or just
play themselves out without a big decline, December should bring an
advance. In the years before a
Presidential Election, the DJI rose 17 times since 1931 and only fell 3
times.
==================================================================================
OLDER HOTLINES
==================================================================================
11/11/2011
DJI = 12154 +260 la/ma=
1.025 21-dma ROC=+0.68 P= +453 (+135) IP21=+.154 V= +64 OP= .31
BREADTH
STATISTICS:
115 (+66) MAXCP stocks Bullish MAXCP Stocks
59 (+3) MINCP stocks Bearish MINCP Stocks
MAXCP stocks are those showing
Tiger Closing Power making new highs.
This suggests heavy Professional Buying. Applying the Tiger Power Ranker's
"bullish" to the MAXCP stocks find those with heavy insider buying and
institutional accumulation. Bearish MINCP stocks show the opposite.
Also use the BOTHUPs condition with MAXCPs and BOTHDOWNS MINCPS.
18 new highs on NASDAQ. 24 new lows on NASDAQ
26 new
highs NYSE 5 new lows on NYSE
11/11/2011 ===> See Key Peerless TigerSoft
Index Charts: Industry Groups and ETFs
DIA
SPY QQQ DJIA-Peerless TigerDJI TigerSPY TigerQQQ
GLD
SLV
Crude
11/11/2001 ===> DAILY Trading 3 Sample Stocks using Closing
Power trend-changes:
SSRI (Silver) and PAAS (Silver) broke CP
uptrendlines, NEM (Gold) still on Buy.
This is updated each night for a
while to show new users how one might trade
some volatile precious metals'
stocks simply using Closing Power.
11/11/2001 ===> Closing Power (CP) Status Report: KEY ETF CHARTS:
The SPY and DIA among the
3 major market ETF Closing Powers restored their CP Up-trendlines
with their CPs rising back above their 21-day ma. Bounces up from
the CP 21-day ma can save a
situation. The QQQ's CP also turned up. But it did not get
up past its 21-day. Therefore, it
is more suspect. The DIA's and QQQ's is
short-term bullish, but must be watched. A CP uptrend
violation coupled with a penetration of the CP 21-day ma would be bearish.
DIA restored its CP UPtrendline - Any close of more than 0.70 BELOW the Opening
will violate the new CP-uptrend. The CP is still above its rising
21-dma.
Opening Power uptrend has been restored.
SPY restored its CP uptrendline- Any close of more than 0.80 BELOW the Opening
will violate the new CP-uptrend. The CP is still above its rising
21-dma.
The Opening Power uptrend has been restored.
QQQ has a new CP Uptrendline
Any close of more than 0.24 BELOW the
Opening
will violate the new and tentative CP-uptrend. The CP
is only at its rising 21-dma.
This makes the new uptrend more suspect. The Opening Power uptrend has
been restored.
GLD restored its CP Uptrendline - Any
close 0.50 BELOW the Opening
will violate the CP
Uptrendline. The Opening
Power is back above its rising ma
PEERLESS REMAINS ON BUYs. The DJI faces the resistance shown
in the downtrending lines below. Support should still be
present at its rising 21-day ma at
11800. Its rising 21-day ma should act as support as long as it is
rising steeply and the DJI's
current Accumulation Index is very positive.
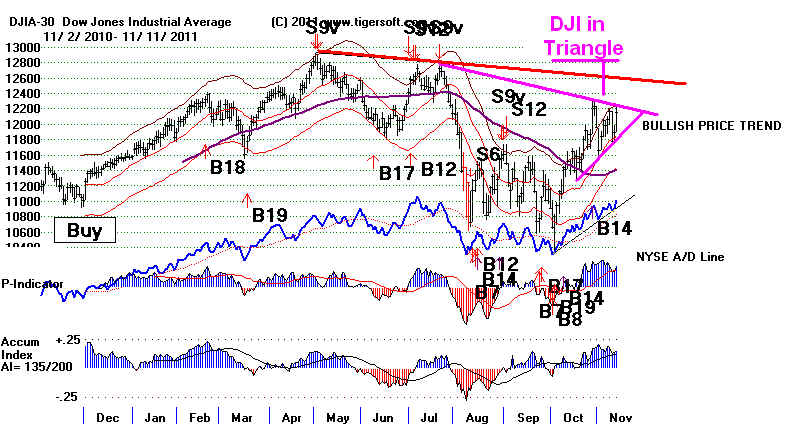
When the DJI is about 3% over the 21-day ma with the Accumulation Index a healthy +.154
and the P-Indicator (21-day ma of Advances - Declines) is very
positive, we usually see higher
prices. This is also true in mid-November in years before the
Presidential Election. See the study I put
together: http://tigersoft.com/Tiger-Blogs/11-11-11/index.htm
See the bullish case of 11/13/2003. Declines
to the lower band at this time of year are more likely to occur when
these two indicators are much
weaker: 11/11/1931, 11/13/1935, 11/17/1975, 11/16/1987. As I
write this, I see the Futures show
the DJI up +50. Don't forget to cover hedging short sales when
their Closing Powers break their
downtrend or the stock closes above the 65-day ma.
Focus next on the weekly DJI. In the chart below you can see how much better
the NYSE
A/D Line is now than it was in May-June
2009. You can also see that the DJI has gotten
back above its rising 52 wk ma. In
2008, it could not and the 52-wk ma was falling. Another
difference - the Accumulation Index now is rising
and above its 21-wk ma. Back in May 2008,
it was negative and below its falling 21-wk ma.
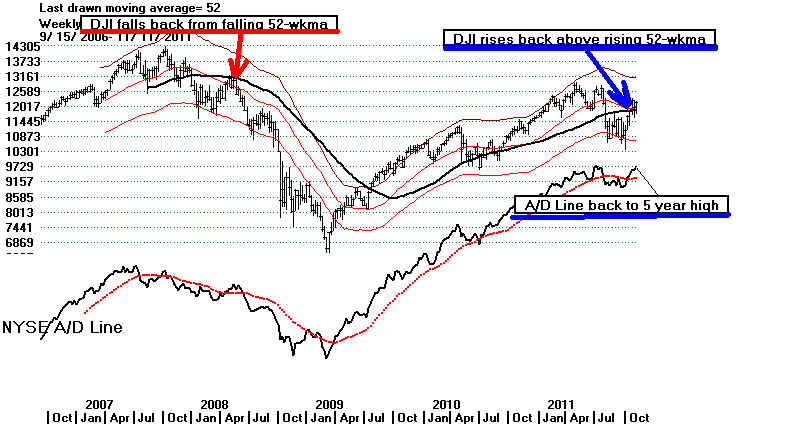
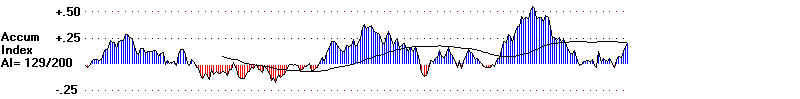
Since the August bottom, Professional ETF trading has
concentrated on the narrower DIA and
QQQ. The broader SPY (SP-500) and general IWM were hit with
more selling in the July-August
sell-off and are lagging in the upswing, though they are
participating.
DIA and QQQ are above their rising 52-week ma. They show a
very positive Accumulation Index,
unlike in 2008 when they both tagged and fell back from their
then falling 52 week ma while showing
negative Accumulation Index readings. SPY is now only
at its flat 52-week ma and shows a positive
Accumulation Index, unlike in 2008 when it tagged and fell back
from its then falling 52 week ma
while showing a negative Accumulation Index. IWM
(Russell-200) is still below its 52-week ma.
For more on the comparison and contrast with 2008, see Is the market a "redux" of 2009?
11-10-2011
What Earlier Period Does The Current Market
Resemble?
GOLD - High Accumulation and Back above Rising 65-DMA
A challenge of 185 seems likely. This is a bullish
seasonal period for Gold.
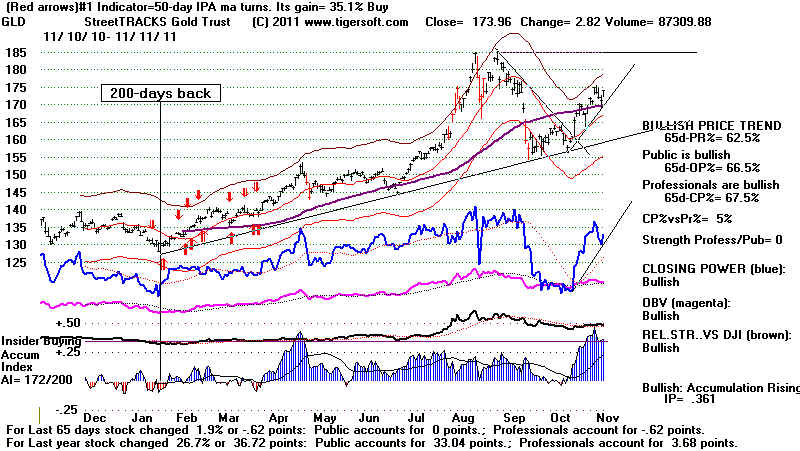
===================================================================================
OLDER HOTLINES
===================================================================================
11/10/2011
DJI = 11894 +113 la/ma= 1.006
21-dma ROC=+0.378 P= +262 (-32) IP21=+.144 V= +6 OP= .245
BREADTH
STATISTICS:
51 (-60) MAXCP stocks Bullish MAXCP Stocks
56 (+16) MINCP stocks Bearish MINCP Stocks
MAXCP stocks are those showing
Tiger Closing Power making new highs.
This suggests heavy Professional Buying. Applying the Tiger Power Ranker's
"bullish" to the MAXCP stocks find those with heavy insider buying and
institutional accumulation. Bearish MINCP stocks show the opposite.
Also use the BOTHUPs condition with MAXCPs and BOTHDOWNS MINCPS.
5 new highs on NASDAQ. 42 new lows on NASDAQ
5 new
highs NYSE 18 new lows on NYSE
11/10/2011 ===> See Key Peerless TigerSoft
Index Charts: Industry Groups and ETFs
DIA
SPY QQQ DJIA-Peerless TigerDJI TigerSPY TigerQQQ
GLD
SLV
Crude
11/10/2001 ===> DAILY Trading 3 Sample Stocks using Closing
Power trend-changes:
SSRI (Silver) and PAAS (Silver) broke CP
uptrnedlines, NEM (Gold) still on Buy.
This is updated each night for a
while to show new users how one might trade
some volatile precious metals'
stocks simply using Closing Power.
11/10/2001 ===>
Closing Power (CP) Status Report: KEY ETF CHARTS:
The 3 major market ETF
Closing Powers broke their CP Up-trendlines Wednesday.
This is short-term bearish, though their CPs may
yet recover from their 21-dma.
DIA
broke its CP UPtrendline -
Any close of more than 1.45 ABOVE the Opening
will restore the CP-uptrend. The CP is still above its rising
21-dma.
Opening Power uptrend has been restored.
SPY CP Uptrendline broken -Any close of more than 2.32 ABOVE the
Opening
will restore the CP uptrend, which is testing its 21-dma. The
Opening Power uptrend has been restored.
QQQ broke its CP Uptrendline - Any close of
more than 1.58 ABOVE the
Opening
will restore the CP Uptrend. The Opening Power broke its
uptrend.
GLD's CP 3 days ago broke its steep
Uptrend - Any close 1.24 ABOVE the Opening
will break the downtrendline. The Opening Power is nack above its
rising ma
PEERLESS REMAINS ON BUYs. The futures appear to be rising.
So is the NYSE A/D Line and the DIA and
SPY CLosing Powers turned up from their rising 21-day
moving averages. Since 1965, the
DJI has risen 67% of the timne over the next two weeks
and 71% of the time over the next month.
The A/D Line is much stronger now, nearer its 12 month
highs, than before most tops. The
DJI does not show a head/shoulders pattern. However,
it needs to get past the resistance-line
not far above 12000 that keep stop rallies this year.
If it were to turn down and the rising
NYSE A/D Line uptrend were broken the DJI would look
like the end of 1947. In that year
and again in the following year, also a Presidential Election
Year, the DJI ricocheted up and down off
the top and bottom of a broad trading range, bounded by
165 and 190. I must add, that good
breadth, by itself, is not enough We also have to watch the
Accumulation Index. A close by the
DJI as low as 2.4% over the 21-day ma with the
Accumulation Index negative did bring an
11% decline in early 1948.
We still must watch the QQQ's head and
shoulders pattern. It neckline is at 46. Penetration
of this level will be bearish. The
QQQ's Closing Power did not turn up today. The QQQ's
relative strength continues to fall
versus the DJI. Tech stocks are being sold as a precaution.
That is weakening the P-Indicator and
Accum.Index, but not enough yet to produce a major Sell.
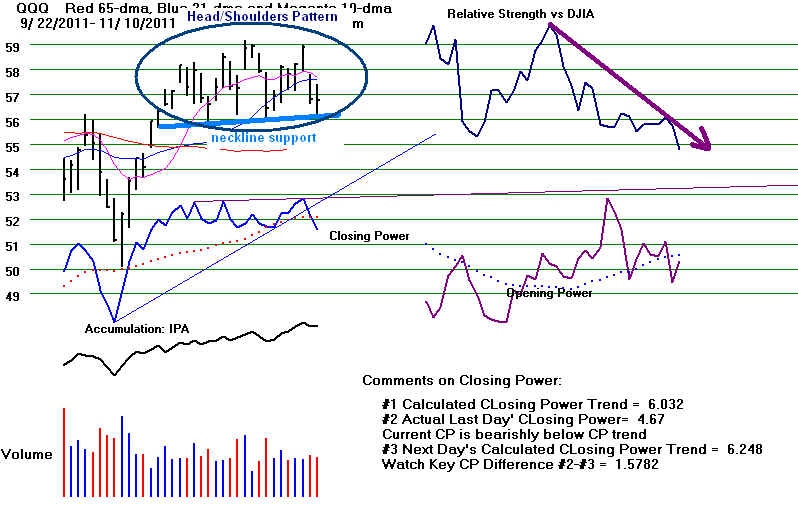
Is the market a "redux" of 2009? See my reply:
11-10-2011 What Earlier Period Does The Current Market Resemble?
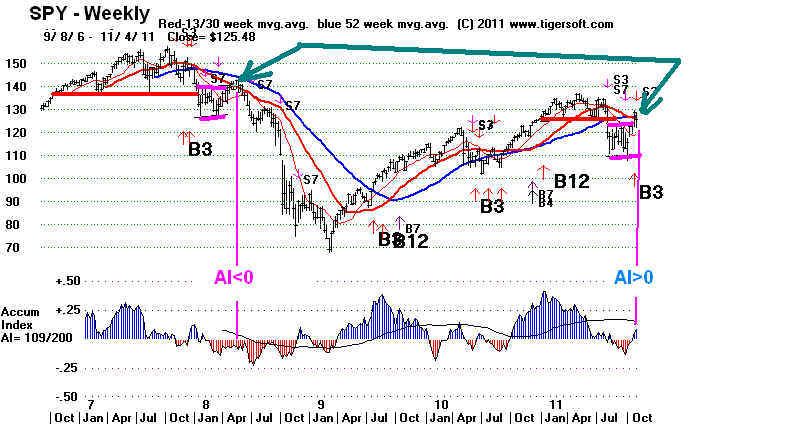
=====================================================================================
OLDER HOTLINES
=====================================================================================
11/9/2011
DJI = 11781 -389
la/ma=0.998 21-dma ROC=+0.368 P= +293 (-134) IP21=+.132 V=
+36 OP= .224
BREADTH
STATISTICS:
111 (-147) MAXCP stocks Bullish MAXCP Stocks
40 (+4) MINCP stocks Bearish
MINCP Stocks
MAXCP stocks are those showing
Tiger Closing Power making new highs.
This suggests heavy Professional Buying. Applying the Tiger Power Ranker's
"bullish" to the MAXCP stocks find those with heavy insider buying and
institutional accumulation. Bearish MINCP stocks show the opposite.
Also use the BOTHUPs condition with MAXCPs and BOTHDOWNS MINCPS.
4 new highs on NASDAQ. 45 new lows on NASDAQ
6 new
highs NYSE 27 new lows on NYSE
11/9/2011 ===> See Key Peerless TigerSoft
Index Charts: Industry Groups and ETFs
DIA
SPY QQQ DJIA-Peerless TigerDJI TigerSPY TigerQQQ
GLD
SLV
Crude
11/9/2001 ===> DAILY Trading 3 Sample Stocks using Closing
Power trend-changes:
SSRI (Silver), PAAS (Silver), NEM (Gold) All on Buys now.
This is updated each night for a while to show new users how one might trade
some volatile precious metals' stocks simply using Closing Power.
11/9/2001 ===>
Closing Power (CP) Status Report: KEY ETF CHARTS:
The 3 major market ETF
Closing Powers broke their CP Up-trendlines.
This is short-term bullish, though they CPs may
yuet recover from their 21-dma.
DIA
broke itsCP UPtrendline -
Any close of more than 1.00 above the Opening
will restore the CP-uptrend. The CP is still above its rising
21-dma.
Opening Power ibroke its uptrend and its 21-dma.
SPY
CP Uptrendline was broken today -Any close of more than 1.30 ABOVE the
Opening
will restore the CP uptrend, which is testing its 21-dma. The
Opening Power uptrend was broken.
QQQ
broke its CP Uptrendline - Any close of more than 0.74 ABOVE the Opening
will restore the CP Uptrend. The Opening Power broke its
uptrend.
GLD's CP two days ago broke its steep
Uptrend - It will take a close of more than 5.55
ABOVE the Opening
to restore the Uptrend of CP. The Opening Power is above its rising ma
PEERLESS REMAINS ON BUYs.
The ETFs' Opening Power penetrated their 21-day ma. The Closing
Powers
have not. The DJI has pulled
back to its rising 21-day with a still quite positive set
of internal strength readings.
Usually. without a Peerless Sell, such a rising 21-day
ma acts as reliable support.
A turn upwards by CLosing Power will be short-term
bullish because such reversals at
support are a positive development.
Seasonality is still bullish.
Since 1965, the DJI has risen 64% of the time over the
week after November 9th.
We try to remember to check the
individual DJI-30 stocks for ones that look bearish.
At this point not many show much
vulnerability. The bearish exceptions are:
1) BAC's weakness has little impact on the averages because it it is so
low priced
in an average that weights
components solely by price.
2) DIS shows a potential
Head/Shoulders pattern but the Accum. Index readings
are still too high to confirm this
pattern's bearishness.
3) GE does show a H/S Pattern with
negative IP21 readings on the right shoulder.
Its neckline is also where support
from its 65-dma support is. Watch it.
QQQ's H/S neckline support is now
at 56. The H/S pattern there can be redrawn to
be extant. A QQQ violation of
56 would be disturbing for tech stocks. The TigerSoft
Index of the 100 QQQ stocks shows
75 are still above the support of their 65-dma.
That is bullish.
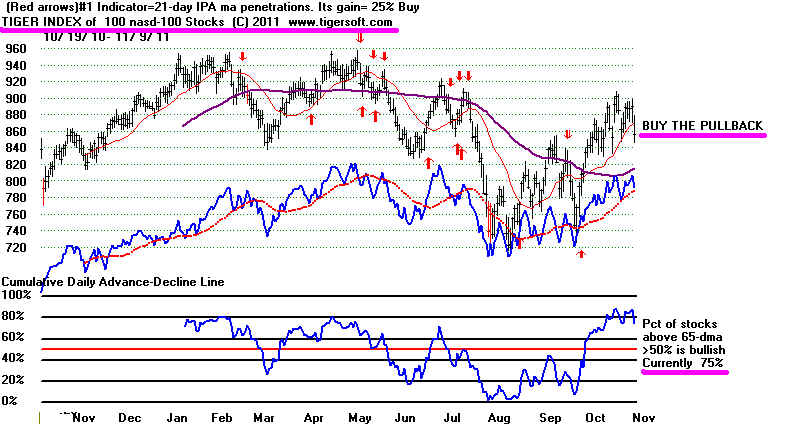
Since 2007, the OPMA penetrations
have worked out well as short-term
sells about 58% of the time.
Closing Power MA penetrations are more reliable, giving
good trading sells about 67% of the
time. See study.
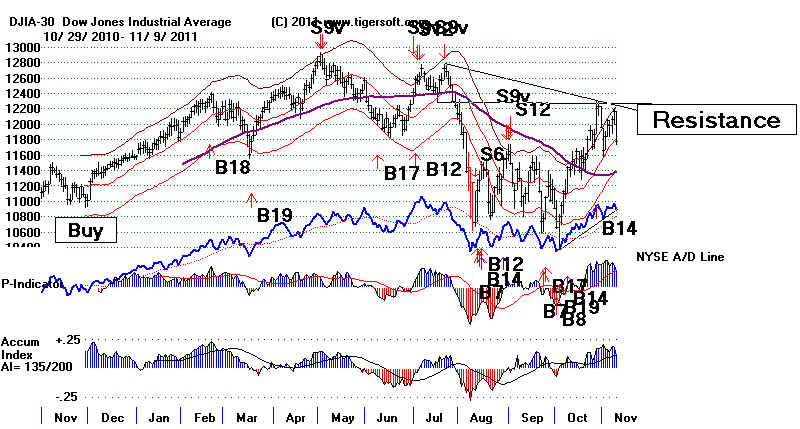
======================================================================================
OLDER HOTLINES
======================================================================================
11/8/2011
DJI = 12170 +192 la/ma=1.032
21-dma ROC=+0.747 P= +426 (-107) IP21=+.180 V= +90 OP= .239
BREADTH
STATISTICS:
258 (+22) MAXCP stocks Bullish MAXCP Stocks
36 (+2) MINCP stocks Bearish
MINCP Stocks
MAXCP stocks are those showing
Tiger Closing Power making new highs.
This suggests heavy Professional Buying. Applying the Tiger Power Ranker's
"bullish" to the MAXCP stocks find those with heavy insider buying and
institutional accumulation. Bearish MINCP stocks show the opposite.
Also use the BOTHUPs condition with MAXCPs and BOTHDOWNS MINCPS.
33 new highs on NASDAQ. 21 new lows on NASDAQ
41 new
highs NYSE 5 new lows on NYSE
11/87/2011 ===> See Key Peerless TigerSoft
Index Charts: Industry Groups and ETFs
DIA
SPY QQQ DJIA-Peerless TigerDJI TigerSPY TigerQQQ
GLD
SLV
Crude
------------------- Closing Power (CP) Status Report: CHARTS:---------------------
The 3 major market ETF
Closing Powers show CP Up-trendlines.
This is short-term bullish.
DIA
is now above a CP UPtrendline -
Any close of more than 0.89 below the
Opening
will break the CP-uptrend. The Opening Power is still
rising.
SPY
is now above a CP Uptrendline -Any close of more than .83 BELOW the
Opening
will break the CP uptrend. The Opening Power is still
rising.
QQQ is
now ABOVE a CP Uptrendline - Any close of more than 0.39 BELOW the Opening
will break the CP Uptrend. The Opening Power is still
rising.
GLD CP is broke its steep
Uptrend - It will take a close of more than 2.16
ABOVE the Opening
to restore the Uptrend of CP. The Opening Power is above its rising ma
PEERLESS REMAINS ON BUYs. But the Futures are sharply down, -180,
from European selling. The
Italian PM's resignation creates more problems
for the big European banks and the
Euro. Will Italian government bonds
collapse? The Italian PM's
resignation is scaring its government's bond holders.
The yields are rising, but their
rise does not appear to be the disastrous
"implosion" we hear this
morning from CNBC. We have suggested some short sales
as hedges from the bearish MINCP
stocks. Our Stocks' Hotline is
about 33% short
bearish MINCP stocks. That
seems about right for now. Let's see how much US Professionals
support the market on the early
weakness we will see today...
Warning
Signs in Italian Bonds - WSJ.com
European
Stocks Drop as Italian Bond Yields Jump to Euro Record
Italy
bond yields soar; euro zone troubles deepen
| Country | 10-Yr Yield | |
|---|---|---|
| Germany | 1.82 | |
| France | 3.05 | |
| Belgium | 4.38 | |
| Spain | 5.58 | |
| Italy | 6.37 Now 7.2% 11/9/2011 | |
| Ireland | 8.21 | |
| Portugal | 11.88 | |
| Greece | 26.77 |
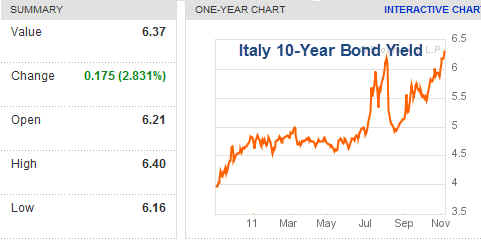
( globaleconomicanalysis.com )
The DJI's round number 12000 resistance which was overcome these
last
two days will be tested as
support. The Closing Powers are rising but a sharply
down Opening will break the rising
Opening Uptrends.
. There should be support on this
weakness. The A/D Line is rising. The NASDAQ's
rally today should have aborted its
potential head and shoulders. Watch the
NASDAQ's neckline at 2600.
This is important support.
Many of the leveraged short ETFs show CP new lows with heavy red
distribution.
Normally, we would see divergences
before a bottom, but these instruments are
oversold. Watch their CP
downtrendlines. Breaks in them will be bullish these
leveraged short instruments.
They are due a bounce. Below is the exploded chart
of SQQQ, the leveraged short of
QQQ. You can see a jump at the opening will break
the falling Opening Power.
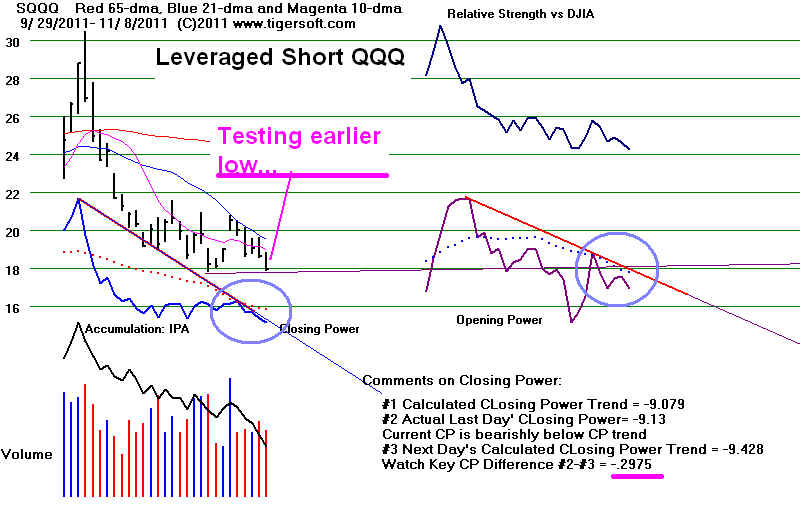
Bullishly Both Opening and Closing
Power Are Rising.
Severe weakness at the opening would break the rising
Opening Power trend. This will be hard for NY Professional
buying to overcome for a day or two.
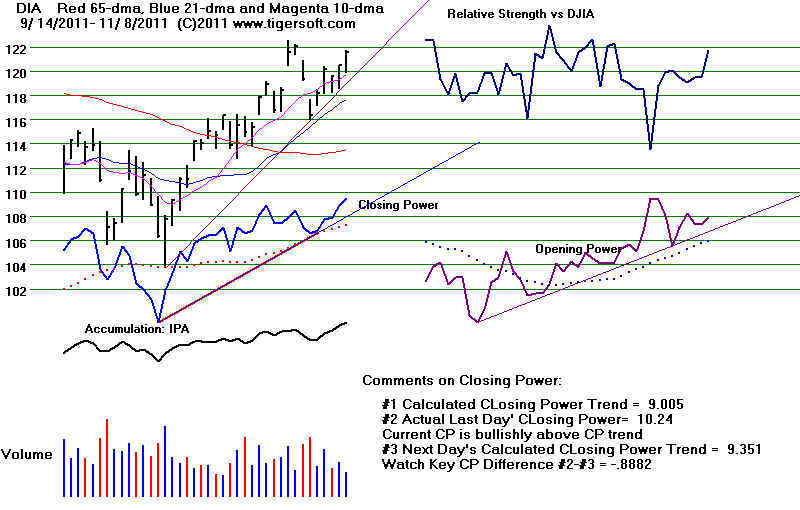
NASDAQ support is at 2600.
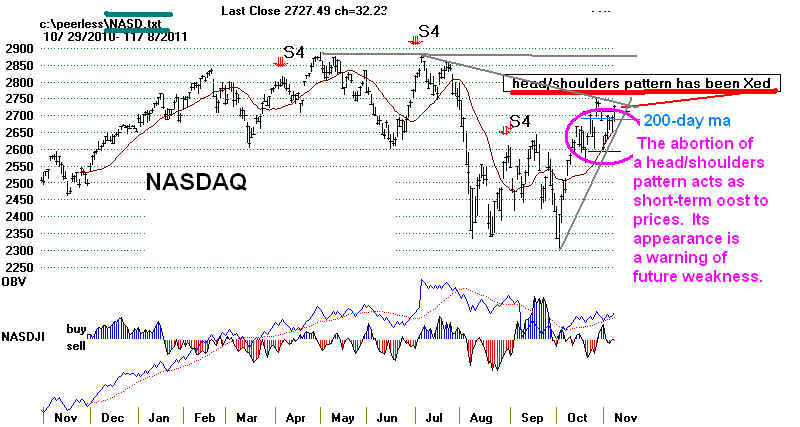
===================================================================================
Older Hotlines
===================================================================================
11/7/2011
DJI = 12068 +85
la/ma=1.027 21-dma ROC=+0.982 P= +533 (+75) IP21=+.19 V=
+101 OP= .252
BREADTH
STATISTICS:
236 (-10) MAXCP stocks Bullish MAXCP Stocks
34 (+0) MINCP stocks Bearish
MINCP Stocks
MAXCP stocks are those showing
Tiger Closing Power making new highs.
This suggests heavy Professional Buying. Applying the Tiger Power Ranker's
"bullish" to the MAXCP stocks find those with heavy insider buying and
institutional accumulation. Bearish MINCP stocks show the opposite.
Also use the BOTHUPs condition with MAXCPs and BOTHDOWNS MINCPS.
18 new highs on NASDAQ. 27 new lows on NASDAQ
24 new
highs NYSE 11 new lows on NYSE
11/7/2011 ===> See Key Peerless TigerSoft
Index Charts: Industry Groups and ETFs
DIA
SPY QQQ DJIA-Peerless TigerDJI TigerSPY TigerQQQ
GLD
SLV
Crude
11/7/2001 ===> DAILY Trading 3 Sample Stocks using Closing
Power trend-changes:
SSRI (Silver), PAAS (Silver), NEM (Gold) All on Buys now.
This will updated each night for a while to show new users how one might trade
some volatile precious metals' stocks simply using Closing Power.
Near Term: updated last: 11/7/2011
------------------- Closing
Power (CP) Status Report: CHARTS:---------------------
The 3 major market ETF
Closing Powers show CP Up-trendlines.
The ETFs' Opening Powers are mixed.
This is short-term bullish.
The QQQ's relative strength versus the DJI is falling.
DIA is now above a CP UPtrendline - Any close of
more than 0.64 below the Opening
will break the CP-uptrend. The Opening Power is still
rising.
SPY is now above a CP Uptrendline
-Any close of more than .38 BELOW the Opening
will break the CP uptrend. The Opening Power is still
rising.
QQQ is now ABOVE a CP Uptrendline
- Any close of more than 0.34 BELOW the Opening
will break the CP Uptrend. The Opening Power is still
rising.
GLD CP
is back above steep Uptrend - It will take a close of more than .23 BELOW the Opening
to break the Uptrend of CP. The Opening Power is above its rising ma
PEERLESS REMAINS ON BUYs. The round number 12000 resistance has not
yet been decisively overcome, but the Closing
Powers are rising again. We should
watch QQQ and the NASDAQ, which are falling a
little behind. These need to make
new clear new highs to destroy their potential
head/shoulders patterns. The QQQ
needs to close above 58.45. Though its
Opening Power is rising, it is the Professionals
and the QQQ's strong closes here that lie
behind the gain over the last 65-days. See
the text just below the Tiger chart for this
data on any stock shown. Nonetheless, the
QQQ's bearish pattern remains a technical
problem. The NASDAQ's right shoulder's
apex is exactly at 2700. A move above
that will be quite bullish for the secondary and
technology stocks. Watch the NASDAQ
closely tomorrow.
If the NASDAQ and the QQQ do not make new
recovery highs, the next DJI new high
may not be confirmed. The resulting
divergence could bring then bring a November decline.
For now, I would not turn bearish, apart from
doing some precautionary hedging.
Bullishly still, the the leveraged short ETFS
(shown at the bottom of the day's Bearish MINCP
Stocks)
show continued great weakness, which is being confirmed by very negative
Accumulation Index readings and falling Closing
Power trends.
Gold's rise still looks it will continue.
Notice that I have each day been posting buy
and sell signals using CLosing Power
trend-changes for GLD, as well as NEM and
two silver stocks. DAILY
Trading 3 Sample Stocks using Closing Power trend-changes
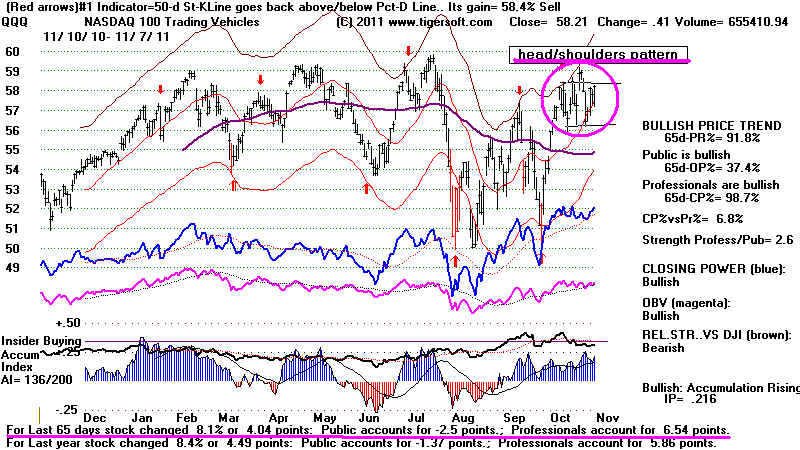 |
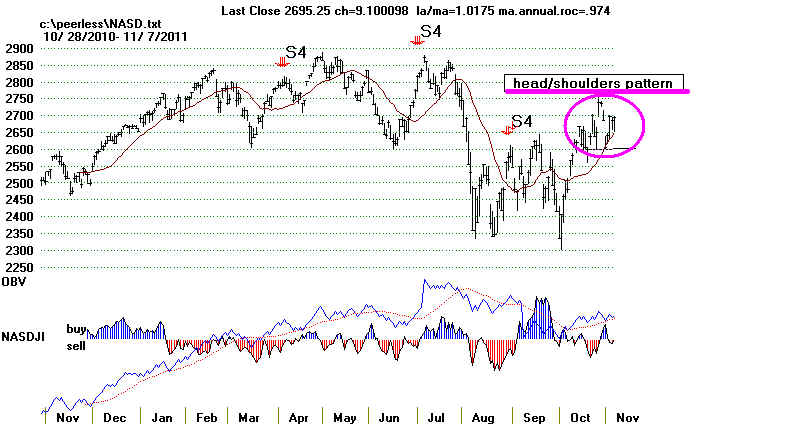 |
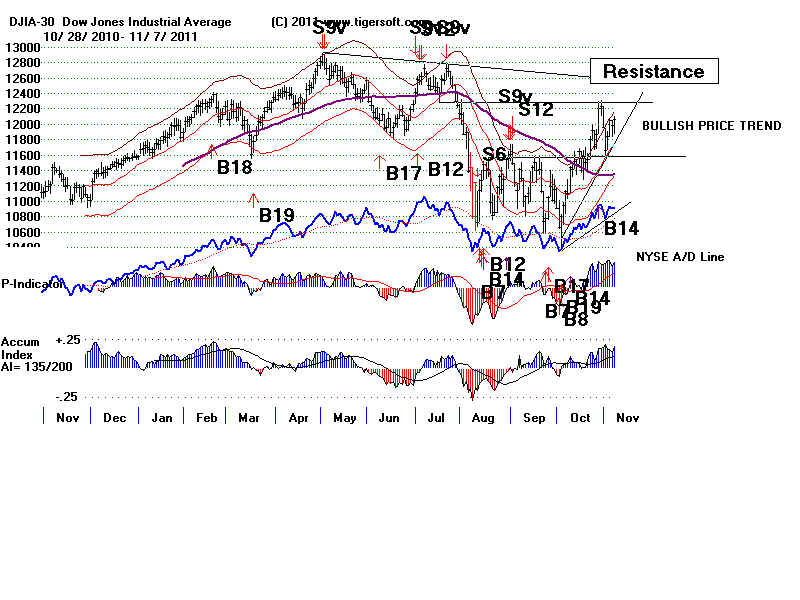 ====================================================================================
OLDER HOTLINES
====================================================================================
11/4/2011
DJI = 11983+208
la/ma=1.024 21-dma ROC=+0.878 P= +458 (-132) IP21=+.141 V= +61
OP= .153
BREADTH
STATISTICS:
246 (+32) MAXCP stocks Bullish MAXCP Stocks
34 (-5) MINCP stocks Bearish
MINCP Stocks
MAXCP stocks are those showing
Tiger Closing Power making new highs.
This suggests heavy Professional Buying. Applying the Tiger Power Ranker's
"bullish" to the MAXCP stocks find those with heavy insider buying and
institutional accumulation. Bearish MINCP stocks show the opposite.
Also use the BOTHUPs condition with MAXCPs and BOTHDOWNS MINCPS.
14 new highs on NASDAQ. 18 new lows on NASDAQ
22 new
highs NYSE 8 new lows on NYSE
11/4/2011 ===> See Key Peerless TigerSoft
Index Charts: Industry Groups and ETFs
DIA
SPY QQQ DJIA-Peerless TigerDJI TigerSPY TigerQQQ
GLD
SLV
Crude
11/4/2001 ===> DAILY Trading 3 Sample Stocks using Closing
Power trend-changes:
SSRI (Silver), PAAS (Silver), NEM (Gold) All on Buys now.
This will updated each night for a while to show new users how one might trade
some volatile precious metals' stocks simply using Closing Power.
Near Term: updated last: 11/4/2011
------------------- Closing
Power (CP) Status Report: CHARTS:---------------------
The 3 major market ETF
Closing Powers show shallow CP Downtrendlines.
The ETFs' Opening Powers are mixed.
This is short-term bearish.
DIA is now below a CP DOWNtrendline - Any close of
more than - 0.05 above the Opening
will break the CP downtrend. The Opening Power is still
rising.
SPY is now above a CP Uptrendline
-Any close of more than .117 BELOW the Opening
will break the CP uptrend. The Opening Power is still
rising.
QQQ is now ABOVE a CP Uptrendline
- Any close of more than 0.104 BELOW the Opening
will break the CP Uptrend. The Opening Power is still
rising.
GLD CP
is below steep Uptrend - It will take a close of more than 2.64 ABOVE the Opening
to restore the Uptrend of CP. The Opening Power is above its rising ma
PEERLESS REMAINS ON BUYs.
A November peak
is still expected. Usually we see non-confirmation Sells or a head
and shoulder develop before a top is made that brings a
decline of 6% or more in the
DJI. These things are not present, yet. But
hedging by being long the most bullish
MAXCP stocks and some of the most bearish MINCP stocks is
available to us, too,
as a profitable strategy. As the year ends,
institutional window-dressing tends to
exaggerate the moves up and down already in place. As
long as both the Opening
and Closing Power are rising, I think we have to give more
chance for a rally above
12400. An Opening down more than 100 DJI points will probably break the rising
Opening Power trendline. See DIA chart below.
That would be disconcerting and
probably bring about another test of the DJI's rising
21-dma 283 points lower than
Friday's close. Such a weak opening will cause us to
wait for any new buying on
our Stocks' Hotline, where we are hedged.
Even so, it remains bullish that:
1) the DJI reversed so quickly from its steeply
rising 21-dma;
2) the NYSE A/D Line is in an uptrend;
3) the number of Closing Power new highs is 7x
the number of CP new lows in
the last two days;
4) there were so many different Buy signals recently
at the bottom of this move; and
5) the DJI is up 57.8% of the time over the next week
since 1965.
6) Both Opening and Closing Power are rising for DIA
(Buy B21 condition)
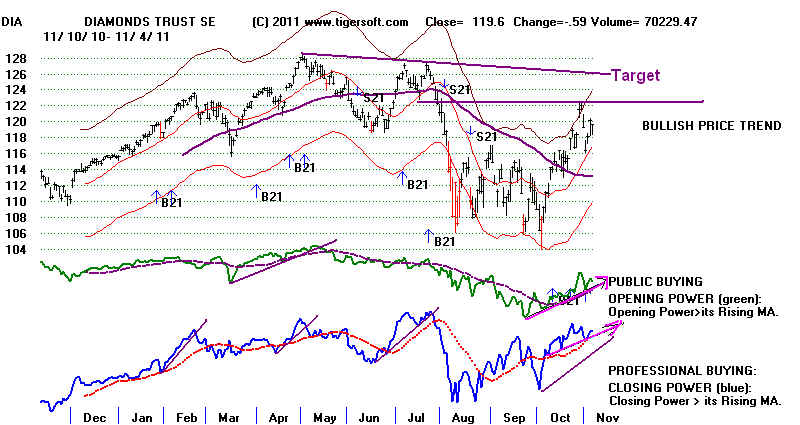
I like the fact that the DJI moved up beyond the top of its
price channel on its move above
12100 a week ago. A lot of time, the failure to reach
the top of a price channel or the upper
band becomes a setup for a bigger sell-off.
We will have to see the QQQ (below) surpass its recent
right shoulder apex at 58.25
to destroy its bearish head/shoulders pattern. The
broader NASDAQ and the DJI, SPY
and IWM all seem to have done this already.
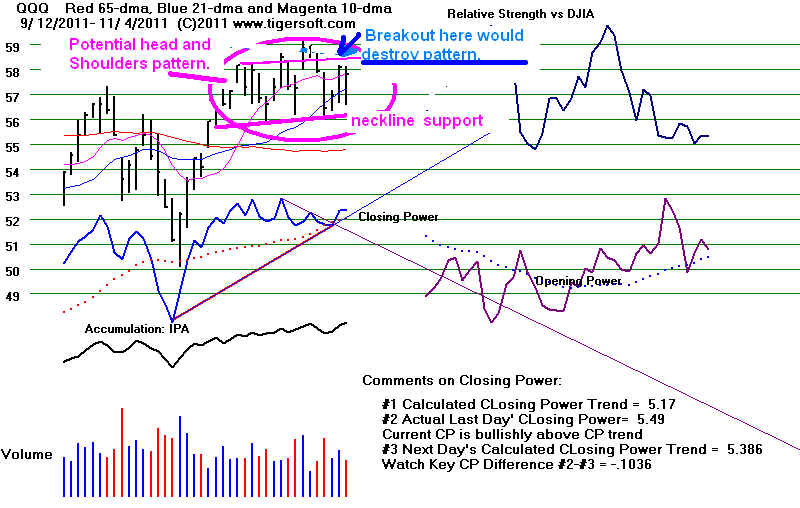
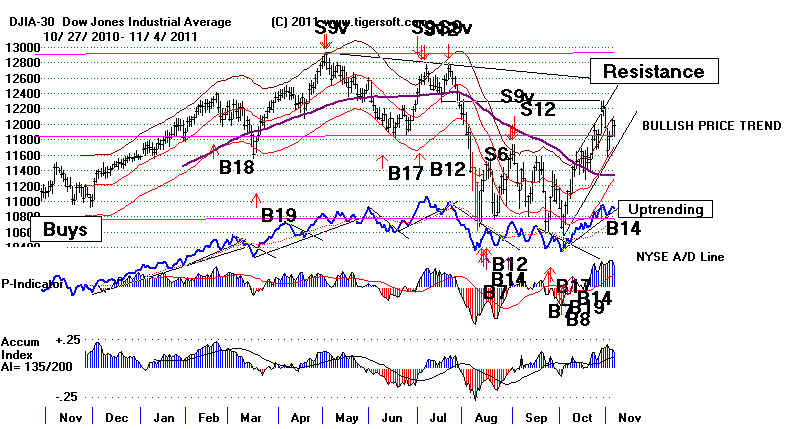 |
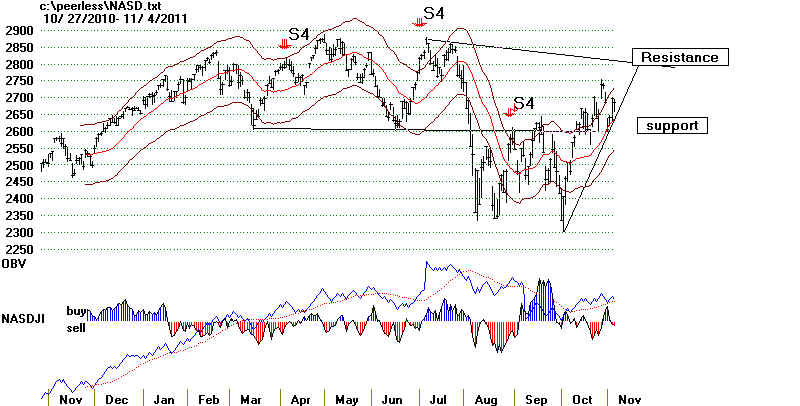 |
====================================================================================
OLDER HOTLINES
====================================================================================
11/3/2011
DJI = 12044 +208 la/ma=1.033
21-dma ROC=+1.132P= +589 (+13) IP21=+.166 V= +114 OP= .238
BREADTH
STATISTICS:
214 (+78) MAXCP stocks Bullish MAXCP Stocks
39 (-8) MINCP stocks Bearish
MINCP Stocks
MAXCP stocks are those showing
Tiger Closing Power making new highs.
This suggests heavy Professional Buying. Applying the Tiger Power Ranker's
"bullish" to the MAXCP stocks find those with heavy insider buying and
institutional accumulation. Bearish MINCP stocks show the opposite.
Also use the BOTHUPs condition with MAXCPs and BOTHDOWNS MINCPS.
12 new highs on NASDAQ. 18 ( -13)
new lows on NASDAQ
10 ( +8) new
highs NYSE 12 (-7) new lows on NYSE
11/3/2011 ===> See Key Peerless TigerSoft
Index Charts: Industry Groups and ETFs
DIA
SPY QQQ DJIA-Peerless TigerDJI TigerSPY TigerQQQ
GLD
SLV
Crude
11/3/2001 ===> DAILY Trading 3 Sample Stocks using Closing
Power trend-changes:
SSRI (Silver), PAAS (Silver), NEM (Gold) All on Buys now.
This will updated each night for a while to show new users how one might trade
some volatile precious metals' stocks simply using Closing Power.
Near Term: updated last: 11/3/2011
------------------- Closing
Power (CP) Status Report: CHARTS:---------------------
The 3 major market ETF
Closing Powers show shallow CP Downtrendlines.
The ETFs' Opening Powers are mixed.
This is short-term bearish.
DIA is now below a CP DOWNtrendline - It will only take a
close of more than +0.185 ABOVE the Opening
to break the CP downtrend. The Opening Power today broke its
uptrend.
SPY is now above a CP Uptrendline
- It will take a close of more than +1.30 BELOW the Opening
to break the CP uptrend. The Opening Power is still rising.
QQQ is now ABOVE a CP Uptrendline
- It would only take a close of more than 0.885 BELOW
the Opening
to break the CP Uptrend. The Opening Power is still
rising.
GLD CP
in Uptrend - It will take a close of more than 1.156 BELOW
the Opening
to break the Uptrend of CP. The Opening Power is above its rising ma
PEERLESS REMAINS ON BUYs. We are seeing a strong rebound off the rising
21-day ma. The Closing Power
downtrends of the SPY, QQQ and IWM were violated.
Look for a new recovery high. The swift
turnaround is easy to explain. Greece's PM
has had to bow to the pressure from the EEC and
the big banks; he has reversed on his
promise of a popular referendum before Greece
could accede to the bankers' insistence on
stringemt austerity and privatizing measures to
his country.
SPY or QQQ might have been bought as their CPs
broke their short-term, shallow
downtrends, which turned up at their 21-day ma.
Look further below for stocks
to consider buying which Professionals appear
to buying while the Public Sells.
We know this from the CP-Divergence-Buy B7s
(first item under Ind-3).
PEERLESS Buy and Reversal Upwards from rising 21-dma
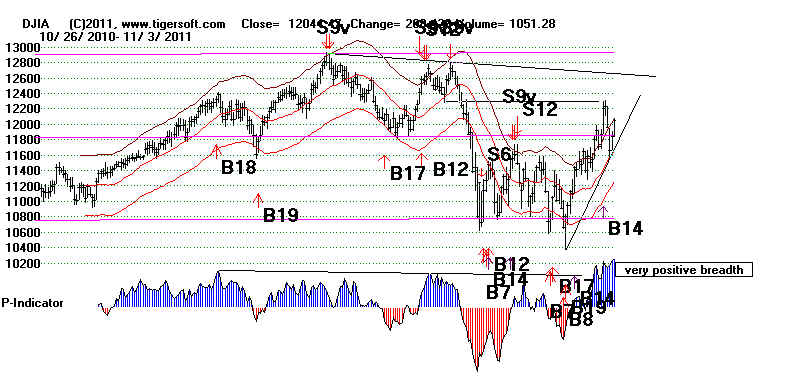
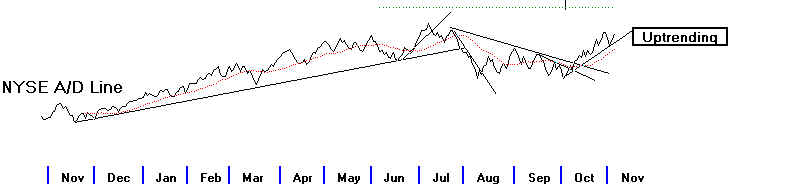
STOCKS WITH CLOSING POWER NEW HIGHS, CP - Buy B7s,
AI/200 >125 and SUBSTANTIAL RECENT ACCUMULATION
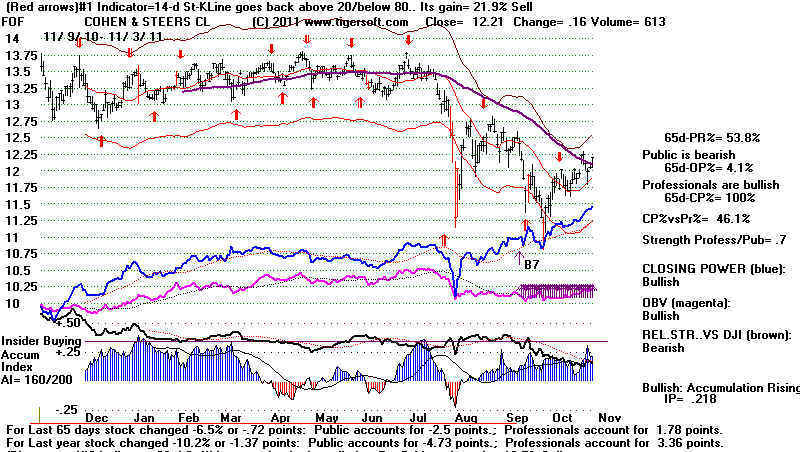 |
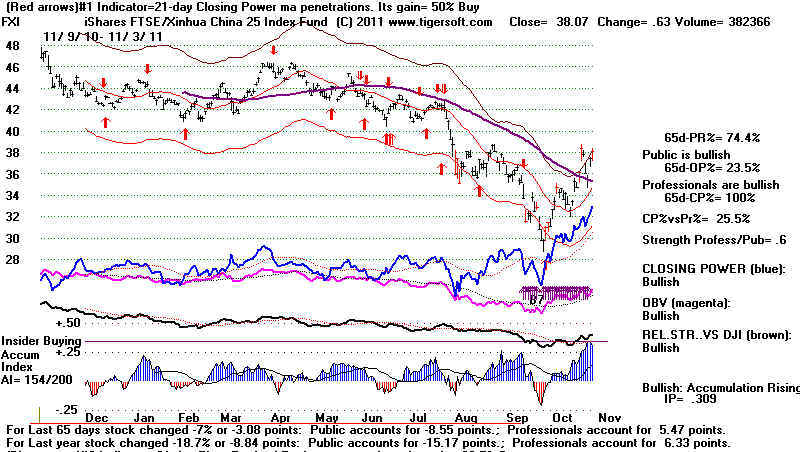 |
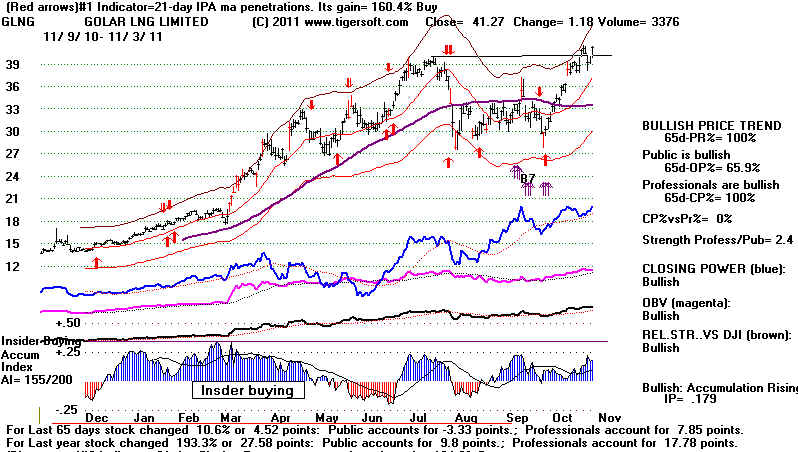 |
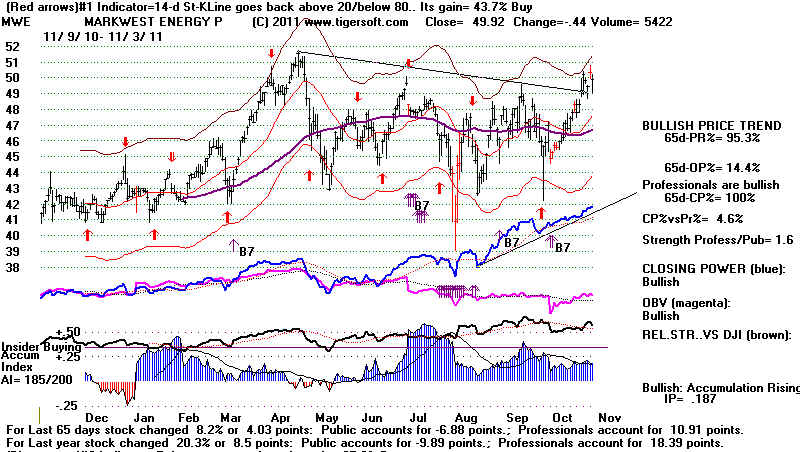 |
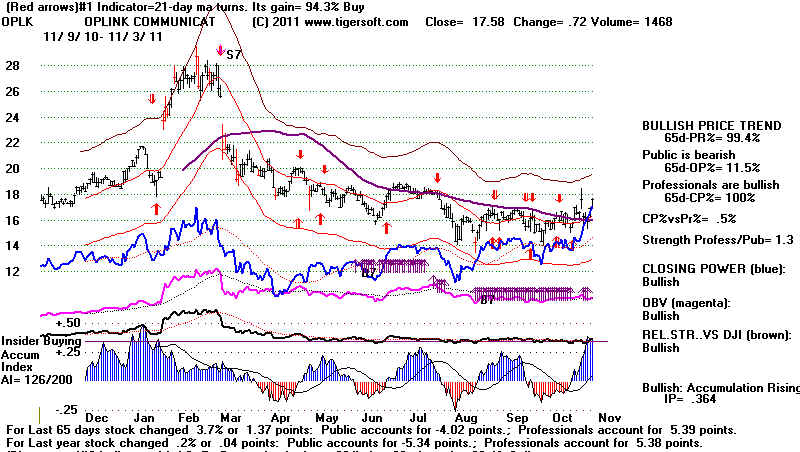 |
===================================================================================
OLDER HOTLINES
===================================================================================
11/2/2011
DJI = 11836 +178 la/ma=1.019
21-dma ROC=+1.058 P= +576 (+65) IP21=+.167 V= +117 OP= .252
BREADTH
STATISTICS:
136 (+20) MAXCP stocks Bullish MAXCP Stocks
47 (+0) MINCP stocks Bearish
MINCP Stocks
MAXCP stocks are those showing
Tiger Closing Power making new highs.
This suggests heavy Professional Buying. Applying the Tiger Power Ranker's
"bullish" to the MAXCP stocks find those with heavy insider buying and
institutional accumulation. Bearish MINCP stocks show the opposite.
Also use the BOTHUPs condition with MAXCPs and BOTHDOWNS MINCPS.
12 new highs on NASDAQ. 18 ( -13)
new lows on NASDAQ
10 ( +8) new
highs NYSE 12 (-7) new lows on NYSE
11/2/2011 ===> See Key Peerless TigerSoft
Index Charts: Industry Groups and ETFs
DIA
SPY QQQ DJIA-Peerless TigerDJI TigerSPY TigerQQQ
GLD
SLV
Crude
11/2/2001 ===>
DAILY Trading 3 Sample Stocks using
Closing Power trend-changes:
I have
suggested hedging using the bearish MINCP stocks posted here while waiting for
the DJI to work off its extremely
overbought condition of last week. But, Buy DIA if its
CP breaks its downtrend. See DIA
chart below. A close more than
1.24 above the DIA's
opening will break the CP downtrend
tomorrow. Buying DIA when the CP and the
operative Peerless signal are in
agreement about trend is usually recommended.
DJI and Peerless Signals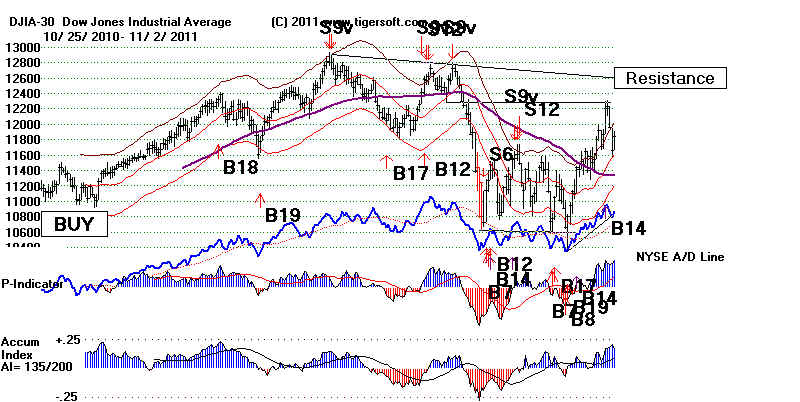 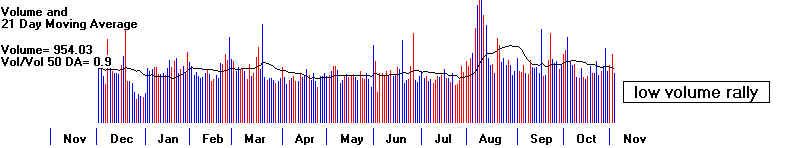 |
DIA shows potential Head/Shoulders and falling CLosing Power 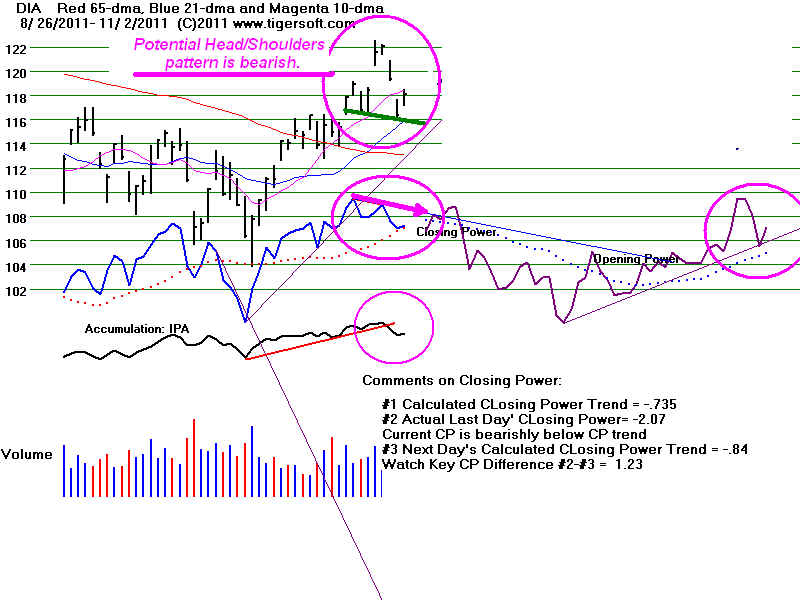 |
===================================================================================
OLDER HOTLINES
===================================================================================
11/1/2011
DJI = 11658 -297 la/ma=1.008
21-dma ROC=+.511 P= +511 (+17) IP21=+.21 V= +133 OP= .275
BREADTH
STATISTICS:
100 (+16) MAXCP stocks Bullish MAXCP Stocks
47 (+11) MINCP stocks Bearish
MINCP Stocks
MAXCP stocks are those showing
Tiger Closing Power making new highs.
This suggests heavy Professional Buying. Applying the Tiger Power Ranker's
"bullish" to the MAXCP stocks find those with heavy insider buying and
institutional accumulation. Bearish MINCP stocks show the opposite.
Also use the BOTHUPs condition with MAXCPs and BOTHDOWNS MINCPS.
8 (+1 new highs on NASDAQ. 31 ( +11)
new lows on NASDAQ
2 ( -9) new
highs NYSE 19
(+16) new lows on NYSE
11/1/2011 ===> See Key Peerless TigerSoft Index Charts: Industry Groups
and ETFs
DIA SPY QQQ DJIA-Peerless TigerDJI
TigerSPY TigerQQQ GLD
SLV Crude
11/1/2001 ===> DAILY Trading 3 Sample Stocks using Closing
Power trend-changes:
SSRI (Silver), PAAS (Silver), NEM (Gold) All on Buys now.
This will updated each night for a while to show new users how one might trade
some volatile precious metals' stocks simply using Closing Power.
Near Term: updated last: 11/1/2011
------------------- Closing
Power (CP) Status Report: CHARTS:---------------------
The 3 major market ETF
Closing Powers show shallow CP Downtrendlines.
The ETFs' Opening Powers are mixed.
This is short-term
bearish, but the DJI is just above its rising 21-dma which should act as support.
DIA is now below a CP DOWNtrendline - It will only take a close of more than +1.6 ABOVE the Opening
to break the CP downtrend. The Opening Power today broke its
uptrend.
SPY is now below a CP DOWNrendline - It will only take a
close of more than +.46 ABOVE the Opening
to break the CP downtrend. The Opening Power is still
rising.
QQQ
is now below a CP DOWNtrendline - It would only take a close of more than
+.05 ABOVE the Opening
to break the CP downtrend. The Opening Power is still
rising.
GLD CP resumed Uptrend - It will take
a close of more than 0.61 BELOW the Opening
to break the CP UPtrend. The Opening Power broke its uptrend today an is below its
rising ma
PEERLESS REMAINS ON BUYs but we now
see CP Downtrends in DIA, QQQ, SPY...
I have suggested hedging while the DJI
works off its extremely overbought condition of last week.
I noticed that the number of MAXCP stocks rose
today increased. This should not be seen if Professionals
expect a deeper decline. The odds do favor a
rebound on another intra-day tagging of the 21-day ma
of the DJI at 11564, about 90 points lower. I
would expect the CP downtrend-lines to be broken
there and that will advise us of a bounce. The bearish MINCP stocks should not be covered in that event.
Aggressive traders may want to buy any of the major
market ETFs that break their CP downtrends.
Now the DJI has fallen back to within 1% of its
steeply rising 21-day ma with the current Accumm Index
very positive. An attempt at a rally should be
expected because
1) the DJI has tagged its 21-day ma,
2) this MA is rising at am annualized rate of more than 100% per year.
3) the IP21 is a very positive +.21 and
4) the OPct is above +.25
In addition, the P-Indicator stands at +511.
Usually the 21-day ma cannot be violated on the first or
even second decline when it is rising this fast and
the key Peerless internal strength indicators are this
positive.
Internal Strength Readings and Support at The 21-DMA
Below are the 36 cases where the DJI closed
within .8% of the 21-day ma while 21-day ma was rising at an
annualized rate (ANN-ROC) of more than 60%.
In 21 cases the DJI rallied at least 3% before falling 3%.
In 15 cases (red) the DJI fell to the lower
band.
There were 15 cases here where the ANN-ROC was
at least 70%. In 10 cases the DJI reached at least the
upper band before falling 3% or
more. (These show a green result.) 5 brought
declines to the lower band
first. A steeper slope and greater
momentum clearly favors a market rebound.
There were 17 cases here where the IP21
was above +.10. Nine (a slight majority) saw declines to the lower
band. I was surprised to see here that a
still higher IP21 did not improve the odds of a rally of at least 3%.
There were 16 cases here where the OPct was
above +.25. In 11 cases the DJI rose at least 3%
before it fell 3%. The current OPct is
+.262. This appears to be a more powerful factor here.
If we look only at the 4 cases where the
ANN-ROC was at least 67% and where the IP21
was at least +.14, we see 3 rallies to at least
the upper band amd one decline to the lower band.
This is probably closest to our current
situation.
| Buys at 21-day ma when ANNROC>.60: 1940-2011 la/ma annroc P-I IP21 V-I OPct Result ------------------------------------------------------------------------------------------------------------------------------------------------- 7/8/1940 1.007 .702 63 .016 41 .326 above UB 7/1/1941 1.009 .656 79 .069 47 .37 to UB twice 7/24/1962 1.003 .728 -264 .086 -633 .303 to UB twice 12/10/1962 1.008 .671 188 .146 480 .283 above UB 12/26/1962 1.004 .768 42 .088 -99 .276 above UB 6/23/1970 1.003 .974 22 .077 -1 .07 fell to lower band and then rallied. 8/6/1970 1.00 .673 142 .077 -1 .174 fell 2% further and rallied above UB 9/14/1970 1.008 .791 241 .159 2 .195 fell 1% further and then UB 9/14/1971 1.00 .604 79 .058 0 .265 Deep decline followed. 10/17/1973 1.008 .892 208 .242 2 .469 Small rally and then deep decline. 3/19/1974 1.002 .652 112 .12 0 .105 fell to LB in bear market trend. 2/25/1975 1.002 .875 161 .10 1 .214 above UB 3/26/1975 1.008 .738 114 .126 1 .193 fell to LB and then rallied above UB 10/30/1975 1.007 .792 149 .086 0 .332 to UB 5/9/1978 1.008 .709 153 -.023 5 .179 to UB twice 12/2/1978 1.006 .698 -1 .04 4 .338 to LB (6% loss) 10/28/1982 1.007 1.029 289 .109 14 .232 above UB 8/30/1984 1.006 .871 229 0 18 .313 2% loss, 2% rally then LB 9/9/1986 1.004 .644 137 .195 12 .167 dropped below LB 12/19/1986 1.005 .635 55 .243 4 .141 1% loss and then far above UB 7/1/1987 1.006 .656 109 .128 10 .416 above UB 11/18/1987 1.003 .606 -6 .055 -9 .171 to LB 3/10/1988 .998 .656 193 .111 13-.045 3% rally and then to LB 6/27/1988 1.009 .810 150 .122 20 .147 2% rally and then to LB 12/5/1997 1.008 .666 233 .181 22 .313 to LB 4/1/1999 1.001 .676 -28 0 -13-.128 above UB 11/10/2000 1.005 .643 -10 .094 -47 .062 to LB 12/3/2001 1.002 .612 238 .115 -25 .218 to LB 4/22/2002 1.0 .679 330 .107 59 .152 to LB 4/9/2003 1.005 .987 341 .158 86 .30 above UB 6/23/2003 1.005 .633 364 .072 26 .432 continued bull market. 12/19/2009 1.005 .814 350 .074 100 .126 to UB 4/20/2009 .999 .67 344 .095 33 .153 above UB 12/3/2010 1.007 .689 280 .222 32 .27 1% decline, 3% rally and then LB 4/14/2011 1.004 .656 333 .047 42 .344 to UB 11/1/2011 1.008 1.037 511 .21 133 .262 |
work in progress...
====================================================================================
OLDER HOTLINES
====================================================================================
10/31/2011
DJI = 11955 -276 la/ma=1.038
21-dma ROC=+1.081 P= +493 (-5) IP21=+.183 V= +126 OP= .271
BREADTH
STATISTICS:
84 (-76) MAXCP stocks Bullish MAXCP
Stocks
36 (+5) MINCP stocks Bearish
MINCP Stocks
MAXCP stocks are those showing
Tiger Closing Power making new highs.
This suggests heavy Professional Buying. Applying the Tiger Power Ranker's
"bullish" to the MAXCP stocks find those with heavy insider buying and
institutional accumulation. Bearish MINCP stocks show the opposite.
Also use the BOTHUPs condition with MAXCPs and BOTHDOWNS MINCPS.
7 (-10 new highs on NASDAQ. 20 ( +11)
new lows on NASDAQ
11 ( -6) new
highs NYSE 3
(-6) new lows on NYSE
10/31/2011 ===> See Key Peerless TigerSoft Index Charts: Industry Groups
and ETFs
DIA SPY QQQ DJIA-Peerless TigerDJI
TigerSPY TigerQQQ GLD
SLV Crude
10/31/2001 ===> DAILY Trading 3 Sample Stocks using Closing
Power trend-changes:
SSRI (Silver), PAAS (Silver), NEM (Gold) All on Buys now.
This will updated each night for a while to show new users how one might trade
some volatile precious metals' stocks simply using Closing Power.
Near Term: updated last: 10/31/2011
------------------- Closing
Power (CP) Status Report: CHARTS:---------------------
The 3 major market ETF
Closing Powers each broke their CP Uptrendlines.
The ETFs' Opening Powers are still rising.
This is short-term
bearish.
DIA is now below a CP DOWNtrendline - It will take a close of more than +1,2 ABOVE the Opening
to break the CP downtrend. The Opening Power is still
rising.
SPY is now below a CP DOWNrendline - It will take a close of
more than +.985 ABOVE the Opening
to break the CP downtrend. The Opening Power is still
rising.
QQQ
is now below a CP DOWNtrendline - It would take a close of more than
+.16 ABOVE the Opening
to break the CP downtrend. The Opening Power is still
rising.
GLD is BELOW its CP Uptrendline - It
will take a close of more than 7.24 ABOVE the Opening
to restore the CP UPtrend. The Opening Power is still rising.
PEERLESS REMAINS ON BUYS
BUT I WOULD BE MUCH MORE HEDGED.

The EURO has not been saved. The Greek PM will
let his people vote on the
austerity program demanded by the
European bankers. This bombshell came out after
today's close in NY. A
"No" vote would scrub the basis for the recent rally.
The "Troika" of lenders - the
European Union, International Monetary Fund and European
Central Bank - say Greece must take more
painful steps to cut its borrowing. But Greece
faces
riots and mass protests on the streets of Athens. The government could lose
its grip on parliament - only 155 of 300
MPs backed the last round of austerity in June
Banks
sink on Greek vote bombshell
Greek
Vote Threatens Bailout
My view http://www.tigersoftware.com/TigerBlogs/April-28-2010/index.html
is that
Greece needs it own currency to sort out
its problems. Bankers demand a single
European wide currency to better control
debt issues everywhere on the Continent.
I would not bet on a "Yes" vote
in Greece.

See how the Closing Power are now in minor downtrends. It is never a good idea
to let
a nice profit get away from us. I admit that
the last two night's hotlines have not been
very loyal to Peerless. This is
because:
1) I
know that historically Peerless does not always give a Sell on a decline from an
overbought condition that brings a decline of 5%-6% to the lower band. There
are not a lot of these cases, but they might be studied by some enterprising souls.
In the last 45 years, there have been 29 such cases, about 1 every 18 months.
Such cases in Octobers are rare. But there were 8 instances in November.
Unsignaled Declines from
Upper Band to Lower Band
1966-2011
Date la/ma annroc
P-I Ch IP21
OP21
3/18/75 1.034 .716 121 -28 .09 .259
5/14/75 1.038 .629 117 6 .041 .36
10/23/75 1.037 .419 99 -10 .044 .209
9/21/76 1.033 .494 178 69 .181 .166
11/11/77 1.037 .405 80 82 .15
.221
1/26/79 1.033 .734 234 50 .087 .265
3/27/79 1.035 .713 163 41 .101 .265
11/30/82 1.034 .778 193 33 .092 .259
11/3/82 1.059 1.886 411 40 .179 .383
8/9/84 1.079 1.218 139 77 .135 .414
11/6/84 1.031 .609 152 27 .113 .191
3/27/86 1.041 .852 215 25 .064 .22
4/12/88 1.033 .439 18 4 .098
.341
2/2/89 1.037 .828 190 -36 .148 .376
5/22/89 1.034 .456 101 -14 .100 .033
6/3/91 1.035 .393 80 -13 .135
.380
2/5/83 1.044 .627 233 15 .115
.425
8/31/94 1.031 .368 112 -5 .032 -.038
11/25/96 1.051 1.038 268 35 .195 .528
2/18/97 1.035 .409 95 -5 .098
.026
7/30/97 1.034 .871 312 48 .137 .479
12/5/97 1.049 .702 79 2 .065
.346
11/23/98 1.062 1.25 258 49 .078 .349
1/8/99 1.058 .806 48 25 .09
.232
3/23/00 1.085 1.043
-46 56 .033 .232
10/31/00 1/052 .31 -208 72 .034 .125
11/29/02 1.033 .649 320 -42 .056 .199
4/26/10 1.017 .394 421 16 .153 .543
?? 10/27/11 1.07 1.255 561 208 .172 .251
Continuing: why limit our faith in Peerless
now?
2)
The good breadth now which Peerless heavily weights owes to the distorting
effect of the Fed's policies of low interest rates. My sense is the same as
Bernanke's,
namely in a very weak economy with little comsumer demand and high unemployment
that
monetary stimulus is not enough, especially when austere fiscal policies rule Europe.
3)
In addition, we know that the first two weeks of November are up only 51% of
the time
since 1965.
4) We
make the most money when Peerless is on a Buy and the Closing Power
trends are up. I would prefer to wait for that
combination again.
Financials were dumped today. Watch the
3x leveraged financial short fund (FAZ).
It held at support and its CP broke its
downtrend. That makes it a Buy if you disregard
Peerless, which traders can often profitably
do, if they are nimble.
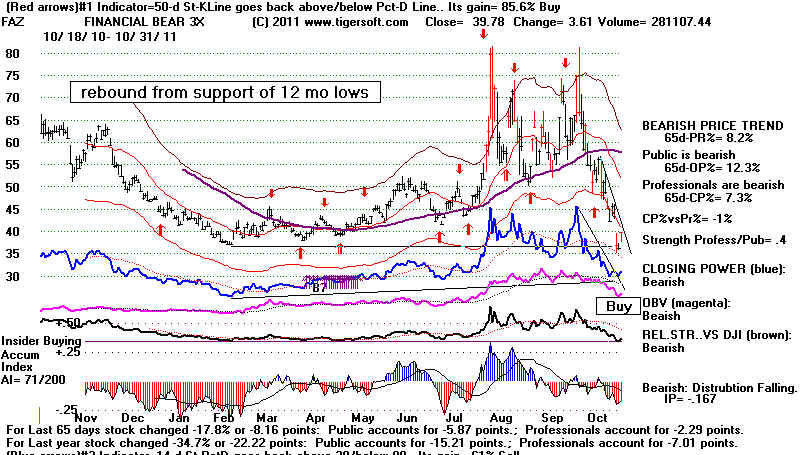
Why are Professionals selling now? MF Global Holdings has filed for
bankruptcy.
This is the eighth biggest filing for
bankruptcy in US history. It has been compared with
Lehman Brothers in 2008. The MF fall-out
may get worse. Customers'
money is missing.
This could not come at a wrse time for Wall
Street, considering the growing support
for the Occupy Wall Street protestors.
In addition, Ex Dem Governor Corzine has been
linked to corruption in New Jersey in 2008.
Now it turns out he was its director when MF
gambled on high paying bonds of Italy, Spain
and Portugal as a way to bail out its miserable
proprietary trading record.
Regulators
Investigating (Corzine's bankrupt) MF Global (for $700 ...
MF
Global is first big US victim of Europe crisis
http://www.nypost.com/p/news/opinion/editorials/item_BsE5tKKPfJXuOL3CDxjVsJ
How
Jon Corzine Bankrupted His Firm
Jon
Corzine to Get $12 Million Severance
Is this a bear market rally, like occurred twice in 2000 with unsignaled drops
from the upper band to the lower band?
Breadth is much better now.
For that reason, I suspect the 11700
support or the 21-day ma will act as good
support and we will go higher after this
support is tested and holds.
In the circumstances, I have suggested traders
watch the CLosing Powers and
do some selling if the CP uptrends were broken.
That has occurred. Now there is a
CP downtrend for the major market ETFs.
My guess is that 11700, the point of breakout
a week ago, is likely now to be tested.
We hope and trust that will hold but
today's 2%+ decline was uncomfortably steep and
the recent rally did not turns the
21-day ma of Volume up. This is a warnig
that there will not be enough buying to
overcome the overhead supply of stock.
Our Stocks' Hotline has taken some profits, in
ALXN, IBM and HOG for example, and
we have gone short some of the bearish MINCP
stocks. I think I would take some more
hedging short sales.
HEAVY DISTRIBUTION MEANS "INSIDER SELLING"
Look at the CP new low (MINCP) stocks that have recently shown IP21 readings
below -.25. Short them on CP breakdowns
if their IP21 is below -.15. See AVID.
OSG and
OSTK (below)
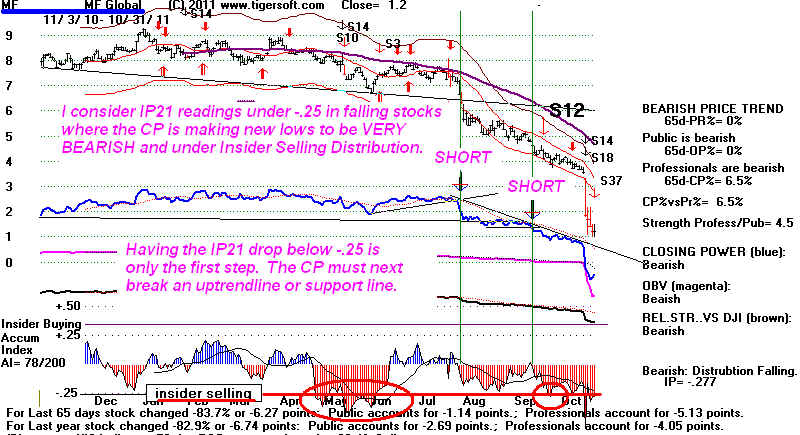
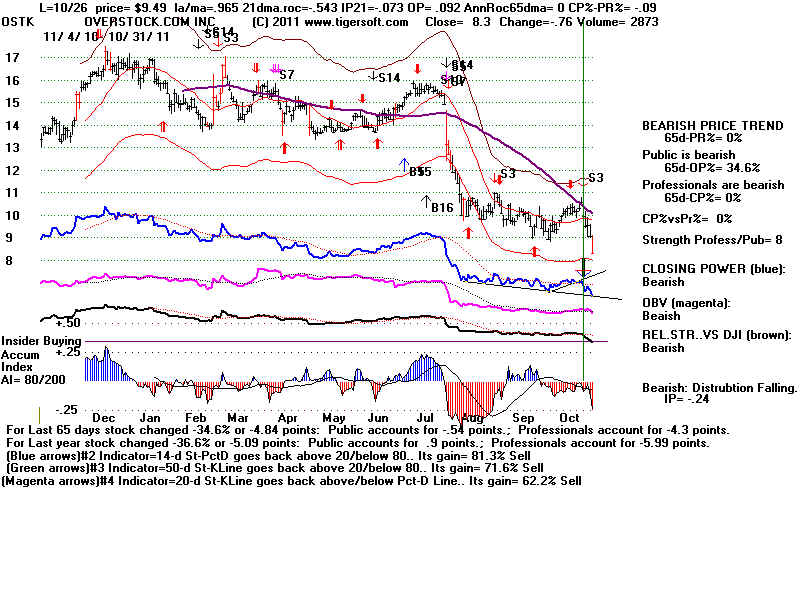
===================================================================================
OLDER HOTLINES
===================================================================================
10/28/2011
DJI = 12231 +23 la/ma=1.067
21-dma ROC=+1.123 P= +498 (-63) IP21=+.177 V= +116 OP= .26
BREADTH
STATISTICS:
157 (-11) MAXCP stocks Bullish MAXCP Stocks
31 (+4) MINCP stocks Bearish
MINCP Stocks
MAXCP stocks are those showing
Tiger Closing Power making new highs.
This suggests heavy Professional Buying. Applying the Tiger Power Ranker's
"bullish" to the MAXCP stocks find those with heavy insider buying and
institutional accumulation. Bearish MINCP stocks show the opposite.
Also use the BOTHUPs condition with MAXCPs and BOTHDOWNS MINCPS.
17 (+1) new highs on NASDAQ. 9 ( -3) new lows on NASDAQ
17 ( -2) new
highs NYSE 9
(+4) new lows on NYSE
10/28/2011 ===> See Key Peerless TigerSoft Index Charts: Industry Groups
and ETFs
DIA SPY QQQ DJIA-Peerless TigerDJI
TigerSPY TigerQQQ GLD
SLV Crude
10/28/2001 ===> DAILY Trading 3 Sample Stocks using Closing
Power trend-changes:
SSRI (Silver), PAAS (Silver), NEM (Gold) All on Buys now.
This will updated each night for a while to show new users how one might trade
some volatile precious metals' stocks simply using Closing Power.
Near Term: updated last: 10/28/2011
------------------- Closing
Power (CP) Status Report: CHARTS:---------------------
The 3 major market ETF
Closing Powers restored their uptrend-lines. The ETFs' Opening Powers are
still rising.
This is short-term bullish, but it a close below the
opening would be bearish.
DIA BACK ABOVE a viable CP UPtrendline - It will take a close of more than +.375 ABOVE the Opening
to sustain the CP uptrend. The Opening Power is still
rising.
SPY BACK ABOVE a viable CP Uptrendline - It will take a close
of more than +.531 ABOVE the Opening
to sustain the CP uptrend. The Opening Power is still rising.
QQQ
BACK ABOVE a vianle CP Uptrendline - It would take a close of more than
+.19 ABOVE the Opening
to sustain the CP uptrend. The Opening Power is still rising. QQQ
is now weaker than the DIA.
GLD is ABOVE its CP Uptrendline - It
will take a close of more than 2.23 BELOW the Opening
to break the CP UPtrend. The Opening Power is still rising.
Its Relative Strength vs DJI is
at downtrendline.
PEERLESS REMAINS ON
BUYS.
The old 2006 Peerless would have just given a
Buy B4 breakout above the upper band.
The current Peerless has simply stayed on Buys
thoughout the 15% October rally.
While simple profit-taking at the opening seems
likelytomorrow, more important is what
happens the rest of the trading day.
Watch the Closing Powers and the ratio of
NYSE advances to declines.
Getting 7% above the upper band is much
more likely to bring additional gains
than a retrreat to the lower band, even
when we look just at only the cases where
the DJI was still below the 12 month
high. The odds of significantly higher prices are 7:2
judging from the 9 cases of this since
1945. I realize this is pretty amazing, considering
the news. But I would trust
Peerless over the Glen Becks of the world any day of the week.
The DJI has reached the minor resistance of the
broken July 2011 bottom. A minor
pullback should be of no surprise. Most
likely, after a shallow retreat it will then
rally and tag the declining resistance line
shown below at 12600 and then hesitate. Without
a Peerless Sell signal, we should expect that
level to be reached. However, volume
has not been so high as to lead us to think
that a breakout is imminent. A lateral movement
with a decline back to the 21-day ma seems a
reasonable guess as to what lies ahead.
I still think the top to this move will occur
in November with a late December rally again.
As long as the Closing Powers and NYSE A/D Line
trend are rising, we have to be short-term bullish.
The rally has taken many by surprise. They now
have to decide if conditions are bullish enough
to chase the rally. If the DJI does stall
out here and falls below the 21-day ma, there is a
danger that we will have seen just a last bear
market rally. But if this is the case, we should
first get a Peerless major Sell. 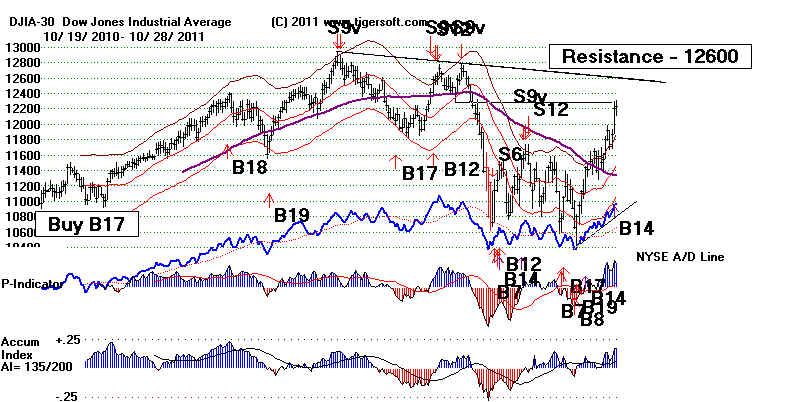
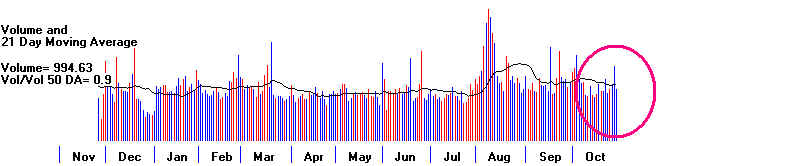
Let's Watch the 3x Short Leveraged ETFs for a Sign of A Reversal.
BGZ - Large Cap
Bear 3x new 12 mo low nut not this is not confirmed by the CP making a new low
or the Accum.
Index making a 2 month low. It remains on a Red Sell. The same is true for DOG -
the leveraged
Short on the DJI-30. The 3x Finnacial Bears is now testing the support at 36 from
its 12 months'
low in February. Much weaker looking are GLL (UltraShort on Gold) and FXP, the
UltraShort on the
Chinese-25. The UltraShort on the QQQ has made a 12 month low in prices,
but not CLosing
Power or red Distribution. It is also on a red Buy.
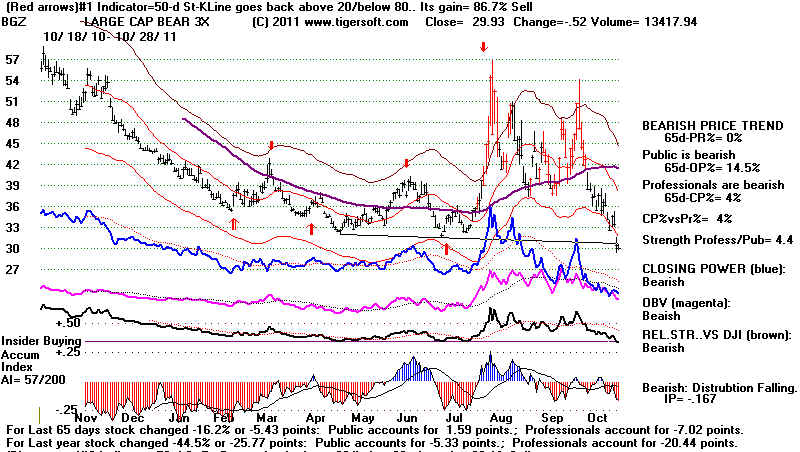 |
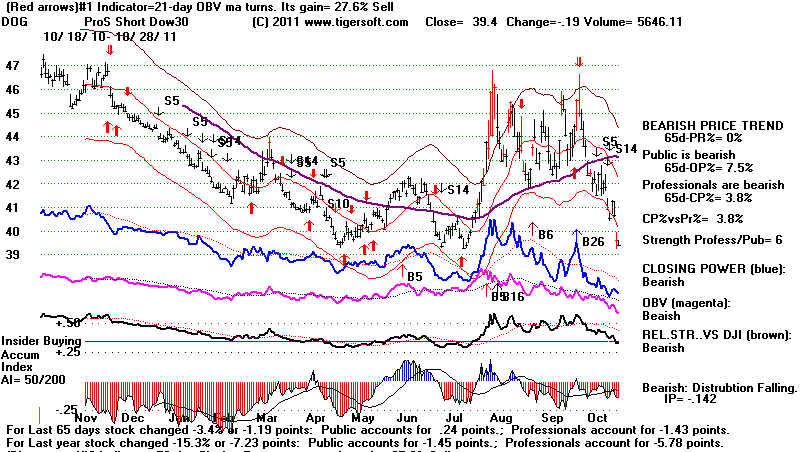 |
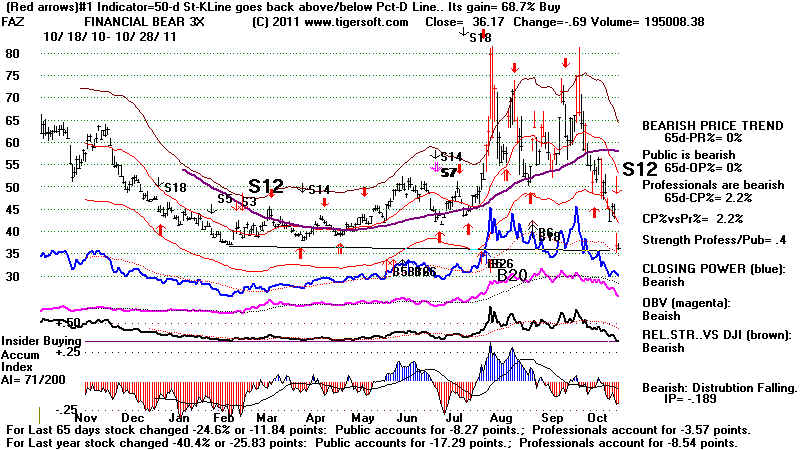 |
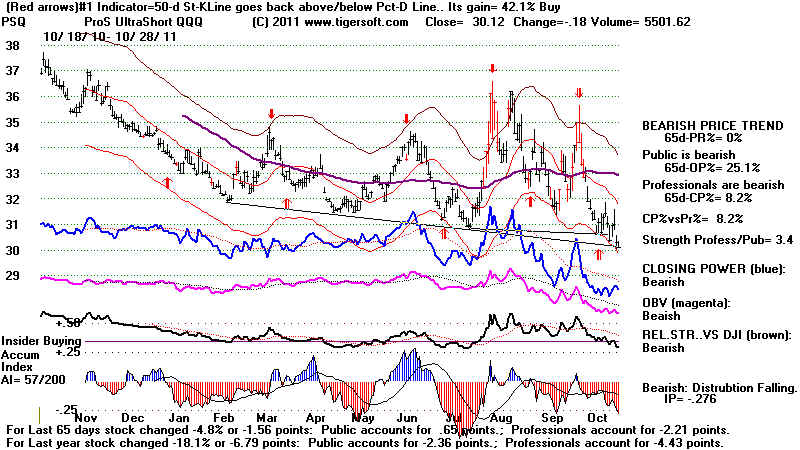 |
Exceptional Market Strength Is Usually Bullish.
Yesterday, the DJI
closed 7% over the 21-day ma without making a 12 mo high. This is highly
unusual. In 9
earlier cases, it was bullish and in 2 it was bearish. In 2 of the 9 cases, the DJI
went
into a consolidation
phase. In 7 of the 11 cases it was entering a rising phase in an on-going
bull market. Here
are earlier cases of this since 1945.
There were 8
cases of the the DJI being 6% to 7% over the 21-day ma without making a new
21 month high.
Only 3 of them produced a decline to the 21-day or lower.
--------------------------------------------------------------------------------------------------------------------------------------------------
11 Moves
above the Upper 7% Band with DJI below 12 Month High since 1945
date
la/ma
prev. decl
subsequent
beavior.
-------------------------------------------------------------------------------------------------------------------------------------------------------------
???? 10/27/2011 7.0% after 16% decline at bear market bottom.
P=561 IP21=.172 V=138
OP21=.253
===> 1/10/1975
7.5% after 13% decline at bear market bottom. DJI began new bull market immediately.
P=218 IP21=.065 V=0
OP21=.457 pulled
back to 21-dma.
===> 1/28/1975
7.2% after 13% decline at bear market bottom. DJI continued bull market.
P=450 IP21=.102 V=3
OP21=.573 advanced steadily
===> 8/23/1982 9.7% after 15 month bear
market. DJI launched a bull
market.
P=52 IP21=.022 V=2 OP21=.063
advanced steadily
===> 8/9/1984 7.9% after 16% decline.. DJI went sidewise for 5 months and then began a bull market.
P= 139 IP21=.135 V=15
OP21=.414 rose 3% and then fell to LB. No Sell
===> 2/11/1991 8.2% after 21% decline.. DJI went sidewise for 11 months and then began a bull market.
P= 418 IP21=.318 V= 54 OP21=.483
pulled back to 21-dma.
===> 3/24/2000 7.9% after 17% decline. DJI fell
back below lower band, went sidewise and began bear market.
P= -4 IP21= .051 V= 32
OP21=.051
Rising Volume.
===> 4/19/2001 8.1% after 15% decline.. DJI went up 10% more
until Peerless Sell and then began a
bearl market.
P= 57 IP21=.182 V= -16 OP21=.289 There was a Peerless Sell a month later 10% higher
at the top..
===> 3/21/2003 7.9% after 16% decline. DJI fell back to ma and then went up in new bull market.
P= 173 IP21=.204 V= 32
OP21=.388 pulled
back to 21-dma.
Rising Volume.
===> 11/4/2008
7.3% after 37% decline. DJI fell below lower band, went sideise and resumed
bear market.
P= -4 IP21= .051 V= 32
OP21=.051
There was a Peerless Sell.
===>
3/25/2009 8.6% after 27% decline. DJI began a new bull market.
P= 131 IP21=
-.027 V= -55 OP21=.064 There was no
Peerless Sell.
Rising Volume.
===> 4/2/2009 8.4% after 27% decline. DJI
began a new bull market.
P= 523 IP21= ,11 V= 167 OP21=.199 There was no Peerless Sell.
Rising Volume.
--------------------------------------------------------------------------------------------------------------------------------------------------[
Moves above the Upper
4% Band with DJI below 12 Month High since 1945
date
la/ma
prev. decl
subsequent
beavior.
-------------------------------------------------------------------------------------------------------------------------------------------------------------
11/5/1955 5.4% after 10% decline...DJI
immediately stalled at old highs for 3 months before upside breakout.
11/10/1960
4.3% after 10% decline...DJI immediately stalled and returned to 21-dma and then
started
a new bull market.
11/14/1962
6.2% after 10% decline at bear market bottom. DJI moved steadily higher
in new bull market.
10/27/1966
4.5% after 9% decline at bear market bottom. DJI stalled for 3 months
and then moved higher
in new bull
market.
4/11/1968
6.5% after 10% decline. DJI moved sidewise for five
months and then rallied 9% higher.
10/24/1969 4.5% after 17% decline.
DJI resumed bear market.
7/17/1970
5.3% after 20% decline. DJI stalled for a month and then moved steadily
higher in new bull market.
8/24/1970
4.8% after 10% decline. DJI stalled for 3 months and then moved
steadily higher in new bull market.
8/24/1971 4.3% after 10% decline.
DJI peaked and fell 13% more.
12/3/1972 4.2% after 13% decline at bear
market bottom. DJI began new bull market immediately.
10/8/1973 5.4% after 17% decline.
DJI peaked and fell 19% in two months.
1/3/1974 6.5% after 19%
decline. DJI peaked and fell 8% in 6 weeks and resumed bear market.
3/6/1974 5.1% after 9%
decline. DJI peaked and fell 11% in 10 weeks and resumed bear market.
6/10/1974 4.1% after 9%
decline. DJI peaked and immediately resumed bear market.
10/14/1974 6.2% after long bear
market decline. DJI peaked and fell 13% to a bear market bottom.
===> 1/10/1975
7.5% after 13% decline at bear market bottom. DJI began new bull market immediately.
===> 1/28/1975
7.2% after 13% decline at bear market bottom. DJI continued bull market.
4/17/1975 6.2% after 13%
decline at bear market bottom. DJI continued bull market.
4/17/1978 5.6% after 15 mo bear market
bottom pattern. DJI began bull market.
4/26/1978 6.5% after
15 mo bear market bottom pattern.. DJI resumed bull market.
8/2/1978 5.6% after 6% decline.
DJI peaked and fell 13% in three months.
1/15/1979 4.2% after 13% decline.
DJI went sidewise for 5 months and rallied 8%.
5/23/1980 4.2% after 16% decline.
DJI launched a bull market.
1/6/1981 5.9% after 9% decline.
DJI peaked, fell to lower band, went sideise and began bear market.
===> 8/23/1982 9.7% after 15 month bear
market. DJI launched a bull market.
===> 8/9/1984 7.9% after 16% decline..
DJI went sidewise for 5 months and then began a bull market.
1/5/1988 5.1% after 35% decline.
DJI fell to lower band, went sideise and began bear market.
===> 2/11/1991 8.2% after 21% decline..
DJI went sidewise for 11 months and then began a bull market.
11/24/1999 4.9% after 20% decline.
DJI fell to lower band, went sideise and began bear market.
DJI exactly stalled at earlier high and there was no Peerless Sell
===>
3/24/2000 7.9% after 17% decline.
DJI fell back below lower band, went sideise and began bear market.
There was a Peerless Sell.
10/31/2000 5.2% after 10% decline.
DJI fell back below lower band, went sideise and began bear market.
There was no Peerless Sell.
===> 4/19/2001
8.1% after 15% decline.. DJI went up 10% more until Peerless Sell and then began a bearl market.
10/11/2001 5.3% after 27% decline.
DJI went up 10% more until Peerless Sell and then began a bearl market.
3/4/2002 6.4 after 27% decline. DJI fell back below lower
band and began bear market.
===> 3/21/2003 7.9% after 16% decline. DJI
fell back to ma and then went up in new bull market.
11/12/2004 4.4% after 10% decline. DJI rose steadily 5% until Peerless
Sell. Went sidewise for a year,
12/10/2007 4.0% after 10% decline.
DJI fell to lower band, went sideise and began bear market.
===> 11/4/2008
7.3% after 37% decline. DJI fell below lower band, went sideise and resumed
bear market.
There was a Peerless Sell.
1/2/2009 4.5% after 36%
decline. DJI fell below lower band, resuming bear market.
There was a Peerless Sell.
===> 3/25/2009 8.6% after 27% decline.
DJI began a new bull market.
===> 4/2/2009 8.4% after 27% decline. DJI
began a new bull market.
5/4/2009 4.9% after 27% decline. DJI began a new bull market.
7/24/2009 6.5% after 7% decline. DJI began a new bull market.
8/2/2010 4.0% after 14%
decline. DJI fell to lower band and began bull market.
7/7/2011 4.4% after 7%
decline. DJI fell belowlower band.
There was a Peerless Sell.
..
d
11/10
====================================================================================
OLDER HOTLINES
====================================================================================
10/27/2011
DJI = 12209 +340 la/ma=1.07
21-dma ROC=+1.255 P= +561 (+208) IP21=+.172 V= +138 OP= .251
BREADTH
STATISTICS:
168 MAXCP stocks Bullish MAXCP Stocks
27 MINCP stocks Bearish MINCP
Stocks
MAXCP stocks are those showing
Tiger Closing Power making new highs.
This suggests heavy Professional Buying. Applying the Tiger Power Ranker's
"bullish" to the MAXCP stocks find those with heavy insider buying and
institutional accumulation. Bearish MINCP stocks show the opposite.
Also use the BOTHUPs condition with MAXCPs and BOTHDOWNS MINCPS.
16 (+11) new highs on NASDAQ. 12 ( -7) new lows on NASDAQ
19 ( +9) new
highs NYSE 5
(+1) new lows on NYSE
10/27/2011 ===> See Key Peerless TigerSoft Index Charts: Industry Groups
and ETFs
DIA SPY QQQ DJIA-Peerless TigerDJI
TigerSPY TigerQQQ GLD
SLV Crude
10/27/2001 ===> DAILY Trading 3 Sample Stocks using Closing
Power trend-changes:
SSRI (Silver), PAAS (Silver), NEM (Gold) All on Buys now.
This will updated each night for a while to show new users how one might trade
some volatile precious metals' stocks simply using Closing Power.
Near Term: updated last: 10/27/2011
------------------- Closing
Power (CP) Status Report: CHARTS:---------------------
The 3 major market ETF
Closing Powers broke their uptrend-lines. This is short-term BEARISH.
The ETFs' Opening Powers are still rising.
DIA BACK ABOVE a viable CP UPtrendline - It will take a close of more than .134 BELOW the Opening
to break the CP uptrend. The Opening Power is still
rising.
SPY BACK ABOVE a viable CP Uptrendline - It will take a close
of more than .2506 BELOW the Opening
to break the CP uptrend. The Opening Power is still rising.
QQQ
BROKE BELOW its CP Uptrendline yesterday - - It would take a close of
only .35 BELOW the Opening
to break the CP uptrend. The Opening Power is still rising. QQQ
is now weaker than the DIA.
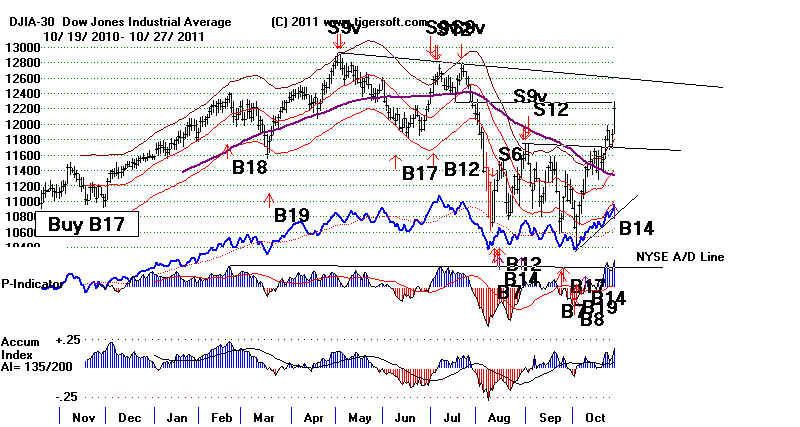
The size of the advance today will almost certainly invite
some profit-taking. I have no problem
with that. You've made some nice money very quickly. The DJI has reached the
12000 objective
I suggested. This has all the appearances of a heavily manipulated advance using
leveraged
Futures and ETFs. See the massive blue Accumulation right at the bottom in many of
the leveraged
major market ETFs, as shown below in BXUB. (Yes, we
will certainly have to start watching
for these hugely bullish divergences in oversold ETFs' markets. They are all in
SECTORS.exe
on the Tiger Data Page.)
Will the market go still higher? I do not see any sign yet from the leveraged
bearish ETFs
that they have reached a bottom. In fact, quite a few are seen in the BEARISH MINCP
stocks. If the market were about to decline in a big way, these leveraged bearish
ETFs
might show the same levels of high Accumulation as they fall to their lower bands, just
as their opposite numbers (the leveraged bullish ETFs) did on October 3rd.
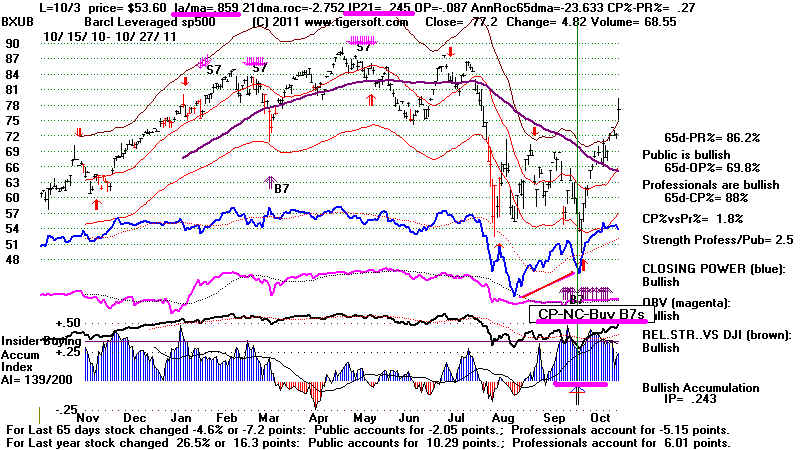
Watch Interest Rates
Why not let someone else assume some of the risks in buying now with the DJI back
above 12100 where all the trouble started? Interest rates may
be going up. See the
H/S pattern on leveraged 7-10 Year Treasuries. What if there is a FED revolt and
Bernanke cannot get his way in adding massive new sums of liquidity to the markets?
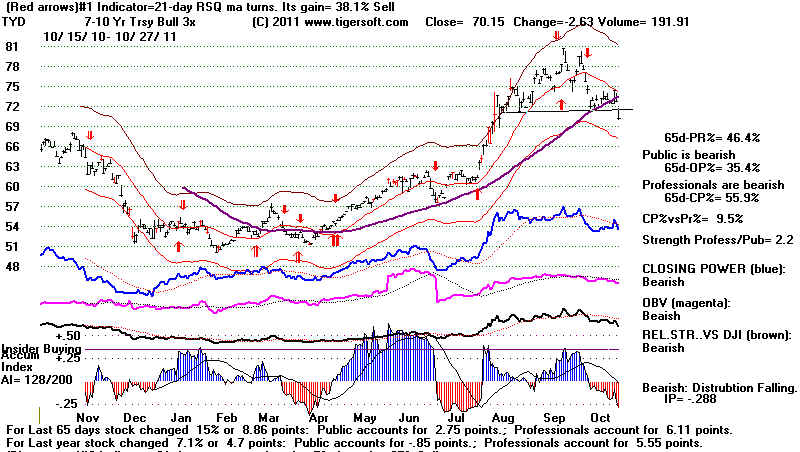
BANKERS ARE SMILING.
Bankers now seem happy that the
governments in Europe have provided tanglible enough assurances
that there will not be a wholesale default by the poorer countries on the Continent.
The real problem, namely
that a single currency does not meet the needs of smaller, weaker countries that would
benefit
from having their own weakened currencies to increase exports and tourism, is not even
discussed.
But Wall Street wanted any fix, even a temporary one. The EURO rose strongly versus the
now suddenly much weaker Dollar. That
has sent up Oil and Gold and, as a renewed inflation hedge,
the US Stock Market. The DJI rose more than +350. At the same time, shorts are
being stampeded
into covering. Nearly all
groups are participating, except Food Commodities.
The Closing Powers are rising again. And, reflecting European buying, the ETF's
Openings have been very
strong. The Opening Powers can be seen in the expanded (exploded) charts of the DIA, SPY,
QQQ
and IWM).
Most big investors are still unsure. New money is suddenly pouring back into defensive Utilities
(Look at the breakout there.) and the best Growth Reits as well as nearly all the
components of the
DJI (which overweights oil)
and the SP-500 (which has many financials).
The number of stocks making Closing Power new highs is 6x the number making CP new lows.
Professionals clearly are betting on still higher prices and have not switched to selling,
even though
the DJI is up 13.5% in three weeks.
Does The ETF Tail Wag The Stock Market DOG?.
The Importance of Positive Non-Confimations at the Lower
Band by The Accumulation Index
The broad American Public is not much in this market. The Wall Street Elite is
reviled in nationwide
demonstrations. Tea Party people reached a crescendo of gloomy pessimism just
as their
Congressmen refused to agree to higher US debt limits and caused US government debt
to be downgraded.. But once again, the market is doing what it does best, making a
mockery
of public sentiment. This is not accidental. With the Presidential Election
coming up next
year, the Ruling Triumverate (Obama Adm., the Fed and leading Wall Street banks) are
boosting
stock prices, perhaps, planning a new QEIII, new home owner loan protection and buying key
leveraged ETFs and major market futures. Professionals are buying even after prices
jump
at the opening from overseas demand. .
It is my contention that Insiders and Professionals planned the bottom of October 3rd.
Our charts
are the evidence. IMPORTANT: Look at the high levels of Accumulation right at the bottom
by many of the leveraged ETFs for the general market as they fell to their lower band.
These are classic
Tiger positive Non-Confirmations. See also how the Closing Powers failed by wide margins
to confirm
their lows, giving B7s. Clearly, there is
merit in studying these ETF charts on a more regular basis here.
. I
will soon start positing them, one for leveraged Bullish ETFs and one for leading
leveraged Bearish ETFs.
I can only do some of these. But I will try to post the ones telling an important
message.
Instead of buying individual stocks or unleveraged major market ETFs, we would have
done better buying these on 10/4/2011. Below are only a few examples.
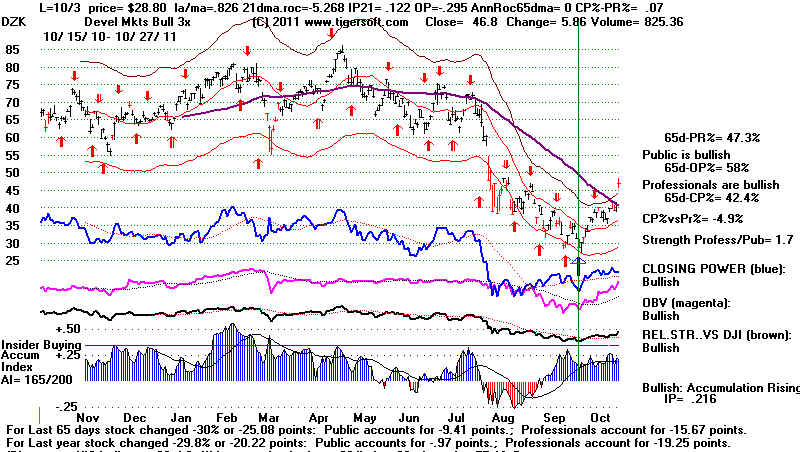 |
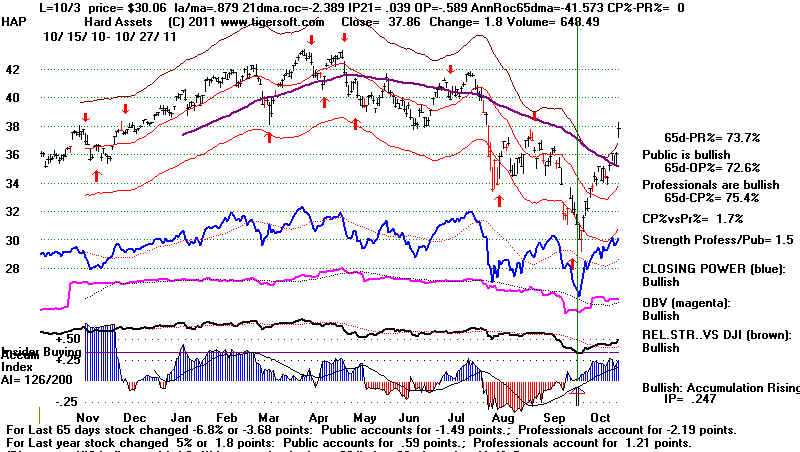 |
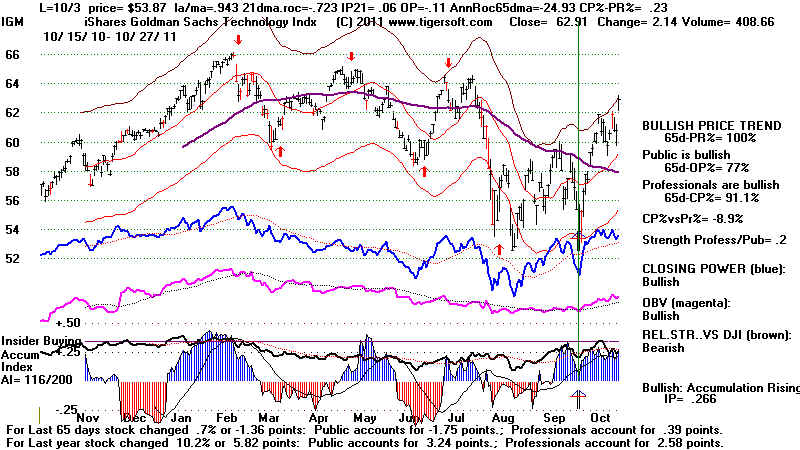 |
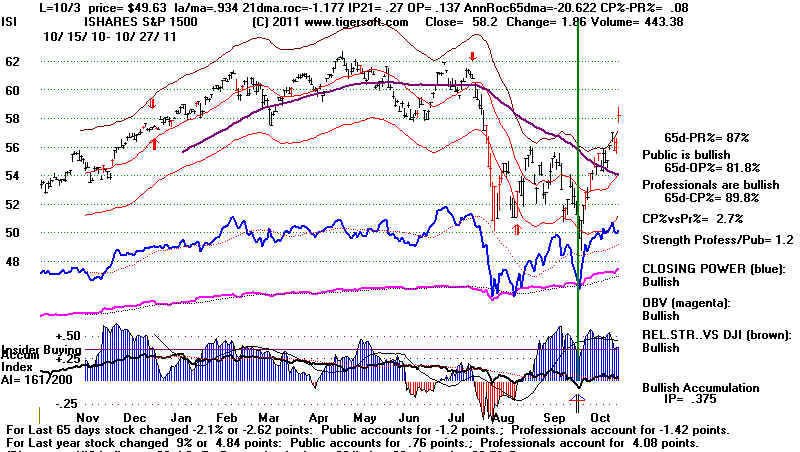 |
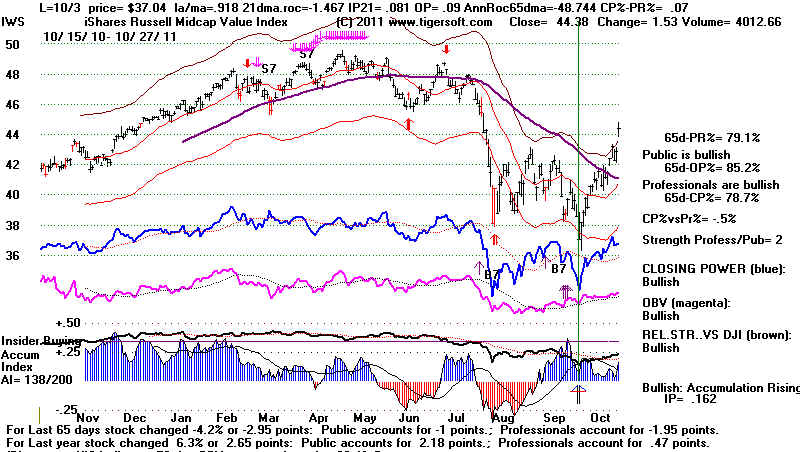 |
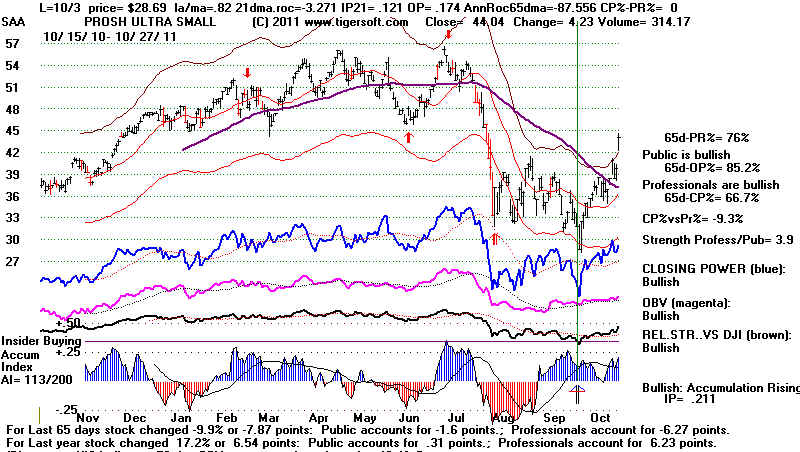 |
=====================================================================================
OLDER HOTLINES
=====================================================================================
10/26/2011
DJI = 11869 +162 la/ma=1.045
21-dma ROC=+.713 P= +353(-4) IP21=+.098 V= +40 OP= .159
BREADTH
STATISTICS:
71(-46)
MAXCP stocks Bullish
MAXCP Stocks
34 (-3)
MINCP stocks Bearish
MINCP Stocks
MAXCP stocks are those showing
Tiger Closing Power making new highs.
This suggests heavy Professional Buying. Applying the Tiger Power Ranker's
"bullish" to the MAXCP stocks find those with heavy insider buying and
institutional accumulation. Bearish MINCP stocks show the opposite.
Also use the BOTHUPs condition with MAXCPs and BOTHDOWNS MINCPS.
16 (+11) new highs on NASDAQ. 12 ( -7) new lows on NASDAQ
19 ( +9) new
highs NYSE 5
(+1) new lows on NYSE
10/26/2011 ===> See Key Peerless TigerSoft Index Charts: Industry Groups
and ETFs
DIA SPY QQQ DJIA-Peerless TigerDJI
TigerSPY TigerQQQ GLD
SLV Crude
10/26/2001 ===> DAILY Trading 3 Sample Stocks using Closing
Power trend-changes:
SSRI (Silver), PAAS (Silver), NEM (Gold) All on Buys now.
This will updated each night for a while to show new users how one might trade
some volatile precious metals' stocks simply using Closing Power.
Near Term:
updated last: 10/26/2011
------------------- Closing
Power (CP) Status Report: CHARTS:---------------------
The 3 major market ETF Closing Powers
broke their uptrend-lines. This is short-term
BEARISH.
The ETFs' Opening Powers are still rising.
DIA BROKE
BELOW its CP UPtrendline -
It will take a close of more than 2.358 ABOVE the Opening
to restore the CP uptrend. The Opening Power is still rising.
SPY
BROKE BELOW its CP Uptrendline - It will take a close of more than 3.0792 ABOVE the Opening
to restore the CP uptrend. The Opening Power is still rising.
QQQ BROKE BELOW
its CP Uptrendline - - It will take a close of more than 1.807 ABOVE the Opening
to restore the CP uptrend. The Opening Power is still rising. QQQ is now
weaker than the DIA.
GLD BROKE
ABOVE its CP Uptrendline - It will take a close of more than 7.09 BELOW the Opening
to restore the CP downtrend. The Opening Power is still rising.
Its Relative Strength vs DJI is at downtrendline.
PEERLESS
REMAINS ON BUYS
The markets are nearing levels of resistance. The DJI's 12000 level (140 points
higher)
is the one I think we have to
watch most closely. There was only a one-day retreat from the DJI's
and NASDAQ's 200-day ma.
I have warned the bears that nearly flat 200-day moving averages
are less powerful resistance
levels; I have emphasized the surprise element of this strong rally in
the normally spooky month of
October; I have showed that Seasonally, a November peak is more
likely than a top now.
And I mentioned that Gold has just turned up. Peaks usually occur
several
weeks after that happens.
These are positives that should allow us to trust Peerless a while longer.
There is rotation, though.
The QQQ is starting to underperform the DJI. Its RELDJI line
is rated as
"bearish". This represents cautious profit-taking in the more
volatile tech stocks.
Note the QQQ's optimal
trading system has given us a Sell and the best system has gained 57%
for the last 11 ten months.
Whenever we see results for the QQQ above 40%, we always put much
more trust in that system's
signals. Look at the QQQ chart again, these red Sells are sometimes
premature. So more of
an advance could certainly occur here. But the QQQ's CLosing Power uptrend
has also been broken.
And today, with the DJI up more than 160, the QQQ actually declined. This is
a bearish mis-step or
tripping by the NASDAQ bull. We probably should sell some of our QQQ stocks,
especially biotechs, when
they next break their Closing Power uptrends.
Let's if a Tiger Buy and
multiple insider buying spikes of Accumulation turn ACFN back up.
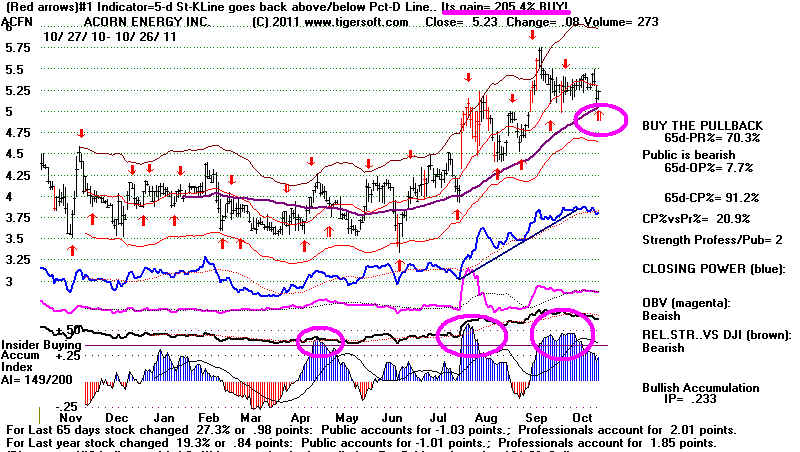
. .
With Peerless still on a buy,
our Stocks' Hotliue will moatly hold tight. No short sales
will be taken. Respect
the upwards momentum. The NYSE A/D Line is still rising nicely.
And the strength of the
Opening Power means that fears for the Euro may have been excessive
or, at least, premature.
AMZN and RIMM fell sharply today and help explain the QQQ
weakness...
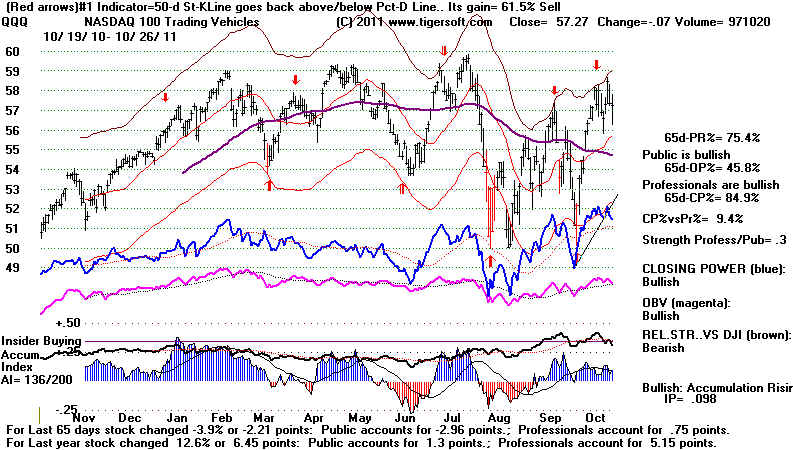
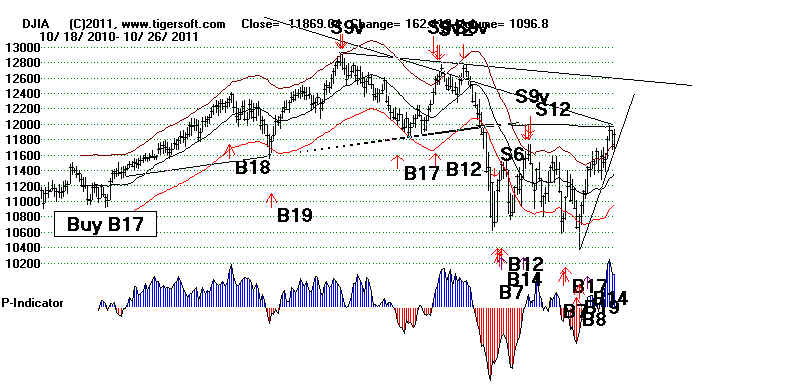
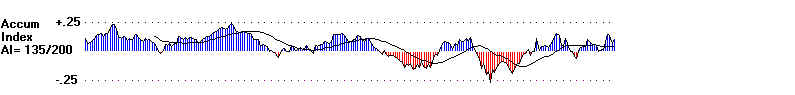
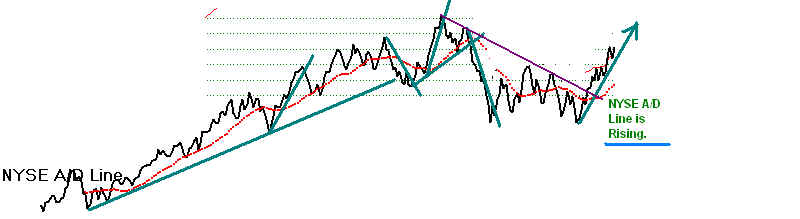
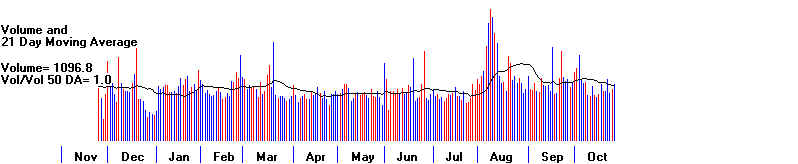
===================================================================================
OLDER HOTLINES
===================================================================================
10/25/2011
DJI = 11706.62 la/ma=1.034
21-dma ROC=+-.699 P= +356 (-161) IP21=+.065 V= +38 OP= .162
BREADTH
STATISTICS:
117(-136)
MAXCP stocks Bullish MAXCP Stocks
34 (-3)
MINCP stocks Bearish MINCP Stocks
MAXCP stocks are those showing
Tiger Closing Power making new highs.
This suggests heavy Professional Buying. Applying the Tiger Power Ranker's
"bullish" to the MAXCP stocks find those with heavy insider buying and
institutional accumulation. Bearish MINCP stocks show the opposite.
Also use the BOTHUPs condition with MAXCPs and BOTHDOWNS MINCPS.
5 (-37) new highs on NASDAQ. 19 (+8) new lows on NASDAQ
10 (-28) new
highs NYSE 4
(-7) new lows on NYSE
10/25/2011 ===> See Key Peerless TigerSoft Index Charts: Industry
Groups and ETFs
DIA
SPY QQQ DJIA-Peerless TigerDJI TigerSPY TigerQQQ GLD SLV Crude
10/25/2001 ===> DAILY Trading 3 Sample Stocks using Closing
Power trend-changes:
SSRI (Silver), PAAS (Silver), NEM
(Gold) All on Buys now.
This will updated each night for a while to show new users how one might trade
some volatile precious metals' stocks simply using Closing Power.
Near Term:
updated last: 10/25/2011
------------------- Closing
Power (CP) Status Report: CHARTS:---------------------
The 3 major market ETF Closing Powers
broke their uptrend-lines. This is short-term
BEARISH.
The ETFs' Opening Powers are still rising.
DIA BROKE BELOW its CP UPtrendline - It will take a close of more
than 1.752 ABOVE the Opening
to restore the CP uptrend. The Opening Power is still rising.
SPY BROKE BELOW its CP Uptrendline - It
will take a close of more than 2.7754 ABOVE the Opening
to restore the CP uptrend. The Opening Power is still rising.
QQQ
BROKE BELOW its CP Uptrendline - - It will take a close of more than 1.0829 ABOVE the Opening
to restore the CP uptrend. The Opening Power is still rising.
GLD BROKE
ABOVE its CP Uptrendline - It will take a close of more than 6.19 BELOW the Opening
to restore the CP downtrend. The Opening Power is still rising.
PEERLESS REMAINS ON BUYS
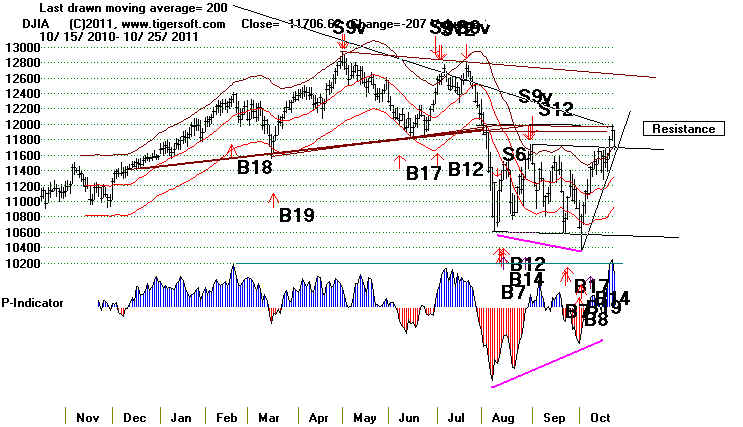
PEERLESS
BUYS SHOULD KEEP US MOSTLY LONG
The urge to take
profits after a 12% DJI rally in 15 trading days was too much for the
Professionals and
others who sold with the DJI tagging the 200-day ma yesterday. As
a result, the major
market ETFs' CLosing Power uptrends were all broken and Gold turned
up sharply. A short-term retreat is now most likely. But, because Peerless has
not given a Sell
signal, the decline
should be shallow, though even a retreat now back to
the 21-day ma would
be by 3.4%. So
some profit-taking is justified in ETFs and stocks whose Closing Power
has been penetrated.
But, I would respect the very unusual size of the advance and still look
for higher prices into
early November. Gold has just started to rise again. The market
tends to top out only
after it has advanced a few weeks, I have observed.
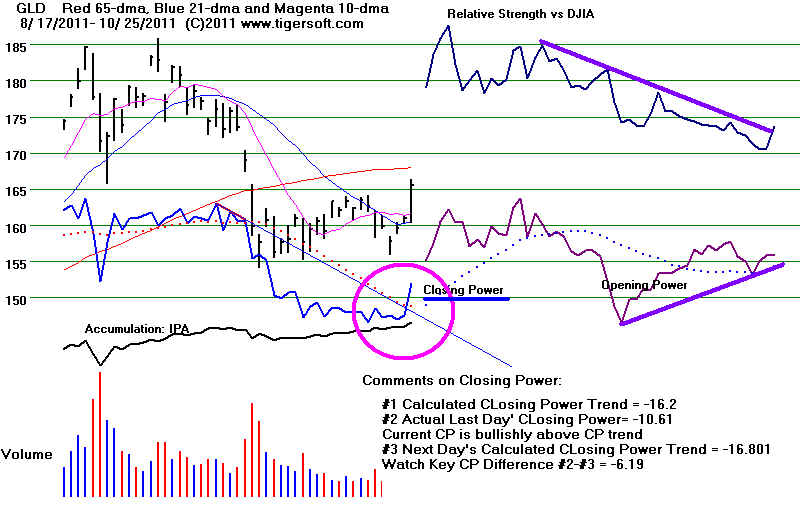
SEASONALITY STATS:
Top in early November?
Then after Thanksgiving, a Rally to New Highs in December...
Money typically comes
into the market during the last few days of the month and the
first week of the new
month. That might help prop the market up despite the grabbing of
quick profits by the
nimblest here. Since 1965, the DJI has risen 67% of the time over
the next week and the
next two weeks after October 25th. These statistics are much less
rosy if we look at all
the years before a Presidential Election since 1931. In
these years, there
were 9 UPs and 11
DOWNs. Since 1967, late Octobers rose 7 times and fell only 4. But
Novembers fell 6 times
and only rose 5.
The
most imortant thing to appreciate from the data below is that in the years before a
Presidential
Election, the stock
market is nearly always higher at the end of December than it is on October 25th
(or the end of
October). A +3% to +4% would be an average gain in this period. The market
was higher in 16 of 20
cases. The only recent exceptions were 1987 and 2007. Late Octobers and
Novembers are a
problem. They are both more likely to see a decline than a gain. Strong
Decembers
do more than make up
for weakness in the late-October to Thanksgiving period.
DJI Performance in Years before Presidential Election Year
Red shows DJI lower than previous level.
Blue show DJI higher than previous level.
DJI
DJI
DJI
DJI last 2 mo
Up/Down from 10/25-Dec 31
Year Oct.25 Oct.31
Nov.30
Dec.31 Up/Down
----------------------------------------------------------------------------------------------------------------------
1931 108.90 103.90 99.90 77.90
D DOWN 28.5%
1935 140.70 139.70 142.30 144.10 U
UP +2.4%
1939 155.50 151.50 145.70 149.90
D DOWN 3.6%
1943 138.20 138.30 129.60 136.20 U
DOWN 1.4%
1947 182.50 181.80
179.50 180.60
D DOWN 1.0%
1951 264.20 262.40
261.30 269.20
U UP +1.9%
1955 458.40 454.90 483.30
488.40 U
UP
+6.5%
1959 633.00 646.60
659.10 679.30
U UP +7.3%
1963 755.60 755.20 750.50 763.00 U
UP
+1.0%
1967 886.73 879.74
875.81 905.11 U UP +2.0%
1971 848.50 839.00
831.34 890.20 U UP +4.9%
1975 840.52 836.04
860.7 852.41
U UP +1.4%
1979 805.46 815.70 822.35 838.91
U UP +4.2%
1983 1252.44 1225.20 1276.02 1258.64 U
UP +0.5%
1987 1950.76 1993.53 1883.55 1938.83 D
Down 0.6%
1991 3004.92 3069.10 2894.68 3163.91 U
UP +5.3%
1995 4753.68 4755.48 5074.49 5117.12 U
UP
+7.6%
1999 10349.92 10729.85
10877.81 11497.12 U UP +3.7%
2003 9582.46 9801.12 9782.46 10453.92
U UP +9.1%
2007 13672.92 13930.01 13371.72 13262.82 D
Down 3.0% Crash Followed.
2011
--------------------------------------------------
9/11
9/11
8/12
15/5 15/5 16/4 from Oct25-Dec31
=====================================================================================
OLDER HOTLINES www.tigersoft.com/212121HOTL
=====================================================================================
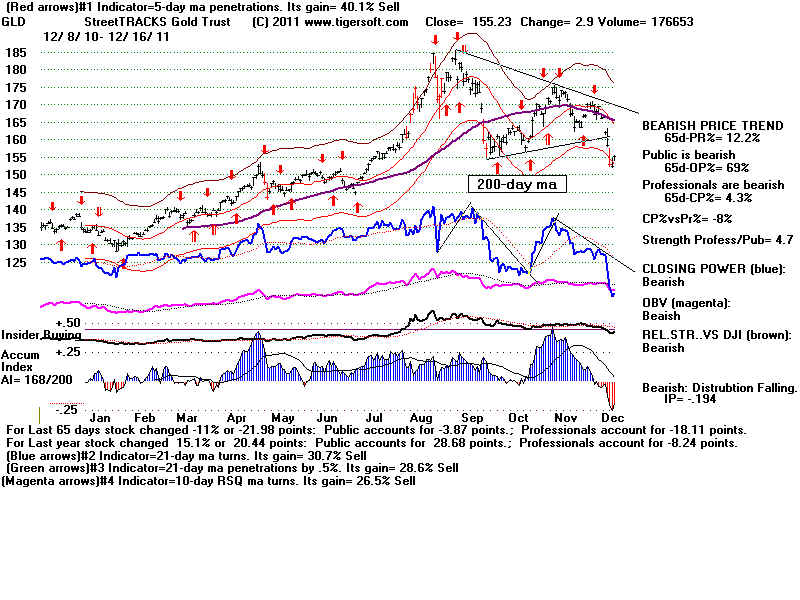
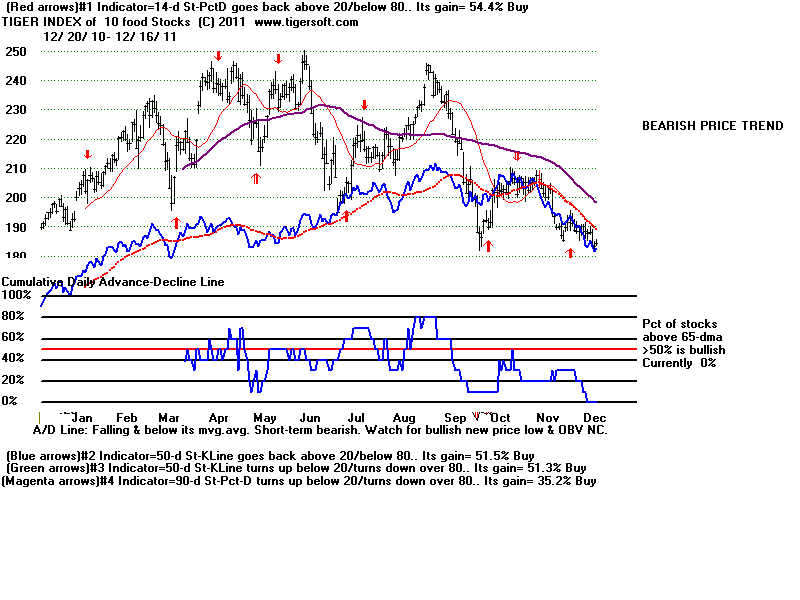
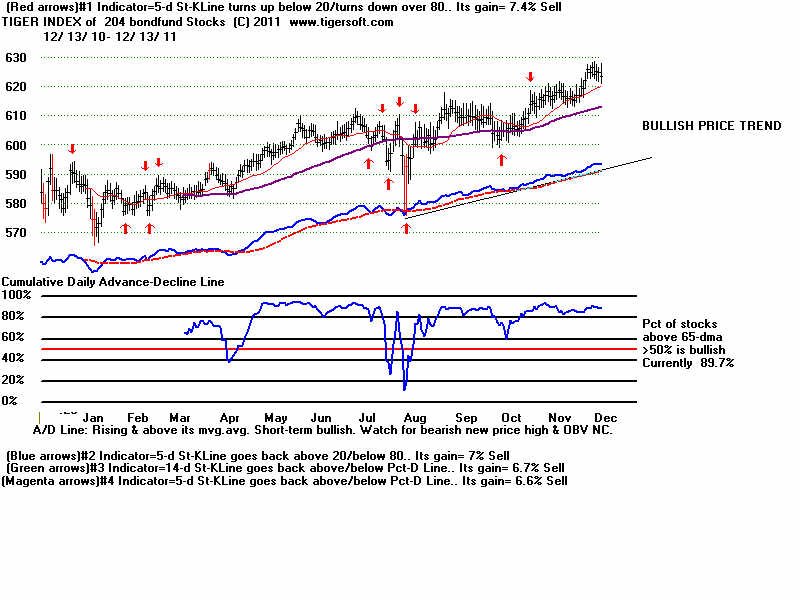
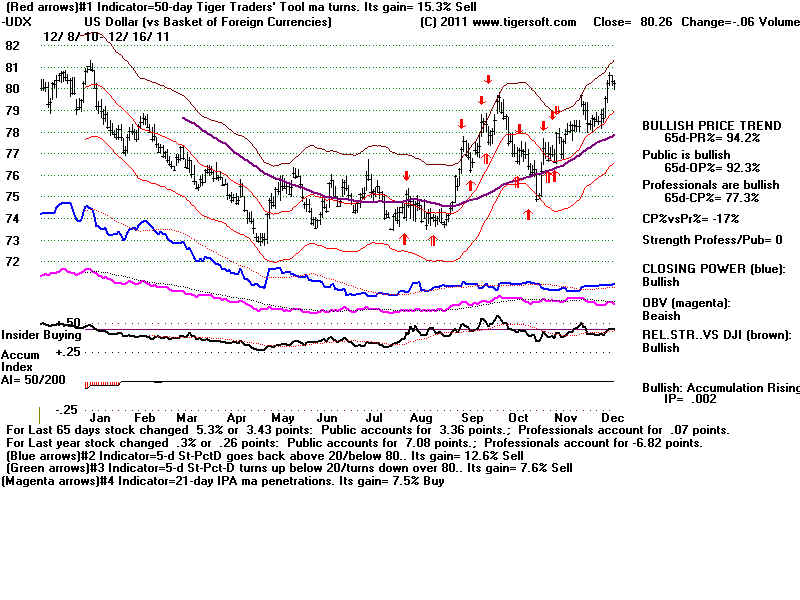
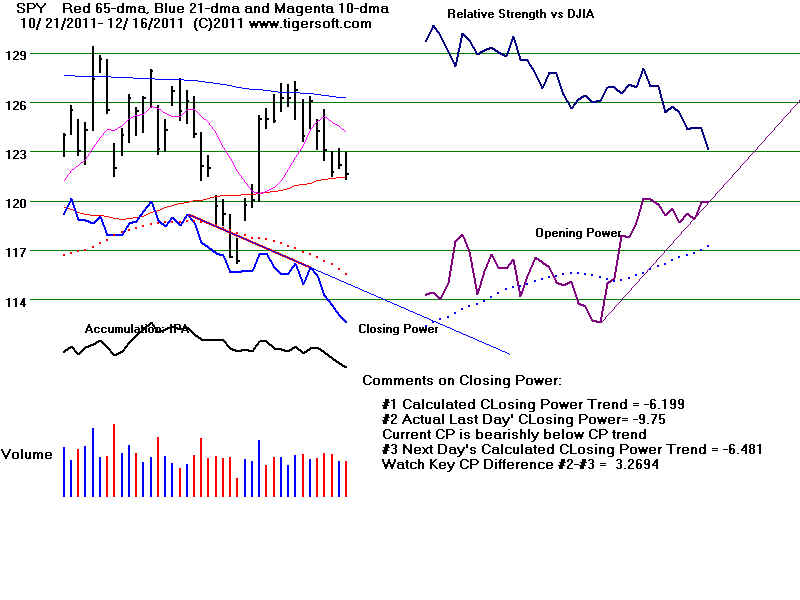
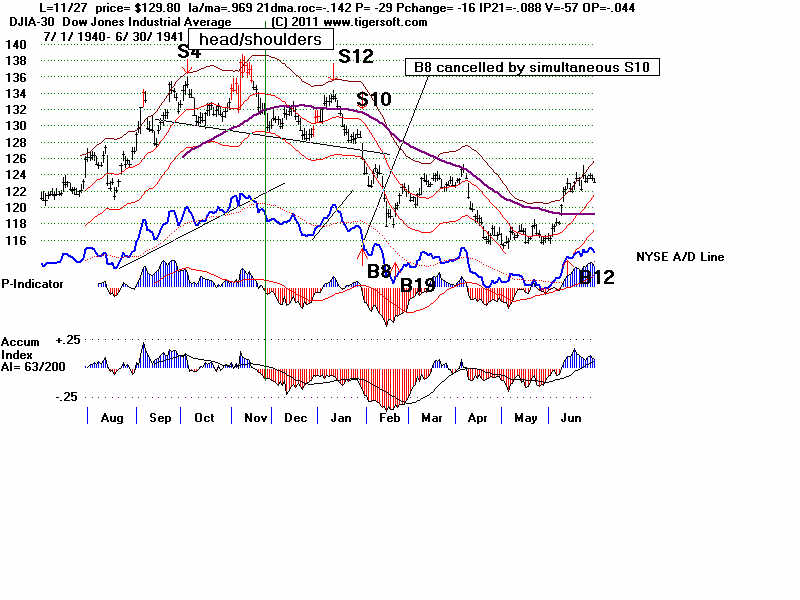
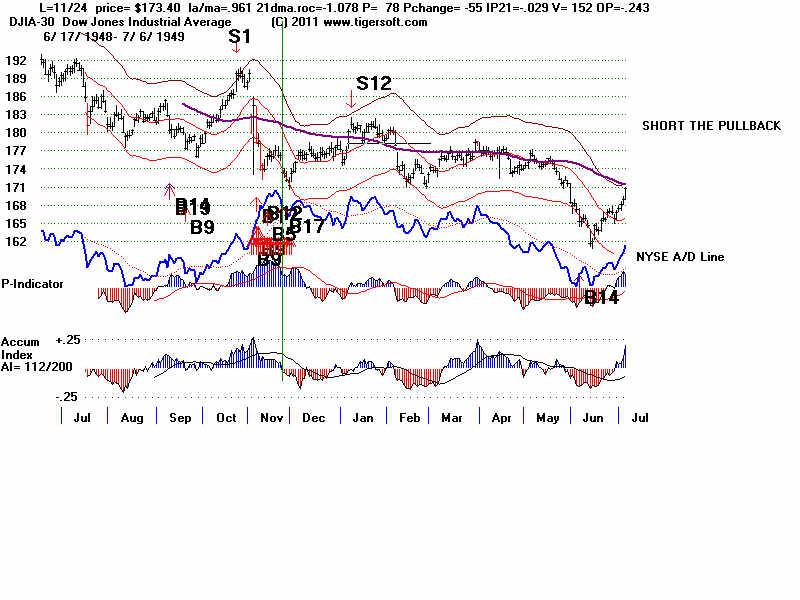
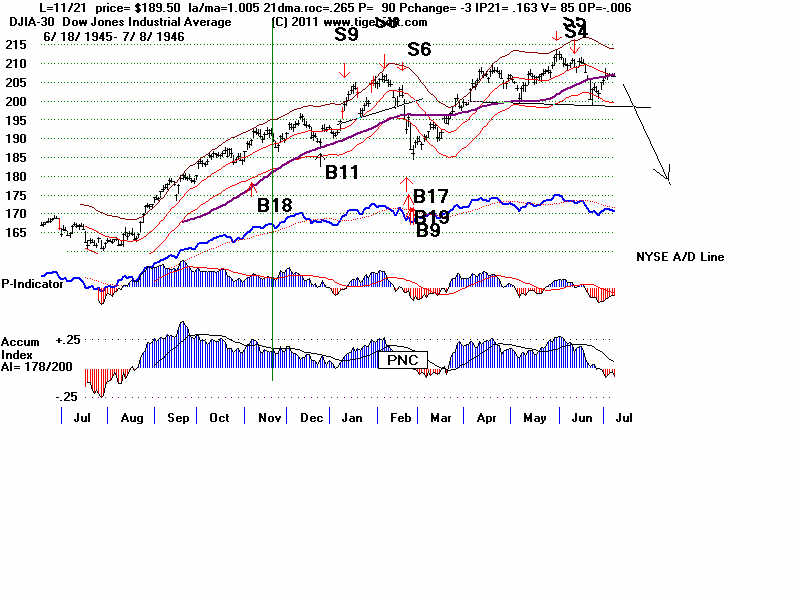
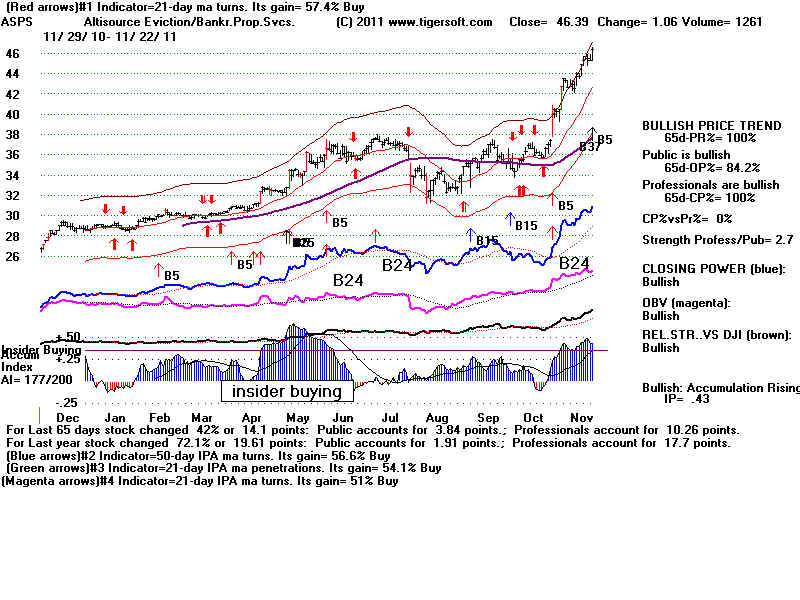
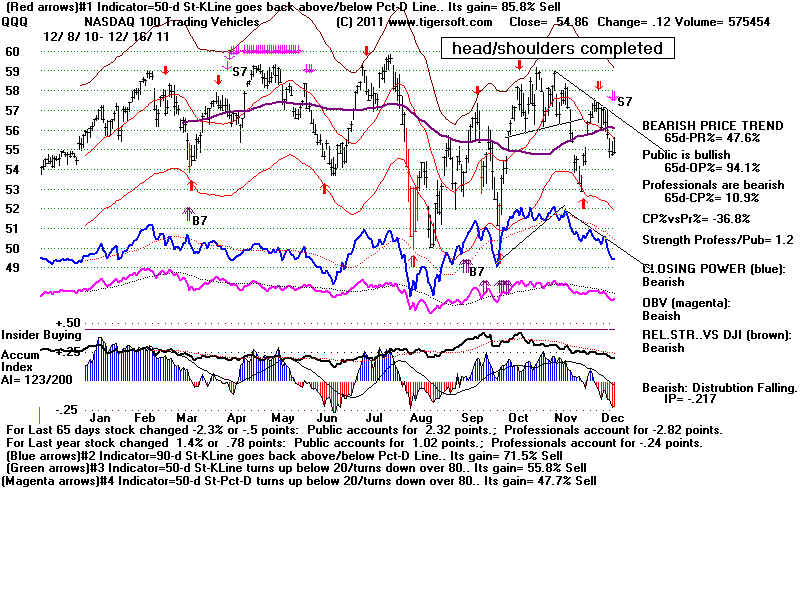
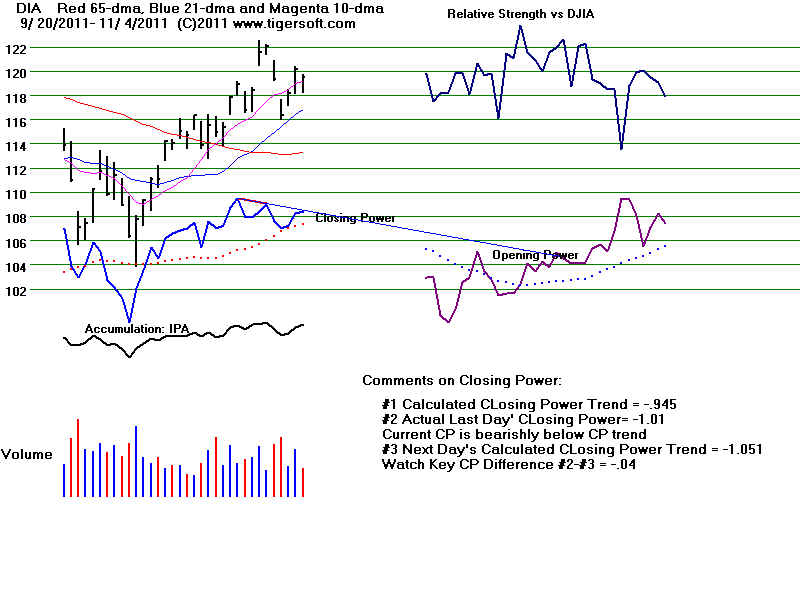
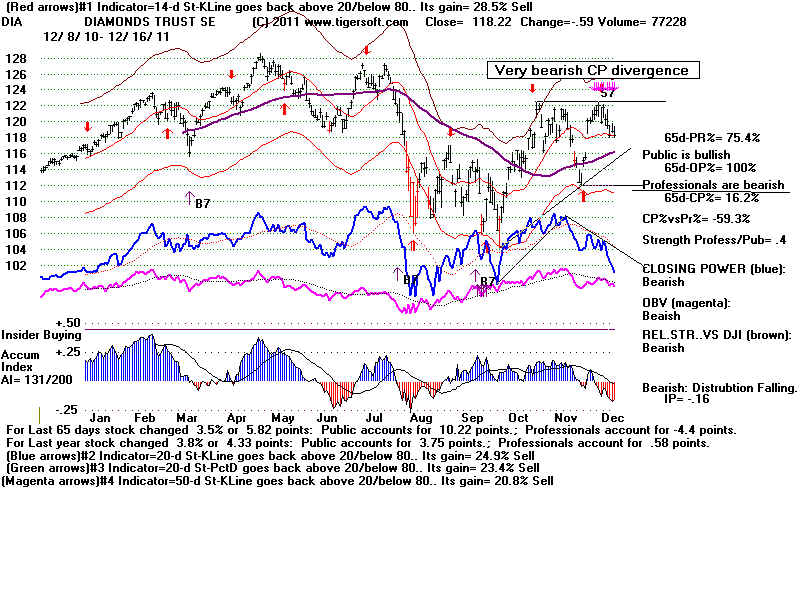
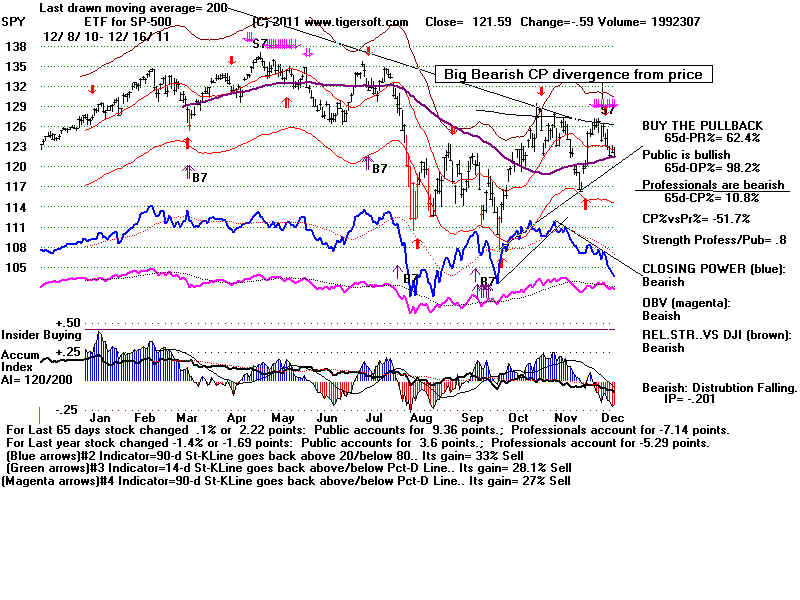
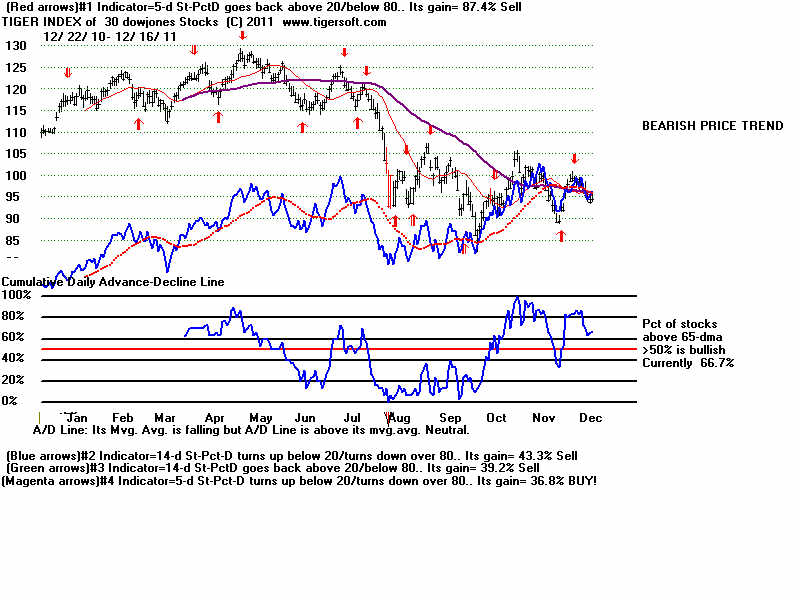
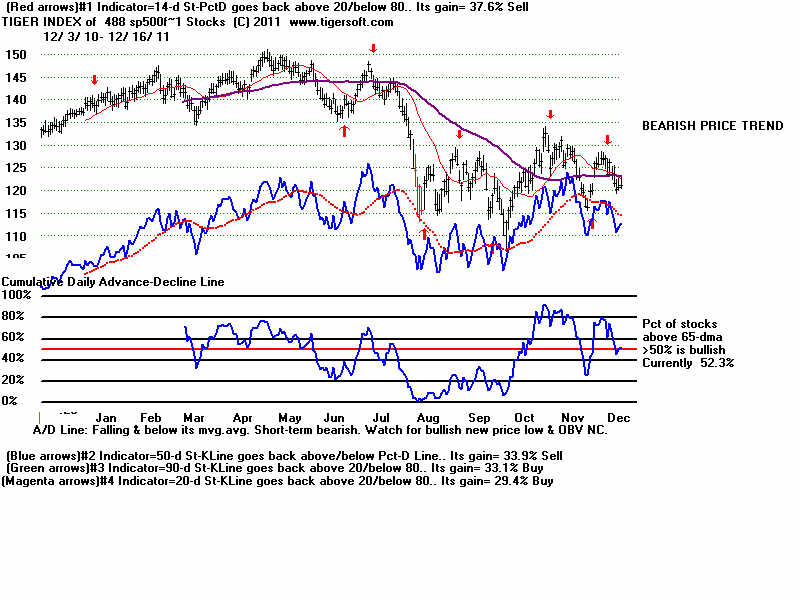
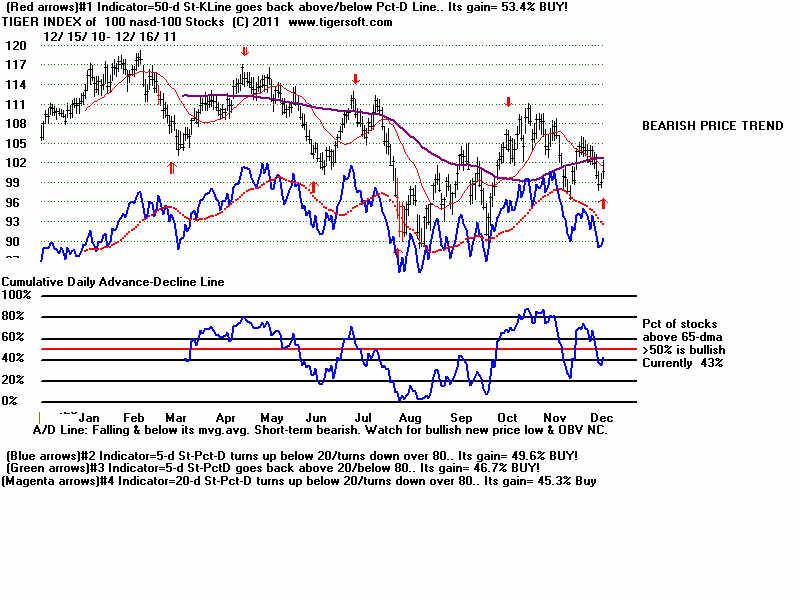
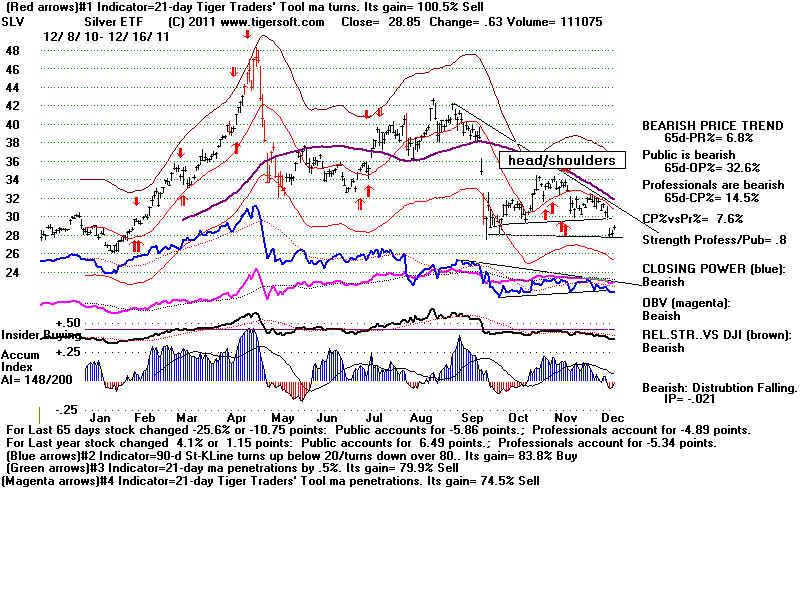
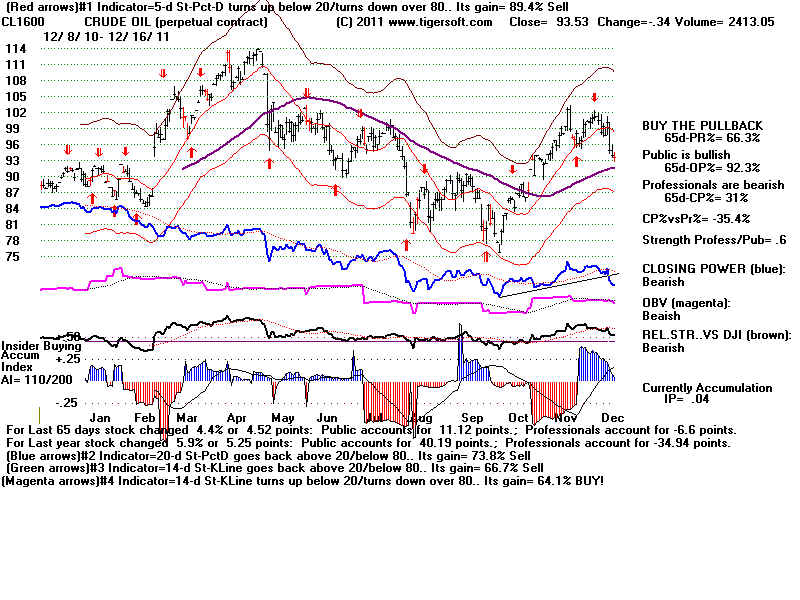
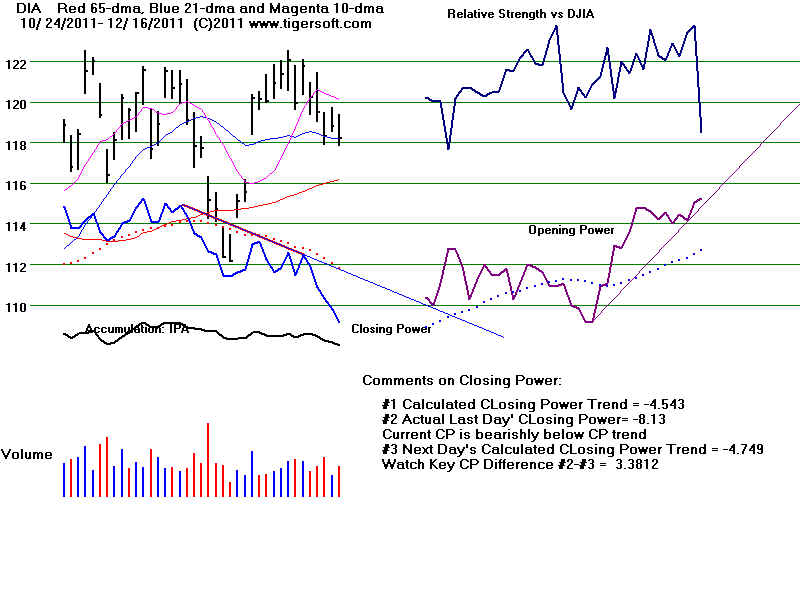
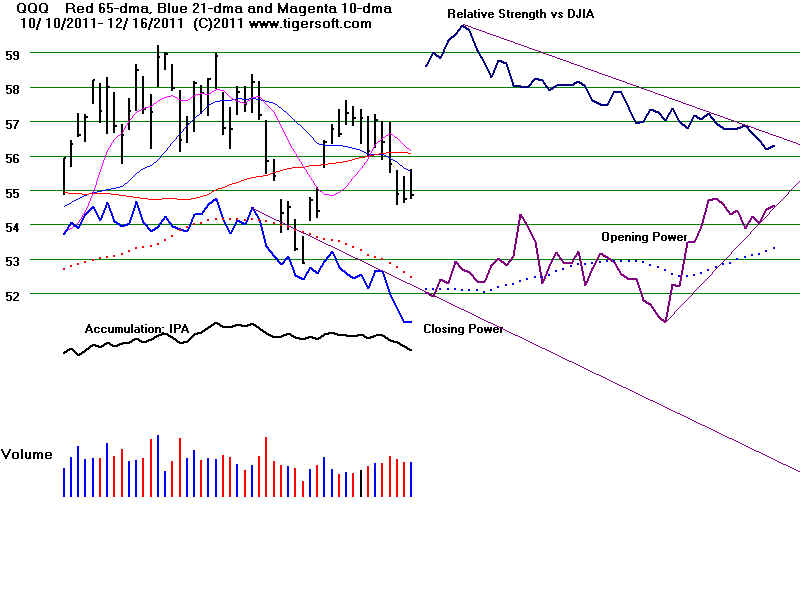
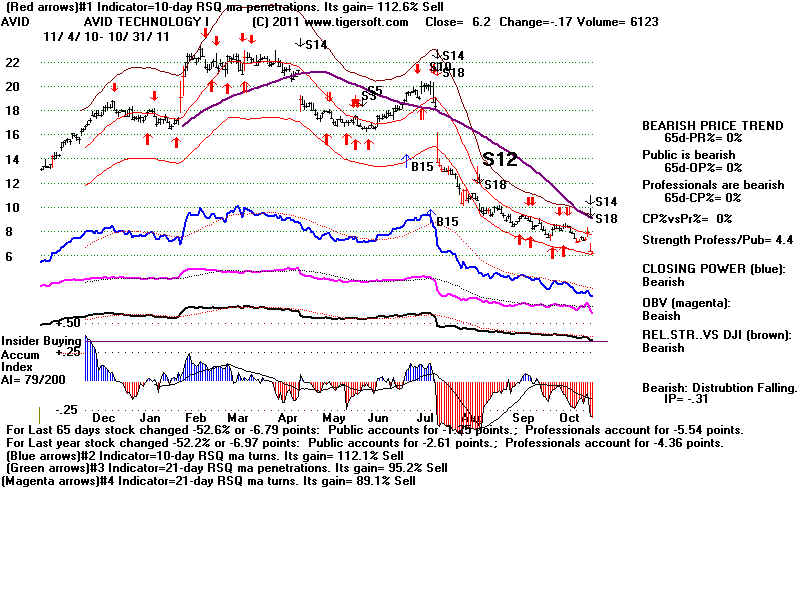
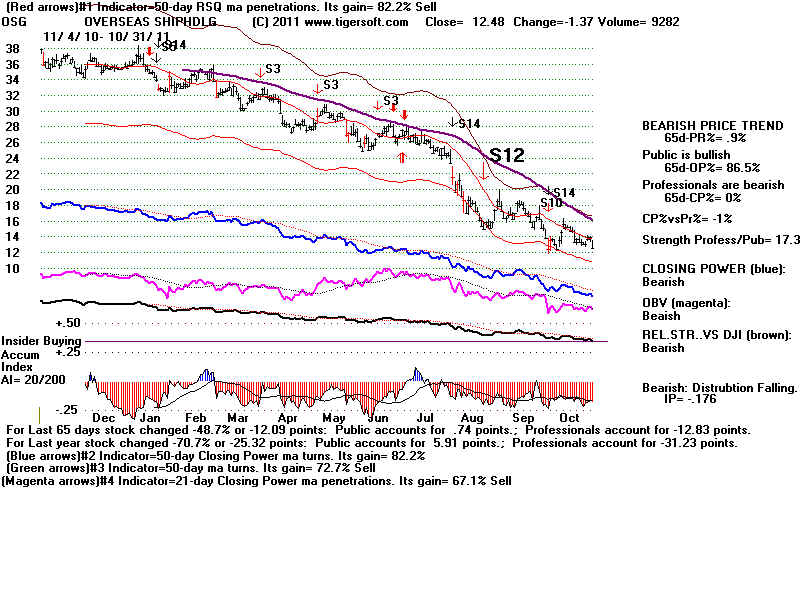
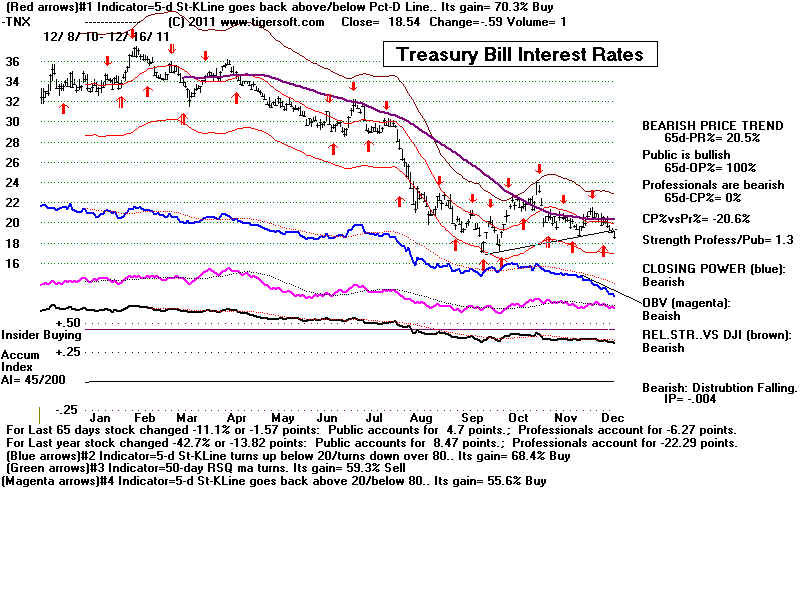
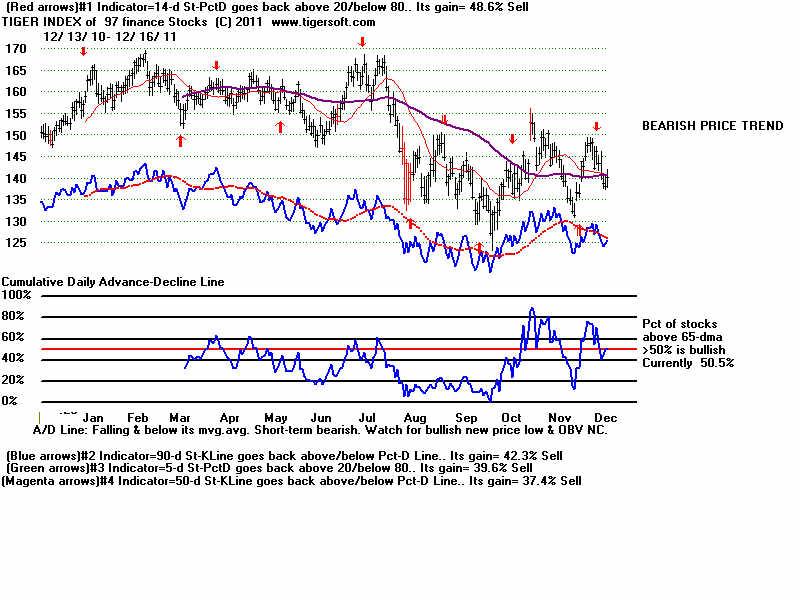
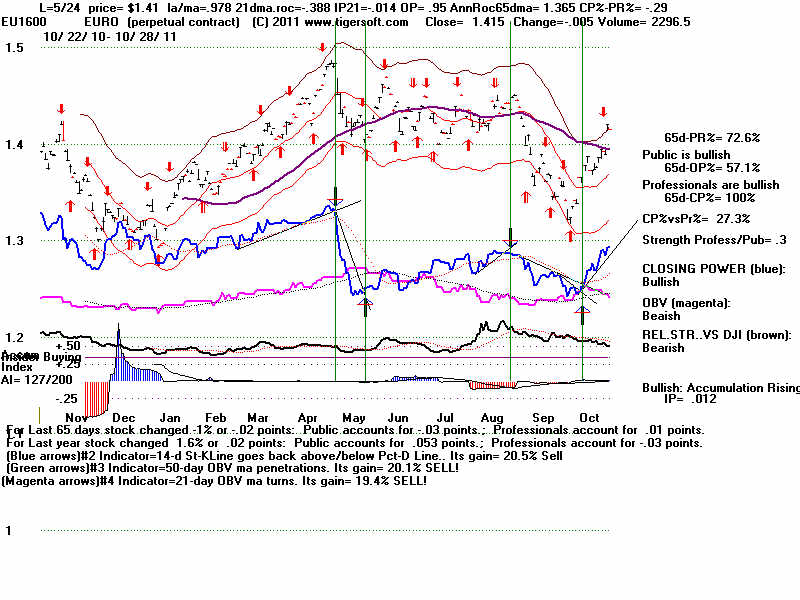
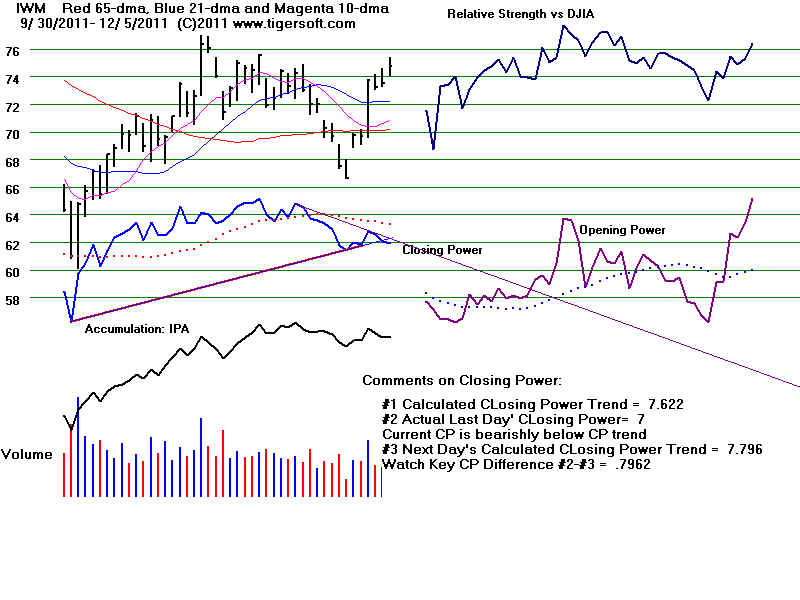
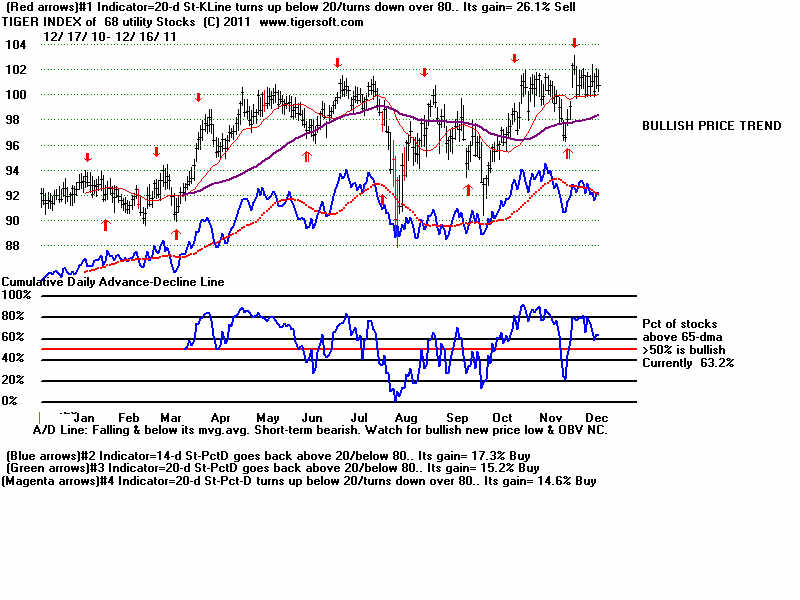
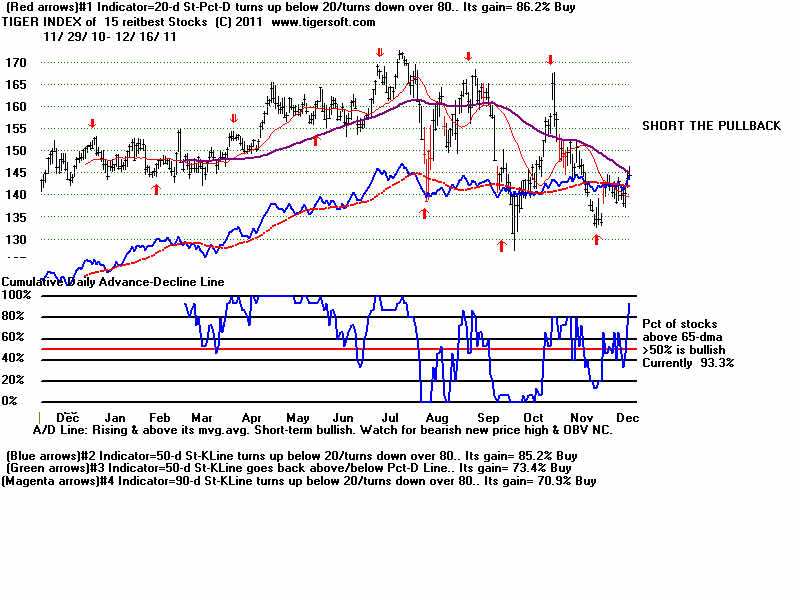
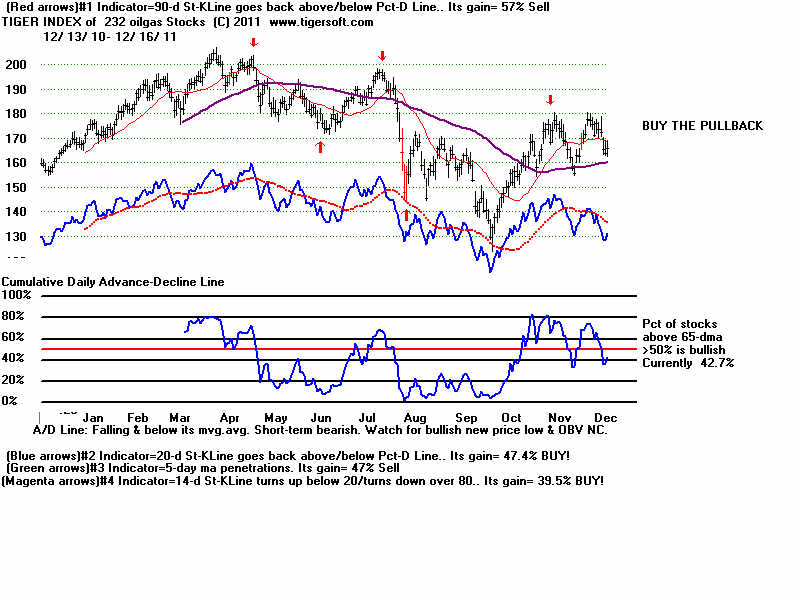
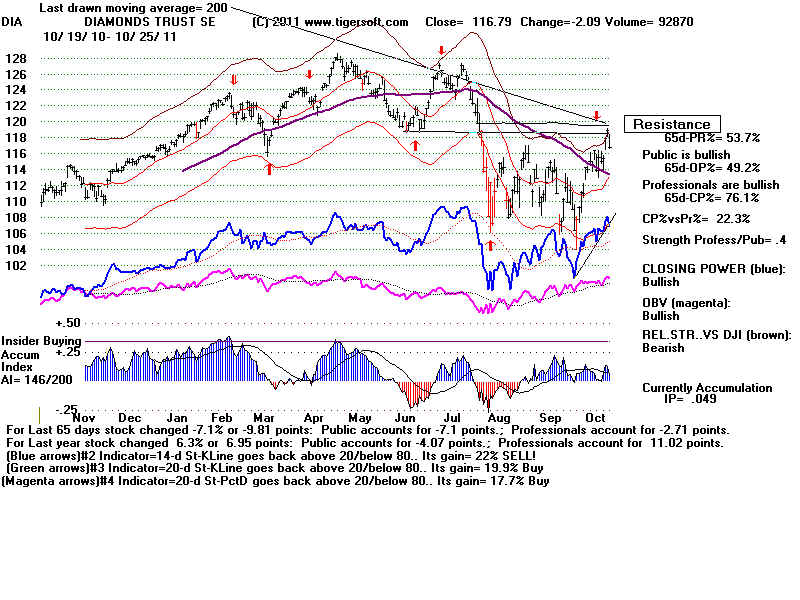
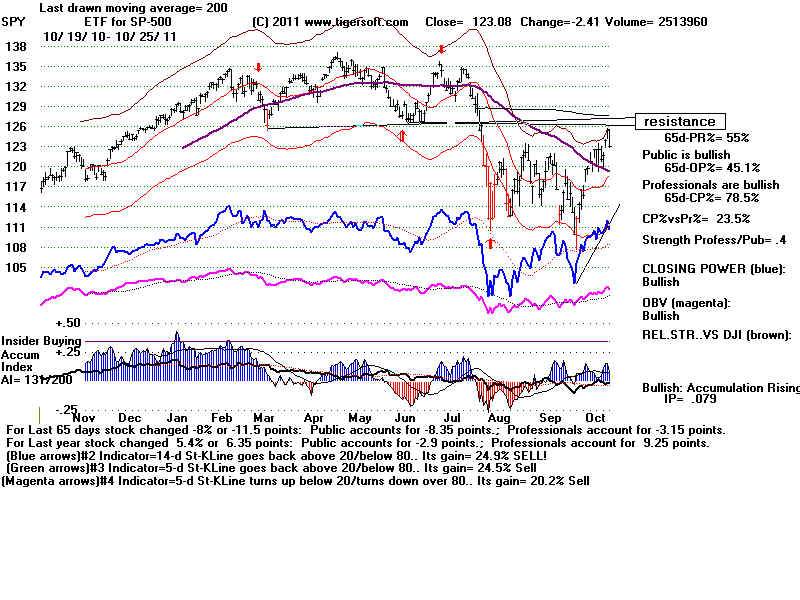
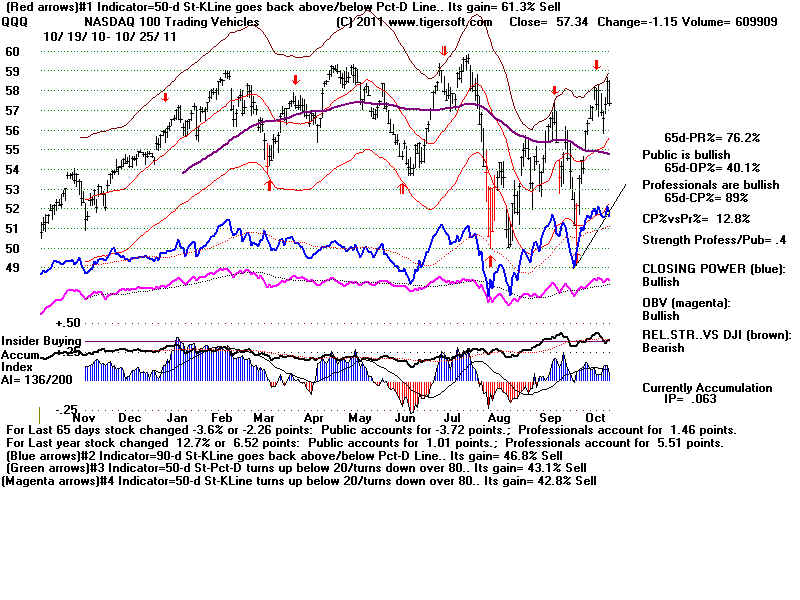
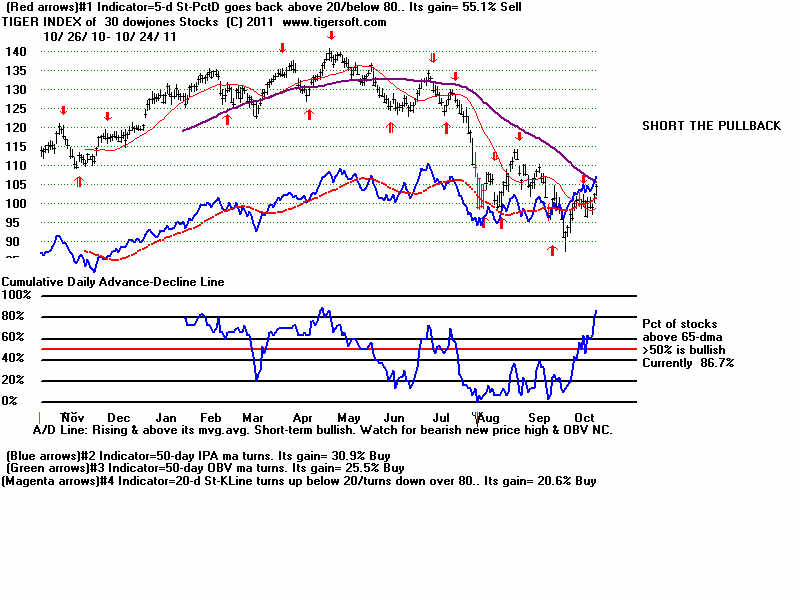
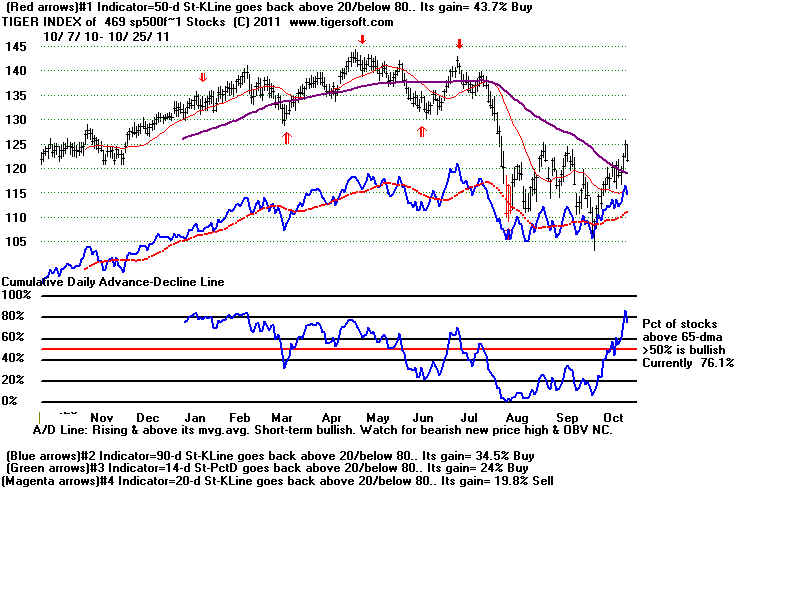
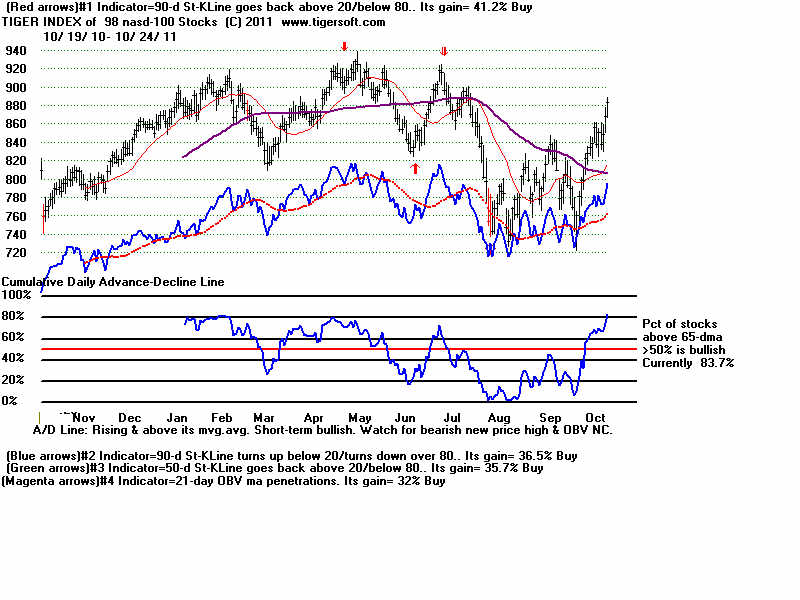
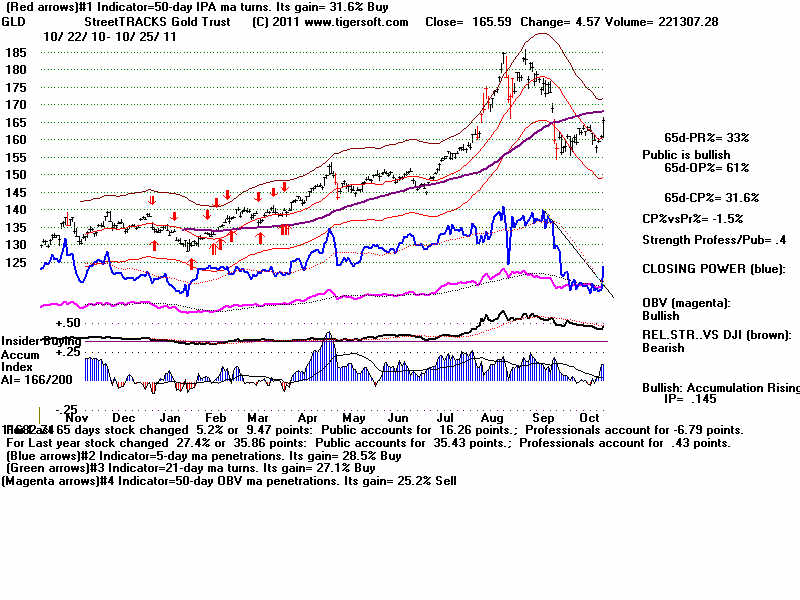
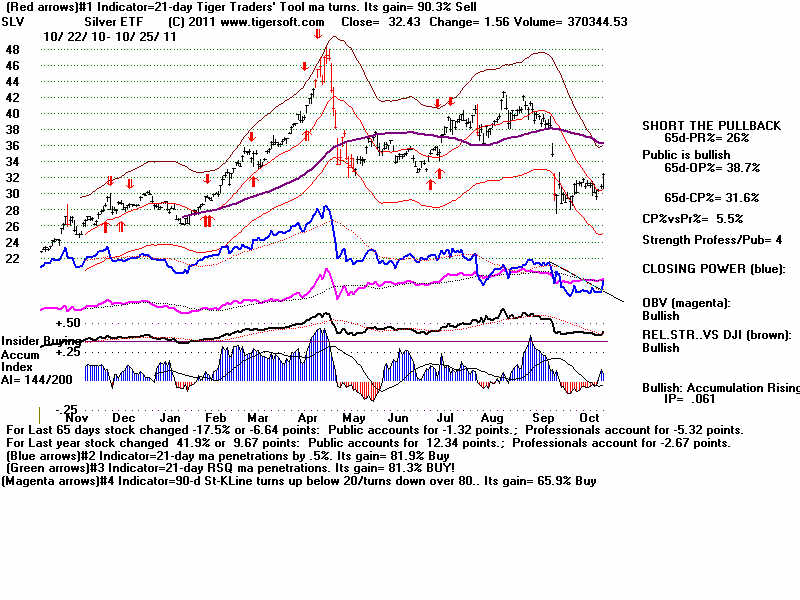
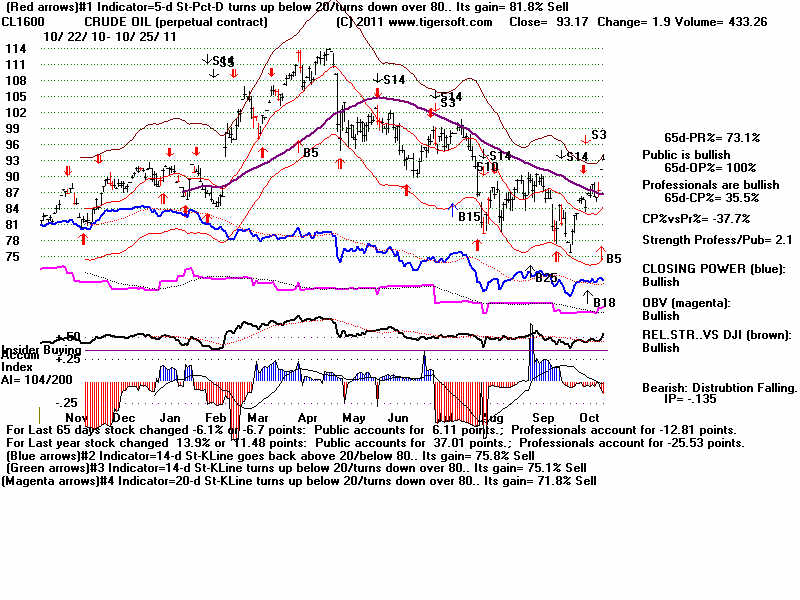
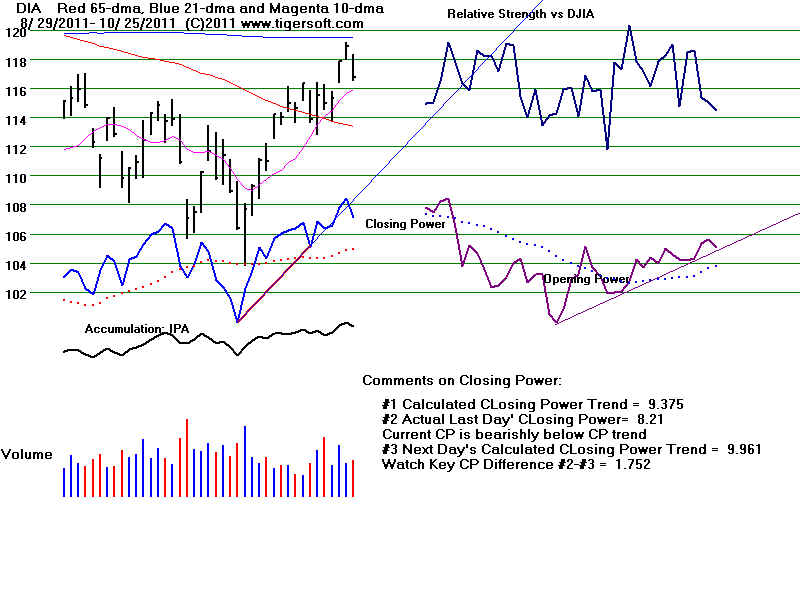
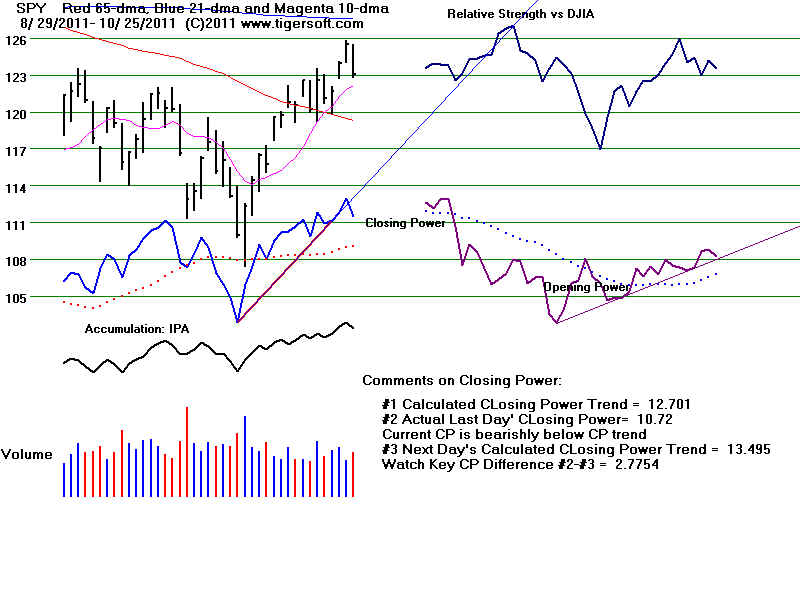
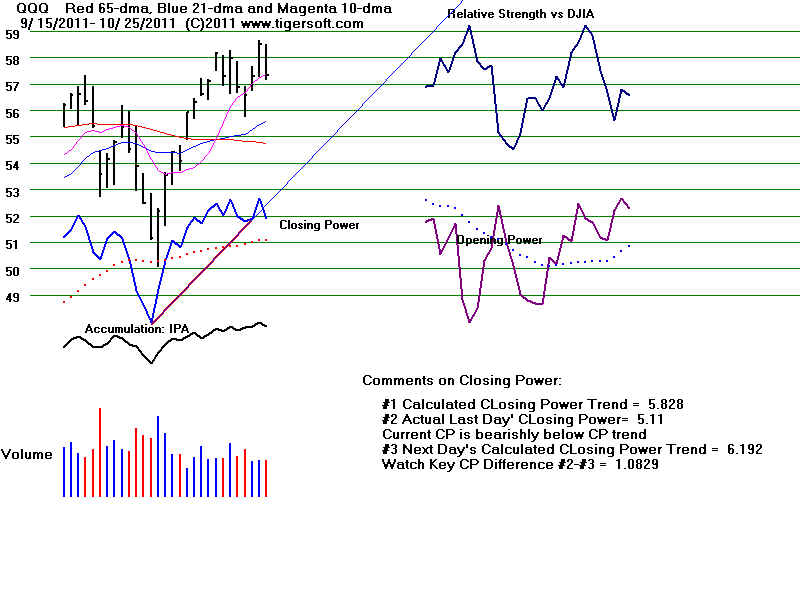