 TIGER HOTLINE
IMPORTANT:
 The location of this Hotline will change Wednesday
night.
You should have received the new location by email. To renew... $350-$370/Yr Order Here.
The location of this Hotline will change Wednesday
night.
You should have received the new location by email. To renew... $350-$370/Yr Order Here.
Email me if you have not received the notice. william_schmidt@hotmail.com
November
San Diego Tiger User Group Meeting
 A
Guide To Profitably Using The Tiger Nightly HOTLINE
A
Guide To Profitably Using The Tiger Nightly HOTLINE
TigerSoft and
Peerless Daily Hotline
(C)
1985-2011 William Schmidt, Ph.D. www.tigersoft.com
All rights
strictly reserved.
Background Studies
10/24/2011 2011's Super Stocks - 90%
Showed Insider Buying as Tiger measures it,
early on and before
their biggest moves
9/30/2011
Key Support failures in
DJI since 1929
Weekly DJI and A/D
Line charts since 1928
6/14/2011
- Tiger Charts of
SPY's Closing, Opening Powers and IDOSC: 1994-2011 Peerless
Buys and Sells applied to DIA, SPY, QQQ and Canadian ETF (EWC)
See New blogs about the
profitability of Peerless Buys and Sells applied to DIA,
SPY, QQQ and EWC
(Canada) and other country ETFs, Brazil, South America
and Mexico. Also
see the study just done of the industry groups that Peerless
Buys and Sells worked
best with since 1986.
http://tigersoftware.com/TigerBlogs/April-28-2011/index.html
http://www.tigersoftware.com/TigerBlogs/April27-2011/Index.html
http://tigersoftware.com/TigerBlogs/4-23-2011/index.html
4/15/2011 Surging Biotech's
- A Wave of Good Hope
3/11/2011 NASDAQ Charts:
1990-2011 Show Reliability of Head/Shoulders
3/8/2011
Compare Grain Tops Now
with Those They Made in 2008:
Rice, Wheat, Oats,
Soybeans
>SPY: TigerSoft
Charts: 1993-2011: Study them to improve your technical analysis skills.
>Head/Shoulders,
CP trends, NC's, zig-zags, Flagrant Accum. Index NNCs and PNCs.
>Use
TigerSoft's Insider Trading Charts To Look Beneath A Stock's Surface
2/23/2011 SPY Candle Stock
Charts: 1993-2011
2/12/2011 Trading Gold and Silver Stocks with
TigerSoft's Key Indicators Measuring Insider
and Professional Buying and Selling.
2/8/2011 Trading The EURO since
1999 Using TigerSoft's Closing Power and Accumulation Index.
This sets out a convenient list of trading rules that should be helpful.
TigerSoft Blogs
11/16/2010 30-Treas.-BONDS and
The DJIA since 1980
11/4/2010 TRADING RESULTS FOR
BULLISH and BEARISH SPECIAL SITUATIONS
What we can learn from
the Picks from Late July - September 2010
10/16/2010 New Research for
Trading with Closing Power
Overnight Market Action:
Bloomberg Futures around
the world before the US Markets open.
CNN Futures before the Opening in NY
24-hour Spot
Chart - Gold 24-hour Spot Chart - Silver
Dollar and
Currencies
Daily NYSE and NASDAQ New Highs.
Earlier Hotlines
2011 8/31/3011 - 10/4/2011 8/12/3011
- 8/31/2011
8/11/2011 - 7/5/2001
7/5/2011 - 6/2/2011
3/31/2011-6/1/2011
1/9/2011 - 3/31/2011
2010
12/9/2010 - 1/8/2011
11/1/2010 - 12/9/2010
10/13/2010 - 10/31/2010
9/28/2010 - 10/13/2010
8/31/2010 - 9/28/2010
6/14/2010-
8/31/2010 5/14/2010 - 7/26/2010
3/23/2010 - 5/14/2010
2/12/2010 - 3/22/2010
1/15/2010 - 2/11/2010
2009 10/21/2009-1/14/2010
8/30/2009-10/20/2009
7/31/2009-8/28/2009
7/1/2009-7/31/2009
6/14/2009-6/30/2009
5/1/2009 -
6/11/2009
3/31/2009-4/30/2009 |
10/25/2011
DJI = 11706.62 la/ma=1.034
21-dma ROC=+-.699 P= +356 (-161) IP21=+.065 V= +38 OP= .162
BREADTH
STATISTICS:
117(-136)
MAXCP stocks Bullish
MAXCP Stocks
34 (-3)
MINCP stocks Bearish
MINCP Stocks
MAXCP stocks are those showing
Tiger Closing Power making new highs.
This suggests heavy Professional Buying. Applying the Tiger Power Ranker's
"bullish" to the MAXCP stocks find those with heavy insider buying and
institutional accumulation. Bearish MINCP stocks show the opposite.
Also use the BOTHUPs condition with MAXCPs and BOTHDOWNS MINCPS.
5 (-37) new highs on NASDAQ. 19 (+8) new lows on NASDAQ
10 (-28) new
highs NYSE 4
(-7) new lows on NYSE
10/25/2011 ===> See Key Peerless TigerSoft Index Charts: Industry Groups and
ETFs
DIA
SPY QQQ
DJIA-Peerless TigerDJI TigerSPY
TigerQQQ GLD SLV
Crude
10/25/2001 ===> DAILY Trading 3 Sample Stocks using Closing
Power trend-changes:
SSRI (Silver), PAAS (Silver), NEM
(Gold) All on Buys now.
This will updated each night for a while to show new users how one might trade
some volatile precious metals' stocks simply using Closing Power.
Near Term:
updated last: 10/25/2011
------------------- Closing
Power (CP) Status Report: CHARTS:---------------------
The 3 major market ETF Closing Powers
broke their uptrend-lines. This is short-term
BEARISH.
The ETFs' Opening Powers are still rising.
DIA BROKE
BELOW its CP UPtrendline -
It will take a close of more than 1.752 ABOVE the Opening
to restore the CP uptrend. The Opening Power is still rising.
SPY
BROKE BELOW its CP Uptrendline - It will take a close of more than 2.7754 ABOVE the Opening
to restore the CP uptrend. The Opening Power is still rising.
QQQ BROKE BELOW
its CP Uptrendline - - It will take a close of more than 1.0829 ABOVE the Opening
to restore the CP uptrend. The Opening Power is still rising.
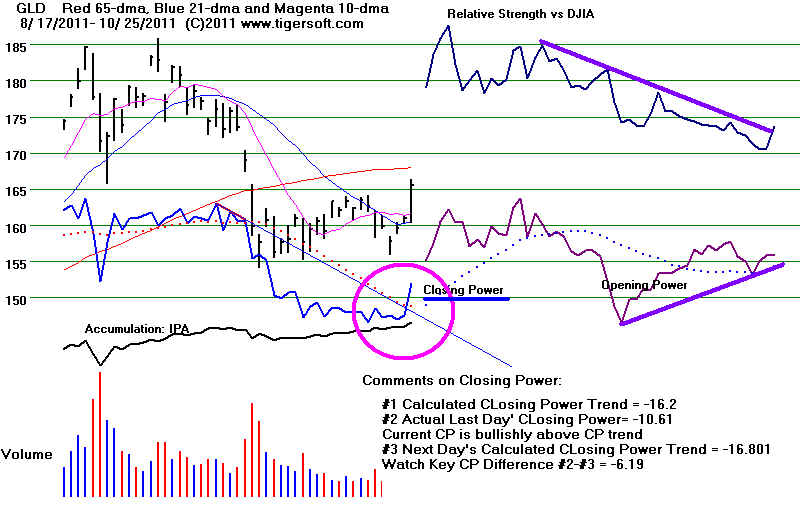
GLD BROKE
ABOVE its CP Uptrendline - It will take a close of more than 6.19 BELOW the Opening
to restore the CP downtrend. The Opening Power is still rising.
PEERLESS REMAINS ON BUYS
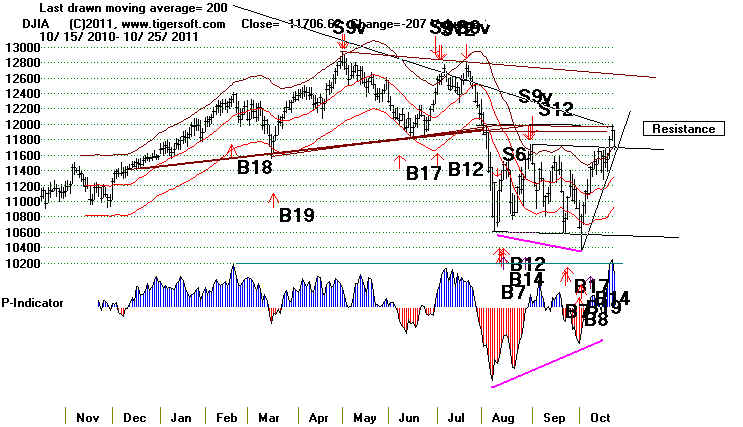
PEERLESS
BUYS SHOULD KEEP US MOSTLY LONG
The urge to take
profits after a 12% DJI rally in 15 trading days was too much for the
Professionals and
others who sold with the DJI tagging the 200-day ma yesterday. As
a result, the major
market ETFs' CLosing Power uptrends were all broken and Gold turned
up sharply. A short-term retreat is now most likely. But, because Peerless has
not given a Sell
signal, the decline
should be shallow, though even a retreat now back to
the 21-day ma would
be by 3.4%. So
some profit-taking is justified in ETFs and stocks whose Closing Power
has been penetrated.
But, I would respect the very unusual size of the advance and still look
for higher prices into
early November. Gold has just started to rise again. The market
tends to top out only
after it has advanced a few weeks, I have observed.
SEASONALITY STATS:
Top in early November?
Then after Thanksgiving, a Rally to New Highs in December...
Money typically comes
into the market during the last few days of the month and the
first week of the new
month. That might help prop the market up despite the grabbing of
quick profits by the
nimblest here. Since 1965, the DJI has risen 67% of the time over
the next week and the
next two weeks after October 25th. These statistics are much less
rosy if we look at all
the years before a Presidential Election since 1931. In
these years, there
were 9 UPs and 11
DOWNs. Since 1967, late Octobers rose 7 times and fell only 4. But
Novembers fell 6 times
and only rose 5.
The
most imortant thing to appreciate from the data below is that in the years before a
Presidential
Election, the stock
market is nearly always higher at the end of December than it is on October 25th
(or the end of
October). A +3% to +4% would be an average gain in this period. The market
was higher in 16 of 20
cases. The only recent exceptions were 1987 and 2007. Late Octobers and
Novembers are a
problem. They are both more likely to see a decline than a gain. Strong
Decembers
do more than make up
for weakness in the late-October to Thanksgiving period.
DJI Performance in Years before Presidential Election Year
Red shows DJI lower than previous level.
Blue show DJI higher than previous level.
DJI
DJI
DJI
DJI last 2 mo
Up/Down from 10/25-Dec 31
Year Oct.25 Oct.31
Nov.30
Dec.31 Up/Down
----------------------------------------------------------------------------------------------------------------------
1931 108.90 103.90 99.90 77.90
D DOWN 28.5%
1935 140.70 139.70 142.30 144.10 U
UP +2.4%
1939 155.50 151.50 145.70 149.90
D DOWN 3.6%
1943 138.20 138.30 129.60 136.20 U
DOWN 1.4%
1947 182.50 181.80
179.50 180.60
D DOWN 1.0%
1951 264.20 262.40
261.30 269.20
U UP +1.9%
1955 458.40 454.90 483.30
488.40 U
UP
+6.5%
1959 633.00 646.60
659.10 679.30
U UP +7.3%
1963 755.60 755.20 750.50 763.00 U
UP
+1.0%
1967 886.73 879.74
875.81 905.11 U UP +2.0%
1971 848.50 839.00
831.34 890.20 U UP +4.9%
1975 840.52 836.04
860.7 852.41
U UP +1.4%
1979 805.46 815.70 822.35 838.91
U UP +4.2%
1983 1252.44 1225.20 1276.02 1258.64 U
UP +0.5%
1987 1950.76 1993.53 1883.55 1938.83 D
Down 0.6%
1991 3004.92 3069.10 2894.68 3163.91 U
UP +5.3%
1995 4753.68 4755.48 5074.49 5117.12 U
UP
+7.6%
1999 10349.92 10729.85
10877.81 11497.12 U UP +3.7%
2003 9582.46 9801.12 9782.46 10453.92
U UP +9.1%
2007 13672.92 13930.01 13371.72 13262.82 D
Down 3.0% Crash Followed.
2011
--------------------------------------------------
9/11
9/11
8/12
15/5 15/5 16/4 from Oct25-Dec31
=====================================================================================
OLDER HOTLINES
=====================================================================================
10/24/2011
DJI = 11914 +105 la/ma=1.055 21-dma
ROC=+1.21 P= +516 (+56) IP21=+.138 V= +115 OP= .243
BREADTH
STATISTICS:
252(+116)
MAXCP stocks Bullish
MAXCP Stocks
37 (-6)
MINCP stocks Bearish
MINCP Stocks Mostly
leveraged Bearish m.m. ETFs
MAXCP stocks are those showing
Tiger Closing Power making new highs.
This suggests heavy Professional Buying. Applying the Tiger Power Ranker's
"bullish" to the MAXCP stocks find those with heavy insider buying and
institutional accumulation. Bearish MINCP stocks show the opposite.
Also use the BOTHUPs condition with MAXCPs and BOTHDOWNS MINCPS.
42 (+18) new highs on NASDAQ. 11 (+1) new lows on NASDAQ
38 (+15) new
highs NYSE 11
(+9) new lows on NYSE
10/24/2011 ===> See Key Peerless TigerSoft Index Charts: Industry Groups and
ETFs
DIA
SPY QQQ
DJIA-Peerless TigerDJI TigerSPY
TigerQQQ GLD SLV
Crude
10/24/2001 ===> DAILY Trading 3 Sample Stocks using Closing
Power trend-changes:
SSRI (Silver), PAAS (Silver), NEM
(Gold) This will updated each night for a
while to show new users how one might trade some volatile precious
metals' stocks simply using Closing Power.
Near Term:
updated last: 10/24/2011
------------------- Closing
Power (CP) Status Report: CHARTS:---------------------
The 3 major market ETF Closing Powers
are in an uptrend. The ETFs' Opening Powers are also still rising.
This is the Bullish BOTH-UP condition.
DIA is
above CP UPtrendline -
It will take a close of more than 0.314 BELOW the Opening
to break the CP uptrend. The Opening Power is rising.
SPY is
above CP Uprendline - It will take a close of more than 0.1315 BELOW the Opening
to break the CP uptrend. The Opening Power is still rising.
QQQ is above CP
Uptrendline - - It will take a close of more than 0.2514 BELOW the Opening
to break the CP uptrend. The Opening Power is rising.
GLD Below CP
Downtrendline - It will take a close of more than 0.05 ABOVE the
Opening
to break the CP downtrend. The Opening Power is rising.
PEERLESS BUYS SHOULD KEEP US LONG
The Closing
Powers are all in rising uptrends. Internal strength indicators are rising. The
Peerless
P-Indicator has even made a yearly high. Many more stock groups show a plurality
of their stocks
above the 65-dma. I think the rally has taken a lot of people and professionals
by surprise.
Don't sell too quickly, even though the DJI has now rallied back to the slightly
falling 200-day
ma. (If it were angling downward more steeply, it would act as better resistance.)
It may bring some
selling, but more likely DJI-12000 will be reached. The SP-500, now at
1274.61, is
expected to face stiffest resistance at 1270, its 200-day ma. Today the NASDAQ
closed
slightly above
its 200-day ma.
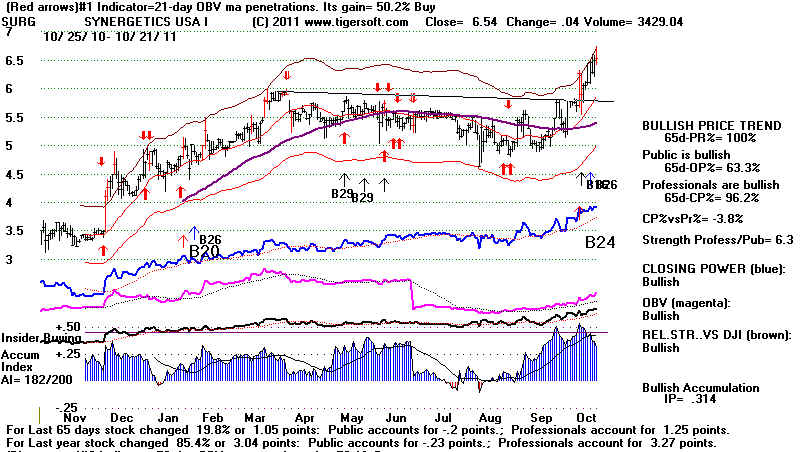
BULLISH SUPER STOCKS FOR 2011
See our 10/24/2011 new study:
2011's Super Stocks - 90%
Showed Insider Buying as Tiger measures it,
early on and before
their biggest moves.
If the CLosing Power uptrends are violated, take profits in major market
ETFs. With stocks
believe in the
Closing Power uptrends, too. And also the importance of
high Accumulation.
I suggest looking
at the new study of the best performing stocks of 2011 above $5 that I
have just
finished. More than 90% of them show an IP21 bulge above +.35
early in or even
before their
biggest advance. Note that I will proabably be revising the software to place
the insider
trading threshold at +.35. The ACCUMVER stocks on the Tiger Data page
now all have had
+.35 or higher Ip21 readings in the last 3 months. We should probably look
each night at all
the new highs in this group. These will all show Buy B24s.
SIMO 16.59 IP21=.02 UU IPA% is lagging AI/200=only 132
DPZ 32.54 IP21=.16 UU Running AI/200=only 125
EP 25.35 IP21=.353 Take-over under
way.
TAYD 9.00 IP21=.121 NH and running. AI/200=only 103
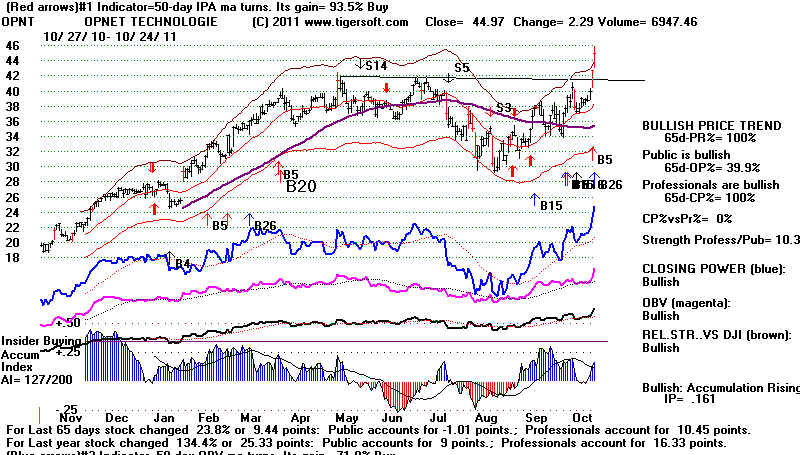
OPNT 44.97 +2.29 IP21=.161 NH breakout - BUY even though AI/200 only
127
PSMT 75.81 +2.04 IP21=.04 (low) AI/200=113 (low)
In additon,
consider the best performing stocks of the year, which is now
downloadable as
SUPER11 from
the Tiger Data page. Below are the highest Power Ranked stocks in SUPER11.
ELAN is the only
one that meets the various IP21 and Closing Power criteria we like most. As happens
often, the first
stage of a very good intermediate-term rally (like ours now) see lots of short-covering.
Price breakouts
in these top performers often bring excellent rallies, as do Closing Power
downtrend-breakouts. I could not find much to buy among these stocks
presently. But one
of the lessons of
this and other Super Stocks' studies is too give them plenty of chance
to prove
themselves when they show tell-tale spikes of high accumulation "Insider
Buying"
HCCI 16.63 - below 65-dma
COG 70.62 - just above 65-dma but IP21= only +.101 Optimized red Sell.
QCOR 34.29 NH but IP21 only +.026
MITK 11.23 IP21<0 and on red Stochastic Sell.
GLNG 39.2 At previous high...IP21=.112 (modest)
DK 15.0 CP short-term flat and IP21=.116 (modest)
PCYC 13.36 NH but IP21= .027 (barely positive)
DPZ (Dominos Pizza) NH IP21=+.156 AI/200=125 (usually 147 or higher is favored)
CVI 25.58 backing off from recebt highs. red Sell CP declining short-term.
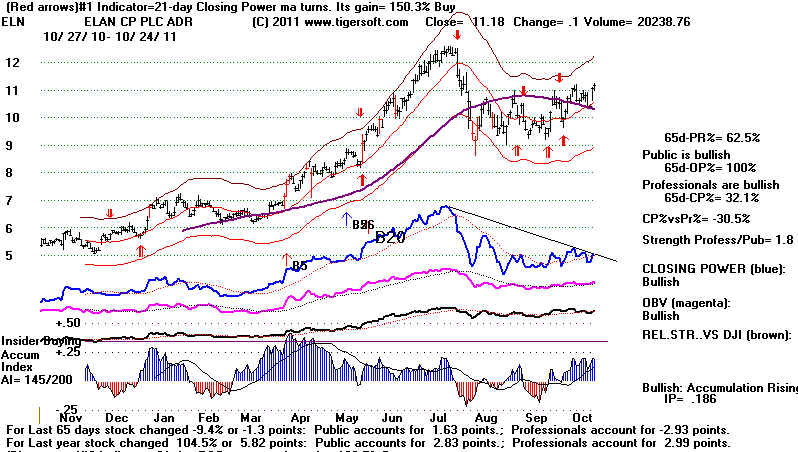
ELAN 11.18 IP21=.186 Look for CP breakout above 3 month downtrend to buy
WTW 71.63 IP21= only +.115 but there is a Buy B7 (CP bullish divergence)
CBST 39.6 IP21=+.233 CP lagged recently.
===================================================================================
OLDER HOTLINES
===================================================================================
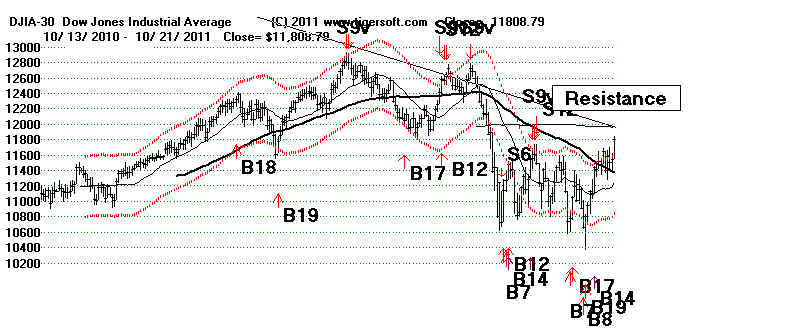
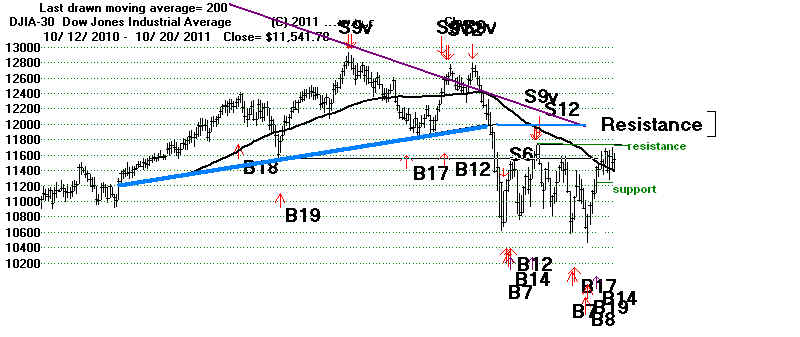
10/21/2011
DJI = 11809
la/ma=1.051 21-dma ROC=+1.24 P= +459 (+221) IP21=+.145 V=
+101 OP= .265
10/21/2011 ===> See Key Peerless TigerSoft Index Charts: Industry Groups and
ETFs
DIA
SPY QQQ
DJIA-Peerless TigerDJI TigerSPY
TigerQQQ GLD SLV
Crude
NEW 10/21/2001 ===>
DAILY Trading 3 Sample Stocks using
Closing Power trend-changes:
SSRI (Silver), PAAS (Silver), NEM
(Gold) This will updated each night for a
while to show new users how one might trade some volatile precious
metals' stocks simply using Closing Power.
Near Term:
updated last: 10/21/2011
------------------- Closing
Power (CP) Status Report: CHARTS:---------------------
The 3 major market ETF Closing Powers
are in an uptrend. The ETFs' Opening Powers are also still rising.
DIA is
above CP UPtrendline -
It will take a close of more than 0.179 BELOW the Opening
to break the CP uptrend. The Opening Power is rising.
SPY is
above CP Uprendline - It will take a close of more than 0.678 BELOW the Opening
to break the CP uptrend. The Opening Power is still rising.
QQQ is above CP
Uptrendline - - It will take a close of more than 0.6877 ABOVE the
Opening
to restore the CP uptrend. The Opening Power is rising.
GLD Below CP
Downtrendline - It will take a close of more than 0.14 ABOVE the Opening
to break the CP downtrend. The Opening Power is rising
but broke its uptrend..
UPSIDE
BREAKOUT:
PEERLESS BUYS STILL SAY "THERE WILL BE MORE STRENGTH"
In the 13 trading days since the October 4th bottom, the SPY has boomed 10%
and DIA, IWM and QQQ have each jumped 9%. Short-term, I
would look for SPY
to face keen resistance at 126.50, 2.5 higher. This was the
low of June 16th that
was violated in July. Broken support is likely to become
resistance on the next rise
to that level.
But without a Peerless Sell signal, I cannot
advise much selling except to take
some trading profits in SPY if the SPY Closing Power breaks its
uptrend after reaching
that level. Why?
Because 1) all our key techinical indicators
are rising. See the charts here.
2) Peerless should be
trusted because of all the back-testing to 1928 I have done;
3) All the anxieties over the EURO, while important and a threat
to many big banks, still
works to strengthen the Dollar and, thereby, allows the Fed much
more easily to keep
interest rates low without worry about inflation. This is
part of the reason that the Dollar
has fallen against a collection of other currencies only about 4%
since 2009, despite the
FED's injection of hundreds of billions of freshly printed
Dollars.
4) Seasonality is bullish after the next 3 trading days. As
I showed Thursday night,
we are much more apt to see a November peak after a 3%+ rise in
the first 3 weeks.
A slight rereat is suggested early next week, in that
historically, since 1965, the DJI rallies only
44.4% of the time over the next 3 trading days. The DJI is,
however, up 57.8% over the
next week. Even better, the historical odds are 64.4% that
it will be above where it is
now a month from now.
5) There is a fifth factor. Last quarters of the year
before a Presidential Election are
usually up. The Administration, Republican and especially
Democrat, typically goes all out
trying to boost the economy. Our case is not so
exceptional, Republicans aside.
I have argued that the current political triumverate
(Wall Street banks, the Obama
Administration
and the Fed under Bernanke) have apparently each agreed to prop up the
market in the period before the 2012 Presidential Election, and
each will do whatever
it can to that end, for its own reasons..
"Marriage of Convenience"
The Fed will keep interest rates low and buy trillions of
US government debt with their newly
printed money. Equally important, Professional
short-selling will be limited and leveraged
major market vehicles (futures and ETFs) will be run upwards
repeatedly, so long as there is
be no real challenge by the Obama Administration of
Wall Street's power and privileges,
namely,
no move to break up of the big banks,
no re-instututing Glass Steagal,
no imposing restrictions on executive pay and power,
no reducing leverage used by banks,
no restricting computerized trading,
no imposing short-term trading taxes and
no curtailing of derivatives and leveraged trading.
It is further underderstood by Wall Street that the Obama
Administration will restrain
its investigations into the conduct of the big banks and their
executives in causing
the Crash of 2007-2009. In particular, no criminal charges will
be brought
against any of the big banks' CEOs for fraud or misrepresentation in the
mortgages
they bundled and sold. Rhetoric asside, Obama has stuck to this
agreement.
STOCKS TO PLAY NOW
Bulges of Accumulation (IP21) above .35 are commonly associated with 2011's
best gainers. I will show this tomorrow night. I will revise
ACCUMVER on the
Tiger Data page to provide data on stocks with this new parameter.
The rally since early October has allowed about 25 stocks over $20 to
advance more than 30%.
Consider buying those which are now above their 65-day ma and have
rising CLosing Powers
and have a current IP21 (Accumulation Index) over +.22.
Look also at the technical characteristics of these stocks as they
reversed and rose.
Many of these technical characteristics were common among a number of
these fine
performing new leaders. This is a study we will frequently refer
to in the future.
See http://tigersoftware.com/TigerBlogs/10-23-20111/index.html
Biggest Gainers since Oct 4th
with IP21 over +.22
Stock price pct gain IP21
-------------------------------------------
SCSS 21.57 44%
.36 chasing is
risky here. check news...
BXUB 72.00 25%
.33
HAYN 57.79 37%
.22
|
DJIA - Rising Internal
Strength Indicators/Major Buys
|
 |
=================================================================================
OLDER HOTLINES
=================================================================================
10/20/2011
DJI = 11542 la/ma=1.032 21-dma ROC=+.444 P=
+238 (+130) IP21=+.073 V= -7 OP= .136
BREADTH
STATISTICS:
74(-5)
MAXCP stocks Bullish MAXCP
Stocks
35 (-1)
MINCP stocks Bearish
MINCP Stocks
MAXCP stocks are those showing Tiger Closing Power making new highs.
This suggests heavy Professional Buying. Applying the Tiger Power Ranker's
"bullish" to the MAXCP stocks find those with heavy insider buying and
institutional accumulation. Bearish MINCP stocks show the opposite.
Also use the BOTHUPs condition with MAXCPs and BOTHDOWNS MINCPS.
19 new highs on NASDAQ. 25 new lows on NASDAQ
12 new
highs NYSE 17
new lows on NYSE
10/20/2011 ===> See Key Peerless TigerSoft Index Charts: Industry Groups and
ETFs
DIA
SPY QQQ
DJIA-Peerless TigerDJI TigerSPY
TigerQQQ GLD SLV
Crude
NEW 10/20/2001 ===>
DAILY Trading 3 Sample Stocks using
Closing Power trend-changes:
SSRI (Silver), PAAS (Silver), NEM
(Gold) This will updated each night for a
while to show new users how one might trade some volatile precious
metals' stocks simply using Closing Power.
Near Term:
updated last: 10/20/2011
------------------- Closing
Power (CP) Status Report: CHARTS:---------------------
Only the DIA's ETF Closing Powers is
still in an uptrend. The ETFs' Opening Powers are also still rising.
Backing and filling seems to be required now.
DIA is
very slightly beloiw CP UPtrendline -
It will take a close of more than 0.594 ABOVE the Opening
to restore the CP uptrend. In cases like this, we should probably wait for the CP to
violate its
new CP uptrend-line to consider the DIA short-term bearish. The Opening Power is
rising.
SPY is
BELOW CP Uprendline - It will take a close of more than 1.88 ABOVE the Opening
to restore the CP uptrend. This is SPY short-term bearish. The Opening
Power is still rising.
QQQ is below CP
Uptrendline - - It will take a close of more than 2.402 ABOVE the
Opening
to restore the CP uptrend. Consider the QQQ short-term bearish. The Opening
Power is rising.
GLD Broke CP
Uptrendline - It will take a close of more than 0.14 ABOVE the Opening
to restore the CP uptrend. Consider the QQQ short-term bearish. The Opening
Power is rising
but broke its uptrend..
PEERLESS BUYS SAY THERE WILL BE MORE STRENGTH
The intenrals (P-I, A/D
Line and Accum. Index) are each improving. This is constructive. So is
the DJI current strength versus the
usual weakness at this time of year. Below are the cases when
Octobers advance by 3% by October
20th, as happened this month. I count 14 cases since 1950.
Always did the DJI reach a November
peak at least 1% higher. A peak 2% higher or more
in November occurred in 10 cases.
Only in 4 instances did the DJI peak 4% or more higher in November.
Bear market declines followed in 4
cases, after rallies of less than 3%: 1968, 1969, 1974 and 2002.
Strong Early Octobers: 1950-2011
9/30 10/20
Peak Nov
2011
10913.30 11541.78
2010
10788.05 11107.97
11444.08 (11/5) up 3% bull mkt followed
2009
9712.28 10041.48
10471.58 (12/1) up 5% bull mkt followed
2005
11679.07 12002.37
12342.56 (11/17) up 3.% bull mkt followed
2003
9275.06 9777.94
9858.46 (11/3) up 1% up more in Dec.
2002
7591.93 8538.24 (10/21)
8896.09 (11/29) up 4% bear mkt decline
followed.
2001
8847.56 9377.03 (10/22)
9959.64
up 7% up more in Dec.
1998
7842.62 8505.85
9374.27
up 10% up more in Dec.
1982
896.25 1034.12
1050.22
up 1% consolidation followed.
1975
793.88 842.25
860.67
up 2% consolidation followed.
1974
607.87 669.82 (10/21)
674.75
up 1% and
then down.
1969
813.09 839.27
860.48
up
2.5% and then down
1968
935.79 967.49
983.34
up 2% and then down.
1953
264.00 273.90
281.40 up
3% bull mkt followed
--------------------------------------------------------------------------------------------------------------------------------------------------
1948
178.30 186.5
189.80
up 1.5% and
then down.
1947
177.50 185.39
DOWN to 176.10 (12/5)
1942
109.10 115.20
117.30
up 2% bull mkt followed

=====================================================================================
OLDER HOTLINES
=====================================================================================
10/19/2011
DJI = 11505 -72 la/ma=1.03 21-dma ROC=+.102 P=
+107 (-27) IP21=+.014 V= -71 OP= .044
BREADTH
STATISTICS:
79 (-61)
MAXCP stocks Bullish MAXCP
Stocks
36 (-3)
MINCP stocks Bearish MINCP Stocks
MAXCP stocks are those showing Tiger Closing Power making new highs.
This suggests heavy Professional Buying. Applying the Tiger Power Ranker's
"bullish" to the MAXCP stocks find those with heavy insider buying and
institutional accumulation. Bearish MINCP stocks show the opposite.
Also use the BOTHUPs condition with MAXCPs and BOTHDOWNS MINCPS.
12 new highs on NASDAQ. 17 new lows on NASDAQ
8 new
highs NYSE 7
new lows on NYSE
10/19/2011 ===> See Key Peerless TigerSoft Index Charts: Industry Groups and
ETFs
DIA
SPY QQQ
DJIA-Peerless TigerDJI TigerSPY
TigerQQQ GLD SLV
Crude
NEW 10/19/2001 ===>
DAILY Trading 3 Sample Stocks using
Closing Power trend-changes:
SSRI (Silver), PAAS (Silver), NEM
(Gold) This will updated each night for a
while to show new users how one might trade some volatile precious
metals' stocks simply using Closing Power.
Near Term:
updated last: 10/19/2011
------------------- Closing
Power (CP) Status Report: CHARTS:---------------------
Only the DIA's ETF Closing Powers is
still in an uptrend. The ETFs' Opening Powers are also still rising.
Backing and filling seems to be required now.
DIA is
above less steep CP UPtrendline -
It will take a close of more than 0.288 BELOW the Opening
to violate the CP uptrend. In cases like this, we should probably wait for the CP to
violate its
new CP uptrend-line to consider the DIA short-term bearish. The Opening Power is
rising.
SPY is
BROKE BELOW CP Uprendline - It will take a close of more than 1.32 ABOVE the Opening
to restore the CP uptrend. This is SPY short-term bearish. The Opening
Power is still rising.
QQQ broke its blue
CP Uptrendline - - It will take a close of more than 1.61 ABOVE the
Opening
to restore the CP uptrend. Consider the QQQ short-term bearish. The Opening
Power is rising.
GLD Broke CP
Uptrendline - A close of .14 ABOVE the Opening is needed
tomorrow to break
the CP DOWNtrend. GLD Openings are above its 21-dma.
A bearish CP divergence is
present with
GLD.
PEERLESS BUYS SAY THERE WILL BE MORE STRENGTH
We have no new sell signals
yet to reverse the Buys. We have come close,
but each time the
DJI has recenly closed more than 2.7% above the 21-day ma,
the P-Indicator
and Accumulation Index are positive. So no S9 or S12 has occurred.
It might seem
that this could soon change, and we could get a sell signal tomorrow
or the next day.
In fact, this is unlikely, even though the P-Indicator is only +107 and
Accumulation
Index only +.014.
Remember that we
use a 21-day ma in creating the P-Indicator and the Accumulation Index.
This means that
tomorrow's construction of the P-Indicator and AI will have to replace the data we now
show with new
data that will not include the data for 9/21/2011 which was quite bearish. As a
consequence, it
will be hard for the P-Indictor or Accumulation Index to fall tomorrow.
We routinely use
the 21-day ma because of the reliable role of the monthly cycle in price
stock price
movements. We do not want to over-weight a bearish part of the month by
counting it
twice. The next 5 days is typically bearish. It rises only 35.6% of the time,
falling -0.8% on
everage since 1965. But then it typically reverses and two weeks from
now it is up 67%
of the time.
The break in the QQQ
and SPY CLosing Power uptrends also argues for some hestitation
here but then a
resumtption of the uptrend. A pullback now would make a later penetration
of the DJI's 11600 more
significant and powerful in a week, or so.
Being slightly
bearishly hedged with a few of the bearish MINCP stocks seems appropiraite and
reasonable.
====================================================================================
OLDER HOTLINES
====================================================================================
10/18/2011
DJI = 11577 +180 la/ma=1.037 21-dma ROC=+.185 P = +134
(+176) IP21=+.014 V= -54 OP= -.123
BREADTH
STATISTICS:
140
MAXCP stocks Bullish MAXCP
Stocks
39
MINCP stocks Bearish MINCP Stocks
MAXCP stocks are those showing Tiger Closing Power making new highs.
This suggests heavy Professional Buying. Applying the Tiger Power Ranker's
"bullish" to the MAXCP stocks find those with heavy insider buying and
institutional accumulation. Bearish MINCP stocks show the opposite.
Also use the BOTHUPs condition with MAXCPs and BOTHDOWNS MINCPS.
13 new highs on NASDAQ. 17 new lows on NASDAQ
19 new
highs NYSE 5
new lows on NYSE
10/18/2011 ===> See Key Peerless TigerSoft Index Charts: Industry Groups and
ETFs
DIA
SPY QQQ
DJIA-Peerless TigerDJI TigerSPY
TigerQQQ GLD SLV
Crude
NEW 10/18/2001 ===>
DAILY Trading 3 Sample Stocks using
Closing Power trend-changes:
SSRI (Silver), PAAS (Silver), NEM
(Gold) This will updated each night for a
while to show new users how one might trade some volatile precious
metals' stocks simply using Closing Power.
Near Term:
updated last: 10/18/2011
------------------- Closing
Power (CP) Status Report: CHARTS:---------------------
All 3 general market ETFs' Closing
Powers established new uptrends today. These CPs
are still above the support of their 21-dma. Opening Powers are also still
rising.
DIA is
above less steep CP UPtrendline -
It will take a close of more than 0.84 BELOW the Opening
to violate the CP uptrend. In cases like this, we should probably wait for the CP to
violate its
new CP uptrend-line to consider the DIA short-term bearish. The Opening Power is
rising.
SPY is
above less steep Uprendline - It will take a close of more than 0.756 BELOW the Opening
to violate the CP uptrend. In cases like this, we should probably wait for the CP to
violate its
new CP uptrend-line to consider the DIA short-term bearish. The Opening Power is
rising.
QQQ broke its steep CP Uptrendline - - It
will take a close of more than 0.246 BELOW the Opening
to violate the less steep CP uptrend. In cases like this, we should probably wait
for the CP to violate its
new CP uptrend-line to consider the DIA short-term bearish. The Opening Power is
rising.
GLD Broke CP
DOWNtrendline - A close of 2.716 BELOW the Opening is needed tomorrow
to restiore
the CP DOWNtrend. GLD CP is still
below its CP 21-dma but Openings are
above its 21-dma.
A bearish CP divergence is present
with GLD.
10/18/2011
Multiple Peerless Buys Still Operate. Looks Like a False
Breakdown
below Falling 65-Day MA. Many of these produce
excellent additional
rallies.
Cases of quick moves back above the broken 65-dma in October
and November since 1929 have all brought moves of more than 5%
higher. There were 7 cases. This condition would seem to qualify as a
legitimate Peerless signal, if a math based program confirms
the visual inspection that the testing shows that I have just
done.
Let's
see how this case turns out. The DJI is already at the upper
band and does not show a very positive Accumulation index.
The number of sectors with a plurality of their
stocks above a 65-dma
is expanding rapidly. This is bullish. But, we still have
to watch the Closing
Power uptrends and consider a penetration of them a short-term
sell.
The DJI is 3.7% over the 21-day ma with the current Accumulation
Index (IP21) standing at only .014. There is plenty of
selling being
done as the DJI nears 11600. Volume is still below its falling
21-dma. Usually it takes more volume to eat up overhead
supply.
RALLIES after DJI Closings Back below A Falling 65-DMA:
1929-1953
> 5 cases of a rally of
more than 5% 4 cases of allies to
peaks less than 5% higher.
+ 10/1/1934 90.40 False move. DJI immediately turned up and moved to 119.50 on
6/21/1935
la/ma annroc
P-I ch IP21 V-I Opct
.998 -.315 -46
-2 -.036 -80 -.112
+ 6/29/1939 130.10 False move. DJI immediately rose. to 144.20 pn 7/24/1939
la/ma annroc
P-I ch IP21 V-I Opct
.952 -.704
-84 -38 -.038 -96 -.071
3/15/1940 146.50
False move. DJI rose in two weeks back to 151.30 above 65 dma on 4/8/1940.
la/ma annroc P-I ch
IP21 V-I Opct
.993 -.145 -10
-20 -.117 -52 -.014
12/28/1943 135.00
False move. DJI rose in a week to 138.30
la/ma annroc P-I
ch IP21 V-I
Opct
1.006 .453
84
0 +.075 43 .228
2/7/1944 134.20 False move.
DJI rose in a week to 140.90 on 3/16/1944
la/ma annroc
P-I ch IP21
V-I Opct
.977 -.338
-33 -8 -.063
-73 -.293
+
4/18/1944 135.10 False
move. DJI rose steeply moving to
159 in June.
la/ma annroc P-I
ch IP21
V-I Opct
.976 -.489
-102 -34 -.223
-176 -.228
+ 10/26/1944 145.00 False move. DJI rose steeply moving to 168.20 on 5/28/1945.
la/ma annroc P-I
ch IP21 V-I
Opct
.988 -.056
13 -20 +.13 -28
-.114
12/26/1951 264.10 False move. DJI rose to 275.40
on 1/22/1952.
la/ma annroc P-I
ch IP21
V-I Opct
.998 .302
37 -29 +.017 -30
-.158
+
5/29/1952 262.90 False move. DJI rose to 279.80 on
8/8/1952.
la/ma
annroc P-I
ch IP21
V-I Opct
1.005 .241
67 +19 +.086
90 -.201
Octobers and Novembers only: 1929-2011
> 7 cases
of a rally of more than 5% 0
cases of allies to peaks less than 5% higher.
+ 10/1/1934 90.40 False move. DJI immediately turned up and moved to 119.50 on
6/21/35
la/ma annroc
P-I ch IP21
V-I Opct
.998 -.315
-46 -2 -.036 -80 -.112
+ 10/26/1944 145.00 False
move. DJI rose big to 168.20 on
5/28/1945.
la/ma annroc P-I
ch IP21 V-I
Opct
.988 -.056
13 -20 +.13 -28 -.114
+ 11/16/1959 634.50 False Move
DJI rose big to 685.50 on 1/5/1959.
la/ma annroc P-I
ch IP21
V-I Opct
.999 -.418
-152 +36 -.035
-498 -.233
+ 11/7/1980 932.42 False Move DJI
rose to 989.30 on 11/21/1980
la/ma annroc
P-I ch IP21
V-I Opct
.986 -.397 -182 -28 -.289
-5 -.11
+ 10/7/1985 1324.37 False Move DJI rose big to1544.50 on 12/17/1985.
la/ma annroc P-I
ch IP21 V-I
Opct
1.003 -.021 -156 --4 -.038
- 9 -.098
+ 11/24/1997 7768 False Move
DJI rose to 8149.13 on 12/5/1998
la/ma annroc P-I
ch IP21
V-I Opct
1.023 .082 -65 --60 +.021 - 16
.287
+ 11/2/1999 10581 False Move DJI rose big to 11582 on 1/13/2000
la/ma annroc
P-I ch IP21
V-I Opct
1.023 .082 -65 --60 +.021 - 16
.287
====================================================================================
OLDER HOTLINES
====================================================================================
10/17/2011
DJI = 11397 -247 la/ma=1.022 21-dma ROC=-.12 P = -43 (-93) IP21=-.001 V= -123
OP= +.04
BREADTH
STATISTICS:
39
MAXCP stocks Bullish MAXCP
Stocks
27
MINCP stocks Bearish
MINCP Stocks
MAXCP stocks are those showing Tiger Closing Power making new highs.
This suggests heavy Professional Buying. Applying the Tiger Power Ranker's
"bullish" to the MAXCP stocks find those with heavy insider buying and
institutional accumulation. Bearish MINCP stocks show the opposite.
Also use the BOTHUPs condition with MAXCPs and BOTHDOWNS MINCPS.
20 new highs on NASDAQ. 7 new lows on NASDAQ
15 new
highs NYSE 6
new lows on NYSE
10/17/2011 ===> See Key Peerless TigerSoft Index Charts: Industry Groups and
ETFs
DIA
SPY QQQ
DJIA-Peerless TigerDJI TigerSPY
TigerQQQ GLD SLV
Crude
NEW 10/17/2001 ===>
DAILY Trading 3 Sample Stocks using
Closing Power trend-changes:
SSRI (Silver), PAAS (Silver), NEM
(Gold) This will updated each night for a
while to show new users how one might trade some volatile precious
metals' stocks simply using Closing Power.
Near Term: updated last: 10/17/2011
------------------- Closing
Power (CP) Status Report: CHARTS:---------------------
All 3 general market ETFs' Closing
Powers broke their steep uptrends today. These CPs
are still above the support of their 21-dma. Opening Powers are also still
rising. A CP retreat
to test the rising 21-dma seems likely.
DIA broke
its steep CP UPtrendline -
It would take a close of more than 4.205 ABOVE the Opening
to restore the CP uptrend. In cases like this, we should probably wait for the CP to
test its
21-dma and consider the DIA short-term bearish.
SPY broke
itst steep Uprendline - It would take a close of more than 4.714 ABOVE
the Opening
to restore the CP uptrend. In cases like this, we should probably wait for the CP to
test its
21-dma and consider the DIA short-term bearish.
QQQ broke its steep CP Uptrendline - - It
would take a close of more than 1.913 ABOVE the Opening
to restore the CP uptrend. In cases like this, we should probably wait for the CP to
test its
21-dma and consider the DIA short-term bearish.
GLD BELOW CP
DOWNtrendline - A close of -.125 ABOVE the Opening is needed tomorrow to
break
the CP DOWNtrend. GLD CP is still
below its CP 21-dma but Openings are
above its 21-dma.
A bearish CP divergence is present
with GLD.
New TigerSoft Exploded Charts shows
exactly how much of a move from the Opening
to the Close is needed to break the Closing Power trendline. Note that a visual break will require,
at least .25 more of a penetration of the calculated uptrend. We have been using
visual
CP trend-breaks. http://tigersoft.com/CP-Trendbreaks/index.html
-----------------------------------------------------------------------------------------------------------------
10/17/2011
Multiple Peerless Buys Still Operate. But A More Decisive
Close
by The DJI back below its Falling 65-Day MA Will Be Bearish and
Call for a Decline back to The Support of 10800. A New Study suggests
the odds of a retreat to the lower band are 2:1
if tomorrow brings a more decisive
close by the DJI below the 65-day ma.
Sell Short a Few of The Bearish MINCP Stocks.
Yesterday's overbought condition (CL/MA = 1.043)
showed multiple non-confirmations.
An automatic 50-day Stochastic Sell has
appeared on the DIA tonight. The steep
Closing Power uptrends have clearly been
violated. A pullback by DIA by 2 more points
to its rising 21-day ma lis next. Most
likely, the DJI will not hold there and the dynamics of the
broad trading range, 10800-11600, will play
out, namely, that with resistance having
been found, now support must be sought by a
test of support. The middle of such
a trading range is usually not very good
support. In addition, the AnnROC and IP21
are both below .07. This warns that the
21-day ma will probably not hold.
After the close, IBM's quarterly earnings
and revenues were announced. Revenues
did not meet expectations, we are
told. This should induce more selling by the public.
But I believe that computer stocks are in
strong hands and the dip over the next few
days will give a good re-buying
opportunity. See the discussion a night ago here.
A deeper general market decline cannot be
predicted now because Peerless remains
on multiple Buys. However, a
weak close tomorrow would cause the DJI to decisively break
back below its falling 65-day ma. This is
bearish. See the study further below. So is
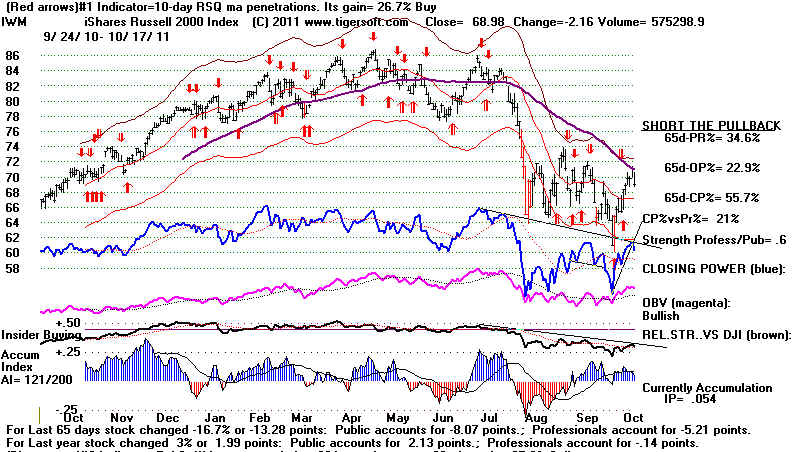
the way the Russell-2000 (IWM) reached
and now has fallen back from its 65-day ma.
DJI Closings Back below A Falling 65-DMA:
1929-1953
In 9 of these 30 cases the break below the declining 65-dma was
false and a
rally of 5% or more ensued within a week.
In 21 instances, it would have paid
to have sold short. False moves were often bear traps, in which the DJI
quickly
turned around and sped up substantially. It is not clear that the standard Peerless
key values would have helped increase the
chances of correctly playing these
moves. More work might be done, but
21 successes and 9 failures is not good enough
to make this a Peerless Sell.
October-November breakdowns proved to be traps
in 6/15 of the 15 cases between 1929 and
2011.
DJI Closings Back below A
Falling 65-DMA: 1929-1953
21 declines 9 rallies
9/19/1930 229 Last chance to sell. Severe Bear
Market followed.
7/8/1931 143.8 Market slipped gradually for 8
weeks and then fell sharply.
7/24/1931 139 Market slipped gradually for 5 weeks and
then fell sharply.
3/24/1932 77.90 Steep decline followed immediately.
1/18/1933 60.40 DJI fell to 51.40 bottom on 2/28/1933
4/26/1934 103.60 DJI fell to 93.20 bottom on 5/11/1934
6/21/1934 97.50 DJI fell to 87.80 on 7/27/1934
8/29/1934 93.70 DJI fell to 86.70 on 9/17/1934
10/1/1934 90.40 False move. DJI immediately turned up
and moved far above 65-dma
.998 -.315 -46
-2 -.036 -80 -.112
1/26/1938 123.20
DJI declined to 118.50 on 2/3/1938 and
then rallied back above upper band.
5/16/1938 115.40
DJI declined to 107.90 on 5/27/1938 and
then rallied back above upper band.
3/17/1939 143.90 DJI
fell sharply to 124..00 on 4/101939
6/29/1939 130.10 False move. DJI immediately rose. to 144.20 pn
7/24/1939
.952 -.704 -84
-38 -.038 -96 -.071
1/9/1940 149.80
DJI declined to 144.70 on 1/15/1940 and
then rallied slightly back above ma
3/15/1940 146.50 False move. DJI rose in two weeks back to
151.30 above 65 dma on 4/8/1940.
.993 -.145 -10
-20 -.117 -52 -.014
5/10/1940 144.80 DJI
fell sharply to 118.80 on 6/101940
1/15/1941 131.50 DJI
fell sharply to 117.90 on 2/191941
12/28/1943 135.00 False move. DJI rose in a week to 138.30
1.006 .453
84 0
+.075 43 .228
2/7/1944 134.20 False move. DJI rose in a week to 140.90 on
3/16/1944
.977 -.338
-33 -8 -.063 -73 -.293
4/18/1944 135.10 False move. DJI rose steeply moving to 159 in
June.
.976 -.489
-102 -34 -.223
-176 -.228
10/26/1944 145.00 False move. DJI rose steeply moving to 168.20
on 5/28/1945.
.988 -.056
13 -20 +.13 -28 -.114
7/11/1946 206.30
DJI fell sharply to 163.10 on 10/91946
3/31/1947 177.200 DJI
fell to 163.60 on 5/191947
2/7/1949 174.40 DJI fell to 171.10 on 2/251949 and then rose to 178.40 on 3/29/1949.
4/20/1949 175.70
DJI fell sharply to 161.60 on 6/131949
5/18/1951 250.10 DJI fell only to
247.00 on 5/23/1951 and then went
sidewise for a month.
12/26/1951 264.10 False move. DJI rose to 275.40 on 1/22/1952.
4/4/1952 265.60 DJI fell to
256.40 on 5/1/1952
5/29/1952 262.90 False move. DJI rose to 279.80 on 8/8/1952.
3/30/1953 283.10 DJI fell to 263.40 on 6/9/1953
==============================================================================
October-November Breakdowns
below A Falling 65-dma
16 cases: 9 (60%) declines 6 (40%) rallies
--------------------------------------------------------------------------------------
10/1/1934 90.40 False move. DJI immediately turned up and
moved far above 65-dma
10/26/1944 145.00 False move. DJI rose steeply moving to 168.20
on 5/28/1945.
11/16/1959 634.50 False Move
11/20/1969 831.18 DJI fell to 783.79 on 12/18/1969 and
then resumed bear market.
10/14/1971 878.36 DJI fell to 797.97 on 11/23/1971
11/15/1974 647.61 DJI fell to 577.60 on 12/6/1974
10/1/1976 979.69 DJI fell to 924.04 on 11/10/1976
11/29/1977 931.86 DJI fell to 807.43 on 12/7/1977
11/7/1980 932.42 False Move
11/14/1984 1206.93 DJI fell to1170.49 on 12/6/1984
10/7/1985 1324.37 False Move
10/17/1997 7847 DJI fell to 7161 on 10/27/1997
11/24/1997 7768 False Move
11/2/1999 10581 False Move
11/15/2000 10708 DJI fell to 10374 on 12/1/2000
10/8/2004 10055 DJI fell to 10374 on 10/25/2004
Taking some new short sales in the BEARISH
MINCP stocks, many of which look
very vulnerable, is now recommended.
====================================================================================
OLDER HOTLINES
====================================================================================
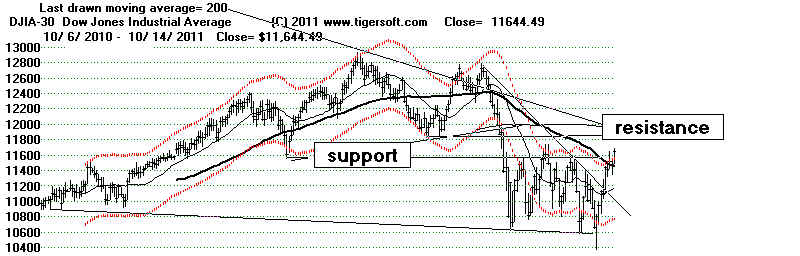
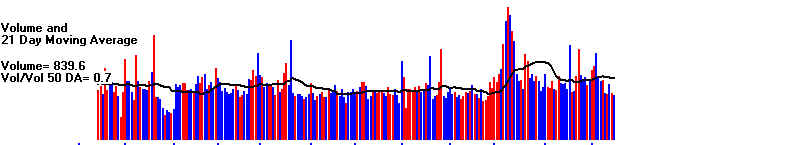
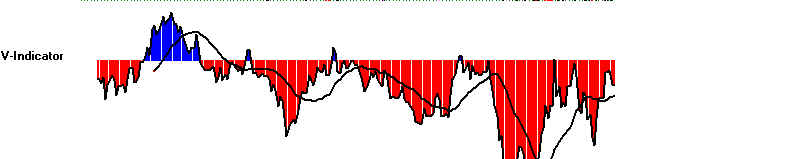
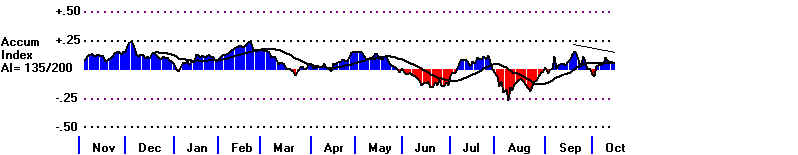
10/14/2011
DJI = 11644-41 la/ma=1.043 21-dma ROC= .226 P =
+50 (+19) IP21= .047 V= -84 OP= +.148
BREADTH
STATISTICS:
146 +5
MAXCP stocks Bullish MAXCP Stocks
24
-2 MINCP stocks Bearish
MINCP Stocks
MAXCP stocks are those showing Tiger Closing Power making new highs.
This suggests heavy Professional Buying. Applying the Tiger Power Ranker's
"bullish" to the MAXCP stocks find those with heavy insider buying and
institutional accumulation. Bearish MINCP stocks show the opposite.
Also use the BOTHUPs condition with MAXCPs and BOTHDOWNS MINCPS.
20 new highs on NASDAQ. 7 new lows on NASDAQ
15 new
highs NYSE 6
new lows on NYSE
10/14/2011 ===> See Key Peerless TigerSoft Index Charts: Industry Groups and
ETFs
DIA
SPY QQQ
DJIA-Peerless TigerDJI TigerSPY
TigerQQQ GLD SLV
Crude
Near Term: updated last: 10/14/2011
------------------- Closing
Power (CP) Status Report: CHARTS:---------------------
All 3 general market ETFs' Closing
Powers are rising but at a rate that seems unsustainable.
Opening Powers sre rising. This is the bullish "BOTHUP"
condition. Momentum now is clearly upwards.
DIA is at
steep CP UPtrendline -
It would take a close of more than 0.87 ABOVE the Opening
to sustain the CP uptrend. In cases like this, we should probably wait for the CP to
fall to
become short-term bearish.
SPY is at
steep Uprendline - It would take a close of more than 1.16 ABOVE the Opening
to sustain the CP uptrend. In cases like this, we should probably wait for the CP to
fall to
become short-term bearish.
QQQ is at steep CP Uptrendline - - It would
take a close of more than 0.654 ABOVE the Opening
to restore the CP uptrend. In cases like this, we should probably wait for the CP to
also fall to
become short-term bearish.
GLD ABOVE CP
DOWNtrendline - A close of 0.13 BELOW the Opening is needed tomorrow to
restore
the CP DOWNtrend. GLD CP is still
below its CP 21-dma but Openings are
above its 21-dma.
New TigerSoft Exploded Charts shows
exactly how much of a move from the Opening
to the Close is needed to break the Closing Power trendline. Note that a visual break will require,
at least .25 more of a penetration of the calculated uptrend. We have been using
visual
CP trend-breaks. http://tigersoft.com/CP-Trendbreaks/index.html
-----------------------------------------------------------------------------------------------------------------
10/14/2011
Multiple Peerless Buys Have Overcome 65-Day MA
>But DJI is now 4% over 21-day ma and Volume is low.
>Also bearish: P-Indicator and Accum. Indicator do not confirm
Friday's
recovery and V-Indicator remains negative.
>Watch
the CLosing Power. A Close below the Opening will be
short-term
bearish and Call for a Retest of 65-dma.
>Seasonaility: DJI rises only 44% of
the time in the week after 10/16/2011,
based on
DJI from 1966-2010... but rallies 60% over the next month from
today's
level.
>There
are more than 5x more stocks being bought agressively by the Pros
and being
aggessively sold.
>NASDAQ new
highs exceed new lows.
The rally is being fueled, more than anything else, by computers and
specific software
companies. IBM and AAPL are soaring. You knew that, of
course, but did you know
that MSFT and DELL are showing multiple Buy B7s, which indicate that
Professionals
are much more eager to buy than the Public is? I suspect
breakouts will occur on their
weekly charts above their long downtrendlines: MSFT over 28 and SELL
over 18.
Let's see if the market can keep bring amazed disbelief to the majority
who scoff at it.
Manipulation? Quite possibly. But the point is, given all the bad
news, the Pros find it
more profitable to make it rise, knowing that the probability is good
that many of the
bears can be induced to buy at much higher prices when the news gets
better or they
must throw in the towel.
As Keynes said: “The
market can stay irrational longer than you can stay solvent.”
 |
Keynes The Speculator
"Keynes traded on high leverage - his broker granted him a margin account to
trade positions of £40,000 with just £4,000 equity...
Easter 1920 found Keynes
vacationing in Rome. He learned that his open currency trades had made him a profit of
£22,000 on francs and a loss of £8,000 on U.S. dollars. A jubilant Keynes wrote to his
mother from Italy on April 16 to say that he was, “indulging in an orgy of shopping.
. . I think we have bought about a ton so far. . .”
Keynes soon learned that
short-term currency trading on high margin, using only his long-term economic predictions
as a guide, was foolhardy. By late May, despite his belief that the U.S. dollar should
rise, it didn’t. And the Deutschmark, which Keynes had bet against, refused to fall.
To Keynes’s dismay, the Deutschmark began a three-month rally.
Keynes was wiped out. Whereas
in April he had been sitting on net profits of £14,000, by the end of May these had
reversed into losses of £13,125. His brokers asked Keynes for £7,000 to keep his account
open. A well known, but anonymous, financier provided him with a loan of £5,000. Sales of
Keynes’s recently published book The Economic Consequences of Peace had turned out to
be healthy and a letter to his publisher asking for an advance elicited a cheque for
£1,500."
(Source: http://www.maynardkeynes.org/keynes-the-speculator.html
) |
DJIA next faces 11800 resistance.


====================================================================================
OLDER HOTLINES
====================================================================================
10/13/2011
DJI = 11478 -41 la/ma=1.029 21-dma ROC= .247 P =
+31 (-102) IP21= .054 V= -80 OP= +.147
BREADTH
STATISTICS:
141 +14
MAXCP stocks Bullish MAXCP Stocks 10/13/2011
26
+3 MINCP stocks Bearish
MINCP Stocks
10/13/2011
MAXCP stocks are those showing Tiger Closing Power making new highs.
This suggests heavy Professional Buying. Applying the Tiger Power Ranker's
"bullish" to the MAXCP stocks find those with heavy insider buying and
institutional accumulation. Bearish MINCP stocks show the opposite.
Also use the BOTHUPs condition with MAXCPs and BOTHDOWNS MINCPS.
9 new highs on NASDAQ. 9 new lows on NASDAQ
5 new
highs NYSE 2
new lows on NYSE
10/13/2011 ===> See Key Peerless TigerSoft Index Charts: Industry Groups and
ETFs
DIA
SPY QQQ
DJIA-Peerless TigerDJI TigerSPY
TigerQQQ GLD SLV
Crude
Near Term: updated last: 10/13/2011
------------------- Closing
Power (CP) Status Report: CHARTS:---------------------
All 3 general market ETFs' Closing
Powers are rising but below the rising CP. So are the Opening Powers.
This is the bullish "BOTHUP" condition. With prices at the 65-day
ma, a reversal is possible,
but the momentum now is clearly upwards.
DIA is
below steep CP UPtrendline -
It would take a close of more than 3.96 ABOVE the Opening
to restore the CP uptrend. In cases like this, we should probably wait for the CP to
also fall to
become short-term bearish.
SPY on
steep Uprendline - It would take a close of more than 4.70 ABOVE the Opening
to restore the CP uptrend. In cases like this, we should probably wait for the CP to
also fall to
become short-term bearish.
QQQ below steep CP Uptrendline - - It would
take a close of more than2.77 ABOVE the Opening
to restore the CP uptrend. In cases like this, we should probably wait for the CP to
also fall to
become short-term bearish.
GLD ABOVE CP
DOWNtrendline - A close of 5.14 BELOW the Opening is needed tomorrow to restore
the CP DOWNtrend. GLD CP is still
below its CP 21-dma but Openings are
above its 21-dma.
New TigerSoft Exploded Charts shows
exactly how much of a move from the Opening
to the Close is needed to break the Closing Power trendline. Note that a visual break will require,
at least .25 more of a penetration of the calculated uptrend. We have been using
visual
CP trend-breaks. http://tigersoft.com/CP-Trendbreaks/index.html
-----------------------------------------------------------------------------------------------------------------
10/13/2011
Multiple Peerless Buys Versus 65-Day MA
Stick with Peerless. We Have The Bears on The Run...
The DJI impressively recovered from a 120 point loss, closing down only 41 while the
NASDAQ
actually rose 16 on rising volume. Without a Peerless sell signal, I think we have
to give the
markets a chance to move higher. Closings are still bullishly above their openings.
MAXCP stocks
outnumber MINCP stocks 5:1, also showing Professionals are much more bullish than bearish.
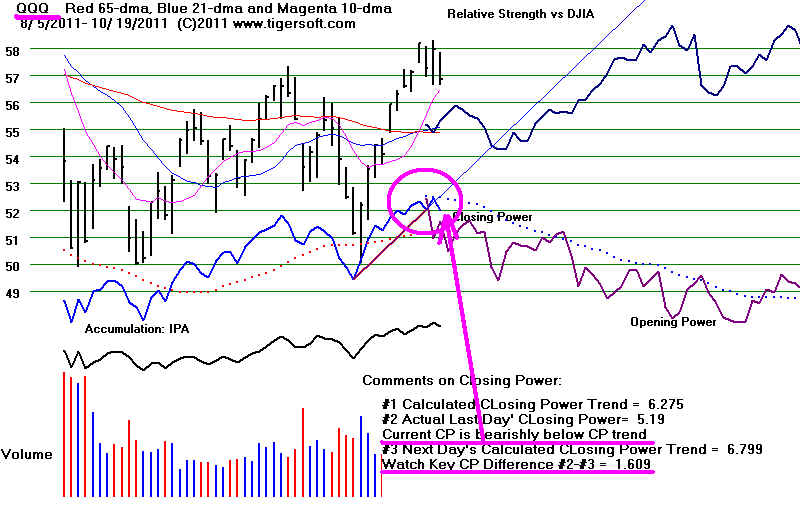
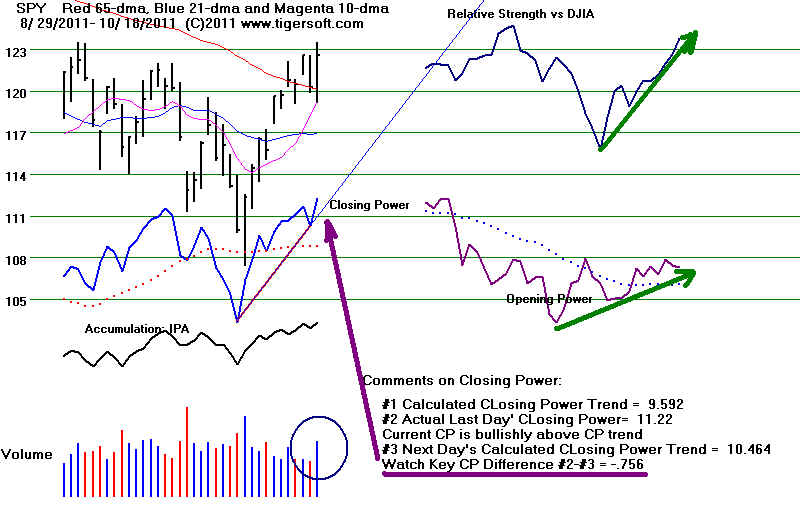
The QQQ is much stronger than the DIA. See below how the CLosing Power has made 12
month highs
ahead of price. This is reliably bullish. The QQQ is above its 65-day ma.
The brown Relative Strength Line
(QQQ/DJI) is rising. See also the Bullih (CP versus OP) Buy B7s recently in the QQQ
chart. Given the
public bearishiness, I take this as quite bullish. IBM,
the most weighty stock in the DJI, and a tech stock
of course, is challenging its all-time highs. This is not what we would expect in a
developing bear market.
The odds of the 65-day ma holding back the DJI clearly are reduced
as we get into late October, November
and December. Since 1972, I count 20 cases of DJI rallies in the Oct-Dec period to a
falling 65-dma,
in 13 cases (65%) the DJI rises more than 4% in the next 2 months.
Our Stocks' Hotline remains 100% bullish (no short sales.)
8%, 7-day rally has now taken prices slightly above the potential resistance of
the falling 65-
====================================================================================
OLDER HOTLINES
====================================================================================
10/12/2011
DJI = 11519 +103 la/ma=1.034 21-dma ROC= .442 P =
+133 (+10) IP21= .054 V= -35 OP= +.23
BREADTH
STATISTICS:
127 +10
MAXCP stocks Bullish MAXCP Stocks 10/11/2011
22
-7 MINCP stocks Bearish
MINCP Stocks
10/11/2011
MAXCP stocks are those showing Tiger Closing Power making new highs.
This suggests heavy Professional Buying. Applying the Tiger Power Ranker's
"bullish" to the MAXCP stocks find those with heavy insider buying and
institutional accumulation. Bearish MINCP stocks show the opposite.
Also use the BOTHUPs condition with MAXCPs and BOTHDOWNS MINCPS.
14 new highs on NASDAQ. 8 new lows on NASDAQ
7 new
highs NYSE 4
new lows on NYSE 1
10/11/2011 ===> See Key Peerless TigerSoft Index Charts: Industry Groups and
ETFs
DIA
SPY QQQ
DJIA-Peerless TigerDJI TigerSPY
TigerQQQ GLD SLV
Crude
Near Term: updated last: 10/12/2011
------------------- Closing
Power (CP) Status Report: CHARTS:---------------------
All 3 general market ETFs' Closing
Powers are uptrending again. So are the Opening Powers.
This is the bullish "BOTHUP" condition. With prices at the 65-day
ma, a reversal is possible,
but the momentum now is clearly upwards.
DIA on
steep CP UPtrendline - A close
of less than 1.03 ABOVE the Opening would violate CP uptrend.
In cases like this, we should probably wait for the CP to also fall to become short-term
bearish.
SPY on
steep Uprendline - A close of less than 3.57 ABOVE the Opening would
violate CP uptrend.
In cases like this, we should wait for the CP to also fall to become short-term bearish.
QQQ below steep CP Uptrendline - - A close of
less than 2.47 ABOVE the Opening would mean
a second-day violate of steep CP uptrend. In cases like this, we should probably
wait for the CP
to also fall another day to become short-term bearish.
GLD ABOVE CP
DOWNtrendline - A close of 4.06 BELOW the Opening is needed tomorrow to restore
the CP DOWNtrend. GLD CP is still
below its CP 21-dma but Openings are
above its 21-dma.
New TigerSoft Exploded Charts shows
exactly how much of a move from the Opening
to the Close is needed to break the Closing Power trendline. Note that a visual break will require,
at least .25 more of a penetration of the calculated uptrend. We have been using
visual
CP trend-breaks. http://tigersoft.com/CP-Trendbreaks/index.html
-----------------------------------------------------------------------------------------------------------------
10/12/2011
Multiple Peerless Buys Versus 65-Day MA
Stick with Peerless. We Have The Bears on The Run...
The DJI's 8%, 7-day rally has now taken prices slightly above the potential resistance of
the falling 65-day ma.
This is un-nerving to the bears, but they are still counting on the the resistance
created by the July
penetration of the June lows (DJI - 11600 and NASDAQ - 2600) to halt
the recovery. A
close above these resistance levels will bring, I predict, much more short-covering.
Seasonality favors a
further rally. The DJI is up 57.8% of the time in the week following
October 12th.
Of course, the rally past the resistance still has not yet happened and volume has been
low
on the rally. But
I think we can confidently believe that Professionals and market makers
are still trying to run
up prices. I say this because the number of stocks making Closing Power
new highs (MAXCP) is 5x
the number of stocks making Closing Power new lows (MINCPs) and
because the Closing
Powers are much stronger than the Opening Power on this rally
for the DIA, SPY or QQQ.
It's true that some traders (and hedge funds) took profits today in leading biotechs
and bonds. But I am impressed that other sectors among those we
follow are now showing
a plurality of their
stocks to be above the 65-dma. The recovery is significantly broadening.
Military stocks (67%),
QQQ stocks (66%),
Utility stocks (63%),
Auto stocks (63%),
Retail Stocks (57%)
DJI-30 (57%)
Though Peerless remains on Buys, we should note the rally still needs to strengthen
more. To be
confirmed, the NYSE A/D Line needs to improve and for the current run to make new
recovery highs.
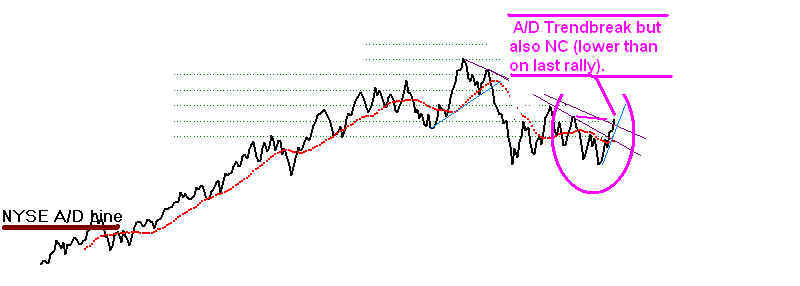
The older 2006 Peerless would have considered these A/D NC's to be Sell S13s.
The new Peerless has
dropped this signal because it gives too many false or unproductive
Sells. The new
Peerless has new ways to call tops on runs like this. One way would be
for the current
Accumulation Index to drop below its 21-day ma. We came close to this
today. In fact,
if you do not use the hypothetical DJI lows as we require with Peerless, but
use the trading
lows, you will get this new signal, a Sell
S4. It could occur this week or
next if the Accum.
Index drops further. In addition, if the Accum. Index drops more and
the NASDAQ
rallies, we could get a NASDAQ Sell S4. As you can see in the NASDAQ
chart below, these
have been quite reliable Sells.
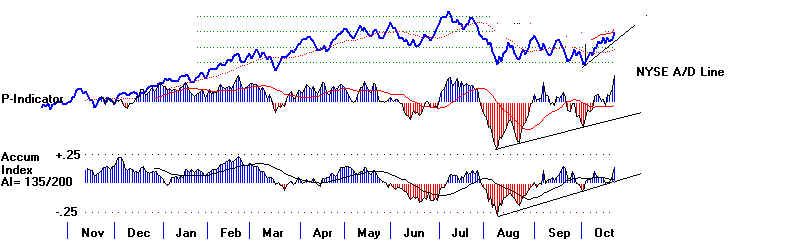
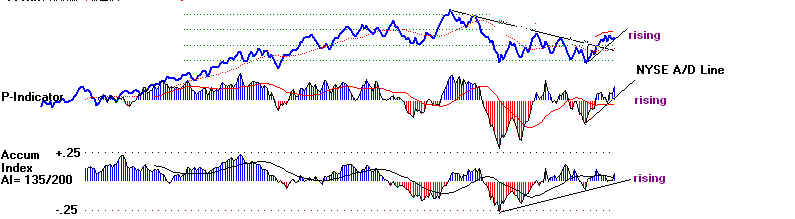
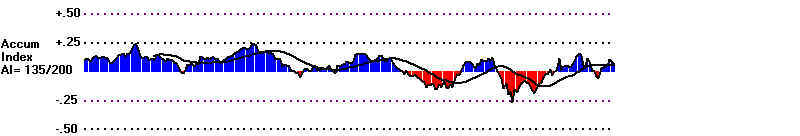
DJIA - Peerless Signals
P-Indicator: non-confirmation of today's high
A/D Line non-confirmation of today's high
Accumulation non-confirmation of today's high
IP21 just above its 21-day ma
I
|
NASDAQ
--- At resistance from broken earlier support
--- RELDJI shows negative non-confirmation.
--- Accumulation non-confirmation of today's high
--- IP21 still above its 21-day ma
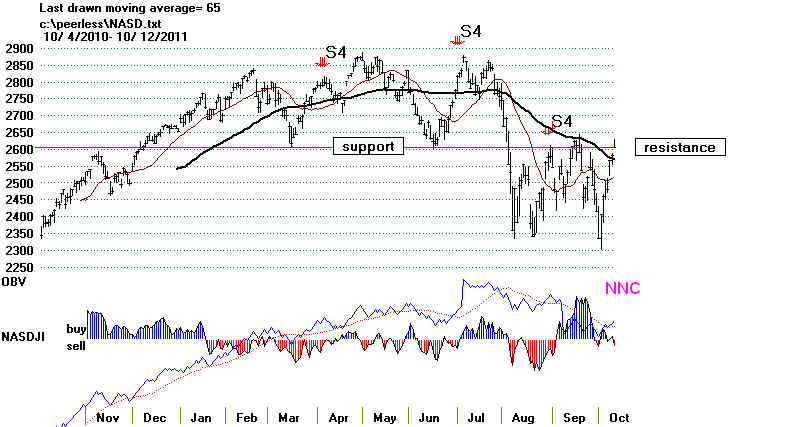
AI Still above AI MA
 |
====================================================================================
Older
Hotlines
====================================================================================
10/11/2011
DJI = 11416 la/ma=1.027 21-dma
ROC= .381 P = +122 (+21) IP21= .073
V= -40 OP= +.23
BREADTH
STATISTICS:
117 +38
MAXCP stocks Bullish MAXCP Stocks 10/11/2011
29
+5 MINCP stocks Bearish
MINCP Stocks
10/11/2011
MAXCP stocks are those showing Tiger Closing Power making new highs.
This suggests heavy Professional Buying. Applying the Tiger Power Ranker's
"bullish" to the MAXCP stocks find those with heavy insider buying and
institutional accumulation. Bearish MINCP stocks show the opposite.
Also use the BOTHUPs condition with MAXCPs and BOTHDOWNS MINCPS.
12 new highs on NASDAQ. 18 new lows on NASDAQ 10/10/2011
5 new
highs NYSE 8
new lows on NYSE 10/10/2011
10/11/2011 ===> See Key Peerless TigerSoft Index Charts: Industry Groups and
ETFs
DIA
SPY QQQ
DJIA-Peerless TigerDJI TigerSPY
TigerQQQ GLD SLV
Crude
Near Term: updated last: 10/11/2011
------------------- Closing
Power (CP) Status Report: CHARTS:---------------------
All 3 general market ETFs' Closing
Powers are uptrending again but the they are very close to
their rising trendlines and so any weakness would break the CP uptrend.
DIA on
steep CP UPtrendline - A close
of less than 1.81 ABOVE the Opening would violate CP uptrend.
In cases like this, we should probably wait for the CP to also fall to become short-term
bearish.
SPY on
steep Uprendline - A close of less than 2.11 ABOVE the Opening would
violate CP uptrend.
In cases like this, we should wait for the CP to also fall to become short-term bearish.
QQQ on steep CP Uptrendline - - A close of less
than 1.29 ABOVE the Opening would violate CP uptrend.
In cases like this, we should wait for the CP to also fall to become short-term bearish.
GLD ABOVE
CP DOWNtrendline - A close of 7.4 BELOW the Opening is needed tomorrow to restore
the CP DOWNtrend. GLD CP is still
below its CP 21-dma but Openings are
above its 21-dma.
New TigerSoft Exploded Charts shows
exactly how much of a move from the Opening
to the Close is needed to break the Closing Power trendline. Note that a visual break will require,
at least .25 more of a penetration of the calculated uptrend. We have been using
visual
CP trend-breaks. http://tigersoft.com/CP-Trendbreaks/index.html
-----------------------------------------------------------------------------------------------------------------
10/11/2011
Multiple Peerless Buys Versus 65-Day MA
Stick with Peerless. We Have The Bears on The Run...
I showed last night that 2/3 of the
time when there are multiple Buys in a two to three
week period, the DJI falls back to at least the lower band, but more often below it, once
the
resistance of the upper band has been reached. The DJI has now almost tagged the
upper
band. So, there is a better than even chance that the market will have to retest its
lows. That might ordinarily get us to take profits in some of the stocks that have
lagged the
last week's rally.
But there is so much public disbelief in this rally and Peerless is still on Buys.
So,
I would prefer just to hold the strongest stocks, including IBM and the biotechs
recommended
here. You might short or two from tonight's bearish MINCP stocks as a hedge.
They keep
falling even in this rising market. However, that runs against the Peerless
strategy. So,
I would rather not do this until we get a Peerless Sell or the Closing Power starts
downtrending, not just breaking its steep uptrend.
Tagging The Falling 65-dma
I do want to study the DJI's behavior when it rallies to a falling 65-day ma, as it has
now. (This will take a few hours. So look for this report later than usual
tonight.)
Early returns show great variability. Simply reaching the falling upper band does
tend to bring a decline, but not by nearly as wide a margin as to permit us to make this
into a Peerless signal. Looking at all these charts does show that a clear upside
penetration
of the 30-week ma reliably bring an additonal rally for at least two weeks, but after that
a re-testing of the 30-week ma is quite common.
A Small Study
I will look at only the bearish periods: 1930-1942, 1960, 1966-1970 to err on the
side of caution.
This is only a sample. But it may offer clues about how what might happen next in
our market
if we look for past cases where the key Peerless parameters were similar to what they are
now.
Now having done the the study, I can say again, the 65-day ma has power to turn back but
also to boost DJI prices if penetrated. Predicting which way it will go is very
difficult based
on only one key indicator, in that some key parameters would seem to be bullish and other
parameters are associated with bearish outcomes.
What does work are the Peerless Buy and Sell signals. Look at how well Peerless
predicts the tests of the 65-day ma with the DJI at the upper band. This is shown in
the list
just below. (There was not time to do the same for the other matching
parameter cases.)
Most important, consider all the cases with the DJI 2.5% to 3.5% over 21-dma
Outcome:
4/6/1933
explosive rally
Buy B12 sets it off
5/27/1936 rally and
bull mkt in two weeks. Buy B2s at bottom
5/24/1939 decline back below lower band.
Earlier Buy B17
7/30/1940 rally after
re-testing two weeks later. Buy B16, Buy B14
6/9/1941 3 month rally Buy B12 sets it off
5/21/1942 major bull mkt starts Buy B4 sets it off
11/9/1960 hesitation and then bull market. Buy B2 and B17 sets it off
10/25/1966 hesitation and then bull market. Buy B6
12/6/1967 2 week rally.
then decline below lower
band. B17
4/1/1968 bull market. Buy
B14 set off rally.
1/5/1970 Decline below lower band Sell S9, S15 are oerfect warnings.
2/27/1970 Hesitation and then decline
below lower band. Sell S9
6/22/1970 Decline to lower band. Sell S9
======================================
9 bullish for 2 weeks at least
3 bearish
======================
Next consider first all the October cases in this period.
Outcome:
10/14/1929
steep decline
10/25/1966 hesitation and then bull market.
10/14/1969
2 week rally. then decline
below lower band.
===========================================
2 bullish for 2 weeks at least
1 bearish
Third, here are all the cases with the
IP21 above .053 and below .103
Clearly an average IP21 as shown now is probably bearish.
6/13/1934
decline
back below lower band.
8/22/1934 decline back below lower band.
4/3/1941 decline back below lower band.
6/22/1970 Decline to lower band.
======================================
4 bearish
=================================
Fourth, here all the cases with the OBVPct
above .18 and below ..28
11/11/1933
decline back
below lower band.
1/5/1933
one week advance... then below
lower band.
5/27/1936 rally and bull mkt
in two weeks.
4/7/1960 Decline back to lower band.
8/16/1960 Decline below lower band.
4/21/1966 Decline below lower band.
6/15/1966 Decline below lower band.
7/14/1970 hesitation and then bull market.
======================================
2 bullish
6 bearish
=================================
DJI Rally and Tag of flat
/ falling 65-dma
--------------------------------------------------------
Date
LA/MA AROC P
P-ch IP21 V-I
Obvpct
----------------------------------------------------------------------------------------------------------------------------------------
10/11/2011 1.027 .381
122 21
.073
-40 +.23 Only the
V-Indicator is negative.
Compare with:
1929-1942
-----------------------------------------------------------------------------------------------------------------------------------------
10/14/1929 .997 -.54
-99 4
-.113
-837 -.344 steep decline
----------------------------------------------------------------------------------------------------------------------------------------
8/26/1930 1.022 -.274
-55 6
.002
-344 .012 two week advance and then DROP
-----------------------------------------------------------------------------------------------------------------------------------------
6/23/1931 1.079 .986 -20
15
.018 -128 -.054 two week advance and then DROP
----------------------------------------------------------------------------------------------------------------------------------------
7/22/1932 1.081 .378
41 17
.025
37
.081 explosive rally
--------------------------------------------------------------------------------------------------------------------------------------
11/11/1933 1.091 1.209 17
8
.141
77
.20 decline back below lower band.
------------------------------------------------------------------------------------------------------------------------------------
1/5/1933 1.041 1.159
-7 6
.045
-59
.194 one week advance... then below lower band.
-----------------------------------------------------------------------------------------------------------------------------------------
4/6/1933 1.031 1.808
0 23
-.049
43
.386 explosive rally
----------------------------------------------------------------------------------------------------------------------------------------
6/13/1934 1.04 .881
72 8
.082
78
.13 decline back
below lower band.
----------------------------------------------------------------------------------------------------------------------------------------
8/22/1934 1.047 .437
72 41
.062
-8
.118 decline back
below lower band.
-----------------------------------------------------------------------------------------------------------------------------------------
9/26/1934 1.018 -.275 -60
16 -048
-101 -238 rally and
bull mkt in two weeks.
-----------------------------------------------------------------------------------------------------------------------------------------
5/27/1936 1.027 .466
42 6
.028
5
.184 rally and bull mkt in two weeks.
-----------------------------------------------------------------------------------------------------------------------------------------
4/18/1938 1.077 -.344 -108 4
-.241
-274 -.148 decline back to lower band.
-----------------------------------------------------------------------------------------------------------------------------------------
5/8/1938 1.041 1.462 20
22 .175
18
.376 decline back below lower band.
-----------------------------------------------------------------------------------------------------------------------------------------
6/6/1938 0.994 -.031 -63
7
-.102 -71 -.045
rally and bull mkt in two weeks.
-----------------------------------------------------------------------------------------------------------------------------------------
5/24/1939 1.03 .692
71 24
.106
44
.144 decline back below
lower band.
-----------------------------------------------------------------------------------------------------------------------------------------
7/30/1940 1.031 .371
36 2
.023
11 .115
rally after re-testing two weeks later.
-----------------------------------------------------------------------------------------------------------------------------------------"
4/3/1941 1.014 .426
46 22
.078
18 .30
decline
back below lower band.
-----------------------------------------------------------------------------------------------------------------------------------------
6/9/1941 1.028 .398
6 16
0
-16
.472 3 month rally
-----------------------------------------------------------------------------------------------------------------------------------------
5/21/1942 1.03 .308
12 15
0
-26
.159 rally and major bull mkt starts
-----------------------------------------------------------------------------------------------------------------------------------------
1960
-----------------------------------------------------------------------------------------------------------------------------------------
4/7/1960 1.018 .423
71 -15
-.002
18
.283 decline back
to lower band.
-----------------------------------------------------------------------------------------------------------------------------------------
5/13/1960 1.006 -.204 -74
24 -.108
-379 -.207 3 week rally.
then decline below lower
band.
-----------------------------------------------------------------------------------------------------------------------------------------
8/16/1960 1.017 -.012 62
23 -.005
-11
.187 3-day rally. Then decline below lower band.
-----------------------------------------------------------------------------------------------------------------------------------------
11/9/1960 1.028 .303 -25
-1 .031
-278
.141 hesitation and then
bull market.
-----------------------------------------------------------------------------------------------------------------------------------------
1966-1982
-----------------------------------------------------------------------------------------------------------------------------------------
4/21/1966 1.018 .257 32
-8 -.035
8
.279 Decline below lower band.
-----------------------------------------------------------------------------------------------------------------------------------------
6/15/1966 1.018 .452 49
40 .019
2
.223 Decline below lower band.
-----------------------------------------------------------------------------------------------------------------------------------------
10/25/1966 1.026 .006 -82
3 -.08
-11
.048 hesitation and then bull market.
-----------------------------------------------------------------------------------------------------------------------------------------
12/6/1967 1.026 .489 33
14 .038
1
.311 2 week rally. then decline below lower band.
------------------------------------------------------------------------------------------------------------------------------------------
4/1/1968 1.031 .297 -7
58 -.013
2
.108 bull market.
----------------------------------------------------------------------------------------------------------------------------------------------
9/19/1969 1.003 .041 -54
13 -.032
-1
.023 Decline to lower band.
--------------------------------------------------------------------------------------------------------------------------------------------
10/14/1969 1.018 .029 -12
23 -.033
-1
.14 2 week rally. then decline below lower band.
----------------------------------------------------------------------------------------------------------------------------------------------
1/5/1970 1.027 .271 -15
72 -.034
-1
.086 Decline
below lower band.
-----------------------------------------------------------------------------------------------------------------------------------------
2/27/1970 1.03 .296 61
48 .023
1
.006 Hesitation and then decline below lower band.
------------------------------------------------------------------------------------------------------------------------------------------
6/22/1970 1.032 .929 5
-7 .071
-1
.061 Decline
to lower band.
-----------------------------------------------------------------------------------------------------------------------------------------
7/14/1970 1.012 .323 -103 14
-.036
-2
.184 hesitation and then bull market.
-----------------------------------------------------------------------------------------------------------------------------------------
==================================================================================
Older Hotlines
==================================================================================
10/10/2011
DJI = 11433 la/ma=1.03 21-dma
ROC= .474 P = +101 (+221) IP21= .104
V= -40 OP= +.305
BREADTH
STATISTICS:
79 +17
MAXCP stocks Bullish
MAXCP Stocks 10/10/2011
24
-6 MINCP stocks Bearish
MINCP Stocks
10/10/2011
MAXCP stocks are those showing Tiger Closing Power making new highs.
This suggests heavy Professional Buying. Applying the Tiger Power Ranker's
"bullish" to the MAXCP stocks find those with heavy insider buying and
institutional accumulation. Bearish MINCP stocks show the opposite.
Also use the BOTHUPs condition with MAXCPs and BOTHDOWNS MINCPS.
8 new highs on NASDAQ. 29 new lows on NASDAQ 10/10/2011
14 new
highs NYSE 4
new lows on NYSE 10/10/2011
10/11/2011 ===> See Key Peerless TigerSoft Index Charts: Industry Groups and
ETFs
DIA
SPY QQQ
DJIA-Peerless TigerDJI TigerSPY
TigerQQQ
GLD SLV Crude
Near Term: updated last: 10/10/2011
------------------- Closing
Power (CP) Status Report: CHARTS:---------------------
All 3 general market ETFs' Closing
Powers are uptrending again but the they are very close to
their rising trendlines and so any weakness would break the CP uptrend.
DIA ABOVE CP UPtrendline - A close of less than 0.935 ABOVE the Opening would
violate CP uptrend.
In cases like this, we should wait for the CP to also fall to become short-term bearish.
SPY ABOVE CP Uprendline - A
close of less than 1.355 ABOVE the Opening would violate CP uptrend.
In cases like this, we should wait for the CP to also fall to become short-term bearish.
QQQ ABOVE CP Uptrendline -
- A close of less than 0.88 ABOVE the Opening would violate CP uptrend.
In cases like this, we should wait for the CP to also fall to become short-term bearish.
GLD ABOVE CP DOWNtrendline -
A close of 2.66 BELOW the Opening is needed tomorrow to restore
the CP DOWNtrend. GLD CP is still
below its CP 21-dma but Openings are
above its 21-dma.
New TigerSoft Exploded Charts shows
exactly how much of a move from the Opening
to the Close is needed to break the Closing Power trendline. Note that a visual break will require,
at least .25 more of a penetration of the calculated uptrend. We have been using
visual
CP trend-breaks. http://tigersoft.com/CP-Trendbreaks/index.html
-----------------------------------------------------------------------------------------------------------------
10/10/2011 A New Buy B14 Added Today to Multiple
Peerless Buys
The DJI is approaching the 65-dma. It is
about 100 points higher. That does not constitute
a Peerless Sell signal. Volume was not high today; so this is probably not a
buyinging climax.
We have had 5 different Buy signals in the last two weeks. This is unique.
Four different
Buy signals in three weeks occurred 6 times since 1929. In 4 case the DJI hit the
upper band and then declined below the lower band. In two cases, a bull market
followed. We will have to do some selling if it looks there is to be a reversal, but
let's wait for some evidence that that is the case.
A Peerless Sell signal should be expected.
.
4 Different Buys in Two Weeks: 1929-2011
Date
Down from Peak
Subsequent DJI Rally
------------
---------------------------------------
-----------------------------
1. Nov. 1937 Down 38% from July
peak to Upper Band and then decline below lower band
Regular Peerless B17, B16, B9, B7
2. Nov 1943 Down 10% from June peak
up past upper band.
Regular Peerless B12, B7, B8, B9
3.
Oct 1946 Down 22% from May
peak to Upper Band and then decline below lower band
Regular Peerless B7, B9, B12, B14
4. Oct 1948 Down
10% from May peak to Sell S12 near Upper Band and then decline below lower band
Regular Peerless B5, B9, B12, B17
5. Sept-Oct 74 Down 34% from Feb peak
to Sell S12 near Upper Band and then decline below lower band
Regular Peerless B8, B19, B9,B12 Bull
market starts 3 months later.
Only 3 (Oct 1981
Down 19% from April peak Rallied to upper band but no
sell and then declined below lower
band. Regular Peerless B9,
B9, B17)
6. Aug
1982 Down 10% from May peak Explosive
rally far above upper band. t
Regular Peerless B8, B12, B13, B14
Only 3 (July 1986 Down 10% from June peak
Rallied to upper band but no sell and then declined to lower
band and then up. Regular Peerless B9, B9, B17)
Only 3 (Oct-Nov 97 Down 13.6% from July peak
Rallied up past Upper Band
Regular Peerless B1, B7, B19 )
Only 3 (Aug-Sept 02
Down 22% from Feb peak Fell 10% below lower band and rallied above upper band.
Regular Peerless B1, B9, B17 )
Only 3 (Dec 02
Down 22% from Feb peak Rallied to
upper band and sell and then declined
to below lower
band and then up strongly. .
Regular Peerless B6, B9, B11 )
Only 3 (Nov 07 Down10% from
Sept peak Rallied to upper band and sell and then declined far below lower
band. Regular Peerless B16, B14, B19 ) Severe
bear market followed.
Only 3 (March 09 Down 53% from 2007 peak
Rallied past upper
band and began new bull market.
Regular Peerless B16, B14, B12 )
Extreme Bear Market Peerless should have been used.
We are long many of the best performing biotechs. I would just let them run.
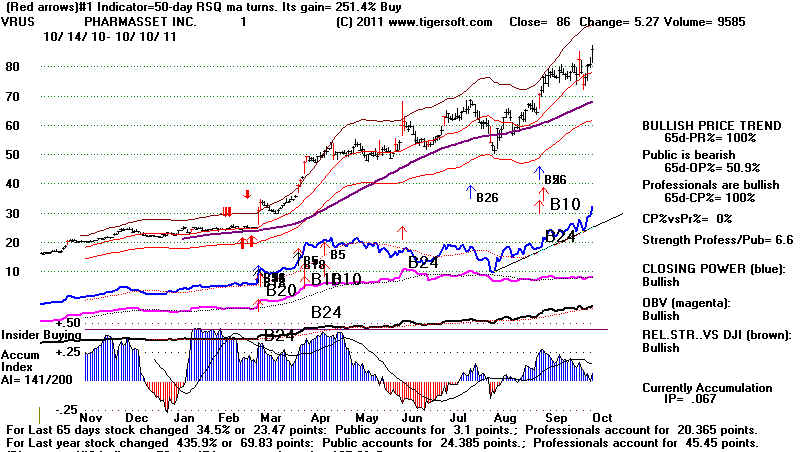
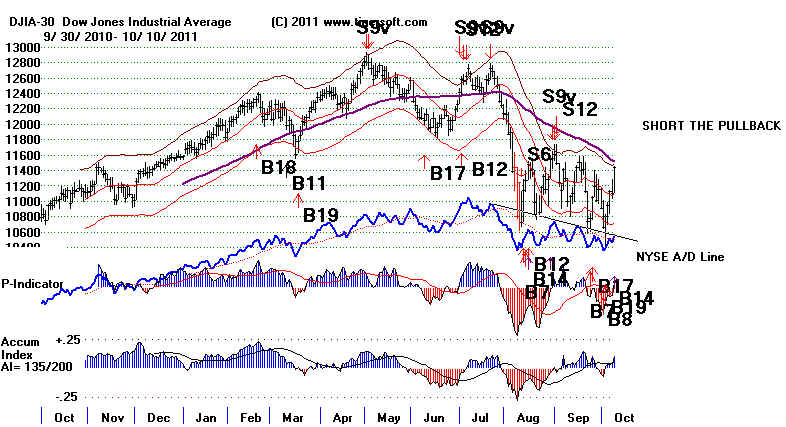
==================================================================================
Older Hotlines
==================================================================================
10/7/2011
DJI = 11103 la/ma=1.002 21-dmaROC=-.207 P = -121 (+19)
IP21= .042 V= -126 OP= +.21
BREADTH
STATISTICS:
62 -27 MAXCP stocks Bullish
MAXCP Stocks
30 +17 MINCP stocks Bearish MINCP
Stocks
MAXCP stocks are those showing Tiger Closing Power making new highs.
This suggests heavy Professional Buying. Applying the Tiger Power Ranker's
"bullish" to the MAXCP stocks find those with heavy insider buying and
institutional accumulation. Bearish MINCP stocks show the opposite.
Also use the BOTHUPs condition with MAXCPs and BOTHDOWNS MINCPS.
0 new highs on NASDAQ. 30 new lows on NASDAQ
2 new
highs NYSE
17 new lows on NYSE
10/7/2011 ===> See Key Peerless TigerSoft Index Charts: Industry Groups and
ETFs
DIA
SPY QQQ
DJIA-Peerless TigerDJI TigerSPY
TigerQQQ
GLD SLV Crude
(The links here have been
corrected.)
Near Term: updated last: 10/7/2011
------------------- Closing
Power (CP) Status Report: CHARTS:---------------------
All 3 general market ETFs' Closing Powers are short-term bearishly
below their CP downtrends.
The short-term is bearish, especially as the
price-downtrends could not be closed above on Friday
and this sets up a pattern of falling bottoms and falling tops. This could change
quickly if there
are strong closes early this coming week. Watch the price downtrends, too.
Some of the shorts will
have to cover if the price downtrends are broken.
DIA BELOW CP DOWNtrendline - A close of 0.54 ABOVE the Opening is needed
tomorrow to break the
CP DOWNtrend and restore the uptrend.. DIA CP is above its CP 21-dma. Openings are in decline.
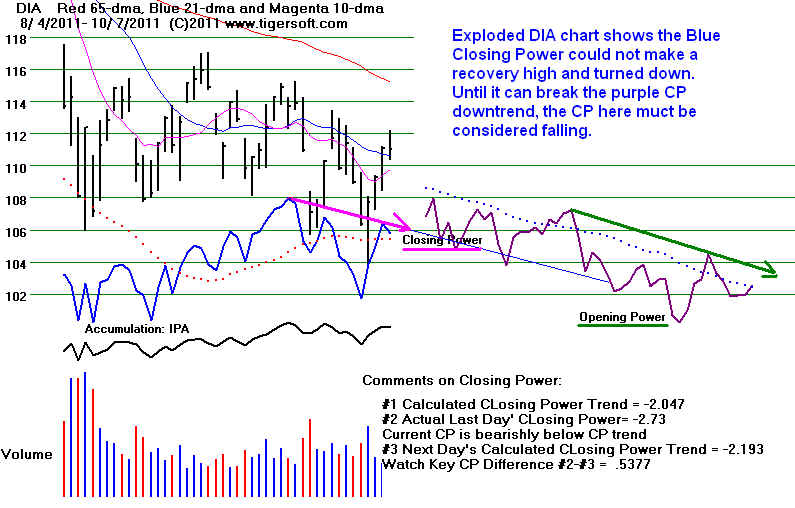
SPY BELOW CP DOWNtrendline
- A close of 1.072 ABOVE the Opening is needed tomorrow to break the
the CP DOWNtrend and restore the uptrend. SPY CP is above its CP 21-dma. Openings are in decline.
QQQ BELOW CP DOWNtrendline -
A close of 0.23 ABOVE the Opening is needed tomorrow to break the
the CP DOWNtrend and restore the uptrend.
QQQ CP is above its CP 21-dma while Openings are in decline.
GLD BELOW CP DOWNtrendline -
A close of 0.262 ABOVE the Opening is needed tomorrow to break the CP DOWNtrend.
GLD CP is still below its CP 21-dma and Openings are its 21-dma.
New TigerSoft Exploded Charts shows
exactly how much of a move from the Opening
to the Close is needed to break the Closing Power trendline. Note that a visual break will require,
at least .25 more of a penetration of the calculated uptrend. We have been using
visual
CP trend-breaks. http://tigersoft.com/CP-Trendbreaks/index.html
-----------------------------------------------------------------------------------------------------------------
10/7/2011 Peerless Remains
on Buys. Prices Are Approaching
A
3-Month Downtrend Resistance. A Breakout above
the
Price Downtrendline confirmed by a Break in the
A/D
Line Would Be Bullish.
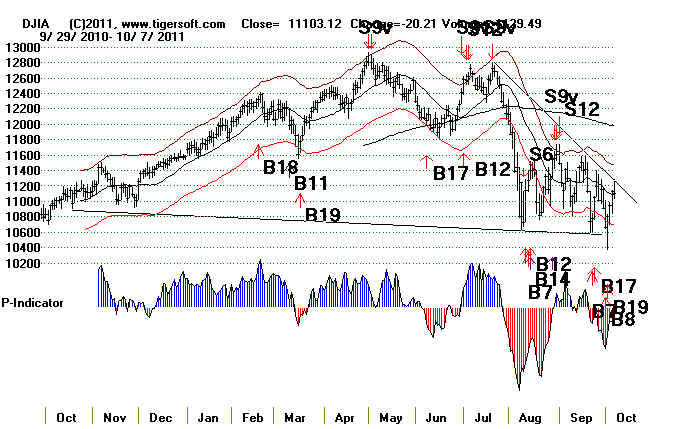
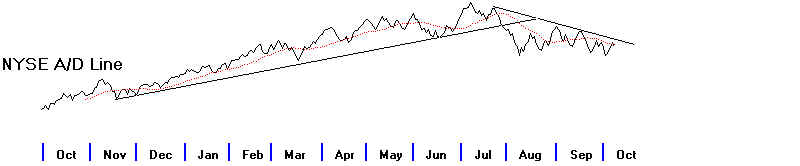
Watch The Closing Power
Monday and Tuesday will be
important. The Closing Powers turned down on Friday. But if they
can turn up strongly, they will break their shallow downtrends. This seems likely because their 21-day
mvg.avgs. are rising and it will take a move to 11499, at least to produce a Peerless
Sell. Note that though
Octobers have a bad reputation, they actually are often HALTERS of bear markets. In
addition, since
1965, the DJI has risen 56% of the time in the 5 and 10 closing day periods after October
9th (today).
Seasonally, we do have to worry about the bearishness of the period for 3 and 5 trading
days after
October 20th, when the DJI rises only 36% and 38% of the time, respectively.
Take some quick trading profits in DIA unless the Closing
is much above the Opening tomorrow.
Also, a strong (+100) opening tomorrow will likely be bullish for the coming week.
In that case, I would not
yet sell DIA or go short any of the ETFs. If there is weakness at the Close
tomorrow, consider
shorting one or two of bearish MINCP stocks. Our Stocks' Hotline will remain only long tonight and
wait for a Peerless Sell or the upper band at 11400 to be reached to take some
profits.
Bullish Closing Power Divergence Stock - TXN
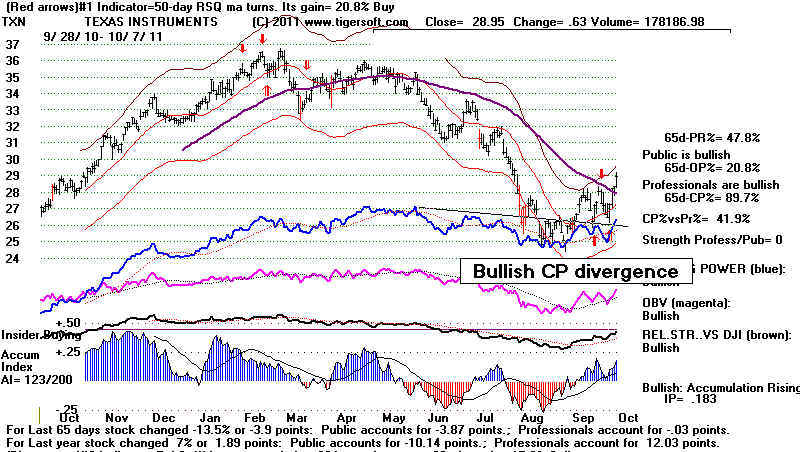 |
| |
Weak Economy More Important the
Demonstrators for Stocks
The main problem now is how weak the economic prospects may be. Technically, the
stock market is
still way too defensive to be really safe. You can see on our industry charts' page
how only Bonds show
a healthy percentage of stocks over their 65-day ma.
See Key Peerless TigerSoft Index Charts:
Industry Groups and ETFs
The demonstrations against big banks, Wall Street, corporate greed and the extremes of
wealth and
poverty are not going away. But the demonstrators' demands are vague. The power of
corporate
lobbying is undiminished, though it may have to be less flagrant and obvious. I
doubt if stocks will be
affected by the demonstrations. So much of the biggest corporations' markets and
labor force are overseas, the big corporations are much more affected by the weakening
overseas economies. See the weak charts of Foreign
ETFs and China. Smaller US companies
are not really the focus of the demonstrators. But, as you
can see below, the smaller companies, as represented by IWM - the Russell 2000 - are now
on a red
Stochastic sell and have a Brown Relative Strength Line which is falling. This
compares IWM with the
DJI-30.
IWM - Russell 2000
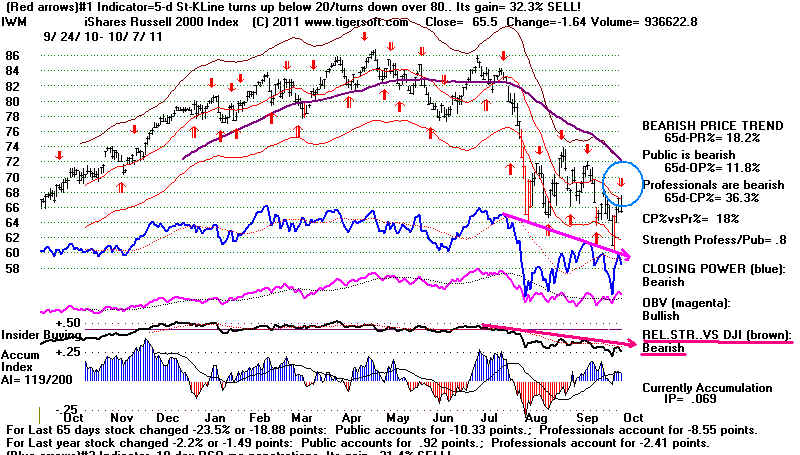
The Closest Historical Parallel: 1937
1937 TOP
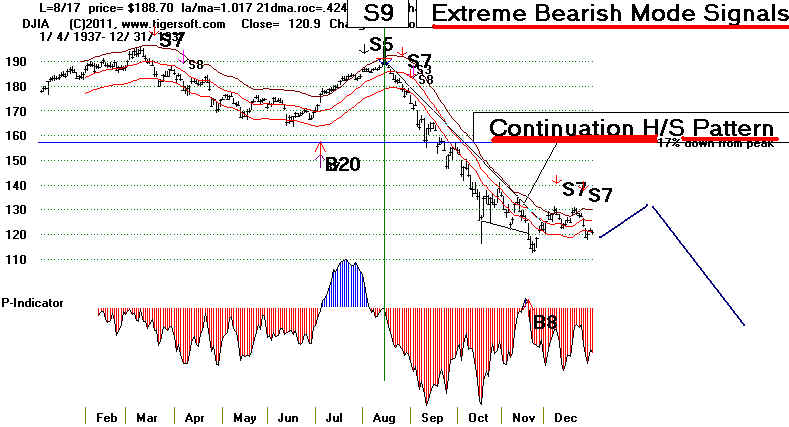
As in 1937, the stock market's recovery from a deep decline
of over 50% has stalled out AND as
in 1937, fiscal austerity has caught on among policy-makers despite the very high
unemployment.
Of course, in 1937 the spectre of Nazi Germany's expansionist militarism hung low over
international
politics. But surely now, the questions of the Euro's survival and a Greek debt
default are not so
significant. Consider also the technical similarites and difference between now and
October 1937,
to get a sense of what lies next for the market now..
On Friday, the key indexes could not get past their falling
downtrends. See in the DJIA how the
major technical features of the market now. There was:
1) a steep sell-off (late July-early
August),
2) the pattern of falling highs and falling
lows, all compressed in a short period of time
3) a continuation head and shoulders pattern.
In these three things, the present market resembles most closely the October 1937 period
when the DJI
still had to decline further and did not bottom out until mid November.
The big defferences between now and 1937 are:
1) that in 1937 the DJI closed down more than
17% from its July peak and in 2011 the DJI only
went below this level intra-day. In 1937, the steepness of the decline would have
properly caused the
use of the Extreme Bearish Mode by Peerless users. Here we have had no cause to switch to
the
Extreme Bearish Mode.
2) The P-Indicator in 1937 stayed negative until
a few days before its temportary Novermber bottom.
Ours now turned positive for two weeks between August and September.
3) The NYSE A/D Line in 1937 confirmed the entire DJI
decline.
As Peerless accords special importance to NYSE breadth, and breadth is much better now, I
would think
we will not see a decline like in 1938 to a point 47% below the July high.. But we may see
another
low, below 10500 and that would set up a drop to 9700, for a 50% correction of what was
gained between
March 2009 and April 2012.
==================================================================================
Older Hotlines
==================================================================================
10/6/2011
DJI = 11123 la/ma=1.003 21-dmaROC=-.313 P = -140 (-15)
IP21= .038 V= -125 OP= +.228
BREADTH
STATISTICS:
95 +41 MAXCP stocks Bullish MAXCP Stocks
13 -16
MINCP stocks Bearish MINCP Stocks
MAXCP stocks are those showing Tiger Closing Power making new highs.
This suggests heavy Professional Buying. Applying the Tiger Power Ranker's
"bullish" to the MAXCP stocks find those with heavy insider buying and
institutional accumulation. Bearish MINCP stocks show the opposite.
Also use the BOTHUPs condition with MAXCPs and BOTHDOWNS MINCPS.
6 new highs on NASDAQ. 19 new lows on NASDAQ
3 new
highs NYSE
5 new lows on NYSE
10/6/2011 See Key Peerless TigerSoft Index Charts: Industry Groups and
ETFs
DIA
SPY QQQ
DJIA-Peerless TigerDJI TigerSPY
TigerQQQ
GLD SLV Crude
Near Term: updated last 10/6/2011
------------------- Closing
Power (CP) Status Report: CHARTS:---------------------
All 3 ETFs' Closing Powers are bullishly rising and above their CP
downtrends. A weak opening
and
then a recovery has been the pattern since the bottom. That
is more likely to continue than change.
DIA ABOVE CP DOWNtrendline - A close of 2.16 BELOW the Opening is needed
tomorrow to restore the CP DOWNtrend.
DIA CP is above its CP 21-dma. Openings are in decline.
SPY ABOVE CP DOWNtrendline
- A close of 2.384 BELOW the Opening is needed tomorrow to restore the CP
DOWNtrend. SPY
CP is above its CP 21-dma. Openings are
in decline.
QQQ ABOVE CP DOWNtrendline -
A close of 2.054 BELOW the Opening is needed tomorrow to restore the CP DOWNtrend.
QQQ CP is ABOVE its CP 21-dma while Openings are in decline.
GLD above CP DOWNtrendline -
A close of 4.14 BELOW the Opening is needed tomorrow to re-restore the CP DOWNtrend.
GLD
CP is still below its CP 21-dma and Openings are in decline.
New TigerSoft Exploded Charts shows
exactly how much of a move from the Opening
to the Close is needed to break the Closing Power trendline. Note that a visual break will require,
at least .25 more of a penetration of the calculated uptrend. We have been using
visual
CP trend-breaks. http://tigersoft.com/CP-Trendbreaks/index.html
-------------------------------------------------------------------------------------
10/6/2011
Recent Older Hotlines - see==> http://tigersoft.com/811Hotline/
ENJOY THE RALLY and BELIEVE THE
PEERLESS BUYS
The Peerless Buys must now confront the DJI and NASDAQ price
downtrends.
With the Closing Powers rising, let's give the market a
chance to show its strength
while we wait events. I am pleased that there are so
few MINCP stocks now, and
those that are present are short ETFs. The trapped
bears are being forced to cover.
Moves past the price downtrendlines would increase further
the pressure on them
to cover..
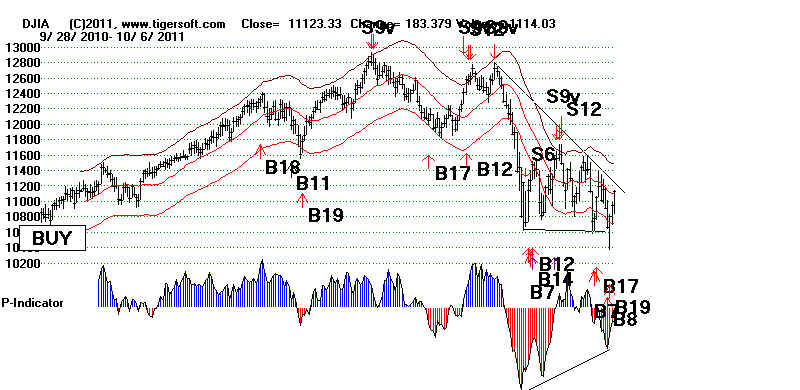
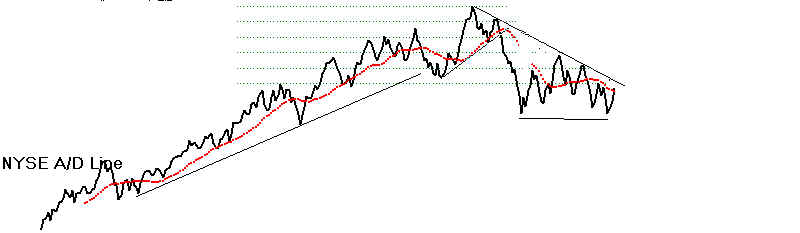

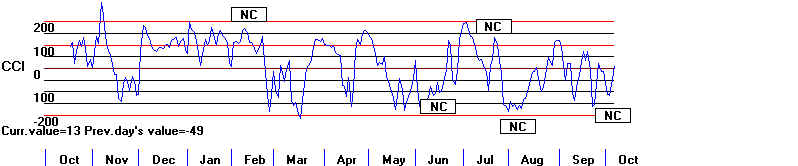
NASDAQ
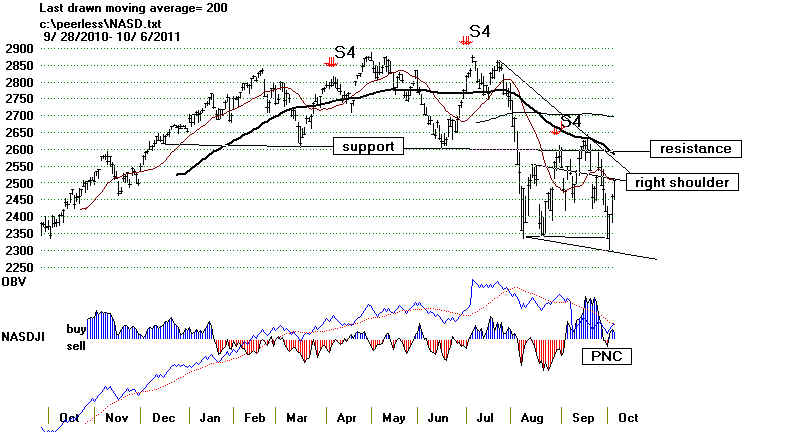
==================================================================================
OLDER HOTLINES
==================================================================================
10/52011
DJI = 10940 la/ma= .985 21-dmaROC=-.214 P = -126 (+133) IP21= .034 V= -129 OP= +.223
BREADTH
STATISTICS:
54 MAXCP stocks Bullish MAXCP
Stocks
29
MINCP stocks Bearish MINCP Stocks
MAXCP stocks are those showing Tiger Closing Power making new highs.
This suggests heavy Professional Buying. Applying the Tiger Power Ranker's
"bullish" to the MAXCP stocks find those with heavy insider buying and
institutional accumulation. Bearish MINCP stocks show the opposite.
Also use the BOTHUPs condition with MAXCPs and BOTHDOWNS MINCPS.
1 new highs on NASDAQ. 28 new lows on NASDAQ
4 new
highs NYSE
11 new lows on NYSE
10/5/2011 See Key Peerless TigerSoft Index Charts: Industry Groups and
ETFs
DIA
SPY QQQ
DJIA-Peerless TigerDJI TigerSPY
TigerQQQ
GLD SLV Crude
Near Term:
updated last 10/5/2011
------------------- Closing
Power (CP) Status Report: CHARTS:---------------------
All 3 ETFs' Closing Powers are rising, but now very close to their CP
downtrends. Another strong day
at close will decisively break their downtrend. Opening Powers are still falling. A weak opening and
then a recovery has been the pattern since the bottom. That
is more likely to continue than change.
DIA BELOW CP DOWNtrendline - A close of 0.08 ABOVE the Opening is needed
tomorrow to break the CP DOWNtrend.
DIA CP is below its CP 21-dma. Openings are in decline.
SPY BELOW CP DOWNtrendline
- A close of 0.10 ABOVE the Opening is needed tomorrow to break the CP
DOWNtrend.
SPY CP is still below its CP 21-dma. Openings are in decline.
QQQ ABOVE CP DOWNtrendline -
A close of 0.354 BELOW the Opening is needed tomorrow to re-confirm the CP
DOWNtrend.
QQQ CP is ABOVE its CP
21-dma while Openings are in decline.
GLD Just above CP
DOWNtrendline - A close of 2.32 BELOW the Opening is needed tomorrow to
re-confirm the CP DOWNtrend.
GLD
CP is still below its CP 21-dma and Openings are in decline.
New TigerSoft Exploded Charts shows
exactly how much of a move from the Opening
to the Close is needed to break the Closing Power trendline. Note that a visual break will require,
at least .25 more of a penetration of the calculated uptrend. We have been using
visual
CP trend-breaks. http://tigersoft.com/CP-Trendbreaks/index.html
-------------------------------------------------------------------------------------------------------------------------------
10/5/2011
Recent Older Hotlines - see==> http://tigersoft.com/811Hotline/
ENJOY THE RALLY and BELIEVE THE
PEERLESS BUYS
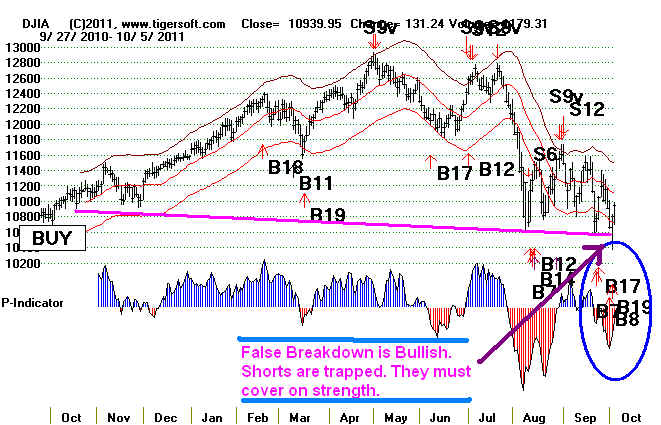
The Peerless Buy signals and improving Closing
Powers are matched against
overwhelming public skepticism and
European selling (judging from the Opening Power's
weakness today). We may be seeing a
remarkable parallel with the Summer of 2010
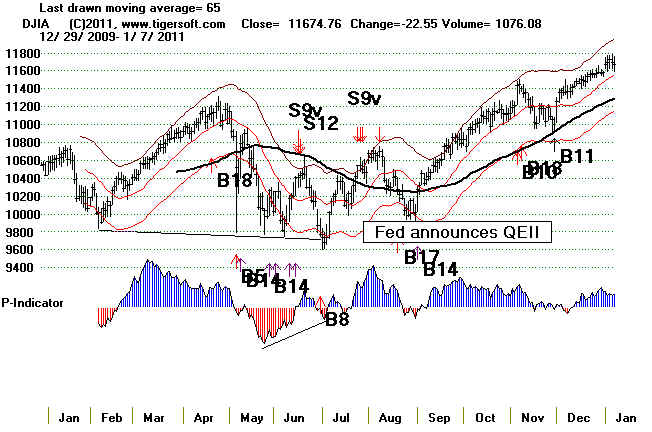
when the DJI marginally made an
unconfirmed low closing and then rallied as
Bernanke's Fed began making huge
purchases of Treasury bonds to keep interest
rates low.
Republicans now complain that this weakens the Dollar. But the Dollar
is holding up nicely despite the Fed's
actions. The earlier rises in Gold, Silver, Oil and
Food
Prices have turned to downtrends. Bernanke's opponents will thus be that
much
harder pressed to argue inflation is a
bigger danger than continuing high unemployment.
It makes good rhetoric, but as Gold sells
off (or simply goes sidewise while the
stock market rises) the Glen Becks of the right
are being doubted and discredited.
Professionals know well that when the
Public has been completely sucked into something,
like Gold and Silver now, and much as
they were drawn into internet stocks in 1999 and 2000,
a panic and a crash in that investment
becomes likely, and can even be engineered. Lower
prices will cause the public to panic, en
masse. It is all mass psychology. That is what I
expect to happen.
Bernanke's own stock will rise if I am
right and the stock market rises without the
Dollar falling. In sum, the false
breakout may act as a snare. A further stock rally
will utterly trap the bears and short
sellers, especially if they do not get their October sell-off.
Will the rally we are seeing have enough
power to get past 12800. Without public participation,
probably not. But for now,
having found the support, it must find resistance.
WHAT TO BUY NOW?
At this juncture, here are some ideas. You may well have a different approach.
But here's mine:
1) Buy the strongest of the 3 major
market ETFs. That would be QQQ. See how
its brown REL STR line has been rising and now turned up again, how its IP21
was positive on the recent test of lows, how its CLosing Power is the strongest
of the 3 and is back above its 21-day ma. And see that the red 50-day Stochastics
Buys and Sells have gained, all by themselves a whopping 46.7% in trading QQQ
long and short for the last year and that they have just given a BUY.
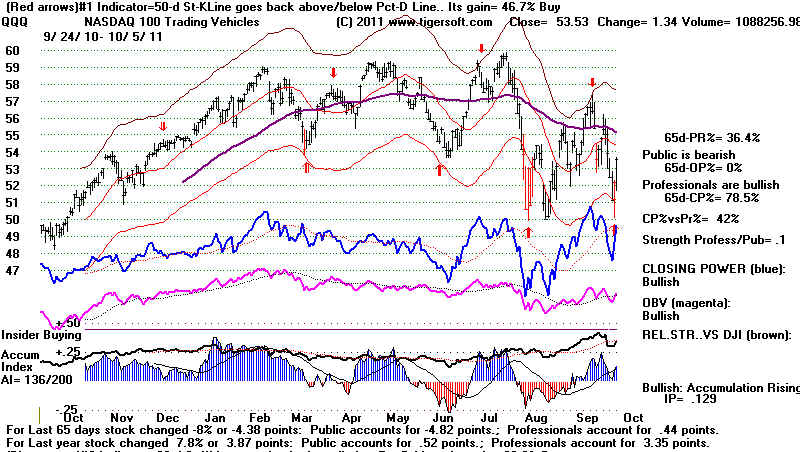
2) Buy IBM - High capitalization, high priced DJI stocks must rise if the market
rises.
3) Buy the best of the Biotechs. Many are seen in our bullish MAXCP group.
JAZZ, VRUS and ALXN
Apart from Bonds, this is the second strongest group
we follow, based on the percentage of stocks in the group above their 65-day ma.
Biotechs top out late in a bull market. Their income does not depend on the business
cycle. Performance investors must buy these stocks when the market rallies.
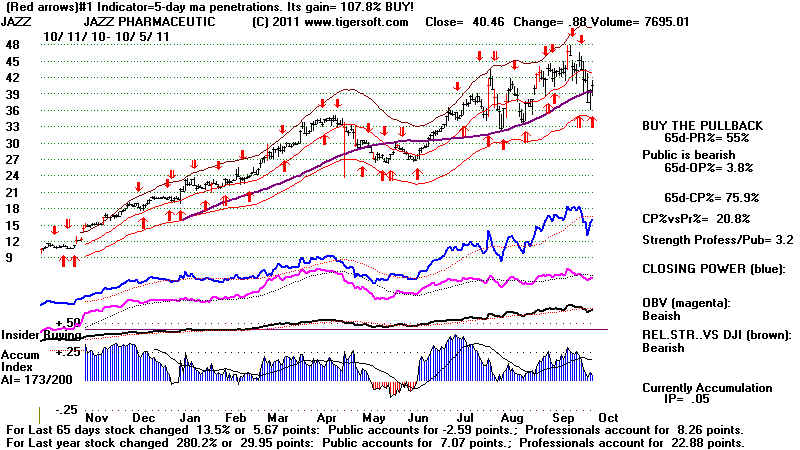
4) Buy stocks that have had recent
Bulges of Accumulation (showing
Insider Buying, which have tested the support of their 65-day ma and
have a CLosing Power which has just turned up and broken its downtrend.
See ATRO BMRN,
SGEN
5) Buy stocks with multiple Buy B7s recently. these signals show very bullish
divergence between Closing Power and Prices. CKSW
BIOS
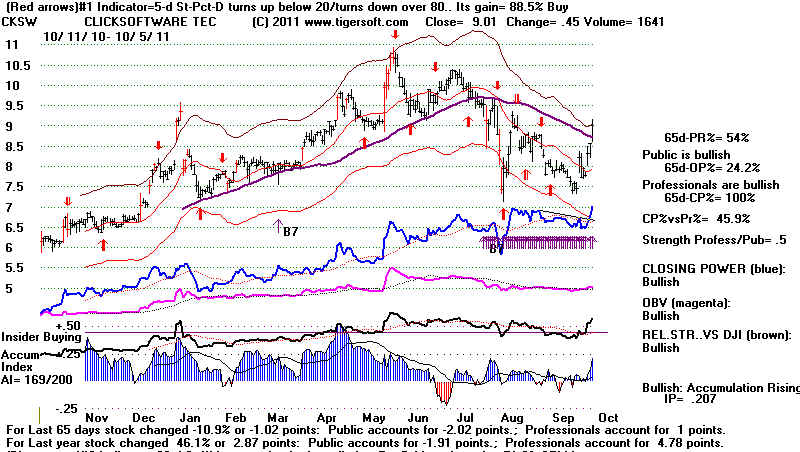

Greenspan: "I was wrong"
Stocks and The 99%ers' Occupation of Wall Street
The regular media is not reporting the
growing size of the NY demonstrators against
Wall Street. Their advertisers and
owners think they can best resist demands for
change by ignoring and ridiculing the
protestors. They do not understand the anger
that set the protests off. They are
also betting that the coming cold and wet weather will
soon force the protestors to go home.
Tents are not permitted by NY ordinance.
In 1920, Wall Street protests led to a bombing of the place. 181
people were either killed or
seriously injured in the September 16,
1920 blast. The 1920 bear market continued until
the middle of the next year. I
suppose the demonstrations now could end in violence.
But the large crowds now are politically
diverse. All but a few want reform not revolution.
The crowds are peaceful and are proudly
non-violent. Of course, it takes only a few
who are violent to change that.
Sell on such news is the lesson in the chart below.
DJI: 1920-1921
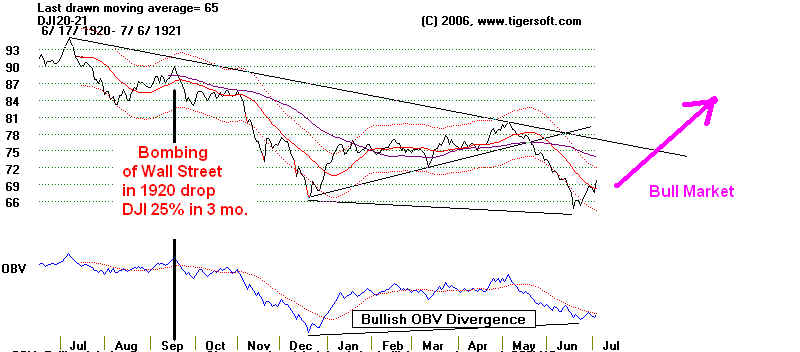
A more important concern should be what
will the protestors' mood be if their
joblessness and impoverishment worsens
while wealthy Wall Streeters continue to
get every break the US Government can
bestow. How long must they wait for jobs and
incomes to feed their families?
Obama, Bernanke and the Big Banks have an alliance,
I have argued. It is vital in that
scheme that the stock market keep rising. The scheme
has to work, they all believe. This is
the only way they know how to create more jobs
and calm social unrest.
It is well-understood by the power elite that the underemployed
and impoverished protestors in NY have
their counterparts, tens of millions of them,
all around the rest of the country.
4/8/2010 "12000 or Bust!
WHY TIGERSOFT REMAINS BULLISH.
The Financial Power
Elite's Biggest Gamble with Your Money. It Is A Desperate Last Gambit.
It MUST Work, or
Else!"
Will there be violence? Non-violent
protest is problematic, because it requires a
lot of time to be successful. There
may not be a lot of time. In addiiton, America has a very
violent history. I don't think
American protestors will have the patience of Ghandi's Indians
under colonial Britain. I think the
economic times for the ex-middle class now are worse than in
the1954-1964 period when Martin Luther
King's non-violence campaign and protests finally
after 10 year brought civil rights'
reforms and LBJ's social reforms, notably Medicaire.
Lastly, it is important to understand
that the urban riots of the 1960s occurred after the
political "concessions" to
economic democracy were made.
Token reforms, say in 2013, when the there is
much more anger if the economy has
not improved, will be then be seen as a
sign that protests are needed and the economic
elite is weakening. The demands
could then become much more comprehensive and
far-reaching. So, there may be a
tipping point, past which reforms come too late. Mayor
Bloomberg alluded to that recently, after
which he was quickly criticized by the right.
In history, the smarter, more far-sighted
wealthy, like Buffet, always understand it is
better to head off mass protests by
making economic concessions, like taxation of
the rich, early-on. The most vocal
Republicans do not think like this. That means the 2012
election looms large.
Winter is not far away.
Will the demonstrators stay their positions in the late October
cold rains, November freezes and December
snows. For now, stocks which are mostly
owned by the protested 1% are rising.
The market still believes the protestors will
soon be gone. The May 8th 1970 student protest on Wall
Street (after the invasion of Cambodia
and Laos and the Kent State massacre)
ended quickly. The stock market made a low at 540
two weeks later that was never approached
again thereafter. In this case, construction
workers in hard hats broke up the
protest. Now union workers stand on the side of the
protestors. This is a much bigger
challenge to Wall Street's power. Still, barring
the unforseen, the real difficulties for
the stock market will, I think, be next Spring, when
weather improves, the economy will
probably not be any better and the super-charged
Presidential campaign agitates and widens
the gap between the left and right in America.
DJI 1970 Bottom
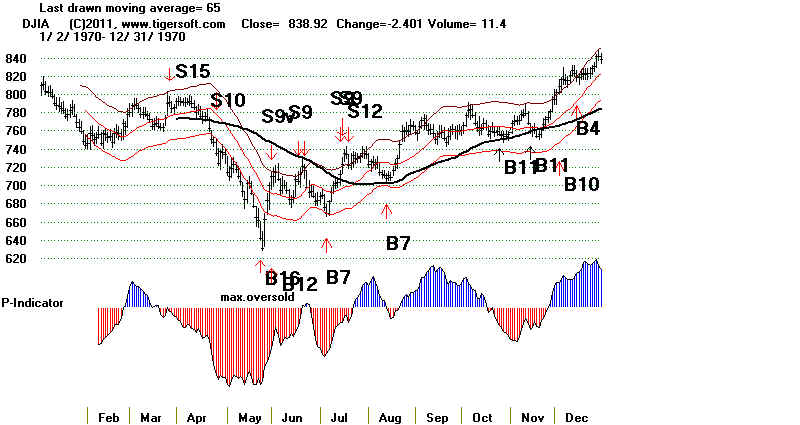
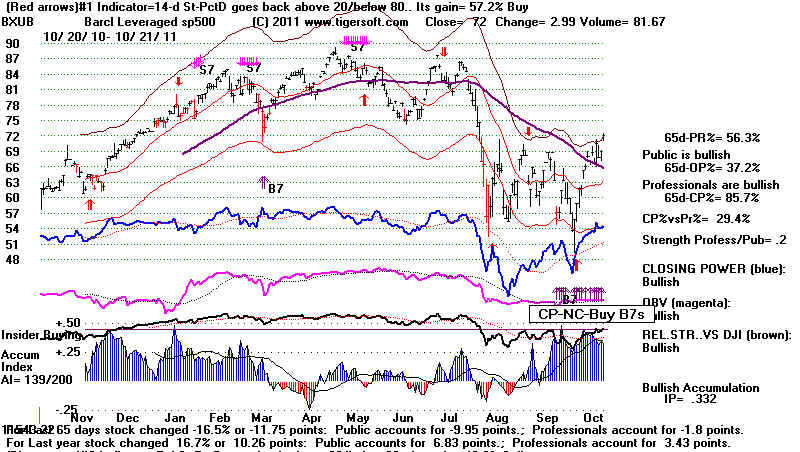
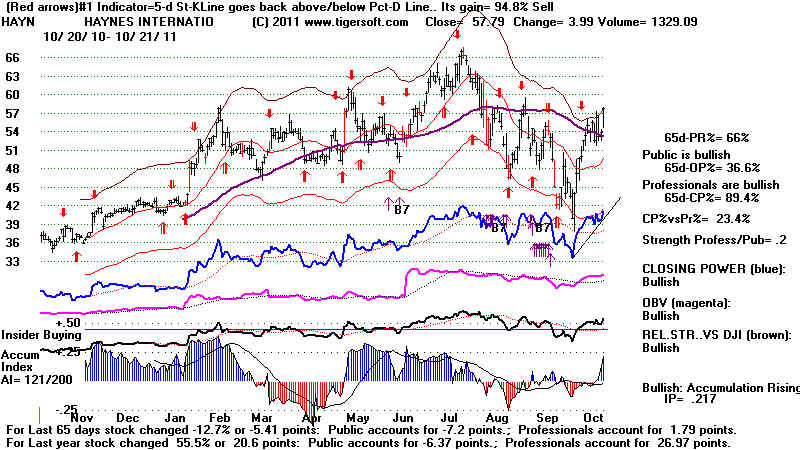
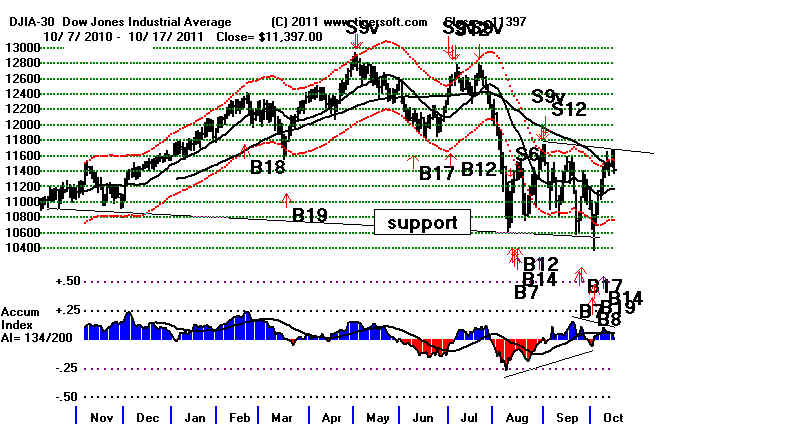
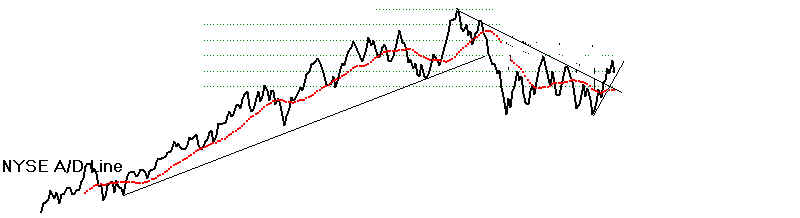
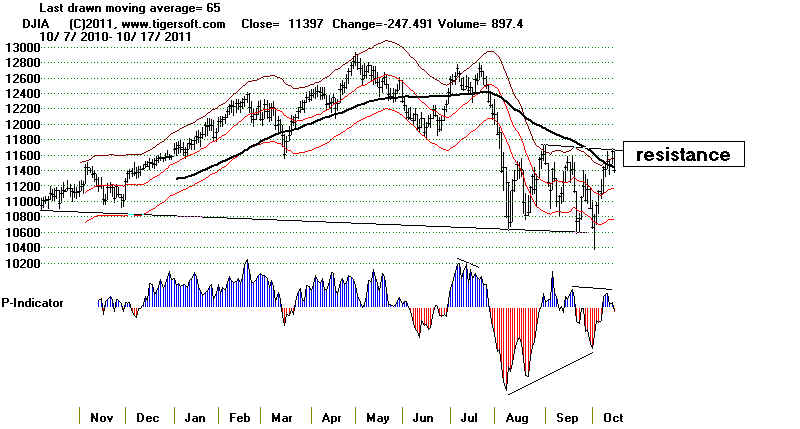
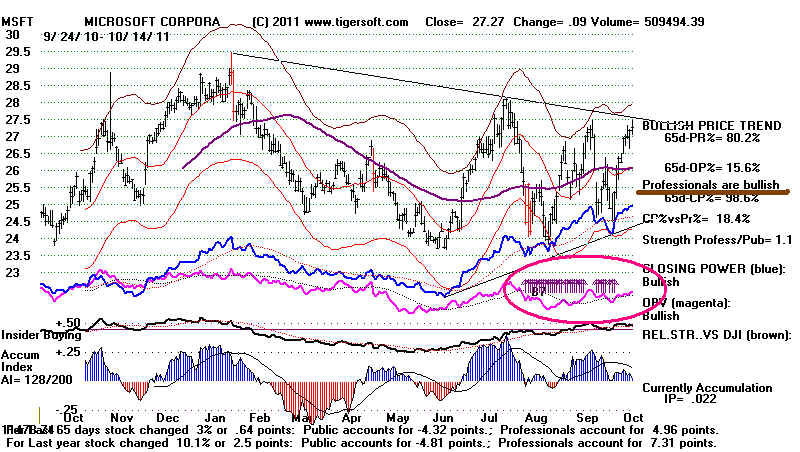
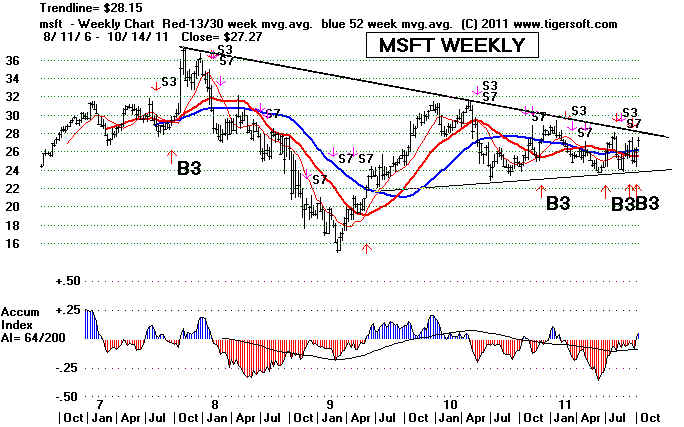
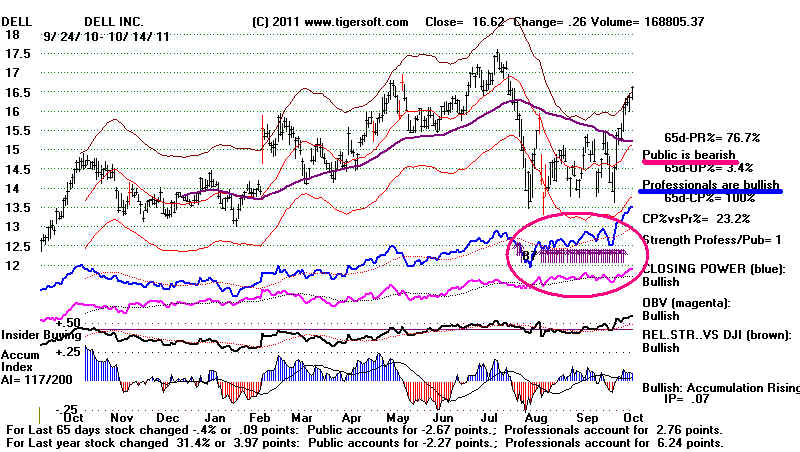
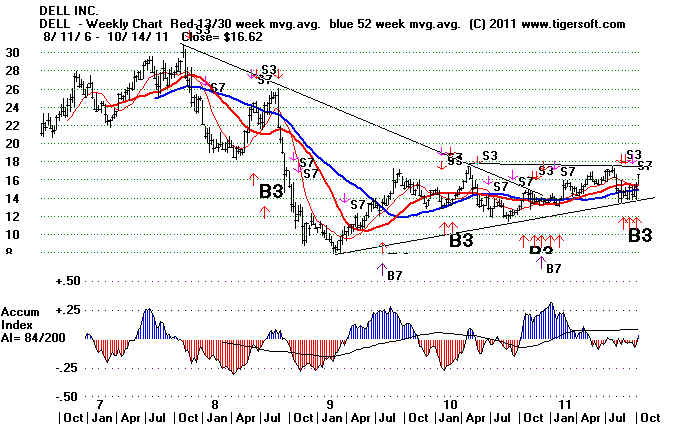
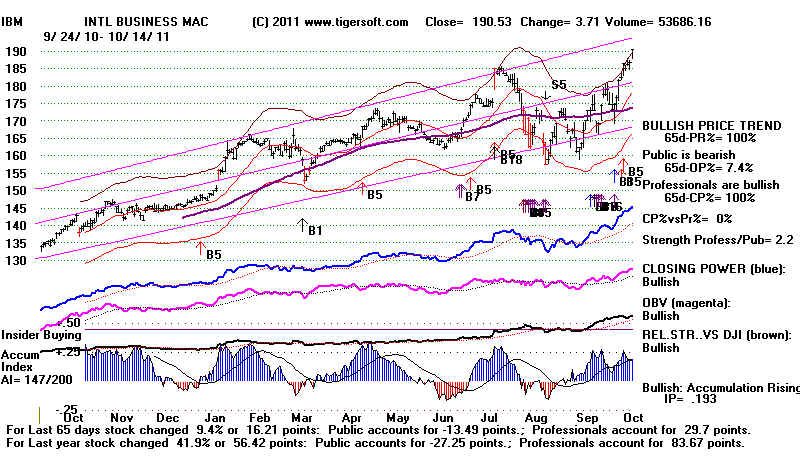
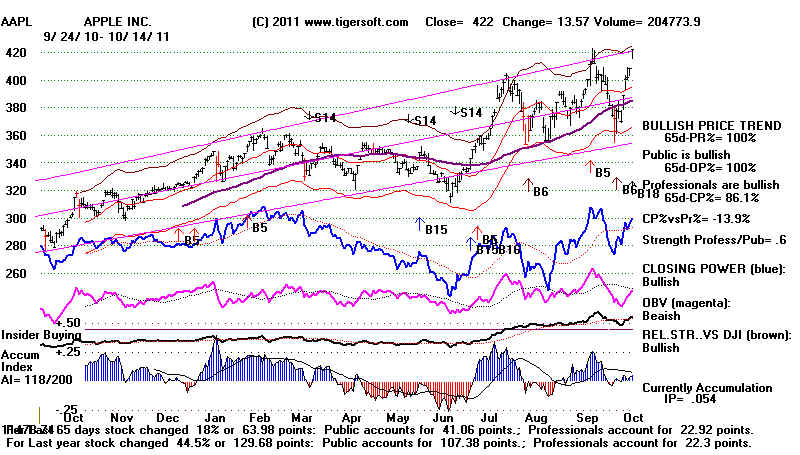
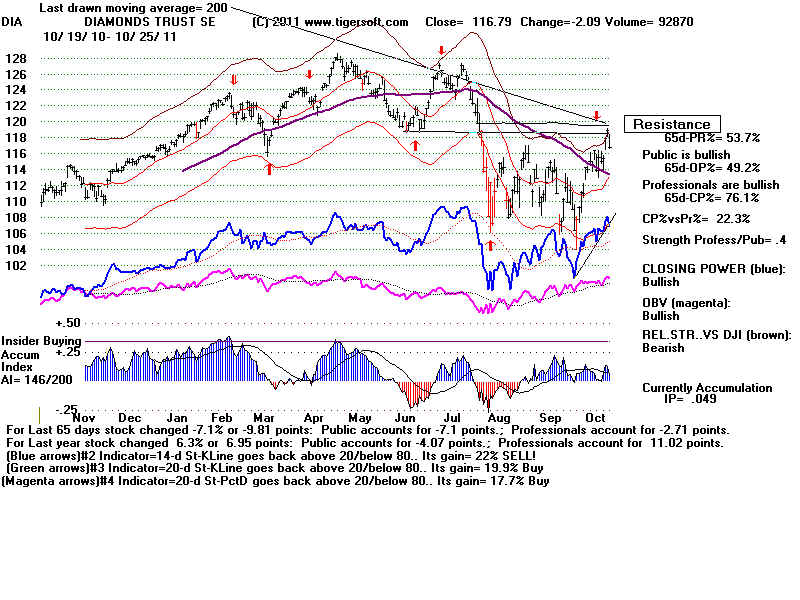
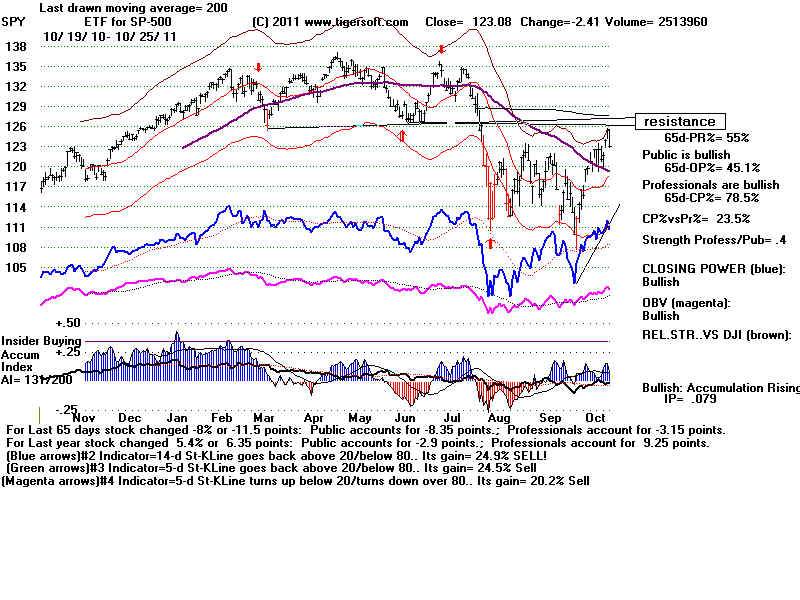
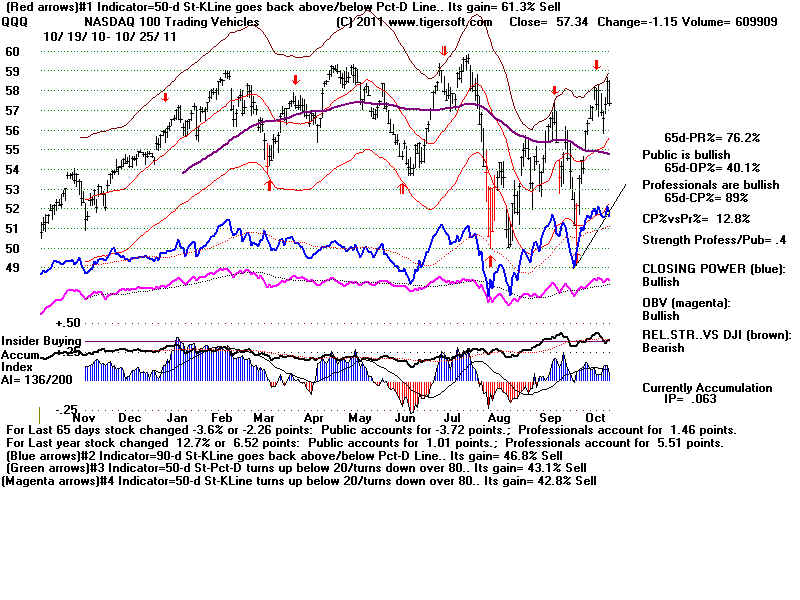
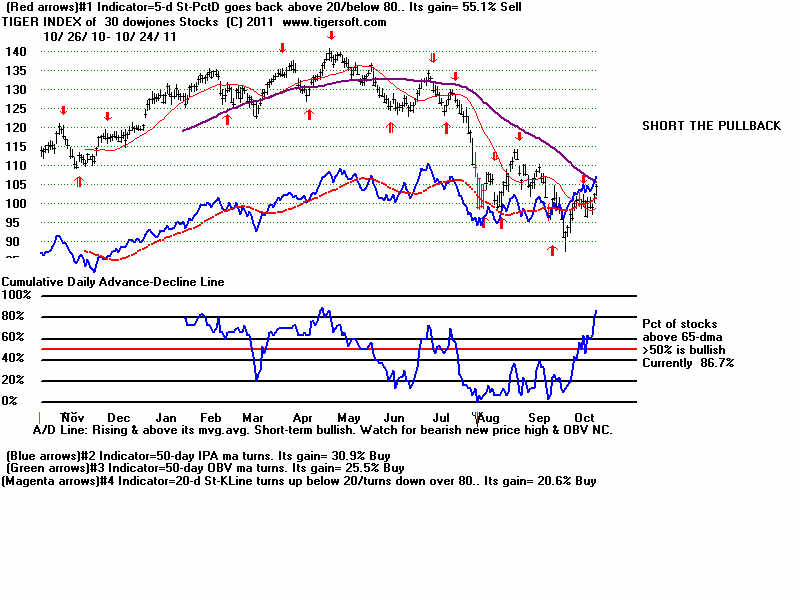
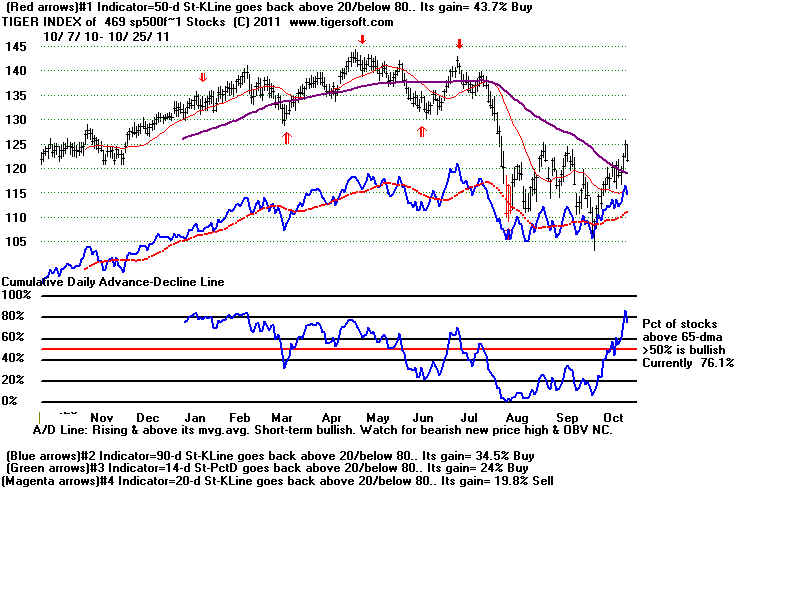
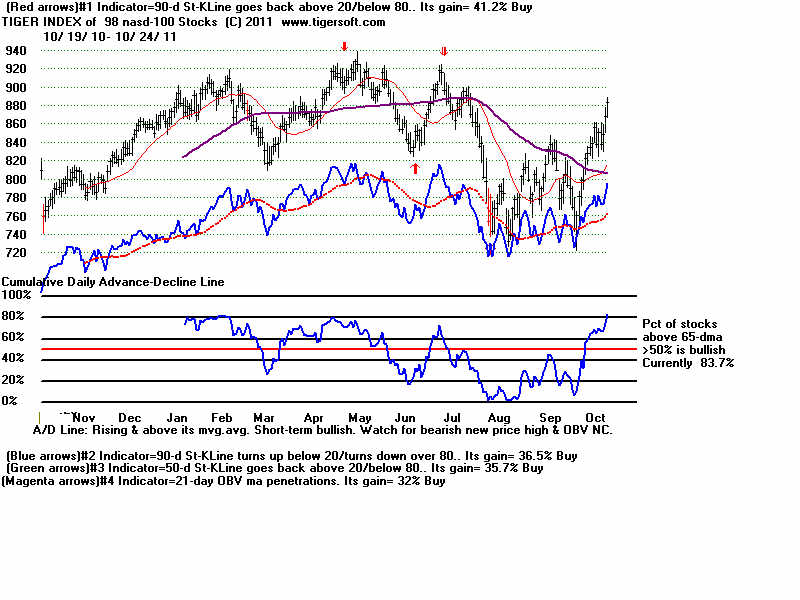
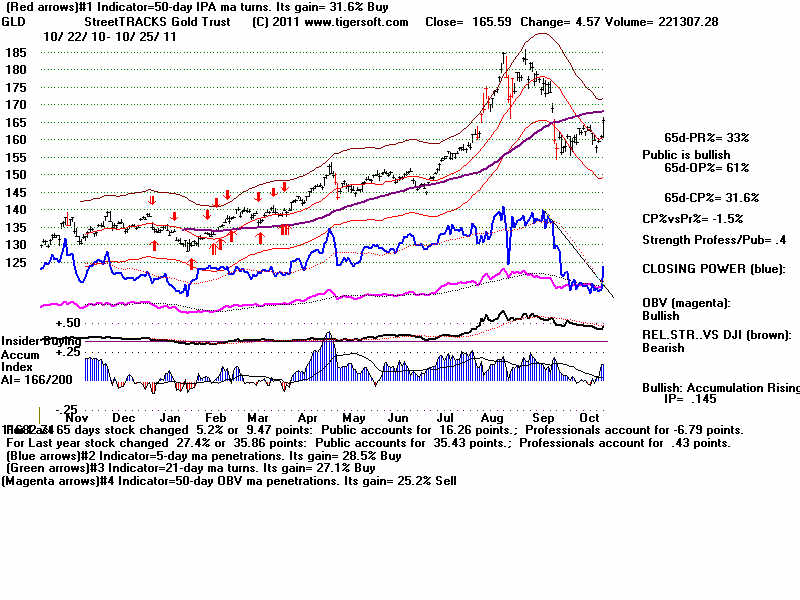
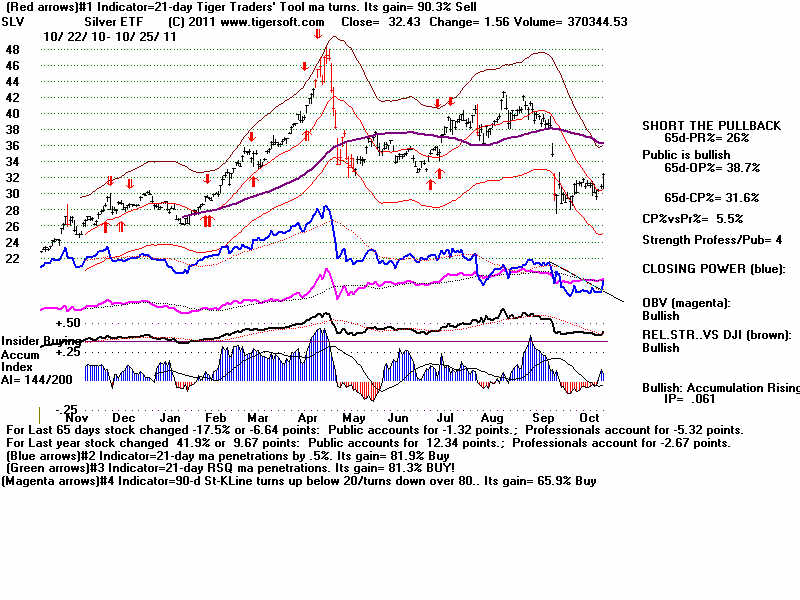
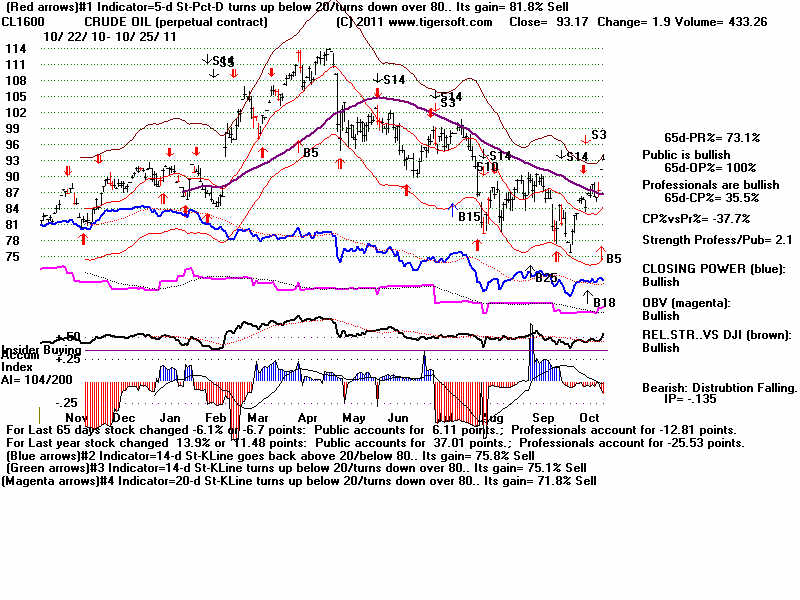
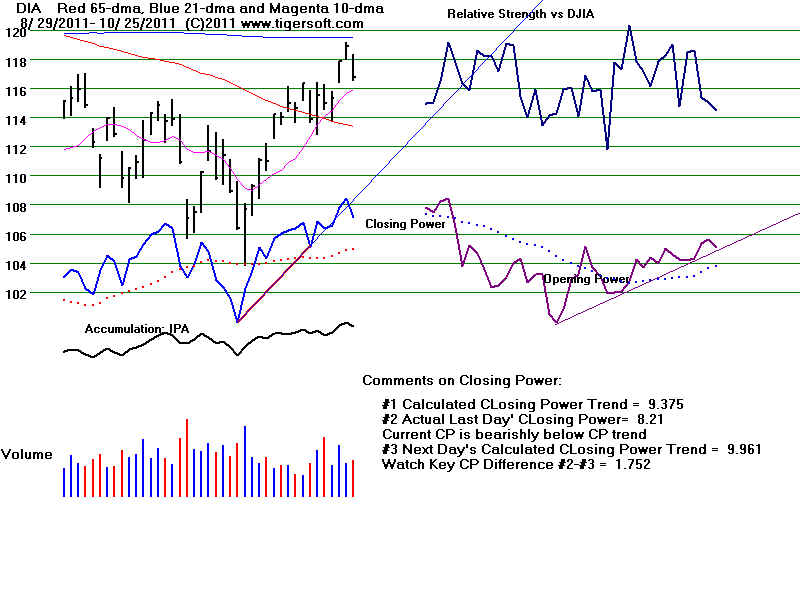
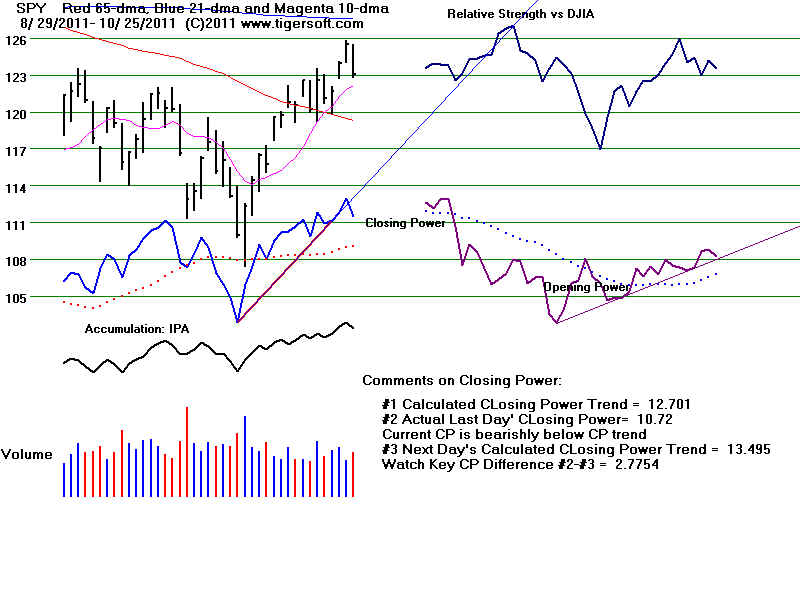
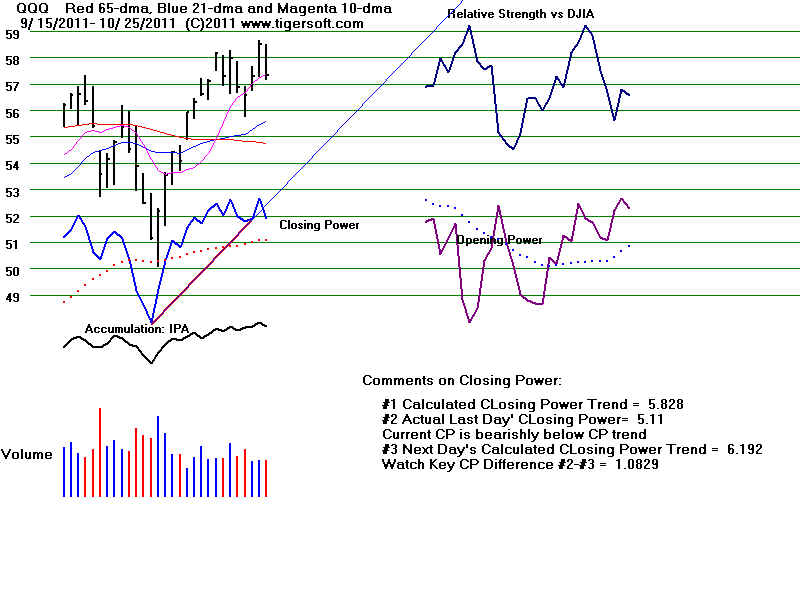
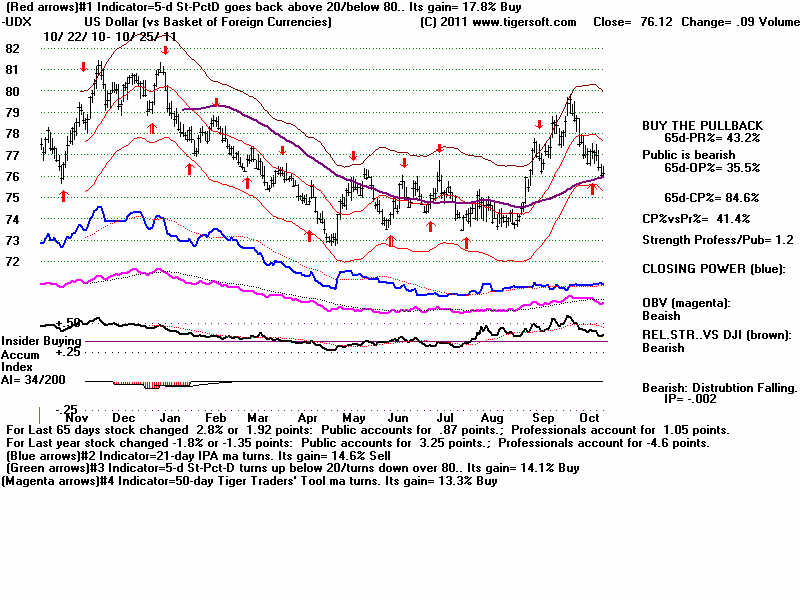
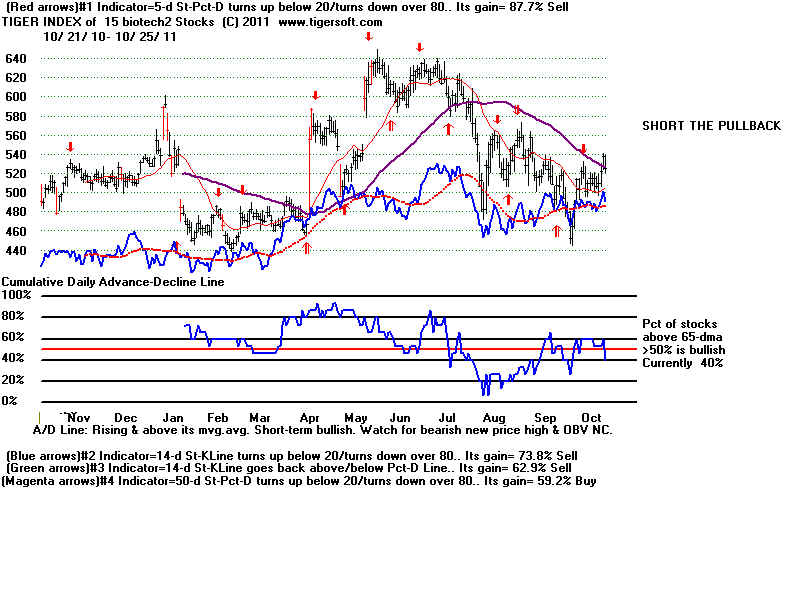
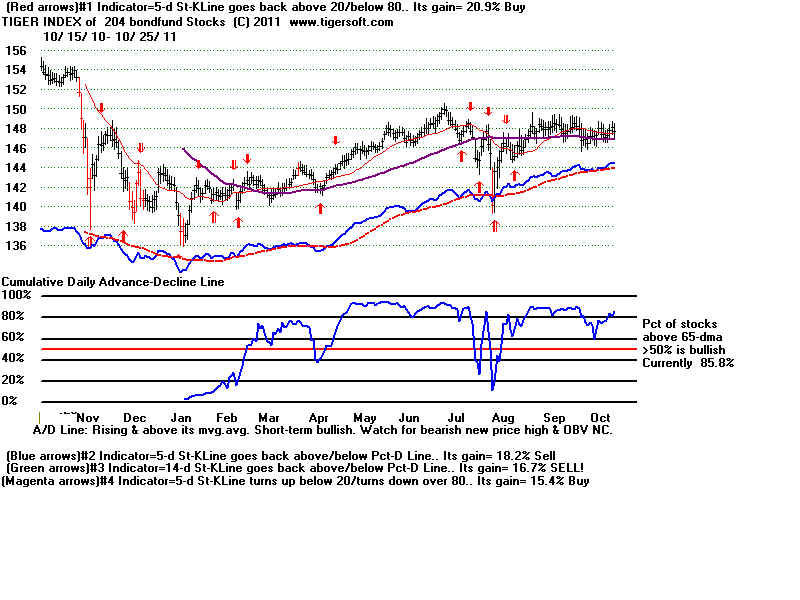
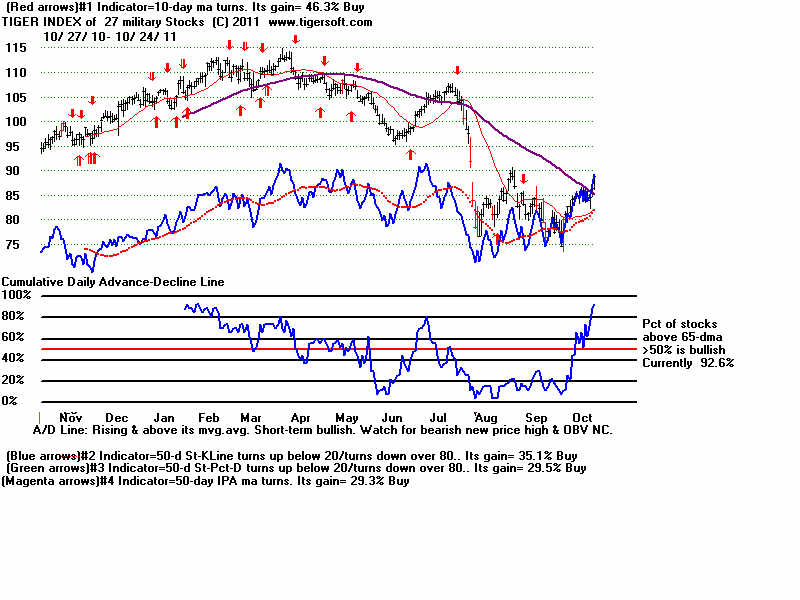
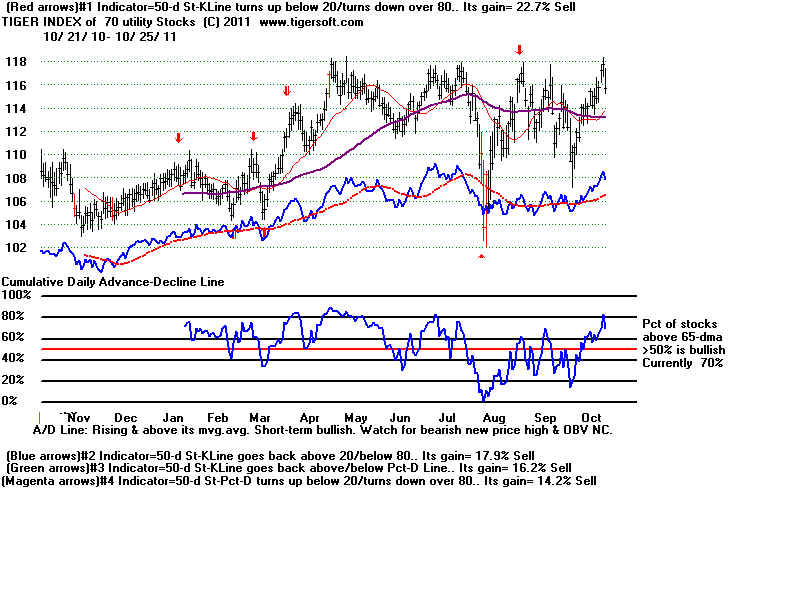
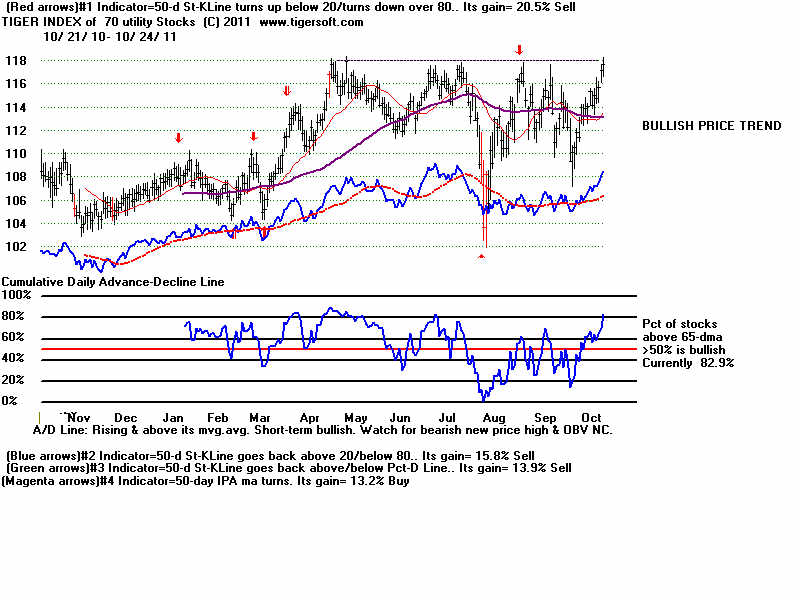
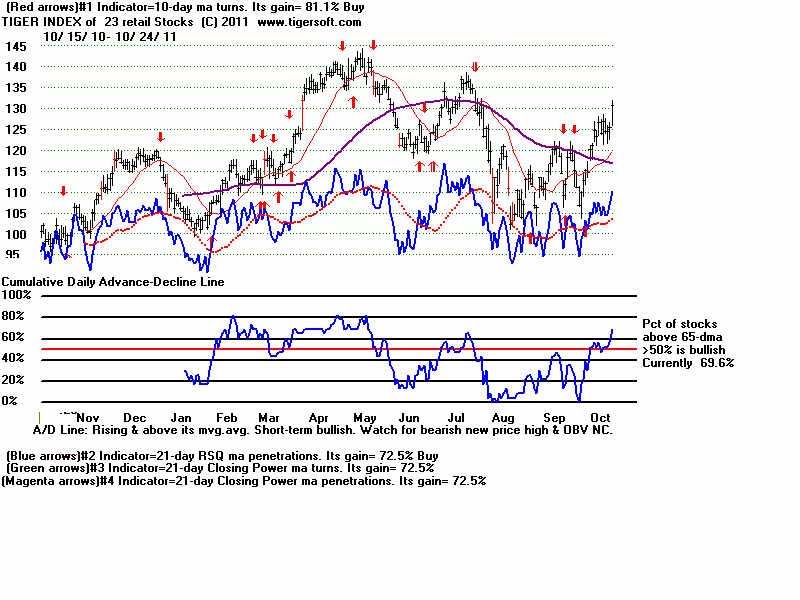
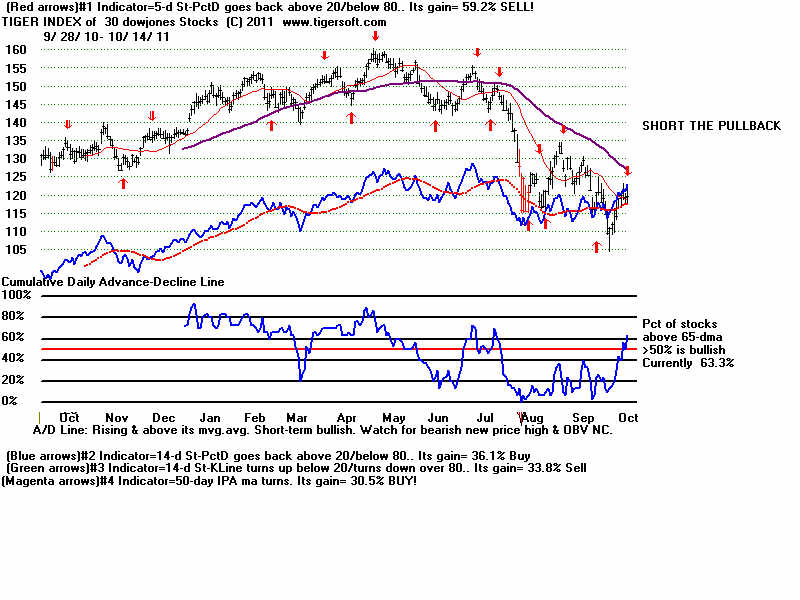