IWM  - Candle Stick Chart - 10/25/2011                       

IWMCAN.BMP (1920054 bytes)
         Tiger/Peerless Charts
             ======= 10/25/2011
  =======  
                            
   
             Pct of Stocks over 65-dma  - Daily Change
                 
                10/25//2011      10/24//2011        10/14//2011        10/4//2011              9/21/2011        9/14/2011                          
-------------------------------------------------------------------------------------------------------------------------------------------------------------

Military Stocks            93%                 93% +3%          67%
   +11%     11% +4% 
Bond Funds                 86%
+4%          82% -2%          77% +8%          81%  -9%             89%  +2%         88%  -1%     
QQQ-100 stocks          80%
-4%           84% +9%          69%    +3%      11%  +3%             25% -12%         34% +12%
Auto Stocks                 76% +7%           69% +23%  
    61%  +21%         13%    +8%           8% -8%           18%  +7%            
SP-500 stocks             76% -11%          87%  +13%       57%  +10%       10%   +3%            18% -12%         32% +8%              
DJI-30 stocks              74%
-13%        87%  +7%         53%   +13%      13%  +3%              33% +2%          13% +3%      
Utility Stocks              70% -13%          83% +13%        67%    +6%       20% +6%              43% -13%          46%  +20%   
Transport Stocks        69%
-5%           74%  +4%         58%   +20%        2% +1%                 5% -3%             9% +4%    
Retails                         65% -5%            70% +13%       57% +4%       
Homebuilding            63%
-12%         75%  +17%       25%                   0%                        0%   -4%           4%  -4%           
Computer Eq              61% -10%         71% +15% 
Oil stocks                   54%
  -10%         64%   +14%     37%   +12%           6%  +2%           15% -6%            24% +10%       
BestREITs                  53%
-14%          67%  + 27%      7%                     0%                        7% -18%           53%  -14% 
Finance Stocks          50% -23%         73%  +13%       36%                  14%+11%              12%  -8%            19% +5%
==========================================================================================        

Biotech (XBI/ IBB)     40%  -20%         60%   +7%       60%                   40% +11%             43% -19%           29% 
Ind. Materials           39%  -13%          52%  +11%      32%   +10% 
Green Stks                33% -8%             41%  -+13%     26%    +6%          5%   0%          
Food Commodities   20% -20%            40%  
+10%      30%                   23%   -4%              43% -12%          64%
Foreign ETFs' Stocks  25% -9%            34% 
+11%      16%    +6%          2%                         2%                   2%               
Chinese Stocks          32% -1%             33%
  +8%        20%    +6%           6% -2%                 14% -1%            19%   +4%       
Gold/Silver Stks        20%
+ 4%           16%  +12%      10%   -1%  
 
 DATA.BMP (953118 bytes)


     DIA

DIA.BMP (1920054 bytes)

DIAEX1.BMP (1920054 bytes)
   DOW STOCKS
MASTDOW.BMP (1920054 bytes) 
QQQ  
QQQ.BMP (1920054 bytes)


QQQEX1.BMP (1920054 bytes)

 
IWM.BMP (1920054 bytes)

IWMEX1.BMP (1920054 bytes)


|
|

SPY 
SPY.BMP (1920054 bytes)

SPYEX1.BMP (1920054 bytes)


   SP500 STOCKS
MASTSPY.BMP (1920054 bytes)
  DOLLAR
-UDX.BMP (1920054 bytes)

INTEREST RATES

-TNX.BMP (1920054 bytes)

GOLD   Futures Perpetual and ETF
GLD.BMP (1920054 bytes)


GLDEX1.BMP (1228854 bytes)
GOLD STOCKS,
MASTGOLD.BMP (1920054 bytes)

SILVER    


SLV.BMP (1920054 bytes)
Crude Oil and USO OIL ETF

USO.BMP (1920054 bytes)

CL1600.BMP (1920054 bytes)

  Index of Oil Stocks
MASTOIL.BMP (1920054 bytes)
FOREIGN ETFS
MASTETF.BMP (1920054 bytes)
FINANCE STOCKS
MASTFIN.BMP (1920054 bytes)


    Tiger Index of Food Commodities
  MASTFOOD.BMP (1920054 bytes)


BONDS
MASTBOND.BMP (1920054 bytes)
 MASTCHIN.BMP (1920054 bytes)
IND MATERIALS
MASTIND.BMP (1920054 bytes)
MASTUTIL.BMP (1920054 bytes)
MASTGREN.BMP (1920054 bytes)
MASTCOMP.BMP (1920054 bytes)
MASTTRAN.BMP (1920054 bytes)
 
MASTBIO.BMP (1920054 bytes)
 

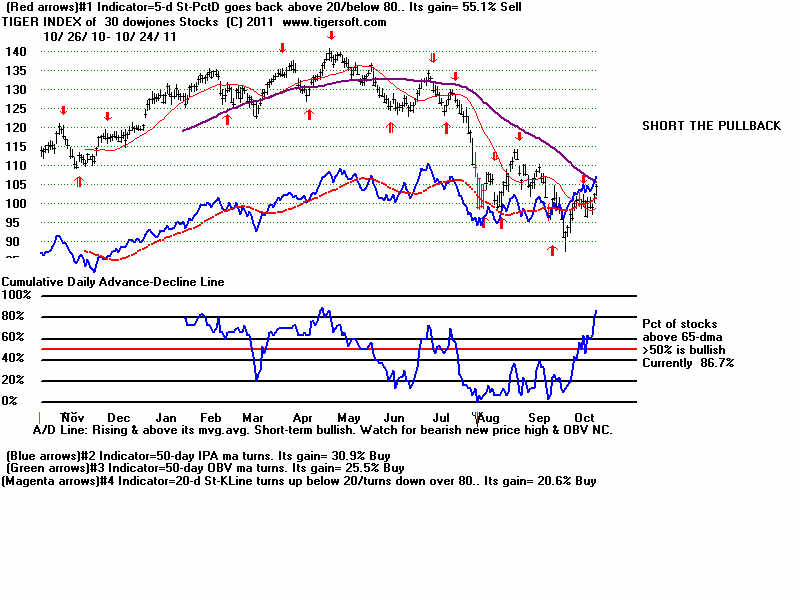
CORRECTIONS IN A BULL MARKET

       Since 1929, there have been 11 bull markets lasting more than 24 months without a
       DJI decline of more than 13.5%.  In that time, there were 27 cases of  8%-13.5% declines
       that puncutated these long advances, like we are now in.  A decline of more than
       13.5% was always bearish, in that it always led to a much deeper bear market.s.  It
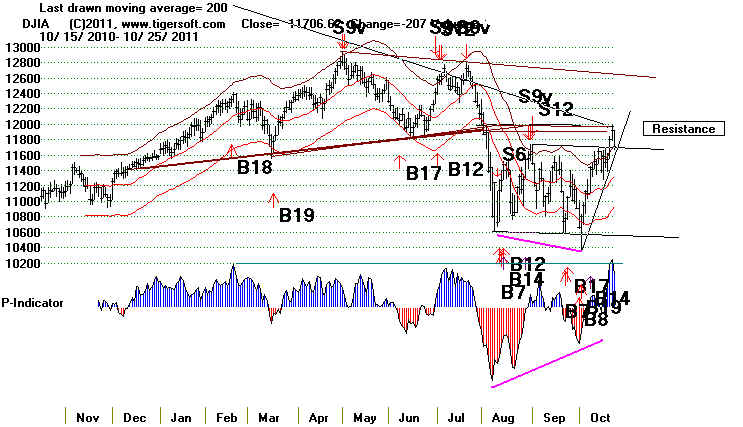
       seems reasonable to use a CLOSING SELL STOP 13.6% below the highest DJI close.
       Here that would be at 11050.  


               Corrections in the 11 Longest DJI Advances since 1928

              1.       7/26/34 - 3/10/1937   30 months
                        Feb-March 1935 10% decline (There was a Sell S12 in January 1935 and Buy B5 at bottom).
                        March-April 1936 12% decline (There was a Sell S12 in March 1936 at top and B2 at bottom.)
                        March-June 1937 15% decline (Sell S9 at top and B8 at bottom.)
                      
              2.      4/28/42 - 5/29/46    49 months
                      
July 1943-November 1943 11% decline(June 1943 Sell S9.  November 194 Buy B9

              3.          9/14/53 -  7/12/57   46 months
                       Sept 1955-October1955 10% decline (Sell S4 at top.  Buy B17 at bottom.)
                       April 1956-May 1956  10% decline (Sell S2 at top. Buy B19 at bottom.)
                       August 1956-Nov 1956   11% decline (Sell S2 at top. Buy B2 in October.)

              4.     10/21/57 -     1/5/60   26 months
                       August 1959-Sept 1969  9% decline (Sell S4 at top. Buy B17 at the bottom.)

              5.   10/23/62 -  1/5/66  38 months
                       May 1965-June 1965  11% decline (Sell S8 at top. Buy B10 in August after the bottom.)

              6.    7/24/84 -  8/25/87  37 months
                       July 1986-Aug 1984  9% decline (Sell S9 before top. Buy B17 in July before the bottom.)
                       Sept 1986-Sept 1984  9% decline (Sell S9 before top. Buy B17 just before the bottom.)
                       April 1987-May 1987  9% decline (Sell S9  at top. Buy B17 at the bottom.)

             7.
  12/4/87 -  7/17/90    32 months
                       Oct 1989-Oct 1989  9% decline (Sell S9 at top. Buy B17 at the bottom.)
                       Jan 1990-Jan 1990  9% decline (Sell S4/S15 at top. Buy B17 at the bottom.)
                       Aug 1987 - November 1987  35% decline (Sell S9/S12 at top. Buy B9 at the bottom.)

             8.    12/4/87 -  7/17/90    32 months
                       Oct 1989-Oct 1989  9% decline (Sell S9 at top. Buy B17 at the bottom.)
                       Jan 1990-Jan 1990  9% decline (Sell S4/S15 at top. Buy B17 at the bottom.)  
                       2.2% declines: 1991 1 ok 3 bad, 1992 2 bad                      

              9.   10/11/90 -  7/15/98  93 months
                     
Jun 1992-Oct 1992  8% decline (Sell S9 at top. Buy B17 at the bottom.)
                      Jan 1994-April 1994  11% decline (Sell S4 at top. Buy B19 at the bottom.)
                      May 1996-July 1996  8% decline (Sell S1 at top. Buy B17 at the bottom.)
                      March 1997-April 1997 10% decline (no sell signal at top. Buy B17 at the bottom.)
                      July 1997 - October 1997 13.5% decline (Sell S12 in September after top. Buy B1/B17 at the bottom.)
                      END July 1998 - October 1998 20% decline (Sell S9/S12 at top. Buy B9 at the bottom.)
                     
2.2% declines: 1991 1 ok 1 bad,  1993: 1 bad, 1994: 1 OK, 1 bad, 1996 2 bad, 1997 2 ok 4 bad.1998

             10. 3/12/2003 -  10/9/07  51 months  
                    
Feb 2004-Oct 1994 9% decline (Sell S9 at top. Buy B2/B9 at the bottom.)
                     May 2007-July 2007  8% decline (Sell S9 at top. Buy B9 at the bottom.)
                     July 2007-Aug 2007  9% decline (Sell S9 at top. Buy B14 two weeks after the bottom.)
                     October 2007-November 2007  10% decline (Sell S4 at top. Buy B1 a week before the bottom.)
                    END December 2007-February 2009 Bear Market 51% Decline. Sell S9/S12 at top
                    2.2% declines: 2003 1 ok, 2007 5 ok.
              11.   3/9/2009 -  4/29/2011  25.5 months
                    
Jan 2010-Feb 2010  8% decline (Sell S9 2 months before top. Buy B17 at the bottom.)
                    END April 2010 - June 2010  13.5% decline (no sell signal at top Buy B8 at the bottom.)
                     2.2% declines These failed to predict a decline in 13 cases.  They accurately predicted a decline only 2x..