Futures
Trading with TigerSoft.
TigerSoft
provided you data for Perpetual Commodity Contracts.
The
basic TigerSoft program lets you get automatic Buys and Sells for
the
SP-500 (W-Minis), metals, currencies and food commodities. Food
commodities
are discussed in this Blog. But first let me show you the
current
chart for the E-Mini. Note that these automatic Buys and Sells
are
optimized automatically. For more information, please see the
Introductory TigerSoft discussion and Special
Price.
General
market timing is the province of our Peerless Stock
Market
Timing ($295). Peerless has now been back-tested
to 1915. A new book is
is
coming out for Peerless.
-----------------------------------
E-Mini ---------------------------------------------------------------------
Simple Ways To Trade Food Commodities
with TigerSoft Accumulation Index and TigerSoft Buys/Sells
See also
2/26/2008 Food Commodities Streak
Upwards. TigerSoft Easily Spotted The Start of Their Moves..
In the past, I have always
said that Tiger's internal strength indicators work best with stocks, indices, metals,
currencies and interest rate driven futures but less well with food
commodities.which are heavily affected by weather
conditions, which no one can predict very well. However, because World Demand has become so important
to food commodities in this Global Economy, Tiger is now doing a fine
job in predicting their movement.
The rules we can set out for trading commodities here, will help you
when they are applied to stocks, ETFs, currencies,
metals and indices. Commodity
traders know that gains like we show below mean very big profits because of
the leverage a trader gets here.
There are many of examples of
the how well Tiger and Peerless work with stocks, indices, metals, currencies
and interest rate driven investment vehicles. What missing is an exposition of TigerSoft and food commodities. This
page will try to remedy that. This page will grow in the course
of the week as time permits. So come back often.
I will set out basic rules in the first commodity to be examined, CORN,
and then we will see how well they work
with the others. We'll see what revisions and supplemental rules
are needed, too.
This should make a
reading of my Explosive
Super Stocks and Short Selling books more
valuable. I hope it
will make some you want to get our software. The Tiger
Accumulation Index was first invented by me in
1981. We have had years of experience using it. The
automatic Buys and Sells are unique to TigerSoft. A fuller
explanation of our indicators and the best way to trade them are in my
books and the Help routines of the
software.
Here we will use at
"perpetual contracts". For prices these employ the contract to expire closest
to,
but at least 16 days away and for volume, they use all months'
contracts' volume. We go back about two years.
We look at 7 commodities: corn, coffee, cocoa, live cattle, orange
juice, pork bellies, soybeans, sugar and wheat.
We will be most interested how well price patterns, the Tiger
Accumulation Index, OBV and automatic signals work..
Corn (C_1620) - done
Coffee (CC1620) -
done
Cocoa (CO1620)
Live Cattle (LC1620) -
done
Orange Juice (OJ1620) -
done
Pork Bellies (PB1620)
Soybeans (S_1620)
Sugar (SU1620)
Wheat (W_1620)
================================================================================
=========================
CORN =================================
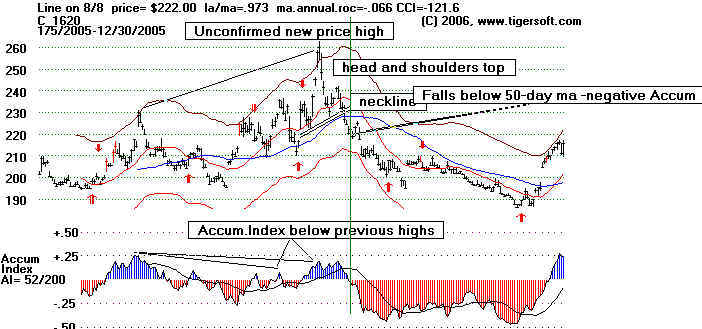
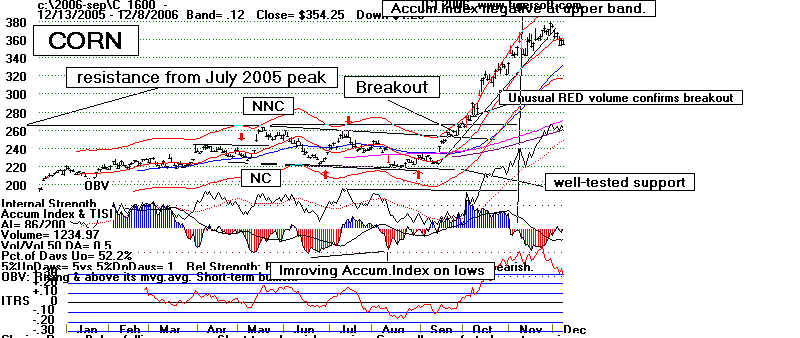
Corn C_1620 - 2005
The chart
below for corn in 2005 illustrates some basic rules for calling a top with the TigerSoft
tools.
(1) The July peak was not confirmed by a higher Tiger
Accumulation Index.
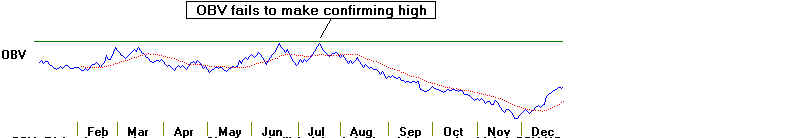
(2) The July peak was not confirmed by a higher OBV
(aggressive buying).
(3) The breakout quickly failed to stay above the
breakpoint at 235. This is a "false breakout".
(4) An upsloping head and shoulders pattern is traced out.
The breaking of the neckline at 227 is bearish.
(5) Prices quickly fell back below the blue 50-day ma and
the Accumulaton index turned negative (red) to confirm
the breakdown.
(6) A simple 20-day Stochastic using the K-Line gave the
best signals in this period. That was the optimized best system.
(7) Prices crossing back above the 50-day ma with the
Accumulaton turning positive signals an upturn. More
evidence of an upturn
would be desirable.
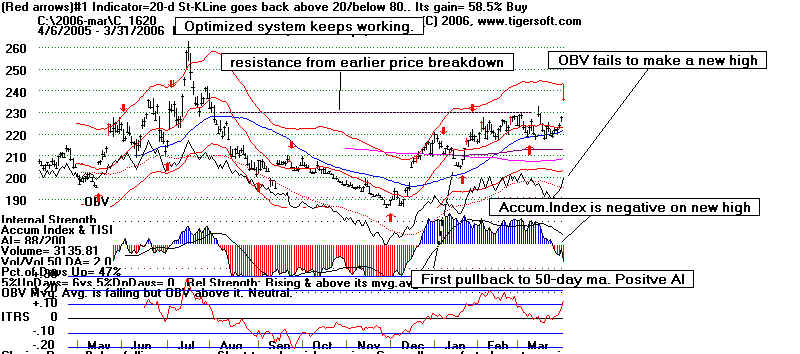
Corn C_1620 -
2005-2006
8) Buy on first
pullback to rising 50-day ma if Tiger Accumulation Index is positive. January 2006.
9) Expect resistance at
point where prices previously broke down. 230.
10) Use Automatic Red
Buys to trade price uptrend.
11) Prepare to sell if
new is made with Tiger Accumulation Index is negative and OBV does
not confirm. Note non-confirmations on last day of chart.
Corn C_1620 -
2006
(12) The May peak was not confirmed by OBV and the Tiger Accumulation Index was
negative.
That is a reliable Sell signal.
(13) Resistance is often created by earlier peaks. The 260 level resistance
started
in July 2005 and stoipped two 3006 rallies.
(14) Buy at well tested support if the Accumulation Index and OBV are not
confirming the price
weakness. This is short-term because of the well-tested horizontal support fails,
it is
best to sell.
(15) Buy on price breakout above well tested resistance ay 260. September 2006.
(16) The price breakout above 260 causes the previously best trading range BUY/SELL system
not to work. Use a trend-following system or a longer-term Stochastic.
(17) Red high volume confirms the breakout and makes it more reliable.
(18) The rising of the Tiger Accumulation Index above the first dotted line confirms the
breakout, too.
(19) When breakout advance takes place without a pullback, you can add to positions at
price uptrend-line.
(20 The November peak at the upper band showed negative readings from the Tiger
Accumulation
Index. This would be a good place to take profits.
SELL
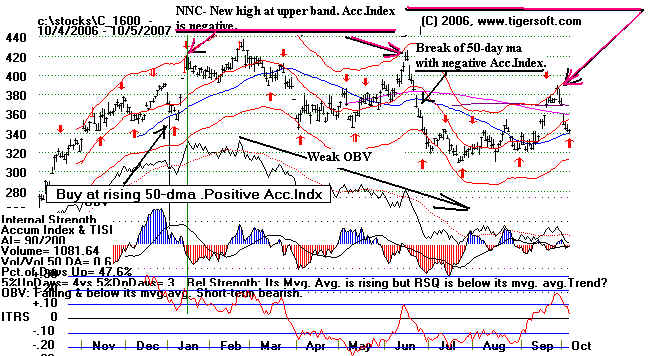
Corn C_1620 -
2006-2007
(21) Buy at rising blue 50-day ma when current Accumulaton Index is very positive.
(22) Prepare to Sell at upper band if Tiger Accumulation is negative. Jan., June and Sept.
2007.
(23) Drop below 50-dma with Accum. Index negative is usually a reliable Sell.
(24) When OBV in declining for more than 2-3 months, prices usually subside.
(25) The basis for the optimized Tiger's Automatic Buys and Sells has switched to
short term trading because Corn has stopped trending.
================================================================================
============================ COFFEE
============================
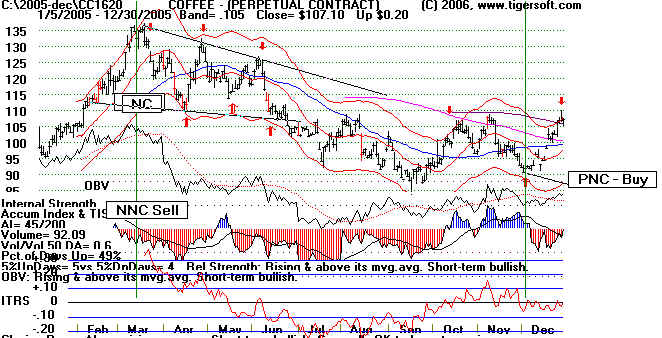
2005 Coffee - CC1620
The March top and December bottom conform exactly to our rule to sell at the
upper band when the Tiger Accumulation is negative (NNC) and Buy at the lower band
when the Accumulation Index is positive (PNC). These rules are made more epmphatic
when the OBV faile to confirm the high or low, as is true in the chart below.
In December 2005, we see another classic Sell based on the same conditions that
appeares at the March top: a new high at the upper band.with the Accum. Index negative
and the OBV not confirming. But you will also notice that the 110 level was
tested five
times.from July to December. In the graph below the one below prices achieve a breakout
above the 110 resistance and rise quickly, Perhaps, this is just short-covering.
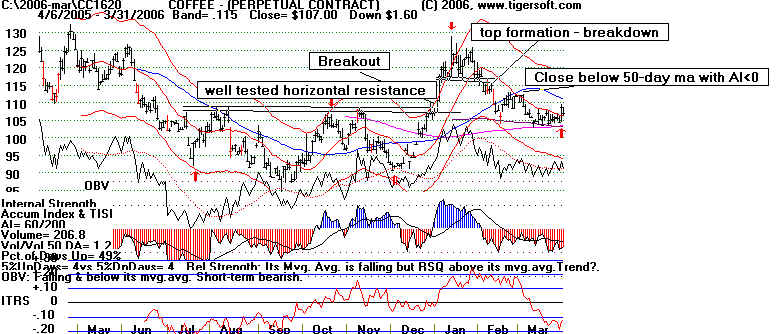
2005 -2006 Coffee - CC1620
See the short-covering breakout above 119 below. Then a quick top formation appears.
Corn
then breaks below its 50 dsy ma eith the Accumulation Index negative, for a Sell.
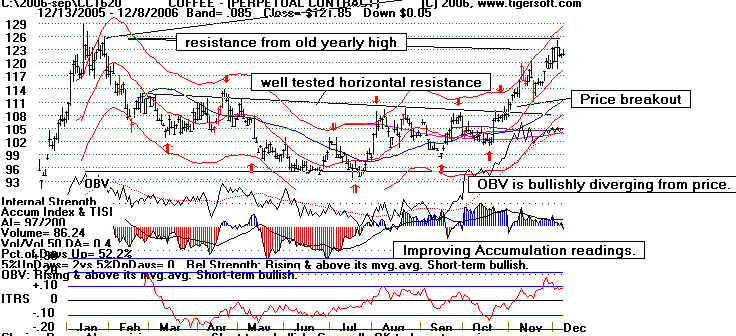
2006 Coffee - CC1620
Do you see how the internal strength indicators grew more and more positive before the
price breakout at 111-114 in October? Buying the breakout there was definitely the
right thing
to do. As long as the Accumulation Index stayed positive on the rally, the odds
favored
prices would challenging the yearly highs near 129. That is what happened.
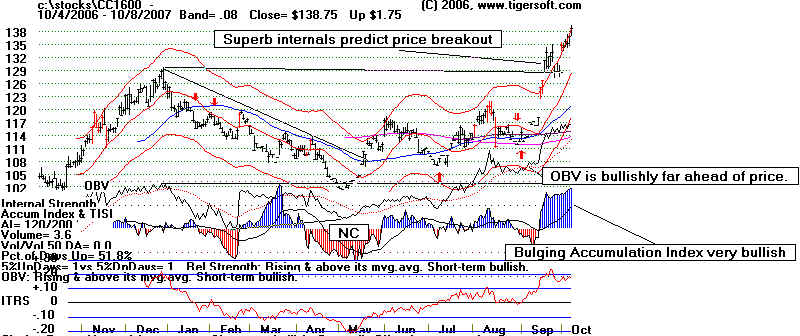
2007 Coffee - CC1620
Coffee's rising internal strength indicators predicted September price
breakout above 130.
Two months before this,
the OBV Line was making new highs and a month before the surge
past 130, the Tiger
Accumulation Index soared to levels signifying informed, big money buying.
Note the bullish breakaway
gaps, too. This presently looks quite strong.
2007 Coffee - CC1620
================================================================================
========================= LIVE COCOA
============================
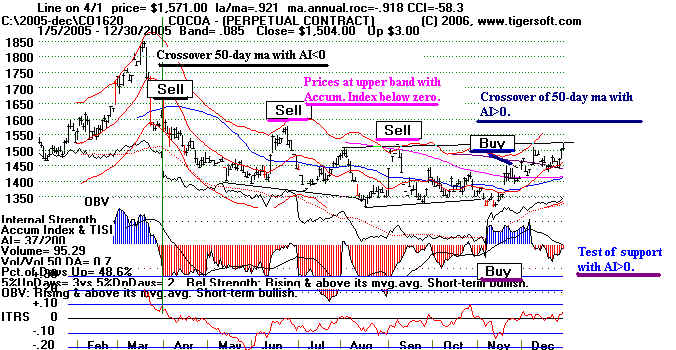
Cocoa - CO1620 2005
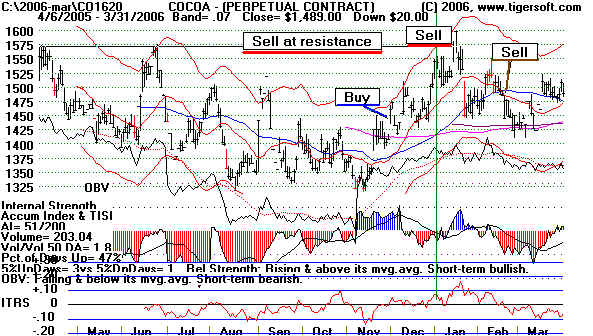
Cocoa - CO1620 2005 - 2006
Not remarked on the
chart below is the normally bearish head and shoulders pattern, from
December to February. This chart
shows mostly red distribution. Longs should have avoided it,
unless it breaks out unexpectedly above
1600. And that might well be simply a short squeeze
if the Tiger Accumulation Index does not
improve markedly.
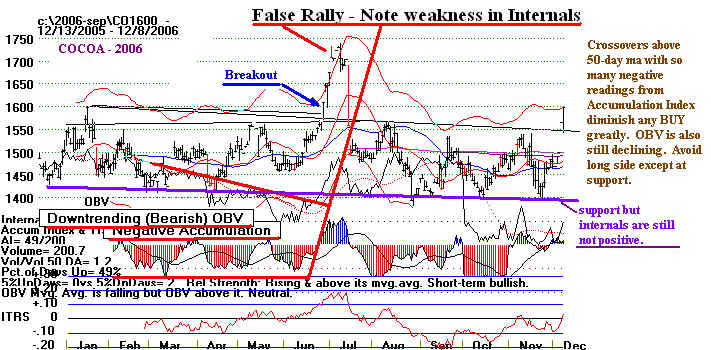
Cocoa - CO1620 2006
False rallies, based on short squeezes are sometimes attmpted in a rising commodities
market among those
commodites which have the weakest internals. The downtrending OBV
is a major sign of
weakness. The steadily negative Accumulation Index is as important. And
it too is bearishly negative.
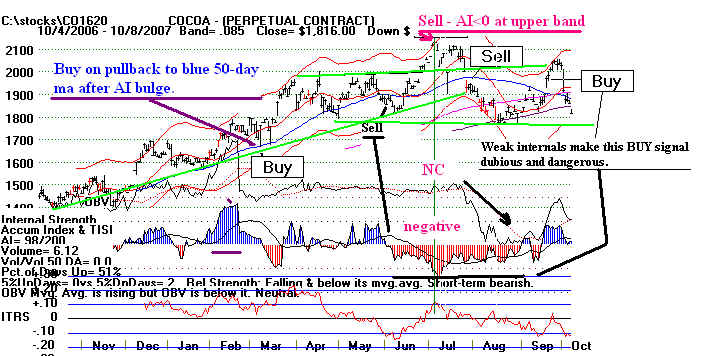
Cocoa - CO1620 2007
We have found pullbacks to the blue 50-dma soon after a bulge from the Tiger Accumulation
Index to be good Buys. You can see that
in early March. But the rally soon ran out of steam.
The final high occurred in early July as COCOA
reached the upper band with the Accumulation
Index negative. The pattern now developing
looks like an extended head and shoulders pattern.
The neckline is the flat green support line.
The key resistance is the green line going through the
pattern's shoulders.
To avoid whip-saws around the 50-day ma, make sure the internals of the commodity support
the trend you expect.
================================================================================
========================= LIVE CATTLE
============================
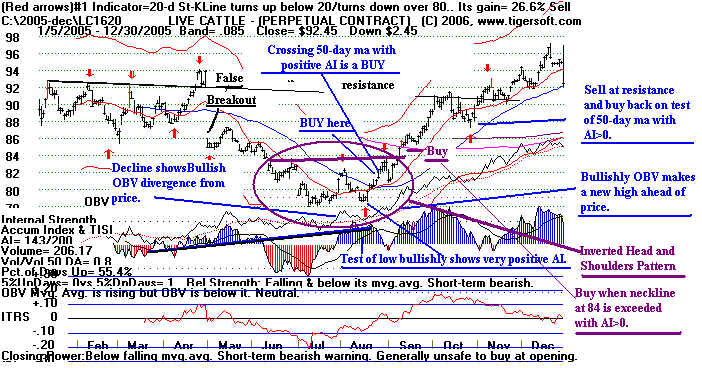
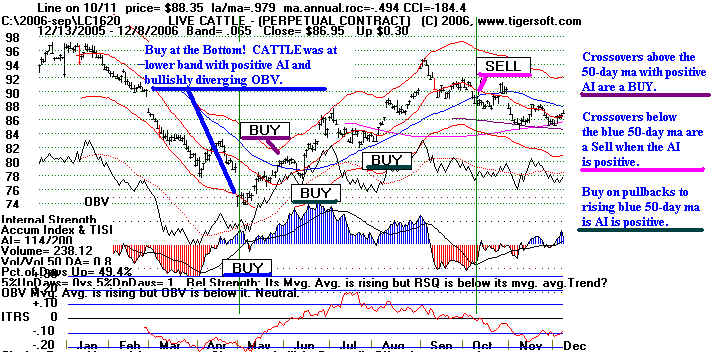
Study the
chart below. It illustrates a lot. It begins with a false breakout above 92.
The gap down a few days later would
have meant a loss. But the bottom was easily
recognized in August Note the
rising OBV line, despite the price decline. This is a
bullish divergence. The Tiger
Accumulation Index was positive on the test of the lows
in August. We recommend
buying also on a close above the blue 50-day ma with the
Tiger Accum. Index positive. See
the inverted head and shoulders pattern. Buy on a
close above the neckline, at 84 in
the chart below, if the AI is positive. You can see at
the resistance line as it is
extended the right. The level of the false breakout will be
resistance on the first rally up to
it.. The retreat to 88 and reversal day up there, just
above the rising 50-day ma is a BUY
with the Accumulation Index positive.
Corn in the chart below had an optimized 20-day Stochastic Buy/Sell system.
This
works fine until there is a breakout.
Trust the breakouts when they are confirmed.
2005 Live Cattle - LC1620
2005 -2006 Live Cattle - LC1620
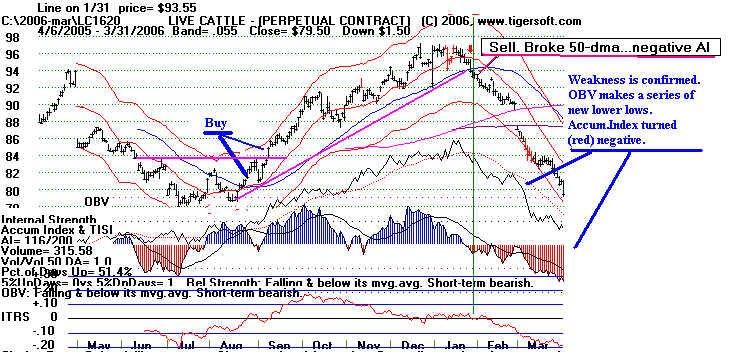
2006 Live Cattle - LC1620
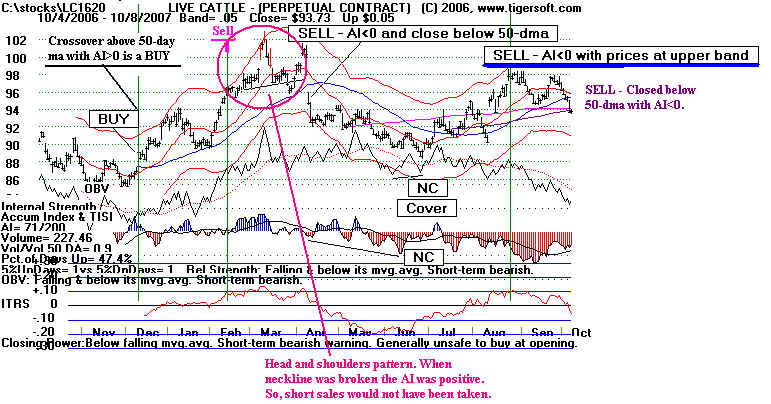
2006 - 2007 Live Cattle - LC1620
The crossover of the 50-day ma in July did have a positive Tiger Accumulation Index
and, so, could have been
bought by our rules. But the prior readings from the Accumulation
Index were not very good,
showing only non-confirmations of new lows, rather than positive
non-confirmations.
Selling or selling short at the upper band with the Accumulation Index
negative is in accordance
with our rules here. Note the resistance at 98 from the previous
reversal pattern in February
and March.
===============================================================================
========================= ORANGE JUICE
============================
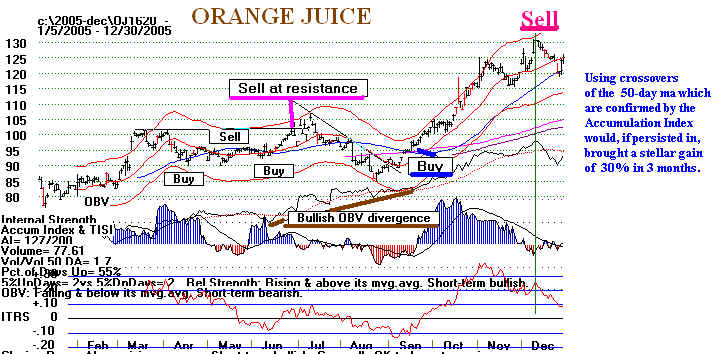
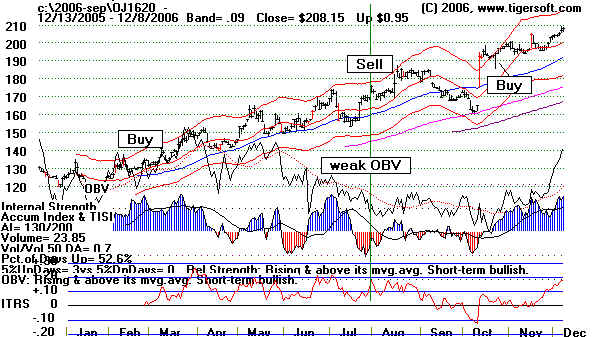
2005 Orange Juice -
OJ1620
2005 -2006 Orange Juice - OJ1620
When you see this much blue Accumulation and the OBV is matching price in strength,
use thee crossover of the
50-day ma with a positive Tiger Accumulation Index to take a
bullish long position.
Here we could have sold on strength at the upper band at 130 and then
retaken the long position at
125 two months later..
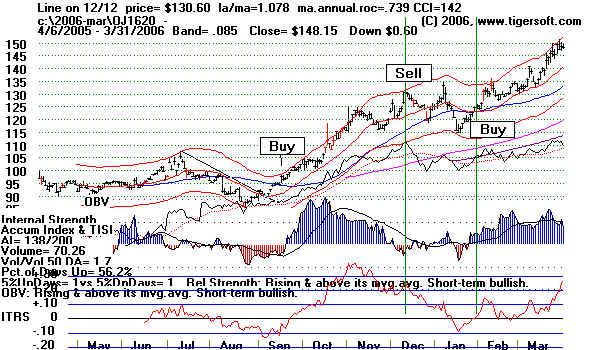
2006 Orange Juice - OJ1620
Stick with the trend
when it is supported by a mostly very blue Tiger Accumulation Index.
Here that would
have meant buying in February at 130, selling at 175 in July and buying
back the long
position at 193 in October.
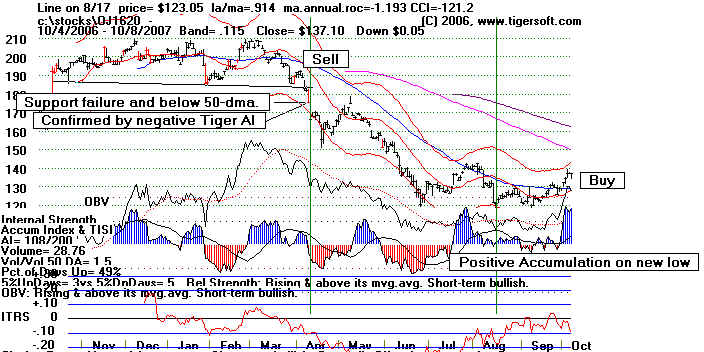
2007 Orange Juice - OJ1620
Use negative readings from the Tiger Accumulation index to confirm a breakdown by
prices below support.
Accordingly, one might have sold or sold short Orange Juice
at 175 in August.
In July it rose slightly above its falling blue 50-day ma with the Accumulation
Index positive.
This might have been used to vicer the short sale. The rate of change of the
50-day ma should also
be considered. It was falling very fast. That means more resistance.
The subsequent tests of
the lows occurred with a very positive Accumulation Index. Buying
here would have been
the correct response to these readings.
===============================================================================
========================= PORK BELLIES
============================
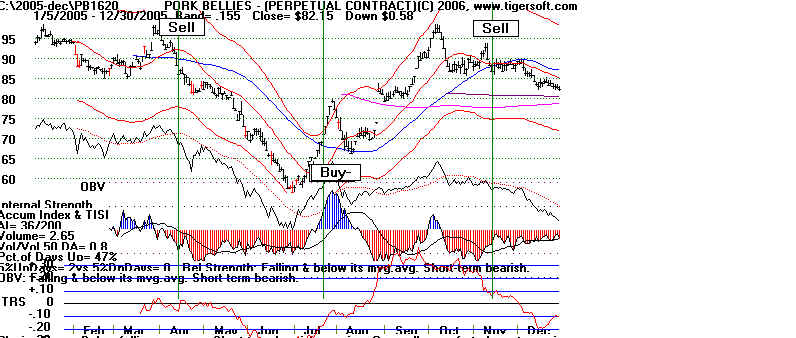
2005 Pork Bellies -
PB1620
Prk bellys' zigs and
zags here can be traded nicely using the crossovers of the blue 50-day ma
when the Tiger Accumulation Index confirms it.
This swings wildly and a simple system is best.
Sell 97
Buy 73
Sell 88
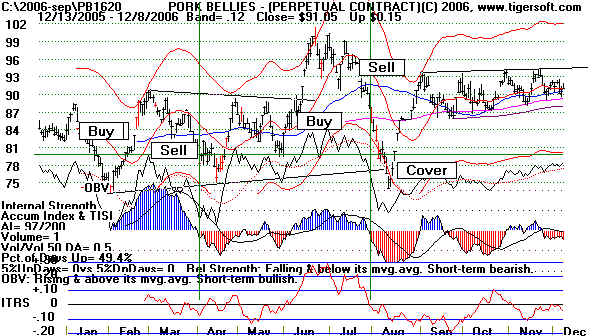
2006 Pork Bellies -
PB1620
Using the same crossover rules and cover at support, these are the trades.
Buy 83 - Feb
Sell 79 - March
Buy 87
Sell 90
Cover 78
2007 Pork Bellies - PB1620
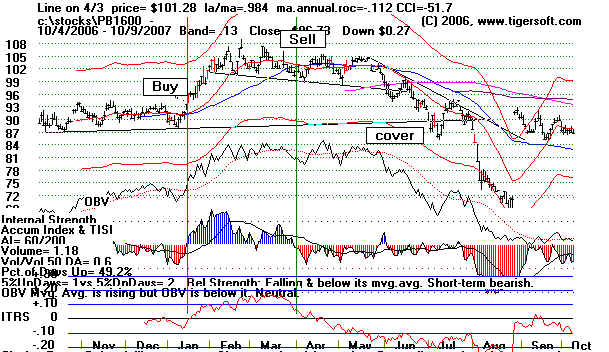
===============================================================================
========================= PORK BELLIES
============================
2005 Pork Bellies -
PB1620
The bearish June-July top pattern should stand out to any serious TigerSoft trader.
You should also see that it takes months for the pattern to be completed and prices to
sell off.
===============================================================================
========================= SOY BEANS
============================
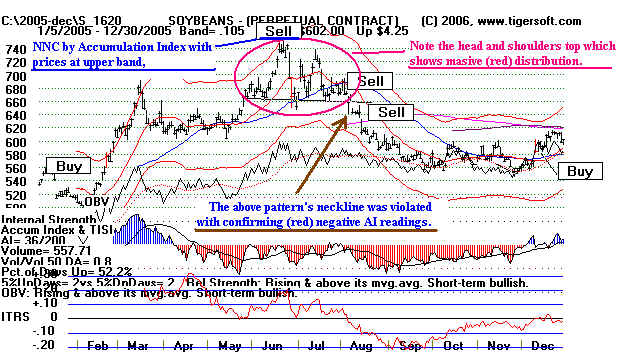
2005 Soy Beans- S 1620
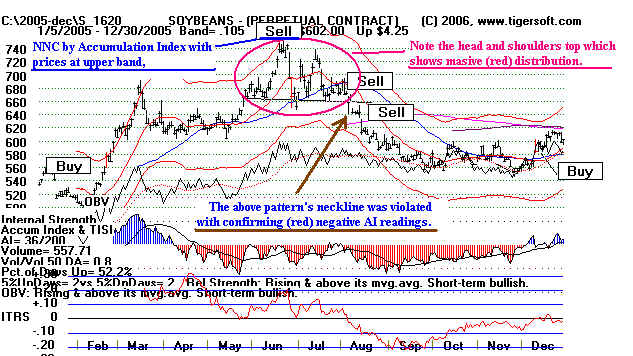
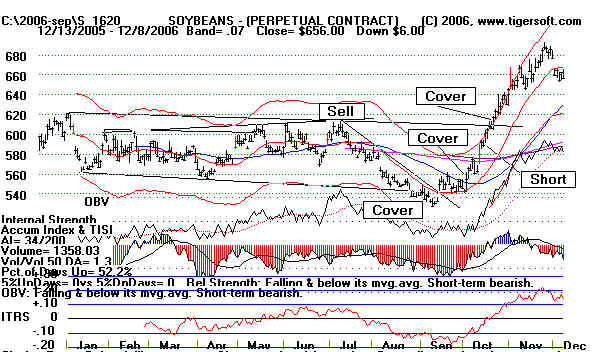
2005 -
2006 Soy Beans- S 1620
The Tiger Accumulation Index stays preponderately negative throughout the span
of time shown in the chart below. This dominates. The OBV Line is stronger.
But the
Accumulation Index tells the story. I would not take moves past the 50-day ma as
points
of entry for a purchase, though short sales might be covered then.
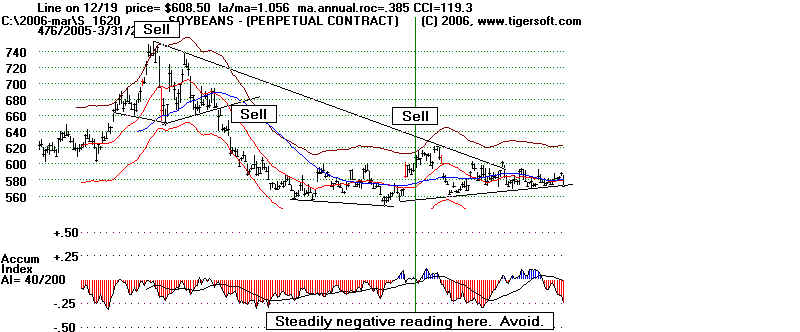 
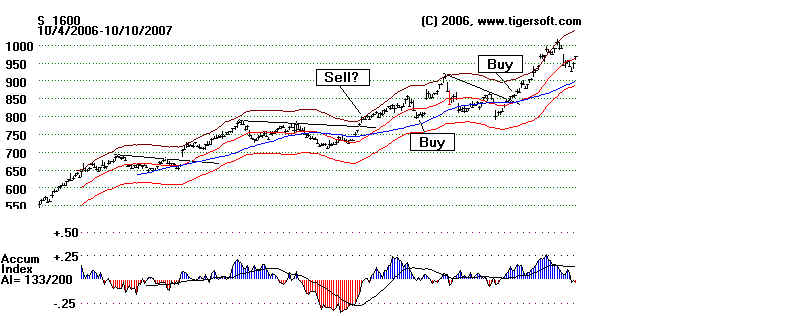
2006 Soy Beans- S 1620
Price breakouts from long bases have to be respected
enough to cover any
short
sales. But with such negative Accumulation, I would not go long on the
breakout in
October at 620.
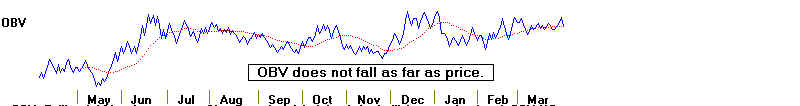
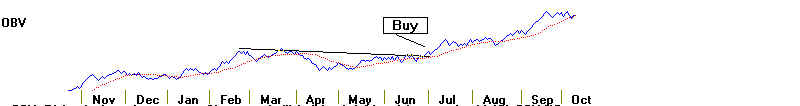
2006 - 2007 Soy Beans- S 1620
The July 2007 breakout of the OBV Line for Soy Beans coincided with its first
post breakout pullback towards its 50-day ma. This is the first reliably entry
point.
The rising Accumulation Index and OBV justify holding the long position though
taking profits at the upper band would have been tempting.
The May breakout above a flat top would have made me hesitate to sell short
even though the upper band is reached with the Accumulation Index negative.
================================================================================
======================
SUGAR ============================
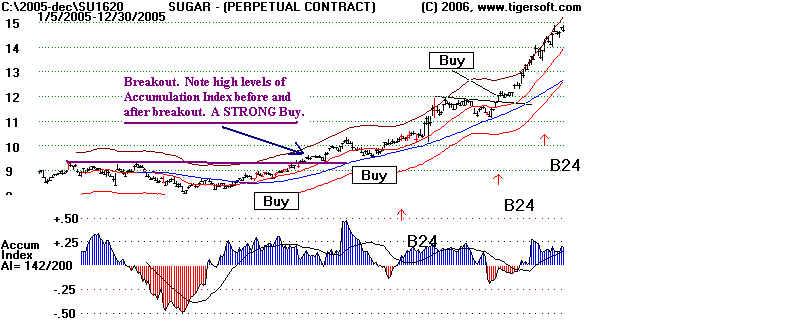
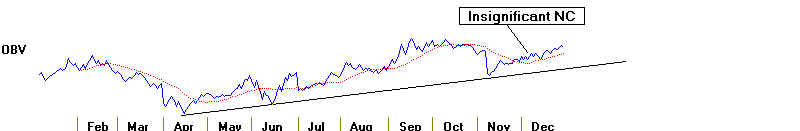
2005 Sugar- SU1620
The power of Sugar's move upwards in 2005 was foretold by the breakout above flat
resistance
preceded and followed by high levels of
(blue) Tiger Accumulation. First, we get a BUY
simply upon the penetration of the blue
50-day ma. Then, give a Buy to the breakout. Next is
a Buy on the first retreat to the rising
50-day ma following the breakout. The flat topped .
breakout is the next point where we would
BUY more. You may use the automatic Buy B24
signals.
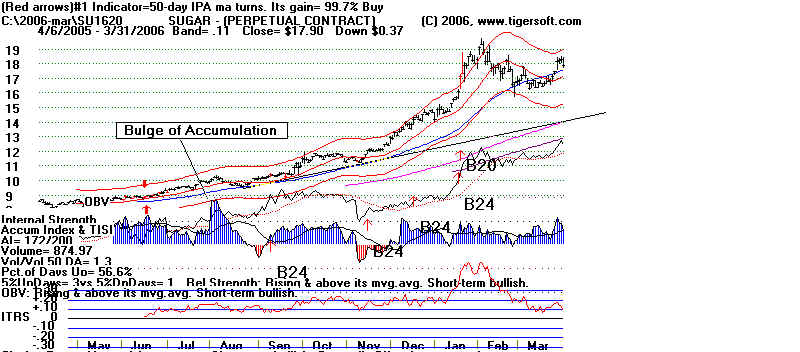
2005 - 2006 Sugar- SU1620
The bulge in the Tiger Accumulation produces a 100% advance in sugar in 6 months.
The lengthy duration of (blue) positive Accumulation is rare. It puts the odds in a
favor
even when there are retreats to a rising 21-day ma and even on the decline to the blue
50-day ma in February.
2006
Sugar- SU1620
There are times when the automatic red Buys and Sells work perfectly for a lengthy
period of time.
I suggest this is true after a big advance. Professionals are retaking
control.
A quick double in
a food commodity is a very good move. After that, be prepared for a
retracement.
In June Sugar's price drops below the falling (blue) 50-day ma. with the
Tiger
Accumulation negative. This is an emphatic Sell. There is no reason to take a
long
position at the
end of the year, as the commodity goes sidewise. The Tiger Accumulation
Index is too
negative.
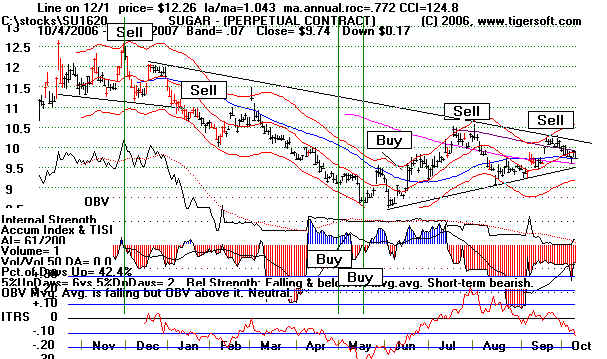
2006 - 2007 Sugar- SU1620
At the end of
2006 and the start of 2007, Sugar develops a bearish head and shoulders
pattern. Red distribution
predominates. Sell short on the breaking of the neckline and on the
first pullback upwards to the falling
50-day ma. At 9 Sugar has fallen to the lower band
with the Accumulation Index positive.
This is a Buy. So is its rise in these conditions back
above the 50-day ma, It is a Sell
at the upper band when the Accumulation Index is negative.
================================================================================
======================
WHEAT ============================
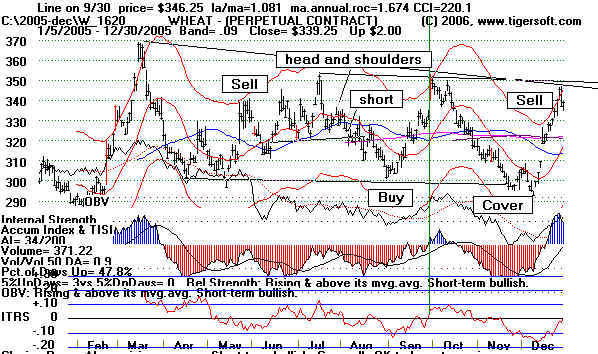
2005 Wheat- W 1620
Recognizing a trading range early-on helps a lot here. Unless the commodities'
markets are weak a whole, it
is usually best to cover short sales on tests of lows.
The mostly red distribution
shown in the Tiger Accumulation Index warns about
going long on moves past the
blue 50-day ma.
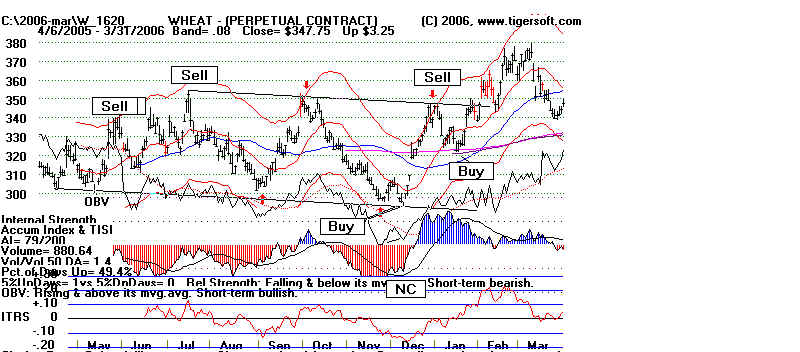
2005 - 2006 Wheat - W 1620
I would not buy in December when prices cross the 50-day ma; the Tiger Accumulation
Index has been
far too negative. The next pullback towards the 50 day ma with the
Accumulation
Index having
turned positive does represent a good Buy.for a quick trade back to the resistance
at 348. One
could reasonably Buy on the breakout over 360 but the Accumulation Index has
weakened
substantially, so that this is viewed as only a quick trade to be sold as soon as the
red 21-day ma is
violated.
2006 Wheat - W 1620
The September breakout was accompanied by a very negative Accumulation
Index. I
would not have bought this breakout. But I would also not have shorted
it until prices
were much higher. Breakouts past a line srawn so precisely through 3
separateshould be
respected. Note the bottoms kept rising.
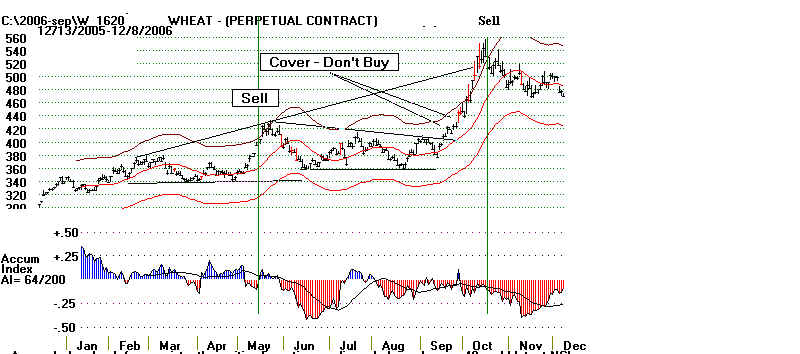
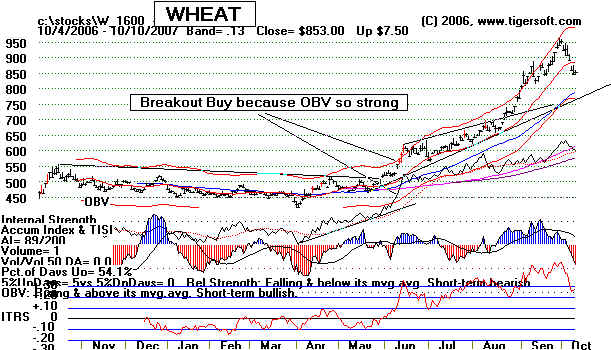
2006 - 2007 Wheat- W 1620
Sometimes prices rise without prior or accompanying high Accumulation.
In that case, we would normally expect to see hte OBV Line rising steeply.
This means there are no dips to buy patiently. Aggressive buying is predominates.
Look closely and you will see a gap on high volume in June. After such a long
sidewise pattern, the breakout must be respected. The high volume gap and strong
OBV can be taken as a Buy, but added care must be taken.
.
|

 Longer term Investing How To Make Your Retirement Nest-Egg
Grow: Rates of Return Tables
Longer term Investing How To Make Your Retirement Nest-Egg
Grow: Rates of Return Tables