 |
TigerSoft's INSIDER WATCH SYSTEM Buy the stocks showing intense, big-money, insider TIGER ACCUMULATION. These stocks have averaged +37%/year from 1990-2009, except for 2008. The "TIGERSOFT Accumulation Index" was originally invented by us back in 1981. Accept no weak immitations! Use the original. Discover exactly how to scan all stocks each night to find these stocks autmatically. (C) 2009 William Schmidt, Ph.D. All rights strictly reserved. |
TigerSoft scans all 7000 stocks for those showing
the major Buy Signals
like
those shown below...
THIS
CHART (KIRK) SHOWS EVERYTHING YOU NEED TO KNOW
ABOUT
WHAT AN EXPLOSIVE SUPER STOCK LOOKS LIKE
AT
THE START OF ITS MOVE. MEMORIZE IT!
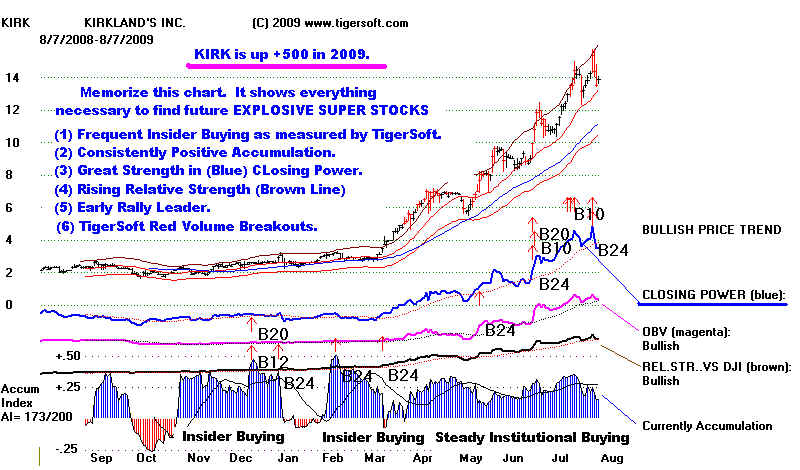
INSIDER BUYING SHOWS US
WHAT TO BUY
Insider
buying and selling are rampant. They are much more
widespead
than the numbers reported in SEC filings. TigerSoft's
measure of
insider buying is much more practical and realistic.
It exists
world-wide. We see it immediately. We see the buying
done by
those who are not officially considered "insiders" by
the SEC.
We measure it simply by watching our Accumulation
Index.
Moves by it above +.50 are considered insider buying.
Our automatic Buy
signals alert you to its presence.
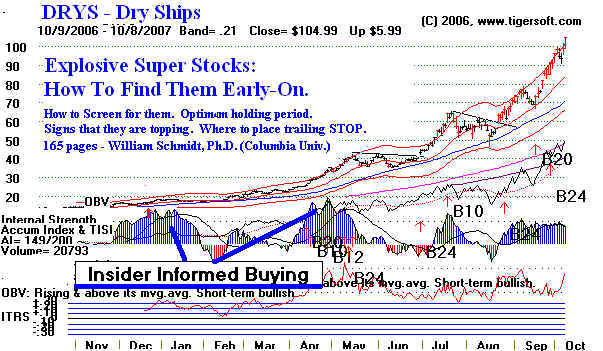
Discover why we recommended DRYS
at 20.
It hit 121 ten months later.
36%/yr. to 55%/yr. Explosive Super
Stocks: 1990-2007
Insiders knew IST was to be bought out.
#3 170 page TigerSoft Book
How To Spot Savvy Insider
Buying

36.2%/year: 1990-2007 - Buying
Qualified, Intensely Accumulated Stocks,
as displayed by TigerSoft and picked out by Tiger-Power-Ranker
Insider Buying
Tipped us off to buy Odyssey Exploration just before it doubled,
5/18/2007
- Tiger's Sunken Treasures' Stock. OMR
Chart below Shows Intense Accumulation's Aftermath.
From 1990-2006, the
"Insider-Watch" system has averaged +36.2% per year.
And using an easy-to-apply "stop loss" would have raised even these high returns
jump dramatically to more than 55%/year! 2006-2007 will raise this performance
statistic
2008 required taking profits earlier than normal because of the multiple Peerless
major Sell signals. But 2009 has brought wonderful games using the
Insider-Watch
system.
Buying only the most intensely insider
accumulated stocks
as flagged by Tiger-Power-Ranker and holding simply one year:
2007 June 2007 examples
2006 +27.7%
2005 +23.9%
2004 +40.9%
2003 +58.4%
2002 +19.0%
2001 + 1.0%
2000 +40.4%
1999 +175.6%
1998 -13.6%
1997 +7.3%
1996 +34.2%
1995 +37.5%
1994 +10.0%
1993 +14.0%
1992 +56.6%
1991 +29.6%
1990 +44.7%
-----------------
Yearly Gain = +36.2% in speculative stocks.
Book: "How
To Find Explosive Super Stocks Early in Their Move"
===> Order Book
More Examples
2006-2007 Biggest Gainers
2009 Explosive Super Stocks
Sample Tiger Chart
More Samples with Explanation
Powerful New proof of efficacy of Tiger's Accumulation Index
"Best and Worst
Performing Stocks of 2007"
Four Typical Phases of A Small
Stock: TASR

Let us show you how to find
EXPLOSIVE
SUPER STOCKS
at the Start of Their Moves:
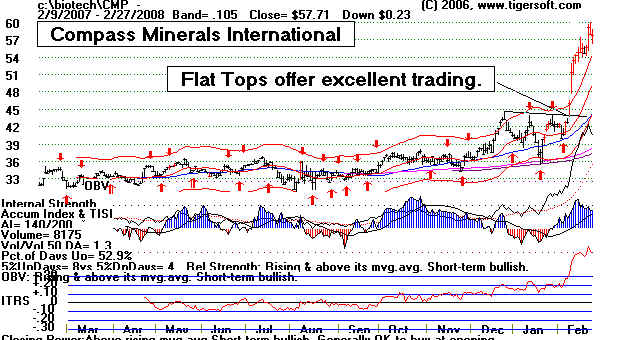
CMP - Compass Minerals International, Inc., through its subsidiaries, engages in the
production
and marketing of inorganic mineral products. http://www.compassminerals.com
170
Page Book by William Schmidt, Ph.D. - only $75....
The book's concepts will show you exactly how to recognize the very best Buys.
Each year, 80%-100 of the year's 10 biggest gainers
have exactly the same pre-conditions we wrote about 10 years ago
that were nearly always present in an explosive super stock
at the start of its big move.
Exactly - what a
perfect stock BUY looks like!
SIE went up in a bear market and kept on rising in
a bull market. Reaching 40 in 2003, it quadrupled in two years!
This is exactly what a potentially explosive super stock
looks like - even in a bear market.
How can you turn this discovery into a profit for you?
Run our Tiger-Power-Stock-Ranker each night,
or subscribe to our on-Line Elite Stock Professional Service.
Either way, the era's new stock-superstars will be found for you,
while they are still modestly priced and in their youth!
Run TIGER's Ranking and Flagging Software
against 7000 stocks.
It Easily Finds those Stocks Having the Most Bullish Signs of Big Money
Accumulation, Explosive Relative Strength and Aggressive Buying...
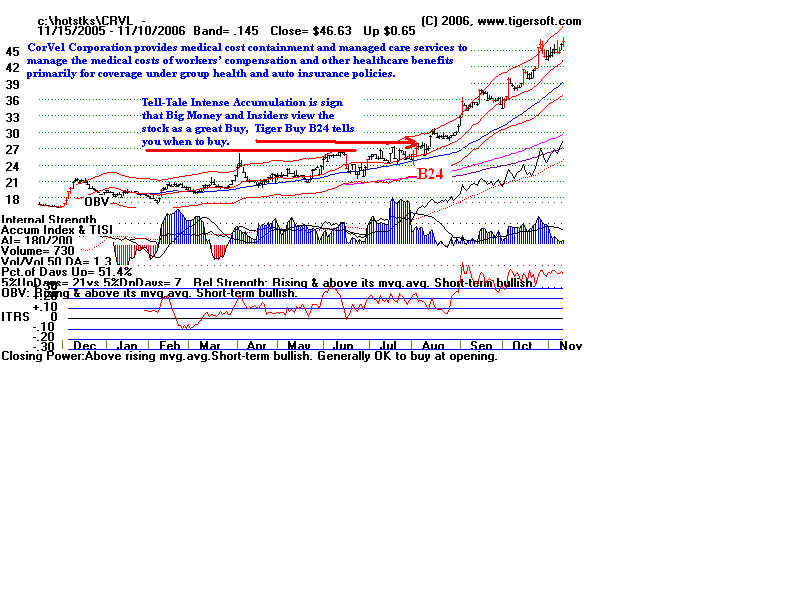
Note the major BUY signals in the Bullish charts below,
especially the Tiger "B10","B12",
"B20" and "B24".
These are the Keys to Finding New Super-Stars in their Youth.
Note the surge in the Tiger's Accumulation Index
as Savvy Insiders and Big Institutions Take
Their Positions.
"Someone on the Inside always knows in adance and
tells his closest associates! Count on It!"
As of 11/07/2003:
LCAV up 2158%
EVOL up 2158%
TRCI up 980%
TRID up 785%
NTPA up 581%
NOOF up 575%
QADI up 574%
ECHO up 558%
ONXX up 449%
LEIX up 438%
The relatively unknown stock below, USNA, had the same
early signs of a big, big move
coming that we described in the 1990's in this book. Note
the major BUY signals,
especially the Tiger B10,B12,B20 and B24 signals and
the surge in the Tiger Accumulation
Indexas Savvy Insiders and Big Institutions Take
Their Positions.
More details about TIGER's EXPLOSIVE
SUPER STOCKS:
>>> ORDER TIGER's
"Explosive Super Stocks" Book by Wm.Schmidt, Ph.D.