| Tiger Investment Software PO Box 9491 San DIego, CA 92169 858-571-3115 |
Tiger's Bullish Special SituationsPage 2 When To Sell
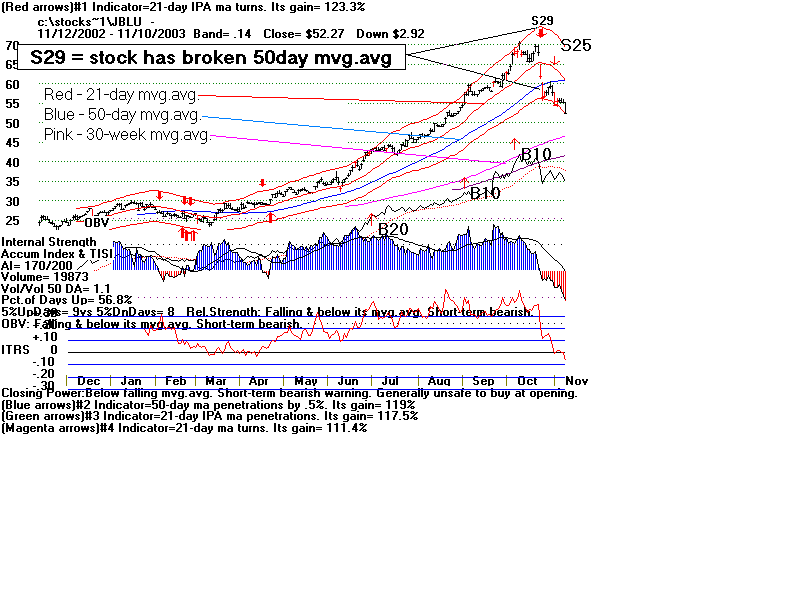
Only some of our Bullish Special Situations go up more than 100%. Few keep rising and rising. We have to know how to stay in the very strongest and let them run and, yet at the same time we have to know when to take profits. This balancing act is the subject of several of my Explosive Super Stocks book. One orthodox way to maximize profits in stocks like this is to let your profits run so long as a key moving average is not violated. TIGER users have found the 21 day, 50 day and 30 week moving averages very useful in defining the short-term, intermediate-term and longer-term uptrends, respectively. When a stock gets too far above it's 30-week moving average (the pink line) and too far above it's 50-day moving average (the blue line), we often suggest locking in profits when the stock finally closes below the 21 day moving average (the middle red line). This is especially true if it has been six months since the 21 day moving average was violated.
|
 |
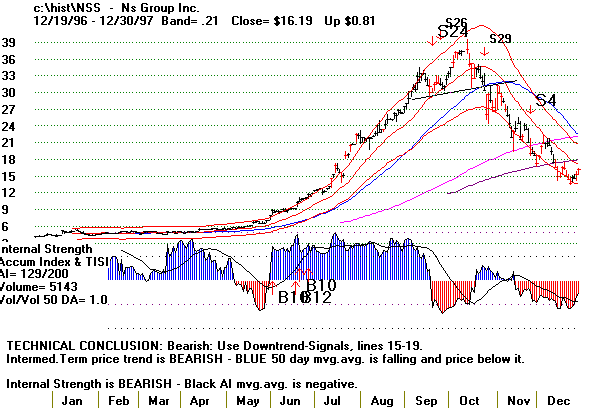
| Another way to determine when to sell our bullish special situations is to use our TIGER automatic sell signals. These will automatically tell you when key moving averages have been violated. That is the function of the "S29" and "S4". In addition, other signals alert you to subtle shifts in volume, when "big-money Accumulation" has turned to "big-money distribution" and when relative strength is starting to wane. You can see all these principles in the chart of NSS, shown just below.
|
 |
3-20-98