| Tiger Investment Software |
Tiger's Daily
Bullish Special Situations
Page 5 More Examples of
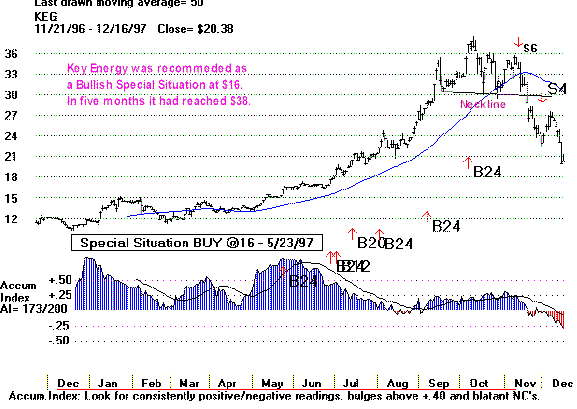
Below you see the 1997 chart of KEG. It more than doubled in a few months after being picked as the Bullish Special Situation stock on May 10, 1997 and June 3, 1997. TIGER users should have sold it after it doubled at $32, after it violated its 50-day moving average at $31 or on the appearance and completion of a bearish head and shoulders pattern with its violation of the neckline at $30.
|
 |
|
Page 1: Introduction: Tiger's Daily Bullish Special Situations Page 3: The 1997 Study of Bullish Special Situations Page 5: More Examples of Bullish Situations in 1997 Page 6: Conclusion: "Chasing Can Pay Off Big" or "Don't Sell Your Big Winners Too Soon"
|
2-27-98