


TigerSoft and Peerless Daily
Hotline
http://www.tigersoft.com/-SBL13HL
New HOTLINE
location
(C) 1985-2013 William Schmidt, Ph.D. www.tigersoft.com All rights strictly reserved.
---> To renew this Hotline, order here $350 (check) - $360(Visa/MC)
=====================================================================================
 A Guide To Profitably Using The
Tiger Nightly HOTLINE
A Guide To Profitably Using The
Tiger Nightly HOTLINE
TigerSoft and Peerless Links, Older
Hotlines...
Please report broken links to william_schmidt@hotmail.com
=====================================================================================
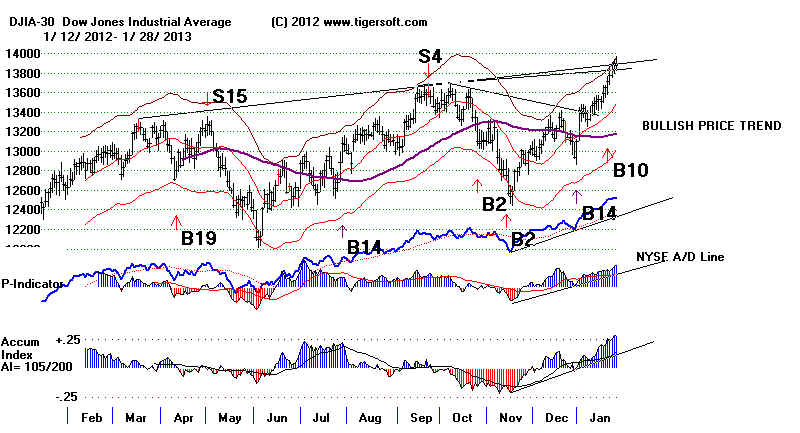
1/28/2013 Buy B10
How much higher can we go? Until there
is a Peerless Sell signal, the NYSE A/D Line breaks its uptrend or
the key ETFs' Closing Powers break their uptrends, I think we must
simply stay heavily long the highest Accumulation stocks and the
strongest big ETFs.
1/28/2013
Key Values: DJI
13882 -14 la/ma=1.029 21droc = .679
P= +553 Pch= +21
IP21 = +.284 V = +59
Opct = +.39
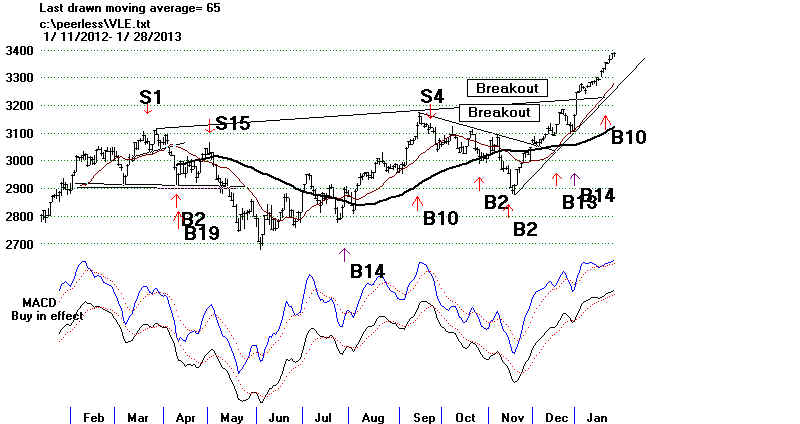
Value Line Is Already Making 12-Mo Highs.
Are we in a new "secular bull market"? Ones
that last only 4-5 years
are often said to be "cyclical bull markets"?
There are many ways
one could try to answer this important question.
My first reaction to this question, as a technician, is to look at the charts.
It suggests more caution now. But not immediately.
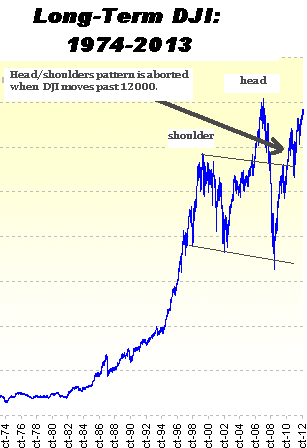
The longest DJI advances, those of the 1920s, the 1950s and the 1980s
and 1990s occurred after breakouts from long bases. Breakouts from such
bases are more bullish than simply a recovery back to an old high. Presumably,
there is a lot of pent-up energy that a breakout releases. By contrast, now,
we really do not have a long, multii-year base now that we can be said to be
breaking out of. Rather, the advance above 12000 seems more like a
short-covering advance that begun in earnest once the right shoulder apex was
surpassed. See the long-term chart below.
Technically, one would expect that the 2007 closing high at 14165 will pose
a lot of resistance because of how deep and scary the intervening decline
was down to 6500. This is a long-standing principle of technical analysis.
In fact, it is the failed rallies back up to the previous high that is what helps
set up a base which when broken brings about secular bull markets.
In fact, there were 3 failed rallies up to 110-120 between 1916 and 1924.
I count 5 failled rallies up to 980-1050 between 1966 and 1982. And there
were no less than 8 failed rallies between 150-210 in the period 1937-1948.
It was only when the DJI broke out above these bases that the DJI
made its longest advances, as shown below.
Aug 1921 - Aug 1929 (8 years)
Feb 1934 - Aug 1937 (3 years, 6 months
April 1942- May 1946 (4 years, 1 month)
Sept 1953 - November 1961 (8 years, 2 months
Aug 1982- Aug 1987 (5 years)
Oct 1990 - July 1997 (6 years, 9 months) - continuation of
1982-1987 advance
Oct 2002 - Oct 2007 (5 years) - recovery based on very easy credit for homowners.
March 2009 - ? - recovery based on very easy credit for big banks.
This is not to say that Federal Reserve policies cannot have a huge impact on
the length of a bull market. The long 5-year bull market from October 2002
to
October 2007 can be explained in part by how low the Federal Reserve
set
the Discount rates in 2001 and 2002, between 1% and 2%.
This
helped set the stage for the housing boom that followed.
The FED's lax regulation of the housing bubble and bank stocks' leverage
go
a long way in explaining the unusual length of the 2002-2007 bull market.
The present bull market, which started in March 2009 is now almost 4 years
old. But, if anything, the Fed is even more accomodating. And rhetoric aside,
the
Obama Administration and Congress seem just as accomodating to Wall Street
and big banks. So, I would think, the bull market will continue. But it will
take
a different shape. As was true from 1967-1969, I think the biggest gains
will be made in smaller stocks; the DJI, itself, will have a harder time, I suspect,
getting past 14200. The greater relative strength now seen in the Value Line
and
Russell-2000 is probably a sign of things to come.
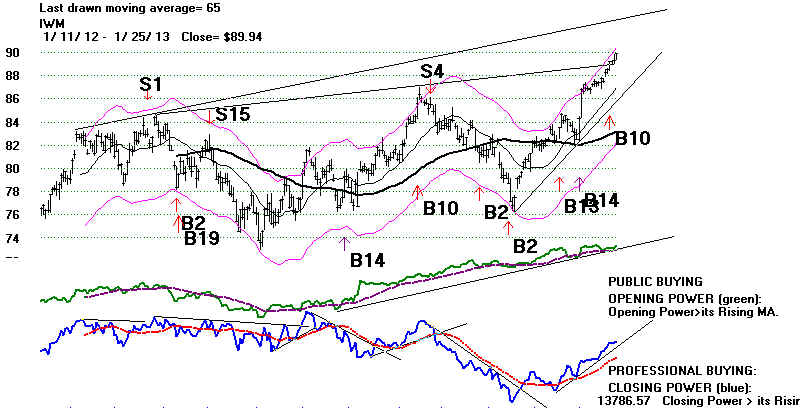
IWM (Russell 2000) and Peerless Automatic Signals
====================================================================================
OLDER HOTLINES
====================================================================================
1/25/2013 Buy B10
Buying Stampede? Don't Get Tranpled.
The DJI has now risen 11 of the last 12 days and is less than 200 points from
its all-time high closing of 14164.93 on 10/9/2007. DIA's Closing Power has
now risen
12 straight days. More on these streaks historically Monday night. .

1927 Cowboys, Horses, Bulls Stampede - W.R. Leigh
Yippie - Yi - Yo!
The
rush into stocks this January has ample precedent, as I showed a week ago.
Tops
are seldom made in the last two weeks of January. But usually January breakouts
that are going to advance past February also produce B12s and/or Buy
B4s. This
requires a strng of closes above the 3.0% upper band and very good breadth. All 8 of
January take-offs with a Buy B4 or B12 advanced into March before peaking and then
falling back to their 2.5% lower band. Such enhancing Buy signals have not yet
occurred.
January Take-Offs since 1966:
First Decline
First Decline
to 2% lower band
to 3.5% lower band.
1967 Buy B6, B10 ...
2/8/1967
5/8/67
1975
Buy B6, B4, B12 ...
3/18/1975
3/18/1975
1976
Buy B9, B10, B12,B4
3/24/1976
3/24/1976
1985
Buy B4
3/1/1985
none in 1985
1986
Buy B4
3/27/1986
5/29/1986
1987
Buy B6, B14, B4
4/6/1987
4/6/1987
1989 Buy B10, B4
2/7/1989
10/9/1989
1992
Buy B17, B10, B4
3/4/1992
6/1/1992
1993
Buy B18
2/5/1993
none in 1993
1995
Buy B6, B18
7/12/1995
none in 1995
1996
Buy B4
3/6/1996
3/19/1996
1997
Buy B17, B4
3/10/1997
3/10/1997
2011 Buy B18
2/10/2011
2/10/2011
2012
B6, B12, B10
3/16/2012
5/1/2012
2013
B14, B10
-------------
---------------
More cases and
their charts
The
Closing Powers are all rising, though they are over-extended short-term.
It is not often that we get 12 straight days where the close is above the opening.
One
warning sign of a top that is definitely NOT present is a
rising XAU, the
Philadelphia Stock Exchange of 15 Precious Metals' Mining Stocks. In fact,
gold
stocks now make a disproportionate share of the Bearish MINCP stocks:
EXK, ANV, ABX and NEM. I did a study of the XAU and
its ITRS (50-day
pct
change of XAU minus 50-day pct change of DJI) as a predictor of the DJI.
The
2012 year-end and January 2013 weekness of XAU's ITRS also occurred
in
1995 and 2003, when new bull markets were being sprung.
See new Blog ---> XAU
As Predictor of DJI: 1984-2013
A Perfect Confluence of Bullish
Factors
Much
of the rally stems from the end of tax-loss selling owing to the desire of
many
to capture gains in 2012 while taxes are lower and some of it in beaten-down
stocks is the result of the end of tax-loss selling for 2012. But without question,
there
is more retail customer optimism. Gold stocks are weak. There is more
confidence. Interest rates will not go up until the official unemployment level
drops
to 6.5%. And Republican threats to bring another debt-crisis as in 2011
have
dried up. All of which has produced a lot of hasty short-covering. We
can
actually see the effects of this is stocks like NFLX, which has rallied 60% in
the
last two days.
Its short interest fell from 13.2 million shares to 10.1 million
on 1/15. So, we
can imagine how stressed these short sellers have been. And this
could
easily become a pattern, as one group of professionals target the shares
of
other stocks with big short interest levels when earnings hold up, as was the
case
for Netflix.
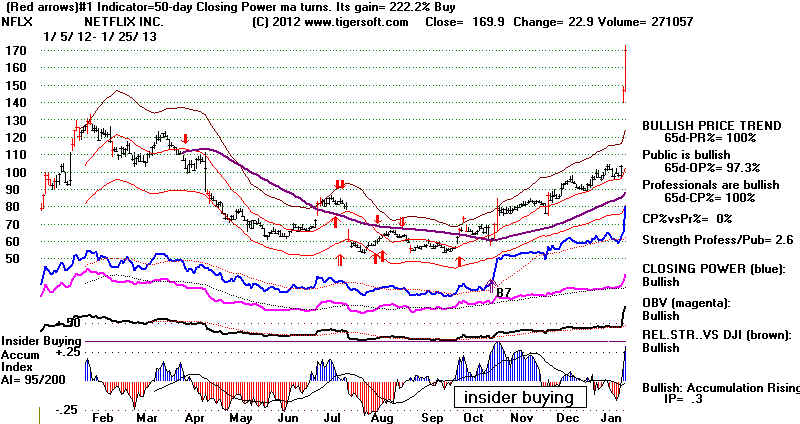
SHORT-COVERING RALLIES:
How Can We Find Them Early-On?
If you look closely at the chart above you will see that the day before it starting
rising so rapidly, its Closing Power rose back above its rising 21-dma. My friend
Fran in San Diego has suggested that this would be worth screening for. Accordingly,
I will be posting on the Tiger Data page each night all the stocks whose CP moves
back above its 21-dma and all those that fall back below its declining 21-dma.
These will be called CPCROSSA and CPCROSSD. I will start recording the
count of each every night here, because I believe that this should help us catch sight of
the
short-term swings of the market. You can easily see the biggest short positions
on th\e NASDAQ here.
I think it will be productive to start following these stocks
with the biggest, say, 50 short positions. I understand that some may prefer to
work with the stocks with the biggest short interest. That should also be possible.
Below is our Tiger Index of the 42 most shorted stocks.
1/25/2013 Key
Values: DJI 13896 +71 la/ma=1.033
21droc = .671 P= +532
Pch= +61
IP21 = +.286 V = +63
Opct = +.384
1/25/2013 To Key Index and Stock Charts
DIA SPY QQQ IWM
S&P OEX NYSE
Value Line
DJIA-Peerless GLD
SLV Crude Oil Foods EURO Dollar 10-Year Rates
Tiger -Bonds Big Banks IBB-BioTechs Military Home-Building Stocks
- Key Stocks AAPL
ADBE GOOG
AMZN EBAY
Biotechs: AMGN ALXN CELG GILD
REGN
and 6 highest priced DJI stocks: IBM CAT CVX MCD MMM and XOM
plus JPM
GS NEM and
F
---> 455 MAXCP stocks Bullish MAXCP Stocks (1/25/2013) BULLish plurality
---> 49 +14
MINCP stocks Bearish
MINCP Stocks (1/25/2013)
--->
124 New Highs on NASDAQ
7 new lows. BULLish plurality
--->
219 New Highs on NYSE
8new lows. BULLish plurality
=====================================================================================
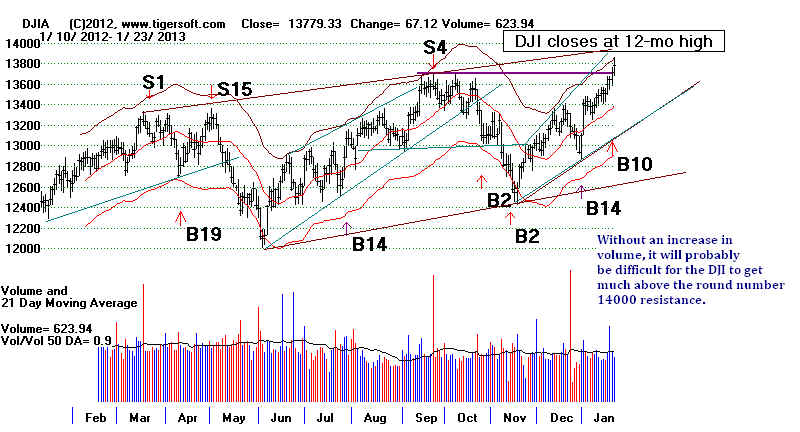
1/24/2014 Buy B10
AAPL's 12% plunge today might
easily have unsettled
a
lesser market. But we are still seeing heavy Professional buying and what
looks
like might be a gathering speculative binge. See below how steady is the
rise
of the blue Closing Powers.
Last
night, I showed how reliably bullish are January Automatic Buy B10s
and
breakout surges. The DJI round number 14000 is expected to be both
a
magnet and a barrier, too.
The Closing Powers for DIA, SPY and QQQ are much stronger than their
Opening
Powers. The pattern is now well established: dull openings followed
by
impressive closes. I suspect we will see the Opening Powers turning up
before too
long. Then if Closings remain strong, we will see even more impressive
gains.
Needless to say, AAPL's weakness is spoiling the QQQ for the bulls.
1/24/2013 To Key Index and Stock Charts
DIA SPY QQQ IWM
S&P OEX NYSE
Value Line
DJIA-Peerless GLD
SLV Crude Oil Foods EURO Dollar 10-Year Rates
Tiger -Bonds Big Banks IBB-BioTechs Military Home-Building Stocks
- Key Stocks AAPL
ADBE GOOG
AMZN EBAY
Biotechs: AMGN ALXN CELG GILD
REGN
and 6 highest priced DJI stocks: IBM CAT CVX MCD MMM and XOM
plus JPM
GS NEM and
F
---> 448 MAXCP stocks Bullish MAXCP Stocks (1/24/2013) BULLish plurality
---> 35
MINCP stocks Bearish
MINCP Stocks (1/24/2013)
--->
111 New Highs on NASDAQ
5 new lows. BULLish plurality
--->
218 New Highs on NYSE
9 new lows. BULLish plurality
==================================================================================
1/23/2014
Buy
B10 January Automatic Buy B10s Are Reliably Quite Bullish.
The round number
14000 will likely act as a magnet and a barrier, too. For now,
institutions are
still taking positions aggressively for more of a rally that could
easily last until
March or April for the DJI and much longer for the high Accumulation/
high Closing
Power "Bullish MAXCP Stocks".
1/23/2013 Key
Values: DJI 13779 +67 la/ma=1.029 21droc = .416 P= +402 Pch= -58
IP21 = +.238 V = -7
Opct = +.144
Today's DJI
jump owed entirely to IBM's 8.64 gain. There were slightly more decliners
than
advancers on the NYSE. Some of the big biotechs, AMGN, ALXN,
BIIB, ILMN
and TEVA
have broken down below falling 65-day ma. And AAPL's
earnings out after
the close
are said to be disappointing.
But the SPY, DIA and IWM Closing Powers are still rising and, above all,
the history
of Peerless
automatic Buy B10s suggests prices will most likely continue to rise without
much of a
pullback for another 6 weeks, at least. Of the 10 January automatic Buy B10s
since 1928,
only one was followed by a decline to the lower band. That was in 1979.
The 1983
case might also be considered a case, too. But in these cases the declines
were
temporary and relatively shallow. Holding the best performing stocks worked out
very well
in those years, too. As you can see in the table below, January DJI-breakouts
which were
only judged Buy B10 breakouts (No B10 appears in their cases) mostly
(60%) also
were followed by rallies that lasted, as least, until March.
Our present
2013 B10 case shows the highest IP21 value (current level of the Tiger Accum. Index)
of any of
the January automatic B10s. No doubt, there is an institutional rush into the
market.
I would
think the DJI itself will face very heavy overhead resistance at the round number 14000.
But, rather
than try to be too clever, I think we should just let the market run until there
is a new
automatic Peerless Sell or the Closing Powers reverse course.
------ January Buy B10s since 1928
------------------------------------------------
Gain la/ma
ann-roc
P-I ch
AdjP-I IP21 V-I Opct
Current Case
1/22/2013
1.026 .411 460 +57 +460 .263
12 .146
1. Auto 1/25/1943 +14.6% 1.028 .516 108 +19
+549 .113 +57 .121
No pullback... Up steadily until May.
Judged 1/15/1954 big gain
1.017 .313 82 _37 +275 .094 +13
.046
No pullback...Up steadily until August
2. Auto 1/5/1961
big gain 1.016 .569 120 +28 +351
.085 +129 .18
No pullback...Up steadily until May.
Judged 1/8/1964 big gain
1.015 .222 33 +13 +93
-.004 -171 .37
No pullback...Up steadily until May.
3. Auto 1/12/1967 +6.9% 1.033 .14 144 +3
+286 .011 +3 .109
No pullback...Up steadily until May.
4. Auto 1/22/1971 +8.8%
1.024 .547 322 +11 +705
.114 +2 .545
No pullback...Up steadily until May.
5. Auto 1/6/1972 +5.6%
1.033 .694 246 +13 +528
.066 +2 .391
No pullback...Up steadily until April.
Judged 1/27/1975 big gain
1.076 1.636 422 +44 +802 +.134 +3 .492
No pullback...Up steadily until July.
6. Auto 1/7/1976 +12.3% 1.057 1.124 286
+35 +539 .200 +2 .534
No pullback...Up steadily until March,
7. Auto 1/15/1979 +6.9% 1.042 .568 133
+42 +252 .108 +2 .321
Pullback to lower band...Then up until
April.
( 1/7/1983 Sell S12
1.04
.334 48 +12 +95 -.062 +1
.002 )
Pullback to lower band... Then up until
October.
Judged 1/21/1985 Big gain 1.041
.525 237 +38 +469 +.097 +8 -.113
Pullback to point of breakout in March and then up strongly.
Judged 1/7/1987 20.6%
1.033 .426 -11
+57 -22 +.149 -3 .096
No pullback...Up steadily until July.
8. Auto 1/12/1989 big
gain 1.023 .454 118 +21
+204 .078 +11 .185
First peak was 2/8/1989 with decliune to lower band.
9. Auto 1/31/1990 big
gain 1.051 .367 109
+18 +201 .062 +7 .133
No pullback until March.
(Auto 12/27/92 +6.6% no
pullback until April).
Judged 1/29/1996 4.6%
1.029 .484 88 +9
+113 +.198 -7 .183
No pullback...Up steadily until March
Judged 1/10/1997 3.8%
1.035 .424 102 -11 +.125 +.055 -5
.304
Pullback below lower band started with S9 on 2/12/1997.
Judged 1/7/1999
1.05 .614 23 -58 +22 +.075 +2 .13
DJI immediately pulled back to the lower band.
Judged 1/11/2006
1.016
.291 358 -14 +330 +.034
+57 .116
DJI immediately pulled back half way to the lower band.
Judged 1/11/2010
1.016
.371 533 +10 +518
+.017 +65
.40
DJI immediately pulled back to the lower band.
Judged 1/3/2011 +9.7%
1.016 .320 277 +11 +277 +.001
+117 .135
No pullback...Up steadily until May
10. Auto 1/18/2012
+4.9% 1.023 .690
553 +46 +553 .125 +95 .108
No pullback until March.
1/23/2013 To Key Index and Stock Charts
DIA SPY QQQ IWM
S&P OEX NYSE
Value Line
DJIA-Peerless GLD
SLV Crude Oil Foods EURO Dollar 10-Year Rates
Tiger -Bonds Big Banks IBB-BioTechs Military Home-Building Stocks
- Key Stocks AAPL
ADBE GOOG
AMZN EBAY
Biotechs: AMGN ALXN CELG GILD
REGN
and 6 highest priced DJI stocks: IBM CAT CVX MCD MMM and XOM
plus JPM
GS NEM and
F
---> 469 MAXCP stocks Bullish MAXCP Stocks (1/23/2013) BULLish plurality
---> 30
MINCP stocks Bearish
MINCP Stocks (1/23/2013)
--->
75(-21) New Highs on NASDAQ
4 new lows. BULLish plurality
--->
180 (-72) New Highs on NYSE
1 new lows. BULLish plurality
=====================================================================================
Mid-Morning 1/23/2014 Comment
I left out the
red words in the key first sentence in last night's Hotline.
Peerless remains on a Buy B14. The new Buy B10 signal today
registers the new closing high for the DJI more than it shows how
much higher the DJI can go. Volume did not rise on the DJI's new
high necause the SP-500, Value Line and NYSE had already made
made new highs.
Mid-Morning additional commentary:
The type of "V" bottom we are seeing does sometimes being a pullback
after another 1% to 2% more DJI gain, but, on the other
hand, if you look at all the cases where the Peerless "V-I" was lagging
and negative, as was true on Friday's close, you can see that there
are many more historical cases of a continued move up than a retreat of 3% or 4%.
How much higher? I would say, as long as the Closes are strong, the
market is going to keep rising. But a very strong opening (75 points up
or more) and then a weak close would be a reversal sign. The DJI 14000
round number is the next most likely level of high resistance.
1/22/2013
Peerless remains on a Buy B14.
The Buy registers the new closing high
for the DJI more than
it sshows how much higher the DJI can go. Volume did not rise
on the DJI's new high
necause the SP-500, Value Line and NYSE had already made
made new highs.
Consolidation just beneath the old highs would have been more bullish.
But as you can see from
the Bullish MAXCP stocks there are a great many stocks
show ing very high
levels of Accuulation as they break out to new 12-mon highs. Normally
these bulges occur 6
months to a year, or a more, before the final new highs.
This is a broad
advance. 27 of the 30 groups of stocks we follow
show a majority of
their component stocks are above their 65-dma.
1/22/2013
To Key Index and Stock Charts
DJI with Peerless Signals
DJI-volume
DIA with CP SPy with CP QQQ with CP IWM with CP S&P OEX NYSE
Value Line
DJIA-Peerless GLD
SLV Crude Oil Foods EURO Dollar 10-Year Rates
Tiger -Bonds Big Banks IBB-BioTechs Military Home-Building Stocks
- Key Stocks AAPL
ADBE GOOG
AMZN EBAY
Biotechs: AMGN ALXN CELG GILD
REGN
and 6 highest priced DJI stocks: IBM CAT CVX MCD MMM and XOM
plus JPM
GS NEM and
F
---> 524 MAXCP stocks Bullish MAXCP Stocks (1/22/2013) BULLish plurality
---> 28 +2
MINCP stocks Bearish
MINCP Stocks (1/22/2013)
--->
160 New Highs on
NASDAQ 2 new lows. BULLish plurality
--->
321 New Highs on NYSE
3 new lows. BULLish plurality
---> 1/22/2013 Stock Sector Ranking: 27 up and 3
down.
Strongest:
12/22/2013
12/24/2012 12/12/2012
---------------------------------------------------------------------------------------------------------------------------------------------------------------------------------------------
Homebldg
100.0% +29.2%
70.8% +4.1 66.7%
BigBanks
100.0% +14.3% 85.7% 28.6
57.1%
Pipeline 100.0% +83.3% 16.7%
16.7%
Reits
97.6% +14.0% 82.6% 61.2 21.4%
Transp
97.4% +19.0% 73.4% +8.8
64.6%
Military
96.3% +11.1%
85.2% +18.5
66.7%
Chem
94.6%
+26.7% 67,9% +3.6
64.3%
Insurance
93.6% +21.9%
61.7% -.4 68.1%
Gaming 93.3% 26.6% 66.7% +20 44.7%
Finance
92.7% +19.1%
73.6% 19.1 54,5%
For.ETFS
90.9% +8.5% 81.8% -8.9 90.9%
IndMaterials
90.6% +21.1% 69.5% +6.2
63.3%
Should We Worry about the Negative V (Volume) -Indicator Reading with the
DJI
with the DJI 2..3% over
the 21-dma in a rising market with DJI at or near 12-month high,
as was true Friday? The studies below show that without a Peerless Sell signal, there is a
much
greater probability of
a continued advance than a decline back as far as the lower band
or the rising 65-dma.
It should be added, though that a negative NNC by the V-I does
make more reliable a
Peerless Sell signal, should one occur.
First here are some
cases since 1945:
la/ma ann-roc
P-I ch
AdjP-I IP21
V-I Opct
3/21/1946
1.026 .037
51 57
202 .09
-93 -.071
DJI rallied from 196.7 to 212.50 (sell S5/S4) before starting a 4.5 mo 23% decline
7/23/1951
1.024 .253
6 22
21 .174 -122 .044
DJI rallied from 255.7 to 276.40 before retreating
to the lower band.
12/7/1952
1.025 .329
46 4
141 .029 -10 .066
DJI rallied from 267.00 to 275.40 before retreating to the lower band
11/4/1954
1.025 .12 -18 12
-59 -.055
-148 -.011
DJI surged into all-time high territory a month later and rallied
strongly until 1956. to 275.40
12/6/1956
1.029 -.067
-83 -20
-262 -.078 -316 -.143
DJI rallied from 492.70 to 499.50 (S9/S12) before retreating to 454.80.
11/6/1958
1.023 .341
37 6
117 .077 -132 .076
DJI rallied from 554.90 to 567.50 (S9/S12) before briefly dipping back to 540.50.
2/24/1959
1.023 .137
37 4
112 -.056 -110 .075
DJI rallied from 602.90 to 678.10 (S4) and then fell back to 616.50
5/17/1960
1.028
.259
64 19
187 .04 -57 -.063
DJI fell back to lower band, only 2% to
rising 65-dma buy.
11/9/1962
1.024 .265
54
1 157
.059 -39
.033
DJI rallied from 722.30 to 734.30 three days later and then collapsed 27% in 7 months.
4/7/1972
1.023 .215 -75 -5
-159
.064 -1
.018
DJI fell back to lower band. Also S9/S15.
8/4/1972
1.024 .265
54
1 157
.059 -39
.033
DJI rallied from 722.30 to 734.30 three days later and then fell to 2/5% lower band.
11/1/1972
1.026 .178
42 38
91 -.046 -1
-.007
DJI rallied from 958.54 to 1051.70 over next 10 weeks. Buy B10.
1/5/1973
1.023 .238
-77 -7
-149 .039 -2 .053
This was major top. Accompanying S9/S12/S15.
4/10/1975 1.024 .162
-84
25 -158 .042 -1
-.15
DJI rallied from 781.29 to 881.81 over next 3 months.
6/17/1976
1.027 .168
15 36 29 .082
0 .052
DJI fell back to lower band. Also
S2/S5.
10/11/1978 1.032 .068 -126 12 -261 -.124
-4 -.101
DJI fell back to lower band. Also S9/S12
8/7/1979 1.024
.097 +50
11 +95 .181 0 +/047
DJI rallied from 863.14 to 897.611 over next 3 months.
I will
check the rest. But the pattern is clear. Without a Peerless Sell,
the type of
negative non-confirmation we now see is not likely to prevent
higher
prices.
The difference in
outcome between the next two cases show that the
rate of change of the
21-dma and the level of IP21 are very important.
The 1986 and 1987 cases
show that January bullishness over-rides
the V-I NNC (negative
non-confirmation).
la/ma ann-roc P-I
ch AdjP-I
IP21 V-I Opct
10/18/1985
1.023 -.009 -1
47 -2
-.031 -2
.087
DJI fell back to lower band. There was no
Peerless Sell presently.
but
la/ma ann-roc
P-I ch
AdjP-I IP21
V-I Opct
10/14/1986
1.025 +.318 -34 66 -67 +.052
-1 .095
DJI began a huge advance,
1/31/1986
1.024 +.258 + 98
38 +187 +.088 -3 .058
DJI rose 15% in next 10 weeks.
1/5/1987
1.024 +.149 -88 73 -173 +.094 -13 -.121
DJI rose 15% in next 10 weeks.
12/23/1992 1.039 +.368 -32 44
-59 +.064 -8 .054
DJI rose 19o% in next 14 weeks.
11/6/1996 1.025 +.417 45
62 58
+.094 -3 .062
DJI rose 10% in next 4 months.
2/4/1998 1.037 +.229
55 3
85 +.122 -12 .062
DJI rose 10% in next 10 weeks.
and the big rally in 1999 despite multiple V-I NNCs.
10/15/2003 1.025 +.294
305 -102 295
+.016 -30 .026
DJI rose 10% in next 3 months.
and the big rally in 2009 despite multiple V-I NNCs.
Other cases of
interest..
la/ma ann-roc
P-I ch
AdjP-I IP21
V-I Opct
10/18/1991
1.023 .209 +73
-4 135
.027
-3 -.038
low
DJI fell back to lower band. There was no
Peerless Sell presently.
--------------------------------------------------------------------------------------------------------------------------------------------
Next here are the cases
where the DJI was testing it earlier high from a few months before
after a 7.5% to 13.5%
decline.
Date
Size of
Outcome
Intervening
Decline
Jan 1981
9.1%
Nominal new high and then decline to lower band. Sell S9
Peak 1/6/1981 la/ma
ann-roc
P-I ch
AdjP-I IP21
V-I Opct
Key Values: 1.059 .381
61 43
107 .031 -1 .11
V-Bottom: 11/20/1980 -> 12/11/1980 -> 1/6/1981
Length 1 months and 17 days.
------------------------------------------------------------------------------------------------------------------------------------------------
Feb 1980
11.0%
False breakout and 16% decline: S9/S12/S15
False breakout: 2/13/1980 la/ma
ann-roc P-I ch AdjP-I
IP21 V-I
Opct
Key Values:
1.028 .478 -26 1 -50
-.01 -1
.168
Semi-V-Bottom: 10/5 -> 11/7 ->2/13/1980
Length 3 months and 8 days.
-----------------------------------------------------------------------------------------------------------------------------------------------
Dec 1959
9.0%
"False breakout". Nominal new closing high
(breakout)
and 10 month decline. Sell
S12 and S15
la/ma
ann-roc P-I ch
AdjP-I IP21
V-I Opct
Peak's key values: 1/5/1960 1.018 .400
+4 +6 13
-.038 -170 .095
Semi-V-Bottom: 8/3/59 -> 9/22/59 ->1/5/1960
Length 5 months and 2 days.
=======================================================================================
1/18/2013
Peerless remains on a Buy B14.
The DJI has made a new 12-month closing high.
It still needs to close above 13700 to
achieve what will look like a price breakout, because the
close is above the previous 12 months'
highest intra-day levels. The S&P-500,
NYSE and
Value
Line have already done this. Apple
is still lagging. This helps account for why the
QQQ
and NASDAQ are lagging.
The history of the DJI forming V-Bottom
Price bottoms, like we see now, and other
bottom formations that last less than 5
months seems worth studying. Of the 17 cases,
only 6 produced a strong advance.
11 brought declines, 6 of which took the DJI far
below the lower band. Fortunately,
without a Peerless Sell signal, there were no
significant declines below the lower
band. I gleaned these from no less than 48
bottoms made with a low 7.5% to 13.5%
below the highest close.
1/18/2013
Key Values: DJI 13650 +54 la/ma=1.023 21droc = .267 P= +403 Pch= -26
IP21 = +.202 V = -12
Opct = +.054
The still negative
-12 V-I readings now may be a problem but it is contradicted by high
IP21 readings of +.202. I think what is going on now is that we see selling in some
higher
priced, big growth stocks, AAPL MRK,
TEVA and AMGN, for example, and that some
money is being used to buy
smaller companies. But growth stocks are still favored,
Specualtion has not gone to an
extreme. While the sample 217 Low-Priced Stocks in
our Tiger download show 69.6% are
above their 65-dma, 79.4% of our Higher Priced
stocks above their 65-dma.
Re-investment is typical as a new year starts.
Conclusion:
as long as the Closing Powers for the key ETFs are rising and there is no
Peerless sell signal,
I would give the market more chance to advance. As I noted a
few days ago, very few tops
are made in the second half of January. At the same time,
we should watch to see if there is
an increase in stocks appearing in our MINCP
group.
.
----------------------------------------------------------------------------------------------------------------------------------------------------------
7.5%-13.5% Corrections
That Last Less Than 6 Months
and Their Outcome
Ranked from Shortest to Longest
Size of
Outcome
Intervening
Decline
-------------------------------------------------------------------------------------------------------------------------------------
Current Case 7.6%
Close above 13700 for clear breakout. Outcome?
No new Peerless Sell
V-Bottom: 9/14/2012 > 11/15/2012 bottom > new closing high 1/18/2013
Length 3 months and 4 days.
--------------------------------------------------------------------------------------------------------------------------------------
Previous Case ranked by length:
9.1% January 1981
Nominal new high and then decline to lower band. Sell S9
Peak 1/6/1981 la/ma
ann-roc P-I
ch AdjP-I
IP21 V-I
Opct
Key Values: 1.059 .381
61 43 107
.031 -1
.11
V-Bottom: 11/20/1980 -> 12/11/1980 -> 1/6/1981
Length 1 months and 17 days.
--------------------------------------------------------------------------------------------------------------------------------------
9.8%
April 1997 Breakout followed by 15% rise in 3 months. B4
Breakout 5/5/1997 la/ma
ann-roc P-I
ch AdjP-I
IP21 V-I
Opct
Key Values: 1.07
1.221 +249 +44
+304 .183 +37 .175
V-Bottom Dates: 3/11/97 -> 4/11/97 ->5/5/97
Length 1 months and 25 days.
-------------------------------------------------------------------------------------------------------------------------------------
10% April 1935 Bull market continues.
Breakout and pull-back only to point of breakout.
Breakout key values
la/ma
ann-roc P-I ch
AdjP-I IP21 V-I
Opct
4/22/1935 1.071 1.231
80 -6 449
.169 74 .394
V-Bottom: 2/18/35 -> 3/18/35 -> 4/18
Length 2 months
--------------------------------------------------------------------------------------------------------------------------------------
8.0% September 1986 Nominal new high and then 9% decline. Earlier S9
Peak 9/4/1986 la/ma
ann-roc P-I
ch AdjP-I
IP21 V-I
Opct
Key Values: 1.032 .916
214 29
410 .26 20
.384
V-Bottom: 7/2 -> 8/1 -> 9/4/1986
Length 2 months and 2 days.
--------------------------------------------------------------------------------------------------------------------------------------
8.1% October 2007 False breakout 9% decline. S4
False BO 10/1/2007 la/ma
ann-roc P-I
ch AdjP-I
IP21 V-I
Opct
Key Values:
1.038 .747 +313 +110
+282 +.089 +73 .346
V-Formation Dates: 7/19/2007 -> 8/16/2007 -> 10/1/2007
Length 2 months and 13 days.
--------------------------------------------------------------------------------------------------------------------------------------
8.0% August 1951. DJI pulled back 1%, rose 4% and then fell to the lower band.
Peak 8/6/1951 la/ma
ann-roc P-I
ch AdjP-I
IP21 V-I
Opct
Key Values 1.034
.707 142 8
433 .199 126
.262
Semi-V-Bottom: 5/3 -> 6/28 - 8/6/1951
Length 3 months and 1 days.
--------------------------------------------------------------------------------------------------------------------------------------
11.4% July 1936 Bull
market continues.
Breakout and pull-back only to breakout for one day.
Breakout key values
la/ma
ann-roc P-I ch
AdjP-I IP21 V-I
Opct
7/17/1936 1.029 .489
35 -12 155
-.004 11 .254
Semi-V formation: 4/6/1936 -> 4/29/1936 -> 7/15/1936
Length 3 months and 9 days.
--------------------------------------------------------------------------------------------------------------------------------------
11.0% February 1980 False
breakout and 16% decline: S9/S12/S15
False breakout: 2/13/1980 la/ma
ann-roc P-I ch AdjP-I
IP21 V-I
Opct
Key Values:
1.028 .478 -26 1 -50
-.01 -1
.168
Semi-V-Bottom: 10/5 -> 11/7 ->2/13/1980
Length 3 months and 8 days.
-----------------------------------------------------------------------------------------------------------------------------------------
13.5% October 1950. DJI
peaked on breakout and declined to lower band. Sell S8.
la/ma ann-roc
P-I ch AdjP-I
IP21 V-I Opct
Peak Key Values: 10/4/1950 1.03 .595
143 15 518 .133 169 .445
Semi-V-Bottom: 6/12 -> 7/14 ->10/3/50
Length 3 months and 21 days.
--------------------------------------------------------------------------------------------------------------------------------------
10% August
1956. DJI fell 10% after testing previous high. Sell S2.
Peak 8/1/1956 la/ma
ann-roc P-I ch AdjP-I
IP21 V-I
Opct
Key values: 1.015 .826
88 5
282 .108 33 .496
Semi-V-Formation: 9/23 -> 10/10 -> 11/5/55
Length 3 months and 25 days.
---------------------------------------------------------------------------------------------------------------------------------------
10% April 1946: Breakout but quick decline back 2.5% lower band.
Breakout point:
la/ma
ann-roc P-I ch
AdjP-I IP21 V-I
Opct
4/9/1946 1.048
.909 125
37 488 .237 109
.263
Semi-V Bottom: 2/4/46 -> 2/26 -> 4/9/46
Length 4 months and 5 days.
------------------------------------------------------------------------------------------------------------------------------------------
8.6% September
2012 False Breakout. 8% decline develops. Sell S4
False BO 9/13/2012 la/ma
ann-roc P-I
ch AdjP-I
IP21 V-I
Opct
Key Values:
1.026 .332 +403 +86 +403
+.06 +59 +.126
V-Bottom: 5/1/2012 > 6/4/2012 -> 9/13/2012
Length 4 months and 12 days.
------------------------------------------------------------------------------------------------------------------------------------------
9.5% May 1990
breakout followed by re-test of breakout point and 5% rally.
Breakout 5/21/1990
la/ma ann-roc
P-I ch
AdjP-I IP21 V-I
Opct
Key Values: 1.04 .649
101 54 198
.122 19 .455
Formation Bottom Dates: 1/3/90 ->1/30/90 ->5/21/1990
l Length 4 months and 18 days.
------------------------------------------------------------------------------------------------------------------------------------------
9.0% December 1959.
Nominal new closing high (breakout) and 10 month
decline.
Sell S12 and S15 called this "false
breakout".
la/ma
ann-roc P-I ch
AdjP-I IP21 V-I Opct
Peak's key values: 1/5/1960 1.018 .400
+4 +6 13
-.038 -170 .095
Semi-V-Bottom: 8/3/59 -> 9/22/59 ->1/5/1960
Length 5 months and 2 days.
--------------------------------------------------------------------------------------------------------------------------------------------
10.6% October 1965. 2% rise and 4% pullback and more new highs. B11 on oullback.
la/ma ann-roc P-I
ch AdjP-I IP21
V-I Opct
Breakout's key values 10/19/1965 1.013 .211 38
-7 106 -.073 8 -.024
Semi-V-Bottom: 5/14/65 -> 6/28/65 ->10/19/1965
Length 5 months and 5 days.
--------------------------------------------------------------------------------------------------------------------------------------------
10% November
1955. DJI stopped at previous peak exactly for 2 months
and then re-tested lower band before running to new highs.
la/ma ann-roc P-I
ch AdjP-I
IP21 V-I Opct
Peak's Key Values 11/16/1955 1.05 1.064 131
-10 + 376 .130 119 .439
Bottom Formation: 9/23/55 -> 10/11/55 -> 3/6/1956
Length 5 months 13 days
-------------------------------------------------------------------------------------------------------------------------------------------
13.4% March 1972
DJI
rallied 5% after testing point of breakout.
la/ma ann-roc
P-I ch AdjP-I IP21
V-I Opct
Breakout's Key Values: 3/1/1972 1.022 .433
58 8 125 .065
0 .189
V-Bottom: 9/6/1972 -> 11/23/72 ->3/1/1972
Length 5 months and 26 days.
-------------------------------------------------------------------------------------------------------------------------------------------
The sense I get looking at all these cases is
that without a Peerless Sell signal, it is usually
best to assume that there will be still
higher prices. I reach the same conclusion seeing
how well all many our Bullish MAXCP
stocks are doing. Professionals remain bullish.
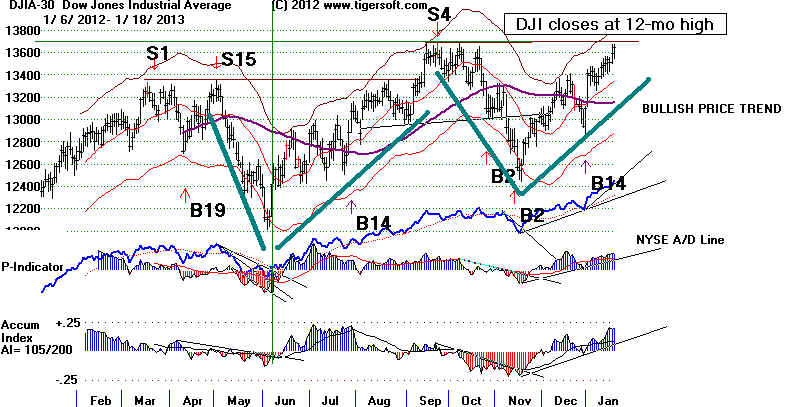
1/18/2013
Key Values: DJI 13650 +54 la/ma=1.023 21droc = .267 P= +403 Pch= -26
IP21 = +.202 V = -12 Opct = +.0542
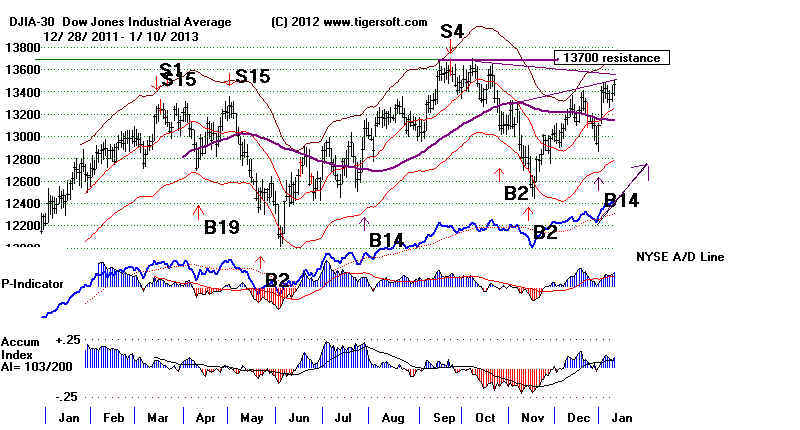
Peerless Automatic Buys and Sells on DJI
P-I, A/D Line and Tiger Accum. Index
Buy B14 is Operative Peerless Signal.
S= Sell B = Buy
Note the two V-Formations in the last year.
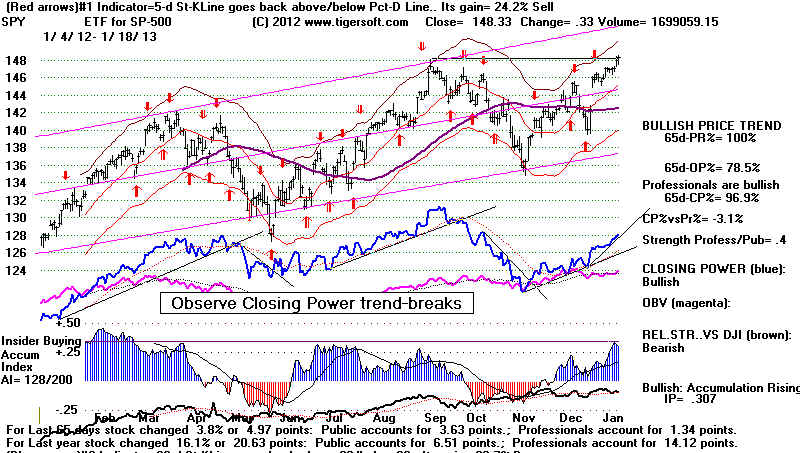
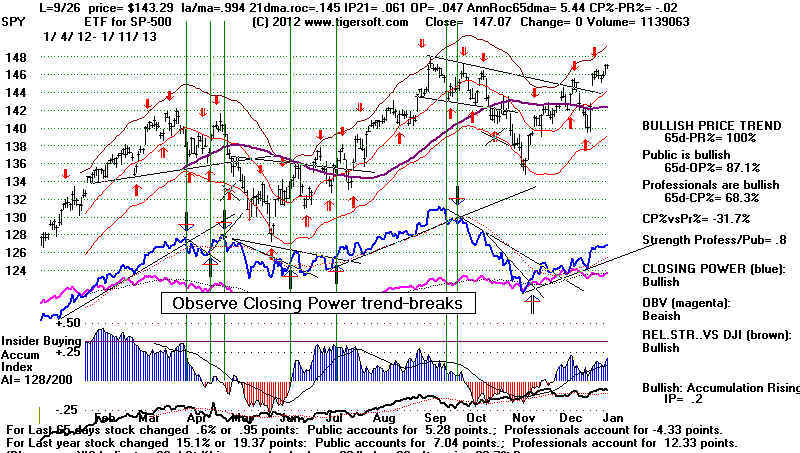
SPY's Closing Power Is Still Rising
1/18/2013
To Key Index and Stock Charts
DIA SPY QQQ IWM
S&P OEX NYSE
Value Line
DJIA-Peerless GLD
SLV Crude Oil Foods EURO Dollar 10-Year Rates
Tiger -Bonds Big Banks IBB-BioTechs Military Home-Building Stocks
- Key Stocks AAPL
ADBE GOOG
AMZN EBAY
Biotechs: AMGN ALXN CELG GILD
REGN
and 6 highest priced DJI stocks: IBM CAT CVX MCD MMM and XOM
plus JPM
GS NEM and
F
---> 443 +57 MAXCP stocks Bullish MAXCP Stocks (1/18/2013) BULLish plurality
---> 26
MINCP stocks Bearish
MINCP Stocks (1/182013)
--->
96(-8) New Highs on NASDAQ
1 new lows. BULLish plurality
--->
252 (+22) New Highs on NYSE
1 new lows. BULLish plurality
===================================================================================
OLDER HOTLINES
===================================================================================
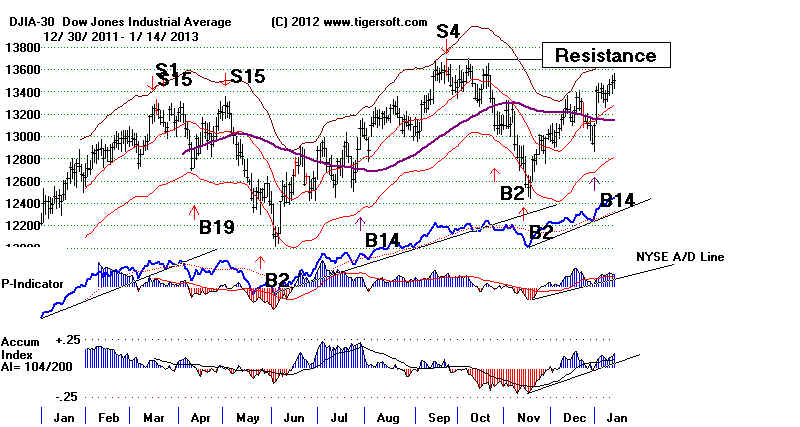
1/17/2013
Peerless remains on a Buy B14. I would think the markets will rise more.
The number of MINCP stocks is very small (26) and the
number of MAXCP stocks (394)
is much, much higher. Clearly
Professionals are still pushing their (and our) favorites higher.
With Bernanke declaring that there will be no rise in
interest rates until the official Unemployment level
reaches 6.5%, traders feel the risks of bearish
surprises are limited and they are encouraged
to speculate in smaller stocks. This could
become the year of the "cats and dogs", where
low-priced stocks do very well. (Actually, most
of the biggest percentage gainers last year
were low-priced stocks, too.)
Powered by a NYSE A/D Line which has led the advance,
rising Closing Powers which
shows us that Professionals are bullish and mnay high
Accumulation breakouts and
tax-loss-ended turnarounds, the markets are back to their
recovery highs. In fact,
the SP-500 has
broken out above 1480 with a current Accumulation Index (IP21)
of better than +.25. This reading can be taken as a
confirmation of its new high. So
has the NYSE made
a new 12-month high with confirming Accumulation along with
the broad-based Value
Line. Smaller caps tend to do well at the beginning of the new
year.
The DJI is only now challenging its set of closing 12-month
highs at 1360013610. Typically it
makes a nominal closing high, at the very least, on a run
like this following a 7.5% to 13.5%
decline. The NASDAQ is still 50 points below its September
highs. The QQQ is 4.5%
below its highs. Should we worry? It is
probably rare for all markets to be rising perfectly
in synch. So, I'm not concerned so much about AAPL, should it fail to rally,
because there are many years
in the past when AAPL lagged in a bull market, as I feel
compelled now to study past situations early in the year
when the DJI closed 2% over
the 21-day ma and showed a V-I reading of only 1 and an
OPct of just +.042, as now.
Is Lagging Volume Much of A Problem?
Volume has been lower than bulls might wish for. And
weighted down by AAPL which has
been underperforming the DJI by 25% over the last 50 days, the
NASDAQ and QQQ
are now lagging. Because Barrons only started reporting
NYSE Up and Down volume
in mid 1965, I have to start with 1966. Below are the cases
where
la/ma > 1.096 and
VI < 2.0 and
OPct < .05 and
IP21> .15
Bull Mkt 6/4/1986 1.027
.457 4 -48 .152
1 .013 DJI advanced 2% over next
month and then fell 8%
low
Bear Mkt rally 10/16/02 1.051 .619 83 139 .169 -62
.004 DJI fell back to 2% lower band,
Bull Mkt 7/27/2013 1.023 .418
266 14 .266 -40 -.138 DJI rose 4% and
then fell 8%.
This is not enough cases to reach much of a conclusion from,
except that it would seem that a lack
of volume probably will act to limit the DJI advance in terms of
additional percentage gains
and how long we can go without a decline. So, we will have
to watch for new Peerless signals
and Closing Power trend-breaks.
1/17/2013 Key Values: DJI 13596 +85 la/ma=1.02 21droc = .322
P= +429 Pch= +24
IP21 = +.191 V = +1 Opct = +.042
Peerless Automatic Buys and Sells on DJI
P-I, A/D Line and Tiger Accum. Index
Buy B14 is Operative Peerless Signal.
S= Sell B = Buy
1/17/2013 To Key Index and
Stock Charts
DIA SPY QQQ IWM
S&P OEX NYSE
Value Line
DJIA-Peerless GLD
SLV Crude Oil Foods EURO Dollar 10-Year Rates
Tiger -Bonds Big Banks IBB-BioTechs Military Home-Building Stocks
- Key Stocks AAPL
ADBE GOOG
AMZN EBAY
Biotechs: AMGN ALXN CELG GILD
REGN
and 6 highest priced DJI stocks: IBM CAT CVX MCD MMM and XOM
plus JPM
GS NEM and
F
---> 394 +40 MAXCP stocks Bullish MAXCP Stocks (1/17/2013) BULLish plurality
---> 26 -6
MINCP stocks Bearish
MINCP Stocks (1/17/2013)
--->
104 (+48) New Highs on NASDAQ
2 new lows. BULLish plurality
--->
230 New Highs on NYSE
1 new lows. BULLish plurality
====================================================================================
OLDER HOTLINES
====================================================================================
1/16/2013
Peerless remains on a Buy.
Certainly,
volume could be higher. The OPct for te DJI stands only at .042 and
the
V-Indicator is only +9. But even negative numbers here would not themselves
bring a
Peerless sell until April. Such is the pattern of market advances if they can
get past
the reversal-prone first 14 days of January. Seasonally, the 5 trading days
following
January 16th are up bring a DJI advance only 39.1% of the time since
1965.
The DJI does average a 0.4% decline over the next week
and a day. But pullbacks
are
necessary to make breakouts more powerful. So, I'd stay optiministic. The
five
trading days after January 25th are up 69.6% of the time and average a
DJI gain of
0.8%.
The uptrends of
the major market ETFs are all still rising: DIA,
SPY, QQQ, IWM.
The key NYSE
ADLine is very strong. Professionals are buying many more stocks
aggressively than
they are shorting: MAXCP stocks outnumber MINCP stocks by
roughly
10:1. Bank stocks like BAC, JPM and GS
made new highs.
There are
numerous Bullish MAXCP stocks showing very high levels of Accumulation.
The SP-500 is
being drawn to its flat topped resistance to attempt a breakout. The
Closing Powers
for SPY and DIA are rising while their Opening Power is in a minor down-
trend. A
weak opening does not prevent an up-day. This is bullish. AAPL got back
above its one-day
broken easily spotted support-line at 500. And the DJI's IP21
stands at a
healthy +.209 Since 1950, there have been only three tops with higher IP21s
as they ran
upwards with the start of the new year. Each of the subsequent declines
only fell between
2.5% and 3.% below the lower band and then rebounded strongly.
If there is a
decline from here, it should be brief and not overly deep.
1/16/2013 Key
Values: DJI 13511 -24 la/ma=1.015 21droc = .337
P= +404 Pch= -4
IP21 = +.209 V = +9 Opct = +.035
Peerless Automatic Buys and Sells on DJI
P-I, A/D Line and Tiger Accum. Index
Buy B14 is Operative Peerless Signal.
S= Sell B = Buy
Technical
note:
There are
many DJI declines of 8% to 13.5% in a bull market. We would cover
short sales
on the general market in many of these cases when the downtrendlines
are broken
in the A/D line and CLosing Power even without a Peerless Buy. This
is
particularly true when there has been no new Sell other than a head/shoulders'
neckline
break, a judged Sell S10. See this below in June and November 2012.
1/16/2013 To Key Index and Stock Charts
DIA SPY QQQ IWM
S&P OEX NYSE
Value Line
DJIA-Peerless GLD
SLV Crude Oil Foods EURO Dollar 10-Year Rates
Tiger -Bonds Big Banks IBB-BioTechs Military Home-Building Stocks
- Key Stocks AAPL
ADBE GOOG
AMZN EBAY
Biotechs: AMGN ALXN CELG GILD
REGN
and 6 highest priced DJI stocks: IBM CAT CVX MCD MMM and XOM
plus JPM
GS NEM and
F
---> 354 MAXCP stocks Bullish MAXCP Stocks (1/16/2013) BULLish plurality
---> 32 +9
MINCP stocks Bearish MINCP Stocks (1/16/2013)
--->
54 (-15) New Highs on NASDAQ
3 new lows. BULLish plurality
--->
89 (-33) New Highs on NYSE
4 new lows. BULLish plurality
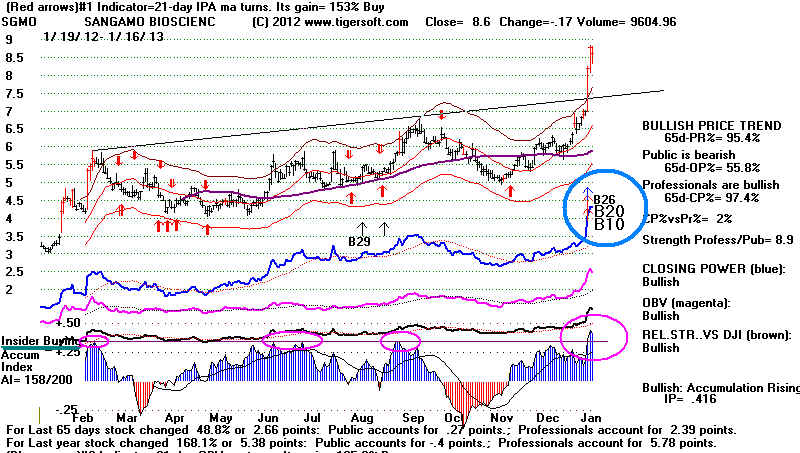
Revolutionary Biotech: SGMO: Turning Genes off and on to Stop
AIDs.
Sangamo Bioscience (SGMO) http://www.sangamo.com
64 employees
"Sangamo BioSciences, Inc., a clinical stage biopharmaceutical company, focuses on
the
research, development, and commercialization of zinc finger DNA-binding proteins (ZFPs)
for
gene regulation and gene modification in the United States. Its ZFPs could be
engineered to make ZFP transcription factors (ZFP TFs) proteins that could be used to turn
genes
on or off; and ZFP nucleases (ZFNs) proteins, which could be used to modify DNA
sequences in various ways." Can
genes be turned on and off in cells?
BBC
News - 'Brake gene' turned off in pancreatic cancer Apr 30, 2012
In
1950, SGMO was 50. Bullishly, it is getting some sponsorship now.
Fidelity Select Biotech fund already has 1.1 million shares. Watch Yahoo to see if it
is
increasing its position. There is no sign of insider buying on Yahoo, but
Tiger's
charts show
otherwise. We take insider-informed buying to be occurring in a rising
stock when
its Accumulation Index (IP21) rises above +.375. This buying is
circled in
the chart below.
--------------------------------------------------------------------------------------------------------------------------------------------------------
Older Hotlines
--------------------------------------------------------------------------------------------------------------------------------------------------------
1/15/2013
DJI Is Being Drawn to Test 13700 Resistance. Stay Mostly Long
until Peerless Gives A Sell, or at
least until Closing Power uptrends for DIA and SPY
are violated. AAPL's breakdown will worry tech stock holders and
may hold back QQQ.
For the DIA, SPY
and IWM, a pattern of weak openings with firmer
closes has set up.
Such Professional buying and Public
Selling is usually bullish.
1/15/2013 To Key Index and Stock Charts
DIA SPY QQQ IWM
S&P OEX NYSE
Value Line
DJIA-Peerless GLD
SLV Crude Oil Foods EURO Dollar 10-Year Rates
Tiger -Bonds Big Banks IBB-BioTechs Military Home-Building Stocks
- Key Stocks AAPL
ADBE GOOG
AMZN EBAY
Biotechs: AMGN ALXN CELG GILD
REGN
and 6 highest priced DJI stocks: IBM CAT CVX MCD MMM and XOM
plus JPM
GS NEM and
F
---> 347 +144 MAXCP stocks Bullish
MAXCP Stocks (1/15/2013) BULLish plurality
---> 23 -13
MINCP stocks Bearish MINCP Stocks (1/15/2013)
--->
69 (-8) New Highs on NASDAQ
8 new lows. BULLish plurality
--->
122 (-6) New Highs on NYSE
3 new lows. BULLish plurality
Peerless Automatic Buys
and Sells on DJI
P-I, A/D Line and Tiger Accum. Index
Buy B14 is Operative Peerless Signal.
S= Sell B = Buy
1/15/2013
Key Values: DJI 13535 +28 la/ma=1.018
21droc = .326 P= +407
Pch= +79
IP21 = +.181 V = +11 Opct = +.035
DIA, One-Year Optimized Red Signals (much less important),
Blue Closing Power and Accumulation Index.
Warning:
Red signals shown below are based on best trading system for last year only.
Stochastic Buys fail when key support fails. Stochastic Sells fail when
key resistance is overcome.
The Blue CLosing Power is still rising, showing Professionals are net buyers.
When that
uptrend is broken, look for a decline back to the support of the rising red
21-dma.
Peerless Remains on
A Buy B14
Without a new Peerless automatic
Sell signal or a head/shoulders top, the odds are
strongly against a decline to the lower
3.5% band. Tonight's new study shows that
DJI declines where there are first no
automatic Peerless Sell signals most often stop at the lower
2% band and
do not get to the lower 3.5% band. Since 1929, there
were 7 such DJI tops,
all in February and March, which dropped
the DJI only to the 2.5 lower band, In 3 cases,
the lower 3.5% band was reached. In
the two other cases where the DJI fell below the lower band
and there was no Peerless Sell, there was
first a head/shoulders pattern: 1931 and 1947. The
study tonight is of the first DJI peaks
of the new year, when they occurred, what the key values were,
what was the Peerless signal and what was
the outcome.
First DJI Peaks after Janaury 14th since 1929
Where There Was No Automatic
Peerless Sell
Date
la/ma annroc
P-I P-ch IP21 V-I Opct
Peerless Outcome
----------------------------------------------------------------------------------------------------------------------------------------------
2/24/1931 1.103 1.762
107 -6 .100
349 .466 No Sell.
Head/Shoulders and Extreme S7. Below LB.
2/10/1947 1.034 .416
84 11 .244
41 .257 No Sell.
Head/Shoulders DJI fell below LB.
2/5/1951 1.036
.693 82 -3 .198
47 258 No
Sell. DJI fell to lower band.
2/18/1963 1.012
.287 52 -3 .149
-61 .448 No Sell. Decline to lower 2% band.
2/8/1967 1.019
.661 219 16 .114 19 .377 No
Sell. Decline to lower 2% band.
3/17/1975 1.047 .948
149 8 .156
1 .364 No
Sell Decline to lower 2% band
2/13/1985 1.019
.629 317 18
.086 19 -.147 No Sell Decline to lower 2% band.
2/7/1989
1.031 .807 181 41
.156 30 .156 No
Sell. Decline to lower band.
3/6/1991
1.029 .831 263
-42 .102 31 .101 No Sell Decline to lower 2% band.
3/3/1992
1.009 .244 17
16 .408
-7 -.033 No Sell Decline
to lower 2% band.
2/5/1993
1.044 .627 233 15
.115 20 .425 No
Sell Decline to lower 2% band.
2/18/2011 1.023
.56 456
8 .238 36 .490 No Sell. Decline to lower band.
The study below shows many
interesting things. First, I wanted to see see how often
there were DJI tops that bring a
decline to the lower 3.5% band or lower from January 15th
to January 31st. In
all the past 65 years, there were only 7 cases of DJI tops over the
next two weeks: 1952, 1959, 1966, 1974, 1979, 1982, 1994 and 2010. Of interest,
none of these years were the year
after a Presidential Election. And by comparison, there
were 29 instances when such a top
occurred between Janaury 2nd and January 14th. A top
was 4x more likely to occur in the
first two weeks of the new year than the second two weeks.
This suggests
that the market may have more upside surprises for the Debt Ceiling bears
and those that consider Apple a
barometer for other stocks.
Significant trading declines
(because they brought a DJI decline to the lower 2% band) occurred as
follows:
Number of
Significant Tops
----------------------------------------------------------
First 2 weeks of January
29
Second 2 weeks of January
7
----
36
First 2 weeks of February
14
Second 2 weeks of Frbruary
5
----
19
First 2 weeks of March
8
Second 2 weeks of March
5
---
13
April
5
May
4
June or later
4
A
second question I wanted to answer was what how often did the DJI drop from
a second-half-January peak to
the lower 3.5% band without a warning. The answer is
only once, 1952, but in this
case a clear-cut head/shoulders pattern acted as warning.
1952 Head/Shoulders. DJI
fell to lower band.
1959 No Sell. Head/Shoulders.
Decline only to lower 2% band.
1966 S12.
DJI fell below lower band.
1974 Earlier S12. DJI fell below lower band.
1979 S12.
Decline to lower band.
1982 S12,
DJI fell below lower band.
1994 S4..
DJI
fell below lower band.
2010 Early S9. DJI fell below lower band
A third question for
the next two weeks that I can now answer is how bad will
a decline be if
we do get a Peerless Sell or a head/shoulder pattern. The data
show 5 instances
of a DJI drop below the lower 3.5% band. So, if a decline
does develop it
is more likely to bring a bigger decline than to just the 3.5% band.
A fourth notion
here is what is the highest level of each key indicator in a past peak.
We might infer
from this that the next peak cannot occur with higher readings.
At least. with
key value levels above these levels, would make a top seem unlikely.
I think we have
to leave out the pre-1945 cases.
There is a lot
more here to mine. "More later", as they say...
La/Ma (How far up from the 21-day ma, the close is, i.e. upper band)
1.059
Annroc (Annualized rate of change of21-dma) ...
1.466
PI (21-day ma of NYSE advances - declines)
456
PI change from previous day.
67
IP21 (Accumulation Index current value)
.408
VI (since 1966 when data first reported.)
53
January-February-March Tops: 1929-2012
Date
la/ma annroc P-I
P-ch IP21 V-I Opct Peerless Outcome
--------------------------------------------------------------------------------------------------------------------------------------------
2/1/1929
1.043 .545 -20
6 -.002 -408 .296 Sell S9/S12 DJI
fell to lower band
2/5/1930 1.065
1.198 90 12 .112
168 .462 Prematurer S9/S12. New S4. Decline to lower 2% band.
2/24/1931 1.103 1.762
107 -6 .100
349 .466 No Sell.
Head/Shoulders and Extreme S7. Below LB.
2/15/1932 1.046 -.484 -66
-18 -.096 -224 -.214 Sell S12. DJI
fell below lower band.
1/10/1933 1.068 .851
4 15
.016 -41 .117 Sell S12. DJI fell below lower band.
2/5/1934 1.059
1.547 233 32 -.01
680 .31 2 Sell S4. DJI fell below lower band.
1/7/1935 1.038
.292 10 -7
-.05 -49 .125 Sell S12 Decline to lower 2% band.
4/6/1936 1.034
.236 -37
-1 -.152 -249 .074 Premature S1/S8.
Concurrent S15. DJI fell below LB..
3/5/1937 1.028
.373 -15
5 .037 -231 .092 Premature
S15. Concurrent S15. DJI fell below LB.
1/11/1938 1.069 1.103
31 37 .038 -65 .181 Sell S9/S12. DJI
fell below lower band
1/4/1939
1.028 .578 29
37 .082 45 .359 No Sell. DJI fell below lower band
1/3/1940
1.026 .505 68
17 .072 54 .222 No Sell. DJI fell to lower band
1/10/1941 1.020
.20 45 11
-.068 7 .481 Sell S12. DJI
fell below lower band
1/5/1942
1.035 -.27
-48 6
.022 -236 -.153 Sell S9. DJI
fell below lower band
1943
No peaks and declines to Lower Band
during first 6 months of year.
1944
No peaks and declines to Lower Band
during first 6 months of year.
-----------------------------------------------------------------------------------------------------------------------------------------------------
3/6/1945 1.022
.581 144 2
.261 186 .525 No Sell/ H/S Top.
DJI fell to lower band
2/1/1946 1.028
.865 157 27 .260
235 . .382 Sell S4. Premature S9. Concurrent S8. Below LB.
Head/Shoulders
2/10/1947 1.034 .416
84 11 .244
41 .257 No Sell.
Head/Shoulders DJI fell below LB.
1/2/1948
1.01 .013 -33
12 .051 -101 .239 No Sell. Head/Shoulders DJI
fell below LB.
1/7/1949 1.024
.370 33 38 -.004 -51 .213 Sell S12. DJI fell below lower band
6/12/1950 1.027 .52
33 -3 .176
-50 .444 Premature S9, Concurrent S5.
DJI fell below lower band
2/5/1951 1.036
.693 82 -3 .198
47 258 No
Sell. DJI fell to lower band.
>1/22/1952
1.021 .349 74 10
.087 19 .371 S1.
Head/Shoulders. DJI fell to lower band.
1/5/1953 1.024 .453
67 21 .188 -9 .399 .Sell S8. Head/Shoulders. DJI fell below lower band
1954
No peaks and declines to Lower Band
during first 6 months of year.
3/3/1955 1.017
.249 105 3
0 74 .153 No Sell.
Quick 1-wk decline to lower band and recovery.
1/3/1956 1.002 .108 -7 -12 -.139 -165
.079 No Sell. Head/Shoulders.
DJI fell to lower band.
1/4/1957 1.014 .640
-38 0 .049
-62 .289 Earlier S12. Head/Shoulders.
DJI fell to lower band
1/7/1958 1.027 -.049 -3
15 -.051 -192 .054 Earlier S12. Decline to lower 2% band.
>1/21/1959
1.019 .515 112
9 .133 122 .442 No
Sell. Head/Shoulders. Decline to
lower 2% band.
1/5/1960 1.018 -.049
-3 15 -.051 -192 .054 S12/S15. Head/Shoulders DJI fell below LB.
5/19/1961 1.026
.376 66
9 .033 -43 .027 No Sell/ H/S Top. Decline to lower 2% band.
3/15/1962 1.014
.154 -6 -3 .033
227 -.029 S10 H/S Top. DJI fell below lower band
2/18/1963 1.012
.287 52 -3 .149
-61 .448 No Sell. Decline to lower 2% band.
5/6/1964 1.008
.078 -47 12 -.055 -582
.116 No Sell/ H/S Top. Decline to lower 2% band.
5/13/1965 1.018
.399 24
3 .110 -262 -254 S8. DJI fell below lower band.
>1/18/1966
1.020 .445 49 -2 -.028 5 .479 S12. DJI fell below lower band.
--------------------------------------------------------------------------------------------------------------------------------------------------
2/8/1967 1.019
.661 219 16 .114 19 .377 No
Sell. Decline to lower 2% band.
1/8/1968 1.020
.222 68 21
-.019 6
.163 S12. DJI fell below lower band.
2/13/1969 1.012
.309 60 -22 .141 0
.27 On earler S1. Decline to lower
band.
1/5/1970 1.027
.241 72
-31 -.034 -1 .058
S12. DJI fell below lower band.
4/28/1971 1.024
.608 82 2
.095 1 .412 S9 a week later. Head/Shoulders. DJI fell below
lower band.
4/18/1972 1.019
.327 -20
4 .054 -1
.151 S15. Decline to lower 2% band.
1/11/1973 1.024
.215 -96
9 .002
-2 .057 S15/S12 . DJI fell below lower band.
>1/17/1974
1.033 .799 182 18 .043
0 -.01
Earlier S12. DJI fell below lower band.
3/17/1975 1.047 .948
149 8 .156
1 .364 No
Sell Decline to lower 2% band.
3/24/1976 1/024 .192
-64
10 -.033 -1
.251 S15. Decline to lower 2% band.
12/31/1976 1.027 .674
289 17 .11
3 .462 S4/S8.
DJI fell below lower band.
12/30/1978 1.015 .021
-18
4 -.015
-1 -.029 No Sell Head/Shoulders DJI fell below lower band.
>1/26/1979
1.033 .734 234 50
.087 4 .268 S12.
Decline to lower band.
2/13/1980 1.028
.478 -26
1 -.01 -1
.205 S15. Head/Shoulders DJI fell below lower band.
1/6/1981
1.059 .381 61
43 .031 -1 .113
S12 Head/Shoulders. Decline to lower band.
>1/29/1982
1.02 -.028 -87
26 .005 -5
.048 S12, DJI fell below lower band.
1/10/1983 1.052
.741 105 56 .002
4 .118 S12 on 1/6/83
Decline to lower band.
1/6/1984
1.022 .152 34
28 -.035 -1 -.154 S12, DJI
fell below lower band.
2/13/1985 1.019
.629 317 18
.086 19 -.147 No Sell Decline to lower 2% band.
1/7/1986
1.022 .645 164
43 .095 13 .105 No Sell Decline to lower 2% band.
4/7/1987
1.019 .529
-5 -3 .15
6 .267 S9 Decline
to lower band.
1/7/1988
1.048 1.466 280 5
.22 25 .417 No Sell. Decline to lower band.
2/7/1989
1.031 .807 181 41
.156 30 .156 No
Sell. Decline to lower band.
1/3/1990
1.027 .270 36
-15 .08 -4
-.093 S4/S15. DJI fell below lower band.
3/6/1991
1.029 .831 263
-42 .102 31 .101 No Sell Decline to lower 2% band.
3/3/1992
1.009 .244 17
16 .408
-7 -.033 No Sell Decline
to lower 2% band.
2/5/1993
1.044 .627 233 15
.115 20 .425 No
Sell Decline to lower 2% band.
>1/31/1994
1.028 .692 150
17 .195 11
.450 S4.. DJI fell below lower band.
1995 No peaks and declines to
Lower Band during first 6 months of year.
3/18/1996 1.021
.283 -25
52 .139 -19 .048
S1 Decline to lower band.
3/10/1997 1.018
.526 173 36 .127
17 .133 S9. DJI fell below lower band.
4/21/1998 1.024
.37 13 -11 .045 -7
.056 S15 Decline to lower band.
1/8/1999
1.058 .806 48
25 .090 10
.231 No Sell. Decline
to lower 2% band.
1/14/2000 1.03
.522 90
27 -.058
-28 .433 S4/S12/S15 DJI fell below lower band.
(1/3/2001 1.025
.639 335 28 .022
-19 .215 S12.
Decline to lower 2% band)
2/2/2001
1.016 -.091 290 -88 .041
-15 -.076 S9.
DJI fell below lower band.
(1/4/2002 1.024
.435 269 -20 .040
0 .291 No Sell. Decline to lower band.
3/13/2002 1.044 1.042
375 -53 .117
53 .236 Premature S9. DJI fell below lower band.
1/14/2003 1.033 .424
217 21 .098
-12 .039 S12. DJI fell below lower band.
2/11/2004 1.017 .285
246 22 .093
-6 .134
S9/S15. DJI fell below lower band.
3/4/2005 1.017
.381 251 40
.093 -15 .14
S15. DJI fell below lower band.
5/10/2006 1.025
.527 117 6
.091 -10 .334
S9. DJI fell below lower band.
2/20/2007 1.013
.208 385 -26
.063 44 .309 Premature S9.
Decline to lower band.
2008 No rallies to
upper band until May 2008.
1/2/2009
1.045 .850 495 18
.058 61 -.004
S12. DJI fell below lower band.
>1/19/2010
1.017 .321 429
37 .078
16 .357 Early S9. DJI fell below lower band.
2/18/2011 1.023
.56 456
8 .238 36 .490 No Sell. Decline to lower band.
3/15/2012 1.022
.344 196 67 .071
5 .236 S1/S15.
Decline to lower band.
====================================================================================
OLDER HOTLINES
====================================================================================
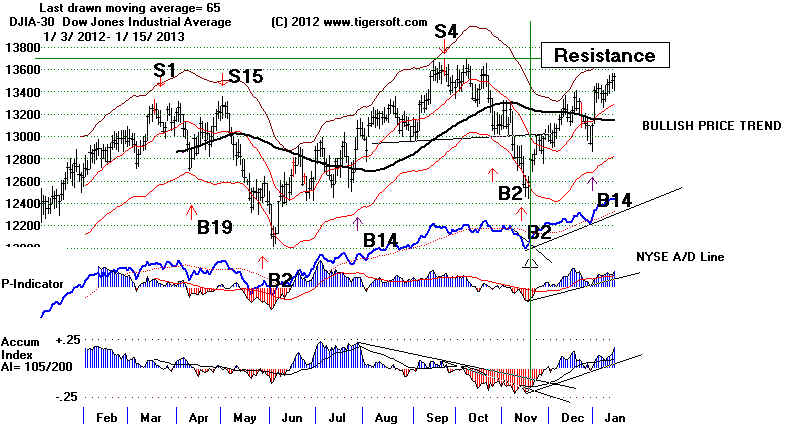
1/14/2013 Peerless Remains on A Buy B14
Peerless remains
on a Buy. Without a Peerless Sell signal or a head/shoulders top,
the odds are
against a decline to the lower band. Given AAPL's huge capitalization,
I would expect a
re-test of the DJI's 21-day ma about 2% lower if AAPL closes below
its 500 support,
which seems likely tomorrow. (Its Closing Power is still falling).
It may be a
surprise but, historically, sizeable AAPL weakness relative to the DJI
has not been
bearish for the general market. There were many times in the past
when AAPL fell
33% or more in a general market that continued to rise:
1983, 1985, 1991,
1992, 1993, 1995, 1996 and 1997.
1/14/2013
Key Values: DJI 13507 +19 la/ma=1.017
21droc = .235 P= +328
Pch= +328
IP21 = +.135 V = --10 Opct = -.048
DIA is being drawn back to its 136-136.5 old highs' resistance.
Its Closign Power is rising and its IP21 is quite respectably positive.
It typically is the strongest index at the end of a run. It is the "last
man standing", if you will. Today it rose despite the NASDAQ's weakness,
owing to AAPL's 3% decline.
1/14/2013 To Key Index and Stock Charts
DIA SPY QQQ IWM
S&P OEX NYSE
Value Line
DJIA-Peerless GLD
SLV Crude Oil Foods EURO Dollar 10-Year Rates
Tiger -Bonds Big Banks IBB-BioTechs Military Home-Building Stocks
- Key Stocks AAPL ADBE GOOG AMZN EBAY
Biotechs: AMGN ALXN CELG GILD
REGN
and 6 highest priced DJI stocks: IBM CAT CVX MCD MMM and XOM
plus JPM
GS NEM and F
---> 203 -14 MAXCP stocks Bullish
MAXCP Stocks (1/14/2013) BULLish plurality
---> 36 +4
MINCP stocks Bearish MINCP Stocks (1/14/2013)
--->
76 (+12) New Highs on NASDAQ
5 new lows. BULLish plurality
--->
128 (-8) New Highs on NYSE
1 new lows. BULLish plurality
====================================================================================
OLD HOTLINES
====================================================================================
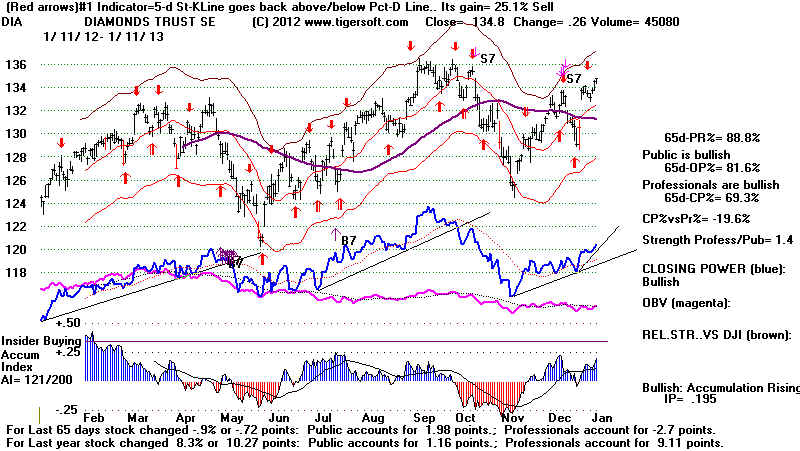
1/11/2013 Peerless Remains on A Buy B14
There are many high Accumulation
breakouts. Transports, Autos, biotechs, housing-related stocks
and food commodity users are advancing as
Sugar and other commodities slip downward
and the Chinese, Europeon and Developing
Countries' economies improve.
The stock market doubts that the House
Republicans will succeed in forcing a debt
reduction- government stoppage next
month. If a true crisis of "financial confidence"
was about to occur because the national
debts were reaching a dangerous threshold,
one might expect the Dollar to be in a
dive and Gold to be rising powerfully. They are
clearly not. The Dollar is not the
Argentine Peso or Weimar Germany's D-Mark. This
will not prevent FOX and CNN from trying
to scare investors. It will leave stocks in
strong hands. And that is bullish.
As long as the Closing Powers for
SPY and QQQ are rising, as long as the NYSE A/D Line
is rising and as long as AAPL does not
break its 500 support, I believe the DJI and
general market will move higher.
"Sneaky" bear markets are very few. First, there must
either some pronounced internal
weakness or, at least, a head/shoulders pattern showing
that something unexpectedly bearish is
about to happen.
AAPL's troubles? Right now, money
coming out of AAPL is probably being reinvested in
lots of much smaller companies. The
broad-based Value Line and NYSE are making
new 12 month highs.
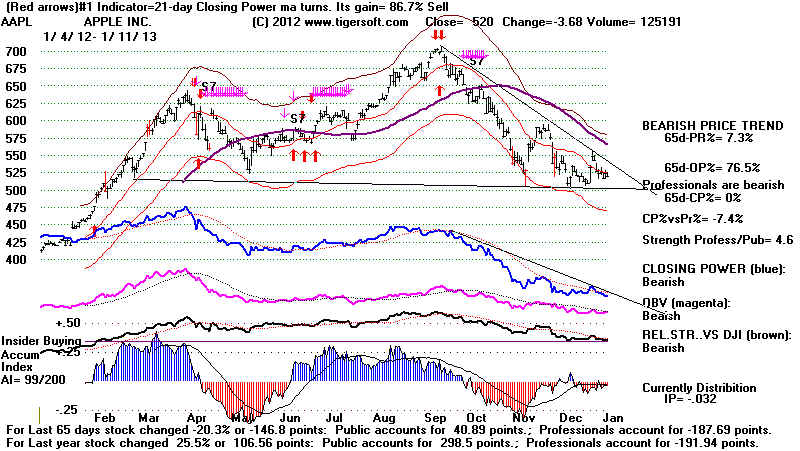
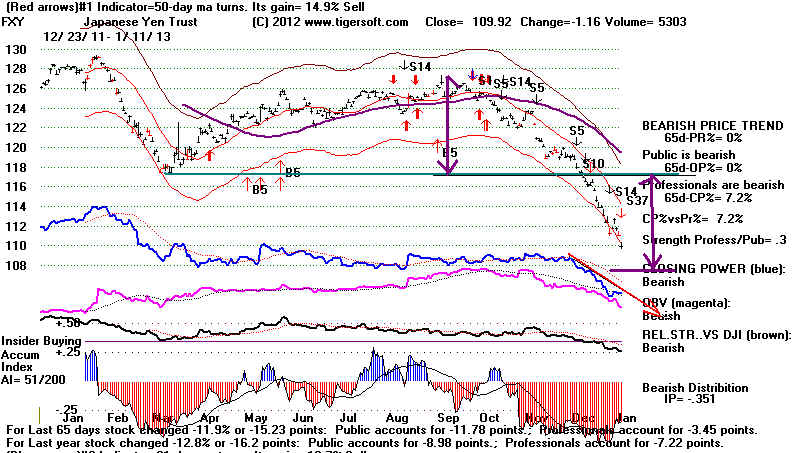
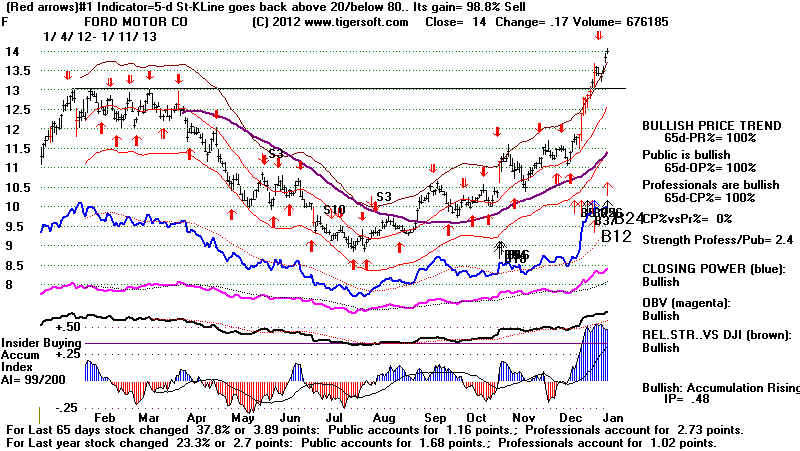
Of more concern is the speed with which
the Japanese Yen is falling. Japanese
imports may become very cheap in the near
futures. If you are a car-buyer that
could help. Ford, meantime, is
bursting out to new highs. The fall-out from the
falling Yen will have to be watched.
1/11/2013 Key Values: DJI
13488 +17 la/ma=1.017 21droc = .216 P=
+324 Pch= -46
IP21 = +.109 V
= --4 Opct = -.129
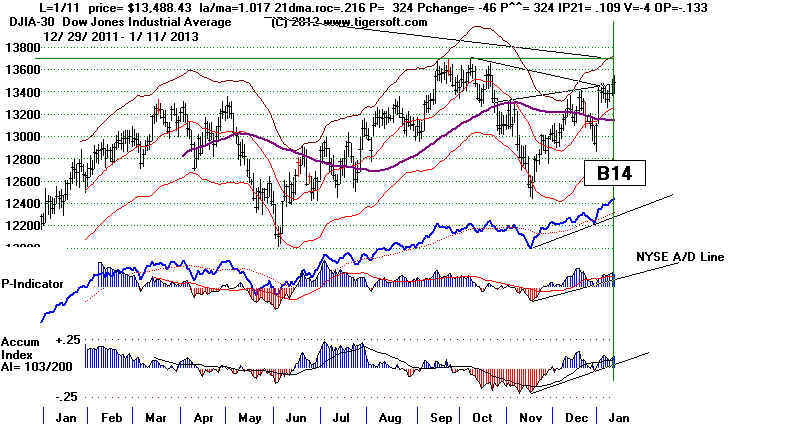
SPY - Blue Closing Power Is Rising.
1/11/2013 To Key Index and Stock Charts
DIA SPY QQQ IWM S&P OEX NYSE Value Line
DJIA-Peerless
TigerDJI TigerSPY Tiger-QQQ GLD SLV Crude Oil Foods
Dollar 10-Year Rates
Tiger -Bonds
Big
Banks IBB-BioTechs
Military Home-Building Stocks
- Key Stocks AAPL
ADBE GOOG
AMZN EBAY Biotechs: AMGN
GILD REGN
and 6 highest priced DJI stocks: IBM CAT CVX MCD MMM and XOM
plus JPM
GS NEM
---> 217 -25 MAXCP stocks Bullish MAXCP Stocks (1/11/2013) BULLish plurality
---> 32 +5
MINCP stocks Bearish MINCP Stocks (1/11/2013)
--->
64 (-31) New Highs on NASDAQ
6 new lows. BULLish plurality
--->
136 (-49) New Highs on NYSE
2 new lows. BULLish plurality
===================================================================================
EARLIER HOTLINES
===================================================================================
1/10/2013 Peerless
Remains on A Buy B14
1/10/2013 Key Values: DJI 13471 +81 la/ma=1.016 21droc = .271 P= +369 Pch= +20
IP21 = +.095 V = -+12 Opct = -.129
The SPY and DIA Closing Powers,
NYSE A/D Line, DJI-AI and DJI-PI are all in rising trends.
It looks like the DJI wants to rally and test
the resistance at 13600. AAPL is still weak, but
the big biotechs rallied convincingly again
today. The broad based Value Line made a new
high today as did the NYSE. The SP-500
has made a 12-month closing high. It still
must get past 1275 is surpass its highest
intra-day trading for the last year.
At this point, I see no reason why the market
cannot continue to advance. The prevailing
tendency is for a post Presidential Election
year rally to move higher when a Democrat
is in the White House in office since 1936 AND
Peerless is on a Buy in January.
We should expect to see a Peerless Sell signal
at the next top and one or more significant
non-confirmations (NCs) at this top, including
an A/D Line NC.
In all 6 cases when a Democrat was in the White
House, the market rallied at least
until March 9th. In 4 of the 6 cases, the
first "top" was in May. See Table 1:
The study I started a few nights ago about
about the length of bull market cycle's is finished.
I show it below in Table 2:. The main conclusion is that the
typical bull market lasts 53 months from
the bottom of a major DJI decline before
peaking and then starting another major (+20% decline).
As the DJI
bottomed in March 2009, we might normally expect the bull market to continue
until peaking in August 2013. But be
careful. While 53 months is the average length
of a bull market, there are big variations.
Only 6 of the 16 cycles show bull market
rallies that actually last between 48 and 63
months. 6 last less than 38 months. 4 last
more than 76 months.
How Will We Spot The Next Major Peak?
1929, 1973, 2000
and 2007 Are The Ideal Types of A Perfect Top
While there are a few cases (December 1969 or
August 1987) of very big bear markets
starting from what might seem like more
independent and isolated non-confirmations
and single Peerless Sell signals, more of the
extreme declines start from peaks showing
multiple Negative Non-Confirmations by the P-I,
IP21 and V-I. They also show an
A/D Line that has fallen far behind the false
final advance of the DJI. They display
multiple Peerless Sells at the final top and
multiple sets of Sells in the previous 6-8
months. And they show either a price
break-down below well-tested support about 10% below the
recent peaks (examples: 1973, 1987, 2000-2001,
2007-2008) OR they easy-to-spot
Head/Shoulders patterns (examples: 1946,
1961-1962 and 1990).
What helped me most, as I began the
research on Peerless in 1981 was looking at the
January 1973 top. It showed multiple
negative non-confirmations at the peak.
The DJI and the "nifty-fifty"
insututional favorites had run up the market superficially.
But most stocks were declining. The NYSE
A/D Line had been downtrending since
mid 1972. Below is the Peerless chart for
the January top of 1972. Interestingly,
Barrons' cover headlined for all the
world to see that the DJI was headed for 1200
with Richard Nixon re-elected and business safe
again from Democrat regulations
and increased corporation taxes. Years
later, I saw how similar the top in 1929
was to the top in early 1973 technically and
how its prospects were portrayed by
the pundits of the time.
The internals of the market are clearly much
stronger now than at those tops shown
below. Eventually, I would expect the key
Peerless internals to deteriorate and look similar
to those shown in the charts below. That
will probably set the stage for another 25%+ declline,
at least.
1929 Major Top before Severe Market Decline
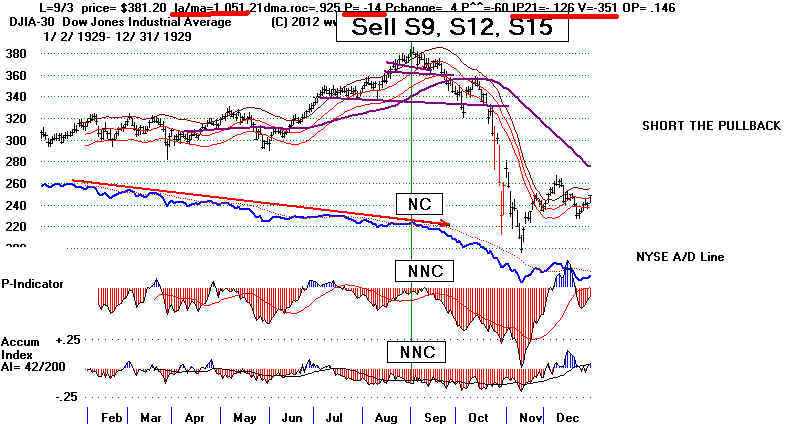
1973 Major Top before Severe Market Decline
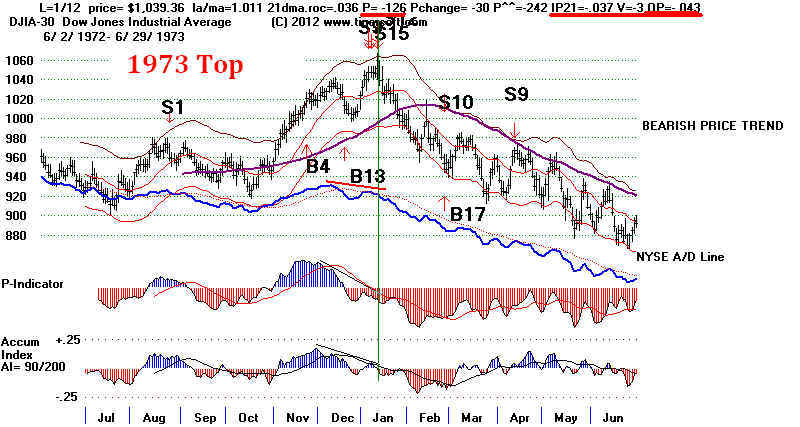
2000 Major Top before Severe Market Decline
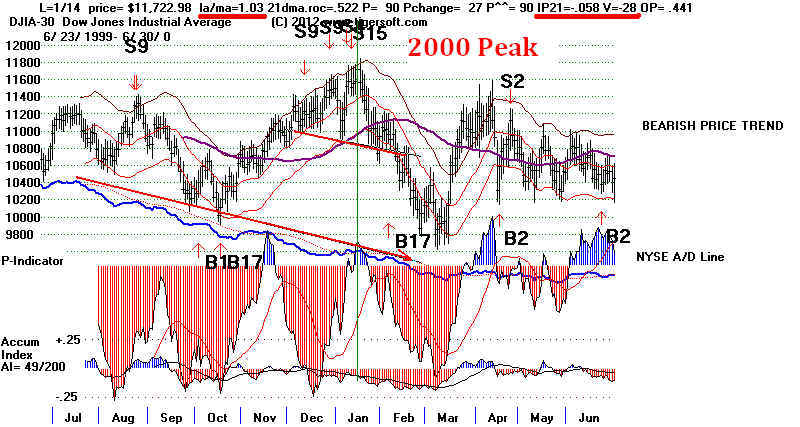
2007 Major Top before Severe Market Decline
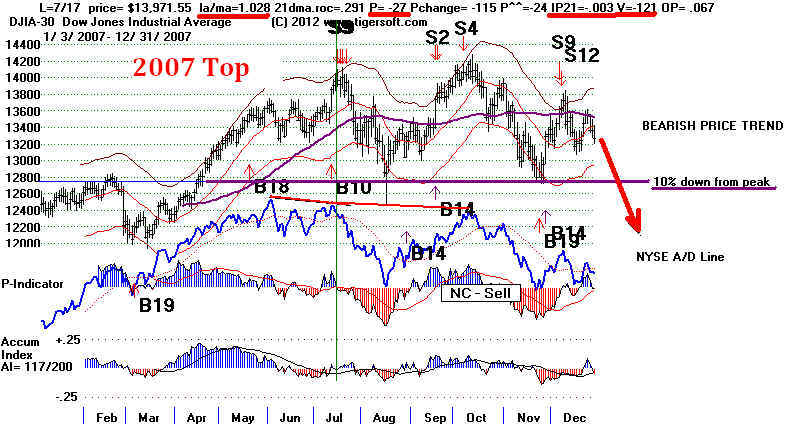
2007 Major Top before Severe Market
Decline
 |
------------------------------------------------------------------------------------------------------------------------------------------------------
Table 1:
Peaks
in the Year after the Presidential Election When A Democrat Is in The White House
Year
Peak
Signs of A
Top Outcome
--------------------------------------------------------------------------------------------------------------------------------------
1937
March 9
Multiple Sells
DJI fell from 193.30 to 167.40 on 6/15/37, Buy B8
S9, S12, S15
P-I NNC
A/D Line NC
A/D Line MA falling
IP21 = .026 NC
V-I = -296 NNC
OPct = .073
1945
May 15 S9
DJI rallied 3% more and then fell back to LB
This is based on P-I
finally turning negative
1961
May 19 No Sell
DJI pulled back to LB and then
rallied more.
PI= 18, NC
A/D Line NC
1965
May 14 S8
DJI fell from 939.60 to 851.40 and
then rallied more.
PI= 18, NC
A/D Line NC
1993
May 27 No Sells
DJI rose until August 25. fell 3% and rallied higher.
A/D Line NC
1997
March 11 No Sell
DJI fell from 7085.16 to 6391.69
and rallied higher.
No Negative NNCs
----------------------------------------------------------------------------------------------------------------------------------------------
1/10/2013
Key Values: DJI 13471 +81 la/ma=1.016
21droc = .271 P= +369
Pch= +20
IP21 = +.095 V = -+12 Opct = -.129
1/10/2013
To Key Index and Stock Charts
DIA SPY QQQ IWM S&P OEX NYSE Value Line
DJIA-Peerless
TigerDJI TigerSPY Tiger-QQQ GLD SLV Crude Oil Foods
Dollar 10-Year Rates
Tiger -Bonds
Big
Banks IBB-BioTechs
Military Home-Building Stocks
- Key Stocks AAPL
ADBE GOOG
AMZN EBAY Biotechs: AMGN
GILD REGN
and 6 highest priced DJI stocks: IBM CAT CVX MCD MMM and XOM
plus JPM
GS NEM
---> 243 -31 MAXCP stocks Bullish MAXCP Stocks (1/10/2013) BULLish plurality
---> 27 -2
MINCP stocks Bearish MINCP Stocks (1/10/2013)
--->
95 (+8) New Highs on NASDAQ 5
new lows. BULLish plurality
--->
185 (-1) New Highs on NYSE
1 new lows. BULLish plurality
------------------------------------------------------------------------------------------------------------------------
Table 2: Lengths of Major Bull Markets:
1915-2013
Here we study the Major Cycles' Length
from a Major Low after
a Bear Market to the Peak before another Big Decline.
Here I consider the serious bear markets of more than 20% to mark
the end of each cycle.
There are 16 cycles since the December 1914 low. From the
bottom
of these 20% plus major bear markets to the final bull market peak before
the next 20% decline, 53 months is the average span of time. The
standard deviation is 27.7. Considering the last major bear market's date
3/9/2009. From this we might estimate that the DJI will finally peak
out in August 2013. But the standard deviation is quite high and only
6 of the 16 cycles showed a DJI bull market advance that lasted 53 months,
plus or minus 10 months. So, such a date has limited certainty or confidence.
DJI
Peaks/Bottoms since 1914.
It was closed the second half of the year
because of WWI.
-------------------------------------------
Major Cycle 1 Trading Resumes---------------------------------------------------
12/1914
Bear Market Bottom
11/21/1916
Bull Market Peak,
DJI - 110.20, 24
months later
12/20/1917 Bear Narket Bottom, DJI = 6710
13 months
later
11/3/1919
Bull
Market Peak, DJI -119.60
23 months later
8/26/1921 Bear Narket Bottom, DJI = 65.50
24 months later
Bottom to Bottom Cycle
length: 6 years 9 months
Bottom to Cycle High length: 4 years 8 months
------------------------------------------- Major Cycle 2 Ending With Severe Bear
Market---------------------------------------------------
8/26/1921
Bear Narket Bottom, DJI = 65.50
3/19/1923
Bull Market Peak, DJI -115.40
19
months later
10/31/1923
Bear Market
Bottom, DJI = 88.50 7
months later.
2/11/1926
Bull Market Peak, DJI -162.30
28
months later
3/30/1926
Bear Market
Bottom, DJI = 135.20 1.5 months later.
9/3/1929
Bull Market Peak, DJI = 381.20
41 months later
7/7/1932
Bear Market Bottom, DJI =
41.80 34
months later.
Bottom to Bottom Cycle length: 10 years
11 months
Bottom to Cycle High length: 8 years 1 month
------------------------------------------- Major Cycle 3 Ending With Severe Bear
Market---------------------------------------------------
7/7/1932
Bear Narket Bottom, DJI = 41.80
Start of new cycle at bear
mkt bottom.
9/7/1932
Bull Market Peak, DJI = 79.90
2 months later
2/27/1933
Bear Market Bottom, DJI = 50.20 5.5
months later
7/7/1933
Bull Market Peak, DJI = 108.30
2 months later
10/19/1933
Bear
Market Bottom, DJI = 84.40 3.5 months later
2/5/1934
Bull Market Peak, DJI = 110.70
4 months later
7/26/1934
Bear
Market Bottom, DJI = 85.50 5.5 months later
3/18/1937
Bull Market Peak, DJI = 194.40
35 months later.
3/31/1938
Bear
Market Bottom, DJI = 85.50 12 months later
Bottom to Bottom Cycle length: 5 years 8
months
Bottom to Cycle High length: 4 years 8 months
------------------------------------------- Major
Cycle 4 Ending With Severe Bear Market---------------------------------------
3/31/1938
Bear
Market Bottom, DJI = 85.50
11/9/1938
Bull
Market Peak, DJI = 158.10
10
months later.
4/11/1939
Bear
Market Bottom, DJI = 123.80 5 months later
9/13/1939
Bull Market Peak, DJI = 154.10
5 months later
4/28/1942
Bear Market
Bottom, DJI = 92.90
31 months later.
Bottom to Bottom Cycle
length: 4 years 1 months
Bottom to Cycle High length: 1 year 5 months
-------------------------------------------
Major Cycle 5 Ending With More Severe Bear Market---------------------------------------
4/28/1942
Bear
Market Bottom, DJI = 92.90
5/29/1946
Bull
Market Peak, DJI = 212.50
49 months later.
3/16/1948
Bear
Market Bottom, DJI = 165.40
32 months later.
6/14/1948
Bull
Market Peak, DJI = 192.90
3 months later.
6/13/1949
Bear
Market Bottom, DJI = 161.60
12 months later.
Bottom to Bottom Cycle length: 7
years 1.5 months
Bottom to Cycle High length: 5 years 1.5 months
---------------------------------- Major Cycle
6 -------------------------------------------------------------------------
6/13/1949
Bear
Market Bottom, DJI = 161.60
9/13/1951
Bull
Market Peak, DJI = 276.40
27 months later.
9/14/1954
Bear Market Bottom, DJI = 255.50
24 months later.
(Protracted shallow weakness)
4/6/1956
Bull Market Peak, DJI = 521.10
27 months later.
2/12/1956
Bear Market Bottom, DJI = 454.60
10 months later.
(Protracted shallow weakness)
7/12/1957
Bull Market Peak, DJI = 520.00
46 months later.
10/21/1957 Bear Market Bottom, DJI = 423.10
3 months later.
Bottom to Bottom Cycle
length: 8 years 4 months
Bottom to Cycle High length: 8 years 1 month
---------------------------------- Major
Cycle 7 -------------------------------------------------------------------------
10/21/1957 Bear Market Bottom, DJI = 423.10
12/31/1959 Bull
Market Peak, DJI = 679.30
26 months later.
10/25/1960 Bear Market Bottom, DJI = 566.00
12 months later.
11/4/1961
Bull
Market Peak, DJI = 732.60
12 months later.
6/27/1962
Bear Market Bottom, DJI = 536.90
7 months later.
Bottom to Bottom Cycle length: 4 years 8
months
Bottom to Cycle High length: 4 years 1 month
---------------------------------- Major Cycle
8 -------------------------------------------------------------------------
6/27/1962 Bear Market Bottom, DJI =
536.90
1/18/1966
Bull
Market Peak, DJI =994.20
37 months later.
10/7/1966
Bear Market Bottom, DJI =744.32
9 months later.
9/26/1967
Bull Market Peak,
DJI = 937.18
10.5 months later.
3/21/1968
Bear Market Bottom, DJI =825.13
6 months later.
12/2/1968
Bull Market
Peak, DJI = 983.34
8.5 months later.
5/26/1970 Bear Market Bottom, DJI =631.16
18
months later.
Bottom to Bottom Cycle length: 7 years 11
months
Bottom to Cycle High length: 6 years 5 month
---------------------------------- Major Cycle
9 -------------------------------------------------------------------------
5/26/1970 Bear Market Bottom, DJI =631.16
4/281971
Bull Market Peak,
DJI = 950.82
11 months later.
11/23/1971 Bear Market Bottom, DJI =797.97
7
months later.
1/11/73
Bull Market Peak, DJI = 1051.70
14 months later.
12/6/1974
Bear Market Bottom, DJI =577.60
23 months later.
Bottom to Bottom Cycle length: 4 years 6
months
Bottom to Cycle High length: 2 years 6.5 months
---------------------------------- Major
Cycle 10 -------------------------------------------------------------------------
12/6/1974
Bear Market Bottom, DJI =577.60
23 months later.
9/21/1976 Bull Market Peak,
DJI = 1014.79
22 months later.
2/28/1978 Bear Market Bottom, DJI = 742.12
17 months later.
Bottom to Bottom Cycle length: 3 years 2
months
Bottom to Cycle High length: 1 years 5 months
---------------------------------- Major Cycle
11 -------------------------------------------------------------------------
2/28/1978 Bear Market Bottom, DJI = 742.12
17 months later.
9/11/1978
Bull Market Peak, DJI =
907.74
7 months later.
11/14/1978 Bear Market Bottom, DJI = 785.26
2 months later.
10/5/1979
Bull Market Peak, DJI =
897.61
11 months later.
11/7/1979 Bear Market Bottom, DJI = 785.26
1 month later.
2/13/1980 Bull Market Peak. DJI = 903.84
3 months later.
3/27/1980 Bear Market Bottom, DJI = 759.98 1.5
months later.
4/7/1981 Bull Market Peak, DJI = 1024.05
12.5 months later.
8/11/82 Bear Market Bottom, DJI = 777.21
16 months later.
Bottom to Bottom Cycle length: 4 years 5
months
Bottom to Cycle High length: 3 years 1 month
------------------------------------ Major
Cycle 12 -----------------------------------------------------------------------
8/11/1982 Bear Market Bottom, DJI = 777.21
1/6/1984
Bull Market Peak, DJI = 1286.64
17 months later.
7/24/1985 Bear Market Bottom, DJI = 1086.57
6.5 months later.
8/25/1987
Bull Market Peak, DJI = 2722.42
25
months later.
12/4/1987 Bear Market Bottom, DJI = 1766.74
3.5 months later.
Bottom to Bottom Cycle length: 5
years 3 months
Bottom to Cycle High length: 5 years
------------------------------------
Major Cycle 13
-----------------------------------------------------------------------
12/4/1987 Bear Market Bottom, DJI = 1766.74
7/16/1990 Bull Market Peak, DJI = 2999.75
32 months later.
10/11/1990 Bear
Market Bottom, DJI = 2365.10 4 months later.
Bottom to Bottom Cycle length: 2 years
10 months
Bottom to Cycle High length: 2 years 7.5 months
------------------------------------ Major
Cycle 14 -----------------------------------------------------------------------
10/11/1990 Bear Market Bottom, DJI = 2365.10
2/1/1994 Bull Market Peak, DJI =
3964.01 38.5 months later.
3/31/1994
Bear Market Bottom, DJI = 3635.97
2 months later.
7/30/1997 Bull
Market Peak, DJI = 8254.99
4 months later.
10/27/1997 Bear Market Bottom, DJI = 7165.15
3 months later.
7/16/1998
Bull
Market Peak, DJI = 8328.19
8 months later.
8/31/1998 Bear Market Bottom, DJI = 7539.07
1.5 months later.
Bottom to Bottom Cycle length: 7 years
10 months
Bottom to Cycle High length: 7 years 9 months
----------------------------------- Major
Cycle 15 -----------------------------------------------------------------------
8/31/1998 Bear Market Bottom, DJI = 7539.07
8/24/1999 Bull Market Peak, DJI = 11283.20
12 months later.
10/15/1999 Bear
Market Bottom, DJI = 10019.71
1/14/2000 Bull Market Peak, DJI = 11722.90
3 months later.
10/9/2002 Bear
Market Bottom, DJI = 7286.27
31 months later.
Bottom to Bottom Cycle length: 4 years
1.5 months
Bottom to Cycle High length: 1 years 3.5 months
----------------------------------- Major
Cycle 16 -----------------------------------------------------------------------
10/9/2002 Bear Market Bottom, DJI =
7286.27
2/11/2004 Bull Market Peak, DJI = 10737.70
14 months later.
10/25/2004 Bear Market
Bottom, DJI = 9749.99 8.5 months later..
3/4/2005 Bull Market Peak, DJI = 10940.85
4.5 months later.
4/18/2005 Bear Market
Bottom, DJI = 10071.25
1.5 months later..
10/9/2007
Bull Market Peak, DJI = 14164.53
30 months later.
3/9/2009 Bear Market
Bottom, DJI = 6547.05
18 months later.
Bottom to Bottom Cycle length: 6
years .5 months
Bottom to Cycle High length: 5 years
-----------------------------------
Major Cycle 17 -----------------------------------------------------------------------
3/9/2009 Bear Market
Bottom, DJI = 6547.05
4/23/2010 Bull Market Peak, DJI = 11204.28 13.5 months later.
7/2/2010 Bear Market Bottom, DJI = 9696.48 2.5 months later..
4/29/2011 Bull Market Peak, DJI = 12810.54 9.5 months later.
10/3/2011 Bear
Market Bottom, DJI = 9696.48 5.5 months later.
? 2013?
Bull
Market Peak ?
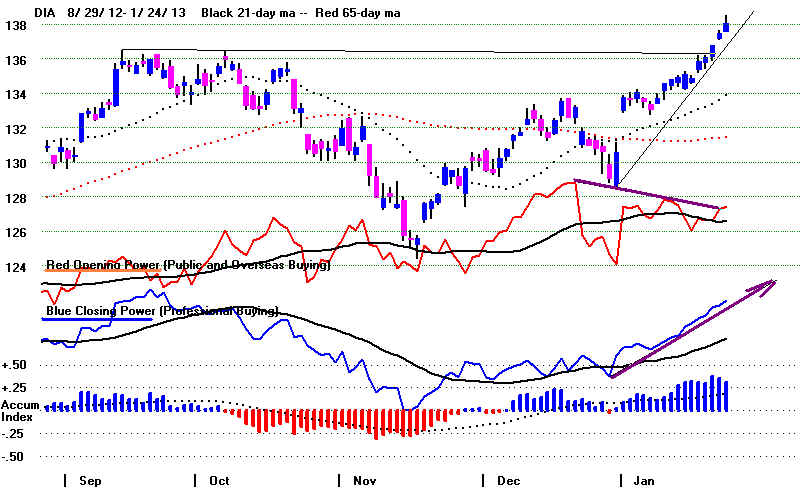
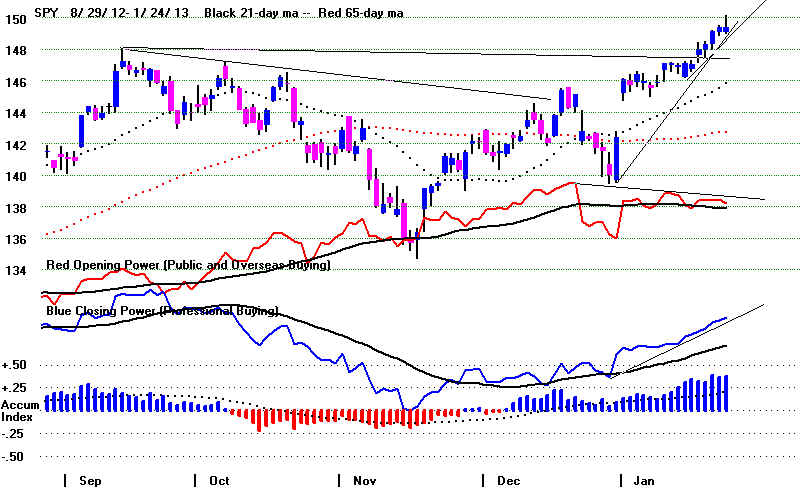
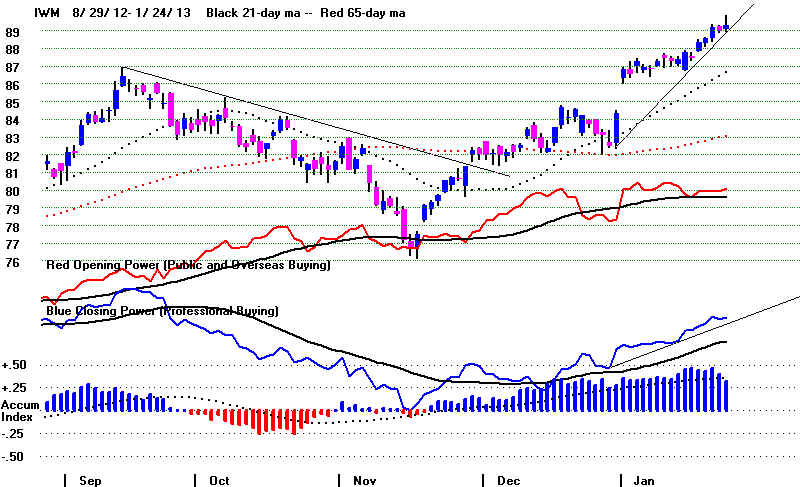
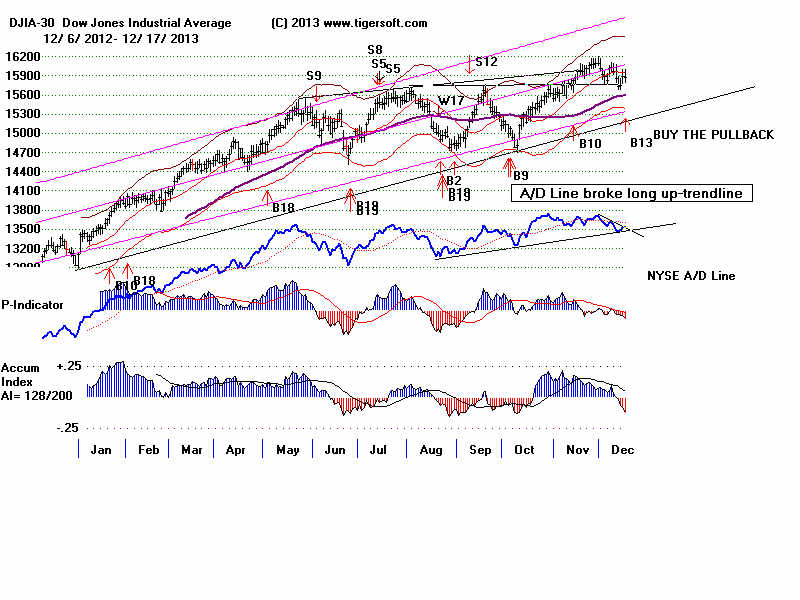
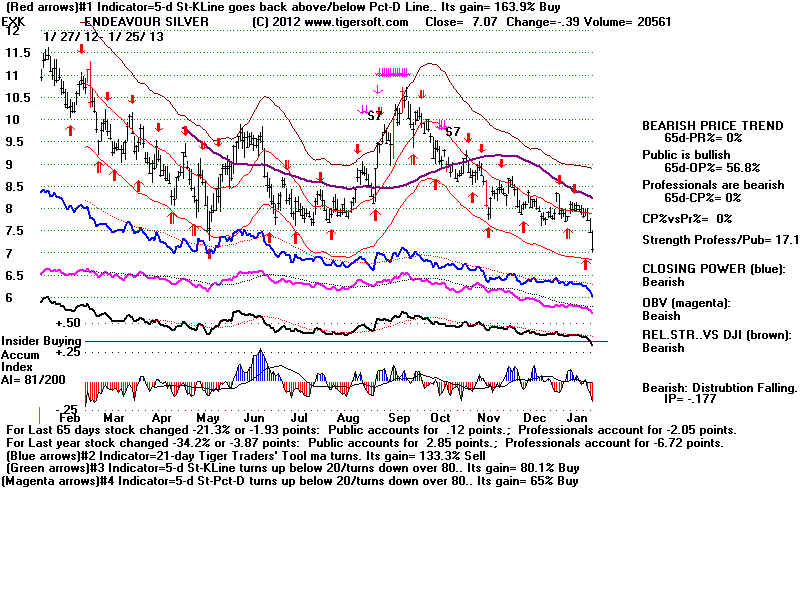
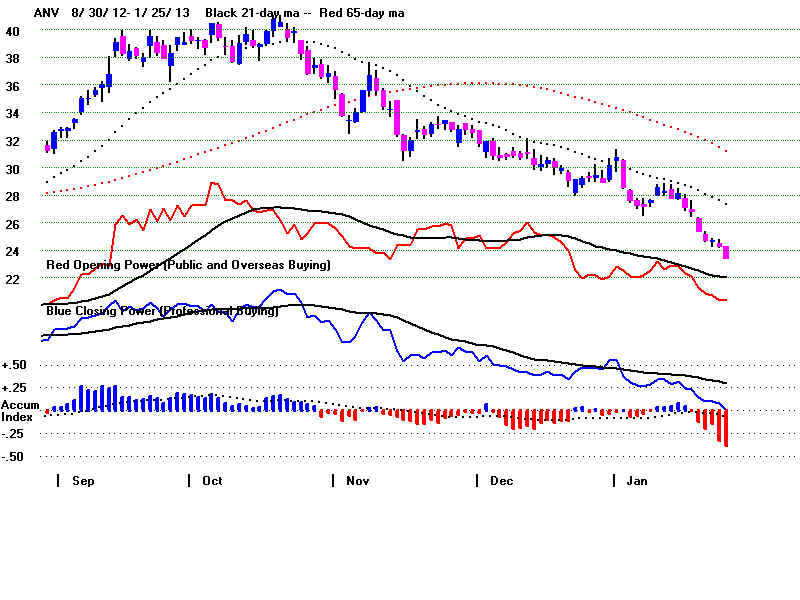
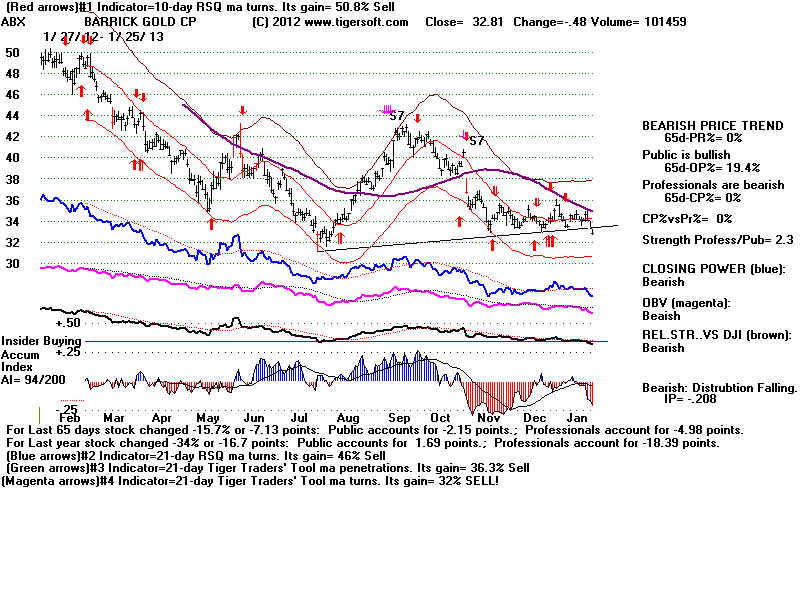
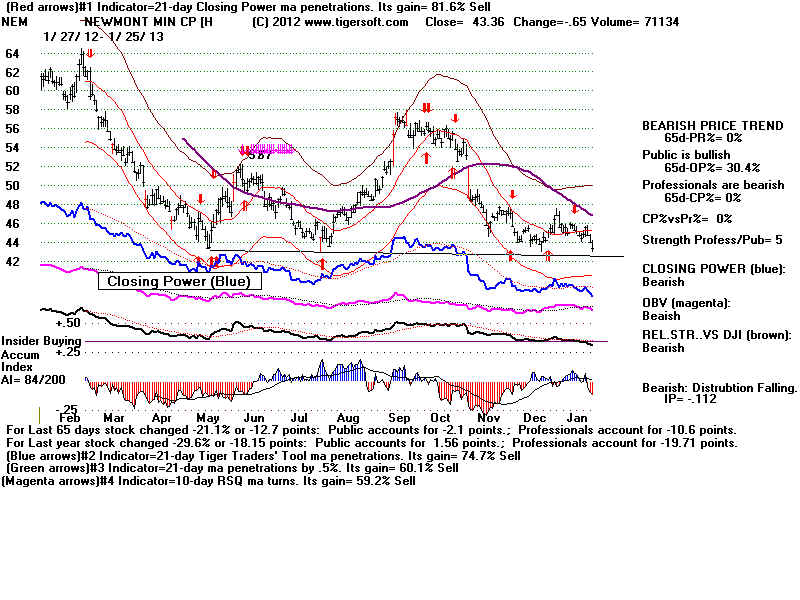
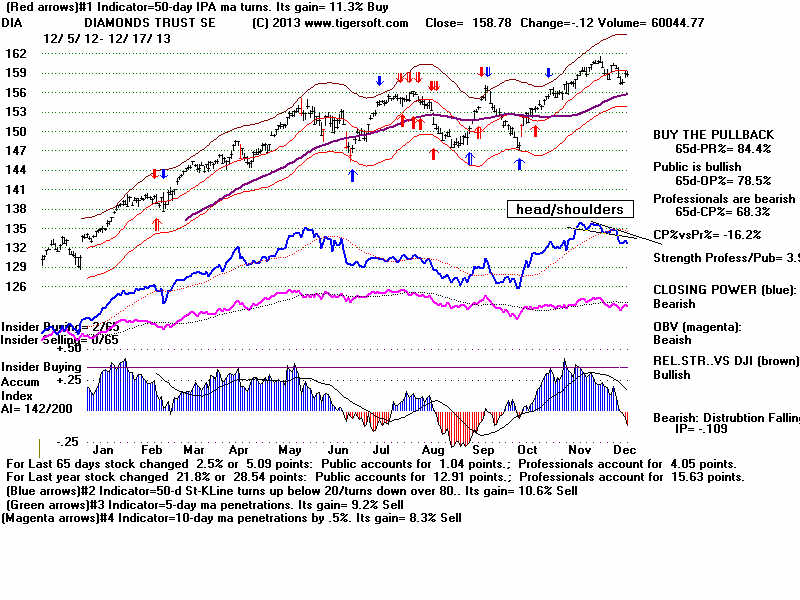
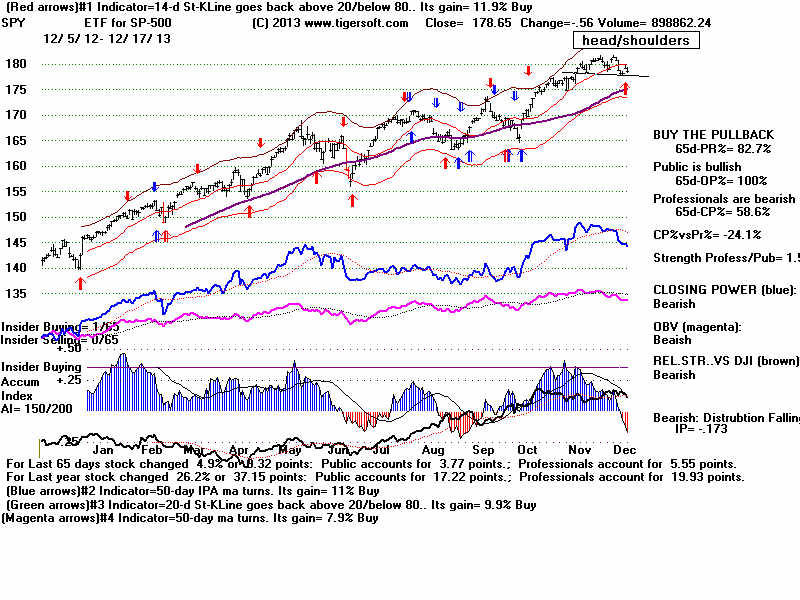
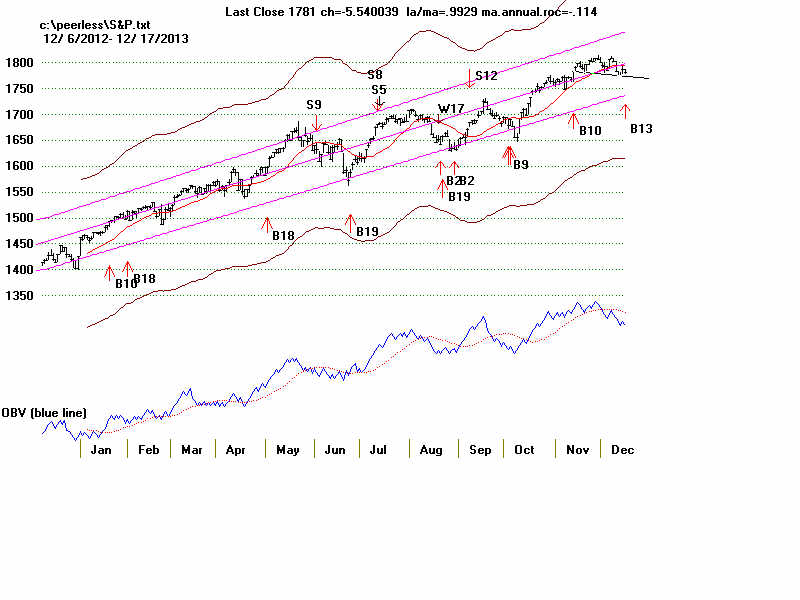
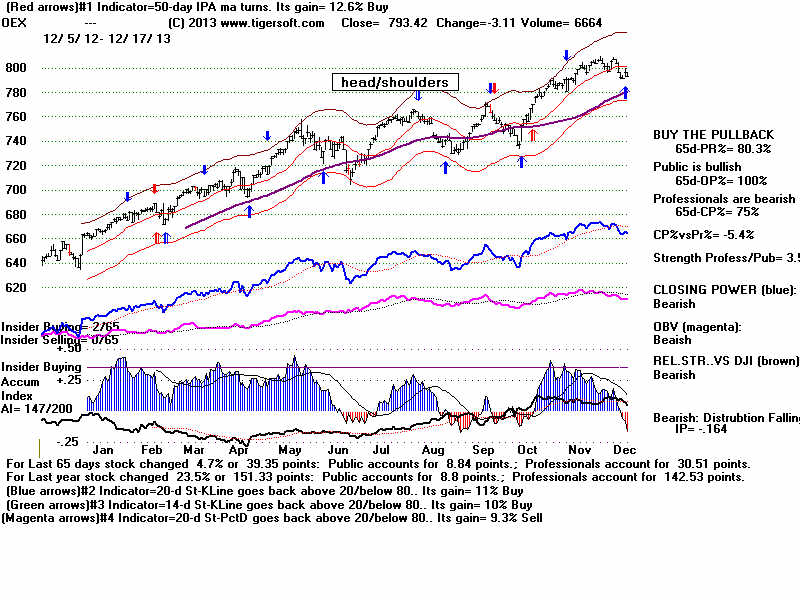
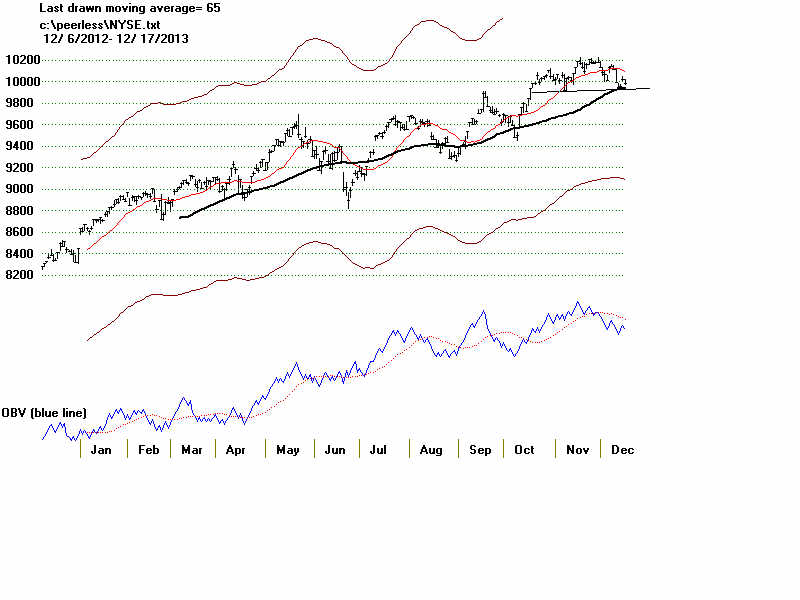
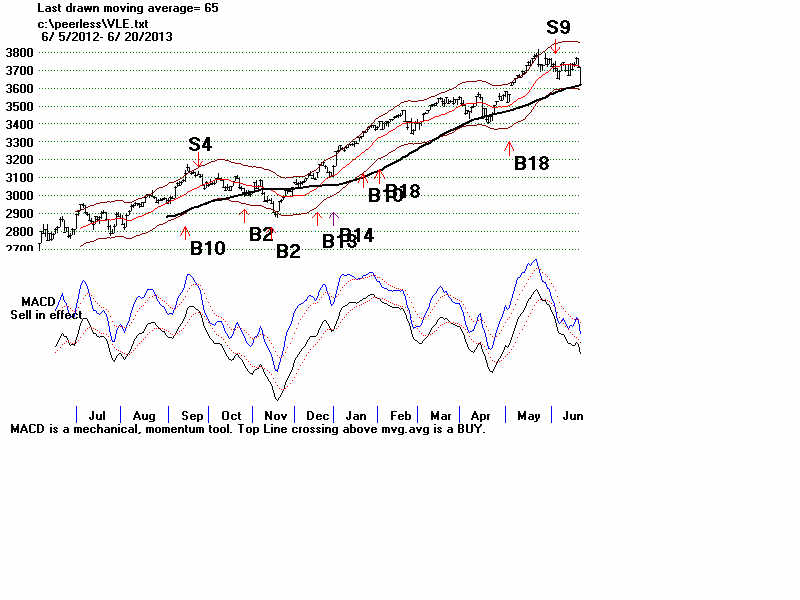
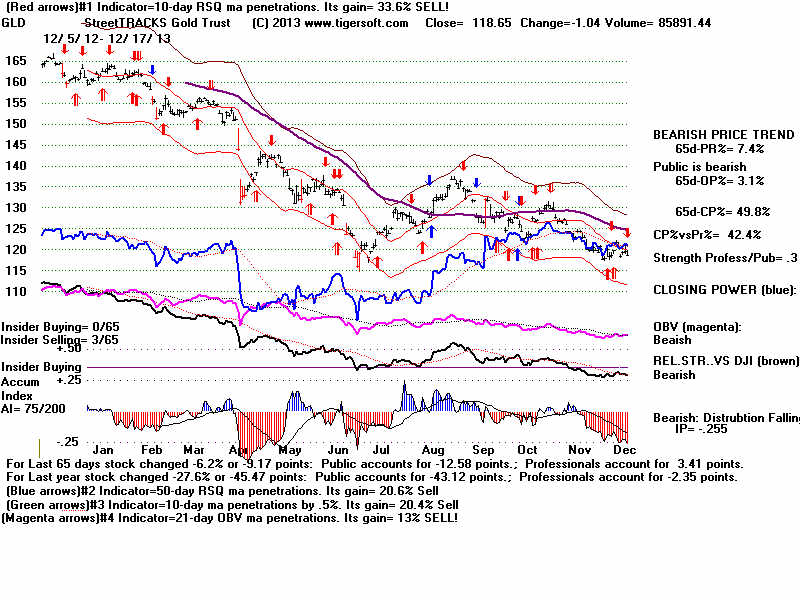
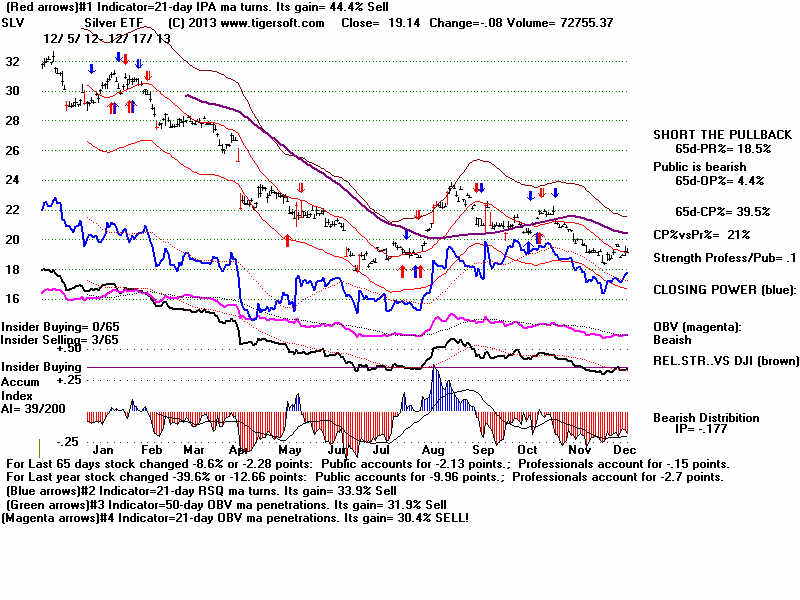
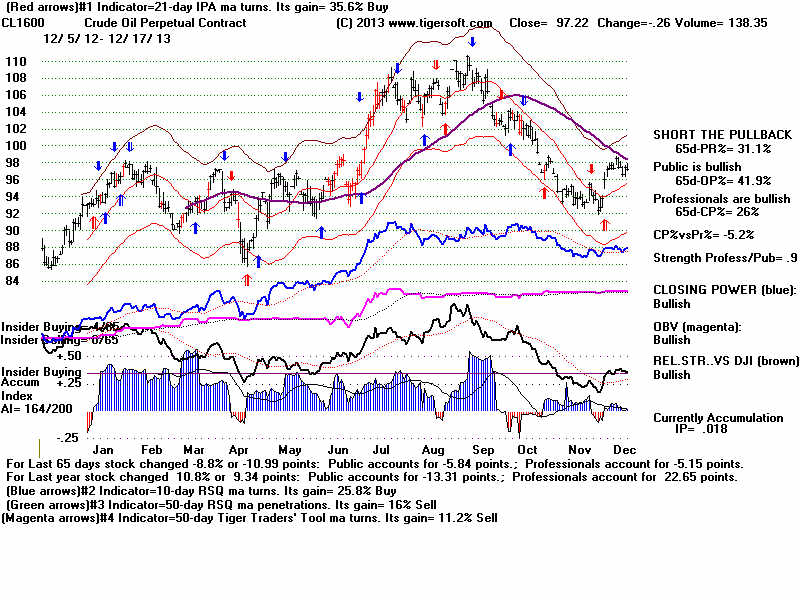
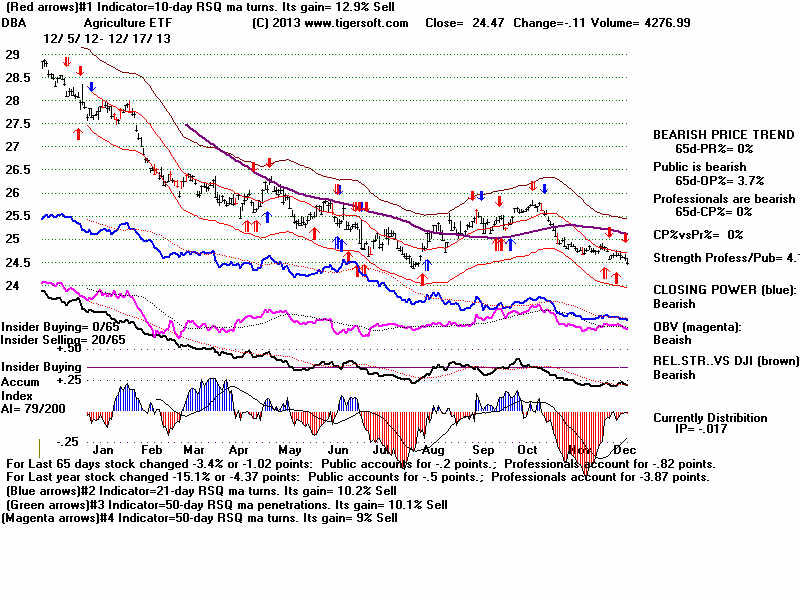
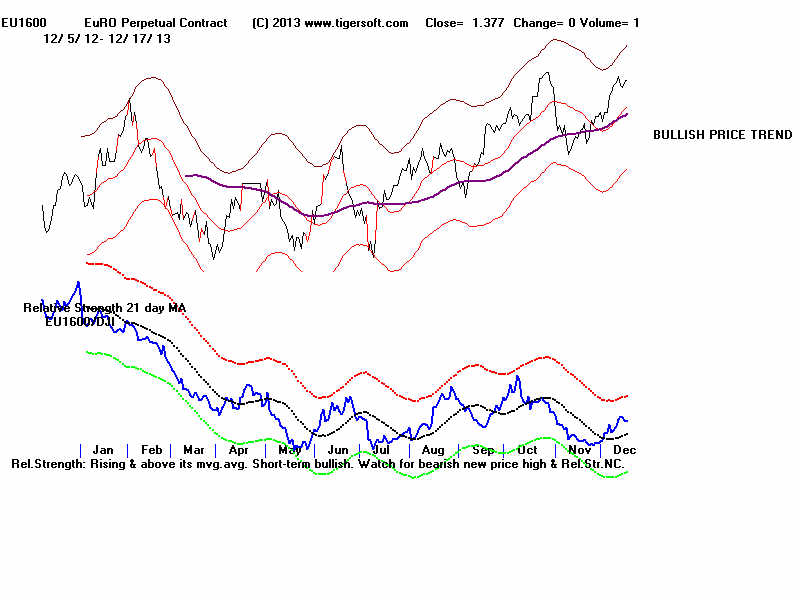
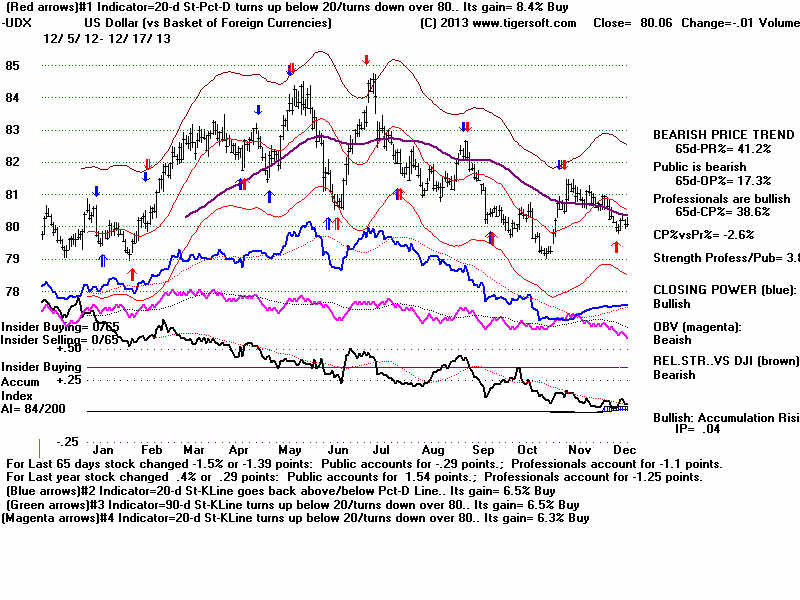
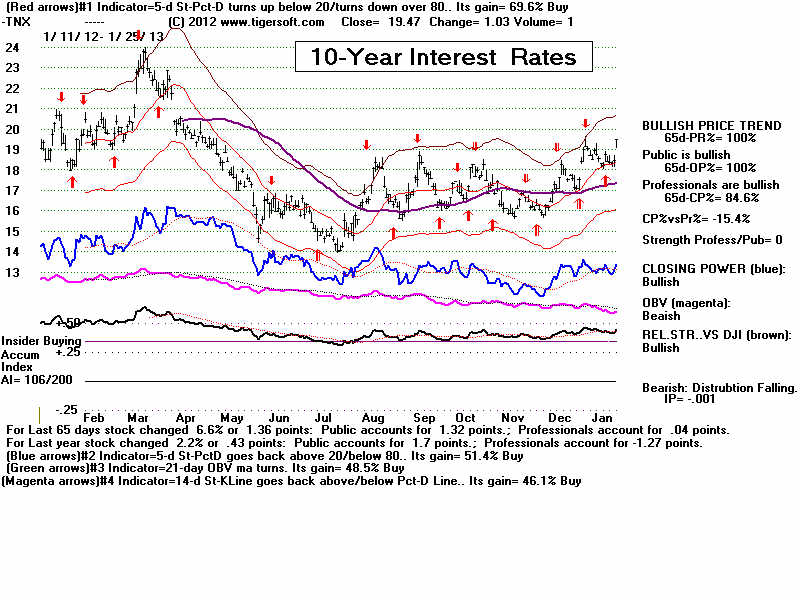
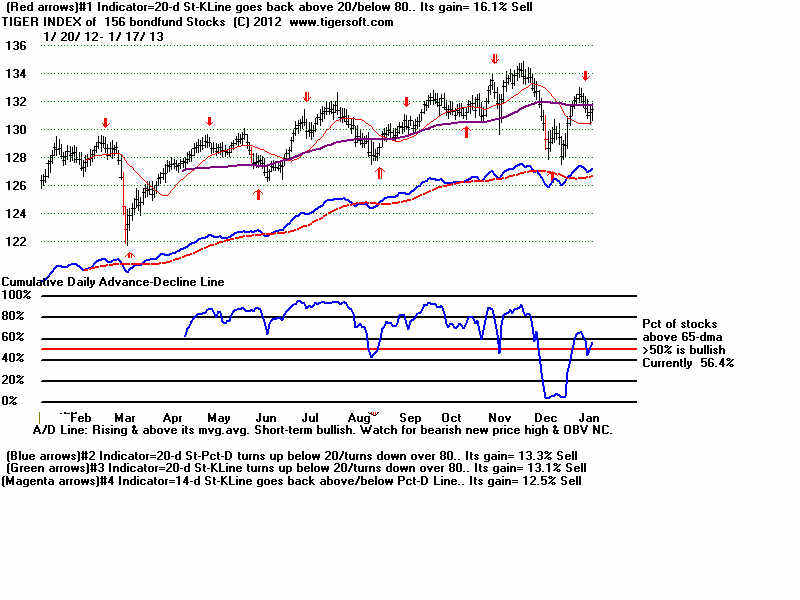
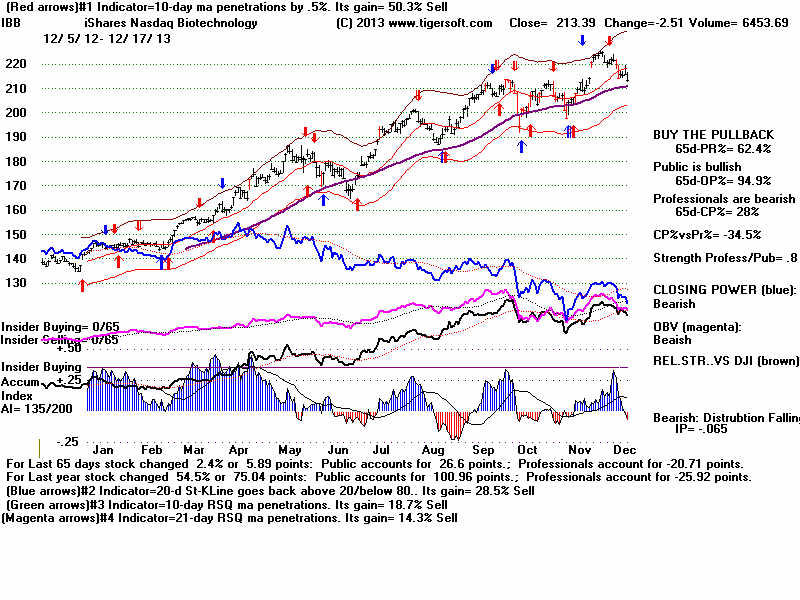
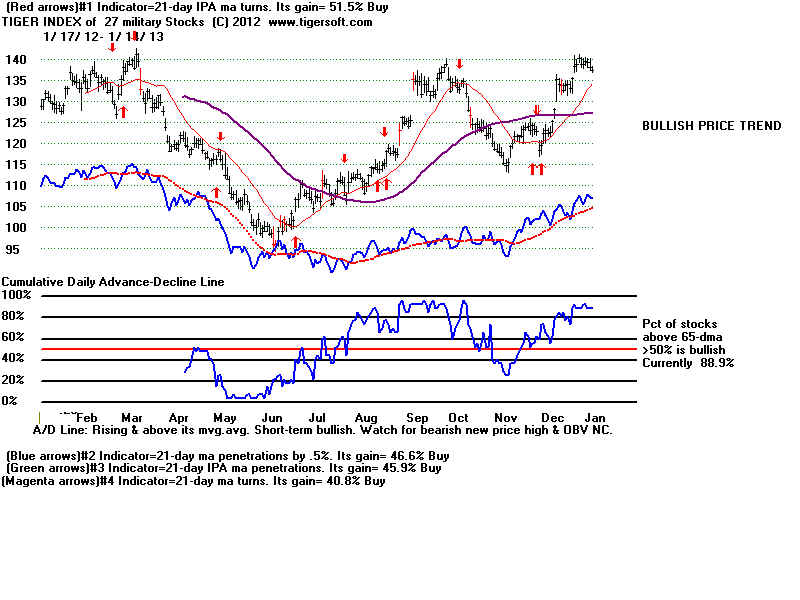
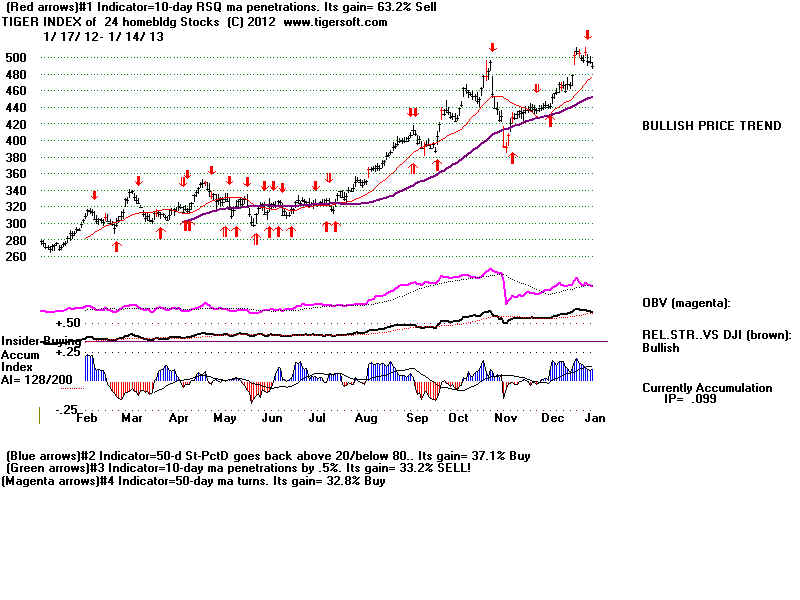
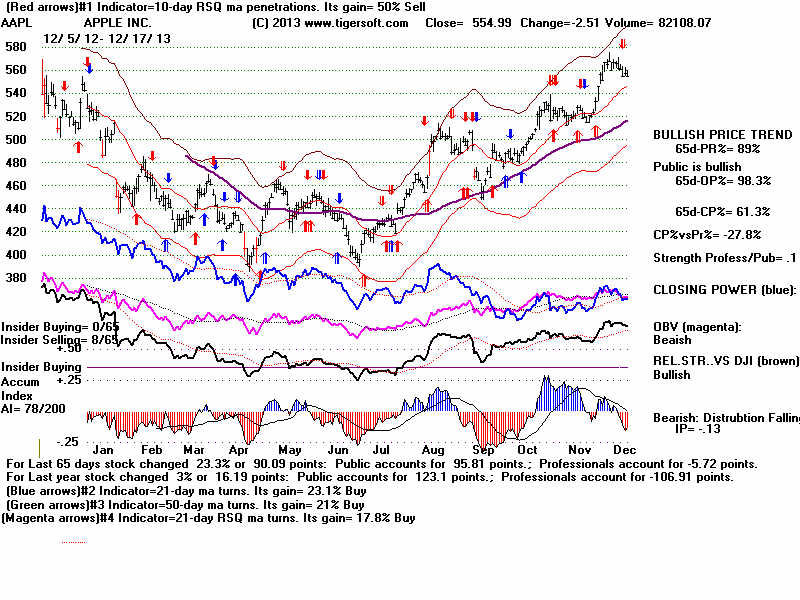
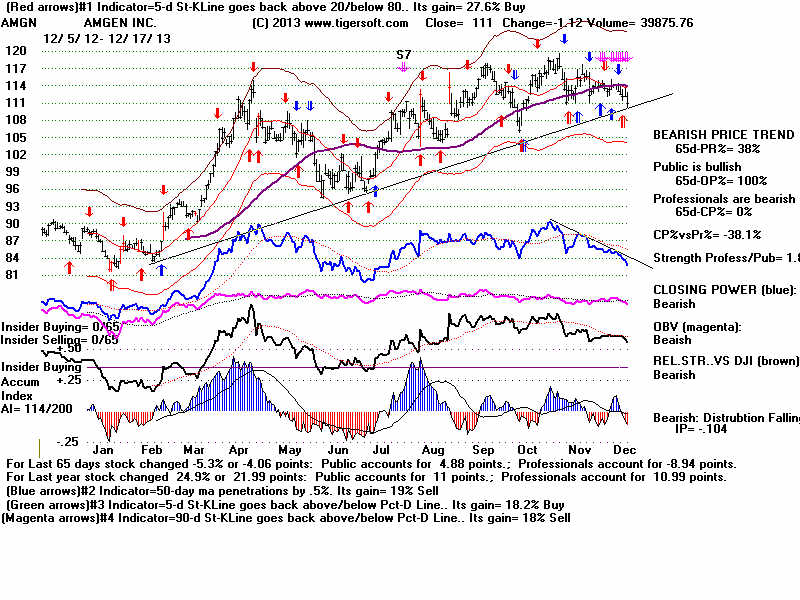
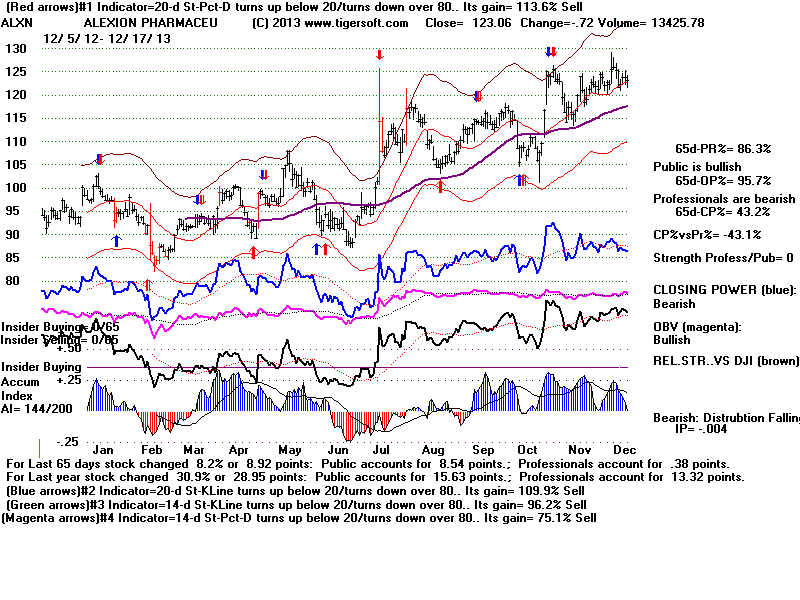
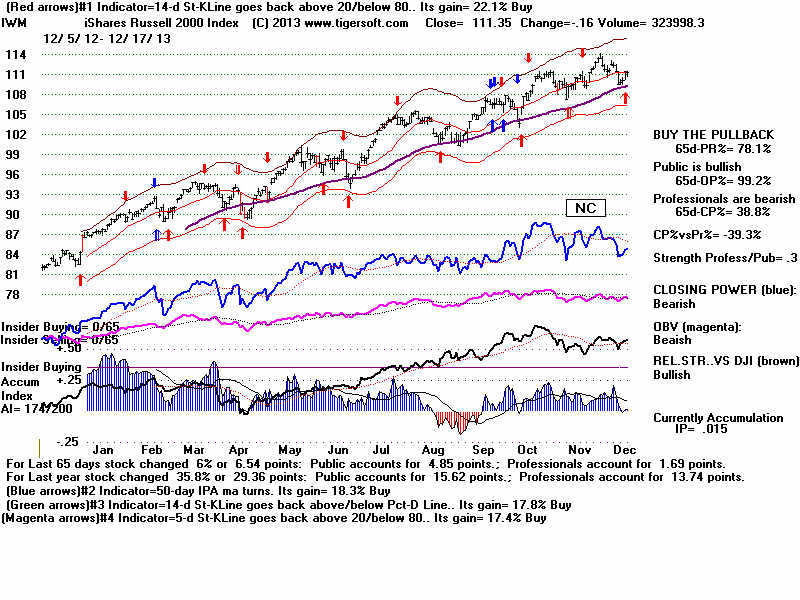
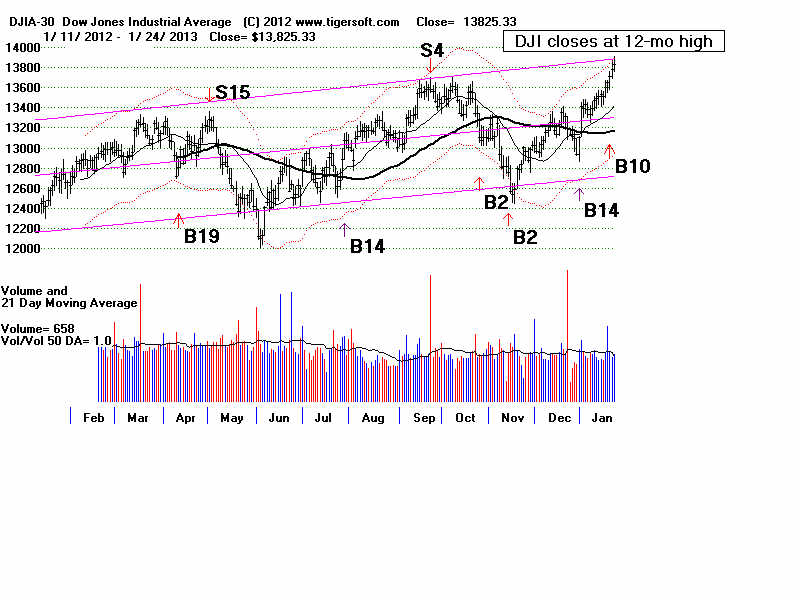
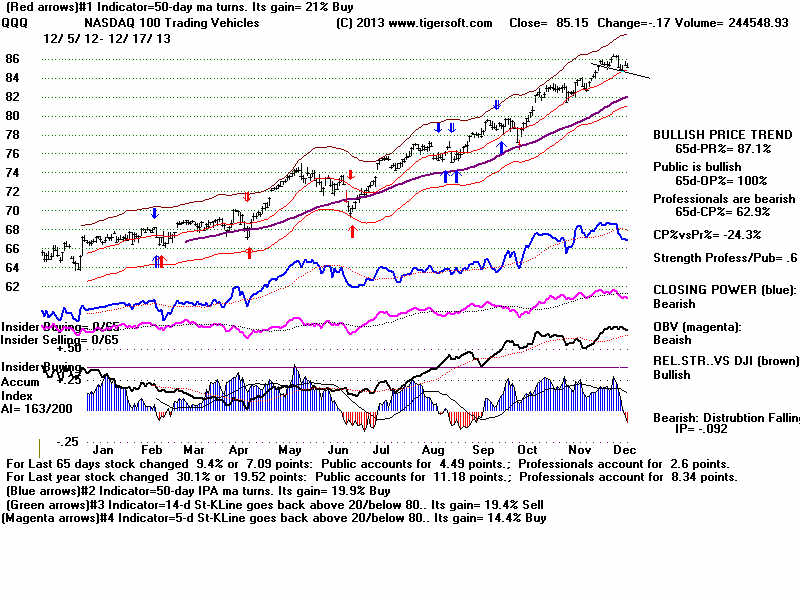
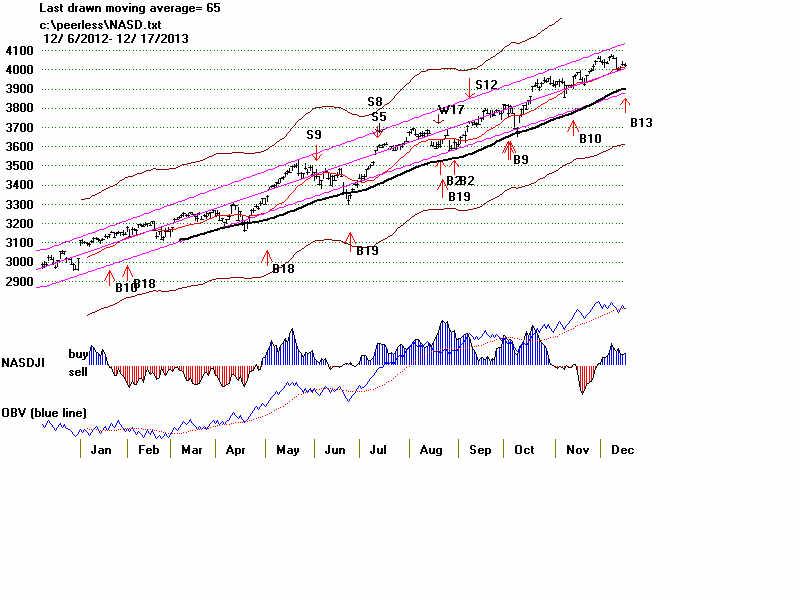
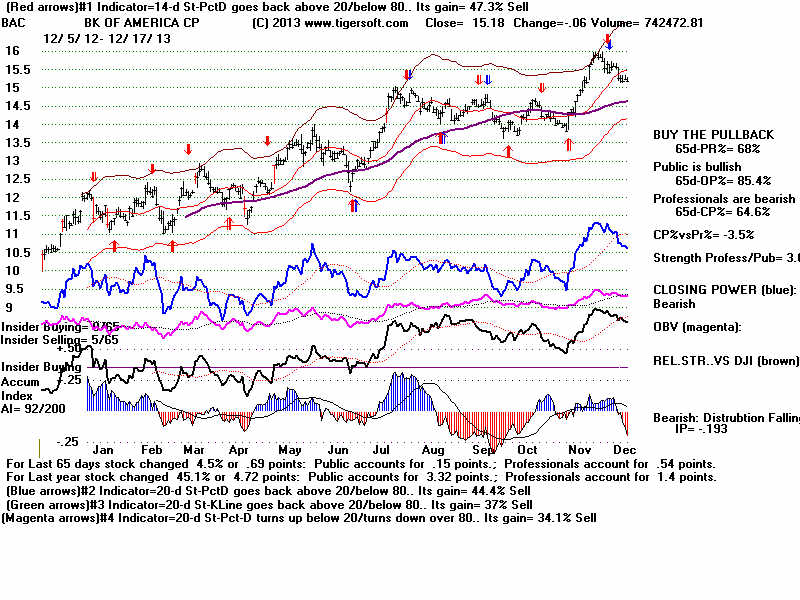
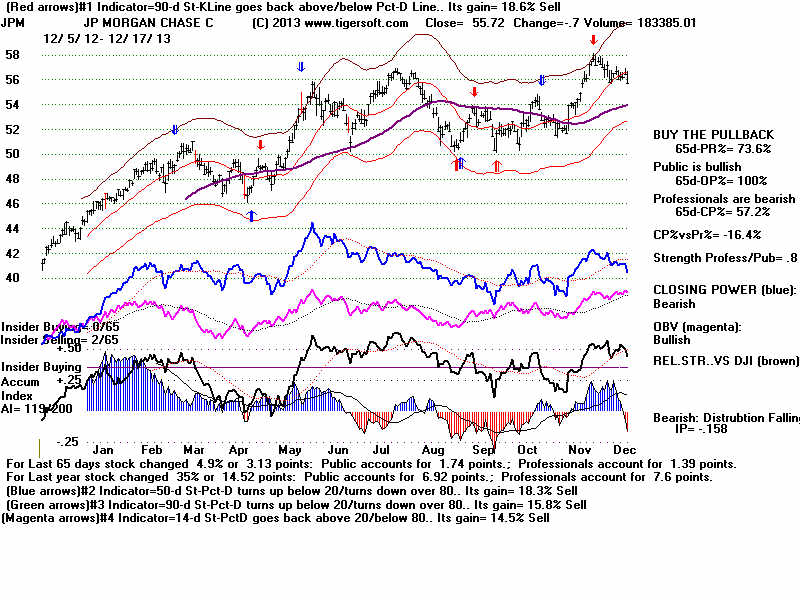
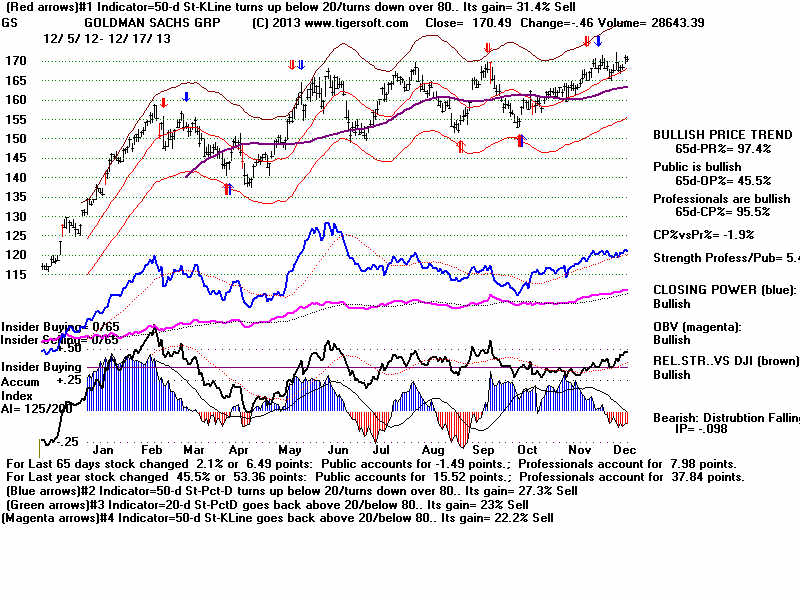
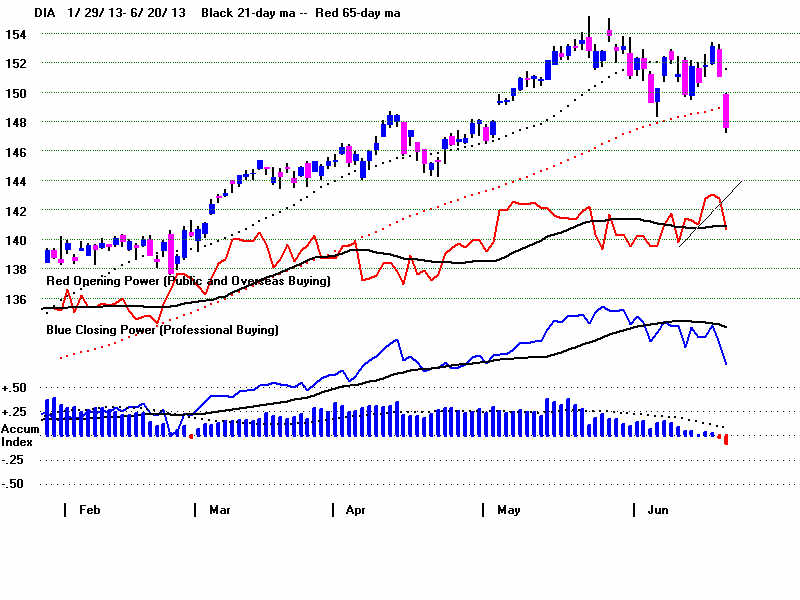
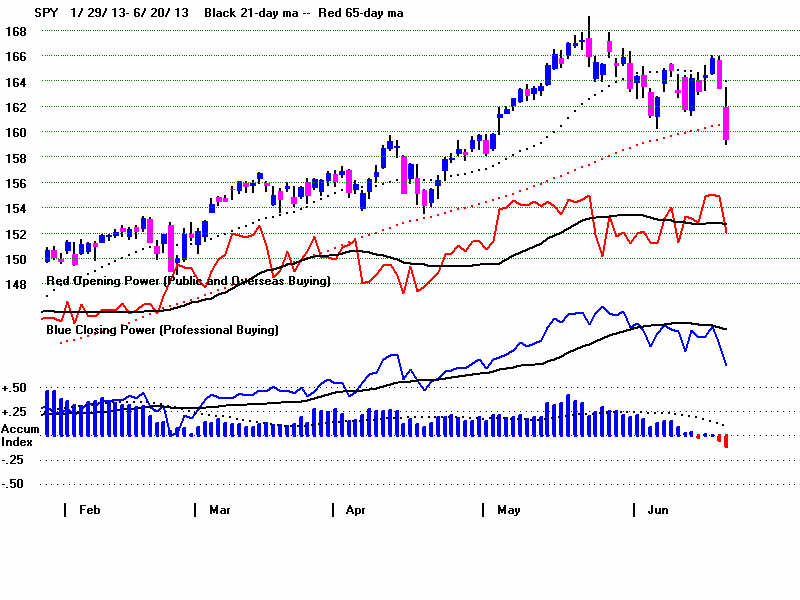
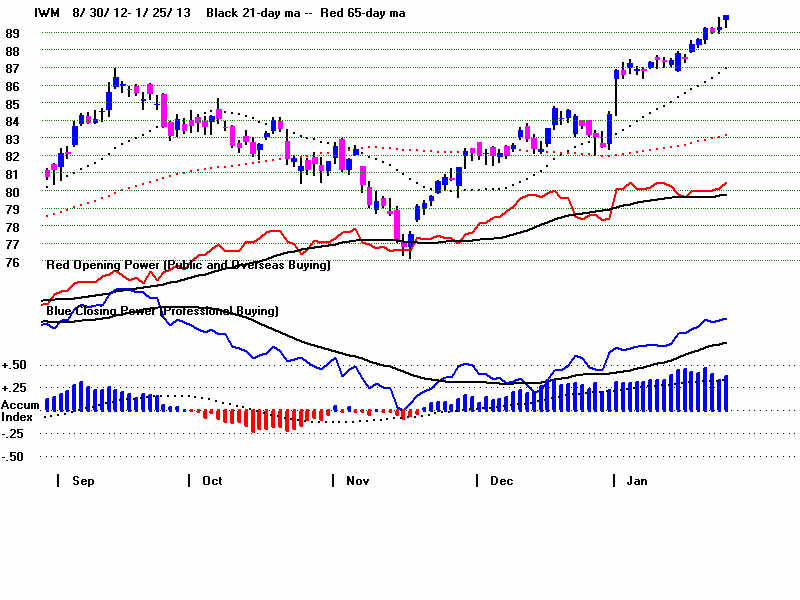
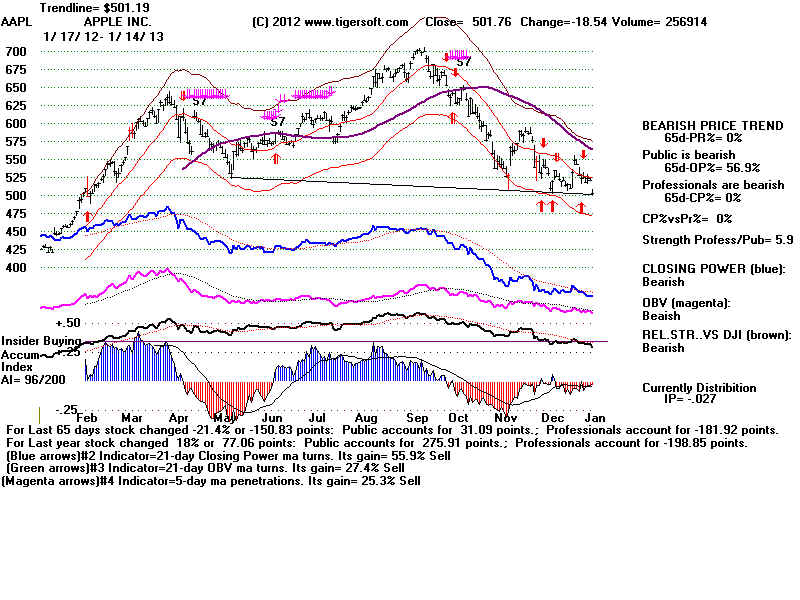