2013 DUST Case Study
         
    (C) June 15, 2013 William Schmidt, Ph.D.

      If one knew of DUST's extstence, it was actually quite easy to make a lot of money
      recently in DUST, the
3x leveraged short on gold mining stocks.
There were several
      key technical signs that gold stocks were in bad trouble, even apart from their being
      overly recommended to the Public by shils (like Glen Beck) for the precious metals and
      gold coin sellers.

                                   
   First Bearish Sign for Gold Stocks as A Group.

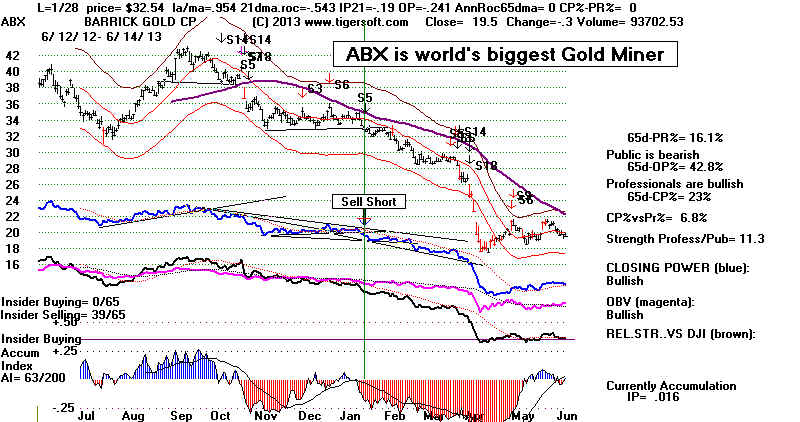
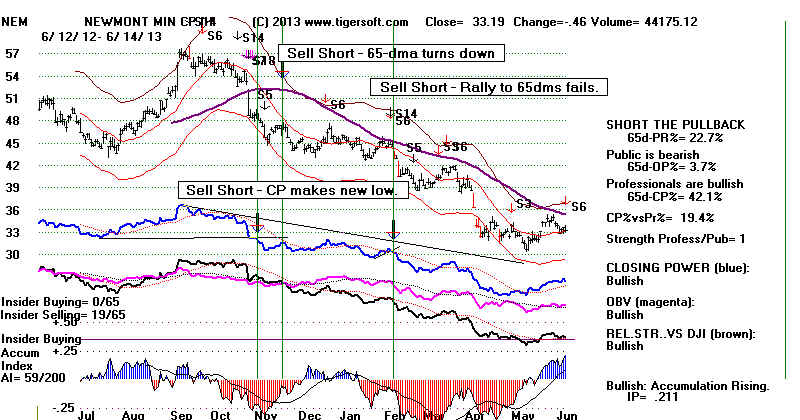
      Early this year, a TigerSoft user should have notice that gold mining leaders,
      ABX and NEM, the world's biggest and second biggest gold mining stocks
      were breaking down badly in January 2013.  Their Closing Powers made new lows
      ahead of price.  Their 65-day ma turned down.   And their Accumulation Index became
      very read and negative.   Our Hotline mentioned this as an indication that the January
      turn upwards in the general market would continue.   (Usually, the DJI does not turn
      down in a strong advance until gold stocks turn upwards.)  

                                             
ABX - World's Biggest Gold Stock
wpe1A.jpg (80319 bytes)


NEM - World's Second Biggest Gold Stock
wpe1C.jpg (77190 bytes)


           Second Bearish Sign for Gold Stocks as A Group.

      By the end of February 2013, gold and silver mining stocks began to frequent in
      significant numbers our Tiger/Peerless Hotline's Bearish MINCP stocks each night.
      We know from past experience that when a group of stocks from the same industry
      start appearing in numbers as a group in the Bearish MINCP stocks, the whole
      group is very bearish and they are apt to go much lower.  

      Typically there are only 8 or 12 bearish MINCP stocks on any given night.  They
      are selected very mechanically out of 5,000-6000 stocks.   All the MINCP stocks
      have Closing Powers making new lows ahead of price.   The most "Breaish" of these
      are found automatically by the Tiger PowerStock Ranker because they show
      exceptionally heavy red Distribution and a lagging Relative Strength Lines.  In other
      words, they are being sold very aggressively by Professionals, Insiders and Institutions. 
     The Bearish MINCP stocks very often decline even in a rising general market.  And
     as our TigerSOft Hotline pointed out many times, gold stocks do tend to fall when the
     overall equities' market is quite strong.

      It was very bearish for the industry as a whole that so many gold and silver mining
      companies starting popping up as Bearish MINCP stocks.

      On 2/22/2013 there were 2 mining stocks in our Bearish MINCP posts: ANV and NEM.
            www.tigersoft.com/-2GBL13HL/special/2-22-down/index.html  

      On 2/28/2013, there were 6:  IAG, EGO, SSRI, BVN, NEM, ANV.
            www.tigersoft.com/-2GBL13HL/special/2-28-down/index.html

      On 3/4/2013, there were 3:  EXK, ABX, GOLD.
             www.tigersoft.com/-2GBL13HL/special/3-4-down/index.htm  

      On 3/5/2013, there were 8: EXK, ANV, NEM, GG, ABX, BVN, GOLD, SSRI.
             www.tigersoftsoft.com/-2GBL13HL/special/3-5-down/index.htm     

      On 3/6/2013 there were 7: EXK, ANV, GG, NEM, GOLD, SSRI. BVN.
              www.tigersoftsoft.com/-2GBL13HL/special/3-6-down/index.htm

                                 
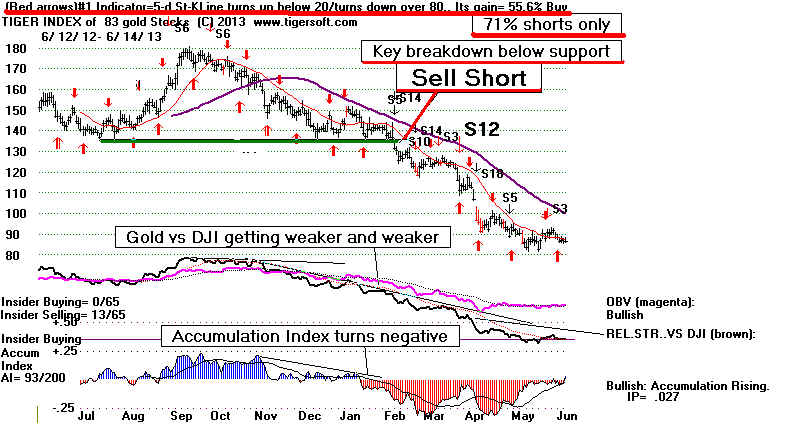
Third Bearish Sign for Gold Stocks as A Group.

    
   TigerSoft gives you the ability to chart an Index for any group of stocks you
         wish and too look at their internal strength indicators including:
                               Relative Strength
                               Accumulation Index
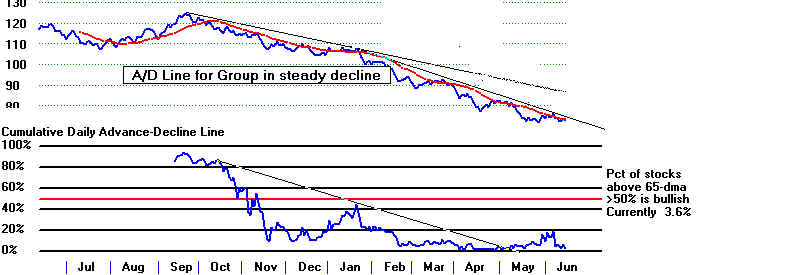
                               Advance-Decline for the Group
                               Pct of Stocks above their 65-dma

         It also lets you see the best trading system for this index.

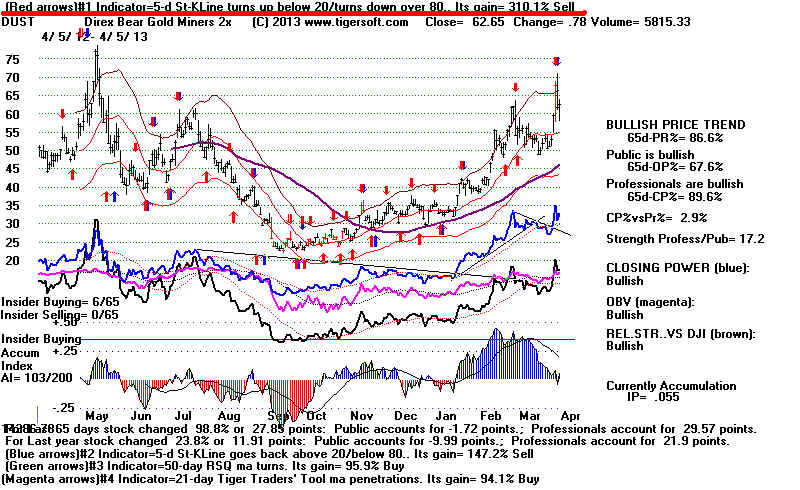
         All signs were very bearish for Gold stocks as a group.  The best trading system
         for the group currently is the 5-day Stochastic K-Line turning up from below 20
         and down from above 80.

MASTGOLD.BMP (1032054 bytes)
MASTGO2.BMP (660054 bytes)

                                                       
What To Do?

      After studying these charts, there could be no doubt that this whole gold stocks'
      group would probably keep going down.
: . 
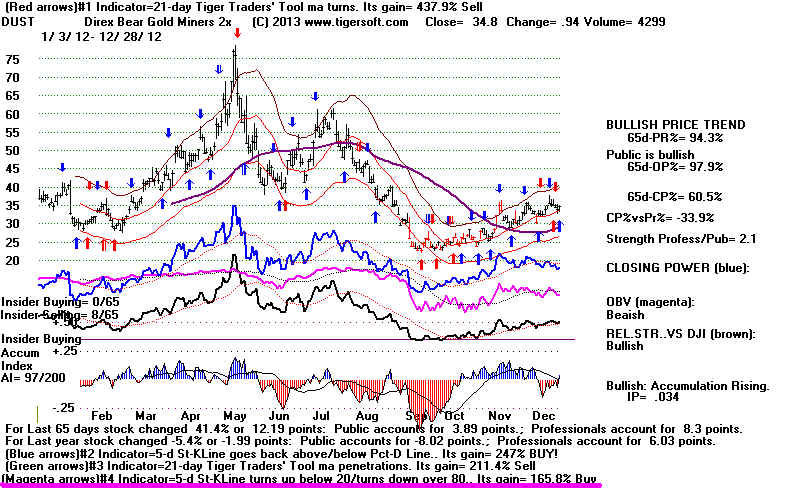
       With this persepctive, DUST (the 3x leveraged short on gold mining stocks)
       was a natural long.  Usually in a very bullish situation, it work out well to
       buy on short-term automatic Stochastic buys and sell when the Closing Power uptrends
       were broken.  In fact, the 5-day Stochastic-K-Line turning up below 20 as a buy
       and turning down below 80 as a Sell was consistently profitable, as you can see
       below.  So, this approach had to be favored.  

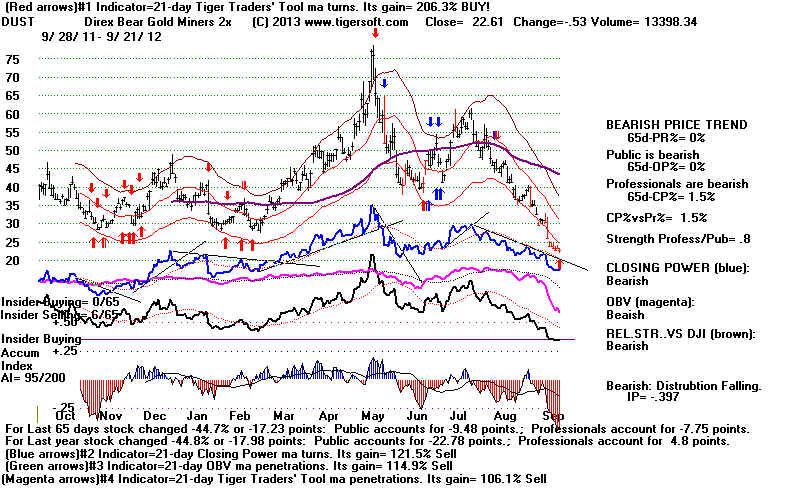
       DUST chart ending 9/21/2012
       5-day Stochastic K-Line turning up below 20 is a buy and down from above 80 is sell gained 80.5%
       But best system was 21-day Tiger Day Traders' Tool MA turns +206.3%.

DUST0912.BMP (1176054 bytes)

       
=====================================================================================
        DUST chart ending 12/28/2013
      
5-day Stochastic K-Line   turning up below 20 is a buy and down from above 80 is sell gained 165.8%
        Best system was 21-day Tiger Day Traders' Tool MA turns +437.9%.

DUST1212.BMP (1176054 bytes)

===================================================================================       
        DUST chart ending 4/5/2013
     
  5-day Stochastic K-Line   turning up below 20 is a buy and down from above 80 is sell gained 310.1%
        21-day Tiger Day Traders' Tool MA turns only gained 19.7%. 

DUST0413.BMP (1176054 bytes)

====================================================================================
        DUST chart ending 6/14/2013
        5-day Stochastic K-Line  turning up below 20 is a buy and down from above 80 is sell gained 872.7%
        Waiting for the K-Line to cross 20 for a Buy and cross below 80 for a Sell gained +383.2%.

DUST0613.BMP (1183254 bytes)

             The only questions remaining were should we Sell on the the 5-day K-Line
              Stochastic Sells or the CLosing Power trend-breaks?  And should we do
              it on the Close or the next day's Opening.  TigerSoft lets you study the
              results signals given by any system using either closes or the next
              day's opening.   Here we can also show what would have happened if
              we started trading DUST at the end of February, not for the whole year.  
              T
he data below show that using the next day's openings to trade works
              out to our advantage.
  Buying and Selling DUST LONG only at the next
              day's Opening would have gained +154% from 2/27/2013 to 6/24/2013.
              $10,000 would have become $25400 in only 4 months.            

             
But because short sale paper losses on DUST using the 5-day Stochastic-K-Line
              are greater than their gains in this 4-month period, we probably should not go
              short on the Stochastic  Sells.  It would seem to be better to do this  when the
              65-dma has   turned down. 
Keep in mind that the leverage here is 3:1.

                                                          Trading                         Trading
                                                          at CLose              at Next Day's Opening

               Long and Short Gain                 +397%                    804%
               7/5/2012 to 6/14/2013

               Long and Short Gain
               2/27/2013 to 6/24/2013   $16230->$49695              $26513->$90395
                                                                  +206%                    +241%
               --------------------------------------------------------------------------------------------------     
               Longs Only Results                    156%                      $254%
               7/5/2012 to 6/14/2013

              
2/27/2013 to 6/24/2013     $10781->$25620              $13948->35399
                                                                  +138%                     +154%


               Biggest Paper Loss Long           38%                        38%
               -------------------------------------------------------------------------------------------------------

               Shorts Only Results                     38%                         86.%
                7/5/2012 to 6/14/2013    

              
2/27/2013 to 6/24/2013      $10888->13285                $14011->18631             
                                                                
    +18.0%                  +24.8%

              
Biggest Paper Loss Short              39%                        32%
               --------------------------------------------------------------------------------------