#1 -- How To Screen A Directory of Stocks
#2 -- What Is Opening Power Doing?
#3 -- Trading Returns Using The Next Days' Opening.
#4 -- Turning Off the Red Buys and Sells O
#5 - Displaying Second,Third and Fourth Best Systems, too
#6 - Running The Power Ranker against Stocks Traded Best
with 5-Day Stochastics.
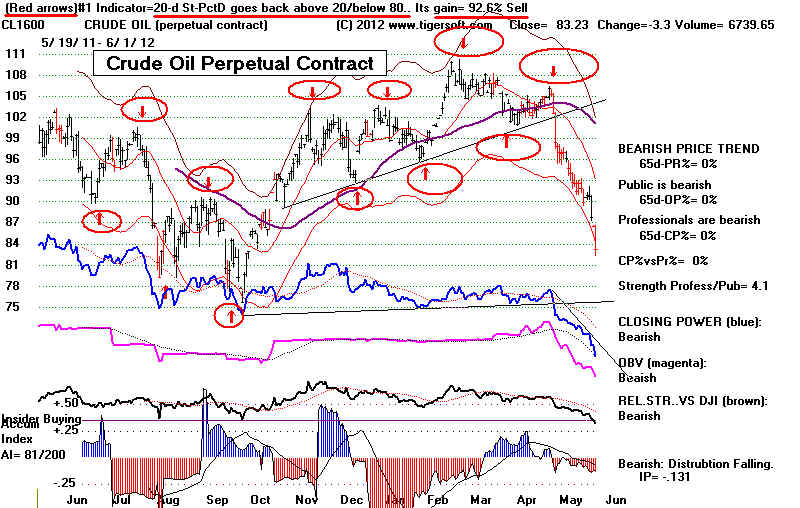
The red Buy and Sell arrows based on the best trading system for
the data displayed appear automatically on a Tiger chart. The best
trading system and its yearly gain is shown on the top line, above
the price chart. I have underlined in red this information in the chart below.
The results of all the trades here is shown to 92.6%. A Stochastic-20
produces these results when the (3-day smoothed) Pct-D rises back
above 20 for a Buy or falls below 80 for a Sell. The results shown here
always assume that one is always long or short having started with $10,000
and trading each signal. $20 per trade is assumed in commissions and
slippage. The results further accume that you trade on the close the day
of the signal.
There are many additonal User-determined displays related to using the
Tiger Optimized Signals. Use the following commands.
User Choices
#1 -- How To Screen A Directory of Stocks
It is not necessary to view charts one by one to find a very profitable
trading candidate. Here is how to have the Power Ranker find the most
profitably traded stocks using the automatic signals in any directory.
Peercomm +
Select Folder +
Pick a directory of stocks to use. Here I will use OILGAS. Click OK.
Older Charting +
Run/Setups (upper left) +
Run Best Indicators (for) All Stocks + OK + "X" (at the upper right) +
Charts -2012/2013 (upper right button) +
Tiger Selections (at top on left) +
#1 Indicators' Results/Status for Stks
In the resulting table, the third column shows the Percentage Gain for the stock.
The second column shows the Best Performing Indicator. You may want to
pick a length Stochastic that matches your trading personality. I suggest also
picking a stock where the results are significant, say above100%.
On 6/14/2013, for a 5-day Stochastic, I find a row that says.
Under Status, you can see whether the current red signal is a Buy or a Sell.
An exclamation mark after the "Buy" or "Sell" would mean a new signal today.
HERO shows a new Sell!
Best System Gain Status Close Change AI/200 IP21 IP Cloaw
vsTISI vs50-dma
CENX 5-d St-Pct D goes back above 20/below 80 104.7%. Sell, 9.61 -.161 127 .141 BF AR
CRZO 5-d St-PctD goes back above 20/below 80 159.8% Sell 26.16 -.500 126 .003 AF AR
EVEP 5-s St-K-Line goes back above/below Pct-D Line 113.4% Buy 34.06 -.23 90 -.137 BF BF
FST 5-d St-Pct D turns up above 20/down below 80 146.4% Buy 4.28 -.13 66 -.152 BF BF
HERO 5-d St-K-Line turns up below 20/down ebove 80 164.4% Sell! 7.00 -.02 133 -.214 BF BR
NBR 5-d St-K-Line turns up below 20/down ebove 80 179.4% Buy 15.90 -.33 139 -.028 BF AR
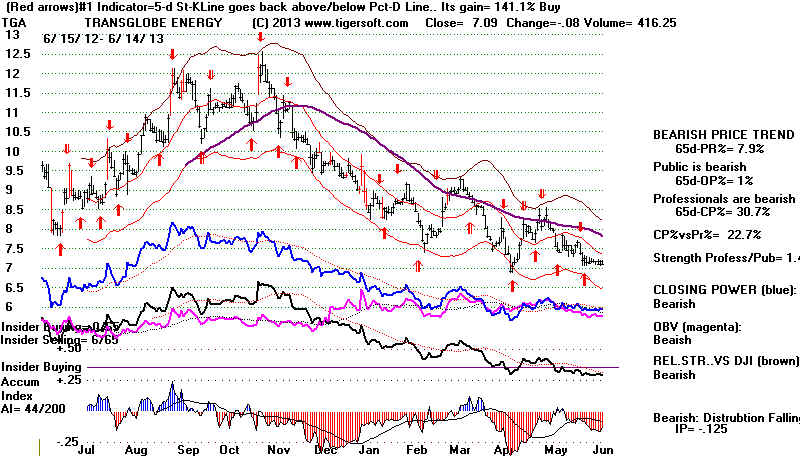
TGA 5-s St-K-Line goes back above/below Pct-D Line 148.3% Buy 7.09 -.08 44 -.093 BF BF
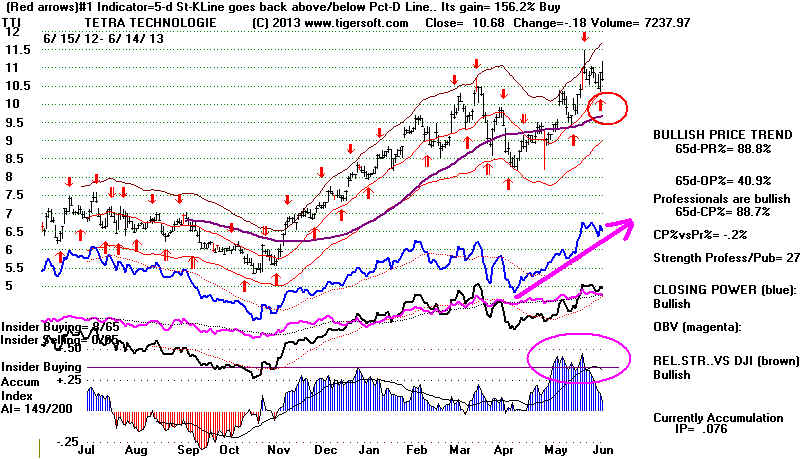
TTI 5-s St-K-Line goes back above/below Pct-D Line 164.7% Buy 10.68 -.18 149 .076 BF AR
WLL 5-d St-K-Line turns up below 20/down ebove 80 164.4% Sell 48.07 -.651 112 .067-.AF AR
For shorting purposes, I would prefer a stock with a low AI/200 score. A bearish score of "50"
for this means that for the last 200 trading days, the Accumulation Index has been positive only
50 days. In the case of TGA, we see an AI/200 score of only 44. I might want to sell this short on
the next red Sell!. If IsClick the ROW of this spreadsheet's data and then click Chart, I can
see the graph.
For Buy purposes, I would prefer a stock with a high AI/200 score. A bullish shore of "145"
or higher is desirable. TTI shows an AI/200 score of 149. The chart does show a recent
Accumulation bulge. This and the fact that the Closing Power are rising are favorable
signs for a long position.
#2 -- What Is Opening Power Doing?
Since you will probably be trading the next day, be sure to study the
Opening and Closing Power lines. If the Opening Power is rising and the
Closing Power is falling it may be best to sell short at the opening and
buy or go long near the Close of trading. With a chart of the screen,
Use Indic-3 + Tiger-Basis-Of-Move-Lines.
#3 -- Trading Returns Using The Next Days' Opening.
You can see what the gains and losses are using the next day's Opening
by clicking Operations + What Happens to $10,000 + No. Sometimes
the next day does better, but mostly the market moves over-night in
the directon of the signal.
Using the same table of trading results for what happens to $10,000,
see what the biggest paper losses were. They are shown for Buys
and for Sells. You may not want to use them if they are too large.
Or you may want to work with STOPs just beyond the previous biggest
paper loss. If the biggest paper loss was -7.6%, it may well be that a loss
much larger than that would show the stock's trading behavior has changed.
#4 -- Turning Off the Red Buys and Sells
The simplest way to temporarily eliminate the red Buys and Sells is to pull the Sub-Menu
Operations down from the top right and choose RestoreSimple Bar Chart or
Restore Top Half Only.
#5 - Displaying Second,Third and Fourth Best Systems, too
You also can tell the computer to not display these red Buys and Sells
or to also show the buys and sells from the
2nd (blue),
3rd (green) and
4th (magenta) best trading systems.
Main Tiger Screen (tiger menacing bull and bear)
+ Runs/Setups + Set Initial Screen's Signals + Y or N (upper right corner_
+ 1 - 4 (in box beneath the Y/N box)
Click Save these parameters to disk.
Click X at the upper right corner.
The trading systems that produce the second, third and fourth best trading
results currently appear at the bottom of the chart. Often when two
or more signals dove-tail, a nice move is about to start.
The red arrows are based whatever is the best trading systen for the stock,
long and short for the last year. You can easily see how this system (or
any other system using Tiger indicators) did only trading long or only
trading short. Click Operations + What Happens to $10,000 (long only) or
What Happens to $10,000 (short only).
You can see the effectivess all the standard TigerSoft trading
systems by placing a Tiger chart on the screen and then pulling down
the sub-men labeled Indic.3 above the chart and choosing either:
Performance of Moving Averages / (Momentum) Indicators
Performance of 5-14-20 Day Stochastics
Performance of 50-90 Dat Stochastics.
You can readily experiment with other lengths besides 5-,14-,20-,50- and 90-day
Stochastics amd moving averages. With a Tiger chart on the screen, pulling down
the sub-menu at the top left labeled Indic.3 and experiment.
#6 - Running The Power Ranker against Stock Traded Best
with 5-Day Stochastics.
We provide the data on the stocks best traded currently with a Stochastic 5.
These are very popular with short-term traders and can bring some very big
gains with minimal effort. Download the STOCH5 directory of stocks from
the Tiger Data Page. Then click the ANALYZE button. When it is done, click
the X at the upper right. From Peercomm click Charts-2012/2013.
Continuing, to find a stock to trade long, click Daily Stocks +
In the middle, find "Tiger Analysis Lists". From there choose "Bullish #12. Top Power Ranked..."
Not all the stocks may now be best traded with a Stochastic-5. We only update this
once a month. So you will want to look at the top 10. Go to the next by hitting the
Down-Arrow key on the key-board.
Or to find a stock to sell short, click Daily Stocks. Then in the middle,"Tiger Analysis Lists",
choose "Bearish #11. Weakest Stocks to Sell Short." Go to the next by hitting the
Down-Arrow key on the key-board.
You can also see just the stocks with new Buys or Sells and find the stocks
that have been best traded with a Stochastic.
Peercomm + Select Folder + Stoch5 + Older Charting + Run/Setups (upper left corner)
+ Run Best Indicators + OK Then when it is finished, click X (upper right)
+ Charts2012/2013 + Tiger Selections + #1 Indicators' Results + Sorts +
ALL Results Sorted by Gain Pct or
New Buys! or
New Sells!
You must further screen these stocks to find those that are of the right
price range, volatility, have decent trading volume and show supporting
internal strength or weakness for the direction of your trade.
Learn The Rules for Added Safety
TigerSoft charts all start by showing you the best simple trading
system for a stock. The red Buys and Sells that first appear are based on
the system described just above the chart. In the first chart above, you will note
that the 20-day Stochastic Pct-D crossing back above 20 for Buys and below 80
for Sells was nearly flawless in 2011-2012 for the perpetual contract of Crude Oil.
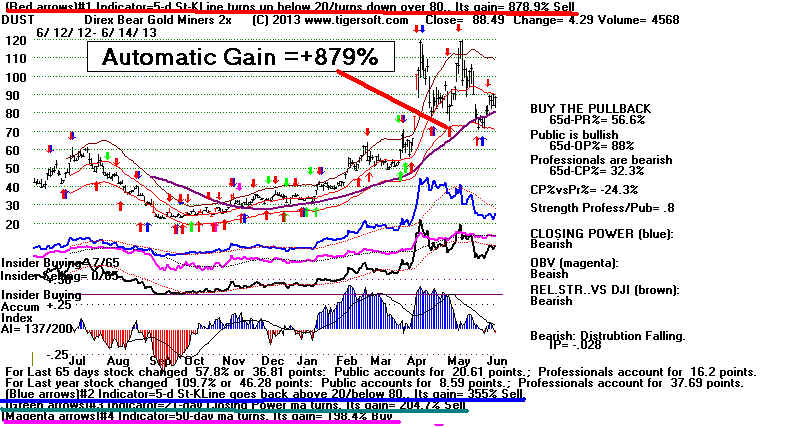
The chart of the short-ETF DUST shows an amazing +879% for the last year.
Because these automatic Buys and Sells are so easy to use, it will temping
to use them before carefully reading the materials here. I urge you not to do that.
The best system can fail, especially if we disregard Peerless, the internal strength
signs for the stock at the time of the signal, the stock's momentum, its key 65-dma,
its chart pattern and the direction that Tiger's Closing Power is moving in. It is
consistently best to trade mostly with the trend as indicated by the factors just mentioned.
Rules and ADBE 2007 Case Study
Blindly Following The Signals: Case Study: SSRI 2008.