


TigerSoft and Peerless Daily
Hotline
-----------------------------------------------------------------------------------------------------------------------
(C) 1985-2014 William Schmidt, Ph.D. www.tigersoft.com
All
rights strictly reserved.
Tiger Software 858-273-5900
PO Box 22784 San Diego,
CA 92192
Email william_schmidt@hotmail.com
Previous Hotline - http://tigersoft.com/1111-HL/index.html
10/22/2013-11/21/2013
----------------------------------------------------------------------------------------------------------------------
----------------------------------------------------------------------------------------------------------------------
 Shhh.
Sharing this hotline address with non-subscribers is a violation of our contract
Shhh.
Sharing this hotline address with non-subscribers is a violation of our contract
with you and a violation of copyright laws. I work hard for you. Respect that
effort!
---> To
renew this Hotline,
order here $350 (check) - $360(Visa/MC)
www.tigersoft.com/-2GBL13HL/index.htm
-----------------------------------------------------------------------------------------------------
 http://tigersoft.com/-HL42013/index.html
http://www.tigersoft.com/-2GBL13HL/index.htm
http://tigersoft.com/-HL42013/index.html
http://www.tigersoft.com/-2GBL13HL/index.htm
 A Guide To Profitably Using The
Tiger Nightly HOTLINE
A Guide To Profitably Using The
Tiger Nightly HOTLINE
 Peerless Signals: 1915-2013

New Peerless
Signals and DJI Charts - version 7/4/2013
1965 1965-6
1966
1966-7
1967
1967-8
1968
1968-9
1969 1969-70
1970
1970-1 1971
1971-2
1972
1972-3
1973
1973-4
1974
1974-5
1975
1975-6
1976
1976-7
1977 1977-1978
1978 1978-79
1979
1979-80
1980
1980-1
1981
1981-2
1982
1982-1983
1983
1983-1984
1984 1984-1985
1985 1985-1986
1986
1986-1987
1987
1987-8
1988 1988-9
1989
1989-90
1990 1990-1
1991
1991-2
1992
1992-3
1993
1993-4
1994
1994-5
1995
1995-1996
1996
1996-7 1997 1997-8
1998
1998-1999
1999
1999-2000
2000
2000-1
2001
2001-2
2002
2002-3
2003
2003-4
2004
2004-5
2005
2005-6
2006
2006-7
2007
2007-8
2008
2008-9
2009 2009-10
2010
2010-11
2011
2011-12
2012
2012-2013
Background and New Studies
Introduction to
Tiger/Peerless Buys and Sells.
Peerless Charts and Signals
Documentation for TigerSoft
Automatic and Optimized Signals.
How reliable is a rising
200-day ma? 2/9/2014
The New 2014 Peerless.exe Software has now been posted on the Elite Stock Professional
Page.
==================================================================================
2/28/2013 IMPORTANT:
This
server has become very slow. The Hotlines will be posted
starting
tonight at www.tigersoftware.com/112211-H/index.htm
a little later
than
usual. Note the "ware" in the address. We will use this new address
until
further notice.
==================================================================================
2/27/2014
It seems that the "Expanded Buy B9" needs a new Sell signal to be
reversed. At the very least, it needs a trend-change in our measures of
Professional (CP)
and Day-Trading buying, if we are to expect even a short-term pullback. Today
SPY's Closing Power broke out above a series of flat tops. That's usually bullish.
So is the powerful surge in the A/D Line since Yellen became Fed Chairwoman.
--> To Key Index and Leading Stock Charts: DJI, SP-500, etc.
DJI Chart
SPY Chart NASDAQ Chart IBB Chart
IWM Chart
--> 237 +52 MAXCP stocks Bullish MAXCP Stocks (2/27/2014)
Bullish plurality
--> 46 -15 MINCP stocks Bearish MINCP Stocks (2/27/2014)
--> 91
+18 New Highs on NASDAQ ? new lows. Bullish plurality
--> 79 +5 New Highs on NYSE 9 -6 new
lows. Bullish
plurality
Have you noticed that the most bearish MINCP charts now are those of the short ETFs?
See the charts of SDS, RWM and TZA below. This has to be bullish.
It is true that many low-priced stocks have enjoyed unsustainable, wild run-ups since
last Summer. But more keep coming on line. Individually, as long as their
Closing Powers
stay above their rising 21-day ma or their steep CP uptrends if they run up too far,
they can be played safely, I think, by users of TigerSoft.
Yes, The Market Appears Over-Bought, but...
Each time I think a convenient pull-back is at hand because of the over-bought
condition of the DJI relative to its 21-day ma, or the lagging Hourly OBV (DISI)
Line or SPY's inability to make a decisively breakout, stocks move higher on economic
news or comments by Yellen, the Fed Chairwoman. Let's just wait for a new
Peerless Sell or, at least, some change in the upper direction of the Closing Power
or the Tiger Day Traders' Tool on SPY (see last chart tonight). Obama's meeting
privately with Boehner may yet yield something constructive. I'm
betting the
Republicans will get aboard a big new (and patriotic) infrastructure rebuilding
program, just as they did under Coolidge and Eisenhower. That would be very
bullish.

Why fight the Fed?
Janet
Yellen says we don't have a stock bubble. Maybe, we should appreciate
not
whether she is right or wrong, but the effects that her statements have on stock prices.
I
think that each time we learn she is going to give a speech, we should buy before it.
“Stock prices have risen pretty robustly,” she told
Congress in November
But looking at several valuation measures -- she specifically cited equity-risk premiums
--
I do "not see stock prices in territory that suggest…bubble-like
conditions.” Source
Bubbles Can and Do Last A Long
Time
It is in their nature. It is the way Wall Street and human nature work.
Low interest rate bubbles have many critics. Examples:
This
is no recovery, this is a bubble – and it will burst
Fed
Has Become 'Facilitator and Financier' of Government Debt
But it has always seened to me that most of the time these critics of a loose
Fed monetary policy are simply re-fighting the battle against a super-inflated
Weimar Deutch Mark of the 1922-1923. When they point out that that
the
Real Economy in the US is lagging, they are right, of course. But that was true
in the 1920s from October 1927 to October 1929, during which time the DJI doubled.
In England, it was true throughout the 1920s when official unemployment never
fell below 7.5%.
What the critics of cheaper credit are missing is that in many ways, the stock market
is rising now precisely because the "Real Economy"
is lagging.
1) It is the weak economy which gives the FED reason to keep rates low.
2) The stock market is rising in large part because it is still the best game
in town for investors, In a weak economy, other forms of investment generally
show much lower rates of return.
3) Why do the critics not understand that high unemployment means low wages
and this contributes mightly to higher profits?
4) A weak US economy means corporation will search for markets overseas
to make and sell things. In a low tariff environment, this is very profitable.
5) A weak US economy also means corporate cash reserves are built up.
These can be used to buy back stock. Or even better, to buy out competitors
when US anti-trust laws are ignored.
6) Finally, critics forget that the Fed is charged specifically under law
with shoring up a weak Economy with low interest rates, even though its
monetary policy is now a very poor alternative to a real Jobs Bill or a
massive investment in public infrastructure, such as highways were in 1920s
and 1950s. |
So, bubbles last much longer than most shorts can tolerate. That was
true in
1967-1968, 1999-2000 and even in 2008 when penny oil stocks went crazy. Proof
of this
today were the rallies in some of the most (red) distributed (and shorted) stocks,
like JCP below. This means that even when hedging, if you go short, it works
out best
overall to cover when the steep Closing Power downtrend is violated. Lots of
back-testing
validates this principle even in bear markets. There are always more Bearish MINCP
stocks to go short.


==================================================================================
OLDER HOTLINES
==================================================================================
2/26/2014
The SPY Needs to Plumb
for Support
The very good breadth and expanded Buy B9 should limit the decline.
Use the Bearish MINCPs to be equally hedged with long
positions.
With the Stochastic-20 over the 80-level and the DJI 1.9% over the 21-dma
the market is in overbought territory. The SP-500 still has not broken out over its
key 1850 resistance. Having found ressitance, the markets must search for support.
Fortunately, the internal strength indicators have turned positive. This should
help limit the decline. Futures are down today. A DJI decline back to test its
rising
21-dma at 16000 is needed. So stay fully hedged. If the
DJI breaks below its 21-day
ma, about 100 poin ts below today's close, we will probably see it fall to 15500.
But because the DJI is up a little more than 5% on this recovery, it is now more likely to
advance to new highs than retreat significantly. I say this looking at the S16 cases
that did not bring sell-offs in March or April when they recovered more than 5%.
Notably 1934 and 1990. If the DJI produces a new high, that would almost
certainly mean an SP-500 breakout run and the possibility of a NASDAQ/QQQ
vertical ascent above their uptrend resistance lines. Peerless Sells
occur only in 1/4 of the cases when the DJI makes a new high in March.
So the bullish Spring seasonality may surprise traders if the DJI can make
another run to new highs.
When I consider the past results of the new "expanded Buy B9", I note that
it's average gain is 13.3%. Breadth (A/D Line) is particularly strong now,
reflecting the low interest rates and Yellen's reputation as a "dove" (i.e.,
a Fed member who places concerns about a weak economic revival above
worries about signs of inflation.)
We see megaphone or diamond
formations in development in the case of
DIA, SPY, QQQ... Usually, they do not reverse until a new high is made.
More often than not they are bullish.
--> To
Key Index and Leading Stock Charts: DJI, SP-500, etc.
DJI Chart
SPY Chart NASDAQ Chart IBB Chart
IWM Chart
--> 185-10 MAXCP stocks Bullish MAXCP Stocks (2/26/2014)
Bullish plurality
--> 61 -4 MINCP stocks Bearish MINCP Stocks (2/26/2014)
--> 73
+8 New Highs on NASDAQ 8 new lows. Bullish plurality
--> 74 +11 New Highs on NYSE 15 new
lows. Bullish
plurality
Positive Internal Strength Indicators
DJI change
la/ma
annroc P-I
IP21 V-I Opct
65-day Pct Change
----------------------------------------------------------------------------------------------------------------------------------------
2/26/14 16198 +19
1.019 .270
+493 +103
+.057 +20 .091 .018
All are positive.
The V-Indicator has turned positive. But 10-day Down Volume is
rising and
10-day Up-volume is falling. That was not bearish enough last year in March
to drop the DJI below its 21-day ma. In the research I did a few years ago on S9vs,
I found that 1st quarter bullish seasonality over-rode a negative V-Indicator
reading at the upper band. There needs to be a bearish breadth divergence, too,
at this time of year.
http://www.tigersoft.com/PeerInst-2012-2013/refinedS9v.htm
It may be that the Hourly OBV Line's declining slope may
also be overridden
right now as long as breadth remains very good. But
clearly, there is some
heavy insitutional selling.
Bank Stock Weakness
I do think it's a good idea to watch the bank stocks.
Yellen's "dovishness"
comes with a desire to see banks have higher reserve requirements. I learned
in ECON-101 that tinkering with this potentially can have a big impact on
the economy. Since the big banks are now as much inclined to use their extra
reserves
to trade the equity, bond and currency markets as make loans, I would view any
news on this front - reserve requirement changes for the big banks -
as bearish for the markets. This may explain the weakness now in Goldman Sachs
(GS), why JPM has also slipped below its 65-dma and why BAC could bearishly
break a lengthy uptrend. She also may be more inclined to enforce the Dodd-Frank
limits on speculative trading, especially in commodities, as opposed to hedged
trading by big banks. The new limits on Commodity trading has sparked a good
rally there.
http://www.bloomberg.com/news/2013-11-05/traders-face-curbs-on-speculation-with-cftc-vote-on-new-limits.html

March Peerless Sells in Rising Markets Are Infrequent
What can bring about a significant top in March in a rising market? Here
are the cases of March tops since 1928 when the 65-day rate of change was
above -4. March Sells are in rising markets did not occur in 1942,
1943, 1944,
1945, 1950, 1954, 1955, 1956, 1957, 1959, 1963, 1964, 1965, 1967, 1969, 1971,
1972, 1975, 1985, 1986, 1987, 1989, 1990, 1991, 1992, 1993, 1995, 1996, 1997,
1998, 1999, 2000, 2003, 2004, 2006, 2010, 2011 (37 instances). This suggests
that the odds are 37:13 against a March top if a new high is made next month.
March Peerless Sells in Rising
Markets: 1928-2014
1 19290301 S9 321.2 .056 19290314 S9 316.3 .041
2 19360303 S15 156.2 .042 19360304 S12 156.7 .045
3 19370303 S9 192.9 .142 19370305 S15 194.1 .147
19370310 S9 194.4 .149 19370311 S4 192.2 .139
4 19390309 S3 151.3 .18
5 19660301 S10 938.19 .173
6 19760324 S15 1009.21 .048 Following a top
7 19770315 S9 965.01 .164
8 19800307 S10 820.56 .052 Following a top
9 19810326 S4 1005.76 .032
10 19840316 S9 1184.36 .083
11 20050308 S4 10912.47 .076
12 20090302 S13 6763.29 .025
13 20120321 S1 13124.62 .024 |
---------------------------------------------------------------------------------------------------------------------------------------------------
OLDER HOTLINES
---------------------------------------------------------------------------------------------------------------------------------------------------
2/25/2014 The
market refuses to sell-off. The DJI is still above its 65-dma.
Consider the past results of the new "expanded Buy B9. Paper losses are
inconsequential
and the average gain is 13.3% with these signals. This make them one of the better
Peerless Buys. We should definitely use it the future. As for now, my
judgement is
that we can employ the Buy B9 and go long SPY (or DJI if you prefer) on a close
by SPY above its resistance, 186. If there is no breakout, we will go long on a DJI
of SPY decline back to their 21-day ma. That should act as support so long
as breadth remains so positive. The S16s's warning of a bigger next decline
may still come true. That would be a natural development in the broadening
top pattern we see in the DJI and SP-500.
--> To Key Index and Leading Stock Charts: DJI, SP-500, etc.
DJI Chart
SPY Chart NASDAQ Chart IBB Chart
IWM Chart
--> 195-47 MAXCP stocks Bullish MAXCP Stocks (2/25/2014)
Bullish plurality
--> 65 +15
MINCP stocks Bearish MINCP
Stocks (2/25/2014)
--> 65
-45 New Highs on NASDAQ 10 new lows. Bullish plurality
--> 63 -44 New Highs on NYSE 12 new
lows. Bullish
plurality
The bearish devergence between the Hourly DJI and OBV (DISI) is increasing.
The Stochast-Pct-D-20 has reached the 80-level. This means it is over-bought.
A decline from here would be signalled by a short-term Stochastic-20 sell. I doubt
if the
markets will runaway to the upside if there is a breakout. With the IP21 still
negative, we could even get a new Peerless Sell at the 3% upper band (la/ma = 1.03).
What to do now in this environment?
Sell short bearish MINCP stocks/ETFs like MXF when they
breakdown below
well-tested support. Each short like this can be used to hedge a bullish MAXCP
stock. The result is usually quite favorable to the hedger.


Revised Buy B9.
2/24/2014; "Expanded Buy B9"
Previously if the DJI reached the lower 3% band and the
P-Indicator
was positive, a Buy B9 results. The new B9 expands these parameters,
by giving a Buy B9 if the P-Indicator is above -34 and the DJI
is more than 4% below the 21-day ma provided it is not January
or the the DJI is not more than 4% down from 65 days ago.
Earlier Expanded
Buy B9s
#1 12/11/1928 very good. Gain = +.161 65-day up-pct = .126
la/ma ann-roc PI PI-ch IP21 V
Opct 65-dayup-pct
.958 .263 -24 +18 .028 -511 .13
.126
Also already a Buy B2.
------------------------------------------------------------------------------
#2 7/24/1933 94.3 Gain = +.054 65-day up-pct = .304
la/ma ann-roc PI PI-ch IP21 V Opct 65-dayup-pct
.932 .165 12 49 -.145 -528 .082 .304
Also A Buy b6
----------------------------------------------------------------------------[--
#3 8/1/1933 92.7 Gain = +.072 65-day up-pct = .268
la/ma ann-roc PI PI-ch IP21 V Opct 65-dayup-pct
.927 -.641 -19 9 -.171 -630 .012
.268
Also a buy B16
-------------------------------------------------------------------------------
#4 11/8/1943 131.7 164 Gain = +.254 65-day up-pct = -.038
la/ma ann-roc PI PI-ch IP21 V Opct
65-dayup-pct
.958 -.527 158 32 -.261 126
-.225 -.038
Already a Buy B9 under previous rules
-------------------------------------------------------------------------------
Avg.Gain = +.133
#5 2/4/2014 15445.24 up so far. 65-day Up-Pct was -.012
la/ma ann-roc PI PI-ch IP21 V Opct 65-dayup-pct
.957 -.753 -30 10 -.149 -133 -.358 -.012

-------------------------------------------------------------------------------
In these expanded Buy B9s, the January cases must be eliminated.
These failures all had an Up-Pct below -.125, so it's hard to know
which of these two factors over-rides the bullishness of the expanded
B9.
1) 1/29/2003 8110.71 TO 7524.03 3/11/04 and then 65day-Up-pct was -.139
2) 1/15/2009 8212.49 fell to 6547.05 ON 3/9/09 65day -UP PCT was -.126
3) 1/23/2009 8077.57 fell to 6547.05 ON 3/9/09 65DAY -Up pct
was =.129 |
==================================================================================
OLD HOTLINES
==================================================================================
2/24/2014 With the
DJI up more than 5% from its low, it seems clear it would
be best to incorporate a new expanded Buy B9 for those cases where the DJI is
4%-5% below the 21-day ma and breadth is improving and the P-Indicator
is above -34. This always worked out well in the past from February to December
as long as the 65-day pct change was not below -.04. A new
Peerless with this
change and the ability to see longer 200-day and 149-da mvg avgs. will be
posted tomorrow on the Tiger ESP page.
Secondary stocks, biotechs, gold and silver stocks, military stocks and
food commodities are the favored groups now. Note, that in the past a rise in
gold and silver stocks is actually a warnng for the market. That was true
for example in August of 1987. When inflationary forces build up, the Dollar gets
weak and the Fed usually decides to raise interest rates. Janet Yellen may not
be able to keep the more conservative Fed Governors from taking actions to
defend the Dollar. Still, considering how far the Fed was behind the curve in 2008,
my guess is that they will be much more concerned about triggering another recession
than inflation.
I do think we still have to be on guard that there will be another, bigger leg down
from a top in March. It is worrisome that the SP-500 could not breakout decisively
above 1850 today. The last hour's sell-off was on heavy volume. See this
in the
Hourly DJI chart below. Bearishly, the DJI is now 2.2% over the 21-day ma
but the IP21 is negative, -.006. This is not enough to bring a sell signal
when
the P-Indicator is as positive as it is now. But it does show lots of institutional
selling
into the strength we are seeing. Look at the 10-day day ma of NYSE Up and Down
Volume below. They appear to be starting to bearishly converge. In additon,
the Stochastic-20 for DIA and SPY have now reached the 80-over-bought levels.
The Tiger Day Traders' Tool is still rising for DIA and SPY.
The volume warnings suggest a pull-back seems likely.
This will probably have only
a small effect on the NASDAQ and QQQ. Out TigerSoft Stocks' Hotline
remains about equally hedged long and short using the MAXCP and MINCP
stocks..
--> To Key Index and Leading Stock Charts: DJI, SP-500, etc.
DJI Chart
SPY Chart NASDAQ Chart IBB Chart
IWM Chart
--> 242 +8 MAXCP stocks Bullish MAXCP Stocks (2/24/2014)
Bullish plurality
--> 50 +4
MINCP stocks Bearish
MINCP Stocks (2/24/2014)
--> 110
+3 New Highs on NASDAQ 9 new lows. Bullish plurality
--> 107 +34 New Highs on NYSE 9 new
lows. Bullish
plurality
 |

 |
 |
 |
ARWR was driven up by underwriters to a big new issue of
the stock.
I think I would take profits in it.
 |
==================================================================================
OLDER HOTLINES
==================================================================================
2/21/2014
Sell S16 - Watchful Waiting. The DJI has not risen more than 5%
from its lows, but speculative "animal spirits" have taken over a number of
high performance funds. None more than FBIOX
(Fidelity biotech).
An SP-500 breakout over 1850 should bring another 5% advance.

Another 1.5% Rally in DJI may bring a Peerless Sell S12
The DJI is now 1.5% over the 21-day ma. The IP21 is -.011.
A lot of distribution
is taking place on this rally. In addition, the Hourly
DJI's chart shows a bearish
OBV (DISI) divergence now. Somewhat higher DJI price will cause the 20-day
Stochastic-Pct
to rise above 90, a level it has reached on every rally in the past year. The Tiger
Traders' Tool has not yet turned down.
The most bullish
factor now is still the Fed and the up-trend.
.
This
weekend a lot of people are reading about Janet Yellen dovishness in 2008
ahead of all the other Fed Governors in 2008. 2000 pages of FOMC and FED
minutes from 2008 were released on Friday.
This is important because many speculators believe the Fed will once again
be behind the curve just as they were in 2008. Partly because of this but mostly
because of human nature, it's a good bet that stock traders (large and small)
will be the victim of their own Animal Spirits
(Keynes' term for what
swerves investors back and forth between excessive fear and excessive confidence.)
And to quote him again: "Markets
can remain irrational longer than you can
remain solvent".
The Fed's Biggest Fear Now:
Letting The Economy Slip into Another Deep Recession.
The minutes shed new light on the Fed in the Dark or off skiiing in Idaho (Mishkin)
while the bank stocks and then the economy plummeted down in 2008.
The FED is clearly very wary of making the same mistake they made throughout
2008 when they badly underestimated the severity of the coming financial collapse.
Geithner's remarks at this time seem particularly uninformed and way off-base.
He was, after all, the head of the NY Fed. His primary concern on March 18th, 2008
was that any pre-emptive actions by the FED would scare confidence away from the
markets. Big US banks were not "as
a whole under-capitalized". This was a few days
after Bear Stearns had collapsed and its assets sold to JP Morgan. (Source.)
.
Bernanke, at least, had the good sense to call emergency FED meetings
starting in January
2008. But he also badly underestimated how much the
mortgages' collapse and derivatives would affect the market. On Sept. 16,
the day after Lehman Brothers filed for bankruptcy, Bernanke declared,
“I think that our policy is looking actually
pretty good.” The Fed declined
at that meeting to cut short-term rates. But three weeks later they were
forced to rescue AIG with a twenty billion bailout.
In October, 2008, with the DJI below 900, Yellen was the most forceful Fed
member calling for action. "Frankly, it is time for
all hands on deck when
it comes to our policy tools...We need to do much more and the sooner the
better...I don’t believe in gradualism in circumstances like these.”
Source.
Fisher in Dallas who had nearly always opposed rate cuts in October 2008
relented: “I will conclude with actually once again agreeing with President Yellen,
as I think I have done twice in history."
---> Hedging by being long the most Accumulated Bullish MAXCPs
and
short the most Distributed Bearish MINCPs keeps working out well.
--> To Key Index and Leading Stock Charts: DJI, SP-500, etc.
DJI Chart
SPY Chart NASDAQ Chart IBB Chart
IWM Chart
--> 234 -27 MAXCP stocks Bullish MAXCP Stocks (2/21/2014)
Bullish plurality
--> 46 -9
MINCP stocks Bearish MINCP Stocks (2/21/2014)
--> 107
+8 New Highs on NASDAQ 9 new lows. Bullish plurality
--> 73 -18 New Highs on NYSE 7 new
lows. Bullish
plurality
As long as the DJI is unable to move up more than 5% from its
recent botton, the bearish scenario remains alive for the DJI, wherein it falls back
in a second decline to lows. The best way to know that the market is too
strong
for this possibility anytime soon will be a powerful breakout by the SP-500.
Actually, there are three markets now. First, there are the bullish MAXCP stocks
that keep surging to new highs after shallow retreats. Srcond, there are the majority
of
stocks that are going sidewise, like the DJI-30, and are not close to making
breakouts or beakdowns. Third are the more and more bearish MINCP stocks.
These have broken their 65-dma, show Closing Powers at or near their year's lows
and show an AI/200 score below 75. These show no ability sustain much of a rally.
Instead some of these steadily decline week to week and some drop precipitously
at unexpected times, ofen when the market is up.
In this environment, I think we should just wait to see whether the DJI will fall
back or
the SPY-500, OEX and IWM will follow the lead of the QQQ and make new
highs. Speculative markets like 1967-1968 and 1999-2000 teach us not to
underestimate
the bullish stampede bt investors into the leaders of the time.
On the other hand, the lessons of early 1977, mid-1986, early 2000 and 2001 and 2002
show that the DJI-30 lead the rest of the market downward and that these these other
indexes
could top out 1-2 months after the DJI does. In this bearish scario, a 10% decline
is
the least depth that occurred. Always Peerless was on a sell. So, waiting now
for a clear A/D Line trendbreak and a Closing Power uptrend break should serve us
well now. That would show the Sell S16 will producing its second leg down.
Such breaks could signal a significant sell-off by the whole market. But,
fortunately
for the bulls, such a top historically is not made until March at the earliest,
when there has been a 5% rally, like now.
DJI
change la/ma
annroc P-I
IP21
V-I Opct
65-day Pct Change S20-Pct-D
----------------------------------------------------------------------------------------------------------------------------------------
2/6/2014 15628 +188 0.973 -.667 -16
-..095 -121
-.357
000 Back above 200-dma
2/7/2014
15794 -5 0.986
-.496 +83 -.058 -98 -.261
+.009
2/10/2014 15802 +8
0.988 -.478 +100 -.044 -99 -.176
+.011
2/11/2014 15995 +103 1.002 -.329 +119
-.014 -88
-.088 +.015 At 65-dma
2/12/2014
15995 -29 1.001 -.218 +205 .010 -66 -.083
+.023
2/13/2014
16028 +33 1.005 -.258 +216 .015 -69 -.086
+.016
2/14/2014
16154 +126 1.014 -.245
+221 .029 -71
-.02 +.023
2/18/2014
16130 -24 1.014 -.214 +246 .025 -66 -.095
+.024
2/19/2014 16041 -89
1.009
-.313 +227 -.009 -64 -.199
+.013
2/20/2014 16133 +92
1.016
-.211 +228 .015 -53
-.110 +.016
2/21/2014
16103 -30 1.015 -.202 +206 -.011 -59 -.120
+.008 +75
==================================================================================
OLDER HOTLINES
==================================================================================
2/20/2014
Perhaps, the Sell S16 probably should have
been reversed by a B9.
B9s typically occur near the 3.5% band with the P-Indicator positive. The revised
B9 would occur 4.5% below the 21-day ma with P-Indicator no lower than -35
and rising.
Bearish Scenarios. The DJI is
still not up more than 5% from the recent bottom. That
means a significant second, delayed S16 decline could start in March. In addition,
a rally 1.5% higher by the DJI would probably bring a new Peerless Sell.
Bullish Scenario. Traders, watch now for a bullish SP-500 breakout above its flat top
at 1850. This should set off a buying surge. Even a shallow pull-back here.
could set up a bullish continuation head and shoulders. Either eventuality
would be quite bullish. Traders should buy SPY on
such a breakout at the
close. It may signal a wild, vertical ascent and we would want to play that
possibility.

5% Up Rule for DJI, Sell S16:
Towards A Revised Buy B9
The 5% DJI
rally up from the recent bottom may appear stronger than the
unreversed
Sell S16 should allow. I would agree. Accordingly, I must look
for new
ways that might spot such reversals in the future. The mere crossing back
above the
rising 200-day ma, however, does not test well enough by itself, or
even when
good breadth is factored in. Early 1977's Peerless chart
shows this.
What about
a 3-day reversal pattern recognition, Michael in Germany has suggested?
I think
that is an excellent idea. It needs to be tested. What about a revised B9 that
looks for
the DJI with these parameter?
la/ma < .959, P> -32. P-change>0 and 65-day up pct > -.015?
This is
more easily back-tested. See below how well it works in most cases. 3 of the
5 failures
came in January. These would be eliminated in the revised Buy B9.
We can also
eliminate the bear market cases by simply requiring the 65-day Up-Pct
to be above
-.05. Let me do a little more study. But I think with these modifications
to a Buy
B9, the program will be improved. There were only 4 earlier cases where
these
parameters
allapplied. But some of the bear market occurrences would have produced
outstanding
gains. Applying these parameters would expand the current B9 in a safe and
reliable
way, I think you will agree.
Revised Buy B9 with parameters shown above
#1 12/11/1928 very good. Gain = +.161
65-day up-pct = .126 Also already a Buy B2
now,
8/11/1930 OK 5.1% 65DAY PCT was -.151
6/29/1932 Perfect 42.8 ---> 76.2 on 9/9/1932
65DAY PCT was -.422
#2 7/24/1933 94.3 --> 99.4 on 8/17 -
65-day up-pct = .304 Also another Buy
#3 8/1/1933 92.7 --->99.4 on 8/17 - 65-day up-pct = .268
Also another Buy
11/18/1937 125.5 FELL TO 11 3.6 ON 11/24
65DAY PCT WAS -.387
1/31/1938 121.9 --- 6.2% -->129.5 65DAY PCT WAS -.092
3/23/1939 140.3 FELL TO 123.8 ON 4/11 65DAY PCT was -.071
#4 11/8/1943 131.7 TO 129.6 ON 11/30 and THEN
ROSE A LOT Buy 65-day up-pct = -.038 Already a Buy B9
10/9/1946 163.1 THIS WAS BOTTOM of BEAR MKT 65DAY PCT was -.214
11/9/1948 CLOSE TO BOTTOM 173.9 ---> 171.2 and then up to upper band.
65-day up-pct = -.05
1/29/2003 8110.71 TO 7524.03
3/11/ AND THEN UP. 65DAY PCT was -.139
1/15/2009 8212.49 FELL TO 6547.05 ON
3/9 65DAY PCT was -.126
1/23/2009 8077.57 FELL TO 6547.05
ON 3/9 65DAY PCT was
=.129
#5 2/4/2014 15445.24
up so far. 65-day Up-Pct was -.012
--> To
Key Index and Leading Stock Charts: DJI, SP-500, etc.
DJI Chart
SPY Chart NASDAQ Chart IBB Chart
IWM Chart
--> 261 +70 MAXCP stocks Bullish MAXCP Stocks
(2/20/2014) Bullish
plurality
--> 55 +11
MINCP stocks Bearish MINCP Stocks (2/20/2014)
--> 99
New Highs on NASDAQ 10 new lows. Bullish plurality
--> 91 New Highs on NYSE 12 new
lows. Bullish
plurality
Consider the Broader
Market, not just the DIA or SPY.
Try to look beyond the DJI when the NASDAQ and QQQ outperform the
DJI
by a wide margin. This has happened before. I have mentioned 1967-1968
and 1999-2000. History teaches us that secondary growth stocks should be played
long at this time, even despite the Sell S16 that Peerless gave at the end of last year.
Look at the Bullish MAXCPs for ideas. Many of these
stocks have been
appearing on our lists nightly since the rally began. As should be expected,
the best
performers are those showing great bulges of Accumulation, Closing Power new highs
and a quickly rising Relative Strength versus the DJI. (The latter is shown by the
brown RSQ
line just above the Accumulation Index on our daily TigerSoft charts.

This is too strong a market to short any but the Bearish
MINCP stocks, which
surprisingly enough to outsiders, keep declining. JCP
and WLT are just the
most obvious examples of that.
.
The DJI is the weakest of the major market ETFs. In the past, a lagging DJI has
shown
that the market has entered a very speculative phase where secondary stocks get
their chance to dance in the sun. But right mow, the DJI is probably too strong
to short. Its coming back above the 65-dma was a warning to cover. So was
the excellent breadth again today. We know from classic chart theory (Edwards
and Magee) that megaphone patterns warn that prices can move unusually
swiftly up from support back to new highs. That is what the NASDAQ, IWM,
QQQ and the SP-500 show.
Last night's recommendation for traders to short DIA on mid-day strength today
was probably premature. But a significant top may still be made for the DJI in March.
While news of a sharp rise in January manufacturing got the DJI to jump up 100 points
between 10:00 AM and 11:00 AM, its close was less than 100 points up for the
day. See the Hourly DJI chart. Note that
the OBV line failed to move higher today.
This is a bearish divergence we should be kept in mind. DIA will probably be a good
short sale again, when the current move's upward momentum and uptrend are reversed.
If we only consider the DJI a little more, it would seem we may see a run to 16300-16400
where its upper band is. Breadth has been good, so other stocks will probably rise
faster and further than the "old-fashioned", "dinosaur" DJI-30.
See below that the
DJI could easily stall out at its 3%-3.5% upper band. Right now, it is may rise
further.
but there still appears to be too much distribution (shown by weak IP21), inadequate
up-volume (shown by negative V-I) and poor intermediate-term momentum (MA-ROC is
negative).


The Sell S16's second decline (wave down) is being delayed. If the DJI rallies up
more
than 5% from its recent lows, say another 200 points more, it would mean that
the S16 no longer looks like those past cases where the next top after the 5%
advance brought a very significant decline. Such an additional advance would suggest
that SPY will achieve a bullish flat-top breakout and we may be starting the long-awaited
NASDAQ's climactic vertical ascent.
Watch Tiger's Day Traders' Tool for DIA. When its current spike upwards ends,
we should see either a reversal or a period of consolidation. Which will occur will
depends on whether secondary stocks take off into a vertical ascent mode.

Secondary growth stocks in the Bullish MAXCPs should be
played aggressively long
now. Watch to see if the IWP can get past the top of its price channel.

==================================================================================
OLDER HOTLINES
==================================================================================
2/19/2014
Sell S16 Deferred. The DJI has reversed downward after
a typical 5% rebound late in a bull market without a Peerless Buy. I suspect
that the NASDAQ and QQQ will not retreat much. They made new
highs and their uptrends seem intact.
Bearishly, the SPY (SP-500) and IWM (Russell-2000) ETFs failed to get
past their January highs' resistance. The DJI and DIA did not even come close
on their 5% recoveries to making it back to the resistance from the
January highs. Today's declines establish price downtrends which will look more and
more formidable if there is a further decline.
I suggest going short DIA again but hold long most of any Bullish MAXCP stocks
you have. Given the recent strength in the major markets' Closing Powers,
traders
should not sell short at the openings. I would sell short DIA if it again opens
higher
but closes below the opening. This will produce a bearish "red
Popsicle" on our
candle-stick charts. We might also wait for the Tiger Day Traders' Tool to turn
down on DIA.
--> To Key Index and Leading Stock Charts: DJI, SP-500, etc.
DJI Chart
SPY Chart NASDAQ Chart IBB Chart
IWM Chart
--> 191 MAXCP stocks Bullish MAXCP Stocks (2/19/2014)
Bullish plurality
--> 36
MINCP stocks Bearish MINCP Stocks (2/19/2014)
--> 48
New Highs on NASDAQ 7 new lows. Bullish plurality
--> 43 New Highs on NYSE 10 new
lows. Bullish
plurality
Deferred Sells and Delayed Sell-Offs Late in A Bull Market
Below I again show that there are a number of cases of "delayed second
declines"
where the DJI rallied only 5% late in a bull market against a successful
Peerless Sell and then fell sharply. In none of these cases, however, did the
decline come as early as February. Usually the peak of the counter-Peerless rally
was March or later.
Resistance commonly occurs when the DJI has advanced 5% against a successful
Peerless Sell signal late in a bull market. I have pointed to a number
of cases and suggested heeding a break in the NYSE to cover short sales
and then to resume the short sale in them. Another case supporting this
approach that I did not mention a few nights ago was in 1940. In all these
cases, abiding by an A/D Line uptrend-break would have worked well.
But the real lesson here is that we need protection against the next big move
in this context which is usually sharply down: viz. 1940, 1946, 1962, 1966 and 1978.
We can take into account other factors, too, which make the current situation
look more bullish, but except for the case of June 2012, the outcome was always
bearish. Such other factors are:
1) a head/shoulders pattern ... Bullishly not present now
2) the A/D Line's strength ... Bullish here.,
3) the tendency of the rebound to last at least until March... Bullsh
Here.
5% Rebounds without A Peerless Buy Late in Bull Market
Sell
Rallies without A Peerless Buy
Second Decline
----------------------------------------------------------------------------------------------------------------
January 1940 (S16)
5% up into April.
26% Sell-off.
May 1946 (S5,S4)
5% up to 65-dma and then
Bear market until October
Head/Shoulders
A/D Line worked well here.
January 1962 (S16)
5% up from 1/29 to 722.3 (3/16/1962)
Bear market
follows.
Head/Shoulders
A/D Line worked well here.
January 1966 (S12)
5% up from 3/15 to 949.83 (4/22/1962)
Bear market follows.
1) War escalating
A/D Line worked well here.
2) Fed also then accused of not
raising rates to fight inflation.
April 1976 (S15)
5% up from 958.09 6/7 to 1007.45
on 6/21 5% decline to 960.44 on 8/26
A/D Line worked well here.
Sept
11, 1978 (S9,S12) 5% up from 861.14 9/21 to 896.74 on
10/12 13% decline
New
S9/S12. A/D Line worked OK.
The Exception
The experience of June 2012 shows that is possible for the DJI to
regain its footing
after a brief dip below the rising 200-day ma late in a bull market and then after some
consolidation at the rising 65-dma, move significantly higher. At the time,
we also had no Buy signal at the time. The Hotline did note that, like now, the NYSE
A/D Line
had failed to confirm the decline to the 200-day ma. There WAs also a mis-shapen
head/shoulders. A Buy B3 was added later because further research discovered
that the Stochastic-20 Pct-D had failed to confirm the low (unlike now). In
addition,
Arthur Merrill showed years ago that June is frequently a bottom in the second
year after a Presidential Election. There are other big differences between then
and now. Our bull market now is two months' older and more vulnerable. Unlike
then,
the Fed now is threatening to retreat from its low interest rate policies. This is
the gist
of the Minutes
of its last FOMC
meeting. Rumor has it that Yellen is also considering
requiring banks to keep a high amount of cash reserves on hand. Big bank stocks
were weak today. And also bearish, arbitrage and take-over bulls surely did not
like the big declines today in both Comcast and Time Warner. Perhaps, Obama's Justice
Department will actually do something to fight the anti-consumer trend towards
monopolization which took off in the 1980s and 1990s. One last point, food commodity
prices are soaring. Inflation is likely to become a much bigger factor in their
thinking
if drought conditions grow worse.
2012 DJI - Note June bottom.
At the time, there was no Buy B3


On balance, I think we have to go short DIA again, but not if the market opens
sharply lower. In that case, I would wait for a rally or another day. Two
stocks
to consider shorting because of their bearish-looking head/shoulders patterns
are AMZN and MMM. Foreign
ETFs look like they are bearishly falling away
from their falling 65-dma.

==================================================================================
OLDER HOTLINES
==================================================================================
2/18/2014 Sell S16
Deferred... First a Rally To New Highs. The NASDAQ,
QQQ (Nasdaq-100), BBH (Biotech ETF),
Military Stocks like GD are already there
and running strongly upwards. Note the megaphone patterns in SPY, QQQ, IWM,
OEX, NYSE. These usually signify that the markets are running wildly and are
temporarily out of control of the market makers and professionals. But Opening
Powers are weaker than Closing Powers. Professionals are buying from the Public
and from investors overseas. This should be bullish. It may even mean
the top of
the megaphone patterns will be broken above.
That is asking a lot, however. Peerless is not on a Buy and there is growing
weakness
in the Dollar which could bring a new rise on interest rates if precious metals, energy
prices and foods keep rising in price for another few weeks. The DJI has achieved
the 5% advance it sometimes gets late in a bull market without the benefit
of a Peerless Buy signal. In addition, the SPY has reached ressitance. Let's
see if a lower opening is reversed again to the upside or this is the end of the
DJI's recovery.
--> To Key Index and Leading Stock Charts: DJI, SP-500, etc.
DJI Chart
SPY Chart NASDAQ Chart IBB Chart
IWM Chart
--> 301 MAXCP stocks Bullish MAXCP Stocks (2/18/2014)
Bullish plurality
--> 36
MINCP stocks Bearish MINCP Stocks (2/18/2014)
--> 124 New Highs on NASDAQ 8 new lows.
Bullish plurality
--> 147 New Highs on NYSE 11 new
lows. Bullish
plurality
Our Stocks' Hotline is long 2x more Bullish MAXCPs than the Bearish MINCPs
we are short. If there is
now a break in the NYSE A/D Line uptrend, the DJI will
fall back, but at this point, it is not clear that its retreat would be able to have
much effect on the favored groups. At 36, the number of MINCP
stocks now
is quite small compared to the 301 MAXCP stocks.
One element that could change that would be signs of inflation, the bugaboo of low
interest rates. Food commodities, oil, natural gas, gold and silver have recently moved
up above long-term downtrends. A weakening Dollar will
put a lot of pressure on
the Feds to raise rates. Watch these early warnings signs of higher interest rates.
A second force in the markets could be the Chinese stock market. Many low
priced Chinse stocks there have had speculative binges in the last six months. Now
the Tiger Index of Chinese stocks shows a head/shoulders pattern with heavy
red distribution. In November 2007, the Tiger Index of Chinese stocks also
showed a similar pattern. That led to a Crash. If China's economy were to
stumble
badly, many bad things might follow, not the least of which would be that they might
have to sell a lot of their US Treasuries. So, let's watch this Index in the coming
days.

SPY Has Reached Resistance
SPY (below) is challenging its January highs. The Mid-cap
stocks and Russell-1000
are lagging a little more. We will be watching to see if these broader indexes can
also make new highs.

The DJI is now up 5% from its recent lows. Ordinarily this is about as much of a
rally
as we are likely to see when there has been no Buy signal late in a bull market.
We could reverse here. Breaks in the A/D Line and Closing Power will tell us
if this 5% limit is to repeat here. As the NASDAQ is much stronger now, it seems
likely we are in a very speculative phase like 1967-1968 and 1999-2000. At
these times the DJI lags the rest of the market. As long as the NYSE A/D Line
is rising, prices for the favored groups will probably keep rising.

============================================================================================
OLDER HOTLINES
============================================================================================
2/14/2014 Sell S16 Deferred... First a Rally To New Highs.
The DJI is now up 5% from its recent lows. Ordinarily this is about as much of a
rally
as we are likely to see when there has been no Buy signal late in a bull market.
We could reverse here. Breaks in the A/D Line and Closing Power will tell us
if this 5% limit is to repeat here. But given the NASDAQ's strength, Yellen's
reitteration of historically low interest rates and the new mergers' environment,
I suspect the DJI will reach its January highs while the other indexes make
their own new highs. It does seem like the NASDAQ is being drawn back to 5000.
--> To Key Index and Leading Stock Charts: DJI, SP-500, etc.
DJI Chart
SPY Chart NASDAQ Chart IBB Chart
IWM Chart
No Peerless Buy. What should we do?
We do know we do not want to let a short sale
gain turn into a loss.
In a rising market, Peerless sometimes gives a good Sell but does not give a Buy
signal even though the DJI rallies. No Buy is produced because the circumstances
of the reversal are not reliably bullish. (Here, for example, the DJI's rally above
the rising 200-day ma is bullish, but not reliably so. There are too many cases
where it fails. I spent two days testing it back to 1928.) Even so, we
can predict
a rally. These tend to occur after Sell S16s if there is a January reversal.
We do not get a Peerless intermediate and automatic Buy because at the time of the
reversal, it cannot be predicted that the rally will reliably present a big
enough
advance, because the resulting rally may be too limited to give a good Peerless sell
and because we will want to be short if there is a sudden reversal down.
Traders can guard against a 5% rally by
using other tools.
Traders in this situation should watch:
1) the Closing Power trend on DIA,
2) the A/D Line trend on the NYSE and
3) use a closing above the 65-dma to close out short positions if they are
still open..
Rallies against A Peerless Sell Late in A Bull Market
and Then A Bigger Second Decline
Sell
Rallies without A Peerless Buy
Second Decline
----------------------------------------------------------------------------------------------------------------
May 1946 (S5,S4)
5% up to 65-dma and then
Bear market until October
A/D Line worked well here.
January 1953 (S16),
1 month 3.2% up to 290.6 (3/17/1953) Fell to
263.4 on 6/10/1953.
A/D Line worked well here.
January 1962 (S16)
5% up from 1/29 to 722.3 (3/16/1962)
Bear market follows.
A/D Line worked well here.
January 1966 (S12)
5% up from 3/15 to 949.83 (4/22/1962)
Bear market follows.
A/D Line worked well here.
April 1971 (S16)
3.5% rally for two weeks to 903.4 7/12/71 7% decline to 839.59
8/10/71.
A/D Line worked well here.
April 1976 (S15)
5% up from 958.09 6/7 to 1007.45
on 6/21 5% decline to 960.44 on 8/26
A/D Line worked well here.
Sept 11, 1978
(S9,S12) 5% up from 861.14 9/21 to 896.74 on 10/12
13% decline
New S9/S12. A/D Line
worked OK.
The
market's swift rise back towards its January highs owes to unusually steady Professional
buying
and
the speculative dynamics of broadening megaphone patterns. While I can't
accord Peerless Buy
status to the DJI's cross-over above a rising 200-day ma
because there are too many failures, I can
certainly advise watching the rising trends of the NYSE A/D
Line and the Closing Powers of
DIA, QQQ and SPY.
Why The Rally?
It's
not clear why Professionals are so intent upon buying other than Janet Yellen
is
believed to be even more of a dove than Bernanke was in the matter of keeping interest
rates
low. Their buying is also sharply increased by Comcast's buying
control of Time Warner.
They
reason there could be a lot more buy-outs, given the massive
amount of idle corporate
cash,
low rates and a seemingly corporate-compliant and deferential Justice Department.
> Justice
Department Weak on Charging Individuals for White Collar ... Jan 20, 2014
> A
Washington activist group has sued to derail the Justice Department's record-setting
$13
billion settlement with JPMorgan,
> What
Goldman Sachs Did and the Justice Department Didn't
Also
Erik
Holder's past corruptability.
200-day ma cross-overs
The BUY B20 is not a new signal. I only put it here in the chart below
to show the DJI's cross-over of the 200-dma. I also used it to do the
back-testing.
It is NOT part of a new Peerless. But there are some changes and discoveries.
New will be the longer-term 30-wk and 200-dma. They will go back to 150 days
from the last day of the graph. I also want the green 200-day ma to change to red
when it turns down. I tried this with the 65-dma, but it makes the Peerless chart to
complicated and hard to read. Very often the zone between the 149-day ma
and the 200-day ma is the "sweet spot". Declines to a rising sweet spot
are bullish.
Rallies to a falling sweet spot are bearish. Declines only to the rising 149-day ma
may actually be more bullish than declines to the 200-day ma. It shows more
strength. The same is true in reverse. Rallies only to the 149-day ma are
more bearish. They show more weakness. The new book will show this and
many things more.


--> 140 -1 MAXCP stocks Bullish
MAXCP Stocks (2/14/2014) Bullish
plurality
--> 51 +2 MINCP stocks Bearish MINCP Stocks (2/14/2014)
--> 65 -34 New Highs on NASDAQ 5 -4 new lows.
Bullish plurality
--> 94 -8 New Highs on NYSE 6 new
lows. Bullish
plurality
DJI change
la/ma
annroc P-I
IP21 V-I
Opct
65-day Pct Change
----------------------------------------------------------------------------------------------------------------------------------------
2/3/2014 15373 -326
0.949 -.783 -41
-.167
-148
-.382 -.02 65-dma turned down.
2/4/2014
15445 +72 0.957 -.753 -31
-.149 -133
-.358
-.012
2/5/2014
15440 -5 0.959 -.726 -44
-.120
-135
-.361
-.007
2/6/2014
15628 +188 0.973 -.667 -16
-..095 -121
-.357
000 Back above 200-dma
2/7/2014
15794 -5 0.986
-.496 +83 -.058 -98 -.261
+.009 65-dma
starts rising
2/10/2014 15802 +8
0.988 -.478 +100 -.044 -99 -.176
+.011
2/11/2014 15995 +103 1.002 -.329 +119 -.014 -88 -.088
+.015 At 65-dma
2/12/2014
15965 -29 1.001 -.218
+205 .010 -66
-.083 +.023
2/13/2014
16028 +66 1.005 -.258 +216 .015 -69 -.086
+.016
2/14/2014 16154 +127 1.014 -.245 +221 .029 -71 -.092
+.023
==================================================================================
OLDER HOTLINES
==================================================================================
2/13/2014 The Sell
S16 remains the operative Peerless signal. But the DJI has
reached its
now rising
65-dma. Rising 65-dma are much less likely to act as resistance.
If DIA and
DJIA move decisively above the 65-dma, they will then bullishly join all the other
and key
indexes and ETFs that have already done this. See NASD, QQQ, SP-500, OEX, SPY,
IWM, FAS, IBB.
Biotechs remain the leaders. A number of the most
Bullish MAXCP
stocks have
reached resistance lines I have drawn. Breakouts by them are apt
to start an
even steeper new leg up. Its already hard to imagine much steepter
rises than
in ARWR and ALXN.
Their rockets' glare ignites a lot of greed,
as do the many line-formation breakout/followed by
long runs that I showed last night.
These
spectacular advances create and reflect a bullishness which will not easily
be stopped.
Even with some profit-taking yesterday, our Stocks' Hotline is long
about twice
as many stocks it has short. In part, this is because there are so
many more Bullish MAXCP stocks than Bearish
MINCP stocks.
In this environment, we must limit losses on short sales. "Don't fight the Fed".
Never has
the Federal Reserve played such a powerful role as now in keeping a
bull market
alive, while running the risk of a speculative bubble. If you have not already
closed your
short on DIA, I would then cover it if the DJI gets hourly above 16052.
Today's
Professional Buying surge after a very weak opening was very impressive.
The DJI's
next resistance is at its recent highs, around 16600.

The Hourly DJI
shows an inverted head/shoulders with a neckline that crosses at 16051.
A move
above that would also decisively put the DJI above its rising. 65-dma. In addition,
seasonality, apart from S16s is bullish. Since 1965, the DJI has risen 70.2% of the
time
in the
month after February 13th with an average gain of 1.6%.

Peerless
normally works well, in part, because markets are mostly moving in close allignment
and because
there have been quite a few cases where the DJI has led down the NASDAQ, the
rest of the
market and the NYSE A/D Line even when they had been acting much stronger.
See the
Peerless charts of 1977, 1986, 2000 and 2001.
What Type of Sell Signal Might We Get if The DJI Makes A New
High?
Sells S16s, except for the one in early 1990, carry with them the
added warning that if
the
initial decline is shallow, the next decline after the next Sell may be much worse.
Right
now, the A/D Line is clearly confirming the DJI's advance. But that will
not
prevent us getting a Sell signal after an advance back to 16600.
This is because a confirming A/D Line has not prevented important Sells at a
number of
past major tops. The A/D Line was also making new highs at the market tops
just below.
By sheer count, the most common Peerless Sells in this environment
are: S16(4),
S4(4), S11(2), S5 (1), S15 (1) I will discuss these more this weekend if
the advance
continues.
May 1946 (S5,S4),
January 1953 (S16),
January 1962 (S16),
January 1966 (S12),
December 1968 (S1)
April 1971 (S16),
September 1976(S1, later S4, S16),
January 1993 (S4), April 2010 (S11)
May 2001 (S4, S11)
March 2002 (S9, S15)
May 2011 (S8, S5).
Sell S16s Often Bring Two Declines
The first decline may end in January but the next leg-down
is apt to be deeper and last until May, October or later. This was true in
1938, 1940, 1960, 1962, 1970, 1977, 1981, 1990 and 2000.
This means the next top may be important. The only real exception
is 1934.
--> 140 -1 MAXCP stocks Bullish MAXCP Stocks (2/13/2014)
Bullish plurality
--> 51 +2
MINCP stocks Bearish
MINCP Stocks (2/13/2014)
--> 99 +33 New Highs on NASDAQ 9 -1 new lows.
Bullish plurality
--> 104 +55 New Highs on NYSE 6 new
lows. Bullish
plurality
DJI change
la/ma
annroc P-I
IP21 V-I
Opct
65-day Pct Change
----------------------------------------------------------------------------------------------------------------------------------------
2/3/2014 15373 -326
0.949 -.783 -41
-.167
-148
-.382 -.02 65-dma turned down.
2/4/2014
15445 +72 0.957 -.753 -31
-.149 -133
-.358
-.012
2/5/2014
15440 -5 0.959 -.726 -44
-.120
-135
-.361
-.007
2/6/2014
15628 +188 0.973 -.667 -16
-..095 -121
-.357
000 Back above 200-dma
2/7/2014
15794 -5 0.986
-.496 +83 -.058 -98 -.261
+.009 65-dma
starts rising
2/10/2014 15802 +8
0.988 -.478 +100 -.044 -99 -.176
+.011
2/11/2014 15995 +103 1.002 -.329 +119 -.014 -88 -.088
+.015 At 65-dma
2/12/2014
15965 -29 1.001 -.218
+205 .010 -66
-.083 +.023
2/13/2014
16028 +66 1.005 -.258 +216 .015 -69 -.086
+.016
#1 19341231
S16 104.00 Gain = +.104
Paper loss = 3.1% Next market bottom 3/18/1935
-------------------------------------------------------------------------
#2 19381230 S16 154.4 +.100 3 straight up days
Paper Loss = none Next market bottoms 1/26/1939 and 4/11/1939.
-------------------------------------------------------------------------
#3 19400103 S16 152.8 +.045 4 straight up days
Paper Loss = none Next market bottoms 1/15/1940 and 6/10/1940.
-------------------------------------------------------------------------
#4 19420102 S16 112.8 +.132 4 straight up days
Paper loss = 0.6% Next market bottoms 4/28/1942
-------------------------------------------------------------------------
#5 19521230 S16 292 +.098 4 straight up days
Paper loss = 0.6% Next market bottoms 6/16/1953
-------------------------------------------------------------------------
#6 19591231 S16 679.3 +.099 3 straight up days
Paper loss = 0.9% Next market bottoms 3/8/1960 and then lower
-------------------------------------------------------------------------
#7 19611228 S16 731.5 +.263 4 straight up days
Paper Loss = none Next market bottoms 1/29/1962 and 6/26/1962.
-------------------------------------------------------------------------
#8 19700102 S16 809.7 +.056 4 straight up days
Paper Loss = none Next market bottoms 2/2/1970 and 5/26/1970
-------------------------------------------------------------------------
#9 19761229 S16 994.93 +.061 5 straight up days
Paper loss = 0.977% Next market bottoms 4/4/1977 and 11/3/1977
-------------------------------------------------------------------------
#10 19810102 S16 972.78 +.042 5 straight up days
Paper loss = 3.3% Peak was on a Friday 1/6/1981 and much lower after
next rally.
-------------------------------------------------------------------------
#11 19900102 S16 2810.15 +.075 4 straight up days
Paper Loss = none Next market bottoms 1/30/1990
-------------------------------------------------------------------------
#12 19991229 S16 11484.66 +.128 2
straight up days
Paper loss = 2.1% Peak was 1/14/2000 Next market bottoms 3/7/2000 and 2001! |
==================================================================================
OLDER HOTLINES
==================================================================================
2/12/2014 Peerless
remains operating under the Sell S16. The DJI failed to get
past its
flat 65-dma. This is bearish. Most likely there will be a DJI retest of its
recent lows
or the DJI
200-day ma. Traders should go short DIA and take
some profits in the
biotechs.
The biotech ETF, IBB, produced a red popsicle on the
Tiger candle-stick charts.
I do not
expect this decline to drop the DJI below the 15000 support. DJI declines
of more
than 9%-13.5% are rare unless there has been a bearish breadth divergence,
multiple
Peerless sell signals and/or a DJI head/shoulders pattern.
Speculative
fevers, like what we are seeing in low-priced
stock line-formation breakouts
some along
only infrequently. They are not easily snuffed out. In 1968, margin
requirements
and
curtailment of trading hours had to be used. The Fed now is still guided by a
de-regulatory
set of
view. So, things are apt to become even wilder on the speculative front, I think.
Wall
Street will be busy today. New mergers' and acquisitions' stories will be
flying about. This will drive up a whole new group of stocks. The reason:
today,
Comcast (#1
cable company) is expected to announce its terms for buying out Time Warner
(#2 cable
company). Last year, Comcast took control of NBC. Comcast has been criticized
on the left
for pushing its more conservative
right-wing programs onto subscribers.
So, it's
possible the Justice Department and the FCC may issue some mild verbal
concerns.
However, there has been very little Government protection of the Consumer
in the last
20 year', as empire-building and monopolization in the Communications industry
increased
rapidly. Consumers are not protected and the Government no longer
cares.
Our Time Warner Cable bill here is up 75% in last five years. Meanwhile,
the
connection to the internet gets slower and slower.
This is
patently a monopoly situation. Cable could be a public utility. As it is, who
do you
complain to
or switch your business, too? They have a monopoly. And when you want
help, you
talk to someone in the Phillipines. So, consumer
groups and some other communications'
companies
are bound to complain. But "Fool me once, shame on you. Fool me
twice, shame
on
me". I fully expect the Obama Adminisitration to cave in here, just as they
have
before the
pressure of health insurance companies and big banks. Some consumer advocates
are aghast
at the implications here. For example, Peter
Weber:
"There's no way Comcast will buy Time Warner Cable: Regulators will look
closely
at giving one company such dominance ...They'll balk at giving Comcast the keys
to our internet."
The
consumer
comments on Yahoo that I've read are all negative towards the merger
and
fearful there will be no regulatory challenge.
Background:
http://en.wikipedia.org/wiki/Concentration_of_media_ownership
Overseas Selling

Greece
is back in the headlines. Official unemployment there is now 28.0%. Youth
unemployment is 61%. The Greek Government has been following the austerity
path
demanded by north Europeon bankers for several years now. Nothing good seems
to
have resulted from this. And again, the anti-Government/anti-Bank protests are
becoming very large and very intense. Terrorists are now making direct threats on
the
bankers pulling the strings. This will almost certainly cause selling in the
overseas
markets. It is not clear that Professionals in the US will do much to prop up the
market
against this selling, given the DJI's weak technical position, with it falling back from
its 65-dma.
http://www.reuters.com/article/2014/02/13/greece-unemployment-idUSL5N0LH1KU20140213
http://online.wsj.com/news/articles/SB10001424052702304603704579326373101984420
http://www.timesofmalta.com/articles/view/20140212/world/Greek-militants-attack-was-protest-at-austerity-policies.506458#.Uvy1JlNTZrM
Another Fed Surprise?
But,
it's always possible that the FED will surprise us as it did last June and suddenly
postpone any reduction in the QE-III buying of long-term mortgages from the Big
Banks.
So, I would close out the DIA short sale if it closes back
above its 65-dma. Instead,
I
think they may do this when the DJI is down 10% and threatening a more significant
support-break at 14700.


--> To Key Index and Leading Stock Charts: DJI, SP-500, etc.
DJI Chart
SPY Chart NASDAQ Chart IBB Chart
IWM Chart
--> 140 -1 MAXCP stocks Bullish MAXCP Stocks (2/12/2014)
Bullish plurality
--> 51 +2
MINCP stocks Bearish
MINCP Stocks (2/12/2014)
--> 66 +11 New Highs on NASDAQ 10 +4 new lows.
Bullish plurality
--> 49 -17 New Highs on NYSE 8 new
lows. Bullish
plurality
DJI change
la/ma
annroc P-I
IP21 V-I
Opct
65-day Pct Change
----------------------------------------------------------------------------------------------------------------------------------------
2/3/2014 15373 -326
0.949 -.783 -41
-.167
-148
-.382 -.02 65-dma turned down.
2/4/2014
15445 +72 0.957 -.753 -31
-.149 -133
-.358
-.012
2/5/2014
15440 -5 0.959 -.726 -44
-.120
-135
-.361
-.007
2/6/2014
15628 +188 0.973 -.667 -16
-..095 -121
-.357
000 Back above 200-dma
2/7/2014
15794 -5 0.986
-.496 +83 -.058 -98 -.261
+.009
2/10/2014 15802 +8
0.988 -.478 +100 -.044 -99 -.176
+.011
2/11/2014 15995 +103 1.002 -.329 +119 -.014 -88 -.088
+.015 At 65-dma
2/12/2014
15995 -29 1.001 -.218
+205 .010 -66
-.083 +.023
==================================================================================
OLDER HOTLINES
==================================================================================
2/11/2014 The easy
part of the DJI's recovery has been completed. Yellen
pulled no
surprises, as was generally expected. Will the DJI now get
past the
resistance
of its now flat 65-dma? It is important for the bulls that it accomplishes
this.
If not, a re-test of the lows is the most likely
scenario. With the DIA's
blue
Closing Powers rising, we have to give it a chance to do this, even with the S16
signal
still active. The booming NASDAQ and BBH seem not much concerned with
what the
DJI does. This is typical of speculative markets like ours.


The Bounce Up off the 200-day ma Is Bullish
A Peerless
S16 signal still operates, but the DJI seems to have
bullishly
tested its rising
200-day ma in that breadth has been excellent and the super-charged
NASDAQ seems ready to explode to new highs. This weekend I examined the
weekly
DJI charts since 1928 and used
a 40-wk ma to approximate a 200-day ma. This study
suggests that the
DJI's coming back above this 200-day ma is a reliable Buy provided
that there has
not been a DJI head and shoulders and the A/D Line confirmed the last
DJI high.
Bullish now, we have no DJI head/shoulders and breadth is good. In
addition,
the DIA's Closing Power and the NYSE A/D Line downtrends were broken
on last
Thursday's close.
In addition, we have many more Bullish MAXCP stocks
than Bearish
MINCP stocks. With the Closing Powers rising and the NASDAQ
showing the
"animal spirits" are here in full force, let's see if the DJI can get past
the 65-dma as
easily as SP-500 did today.
As a result, I
have suggested short-term traders (under a month) cover their DIA short sales
and go long more
stocks than they are short using our Bullish MAXCP and BEARISH
MINCP lists. Last night I mentioned that there are a
number of high relative strength,
very high
Accumulation stocks (especially biotechs) that Professionals are buying
very
aggressively. These are the ones we should favor.
--> To Key Index and Leading Stock Charts: DJI, SP-500, etc.
DJI Chart
SPY Chart NASDAQ Chart IBB Chart
IWM Chart
--> 141 +32 MAXCP stocks Bullish MAXCP Stocks (2/11/2014)
Bullish plurality
--> 49 -26
MINCP stocks Bearish
MINCP Stocks (2/11/2014)
--> 55 +0 New Highs on NASDAQ 6 +3 new lows.
Bullish plurality
--> 66 +30 New Highs on NYSE 7 new
lows. Bullish
plurality
The Fed Has Given Another Green Light To Speculators.
In the past, I
have witnessed how the speculative periods of 1967-1968, 1977, 1999-2000
and 2008 offered
many, many profitable long trades despite a lagging DJI, even though
it turned our to
be the end of bull markets. This seems to describe our own market now.
. It's OK to be long, I thnk.
Our Tiger trading tools should tell us when to sell the
current explosive
super stocks. (See the list I gave last night. My new Explosive Super
Stocks talks at
length about this. A printed 2014 edition will be offered soon).
Hold More Long than Short for Now
Tomorrow we
will see if the DJI's flat 65-dma halts the recovery. In a non-speculative
market,
which this is not, one usually can count on a pullback from this resistance.
But in a
speculative market, we often see uncontrolled "zags" upward. The more of
these these
that occur, the more dangerous the market becomes.
Wilder
zigs(down) and then zags (up) very often set up a final top. These
speculative
bursts up
after 5%-11% DJI declines result in giving the Public a false sense of
confidence.
It makes them think that all declines are buying opportunities. It is when
the last
and final zig downwards is not followed by a zag upwards, that they end up losing
so much
money.
Below I
show tonight the type of price patterns that have occurred at important tops since
1929.
In 17 of the 21 cases there were NYSE A/D Line non-confirmations of the
last
new high.
In 4 instances this was not true. Since the A/D Line
has recently confirmed
the last
DJI, until prices form an obvious top, especially a head/shoulders, we
probably
should feel safe. But if the DJI were to turn sharply lower from here,
it would
make the present pattern of zigs and zags look like the basic one that
occurred in
1929, 1972-1973, 1980-1981, 1986-1987 and 1999-2000. The problem
with this
analogy is that breadth (A/D Line) is now much stronger. All these patterns
showed lots
of S9s. We have very positive breadth now. There have been no S9s.
Top Patterns in The Past Often Repeat
Wild "Zigs and Zags", Breadth NCs (non-confirmations of DJI new
highs)
and
Head/Shoulders pattern mark most major tops. We still need Peerless Sell
signals to
be sure and to time these tops.
 |
ZIG and ZAGS AS A TOP IS MADE:
1928-2014
=============================1929 3 zigs (down), 3 zags (up), a 30% advance,a 48% plunge
(There also was a head/shoulders.)
A/D NC, Sell S9/Sell S12 at top, head/shoulders top.
---------------------------------------------------------------------------
1937 Double top (second below the first),a 40% plunge.
A/D NC, Sell S4, S8
---------------------------------------------------------------------------
1939-1940 8 mo-long "home plate" Pattern, a 26% plunge
A/D NC, Sell S16, Sell S1, S13
---------------------------------------------------------------------------
1946 10% decline/snap back to new highs, head/shoulders,24% plunge
NO A/D NC, Sell S5, S4, S13
---------------------------------------------------------------------------
1956-1957 3 10% zags down, 2 zigs up and a 19% plunge.
A/D NC, Sell S7, S4, S10
---------------------------------------------------------------------------
1959 1 9% zig and zag and 17% sell-off
A/D NC, S16, S15, S1, S10
---------------------------------------------------------------------------
1961-1962 9 month wide head/shoulders pattern and 27% plunge
A/D NC, S16, S10
---------------------------------------------------------------------------
1965-1966 10.5% zig and 18.5% zag and a 24% sell off
A/D NC, S4, S12, S10
---------------------------------------------------------------------------
1968-1969 8.7% zig and 8% zag and 331/962 bear market decline
A/D NC, S9, S3
---------------------------------------------------------------------------
1971 3 month head/shoulders and 17% decline.
NO A/D NC, S19 (formerly B9B)...Later S9s.
---------------------------------------------------------------------------
1972 3 5% zigs down, 2 5% zags down, a final 14% up and 45.2% bear mkt.
A/D NC, S4, S9, S12, S10
----------------------------------------------------------------------------
1976 2 5% zigs and zags, a 8% zig and zag and 25.7% bear market
NO A/D NC, S4, S16
----------------------------------------------------------------------------
1979-1980 1 11% zig down, 1 14% zag up and 16% plunge
A/D NC, S9, S15
----------------------------------------------------------------------------
1980-1981 2 5% zigs and zags, 9% zig and zag, 7% zig and 10% zag, and 24.1%
bear market.
A/D NC, earlier S9s, S15, S12
-----------------------------------------------------------------------------
1983-1984 Rising Wedge and 15.5% mini-bear market.
A/D NC, S4, S12
-----------------------------------------------------------------------------
1986-1987 2 9% zigs, 1 9% zag and 1 35.5% decline.
A/D NC, S4, S8, S9 and S12
-----------------------------------------------------------------------------
1989-1990 2 9% zigs, 1 9% zag and a last 18% zag and then a 21% plunge
A/D NC, S9, S8
-----------------------------------------------------------------------------
1998 1 6% zag and zag, then a 20% plunge
A/D NC, S9, S12
------------------------------------------------------------------------------
1999-2000 2 6% zigs and zags, a 12% zig and a 18% zag up and then 17% plunge
and long bear market.
A/D NC, S9, S16, S15 and S4
------------------------------------------------------------------------------
2007 2 10% zigs, 1 10% zag, a final 8% zag followed by a 51% bear market
decline
A/D NC, S9, S5, S2, S4, S9 and S12
------------------------------------------------------------------------------
2011 up-sloping head/shoulers 7% high and then 17% plunge.
NO A/D NC, S8, S5, S9, S12
------------------------------------------------------------------------------
Where will our market go?
2013-2014 3 5% zigs and 2 5% zag, a 12% up and 7% decline and ???
NO A/D NC S16
|
DJI change la/ma
annroc P-I
IP21 V-I
Opct
65-day Pct Change
----------------------------------------------------------------------------------------------------------------------------------------
2/3/2014 15373 -326
0.949 -.783 -41
-.167
-148
-.382 -.02 65-dma turned down.
2/4/2014
15445 +72 0.957 -.753 -31
-.149 -133
-.358
-.012
2/5/2014
15440 -5 0.959 -.726 -44
-.120
-135
-.361
-.007
2/6/2014
15628 +188 0.973 -.667 -16
-..095 -121
-.357
000 Back above 200-dma
2/7/2014
15794 -5 0.986
-.496 +83 -.058 -98 -.261
+.009
2/10/2014
15802 +8
0.988 -.478 +100 -.044 -99 -.176
+.011
==================================================================================
OLDER HOTLINES
==================================================================================
2/10/2014 A Peerless
S16 signal still operates, but the DJI seems to have
bullishly
tested its rising
200-day ma in that breadth has been excellent and the super-charged
NASDAQ seems
ready to explode to new highs.
The DJI and SPY
hesitated today. Tomorrow we get to see what the new Fed Chairperson has
to say about the
weak job creation numbers of December and January, about the direction "
of QE-III and
what, if anything, she wants to say about the politically charged issues of
falling wages,
insufficient jobs, rising CEO pay and banks that are too big to fail.
Barring something
unexplected tomorrow, the DJI seems headed for 16000 where it will
face stiff
resistance from its violated 65-dma. At that point, there should be either a
re-testing
of the lows or a
consolidation pattern.
"Just when I thought I was out, they
pull me back in."
The Godfather.
The DJI's rising
back above a rising 200-day ma when there has been no obvious
recent A/D
Line non-confirmation of a new high and no obvious DJI head/shoulders
pattern
seems to be a good place to Cover shorts and aggressively Buy historically,
based on
the research I did this weekend on 40-week ma penetrations. Peerless presently
only shows
about 50 days of the 200-day ma on its charts. That will soon be remedied,
so we can
see if a new Buy signal based on this concept should be added. This will
delay the
Peerless book somewhat. But ever since June
2012, when a similar reversal
occurred, I
have been thinking the Peerless graphing needs to plot this ma over the
whole
chart, or at least the last 200 days. This will help. I'm sure. See what
I wrote this weekend:
How
reliable is a rising 200-day ma? 2/9/2014


The NASDAQ or Biotechs seem headed
much higher. They are much stronger than
the DJI.
Speculative bull markets like 1967-1969, 1999-2000, early 1977 and 2008
can end for the
DJI before it ends for the most favored geoups in the market.
In keeping with
this traditon or pattern, biotechs and bigger high techs are enjoying
one new surge of
buying after another. As in these previous years, much of the
gains are coming
at the openings. These are the sectors the hot money funds and
public keep
buying. (Something not mentioned by Wall Street, but probably true is
that a good part
of this money is on margin from smaller traders who are trying to
make up in Wall
Street what their lagging wages have lost.)
Note that I think
it's fine for us to buy these exceptionally strong stocks. We
have special
tools to see the insider and professional buying. And we have tools
and concepts
like negative IP21 on new highs, red popsicles, Closing Power NCs
and
uptrenline-penetrations, head/shoulders patterns, OBV NCs and false breakouts
to tell us when
to sell.

t
Biotechs are the most favored group now. Their exceptional
relative strength is a
great magnet for
aggressive speculators. But it's more than that. There is a flowering
productivity of
biotech research like never before. Added to that, the government
is providing
millions of new customers for pharmacueticals through ObamaCare.
And if that is
not enough, we all are getting the sense that the FED is utterly unwilling
to let the DJI
fall even 10%. Now with the weak jobs' numbers that came out last Friday,
most observers
feel QE-III may be here for many months more. How can there not
be another big
speculative bubble? Buying the highest Power Ranked stocks
making Closing
Power new highs in the area of cell biology and biochemistry seems a great way
to play the
market until something changes this bullish concatentation of forces.
See the charts of
ALXN, ANAC, ARWR, FLDM and SMCI.
As long as their
Closing Powers
are rising, the odds favor much higher prices.
--> To Key Index and Leading Stock Charts: DJI, SP-500, etc.
DJI Chart
SPY Chart NASDAQ Chart IBB Chart
IWM Chart
--> 109 +14 MAXCP stocks Bullish MAXCP Stocks (2/10/2014)
Bullish plurality
--> 75 +10
MINCP stocks Bearish
MINCP Stocks (2/10/2014)
--> 55 +20 New Highs on NASDAQ 3 -7 new lows.
Bullish plurality
--> 36 -4 New Highs on NYSE 5 new lows. Bullish plurality
DJI change
la/ma
annroc P-I
IP21 V-I
Opct
65-day Pct Change
----------------------------------------------------------------------------------------------------------------------------------------
2/3/2014 15373 -326
0.949 -.783 -41
-.167
-148
-.382 -.02 65-dma turned down.
2/4/2014
15445 +72 0.957 -.753 -31
-.149 -133
-.358
-.012
2/5/2014
15440 -5 0.959 -.726 -44
-.120
-135
-.361
-.007
2/6/2014
15628 +188 0.973 -.667 -16
-..095 -121
-.357
000 Back above 200-dma
2/7/2014
15794 -5 0.986
-.496 +83 -.058 -98 -.261
+.009
2/10/2014
15802 +8
0.988 -.478 +100 -.044 -99 -.176
+.011

==================================================================================
OLDER HOTLINES
==================================================================================
2/7/2014 A Peerless S16 signal
still operates, but the DJI seems to have
successfully
tested its rising 200-day ma in that breadth was excellent on the second
strong up-day.
But a lot still depends on the testimony that the new Fed Chairwoman offers
Congress this
week. The market technically will probably take its cue from how
the SP-500 and SPY handle the overhead
resistance of their 65-dma.
A Test of The Recent Lows
Usually after a
sharp sell-off which breaks the 200-day ma and the recovery
back above it,
there is a big bounce. This is what we have seen Thursday and
Friday. But
then most often there is next a pullback. An inverted head/shoulders
may be formed or
there may be a re-testing of the recent lows. If the market is
in tolerably good
health, the decline does not bring more than a nominal closing low.
Often this is the
low that brings the Peerless Buy signal. From this low comes a
second rebound
and a new zig-zag-up pattern is created. Traders can use this new
uptrendline in
prices, Closing Power or the A/D line to know when to sell if they
have taken long
positions on this pull-back. See some
examples here.
Having an
uptrendline is a source of comfort and confidence to traders. I suspect that is
what we will see
next but it may not occur until the 65-dma of the DJI is tested.
Watch SPY
tomorrow to see how well it copes with the resistance of its 65-dma.
What To Do
Short-term traders
should now have covered their DIA shorts when its Closing Power's
downtrend and the A/D
Line's downtrend were violated. Intermediate-term traders
using the Peerless Sell
Sell Signal might wait for the DJI to close back above
its 65-dma, now 236
points higher at 16030 or buy on the pull-back. In the future,
I think we
will have to act in
accordance with the new research below showing that an extended
rising 200-day ma
usually acts as good support as long as the A/D Line confirmed the last
DJI high and cover on
the cross-over back above the 200-day ma. Out Hotline
is now long more stocks
than it is short.
--> To Key Index and Leading Stock Charts: DJI, SP-500, etc.
DJI Chart
SPY Chart NASDAQ Chart IBB Chart
IWM Chart
--> 95 +35 MAXCP stocks Bullish MAXCP Stocks (2/7/2014)
Bullish plurality
--> 65 -40
MINCP stocks Bearish
MINCP Stocks (2/7/2014)
-->
AI Bulges and CP hooks back up
--> 35 +13 New Highs on NASDAQ 10 -10 new lows.
Bullish plurality
--> 40 New Highs on NYSE 6 new lows. Bullish plurality
How reliable is buying when a
rising 200 day ma
appears to be successfully tested?
Peerless uses
only daily charts and stores only one year of data to produce its
Buys and Sells.
But I have long wondered what significance should be attached
to the tests and
breaks of the 200-day ma. One of the first things I learned when
I looked back at
the 1929-1932 bear market, was that the 200-day ma stopped
all rallies until
the end of that debacle. But without some serious new programming,
we can't see the
200-day ma on more than about 50 of the last trading days on our
Peerless charts.
So, that has been a barrier to back-testing this concept. At least
it was been until
this weekend, when I looked at the weekly DJI charts going back
to 1928 and used
a 40-week ma to approximate the 200-day ma.
See http://tigersoft.com/PeerInst-2012/WEEKLY/INDEX.htm
What I discovered
was that there have been 9 bull markets since 1932 where, like
now, there had
been 3 or more successful tests of a rising 40-week ma. In 7 of the
9, the rising
200-day ma was not broken decisively until the weekly A/D Line failed to confirm
a DJI high.
Since the weekly A/D Line confirmed the last DJI high, the odds are 7 of 9
that we
have just seen a successful test of the 200-day ma and the DJI will next
want to challenge
its recent highs.
The two
exceptions are interesting. In the first, mid-1946, the DJI formed an
unmistakeable
head/shoulders top before the breaking of the 200-day ma. That
is not true here.
In the second case, January-February 1977, the weekly A/D Line
only barely
confirmed the last new high. However, there was a Buy B17 then
and a 4% rally
before the bear market developed.
What all this
means, is that short sellers should probably grab their S16 signal
profits if the
market sells off on Monday and we should buy some of the
Bullish MAXCP stocks or those with recent high Accumulation bulges whose Closing
Power downtrends are hooking back up.
Margin Debt is At Record Highs (Source)

==================================================================================
2/6/2014 A Sell S16 still
operates. Intermediate-term Peerless users should
remain short DIA
even though a brief rally seems to be taking place that will relieve
the short-term
oversold condition. My thinking is that it may serve ultimately
to weaken the
market by causing premature short-sovering. Note that most of the
gains since
November have been made at the openings. This is more a sign of over-seas
and Public
buying. Professional buying is much more cautious, though the steep
Closing Power
downtrend has been broken.

--> To
Key Index and Leading Stock Charts: DJI, SP-500, etc.
DJI Chart
SPY Chart NASDAQ Chart IBB Chart
IWM Chart
--> 60 +32 MAXCP stocks Bullish MAXCP
Stocks (2/6/2014)
-->
105 -88
MINCP stocks Bearish
MINCP Stocks (2/6/2014)
Bearish plurality
--> 22 New Highs on NASDAQ 20 new lows.
Bullish plurality
--> 14 New Highs on NYSE 10 new lows. Bullish plurality
But we'll see.
The DJI did bullishly rise back above its rising 200-day ma and the A/D Line
downtrend has
been broken. Back in June 2012 that was enough to produce a recovery
after the DJI had
also fallen 7% from its highs. The Stochastic-20 had failed to confirm
the June low and
then turned up, too This last factor is a reliable Buy, but not in early February.
See the study of
early February bounces farther below in this Hotline. In our case now,
the blue 20day
Stochastic failed to produce an unconfirmed low from this Stochastic-20.
But to be fair,
our case does show an A/D Line NC and that can be bullish, though it is
not good enough
to produce its own Buy signal.
DJI has
surpassed rising 21-day but 65-dma will act as resistance.
A/D Line downtrend broken. But early Februaries are usually
not bullish. 
June 2012 Bottom occurred as DJI surpassed rising 200-day ma

Early February Declines To Lower Band
Usually Go Lower.
Early Februaries
have always been a bad time to buy on dips to the lower band
unless Peerless
has givem a Buy signal.
2/8/1960
.965 -.209 DJI fell from 619.4 to 599.1 on
3/8/1960
2/2/1970
.957 -.236
Buy B8 and rally to upper band.
Then collapse.
2/2/1973 .960 -.141 Dell
kept falling in dangerous bear market.
2/2/1981
.971 -.005
Buy B17 DJI rallied past upper band. Bear market
started
after June peak.
2/2/1984
.968 -.111
DJI fell from 1213.88 to 1134.63
before rallying to upper band.
2/7/2003
.946 -.11
DJI fell from 8764.23 to 7524.06 and
then began a bull market after B8 and B17.
2/2/2009 .948
-.007 DJI
fell from 7936.75 to 6547.05 5 weeks later.
2/8/2010 .95 8
-.039 Buy B17.
DJI rallied above upper band.
Rallies are also
likely to be limited on the first tagging of the lower band in
February when our
IP21 (current Accumulation Index) is below -.12.
Normally
the DJI continues
to decline in these cases, especially when there is no Peerless
Buy signal.
I show the "LA/MA" number. This is the DJI's close divided by the
21-day ma.
Below in RED are the cases since 1928 when the DJI fell to the lower band
in February.
(1) tags of the lower band before 9th,
(2) very negative IP21 cases (<-.12),
(3) where the DJI kept falling and
(4) where a low was hit with the DJI below the 5.1% lower band.
This shows more the 5.1% band may be broken.
February Bounces
and Breakdowns at The Lower Band: 1929-2014
LA/MA IP21
-------------------------------------------------------------------------------------------------------------------------------------
2/3/2014
.949 -.167
No Buy signal...Bounce???
............................................................................................................................................................................................2/15/1929 .969 -.056 Bounce to upper band after Buy B2. Then to LB.
2/10/1932 .908 -.109 No Buy signal..
Bounce above upper band and then steep decline much lower.
(.908 shows that much greater weakness followed. )
2/27/1933 .876 -.098 Big hounce and decline back 2% lower band and up, up!
2/26/1934 .958 -.068 DJI fell from 103.1 to 98.8 before rally to upper band and falling 2/3/1938 .925 -.042 Rallied to upper band and then fell sharply to new lows.
2/14/1941 .937 -.373 7 week rally and then decline to new low.
2/11/1942 .969 -.087 No Buy signal DJI fell from 106.5 to 92.9
2/25/1946 .930 +.008 B9 ...DJI rose back past upper band.
2/10/1948 .956 -.195 Bottom. Bull Market started. Buy signal followed..
2/11/1949 .964 -.175 DJI rallied from 171.9 to 178.4
and fell to new lows.
It rallied back to neckline of broken H/S
2/20/1952 .960 -.105 No Buy signal
DJI rallied from 258.5 to 267.2 and then made a new low.
It rallied back to neckline of broken H/S
2/12/1957 .957 -.134 Bottom. Good rally ensued.
2/9/1959 .971 -.09 Buy B19 Bull market continued.
2/8/1960 .965 -.209 DJI fell from 619.4 to 599.1 on 3/8/1960
2/24/1966 .969 -.136 DJI fell from 950.66 to 911.08 before rallying briefly and
falling again.
2/9/1968 .968 -.194 DJI fell from 840.04 to 826.05 and then resumed bull market.
2/26/1969 .968 +.01 No Buy signal. No recovery for 10 weeks.
Then steep decline and bear market followed.
2/2/1970 .957 -.236 Buy B8 and rally to upper band. Then collapse.
2/2/1973 .960 -.141 Dell kept falling in dangerous bear market.
2/11/1974 .950 -.089 No Buy signal
DJI rallied to upper band but then
gradually kept falling in a bear market.
2/27/1979 .973 -.150 No Buy signal DJI rallied past upper band and pulled back.
2/27/1980 .972 -.026 DJI fell from 855.12 to 759.13 in two months.
2/2/1981 .971 -.005 Buy B17 DJI rallied past upper band.
2/23/1982 .969 -.064 DJI fell from 812.98 to 795.47 and
after B8 then rallied to upper band.
2/2/1984 .968 -.111 DJI fell from 1213.88 to 1134.63 before rallying to upper band.
2/9/2000 .959 -.173 DJI fell from 10699.16 to 9796.03 a month later and rallied.
2/23/2001 .967 -.012 DJI fell from 10441.9 to 9389.48 a month later
2/7/2003 .946 -.11 DJI fell from 8764.23 to 7524.06 and
then began a bull market after B8 and B17.
2/27/2007 .967 -.001 DJI fell from 12216.24 to 120050.41 and then rallied with B19.
2/2/2009 .948 -.007 DJI fell from 7936.75 to 6547.05 5 weeks later.
2/8/2010 .958 -.039 Buy B17. DJI rallied above upper band.
|
===================================================================
OLDER HOTLINES
===================================================================
2/5/2014
A Sell S16 still operates. Short-term traders should cover the short in DIA if the
NYSE A/D Line
breaks its downtrendline or the Closing Power for the DIA breaks
its steep
downtrendline. Remember perfection is impossible. Our jobs is make money
trading the
trends we are given.
However, I will
assume that Orthodox Peerless intermediate-term users are waiting
for a Peerless
Buy signal. So, we will officially remain short on an intermediate-term basis.
The next rally
must be expected to fail until Peerless gives a Buy signal.
While we have no
new Peerless Buy signal, it is probably a good idea for short-term traders
to cover the
short in DIA if the DJI closes back above its rising 200 day ma and the NYSE
A/D Line
downtrend is violated. I showed last night that in the past there were a
number of
tradeable DJI rallies from a point 7% below the S16 and the January highs.
This is the
lowest level the DJI has reached on this decline. A break in the Closing
Power would also
be a bullish sign.
Usually we get a
Peerless Buy signal before the DJI recovers much after a Sell S16.
But there are no
guarantees that the market may not first be revived by the Central Bankers
in Europe of the
Fed. They are afraid of failing to act quickly enough, as memories
of 2007 and 2008
are fresh.
You can see in
the charts at the bottom of today's Hotline, a break in the A/D Line
downtrend in
these conditions ordinarily brings a tradeable rally. This would have worked well
in 1962, but it
was a little early in 1960. Mostly we are better off waiting for
a Peerless Buy.
I would take a
long-term position in one or two of the de-salinization stocks below,
ERII or LIQT. These will be
added to our nightly charts here. Among biomedical
and biotech
stocks, TRIB is the highest power ranked. Buy it. Watch the other very high
ranked. like ANAC
and buy them when their Closing Power hooks back up.
--> To
Key Index and Leading Stock Charts: DJI, SP-500, etc.
DJI Chart
SPY Chart NASDAQ Chart IBB Chart
IWM Chart
A Way Out of The Economic Malaise
A lot of
important economists see the signs of another recession ahead. They offer
the usual
bearish choruses: over-speculation, under-consumption, interest rates can only
go up and
reduced government deficits are deflationary if private capital does not
pick up the
slack. But there is hope, at least in certain industries.
After World War I, there was a big decline in the market, in prices, wages
and in the general
economy. Post-war austerity, high interest rates and Fear
(Wall
Street was bombed) caused the decline. What brought about the recovery.
New tax
cuts and public works' government spending programs were not used by Harding as
stimulants.
After all, this was the era of Republican President's laissez-faire.
What I
think perked the early 1920s up were all the inventions and innovations.
People
"had to have" electricity, cars, radios, sewing machines and
refrigerators.
Roads and
highways had to be built.
"In 1924, the Federal Road Act offered federal money to state legislatures,
which would organize highway departments and match federal funds. Spurred
on by this federal money, every section of the country launched ambitious
road building programs during the 1920s. By the end of the decade, highway
construction programs employed more men and spent more money than any
single private industry." http://www.angelfire.com/co/pscst/tech.html
This
suggests the best hope for a recovery would be a massive government spending
on
rebuilding the American infrastructure, thereby guaranteeing every young person
a job.
The passage of the Inter-State Highway Bill in 1955 had much the same impact
asa
occurred in the 1920s.
Better and
cheaper educational facilities certainly would seem appropriate here.
GI-Bills and the National Defense
Education Act of 1958 played big roles roles.
New
technologies must be encouraged. Many may threaten jobs (like robotics) but
some create
whole new industries. This is what we want to promote every way possible.
We want to
be on the alert always for such new technologies. Just when someone says
everything
important has already been invented, something new comes along. And the
stocks that
represent these break-throughs often go up in bear market ann become
the
explosive super stocks in the next bull market. Biotechs like AMGEN prove
this.
Desalinization Is Certain To Be
A Growth Inustry

A new
technology that surely will take on more and more importance as our
planet
becomes hotter and drier is desalinization.
The technology to turn sea
water into
fresh water is improving dramatically.
Desalination
Seen Booming at 15% a Year as World Water Dries Up Feb 14, 2013
Lockheed Martin Desalination Graphene Filters - March 22, 2013
New "water chip" promises simple, portable,
membrane-free water July 3, 2013
Here are the stocks that seem most interesting as purer plays in this area.
ERII is the
a near-by company building a desalinization plant in San Diego County.
ERII Energy Recovery San Leandro,
California http://www.energyrecovery.com
71 employees
energy recovery devices and turbochargers for water desalination; turbochargers designed
for low-pressure brackish and high-pressure seawater reverse osmosis systems; and pumps
ranging from high-pressure multi- and single-stage centrifugal pumps to circulation and
high-speed pumps.
Energy Recovery Inc.: The Little Company With The Big
Technologyat Seeking Alpha(Wed, Jan 29)
-------------------------------------------------------------------------------------------------------------------------------------------------------
LIQT LIQTECH Intern 74 employees
Denmark http://www.liqtech.com
manufactures and sells ceramic membranes for the filtration of liquid under the LiqTech
and Cometas brand names that are used for the filtration of produced water
LiqTech
International, Inc. Announces Milestone Order for Flat Sheet MembranesPR
Newswire( (Thu, Jan
LiqTech
International, Inc. Announces Increase Of Provital Order For 2014PR Newswire( (Wed,
Dec 18)
-------------------------------------------------------------------------------------------------------------------------------------------------------
CWCO Consolidated Water - operates seawater
desalination plants and other water services in the Cayman Islands, the Bahamas, Belize,
the British Virgin Islands, and Bermuda, using reverse osmosis technology to convert
seawater to drinkable water. The stock trades at 17 times forward earnings and pays a
decent yield of 2.8%. The company has raised its dividend in eight of the last ten
years. Cayman Islands http://www.cwco.com
124 employees
-------------------------------------------------------------------------------------------------------------------------------
TTEK Tetra Tech -
designs and builds desalination systems that use seawater, brackish water, and reclaimed
wastewater sources to help increase water supply, and has been designing desalination
plants in Florida since the 1990s. It also designed the first California desalination
plant, the Corona Temescal Desalter. The stock trades at 15 times forward earnings.
Earnings for the latest quarter were up 19% year over year.
Pasdadena 14,000 employees
DJIA
CHARTS
 |
Here the A/D Line Break was early.
 |
 |
 |
 |
 |
 |
-->
28 MAXCP
stocks Bullish MAXCP Stocks (2/5/2014)
--> 193 MINCP stocks Bearish MINCP Stocks (2/5/2014) Bearish
plurality
--> 12 New Highs on NASDAQ 42 new lows.
Bearish plurality
-->
10 New Highs
on NYSE
39 new lows. Bearish plurality
DJI change
la/ma
annroc P-I
IP21 V-I
Opct
65-day Pct Change
----------------------------------------------------------------------------------------------------------------------------------------
1/13/2014
16258 -179
.998 .296 +358
-.021
30 .168
.098
-------------------------------------------------------------------------------------------------------------------------
1/14/2014
16374 +116 1.004
.464 +441 +.021 53
.266 .082
1/15/2014
16482 +108 1.008 .530 +465 +.036
62 .271
.081
1/16/2014
16417 -65 1.003 .388 +438
+.034 47 .179
.072
1/17/2014
16459 +41
1.003 .424 +425 +.042 38
.283 .085
1/21/2014
16414 -44 1.000 .179 +386 -.021 17 .175
.067
------------------------------------------------------------------------------------------------------------------------
1/22/2014
16373 -41 0.997 .141 +453 -.031 25 .083
.065
1/23/2014
16197 -176
0.986 -.017 +328
-.012 -23 -.119
.051
1/24/2014
15879 -318
0.968 -.301 +157
-.072 -71 -.230
.031
1/27/2014 15838
-41 0.967 -.377 +38 -.098 -93 -.297
.023
1/28/2014 15929 +101 0.974 -.401 +101 -.108 -93 -.278
.033
1/29/2014
15739 -190 0.965 -.538 +16 -.118 -106 -.294
.014
1/30/2014
15849 +110 0.973 -.478 +96 -.119 -92
-.276
.017
1/31/2014
15699 -150 0.966 -.642 +15
-.136 -123 -.370
.008
2/3/2014
15373 -326 0.949 -.783 -41
-.167 -148
-.382 -.02 65-dma turned down.
2/4/2014
15445 +72 0.957 -.753 -31
-.149 -133
-.358 -.012
2/5/2014
15440 -5 0.959
-.726 -44
-.120 -135
-.361 -.007
==================================================================================
OLDER HOTLINES
==================================================================================
2/4/2014
A Sell S16 still operates. Stay short DIA.
We want to watch and see if the
NASDAQ, QQQ and even BBH follow the DJI down, as they
did in March 2000 and
more decisively in
February 2001. I think it is significant for tech stocks that
the semiconductors'
ETF, SOX, has completed a bearish head and shoulders pattern.
Because of its weight
(12%) in the QQQ, watch to see if AAPL
turns back down or
continues its recovery.
In 3 of the 7 cases of
Sell S16s since 1960, the DJI did reverse for a while after
falling 7% from its
highs, as we has just occurred. But the presence of heavy (red) volume
as we have seen usually
means only minor low-volume counter-trend bounces. The
breaking below the
lower bands increases the chances for an additional decline as
does the breaking of
support in a top pattern (example 1960 and 2000).
--> To
Key Index and Leading Stock Charts: DJI, SP-500, etc.
DJI Chart
SPY Chart NASDAQ Chart IBB Chart
IWM Chart .

For a bottom, besides
Peerless Buy signals, we will need to see a very positive (blue)
day of volume, perhaps
like that seen soon after the bottom in early February in 1990 or 1962.
Trend-breaks in
downtrends of the Closing Powers and the NYSE A/D Line should also
tell us when to cover
our short sales even if Peerless gives no buy signals.
Below are chart of Sell
S16s since 1960.
Sell S16s since 1960
-->
24 MAXCP
stocks Bullish MAXCP Stocks (2/4/2014)
--> 293 MINCP stocks Bearish MINCP Stocks (2/4/2014) Bearish
plurality
--> 16 New Highs on NASDAQ 33 new lows. Bearish plurality
-->
12 New Highs
on NYSE 27 new lows. Bearish plurality
DJI change
la/ma
annroc P-I
IP21 V-I
Opct
65-day Pct Change
----------------------------------------------------------------------------------------------------------------------------------------
1/13/2014
16258 -179
.998 .296 +358
-.021
30 .168
.098
-------------------------------------------------------------------------------------------------------------------------
1/14/2014
16374 +116 1.004
.464 +441 +.021 53
.266 .082
1/15/2014
16482 +108 1.008 .530 +465 +.036
62 .271
.081
1/16/2014
16417 -65 1.003 .388 +438
+.034 47 .179
.072
1/17/2014
16459 +41
1.003 .424 +425 +.042 38
.283 .085
1/21/2014
16414 -44 1.000 .179 +386 -.021 17 .175
.067
------------------------------------------------------------------------------------------------------------------------
1/22/2014
16373 -41 0.997 .141 +453 -.031 25 .083
.065
1/23/2014
16197 -176
0.986 -.017 +328
-.012 -23 -.119
.051
1/24/2014
15879 -318
0.968 -.301 +157
-.072 -71 -.230
.031
1/27/2014 15838
-41 0.967 -.377 +38 -.098 -93 -.297
.023
1/28/2014 15929 +101 0.974 -.401 +101 -.108 -93 -.278
.033
1/29/2014
15739 -190 0.965 -.538 +16 -.118 -106 -.294
.014
1/30/2014
15849 +110 0.973 -.478 +96 -.119 -92
-.276
.017
1/31/2014
15699 -150 0.966 -.642 +15
-.136 -123 -.370
.008
2/3/2014
15373 -326 0.949 -.783 -41
-.167 -148
-.382 -.02 65-dma turned down.
2/4/2014
15445 +72 0.957 -.753 -31
-.149 -133
-.358 -.012
==================================================================================
2/3/2014
Sell S16 still operates. Stay short DIA. The best support is at 14800,
about 10% from the
recent peak. Be careful about buying on strong openings,
this year most have be
destroyed by weak closings. This shows steady Professional
selling.
Eventually, the Closing Power downtrends will be broken and it will
be safe to buy.
But not yet. The broken support at 15750 and the now falling
65-dma will be firm
resistance levels that should stop any rally.
--> To
Key Index and Leading Stock Charts: DJI, SP-500, etc.
DJI Chart
SPY Chart NASDAQ Chart IBB Chart
IWM Chart


Trust The Bearish Technicals
The excuse given for
the 300 point DJI drop was the sharp drop in US
manufacturing new
orders. The
relationship between the US Manufacturing Index
and
the stock market is difficult to see or understand. But it may mean the Fed
will keep rates low a
lot longer. When will Janaet Yellen do some yelling?
Right now we're better
off considering the technicals and Peerless, I think. Peerless
remains on a Sell and
both Opening and Closing Powers are falling, This is a
most dangerous
condition. Why try to catch a falling knife? Let's let the Professionals
tell us when we should
be buyers.
Peerless had a Sell S16 at the end of December.
Typically
a 10%-11% sell-off follows. Right now
we are down 7% from the highs.
Sell S16s normally
bring declines of 7% to 13%. The average low is
about 11% below the
high in the first quarter. 6 of the 11 Sell S16s were
reversed by a two-day
reversal Buy B19. Any Peerless Buy on the screen
can reverse the Sell
S18.
Brief rallies that
failed badly following the next Buy signal after a Sell S16
were common. A much
bigger decline following the next Buy and then
the next Sell were seen
in 4 cases.
1) 20% second decline, 3/10/1939- 4/11/1939
2) 25% second decline, 4/8/1940- 6/10/1940
3) 20% second decline, 3/26/1970-5/26/1970
4) 17% second decline, 3/16/1970-10/25/1970
In only 3 of the 11 instances did a bull market
follow the Sell S16 decline.
Sell S16s are much more
likely to bring a decline until at least June. Interestingly,
Arthur Merrill wrote
that the end of June commonly marked the end of the DJI's
tendency to be weak in
the year of the mid-term elections.
Aftermath of Past Sell S16s
Subsequent Date
Reversing Buy
low of low
------------------------------------------------------------------------------------------------
20131230 S16
16504
?
19991229
S16
11484.66
+.17 3/8/2000 Reversed by Buy B17 Bear Mkt folows
19900102 S16
2810.15
+.10
1/29/1990 Reversed by Buy B5, B17 Bull Mkt resumes
19810102
S16
972.78
+.07
2/13/1981 Reversed by Buy B17 Only Brief rally.
19761229
S16
994.93
+.07
2/24/1977 Reversed by Buy B17. Only Brief rally.
19700102
S16
809.7
+.08 1/27/1970 Reversed by Buy
B8. Only Brief rally.
19611228
S16
731.5
+.27 June low... Buy B16 Bear
Mkt folows
19591231
S16
679.3
+.13 Reversed by Buy B17. Bear Mkt until October.
19521230 S16
292
+.10 Reversed by Buy B3, B14 on 6/10/1953. Bull Mkt starts.
19420102 S16
112.8
+.18 Reversed by Buy B8 on 4/13/1942
Bull Mkt starts.
19400103 S16
152.8
+.05 No buy signal until May 1940..B16 Only Brief rally.
19381230
S16
154.4
+.11 B19 on 1/27/1939. Only Brief rally.
Recovery back to upper band and then
bigger plunge.
 |
 |
-->
40 MAXCP
stocks Bullish MAXCP Stocks (1/31/2014)
--> 347 MINCP stocks Bearish MINCP Stocks (1/31/2014) Bearish plurality
--> 9 New Highs on NASDAQ 59 new lows. Bearish plurality
-->
4 New
Highs on NYSE 103 new lows. Bearish plurality
DJI change
la/ma
annroc P-I
IP21 V-I
Opct
65-day Pct Change
----------------------------------------------------------------------------------------------------------------------------------------
1/13/2014
16258 -179
.998 .296 +358
-.021
30 .168
.098
-------------------------------------------------------------------------------------------------------------------------
1/14/2014
16374 +116 1.004
.464 +441 +.021 53
.266 .082
1/15/2014
16482 +108 1.008 .530 +465 +.036
62 .271
.081
1/16/2014
16417 -65 1.003 .388 +438
+.034 47 .179
.072
1/17/2014
16459 +41
1.003 .424 +425 +.042 38
.283 .085
1/21/2014
16414 -44 1.000 .179 +386 -.021 17 .175
.067
------------------------------------------------------------------------------------------------------------------------
1/22/2014
16373 -41 0.997 .141 +453 -.031 25 .083
.065
1/23/2014
16197 -176
0.986 -.017 +328
-.012 -23 -.119
.051
1/24/2014
15879 -318
0.968 -.301 +157
-.072 -71 -.230
.031
1/27/2014 15838
-41 0.967 -.377 +38 -.098 -93 -.297
.023
1/28/2014 15929 +101 0.974 -.401 +101 -.108 -93 -.278
.033
1/29/2014
15739 -190 0.965 -.538 +16 -.118 -106 -.294
.014
1/30/2014
15849 +110 0.973 -.478 +96 -.119 -92
-.276
.017
1/31/2014
15699 -150 0.966 -.642 +15
-.136 -123 -.370
.008
2/3/2014
15373 -326 0.949 -.783 -41
-.167 -148 -.382
-.02 65-dma turned down.
-------------------------------------------------------------------------------------------------------------------
===================================================================
OLDER HOTLINE
===================================================================
1/31/2014 Peerless Sell S16. No Peerless Buy Signal. |
A limited DJI recovery is possible, but without a Peerless Buy Signal,
it may not get past its 65-dma.
Peerless Users Should Hold DIA Short
>The Sell S16 is very reliable and typically brings a 10% decline.
>Both Opening and Closing Powers are Falling for DIA and SPY
Speculators who want to hedge the short on OEX may want to consider
buying OEX Calls after additional weakness and then a positive OEX close.
>CCI NCs like we have now are reliably bullish. 2008 was the
exception.
>Since
1933, a new Fed Chairperson has brought a rally in every case but one.
--> To
Key Index and Leading Stock Charts: DJI, SP-500, etc.
DJI Chart
SPY Chart NASDAQ Chart IBB Chart
IWM Chart
Given our Sell S16, that both the Opening and Closing Powers for the
DIA and SPY are below their falling 21-day ma and the behavior
of the DJI at this time of the year when a Democrat is in the White House, I
would think there is probably another 5% downside risk for the DJI. Even a relief
rally now
may not help muich. It would set the DJI and SP-500 up with bearish head and
shoulders patterns.
Nevertheless, I have found some reasons I think justify taking a speculative call
position in the OEX, one strike price out and to expire in March, if there is a
positive reversal day.
Back in 2005 or 2006, I wrote a Book on Options' Trading. (It's priced at $40.
The documentation is limited, because soon after I lost the source code for the
signals you can still get using the 2006 software.)
Its most important finding for the period from 1970 to 2006 was that one should use
CCI (Commodity Channel Index) non-confirmations of OEX new lows to buy OEX Calls
one strike price out of the money with 6 weeks or so until expiration.
However, it
was wrong if it gave a Buy just as prices were collapsing, as in the September 1987,
August 1990, August 1998, ...middle of 2008.
Understand how different options trading is. The risks are strictly limited in a
call.
But this particular over-sold pattern works over and over, so that a double is a
reasonable expectation 2 out of 3 times. Even with 1 of the 3 positions being an
entire loss,
one would still end up ahead. Two $1000 investments would become $2000
and one option would expire worthless. In other words, the gain is 67% on average
for a 6 weeks' trade. Compare the current CCI non-confirmation of OEX weakness
with earlier cases. Here I go back to 2004, 2005, 2006 (none), 2007, 2008, 2009, 2010,
2011, 2012, 2013. Peerless users have the data back to 1980 and can
reproduce the
necessary OEX-CCI charts to see the value here.

New Fed Chairmen Tend To Bullish for The Market.
Greenspan Was A Notable Exception.
Yellen Will Be Probably Soon Tested by The Market, too.

She is a dove regarding QE-III.
But will she want to raise bank's capital requirements?
What will she do about bank frauds, over-charging, CEO pay?
The FED will probably make or break this market. Low rates will hold up most
dividend plays and they account for a lot of NYSE stocks. Another force is at work
here.
The new Fed Chairwoman may soon be tested by the markets. Greenspan
had only been a Fed Chairman for 3 months when the DJI crashed in October 1987.
But generally speaking, a new Fed Chairman brings a rally. Yellen's dovish
reputation
seems quite solid. I would think that her first words as FED Chairwoman will rally
the market. However, her Economist
husband has written about CEO looting of
corporations and it is reasonable to want to know how much he may influence his
wife in the matter of regulating big banks and CEOs to prevent excessive profiteering
at the expense of consumers or shareholders. He also has written about excesses of
greed, fear and corruption in the markets.
Akerlof, George A. and Robert J. Shiller. 2009.
Animal
Spirits: How Human Psychology Drives the Economy,
and
Why It Matters for Global Capitalism
Fed Chairmen - Date of Appointment - Intermediate-Term Outcome
--------------------- ---------------------
--------------------------------------------------------
Charles Hamlin August 10, 1914 market closed because of WWI in Europe.
William Hardin August 10, 1916 DJI rallied from 90 to 110 in 3 months.
---------------------------------------------------------------------------------------------------------------------------
Daniel Crissinger May 21, 1923 DJI fell from 99 to 87 in 3 months.
Roy Young October 4, 1927 DJI fell from 199 to 182 in 2 weeks and then
went much higher.
Eugene Meyer September 16, 1930 DJI fell from 237 to 160 in 3 months
----------------------------------------------------------------------------------------------------------------------------
Eugene Black May 19, 1933 DJI rallied from 84 to 110 in 2 months.
Mariner Eccles November 15, 1934 DJI rallied from 99 to 106 in 6 weeks.
Thomas McCabe April 15, 1948 DJI rallied from 180 to 193 in 2 months.
William Martin April 2, 1951 DJI rallied
from 244 to 264 in 1 month.
Arthur Burns February 1, 1970 DJI rallied from 746 to 790 in 1 month.
William Miller March 8, 1978 DJI rallied from 750 to 850 in 3 months.
Paul Volcker August 6, 1979 DJI rallied from 850 to 890 in 2 months.
Alan Greenspan August 11, 1987 DJI fell from 2700 to 1750 in 2 months. He raised rates!
Ben Bernanke February 1, 2006 DJI rallied from 10900 to 11600 in 3 months.
Janet Yellen February 1, 2014 ????
Good Breadth May Not Save The Market Now.
But the long-term trend of the A/D Line is still rising.
There are some positives and that is likely to bring a short-term rally. Breadth is
the
most important bullish technical. The NYSE A/D Line did not confirm the DJI's new
low.
Pre-2007 Peerless would award a Buy B11 now to the market because of this. But
good breadth is not always the answer. Look back at February 1977. The A/D
Line
did not confirm the lows there, but the resulting rallies were quickly snuffed out.
Eventually, the NASDAQ turned down, following the DJI into a bear market for another
year. This was also a time when there was a Sell S16. Environments seem
different now,
but maybe not. Back then there was inflation, rising oil prices and a
belt-tightening Carter
Administration had just come to Washington. But wait,
there might end up being a similarilty.
In August of 1977, the Feds began driving up interest rates. By then all stocks were
falling and the DJI did not bottom out until March 1978 at 742, down 25% from its
late December high.
Discount Rate
1/19/1976
5.50%
Drop sets off excellent rally.
11/22/1976
5.25% Drop permits
year-end rally.
8/31/1977
5.75% sends market lower.
10/26/1977
6.00% bear market rally to upper band and then much lower.
1/9/1978
6.50%+1.2% sends bear market lower.
( http://www.tigersoft.com/tiger-blogs/8-18-2003/index.htm
)

A Break in The NYSE A/D Line Uptrend Was The Key in 2002.
The A/D Line failed to confirm the DJI's new lows in mid 2002. Such
non-confirmations
(NC) did not help the DJI once the A/D Line Uptrend was violated.

--> 103 MAXCP stocks Bullish MAXCP Stocks (1/31/2014)
Bullish plurality
--> 83 MINCP stocks Bearish MINCP Stocks (1/31/2014)
--> 40 New Highs on NASDAQ 22 new lows. Bullish
plurality
-->
30 New
Highs on NYSE 37 new lows. Bearish plurality
DJI change
la/ma
annroc P-I
IP21 V-I
Opct
65-day Pct Change
----------------------------------------------------------------------------------------------------------------------------------------
1/13/2014
16258 -179
.998 .296 +358
-.021
30 .168
.098
-------------------------------------------------------------------------------------------------------------------------
1/14/2014
16374 +116 1.004
.464 +441 +.021 53
.266 .082
1/15/2014
16482 +108 1.008 .530 +465 +.036
62 .271
.081
1/16/2014
16417 -65 1.003 .388 +438
+.034 47 .179
.072
1/17/2014
16459 +41
1.003 .424 +425 +.042 38
.283 .085
1/21/2014
16414 -44 1.000 .179 +386 -.021 17 .175
.067
------------------------------------------------------------------------------------------------------------------------
1/22/2014
16373 -41 0.997 .141 +453 -.031 25 .083
.065
1/23/2014
16197 -176
0.986 -.017 +328
-.012 -23 -.119
.051
1/24/2014
15879 -318
0.968 -.301 +157
-.072 -71 -.230
.031
1/27/2014 15838
-41 0.967 -.377 +38 -.098 -93 -.297
.023
1/28/2014 15929 +101 0.974 -.401 +101 -.108 -93 -.278
.033
1/29/2014
15739 -190 0.965 -.538 +16 -.118 -106 -.294
.014
1/30/2014
15849 +110 0.973 -.478 +96 -.119 -92
-.276
.017
1/31/2014
15699 -150 0.966 -.642 +15
-.136 -123 -.370
.008
=================================================================================
OLDER HOTLINES
=================================================================================
1/30/2014 Peerless Sell S16. No Peerless Buy Signal. Stay
short DIA.
The
DJI may still try to form a head/shoulders pattern. It will need to get past
its
65-dma. It failed to do that today after a big opening. Note that a rally a
little higher
would
not be bullish. Usually a head/shoulders pattern produces a bearish result.
But
even more bearish is when the DJI is too weak to make a right shoulder.
So, a
failure to rally now going into the new month and instead, a plunge straight down
would
be quite scary. The failure by the DJI to form a right shoulder from
similar points of support has produced a number of bear markets. (See last night's
letter for a list of such cases.).
Today's high opening with no follow through is bearish and means the Closing
Powers are still falling. Our interpretation: Professionals are still selling very
heavily into
whatever rallies they are offered by overseas buyers and the Public. Good economic
news
has long been anticipated by the "big boys". So today's news gave them a
chance
to
take profits ahead of what may be a particularly ugly political season, one that
is
peppered with charges of "class warfare" and "NAZI-like vendettas against
Wall
Street's super Rich".
A 10%
DJI decline would be in keeping with past Sell S16s. A much bigger decline
seems
unlikely because we have not had a series of Sell S9s and Sell S12s. But they
are
not essential. Examples of bear markets without multiple S9s and S12s or
without head/shoulders patterns include 1966 and 1977. Our Stocks'
Hotline will
take
profits in some of the strong biotechs. Usually a falling DJI does eventually
pull
down the NASDAQ and even biotechs. Some leading NASDAQs have fallen
hard
recently: Watch AAPL, AMZN and YHOO for example.
The
+22% jump today in biotech ALXN was a nice surprise to
wake up to. It shows
the
virtue of buying very high IP21stocks and it shows how quickly the shorts rush
to
cover when these stocks make new highs.


--> To
Key Index and Leading Stock Charts: DJI, SP-500, etc.
DJI Chart SPY Chart NASDAQ Chart IBB Chart
IWM Chart
-----------------------------------------------------------------------------------------------------
---->A slightly revised Peerless will be posted tomorrow for
downloading on
TESP. Those placing separate orders will get emails tomorrow.
------------------------------------------------------------------------------------------------------
--> 59 MAXCP stocks Bullish MAXCP Stocks (1/30/2014)
--> 121 MINCP stocks Bearish MINCP Stocks (1/30/2014) Bearish plurality
--> 47 New Highs on NASDAQ 11 new lows. Bullish
plurality
-->
35 New
Highs on NYSE 17 new lows. Bullish plurality
Big
Movers each day may give you some ideas.
Example Low-Priced Water desalinization play..
DJI change
la/ma
annroc P-I
IP21 V-I
Opct
65-day Pct Change
----------------------------------------------------------------------------------------------------------------------------------------
1/13/2014
16258 -179
.998 .296 +358
-.021
30 .168
.098
-------------------------------------------------------------------------------------------------------------------------
1/14/2014
16374 +116 1.004
.464 +441 +.021 53
.266 .082
1/15/2014
16482 +108 1.008 .530 +465 +.036
62 .271
.081
1/16/2014
16417 -65 1.003 .388 +438
+.034 47 .179
.072
1/17/2014
16459 +41
1.003 .424 +425 +.042 38
.283 .085
1/21/2014
16414 -44 1.000 .179 +386 -.021 17 .175
.067
------------------------------------------------------------------------------------------------------------------------
1/22/2014
16373 -41 0.997 .141 +453 -.031 25 .083
.065
1/23/2014
16197 -176
0.986 -.017 +328
-.012 -23 -.119
.051
1/24/2014
15879 -318
0.968 -.301 +157
-.072 -71 -.230
.031
1/27/2014 15838
-41 0.967 -.377 +38 -.098 -93 -.297
.023
1/28/2014 15929 +101 0.974 -.401 +101 -.108 -93 -.278
.033
1/29/2014
15739 -190 0.965 -.538 +16 -.118 -106 -.294
.014
1/30/2014
15849 +110 0.973 -.478 +96 -.119 -92 -.276
.017
=====================================================================================
OLDER HOTLINES
=====================================================================================
1/29/2014 Peerless
Sell S16. No Peerless Buy Signal. The down-day volume
has been
much heavier than the up-day volume on DIA. Both its Opening and
Closing
Power are now falling. S12s typically bring 10% DJI sell-offs. The
DJI has
only retreated 5%, so far.
Warning: A failure of the DJI now to rally and, instead, an additional
direct decline
to 14750
would give the DJI the appearance of having been too weak to even form a
head/shoulders top. This most often leads to a
sustained bear market after one last rally.
(See the cases
below).
Still, I
understand that short-term traders probably are eager to cover some of
their short position on DIA, especially if the Closing tomorrow is above its
Opening.
That would
serve to break the steep CP downtrend-line. But at this point, I can only see
a limited
upside rally. So, intermediate-term traders using Peerless should simply
stay short
and I will assume we are still short it here.
--> To Key Index and Leading Stock
Charts: DJI, SP-500, etc.
DJI Chart SPY Chart NASDAQ Chart IBB Chart
IWM Chart


If the
close in DIA is not down below the opening tomorrow, active short-term traders
may want to
cover half their DIA shorts. My thought, though, is we may still go lower.
The average
S16 brings a decline of 10%. And the DJI will face resistance simply
trying to
get back above its 65-dma. Furthermore, if the DJI cannot surpass
its broken
65-dma, a bigger decline will probably follow. The next support is down
1000 points
lower.
The Closing
Powers keep falling. But the Tiger Day Traders's Tool for SPY rose today
and we do
now have automatic Red and Blue short-term Buys on SPY. These are
very
short-term signs now. The CP 21-day ma is clearly falling.
What If No Right Shoulder Forms?
Intermediate-term traders must watch SPY this coming week to see if it forms
a
head/shoulders pattern. But it may happen that the DJI and SP-500 are now so weak
that they
can't even form a head/shoulders pattern and develop a weak right shoulder rally.
Look back
at the top in early 1966 as an example of how the DJI might sliced right through
its
previous lows without bothering to form a head/shoulders top. That is a serious sign
of
weakness. In 1966, it foreshadowed a bear market.
Cases Where No Right Shoulder Formed
1. September 1929 Inital 14% decline, 9 rise and then 47% collapse from
Sept. high..
2. March 18, 1938. Initial 14.5% decline, 15% rise and then 41% collapse from
August high.
3. January 19, 1960. Initial 12.5% decline, 10% rally and then 13.5% decline
until October.
4 January 6, 1969. Initial 9% decline. 7% rally and then bear market that
lasted til May 1970.
5 February 1, 1973. No good rally for months. Bear market lasted
until December 1975.
6 January 18, 1977. Steady decline for months.
7 September 1, 1987 Initial decline from 2611 to 2500. Recovery to
2600. Collapse followed to 1750.

Sell Short on The Rumour and Cover on the News?
I think we
can can safely assume that the FED's plans to reduce by $10 billion
their
buying of mortgages from banks leaked out to some big bank traders a week ago.
Now that
the news is out, one might think there should be a recovery by SPY to 180,
so that it
may tests its over-hanging resistance of its 65-dma. What it does at that
point with
be very important.
I take it as a
bullish sign that both Biotechs and Big Banks held up well
today.
But banks could
still be forming their own head/shoulders pattern. And biotechs
have a habit of
topping out a month or two after the DJI does.

DJI change
la/ma
annroc P-I
IP21 V-I
Opct
65-day Pct Change
----------------------------------------------------------------------------------------------------------------------------------------
1/13/2014
16258 -179
.998 .296 +358
-.021
30 .168
.098
-------------------------------------------------------------------------------------------------------------------------
1/14/2014
16374 +116 1.004
.464 +441 +.021 53
.266 .082
1/15/2014
16482 +108 1.008 .530 +465 +.036
62 .271
.081
1/16/2014
16417 -65 1.003 .388 +438
+.034 47 .179
.072
1/17/2014
16459 +41
1.003 .424 +425 +.042 38
.283 .085
1/21/2014
16414 -44 1.000 .179 +386 -.021 17 .175
.067
------------------------------------------------------------------------------------------------------------------------
1/22/2014
16373 -41 0.997 .141 +453 -.031 25 .083
.065
1/23/2014
16197 -176
0.986 -.017 +328
-.012 -23 -.119
.051
1/24/2014
15879 -318
0.968 -.301 +157
-.072 -71 -.230
.031
1/27/2014 15838
-41 0.967 -.377 +38 -.098 -93 -.297
.023
1/28/2014 15929 +101 0.974 -.401 +101 -.108 -93 -.278
.033
1/29/2014
15739 -190 0.965 -.538 +16 -.118 -106 -.294
.014
--> 44 MAXCP stocks Bullish MAXCP Stocks
(1/29/2014)
--> 149 MINCP stocks Bearish MINCP Stocks (1/29/2014) Bearish plurality
--> 16 New Highs on NASDAQ 23
new lows. Bearish plurality
-->
11 New Highs on NYSE 59 new lows. Bearish plurality
==================================================================================
OLDER HOTLINES
==================================================================================
1/28/2014 Peerless
Sell S16. No Peerless Buy Signal. The DJI needs to get
back above its
violated 65-dma, if we are to see a rebound to 16200. If it cannot
surpass in the
next week its broken 65-dma, a bigger decline will probably follow.
The next support
down is 1000 points lower.

I don't think the President pulled any surprise punches against Wall Street
tonight.
But now there is more and more press discussion of "inequality" And that
is leading
to discussions now of wealth taxes. Fanciful and far-fetched? Yes. But
there it was
in the NY Times tonight: "Capitalism
vs Democracy". Wall Street may be particularly
vulnerable to new taxes. They are very sensitive to this whole topic. Forbes
in 2012
reported that the Super Rich have hidden
$21 trillion off-shore.


Technically, a DJI recovery to 16000-16100 may next occur. After that, what
happens will probably depend on the Fed. Without a Peerless Buy signal, the odds
do favor another test of the recent lows and that may not hold. The good breadth
now reflects the low interest rates. But there are still bearish technicals.
The negative
IP21, V-I and falling Closing Power show that there is still ample selling in those
common stocks that start to falter. It's not a bad time to be hedged.
Our Stocks'
Hotline is about equally hedged long and short.
--> To Key Index and Leading Stock
Charts: DJI, SP-500, etc.
DJI Chart SPY Chart NASDAQ Chart IBB Chart
IWM Chart
DJI change
la/ma
annroc P-I
IP21 V-I
Opct
65-day Pct Change
----------------------------------------------------------------------------------------------------------------------------------------
1/13/2014
16258 -179
.998 .296 +358
-.021
30 .168
.098
-------------------------------------------------------------------------------------------------------------------------
1/14/2014
16374 +116 1.004
.464 +441 +.021 53
.266 .082
1/15/2014
16482 +108 1.008 .530 +465 +.036
62 .271
.081
1/16/2014
16417 -65 1.003 .388 +438
+.034 47 .179
.072
1/17/2014
16459 +41
1.003 .424 +425 +.042 38
.283 .085
1/21/2014
16414 -44 1.000 .179 +386 -.021 17 .175
.067
------------------------------------------------------------------------------------------------------------------------
1/22/2014
16373 -41 0.997 .141 +453 -.031 25 .083
.065
1/23/2014
16197 -176
0.986 -.017 +328
-.012 -23 -.119
.051
1/24/2014
15879 -318
0.968 -.301 +157
-.072 -71 -.230
.031
1/27/2014 15838
-41 0.967 -.377 +38 -.098 -93 -.297
.023
1/28/2014 15929 +101 0.974 -.401 +101 -.108 -93 -.278
.033
--> 34 MAXCP stocks Bullish MAXCP Stocks
(1/28/2014)
--> 186 MINCP stocks Bearish MINCP Stocks (1/28/2014) Bearish plurality
--> 27 New Highs on NASDAQ 2
new lows. Bullish
plurality
-->
13 New Highs on NYSE 17 new lows. Bearish plurality
What The Charts Say
A DJI bounce up to 16000-16100 would be in keeping potential
head and shoulders patterns that seem to be in the process of being created.
The apex of a symmetrical hypothetical right shoulder in the head and shoulders
pattern is the key point to watch. If prices get much past that level, the head
and shoulders pattern usually aborts and prices and make news highs and run again,
though seldom with same vigor as before. If prices stall out at the apex of the
potential right should apex, they usually decline sharply below the neckline.
This completes the bearish head/shoulders pattern and a bad sell-off follows.
The height of the pattern gives chartists a way to measure how far prices
may then drop.
So such patterns have the potential to be either good or very bad.
Like man, they have a certain amount of free will to be good or bad. These
patterns may be forming in DJI, SP-500,
SPY (below) and in QQQ, NYSE
and OEX.
IWM and the NASDAQ do not have
potential head/shoulders patterns.
But they also have built-in resistance levels now by virtue of their recent false
breakouts.
The point of breakout in each that "should" have held up now becomes resistance.
Momentum
When the 65-day ma is rising at a good rate, it usually acts as support.
Sometimes prices slightly break such a mvg.avg. When they get back above
it, especially if their blue Closing Power hooks back up, it is usually a good time
for traders to buy. See below SPY's chart. It would look much stronger
if the
Closing Power convincingly broke its downtrendline and the Tiger Day Traders'
Tool would, at least, break its downtrend so selling at the opening was not so
much more profitable than buying at the opening.


Seasonality
Seasonality is short-term
bullish. But there are 12 cases where
the first half of the Mid-Term Election years since 1934 when there was
10% or more sell-off from a top between late December and February 9th.
This has not been true since 1994.
Peak
Decline...... Bottom
----------------------------------------------------------------------------------------------------------
1934 110.7 Feb 5th(Sell S12)
17.1%
91.8 June 1 (Buy B8)
1938 133.2 Jan 12 (Sell S9/S12)
25.8% 98.9 March 31 (Buy B16)
1942 114.2 Jan 5 (Sell S9/S16)
18.9% 92.9 April 28 (Buy B8 a week earlier)
1946 206.6 Feb 5 (earlier S9)
10.0% 186.00
February 26 (Buy B9)
1950
6/12 228.4 (Sell S5)
no sell-off until June.
13.6%
197.5 July 7 (Buy B12)
1954 no
sell-off all year
1958 no
sell-off all year
1962 731.5 Dec 28 (Sell 16)
26.8% 535.7 June 26 (BuyB16)
1966 995.15 Feb
9 (S12
earlier) 25% bear market until October.
1970 811.31 Jan
5 (S16,S9,
S12) 22.2% 631.6 May 5 (Buy B16)
1974 880.69 Jan
3 (Sell S12)
8.7% 803.58 May 30 (Buy B3)
Bear market did not end until December.
1978 831.17 Dec 30 (no sell)
10.7%
742.12 Feb 28 (Buy B9 and B17)
1982 882.52 Jan 4 (no sell)
10.6% 788.62 June 18 (Buy B3)
1986 DJI rallied
until July
1990 2809.73 Jan 3 (S4, S15, S16) 9.5% 2543.24 Jan 30 (Sell 30)
1994 3964.01 Feb 1 (S4)
8.0% 3645.96 March 31 (B19)
1998 DJI rallied until
July
2002 10632 March 12 (S9, S15)
Bear Market followed.
2006 11643 May 5 (S9,S7)
10747 July 17 (B9)
2010 11205 April 26 (S11)
9743.62 July 6 (B8)
==================================================================================
OLDER HOTLINES
==================================================================================
1/27/2014 Peerless
Sell S16. No Peerless Buy Signal. But a Bounce up
to 16000-16100 Could Be Shaping Up, depending on Obama's Speech.
That might bring a Buy B19. At this time, the Futures are up +85.
Apple's earnings have apparently disappointed. So the NASDAQ
will be under pressure tomorrow. Biotechs were clobbered today,
I suspect Obama will propose
nothing that will come as a surprise to Wall Street or will
scare the "big boys"
there. The over-night rally that seems to be shaping up suggests
that word has gotten out about how
innocuous his State of the Union Address will be.
But we can't know for sure.
Surely, he should understand that Main Street feels left
out by much of the big Wall Street
recovery he has encouraged. There's no doubt that
the market appreciates that the
scary subject of how public policy should address
the galloping "Income
inequality" in the US seems to be on retreat again as the subject
of his speech, according to close
White House observers.
--> To Key Index and Leading Stock Charts: DJI, SP-500, etc.
DJI Chart SPY Chart NASDAQ Chart IBB Chart
IWM Chart
This will encourage a technical
bounce up from the normally reliable lower 3.5% band.
And this should come as no surprise
as we go into the last week of January. The DJI
is up 67.4% of the time over the
next week since 1965 and rises 0.7%.
Without a new Peerless Buy signal
the rally should be limited. Resistance is likely
at the apex of the right shoulder
seen below in the DIA chart. The Closing Powers
are still declining. The
Accumulation Index is negative. But, this past year, the Stochastic-20
has produced excellent buys when it
turned back above 20. Covering some of the
short sales that have fallen the
most is probably not a bad idea.
DJIA has fallen to future neckline support.


-->
40 MAXCP
stocks Bullish MAXCP Stocks (1/27/2014)
--> 276 MINCP stocks Bearish MINCP Stocks (1/27/2014) Bearish plurality
--> 17 New Highs on NASDAQ 32
new lows. Bearish plurality
-->
8 New Highs on NYSE 39 new lows. Bearish plurality
Biotechs Bearish TigerSoft Candle-Sticks soon to be flagged.
DJI
change la/ma
annroc P-I
IP21
V-I Opct
65-day Pct Change
----------------------------------------------------------------------------------------------------------------------------------------
1/13/2014
16258 -179
.998 .296 +358
-.021
30 .168
.098
1/14/2014
16374 +116 1.004 .464 +441 +.021
53 .266
.082
1/15/2014
16482 +108 1.008 .530 +465 +.036
62 .271
.081
1/16/2014
16417 -65 1.003 .388 +438
+.034 47 .179
.072
1/17/2014
16459 +41
1.003 .424 +425 +.042 38
.283 .085
1/21/2014
16414 -44 1.000 .179 +386 -.021 17 .175
.067
1/22/2014
16373 -41 0.997 .141 +453 -.031 25
.083 .065
1/23/2014
16197 -176
0.986 -.017 +328
-.012 -23 -.119
.051
1/24/2014
15879 -318
0.968 -.301 +157
-.072 -71 -.230
.031
1/27/2014 15838
-41 0.967 -.377 +38 -.098 -93 -.297
.023
===================================================================================
OLDER HOTLINES
===================================================================================
1/24/2014
Peerless Sell S16. No Peerless Buy
Signal.
Buying at the lower band when the DJI is
uptrending is appealing. It is especially appealing
when the P-Indicator is positive. Usually
declines that are going to knife through the lower band
have a negative P-Indicator when the DJI falls
3% to 3.5% below the lower band.
Right now it is +157. In many markets
this would produce a Buy B9.
But several factors now prevent the Buy B9.
The first is that there are special, more
stringent rules for quick tests of the lower
band in pivots-down in January. The second
is the presence of the Sell S16. This
averages 10% subsequent declines. If true here, we
should see 15000 before it is safe to buy.
The third is that the V-Indicator and IP21
are both negative. The fourth is how
quickly the DJI has fallen. And, one more thing,
I have mentioned the bearishness at this time
of the year when a Democrat is in the White House.
Obama's State of The Union May Surprise and Please Wall Street
This last factor may work to help the market.
Obama is not really a threat to Wall Street.
His rhetorical populism is belied by how close
to Wall Street most of his advisors are.
http://dissentingdemocrat.wordpress.com/2014/01/12/the-obama-record-3/
http://www.truth-out.org/news/item/18852-shocking-new-research-reveals-obamas-legacy-could-be-an-america-of-aristocrats-and-peons
http://www.motherjones.com/politics/2011/08/obama-real-politics-revealed-cabinet-members
http://www.salon.com/2012/01/23/the_wall_streeters_obama_loves_most/
What I read this week suggests the President
will not be seeking an extension of Unemployment
benefits. He will seek a $9.00/hour
minimum wage and make a "personal appeal" to CEOs
of big corporation To hire more of long-term
unemployed Americans. It this is all he does
to rock the boat, I would think the market will
rebound 250 points at the end of this month.
But will it rally enough to get another
Peerless Sell? It may not. So, it's probably best to
stay short DIA until we get a new Peerless Buy
signal.
Conclusion: Peerless is usually right.
Stay short DIA. Note the way the Closing Powers are now
falling and the many bearish "red
popsicles" in the TigerSoft candle stick charts.
--> To Key Index and Leading Stock
Charts: DJI, SP-500, etc.
DJI Chart SPY Chart NASDAQ Chart IBB Chart
IWM Chart
January/February
Tagging of Lower Band
with P-Indicator Positive
There have
been 14 previous cases of the DJI falling at least 2.6% below the 21-day
ma in
January and February with the P-Indicator positive.
In 7 cases the DJI fell much lower.
In 5 cases the DJI fell 2% to 4% lower and then rallied, typically more than 10%.
In 2 cases the DJI was at or almost at the bottom and rallied more
than 10%/
la/ma P-I IP21
V-I Active
Signal Outcome
2/1/1933
.955 5 -.096 -34
S12 1/17
DJI
fell from 59.1 to 53.8 low on 2/27
2/26/1934
.958 33 -.068 +4
S12 2/5 DJI fell from 103.1 to 91.8 low on 5/14
1/26/1938
.961 11 .044 -36 Buy B17
DJI fell 2% more and rallied 12%.
1/24/1968
.966 35 -.105 +1 Sell
1/8 DJI fell from 908.92 to 825.13 on 3/21
2/12/1974
.955 4 -.039 -2
BuyB9/B17 DJI fell 2% and rallied 11% on 3/13
1/26/1981
.973 5 .048 -5
Buy B17 on 2/2 DJI rose 2% and rallied 10% on 4/24
1/24/1983
.968 56 -.027 1
S12 1/7 Buy B9 Bull market resumed.
1/20/1988
.957 63 -..01 -4
Buy B17 DJI rose 11% on 3/18
2/22/1996
.974 11 -.019 -130 S12 1/4, S9 2/5
DJI fell 10526.81 to 9594.78)
1/22/2002
.970 188 -.151 -164 No sells.
DJI fell 2% more and then rallied 11% on
3/18/2002
1/22/2003
.970 125 -.001 -76 Sell S12 1/6
DJI fell from
8773.57 to 7524.06 on 3/11/2003.
2/28/2007
.972 257 .015 -49 DJI fell 400 (12632-12216 on
this day). DJI fell to 12050.41 and rallied.
1/14/2009
.948 162 -.073 -137 S4,S12 1/6
DJI
fell from 8200.14 to 6547.05
1/26/2010
.968 26 -.001 -146 no signals B17 DJI fell 4% and then rallied 13%.
1/24/2014
.968 157 -.072 - -71 S16 12/30
?????
Aftermath of Past Sell S16s
--------------------------------------------------
20131230 S16
16504 ?
19991229
S16
11484.66
+.128
19900102
S16
2810.15
+.075
19810102
S16
972.78
+.042
19761229
S16
994.93
+.061
19700102
S16
809.7
+.056
19611228
S16
731.5
+.263
19591231
S16
679.3
+.099
19521230 S16
292
+.098
19420102 S16
112.8
+.132
19400103 S16
152.8
+.045
19381230
S16
154.4
+.100
19341231
S16
104.00
+.104
-----------------------------------------------
Avg decline = +.100
Peaks with a Democrat in White House
Going into Year of Mid-Term Elections:
1933-2013
2/5/1934 DJI fell 17% to 5/14/1934.
1/11/1938 DJI fell 26% to 3/3/1938
1/6/1942 DJI fell 18% to 4/29/1942
2/5/1946 DJI fell 10% to 2/26/1946
1/9/1950 to 1/13/1950... 3% decline....No serious decline here. Market kept rallying.
12/12/1961 DJI fell 27% to 6/26/1961
2/9/1966 DJI fell 25% to 10/7/1966
12/30/1978 DJI fell 11% to 3/1/1978
1/31/1994 DJI fell 9.5% to 4/4/1994
12/5/1997 DJI fell 8% to 1/12/1978
1/14/2000 DJI fell 16% to 3/7/2000
1/19/2010 DJI fell 8% to 2/5/2010
-->
40 MAXCP
stocks Bullish MAXCP Stocks (1/24/2014)
--> 211 MINCP stocks Bearish MINCP Stocks (1/24/2014)
--> 15 New Highs on NASDAQ 23
new lows. Bearish plurality
-->
3 New Highs on NYSE 50 new lows. Bearish plurality
DJI
change la/ma
annroc P-I
IP21
V-I Opct
65-day Pct Change
----------------------------------------------------------------------------------------------------------------------------------------
1/13/2014
16258 -179
.998 .296 +358
-.021
30 .168
.098
1/14/2014
16374 +116 1.004 .464 +441 +.021
53 .266
.082
1/15/2014
16482 +108 1.008 .530 +465 +.036
62 .271
.081
1/16/2014
16417 -65 1.003 .388 +438
+.034 47 .179
.072
1/17/2014
16459 +41
1.003 .424 +425 +.042 38
.283 .085
1/21/2014
16414 -44 1.000 .179 +386 -.021 17 .175
.067
1/22/2014
16373 -41 0.997 .141 +453 -.031 25
.083 .065
1/23/2014
16197 -176
0.986 -.017 +328
-.012 -23 -.119
.051
1/24/2014
15879 -318
0.968 -.301 +157
-.072 -71 -.230
.031


==================================================================================
OLDER HOTMAILS
==================================================================================
1/23/2014
Peerless Sell S16 vs NASDAQ Breakout and Biotech Bubble.
Stay Short DIA.
Sell IBB and QQQ. Too
risky if DJI keeps falling.

While the DJI may now find support at its 14 week price uptrendline, which it has
just fallen to, there is no new Peerless Buy signal yet. Keep in mind that a
typical Sell S16 drops the DJI 10%. A rising NYSE A/D Line did not help the DJI
in 1977. In additon, DJI pivots down in January are especially likely with a
Democrat in the White House. Apparently, Wall Streeters fear the changes that
a Democrat in the White House might pursue, possibly if the electorate gives his party
control of Congress. A number of Sell S16s have brought significant declines:
1959 - 1960, 1961-1962, 1965-1966, 1976-1977, 1999-2000.
I suspect where the stock market goes this year will now depends on how
"leftist"
Obama chooses to be, starting with his State of The Union speech next Tuesday
night. Having watched his every move and speech since 2008, I just can't see
him
deliberately rocking Wall Street's boat. But he may set in motion forces that do.
--> To Key Index and
Leading Stock Charts: DJI, SP-500, etc.
DJI Chart SPY Chart NASDAQ Chart IBB Chart
IWM Chart
->
115 MAXCP
stocks Bullish MAXCP Stocks (1/23/2014)
--> 118
MINCP stocks Bearish
MINCP Stocks (1/23/2014)
--> 45 New Highs on NASDAQ 18
new lows. Bullish plurality
-->
44 New Highs on NYSE 25 new lows. Bullish plurality
---> Bullish
Biotechs up the most...
DJI
change la/ma
annroc P-I
IP21 V-I
Opct
65-day Pct Change
----------------------------------------------------------------------------------------------------------------------------------------
1/13/2014
16258 -179
.998 .296 +358
-.021
30 .168
.098
1/14/2014
16374 +116 1.004 .464 +441 +.021
53 .266
.082
1/15/2014
16482 +108 1.008 .530 +465 +.036
62 .271
.081
1/16/2014
16417 -65 1.003 .388 +438
+.034 47 .179
.072
1/17/2014
16459 +41
1.003 .424 +425 +.042 38
.283 .085
1/21/2014
16414 -44 1.000 .179 +386 -.021 17 .175
.067
1/22/2014
16373 -41 0.997 .141 +453 -.031 25
.083 .065
1/23/2014
16197 -176
0.986 -.017 +328
-.012 -23 -.119
.051
Traders seem quite concerned that Obama's populist side will come out in his
State of the Union Speech on the evening of January 27th.
Divided
Democrats Put Obama in a State of the Union Squeeze
House Republicans have made it very easy for a populist Democrat to score points
with millions of Americans this Election Year. People are concerned about
their
job security, many other have been laid off and can't find a job or are working in a
low-paying job and would dearly love a higher minimum wage.
As a result:
76% of
Americans support raising the minimum wage to $9.00, at least. 69%
want unemployment
relief
to be extended.
So, Democrats may be able to win back a number of House seats. But big money could
well buy them off before anything comes of it. This is normal. The difference
between
a political bribe, a campaign contribution and political extortion is often a matter of
perspective. Very often the best way for a politician in office to raise
money is to
threaten to raise taxes on or regulate a corporation. What they really want is their
money.
Obama, I think, will probably make these two popular demands in his State of the Union
speech. But it is very unlikely he will go further than this, I think. For
one thing, his
concerns about the working poor in America would seem just too hollow and false
if continues to push for his SHAFTA extension of NAFTA. But while Obama may
not move much to the "left", other Democrats may. That is a real
concern to Wall Street.
It, of course, fears that once class issues become the subject of media discussion,
it is only a small step to raising new taxes on trading. corporations, the rich and
capital gains, eventually leading to a wealth tax. The right-wing will exaggerate
these
fears, by telling us that Obama is really a socialist and it is only a matter of time
before his true self emerges. The real threat depends upon what will be the
outcome
of the 2014 elecltions and who will run for the Democrats in 2016.
Obama Is Likely To Limit His "Redistributionist"
Demands To A Higher Minimum Wage and an Extension of Unemployment Benfits.
Five years ago, Obama told Jay Leno and his 20 million listeneners that the
financial crash was not the result of any illegal acts by the nations' big bankers.
The market liked that message and roared ahead, with the help of the Fed and
Obama's Wall-street friendly White House Staff. For five years, Obama has been
mostly been very cautious about doing anything that would upset Wall Street.
His
White House has called anything that sounded "redistributionist" to be the
product
of the "professional left" within the Democratic Party. He frequently has
told
business audiences that he is a "free market" man who taught at the University
of Chicago (long renowned for its libertarian economics department). And in truth,
wherever possible, Obama has preferred the Federal Government to contract for
services than do them itself. The "free market should be allowed to fix
problems, he says.
Health care? Set up statewide health insurance networks, he said. Medicaid for
all (Canadian like socialized medicine) he did not support.
High Minimum Wages Is Very Popular
The number of US workers paid the minimum wage or less is 3.6 million.
The
minimum wage has barely doubled since 1981, falling way behind the rising prices for
rent, food, gas, college tuitions, postage stamps... With Wall Street way up and
jobs going overseas the Republicans in Congress have given Obama and the
Democrats a very easy to make argument in the 2014 elections.
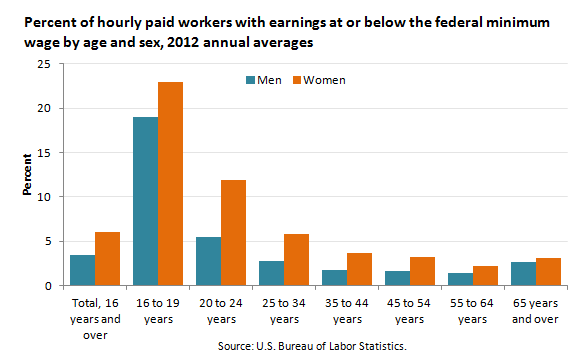
http://www.bls.gov/opub/ted/2013/ted_20130325.htm
Federally Required Minimum Wage in US
| Jan 1, 1981 |
|
$3.35 for all covered, nonexempt workers |
| Apr 1, 19904 |
|
$3.80 for all covered, nonexempt workers |
| Apr 1, 1991 |
|
$4.25 for all covered, nonexempt workers |
| Oct 1, 1996 |
|
$4.75 for all covered, nonexempt workers |
| Sep 1, 19975 |
|
$5.15 for all covered, nonexempt workers |
| Jul 24, 2007 |
|
$5.85 for all covered, nonexempt workers |
| Jul 24, 2008 |
|
$6.55 for all covered, nonexempt workers |
| Jul 24, 2009 |
|
$7.25 for all covered, nonexempt worke |
-----------------------------------------------------------------------------------------------------------------------------------------------------
OLDER HOTMAILS
==================================================================================
1/22/2014
Peerless Sell S16 vs NASDAQ Breakout and Biotech Bubble.
Stay
Short DIA but hold long IBB and QQQ
Even though the
DJI lost 41 today, the NASDAQ, QQQ, IWM and IBB all rose.
There were 919
more stocks up than down on the NYSE/. What's up (or rather,
what's
down) with the DJI?
The answer
seems to be that big institutions are selling previously considered safe
blue chips
stocks. Perhaps, they sense that the "big dinosaurs" will not get their way
with
SHAFTA, Obama's effort to lower US trade barriers even further than Clinton's NAFTA.
In any
case, big institutions are also influenced by the bullish emotions behind the NASDAQ's
strength.
As in 1967 and early 2000, they see much more opportunity now in many
tech and
biotech stocks. Look at the very high levels of
Accumulation in our Bullish
MAXCP stocks tonight. By comparison, the DJI-30, BA and
Visa excepted,
look quite
anaemic.
Obama's sequel to NAFTA looks incredibly dumb.
We must assume they are getting a lot of money
from companies like Walmart and Home Depot that
depend upon Chinese imports to stock their stores.
To me, it looks like another "inside job".

http://dissentingdemocrat.files.wordpress.com/2013/12/nafta.png
When Both
Professionals and Institutions Are Sellers,
it's best to bet on a further decline.
I think you
can blame both institutions and professional traders for the selling in the
DJI.
It was widespread. There were 17 DJI stocks down more than 1% It was not
just IBM's
4% drop. IBM is no longer the behemoth of the DJI. The selling was
a matter of
institutional distribution and continuing Professional selling during the day.
This means
the decline will probably continue for the DJI. I suspect as long as the DJI
stays above
its 65-dma and the FED does not rock the boat of low interest rates,
the NASDAQ,
QQQ and IBB will more than hold up.
Studying
the selling in the 17 biggest decliners in the DJI reveals that 11 had a negative
IP21
(current Accumulation Index) and 11 also had bearishly falling Closing Powers. So,
this
remains a risky market for the DJI. Simple profit-taking and switching to more
compelling
growth stocks should cause it to retreat 5% back to 15700 to test the
breakout
support there. As we know from using the Bearish MINCP
stocks, this is
a risky
market for DIA when both Institutions (IP21) and Professionals (Closing Power)
are
bearish.
PctDown IP21 Closing Power trend
IBM -4% .10 Closing
Power strong. Testing 65-dma now
INTC -2% .08 Closing Power is in a rising trend but last new high was not confirmed.
PG -2% -.22
Closing Power fell to new 3 month low today.
GE -2% -.07 Price Support
broken. Closing Power fell to new 3 month low today.
DD -2% -.01 Closing Power fell
to new 4 week low today.
CAT -2% .07 Closing
Power is in uptrend.
HD -1% -.12
Closing Power bearish divergence.
CP%-Pr% = -66.3%
JPM -1% -.06 At Closing Power support Last CP new
high was not confirmed.
KO -1% -.07 Closing Power is falling.
MCD -1% -.16 Closing
Power made 12 month low ahead of price.
MMM -1% +.02 At Closing Power support
MRK -1% +.13 Closing Power is in uptrend.
NKE -1% -.25 Closing Power is falling at a steep angle. .
T -1% -.25
Closing Power made 12 month low ahead of
price.
TRV -1% -.18 Closing Power is falling at a steep angle. .
VZ -1% +.01 Closing
Power is falling.
WMT -1% -.14 Closing
Power is falling.
XOM -1% -.08 CP broke its
uptrend today.
--> To
Key Index and Leading Stock Charts: DJI, SP-500, etc.
DJI Chart SPY Chart NASDAQ Chart IBB Chart
IWM Chart
->
122 MAXCP
stocks Bullish MAXCP Stocks (1/22/2014)
--> 77
MINCP stocks Bearish
MINCP Stocks (1/22/2014)
--> 141 New Highs on NASDAQ 11
new lows. Bullish plurality
--> 119 New Highs on NYSE 13 new lows. Bullish plurality
---> Bullish
Biotechs up the most...
DJI
change la/ma
annroc P-I
IP21 V-I
Opct
65-day Pct Change
----------------------------------------------------------------------------------------------------------------------------------------
1/13/2014
16258 -179
.998 .296 +358
-.021
30 .168
.098
1/14/2014
16374 +116 1.004 .464 +441 +.021
53 .266
.082
1/15/2014
16482 +108 1.008 .530 +465 +.036
62 .271
.081
1/16/2014
16417 -65 1.003 .388 +438
+.034 47 .179
.072
1/17/2014
16459 +41
1.003 .424 +425 +.042 38
.283 .085
1/21/2014
16414 -44 1.000 .179 +386 -.021 17 .175
.067
1/22/2014
16373 -41 0.997 .141 +453 -.031 25
.083 .065
-----------------------------------------------------------------------------------------------------------------------------------------------------
OLDER HOTMAILS
----------------------------------------------------------------------------------------------------------------------------------------------------
1/21/2014
Peerless Sell S16 vs NASDAQ Breakout and
Biotech Bubble.
Short DIA but hold long IBB and QQQ
--> To Key Index and Leading Stock Charts: DJI, SP-500, etc.
DJI Chart SPY Chart NASDAQ Chart IBB Chart
IWM Chart
->
123 MAXCP
stocks Bullish MAXCP Stocks (1/21/2014)
--> 110
MINCP stocks Bearish
MINCP Stocks (1/21/2014)
--> 127 New Highs on NASDAQ 4
new lows. Bullish plurality
--> 104 New Highs on NYSE 12 new lows. Bullish plurality
---> Biotechs up
the most...FDA Applications/Approvals.

Higher Opening Failures
Institutions and Professonals sold a lot of DIA shares on strength at today's opening,
which was .95/164.08 (0.579%) over Friday's close. They drove it down 0.79% at its
lows.
This is quite a "higher opening failure". It may whet the appetite of day
traders who like
to sell short higher openings and cover as DIA fades. Since the end of the year,
shorting the
openings in DIA has been potentially much more profitable than buying the openings.
Showing this is the purpose of our Tiger Day Traders' Tool, which is shown below.
Given our Sell S16, I have to think DIA should be shorted, but QQQ and IBB should
be held long.
I studied past cases of similar "higher opening failures", the ones that cause a
red popscicle to appear on Tiger candlestick charts. They are not reliable enough
by themselves to trade with, except by very, very short-term traders. To work out on
an internediate-term basis, there should be a Peerless Sell. Other negative
technical
factors being present also are important. It will help to have a clearly negative
IP21
(as is true on the DJI is now) or to have the DIA's 65-dma just been broken
or to have a rally to it which has just failed.
I found something new, too. I discovered that when there are very few such
"higher
opening failures" in a year, the market is unlikely to decline very seriously.
There
was only 1 such case in 2013 plus the occurrence today in 2014. That actually bodes
well for the market this year.
Higher Opening Failures in DIA by Year
1998 16 20% decline in
Sept-Oct
1999 6 rising market
2000 8 market top
2001 6 bear
market
2002 9 bear
market
2003 8 Bear
market ended in March
2004 4 consolidatimg
market
2005 0 gradual up trend
2006 3 uptrending
market
2007 3 tops made
2008 12 Bear market develops
2009 13 Bear market until
March. 7 took place when 65-dma was rising.
2010 4 consolidating
market
2011 4 consolidating
market
2012 1 rising market
2013 1 rising market.

This reversal down produced the bearish "red popsicle" seen in the TigerSoft
candle stock
chart of DIA above. I took these two values (shown above) to see how many
strong openings' down reversals took place in DIA since 1968. I quickly learned
that there were too many case to study quickly. But a number of observations can
be made tonight. Such reversals must ride on the back of other factors. By
themselves,
there are too many failures, especially if DIA is below its 65-dma, the DJI is below
its 21-dma, the Annualized Rate of change of the 21-dma is rising faster than .60
or DJI is more than 3% over the 21-day ma. As with "piffle stocks", having
a
negative IP21 adds a lot to the reliability of these "big reversals down".
A number
of the best occurrences were seen when DIA failed the same day to surpass its key
65-dma.
Sharp Reversals Down from a Strong Opening in DIA 1998-2000
These all occur with DIA above 65-dma
la/ma
ann.roc IP21
Subsequent Behavior
2/23/1998
1.032 1.036 .166 DIA rose from 84.25 to 92.01 on
4/14/98
3/25/1998
1.023 .669 .357 DIA rose from 88.27
to 92.01 on 4/14/98
4/28/1998
.985 .095 .107 DIA fell from 88.98 to 86 on 6/15/1998
7/29/1998
.977 -.145 .044 DIA fell from 89.01 to 78.53 on 9/1/1998
right at newly falling 65-dma.
11/11/1998 1.074
.186 .006 DIA rose from 88.35 to 93.09 on
11/24/1998
12/28/1998 1/062
.542 .042 DJI fell from 91.93
to 91.31 on 1/22/1999
1/19/1999
1.005 .669 .099 DJI rose from 93.06 to
110 in Mat 1999
2/16/1999
.999 .235 .008 DJI rose from
92.70 to 110 in Mat 1999
9/10/1999
1.009 .112 .131 DJI fell
from 110.31 to 100. on 10/15/1999\
1/3/2000
1.047 .351 -.116
DJI fell from 113.50 to 98.46 on 3/8/2000.
3/31/2000 successful
4/28/2000
successful
6/2/2000
successful
12/13/2000
successful ...
DJI
change la/ma
annroc P-I
IP21 V-I
Opct 65-day Pct Change
----------------------------------------------------------------------------------------------------------------------------------------
1/13/2014
16258 -179
.998 .296 +358
-.021
30 .168
.098
1/14/2014
16374 +116 1.004 .464 +441 +.021
53 .266
.082
1/15/2014
16482 +108 1.008 .530 +465 +.036
62 .271
.081
1/16/2014
16417 -65 1.003 .388 +438
+.034 47 .179
.072
1/17/2014
16459 +41
1.003 .424 +425 +.042 38
.283 .085
1/20/2014
16414 -44 1.000 .179 +386 -.021 17 .175
.067
The 1999-2000 experience shows us that Biotechs and the NASDAQ-100 can remain
strong even if the DJI pivots down from Peerles Sells, including our own era's
Sell S16s. This year, Biotechs have been rushing upwards, while the DJI and SP-500
seem unable
to make new highs or breakdown. I would stay long IBB
and QQQ, buit also be short
some of the heavily distributed Bearish MINCP stocks.
-----------------------------------------------------------------------------------------------------------------------------------------------------
OLDER HOTMAILS
----------------------------------------------------------------------------------------------------------------------------------------------------
1/17/2014
S16 vs NASDAQ Breakout and Biotech
Bubble
DJI Chart
NASDAQ Chart IBB Chart
--> To Key Index and Leading Stock Charts: DJI, SP-500, etc.
->
142 MAXCP
stocks Bullish MAXCP Stocks (1/17/2014)
--> 93
MINCP stocks Bearish
MINCP Stocks (1/17/2014)
--> 74 New Highs on NASDAQ 11
new lows. Bullish plurality
--> 77 New Highs on NYSE 13 new lows. Bullish plurality
---> 17 Biotechs
up more than 220 in last year.
DJI
change la/ma
annroc P-I
IP21
V-I Opct
65-day Pct Change
----------------------------------------------------------------------------------------------------------------------------------------
1/13/2014
16258 -179
.998 .296 +358
-.021
30 .168
.098
1/14/2014
16374 +116 1.004 .464 +441 +.021
53 .266
.082
1/15/2014
16482 +108 1.008 .530 +465 +.036
62 .271
.081
1/16/2014
16417 -65 1.003 .388 +438
+.034 47 .179
.072
1/17/2014
16459 +41
1.003 .424 +425 +.042 38
.283 .085
The 1999-2000 experience shows us that Biotechs and the NASDAQ-100 can remain
strong even if the DJI pivots down from Peerles Sells, including our own era's
Sell S16s. Biotechs have been rushing upwards, while the DJI and SP-500 seem unable
to make new highs.
Despite the considerable anxiety that the market now is pushing up to a cresendo
of speculation, there are big differences between now and early 2000. In March 2000,
the bubbling sectors were up much, much more than seems likely will happen
this year. In 2000, there were many more non-biotech that were up prodigiously.
It is in the biotech arena that we primarily see similarities between now and 2000.
This is the group we want to watch closely now. We must be alert for signs that our
era's biotech super-stocks are topping out. Looking back at 1999-2000 gives us a
good idea of what to watch for. If the biotechs were to fall apart in the next
few months, I would think many will fall 50% in a few months. That would hit
the entire market hard.

Opening Power's Uptrend
We want to watch the Openings, too. Over the last 65 trading days,
SPY has gained 12.7 point, of which two thirds have come from higher openkngs.
Closing Powe's trend is flat since early November.
I think we have to wait another day or two to decide if we want to retake
short positions in SPY. It has a classic flat-topped megaphone pattern. These
are
not particularly bullish, but in the 3 cases I can find of the pattern since 1994
in SPY,
there has always been an upside breakout.
In the middle of last week, I suggested buying either IBB or QQQ because
of their price breakouts. But hold short some of the heavily distributed beairsh
MINCP stocks. Look how much red distribution there is in retail stocks
BBY, JCP and RSH in the SP-500. LULU is crumbling apart. Target and PLCE
may be next.
THE BIOTECH BOOM
Biotechs are booming for many reasons, not the least important of which
is that the Government will pay a lot of the health care costs of the millions who
otherwise would not have health insurance. Pharmacyclic's (PCYC) new drug
ibrutinib to treat patients with mantle cell lymphoma (MCL) will cost $130,000
per year per
patient. There are approximately 11,000 MCL patients in the U.S., with 3,000 patients
diagnosed each year.
There has been lots of criticism of Obamacare, but very little attention has been
given in the corporate media to how much money drug companies will start to get
when the newly insured finally get their cards and get medical attention for conditions
that they have ignored fo years because of lack of insurance and funds. At
some point,
the media will start asking about the sky-high prices of prescriptions. That could
really hit the biotech boom. How much is "too high"? The
problem with biotechs
has long been all the "dry holes", as it were. The FDA's
data show little increase
in the number of approved new drug applications. In fact, there has been a decline
since 1996. Biotechs may being doing a little better than this data suggest.
There were
39 "new
molecular entities" in 2012, which was a record. However, in 2013, there
were only
25. The number of FDA drug approvals reflects both research/nnovation
and the federal government's efficiency in reviewing new therapies.
1996 131 Peak- before high
profile drug safety failures. Example Vioxx
1997 121
1998 90
1999 83
2000 98
2001 66
2002 78
2003 72
2004 119
2005 80
2006 101
2007 78
2008 89
2009 90
2010 93
2011 99
2012
2013's most important new therapy has been the GILD's
hepatitis C drug. Millions
are infected with this liver-destroying virus. GILD's daily pill, Sovaldi, has been shown
to cure roughly 90 percent of hepatitis C cases in just 12 weeks, compared with older
drugs that cure about three out of four patients and can take up to a year. This is
such a dramatic improvement that it adds a great deal of hope to makes of other new
drugs.
BIOTECHS' BOOMS AND BUSTS
Stock booms have their own hyperbolic logic and dynamics. They are much more than
self-perpetuating. In the end they are utterly self-desructing. When finally
their steep
price uptrends break, we will probably see declines of at least 50% in a few months.
That is certainly the lesson learned from the booming biotechs in March 2000.
(I find it intriguing that the boom followed very closely on the heels of the creation
of the biotech ETF, BBH, in the fall of 1999.)
BIOTECH BOOM AND BUSTS in 1999-2000
10/19/99 -------- 2000 Peak ----------- Subsequent Sell-Off
Low
Price Price Gain Peak
Price Date
---------------------------------------------------------------------------------------------
MYGN
4.86 57.47 +1082.5% 3/9/2000 11.09
4/14/2000
A Closing Power trend-break would have brought a Sell at 36.14 on 3/15/2000
CELG
2.24
15.34 +584.8% 3/6/2000
6.49
4/4/2000
A Closing Power trend-break would have brought a Sell at 14.67 on 3/9/2000
IMCL
12.50 84.56 +576.5% 3/6/2000
33.31
4/17/2000
A Closing Power trend-break would have brought a Sell at 52.50 on 3/14/2000
HGSI
19.19 112.63 +486.9% 3/1/2000
27.64
4/17/2000
A Closing Power trend-break would have brought a Sell at 108.00 on 3/3/2000
AMLN
4.06
18.25 +349.5% 3/6/2000
7.50
5/23/2000
A Closing Power trend-break would have brought a Sell at 15.93 on 3/9/2000
When To Sell A Explosive Super Stock
A work in progress.
This is from a chapter in my newly revised Explosive
Super Stocks
We want to start comparing the market and its stocksnow more exactly with the
1999-2000
buuble. Like then, it is biotechs stocks which are the biggest gainers, though some
new
tech stocks beg comparisons with the internet stocks of 1999-2000.
Studying these cases allows us to develop a number of "Red Flags", which when
they occur we should either cause us to sell such stocks out right or work with
10-day ma stops, or stops 15% below their highs or with stops when the
the steepest Closing Power uptrends are broken.
New Red Flags for Super Stocks inferred from the data below:
#1 Stocks up more than 220% in 6 months are at risk in the late stages of a
bull market. We must be on the look out for other warnings signs.
#2 Stocks up more than 48% over their 21-day ma are at high risk in the late
stages of a bull market. We must be on the look out for other warnings signs.
#3) Stocks whose IP21 is less than .07 when they are 15% over the 21-day ma are
at high risk in the late stages of a bull market. We must be on the look out for
other warnings signs in such stocks.
4) Stocks whose 65-dma is rising at an annualized rate of more than 4.00 (400% are
at high risk in the late stages of a bull market. We must be on the look out for
other warnings signs in such stocks.
5) Explosive super stocks whose CP%-PR% is below -.25 (bearish
CLosing Power divergence) when the stock is more than 15% over the 21-dma are at risk.
6) Runaway explosive super stocks making new highs that are not confirmed
by their Closing Power are at great risk if they are more an 25% over their 21-dma.
7) Runaway explosive super stocks making new highs that are not confirmed
by their Closing Power are at great risk if they are more an 25% over their 21-dma.
8) Because some super stocks show no signs of a top other than they are wildly
hyperbolic, work with stops wither 15% below the revious high or sell when their
Closing Power uptrendlines are broken.
9) It is hard to sell a big winner. But that is what must be done. Other signs
that a top has been made are the sudden appearance of a head/shoulders pattern
and false breakouts above flat tops after a very steep advance.
The Bubble Stock of 1999-2000
1999-2000
2013-2014
6 month Pct Gain
Yearly Pct Gain
10/19/99 to peak
65dma
CP OBV
la/ma IP21 OP21
AnnRoc CP%-PR% NC NC
------------------------------------------------------------------------------------------------------------------------------------------------------------
DIA
102.18
117.50 +13.0%
1/14/2000
1.032 .022
.47
.542
-.56
NC NC
DIA 10/9/13 147.78 12/31/13 165.47 +12.0%
SPY
127.0
153,56 +20.9%
3/24/2000
1.083 .208
.217 .264
-.25
NC
NC
SPY 10/9/13 165.60 1/17/14 183.64
+10.9%
QQQ
59.44
117.56 +97.8%
4/24/2000
1.07 .093
.06
1.126
-.48
NC
NC
QQQ 10/9/13 78.61 1/17/14 87.85 +11.8%
NASDAQ 2688.17 5048.61 +87.8%
3/10/2000 1.085 .231
.242 1.348
-----
NASDAQ 10/9/13
3678 1/17/14 4198 +14.1%
BBH (Biotech
Index) 35.44 <1>
80.60 +127.4%
IBB (NASDAQ BIOTECHS) 10/9/13
194.50 1/17/14 247.42 +27.2%
--------------------------------------------
NET TECHS
-----------------------------------------------------------------------------
BRCM
36.58
164.00 +348.3%
3/23/2000 1.129 .121 .345
3.03 -.29
NC
JNPR
39.32
153.50 +290.4%
3/28/2000 1.159 .041 .321
4.085 -.50
NC
QCOM
24.75
89.66 +262.3% 1/3/2000 1.481 .042 .399
6.106 -.75
NC NC
BRCD
29.74
118.75 +229.3%
1/3/2000 1.1291 .485 .521
4.644 0
YHOO
43.72
118.75 +171.6%
1/3/2000
1.1291 .485 .521
4.644 0
A Closing Power trend-break would have brought a Sell at 102.63 on 1/5/2000
EMC
34.72
71.63 +106.3%
3/27/2000 1.128
.038 .211
1.456 -.22
NC
EBAY
16.70
29.98
+79.5% 12/10/2000
1.252 .121
.309 2.178
.03
NC
CSCO
33.69
80.06
+57.0% 3/22/2000
1.16 .069
.217 1.819 -.18 NC NC
INTC
32.56
72.03 +55.0%
3/22/2000
1.195 .23
.416
2.322 0
AMZN
76.62
106.68 +39.2%
12/10/2000 1.256
.006 .419
2.17 -.63 NC NC
MSFT
43.16
59.56 +38.0%
12/27/2000
1.17 .201
.551 1.145
0
NC
---------------------------------------------------------------------------------------------------------------------------------------------
5/12
6/12 6/12
5/12
--------------------------------------------
BIOTECHS
-----------------------------------------------------------------------------
MYGN
4.86 57.47 +1082.5% 3/9/2000 1.573 .228 .552
9.036 0
A Closing Power trend-break would have brought a Sell at 36.14 on 3/15/2000
CELG
2.24
15.34 +584.8% 3/6/2000 1.36
.183 .486
5.403
0
A Closing Power trend-break would have brought a Sell at 14.67 on 3/9/2000
IMCL
12.50 84.56 +576.5% 3/6/2000 1.725 .488 .608
8.449 0
A Closing Power trend-break would have brought a Sell at 54.22 on 3/15/2000
HGSI
19.19 112.63 +486.9% 3/1/2000
1.346 .043 .376 6.257 -.24
NC NC
AMLN
4.06
18.25 +349.5% 3/6/2000
1.262 .240
.239 3.402
0
A Closing Power trend-break would have brought a Sell at 15.93 on 3/9/2000
PCYC
30.00
85.00 +183.3%
2/18/2000
1.370 .052
.516 4.341
0
A Closing Power trend-break would have brought a Sell at 75.50 on 3/8/2000
AMGN 41.97
74.68 +77.9%
1/21/2000
1.171 .054
.466 2.512 -.93
NC NC
BBH (Biotech Index) 35.44 <1>
80.60
3/6/2000
1.207 .21
.136 3.406
-.07 NC
-------------------------------------------------------------------------------------------------------------------
3/8
2/8 2/8 3/8
<1>11/24/1999 -
first day of trading. 56.4% gain in BBH at its peak.
===================================================================================
OLDER HOTLINES
===================================================================================
1/16/2014 Today we saw more NASDAQ strength and DJI hesitation in
the aftermath of the Peerless Sell S16. Today finally saw the breakout above
its unusually flat and well tested resistance by GILD. Gilead Sciences is
Fidelity's biggest biotech position by a wide margin. 16.7% of FBIOX is in GILD.
This is a much-watched leader.
The NASDAQ seems on course for 5000. See last night's hotline. Its conclusions
still seem valid. Traders should expect steep vertical ascents now in the
NASDAQ, QQQ and IBB (NASDAQ biotech ETF). It is unclear
how much the DJI-30 itself can rally, given the Sell
S16.
--> To Key Index and Leading Stock Charts: DJI, SP-500, etc.
---> Super
2013-2014 Biotechs
->
184 MAXCP stocks Bullish
MAXCP Stocks (1/16/2014) Bullish plurality
--> 53 MINCP stocks
Bearish MINCP Stocks (1/16/2014)
--> 115 New Highs on NASDAQ
9 new lows. Bullish plurality
--> 111 New Highs on NYSE 9 new lows. Bullish plurality
DJI
change la/ma
annroc P-I
IP21
V-I Opct
65-day Pct Change
----------------------------------------------------------------------------------------------------------------------------------------
1/13/2014
16258 -179
.998 .296 +358
-.021
30 .168
.098
1/14/2014
16374 +116 1.004 .464 +441 +.021
53 .266
.082
1/15/2014
16482 +108 1.008 .530 +465 +.036
62 .271
.081
1/16/2014
16417 -65 1.003 .388 +438
+.034 47 .179
.072
It is the red hot biotech group which is
boosting the NASDAQ more than any other.
IWM and the NASDAQ showed similar breakouts a few days ago.
The QQQ
has been lifted, too. GILD's breakout today has given
legitimacy and confidence
to a growing number of biotechs. This past year's list of super-Biotechs is growing
in numbers. The NASDAQ's Biotech ETF IBB is the easiest way to follow and
trade this group now. Nptice in the flat topped breakouts below how
professionals
switch back to being net-buyers when there is a flat topped breakout. The pattern
is quite reliably bullish short-term. For us also, these patterns usually should be
bought. We can always sell when the breakout fails. And we should if this
develops.
But we have an advantage. After a flat topped breakout, we can let prices run so
long as the short-term Closing Power uptrend lasts. We want to do this now because
the 1999-2000 experience shows that the NASDAQ, QQQ and leading biotechs can
keep rising until March even if the December S16 derails the DJI.
Late in a bull market, flat top breakouts are usually extremely profitable in
the strongest stocks up to that point. Recommended IBB and GILD would certainly
seem similar to the examples below from 1999-2000..
Flat-topped Breakouts were very
Profitable in late 1999-2000.:
QCOM 11/3/1999 32.56
12/13/1999 52.50
hit 100 on 1/3/1999
QQQQ 11/3/1999 66.75
12/16/1999 83.06
2/28/1999 102.41
CSCO 11/8/1999 37.66
hit 80.06 on 3/27/2000
HGSI 11/17/1999 24.91
hit 112.63 on 3/1/2000
IMCL 1/14/2000 23.94
hit 84.56 on 3/6/2000
Below is some of the research I have out together concerning flat topped breakouts
in stocks in parabolic ascents. These ideas are detailed also in my Explosve Super
Stocks. A new edition will be done soo.
http://www.tigersoft.com/-2GBL13HL/ParabolicAscents/index.html
http://www.tigersoft.com/htm/1212/Hint-5-5-2006.htm
http://www.tigersoft.com/tiger-blogs/March-6-2008/index.html
http://tigersoft.com/ron/ (DJI flat top
breakouts)
http://www.tigersoft.com/tiger-blogs/11-15-2007/index.html
(recognizing false breakouts)
==================================================================================
OLDER HOTLINES
==================================================================================
1/15/2014 The NASDAQ has achieved a new high above flat resistance within
a hyperbolic uptrend. That is usually very bullish. The DJI is still coping with the
Sell S16 and has not broken out. Sell S16s are usually quite bearish.
--> To Key Index and Leading Stock Charts: DJI, SP-500, etc.
->
168 MAXCP stocks Bullish
MAXCP Stocks (1/15/2014) Bullish plurality
--> 53 MINCP stocks
Bearish MINCP Stocks (1/15/2014)
--> 145 New Highs on NASDAQ 6
new lows. Bullish plurality
--> 154 New Highs on NYSE 8 new lows. Bullish plurality
DJI
change la/ma
annroc P-I
IP21
V-I Opct
65-day Pct Change
----------------------------------------------------------------------------------------------------------------------------------------
1/13/2014
16258 -179
.998 .296 +358
-.021
30 .168
.098
1/14/2014
16374 +116 1.004 .464 +441 +.021
53 .266
.082
1/15/2014
16482 +108 1.008 .530 +465 +.036
62 .271
.081
The Tug of War Continues
What has happened in the past when the NASDAQ and DJI were diverging
as
Peerless gave a Sell S16? In 1977, the NASDAQ held up for 5 months, but
the DJI
immediately started a bear market. Note that 1977 was a period of rising inflation
and fears
of much higher oil prices. Now in 2014, oil prices are falling. The other case
is
probably more likely to be repeated given the signs of excessive speculation. In 2000,
after a late December 1999 Sell S16, the DJI fell 17% by mid-March 2000 all the while
the NASDAQ was advancing more than 20%.
If the Fed does nothing untoward about interest rates, if more big banks announce record
profits like BAC just did, if more amazing biotech breakthroughs occur and if a new
take-over mania develops, I think it's a very good bet that the NASDAQ will reach 5000
and QQQ will be above 100. That's why I suggested that aggressive traders go long
QQQ
yesterday because its recent Closing Power downtrend had ended.
What will the DJI do? Peerless S16s have never been
wrong. But a decisive breakout
above the DJI's tops could bring a reversing Peerless Buy signal. We'll have to
wait and see. A break in DIA's rising Opening Power uptrend would be bearish.
A reversal back down by the blue Closing Power would be bearish. Presently, the
rising Accumulation index will probably buffer DIA on its next decline. We will be
watching
to see if DIA reverses here, sp that we may re-take a short position in it.

Hesitation for a day or two seems likely. Our
top biotech performers mostly fell
back today. I think we should continue to watch to see what happens in the tug-of-war
between bearish profit-taking Professionals in GILD on the one hand and
the Public and performance-minded fund managers on the other
hand who want
the stock to make a flat-topped breakout. Nothing was decided today. I
would expect
that a GILD breakout will jumpstart another advance by biotechs generally. That
will influence the action of QQQQ and the NASDAQ. Traders may want to follow
my nightly comments on the top performing 17
biotech stocks. We will be looking
for signs of a speculative top in them.
==================================================================================
OLDER HOTLINES
==================================================================================
1/14/2014 Flat Top Breakouts as
NASDAQ may achieve tomorrow
should ordinarily be played by traders. If they fail, the risk is small if you sell
quickly. In this environment, one of accelerating speculation, the rewards
are a quick 7%-15% in the NASDAQ if they succeed.
Today, the P-I, V-I and IP21 indicators on the DJI each made a new high for
this year. This is bullish, but the DJI still needs to get past its recent point of
breakdown on the Hourly chart at 16400.
--> To
Key Index and Leading Stock Charts: DJI, SP-500, etc.
The Peerless Sell S16 is still operative.
Equally important now, the NASDAQ
is
threatening to breakout above its recent flat resistance at 4200. Given the
NASDAQ's
accelerating (hyperbolic) uptrend, a breakout there may being bring
a dramatic
vertical ascent as was seen between October 1999 and March 2000,
half of
which occurred when Peerless showed a Sell S16 and the DJI was falling 15%.
So, a
NASDAQ 10% rise is quite possible now. But we will need to see how the
market
closes tomorow to be surer.

The QQQ is probably the best way to trade a NASDAQ breakout.
See the
exploded
QQQ chart just below. It is Public buying which will probably drive
the
advance. Over the last 65 trading days, QQQ has risen 10.67 points.
Higher
openings accounted for 6.3 points. Higher closings above the opening
only
accounted for 4.37 points. In the chart below, you can see how regularly
the
openings have been higher than the previous day's openings. This is typical of
speculative
periods in the stock market. Once the Closing Power downtrends
are broken
in this environment, Professionals usually start to buy quite aggressively.
If the
NASDAQ scores a new high above 4200, I think that is what we will see
happen to
the QQQ. It seems to be aiming for its all-time high of 119 in March 2000.

The
Biotechs did not wilt today. Just the opposite. IBB
was up a whopping 3.6%.
This shows
that performance funds and momentum players are
over-coming
instutional profit-taking, even in the biggest
biotechs, the ones
owned by Fidelity for example. We will start monitoring the 15 or so best performing
Biotechs nightly here. In this way, when
they show the tell-tale signs
of an
actual top, I can show them. We can see that there is a bubble in the group
based on
how many are up more 250% in the past year. But there is no sign
that a top
has yet been put in place. Instead of failing their recent breakouts,
both the
biotech ETFs, BBH and IBB today
ran further up and away from their recent points
of
breakout, as did FBIOX, the Fidelity Biotech fund. As long as the
"Best Biotechs"
are nearly
all in uptrends, show no head/shoulders patterns, false breakouts and stay
above their
65-dma, we can be pretty sure that the aggressive buyers still have the upper
hand in the
tug-of-war with the profit-takers. (Tiger Data
subscribers, look for BESTBIO.exe
on the
Tiger Data page. This download will give you the top 15 biotech gainers for the past
12 months.)
The Tug of War: Professional Profit-Takers versus Performance Funds and Speculators
who are buy at or
near the opening.

A Test Case
How
important is a lagging Closing Power when at the time a flat top beckons
for a
breakout? In other words, can professional selling prevent a vertical ascent
driven by
public speculators?
Let's watch
GILD below and to see if it can surpass 76 and what happens then to it.
My
judgement is that if GILD does breakout, it will quickly rise 10% and the
Closing
Power downtrend will be decisively broken, because Professionals are not
stubborn
and flat topped breakouts like this are like free candy, hard to pass up.

Closing Power Trend-Changes
Traders will now want to watch the Closing Power downtrends for the major
market ETFs.
Only DIA
appears to be in a "safe" downtrend. See the exploded charts of SPY and
IWM
below.
The rising Opening Power shows how regularly there have been daily higher
openings.
The charts below also show what it would take tomorrow (the close versus the
opening) to
break the CP downtrends.
 |
 |
 |
->
116 MAXCP
stocks Bullish MAXCP Stocks (1/14/2014) Bullish plurality
--> 89
MINCP stocks Bearish
MINCP Stocks (1/14/2014)
--> 100 New Highs on NASDAQ 5
new lows. Bullish plurality
--> 75 New Highs on NYSE 10 new lows. Bullish plurality
DJI change
la/ma annroc P-I
IP21 V-I Opct
65-day Pct Change
----------------------------------------------------------------------------------------------------------------------------------------
12/26/2013
16480 +122
1.028 .303 +133 -.036
-1 .182 .074
12/27/2013
16478 -1.5
1.026 .301
+119
-.031
5 .102 .078
12/30/2013 16504
+26 1.027 .302
+79 -.027
-2 .097
.076
12/31/2013 16577
+73 1.03 .363
+108 .010
9
.167 .086
1/2/2014
16441 -135 1.02 .320
+123 .010
7
.169 .086
1/3/2014
16470 +29 1.02 .410
+75 .014
21
.263 .084
1/6/2014
16425 -45
1.016 .395 +222
-.016 17
.270 .085
1/7/2014
16531 +106
1.02 .522 +316
.002 35
.369 .102
1/8/2014
16463 -68
1.015 .325 +233
-.024 19
.267 .092
1/9/2014
16445 -18
1.012 .308 +240
-.022
10 .17
.100
1/10/2014 16437
-8
1.011 .340 +332
-.014 28
.167 .112
1/13/2014
16258 -179
.998 .296 +358
-.021
30 .168
.098
1/14/2014
16374 +116 1.004 .464 +441 +.021
53 .266
.0082
----------------------------------------------------------------------------------------------------------------------------
---------------------------------------------------------------------------------------------------------------------------------------------------
OLDER HOTLINES
---------------------------------------------------------------------------------------------------------------------------------------------------
1/13/2014 The DJI has now
fallen back to its rising 21-dma. But its IP21 is negaive.
That should limit any bounce. Sell more Bearish
MINCP Stocks short.
A number of these have collapsed recently. See SODA
(-24%) today. I think this
is a taste of things to come. Hold SPY or IWM Short. The Biotech bubble
is
getting even bigger. Below are flags to watch for. They should show when
the "Gig is up" for the Biotech Bubble.
Mid-Term Year Januaries in the 4-year Presidential cycle are usually not a good time
for the DJI when a Democrat is in the White House. Closing Powers turned down
sharply
today. January 1977 shows that a Sell S16 can drive the DJI down even when the
P-Indicator is quite positive,
Bearish "red Roller-Pins" appeared in a
number of biotech TigerSoft candle-stick charts.
See BBH chart (Biotech Index) below. A failure by it to stay above its breakout
point, 89,
now would be quite bearish. False breakouts often mark major speculative tops.

--> To
Key Index and Leading Stock Charts: DJI, SP-500, etc.
A Peerless Sell S16 is now operative. "There
have been 10 earlier Sell S16s.
These signal
average a DJI decline of 10% at the time of the next Peerless buy signal.
The biggest paper
loss was never as much as 3.5%. The longest one had to wait
was January
12th before seeing the DJI decline to at least the lower band."
->
100 MAXCP
stocks Bullish MAXCP Stocks (1/13/2014)
--> 136
MINCP stocks Bearish
MINCP Stocks (1/13/2014) Bearish
Plurality
--> 47 New Highs on NASDAQ 13
new lows. Bullish plurality
--> 34 New Highs on NYSE 14 new lows. Bullish plurality
DJI change
la/ma annroc P-I
IP21 V-I Opct
65-day Pct Change
----------------------------------------------------------------------------------------------------------------------------------------
12/26/2013
16480 +122
1.028 .303 +133 -.036
-1 .182 .074
12/27/2013
16478 -1.5
1.026 .301
+119
-.031
5 .102 .078
12/30/2013 16504
+26 1.027 .302
+79 -.027
-2 .097
.076
12/31/2013 16577
+73 1.03 .363
+108 .010
9
.167 .086
1/2/2014
16441 -135 1.02 .320
+123 .010
7
.169 .086
1/3/2014
16470 +29 1.02 .410
+75 .014
21
.263 .084
1/6/2014
16425 -45
1.016 .395 +222
-.016 17
.270 .085
1/7/2014
16531 +106
1.02 .522 +316
.002 35
.369 .102
1/8/2014
16463 -68
1.015 .325 +233
-.024 19
.267 .092
1/9/2014
16445 -18
1.012 .308 +240
-.022
10 .17
.100
1/10/2014 16437
-8
1.011 .340 +332
-.014 28
.167 .112
1/13/2014
16258 -179
.998 .296 +358
-.021
30 .168
.098
-------------------------------------------------------------------------------------------------------------------------
 Over the years, I have found lots of bearish flags
that warn when a
decline is likely in over-played, over-speculative stocks. After
the
stock market has been rising for more than four years, it is only natural that
some
growth and technology stocks are run up in a frenzy of increased speculattion.
This
is the very nature Wall Street. But after nearly every boom, comes a bust.
We must be alert to that possibility now.
How much higher can biotechs go?

After
a long bull market, no warning is more important than the number of stocks
in
hyberbolic uptrends, or above their previous well-tested rising resistance lines
or up
more than, say 240% in the last year. This shows the speculative bubble
has
been blown up to unsustainable levels. Right now, I count 15 Biotech stocks
up
that much. I have no such counts for biotechs in 1999-2000, but the best rose
1000%
at their peaks: IMCL 8.44 to 84.65 on 3/6/2000 and 9.00 to 112.63 on 3/1/2000.
Examination of IMCL, HGSI and QCOM in 2000 teaches us many lessons. My new
Explosive Super Stocks book looks at them closely.
Here are three Red Flags to use now to sell biotechs like
these.
#1 Sell a super stock in a price bubble at this juncture when it violates
its rising 10-day ma;
#2 Sell the super stock when it when it makes a false breakout
#3 After #1 or #2, sell short these stocks or buy puts on them when their
Closing Power sets up a clear downtrend with a minor CP new low..
ICPT 445.83 +1222%
IDRA 5.03 +569%
BCRX 10.51 +521%
ARWR 12.32 +464%
PBYI 112.26 +387%
ACAD 23.32 +333%
ALNY 93,28 +326%
GALE 7.24 +320%
CLVS 76.26 +295%
NPSP 35.0 +293%
ANAC 17.52 +254%
CLDX 25.66 +248%
SNMX 5.69 +244%
ISIS 47.22 +233%
CYTR 7.47 +230%
Speculative Bubble in Bios Gets Even Bigger.

Sell Bubble Stocks When They Close Below their 10-day ma
This is the most important rule. Speculators and mutual
funds seeking high
performance buy these stocks very aggressively. That's what makes their
price
rises are go vertically hyperbolic. Often they double in the last six weeks.
Greed
being what it is, it's very hard for anyone watching not to want to be part
of
the action. But for the fund managers and the public alike, there is great danger.
Losses must be taken quickly without regrets. Doubling down is disastrous.
Those
who buy these "bubble" stocks eventually learn a whole new meaning
to
the phrase, "he who lives by the sword, dies by the sword".
Super, explosive stocks that rise 400%, 500%, sometimes 1000% are
all
part of a game of game musical chairs. As soon as each era's "piffle"
stocks
stop
rising and simply fall back below their 10-day ma, good traders know they
must
sell. It is too dangerous to wait. At this time, we should forget all other
indicators. It was momentum which brought in the buyers for the last six months.
Without momentum, profit-takers will be quick to act. Count on this. The more
seasoned traders know from the 1999-2000 and 2007-2008 bubbles, understand
what
Groucho's stock broker meant when he told him in late 1929, "the gig is up".
When
piffle stocks up 500% prices break their uptrends, there will be very few
bids,
lots of stop loss orders and lots more market sell orders. These stocks will then
fall
50% even faster than they went up.
==================================================================================
OLDER HOTLINES
==================================================================================
1/10/2014 The DJI has been stuck in a narrow hourly range of 16400-16600.
The next 10
days' seasonality is "flat", not bullish. Let's see if the DJI will be
able
to retreat
downward despite the good breadth. The Sell S16 of December 1976 accomplished
this.
Despite a strong A/D line for the first 6 months of 1977, the DJI fell 10%
and settled
into a 15 month-long bear market. .
1/10/2014 --> To Key Index and Leading Stock Charts: DJI, SP-500, etc.
A Peerless Sell S16 is now operative. "There
have been 10 earlier Sell S16s.
These signal
average a DJI decline of 10% at the time of the next Peerless buy signal.
The biggest paper
loss was never as much as 3.5%. The longest one had to wait
was January
12th before seeing the DJI decline to at least the lower band."
No
Jobs, No Benefits, and Lousy Pay New York Times ?- 2 days ago
Friday's good breadth owed to the dismal jobs report. The private
economy is
barely able to
provide enough new jobs for an expanding population base. The
drop of the
official unemployment rate is therefore very misleading. It also reflects how
many Americans
have given up on getting a good job. To bond traders,
the thinking is
that such bad job news means the Fed will not soon raise interest
rates.
Indeed, 10-year bond rates fell more than one basis point on Friday. The rising
A/D Line thus
reflects the continuing value placed on 3%-4%/year dividend stocks
and ETFs
But
unfortunately, the jobs report is just one more sign that there is a dangerously
wide gap between
Wall Street and Main Street, which the Fed has made worse
not better.
The bubble they have created in stocks should be seen as dangerous.
Extremes of
wealth, over-speculation, under-consumption, over-production and falling
commodity prices
all characterized the late 1920s. True, the market now does not show
red Distribution
like it did throughout 1929 and the NYSE A/D Line is rising, not
falling.
Still, with this background given the Fed's current monetary cul-de-sac, I think that
every Peerless
sell signal deserves to be taken seriously.
But what if the NASDAQ and DJI Breakout To The Upside?

More and more,
the DJI appears to be trapped in a narrow, high-level rectangle.
Such rectangle
patterns are usually continuation patterns, even when they come late
in a bull market.
Compare the DJI's emerging, flat topped rectangle pattern now
with the ones
in December 1986-January 1987 and in October 1928. Both led to
powerful upside
breakouts and another 8 months' DJI strength before a Crash
did come.
Traders, therefore, should probably consider a DJI breakout above 16700
here to be a
judged Buy B10 Breakout. But we'll take that up if it happens.
DJI: October 1928.

DJI: December 1986-January 1987

---> 161 MAXCP stocks Bullish MAXCP
Stocks (1/10/2014) Bullish
plurality
--> 74
MINCP stocks Bearish
MINCP Stocks (1/10/2014)
--> 119 New Highs on NASDAQ 11
new lows. Bullish plurality
--> 152 New Highs on NYSE 7 new lows. Bullish plurality


Low
Interest Rates Are Keeping Alive Numerous Individual Stock Bubbles
Friday, there were 11
new highs with gains or more than 10%. Among the 161
Bullish MAXCP Stocks, I counted 19 stocks that have moved up
past their rising
resistance lines.
ACAC 52.55 +3.09, ALKS 45.13 +2.08, ARTC 46.48 +.30, ATK 135.89 +10.64
AYI 132.66
+ 9.16, CCIH 14,28 + .02, CV 64.27 +1.0. DEPO 11.52 +.31 DLB 41.7 +.84
FLDM 41.14
ICPT 223.83 +169.96 INCY 59.57 +3.8 LPLA 51.14
+.80 RPM 43.09 +.81
SGMO 19.07
+.19 STZ 80.05 +2.6 TMO 114.46 +.46 VRX 133.5 +1.33 ZLTQ 21.4 +1.29
So far, the
insttitutional distribution (IP21<0) in these high performance stocks is not
particularly
high. Only 28 of the 236 new highs and 6 of the 161 Bullish
MAXCP Stocks
showed negative
current Accumulation (IP21).
----------------------------------------------------------------------------------------------------------------------------------------------
OLDER HOTLINES
----------------------------------------------------------------------------------------------------------------------------------------------
1/9/2013 The Peerless
Sell S16 remains operative. There have been 10
earlier Sell
S16s. These signal average a DJI decline of 10% at the time of the next
Peerless buy
signal. The biggest paper loss was never as much as 3.5%. The longest
one had to wait
was Januaary 12th before seeing the DJI decline to at least
the lower band.
Despite, the Sell, breadth has been constructive so far this year because
the Fed promises
to keep interest rates very low. But bearishly, the DJI's Accumlation
Index is now
negative, thereby showing institutional selling on strength in many,
many stocks that
have risen a long ways already. In addition, the Tiger Closing Power
for IWM, the very
broad-based Russell -2000, is in a short-term downtrend.
Professionals now
consider most stocks have more downside potential than
upside potential.
That is, of course, also what the Sell S16s is telling us.
With this in
mind, I have suggested shorting some of the Bearish MINCP stocks
as a hedge and
selling out long positions in major market ETFs until we get
a new Peerless
Buy. Aggressive traders may want to short IWM and SPY, too.
A 10% avg. DJI
decline makes the Sell S16 a significant Peerless Sell signal.
1/9/2014 --> To Key Index and
Leading Stock Charts: DJI, SP-500, etc.
---> 131 MAXCP stocks Bullish MAXCP
Stocks (1/9/2014) Bullish
plurality
--> 99
MINCP stocks Bearish
MINCP Stocks (1/9/2014)
--> 111 New Highs on NASDAQ 11
new lows. Bullish plurality
--> 110 New Highs on NYSE 14 new lows. Bullish plurality
But if you cannot
tolerate as much as a 3.5% loss, then I suggest watching the
Closing Power
downtrend-lines and their 21-day ma. A break in IWM's CP
downtrendline and
a movement by SPY's CP back above its 21-dma
should by used to
cover these shorts by those who are unwilling to hold a position
that might rally
as much as a 3.5%. The idea here is also that if the next rally fizzles
out, one could go
then short again.

A break in this downtrend, would probably start another rally back to
IWM's
recent highs.
It would show that Professionals have decided that they cannot
break prices down
right now. The momentum of the year-long uptrend is too strong.
So knowing this,
how can we decide when to cover IWM's short sales
if we wish to
trade short-term? The answer is to employ the Tiger "Explode" function,
the last item in
the pull-down menu Lines
on the graphing page,
lets us get the answer.
We explode the
last 50 trading days by clicking 50 days ago and then clicking
just to the right
of the current date. Notice the enlarged blue Closing
Power
line in the
middle of the left side of the new expanded chart. next click Lines at
the top, choose Draw Closing Power trend, Show Stats. Then carefully point
the mouse at the
two points you want the CP downtrendline to go through.
Click one point and then click the second point with the left
mouse-key.
When this is
done, the computer will give you a statistic to show how much
IWM's close must
be above its opening tomorrow to break the CP downtrendline.
This is the meaning Watch Key CP difference #2-#3 = + .59.
A close more than .59 above the opening on Friday would break the
downtrend.

In addition, the DIA's Closing Power has now fallen to is 3-month rising
support.
A breaking of
this uptrend would hurt DIA, even though its rising Opening
Power is in a
steady uptrend. Professionals usually win out when Opening
Power is rising
and Closing Power is falling. But Professionals are not
stubborn.
If they see that support is going to hold, they reverse positions
and become buyers
again.

With this in mind, we want also now to watch how SPY's
Closing Power behaves. Will it next turn down decisively below
the CP's 21-dma or move back above it.

DJI
change
la/ma
annroc P-I
IP21 V-I Opct
65-day Pct Change
----------------------------------------------------------------------------------------------------------------------------------------
12/26/2013
16480 +122
1.028 .303 +133 -.036
-1 .182 .074
12/27/2013
16478 -1.5
1.026 .301
+119
-.031
5 .102 .078
12/30/2013 16504
+26 1.027 .302
+79 -.027
-2 .097
.076
12/31/2013 16577
+73 1.03 .363
+108 .010
9
.167 .086
1/2/2014
16441 -135 1.02 .320
+123 .010
7
.169 .086
1/3/2014
16470 +29 1.02 .410
+75 .014
21
.263 .084
1/6/2014
16425 -45
1.016 .395 +222
-.016 17
.270 .085
1/7/2014
16531 +106
1.02 .522 +316
.002 35
.369 .102
1/8/2014
16463 -68
1.015 .325 +233
-.024 19
.267 .092
1/9/2014
16445 -18
1.012 .308 +240
-.022
10 .17
.100
=================================================================================
OLDER HOTLINES
=================================================================================
1/8/2014 The Peerless
Sell S16 remains in place, but
the NASDAQ and
QQQ still show no signs of pulling back much. Our Stocks'
Hotline is now hedged,
being long about the
same number of bullish MAXCP stocks as we are short,
among the Bearish MINCP
stocks. Hold short IWM and SPY
so long as
their Closing
Power downtrends are not clearly violated.
1/8/2014 --> To Key Index and
Leading Stock Charts: DJI, SP-500, etc.
---> 144 MAXCP stocks Bullish MAXCP
Stocks (1/8/2014) Bullish
plurality
--> 80
MINCP stocks Bearish
MINCP Stocks (1/8/2014)
--> 110 New Highs on NASDAQ 10
new lows. Bullish plurality
--> 92 New Highs on NYSE 10 new lows. Bullish plurality

Public and
overseas buying is much more aggressive than Professional Buying.
That is the
reason the Opening Power for SPY is rising and its Closing Power is flat.
This is typical
of a late-stage bull market. Be careful about buying at the openings;
too many times,
an early rally fails. For day traders, the Tiger Day Traders'
tool not shown
here suggests that there is more downside risk at the opening
than upside
potentia for traders taking a long position at the opening.

Biotechs ETFS did breakout out above their flat topped
resistance. I warned that
back in early
2000, the occasion of the last Sell S16, the DJI started its decline
after January
14th and the NASDAQ, which was also accelerating up, failed to
decline until
March.
With the Fed
still pouring in record sums into the stock market via purchases of
the big banks'
mortgages, our situation now has unique aspects that may
delay a bigger
decline. It's clear the Fed is deathly afraid of letting the
market find its
own level without government subsidies for fear it will begin a long dive.
Knowing this,
performance funds are loathe to sell too soon their favorite stocks.
The biggest bank
stocks are still in uptrends, too. Before there can be much of
a decline, the
big bank stocks like BAC, JPM
and WFC will have to break
their year-long
price uptrends.
The DJI itself seems
stuck in a narrow trading range. The hourly resistamce is at
16550-16584
and the hourly support is now at 16400-16427. See in the
Hourly chart below how the
Red-down-hour volume
has been higher than blue up-hour volume for the last 3
trading says, just as
is was until the pre-Christmas rally began. This and the
negative Accumulation
Index on the DJI chart warn that institutions continue to sell
heavily into rallies
the stocks that are not their most preferred holdings.

The biggest funds' most
preferred holdings are still doing well. See the Tiger chart
of the
"BigFidel" stocks below. These are the 27 stocks that the 40+ Fidelity
Select funds
have their
biggest posiitons in:
AAPL, AMGN, BA, CMCSA,
CSCO, DIS, ESRX, GE, GILD, GOOG, HD,
HMC, KO, LOW, MCD, PG,
QCOM, SBUX, T, TM, UNH, UPS, USB, UTX and V.
BA remains the highest
Power Ranked of this group.

DJI change
la/ma annroc P-I
IP21 V-I Opct
65-day Pct Change
----------------------------------------------------------------------------------------------------------------------------------------
12/26/2013
16480 +122
1.028 .303 +133 -.036
-1 .182 .074
12/27/2013
16478 -1.5
1.026 .301
+119
-.031
5 .102 .078
12/30/2013 16504
+26 1.027 .302
+79 -.027
-2 .097
.076
12/31/2013 16577
+73 1.03 .363
+108 .010
9
.167 .086
1/2/2014
16441 -135 1.02 .320
+123 .010
7
.169 .086
1/3/2014
16470 +29 1.02 .410
+75 .014
21
.263 .084
1/6/2014
16425 -45
1.016 .395 +222
-.016 17
.270 .085
1/7/2014
16531 +106
1.02 .522 +316
.002 35
.369 .102
1/8/2014
16463 -68
1.015 .325 +233
-.024 19
.267 .092
==================================================================================
OLDER HOTLINES
==================================================================================
1/7/2014 The Peerless Sell S16 remains in Place. Only
once did the DJI refuse
to sell off past
January 7th. That was in January 2000 when the DJI peaked on
the 12th of
January after its Sell S16, but the NASDAQ stayed strong until March.
1/7/2014 --> To
Key Index and Leading Stock Charts: DJI, SP-500, etc.
The key ETFs' Closing Powers are falling but their Opening Powers
are still in an uptrend.
Professionals
have not switched to the Buy side, as a whole. In addition, institutions are
still, on
balance, selling into the rally. Though the DJI is 2% over the 21-day ma, the
Accumulation
index is barely positive. I would stay hedged using our Bullish MAXCPs
and Bearish MINCP
stocks. It would be consistent with the minimum upside objective
for the DJI being
12675 and the 3.3% paper loss in 2000 after a Sell S16, for the DJI
or rally 2% or 3%
more.


Today the big
banks backed off their recent gains. Some of the biotechs picked up speed again.
Watch the
Biotechs' Index BBH (88.48) to see if it can breakout past
its flat resistance at
89.18. Or IBB
(226,93 above 228.10. Though a defensive group, that would boost QQQ
and NASDAQ.
See how the NASDAQ's chart still shows an accelerating uptrend,
potentially
capable of making the NASDAQ run vertically upwards as it did from January
to March 2000
despite multiple Peerless Sells. The primary difference for the NASDAQ
now and then was
that the NASDAQ's "NASDJI" (Tiger relative strength indicator0
is now negative.
Back then it stayed positive from October 21, 1999 to March 21, 2000.
--> 100 MAXCP stocks Bullish
MAXCP Stocks (1/7/2014) Bullish
plurality
--> 62
MINCP stocks Bearish
MINCP Stocks (1/7/2014)
--> 95 New Highs on NASDAQ 5
new lows. Bullish plurality
--> 85 New Highs on NYSE 4 new lows. Bullish plurality
DJI change
la/ma annroc P-I
IP21 V-I Opct
65-day Pct Change
----------------------------------------------------------------------------------------------------------------------------------------
12/30/2013 16504
+26 1.027 .302
+79 -.027
-2 .097
.076
Sell S16
12/31/2013 16577
+73 1.03 .363
+108 .010
9
.167 .086
1/2/2014
16441 -135 1.02 .320
+123 .010
7
.169 .086
1/3/2014
16470 +29 1.02 .410
+75 .014
21
.263 .084
1/6/2014
16425 -45
1.016 .395 +222
-.016 17
.270 .085
1/7/2014
16531 +105
1.02 .522
+316 .002
35 .369
.102
low
===================================================================================
Older
Hotlines
===================================================================================
1/6/2013 The Peerless Sell S16 remains in Place. The
key ETFs' Closing Powers
are falling but
their Opening Powers are still in an uptrend. It's not clear that the
Professionals'
selling is ready yet to overcome the trend of higher openings. Another
division in the
market: the still rising big banks versus the the higher priced biotechs,
some of which
look vulnerable because of their Closing Power downtrends.
1/6/2014 --> To
Key Index and Leading Stock Charts: DJI, SP-500, etc.
 Because Sell Sell 16s
average DJI declines of 10% and
Because Sell Sell 16s
average DJI declines of 10% and
because the
biggest loss to someone shorting the DJI when a Sell S16 occurred
was never as much
as 3.4%, I think we should emphasize shorting stocks showing
bearish
characteristics. These are some of the bearish patterns we are starting to
see now.
1) New 52-week lows confirmed by the Closing Power making a new low and
having an Accumulation Index below zero. Examples: SODA,
TSM and SHOS.
2) Head and shoulder patterns with prices below their 65-dma, showing falling
Closing Power and red distribution. These are very vulnerable
so long as their Closing Powers are in downtrends and their Accumulation index is
negative. Examples FSLR, F,
CELG, MSFT, EXPD, ECL, COST. (There are
not many head/shoulders now. That will help stay the market.)
3) Low priced stocks up 75% or more in the last 6 months with negative Accumulation,
fail to surpass their 65-day ma on a recovery and then break their Closing Power
uptrends are vulnerable "piffle" stocks. Note the recent upside down red
popsicles
in the Tiger candle-stick charts. This is a key characteristic of a "piffle
stock".

4) Major market ETFs that have broken their uptrends following Closing Power
non-confirmation of new lows. Examples. SPY
and IWM.
5) Low Accum. stocks just as they break below their 65-dma. See GNI below.
Watch CLF, MBI, RT. The new Peerless update flags these nicely.
"Going to 0" - Seeking Alpha's Super
Bearish Recommendation.
Today's hit in GNI was no 2:1 stock split.
Air pockets like this occur as a market approaches a top.
Great Northern Iron Now Worth Less Than $21, Will Fall To
$0 In 15 Months Seeking Alpha(Sun, Jan 5)

---> 63 MAXCP stocks Bullish MAXCP
Stocks (1/6/2014) Bullish
plurality
--> 59
MINCP stocks Bearish
MINCP Stocks (1/6/2014)
--> 64 New Highs on NASDAQ 10
new lows. Bullish plurality
--> 43 New Highs on NYSE 8 new lows. Bullish plurality
DJI change
la/ma
annroc P-I
IP21 V-I Opct
65-day Pct Change
----------------------------------------------------------------------------------------------------------------------------------------
12/26/2013
16480 +122
1.028 .303 +133 -.036
-1 .182 .074
12/27/2013
16478 -1.5
1.026 .301
+119
-.031
5 .102 .078
12/30/2013 16504
+26 1.027 .302
+79 -.027
-2 .097
.076
12/31/2013 16577
+73 1.03 .363
+108 .010
9
.167 .086
1/2/2014
16441 -135 1.02 .320
+123 .010
7
.169 .086
1/3/2014
16470 +29 1.02 .410
+75 .014
21
.263 .084
1/6/2014
16425 -45
1.016 .395 +222
-.016 17
.270 .085
===================================================================================
Older
Hotlines
===================================================================================
The
Peerless Sell S16 Is in Place. Do some selling.
Do some shorting.
1/3/2013 The average decline after a Sell S16 is
10%. A paper loss of more
than 4% would have no
precedent and cast serious doubt on the Sell S16.
That all S16s were
profitable is bearish enough to warrant, at the least,
a hedged position
now. More aggressive traders will want to be short
ETFs that have Closing
Power downtrends like IWM or show Closing Power non-
confirmations and CP
trend-breaks like SPY. Bearish MINCP stocks showing
head and
shoulders patterns, red
Distribution and a weak Closing Power also should be considered
for shorting. See EXXI, KERX, MBB, PZE and RMTI. These are examples in tonight's
MINCP stocks. For a head/shoulder pattern to become
seriously bearish, the
stock must fall below
its 65-dma. This is also true with the pink Sell S7s that
show that Closing Power
is seriously lagging prices and Opening Power, which
represents public
buying.

---> 87 MAXCP stocks Bullish MAXCP
Stocks (1/3/2014) Bullish
plurality
--> 44
MINCP stocks Bearish
MINCP Stocks (1/3/2014)
--> 65 New Highs on NASDAQ 1
new lows. Bullish plurality
--> 43 New Highs on NYSE 8 new lows. Bullish plurality
1/3/2014 --> To Key Index and Leading Stock Charts: DJI, SP-500, etc.

DJI
change
la/ma
annroc P-I
IP21
V-I Opct
65-day Pct Change
-----------------------------------------------------------------------------------------------------------------------------------------
12/26/2013
16480 +122
1.028 .303
+133
-.036
-1 .182
.074
12/27/2013
16478 -1.5
1.026 .301
+119
-.031
5 .102 .078
12/30/2013 16504
+26 1.027 .302
+79 -.027
-2 .097
.076
12/31/2013 16577
+73 1.03 .363
+108 .010
9
.167 .086
1/2/2014
16441 -135 1.02 .320
+123 .010
7
.169 .086
1/3/2014
16470 +29 1.02 .410
+75 .014
21
.263 .084
===================================================================================
Older
Hotlines
===================================================================================
1/2/2014
The sharp sell-off today has convincingly "clinched" the Peerless Sell S16.
It remains to be seen if the QQQ and the
NASDAQ will decline now by much. Much
will depend on how resilient biotechs
are. Short-sellers should probably focus on the DJI and
SP-500, in other words SPY and DIA.
The DJI fell more than 0.8% today and
there were 1029 more decliners on the NYSE than advancers.
The SPY's Closing Power has slightly
broken its uptrend after failing to make a new high
to confirm the recent price highs.
This is a reliable Closing Power Sell.
The typical DJI decline after a Sell S16
is 10%. That would send the DJI back down to 15000.
The highest the DJI can probably now go
without a new Peerless Buy signal is about 16750,
based on the biggest paper losses with
Sell S16s and the 16750 DJI price target using
height of the 14750-15750 trading range
and the breakout at 15750.
--->
171 MAXCP
stocks Bullish MAXCP Stocks (1/2/2014) Bullish plurality
-->
36
MINCP stocks Bearish
MINCP Stocks (1/2/2014)
--> 107
New Highs on NASDAQ 9
new lows. Bullish plurality
--> 153 New Highs on NYSE 9 new lows. Bullish plurality
1/2/2014 --> To Key Index and
Leading Stock Charts: DJI, SP-500, etc.
There are more bearish looking stocks right now. Short selling now is
made harder
because of the way last years' poorest
performing stocks often bounce back a ways
in the new year because their year-end
tax selling comes off. Gold and silver stocks look
like particularly good candidates for a
recovery based on the end of the heavy tax-loss selling
in them in 2013. Previously
mentioned silver mining stocks, SSRI and PAAS were up
nicely and should keep advancing.
Look for head and shoulders patterns now, too.
MSFT and Ford are current examples. The Peerless sell signal suggests
DIA, SPY and FAS (3x Bullish Financials)
should be shorted.
What Is The Significance of A Steeply
Down Day
for The DJI in Early January?
This is a time when new money that comes in at
year-end ordinarily lifts the market.
When this customary event fails to develop and
instead old money heavily takes profits
in the new year, a bearish cast is most often
placed on the market.
Since 1945, there have been 21 previous
instances of a 0.7% or more decline in the
first five trading days of January. In 13
(61.9%) of these cases the DJI fell decisively.
The IP21 stands today at .015 and the V-I is
only +7 with the DJI still 2% over the
21-day ma. These readings while bearish,
could be much worse. That would make the current
market even more bearish. New research
tonight shows that if the IP21 had been negative
the odds of a DJI rally would only be 2/9.
If the V-Indicator were below -30, then the
chances for rally after a 0.8% early decline
would be only be 20%. With both the
IP21 and V-I above zero, the 0.8% DJI down day
this week has produced 1 good advance
and 3 significant declines since 1945.
DJI
change
la/ma annroc P-I
IP21 V-I Opct
65-day Pct Change
-----------------------------------------------------------------------------------------------------------------------------------------
12/26/2013
16480 +122
1.028 .303
+133
-.036
-1 .182
.074
12/27/2013
16478 -1.5
1.026 .301
+119
-.031
5 .102 .078
12/30/2013 16504
+26 1.027 .302
+79 -.027
-2 .097
.076
12/31/2013 16577
+73 1.03 .363
+108 .010
9
.167 .086
1/2/2014
16441 -135 1.02 .320
+123 .010
7
.169 .086
Aftermath of the 21
0.7% DJI Down days in First 5 Days of January
1945 - 2013
Conclusion:
1. All 21 cases
8 DJI advances but 13 declines. 6 straight declines since 1980
2. When
IP21 was < 0 there were
2 DJI advances and 9
DJI declines
3 When
IP21 was > 0 there were
4 DJI advances and 3 declines
4 When both IP21 and V-I were
< 0 there was
1 DJI advances and 8 DJI declines
5 When both IP21 and V-I were > 0
there was
1 DJI advances and 3 DJI declines
6 When
V-Indicator was below -30
2 DJI advances and 8
declines
All Cases: 1945-2013
#1 1/5/1948
DJI fell from 179.5 to 165.4 on 3/16/1948
IP21 = .032 V .= -88
#2 1/3/1949 DJI fell from 175 to 161.9 on 6/14/1949
IP21 = -.047 V = -176
#3 1/5/1955 DJI rose from 397.2 to 467.4 on 6/17/1954
IP21 = .02 V = -140
#4 1/3/1961 DJI rose from 610.2 to 705.9 on 5/19/1861
IP21 = .046 V = -12
#5 1/2/1962 + 1/5/1962 DJI fell from 724.7
to 536.9 on 6/27/1962
IP21 = -.042 V = -458
#6 1/2/1963 DJI rose from 646.8 to 726.9 on 6/6/1963
IP21 = .006 V = -79
#7 1/4/1971 DJI
rose from 830.57 to 950.82 on 4/28/1971
IP21 = .107 V = 0
#8 1/4/1977 + 1/5/1977 DJI falls (1977 Bear
market began.)
IP21 = .089 V = 2
#9 1/4/1978 DJI falls from 817.74 to 742.12 on 2/28/1978
IP21 = -.018 V = -2
#10 1/2/1980 DJI
rallies 8% from 624.57 but then falls to 759.13 on 4/21/1980
IP21 = -.015 V = 0
#11 1/5/1982 DJI
fell from 865.3 to 795.47 on 3/8/1982
IP21 = - .109 V = -5
#12 1/3/1983 DJI
rose from 1027 to 1229.68 on 5/10/1983
IP21 = -.17 V
= -4
#13 1/2/1985 + 1/3/1985 DJI rallied from
1198.87 to 1327.28 on 6/6/1985
IP21 = .005 V = -1
#14 1/3/1989 DJI rose from 2144.64 to 2516.91 on 6/8
IP21 = .016 V = 1
#15 1/5/1990 DJI fell from 2773.25 to 2543.24 on 1/30/90
IP21 = -.012 V= -39
#16 1/2/1991 + 1/3/ =1991 DJI fell from 2610.64 to 2483.91
but then rose to 3035.33 on 6/3/1991
IP21 = .103 V = + 2
#17 1/3/2000 + 1/4/2000
DJI fell from 11357.51 to
9796.03 on 3/7/2000
IP21 = -.079 V= - 75
#18 1/2/2001 + 1/5/2001
DJI fell from 10646.15 to
9504.78 on 3/23/2001
IP21 = -.021 V = -38
#19 1/4/2005
DJI fell 10630.78 to 10012.36 on 4/20/2005
IP21 = -.007 and V = -60
#29 1/2/2008 + 1/4/2008
DJI fell from 13043.96 to 11704.15
IP21 = -.048 and V = -153
#21 1/5/2009
DJI fell from 8952.89 to 6547.05 on 3/9/2009
IP21 = .01 V = 31
|
===============================================================================
OLDER HOTLINES
===============================================================================
12/31/2013
Will the Sell
S16 be powerful enough to stop the quickening acceleration upwards
by the NASDAQ
and QQQ now? 1986-1987 and 1999-2000 say "not for
a while".
1959-1960 and 1961-1962 say "Yes and
soon."
Sell S16s have not produced a loss in 12
cases. But let's let the technical picture
become clearer. There is still a
good chance the NASDAQ and QQQ will accelerate
up this month because the Fed just does
not dare raise rates or end its mortgage buying
program. There still are not many
attractive short sales below. Professionals have
not turned bearish, though funds continue
to sell into strength.
---> 171 MAXCP stocks Bullish MAXCP Stocks (12/31/2013)
Bullish plurality
--> 36 MINCP stocks
Bearish MINCP Stocks (12/31/2013)
--> 107 New Highs on NASDAQ 9
new lows. Bullish plurality
--> 153 New Highs on NYSE 9 new lows. Bullish plurality
12/31/2013 --> To Key Index and Leading Stock Charts: DJI, SP-500, etc.

Looking for past parallels is usually of
help. The first parallel to consider
is the 1986-1987 period. The DJI's
flat-to-rising trading range last Summer
has been regularly compared here to the
similar trading range in the Summer of 1986.
If that parallel holds true, 2014 will
see a big surge upwards as occurred
in the first 8 months of 1987, but first
we should see a series of new Peerless Buy
signals to mark the January take-off.
DJI 1986-1987

The second parallel I've often mentioned
here is with the final "bubble" top
of early 2000. The booming market
of 1995-1999 might be compared to the
gathering upward momentum now. Back
then, the December 29, 1999 Sell S16
did bring a 16% reversal down by the DJI,
but not until January 14th. Moreover,
the NASDAQ kept rising until March 10th.
In both these cases the DJI was rising,
like now, easily into all-time high territory.
Most of the Sell S16s did not try to
reverse a DJI at an all-time high. The only exceptions
that swiftly brought DJI declines were
1959-1960 and 1961-1962. So, this tends
to suggest we should be cautious about
the Sell S16.
What's bullish now is momentum. the
accelerating uptrend of the NASDAQ and the QQQ
as well as the steady momentum of the DIA and SPY. These bring out
the greed in
traders and the natural fear that if they
sell prematurely, they will miss the rest
of the speculative boom.

As you can see from the NASDAQ and QQQ charts,
the more speculative US markets
and the major market ETFs have been pushed way
up by the Fed to the top of their price
channels. Charting theory tells us that a
breakout above a top of a price channel
is often a prelude to a buying climax, but
first prices must rise the height of their
earlier price channel above the point of their
new breakout.
Let's Give The Advance More Room To Play Out
I think we have to give the market more
time to rally. The Peerless Sell S16
of yesterday has not been
"clinched" by having NYSE declining stocks outnumber
advancing stocks today. In
addition, the Closing Power for DIA and SPY are still rising.
Our Tiger Stocks' Hotline has not yet
switched to a bearish posture, but we will
probably become hedged next week. The
artificial boost to the market of year-end though
window-dressing and the New Year
investment of funds often boosts the market for
about 4-5 trading days into the new year.
After that if the QQQ and NASDAQ have
not broken above the top of their price
channels, Sell S16 is likely to work out.
In the past, the average DJI decline
following a Sell S16 was 10.0% in the 12 cases.
We can afford to be surer that the upward
momentum has stalled before selling short.
The Fed's Very Visible Predicament Lies Behind The Market's Boom
Now.
Many observers feel the Feds will continue to
subsidize Wall Street investing
and speculation. As I see it, they
have little choice but to do this. They
have a basic dilema. They know very well
that speculation is getting wilder and wilder.
They also know that the low interest rates are
not doing much to boost most areas
of the domestic US economy. They probably
see that they are making the rich much richer
and possibly even creating another housing
bubble. But as they see it, without their
efforts, the market might crash and the economy
go into another tailspin.
Still the Fed can be faulted. It is a
captive of the biggest banks. They are unwilling
to do thngs which could change the current
market's dynamics: namely,
1) to raise margin requirements to reduce speculation,
2) to end the short-selling on down-ticks or to eliminate leveraged
long and short ETFs or
3) to stop the big banks from using the Fed's cheap money mostly
to speculate in the stock market or
4) to require that the banks readily loan money to consumers and to
small businessmen.
Constrained as they are, the Fed has done
little to boost US manufacturing, reduce long-term
unemployment in US or help raise wages and
reduce the staggering levels of inequality in the US.
As such, the US economy's underpinning are
still fragile and the FED is deathly afraid that
any tightening of monetary policies, especially
combined with the existing fiscal drag
of the budget-balancing in Washington), could
readily bring about a stock market collapse
and then a relapse of the economy into another
near Depression. So, any market decline
will probably be met by renewed efforts on
their part to pump tihngs up again.
DJI
change
la/ma annroc
P-I
IP21 V-I
Opct 65-day Pct Change
-----------------------------------------------------------------------------------------------------------------------------------------
12/26/2013
16480 +122
1.028 .303 +133 -.036
-1 .182 .074
12/27/2013
16478 -1.5
1.026 .301
+119
-.031
5 .102 .078
12/30/2013 16504
+26
1.027 .302
+79 -.027 -2
12/31/2013 16577
+73 1.03 .363
+108 .010
9
.167 .086
Past Sell S16s
Clinching = "waiting for 50 more down than up on NYSED
to act on Sell S16.
Clinching the Sell S16 would have meant selling slightly lower on weakess in 8 of
the 12 cases.
#1 19341231 S16
104.00
+.104
ADV
DEC
12/31 402 194
1/2 346 202
1/3 412 202
1/4 268 332 104.7 clinched
2/18
107.2
Paper loss =
3.1% (The rising 65-dma
acted as support but no Buy signal given.)
la/ma
AnnRoc P-I
PI ch P^^Adj
IP21 V-I Opct 65-d cpct ch.
KVal 1.024 .141 2 1
12 -.065
-49 .081 .149
A second S16 followed:
19350102 S16
104.5
.042 4 straight up days
-----------------------------------------------------------------------
#2 19381230 S16
154.4
+.100
3 straight up days
ADV
DEC
12/30 477 202
1/3 257 407 153.6 clinched, (lower
than ordignal Sell)
Paper Loss = none
KVal 1.029 .366 -4 -10
-20 .046 0
.278 .151
-----------------------------------------------------------------------
#3 19400103 S16
152.8
+.045
4 straight up days
ADV DEC
1/3 643 64 152.8
1/4 316 321 152.4
1/5 225 430 151.5 clinched (lower
than ordignal Sell)
clinched,
Paper Loss = none
KVal 1.026 .505 68 17
343 .072 54 .202
-.002
-----------------------------------------------------------------------
#4 19420102 S16
112.8
+.132
4 straight up days
ADV DEC
1/2 530 74 112.8
1/5 469 146 114.2
1/6 281 333 113.9 clinched
Paper loss = 0.6%
KVal 1.022 -.302 -55 6
-275
.039 -238 -.141 -.108
----------------------------------------------------------------------
#5 19521230 S16
292
+.098 4 straight up days
ADV DEC
12/30 573 390 292
12/31 520 390 291.9
1/2 557 332 292.1
1/5 694 270 293.8
1/6 281 573 292.2 clinched
Paper loss = 0.6%
KVal 1.022 .346 37 -6
139 .129 -57
.416 .074
----------------------------------------------------------------------
#6 19591231 S16
679.3
+.099
3 straight up days
Paper loss = 0.5%
ADV DEC
1/6/59 439 619 682.2 clinched This
was peak (lower than ordignal
Sell)
KVal 1.011 .266 -18
-8 -52 -.057 -243
.086 .067
----------------------------------------------------------------------
#7 19611228 S16
731.5
+.263
4 straight up days
Paper Loss =
none
ADV DEC
12/28/61 439 619 682.2 clinched This
was peak (lower than ordignal
Sell)
KVal 1.005 .056 -78
-2 -225 -.042 -510 .171
.057
----------------------------------------------------------------------
#8 19700102 S16
809.7
+.056
4 straight up days
Paper Loss = none
763.99
ADV DEC
1/6/70 488 890 803.66 clinched This
was day after a peak (lower than
ordignal Sell)
KVal 1.026 .126 -87
67 -185 -.053
-2 -.001 -.005
----------------------------------------------------------------------
#9 19761229 S16
994.93
+.061 5 straight up days
Paper loss = 0.977%
ADV DEC
1/4/77 588 965 987.87 clinched This
was 2 daya after a peak (lower
than ordignal Sell)
KVal 1.022 .55 235 6
434 .096 2 .394
-.015
----------------------------------------------------------------------
#10 19810102 S16
972.78
+.042
5 straight up days
Paper loss =
3.3%
ADV DEC
1/7/81 219 1552 980.89 clinched
KVal 1.029 -.264 -71
30 -123 -.04
-5 -.017 .017
----------------------------------------------------------------------
#11 19900102 S16
2810.15
+.075
4 straight up days
Paper Loss =
none
ADV DEC
1/4/90 645 924 2796.08 clinched (lower
than ordignal Sell)
KVal 1.028 .453 50 30
99 .108 -1
.021 .042
----------------------------------------------------------------------
#12 19991229 S16
11484.66
+.128
2 straight up days
Paper loss =
2.1%
ADV DEC
1/3/00 1079 2140 11357.51 clinched (lower than
ordignal Sell)
KVal 1.025 .571 -216 98
-215 -.063 -67 .239
.114
-----------------------------------------------------------------------
No. = 12 +.100
|
--------------------------------------------------------------------------------------------------------------------------------------------------------
OLDER HOTLINES
------------------------------------------------------------------------------------------------------------------------------------------------------
12/30/2013 New
Peerless Sell S16 today. The odds do favor slightly higher prices
over the next two-three days of
trading. But the average DJI decline following a
Sell S16 is 10.0%. There have
been 12 previous S16s, counting a cluster of them
as just one case.
---> 147
MAXCP stocks Bullish MAXCP Stocks (12/30/2013)
Bullish plurality
--> 40 MINCP stocks
Bearish MINCP Stocks (12/30/2013)
--> 78 New Highs on NASDAQ 5
new lows. Bullish plurality
--> 90 New Highs on NYSE 20 new lows. Bullish plurality
12/30/2013 --> To Key Index and Leading Stock Charts: DJI, SP-500, etc.
The Sell S16 was introduced this
Summer. Is is usually caused by the failure of the
Santa Claus rally to lift the
V-Indicator above, say, +10 at the end of the year even
though the DJI itself has rallied
more than 2.2% over the 21-day ma. The DJI is
currently 2.7% over the 21-dma and
the V-I stands only at -2.
(The V-I is the 21-day ma of 85% of the NYSE up-volume minus 100% of
NYSE up-volume. The exact code for the S16 signal will be disclosed in the
forth-coming Peerless book.)
In our case, the IP21 (current
Accumulation index) is a weak-looking -.027.
In 6 of the 12 earlier Sell S16s
the IP21 was also negative. Distribution by big money
is shown here to be going on
unabated by the Santa Claus rally. This is not a good
sign.
The most bullish aspect of the
current market's internal strength is that the P-I is positive,
at +79. But when adjusted for
the number of shares now traded on the NYSE, this is
about only about +10 by 1929
standards, which is not very impressive at this time of year.
We find that 4 of the earlier 12
Sell S16s had higher adjusted P-I readings than now.
So, breadth
is probably not good enough now to save the market from a decline at least
to the lower band.
In addition, the P-Indicator fell
by 40 from Friday. This is the biggest P-I decline on the
day of the Sell S16. Further
breadth deterioration will not go unobserved by many technically
minded traders.
A Little Higher?
In the 12 earlier S16 cases, there
were only 3 instances where the DJI rose another 2.1%-3.3%.
That makes the odds only 25% of
another 3% rally. In 5 cases, the Sell S16 marked the
exact top and in another 5 cases, a
short seller here would have only have had to endure an
additional rally of 0.1% to 1.0%.
How Much of A Decline?
The average S16 brings a 10% profit
to the short seller on the DJI. New research
shows that Buy B9s should be
suppressed for about a month after the Sell S16. The
DJI typically goes below the
first tagging of the lower 3.5% band.
What To Do?
I would say it's time to
reduce long positions. DIA and SPY might be shorted, too,
but being cautious by nature,
I would like to see a reversal down by these indexes first.
From the charts of Sell S12s
(which will be linked to tomorrow), you will see that it is unusual
for the DJI not to advance
into early January. Only in two cases did an S12 before
the new year become a perfect
Sell and show no paper loss if the DJI was shorted.
19381230 S16
154.4
No Paper Loss +.100
19611228 S16
731.5
No Paper Loss +.263


Sell S16s:
1929-2013
20131230
S16
16504
6 straight up days
KVal 1.027
.302
79
-40
79 -.027 -2
.097 .076
Key Values' Ranges: Highs and Lows
Earlier S16s Current
LA/MA range 1.005 to
1.029 1.027
AnnRoc
-.302 to
+.571 .302
P-I
-216 to + 235 +79
P-I ch
-10 to + 98 -40 Outside the past range.
P-I^^ (adj)
-275 to +444
+79
IP21
-.065 to + .129 -.027|
V-I
-510 to +54
-2.0
OPct
-.141 to + .416 +.097
65-d pct ch
-.108 to + .151
+.076
--------------------------------------------------------------------------------------------------------------------
#1 19341231      S16            104.00        +.104
    Paper loss =  3.1%   Next market bottom 3/18/1935
      la/ma     AnnRoc       P-I     PI ch       P^^Adj      IP21   V-I   Opct  65-d cpct ch.
KVal  1.024  .141      2     1        12   -.065 -49 .081  .149
    A second S16 followed:
19350102      S16            104.5         .042   4 straight up days
-----------------------------------------------------------------------
#2 19381230      S16            154.4        +.100     3 straight up days
    Paper Loss = none   Next market bottoms  1/26/1939 and 4/11/1939.
KVal  1.029  .366     -4    -10       -20  .046   0  .278   .151
-----------------------------------------------------------------------
#3 19400103      S16            152.8        +.045   4 straight up days
    Paper Loss = none  Next market bottoms  1/15/1940 and 6/10/1940.
KVal  1.026  .505     68     17       343  .072  54  .202    -.002
-----------------------------------------------------------------------
#4 19420102      S16            112.8        +.132   4 straight up days
    Paper loss = 0.6% Next market bottoms  4/28/1942
KVal  1.022 -.302    -55     6       -275  .039 -238 -.141   -.108
----------------------------------------------------------------------
#5 19521230      S16            292          +.098   4 straight up days
    Paper loss = 0.6%   Next market bottoms  6/16/1953
KVal  1.022  .346     37     -6        139 .129  -57  .416    .074
----------------------------------------------------------------------
#6 19591231      S16            679.3        +.099   3 straight up days
    Paper loss = 0.9%    Next market bottoms  3/8/1960
KVal  1.011  .266    -18     -8        -52 -.057 -243  .086    .067
----------------------------------------------------------------------
#7 19611228      S16            731.5        +.263   4 straight up days
     Paper Loss = none  Next market bottoms  1/29/1962 and 6/26/1962.
KVal  1.005  .056    -78     -2       -225 -.042 -510  .171    .057
----------------------------------------------------------------------
#8 19700102      S16            809.7        +.056  4 straight up days
          Paper Loss = none   Next market bottoms  6/2/1970 and 5/26/1970
KVal  1.026  .126    -87     67       -185 -.053  -2  -.001    -.005
----------------------------------------------------------------------
#9 19761229      S16            994.93       +.061   5 straight up days
    Paper loss = 0.977%   Next market bottoms  4/4/1977 and 11/3/1977
KVal  1.022  .55    235      6         434  .096  2   .394    -.015
----------------------------------------------------------------------
#10 19810102      S16            972.78       +.042   5 straight up days
    Paper loss =  3.3%   Peak was on a Friday 1/6/1981
                           Next market bottoms  2/13/1981 and 9/25/1981
KVal  1.029 -.264   -71     30        -123  -.04  -5  -.017    .017
----------------------------------------------------------------------
#11 19900102      S16            2810.15      +.075   4 straight up days
      Paper Loss = none   Next market bottoms  1/30/1990
KVal  1.028  .453    50     30          99  .108  -1   .021    .042
----------------------------------------------------------------------
#12 19991229      S16            11484.66     +.128   2 straight up days
    Paper loss =  2.1%  Peak was 1/14/2000  Next market bottoms  3/7/2000
KVal  1.025  .571   -216    98         -215 -.063  -67  .239   .114

-----------------------------------------------------------------------
                             No. = 12      +.100
|
====================================================================================
OLDER HOTLINES
====================================================================================
12/27/2013 Still no Peerless Sell signal. Only a 1.5 point DJI decline
after 6 straight DJI up days
is impressive. The minimum upside target is 16750. There remains red
distribution,
to be sure. Our Accumulation Index
(IP21) is a -.031 despite the DJI
being 2.6% over the 21-day ma.
But the present key values would
NOT produce a Sell signal if it were Monday.
12/27/2013 --> To Key Index and
Leading Stock Charts: DJI, SP-500, etc.
Seasonality is still favorable. Since
1965, the DJI has rallied 69.6% of the time over the next week and
advanced +0.9% on average since 1965,
Typically the real test will come in early next year.
It's true, howeverm that early Januarys
are often pivotal months. Next week the market
will be buffeted by lots of tax loss
selling, buying and shifting of funds.
How Bearish Is January in A Rising Market?
Since 1928:I count:
21 Peerless Sells and then bearish Januarys.
4 cases where the DJI fell only to the 2 1/2%-3/ 1/2% lower
band without a Peerless Sell
and then reversed strongly upwards. This is the category we have to be
concerned about.
27 instances where the DJI kept right on rallying without a reversal
in January down.
23 cases where the DJI went sidewise in January.
The conclusion that I draw from this is
that without a Peerless Sell the odds heavily favor
a continuation of the bull market another
month, though there is a small chance (4 cases
in 84 years) that the DJI will next drop
to the lower band without a Peerless Sell.
January Reversals' Down January
Sidewise Jan Cont Ups Jan Cont Downs
Jan.Reversals Up
----------------------------------
---------------------[-
------------------- ---------------------
------------------------
38-39 (S16)
. 28-29 30-31 31-32
35-36
32-33
29-30
39-40 (S16,S1
34-35
36-37
77-78
66-67
40-41 S12)
37-38
42-32
81-82
78-79
41-42 (S16,S9)
43-44
44-45
79-80
47-48 (S10)
46-47
45-46
52-53 (S16)
48-49
49-50
55-56 Decline to LB
51-52
50-51
56-57 (S9,S1,S12)
54-55
53-54
59-60 (S16,S15,S1,S10)
57-58
60-61
61-62 (S16, S10)
58-59
62-63
65-66 (S4,S12)
68-69
63-64
67-68 (S12)
71-72
64-65
69-70 (S16,S9)
82-83
70-71
72-73 (S15,S9,S4,S12)
87-88
75-76
73-74 (S12)
90-91
84-85
76-77 (S4,S16)
92-93
85-86
80-81 (S9,S16,S12)
98-99
86-87
83-84 (S12)
00-01
88-89
89-90 ( S4,S16,S15)
03-04
91-92
99-00 (S9,S16,S15,S4)
05-06
93-94
01-02 Decline to LB
06-07
94-95
02-03 (S12)
95-96
04-05 Decline to 2% LB
96-97
08-09 (S6)
97-98
09-10 Decline to LB
10-11
11-12
12-13
-------------------------------------------------------------------------------------------------------------------------------------[
21 Peerless Sells
23 Jan flat
27 Cont. up 3 cont. down
4 reversals up
4 No Sell -
decline to 2%-3.5% LB
Bullish Both Up Condition for SPY and QQQ
Right now both the Opening Power and
Closing Power are rising. This keeps alive
a January vertical ascent scenario.
It's very hard for a long bull market to stop,
and this one is 57 months' old, without
blatant Sell S9s and/or climactic vertical
ascents, as the DJI saw in 1987 or the
NASDAQ saw in 2000.
 |
 |
DJI change
la/ma
annroc P-I
IP21
V-I
Opct 65-day Pct
Change
-----------------------------------------------------------------------------------------------------------------------------------------
12/17/2013
15875 -9 .995
-.064 -168 -.118
-89 -.061 024
12/18/2013
16168 52 1.013 .143
-52
-.042 -56 -.042 041
12/19/2013
16179 +11
1.013 .158
-20
-.023 -48 .053
032
12/20/2013
16221 +42
1.015 .239
+103
-.026
-9 .214 037
12/23/2013
16295 +73
1.018 .212
+94
-.043
-11 .211 054
12/24/2013
16358 +122
1.021 .218
+107
-.058
-12 .193
.062
12/26/2013
16480 +122
1.028 .303 +133 -.036
-1 .182 .074
12/27/2013
16478 -1.5
1.026 .301
+119
-.031
5 .102
.078
---> 121 MAXCP stocks Bullish MAXCP Stocks
(12/27/2013) Bullish
plurality
--> 40 MINCP stocks
Bearish MINCP Stocks (12/27/2013)
--> 77 New Highs on NASDAQ 3
new lows. Bullish plurality
--> 90 New Highs on NYSE 29 new lows. Bullish plurality
====================================================================================
OLDER HOTLINES
====================================================================================
12/26/2013 Light volume Santa Claus
rallies like this are usually reversed in January,
but 6-straight DJI up days is impressive.
I can find no year-end tops where this occurs.

--> To Key Index and Leading Stock Charts: DJI, SP-500, etc.
Peerless still is on its Buys. However, the DJI has now reached its 2.8% upper
band and the IP21 (Accum. Index) is -.036 and the V-I is -1. If
these levels persist until next week
we will get a Peerless Sell S16. (See below).
I would say the odds favor a reversal and
another decline to the lower band. But only after
we see still higher prices. That's
because
(1) the seasonality is still bullish. Since 1965, the DJI has risen 63% of the time
over the next 3 trading days and 67.4% over the next 5 trading days.
(2) the 1000-point wide trading range breakout at 15750 suggests a minimum
upside
target of 16750.
(3) Before a reversal happens here, we should get a Peerless Sell. That's the
lesson of all the data back to 1928 with Peerless.
(4) The 6-straight DJI Up-Days has never occurred right before a Sell S16.
I looked back to find historical parallels just
to be sure. where the key Peerless indicators
had conditions after Christmas similar to ours
now. The three closest cases are shown below.
In each case the DJI rose more, at least until
January. In two cases, there was an
early January top and decline to the lower
band. In one case, a bull market developed.
As we have already had a long bull market, I
suspect early January will, in fact, being a top and
a decline to the lower band.
la/ma IP21 V-I Outcome
12/26/2013 1.028
-.036 -1 ????
12/28/1973 1.03
-.027 -3 DJI rose from 848.02 to 880.23 on 1/41974 and then
fell back 9%
12/31/1974 1.03
-.029 -3 New bull market followed. 6
straight up-days ending 1/7/1975
12/28/1982 1.029
-.114 -1 DJI rose from 1058.87 to 1092.25 on 1/11 and then
fell to the lower band.
|
Sell S16 (C) 2013 William Schmidt,
Ph.D. December Version 12/20/2013
--------------------------------------------------------------------------------------------------------------------------------------------
Santa Claus Rally Fails To Bring A
Strong Rally at Year-End
There have been 13
Sell S16s in the 84 years between 2012-1928.
The average decline until the next Peerless Buy was 7.1%. It is common
for these Sells to
reverse rallies of 3-5 straight Up-days. Not counted in these
statistics
was an additional Sell S16 which is based on different rules that
occurred only once
using the Extreme Bearish Mode between 1929 and 1932
>10%
4
5%-9.99%
3
2%-4.99%
5
0%-1.99%
1
losses
0
Sell S16s:
1929-201319341231 S16 104 .038 4 straight up days
19350102 S16 104.5 .042 4 straight up days
19381230 S16 154.4 .1 3 straight up days
19400103 S16 152.8 .045 4 straight up days
19420102 S16 112.8 .132 4 straight up days
19521230 S16 292 .022 4 straight up days
19591231 S16 679.3 .005 3 straight up days
19611228 S16 731.5 .177 4 straight up days
19700102 S16 809.7 .056 4 straight up days
19761229 S16 994.93 .061 5 straight up days
19810102 S16 972.78 .035 5 straight up days
19900102 S16 2810.15 .075 4 straight up days
19991229 S16 11484.66 .128 2 straight up days
------------------------------------------------
No. = 13 .071
PE          3     .043
PE +1       2     .106
PE +2       5     .080
PE +3       3     .058
Jan         6      .064
Dec         7      .076
1-10        5      .064
11-20       0
21-31       8      .076
|

|
DJI
DJI change la/ma
annroc P-I
IP21 V-I
Opct
65-day Pct Change
-----------------------------------------------------------------------------------------------------------------------------------------
11/27/2013
16097 (high)
+25 1.017
.314 -43 NC .069 -38 .297
089
...
12/13/2013
15755 (low)
+16 .987 -.049 -117 -.06
-71 .041
029
12/16/2013
15885
+130 .995 .006 -112
-.081 -70 .044 033
12/17/2013
15875
-9 .995
-.064 -168 -.118
-89 -.061
024
12/18/2013
16168
52
1.013 .143
-52
-.042 -56
-.042 041
12/19/2013
16179
+11 1.013 .158 -20 -.023
-48 .053 032
12/20/2013
16221
+42 1.015 .239 +103 -.026
-9 .214 037
12/23/2013
16295
+73 1.018 .212 +94 -.043
-11 .211 054
12/24/2013
16358
+122 1.021 .218 +107 -.058
-12 .193
.062
12/26/2013
16480
+122 1.028 .303 +133 -.036
-1 .182
.074
---> 171 MAXCP stocks Bullish MAXCP Stocks
(12/26/2013) Bullish
plurality
--> 37 MINCP stocks
Bearish MINCP Stocks (12/26/2013)
--> 130 New Highs on NASDAQ 9
new lows. Bullish plurality
--> 179 New Highs on NYSE 23 new lows. Bullish plurality

"Merry Christmas.... Peace and Good Will to All" |
=================================================================================
12/23/2013 Still Higher Prices
Must Be Expected.
It's true that the Hourly DJI chart continues to show heavy down volume.
Perhaps,
this is the result
simply of tax-selling. I would place more trust in the active
Peerless Buy Signals.
(B9/B10/B13). The tradition of a Santa Claus Rally sponsored
by the Fed is not a
tradition we should gainsay. Moreover, the DJI's breakout at
15750 from a thousand
point-wide flat trading range sets up a minimum upside objective
of 16750.
It's also no accident, I think, that there are lots of Bullish
MAXCP stocks and
very few good-looking
short sales among our Bearish MINCP stocks. We see
lots
of very high
Accumulation Breakouts and New Highs. By contrast, most of the Bearish
MINCP stocks are
counter-cyclical gold stocks and leveraged bearish ETFs on the
general market.
--> To Key Index and
Leading Stock Charts: DJI, SP-500, etc.
The famous trader Jesse
Livermore often said that a good trader must learn
how important it is
simply to hold onto winning positions and let them run. I'm sure
he would have added,
were he around today, that a "good trader must happily
appreciate and accept
the FED's generosity" and not worry too much about whether
its methods conform to
others' tendentious ideological standards.

This happy and contented tiger is smiling as 2013 comes to an end..
DJI
DJI change la/ma
annroc
P-I
IP21 V-I
Opct
65-day Pct Change
-----------------------------------------------------------------------------------------------------------------------------------------
11/27/2013
16097 (high)
+25 1.017
.314 -43 NC .069 -38 .297
089
...
12/13/2013
15755 (low)
+16 .987 -.049 -117 -.06
-71 .041
029
12/16/2013
15885
+130 .995 .006 -112
-.081 -70 .044 033
12/17/2013
15875
-9 .995
-.064 -168 -.118
-89 -.061
024
12/18/2013
16168
52
1.013 .143
-52
-.042 -56
-.042 041
12/19/2013
16179
+11 1.013 .158 -20 -.023
-48 .053 032
12/20/2013
16221
+42 1.015 .239 +103 -.026
-9 .214 037
12/23/2013
16295
+73 1.018 .212 +94 -.043
-11 .211 054
bearish
---> 244 MAXCP stocks Bullish MAXCP Stocks
(12/23/2013) Bullish
plurality
--> 33 MINCP stocks
Bearish MINCP Stocks (12/23/2013)
--> 234 New Highs on NASDAQ 11 new lows. Bullish plurality
--> 226 New Highs on NYSE 13 new lows. Bullish plurality

====================================================================
OLDER HOTLINES
====================================================================
12/20/2013 This Could Be The
Beginning of A NASDAQ/QQQ Vertical Ascent
The Peerless Buys Signals
(B9/B10/B13) and the regular Santa Claus Rally are propelling
the DJI towards the
minimum 16750-16800 target. The Nasdaq, QQQ and IWM
need to show
a little more strength to
show that they are taking over market leadership enough to allow
a 1999-2000-like vertical
take-off by the Nasdaq and QQQ. Bernanke's statement that the
Fed will not be raising rates
and the revision up of the growth in GNP have once again
caught the bears by surprise.
The DJI's advancing into all-time high territory makes it that
much easier to run them in
and force high-performance hedge funds to keep chasing the
advance. The continuing
weakness in Gold and Gold Stocks are also very bullish signs,
as they usually advance more than
25% just before the market turns significantly
down.
--> To Key Index and Leading Stock Charts: DJI, SP-500, etc.
DJI
DJI change la/ma
annroc
P-I
IP21 V-I
Opct
65-day Pct Change
-----------------------------------------------------------------------------------------------------------------------------------------
11/27/2013
16097 (high)
+25 1.017
.314 -43 NC .069 -38 .297
089
...
12/13/2013
15755 (low)
+16 .987 -.049 -117 -.06
-71 .041
029
12/16/2013
15885
+130 .995 .006 -112
-.081 -70 .044 033
12/17/2013
15875
-9 .995
-.064 -168 -.118
-89 -.061
024
12/18/2013
16168
52
1.013 .143
-52
-.042 -56
-.042 041
12/19/2013
16179
+11 1.013 .158 -20 -.023
-48 .053 032
12/20/2013
16221
+42 1.015 .239 +103 -.026
-9 .214 037
still bearish
Most Bullish
Leveraged ETFs
TQQQ 118.08 +3.45 AI/200=165 IP21=.113
TNA 73.43 + 3.22 AI/200=174
IP21 =.129
URTY 84.06 +3.62 AI/200=174 IP21 = .122
BIIB 147.00 +5.84 AI/200 = 172 IP21= .093 - Biotechs
------------------------------------------------------------------------------------------------------------------------------------------
NASDAQ Flat topped Breakout is Bullish


---> 259 MAXCP stocks Bullish MAXCP Stocks (12/20/2013)
Bullish plurality
--> 43 MINCP stocks Bearish MINCP Stocks (12/20/2013)
--> 172 New Highs on NASDAQ 12 new lows. Bullish plurality
--> 189 New
Highs on NYSE 15 new lows. Bullish plurality
=====================================================================
OLDER HOTLINES
=====================================================================
12/19/2013 Wall Street Still Believes in Santa Claus - after all these years.
The DJI rallies 76.1% of time for the 10 days
after 12/19 and produces an average gain of 1.7%.

Give the bullish signals a chance now to
produce a bigger market advance.
--> To Key Index and Leading Stock
Charts: DJI, SP-500, etc.
The DJI would not fall back to profit-taking
today. That's in keeping with the spirit
of the season and the Peerless Buys.
It also puts pressure on the bears to cover
and the high performance-hedge funds to buy
back on strength for fear of missing a
bigger advance.
With the DJI 1.3% over the 21-dma and all three
of our primary internal strength
indicators negative, we should get some peace
of mind knowing that it is
very rare to get a Sell signal right before Christmas. Without a Sell , a big decline
is most unlikely. I checked this: if the
DJI had closed 300 points higher today,
we still would not have gotten a Peerless Sell.
After Christmas,
things may be different. Given the negative internals and the DJI's strength,
the most likely Sell will occur from the
December 28th to the January 3rd and
it will be a Sell
S16. This is the signal that is based on a Santa Claus rally that
peters out and stalls without bringing along
the rest of the market.
Key Values Now
la/ma
P-I IP21
V-I
12/19/2013
16179
+11 1.013 .158 -20 -.023
-48 .053 032
The difference between a January pivot downwards and
a January take-off is sometimes
not very much. For example, in 1987 the DJI
broke to a new high on January 5th. It was
2.4% over the 21-dma with the P-Indicator a -99 and
the V-I a - 13. There was no sell
signal because the IP21 was +.094. So,
the IP21 needs now to get back above zero and move
higher. To do this the DJI must close near its
daily highs and volume must rise.
Right now, seasonality and the prospect of low
interest rates for many months longer
are at work. They should keep up the upward
momentum going. By my reckoning, the
DJI still has a minimum
upward objective of .16750-16800, based on the height of the previous
pattern, 14700-15750.
Watch The QQQ's Closing Power.
Will It Get back above its 21-dma and produce
the bullish "Both-Up" condition?
If AAPL can turn
back up and the leading biotechs can overcome their profit-taking,
I would think QQQ
will resume its leadership.

NYSE is at Apex of Right Shoulder, A High Inflection Point.
Another element in the picture is the NYSE (chart
below). It could be forming
its own head and shoulders. A reversal tomorrow
down by it tomorrow would
make its price pattern look bearish enough to spook
some traders of dividend stocks,
the type that heavily populate the NYSE. On the
other hand, an advance by the
NYSE tomorrow would destroy this bearish pattern.
That would be quite bullish short-term.

DJI
DJI change la/ma
annroc P-I
IP21
V-I
Opct
65-day Pct Change
-----------------------------------------------------------------------------------------------------------------------------------------
11/27/2013
16097 (high)
+25 1.017
.314 -43 NC .069 -38 .297
089
11/29/2013
16086
- 11 1.015
.352 +41
.072 -28 .317
085
12/02/2013
16009
- 78 1.008
.348 +9
.080 -25 .341
078
12/03/2013
15915
- 94 1.001
.224 -10
.066
-40
.231
074
12/04/2013
15890
- 25
.999 .188 -94
.071
-54
.131
071
12/05/2013
15822
- 68
.994 .152 -89
.042
-51
.134
059
12/06/2013
16020 +199 1.006
.204 -34
.049
-41
.132
072
12/09/2013
16026
+5 1.005
.323 +49
.097
-4 .249
073
12/10/2013
15973
-52 1.001 .158
-1
.038 -27
.146
060
12/11/2013
15853
-120 .993 .053
-54
.001 -54
.052
043
12/12/2013
15739
-114 .986 -.008 -83
-.017
-55 .047
026
12/13/2013
15755
+16 .987 -.049 -117 -.06
-71 .041
029
12/16/2013
15885
+130 .995 .006 -112
-.081
-70 .044
033
12/17/2013
15875
-9 .995
-.064 -168 -.118
-89 -.061
024
12/18/2013
16168
52
1.013 .143
-52
-.042 -56
-.042 041
12/19/2013
16179
+11 1.013 .158 -20 -.023
-48 .053 032
3:00 PM DJI DJI at Close Last Hour Change
--------------------------------------------
12/11/2011 15884.54 15843.53
-41.01
12/12/2013 15792.38 15739.43
-52.95
12/13/2013
15766.28 15755.36
-10.92
12/16/2013 15620.88
15608.97
-11.91
12/17/2013 15880.36
15875.26
-5.10
Down last hour pattern continues...
12/18/2013 16068.20
16167.97 +99.77
12/19/2013 16177.22
16179.0 +1.78
---> 170 MAXCP stocks Bullish MAXCP Stocks (12/192013)
Bullish plurality
--> 53 MINCP stocks Bearish MINCP Stocks (12/19/2013)
--> 56 New Highs on NASDAQ 11 new lows. Bullish plurality
--> 83 New Highs on NYSE 30 new lows. Bullish plurality
====================================================================================
OLDER HOTLINES
====================================================================================
12/18/2013
Today the DJI rose +292, 1.84%. WOW! Big Bankers
were downright ecstatic. Bernanke
said rates would be kept low even as the Fed starts
to taper next year. This was a lot
better response by the market than was expected.
The heavy sellers of the last two weeks
were taken by surprise. The word got out
on Monday, of course, to the insiders,
hence that day's big rally at the opening.

--> To Key Index and Leading Stock
Charts: DJI, SP-500, etc.
Everything but autos and airlines looked
better after today's action. Perhaps. oil
prices will be going up next year as the
Fed risks outright inflation to keep rates
low.
For now, it looks like a nice Christmas
rally is under way. The Buy B13
could become
quite profitable, provided the technicals
and our key Peerless indicators consideraby
improve and turn positive by year-end.
Right now, a small retreat seems likely.
A widely unconfirmed marginal new high
like today's usually brings a pull-back.
All these indicators, the A/D Line, P-I,
V-I, IP21 and OPct, lagged today's DJI
new all-time high. So did the
number of new highs on the NYSE and NASDAQ
as well as MAXCPs. A follow-through
by the non-DJI stocks now would be most
helpful.
Seasonality is bullish through the end of
the year. In fact, there have have only
been Peerless Sells in 8 of the 84
Decembers after the 17th since 1928. On this basis
we might conclude there is less than a
10% chance of a new Sell this year. Even more
bullish, on that basis, is the fact that in all those years there has only been one case
of a Peerless Sell between now and
Christmas. That was is 1976 and the market still rose
until the end of the year.
The technical problem right now is that
if there very little improvement in the P-I,
IP21 and V-I, we will almost certainly
get a new Sell S16 on whatever syear-end trength
there
is. (I will fix the link to the
Sell S16 tomorrow.) As you may recall, it occurs because
the year-end rally fails by the 29th to
bring sufficient improvement in our key indicators.
It is quite reliable.)
Peerless Sells from 17th to 31st of
December: 1928-2012
today
la/ma aroc P-I
IP21 V-I
Opct 65- change
1.013 .143 -52 -.047 -56 -.042
.041
19341231 S16
104 .038
la/ma aroc P-I
IP21 V-I Opct 65- change
1.024 .141 2 -.065
-49 .081 .149
19381230 S16
154.4 .1
la/ma aroc
P-I IP21 V-I Opct
65- change
1.029 .366 -4
.046 0 .149 .151
19521230 S16
292
.022
la/ma aroc
P-I IP21 V-I
Opct 65- change
1.022 .346 37 .129 -57
.406 .074
19591231 S16
679.3 .005
la/ma aroc
P-I IP21 V-I
Opct 65- change
1.011 .266 -18
-.057 -243 .086 .067
19611228 S16
731.5 .177
la/ma aroc
P-I IP21 V-I
Opct 65- change
1.005 .056 -78
-.042 -510
.171 .057
19731228 S12 848.02
.028
la/ma aroc
P-I IP21
V-I Opct 65- change
1.03 .119 -125
-.027 -3
.154 -.107
19761222 S4
984.54 .051
la/ma aroc
P-I IP21
V-I Opct
65- change
1.02 .354 -7 .066
2 .303 -.011
19761229 S16
994.93 .061
la/ma aroc
P-I IP21
V-I Opct
65- change
1.022 .550 6 .096
2 .394 -.015
19871228 S9
1942.97 .016
la/ma aroc
P-I
IP21 V-I Opct
65- change
1.021 -.025 -37 .132 -8
.166 -.243
DJI
DJI change la/ma
annroc P-I
IP21
V-I
Opct
65-day Pct Change
-----------------------------------------------------------------------------------------------------------------------------------------
11/27/2013
16097 (high)
+25 1.017
.314 -43 NC .069 -38 .297
089
11/29/2013
16086
- 11 1.015
.352 +41
.072 -28 .317
085
12/02/2013
16009
- 78 1.008
.348 +9
.080 -25 .341
078
12/03/2013
15915
- 94 1.001
.224 -10
.066
-40
.231
074
12/04/2013
15890
- 25
.999 .188 -94
.071
-54
.131
071
12/05/2013
15822
- 68
.994 .152 -89
.042
-51
.134
059
12/06/2013
16020 +199 1.006
.204 -34
.049
-41
.132
072
12/09/2013
16026
+5 1.005
.323 +49
.097
-4 .249
073
12/10/2013
15973
-52 1.001 .158
-1
.038 -27
.146
060
12/11/2013
15853
-120 .993 .053
-54
.001 -54
.052
043
12/12/2013
15739
-114 .986 -.008 -83
-.017
-55 .047
026
12/13/2013
15755
+16 .987 -.049 -117 -.06
-71 .041
029
12/16/2013
15885
+130 .995 .006 -112
-.081
-70 .044
033
12/17/2013
15875
-9 .995
-.064 -168 -.118
-89 -.061
024
12/18/2013
16168
52
1.013 .143
-52
-.042 -56
-.042 041
3:00 PM DJI DJI at Close Last Hour Change
--------------------------------------------
12/11/2011 15884.54 15843.53
-41.01
12/12/2013 15792.38 15739.43
-52.95
12/13/2013
15766.28 15755.36
-10.92
12/16/2013 15620.88
15608.97
-11.91
12/17/2013 15880.36
15875.26
-5.10
Down last hour pattern continues...
12/18/2013 16068.20
16167.97 +99.77
---> 170 MAXCP stocks Bullish MAXCP Stocks (12/182013)
Bullish plurality
--> 57 MINCP stocks Bearish MINCP Stocks (12/18/2013)
--> 98 New Highs on NASDAQ 14 new lows. Bullish plurality
--> 150 New Highs on NYSE 26 new lows. Bullish plurality
====================================================================================
OLDER HOTLINES
====================================================================================
12/17/2013 Today's
close did bring the Buy B13
by the slimmest of margins.
The V-Indicator stands at -89. If it had been -91, we would not have gotten the
Buy B13.
The Buy B13 reminds us that the period between now and the end of the year
is most the bullish two weeks of the year. Since 1965, the DJI has risen 89.1%
of the time over the next ten trading days and gained on average 2.0%.
Any Fed announcement on the fate of QE-III will probably dramatically
effect the market's direction tomorrow. With a Buy B13, I would expect the lower
3.5% band to be very good support if the market should sell off for a few more
days.
--> To Key Index and
Leading Stock Charts: DJI, SP-500, etc.

The market will have to struggle if the FED decides to curb QE-III. At this
writing,
the Futures are up 33.00 We will soon see what the Fed intends. A friend
suggested
the Fed will dare do nothing for fear of raising the national Debt. Guessing will
give
way to reality tomorrow. Profit-taking in the big gains is certainly afoot in the
Biotechs. AMGN, GILD
and PCYC show particularly weak Closing Powers. In
April
2000, at the major tech top then, we saw similar profound Closing Power weakness in
computer, internet and biotech
stocks, the three leading groups. Right now, we are
only seeing it in biotechs. So, I would stay away from them for now.
Very Weak Hourly Volume
The DJI's down-Hour Volume has completely
dominated its up-Hour Volume. The
Hourly DJI's OBV Line (DISI) is actually making 2-month new
lows ahead. Note that I
stopped following Hourly volume from 2004 until just recently, so I can't say more
exactly what this is likely to mean. Still, my sense is that this weakness means
that
any Santa Claus rally will be somewhat limited even if the Fed remains "dovish"
and continues QE-III. If we do see a rally until January, it will still
probably bring
a Peerless sell signal at the end of this year or early next. These are relatively
common. Then a decline of 10% early next year would be in keeping with past years
at this time when a Democrat was President.
TigerSoft-Style Hedging Should Work Well Now
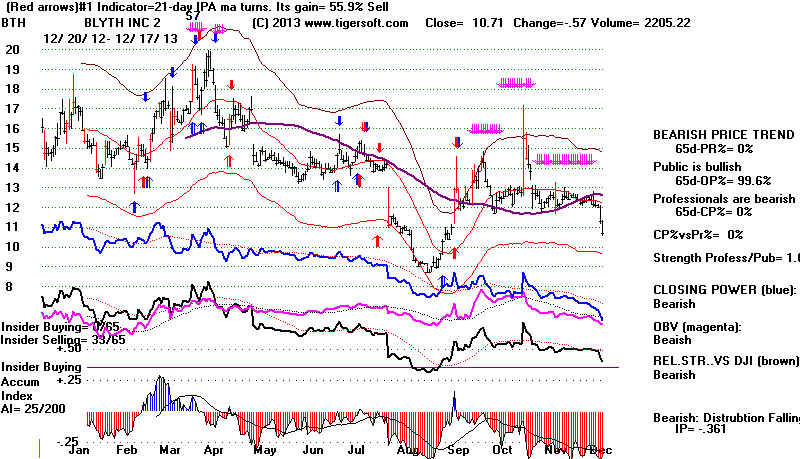
Hedging still should be considered a reasonable strategy even with the new
Buy B13. Powerful selling pressures are very evident in the steadily high Down-Hour
Volume and lack of impressive up-Hour Volume and tax selling will likely continue
to the end of the year on both the year's weakest stocks and some of the biggest winners.
See the MINCP stocks tonight. At the same time,
there are a number of MAXCP stocks
that look very bullish, showing bulging Accumulation, flat tops and strong Closing
Power. I also like SSRI, a totally beaten-down silver
stock, that surpassed its
65-dma a few days ago and has been rising since.
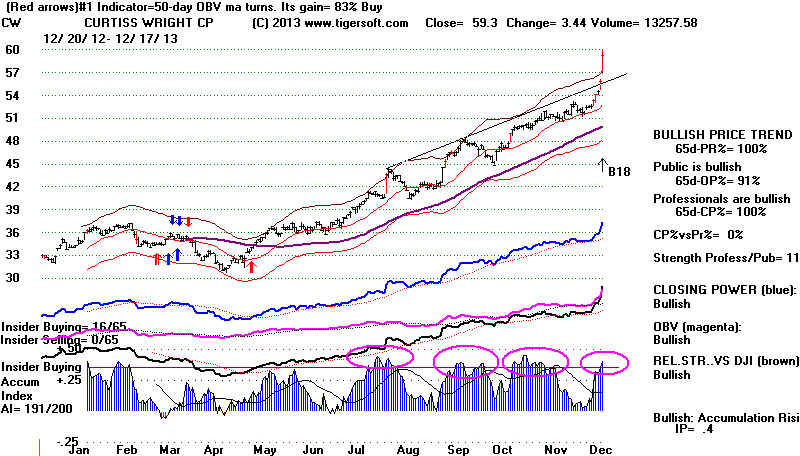 |
|
---> 79 MAXCP stocks Bullish MAXCP Stocks (12/172013)
--> 101 MINCP stocks Bearish
MINCP Stocks (12/17/2013) Bearlish plurality
--> 42 New Highs on NASDAQ 15 new lows. Bullish plurality
--> 41 New Highs on NYSE 31 new lows. Bullish plurality
DJI
DJI change la/ma
annroc P-I
IP21
V-I
Opct
65-day Pct Change
-----------------------------------------------------------------------------------------------------------------------------------------
11/27/2013
16097 (high)
+25 1.017
.314 -43 NC .069 -38 .297
089
11/29/2013
16086
- 11 1.015
.352 +41
.072 -28 .317
085
12/02/2013
16009
- 78 1.008
.348 +9
.080 -25 .341
078
12/03/2013
15915
- 94 1.001
.224 -10
.066
-40
.231
074
12/04/2013
15890
- 25
.999 .188 -94
.071
-54
.131
071
12/05/2013
15822
- 68
.994 .152 -89
.042
-51
.134
059
12/06/2013
16020 +199 1.006
.204 -34
.049
-41
.132
072
12/09/2013
16026
+5 1.005
.323 +49
.097
-4 .249
073
12/10/2013
15973
-52 1.001 .158
-1
.038 -27
.146
060
12/11/2013
15853
-120 .993 .053
-54
.001 -54
.052
043
12/12/2013
15739
-114 .986 -.008 -83
-.017
-55 .047
026
12/13/2013
15755
+16 .987 -.049 -117 -.06
-71 .041
029
12/16/2013
15885
+130 .995 .006 -112
-.081
-70 .044
033
12/17/2013
15875
-9 .995
-.064 -168
-.118 -89
-.061 024
3:00 PM DJI DJI at Close Last Hour Change
--------------------------------------------
12/11/2011 15884.54 15843.53
-41.01
12/12/2013 15792.38 15739.43
-52.95
12/13/2013
15766.28 15755.36
-10.92
12/16/2013 15620.88
15608.97
-11.91
12/17/2013 15880.36
15875.26
-5.10
Down last hour pattern continues...

===================================================================================
OLDER HOTLINES
===================================================================================
12/16/2013
--> To Key Index and
Leading Stock Charts: DJI, SP-500, etc.
A Buy B10 is
the Peerless operative signal. Seasonally, the next few days
typically offer a good
entry point for a two-week trade. Five days out, the
the DJI has risen on
average 0.9% and risen 76.1% of the time since 1965.
Look for a Buy B13
tomorrow night. Two weeks out, the DJI is up on average
+2.3% and rises 71.7%
of the time. I expect a Buy B13 tomorrow night.
With a Democrat in the
White House a typical Buy B13 gains 6.9% before it is reversed.
After the next Peerless
Sell in January, I would expect a decline.

---> 66 MAXCP stocks Bullish MAXCP Stocks (12/162013)
--> 97 MINCP stocks Bearish MINCP Stocks (12/16/2013) Bearlish
plurality
--> 72 New Highs on NASDAQ 20 new lows. Bullish plurality
--> 55 New Highs on NYSE 32 new lows. Bullish plurality
-------------------------------------------------------------------------------------------------------------------------------------------------
Market
Makers Want A Rally - That's The Lesson in Today's Much Higher Opening.
Because the first hour
NYSE volume today was so light and there was no news to account
for the triple digit
jump, I think we can assume that market makers conspired to boost
prices to allow them to
sell some of their inventory of shares that they bought in the last
few days of high volume
selling. See the heavy down hour volume on our Hourly DJI
chart.
A less conspiratorial
view would simply say that the market was looking forward to the
traditional Santa Claus
rally. Did you enjoy the The Lone Ranger Buy B13 cartoon
last night?
The fact is that the 10 trading days after December 17th, tomorrow, have risen 89.1% of
the time since 1965. A
pullback today would give us a nice entry point for buying
the major market ETFs,
of which I favor QQQ. The Tiger chart of the NASDAQ-100
stocks shows the QQQ
stocks as a whole have given up very little ground recently.

We will almost
certainly get a Buy B13 from Peerless this week. This is the Santa
Claus Buy, You
can see this by using the Peercomm editor and changing the date
for today's trading
from the 16th to the 17th and then plotting the DJI chart and
asking for the signals.
This makes a Buy B13
appear. The Buy B13 is a signal
we have used since 1993
when the first Windows Peerless was written.
Below is the actual VB
code that produces Buy B13s. Some of you have asked about
how the signals are
generated in Visual Basic. This is how the Buy B13s are produced.
It details the rules:
Buy on the 17th or the 18th or the 19th...23rd day of December
provided the DJI is
above the 3.5% lower band and below the 1.5% upper band.
To get
a Buy B13 when the P-Indicator is below -35 and V-Indicator is below -90,
the DJI must be below
the 1% lower band. Right now the DJI is above the 1%
lower band and the
P-Indicator is -112. But we would still get a Buy B13 if today
were the 17th because
the V-Indicator now stands at -70. So, we will have to examine
the V-Indicator
tomorrow night.
-------------- Buy B13 Code --------------
'Christmas rally
For i = 40 To rn ' i = the day-record, rn = the last day record in the
file
' c:\peerless\data.txt" We process the record in sequence
' from 40 to the current one.
If mo(i) <> 12 Then 130 ' Only Decembers are considered.
If da(i) < 17 Or da(i) > 24 Then 130 ' Only days 17 to 24 are
considered.
For j = i - 15 To i 'We look back
15 days each day we process to see if
'there
was an Sell S9. If so, we skip this date for 10 days.
If
S9(j) = 1 Then i = i + 10: GoTo 130
if
S9(j) = 9 And mo(j) = 12 And da(i) > 16 And da(i) < 25 And p(i) < p(i - 1) Then i
= i + 10: GoTo 130
Next j
If (yr(i)) / 4 <> Int(yr(i)) / 4 And la(i) / ma(i) > .99 And pvv(i)
< -90 And p(i) < -35 Then 130
'This was added 5/9/2013 to prevent 1947's bad 12/17 bad Buy B13
'It says that in a non-Presidential Election Year to skip the record
without
'according a Buy B13 if the DJI is above the 1% lower band, the V-indicator
'is below -90 (quite low) and the P-Indicator is below -35.
pi =
i
If
(la(i) / ma(i)) > .965 And (la(i) / ma(i)) < 1.018 Then pi = i: B13arrows (pi): i =
i + 10
'This places a Buy B13 on the screen provided the DJI is above the 3.5% lower
'band and is below the 1.8% upper band.
130 Next i
How has the Buy
B13 done when a Democrat was in the White House since 1945 in the
year after the
Presidential Election? This can be computed from the table showing all
signals at Buy
B13--Santa Claus Buy
Date
DJI Gain if DJIA
Bought here
and sold on next Peerless Sell.
-------------------------------------------------------------------------------------------
19451217
B13 190.4
.046
19491220 B13
197.2
.119
19611218 B13
727.7
.005
19651217 B13
957.9
.029
19931217 B13
3751.57
.058
19971217 B13
7957.41
.154
20091217 B13
10308.26
.069
-------------------------------------------------------------
No.= 7 Avg.= .069
DJI
DJI change la/ma
annroc P-I
IP21
V-I
Opct
65-day Pct Change
-----------------------------------------------------------------------------------------------------------------------------------------
11/27/2013
16097 (high)
+25 1.017
.314 -43 NC .069 -38 .297
089
11/29/2013
16086
- 11 1.015
.352 +41
.072 -28 .317
085
12/02/2013
16009
- 78 1.008
.348 +9
.080 -25 .341
078
12/03/2013
15915
- 94 1.001
.224 -10
.066
-40
.231
074
12/04/2013
15890
- 25
.999 .188 -94
.071
-54
.131
071
12/05/2013
15822
- 68
.994 .152 -89
.042
-51
.134
059
12/06/2013
16020 +199 1.006
.204 -34
.049
-41
.132
072
12/09/2013
16026
+5 1.005
.323 +49
.097
-4 .249
073
12/10/2013
15973
-52 1.001 .158
-1
.038 -27
.146
060
12/11/2013
15853
-120 .993 .053
-54
.001 -54
.052
043
12/12/2013
15739
-114 .986 -.008 -83
-.017
-55 .047
026
12/13/2013
15755
+16 .987 -.049 -117 -.06
-71 .041
029
12/16/2013
15885
+130 .995 .006 -112
-.081
-70 .044
033
3:00 PM DJI DJI at Close Last Hour Change
--------------------------------------------
12/11/2011 15884.54 15843.53
-41.01
12/12/2013 15792.38 15739.43
-52.95
12/13/2013
15766.28 15755.36
-10.92
12/16/2013 15620.88
15608.97 -11.91
====================================================================
12/13/2013
--> To Key Index and Leading Stock Charts: DJI, SP-500, etc.
The Stock Market is very worried. We should be, too.
The particularly heavy Hourly
selling has prompted me to suggest being hedged
with some short sales from our bearish MINCP group. A new Santa Claus Rally Buy B13
should be trusted, however.
It may occur on Tuesday's close. It has successfully
reversed 10 DJI first half of
December declines since 1945 even when a bear market
lay directly ahead.
Unfortunately, even with a Buy B13, the fact that a Democrat
is in the White House strongly
suggests a significant decline early next year. The
simultaneous tightening of both
fiscal and monetary policy when Unemplloyment is
so high has very bearish historical
precedents: October 1979, October 1978, Mid-1937.

A Buy B10 is
the Peerless operative signal now but a close below 15680 would
render the breakout Buy B10 void.
Breakout Buy B10s should not pullback below
their point of breakout. When
they do, the odds then favor a test of the bottom of the
previous trading range. Here
that would mean 14700, 1000 DJI points lower. See the
study I did recently
supporting this conclusion. 85% of the DJI declines over 6% are started
with a Peerless Sell signal, but
since 1945, there have been 24 such declines, all between 6%
and 9%, when there was no Peerless
Sell.
Not wanting to endure this deep a decline, I have already suggested hedging
and selling QQQ (previously the
strongest of the major market ETFs) if the DJI
closes below 15680. That may
seem pointless now, because on Tuesday we will
almost certainly get a Santa Claus Buy B13.
Only 3 of the 64 Buy B13s produced a loss.
And there have been 10 cases since
1945 when a Buy B13 reversed a first-half of
December decline.
Can A Buy B13 Save The Day?
Buy 13s brought
reversals in 10 cases when the first half of December was weak.
Weakness in December
did not always lead to a decline the next year.
#1
1957 DJI fell
until 12/18 12/17/1957 very profitable Buy
B17
#2 1964 DJI fell until 12/15 12/17/1957
very profitable Buy B17
#3 1969 DJI fell until 12/17 12/17/1957
profitable Buy B17 BEAR
MKT FOLLOWED
#4 1977 DJI fell until 12/19 12/19/1957
profitable Buy B17 BEAR MKT FOLLOWED
#5 1978 12/6 DJI fell until 12/18 12/18/1957 very
profitable Buy B17
#6 1980
DJI fell until 12/16 12/17/1957 profitable Buy B17
BEAR MKT SOON FOLLOWED
#7 1983 DJI fell steadily all month...12/19/1957
profitable Buy B17 BEAR MKT FOLLOWED
#8 1996 DJI fell 5% to 12/16 12/18/1957 very profitable Buy B17
#9 1998
Fell until 12/14 bottom 12/17/1957 very profitable Buy B17
#10 2000
DJI fell until 12/21 12/18/1957 very profitable Buy B17 BEAR MKT FOLLOWED
Be Careful...Don't Fight The Fed
Still, I will probably suggest waiting for something else technically to confirm
the Buy B13,
such as another Buy signal or
a break in one of more of the daily downtrendlines for Closing
Power or the A/D Line.
Recall the study I did recently showing how often the market
has topped out between
December and February when a Democrat has been in the White
House going into the year of
Mid-Term Elections. In 11 of 12 cases, the declines ranged
from 8% to 26%,
Three started in December, 5 began in January and 3 in February.
Peaks with a Democrat in White House
Going into Year of Mid-Term Elections:
1933-2013
2/5/1934 DJI fell 17% to 5/14/1934.
1/11/1938 DJI fell 26% to 3/3/1938
1/6/1942 DJI fell 18% to 4/29/1942
2/5/1946 DJI fell 10% to 2/26/1946
1/9/1950 to 1/13/1950... 3% decline....No serious decline here. Market kept rallying.
12/12/1961 DJI fell 27% to 6/26/1961
2/9/1966 DJI fell 25% to 10/7/1966
12/30/1978 DJI fell 11% to 3/1/1978
1/31/1994 DJI fell 9.5% to 4/4/1994
12/5/1997 DJI fell 8% to 1/12/1978
1/14/2000 DJI fell 16% to 3/7/2000
1/19/2010 DJI fell 8% to 2/5/2010
Weakness the entire month of Decembers are rare since 1945. Of the four weakest,
three warned of declines the
next year.
1968 DJI fell steadily
all month... No Buy B13... BEAR MKT FOLLOWED
1983 DJI fell steadily all
month... BEAR MKT FOLLOWED
2007 12/10 peak. No year-end rally of consequence. BEAR MKT FOLLOWED
The Lessons of 1979, 1978, 1937
Only bad things happen to the Stock
Market when both fiscal and monetary polices
are simultaneously tightened if much of
America remains unemployed.
Three other factors make me very cautious now. Most obvious, the Peerless
volume charts below for the
Hourly DJI looks "ominous". Up hour volumes
are pitifully low now.
Down-hour volume is now dwarfing up-hour volume. Second,
it is rare that Decembers
begin so badly, but when they do, it usually is a bad sign.
Thirdly, I used to teach
Macro-economics. And what the Fed and Congress are about
to do is highly deflationary.
It will lower profits and bring a drop in stock prices. The
last time the Government used
both monetary and fiscal policy to slow down a weak
economic recovery with much
of the country in depressed conditions was in October 1979
and October 1978.
People remember Volcker's tight money, but they forget Carter
fought for a balanced budget
"on the back of the poor and the unemployed." The DJI
fell 13% very quickly in both
cases. It did the same thing in 1937, too, but much worse.
In 1937-1938, it collapsed
47%. In all these cases, BOTH monetary and fiscal brakes
were put on too strongly.
See:
http://www.tigersoft.com/tiger-blogs/8-18-2003/index.htm
http://books.google.com/books?id=UEGPFXrScoIC&pg=PA94&lpg=PA94&dq=Carter+budget+balancing+1978&source=bl&ots=9o7RSDzWuN&sig=25Su2UIOwxzhUaR11i4WHUUlsFM&hl=en&sa=X&ei=48GuUvHqKtDwoATWj4GwBA&ved=0CGEQ6AEwCQ#v=onepage&q=Carter%20budget%20balancing%201978&f=false
http://www.economist.com/node/13856176
http://www.tigersoftware.com/TigerBlogs/Obamas1937/index.html
http://economix.blogs.nytimes.com/2011/07/12/are-we-about-to-repeat-the-mistakes-of-1937/
https://faculty.fuqua.duke.edu/~dah7/JF1990.pdf
The Fed's Open Market Committee meets this week and will announce their plans
to start cutting back on QE-III.
In addition, the Senate will probably accept the Ryan-Murray
Federal budget cutting
"compromise"between an avowed Conservative Republican and a
fiscally conservative Democrat, who
did not fight for tax increases on the rich or an
extension of long-term unemployment
benefits. The agreement
exactly slices in half the
Sequestration's budget cutbacks.
This is very deflationary. In effect, the Government will be putting both feet down
to brake the economy. Both
monetary and fiscal brakes will be applied. It is these actions
which are jolting Wall Street now
and scaring a lot of investors into a quick dumping of
stocks that have advanced a long
ways, like "15-bagger" PCYC, as well as causing
renewed dumping of government bond
funds for fear of higher interest rates.


DJI
DJI change
la/ma
annroc P-I
IP21 V-I
Opct
65-day Pct Change
------------------------------------
-----------------------------------------------------------------------------------------------
11/27/2013
16097 (high)
+25 1.017
.314 -43 NC .069 -38 .297
089
11/29/2013
16086
- 11 1.015
.352 +41
.072 -28 .317
085
12/02/2013
16009
- 78 1.008
.348 +9
.080 -25 .341
078
12/03/2013
15915
- 94 1.001
.224 -10
.066
-40
.231
074
12/04/2013
15890
- 25
.999 .188 -94
.071
-54
.131
071
12/05/2013
15822
- 68
.994 .152 -89
.042
-51
.134
059
12/06/2013
16020 +199 1.006
.204 -34
.049
-41
.132
072
12/09/2013
16026
+5 1.005
.323 +49
.097
-4 .249
073
12/10/2013
15973
-52 1.001 .158
-1
.038 -27
.146
060
12/11/2013
15853
-120 .993 .053
-54
.001 -54
.052
043
12/12/2013
15739
-114 .986 -.008 -83
-.017
-55 .047
026
12/13/2013
15755
+16 .987 -.049 -117 -.06
-71 .041
029
3:00 PM DJI DJI at Close Last Hour Change
--------------------------------------------
12/11/2011 15884.54 15843.53
-41.01
12/12/2013 15792.38 15739.43
-52.95
12/13/2013
15766.28 15755.36
-10.92
----> MAXCP stocks Bullish MAXCP Stocks (12/13/32013)
---> MINCP stocks Bearish MINCP Stocks (12/13/2013)
---> New Highs on NASDAQ
new lows.
---> New Highs on NYSE new lows.
====================================================================
12/12/2013
Buy B10 is
the Peerless operative signal. But we must now wait
to
see if the DJI's earlier breakout point at 15700 will act as expected support.
Seasonally,
since
1965, the DJI has risen 72.3% of the time and an average +1.3% since 12/12 over
the
next 10 trading days.
--> To
Key Index and Leading Stock Charts: DJI, SP-500, etc.
We
have to expect a Peerless "Santa Claus" Buy B13
on December 17th, even though
DJI's
Down-Hour Volume has become much greater than up-hour, even though
the NYSE A/D line uptrend for the last 12 months was slightly
violated today and even
though the NYSE and SP-500
have marginally completed head/shoulders patterns.
This
is asking a lot, considering the heavy profit-taking occurring now in some of the
year's biggest gainers. But I did notice that some of the selling pressure came off of
the biotechs and the NASDAQ closed down only 5 and the QQQ down only .22.
The House's passage of the Budget Bill, however austere, removes some of the
uncertainty for the stock market. With jobless claims rising today, it's
hard to believe
the Fed will reduce QE-III this month.
Consequently, I would still trust Peerless. But before buying again, let's see a
good
reversal here. Peerless will remain on a Buy until either we get a Peerless Sell or
the DJI closes below 15680, thereby making the recent breakout above 15700 appear
to be false.
If you're long QQQ, as suggested, consider shorting some of the Bearish MINCP
stocks as a hedge against this being one of the infrequent Decembers that keep falling.
Decembers rarely are down for the whole month. But it can happen, notably 1968, 1986
and 2007.
Here is a linked to the study I did recently of failed Buy B10s and DJI
breakouts.

DJI DJI change la/ma annroc
P-I
IP21 V-I
Opct
65-day Pct Change
------------------------------------
-----------------------------------------------------------------------------------------------
11/27/2013
16097 (high)
+25 1.017
.314 -43 NC .069 -38 .297
089
11/29/2013
16086
- 11 1.015
.352 +41
.072 -28 .317
085
12/02/2013
16009
- 78 1.008
.348 +9
.080 -25 .341
078
12/03/2013
15915
- 94 1.001
.224 -10
.066
-40
.231
074
12/04/2013
15890
- 25
.999 .188 -94
.071
-54
.131
071
12/05/2013
15822
- 68
.994 .152 -89
.042
-51
.134
059
12/06/2013
16020 +199 1.006
.204 -34
.049
-41
.132
072
12/09/2013
16026
+5 1.005
.323 +49
.097
-4 .249
073
12/10/2013
15973
-52 1.001 .158
-1
.038 -27
.146
060
12/11/2013
15853
-120 .993 .053
-54
.001 -54
.052
043
12/12/2013
15739
-114 .986 -.008
-83
-.017 -55
.047
026
3:00 PM DJI DJI at Close Change
2-month Cumulative
--------------------------------------------------------------------
12/11/2011 15884.54 15843.53
-41.01
84.74
12/12/2013 15792.38 15739.43
-52.95
31.69
----> 25 MAXCP stocks Bullish MAXCP Stocks (12/122013)
---> 161 MINCP stocks Bearish MINCP Stocks (12/12/2013) Bearlish
plurality
---> 23 New
Highs on NASDAQ 32 new lows. Bearlish plurality
---> 18 New Highs
on NYSE 143 new lows. Bullish plurality
==================================================================================
OLDER HOTLINES
==================================================================================
12/11/2013
Buy B10 is
the Peerless operative signal.
---> To
Key Index and Leading Stock Charts: DJI, SP-500, etc.
Peerless will
remain on a Buy until either we get a Peerless Sell or the DJI closes
below 15680,
thereby making the recent breakout above 15700 appear to be false.
I know that the
market's sharp and broad decline is scary. It will probably induce
more
profit-taking. One thing that should reassure traders here: unless something
dramatic happens,
I would think we will get the yearly Santa Claus Buy B13
just 4 trading
from now. Another is how softly the Government has tapped the wrists
of the naughty
big banks. The big fear remains the Fed will back off the monetary
stimulation at a
time when Congress keeps putting more fiscal brakes on the Economy.
The stock
market's expansion has bet heavily on an economic recovery when the
Fed finally eases
off its QE-3 accelerator.
Technically,
down-volume has risen steadily but not dramatically. We see this
in the ObvPct Hourly DJI chart. This suggests there will have
to be another
test of the
expected 15700-15750 support. Today the DJI fell more than 40 points
in the last
hour. Each time this has happened in the last two months, it produced
a reversal
back up. It seems to have been a short-term selling climax. Similarly, many
high priced
biotechs fell steeply today. The last time this happened, there also was
a reversal
back up.
What To Do?
The
Accumulation Index is still positive, the Public are still net buyers (judging from
the rising
Openng Power and Professionals know to buy for a Santa Claus rally
after
December 16th. This gives us hope. But Peerless by failing to give a timely
Sell
has missed
two dozen tops and 6% to 9% drops in the DJI since 1945. That's about once
every three
or four years. So, Peerless is not perfect. My thinking is that we can either
1) hedge now by shorting some of the Bearish MINCP stoocks,
2) step aside until the next signal or
3) hold QQQ with the plan to sell if the DJI closes below 15680.
Weak Closing Power versis Positive Accumulation

The problem
with upwards reversals from short-term oversold conditions, of course,
is that
they condition the broad public to keep considering all dips as buying opportunities.
This is
dangerous thinking. At some point, it will work out very badly when a market top
is actually
made.
Biotechs
now are an important test of the battle going on between profit-taking Professionals
and the
late-to-the-Party Public/Performance Mutual Funds who are buying on all dips.
We see this
in IBB. The Closing Power is falling faster and faster
but the Opening
Power is
rising and the Accumulation Index remains positive. In the case of many high priced
Biotechs,
it is the Professionals who are selling to the Public. After a very big advance,
this is
definitely bearish. It is exactly what happened to the booming tech stocks in 2000
at their
top. So, we will want to watch the Biotechs closely now. They will be
a good way
to judge when the current selling wave is over and how much damage has
been done.
See how the Closing Power is already making 12-month lows in the
cases of
the super-performers, BBH, GILD
and PCYC. PCYC was only $5/share in early 2011.
DJI DJI change
la/ma
annroc P-I
IP21 V-I
Opct
65-day Pct Change
------------------------------------
-----------------------------------------------------------------------------------------------
11/27/2013
16097 (high)
+25 1.017
.314 -43 NC .069 -38 .297
089
11/29/2013
16086
- 11 1.015
.352 +41
.072 -28 .317
085
12/02/2013
16009
- 78 1.008
.348 +9
.080 -25 .341
078
12/03/2013
15915
- 94 1.001
.224 -10
.066
-40
.231
074
12/04/2013
15890
- 25
.999 .188 -94
.071
-54
.131
071
12/05/2013
15822
- 68
.994 .152 -89
.042
-51
.134
059
12/06/2013
16020 +199 1.006
.204 -34
.049
-41
.132
072
12/09/2013
16026
+5
1.005 .323 +49 .097 -4
.249
073
12/10/2013
15973
-52 1.001
.158 -1
.038
-27 .146
060
12/11/2013
15853
-120
.993 .053 -54
.001
-54 .052
043
3:00 PM DJI DJI at Close Change
2-month Cumulative
--------------------------------------------------------------------
12/11/2011 15884.54 15843.53
-41.01
84.74
----> 37 MAXCP stocks Bullish MAXCP Stocks (12/112013)
---> 184 MINCP stocks Bearish MINCP Stocks (12/112013) Bearlish
plurality
---> 15 New
Highs on NASDAQ 30 new lows. Bearlish plurality
---> 9 New Highs
on NYSE 116 new lows. Bullish plurality
Two
Feet Are Heavy on Both Economic Pedals

The biggest risk
remains how fiscal and monetary policy are working at cross purposes.
The new Congressional
Budget agreement will cause more lay-offs and is deflationary.
All the while the Fed'
QE-3 is very inflationary to stock prices and to a much lesser
degree the entire
economy. It reminds me of the sister of a friend of mine in high school.
She always drove with
her left foot on the brake and her right foot on the gas. If she
was distracted,
startled or frightened, there was a tendency for both feet to go down hard
at the same time.
This was not good for the engine and outright dangerous for the
passengers and nearby
traffic, especially those in cars behind hers,since her brake lights
were always on.
Who's Afraid of the Big Bad Volcker Rule?
There was plenty
to perplex the bulls today. The different regulatory agencies and the
Fed have finally
worked out the new Volcker Rule in the Dodd-Frank Financial Reform
Bill. It is
said to be designed to limit risky proprietary big bank trading for their own account.
The new
regulations still allow them to trade to reduce risk (to hedge). They may still make
markets.
Brokerages and banks are not separated as they were for 65 years under
Glass Steagall,
from 1934 to 1999. The inherent conflicts of interest and resulting
incentives to
commit fraud at the expense of customers seem mostly unaddressed.
There are also no
limits to the size of the big banks. So, nothing targets how much their
very size restrains
competition or endangers the Public if there is another Crash.
Not surprisingly,
the big banks got clipped today, between 1% and 2%. This is nothing
like one might
expect if the new rules really were going to dent their profits. GS lost 2.13,
JPM - .63 and
BAC, the most leveraged 2%.
Why did they not
go down more? This is the Big Banks we are talking about. The
Government does
not regulate them. They run the Government. They staff the regulatory
agencies.
They have bribed Washington politicians so much, neither Party dares challenge
them. And
as a kicker, if anyone really did threaten them, the big banks would threaten to
"tank"
the market and the whole economy. This was the wide-open truth we saw in October
2007, when all
pretense came off.

So, surprise,
surprise. The big banks will mostly regulate themselves to comply. There
is
no procedure in
them for the CEOs to attest that their own banks are actually in compliance.
It is not clear
how they are to be held accountable if they are not in compliance. The new
rules, 1000 pages
long, will not go into effect until July 2015. The big bank CEOs must
certify each year
that they have "in place processes to establish, maintain, enforce, review,
test and
modify” a program to monitor compliance with the rule.
http://dealbook.nytimes.com/2013/12/10/regulators-vote-to-approve-volcker-rule/?_r=0
===============================================================================================
OLDER HOTLINES
===============================================================================================
12/10/2013 Buy B10 is
the Peerless operative signal.
---> To
Key Index and Leading Stock Charts: DJI, SP-500, etc.
Seasonally, there may be a small decline
over the next week. Since 1965, the DJI has
risen only 48.9% in this period.
But over the next month, it rose 76.6% of the time
and gained on average 1.9%. I
noticed that the beaten-down silver stocks, SSRI
and PAAS
have climbed back above their 65-dma. They should rally now. The
Dollar's recent
weakness and Crude Oil's rise may weight upon the
Fed's doves.
but my sense is that the Fed will dare do
nothing. Memories of the horrible 2008
panic and collapse has made them very
wary of spooking the market. Meanwhile,
banks and FAS
a close to their highs. (What's another $85 billion among banking friends
anyway?)

Technically, there is no barking
dog. So, maybe there is no thief or grinch coming in the
middle of the night to steal away
the bull market.
If the stock market were about to
become very weak, I think we would see Red Distribution
in SPY,
QQQ, DIA and IWM. We would also see much weaker Closing Powers in these
major market ETFs. We would
almost certainly see head/shoulders patterns in the key
stocks I chart each night here.
Bank stocks would show some weakness. FAS is near its
yearly highs.
Last Hour Strength Is Bullish
If the market were about to swoon
badly I think we would probably see the last hour prices
for the DJI drop, day after day,
reflecting the dumping of big institutional positions that
cannot be sold earlier in the day.
In this regard, see in the Hourly Study
I did tonight.
It shows how the last hour's
trading (which often comprises 30% or more of the entire day's
trading) has actually tended to
rise in the last month or two. At the bottom of tonight's Hotline,
I show the Cumulative Price Change
of the DJI's Close versus its level at 3:00 PM EST
i.e.the cumulative change in the
DJI in the hour before the Close. It is now net +125 since
October 17th. I will post
this number again if there is a change.
December brings lots of tax-based
selling. The number of Bearish MINCP stocks has
risen of late, giving us some
appealing hedging p\possibilities. December is a month for
socializing , too. What
better stock to play the party spirit than the owner of match.com
shown just below?


DJI
DJI change
la/ma
annroc P-I
IP21 V-I
Opct
65-day Pct Change
------------------------------------
-----------------------------------------------------------------------------------------------
11/27/2013
16097 (high)
+25 1.017
.314 -43 NC .069 -38 .297
089
11/29/2013
16086
- 11 1.015
.352 +41
.072 -28 .317
085
12/02/2013
16009
- 78 1.008
.348 +9
.080 -25 .341
078
12/03/2013
15915
- 94 1.001
.224 -10
.066
-40
.231
074
12/04/2013
15890
- 25
.999 .188 -94
.071
-54
.131
071
12/05/2013
15822
- 68
.994 .152 -89
.042
-51
.134
059
12/06/2013
16020 +199 1.006
.204 -34
.049
-41
.132
072
12/09/2013
16026
+5
1.005 .323 +49 .097 -4
.249
073
12/10/2013
15973
-52 1.001
.158 -1
.038
-27 .146
060
----> 97 MAXCP stocks Bullish MAXCP Stocks (12/102013)
Bullish plurality
---> 87 MINCP stocks Bearish MINCP Stocks (12/10/2013)
---> 36 New
Highs on NASDAQ 24 new lows. Bullish plurality
---> 38 New Highs
on NYSE 37 new lows. Bullish plurality
HOURLY DJI STUDIES
              RECENT LAST HOUR DJI CHANGE AS A PREDICTOR
                                     10/17/2013 - 12/10/2013
 ---------DJIA---------
 Hour before   at Close      Last Hour     Cumulative
 Close                       Change (3)    Last Hour Change
 ----------------------------------------------------------
 15326.44      15373.83      47.39         47.39
                             Big Jump at close (3) is bullish
 15332.01      15371.65      39.64         87.03
 15400.16      15399.65     -.51           86.52
 15370.76      15392.2       21.44         107.96
 15478.44      15467.66     -10.78         97.18
 15423.31      15413.33     -9.98          87.2
 15528.05      15509.21     -18.84         68.36
 15538.18      15570.28      32.1          100.46
 15590.57      15568.93     -21.64         78.82
 15667.49      15680.35      12.86         91.68
 15613.94      15618.76      4.82          96.5
 15623.45      15545.75     -77.7          18.8
 15592.83      15615.55      22.72         41.52
 15628.65      15639.12      10.47         51.99
 15635.08      15618.22     -16.86         35.13
 15737.58      15746.88      9.3           44.43
 15643.97      15593.98     -49.99        -5.56
 15703.73      15761.78      58.05         52.49
                             Big Jump at close (3)is bullish
 15778.67      15783.1       4.43          56.92
 15755.29      15750.67     -4.62          52.3
 15761.92      15821.63      59.71         112.01
                             Big Jump at close (3) is bullish
 15864.53      15876.22      11.69         123.7
 15939.12      15961.7       22.58         146.28
 15996.55      15976.02     -20.53         125.75  (12/10/2013)
                     Added afterwards:
 15884.54      15843.53     -41.01          84.74  (12/11/2011)
---------------------------------------------------------------------------

|
===================================================================================
OLDER HOTLINES
===================================================================================
12/9/2013 Buy B10 is
the Peerless operative signal. As stated last night:
"So long as the DJI does not fall below 15700, I think we have to be bullish.
The market rises 75% of the time in Decembers. We
have a Peerless Buy B10 operating.
The November Buy B10s average DJI gains of 12.9% when
they are next reversed.
The NASDAQ and QQQ could be setting up for a vertical
ascent. The 1999-2000
scenario shows that the gains in the NASDAQ and QQQ can be
more than 50% in the
months before a long bull market ends."
12/9/2013 ---> To
Key Index and Leading Stock Charts: DJI, SP-500, etc.
High priced NASDAQ stocks like AAPL,
GOOG, BIDU and WYNN boosted the QQQ today
as the market mostly sat on its hands. Some
individual Biotechs rose steeply today.
Speculative interest in future growth still is strong.
Biotechs often become special situations, too.
That means that they can rally wonderfully in an up market
or even in a down general market
if their story is sufficiently compelling. Tiger
offers the tools to find and trade these stocks.
I have updated my Explosive Super Stocks
with a full-length, web-based edition. If you would like to
read it, send check for $25 to William Schmidt, 5970
Gullstrand Street, San Diego, CA 92122.
----> 119 MAXCP stocks Bullish MAXCP Stocks (12/9/2013)
Bullish plurality
---> 96 MINCP stocks Bearish MINCP Stocks (12/9/2013)
---> 78 New
Highs on NASDAQ 24 new lows. Bullish plurality
---> 64 New Highs
on NYSE 24 new lows. Bullish plurality
Biotechs are a natural place for us to mine for future
explosive stocks. A good way to start
is to look at the stocks up the most in the last 65 trading
days and pay closest attention
to those whose IP21 (current Accumulation) is above +.20.
Because we have our Closing
Power uptrendlines to use to tell us when Professionals are
switching from net -buying
to net-selling, we can chase these stocks, provided that
they show bulges of intense Accumulation
above +.375. The latter condition shows significant
insider buying. Such stocks also usually
become tightly held and dip back only to their rising
65-dma in weak general markets.
Here are the candidates using that approach now. Once
such stocks are found and shown
to qualify in the matters of Accumulation bulges and rising
Closing Power (GENT and ANAC
meet these conditions now), see if the stock's story really
does offer ample prospects
of much higher earnings. Google and Yahoo make
searches for news on such stocks very easy.
A big jump in future earnings for several years is the most
reliable type of news that moves a stock.
The other factor behind these stock is the possibility of a
take-over or buy-out. You will also
want to check the comments of the public about the stock.
Consider it bullish when a number
of shorts tell you on Yahoo that the stock must surely soon
crash and burn. It is they who are often
badly "burned".
Biotechs up>50% in
last 65 trading days
GENT (Gentrium - Italy) 57.1
168
.20 Perfect
ANAC Anacor Pharm 16.98
126
.27 Perfect
ENTA
29.66 80
.28 - no recent bulge of IP21>.375
PBYI Puma Biotech. 88.68
115
.52 -
The recent sudden jump of IP21 on new high, rid high volume and gap warrants
exploration. We find the following:
===================================================================================
OLDER HOTLINES
===================================================================================
12/6/2013 So long as the DJI does not
fall below 15700, I think we have to be bullish.
The market rises 75% of the time in Decembers. We
have a Peerless Buy B10 operating.
The November Buy B10s average DJI gains of 12.9% when
they are next reversed.
The NASDAQ and QQQ could be setting up for a vertical
ascent. The 1999-2000
scenario shows that the gains in the NASDAQ and QQQ can be
more than 50% in the
months before a long bull market ends.
12/6/2013 ---> To
Key Index and Leading Stock Charts: DJI, SP-500, etc.
----> 128 MAXCP stocks Bullish MAXCP Stocks (12/6/2013)
Bullish plurality
---> 94 MINCP stocks Bearish MINCP Stocks (12/6/2013)
---> 97 New
Highs on NASDAQ 15 new lows. Bullish plurality
---> 82 New Highs
on NYSE 37 new lows. Bullish
plurality
Semi-conductor stocks are
acting as a leading industry group. The new study of
the Best
Performing Stocks of 2013 shows how important it is to watch for the industries
that are over-represented in each era's super stocks.
Solar energy stocks were such a
group in much of 2013. Consider some of the
semi-conductors now.
We will continue to watch such technical problems as
unconfirming breadth and Closing
Power as well as red high down-day volume (a new concept
here). The most dangerous
signals, of course are S9s and S12s. But a new high
in red down-day volume for the last
month at the high or a day or two afterward is bearish,
too. I call this the "Big Red Sell".
When one looks back at the most significant market
tops in the past, one quickly notices
how many times there were warnings in the form of
unusual red (down-day) volume. Here
the volume is the sum of the NYSE up and down volume.
Red is accorded any day when
the DJI declines. More work will have to be presented here
on this warning here as there are many cases when the
decline that follows is quite limited.
We see this 2013. Its behavior this year is shaped by
the very low interest rates, the
perception by very big players that the rates will rise
again and by the underlying momentum
and high Accumulation. The later two factors make
lots of investors believe that
all dips are buying opportunities.
Very often at tops, the Red-Down-Day
volume jumps above all recent blue (up-day) volume
nearby,
going back a month or more. Clearly this is a warning. In all the cases below
Peerless
also gave its own Sell signal. But we cannot count on Peerless always being
able to do
this. So, this should Big-Red-Down-Day-Volume signal is worth watching for.
I will add
its warning somehow to Peerless in the next few weeks.
9/5/1929 red volume was
highest since since 3/27/1929 (Case 1)
9/9/1941 Red volume rose above all blue-volume back to 7/22/1941 (Case 1)
1/14/1960 at top, the red high volume was highest since 12/1/1959. (Case 1)
12/29/1961 at top, the red high high volume was highest since 11/9/1961 (Case 1)
1/26/1966 at top, the red high volume was highest since 12/15/1966 (Case
1)
12/5/1968 red volume was highest since 10/17/1968 (Case 1)
9/22/1976 red high volume was highest in a long time at top. (Case 1)
9/13/1978 red high volume was highest volume since 8/18/1978
10/9/1979 red down day volume was highest in a long time, 9+ months. (Case 1)
7/23/1990 Red volume rose to highest levels since 5/15/1990
2/4/1994 Red volume rose to highest level for many months. (Case 1)
7/22/1998 Red volume was highest since 6/17/1998. (Case 1)
7/20/2007 one day after the top, red down volume reached highest levels since
6/15/2007. (Case 1)
5/4/2011 Red volume rose to highest since 3/18/2011.

Highest Power
Ranked of Leveraged ETFs
AI/200 IP21 Close la/ma
OpenPwr ClosePwr
TNA 178
.09 72.46
1.04 Up
Up
TQQQ 163 .14
115.24 1.07
Up
Up
URTY 175 .15
81.53 1.04
Up
?

DJI
la/ma annroc
P-I
IP21
V-I
Opct
65-day Pct Change
------------------------------------
-----------------------------------------------------------------------------------------------
11/27/2013
16097 (high)
+25 1.017
.314 -43 NC .069 -38 .297
089
11/29/2013
16086
- 11 1.015
.352 +41
.072 -28 .317
085
12/02/2013
16009
- 78 1.008
.348 +9
.080 -25 .341
078
12/03/2013
15915
- 94 1.001
.224 -10
.066
-40
.231
074
12/04/2013
15890
- 25
.999 .188 -94
.071
-54
.131
071
12/05/2013
15822
- 68
.994 .152 -89
.042
-51
.134
059
12/06/2013
16020 +199 1.006
.204 -34
.049
-41
.132
072
The Biggest Gainers of 2013
http://tigersoft.com/Best2013/index.html
These show many ideal take-offs.
Study the tell-tale high
Accumulation, Buy signals and flat-topped breakouts
on high volume (shown as red on price bars) and gaps.
See how they refuse to drop below their rising 65-dma.,
where we look for successful tests by watcing for the
Closing Power to hook back up.
----------------------------------------------------------------------------------------------------------------------------------------------
Highest Accumulation Stocks Usually Advance with Rest of
The Market
===================================================================================
OLDER HOTLINES
===================================================================================
12/5/2013 Look for a good rebound
from the over-sold short-term condition.
The previous 6 November B10s averaged gains of 12.9%, which is slightly above
all Buy B10s.

12/5/2013 ---> To
Key Index and Leading Stock Charts: DJI, SP-500, etc.
---->94 MAXCP stocks Bullish MAXCP Stocks (12/5/2013)
Bullish plurality
---> 60 MINCP stocks Bearish MINCP Stocks (12/4/2013) Bearish
Plurality
---> 47 New
Highs on NASDAQ 17 new lows. Bullish plurality
---> 20 New Highs
on NYSE 95 new lows. Bearish
Plurality
But just in case, treat 15700 as the key support. Do a lot of selling and
selling short
if the Buy B10 fails and the DJI closes below 15680.
Peerless remains on a Buy. The five-day decline is bringing the
DJI closer
and closer to a test of 15700. This is key internal support. This was the
resistance
in the previous 6 month-long trading range. Ordinarily, the breakout-point at the
old resistance acts as support if the breakout was valid. But DJI breakouts above
flat, well-tested (3x or more) resistance over a month long are not all successful.
Since 1916, I count 10 "false DJI breakouts". For details and charts
see
http://tigersoft.com/PeerInst-2012/FalseBreakouts/index.htm
Usually we get warnings on the breakouts that will soon prove to be be
false. The absence of a Buy B10 sometimes works this way. New Peerless
Sell signals
are probably the best warnings. Primarily, we see low readings on the breakout
new high for the P-Indicator, A/D Line, IP21, V-Indicator, OPct. and red volume new highs.
The bigger and more numerous the non-confirmations, the deeper the decline
is apt to be, though the July 1929 case shows the biggest decline may sometimes be
postponed while the market makes one more good-sized advance. How deep the decline
will be on a false breakout also depends on seasonality. If we include the
"false breakouts"
of 10/1/1918 and 10/4/1940, then 7 of the 10 occurred between between September and
December.
Since 1928, 5 of the 7 breakouts that proved to be false
brought declines
of 10% or more. This fact alone should get us to do some selling sell and
selling short
if the DJI closes below, say, 15680. It's true we have no Peerless Sell, but
did a
negative non-confirmations by the P-Indicator with the DJI 1.7% over the 21-dma
on 11/27 and we have now seen 5 straight red (down) days. On the way up on
11/1 and 11/7, the red down-day volume was higher than any blue up-day volume
since June.
The good news is that there has not been a been a false breakdown yet; past
November B10s average DJI gains of 12.9% when reversed automatically and
right now the DJI Futures are up +69.
False Breakouts: 1915-2013
False Breakouts Warnings
Subsequent Action
-----------------------------------------------------------------------------------------------------------
July 1929
S9, S12 A/D Line NC, P<0, VI<0
10% decline
November 1940 earlier S4 very high red
volume Bear Market follows
November 1950
only 6% decline
September 1955 S7,
S8, S4, A/D Line NC, VI<0
10% decline
Very high red volume warning
April 1965
S7, IP21<0, VI<0 on breakout
11% decline
December 1986 A/D Line NC, IP21<0, VI<0 on breakout
only 3%
decline
July 1998
S9, S12 A/D Line
19% decline
December 1999 S9,
S12 A/D Line NC, P<0, VI<0
17% decline
? November 14, 2013 A/D Line. VI<0 - Still above the point of
breakout.
DJI
la/ma annroc
P-I
IP21
V-I
Opct
65-day Pct Change
-----------------------------------------------------------------------------------------------------------------------------------
11/27/2013
16097 (high)
+25 1.017
.314 -43 NC .069 -38 .297
089
11/29/2013
16086
- 11 1.015
.352 +41
.072 -28 .317
085
12/02/2013
16009
- 78 1.008
.348 +9
.080 -25 .341
078
12/03/2013
15915
- 94 1.001
.224 -10
.066
-40
.231
074
12/04/2013
15890
- 25
.999 .188 -94
.071
-54
.131
071
12/05/2013
15822
- 68
.994 .152 -89
.042
-51
.134
059
----------------------------------------------------------------------------------------------------------------------------------------------
New research; on automatic Buy B10s since 1928
Presidential Election Year   2   .086
PE + 1                      11   .122
PE + 2                       5   .267
PE + 3                       8   .078
January       7   .074
February      1   .404
March         2   .109
April         1   .101
May           2   .074
June          2   .234
July          1   .112
August        5   .114
September     5   .095
October       1   .254
November      6   .129
December      2   .086
1-10 13 .166
11-20 13 .099
21-31 9 .086.
( http://www.tigersoft.com/PeerInst-2012/-Buy-B10.htm )
==================================================================================
===================================================================================
OLDER HOTLINES
===================================================================================
12/4/2013 Peerless remains on a Buy. The four-day DJI decline is now bringing a
test of 15700. This was the resistance in the previous 6 month-long trading range.
Now the breakout-point at the old resistance "should" act as support if the breakout
was valid. If the earlier breakout-point's support should fail, I would think the the DJI will
only retreat another 200 points. Notice that the NASDAQ and QQQ were much stronger
today.
12/4/2013 ---> To Key Index and Leading Stock Charts: DJI, SP-500, etc.
----> 104 MAXCP stocks Bullish MAXCP Stocks (12/4/2013) Bullish plurality
---> 68 MINCP stocks Bearish MINCP Stocks (12/4/2013)
---> 42 New Highs on NASDAQ 13 new lows. Bullish plurality
---> 26 New Highs on NYSE 50 new lows. Bearish Plurality
DJI la/ma annroc P-I IP21 V-I Opct 65-day Pct Change
-----------------------------------------------------------------------------------------------------------------------------------
11/27/2013 16097 (high) +25 1.017 .314 -43 NC .069 -38 .297 089
11/29/2013 16086 - 11 1.015 .352 +41 .072 -28 .317 085
12/02/2013 16009 - 78 1.008 .348 +9 .080 -25 .341 078
12/03/2013 15915 - 94 1.001 .224 -10 .066 -40 .231 074
12/04/2013 15890 - 25 .999 .188 -94 .071 -54 .131 071
================================================================================================================================================
----------------------------------------------------------------------------------------------------------------------------------------------------- OLDER HOTLINES
-----------------------------------------------------------------------------------------------------------------------------------------------------
12/3/2013 Peerless remains on a Buy. The three-day DJI decline has pulled its
prices back to the point of breakout and to the support of its rising 21-dma
The Closing Powers are also back to their rising 21-day ma. These, too, often
act as support. But if volume rises on a further decline, we may see the the 1986
scenario unfold here. That would bring at most a 3% retreat from the DJI high,
to 15500. Usually a December rally is much more likely than a December decline.
About 25% of Decembers produce declines to the middle of the month
or longer. At that point, we usually get a Buy B13 and then a Santa Claus rally.
CAUTION: FALSE BREAKOUTS
The earlier 15700 support will be an important level to watch. If the DJI
should close below that on this decline, it would make the breakout there would
seem false. This would bearish. In that event, sell more of the stocks whose
Closing Power uptrends are broken and sell short more of the Bearish MINCP
stocks. Our Stocks' Hotline has done that tonight.
 CAUTIONS: Watch To See if a Head/Shoulders Develops.
Watch for bearish new highs in Red (Down-Day) Volume above Blue (Up-Day) Volume
CAUTIONS: Watch To See if a Head/Shoulders Develops.
Watch for bearish new highs in Red (Down-Day) Volume above Blue (Up-Day) Volume
 In giving no Sell signal, Peerless could be wrong this time. We saw that the DJI
reached the upper 2.1% band with the P-Indicator negative. But at the time.
I showed that having a very positive Accumulation Index (IP21) makes it inadvisable
to Sell despite the bearish NNC (negative non-confirmation of P-I approaching upper band).
The Futures were up. That may mean the recent lows will hold. The next rally will
be very important in terms of price and volume. We could now see a bearish, though
compact, head/shoulders pattern on the DJI unfold. See the circled chart below.
I would judge a close below the neckline (15850 ) to be a judged Sell S10, much
like occurred on 6/14/2001 ( 2001) and 6/4/2010 (2010). However, a close above 16120
would tend to destroy the head/shoulders pattern because the apex of the potential
right shoulder would then be above the apex of left shoulder. It is useful to assume
symmetry in these patterns. Watch the volume, too. Low volume on any rebound here
would be what one should expect if there is to be a head/shoulders pattern.
Volume Warnings at Top New Research)
Peerless does not usually look directly at daily volume. Instead, we use a variety of
technical indicators that factor in daily volume. Even though NYSE volume (or the sum
of NYSE up and NYSE down volume) amounts to a diminishing percentage of all
trading volume and volume is much influences by computerized trading, I think it is still
very important. The numbers we get are still a very good sample of all trading volume.
When one looks back at the most significant market tops in the past, one quickly notices
how many times there were warnings in the form of unusual red (down-day) volume.
Case 1: Very often it rose above all recent blue (up-day) volume right at the peak or a day
or two afterward. This is the most bearish.
Case 2 Sometimes, red volume made several new 20-day to 5-month of more highs as the DJI
advanced to its peak. In other words, the DJI ignored for a month or so the jumps to
new highs by red (down-day) volume. Our case now showed 2 such jumps to marginal new highs
by red high volume. See the SJI chart above. .
Case 3 Sometimes, the day after the top, the red volume rose almost to the level of the
blue (up-day).
Cases 4 and 5 are less reliable.
#4, The DJI falls 5 straight days or more. This is warning S17.
#5, The red volume jumps above its 21 day ma as decline quickly unfolds.
In giving no Sell signal, Peerless could be wrong this time. We saw that the DJI
reached the upper 2.1% band with the P-Indicator negative. But at the time.
I showed that having a very positive Accumulation Index (IP21) makes it inadvisable
to Sell despite the bearish NNC (negative non-confirmation of P-I approaching upper band).
The Futures were up. That may mean the recent lows will hold. The next rally will
be very important in terms of price and volume. We could now see a bearish, though
compact, head/shoulders pattern on the DJI unfold. See the circled chart below.
I would judge a close below the neckline (15850 ) to be a judged Sell S10, much
like occurred on 6/14/2001 ( 2001) and 6/4/2010 (2010). However, a close above 16120
would tend to destroy the head/shoulders pattern because the apex of the potential
right shoulder would then be above the apex of left shoulder. It is useful to assume
symmetry in these patterns. Watch the volume, too. Low volume on any rebound here
would be what one should expect if there is to be a head/shoulders pattern.
Volume Warnings at Top New Research)
Peerless does not usually look directly at daily volume. Instead, we use a variety of
technical indicators that factor in daily volume. Even though NYSE volume (or the sum
of NYSE up and NYSE down volume) amounts to a diminishing percentage of all
trading volume and volume is much influences by computerized trading, I think it is still
very important. The numbers we get are still a very good sample of all trading volume.
When one looks back at the most significant market tops in the past, one quickly notices
how many times there were warnings in the form of unusual red (down-day) volume.
Case 1: Very often it rose above all recent blue (up-day) volume right at the peak or a day
or two afterward. This is the most bearish.
Case 2 Sometimes, red volume made several new 20-day to 5-month of more highs as the DJI
advanced to its peak. In other words, the DJI ignored for a month or so the jumps to
new highs by red (down-day) volume. Our case now showed 2 such jumps to marginal new highs
by red high volume. See the SJI chart above. .
Case 3 Sometimes, the day after the top, the red volume rose almost to the level of the
blue (up-day).
Cases 4 and 5 are less reliable.
#4, The DJI falls 5 straight days or more. This is warning S17.
#5, The red volume jumps above its 21 day ma as decline quickly unfolds.
Very High Red (Down-Day) Volume
Warnings
of Significant Market Tops
1928-2013
9/5/1929 red volume was highest since since 3/27/1929 (Case 1)
4/23/1930 red volume rose above its 21-dma. This was 4 days from top. (Case 5)
3/28/1937 red volume reached a very high level right at top. It was 85% of the blue
volume a few days earlier.
(Case 3)
8/20/1937 5 straight down days. Warning S17. Case 4
9/9/1941 Red volume rose above all blue-volume back to 7/22/1941 (Case 1)
6/6/1946 top showed no increase in red volume. It did show 5 straight down days.
Warning S17. Case 4
7/11/1957 at top, the red high volume almost as high as blue day volume day before.
(Case 3)
1/14/1960 at top, the red high volume was highest since 12/1/1959. (Case 1)
12/29/1961 at top, the red high high volume was highest since 11/9/1961 (Case 1)
1/26/1966 at top, the red high volume was highest since 12/15/1966 (Case
1)
12/5/1968 red volume was highest since 10/17/1968 (Case 1)
1/12/1973 red volume was almost as high as on previous up day peak. (Case 3)
9/22/1977 red high volume was highest in a long time at top. (Case 1)
9/13/1978 red high volume was highest volume since 8/18/1978, This was on first
down day from peak. (Case 1) Later 7 straight down days followed.
10/9/1979 red down day volume was highest in a long time, 9+ months. (Case 1)
Going into Feb 1980 top there were three record high down volume days (Case 1)
Going into April 1981 top there were three record high volume days.
(Case 1)
After the top, the DJI fell six straight days. (Case 4)
A week after Jan 1984, top there were 7 straight down days, (Case 4)
10/14/1987 Red volume belatedly rose to its highest level since 8/11/87
7/23/1990 Red volume rose to highest levels since 5/15/1990. This was second day down.
(Case 1)
2/4/1994 Red volume rose to highest level for many months. (Case 1) This
was second day down from peak.
There were no clear red volume warnings at October 1997 top.
7/22/1998 Red volume was highest since 6/17/1998. (Case 1)
1/24/2000 5 straight down days after peak. (Case 4)
7/20/2007 one day after the top, red down volume reached highest levels since
6/15/2007. (Case 1)
On decline, red high volume made a series of highs
5/4/2011 Red volume rose to highest since 3/18/2011. This was one day from
peak. (Case 1)
8/3/2007 8 straight down days. (Case 4)
5/4/2011 Red volume rose to highest since 3/21/2011. This was one day from
peak. (Case 1)
|
12/3/2013 ---> To
Key Index and Leading Stock Charts: DJI, SP-500, etc.
----> 70 MAXCP stocks Bullish MAXCP Stocks (12/3/2013)
---> 98 MINCP stocks Bearish MINCP Stocks (12/3/2013) Bearish
Plurality
---> 38 New
Highs on NASDAQ 17 new lows. Bullish plurality
---> 19 New Highs
on NYSE 46 new lows. Bearish
Plurality
DJI
la/ma annroc
P-I
IP21
V-I
Opct
65-day Pct Change
-----------------------------------------------------------------------------------------------------------------------------------
11/27/2013
16097 (high)
+25 1.017
.314 -43 NC .069 -38 .297
089
11/29/2013
16086
- 11 1.015
.352 +41
.072 -28 .317
085
12/02/2013
16009
- 78 1.008
.348 +9
.080 -25 .341
078
12/03/2013
15915
- 94 1.001
.224 -10
.066
-40
.231
074
==================================================================================
OLDER HOTLINES
==================================================================================
12/2/2013 A 3% Decline back to 15600 would be in keeping with the 1986 Market
that closely parallels our own. A bigger December decline would suggest trouble next
year. Yahoo is busy scaring people into selling. But Peerless has not given a
Sell.
Nobel Prize
economist Schiller warns of U.S. stock market bubble
Billionaires,
Buffett, Paulson and Soros Are Dumping Stocks
The Peerless Buy
B10 sets up an average Peerless goal of 16676.
Gold and silver keep falling. This is bullish for the market as a whole. We
should
expect the Fed NOT to upset the holiday's markets, I believe. Not for nothing does
December have the reputation for being the most bullish month of the year. Momentum
like we have seen is more likely to end in a final upside buying climax than simply
just gradually turn negative. The DJI's Trading range breakout offers a minimum
upside target above 16800 and Peerless has given no Sell.
.
Still, vigilance and caution are warranted now, I judge.
Here's why:
#1 Generally it is a short-term sell when the A/D Line or Closing Power fails to confirm
and then breaks its own uptrending support-line. Another down-day would probably
cause this. See the A/D Line and SPY's Closing Power below. (A fourth straight
DJI
down-day (on Wednesday) on rising volume also has a bearish history in rising markets.)
Weakness tomorrow will give a Stochastic-20 Pct Sell. This has been 75% reliable
in the second of the year on the DJI.) As you can see below, there were more new
lows than
highs on the NYSE today and our MNCP stocks outnumbered MAXCP stocks. I have
suggested shorting the most heavily distributed stocks in our
MINCPs. They are likely
to be under heavy tax-loss selling throughout the month.
#2 The last month's trading the SPY shows a bearish rising wedge price pattern.
#3 Looking back at 1986, which I consider the closest parallel to the present that I can
find, we see a similar breakout followed by a shallow 2%-3% early December decline.
Only after a weak-looking December, was there then a very big breakout in 1987.
See 1986 chart below.
#4 Were it not for the fact that the period from December to March brings so many tops
going into the Mid-term Election Year with a Democrat in the White House, I would
bet on another January take-off. Perhaps, the surprise will be that the stock market
will appear to be breaking out in January 2014 and then badly fail. Recall the
there were take-offs in 2012 and 2013. (Actually, there can be three January
take-offs
in a row. Notably, 1985, 1986 and 1987.)
#5 Just the market's "maturity" is enough to warrant
concern. Now 4 year and 9 months
of age, we
should note that there have been 3 longer advances without a DJI decline
of 20% of more since 1929. The longest bull markets since 1929 are shown
below.
Three of them were much longer the the current bull market.
October 1933 - March 1937 - 3 year and 6 month
April 1942 - May 1946 -
4 years and 1
month
June 1949 - June 1957 -
8 years.and 1 month
June 1962 - January 1966 3 years and 7
months
August 1982 - August 1987 - 5 years
October 1990 - July 1998 - 7 year and 11 months
January 2003 - October 2007 - 4 year and 9 months
#6 We all know that December is the most bullish month
of the year. But in a rising
market might December not even bring a rally above its levels at the November's peak?
And would the lack of a December rally then warn of trouble next year? The answer is
"YES". This was so in:
1968 DJI fell steadily all
month... BEAR MKT FOLLOWED
1983 DJI fell steadily all
month... BEAR MKT FOLLOWED
2007 12/10 peak. No year-end rally of consequence. BEAR MKT FOLLOWED
it
was not so in
1986 12/3
was peak. DJI fell back graduallt, falling 3% by the end of the month..
I would classify 17 of the 68 Decmbers since 1945 as being bearish,
at least for the
first half of the month. This suggests the odds are only 25% of the present decline
falling until after the 15th of December.
December Peaks
above the high of Nov.
-----------------------------------------------
1945 12/11
1946 12/20 end of bear market.
1947 December's high was below
November's peak. 3 straight down days ending 12/8
1948 12/30
1949 DJI rose steadily throughout
December.
1950 DJI rose steadily throughout
December, and reach the Nov peak on 12/29
1951 DJI rose steadily throughout
December.
1952 DJI rose steadily
throughout December.
1953 12/18
1954 DJI rose steadily
throughout December.
1955 12/30
1956 DJI rose steadily
throughout December.
1957 12/2 DJI fell until 12/18
3 straight down-days ending 12/10/1957
1958 DJI rose steadily
throughout December.
1959 DJI rose steadily
throughout December.
1960 After 12/6 bottom, DJI rose all
month.
1961 12/13 - DJI stayed in toght trading range all month.
1962 12/13 - DJI stayed in toght trading range all month.
1963 12/18 DJI rose steadily
throughout December.
1964 12/2 DJI fell until 12/15.
3 straight down-days ending 12/10/1957
1965 DJI rose steadily
throughout December.
1966 12/13 Peak DJI fell back
4% for rest of month. 4 straight down days ending 12/21
1967 DJI rose steadily
throughout December.
1968 DJI fell steadily all
month... BEAR MKT FOLLOWED 3 straight down days ending
12/24
1969 DJI fell until 12/17
BEAR MKT FOLLOWED 3 straight down days
ending 12/9
1970 DJI rose steadily
throughout December.
1971 DJI rose steadily
throughout December.
1972 12/11
1973 erratic but closed on high of month
1974 bear market bottom on 12/6. Then moved up.
1975 bottom on 12/9 and then up to end of month.
1976 DJI rose steadily
throughout December.
1977 DJI fell until 12/19
BEAR MKT FOLLOWED
3 straight down days ending 12/7
1978 12/6 DJI fell until
12/18
1979 12/17
1980 DJI fell until
12/16 BEAR MKT SOON FOLLOWED 3 straight down days ending 12/8
1981 12/4 and fell for rest of
month BEAR MKT FOLLOWED 3 straight down days ending 12/24
1982 12/8 and 12/27
1983 DJI fell steadily
all month... BEAR MKT FOLLOWED 5 straight down days
ending 12/16
1984 12/7 bottom but it did not surpass November highs.
1985 DJI rose steadily
throughout December.
1986 12/3 was peak. DJI fell back 3%.
1987 12/4 bottom. DJI then nrose steadily throughout December.
1988 DJI then rose steadily throughout December.
1989 12/13
1990 DJI rose steadily
throughout December.
1991
12/10 bottom and then strongly
up.
1992 DJI rose throughout
December.
1993 DJI rose throughout
December.
1994
12/9 bottom and then strongly
up.
1995 12/13
1996
DJI fell 5% to 12/16 and then
rallied back.
1997 12/5 was peak.
1998
Fell until 12/14 bottom and then rebounded
strongly.
1999 DJI rose throughout
December.
2000 12/6 was peak. DJI fell until 12/21
and then rebounded strongly.
2001 DJI rose throughout
December.
2002 DJI fell steadily
all month... BEAR MKT FOLLOWED 5
straight down days ending 12/6
2003 DJI rose throughout
December.
2004 DJI rose throughout
December.
2005 Narrow
trading range
2006 DJI rose throughout
December.
2007 12/10 peak. No year-end rally of consequence. BEAR MKT FOLLOWED
2008 12/10 peak.
2009 Narrow trading range
2010 DJI rose throughout
December.
2011 Narrow trading range
2012 12/19
#7 The last concern I have is that there may be a break in the market without a typical
Peerless Sell S9, S12 or S15 or even a Sell S1 or S4. Without a Peerless Sell, a
7% retreat in the DJI is the most I think we should consider possible. based on the
past. (More on this tomorrow night).


---> To
Key Index and Leading Stock Charts: DJI, SP-500, etc.
----> 79 MAXCP stocks Bullish MAXCP Stocks (12/2/2013)
---> 96 MINCP stocks Bearish MINCP Stocks (12/2/2013) Bearish
Plurality
---> 60 New
Highs on NASDAQ 18 new lows. Bullish plurality
---> 40 New Highs on NYSE 42 new lows.
Bearish
Plurality
DJI
la/ma annroc
P-I
IP21
V-I
Opct
65-day Pct Change
-----------------------------------------------------------------------------------------------------------------------------------
11/27/2013
16097 (high)
+25 1.017
.314 -43 NC .069 -38 .297
089
11/29/2013
16086
- 11 1.015 .352 +41 .072
-28
.317
085
12/02/2013
16009
- 78 1.008 .348 +9 .080
-25
.341
078
====================================================================================
OLDER HOTLINES
====================================================================================
12/1/2013
The Peerless Buy B10 sets up
an average Peerless goal of 16676.
---> To
Key Index and Leading Stock Charts: DJI, SP-500, etc.
---->
76 MAXCP stocks
Bullish MAXCP Stocks (11/29/2013) Bullish
plurality
---> 40
MINCP stocks Bearish MINCP Stocks (11/29/2013)
---> 156 New Highs on NASDAQ
5 new lows. Bullish plurality
---> 62 New Highs on NYSE 5 new lows.
Bullish
plurality
DJI
la/ma
annroc
P-I
IP21 V-I
Opct
65-day Pct Change
-----------------------------------------------------------------------------------------------------------------------------------
11/7/2013
15594 -153 1.000 .61 +301
.159
+6
.115 007
11/8/2013
15762 +167
1.017 .489 +222
.158
-5 .120
016
11/11/2013
15783 +21 1.016 .419 +159
.139
-13 .115
023
11/12/201
15751 -32 1.013 .344 +97
.109
-28 .035
021
11/13/2013
15822 +71
1.015 .500
+228 .179 +6 .124
024
11/14/2013
15876 +54
1.017 .384
+187 .168 -4 .119 035
11/15/2013
15962 +85
1.021 .450
+136 NC .166 -10 .220 056
11/18/2013
15976 +14
1.020 .439
+38 NC .140 -31 .206 059
11/19/2013
15967 -9 1.018
.437 -11 .126 -36
.206
063
11/20/2013
15901 66
1.012
.329 -126
.102 -57
.117
059
11/21/2013
16010 +109
1.017 .452
-42 NNC
.115
-31
.21
074
11/22/2013
16065 +55
1.019 .420
-32 NNC .124
-27
.203
073
11/25/2013
16073 +8 1.018
.377
-76 NNC .106
-38
.200
07
11/26/2013
16073 +0 1.016
.380
-47 NNC .088 -36 .304
075
11/27/2013
16097 +25
1.017 .314 -43 NC .069 -38 .297 089
11/29/2013
16086 - 11
1.015
.352 +41 .072
-28
.317
085
The real excitement now is in the QQQ and
the NASDAQ. These have accelerating upwards.
They appear to be starting "vertical
ascents", like were seen from October 1999-March 2000.
The differences now are: 1) The public
now is not so bullish or financially able to boost the market;
2) The NYSE A/D line in 1999 had been
lagging a long time; 3) The 1999-2000 SPY/QQQ Closing Power
bearish divergences were much more
pronounced than now.

Current QQQ and NASDAQ Charts
 |
 |
December Bullishness
Since 1965, the DJI has risen 63.8% of
the time over the next 3 trading days, but
only 53.2% over the next two weeks.
70.2% of the time the DJI is up over the
next 21 trading days. The average
December gain since 1965 has been 2% on the DJI.
With a Democrat in the White House,
Decembers the year after a Presidential Election
Year have all risen since 1945. The
December 1933 and 1945 cases also saw rallies,
but the bear market Decembers of 1937 and
1941 did not..
With a Democrat in the White House, we
should expect a market top between December 8th
and February 2nd. In 2 cases the
DJI's peak did not get a Peerless Sell and still fell 7%:
12/8/1997 and 1/19/2010. These were in rising markets like our own.
In one case, a Peerless Sell
was only given when support was broken.
This was in 12/30/1977 in an on-going bear market.
Nov 30 Dec 31
1945 191.5
192.9 +0.7% Peaked 2/2/1946 at 205.8 after 1/10/1946 Sell S9
1949 191.6 200.5
+4.6% Hit 204.5 peak on 2/2/1950 and went sidewise
until 3/15 upside breakout.
1961 721.6 731.5
+1.4% Peaked 12/29/1962 (Sell S16) and started
27% bear market.
1965 946.7 969.3
+2.4% Peaked 1/18/1966 (Sell S12,
S4) and started a 9 month bear mkt.
1977 829.7 831.2
+0.2% Peaked 12/30/1977 at 831.7 and
fell 11%. No Sell at top.
1993 3684
3754 +1.9% Peaked 1/31/1994 at 3978 eith Sell S4. 9% decline followed. .
1997 7823
7908 +1.1% Peaked on 12/8/1997 amd fell 7% to 1/9/1998.
No Sell at top.
2009 10345 10428
+0.8% Peaked on 1/19/2010 amd fell 7% to
2/8/1998. No Sell at top.
----------------------------------------------
Avg. = +1.5%
Identifying Tops without Peerless Sell Signals
What was there about the 12/8/1997 and 1/19/2010 cases that we might have seen to see that
7% declines were about to start.
Let's look at the SPY and also the DIA charts for these two cases?
In the first case, prices rose back to
resistance after a 10% sell-off. A reversal should have been
watched for. The A/D Line was
weaker than on the previous high. So, that is considered a non-confirmation
(NC). Then the A/D Line broke its
uptrend. This was a short-term Sell. The SPY chart is similar.
The Closing Power failed to confirm the rally.
It peaked far below its previous high. Then it, too,
broke its uptrend. This was a short-term
Sell.
In the second case, we see a DJI breakout
failure followed by an A/D Line trend-break. The SPY
chart is identical. But there we see the
Closing Power has failed to confirm the high and breaks
its uptrend. This should be taken as a
short-term Sell.
12/8/1997 Peak
 |
 |
1/19/2010 Peak
 |
 |
DJI
la/ma
annroc
P-I
IP21
V-I
Opct
65-day Pct Change
-----------------------------------------------------------------------------------------------------------------------------------
11/7/2013
15594 -153 1.000 .61
+301
.159
+6
.115 007
11/8/2013
15762 +167
1.017 .489 +222
.158
-5 .120
016
11/11/2013
15783 +21 1.016 .419 +159
.139
-13 .115
023
11/12/201
15751 -32 1.013 .344 +97
.109
-28 .035
021
11/13/2013
15822 +71
1.015 .500
+228 .179 +6 .124
024
11/14/2013
15876 +54
1.017 .384
+187 .168 -4 .119 035
11/15/2013
15962 +85
1.021 .450
+136 NC .166 -10 .220 056
11/18/2013
15976 +14
1.020 .439
+38 NC .140 -31 .206 059
11/19/2013
15967 -9 1.018
.437 -11 .126 -36
.206
063
11/20/2013
15901 - 66
1.012
.329 -126
.102 -57 .117
059
11/21/2013
16010 +109
1.017 .452
-42 NNC
.115
-31
.21
074
11/22/2013
16065 +55
1.019 .420
-32 NNC .124
-27
.203
073
11/25/2013
16073 +8 1.018
.377
-76 NNC .106
-38
.200
07
11/26/2013
16073 +0 1.016
.380
-47 NNC .088 -36 .304
075
11/27/2013
16097 +25
1.017 .314 -43 NNC .069 -38 .297 089
11/29/2013
16086 - 11
1.015
.352 +41 .072
-28
.317
085
------------------------------------------------------------------------------------------------------------------------------------------------------
 Happy Thanksgiving to all.
--------------------------------------------------------------------------------------------------------------------------------------------------
11/27/2013 Will The Smaller
Stocks and NASDAQ Take-Off Past
Their Upper Bands and Rising Resistance Levels?
Seems Probable.
The
more the stock market rallies, the greater the skepticism among Fed critics,
TV
talking-head and conservative neo-Austrian commentators. My view is that
all ideological thinking is bad for your financial
economic health. As JM Keynes
explained 70 years ago:
"Markets can remain
irrational longer than you can remain solvent."
The commentators below might want to reconsider their certainty about an
imminent market top. We, on the other hand, should be happy that there so many
shorts to be run in as the market makes new all-time high, after all-time high,
where the path of least resistance is UP.
Stock
market crash is imminent! - 8/10/2013 - Tom Heneghan Explosive
Stock
Market Crash imminent - 2013 - Siam Kid
MARKET
CRASH & DEBT BUBBLE BURST IMMINENT 11/7/2013...
Yale
Economist Shiller: Stock Market Is in a Bubble - July 31, 2013
HUSSMAN:
The Stock Market Will Probably Crash - August 22, 2013
"Yellen
Has Ensured An Equity Market Crash Is Inevitable" Tyler Durdenm
11/13/2013
:The Stock Market
Bubble", 10/15/2013 Joseph Carducci
Why
Stocks Are Undoubtedly Experiencing A Massive Bubble - Forbes
10/8/2013 Jesse Columbo
David
Stockman and the cult of gloom
Marc
Faber Warns "Karl Marx Was Right" Nov
7, 2013
Jim Rogers:
"This Is Absolute Insanity" Nov 12, 2013
The Technicals Are Still Much Too Bullish
To Call A Top.
These
"nay-sayers" may be right... eventually. But, the market could go up
another 9 months if the 1986-1987 parallel holds true. See last night's
Hotline.
1929
is not a good parallel, I think. The A/D Line and Accumulation Index
were
much more bearish in the nime months before the September 1929 peak.
Getting the reliable A/D Line data before 1965 is very difficult. The super-bears
probably have not looked at the A/D Line for 1929. They also probably have not
looked at how negative the Tiger Accumulation Index was for much of the year.
The
breadth now is also still rising, unlike what we saw late in 1999, a few months
before the final top.
2013 Bull Market shows rising NYSE A/D Line and Positive
Accum. Index

1929 Peak
2000 Peak

Climactic Vertical Ascent Mode?
With
our active Peerless Buy signals, powerful momentum, Fed and the seasonality,
I
think there is a very good chance that we are on the verge of a climactic "vertical
ascent"
by
the NASDAQ and QQQ. This advance may someday be compared to the climactic
1999-2000 advance.
remains very high.so much pessimism

------------------------------------------------------------------------------------------------------------------------------------------------------
OLDER HOTLINES
------------------------------------------------------------------------------------------------------------------------------------------------------
11/26/2013 The Lagging A/D Line and P-Indicator
may bring a shallow decline from
a peak in early
December. That,at least, is what took place in December 1986 under
technical circumstances
very much like our own, namely (1) the DJI had just broken
above the top of a 6+
month. well-defined trading range and (2) the NYSE A/D Line
and P-Indicator started
to lag the DJI very noticeably. See the charts in last night's
Hotline.
Nevertheless, I think we have to ignore that possibility for now. Let's see
if the NASDAQ can keep
moving up, as it started today.
The Peerless Buy B10 sets up
an average Peerless goal of 16676.
The 1000 points' height
of the previous trading range gives technicians a classic way to
calculate a minimum DJI upside target now of 16900. More
interesting to watch
will be the NASDAQ and
QQQ. They may still breakout out above the top of their
well-tested price
channels. This could re-establish the"bubble" 1999-2000 scenario.
But they also may be
forming bearish rising wedge patterns.
The flat-topped
breakout today by the Russell-2000 ETF IWM and the leveraged small cap ETF
TNA should give hope to
the bulls who are anticipating a swft "vertical ascent" by the
NASDAQ and QQQ, one
that may be compared to their 80% advances between October
1999 and March 2000.
High-priced AAPL and GOOG
rose sharply today. Added to the
BBH and IBB Biotech breakouts of
last week, it does appear that these other groups
will move up more and
there will be a NASDAQ breakout above the resistance at the
top of their price
channel. The rising big banks and falling gold stocks are very bullish
signs, too. In
addition, it would be very surprising to see the Fed do anything that would
hurt the economic
recovery right before Christmas.
We
should relax and have a beautiful and thankful holiday. The next regular Hotline
will be
Sunday night.
The charts will be here as usual on Thursday evng. for Friday's limited trading.


11/26/2013 ---> To
Key Index and Leading Stock Charts: DJI, SP-500, etc.
---->
174 MAXCP stocks
Bullish MAXCP Stocks (11/26/2013) Bullish
plurality
---> 77
MINCP stocks Bearish
MINCP Stocks (11/26/2013)
---> 131
New Highs on NASDAQ
22 new lows. Bullish plurality
---> 106 New Highs on NYSE 33 new lows.
Bullish
plurality
DJI
la/ma
annroc
P-I
IP21 V-I
Opct
65-day Pct Change
-----------------------------------------------------------------------------------------------------------------------------------
11/7/2013
15594 -153 1.000 .61 +301
.159
+6
.115 007
11/8/2013
15762 +167
1.017 .489 +222
.158
-5 .120
016
11/11/2013
15783 +21 1.016 .419 +159
.139
-13 .115
023
11/12/201
15751 -32 1.013 .344 +97
.109
-28 .035
021
11/13/2013
15822 +71
1.015 .500
+228 .179 +6 .124
024
11/14/2013
15876 +54
1.017 .384
+187 .168 -4 .119 035
11/15/2013
15962 +85
1.021 .450
+136 NC .166 -10 .220 056
11/18/2013
15976 +14
1.020 .439
+38 NC .140 -31 .206 059
11/19/2013
15967 -9 1.018
.437 -11 .126 -36
.206
063
11/20/2013
15901 66
1.012
.329 -126
.102 -57
.117
059
11/21/2013
16010 +109
1.017 .452
-42 NNC
.115
-31
.21
074
11/22/2013
16065 +55
1.019 .420
-32 NNC .124
-27
.203
073
11/25/2013
16073 +8 1.018
.377
-76 NNC .106
-38
.200
07
11/26/2013
16073 +0 1.016
.380
-47 NNC .088 -36 .304
075
===================================================================
OLDER HOTLINES
===================================================================
11/25/2013 The Peerless Buy B10 sets
up an average Peerless goal of 16676.
The 1000 points' height
of the previous trading range gives technicians a classic way to
calculate a minimum DJI upside target now of 16900. More
interesting to watch
will be the NASDAQ and
QQQ. They may still breakout out above the top of their
well-tested price
channels. This could re-establish the"bubble" 1999-2000 scenario.
But they also may be
forming bearish rising wedge patterns. We will have to wait and
see which way prices
break for them. Meanwhile, the DJI and SP-500 must be expected
to continue higher due
to the B10, the momentum, the seasonality and the FED even
though the A/D Line is
now lagging and the P-Indicator is negative.

11/25/2013 ---> To
Key Index and Leading Stock Charts: DJI, SP-500, etc.
---->
174 MAXCP stocks Bullish
MAXCP Stocks (11/25/2013) Bullish
plurality
---> 77
MINCP stocks Bearish MINCP Stocks (11/25/2013)
---> 131
New Highs on NASDAQ
22 new lows. Bullish plurality
---> 106 New Highs on NYSE 33 new lows.
Bullish
plurality
The Lagging NYSE A/D Line
The NYSE A/D Line has
started to lag the DJI's advance. Often this is a warning that
interest rates may be
going up. But, it takes a lot to stop a market with so much
upward momentum and, as
I've pointed out recently, with the Accumulation Index
above +.10, as it is
now, Sell S9s are not reliable in November and December when
they are based on a
negative P-Indicator with the DJI 2% above the upper band.
The closest parallel I
can find to now is still 1986. Compare the chart below with
our own. Besides
the trading ranges' parallel, the NYSE A/D Line and P-Indicator,
also turned negative in
November and December 1986 following the DJI breakout.
This led to a 2%
retreat in mid December and than a very big advance that
started in January
1987.
DJI
la/ma
annroc
P-I
IP21 V-I
Opct
65-day Pct Change
-----------------------------------------------------------------------------------------------------------------------------------
11/7/2013
15594 -153 1.000 .61 +301
.159
+6
.115 007
11/8/2013
15762 +167
1.017 .489 +222
.158
-5 .120
016
11/11/2013
15783 +21 1.016 .419 +159
.139
-13 .115
023
11/12/201
15751 -32 1.013
.344 +97
.109 -28
.035
021
11/13/2013
15822 +71
1.015 .500
+228 .179
+6 .124 024
11/14/2013
15876 +54
1.017 .384
+187 .168
-4
.119
035
11/15/2013
15962 +85
1.021 .450
+136 NC .166 -10 .220 056
11/18/2013
15976 +14
1.020 .439
+38 NC .140 -31 .206 059
11/19/2013
15967 -9 1.018
.437 -11 .126 -36
.206
063
11/20/2013
15901 66
1.012 .329 -126 .102 -57
.117 059
11/21/2013
16010 +109
1.017 .452
-42 NNC
.115
-31
.21
074
11/22/2013
16065 +55
1.019 .420
-32 NNC .124
-27
.203
073
11/25/2013
16073 +8 1.018 .377
-76 NNC .106
-38
.200
07
What Is Historical Significance of A Negative P-Indicator at
Thanksgiving?
Still, it is probably a
good exercise in caution to review the cases since 1945 around Thanksgiving
(Thursday) when the
P-Indicator turned negative in a rising market. I count 15 cases of this.
In 10 instances the DJI
rallied for more than 2 weeks. In 5 cases it did not. When the Accumulation
Index was positive, it
always rose, except in 1986, where the DJI fell a little more than 2%
and then exploded
upwards. In many ways, the 1986 case is the one most similar to ours now.
As in our case now, the
DJI then was breaking out of an extended, well-tested trading range
following a long
advance. The biggest difference was that a Republican was in the White House
and the DJI is more
likely to rally at the start of the year of Mid-Term Elections when a Republican
is in the White House.
Notice, also how in 1986, in November and December, the NYSE A/D Line
turned down quite
strongly with the P-Indicator dropping back a long ways.
Compare these two charts:
1986-1987 and 2013.
1986-1987

2013

New Study:
Cases Where IP21 Was Negative At Thanksgiving since 1945 in A
Rising Market
la/ma P-I
IP21 Result...
11/23/1956 .978 -67 -.113 DJI rallied from lower band (472.6) to upper band (496) on Jan 2, 1957
and
then fell back 8% to a new low.
11/27/1959 1.011 -29 -.043 DJI rallied from 653 to upper band at
679.1 on 1/4 and
then fell 12%.
11/29/1963 1.007 -94 -.100 DJI rallied from 751 to 830 in May without even a 3% decline.
#1 11/25/1964 1.004 -7
-.015 DJI fell from 882 to 858 on 12/15/1964 and
then rallied until May 15.
11/29/1965 .992
-6 -.048 DJI rallied from 947 to 994 on Jan. 18, 1966 and
then began a bear market.
11/29/1967 1.019 -79 -.088 DJI rallied from 883 to 908 on Jan. 9, 1968 and
then fell 9% by March.
11/25/1970 1.012 -4 -.148
DJI rallied from 775 to 951 on April 28, 1971
#2 11/25/1980
1.025 -22 -.016 DJI fell from 983 to 908 0n
12/11/1980 and
then rallied back to the upper band.
#3 11/29/1984
.985 -33 -.032 DJI fell from 1193 to
1163 0n 12/7/1984 and
then rallied until March 1, 1985 (1299).
#4 12/4/1986
1.025 -20 +.186 DJI fell from 1940 to 1896 on 12/31 and
then rallied until April (2405).
11/30/1989 1.007 -148 +.015 DJI rallied from 2115 to 2347 on
Feb. 7, 1989
11/29/1991 .968 -127 +.014 Two weeks later DJI rallied from
2895 to 3272 on 1/28/1991
11/29/1993 1.001 -154 +.049 DJI rallied from 3678 to 3964.01
on 2/1/1993
11/24/1999 1.023 -36 +.003 DJI rallied from 11008 to 3964.01
to 11497 on 12/31/1999
Two weeks later DJI started a bear market from 11723 high on
1/14/2000.
#5 11/30/2007 1.014 -403 -.102 2% rally over next week.
A week later an extreme bear market started.
===================================================================================
OLDER HOTLINES
===================================================================================
11/22/2013
The Peerless Buy B10 sets
up an average Peerless goal of 16676.
The 1000 points' height
of the previous trading range gives technicians a classic way to
caclulate a minimum DJI upside target now of 16900. More
interesting to watch
will be the NASDAQ and
QQQ. They may still breakout out above the top of their
well-tested price
channels. This could re-establish the"bubble" 1999-2000 scenario.
Peerless Signals and DJI
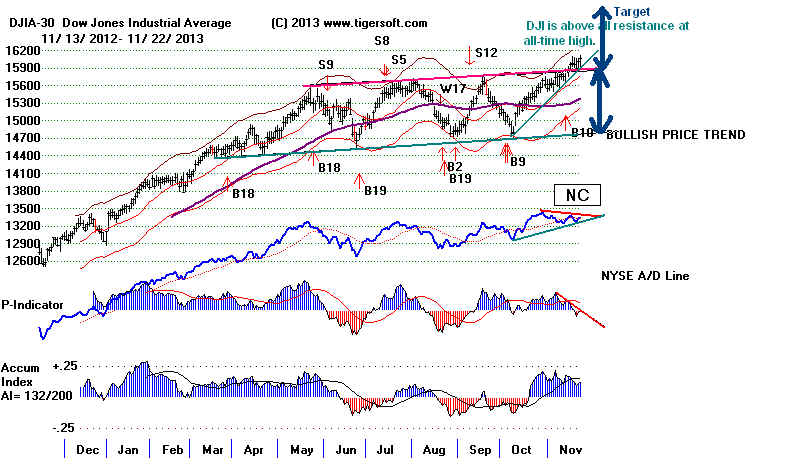
Friday, the
Biotechs broke out above their flat resistance levels. See BBH and IBB below
NASDAQ IBB Biotech Flat-Topped Breakout
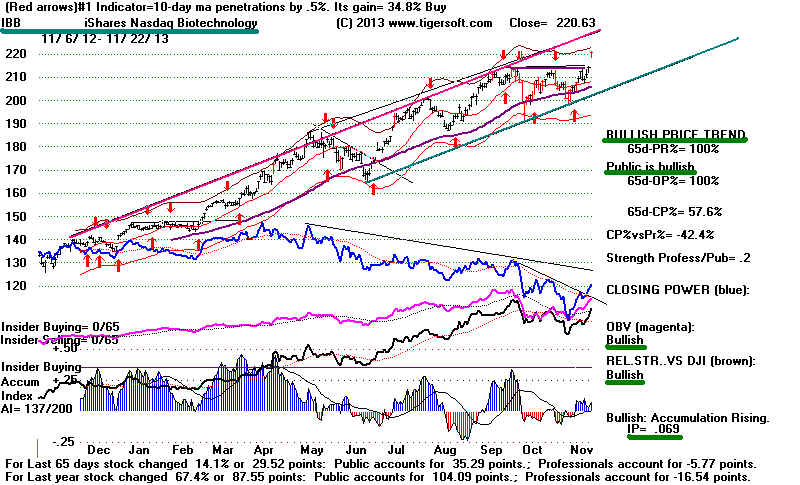
Momentum players
will probably push these higher and that will boost the NASDAQ
and QQQ. It
remains to be seen if the NASDAQ can recapture market leadership
from the DJI.
The TigerSoft RELDJI Indicator is still negative. It measures the
strength of the
NASDAQ versus the DJI. Right now it is quite negative. This
fact argues
against a climactic advance now in the NASDAQ and QQQ, which
is actually
bullish for the present, since very often the market does something
spectacular to
draw in unwary public investors near the end of a long advance.
Peerless Signals and NASDAQ Trendlines
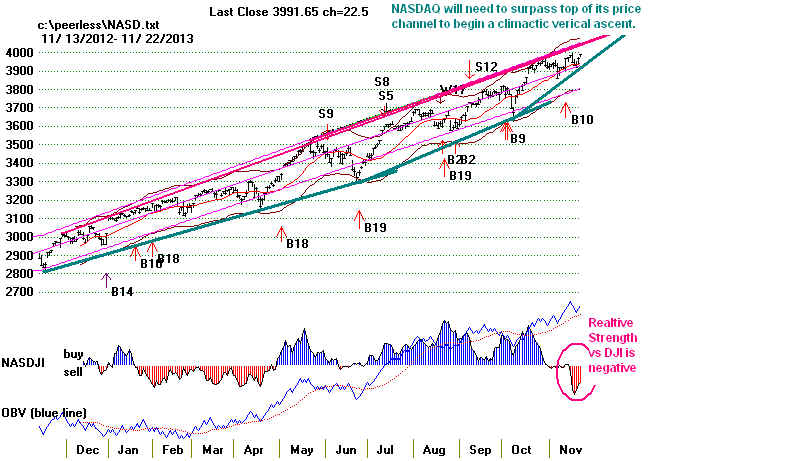
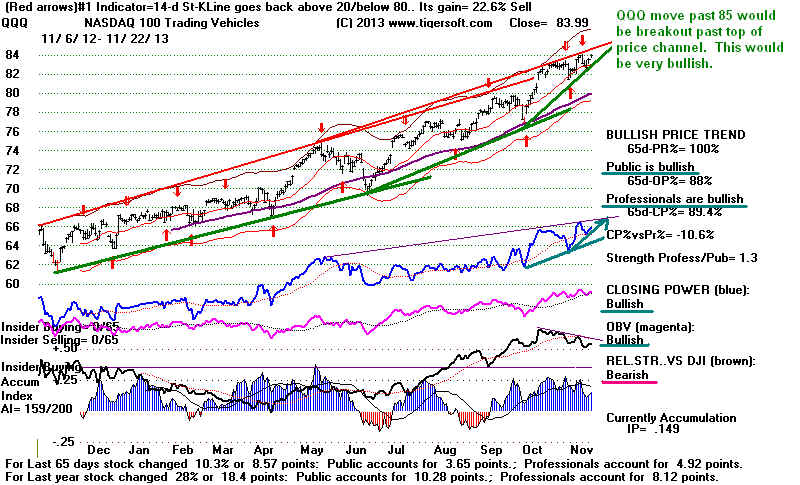
Will There Be A Sell S9?
The DJI stands 1.9%
over the 21-day ma with the P-Indicator still negative. P-I is
now -32.
Because the Accumulation Index is quite positive (>.10) and it is
November,
we won't easily
get a Sell S9 with Peerless as it stands now. Earlier in the year, a Sell S9
would probably
have occurred if the DJI were to reach the 3% upper band. Seasonality
is too bullish
now. The programs have been written tot take that into account. The DJI
rises 70.2% of
the time over the next month and typically gains 1.8%. With a Democrat
in the White
House going into the year of the mid-term Elections, we do have to be
watchful of a top
between December and February.
I know there are
some bears out there. So, here are the results if one got a Sell S9
in November or
December in the years 1929, 1933, 1937, 1941...2001, 2005, 2009,
2013 when the
DJI, as now, was simply 1.9% or more over the 21-dma with the P-Indicator
negative. In a rising market, all four of the "Sell S9s" based on these
simple parameters
would have
brought losses. In a declining market, the signals did much better, though
in 2 of the 9
cases, they were significantly premature bring paper losses of more than 4%.
Sell S9 based on only
LA/MA >1.018 and P-I<0
la/ma PI
IP21 Gain
-----------------------------------------------------------------------------------------------
bear mkt 12/2/1929 1.024 -62 .002 +3.7%
DJI rallied 3% before falling to lower band.
bear mkt 12/3/1929 1.053 -.9 .049 +6.8%
bear mkt 11/8/1933 1.038 -12 .006 95.5 DJI reached 102 before falling to lower band (95.5) on
12/21/1933
bear mkt 11/24/1933 1.046 -8 -.005 98.1 DJI reached 102 before falling to lower band (95.5) on
12/21/1933
bear mkt 12/3/1937 1.025 -109 -.125 127.6 DJI fell to lower band 118.9 on 12/28/1937
bear mkt 12/8/1937 1.044 -58 -.041
129.8 DJI fell to lower band 118.9 on
12/28/1937
bear mkt 12/26/1973 1.02 -148 -.041 +1.1% DJI rose from 837.36 and reached 855.32 and then fell to 828.46
bear mkt 12/27/1973 1.034 -84 .016 +2.6% DJI rose from 851.01 and reached 855.32 and then fell
to 828.46
bear mkt 11/10/1977 1.023 -2
.128 +3.1% DJI rose from 832.55 and reached 845.89 and then fell to
828.46
11/24/1989 1.019 -28 .046 -.008%
DJI rose from 2676 to 2751 before falling back to a Buy signal.
11/20/1997 1.031 -106 -.014 -1.7% DJI rose from
7827 to 8111 before falling to 7660.
11/3/2005 1.019 -101-.03 -2.8%
DJI rallied and broke out...
11/9/2009 1.029 -47 .051. -0.8%
DJI rallied and then gave Buy B13
11/22/2013 ---> To Key Index and Leading Stock Charts:
DJI, SP-500, etc.
---->
288 +164 MAXCP stocks Bullish MAXCP Stocks
(11/22`/2013) Bullish plurality
---> 68 -22 MINCP stocks
Bearish MINCP Stocks
(11/22/2013)
---> 172
New Highs on NASDAQ
14 new lows. Bullish plurality
---> 158 New Highs on NYSE 29 new lows.
Bullish
plurality
DJI
la/ma
annroc
P-I
IP21 V-I
Opct
65-day Pct Change
-----------------------------------------------------------------------------------------------------------------------------------
11/7/2013
15594 -153 1.000 .61 +301
.159
+6
.115 007
11/8/2013
15762 +167
1.017 .489 +222
.158
-5 .120
016
11/11/2013
15783 +21 1.016 .419 +159
.139
-13 .115
023
11/12/201
15751 -32 1.013
.344 +97
.109 -28
.035
021
11/13/2013
15822 +71
1.015 .500
+228 .179
+6 .124 024
11/14/2013
15876 +54
1.017 .384
+187 .168
-4
.119
035
11/15/2013
15962 +85
1.021 .450
+136 NC .166 -10 .220 056
11/18/2013
15976 +14
1.020 .439
+38 NC .140 -31 .206 059
11/19/2013
15967 -9 1.018
.437 -11 .126 -36
.206
063
11/20/2013
15901 66
1.012 .329 -126 .102 -57
.117 059
11/21/2013
16010 +109
1.017 .452
-42 NNC
.115
-31
.21
074
11/22/2013
16065 +55
1.019 .420
-32 NNC .124
-27
.203
073
************************************************************************************
===================================================================================


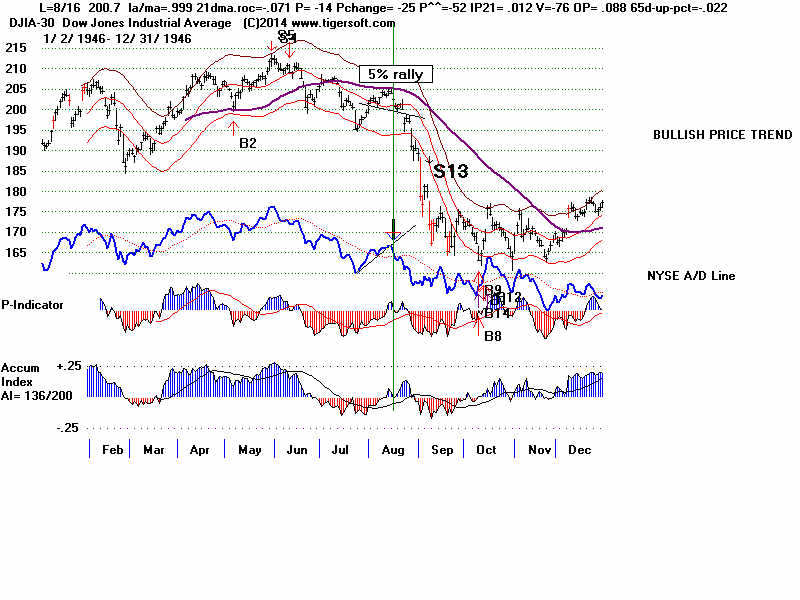
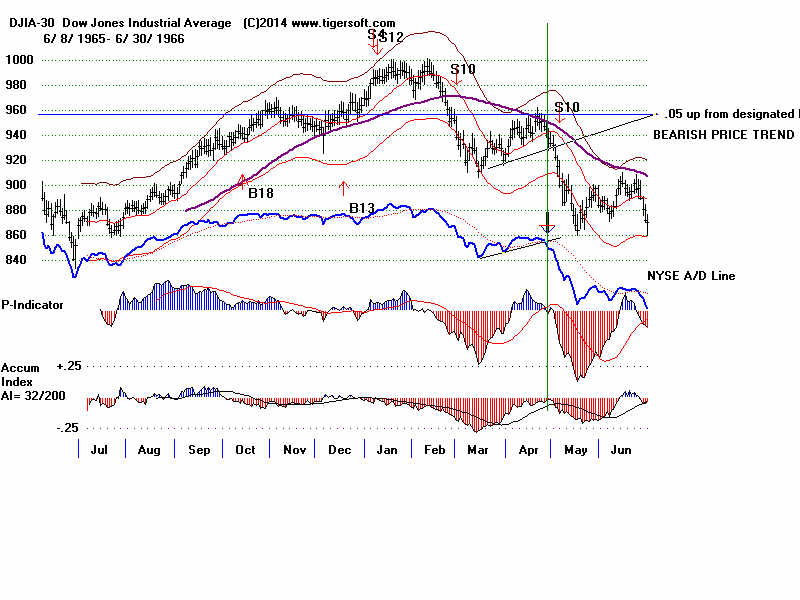
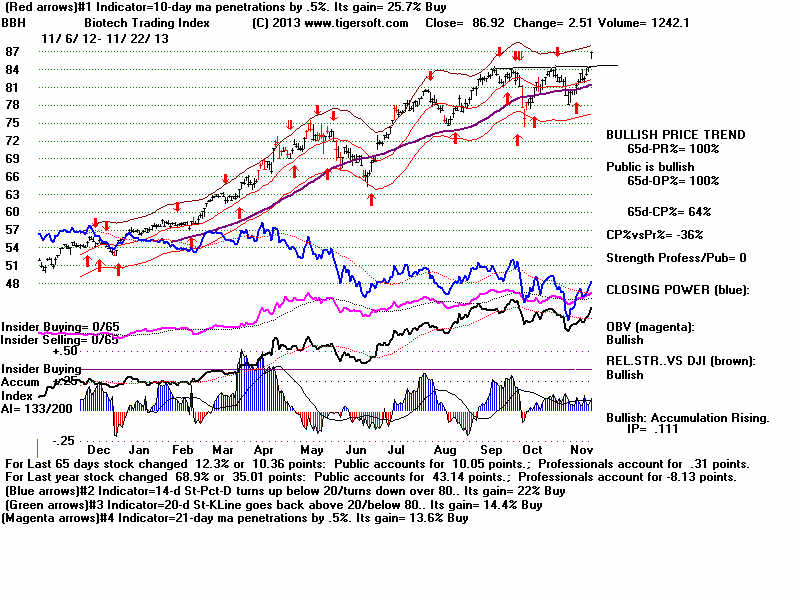
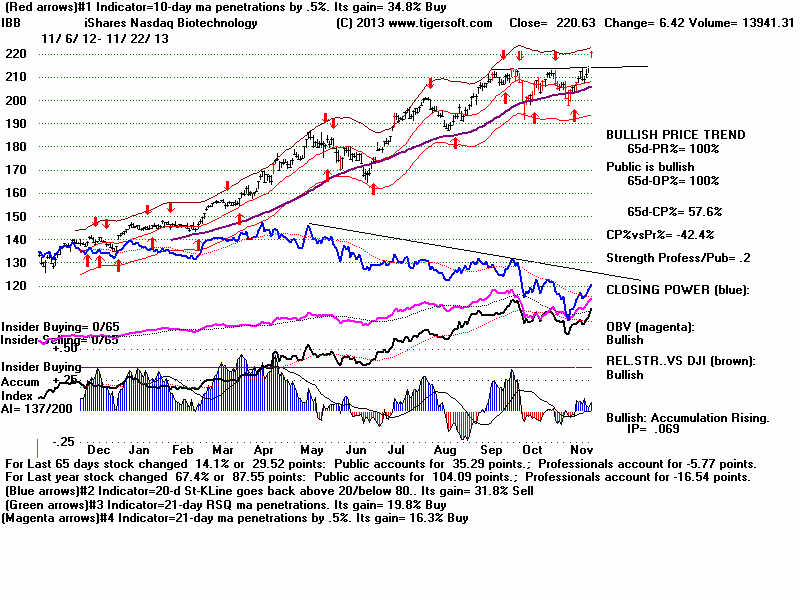