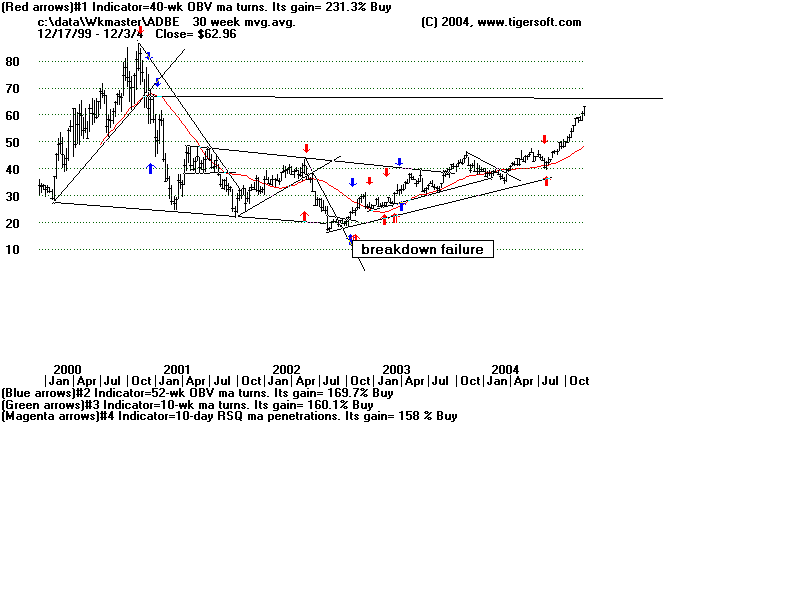
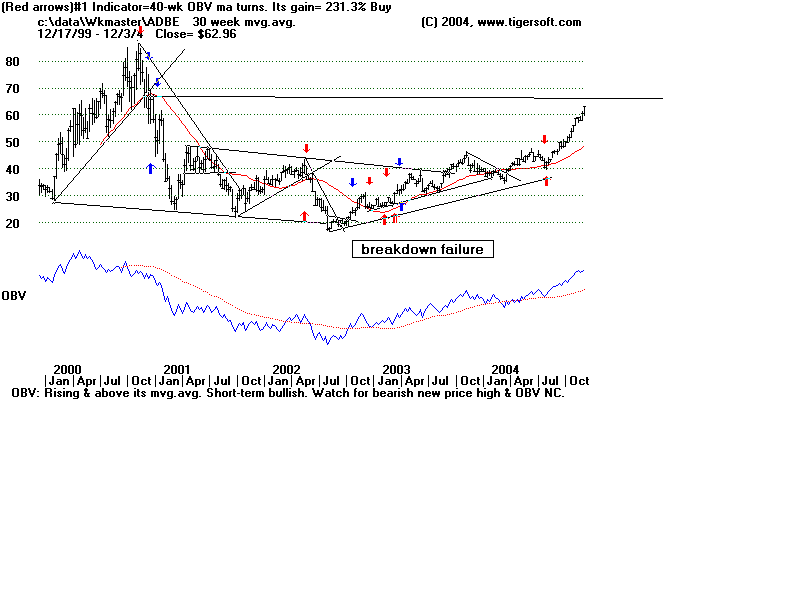
The chart immediately below shows how TIGERSOFT advises you of the best
trading system for ADOBE's stock. A 40-week OBV mvg.avg. turning up
and turning down gives great Buy and Sell signals. Using it would have
gained you 231% from Janauary 2000 to December 2004.
Once you know that the longer-term trend is probably up, you might want
to use our daily charts' Buys and Sells in accordance with the longer-term trend.
See also the weekly charts of IMCLONE and EBAY.

Weekly charts show longer term support and resistance levels. The trendlines are
important, too. A violation of the up- and down-trendlines typically meant a
bigger move had started. In addition, the failure of the breakdown in mid 2002 to start
a bigger decline was an important sign that a bottom has been reached.
