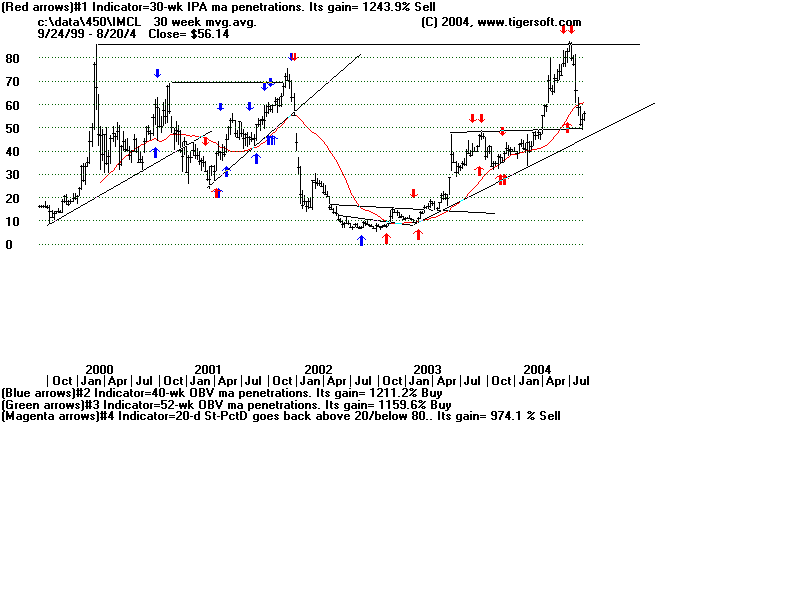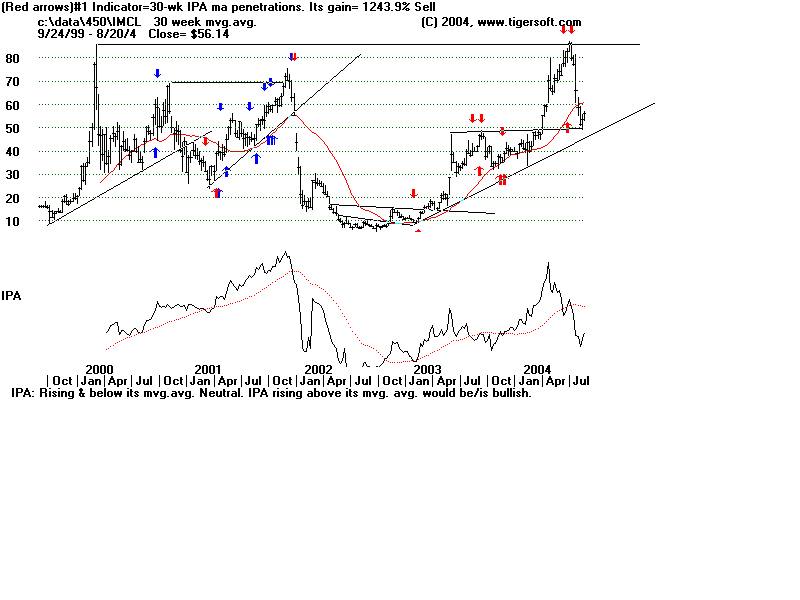

| WEEKLY CHARTS OF STOCKS SHOWING AUTOMATIC BUY AND SELL SIGNALS ON IMCLONE (IMCL) Our weekly chart of IMCL automatically shows that penetrations of the 30-week TigerSoft's "IPA" moving average has gained 1243.9% since January 2000. The bottom of the graph also shows the 2nd, 3rd and 4th best systems for buying and selling IMCLONE since 2000 are shown at the bottom of the TigerSoft charts. You will also want to look at the trendlines, support-lines and resistance-lines on IMCL's chart. Breaks in IMCL's uptrends have brought very big declines... The bottom chart shows the IPA indicator that produced these signals. This allows the user to see how close the system is to giving a reversing signal. |
 |
 |