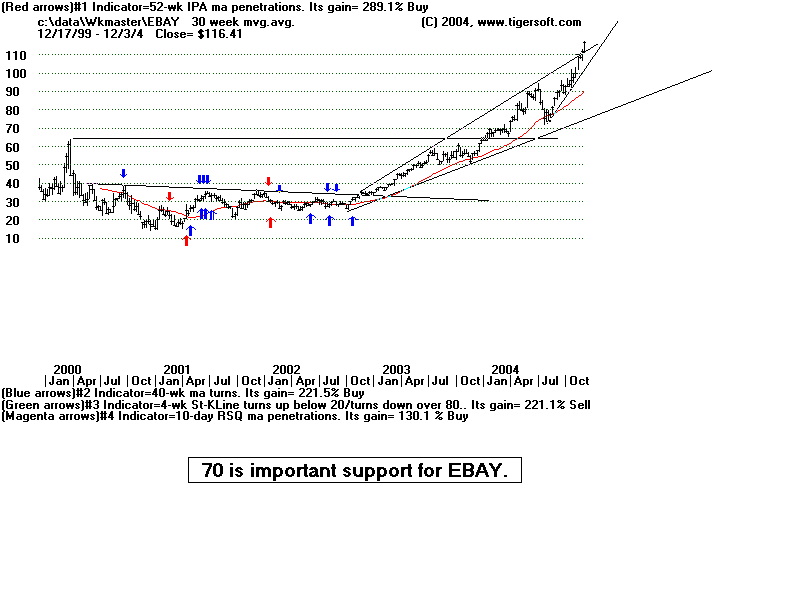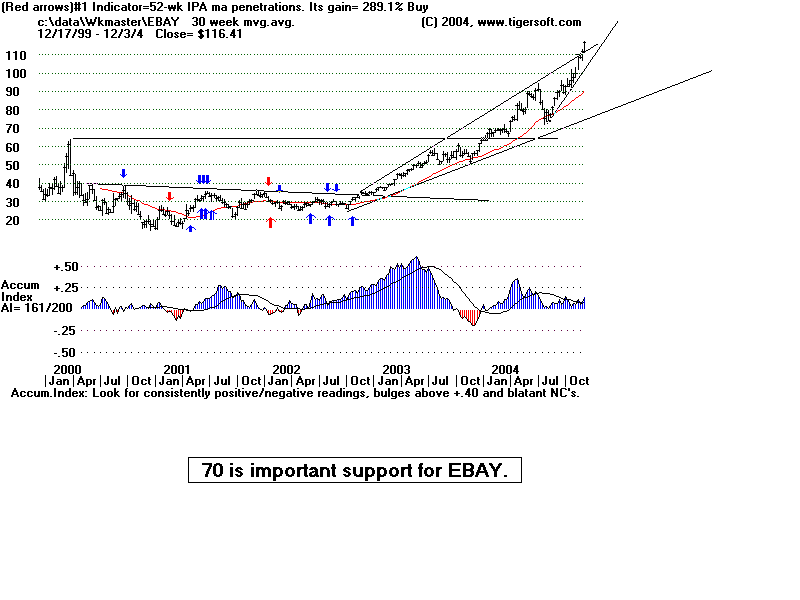
| WEEKLY CHARTS OF STOCKS SHOWING AUTOMATIC BUY AND SELL SIGNALS ON EBAY (EBAY - NASDAQ) The weekly charts of EBAY show significant support levels, resistance levels and trendlines. They also show the best trading systems for this stock. In the second chart below you will see how the bulge of Accumulation Index in the beginning of 2003 sent a message that EBAY would be a true power-house! |
 |
 |