What We Want To Avoid!
Shanghai Composite Is Very
Over-Extended.
China's stock index has risen more than 400%
since mid 2005. On the long term
chart below we see that it is on the verge of breaking its uptrendline. Our Hotline
has taken profits in all foreign ETFs when they simply violated a much faster
ascent line based on their breaking of a ten-day moving average.
China and foreign markets have been the
locomotives for the long bull market
that began in early 2003. If that were to change, the last pillar holding up the
market
would be taken away. There are few support levels close by if the necklines in the
bearish head and shoulders patterns are broken. What's worse, the DJI has gone a
record 56 months with closing down 10% from its highs. Any way we look at it, stocks
appear vulnerable. The best thing we can say now is that bearishness of the
financial
world has been in the press for many days, though they ignore the root causes or the
seriousness of the longer term situation for the US, thinking the Fed can simply make
the problems go away by lowering interest rates. That simple-mindedness is a core
feature of the problem. As long as the US government squanders tens of
billions on
Bush's stupid and insane war of occupation in Iraq, the US Debt will seem hopelessly
large and foreigners will dislike the Dollar and distrust America.

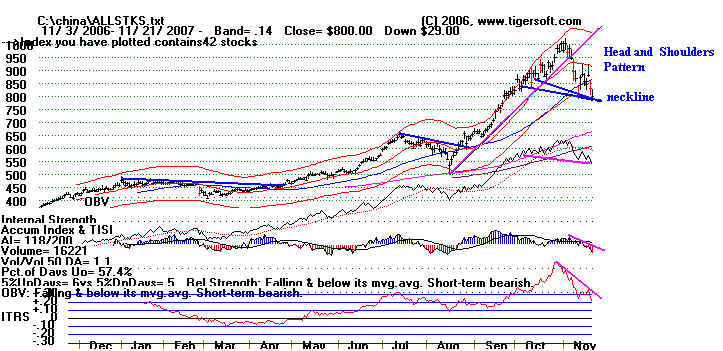
The next chart is Tiger's Index of
Chinese stocks and ETFs. See the head
developing head and shoulders
pattern in it. The 20% decline since the peak a month
ago exactly matched the depth
of the July-August peak and puts this index at the key
neckline in the pattern.
A breaking of the neckline would be very bearish, especially
since Chinese stocks are so
over-extended, and at the very least, in need of a "correction"
or "shake out" to
clear out the weakest holders.
Do not underestimate how many people watch these popular patterns They
are self-fulfilling to
some extent. But they are also reliable in this context. Bad
things happen to stocks
when necklines like this are broken. Beware!
----------------------- Tiger Index
of 42 Chinese Stocks and Closed End Funds --------------------------
A breaking
of the neckline would be quite bearish, given its long advance.
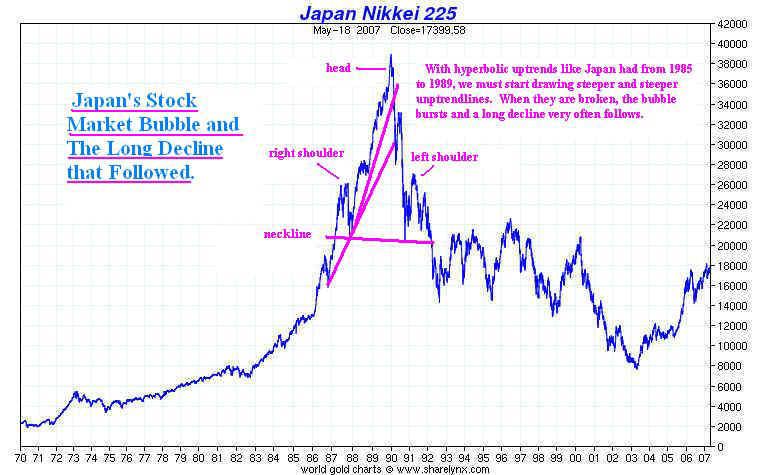
Head and Shoulders Tops Warn Us That
The Current Long World Bull Market May Be Ending
The chart below shows the Tiger Index
of 55 foreign ETFs. This is a good measure
of the world bull market for the last
year. The gains in foreign markets have been huge.
See what I wrote this summer about what
many consider a "bubble" waiting to be burst.
On June
17, 2007 I noted another bullish breakout in a long series of excellent trading
opportunities. But the next day, I warned that the foreign markets bullish runs
were
becoming more and more over-extended.
---------------------------------------
Tiger Index if 55 Foreign ETFs ----------------------------------------------
Sometimes, these patterns don't get completed.
But they are distinctly bearish. Watch to see if it is.
That would be most bearish. 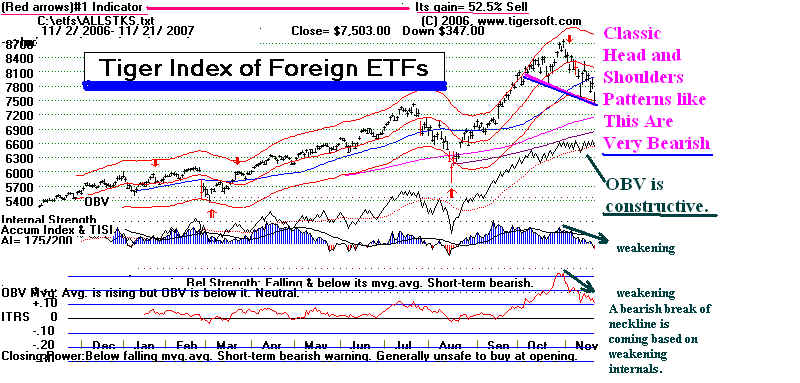
ETFS' Head and Shoulders Patterns Are
All Too
Common Now. This IS
Bearish!
We analyze
foreign ETFs individually. An alarming number of individual
ETFs display current head and shoulders patterns. There are 55 foreign ETFs
that we currently
follow. 31 of them have bearish head and shoulders patterns.
This is a very
high percentage.
18 of the price patterns have already been completed. The worst is the EQU UK.
Chinese ETFs have not yet broken below their neckline, but are very close to it.
Completed downsloping neckline (9)
EWU - United Kingdom - Accum Index = +.25
GRR - Asia Tiger - Accum .Index = +.07 26.88
200-day ma -24.15
IEV - Europe 350 - Accum .Index = +.05 115.72
200-day ma= 114.
SGF - Singapore - Accum Index = -.15 below
all mvg.avgs. VERY BEARISH
TWN - Taiwan - Accum Index = -.05 below all key
mvg.avgs.
EPP - Pacific except Japan - Accum. Index =+ .12 above 200-day ma
JFC - China Region - Accum Index <0 weak OBV Very Bearish
KF - Korea Fund - Accum Index =. +.10
.82 above 200-day ma.
TFC - Taiwan Greater China Fund below all
mvg,,avgs. Accum Index = =.22
Completed flat or rising neckline (9)
EKH - Europe - Accum.Index = + ..04
Closed at 200 day ma.
EWC- Canada - Accum. Index = <0. 200-day ma= 29.5
EWD - Sweden - Accum. Index= +.20
below all key mvg.avgs.
EWH - Hong Kong - Accum Index= -.02 Very weak OBV.
200-day ma=18.75 VERY BEARISH
EWN - Netherlands - Accum .Index =
0 Weak below all key mvg.avgs..
EWY - South Korea - Acc. Index = +.15 Just above 200-day ma
EZA - South Africa - Accum Index = +.05 above 200-day ma
EZU - EMU Index - Accum .Index = +.15 above
200 day ma
VGK - Europe - Accum Index = +.25 Just above
200-day ma
Incomplete downsloping neckline (11)
CHN - China Fund -
Acc.Index <0 ... red distribution on right shoulder.
EEB - Foreign ADRs - Accum. Index<0
EEM - Emerging markets - Accum. Index = +.10 above 200-day ma OBV is
strong.
EWA - Australia - Accum Index <0 Classic pattern. Very Bearsh At neckline
EWI - Italy - Accum Index= +.15
EWQ - France - Accum. Index = .05
EWT - Taiwan - Accum. Index = -.05
FXI - Xinhua China 25 - Accum .Index = +.04 Closed at neckline.
IXP - Global Telecomm - Accum Index = +.25
VPL - Vanguard Pacific
Accum index = +.18
VWO - Emerging - Accum Index Accum index = .10
Incomplete flat or rising neckline (2)
ILF - Latin America - Accum Index - -.02 Watch
FEZ - Euro - Accum Index <0 OBV is very weak..75 above neckline
===================================================================================
Review:
CLASSICAL
TECHNICAL ANALYSIS:
HEAD AND SHOULDERS PATTERNS
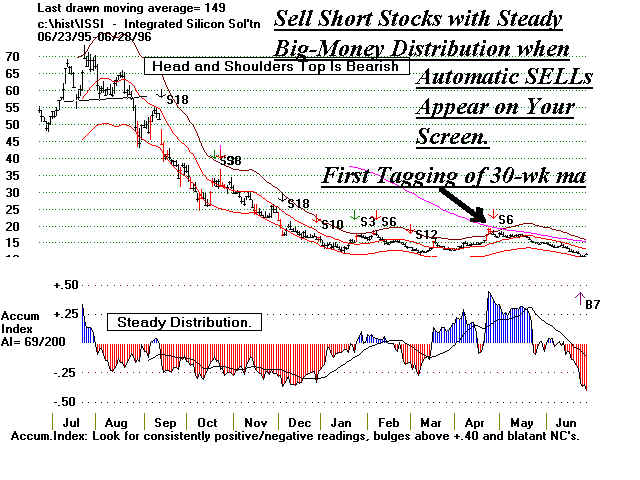
Bearish Head And Shoulders Patterns Show Increasing Red
Distribution
From Tiger's Original and Proprietary Accumulation Index. on Their
Right Shoulder.
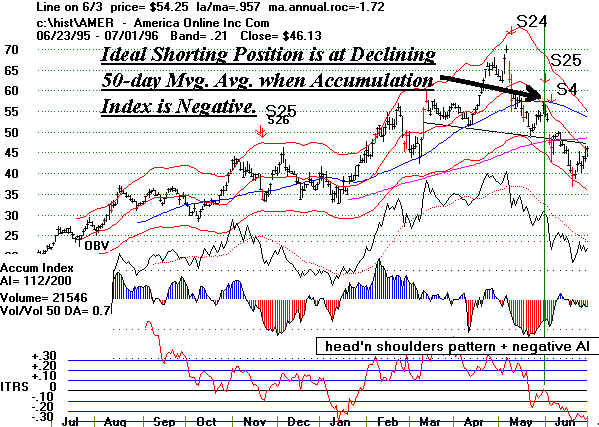
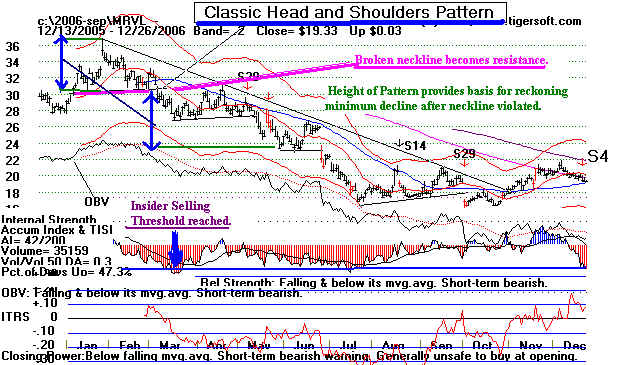
-------------------------------- MRVL Head and Shoulders
------------------------------------------
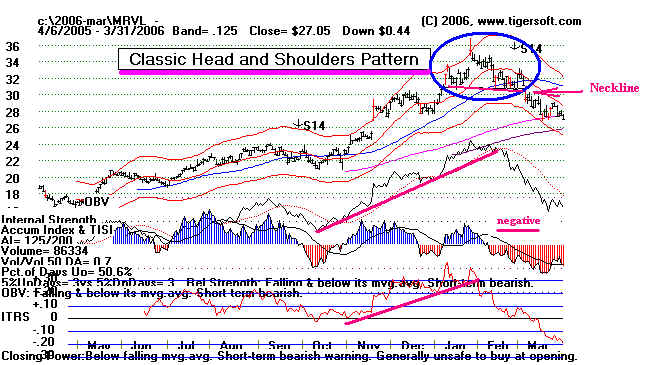
Would you have bought MRV at 28
above in March 2006? The general market was
still rising. We
had no Major Sell until May 5th, 2006. Simply avoiding it until it came back
above a rising blue
50-day mvg.avg. was a much better choice. the negative readings from the
the Tiger Accumulation
index typical make rallies to a declining 50-day ma a good point to
sell short. There
was never any reason technically to buy the stock.
------------------------------------------------------------------------------------------------------------------------
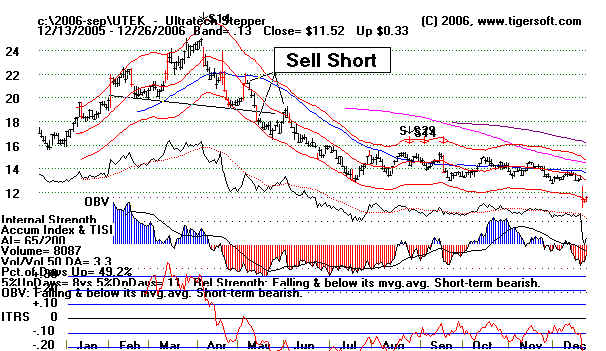
Study the classic head and shoulders in the stock below.
It made a lot of money for customers
who took our advice and
shorted it as shown.
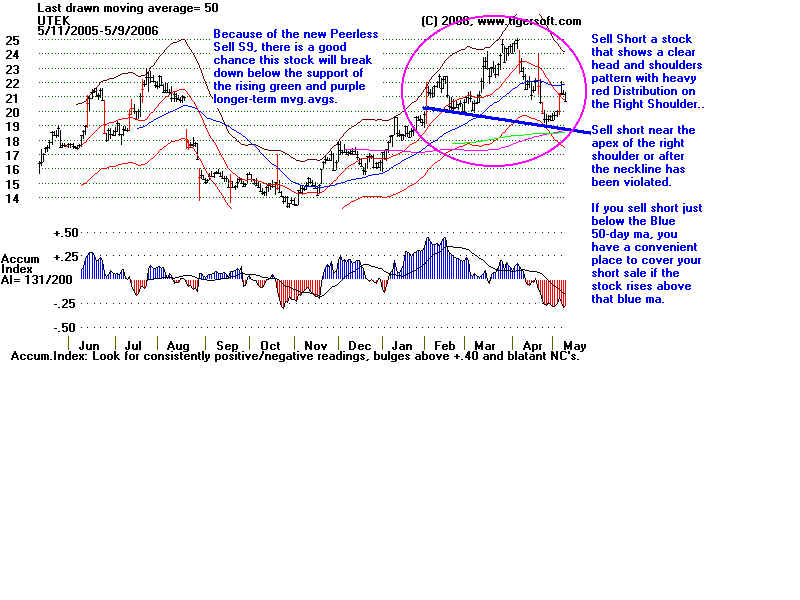
The Bearish Outcome:
Bearish Head And Shoulders Patterns: Some
Pointers
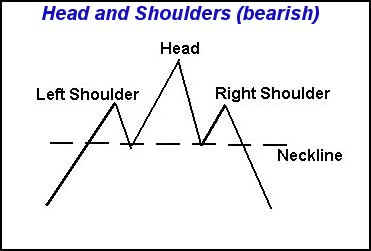
Things to notice:
Symmetry between right and left shoulder.
Apex of right shoulder is typical the same distance above the neckline as the right
shoulder's apex is.
Volume is light on right shoulder.
Volume usually picks up as the neckline is broken.
Head & Shoulders patterns show:
- Left Shoulder: Bulls push prices upwards making new highs; but these new highs
are short lived and prices retreat.
- Head: Prices don't retreat for long because bulls buy the dip. Prices surpass
the previous high; a bullish sign, often
on lower volume. Watch for a reversal day marking the head's peak. Prices
retreat again but find support.
- Right Shoulder: The bulls push prices higher again, but this time prices fail
to make a higher high. They make a
peak about the same distance away from the neckline as the first shoulder's apex is away
from the neckline. The time
it takes to form a right shoulder often matches the time it took to build a right
shoulder.
Neckline. Prices break below a line drawn through the recent intro-day or closing
lows. Volume picks up.
Pullback. If general market conditions are good there may be a quick rally back to
the neckline, where they
turn down again on rising volume.
Sell Signal:
If prices break the neckline- support line, it shows that the bears
are in charge. Sell and Sell short.
A downward sloping neckline is
sometimes seen as a more bearish than a pattern showing a flat line. This is
not necessarily true. It depends on
the stocks internal strength readings. See my Short Selling manual. pattern,
|