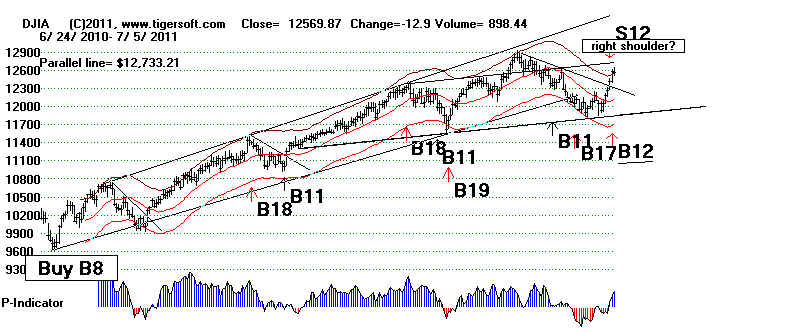
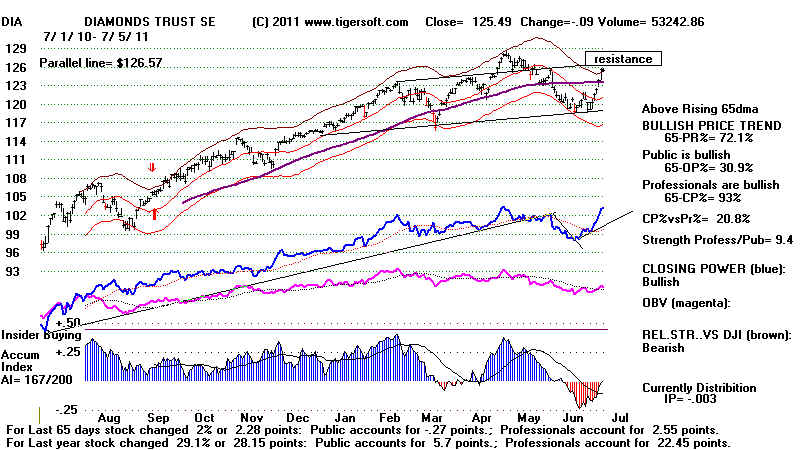
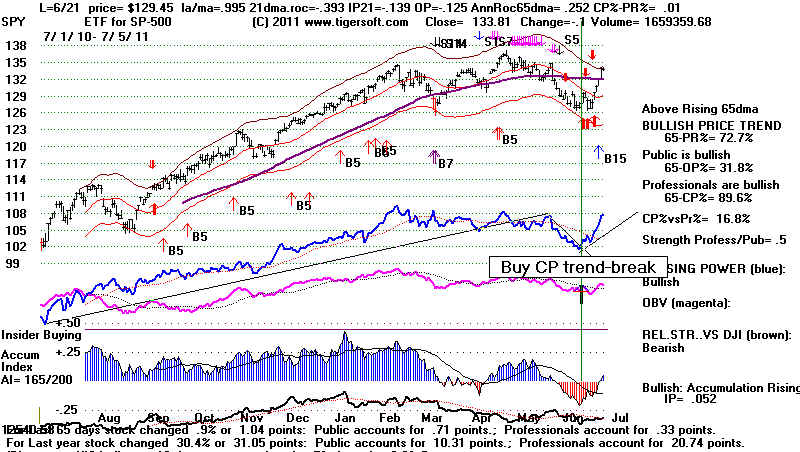
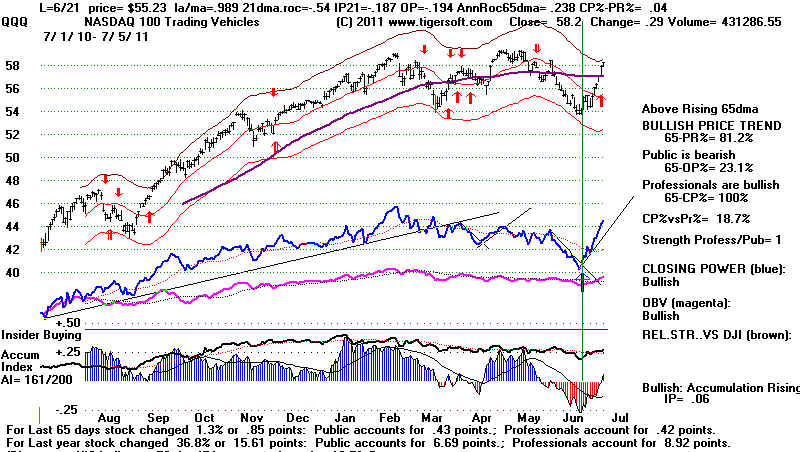
8/11/2011 DJI = 11143.31 la/ma= .928 21-dmaROC= -1.329 P = -605 (-49 ) IP21= -.187 V= - 420 OP= -.271
BREADTH STATISTICS:
58 (+15) MAXCP
stocks - Bullish MAXCP Stocks
129 (-311) MINCP stocks
- Bearish MINCP Stocks
(MAXCP stocks are those showing Tiger Closing Power
making new highs.
This suggests heavy Professional Buying. Applying the Tiger Power
Ranker's
"bullish" to the MAXCP stocks find those with heavy insider buying and
institutional accumulation. Bearish MINCP stocks show the opposite.
At this point these are extended a long ways, so - use well-tested CP trendbreaks
to close out positions. Sell S7s occur when Professionals are much more bearish
than the Public is.
3 new
highs on NASDAQ. 26 new
lows on NASDAQ
2 new
highs NYSE
11 new lows on NYSE
8/11/2011 ===> See Key Peerless
TigerSoft Index Charts: Industry Groups and ETFs
DIA SPY
QQQ DJIA-Peerless
TigerDJI TigerSPY TigerQQQ
GLD SLV
Crude
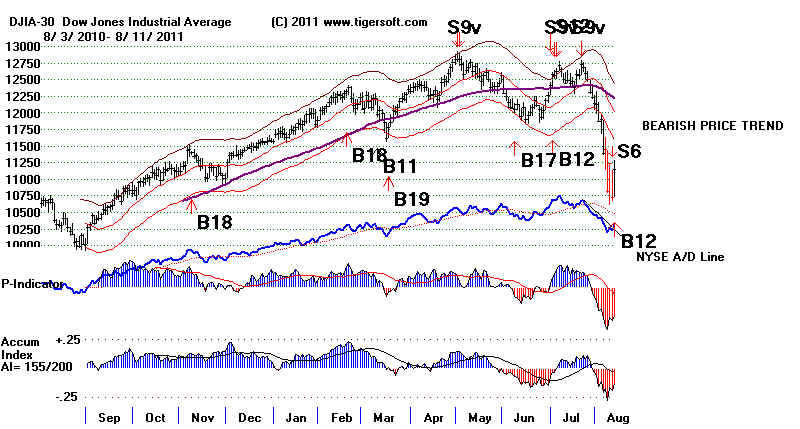
8/11/2011 The Dramamine Market. We have greatly reduced the number of
our short sales as each broke its
downtrendline. Now there is a rising
Closing Power uptrend for the QQQ. Very
nimble traders may wish to
trade it LONG, but the extreme volatility
is too much for me. Also, the
pattern after comparable past steep sell-offs
is for the peaks of the first tight
pattern on the decline to be resistance.
A close above DIA 112.95, the top of
its tight pattern, would be bullish. But
even then, there will be resistance at the
falling 21-day ma and at the broken lows.
There are still many more MINCP
stocks than MAXCP stocks. This is a good
time to let the computers trade with each other.
The danger is our little boats will be capsized
by traders rushing from one
side of the boat to the other. Let's go
ashore for a while.
QQQ Closing Power has zig-zagged
upward.
Professionals
are covering their shorts.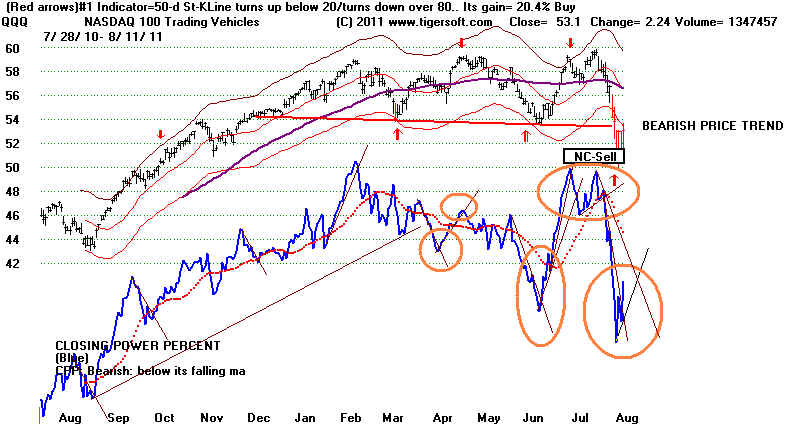
The Whipsaw
Computerized Trading Market Brought a New Buy B12.
I would only trust it as long as
the short-term QQQ's Closing Power and NYSE
uptrendlines are not violated.
Historically, the earlier four price patterns like the
present after a sharp
market-selloff each broke down after being unable to get
past their short-term highs.
Just as the Buy B14 had to
mistrusted two days ago and discarded yesterday
because it occurred with its
downside momentum too powerful and far below
previous cases of the same signal
going back to 1928, so too, today's Buy B12
also takes place farther below the
21-day ma and with greater downside momentum
of the annualized 21-day ma than
any earlier case of the Buy B12. When I wrote
the Peerless software I did not
even consider that a Buy B14 or a Buy B12 could
take place immediately after such
market weakness. This consideration should,
I think, make us doubt the new Buy
B12. I would prefer to trust the QQQ's rising
Closing Power.
This particular Buy B12 signal
occurs when two of the last three days show
exceptionally high ratio of NYSE
advances to declines, more than 10:1. There
are only five previous cases since
1928, but they were each very profitable.
However, as you can see below the
lowest key values for all five B12s were higher
than the all our current key
values, except IP21. Accordingly, the current Buy B12
has to considered highly suspect.
CL/MA ROC
PI AI (IP21)
V OP21
Current
.928 -1.329 -532
-.131 -361 -.224
Lowest for all
.988
-1.186 -496 -.179 -317 -214
previous 5
  4/10/1933   62.10  Gain= +66.5% No Paper Loss
  CL/MA    ROC    PI          AI (IP21) V   OP21
  1.074   1.992  15(13)   -.03    90  .367
  Volume was 30% above its  21-dma
|
6/22/1938
129.90
Gain=
+ 13.4% No Paper Loss
(Also 6/23/1938 127.40 and
6/24/1938 129.1 )
CL/MA ROC PI AI (IP21) V OP21
+0.7% if exetreme bearish mode used.
1.095 1.056 43((34) .08 61 .216
B12s also on the next two days.
Volume was 100% above its
21-dma. |
9/30/1938
141.50
Gain= +
11.3% No Paper Loss
B12s also on the next two days.
CL/MA ROC PI AI (IP21) V OP21
+0.7% if exetreme bearish mode used.
1.032 .191 0((34) .077 -50 .048
Volume was 20% above its
21-dma. |
11/4/1943
136.3 Gain= + 9.0%
1/14/44 S1 5% Paper Loss
also 11/5/1943 - 135.3
CL/MA ROC
PI
AI (IP21) V OP21
.988 (lowest)
-.285 121 (54) -.179
62 -.135
DJI fell to 129.60 on 11/30 and then recovered to up per band, declined
again and took off. Very low IP21 here.
Volume was 60% above its
ma. |
3/12/2009 7170.06 Gain = 9.3% No Paper
Loss.
CL/MA ROC PI
AI (IP21) V OP21
.998
-1.186 -496 (+227) -.113 -317 -.214 |
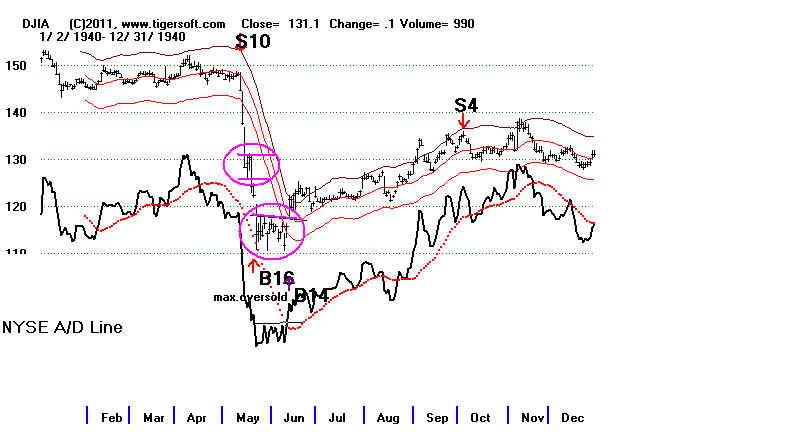
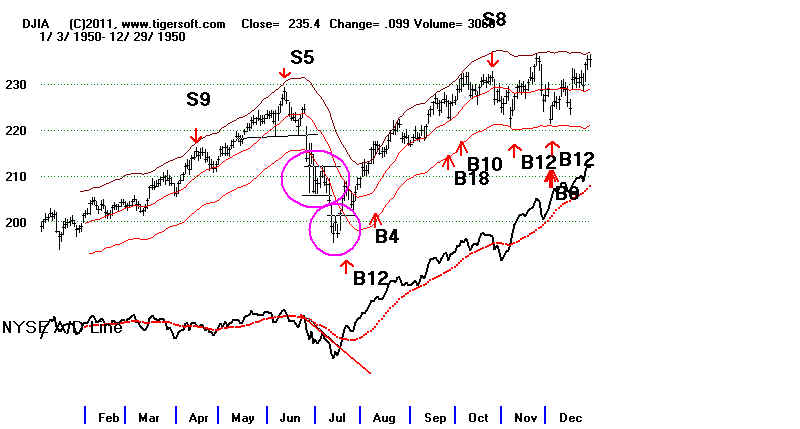
The up-down-up trading here has precedent after a steep decline. The pattern here
is a tight trading range bound by the
short-term highs and lows. I found four cases.
In each case the first tight pattern was
a continuation pattern. There was then another
decline. The second tight
consolidation proved to be a pivot point and the DJI moved higher.
1940 German attack on
Western Europe sends the DJI lower.
 |
1950 - North
Korea attacked South Korea to drop the DJI in June..
 |
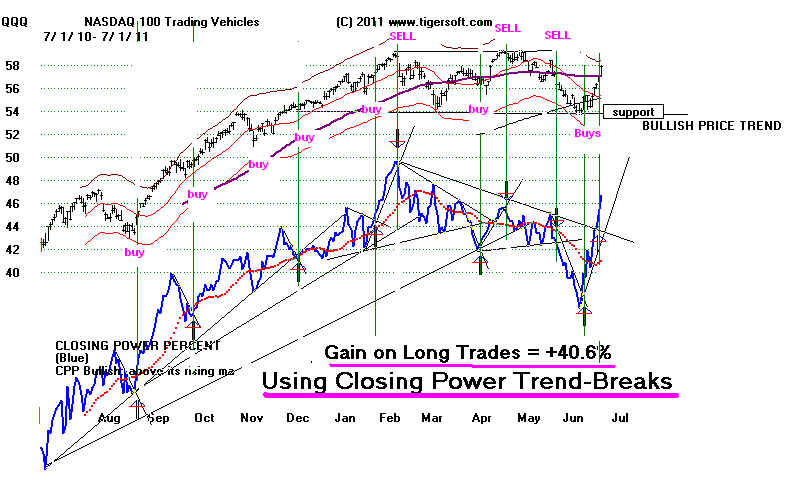
QQQ Zig-Zagging higher.
This gives traders a way to watch and reverse trading potations.
Note that the red Buy and Sell signals are optimized for the data on
the chart.
Yesterday, with different data, there was a different optimum trading
system and
it was on a Sell.
|
====================================================================================
Older Hotlines
====================================================================================
8/10/2011 DJI = 10719.94 la/ma= .888 21-dmaROC= -1.691 P = -605 (-49 ) IP21= -.187 V= - 420 OP= -.271
BREADTH STATISTICS:
43 (-4) MAXCP
stocks - Bullish MAXCP Stocks
440 MINCP stocks
- Bearish MINCP Stocks
(MAXCP stocks are those showing Tiger Closing Power
making new highs.
This suggests heavy Professional Buying. Applying the Tiger Power
Ranker's
"bullish" to the MAXCP stocks find those with heavy insider buying and
institutional accumulation. Bearish MINCP stocks show the opposite.
At this point these are extended a long ways, so - use well-tested CP trendbreaks
to close out positions. Sell S7s occur when Professionals are much more bearish
than the Public is.
3 new
highs on NASDAQ. 155
new lows on NASDAQ
2
new
highs NYSE
153 new lows on NYSE
8/10/2011
===> See
Key Peerless TigerSoft Index Charts: Industry Groups and ETFs
DIA SPY
QQQ DJIA-Peerless
TigerDJI TigerSPY
TigerQQQ GLD SLV
Crude
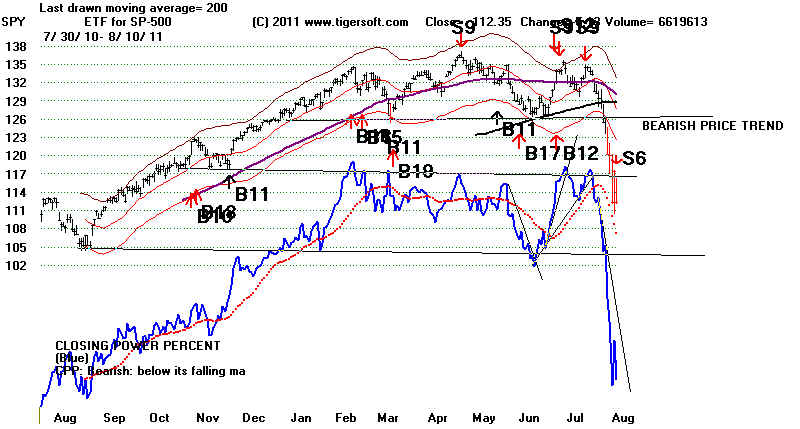
8/10/2011 ONE DAY UP BIG and the NEXT DAY DOWN BIG = SELL S6
.
This signal only has occurred in Extreme Bear Markets and 1987.
Hold Tightly Half Your Shorts and the Long Gold Position.
As I write this the Futures
are up +188 for the DJI and 22.5 for the SP-500.
Keep in mind that a higher
NYSE Opening will only make it harder for a still higher
NYSE close and that is what
is needed to break the Closing Power downtrend.
Without a new Peerless Buy
signal, only nimble traders should try to play the rally
that a break in the Closing
Power downtrends usually predicts.
Blue Closing Power Downtrend is still operative.
So
much for the yesterday's Buy B14 and boost of low interest rates for
two more years. At
least the B14 was never clinched by the Closing Powers and it
came with ample warning here.
This is a dangerous market.
The inability to mount more than a one day rally is
is the trademark of such
extreme sell-offs as October 1987 and August 1937. Traders
and institutions want out
before there can even be a second day of rally. And everyone
remembers 2008-2009.
This time they want to sell first and ask questions later. Add to
this the short selling in 3x
leveraged short ETFs that can be margined and you can see
how quickly the herd of
trend-following big hedge fund players can trample on
everyone else. And, of
course, courtesy of the SEC, they can also readily sell short
on down-ticks. The SEC
at the behest of Wall Street has engineered the perfect
mechanism for creating a
Crash. So, the rate of decline is very high now, and matched
only by 1987's 3 week 35% DJI
free-fall.
The market is afraid of everything
now. Of events in London, France and elsewhere.
Of the potential for the gathering
recession world-wide. Of another US depression,
because we now have what the
economist Keynes called a "liquidity trap".
"The liquidity trap, in Keynesian
economics, is a situation where monetary policy
is unable to stimulate an economy, either through
lowering interest rates or
increasing the money
supply. Liquidity traps typically occur when expectations
of adverse events (e.g., deflation, insufficient aggregate
demand, or civil
or
international war) make persons
with liquid assets unwilling to invest."
It may be interesting for you to read the entire article at http://en.wikipedia.org/wiki/Liquidity_trap
Even the national mainstream media
is asking where the national leadership is?
Obama's
ignorance of economics shows clearly. He has allowed the Presidency
to be straitjacketed when it comes
to fiscal macroeconomic initiatives. Sadly,
contemporary Republican leaders
seem not even believe in the need for much
government, except to make wars.
How is this different than when the Hoover's
Treasury Secretary,
proclaimed “Liquidate labor, liquidate stocks, liquidate the farmers,
liquidate real estate.”
When prices were low enough, strong-willed entrepreneurs
would pick up the pieces and
restore the economy. Hoover described Mellon's
views on the economic collapse like
this:
"It will purge the rottenness out of the system. High
costs of living and high living
will come down. People will work harder, live a more moral life. Values will be
adjusted, and enterprising people will pick up the wrecks from less competent people”.
http://delong.typepad.com/delong_economics_only/2007/02/why_oh_why_cant.html
The DJI's Annualized Rate of
Decline Is -169%
As I feared last night might
happen, the downward momentum was too great and
yesterday's 1-day rally was
completely snuffed out with an even bigger decline today.
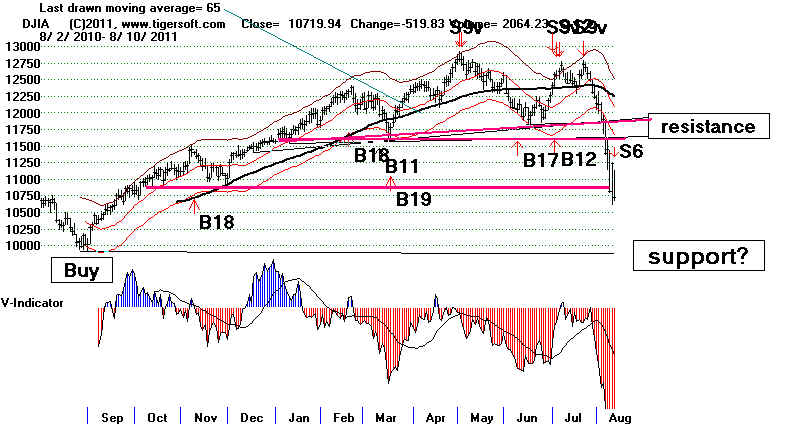
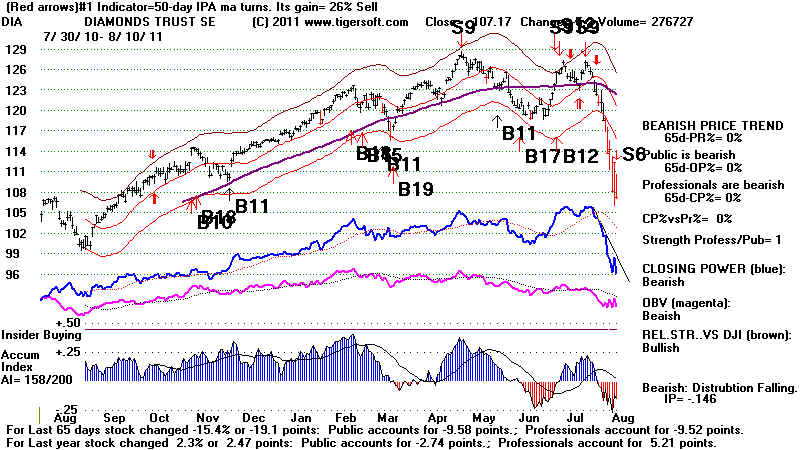
This produced the Sell S6 in the
Peerless DJI chart you see below. The Closing Powers
never clinched the Buy B14.
And today I added to our software the requirement that
the DJI's close in the case
if Buy B14s be above 95% of the DJI's 21-dma Elite
Subscribers and those who got
the Sell S9v update will be emailed the address
for this update tonight.
These two-day dramatic
reversal Sell Signals are associated with and have only
occurred in the much
bigger declines in the extreme bear markets of 1929-1932 and
1937-1938, as well as
once in 1987. See
these charts here with the past Extreme
Bear Market Sell S6s.


|
 |
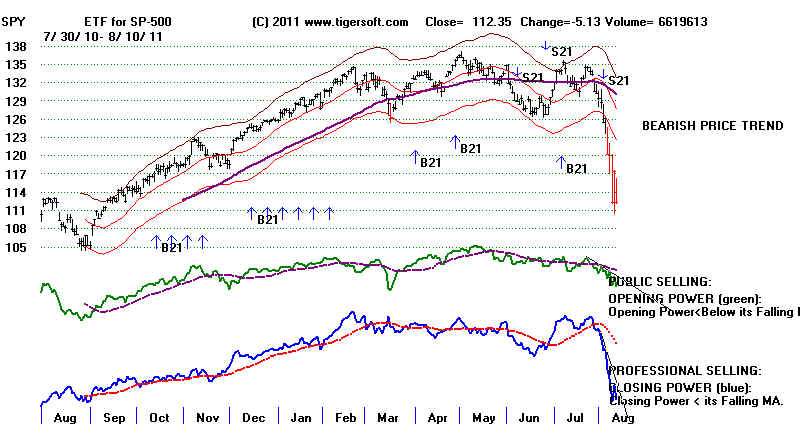
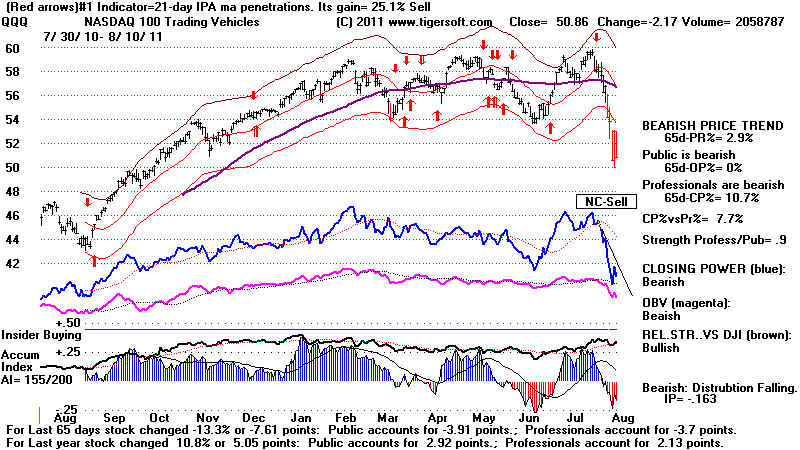
SPY with green Opening Power and Blue Closing Power.
B21s and S21s show when both indicators are trending up or down.
 |
 |
 |
o
====================================================================================
OLDER HOTLINES
====================================================================================
8/9/2011 DJI =
11239.77 la/ma= .924 21-dmaROC= -1.233 P = - 557 (+228) IP21= -.161 V= - 350 OP= -.237
BREADTH STATISTICS:
47 (+12) MAXCP
stocks - Bullish MAXCP Stocks
782 MINCP stocks
- Bearish MINCP Stocks
(MAXCP stocks are those showing Tiger Closing Power
making new highs.
This suggests heavy Professional Buying. Applying the Tiger Power
Ranker's
"bullish" to the MAXCP stocks find those with heavy insider buying and
institutional accumulation. Bearish MINCP stocks show the opposite.
At this point these are extended a long ways, so - use well-tested CP trendbreaks
to close out positions. Sell S7s occur when Professionals are much more bearish
than the Public is.
12
new
highs on NASDAQ.
69 new lows on NASDAQ
0
new
highs NYSE
664 new lows on NYSE
8/9/2011
===> See
Key Peerless TigerSoft Index Charts: Industry Groups and ETFs
DIA SPY
QQQ DJIA-Peerless
TigerDJI TigerSPY
TigerQQQ GLD SLV
Crude
A ONE DAY BUY B14 RALLY IS PROBABLY NOT ENOUGH.
The
New Buy B14 Needs To Be Clinched by A Closing Power Break of Its
Downtrend. A Strong Closing above the NYSE
Opening Will Do
That.
8/9/2011
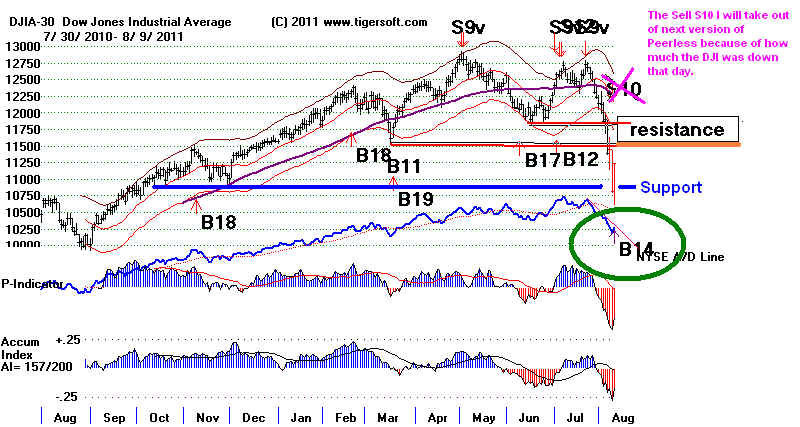
New Buy B14 The DJI
has dropped 11.7% since the Sell S9V on July 21st
with the DJI at 12724.41. Support
is now at 10900 and resistance starts at 11600 and
will be greatest at 11800. A rapid, high
volume move up stands the best chance of
overcoming the resistance. If there is a
Buy B14 rally, we will be watching the Tiger Closing
Power uptrend to get a sense of when the next
decline and test of support at 10900 will
probably start. While the Buy B14 works
out profitably more than 85% of the time, the
DJI is now further below the 21-dma than in any
earlier case. Time will tell if the type of
Sell S9V we saw on July 21st should prevent the
appearance of a Buy B4 buy, as other S9s
and S12s do. The back-testing did not
insert this condition. So, I am not so worried
about the Sell S9V, as simply the downward
momentum in so many stocks. The number
of MINCP stocks is huge. Professionals
are still selling and heavily short 15 times more stocks
than they are bullish .
My recommendations:
A retreat to test 11000 is quite possible. Close out half the shorts
on this weakness and the rest when their
Closing Powers break their downtrend.
Hold Gold and do some buying in recently
bulging Accum. Index stocks whose
Closing Power downtrend has been broken.
See the AI Bulge and Bullish MAXCP Stocks.
MY CONCERN
A one day DJI relief rally is probably
not enough to reverse the many badly faltering stocks.
The fiscal strait jacket I have talked
about so much also has not changed. The market may
still heed the Sell S9v with this signal
over-riding the the Buy B14. With regular S9s, the B14
would be suppressed for 20 days.
A sharply down day tomorrow would mean
the market is spurning Bernanke's
low interest rates and expects a much
deeper Recession. This is a distinct possibility.
So use the Closing Power of the SPY to
clinch the Buy B14.
Current DJI with Peerless Signals, A/D Line, P-Indicator and Accum.
Index.
Today, Bernanke said interest rates would
not be raised by the Fed until 2013. If we
really can believe he can really make
such a guarantee (which had 3 Fed dissenters
and might have to be reversed if there is
a big Dollar slide when other nations
raise their interest rates) then this
removes one of the biggest fears the market has,
namely that higher interest rates will
woo investors away from equities. It may also spur
some investment and jobs, though now
there is no hurry to borrow to begin a development
before rates go up. The big
question is will this help a faltering economy. Can a
stimulate monetary policy override a
deflationary fiscal policy? Will it prevent
the economy from stalling out, as
occurred in 1930 and 1937, because of budget
balancing in a growing Depression?
My belief is that it will prop up the stock market,
and that is one of the responsibilities
of the Fed,as it was originally set up. It will probably
not help Main Street much.
Tiger Blog - February 5, 2008
The Limits of Monetary Policy: Will The
"Stagflation" of The 1970s Reappear?
Richard Fisher - 1/12/2011
The Limits of Monetary
Policy: ‘Monetary Policy Responsibility Cannot Substitute for Government
Irresponsibility’
The Buy B14 signal historically
produces a profit more than 80% of the time. There
are some paper losses, but these
tend to occur when the Buy B14 tries to turn up an
long, on-going bear market.
It occurs when daily NYSE Up volume is more than 18x
NYSE Down Volume. Today we
saw a ratio of more than 30 to 1, a complete reversal
from Monday's emotional sell-off.
Summer B14s are the most reliable. However, there
are no cases of a Buy B14 taking
place after such a swift sell-off and with the DJI
so much (7.6% here) below the
21-day ma. After other Sell S9s and Sell S12s based
on A/D Line, P-Indicator and
Accumulation Index divergences and negative non-confirmations
at the upper band, the Peerless
software requires a 20 trading day wait before there
can be a Buy B14. So, the
question here is should the S9V which is based on the
V-Indicator's negative
non-confirmation also have prevented a Buy B14. My feeling
is we should take the Buy B14 if
the Closing Power clinches it.
Back in 2007, Buy B14s successfully
turned up the DJI after the July and October Sells
and their steep 10% sell-offs.
Waiting for the Closing Power to break its downtrend
made the B14 safer Of course,
the DJI here has fallen 15% from its high and
the broken support levels are not
very far overhead. They are apt to act resistance if a
recovery does not quickly take the
DJI above them.
The biggest problem now from our
point of view is that the Tiger Closing Power
downtrend has not clearly been
violated and it has a lot of downward momentum.
A new CP uptrend, with a rising zig and
zag would be very constructive. See how the
Closing Powers turned up in 2007 on
the SPY. This shows us what we want to see here.
SPY - 2007 with Peerless Signals and Closing Power Trends.
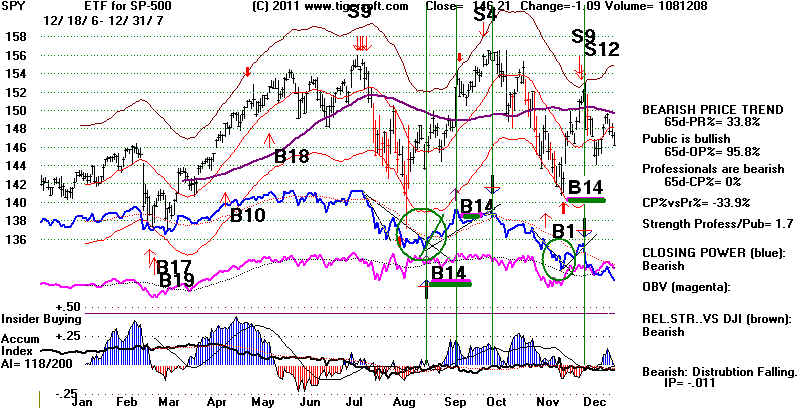
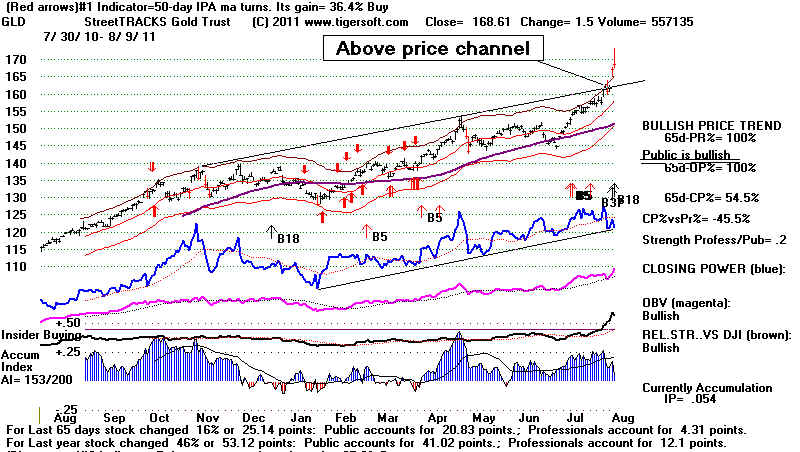
We've made a lot of money in
the short sales these past two weeks. Lock the profits
in on at least half and cover
them tomorrow. The other half should be covered fully when
their Closing Power
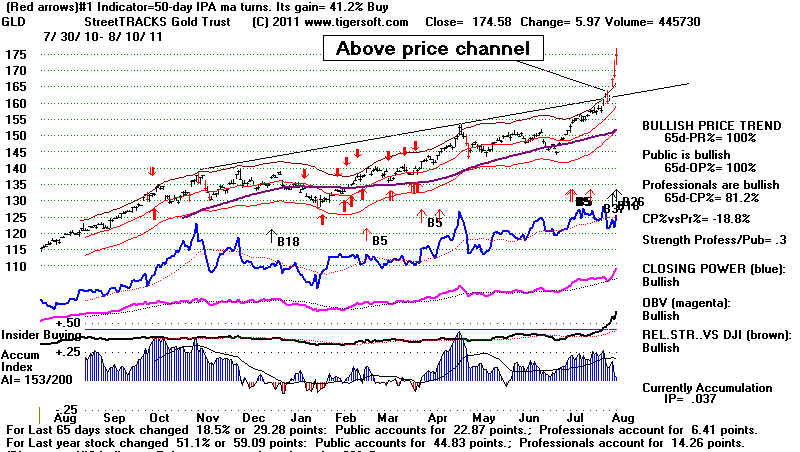
downtrends are broken. Gold has been a stellar performer. It is
above the top of its price
channel and running in all-time high territory. Low interest
rates and a potentially weak
Dollar lie behind its rise. Let it run. And buy some
of the high Accumulation,
bulging Accumulation stocks when their Closing Power
downtrend is broken.
===================================================================================
OLDER HOTLINES
===================================================================================
8/8/2011 DJI = 10809.85 la/ma= .885 21-dmaROC= -1.787 P = - 786 (-85) IP21= -.275 V=
- 477 OP=
-.386
BREADTH STATISTICS:
25 (-1) MAXCP
stocks - Bullish MAXCP Stocks
1000 reached MINCP stocks
- Bearish MINCP Stocks These are really falling!
(MAXCP stocks are those showing Tiger Closing Power
making new highs.
This suggests heavy Professional Buying. Applying the Tiger Power
Ranker's
"bullish" to the MAXCP stocks find those with heavy insider buying and
institutional accumulation. Bearish MINCP stocks show the opposite.
At this point these are extended a long ways, so - use well-tested CP trendbreaks
to close out positions. Sell S7s occur when Professionals are much more bearish
than the Public is.
0 new
highs on NASDAQ.
616 new lows on NASDAQ
0
new
highs NYSE
1202 new lows on NYSE
8/8/2011
===> See
Key Peerless TigerSoft Index Charts: Industry Groups and ETFs
DIA SPY
QQQ DJIA-Peerless
TigerDJI TigerSPY
TigerQQQ GLD SLV
Crude
8/8/2011
Sell S9v No
Peerless Buy Yet. Closing Powers are declining. Hold the
shorts. Gold is our only long.
Respect the Peerless Sell signals and what Professionals
are shown to be doing using Closing
Power. The way the market knifed easily through
support levels today should make us
extremely reluctant to try to pick a bottom until, perhaps,
we reach the 2010's mid-year correction
low around 9700. Note that this would represent
a 50% correction of the entire gain from
March 2009 to July 2012, but it would all be telescoped
into perhaps 3 weeks. The DJI's
rate of decline is particularly steep compared to the declines
from other tops. I take that to be
very bearish.
Going back to 1929, we only find one more
rapid decline when the DJI fell more than 10%
from a peak near the bull market high.
That was in 1987 when a 35% decline from the
top occurred. The DJI is now
falling at a rate of 7.5%/wk. We might also compare the
speed of the decline now with 1929
(4.5%/wk for 10 weeks) and 1940 (4.1% in 6 weeks.)
Declines from Near Bull Market Tops
DJI TOPs
DJI BOTTOMs
Pct Drop
Rate of Decline
--------------
----------------------
-------------
----------------[------
>> 7/21/2011
12724.41 - 8/8/2011 10809.85 15% in 2 weeks. 7.5%/wk
<<
9/3/1929 381.20 -
11/13/1929 -198.70 45% in 10 weeks.
4.5%/wk
4/15/1930 293.30 - 6/23/1930 -
219.50 28% in 9 weeks
3.1%/wk
8/16/1937 189.30 - 11/23/1937 - 115.98
40% in 13 weeks 3.1%/wk
4/8/1940 151.30 -
5/21/1940 - 114.10 25% in 6 weeks
4.1%/wk
9/18/1941 128.80 - 12/23/1941 - 106.30
18% in 13 weeks 1.4%/wk
8/13/1946 204.50 - 10/9/1946 - 163.10
20% in 7 weeks
2.8%/wk
6/12/1950 228.40 - 7/17/1950 - 197.68
13.5% in 5 weeks 2.7%/wk
7/12/1957 520.80 - 10/21/1957 - 423.10
19% in 13 weeks 1.5%/wk
1/15/1960 685.50 - 3/8/1960 - 599.70
12% in 7 weeks
1.7%/wk
3/15/1962 723.50 - 8/26/1962 535.70
26% in 22 weeks 1.3%/wk
2/9/1966 995.15 - 3/15/1966 -
911.08 8.5% in 5 weeks
1.7%/wk
5/14/1969 968.95 - 7/29/1969 -
801.96 17% in 10 weeks 1.7%/wk
4/28/1971 950.82 - 6/23/1971 -
879.95 8% in 7 weeks
1.1%/wk
1/11/1973 1051.70 - 3/22/1973 -
925.70 13% in 10 weeks 1.3%/wk
12/31/1977 1004.65 - 2/11/1977 -
931.52 7% in 6 weeks 1.2%/wk
10/12/1978 896.74 - 11/15/1978 -
785.50 12% in 4 weeks 3.0%/wk
10/5/1979 897.61 - 11/17/1979 -
796.67 12% in 6 weeks 2.0%/wk
2/13/1980 903.84 - 3/27/1980
- 759.98 16% in 6 weeks
2.7%/wk
6/15/1981 1911.99 - 9/25/1981
- 824.01 19% in 14 weeks 1.4%/wk
1/9/1984 1286.22 - 2/23/1984
- 1134.63 11.5% in 6 weeks 1.9%/wk
10/2/1987
2640.99 - 10/19/1987 - 1738.74 34.5% in 3 weeks. 11.5%/wk
10/9/1989 2791.41 -
10/13/1989 - 2569.26 8.5% in 1 week
8.5%/wk
1/2/1990 2810.15 - 1/30/1990
- 2543.24 10% in 4 weeks
2.5%/wk
10/7/1997
8178.31 - 10/27/1997 - 7161.15 13% in 3 weeks 4.3%/wk
7/17/1998 9337.97 - 8/31/1998
- 7539.07 19% in 6 weeks 3.2%/wk
8/24/1999 11283.30
-10/15/1999 - 10019.71 11% in 6 weeks 1.8%/wk
1/13/2000 11582.43 - 3/7/2000 -
9796.03 16% in 7 weeks 2.2%/wk
5/21/2001 11337.92 - 9/21/2001 -
8235.81 28% in 17 weeks 1.7%/wk
12/10/2008 13727.03 - 1/22/2008 -
11971.19 15% in 6 weeks 2.5%/wk
Of course, the market is quite oversold
on a short-term basis. Just a rally to
get shorts to take some quick profits
could bring a rally back up to 11000 on the DJI.
A higher opening is not to be trusted.
We need to see a big improvement
at the NYSE Close up from the NYSE
Opening to cause our Tiger Closing Power
to break its downtrend.
Without that and a new Peerless Buy, I
would use a rally to perhaps 10000 to go
short more of the Bearish MINCP
Stocks. I cannot recommend shorting the
ETFs until we see a rally and another
Closing Power uptrend-break.
"Don't Blame the S&P People", Mr.
President. They are only the messengers.
Obama looked listless and exhausted.
He did not seem to have any idea what to
say about today's 6% one day.
Mainly, he blamed the S&P downgrade
for the current decline. He would
not admit that his compromise with the
Tea Party has left him in a spending
straight jacket and without any new
revenue sources. As a result, he
cannot use fiscal policy to provide jobs. Wall
Street understands this all to well and
how vulnerable the weakening US economy is now.
Just what is there now to prevent a
"Double Dip" and a market crash like 1937-1938?
The unpleasant truth is that government
austerity programs like those of Cameron in the UK
and now Obama in the US are much more
suited to bringing another Depression and
an extreme bear market decline
(1930-1933), not to mention urban riots, widespread
social unrest and more dangerous
political demagoguery. (See the Blog I have
written about this: http://tigersoftware.com/TigerBlogs/83---2011/index.html
)
There is so much more to the severity of
this decline than Washington wants to
admit. Democrats and Republicans
there, it is now widely perceived, are not facing the
real issues. Neither party is
considering ending the costly wars, imposing
protective tariffs or even Buy American
in the government's own buying. Taxation of
the very wealthy is popular 3:1, but the
leaders of both parties want all the big campaign
contributions and so do nothing.
Worse still for us, Obama is clearly unfamiliar with the
history of the 1930s. He is
unwilling to use the Presidential bully pulpit to shape the political
agenda.
As much as Hoover, he does not seem to be
able to conceive how much good could
come from a massive public works program
like FDR employed. As a follower of the
Chicago free market school, he appears
unable to conceive of, or seriously consider,
any specific direct government jobs'
plan. What he did in 2009 in the name of public
works turned out to be a very token
gesture, after a lot of rhetoric and exaggerated
advance billing. Like Hoover, he
is almost exclusively relying on growth to
come in the private sector. Many
economists warned him it was not enough. Quite
possibly, it was actually designed by his
Wall Street advisers to fail, to give a bad name
to such programs in the future. See
http://www.democraticunderground.com/discuss/duboard.php?az=view_all&address=439x1672584
In any case, he can talk all he wants
about Public Works now, but he knows he does
not have the votes or the federal
revenues And Unfortunately, the last two week's market
decline has just made adequate private
investment in jobs much more unlikely. Expect the
Wall Street decline to reduce consumption
and investment dramatically in the coming months. .
=====================================================================================
OLDER HOTLINES
=====================================================================================
8/5/2011 DJI = 11444.61 la/ma= .930 21-dmaROC= -1.227 P = - 701 (-152) IP21= -.173 V=
- 383 OP=
-.322
BREADTH STATISTICS:
26 (-6) MAXCP
stocks - Bullish MAXCP Stocks
969 MINCP
stocks - Bearish MINCP Stocks
(MAXCP stocks are those showing Tiger Closing Power
making new highs.
This suggests heavy Professional Buying. Applying the Tiger Power
Ranker's
"bullish" to the MAXCP stocks find those with heavy insider buying and
institutional accumulation. Bearish MINCP stocks show the opposite.
At this point these are extended a long ways, so - use well-tested CP trendbreaks
to close out positions. Sell S7s occur when Professionals are much more bearish
than the Public is.
2 new
highs on NASDAQ. 260 new lows
on NASDAQ
1
new
highs NYSE
395 new lows on NYSE
8/5/2011
===> See
Key Peerless TigerSoft Index Charts: Industry Groups and ETFs
DIA SPY
QQQ DJIA-Peerless
TigerDJI TigerSPY
TigerQQQ GLD SLV
Crude
8/5/2011
Sell S9v No
Peerless Buy Yet. Closing Powers are declining. Hold the
shorts. Gold is our only long.
Respect the Peerless Sell signals and what Professionals
are shown to be doing using Closing
Power. To buy we need a Peerless Buy and a Closing
Power downtrend-break. I have
previously painted a picture of a perfect financial storm.
Read below the charts what some of the
positives are. Perhaps, a crash or a bear
market will be avoided. Let's hope.
Our Closing Power gives you an edge. You
can with reasonable safety go short
the Bearish MINCP stocks if
you are willing to cover when the Closing Powers
break their downtrend. This is your way
to stay in agreement with the perceptions
of the professionals and market makers.
If a rally were to occur, something which I do
not expect, I would buy only the highest
AI/200 stocks with recent bulges of Accumulation
soon after their CP downtrends are broken.
(The Elite Subscribers' Page will make some
suggestions here.)
Stick with what Peerless and the Closing Power Tells Us.
The financial news is very unnerving, to
put it mildly. But before repeating my
concerns that we are starting a new bear
market, let me show some positives.
I do this both to be balanced and because
another crash or a Depression would
be a horrible tragedy. I do not
want to propel the ball downhill, even by a nudge
with what I write. A buy signal and
a Closing Power downtrend-break would
be bullish and get us to do some buying.
Positives:
1) The S&P downgrade has probably
been already priced into the decline. Many
expected it, after the long delay by
Washington to do the routine raising of the
debt limit.
2) August is typically an up month.
In years before the Presidential Election it has
fallen in just 7 of the last 24 cases
since 1915.
3) The DJI is still above the 13.5%-down
level which reliably warns of a bear market.
AA+ is not so bad.
4) Moody's and Fitch have not downgraded
US credit yet.
5) Canada survived a similar downgrade in
the 1990s.
6) AA+ is still a long ways above junk
bond status.
7) Corporations are sitting on a hoard of
$2.5 Trillion Dollars.Even, if they are slow to
deploy it to hire people, they will, at
least, use if to buy bonds, buy their stock back and
for R&D. And even if they spent
it all on PR and lobbying, it would mean money circulating
and jobs for someone.
8) the FED may do more to prevent the
collapse of big bankers. It may accept more
"toxic mortgages" as
collateral for cheap 0% loans. (This seems unlikely, however,
given how much red ink is already on
their hidden balance sheets.)
9) QEIII? The Fed will probably
have to continue printing money by buying Treasury bills.
This will prop up the bond market.
The bond market is much bigger than the equities'
market.
Positive Possibilities for Employment in
US
Between now and the Election, the
Administration must be expected to do all
it can to reduce joblessness in the US
and boost the economy. Do not underestimate
Obama's desire to get re-elected.
1) The Admijistration can speed up the spending of appropriated money.
2) They could go around the country and
campaign for a US JOBS bill. (Conceivably, some
Republcans will go along with it and it
could pass.)
3) They could popularly campaign to buy
American. (This runs against the Democrat's
Free Trade bent, however and what Wall
Street wants them to do.)
4) They could legally award contracts
much more to those companies who make in the US
what the government buys.
And the very costly wars half way around
the world could be stopped earlier than expected.
They are unpopular and Obama wants to get
re-elected.
---------------------------------------------------------------------------------------------------------------------------------------------
Comparisons with 1930 and 1937 Are Certainly Bearish
.
In both years, Presidents Hoover
and Roosevelt moved to balance their federal
budgets in the miidle of worsening
economies in recessions. Depressions followed>
The DJI has recovered more than 2/3
of what it lost in the 51% decline in 2007-2009
from 11460 to 6560. In 1930,
the DJI recovered a little more than 50%. In 1937, the DJI
had recovered not quite 50% of what
was lost between 1929 and 1932. I am no
Elliot Wave expert, but I believe
it is bullish when more than 2/2 is recovered.
====================================================================================
OLDER HOTLINES
====================================================================================
8/4/2011 DJI = 11383.68 la/ma= .920 21-dmaROC= -1.19 P = - 549 (-154) IP21= -.204 V=
- 331 OP=
-.429
BREADTH STATISTICS:
32 (-15) MAXCP stocks - Bullish
MAXCP Stocks
831) MINCP
stocks - Bearish MINCP Stocks
(MAXCP stocks are those showing Tiger Closing Power
making new highs.
This suggests heavy Professional Buying. Applying the Tiger Power
Ranker's
"bullish" to the MAXCP stocks find those with heavy insider buying and
institutional accumulation. Bearish MINCP stocks show the opposite.
At this point these are extended a long ways, so - use well-tested CP trendbreaks
to close out positions. Sell S7s occur when Professionals are much more bearish
than the Public is.
4 new
highs on NASDAQ. 260 new lows
on NASDAQ
3
new
highs NYSE
404 new lows on NYSE
8/4/2011
===> See
Key Peerless TigerSoft Index Charts: Industry Groups and ETFs
DIA SPY
QQQ DJIA-Peerless
TigerDJI TigerSPY TigerQQQ
GLD SLV
Crude
8/4/2011
Sell S9v No
Peerless Buy Yet. Closing Powers are declining. The
plunge below the 200-day ma has brought
about a lot of profit-taking after a 26
month long bull market.
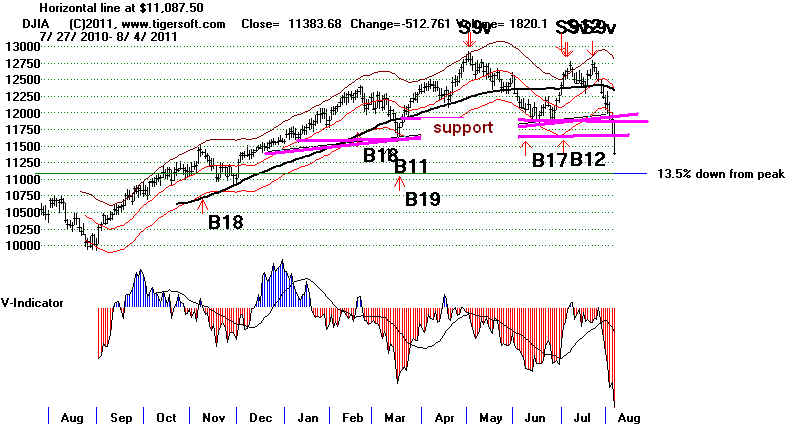
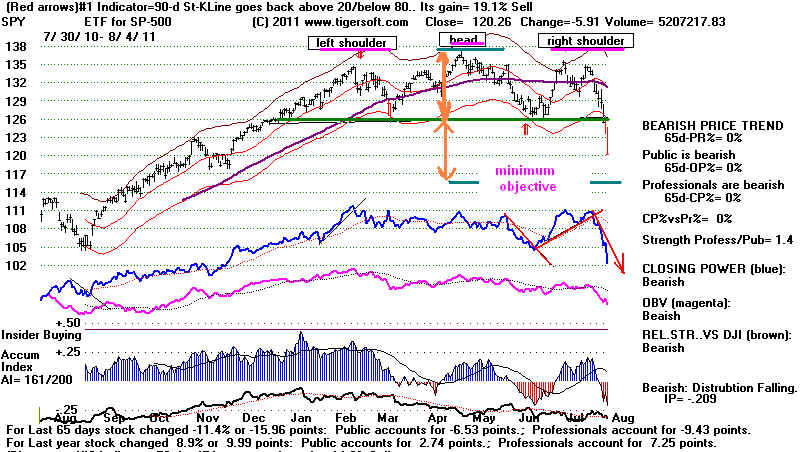
Unfortunately, as I have written, this free-fall appears to be much
more than a technically based sell-off.
The head/shoulders pattern plunge stems
from gaping doubts about the economic
intelligence of our leaders and a realization
that our political system is locked in
grid-lock and the US government appears now
powerless and unwilling to prevent a
double-dip. This could be a "Hoover moment."
We will be very lucky to only see a
decline back to 10000.
Our Tahiti rule is that multiple Peerless
Sells and a key support failure should cause
us to prepare for a bear market. We
should sell all our Tahiti DJIA-30 stocks.
The parallel with 1937 is still close.
I was surprised that so many talking heads on
television have reached Keynesian-based
bearish conclusions about what Obama
has agreed to. CNBC, of
course, blamed European difficulties. The continued sell-off
in Crude Oil is mostly a reflection of US
deflation fears. The Jobs Report tomorrow is
expected to show a worsening employment
picture in the US. In many ways this
is a "perfect financial storm".
We have no good reason to buy yet.
The downside volatility reflects
institutions rushing to the exits. It is not just
momentum players who are selling.
Gold's reversal today tells me that leveraged hedge
funds are worried and have decided to
raise money to protect against margin calls.
The lesson of 2008 is fresh in their
minds.
An emotional sell-off on Monday morning
has been set up. The failure to rally has
caught a lot of investors in various
unproductive states of mind, ranging from
DENIAL, DEER-in HEADLIGHTS to SHEER
PANIC. We are better served by waiting
for a Peerless Buy and a break in the
Closing Power Lines' downtrends.
Could Monday bring a selling
climax? Perhaps. The DJI is already down 11% from the peak.
Corporations, Maria B. says, are
sitting on a hoard of $2.5 trillion. And the 13.5% down-
from-the peak line has not been
penetrated. This line very often is the boundary between a
correction and a bear market. See
such lines on the bear markets since 1981.
HEDGE LESS and SELL MORE
We have taken a lot of short sales
among the Bearish MINCP stocks. At some point we
may want to cover them as a public
service. But do not do any buying yet. Gold is
the only long position I would hold
now, unless a position's CLosing Power is
still rising. The REITs we
turned to as a defensive play early in the week have dropped
like everything else, perhaps even
more, as funds have sold alomost everything they
still had a profit in. This
is not a good sign. Unless the Jobs Report figures are distorted
for political purposes, they should
not offer much comfort. The best hope the market
has is that the Fed will try to
stem the tide. But its balance sheet must look very red.
I'm not so sure it will have any
more courage than Obama did until the DJI is down
much more.
=====================================================================================
OLDER HOTLINES
=====================================================================================
8/3/2011 DJI = 11896.44 la/ma=
.957 21-dmaROC= -.643 P = - 396 (+26) IP21= -.109
V= - 248 OP= -.318
BREADTH STATISTICS:
47 (+6) MAXCP stocks - Bullish
MAXCP Stocks
447 (-26) MINCP stocks - Bearish MINCP
Stocks
(MAXCP stocks are those showing Tiger Closing Power
making new highs.
This suggests heavy Professional Buying. Applying the Tiger Power
Ranker's
"bullish" to the MAXCP stocks find those with heavy insider buying and
institutional accumulation. Bearish MINCP stocks show the opposite.
At this point these are extended a long ways, so - use well-tested CP trendbreaks
to close out positions. Sell S7s occur when Professionals are much more bearish
than the Public is.
15 new
highs on NASDAQ. 78 new
lows on NASDAQ
7
new
highs NYSE
86 new lows on NYSE
8/3/2011 ===> See Key Peerless TigerSoft
Index Charts: Industry Groups and ETFs
DIA SPY QQQ DJIA-Peerless
TigerDJI TigerSPY TigerQQQ
GLD SLV
Crude
8/3/2011
Sell S9v No
Peerless Buy Yet.
The Market Should Try To Extend The
Bounce. But Stay Hedged.
There is zone of support still underneath
the market. We cannot assume a new
bear market until the DJI drops 13.5%
below the peak. On the other hand, we cannot really
trust that the search for, and test of
support, is over until the Closing Power downtrends
are broken.
Respect the Speed of the Decline.
Appreciate that Head and Shoulders are the
way the market adjusts to unexpected
news. That news I take to be the perception now
of how vulnerable the US government is to
minority Tea-Party threats to bring It down,
causing massive harm to all Americans,
while it is at war and at a time when the economy
is slowing appreciably.
Yahoo
Economic news sours investors
Services
firms expand at slowest pace in 17 months
Unemployment
rose in nearly all US cities
Foreign investors must surely be
re-thinking their investments in the US and
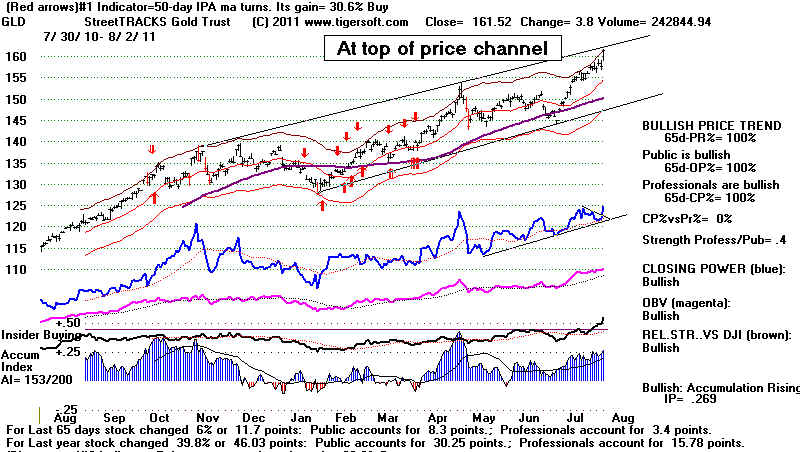
buying Gold. Gold is about to get past the top of its year-long price
channel.
I still recommend buying it. It
could go "vertical" soon. The Dollar today was turned
back down from its 65-dma, even though
Crude fell 1.86 today. A falling Dollar
and a weakening economy comes too close
to being the worst of all economic worlds.
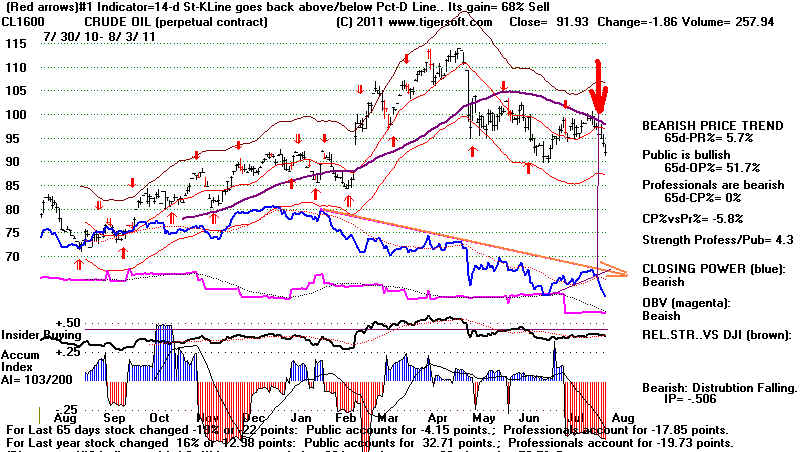
Let us hope the Federal Reserve is not so
easily bullied and intimidated, as Obama was.
Bernanke needs to speek out soon.
After eight straight days, a recovery
attempt was to be expected. The Closing Powers
are still falling. The 8% decline we have
seen in the DJI would look like a typical
intermediate-term correction were it not for
the speed of the decline. In this, as I showed
yesterday, the current decline is a lot like
the dangerous top in 1937.
Today's rally, however, was on increased
volume. In 1937, the first day's rally to
occur with higher volume than the down-day
before was not until the DJI was 10.4%
below the lower band. Maybe, the Fed will come up with something from their toolbox.
There is another reason for not despairing.
Really significant tops usually show a much
wider breadth divergence (A/D Line divergences
and P-I NNCs), one or more regular S9s
and often have S12s and other Sells. All
we had at the July twin peaks were a set of
Sell S9vs. Another point, independent
Sell S9vs are rare and there are no cases of
the subsequent declines going more than 8% down
from the top. Below are the
independent Sell S9vs.
INDEPENDENT Sell S9Vs (no accompanying Peerless Sell S9)
Deepest Intra-Day Decline
8/23/1996 2.9% intra day decline at low on 8/30/1996 and a close 1.3% below the
21dma.
8/4/2010 7% intra day decline at low on 8/26/2011 and a close 4% below the
21dma..
5/2/2011 7.5% intra day decline at low on 6/16/2011 and a close 2.3% below 21dma.
This independent Sell S9v's decline is the
deepest to date. That should be a caution, in itself.
Historically, Sell S9vs are more likely to
bring declines that last at least 4-5 weeks. That
should be a caution, too, and suggest there
could easily be more of a decline or bottoming
here. Of course, the DJI could
choose to ignore all the worsening economic reports and
it could reverse here quickly without a major
Peerless Buy. That would be unusual. But it
could happen. Short-term traders, as
opposed to those who want to hold for longer than
two weeks, should just watch the Tiger CLosing
Power on the DIA, SPY and QQQ and
buy the one that first that breaks its CP
downtrend.
=====================================================================================
OLDER HOTLINES
=====================================================================================
8/2/2011 DJI = 11866.62 la/ma=
.952 21-dmaROC= -.682 P = - 422 (-177) IP21= -.193 V=
- 153 OP=
-.442
BREADTH STATISTICS:
41 (-6) MAXCP stocks - Bullish
MAXCP Stocks
473 (+18-0 MINCP stocks - Bearish MINCP
Stocks
5/13/2011 Hedging Examples -
SCLN @ 5.56 and RDN, @5.18 now 6.27 and 3.55, respectively
(MAXCP stocks are those
showing Tiger Closing Power making new highs.
This suggests heavy Professional Buying. Applying the Tiger Power
Ranker's
"bullish" to the MAXCP stocks find those with heavy insider buying and
institutional accumulation. Bearish MINCP stocks show the opposite.
At this point these are extended a long ways, so - use well-tested CP trendbreaks
to close out positions. Sell S7s occur when Professionals are much more bearish
than the Public is.
6 new
highs on NASDAQ. 121
new lows on NASDAQ
4
new
highs NYSE
151 new lows on NYSE
8/2/2011 ===> See Key Peerless TigerSoft
Index Charts: Industry Groups and ETFs
DIA SPY QQQ DJIA-Peerless
TigerDJI TigerSPY TigerQQQ
GLD SLV
Crude
8/2/2011 The
Markets Are at Key Support. Stay Hedged. Things Could
Easily Go from Bad to Worse. Wall Street Seems To Be
Losing Control
just when It Seems They Have Been Victorious.
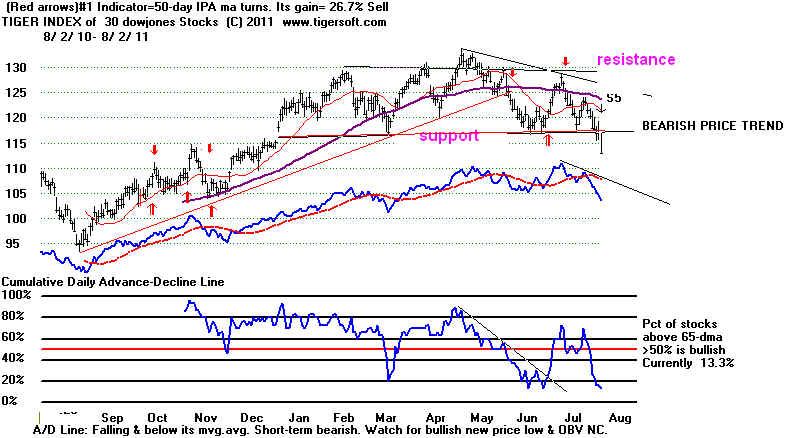
Sell S9v No Peerless Buy Yet. The DJIA seems to have violated its
rising
200-day ma and the neckline support in its
head/shoulders pattern. With the
Closing Powers falling, I see no reason to buy
or close out short positions.
Professionals are selling heavily and staking
out short positions. We have already
done this. Now a
one or two day bounce would seem likely. Even the steepest sell-offs
do not go down 9 or 10 straight days.
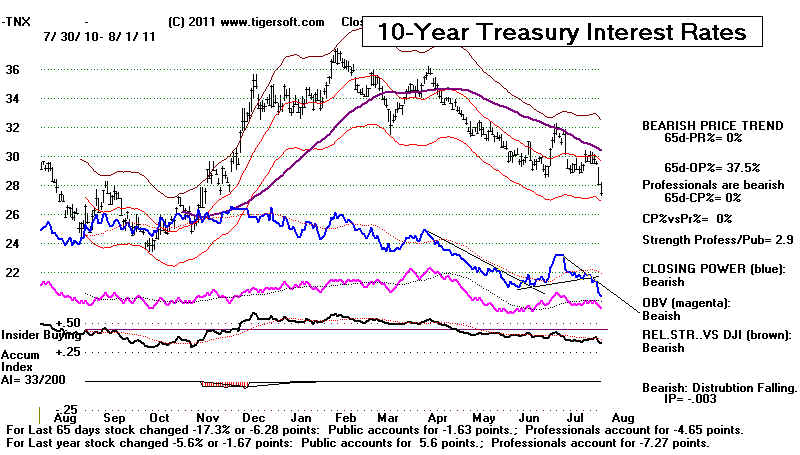
The dramatic fall in interest rates I mentioned
last night can be interpreted as a
flight by investors to safety, because they
sense a serious economic slump
lies ahead. Investors have been bidding
up the stock market rather than starting
new businesses in the US. So too, I
suspect, have corporations and banks. With the
trend breaking down, they will sell and sell
some more. To prevent this, the market
and the Fed must make a stand here.
I would look for Bernanke to do something
soon to try to prop up the market and turn it
back up. The Fed cannot let shorts
get comfortably in control.
I have warned that S9Vs historically are more
likely to drop the DJI below the
lower band than have it stop there. In
addition, with an Sell S9V operative,
it normally takes 5 weeks for the DJI the DJI
to fall below the lower band.
In the present case, it only took two.
I hate to scare readers, but the severity,
speed and steadiness of the decline (8 straight
days down) invite comparions
with the the start of the worst bear markets
from their tops. In our case, the DJI is
down 6.7% in 8 days. Only the 1937 and
1987 tops saw 8 days slides that
were down more. Like after the August
1937 top, in 8 days the DJI fell about 7%
and was about 5% below the 21-day ma. In
all the other cases, the decline started
more gradually.
To me this suggests, we study the 1937 chart
closely. In the 1937 case, the DJI
only managed 1 day rallies until it had fallen
more than 16%. The exceptional
downward velocity here soon afterward generated
a Peerless Sell S13
automatically. This tells Peerless users
to switch to the Extreme Bearish mode.
Of course, we may not see such a big sell-off.
Steep intermediate-term corrections
usually stop about 10% to 13.5% down from the
peak. That would mean we have
perhaps 3.3% to 6.8% more to endure. A
DJI decline of more than 13.5% tilts
the scales to being in a bear market of 20% or
more.
Market Behavior 8 Trading Days after The Worst Market Tops
DJI top 8 days later of 8 days
internals 8 days later
la/ma P IP21 V-I
9/3/1929
381.20
366.90 -3.8% 4 were down
.989 -26 -.11 -478
8/16/1937
189.30
175.90 -7.1%
7 were down .95
-124 -.131 -177
3/16/1962
722.30
711.30 -1.5% 6 were down
.996 -20 -.033 -256
5/14/1969
968.75
946,94 -2.3% 4 were
down .992 22 .067
0
1/11/1973
1051.70
1004.39 -4.5% 6 were down .976 .051
-.021 -3
10/5/1987
2640.18 2355.09
-10.8% 6 were down .926 -237 -.108
-27
7/17/1990
2999.75 2917.33
-2.8% 5 were down .995 -71
.144 -16
7/17/1998
9337.97
8914.96 -4.5% 4 were down ,979 -250
-.006 -79
1/14/2000
11722.98 10738.87 -4.0%
5 were down .949 -137 -.155 -.055
10/9/2007 14164.53.
13566.97 4.2% 7 were down
.974 -18 -.007 -133
7/21/2011 12724.41
11866.62 -6.7% 8 were down
.952 -422 -.153
-266
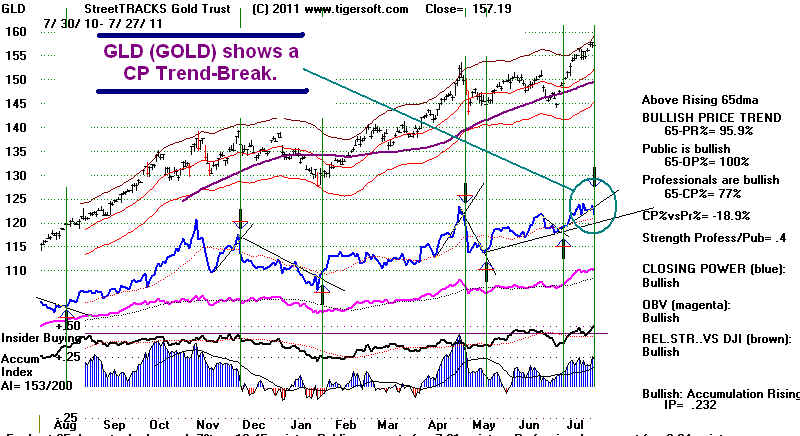
Why Is Gold So Strong?
GLD gave a CLosing Power Buy today by breaking
its short-term CP downtrend.
If it continues to rally, it will get past the
top of its price channel and go into blow-off
mode. We should be buyers. I think
that is what will happen.
The Italian and Spanish markets are very weak.
These economies are too big to be
bailed out as Greece was, if these countryies
go into fiscal crisis mode. As a
consequence, Gold and the Swiss Franc are being
used by Europeans as havens,
just as bonds are here.
Budget Balancing Now Is Dangerous
The Conservative government is the UK under
Cameron is curring back on
government spending. As an avowed
Keynesian, I think this will only make
the budget much harder to eventually balance.
It vitrually guarantees higher
unemployment, especially when wealthy
individuals, corporations and banks
are in hoarding mode.
George Santayanna warned that "Those who
do not learn from history are
doomed to repeat it. I fear Obama and the
Tea Party folks are about to get
a lesson the hard way. Tragically, tens
of millions of Americans will suffer for
their so-called leaders' ignorance of
economic history. Of course, this is my
opinion, but it was the subject of my
dissertation. Here is some of the forgotten
evidence:
1) FDR's budget balancing and cutting
government spending in the middle of
the deep recession in 1937 was, I think,
the primary cause for the 1937 47%
stock market crash.
2) Later in life, President Hoover rued
the laisseez-faire advise of Andrew Mellon,
his Treasury Secretary. Tragically,
he ran a Federal Budget surplus in 1930 and
engaged only in paltry increases (under
$257 million / year) in federal government
spending in 1930 and 1931, just when
private investment and government revenue
were collapsing. 1932 saw an increase of
$1 billion, but in 1933 he reduced
government spending, despite unemployment
levels of 25%..
, 3) Winston Churchill, who was British Chancellor of
the Exchequer from 1924-1926,
at the end of his life accepted the harsh
Keynes judgement at the time (1926) and said
the worst mistake of his long career was taking
Britain back on the Gold Standard
as London's bankers had insisted was necessary
to defend the Pound while unemployment
was very high.
DJIA
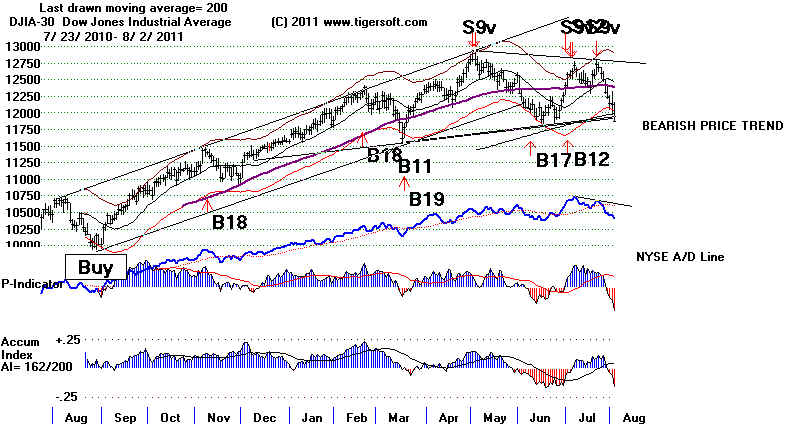 |
DIA
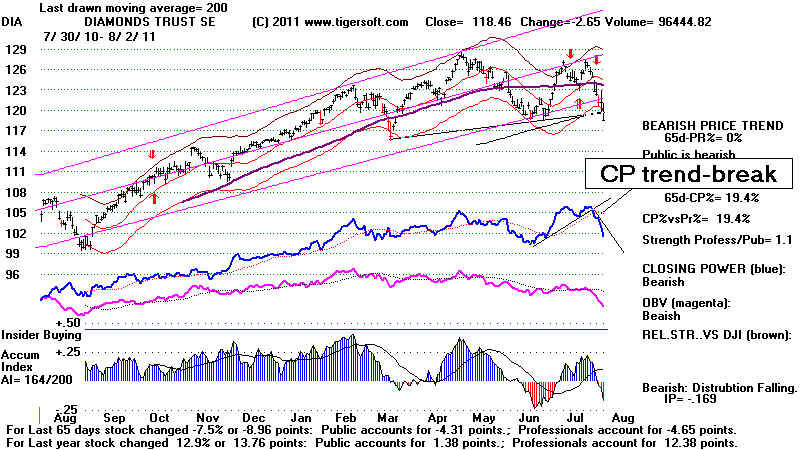 |
TIGER INDEX
OF DJI-30
 |
SPY
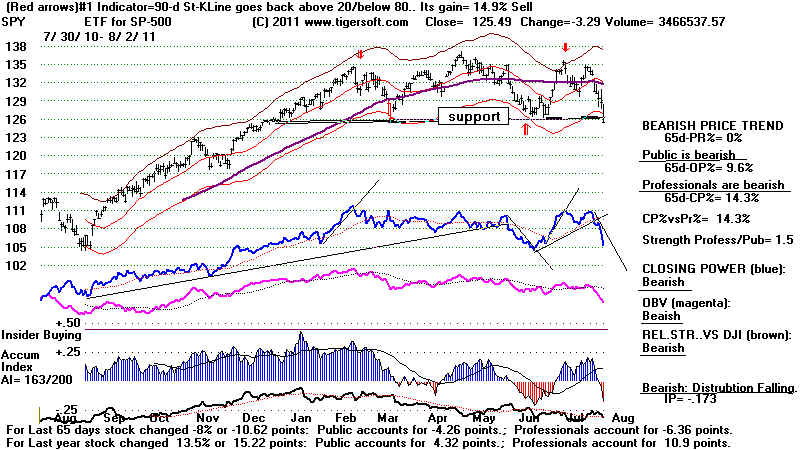 |
QQQ
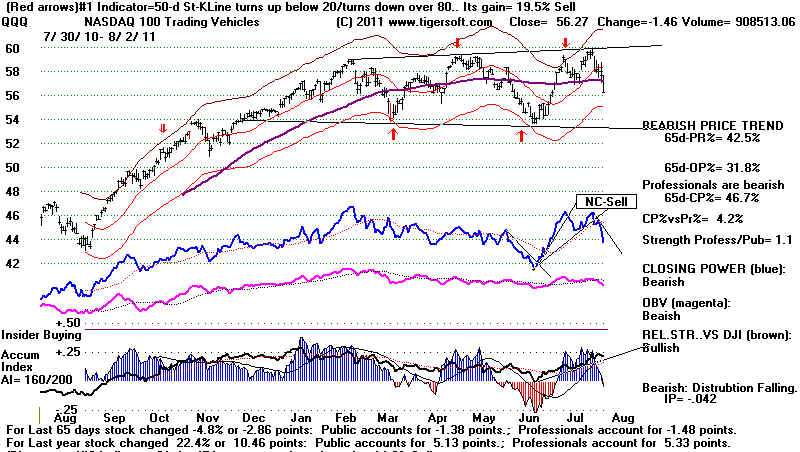 |
====================================================================================
OLDER HOTLINES
====================================================================================
8/1/2011 DJI = 12132.49 la/ma= .971 21-dmaROC= -.268 P = - 246 (-60) IP21= -.061 V=
- 164 OP=
-.339
BREADTH STATISTICS:
47 (+13) MAXCP stocks - Bullish
MAXCP Stocks
293 (+59) MINCP
stocks - Bearish MINCP Stocks
5/13/2011 Hedging Examples -
SCLN @ 5.56 and RDN, @5.18 now 6.23 and 3.36, respectively
(MAXCP stocks are those
showing Tiger Closing Power making new highs.
This suggests heavy Professional Buying. Applying the Tiger Power
Ranker's
"bullish" to the MAXCP stocks find those with heavy insider buying and
institutional accumulation. Bearish MINCP stocks show the opposite.
At this point these are extended a long ways, so - use well-tested CP trendbreaks
to close out positions. Sell S7s occur when Professionals are much more bearish
than the Public is.
13 new
highs on NASDAQ. 48 new
lows on NASDAQ
10 new
highs NYSE
46 new lows on NYSE
8/1/2011 ===> See Key Peerless TigerSoft
Index Charts: Industry Groups and ETFs
DIA SPY QQQ DJIA-Peerless
TigerDJI TigerSPY TigerQQQ
GLD SLV
Crude
8/1/2011 The
Markets Are at Key Support. Stay Hedged. Things Could
Easily Go from Bad to Worse. Wall Street Could Be
Losing Control
just when It Seems They Have Been Victorious.
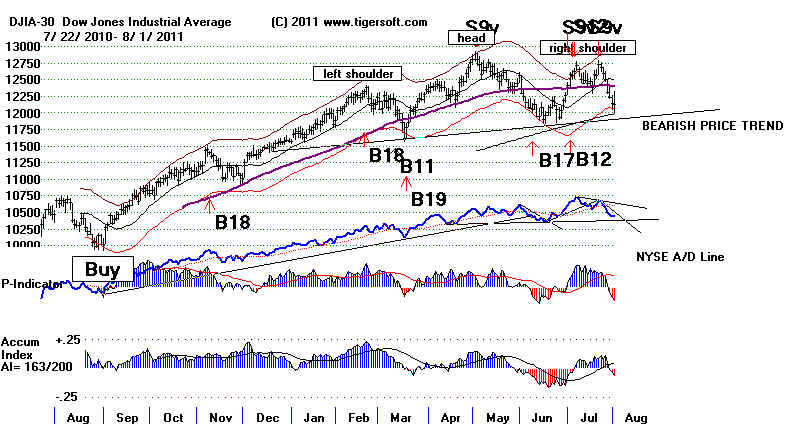
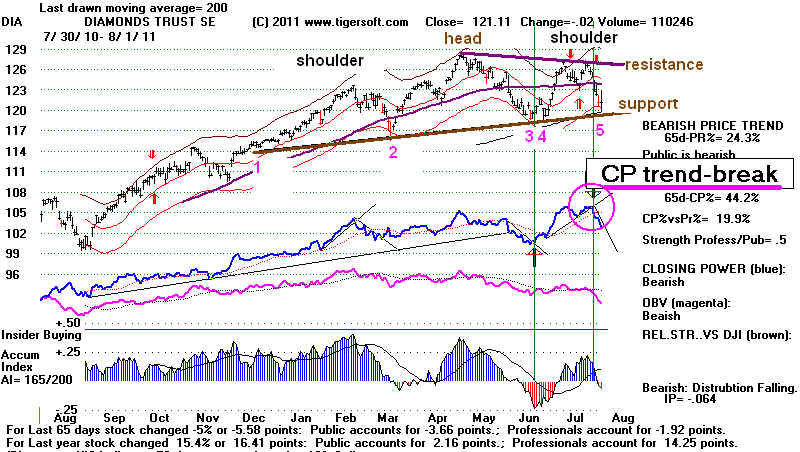
Sell S9v No Peerless Buy Yet. The DJIA is in the process of testing
its rising
200-day ma and the neckline support in its
head/shoulders pattern. There were
more up than down today, but NYSE Down Volume
was 75% more than NYSE Up Volume.
The selling pressure has not come off, as
Professionals are still selling. The
Closing Powers for the key general market ETFs
are still falling. The DJI lost
all of a 170 point opening and 130 points
more, only to close flat. Don't
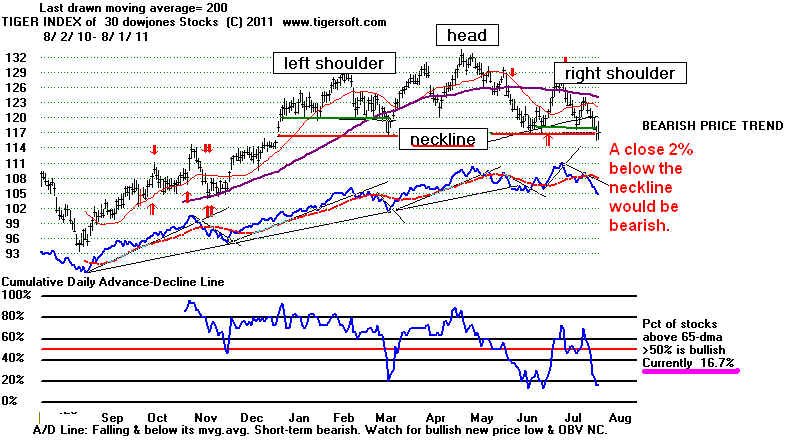
discount the DJI's head and shoulders pattern
because its neckline is rising. After a two
year rally, there is a lot that could be
reversed by a decline. And if we weight the
DJI not just by price (which over-weights high
priced IBM, XOM and CVX) the
dangers of a breakdown are clearer, because the
neckline is flat. See the chart below.
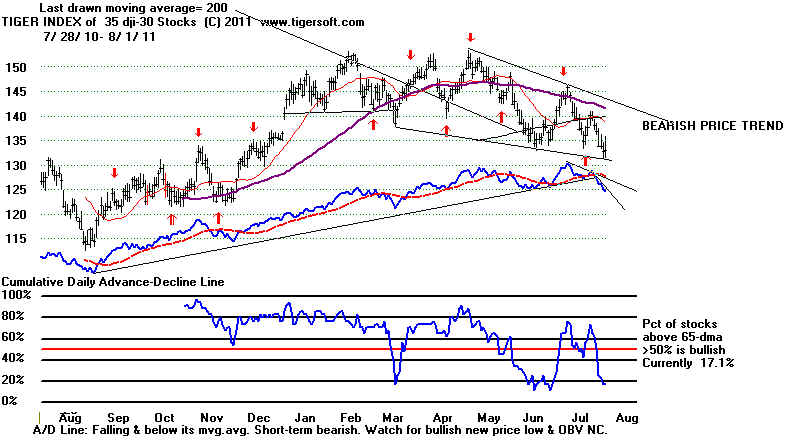
Tiger Index of DJI-30 Stocks
The Tiger Index charts weight each stock is
weighted by volume as well as by price.
This respects capitalization and investor
interest better, I think. Significantly, it
shows the DJI is below its 200-day ma.
The falling 65-day ma is also more
apparent, in that its rate of decline is
accelerating. And since only 17% of the
DJI stocks are above their 65-day ma, any rally
will face resistance as these
stocks approach their 65-day ma
What To Do?
I suggested
staying hedged and buying the highest ranked REITS yesterday.
I forgot to
say "Do Not Buy at the Opening" if it is inordinately higher. Obama
gave Wall
Street what they wanted, no new taxes, reduced spending and no
immediate
default. One might expect Wall Street to, at least, say "Thank you".
And, in
fact, interest rates did fall today as the Dollar held steady. Reits are
usually among the
last stocks to seriously decline when a bull market is ending.
Obama Seems Much More Vulnerable.
As a quiet friend of Wall Street, this is bearish.
The problem now, as I see it, is that Obama has again totally "caved in"
to the T-Party people, who really do not believe in the US government
anyway. Like Neville Chamberlain, Obama has engaged in appeasement
with people who are destructive terrorists,
.
They correctly see that he is a political invertebrate. They will keep testing him
at every turn in the months to come. The resulting spending cuts will grow
deeper just as the economy slides downhill. Layoffs will grow and
consumer demand will drop. Businesses will hoard or invest overseas.
Banks will tighten, not loosen, their loans even to very good customers.
Home prices will sink further.
And government revenues will shrink further, too. Whether intended or not
by the T-Party, and they certainly do not read Keynes, they are doing just the
right thing to weaken the US economy just when it is most vulnerable, and
thereby make Obama susceptible to a political upset in 2012. The public has
largely been led by the mainstream media into thinking that the credit-rating
of the US easily trumps the issue of 16% long-term unemployment. But much
higher employment would solve a lot of fiscal and revenue problems.
Obama avoids the bully pulpit on the issues of taxing the very rich, ending
foreign wars, closing unneeded overseas military bases, infrastructure
spending and new trade policies which protect American jobs and require
investment in the US, rather than expatriation of hundreds of billions each
year.
These are supported 2:1. But he does not raise these issues frontally. He
appears to be betting his political future on Wall Street and so does not want to do
anything which could rock that boat of campaign contributors.
But if economic conditions worsen, as seems likely, it will be Obama who will be most
blamed in 2012. I have argued here that Obama's protection and support of
Wall Street lie behind much of the DJI rally from 6500 to 12800 over the last
18 months. Now it looks like he will lose his bet, A weaker economy will
make
him much more politically vulnerable. This will add a lot more financial
uncertainty.
Whereas Wall Street has long ignored Main Street. It cannot ignore Washington.
So, It behooves the moguls of Wall Street now to get the Senate to swiftly
sign onto the Debt legislation that has just passed the House and then to
prop up now and boost the stock market. I just can't see how a market collapse
is in their interest. A collapse would only generate a much fiercer, possibly
more dangerous, round of public contempt for Wall Street. A new TARP would not
be possible.
Accordingly, If the market does break support, it probably means the economy is
much worse than has been admitted and there is nothing the Fed can do
any longer to prop it up. In that case, look out below! We will be closing out
long positions and even more aggressively shorting.
For the sake of the economy, let us hope a risky breakdown below
the price neckline of the DJI-30 is averted.
We appear to be at a cross-roads, a high inflection point. It is best to stay
hedged with some of the many bearish MINCP stocks. In that connection,
the meaning of there being so many more MINCP stocks (293) than MAXCP
stocks (47) is clear. Professionals are still betting that there will be a
breakdown.
They are usually right.
DJIA
|
DIA
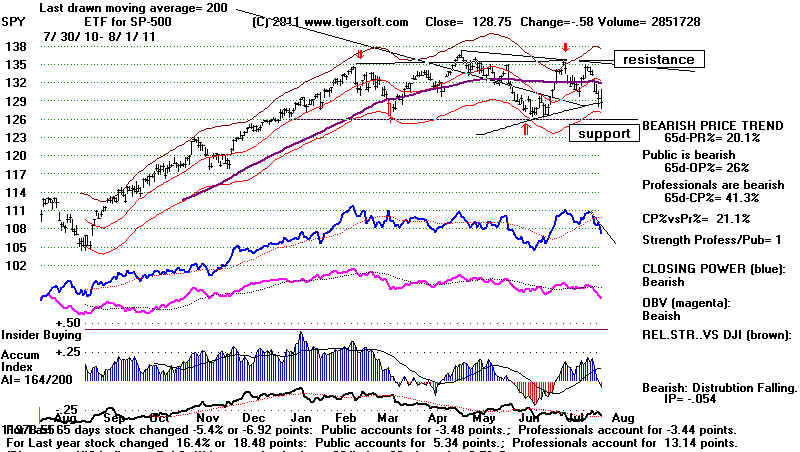
approaching neckline support and 200-dma.
TIGER INDEX OF DJI-30
|
SPY
at rising 200-day ma
 |
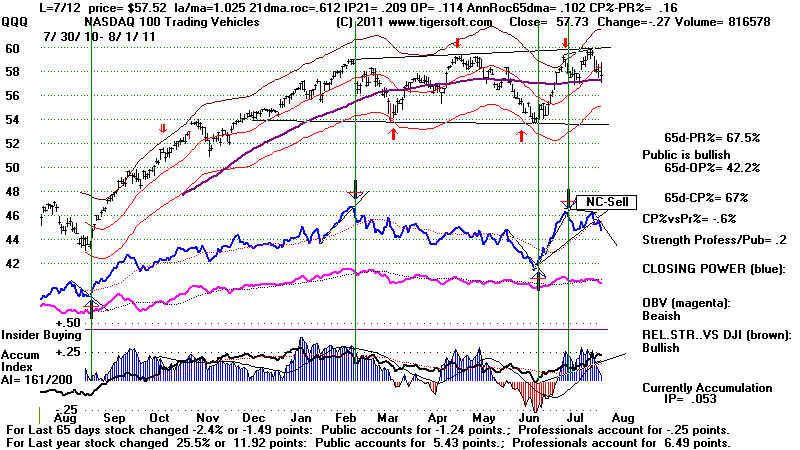
QQQ
seems to be holding up at 65-dma but Closing Power
is declining.
 |
===================================================================================
Older Hotlines
===================================================================================
7/29/11 DJI = 12143.24
la/ma= .971 21-dmaROC= -.112 P = -186 (-106) IP21= -.029 V= - 148 OP= -.218
BREADTH STATISTICS:
34 (-6) MAXCP stocks - Bullish
MAXCP Stocks
234 (+4) MINCP stocks - Bearish MINCP
Stocks
5/13/2011 Hedging Examples -
SCLN @ 5.56 and RDN, @5.18 now 6.23 and 3.36, respectively
(MAXCP stocks are those
showing Tiger Closing Power making new highs.
This suggests heavy Professional Buying. Applying the Tiger Power
Ranker's
"bullish" to the MAXCP stocks find those with heavy insider buying and
institutional accumulation. Bearish MINCP stocks show the opposite.
At this point these are extended a long ways, so - use well-tested CP trendbreaks
to close out positions. Sell S7s occur when Professionals are much more bearish
than the Public is.
20 new
highs on NASDAQ. 48 new
lows on NASDAQ
9 new
highs NYSE
76 new lows on NYSE
Apparently An Agreement to Cut Back Domestic Spending back
to 1950s levels and Raise Debt Limit. But Progressive Dems may bolt
and Tea Party Repubs may vote "No" and even Fillibuster in the
Senate to require a 60% Approval. The DJIA futures are up +181 as
this is written. REITs should resume
their place as the strongest
industry group. Buy the Highest Power Ranked but stay hedged.
Sell S9v No Peerless Buy Yet.... Will the agreement hold?
Will the market rally now?
The DJI has tagged the lower band.
But S9vs are just as likely to produce
declines below the lower band as stop
there. The speed with which the DJI has
fallen to the lower band from the last
Sell S9v is historically additionally bearish.
Sell S9 signals suppress most Peerless
buys for 15 trading days, so that
the bearishness of the signal has had a
reasonable chance to play out.
Since 1965, there have been 20 similarly
rapid declines from the upper band to the lower
band. In 11 cases, 55% of the time,
the DJI fell below the lower band. In 9 cases (45%)
of the the time, the DJI rallied back to
the upper band. There were 3 earlier July cases.
Each saw the DJI continue to fall and
break below th elower band.
10/29/73 below lower band.
4/24/74 reversed up
8/1/74 reversed up
8/14/74 below lower
band.
7/23/75 below lower band
10/19/78 below lower band
12/15/82 reversed up
9/11/86 below lower band.
4/14/87 reversed up
10/12/87 below lower band
10/13/89 reversed up
8/15/97 reversed up
7/27/98 below lower band
4/13/00 reversed up
5/24/00 reversed up
5/19/06 below lower band S9V
7/27/07 below lower band
3/10/08 revered up
11/17/08 below lower band
6/23/10 below lower band
=================================
11 below lower band
9 revered up to upper band
The uptrending support line through the
March and June bottoms crosses at about 11950.
The rising 200 day ma crosses at
this level. This "should" be support. But it has not
yet even been tested. The
general sense is that if there is a budget comprimise, the market
will rally again. The pundits could
be wrong that there will, in fact, be a compromise.
And they could be wrong that raising the
Budget Deficit limits will bring more than a short-term
bounce in the market.
The stock market is pretty smart.
It knows that cutting a trillion Dollars out of the US
Budget is hugely deflationary in the US.
But I don't think it cares. The US stock market
is, I would argue, less closely connected
to Main Street in America than the perceptions
of the very weathy who own most stocks.
As they have not had their taxes raised, they
should be very pleased and the market
should be happy with that.
. True, we still have a huge federal deficit.
Also true, cutting a trillion Dollars from the Federal
Budget guarantees thousands of lay-offs
and much less spending by the elderly and the
unemployed. And they will be angry.
Expect much more political polarization in 2012.
But all this is not what the stock market
cares about until the political status quo is
seriously threatened. It is
not. Obama dies not even have a challenger in sight.
So, I would think that a short-term rally
back to the upper band will occur if there is
an agreement. I suspect there will
be an Agreement. (Wall Street demands it of its puppets
and they will listen.) As long as
the US credit rating of "AAA" is retained, look for a nice
rally by bonds, utilites and REITs. Those
have been the leaders. They should turn up
quite powerfully this week.
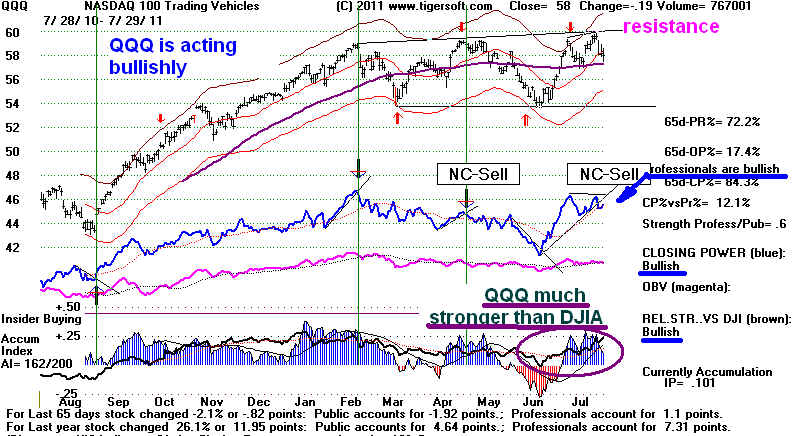
The QQQ has been much stronger than
the DIA or SPY. Its strength owed to the
success recently of AAPL, GOOG and MSFT.
They look over-extended. I would
rather buy the best of the REITS. Of
course, if QQQ should break above 60, I would
buy it, too. Continue the
hedging, too, but shift some money into the bullish MAXCPs.
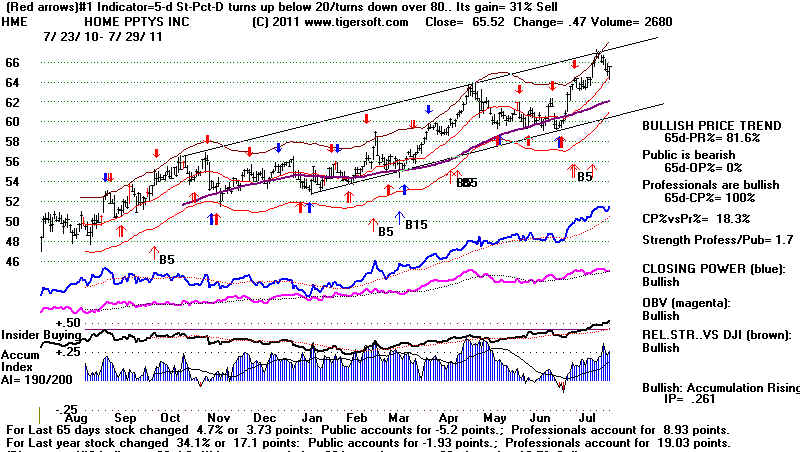
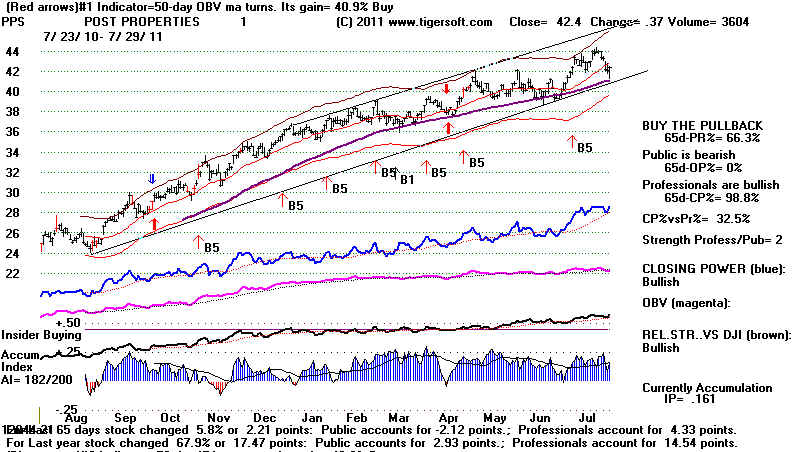
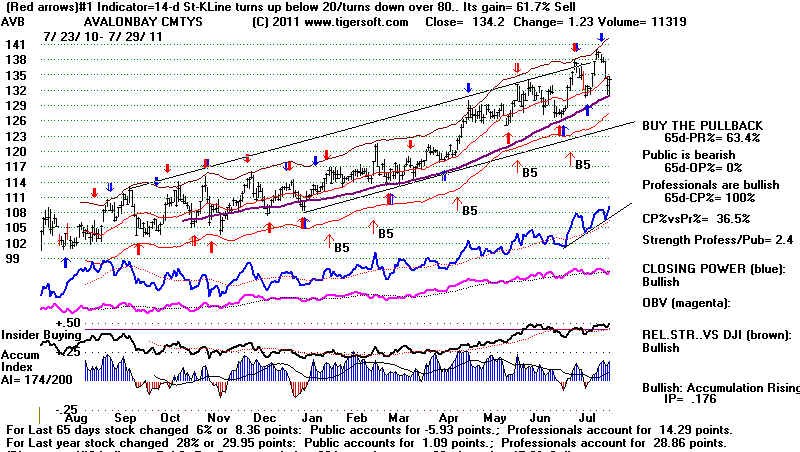
HWE, PPS and AVB are the three highest Power Ranked REIT. I would
buy them now.
 |
 |
 |
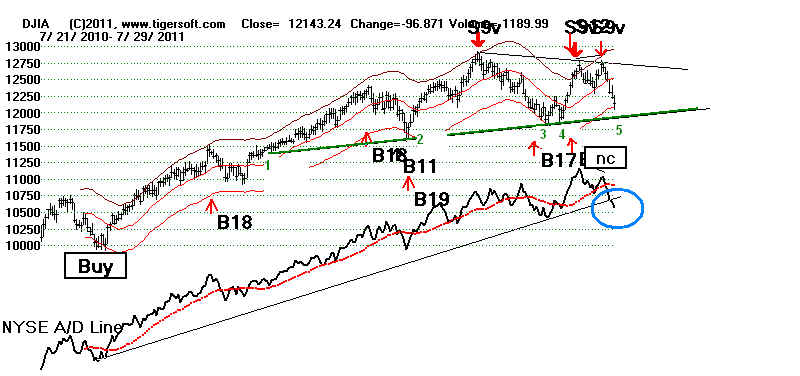
DJIA


 |
DIA
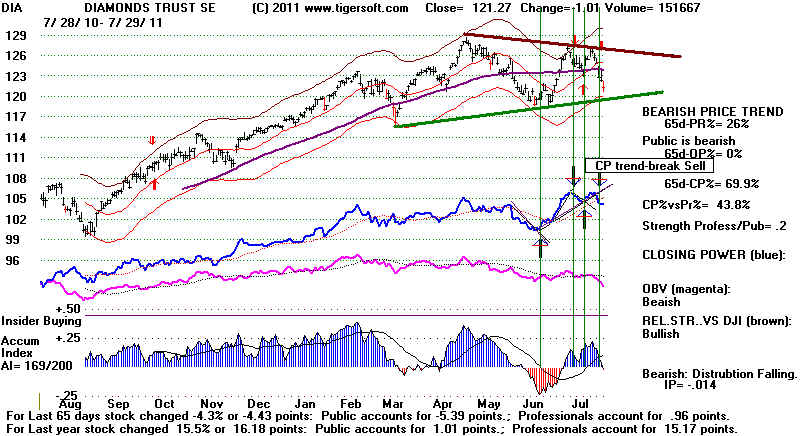 |
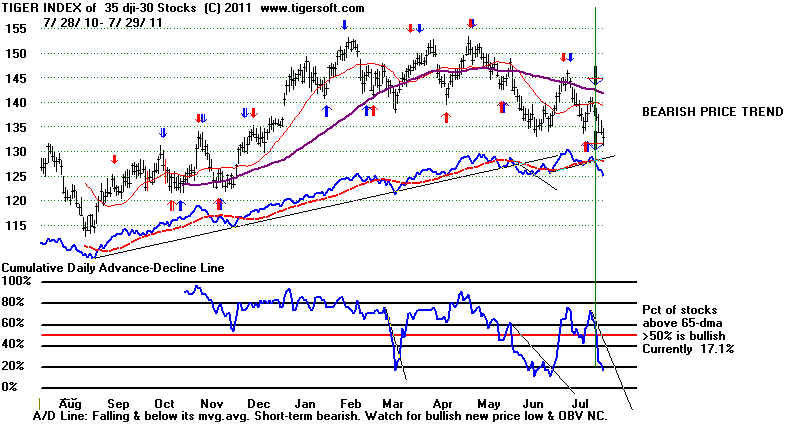
Tiger DJI
and A/D Line falliing. 17% above 65-dma
 |
SPY
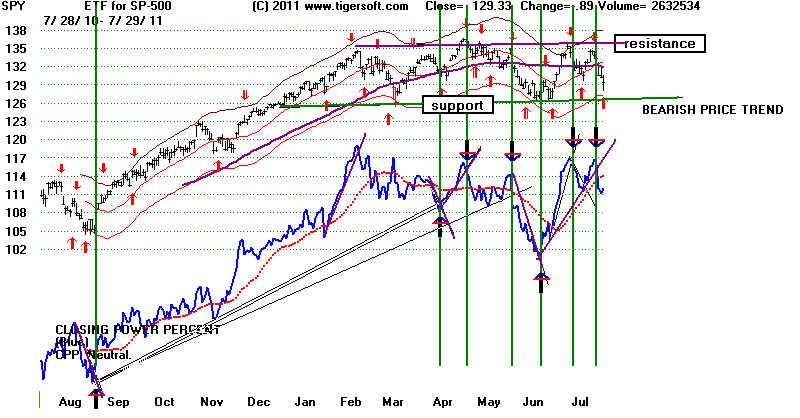 |
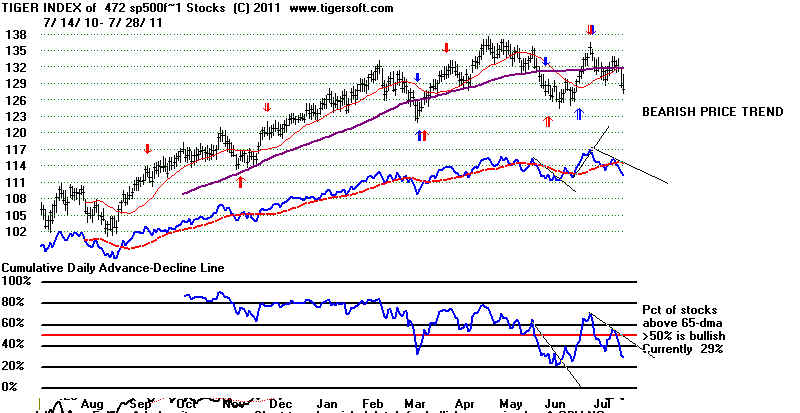
Tiger
SP-500 nnd A/D Line falliing. 29% above 65-dma
 |
QQQ
 |
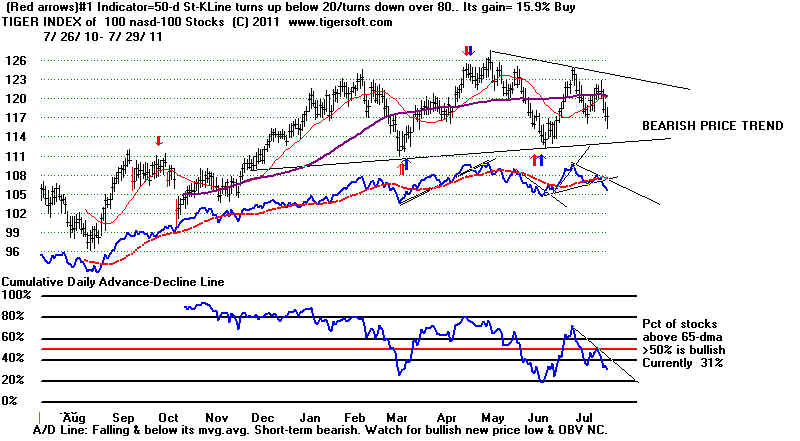
Tiger QQQ
and A/D Line falliing. 31% above 65-dma
 |
====================================================================================
OLDER HOTLINES
====================================================================================
7/28/11 DJI = 12240.11
la/ma= .978 21-dmaROC= .049 P = -81 (-123) IP21=.004 V= - 101 OP= -.114
BREADTH STATISTICS:
34 (-6) MAXCP stocks - Bullish
MAXCP Stocks
234 (+4) MINCP stocks - Bearish MINCP
Stocks
5/13/2011 Hedging Examples -
SCLN @ 5.56 and RDN, @5.18 now 6.23 and 3.36, respectively
(MAXCP stocks are those showing
Tiger Closing Power making new highs.
This suggests heavy Professional Buying. Applying the Tiger Power Ranker's
"bullish" to the MAXCP stocks find those with heavy insider buying and
institutional accumulation. Bearish MINCP stocks show the opposite.
At this point these are extended a long ways, so - use well-tested CP trendbreaks
to close out positions. Sell S7s occur when Professionals are much more bearish
than the Public is.
12 new
highs on NASDAQ. 47 new
lows on NASDAQ
12 new
highs NYSE
67 new lows on NYSE
7/28/2011
===> See
Key Peerless TigerSoft Index Charts: Industry Groups and ETFs
DIA SPY QQQ DJIA-Peerless
TigerDJI TigerSPY TigerQQQ
GLD SLV
Crude
Sell S9v The DJI has nearly reached the lower band. But S9vs
are just as likely
to produce declines below the lower band
as stop there. And as I mentioned last
night, the best support in a horizontal
trading range is not the lower band, but the
line going through the earlier DJI lows.
(See the charts of 1956 and 1986 as examples.)
Each of the key Peerless Indicators
(P-Indicator, A/D Line, Accum. Index and V-Indicator
dropped below) their 21-day ma.
This is not a good sign. Nor is the abundance of
bearish MINCP stocks with a current
Accumulation Index below -.20.
===================================================================================
OLDER HOTLINES
===================================================================================
7/27/11 DJI = 12302.55 la/ma=
.983 21-dmaROC= .247 P = 42 (-176) IP21=.055 V= -
63 OP= .025
BREADTH STATISTICS:
40
(-94) MAXCP
stocks - Bullish MAXCP Stocks
Check out our CPHD
230 (+128) MINCP stocks - Bearish MINCP
Stocks
5/13/2011 Hedging Examples -
SCLN @ 5.56 and RDN, @5.18 now 6.23 and 3.36, respectively
(MAXCP stocks are those showing
Tiger Closing Power making new highs.
This suggests heavy Professional Buying. Applying the Tiger Power Ranker's
"bullish" to the MAXCP stocks find those with heavy insider buying and
institutional accumulation. Bearish MINCP stocks show the opposite.
At this point these are extended a long ways, so - use well-tested CP trendbreaks
to close out positions. Sell S7s occur when Professionals are much more bearish
than the Public is.
5 new
highs on NASDAQ. 68 new
lows on NASDAQ
7 new
highs NYSE
79 new lows on NYSE
7/27/2011
===> See
Key Peerless TigerSoft Index Charts: Industry Groups and ETFs
DIA SPY QQQ DJIA-Peerless
TigerDJI TigerSPY TigerQQQ
GLD SLV
Crude
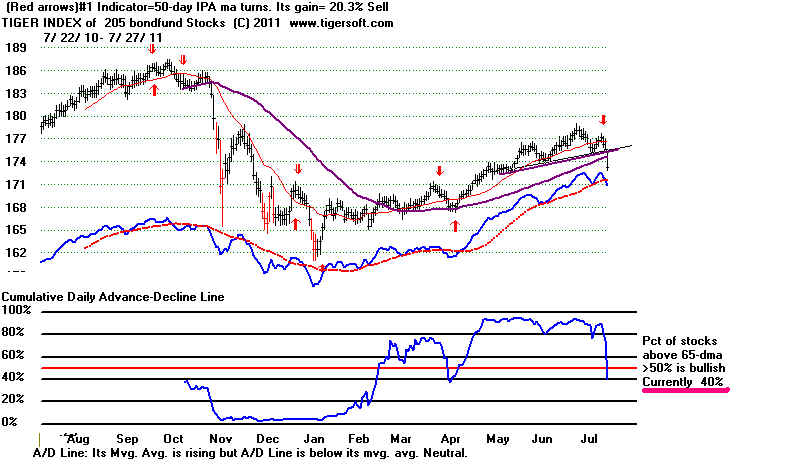
Sell S9v Today hurt the market a lot. Interest rate sensitive
stocks were hit with a
selling we have not seen for some time. Suddenly more
Bond Funds are below their
65-dma than above it. They have been the leaders.
Now the concern is that interest rates
will soon be rising. Only 32% of the SP-500 stocks
are above the 65-dma. They now
have that much more resistance overhead to stop the next
rally.
TIGER INDEX OF BOND FUNDS
The history of refined Sell S9vs suggests that there is a
47% (9/19) probability
of a DJI decline below the lower band within the next 5
weeks and a 94% chance that the
lower 3.5% band will be reached. The lower band is
now only 1.8% away. With the
P-Indicator and Accumulation Index still positive, we might
see bounce tomorrow
or even a Buy B9 if the DJI falls 200 points lower.
But a Buy signal tomorrow seems unlikely.
Without a buy signal, it's difficult to see much of a
recovery. And even if there was
a Buy signal, usually in trading ranges like the SP-500 now
shows, there are not sufficient
bids in the middle of the range to hold up prices once they
start to fall in earnest. The best
support is to be expected at the bottom of the trading
range. A surprise compromise
on the Debt ceiling would, however, cause a rush by shorts
to cover and bring the
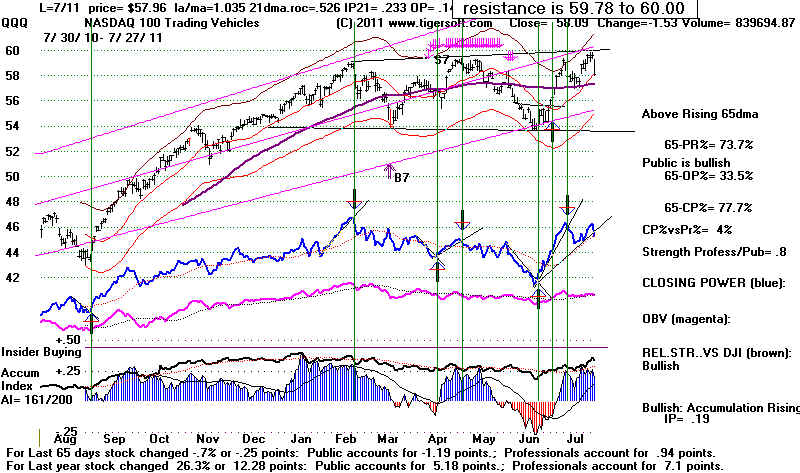
QQQ back to the 59-60 level. I would buy the QQQ on a
close by the it above 60. The
reasoning was explained last night.
SPY
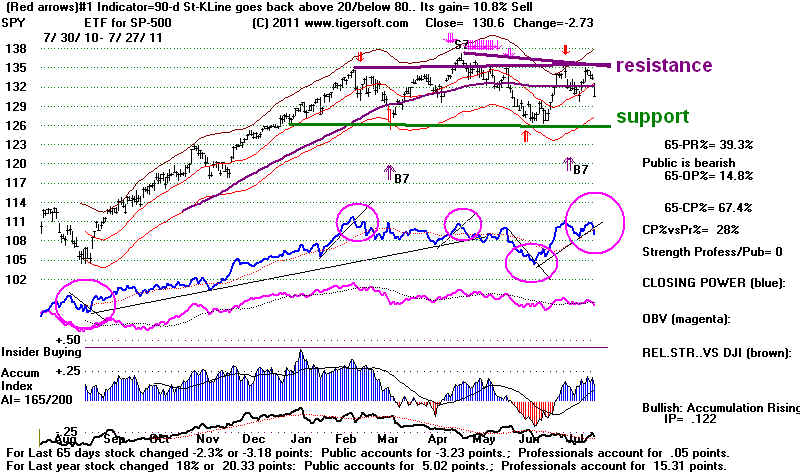 |
Note how today the ETFs' Closing Powers broke their uptrends.
What I was afraid would
happen has occurred: we have seen three days of very weak
openings this week that
have set the tone for the rest of the day. Waiting for the
Closing Power trend-break to
Sell would have given too much away, Breaks in the Opening
Power 21-day ma was
be watched. This past year they have been bearish.
The bearishness of the refined
S9v really helped here. It also made me accept the reality
of the extreme polarization
over the budget in Washington.
DIA CLOSING POWER TREND-BREAKS
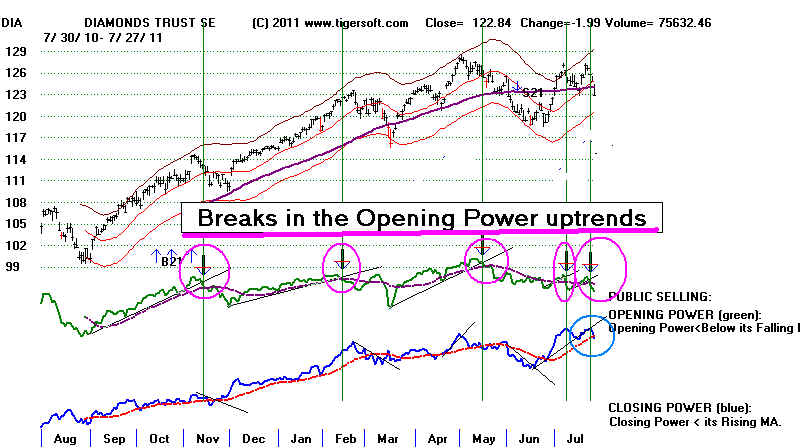
The best thing now seems to remain short a decent
number of bearish MINCP
stocks.
Most of them keep falling.
DJIA
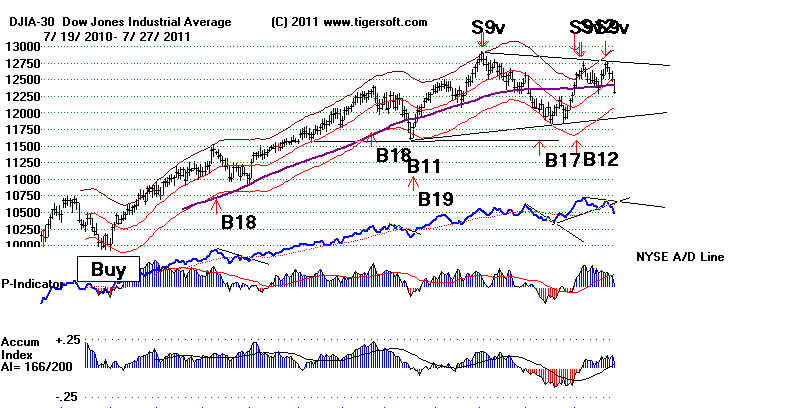
 |
GLD
 |
QQQ
NASDAQ-100
 |
|
NASDAQ-10
 |
------------------------------------------------------------------------------------------------------------------------
OLDER HOTLINES
-------------------------------------------------------------------------------------------------------------------------
7/26/11 DJI = 12501.30 la/ma= 1.00 21-dmaROC= .541 P = 217 (-4) IP21=.226 V= +1 OP= .081
BREADTH STATISTICS:
136
(-50) MAXCP
stocks - Bullish MAXCP Stocks
Check out our CPHD
102 (+27) MINCP stocks - Bearish MINCP Stocks
5/13/2011 Hedging Examples -
SCLN @ 5.56 and RDN, @5.18 now 6.62 and 3.52, respectively
(MAXCP stocks are those showing
Tiger Closing Power making new highs.
This suggests heavy Professional Buying. Applying the Tiger Power Ranker's
"bullish" to the MAXCP stocks find those with heavy insider buying and
institutional accumulation. Bearish MINCP stocks show the opposite.
At this point these are extended a long ways, so - use well-tested CP trendbreaks
to close out positions. Sell S7s occur when Professionals are much more bearish
than the Public is.
15 new
highs on NASDAQ. 20 new
lows on NASDAQ
20 new
highs NYSE
35 new lows on NYSE
Sell S9v The history of refined Sell S9vs suggests that there is a 47%
(9/19) probability
of a DJI decline below the lower band within the next
5 weeks. That does not preclude
the possibility of a QQQ flat-topped breakout over
60. (See the parallel with 1996, when
there would have been a 2.3% loss using the Sell S9v,
after the DJI formed a flat-topped
resistance and then broke out over it to the upside
with a reversing Buy B10 after only
a DJI retreat to the 21-day ma. <Added
Wednesday AM> )
The Closing Powers of the DIA, SPY and QQQ are still
rising and the three biggest NASDAQ
stocks are surging. See the charts of AAPL, GOOG and MSFT below.
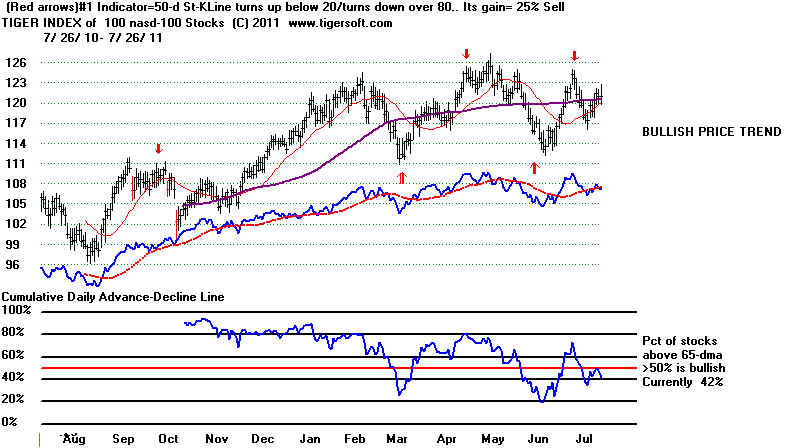
The NASDAQ
and QQQ are capitalization weighted. These
three stocks explain much of why the
NASDAQ has held up this week while the DJI
declined. And don't forget, too, that IBM
single-handedly has more say about where the DJI-30
goes than any other stock, simply
by virtue of its very high price. And IBM's
uptrend and high Accumulation right now are
most impressive. It is at the top of its price
channel. If it should break above the top of
its channel, look out shorts! See its chart
below.
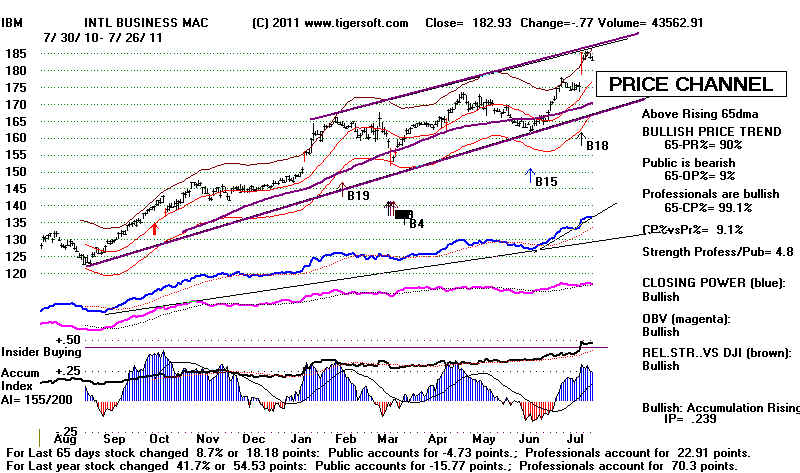
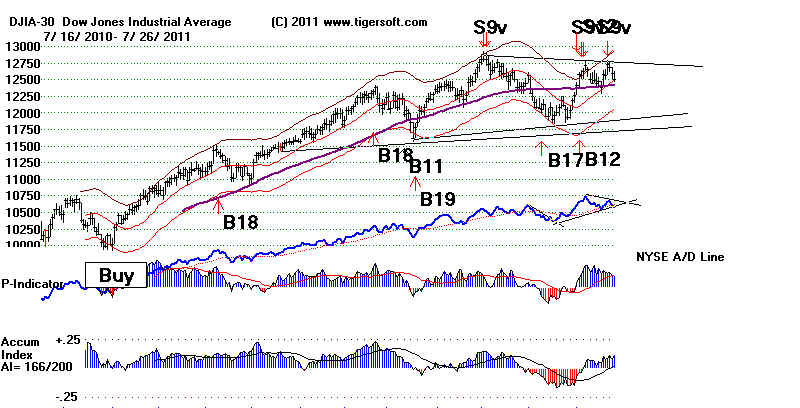
So, it may be that we are the verge of a new narrow
"nifty rally" to new highs, led perhaps
by the biggest tech stocks. This would explain
the high level of Accumulation in our NASDAQ
chart. If there is a further narrow rally led
by these the biggest tech stocks and the DJI makes
a new high and reaches the upper band, we could see a
normal Sell S9 in August, as the A/D
Line and the P-Indicator badly lag the DJI. We
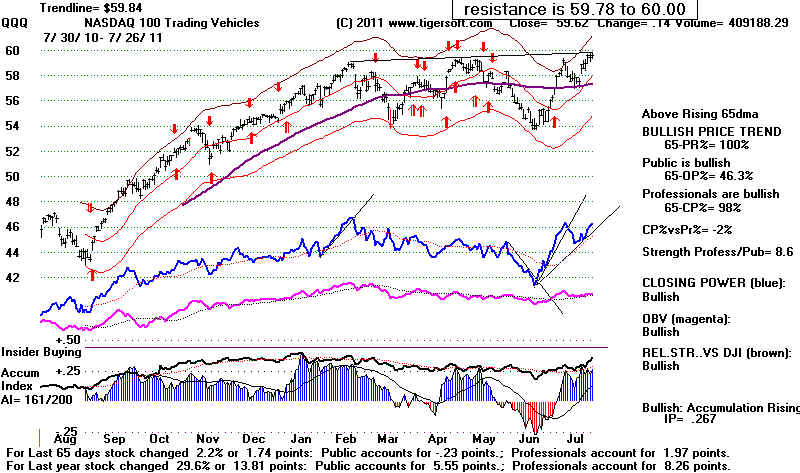
will; have to watch and see.... Traders should
buy the QQQ on a close above 60 to take advantage of
a flat-topped breakout situation
where shorts are forced to cover.
Until then, the Sell S9v signifies trouble ahead for
the market and I urge taking some short
positions in the Bearish MINCP Stocks . Long
positions among the Bullish MAXCP Stocks
should still be held if their Closing Powers are
rising. As proof that these bullish MAXCP
stocks still have the power to move higher, I mention
CPHD's nine point take-off Friday
and CLFD's jump higher
today. Both are stocks we have been long on the Tiger Hotline
and held in the belief that the reason for the
insider buying surge we detected using our
Accumulation Index had yet to come out, and when it
did the stocks would be significantly higher.
Software Update
The
refined Sell S9v will be added this week as a signal option on Peerless programs and
made available to all Elite Subscriber users.
Because the Sell S9v cannot be accurately
tested before 1966, I am reluctant to include it as a
full-fledged Peerless signal, but its 46-year
track-record is significantly bearish. So,
traders using it with our Closing Power should
expect good results. Updates to the Peerless
Software are available to others, but
it is necessary to charge $60 for the update, if you
are ready have Peerless.
 |
QQQQ
 |
NASDAQ-100 Stocks
with A/D Line
 |
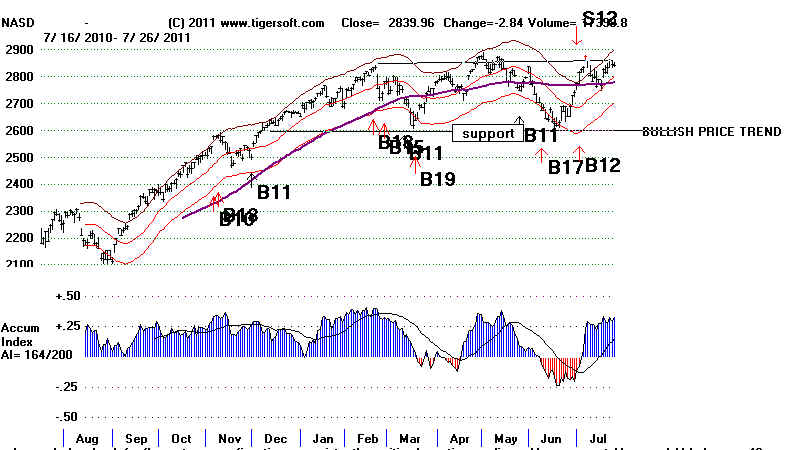 |
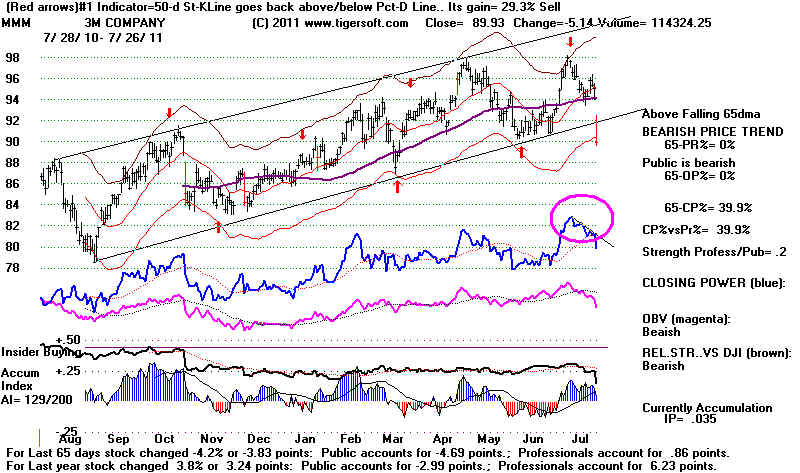
Watch for zig-zag clusters downwards, as MMM recently
displayed.
These we have frequently noted usually have a bearish
outcome.
 |
====================================================================================
OLDER HOTLINES
====================================================================================
7/25/2011
MAXCP stocks - Bullish
MAXCP Stocks Check out our CPHD
MINCP stocks
- Bearish MINCP Stocks
14 new
highs on NASDAQ. 21 new
lows on NASDAQ
12 new
highs NYSE
29 new lows on NYSE
7/25/2011 The new warning Refined Sell S9v should keep us
very wary now...
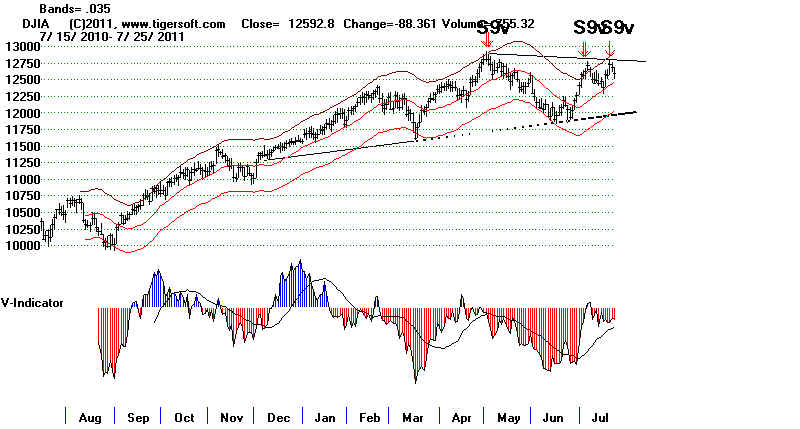
While S9vs are
not fully satisfactory as independent, intermediate-term major
Peerless Sell signals, they have reliably brought retreats
to the 21-day ma since 1966
and 9 (47%) of the 19 S9vs produced DJI declines below the lower
band. That is what
worries me now. A decline below the lower band could start
to feed on itself if
interest rates belatedly rise.
Certainly, traders should employ S9vs when the key ETF's Closing
Power uptrends are
violated.
A big problem with S9vs is that they can only be accurately
tested back to 1966. When
the necessary Up and Down volume pre-1966 data are estimated
using total NYSE
volume and simply the ratio of advances and declines, we get too
many losing Sells in
the bull markets of 1935, 1936 and 1954. At first
blush, this casts some doubt on the S9v.
But consider something else. It is reasonable to believe
that in such strongly rising markets,
the actual Up volume was actually much higher and the actual Down
Volume was much lower
than we get estimating it using only the ratio of advances to
declines. Unfortunately,
without the actual NYSE Up and Down volume for 1935, 1936 and
1954, for example. we
just cannot calculate the needed numbers accurately.
What is important for us now to understand is that If we take the
only the period since
1965, every one of the 19 refined May-September S9vs did bring a
short-term decline at least to
the 21-day ma. Nearly half of them also brought
declines below the lower band.
Accordingly,
short-term we have to be bearish, especially if the resistance just overhead
turns back another rally and if the Closing Power uptrends
are violated.
Have you heard of the "Titanic effect"? I read
about this in BARRONS more 20 years ago.
I do not recall the author. It certainly worked well in
2007. It occurs when, as now, the new
lows on the NASDAQ and the NYSE outnumber the new highs with the
DJI very close to
its yearly high. Register this as another warning sign.
HEDGING STRATEGY USING TIGERSOFT
On our Stocks'
Hotline, we are out of the major ETFs now and hedged by being short
as many bearish MINCP stocks as we are long among the bullish
MAXCP stocks.
You saw the way CPHD jumped 30% yesterday. High
accumulation and Closing
Power new highs still are working their magic, just as heavy
insider and professional selling
commonly bring big declines, even in a rising market. Below
are two stocks picked here
on the same day in May. RDN was to be shorted and SCLN was
to be purchased long.
Both have worked out well. RDN has fallen from 5.18 to 3.52, a
decline of about 30%.
SCLN has risen nearly 20% in the same period, from 5.56 to
6.52. See their charts below.
Hedging this way is recommended if you pick stocks in this
fashion.
Sell Short
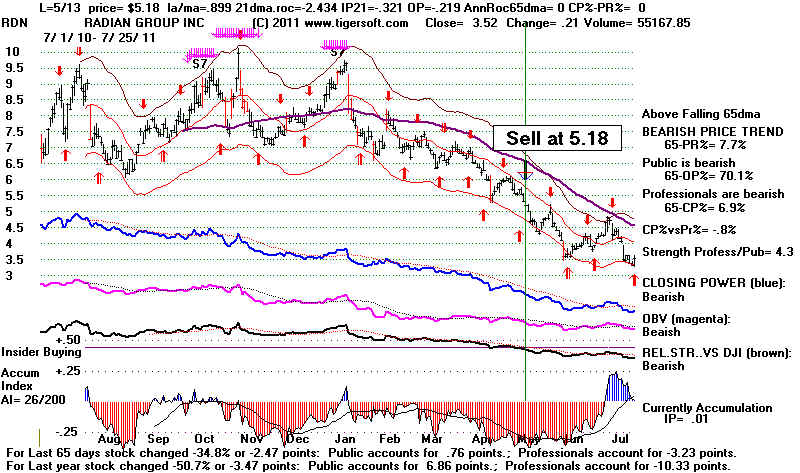 |
Buy
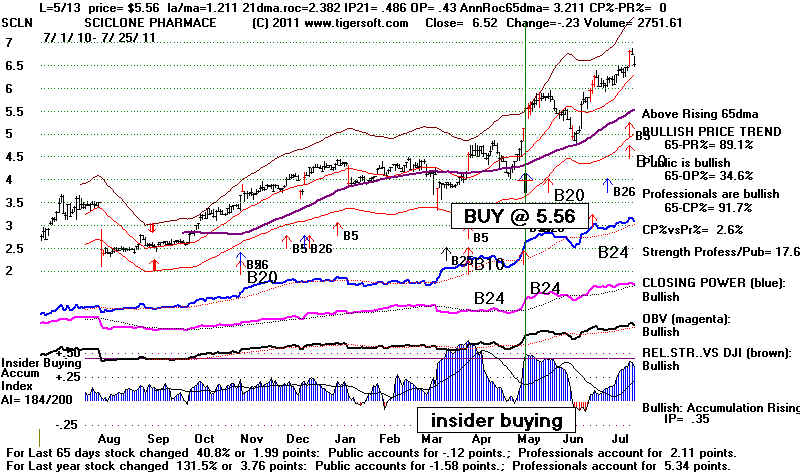 |
I still would respect the uptrend, especially as the market is
clearly holding up well
in the face of the mass fear the talking heads are creating as
they discuss the nearing
"Doomsday" of US government default on its debt.
The NASDAQ has held up very
well and the QQQ now has a very flat topped resistance line,
which we can trade
short-term. I like trading such flat-topped
horizontal resistance breakouts because
the moves usually come quick and one can work with a sell stop
just below the point of
breakout if it does not work out as expected. If you are so
inclined, buy the QQQ
on a closing breakout above 60.
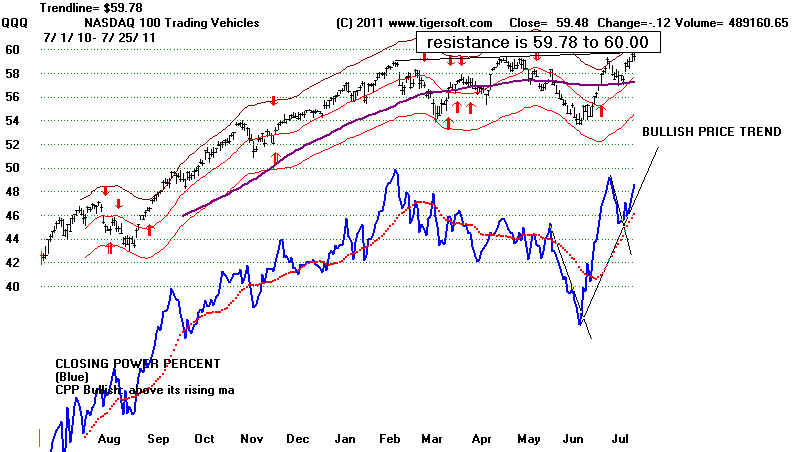
Work in progress...
PEERLESS
INTERMEDIATE-TERM SIGNALS and INDICATORS
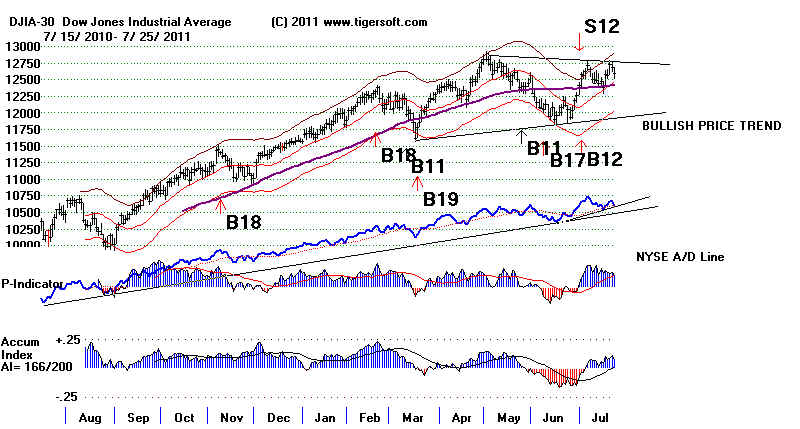 |
SPY
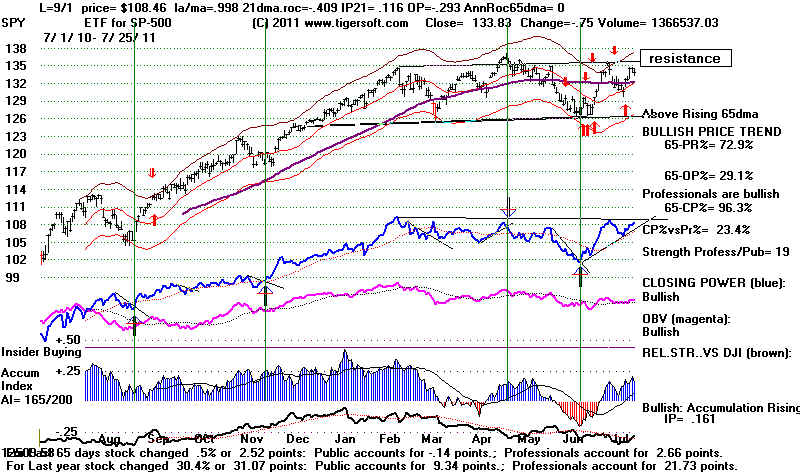 |
DIA
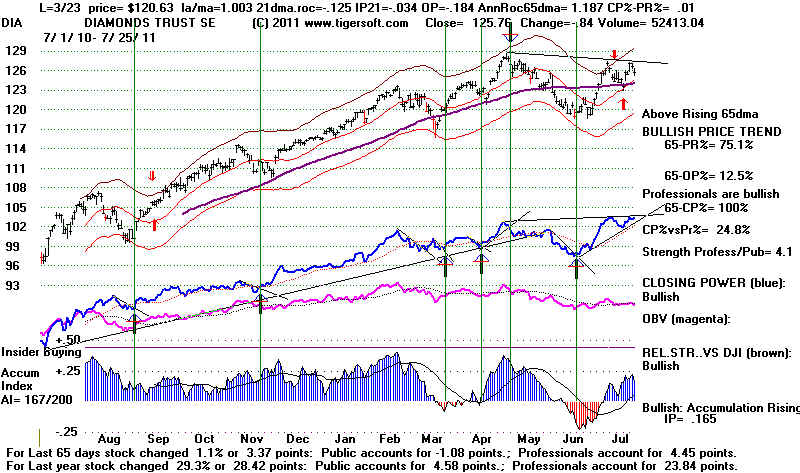 |
==================================================================================
OLDER HOTLINES
===================================================================================
7/22/11 DJI = 12681.16 la/ma= 1.019 21-dmaROC= .548 P = 288 (19) IP21=-.112 V= - 37 OP= .011
BREADTH STATISTICS:
174 (-1 )
MAXCP stocks -
Bullish MAXCP Stocks Check out
our CPHD
44(-17) MINCP stocks
- Bearish MINCP Stocks
5/13/2011 Hedging Examples - SCLN @ 5.56 and RDN,
@5.18 now 6.09 and 4.24 respectively
(MAXCP stocks are those showing
Tiger Closing Power making new highs.
This suggests heavy Professional Buying. Applying the Tiger Power Ranker's
"bullish" to the MAXCP stocks find those with heavy insider buying and
institutional accumulation. Bearish MINCP stocks show the opposite.
At this point these are extended a long ways, so - use well-tested CP trendbreaks
to close out positions. Sell S7s occur when Professionals are much more bearish
than the Public is.
39 new
highs on NASDAQ. 10 new
lows on NASDAQ
47 new
highs NYSE
13 new lows on NYSE
7/22/2011
===> See
Key Peerless TigerSoft Index Charts: Industry Groups and ETFs
DIA SPY QQQ DJIA-Peerless
TigerDJI TigerSPY TigerQQQ
GLD SLV
Crude
The Volume Fuel for An Extension of The
Summer Rally is Running Low.
Buy B12 versus New Sell S9v
The S9v research I have just done for the S9vs suggests we are at or near
a top, in which there is a 45% chance for a
decline below the lower band.
Another week of rallying and a new high in
August would not change
the Sell S9s. Only a new Peerless Buy
signal or the V-Indicator turning
positive for a week or more would alter that.
A new Peerless rule based
on the new S9vs occurring between May and
September seems reasonable.
Some testing for the period 1928-1965 still has
to be done, as well as
testing the importance rate of change of the
V-Indicator itself. This will
be shown Monday night.
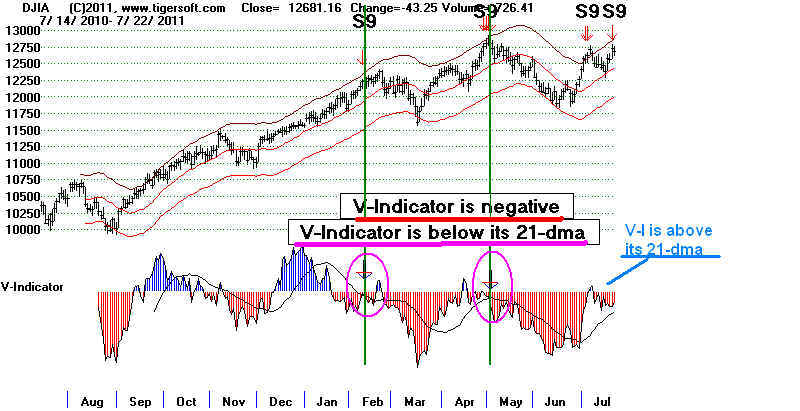
Budget Compromise?
No
debt deal yet: GOP, Democrats ready rival plans
Boehner
preparing to move on debt limit
Partisan
dispute to partially shut down FAA
The A/D Line is stile rising for
NYSE stocks. Will interest rates really
stay low if there is a US
Government default? A Budget compromise
could still occur. But, all
things considered, I don't see any movement
towards it. Each side is
afraid of looking bad to its political base
and to its financiers.
In a Parliamentary system, the
Prime Minister would now have to call
for parliamentary new elections.
One Presidential system
solution to a stalemate is for the
President to act unilaterally
to raise the Budget limit and let
the Supreme Court decide. Another
would be for Congress to authorize
only certain specific expenditures.
That may be what the House
Republicans will do next. My guess is
a Constitutional crisis is at hand.
And the stalemate may not be
resolved until there is either a
new President or a new House of
Representatives. We are
still on our first Republic. The French
have had five in the same 200 +
years. Stalemate and Imperialism
caused four new constitutions for
France. The US Constitution
is a part of the problem now.
The Founding fathers may erred in
creating so many checks and
balances that change when it is needed
is not possible.
The Sell S9v gives us what looks
like a good place to take profits
and aggressively sell short, while
we await developments. The
country's polarization and the D.C.
bottleneck certainly seem bad
enough to create another decline in
prices to the lower band, at the
least. These create too
many unknowns. Gold and probably Silver
should rise more in this
environment.
DJIA, Peerless Signals and Key Indicators
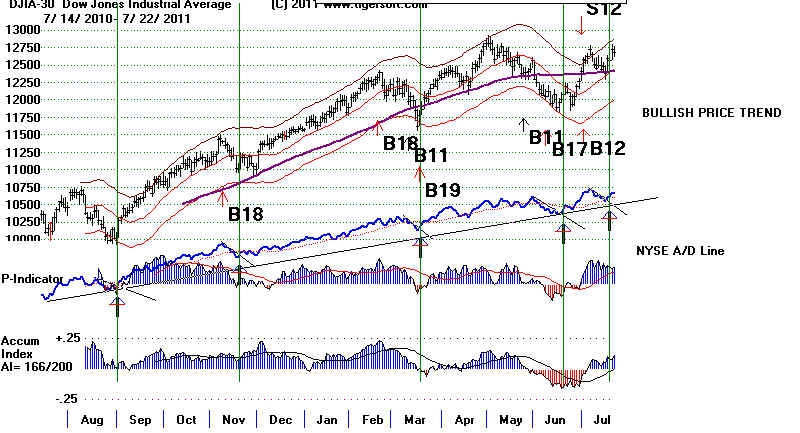
Our QQQ long position has to be considered a
Sell now. Note the
Closing Power up-trend and the resistance just
overhead. Closing
Power traders may want to wait for a
trend-break in CP. But several
openings 100 points down this coming week is a
strong possibility,
because of the failure in Washington to
compromise. Selling when
resistance proves too much for the market is
usually not a bad idea
even if Closing Powers rising. We know
that August is usually a good
time to sell because the bearishness of
Septembers, even in the third
year of the four-year cycle.
QQQ is at Resistance
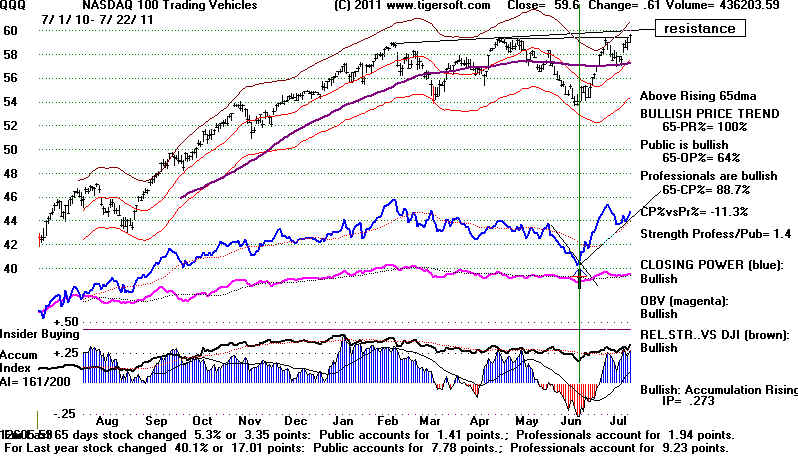
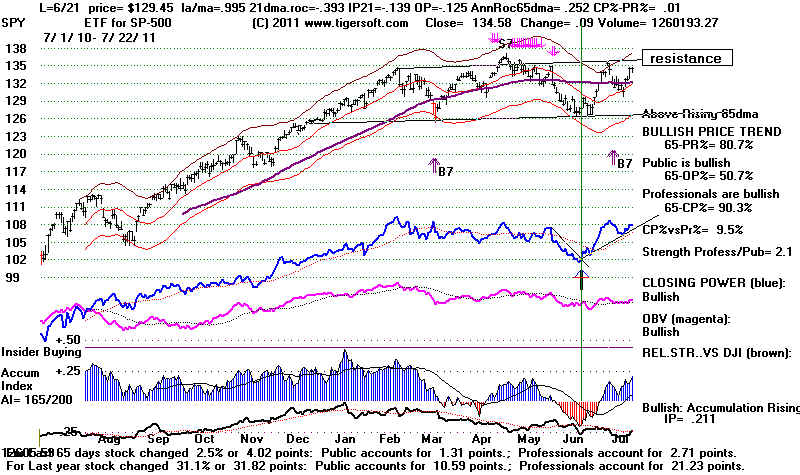 |
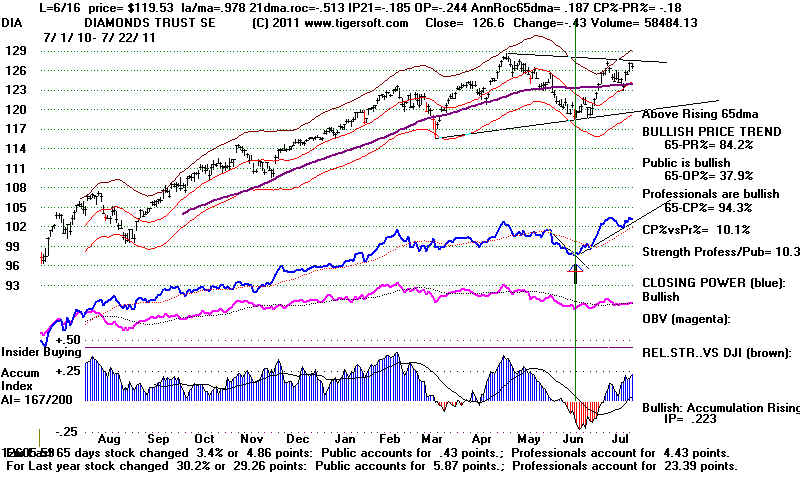 |
Sell S9vs
There were 19 S9Vs from May to September in the period 1965-2011.
Only 1 produced
a loss for a short seller. 9
of these 20 led to declines below the lower band and 7 resulted
in declines to the lower band.
"Raw" S9vs, as used here, occur when the DJI is above the 2.45% over the 21-dma
with
the V-Indicator 0 or less and the
annualized rate of change of the 21-dma is between
.40 and .60. All three conditions
occurred Thursday.
Researching these parameters show that
the "S9vs" have bearish potential
in their own right, independently of the
levels of the P-Indicator or the V-Indicator,
when used advisedly, as shown bellow.
In addition, "raw" S9vs have to be mistrusted
when the DJI is more than 5% over the
21-day ma, as this often shows the market
is taking off after a bear market.
The Sell S9v's last table shows how each
Sell S9v has all the Peerless key values
for the date of the signal shown. Our
Hotline also presents these each night at
the top of the report.
DJI
Last Price/21-dma
Annualized Rate of Change for 21-day ma
P-Indicator
P-Indicator Daily Change
IP21
V-Indicator
OBV-Pct.
Between 1965 and 2011, there were a
total of 59 "raw" S9Vs. There were 21 instances
of the DJI subsequently falling
below the lower band in 3 months. In 13 more cases,
the DJI fell to the lower band and
in 3 more cases it fell half way between the 21-dma
and the lower band. If short
sales in these cases were all profitable, "Raw" Sell S9vs
succeeded in 37 of 59 cases for the
intermediate-term trader. Subsequent declines
only to the 21-day ma would also
have generated profitable short-term trades in 4 more
cases. So for a trader,
the success rate of an S9v would have been 41/59 with these
"raw" S9vs. Note
that in 18 cases, the DJI kept rising and a loss on a short sale
taken with the raw S9v would have
occurred. A failure rate of 30% is too high.
Fortunately, we can improve the
success rate by taking only the Sell S9vs in February
and from May to September. In
these months there were 26 S9vs and only 2 losses.
This loss rate of less than 10%.
12 of these seasonally qualified 26 S9vs produced
DJI declines below the lower band.
In 8 cases the DJI fell to the lower band.
If treating as acceptable the
February S9vs seems too arbitrary, we certainly should
consider tops from May to
September. There were 19 S9Vs from May to September.
Only 1 produced a loss for a short
seller. 9 of these 20 led to declines below the lower
band and 7 resulted in declines to
the lower band.
Another dimension is the
Presidential four year cycle. We are most interested
now in the 3rd-year, (Example:
1995, 1999, 2003, 2007, 2011...) The year before
the Presidential Election year was
generally a bad year to employ an S9v.
11 of 22 brought losses. But
this is not true of July and August in these years.
Sell S9vs, based on the data from
1965 to 2011, should be acted on when
they take place between July and
September in the 3rd Year of a Presidential
Election Year. There
were 4 "raw" S9vs in July and August in the year before a
Presidential Election Year.
Each would all been profitably traded by a short seller
acting on the S9v. In 2
of the 4 cases (8/23/1999 and 8/26/1999) the DJI fell below the
lower band. In another case
(7/ 9/1999) the DJI dropped to the lower band. The fourth
case (this year - 7/5/2011) brought
a decline to the 21-day ma.
1
===================================================================================
OLDER HOTLINES
===================================================================================
7/21/11 DJI = 12724.41
la/ma= 1.025 21-dmaROC= .513 P =
269 (-16) IP21=-.085 V= - 51 OP= .005
BREADTH STATISTICS:
175 (+35 )
MAXCP stocks -
Bullish MAXCP Stocks
61(-13) MINCP stocks
- Bearish MINCP Stocks
5/13/2011 Hedging Examples - SCLN @ 5.56 and RDN,
@5.18 now 6.09 and 4.24 respectively
(MAXCP stocks are those showing
Tiger Closing Power making new highs.
This suggests heavy Professional Buying. Applying the Tiger Power Ranker's
"bullish" to the MAXCP stocks find those with heavy insider buying and
institutional accumulation. Bearish MINCP stocks show the opposite.
At this point these are extended a long ways, so - use well-tested CP trendbreaks
to close out positions. Sell S7s occur when Professionals are much more bearish
than the Public is.
49 new
highs on NASDAQ. 10 new
lows on NASDAQ
98 new
highs NYSE
6 new lows on NYSE
7/21/2011
===> See
Key Peerless TigerSoft Index Charts: Industry Groups and ETFs
DIA SPY QQQ DJIA-Peerless
TigerDJI TigerSPY TigerQQQ
GLD SLV
Crude
Buy B12 A Rally to New Highs
Still Seems Likely.
Today's rally might seem
to come out of a bull market play book, except for the negative
V-Indicator. There were 4x more advancers on the NYSE than
decliners. Up volume was
5x Down Volume. The P-Indicator and the Accumulation are both
very positive.
Unfortunately, the negative V-Indicator readings with the DJI
2.5% over its 21-day
ma has to be considered a warning that the market will have
trouble advancing more than
four more weeks. See the last two years' DJI charts.
The vertical lines in the charts
below show when the DJI was at or above the +2.5% upper band and
the V-Indicator was
negative.
Added Friday AM
The more lengthy DJI rallies occurred when the V-Indicator stayed
positive for two weeks.
Recently, we have
seen positive V-Indicator reading for no more than 3-days at a time.
See also the DJI charts of 2005-2006, 2006-2007,
2007-2008, 2008-2009.
In 2003. the
bull market take-off saw the V-Indicator staying positive
for two months. I will make these
occurrences into an "advisory signals" this weekend and
do more systematic testing
and write it up here this weekend.
2009-2010
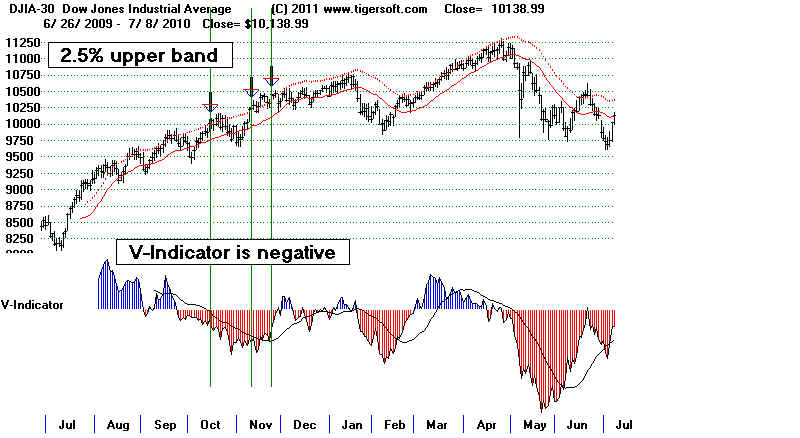
2010-2011
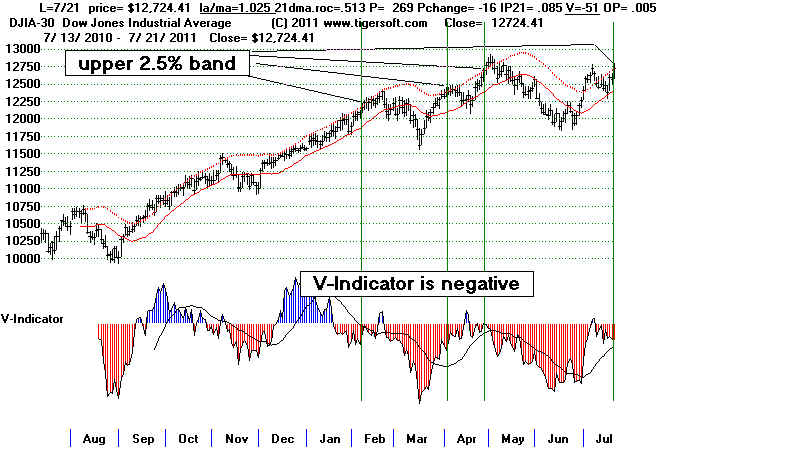
Price Channel Breakouts
Another sign that we
are in the later stages of the bull market are the numerous
accelerations up in stocks. This normally occurs either on a
take-off as a new bull market
starts or in the climactic final stages.
More and more
stocks are accelerating up past their upper channel resistance
lines. This typically means a blow-off move is coming. The
usual upside target is
is the height of the channel in points added to the point of breakout.
These
stocks are appealing now to traders because of how quickly they often
rise,
as shorts scurry to cover. Watch the industry groups such
stocks are in.
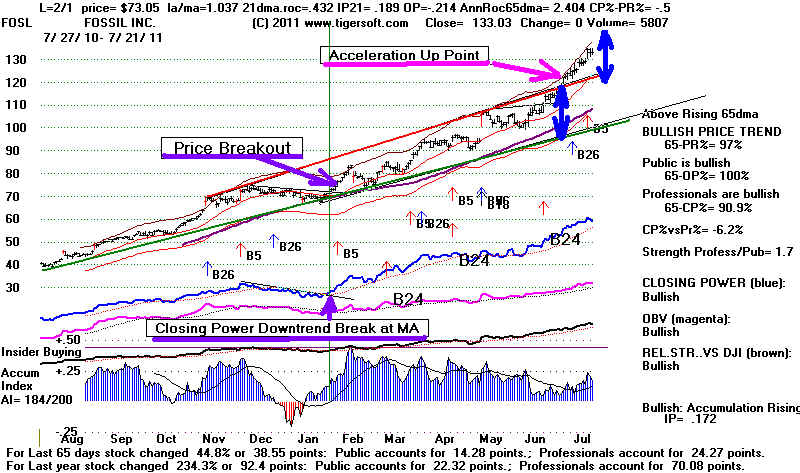
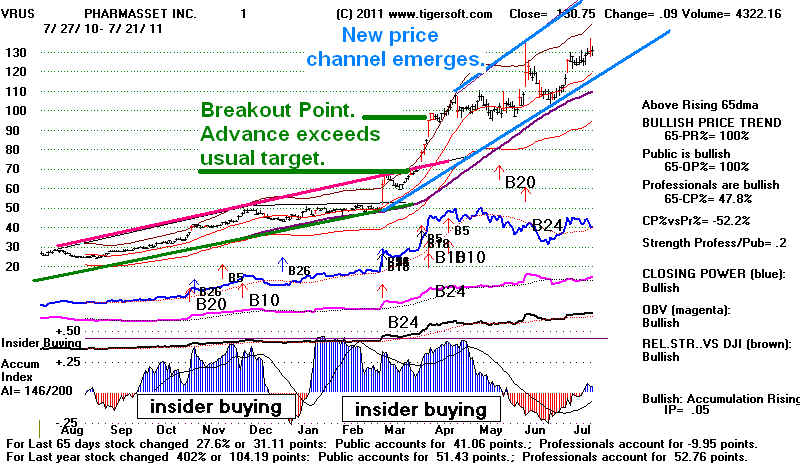
SCLN Looks like an AGGRESSIVE BUY
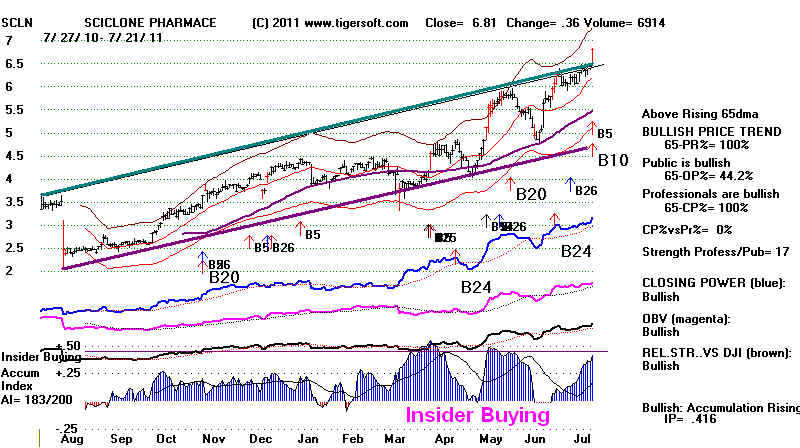
Tiger users can trade these
channel upside breakouts more safely than other
traders by watching and
abiding by the Closing Power uptrendline. I suggest
finding high Accumulation
stocks in this situation, like SCLN The best approach
is to run the Power Ranker
Analysis and then visually screen the "bullish" MAXCP
stocks, the "new
highs" among the ACCUMVER stocks and stocks with an
"IP21 over +.25" in
the NEWHIGH group from the Tiger Data page. Of course, one
can also examine the
"ALMOSTNH"s in these groups and see if there is a breakout
point that could be watched
for the next day or two. AMSWA is almost a decisive
breakout now and shows high
Accumulation and a strong Closing Power.
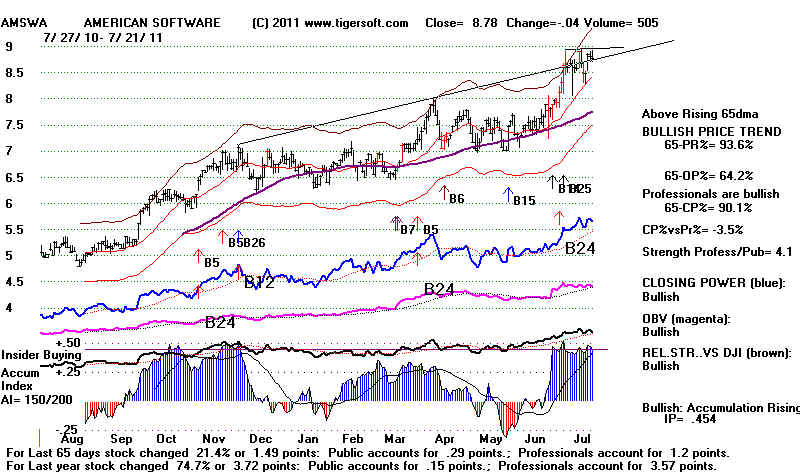
Such "almost new highs" can be frustrating, however. They sometimes delay
their
breakouts longer than we might like. This is why I prefer stocks like
this that have
already broken above their channel lines. They must show very high Accumulation,
I would emphasize. Otherwise, there is a higher chance of a false move,
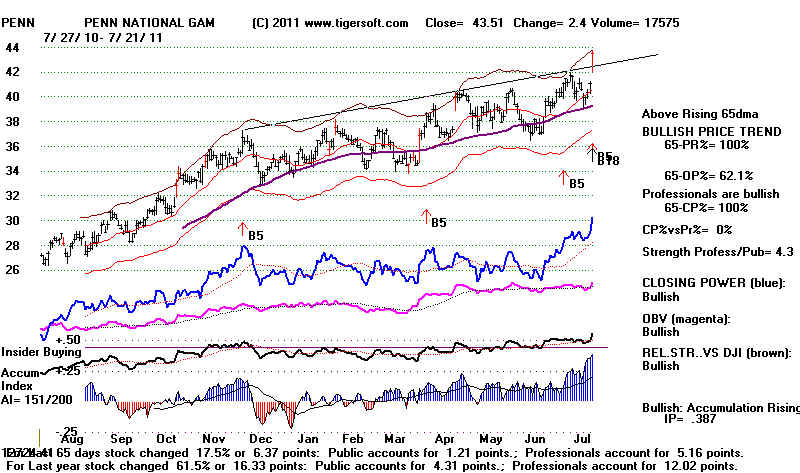
Use Some Common Sense in Picking Short Sales
A week or two ago, I warned about the risks of shorting the airlines' stocks, since they
were in the position of being monopolies and could react to higher airfares and fewer
passengers, by doing what firms in competitive markets cannot, namely raise air fares
in unison with others. This is what is now happening:
Fare
hikes help United Continental and US Airways
====================================================================================
OLDER HOTLINES
====================================================================================
7/20/11 DJI = 12571.91
la/ma= 1.014 21-dmaROC= .473 P =
284 (-37) IP21=-.083 V= - 50 OP= - .002
BREADTH STATISTICS:
138 (-38 )
MAXCP stocks -
Bullish MAXCP Stocks
74 (-33) MINCP stocks
- Bearish MINCP Stocks
5/13/2011 Hedging Examples - SCLN @ 5.56 and RDN,
@5.18 now 6.09 and 4.24 respectively
(MAXCP stocks are those showing
Tiger Closing Power making new highs.
This suggests heavy Professional Buying. Applying the Tiger Power Ranker's
"bullish" to the MAXCP stocks find those with heavy insider buying and
institutional accumulation. Bearish MINCP stocks show the opposite.
At this point these are extended a long ways, so - use well-tested CP trendbreaks
to close out positions. Sell S7s occur when Professionals are much more bearish
than the Public is.
34 new
highs on NASDAQ. 19 new
lows on NASDAQ
37 new
highs NYSE
11 new lows on NYSE
7/20/2011
===> See
Key Peerless TigerSoft Index Charts: Industry Groups and ETFs
DIA SPY QQQ DJIA-Peerless
TigerDJI TigerSPY TigerQQQ
GLD SLV
Crude
Buy B12 A Rally to New Highs
Still Seems Likely. But hedging the some
short sales on the most heavily
distributed MINCP stocks is suggested.
The charts
of the Peerless-DJI, DIA, SPY and QQQ can be seen by clicking on the links
3 lines above. I'd like to conserve space in the actual
nightly hotline.
Seasonally, the next 5 trading days are apt to be weak, in that since 1965, the DJI has
risen only 37.8% of the time over the next week. But
the Peerless internals are good now.
Considering earlier recent cases where the DJI had similar
internals suggests another 3%-5%
rally in the next month. I would think the market
will not break the rising 21-day ma
on another test.
la/ma annROC
IP21
OUTCOME
7/20/2011 1.014 .473 .083 ?
12/29/2010 1.013 .556 .072 DJI rose from 11585
to 12391 in 7 weeks. (6%)
4/21/2011 1.014 .406 .077 DJI
immediately rallied to upper band., 12505 to 12808. (+2.5%)
1/16/2011 1.014 .349 .056 DJI
immediately rallied from 11697.31 to 12268.19 in a month (5%)
4/13/2010 1.014 .433 .092
DJI rose from 11019.42 to 11205.01 in 3 weeks (2%)
3/31/2010 1.014 .502 .075
DJI rose from 10856.63 to 11205.01 in 3 weeks (3%)
The la/ma shows how over-bought the DJI is. The
annROC shows the DJI's intermediate-term
momentum and IP21 shows our internal strength Accumulation
Index. Loading these key
values since 1965, where we have reliable data and showing
the gains 5, 10 and 20 trading days
out would be an interesting project, once the Peerless book
is finished.
The continuing strength in many high priced stocks is
bullish. This has to be a sign of
how tightly the Professionals are holding onto these
stocks is. These are all in the HIPOPT
group on our Tiger Data page. Look at how easy
it is to trade these by buying after a
test of the 65-dma and a CP break of its
downtrend-line. CRR shows this repeatedly.
Call options on these would have paid on nicely.
File this information away for use
after the next decline.
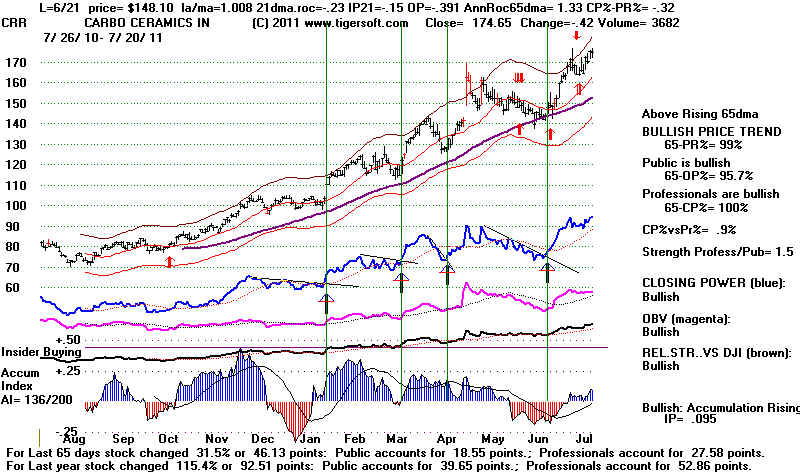
AAPL shows a CP NC of the new price high and a
break in its CP uptrendline
ISRG jumped 22.57 but its IP21 is below 0.
CMG is still cooking!
AZO's CP is still rising nicely.
===================================================================================
7/19/11 DJI = 12587.42 la/ma= 1.018 21-dmaROC= .562 P = 321 (+48) IP21=-.104 V= - 41 OP=
.079
BREADTH STATISTICS:
167 (+102 )
MAXCP stocks -
Bullish MAXCP Stocks
107 (-44) MINCP stocks
- Bearish MINCP Stocks
5/13/2011 Hedging Examples - SCLN @ 5.56 and RDN,
@5.18 now 6.09 and 4.24 respectively
(MAXCP stocks are those showing
Tiger Closing Power making new highs.
This suggests heavy Professional Buying. Applying the Tiger Power Ranker's
"bullish" to the MAXCP stocks find those with heavy insider buying and
institutional accumulation. Bearish MINCP stocks show the opposite.
At this point these are extended a long ways, so - use well-tested CP trendbreaks
to close out positions. Sell S7s occur when Professionals are much more bearish
than the Public is.
56 new
highs on NASDAQ. 17 new
lows on NASDAQ
58 new
highs NYSE
10 new lows on NYSE
7/19/2011
===> See
Key Peerless TigerSoft Index Charts: Industry Groups and ETFs
DIA SPY QQQ DJIA-Peerless
TigerDJI TigerSPY TigerQQQ
GLD SLV
Crude
Buy B12 QQQ Was Bought on strong
close today. A Rally to New Highs
Suddenly Looks Likely.
The DJI, SP-500, QQQ and NASDAQ barely touched their rising 21-day ma
and then took off with vigor and vim today. It is usually more
bullish
when the 21-day ma is not penetrated, as today. The ETFs are now
expected
to challenge the resistance line going through their recent highs.
With the
Buy B12, the current Accumulation Index readings (IP21) above +.25
and the Closing Powers again uptrending, I have to think that there is
a good chance the indexes will be making new highs soon. The NYSE
A/D Line downtrend turn up today, too, from its rising 21-day ma.
It has
been bullishly leading the DJIA. Today's and yesterday's trading
show
a classic 2-day reversal upwards. Yesterday NYSE down volume was
11x
up volume. Today's up volume was 6x down volume. Short-term
traders
may want to work with closing stops just below Monday's low. With
the
DJI, that would be 12276.59; with SPY that would be 129.63 and with QQQ
the low was 56.98.
It occurs to
me that if this is the start of a move to new highs, we might
gain from noting the stocks Professionals were most eagerly buying
today.
Here are the stocks up more than 5% today, with an IP21 (current
Accumulation
Index) above +.22 and the CLosing Power making a new high.
I would favor
stocks with an AI/200 over 150. Tiger users may list these stocks
in a spread
sheet using the MAXCP data from out Tiger data base and employing the
following commands:
Peercomm + Older Charting + Ranking Results (top of page) +
User Set Ranking: Pct Change, AI/200, IP21 + 1 + 1
PRO and IBM are the most appealing buys.
7/19 1-day
AI/200 IP21
Pct.Ch.
----------------------------------------------------------------------------------------------------------------------------------------------------
PRO
18.17 +9% 158
.22 B7s and red high vol.
breakout.
ACTG 39.61 +8% 141
.24 recent B7
PDC 16.75 +8%
112 .29 red high volume
breakout NH
KONA 7.5 +7%
145 .63 Buy B24, B12, B20
ATHN 48.36 +6% 147
.23 recent B7
KAI 33.4 +6%
157 .34 CP has been
lagging
red high volume breakout NH
PRO 8.73 +5% 176 .39 Recent Red S7s.
GTLS 61.33 +5% 140
.29 Recent Red S7s.
IBM 185.21 +5% 162
.31 B7s and red high vol. breakout.
Gold and Silver weakened and broke their Closing Power uptrends, while Crude Oil's CP
broke above its downtrendline. Oil and Drilling stocks should be favored.
PRO
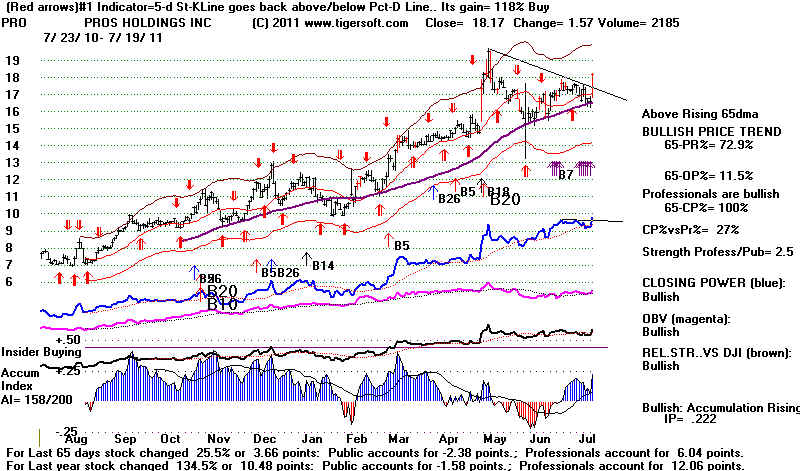 |
IBM
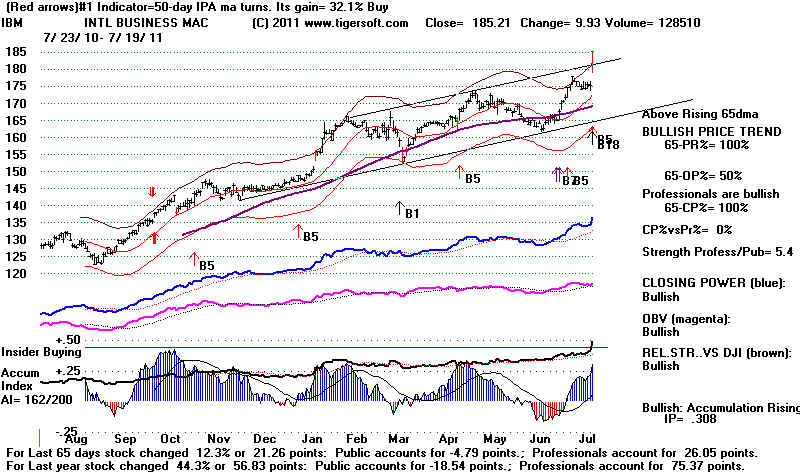 |
DJIA
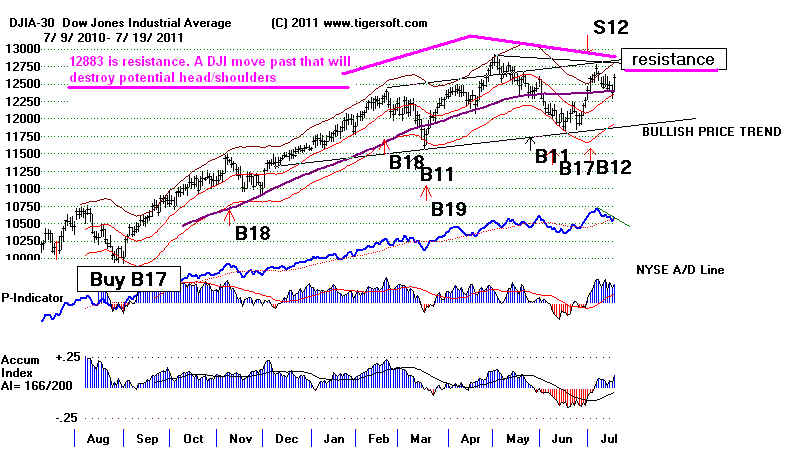 |
DIA
Minor CLosing Power downtrend-line broken. A rally to resistance
is expected, with a good chance for a breakout.
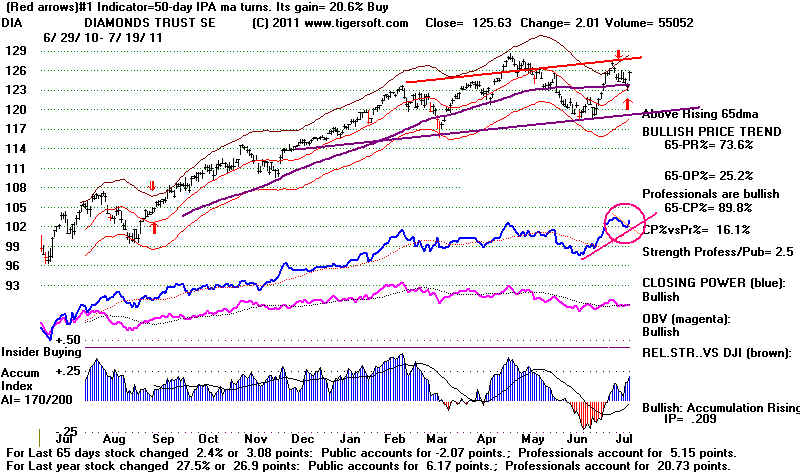 |
SPY
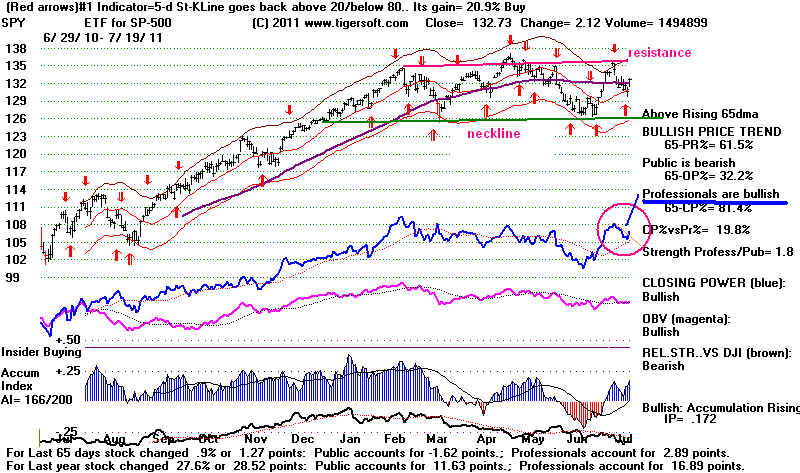 |
QQQ
Flat resistance is usually exceeded.
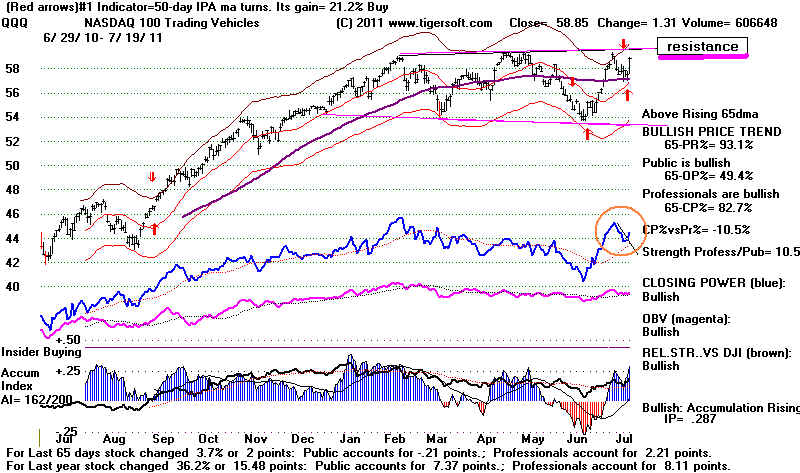 |
===================================================================================
Older Hotlines
===================================================================================
7/18/11 DJI = 12385.16
la/ma= 1.004 21-dmaROC= .409 P =
272 (-88) IP21=-.047 V= - 48 OP= .112
BREADTH STATISTICS:
65 (-20 )
MAXCP stocks -
Bullish MAXCP Stocks
149 (+40) MINCP stocks
- Bearish MINCP Stocks
5/13/2011 Hedging Examples - SCLN @ 5.56 and RDN,
@5.18 now 6.09 and 4.24 respectively
(MAXCP stocks are those showing
Tiger Closing Power making new highs.
This suggests heavy Professional Buying. Applying the Tiger Power Ranker's
"bullish" to the MAXCP stocks find those with heavy insider buying and
institutional accumulation. Bearish MINCP stocks show the opposite.
At this point these are extended a long ways, so - use well-tested CP trendbreaks
to close out positions. Sell S7s occur when Professionals are much more bearish
than the Public is.
24 new
highs on NASDAQ. 18 new
lows on NASDAQ
41 new
highs NYSE
23 new lows on NYSE
7/18/2011
===> See
Key Peerless TigerSoft Index Charts: Industry Groups and ETFs
DIA SPY QQQ DJIA-Peerless
TigerDJI TigerSPY TigerQQQ
GLD SLV
Crude
Buy B12 Buy the QQQ on a strong
close.
Pundits are telling us
that the house Republicans and the Obama
Administration are 800
billion dollars or more apart. They tell us
that the Democrats are
tied hopelessly close to Wall Street and that
the powerful political
appeal of the Presidency makes Republicans
go crazy, negotiating
with the enemy as Nixon and Reagan did
in 1968 and 1980 and
not counting votes fairly in 2000, as JFK arranged
in 1960. Perhaps,
but if negotiations about the Federal budget were
really about to break
off and the US was about to default on its debt
payments, one would
think the Dollar would be collapsing. It is not.
That is one reason for
expecting a rally soon. The strength and bullish
Accumulation see in the
NASDAQ charts are others.
DOLLAR IS NOT COLLAPSING.
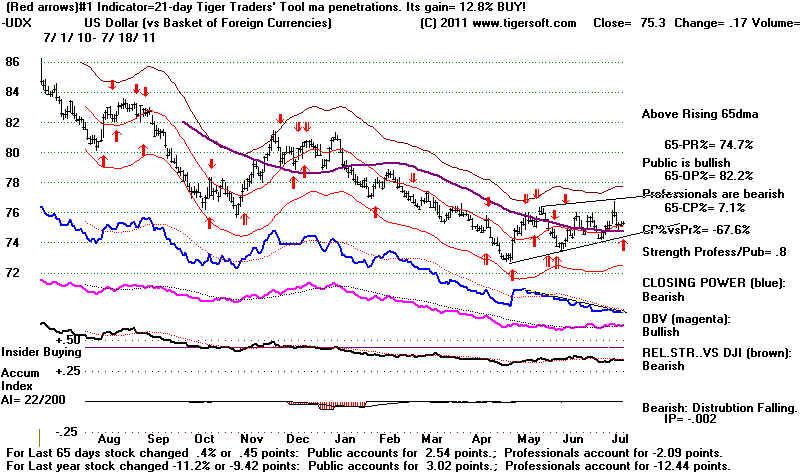
Key ETFS are pulling
back to test their rising 21-day ma and
the Blue Closing Powers have not yet tagged their rising 21-day ma.
This is usually a good
place to Buy on the first test for a bounce.
The CLosing Powers will
need to turn up after a little more weakness.
Below is the daily
ratio of the QQQ to the DJI. This is called the
QQQ/DJI RSQuotient.
An uptrend is starting. A breakout by it
above resistance would
be bullish.

The NASDAQ's chart
below shows how the close was just above
the 21-day ma today.
It also shows OBV is in a very strong uptrend. Selling
volume appears light.
In addition, note the high level of blue Accumulation.
There seems to be lots
of institutional buy orders just underneath current
prices. Lastly,
the NASDAQ's RELDJI relative strength oscillator is
positive, showing that
speculators are favoring NASDAQ stocks over
blue chips. This
is not what I would expect to see if the markets
were about to fall over
a cliff. If the CLosing Power turns up tomorrow,
buy QQQ. We last
sold the major market ETFs very close to their peaks.
NASDAQ
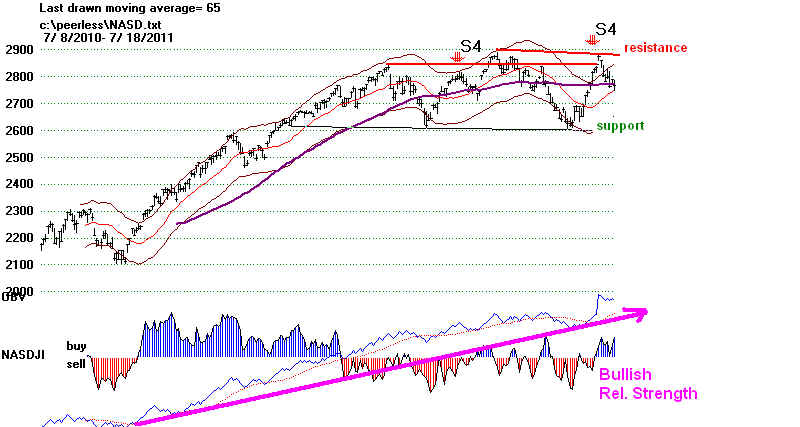
 |
--------------------------------------------------------------------------------------------------------------------------------
OLDER HOTLINES
--------------------------------------------------------------------------------------------------------------------------------
7/15/11 DJI = 12480 la/ma= 1.013 21-dmaROC= .564 P = 360 (+131 IP21=-.063 V= - 18 OP=
.206
BREADTH STATISTICS:
85 (-2
) MAXCP
stocks - Bullish MAXCP
Stocks
109 (+18) MINCP stocks
- Bearish MINCP Stocks
5/13/2011 Hedging Examples - SCLN @ 5.56 and RDN,
@5.18 now 6.09 and 4.24 respectively
(MAXCP stocks are those showing
Tiger Closing Power making new highs.
This suggests heavy Professional Buying. Applying the Tiger Power Ranker's
"bullish" to the MAXCP stocks find those with heavy insider buying and
institutional accumulation. Bearish MINCP stocks show the opposite.
At this point these are extended a long ways, so - use well-tested CP trendbreaks
to close out positions. Sell S7s occur when Professionals are much more bearish
than the Public is.
24 new
highs on NASDAQ. 18 new
lows on NASDAQ
41 new
highs NYSE
23 new lows on NYSE
7/15/2011
===> See
Key Peerless TigerSoft Index Charts: Industry Groups and ETFs
DIA SPY QQQ DJIA-Peerless
TigerDJI TigerSPY TigerQQQ
GLD SLV
Crude
7/15/2011 Buy B12 - Patience.
Key ETFS are pulling
back to test their rising 21-day ma and
the Blue Closing Powers have not yet tagged their rising 21-day ma.
This is usually a good
place to Buy on the first test for a bounce.
Be concerned and cautious. Warnings for us now are:
1) the continued uncertainty over the deadlocked US Budget and Deficit. To break the
deadlock, Obama seems inclined to agree to the Republican's proposed Balanced
Budget amendment to the Constitution. We'll
see.
2) the potential of the DJI price pattern to become a menacing head and shoulders
pattern (See Head and Shoulders S10 ), as well as
3) how far along the Buy B12 signal occurred in an on-going bull market, rather
than being the much more powerful B12 take-off from a long or deep bottom. Only
the March 1945 Buy B12 occurred this late in a bull market. In its case, the DJI
needed to retreat to the DJI's lower band before taking off. It occurred 34 months
into the then bull market that started in May 1942. By comparison, the DJI has now
been rising for 28 months since the bear market bottom.
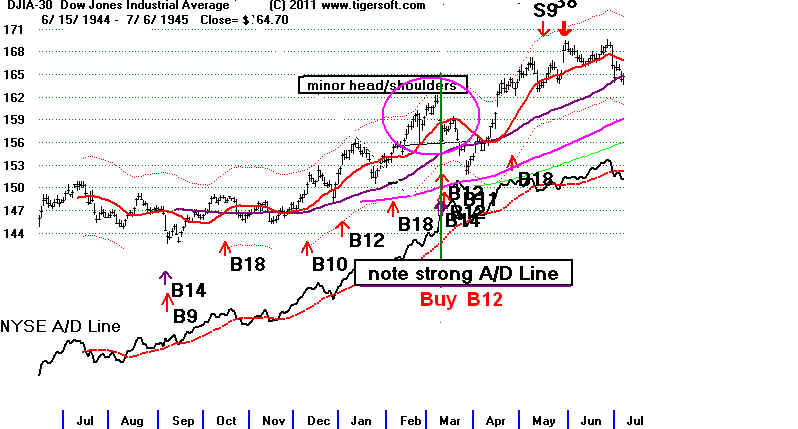 |
Gold and some gold stocks are beneficiaries of the Washington stalemate, as gold-bugs
fear-monger about a US currency collapse. Gold, however, has reached its upper band
without bringing Closing Power and Professionals into new high ground. Professionals
still mostly believe that there will be a compromise soon between the President and
House Republicans. The Dollar is not collapsing. In fact, it could move either
way
from its present position just above its 65-day ma.
Perpetual Gold
Contract
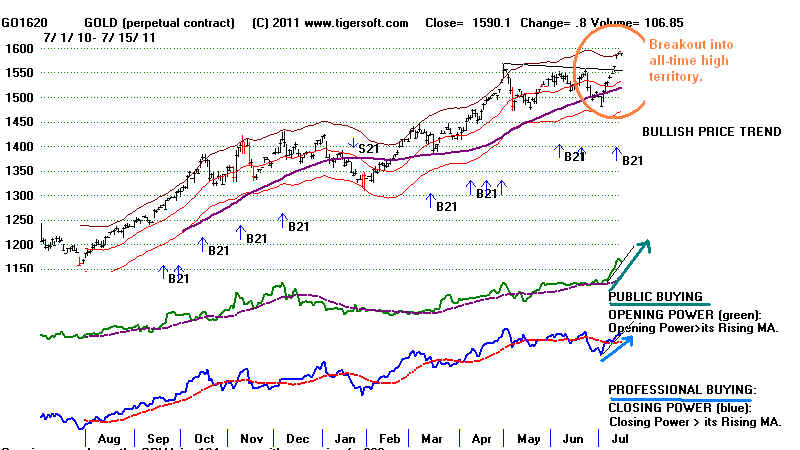 |
Dollar
 |
Midway Gold
 |
DJIA
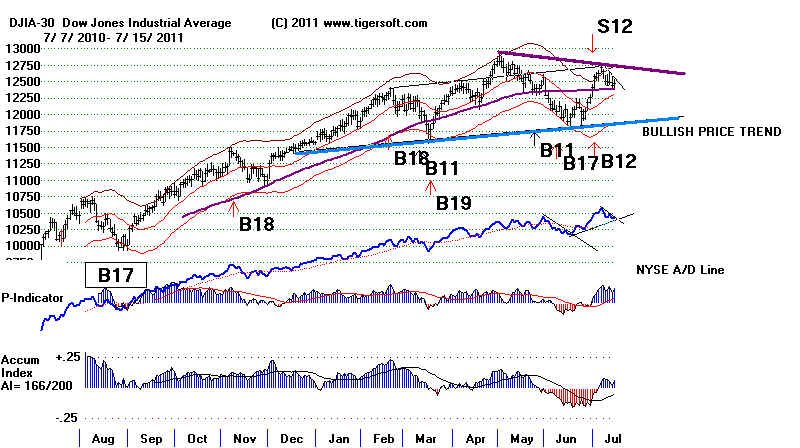 |
=================================================================================
OLDER HOTLINES
=================================================================================
7/14/11 DJI = 12437.12 la/ma= 1.012 21-dmaROC= .35 P = 229 (-181) IP21=-.021 V=- 63 OP= ..101
BREADTH STATISTICS:
87 (-140)
MAXCP stocks -
Bullish MAXCP Stocks
91 (+40) MINCP stocks
- Bearish MINCP Stocks
5/13/2011 Hedging Examples - SCLN @ 5.56 and RDN,
@5.18 now 6.09 and 4.24 respectively
(MAXCP stocks are those showing
Tiger Closing Power making new highs.
This suggests heavy Professional Buying. Applying the Tiger Power Ranker's
"bullish" to the MAXCP stocks find those with heavy insider buying and
institutional accumulation. Bearish MINCP stocks show the opposite.
At this point these are extended a long ways, so - use well-tested CP trendbreaks
to close out positions. Sell S7s occur when Professionals are much more bearish
than the Public is.
20 new
highs on NASDAQ. 23 new
lows on NASDAQ
12 new
highs NYSE
37 new lows on NYSE
7/14/2011
===> See
Key Peerless TigerSoft Index Charts: Industry Groups and ETFs
DIA SPY QQQ DJIA-Peerless
TigerDJI TigerSPY TigerQQQ
GLD SLV
Crude
More Headroom Is Needed To Give Us An Attractive
Point to Buy.
7/11/11 Buy B12. Hedge if you do not know whether the Debt Limit will
be
Increased in the next few days!?
We've had
a pullback now to the DJI's 65-dma. The DJI may still pull back to the
21-day ma. My guess is there will be a Budget agreement in the next week. Only
one
side has to blink. I would think the agreement will send the market up
sharply
for a
few days. For this to happen, we will need to see the Closing Powers turn up.
Professionals usually know something like this in advance of the news reports.
Look
at the bearish head and shoulders that is forming in IYY. This purports to be
an
index of the entire US equities market. Its Closing Power uptrendline will be
tested tomorrow. We have a useful downtrendline to work with in it.
There
are some stocks that appear to be attractive short sales on tonight's bearish
MINCP Stocks tonight. SFEG shows a significant amount of
Professional and Insider
buying. Santa Fe Gold Gears up for
Full Production at Summit Silver-Gold (June 28, 2011)
Santa Fe Gold Corporation
(SFEG.OB)
Currently,
the ETFs' Closing Powers are pulling back. Note in the charts below the
triangle pattern that the DJI now shows. And see below that I am now using the
Closing Power Pct Lines, so that we can see the trendlines a little better.
See
the 7/14/2011 Guide
To Proftiably Using The Tiger Nightly HOTLINE
===================================================================================
7/13/11 DJI = 12491.61
la/ma= 1.018 21-dmaROC= .523 P =
409 (+66) IP21=-.059 V=- 6 OP= ..181
BREADTH STATISTICS:
227 (+24)
MAXCP stocks -
Bullish MAXCP Stocks
51 (+7)
MINCP stocks - Bearish MINCP Stocks
5/13/2011 Hedging Examples - SCLN @ 5.56 and RDN,
@5.18 now 6.09 and 4.24 respectively
(MAXCP stocks are those showing
Tiger Closing Power making new highs.
This suggests heavy Professional Buying. Applying the Tiger Power Ranker's
"bullish" to the MAXCP stocks find those with heavy insider buying and
institutional accumulation. Bearish MINCP stocks show the opposite.
At this point these are extended a long ways, so - use well-tested CP trendbreaks
to close out positions. Sell S7s occur when Professionals are much more bearish
than the Public is.
38 new
highs on NASDAQ. 15 new
lows on NASDAQ
25 new
highs NYSE
10 new lows on NYSE
7/13/2011
===> See
Key Peerless TigerSoft Index Charts: Industry Groups and ETFs
DIA SPY QQQ DJIA-Peerless
TigerDJI TigerSPY TigerQQQ
GLD SLV
Crude
More Headroom Is Needed To Give Us An Attractive
Point to Buy.
7/11/11 Resistance has been reached. Today's late sell-off
shows this overhead
resistance.
Usually after the top of a 7% to 10% wide trading range has been reached,
support
must be plumbed for. Look at some examples: 1956, 1986, 1989-1990, 1992
and 2007.
Multiple Sells would warn of a breakdown. Otherwise, expect an upside
breakout.
The big
difference between the present market and these past cases, except for 2007,
is the
absence of any Sell S9s and how much stronger the NYSE A/D Line is now
than the
DJI. The Peerless.Buy B12 and uptrending CLosing Powers suggest there
will still
be another assault on the recent highs and DJI 12900. However, by my
reckonings,
we are running out of time. Seasonality in the third year year of the
four year
Presidential cycle will turn bearish in early September, just 6-7 weaks away.
A
retreat to the 21-DMA may short-term be the best re-entry point to buy. The 21-dma
is at
12277, about 200 points below today's close. However, I have to note that
broad
trading ranges often have vacuums of buy orders develop in the middle their
trading range. This means a
decline back to the lower well-tested support levels could
easily occur once the support of the 21-day ma has been eaten up. In additon,
I
would accord the 21-day ma only the power to bring about a single reversal.
Bearish News Puts Stock into Strong Hands
No doubt, the falling Dollar is forcing investors into the stock market, but after
allowing
for this, it is really quite remarkable that the stock market has held up so well
given all
the scary news:
1) A looming US Federal Debt Default.
2) Obama stormed out of a tense US Debt meeting with Republican leaders from
the House of Representatives.
3) Unemployment is Rising. Huge Federal Spending Cuts Are Close.
4) More European countries approach financial defaults: Italy, Portugal, Ireland...
5) Moody's is threatening to lower the US Government's Credit Rating.
6) Bernanke warns that a US debt default would be a "calamity".
7) Beranke says he will not commit to have the Fed buy much more US debt
unless economic conditions are much worse than they are now.
The media is giving lots of coverage:
Bernanke warns of
a "huge financial calamity" - CBS News
Bernanke Warns of
'Calamity' if Debt Deal Is Not Reached - NYTimes.com
With all this bad news, stocks are being sold by the public to professionals.
That puts the stock in ordinarily strong hands. The Pros are betting that the
talks
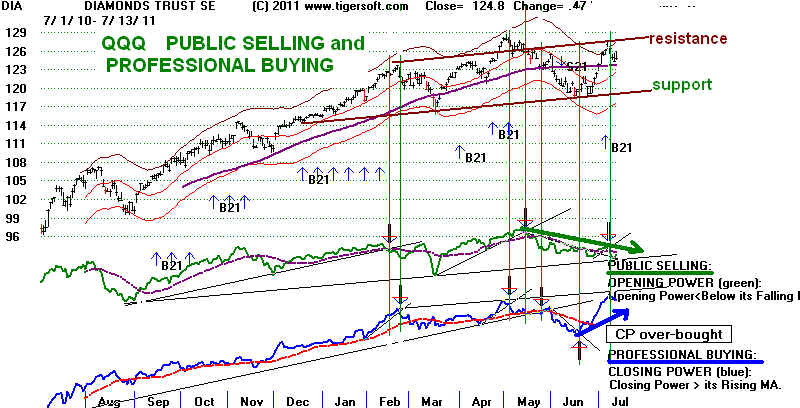
between Obama and leading House Republicans are just "theater". An
agreement
will be forthcoming. I hope and believe that they are probably right.
I have also said that most stocks are owned by the very wealthy. And, as plutocrats,
they are mostly quite quite pleased with how much their power and wealth
have grown without a serious challenge. That may prove to be a problem.
A backlash
could be much worse than they foresee. In that case, there could be a mad rush
to the exits and another financial panic, like 1907, 1920, 1929 and 2008. The 2012
Presidential Election is likely to be filled with what they consider "class
war" accusations.
My bet is the stock market will not like that. It may decline into the campaign
season. That is partly why I am concerned about how the market will do after
August.
QQQ
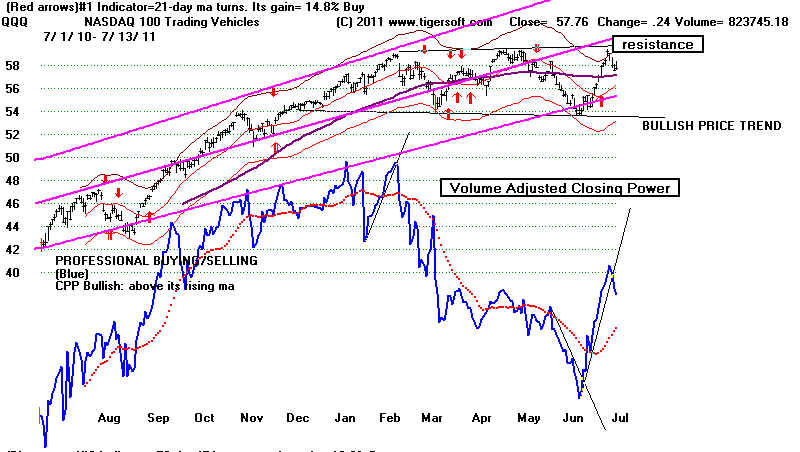 |
Gold and Gold stocks are certainly
benefitting from the perception that the
talks between Obama and House Republicans will fail. Here are the highest
Power ranked Gold Stocks
====================================================================================
7/12/11 DJI = 12446.88 la/ma= 1.016 21-dmaROC= .482 P = 343 (+65) IP21=-.071 V=- 23 OP= .193
BREADTH STATISTICS:
203(-88)
MAXCP stocks -
Bullish MAXCP Stocks (none
tonight)
44 (+6) MINCP stocks - Bearish MINCP
Stocks
5/13/2011 Hedging Examples - SCLN @ 5.56 and RDN,
@5.18 now 6.09 and 4.24 respectively
(MAXCP stocks are those showing
Tiger Closing Power making new highs.
This suggests heavy Professional Buying. Applying the Tiger Power Ranker's
"bullish" to the MAXCP stocks find those with heavy insider buying and
institutional accumulation. Bearish MINCP stocks show the opposite.
At this point these are extended a long ways, so - use well-tested CP trendbreaks
to close out positions. Sell S7s occur when Professionals are much more bearish
than the Public is.
18 new
highs on NASDAQ. 19new lows on
NASDAQ
16 new
highs NYSE
30 new lows on NYSE
7/12/2011
===> See
Key Peerless TigerSoft Index Charts: Industry Groups and ETFs
DIA SPY QQQ DJIA-Peerless
TigerDJI TigerSPY TigerQQQ
GLD SLV
Crude
7/11/11 Resistance has been reached. Now support must be
plumbed for.
A
retreat To 21-DMA looks like the best re-entry point... The..Buy B12, excellent
breadth (advances minus declines) and uptrending CLosing Powers suggest
there
will be another assault on the recent highs and DJI 12900. But
more
headroom is needed to give us an attractive point to Buy. Hedging by being
long
some
of the bullish MAXCP and short some of the bearish MINCP stocks seems
reasonable. The best REITs rose today, while solar and airline
stocks were weak.
I
would not short airlines stocks. Their oligoplistic position allows them to raise
rates
in a weak economy and Crude Oil could turn back down. Oil's Closing Power
bearishly just broke its uptrend and gave a new Sell. Declining Oil prices would
help the
Fed
if it wants to keep rates low. Fed
policy makers are now divided. The weak Jobs
Report last week does reinforce Bernanke's "soft" position.
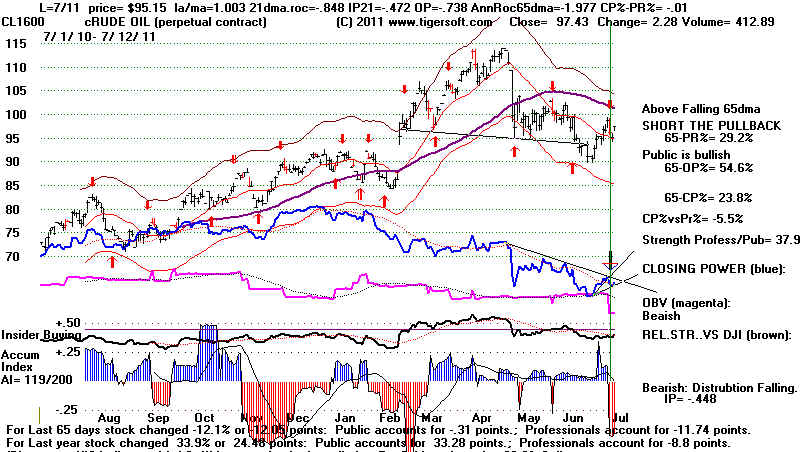
Gold is
challenging its highs. Gold Stocks have been
lagging. It still seems safest
just
to trade GLD on each of the CLosing Power trend-breaks. Using long positions
only
would have gained 33% in the past year. Traders should
buy GLD just on the basis
of
its flat resistance breakout into all-time high territory.
Trade it on the long side with
CLosing for the next six months. Solar and green
and Chinese stocks are weak and
weakening. Nothing is on the horizon that I can see to change their general price
trend.
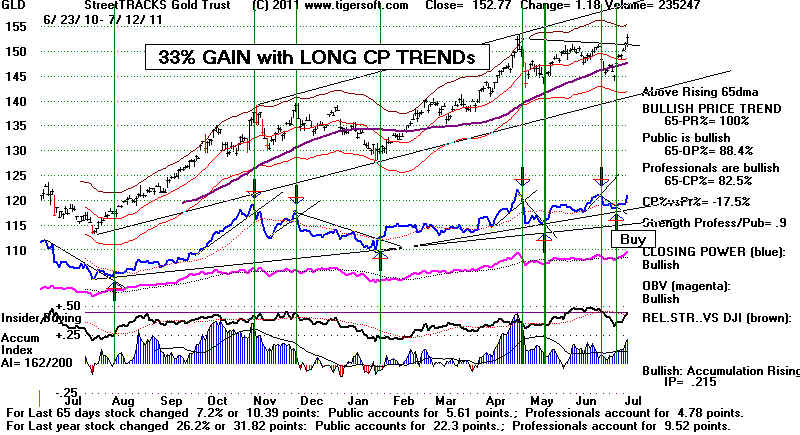
DJIA - Right shoulder sell-off but A/D
Line Uptrending.
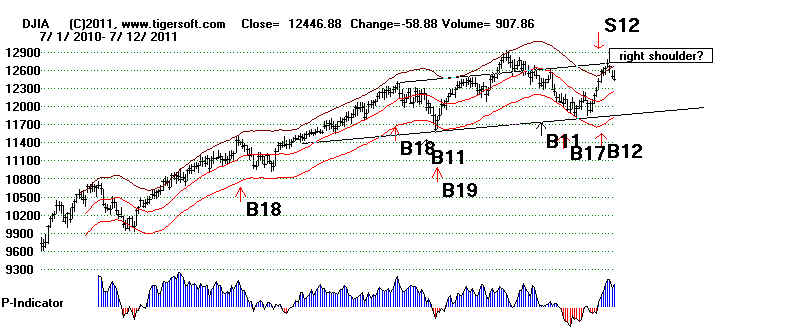

 |
DIA - Steep overbpught CP Uptrendline break...
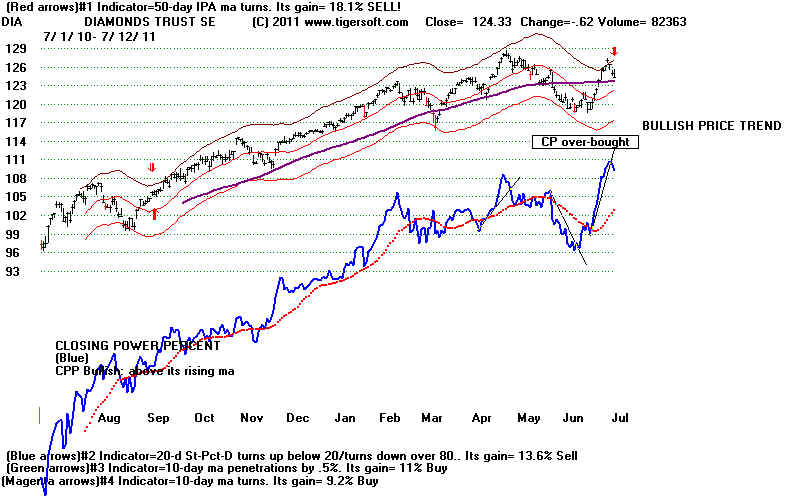 |
SPY - Steep overbought CP Uptrendline break...
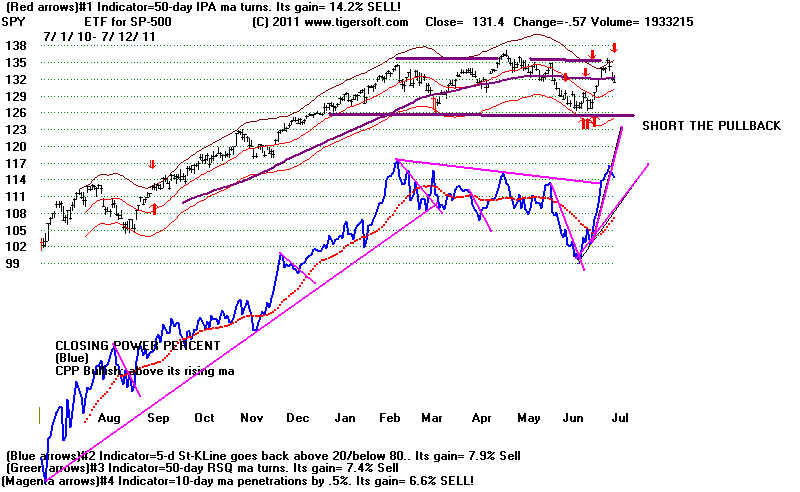 |
QQQ Flat Trading Range
but weakening volume-based CLosing Power Pct 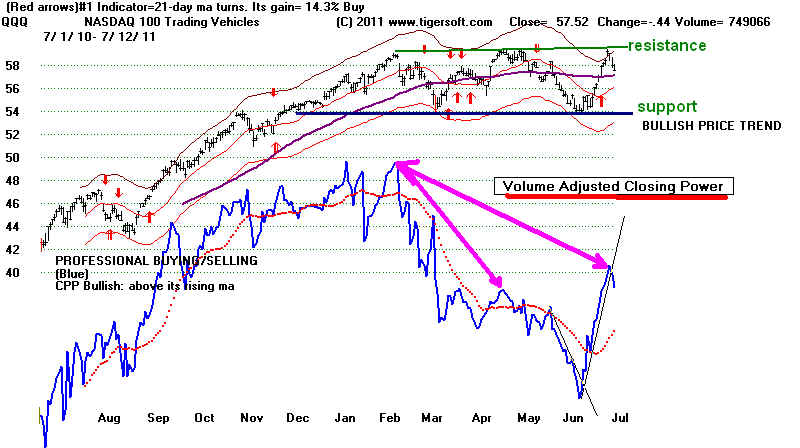 |
============================================================================================
OLDER HOTLINES
============================================================================================
7/11/11 DJI = 12505.76 la/ma= 1.023 21-dmaROC= .373 P = 278 (-143) IP21=-.073 V=-
40 OP= .187
BREADTH STATISTICS:
261(-189)
MAXCP stocks -
Bullish MAXCP Stocks (none
tonight)
38 (+5) MINCP stocks - Bearish MINCP
Stocks
5/13/2011 Examples -
SCLN @ 5.56 and RDN, @5.18
(MAXCP stocks are those showing
Tiger Closing Power making new highs.
This suggests heavy Professional Buying. Applying the Tiger Power Ranker's
"bullish" to the MAXCP stocks find those with heavy insider buying and
institutional accumulation. Bearish MINCP stocks show the opposite.
At this point these are extended a long ways, so - use well-tested CP trendbreaks
to close out positions. Sell S7s occur when Professionals are much more bearish
than the Public is.
17 new
highs on NASDAQ. 17 new lows on
NASDAQ
10 new
highs NYSE
25 new lows on NYSE
7/11/2011
===> See
Key Peerless TigerSoft Index Charts: Industry Groups and ETFs
DIA SPY QQQ DJIA-Peerless
TigerDJI TigerSPY TigerQQQ
GLD SLV
Crude
7/11/11 Resistance has been reached. Now support must be
plumbed for.
A retreat To 21-DMA Looks like best re-entry
point.... A bearish
Head/Shoulders Pattern in the DJI does not help. Overseas Selling
is increasing. See the way Opening Power has broke its uptrend.
This past year we have seen something new from the market. Breaks in Closing
Power uptrends for the SPY have called tops as well as breaks in Closing
Power uptrends. This probably owes to the extent to which weakness in the Euro
has rocked a number of rallies. Certainly, if the CLosing Power is over-bought
and unable to rally much more, a break in the Opening Power uptrend will hurt
the market. That is what has just happened.
We sold SPY last week and should have taken some nice profits today in
our Bullish MAXCP stocks. I would tomorrow hedge with some short sales
among LOW ACCUMULATION stocks that have rallied to and
been turned back
down by their 65-dma. Their recent Closing Power uptrends should have
broken recently. Some like RIG also have bearish head and shoulders patterns,
making them that much more vulnerable.
Opening Power Breaks Uptrend with
Closing Power over-extended. 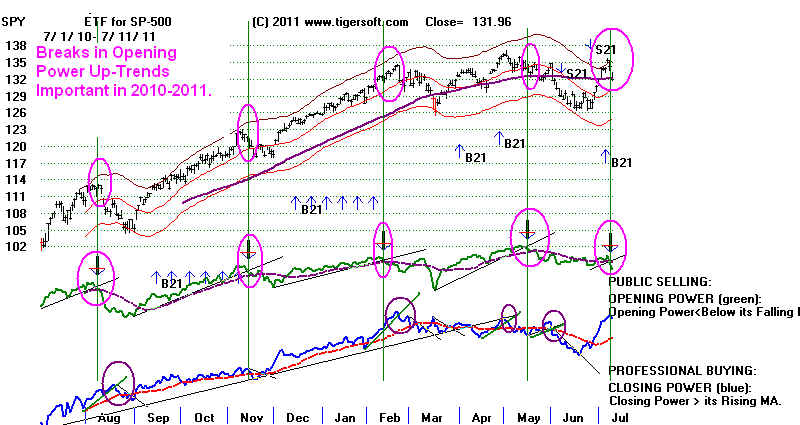
Buy B12 I said incorrectly last
night that there has never been a Buy B12
this late
in a bull market. There were Buy B12s in January and March 1945, 31 and 33
months after the
DJI turned up in May 1942. The recent Buy B12 occurred 28 months
after the March
2009 bottom. Nevertheless, Professionals can only push the market
up so long in
isolation. Overseas overnight sellers just dumped too much stock because
of more threats
to the Euro and the big banks there... The ratio of Closing Power
new highs to news
is still very bullish and more gradual Closing Power and NYSED
A/D Line
trendlines are still intact.
If there should
be a deeper decline, the lower band, an automatic Buy B7 will
probably occur.
This appears when the lower band is reached soon after a Buy B12
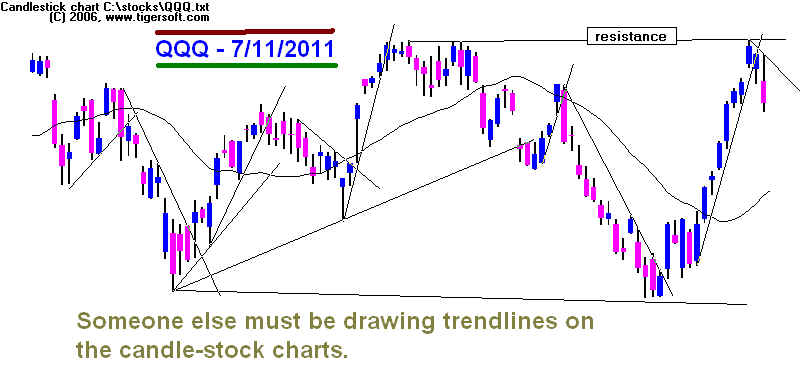
DJIA
A/D Line is rising.
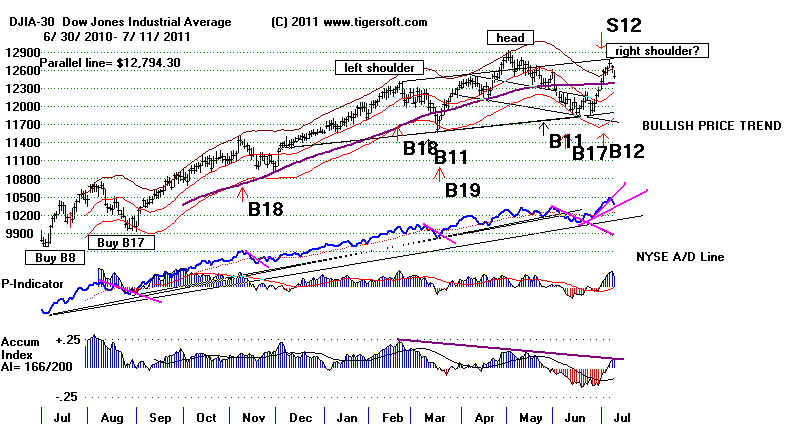 |
DIA
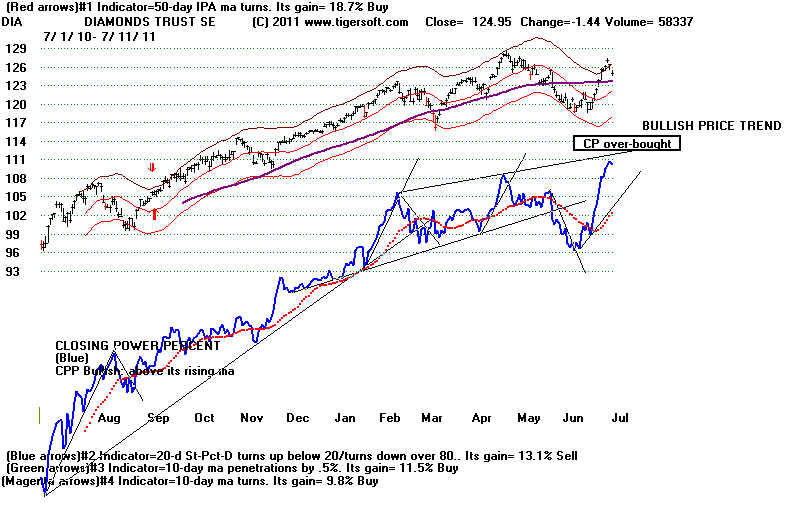 |
SPY
Closing Power Buy B7
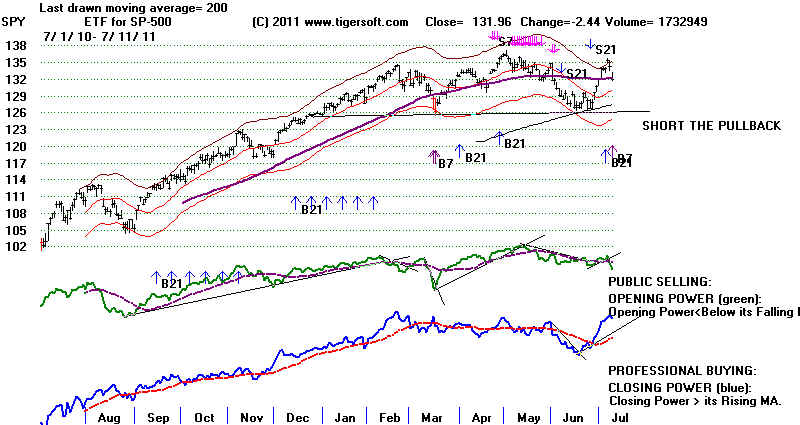 |
QQQ
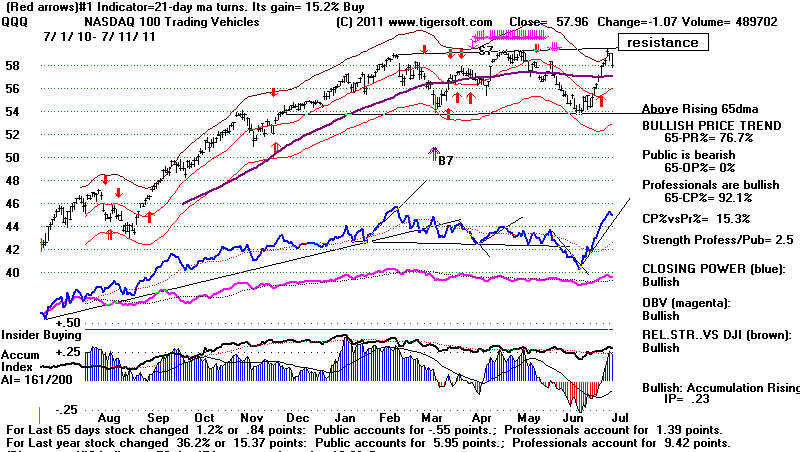 |
===================================================================================
7/8/11 DJI = 12657.20 la/ma= 1.037 21-dmaROC= .594 P = +420 (-12) IP21=-.081 V=+14 OP= .255
BREADTH STATISTICS:
450(+59)
MAXCP stocks -
Bullish MAXCP Stocks
33 (0) MINCP stocks - Bearish MINCP
Stocks
5/13/2011 Examples -
SCLN @ 5.56 and RDN, @5.18
(MAXCP stocks are those showing
Tiger Closing Power making new highs.
This suggests heavy Professional Buying. Applying the Tiger Power Ranker's
"bullish" to the MAXCP stocks find those with heavy insider buying and
institutional accumulation. Bearish MINCP stocks show the opposite.
At this point these are extended a long ways, so - use well-tested CP trendbreaks
to close out positions. Sell S7s occur when Professionals are much more bearish
than the Public is.
48 new
highs on NASDAQ. 14 new lows on
NASDAQ
29 new
highs NYSE
10 new lows on NYSE
7/8/2011
===> See
Key Peerless TigerSoft Index Charts: Industry Groups and ETFs
DIA SPY QQQ DJIA-Peerless
TigerDJI TigerSPY TigerQQQ
GLD SLV
Crude
Take Some Profits despite the BUY B12. A Retreat To
21-DMA Will
Give Us A Better Re-Entry
Point....
7/8/11 Buy
B12 There has never been a Buy B12 this far along in a bull market.
So, it is best not to get
carried away with it. The B12 is based on a week of unusually
good breadth statistics.
Much of the good breadth owes to interest rates being kept
low by the Fed because of the
need, as Bernanke sees it, to prevent a recession from
becoming a depression by the
only government stimulus available. As a result, we see
more than 80% of utility
stocks above their 65-dma. 93% of the many bond funds on the
NYSE and 95.5% of the REITs
are above their 65-dma. This is not to say that other
areas are not doing very
well. But the percentage of QQQ stocks above their 65-dma
has been falling on rallies
for 6 months and our index of the QQQ stocks shows the
resistance of the old highs has
been reached.
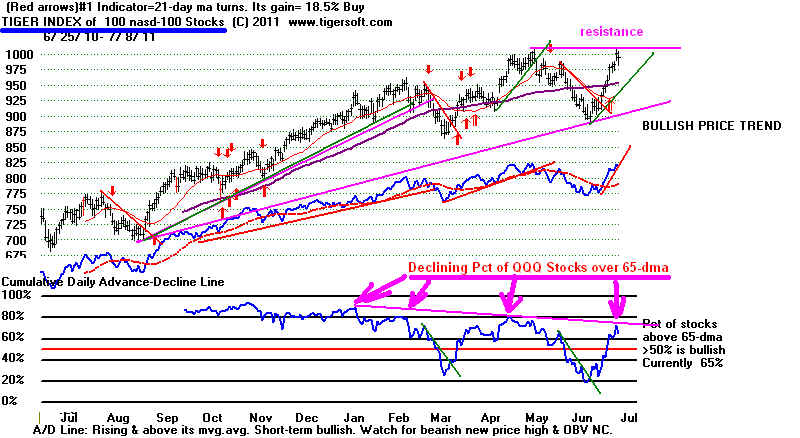
Let's wait and see if there is a
minor pullback from the overbought condition the major
markets have reached. A
retreat back to the rising 21-day ma of the DJI and the ETFs
would be constructive.
The DJI rose 800 points in only 9 days. The Closing Power has
now risen 9 days straight days.
It shows Professionals are still confident and stocks
are in tight hands. I have to
note again that the DJI has reached the apex of what could
become a right shoulder in a
head/shoulders pattern. See the chart just below. 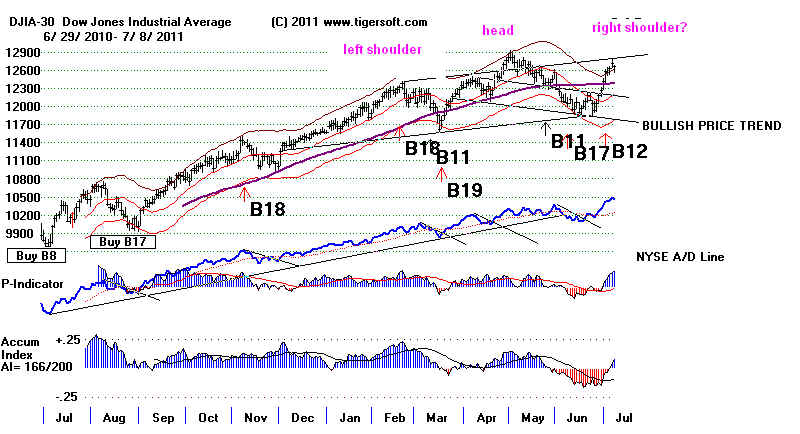
While 65% of the SP-500 stocks are now above their 65-dma,
the steep A/D Line
for
the SP-500 stocks has been penetrated. And, like with the QQQ, the number
of
SP-500 stocks above their 65-day ma has been steadily weakening over the
last
6 months on rallies.
.
Tiger Index of SP-500 Stocks
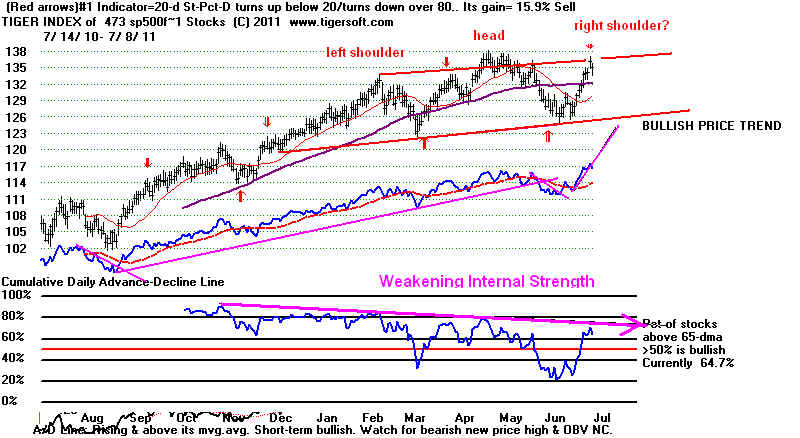
WHY HAS THE MARKET RALLIED?
The basic reason for the strong stock market this
year has not been US economic growth.
Friday's Job Report was a shock. A better explanation is that the governing Plutocracy
is pleased with their growing control and the absence of any realistic political
alternative to
their power.
Other explanations are the short squeeze, summer
bullishness and this, after all, is the bullish
third year in the Presidential Four-Year cycle.
Lastly, this is a Professionally run/rigged rally. We see this in the 8 straight
CLosing Power
up days and the way all the DJIA-30 stocks, except for PFE, participated in the jump.
DJI-30
stocks are relatively easily bought and sold in huge amounts. They are perfect for
computerized
trading. And their movements usually can get the Public to react in a predictable
way.
7/8 Gain Last
9 Days
IBM 176.49 +6%
CAT 105.89 +10%
CVX 105.89 +8%
MMM 97.62 +7%
UTX 90.35 +7%
MCD 85.60 +4%
XOM 82.42 +7%
BA 75.06
+5%
KO 68.68
+5%
JNJ 67.56
+3%
----------------------------------------------------------------------------------------------------------------
Sum = 968.08 60.3% of total.
PG 64.93 +3%
TRV 58.66 +3%
DD 55.42 +6%
WMT 54.08 +3%
AXP 53.07 +9%
JPM 40.74 +3%
DIS 39.90 +6%
VZ 37.47 +4%
HD 36.61 +4%
HPQ 36.43 +4%
MRK 36.11 +4%
KFT 35.71 +3%
T 31.14 +2%
MSFT 26.92 +10%
INTC 23.09 +8%
PFE 20.16 +0%
----------------------------------------------------------------------------------------------------------------
We should probably start following the tem highest priced DJI stocks on a
daily basis. When these top out, the market will be ready to reverse downward.
That is probably not true yet.
CAT 110.41 At upper band. Closing Power
still rising AI/200=156 IP21=.203
CVX 105.89 At upper band.
Closing Power still rising AI/200=174 IP21=.192
MMM 97.62 At upper band. Closing Power
still rising AI/200=125 IP21=.175
UTX 90.35 At upper band.
Closing Power still rising AI/200=155 IP21=.086
MCD 85.60 At upper band. Closing
Power still rising AI/200=93 IP21=.184
XOM 82,42 At falling 65-dma. CP Power still rising. AI/200=151 IP21= .072
BA 75.06 At falling
65-dma. CP broke uptrend.
AI/200=113 IP21= -.008
KO 68.68 At
upper band. Closing Power still rising AI/200=154 IP21=.104
JNJ 67.56 New High.
Closing Power still rising AI/200=140 IP21=.077
innveral factors, at least. One, there has been a short squeeze. Two, high priced
DJI
stocks are doing well. The DJIA-30 weights its components by price only. This
means IBM
is weighted more than the six lowest priced DJI stocks.
If we concentrate on only the top 10 DJI-30 stocks, we are observing more than 60% of the
DJI's
trading volatility. 9 of 10 of these
are rated bullish now.
IBM 176.49 At upper band. Closing Power
still rising AI/200=155 IP21=.183
CAT 110.41 At upper band. Closing Power
still rising AI/200=156 IP21=.203
CVX 105.89 At upper band.
Closing Power still rising AI/200=174 IP21=.192
MMM 97.62 At upper band. Closing Power
still rising AI/200=125 IP21=.175
UTX 90.35 At upper band.
Closing Power still rising AI/200=155 IP21=.086
MCD 85.60 At upper band. Closing
Power still rising AI/200=93 IP21=.184
XOM 82,42 At falling 65-dma. CP Power still rising. AI/200=151 IP21= .072
BA 75.06 At falling
65-dma. CP broke uptrend.
AI/200=113 IP21= -.008
KO 68.68 At
upper band. Closing Power still rising AI/200=154 IP21=.104
JNJ 67.56 New High.
Closing Power still rising AI/200=140 IP21=.077
--------------------
60.% of Sum of All 30 DJIA Stocks
====================================================================================
OLDER HOTLINES
====================================================================================]
7/7/11 DJI = 12718.49 la/ma= 1.044 21-dmaROC= .635 P = +416 (+71) IP21=-.061 V=+11 OP= .263
BREADTH STATISTICS:
391 (-1)
MAXCP stocks -
Bullish MAXCP Stocks
33 (-5) MINCP stocks - Bearish MINCP Stocks
5/13/2011 Examples -
SCLN @ 5.56 and RDN, @5.18
(MAXCP stocks are those showing
Tiger Closing Power making new highs.
This suggests heavy Professional Buying. Applying the Tiger Power Ranker's
"bullish" to the MAXCP stocks find those with heavy insider buying and
institutional accumulation. Bearish MINCP stocks show the opposite.
At this point these are extended a long ways, so - use well-tested CP trendbreaks
to close out positions. Sell S7s occur when Professionals are much more bearish
than the Public is.
140 new
highs on NASDAQ. 10 new lows on
NASDAQ
167 new
highs NYSE 5
new lows on NYSE
7/7/2011
===> See
Key Peerless TigerSoft Index Charts: Industry Groups and ETFs
DIA SPY QQQ DJIA-Peerless
TigerDJI TigerSPY TigerQQQ
GLD SLV
Crude
7/7/11 Our Summer Rally Heats Up. The DJI's Potential
Right Shoulder has been
reached. A move above it
would abort the bears' last hope, "short" (pardon the term)
of a complete collapse of the Buget
talks and a US credit default. The Buy
B12 gives us
hope that there will be a DJI
move past 13000. The average gain is 9% when Buy B12s
occur in rising markets. We
see that the ETFs' Closing Powers continue to streak upwards.
Certainly the large number of
stocks showing Closing Power new highs and
very positive Accumulation is
bullish. And now only Gold and Chinese Stocks,
among our Industry Groups, show a
majority of stocks below their 65-dma. The rally
has taken many of the bears by
surprise.
 This sudden bear trap seems
suitable for a bigger move than a simple This sudden bear trap seems
suitable for a bigger move than a simple
DJI re-testing of the recent
highs at 12900, but first the DJI must get past the resistance
from the potential right shoulder
apex shown below. Since 1965, the DJI has risen 62.2% of
the time in the week after July
7th. Thereafter, it is more likely to slow down, but still be
higher in 2 months 60% of the time.
==================================================================================
OLDER HOTLINES
==================================================================================
7/6/11 DJI = 12626.02
la/ma= 1.039 21-dmaROC= .526 P =
+345 (+105) IP21= .004 V= -10 OP= .17
BREADTH STATISTICS:
392
MAXCP stocks -
Bullish MAXCP Stocks
38 +4 MINCP stocks - Bearish MINCP Stocks
5/13/2011 Examples -
SCLN @ 5.56 and RDN, @5.18
(MAXCP stocks are those showing
Tiger Closing Power making new highs.
This suggests heavy Professional Buying. Applying the Tiger Power Ranker's
"bullish" to the MAXCP stocks find those with heavy insider buying and
institutional accumulation. Bearish MINCP stocks show the opposite.
At this point these are extended a long ways, so - use well-tested CP trendbreaks
to close out positions. Sell S7s occur when Professionals are much more bearish
than the Public is.
86 new
highs on NASDAQ. 14 new lows on NASDAQ
100 new
highs NYSE 9
new lows on NYSE
7/6/2011
===> See
Key Peerless TigerSoft Index Charts: Industry Groups and ETFs
DIA SPY QQQ DJIA-Peerless
TigerDJI TigerSPY TigerQQQ
GLD SLV
Crude
7/6/11 The Closing has been above the Opening for
7 straight days. I am doing a brief
historical study now to see what significance this has historically with the QQQ.
The QQQ has been traded since 1998. Going back to 1998, we can see that 7 straight
days of a higher closing above the opening occurs in bull markets only when they
have much more to go before they reach a major top. This did not preclude minor
declines of 2% and 6% in 2006 and 2007. Note that in 6 of 8 cases the QQQ
immediately
rose. In both July cases, the QQQ rose more before even pausing and then going
much higher.
Date QQQ
IP21 LA/MA Result
--------------------------------------------------------------------
7/6/2011 58.39
.131 1.051
2/8/2011 58.03 .286 1.023
reached peak on 58.86 on 2/17/2011
9/14/2009 41.68 .156 1.038 rose to 46.22 gradually peak on 12/28/2009
7/20/2009 37.92
.181 1.055 rose to 46.22
gradually peak on 12/28/2009
2/22/2007 45.42 .185 1.026 fell immediately to 42.15 in a week and then rose a lot.
11/20/2006 44.39 .283 1.034 fell
gradually to 43.11 on 12/26/2006.
10/11/2006 41.54 .157 1.022 rose
gradually to 44.73 on 11/22/2006
1/11/2006 43.21
This was peak. It fell to 40.96 on 2/10/2006.
7/15/2005 38.89
.01 1.034 rose to 40.08
and then fell back for 3 months
5/23/2005 37.85 .293 1.051 rose to 38.40 on
6/1/2005 and then fell back for a month
5/29/2003 29.31 .025 1.034 rose gradually to 32.28 on 7/8/2003.
Bear Market 8/22/2002 25.94 .238
1.105 fell immediately to 20.06 in 6 weeks.
So Many Recent Bullish Blue Days on Tiger
Candle Stick QQQ Chart Shows
This Bull Market Still Has A Lot of Strength Left
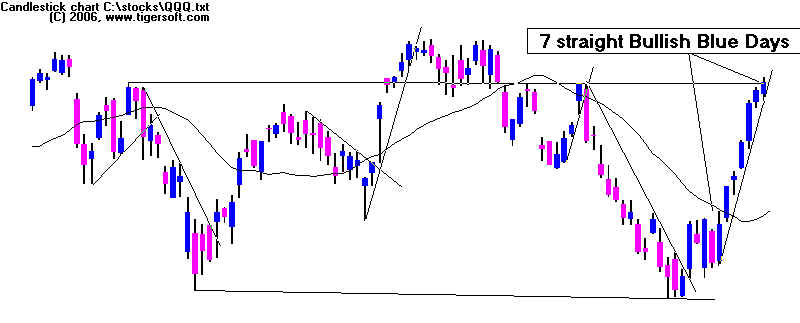
7/6/11 The Buy B12 gives
us hope that there will be a DJI move past 13000.
Certainly that's the message from the
large number of stocks showing Closing Power
new highs and very positive Accumulation.
A resolution of the impasse over the federal
Budget must be near. Or perhaps,
businesses just feel thay can be a lot more profitable
if there is less oversight from
non-functioning regulatory agencies. Either way, the ETFs'
Closing Powers are still rising, even if
they are overbought. In this environment, I would
stay long a selection of our bullish
MAXCP stocks. In that connection, here is part of a note
sent a subscriber. I should have
added that trading the "bearish" MINCP stocks clearly
works best when we are operating under a
Peerless Sell and trading the "bullish"
MAXCP stocks is suggested now while we
operate with a Peerless Buy and rising
Closing Powers.
I'd encourage to start at basic and simplest.
http://tigersoft.com/SimpleMoney/Index.html
Just Watch What The Professionals Are Doing. Trading Profits are then Very Simple with TigerSoft.
Very often, it helps to compare stocks now under consideration
with ideal types of bullish and bearish stocks, based on past examples
of what worked out as predicted using
1) Very Positive or very negative Accumulation.
2) Closing Power making new highs ahead of prices
or making new lows ahead of prioes.
3. Flat resistance giving way with the thunder of
high (re) volume and with a gap.
or
Flat support giving way with the thunder of
high (red) volume and with a gap.
Examples are all over tigersoft.com
Explosive Super Stocks Killer Short Sales
Also if you do a 250 day Pct Change ranking of the stocks in
any directory or c:\Elitstks, you will see
how common these parameters are in the 10 best and 10 worst performing.
UP THE MOST
VRUS (perfect example)
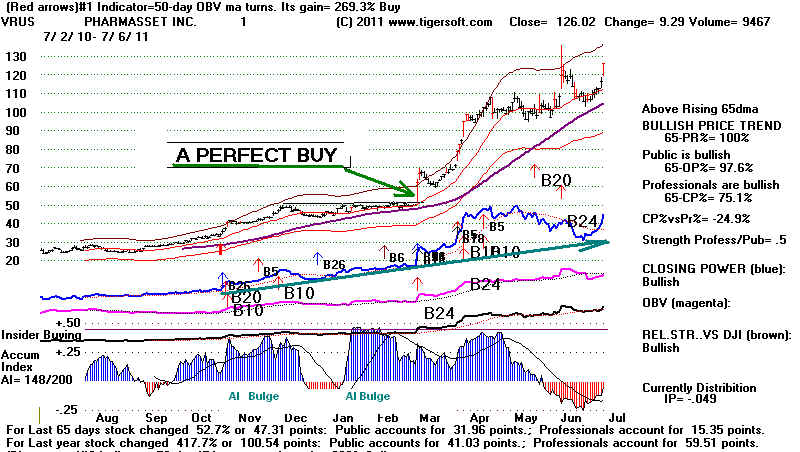 ELMG (buyout after flat topped breakouts confirmed by CP)
REGN (Dec AI bulge and CP new high at 34. Hit 70 in April.)
BIIB (Oct and Nove AI bulges. CP new highs. Flat breakouts.
RADA (Feb and March and May AI bulges - CP confirming. B7s
IPGP (perfect example)
IMGN (note AI bulge, test of 65-dma and CP trend-break)
DPZ (steady advance accelerates)
FOSL (Feb bulge. CP confirming. Politely never pulls back.)
JAZZ (perfect)
DOWN THE MOST (don't stks needing adjustment for splits)
ENER (perfect example)
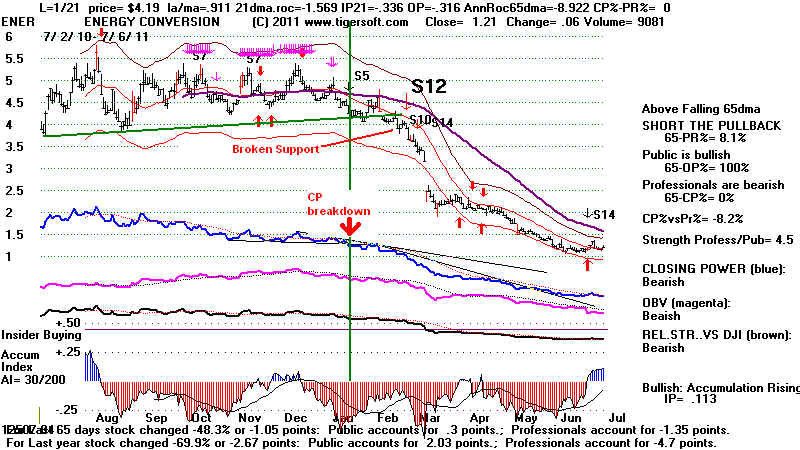 AMSC
XING
RIMM (perfect example)
LPHI (Good example)
SEED (good example)
OMX (good example)
MIPS (good example)
CEDC
ISIG
FRO hotmail;.com(good example)
DJIA
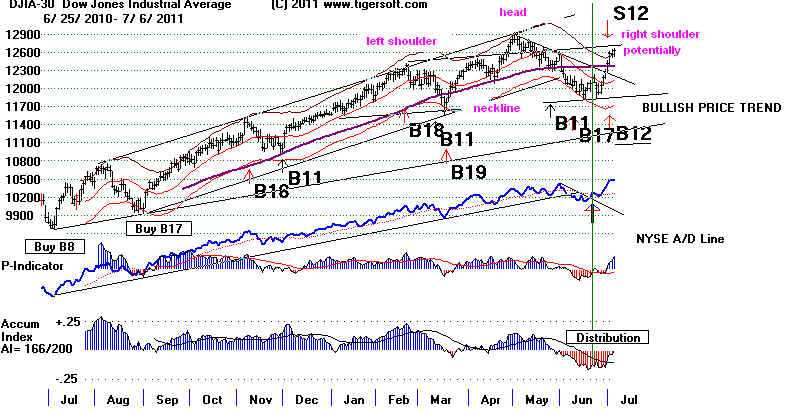 |
DIA
Most recently a TigerSoft S9 (AI NNC)
Bothup: Closing Power and Opening
Power are rising.
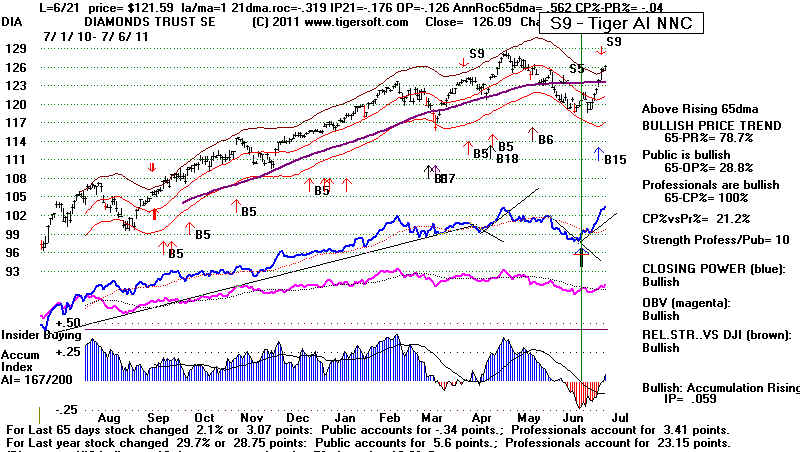 |
SPY Closing Power is in
rising trend.
Both Opening and Closing Power
are Rising
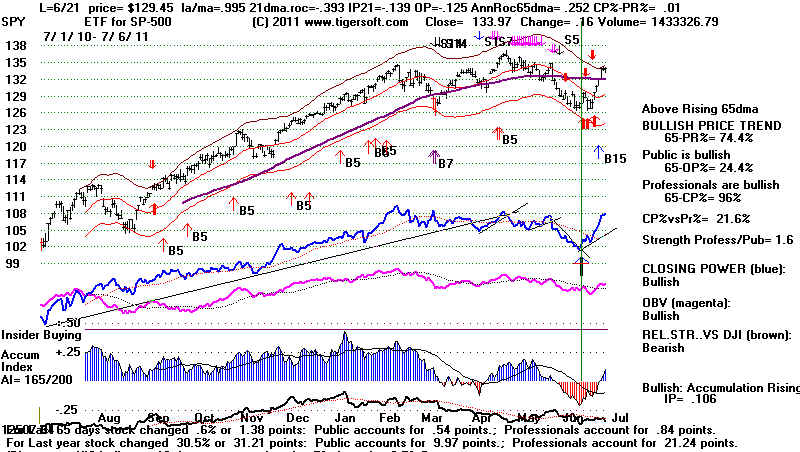 |
QQQ - Closing Power is in rising
trend. Public skepticism..
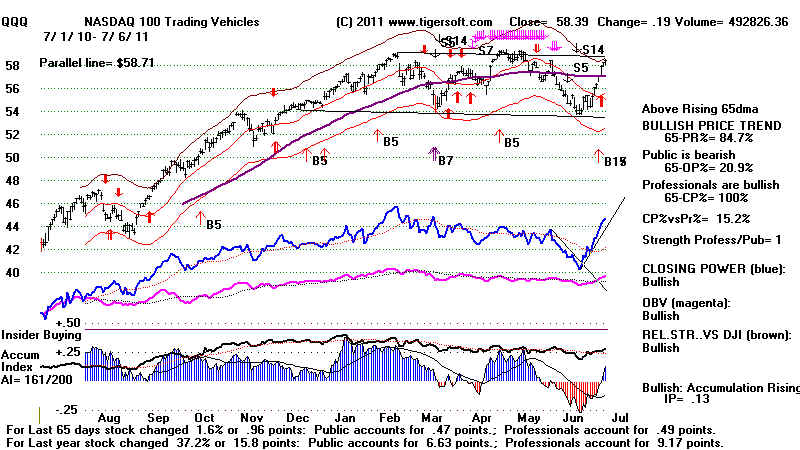 |
====================================================================================
OLDER HOTLINES
====================================================================================
7/5/11 DJI = 12569.87
la/ma= 1.037 21-dmaROC= .412 P =
+239 (+57) IP21= -.034 V=
-48 OP= .081
BREADTH STATISTICS:
400 +25 MAXCP stocks - Bullish MAXCP Stocks
34 +15 MINCP stocks - Bearish MINCP Stocks
5/13/2011 Examples -
SCLN @ 5.56 and RDN, @5.18
(MAXCP stocks are those showing
Tiger Closing Power making new highs.
This suggests heavy Professional Buying. Applying the Tiger Power Ranker's
"bullish" to the MAXCP stocks find those with heavy insider buying and
institutional accumulation. Bearish MINCP stocks show the opposite.
At this point these are extended a long ways, so - use well-tested CP trendbreaks
to close out positions. Sell S7s occur when Professionals are much more bearish
than the Public is.
99 new
highs on NASDAQ. 14 new lows on NASDAQ
94
new
highs NYSE 7
new lows on NYSE
7/5/2011
===> See
Key Peerless TigerSoft Index Charts: Industry Groups and ETFs
DIA SPY QQQ DJIA-Peerless
TigerDJI TigerSPY TigerQQQ
GLD SLV
Crude
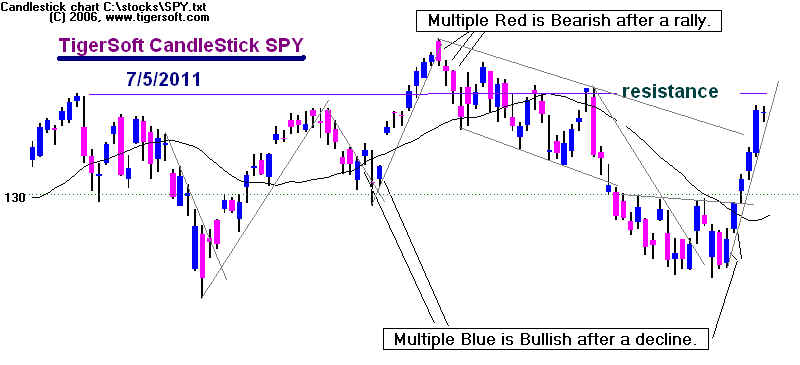
7/5/11 The Buy
B12 tells us we will probably see higher prices, but traders should, I think,
take some profits in the general market
ETFs, DIA, QQQ and SPY. A little correction by
the blue CLosing Powers from their
over-bought condition would seem likely after five
straight very good days and a pause.
The Accumulation Index and V-Indicator are
both negative at the upper band.
These must be construed as trading warnings this
far into a bull market. We can set
aside negative non-confirmations at the upper band
only while breadth remains very strong.
Today NYSE decliners overtook advancers.
One day of consolidation does not take
away from the superb breadth. But bearishly,
there is still the possibility of the
DJI forming a right shoulder where it is now in a bigger
head/shoulders pattern like the one I
drew over the weekend.
Tomorrow, I want to show the significance
of negati\ve non-confirmations at the upper
band by SPY and QQQ. These are
Tiger chart S9s, which are not to be confused with
Peerless Sell S9s. Click here tomorrow for the links to the SPY Tiger S9s..
Our MAXCP stocks are apt to
continue to rise even if the general market consolidates.
There are relatively few MINCP
stocks. Airlines are frequent fliers in this bearish group:
See AMR, LCC and DAL.
Traders must think that Crude Oil is going to recover. CVX is
our Tahiti stock for the 2nd
quarter of 2011.
CL1600 - CRUDE OIL Perpetual
Contract 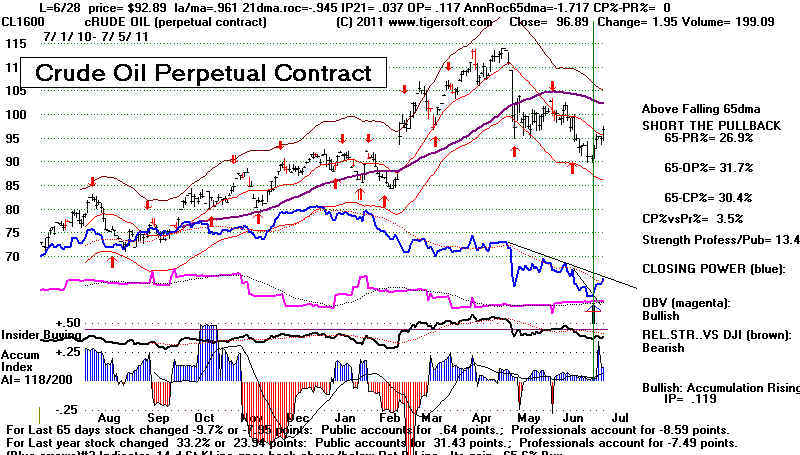 CVX - Chevron
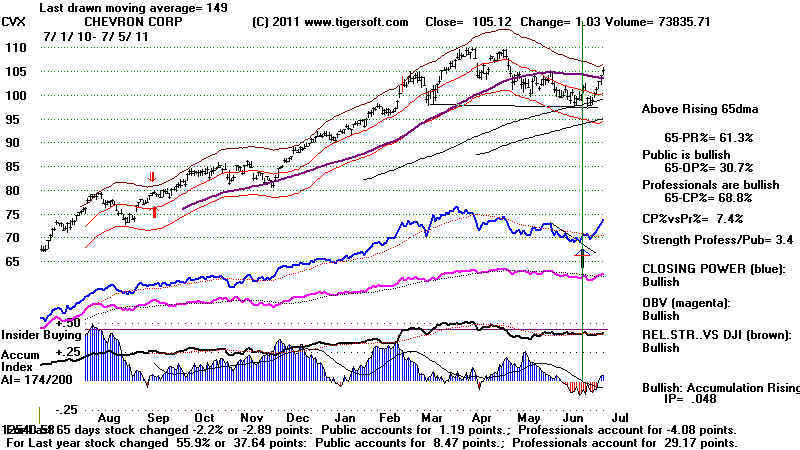
==============================================================================================
OLDER HOTLINES
==============================================================================================
7/1/11 DJI = 12582.77 la/ma= 1.04 21-dmaROC= .329 P = +181 (+103) IP21= -.031 V= -63 OP= .081
BREADTH STATISTICS:
375 +168 MAXCP stocks - Bullish MAXCP Stocks
19 -9 MINCP stocks - Bearish MINCP Stocks
5/13/2011 Examples -
SCLN @ 5.56 and RDN, @5.18
(MAXCP stocks are those showing
Tiger Closing Power making new highs.
This suggests heavy Professional Buying. Applying the Tiger Power Ranker's
"bullish" to the MAXCP stocks find those with heavy insider buying and
institutional accumulation. Bearish MINCP stocks show the opposite.
At this point these are extended a long ways, so - use well-tested CP trendbreaks
to close out positions. Sell S7s occur when Professionals are much more bearish
than the Public is.
110 new
highs on NASDAQ. 9 new lows on NASDAQ
135
new
highs NYSE 3
new lows on NYSE
7/1/2011
===> See Key Peerless TigerSoft
Index Charts: Industry Groups and ETFs
DIA SPY QQQ DJIA-Peerless
TigerDJI
TigerSPY
TigerQQQ
GLD
SLV
Crude
7/4/11 Happy and
safe Fourth of July.
The unclinched Sell S12 of Thursday was replaced Friday by a new Buy B12.
The Buy B12 arises from the
exceptionally fine breadth we have had for the last
five trading days and the high ratio of NYSE up to down volume.
NYSE
Adv / Decl UpV / Down V
------------------------------------------------------
6/27/2011 2089/969 636.35 / 187.06
6/28/2011 2457/605 671.73 / 120.74
6/29/2011 2121/926 728.79 / 174.22
6/30/2011 2249/813 760.32 / 230.25
7/1/2011 2518/544 784.2 / 69.44 (very low)
The rally and the Buy B12 have caught a lot of people by surprise. Helping fuel
the rally were the shorts. Short
interest on the NYSE rose 2.53% in the first half
of
June. Certainly, the rally may have been rigged by Professionals. That may
limit it. A small pull-back next week may take place. Volume was low. Not all
the players were attending the market right before a three-day weekend. There
is a potential for a top at 12600, where a right shoulder apex might form. But the
element of surprise reminds me of the July take-off in 1984. As long as breadth is
good, the NYSE A/D Line is uptrending and the CLosing Power uptrends are intact,
let's just hold our long positions. Do not underestimate how much the Administration
wants the DJI to get back above 13,000 or even 14,000 to garner campaign
contributions and political advertising money for next year. Professionals are
bullish. We should be, too.
Political Partisans at election time never seem to make money in the market. That
may be true now, too. Reading Yahoo posts on the economy early last week, it was
impossible to find a single bull. The unanimity of their negativity made me think
they were all paid shils for one Tea-party candidate or another. Regardless of that,
Buy B12s in rising bull markets are reliably bullish. They average gains of nearly
10%, even when the current Accumulation Index (aka IP21) is negative. Here
are the cass since 1929. Do notice that volume was low and the related OPct was
only +.076. When the OPct was below .10, as now, the rising market Buy B12 gains
were
only 4.9% in the four previous cases.
Rising Market Buy B12s
Date Gain
IP21 OPct
Result
6/22/1938 +13.4%..
.08 +.216 bull market rally
followed
9/30/1938 +11.3%.. .077 +.048 bull market rally followed
1/3/1940 -
5.2%.. .072 +.069
War in Western Europe brought big decline.
6/12/1941 +4.8%.. .106 +.396
Small rally and then Pearl Harbor.
11/4/1943 +9.0%.. -.179 -.135 Small
rally and then Pearl Harbor. 5% Paper Loss
1/3/1945 +6.3%.. .245
+.408 Small rally..
3/9/1945 +3.9%.. .133
+.29 Small rally..
8/7/1945 +15.9%.. .159
+.349 bull market rally followed
5/23/1947 +10.4%.. -.053
-.198 bull market rally followed
3/22/1948 +11.2%.. -.052
+.142 bull market rally followed
11/5/1948 +1.6%.. .161
+.188 Small rally..
12/5/1950 +16.5%.. .131 +.176
bull market rally followed
8/3/1953 +8.5%.. .101
+.234 bull market rally followed 7% Paper Loss.
1/6/1954 +5.5%.. .079 -.287 bull market rally
followed
1/6/1976 +13.3%.. .169 +.441
bull market rally followed
1/17/1991 +27.8%..
.006 +.155 bull market rally followed
4/3/2009 +9.3%.. .157
+.286 bull market rally followed
-----------------------------------------------------------------------------------------
Current 7/1/2011
????????.. -.031 +.076
bull market rally followed
----------------------------------------------------------------------------------------------------------
N=17 Avg = + 9.7%
8 of 17 brought gains of more than 10%
N=5
+4.9% where OPct was below +.10
N=3
+10.2% where IP21<0.
MANIPULATION? No!!! Never!!!
Just how cynical should we be about what Professionals are up to?
A lot of observers have noted computerized program trading is now dominant.
As much as 75% of the NYSE trades on any given day are now of this variety.
As for the good breadth last week, cynics will surely say that the new type of
computerized trading can encompass thousands of stocks in a single order.
The program traders are fearless, knowing that they can reverse course instantly
because they can now sell short on down-ticks highly leveraged general market ETFs.
.
But the good breadth is also a function of lower interest rates. I believe the
low rates
are here until after the 2012 Election. That is why bonds, REITs and utilities are
acting so well. Bernanke firmly believes that the monetary mistakes of the
Depression must be avoided, at all costs. He'll continue to keep rates low,
as long as he can. The declines in Food Prices, Gold, Silver and Oil all work
in his favor. Knowing this, the program traders have put in buy order which
encompass a wider scope of stocks, including many dividend/interest rate
sensitive stocks, bond funds on NYSE.
The domination of the markets by Professionals now does NOT make
Peerless less reliable. If anything, Peerless is made more reliable.
Breadth
trumped volume in 2009 and 2010, and will probbaly do so in 2011. Peerless
also heavily weights political seasonality. Until there is compelling contrary
evidence, it is better to trade believing that History repeats and repeats and that
the cycles of Greed and Fear as filtered through our chart patterns, NYSE breadth,
Government intervention and Seasonality are more important than new
variables that we cannot now imagine. Actually, It is when the Public is in the
market very heavily that we have to heed Opening Power.
Keep in mind the overwhelming ratio of Closing Power new high stocks
versus Closing Power new lows: 375/19. A number of stocks with CLosing Power
new highs also show recent bulges of Accumulation (insider buying). Let me
point out BZF, which I have adjusted for a large cash
dividend, biomedicals
like CPHD and the auto parts store, ORLY.
I have long favored Flat Topped
breakouts like TDG.
|
 TIGER HOTLINE
 TIGER HOTLINE
![]() A Guide To Profitably Using The
Tiger Nightly HOTLINE
A Guide To Profitably Using The
Tiger Nightly HOTLINE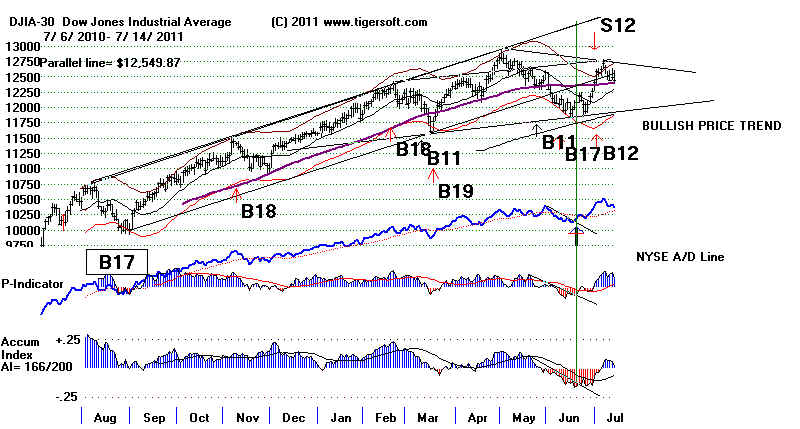
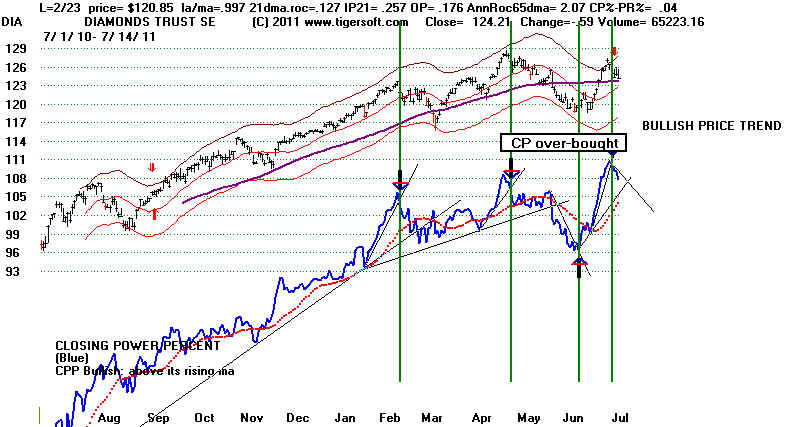
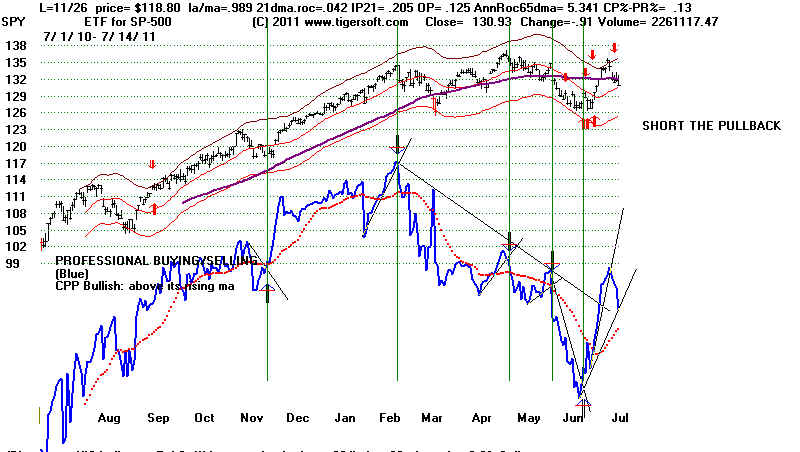
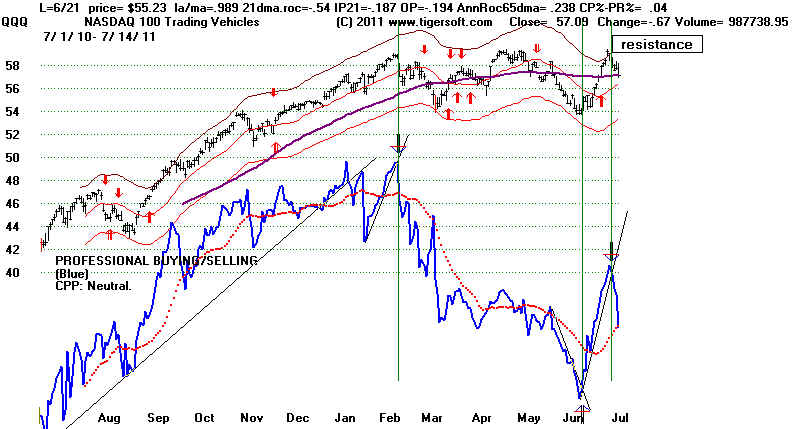

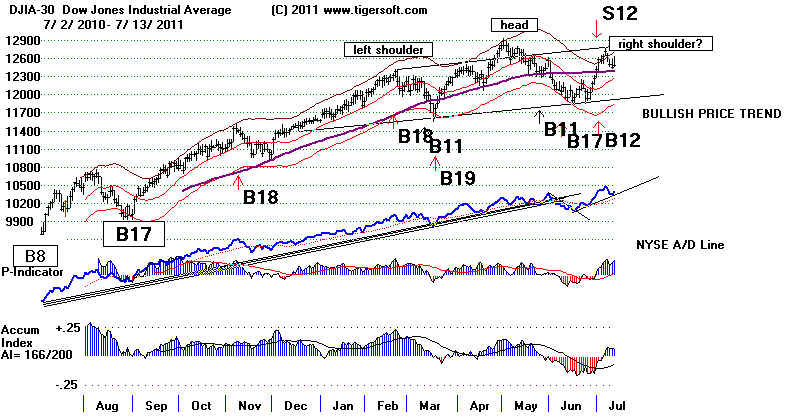
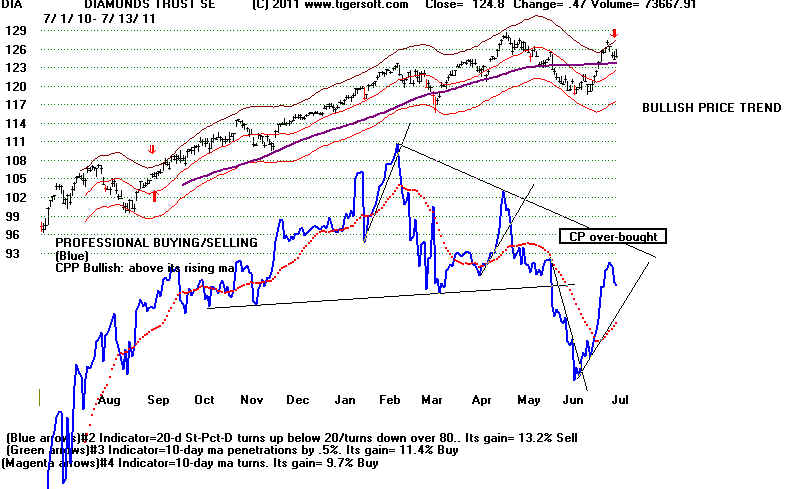
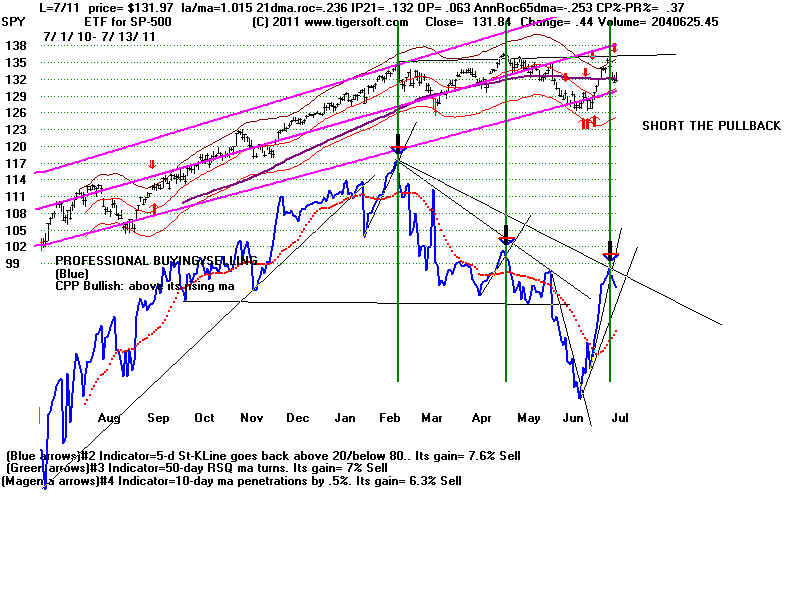


 This sudden bear trap seems
suitable for a bigger move than a simple
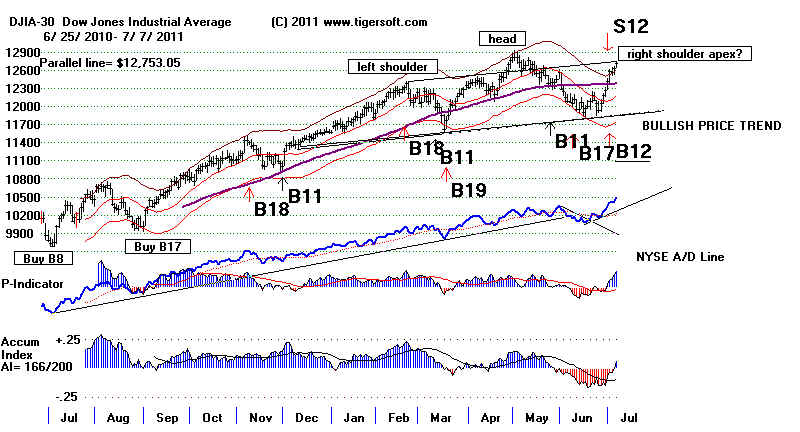
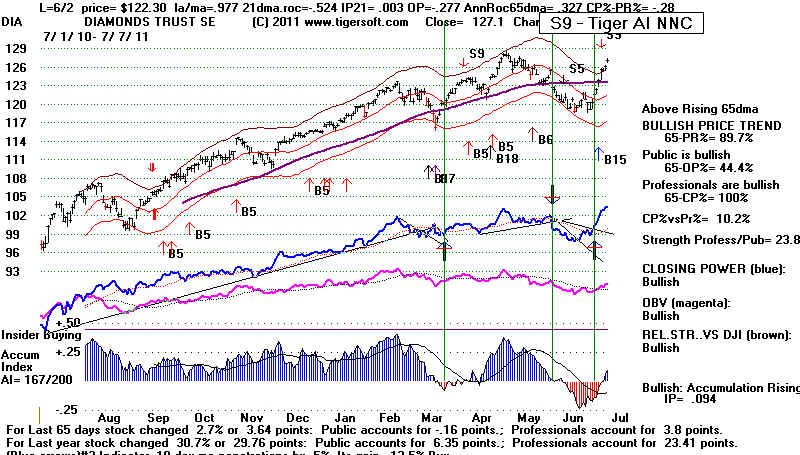
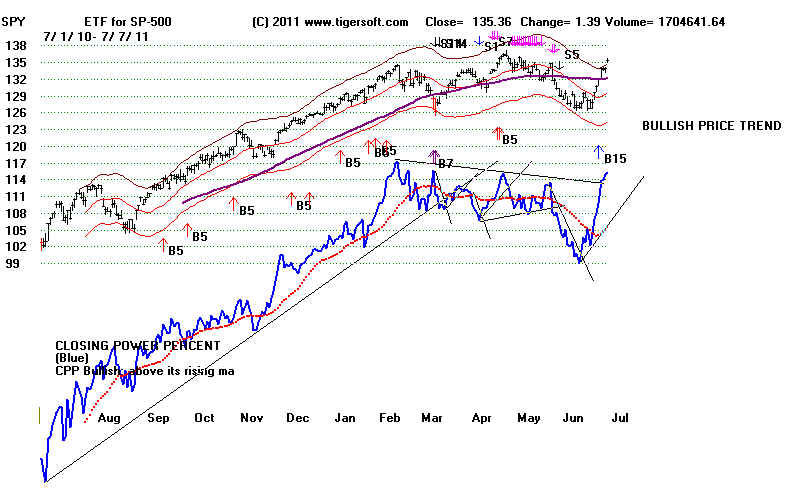
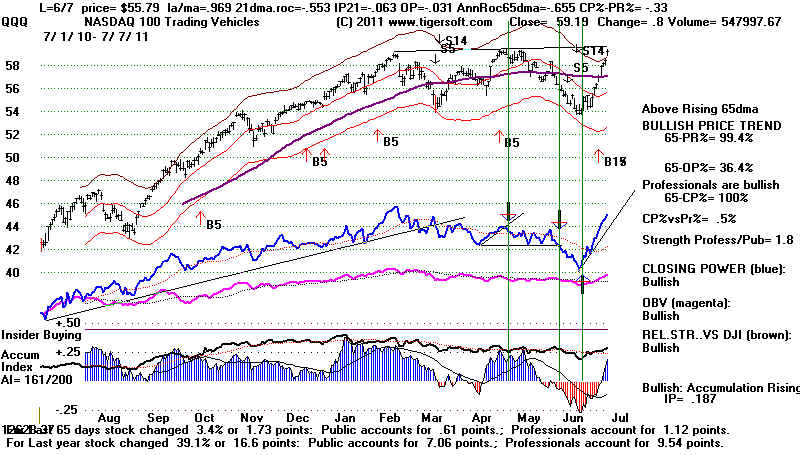

 ELMG (buyout after flat topped breakouts confirmed by CP)
REGN (Dec AI bulge and CP new high at 34. Hit 70 in April.)
BIIB (Oct and Nove AI bulges. CP new highs. Flat breakouts.
RADA (Feb and March and May AI bulges - CP confirming. B7s
IPGP (perfect example)
IMGN (note AI bulge, test of 65-dma and CP trend-break)
DPZ (steady advance accelerates)
FOSL (Feb bulge. CP confirming. Politely never pulls back.)
JAZZ (perfect)
DOWN THE MOST (don't stks needing adjustment for splits)
ENER (perfect example)
 AMSC
XING
RIMM (perfect example)
LPHI (Good example)
SEED (good example)
OMX (good example)
MIPS (good example)
CEDC
ISIG
FRO hotmail;.com(good example)


 CVX - Chevron
