 TIGER HOTLINE
 A
Guide To Profitably Using The Tiger Nightly HOTLINE
A
Guide To Profitably Using The Tiger Nightly HOTLINE TIGER HOTLINE
A
Guide To Profitably Using The Tiger Nightly HOTLINE
TigerSoft and
Peerless Daily Hotline
(C)
1985-2011 William Schmidt, Ph.D. www.tigersoft.com
All rights strictly
reserved.
Notice: HOTLINE's ADDRESS CHANGES WEDNESDAY (tomorrow)
You should have received an email giving
the new address, but mistakes are made.
Sorry - let us know. And if you
want to renew. Contact us. $360 by CC and $350 by check.
 ===> Order
Here
===> Order
Here
+++++++++++++++++++++++++++++++++++++++++++++++++++++++++++++++++++++++++++++++++++
Earlier Hotlines: 8/12/3011 - 8/31/2011
10/4/2011 300+ Point Last
Hour Rally

WORK IN PROGRESS
10/4/2011
DJI = 10809 +153 la/ma= .972 21-dmaROC=-.461 P = -260 (+132)
IP21= +.021 V= -193 OP= +.132
BREADTH
STATISTICS:
38 MAXCP stocks Bullish MAXCP Stocks
215
MINCP stocks Bearish MINCP Stocks
MAXCP stocks are those showing Tiger Closing Power making new highs.
This suggests heavy Professional Buying. Applying the Tiger Power Ranker's
"bullish" to the MAXCP stocks find those with heavy insider buying and
institutional accumulation. Bearish MINCP stocks show the opposite.
Also use the BOTHUPs condition with MAXCPs and BOTHDOWNS MINCPS.
2 new highs on NASDAQ. 129 new lows on NASDAQ
5 new
highs NYSE
224 new lows on NYSE
10/4/2011 ===> See Key Peerless TigerSoft Index
Charts: Industry Groups and ETFs
DIA SPY QQQ DJIA-Peerless
TigerDJI TigerSPY TigerQQQ GLD SLV Crude
Will Buy B7, B8 and B17 Prevent A Serious Breakdown?
Near Term: updated last 10/4/2011
------------------- Closing
Power (CP) Status Report: CHARTS:---------------------
3 ETFs' Closing Powers are FALLING and now below their 21-day ma
As long as Closings are FALLING, a decline seems likely until the DJI
price support, 10580, is reached.
DIA BELOW
CP DOWNtrendline - A close of
1.63 ABOVE the Opening is needed tomorrow to break the CP DOWNtrend.
DIA CP is below its CP 21-dma while Openings are in decline.
SPY BELOW CP DOWNtrendline - A close of 1.78
ABOVE the Opening is needed tomorrow to break the CP DOWNtrend. SPY CP is still below its CP 21-dma while Openings are in decline.
QQQ BELOW CP DOWNtrendline - A close of .55 ABOVE the
Opening is needed tomorrow to break the CP DOWNtrend.
QQQ CP is still below its CP 21-dma while
Openings are in decline.
GLD
is below CP DOWNtrendline - A close of .55 ABOVE the Opening is needed
tomorrow to break the CP DOWNtrend.
New TigerSoft Exploded Charts shows
exactly how much of a move from the Opening
to the Close is needed to break the Closing Power trendline. Note that a visual break will require,
at least .25 more of a penetration of the calculated uptrend. We have been using
visual
CP trend-breaks. http://tigersoft.com/CP-Trendbreaks/index.html
-------------------------------------------------------------------------------------------------------------------------------
Peerless and the Fed Are
Trying
To Keep The DJI from breaking 10580. The Last Hour
Reversal Today Brought Another Peerless Buy, a B19.
10/4/2011 Bernanke
fails to rule out QE3
False breakdowns like today''s are bullish. I have to emphasize
again
that Peerless works with closing prices and support lines through
the lowest
possible levels, the previous hypothetical lows. We require
DJI closes below
such support-line levels. We do definitely not simply use a new
closing low.
We do this precisely because of how often there are intra-day
false moves at
bottoms. Another thing: DJI bottoms very often show nominal
new closing low,
just one day, below a previous close, at which time the key
Peerless Indicators
are not confirming by being below their levels of the recent low.
This is what
yesterday's Buy B8 signalled. See the discussion then. The
failure by the DJI to
break to new lows suggests a very tradeable bottom is now in
place. Having
found support, the market must now rally to find resistance.
Last hour rallies, of couse, like today's must be considered a mite
suspect.
All the 300+ points of the gains came in the last hour. It
would be more convincing
if the rally had started earlier today, say, after a weak first
hour.
But today certainly does come as a surprise to the many bears. No
one
was bullish, except me, at the last SD Tiher User Group meeting.
The August 10600
low was violated. The sell stops there were triggered.
Now stocks are in stronger hands,
professional hands who want a rally. See how much the
ETFs' Closing Powers have
turned up today, though the downtrends have not been violated.
The CP turning up at price
support usually makes a good trade.
So,
until the DJI closes below today's low, it is probably
best to cover most of the shorts we have enjoyed among the bearish
MINCP stocks and buy some of the bullish MAXCP stocks for, at least
a quick rally of a few days, but probably more, a rally back to 11400-11600
and even the 65-day ma. Note that a penetration of the lows yesterday
would force us next quickly to reverse and go heavily short the bearish
MINCP stocks. Most likely, that would bring a judged Sell S10,
The multitude of recent Peerless Buy signals has to be considered
bullish.
Sentiment is pretty negative. All the sellers may have had their
chance. Today
Bernanke said the FED would be ready to buy Treasuries just as
they did last
September and October. Such buying brought a nice market
recovery from a
near-breakdown in the second half of 2010. Another bullish
point, a big rally up from
here would represent the third wave up sinc ethe March 2009
bottom. Many Elliot
Wave afficionadas believe that third waves are needed to bring a
major top.
It
seems that Europeans are selling EURO based assets and buying US stocks.
The Dollar is rising along with
stocks. The inflation plays, Gold and Crude Oil declined today.
It is said multinational corporations are sitting on two trillion
dollars in cash. They
may start employing it by by buying their smaller beaten down
competitors, assuming
the government continues to look the other ways at most such
mergers. Watch
for signs of this. See www.mergerjournal.com

.


===================================================================================
OLDER HOTLINES
===================================================================================
Earlier Hotlines: 8/12/3011 -
8/31/2011
10/3/2011
DJI = 10655 la/ma= .957 21-dmaROC=-.893 P = -392 (-53) IP21= -.064 V= -281 OP= +.028
BREADTH
STATISTICS:
17 MAXCP stocks Bullish MAXCP Stocks None except beari-ETFs and
bonds
771
MINCP stocks Bearish MINCP Stocks
MAXCP stocks are those showing Tiger Closing Power making new highs.
This suggests heavy Professional Buying. Applying the Tiger Power Ranker's
"bullish" to the MAXCP stocks find those with heavy insider buying and
institutional accumulation. Bearish MINCP stocks show the opposite.
Also use the BOTHUPs condition with MAXCPs and BOTHDOWNS MINCPS.
9.30.11 2 new highs on NASDAQ. 554 new lows on NASDAQ
3 new
highs NYSE
764 new lows on NYSE
10/3/2011 ===> See Key Peerless TigerSoft Index
Charts: Industry Groups and ETFs
DIA SPY QQQ DJIA-Peerless
TigerDJI TigerSPY TigerQQQ GLD SLV Crude
Will Buy B7, B8 and B17 Prevent A Serious Breakdown?
Near Term: updated last 10/3/2011
------------------- Closing
Power (CP) Status Report: CHARTS:---------------------
3 ETFs' Closing Powers are FALLING and now below their 21-day ma
As long as Closings are FALLING, a decline seems likely until the DJI
price support, 10580, is reached.
DIA BELOW
CP DOWNtrendline - A close of
4.47 ABOVE the Opening is needed tomorrow to break the CP DOWNtrend.
DIA CP is below its CP 21-dma while Openings are in decline.
SPY BELOW CP DOWNtrendline - A close of 6.53
ABOVE the Opening is needed tomorrow to break the CP DOWNtrend. SPY CP is still below its CP 21-dma while Openings are in decline.
QQQ BELOW CP DOWNtrendline - A close of 3.02 ABOVE
the Opening is needed tomorrow to break the CP DOWNtrend.
QQQ CP is still below its CP 21-dma while
Openings are in decline.
GLD
Just above CP DOWNtrendline - A close MORE than 4.39 below the
Opening would restore the CP DOWNtrend.
New TigerSoft Exploded Charts shows
exactly how much of a move from the Opening
to the Close is needed to break the Closing Power trendline. Note that a visual break will require,
at least .25 more of a penetration of the calculated uptrend. We have been using
visual
CP trend-breaks. http://tigersoft.com/CP-Trendbreaks/index.html
-------------------------------------------------------------------------------------------------------------------------------
Peerless and the Fed Are Trying
To Keep The DJI from breaking 10580, 70 Points Lower.
Stay Bearishly Hedged as long as the Closing Powers
are falling.
Fed
Members Dropping Hints on QE3 « SGTreport.com
Bernanke
Hints At QE3 | The Daily Capitalist
New lows were made by
the DJIA, SP-500, NYSE, NASDAQ, Value-Line and IWM (ETF for
Russell-2000). Can a DJI breaking
of the key support line going through the lows be
far behind? Today's Peerless Buy B8 registers the fact
that that the P-Indicator on our
DJI chart is much
improved from its levels in early August. The last time a Buy B8 signal
occurred was in July 2010 at what was a
significant bottom. The DJI recovered then after a
marginal breaking of a well-tested
support level following a similar P-I non-confirmation
of a new low. Compare the key
values then with those now. The P-Indicator (P-I) is actually
much lower now than it was at the last
Buy B8. The rate of the decline (ANNROC) is far
higher now. The Accumulation (IP21)
levels are similar. The OBV (OPCT) is much better now
Unfortunately, looking at the key
statistics for 1930's June breakdown leading to the awful
1930-1932 decline makes us realize that
Non-Confirmations by the P-Indicator and
Accumulation Index do not prevent a very
serious decline if there is a clear key support failure.
I have mentioned mid-1930 before as a key point where history parallels the present,
because of Hoover's efforts to balance
the budget soon after a market crash (1929)
during a severe recession. Mid-1937
was the other prime example in the US of the
dangers to the market of budget balancing
while unemployment was high. Bernanke
alluded
to this: "Bernanke wasn't shy in offering Congress more advice: He
reiterated his
warning that lawmakers should not cut
spending sharply while the economy is weak."
They key point here, and I have mentioned
it frequently, is that Peerless Buys
should be
considered reversed by a judged Sell S10 (a key well-tested
support failure), as was true in
945. The 1930 and 1945 charts are
shown at the bottom of today's report.
CL/MA
ANNROC
P-I P-ch IP21
V-I
Ocpt
Outcomet
10/3/2011
.957 -.893
-392 -53 -.064
-281 +.028 ???????
6/30/2010 .961 -.292
-6 45 -.07
-166 -.039 Recovery
6/6/1930 .977
.009 -28 -23
-.023 -295 .375 Severe
Bear Market
6/30/2010
6/30/2010 |
10/3/2011
10/3/2011 |
Unfortunately, we are also only in
early October. We have 6 more weeks of still seasonal
bearishness to contend with.
Most disconcerting technically is the now
near free-fall occurring in
mid-caps and secondary stocks. Look at how fast
the IWM is falling. But
notice, too, that the CLosing Power and Accumulation
Index are not confirming the
severity of the decline. There is hope, though
the minimal bearishness inherent in
IWM's pattern gives a downside target of
54, 7 points lower than today's
close.

Both Opening and CLosing Power are
falling now for the key general market
ETFs. This is the recipe for a panic if the DJI does not hold support. In a
panic,
the last bastions for investors give way. Already
REITs have broken down
badly. Today, the strong biotechs sold off.
They may be anticipating a failure
of DJI 10580. Unlike in 2008 when the panic was total, GLD
actually rose today
and is still above a rising 149-day (30 wk ma). Another big decline by GLD could
make the current market look lime 2008. So would a decisive new yearly low by
Crude Oil.
Stick with
the CP Downtrend
and Bearish MINCP Stocks
The falling Closing Power and bearish MINCP stocks
have worked nicely for us
in
this cruel decline. Stay short a
good assortment of the many bearish MINCP stocks
we
have shown here. They
consistently do worse than the major ETFs. Example:
Bearish MINCP STOCKS
Outperform DIA on Downside by 4x
Bearish MINCP 9/21
10/3 Change
Stocks
----------------------
---------- --------- -------------
FSLR
73.52 57.9 -21.2%
TZOO
27.87 21.02 -24.6%
BAC
6.38 5.53
-13.3%
NAT
15.8 12.29 -22.2%
JOE
15.57 14.79 -5.0%
TSL
7.75 5.58
-28.0%
FARM
5.16 5.15
0
FORM
6.71 5.97
-11.0%
PETS
9.11 8.57
-5.9%
KWT
5.37 4.22
-21.4%
JRCC
7.74 5.55
-28.3%
============================================
Avg. = -16.4%
DIA
110.94 106.36 - 4.1%
Hold only biotechs that can stay above their rising 65 day
ma.
and, as a precaution, sell 1/2 of the positions if they close below their 21-day
ma in
this environment with a CP below its 21-day ma.

1930 Breakdown
The key indicators belatedly confirmed the breakdown
in 1930.

1945 H/S Versus Buys

===================================================================================
9/302011
DJI = 10913 la/ma= .977 21-dmaROC=-.744 P = -340 (-131) IP21= -.047 V= -254 OP= +.045
BREADTH
STATISTICS:
17 MAXCP stocks Bullish MAXCP
Stocks only 2
stocks!
425
MINCP stocks
Bearish MINCP Stocks
MAXCP stocks are those showing Tiger Closing Power making new highs.
This suggests heavy Professional Buying. Applying the Tiger Power Ranker's
"bullish" to the MAXCP stocks find those with heavy insider buying and
institutional accumulation. Bearish MINCP stocks show the opposite.
Also use the BOTHUPs condition with MAXCPs and BOTHDOWNS MINCPS.
9.30.11 2 new highs on NASDAQ. 155 new lows on NASDAQ
15 new
highs NYSE
197 new lows on NYSE
9/30/2011 ===> See Key Peerless TigerSoft Index
Charts: Industry Groups and ETFs
DIA SPY QQQ DJIA-Peerless
TigerDJI TigerSPY TigerQQQ GLD SLV Crude
Will Buy B7 and B17 Prevent A Serious Breakdown?
Near Term: updated last 9/30/2011
------------------- Closing
Power (CP) Status Report: CHARTS:---------------------
3 ETFs' Closing Powers are FALLING and now below their 21-day ma
As long as Closings are FALLING, a decline seems likely until price
support is reached.
DIA BELOW
CP DOWNtrendline - A close of
2.85 ABOVE the Opening is needed tomorrow to break the CP DOWNtrend.
DIA CP is below its CP 21-dma while Openings are in decline.
SPY BELOW CP DOWNtrendline - A close of 4.32
ABOVE the Opening is needed tomorrow to break the CP DOWNtrend.
SPY CP is still below its CP 21-dma while Openings are in decline.
QQQ BELOW CP DOWNtrendline - A close of 2.75
ABOVE the Opening is needed tomorrow to break the CP DOWNtrend.
QQQ CP is still below its CP 21-dma while
Openings are in decline.
GLD
Just above CP DOWNtrendline - A close MORE than 2.70 below the
Opening would restore the CP DOWNtrend.
New TigerSoft Exploded Charts shows
exactly how much of a move from the Opening
to the Close is needed to break the Closing Power trendline. Note that a visual break will require,
at least .25 more of a penetration of the calculated uptrend. We have been using
visual
CP trend-breaks. http://tigersoft.com/CP-Trendbreaks/index.html
-------------------------------------------------------------------------------------------------------------------------------
9/30/2011
Notice - The Hotline's address will
change on Wednesday night. Look for an email from us
Monday if you
subscription is current. If we make a mistake, which is not exactly unheeard of,
just email us.
Renewals are $350 by check and $360 by CC. You can get Data, Hotline, Updates
anbd Stocks'
Hotline for $595 by CC.
I fugured out how
to fix my broken cimputer, so the Hotlines will get longer again. I hope that
is not a problem.
NYSE A/D Line Is Out-Performing the DJI. This Will Help The
10580 Support Hold.
But The History of
Autumns before A Presidential Election Suggests That
We Will Not Be Safe
until November. Stay Hedged with Bearish MINCP
Stocks. Shorts
Should Be More Heavily Weighted.
Trust that there is a reason, which we
probably have not heard on the news yet,
why Professionals are
so bearish, that they are selling down hundreds and hundreds
of stocks to new lows
and bidding up only a handful. The Peerless Buy B9 and
Buy B17 signals work a high percentage of the time, but they
can and should be reversed
by a DJI closing
failure to hold above a lengthy, well-tested support failure. Our Stocks'
Hotline still holds a
several biotechs, but we are short 3x more stocks than we are long.
Note that we sold all
our Tahiti stocks when the DJI broke the 11700 support failure
in late July, because
of the multiple Sell S9v. We will now have to see if the test of
support at 11600 will
hold or not. If it does hold and the CLosing Power is violated,
we will buy DIA and
IBM, most likely among the DJI-30.
Friday's Buy
B7 and Monday's Buy B17 Must Now Hold the DJI up.
If its close breaks 10580, look
for a 1000 point deeper decline.
In the chart below, see how
the well-tested support line in the DJI
now crosses at 10580.
Next study the charts of earlier key
breaks in well-tested
support.
9/30/2011 Key Support failures in DJI since 1929
Looking at all the major support failures since 1928, we see that
the most bearish of them
occur when the NYSE A/D Line is
is much weaker than than the
DJI (1929, 1930, 1973) or there is a
breaking of the neckline in a
head/shoulder pattern (1962) or a
hands-above-the-head pattern
(1987). The least bearish breakdown
occurred when the A/D Line
was clearly stronger than the DJI
(1997 - brief breakdown
shakeout) and 2010 (a marginal one-day
breakdown and then a big
rally.
Our case now shows a rising A/D Line during the period when the
key suppport level was
forming. So, that is generally bullish. Unfortunately,
more and more NYSE stocks are
primarily dividend plays and are
benefitting from the very low
interest rate environment. So, some
would say that that a rising
A/D Line is not so protective against
a bear market. They can
point to the very strong A/D Line for 5 months
after the 9/11 terrorist
attack which was then followed by a bear market
that did not end until
October 2002.
That Bonds now are the only
group with more than 50% of their stocks
above the 65-day ma shows
just how defensive the market is now. Has the
bearishness and pessimism
become too great? If we are in a time-loop
back to 1930, it can get a
lot worse. Balancing the budget, as Europe seeks to do,
in the middle of a recession,
is very dangerous and reminiscent of 1930 and
1937.
The 1977 bear
market also showed a misleadingly strong A/D Line in its
first half. Government spending cut-backs real or planned then dropped
the
market, as is happening now
1977. Carter's federal fiscal policies are mostly
forgotten but I recall them
as being suprisingly austere, reflecting his
tenure and experience as a
Southern governor.
" The combination of rising prices, persistent unemployment, and a
stagnant economy
had by 1977, when Carter took office, been dubbed "stagflation." The Carter
administration
sought to slow inflation by raising interest rates and restraining federal spending.
Along with other measures, the program of federal fiscal austerity that Carter followed
eventually
brought inflation under control but at considerable political cost. Wage workers, a core
Democratic Party constituency, fared poorly under Carter's economic prescriptions. In the
battle to control inflation, administration policies encouraged reduced employment"
Source.
Seasonality will not become
bullish until after Thanksgiving, 11/24.
For now the market will have to struggle to stay upright. Consider the bottoms
to decline in the Fall of years before the Presidential Election. Rallies
regularly occur but they November is the month of most bottoms. I mark
those in BLUE (9). October bottoms (7) are marked in RED.
2007 - Exceptional - Bottom 11/20 and rally
ended at upper band, only to start a bear market.
2003 - rising market - 9/30 was dip to lower band.
1999 - Bottom 10/18 followed by rally above
upper band.
1995 - rising market
1991 - 10/7 bottom and rally almost to upper
band,
1987 - 10/19 bottom and rally to upper band
1983 - 11/7 bottom and
rally to upper band.
1979 - 11/6 bottom and rally above upper
band
1975 - 10/1 bottom and rally to upper band
and beyond.
1971 - 11/24 bottom and rally above upper
band.
1967 - 11/8 bottom and rally above upper
band.
1963- 11/22 bottom and rally above upper
band.
1959 - 9/22 bottom and rally above upper band.
1955 - 11/11 bottom and rally above upper
band
1951 - 11/7/ bottom and rally to uppe rband.
1947 - 9/26 bottom and rally to upper band
1943 - 11/30 bottom and rally above upper
band
1939 - rising market
1935 - 10/2 dip to lower band in rising
market
1931 - 10/2 dip to lower band in rising
market
1927 - 10/24 bottom and rally above upper
band
2011 Shows Rising NYSE A/D Line.
Historically, This Argues against a Breakdown.


===================================================================================
Older Hotline
===================================================================================
9/292011
DJI = 11154 la/ma= .995 21-dmaROC=-.43 P = -209 (+24) IP21= -.005 V= -179 OP= +.146
BREADTH
STATISTICS:
10 MAXCP stocks Bullish MAXCP
Stocks only 1
stock!
336
MINCP stocks
Bearish MINCP Stocks
MAXCP stocks are those showing Tiger Closing Power making new highs.
This suggests heavy Professional Buying. Applying the Tiger Power Ranker's
"bullish" to the MAXCP stocks find those with heavy insider buying and
institutional accumulation. Bearish MINCP stocks show the opposite.
Also use the BOTHUPs condition with MAXCPs and BOTHDOWNS MINCPS.
9.29.11 2 new highs on NASDAQ. 100 new lows on NASDAQ
4 new
highs NYSE
48 new lows on NYSE
9/29/2011 ===> See Key Peerless TigerSoft Index
Charts: Industry Groups and ETFs
DIA SPY QQQ DJIA-Peerless
TigerDJI TigerSPY TigerQQQ GLD SLV Crude
Near Term: updated last 9/29/2011
------------------- Closing
Power (CP) Status Report: CHARTS:---------------------
3 ETFs' Closing Powers are FALLING but above their 21-day ma
As long as Closings are FALLING, a decline seems likely
though there is a chance for the CP torally from the 21-dma, which is
now shown in the CP charts. See the now red Tiger Candle-Stick
chart of SPY below.
DIA BELOW
CP DOWNtrendline - A close of
2.46 ABOVE the Opening is needed tomorrow to break the CP DOWNtrend.
DIA CP is still above its CP 21-dma while Openings are in decline.
SPY BELOW CP DOWNtrendline - A close of 341 ABOVE the
Opening is needed tomorrow to break the CP DOWNtrend.
SPY CP is still above its CP 21-dma while Openings are in decline.
QQQ BELOW CP DOWNtrendline - A close of 2.34ABOVE the
Opening is needed tomorrow to break the CP DOWNtrend.
QQQ CP is still above its CP 21-dma while Openings are in decline.
GLD
BELOW CP DOWNtrendline - A close MORE than 0.24 above the
Opening would break the CP DOWNtrend.
New TigerSoft Exploded Charts shows
exactly how much of a move from the Opening
to the Close is needed to break the Closing Power trendline. Note that a visual break will require,
at least .25 more of a penetration of the calculated uptrend. We have been using
visual
CP trend-breaks. http://tigersoft.com/CP-Trendbreaks/index.html
-------------------------------------------------------------------------------------------------------------------------------
9/29/2011
Will
Buy B7 and B17 Prevent A Serious Breakdown?
Friday's
Buy B7 and Monday's Buy B17 Must Now Hold the
DJI up.
If it breaks 10600, look for a 1000 point deeper decline.
Fortunately,
for now, Openings are uptrending and there is a concerted
effort to
boost the DJI-30, especially its highest priced component
IBM, because
IBM has 30x the weight of BAC, Bank of America, in its
moves. Lower
capitalization stocks, such as comprise the Russell-2000
and its ETF,
IWM, are hovering near the recent lows. Professionals
are betting on
a breakdown apparently. We see this in the fact that
there are more
than 300 MINCP stocks again today, despite the rally.
The internal strength indicators remain mostly negative.
A rally to the
upper band could easily set up another S9/S12 and an
October sell-off.
We will want to watch to see if the market's breadth
expands if the
rally can continue. There is a lot of vulnerability
to the market if
the DJI cannot hold above 10600. The Fed and the
Obama Administration
(Geithner from the NY Fed) watch these technicals closely.
They
are aware of the need to not let the market breakdown now
and set up
a steep October panic. Will they succeed? They
are going to try
very hard. If heavy European and Opening Selling
starts up again,
a dangerous situation will develop. Both Opening and
CLosing Power
would start falling in unison. This is the bearish
"BOTH DOWN" pattern
that occurred in September and October 2008.
We are short more BEARISH MINCP stocks on our Stocks'
Hotline
than we are long. At this point, buy only defensive
high accumulation
stocks like IBM if you want to play this rally on the long
side. The
fact that ETFs' Closing Powers are falling denies us them
as safe
vehicles. As a matter of fact, these show bearish CP
head/shoulder
patterns.


======================================================================================
OLDER HOTLINES
======================================================================================
9/282011
DJI = 11011 -180 la/ma= .981 21-dmaROC= .559 P = -233 (-228) IP21= -.002 V= -195 OP= +.149
BREADTH
STATISTICS:
19 MAXCP stocks Bullish MAXCP
Stocks
317
MINCP stocks
Bearish MINCP Stocks
MAXCP stocks are those showing Tiger Closing Power making new highs.
This suggests heavy Professional Buying. Applying the Tiger Power Ranker's
"bullish" to the MAXCP stocks find those with heavy insider buying and
institutional accumulation. Bearish MINCP stocks show the opposite.
Also use the BOTHUPs condition with MAXCPs and BOTHDOWNS MINCPS.
9.28.11 4 new highs on NASDAQ. 103 new lows on NASDAQ
2 new
highs NYSE
72 new lows on NYSE
9/28/2011 ===> See Key Peerless TigerSoft Index
Charts: Industry Groups and ETFs
DIA SPY QQQ DJIA-Peerless
TigerDJI TigerSPY TigerQQQ GLD SLV Crude
Near Term: updated last 9/28/2011
------------------- Closing
Power (CP) Status Report: CHARTS:---------------------
Peerless Buy signal at neckline support has to be respected.
Close out shorts in DIA and SPY.
3 ETFs' Closing Powers are FALLING but above their 21-day ma
As long as Closings are FALLING, a decline seems likely
though there is a chance for the CP torally from the 21-dma, which is
now shown in the CP charts. See the now red Tiger Candle-Stick
chart of SPY below.
DIA BELOW
CP DOWNtrendline - A close of
2.15 ABOVE the Opening is needed tomorrow to break the CP DOWNtrend.
DIA CP is still above its CP 21-dma while Openings are in decline.
SPY BELOW CP DOWNtrendline - A close of 2.64 ABOVE the
Opening is needed tomorrow to break the CP DOWNtrend.
SPY CP is still above its CP 21-dma while Openings are in decline.
QQQ BELOW CP DOWNtrendline - A close of 0.47 ABOVE
the Opening is needed tomorrow to break the CP DOWNtrend.
QQQ CP is still above its CP 21-dma while Openings are in decline.
GLD
BELOW CP DOWNtrendline - A close MORE than 1.1 above the Opening
would break the CP DOWNtrend.
New TigerSoft Exploded Charts shows
exactly how much of a move from the Opening
to the Close is needed to break the Closing Power trendline. Note that a visual break will require,
at least .25 more of a penetration of the calculated uptrend. We have been using
visual
CP trend-breaks. http://tigersoft.com/CP-Trendbreaks/index.html
-------------------------------------------------------------------------------------------------------------------------------
9/28/2011
Friday's
Buy B7 and Monday's Buy B17 Must Now Hold the
Market up despite head/shoulders, bearish seasonality,
falling Closing Powers, Washington political stalemate and
Deflationary austerity fiscal policies in Europe and
Canada.
Though the CP
uptrends were broken today, they are still above
their rising 21-day ma. In addition, the steep
downtrend for
major market ETFs' Opening Powers was
broken. We should
see stronger openings for a while. Resistance is
expected at DJI 11350 now.
The near-term uptrend price trend is just below today's
close.
Deflationary Liquidity Trap in Europe.
Can US Escape? Only Bernanke Seems to be Trying to Prevent
It Here.
Foreign ETFs are weaker than
the US indexes. So are Chinese
stocks. The US may well be dragged down by a
world-wide
deflation brought about by misguided austerity policies
elsewhere.
Nowhere do we here talk of how these policies failed in
1930 and
1931. This is not leadership. This is
kow-towing to central bankers.
Gold and Silver have now caved in. Oil is
steadily falling. It sure
looks like the world has entered a deflationary liquidity
trap. This
is like a black-hole. It is self-perpetuating and
self-accelerating.
Ordinary tinkering as monetary policy offers will not work.
Bernanke
said as much today when he said that we are in an economic
crisis, where
the number who are unemployed for more than a year in the
US
could soon represent the majority of the unemployed.
The policy solutions are there. They include:
drastic cuts in wasteful military spending,
closing expensive foreign bases,
stopping stupid, expensive, unwinnable foreign wars,
massive public works spending in the US,
New Deal like youth conservation jobs,
heavy taxation of the very wealthy who invest overseas,
buy American campaigns to promote US manufacturing,
State owned banks to break the hold over tight-fisted loan policies by "too big to
fail banks"
promotion of small businesses instead of multinational corporations
and protective TARIFFs to allow US manufacturing to recover.
None are seriously offered as real alternatives. With few
exceptions, they
are not even seriously discussed by the Dems or Repubs.
The evidence
seems to point to us being in a time-warp back to 1930
economically.
Keep in mind that in 2007 the DJI had risen twice as much
in the
previous 25 years as it has in 1929. Hedging with bearish MINCP
short sales
each time the CP starts falling is recommended over hedging
against inflation with Gold or Silver. The blackout by the major media
on the very large demonstrations on Wall Street will have
to be broken
soon. Demonstrations on Wall Street are usually
accompanied by sharp
sell-offs: See 1929 and 1970.
The DIA position taken at opening Monday had to be sold
today
when the red CP uptrendline was broken. The DIA
fell sufficiently
below the opening. The amounts are posted above
here. Add ,10
or so, to guard against an intra-day whip-saw. I would not take a
short position in DIA on the CP trendbreak because of the
still operative Peerless buys. I would do some short-sale
hedging on the trend-break with some of the bearish MINCP stocks
posted here recently. It has to be bearish that professionals
have switched to the short side, by a 15:1 margin when we
compare
the number of MINCP stocks and MAXCP stocks. These
are the
number of stocks making Closing Power new lows and new highs
for the last two days.
CP downtrending short-term
Note dotted CP 21-dma in these charts now.

Above
note that the Closing Power moving averages are still rising. That gives us some
hope for a quick reversal in a day or two.
However, if the markets fail to rally in the next two
days, another test of 10600 seems likely. A closing
break of this well-tested
support will be judged a Sell S10 and H/S Neckline Break.
Such action has
over-riden premature buy signals in the past, most notably
1939, 1945 and
1951. In these cases, the DJI fell significantly
further down before recovering.
I have now added dotted lines for the CP 21-day ma. on the
exploded chart.
I will do the same thing for the Opening Power 21-day ma
and post the update
on the Elite Stock Professionals (ESP) page for downloading
to your computer.
The 21-day CP ma can still bring a reversal after the CP
trend is broken.
We just have to wait and see. Breaks of the CP ma are
apt to bring a new
selling wave. See the past SPY charts to get a sense
of this:
SPY:
TigerSoft Charts: 1993-2011: Study them to improve your technical analysis skills.
Also note, how the TigerSoft Candle Stick chart has
bearishly turned red.
2/23/2011
SPY
Candle Stock Charts: 1993-2011

======================================================================================
OLDER HOTLINES
=======================================================================================
9/27/2011 ===>
See Key Peerless TigerSoft
Index Charts: Industry Groups and ETFs
DIA SPY QQQ DJIA-Peerless
TigerDJI TigerSPY TigerQQQ GLD SLV Crude
Near Term: updated last 9/27/2011
------------------- Closing
Power (CP) Status Report: CHARTS:---------------------
Peerless Buy signal at neckline support has to be respected.
Close out shorts in DIA and SPY.
The Fearless and Peerless should hold DIA for a quick rally to
resistance at 114.
This could have been bought at the Opening on Monday, 108.41
3 ETFs' Closing Powers are rising and above their 21-day ma
As long as Closings are RISING, rally should continue. See red/blue Tiger Candle-Stick chart of SPY..
DIA ABOVE
CP uptrendline - A close of
1.05 BELOW the Opening is needed tomorrow to break the CP uptrend.
DIA CP is back above its CP 21-dma while Openings are in decline.
SPY ABOVE CP uptrendline - A close oo 0.51 BELOW the
Opening is needed tomorrow to break the CP uptrend.
SPY CP is back above its CP 21-dma while Openings are in decline.
QQQ ABOVE CP uptrendline - A close of 0.91 BELOW the
Opening is needed tomorrow to break the CP uptrend.
QQQ CP is back above its
CP 21-dma while Openings are in decline.
GLD
CP triangle - A close MORE than 2.8 above the Opening would break the
CP DOWNtrend.
New TigerSoft Exploded Charts shows
exactly how much of a move from the Opening
to the Close is needed to break the Closing Power trendline. Note that a visual break will require,
at least .25 more of a penetration of the calculated uptrend. We have been using
visual
CP trend-breaks. http://tigersoft.com/CP-Trendbreaks/index.html
-------------------------------------------------------------------------------------------------------------------------------
9/27/2011
Friday's
New Buy B7 had a Buy B17 Reinforcing It on
Monday.
The
Closing Powers are still rising. The rally takes place despite
the widespread public disbelief and pessimism. The
Professionals
are betting on higher prices. So should we, though we will take
trading profits in DIA at 114 or if the CP violates the CP
uptrend
towards the CLose. The backing off of the highs today reflects the
large supply of stock that is overhead.
===================================================================================\
OLDER HOTLINES
===================================================================================
9/26/2011
DJI = 11045 +272 la/ma= .981 21-dmaROC= -.112 P = -9 (+144) IP21=
+.11 V= -105 OP= +.23
BREADTH
STATISTICS:
121 MAXCP stocks Bullish MAXCP Stocks
50 MINCP stocks
Bearish MINCP Stocks
MAXCP stocks are those showing Tiger Closing Power making new highs.
This suggests heavy Professional Buying. Applying the Tiger Power Ranker's
"bullish" to the MAXCP stocks find those with heavy insider buying and
institutional accumulation. Bearish MINCP stocks show the opposite.
Also use the BOTHUPs condition with MAXCPs and BOTHDOWNS MINCPS.
9.26.11 3 new highs on NASDAQ. 72 new lows on NASDAQ
5 new
highs NYSE
43 new lows on NYSE
9/26/2011 ===>
See Key Peerless TigerSoft
Index Charts: Industry Groups and ETFs
DIA SPY QQQ DJIA-Peerless
TigerDJI TigerSPY TigerQQQ GLD SLV Crude
Near Term:
updated last 9/26/2011
------------------- Closing
Power (CP) Status Report: CHARTS:---------------------
Peerless Buy signal at neckline support has to be respected.
Close out shorts in DIA and SPY.
The Fearless and Peerless should hold DIA for a quick rally to
resistance at perhaps 114.
This could have been bought at the Opening on Monday, 108.41
3 ETFs' Closing Powers are rising and above their 21-day ma
As long as Closings are strong, rally should continue. See red/blue Tiger Candle-Stick chart of SPY..
DIA BELOW
CP uptrendline - A close of
2.05 BELOW the Opening is needed tomorrow to break the CP uptrend.
DIA CP is back above its CP 21-dma while Openings are in decline.
SPY BELOW CP uptrendline - A close oo 1.87 BELOW the
Opening is needed tomorrow to break the CP uptrend.
SPY CP is back above its CP 21-dma while Openings are in decline.
QQQ BELOW CP uptrendline - A close of 0.60 BELOW the
Opening is needed tomorrow to break the CP uptrend.
QQQ CP is back above its
CP 21-dma while Openings are in decline.
GLD
CP triangle - A close MORE than 2.51 above the Opening would break
the CP DOWNtrend.
New TigerSoft Exploded Charts shows
exactly how much of a move from the Opening
to the Close is needed to break the Closing Power trendline. Note that a visual break will require,
at least .25 more of a penetration of the calculated uptrend. We have been using
visual
CP trend-breaks. http://tigersoft.com/CP-Trendbreaks/index.html
-------------------------------------------------------------------------------------------------------------------------------
Friday's
New Buy B7 had a Buy B17 Reinforcing It today
(Monday).
1) Bearish Seasonality ---- this lasts until the 20th of October...
2) Head/Shoulders -- a DJI close
above 11700 is needed to abort the pattern...
3) Bernanke versus Republicans -- Bernanke seems to be as sure in his opinions as the T-Partyers.
4) "Tax The Rich" versus "No New Taxes" - Populist talk surely scares the wealthy who own most
stocks.
5) Another US Debt Crisis Looms - It's
not over until the T-Party folks learn the advantages gov't offers.
6) European Austerity Policies Match Those of 1930 - 1923 Weimar Germany's experience is an obsession.
7) European Bankers Put Squeeze on Greece - And they have the EEC making their demands for them.
8) American Bankers' Loans Dry up despite Their Profitability - No
pressure on them from Obama,
Geithner, the Fed or the T=Party-goers. If the Gov't really wanted to stimulate,
it would encourage states to set up publicly owned banks like the Bank of ND.
California is looking into thjis possibility tohelp homeowners and small business folks.
We see very strong Closing Powers.
Professionals' opinions fly in the face of prevailing skepticism and
disgust at the market among many, many individual traders. Go to any Yahoo
site dealing with the general
market or comments about the news and you will see this conflict of opinions.
Europeans and Asians, as a whole,
are very bearish, too. What do the professionals know who keep buying?
I presume it is that the FED is
absolutely determined not to let the market drop. The Buy B17's bullish history can
be seen here.
http://tigersoft.com/PeerInst/--Buy-B17.htm

See the Buy B7s on the DIA and SPY charts.
===================================================================================\
OLDER HOTLINES
===================================================================================
9/23/2011
DJI = 10771 +38 la/ma= .9566 21-dmaROC=-.579 P = -153 (-18) IP21=
+.036 V= -175 OP= +.129
BREADTH STATISTICS:
82 MAXCP stocks Bullish MAXCP Stocks
144 MINCP stocks Bearish
MINCP Stocks
MAXCP stocks are those showing Tiger Closing Power making new highs.
This suggests heavy Professional Buying. Applying the Tiger Power Ranker's
"bullish" to the MAXCP stocks find those with heavy insider buying and
institutional accumulation. Bearish MINCP stocks show the opposite.
Also use the BOTHUPs condition with MAXCPs and BOTHDOWNS MINCPS.
9.23.11 1 new highs on NASDAQ. 71 new lows on NASDAQ
4 new
highs NYSE
75 new lows on NYSE
9/23/2011 ===>
See Key Peerless TigerSoft
Index Charts: Industry Groups and ETFs
DIA SPY QQQ DJIA-Peerless
TigerDJI TigerSPY TigerQQQ GLD SLV Crude
------------------- Closing
Power (CP) Status Report: CHARTS:---------------------
Peerless Buy signal at neckline support has to be
respected.
Close out shorts in DIA and SPY.
The Fearless
and Peerless should buy DIA for a quick rally from support.
Because the Closing Powers are still falling, expect only a brief
rally, perhaps only two days.
Near Term:
updated last 9/23/2011
DIA BELOW
CP uptrendline - A close of
2.28 above the Opening is needed tomorrow to restore he CP uptrend.
DIA CP is back above its CP 21-dma while Openings are in decline.
SPY BELOW CP uptrendline - A close oo 3.62 above the
Opening is needed tomorrow to restore he CP uptrend.
SPY CP is back above its CP 21-dma while Openings are in decline.
QQQ BELOW CP uptrendline - A close of 1.26 above the
Opening is needed tomorrow to restore he CP uptrend.
QQQ CP is back above its
CP 21-dma while Openings are in decline.
GLD
CP triangle - A close MORE than 3.65 above the Opening would restore
the CP UPtrend.
New TigerSoft Exploded Charts shows
exactly how much of a move from the Opening
to the Close is needed to break the Closing Power trendline. Note that a visual break will require,
at least .25 more of a penetration of the calculated uptrend. We have been using
visual
CP trend-breaks. http://tigersoft.com/CP-Trendbreaks/index.html
-------------------------------------------------------------------------------------------------------------------------------
Friday's New Buy B7 versus
1) Bearish Seasonality,
2) Head/Shoulders
3) Bernanke versus Republicans
4) "Tax The Rich" versus "No New Taxes"
5) Another US Debt Crisis Looms
6) European Austerity Policies Match Those of 1930
7) European Bankers Put Squeeze on Greece
8) American Bankers' Loans Dry up despite Their Profitability
Can Friday's Peerless
Buy B7s reverse the market when it faces so
many negatives? These signals occur mainly in the aftermath of
Buy
B12s on declines to the lower band. Normally, they are reliable,
though
the Buy B7
two weeks ago gained very little facing the same forces.
The DJI's Head/Shoulder's neckline was slightly violated. 10590
offers some
last support. The slight breaking of the DJI's closing saw
multiple
non-confirmations:
P-Indicator
V-Indicator
Accum. Index
IDOSC
These
nonconfirmations show there is support at 10600-10700. But will
it be enough to hold the market up if there are another series of
very weak
openings? See the green line below and how its weakness has
been
fought by the blue line representing NY Professional buying.
The blue
Closing Power has turned up from its rising 21-day ma. This
will help the Buy B17.
Barring a DJI opening below 10590, traders have to be buyers now
for another
quick rally back above 11400. A close below 10500 will be
judged a Sell S10,
whether or not the signal appears on the screen.
Our Stocks' Hotline has said to close out at nice profits half of
the
recently shorted "bearish MINCP stocks". If you
want to wait out
the bearish seasonality for the next few weeks, you have my full
appreciation
and understanding. There are a lot of negative forces at
work now. And
the Professional buying we have just seen develop could easily
dry up and
be reversed. I respect Head and Shoulders patterns.
Normally I would
wait for their bearish downside potential to play out or for the
bearishness to
be dissipated by the downtrend of the NYSE A/D Line being /
broken. Without
one of these, waiting now seems amply reasonable.
Fearless and
Peerless traders should consider buying DIA, RGR and ALXN.


DJIA - New Buy B7.|

==================================================================================
OLDER HOTLINES
==================================================================================
9/22/2011
DJI = 10734 -391 la/ma= .951 21-dmaROC=-.466 P = -135 (-216) IP21=
+.053 V= -166 OP= +.125
BREADTH STATISTICS:
33
-13 MAXCP stocks Bullish
MAXCP Stocks
260(+37) MINCP stocks
Bearish MINCP Stocks
MAXCP stocks are those showing Tiger Closing Power making new highs.
This suggests heavy Professional Buying. Applying the Tiger Power Ranker's
"bullish" to the MAXCP stocks find those with heavy insider buying and
institutional accumulation. Bearish MINCP stocks show the opposite.
Also use the BOTHUPs condition with MAXCPs and BOTHDOWNS MINCPS.
2new highs on NASDAQ. 412 new lows on NASDAQ
5 new
highs NYSE
573 new lows on NYSE
9/22/2011 ===>
See Key Peerless TigerSoft
Index Charts: Industry Groups and ETFs
DIA SPY QQQ DJIA-Peerless
TigerDJI TigerSPY TigerQQQ GLD SLV Crude
------------------- Closing
Power (CP) Status Report: CHARTS:---------------------
Major Market ETFS' CP uptrends were bearishly broken
Wednesday.
This is usually bearish with the CPs below their mvg.avgs.
| We suggested shorting DIA and SPY on the trend-break.
Near Term:
DIA BELOW
CP uptrendline - A close of
2.90 above the Opening is needed tomorrow to restore he CP uptrend.
DIA,CP is below its CP 21-dma while Openings are in decline.
SPY BELOW CP uptrendline - A close of 4.6 above the
Opening is needed tomorrow to restore he CP uptrend.
SPY'CP is below its CP 21-dma while Openings are in decline.
QQQ BELOW CP uptrendline - A close of 1.94 above the
Opening is needed tomorrow to restore he CP uptrend.
QQQ'CP
is below its CP 21-dma while Openings are in decline.
GLD
CP triangle - A close MORE than .05 above the Opening would restore
the CP DOWNtrend.
New TigerSoft Exploded Charts shows
exactly how much of a move from the Opening
to the Close is needed to break the Closing Power trendline. Note that a visual break will require,
at least .25 more of a penetration of the calculated uptrend. We have been using
visual
CP trend-breaks. http://tigersoft.com/CP-Trendbreaks/index.html
-------------------------------------------------------------------------------------------------------------------------------
Sell Signals,
Bearish Seasonality, Head/Shoulders
Bernanke versus Republicans
"Tax The Rich" versus "No New Taxes"
Another US Debt Crisis Looms
European Austerity Policies Match Those of 1930
The DJI's Head/Shoulder's neckline was violated. 10590 offers
some
last support. The minimum downside projection using this pattern
is 9800. A decline back to 9650 would represent a 50% correction
of the move up from 6500 to 12800.|
I can't help point out that the DJI in 2007 at 14160 was up 16x from
its
low 24 years before. In 1929, the DJI was up only 8x above its
low 24
years earlier. A decline back to 7000 now would only test the
very long-term
DJI uptrend that starts back in 1900. At the same time, if the DJI can
hold above 9500, or so, we could see the third major upswing since
the March 2009 low. So 9500 will be important. Expect Obama
to do
a lot more to prevent a deeper decline. I would think that the
T-Party Congress
will have to do more than say "balance the budget" and
"no new taxes".
Otherwise, we are probably all be doomed to see a repeat of 1930-1931.
Some would point out that the market has held up extraordinarily in
the face of so many negatives. But, I see no reason to buy here
at the
earlier lows when downside volatility is so great, Even if we had
a
buy signal, I would urge traders to let the bearishness of the
DJI's
head/shoulders pattern play itself out. See the charts of past
head/shoulders patterns where Buy B17s could not prevent a breaking
of support and a DJI decline substantially lower: 1939, 1945 and 1952.
When these patterns appear, it often helps to watch closely the
downtrend of the NYSE A/D Line... It can't be good that even Gold is
in a steep decline. Bonds are the only haven now.
Hold all the short positions. Our Stocks' Hotline is long 2
stocks and short
more than a dozen.

==================================================================================
OLDER HOTLINES
==================================================================================
9/21/2011
DJI = 11125 -283 la/ma= .984 21-dmaROC= .285 P = 80
(-85) IP21= +.135 V= -55 OP= +.245
BREADTH STATISTICS:
46
-119 MAXCP stocks Bullish
MAXCP Stocks
223(+146) MINCP stocks
Bearish MINCP Stocks
MAXCP stocks are those showing Tiger Closing Power making new highs.
This suggests heavy Professional Buying. Applying the Tiger Power Ranker's
"bullish" to the MAXCP stocks find those with heavy insider buying and
institutional accumulation. Bearish MINCP stocks show the opposite.
Also use the BOTHUPs condition with MAXCPs and BOTHDOWNS MINCPS.
3 new highs on NASDAQ. 232 new lows on NASDAQ
4 new
highs NYSE
273 new lows on NYSE
9/21/2011 ===>
See Key Peerless TigerSoft
Index Charts: Industry Groups and ETFs
DIA SPY QQQ DJIA-Peerless
TigerDJI TigerSPY TigerQQQ GLD SLV Crude
------------------- Closing
Power (CP) Status Report: CHARTS:---------------------
Major Market ETFS' CP uptrends were broken
today.
This is usally bearish, though the CPs are stlll above their mvg.avgs.
If the ma are tested but no penetrated, a short-term rakky
usually follows.
The CP uptrends can be revived if the CP gets back the broken CP uptrendline.
Near Term:
DIA above
CP uptrendline - A close of
1.69 above the Opening is needed tomorrow to restore he CP uptrend.
DIA,CP is still above its CP 21-dma while Openings are in decline.
SPY above CP uptrendline - A close of 3.45 above the
Opening is needed tomorrow to restore he CP uptrend.
SPY'CP is still above its CP 21-dma while Openings are in decline.
QQQ above CP uptrendline - A close of 1.26 above the
Opening is needed tomorrow to restore he CP uptrend.
QQQ'CP
is still above its CP 21-dma while Openings are in decline.
GLD
CP triangle - A close MORE than .15 below the Opening would break
the CP DOWNtrend.
New TigerSoft Exploded Charts shows
exactly how much of a move from the Opening
to the Close is needed to break the Closing Power trendline. Note that a visual break will require,
at least .25 more of a penetration of the calculated uptrend. We have been using
visual
CP trend-breaks. http://tigersoft.com/CP-Trendbreaks/index.html
-------------------------------------------------------------------------------------------------------------------------------
Sell Signals,
Bearish Seasonality, Head/Shoulders
Bernanke versus Republicans
"Tax The Rich" versus "No New Taxes"
I think we can
expect the DJI to re-test 10700, given the operative Peerless Sell signals,
the emerging head/shoulders pattern, the Republicans demand that Bernanke not
try to stimulate the economy anymore and the tax-the-rich rhetoric of the
Administration,
Add all these negatives to the bearish seasonality for the next two weeks, in
which the DJI
rallies only 44% of the time typically since 1966 over the next two weeks.
Because the
P-Indicator and Accum. Index are quite positive, it is possible that we will
get a buy signal
on a decline to 10800. Short-term trraders should have sold sort DIA or
SPY today,
as the Closing Power uptrends were broken. Our Stocks' Hotline is
overwhelmingly
short bearish MINCP stocks. These have mostly kept on declining,
despite the rally.
If they can't go up in a bullish period, what will they do in a very weak
market? It
is significant, I think that so many more stocks are making new lows than new
highs,
that the number of MINCP stocks far exceeds MAXCP stocks and the NYSE A/D
Line
is on the verge of a break in its recent uptrendline, possibly ahead of the
DJI itself.
Our study of DJI head and shoulders patterns recommends shorting when the A/D
Line
uptrend is broken following the development of a symetrical right shoulders
in a head
and shoulders pattern. In addition, there are a number of cases, where,
despite a
Peerless Buy signal, the DJI must play out the bearish potential in a
completed
head and shoulders pattern. This means a close below 11700 would trump
any Peerless
buy signal until we see other evidence of a bottom. My guess is that a
bottom will
be made near 9800 in early October.

==================================================================================
OLDER HOTLINES
==================================================================================
9/20/2011
DJI = 11409 +5 la/ma= 1.01 21-dmaROC= .624
P = 165 (+35) IP21= +.151 V= -9 OP= +.36
BREADTH STATISTICS:
165 MAXCP stocks Bullish MAXCP Stocks
77 (+36) MINCP stocks
Bearish MINCP Stocks
MAXCP stocks are those showing Tiger Closing Power making new highs.
This suggests heavy Professional Buying. Applying the Tiger Power Ranker's
"bullish" to the MAXCP stocks find those with heavy insider buying and
institutional accumulation. Bearish MINCP stocks show the opposite.
Also use the BOTHUPs condition with MAXCPs and BOTHDOWNS MINCPS.
? new highs on NASDAQ. ? new lows on NASDAQ
10 new
highs NYSE
47 new lows on NYSE
9/20/2011 ===>
See Key Peerless TigerSoft
Index Charts: Industry Groups and ETFs
DIA SPY QQQ DJIA-Peerless
TigerDJI TigerSPY TigerQQQ GLD SLV Crude
------------------- Closing
Power (CP) Status Report: CHARTS:---------------------
Major Market ETFS' CP downtrends were broken last
Monday.
Short-term bullish Uprends are in place.
The ETFs' Closing Powers have stretched a long ways above the
21-day ma. Usually this brings a CP pullback
closer to the 21-dma. If it does and there is another move up by the
CP, we will use the new steeper CP uptrendline.
Near Term:
DIA above
CP uptrendline - A close of
1.63 below the Opening is needed tomorrow to break the CP uptrend.
DIA is still above its CP 21-dma while Openings are in decline.
SPY above CP uptrendline - A close of .69 below the
Opening would break the CP uptrend.
SPY is still above its CP 21-dma while Openings are in decline.
QQQ above CP uptrendline - A close of .36 below the
Opening would break the CP uptrend.
QQQ
is still above its CP 21-dma while Openings are in decline.
GLD
CP triangle - A close MORE than .87 above the Opening would break
the CP DOWNtrend.
New TigerSoft Exploded Charts shows
exactly how much of a move from the Opening
to the Close is needed to break the Closing Power trendline. Note that a visual break will require,
at least .25 more of a penetration of the calculated uptrend. We have been using
visual
CP trend-breaks. http://tigersoft.com/CP-Trendbreaks/index.html
-------------------------------------------------------------------------------------------------------------------------------
OPENING POWER
versus CLOSING POWER
Peerless Sells versus Rising CLOSING POWER
Bernanke versus Bearish Seasonality
"Tax The Rich" versus "No New Taxes"
Finally, the key ETFs closed below their openings. This
is bearish, though the Closing Power uptrends are still in
place. Look at the TigerSoft CandleStick SPY chart below.
Today see what I call, perhaps irreverently, an upside down
red popsickle. This formation I have previously studied.

"Upside-down red popsickles" have a distinctly bearish track record.
See 2/23/2011 SPY Candle Stock
Charts: 1993-2011
Stay Bearishly Hedged
As for the general market, my observations from last night still stand.
Most likely, there will be a retreat from 11600 on the DJi and the apex of
right shoulder in the DJI's bearish continuation head and shoulders pattern.
Respect the seasonally bearish two-week period we are entering now with the
start of Fall.
TIGER Stock Trading Tools
Closing Powers changes of directions are reflected in Tiger's Candle Stick charts.
Blue Candle Stick bars imean the CP was rising. Red means CP was falling that
day. We use CP trendlines and moving averages to spot when a significant tend
change occurs. "Popsickle" patterns in Candle Stick charts is
another.


Here are some other notions for trading stocks with TigerSoft..
1) FSLR fooled us for a day last week. It broke
above its steep downtrending
closing Power for one day and then began a new steep decline.
The internals were weak and when the CLosing Power turned down again,
I recommended re-shorting the stock. As a bearish MINCP stock
it showed sustained selling pressure. Its declining CLosing Power turned
down at its falling 21-day ma. The 21-day ma of CP will have to be added to
the exploded graphs.
2) The immportance of sustained institutional selling has to be stressed.
Look for stocks with AI/200 scores under 80, or even lower whose
red distribution is growing. See the charts of FORM. TSL and TZOO
3) Another thing to understand is that as fewer growth stocks make
new highs, thjse that do get even more attention and move up
faster than normal. ALXN is an example of this.
4) Look for unusually posiitve or negative CLosing Power days.
These show Professionals jumping in, either as heavy buyers or
sellers. Expect prices to move in the direction the Pros want.
The old TigerSoft Candle Stick charts let you spot such unusual
Propfessional (blue) buying or selling. GR shows this to
the upside.
MNTA shows it on the downside. Also see how WMGI's bullish breakout
was picked up on by a 5 straight Blue days.
==================================================================================
OLDER HOTLINES
==================================================================================
9/19/2011
DJI = 11404 -110 la/ma= 1.012 21-dmaROC=
.438 P = 129 (+51) IP21= +.126 V= -46 OP= +.230
BREADTH STATISTICS:
236 (+60) MAXCP stocks Bullish MAXCP Stocks
41 (+8) MINCP stocks
Bearish MINCP Stocks
MAXCP stocks are those showing Tiger Closing Power making new highs.
This suggests heavy Professional Buying. Applying the Tiger Power Ranker's
"bullish" to the MAXCP stocks find those with heavy insider buying and
institutional accumulation. Bearish MINCP stocks show the opposite.
Also use the BOTHUPs condition with MAXCPs and BOTHDOWNS MINCPS.
16 new highs on NASDAQ. 54 new lows on NASDAQ
10 new
highs NYSE
47 new lows on NYSE
9/19/2011 ===>
See Key Peerless TigerSoft
Index Charts: Industry Groups and ETFs
DIA SPY QQQ DJIA-Peerless
TigerDJI TigerSPY TigerQQQ GLD SLV Crude
------------------- Closing
Power (CP) Status Report: CHARTS:---------------------
Major Market ETFS' CP downtrends were broken
Monday. Short-term bullish Uprends are in place.
The ETFs' Closing Powers have stretched a long ways above the
21-day ma. Usually this brings a CP pullback
closer to the 21-dma. If it does and there is another move up by the
CP, we will use the new steeper CP uptrendline.
Near Term:
DIA above
CP uptrendline - A close of
2.36 below the Opening is needed tomorrow to break the CP uptrend.
DIA is still above its CP 21-dma while Openings are in steep decline.
SPY above CP uptrendline - A close of 1.90 below the
Opening would break the CP uptrend.
SPY is still above its CP 21-dma while Openings are in steep decline.
QQQ above CP uptrendline - A close of 1.24 below the
Opening would break the CP uptrend.
QQQ
is still above its CP 21-dma while Openings are in steep decline.
GLD
CP triangle - A close MORE than 3.46 above the Opening would break the CP
DOWNtrend.
New TigerSoft Exploded Charts shows
exactly how much of a move from the Opening
to the Close is needed to break the Closing Power trendline. Note that a visual break will require,
at least .25 more of a penetration of the calculated uptrend. We have been using
visual
CP trend-breaks. http://tigersoft.com/CP-Trendbreaks/index.html
-------------------------------------------------------------------------------------------------------------------------------
OPENING POWER
versus CLOSING POWER
Overseas Selling vs US Buying
Peerless Remains on a Sell ... Expect Much Keener Resistance Now,
Closing Power's Uptrend Shows US Professionals Are
Buying
from Europeans. Usually, the US Pros Win out so long as they
keep making Closings stay above Openings in N.Y. They Must
Know Bernanke Is Going To Unveil A New Plan to Buy US Debt.
But they could be wrong. And the start of Fall (tomorrow) often
brings a fall in the market. Stay hedged with an emphasis on the Bearish
MINCP Stocks. Wait to go short the ETFS until their CLosing
Power uptrends are broken.
The 6-day pattern of late has been a weak
opening and a strong close.
Look for a
strong opening and a weak close to signal a reversal. This will
change the
color of the Tiger candlestic bars from to blue to red. This has
typically
been a reversal point, for the last year...


Foreign
ETFs have been the weakest group we follow. Europeans sold to
American professionals.
The DJI had been down more than 200
points, but recovered about half that. The key US ETFs found support
at their 21-day ma and then turned up.
Two immediate forces are in conflict. Will big banks be bailed
out of their exposure to Southern
European Debt AND what will Bernanke do to lift the market. when
the Fall (Autumn) starts?
As we are on a sell from Peerless
and there appears to ample resistance at 11600 and the apex of
the right shoulder in the DJI's
head/shoulder pattern, I think a retreat back to 11000 is likely after
the Fed announces its new policy at
the end of the month.
But, as long as the key Closing
Pwers are rising, the market will not fold and any decline is apt to be
shallow. If the Closing
Powers were to break their uptrends, look for a decline back to the neckline at
10800, and if that is broken to
9700. As long as the key ETFs (QQQ, SPY and DIA) do not break
their CP uptrend-lines, there is a
good chance in October for a move by the DJI back up to 12000.
The seasonality of the next two
weeks works against this. But one thing I am struck by is how the
weekly DJI chart shows we have seen
only two major surges upward since the March 2009 bottom.
A third one often occurs, according
to Elliot Wave analysis, and
before a big drop and a bear market,
we usually see the weekly A/D
Line failure to confirm a new hhigh. That has not been seen yet. The low
interest rate environment does
encourage speculation, and this may help explain the NASDAQ's
outperforming the DJI.
See http://en.wikipedia.org/wiki/Elliott_Wave_Principle
|
News Opposites Stocks slide as worries about Greek debt persist Bernanke is tolerating dissent but pushing past it |
 |
WEEKLY DJIA
=================================================================================
OLDER HOTLINES
=================================================================================
9/16/2011
DJI = 11509. +76 la/ma= 1.023 21-dmaROC=
.105 P = -78 (-26) IP21= +.003 V= -87 OP= +.213
BREADTH STATISTICS:
176 (-29) MAXCP stocks Bullish MAXCP Stocks
33 (+6) MINCP stocks
Bearish MINCP Stocks
MAXCP stocks are those showing Tiger Closing Power making new highs.
This suggests heavy Professional Buying. Applying the Tiger Power Ranker's
"bullish" to the MAXCP stocks find those with heavy insider buying and
institutional accumulation. Bearish MINCP stocks show the opposite.
Also use the BOTHUPs condition with MAXCPs and BOTHDOWNS MINCPS.
new highs on NASDAQ. new lows on NASDAQ
new
highs NYSE
new lows on NYSE
9/16/2011 ===>
See Key Peerless TigerSoft
Index Charts: Industry Groups and ETFs
DIA SPY QQQ DJIA-Peerless
TigerDJI TigerSPY TigerQQQ GLD SLV Crude
------------------- Closing
Power (CP) Status Report: CHARTS:---------------------
Major Market ETFS' CP downtrends were broken
Monday. Short-term bullish Uprends are in place.
The ETFs' Closing Powers have stretched a long ways above the
21-day ma. Usually this brings a CP pullback
closer to the 21-dma. If it does and there is another move up by the
CP, we will use the new steeper CP uptrendline.
Near Term:
DIA above
CP uptrendline - A close of
2.05 below the Opening is needed tomorrow to break the CP uptrend.
DIA is still above its CP 21-dma while Openings are in steep decline.
SPY above CP uptrendline - A close of 1.69below the
Opening would break the CP uptrend.
SPY is still above its CP 21-dma while Openings are in steep decline.
QQQ above CP uptrendline - A close of 2.05 below the
Opening would break the CP uptrend.
QQQ
is still above its CP 21-dma while Openings are in steep decline.
GLD
CP triangle - A close less than 1.14 above the Opening would break the CP
uptrend.
New TigerSoft Exploded Charts shows
exactly how much of a move from the Opening
to the Close is needed to break the Closing Power trendline. Note that a visual break will require,
at least .25 more of a penetration of the calculated uptrend. We have been using
visual
CP trend-breaks. http://tigersoft.com/CP-Trendbreaks/index.html
OPENING POWER
versus CLOSING POWER
Overseas Selling vs US Buying
Peerless Remains on a Sell
... Expect Much Keener Resistance,
Closing Power's Uptrend Shows Professionals Have Been Bullish...
Foreign
ETFs have been the weakest group we follow. The Austrian economic
school of thought
dominates all the European governments at
the moment. My studies convince me that this is very bearish,
The mainstream media completely neglects
this as they talk about heroic efforts in Brussels, Paris
and Berlin to save tre Euro and bailout
Greece, etc. The truth is that the Austrian school of economics
fixates on balanced budgets. This
is a 19th century philosophy. This was applied full blown and
blindly in 1930-1932 . High
unemployment was turned into a Depression. The only major country
to recover economically in the 1930s was
NAZI Germany, where politics over-ruled archaic economic
thinking. The Budget in the US
shows a deep deficit. Despite what we are told, this is what keepijng us
out of a Depression. It may explain
why the US stock market is out-performing foreign stock exchanges.
If I am right, the only way the US will
be able to be avoid being dragged down is to put up trade barriers
and consciously rebuild its own
industries for a much bigger internal market with lots of government
assistance.
FOREIGN ETFS WEAKER THAN DJI
Relative Strength Line makes New Low
 .
.
BEARISH TECHNICAL SIGNS
The 5-day straight-up rally this week has left the DJI 2.3% over its 21-day ma.
For the next two weeks, iIt will have a
harder time advancing. It has reached the resistance
of the apex of a right shoulder in a
potential continuation head and shoulder
pattern. While a move above the apex,
about 11600, would force shorts to admit
that this bearish pattern is
self-destructing, any decline now would tend to
confirm the pattern and cast its shadow
over the market. Cynics have to believe
the market will do what is least
expected. That would mean a rally above 10700
next and a move to 12000. With the
Closing Power still rising, that is a possibility.
But breadth turned mediocre on Friday and
I doubt if the European bankers will get
the governments of Northern Europe to
guarantee the debts of Greece, Italy,
Spain and Ireland. One
currency for so many widely different countries was a
step too far. But just as America cannot
accept its limitations in Afghanistan,
so, too, the Pan-Europeans stubbornly
cannot see how difficult their task is.
A hesitation, at the very least, should
be expected of the market now. Seasonality
has just become distinctly bearish.
Since 1965, the next three trading
days after 9/18 are down 62.2% of the
time. Over the next week, a decline in
the DJI occurs in 60% of the last 45
years, with it falling 55.6% of the time
over the next two weeks and 51.1% over
the next month. The end of the month
bounce may be missing htis year.
Historians have shown that the stock market
has a 2:1 downward bias between the
Jewish New Year (Rosh Hashanah) - Sept. 28th,
2011 and the Day of Atonement (Yom
Kippur) - October 7th-8th.
http://www.chrisperruna.com/2007/09/10/sell-rosh-hashanah-buy-yom-kippur/
Technically, the DJI may be vulnerable
now for a different reason. It has almost
reached the upper 2.5% band and could
easily stall out, based on how weak
its upward momentum is when we smooth the
data to nullify the typical
monthly buying-selling market cycle by
using a 21-day ma. It closed
2.3% of the 21-day ma with the annualized
rate of change of the DJI's
21-dma only .105. Added to this,
the V-Indicator is negative. Historically,
since 1966, a decline to the lower band
occurs in 13 of 18 cases that show such a lack of
momentum and a negative V-I Indicator
with the DJI 2.3% to 2.5% up from the 21-day ma.
In 4 cases the DJI hesitated and then
broke-out and advanced strongly. On the bullish
side, I have to add that this time the
momentum and current Accum.Index (IP21)
are the highest in the cases studied.
Below are the cases.
Cases since 1966 - Januaries omitted to facilitate calculations.
DJI CLoses 2.3% to 2.5% over 21-dma with Annualized 21-dma
Momentum under .11 and V-Indicator in Negative Territory,
There were 18 earlier instances:
1 Decline 1/2 way to LB from MA
1990
6 Declines to Lower Band or below after small loss
2010, 2008, 1997, 1987, 1984, 1973
7 Decline to Lower band or Below
1998, 1983, 1975, 1974, 1973, 1972, 1970
4 Breakout and Rally
2001, Dec-1998, 1997, 1973
9/16/2011 11509 - Open
LA/MA AROC PI ch IP21 V-I Opct
1.023 .105 78 26 .083 -87 .204
high high
1 6/15/2010 10405 DJI moved a little
higher (10442) than declined below LB
1.024 -.252 10 217 -.009 -147 -.184
2 7/23/2008 11632 DJI moved a little higher (11782) than declined below LB
1.024 -.22 -266 87 -.002 -211 -.052
3 4/11/2001 10013 breakout above flat
resistance sent DJI higher
1.024 -.337 -140 -20 .016 -187 .002
4 12/24/98 9217.98 December rally and breakout new high
1.023 -.11 -130 16 .034 52 .077
5 9/29/98 8080.51 Decline to lower
band
1.023 .043 41 61 .058 -45 .043
6 11/24/97 7768 little higher (8110.84) and then decline to lower band.
1.023 .082 -65 -60 .024 -16 .276
high
7 4/24/97 higher - strong upside
breakout followed.
1.025 -.151 -187 -12 .035 -54 -.043
8 10/22/90 2516.09 declined half
way to lb (2436.14)
1.023 .018 -176 22 .047 -17 -.007
9 12/14/87 1932.86 decl to lower band (1879.14) after additl rally (2031.50)
1.025 -.173 -117 -1 .078 -21 .095
10 10/18/84 1225.38 decl to lower band (1163.21) after small additl rally (1244.15)
1.023 -.009 -1 47 -.03` -2 .086
11 7/26/83 1243.69 decl to lower band (1168.27)
1.024 .02 -73 21 .058 -4 .183
12 8/29/75 835.34 decl to lower
band (784.16)
1.024 .055 -139 23 -.102 -3 .008
13 6/6/74 845.35 decl below lower band (759.62)
1.023 -.026 -117 32 -.065 -2 .001
14 9/6/73 901.04 fell back only
to ma (880.57) and then up for 6 weeks.
1.024 -.145 -40 32 .027 -1 -.071
15 7/11/73 908.19 decl below
lower band (851.90) but first rallied up 934.53
1.024 -.093 -60 51 -.01 -2 .118
16 4/11/73 967.41 decl below lower band (895.17)
1.023 -.109 -158 1 .049 -3 -.093
17 5/22/72 965.31 decl to lower band (916.69)
1.023 -.019 -89 13 -.031 -2 .126
18 6/24/70 706.52 decl to lower band (669.36)
1.024 -.204 -165 -47 -.006 -3 -.13
===================================================================================
9/15/2011
DJI = 11433 +141 la/ma= 1.017 21-dmaROC=
.029 P = 104 (+149) IP21= +.053 V=
-86 OP= +.177
BREADTH STATISTICS:
205 MAXCP stocks Bullish MAXCP Stocks
27 MINCP stocks
Bearish MINCP Stocks
MAXCP stocks are those showing Tiger Closing Power making new highs.
This suggests heavy Professional Buying. Applying the Tiger Power Ranker's
"bullish" to the MAXCP stocks find those with heavy insider buying and
institutional accumulation. Bearish MINCP stocks show the opposite.
Also use the BOTHUPs condition with MAXCPs and BOTHDOWNS MINCPS.
new highs on NASDAQ. new lows on NASDAQ
new
highs NYSE
new lows on NYSE
9/15/2011 ===>
See Key Peerless TigerSoft
Index Charts: Industry Groups and ETFs
DIA SPY QQQ DJIA-Peerless
TigerDJI TigerSPY TigerQQQ GLD SLV Crude
------------------- Closing
Power (CP) Status Report: CHARTS:---------------------
Major Market ETFS' CP downtrends were broken
Monday. Short-term bullish Uprends are in place.
Near Term:
DIA above
CP uptrendline - A close of
2.12 below the Opening is needed tomorrow to break the CP uptrend.
DIA is still above its CP 21-dma while Openings are in steep decline.
SPY above CP uptrendline - A close of 2.03 below the
Opening would break the CP uptrend.
SPY is still above its CP 21-dma while Openings are in steep decline.
QQQ above CP uptrendline - A close of 0.85 below the
Opening would break the CP uptrend.
QQQ
is still above its CP 21-dma while Openings are in steep decline.
GLD
CP triangle - A close less than 08 above the Opening would break the CP
uptrend.
New TigerSoft Exploded Charts shows
exactly how much of a move from the Opening
to the Close is needed to break the Closing Power trendline. Note that a visual break will require,
at least .25 more of a penetration of the calculated uptrend. We have been using
visual
CP trend-breaks. http://tigersoft.com/CP-Trendbreaks/index.html
OPENING POWER
versus CLOSING POWER
Peerless Remains on a Sell
More Thoughts on the Test B9 I mentioned
this last weekend.
A rally up from the DJI's
neckline to the potential apex of the right shouler
in the continuation head/shoulders pattern was not unexpected just based
on the DJI's price pattern. Breadth has been good on the rally, but the
indexes are still below their 200-day ma. We have to wait for the Closing
Power uptrends to be violated to go short the major market ETFs. Though the
QQQ has been the strongest ETF, rhe best performing groups remain
defensive stocks (bonds, utilities and the high AI/200-bullish CP biotechs).
See biotech leader, ALXN's nice breakout today,
along with CPHD's.
We must wait now for the Closing Power uptrends to break to know that
meaningful resistance has been reached.
I should have been more bullish this past weekend and suggested long
positions in the strongest of the ETFs, QQQ. That could have been
justified on several grounds:
1) Risk:Reward ratio was modestly favorable. If the DJI support at
10700 had
been violated, we could have quickly sold long positions,
To the upside there
looked to be 3% upside potential.
2) Closing Power uptrends usually win out in the face of Opening Power
downtrends. And playing a CP uptrend while it lasts can
sometimes
bring bigger gains than one might initially expect, because
Openings
may start to be much stronger if there is good news.
3) The Test-B9 I mentioned this weekend, which occurred on Friday's close,
had not been wrong since 1939, when Germany's invasion of
Czechoslovakia
routed the market and the test B9 signal of March failed.
Invasions that start
world wars have to be considered exceptional events. In
that case, there
was a clear head/shoulders pattern to warn us away. As
readers know,
head/shoulders patterns often signal or portend events like
invasions,
wars, assassinations, Presidential heart attacks, The
Japanese attack
on Pearl Harbor, the North Korean attack on South Korea, the
Cuban
Missile Crisis, Iraq's invasion of Kuwait and the 9/11 attack on
the World Trade
Center all saw head/shoulders patterns develop, usually before
the event.
We see a potential continuation Head/Shoulders pattern now
developing
in the DJI. I think the weakness owes to the economic
malaise in the
US and the unending struggle to prop up the Euro in the
face of great
inequalities between European nations. Let us hope,
the Fed figures
out how to keep the DJI from falling below 10700 and the
neckline there.
QQQ is back above 65-dma
but has just reached the 200-day ma

DIA's head and shoulders pattern

DJIA and Peerless Signals
11500 appears to be resistance. Watch the A/D Line to
see if it will break its downtrendline.

===============================================================================
Older Hotline
===============================================================================
9/14/2011
DJI = 11247 +141 la/ma= 1.0 21-dmaROC=
-.25 P = -46 (-53) IP21= +.032
V= -152 OP= +.095
BREADTH STATISTICS:
201 MAXCP stocks Bullish MAXCP Stocks
23 MINCP stocks
Bearish MINCP Stocks
MAXCP stocks are those showing Tiger Closing Power making new highs.
This suggests heavy Professional Buying. Applying the Tiger Power Ranker's
"bullish" to the MAXCP stocks find those with heavy insider buying and
institutional accumulation. Bearish MINCP stocks show the opposite.
Also use the BOTHUPs condition with MAXCPs and BOTHDOWNS MINCPS.
18 new highs on NASDAQ. 20 new lows on NASDAQ
10
new
highs NYSE
10 new lows on NYSE
9/13/2011 ===>
See Key Peerless TigerSoft
Index Charts: Industry Groups and ETFs
DIA SPY QQQ DJIA-Peerless
TigerDJI TigerSPY TigerQQQ GLD SLV Crude
------------------- Closing
Power (CP) Status Report: CHARTS:---------------------
Major Market ETFS' CP downtrends were broken Monday. Short-term Uprends
are in place.
Near Term:
DIA above
CP uptrendline - A close of
0.84 below the Opening would break the CP uptrend.
DIA is still above its CP 21-dma while Openings are in steep decline.
SPY above CP uptrendline - A close of 0.50 below the
Opening would break the CP uptrend.
SPY is still above its CP 21-dma while Openings are in steep decline.
QQQ above CP uptrendline - A close of 0.45 below the
Opening would break the CP uptrend.
QQQ
is still above its CP 21-dma while Openings are in steep decline.
GLD
CP triangle - A close of 0.38 below the Opening would break the CP
uptrend.
New TigerSoft Exploded Charts shows
exactly how much of a move from the Opening
to the Close is needed to break the Closing Power trendline. Note that a visual break will require,
at least .25 more of a penetration of the calculated uptrend. We have been using
visual
CP trend-breaks. http://tigersoft.com/CP-Trendbreaks/index.html
OPENING POWER
versus CLOSING POWER
Peerless Remains on a Sell
Professionals are clearly bullish.
Closing Powers are rising and
the number of MAXCP (CP new highs)
is 9x the number of MINCP
new lows. Having plumbed for
and found support, the market
must rally and find resistance.
We can wait for the Closing Power
uptrends to break to know that
meaningful resistance has been
reached.
Last night my 1998 MSFT Front Page failed
in the middle of doing
the hotline. I wanted to post those
case since 2000 when, as now,
the
QQQ's Closing Power was rising steeply while Opening Power
was
falling. The conclusion I reach from the handful of cases is
that the Closing Power wins out for a
while, certainly enough for
nimble traders to take advantage of QQQ
rallies for a few very good
days, like today's. But when the
Closing Power does finally break its
uptrend, if the QQQ rally quickly stall,
there is a big decline.
And if there are multiple Sells operating
and a key (here-11700)
DJI support failure, a much bigger
decline follows. This was certainly
the case in 2008. Professionals
quickly reversed their long positions
to short positions.
The strong QQQ was turned back today from
its falling 65-dma.
It CP uptrend is still in place. It
would take only a .46 close below the
opening to break the CP uptrend in the
QQQ. The DIA and SPY
are being held back by bearish
continuation head and shoulders
patterns.
Stay short the MINCP stocks that have still have falling CPs and go
short DIA or SPY when the Closing Power
uptrend-line is broken.
It is true, the market is acting well in
the face of so much weak
economic news, here and in Europe.
Trading with the Professionals'
Closing Power reduces stress and adds to
profits.
The Hotline will get a little longer
soon, as soon as I master the
mysteries of Oracle's Dream Weaver.
------------------- Closing Power (CP) Status Report: CHARTS:---------------------
Major Market ETFS' CP downtrends were broken Monday. Short-term Uprends
are in place.
Near Term:
DIA above
CP uptrendline - A close of
0.84 below the Opening would break the CP uptrend.
DIA is still above its CP 21-dma while Openings are in steep decline.
SPY above CP uptrendline - A close of 0.50 below the
Opening would break the CP uptrend.
SPY is still above its CP 21-dma while Openings are in steep decline.
QQQ above CP uptrendline - A close of 0.45 below the
Opening would break the CP uptrend.
QQQ
is still above its CP 21-dma while Openings are in steep decline.
GLD
CP triangle - A close of 0.38 below the Opening would break the CP
uptrend.
New TigerSoft Exploded Charts shows
exactly how much of a move from the Opening
to the Close is needed to break the Closing Power trendline. Note that a visual break will require,
at least .25 more of a penetration of the calculated uptrend. We have been using
visual
CP trend-breaks. http://tigersoft.com/CP-Trendbreaks/index.html
=================================================================================
OLDER HOTLINES
================================================================================
9/13/2011
DJI = 11106 +45 la/ma= .987 21-dmaROC=
.172 P = 7 (+36) IP21= +.052 V=
-141 OP= +.096
BREADTH STATISTICS:
188 MAXCP stocks Bullish MAXCP Stocks
25 MINCP stocks
Bearish MINCP Stocks
MAXCP stocks are those showing Tiger Closing Power making new highs.
This suggests heavy Professional Buying. Applying the Tiger Power Ranker's
"bullish" to the MAXCP stocks find those with heavy insider buying and
institutional accumulation. Bearish MINCP stocks show the opposite.
Also use the BOTHUPs condition with MAXCPs and BOTHDOWNS MINCPS.
12 new highs on NASDAQ. 73 new lows on NASDAQ
13
new
highs NYSE
42 new lows on NYSE
9/13/2011 ===>
See Key Peerless TigerSoft
Index Charts: Industry Groups and ETFs
DIA SPY QQQ DJIA-Peerless
TigerDJI TigerSPY TigerQQQ GLD SLV Crude
OPENING POWER
versus CLOSING POWER
Peerless Remains on a Sell
This
hotline is being written while I am having computer problems. So, it must be
short, I think the rising Closing Power
trend may hold up for a while, but I fear
the weakness in the falling Opening Power will
be too much for it. The primary
problems for the bulls now are: Peerless
remains on a Sell; the DJI shows a bearish
continuation head/shoulders pattern; Septembers
are often bad months; Openings
(representing overseas trading) are very weak;
volume keeps rising on down-days;
and now there is a growing mutiny in the Fed
against Bernanke's cheap money
policies. It's true the NASDAQ and the
QQQ are now outperforming the DJI and
SP-500. But there are too many negatives
to ignore. Add shorts to DIA and SPY
if the Closing Power uptrend lines are broken.
Hold short the bearish MINCP stocks
as long as their Closing Power trends remain
down.
------------------- Closing Power (CP) Status Report: CHARTS:---------------------
Major Market ETFS' CP downtrends were broken Monday. Short-term Uprends
are in place.
Near Term:
DIA above
CP uptrendline - A close of
1.19 below the Opening would break the CP uptrend.
DIA is still above its CP 21-dma while Openings are in steep decline.
SPY above CP uptrendline - A close of 1.37 below the
Opening would break the CP uptrend.
SPY is still above its CP 21-dma while Openings are in steep decline.
QQQ above CP uptrendline - A close of .79 below the
Opening would break the CP uptrend.
QQQ
is still above its CP 21-dma while Openings are in steep decline.
GLD
CP triangle - A close of ,82 below the Opening would break the CP
uptrend.
New TigerSoft Exploded Charts shows
exactly how much of a move from the Opening
to the Close is needed to break the Closing Power trendline. Note that a visual break will require,
at least .25 more of a penetration of the calculated uptrend. We have been using
visual
CP trend-breaks. http://tigersoft.com/CP-Trendbreaks/index.html
=================================================================================
OLDER HOTLINES
=================================================================================
9/12/2011
DJI = 11061 +69 la/ma= .982 21-dmaROC=
-.087 P = -30 (-130) IP21= +.04 V=
-156 OP= +.103
BREADTH STATISTICS:
126 MAXCP stocks Bullish MAXCP Stocks
47 MINCP stocks
Bearish MINCP Stocks
MAXCP stocks are those showing Tiger Closing Power making new highs.
This suggests heavy Professional Buying. Applying the Tiger Power Ranker's
"bullish" to the MAXCP stocks find those with heavy insider buying and
institutional accumulation. Bearish MINCP stocks show the opposite.
Also use the BOTHUPs condition with MAXCPs and BOTHDOWNS MINCPS.
5 new highs on NASDAQ. 83 new lows on NASDAQ
6
new
highs NYSE
98 new lows on NYSE
9/12/2011 ===>
See Key Peerless TigerSoft
Index Charts: Industry Groups and ETFs
DIA SPY QQQ DJIA-Peerless
TigerDJI TigerSPY TigerQQQ GLD SLV Crude
It's Hard To
Be Too Cyncial
Peerless Remains on A Sell. If Support Holds, A 3%
Rally Seems Likely.
Wall
Street professionals, government finance ministers' and the Fed probably
orchestrated today's buying right at the
DJI's critical H/S neckline-support. The
timeliness of this buying suggests
coordinated buying. Will it continue if European
selling again brings another big sell-off
tomorrow? As I write this, the Futures show the DJI is
down 61. We will just have to wait
and see. The Peerless Sells advise that the efforts to
hold up the market will not succeed.
I would suggest that rumors that China
would buy big chunks of the Italian debt were
spread to explain and reinforce a
desperate rally attempt. Interestingly, all the DIA and
SPY rally occurred in the critical last
hour, though word of plans for a rally was
leaked earlier in the day. The
strongest Closing Power Biotechs turned up much earlier.
Someone on TV said the early decline just
could not be extended. "It was as like trying to
push a big ballon under
water." True enough, the Peerless lower 3.5% band usually
does act as support.
.
If the Fed is the coordinator of this
buying, then I would expect the support
near 10700-10800 to hold. The Fed
is the natural coordinator of such an effort.
And the FED is just too big to fight.
But if the FED is not behind this buying, look
out below. The rally today was a
sign of desperation. In this case, the weakness
in the Opening Powers from European
selling will just be too much for the NY professionals
who are trying to prevent a bigger
decline.
Clearly, the Fed draws trendlines on the
DJI. They do this when they are very worried.
Their secretive, unannounced buying, in
their minds, serves to Increase "asset prices" and
aid the economic recovery. If
pumping up of the market is a legitimate and worthy tactic,
why does the Fed not just admit and
report their activities? Fear of being too political
is one reason. Many do not believe
the Fed should engage in stock manipulation. My problem
with it is only that it does not left all
boats. Main Street is left with relatively less and at
that much greater disadvantage in the
great American sport of buying politicians. But
values aside, our Closing Power does give
us an edge in spotting such insider and
professional buying. Opening Power
shows us Public and overseas buying and selling.
Usually the Professionals win out, but
not always. When the Professionals make a mistake,
they are quick to reverse, unlike the
public.
The Peerless Sell signals were not
reversed with a Buy today. A more complicated head and
shoulders in still present in the DJI.
This is still bearish. A breakdown below 10700
would set up a dangerous situation and,
very likely, a DJI decline of another 1000
points..
I suggest staying
short the most bearish MINCP stocks and again waiting for the
CP uptrend support to break before
shorting more of SPY or DIA. If you are short
them already, I would close this position
out on early weakness tomorrow only
if you are not comfortable with a
potential 2% - 3% rally from the lower band. To say
this again, traders who are not
comfortable riding out paper losses of 3% are encouraged
to use the Closing Power trendbreaks'
statistics posted below. Example: The DIA did rally
today up the requisite and specified
amount, 1.45, above today's opening to warn of a
reversal. The DIA opened at
108.46. The DIA move above 109.91 "restored" the CP uptrend.
Adding .10 for more certainty, one might
have used the data from last night's hotline to close
out the short DIA position at 110.01 in
the last half hour.
Tomorow, if the DIA
turns down more than 1.35 + .14 (points margin of error),
or 1.49, from the opening, I would go
short it again tomorrow.
Please understand that mostly, I would
trade in the direction that Peerless gives, which is
now DOWN because of the active Sells.
Going long now is not recommended on a CP
downtrend-break.
------------------- Closing Power (CP) Status Report: CHARTS:---------------------
Major Market ETFS' CP downtrends were broken Monday. Short-term Uprends
are in place.
Near Term:
DIA above
CP uptrendline - A close of
1.35 below the Opening would break the CP uptrend.
DIA is still above its CP 21-dma while Openings are in steep decline.
SPY above CP uptrendline - A close of 1.08 below the
Opening would break the CP uptrend.
SPY is still above its CP 21-dma while Openings are in steep decline.
QQQ above CP uptrendline - A close of .59 below the
Opening would break the CP uptrend.
QQQ
is still above its CP 21-dma while Openings are in steep decline.
GLD
below CP downtrendline - A close of 1.07 above the Opening would break the CP
downtrend.
New TigerSoft Exploded Charts shows
exactly how much of a move from the Opening
to the Close is needed to break the Closing Power trendline. Note that a visual break will require,
at least .25 more of a penetration of the calculated uptrend. We have been using
visual
CP trend-breaks. http://tigersoft.com/CP-Trendbreaks/index.html
==> The Peerless Sell signals have
brought an important test of Support.
A one hour rally has to be treated
with some suspicion.
All the DJI gains came in the last 15 minutes.

It was in the last hour that the DJI rallied,
supposedly on news that China would
step in and buy Italian debt. My sense is that
the US government was heavily
involved in trying to support the market at a
critical juncture. Whether the FED
actually bought in key ETFs and futures or help
arrange a consortium of big
banks, we'll never know probably. The main
thing to know is how intent professionals
are now in the US to avoid letting the DIA, SPY and
QQQ break the key price support
they tested. If they fail, and the DJI breaks
below 10700, expect them quickly to
switch to the short side.

The DJI may still complete a bearish continuation
head and shoulders pattern. The
pattern would have two shoulders on each side of the
head. If this develops
on schedule, we will see another DJI rally back up to
11500. More compicated,
but still symetrical head and shoulders patterns are
not uncommon. The main
thing we should see here if there is a neckline
support failure and a bigger decline
coming, will be reduced volume on the right shoulders
and weaker readings
from the Accumulation Index.

====================================================================================
OLDER HOTLINES
====================================================================================
9/9/2011
DJI = 10992 -303 la/ma= .976 21-dmaROC= .288 P = +100
(-31) IP21= +.038 V= -88 OP= +.132
BREADTH STATISTICS:
52 MAXCP stocks Bullish MAXCP
Stocks
61 MINCP stocks
Bearish MINCP Stocks
MAXCP stocks are those showing Tiger Closing Power making new highs.
This suggests heavy Professional Buying. Applying the Tiger Power Ranker's
"bullish" to the MAXCP stocks find those with heavy insider buying and
institutional accumulation. Bearish MINCP stocks show the opposite.
Also use the BOTHUPs condition with MAXCPs and BOTHDOWNS MINCPS.
1 new highs on NASDAQ. 106 new lows on NASDAQ
8
new
highs NYSE
99 new lows on NYSE
9/9/2011 ===>
See Key Peerless TigerSoft
Index Charts: Industry Groups and ETFs
DIA SPY QQQ DJIA-Peerless
TigerDJI TigerSPY TigerQQQ GLD SLV Crude
DJI's 300 point plunge brings important test of H/S
neckline support.
------------------- Closing Power Status Report: CHARTS:---------------------
Major Market ETFS' CP uptrends were broken Friday. Longer-term
Downtrends are in place.
Near Term:
DIA below
CP uptrendline - A close of
1.45 above the Opening would restore the CP uptrend.
DIA is still above its CP 21-dma
SPY below CP uptrendline - A close of 1.33 above the
Opening would restrore the CP uptrend.
SPY is still above its CP 21-dma
QQQ below CP uptrendline - A close of .75 above the
Opening would restrore the CP uptrend.
QQQ is still above its CP 21-dma
GLD
below CP downtrendline - A close of 0.79 below the Opening would break the CP
uptrend.
New TigerSoft Exploded Charts shows
exactly how much of a move from the Opening
to the Close is needed to break the Closing Power trendline. Note that a visual break will require,
at least .25 more of a penetration of the calculated uptrend. We have been using
visual
CP trend-breaks. http://tigersoft.com/CP-Trendbreaks/index.html
==> The Peerless Sell
signals have brought an important test of Support..
The DJi has traced out a bearish head and
shoulders formation over the last 13 trading
days. The neckline-support
the DJI has reached represents key support. A closing
penetration of it is expected to
bring a further decline by the DJI to 9680. That level
was support in June 2010 and also
is a 50% retracement of the gain from 6570 (March 2009)
to 12810 (April 2011).
Continuation head and shoulders patterns like this appeared in
August-September 1930, April-May
2008 and July-August, just before severe declines.
They are circled in red in the two
charts below. Based on the absence of a new buy
signal from Peerless, the bearish
seasonality of September-October and the way that
daily volume has refularly picked
up on down-days, I have to think we will see much
lower prices soon. The
political stalemate in Washington jst when economic leadership
is needed and the deflationary
fiscal policies in Europe provide ample reinforcement.
Something more will be needed by
the FED very soon to avert another sell-off.
Watch GE
snd AMTD on Monday. 15 is well-tested near-term GE
support. Brokerage
AMTD is at its support of 13.6.
A violation of these would be bad. Bank stocks like
BAC,
C (26.74 -1.24), GS (102.25-2.54), GSBC (15.72 -.67). HBAN
(4.6 -.2),
HCBK
(5.53 - .15), JPM (32.08 -1.43), MS (15.28-.56) and UBS (11.87 -.77) are leading
the decline. Short them and
stay short until their CP downtrends are broken to the upside.
1930 |
2007-2008 |
The DJI is now 2.4% below the 21-day ma
with both the P-Indicator and Accumulation
Index still positive. This
technical configuration CAN be bullish, but it also is just as likely
in history to immediately precede a big
drop. This adds great importance to what happens
next week. In the 4 cases when the
DJI was below its 200-day ma, which is true now, there
were 3 instances of severe declines.
On the other hand, this has always been a bullish
configuration since 1958. Peerless
has not given a reversing Buy signal and the Closing
Power uptrends have been violated.
I recommended shorting DIA and SPY
when the
CP uptrend was seen to be breaking.
I would stay short the bearish MINCP stocks advised
and close out long positions whent their
CP uptrends are violated.
|
Cases since 1928 when DJI was 2.3% to 2.5% below its 21-day with Positive Peerless P-Indicator and Accumulation Index Readings. Outcome: 4 up 3 down Date la/ma MA-ROC P-I IP21 V-I Opct 9/9/2011 .976 .288 100 -31 .038 -88 .126 below 200-day ma Outcome uncertain 4/10/96 .976 -.201 6 -60 .042 -15 -.077 DJI rose immediately. 1/8/88 .975 .261 185 -95 .118 14 .304 below 200-day ma DJI rose immediately 11/18/86 .975 .04 18 -22 .061 0 .021 DJI rose immediately. 11/25/58 .977 .022 25 -9 .039 -173 .248 DJI rose immediately. 3/17/1939 .976 -.057 17 -34 .008 -30 .016 below 200-day ma DJI fell from 143.90 to 124.00 on 4/10/1939 2/3/1932 .976 1.058 50 -1 .057 110 .071 below 200-day ma DJI fell from 78.30 to 71.80. 11/16/1931 .977 .679 2 -19 .077 -56 .076 below 200-day ma DJI immediately fell from 104.80 to 71.20 on 1/5/20 |
DIA has broken CP
uptrend.
Its Opening Power has broken to new lows.
The almost completed head and shoulders pattern is bearish.
9/9/2011

DJIA    NASDAQ   |
==================================================================================
OLDER HOTLINES
==================================================================================
9/8/2011
DJI =
11296 -119 la/ma= 1.004 21-dmaROC= .059 P = +130 (-207) IP21=- .005 V= -121
OP= +.093
BREADTH STATISTICS:
177 (-29) MAXCP stocks Bullish MAXCP
Stocks
25 (+9) MINCP stocks
Bearish
MINCP Stocks
MAXCP stocks are those showing Tiger Closing Power making new highs.
This suggests heavy Professional Buying. Applying the Tiger Power Ranker's
"bullish" to the MAXCP stocks find those with heavy insider buying and
institutional accumulation. Bearish MINCP stocks show the opposite.
Also use the BOTHUPs condition with MAXCPs and BOTHDOWNS MINCPS.
12 new highs on NASDAQ. 24 new lows on NASDAQ
10
new
highs NYSE
14 new lows on NYSE
9/8/2011 ===>
See Key Peerless TigerSoft
Index Charts: Industry Groups and ETFs
DIA SPY QQQ DJIA-Peerless
TigerDJI TigerSPY TigerQQQ GLD SLV Crude
Think Wall Street Here. Not Main Street.
To foreign
observers and some people here, too, the fate of Obama's modest
Jobs' Creation Proposals will test the viability of the
American political system
as the economy flounders without guidance from Washington.
If Repubs say "no"
to Obama, we can expect the economic situation to worsen,
as it is in Europe
where Austrian economic theory and
austerity reign, not Keynesianism. And in
this situation, we can expect Obama to blame, pretty
effectively I think, Congressional
Republicans for lack of compromise.
Remember that Wall Street secretly likes Obama. He
has protected them. He has not
regulated them, jailed any of them or taken away any of
their bonuses. He has given
them a 27 month rally. So, more stalemate may
actually be to Wall Street's liking.
Many there want him to have another term. But if the Repubs say "yes" to the proposals,
the very modesty of the proposals is likely to produce
longer economic stagnation, not much
growth and much more widespread dislike of Obama. In
that case, he might be defeated
in 2012 and Wall Street might have to cope with a much more
radical tea-party type, with all
the uncertainties that that would bring.
Bernanke could and will help. But he is holding his
fire until he is needed more
and he can extract some good publicity out of what he
finally does.
Without Bernanke's immediate help, I would think that the
stock market will soon
go into a September-October slump. The Peerless Sell signals, much greater downside
volatility and heavier volume on down-days are bearish.
But for now, Professionals
are trying to run prices back closer to the 65-day ma. In theory, that gives the SP-500
fifty to sixty more points of upside and the DJI six
hundred more potential points to rally.
In actuality, the DJI's upside is much less I think.
It may trace out a bearish continuation
head and shoulders pattern if it cannot get past 11570.
Watch the number of MINCP stocks.
Their numbers have shrunk to only 25. Before another
plunge, I would expect that number
to move up quickly.
I like the shorts we have in the bearish MINCP stocks
and the longs in the best of the
still strong biotechs. When the Closing Power
uptrends for the DJI and SPY are broken,
I would add short sales there. Note that we do
not have to wait for the next day's
opening to go short these. About an hour before
the close in NY, see if the DIA and
SPY are below the Opening by the amounts shown below.
------------------- Closing Power Status Report: CHARTS:---------------------
Near Term:
DIA above
CP uptrendline - A close of
.83 below the Opening would break CP uptrend.
SPY above CP uptrendline - A close of 1.04 below the
Opening would break CP uptrend.
QQQ above CP uptrendline - A close of 0.44 below the
Opening would break CP uptrend.
GLD
above CP downtrendline - A close of 0.44 below the Opening would restore the CP
downtrend.
New TigerSoft Exploded Charts shows
exactly how much of a move from the Opening
to the Close is needed to break the Closing Power trendline. Note that a visual break will require,
at least .25 more of a penetration of the calculated uptrend. We have been using
visual
CP trend-breaks. http://tigersoft.com/CP-Trendbreaks/index.html
==> The Peerless Sell
signals, nearby overhead resistance, higher
volume on declines and bearish
September seasonality argue for another test
of support when the CP uptrends are
violated.
DJIA


NASDAQ


==================================================================================
OLDER HOTLINES
==================================================================================
9/7/2011
DJI =
11415 +276 la/ma= 1.015 21-dmaROC= .642 P = +337 (+257) IP21= .112 V=
+1 OP= +.204
BREADTH STATISTICS:
206 MAXCP stocks Bullish
MAXCP Stocks
16 (-19) MINCP stocks
Bearish MINCP Stocks
MAXCP stocks are those showing Tiger Closing Power making new highs.
This suggests heavy Professional Buying. Applying the Tiger Power Ranker's
"bullish" to the MAXCP stocks find those with heavy insider buying and
institutional accumulation. Bearish MINCP stocks show the opposite.
Also use the BOTHUPs condition with MAXCPs and BOTHDOWNS MINCPS.
7 new highs on NASDAQ. 11 new lows on NASDAQ
6
new
highs NYSE
8 new lows on NYSE
9/7/2011 ===>
See Key Peerless TigerSoft
Index Charts: Industry Groups and ETFs
DIA SPY QQQ DJIA-Peerless
TigerDJI TigerSPY TigerQQQ GLD SLV Crude
------------------- Closing Power Status Report: CHARTS:---------------------
Near Term:
==> DIA, SPY and QQQ show rising CP
uptrendlines and falling Opening Power.
Professionals have been buying while Foreigners and
the American Public have been selling.
DIA
above CP uptrendline - A close of 1.72 below the
Opening would break CP uptrend.
SPY above CP uptrendline - A close of 2.19 below the
Opening would break CP uptrend.
QQQ above CP uptrendline - A close of 0.78 below the
Opening would break CP uptrend.
GLD below CP downtrendline -
A close of 0.78 above the Opening would break CP downtrend.
New TigerSoft Exploded Charts shows
exactly how much of a move from the Opening
to the Close is needed to break the Closing Power trendline. Note that a visual break will require,
at least .25 more of a penetration of the calculated uptrend. We have been using
visual
CP trend-breaks. http://tigersoft.com/CP-Trendbreaks/index.html

Intermediate-Term:
Multiple Sells Still Operate: the S9V, S12 and NASDAQ S4
Bode Poorly for Weakest Month of Year, September.
But first, tomorrow, Bernanke and Obama Will
Try To Boost The Market
One of the
costliest mistakes a trader can make is forgetting that the market falls steeply only a
small
portion of the time. It is therefore often a
mistake, unless one has a lot of capital and strong nerves, to
ride out volatile rallies if one can avoid them and
to fall in love with the short side. Even back in 2008,
when the market was falling much of the time, we
found it was important for traders to observe the breaks
in the Closing Power downtrends when they were short.
Covering when the Closing Power broke its
downtrend locked in great gains, missed few bigger
shorting gains, preserved capital and left one
fresh to look for new short sales when their CLosing
Power uptrends were broken.
Right now, the Closing Powers are rising for the
ETFs. Most of us would probably be better off waiting
for the uptrending CLosing Power to break to go
short. You can see that we can now tell you in advance
what it will take the next day near the close to
break a CLosing Power trend. The new exploded
Tiger charts should help traders a lot. See
that the QQQ chart above shows that it will take a -.79
difference between the close and the opening there to
break the uptrend. You do not have to take
the next day's opening prices. You can take the
prices near the close.
I would
stick with the short sales in the Bearish MINCP stocks as long as their CLosing Powers
remain
in downtrends and now wait for the new rising Closing
Power trend to be broken to initiate shorts
on the key ETFs. I said yesterday that there
are a some excellent biomed BULLISH MAXCP stocks
that traders might hold long while their Closing
Powers are rising. Select Biomedicals, Select REITS,
Bonds and Gold Stocks are the only groups that show
more than 50% of their stocks are above their
65-day ma. This signifies a defensive market,
and not most likely the start of a powerful new advance.
But presently, there are many more MAXCP stocks than
MINCP stocks. Professionals see more opportunity
on the long side.
Today's rally had much to do with (1)
Expectations that the speeches by Bernanke and Obama
tomorrow (Thursday) will bring in new buyers,
probably late in the advance; (2) Germany's
Supreme Court not disallowing its government buying
higher risk bonds of Greece, Itally, Spain...
to allow the Euro to continue to operate as a major
reserve currency; and (3) word that House Republican
Eric Cantor might be willing support some ostimulus
proposals.
As there is so much overhead resistance and volume is
low, I doubt if this rally will take the
DJI up past 11700. But there is no point in
being stubborn or always short. Right now the Closing Powers
are rising and stimulus plans from Obama and Bernanke
will surely help bolster the market near-term....
The Old BUY B14?
Though NYSE up volume dwrarfed NYSE down volume
today, there was no Peerless Buy B14 from
our Peerless software dated March 1, 2009 or
later. If you are using a current version of Peercomm
(the 8 button screen), you will see that the top
button on the right takes you to a new version of
Peerless. If you use the second button down on
the right, you can see the Peerless signals, as of
July 2007.
The more recent software did not give a Buy B14
today. The older software does. Back-testing
has shown the value of not allowing a Buy B14 until a
month has passed since an S9 or S12.
See effects of this and other exclusionary rules in
the table below, where I went over the trading results
of the new Peerless and the Old Peerless Buy B14
signals.
The older versions' trading gains average only half
the newer's gains. In addition, note how many more
Buy B14s there are recently, especially when using
the older Peerless. This is the result, I would say, of how
dominant now is member firms' short-term computerized
trading, all in the context of leveraged long and
short ETFs and no restrictions on short selling on
down-ticks. Too many of the recent Buy B14s from the older
Peerless bring very small gains, with none being more than
3.7%.
I think that this demonstrates the following.
1) Get and use the newer Peerless.
2) Be sure to input the correct and corrected data. Use our Data.
3) The numerous older Buy B14s are only very short-term Buys.
A Comparison of Old and New Buy
B14s
Date of Buy B14
Older Buy B14's Gain
New
B14's Gain
-----------------------------------------------------------------------------------------------------------------------------
4/8/1968
4.0% OK
4.2% OK
11/1/1978
0.9%
none
1/28/1982
-4.2%
-3.6%
8/20/1982
20.2% Great
+21.6% Great
1/2/1987
15.7%Great
+24.4% Great
1/5/1987
13.3% great
+22.2% Great
5/31/1988
6.3% OK
-3.6% Worse
5/11/1990
4.8% OK
+6.6% Better
1/19/2006
2.2% OK
+6.4% Better
6/15/2006
1.2% OK
+1.2%
8/29/2007
3.7% OK
+5.8% Better
9/18/2007
0.3% OK
+2.4% Better
11/28/2007
0.6%
+2.5% Better
3/18/2008
1.1%
+1.3% Better
3/12/2009
0.7%
+18.6% Great
5/4/2009
-1.7%
+ 0.9% Better
11/9/2009
0.2%
+ 0.4% Better
5/10/2010
-3.5%
-3.5%
5/27/2010
1.5%
+ 1.5%
6/2/2010
1.6%
+1.6%
6/10/2010
2.3%
+ 2.3%
6/15/2010
0.0%
+ 0.0%
7/7/2010
3.4% OK
none
9/1/2010
3.2% OK
+22.2% Great ...Much Better
8/9/2011
2.8%
none
8/11/2011
3.7% OK
+3.7%
8/15/2011
0.7%
0.7%
8/29/2011
0.2%
0.2%
9/7/2011
????
none
===================================================================
AVG = 3.0% AVG = 5.7%
STOCKS:
Stay long these only while the CLosing Powers
are rising. Click on links
to see exploded chart with details about CP
ELGX 9.35
LMAT
6.89
JAZZ
43.61
ALXN
59.54
VRUS.
71.94
==================================================================================
OLDER HOTLINES
==================================================================================
9/6/2011
DJI = 11139 -101 la/ma=
.993 21-dmaROC= -.323 P = +79 (+3) IP21= -.004 V= - 152 OP= +.078
BREADTH STATISTICS:
153 (+104) MAXCP
stocks Bullish
MAXCP Stocks
35 (-33) MINCP stocks
Bearish MINCP Stocks
MAXCP stocks are those showing Tiger Closing Power making new highs.
This suggests heavy Professional Buying. Applying the Tiger Power Ranker's
"bullish" to the MAXCP stocks find those with heavy insider buying and
institutional accumulation. Bearish MINCP stocks show the opposite.
Also use the BOTHUPs condition with MAXCPs and BOTHDOWNS MINCPS.
9
new highs on NASDAQ. 92 new lows on NASDAQ
3
new
highs NYSE
48 new lows on NYSE
9/6/2011 ===>
See Key Peerless TigerSoft
Index Charts: Industry Groups and ETFs
DIA SPY QQQ DJIA-Peerless
TigerDJI TigerSPY TigerQQQ
GLD
SLV
Crude
Multiple Sells: S9V, S12 and NASDAQ S4
Bode Poorly for Weakest Month of Year, September.
I would
stick with the short sales in the Bearish MINCP stocks and now wait for the new
rising Closing Power trend to be broken to initiate
shorts on the key ETFs. There are a few
biomed BULLISH MAXCP stocks that traders might buy
and hold as long as their Closing Powers
are rising. See how the Closing Powers of these have
made new high and they continue to show
high institutional accumulation: ELGX, LMAT, JAZZ, ALXN and VRUS. These stocks are, of course,
viewed as being much more independent of the general
economic slowdown. As fewer and
fewer stocks continue to rally, performance investors
must pour more and more money into
these stocks. If you believe that the
Administration and the Fed will be able to hold the market
up until after 2012, these are surely among the
stocks to buy.

Obama's Stimulus Seems Very Modest
Obama's Thursday Speech about Jobs has been leaked.
Obama to propose $300 billion jobs plan
Wall
Street is safe. There are no challenges to its supremacy. As should be expected now
from Obama,
there are no proposals for new taxes on Wall Street
or the super-wealthy. Obama's Public Works proposals,
extension of Unemployment benefits and lowering of
the payroll tax are very modest and most likely will
not be passed by the anti-Government spending House,
anyway. Even if they are passed, they are not nearly
enough to turn the economy around and end the
malaise.
More market weakness, threrefore, seems likely as the
prospects for more Main Street/ US Manufacturing
weakness and under-consumptiom are understood better.
The fiscal stimulus in these proposals will
do very little to lower the jobless rate. Look
for downbeat comments by Roubini
tomorrow. The humble size
of Obama's Jobs' proposal may, however,
energize another Democrat to challenge Obama in 2012.
As Wall Street has gotten comfortable with Obama and
knows not to pay attention to any populist rhetoric
he might let slip out, such a challenge in the
Presidential Primaries next year might hurt the market.
Let's see how far the near-term rally predicted
by the now rising CLosing Power trends can boost the market.
My guess is perhaps to 11400.
------------------- Closing Power Status Report: CHARTS:---------------------
DIA above CP
uptrendline - A close of 1.00 below the
Opening would break CP uptrend.
SPY above CP uptrendline - A close of 1.35 below the
Opening would break CP uptrend.
QQQ above CP uptrendline - A close of 0.53 below the
Opening would break CP uptrend.
New TigerSoft Exploded Charts shows exactly how much of a move from the Opening
to the Close is needed to break the Closing
Power trendline. Note that a
visual break will require,
at least .25 more of a penetration of the calculated uptrend. We have been using
visual
CP trend-breaks.
http://tigersoft.com/CP-Trendbreaks/index.html
-------------------------------------------------------------------------------------------------------------------
Weak Openings Are Caused by Market
Weakness in Europe
Many in
Europe's poorer countries and the poorer regions of the UK believe that the austere fiscal
policies
imposed by central bankers signal them out for the
most sacrifices and much higher unemployment.
It remains to be seen if better-off Germany will
continue to prop up and guarantee the debt of
Greece, Italy, Spain and Portugal.
Protests in Italy against Austerity Programs - Italians
vow protests over austerity will grow
Protests in Spain against Balanced Budget Amendment -
Spanish
Unions Announce Protests Against Constitutional Reform
Wales and Scotland wants more fiscal autonomy, The 2011 Devolved Elections in the UK
.
Recent
weakness of the EURO and the Swiss decision not to let their currency rise anymore,
has had the effect of strengthening the Dollar as a
reserve currency. This gives the Fed and
Bernanke much more leeway and freedom to pursue a new
QEIII program of Fed printed money
to buy US Treasury debt and keep interest rates very
low. This may not stimulate the economy
but would certainly boost Wall Street. This
policy boosts Gold, commoditiy prices and the stock
market. The Administration and the FED
definitely do not want a market Crash before the
2012 Presidential Election. See how the DJIA
was lifted from September 2010 to May 2011. Many
consider the Fed's heavy buying of Treasury debt in
this period to be the cause. Today, the
Dollar rose and interest rates fell. Note how the US markets rose today
after opening down more
than 200.

DJIA - Peerless Signals


==================================================================================
OLDER HOTLINES
==================================================================================
HAPPY LABOR
DAY WEEKEND
9/2/2011
DJI = 11240 -253 la/ma=
1.00 21-dmaROC= -.152 P = +76 (+32) IP21= .0 V= - 150 OP= +.189
BREADTH STATISTICS:
49 (-1) MAXCP
stocks Bullish New Highs
68 (+37) MINCP stocks
Bearish
MINCP Stocks
MAXCP stocks are those showing Tiger Closing Power making new highs.
This suggests heavy Professional Buying. Applying the Tiger Power Ranker's
"bullish" to the MAXCP stocks find those with heavy insider buying and
institutional accumulation. Bearish MINCP stocks show the opposite.
Also use the BOTHUPs condition with MAXCPs and BOTHDOWNS MINCPS.
Sell S7s occur when Professionals are much more bearish than the Public is.
6 new highs on NASDAQ. 71 new lows on NASDAQ
5
new
highs NYSE
28 new lows on NYSE
9/2/2011 ===>
See Key Peerless TigerSoft
Index Charts: Industry Groups and ETFs
DIA SPY QQQ DJIA-Peerless
TigerDJI TigerSPY TigerQQQ GLD SLV Crude
Multiple Sells: S9V, S12 and NASDAQ S4
Bode Poorly for Weakest Month of
Year, September, Coming Up.
Much
More Political Leadership Is Sorely Needed SOON.
The
steep decline more than justifies a bearish posture, I think. Selling short many more of the BEARISH
MINCP stocks and selling remaining long positions if
they break they rising CLosing Powers is recommended.
The NASDAQ Sell S4s are reliably bearish. As is the
new falling 21-dma S9V, whose historical trading results
are shown below.
Now we see a Sell S12 for this past Thursday using
the Barrons NYSE up and down volume for this week.
(Barron's data is what we have consistenly used.)
Be sure to download the edited PEER04.exe.
Our source of data, Dial Data, does make occasional
mistakes. We try to catch them. As you can
see with this report, there is a certain amount of
redundancy to the Peerless signals. This helps
in such cases where the data comes in wrong.
See Sell S12 Sell S9/S12 Combinations.


What Would It Take To Get A
Closing Power Trend Reversal?
DIA needs to be .8811
above Opening on Tuesday
SPY needs to be ,874 above Opening on Tuesday
QQQ needs to be .806 above Opening on Tuesday.
(IMPORTANT: More than this will be needed to make the break visible on the yearly charts.)
The Closing Power uptrends were broken quite
decisively. It is true that the DJI's price uptrend is still rising.
The DJI's price uptrendline crosses at about 10913,
still 327 DJI points lower. The NYSE A/D Line is also
rising. The DJI closed today exactly at its 21-dma.
This is much better support when it is rising. It is now falling.
The number of new lows has over-taken new highs and
the number of MINCP stocks has overtaken the number
of MAXCPs. Volume picked up on the key ETFs
today on the decline. The Closing Power also is back to its
21-dma. That may act as support briefly on
Monday after a weak opening.
New Tiger software now permits us ot see how much of
an improvement it would take from the next day's
opening to break a selected Closing Power trendline.
In the QQQ chart below, see that the Closing Power
downtrend would be broken tomorrow if the blue CP
Line were to rise +.806. This means the
Close will have
to be +.806 above the opening. Actually,
a little more than than this is needed to be decisive and to make
it visible on the 1-year chart.
New TigerSoft Exploded Chart
It shows exactly how much of a move from the Opening
is needed to break the Closing Power trendline.
http://tigersoft.com/CP-Trendbreaks/index.html
This update has been posted for ESP subscribers and links will be
be sent others tomorrow who have bought the S9Vs update for $75.


There has been
lots of bearish news:
Employers
add no net jobs in Aug.; rate unchanged
Experts
downbeat on global economy
Feds
sue biggest US banks over risky mortgages-
Oil
down nearly 3 percent on jobs report, dollar-
The
Swiss are trying to prevent their currency's rise visa-a-vs the Euro. This may
hurt Gold temporarily.
Watching the
5-day DJI chart is helpful in this high-volatility environment
FIVE-DAY DJIA Chart from
Yahoo

New Falling 21-day ma Sell S9Vs
since 1966
With this signal the DJI must close between 2.4% and 3.95% over
the 21-dma with the
V-Indicator falling and the
21-dmaROC must be below -.10. Five previous cases.
Afterwards, the DJI always
fell to the lower band. In one case, there was a paper
loss of a little more than
3%. The most recent case is the only one that would
not have produced a normal
Sell S9. Better breadth this time is the difference.
The better breadth and
strength in defensive dividend paying stocks reflect
the Feds' easy money
policies. But easy money does not necessarily
bring a recovery when
1) Corporations won't, don't need to and are not required to invest in the US,
2) State and Local Government are running deficits and laying people off,
3) The average consumer is tapped out and cannot borrow from the banks
4) Vast sums are lost because of foreign wars and contractor corruption.
We are again back to the issue of
political gridlock and the failure of our political
leadership to address the issues
above and thereby help Main Street not just
Wall Street. I do not see how
the contradictions between Main Street and Wall
Street can be resolved without Wall
Street taking a lot more hits. The biggest
corporations are mutinational.
The 1930s' lessons suggest national solutions
will probably have to be attempted,
including tariffs and restrictions on export of
capital. Wall Street will not
like this at all.
Sell S9vs
Date
la/ma MAROC P-I
IP21 V-I Opct
1) 9/15/1966
1.029 -.143 -174 +50 -.078 -13 -.146 Chart
already Sell S9
Immediately fell to lower 5% band
in bear market.
Date
la/ma MAROC P-I
IP21 V-I Opct
2) 6/1/1970
1.028 -.40 -237 +40 -.026 -3 -.125 Chart
already Sell S9
fell immediately to lower band
Date
la/ma MAROC
P-I
IP21 V-I Opct
3) 9/23/1998 8154.41 1.026 -.616
-201 87 .018 -90 -.051 Chart
already Sell S9
fell immediately to
lower band.
Date
la/ma MAROC
P-I
IP21 V-I Opct
4) 8/8/2002 8712.02 1.039
-.144 -271 132 .063 -327 -.254
Chart
already Sell S9
Rallied to 9053.64 ( 3.% Paper Loss
) and then fell below the
lower band.
Date
la/ma MAROC
P-I
IP21 V-I Opct
5) 6/16/10 10409.46 1.025 -.253
12 -2 -.013 -150 -.196
Chart
already Sell S9
Rallied to 10442.41 on 6/21/10 ( 0.4% Paper Loss ) and then fell to
9686.49 (5% lower band)
Date
la/ma MAROC
P-I
IP21 V-I Opct
6) 8/30/11 11559.95 1.025
-.603 7 29
.047 -122 .21 (Also see Chart above)
8/31/11 11613.53 1.031 -.267
134 126 .078 -49 .283
Sell S12 a day later...
Open
=================================================================================
EARLIER HOTLINES
=================================================================================
9/1/2011
Earlier Hotlines: 8/12/3011 -
8/31/2011
DJI = 11494 -120 la/ma=
1.031 21-dmaROC= -.426 P =
+43 (-91) IP21= -.036 V= - 192 OP= +.15
BREADTH STATISTICS:
50 (-73) MAXCP
stocks Bullish New Highs and MAXCP Stocks
31 (+20) MINCP stocks
Bearish
MINCP Stocks
MAXCP stocks are those showing Tiger Closing Power making new highs.
This suggests heavy Professional Buying. Applying the Tiger Power Ranker's
"bullish" to the MAXCP stocks find those with heavy insider buying and
institutional accumulation. Bearish MINCP stocks show the opposite.
Also use the BOTHUPs condition with MAXCPs and BOTHDOWNS MINCPS.
Sell S7s occur when Professionals are much more bearish than the Public is.
7 new highs on NASDAQ. 16 new lows on NASDAQ
10
new
highs NYSE
4 new lows on NYSE
9/11/2011 ===>
See Key Peerless TigerSoft
Index Charts: Industry Groups and ETFs
DIA SPY QQQ DJIA-Peerless
TigerDJI TigerSPY TigerQQQ GLD SLV Crude
NASDAQ Sell
S4. NASDAQ falling back from Resistance.
( To produce: Peercomm + Charts 2011 + Short Term Indexes + NASDAQ
+ OK)
(Note that the NASDAQ is much breader
an index than the QQQ)


BIG BANKS' FRAUD SELLING BUNDLED MORTGAGES
 Big
Banks are to be sued for
Big
Banks are to be sued for
mortgage
fraud in how they packaged and resold them. This was reported tonight.
It will cause a weak opening tomorrow.
Goldman is probably the most vulnerable.
This is not new news, except insofar as the
Obama Adminsitration has chosen finally to
actively prosecute them. Goldman
knew these mortgages were poor investments.
They set up a hedge fund to sell short $10
billion woth of them in 2007, apart from all the credit
default swaps they also bought. Proving
fraud should not be hard.
See my blog of 5/20/2009: Goldman Sachs: The
Unbridled Greed Corruption between
Washington and Wall
Street.

New Sell S9V?
Yesterday the DJI closed 3.1% over a falling
21-day ma with the V-Indicator a -49. Research
this weekend will have to be done to see if
this tests well as a good Sell signal to reverse
the current Peerless Buys. It certainly
can't be bullish. Fortunately, we have only a few long
positions. I hesitate to make short sale
recommendations while Peerless is on a regular
Buy. I would suggest going short some of
the Bearish MINCP Stocks, always using the
Closing Power downtrendline to know how long to
say short.
The Peerless DJIA Buys B12/B7 and B14 still operate,
but yesterday I
decided to take profits
in many of the stocks bought for this rally on
our Tiger Stocks' Hotline, and mentioned that
here on the HL. Volume was too low on the
rally to eat up the expected over-head supply.
And 50% retracements had been achieved of what
was lost in the late July-early August
decline The new DIA and SPY Exploded charts'
Closing Power uptrends have today been
violated. Breaks cannot yet be seen on
the year-charts, owing to scaling differences.
The QQQ's CP uptrend has not been broken, but
the Peerless NASDAQ chart shows
multiple Sell S4s.
NASDAQ S4s are reliable. There have been
15 earlier cases since 1990. In 8 of the 15
cases, the NASDAQ declined immediately.
There were 2 big paper losses, in 2000 and 2001,
of 14% and 22%. But they were clearly
early warnings. In fact, In only 3 cases did the
market not enter a bear market soon, if it was
not already in one. These signals occur
because the NASDAQ has risen more than 2.5%
over 21-dma with the Tiger Accum. Index
and Relative Strength "NASDJI" in
negative territory. Recall that I warned this was too much
a defensive rally. The more speculative
NASDAQ lags the DJI when this is true. As a result
of this study, the next Peerless will change
the IP21 requirement to -be below -.01 and
disallow the signal of the NASDAQ is more than
5.1% over the 21-dma..
Here is the track record since 1988 of the Peerless NASDAQ Sell S4.
Date
Nasdaq
LA/MA IP21 Result
--------------------------------------------------------------------------------------------------------------------------------------------
1 6/6/2000
3756.37 1.072 -.019 NASD rallied to 4274.67 on
7/17/2000 and then fell to 3663.00
14% PAPER LOSS
2 8/21/2000 3953.15 1.029
-.097 NASD rallied to 4234.33 on 9/1/2000 and then a bear market...
4 more thru 8/25/2000 7% PAPER LOSS
3 11/2/2000 3429.02 1.035 -.016 Immediate decline. No paper loss. Bear
market followed.
4 12/11/2000 3815.1 1.05 -.09
Immediate decline. No paper loss. Bear market followed.
5 4/11/2001
1898.95 1.029 -.137 NASD rallied to 2313.05 on 5/22/2001
and then fell to 1423.19 on 9/21/2001
22% PAPER LOSS
6 more signals thru 4/26/2001
6 5/18/2001 2198.88 1.032 -.007 Immediate decline. No paper loss. Fell
to 1423.19 on 9/21/2001
7 1/8/2002
2055.73 1.034 -.072 Immediate decline. No paper loss. Fell to
1429.33 on 6/22/2002
8 3/4/2002 1859.32 1.031
-.09 NASD rallied to 1929.49 and then bear market resumed.
1 more signals 4% PAPER LOSS
9 5/16/2002 1730.44 1.027 -.14
Immediate decline. No paper loss. Fell to 1429.33 on 6/22/2002
1 more signals
(X BAD
9/2/2004 1873.43 1.03 0 (not below 0) NASD rallied sharply... )
10 7/3/2006 2190.43 1.027
-.162 Immediate decline. No paper loss. Fell to 2020.39 on 7/21/2006
11 12/6/2007
2709.03 1.028 -.089 Immediate
decline. No paper loss. Bear market followed.
2 more signals
12 11/16/2009 2197.85
1.034 -.028 NASD rallied to 2317.17 and then fell to 2125.43 on 2/4/2010.
5.4% PAPER LOSS
13 6/16/2010 2305.93 1.029 -.019 Immediate decline. No paper loss. Fell
to 2091.79 on 7/21/2010
14 4/4/2011 2789.19
1.025 -.001
(barely below 0)
4/5/2011 2791.19
1.025 0 (not below 0)
4/6/2011 2799.82
1.028 -.031 NASD rallied to 2873.54 on 4/29 and then fell
to to 2616.48 on 6/17/2011 2.6%
PAPER LOSS
2 more signals
15 6/30/2011 2773.52 1.033 -.11
NASD rallied to 2834.02 on 7/6/11 and then fell to 2341.84 on
8/19/2011 2.2% PAPER LOSS
1 more signal
16 8/29/2011 2562.11 1.026 -.046
2 more signals
Another condition to be concerned about
is the fact that the DJI yesterday closed
more than 3% over the 21-dma with the
V-Indicator negative. The track
record for such
a V-Indicator NNC will have to be posted
this weekend....
I think we have to sell the DIA position
we bought a week ago on strength tomorrow.
following the expected weak opening.
It used to be that the trading day before Labor Day
was up 67% of the time. Arthur
Merrill studied the DJI between 1890 and 1984 and showed this.
My own research can only say that the DJI
has risen 62.2% of the time in the 3 trading days
following September 1st.
Unfortunately, it rises only 42.2% of the time over the next 21
trading days and loses 0.7%.
DJIA    |
Exploded
DIA - - Closing Power did break uptrend Yearly DIA  |
Exploded
SPY - Closing Power did break uptrend Yearly SPY  |
Exploded
QQQ - Closing Power did NOT break uptrend Yearly QQQ  |
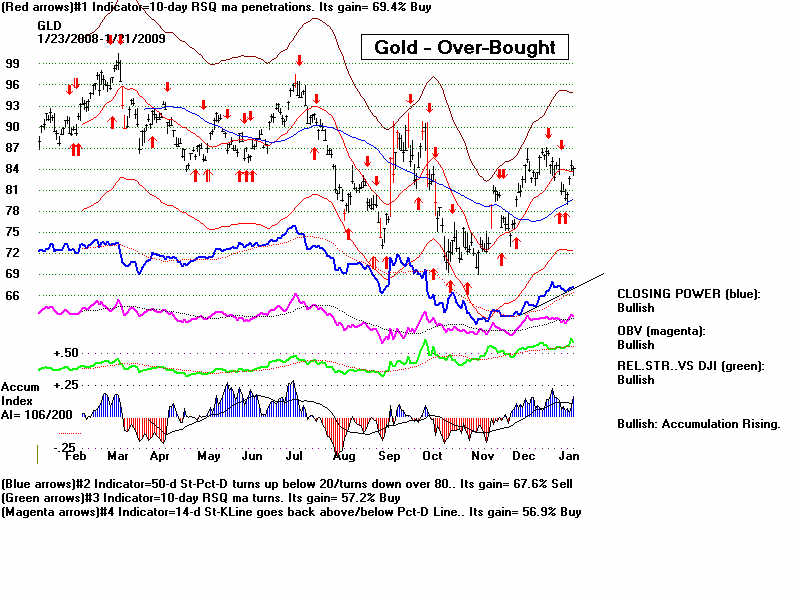
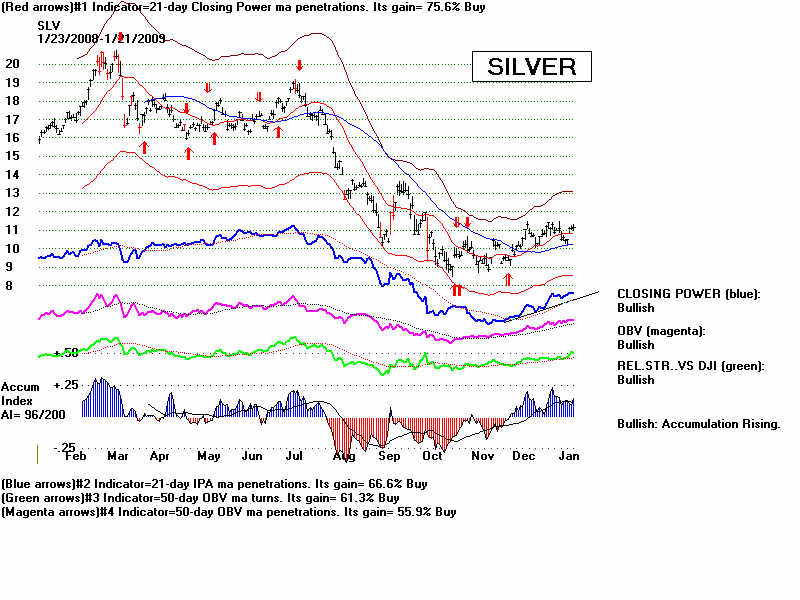
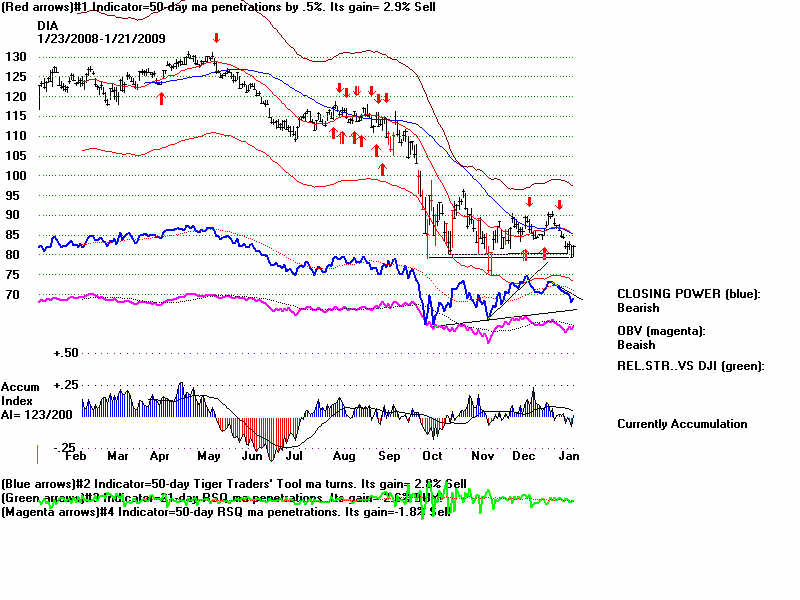
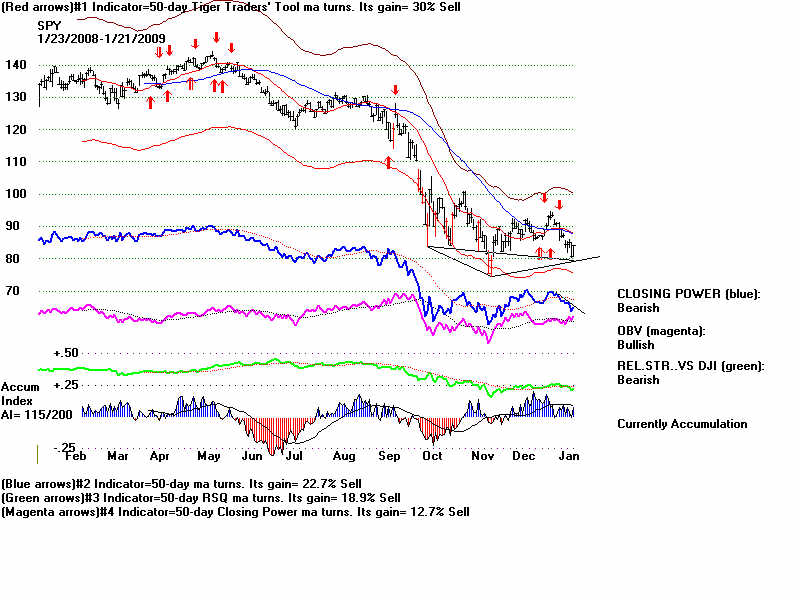