CLOSING POWER TREND-BREAKS
(C) 2011 9/5/2011 www.tigersoft.com
Closing Power trendbreaks, especially as we suggest them to be
used, very often produce excellent trading gains. This is because
TigerSoft Closing Power measures changes in the trends
of net professional buying and selling.
Here's how to know EXACTLY how much of a rise or fall in
TigerSoft's Closing Power the next day will bring a break in the
Closing Power trend you draw. Using the TigerSoft of 9/5/2011
or later, take the following steps:
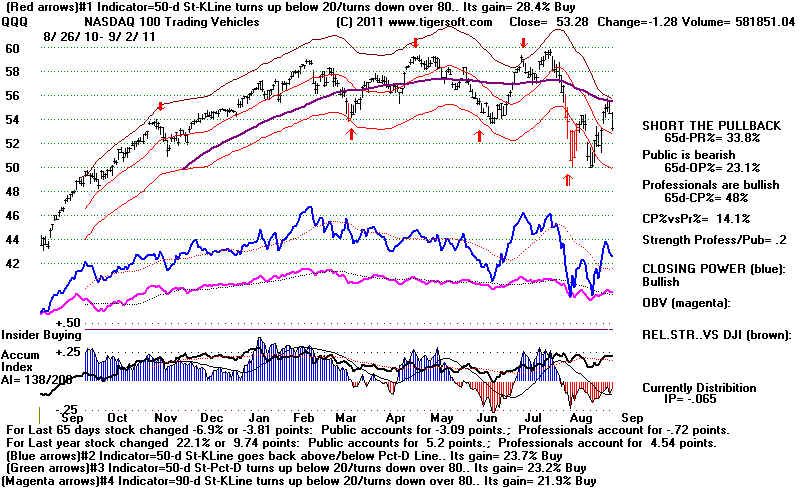
First, put a graph like the one below for QQQ on the screen.
Peercomm + Chart-2011 + Daily Stocks + QQQ
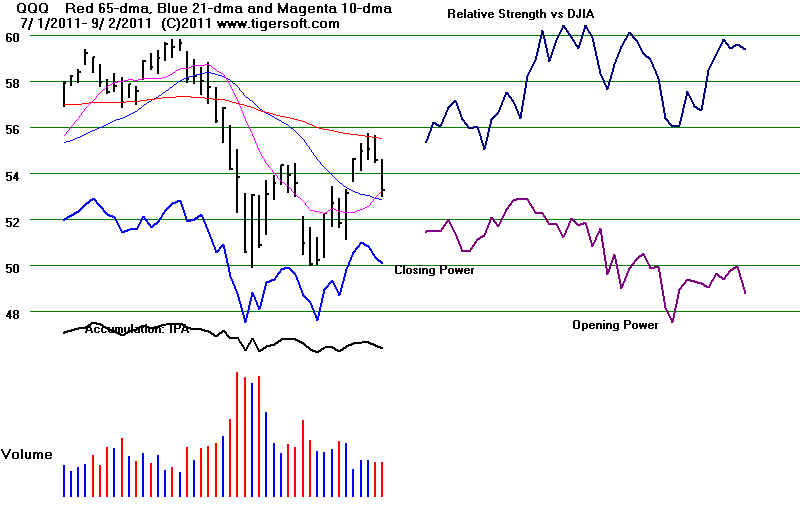
Second, produce an enlarged TigerSoft chart of the last 40, or
so, trading days on the screen.
Lines + Explode Selected Screen Area + OK
Click with left mouse key a spot on the screen back about
40 trading days back from the last day.
Click with left mouse key a spot on the screen just past
the last trading day.
This produces a graph like this. Note the blue Closing Power
just underneath the black daily price bars in the middle of the
left side of the screen.
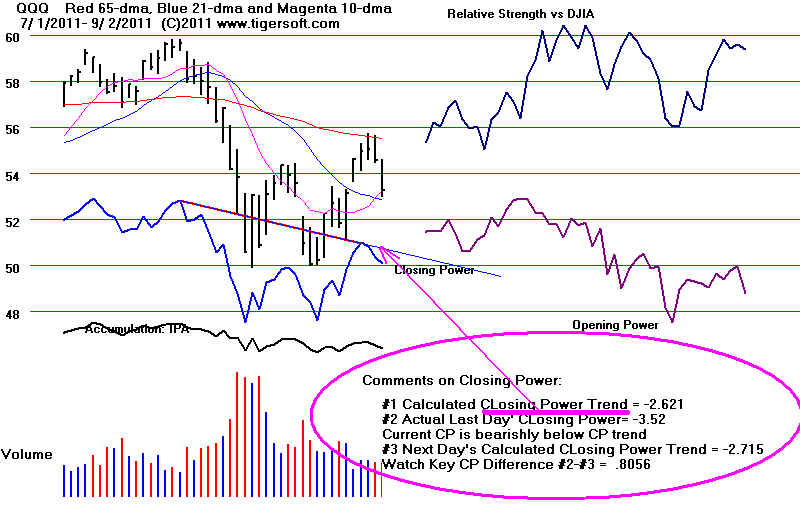
Third, at the top of the screen choose
Lines + Draw Closing Power Trend, Show Stats
Pick two spots on the blue Closing Power trend which
you want to draw the CP trendline through. Pick the earlier
point first. Try to point the mouse exactly at the points you
want. Click the two points carefully with the left mouse-keys. Do not pick
a point much before the first data element or much after the last date.
This will draw a straight red line through these two points and
then extend it further to the right as a finer dark line.
It provides you helpful information on the
CP trendline, how close the current CP value is to
the trendline and what it would take in the way of
a move from the Opening the next trading day to
surpass the CP trendline.
Study the Comments on Closing Power at the lower right:
.
#1 shows where the CP trendline now crosses.
#2 shows the current (actual) CP value.
If the current value is above the CP trendline, the condition is bullish.
If it is below the CP trendline, the condition is bearish.
#3 shows what it would take the next day to get back above
a downtrending CP trendline or above a rising CP trendline.
Watch key CP Difference: #2 - #3
In the example below, QQQ's drawn trendline is downtrending.
It would take a close of more than .8056 above the opening on
the next day to break the downtrend. The software uses the
trendline using the actual CP points, so you can draw the trendline
a little off and still get the correct results.
Example of Downtrending Purple CP trendline.
 .
. Example of Uptrending Purple CP trendline.
