with Positive Peerless P-Indicator and Accumulation Index Readings.
Outcome: 4 up 3 down
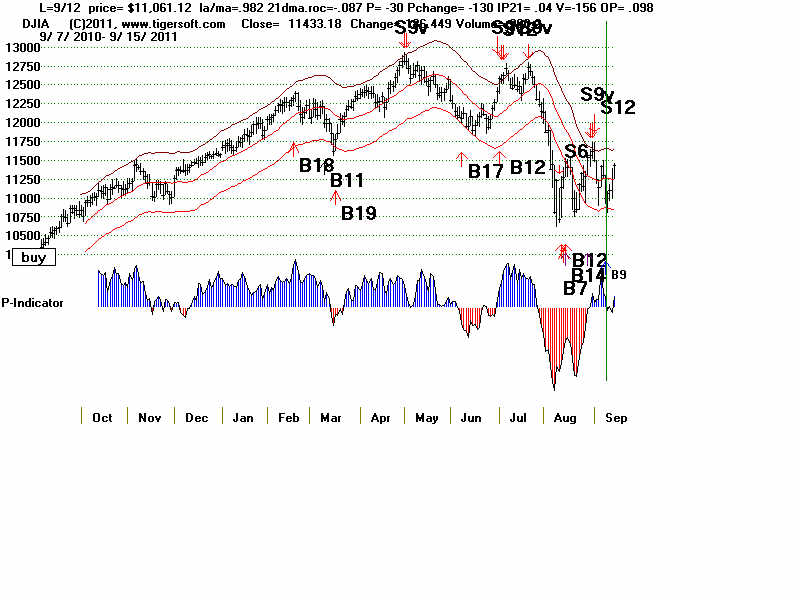
Date la/ma MA-ROC P-I IP21 V-I Opct
9/9/2011 .976 .288 100 -31 .038 -88 .126 below 200-day ma
Outcome - rally to apex of right shoulder in H/S oattern
4/10/96 .976 -.201 6 -60 .042 -15 -.077
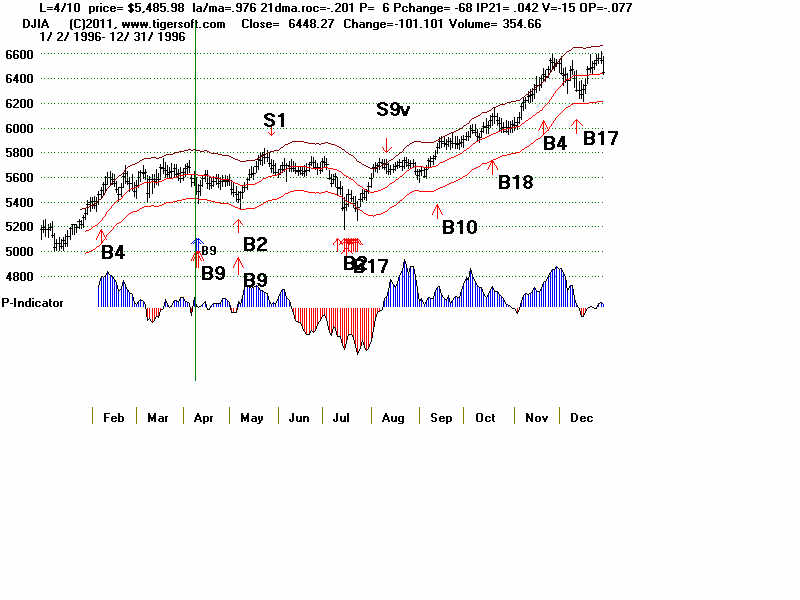
DJI rose immediately.
1/8/88 .975 .261 185 -95 .118 14 .304 below 200-day ma
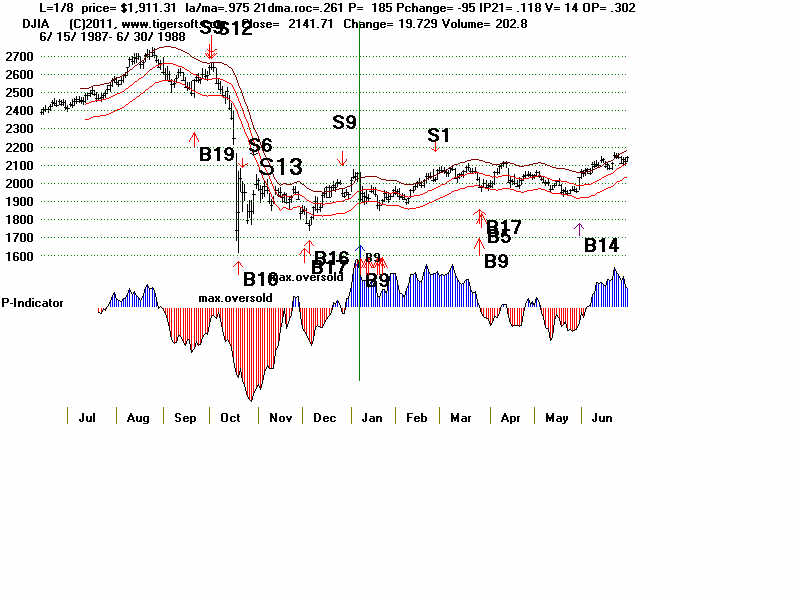
DJI rose immediately
11/18/86 .975 .04 18 -22 .061 0 .021
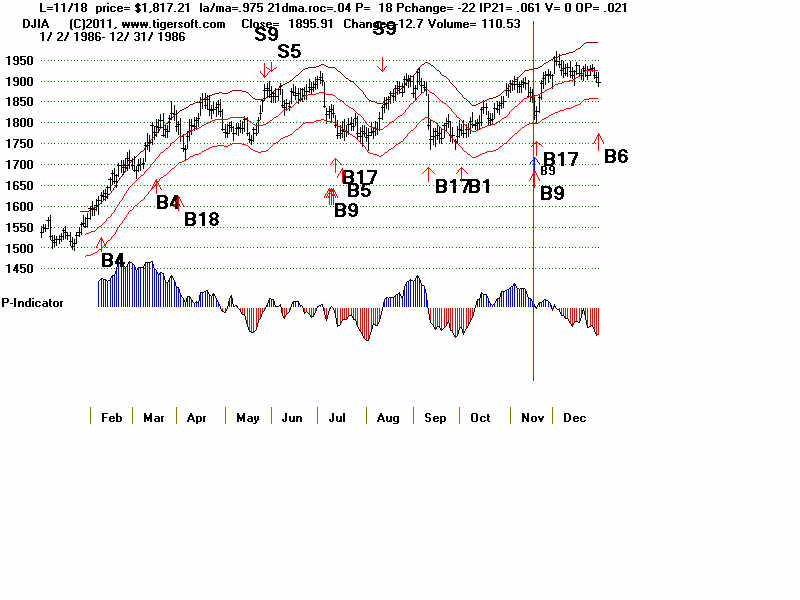
DJI rose immediately.
11/25/58 .977 .022 25 -9 .039 -173 .248
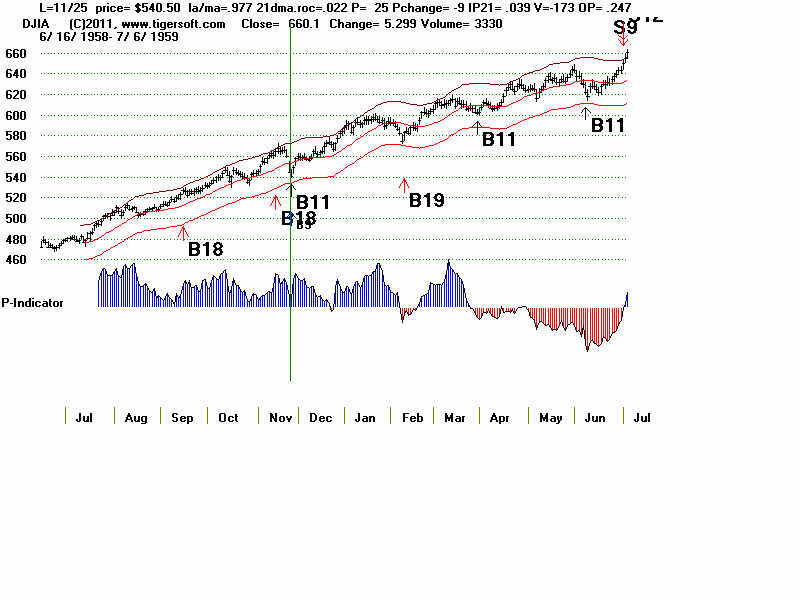
DJI rose immediately.
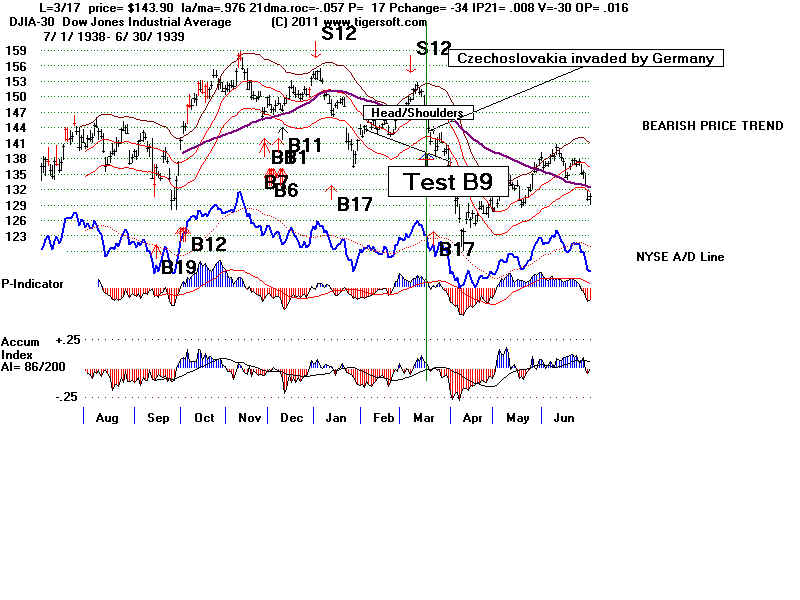
3/17/1939 .976 -.057 17 -34 .008 -30 .016 below 200-day ma
DJI fell from 143.90 to 124.00 on 4/10/1939
H/S Pattern warns of big trouble.
http://en.wikipedia.org/wiki/German_occupation_of_Czechoslovakia
2/3/1932 .976 1.058 50 -1 .057 110 .071 below 200-day ma
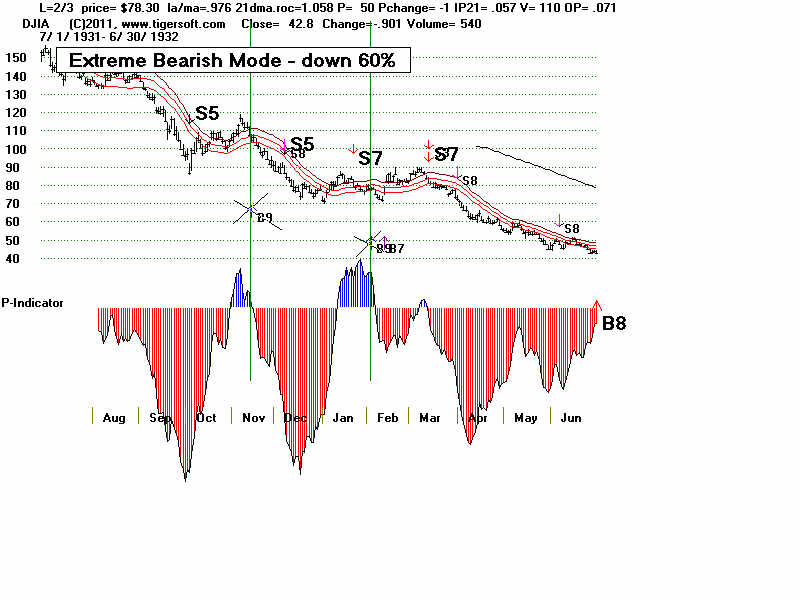
DJI fell from 78.30 to 71.80.
Here the B9 would have been not used because the market mode would then have
been "Extreme Bearish".
11/16/1931 .977 .679 2 -19 .077 -56 .076 below 200-day ma
DJI immediately fell from 104.80 to 71.20 on 1/5/
Here the B9 would have been not used because the market mode would then have
been "Extreme Bearish".